Final Report: Zero-Based Budget Review
851
. A Report for Consolidated Technology Services (WaTech) Final Report: Zero-Based Budget Review 30 June 2018 Engagement: 330046686
-
Upload
khangminh22 -
Category
Documents
-
view
0 -
download
0
Transcript of Final Report: Zero-Based Budget Review

.
A Report for
Consolidated Technology Services (WaTech)
Final Report: Zero-Based Budget Review
30 June 2018
Engagement: 330046686

Engagement: 330046686 — Version 1
Final Report: Zero-Based Budget Review
Report for Consolidated Technology Services (WaTech)
30 June 2018 — Page i
Table of Contents
Executive Summary ...................................................................................................... 1
Executive Summary ........................................................................................................... 2
Report Introduction and Overview............................................................................... 5
Background ........................................................................................................................ 6
Findings ............................................................................................................................. 7
Recommendations: Overview ............................................................................................. 8
Recommendations: Service-by-Service .............................................................................. 9
Recommendations: Transformational Opportunities ......................................................... 34
Recommendations: Enabling Capabilities......................................................................... 38
Strategic Advice ............................................................................................................... 40
Analysis and Future State Recommendations ......................................................... 44
Comprehensive Service/Program Analysis Approach ....................................................... 45
Network and Telephony Analysis and Recommendations ................................................ 48
1. Switched Long Distance ..................................................................................... 49
2. Centrex .............................................................................................................. 52
3. PBX/VoIP/IVR .................................................................................................... 55
4. Citrix Edge.......................................................................................................... 58
5. SSL VPN (Remote Access) ................................................................................ 61
6. Cloud and Office VPN ........................................................................................ 64
7. Network – Core/Transport/Firewall ..................................................................... 67
8. DNS/DHCP ........................................................................................................ 70
Platform Services Analysis and Recommendations .......................................................... 73
1. SDC/QDC Colocation ......................................................................................... 74
2. Mainframe .......................................................................................................... 77
3. Backup ............................................................................................................... 80
4. Storage (SAN/NAS) ............................................................................................ 83
5. WaServ/Email Vault Storage .............................................................................. 86
6. Server Support Services..................................................................................... 89
7. DB Management Services .................................................................................. 92
8. Managed Server Hosting (Legacy) ..................................................................... 95
9. Platform & Connectivity (“Nutanix/Gov”) ............................................................. 98
10. Private Cloud .................................................................................................. 101
Security & Identity Services Analysis and Recommendations......................................... 104
1. Security Lead in Gov ........................................................................................ 105
2. Sec. Ed/Awareness .......................................................................................... 108
3. Sec. Design Review ......................................................................................... 111
4. SOC/Inc. Response .......................................................................................... 114

Engagement: 330046686 — Version 1
Final Report: Zero-Based Budget Review
Report for Consolidated Technology Services (WaTech)
30 June 2018 — Page ii
5. CERT Assessments ......................................................................................... 117
6. Vulnerability Assessment (Tool as a Service) ................................................... 120
7. SIEM (L&M) ...................................................................................................... 123
8. SAW/SEAP ...................................................................................................... 126
9. Security Gateway/F5 ........................................................................................ 129
10. Certification Authority ..................................................................................... 132
11. Secure FTP .................................................................................................... 135
12. Active Directory/ IAM ...................................................................................... 138
Workspace Services Analysis and Recommendations ................................................... 141
1. Desktop/LAN Support ....................................................................................... 142
2. Directory Assistance (citizens) .......................................................................... 145
3. Mobile Device Management ............................................................................. 148
4. Shared Email Services ..................................................................................... 151
5. Skype Services ................................................................................................ 154
6. WebEx Video Conf. .......................................................................................... 157
7. Teleconferencing .............................................................................................. 160
8. Wireless (WIFI) ................................................................................................ 163
9. Enterprise SharePoint ...................................................................................... 166
10. Office 365 Activation ...................................................................................... 169
Application Services Analysis and Recommendations .................................................... 172
1. Project Management ........................................................................................ 173
2. Agile Business Analysts ................................................................................... 176
3. UX & Accessibility ............................................................................................ 179
4. Web Platform/Design ....................................................................................... 182
5. Access Washington .......................................................................................... 185
6. Usability Lab ..................................................................................................... 188
7. BPaaS (ServiceNow Dev) ................................................................................ 191
8. ESF – Finance ................................................................................................. 194
9. ESF – HR/Payroll ............................................................................................. 197
10. ESF – Budget ................................................................................................. 200
11. ESF – Enterprise Reporting ............................................................................ 203
12. Gov’s Apps (OFM Enterprise) ......................................................................... 206
13. E-Time ........................................................................................................... 209
14. JINDEX .......................................................................................................... 212
IT Programs Analysis and Recommendations ................................................................ 215
1. OCIO Oversight ................................................................................................ 216
2. OCIO Policy and EA ......................................................................................... 219
3. Open Data ........................................................................................................ 222
4. TBM Program ................................................................................................... 225

Engagement: 330046686 — Version 1
Final Report: Zero-Based Budget Review
Report for Consolidated Technology Services (WaTech)
30 June 2018 — Page iii
5. OneNet ............................................................................................................. 228
6. Geospatial Governance .................................................................................... 231
7. Geospatial Portal and Imagery Data ................................................................. 234
8. WAMAS ........................................................................................................... 237
9. Video Production Services ............................................................................... 240
Current State Inventory ............................................................................................ 243
Current State Inventory Introduction ............................................................................... 244
1. Telephony Services .................................................................................................... 245
(3341) Centrex ..................................................................................................... 245
(3342) Private Branch Exchange .......................................................................... 255
(3321) Switched Long Distance ............................................................................ 271
(3331) Conferencing............................................................................................. 280
(3332) Directory Assistance/Telephone Information ............................................. 290
2. Data Network Services ............................................................................................... 295
(3480) Network – Core, Transport and Connectivity ............................................. 295
(3466) Cloud and Office VPN ............................................................................... 333
3. Access and Security Services ................................................................................... 344
(3541) Remote Access Services .......................................................................... 344
(3540) Security Gateway Services and (4671 / Formerly 3540) Security Gateway Support .................................................................................... 353
(4672 / Formerly Security Infrastructure Allocation) Security Infrastructure Support – VA, SIEM, and DNS ................................................................ 367
(1165) Wireless .................................................................................................... 379
4. Server Hosting Services ............................................................................................. 386
(4790) Private Cloud ............................................................................................ 386
(4722) Server Hosting Provisioning, (4723) Services Secure Web Hosting, and (4785) Server Support Services ....................................................... 401
(4231) Platform & Connectivity Service ................................................................ 416
5. Storage Hosting Services ........................................................................................... 423
(4589) Server and Mainframe Storage ................................................................. 423
(4593) WaServ/Nearline Storage.......................................................................... 432
(4595) Backup ...................................................................................................... 438
6. Mainframe Hosting Services ....................................................................................... 444
(4562) High Capacity Computing and Mainframe ................................................. 444
7. Colocation Hosting Services ....................................................................................... 454
(4803) State Data Center (SDC) Facility Services ................................................ 454
8. Desktop Services ....................................................................................................... 484
(8111) Desktop Support ....................................................................................... 484
9. Collaboration Services ................................................................................................ 497

Engagement: 330046686 — Version 1
Final Report: Zero-Based Budget Review
Report for Consolidated Technology Services (WaTech)
30 June 2018 — Page iv
(4721) Active Directory & (4724) Identity Management ........................................ 497
(4730) Shared Services E-Mail ............................................................................. 508
(4742) Skype Services ......................................................................................... 519
(4365) Office 365 License Activation .................................................................... 525
(4741) Enterprise SharePoint ............................................................................... 529
(4744) Secure FTP ............................................................................................... 535
(4727) Email ListServ (Retired Service)................................................................ 541
10. Project Management Services .................................................................................. 543
(2120) Project Management ................................................................................. 543
11. App Dev and Support Services ................................................................................. 553
(8310) Enterprise Systems ................................................................................... 553
(8413) Governor’s Apps Support (OFM Enterprise) .............................................. 582
(8411) DES Systems Support .............................................................................. 588
(8840) JINDEX ..................................................................................................... 591
(8213) E-Time ...................................................................................................... 598
(8214) Mainframe Testing .................................................................................... 601
12. Web, Video, and BI Services .................................................................................... 605
(8682) Web Platform/ Design ............................................................................... 605
8610 Cost Code – Related Services Introduction ................................................. 614
(8610) Formerly Access Washington (Defunded) ................................................. 615
(8610) Usability Lab ............................................................................................. 619
(8681) Usability Experience (UX) ......................................................................... 624
(8215) Agile Business Analysts ............................................................................ 629
(8652) Business Automation as a Service ............................................................ 634
(8211) Data Management Service ........................................................................ 638
(8650) Video Production Services (E-Gov/ Other Services) .................................. 646
13. GIS Location Based Services ................................................................................... 652
GIS Location Based Services – Intro .................................................................... 652
(8710) Geospatial Portal ...................................................................................... 652
(8711) Washington Master Addressing Service – WAMAS................................... 660
(1230) Geospatial Initiatives / GIT Committee ...................................................... 668
(1240) WA Geographic Council – WAGIC ............................................................ 674
14. Office of the CIO Services ........................................................................................ 679
(1200) Office of the CIO ....................................................................................... 679
(1210) 800 Mhz .................................................................................................... 693
(1260) OneNet ..................................................................................................... 697
15. Cybersecurity Services ............................................................................................. 702
(3570) OCS Allocation Services ........................................................................... 702
(3571) Forensics Investigation and Consulting ..................................................... 717

Engagement: 330046686 — Version 1
Final Report: Zero-Based Budget Review
Report for Consolidated Technology Services (WaTech)
30 June 2018 — Page v
Addendum. Further Considerations for Zero-Based Review ........................................... 721
Appendix – Benchmark Results .............................................................................. 723
IT Staffing and Spending Benchmark – Overview ........................................... 725
IT Staffing and Spending Benchmark – Details ............................................... 726
Data Network (Wide-Area Network, Internet Access Services, Inter/Intra Data Center Connectivity) ..................................... 729
End-User Computing and Local-Area Network ................................... 730
Mainframe Enterprise Computing ........................................................ 731
Windows and Linux Enterprise Computing ......................................... 732
Voice (Premise – PBX/VoIP) ................................................................. 733
Voice (Long Distance) ........................................................................... 734
IT Service Catalog Rate Assessment – Overview ............................................ 735
IT Service Catalog Rate Assessment – Details ................................................ 736
Network & Telephony Services ............................................................ 737
Platform Services .................................................................................. 740
Security & Identity Services ................................................................. 744
Workspace Services .............................................................................. 745
Application Services ............................................................................. 749
Appendix – Current State (Voice of the Customer) ................................................ 751
1. Telephony Services .................................................................................................... 753
(3341) Centrex ..................................................................................................... 753
(3342) Private Branch Exchange .......................................................................... 753
(3321) Switched Long Distance ............................................................................ 756
(3331) Conferencing............................................................................................. 756
(3332) Directory Assistance/Telephone Information ............................................. 757
2. Data Network Services ............................................................................................... 758
(3480) Network – Core, Transport and Connectivity ............................................. 758
(3466) Cloud and Office VPN ............................................................................... 760
3. Access & Security Services ........................................................................................ 762
(3541) Remote Access Services .......................................................................... 762
(3540) Security Gateway Services and (4671 / Formerly 3540) Security Gateway Support .................................................................................... 763
(4672 / Formerly Security Infrastructure Allocation) Security Infrastructure Support – VA, SIEM, and DNS ................................................................ 764
(1165) Wireless .................................................................................................... 765
4. Server Hosting Services ............................................................................................. 767
(4790) Private Cloud ............................................................................................ 767
(4722) Server Hosting Provisioning, (4723) Services Secure Web Hosting, and (4785) Server Support Services ....................................................... 769

Engagement: 330046686 — Version 1
Final Report: Zero-Based Budget Review
Report for Consolidated Technology Services (WaTech)
30 June 2018 — Page vi
(4231) Platform & Connectivity Service ................................................................ 770
5. Storage Hosting Services ........................................................................................... 771
(4589) Server and Mainframe Storage (SAN/NAS) .............................................. 771
(4593) Nearline Storage (WaServ Vault) .............................................................. 771
(4595) Backup ...................................................................................................... 772
6. Mainframe Hosting Services ....................................................................................... 773
(4562) High Capacity Computing.......................................................................... 773
7. Colocation Hosting Services ....................................................................................... 774
(4803) State Data Center Facility Services ........................................................... 774
8. Desktop Hosting Services .......................................................................................... 776
(8111) Desktop Support ....................................................................................... 776
9. Collaboration Services ................................................................................................ 776
(4721) Active Directory & (4724) Identity Management ........................................ 777
(4730) Shared Services E-Mail ............................................................................. 777
(4742) Skype Services ......................................................................................... 780
(4365) Office 365 License Activation .................................................................... 781
(4741) Enterprise SharePoint ............................................................................... 782
(4744) Secure FTP ............................................................................................... 782
(4727) Email ListServ (Retired Service)................................................................ 783
10. Project Management Services .................................................................................. 784
(2120) Project Management ................................................................................. 784
11. Application Support and Development Services ....................................................... 787
(8310) Enterprise Systems ................................................................................... 787
(8413) Governor’s Apps Support (OFM Enterprise) .............................................. 788
(8411) DES Systems Support .............................................................................. 788
(8840) JINDEX ..................................................................................................... 788
(8213) E-Time ...................................................................................................... 789
(8214) Mainframe Testing .................................................................................... 789
12. Web, Video and BI Services ..................................................................................... 790
(8682) Web Platform/ Design ............................................................................... 790
(8610) Formerly Access Washington (Defunded) ................................................. 794
(8610) Usability Lab ............................................................................................. 794
(8681) Usability Experience (UX) ......................................................................... 794
(8215) Agile Business Analysts ............................................................................ 795
(8652) Business Automation as a Service ............................................................ 796
(8211) Data Management Services ...................................................................... 797
(8650) Video Production Services (E-Gov/ Other Services) .................................. 798
13. GIS Location-Based Services ................................................................................... 800
(8710) Geospatial Portal ...................................................................................... 800

Engagement: 330046686 — Version 1
Final Report: Zero-Based Budget Review
Report for Consolidated Technology Services (WaTech)
30 June 2018 — Page vii
(8711) Washington Master Addressing Service – WAMAS................................... 801
(1230) Geospatial Initiatives / GIT Committee ...................................................... 801
(1240) WA Geographic Council – WAGIC ............................................................ 802
14. Office of the CIO Services ........................................................................................ 803
(1200) Office of the CIO ....................................................................................... 803
(1210) 800 Mhz .................................................................................................... 805
(1260) OneNet ..................................................................................................... 805
15. Office of Cybersecurity Services ............................................................................... 806
(3570) Office of Cybersecurity .............................................................................. 806
(3571) Forensics Investigation and Consulting ..................................................... 808
Appendix – Reference Material ................................................................................ 810
Analysis Methodology Details ......................................................................................... 811
List of Acronyms ............................................................................................................. 819
List of Participating Agencies (Interviews and Focus Groups) ........................................ 823
List of Tables and Figures .............................................................................................. 824

Page 1 of 851
Executive Summary

Page 2 of 851
Executive Summary
This report was commissioned to document an inventory of WaTech’s current services that provides descriptions in sufficient detail to enable an expert review of each service and, considering the current state and trajectory of that service along with industry and technology trends, developments and best practices, answer the following questions:
1. Is the current service (or program) funded appropriately and does WaTech have adequate staffing to support the service?
2. Should WaTech continue to offer this service?
If so, what is the affirmative rationale as to why this is the case, including a description of the expected benefits customers should receive?
If not, what are the reasonable service delivery alternatives and associated transition costs and impacts?
Gartner Consulting leveraged a project approach and analysis methodology that was designed to encompass the full portfolio, collect data needed for evaluation, and develop unbiased third party recommendations leveraging Gartner benchmarking data, and its industry research insights.
During the course of the analysis, Gartner found that WaTech’s services are imbalanced from a staffing and financial perspective. Several services are inadequately resourced with single-person dependencies and skill gaps in some instances, while other services are staffed at or above peer staffing levels and delivered at the same cost or greater than peers. Gartner also found that the current portfolio of services are poorly documented, with many legacy one-off fee-for-service offerings that at times overlap, and have limited agency adoption (i.e., WaTech is the primary consumer via an internal sales process). Several of WaTech’s services are inadequately resourced financially, and some services have been moved between allocations with changes in the chargeback mechanism that has reduced alignment to actual usage and makes it likely that alignment of funding to cost will drift over time.
While WaTech anticipates returning to recoverability as of this fiscal year, Gartner believes that unless WaTech refocuses on maturing key enabling capabilities, and invests in some degree of transformation, WaTech will likely lose more customers across multiple services and will struggle with recoverability in the near future.
In this report, Gartner provides a set of service-specific recommendations that answers the two questions posed above, and also provides additional macro-level enabling and transformational recommendations.
Enabling recommendations span four categories:
Service Management – recommendations include overhauling the service catalog and transitioning away from siloed service offerings, maturing IT service management processes and establishing a continual service improvement culture driven initially by simple metrics, and automating delivery processes where feasible.
Workforce Management/ Organizational Structure – recommendations focus on consolidating the organizational structure to enable multidisciplinary teaming aligned to services, establishing a flexible workforce, improving performance management, and preparing employees for transformational change.

Page 3 of 851
Financial Management/Procurement – recommendations focus on maturing financial management, budgeting, demand management, cost modeling and estimation practices in ways that enable effective service management and improve transparency/fairness.
Leadership/Culture/Governance – recommendations focus on elevating key roles (e.g., service owners, technology architecture) as top level functions, and empowering leadership to refocus on a customer service-orientation.
Transformational recommendations focus on divestment of several services to enable WaTech to slim down and focus, and investment in several key focus areas. Gartner recommends that WaTech make the following transformational changes:
Divest Enterprise Applications services to enable improved alignment to One Washington.
Divest Desktop services to allow transformation efforts to be focused in other areas.
Invest in Collaboration with the creation of a customer driven, WaTech led, and centrally funded migration project to move to Office 365.
Invest in Telephony with the creation of a customer driven, WaTech led, and centrally funded assessment and strategy project that explores a more focused, comprehensive and rapid statewide Voice over Internet Protocol (VoIP) implementation.
Invest in Security starting with an assessment of the maturity of both the enterprise and WaTech security programs, identify gaps, and clarify future role alignment and investment needed to close gaps, and create and fund a comprehensive 3 to 5 year strategic security roadmap.
Invest in Private Cloud with the creation of a customer driven, WaTech led, and centrally funded migration project to retire the legacy environments and consolidate workload on a more robust Private Cloud service.
Gartner acknowledges these recommended changes are substantial, and WaTech will not be able to execute on these recommendations alone. WaTech’s success will be dependent on establishing independent transformation governance, through an independent body (Program Office/Board) to control the transformation, including proviso spending authority (internal organizational governance will not be enough). Agency buy-in and active participation, as well as strong executive sponsorship out of Office of Financial Management and the Governor’s Office, will be prerequisites for success. WaTech should also engage an external party with industry perspective and objectivity to develop the transformation strategy and oversee its execution.
As WaTech moves forward with action planning, Gartner recommends that WaTech conduct the following activities:
Secure additional funding for development of a WaTech Transformation Governance Board and a comprehensive WaTech Transformation Plan.
Establish an independent governance board to include representatives from key stakeholders across the State of Washington, including the Governor’s Office, OFM, WaTech, Washington Legislature, Large Agencies, Small Agencies and an eternal oversight firm. A charter would need to be established, approved and funded.
Once the governance board has been established the external party would be responsible for driving the development of a multi-year comprehensive Transformation plan. The plan will address key decision points from the Zero-Based Budget Report and

Page 4 of 851
outline a phase by phase transformation roadmap, to include details relating to budgeting, resourcing, dependencies and timelines.

Page 5 of 851
Report Introduction and Overview

Page 6 of 851
Background
The State of Washington has been working to drive IT service delivery consolidation for many years starting from the establishment of Department of Information Services (DIS) in 1987. On several occasions since then, Washington has combined organizations in an effort to drive cost savings through increased economies of scale and efficiency. This drive for greater IT centralization has ultimately resulted in the creation of the Consolidated Technology Services (CTS) Agency, or WaTech as the organization has been unofficially rebranded.
Figure 1. An abbreviated timeline of WaTech history
However, the drive toward centralization has not been without its challenges. WaTech has been unable to deliver all of the benefits originally envisioned, which has been due in part to investment missteps such as the decision to build the State Data Center, implementation challenges such as those encountered during the initial build out of the Private Cloud, and poor management decisions such as the decision to focus on agency rebranding rather than investing in the substantial changes required to drive benefits expected from organizational mergers.
WaTech has overspent its planned budgets and under-recovered its costs for many years which necessitated the recent focus on fiscal responsibility. However, the budget squeeze has exacerbated its service delivery and customer satisfaction issues, which in turn has driven further service adoption challenges in a reinforcing cycle.
In spite of working directly with the Office of Financial Management (OFM) on a multi-year “get-well plan,” WaTech continues to experience service-specific losses. Given ongoing recoverability challenges as well as other concerns highlighted in the State Auditor’s Report released in December of 2017, the State Legislature has demanded change to address deficiencies through Section 150(7) within 17-19 Operating Budget which requires WaTech to conduct a zero-based budget review of all services offered to customers.
In order to address the Legislature’s concerns, WaTech needed to reassess its portfolio of services, make plans to course correct as appropriate, and define action plans to transition away from some services and to strengthen the remaining portfolio.
WaTech selected Gartner to assess the current state and make recommendations given its positioning as an industry leader in IT research and benchmarking.

Page 7 of 851
In order to develop unbiased recommendations, Gartner followed a comprehensive and rigorous methodology. The discovery phase included review of WaTech’s full portfolio of programs and services, a review of dozens of documents and financial data reports, and over 100 interviews and focus groups with WaTech as well as seventeen agencies.
Once the discovery phase was completed, Gartner scored each service using six criteria to evaluate Ability to Execute and Value Generation. Each service was then mapped to a rating: discontinue, contain, improve, or expand.
Figure 2. Gartner’s Project Approach
Findings
In addition to the service-by-service current state inventory documentation in the body of this report, Gartner also developed a set of high level findings based on an analysis of the data collected through the discovery process. These findings include an external/customer perspective of WaTech and an internal perspective of WaTech in the lists below.
Gartner Review of Customer/External Perspective (Key Findings)
Generally, service quality is not meeting customer expectations or industry standards, some but not all of this is due to WaTech’s choice to defer refreshes/upgrades and reduce or not replace front-line staff.
WaTech has not modernized or consolidated many legacy services (network is an exception) or partnered effectively with agencies to develop new ones (WiFi is an exception).
WaTech has attempted to be all things to all agencies rather than focusing on a few key customers or improving the quality of critical high volume services that account for most of its revenue/value add.
WaTech’s leadership and culture are laser-focused on cost recovery which leaves little energy for focus or concern regarding customer needs or the quality of the services being delivered.

Page 8 of 851
Washington has a loosely federated IT ecosystem where agencies control their budgets and there are few mandates for the use of centralized, shared services. WaTech should not expect this to change.
Change is needed in WaTech leadership, service offerings and delivery quality to gain trust and credibility with state agencies who are looking at outside options for technology solutions.
There is a broadly held customer perception that there is a conflict of interest between WaTech’s policy making roles within the Office of the Chief Information Officer (OCIO) and its service provider role and believe many policies are driven directly or unconsciously by WaTech financial interests.
WaTech’s actions to improve cost recovery by raising rates, changing cost recovery models or charging for previously included services (often perceived to be without adequate notice or any justification) have damaged relationships with customers.
Gartner Review of Internal Perspective (Key Findings)
WaTech as an organization lacks a clear business and organizational strategy. This has enabled different leaders and managers to pursue their own, sometimes competing agendas and objectives.
The OCIO has not focused on defining Enterprise Architecture and providing statewide technology leadership and guidance, effectively outsourcing this function to large agencies and technical resources within the service provider organization.
Most individual services lack clearly defined technology/feature roadmaps that are bought into by the customers using the services. Roadmaps that do exist focus mostly on refresh and cost containment.
Some key roles (Customer Relationship Management, Service Owners, technology leadership) are pushed too far down in the organization to be effective or too dispersed/blurred with tactical operations/delivery roles to be effective.
Many parts of WaTech’s organization are needlessly siloed based on technology, historical pre-merger groupings, random manager assignments and other factors, when they should be aligned with the services delivered.
An inconsistent approach to performance management coupled with potential union barriers and lack of flexible contracting models make a high performance, flexible and accountable workforce difficult to achieve.
A majority of WaTech costs are recovered through a small number of enterprise level allocations which makes it difficult to understand what services are included, for what purpose and at what service level/cost.
WaTech has too many granular and overlapping services, with service definitions poorly documented.
Recommendations: Overview
Gartner developed two sets of recommendations for WaTech: service recommendations and enabling recommendations.
The service recommendations section includes:
A summary of each service-specific recommendation.

Page 9 of 851
A summary of key transformational investment opportunities and associated considerations for discontinuing related legacy services where relevant.
The enabling recommendations section includes:
Recommendations organized by key capabilities that WaTech will need to mature. WaTech is unlikely to be successful by simply making changes to the existing portfolio of services without addressing many of its capability gaps.
Recommendations: Service-by-Service
For each service and program delivered, Gartner was asked to complete an analysis to answer the questions posed by WaTech:
1. Is the current service funded appropriately and does WaTech have adequate staffing to support the service?
2. Should WaTech continue to offer this service?
If so, what is the affirmative rationale as to why this is the case, including a description of the expected benefits customers should receive?
If not, what are the reasonable service delivery alternatives and associated transition costs and impacts?
Once all of the required data was collected, Gartner leveraged its service scoring and rating methodology to develop a set of service-specific recommendations. Each service was scored against the three components that combine to yield an “Ability to Execute” score, and the three components that combine to yield a “Value Generation” score. Then each service was mapped to a quadrant in a two-by-two matrix with “Ability to Execute” on the Y-Axis and “Value Generation” on the X-Axis to yield the service rating: Expand, Improve, Contain and Discontinue (defined in the rating key below).
Table 1. Scoring Detail and Rating Key
Rating Key Definition Ability to Execute Value Generation Expand Promote and Sustain High High Improve Realign and Refresh Low High Contain Limited Action Beyond Minimal Refresh High Low Discontinue* Actively Work to Retire or Transition Low Low

Page 10 of 851
A summary of the service recommendations are provided in the tables below. The detailed analysis write-up is provided in the Future State section of this document.
Gartner also introduced a service categorization framework to enable a more effective review of the services with the intention of beginning to break down delivery silos, rather than reviewing services in the largely service-owner siloed format that was leveraged in the current state inventory portion of the project.
Figure 3. Gartner Service Categorization Framework for the Analysis
The service recommendations provided below have been aligned to this categorization.

Page 11 of 851
Figure 4. Service-by-Service Rating Overview (Review of Services as Currently Delivered)
* The discontinued category includes some services where Gartner recommends shifting the resources, e.g., discontinuing external delivery of Project Management as a Service and refocusing effort as an internal delivery capability, transitioning resources and responsibilities for JINDEX and OneNet to other agencies that support the primary business capabilities, etc. Summary details for each service are provided on the following pages.

Page 12 of 851
Services and Programs WaTech Should Continue to Offer
This section includes the services that Gartner recommends WaTech continue to offer. Gartner has provided recommendations on how WaTech should proceed with implementing needed investments for services that were rated as improve, these investments are intended to increase the benefits that customer agencies receive from WaTech’s services. Gartner has also provided smaller enhancement recommendations for services rated as expand and contain as well.
Table 2. Services/Programs WaTech Should Continue to Offer
Service/Program Rating Rationale for Continued Delivery and Recommended Enhancements
IT P
rogr
ams
Open Data Expand
Open data is a high value government initiative that is in line with WaTech’s legislative charter.
WaTech’s OCIO Privacy Office should continue to expand agency participation in this critical initiative that enhances open government and accountability.
Geospatial Governance Expand
Geospatial data is an enabler of open government and the OCIO plays an important role in enabling statewide geospatial governance.
The OCIO should continue to lead a group of committed agencies and reach out to additional agencies to expand agency interest in participating in statewide GIS governance and programs.
Geospatial Portal & Imagery Improve
Widespread adoption of the shared Geospatial Portal improves the value to all participants and to the State.
Recommendation is to complete the migration to the cloud to stabilize the performance of this service (current expected completion of migration to Private Cloud slated for August 2018).
Washington Master Addressing Services (WAMAS) Improve
Widespread adoption of WAMAS improves the value to all participants and to the State.
Recommendation is to complete the migration to the cloud to stabilize the performance of this service (current expected completion of migration to Private Cloud slated for August 2018).

Page 13 of 851
Service/Program Rating Rationale for Continued Delivery and Recommended Enhancements
OCIO Policy & Enterprise Architecture (EA) Improve
Policy development and forward looking enterprise architecture development are critical central functions that OCIO must continue to provide.
However, OCIO needs to simplify the policymaking process and improve transparency, increase opportunities for agencies to weigh in and gain buy-in, without paralyzing the process.
OCIO needs to invest additional resources and staff in Enterprise Architecture development and statewide IT strategy development as the capability is currently limited with only a couple staff executing these functions.
OCIO Oversight Improve
OCIO enterprise-level oversight of major projects is a strategic offering.
The OCIO needs to increase staffing levels and expand skillsets in order to provide valuable oversight beyond a basic “check the box” effort.
Given current workload and staffing, OCIO is only able to support each project on average a couple hours a week.
Additionally, OCIO should work with customers to refine the methodology and processes used for project oversight initiatives, and consider establishing an independent oversight budget as a percentage of project cost.
Technology Business Management (TBM) Program Improve
The business value of the TBM information to the ultimate consumers of the information (legislature, OFM, open government advocates) is unclear.
The TBM program provides OFM and Legislative Staff with an additional lens through which to compare IT spending across agencies but it does not appear that the original vision of making direct comparisons and benchmarking – internally and externally has been achieved.
The TBM program currently consumes at least $1.2M in good/services and labor costs per year, and when agency compliance costs are factored in the actual cost may be three to four times this cost.
A deeper dive assessment that calculates return on investment would help illuminate value and appropriateness of continuing to fund the next phase of the TBM roadmap.
Page 14 of 851
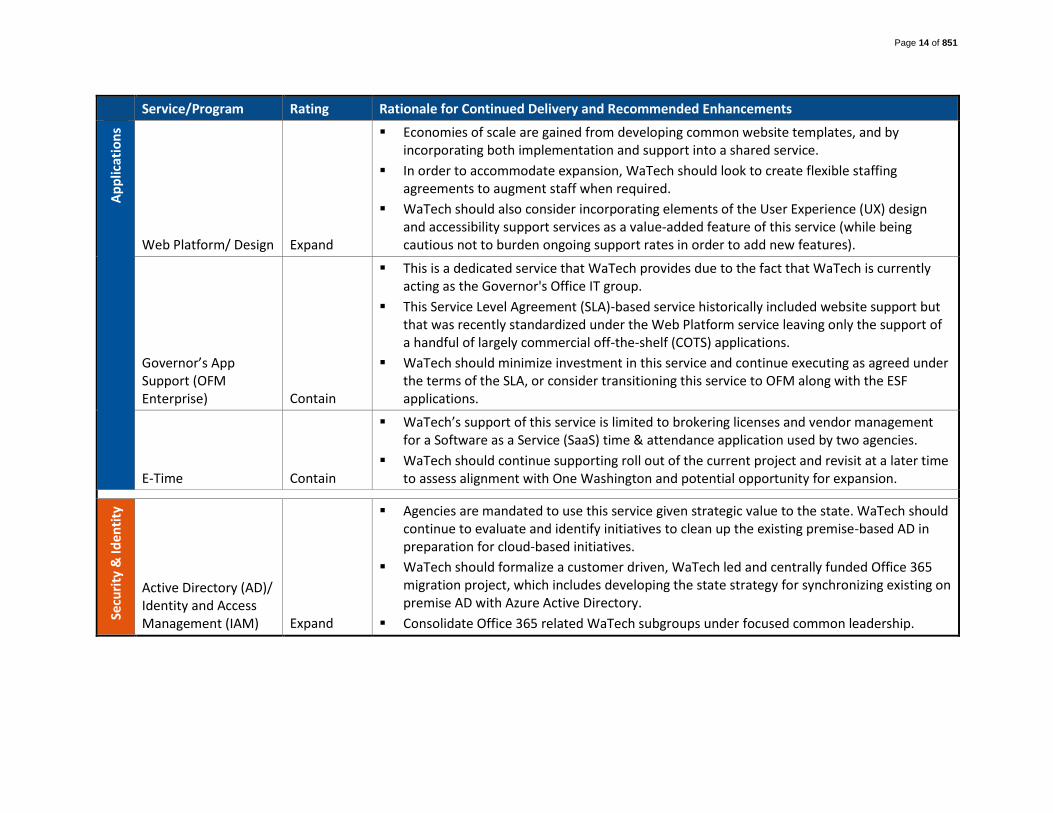
Service/Program Rating Rationale for Continued Delivery and Recommended Enhancements A
pp
licat
ion
s
Web Platform/ Design Expand
Economies of scale are gained from developing common website templates, and by incorporating both implementation and support into a shared service.
In order to accommodate expansion, WaTech should look to create flexible staffing agreements to augment staff when required.
WaTech should also consider incorporating elements of the User Experience (UX) design and accessibility support services as a value-added feature of this service (while being cautious not to burden ongoing support rates in order to add new features).
Governor’s App Support (OFM Enterprise) Contain
This is a dedicated service that WaTech provides due to the fact that WaTech is currently acting as the Governor's Office IT group.
This Service Level Agreement (SLA)-based service historically included website support but that was recently standardized under the Web Platform service leaving only the support of a handful of largely commercial off-the-shelf (COTS) applications.
WaTech should minimize investment in this service and continue executing as agreed under the terms of the SLA, or consider transitioning this service to OFM along with the ESF applications.
E-Time Contain
WaTech’s support of this service is limited to brokering licenses and vendor management for a Software as a Service (SaaS) time & attendance application used by two agencies.
WaTech should continue supporting roll out of the current project and revisit at a later time to assess alignment with One Washington and potential opportunity for expansion.
Secu
rity
& Id
en
tity
Active Directory (AD)/ Identity and Access Management (IAM) Expand
Agencies are mandated to use this service given strategic value to the state. WaTech should continue to evaluate and identify initiatives to clean up the existing premise-based AD in preparation for cloud-based initiatives.
WaTech should formalize a customer driven, WaTech led and centrally funded Office 365 migration project, which includes developing the state strategy for synchronizing existing on premise AD with Azure Active Directory.
Consolidate Office 365 related WaTech subgroups under focused common leadership.

Page 15 of 851
Service/Program Rating Rationale for Continued Delivery and Recommended Enhancements
Secure File Transfer Protocol (SFTP) Expand
SFTP is embedded deeply in many customer data sharing jobs and workflow. Consequently, replacing SFTP with any alternative file transfer solution would be a long, large, complex undertaking requiring significant coordination with many agencies.
While One Washington will ultimately replace many of the legacy mainframe applications that this service primarily supports and WaTech will need to plan to accommodate a more modern approach to integration that will be driven by that project, WaTech will still need to support this service for many more years (at least 5 to 10 more years).
WaTech should sustain the existing solution at the current delivery levels and expand to accommodate natural growth as customer integration needs require.
Security Leadership in Government Improve
Providing centralized leadership for cybersecurity across the state is seen by customer agencies as a key strategic capability.
The State’s first State Chief Information Security Officer (CISO) recently retired so it will be important for WaTech to identify a new CISO with strong leadership skills and experience in public sector to continue Washington’s leadership with partners inside and outside the state.
Going forward the largest opportunity for Office of Cybersecurity (OCS) will be enhancing its leadership position within governance, risk and compliance activities.
OCS should look to create a security governance and risk dashboard that tracks the posture of agencies and aggregates this into an overall score that can be communicated to State leaders and tracked over time, and should also organize the security governance and decision making process in a way that maximizes business leadership’s engagement in risk management, and continue to work on security community building within the state that focuses on establishing stronger two-way communication and more effective security policy-making and enforcement.

Page 16 of 851
Service/Program Rating Rationale for Continued Delivery and Recommended Enhancements
Security Design Review Improve
Service has been mandated by the state as an essential service given that it helps to standardize risk management across the state agencies and minimize the State’s exposure to risk.
However, the backlog of design reviews introduces additional risk to the State by causing project delays. OCS should develop process improvements to ensure consistency and expediency (e.g., additional review tiers, provide additional support materials to customers like checklists and process directions and advice), establish prioritization of reviews and define SLAs for time to respond.
Another approach could include reducing workload on experts by breaking down the process to identify additional pieces that can be completed by customers or junior staff.
SOC/ Incident Response Improve
Standing up OCS to lead enterprise security efforts was an important step (separating Policy/Compliance control function), however, it exposed as many gaps as it closed. Funding and resources for WaTech’s internal security team were unintentionally shifted to the Office of Cybersecurity and need to be resourced to meet customer needs.
Roles and responsibilities for OCS, WaTech and agencies as it pertains to Security Operations statewide (including monitoring, notification, threat detection and analysis, change management and control, Host-based IDS/IPS and ongoing vulnerability management, etc.) are not well defined and gaps (acknowledged and unacknowledged) clearly exist, and the lack of clarity is further complicated by increasing use of the public cloud.
The current model and operations of OCS SOC should be reevaluated to better address the needs of WaTech and other agencies to enable the most effective statewide security posture. WaTech should clarify the separation of duties/accountability between WaTech and OCS in order to make certain that operational/technical roles are clear and that the policy making and compliance role of OCS is not compromised.
WaTech should assess the maturity of both the enterprise and WaTech security program, identify gaps, investment needed to close gaps, and create a comprehensive 3 to 5 year strategic security roadmap.

Page 17 of 851
Service/Program Rating Rationale for Continued Delivery and Recommended Enhancements
CERT Assessments Improve
The CERT Assessment provides OCS with insight into agencies’ security postures and is an opportunity for OCS to better understand security gaps at agencies.
However, the current CERT Assessment team is heavily backlogged (they are only able to take on agencies of a certain size with a wait time over six months and no circling back for compliance checks).
OCS should create a more comprehensive method of measuring the effectiveness of all security programs and identifying and prioritizing gaps.
Vulnerability Assessment Improve
This service as defined today is of limited value (i.e., “host your own tool as a service” where the tool doesn’t meet all the requirements).
Ultimately agencies will need to implement and mature their own Vulnerability Management programs.
This service should be realigned as a broader offering in conjunction with an OCS compliance program that is not limited to license provisioning/hosting and instead rolls out a more comprehensive service built around a WaTech Center of Excellence.
Once WaTech builds up their own internal Vulnerability Management capabilities they will be able to expand the service to include more emphasis on training agencies to establish their own sustainable Vulnerability Management programs.
SIEM (L&M) Improve
This service as defined today is of limited value (i.e., “host your own tool as a service” where the tool doesn’t meet all the requirements).
WaTech should work with the vendor to evaluate the possibility of developing a “multi-tenant” solution for packets, in order to segment customer data, similar to the way the vendor did this for logs, which would enable a more effective partnership between the statewide “Command SOC” and agency SOCs/incident responders.
At a minimum WaTech should separate out the cost management (from DNS and Vulnerability Assessment) for more effective forecasting of long-term needs, and separate out Chargeback from the network allocation.

Page 18 of 851
Service/Program Rating Rationale for Continued Delivery and Recommended Enhancements
Security Gateway/F5 Improve
Security gateway services (forward and reverse proxy, etc.) typically have fairly common requirements across customers that can be satisfied through shared security appliances but WaTech has neglected this area for many years.
The interim leadership consolidated legacy gateway services onto the F5 platform as a cost saving measure, but the decision was made without completing a functional requirements analysis. WaTech should work with customers to define the functional requirements for gateway services and refine the service offering definitions.
Once requirements are more clearly defined, WaTech should conduct a gap assessment of the tools, process and staffing used to deliver the service offerings, and develop a roadmap for addressing the identified gaps (which may include new solutions, governance, processes, etc.)
Secure Access Washington (SAW)/SEAP Improve
If the state chooses to mandate a single citizen identity solution through a centralized application such as SAW, there needs to be more flexibility with the customer login interface.
Beyond the standard interface, SAW should also enable greater implementation flexibility via APIs.
WaTech should assess the long-term viability of the SAW solution and determine whether it makes sense to keep investing in the current platform, and develop a customer-driven and WaTech led strategy for citizen identity and authentication services.
Certification Authority Improve
Certification Authority services typically have common requirements across customers that can be satisfied through shared Private Key Infrastructure (PKI).
WaTech should finish moving certificate requests to self-service function for customers and evaluate opportunities to incorporate certificates into the Mobile Device Management processes. WaTech should also move costs into its own cost center for better transparency.
Security Ed/ Awareness Training Contain
Security education and training are strategically aligned to the State’s priorities, though OCS is one provider among many.
OCS should continue to focus on delivering third party services that provide maximum value to the agencies and continue to survey customers to validate fit of current training portfolio to customer needs and tailor as appropriate.
Page 19 of 851
Service/Program Rating Rationale for Continued Delivery and Recommended Enhancements W
ork
spac
e
Wireless (WiFi) Expand
Service offers key functionality for roaming users that is valuable (standardized platform) and generally well perceived by customers.
WaTech should develop a marketing program to expand the service, and establish a technology refresh strategy to make sure they are deploying the appropriate generation of access points and budgeting for regular lifecycle refresh.
WebEx Video Conferencing Expand
This is a brokered service with additional value-added services offered by WaTech (account creation/management, vendor management).
WaTech has been able to charge a premium for this service, resulting in an annual surplus but as this service expands to a larger user base, thus offering economies of scale, WaTech should explore ways to pass cost reductions to customers via reduced rates.
As a first step WaTech should break out costs of WebEx and Teleconferencing services separately to better understand viability of each service.
Additionally, WaTech offers multiple competing collaboration and communications services and needs to define a go-to-market strategy for each of its offerings in the near term and in the longer term as a part of a more comprehensive Unified Communications and Collaboration (UCC) strategy.
Teleconferencing Improve
WaTech has been able to charge a premium for this service, resulting in an annual surplus, WaTech should explore ways to pass cost reductions to customers via reduced rates (e.g., Rollout self-scheduling and call management capabilities).
As a first step WaTech should break out costs of WebEx and Teleconferencing services separately to better understand viability of each service.
Additionally, WaTech offers multiple competing collaboration and communications services and needs to define a go-to-market strategy for each of its offerings in the near term and in the longer term as a part of a more comprehensive Unified Communications and Collaboration (UCC) strategy.
Mobile Device Mgmt Improve
Security of mobile devices is a key strategic consideration for the state in protecting mobile data. Establishing a common shared Mobile Device Management (MDM) solution across all agencies helps to reduce inefficiencies and protects data.
However, the current service is not meeting customer requirements. WaTech needs to develop a customer driven, WaTech led and centrally funded Mobile Device management strategy, including involvement from OCS for security policy considerations.

Page 20 of 851
Service/Program Rating Rationale for Continued Delivery and Recommended Enhancements
Directory Assistance (citizens) Contain
The directory assistance service is an important statewide service that connects citizens to state resources. However, it is delivered at a high cost ($13 per call) and WaTech should explore ways to contain or even reduce costs.
Pla
tfo
rm
State Data Center (SDC) Colocation/ Quincy Data Center (QDC) Colocation Expand
Due to heavy prior investment (and no ability to divest), the state is bound to subsidizing delivery in order to incentivize agency behavior that maximizes the value in state investment. Although the service is priced competitively, agency adoption is too low to enable operational cost recovery at current price point (building debt service is recovered through a separate allocation).
WaTech should expand marketing of service and aggressively follow up on waivers to ensure maximum use of facility.
WaTech should also explore other action(s) to enable recoverability (e.g., small price increase, adjusted rate model with cabling as a separate fee-for-service offering, additional state subsidy).

Page 21 of 851
Service/Program Rating Rationale for Continued Delivery and Recommended Enhancements
Private Cloud Improve
WaTech recently implemented a new Private Cloud offering intended to replace legacy compute services. Performance and reliability issues early in the rollout stalled adoption, and ongoing support of other environments limits staff/resources.
WaTech should invest in expanded features/ more robust private cloud offering, and discontinue point solutions (Data Mgmt, Platform & Connectivity, Managed Server, Storage, Backup) as individual services – i.e., reconsider service as an expanded offering more in line with industry.
However, given positioning as an optional service, and late market introduction, WaTech may not be able to drive the kind of volume needed to prove the solution is cheaper/better than agency solutions, and may struggle to achieve significant agency adoption.
A critical success factor will be to avoid overinvestment in new feature rollouts, and keeping close coordination with customers to ensure any investments are in line with expressed needs.
Successful discontinuance of legacy solutions will be dependent on dedicating staff/funding to focused customer migration teams, and in purchasing additional capacity in the Private Cloud in advance of when major workloads are slated to migrate.
Once legacy services are discontinued, a combined and streamlined multi-disciplinary team should be able to manage the equivalent workload that was previously managed by three teams.
WaServ/ Email Vault Improve
Based on Gartner’s understanding there is a strong business case for email archival to be delivered centrally across all agencies.
WaTech should conduct a gap analysis between the functionality that vault provides versus what’s available either from Microsoft directly as a part of the cloud-based subscription or some other cloud toolset.
WaTech needs to define the architecture for O365 and develop a strategy for modernization of email archival.

Page 22 of 851
Service/Program Rating Rationale for Continued Delivery and Recommended Enhancements
Mainframe Contain
Customers are wary of the implications of being one of the last mainframe users.
They have plans to migrate off the platform, though many of these plans are not well-defined or funded.
WaTech should develop a Statewide Mainframe migration strategy/roadmap which includes buy-in and commitment from mainframe stakeholders (WaTech, One Washington, WaTech Mainframe customer agencies) and agencies that operate their own mainframes.
Develop a sourcing strategy that will provide best value to the state (leverage the RFP process to identify most effective way for containing mainframe costs as agencies exit the service).
Ne
two
rk a
nd
Te
lep
ho
ny
Network – Core/ Transport/ Firewall Expand
WAN services (particularly the SMON, campus fiber network, and the data center LAN) must be delivered as a shared service. It does not make sense strategically to take any other approach.
However, agencies expressed some frustrations, particularly around inflexibility of the new allocation, circuit procurement timelines, reliability of remote office network connectivity and communication/customer service.
WaTech should assess customer requirements (e.g., enabling greater flexibility in adding removing office locations, better reliability at remote locations, etc.), develop a customer driven strategy and long-term investment plan/ product features roadmap.
Assess needed adjustments to chargeback approach that enables agencies to execute business at best value for the state (e.g., move to a simplified FFS model, or if remaining with allocation, move to an all-inclusive model that enables more agile site reduction, work with agencies to add networking considerations early in site evaluation processes to ensure agencies pick locations compatible with best value to state).
Establish a plan for periodic benchmark to ensure costs remain appropriate over time (particularly critical if remaining with allocation approach for chargeback).

Page 23 of 851
Service/Program Rating Rationale for Continued Delivery and Recommended Enhancements
Cloud and Office VPN Improve
The service is an important shared service given WaTech’s responsibility for network security. WaTech should assess customer requirements for future use of service and conduct a gap analysis to ensure architecture will meet needs.
WaTech should plan to better integrate cloud and office VPN services into broader set of network services.
As the cloud highway is implemented identify ideal use cases for how this offering fits in the portfolio and develop customer communication materials that educates them on best ways to leverage the available offerings.
Secure Sockets Layer Virtual Private Network (SSL VPN Remote Access) Improve
SSL VPN is commonly provided as a shared service by state shared services organizations and WaTech is able to deliver it at pricing that is in line with peers. WaTech should complete configuration of Disaster Recovery capability (critical priority given importance of remote access service during a disaster situation).
Document processes and define metrics for reporting (e.g., comparative availability of soft and hard tokens, and certificates underpinning the SSL VPN service). Develop a strategy for encouraging greater and more rapid adoption of soft tokens (e.g., potentially passing back some additional savings to the customer to encourage further adoption).
Domain Name System (DNS)/ Dynamic Host Control Protocol (DHCP) Improve
WaTech leverages a key agreement with another state along with a shared set of appliances to deliver what is typically provided as a leveraged shared service.
WaTech should develop a long-term cost model that incorporates potential improvements, like self-service and automation, and update cost tracking and chargeback in order to drive better transparency and ensure appropriate availability of staffing and funding.
Private Branch Exchange (PBX)/ Interactive Voice Response (IVR)/ Voice over Internet Protocol (VoIP) Improve
A statewide strategy is needed to avoid spending millions in redundant technology as agencies implement their own solutions. WaTech should partner with key customers to conduct an architectural assessment, develop a statewide IP Telephony Transformation strategy and obtain buy-in and funding from state leadership, establish a customer-driven strategy for moving forward with VoIP implementation.
The comprehensive statewide plan should clearly delineate responsibility for obtaining funding. WaTech should simplify the rate model and get down to a “per phone per month” charge (possibly metro versus non-metro rates).

Page 24 of 851
Service/Program Rating Rationale for Continued Delivery and Recommended Enhancements
Switched Long Distance Contain
Customers view the service as expensive due to 100% long distance markup over carrier rates, as customers move off other telephony services they have stated an intention to move away from Long Distance as well.
WaTech should assess ROI of pin code and billing management, and evaluate opportunities to reduce delivery costs, including impact of elimination of pin code and billing management on pricing.

Page 25 of 851
Services and Programs WaTech Should No Longer Offer
For each of the services Gartner recommends that WaTech stop providing to customer agencies, Gartner developed high level transition cost estimates. Transition cost estimates are intended to reflect WaTech’s full cost to stop providing the service, and therefore incorporates the estimated labor cost of planning; labor cost of transition/transformation execution; selling or destroying assets no longer required, and any lost value of discarded assets (unsaleable); communication, coordination and handoff to other agencies, as required; removal from service catalog. Transition costs are estimated for WaTech only. Agencies may incur additional costs.
Size of Transition Investment
Limited Cost Small Cost Medium Cost Significant Cost
Dollar Estimate $0 to $10,000 $10,000 to $250,000 $250,001 to $1,000,000 $1,000,001 or greater
Summary View of Service Transition Costs
Video Production Services
Agile Business Analysts
Access Washington
Project Management
ESF – Finance
ESF – Budget
ESF – HR/Payroll
ESF – Enterprise Reporting
JINDEX
OneNet
UX & Accessibility
Usability Lab
BPaaS (ServiceNow Dev)
Centrex
Citrix Edge
Managed Server Hosting (Legacy)
Platform & Connectivity
DB Management Services
Server Support Services
Storage
Backup
Desktop/LAN
Skype
Shared Email
Enterprise SharePoint
Office 365 Activation

Page 26 of 851
Table 3. Services/Programs WaTech Should No Longer Offer
Service/Program Rating Delivery Alternatives and Transition Considerations Transition Cost IT
Pro
gram
s
OneNet Discontinue
Service is dedicated to one agency (does not align with shared delivery model).
Recommendation is to work with Washington Military Department to transition service with minimal impact.
Smooth transition will require negotiation with the Washington Military Department on timing and terms of handoff (e.g., assignment of resources, sourcing efforts, etc.). Small Cost
Video Production Services Discontinue
Service is non-strategic (does not align with shared delivery model and legislative charter) and is difficult to consistently recover (dependent on a single resource, short-term consulting work).
Recommendation is to find a new home for the service (outside of WaTech) or shut it down.
WaTech is under contract to begin a large project and may want to complete that project while looking for a better aligned government organization to take over this service, and/or to allow sufficient lead time for service discontinuance to minimize impact to agencies. Limited Cost
Ap
plic
atio
ns
ESF – Finance, Budget, HR/Payroll, Reporting Improve*
Legacy application development and support team should be merged with One Washington. Ultimately this could be a future investment area for WaTech (if One Washington were to come under WaTech) otherwise WaTech should look to discontinue the service by hiving it off and transitioning it to OFM to manage.
At a minimum, WaTech should improve the service by realigning resources under streamlined management structure in order to better align with customer objectives.
*Strategic Advice – while this service was rated as “Improve” and could be improved through realignment of resources, Gartner is making the strategic recommendation for WaTech to divest this service and transition responsibility to OFM Small Cost
Page 27 of 851
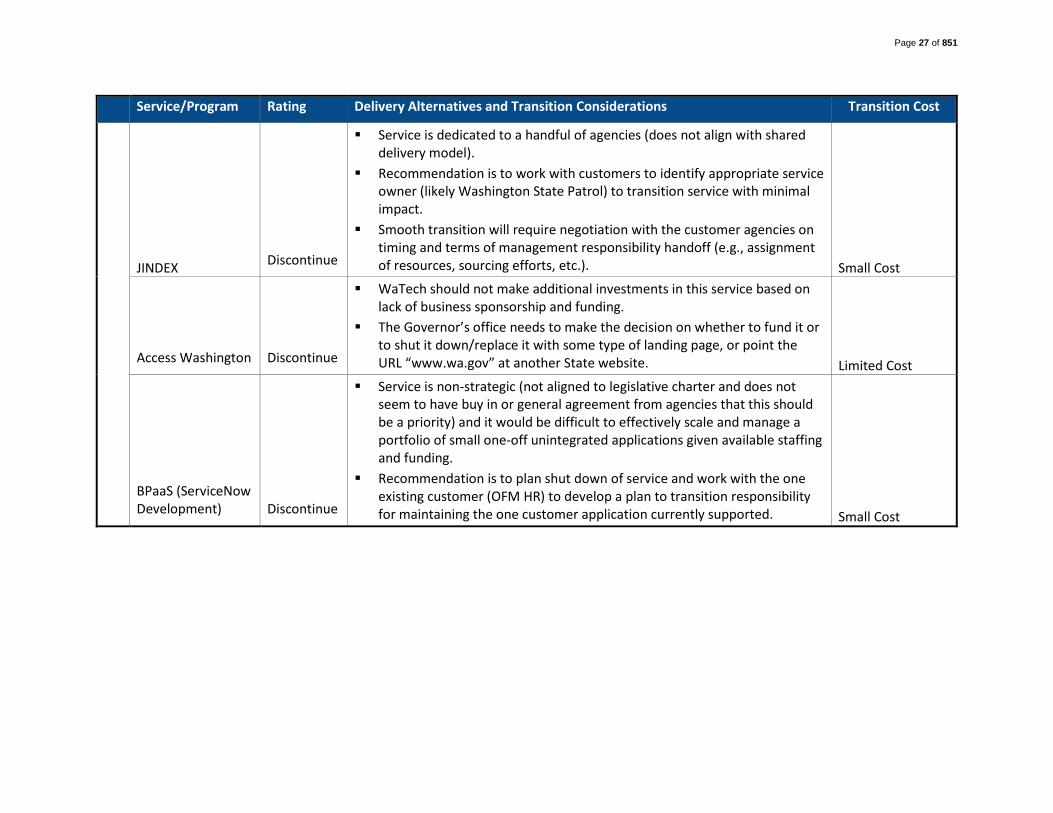
Service/Program Rating Delivery Alternatives and Transition Considerations Transition Cost
JINDEX Discontinue
Service is dedicated to a handful of agencies (does not align with shared delivery model).
Recommendation is to work with customers to identify appropriate service owner (likely Washington State Patrol) to transition service with minimal impact.
Smooth transition will require negotiation with the customer agencies on timing and terms of management responsibility handoff (e.g., assignment of resources, sourcing efforts, etc.). Small Cost
Access Washington Discontinue
WaTech should not make additional investments in this service based on lack of business sponsorship and funding.
The Governor’s office needs to make the decision on whether to fund it or to shut it down/replace it with some type of landing page, or point the URL “www.wa.gov” at another State website. Limited Cost
BPaaS (ServiceNow Development) Discontinue
Service is non-strategic (not aligned to legislative charter and does not seem to have buy in or general agreement from agencies that this should be a priority) and it would be difficult to effectively scale and manage a portfolio of small one-off unintegrated applications given available staffing and funding.
Recommendation is to plan shut down of service and work with the one existing customer (OFM HR) to develop a plan to transition responsibility for maintaining the one customer application currently supported. Small Cost

Page 28 of 851
Service/Program Rating Delivery Alternatives and Transition Considerations Transition Cost
User Experience (UX) & Accessibility Discontinue
WaTech has a small portfolio of successful UX and Accessibility projects but workload is episodic and the parameters of the “consulting practice” are not well defined (e.g., goals for billability, lead development, resourcing strategy, etc.).
WaTech should consider incorporating elements of the UX design and accessibility support services as a value-added feature of the Web Platform/ Design service (while being cautious not to burden ongoing support rates in order to add new features).
WaTech should look to transition away from providing this as a stand-alone service.
Agencies will be able to contract for third party support in line with rates currently paid to WaTech and transition risks are minimal given low service adoption. Small Cost
Usability Lab Discontinue
Service is included in an allocation making it “free” for agencies paying for the Enterprise Systems Fee but historical usage is only 30%.
In general, there are a limited number of agencies performing high volume custom development work which would call for high-end usability testing.
WaTech should repurpose the physical space and discontinue the service. Small Cost

Page 29 of 851
Service/Program Rating Delivery Alternatives and Transition Considerations Transition Cost
Project Management Discontinue
Project Management (PM) as a Service is a non-strategic service for WaTech to deliver.
It is a commodity service that is widely available from third parties, and WaTech does not have a well-established “consulting practice” to ensure alignment of supply and demand of PM as a professional services offering.
WaTech should stop selling PM services as a service and embed costs as a part of ongoing WaTech operations (eliminate disincentive to leverage project managers in key operational projects, but still track billed time for showback purposes, and discontinue efforts to sell PM services to other agencies).
WaTech needs to establish Project Management Office (PMO) governance for ongoing needs evaluation and prioritization, to ensure appropriate pipeline management and rightsizing of staff to meet requirements.
WaTech should also establish flexible contracts to utilize third party project managers to meet short-term demand as needed. WaTech only has one external customer today and should complete the terms of the existing agreement to eliminate transition impact, but WaTech should immediately discontinue marketing this service externally. Limited Cost
Agile Business Analysts Discontinue
Service is dependent on episodic capacity (i.e., “spare time”) from staff who are committed to supporting enterprise systems on a full-time basis.
Staff are fully funded to support OFM applications necessitating system for reimbursing the Enterprise Systems Fee for time spent.
WaTech should discontinue this as a stand-alone service and refocus on the enterprise application portfolios where there may be an opportunity to improve delivery effectiveness.
Resources should be realigned to best meet the needs of the enterprise application business owners (realigned to focus only on Enterprise Systems). Given service is still in the experimental stage (2-3 projects), transition impacts will be limited. Limited Cost

Page 30 of 851
Service/Program Rating Delivery Alternatives and Transition Considerations Transition Cost W
ork
spac
e
Desktop/LAN Improve*
The Revised Code of Washington explicitly defines WaTech’s mission as encompassing responsibility of desktop services but WaTech has not been able to successfully drive sufficient standardization and automation to gain efficiencies and drive service adoption.
WaTech only supports a handful of small agencies with about 50% of supported desktops within two large agencies (OFM or DES) and most of the rest internal within WaTech.
The service stability is at risk if either large customer decides to move away from WaTech’s service. DES has expressed the desire to move away within the next year.
WaTech needs to develop a customer driven, WaTech led strategy for modernizing the service and minimizing costs going forward (e.g., automation, virtualization, remote support, etc.) and maturing processes (e.g., performance management), or handoff responsibility to DES, OFM and possibly another provider for small agency support.
*Strategic Advice – while this service was rated as “Improve” and could be improved through a transformational modernization effort led by WaTech, Gartner is making the strategic recommendation for WaTech to divest this service and transition responsibility Medium Cost

Page 31 of 851
Service/Program Rating Delivery Alternatives and Transition Considerations Transition Cost
Office 365 Activation, Skype, Shared Email, and Enterprise SharePoint
Discontinue
WaTech collaboration services are currently centered on hosting as much of the administrative responsibilities have been pushed to the agencies.
In line with industry direction to move to cloud-based collaboration tools, WaTech is currently pursuing an effectively unfunded migration to Office 365 with a selected architecture that is a major point of customer contention.
WaTech needs to establish a customer driven, WaTech led and centrally funded Office 365 migration project, consolidate Office 365 related WaTech subgroups under focused common leadership, and define a longer term comprehensive UCC strategy, including Audio/Web conferencing, telephony and collaboration services.
WaTech has a key role to play in migration to O365 but its future service provider role will be limited as the hosted services are retired.
WaTech should prioritize the development of replacement/upgrade strategy for vault storage to avoid functional degradation after the move to O365.
Successful discontinuance of legacy solutions will be dependent on dedicating investment dollars on focused customer migration teams.
Following through on architecture assessment to validate the ability to support a multi-tenant architecture will help reestablish customer confidence in WaTech. Significant Cost
Pla
tfo
rm
Managed Server Hosting (Legacy)
Discontinue
WaTech should improve the Private Cloud offering and form a focused workload migration planning and execution team to create painless, value-added migration path and migrate existing workloads to Private Cloud at no incremental cost to current customers. Medium Cost
Platform & Connectivity Discontinue
WaTech should improve the Private Cloud offering and form a focused workload migration planning and execution team to create painless, value-added migration path and migrate existing workloads to Private Cloud at no incremental cost to current customers. Address additional migration issues around SharePoint, file sharing and Core LAN infrastructure. Medium Cost
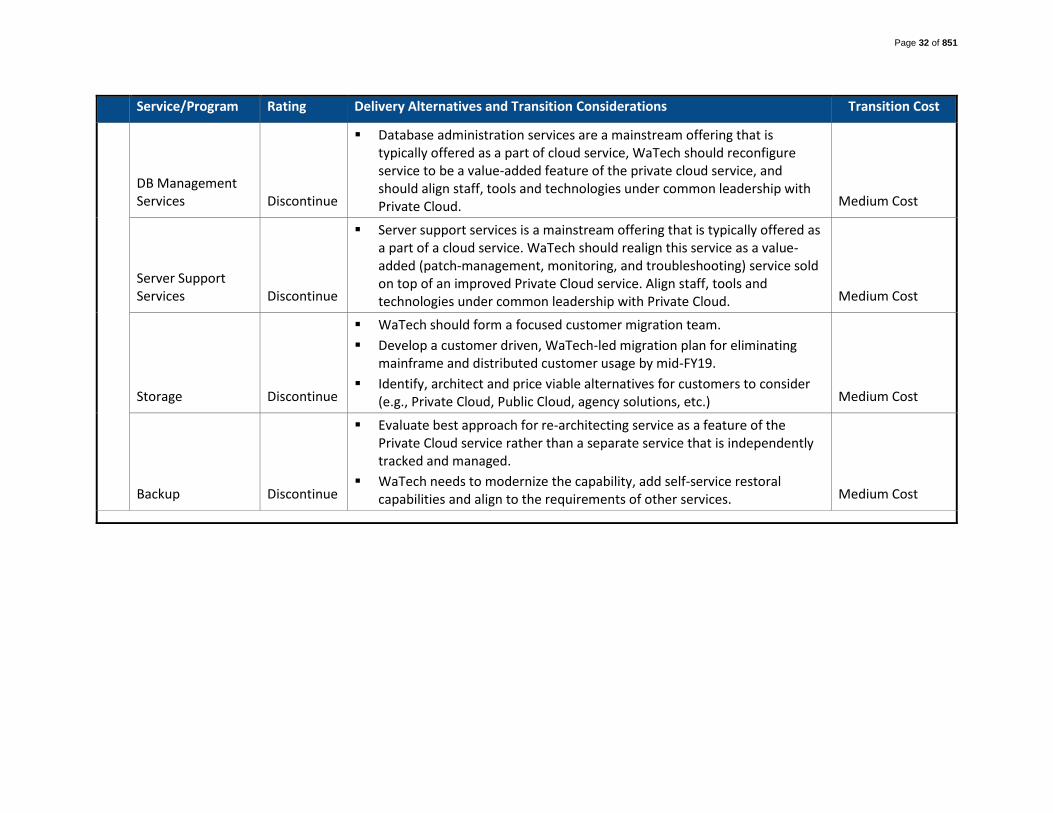
Page 32 of 851
Service/Program Rating Delivery Alternatives and Transition Considerations Transition Cost
DB Management Services Discontinue
Database administration services are a mainstream offering that is typically offered as a part of cloud service, WaTech should reconfigure service to be a value-added feature of the private cloud service, and should align staff, tools and technologies under common leadership with Private Cloud. Medium Cost
Server Support Services Discontinue
Server support services is a mainstream offering that is typically offered as a part of a cloud service. WaTech should realign this service as a value-added (patch-management, monitoring, and troubleshooting) service sold on top of an improved Private Cloud service. Align staff, tools and technologies under common leadership with Private Cloud. Medium Cost
Storage Discontinue
WaTech should form a focused customer migration team.
Develop a customer driven, WaTech-led migration plan for eliminating mainframe and distributed customer usage by mid-FY19.
Identify, architect and price viable alternatives for customers to consider (e.g., Private Cloud, Public Cloud, agency solutions, etc.) Medium Cost
Backup Discontinue
Evaluate best approach for re-architecting service as a feature of the Private Cloud service rather than a separate service that is independently tracked and managed.
WaTech needs to modernize the capability, add self-service restoral capabilities and align to the requirements of other services. Medium Cost

Page 33 of 851
Service/Program Rating Delivery Alternatives and Transition Considerations Transition Cost N
etw
ork
an
d T
ele
ph
on
y
Centrex Discontinue
As the line counts are reduced, the cost per line will increase, and it will be difficult for WaTech to continue delivering this service.
WaTech should discontinue this service by transitioning vendor and provisioning management responsibilities to the agencies or encourage agencies to use more modern telephony services (e.g., VoIP/PBX) where feasible. WaTech should ensure that DES negotiates a master agreement that is available to agencies for direct purchase.
WaTech should either develop a smooth transition process or continue raising the price and offer the alternative to transition the contract to the agencies, rather than, or in addition to, establishing a service cutoff date.
Agencies will lose some self-service features as WaTech supports a CenturyLink tool that is managed on behalf of agencies. Small Cost
Citrix Edge Discontinue
The last Citrix Subject Matter Expert left WaTech in May 2014, the service is provided on infrastructure that is due for a refresh, there is no disaster recovery solution and WaTech does not track or report on performance.
While this service is commonly provided as a shared service by state shared services organizations, WaTech has already announced an end of service date and all but four customers have migrated off.
WaTech should collaborate with remaining customers to define a migration plan to meets their requirements and while minimizing risk associated with ending the service offering.
WaTech reports that the SSL VPN service is sufficient to meet customer’s remote access requirements, and those that require Citrix Edge will need to self-support or contract for third party support after WaTech discontinues its service offering. Small Cost

Page 34 of 851
Recommendations: Transformational Opportunities
While Gartner has provided recommendations specific to each service delivered, many of these service-specific recommendations roll up to five major transformational efforts. The five tables below highlight these high priority transformation opportunities: collaboration, enterprise applications, private cloud, telephony and security.
Successful execution of each of these efforts will likely require realignment of staff, a dedicated project budget, a customer driven approach, independent oversight and control of the transformation budget, as well as a concerted effort by WaTech to mature capabilities and establish a customer and service-delivery driven culture. This section discusses the transformational opportunities, while the next two sections address the required focus on maturing enabling capabilities, and additional strategic advice related to the governance and oversight approach.
Table 4. Transformational Project Opportunity – Collaboration
Background WaTech is currently pursuing an effectively unfunded migration to Office 365 with a selected architecture that is a major point of customer contention.
Decision Point
Whether to formally invest in a statewide project to migrate to Office 365, and discontinue premise-based services (Skype, Shared Email, and SharePoint) and the O365 Activation service as it is currently provided.
Recommended Actions
Create a customer driven, WaTech led and centrally funded Office 365 migration project.
Consolidate Office 365 related WaTech sub-groups under focused common leadership.
Integrate with a comprehensive UCC strategy, including Audio/Web conferencing, telephony and collaboration services.
Risk Associated with Inaction
Greater likelihood of project failure or delay, given staffing and funding challenges.
Lower probability of resolving architectural issues related to active directory and global address replication, and vault storage replacement.
Continued source of friction between WaTech and agency technical resources resulting in uncoordinated agency migrations.
Further Guidance and Recommendations
WaTech has a key role to play in migration to O365 but its future service provider role will be limited as the hosted services are retired.
WaTech should prioritize the development of replacement/upgrade strategy for vault storage to avoid functional degradation after the move to O365.
Following through on architecture assessment to validate the ability to support a multi-tenant architecture will help reestablish customer confidence in WaTech.
Successful discontinuance of legacy solutions will be dependent on dedicating investment dollars on focused customer migration teams.

Page 35 of 851
Table 5. Transformational Project Opportunity – Enterprise Applications
Background WaTech is currently providing enterprise support for legacy applications that will largely be replaced by the One Washington ERP transformation program.
Decision Point
Whether to realign the Enterprise Application support team to ensure smooth operations until One Washington project is completed while also directly supporting the One Washington program.
Recommended Actions
Tactical Next Steps: Minimize further customization and further investment in anticipation of One Washington. Assess opportunity to realign resources under streamlined management structure in order in order to better align with customer objectives.
Strategic Next Steps: Merge this application development and support team under One Washington. Ultimately this could be a future investment area for WaTech (if One Washington were to come under WaTech as a critical service) otherwise WaTech should look to transfer the service to OFM to manage.
Risk Associated with Inaction
Allowing organizational boundaries to inhibit effective collaboration with OFM could create an unhealthy overdependence on the Strategic Partner vendor for expertise and execution capability.
Further Guidance and Recommendations
Stay in close coordination with One Washington as the legacy application hosting service provider to understand future impacts to hosting service cost/revenue (e.g., future fit gap of functional requirements will clarify the functionality that will remain, project planning will clarify timelines for replacement, etc.).
WaTech should consolidate all of the enterprise application support functions (including systems analysts, reporting, and business analysts) and move them organizationally to OFM, where they could be aligned with the One Washington transformation program.
The readiness of OFM and/or One Washington to absorb and support the enterprise applications functions should be assessed. It is likely that some level of additional IT leadership and support will be required within OFM to enable success.
Responsibility for providing technical infrastructure (mainframe, hosting), operations and related support services should remain with WaTech.
Table 6. Transformational Project Opportunity – Private Cloud
Background
WaTech recently implemented a new private cloud offering intended to replace legacy compute services. Performance and reliability issues early in the rollout stalled adoption, and ongoing support of other environments limits staff/resources.
Decision Point
Whether to formally invest in expanded features/ more robust private cloud offering, and discontinue point solutions (Data Management, Platform & Connectivity, Managed Server, Storage, Backup) as individual services – i.e., reconsider service as an expanded offering more in line with industry.
Recommended Actions
Re-envision a more holistic service that is inclusive of all customer needs (e.g., security, Disaster Recovery, network, backup, archiving, database/SQL, monitoring/performance reporting).

Page 36 of 851
Hire a cloud architect and evaluate re-platforming the private cloud onto some type of appliance-based hyper-converged infrastructure (i.e., evaluate transitioning to a simplified architecture that would reduce time required to test, troubleshoot and optimize compared to the reference architecture approach).
Create a private cloud team that includes all of the disciplines and skills necessary to create the holistic service envisioned above.
Risk Associated with Inaction
Continued overspending to support a multitude of similar disconnected offerings.
Further Guidance and Recommendations
Given positioning as an optional service, and late market introduction, WaTech may not be able to drive the kind of volume needed to prove the solution is cheaper/better than agency solutions, and may struggle to achieve significant agency adoption.
A critical success factor will be to avoid overinvestment in new feature rollouts, and keeping close coordination with customers to ensure any investments are in line with expressed needs.
Successful discontinuance of legacy solutions will be dependent on dedicating staff/funding to focused customer migration teams, and in purchasing additional capacity in the Private Cloud in advance of when major workloads are slated to migrate.
Once legacy services are discontinued, a combined and streamlined multi-disciplinary team should be able to manage the equivalent workload that was previously managed by three teams.
Table 7. Transformational Project Opportunity – Telephony
Background
WaTech is currently pursuing TDM to VoIP migration as resources are available and as customers are interested (long planning horizon/phased approach).
Decision Point Whether to invest in developing and implementing a more focused, comprehensive and rapid statewide VoIP implementation migration.
Recommended Actions
Partner with key customers to develop a statewide IP Telephony Transformation strategy and obtain buy-in and funding from state leadership.
Focus on UCC/contact center enablement and cost reduction.
Even without a statewide investment, WaTech still needs to establish a customer-driven strategy for moving forward with VoIP implementations.
Simplify rate model and get down to a per-phone-per-month charge (possibly metro versus non-metro rates).
Risk Associated with Inaction
A statewide strategy is needed to avoid spending millions in redundant technology as agencies implement their own solutions.
The longer the timeline for conversion the greater the probability of losing part of the customer base to alternative providers/solutions making cost recovery difficult.
Aging equipment will lead to higher maintenance cost/increasing failures with a longer phased transformation.

Page 37 of 851
Further Guidance and Recommendations
Architectural assessment and strategy development is a critical first step.
Comprehensive statewide plan should clearly delineate responsibility for obtaining funding.
Replacement of building wiring (where needed) may represent millions of dollars in investment decisions – may be best to leave responsibility with specific agencies to reduce risk to a statewide project.
VoIP phone replacement is a major expense associated with conversion. This is best negotiated centrally/collectively for volume-based pricing.
Table 8. Transformational Project Opportunity – Security
Background
Standing up OCS to lead enterprise security efforts was an important step (separating Policy/Compliance control function), however, it exposed as many gaps as it closed. Funding and resources for WaTech’s internal security team were unintentionally shifted to the Office of Cybersecurity and need to be resourced to meet customer needs, and the responsibilities across OCS versus WaTech versus the agencies are not well defined and gaps (acknowledged and unacknowledged) clearly exist.
Decision Point Whether to fund an effort to clarify WaTech and the State’s security gaps/exposures, refine roles and responsibilities and close the gaps.
Recommended Actions
Identify a new State CISO with strong leadership skills, security credibility and experience in public sector to enable partnerships inside and outside the State.
Create a comprehensive method of measuring the effectiveness of all security programs and identifying and prioritizing gaps.
Assess the maturity of both the enterprise and WaTech security program, identify gaps, investment needed to close gaps, and create a comprehensive 3 to 5 year strategic security roadmap.
Risk Associated with Inaction
Loss of momentum improving the State’s Cybersecurity awareness and posture.
Significant WaTech internal security gaps that could compromise systems/data.

Page 38 of 851
Further Guidance and Recommendations
Continue to work on security community building within the state that focuses on establishing stronger two-way communication and more effective security policy-making and enforcement.
Do not limit Vulnerability Assessment and Log Event Processing to license provisioning/hosting. Instead roll out more comprehensive services built around a Center of Excellence.
Do not try to build internal security capabilities where external options are available, particularly for 7/24 functions requiring highly skilled analysts.
Create a security governance and risk dashboard that tracks the posture of agencies and aggregates this into an overall score that can be communicated to State leaders and tracked over time.
Organize the security governance and decision making process in a way that maximizes business leadership’s engagement in risk management.
Clarify the separation of duties/accountability between WaTech and OCS in order to make certain that operational/technical roles are clear and that the policy making and compliance role of OCS is not compromised.
Recommendations: Enabling Capabilities
WaTech has been through multiple organizational changes and transformation efforts – but has yet to find lasting success. Gartner has made many service specific recommendations, but given WaTech’s current state, simply transitioning out of a few services will be insufficient to ensure long-term ROI on centralized IT services. WaTech must focus on maturing key enabling capabilities in order to achieve desired results from transformational change.
Figure 5. Key Enabling Capabilities
Recommendations for each of these areas is provided below.
Service Management Enabling Recommendations:
Replace the existing service catalog with one which describes services in detail (features, service levels, performance metrics and customer versus WaTech responsibilities). This should be a living document which evolves with the services.
Establish a clear separation between service owner and technical engineering/operational roles. Align service owner role with revitalized customer relationship management and technology architecture functions.

Page 39 of 851
Establish clear, forward looking, lifecycle oriented product roadmaps and funding models.
Consolidate services around clear customer acknowledged value propositions. Transition away from services that are siloed by technology, product, historical factors/workgroups and other irrelevant factors.
Mature IT Service Management processes (focusing first on – request, incident, change, problem, and service performance management).
Establish a continual service improvement culture driven initially by simple metrics.
Align IT Service Management tools to processes and measurement and reporting needs.
Automate technical service delivery where feasible.
Workforce Management/ Organizational Structure Recommendations:
Consolidate and simplify the organizational structure so that it’s better aligned to the services delivered and enables multidisciplinary teaming.
Create a more flexible workforce model to the extent feasible by removing contractual and procurement barriers to engaging contract resources when required. Negotiate with the unions to identify ways to enable the transformational change that needs to occur.
Accelerate overhaul and realignment of employee performance management (rationalizing position descriptions, completing a baseline skills assessment, standardizing/maturing performance management processes, identifying critical staff for retention, as well as staff who require coaching or other action).
Assess the readiness of the staff for the planned changes and create an empowered organizational change management team that is focused specifically on enabling the transformation by continually engaging and informing the team in the process.
Financial Management/ Procurement Recommendations:
Improve baseline financial management capabilities and focus them on enabling service management and meeting customer needs (improving transparency/fairness) rather than focusing on reducing administrative burden through over simplification.
Target the “right number” of allocations/cost codes that effectively enables appropriate chargeback, internal accountability and effective portfolio planning.
Overhaul the chart of accounts to align with the “to be” service portfolio/catalog.

Page 40 of 851
Mature budgeting, cost modeling and estimation practices, eliminate siloed and error-prone manual processes wherever feasible.
Formalize demand management and align it with customer budget projections to reduce the risk of overinvestment when budgeting for future needs (align supply).
Overhaul time tracking practices by realigning them to the updated chart of accounts, ensuring consistency, and expanding them more broadly in the organization.
Simplify technology procurement (use of MSA and common procurement vehicles).
Expand WaTech authority to negotiate/procure on behalf of agencies in key focus areas (e.g., network, security).
Leadership/ Culture/ Governance Recommendations:
Establish an empowered leadership team that can refocus the organization on customer needs while still ensuring recoverability (the “basic table stakes” that maturation of financial management capabilities will help to address).
Establish customer relationship management, service ownership and technology architecture as top level functions within the organization (e.g., Chief Technology Officer/Chief Customer Officer).
Establish a transparency-oriented culture (both internally and with customers) that is rooted in doing the right things for the right customers for the right reasons at the right times. Reward those who exhibit these behaviors.
Ensure that new leaders have the right combination of government, technology and operational skills to have clear credibility with both staff and customers.
Strategic Advice
Taking on multiple large scale projects and transformational efforts at the same time is risky. State stakeholders must determine the risk appetite and willingness to invest further in WaTech when ROI is ultimately dependent on broad agency adoption.
Stakeholders including WaTech, customer agencies, Office of Financial Management and the legislature need to answer collectively the question as to whether WaTech should only provide critical centralized services, or play a bigger role in supporting the “small” agencies, or an even bigger and more strategic role with application development and cloud enablement.
Given the greater risk associated with high degrees of transformation, Gartner recommends that WaTech slim down and focus on a smaller number of services.

Page 41 of 851
Figure 6. Strategic Recommendation Summary
To successfully transform, Gartner recommends that WaTech prioritize investments that enable it to improve its focus on its foundational services. This prioritization includes divesting a couple large services (as well as a couple smaller services called out in the service-specific recommendations) that will enable WaTech to slim down and focus.
Divest Enterprise Applications:
Providing support for the legacy enterprise and OFM applications provides no clear benefit to either WaTech or OFM and has become a pain-point as WaTech has lost customer focus and OFM must execute One Washington without the direct support of these resources.
Gartner recommends that WaTech consolidate all of the enterprise application support functions (including systems analysts, reporting, and business analysts) and move them organizationally to OFM, where they should be aligned with the One Washington transformation program. Responsibility to provide technical infrastructure (mainframe, hosting), operations and related support services should remain with WaTech.
Divest Desktop and LAN Support Services:
WaTech’s capitol complex desktop and IT workspace services have not met basic expectations for many years. With DES’s desire to bring their environment in-house, this is now essentially a dedicated service for OFM that lacks economies of scale and requires downsizing and transformation.
Gartner recommends the State reevaluate the business case for WaTech to provide this service and consider tasking OFM with supporting itself and the Governor’s office. A solution for a handful of small agencies may also be needed.
Some transformation investments may be warranted. However, they must be carefully planned and externally governed. Gartner recommends WaTech invest in maturing security, the migration to Office 365, the migration to modern IP-based telephony, and consolidating legacy environments onto the Private Cloud.
Invest in Maturing Security:

Page 42 of 851
Cybersecurity will be increasingly important – and expensive – as agencies become more networked and move services to the cloud. While standing up OCS was an important step (establishing statewide policy/compliance as a separate group), it exposed more problems than it solved. Funding and resources for WaTech’s internal security team were unintentionally shifted to the Office of Cybersecurity and need to be resourced to meet customer needs. The State lacks an overall Cybersecurity strategy and capability framework that clearly defines Agency versus OCS versus WaTech roles – or an effective method of measuring maturity and effectiveness.
Gartner recommends that WaTech assess the maturity of both the enterprise and WaTech security program, identify gaps, and clarify future roles and investment needed to close gaps, and create and fund a comprehensive 3 to 5 year strategic security roadmap.
Invest in Migration to Office 365 (and establishing more limited role for WaTech post migration):
While many agencies appear to have made a strategic decision to move email and other key WaTech services to Microsoft’s Office 365 cloud offering, no formal enterprise migration project has been chartered or funded.
Gartner recommends that the State task WaTech with developing a migration plan and executing it on behalf of its customers. WaTech should not be expected to fund this migration out of its current services and rates. Gartner recommends that the migration planning and funding should be overseen by the independent body (PMO / Board).
Invest in Migration to IP-based Telephony:
WaTech has been trying to incrementally rollout more modern IP-based telephony and contact center capabilities. Without centralized funding this could take a decade to complete and some customers may not be willing to wait for it to happen.
Gartner recommends that the State fund a Customer-driven, WaTech led enterprise telephony transformation project which is clearly focused on modernization and cost reduction. Gartner recommends that the migration planning and funding should be overseen by an independent body (PMO / Board).
Invest in Consolidating Legacy Environment onto a more robust Private Cloud:
WaTech’s hosting services (specifically the Private Cloud) requires transformation and investment to remain viable, however any investment must be calibrated against the fact that many agencies have already created their own “cloud” and convincing others to use WaTech will be a hard sell.
Gartner recommends that WaTech focus investments and transformation activities on improvements necessary to support WaTech driven workloads and complete the migration of all workloads from the two other environments, reduce costs and improve customer service through automation. Any transformation funding should be overseen by the independent body (PMO / Board) and WaTech should avoid purchases of capacity or investment in features that are not immediately needed.
No matter the level of transformational change selected, it’s important to consider the broader political environment to address key risk factors. Combining the State CIO and WaTech Director roles compromises the effectiveness of both roles and complicates WaTech’s ability to regain customer trust and successfully transform itself. The State should consider moving back toward a model with clear separation of duties, accountability, staff and funding. There are many ways to accomplish this (e.g., could include both positions appointed with separated reporting structure or in-line reporting structure), though separate organizations would be ideal.

Page 43 of 851
Executing this transformation would be difficult, if not impossible, for WaTech to do on its own. Establishing independent transformation governance and gaining agency buy-in and active participation will be key. WaTech should establish an independent body (Program Office/Board) to control the transformation as internal organizational governance will not be enough and the function must be independent of WaTech. The independent body should receive proviso control of spending authority.
WaTech should also engage an external party with industry perspective and objectivity to develop the transformation strategy and oversee its execution. WaTech should not proceed with transformation effort without strong executive sponsorship out of OFM and the Governor’s Office.

Page 44 of 851
Analysis and Future State Recommendations
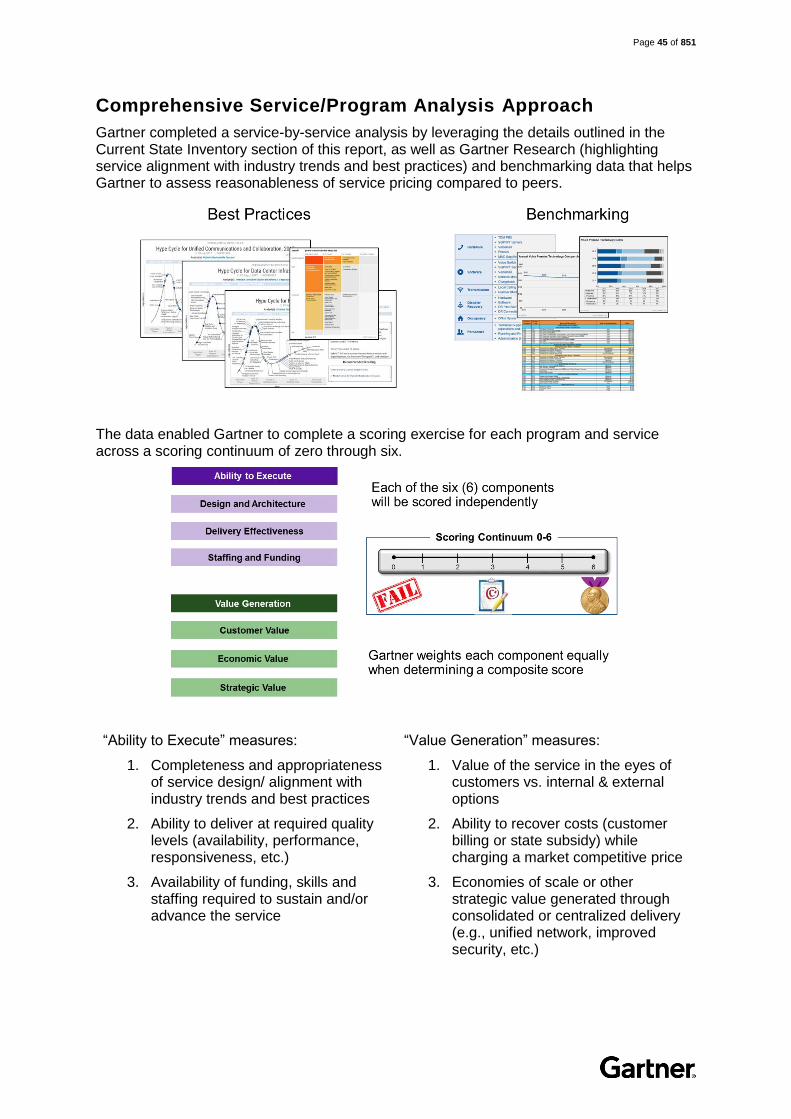
Page 45 of 851
Comprehensive Service/Program Analysis Approach
Gartner completed a service-by-service analysis by leveraging the details outlined in the Current State Inventory section of this report, as well as Gartner Research (highlighting service alignment with industry trends and best practices) and benchmarking data that helps Gartner to assess reasonableness of service pricing compared to peers.
The data enabled Gartner to complete a scoring exercise for each program and service across a scoring continuum of zero through six.
“Ability to Execute” measures:
1. Completeness and appropriateness of service design/ alignment with industry trends and best practices
2. Ability to deliver at required quality levels (availability, performance, responsiveness, etc.)
3. Availability of funding, skills and staffing required to sustain and/or advance the service
“Value Generation” measures:
1. Value of the service in the eyes of customers vs. internal & external options
2. Ability to recover costs (customer billing or state subsidy) while charging a market competitive price
3. Economies of scale or other strategic value generated through consolidated or centralized delivery (e.g., unified network, improved security, etc.)

Page 46 of 851
The scores were then mapped onto a two-by-two matrix and translated into service ratings. The final step was to provide WaTech a recommendation on the path forward.
Additional methodology details are provided in the appendix.
Gartner used the following service categorization framework to enable a more effective review of the services with the intention of beginning to break down delivery silos, rather than reviewing services in the largely service-owner siloed format that was leveraged in the current state inventory portion of the project.
Figure 7. Gartner Service Categorization Framework for the Analysis
The service recommendations provided below have been aligned to this categorization.

Page 47 of 851
.
An overview of all service/program ratings is provided in the figure below for ease of reference.
Figure 8. Service-by-Service Rating Overview (Review of Services as Currently Delivered)
* The discontinued category includes some services where Gartner recommends shifting the resources, e.g., discontinuing external delivery of Project Management as a Service and refocusing effort as an internal delivery capability, transitioning resources and responsibilities for JINDEX and OneNet to other agencies that support the primary business capabilities, etc. Summary details for each service are provided on the following pages.

Page 48 of 851
.
Network and Telephony Analysis and Recommendations
This section includes the following services:
1. Switched Long Distance
2. Centrex
3. PBX/VoIP/IVR
4. Citrix Edge
5. SSL VPN (Remote Access)
6. Cloud and Office VPN
7. Network – Core/Transport/Firewall
8. DNS/DHCP

Page 49 of 851
.
1. Switched Long Distance
The service definition for Switched Long Distance is provided in the Current State Inventory section of this report under the Telephony subsection.

Page 50 of 851
.

Page 51 of 851
.

Page 52 of 851
.
2. Centrex
The service definition for Centrex is provided in the Current State Inventory section of this report under the Telephony subsection.

Page 53 of 851
.

Page 54 of 851
.

Page 55 of 851
.
3. PBX/VoIP/IVR
The service definition for PBX/VoIP/IVR is provided in the Current State Inventory section of this report under the Telephony subsection.

Page 56 of 851
.
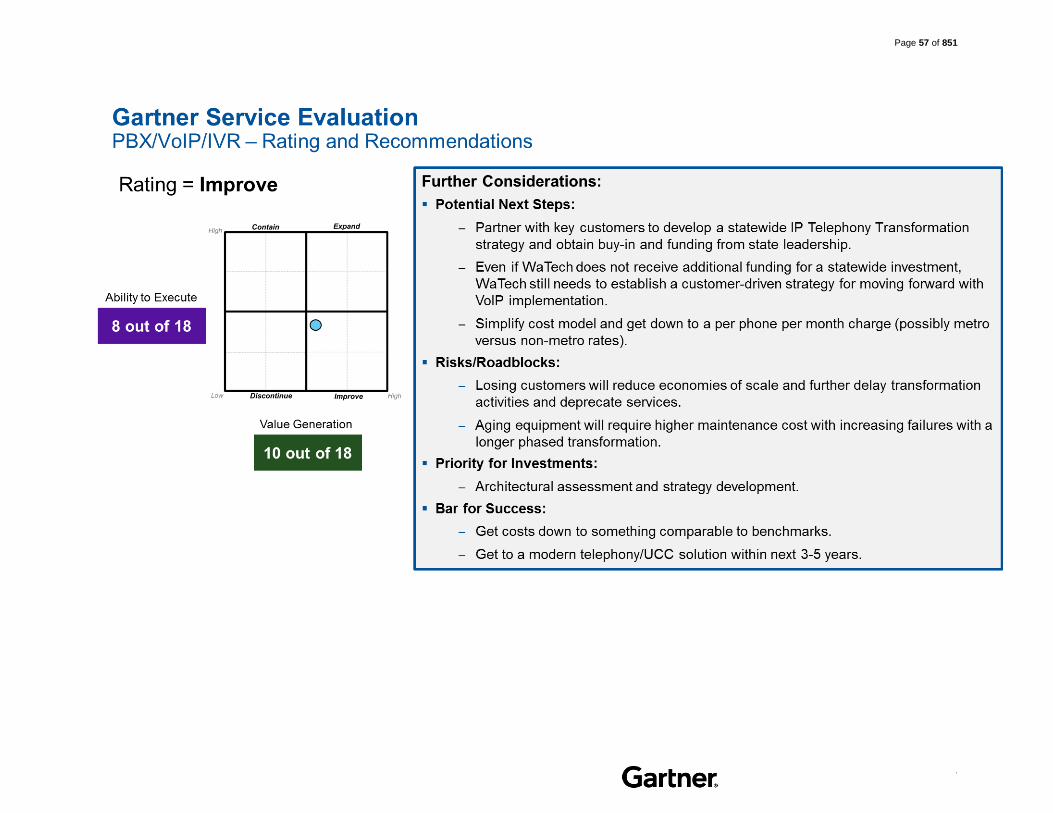
Page 57 of 851
.

Page 58 of 851
.
4. Citrix Edge
The service definition for Citrix Edge is provided in the Current State Inventory section of this report under the Access & Security subsection.

Page 59 of 851
.
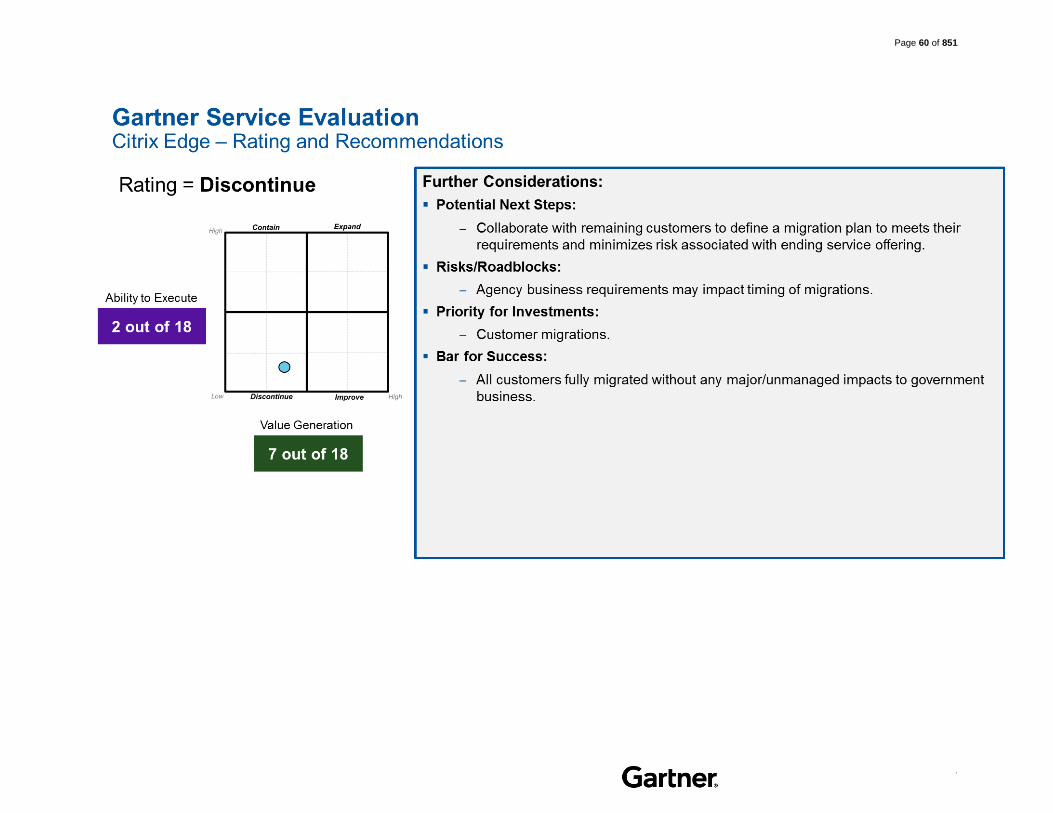
Page 60 of 851
.

Page 61 of 851
.
5. SSL VPN (Remote Access)
The service definition for SSL VPN (Remote Access) is provided in the Current State Inventory section of this report under the Access and Security subsection.

Page 62 of 851
.

Page 63 of 851
.

Page 64 of 851
.
6. Cloud and Office VPN
The service definition for Cloud and Office VPN is provided in the Current State Inventory section of this report under the Data Network subsection.

Page 65 of 851
.

Page 66 of 851
.
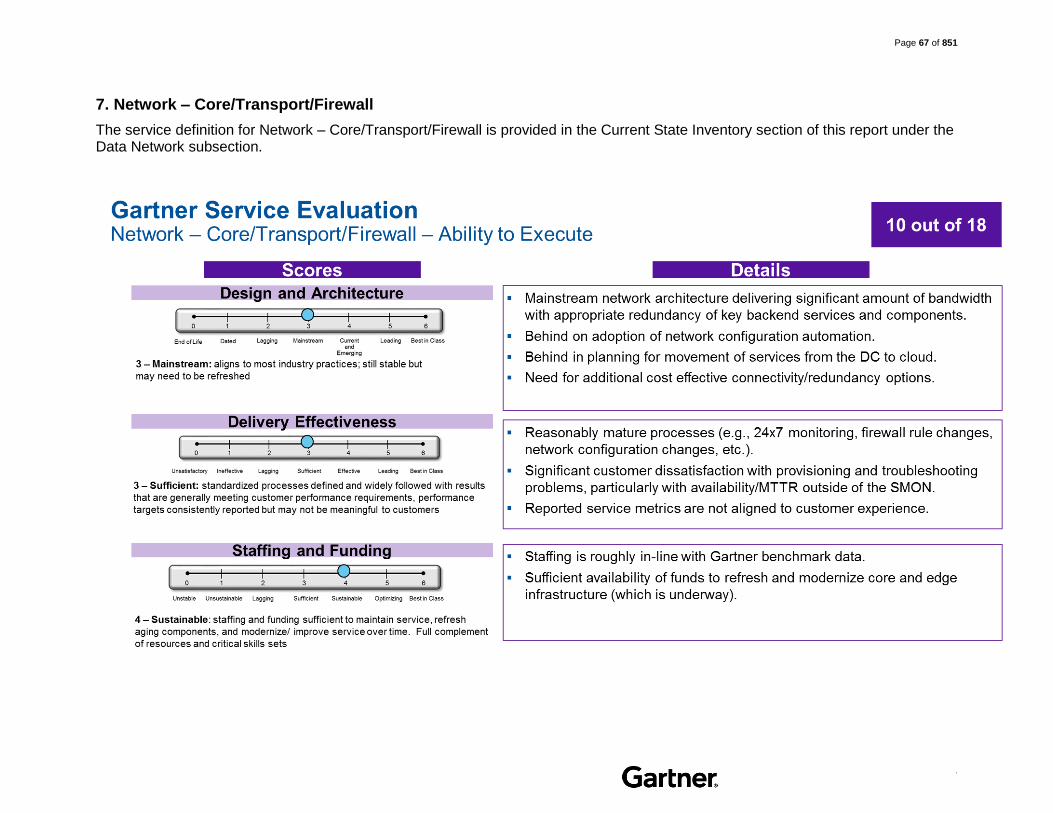
Page 67 of 851
.
7. Network – Core/Transport/Firewall
The service definition for Network – Core/Transport/Firewall is provided in the Current State Inventory section of this report under the Data Network subsection.

Page 68 of 851
.

Page 69 of 851
.

Page 70 of 851
.
8. DNS/DHCP
The service definition for DNS/DHCP is provided in the Current State Inventory section of this report under the Access & Security subsection.

Page 71 of 851
.

Page 72 of 851
.

Page 73 of 851
.
Platform Services Analysis and Recommendations
This section includes the following services:
1. SDC/QDC Colocation
2. Mainframe
3. Backup
4. Storage (SAN/NAS)
5. WaServ/Email Vault Storage
6. Server Support Services
7. DB Management Services
8. Managed Server Hosting (Legacy)
9. Platform & Connectivity (“Nutanix/Gov”)
10. Private Cloud

Page 74 of 851
.
1. SDC/QDC Colocation
The service definition for SDC/QDC Colocation is provided in the Current State Inventory section of this report under the Hosting Colocation subsection.

Page 75 of 851
.

Page 76 of 851
.

Page 77 of 851
.
2. Mainframe
The service definition for Mainframe is provided in the Current State Inventory section of this report under the Hosting Mainframe subsection.

Page 78 of 851
.

Page 79 of 851
.

Page 80 of 851
.
3. Backup
The service definition for Backup is provided in the Current State Inventory section of this report under the Hosting Storage subsection.

Page 81 of 851
.

Page 82 of 851
.

Page 83 of 851
.
4. Storage (SAN/NAS)
The service definition for Storage (SAN/NAS) is provided in the Current State Inventory section of this report under the Hosting Storage subsection.

Page 84 of 851
.

Page 85 of 851
.

Page 86 of 851
.
5. WaServ/Email Vault Storage
The service definition for WaServ/Email Vault Storage is provided in the Current State Inventory section of this report under the Hosting Storage subsection.

Page 87 of 851
.

Page 88 of 851
.

Page 89 of 851
.
6. Server Support Services
The service definition for Server Support Services is provided in the Current State Inventory section of this report under the Hosting Server subsection.

Page 90 of 851
.

Page 91 of 851
.
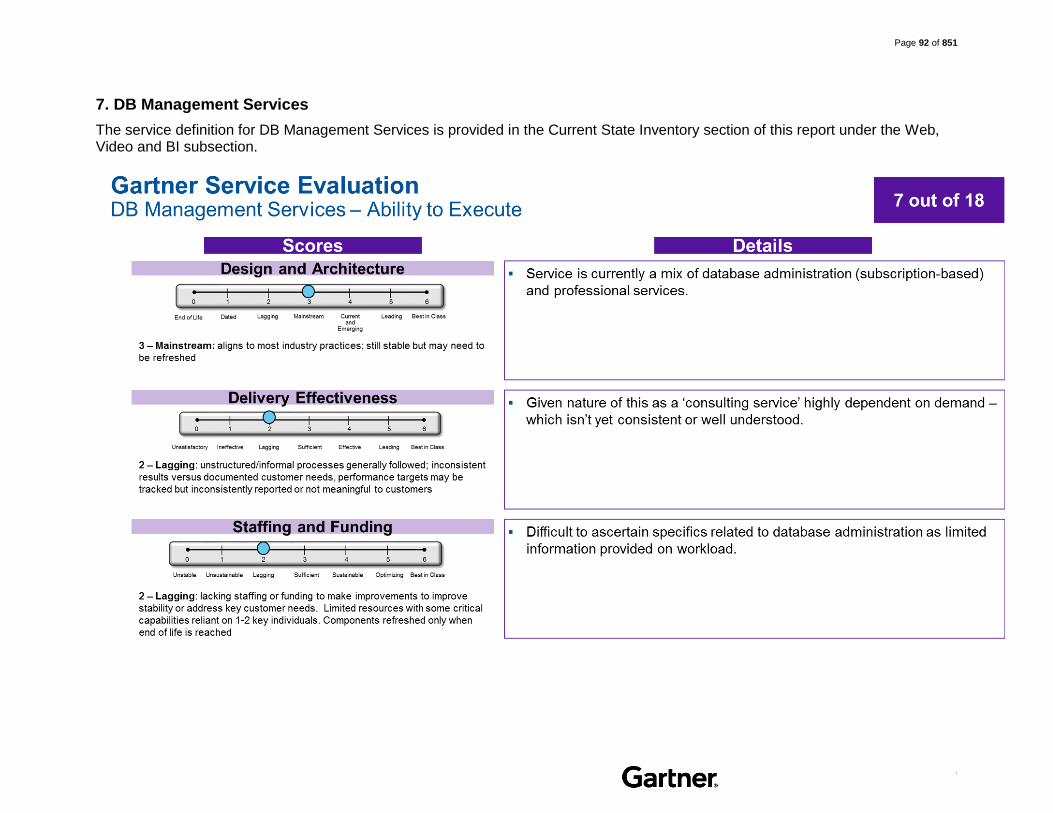
Page 92 of 851
.
7. DB Management Services
The service definition for DB Management Services is provided in the Current State Inventory section of this report under the Web, Video and BI subsection.

Page 93 of 851
.

Page 94 of 851
.

Page 95 of 851
.
8. Managed Server Hosting (Legacy)
The service definition for Managed Server Hosting (Legacy) is provided in the Current State Inventory section of this report under the Hosting Server subsection.

Page 96 of 851
.

Page 97 of 851
.

Page 98 of 851
.
9. Platform & Connectivity (“Nutanix/Gov”)
The service definition for Platform & Connectivity (“Nutanix/Gov”) is provided in the Current State Inventory section of this report under the Hosting Server subsection.
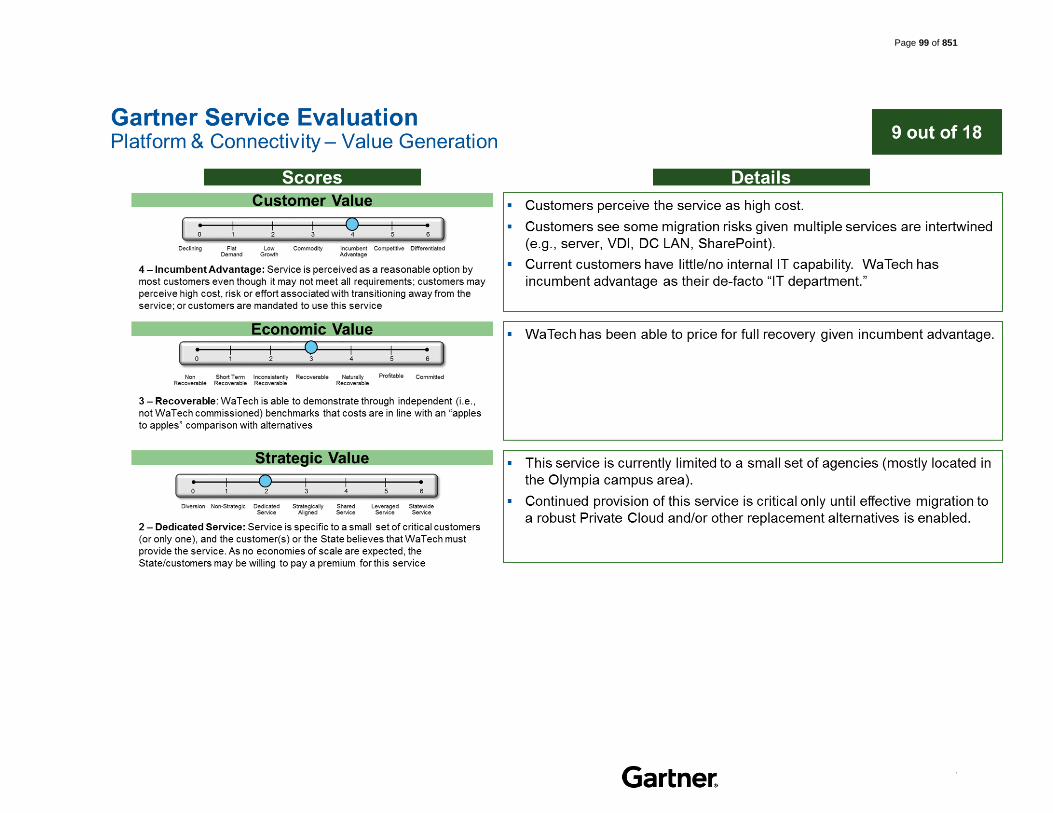
Page 99 of 851
.
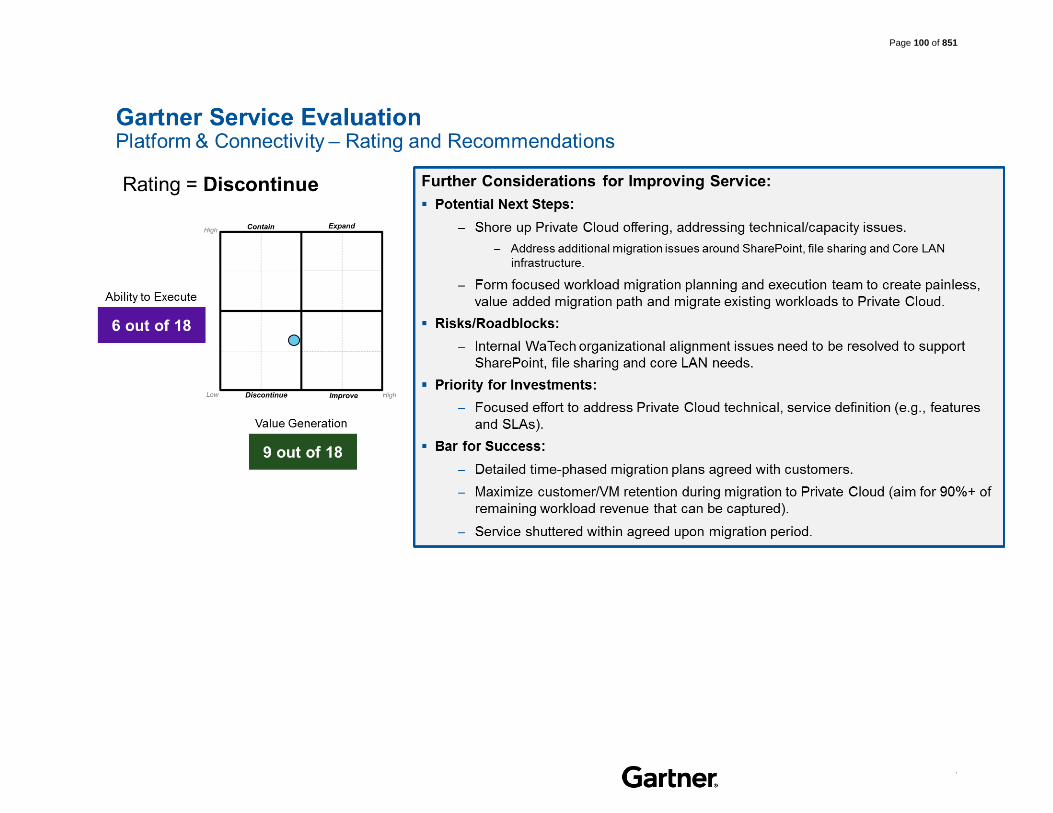
Page 100 of 851
.

Page 101 of 851
.
10. Private Cloud
The service definition for Private Cloud is provided in the Current State Inventory section of this report under the Hosting Server subsection.
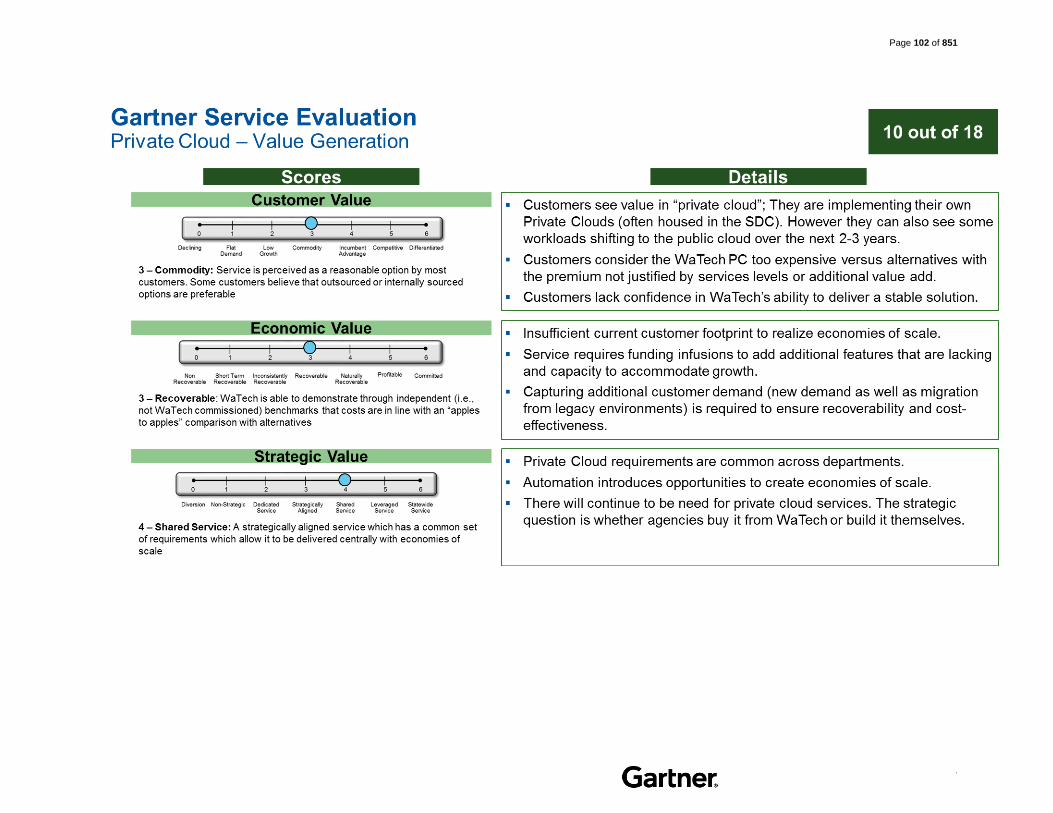
Page 102 of 851
.

Page 103 of 851
.

Page 104 of 851
.
Security & Identity Services Analysis and Recommendations
This section includes the following services:
1. Security Lead in Gov
2. Sec. Ed/Awareness
3. Sec. Design Review
4. SOC/Inc. Response
5. CERT Assessments
6. Vulnerability Assessment (Tool as a Service)
7. SIEM (L&M)
8. SAW/SEAP
9. Security Gateway/F5
10. Certification Authority
11. Secure FTP
12. Active Directory/ IAM

Page 105 of 851
.
1. Security Lead in Gov
The service definition for Security Lead in Government is provided in the Current State Inventory section of this report under the Cybersecurity subsection.

Page 106 of 851
.

Page 107 of 851
.

Page 108 of 851
.
2. Sec. Ed/Awareness
The service definition for Security Education/Awareness is provided in the Current State Inventory section of this report under the Cybersecurity subsection.

Page 109 of 851
.

Page 110 of 851
.

Page 111 of 851
.
3. Sec. Design Review
The service definition for Security Design Review is provided in the Current State Inventory section of this report under the Cybersecurity subsection.

Page 112 of 851
.

Page 113 of 851
.

Page 114 of 851
.
4. SOC/Inc. Response
The service definition for SOC/Incident Response is provided in the Current State Inventory section of this report under the Cybersecurity subsection.

Page 115 of 851
.

Page 116 of 851
.

Page 117 of 851
.
5. CERT Assessments
The service definition for CERT Assessments is provided in the Current State Inventory section of this report under the Cybersecurity subsection.

Page 118 of 851
.

Page 119 of 851
.

Page 120 of 851
.
6. Vulnerability Assessment (Tool as a Service)
The service definition for Vulnerability Assessment is provided in the Current State Inventory section of this report under the Access & Security subsection.

Page 121 of 851
.

Page 122 of 851
.

Page 123 of 851
.
7. SIEM (L&M)
The service definition for SIEM (L&M) is provided in the Current State Inventory section of this report under the Access & Security subsection.

Page 124 of 851
.

Page 125 of 851
.
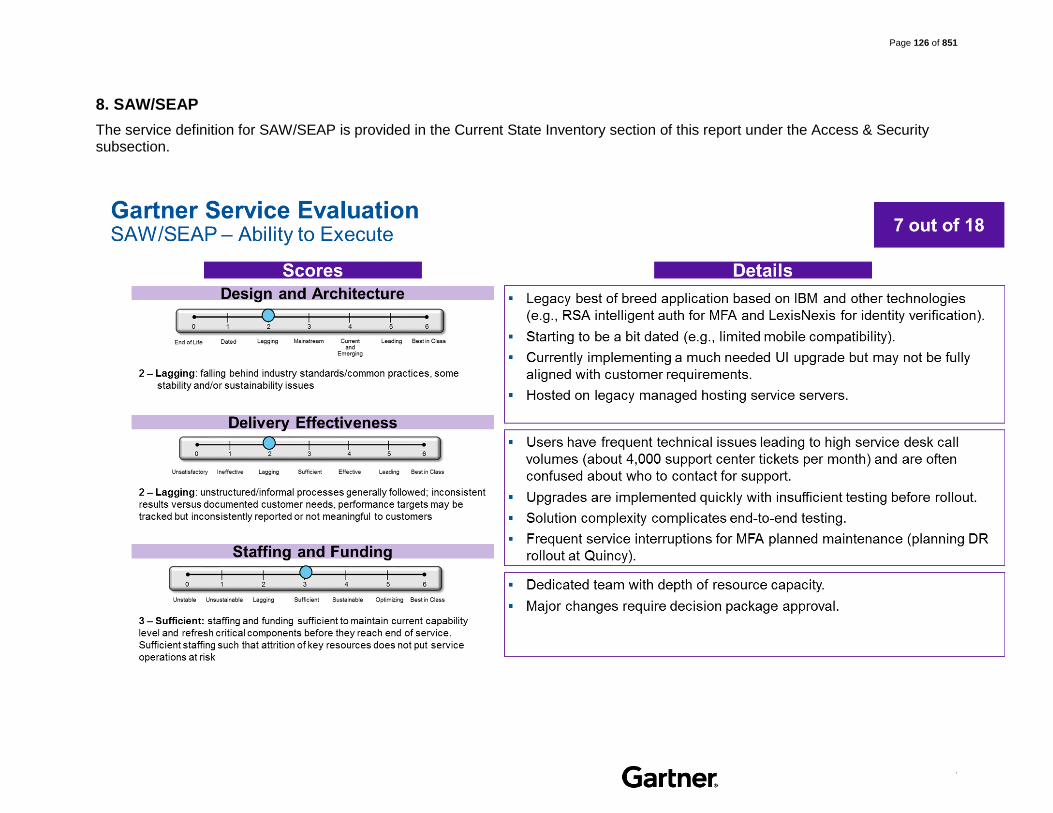
Page 126 of 851
.
8. SAW/SEAP
The service definition for SAW/SEAP is provided in the Current State Inventory section of this report under the Access & Security subsection.

Page 127 of 851
.

Page 128 of 851
.
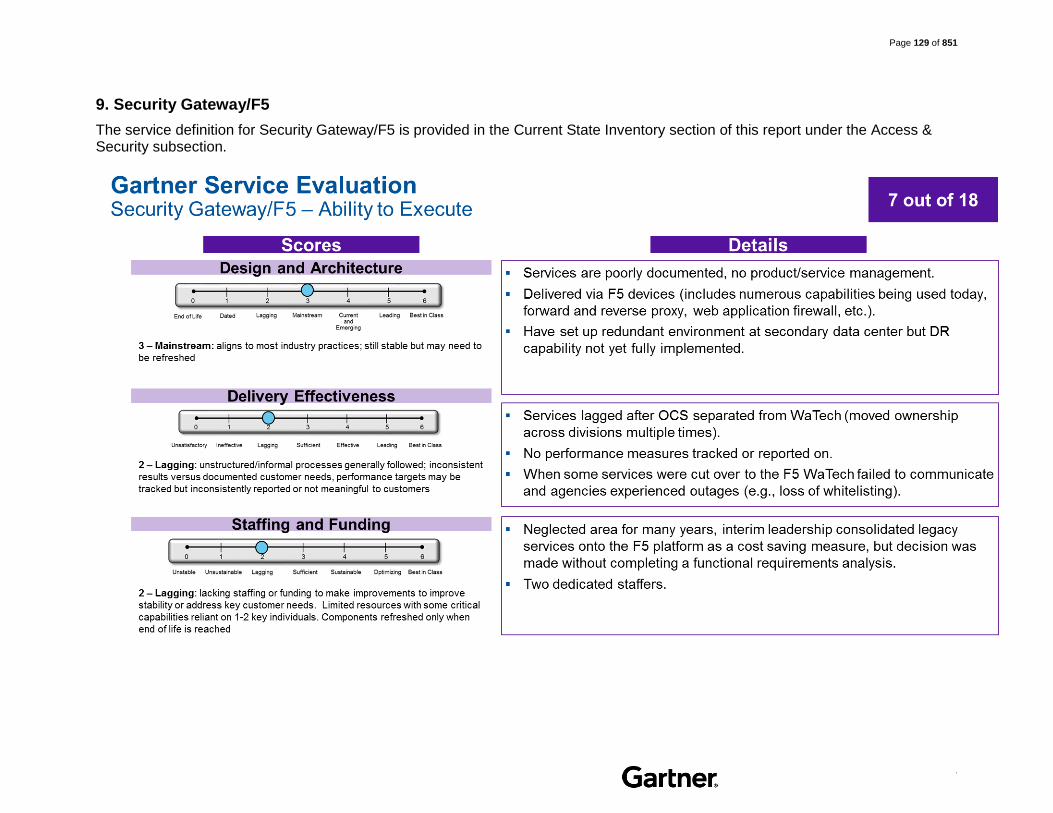
Page 129 of 851
.
9. Security Gateway/F5
The service definition for Security Gateway/F5 is provided in the Current State Inventory section of this report under the Access & Security subsection.

Page 130 of 851
.
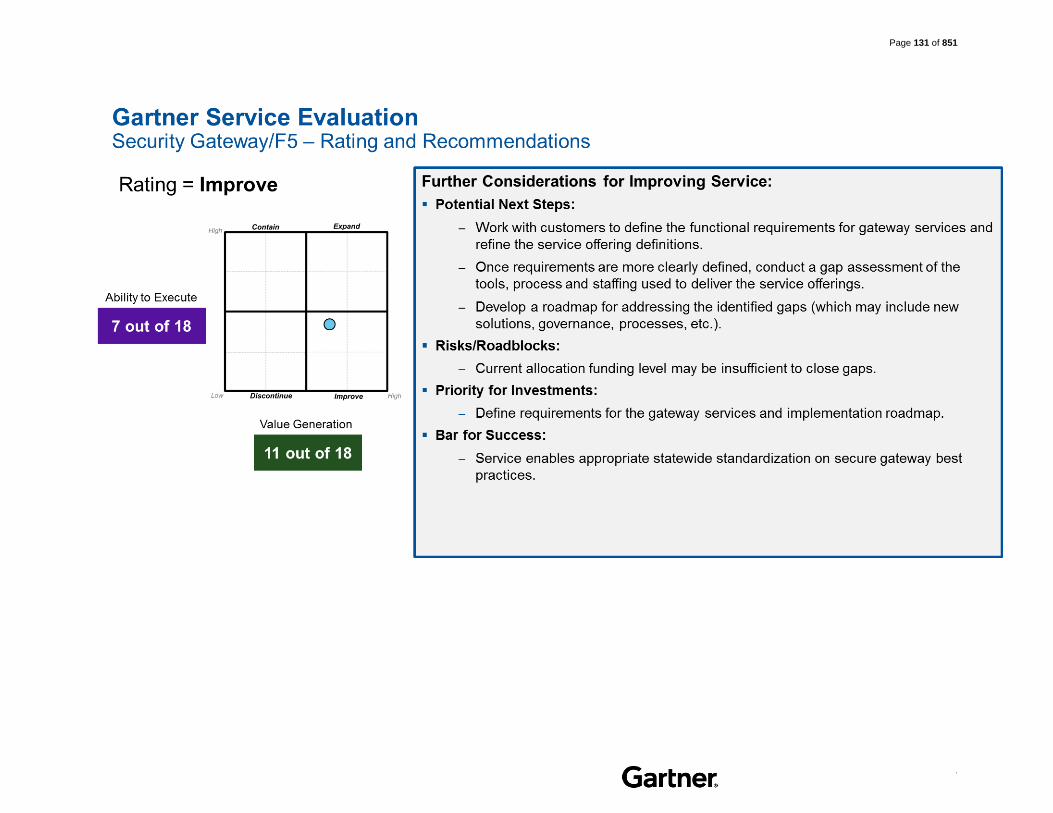
Page 131 of 851
.

Page 132 of 851
.
10. Certification Authority
The service definition for Certification Authority is provided in the Current State Inventory section of this report under the Access & Security subsection.

Page 133 of 851
.

Page 134 of 851
.

Page 135 of 851
.
11. Secure FTP
The service definition for Secure FTP is provided in the Current State Inventory section of this report under the Messaging & Collaboration subsection.

Page 136 of 851
.

Page 137 of 851
.

Page 138 of 851
.
12. Active Directory/ IAM
The service definition for Active Directory/IAM is provided in the Current State Inventory section of this report under the Messaging & Collaboration subsection.

Page 139 of 851
.

Page 140 of 851
.
Page 141 of 851
.
Workspace Services Analysis and Recommendations
This section includes the following services:
1. Desktop/LAN Support
2. Directory Assistance (citizens)
3. Mobile Device Management
4. Shared Email
5. Skype Services
6. WebEx Video Conf.
7. Teleconferencing
8. Wireless (WIFI)
9. Enterprise SharePoint
10. Office 365 Activation

Page 142 of 851
.
1. Desktop/LAN Support
The service definition for Desktop/LAN Support is provided in the Current State Inventory section of this report under the Desktop subsection.

Page 143 of 851
.
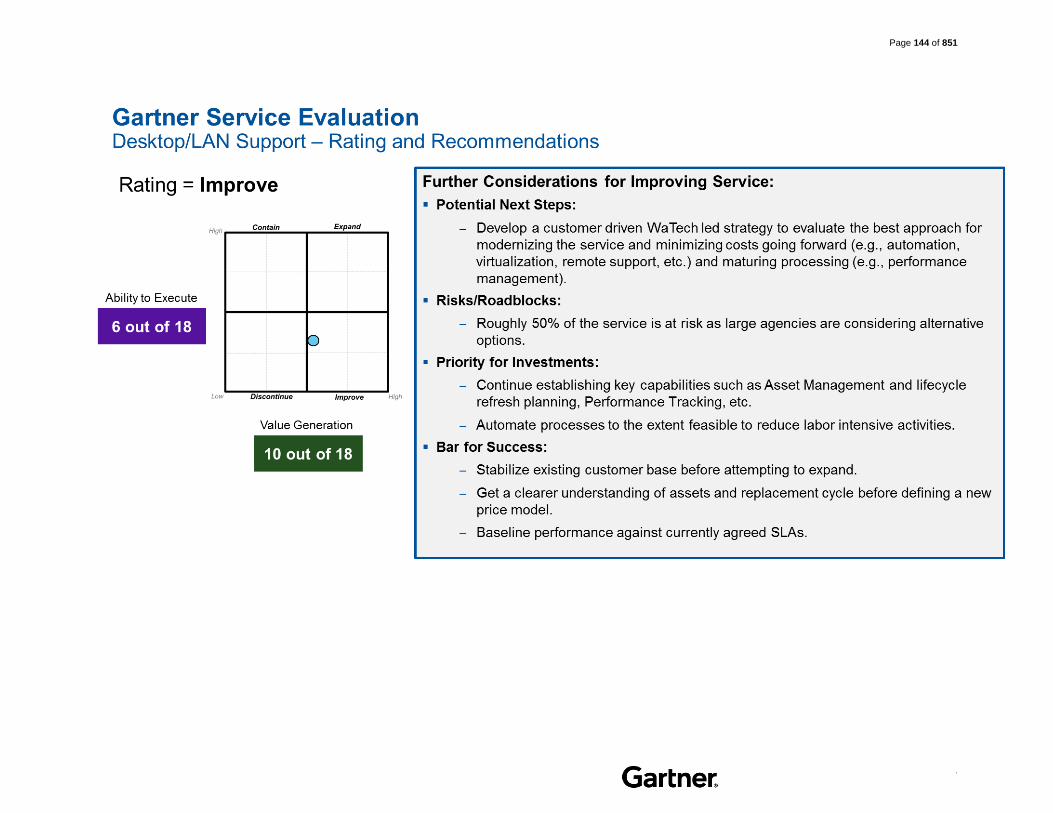
Page 144 of 851
.

Page 145 of 851
.
2. Directory Assistance (citizens)
The service definition for Directory Assistance (citizens) is provided in the Current State Inventory section of this report under the Telephony subsection.
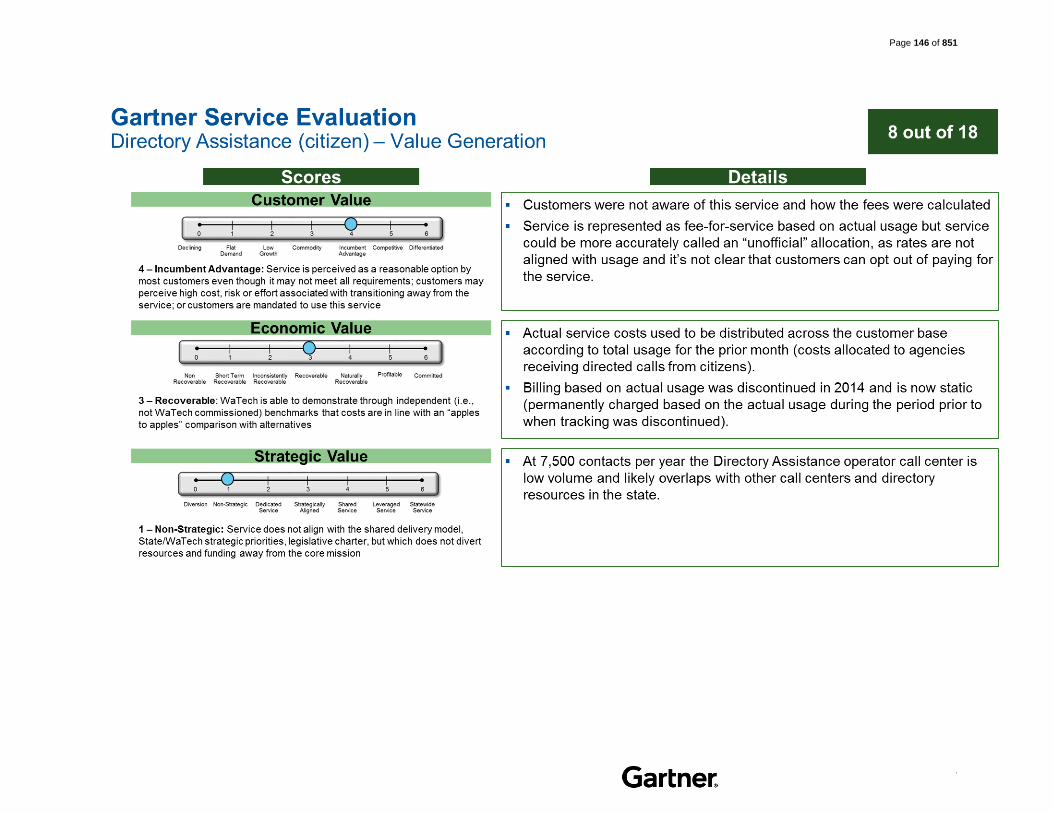
Page 146 of 851
.

Page 147 of 851
.

Page 148 of 851
.
3. Mobile Device Management
The service definition for Mobile Device Management is provided in the Current State Inventory section of this report under the Messaging & Collaboration subsection.

Page 149 of 851
.

Page 150 of 851
.

Page 151 of 851
.
4. Shared Email Services
The service definition for Shared Email Services is provided in the Current State Inventory section of this report under the Messaging & Collaboration subsection.

Page 152 of 851
.

Page 153 of 851
.

Page 154 of 851
.
5. Skype Services
The service definition for Skype Services is provided in the Current State Inventory section of this report under the Messaging & Collaboration subsection.

Page 155 of 851
.

Page 156 of 851
.

Page 157 of 851
.
6. WebEx Video Conf.
The service definition for WebEx Video Conf. is provided in the Current State Inventory section of this report under the Telephony subsection.

Page 158 of 851
.

Page 159 of 851
.

Page 160 of 851
.
7. Teleconferencing
The service definition for Teleconferencing is provided in the Current State Inventory section of this report under the Telephony subsection.

Page 161 of 851
.

Page 162 of 851
.

Page 163 of 851
.
8. Wireless (WIFI)
The service definition for Wireless (WIFI) is provided in the Current State Inventory section of this report under the Access and Security subsection.

Page 164 of 851
.

Page 165 of 851
.

Page 166 of 851
.
9. Enterprise SharePoint
The service definition for Enterprise SharePoint is provided in the Current State Inventory section of this report under the Messaging & Collaboration subsection.

Page 167 of 851
.
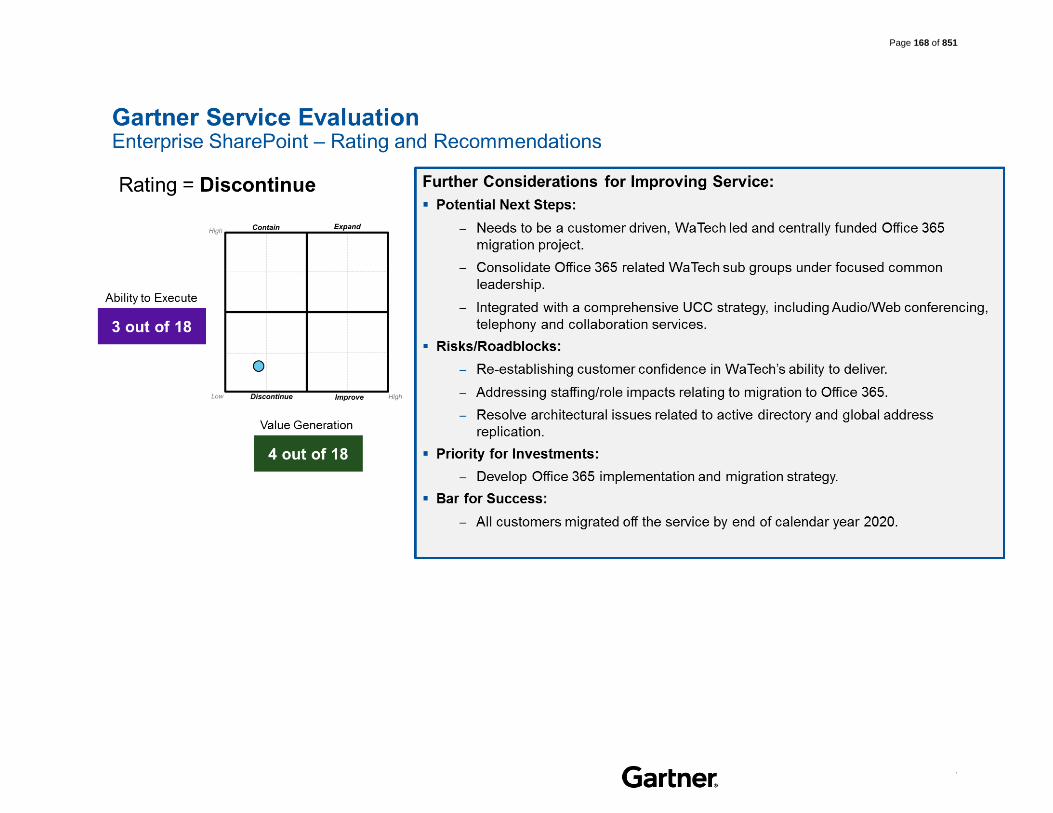
Page 168 of 851
.

Page 169 of 851
.
10. Office 365 Activation
The service definition for Office 365 Activation is provided in the Current State Inventory section of this report under the Messaging & Collaboration subsection.

Page 170 of 851
.

Page 171 of 851
.

Page 172 of 851
.
Application Services Analysis and Recommendations
This section includes the following services:
1. Project Management
2. Agile Business Analysts
3. UX & Accessibility
4. Web Platform/Design
5. Access Washington
6. Usability Lab
7. BPaaS (ServiceNow Dev)
8. ESF – Finance
9. ESF – HR/Payroll
10. ESF – Budget
11. ESF – Enterprise Reporting
12. OFM Enterprise (Gov’s Apps)
13. E-Time
14. JINDEX

Page 173 of 851
.
1. Project Management
The service definition for Project Management is provided in the Current State Inventory section of this report under the Project Management subsection.

Page 174 of 851
.

Page 175 of 851
.

Page 176 of 851
.
2. Agile Business Analysts
The service definition for Agile Business Analysts is provided in the Current State Inventory section of this report under the Web, Video, and BI subsection sub-section.

Page 177 of 851
.

Page 178 of 851
.

Page 179 of 851
.
3. UX & Accessibility
The service definition for UX & Accessibility is provided in the Current State Inventory section of this report under the Web, Video, and BI subsection sub-section.
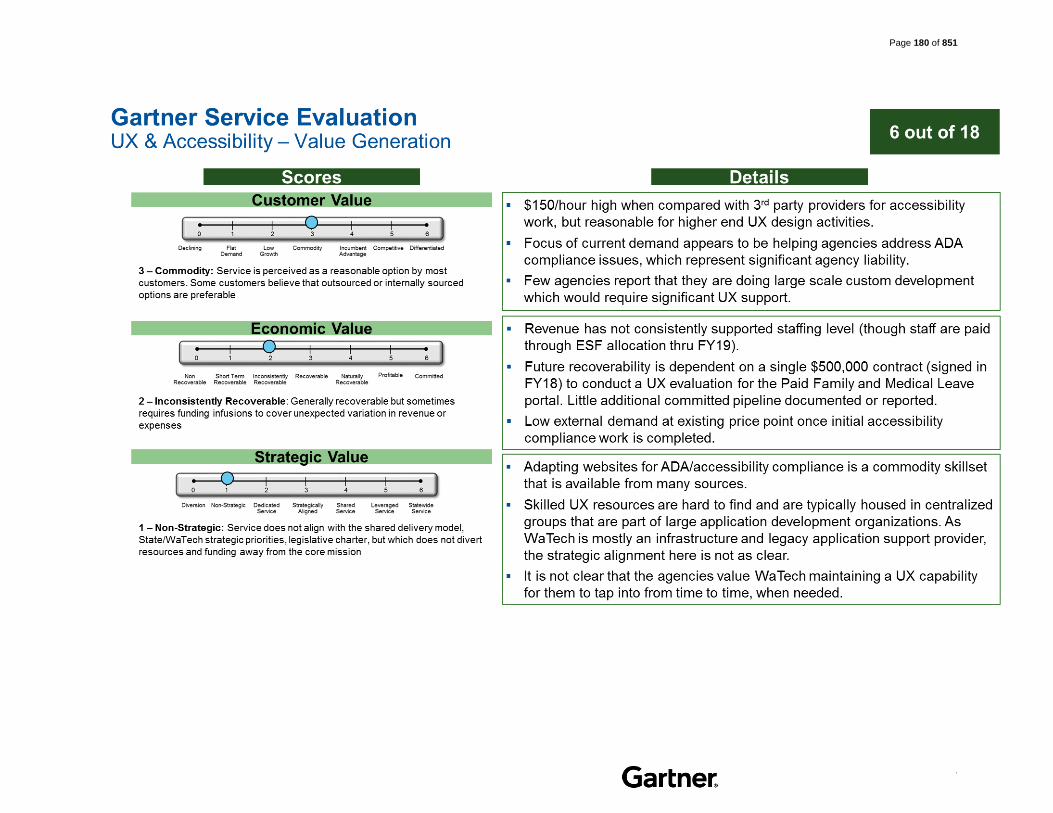
Page 180 of 851
.

Page 181 of 851
.

Page 182 of 851
.
4. Web Platform/Design
The service definition for Web Platform/Design is provided in the Current State Inventory section of this report under the Web, Video, and BI subsection sub-section.

Page 183 of 851
.

Page 184 of 851
.

Page 185 of 851
.
5. Access Washington
The service definition for Access Washington is provided in the Current State Inventory section of this report under the Web, Video, and BI subsection sub-section.

Page 186 of 851
.
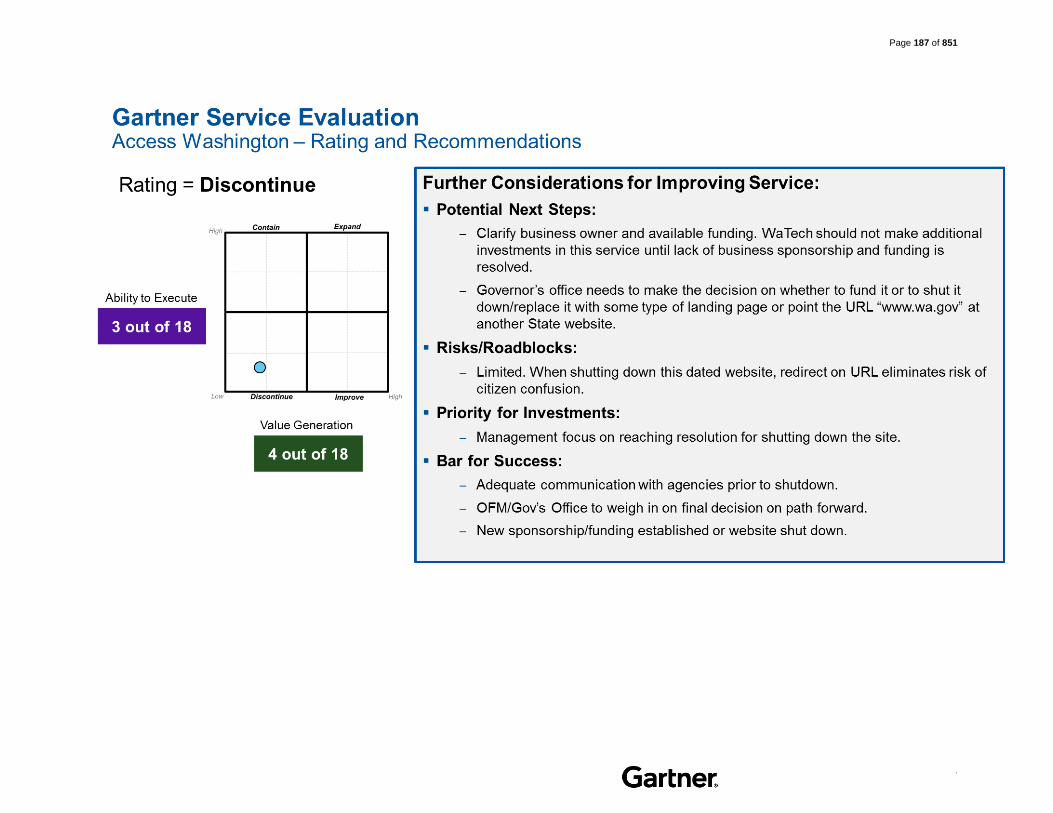
Page 187 of 851
.

Page 188 of 851
.
6. Usability Lab
The service definition for Usability Lab is provided in the Current State Inventory section of this report under the Web, Video, and BI subsection sub-section.

Page 189 of 851
.

Page 190 of 851
.

Page 191 of 851
.
7. BPaaS (ServiceNow Dev)
The service definition for BPaaS (ServiceNow Dev) is provided in the Current State Inventory section of this report under the Web, Video, and BI subsection.

Page 192 of 851
.

Page 193 of 851
.

Page 194 of 851
.
8. ESF – Finance
The service definition for ESF – Finance is provided in the Current State Inventory section of this report under the Applications Development and Support subsection.

Page 195 of 851
.

Page 196 of 851
.

Page 197 of 851
.
9. ESF – HR/Payroll
The service definition for ESF – HR/Payroll is provided in the Current State Inventory section of this report under the Applications Development and Support subsection.
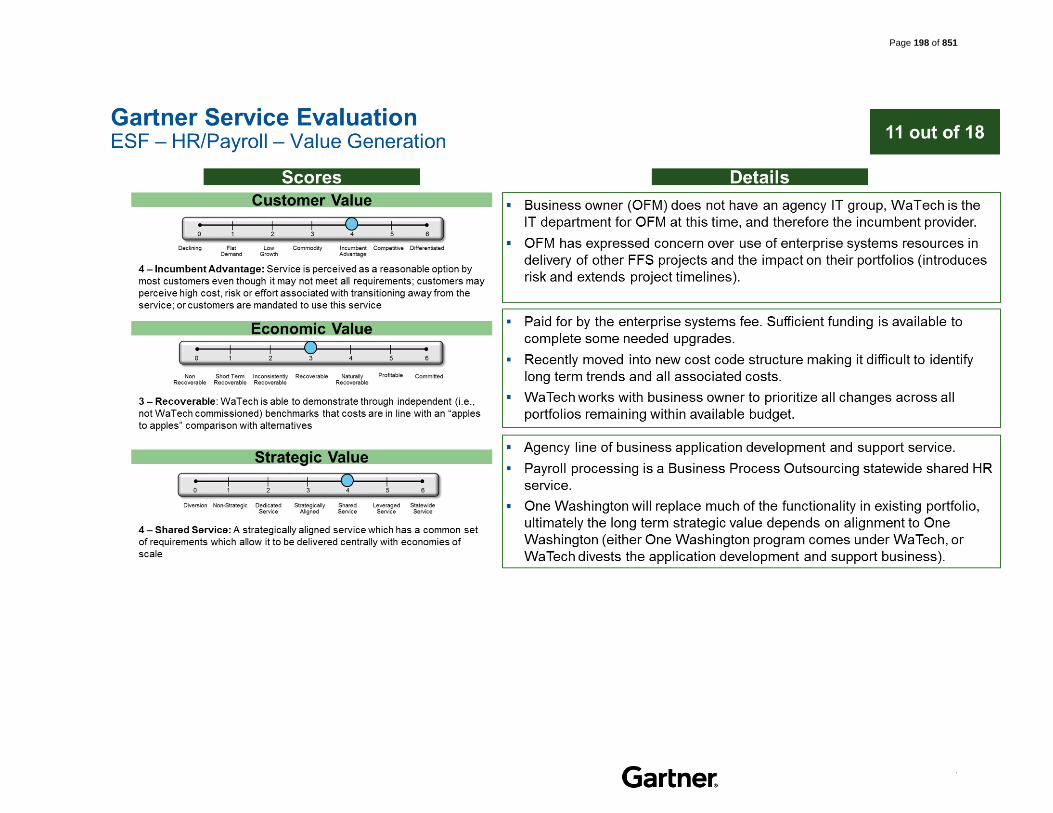
Page 198 of 851
.

Page 199 of 851
.

Page 200 of 851
.
10. ESF – Budget
The service definition for ESF – Budget is provided in the Current State Inventory section of this report under the Applications Development and Support subsection.

Page 201 of 851
.

Page 202 of 851
.

Page 203 of 851
.
11. ESF – Enterprise Reporting
The service definition for ESF – Enterprise Reporting is provided in the Current State Inventory section of this report under the Applications Development and Support subsection.

Page 204 of 851
.

Page 205 of 851
.
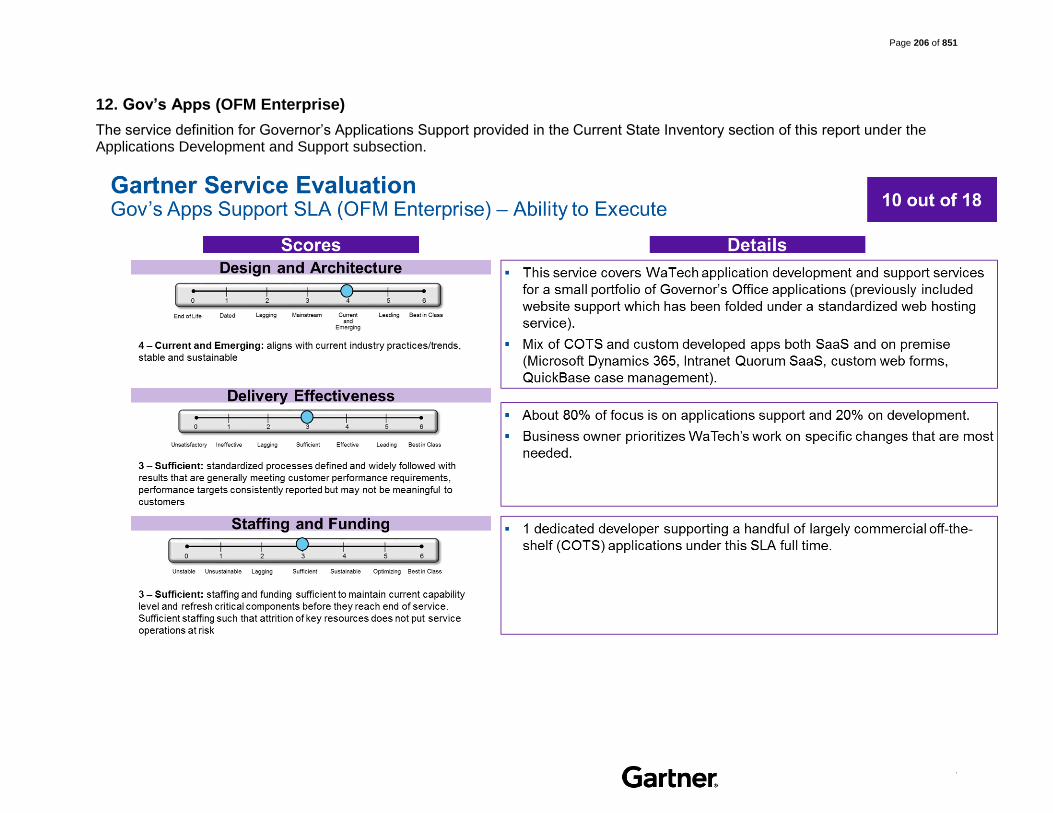
Page 206 of 851
.
12. Gov’s Apps (OFM Enterprise)
The service definition for Governor’s Applications Support provided in the Current State Inventory section of this report under the Applications Development and Support subsection.

Page 207 of 851
.

Page 208 of 851
.
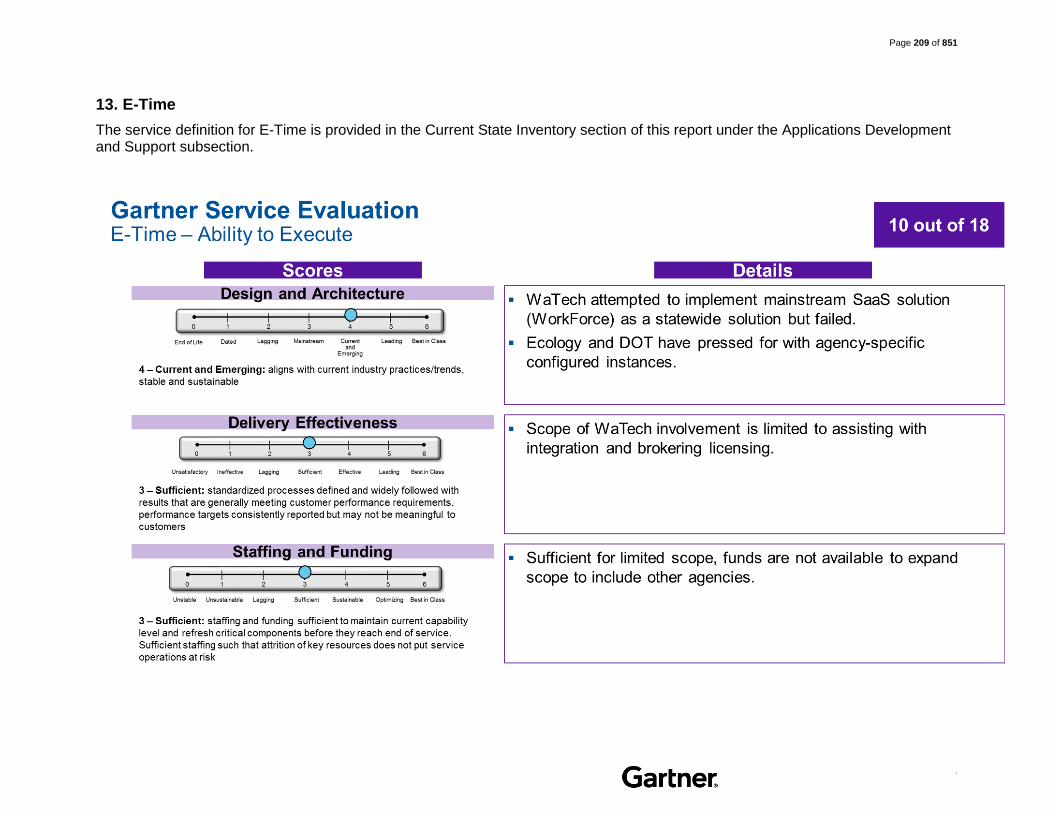
Page 209 of 851
.
13. E-Time
The service definition for E-Time is provided in the Current State Inventory section of this report under the Applications Development and Support subsection.

Page 210 of 851
.

Page 211 of 851
.

Page 212 of 851
.
14. JINDEX
The service definition for JINDEX is provided in the Current State Inventory section of this report under the Applications Development and Support subsection.

Page 213 of 851
.

Page 214 of 851
.

Page 215 of 851
.
IT Programs Analysis and Recommendations
This section includes the following services:
1. OCIO Oversight
2. OCIO Policy and EA
3. Open Data
4. TBM Program
5. 800 MHz
6. OneNet
7. Geospatial Governance
8. Geospatial Portal and Imagery Data
9. WAMAS
10. Video Production Services
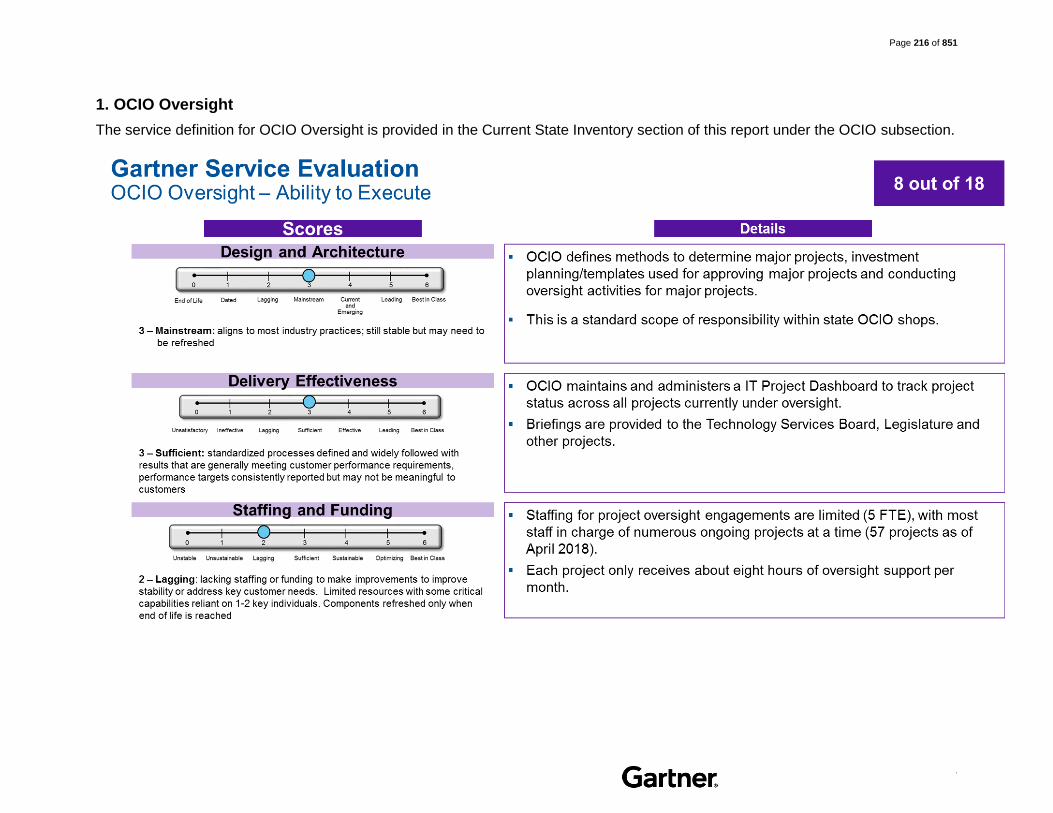
Page 216 of 851
.
1. OCIO Oversight
The service definition for OCIO Oversight is provided in the Current State Inventory section of this report under the OCIO subsection.

Page 217 of 851
.
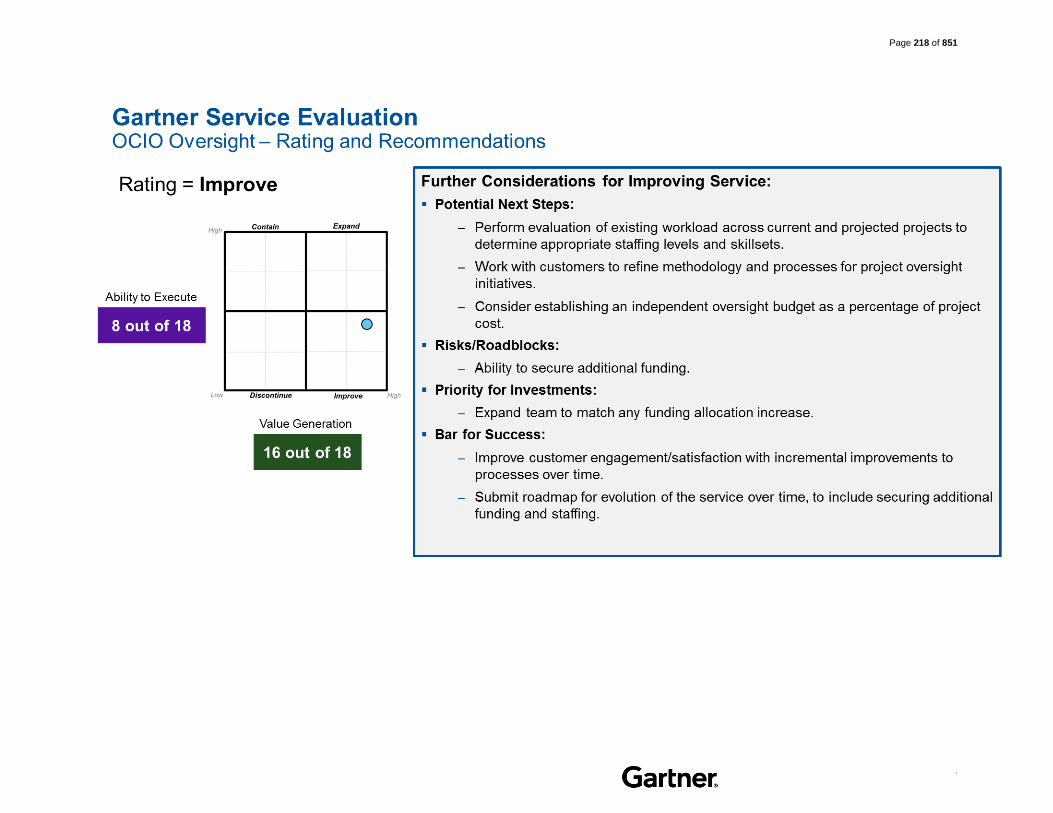
Page 218 of 851
.

Page 219 of 851
.
2. OCIO Policy and EA
The service definition for OCIO Policy and EA is provided in the Current State Inventory section of this report under the OCIO subsection.

Page 220 of 851
.

Page 221 of 851
.

Page 222 of 851
.
3. Open Data
The service definition for Open Data is provided in the Current State Inventory section of this report under the OCIO subsection.

Page 223 of 851
.

Page 224 of 851
.

Page 225 of 851
.
4. TBM Program
The service definition for TBM Program is provided in the Current State Inventory section of this report under the OCIO subsection.

Page 226 of 851
.

Page 227 of 851
.

Page 228 of 851
.
5. OneNet
The service definition for OneNet is provided in the Current State Inventory section of this report under the OCIO subsection.

Page 229 of 851
.

Page 230 of 851
.

Page 231 of 851
.
6. Geospatial Governance
The service definition for Geospatial Governance is provided in the Current State Inventory section of this report under the GIS Location-Based Services subsection.

Page 232 of 851
.

Page 233 of 851
.
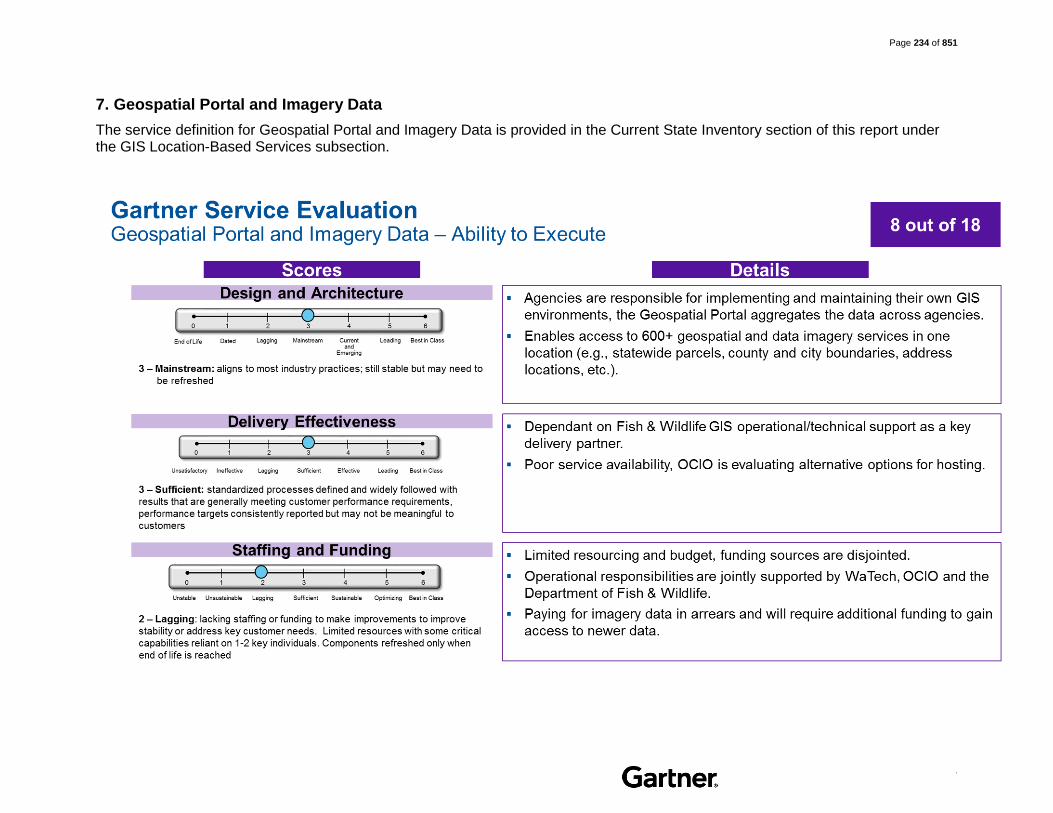
Page 234 of 851
.
7. Geospatial Portal and Imagery Data
The service definition for Geospatial Portal and Imagery Data is provided in the Current State Inventory section of this report under the GIS Location-Based Services subsection.

Page 235 of 851
.

Page 236 of 851
.

Page 237 of 851
.
8. WAMAS
The service definition for WAMAS is provided in the Current State Inventory section of this report under the GIS Location-Based Services subsection.

Page 238 of 851
.

Page 239 of 851
.

Page 240 of 851
.
9. Video Production Services
The service definition for Video Production services is provided in the Current State Inventory section of this report under the Web, Video, and BI
Sub-section.
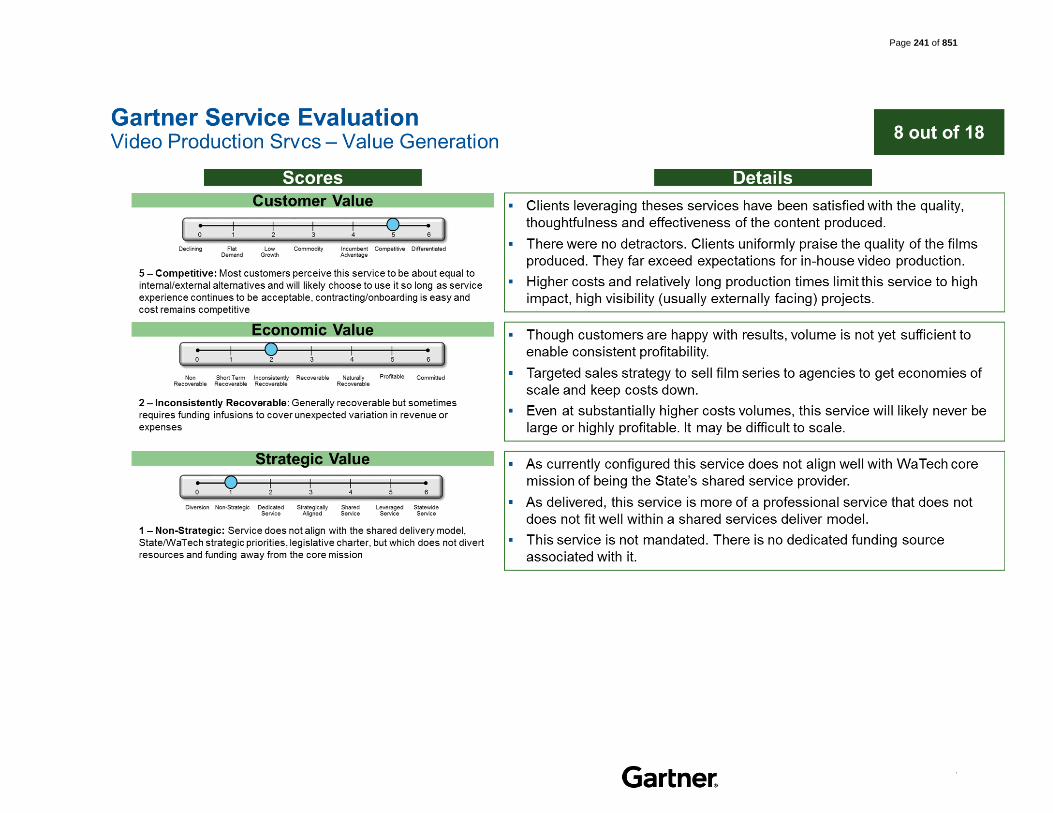
Page 241 of 851
.

Page 242 of 851
.

Page 243 of 851
.
Current State Inventory

Page 244 of 851
.
Current State Inventory Introduction
This section of the report documents an inventory of WaTech’s current services that provides descriptions in sufficient detail to enable expert review of each service and, considering the current state and trajectory of that service along with industry and technology trends, developments and best practices, answer the following questions:
1. Is the current service (or program) funded appropriately and does WaTech have adequate staffing to support the service?
2. Should WaTech continue to offer this service?
If so, what is the affirmative rationale as to why this is the case, including a description of the expected benefits customers should receive?
If not, what are the reasonable service delivery alternatives and associated transition costs and impacts?
Gartner Consulting leveraged a project approach and analysis methodology that was designed to encompass the full portfolio, collect data needed for evaluation, and develop unbiased third party recommendations leveraging Gartner benchmarking data, and its industry research insights.
In order to collect the information needed in sufficient detail, Gartner started with a review of the WaTech service catalog and other documentation, followed with multiple rounds of interviews. Based on the information collected, Gartner created an initial draft of the current state inventory documentation that was then finalized through multiple review cycles with WaTech staff.
Each program/service information encompasses the following elements.
Background
(A) Service description
(B) Statutory basis for creation of service or program
(C) How the service fits into to the CTS strategic plan and goals
(D) Performance measures used to measure effectiveness and efficiency of service
or program
(E) Current cost to maintain the service – including staffing levels, direct costs,
indirect costs, and any overhead costs
(F/G) Rate structure CTS is currently billing to customer
(H) Analysis of Current Cost Recoverability
(I) Level of service actually provided today
(J) Current Customers
(K) Current and Historical Usage Volumes
(L) Customer Satisfaction and Future Demand
(M) High Level Architecture

Page 245 of 851
.
1. Telephony Services
(3341) Centrex
Background
The Centrex service is also referred to as the Central Office Service
A. Service Description
Definition
WaTech provides brokered Centrex services with CenturyLink and Frontier via competitively bid contracts. WaTech Centrex service includes free calling within the local exchange area, access to the state’s long distance network, and access to the local operator and emergency services. WaTech Centrex offerings include an abbreviated dialing plan (3, 4, or 5 digits) that can be used to dial between any two phones that are in Centrex. In Olympia and Lacey, Centrex and PBX users are part of the same five digit dial plan with a few exceptions, so they can call each other using 5 digits. Access to a Local Exchange Carrier voice messaging system is available at reduced rates.
Features
Call forward
Caller ID
Three-Way Calling
Call Transfer
Speed Dial
Audible and/or visual message waiting indicator
Call Hold
The Frontier Centrex offering also includes domestic long distance (50 states), and voice mail in the monthly line rate at no additional charge
Voicemail Features CenturyLink (Extra Charge) Frontier (Included)
Maximum greeting length 3 minutes 2 minutes
Maximum message length 5 minutes 5 minutes
Message limit 100 messages 50 messages
Message retention 60 days 30 days
Email receipt and notification of voicemail
Included No
Maximum number of distribution lists
10 5
Number of destinations per distribution list
25 24

Page 246 of 851
.
Notes
Service is provided solely by the Centrex Provider (contracted carrier)
Customer is responsible for submitting work orders directly to WaTech to have service turned-up at customer sites. WaTech then places the order with the contracted carrier and helps to coordinate the installation with the customer.
Internal building telephone wiring is the responsibility of the customer
Analog phones are purchased and maintained by the customer
WaTech’s ongoing delivery role is limited to vendor management. WaTech works with the customer to understand any service problems, reports them to the carrier, and follows up with the carrier until it is resolved
Additional self-service feature (access to Centrex Management System to change features on near real-time basis) is available to a limited set of customers
B. Statutory Basis for Creation of Service or Program
WaTech’s delivery of this specific service is not mandated by statute. However, RCW 43.105.385 states that over time state agencies should move toward using WaTech as their central service provider for all utility-based infrastructure services. State agencies have the option to contract directly with local exchange carriers and many choose to do so, especially in service areas where WaTech Centrex is not offered.
C. How the Service Fits into the CTS Strategic Plan and Goals
WaTech reports that this service supports the strategic roadmap to ensure all digital and analog telephone systems are transitioned to Internet protocols.
D. Performance Measures used to Measure Effectiveness and Efficiency
WaTech has several types of performance measures for this service:
Availability –The contracted providers monitor performance and provide reports on the service performance as requested for a fee. The latest agreement with CenturyLink is for a non-blocking Centrex Service
Incident Response – Follows standard WaTech incident management process with targets based on ticket severity
Request Fulfillment – WaTech provides customers with onboarding timeline guidance based on their experience and location specific variables of what typical timelines can be. Once a service is in place there are guaranteed intervals contained in the Service Level Agreements for additional services. For normal activities these intervals are up to several days for new services and much sooner for simple changes. WaTech tracks request fulfilment activities and aims to meet the following Service Level Objectives (SLOs):
Service Level Objectives are monitored for all Telephony Services as follows. This includes Centrex, PBX, Long Distance, and Conference Services.

Page 247 of 851
.
Group Service Level Objective
Service Requests
Telephony Projects 30 Days
Telephony Moves, Adds and Changes 3 Business Days (equates to 4.2 Calendar days)
Incidents 5 Days
WaTech negotiates agreed upon time intervals for carriers to install new services. The time to onboard new customers varies depending on the carrier and the amount of service being ordered. When WaTech experiences issues maintaining these intervals they escalate according to a defined escalation contact roster.
E. Current Cost to Maintain the Service
Staffing
Staff are not fully dedicated to the delivery of this service; therefore, WaTech uses transfer rules to assign staff to the service for the purposes of tracking and forecasting costs (shown as the 3.2 FTEs in direct/indirect labor in the diagram below). These transfer rules were developed by estimating actual staff time spent on activities related to the service.
In addition, 0.77 percent of total overhead costs are being transferred to this service. If you apply that total cost percentage to the 65 FTE within overhead, it would be about 0.5 overhead FTE.
WaTech’s line staff are responsible for completing and submitting move, add, change, and delete forms to the contracted carriers. WaTech pulls carrier billing information into WaTech’s telephony and network specific billing system (referred to as OSS, which is an Operational Support System) and provides bills to customers. About 3 FTEs are completing these activities today.

Page 248 of 851
.
Figure 9. Centrex Service Staffing
Note: Staffing numbers pulled from “Estimated Overhead FM6 December”
Figure 10. Centrex Direct/Indirect Staffing
Note: Staffing details pulled from “Org Chart - Color Coded 01.01.18” and combined with transfer rules in “FY18 Master Indexes 12-19-17”. WaTech indicated the transfer rules included in the 12-19-17 file are slightly inaccurate (e.g., only 2% of code 3110 should be applied to Centrex) but a full set of updated transfer rules were not provided for correction before the zero based budget project conclusion.
Workload Supported
The three people delivering the Centrex service currently support the workload defined in the table below:

Page 249 of 851
.
Table 9. Centrex Workload Supported
Description Workload Supported
Number of Lines as of January 1, 2018 7,095 lines
Average Number of Lines Forecasted in FY18 6,642 lines
Average Number of Lines Forecasted in FY19 5,220 lines
Note: Workload information is current as of January 2018 and this detail was provided by WaTech via hard copy documentation on 2/14/2018, forecasted line estimates were provided in the file “Centrex Spending Plan Increase 201719 to OFM $45 Jan 2018 start”. Note that WaTech forecasts lines will drop off at a rate of about 5% in early 2018 and slowing to 1% per month at the end of 2018 and sustaining a monthly reduction of 1% through the end of FY19. Given this assumption, WaTech anticipates 5,616 lines at the end of FY18, and 4,824 by the end of FY19, average line count per fiscal year are provided in the table.
Direct, Indirect and Overhead Costs
WaTech’s planned expenses for this fiscal year are provided in the table below.
Table 10. Centrex FY18 Planned Service Expenses
Cost Components
FY18 Planned FY19 Planned Cost Details
A Salaries
212,437 220,092 3 Planned FTEs
B Benefits
114,692 114,474
E Goods & Services
2,192,220 2,349,000
Line costs billed to WaTech by the contracted carriers. Year-over-year changes account for assumed reduction in lines
E Internal Purchases
17,520 17,520 Desktop and telephony for delivery staff
G Travel
300 300 J Non-capitalized Assets
240 240
T Transfers
126,000 126,000 Agency overhead Total Planned Expenses
2,663,409 2,828,426
Note: Cost details were pulled from “Centrex Spending Plan Increase 201719 to OFM $45 Jan 2018 start” excel spend plan provided in March 2018; the salary and benefit costs assume vacancies are filled. Note, currently over 60% of all supported Centrex are line only (used for fax, modems, or alarm lines).
Given that the Centrex service is largely a brokered service, WaTech has not made large capital investments associated with this service (there are no depreciated assets with low book value being tracked that would indicate major deferred maintenance or lifecycle refresh requirements).
WaTech incurs the following carrier costs:
Century Link $21.00 per line (~$25 after taxes, fees, and surcharges)
Frontier: $17.95 per line (~$31 after taxes, fees, and, surcharges)
Frontier also includes voicemail and LD calling in their rate. Century Link charges $3.00 extra per voicemail and all of the lines are PIC’d to Magna5 for long distance. Frontier includes voicemail and long distance in their rates, so it is one inclusive rate. If you add a

Page 250 of 851
.
voicemail box to a Century Link line and compare it to a Frontier line, after taxes and fees both come out to around $31 per line for the cost to WaTech.
Given near-term planned operating expenses and forecasted supported lines, WaTech will have the following workload costs for its Centrex service in FY18 and FY19:
Table 11. Centrex Cost by Workload
Description Workload Cost Details
Number of Directly Supporting FTEs 3
Number of Lines (average in FY18) 6,642
Number of Lines (average in FY19) 5,220
Lines per FTE (average in FY18) 2,214 lines/ FTE
Lines per FTE (average in FY19) 1,740 lines/ FTE
Estimated Costs for Maintaining all Lines in FY18 $ 2,663,408.96
Estimated Costs for Maintaining all Lines in FY19 $ 2,828,426.26
Cost per Line FY18
$33.42 per line per month ($2,663,408 operational cost / 6,642 average supported lines / 12 months)
Cost per Line FY19
$45.15 per line per month ($2,828,426 operational cost / 5,220 average supported lines / 12 months)
Note: Workload cost in the table above is calculated based on WaTech’s alignment of costs to this service without adjustment for alignment to Gartner consensus models.
F/G. Rate structure CTS is currently billing to customers
The service is provided on a fee for service basis; rates are listed in the table below:
Table 12. Centrex Rates
Description Rate Detail
Standard Centrex service statewide $45 per line per month (as of 1/1/2018)
Mailbox CenturyLink $3.50 per mailbox per month. Frontier no additional charge.
Domestic Long Distance
CenturyLink must pay additional fees (see Switched Long Distance service). Frontier no additional charge.
Note: WaTech did not provide any details around typical customer line configurations and typical costs incurred by customers across the two carrier options. No data was provided to indicate how much customers save on average by choosing the Frontier service which includes domestic long distance at no additional charge.
Customers can use Apptio to review detailed telephony data.
Prior to January, WaTech was charging Centrex rates that ranged from $23 per line per month to $36 per line per month; these rates had been in place since from between 1997 and 2009. With the January rate change, rates have increased by 25% which in some cases nearly doubles billed cost recovery.
H. Analysis of Current Cost Recoverability
This service was not cost recoverable prior to the rate change on January 1, 2018. WaTech is now forecasting cost recovery in FY18. However, given forecasted reductions in lines, WaTech is forecasting that this service will not be cost recoverable in FY19.

Page 251 of 851
.
Table 13. Centrex Cost Recoverability (Actual FY16-FY18)
Service Income FY16 FY17 FY18 H1
Service Revenue (3341) 2,965,892 2,845,397 1,356,998
Service Expenses (3341) (4,180,853) (3,643,071) (1,677,027)
Net Income (1,214,960.81) (797,674.21) (320,028) Note: Cost recoverability detail pulled from “AFRS Financial Download (Fiscal Years 2016 – Current)”
Table 14. Centrex Cost Recoverability (Forecasted FY18-FY19)
Service Income FY18 FY19
Service Revenue (3341) 2,946,721 2,818,800
Service Expenses (3341) (2,663,409) (2,828,426)
Net Income 283,312 (9,626) Note: Forecasted Cost recoverability detail pulled from “Centrex Spending Plan Increase 201719 to OFM $45 Jan 2018 start” excel spend plan provide in February 2018
I. Service Level Actually Provided Today
While there are no specific service level targets associated with customer onboarding and service request fulfilment, WaTech reports that customers are typically on-boarded within 1-3 weeks from the time customers submit all of the required information for (contact and billing) and this information is provided to the contracted carriers. Contracted carriers are responsible for ensuring sufficient capacity to turn up new service requests. The contracted carriers notify WaTech of any capacity issues and anticipated relief dates. However, WaTech indicated that they have never experienced capacity issues with any Centrex carriers.
Additionally, WaTech is responsible for communicating service issues to the carrier, and must follow up with the carrier until it is resolved. WaTech indicated that while individual lines have experienced issues, there have not been any large scale outages. The smaller outages are tracked and reported in WaTech’s ticketing system.
Service Level Objectives are monitored for all Telephony Services as follows (this includes Centrex, PBX, Long Distance, and Conference Services).
Table 15. Service Level Objectives for Telephony (Centrex, PBX, SLD, Conferencing)
Group Service Level Objective
Service Requests
Telephony Projects 30 Days
Telephony Moves, Adds and Changes 3 Business Days (equates to 4.2 Calendar days)
Incidents 5 Days

Page 252 of 851
.
Table 16. Service Level Report for Telephony Projects (Centrex, PBX, SLD, Conferencing)
Note: SLA Performance chart provided by WaTech during Current State Inventory review.
Figure 11. Service Level Report for Telephony Moves, Adds, and Changes (Centrex, PBX, SLD, Conferencing)
Note: SLA Performance chart provided by WaTech during Current State Inventory review.
0.00
5.00
10.00
15.00
20.00
25.00
30.00
35.00
0
20
40
60
80
100
120
140
160
180A
pr-
17
Ma
y-1
7
Jun
-17
Jul-
17
Au
g-1
7
Se
p-1
7
Oct-
17
No
v-1
7
De
c-1
7
Jan
-18
Fe
b-1
8
Ma
r-1
8
Ap
r-18
Avera
ge D
ays
Num
ber
of
Tic
kets
Telephony Projects
Number of SR Average time SLO
00.511.522.533.544.5
0
500
1000
1500
2000
Ap
r-17
Ma
y-1
7
Jun
-17
Jul-
17
Au
g-1
7
Se
p-1
7
Oct-
17
Nov-1
7
Dec-1
7
Jan
-18
Fe
b-1
8
Ma
r-1
8
Ap
r-18
Avera
ge D
ays
Num
ber
opf
Tic
kets
Telephony Moves, Adds and Changes
Number of SR Average time SLO

Page 253 of 851
.
Figure 12. Service Level Report for All Telephony Incidents (Centrex, PBX, SLD, Conferencing)
Note: SLA Performance chart provided by WaTech during Current State Inventory review.
J. Current Customers
WaTech has about two hundred Centrex customer entities which includes many state agencies, counties, cities, and school districts. The largest 10 customers account for over half of the amount WaTech billed for this service in FY17.
Additionally, WaTech captures $40,740 of revenue for Centrex services via internal sales transfers. If WaTech were a billable customer it would be about the twenty-second largest.
Table 17. Centrex Current List of Customers
# Customer FY17 ($) FY17 (%) FY18 H1 ($) FY18 H1 (%)
1 3000-DEPARTMENT OF SOCIAL AND HEALTH SERVICES
525,624 18 261,547 19
2 3100-DEPARTMENT OF CORRECTIONS
206,948 7 86,537 6
3 2250-WASHINGTON STATE PATROL
171,952 6 86,323 6
4 4050-DEPARTMENT OF TRANSPORTATION
119,833 4 59,553 4
5 2400-DEPARTMENT OF LICENSING
114,417 4 57,462 4
6 4610-DEPARTMENT OF ECOLOGY
103,778 4 51,283 4
7 1790-DEPARTMENT OF ENTERPRISE SERVICES
84,607 3 42,914 3
8 A550-SEATTLE SCHOOL DISTRICT 1 TELC ONLY
81,668 3 40,984 3
9 4770-DEPARTMENT OF FISH AND WILDLIFE
62,189 2 31,533 2
0.00
1.00
2.00
3.00
4.00
5.00
6.00
0
50
100
150
200
250
300
350
400A
pr-
17
Ma
y-1
7
Jun
-17
Jul-
17
Au
g-1
7
Se
p-1
7
Oct-
17
No
v-1
7
De
c-1
7
Jan
-18
Fe
b-1
8
Ma
r-1
8
Ap
r-18
Avera
ge D
ays
Num
ber
of
Tic
kets
Telephony Incidents
Number of IN Average time SLO

Page 254 of 851
.
# Customer FY17 ($) FY17 (%) FY18 H1 ($) FY18 H1 (%)
10 5400-EMPLOYMENT SECURITY DEPARTMENT
60,058 2 29,709 2
Total Top 10 Billable Customers
1,531,074 54 747,845 55
Total for All Other Billable Customers
1,277,888 45 595,483 44
Total WaTech Internal Sales 37,014 1 13,636 1
Total Revenue 2,845,976 100 1,356,964 100
Note: Customer billing details pulled from “Billing Data - Apptio FFS Only (2018-05-16)” excel file.
K. Current and Historical Usage Volumes
This service is in a slow decline as PBX and/or Voice-over-IP (VoIP) usage has gradually replaced it. As of January of 2018, there were 7,095 remaining Centrex lines.
Year Supported Lines Trend (%)
Delta 2014-2018 9,436 to 7,095 lines 25% reduction in lines supported
Jan 1, 2018 7,095 lines 10% reduction in lines supported
Oct 1, 2017: 7,905 lines 5% reduction in lines supported
Oct 1, 2016: 8,286 lines 4% reduction in lines supported
Oct 1, 2015: 8,640 lines 8% reduction in lines supported
Oct 1, 2014: 9,436 lines Baseline
Note: Historical usage data provided by WaTech during inventory review.
L. Customer Satisfaction and Future Demand
The Customer Voice appendix to this report includes customer satisfaction and future demand details based on the results of agency interviews and focus groups conducted during the project.
M. High Level Architecture
The technical architecture is defined by the contracted carrier. WaTech provides a managed services wrapper around a brokered carrier service. WaTech has 2 contracts, one with Century Link and the other with Frontier, 85% of customers are using Century Link and 15% are using Frontier. Over 60% of all Centrex are line only (used for fax, modems, or alarm lines).
For the CentryLink service, WaTech leases a Centron self-service tool and manages configuration to enable agency customer self-service.

Page 255 of 851
.
(3342) Private Branch Exchange
Background
The Private Branch Exchange service is also referred to as PBX
This service includes Call Center, IVR (Interactive Voice Response), voicemail services
A. Service Description
Definition
WaTech installs, operates, and maintains premise-based shared Private Branch Exchange (PBX) systems that delivers voice telephone service to public organizations. WaTech supports Avaya and Nortel PBX platforms. The Avaya offering is a hybrid architecture that is used to provide Voice over IP (VoIP), digital, and analog services, while the Nortel platform is used to provide only digital and analog services.
Associated with the PBX service, WaTech also provides several voicemail solutions; including, Octel, Avaya Audix, & Nortel Call Pilot. The primary voice mail system used with the networked Avaya PBX systems is the Avaya Aura platform.
WaTech estimates that it installs, operates, and maintains a significant percentage (at minimum ~80%) of the state’s ACDs and Call Centers. WaTech has invested in advanced Call Center tools which WaTech leverages across a large base of agents, both brick and mortar and remote. The groups that WaTech supports range from very small Automated Call Distributions (ACDs) to Call Centers with hundreds of agents fielding thousands of calls. WaTech is in the process of installing Avaya’s latest omni-channel product for next generation capabilities.
Customers may purchase an Interactive Voice Response (IVR) solution along with their PBX service. An IVR is a voice/call-processing option for improving call center functionality and integration. It enables callers to have more flexibility to access information or leave messages. Use of this option can “offload” call volume from agents to the IVR or improve load balancing by allowing customers to leave their number and have the system call them when their place in the queue comes up. Customer may also choose to configure speech recognition in their IVR applications for an additional fee. There are several other applications that have been purchased and are available for customers to use with minimal upfront charges and cost:
SureConnect that holds a place in queue and does call back to the customer when the space is first in queue,
Audio Forms like customer satisfaction survey forms, report forms, order forms, application forms, status reports, claim filing, etc.,
Some of the other applications are estimated wait time and position in queue, and a customized application for referral of disconnected PBX numbers.
Voice Services provided via VoIP technologies, which leverage the SGN for call signaling and call streaming is considered to be part of the “PBX” offering. Under the VoIP model, the PBX hardware/software and associated tie-line and PSTN trunking is eliminated and replaced by centralized call management servers and centralized SIP trunking which are accessed over the SGN. The agencies are billed under specific VoIP PBX rates, which includes a fully WaTech managed option as well as a limited customer managed.

Page 256 of 851
.
Fully Managed is where WaTech does all the Moves and Changes work, Self-Service is where the customer does all of the Moves and Changes work, and in both cases “Adds and Deletes” are managed by WaTech.
At present, WaTech reports that all of the Avaya sites are VoIP based with a combination of analog, digital and VoIP endpoints. All of the connections between the PBXs are using SIP via Avaya Session Managers. There are redundant gigabit Ethernet connections at SDC and QDC for SIP trunking. These connections provide local, long distance and toll free service to the PSTN. WaTech is in the process of removing T1s at sites and replacing the functionality with SIP. WaTech is implementing a blended solution with a TDM backup to primary SIP feeds. Additionally, WaTech is about 66% through the process of consolidating our PBX footprint.
All new sites are being installed as VoIP, the only exceptions being correctional institutions and sites where the cable plant will not support VoIP. WaTech’s business model calls for customers to purchase their handsets. There are approximately 5,000 VoIP handsets and growing. In 2016 WaTech issued guidance to customers to replace digital and analog handsets with VoIP, with a stated target of having this conversion completed by 2024.
On the network side, WaTech is overhauling PSTN access and converting to SIP at what WaTech describes as a careful pace. WaTech plans to reduce T1s to the PSTN by 90% over the next few years. WaTech is developing new network-based redundancy incorporating point to multi point Ethernet services and reviewing the use of voice over LTE as a backup methodology. WaTech reports that it is very near to having a secure SIP edge to the network which will allow greater flexibility for deploying SIP endpoints.
WaTech states that they have created a master plan for VoIP rollout. However, customer costs associated with conversion to VoIP have not been funded.
WaTech noted that a large part of the endpoint conversion is customer funded and somewhat out of their control. WaTech has published an overall timeline for VoIP conversion in the form of a service announcement, with an end date of 2024. WaTech also has two projects underway; one is for the implementation of SIP services and a tracking project for deployment of VoIP endpoints.
Features
PBX/VoIP features include the following:
Location based dialing with abbreviated dial plan (4 or 5 digits)
Enhanced 911
On net dialing to all networked PBXs (most Avaya PBXs are connected to the statewide MPLS network)
Custom telephone configurations (Avaya architecture includes over 300 features)
Expanded free dialing to most of the population in the State at no additional charge
One number service that lets users receive calls to their office phone on their cell phone or another phone (i.e., call forwarding)
Soft phone client software that lets users control their office phone using a PC on site. When off site, the software allows users to route calls to a phone using the public telephone network or use the PC with an IP network
Call recording capability
Features and benefits unique to VoIP include;
o Wideband audio G.722 (HD Voice)

Page 257 of 851
.
o Multiple device (10) ringing (SIP)
o Video conferencing- using UC client
o Mobility- Hot desking
o Skype integration (Avaya Communicator for Lync)
o Soft clients for PC, MAC, Android – BYOD
o Greater Resiliency (ability to register to multiple devices)
o Tighter integration with network based solutions to perform call control and routing functions
o Less infrastructure required for VoIP deployments, i.e., gateways category 3 wiring drops
o Easier relocation of handsets
o Handsets are addressable and can be updated with new features and fixes.
Aura voicemail features include the following (for an additional fee):
Voicemail Features Standard Premium
Maximum greeting length 90 seconds 90 seconds
Maximum message length 4 minutes 4 minutes
Message storage limit 20 minutes 40 minutes
Message retention For life of system For life of system
Email notification No Yes
Text or page notification No Yes
Outcalling notification No Yes
Web access for user preference configuration
No Yes
Speech access Limited to VM users Yes
Reach Me No Yes
Voice recognition for addressing
No Yes
Visual message waiting indicator
Yes Yes
Greetings user can record Two (busy/no answer) Two (busy/no answer)
Extended absence greeting Yes Yes
IMAP4/POP3 access (email integration)
No Yes
IMAP4/POP3 access (email integration)
No Yes
Call Center features include the following (available for some Avaya PBX customers at an additional fee):
Skills based routing
A comprehensive management system with real time and historical reporting
Service observing
Custom Interactive voice response application development and service
IP agent software which allows call center agents to participate in call centers from any location with an IP connection and phone

Page 258 of 851
.
IVR Based Call back functionality that lets callers to a call center receive a call back rather than wait in queue
Other IVR based applications are available for customers, such as surveys, estimated wait time, position in queue, audio questionnaires and others
Bulk call recording
Workforce Optimization
Notes
WaTech proposes a PBX solution based on the requirements to serve the location. The per seat cost proposed aims to recover the costs associated with the installation of the service. These costs include the cost of any hardware, software, licensing, network and support of the service location. Since many of WaTech’s costs are leveraged across a large customer base, WaTech estimates that its service may be significantly less than what an individual customer would pay for an equivalent service.
WaTech supports customers with identifying requirements and implementing initial configurations
WaTech provides a site manager to customers for consultation and support of large scale projects and advanced telephony applications.
For most customers, WaTech is responsible for configuring all moves, adds and changes; however, a growing subset of customers have limited administrative access which enables them to make changes to phones and/or voicemail boxes assigned to their agency’s staff
Customers are responsible for building wiring and PoE network switches
Customers are responsible for purchasing phones and replacing them when needed
WaTech has a contractual arrangement with Cerium for Avaya products that includes a third party clause for interactive Northwest, Inc. (INI) to develop applications. This arrangement allows agencies to develop custom applications at their expense. WaTech assists customers by working with the developer, making required programming changes, and providing day to day support
IVR systems are available on a subscription basis to many WaTech Avaya PBX telephone customers. WaTech owns and operates the IVR environment (which includes hardware, software, Avaya licensing, and VMware licensing). WaTech maintains the IVR and keeps software at or near current software versions through contracted arrangements with vendors.
WaTech can provide most PBX customers with call detail records as requested. Many customers request regular customized reports at various intervals, which are automatically generated and emailed to customers. WaTech is responsible for keeping all PBX and voicemail systems updated with current hardware, firmware, and software, and the costs of these upgrades are incorporated into the negotiated rates.
WaTech coordinates technical issue resolution with customer agency telecom coordinators. WaTech technical resources include a team of experienced technicians who resolve most issues, supported by vendor and manufacturer technicians under contract.
Customers may exit the service agreement at any time without financial penalty beyond the cost of replacing the service with another product.

Page 259 of 851
.
IVR application improvements are all paid for by the customers and programmed by the Avaya Business Partner and contracted developer Interactive Northwest Incorporated (INI)
IVR customers must sign up for a one-year time commitment (due to yearly maintenance and upgrade payments to the manufacturer).
B. Statutory Basis for Creation of Service or Program
WaTech’s delivery of this specific service is not mandated by statute. However, RCW 43.105.385 states that over time state agencies should move toward using WaTech as their central service provider for all utility-based infrastructure services. State agencies have the option to contract directly with other providers, or to deliver the service for themselves and some choose to do so.
C. How the Service Fits into the CTS Strategic Plan and Goals
WaTech reports that this service supports the strategic roadmap to ensure all digital and analog telephone systems are transitioned to Internet protocols.
D. Performance Measures used to Measure Effectiveness and Efficiency
WaTech tracks the following performance measures for this service:
Availability – WaTech tracks and measures server up-time to track and measure performance using SolarWinds; WaTech also receives detailed performance reports on call quality, call volume, and many other attributes These reports are provided monthly by Avaya as part of our maintenance agreement using Prognosis software
Capacity – WaTech collects and analyzes trunking measurements to ensure adequate PSTN access for all sites
Incident Response – Follows standard WaTech incident management process with targets based on ticket severity
Request Fulfillment – WaTech provides customers with onboarding timeline guidance based on their experience and location specific variables of what typical timelines can be. Once a service is in place there are guaranteed intervals contained in the Service Level Agreements for additional services. For normal activities these intervals are up to several days for new services and much sooner for simple changes. WaTech tracks request fulfilment activities and aims to meet the following Service Level Objectives (SLOs):
Service Level Objectives are monitored for all Telephony Services as follows. This includes Centrex, PBX, Long Distance, and Conference Services.
Group Service Level Objective
Service Requests
Telephony Projects 30 Days
Telephony Moves, Adds and Changes 3 Business Days (equates to 4.2 Calendar days)
Incidents 5 Days
E. Current Cost to Maintain the Service
Staffing
Staff are not fully dedicated to the delivery of this service; therefore, WaTech uses transfer rules to assign staff to the service for the purposes of tracking and forecasting costs (shown

Page 260 of 851
.
as the 21 FTEs in direct/indirect labor in the diagram below). These transfer rules were developed by estimating actual staff time spent on activities related to the service.
In addition, 5.38 percent of total overhead costs are being transferred to this service. If you apply that total cost percentage to the 65 FTE within overhead, it would be about 3.5 overhead FTE.
WaTech’s line staff are responsible for coordinating customer site turn-ups and moves; monitoring and troubleshooting system issues; and processing and implementing requests for moves, adds, changes, and deletes; and processing and submitting call detail records to customers. About 21 FTEs are completing these activities today.
WaTech also contracts a commercial cabling vendor to perform Main Distribution Frame (MDF) cross connects in the Olympia/Lacey area. This service is offered to customers and is included with the per seat cost of the PBX product.
Figure 13. PBX Service Staffing
Note: Staffing numbers pulled from “Estimated Overhead FM6 December”

Page 261 of 851
.
Figure 14. PBX Direct/Indirect Staffing
Note: Staffing details pulled from “Org Chart - Color Coded 01.01.18” and combined with transfer rules in “FY18 Master Indexes 12-19-17”
Workload Supported
A twenty-one staff member team supports the workload defined in the table below:
Table 18. PBX Workload Supported
Description Workload Supported
PBX: Total lines supported (across all PBXs and including IVR lines) 53,115 lines
Large Avaya – # PBXs supported/ lines 4 PBXs / 38,851 lines
Stand-alone Nortel – # PBXs supported/ lines 21 PBXs / 7,503 lines
Stand-alone Avaya – # PBXs supported/ lines 21 PBXs / 6,761 lines
IVR: Total ports supported 762 ports
Total IVR lines supported 3,342 lines
Large Avaya – # PBXs supported/ lines 4 PBXs / 3,263 lines
Stand-alone Avaya – # PBXs supported/ lines 4 PBXs / 79 lines
Voicemail: Total mailboxes supported 34,807 mailboxes*
Large Avaya – # PBXs supported/ # premium mailboxes 4 PBXs/ 3,851 mailboxes
Large Avaya – # PBXs supported/ # standard mailboxes 4 PBXs/ 19,254 mailboxes
Stand-alone Avaya – # PBXs supported/ # standard mailboxes 4 PBXs/ 462 mailboxes

Page 262 of 851
.
Description Workload Supported
Stand-alone Nortel – # PBXs supported/ # standard mailboxes 6 PBXs/ 6,853 mailboxes
VoIP: Total lines supported 1,570 lines
One-X Agents (software client) 1,405 lines
IP Softphones (software client) 165 lines
IP Supported Lines 5,227 out of 50,098 lines
Administrators: Total Call Manager users supported 5,292 users
Note: Usage details provided by WaTech in hard copy during an interview in February 2018. There are about fifteen thousand lines without mailboxes due to the fact that Labor & Industries manages their own voicemail system which accounts for 2500 mailboxes, and two DOC PBXs also have their own messaging systems that are not managed as a part of this service.
Direct, Indirect and Overhead Costs
WaTech’s forecasted spend for this fiscal and next fiscal year are provided in the table below.
Table 19. PBX FY18 and FY19 Forecasted Spend
Cost Components
FY18 Planned FY19 Planned Cost Details
A Salaries 2,151,715 2,142,607 21 FTEs
B Benefits 717,600 712,908
E Goods & Services
7,859,940 8,325,240
Includes consolidation of SEA PBX, TAC PBX, TUM PBX, OLY1 PBX to the two main Olympia PBXs (2 and 3), as well as major upgrades to the two major PBXs. Also, includes Nortel to Avaya conversions.
Includes about $4.6M for regular ongoing recurring costs for software maintenance.
E Internal Purchases
1,113,800 1,141,800 Major costs include server hosting environment
G Travel 24,000 24,000
J Non-capitalized Assets 100,000 200,000
P Debt - Interest & Other Payments 24,130.79 13,026 PBX equipment interest payments
P Debt - Principal Payments 244,106 151,197 PBX equipment COPS payments
T Transfers 998,264 1,010,342 Overhead

Page 263 of 851
.
Cost Components
FY18 Planned FY19 Planned Cost Details
Total Planned Expenses
13,233,556 13,721,120
Note: Cost details were pulled from “Network Services” excel spend plan provide in February 2018; the salary and benefit costs assume vacancies are filled
WaTech has made large capital investments in the past in order to deliver this service with a distributed architecture and there are currently many depreciated assets with low book value being tracked. This implies that WaTech has a high volume of deferred maintenance; however, given WaTech has largely consolidated this infrastructure onto statewide platforms which greatly reduces the hardware based capital investments needed, much of this equipment will not need to be replaced.
Table 20. PBX Equipment Depreciation
Acquisition Cost Accumulated Depreciation Net Book Value
13,032,514 11,499,391 1,533,123
Additionally, WaTech is expecting some minor outlays to consolidate PBXs over the next several years. WaTech is also completing the process of converting to SIP trunking and SIP phones/endpoints. WaTech estimates that there is an opportunity to save around $1M per year through the elimination of carrier PRI lines. In whole, WaTech is forecasted to be completely cost recoverable, given a planned approach to consolidate down to 2 PBXs (one for the majority of the sites and the other for Call Center only sites) over a long time horizon as explained below.
WaTech provided a series of plans, progress reports and communications related to the VoIP projects. WaTech has a high-level master plan for consolidating and or refreshing equipment across served sites. However, WaTech plans to complete end point conversions to VoIP over a very long time horizon, and plans to complete this process with existing resources.
WaTech provided the following details on development of the plan and rationale for the approach. WaTech reports that they did evaluate alternative approaches for completing the migration faster, however WaTech referenced the restrictions of the current cost recovery model and the limited availability of knowledgeable staff as constraining their possible options to a quicker migration approaches. WaTech also reported that the core and supporting PBX infrastructure is running 100% VoIP today.
Given WaTech’s planned operating expenses, in FY18 WaTech will have the following workload costs for its PBX service:
Table 21. PBX Cost by Workload
Description Workload Cost Details
Number of Directly Supporting FTEs 21 (assuming fully staffed)
Number of Lines 53,115 active lines (in use or being billed, with at forecasted growth rate of 3% through end of FY19)
Cost in FY18 $13,233,556
Cost in FY19 $13,721,120
Lines per FTE 2,529 lines per FTE (assuming fully staffed)
Cost per Line in FY18 $21 per line per month

Page 264 of 851
.
Description Workload Cost Details
Cost per Line in FY19 $22 per line per month
Note: Workload cost in the table above is calculated based on WaTech’s alignment of costs to this service without adjustment for alignment to Gartner consensus models.
F/G. Rate structure CTS is currently billing to customers
The service is provided on a fee for service basis. Customers are provided a custom quote using a combination of the rates listed in the table below along with a custom PBX line rate:
Table 22. PBX Rates
Description Rate Detail
PBX line rate
Line rates are tailored and provided via customized all-inclusive PBX service quote. There are two standard VoIP rates: $24 per seat for the fully managed VoIP service and $22 for VoIP with limited PBX management by the customer.
Failover Gateway Custom quote for site survivability option
Aura Voicemail Box
Option 1: Standard Service per box per month $3.83 Option 2: Premium Service, per box, per month (includes unified messaging, speech attendant, reach me and additional storage): $5.00
Domestic Long Distance Expanded free dialing to most of the population in the State at no additional charge
IVR (ongoing subscription fee)
Option 1: Standard Interactive Voice Response applications, $120 per port, per month Option 2: Standard IVR plus speech recognition, $240 per port, per month (rate includes agent rates for remote agent software, and access to low volume dedicated toll free charges)
IVR (one-time development fee) Custom quote for contracted support based on project requirements
Customers can use Apptio to review detailed telephony data.
H. Analysis of Current Cost Recoverability
This service is forecasted to be cost recoverable in FY18 but is currently forecasted to incur a small loss in FY19. WaTech stated that they view this service as sustainable over time.
Table 23. PBX Cost Recoverability (Actual FY16-FY18 H1)
Service Income FY16 FY17 FY18 H1
Service Revenue (3342) 13,414,306 13,791,278 6,877,831
Service Expenses (3342) (13,714,783) (13,764,591) (5,827,527)
Net Income (300,476.61) 26,687.26 1,050,304.17
Note: Actual revenue and expenses pulled from “AFRS Financial Download (Extracted on 2018-05-15)”
Table 24. PBX Cost Recoverability (Forecasted FY18-FY19)
Service Income FY18 FY19
Service Revenue (3342) 13,526,160
13,526,160
Service Expenses (3342) 13,233,556 3,721,120

Page 265 of 851
.
Service Income FY18 FY19
Net Income 292,604 (194,960)
Note: Forecasted Cost recoverability detail pulled from “Network Services” excel spend plan provide in February 2018.
I. Service Level Actually Provided Today
While there are no specific service level targets associated with customer onboarding and service request fulfilment, WaTech reports that customers are typically onboarded within either 3 to 4 weeks, or 3 to 4 months from the time customers submit all of the required information for (contact and billing), depending on whether the site requires a new data connection (which requires months to install), or just an upgraded router (which requires weeks to install). WaTech anticipates that as converged VoIP is adopted by the largest customers, the onboarding timelines will be significantly reduced.
Aggregated across all sites, PBX is typically a high availability service.
Figure 15. PBX Availability Report (Aggregated Across Sites)
Note: This high level view of PBX availability averaged across all sites was pulled from the most recent quarterly dashboards. The fall below 99.8% in January 2017 was caused by extensive damage to a main fiber facility that caused extensive degradation to call processing capability.
WaTech drills down into site-specific reports in the Orion monitoring system, and is able to get a real time view of many sites using the IP-SLA module of Orion (see below).
Figure 16. Example Availability Report from Orion Monitoring System
Customer Site Name Average Availability Timestamp
Olympia OLY1 PBX 100.00 % January 2018
Tumwater L&I S8710 100.00 % January 2018
Olympia OLY2 PBX 100.00 % January 2018
Olympia OLY1 PBX 100.00 % February 2018
Olympia OLY2 PBX 100.00 % February 2018
Tumwater L&I S8710 100.00 % February 2018
Olympia OLY1 PBX 100.00 % March 2018
Olympia OLY2 PBX 100.00 % March 2018
Tumwater L&I S8710 100.00 % March 2018
Tumwater L&I S8710 100.00 % April 2018 Olympia OLY1 PBX 100.00 % April 2018

Page 266 of 851
.
Olympia OLY2 PBX 100.00 % April 2018
Note: Orion IP-SLA example availability report provided by WaTech during inventory review.
Figure 17. Orion IP-SLA Module View
Note: Orion IP-SLA module view provided by WaTech during inventory review.
Service Level Objectives are monitored for all Telephony Services as follows (this includes Centrex, PBX, Long Distance, and Conference Services).
Table 25. Service Level Objectives for Telephony (Centrex, PBX, SLD, Conferencing)
Group Service Level Objective
Service Requests
Telephony Projects 30 Days
Telephony Moves, Adds and Changes 3 Business Days (equates to 4.2 Calendar days)
Incidents 5 Days

Page 267 of 851
.
Table 26. Service Level Report for Telephony Projects (Centrex, PBX, SLD, Conferencing)
Note: SLA Performance chart provided by WaTech during Current State Inventory review.
Figure 18. Service Level Report for Telephony Moves, Adds, and Changes (Centrex, PBX, SLD, Conferencing)
Note: SLA Performance chart provided by WaTech during Current State Inventory review.
0.00
5.00
10.00
15.00
20.00
25.00
30.00
35.00
0
20
40
60
80
100
120
140
160
180A
pr-
17
Ma
y-1
7
Jun
-17
Jul-
17
Au
g-1
7
Se
p-1
7
Oct-
17
No
v-1
7
De
c-1
7
Jan
-18
Fe
b-1
8
Ma
r-1
8
Ap
r-18
Avera
ge D
ays
Num
ber
of
Tic
kets
Telephony Projects
Number of SR Average time SLO
00.511.522.533.544.5
0
500
1000
1500
2000
Ap
r-17
Ma
y-1
7
Jun
-17
Jul-
17
Au
g-1
7
Se
p-1
7
Oct-
17
Nov-1
7
Dec-1
7
Jan
-18
Fe
b-1
8
Ma
r-1
8
Ap
r-18
Avera
ge D
ays
Num
ber
opf
Tic
kets
Telephony Moves, Adds and Changes
Number of SR Average time SLO

Page 268 of 851
.
Figure 19. Service Level Report for All Telephony Incidents (Centrex, PBX, SLD, Conferencing)
Note: SLA Performance chart provided by WaTech during Current State Inventory review.
J. Current Customers
WaTech has fifty-five PBX customers which includes most state agencies. The largest 10 customers account for over eighty-five percent of the amount WaTech billed for this service in FY18.
Internal sales are the eleventh largest source of revenue. WaTech captures two-hundred thousand dollars of revenue for PBX services via internal sales transfers.
Table 27. PBX Current List of Customers
# Customer FY17 ($) FY17 (%) FY18 H1 ($) FY18 H1 (%)
1 3000-DEPARTMENT OF SOCIAL AND HEALTH SERVICES
7,023,248 51 3,433,833 50
2 3100-DEPARTMENT OF CORRECTIONS
1,305,637 9 710,382 10
3 5400-EMPLOYMENT SECURITY DEPARTMENT
615,628 4 325,786 5
4 1070-STATE HEALTH CARE AUTHORITY
571,883 4 305,198 4
5 2350-DEPARTMENT OF LABOR AND INDUSTRIES
589,921 4 280,360 4
6 4610-DEPARTMENT OF ECOLOGY
487,320 4 245,196 4
7 2400-DEPARTMENT OF LICENSING
398,922 3 205,674 3
8 4900-DEPARTMENT OF NATURAL RESOURCES
314,096 2 158,481 2
9 1790-DEPARTMENT OF ENTERPRISE SERVICES
221,331 2 110,325 2
10 3050-DEPARTMENT OF VETERANS' AFFAIRS
189,203 1 104,565 2
0.00
1.00
2.00
3.00
4.00
5.00
6.00
0
50
100
150
200
250
300
350
400A
pr-
17
Ma
y-1
7
Jun
-17
Jul-
17
Au
g-1
7
Se
p-1
7
Oct-
17
No
v-1
7
De
c-1
7
Jan
-18
Fe
b-1
8
Ma
r-1
8
Ap
r-18
Avera
ge D
ays
Num
ber
of
Tic
kets
Telephony Incidents
Number of IN Average time SLO

Page 269 of 851
.
# Customer FY17 ($) FY17 (%) FY18 H1 ($) FY18 H1 (%)
Total Top 10 Billable Customers
11,717,189 85 5,879,799 85
Total for All Other Billable Customers
1,868,136 14 897,411 13
Total WaTech Internal Sales 205,953 1 100,621 1
Total Revenue 13,791,278 100 6,877,831 100
Note: Customer billing details pulled from “Billing Data - Apptio FFS Only (2018-05-16)” excel file
K. Current and Historical Usage Volumes
Currently WaTech is supporting just over fifty thousand PBX lines (additional workload detail is provided in the workload table in section E). The number of lines has steadily increased over the last five years:
Table 28. Historical PBX Usage
Year Supported Lines Trend (%)
Delta 2014-2018 - 72% increase in lines supported
2018 40,413
21% increase in lines supported
2017 33,529 11% increase in lines supported
2016 30,099 11% increase in lines supported
2015 27,071 15% increase in lines supported
2014 23,449 Baseline
Note: Historical usage data provided by WaTech in March. Billable lines excludes WaTech lines.
WaTech is anticipating, with a stated high level of confidence, growth in customer demand of about 3% per year over the next five years for PBX services. In addition, WaTech is anticipating growth of one IVR application every two years, and about 10% growth in IVR port demand over the next five years with a high degree of confidence.
L. Customer Satisfaction and Future Demand
The Customer Voice appendix to this report includes customer satisfaction and future demand details based on the results of agency interviews and focus groups conducted during the project.
M. High Level Architecture
WaTech currently supports a mix of large and small PBXs from Avaya and Nortel. WaTech is working on consolidating onto a single statewide IP- based PBX solution (which includes a set of redundant communication manager servers in Olympia and a single enterprise survivable server in Quincy. All three servers can handle the full load of the system). WaTech recently upgraded one of the larger PBXs and upgraded to current versions for operating systems and call center software for the statewide solution. As a part of this effort, WaTech is eliminating PRI lines and converting over to SIP trunking (WaTech estimates it is 25% complete with this process).
The solution includes many infrastructure dependencies that must be maintained and updated, including network switches, routers, telephony gateways, servers, hypervisors, etc.
There is a test lab environment available for testing configurations before deploying to production. Additionally, servers are configured for high availability and a disaster recovery environment is configured at the Quincy Data Center. Disaster Recovery procedures are

Page 270 of 851
.
tested yearly (however, due to system upgrades and large network outages due to maintenance, WaTech has closer to 2-3 yearly tests).
Disaster recovery for the IVR service is limited to replication of certain key applications among multiple servers connected to different PBXs. Replicated applications do successfully overflow during periods of demand when capacity constraints are exceeded.
The service has been architected to protect customer data: Call Control, Media are encrypted, and Voicemail files are encrypted at rest.
Page 271 of 851
.
(3321) Switched Long Distance
Background
This service is officially referenced as Switched Long Distance (SLD) which replaced the state operated long distance service known as SCAN (which existed for 30 years). The state’s long distance is interchangeably referred to as SCAN, switched long distance, SLD, long distance, and LD.
This service was honored by the Office of the Governor in 2014 by saving the state over three million dollars per year by decommissioning a dedicated private line network, replacing it with a brokered service, and by leveraging the PBX network to carry most of the intrastate traffic for customers on the system.
A. Description
Definition
WaTech offers a brokered long distance service. Customers who purchase local telephone services through WaTech will automatically receive WaTech supported long distance service, but the service is also available to other agencies and publicly funded organizations who manage their own telephone services. WaTech Long Distance service is an available alternative to commercial long distance.
Features
Almost all customers use WaTech provided 7-digit account/authorization (auth) numbers which includes a traveling Auth feature that allows long distance calls to be originated from other WaTech connected sites using the same auth number.
International calls can be allowed or blocked by individual auth number
Fraud protection
Custom billing
No LD contracts (no long-term commitment)
Custom LD connections (in some cases LD access can be configured to bill by trunk group – which does away with auth number requirement).
Notes
WaTech tracks and coordinates adds, changes and deletes across all auth numbers WaTech authorizes all dedicated and switched connections to LD carrier
WaTech works with customers directly to coordinate and configure the service with the LD carrier
WaTech works with telecom coordinators in customer agencies/organizations to resolve technical issues with the LD carrier
WaTech works with the LD carrier on connections issues with WaTech-managed PBXs (and other customer connections when requested)
WaTech works with the LD carrier to safeguard against toll fraud on WaTech-managed PBXs (and other customer connections when requested)

Page 272 of 851
.
Customers that select the vendor supported option (mainly customers that do not use WaTech provided auth numbers) receive billing directly from the LD vendor at WaTech set rates. Customers may not go directly to the LD carrier for service activation. WaTech must authorize each customer connection to the WaTech LD service to the vendor. WaTech is the escalation contact for all users of the service.
WaTech provides bills directly to customers for dedicated access when customers have signed up to be managed by WaTech
Customers may receive WaTech bills in hard-copy or multiple electronic forms Customers that receive direct LD carrier billing may receive paper summary with call detail downloadable electronically.
B. Statutory Basis for Creation of Service or Program
WaTech’s delivery of this specific service is not mandated by statute. However, RCW 43.105.385 states that over time state agencies should move toward using WaTech as their central service provider for all utility-based infrastructure services. State agencies have the option to contract directly with carriers and some choose to do so.
C. How the Service Fits into the CTS Strategic Plan and Goals
WaTech reports that this service is not listed as strategic at this time based on strategic plans or technology roadmaps.
WaTech views its value proposition as having centralized contracting expertise to negotiate stronger terms and conditions, and to create economies of scale to secure attractive vendor pricing through competitively bid contracts. However, agencies are able to secure their own long distance agreements directly with vendors.
WaTech has no plans to evolve this offering and will continue to offer this service with the same features and support as currently defined.
D. Performance Measures used to Measure Effectiveness and Efficiency
WaTech only has two types of performance measures for this service:
LD dial-tone availability is tracked to measure service performance, the contract with the LD carrier Magna5 requires 99.999% availability
Reports are provided to WaTech by the LD carrier (or directly to the customer agency for the Vendor billed and supported option).
Request Fulfillment – WaTech provides customers with onboarding timeline guidance based on their experience and location specific variables of what typical timelines can be. Once a service is in place there are guaranteed intervals contained in the Service Level Agreements for additional services. For normal activities these intervals are up to several days for new services and much sooner for simple changes. WaTech tracks request fulfilment activities and aims to meet the following Service Level Objectives (SLOs):
Service Level Objectives are monitored for all Telephony Services as follows. This includes Centrex, PBX, Long Distance, and Conference Services.
Group Service Level Objective
Service Requests
Telephony Projects 30 Days
Telephony Moves, Adds and Changes 3 Business Days (equates to 4.2 Calendar days)
Incidents 5 Days

Page 273 of 851
.
E. Current Cost to Maintain the Service
Staffing
Staff are not fully dedicated to the delivery of this service; therefore, WaTech uses transfer rules to assign staff to the service for the purposes of tracking and forecasting costs (shown as the 4.3 FTEs in direct/indirect labor in the diagram below). These transfer rules were developed by estimating actual staff time spent on activities related to the service.
In addition, 1.1 percent of total overhead costs are being transferred to this service. If you apply that total cost percentage to the 65 FTE within overhead, it would be about 0.7 overhead FTE.
WaTech’s line staff are responsible for scheduling service changes (turn-up and disconnect), and supporting customers in mediating issues with the contracted LD carrier. WaTech pulls carrier billing information into WaTech’s billing system and provides bills to customers. About 4.3 FTEs are completing these activities today.
Figure 20. Long Distance Service Staffing
Note: Staffing numbers pulled from “Estimated Overhead FM6 December”

Page 274 of 851
.
Figure 21. Long Distance Direct/Indirect Staffing
Note: Staffing details pulled from “Org Chart - Color Coded 01.01.18” and combined with transfer rules in “FY18 Master Indexes 12-19-17”
Workload Supported
The 4.3 people delivering the long distance service currently support the workload defined in the table below:
Table 29. Long Distance Workload Supported
Description Workload Supported
Minutes per month / and per year 1,756,743 min per month / 21,080,916 min per year
Active Dialing Codes 68,277 codes
Note: WaTech initially provided a long distance workload of 1,756,743 minutes month (or 21,080,916 minutes per year). WaTech subsequently provided a workload of 1,174,608 minutes per month (or 14,095,296) at an average blended rate of $0.0425 per minute. The updated combination of workload and rate provided does not yield WaTech’s annual revenue but is instead roughly half of annual revenue. For the purposes of this report, in order to avoid overstating deviation from peer rates and cost, Gartner used the more favorable numbers for each of the benchmarks. Gartner assumed the higher number of minutes when calculating the cost benchmark, and used the subsequently provided blended rate of $.0425 per minute for the rate comparison (which is lower than the blended rate implied by the forecasted revenue).
Direct, Indirect and Overhead Costs
WaTech’s planned expenses for this fiscal year are provided in the table below.

Page 275 of 851
.
Table 30. Long Distance FY18 Planned Service Expenses
Cost Components
FY18 Planned FY19 Planned Cost Details
A Salaries 282,272 278,518 4.3 FTE
B Benefits 116,437 114,503
E Goods & Services
576,000 576,000 Carrier pass through charges
E Internal Purchases
34,500 34,500 Desktop
T Transfers 170,100 70,100 Overhead
Total Planned Expenses
1,179,309 1,173,621
Note: Cost details were pulled from “Network Services” excel spend plan provide in February 2018; the salary and benefit costs assume vacancies are filled
Given that the long distance service is largely a brokered service, WaTech has not made large capital investments associated with this service (there are no depreciated assets with low book value being tracked that would indicate major deferred maintenance or lifecycle refresh requirements).
The costs for the long distance service have been consistent for many years and the vendor includes all upgrades in their rates.
Table 31. Long Distance Cost by Workload
Description Workload Cost Details
Minutes per month / per year 1,756,743 min per month/ 21,080,916 per year
Cost per minute from vendor $0.027 per minute (based on $576k planned carrier spend)
Cost per minute from WaTech $0.054 per minute (based on planned expenses of $1.2M)
Note: WaTech provided this workload via hard copy documentation provided during interviews. Gartner used this higher workload to calculate the cost benchmark in another section of this report. Workload cost in the table above is calculated based on WaTech’s alignment of costs to this service without adjustment for alignment to Gartner consensus models.
F/G. Rate structure CTS is currently billing to customers
The long distance service is provided on a fee for service basis. Service offering rates are listed in the table below:
Rate Details Switched Access Rates Dedicated Access Details
Offering “WaTech billed and supported”
“Vendor billed and supported”
“WaTech billed and supported”
“Vendor billed and supported”
Billing WaTech provides the bill
Vendor provides the bill
WaTech provides the bill
Vendor provides the bill
Support
WaTech provides support for Auth numbers, and provides escalation to vendor
WaTech provides escalation to vendor
WaTech provides support for Auth numbers, and provides escalation to vendor
WaTech provides escalation to vendor

Page 276 of 851
.
Rate Details Switched Access Rates Dedicated Access Details
Intrastate/ Interstate LD $0.049 $0.045 $0.035 $0.029
Calls to Canada $0.08 $0.07 $0.035 $0.029
International (Not Canada) Varies Varies Varies Varies
H. Analysis of Current Cost Recoverability
Based on WaTech’s forecasted spend and revenue, the long distance service is cost recoverable.
Table 32. Long Distance Cost Recoverability (Actual FY16-FY18)
Service Income FY16 FY17 FY18 H1
Service Revenue (3321) 1,398,448 1,240,558 596,743
Service Expenses (3321) (1,492,908) (1,237,135) (565,982)
Net Income (94,459.62) 3,423.01 30,761.69 Note: Actual revenue and expenses pulled from “AFRS Financial Download (Extracted on 2018-05-15)”.
Table 33. Long Distance Cost Recoverability (Forecasted FY18-FY19)
Service Income FY18 FY19
Service Revenue (3321) 1,236,000 1,236,000
Service Expenses (3321) (1,179,309) (1,173,621)
Net Income 56,691.24 62,379
Note: Forecasted Cost recoverability detail pulled from “Network Services” excel spend plan provide in February 2018.
I. Service Level Actually Delivered
While there are no specific service level targets associated with customer onboarding and service request fulfilment, WaTech reports that on average customers are typically onboarded within 2-3 weeks from the time customers submit all of the required information for (contact and billing) and it’s provided to the contracted carrier. Onboarding time varies depending on the specific service, for switched access (which only requires a Presubscribed Inter-Exchange Carrier Charge code change) customers are typically onboarded within 3-5 days, for dedicated access (which requires a circuit install) customers are typically onboarded within 30-45 days, and for on-net access (where LD is already in place) onboarding can happen immediately.
The contracted carrier is responsible for ensuring sufficient network capacity to turn up new service requests. The contracted carrier notifies WaTech of any capacity issues and anticipated relief dates. WaTech reports that capacity issues are very few and are typically managed by the customer as connections from the customer to the LD carrier are via customer provided facilities, for switched access (via the PIC on customers PSTN facilities) or dedicated access (via customer T1 or SIP circuits to the carrier), while on-net access (via WaTech PBXs) is managed as part of the PBX service.
Additionally, WaTech is responsible for communicating service issues to the carrier, and must follow up with the carrier until it is resolved. WaTech reports that once LD service has been established, most issues are related to authorization numbers, or customer premise equipment.

Page 277 of 851
.
Service Level Objectives are monitored for all Telephony Services as follows (this includes Centrex, PBX, Long Distance, and Conference Services).
Table 34. Service Level Objectives for Telephony (Centrex, PBX, SLD, Conferencing)
Group Service Level Objective
Service Requests
Telephony Projects 30 Days
Telephony Moves, Adds and Changes 3 Business Days (equates to 4.2 Calendar days)
Incidents 5 Days
Table 35. Service Level Report for Telephony Projects (Centrex, PBX, SLD, Conferencing)
Note: SLA Performance chart provided by WaTech during Current State Inventory review.
Figure 22. Service Level Report for Telephony Moves, Adds, and Changes (Centrex, PBX, SLD, Conferencing)
Note: SLA Performance chart provided by WaTech during Current State Inventory review.
0.00
5.00
10.00
15.00
20.00
25.00
30.00
35.00
0
20
40
60
80
100
120
140
160
180
Ap
r-17
Ma
y-1
7
Jun
-17
Jul-
17
Au
g-1
7
Se
p-1
7
Oct-
17
Nov-1
7
Dec-1
7
Jan
-18
Fe
b-1
8
Ma
r-1
8
Ap
r-18
Avera
ge D
ays
Num
ber
of
Tic
kets
Telephony Projects
Number of SR Average time SLO
00.511.522.533.544.5
0
500
1000
1500
2000
Ap
r-17
Ma
y-1
7
Jun
-17
Jul-
17
Au
g-1
7
Se
p-1
7
Oct-
17
Nov-1
7
Dec-1
7
Jan
-18
Fe
b-1
8
Ma
r-1
8
Ap
r-18
Avera
ge D
ays
Num
ber
opf
Tic
kets
Telephony Moves, Adds and Changes
Number of SR Average time SLO

Page 278 of 851
.
Figure 23. Service Level Report for All Telephony Incidents (Centrex, PBX, SLD, Conferencing)
Note: SLA Performance chart provided by WaTech during Current State Inventory review.
J. Current Customers
WaTech has nearly two hundred long distance customers which includes many state agencies, county and city agencies and school districts. The largest 10 customers account for over two thirds of the amount WaTech’s billed for this service in FY18.
Additionally, WaTech spends a negligible amount on long distance calling. WaTech internal sales are the sixty-sixth largest source of revenue.
Table 36. Long Distance Service Current List of Customers
# Customer FY17 ($) FY17 (%) FY18 H1 ($) FY18 H1 (%)
1 3000-DEPARTMENT OF SOCIAL AND HEALTH SERVICES
403,332 33 195,260 33
2 5400-EMPLOYMENT SECURITY DEPARTMENT
149,931 12 62,821 11
3 4050-DEPARTMENT OF TRANSPORTATION
64,987 5 30,391 5
4 3100-DEPARTMENT OF CORRECTIONS
65,430 5 30,342 5
5 2350-DEPARTMENT OF LABOR AND INDUSTRIES
37,850 3 20,522 3
6 1400-DEPARTMENT OF REVENUE
43,375 3 19,674 3
7 4610-DEPARTMENT OF ECOLOGY
24,733 2 15,505 3
8 2450-MILITARY DEPARTMENT 24,636 2 12,059 2
9 2250-WASHINGTON STATE PATROL
18,663 2 12,018 2
10 2400-DEPARTMENT OF LICENSING
19,284 2 9,321 2
0.00
1.00
2.00
3.00
4.00
5.00
6.00
0
50
100
150
200
250
300
350
400A
pr-
17
Ma
y-1
7
Jun
-17
Jul-
17
Au
g-1
7
Se
p-1
7
Oct-
17
No
v-1
7
De
c-1
7
Jan
-18
Fe
b-1
8
Ma
r-1
8
Ap
r-18
Avera
ge D
ays
Num
ber
of
Tic
kets
Telephony Incidents
Number of IN Average time SLO

Page 279 of 851
.
# Customer FY17 ($) FY17 (%) FY18 H1 ($) FY18 H1 (%)
Total Top 10 Billable Customers
852,221 69 407,913 68
Total for All Other Billable Customers
385,366 31 187,419 31
Total WaTech Internal Sales 3,070 0 1,449 0
Total Revenue 1,240,656 100 596,781 100
Note: Customer billing details pulled from “Billing Data - Apptio FFS Only (2018-05-16)” excel file
K. Current and Historical Usage Volumes
Overall long distance usage in the month of January 2018 was 1,756,743 minutes.
Table 37. Switched Long Distance Customer Usage
Service Offering FY17 ($) FY17 (%) FY18 H1 ($) FY18 H1 (%)
SWITCHED LD CANADIAN 3,974 0 1,746 0
SWITCHED LD IN STATE 799,974 64 369,689 62
SWITCHED LD INFORMATION 120 0 65 0
SWITCHED LD INTERNATIONAL 3,722 0 2,279 0
SWITCHED LD OUTSIDE WA STATE 432,866 35
223,002 37
Total Revenue 1,240,656 100 596,781 100
Note: Customer billing details pulled from “Billing Data - Apptio FFS Only (2018-05-16)” excel file
WaTech has received feedback from a subset of customers who would prefer greater simplicity (e.g., eliminate requirement for Authorization Codes, and incorporate free long distance into PBX telephone rates). However, WaTech has also received feedback from another subset of customers who require the additional rigor, security, and auditability that authorization codes provide.
There are only three customers who get billed externally to WaTech and those organizations use their own authorization codes format that is developed with Magna5
WaTech anticipates, with a stated high level of confidence, growth in customer demand of about 1% per year over the next five years.
L. Customer Satisfaction and Future Demand
The Customer Voice appendix to this report includes customer satisfaction and future demand details based on the results of agency interviews and focus groups conducted during the project.
M. High Level Architecture
There is no disaster recovery provided for long distance services. However, WaTech does offer disaster recovery at Quincy for switched long distance traffic routed through the WaTech managed PBXs. Many customers with dedicated LD facilities utilize their local facilities (PIC’d to the carrier) as a backup path. The standard technologies leveraged in this service offer some encryption: Session Initiation Protocol (SIP) sessions to the LD carrier (or TDM where T1’s are used).

Page 280 of 851
.
(3331) Conferencing
A. Service Description
Two services are included under the Conferencing code 3331 (both Audio and WebEx are included). However, customers can employ one, the other, or both, and the service offering number under the cost code captures the specifics
A. Service Description
Definition
In addition to Skype (see Collaboration section for service details), WaTech also offers 1) Audio and 2) WebEx and Video conferencing services.
1. Audio Conferencing Service Offering
WaTech’s managed Audio Conferencing service provides operator-scheduled conference calls for up to 250 participants
All audio calls must be scheduled through the operator support desk during the business day (7:30 a.m. to 5:00 p.m., Monday through Friday)
Attendees dial the provided conference bridge number, enter the assigned pin code, and connect to the conference
In addition to scheduling all conference calls, operators are also available to provide support establishing the conference call on “Operator Assisted” calls. This optional support service is available for calls scheduled between 7:30 a.m. to 5:00 p.m., Monday through Friday
“Meet Me” calls that do not require operator support can be held 24 hours a day, 7 days a week
Customers may also choose to do a combination of “Meet Me” and “Operator Assisted” call types, as needed
2. WebEx and Video Conferencing Service Offering
The WebEx suite of communication services includes interactive video conferencing, web collaboration, and audio conferencing – via either telephone or Voice over Internet Protocol (VoIP)
Online meetings through WebEx can be used to demonstrate products and services, share presentations, conduct online training sessions and collaborate on documents. The service can display up to six video images simultaneously
Technical assistance and online training available 24x7, directly from WebEx solution vendor, with additional instructor-led formats available from solution vendor
Conference recording is available to customers who specifically request it on the application form and agree to the Supplemental Terms of Use.
Host accounts include 1GB of recording storage free, additional storage can be purchased for $4.56 per GB per month.
Features
The conferencing services have the following features:

Page 281 of 851
.
Feature WebEx and
Video “Meet Me”
Audio
“Operator Assisted”
Audio
Support for telephone Yes Yes Yes
Support for VoIP calling Yes Yes Yes
Support for video Yes No No
Operator assisted calling No No Yes
Support for interactive collaboration (chat) Yes No No
Flexible meeting time (any time) Yes Yes No
Self-Service scheduling capability Yes No No
Ability to host conferences with participants world-wide Yes No Yes
Online training Yes No No
Conference recording capability Yes No No
Host account storage Yes (1 GB included) No No
Notes
For WebEx:
WaTech technical staff are responsible for the initial creation of accounts and temporary passwords for the WebEx service
WaTech works with customers on account and connectivity issues, and works with the WebEx vendor to resolve issues within WebEx networks
WaTech is also responsible for the creation, modification, and deletion of user accounts along with the associated storage
Customers do not have to commit to a term when signing up for this service
VoIP calling requires all participants to have sound cards, speakers, and microphones. While VoIP audio quality is generally very good, it is influenced by the performance of the customer’s Local Area Network/Wide Area Network environment. Therefore, there is no guarantee of voice quality
WebEx base subscription includes: recording option is available, up to 1000 participants per session, unlimited usage for named account holder
Subscriptions are dedicated to one person and cannot be shared, and meetings cannot overlap
For Audio Conferencing:
WaTech support the bridge servers, associated conference ports, and trunking into the bridge. WaTech supports call scheduling and provides operator assisted conferencing when requested
All other aspects of the service are the customer’s responsibility (e.g., local LAN for VoIP dialing, handsets, conference room equipment, etc.)
B. Statutory Basis for Creation of Service or Program
WaTech’s delivery of this specific service is not mandated by statute. However, RCW 43.105.385 states that over time state agencies should move toward using WaTech as their central service provider for all utility-based infrastructure services. . State agencies have the option to contract directly with other providers, or to deliver the service for themselves and many choose to do so.

Page 282 of 851
.
C. How the Service Fits into the CTS Strategic Plan and Goals
WaTech reports that this service is not listed as strategic at this time based on strategic plans or technology roadmaps.
The competing service, Skype, is considered to be a strategic fee for service offering, as defined in the WaTech Dashboard. WebEx in particular is currently declining as Skype usage increases.
D. Performance Measures used to Measure Effectiveness and Efficiency
WaTech tracks the following performance measures for this service:
Availability (WebEx) – The vendor provides WaTech with reports, which are provided to customers when requested
Availability (Audio) – WaTech measures server uptime as a performance measure, which are provided to customers when requested
Incident Response – Follows standard WaTech incident management process with targets based on ticket severity
Request Fulfillment (Audio) – WaTech has arranged operators into a call center group with well-defined metrics to monitor customer response time, if performance degrades, the call group is expanded to include other cross-trained agents who are capable of handling conferencing calls
Capacity (Audio) – WaTech generates monthly reports on usage and call volume
Request Fulfillment – WaTech provides customers with onboarding timeline guidance based on their experience and location specific variables of what typical timelines can be. Once a service is in place there are guaranteed intervals contained in the Service Level Agreements for additional services. For normal activities these intervals are up to several days for new services and much sooner for simple changes. WaTech tracks request fulfilment activities and aims to meet the following Service Level Objectives (SLOs):
Service Level Objectives are monitored for all Telephony Services as follows. This includes Centrex, PBX, Long Distance, and Conference Services.
Group Service Level Objective
Service Requests
Telephony Projects 30 Days
Telephony Moves, Adds and Changes 3 Business Days (equates to 4.2 Calendar days)
Incidents 5 Days
E. Current Cost to Maintain the Service
Staffing
Staff are not fully dedicated to the delivery of this service; therefore, WaTech uses transfer rules to assign staff to the service for the purposes of tracking and forecasting costs (shown as the 5.6 FTEs in direct/indirect labor in the diagram below). These transfer rules were developed by estimating actual staff time spent on activities related to the service.
In addition, 1.4 percent of total overhead costs are being transferred to this service. If you apply that total cost percentage to the 65 FTE within overhead, it would be about 0.9 overhead FTE.

Page 283 of 851
.
WaTech’s line staff are responsible for creating, modifying and deleting accounts, and associated storage, troubleshooting connectivity issues and managing the vendor for the WebEx service. WaTech staff support the bridge servers, associated conference ports, and trunking into the bridge for the audio conferencing service, as well as call scheduling and operator assistance when requested. About 5.6 FTEs are completing these activities today.
Figure 24. Conferencing Service Staffing
Note: Staffing numbers pulled from “Estimated Overhead FM6 December”
Figure 25. Conferencing Service Direct/Indirect Staffing
Note: Staffing details pulled from “Org Chart - Color Coded 01.01.18” and combined with transfer rules in “FY18 Master Indexes 12-19-17”

Page 284 of 851
.
Workload Supported
The 5.6 people delivering the Conferencing services currently support the workload defined in the table below:
Table 38. Conferencing Workload Supported
Description Workload Supported
WebEx Accounts 625 accounts
Audio Conferencing Users 10,601 users
Audio Conferencing # of Calls 1,737 calls
Audio Conferencing Total Minutes per month 121,495 minutes
Direct, Indirect and Overhead Costs
WaTech’s planned expenses for this fiscal year are provided in the table below.
Table 39. Conferencing FY18 Planned Service Expenses
Cost Components
FY18 Planned FY19 Planned Cost Details
A Salaries 290,929 290,474 5.6 FTEs
B Benefits 108,147 107,912
E Goods & Services 289,200 289,200 WebEx licenses
E Internal Purchases 26,200 26,200 Desktop
G Travel 120 120
J Non-capitalized Assets 150,000 240 Avaya conferencing upgrade in FY18
T Transfers 189,000 189,000 Overhead
Total Planned Expensed 1,053,596 903,146
Note: Cost details were pulled from “Network Services” excel spend plan provide in February 2018; the salary and benefit costs assume vacancies are filled
WaTech made a large capital investment in this service back in 2007. WaTech completed an upgrade to version 6 in 2014 and plans to refresh the hardware next year.
Table 40. Conference Equipment Depreciation
Acquisition Cost Accumulated Depreciation Net Book Value
291,557 291,557 0
Given these planned operating expenses, in FY18 WaTech will have the following workload costs for its Centrex service:
Table 41. Conferencing Cost by Workload
Description Workload Cost Details
Cost to maintain workload in FY18 $ 1,053,596.10
Estimated percentage of cost associated with WebEx 60%
Cost associated with WebEx service $ 632,157
Cost associated with Audio Conferencing service $ 421,438
WebEx Accounts 625 accounts

Page 285 of 851
.
Description Workload Cost Details
Audio Conferencing Total Minutes per month 121,495 minutes per month (or 1,457,940 minutes per year)
Cost per WebEx Account $293.32 per account
Cost per Audio Conferencing Minute $0.29 per minute
Note: Workload cost in the table above is calculated based on WaTech’s alignment of costs to this service without adjustment for alignment to Gartner consensus models.
F/G. Rate structure CTS is currently billing to customers
The service is provided on a fee for service basis; rates are listed in the table below:
Table 42. Audio Conferencing Rates
Description Rate Detail
Pre-Scheduled “Meet Me” Call $0.09 per minute per participant
“Operator Assisted” long distance Regular rate plus applicable long distance
Operator scheduling and assistance Included in rates
Calls exceeding scheduled time Incur additional charges at stated rates to cover additional time
Table 43. WebEx Conferencing Rates
Description Rate Detail
Monthly subscription $35.00 per month
Per minute Voice / Audio Options:
1. Toll Free/ Callback (800 Service)
$0.07
(or a special quote over 100,000 min/month)
2. Toll (San Francisco voice bridge) Host pays per minute per user bridging fee and participants pay their own long distance
$0.04 bridging fee
(does not include long distance)
3. VoIP No additional charge for VoIP
Additional host storage (1GB of recording storage free) $4.56 per GB per month
The rate for Audio conferencing has not been updated since 1997, and the WebEx rates haven’t been updated since 2013.
Customers can view the detail for these services within Apptio.
H. Analysis of Current Cost Recoverability
This service is more than cost recoverable, it’s highly profitable.
Table 44. Conferencing Cost Recoverability (Actual FY16-FY18 H1)
Service Income FY16 FY17 FY18 H1
Service Revenue (3331) 1,768,346 1,854,031 868,162

Page 286 of 851
.
Service Income FY16 FY17 FY18 H1
Service Expenses (3331) (1,229,895) (1,172,559) (535,415)
Net Income 538,451.28 681,472.13 332,747.56
Note: Actual revenue and expenses pulled from “AFRS Financial Download (Extracted on 2018-05-15)”
Table 45. Conferencing Cost Recoverability (Forecasted FY18-FY19)
Service Income FY18 FY19
Service Revenue (3331) 1,855,199 1,855,656
Service Expenses (3331) (1,053,596) (903,146)
Net Income 801,603 952,510 Note: Forecasted Cost recoverability detail pulled from “Network Services” excel spend plan provide in February 2018
I. Service Level Actually Provided Today
While there are no formal service targets, WaTech estimates that new customers are onboarded within 48 hours of a request for a new account, if all required information (contact and billing) is provided. While availability is tracked, this additional service performance data was not provided for review and inclusion in this inventory.
Service Level Objectives are monitored for all Telephony Services as follows (this includes Centrex, PBX, Long Distance, and Conference Services).
Table 46. Service Level Objectives for Telephony (Centrex, PBX, SLD, Conferencing)
Group Service Level Objective
Service Requests
Telephony Projects 30 Days
Telephony Moves, Adds and Changes 3 Business Days (equates to 4.2 Calendar days)
Incidents 5 Days
Table 47. Service Level Report for Telephony Projects (Centrex, PBX, SLD, Conferencing)
Note: SLA Performance chart provided by WaTech during Current State Inventory review.
0.00
5.00
10.00
15.00
20.00
25.00
30.00
35.00
0
20
40
60
80
100
120
140
160
180
Ap
r-17
Ma
y-1
7
Jun
-17
Jul-
17
Au
g-1
7
Se
p-1
7
Oct-
17
Nov-1
7
Dec-1
7
Jan
-18
Fe
b-1
8
Ma
r-1
8
Ap
r-18
Avera
ge D
ays
Num
ber
of
Tic
kets
Telephony Projects
Number of SR Average time SLO

Page 287 of 851
.
Figure 26. Service Level Report for Telephony Moves, Adds, and Changes (Centrex, PBX, SLD, Conferencing)
Note: SLA Performance chart provided by WaTech during Current State Inventory review.
Figure 27. Service Level Report for All Telephony Incidents (Centrex, PBX, SLD, Conferencing)
Note: SLA Performance chart provided by WaTech during Current State Inventory review.
J. Current Customers
WaTech has almost one-hundred Conferencing customers. The largest ten customers account for over eighty percent of the amount WaTech billed for this service in FY18.
Additionally, WaTech captures about forty-thousand dollars of revenue for Conferencing services via internal sales transfers. WaTech internal sales is the eleventh largest source of revenue.
00.511.522.533.544.5
0
500
1000
1500
2000A
pr-
17
Ma
y-1
7
Jun
-17
Jul-
17
Au
g-1
7
Se
p-1
7
Oct-
17
No
v-1
7
De
c-1
7
Jan
-18
Fe
b-1
8
Ma
r-1
8
Ap
r-18
Avera
ge D
ays
Num
ber
opf
Tic
kets
Telephony Moves, Adds and Changes
Number of SR Average time SLO
0.00
1.00
2.00
3.00
4.00
5.00
6.00
0
50
100
150
200
250
300
350
400
Ap
r-17
Ma
y-1
7
Jun
-17
Jul-
17
Au
g-1
7
Se
p-1
7
Oct-
17
No
v-1
7
De
c-1
7
Jan
-18
Fe
b-1
8
Ma
r-1
8
Ap
r-18
Avera
ge D
ays
Num
ber
of
Tic
kets
Telephony Incidents
Number of IN Average time SLO

Page 288 of 851
.
Table 48. Overall Conferencing (WebEx and Audio) Current List of Customers
# Customer FY17 ($) FY17 (%) FY18 H1 ($) FY18 H1 (%)
1
3000-DEPARTMENT OF SOCIAL AND HEALTH SERVICES 714,493 39 351,184 41
2 4610-DEPARTMENT OF ECOLOGY 163,284 9 66,784 8
3 4770-DEPARTMENT OF FISH AND WILDLIFE 123,034 7 66,105 8
4 1100-OFFICE OF ADMINISTRATIVE HEARINGS 96,904 5 45,300 5
5 4900-DEPARTMENT OF NATURAL RESOURCES 62,507 3 43,671 5
6 5400-EMPLOYMENT SECURITY DEPARTMENT 75,848 4 28,490 3
7 1400-DEPARTMENT OF REVENUE 44,755 2 24,546 3
8 4950-DEPARTMENT OF AGRICULTURE 42,039 2 22,687 3
9 1030-DEPARTMENT OF COMMERCE 41,592 2 19,913 2
10 2400-DEPARTMENT OF LICENSING 60,674 3 18,017 2
Total Top 10 Billable Customers 1,425,131 77 686,698 79
Total for All Other Billable Customers 389,607 21 165,671 19
Total WaTech Internal Sales 40,521 2 14,569 2
Total Revenue 1,855,258 100 866,938 100
Note: Customer billing details pulled from “Billing Data - Apptio FFS Only (2018-05-16)” excel file
K. Current and Historical Usage Volumes
Overall Audio Conference usage as of January 2018, provided in the table below:
Table 49. Conferencing Customer Usage
Service Offering FY17 ($) FY17 (%) FY18 H1 ($) FY18 H1 (%)
CONFERENCE CALLING (BRIDGE) 1,090,435 59 530,993 61
WEB MEETING CENTER CONFERENCE 253,612 14 126,682 15
WEBEX 100K BASE MINUTES 92,392 5 22,156 3
WEBEX ADDITIONAL STORAGE 8,195 0 3,523 0
WEBEX MTG OR TRAINING CENTER AUDIO 345,203 19 115,479 13
WEBEX SELF WEB/VIDEO 59,271 3 18,603 2
WEBEX VOIP AUDIO 1,609 0 809 0
WEBSELF AUDIO - USERS PAY TOLL 4,541 0 48,694 6
Total Revenue 1,855,258 100 866,938 100
Note: Customer billing details pulled from “Billing Data - Apptio FFS Only (2018-05-16)” excel file.

Page 289 of 851
.
WaTech anticipates, with a high level of confidence, decline in customer demand for WebEx of about 3% per year over the next five years due to the adoption of Skype. WaTech anticipates, with a high degree of confidence, an increase in customer demand for audio conferencing over the next five years.
L. Customer Satisfaction and Future Demand
The Customer Voice appendix to this report includes customer satisfaction and future demand details based on the results of agency interviews and focus groups conducted during the project.
M. High Level Architecture
Call control and media are encrypted for both the Audio and WebEx services.
WebEx is a SaaS solution provided out of multiple data centers, and DR is provided as a part of that service. WebEx also provides space and accounts for testing prior to software upgrades. However, the Audio service is not configured for DR.
WaTech reported that Avaya is not going to produce a version 7 of the product. Version 6.3 will be the last version. Avaya’s newer product, Avaya Aura Conferencing, does not support operated assisted calling.
WaTech has budgeted a hardware upgrade this year to keep the hardware current. Avaya will support this product until 2025.

Page 290 of 851
.
(3332) Directory Assistance/Telephone Information
Background
This service enables citizens to call an operator desk and request an operator transfer to a state resource.
The telephone information support team (telephone operators) that supports this service also provides operator assistance for conferencing calling, that cost is covered under the conference call service. Support for conferencing accounts for eighty-five percent of the team’s time (and about 62% of the calls) and the remaining fifteen percent is allocated to this service (to cover the 38% of the 7,500 calls annually).
Historically WaTech would track actual usage and charge back agencies based on actual number of citizen call transfers into the agency.
WaTech reports that around the 2014 timeframe the background a data feed that enabled billing started using static data. Responsibility for the decision is unclear, but it is clear that customers were not informed of the change. For the past several years the cost has been set at a static fifteen percent of operator labor and the approach to chargeback has been a monthly set rate (ostensibly based on the percentage share at the time the change was made) charged to forty agencies.
WaTech also reports that around the 2015 timeframe, WaTech submitted a request to discontinue the service, but was not authorized to do so.
There is no service catalog entry associated with this service.
A. Service Description
WaTech supports citizens with phone operator-assisted directory assistance, i.e., telephone number or email address lookup and transfer services for a state government agency, college, school, local government, or individual government employee. WaTech maintains an Online Telephone Directory and staffs a service desk with operators that may be reached by telephone (360-753-5000 / toll-free 1-800-321-2808).
B. Statutory Basis for Creation of Service or Program
WaTech delivery of this specific service is not mandated by statute.
C. How the Service Fits into the CTS Strategic Plan and Goals
WaTech reports that this service is not listed as strategic at this time based on strategic plans or technology roadmaps.
D. Performance Measures used to Measure Effectiveness and Efficiency
WaTech does not measure and report on performance measures associated with this service.
E. Current Cost to Maintain the Service
Staffing
Staff are not fully dedicated to the delivery of this service; therefore, WaTech uses transfer rules to assign staff to the service for the purposes of tracking and forecasting costs (shown as the 0.5 FTEs in direct/indirect labor in the diagram below). These transfer rules were developed by estimating actual staff time spent on activities related to the service.

Page 291 of 851
.
In addition, 0.15 percent of total overhead costs are being transferred to this service. If you apply that total cost percentage to the 65 FTE within overhead, it would be about 0.1 overhead FTE.
WaTech’s line staff are responsible for answering inquiries as received. About 0.5 FTEs are completing these activities today.
Figure 28. Telephone Information Staffing
Note: Staffing numbers pulled from “Estimated Overhead FM6 December”
Figure 29. Telephone Information Direct/Indirect Staffing
Note: Staffing details pulled from “Org Chart - Color Coded 01.01.18” and combined with transfer rules in “FY18 Master Indexes 12-19-17”. Note, while the current transfer rules indicate that 1% of the 3110 TSD-Administration code costs are applied to this service, WaTech has confirmed that is not accurate, though details on how the costs should be reapplied were not provided for inclusion in this inventory.

Page 292 of 851
.
Workload Supported
WaTech receives on average about six hundred telephone directory assistance calls on a monthly basis.
Direct, Indirect and Overhead Costs
WaTech’s planned expenses for this fiscal year are provided in the table below.
Table 50. Telephone Information FY18 Planned Service Expenses
Cost Components
FY18 Planned FY19 Planned Cost Details
A Salaries 30,000 30,000 Part time support from several resources
B Benefits 14,400 14,400
E Goods & Services
9,600 9,600 Telecom services
E Internal Purchases
19,460 19,460 Desktop
T Transfers 26,460 26,460 Overhead
Total Planned Expenses
99,920 99,920
Note: Cost details were pulled from “Network Services” excel spend plan provide in February 2018; the salary and benefit costs assume vacancies are filled
Given the annual cost of about one-hundred thousand dollars and an annual call rate of about 7,500 calls in FY18. Each call costs the state about $13.32 to field.
F/G. Rate structure CTS is currently billing to customers
The Telephone Information service is reported to be a fee for service basis. However, in reality billing is static on a month to month basis and it’s not clear whether agencies can opt out. This service is more accurately an “unofficial” allocation.
H. Analysis of Current Cost Recoverability
This service is cost recoverable.
Table 51. Telephone Information Cost Recoverability (Actual FY16-FY18)
Service Income FY16 FY17 FY18 H1
Service Revenue (3332) 108,000 108,000 54,000
Service Expenses (3332) (100,946) (98,166) (35,471)
Net Income 7,054.24 9,834.35 18,528.88
Note: Actual revenue and expenses pulled from “AFRS Financial Download (Extracted on 2018-05-15)”
Table 52. Telephone Information Cost Recoverability (Forecasted FY18-FY19)
Service Income FY18 FY19
Service Revenue (3332) 107,640 107,640
Service Expenses (3332) (99,920) (99,920)
Net Income 7,720 7,720

Page 293 of 851
.
Note: Forecasted Cost recoverability detail pulled from “Network Services” excel spend plan provide in February 2018.
I. Service Level Actually Provided Today
WaTech has consistently maintained a relatively low abandonment rate and fast speed to answer (given the non-emergency context of the call center).
Note: Performance detail provided by WaTech in “Just Operators Call SLA Report”
Note: Performance detail provided by WaTech in “Just Operators Call SLA Report”
K. Current and Historical Usage Volumes
As shown in the section above, the call volume has dropped almost a third in two years thru March 2018 (from about eight or nine-hundred calls per month to five or six-hundred currently). Call volume accounts for almost 40% of operator call volume.
During the same period call volume for conferencing has stayed relatively consistent at about eleven hundred calls per month.
J. Current Customers
WaTech has forty customers of this service. WaTech internal sales is the fourth largest source of revenue.
Table 53. Telephone Information Current List of Customers
# Customer FY17 ($) FY17 (%) FY18 H1 ($) FY18 H1 (%)
1 2400-DEPARTMENT OF LICENSING
14,831 14 7,416 14
Month Arrivals Aban Calls Aban Rate Avg Aban Time Avg Speed Ans Avg Hold Time
FY17 Totals 9298 691 7% 00:44 00:16 00:35Jul-16 808 36 4% 00:24 00:12 00:32
Aug-16 987 52 5% 00:26 00:13 00:32
Sep-16 848 68 8% 00:27 00:15 00:30
Oct-16 750 50 7% 00:38 00:17 00:40
Nov-16 695 57 8% 01:10 00:15 00:37
Dec-16 648 52 8% 00:25 00:13 00:36
Jan-17 819 91 11% 01:19 00:27 00:44
Feb-17 736 64 9% 01:06 00:24 00:29
Mar-17 866 66 8% 00:23 00:14 00:40
Apr-17 748 49 7% 00:37 00:12 00:39
May-17 686 55 8% 01:04 00:16 00:36
Jun-17 707 51 7% 00:47 00:12 00:27
Operator Services
Month Arrivals Aban Calls Aban Rate Avg Aban Time Avg Speed Ans Avg Hold Time
FY18 Totals 5525 393 7% 00:49 00:18 00:29Jul-17 684 51 7% 01:03 00:15 00:50
Aug-17 682 44 6% 00:24 00:16 00:32
Sep-17 591 44 7% 00:53 00:20 00:27
Oct-17 656 45 7% 00:49 00:18 00:20
Nov-17 529 41 8% 00:56 00:18 00:37
Dec-17 495 38 8% 01:16 00:24 00:27
Jan-18 680 70 10% 00:40 00:17 00:25
Feb-18 624 35 6% 00:39 00:19 00:18
Mar-18 584 25 4% 00:41 00:14 00:24
Operator Services

Page 294 of 851
.
# Customer FY17 ($) FY17 (%) FY18 H1 ($) FY18 H1 (%)
2 3000-DEPARTMENT OF SOCIAL AND HEALTH SERVICES
13,690 13 6,845 13
3 1000-OFFICE OF THE ATTORNEY GENERAL
7,225 7 3,613 7
4 3030-DEPARTMENT OF HEALTH
5,704 5 2,852 5
5 2350-DEPARTMENT OF LABOR AND INDUSTRIES
4,944 5 2,472 5
6 1790-DEPARTMENT OF ENTERPRISE SERVICES
4,183 4 2,092 4
7 4050-DEPARTMENT OF TRANSPORTATION
3,803 4 1,901 4
8 1030-DEPARTMENT OF COMMERCE
3,042 3 1,521 3
9 1240-DEPARTMENT OF RETIREMENT SYSTEMS
3,042 3 1,521 3
10 1070-STATE HEALTH CARE AUTHORITY
2,662 2 1,331 2
Total Top 10 Billable Customers
63,127 58 31,563 58
Total for All Other Billable Customers
38,028 35 19,014 35
Total WaTech Internal Sales 6,845 6 3,423 6
Total Revenue 108,000 100 54,000 100
Note: Customer billing details pulled from “Billing Data - Apptio FFS Only (2018-05-16)” excel file
L. Customer Satisfaction and Future Demand
The Customer Voice appendix to this report includes customer satisfaction and future demand details based on the results of agency interviews and focus groups conducted during the project.
M. High Level Architecture
This service is provided via a central call center line. No additional details about the call center configuration (IVR, etc.) have been provided.

Page 295 of 851
.
2. Data Network Services
(3480) Network – Core, Transport and Connectivity
Background
Most of C338 Data Network Revenue flows to cost code 3480 (93.4%), and almost all of WaTech’s data network related costs are covered under this source of revenue, with the exception of Office VPN and Cloud VPN which is provided on a fee for service basis, and the “Cloud Highway” service which DSHS and HCA are providing some of the initial funding directly via an IAA.
Another 1.7% of the C338 Data Network Revenue (about $495,000 per year) flows to 3408 Quincy Data Center for Quincy Data Center operations (the code 3408 is named Node Site Facilities within AFRS but includes only revenue and cost related to the Quincy Data Center).
The remaining 4.9% of the C338 Data Network Revenue flows to 4672 Security Infrastructure Support, which covers Domain Name System (DNS), Security Information and Event Management (SIEM), and Vulnerability Assessment (VA) services. These are not data network services and are therefore covered under the Access & Security Section of the service inventory. DNS, SIEM, and VA services are not delivered by Network Services Division (NSD). However, the funding for them now flows through C338 Data Network Revenue. Prior to FY18, these services were included in a separate allocation, called the Security Infrastructure Allocation. This change happened when the Office of Cybersecurity was created and separated from WaTech the service delivery organization. At that time six of the seven services that were originally included in the Security Infrastructure Allocation were divided among remaining WaTech service delivery groups to manage, as the only service Office of Cybersecurity retained from the Security Infrastructure Allocation was responsibility for the Security Design Review. The Managed Firewall services portion was moved to be part of the Network Services division and that accounted for ~50% of the remaining expense.
Data network revenue covers the following data network cost centers: 3471 Network Core, 3472 End of Row Connectivity, 3473 Managed Firewall, 3465 CE/PE Equipment, 3463 SMON (State Metropolitan Optical Network), 3462 Campus Fiber Network, and 3461 Vendor Last Mile
Two additional cost codes, 3466 Office and Cloud VPN, and 3443 Network Chargeback, are provided outside of the allocation and are therefore addressed in separate sections of this document
A. Service Description
Definition
WaTech’s Network Services deliver the networking infrastructure and technology that provides access to the State’s Wide Area Network (WAN), the core network, the Internet, and firewall services in the State’s primary and secondary data centers (State Data Center and Quincy Data Center).
WaTech splits Network Services into three main components: Network Core; Transport and Connectivity; and Managed Firewall. WaTech provides monitoring and troubleshooting

Page 296 of 851
.
support across these components, determining on a real-time and an ongoing basis the degree to which the network is performing as anticipated and managing any incidents or potential problems determined through monitoring tools or through reports from users.
The Network Core is the network segment located at the State Data Center (SDC) and WaTech’s portion of the Quincy Data Center (QDC). WaTech manages several components included in core network services, including:
State Government Network (SGN) Logical State Networks – the state’s security boundary for its enterprise, managed internal network that is built around Internet technologies, security, and standards (such as OCIO Policy 141.10) to enable participating agencies to share mission critical applications and data within the statewide private network.
Inter-Governmental Network (IGN) Logical State Network – the state managed private network with known end-points and tenants that provides Washington state counties, cities, federal agencies, tribes, health districts, and other authorized customers secure access to managed gateways and applications owned by the State.
Public-facing Government Network (PGN) Logical State Networks – provides secured and unsecured public access to online government web services through the Internet.
Internet – all of the State’s inbound and outbound internet traffic flows through WaTech’s redundant core network.
Routing Isolation and Aggregation – ensures that connections are both securely “known and connected” to each other, where/how needed, as well as isolated from each other, where/how required, through the use of Virtual Routing and Forwarding (VRFs) tables and Virtual Local Area Networks (VLANs).
WAN Circuit Aggregation – aggregates connections from various commercial providers, WaTech’s State Metropolitan Optical Network (SMON), and campus fiber infrastructure, which are brought into the network core with seamless interconnectivity.
End of Row Connectivity – Provides network connectivity for WaTech Colocation Service customers.
Transport and Connectivity covers the data transported within the State’s Wide Area Network (WAN) that runs over a combination of a WaTech operated metropolitan optical network running over primarily long-term leased dark fiber, and competitively acquired commercial carrier Ethernet services. Transport and Connectivity is made up of the following components:
State Metropolitan Optical Network (SMON) – includes a series of three interconnected managed fiber rings established between select areas of Olympia, Tumwater, and Lacey.
Campus Fiber Network (CFN) – allows customer sites to be connected using fiber optic facilities installed throughout the capitol campus; CFN circuits are primarily terminated into SMON node sites.
Vendor Last Mile – provides a means to facilitate customer site connectivity to the state network utilizing commercial vendor provided Ethernet services.
Provider and Customer Edge (PE/CE) – includes device provisioning and management of all Provider Edge Devices, which are deployed at sites housing multiple WaTech customers. PE devices allow secure transport of data through one physical circuit to multiple customers at a site. Customer Edge (CE’s) devices are
Page 297 of 851
.
customer owned and typically co-managed by WaTech. CE routers are deployed at sites that house only one WaTech customer or sites where the customer chooses to deploy a CE router behind WaTech’s PE router.
Network Services are provided based on specific customer requirements. Customers may choose to acquire only a subset of offerings within Network Core, Transport and Connectivity, Managed Firewall, or combinations of them.
Features
WaTech’s Network Core is fully redundant within the SDC and fully extended and duplicated at the QDC, with fully redundant Internet connections at each data center with geographically diverse fiber routes to different Internet peering points.
All three logical networks (SGN, PGN, and IGN) are fully replicated across data centers by using Cisco’s Overlay Transport Virtualization technology to extend the VLANs.
IGN access enables application access and information sharing across all levels of government with physical network aggregation presence in all 39 Washington counties, select locations and other governmental entities.
PGN provides citizens access to individualized government services through portals and Web sites, improving service and cutting costs. The security standards do not require that agencies host public facing websites on the PGN. Agencies are free to choose an external hosting provider or deploy on the state network. In either circumstance, the agency must work with the Office of Cybersecurity to ensure the deployment complies with state security standards.
Internet access provides high speed, redundant, secured access, and includes IP addressing.
VRFs allow network paths to be privately segmented (layer 3 isolation) via a routing table across multiple routing devices. VRFs enable flexible and scalable network designs to interconnect multiple customer Local Area Networks (LANs); also called Wide Area Network (WAN) aggregation.
VLANs and VRF’s allow for layer 3 packet level segregation.
The WaTech Network Operations Center (NOC) provides active monitoring of the Network Core and all customer connections, which attach to the Network Core.
Network monitoring is 24x7x365 at WaTech. Staff are always monitoring and responding to incidents. WaTech uses SolarWinds for monitoring network status and Netflow, Savvius for packet analysis, Scrutinizer for Netflow analytics, Cisco Transport Controller for the optical network and Gigamon for network aggregation management.
WaTech managed devices include Cisco SmartNet and troubleshooting support (or other equivalent support agreements from other vendors).
The Network is monitored 24/7 and the operations center is able to quickly respond to issues as they arise with either technicians onsite or technicians responding remotely with full capabilities to resolve issues.
Updated transport and connectivity procurement process with improved service levels, which introduces penalties on carriers who fail to, meet the agreed service levels with a new Master Services Agreement (MSA) and associated technical addendums. Vendors must execute the MSA and technical addendum(s) in order to participate in procurements, the current pool of vendors who have signed the MSA, and the Addendums they have signed up for follow in the table below:

Page 298 of 851
.
Vendor Wireline Ethernet
Addendum Fixed Wireless
Addendum
AccelNet No No
CenturyLink Yes No
Comcast Yes No
Frontier Yes No
GorgeNetworks Yes No
Magna5 Yes Yes
Visionary Networks (dba Mammoth Networks) Yes Yes
NoaNet Yes No
Noel Yes Yes
StarTouch Yes Yes
Threshold Yes No
Wave Yes Yes
Zayo Yes No *Note: the state still receives some Ethernet services from another set of contracts, the Secondary Ethernet pre-approved vendors. No additional services will be added under those contracts
Roles and responsibilities for the Customer and WaTech are provided in the table below:
Activity Customer WaTech
Define requirements & design (Collaborative requirements gathering by both the customer and CTS/WaTech, to meet customer’s current and future needs) X X
Provide detailed site information for circuit and equipment installation including floor diagrams identifying key locations (e.g. MPOP, LAN room, Computer room) X
Technical Designing / Provisioning with Vendor X
Participate in pre-cutover collaboration calls (Prior to scheduled circuit cutover, CTS/WaTech will setup a pre-cutover call to review the cutover work activities and details to ensure the successful turn up of the circuit. Customer will include the appropriate customer technical staff in on the call. WaTech will include the appropriate WaTech technical staff in the call) X X
Provide secure space and power for circuit equipment X
Provide secure space and power for Provider Edge (WaTech) equipment X
Provide access to WaTech vendors X
Maintenance/Operation of circuits X
Vendor Quote acceptance X
Vendor and Contract Management X
Circuit Capacity Planning (Collaborative circuit capacity planning by both the customer and CTS/WaTech, to meet customer’s current and future needs. Customer to provide information about future use of circuit – any changes in usage patterns, new applications, etc.) X X
Own Customer Edge Equipment (includes purchasing, tagging/tracking, surplus, etc.) X

Page 299 of 851
.
Activity Customer WaTech
Own Provider Edge Equipment (includes purchasing, tagging/tracking, surplus, etc.) X
Manage Customer Edge (CE) Equipment (CTS/WaTech will provide configuration support for CE equipment that is a ‘standard model’ supported by WaTech. This includes maintaining the equipment configuration and appropriate configuration backups Standard model details provided in the notes section below.) X X
Manage Provider Edge (PE) Equipment X
Cutover to new connections within 30 days of circuit delivery (CTS/WaTech and Customer must provide necessary resources to ensure new circuits are implemented into production promptly.) X X
Provide patch cable and connect router to switch X
Placement of switch or installation of an RJ45 (Customer directs vendor placement onsite) X
Notes
Where WaTech manages or co-manages CE equipment WaTech monitors and implements the networking equipment configurations and addresses incidents (break/fix), used in the delivery of WaTech’s Network Services. There are some exceptions to this for agencies who manage their own CE equipment. All agencies are responsible for software upgrade and patch management. They are not required (but it is best practice) to provide WaTech with the ability to monitor, configure and remotely reboot the CE equipment.
WaTech performs Network Service maintenance in ways to minimize interruptions on services and customers. Maintenance events are scheduled and published in advance. Impact on customers is the primary consideration for determining the maintenance window of specific events. WaTech’s network providers are required to schedule maintenance activities between the hours of 10 p.m. and 6 a.m.
Standard service for CE equipment includes configuration management and monitoring of authorized Cisco devices on the Customer Edge. There is no additional cost for WaTech to provide configuration and operational management. The Network Operations Center (NOC) works with the customer team to help coordinate any SmartNet repairs or device maintenance with Cisco under the SmartNet contract purchased for CE devices. Once the equipment is repaired, the NOC will work to get connectivity back online and tested to assure the repair is complete and working as expected.
Customers of the Standard CE service must cover device(s) with a SmartNet maintenance contract with Cisco. Customers who do not have sufficient staff and/or resources to perform hardware installations or parts replacements must consider purchasing onsite hardware maintenance support. WaTech does not have staff available to send technicians to a customer location to perform such work. WaTech will coordinate such activities based on the coverage arranged for each device.
Customers are responsible for Non-Recurring Costs (NRC) exceeding a set amount; customer local area networks; wireless services; voice services; and audio/video conferencing services.
Internal WaTech network management tools and appliances; and software (though access to some monitoring tools for agency staff may be optionally available for an additional fee).

Page 300 of 851
.
Allocated customers receive up to five network segments (Virtual Routing and Forwarding tables [VRFs]) and three firewalls. Additional services can be purchased through the fee for service offering.
Customers are responsible for Termination Liability for circuits cancelled by customer prior to the end of the requested term.
Customers are responsible for non-standard/exceptional (one off) costs; purchase and maintenance of Customer Edge (CE) devices; and funding multiple circuits to one site/customer (Example, Transport & Connectivity Services for Disaster Recovery/Business Continuity purposes).
Only customers located at agency offices within the service area of the SMON may be connected to this network.
WaTech is solely responsible for running the competitive procurements for carrier network services associated with the WaTech managed services (which includes but is not limited to local access connectivity, wide-area network connectivity, and data transport services). Agencies work with WaTech to define the procurement requirements and are regularly updated on the status of the procurement. WaTech sends bid requests to all vendors with a signed Master Services Agreement and technical addendum for the service being procured, and selects a provider based on the published RFQ defined selection criteria. Occasionally, Agencies also participate in the review and selection process.
WaTech is responsible for all contract negotiation, contract management, vendor management, vendor invoice management, invoice reconciliation, and vendor service credits for non-performance.
B. Statutory Basis for Creation of Service or Program
WaTech’s delivery of this specific service is not mandated by statute. However, RCW 43.105.385 states that over time state agencies should move toward using WaTech as their central service provider for all utility-based infrastructure services.
C. How the Service Fits into the CTS Strategic Plan and Goals
WaTech reports that this service supports the strategic roadmap to ensure Washington State’s network is managed as a critical asset.
D. Performance Measures used to Measure Effectiveness and Efficiency
WaTech tracks request fulfilment activities and aims to meet the following Service Level Objectives (SLOs):
Group Service Level Objective
Service Requests
Circuit Implementations (remote sites) 120 Days
Data Center Efforts (moves, adds, and changes) 60 Days
Incidents 5 Days
WaTech recognizes that network services must be available 24 hours per day, 365 calendar days per year. The network is monitored 24/7 and the operations center is able to quickly respond to issues as they arise with either technicians onsite or technicians responding remotely with full capabilities to resolve issues. WaTech has defined overall availability for the network services it delivers.
Availability: The service availability objective is 99.9% for Transport and Connectivity measured on a monthly basis per site (excluding maintenance)

Page 301 of 851
.
The service availability objective is 99.99% for Network Core.
WaTech continually works with its contracted vendors on meeting the contractual obligations to ensure the availability of the Data Network. The new MSA includes service level definitions with penalties for carriers who fail to meet the agreement terms.
For both the Wireline Ethernet and the Fixed Wireless Tech Addendums, the service must meet the Performance Minimum levels set forth below. The failure to meet Performance Minimums shall result in a five (5) percent Service Level Credit(s) for the affected Products and Services unless otherwise defined herein. Performance Minimums are defined as:
The Service shall have a maximum Latency of fifteen (15) ms on a one minute average from egress port on a CTS User’s devices to ingress port on the CTS User’s device within specified circuit;
The Maximum Jitter for the Service shall be no more than five (5) ms from egress port on a CTS User’s devices to ingress port on the CTS User’s device within specified circuit;
The Maximum Packet Loss shall be < 0.1% of the total packet throughput on Service Path utilizing five (5) minute averages from egress port on a CTS User’s devices to ingress port on the CTS User’s device within specified circuit;
The Service shall have a Performance Minimum of 99.9% Availability excluding scheduled maintenance, per one (1) calendar month;
The Service shall have a Performance Minimum of 99% Availability inclusive of scheduled maintenance, per one (1) calendar month; and
The Service is required to provide a MTTR of four (4) hours or less, per one (1) calendar month.
The Service shall not have a single Outage that negatively affects over thirty (30) CTS User sites for a period longer than fifteen (15) minutes.
Contractor’s Service is designed to provide a Service Availability of at least 99.9%, excluding scheduled maintenance. If the Target Availability as defined in the applicable chart below is not achieved in a calendar month, CTS shall be entitled to the Service Level Credits set forth herein. Service Level Availability is calculated on a calendar month, which will be pro-rated for the first calendar month of service.
Target Availability Actual Outage (Monthly) Service Level Credit as % of MRC for the applicable Service
99.9% Availability
(Excluding Scheduled Maintenance)
Less than 43 minutes Target Met
>43 minutes to 1 hour 5%
>1 hour to 3 hours 10%
>3 hours to 5 hours 15%
>5 hours An additional 5% for each additional hour of Outage
In the event of a single Outage that negatively impacts over thirty (30) CTS User sites for a period longer than fifteen (15) minutes Contractor shall grant CTS an additional Service Level Credit of five (5) percent against the MRC.

Page 302 of 851
.
Contractor’s Service is designed to provide a Service Availability of at least 99%, including scheduled maintenance. If the Target Availability, including maintenance periods, as defined in the applicable chart below is not achieved in a calendar month, CTS shall be entitled to the Service Level Credits set forth herein. Service Level Availability is calculated on a calendar month, which will be pro-rated for the first calendar month of service.
Target Availability Actual Outage and Scheduled Maintenance (Monthly)
Service Level Credit as % of MRC for the applicable Service
99% Availability
(Including Scheduled Maintenance)
Less than 7 hours 18 minutes Target Met
>7 hours 18 minutes to 9 hours 5%
>9 hour to 12 hours 10%
>12 hours to 15 hours 15%
>15 hours
An additional 5% for each additional 3 hour of Outage due to scheduled Maintenance
Scalability is another key design goal of Network Services. The network is adaptable to meet customer needs.
Capacity: WaTech monitors network usage (demand) and capacity. If a customer’s usage exceeds 70%, WaTech ensures that additional bandwidth is provisioned in order to meet the customer business requirements for network bandwidth. Currently, NSD leverages a threshold of 70% as well as other triggers when recommending a circuit to be upgraded. NSD does not get an alert of when a circuit is above the 70% threshold. NSD conducts a monthly analysis of circuit utilization and then makes recommendations to the internal team that initiates upgrades.
WaTech provides Ethernet Circuit Procurement Timeline estimates but does not provide a commitment to a specific level of service or obligations for responding to inquiries.
Time Estimates Description
1 day
Need for new/replacement Ethernet circuit identified (example, customer sends request to WaTech for new Ethernet circuit or WaTech initiates request)
7 days
Requirements gathering and confirmation between customer and WaTech. Requirements are finalized (depends on Agency and WaTech coordination)
7 days WaTech procurement Requirements converted to RFQ
28 days
RFQ Bid Process
Procurement released to vendors
Vendor questions and answers period Apparently successful vendors (ASV) announced
7 days Vendor debriefing period
7 days Contract work - Supplemental work orders issued for signatures
3 days Technical circuit orders issued to vendors

Page 303 of 851
.
Time Estimates Description
Based on the Guaranteed Install Interval - number of days
Vendors process technical order and initiate work activities to build circuit, install cabling and electronics at customer site (Potential steps include permits, right of entry approvals, easement approvals, construction projects, etc.)
1 day Vendor turns circuit over to WaTech
3-15 days WaTech and customer finalize implementation configurations and coordinate scheduled cutover to new circuit.
2-3 months + vendor processing and build time Total time
E. Current Cost to Maintain the Service
Staffing
Staff are not fully dedicated to the delivery of this service; therefore, WaTech uses transfer rules to assign staff to the service for the purposes of tracking and forecasting costs (shown as the 45.8 FTEs in direct/indirect labor in the diagram below). These transfer rules were developed by estimating actual staff time spent on activities related to the service.
In addition, 11.6 percent of total overhead costs are being transferred to this service. If you apply that total cost percentage to the 65 FTEs within overhead, it would be about 7.5 overhead FTEs.
WaTech’s line staff are primarily responsible for vendor and contract management related to carrier connectivity (circuits and last mile); network design, planning and implementation; acquisition and management of equipment at the edge and core; and remote troubleshooting (majority of onsite installation, configuration, and troubleshooting contracted with vendors, which are managed remotely by WaTech). About 45.8 FTEs are completing these activities today.
Figure 30. Data Network Service Staffing

Page 304 of 851
.
Note: Staffing numbers and percentage of overhead pulled from “Estimated Overhead FM6 December” and adjusted due to an estimated increase in VPN staffing by 1.5 FTEs and related costs with the corresponding decrease in CC 3461 Vendor Last Mile.

Page 305 of 851
.
Figure 31. Data Network Service Direct/Indirect Staffing
Note: Staffing details pulled from “Org Chart - Color Coded 01.01.18” and combined with transfer rules in “FY18 Master Indexes 12-19-17.” Each cost code falling under 3480 has non-labor costs directly assigned; however, labor cost is only assigned to these codes via transfer

Page 306 of 851
Workload Supported
The current supported workload is defined in the table below:
Table 54. Data Network Service Workload Supported
Description Workload Supported
Total Workload
Total Number of Supported Devices (including Firewalls, Routers, and Switches)
269 Firewalls (185 managed by WaTech)
400 Core Network Devices
247 Shared sites
857 CE Routers
Total = 1,749 Devices
Total Number of Supported State Users
This is defined as the total number of State (City, County, Tribes, Federal, etc. are not included in this number) users in agencies where WaTech provides WAN connectivity, If this number is known, please provide it. If it is not known, please add of the total employee count for each agency for which WaTech provided WAN connectivity in FY2017
>60,000 Supported users
Total Number of Sites
A site is defined as a physical location where WAN services are provided. In the case where multiple agencies are housed in a single location, this should be counted as a single location, except in cases where WAN connectivity is separately provisioned and managed.
The Site total should include all sites, not just sites where customer activities occur or for which customers are billed. Any other sites with WaTech provided connectivity should also be included. This would include connectivity to local agencies on the IGN as well as WaTech internal Facilities, Node Locations, or data centers.
WaTech provides Data Connectivity at 747 unique addresses in Washington
Transport Workload
Strands/ Miles of Fiber Managed (SMON)
3,714 strands total (~1,599 miles)
2,514 strands of single mode fiber (~1,190 miles)
1,200 strands of multi-mode fiber (~409 miles)
Total Number of Physical Circuits 960 circuits
See Figure Below for Circuits Counts provided by WaTech (summarized by Gartner)
Vendor Provided Circuits (Vendor Last Mile) 852 circuits

Page 307 of 851
Description Workload Supported
(Note: vendor provided but WaTech managed)
See Figure Below for Circuit Counts provided by WaTech (summarized by Gartner)
WaTech Provided Physical Circuits (SMON)
108 circuits
Total Number of Customer Connections 1,263 connections
Vendor provided Customer Connections 1,082 connections
WaTech provided (SMON) Customer Connections 181 connections
Transported Data via WaTech Circuits captured via Orion Monthly
~3.4 Petabyte of data each month
Total Number of Shared Site Routers on both the SMON and Vendor provided circuits (SMON circuits - 100% are WaTech owned/managed)
247 routers
Total Number of Customer Edge (CE) Routers 856 routers
~38% (326 routers) are WaTech owned/managed
~28% (243 routers) are WaTech co-managed
~33% (287 routers) are Agency managed
Core Workload
Total Number of Core Routers 133 routers
Total Number of Logical WAN Connections
A logical connection is defined as a customer’s WAN connection to WaTech’s networking equipment. (i.e., ports provisioned on 9k’s, SMON, etc., that provide customer with connectivity)
~1,800 logical connections
Firewall contexts (SDC and QDC) 269 Total Firewall Contexts (Logical Firewalls)
61% Managed by WaTech (including all internet edge)
39% Delegated to Agencies
Core devices Managed (SDC and QDC)
This is routing and switching devices NSD manages within the two data centers. This includes 8 core/edge firewalls. Servers and storage are not managed by NSD.
Note that CE routers (~857) are accounted for elsewhere in this document.
~ 400 physical core devices in SDC and QDC (including 133 core routers)
Port Connections (SDC and QDC)
These are Ethernet port connections provided on end of row switches or top of rack switches that are used to
Over 2,700 port connections

Page 308 of 851
Description Workload Supported
connect compute, storage, security and other devices to the data center network.
Note: Workload information is current as of January 2018 and this detail was provided by WaTech in the “Network Allocation Deep Dive” PPT provided in February
WaTech provided Gartner with a historical summary of the number and types of circuits that were included in the network transport services from FY14 through what is currently deployed as of mid FY18. Gartner summarized this information in the following chart. This chart shows that there has been a steady progression over the past 5 years toward higher and higher bandwidth circuits. According to this analysis, over this period, the total amount of bandwidth delivered increased 154% and the average amount of bandwidth available per circuit has increased by 195%.
When asked about minor discrepancies in the counts summarized here and other data provided, WaTech reported that minor variance across various site and connection counts has to do with different methods of counting circuits for allocation tracking versus quarterly reports.

Page 309 of 851
Figure 32. Historical Circuit Usage Provided by WaTech (Summarized by Gartner)
Note: This table was created from the data used in an allocation comparison FY15 to FY18.
Direct, Indirect and Overhead Costs.
A summary level view of WaTech’s planned expenses for this fiscal year are provided in the table below.
Circuit Count by Type FY14 FY15 FY16 FY17 FY18
T1 385 137 60 29 26
10M Ethernet 507 566 522 484 438
100M Ethernet 129 179 232 356 370
1 Gig Ethernet - - - - 18
SMON 92 99 95 102 108
Total Circuits 1,113 981 909 971 960
Year Over Year Change in Circuits FY14 FY15 FY16 FY17 FY18
T1 (248) (77) (31) (3)
10M Ethernet 59 (44) (38) (46)
100M Ethernet 50 53 124 14
1 Gig Ethernet - - - 18
SMON 7 (4) 7 6
Net Total (132) (72) 62 (11)
Total Bandwidth by Circuit Type FY14 FY15 FY16 FY17 FY18
1.5 Mbps 577.50 205.50 90.00 43.50 39.00
10 Mbps 5,070 5,660 5,220 4,840 4,378
100 Mbps 12,900 17,900 23,197 35,577 36,983
1000 Mbps - - - - 18,330
1000 Mbps 92,000 99,000 95,000 102,000 107,800
Total Bandwidth Across All Circuits
(in Mbps) 110,548 122,766 123,507 142,460 167,530
Total Bandwidth Across All Circuits
(in Gbps) 110.55 122.77 123.51 142.46 167.53
Year over Year % Change
in Total Bandwidth 11% 1% 15% 18%
Cumulative % Change
in Total Bandwidth 11% 12% 29% 52%
Average Bandwidth per Circuit
(in Mbps) 99 125 136 147 175
Year over Year % Change
in Average Bandwidth per Circuit 26% 9% 8% 19%
Cumulative % Change
in Average Bandwidth per Circuit 26% 37% 48% 76%

Page 310 of 851
Table 55. Data Network Service FY18 Planned Service Expenses (Overall – Associated All Costs 3471, 3472, 3473, 3465, 3463, 3462, 3461)
Cost Components FY18 Planned FY19 Planned Cost Details
A Salaries 4,071,083 4,133,940 45.8 Planned FTEs
B Benefits 1,309,718 1,258,052
C Personal Services 72,000 72,000
Driven by legal and vendor consultation services
E Goods & Services 11,503,754 11,243,583
Driven primarily by carrier circuits, fiber leases, Internet connectivity, and vendor installation costs
E Internal Purchases 1,279,580 1,279,580
Driven primarily by colocation and desktop support fees
E Prepaid Monthly 1,271,773 1,115,901
Driven primarily by SmartNet warranty replacement prepayment
G Travel 19,100 19,100
J Non-capitalized Assets 2,208,154 2,367,829
Driven by lifecycle refresh of equipment at SDC; equipment needed to support disaster recovery/business continuity at QDC; and equipment to support the growing customer demand such as monitoring tools, timing sources, chassis, modules, SFPs, UPS’ and PEs
P Debt - Interest & Other Payments 40,549 83,937
Driven primarily by prior purchase of SMON equipment
P Debt - Principal Payments 606,853 646,356
Driven primarily by prior purchase of SMON equipment
T Transfers 1,756,500 1,784,706 Overhead
Total Planned Expenses 24,139,063 24,004,984
Note: Cost details were pulled from “Network Services” excel spend plan provide in February 2018
A detailed view of WaTech’s planned expenses for this fiscal year are provided in the tables below for each cost code.
Table 56. Data Network Service FY18 Planned Service Expenses (3471 Core only)
Cost Components FY18 Planned FY19 Planned Cost Details
A Salaries 998,676 998,244 11 Planned FTEs
B Benefits 236,892 236,676
E Goods & Services 656,250 691,000
Internet Fee, Netflow, scheduled software maintenance (ARIN, Savvius, IPv6, IPv4, RADb, and Solarwinds) and Gigamon hardware maintenance
E Internal Purchases 367,000 367,000
Enclosures (colocation) Desktop
E Prepaid Monthly 633,279 598,033
Existing SmartNet plus new prepayments (EPNM, ICE, etc.)

Page 311 of 851
Cost Components FY18 Planned FY19 Planned Cost Details
G Travel 1,800 1,800
J Non-capitalized Assets 1,392,000 1,403,096
Disaster Recovery Lifecycle Replacement …(Redacted)…. Network Upgrade (Chassis, Modules, Timing Sources, and SFPs)
P Debt - Interest & Other Payments 1,568 2,000
P Debt - Principal Payments 31,350 49,500
Network aggregation equipment and NK5 routers
T Transfers 415,800 415,800 Overhead
Total Planned Expenses 4,734,615 4,763,149
Note: Cost details were pulled from “Network Services” excel spend plan provide in February 2018
Table 57. Data Network Service FY18 Planned Service Expenses (3472 End of Row Connectivity only)
Cost Components FY18 Planned FY19 Planned Cost Details
A Salaries 240,000 240,000 2.3 Planned FTEs
B Benefits 76,800 76,800
E Goods & Services 24,000 24,000
E Internal Purchases 455,500 455,500
Desktop Enclosures (Colocation in SDC and QDC)
E Prepaid Monthly 93,868 93,868
SmartNet
G Travel 480 480
J Non-capitalized Assets 42,000 40,000
DR and Network Upgrade (includes equipment parts needed to support growing demand such as Small Form-Factor Pluggable Transceivers (SFPs) and modules)
T Transfers 86,940 86,940 Overhead
Total Planned Expenses 1,019,588 1,017,588
Note: Cost details were pulled from “Network Services” excel spend plan provide in February 2018
Table 58. Data Network Service FY18 Planned Service Expenses (3473 Perimeter/ Firewall only)
Cost Components FY18 Planned FY19 Planned Cost Details
A Salaries 505,307 505,344 6.5 Planned FTEs
B Benefits 168,674 168,692
E Goods & Services 762,000 623,750 Hardware Maintenance and Engineer

Page 312 of 851
Cost Components FY18 Planned FY19 Planned Cost Details
E Internal Purchases 281,140 281,140
Data Processing Services, Central Service Allocation Charge, and Desktop
G Travel 8,000 8,000
J Non-capitalized Assets 175,454 576,033 Software
T Transfers 245,700 245,700 Overhead
Total Planned Expense 2,146,275 2,408,659
Note: Cost details were pulled from “Network Services” excel spend plan provide in February 2018
Table 59. Data Network Service FY18 Planned Service Expenses (3465 CE/PE Equipment only)
Cost Components FY18 Planned FY19 Planned Cost Details
A Salaries
300,000
300,000 3.8 Planned FTEs
B Benefits
97,200
97,200
E Goods & Services
105,000
45,000 Vendor installs/consults (for PEs and UPS’)
E Internal Purchases
24,016
24,016 Desktop
E Prepaid Monthly
144,626
24,000 SmartNet
G Travel 660 660
J Non-capitalized Assets
329,700
209,700
CE/PE hardware for shared sites and- accessories/tools necessary to support monitoring, disaster recovery, business continuity and growing customer demand (hardware upgrades needed to support higher bandwidth, UPS’, SFPs, etc.)
P Debt - Interest & Other Payments
4,545
2,937 Interest on previous COPS that have not been
paid off
P Debt - Principal Payments
21,089
22,143
Principal payment on previous COPS that have not been paid off
T Transfers
143,640
143,640 Overhead
Total Planned Expenses
1,170,476
869,296
Note: Cost details were pulled from “Network Services” excel spend plan provide in February 2018

Page 313 of 851
Table 60. Data Network Service FY18 Planned Service Expenses (3463 SMON only)
Cost Components FY18 Planned FY19 Planned Cost Details
A Salaries 416,412 395,592 4.5 Planned FTEs
B Benefits 142,884 132,156
E Goods & Services 569,167 410,000
Majority of cost driven but SMON Ring and DCI Costs Vendor Installs and Consults
E Internal Purchases 40,500 40,500 Desktop
E Prepaid Monthly 400,000 400,000 SmartNet
G Travel 5,160 5,160
J Non-capitalized Assets 263,000 133,000
Disaster Recovery Network Upgrade - UPS, SFPs, Modules
P Debt - Interest & Other Payments 34,436 79,000
Interest on Cisco optical networking equipment (wave division multiplexing)
P Debt - Principal Payments 554,414 574,713
Principal payment for Cisco optical networking equipment (wave division multiplexing)
T Transfers 170,100 170,100 Overhead
Total Planned Expenses 2,596,072 2,340,221
Note: Cost details were pulled from “Network Services” excel spend plan provide in February 2018
Table 61. Data Network Service FY18 Planned Service Expenses (3462 Campus Fiber Network only)
Cost Components FY18 Planned FY19 Planned Cost Details
A Salaries 270,000 270,000 3.2 Planned FTEs
B Benefits 86,400 86,400
E Goods & Services 50,250 50,250
Vendor Installs and Consults (Fiber leases and pole rental)
E Internal Purchases
20,560
20,560 Desktop
G Travel 600 600
J Non-capitalized Assets 4,000 4,000 Accessories and Tools; UPS’, SFPs, and Modules
T Transfers
120,960 120,960 Overhead

Page 314 of 851
Cost Components FY18 Planned FY19 Planned Cost Details
Total Planned Expense
552,770
552,770
Note: Cost details were pulled from “Network Services” excel spend plan provide in February 2018
Table 62. Data Network Service FY18 Planned Service Expenses (3461 Vendor Last Mile only)
Cost Components FY18 Planned FY19 Planned Cost Details
A Salaries
1,340,688
1,424,760 14.5 planned FTEs
B Benefits
500,868
460,128
C Personal Services
72,000
72,000
OLS legal fees and external vendor consulting fees
E Goods & Services
9,337,087
9,399,583 Vendor circuits and fiber leases
E Internal Purchases
90,864
90,864 Desktop
G Travel
2,400
2,400
J Non-capitalized Assets
2,000
2,000 Accessories and Tools
T Transfers
573,360
601,566 Overhead
Total Planned Expenses
11,919,267
12,053,301
Note: Cost details were pulled from “Network Services” excel spend plan provide in February 2018
WaTech provided the following Lifecycle Cost Estimates and Timelines summary information to provide a more accurate picture of data network asset health in place of depreciation data that no longer reflected a full picture (partially due to realignment of historical network cost codes). WaTech’s analysis includes lifecycle timeframe(s) for each of the various network infrastructure, architecture, technology, and tools associated with maintaining the SDC, QDC, SMON, Campus Fiber, OSS, and enabling Cloud network connectivity due to Last Day of Support (LDoS).
The State Data Center (SDC) network infrastructure (equipment & licensing) was purchased in 2011 for approximately $4.858 million (NRC). The Quincy Data Center (QDC) became operational in 2013 and it is smaller scaled version of the SDC. The State Metropolitan Optical Network (SMON) was installed in 2011, and the installation and recurring costs through 2020 are $7,127,125. The Office Support System (OSS) was procured in 2003 and the cost through 2017 are $6,097,000.
WaTech also provided the following disclaimers on Network Lifecycle Cost Estimates:

Page 315 of 851
No telephony or facility out-of-band (FOOB) lifecycle costs are included in this lifecycle summary.
The costs listed are all one-time purchase costs (NRC) without taxes/fees and maintenance costs.
In general, associated ongoing O&M charges add up to approximately 50% of the NRC over the life span of network infrastructure.
The standard state discount from WaTech’s Cisco contract was used for pricing.
Architecture design per OCIO 141 – Securing Information Technology Assets.
Table 63. WaTech Estimate of Network Lifecycle Cost and Timelines
Fiscal Yr Sum of Est. Cost
FY 16 $1,454,325
FY 17 $1,599,205
FY 18 $5,633,206
FY 19 $7,583,039
FY 20 $1,879,340
FY 21 $1,696,518
FY 22 $1,135,698
FY 23 $3,985,180
Grand Total $24,966,510
NSD Network End of Life Summary Fiscal Yr Description Qty Purchase By Total Est. Cost
FY 16 Redacted 1 6/30/2016 $1,454,325
FY 16 Total 1 6/30/2016 $1,454,325
FY 17 Redacted 1 6/30/2017 $1,454,985 Redacted 1 6/30/2017 $30,000 Redacted 3 7/31/2017 $14,400 Redacted 1 7/31/2017 $0 Redacted 2 12/31/2017 $23,490 Redacted 5 12/31/2017 $76,330
FY 17 Total 13 12/31/2017 $1,599,205
FY 18 Redacted 1 7/31/2017 $813,067 Redacted 1 10/30/2017 $13,054 Redacted 1 12/31/2017 $320,122 Redacted 1 12/31/2017 $732,708 Redacted 1 12/31/2017 $15,814
Redacted 1 12/31/2017 $506,024
Redacted 1 12/31/2017 $96,037 Redacted 1 12/31/2017 $208,750 Redacted 3 12/31/2017 $258,878 Redacted 1 4/30/2018 $285,424 Redacted 60 6/30/2018 $179,090 Redacted 1 6/30/2018 $33,883 Redacted 9 6/30/2018 $0

Page 316 of 851
Redacted 1 6/30/2018 $93,221 Redacted 1 6/30/2018 $154,000 Redacted 1 6/30/2018 $63,601 Redacted 1 6/30/2018 $85,495 Redacted 1 6/30/2018 $22,647 Redacted 1 6/30/2018 $73,313 Redacted 5 6/30/2018 $555,777 Redacted 26 6/30/2018 $548,100 Redacted 32 6/30/2018 $574,200
FY 18 Total 151 6/30/2018 $5,633,206
FY 19 Redacted 2 7/31/2018 $0 Redacted 1 7/31/2018 $0 Redacted 1 7/31/2018 $3,600 Redacted 8 7/31/2018 $0 Redacted 2 7/31/2018 $0 Redacted 1 7/31/2018 $0 Redacted 1 8/31/2018 $5,000,000 Redacted 1 10/30/2018 $13,054 Redacted 1 2/28/2019 $500,000 Redacted 2 5/31/2019 $36,000 Redacted 4 5/31/2019 $2,784 Redacted 6 5/31/2019 $10,920 Redacted 2 6/30/2019 $0 Redacted 2 6/30/2019 $44,080
Redacted 10 6/30/2019 $1,507,361
Redacted 1 6/30/2019 $195,000 Redacted 1 8/29/2019 $140,000 Redacted 55 5/31/2020 $130,240
FY 19 Total 101 5/31/2020 $7,583,039
FY 20 Redacted 1 6/30/2019 $675,000
Redacted 1 10/30/2019 $13,054
Redacted 1 3/31/2020 $200,000
Redacted 3 6/30/2020 $89,300
Redacted 1 6/30/2020 $0
Redacted 24 6/30/2020 $245,000
Redacted 9 12/30/2020 $403,986
Redacted 1 12/30/2020 $87,120
Redacted 1 1/31/2021 $14,500
Redacted 1 5/31/2021 $5,220
Redacted 28 5/31/2021 $146,160
FY 20 Total 71 5/31/2021 $1,879,340

Page 317 of 851
FY 21 Redacted 1 10/30/2020 $13,054
Redacted 1 12/31/2020 $40,000
Redacted 5 12/31/2021 $309,690
Redacted 1 12/31/2021 $42,570
Redacted 1 1/31/2022 $30,000
Redacted 4 2/28/2022 $124,800
Redacted 12 6/30/2022 $109,968
Redacted 24 6/30/2022 $219,936
Redacted 40 6/30/2022 $6,500
Redacted 1 2/28/2023 $800,000
FY 21 Total 90 2/28/2023 $1,696,518
FY 22 Redacted 20 6/30/2021 $2,937
Redacted 4 6/30/2021 $195,528
Redacted 1 10/30/2021 $13,054
Redacted 2 6/30/2022 $28,000
Redacted 1 9/30/2022 $115,245
Redacted 1 9/30/2022 $384,146
Redacted 1 9/30/2022 $18,977
Redacted 9 12/31/2022 $246,891
Redacted 2 12/31/2022 $24,000
Redacted 4 6/30/2023 $106,920
FY 22 Total 45 6/30/2023 $1,135,698
FY 23 Redacted 1 6/30/2022 $878,048
Redacted 1 6/30/2022 $3,000
Redacted 1 9/30/2022 $607,229
Redacted 1 10/30/2022 $13,054
Redacted 2 2/28/2023 $26,000
Redacted 1 3/31/2023 $200,000
Redacted 60 4/30/2023 $149,689
Redacted 18 6/30/2023 $374,400
Redacted 8 6/30/2023 $33,280
Redacted 58 6/30/2023 $1,206,400
Redacted 16 6/30/2023 $54,080
Redacted 1 8/29/2023 $440,000
FY 23 Total 168 8/29/2023 $3,985,180

Page 318 of 851
Grand Total 640 8/29/2023 $24,966,510
WaTech Lifecycle Analysis Notes: (*) – Module was removed – No cost (**) – Entire device being replaced with … (Redacted)… so no cost for this module (***) – Devices being replaced with devices in stock … (Redacted)… so no cost for these devices (****) – Device being replaced with new devices … (Redacted)… so no cost for this module (*****) – This module is being replaced with a new supervisor module so no cost for this module (*+5) – These modules, P/S are being replaced with a new device… (Redacted)… so no cost for these modules (*+6) – This device is being replaced with a new device … (Redacted)… so this module does not need to be procured Acronym Legend:
SDC – State Data Center
QDC – Quincy Data Center
OCS – Office of Cybersecurity
SOC – Security Operation Center
IDS – Intrusion Detection System
IPS – Intrusion Protection System
NLT – No Later Than (represents the last day of support, end-of-life date, and/or
OOB – Out-of-Band
FOOB – Facilities OOB
WAN – Wide Area Network
OSS – Operations Support Systems
SMON – State Metropolitan Optical Network
DWDM – Dense Wavelength Division Multiplexing
MAC – Move, Add, Change (any & all modifications to the network infrastructure, architecture, & technology)
IPAM – Internet Protocol Address Management
MPLS – Multiprotocol Label Switching (segments network traffic during routing)
COLO – Data Center Colocation Services
O&M – Operations and Maintenance
MRC – Monthly Reoccurring Cost
NCR – Non Reoccurring Cost (One-time)
Given WaTech’s near-term planned operating expenses, WaTech will have the following workload costs for this service in FY18:
Table 64. Data Network Service Cost by Workload
Description Workload Cost Details
Cost per Supported End User
60,000 end users at an annual cost of about $16.4M (16.4M/60,000) $273 per supported end user a year
Cost per Supported WAN Site
747 physical addresses with a circuit (16.4M/747/12) $1,829 per site per month
Note: Workload cost in the table above is calculated based on WaTech’s alignment of costs to this service without adjustment for alignment to Gartner consensus models.
F/G. Rate structure CTS is currently billing to customers
As of fiscal year 2017, data network services are primarily provided via an allocation. Allocation methodology allocates the total cost of the transport and connectivity portion of the state network based on the number of circuits each agency has and by type of circuit/capacity, for the selected point in time snapshot of usage. The 17-19 biennium’s methodology was based upon a data snapshot taken in August of 2016 (utilizing statewide

Page 319 of 851
cost averages for type of capacity). The next scheduled refresh is in July 2018, which would likely be in effect for the 19-21 biennium.
For the current 17-19 biennium, WaTech provided the base cost of the state network and divided it into two components:
$5.4M/year for the network core, which was allocated based on FTEs.
$16.1M/year for data transport, which was allocated based on connectivity type.
o Each T-1 connection is $1,200 per month o Each 10 Mbps connection is $1,250 per month o Each 100 Mbps connection is $1,850 per month o Each 1 Gbps connection is $2,800 per month o Each SMON connection for an Agency/Address combination is $2,300 per
month
From there, in order to use the central service model, OFM converted the calculations above into an allocation. OFM took each agency’s total charge (network core + connectivity = total), and divided it by the total expenditure authority for the network. OFM uses the agency allocation percentages to spread the entire cost of the network and all its associated cost increases/decreases; OFM's calculations no longer separate the costs out by core/transport or by individual per connection cost. OFM only uses the percentages generated by the data from the bullets above. Additionally, OFM then merged the Security Infrastructure allocation into the Network allocation utilizing the same percentages driven from the calculations above.
Customers that are not a part of the allocation, and customers that are part of the allocation and want a substantial increase in service may acquire services on a fee for service basis. Rates are listed in the table below:
Table 65. Data Network Service Rates (Fee-for-Service)
Description Rate Detail
Network Core Port Usage Port Price Per Month
10Mbps/100Mbps/1Gbps Connection $165 per port per month
10Gbps Connection $1,300 per port per month
Management Interface $35 per port per month
One-Time Installation Charge $265 per port
Internet access Per Month Based on the number of FTEs
Less than 20 FTEs $10 per month per FTE
20 -150 FTEs $130 per month
151 - 500 FTEs $230 per month
501 - 1,000 FTEs $400 per month
More than 1,000 FTEs $820 per month
Transport and Connectivity Per month as quoted
All connections (outside of Olympia Campus fiber network) Rates are tailored to meet customer needs
Campus fiber network routes $655 per connection, per month (Olympia campus only).
Service rates changed on July 1, 2015 with the move to the allocation model.
H. Analysis of Current Cost Recoverability
This service is cost recoverable. The cost and revenue are shown in the table below.
Core network costs include: Core (3471), End of Row (3472) and Firewall (3473).

Page 320 of 851
While the costs for Transport include: Vendor Last Mile (3461), Campus Fiber Network (3462), SMON Ring (3463), and CE/PE Equipment (3465), and the historical code for Next Generation Netwk (Ngn) Ring & Sites (3464).
Cost Code 3480 covers the revenue for all of the above services.
Table 66. Data Network Service Cost Recoverability (Actual FY16-FY18)
Service Income FY16 FY17 FY18 H1
Service Revenue (3480) 22,922,199 24,245,723
12,626,792
Service Expense (3471) (3,623,342) (3,519,136)
(1,421,193)
Service Expense (3472) (874,548) (1,067,459)
(604,291)
Service Expense (3473) 0 (738,301)
(2,118,132)
Service Expenses (3465) (1,228,326) (1,189,101)
(688,298)
Service Expenses (3464)** (1,906,493) (700,321) 0
Service Expenses (3463) (1,906,993) (2,115,641)
(1,294,420)
Service Expenses (3462) (767,321) (556,703)
(247,834)
Service Expenses (3461) (11,193,648) (10,625,223)
(5,680,729)
Service Expenses (Total Across All Codes) (21,500,670) (20,511,884) (12,054,897)
Net Income
1,421,529
3,733,839
571,895
Note: Actual revenue and expenses pulled from “AFRS Financial Download (Extracted on 2018-05-15)”. (**) Use of the Next Generation Network Code has been discontinued. The purpose of the NGN was to aggregate T1 circuits and WaTech has discontinued the majority of T1s. Additionally, WaTech moved DR services to Quincy, which used to be a part of the Spokane Node site on the NGN.
Table 67. Data Network Service Cost Recoverability (Forecasted FY18-FY19)
Service Income FY18 FY19
Service Revenue (3480) 24,931,500 25,229,500
Service Expense (3471) (4,734,615) (4,763,149)
Service Expense (3472) (1,019,588) (1,017,588)
Service Expense (3473) (2,146,275) (2,408,659)
Service Expenses (3465) (1,170,476) (869,296)
Service Expenses (3463) (2,596,072) (2,340,221)
Service Expenses (3462) (552,770) (552,770)
Service Expenses (3461) (11,919,267) (12,053,301)
Service Expenses (Total Across All Codes) (24,139,063) (24,004,984)
Net Income 792,437 1,224,516
Note: Forecasted cost recoverability detail pulled from “Network” excel spend plan provided in February 2018

Page 321 of 851
I. Service Level Actually Provided Today
WaTech reports that historically the sites that are connected via the SMON have higher availability than sites connected via carrier Ethernet (which is shown in the availability chart below, which illustrates availability averaged across all sites including planned maintenance windows). However, WaTech’s service availability target is 99.9% on a site-by-site basis, excluding planned maintenance windows. Therefore, the chart below does not show WaTech’s performance compared to its service level objective; instead, it represents service availability including all scheduled maintenance. WaTech did not provide any reports that shows actual availability in comparison to the service level objective in the aggregate, on a customer-by-customer basis, or on a site-by-site basis. The WaTech per month, per site SLO is much more stringent than what is being reported here in this chart. Based on the information provided, WaTech does not appear to report on the number of locations by Agency, which failed to meet the SLO for each month, and does not track these historically in order to identify chronic outage or vendor performance issues.
Figure 33. Average Availability Aggregated across Sites (including planned maintenance)
Note: Figure provided in data network metrics presentation provided in March 2018. This figure includes maintenance downtime and shows availability aggregated across sites, whereas the SLO is defined as exclusive of maintenance downtime and is defined on a site-by-site basis.
WaTech’s Service Level Objective is 100% completion within 120 days for vendor circuit implementations at remote sites and 60 days for data center efforts like customer adds, moves and changes. Additionally, the Service Level Objective to resolve incidents such as circuit or connectivity disruptions and degradation is 100% completion within 5 days. The following charts depict the monthly moving average across all Data Network Service Requests and Incidents. The agency migrated to a new ticketing system prior to capturing these metrics, and the uphill trend is expected until the data normalizes. The average completion duration of Circuit Implementations also started exceeding the target SLO for service requests in October due to personnel changes; in order to address this issue, WaTech hired a new ITS5 in mid-March with plans to hire another ITS4 in the next few months. WaTech is working with vendors to address and resolve delays with circuit installation, which affects the service request closure rate.
These are the Service Level Objectives for each work area within Network Services:

Page 322 of 851
Group Service Level Objective
Service Requests
Circuit Implementations (remote sites) 120 Days
Data Center Efforts (moves, adds, and changes) 60 Days
Incidents 5 Days
Figure 34. Data Network Service Requests
0
20
40
60
80
100
120
140
160
0
20
40
60
80
100
120
140
Apr-
17
May
-17
Jun-
17
Jul-1
7
Aug-
17
Sep-
17
Oct
-17
Nov
-17
Dec-
17
Jan-
18
Feb-
18
Mar
-18
Aver
age
Days
Num
ber o
f Tic
kets
Circuit Implementations
Number of SR Average time SLO
0
10
20
30
40
50
60
70
80
90
100
0
10
20
30
40
50
60
70
80
Apr-
17
May
-17
Jun-
17
Jul-1
7
Aug-
17
Sep-
17
Oct
-17
Nov
-17
Dec
-17
Jan-
18
Feb-
18
Mar
-18
Aver
age
Day
s
Num
ber o
f TTi
cket
s
Data Center Efforts
Number of SR Average time SLO

Page 323 of 851
Note: Incident Handling and request fulfilment performance charts provided by WaTech during inventory review.
J. Current Customers
WaTech has 70 state data network allocation customers and almost 90 fee for service customers (most FFS customer are counties, cities and other entities that cannot be included in the allocation for legal/fiscal reasons). The largest 10 customers account for over 75% of the amount WaTech billed for this service in FY18.
Table 68. Data Network Service Current List of Customers
# Customer FY17 ($) FY17 (%) FY18 H1 ($) FY18 H1 (%)
1 DEPARTMENT OF SOCIAL AND HEALTH SERVICES
6,093,897
26
3,447,467 26
2 DEPARTMENT OF CORRECTIONS
2,910,853
13
1,747,496 13
3 DEPARTMENT OF LICENSING
2,276,362
10
2,347,327 18
4 EMPLOYMENT SECURITY DEPARTMENT
1,523,799
7
577,228 4
5 DEPARTMENT OF LABOR AND INDUSTRIES
965,382
4
470,139 4
6 DEPARTMENT OF LICENSING
1,138,181
5 -
7 DEPARTMENT OF FISH AND WILDLIFE
659,659
3
372,841 3
8 DEPARTMENT OF REVENUE
553,385
2
266,204 2
9 WASHINGTON STATE PATROL
567,925
2
250,694 2
10 OFFICE OF FINANCIAL MANAGEMENT
771,314
3
46,480 0
Total Top 10 Billable Customers
17,460,755
75
9,525,876 73
Total for All Other Billable Customers
957,220
4
3,484,539 27
0
1
2
3
4
5
6
0
50
100
150
200
250
300
350
400
Apr-
17
May
-17
Jun-
17
Jul-1
7
Aug-
17
Sep-
17
Oct
-17
Nov
-17
Dec
-17
Jan-
18
Feb-
18
Mar
-18
Aver
age
Day
s
Num
ber o
f Tic
kets
Data Network Incidents
Number of IN Average time SLO

Page 324 of 851
# Customer FY17 ($) FY17 (%) FY18 H1 ($) FY18 H1 (%)
Total WaTech Internal Sales
4,799,844
21
90,388 1
Total Revenue
23,217,819
100
13,100,803 100
Note: Customer billing details pulled from “GARTNER – ALLOCATION” excel file. Slight discrepancy between the total revenue within Apptio and within AFRS.
K. Current and Historical Usage Volumes
Many of the state data network sites are state-owned buildings or buildings that have been leased long-term. These sites are very stable and as the state has moved to an allocation approach from a chargeback approach, the WaTech team has worked to consolidate circuits at shared locations. The chart below shows the number of non-SMON sites where WaTech has been able to consolidate multiple circuits into a larger capacity circuit to meet the customer’s needs.
Note: Customer usage trend data provided in “Network Allocation Deep Dive” presentation

Page 325 of 851
Note: Customer usage trend data provided in “Network Allocation Deep Dive” presentation
In addition to the more stable sites, many agencies frequently stand-up temporary office spaces. The number and location of these short-term offices fluctuate year-to-year.
The majority of traffic handled by WaTech remains within the state’s WAN, while only three percent of current traffic is internet traffic.
L. Customer Satisfaction and Future Demand
The Customer Voice appendix to this report includes customer satisfaction and future demand details based on the results of agency interviews and focus groups conducted during the project.
M. High Level Architecture
WaTech maintains four Internet Service Provider (ISP) connections with geographic diversity (one provided by the University of Washington … (Redacted)… All four circuits are active and available 100% of the time. WaTech has priorities set (e.g. route cost parameters) to cause the two ISP’s at the SDC to be used first, should one or both fail, traffic dynamically will use the two at WaTech’s DR location at the QDC.
The core network currently includes three geographically diverse data center interconnects between SDC and QDC with a total bandwidth of 30 Gbps between the three DCIs. Additionally, a fourth 10Gbps DCI leveraging part of the SMON is being turned up this summer.
There are three main rings on the SMON in Thurston County with an interconnection between the rings in Olympia on the main ring. The main ring passes through the SDC, and after the fourth DCI is installed in the summer it will also go to the QDC. At this point, if a fiber cut occurs on the SMON and cannot reach the SDC, the traffic will re-route the reverse path along the ring through the QDC and then through the data center interconnects to the SDC, so that is the ring is self-healing. About twenty percent of SGN sites, most of the largest sites, are connected via the SMON.

Page 326 of 851
Historically, WaTech acquired carrier point-to-point carrier Ethernet connections to connect remote sites (those not connected via the SMON rings), which increased the risk of outages as the single path was a single point of failure. In order to improve reliability for remote sites, WaTech now requires carriers to provide handoffs at both the primary and secondary data centers, with each new circuit terminating in both the SDC and QDC the remote sites.
The Network Core includes over 662 devices; carrier-class switching and routing equipment; firewalls, primary transport circuits between the data centers; and support infrastructure.
Most agency remote sites are connected to the SGN via carrier Ethernet.
High level conceptual architecture diagrams for the data network service follow below.

Page 327 of 851
Figure 35. Conceptual Network Architecture – State Data Center (SDC)
REDACTED
Note: Architecture diagram provided by WaTech during Current State Inventory document review cycles

Page 328 of 851
Figure 36. Conceptual Network Architecture – Quincy Data Center (QDC)
REDACTED
Note: Architecture diagram provided by WaTech during Current State Inventory document review cycles

Page 329 of 851
Figure 37. State Data Center (SDC) Network Core Topology
REDACTED
Note: Architecture diagram provided by WaTech during Current State Inventory document review cycles
Figure 38. Quincy Data Center (QDC) Network Core Topology
REDACTED
Note: Architecture diagram provided by WaTech during Current State Inventory document review cycles.

Page 330 of 851
Figure 39. State Data Center (SDC) Wide Area Network (WAN) Aggregation Environment
REDACTED
Figure 40. Quincy Data Center (QDC) Wide Area Network (WAN) Aggregation Environment
REDACTED
Note: Architecture diagram provided by WaTech during Current State Inventory document review cycles.

Page 331 of 851
Figure 41. State Data Center (SDC) Edge Environment
REDACTED

Page 332 of 851
Figure 42. Quincy Data Center (QDC) Edge Environment
REDACTED
Note: Architecture diagram provided by WaTech during Current State Inventory document review cycles.

Page 333 of 851
(3466) Cloud and Office VPN
Background
Site-to-Site VPN or IPSEC VPN are terms that can be applied to both Cloud and Office VPN offerings.
The Cloud VPN and Office VPN have recently diverged as two separate offerings under the same cost code with different pricing structures – they came out of the common Office VPN service.
Separately from the Cloud VPN service, WaTech is pursuing a Cloud Highway, or private data center interconnect route to the Westin Internet Colocation Data Center in Seattle. This Cloud Highway is not covered under this cost code.
A. Service Description
Definition
WaTech offers two site-to-site Virtual Private Network (VPN) services: Cloud VPN and Office VPN.
The Office VPN Service provides a secure, cost-effective way to connect employees to their agency’s main network, through a local Internet Service Provider (ISP), such as CenturyLink or Comcast; as long as the agency’s primary network location is on the WaTech managed SGN or IGN networks.
WaTech’s Cloud VPN Service provides a secure way to connect employees to their agency’s applications and other services hosted in a public cloud network using an Internet connection, as long as the agency’s primary network location is on the WaTech managed SGN network.
Features
For both services, the WaTech Network Operations Center (NOC) provides 24x7x365 coverage with proactive monitoring, troubleshooting, and immediate alerting of service outages relating to the VPN service, platform, and associated features, and 24x7x365 customer support through the WaTech Support Center.
Office VPN Features
Branch Office connection option supports remote office(s) of employees and/or network devices.
Site-to-Site connection option provides a WaTech VPN endpoint for a customer or contractual partner owned VPN-capable device to establish a site to site tunnel, creating a secure access solution for users to connect to private network resources located on the WaTech controlled network.
Office VPNs are easy to provision and are highly secure.
WaTech configures and maintains the Office VPN hardware and software platform as well as the software system environment.
Cloud VPN Features

Page 334 of 851
The Cloud VPN platform is scalable to support variable speeds (throughput) and multiple cloud environments such as but not limited to Amazon Web Services (AWS) Commercial and Government and Microsoft Azure Commercial and Government
Cloud VPNs are easy to provision and are highly secure
WaTech configures and maintains the Cloud VPN hardware and software platform as well as the software system environment
Notes
Customer agency’s primary network location must be on the State Government SGN or the IGN for Office VPN, and must be on the SGN for Cloud VPN
Office VPN supports remote office(s) of employees and/or network devices, or provides a WaTech VPN endpoint for a customer or contractual partner owned VPN-capable device to establish a site to site tunnel, creating a secure access solution for users to connect to private network resources located on the WaTech controlled network
Office VPN services are aligned with other services so the Enterprise Data Network project coordinators will be Point of Contact for all moves, add, changes and follow the same process they do for other WAN requests; NetOps will address incidents
Cloud VPN follows the same intake/support process as Office VPN, but supports connection to public Cloud providers like Azure and AWS, so onboard process starts with a Security Design Review in the Office of Cybersecurity
WaTech will use reasonable efforts to assure that production servers will be available 24-hours, 7-days-a-week, excluding coordinated maintenance activities; provide and maintain the VPN hardware and software platform and the software system environment; reasonably manage and maintain the physical environment housing the production servers in accordance with applicable WaTech policies, which may include measures such as:
o Assuring that only WaTech authorized personnel are allowed access to the physical environment using both electronic monitoring and security guards.
o Providing environmental controls and monitoring of Data Center physical environment.
o Maintaining fire detection and suppression systems. o Providing conditioned power.
Provide support through the WaTech Support Center as follows:
o VPN Service Installation will be available 7:00 am – 8:00 pm Monday through Friday.
o VPN Incident Response will be available 24x7 for complete site/service outages relating to only the VPN service, features, and devices.
Customer is required to maintain an account with an Internet Service Provider (ISP). The ISP connection will enable the Customer to connect to the WaTech IPsec Concentrator.
Customer must agree to Terms of Service as a condition of receiving the service. Some Customer responsibilities include responsibility for the physical health of Office VPN Device while on customer premises, and keeping the equipment attached to the Uninterruptible Power Supply.
When a customer submits a ticket for troubleshooting support, the burden is on the customer to complete ISP speed test, using the latest version of iPerf* (currently

Page 335 of 851
iPerf3) with a host workstation at the Branch Office site in question and a server within the customer VRF.
B. Statutory Basis for Creation of Service or Program
WaTech’s delivery of this specific service is not mandated by statute. However, RCW 43.105.385 states that over time state agencies should move toward using WaTech as their central service provider for all utility-based infrastructure services.
C. How the Service Fits into the CTS Strategic Plan and Goals
WaTech reports that this service supports the strategic roadmap to ensure Washington State’s network is managed as a critical asset.
D. Performance Measures used to Measure Effectiveness and Efficiency
As a part of the Terms of Service, WaTech follows the state process for security, change, and problem management. WaTech has defined one service level target.
Availability – service will be available 24 hours a day, 7 days a week but WaTech shall not be liable for any damages resulting from any service interruptions, downtimes, or any other factor beyond WaTech’s control
E. Current Cost to Maintain the Service
Staffing
Staff are dedicated to the delivery of this service; therefore, WaTech directly assigns staff to the service for the purposes of tracking and forecasting costs (shown as the 2.95 FTEs in direct/indirect labor in the diagram below).
In addition, 0.88 percent of total overhead costs are being transferred to this service. If you apply that total cost percentage to the 65 FTE within overhead, it would be about 0.57 overhead FTE.
WaTech’s line staff are responsible for managing, installing, and configuring the equipment. (About 3.5 FTE is completing these activities today).

Page 336 of 851
Figure 43. Office and Cloud VPN Staffing
Note: Staffing numbers and percentage of overhead pulled from “Estimated Overhead FM6 December” and correct by WaTech during document reviews in March. Adjusted due to an estimated increase in VPN staffing by 1.5 FTEs with the corresponding decrease in CC 3461 Vendor Last Mile.
Figure 44. Office and Cloud VPN Services and Support Direct/Indirect Staffing
Note: Staffing details pulled from “Org Chart - Color Coded 01.01.18” and combined with transfer rules in “FY18 Master Indexes 12-19-17” and corrected by WaTech during document reviews in March
Workload Supported
The current supported workload is defined in the table below:
Table 69. Office and Cloud VPN Workload Supported
Description Workload Supported
Total Number of Sites 166 Office and Cloud VPN sites
Note: Workload information was provided by WaTech in April of 2018
Direct, Indirect and Overhead Costs
WaTech’s planned expenses for this fiscal year are provided in the table below.

Page 337 of 851
Table 70. Office and Cloud VPN FY18 Planned Service Expenses
Cost Components FY18 Planned FY19 Planned Cost Details
A Salaries 337,656 337,668 3.5 Planned FTEs
B Benefits 108,336 108,348
E Goods & Services 34,583 100,583 Fortinet/Xilogix Hardware Maintenance
E Internal Purchases 22,922 6,880
Desktop Data Processing
G Travel 5,500 5,500
J Non-capitalized Assets 431 43,000 … (Redacted)… T Transfers 82,300 132,300 Overhead
Total Planned Expenses 591,728 734,280
Note: Cost details were pulled from “IPSec Proposed Rate Impact” excel spend plan provided in April 2018 and updated during inventory review.
WaTech last invested in this service in FY15 and there is still some limited book value remaining on the capitalized assets used to deliver this service.
Table 71. Office and Cloud VPN Equipment Depreciation
Acquisition Cost Accumulated Depreciation Net Book Value
99,884 64,826 35,067
Given near-term planned operating expenses, WaTech will have the following workload costs for this service in FY18:
Table 72. Office and Cloud VPN Cost by Workload
Description Workload Cost Details
Average number of sites supported in FY18 (164 sites plus 140 sites)/ 2 =
152 supported sites
Average number of sites supported in FY19 (188 sites plus 164 sites) / 2 =
176 supported sites
Average cost per site per month in FY18 $324.41 per site per month in FY18
Average cost per site per month in FY19 $347.67 per site per month in FY19
Note: Workload cost in the table above is calculated based on WaTech’s alignment of costs to this service without adjustment for alignment to Gartner consensus models.
F/G. Rate structure CTS is currently billing to customers
The service is provided on a fee for service basis. Cloud VPN and Office VPN are subscription services billed monthly. Billing occurs only in the months when services are provided.
Rates are listed in the table below:

Page 338 of 851
Table 73. Office and Cloud VPN Rates
Description Rate Detail
Office VPN Pricing
Office VPN Site Setup Fee $500 (billed upon service initiation for each new site)
Office VPN Site Monthly Service Fee $285 per site per month
Cloud VPN Tunnel Type Pricing Options
Cloud VPN – Primary Tunnel $1,055 Per Tunnel per month
Cloud VPN – Backup Tunnel $285 Per Tunnel per month
Cloud VPN Site Setup Fee No additional Cost
Cloud VPN ISP Utilization Tiered Pricing Options Aggregated Across All Tunnels
Cloud VPN ISP – 1 Gbps $1,000 Aggregated Across All Agency Tunnels
Cloud VPN ISP – 500 Mbps $500 Aggregated Across All Agency Tunnels
Cloud VPN ISP – 100 Mbps $100 Aggregated Across All Agency Tunnels
Rates were updated 1/1/2018. WaTech went from nine different rates in Office VPN down to one and introduced a new offering, the Cloud VPN.
H. Analysis of Current Cost Recoverability
This service is cost recoverable.
Table 74. Office and Cloud VPN Cost Recoverability (Actual FY16-FY18 H1)
Service Income FY16 FY17 FY18 H1
Service Revenue (3466) 0 203,102 198,235
Service Expense (3466) 0 (246,235) (125,647)
Net Income 0 (43,133) 72,588 Note: Actual revenue and expenses pulled from “AFRS Financial Download (Extracted on 2018-05-15)”. The Site-to-Site VPN used to be included with Remote Access Services. Revenue and Expenses prior to FY17 are included with code 3541 for Remote Access.
Table 75. Office and Cloud VPN Cost Recoverability (Forecasted FY18-FY19)
Service Income FY18 FY19
Service Revenue (3466) 528,000 729,000
Service Expense (3466) (591,728) (734,280)
Net Income (63,728) (5,280) Note: Forecasted Cost recoverability detail pulled from “IPSec proposed rate impact” excel spend plan provided in April 2018. Note: revenue assumes two additional sites per month thru FY19, and a rate increase beginning in January of FY18.
I. Service Level Actually Provided Today
WaTech monitors availability of the VPN Concentrator

Page 339 of 851
Note: Historical VPN Concentrator Availability details provided by WaTech during document review process.
J. Current Customers
WaTech has 35 billable customers. The largest 10 customers account for almost 75% of the amount WaTech billed for this service in FY18.
Additionally, WaTech captures about $5,000 of revenue via internal sales transfers annually. If WaTech were a billable customer, it would be about the ninth largest (as shown below).
Table 76. Office and Cloud VPN Current List of Customers
# Customer FY17 ($) FY17 (%) FY18 H1 ($) FY18 H1 (%)
1
3000-DEPARTMENT OF SOCIAL AND HEALTH SERVICES
21,850 14 31,110 16
2 4650-STATE PARKS AND RECREATION COMMISSION
15,285 10 27,340 14
3 1790-DEPARTMENT OF ENTERPRISE SERVICES
16,645 10 17,200 9
4 0950-OFFICE OF THE STATE AUDITOR
7,920 5 16,495 8
5 1070-STATE HEALTH CARE AUTHORITY
10,520 7 14,040 7
6 3100-DEPARTMENT OF CORRECTIONS
12,730 8 12,300 6
7 3570-DEPARTMENT OF EARLY LEARNING
6,930 4 6,930 3
8 1000-OFFICE OF THE ATTORNEY GENERAL
5,220 3 6,880 3
9 2350-DEPARTMENT OF LABOR AND INDUSTRIES
6,845 4 6,660 3
10 1900-BOARD OF INDUSTRIAL INSURANCE APPEALS
5,010 3 5,010 3
94%
95%
96%
97%
98%
99%
100%
Office/Cloud VPN Concentrator Availablity
200D (QDC) Avail. %
1000D (SDC) Avail. %

Page 340 of 851
# Customer FY17 ($) FY17 (%) FY18 H1 ($) FY18 H1 (%)
Total Top 10 Billable Customers
108,955 69 143,965 72
Total for All Other Billable Customers
46,200 29 50,835 25
Total WaTech Internal Sales 3,645 2 5,120 3
Total Revenue 158,800 100 199,920 100
Note: Customer billing details pulled from “Billing Data - Apptio FFS Only (2018-05-16)” excel file. In FY17 this service was realigned under a new cost code. Prior to FY17 this service was managed as a part of the remote access service offerings.
K. Current and Historical Usage Volumes
The service growth since August 2016 has been 41 percent (from 94 tunnels to the current 160+ supported tunnels). With the current work orders in place, the number of implementations appears to nearly double over the course of 2017-2018. Signed agreements are in place for Parks (100 tunnels) and with additional current customer requests in the queue.
L. Customer Satisfaction and Future Demand
The Customer Voice appendix to this report includes customer satisfaction and future demand details based on the results of agency interviews and focus groups conducted during the project.
M. High Level Architecture
Cloud VPN is same platform as Office VPN, which was recently upgraded to support 10 GB in the SDC specifically for Cloud VPN due to the increased utilization expected.
The diagram below illustrates the network diagram for Office VPN and Cloud VPN from a remote site back to the State Data Center (SDC). Office and Cloud VPN connectivity natively points back to the SDC (where primary network services reside) for the majority of VPN consumers. WaTech currently has 2x (two) VPN Concentrators active and deployed in the SDC.

Page 341 of 851
Figure 45. Office and Cloud VPN Conceptual Architecture (remote site connectivity natively points back to the SDC)
REDACTED
Note: Architecture diagram provided by WaTech during Current State Inventory document review cycles
The diagram below illustrates the network diagram for Office VPN and Cloud VPN from a remote site back to the Quincy Data Center (QDC). A small number of customers leverage WaTech VPN Concentrator as their primary VPN connection in lieu of the SDC for their remote connectivity needs.

Page 342 of 851
Figure 46. Cloud and Office VPN Conceptual Architecture (primary connection to QDC in lieu of SDC)
REDACTED
Note: Architecture diagram provided by WaTech during Current State Inventory document review cycles
The diagram below illustrates the network diagram for Office VPN and Cloud VPN used in a Business Continuity (BC) scenario. WaTech has a handful of customers that leverage WaTech’s VPN Concentrator located in the SDC as their primary connection into the SGN and in the event that the SDC is not reachable, customer connectivity swings over to the QDC to maintain network connectivity. This connectivity swing is a manual process requiring manual intervention in order to restore routes.

Page 343 of 851
Figure 47. Cloud and Office VPN Conceptual Architecture (Business Continuity with Manual Intervention)
REDACTED
Note: Architecture diagram provided by WaTech during Current State Inventory document review cycles

Page 344 of 851
3. Access and Security Services
(3541) Remote Access Services
Background
Remote Access (3541) currently includes two different individual user-oriented, internet-based remote access services, Virtual Private Network (VPN) remote access and Citrix Edge host-based remote access.
In addition, the Remote Access cost code also includes a token-based authentication service that excludes the remote access portion of the service (i.e., customers may purchase tokens for use with their own systems without the additional purchase of a VPN or Citrix account, and customers of the VPN and Citrix services may opt to purchase additional tokens without purchases additional VPN and Citrix accounts).
The WaTech online service catalog entries for Citrix Edge, for Virtual Private Network, and for Strong Authentication (which describes WaTech’s token-based authentication service for RSA SecurID tokens as a stand-alone service)
It is worth noting that, the Citrix Edge offering which has a planned sunset date of June 2018, has low usage making up just 2% of the revenue and 3% of the user base for remote access services. There are four remaining customer agencies: ATG, DNR, LOT, and DES.
Note of clarification: WaTech also provides an IPSec-based site-to-site VPN service. When cost code 3541 was part of program 060 (Security/OCS), it included SSL VPN as well as the site-to-site VPN service. However, the VPN services were broken out of program 060 (in the middle of FY 17), the site-to-site VPN service was put into program 030 with a new cost center (3466) and SSL VPN services were put into program 040. Program 040 chose to retain the cost center 3541 rather than setting up a new cost center. The IPSec-based site-to-site VPN service (now called Office and Cloud VPN services) are managed by the Network Services Division and provided via Fortinet hardware. The Office and Cloud VPN services are discussed in the Network section of the service inventory
A. Service Description
Definition
Remote access services enable authorized end users to access resources on the State Government Network (SGN) from an external location via the public Internet. Currently WaTech provides two remote services offerings, Citrix Edge and SSL VPN. The Citrix solution allows a customer to establish a remote session with a Citrix host which itself is located on the SGN. The only traffic that goes back and forth over this type of connection is key strokes, screen images and print output which is transmitted via Citrix’s ICA protocol and encrypted through TLS. The SSL VPN establishes a secure tunnel over the public Internet between the users’ computing device and a VPN gateway located in the PGN at the SDC or QDC. The VPN gateway completes the connection by establishing an IP connection between itself and the host compute device located somewhere on the SGN.
The Citrix Edge service provides secure remote access from any web browser on any device via the Internet, without a requirement for pre-installed client software. The service provides agency administrators with a single point of control to manage user access and actions,

Page 345 of 851
based on both the endpoint device and the user’s profile (e.g., an administrator may set up different access rights for a recognized versus an unrecognized device). User credentials are validated through a multi-factor authentication process. The end-user experiences the feeling of a local network connection. WaTech Citrix Edge Service is available to customer agencies using the Citrix Presentation Server or Xen Server environments.
The SSL VPN service provides secure remote access from any computer, from any web browser via the Internet (though a wider set of options for authentication are provided for State-owned and active-directory connected computers). The remote computer’s web browser establishes a Secure Sockets Layer (SSL) VPN connection to the agency’s network. User authentication is provided by RSA SecurID® tokens, or certificates, which provide a way to positively identify users with a two-part authentication process. The authentication process uses one item that users know – a PIN – and one item that users have – a token to provide a one-time password. Authentication is available via RSA SecurID Token or AD Certificate for State-owned computers, while other computers are limited to authentication via an RSA SecurID Token.
Agencies may use the soft tokens provided as a part of the remote access services for two-factor authentication for a variety of applications or resources, such as: web applications, wireless access points, routers and switches, etc. Customers with RSA tokens may choose to purchase a second token for use with their account remote access account. Certificates are permitted on state-owned, active directory-connected computers.
In addition to these two remote access services, customers may purchase the tokens only (without purchasing remote access services) via the “Strong Authentication” service – for use with some of their own systems, or WaTech’s SAM (Secure Access Manager) system. For these systems, WaTech does not provide any remote access service, just RSA SecurID two-factor authentication.
Features
Citrix Edge Features:
Includes RSA SecureID features
Enables remote users to access resources on the State Government Network from any computer, including state-issued laptops, desktops and tablets
SSL VPN Features:
Enables remote users to access resources on the State Government Network from any computer, including state-issued laptops, desktops and tablets
RSA SecureID Features:
The token generates a unique pattern of digits which change every minute to generate the one-time password. The certificate is a digitally signed document that sits on the user’s device and requires a password to activate.
Tokens are available to customers either as a physical hardware device that can be carried on a keychain or lanyard, or as a software application that can be installed on a supported mobile workstation or Smartphone
Customers may elect to purchase the token only, without purchasing any associated remote access services
Notes
Disaster recovery is not yet available for SSL VPN, but it is under development

Page 346 of 851
B. Statutory Basis for Creation of Service or Program
There is no statutory mandate for WaTech to deliver this service. While Cybersecurity Policy 141.10 includes minimum requirements for remote access; it does not mandate the use of WaTech managed SSL VPN or Citrix Edge host-based remote access services.
C. How the Service Fits into the CTS Strategic Plan and Goals
WaTech reports that this service supports the strategic roadmap to expand employee mobility.
D. Performance Measures used to Measure Effectiveness and Efficiency
WaTech does not have any service level targets for this service beyond the standard incident response targets, i.e., there are no targets associated with service availability, incident resolution, customer onboarding, etc.
E. Current Cost to Maintain the Service
Staffing
Several resources are fully dedicated to delivering this service. Additional resources support part time; therefore, WaTech uses transfer rules to assign staff to the service for the purposes of tracking and forecasting costs (shown as the 5.92 FTEs in direct/indirect labor in the diagram below). These transfer rules were developed by estimating actual staff time spent on activities related to the service.
None of these staff are dedicated to delivery of Citrix Edge. The last Citrix SME left CTS in May 2014.
In addition, 1.5 percent of total overhead costs are being transferred to this service. If you apply that total cost percentage to the 65 FTE within overhead, it would be about 0.98 overhead FTE.
Figure 48. Remote Access Service Staffing
Note: Staffing numbers pulled from “Estimated Overhead FM6 December”. Remote Access services are being transitioned to the WaTech CISO as the new Service Owner, given that this organizational change is currently in progress, the new Service Owner was unable to validate this information.

Page 347 of 851
Figure 49. Remote Access Services Direct/Indirect Staffing
Note: Staffing details pulled from “Org Chart - Color Coded 01.01.18” and combined with transfer rules in “FY18 Master Indexes 12-19-17”. Remote Access services are being transitioned to the WaTech CISO as the new Service Owner, given that this organizational change is currently in progress, the new Service Owner was unable to validate this information.
Workload Supported
The current supported workload is defined in the table below:
Table 77. Remote Access Workload Supported
Type of Workload Current Workload Supported
VPN KEY FOB (and auth only) 3,783 key fobs in use for all purposes, including VPN accounts
VPN SOFT/CERT SVC 2,829 VPN accounts using soft tokens and certificates (excluding hardware token VPN accounts which are included above)
SOFTWARE TOKEN AUTHENTICATION
9,134 software tokens in use for all purposes
CERTIFICATE ONLY AUTHENTICATION
3,634 certificates in use for all purposes
CITRIX SOFT/CERT SVC 589 citrix accounts
Note: Workload estimated based on billing data which also aligned to data provided by WaTech technical staff who indicated that there are currently about 9,000 software tokens in use for all purposes and 3,000 hard token key fobs assigned out for all uses (VPN, Citrix, and authentication only).

Page 348 of 851
Direct, Indirect and Overhead Costs
WaTech’s planned expenses for this biennium are provided in the table below.
Table 78. Remote Access FY18 Planned Service Expenses
Cost Components
FY18 Planned FY19 Planned Cost Details
A Salaries 374,269 362,526 5.18 Planned FTEs (FY18) and 4.86 FTEs (FY19)
B Benefits 139,668 147,582
E Goods & Services 175,115 182,036 Cisco, RSA and HP maintenance
E Internal Purchases 65,424 65,424 Desktop and Server Hosting
G Travel 4,144 3,888
J Non-capitalized Assets 200,000 200,000 Key fobs
P Debt - Interest & Other Payments 1,204 0 Interest payments for F5 servers
P Debt - Principal Payments 24,080 0 Principal payments for F5 servers
T Transfers 210,853 212,706 Overhead
Total Planned Expenses 1,194,757 1,174,162
Note: Cost details were pulled from “3541 SP” excel spend plan provided in February 2018. Customer usage of hard token/key fobs is not decreasing as quickly as WaTech originally anticipated, and WaTech therefore forecasted budget for hard tokens in FY19. However, WaTech is evaluating discontinuing purchase of hard tokens on behalf of customers.
WaTech made large capital investments in December of 2015 in the F5 servers as a replacement for the Juniper SSL VPN, at around the same time, WaTech decommissioned the Cisco IPSec VPN service offering for users (but not for the IPSec site-to-site service which is still maintained) and migrated all of those users directly to the F5. These assets will continue to depreciate through the upcoming biennium. However, the Citrix Netscaler solution is fully depreciated, and WaTech plans to retire the service rather than make an additional investment.
Table 79. Remote Access Equipment Depreciation
Acquisition Cost Accumulated Depreciation Net Book Value
349,556 254,062 95,494
Given near-term planned operating expenses, WaTech will have the following workload costs for this service in FY18:
Table 80. Remote Access Cost by Workload
Description Workload Cost Details
Estimate of Accounts Roughly 30,000 user accounts for all remote access services (average for FY18)

Page 349 of 851
Description Workload Cost Details
FY18 operating budget (including all accounts) 1,194,757
Rough estimate of cost per user account $3.32 per user per month
Note: Workload cost in the table above is calculated based on WaTech’s alignment of costs to this service without adjustment for alignment to Gartner consensus models.
F/G. Rate structure CTS is currently billing to customers
The service is provided on a fee for service basis; rates are listed in the table below:
Table 81. Remote Access Rates
Description Rate Detail
VPN One-Time Set-Up Fee $180 one-time
VPN Account with Hard Token Key Fob $17.45 per month per account
VPN Account with Soft Token $9.00 per month per account
VPN Account with Certificate $6.00 per month per account
Authentication Only – Hard Token Key Fob $17.45 per month per token
Authentication Only – Soft Token $3.00 per month per token
Authentication Only – Certificate $6.00 per month per certificate
Citrix Account with Hard Token Key Fob $17.45 per month per account
Citrix Account with Soft Token $9.00 per month per account
Citrix Account with Certificate $6.00 per month per account
Note: Citrix accounts are slated for retirement, and WaTech is also evaluating discontinuance of the hard token key fob option.
Rates for hardware token was last updated in 2007, all other SSL VPN rates were updated in 2012.
H. Analysis of Current Cost Recoverability
This service is profitable given WaTech’s planned expense and revenue projections.
Table 82. Remote Access Cost Recoverability (Actual FY16-FY18)
Service Income FY16 FY17 FY18 H1
Service Revenue (3541) 1,962,444 1,924,281 1,001,919
Service Expenses (3541) (1,843,751) (970,467) (537,940)
Net Income 118,693 953,814 463,979
Note: Cost recoverability detail pulled from “AFRS Financial Download (Extracted on 2018-05-15)”. The historical fiscal data for this service is not fully accurate due to the split of OCS from the WaTech Service Provider organization. When 3541 was part of program 060 (Security/OCS), it included SSL VPN as well as the site-to-site VPN service. When VPN services were broken out of program 060 (in the middle of FY 17), the site-to-site VPN service was put into program 030 with a new cost center (3466) and SSL VPN services were put into program 040. Program 040 chose to retain the cost center 3541 rather than setting up a new cost center, which is why there are two sets of line items for cc3541 (one in program 060 and one in program 040).

Page 350 of 851
Table 83. Remote Access Cost Recoverability (Forecasted FY18-FY19)
Service Income FY18 FY19
Service Revenue (3541) 1,612,548 2,059,548
Service Expenses (3541) (1,194,757) (1,174,162)
Net Income 417,791 885,386
Note: Forecasted Cost recoverability detail pulled from “3541 SP” excel spend plan provided in February 2018. The revenue estimates assume that accounts will grow by over 5,000 during the biennium.
I. Service Level Actually Provided Today
No historical service delivery performance data has been provided for this inventory report.
J. Current Customers
WaTech has over 100 customers. The largest 10 customers account for over three quarters of the amount WaTech billed for this service in FY18.
Additionally, WaTech captures about $70,000 of revenue annually for via internal sales transfers. If WaTech were a billable customer it would be about the tenth largest (as shown below).
Table 84. Remote Access Current List of Customers
# Customer FY17 ($) FY17 (%) FY18 H1 ($) FY18 H1 (%)
1 DEPARTMENT OF SOCIAL AND HEALTH SERVICES
423,042 23 227,292 24
2 DEPARTMENT OF LABOR AND INDUSTRIES
257,993 14 106,949 11
3 DEPARTMENT OF CORRECTIONS
96,674 5 63,447 7
4 DEPARTMENT OF HEALTH 137,804 7 57,283 6
5 OFFICE OF THE ATTORNEY GENERAL
85,176 5 53,452 6
6 DEPARTMENT OF REVENUE 95,435 5 51,444 5
7 DEPARTMENT OF FISH AND WILDLIFE
39,497 2 43,122 4
8 EMPLOYMENT SECURITY DEPARTMENT
93,522 5 42,910 4
9 DEPARTMENT OF NATURAL RESOURCES
104,103 6 40,465 4
10 DEPARTMENT OF ECOLOGY 46,384 3 38,593 4
Total Top 10 Billable Customers
1,379,628 74 724,957 75
Total for All Other Billable Customers
475,452 22 240,684 21
Total WaTech Internal Sales 69,201 4 36,278 4
Total Revenue 1,924,281 100 1,001,919 100
Note: Customer billing details pulled from “Billing Data – Apptio FFS Only 2018-05-16)”

Page 351 of 851
K. Current and Historical Usage Volumes
Customer usage is trending up for soft tokens and trending down for hard tokens.
Table 85. Historical SSL VPN Customer Usage
Note: The historical customer usage figure was pulled from the Quarterly Performance Dashboard report
Based on data available in Apptio, the Citrix host-based remote access makes up only 2% of the revenue for remote access services. Certificate-based and software token-based VPN services make up the largest share of revenue, and they are both growing.
Table 86. Remote Access Customer Usage
Service Offering FY17 ($) FY17 (%) FY18 H1 ($) FY18 H1 (%)
VPN KEY FOB 1,001,645 52 396,045 40
CERTIFICATE-ONLY AUTHENTICATION 275,460 14 328,824 33
SOFTWARE TOKEN AUTHENTICATION 309,954 16 154,029 15
VPN SOFT/CERT SVC 150,714 8 101,829 10
CITRIX SOFT/CERT SVC 40,248 2 21,192 2
ENTERPRISE IPSEC VPN SERVICE 146,260 8 0 0
Total Revenue 1,924,281 100 1,001,919 100
Note: Data pulled from “Apptio-FFS Only (2018-05-16). FY17 data includes part of the revenue associated with IPSEC VPN service that is no longer included under this cost code.
L. Customer Satisfaction and Future Demand
The Customer Voice appendix to this report includes customer satisfaction and future demand details based on the results of agency interviews and focus groups conducted during the project.
M. High Level Architecture
The SSL VPN service is offered via an F5 SSL VPN Gateway. There are servers in both SDC and QDC with the same generation hardware, but they were not fully configured due to a lack of resources. This is a significant flaw in the State’s current DR capabilities as remote access is one of the most important services to have available in the event of a disaster as it

Page 352 of 851
enables State employees to access resources and do their jobs from remote locations or from their homes, when directed. These servers are in the process of being refreshed, and once the upgrade is completed WaTech will be able to make DR available.
RSA tokens are used for one time password (OTP) generation; tokens may be either physical or virtual. There is an RSA SecureID server in QDC.
For certificate-based authentication, remote users from only a select few agencies (DSHS, LNI, eClient, possibly a few others) will have access via QDC if SDC is lost. WaTech reports that significant configuration would be required to enable DR for other agencies.
The Citrix solution works as follows: the user leverages a browser (or Citrix receiver client) to establish a connection to the Citrix NetScaler via HTTPS, the user is authenticated via RSA SecurID, and a connection from the NetScaler to the Citrix Virtual Delivery Agent (VDA) application delivery controller is established via ICA (Citrix proprietary protocol). Communication from the browser is encrypted from the user’s PC to NetScaler, then decrypted/re-encrypted for connection from NetScaler to Citrix VDA.
The Netscaler server is only located in SDC. There is no Netscaler in in QDC.

Page 353 of 851
(3540) Security Gateway Services and (4671 / Formerly 3540) Security Gateway Support
Background
Security Gateway Service was recently subdivided into two codes, both of these codes are included in this section (cost codes 3540 and 4671) of the current service inventory
Security Gateway Services includes several secure web gateway-based services that are provided through two different technical solutions, the F5 Server and customized IBM technologies that were used to build SecureAccess Washington/SEAP
Security Gateway Services includes the full cost of maintaining an on-premise Certificate Authority, though it is also leveraged by Desktop Support services and Certificate Only Authentication Fee for Service under Remote Access Services
The WaTech online service catalog entries associated with this section include:
o Secure Certificates (formerly Internal Certificate Authority) o SecureAccess Washington(SAW)/SAW Enabled Agency Portal (SEAP)
(Reverse Proxy provided via the customized IBM solution) o Fortress Anonymous (Reverse proxy services without authentication in the
process of migrating to the F5 Server o Web Services Gateway (Reverse proxy services available with and without
authentication, provided via the F5 Server) o Secure Web Proxy, formerly the Enterprise Forward Proxy (Forward Proxy in
the process of migrating to the F5 Server) o Application Security Management (Web Application Firewall services
provided via the F5 Server)
A. Service Description
Secure Certificates, formerly Internal Certificate Authority, Definition:
(Certificate Authority Service used by SecureAccess Washington and other services)
Secure Certificates is a WaTech hosted and managed Public Key Infrastructure (PKI) Certificate Authority that enables end point authentication and inter-server data encryption via SSL/TLS.
Secure Certificates address the whole digital certificate lifecycle. Secure Certificates provide a website for certificate requests, verification, approval, and download. Additionally Secure Certificates provide a Certificate Revocation List (CRL) and Online Certificate Status Protocol (OCSP) which allows systems to validate that a certificate has not been revoked and email notification for timely renewal of certificates.
Certificates issued to State Agencies are used for encryption, authentication, and identification of servers and/or client via SSL and TLS. Some agencies use Secure Certificates to provide protection of sensitive data and high value resources.
Secure Certificates Features:
Certificate Revocation List (CRL) and Online Certificate Status Protocol (OCSP) which allows systems to validate the certificate status.
Real-time manual processing of customer requests for approval and installation of certificates.

Page 354 of 851
A redundant, highly available production environment to support automated certificate requests & issuance.
Includes customer test and production environments.
Certificate Authority Notes:
Secure Certificates was created as part of the decision package for the Integration Competency Center (though WaTech subject matter experts were uncertain whether the center still exists)
WaTech-managed secure certificates are not intended for personal identification such as non-repudiation, digital signature, or smart cards (cards that you carry with a digital certificate and use to authenticate by the card into the system).
Secure Access Washington (SAW) /SAW Enabled Agency Portal (SEAP) Definition:
(Reverse Proxy with authentication, provided via the customized IBM solution)
SecureAccess Washington® provides authorized end-users located outside the state’s network with secure access to public data hosted on the government network, with self-administered single sign-on access to multiple agency applications. Access is limited to known users.
Some agencies use SecureAccess Washington® to provide selective access to their online documents or services. Examples of these documents and services include Master Business Licenses, Vehicle Tab Renewals and Employment Security Job Search Resources.
Agencies may optionally develop a customized the front-end, SEAP, in order to include agency-specific look and feel.
SAW/SEAP Features:
To use a service or application protected by SecureAccess Washington®, users must provide a user ID and password – as an authentication mechanism
The service may also be configured to require Identity Verification and Multi-Factor Authentication
Agency customers get to implement specific predefined policies (High Security or Standard Security application)
SAW/SEAP Notes:
The agency owner of the service is responsible for allowing or denying access and for verifying individuals' identities.
Agencies with SEAP solution are responsible for the technical development work and standing up a tier 1 help desk for end user support.
LexisNexis per user SaaS for Identity Verification.
Risk-based authentication also provided (continuous evaluation of multiple attributes, cookies, browser, session details, and if risk identified, a request for authentication is sent during the session – email, SMS or phone call challenge
There is currently a major UI development effort in progress that is slated to go live in June of 2018
Fortress Anonymous Definition:
(Reverse Proxy services without authentication, in the process of migrating to the F5 Server)
Fortress Anonymous (reverse proxy service) provides end-users located outside the state’s network with secure access to public data hosted on the government network, when the integrity and availability of the data must be protected from targeted attack, and user

Page 355 of 851
authentication is not required. The reverse proxy service protects the state’s assets behind the secured gateway by masking the IP addresses. The reverse proxy also provides encryption between the service and the end user accessing the information.
The reverse proxy protects the source identity for many public services, including: the Unemployment Claims Application, the Division of Child Support New Hire Reporting program, and the Vehicle Tab renewal service.
Fortress Anonymous Reverse Proxy Features:
Agencies retain self-administration rights to their applications and maintain control
Development, customer-test and production environments are available, as well as a separate production environment to support automated registration and setup for public applications
Real-time translation of application URLs avoiding outsider recoding of applications to work with the Web Services Gateway
Real-time online customer registration and maintenance of anonymous applications
A redundant, actively load balanced production environment to support automated registration and setup for public facing applications.
Support from 8AM to 5PM, Monday through Friday, provided for customer test environment, and production environment includes 24 x 7 on call technical support for incident resolution
Web Services Gateway Definition:
(Reverse proxy services available with and without authentication, provided via the F5 Server)
The Web Services Gateway (WSG) enables agencies to make their State Government Network (SGN)/Intergovernmental Network (IGN) web services available to the Internet in a secure and reliable manner. The WSG supports a variety of WS standards, including but not limited to: WS-Addressing, WS-ReliableMessaging, WS-Policy, WS-Security, and WS-SecureConversation.
Web Services Gateway Features:
A redundant, actively load balanced production environment to support automated registration and setup for public facing applications.
Includes development, system test, production, and customer test environments.
The production system has a 24x7 availability target and the test system has an 8AM to 5PM availability target, Monday through Friday
Functionality includes two types of managed authentication at the edge (Mutual SSL authentication and SAW integration for web services), service level monitoring, treat mitigation, fine grained access control, support for industry web services (WS) standards
Secure Web Proxy, formerly Enterprise Forward Proxy Definition:
(Forward Proxy provided via the F5 Server)
The Secure Web Proxy service is an outbound Internet traffic proxy which provides content analysis and filtering. The service is available to agencies connected to the State Government Network. This service provides high-availability in Olympia with future plans to support business continuity in Eastern Washington. The service supports delegated partitions and administration which provides agencies the ability to control their own agency level configurations.

Page 356 of 851
All user initiated web requests are enforced by an agency defined Internet use policy
Outbound traffic is scanned for key web protocols—including HTTP, HTTPS, and FTP
Masks individual client IPs, proxy requested web pages and provides protection against malware
Provides a highly available production and customer-test environment for content caching, filtering, and interception (but without a disaster recovery solution)
Production environment includes 24 x 7 on call technical support for incident resolution
Application Security Management Definition:
(Web Application Firewall services provided via the F5 Server)
Web Application Firewall services blocks malicious attacks before they reach Web applications and is compatible with major Web technologies and platforms. There are two options for the ASM service:
Managed ASM: This solution is fully managed by WaTech to include policy building and configuration. A base ruleset is applied that is designed to protect Web application resources against commonly known attack vectors.
Delegated ASM: This solution is for partner agencies that desire a customizable solution and the technical capability to administer the policy and configuration settings.
Application Security Management Features:
Establish network security to protect critical assets
Built-in reporting capability
Delegated or managed administration
Infrastructure fully managed by WaTech
Service complies with ISB standards
Service protection and monitoring 24x7
B. Statutory Basis for Creation of Service or Program
The Office of the CIO is empowered to make policy and the use of SecureAccess Washington is mandated by OCIO policy 141.10 for certain use cases.
C. How the Service Fits into the CTS Strategic Plan and Goals
WaTech reports that these services support the strategic roadmap to expand security and identity management services.
D. Performance Measures used to Measure Effectiveness and Efficiency
SAW/SEAP provides limited agency-specific reports. Outages are tracked with service alerts and notifications on the support.watech.wa.gov page. Agency customers can pull these details at-will. Agency-specific preconfigured reports are available within SAW for agency administrators to run as needed. Some agencies have requested additional one-off/scheduled reports which are handled as request tickets on a case by case basis.
WaTech does not have any service level targets for the other proxy services.

Page 357 of 851
E. Current Cost to Maintain the Service
Staffing
Several resources are fully dedicated to delivering this service. Additional resources support part time; therefore, WaTech uses transfer rules to assign staff to the service for the purposes of tracking and forecasting costs (shown as the 16.77 FTEs in direct/indirect labor in the diagram below). These transfer rules were developed by estimating actual staff time spent on activities related to the service.
A dedicated team of 7 support SAW/SEAP and a dedicated team of 2 support the F5 services. Additional personnel support part-time.
In addition, 4.26 percent of total overhead costs are being transferred to this service. If you apply that total cost percentage to the 65 FTE within overhead, it would be about 2.77 overhead FTE.
Figure 50. Security Gateway Services and Support Staffing
Note: Staffing numbers pulled from “Estimated Overhead FM6 December”

Page 358 of 851
Figure 51. Security Gateway Services and Support Direct/Indirect Staffing
Note: Staffing details pulled from “Org Chart - Color Coded 01.01.18” and combined with transfer rules in “FY18 Master Indexes 12-19-17”. The F5 services are transferring to a new Service Owner; adjustments to staffing have not been finalized.
Workload Supported
The current supported workload is defined in the table below:
Table 87. Security Gateway Services (F5 Server Services) Workload Supported
Description Current Workload Supported
Number of applications available via the F5 Reverse Proxy
230 active (5-600 applications in total but most have availability limited by business cycle need)
Note: Workload provided during interviews
Table 88. Security Gateway Services (SAW/SEAP) Workload Supported
Description Current Workload Supported
SAW Users 5.2 million
LexisNexis Users 9 customer agencies (number of users not provided)
SEAP instances 8 instances
Number of applications available via the SAW portal
260 applications
Note: Workload details provided during interviews and inventory review.

Page 359 of 851
Direct, Indirect and Overhead Costs
Planned expenses for the both Security Gateway Service and Security Gateway Support are provided in the two tables below. A new cost code was added in FY17 in order to split the costs for F5-related proxy services apart from SAW-related costs.
WaTech’s planned expenses for the Security Gateway Services (3540) for this fiscal year is provided in the first table below.
Table 89. Security Gateway Services (3540) FY18 Planned Service Expenses (cost related to SAW/SEAP and Secure Certificates)
Cost Components FY18 Planned FY19 Planned Cost Details
A Salaries 1,177,083 1,146,120 17.63 Planned FTEs
B Benefits 428,604 507,058
E Goods & Services 1,258,949 1,070,209
Maintenance/subscription: Thales PCI ($27k), RSA ($275k), IBM passport ($342k), LexisNexis KBA ($264K; Professional services: ISAM ($230k)
E Internal Purchases 327,062 304,872
Desktop, Server Hosting, Shared Web Hosting, Private Cloud, Colocation, Project Manager
T Transfers 717,633
723,939 Agency overhead
Total Planned Expenses
3,909,331 3,752,198
Note: Cost details pulled from “3540 SP” and “4671 SP” excel spend plan provided in February 2018. Note that all costs associated with managing certificate-based authentication is covered under the security gateway allocation, though part of the usage is generated from other services, like remote access.
WaTech’s planned expenses the Security Gateway Support (4671) for this fiscal year are provided in the table below.
Table 90. Security Gateway Support (4671) FY18 Planned Service Expenses (costs related to F5 proxy services)
Cost Components
FY18 Planned FY19 Planned Cost Details
A Salaries 170,184 141,480 1.72 Planned FTEs
B Benefits 56,196 47,340
E Goods & Services 735,644 770,180
Splunk support, Linux/Red Hat operating system support, McAfee Web Gateway (to be eliminated in FY19)
E Internal Purchases 528 528
Desktop
J Non-capitalized Assets 20,296 0
Splunk hard drives
P Debt - Interest &
15,916 6,600 Recent investment in ISAM, servers, F5

Page 360 of 851
Cost Components
FY18 Planned FY19 Planned Cost Details
Other Payments
P Debt - Principal Payments 230,305 110,000
Recent investment in ISAM, servers, F5
T Transfers 70,013 70,628 Overhead
Total Planned Expenses
1,299,082 1,146,756
Note: Cost details pulled from “3540 SP” and “4671 SP” excel spend plan provided in February 2018. The F5 costs included in this forecasted spend are related to Web Proxy, Fortress Anonymous, and ASM. The F5-related cost associated with Email and SSL VPN services, which also use the F5 are included under those separate cost codes.
WaTech made major investments in this service in 2016 and 2017.
Table 91. Security Gateway Services Equipment Depreciation
Acquisition Cost Accumulated Depreciation Net Book Value
1,952,100 1,103,164 848,936
Given near-term planned operating expenses, WaTech will have the following workload costs for this service in FY18:
Table 92. Security Gateway Services Cost by Workload
Description Workload Cost Details
SAW Users 5.2 Million
Planned SAW expenses in FY18 3,909,331
Approximate cost per SAW user 0.75 per user per year
Note: Workload cost in the table above is calculated based on WaTech’s alignment of costs to this service without adjustment for alignment to Gartner consensus models.
F/G. Rate structure CTS is currently billing to customers
The service is funded via an allocation. Allocation funding is based on the agency's number of budgeted FTEs and number of applications each agency has using the gateway. OFM maintains the source data for budgeted FTEs and WaTech tracks the number of applications. Additionally, agencies with 50+ FTEs pay a yearly base fee of $1500. The allocation amount was updated in FY17 to account for increased workload.
Customers who are not part of the allocation may elect to purchase this service on a fee for service basis. Rates are defined in the table below:

Page 361 of 851
Table 93. Security Gateway Services Fee for Service Rates
Description Rate
SecureAccess Washington for partner agencies not included in the monthly Security Gateway allocation with more than 50 FTEs
$1,500 monthly base fee plus a per FTE monthly fee and a per application fee
Note that the per FTE amount changes each biennium (pending the adjustment to the Central Service Model). Based on the 2018 supplemental budget, the per FTE fee is about $3.25 per month.
SecureAccess Washington for partner agencies not included in the monthly Security Gateway allocation with less than 50 FTEs
$500 monthly base fee and a per application fee
One-time set up fee Five (5) percent of the monthly fee
Note: rates for monthly per FTE fees and application fees are driven by the central service billing model
H. Analysis of Current Cost Recoverability
This service is not cost recoverable.
Table 94. Security Gateway Services Cost Recoverability (Actual FY16-FY18 H1)
Service Income FY16 FY17 FY18 H1
Service Revenue (3540) 4,020,402 4,332,444 1,839,054
Service Revenue (4671) 0 783,647 665,554
Service Expenses (3540) (6,378,094) (3,905,761) (1,860,809)
Service Expenses (4671) 0 (559,486) (726,379)
Net Income (2,357,692) 650,844 (82,580)
Note: Cost recoverability detail pulled from “AFRS Financial Download (Fiscal Years 2016 – Current)”. An adjustment has been made to apply 30% of the FY17 expenses and 51% of the FY17 revenue for cost code 4671 to the Infrastructure Security Services (DNS, VA, and SIEM), with 70% of expenses and 49% of revenue applied here to Security Services. This adjustment was made due to WaTech’s historical changes cost codes (historically Certificate Authority was funded via the Security Infrastructure Allocation but it is now funded through the Security Gateway allocation).
Table 95. Security Gateway Services Cost Recoverability (Forecasted FY18-FY19)
Service Income FY18 FY19
Service Revenue (3540) 3,793,313 3,870,870
Service Revenue (4671) 1,264,436 1,171,448
Service Expenses (3540) (3,909,331) (3,752,198)
Service Expenses (4671) (1,299,082) (1,146,756)
Net Income (150,664) 143,364
Note: Forecasted Cost recoverability detail pulled from “3540 SP” and “4671 SP” excel spend plan provided in February 2018. Revenue increased between FY17 and FY18 due to increased users as well as for approved capital expenditures for major infrastructure upgrades (ISam 9 upgrade, new F5s). SAW has grown from 3 million users in FY16 to 5.2 million in FY17.

Page 362 of 851
I. Service Level Actually Provided Today
SAW/SEAP has reported several performance challenges.
Agency administrators lack sufficient management tools
On-screen directions/help menus are limited, and users have frequent technical issues leading to high service desk call volumes (about 4,000 support center tickets per month)
Users report being confused about the appropriate party to contact for support
Upgrades are implemented quickly with insufficient testing before rollout
Changes to the system impacts a large number of users which adds complexity for end-to-end testing
There are frequent service interruptions related to multi-factor authentication-related planned maintenance
Limited compatibility with mobile devices
WaTech did not provide any details on service performance for the other proxy services provided as a part of the Web Services Gateway allocation.
J. Current Customers
WaTech bills over 90 agencies for the allocation, there are also 9 counties that pay fee for service for the security gateway services. The largest 10 customers account for over half of the amount WaTech billed for this service in FY18.
Additionally, WaTech captures a small amount of revenue via internal sales transfers. However, this is only minimal at less than $20,000 in FY17.
Table 96. Security Gateway Services Current List of Customers
# Customer FY17 ($) FY17 (%) FY18 H1 ($) FY18 H1 (%)
1 DEPARTMENT OF SOCIAL AND HEALTH SERVICES
680,563
14
353,903 15
2 DEPARTMENT OF ECOLOGY
323,002
7
163,842 7
3 DEPARTMENT OF CORRECTIONS
277,532
6
141,947 6
4 DEPARTMENT OF TRANSPORTATION
244,762
5
115,683 5
5 DEPARTMENT OF LABOR AND INDUSTRIES
217,355
4
105,326 4
6 EMPLOYMENT SECURITY DEPARTMENT
207,063
4
101,830 4
7 DEPARTMENT OF HEALTH
204,546
4
102,921 4
8 ENTERPRISE SERVICES DEPARTMENT OF
165,243
3
89,527 4
9 DEPARTMENT OF NATURAL RESOURCES
171,146
3
82,496 3
10 DEPARTMENT OF FISH AND WILDLIFE
142,794
3
71,525 3
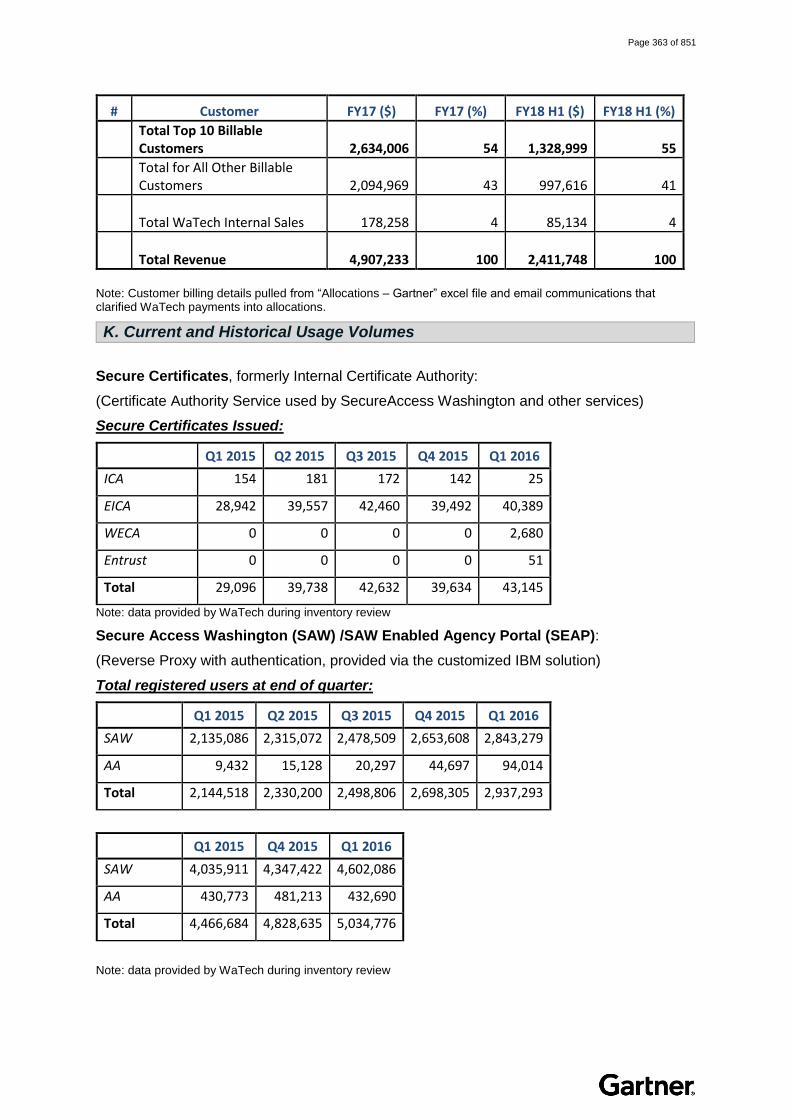
Page 363 of 851
# Customer FY17 ($) FY17 (%) FY18 H1 ($) FY18 H1 (%)
Total Top 10 Billable Customers
2,634,006
54
1,328,999 55
Total for All Other Billable Customers
2,094,969
43
997,616 41
Total WaTech Internal Sales
178,258
4
85,134 4
Total Revenue
4,907,233
100
2,411,748 100
Note: Customer billing details pulled from “Allocations – Gartner” excel file and email communications that clarified WaTech payments into allocations.
K. Current and Historical Usage Volumes
Secure Certificates, formerly Internal Certificate Authority:
(Certificate Authority Service used by SecureAccess Washington and other services)
Secure Certificates Issued:
Q1 2015 Q2 2015 Q3 2015 Q4 2015 Q1 2016
ICA 154 181 172 142 25
EICA 28,942 39,557 42,460 39,492 40,389
WECA 0 0 0 0 2,680
Entrust 0 0 0 0 51
Total 29,096 39,738 42,632 39,634 43,145
Note: data provided by WaTech during inventory review
Secure Access Washington (SAW) /SAW Enabled Agency Portal (SEAP):
(Reverse Proxy with authentication, provided via the customized IBM solution)
Total registered users at end of quarter:
Q1 2015 Q2 2015 Q3 2015 Q4 2015 Q1 2016
SAW 2,135,086 2,315,072 2,478,509 2,653,608 2,843,279
AA 9,432 15,128 20,297 44,697 94,014
Total 2,144,518 2,330,200 2,498,806 2,698,305 2,937,293
Q1 2015 Q4 2015 Q1 2016
SAW 4,035,911 4,347,422 4,602,086
AA 430,773 481,213 432,690
Total 4,466,684 4,828,635 5,034,776
Note: data provided by WaTech during inventory review

Page 364 of 851
Fortress Anonymous:
(Reverse Proxy services without authentication, provided via the F5 Server)
No historical usage data provided by WaTech for inclusion in this inventory.
Web Services Gateway:
(Reverse Proxy services for web service calls, provided via the F5 Server)
No historical usage data provided by WaTech for inclusion in this inventory.
Secure Web Proxy, formerly Enterprise Forward Proxy Definition:
(Forward Proxy and Web Application Firewall services provided via the F5 Server)
There are currently eight customer agencies
DSHS (ESA, CSD, ACES)
DOL
PCI
LNI
UTC
DOC
DFI
ATG
WaTech Enterprise Services
Application Security Management Definition:
(Web Application Firewall services provided via the F5 Server)
No historical usage data provided by WaTech for inclusion in this inventory.
L. Customer Satisfaction and Future Demand
The Customer Voice appendix to this report includes customer satisfaction and future demand details based on the results of agency interviews and focus groups conducted during the project.
M. High Level Architecture
Secure Certificates, formerly Internal Certificate Authority:
(Certificate Authority Service used by SecureAccess Washington and other services)
The Certificate Authority is a Window-based solution that is currently managed by the SAW team. However, WaTech is planning to realign support to the Identity Management team given better alignment of skills and experience. WaTech is also planning to implement self-service functionality. There is a disaster recovery capability in place at the Quincy Data Center for this service.
WaTech would like to discontinue operations of its independently managed on-premise certificate authority. The Identity and Access Management team would like to move certificate-based authentication services to Azure Active Directory (AAD). However, many public users leverage the SAW service today, and a move to AAD would require members of the public to sign up for Microsoft accounts.
Secure Access Washington (SAW) /SAW Enabled Agency Portal (SEAP):
(Reverse Proxy with authentication, provided via the customized IBM solution)

Page 365 of 851
The current SAW environment is a custom developed solution with technical complexity. WaTech is implementing Multi-Factor authentication at the Quincy Data Center and plans to use the Zerto tool to complete the migration to Quincy. Additionally, WaTech is working on a rewrite of the SAW application using a micro programming API-drive approach and moving away from the monolithic legacy solution.
The SecureAccess Washington portal is served up from application servers hosted on the WaTech legacy VMware hosting environment in the SDC. Incoming requests are load-balanced and sent to the IBM Security Access Manager (ISAM) appliance.
WaTech currently uses RSA Certificate Manager. The RSA Mutli-Factor Authentication solution has an Oracle database backend. WaTech evaluated replacing the RSA MFA solution with IBM due to challenges with customer service, and to reduce cost. IBM has an appliance-based pricing model, whereas RSA has a user-based pricing model. WaTech estimated that while the upfront migration would be expensive, the longer term savings from the change in pricing model would have made the solution less expensive overall. WaTech will continue to use RSA Certificate Manager but also plans to submit a decision package to seek funding for this project.
Additionally, LexisNexis knowledge-based identity verification was introduced as an optional service for agency use with the MFA service. The usecase for identity verification by LexisNexis is defined by an agency’s need to identify their end users while lacking the information needed to do so independently.
User interface upgrades are in development and slated for release in June 2018. These changes will include agency acronym in the URL, agency branding on the Portal Page, new more consistent look and feel with State of Washington theme, contextualized user help with automated ticket creation and routing, ADA compliance with WCAG 2.0 AAA, and enhanced device aware mobile experience. Due to these changes, many agency have stated that they will move away from the SEAP solution.
Fortress Anonymous:
(Reverse Proxy services without authentication, in the process of migrating to the F5 Server)
No architecture details provided except that WaTech is in the process of migrating this service to the F5 server.
Web Services Gateway:
(Reverse Proxy services for web service calls, provided via the F5 Server)
Previously, WaTech used IBM Data Power devices. WaTech has migrated this service to the F5 server, which was originally purchased as a load balancer for SAW. There is no Disaster Recovery for the Web Services Gateway.
Secure Web Proxy, formerly Enterprise Forward Proxy:
(Forward Proxy provided via the F5 Server)
Previously WaTech used McAfee for forward proxy services and web content filtering. When the maintenance contract was up for renewal McAfee would not negotiate a reduced price, so WaTech decided to transition to the existing F5 in order to reduce cost. The cutover from McAfee to the F5 occurred at the end of December in 2017.
However, WaTech did not complete a detailed requirements and fit-gap analysis to determine whether the F5 would meet customer requirements for proxy services. At the time of this cutover, only one agency had properly configured lists on the proxy server for web content filtering, in addition to WaTech’s usage within the eClient domain (Governor’s Office, OFM and two small agencies).
While agency logs were not segregated on the McAfee they are segregated on the F5 server.
Page 366 of 851
Website classification (white lists and black lists) services are provided via a separate company, Forcepoint (previously Websense).
There is currently no Disaster Recovery for the Secure Web Proxy service.
Application Security Management:
(Web Application Firewall services provided via the F5 Server)
WaTech decided to transition to the existing solution to the F5 in order to reduce cost. The cutover to the F5 occurred at the end of December in 2017.

Page 367 of 851
(4672 / Formerly Security Infrastructure Allocation) Security Infrastructure Support – VA, SIEM, and DNS
Background
Security Infrastructure Support used to be covered under a standalone allocation, but as of FY18, the service was moved to a new stand-alone cost code, 4672, and is now paid for via a transfer from the State Data Network Allocation (4.9%)
Three services are provided under cost code 4672, Domain Name Service (DNS), Vulnerability Assessment, and Security Information and Event Management (SIEM)
Vulnerability Assessment was originally included in a sizeable decision package of around $10.5M in FY14/15 to stand up certain centralized security services, including Vulnerability Assessment. However, as detailed in the State’s Auditor’s report released in September 2017, WaTech initially failed to deploy a tool that met customer requirements
In an effort to address perceived deficiencies in the ability to provide adequate services to state agencies, WaTech has toggled between challenges implementing a multi-tenant solution and an inability to meet key application scanning functional requirements. WaTech started with Qualys, switched to TripWire, and then began evaluating a change back to Qualys or acquisition of additional tools to fill the requirements through an RFI process before electing to discontinue that effort given that the agency still needed to pay for the TripWire solution. The TripWire deployment architecture was adjusted rather than moving to another solution
The SIEM service aligns to the Logging and Monitoring entry in the online service catalog
DNS aligns to the Domain Naming Services (DNS) entry in the service catalog
Vulnerability Assessment service aligns to the Vulnerability Assessment service catalog entry
A. Service Description
Vulnerability Assessment:
WaTech operates a hardware and software vulnerability scanning platform service which enables agency security teams to identify where vulnerabilities reside across their environment of network components, servers, workstations, databases, and installed Commercial off the Shelf Software (COTS) programs.
There are two options for use of this service:
Option 1 – Unlimited Virtual License Model – Customers have unlimited access to software licenses to install and configure vulnerability scanners, central servers, and reporting engines in their own virtual environment or in the WaTech Private Cloud.
Option 2 – Central Shared Hardware Model – Customers have access to configure and schedule scans of their environments leveraging the central shared hardware platform.
Notes:
Web application code vulnerability scanning and configuration compliance scanning are not included in this service. Agencies will be responsible for configuring the solution, running their own scans and reports, and interpreting the results.

Page 368 of 851
WaTech has only limited plans to provide service beyond brokering of tool licenses and managing the vendor relationship. WaTech will also be managing the Option 2 infrastructure, supporting and assisting deployments of Option 1, and providing platform use assistance to Option 1 and Option 2 customers.
Agencies who choose to deploy option 1 in the private cloud will have to pay related hosting fees. Agencies can deploy within their own infrastructure, and most Option 1 customers in the current queue have stated plans to use their own infrastructure and not the WaTech Private Cloud.
Agencies who selected Option 2 during the initial rollout of the service have been able to continue using the service (though it has really only actively been used by WaTech and not the other agencies that originally deployed on this model).
Logging and Monitoring (Security Information and Event Management):
The Logging & Monitoring service provides a Security Information Event Management (SIEM) platform for use in monitoring targeted network, systems, applications, and security log sources. This centralized visibility enables reporting and alerts on abnormal traffic detection in near real time. By monitoring and tracking system events, agencies will be better equipped to identify indicators of compromise and take action for incident response.
Features of Logging and Monitoring:
The Logging and Monitoring service will aggregate and report on log data events within your information technology environment.
The service is offered as a delegated administration model so customer data and system resources are separate and administered by Customer administrators.
Provides 24x7 monitoring of event activity in the SIEM through third party managed security services who will evaluate activity and when necessary notify and escalate to your team to take action.
Managed services staff members provide technical expertise in use of the platform and are on call 24x7 to resolve any system problems with the production environment.
Produce trending reports which allow for measurement of effectiveness of activities
Actively discover misconfigured systems or devices for management or removal.
Notes:
Agencies are responsible for configuring the tool to ingest required logs
Agencies will be assigned a maximum number of events per second (EPS) based on their percentage payments in the former Security Infrastructure Allocation (as of June 30, 2017)
Agencies are assigned 90 days of active data retention and 12 months of backup data retention. The storage needed to support the active and backup retention is calculated based on the retention periods and assigned events per second.
Only EPS is tracked and billable for exceeding the assigned amount. Storage for the base service is not tracked or billed. Customers who choose to request backup data retention beyond the 12 months included in the service are billed for the storage needed to store data beyond the 12 month retention.
Agencies will be provided weekly and monthly reports on their events per second. If an agency go over their limit, a fee will be assessed and bill to the agency.
Basic Requirements for the Logging and Monitoring Service

Page 369 of 851
o Connectivity to the State Government Network (SGN) o Member of the Enterprise Active Directory Forest (EAD) or Access to an
Agency based Active Directory service o Connectivity to the MPLS Wide Area Network (Customer VRF) o Contributor to the State Network Allocation
DNS:
WaTech Domain Naming Service (DNS) is available to all agencies connected to the State Government Network (SGN) or the IntraGovernmental Network (IGN). Washington State administers the .wa.gov and state.wa.us domains.
The .wa.gov sub-domain is now available to cities and counties – it had previously been available only to state agencies, boards, and commissions. Local governments currently use a variety of domain names, such as city.org or county-state.com. Cities and counties now have the option of using a domain name consistent with state government domain name conventions.
Notes:
There is no self-service associated with this service
Agencies must contact the service desk to submit requests and notify WaTech of incidents
B. Statutory Basis for Creation of Service or Program
There is no statutory mandate for WaTech’s delivery of Logging and Monitoring and Vulnerability Assessment solutions. However, state regulations and OCIO policies require agencies to meet specific data retention requirements, these security infrastructure services are positioned as agency enablers, though agencies do have the option to purchase similar solutions from other providers, and some choose to do so.
C. How the Service Fits into the CTS Strategic Plan and Goals
This service supports the strategic roadmap to expand security and identity management services.
D. Performance Measures used to Measure Effectiveness and Efficiency
WaTech plans to track and report on events per second usage metrics to customers. Additionally, the solution vendor will provide monitoring services/uptime reports to customers. Storage for the base service is not tracked or billed. Customers who choose to request backup data retention beyond the 12 months included in the service are billed for the storage needed to store data beyond the 12 month retention.
WaTech holds monthly customer meetings for Logging and Monitoring and Vulnerability Assessments as an open forum for customers. WaTech is already reviewing metrics in EasyVista ticketing system for internal operations, and plans to expand reporting for these service offerings as agencies adopt the services. The WaTech implementation team is currently reporting customer adoption metrics to WaTech executives.
E. Current Cost to Maintain the Service
Staffing
Staff are not fully dedicated to the delivery of this service; therefore, WaTech uses transfer rules to assign staff to the service for the purposes of tracking and forecasting costs (shown as the 1.16 FTEs in direct/indirect labor in the diagram below). These transfer rules were developed by estimating actual staff time spent on activities related to the service.
There is 0.5 FTE budgeted to support Vulnerability Management.

Page 370 of 851
Logging and Monitoring, does not include budgeted labor. The service is supported by existing WaTech InfoSec staff in conjunction with ADT, the Managed Security Services Provider (MSSP) supporting the platform. The costs for the MSSP are part of the existing contract.
In addition, 0.29 percent of total overhead costs are being transferred to this service. If you apply that total cost percentage to the 65 FTE within overhead, it would be about 0.19 overhead FTE.
Figure 52. Security Infrastructure Support Staffing
Note: Staffing numbers pulled from “Estimated Overhead FM6 December”
Figure 53. Security Infrastructure Support Direct/Indirect Staffing

Page 371 of 851
Note: Staffing details pulled from “Org Chart - Color Coded 01.01.18” and combined with transfer rules in “FY18 Master Indexes 12-19-17”
Workload Supported
The current supported workload is defined in the table below:
Table 97. Security Infrastructure Support Workload Supported
Description Current Workload Supported
DNS - Workload DHCP Scopes, # of Internal and External Managed Domain Names, etc., detail not provided
VA - Number of Hosts to be Scanned IPs to be scanned will grow up to 100,000 (with potential to grow significantly beyond this level)
VA – # of Active Agencies using the Service
3 (with 13 deployments pending)
SIEM – Total Events per Second (All Agencies)
69,000
SIEM – Total Achiever Storage available per year (All Agencies)
109.3 TB of archiver storage
SIEM – # of Active Agencies using the Service
5 (with 17 deployments pending)
SIEM – Event retention Retention provided with the service is 90 days active (defined as reportable, searchable, available for hunting and investigations), 12 months archived (effectively backup of logged data, reportable only)
SIEM – Potential volume of events Determined by events per second. Based on the percentage paid against the total allocation amount, an agency can be assigned anywhere from 600 events per second to 5000 events per second.
If all 22 agencies currently confirmed for the service use all the EPS initially assigned to them, this would come to about 32K EPS out of the 69K licensed.
If all 22 agencies used the maximum EPS assigned to them (the maximum they can use before they would be billed an additional fee), then the total EPS through the system would be about 52K EPS.
Note: A “16-RFI-184 amendment 1” document is the source of VA scanning workload.
Direct, Indirect and Overhead Costs
WaTech’s planned expenses for this fiscal year are provided in the table below.
Table 98. Security Infrastructure Support FY18 Planned Service Expenses
Cost Components FY18 Planned FY19 Planned Cost Details
A Salaries 128,478 69,810 1.46 Planned FTEs
B Benefits 44,166 25,998

Page 372 of 851
Cost Components FY18 Planned FY19 Planned Cost Details
E Goods & Services 972,738 904,754
Large software acquisitions in SIEM (700,000 – including logs and a packet feature that is only provided to OCS for 252,000) and VA (48,915) and DNS (274,629)
E Internal Purchases 249,537 197,304
Desktop, Colocation, Storage & Backup, and Server Hosting with Support
G Travel 672 664
P Debt - Interest & Other Payments 17,641 10,824
Interest associated with prior Vulnerability Assessment tool procurement
P Debt - Principal Payments 133,008 139,658
Debt associated with prior Vulnerability Assessment tool procurement
T Transfers 124,965 126,063 Agency overhead
Total Planned Expenses 1,671,205 1,475,075
Note: Cost details were pulled from “4672 SP” excel spend plan provided in February 2018. Finance is working on a Decision Package to get additional funding from OCS for the logging packet feature, or increase the Network Allocation to cover it. The hardware, software, and support and MSSP services for the SIEM are all included in the $700k fee. The costs cannot be divided out further by service as WaTech reports that will result in prorated costs that would not be accurate.
WaTech made large capital investments in order to deliver these services, but had challenges in rolling them out. WaTech is still paying down the debt from the initial procurement.
Table 99. Security Infrastructure Support Equipment Depreciation
Acquisition Cost Accumulated Depreciation Net Book Value
2,749,995 1,815,368 934,628
Given near-term planned operating expenses, WaTech will have the following workload costs for this service in FY18:
Table 100. Security Infrastructure Support Cost by Workload
Description Workload Cost Details
VA – # of Active Agencies using the Service 3 active (with 13 deployments pending)
VA - Current Operational Cost ~ 390,000
VA – Average Cost per Active/Pending Agency ~ 24,375 per active/pending agency
SIEM – # of Agencies using the Service and Pending Deployment
5 active (with 17 deployments pending)
SIEM – Current Operational Cost per year ~ 750,000
SIEM – Average Cost per Active/Pending Agency ~ 34,091 per active/pending agency
Note: Workload cost in the table above is calculated based on WaTech’s alignment of costs to this service without adjustment for alignment to Gartner consensus models.

Page 373 of 851
F/G. Rate structure CTS is currently billing to customers
As of July 1, 2017 the Logging and Monitoring, Vulnerability Assessment, and DNS services are included in the network allocation, which now includes the former security allocation.
The percentage agencies contributed to the security allocation in fiscal year 2017 is applied to set the baseline for provisioning a Customer’s SIEM capacity. Use of the service beyond a Customer’s provisioned service level will incur additional costs:
In the event a Customer exceeds their allocated capacity WaTech will work with the Customer and the vendor to negotiate then current pricing for additional licensing and or hardware required to provide the Customer with additional capacity at the Customer’s expense
Agencies that require longer data retention beyond the provisioned level will incur additional costs per the existing WaTech storage rates. WaTech commodity storage rates can be found here – Storage Area Network.
Each allocated Customer’s provisioned level includes:
A minimum baseline of 500 EPS with not more than 90 days of log data retention in the primary storage and 9 months in archived storage, for a total of 12 months retention.
Your provisioned EPS will increase beyond the minimum baseline based on your contribution into the allocation
Features not covered by the allocation, such as packet capture and training offerings, are optionally available at additional costs and can be brokered through the WaTech vendor contract for a handling fee of 5% of the new purchase price.
Cities and counties now have the option of using a domain name consistent with state government domain name conventions by paying one-time set-up fee and an hourly rate for support as defined in the table below.
Table 101. DNS Fee for Service Rates
Description Rate Details
One-Time Setup Fee $120 per name
Time and Services (One hour minimum charge) $60 per hour
Note: While DNS rates are in place, WaTech provided clarification that they have never charged a customer for the service (neither set-up nor services charges).
H. Analysis of Current Cost Recoverability
This service not cost recoverable.
Table 102. Security Infrastructure Support Cost Recoverability (Actual FY16-FY18)
Service Income FY16 FY17 FY18 (H1)
Service Revenue (3520)* 6,950,301 3,475,150 0
Service Revenue (4672) 0 0 644,762
Service Revenue (4671)* 0 828,275 0
Service Expenses (3521)* (1,209,133) (858,561) 0
Service Expenses (3520)* (4,977,391) (1,788,838) 0
Page 374 of 851
Service Income FY16 FY17 FY18 (H1)
Service Expenses (4672) 0 0 (852,699)
Service Expenses (4671)* 0 236,376 0
Net Income 763,777 1,892,402 -207,937)
Note: Cost recoverability detail pulled from “AFRS Financial Download (Fiscal Years 2016 – Current)”
*Code 3520 and 3521 have been included in this section as they are historical codes for the Enterprise Security Infrastructure Allocation. The Enterprise Security Infrastructure Allocation originally included seven services: Managed Firewall, DNS, Vulnerability Assessment, Logging and Monitoring, Certificate Authority, Network Security Design Review, and Strong Authentication. Only Vulnerability Assessment, DNS, and Logging and Monitoring are now covered under this cost code which now receives revenue from the Data Network Allocation. Managed Firewall is now managed by Network Services Division and covered under the Data Network Allocation, Network Security Design Review is executed by Office of Cybersecurity and covered under the OCS appropriation, Certificate Authority is covered under the Security Gateway allocation, and Strong Authentication is now covered under the Remote Access Services.
WaTech has elected to create the new accounting code of 4672 given the change is revenue source, as these services are now paid for via a percentage of the State Data Network Allocation. FY17 and FY18 are not fully comparable as a partial year of revenue and expenses associated with these other services are included in FY17 but not in FY18. FY17 data in the table above has been adjusted for cost 4672.
Additionally, the WaTech Service Owner provided input indicating that the costs for the entire RSA Netwitness platform includes a 252,000 year cost for Packet capture and analysis, which is not part of the service agency customers have access to, it is consumed solely by OCS; the Service Owner stated that it should not be counted as part of the cost of running the service. An adjustment has been made to apply 30% of the FY17 expenses and 51% of the FY17 revenue for cost code 4671 to the Infrastructure Security Services (DNS, VA, and SIEM), with 70% of expenses and 49% of revenue applied to Security Gateway Services. This adjustment was made due to WaTech’s historical changes cost codes.
Table 103. Security Infrastructure Support Cost Recoverability (Forecasted FY18-FY19)
Service Income FY18 FY19
Service Revenue (4672) 1,288,308 1,298,157
Service Expenses (4672) (1,671,205) (1,475,075)
Net Income (382,897) (176,918)
Note: Forecasted Cost recoverability detail pulled from “4672” excel spend plan provided in February 2018
WaTech service operations staff provided additional clarifying detail that the Security Infrastructure allocation was folded into the network allocation just recently. However, the chargeback mechanism for the network allocation was developed before the security infrastructure was added to the service. WaTech service operations suggested that if these services continue, the method used to calculate the customer payments into the network allocation should be updated to include relevant security service concepts rather than to just network connections.
I. Service Level Actually Provided Today
No data on service performance was provided for these services.
J. Current Customers
As of FY18 the Security Infrastructure Support is paid for by a transfer of 4.9% from the state data network revenue. WaTech has 70 state data network allocation customers and almost 90 fee for service customers (mostly counties and cities that cannot be included in the allocation). The largest 10 customers account for over three quarters of the amount WaTech billed for this service in FY18.
Prior to WaTech’s establishment of this Data Network Allocation transfer payment, the Enterprise Security Infrastructure Allocation was used to fund the services still offered under

Page 375 of 851
this code today as a part of a set of seven services there were intended to be funded via the Infrastructure Security Allocation: Managed Firewall, DNS, Vulnerability Assessment, Logging and Monitoring, Certificate Authority, Network Security Design Review, and Strong Authentication. Only Vulnerability Assessment, DNS, and Logging and Monitoring are now covered under this cost code which now receives revenue from the Data Network Allocation. The roughly $6.5M in funding in FY17 as well as the additional $6.5M in FY16
Table 104. Security Infrastructure Support Current List of Customers
# Customer FY17 ($) FY17 (%) FY18 H1 ($) FY18 H1 (%)
1 DEPARTMENT OF SOCIAL AND HEALTH SERVICES
1,826,139 28
168,926
26
2 DEPARTMENT OF CORRECTIONS
903,556 14
85,627
13
3 LICENSING DEPT OF 113,431 2 115,019 18
4 EMPLOYMENT SECURITY DEPARTMENT
276,248 4
28,284
4
5 DEPARTMENT OF LABOR AND INDUSTRIES 331,775 5
23,037
4
6 DEPARTMENT OF LICENSING 56,716 1 0 0
7 DEPARTMENT OF FISH AND WILDLIFE
196,391 3
18,269
3
8 DEPARTMENT OF REVENUE 153,401 2 13,044 2
9 WASHINGTON STATE PATROL 289,846 4 12,284 2
10 OFFICE OF FINANCIAL MANAGEMENT
43,101 1
2,278
0
Total Top 10 Billable Customers
4,190,603 64
466,768
73
Total for All Other Billable Customers
2,264,254 35
170,742
27
Total WaTech Internal Sales 93,822 1 4,429 1
Total Revenue 6,548,679 100 641,939 100
Note: In FY17 Security Infrastructure funding also covered services that are now managed by Network Services Division (Managed Firewall), Computer Services Division (Certificate Authority), Office of Cybersecurity (Network Security Design Review), and Business Operations (Strong Authentication). These services were originally delivered by a centralized WaTech security team, but with the creation of Office of Cybersecurity and associated reduction in WaTech service provider security staffing, additional personnel began managing these security operations services.
K. Current and Historical Usage Volumes
The following customers have expressed interest in using the SIEM service or are currently using the service:
Level of Interest # of Customers
Confirmed without TOS 5
Confirmed with TOS Deployment Pending 17
Deployed 5
Total agencies in current queue 27
Note: Customer interest provided during inventory review

Page 376 of 851
The following customers have expressed interest in using the VA service or are currently using the service:
Level of Interest # of Customers
Confirmed without TOS 9
Confirmed with TOS Deployment Pending 13
Deployed 3
Total agencies in current queue 25
Note: Customer interest provided during inventory review
For the Logging and Monitoring Service, WaTech will split 69,000 Events Per Second and 140 TB of archiver storage for twelve months among agencies based on share of allocation payment.
Department of Revenue was the first to have the SIEM rolled out and WaTech followed. The individuals who managed the deployment are now with OCS, which did not exist as an organization at that time. The service has been used by WaTech aside from OCS since then, and has also been continued to be used by what is now OCS. Both the WaTech and OCS deployments occurred several years ago. Additional agencies went live on the service over one year age, including – LNI, DSHS, DOC, SAO, LCB, DFI, DEL, DSB, UTC.
In addition to WaTech and OCS, DOR, LNI, DOC, DSHS, SAO, LCB are the most active customers of the service. They have between one and two years of data.
No data was provided for customer DNS service usage.
For Vulnerability Assessment, the service is used actively by WaTech. But it is not really used actively by other agencies that originally deployed on “option 2” for central WaTech hosting.
For the re-deployment, which includes both Option 1 and Option 2 on the service catalog, smaller agencies have asked to be deployed to Option 2, while the rest have requested Option 1, which also continues to be available.
L. Customer Satisfaction and Future Demand
The Customer Voice appendix to this report includes customer satisfaction and future demand details based on the results of agency interviews and focus groups conducted during the project.
M. High Level Architecture
DNS is a BlueCat virtualized appliance. There are two internal servers (SDC/QDC), two external recursive servers (SDC/QDC), and two external non-recursive servers (SDC/QDC). That makes three servers in SDC and three in QDC. WaTech also has a mutual backup agreement with the State of Oregon, replicating external zones to them, and they replicate theirs to WaTech. WaTech is beginning to assess implementation of a self-service architecture, but hasn’t been able to engineer the solution yet.
A major investment has been made in TripWire products to perform vulnerability assessment and management. It is intended to replace Qualys which was previously used until customers complained that it did not support a multi-tenant architecture. However, many customers have found that Tripwire has not filled all of their requirements, as there is critical application vulnerability assessment functionality that is missing from TripWire currently (for which Qualys is known). The vulnerability management tool is intended to be a self-managed service (largely focused on license provisioning with some limited additional services provided by Watech to the agencies).

Page 377 of 851
For the VA TripWire tool as a service, many agencies will be responsible for configuring their own instances of the tool, running their own scans and analyzing the results. WaTech will perform vulnerability management for all WaTech managed services. It is unclear who will have responsibility for aggregating this information across all attack surfaces/agencies and holding agencies responsible for remediation.
A major investment has also been made in the RSA Security Analytics tool, an enterprise Security Incident and Event Management and Event management (SIEM) product. The purpose of a SIEM is to harvest, analyze and report on security log data across an enterprise, including network-based security controls and host operating systems and applications.
The tool has been configured to log the following:
At WaTech:
Windows servers for internal, enterprise services, and systems for customers (DES, OFM, GA) – Including HRMS, ssv.wa.lcl, wa.lcl, wax.wa.lcl, eapp.wa.lcl, eclient.wa.lcl servers and domain controllers
Systems supporting enterprise services – Including Ironport, Avamar, fireeye, tippingpoint, Fortinet, Wireless
Switches, routers and other network gear supporting internal and enterprise services – HP, Cisco, F5
There are approximately 600 unique log sources from the categories above in the SIEM for WaTech
Operational outside WaTech:
Of the customers listed previously as using the SIEM, the most use has been by these agencies – DOR, LNI, DOC, DSHS
Management (operational and administrative):
WaTech supports all the hardware, software, and instances used by customers. Recently, an MSSP has been added for administrative and operational support of WaTech and customer instances
At their request, agencies are responsible for adding their own log sources to the their SIEM instances
The SIEM tool is intended to be a self-managed (largely focused on license provisioning with some limited additional services provided by Watech to the agencies). With this service, the agencies will be responsible for integrating and managing their own RSA instances to collect and analyze their own logs. WaTech will perform these services for all WaTech-managed services. It is unclear who will have responsibility for aggregating the information across all agencies and completing the following:
Correlating, analyzing, suppressing and prioritizing events in order to identify critical, security compromising events in near real time, and
Storing the historical data in a data warehouse type of environment where it can be used for future threat detection and forensic investigation (which is currently only planned to done on a per agency basis using the 12 months of Archiver retention made available to each agency).
There are two major components licensed from RSA for the NetWitness platform – Logs and Packets. These have separate costs in the contract. The Logs features of the SIEM is part of the service to agencies, and used by WaTech and the agencies specified. The infrastructure sizing, storage, capacity, EPS measurements, etc., address the Logs features made available to the agencies. The Packets feature is licensed separately from the Logs features.

Page 378 of 851
The Packet Capture features are not part of the service and not made available to agencies. The Packet Capture features are largely only used by OCS.
It is also unclear who will have responsibility for aggregating the agency data and how this will be funded. If not properly planned, the data storage costs could be quite significant over time. OCS has visibility into data across all agency instances in the SIEM, though it is not clear that they leverage the log data, but instead focus on the packet capture.

Page 379 of 851
(1165) Wireless
Background
Wireless was originally implemented as a pilot project. Therefore, within some documentation it is referred to as a project. However, Wireless is no longer a project and is instead a standardized WaTech service.
This service is defined under the Wireless Service entry in the online service catalog.
A. Service Description
Definition
Wireless is a statewide service that offers mobility and productivity via secure, centrally managed, and supported common infrastructure. WaTech completes a site survey to assess requirements, identifies options for access point placement, and provides pre-configured access points for customers to self-install.
Features
No up-front or recurring equipment costs
Subscription pricing
Full integration to state government networks
Full compliance with state security standards and policies
Secure roaming to customer (agency) network resources
Professional network design
Local agency control and administration
Centralized support
The Wireless service basic rate includes all of the following networks:
Wireless Network/SSIDs Users Access to Authentication
<Local Agency Name> Employees Agency resources Joined to Active Directory & User Certificate
Roaming Employees
Customer agency resources while visiting another agency
Joined to Active Directory & User Certificate
Sponsored Guest Guests Internet Assigned Username & Password
Guest Guests Internet Pre-Shared Key
Notes
The WaTech Service Desk is the first point of contact for prospective customers wishing to schedule an overview of the Wireless service.
Prospective customers must submit a request to the WaTech Service Desk through the Online Terms of Service agreement form.

Page 380 of 851
Prospective customers must confirm that basic requirements are met:
Basic Requirements for the Wireless Service Local
Agency Roaming Guests
✔ Connectivity to the State Government Network (SGN) Required Required Required
✔ Member of the Enterprise Active Directory Forest (EAD) Required Required -
✔ Connectivity to the MPLS Wide Area Network (Agency VRF) Required Required -
B. Statutory Basis for Creation of Service or Program
There is not statutory mandate for WaTech to provide this specific service. However, Office of the CIO policy only allows for use of WaTech’s Wi-Fi service, given WaTech is the only approved internet services provider. For agencies to configure their own Wi-Fi solution they would have to be configured using token-based remote access back to the SDC.
C. How the Service Fits into the CTS Strategic Plan and Goals
WaTech reports that this service supports the strategic roadmap to expand employee mobility.
D. Performance Measures used to Measure Effectiveness and Efficiency
WaTech does not have any service level targets associated with this service. WaTech does not provide performance reports to customers of this service.
E. Current Cost to Maintain the Service
Staffing
A dedicated staff of three delivers this service. Additionally, part-time resources also provide support. WaTech uses transfer rules to assign staff to the service for the purposes of tracking and forecasting costs (shown as the 3.22 FTEs in direct/indirect labor in the diagram below). These transfer rules were developed by estimating actual staff time spent on activities related to the service.
In addition, 0.82 percent of total overhead costs are being transferred to this service. If you apply that total cost percentage to the 65 FTE within overhead, it would be about 0.53 overhead FTE.

Page 381 of 851
Figure 54. Wireless Staffing
Note: Staffing numbers pulled from “Estimated Overhead FM6 December”
Figure 55. Security Infrastructure Support Direct/Indirect Staffing
Note: Staffing details pulled from “Org Chart - Color Coded 01.01.18” and combined with transfer rules in “FY18 Master Indexes 12-19-17”
Workload Supported
The current supported workload is defined in the table below:
Table 105. Wireless Workload Supported
Type of Workload Current Workload Supported
Number of Access Points (start of FY18) 1,108 as of July 2017 (1,313 as of January 2018, and 1,479 at the end of FY18)

Page 382 of 851
Type of Workload Current Workload Supported
Number of New Access Points (to be added during FY18)
371
Number of New Site (to be added during FY18) 38 (at an average of 10 access points per site)
Note: Workload information is current as of January 2018 and this detail was provided by WaTech via an Apptio trend report for Wireless Service; Number of access points calculated by the total number of Current Units Sold (a wireless site survey for DSHS is not included in this figure), and “Wireless (Parks and Per Month Increase)”
Direct, Indirect and Overhead Costs
WaTech’s planned expenses for this fiscal year are provided in the table below.
Table 106. Wireless FY18 Planned Service Expenses
Cost Components FY18 Planned FY19 Planned Cost Details
A Salaries 275,916 284,178 3.25 FTEs Planned FTEs
B Benefits 96,132 99,714
E Goods & Services 101,703 106,393
SmartNet, EndPoint License, Site Survey, ArcGIS Online
E Internal Purchases 186,612 137,844
Project Manager (FY18 only), Desktop Support, Server Hosting and Support, Storage and Backup
G Travel 5,004 10,000 Site installation
J Non-capitalized Assets 142,000 230,004
Access points and equipment for installation ($383 per access point)
T Transfers 132,292 133,454 Agency overhead
Total Planned Expenses
939,659 1,001,587
Note: Cost details were pulled from “1165 SP_Rate Increase Eff 1-1-18” excel spend plan provided in February 2018
WaTech invested in wireless controllers in 2014. While these assets do not need to be replaced in the near term, WaTech reports that a large number of access points (non-capitalized assets) will need to be replaced as a bundle as original acquisition was made in bulk rather than staggered.
Table 107. Wireless Equipment Depreciation
Acquisition Cost Accumulated Depreciation Net Book Value
205,630 122,807 82,823
Given near-term planned operating expenses, WaTech will have the following workload costs for this service in FY18:

Page 383 of 851
Table 108. Wireless Cost by Workload
Description Workload Cost Details
New Access Point $418 per AP
Labor Cost per New Site Deployment (including customer requirements collection, site survey, coordination, configuration, etc.)
Assuming that most labor cost is related to these new site rollouts, and it takes 1 person about 2 weeks of work per site to plan and coordinate, which would be about 20 sites per person annually.
Around $400,000 for 2 FTEs to implement 40 sites = about $10,000 per site, or $1,000 per AP.
Labor Cost associated with Equipment Refresh (including coordination, configuration)
Assuming 1/2 of the effort of a new site (1 person 1 week).
About $5,000 per site, or about $500 per AP.
Lifecycle of APs / Frequency of required replacement (Refresh workload)
Once every 4 or 5 years (for baseline 1,500 APs that is 35-40 sites/375 APs).
Around $200,000 for 1 FTE focused on refresh of 40 sites.
Three Year Cost of an AP One-Time Deployment (AP cost + Initial Deployment Labor)
$418 + $1,000 = ~ $1,418 per AP
Maintenance/Refresh (AP refresh cost + refresh labor)
$418 + $500 = ~ $918 per AP over 4 years
Total cost for initial 4-year period (deployment and initial refresh) ~ $2,336 ($584 per AP per year – or $49 per month).
Ongoing cost per every 4-year period after the initial period ~ $918 ($229 per AP per year – or $19 per month).
Note: Workload costs in the table represent rough estimates. Associated network costs are excluded from this workload view, and support/maintenance costs are likely underestimated. The estimates are on the low side. However, these estimates are intended to demonstrate potential for increasing profitability in the future, once the service reaches a steady state lifecycle refresh pattern. Workload cost in the table above is calculated based on WaTech’s alignment of costs to this service without adjustment for alignment to Gartner consensus models.
F/G. Rate structure CTS is currently billing to customers
The service is provided on a fee for service basis; rates are listed in the table below:
Table 109. Wireless Rates
Description Rate Detail
Monthly Rate $50 per Access Point
One-Time Costs Based on quote
The monthly FFS rate for Wireless services recently increased from $35 per access point to $50 per access point. This became effective as of January 18, 2018.
H. Analysis of Current Cost Recoverability
This service is not cost recoverable. WaTech is assuming installation of new access points at a pace of 12 per month throughout the biennium to build the revenue projection.

Page 384 of 851
Table 110. Wireless Cost Recoverability (Actual FY16-FY18)
Service Income FY16 FY17 FY18 (H1)
Service Revenue (1165) 342,667 495,619 266,014
Service Expenses (1165) (936,370) (909,434) (543,300)
Net Income (593,703) (413,814) (277,286) Note: Cost recoverability detail pulled from “AFRS Financial Download (Fiscal Years 2016 – Current)”
Table 111. Wireless Cost Recoverability (Forecasted FY18-FY19)
Service Income FY18 FY19
Service Revenue (1165) 732,383 1,103,208
Service Expenses (1165) (939,659) (1,001,587)
Net Income (207,276) 101,621 Note: Forecasted Cost recoverability detail pulled from “1165” excel spend plan provided in February 2018. Revenue projections for FY18 assumes an increase of 371 access points and FY19 assumes an increase of 130 access points.
I. Service Level Actually Provided Today
No details on service performance were provided for this inventory report.
J. Current Customers
WaTech has 25 customers. The largest 10 customers account for over 90% of the amount WaTech billed for this service in FY18.
Additionally, WaTech captures about $35,400 of revenue for Wireless service via internal sales transfers. If WaTech were a billable customer it would be about the fourth largest (as shown below for FY17).
Table 112. Wireless Current List of Customers
# Customer FY17 ($) FY17 (%) FY18 H1 ($) FY18 H1 (%)
1 DEPARTMENT OF SOCIAL AND HEALTH SERVICES
147,526 30 81,753 31
2 EMPLOYMENT SECURITY DEPARTMENT
91,827 19 41,130 15
3 DEPARTMENT OF NATURAL RESOURCES
57,515 12 28,770 11
4 DEPARTMENT OF REVENUE 34,813 7 17,010 6
5 DEPARTMENT OF VETERANS' AFFAIRS
28,357 6 15,848 6
6 ENTERPRISE SERVICES DEPARTMENT OF
15,021 3 14,339 5
7 OFFICE OF FINANCIAL MANAGEMENT
5,670 1 11,273 4
8 OFFICE OF THE STATE AUDITOR 2,504 1 6,774 3
9 DEPARTMENT OF FINANCIAL INSTITUTIONS
13,440 3 6,720 3
10 UTILITIES AND TRANSPORTATION COMMISSION
12,600 3 6,300 2
Total Top 10 Billable Customers
409,274 83 229,918 86

Page 385 of 851
# Customer FY17 ($) FY17 (%) FY18 H1 ($) FY18 H1 (%)
Total for All Other Billable Customers
50,942 10 24,850 10
Total WaTech Internal Sales 35,404 7 11,246 4
Total Revenue 495,619 100 266,014 100
Note: Customer billing details pulled from “Apptio Download – Sales History (FFS and Allocations since 07-2016)” excel file; WaTech internal sales data pulled from “CTS Internal Sales JV Jan 2018”
K. Current and Historical Usage Volumes
The access point revenue is the largest source of revenue. As additional sites are added, the share of revenue for access points will continue to grow.
Table 113. Wireless Customer Usage
Service Offering FY17 ($) FY17 (%) FY18 H1 ($) FY18 H1 (%)
WIRELESS SERVICE - ACCESS POINT 377,510 76 243,565 92
WIRELESS SERVICE - SITE SURVEY 93,591 19 19,373 7
WIRELESS SERVICE-OTHER NONRECURRING
24,518 5 3,076 1
Total Revenue 495,619 100 266,014 100
Use of the wireless service is growing. WaTech anticipates rolling out an additional 200 access points to support a large hospital this biennium.
Note: the above growth trend was pulled from WaTech’s quarterly performance dashboard report
L. Customer Satisfaction and Future Demand
The Customer Voice appendix to this report includes customer satisfaction and future demand details based on the results of agency interviews and focus groups conducted during the project.
M. High Level Architecture
Cisco solution configured for direct access into the SGN.
Each individual site is surveyed and WaTech develops and implements a site-specific design (number of access points, placement, etc.) based on customer requirements.

Page 386 of 851
4. Server Hosting Services
(4790) Private Cloud
Background
This service is listed in the WaTech service catalog as Private Cloud; it has recently been rebranded in marketing material as the “Converge Washington State Cloud”
The Private Cloud service was established in 2013 but the environment was completely refreshed and the service restarted in 2016
The Private Cloud is presented by WaTech as a replacement for the Managed Server Hosting Service (4722) and Shared Web Hosting Service (4723) services. WaTech also provides managed server hosting services under Platform and Connectivity (4231) but this environment is being managed mainly for OFM and is not a shared service that is actively marketed to new customers, ultimately this environment may also migrate to the Private Cloud but that migration is further out and may not occur within this biennium.
Note: Shared Web Hosting has been deprecated. The only service still charged to 4723 is Secure Web Hosting.
Currently, Operating System level server administration support is not provided for the Private cloud as resourcing considerations have not yet been finalized; however, several engineers are receiving additional training in order to receive administrative privileges on the private cloud environment for future service delivery enablement. (Note that additional support is provided to Platform and Connectivity service customers via a stand-alone team that manages the virtualized environment for that specific service, and it is also provided for the Managed Server Hosting service (4722) and Shared Web Hosting (4723) by a team that manages that specific environment, and billed to customers via a third cost code/ separate line item in billing agreements, Server Support Services (4785). The Private Cloud is currently the only hosting environment on which additional support isn’t yet offered.)
A. Service Description
Definition
The Private Cloud service provides customers with an Infrastructure-as-a-Service (IaaS) private cloud located within the State Data Center and Quincy Disaster Recovery Data Center. Using a self-service portal, customers have on-demand access to an allocated pool of compute and storage resources that can be rapidly provisioned and released as virtual servers on a pay-as-you-go basis. Agencies only pay for the compute and storage resources that they use
The WaTech Private Cloud shared virtual infrastructure reduces or eliminates the need for capital expenditures by customers and allows them to realize cost savings compared to both dedicated physical server environments and agency specific virtual server environments because there is no need for the agency to purchase hardware and software license capacity in advance of requirements or in excess of requirements.
Additionally, agencies may increase resource utilization as it is needed and release it as soon as it is no longer needed. Options such as increasing storage, random access memory (RAM), and central processor units (CPU) along with the ability to do server backups are

Page 387 of 851
available during and after provisioning and are completely in the hands of customer designated agency administrative staff.
Finally, the Private Cloud is compatible with the State’s backup and data archiving solution and has the ability to be configured to fail over (upon Agency administrator request) to the State’s Disaster Recovery center in Quincy, WA. Failover can be automated or manual, depending on the agency’s requirements. Backup, archiving and disaster recovery are not available through the self-services portal. Manual WaTech intervention is required. Extra service fees (above and beyond the cost of the base compute and storage resources) apply for backup, archive and disaster recovery failover.
WaTech is currently working to enable an additional Operational/Technical support service (e.g., Operating System level of support) for the Private Cloud for an additional fee (see note below for details). However, this service is not available on the Private Cloud today. Without this capability, Private Cloud is not an equivalent replacement for the services that are being deprecated. Some agencies may not be prepared to vacate the legacy infrastructure without this capability being in place.
Features
Private Cloud (without any Operational/Technical Support) includes the following features and capabilities:
Automated self-provisioning of the Virtual Machine (VM) and network (Note that the network is preconfigured for automated provisioning during onboarding, and preconfigured automation does not include automated joining of the VM to Active Directory or provisioning of firewall rules)
Enterprise Active Directory Authentication for Management
Completely Self Service provisioning of Virtual Instances once the Agency’s virtual data center has been defined within the Private Cloud Infrastructure
Upgradable/Down-gradable VM Resources (CPU, Storage, RAM) using self-service portal
On-Demand Instances which let customers pay for compute capacity by the hour or minutes with no long-term commitments. Customers can spin up VMs for an hour and delete them and they would only pay for the hour.
Windows Server Licensing
VM Snapshots
Hosts are physically connected to the State Government Network (SGN) over multiple 10 GB connections.
Data stored on State maintained equipment located in either the State Data Center (SDC) or the Quincy Data Center (QDC).
VMs are configured with highly available compute clusters. Clusters are configured in an N+2 configuration. This allows WaTech to allow a 2 host failure without effecting customer availability, although performance may be somewhat affected in some instances. It also allows us to perform maintenance without disrupting services.
State Government Network (SGN) Connectivity without VPN overhead that would be encountered when connecting to a cloud services like Amazon or Azure
o The VPN protocol and processing overhead reduces the throughput of a Virtual Private Network (VPN) connection.

Page 388 of 851
o Current connections to Amazon and Azure are accomplished through a VPN which is stated to run at 1Gbs (~$1000/month), 500Mbs (~$500/month). WaTech network engineers report that the actual peak realized bandwidth of the 1GB VPN is only about 650Mbs.
Private Cloud allows the agency administrators to configure what Virtual Local Area Network (VLAN)/ Virtual Routing and Forwarding (VRFs) that they want to connect to through the self-service interface. VLANs configured by Private Cloud WaTech engineers are ported from the Private Cloud network to the right VLANs or VRFs on the SGN.
o Note: Those VLANs must be added manually to the VMware vCenter by WaTech Private Cloud engineers and configured on the distributed virtual switches in order to be presented as a valid option for a specific agency in the self-service portal.
o VLANs that are allowed to communicate to each other will occur at the virtual switch layer and will not traverse back out to physical network equipment in all other cases the traffic may have to traverse physical network which may degrade performance.
Servers can be on the SGN or the Public Government Network (PGN-Internet Facing)
Fast all flash storage
Structured Query Language (SQL) Data Center licensing, disaster recovery, and technical support are available as additional priced options
Trend Deep Security Firewall Available and Trend Deep Anti-Virus/Anti-Malware Software Available for deployment at no additional cost. They cannot be automatically deployed through the Self-Service Interface, manual action by WaTech Engineers is required
Currently in the virtual environment, Intrusion Prevention System (IPS) software is offered using Trend Deep Security. This is an optional service. Customers have access to use Trend Deep Security for network security which includes IDS/IPS and Firewall, System Security which includes application control, integrity monitoring, and log inspection, and Malware Prevention.
Disaster Recovery using Zerto Disaster Recovery (DR) Toolset (optional component at additional cost, not available directly through the self-service interface, manual intervention by WaTech required):
Automate recoveries under some circumstances
Replicate data from to another server or data center efficiently
Simplify and script disaster recovery processes
Recover from multiple checkpoints
Supports extremely short recovery point and recovery time objectives
o Zerto DR makes an initial replication of the VM’s VMDK files at the remote location. In this case Quincy, but it could be AWS, Azure, etc. The recovery point could be as little a couple seconds up to a month. This would depend on customer requirements/budget.
o Zerto replicates all files associated with a Zerto Protected Virtual Server. Server VMDK files are stored at the replication target. (Note that this process is not Storage Replication.)

Page 389 of 851
o Customers can also use Overlay Transport Virtualization (OVT) features in the network to preserve IP addresses and minimize configuration changes during disaster recoveries. With OTV a customer’s VLAN and IPs are spanned between the Olympia and Quincy Data Centers. Virtual servers with IPs in the same range can operate as in the same network.
o Note that while the failover over of the customer’s environment could be fully automated, it is not recommended. If a network outage occurred that lasted longer than the failover delay time, then the DR site would become active and there would be two identical servers on the network (since WaTech is using OTV to provide the same IPs and networking to QDC). For that reason and the chance of “Boot Storm” WaTech highly suggests that customers plan for a manual failover.
o Additionally, in the event of a statewide disaster the governor will prioritize the recovery of critical state services. The Private Cloud service is also dependent on many other enterprise services (Networking, Firewall, and Active Directory). These would have to be restored to enable fail-over of all services to QDC.
Resources available at all times
Test on customer’s own schedule
Shared (across all agencies) two 10Gbps circuits between SDC and QDC
Networking included – no data transfer fees
Co-located with failover redundancy of other WaTech services including Avamar Backup and Recovery, Enterprise Active Directory, Firewall, Secure Gateways, Internet and VPN services
Notes
Minimum Configuration: 1 vCPU; 4 GB Memory; 100 GB Storage
Components can be added in these increments: Virtual CPU by 1vCPU increments, Memory by 1 GB Increments, Storage by 1 GB Increments
Customers are responsible from the operating system up the stack (OS, middleware, runtime, data and applications), unless they purchase additional Operational/ Technical support to cover the OS level components as described above
WaTech is responsible for networking, storage, servers and virtualization layers; that is for configuring and upgrading the environment, up to the hypervisor and virtual machine blue print, and onboarding new customers
WaTech is currently working to enable an additional Operational/Technical support service for an additional fee, this will cover server administration support at the operating system level. This service includes components such as:
o Operating System/DBMS/System Utility/Tool configuration, patching and updating
o File System level storage capacity management and monitoring o File System level backup/restore/archive management o Installation and patching of user requested applications (Commercial off-the-
shelf, Line of Business, etc.) o Applications/Operating System Process level performance/availability
monitoring. o Server and application operational support (e.g. reboots, process
starts/stops/restarts, server component capacity monitoring—CPU, memory, storage, process threads, etc.)

Page 390 of 851
o Remediation of security vulnerability gaps o Management of software licenses/keys and remediation of identified security
vulnerabilities.
B. Statutory Basis for Creation of Service or Program
There is no statutory requirement for WaTech to deliver this service.
C. How the Service Fits into the CTS Strategic Plan and Goals
WaTech reports that this service supports the strategic roadmap to ensure platforms and products are sourced for better performance.
D. Performance Measures used to Measure Effectiveness and Efficiency
WaTech has service targets for time to respond. WaTech targets response to a request within 1 hour if received during business hours (Monday through Friday 8-5), and within 2 hours if received after hours.
There are no additional performance targets communicated to customers of this service.
There are no availability targets
There are no outage recovery targets
There are no maintenance windows identified
E. Current Cost to Maintain the Service
Staffing
Two staff are fully dedicated to the delivery of this service; however, additional teams provide some support. WaTech uses transfer rules to assign staff to the service for the purposes of tracking and forecasting costs (shown as the 2.2 FTEs in direct/indirect labor in the diagram below). These transfer rules were developed by estimating actual staff time spent on activities related to the service.
In addition, 0.55 percent of total overhead costs are being transferred to this service. If you apply that total cost percentage to the 65 FTE within overhead, it would be about 0.36 overhead FTE.
Figure 56. Private Cloud Service Staffing

Page 391 of 851
Note: Staffing numbers pulled from “Estimated Overhead FM6 December”
Figure 57. Private Cloud Service Direct/Indirect Staffing
Note: Staffing details pulled from “Org Chart - Color Coded 01.01.18” and combined with transfer rules in “FY18 Master Indexes 12-19-17”
Workload Supported
The current supported workload is defined in the table below:
Table 114. Private Cloud Workload Supported
Description Workload Supported
Total Number of VMs -SDC Primary Cluster -SDC SQL Cluster -QDC DR Cluster
421 VMs 355 VMs 12 VMs 55 VMs (Note: total billed across clusters is 284 as of January 2018. The totals listed here include unbilled management VMs.)
Average number of vCPUs for the above VMs -SDC Primary Cluster -SDC SQL Cluster -QDC DR Cluster
3 vCPUs 5 vCPUs 4 vCPUs
Average GB of RAM for the above VMs -SDC Primary Cluster -SDC SQL Cluster -QDC DR Cluster
10 GB 93 GB 20 GB
Average Storage for the above VMs -SDC Primary Cluster -SDC SQL Cluster -QDC DR Cluster
324 GB 1,543 GB 304 GB
Total Storage (Customer Usage) out of Usable Storage -SDC Primary Cluster
152.78 out of 383.5 TB total 105 out of 213 TB 25.85 out of 105 TB

Page 392 of 851
Description Workload Supported
-SDC SQL Cluster -QDC DR Cluster
21.93 out of 65.50 TB
Total RAM in Use out of Installed RAM -SDC Primary Cluster -SDC SQL Cluster -QDC DR Cluster
4.569TB out of 16.5 3.01TB out of 7.50TB total 779GB out of 4.50TB total 1.18TB out of 4.50TB total
Total Number and Type of CPUs - SDC Primary Cluster -SDC SQL Cluster -QDC DR Cluster
155.58 GHz (25% of 20 Processors 14 Cores each. 280 total cores.) 2.39 GHz (2% of SDC SQL 12 Processors 8 Cores each. 96 total cores.) 20.77GHz (5% of 12 Processors 14 cores each. 168 total cores)
Note: Workload information provided as comments and in the Cloud Host Information file provided during review of inventory documentation.
Direct, Indirect and Overhead Costs
WaTech’s planned expenses for this fiscal year are provided in the table below.
Table 115. Private Cloud FY18 Planned Service Expenses
Cost Components
FY18 Planned FY19 Planned Cost Details
A Salaries 274,644 282,876 Salaries and benefits associated with 2 FTEs (includes direct staff and management)
B Benefits 89,820 92,988
E Goods & Services 709,292 287,331
vSAN, Zerto, SQL Server, Deep Security, and hardware maintenance
E Internal Purchases 14,580. 14,580
Desktop support
E Prepaid Monthly 0 574,560
E Prepaid Expense 574,559 603,287
VMware Enterprise Agreement through Accel Bi Corp. WaTech’s current accounting rule is to put any non-capital purchases of $500k or more as Prepaid and amortize it over the life of the expenses.
E Prepaid Elimination (574,559) (603,287)
G Travel 2,184 2,184
J Capitalized Assets 613,205 463,205
Additional hosted, upgraded memory and capacity, key management system
P Debt - Interest & Other Payments 8,000 8,000
Payments on servers
P Debt - Principal Payments 135,333 135,333
Payments on servers
T Transfers 111,125 112,102 Overhead

Page 393 of 851
Cost Components
FY18 Planned FY19 Planned Cost Details
Total Planned Expenses 1,958,183 1,973,159
Note: Cost details were pulled from “4790 SP” excel spend plan provide in February 2018
WaTech made a new investment in the private cloud in 2016 and 2017.
Table 116. Private Cloud Equipment Depreciation
Acquisition Cost Accumulated Depreciation Net Book Value
466,638 90,596 375,682
Given near-term planned operating expenses, WaTech will have the following workload costs for this service in FY18:
Table 117. Private Cloud Cost by Workload
Description Workload Cost Details
Total number of VMs Billed to Customers 284 Billed VMs
Average Cost Per VM Billed $574 per VM per month
Note: Workload cost in the table above is calculated based on WaTech’s alignment of costs to this service without adjustment for alignment to Gartner consensus models.
F/G. Rate structure CTS is currently billing to customers
The service is provided on a fee for service basis; rates are listed in the table below. Rates are cited in months, but they are calculated for invoicing on an hourly basis. Customers that choose to implement disaster recovery at QDC must pay the full rates listed in the table below for each VM that is configured for disaster recovery.
Table 118. Private Cloud Rates
Description Rate Detail
Virtual CPU (Core per month)
$43.00 Core per month (Primary and DR VMs charged separately at the same rate)
Memory (GB per month)
$9.00 GB per month (Primary and DR VMs charged separately at the same rate)
Storage (GB per month)
$0.10 GB per month (Primary and DR VMs charged separately at the same rate)
*Microsoft SQL Licensing per Virtual CPU (Core) (available in dedicated SQL Infrastructure) *Note: this Service is separate from Private Cloud. The customer must navigate to a different group in order to purchase MS SQL from WaTech for use on the private Cloud.
$75 per core per month (Primary and DR VMs charged separately at the same rate)
Rates were last updated in December, 2018.
WaTech has announced that Operational System level technical support pricing and Zerto Disaster Recovery pricing will be added to the rate model.
Page 394 of 851
When the Disaster Recovery concept was originally introduced, WaTech had created a service rate model based on an assumed level of agency demand for the service. The realized agency demand has been lower than anticipated, and WaTech has raised prices higher than was first communicated to agencies in order to recover for the service. WaTech is planning to charge agencies the full price for virtual machines at the Quincy Data Center, equivalent to the price paid in the State Data Center.
H. Analysis of Current Cost Recoverability
Given WaTech’s revenue assumptions and planned spend at the time biennium forecasting was completed, this service would be cost recoverable. However, the revenue forecast assumes that LNI will migrate from the legacy environment to the Private Cloud, but LNI recently communicated intention to pursue an alternative path forward. Given current forecasts for growth, Private Cloud may not be recoverable.
Table 119. Private Cloud Cost Recoverability (Actual FY16-FY18 H1)
Service Income FY16 FY17 FY18 H1
Service Revenue (4790) 0 502,100 624,741 Service Expense (4790) 0 (574,277) (746,217) Net Income 0 (72,177) (121,476)
Note: Actual revenue and expenses pulled from “AFRS Financial Download (Extracted on 2018-05-15)”
Table 120. Private Cloud Cost Recoverability (Forecasted FY18-FY19)
Service Income FY18 FY19
Service Revenue (4790) 3,234,076 4,253,808
Service Expense (4790) (1,958,183) (1,973,159)
Net Income 1,275,893 2,280,649 Note: Forecasted Cost recoverability detail pulled from “4790” excel spend plan provided in February 2018
The FY18 forecast assumed that LNI would migrate from the legacy environment to Private Cloud. That accounts for a big portion of the revenue increases reflected above. In FY 18, the forecast also assumes that most of the servers in legacy environment moved to Private Cloud. In FY 19, WaTech anticipates just a minimal growth. Taken together, WaTech believes that revenues will rise much faster than expenses. However, analysis completed to date does not address staffing considerations for an expanded Private Cloud and instead focuses on server purchases.
FY2018 costs are built with the following assumptions:
Upgrade Timing
Upgraded Cluster
Upgrade Cost Customer Migration Enabled New Associated
Monthly Revenue
July 2018 SDC General
74,754
Migrate in PGN Cluster
Migrate in ESS Cluster
Migrate in LNI Dev 42,014
July 2018 SDC SQL 29,893
Migrate in LNI Dev SQL
Migrate in LNI Prod SQL 34,490
September 2018
SDC General
65,220
Migrate in LNI Prod
Migrate non-LNI Legacy 50,719
September 2018 SDC SQL
21,740
Migrate in non-LNI Legacy SQL
Migrate in HRMS Prod SQL 37,994
Page 395 of 851
Upgrade Timing
Upgraded Cluster
Upgrade Cost Customer Migration Enabled New Associated
Monthly Revenue
September 2018 QDC
118,633
Add DCS Production DR
Add DCS Prod SQL DR
Add DCS Imaging DR
Add UTC DR
Add DRS DR
Add LNI DR Production
Add LNI DR Production SQL 32,699
January 2019
SDC General
21,740 Add HRMS Production
11,026
March 2019
39,177
Add Vault Workload 75%
Add OFM P20 DB
Add OFM PCHEES DB 14,550
March 2019
SDC General
108,700
Add Vault EV App - 75% of current sizing
Add Vault DA App - 75% of current sizing
Migration OFM P20 App
Migration OFM CNET PCHEES
Growth 58,902
March 2019 SDC SQL
21,740 Growth
15,392
Total Upgrade Expenses
501,596 Total New Revenue
297,786 Note: The estimates included in the table above included revenue and expense (equipment only) projections associated with migration of LNI to the Private Cloud, and therefore overstate future revenue.
I. Service Level Actually Provided Today
The Private Cloud has performed poorly during SQL transaction performance testing that was performed by a VMware engineer contracted by the state directly from VMware. During testing, when a typical I/O block size (64kb) was selected, the read latency was high (10-15ms) and when the I/O block size was large (1024 kb), which is in line with SQL transaction use cases, the latency was very high (75-125ms). The tests were run on the vSAN and the Private Cloud environment was also configured to run the same tests using the NetApp storage instead of the vSAN as an experimental control. The NetApp storage performed consistently well.
VMware did not initially diagnose a root cause of this poor performance. While VMware and WaTech did not perform an analysis of I/O wait, the results of running the test against the NetApp as a control seemed to suggest that there may be an issue with the configuration of the commodity storage in the hyperconverged system the Private Cloud is running on.

Page 396 of 851
WaTech continued to work with VMware after the initial challenges. At this time, WaTech reports that VMware suggested that top of rack switches and an upgrade to vSAN will correct the issues. However, until those actions are completed and the initial test re-ran, it is difficult to confirm whether these changes will address the root cause.
Additionally, WaTech has reported a high number of HP server blade failures early in the implementation and roll out of the Private Cloud that has caused some outages and affected the reputation of the Private Cloud environment.
J. Current Customers
WaTech has thirteen billable customers. WaTech internal sales are the second largest source of revenue.
Table 121. Private Cloud Current List of Customers
# Customer FY17 ($) FY17 (%) FY18 H1 ($) FY18 H1 (%)
1 3000-DEPARTMENT OF SOCIAL AND HEALTH SERVICES 47,087 10 175,965 29
2 2150-UTILITIES AND TRANSPORTATION COMMISSION 111,270 25 92,882 15
3 1240-DEPARTMENT OF RETIREMENT SYSTEMS 94,843 21 80,908 13
4 3030-DEPARTMENT OF HEALTH 14,185 3 68,393 11
5 3550-DEPARTMENT OF ARCHAEOLOGY AND HISTORIC PRESERVATION 31,597 7 17,875 3
6 2350-DEPARTMENT OF LABOR AND INDUSTRIES 7,950 2 4,522 1
7 2750-PUBLIC EMPLOYMENT RELATIONS COMMISSION 2,744 1 1,797 0
8 3870-WASHINGTON STATE ARTS COMMISSION 2,721 1 1,717 0
9 3570-DEPARTMENT OF EARLY LEARNING 4,184 1 450 0
10 1400-DEPARTMENT OF REVENUE - 269 0
Total Top 10 Billable Customers 316,580 70 444,778 74
Total for All Other Billable Customers 4,657 1 (936) (0)
Total WaTech Internal Sales 129,023 29 158,808 26
Total Revenue 450,261 100 602,650 100
Note: Customer billing details pulled from “Billing Data - Apptio FFS Only (2018-05-16)” excel file
K. Current and Historical Usage Volumes
Billing for the Private cloud has increased by 300% year over year between January of 2017 and 2018. Given the current pipeline it’s possible that usage may double again in the upcoming year.
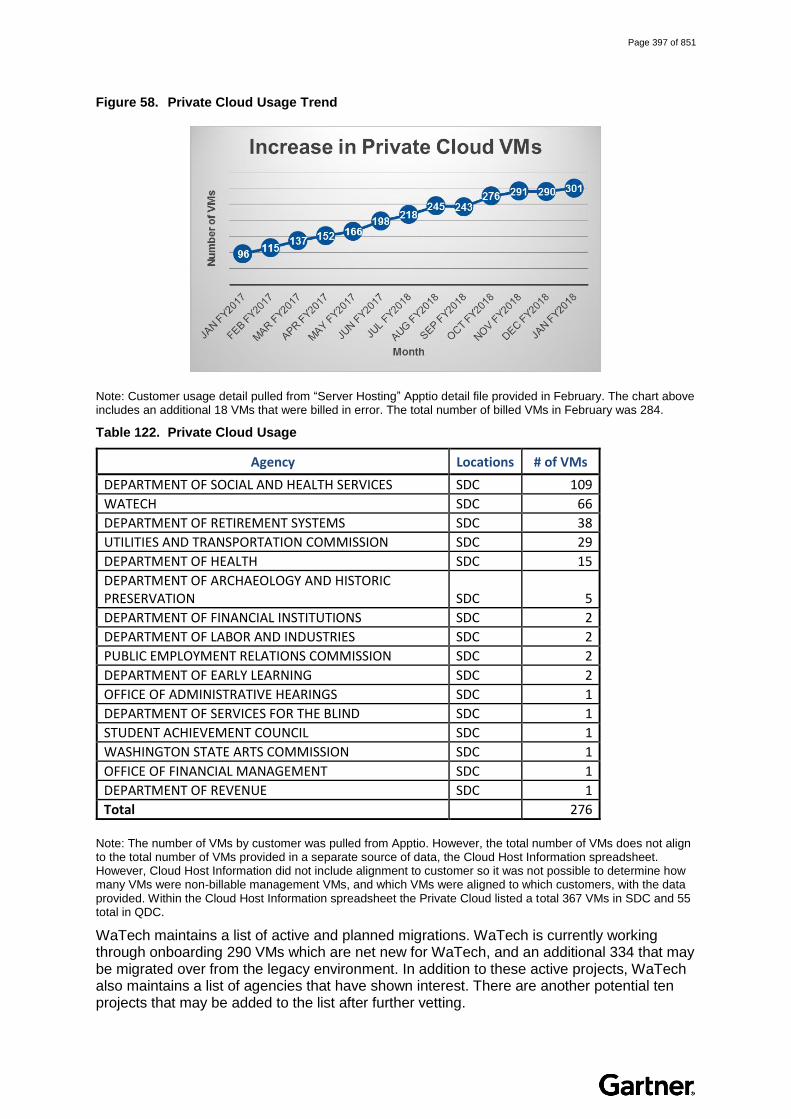
Page 397 of 851
Figure 58. Private Cloud Usage Trend
Note: Customer usage detail pulled from “Server Hosting” Apptio detail file provided in February. The chart above includes an additional 18 VMs that were billed in error. The total number of billed VMs in February was 284.
Table 122. Private Cloud Usage
Agency Locations # of VMs
DEPARTMENT OF SOCIAL AND HEALTH SERVICES SDC 109
WATECH SDC 66
DEPARTMENT OF RETIREMENT SYSTEMS SDC 38
UTILITIES AND TRANSPORTATION COMMISSION SDC 29
DEPARTMENT OF HEALTH SDC 15
DEPARTMENT OF ARCHAEOLOGY AND HISTORIC PRESERVATION SDC 5
DEPARTMENT OF FINANCIAL INSTITUTIONS SDC 2
DEPARTMENT OF LABOR AND INDUSTRIES SDC 2
PUBLIC EMPLOYMENT RELATIONS COMMISSION SDC 2
DEPARTMENT OF EARLY LEARNING SDC 2
OFFICE OF ADMINISTRATIVE HEARINGS SDC 1
DEPARTMENT OF SERVICES FOR THE BLIND SDC 1
STUDENT ACHIEVEMENT COUNCIL SDC 1
WASHINGTON STATE ARTS COMMISSION SDC 1
OFFICE OF FINANCIAL MANAGEMENT SDC 1
DEPARTMENT OF REVENUE SDC 1
Total 276
Note: The number of VMs by customer was pulled from Apptio. However, the total number of VMs does not align to the total number of VMs provided in a separate source of data, the Cloud Host Information spreadsheet. However, Cloud Host Information did not include alignment to customer so it was not possible to determine how many VMs were non-billable management VMs, and which VMs were aligned to which customers, with the data provided. Within the Cloud Host Information spreadsheet the Private Cloud listed a total 367 VMs in SDC and 55 total in QDC.
WaTech maintains a list of active and planned migrations. WaTech is currently working through onboarding 290 VMs which are net new for WaTech, and an additional 334 that may be migrated over from the legacy environment. In addition to these active projects, WaTech also maintains a list of agencies that have shown interest. There are another potential ten projects that may be added to the list after further vetting.

Page 398 of 851
Table 123. Private Cloud New Customer Forecasts
Agency Status Projects Locations # of VMs
1 DSB In Process New agency onboarding SDC/QDC VM > 2
2 BTA In Process New agency onboarding DC SDC VM > 2
3 UTC In Process New agency onboarding with DR SDC/QDC VM = 42
4 WSIPP In Design Stage New agency onboarding SDC/QDC VM > 5
5 OCIO-GIS
POC Complete – Waiting for Perm VLAN/IP's New agency onboarding SDC VM > 2
6 ACB In Network Design New agency onboarding SDC VM > 4
7 BIIA Waiting for OCS Design New PGN Website Site SDC VM > 1
8 DRS Waiting for Customer New DR environment QDC VM > 140
9 OAH Waiting for OCS Design New PGN Website Site SDC VM > 1
10 WWA ESF On Hold for More Testing New agency onboarding SDC VM > 1
11 PDC In Process New agency onboarding SDC VM > 7
12 DSHS-DCS In Process OTV for QDC DR SDC/QDC VM > 50
13 SAO In Process New agency onboarding SDC
Still in planning phase
14 DFI Waiting for OCS Design New PGN Website Site SDC VM > 2
15 HRMS Waiting for OCS Design New DR environment QDC VM > 31
16 DSHS-DVR Waiting for OCS Design New agency onboarding SDC
Still in planning phase
17 ESS* Not yet started Legacy Environment VM Migration SDC VM >120
18 PGN* Not yet started Legacy Environment VM Migration SDC VM > 30
19 SGN* Not yet started Legacy Environment VM Migration SDC VM > 140
20 SGN SQL* Not yet started Legacy Environment VM Migration SDC 29
21 SGN SQL DEV Not yet started
Legacy Environment VM Migration SDC 15
VM > 624
Note: Anticipated customer migration list provided by WaTech via email in February 2018. Note that LNI’s 172 virtual machines are not included in the Legacy Environment Migration total, As LNI has signaled intention to move away from WaTech’s services rather than migrate into the Private Cloud.
L. Customer Satisfaction and Future Demand
The Customer Voice appendix to this report includes customer satisfaction and future demand details based on the results of agency interviews and focus groups conducted during the project.

Page 399 of 851
M. High Level Architecture
The Private Cloud is built around a Software Designed Data Center (SDDC) model. It is a hyperconverged solution that is hardware agnostic. The approach that WaTech is taking is what Gartner calls the “reference architecture” approach to hyperconverged. This is defined as an approach where the hardware and software vendors work together to test and certify the hyperconverged software running on a limited set of qualified hardware models.
The Private Cloud is a VMware virtualized environment running on top of a commodity rack servers, with pre-configured all flash virtual SAN (vSAN); this equipment is what’s called a ReadyNode by VMware. At the present time, WaTech has chosen to use HP DL380 Servers that are on the vSAN Ready-Node HCL.
One reason WaTech selected this approach was to avoid binding to using a specific hardware vendor (i.e., vendor lock-in). Dell, Lenovo, HP, EMC, Cisco, etc. all have “commodity” hardware on the vSAN HCL. WaTech can buy hosts or just resources from any of these hardware vendors when WaTech needs to expand the environment.
However, on the other hand, there is additional complexity that must be managed with the reference architecture approach, and WaTech has been working closely with VMware to get support in troubleshooting performance issues.
The Private Cloud includes a primary cluster at SDC, a dedicated SQL cluster at SDC, and a third cluster recently installed at QDC for disaster recovery.
The commodity servers used as hosts across all clusters in the solution have been configured the same:
Dual 2.4GHz 14 core Intel Xeon processor
Two 800GB RAM
Fourteen 1.6TB storage drives
There are eight hosts configured in the SDC primary environment with total combined vSAN storage of 130.99TB, and there are six hosts in the SDC SQL cluster with a combined vSAN storage of 70TB, the single DR environment at QDC includes six hosts with a combined vSAN storage of 70TB.
Zerto DR Orchestration solution has recently been configured to enable VM-level DR backup and recovery over the SGN, however while several customers are currently planning to stand up virtualized DR servers in the QDC private cloud cluster, no customers have built out their DR solutions yet. The environment has been configured so that customers directly access the Zerto Orchestration tool, separately from the VMware provisioning console, to configure their own disaster recovery orchestration. Zerto is not currently a standard part of the Private Cloud. It is an optional service that all agencies within the Private Cloud can sign up to. DR requires that like resource amounts (CPU, Memory, and Storage) be available in the recovery location in the event a fail-over is required. This basically doubles the cost of a server. Most agencies are not prepared for that level of cost increase.
DR and/or Zerto cannot be added by agencies in an automated way using the self-service portal.
As of the date the configurations were provided, the VMware environment was effectively up to date on version 6 (a new v6.0 patch had just been released). The WaTech team sets up resource pools for customers and provides direct console access to customers for the specific delegated resource pools. Customers can use the vRealize Cloud Portal and vRealize Operations for self-service provisioning and monitoring of their environment.
Customers also have access to Trend Deep Security Firewall; however, at the time of report writing, this software has not been budgeted and WaTech is continuing this portion of the service offering. However, WaTech has acquired VMware NSX, which provides a more

Page 400 of 851
robust firewall and micro-segmentation capability. The plan is to retire Trend Micro Deep Security once NSX is configured and available for customer use.
No additional storage has been provisioned for the Private Cloud, all storage is located in the host hardware.
WaTech is planning to engage VMware to implement NSX (software defined networking tool) and vRealize Business (benchmarking and billing) WaTech anticipates that NSX will save several weeks in new customer on-boarding given the elimination of network and firewall group dependencies.
WaTech is also planning to use VMware as a cloud management platform to offer Amazon Web Services public cloud brokerage (identified specifically as it is the only VMware supported option) through the Private Cloud service.

Page 401 of 851
(4722) Server Hosting Provisioning, (4723) Services Secure Web Hosting, and (4785) Server Support Services
Background
This section discusses the hosting services provided on the Legacy VMware hosting environment. This includes (4722) for servers hosted on the State Government Network (SGN) and (4723) for servers hosted on the Public Government Network (PGN), and server administration/support through the operating system level (4785) which is provided optionally for any hosted server.
This service is covered under the Managed Server Hosting and Virtual Server Hosting entries in the online service catalog.
Note that this service is slated for retirement, and as such, this section was not as thoroughly reviewed by WaTech. Some of the information may contain minor inaccuracies.
A. Service Description
Definition
WaTech offers both virtual and physical server provisioning and hosting services to customers.
Physical provisioning and hosting provides customers with physical servers hosted in the State Data Center (SDC) or Quincy Data Center (QDC). WaTech procures the servers on behalf of the agency or enters into a leasing agreement, receives the equipment at the appropriate data center, and completes installation and cabling.
WaTech still owns the equipment and pays for all the costs – colocation included. The customers are billed monthly rates that WaTech anticipates would cover all the costs.
Virtual server provisioning and hosting provides customers with a virtual server on a virtualized server environment located within the SDC.
For both physical and virtual managed hosting services, customers may choose to purchase additional Operational/Technical support for an additional fee, which covers server administration support at the operating system level. This service includes components such as:
Operating System/DBMS/System Utility/Tool configuration, patching and updating
File System level storage capacity management and monitoring
File System level backup/restore/archive management
Installation and patching of user requested applications (COTS, line of business, etc.)
Applications/Operating System Process level performance/availability monitoring.
Server and application operational support (e.g. reboots, process starts/stops/restarts, server component capacity monitoring—CPU, memory, storage, process threads, etc.)
Remediation of security vulnerability gaps
Management of software licenses/keys and remediation of identified security vulnerabilities.

Page 402 of 851
Features
Hosting Service Details
Physical Server Provisioning and Hosting
New server provisioning
7x24 monitoring
7x24 or next business day break fix support depending of severity of customer impact
Data backup and restoration tailored to customer needs
Storage provisioning capacity management
Vendor coordination for server hardware and software system problems
Connectivity of agency and SGN Networks including ongoing performance and capacity monitoring
Virtual Server Provisioning and Hosting
Includes what is provided for physical servers, plus the items below
New servers can be provisioned in hours rather than weeks (once a ticket has been passed to WaTech’s team for manual provisioning)
Additional compute, storage and network resources can be added or removed on demand (manually with the submission of a ticket to the service desk)
VMware Virtual Infrastructure 5.1 (ESX and Virtual Center) licensing included, for WaTech employees to provision and de-provision resources on customers’ behalf
WaTech uses VMware's VMotion to move servers from one physical host to another without disruption, and dynamic load balancing to ensure virtual server workloads are evenly distributed across physical server hosts
Dynamic restart of virtual servers on an alternate physical server host if a host server fails
Highly available compute, network, and storage
WaTech maintenance and monitoring of the virtual server environment
Technical support 24 hours a day
Operational/ Technical Support (Optional)
Setup and maintenance of the operating system, server updates and patching via Microsoft WSUS, server monitoring
System software installation, updates, patches and fixes
Configuration and administration of Trend Deep Security firewall for micro segmentation including monitoring and issue mitigation
Troubleshooting of OS-related issues
Capacity/Performance monitoring for Windows Server and Unix systems that is tailored to customer needs
Recommendations on optimizing server performance resource utilization

Page 403 of 851
Notes
Unless customers purchase the additional Operational/Technical support, they are responsible from the operating system up the stack (OS, middleware, runtime, data and applications described above
WaTech is responsible for networking, storage, servers and virtualization layers; that is for configuring and upgrading the environment, up to the hypervisor and virtual machine blue print, and onboarding new customers
This service is slated for retirement in August or September of 2018
For SQL licenses, WaTech purchases the licenses and bills the customer $75 per CPU per month. (However, FY 18 SQL revenues are not in this cost center; this is also true for SQL support. It is now under Data Management 8211.)
B. Statutory Basis for Creation of Service or Program
There is no statutory mandate for WaTech’s delivery of this service.
C. How the Service Fits into the CTS Strategic Plan and Goals
WaTech reports that this service supports the strategic roadmap to ensure platforms and products are sourced for better performance and therefore is being retired.
D. Performance Measures used to Measure Effectiveness and Efficiency
WaTech does not have any service level targets associated with this service.
E. Current Cost to Maintain the Service
Staffing
Staff are not fully dedicated to the delivery of these services; therefore, WaTech uses transfer rules to assign staff to the service for the purposes of tracking and forecasting costs (shown as the 3.81 FTEs in direct/indirect labor for Server Hosting Services and 3.85 FTEs in direct/indirect labor for Support Services in the diagram below). These transfer rules were developed by estimating actual staff time spent on activities related to the service.
In addition, 1.95 percent of total overhead costs are being transferred to this service. If you apply that total cost percentage to the 65 FTE within overhead, it would be about 1.27 overhead FTE.

Page 404 of 851
Figure 59. Server Hosting Provisioning Services (4722) and Support (4785) Staffing
Note: Staffing numbers pulled from “Estimated Overhead FM6 December”. WaTech no longer provides any support to all the web sites in shared web hosting – WaTech is just maintaining as is. Therefore, no staff time is really allocated to that service. The costs for the actual server hosting (and any staff time spending on maintaining the servers) are billed to cc 4723 under the internal sales/internal purchases process.

Page 405 of 851
Figure 60. Server Hosting Provisioning Services (4722) and Support (4785) Direct/Indirect Staffing
Note: Staffing details pulled from “Org Chart - Color Coded 01.01.18” and combined with transfer rules in “FY18 Master Indexes 12-19-17”. The staff delivering the service under (4722) also delivers Shared Web Hosting (4723), and the staff costs for delivering that service is accounted for here as no transfer rule has been established to assign labor to 4723.

Page 406 of 851
. .
Workload Supported
The current supported workload is defined in the table below:
Table 124. Server Hosting Provisioning Services Workload Supported
Description Workload Supported
Total Number of virtual machines hosted 519
Total Number of Physical Machines Hosted 115 (machine details not provided)
Total Number of Servers under Operational/Technical Support
Not provided
Average vCPU’s per VM 3.6 vCPUs
Average RAM per VM 11 Gb
Average Storage in GB per VM 187 Gb
Note: Information partially pulled from Apptio and partially pulled from Information provided during review via the Cloud Host Information spreadsheet. Numbers were very similar across sources but not perfectly in alignment.
Direct, Indirect and Overhead Costs
WaTech’s planned expenses for this fiscal year are provided in the tables below.
Table 125. Managed Server Hosting (All Codes) FY18 Planned Service Expenses
Cost Components FY18 Planned FY19 Planned Cost Details
A Salaries 663,048 569,142 About 7.5 FTEs
B Benefits 255,990 211,422
E Goods & Services
653,783 558,018
Software: Microsoft, Red Hat, Deep Trend, Oracle, VMware, Deep Sec, SolarWinds and Fortinet firewall and Hardware maintenance
E Internal Purchases 1,207,788 1,207,788
$1M worth of Storage and Backup, Desktop and Colocation
G Travel 5,632 5,088
J Non-capitalized Assets 239 239
P Debt - Principal Payments 84,141 0
T Transfers 351,285 354,373 Overhead
Total Planned Expenses 3,221,906 2,906,070
Table 126. Server Hosting Provisioning Services (4722) FY18 Planned Service Expenses
Cost Components FY18 Planned FY19 Planned Cost Details
A Salaries 329,646 240,630
Salaries and benefits associated with 3.98 FTEs in FY18 and 2.77 FTEs in FY19 (includes direct staff and management)
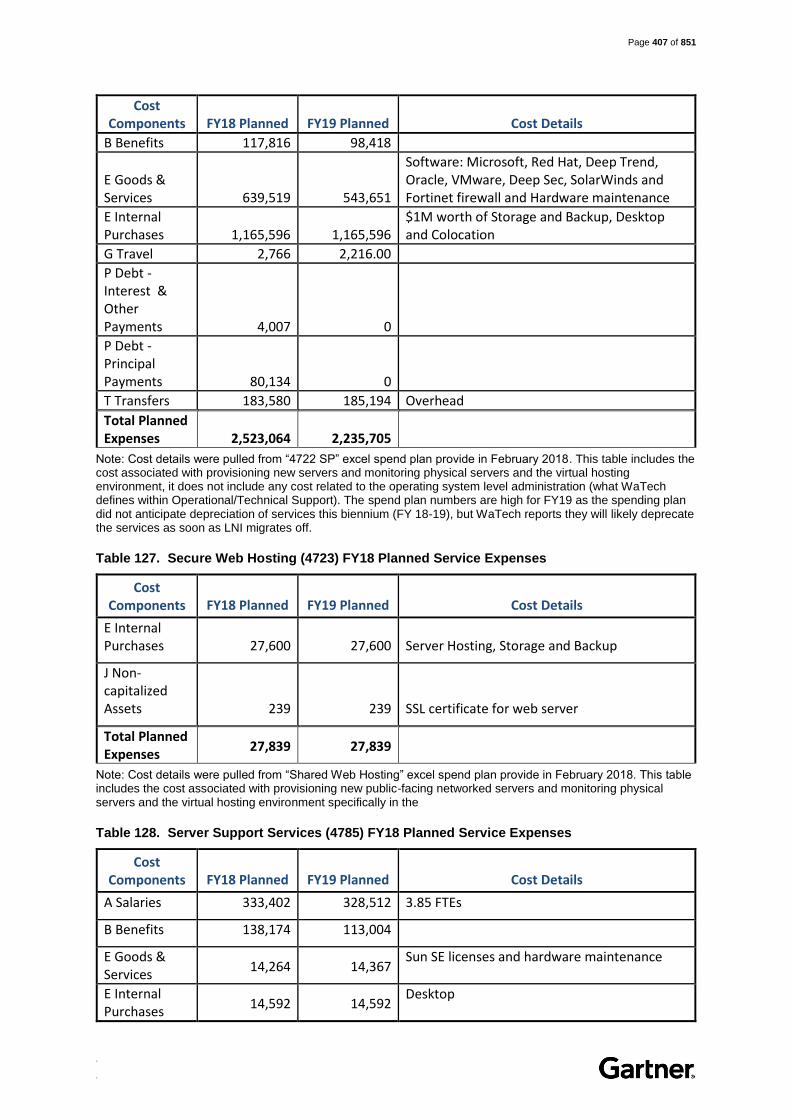
Page 407 of 851
. .
Cost Components FY18 Planned FY19 Planned Cost Details
B Benefits 117,816 98,418
E Goods & Services 639,519 543,651
Software: Microsoft, Red Hat, Deep Trend, Oracle, VMware, Deep Sec, SolarWinds and Fortinet firewall and Hardware maintenance
E Internal Purchases 1,165,596 1,165,596
$1M worth of Storage and Backup, Desktop and Colocation
G Travel 2,766 2,216.00
P Debt - Interest & Other Payments 4,007 0
P Debt - Principal Payments 80,134 0
T Transfers 183,580 185,194 Overhead
Total Planned Expenses 2,523,064 2,235,705
Note: Cost details were pulled from “4722 SP” excel spend plan provide in February 2018. This table includes the cost associated with provisioning new servers and monitoring physical servers and the virtual hosting environment, it does not include any cost related to the operating system level administration (what WaTech defines within Operational/Technical Support). The spend plan numbers are high for FY19 as the spending plan did not anticipate depreciation of services this biennium (FY 18-19), but WaTech reports they will likely deprecate the services as soon as LNI migrates off.
Table 127. Secure Web Hosting (4723) FY18 Planned Service Expenses
Cost Components FY18 Planned FY19 Planned Cost Details
E Internal Purchases 27,600 27,600 Server Hosting, Storage and Backup
J Non-capitalized Assets 239 239 SSL certificate for web server
Total Planned Expenses
27,839 27,839
Note: Cost details were pulled from “Shared Web Hosting” excel spend plan provide in February 2018. This table includes the cost associated with provisioning new public-facing networked servers and monitoring physical servers and the virtual hosting environment specifically in the
Table 128. Server Support Services (4785) FY18 Planned Service Expenses
Cost Components FY18 Planned FY19 Planned Cost Details
A Salaries 333,402 328,512 3.85 FTEs
B Benefits 138,174 113,004
E Goods & Services
14,264 14,367 Sun SE licenses and hardware maintenance
E Internal Purchases
14,592 14,592 Desktop

Page 408 of 851
. .
Cost Components FY18 Planned FY19 Planned Cost Details
G Travel 2,866 2,872
T Transfers 167,705 169,179 Overhead
Total Planned Expenses
671,003 642,526
Note: Cost details were pulled from “4785 SP” excel spend plan provide in February 2018. This table includes the cost related to the operating system level administration (what WaTech defines within Operational/Technical Support).
WaTech has made large capital investments in order to deliver this service and there are currently many depreciated assets with low book value being tracked. WaTech has made the decision to retire this environment in favor of the private cloud.
Table 129. Server Hosting Provisioning Services Equipment Depreciation
Acquisition Cost Accumulated Depreciation Net Book Value
1,560,085 1,332,974 227,111
Given near-term planned operating expenses, WaTech will have the following workload costs for this service in FY18:
Table 130. Server Hosting Provisioning Services Cost by Workload
Description Workload Cost Details
Total number of virtual servers hosted (billed to customers) 519 Virtual Servers
Total number of physical servers hosted 115 Physical Servers
Total number of hosted servers 634 Hosted Servers
Cost for server hosting $2,263,544
Average cost per server hosted (excluding OS administrative Operational/Technical support services) $297 per server per month
Total number of Servers under Operational/Technical Support 176 Servers
Total cost for Operational/Technical Support $642,526 support cost
Average cost per server for OS administrative Operational/Technical support services $304.23 per server per month
Note: Workload cost in the table above is calculated based on WaTech’s alignment of costs to this service without adjustment for alignment to Gartner consensus models.
F/G. Rate structure CTS is currently billing to customers
Rates for Server Hosting are comprised of rates for monitoring, space, and a negotiated network charge.
The service is provided on a fee for service basis based on the amount of storage used.
Table 131. Server Hosting Provisioning Services Rates
Description Rate Detail
Virtual and Physical servers
Custom SLAs calculated based on storage usage
SLAs are built around storage usage, both for Server Provisioning (4722) and Shared Web Hosting (4723) WaTech charges a one-time setup fee of
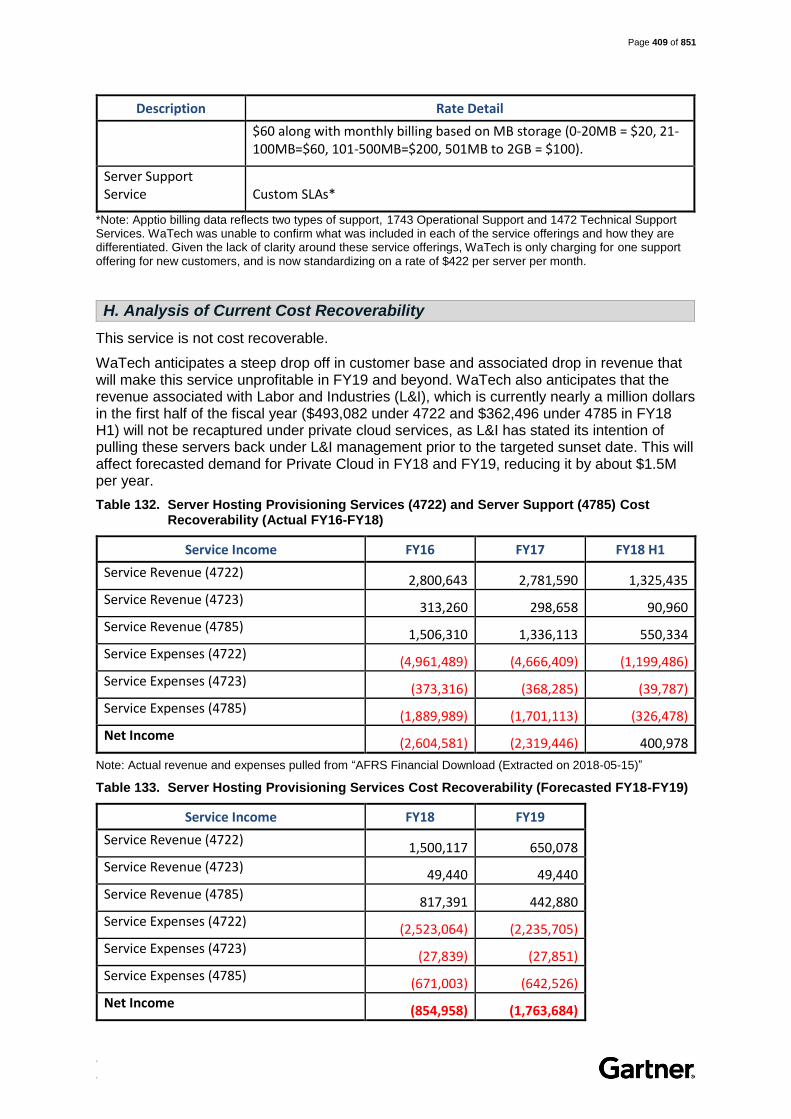
Page 409 of 851
. .
Description Rate Detail
$60 along with monthly billing based on MB storage (0-20MB = $20, 21-100MB=$60, 101-500MB=$200, 501MB to 2GB = $100).
Server Support Service Custom SLAs*
*Note: Apptio billing data reflects two types of support, 1743 Operational Support and 1472 Technical Support Services. WaTech was unable to confirm what was included in each of the service offerings and how they are differentiated. Given the lack of clarity around these service offerings, WaTech is only charging for one support offering for new customers, and is now standardizing on a rate of $422 per server per month.
H. Analysis of Current Cost Recoverability
This service is not cost recoverable.
WaTech anticipates a steep drop off in customer base and associated drop in revenue that will make this service unprofitable in FY19 and beyond. WaTech also anticipates that the revenue associated with Labor and Industries (L&I), which is currently nearly a million dollars in the first half of the fiscal year ($493,082 under 4722 and $362,496 under 4785 in FY18 H1) will not be recaptured under private cloud services, as L&I has stated its intention of pulling these servers back under L&I management prior to the targeted sunset date. This will affect forecasted demand for Private Cloud in FY18 and FY19, reducing it by about $1.5M per year.
Table 132. Server Hosting Provisioning Services (4722) and Server Support (4785) Cost Recoverability (Actual FY16-FY18)
Service Income FY16 FY17 FY18 H1
Service Revenue (4722) 2,800,643 2,781,590 1,325,435
Service Revenue (4723) 313,260 298,658 90,960
Service Revenue (4785) 1,506,310 1,336,113 550,334
Service Expenses (4722) (4,961,489) (4,666,409) (1,199,486)
Service Expenses (4723) (373,316) (368,285) (39,787)
Service Expenses (4785) (1,889,989) (1,701,113) (326,478)
Net Income (2,604,581) (2,319,446) 400,978
Note: Actual revenue and expenses pulled from “AFRS Financial Download (Extracted on 2018-05-15)”
Table 133. Server Hosting Provisioning Services Cost Recoverability (Forecasted FY18-FY19)
Service Income FY18 FY19
Service Revenue (4722) 1,500,117 650,078
Service Revenue (4723) 49,440 49,440
Service Revenue (4785) 817,391 442,880
Service Expenses (4722) (2,523,064) (2,235,705)
Service Expenses (4723) (27,839) (27,851)
Service Expenses (4785) (671,003) (642,526)
Net Income (854,958) (1,763,684)

Page 410 of 851
. .
Note: Forecasted Cost recoverability detail pulled from “4722 SP”, “4723 SP” and “SP 4785” excel spend plans provide in February 2018.
I. Service Level Actually Provided Today
WaTech does not track and report on performance for these services. However, given these services do not include a self-service capability where customers can provision their own servers, and does not include any automation for provisioning (server, network, active directory, firewall rules, etc.), customers must submit a request through the helpdesk and wait for new resources to be provisioned by WaTech staff on their behalf.
No reports on environment availability have been provided. It is unclear how reliable this service is.
J. Current Customers
WaTech has over a couple dozen customers across its legacy managed hosting services (4722, 4723 and 4785). Over eighty percent of the revenue for these services comes from LNI and internal sales.
Table 134. Managed Server Hosting (4722, 4723, and 4785) Current List of Customers
# Customer FY17 ($) FY17 (%) FY18 H1 ($) FY18 H1 (%)
1 2350-DEPARTMENT OF LABOR AND INDUSTRIES 1,643,470 37 855,578 42
2
2150-UTILITIES AND TRANSPORTATION COMMISSION 143,620 3 61,545 3
3 3030-DEPARTMENT OF HEALTH 90,901 2 54,676 3
4
3000-DEPARTMENT OF SOCIAL AND HEALTH SERVICES 45,498 1 14,836 1
5 1170-WASHINGTON STATE GAMBLING COMMISSION 28,400 1 15,000 1
6
3550-DEPARTMENT OF ARCHAEOLOGY AND HISTORIC PRESERVATION 26,284 1 13,142 1
7 2400-DEPARTMENT OF LICENSING 16,000 0 4,200 0
8 4770-DEPARTMENT OF FISH AND WILDLIFE 15,069 0 3,321 0
9 1010-CASELOAD FORECAST COUNCIL 14,582 0 9,537 0
10 0950-OFFICE OF THE STATE AUDITOR 12,037 0 7,436 0
Total Top 10 Billable Customers 2,035,861 46 1,039,271 51
Total for All Other Billable Customers 224,281 5 47,226 2
Total WaTech Internal Sales 2,181,371 49 959,580 47
Total Revenue 4,441,513 100 2,046,077 100
Note: Customer billing details pulled from “Billing Data - Apptio FFS Only (2018-05-16)” excel file
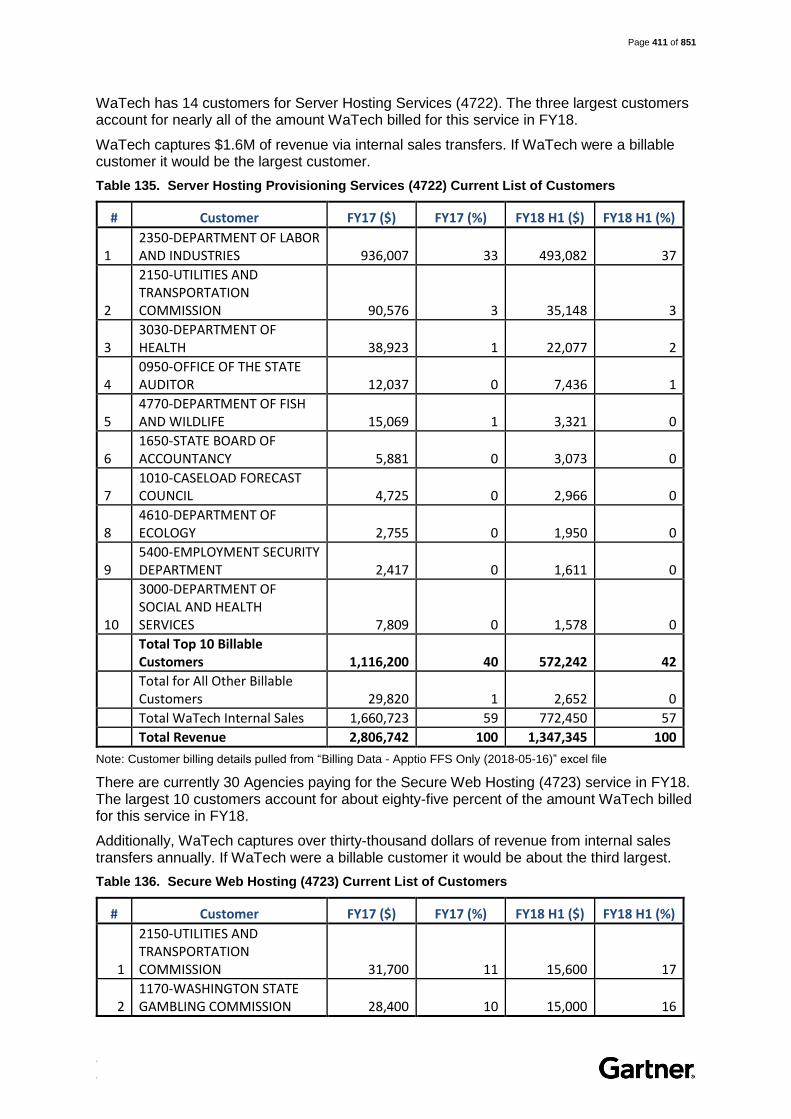
Page 411 of 851
. .
WaTech has 14 customers for Server Hosting Services (4722). The three largest customers account for nearly all of the amount WaTech billed for this service in FY18.
WaTech captures $1.6M of revenue via internal sales transfers. If WaTech were a billable customer it would be the largest customer.
Table 135. Server Hosting Provisioning Services (4722) Current List of Customers
# Customer FY17 ($) FY17 (%) FY18 H1 ($) FY18 H1 (%)
1 2350-DEPARTMENT OF LABOR AND INDUSTRIES 936,007 33 493,082 37
2
2150-UTILITIES AND TRANSPORTATION COMMISSION 90,576 3 35,148 3
3 3030-DEPARTMENT OF HEALTH 38,923 1 22,077 2
4 0950-OFFICE OF THE STATE AUDITOR 12,037 0 7,436 1
5 4770-DEPARTMENT OF FISH AND WILDLIFE 15,069 1 3,321 0
6 1650-STATE BOARD OF ACCOUNTANCY 5,881 0 3,073 0
7 1010-CASELOAD FORECAST COUNCIL 4,725 0 2,966 0
8 4610-DEPARTMENT OF ECOLOGY 2,755 0 1,950 0
9 5400-EMPLOYMENT SECURITY DEPARTMENT 2,417 0 1,611 0
10
3000-DEPARTMENT OF SOCIAL AND HEALTH SERVICES 7,809 0 1,578 0
Total Top 10 Billable Customers 1,116,200 40 572,242 42
Total for All Other Billable Customers 29,820 1 2,652 0
Total WaTech Internal Sales 1,660,723 59 772,450 57
Total Revenue 2,806,742 100 1,347,345 100
Note: Customer billing details pulled from “Billing Data - Apptio FFS Only (2018-05-16)” excel file
There are currently 30 Agencies paying for the Secure Web Hosting (4723) service in FY18. The largest 10 customers account for about eighty-five percent of the amount WaTech billed for this service in FY18.
Additionally, WaTech captures over thirty-thousand dollars of revenue from internal sales transfers annually. If WaTech were a billable customer it would be about the third largest.
Table 136. Secure Web Hosting (4723) Current List of Customers
# Customer FY17 ($) FY17 (%) FY18 H1 ($) FY18 H1 (%)
1
2150-UTILITIES AND TRANSPORTATION COMMISSION 31,700 11 15,600 17
2 1170-WASHINGTON STATE GAMBLING COMMISSION 28,400 10 15,000 16

Page 412 of 851
. .
# Customer FY17 ($) FY17 (%) FY18 H1 ($) FY18 H1 (%)
3
3000-DEPARTMENT OF SOCIAL AND HEALTH SERVICES 21,520 7 11,020 12
4 2250-WASHINGTON STATE PATROL 9,200 3 5,000 5
5 2400-DEPARTMENT OF LICENSING 16,000 5 4,200 5
6 1900-BOARD OF INDUSTRIAL INSURANCE APPEALS 6,640 2 3,600 4
7 D410-LACEY CITY 8,300 3 2,800 3
8 1020-DEPARTMENT OF FINANCIAL INSTITUTIONS 8,320 3 2,660 3
9 1260-STATE INVESTMENT BOARD 3,400 1 2,400 3
10 3100-DEPARTMENT OF CORRECTIONS 5,000 2 2,400 3
Total Top 10 Billable Customers 138,480 46 64,680 71
Total for All Other Billable Customers 113,960 38 11,960 13
Total WaTech Internal Sales 46,218 15 14,320 16
Total Revenue 298,658 100 90,960 100
Note: Customer billing details pulled from “Billing Data - Apptio FFS Only (2018-05-16)” excel file
WaTech has nine customers of Server Support Services (4785). The largest two customers account for ninety percent of the amount WaTech billed for this service in FY18. WaTech captures. If WaTech were a billable customer it would be the second largest.
Table 137. Server Support Services (4785) Current List of Customers
# Customer FY17 ($) FY17 (%) FY18 H1 ($) FY18 H1 (%)
1 2350-DEPARTMENT OF LABOR AND INDUSTRIES 707,463 53 362,496 60
2 3030-DEPARTMENT OF HEALTH 51,978 4 32,599 5
3
3550-DEPARTMENT OF ARCHAEOLOGY AND HISTORIC PRESERVATION 26,284 2 13,142 2
4
2150-UTILITIES AND TRANSPORTATION COMMISSION 21,344 2 10,797 2
5 1010-CASELOAD FORECAST COUNCIL 9,857 1 6,571 1
6 4610-DEPARTMENT OF ECOLOGY 6,571 0 3,286 1
7 5400-EMPLOYMENT SECURITY DEPARTMENT 6,571 0 3,286 1
8
3000-DEPARTMENT OF SOCIAL AND HEALTH SERVICES 16,169 1 2,238 0

Page 413 of 851
. .
# Customer FY17 ($) FY17 (%) FY18 H1 ($) FY18 H1 (%)
9 1790-DEPARTMENT OF ENTERPRISE SERVICES 6,571 0 548 0
Total Top 10 Billable Customers 852,808 64 434,961 72
Total for All Other Billable Customers 8,874 1 - -
Total WaTech Internal Sales 474,430 36 172,810 28
Total Revenue 1,336,113 100 607,772 100
Note: Customer billing details pulled from “Billing Data - Apptio FFS Only (2018-05-16)” excel file
K. Current and Historical Usage Volumes
Over ninety percent of WaTech’s revenue in Server Hosting Provisioning Services come from virtual hosting.
Table 138. Server Hosting Provisioning (4722) Services Customer Usage
Service Offering FY17 ($) FY17 (%) FY18 H1 ($) FY18 H1 (%)
CTS SERVER HOSTING-PHYSICAL INFRAST
226,329 8
93,412 7
CTS SERVER HOSTING-VIRTUAL INFRASTR
2,559,069 91
1,253,933 93
CTS SERVER HOSTING-PRIVATE CLOUD IN
21,344 1 0 0
Total Revenue 2,806,742 100 1,347,345 100
Note: Customer billing details pulled from “Billing Data - Apptio FFS Only (2018-05-16)” excel file
Over the past year Server Hosting Provisioning for virtual servers has started to trend down. This will accelerate rapidly as the largest customer (beyond WaTech as a customer for its own service) has confirmed plans to move off WaTech’s hosting service. Over 25% of the workload revenue will be lost (129 VMs) which will not be recaptured in private cloud revenue.
Note: Customer usage detail pulled from “Server Hosting” Apptio detail file provided in February.
The number of physical servers has fluctuated slightly over the last year.

Page 414 of 851
. .
Note: Customer usage detail pulled from “Server Hosting” Apptio detail file provided in February
According to the Apptio sales history report for 4723, 71% of the revenue for this service in FY18 was the Shared Web Hosting service offering. However, WaTech has reported that applications hosted under that offering have migrated off, and the only remaining portion of this service is the Secure Web Hosting service offering.
Table 139. Secure Web Hosting (4723) Usage
Service Offering FY17 ($) FY17 (%) FY18 H1 ($) FY18 H1 (%)
SECURE WEB HOSTING 49,802 17 24,720 27
SHARED WEB HOSTING 247,696 83 66,040 73
URL REDIRECT 1,160 0 200 0
Total Revenue 298,658 100 90,960 100
Note: Customer billing details pulled from “Billing Data - Apptio FFS Only (2018-05-16)” excel file
For Server Support Service there is a Server Technical Support offering and Operational Support offering. However, WaTech is unable to provide documentation that would substantiate a difference between this two offerings. Due to uncertainty, WaTech has stopped adding new customers to Technical Support services and only sells Operational Support to new customers.
Table 140. Server Support Services (4785) Usage
Service Offering FY17 ($) FY17 (%) FY18 H1 ($) FY18 H1 (%)
CTS SERVER OPERATIONAL SPPT SERVICE 319,375 24 153,750 25
CTS SERVER TECHNICAL SPPT SERVICES 1,016,738 76 454,022 75
Total Revenue 1,336,113 100 607,772 100
Note: Customer billing details pulled from “Billing Data - Apptio FFS Only (2018-05-16)” excel file

Page 415 of 851
. .
L. Customer Satisfaction and Future Demand
The Customer Voice appendix to this report includes customer satisfaction and future demand details based on the results of agency interviews and focus groups conducted during the project.
M. High Level Architecture
This service includes a variety of platforms including HP-ProLiant servers, Sun Solaris, and Linux across physical and virtualized servers.
The virtualized service is provided via VMware vSphere 5.1 environment (separate from both private cloud and the Platform & Connectivity environments). Self-service capabilities have not been configured and customers are dependent on WaTech to spin up new servers when requested. The VMware vSphere environment has not been upgraded since the service was initially created.
The VMAX and NetApp storage and Avamar backup services are connected to these physical and virtualized servers.

Page 416 of 851
. .
(4231) Platform & Connectivity Service
Background
This service involves the management of OFM, WaTech, DES, GOV, and some small agencies core agency LAN network, and their server and storage environment. Following the CTS, OFM and DES merger, this environment was kept separate and was not consolidated with the other managed server hosting and storage environments. This is despite the fact that there has long been a plan to do so, and this plan has been used a rationale for not refreshing equipment/software and expanding capacity
WaTech still plans to migrate the workload on the Platform & Connectivity Service to the Private Cloud in FY19
This is not a statewide service; it is only available to WaTech Desktop Services (FileDepot, core routing, etc.), OFM, DES, and the Governor’s office, etc.
Historically this service was combined (financially) with Desktop and LAN Support, but the “front end” (Desktop and LAN) and “back end” (Servers, Storage and OFM Core LAN network) were split into separate cost codes in an attempt to provide greater cost transparency to the customers. Prior to the financial split, both services were billed to OFM, WaTech, and DES as a services largely understood by customers to be for desktop services. It was billed at $5,000 per desktop which was perceived to be too high for a “desktop” service. Following the service split/redefinition, the cost of Desktop and LAN service was reduced to $3,500 per desktop. The remaining cost was allocated to the new Platform and Connectivity Service
There is presently no service catalog entry that aligns to this service
A. Service Description
Definition
The Platform and Connectivity service includes services that make up much of WaTech’s back office IT support for OFM. These include:
OFM, DES, GOV and small agencies’ Application Server Hosting
o Managed virtual server hosting - operated from a legacy converged Nutanix and HP blade (not blades – HP G7) infrastructure
o Managed physical server hosting- there are only a few remaining
Virtual desktop infrastructure services (Approximately 67 persistent VDI instances running on the converged Nutanix platform)
Server level backups
MS SQL database level backups
OFM, DES, GOV and small agencies’ Core DC LAN network infrastructure which provides connectivity to OFM, DES, GOV and small agency servers and databases located in the SDC
FileDepot Unstructured Data/File Storage Services

Page 417 of 851
. .
SharePoint Site (as separately defined in the SharePoint entry in the Collaboration and Messaging section of the services inventory)
System Administration:
o Operating System/DBMS/System Utility/Tool configuration, patching and updating
o File System level storage capacity management and monitoring o File System level backup/restore/archive management o Installation and patching of user requested applications (COTS, line of
business, etc.) The PCS group supports Server OS and below (in the tech stack) The SysOps team supports above the OS, including the business
applications o Operating System and Application Level Availability and Performance
Monitoring Operating System level performance/availability monitoring is done by
PCS. Application monitoring is performed by Systems Operations, not PCS
(4231). Systems Operations staff are paid for by the Enterprise Services Fee (ESF – 8315)
o Server and application operational support (e.g. reboots, process starts/stops/restarts, server component capacity monitoring—CPU, memory, storage, process threads, etc.)
o Remediation of security vulnerability gaps o Management of software licenses/keys and remediation of identified security
vulnerabilities.
Network Administration
o Firewall, Router and switch configuration and maintenance o Network performance and capacity monitoring o Incident troubleshooting and resolution
B. Statutory Basis for Creation of Service or Program
WaTech delivery of this specific service is not mandated by statute.
C. How the Service Fits into the CTS Strategic Plan and Goals
WaTech reports that this service supports the strategic roadmap to ensure platforms and products are sourced for better performance and therefore is being retired.
D. Performance Measures used to Measure Effectiveness and Efficiency
WaTech calculates uptime metrics for the servers and network devices supported by PCS via the SolarWinds Orion tools, same for application uptime for critical applications.
E. Current Cost to Maintain the Service
Staffing
The majority of the staff supporting Platform and Connectivity service are a fully dedicated team, however, some additional WaTech resources provide some part-time support For division management and support center staff, WaTech uses transfer rules to assign staff to the service for the purposes of tracking and forecasting costs These transfer rules were developed by estimating actual staff time spent on activities related to the service. These totaled to 7.31 FTEs in direct/indirect labor in the diagram below.

Page 418 of 851
. .
In addition, 1.86 percent of total overhead costs are being transferred to this service. If you apply that total cost percentage to the 65 FTE within overhead, it would be about 1.21 overhead FTE.
Figure 61. Platform and Connectivity Service Staffing
Note: Staffing numbers pulled from “Estimated Overhead FM6 December”
Figure 62. Platform and Connectivity Service Direct/Indirect Staffing
Note: Staffing details pulled from “Org Chart - Color Coded 01.01.18” and combined with transfer rules in “FY18 Master Indexes 12-19-17”

Page 419 of 851
. .
Workload Supported
The current supported workload is defined in the table below:
Table 141. Platform and Connectivity Service Workload Supported
Description Workload Supported
Total Number of virtual machines hosted 559 virtual machines
Total Number of Physical Machines Hosted 50 physical machines
Total Number of Servers under Operational/Technical Support 500 supported servers
Network Devices supported (including firewall, switches, high end core switches, proxy servers, etc.) 260 network devices
Number of Network Users Supported 2500 users
Average Storage in GB per VM
450 GB provisioned
281 GB used
Average vCPU’s per VM 2.8 vCPU
Average RAM per VM 11.5 GB
Note: Workload information to be provided during inventory review.
Table 142. Platform and Connectivity Service Workload Supported
Entity Month Year Share
of Server
# of CPU
Amount of
Memory (GB)
Amount of Used
Space (GB)
Amount of Provisioned Space (GB)
OFM March 2018 270.08 851 3,669 98,205.81 153,149.94
GOV March 2018 9.70 102 432 48,85.54 8,781.64
DES March 2018 78.95 342 1,340 25,349.97 41,846.32
GIS March 2018 11.00 37 112 565.30 1,148.39
WAMAs March 2018 7.00 26 120 465.00 1,632.37
OCIO March 2018 0.50 38 196 2,165.31 4107.96
OCS March 2018 1.00 38 196 2,165.31 4,107.96
WaTech March 2018 4.00 8 28 162.34 380.48
Desktop March 2018 89.90 175 687 9,364.81 14,741.58
Forecasting March 2018 28.97 200 946 34,201.74 554,77.70
Totals 501.10 1817 7726 177,531.13 285,374.34
Note: the virtual machines captured in the table above reflect a point-in-time snapshot of the most recent available supported workload, VMs do fluctuate slightly on a month to month basis.
Note: Additional PCS workload not captured in the table above:
Support of 5 Active Directory domains (eClient, eApp, GA, OFM, DOP, & DIS)

Page 420 of 851
. .
Support of DHCP servers
Unstructured data provided via FileDepot in support of Desktop Services
Internal DNS support
Internal F5 support
Support for TV’s in elevator lobbies
Azure VPN tunnel support
Data Domain administration and support for server images and SQL backups 100TB in SDC and 100TB in QDC
Virtual infrastructure hosted in QDC
Network support for remote OFM/GOV remote offices (OFCO/Tukwila)
PCS still hosts DES servers, until they leave later this year.
Firewall administration for OFM/GOV/DES servers/applications
Direct, Indirect and Overhead Costs
WaTech’s planned expenses for this fiscal year are provided in the table below.
Table 143. Platform and Connectivity Service FY18 Planned Service Expenses
Cost Components
FY18 Planned FY19 Planned Cost Details
A Salaries 741,997 682,152
B Benefits 271,620 271,428
E Goods & Services
777,379 812,181
Software: ReplaceMagic, F5, Fortinet, Vranger, Bomgar, CRM and Easy Vista, McAfee, Crix, Microsoft, IBM, VMWare, SolarWinds, EMC Data Domain, IBM, Nutanix and Cisco hardware maintenance
E Internal Purchases
145,020 145,020 Colocation and Desktop
G Travel 6,976 6,104
J Non-capitalized Assets 167,382 170,751 Hosts, blades, network equipment
T Transfers 354,949 358,068 Overhead
Total Planned Expenses
2,465,323 2,445,704
Note: Cost details were pulled from “4231 SP” excel spend plan provide in February 2018
WaTech made recent capital investments for the virtualized hosting environment. However, additional upgrades will be needed in the near term. No upgrades were budgeted for this biennium.
Table 144. Platform and Connectivity Service Equipment Depreciation
Acquisition Cost Accumulated Depreciation Net Book Value
2,506,812 1,988,141 518,671
Given comingled cost tracking for a variety of services provided under this cost code, it is not possible to provide a workload cost estimate for the services under this code at this time.

Page 421 of 851
. .
F/G. Rate structure CTS is currently billing to customers
The service is provided based on a negotiated Service Level Agreement.
H. Analysis of Current Cost Recoverability
This service is cost recoverable based on available data and WaTech’s forecasted spend.
Table 145. Platform and Connectivity Service Cost Recoverability (Actual FY16-FY18)
Service Income FY16 FY17 FY18 H1
Service Revenue (4231) 0 0 1,102,804 Service Expense (4231) 0 0 (1,112,838) Net Income 0 0 (10,034)
Note: Actual revenue and expenses pulled from “AFRS Financial Download (Extracted on 2018-05-15). Historical billing for this service is tied to Desktop and Network SLAs. This service separation is new this year in order to add better transparency and more appropriate pricing for desktop services. Given available information, it was not possible to separate the server and core network support costs for FY16 and FY17 from the desktop and LAN support.
Table 146. Platform and Connectivity Service Cost Recoverability (Forecasted FY18-FY19)
Service Income FY18 FY19
Service Revenue (4231) 3,213,024 3,213,024
Service Expense (4231) 2,465,323 2,445,704
Net Income 747,701 767,320 Note: Forecasted Cost recoverability detail pulled from “4231” excel spend plan provide in February 2018
I. Service Level Actually Provided Today
WaTech calculates uptime metrics for the servers and network devices supported by PCS via the SolarWinds Orion tools, same for application uptime for critical applications. WaTech provided reports indicating consistent performance in line with targets
J. Current Customers
Customer data was not provided; however, it is understood that this service is delivered specifically to OFM, Governor’s Office, WaTech, and DES via SLA.
K. Current and Historical Usage Volumes
Customer usage data not provided for this service. However, given the assumptions implicit in the spend plan revenue projection, the customer focus is on server hosting and backup.
Table 147. Platform and Connectivity Service Customer Usage
Service Offering % of Spend
Server Hosting 69
Backup 22
SQL backup 0
Core Routing 3
Unstructured Data Services 3
SharePoint 1
System Administration 2
Network Administration 0

Page 422 of 851
. .
L. Customer Satisfaction and Future Demand
The Customer Voice appendix to this report includes customer satisfaction and future demand details based on the results of agency interviews and focus groups conducted during the project.
M. High Level Architecture
Currently this Platform and Connectivity team manages a Nutanix VMware environment, data domain storage, and the core routing. While the desktop support team (8111) provide desktop and LAN support.
When WaTech merged with OCIO and ETS (part of OFM) each organization had separate core networks and server and storage environments. WaTech took over management of this environment on behalf of customers. Thus far WaTech has not made much progress in migrating customer’s network to WaTech’s network. The current Platform and Connectivity service network topology is provided in the diagram below.
Note: Architecture provided by WaTech in March of 2018.

Page 423 of 851
. .
5. Storage Hosting Services
(4589) Server and Mainframe Storage
Background
This service is referred to interchangeably as Storage Area Network, SAN, Ultra High Performance (UHP), and Server and Mainframe Storage
Both the NetApp and VMAX storage devices are currently used to provide storage services under this cost code
WaTech’s mainframe service as well as the managed servers service connects into this SAN – these storage charges, while ultimately for the same environment, are covered under different cost codes
A. Service Description
Definition
Customers with servers in the State Data Center can easily connect to extra storage via the WaTech Storage Area Network (SAN). Rather than purchasing larger hard drives to accommodate growing storage needs, many customers choose to connect their servers to SAN.
SAN is ideal for Windows and UNIX server-based applications that need large amounts of storage (terabytes). Servers connected to SAN have direct, high-speed access to data. Servers connected to SAN also have exclusive access to their data. An agency’s data is not available to other agencies using SAN.
SAN storage is available in three performance tiers:
Ultra-High Performance
High Performance
Commodity
Features
Each of the storage options allow for flexible growth potential without a lengthy purchasing process, are sharable over multiple servers and applications, and make it easy to add storage to servers. However, each type of storage has features and price points that make them better suited to certain use cases:
Commodity High Performance Ultra-High Performance
What is it? Lower-end open system storage
Very high performing open system storage
Highest performing open system storage currently available from WaTech

Page 424 of 851
. .
Commodity High Performance Ultra-High Performance
How should it be used?
Used for application components where transaction volumes and I/O requirements are low, with a higher ratio of reads to writes
Used for the majority of application components where performance demands are varied and high transaction volumes and high I/O are required in predictable, but short periods
Used for application systems or application components that have very high demands in the form of high transaction volumes, large data payloads, and very high I/O on a continual and consistent basis
Notes
Servers must be located in the SDC, the SAN service is not offered in QDC
WaTech is responsible for fulfilling customer requests to provision storage, monitoring system performance, troubleshooting any issues, and communicating resolution of any outage to customers
WaTech manages the storage vendor and is responsible for ensuring capacity is acquired with sufficient lead time
B. Statutory Basis for Creation of Service or Program
There is no statutory mandate for WaTech to deliver this service.
C. How the Service Fits into the CTS Strategic Plan and Goals
WaTech reports that this service supports the strategic roadmap to ensure platforms and products are sourced for better performance and therefore moving toward an operational expenditure model.
D. Performance Measures used to Measure Effectiveness and Efficiency
WaTech does not track and report against any specific performance targets for these services. However, WaTech does monitor capacity and performance of the storage environment.
For VMAX storage device, capacity monitoring is done manually and performance is not regularly monitored. However, if a customer reports performance problems, there are a series of steps that WaTech follows to review available performance data in the Unisphere tool and troubleshoot the issue. In addition, each of WaTech’s systems have “phone home” included, so performance issues are also seen by the vendor. WaTech stated that they do not provide performance reports to customers, as they are technical and not graphical.
Operational aspects of the NetApp device is similar. Capacity monitoring is also done manually for the NetApp storage device and performance is not regularly monitored.
E. Current Cost to Maintain the Service
Staffing
Staff are not fully dedicated to the delivery of this service; therefore, WaTech uses transfer rules to assign staff to the service for the purposes of tracking and forecasting costs (shown as the 0.97 FTEs in direct/indirect labor in the diagram below). These transfer rules were developed by estimating actual staff time spent on activities related to the service.

Page 425 of 851
. .
In addition, 0.25 percent of total overhead costs are being transferred to this service. If you apply that total cost percentage to the 65 FTE within overhead, it would be about 0.16 overhead FTE.
Figure 63. Server and Mainframe Storage Staffing
Note: Staffing numbers pulled from “Estimated Overhead FM6 December”
Figure 64. Server and Mainframe Storage Direct/Indirect Staffing
Note: Staffing details pulled from “Org Chart - Color Coded 01.01.18” and combined with transfer rules in “FY18 Master Indexes 12-19-17”
Workload Supported
The current supported workload is defined in the table below:

Page 426 of 851
. .
Table 148. Server and Mainframe Storage Workload Supported
Description Workload Supported
VMAX storage capacity used 269.89 TB (out of 319.68 TB – 84% capacity)
NetApp Storage 29.22 TB (out of 69.77 TB – 42% capacity)
Total Storage Workload 299.11 TB
Total Storage Capacity 389.45 TB
Note: Workload information is current as of January 2018 and WaTech provided this detail via email on 2/27/2018. Note that the reported capacity used is the useable storage that is configured and allocated to LUN/Servers. The customer is billed for the useable amount that is assigned/allocated. The useable TB excludes the RAID/Striping/Mirroring overhead.
Direct, Indirect and Overhead Costs
WaTech’s planned expenses for this fiscal year are provided in the table below.
Table 149. Server and Mainframe Storage FY18 Planned Service Expenses
Cost Components FY18 Planned FY19 Planned Cost Details
A Salaries 77,502.00
9,004.00
B Benefits 26,556.00
20,268.00
E Goods & Services 799,720.00
525,575.00
VMAX and NetApp software and hardware maintenance (reduction in FY19 due to end of VMAX license – current plan is to move to OpEx approach but that is not reflected in the spend plan)
E Internal Purchases 227,232.00
227,232.00
Server hosting and collocation make up a majority of cost
G Travel 506.00
504.00
P Debt - Interest & Other Payments 35,751.00
16,235.00
Storage hardware COP
P Debt - Principal Payments 390,320.00
324,689.00
Storage hardware COP
T Transfers 43,962.00
44,348.00 Overhead
Total Planned Expenses 1,601,549.00
1,217,855.00
Note: Cost details were pulled from “4589 SP” excel spend plan provide in February 2018; depreciation details pulled from “FM06 Depr Details 3-16.” Additionally, the high cost of colocation is related to the size and weight of the equipment (which requires an entire row and floor reinforcement to support its weight). Additionally, the COP for the VMAX will be completely paid off as of 6/1/2019.

Page 427 of 851
. .
Over three million dollars of assets were bought to enable this service in 2013. WaTech has not invested in capital expenditures in this service. The net value of assets will drop to zero before FY19.
Table 150. Server and Mainframe Storage Accumulated Depreciation Expenses
Acquisition Cost Accumulated Depreciation Net Book Value
3,384,509 3,299,310 85,199
While WaTech has released an RFI to begin evaluating options to replace the VMAX solution, with a preference for procurement using operating expenses, WaTech has not yet developed a longer term service cost model that incorporates replacement of the end of life VMAX (whether purchased as a capital expense or using an ongoing operating expense).
Given near-term planned operating expenses, WaTech will have the following workload costs for this service in FY18:
Table 151. Server and Mainframe Storage Cost by Workload
Description Workload Cost Details
Total Storage Workload 299,110 GB (299.11 TB)
Annual cost for full workload in FY18 $1,847,972
Cost per GB per month $0.52 per GB per month
Note: Workload cost in the table above is calculated based on WaTech’s alignment of costs to this service without adjustment for alignment to Gartner consensus models.
F/G. Rate structure CTS is currently billing to customers
The service is provided on a fee for service basis; rates are listed in the table below:
Table 152. Server and Mainframe Storage Rates
Description Rate Detail
Ultra-High Performance $1.48 per GB per Month
High Performance $0.36 per GB per Month
Commodity $0.17 per GB per Month
The rates for this service were last updated in April of 2013.
H. Analysis of Current Cost Recoverability
This service is only cost recoverable in FY19 and beyond given that WaTech’s spend plan assumptions do not include replacing the end of life VMAX and the asset is fully depreciated.
Table 153. Server and Mainframe Storage Cost Recoverability (Actual FY16-FY18)
Service Income FY16 FY17 FY18 H1
Service Revenue (4589) 1,118,274 1,251,445 640,844
Service Expense (4589) (1,980,955) (1,579,457) (604,434)
Net Income (862,681) (328,012) 36,410
Note: Actual revenue and expenses pulled from “AFRS Financial Download (Extracted on 2018-05-15)”
Table 154. Server and Mainframe Storage Cost Recoverability (Forecasted FY18-FY19)
Service Income FY18 FY19
Service Revenue (4589) 1,347,368 1,511,857
Service Expense (4589) (1,601,549) (1,217,855)

Page 428 of 851
. .
Service Income FY18 FY19
Net Income (254,181) 294,002
Note: Forecasted Cost recoverability detail pulled from “4589 SP” excel spend plan provide in February 2018
I. Service Level Actually Provided Today
The results of a February NetApp performance test showed IOPS of 3432.01, and throughput of 139.1 Mbps. No additional service details provided (e.g., availability, mean-time-to-restore outages, time to respond to requests for service, etc.).
The VMAX solution is oversubscribed and effectively out of capacity.
J. Current Customers
WaTech has seven customers. The largest three customers account for nearly the entire amount WaTech billed for this service in FY18.
Additionally, WaTech captures $1.1M of revenue for mainframe and server storage via internal sales transfers. If WaTech were a billable customer, it would be the largest.
Table 155. Server and Mainframe Storage Current List of Customers
# Customer FY17 ($) FY17 (%) FY18 H1 ($) FY18 H1 (%)
1 3000-DEPARTMENT OF SOCIAL AND HEALTH SERVICES 29,681 2 14,591 2
2 3030-DEPARTMENT OF HEALTH 27,145 2 14,251 2
3 2350-DEPARTMENT OF LABOR AND INDUSTRIES 62,525 5 6,360 1
4 1010-CASELOAD FORECAST COUNCIL 1,227 0 784 0
5 1070-STATE HEALTH CARE AUTHORITY 667 0 510 0
6 1240-DEPARTMENT OF RETIREMENT SYSTEMS 673 0 275 0
7 4620-WASHINGTON POLLUTION LIABILITY INSURANCE PROGRAM 159 0 80 0
Total Top 10 Billable Customers 122,077 10 36,851 6
Total for All Other Billable Customers 2,279 0 0 0
Total WaTech Internal Sales 1,127,088 90 603,993 94
Total Revenue 1,251,445 100 640,844 100
Note: Customer billing details pulled from “Billing Data - Apptio FFS Only (2018-05-16)” excel file
K. Current and Historical Usage Volumes
The Ultra High Performance storage is used only sparingly for limited use cases given high cost. Customers prefer the less expensive storage.

Page 429 of 851
. .
Service Offering FY17 ($) FY17 (%) FY18 H1 ($) FY18 H1 (%)
COMMODITY STORAGE 255,002 20 157,567 25
DISK STORAGE - S390 205 0 0 0
HP (HIGH PERFORMANCE) STORAGE
878,005
70
419,740
65
ONLINE DISK - S/390 4,183 0 0 0
UHP(ULTRA HIGH PERFORMANCE) STORAGE 114,050 9 63,537 10
Total 1,251,445 100 640,844 100
Note: Customer billing details pulled from “Billing Data - Apptio FFS Only (2018-05-16)” excel file
L. Customer Satisfaction and Future Demand
The Customer Voice appendix to this report includes customer satisfaction and future demand details based on the results of agency interviews and focus groups conducted during the project.
M. High Level Architecture
The SAN architecture had originally planned to implement the NetApp in front of the VMAX solution. However, given challenges with patching of the VMAX solution, the configuration was adjusted. Currently the mainframe is connected directly to the VMAX via fibre channel (FICON and FC), and any other physical servers that require FC connections are connected via Cisco SAN Switches to the VMAX. The FC design was implemented for performance reasons; however, this is no longer a design constraint given improvements in network bandwidth and latency an IP-based connection will be sufficient in the future.
The Mainframe (separate High Capacity Computing service) and the legacy OFM server environment with a Nutanix and VMware architecture (separate Platform & Connectivity service) are big consumers of this storage service. WaTech is currently planning to eliminate the VMAX solution from the SAN, and is targeting separate replacement solutions for the mainframe and the server environments.
The SAN environment is not mirrored at Quincy (neither the VMAX nor the NetApp are at Quincy). There is no disaster recovery associated with the SAN solution. WaTech is dependent on the backup service for recovery. Note that the Mainframe portion of the SAN environment is replicated to SunGard, which is covered separately under the mainframe service.
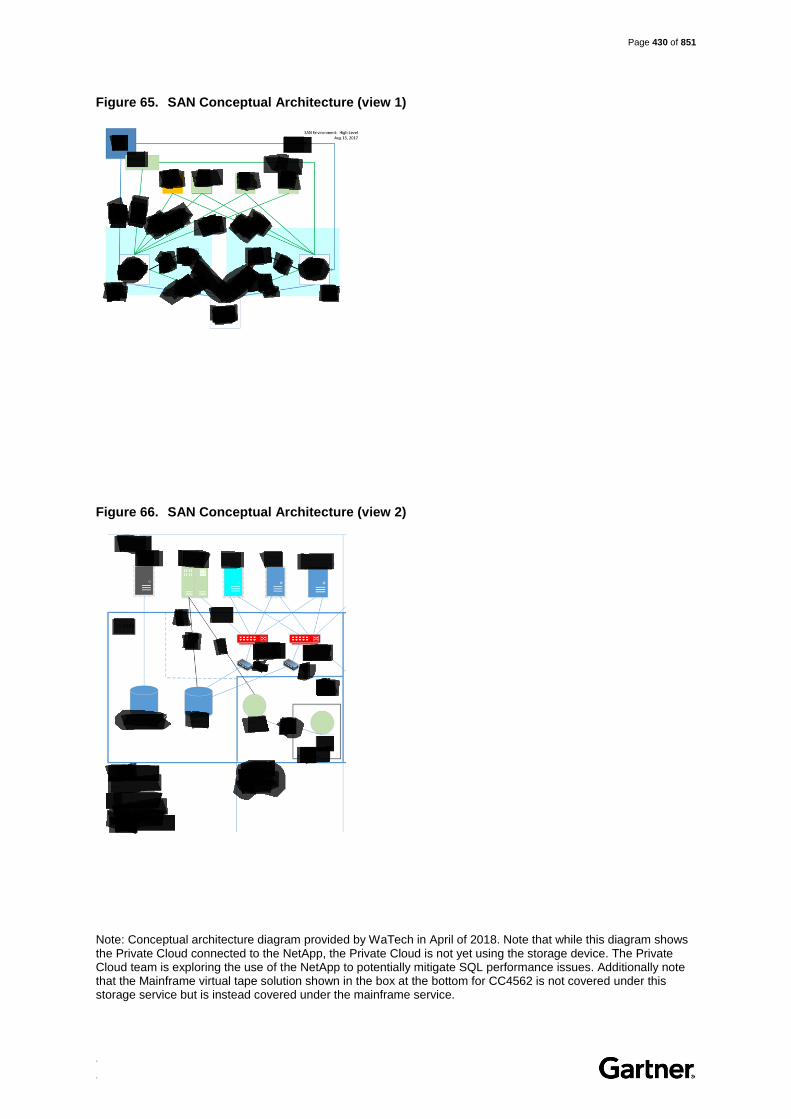
Page 430 of 851
. .
Figure 65. SAN Conceptual Architecture (view 1)
Figure 66. SAN Conceptual Architecture (view 2)
Note: Conceptual architecture diagram provided by WaTech in April of 2018. Note that while this diagram shows the Private Cloud connected to the NetApp, the Private Cloud is not yet using the storage device. The Private Cloud team is exploring the use of the NetApp to potentially mitigate SQL performance issues. Additionally note that the Mainframe virtual tape solution shown in the box at the bottom for CC4562 is not covered under this storage service but is instead covered under the mainframe service.

Page 431 of 851
. .
WaTech is the largest consumer of both the VMAX and NetApp environment. When L&I vacates the environment, WaTech will be the largest consumer. As WaTech migrates off the legacy VMAX environment, the storage will move to the VSAN (contained within the Private Cloud HP hyperconverged environment), the NetApp, or the replacement storage solution currently being selected through an RFP process for OpEx-based storage solutions.

Page 432 of 851
. .
(4593) WaServ/Nearline Storage
Background
This service is referred to interchangeably as the Email Vault, WaServ, Nearline Storage and Centera Storage
The Electronic Records Vault (WaServ) service catalog entry aligns to this service
The EMC Centera storage device is currently used to provide storage services under this cost code
A. Service Description
Definition
The Washington State Electronic Records Vault Service (WaServ) can store email according to each agency’s records and retention requirements. State employees use email to process large amounts of information, and that email must be handled in a manner that complies with legal and fiscal requirements.
WaServ provides a solution to the explosive growth of individual mailboxes by moving email to the Vault. Through this service, a secure email repository is available to simplify searches for email data – a useful feature for organizing and storing corporate knowledge. With WaServ, agencies can also respond quickly to public records requests.
The primary business case associated with the implementation of this capability was avoidance of default or adverse court judgments resulting from the inability of the state to be responsive to discovery requests.
Notes
Agencies are responsible for executing search and recovery
WaTech’s is responsible for fulfilling customer requests to provision storage, monitoring system performance, troubleshooting any issues, and communicating resolution of any outage to customers
B. Statutory Basis for Creation of Service or Program
There is no statutory mandate for WaTech to deliver this service.
C. How the Service Fits into the CTS Strategic Plan and Goals
WaTech reports that this service supports the strategic roadmap to ensure platforms and products are sourced for better performance.
D. Performance Measures used to Measure Effectiveness and Efficiency
WaTech does not track or report on any performance measures for this service.
E. Current Cost to Maintain the Service
Staffing
Staff are not fully dedicated to the delivery of this service; therefore, WaTech uses transfer rules to assign staff to the service for the purposes of tracking and forecasting costs (shown as the 1.6 FTEs in direct/indirect labor in the diagram below). These transfer rules were developed by estimating actual staff time spent on activities related to the service.

Page 433 of 851
. .
In addition, 0.4 percent of total overhead costs are being transferred to this service. If you apply that total cost percentage to the 65 FTE within overhead, it would be about 0.26 overhead FTE.
Figure 67. Nearline Storage Staffing
Note: Staffing numbers pulled from “Estimated Overhead FM6 December”
Figure 68. Nearline Storage Direct/Indirect Staffing
Note: Staffing details pulled from “Org Chart - Color Coded 01.01.18” and combined with transfer rules in “FY18 Master Indexes 12-19-17”

Page 434 of 851
. .
Workload Supported
The current supported workload is defined in the table below:
Table 156. Nearline Storage Workload Supported
Description Workload Supported
Amount of data stored – Centera Cluster (SDC) primary 190.337 TB used (out of 268.27 – 72% of capacity)
Amount of data stored – Centera Cluster (Quincy) replicated environment 174.02 TB used (out of 268.27 – 65% of capacity)
Total TB of storage stored 368.37 TB used (out of 536.54 – 69% of capacity)
Note: Workload information is current as of January 2018 and WaTech provided this detail via email on 2/27/2018. Note that the two environments (SDC and QDC) are supposed to utilize their capacity at the same levels. The 10G connections into Quincy were recently activated, and the synchronizing between the two systems is occurring however it’s not happening as quickly as anticipated.
Direct, Indirect and Overhead Costs
WaTech’s planned expenses for this fiscal year are provided in the table below.
Table 157. Nearline Workload FY18 Planned Service Expenses
Cost Components
FY18 Planned FY19 Planned Cost Details
A Salaries 129,792 105,499
B Benefits 48,036 38,010
E Goods & Services 79,326 82,991 EMC Centera hardware maintenance
E Internal Purchases 31,416 31,416
Collocation at SDC and QDC are the major expense
G Travel 967 952
P Debt - Interest & Other Payments 6,817 3,494 Interest payment on Centera equipment COP
P Debt - Principal Payments 66,462 69,870 Debt payment on Centera equipment COP
T Transfers 73,269 73,913 Overhead
Total Planned Expenses 436,085 406,145
Note: Cost details were pulled from “4593 SP” excel spend plan provide in February 2018; depreciation details pulled from “FM06 Depr Details 3-16”
WaTech has not invested in capital expenditures in this service since 2015. The net value of assets will drop to zero before the end of FY19.
Table 158. Nearline Storage Accumulated Depreciation Expenses
Acquisition Cost Accumulated Depreciation Net Book Value
743,186 646,108 97,078
WaTech has not yet developed a longer-term service cost model that incorporates replacement of the depreciated equipment. Given near-term planned operating expenses, WaTech will have the following workload costs for this service in FY18:

Page 435 of 851
. .
Table 159. Nearline Cost by Workload
Description Workload Cost Details
Amount of data stored (primary) 190,337 GB (190.337 TB)
Annual cost for full workload in FY18 $505,584.70 per year
Cost per GB per month $0.22 per GB per month
Note: Workload cost in the table above is calculated based on WaTech’s alignment of costs to this service without adjustment for alignment to Gartner consensus models.
F/G. Rate structure CTS is currently billing to customers
The service is provided on a fee for service basis; rates are listed in the table below:
Table 160. Nearline Rates
Description Rate Detail
Vault storage charge $1.27/Managed GB per month
(Note that this charge is calculated based on use of primary storage only. Vault storage is protected by offsite replication which is included in the $1.27 rate.)
Seat License $2.25 per seat (Only for agencies who do not receive WaTech’s email service. Agencies who do receive WaTech’s email services pay for this seat licensing as a part of the $4.90 mailbox charge)
The rates for this service were last updated in September of 2014.
H. Analysis of Current Cost Recoverability
This service has been very profitable for WaTech, and will become even more profitable based on WaTech’s forecasted increase in revenue. However, there is a plan to migrate all email to Microsoft’s Cloud based Office 365 offering. It is unclear that once this migration occurs whether or not this service will continue to be the State’s repository for archived email.
Table 161. Nearline Storage Cost Recoverability (Actual FY16-FY18 H1)
Service Income FY16 FY17 FY18 H1
Service Revenue (4593) 1,429,898 1,663,508 1,388,537
Service Expense (4593) (418,178) (330,423) (238,589)
Net Income 1,011,720 1,333,085 1,149,948
Note: Actual revenue and expenses pulled from “AFRS Financial Download (Extracted on 2018-05-15)”
Table 162. Nearline Storage Cost Recoverability (Forecasted FY18-FY19)
Service Income FY18 FY19
Service Revenue 2,944,429 3,253,428
Service Expense (436,085) (406,145)
Net Income 2,508,344 2,847,283
Note: Forecasted Cost recoverability detail pulled from “4593 SP” excel spend plan provide in February 2018; depreciation details pulled from “FM06 Depr Details 3-16.” The expenses increase dramatically between FY17
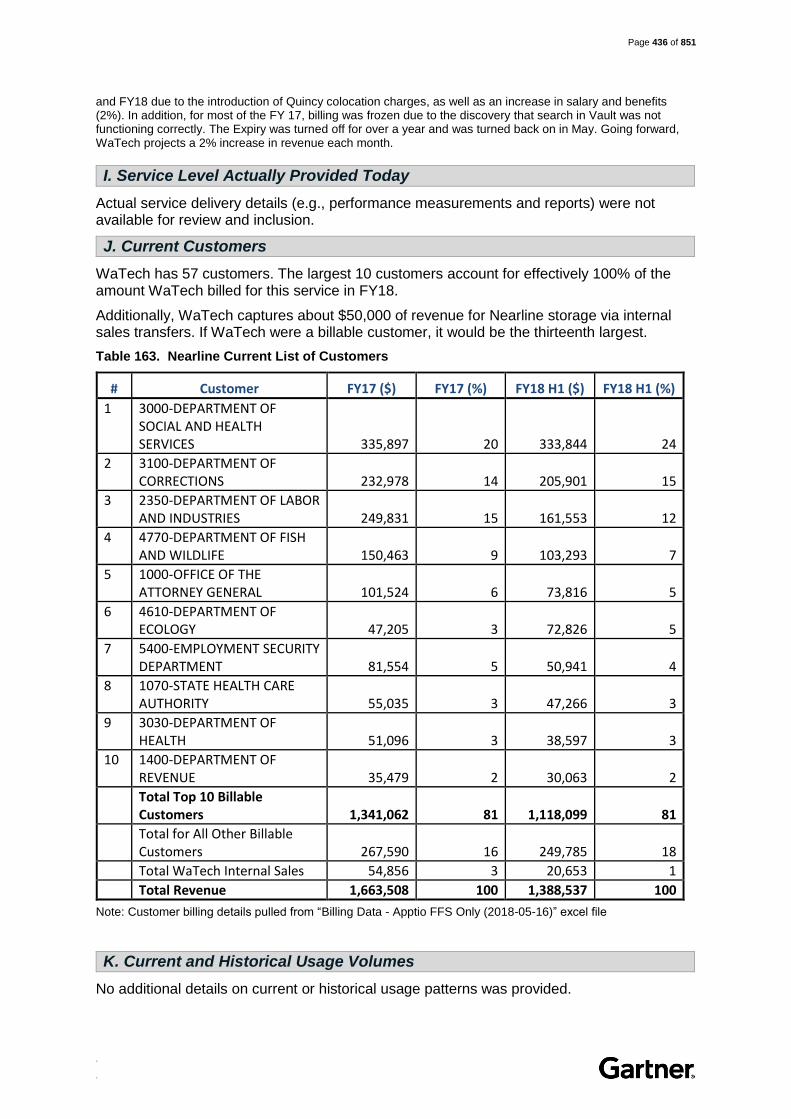
Page 436 of 851
. .
and FY18 due to the introduction of Quincy colocation charges, as well as an increase in salary and benefits (2%). In addition, for most of the FY 17, billing was frozen due to the discovery that search in Vault was not functioning correctly. The Expiry was turned off for over a year and was turned back on in May. Going forward, WaTech projects a 2% increase in revenue each month.
I. Service Level Actually Provided Today
Actual service delivery details (e.g., performance measurements and reports) were not available for review and inclusion.
J. Current Customers
WaTech has 57 customers. The largest 10 customers account for effectively 100% of the amount WaTech billed for this service in FY18.
Additionally, WaTech captures about $50,000 of revenue for Nearline storage via internal sales transfers. If WaTech were a billable customer, it would be the thirteenth largest.
Table 163. Nearline Current List of Customers
# Customer FY17 ($) FY17 (%) FY18 H1 ($) FY18 H1 (%)
1 3000-DEPARTMENT OF SOCIAL AND HEALTH SERVICES 335,897 20 333,844 24
2 3100-DEPARTMENT OF CORRECTIONS 232,978 14 205,901 15
3 2350-DEPARTMENT OF LABOR AND INDUSTRIES 249,831 15 161,553 12
4 4770-DEPARTMENT OF FISH AND WILDLIFE 150,463 9 103,293 7
5 1000-OFFICE OF THE ATTORNEY GENERAL 101,524 6 73,816 5
6 4610-DEPARTMENT OF ECOLOGY 47,205 3 72,826 5
7 5400-EMPLOYMENT SECURITY DEPARTMENT 81,554 5 50,941 4
8 1070-STATE HEALTH CARE AUTHORITY 55,035 3 47,266 3
9 3030-DEPARTMENT OF HEALTH 51,096 3 38,597 3
10 1400-DEPARTMENT OF REVENUE 35,479 2 30,063 2
Total Top 10 Billable Customers 1,341,062 81 1,118,099 81
Total for All Other Billable Customers 267,590 16 249,785 18
Total WaTech Internal Sales 54,856 3 20,653 1
Total Revenue 1,663,508 100 1,388,537 100
Note: Customer billing details pulled from “Billing Data - Apptio FFS Only (2018-05-16)” excel file
K. Current and Historical Usage Volumes
No additional details on current or historical usage patterns was provided.
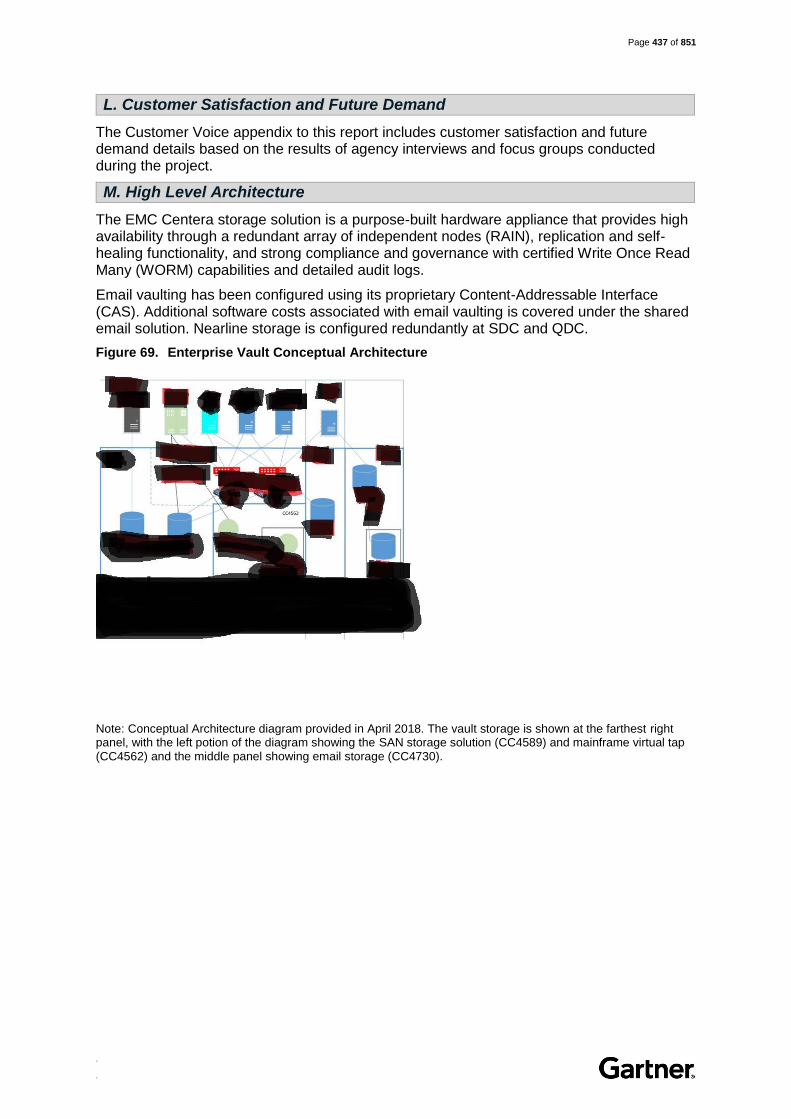
Page 437 of 851
. .
L. Customer Satisfaction and Future Demand
The Customer Voice appendix to this report includes customer satisfaction and future demand details based on the results of agency interviews and focus groups conducted during the project.
M. High Level Architecture
The EMC Centera storage solution is a purpose-built hardware appliance that provides high availability through a redundant array of independent nodes (RAIN), replication and self-healing functionality, and strong compliance and governance with certified Write Once Read Many (WORM) capabilities and detailed audit logs.
Email vaulting has been configured using its proprietary Content-Addressable Interface (CAS). Additional software costs associated with email vaulting is covered under the shared email solution. Nearline storage is configured redundantly at SDC and QDC.
Figure 69. Enterprise Vault Conceptual Architecture
Note: Conceptual Architecture diagram provided in April 2018. The vault storage is shown at the farthest right panel, with the left potion of the diagram showing the SAN storage solution (CC4589) and mainframe virtual tap (CC4562) and the middle panel showing email storage (CC4730).

Page 438 of 851
. .
(4595) Backup
Background
This service is referred to interchangeably as Backup, Server Backup, Server Backup Services, SVS
The Avamar backup solution is currently used to provide backup services under this cost code
A. Service Description
Definition
Server Backup Services (SBS) provide a comprehensive system for backing up and restoring almost any type of server over the State Government Network (SGN) and the Public Government Network (PGN). SBS can backup and restore a single file, all files on a disk or an entire server, whether physical or virtual.
Features
Backup a file, disk, or server automatically
Onsite and offsite data storage for customer selected server data
Data is available during disaster recovery situations
File security
No tapes or listings to manage
Notification lets you know when there’s a backup interruption, so you can fix it before it becomes a problem
Notes
WaTech is responsible for creating the customer agency connection to the backup solution, and agencies are responsible for configuring their own server backups via agent software
Almost any server accessible via the SGN and PGN may be backed up via this service
SBS uses a variety of technologies to provide backup and restore services, archival and retrieval, storage management and disaster recovery
WaTech supports physical as well as virtual servers, running a Windows OS or Linux/Unix variants
B. Statutory Basis for Creation of Service or Program
There is no statutory mandate for WaTech to deliver this service.
C. How the Service Fits into the CTS Strategic Plan and Goals
WaTech reports that this service supports the strategic roadmap to ensure platforms and products are sourced for better performance and therefore moving toward an operational expenditure model.

Page 439 of 851
. .
D. Performance Measures used to Measure Effectiveness and Efficiency
WaTech receives updates via change management and service alerts, but do not present reports to agencies on daily service performance.
E. Current Cost to Maintain the Service
Staffing
Staff are not fully dedicated to the delivery of this service; therefore, WaTech uses transfer rules to assign staff to the service for the purposes of tracking and forecasting costs (shown as the 1.34 FTEs in direct/indirect labor in the diagram below). These transfer rules were developed by estimating actual staff time spent on activities related to the service.
In addition, 0.34 percent of total overhead costs are being transferred to this service. If you apply that total cost percentage to the 65 FTE within overhead, it would be about 0.22 overhead FTE.
Figure 70. Backup Service Staffing
Note: Staffing numbers pulled from “Estimated Overhead FM6 December”

Page 440 of 851
. .
Figure 71. Backup Service Direct/Indirect Staffing
Note: Staffing details pulled from “Org Chart - Color Coded 01.01.18” and combined with transfer rules in “FY18 Master Indexes 12-19-17”
Workload Supported
The current supported workload is defined in the table below:
Table 164. Backup Service Workload Supported
Description Workload Supported
Amount of data backed up 130.56 TB
Note: Workload information is estimated based on fees paid by customers given stated rates
Direct, Indirect and Overhead Costs
WaTech’s planned expenses for this fiscal year are provided in the table below.
Table 165. Backup Service FY18 Planned Service Expenses
Cost Components FY18 Planned FY19 Planned Cost Details
A Salaries 123,468 125,706
B Benefits 44,010 43,494
E Goods & Services 228,777 239,980
99% Avamar Maintenance
E Internal Purchases 45,648 45,648
Server hosting and colocation, and desktop purchases
G Travel 1,116 1,112
P Debt - Interest & Other Payments 17,632 9,037
Interest on Avamar equipment purchase

Page 441 of 851
. .
Cost Components FY18 Planned FY19 Planned Cost Details
P Debt - Principal Payments 171,916 180,732
Debt on Avamar equipment purchase
T Transfers 58,615 59,131 Overhead
Total Planned Expenses 691,182 704,840
Note: Cost details were pulled from “4595 SP” excel spend plan provide in February 2018; depreciation details pulled from “FM06 Depr Details 3-16”
About three-quarters of a million dollars of assets were bought to enable this service in 2014, and no additional capital expenditures have been made in this service since the initial investment. The net value of assets will drop to zero before FY19.
Table 166. Backup Service Accumulated Depreciation Expenses
Acquisition Cost Accumulated Depreciation Net Book Value
740,930 602,006 138,924
WaTech has not yet developed a longer-term service cost model that incorporates replacement of the depreciated equipment. Given near-term planned operating expenses, WaTech will have the following workload costs for this service in FY18:
Table 167. Backup Service Cost by Workload
Description Workload Cost Details
Backup workload in GB 130,560 GB (130.56 TB)
Annual cost for full workload in FY18 $ 876,414
Cost per GB backup per month $0.56 per GB per month
Note: Workload cost in the table above is calculated based on WaTech’s alignment of costs to this service without adjustment for alignment to Gartner consensus models.
F/G. Rate structure CTS is currently billing to customers
The service is provided on a fee for service basis; rates are listed in the table below:
Table 168. Backup Rates
Description Rate Detail
Server Backup per GB per month $0.50 GB per month
Rates were last updated in July of 2015.
H. Analysis of Current Cost Recoverability
This service is not currently cost recoverable.
Table 169. Backup Cost Recoverability (Actual FY16-FY18)
Service Income FY16 FY17 FY18 H1
Service Revenue (4595) 1,060,349 783,365 436,681
Service Expense (4595) (939,192) (871,699) (364,602)
Net Income 121,157 (88,334) 72,079

Page 442 of 851
. .
Note: Actual revenue and expenses pulled from “AFRS Financial Download (Extracted on 2018-05-15). Revenue dropped in FY17 given an accounting move to take service (Virtual Tape s/390 and Cartridge Vaulting – Unisys) out of this cost code and move them to 4438 and 4562 mainframe service cost codes.
Table 170. Backup Cost Recoverability (Forecasted FY18-FY19)
Service Income FY18 FY19
Service Revenue (4595) 846,785 976,928
Service Expense (4595) 691,182 704,840
Net Income 155,603 272,088 Note: Forecasted Cost recoverability detail pulled from “4595 SP” excel spend plan provided in February 2018. Revenue projections for FY18 and FY19 assume 1.2% increase each month (based on FY16 billing data for Backup Service – 1738).
I. Service Level Actually Provided Today
No additional details on level of service were provided.
J. Current Customers
WaTech has 21 customers. The largest 10 customers account for nearly 100% of the amount WaTech billed for this service in FY18.
Additionally, WaTech captures about $150,000 of revenue for backup via internal sales transfers. If WaTech were a billable customer, it would be about the third largest.
Table 171. Backup Current List of Customers
# Customer FY17 ($) FY17 (%) FY18 H1 ($) FY18 H1 (%)
1 3000-DEPARTMENT OF SOCIAL AND HEALTH SERVICES 172,951 22 100,777 23
2 2350-DEPARTMENT OF LABOR AND INDUSTRIES 171,851 22 92,891 21
3 4950-DEPARTMENT OF AGRICULTURE 94,712 12 58,422 13
4 1020-DEPARTMENT OF FINANCIAL INSTITUTIONS 67,324 9 39,418 9
5 2150-UTILITIES AND TRANSPORTATION COMMISSION 55,869 7 31,404 7
6 3030-DEPARTMENT OF HEALTH 25,419 3 15,553 4
7 3550-DEPARTMENT OF ARCHAEOLOGY AND HISTORIC PRESERVATION 13,533 2 6,716 2
8 1240-DEPARTMENT OF RETIREMENT SYSTEMS 4,427 1 3,965 1
9 0950-OFFICE OF THE STATE AUDITOR 5,460 1 3,231 1
10 3870-WASHINGTON STATE ARTS COMMISSION 4,690 1 2,109 0
Total Top 10 Billable Customers 616,235 79 354,485 81

Page 443 of 851
. .
# Customer FY17 ($) FY17 (%) FY18 H1 ($) FY18 H1 (%)
Total for All Other Billable Customers 9,820 1 5,237 1
Total WaTech Internal Sales 157,310 20 76,958 18
Total Revenue 783,365 100 436,681 100
Note: Customer billing details pulled from “Billing Data - Apptio FFS Only (2018-05-16)” excel file
K. Current and Historical Usage Volumes
The environment is at capacity and continues to grow. WaTech recently had to acquire an additional storage tray for the Olympia and Quincy locations in spite of the fact that the Avamar solution may be replaced in the next year.
L. Customer Satisfaction and Future Demand
The Customer Voice appendix to this report includes customer satisfaction and future demand details based on the results of agency interviews and focus groups conducted during the project.
M. High Level Architecture
The Avamar solution is configured to back up the NetApp and VMAX SAN environment, the Private Cloud vSAN, as well as other physical servers and hosting environments. The Avamar solution has been configured redundantly at SDC and QDC.
Figure 72. Backup Conceptual Architecture
Note: Conceptual Architecture diagram for the Backup service provided in April 2018 (the left pane above). The Platform & Connectivity service is backed up to a separate Data Domain environment, which is not included as a part of this service, and is instead included in the Platform & Connectivity service.

Page 444 of 851
. .
6. Mainframe Hosting Services
(4562) High Capacity Computing and Mainframe
Background
High Capacity Computing, Mainframe Services, and S390 are used interchangeably to refer to this service
This service is defined under several entries in the online service catalog:
o System 390 Mainframe Platform o Disk Archive S/390 o S/390 Disk Storage o Tape Backup o Enterprise Output Solutions (EOS)
A. Service Description
Definition
Customers purchase S390 mainframe computer platform services to host large systems and critical applications. WaTech's S390 platform is currently housed in the State Data Center (SDC) and operates 24 hours a day, 7 days a week.
WaTech provides end-to-end support services to its mainframe customers: software installation, testing, implementation, and maintenance; diagnosis and correction for software; performance monitoring and tuning; implementation of software upgrades and updates; and, backups and disaster recovery. WaTech provides both general purpose LPARs and tailored LPARs so that an agency's specific sets of resources can be operated independently with its own operating system instances and applications.
As part of its mainframe platform, WaTech provides end-to-end storage, which includes storage, archival, backup, and disaster recovery solutions for customers and their state data and documents. WaTech installs, tests, implements, and maintains software on behalf of customers, in addition to conducting performance monitoring and tuning. WaTech manages and provides tape backup services, including virtual tape.
The Tape Backup service provides mainframe customers with the ability to backup data directly to tape. S390 mainframe customers may also choose to write to virtual tape; in this scenario, WaTech provides and maintains both a copy at the SDC and an off-site copy.
In addition, while WaTech does not operate a print shop, it provides an Enterprise Output Solution (EOS) service for mainframe, which provides licensing for a document management software system that manages the electronic archival, retrieval, and distribution of computer-generated reports. By managing the electronic versions of documents, EOS reduces the use of paper and the need for printing and physical distribution. Additionally, online viewing through a PC or web browser gives end-users immediate access to the information.
Features
Online processing of Customer Information Control System (CICS), an IBM systems software that enables transactions entered from remote terminals to be processed concurrently by application programs

Page 445 of 851
. .
Batch job processing – batch jobs can be submitted from Remote Job Entry (RJE) stations, online terminals, over the counter, or automatically via job scheduling software
Software installation, testing, implementation and maintenance
Software problem diagnosis and correction
Performance monitoring and tuning
Coordinated implementation of new or improved software
Backups ensure data integrity and disaster recovery
Meet compliance rules and avoid data loss and downtime
Enterprise Output Solution provides simple or compound find/search with Boolean support, report reformatting, and Table of Contents (TOC) search capabilities
Notes
The S390 mainframe platform is host to agency legacy application systems.
Customers are responsible for submitting online requests to add, delete, or change CICS entries and/or VSAM CICS file entries. Requests are received by the WaTech Service Desk
The virtual tape library solution is run on an EMC 2100, replicated to Philadelphia, PA via SunGard
WaTech does not provide print services; printing is provided by DES. However, WaTech is responsible for running customer jobs on mainframe and ensuring job completion and transmission to print
WaTech provides pre-printing support, answering questions, completing diagnostics
Agencies retain control of EOS reports, each agency EOS coordinator has full control over who can access their reports, and also control restoration of archived reports
B. Statutory Basis for Creation of Service or Program
In 1987, the Department of Information Systems (DIS) was created in statute (RCW 43.105) for the purpose of centralizing Washington agency computing needs. Over time, the DIS name has changed, as have computing platforms and customer agency requirements. What was formerly DIS is now WaTech, but the mainframe service remains as a legacy of this enabling legislation.
While agencies were encouraged to use the WaTech service, and at one time, most Executive Branch agencies were centralized on this platform, use of WaTech’s service was not explicitly mandated. There are still three additional mainframes managed by other agencies in the state. DOT, DSHS, and AOC each run their own mainframes today.
C. How the Service Fits into the CTS Strategic Plan and Goals
WaTech reports that High Capacity Computing (4562) supports the strategic roadmap to ensure platforms and products are sourced for better performance, and the strategic roadmap to ensure Washington State’s IT operations are protected.
D. Performance Measures used to Measure Effectiveness and Efficiency
WaTech has set formal service level targets, and tracks and formally reports on service levels. Customers receive individualized reports for performance against SLA targets (response time, availability and batch job counts).

Page 446 of 851
. .
E. Current Cost to Maintain the Service
Staffing
A staff of about 20 are fully dedicated to the delivery of this service; this team is supported part-time by additional resources therefore, WaTech uses transfer rules to assign staff to the service for the purposes of tracking and forecasting costs (shown as the 25.44 FTEs in direct/indirect labor in the diagram below). These transfer rules were developed by estimating actual staff time spent on activities related to the service.
In addition, 6.4 percent of total overhead costs are being transferred to this service. If you apply that total cost percentage to the 65 FTE within overhead, it would be about 4.21 overhead FTE.
In the next 5 years, 40% of the mainframe team is eligible to retire, and WaTech will have difficulty recruiting knowledgeable talent to replace retiring employees.
Figure 73. Mainframe Service Staffing
Note: Staffing numbers pulled from “Estimated Overhead FM6 December”

Page 447 of 851
. .
Figure 74. Mainframe Services Direct/Indirect Staffing
Note: Staffing details pulled from “Org Chart - Color Coded 01.01.18” and combined with transfer rules in “FY18 Master Indexes 12-19-17”
Workload Supported
The current supported workload is defined in the table below:
Table 172. Mainframe Services Workload Supported
Description Workload Supported
Configured MIPS 1,639 general purpose MIPS and 2,091 IFL MIPS. zIIP MIPS largely unused.
Note: Workload information is current as of January 2018.
Direct, Indirect and Overhead Costs
WaTech’s planned expenses for this fiscal year are provided in the table below.
Table 173. Mainframe Services FY18 Planned Service Expenses
Cost Components
FY18 Planned FY19 Planned Cost Details
A Salaries 2,136,864 1,836,402
25.04 Planned FTEs in FY18 dropping to 20.44 in FY19 (Biennium plan eliminates five positions - one effective Sept 2017 and four effective Jan 2018).
B Benefits 747,894 683,472
E Goods & Services 4,352,196 4,560,669
1. Software and hardware maintenance:
IBM (monthly processing fee
Software Xcel (quarterly)
SunGard (DR)

Page 448 of 851
. .
Cost Components
FY18 Planned FY19 Planned Cost Details
Allen System Group Inc.
SUSE Linux subscription
KOMMAND maintenance
ASC maintenance
Star Tools FDM maintenance
ADAPREP maintenance
FastPack maintenance
FATS/FATAR maintenance
Mainstar maintenance
Dataminer maintenance
Streamweaver maintenance
TS-Tutor support
Easy SMF licenses
CA Training
CA maintenance
MXG licenses
Passport Advantage Subscription
IPLA Software and support (October and January)
JCL-Prep maintenance
EOS annual maintenance
IOF licenses
Simulate 2000 software
Advisor & security center maintenance (Vanguard)
Server Elite maintenance
PKZIP software
DLM hardware maintenance
COBOL report writing
SAS licenses
Abenaid+ (Compuware)
Vangard administrator software
VPS maintenance
Elixir Technologies DesignPro support
EOS Thin Client
TRIM (Treehouse) maintenance
QA batch support (Legacy Solution)
$AVRS maintenance
SSL Certificate
E Internal Purchases 157,212 157,212
Network allocation (included in CSD overhead), desktop support, server hosting (supporting and hosting), storage and backup, colocation, and web hosting
E Prepaid Monthly 3,009,225 3,159,693
CA and Software AG (prepaid monthly accrual for current year)
E Prepaid Expense 3,102,793 3,257,932
CA and Software AG (prepaid for future fiscal year)

Page 449 of 851
. .
Cost Components
FY18 Planned FY19 Planned Cost Details
E Prepaid Elimination
(3,102,793)
(3,257,932)
Prepaid future year eliminated
G Travel 18,296 16,352
P Debt - Interest & Other Payments 74,308 44,519
P Debt - Principal Payments 591,894 622,050
T Transfers 1,134,454 1,144,423 Agency overhead
Total Planned Expenses
12,222,343 12,224,792
Note: Forecasted Cost recoverability detail pulled from “4562 – Mainframe” excel spend plan provided in February 2018; the salary and benefit costs assume vacancies are filled
WaTech's mainframe hardware has depreciated significantly. An RFP seeking hardware as a service solution is expected to be released in April of this year. WaTech expects deadlines for maintenance negotiations to take place in September 2018. Typically, maintenance and operations (M&O) is 20% of the original purchase price. WaTech plans for annual budget increases of 5%.
Table 174. Mainframe Services Equipment Depreciation
Acquisition Cost Accumulated Depreciation Net Book Value
17,554,549 16,616,185 938,363
F/G. Rate structure CTS is currently billing to customers
Mainframe services are provided on a fee for service (FFS) basis. Rates are listed in the table below:
Table 175. Mainframe Services Rates
Description Rate Detail
S390 Processing (ADABAS, Batch, CICS, and TSO)
$333.41 per CPU hour, adjusted per factors listed below
Disk Archive and Storage – S390 $0.0017 per GB per hour (or about $1.26 GB per month)
Online Disk – S390 $0.0019 per GB per hour (or about $1.41 GB per month)
Virtual Tape – S390 $0.0014 per GB per hour (or about $1.04 GB per month)
WaTech offers printed output in different formats (simplex, duplex, continuous feed, cut-sheet, etc.) from various technology platforms that can be used in high-speed laser printers and various pre and post processing equipment.
Multipliers
Job Class - Descriptions
Turnaround Objective Prime (Monday – Friday 6 am to 6 pm)
Non-Prime
R - Regular Schedule
Due out time 1.00 .50

Page 450 of 851
. .
Multipliers
O - On-demand schedule
Start execution within 60 minutes
1.50 .75
J - Superhot 6 minutes 4.00 2.00
H - Hot 1 hour 2.50 1.25
A - Priority 2 hours 2.00 1.00
D - Standard 4 hours 1.50 .75
E - Off-prime Next morning .65
F - Large Print N/A 1.00 1.00
C - High Resource N/A 1.50 .75
Time Share Option N/A 1.00 .50 *The multiplier is used to figure the final per-CPU Hour rate. For example: If a regularly recurring job requiring 1.5 CPU hours is run during non-prime hours, the final cost of the job would be $250.06. (e.g., $333.41 CPU per hour X 1.5 CPU hours X a multiplier of .50 = $250.06)
Volume Discounts
Description Discount
ADABAS (discount is only applied to monthly sales amount greater than $3000) 30% discount
Batch (discount is only applied to monthly sales amount greater than $14,000) 30% discount
CICS (discount is only applied to monthly sales amount greater than $3,000) 30% discount
TSO (discount is only applied to monthly sales amount greater than $3,000) 30% discount
For example: Agency Q has purchased $4,000 in ADABAS service, $15,000 in Batch service, $3,100 in CICS service, and $2,900 in TSO service in one month. Their bill would reflect the following:
Discount Example
ADABAS $4,000 30% discount $3,700 billed for ADABAS
Batch $15,000 30% discount $14,700 billed for Batch
CICS $3,100 30% discount $3,070 billed for CICS
TSO $2,900 30% discount $2,900 billed for TSO (amount does not qualify for discount)
H. Analysis of Current Cost Recoverability
Mainframe FFS related support is currently not cost recoverable. However, in recognition of the continuing need to support critical state applications on the mainframe, OFM has approved a permanent allocation of $2 million per year to supplement the FFS revenues. These funds are factored into the revenue projection as a flat monthly revenue of about $167,000. The combined FFS revenue and the allocation revenue is projected to provide cost recoverability this biennium.
Without the additional allocation revenue, mainframe services' volume discount incentive had created a $1.5 million revenue loss. The volume discount has been in place for 25 years; however, once customer volume dropped significantly, the discount option was never removed and continues to lose revenue.
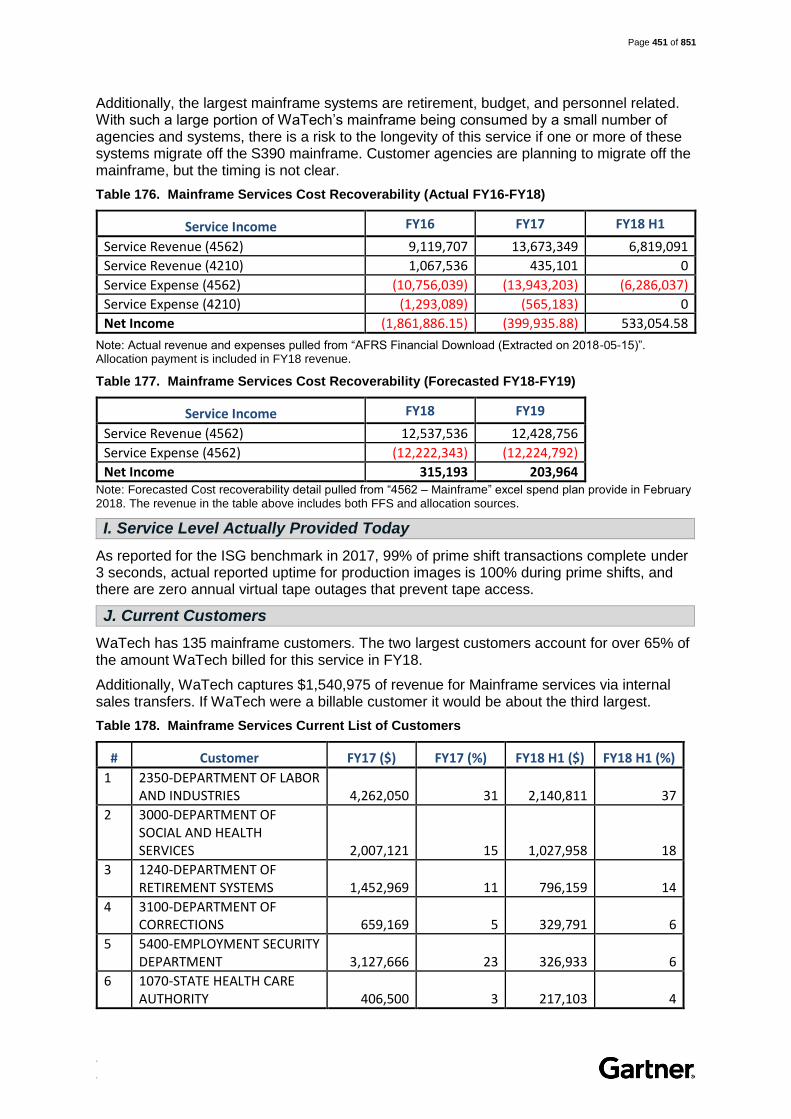
Page 451 of 851
. .
Additionally, the largest mainframe systems are retirement, budget, and personnel related. With such a large portion of WaTech’s mainframe being consumed by a small number of agencies and systems, there is a risk to the longevity of this service if one or more of these systems migrate off the S390 mainframe. Customer agencies are planning to migrate off the mainframe, but the timing is not clear.
Table 176. Mainframe Services Cost Recoverability (Actual FY16-FY18)
Service Income FY16 FY17 FY18 H1
Service Revenue (4562) 9,119,707 13,673,349 6,819,091
Service Revenue (4210) 1,067,536 435,101 0
Service Expense (4562) (10,756,039) (13,943,203) (6,286,037)
Service Expense (4210) (1,293,089) (565,183) 0
Net Income (1,861,886.15) (399,935.88) 533,054.58
Note: Actual revenue and expenses pulled from “AFRS Financial Download (Extracted on 2018-05-15)”. Allocation payment is included in FY18 revenue.
Table 177. Mainframe Services Cost Recoverability (Forecasted FY18-FY19)
Service Income FY18 FY19
Service Revenue (4562) 12,537,536 12,428,756
Service Expense (4562) (12,222,343) (12,224,792)
Net Income 315,193 203,964 Note: Forecasted Cost recoverability detail pulled from “4562 – Mainframe” excel spend plan provide in February 2018. The revenue in the table above includes both FFS and allocation sources.
I. Service Level Actually Provided Today
As reported for the ISG benchmark in 2017, 99% of prime shift transactions complete under 3 seconds, actual reported uptime for production images is 100% during prime shifts, and there are zero annual virtual tape outages that prevent tape access.
J. Current Customers
WaTech has 135 mainframe customers. The two largest customers account for over 65% of the amount WaTech billed for this service in FY18.
Additionally, WaTech captures $1,540,975 of revenue for Mainframe services via internal sales transfers. If WaTech were a billable customer it would be about the third largest.
Table 178. Mainframe Services Current List of Customers
# Customer FY17 ($) FY17 (%) FY18 H1 ($) FY18 H1 (%)
1 2350-DEPARTMENT OF LABOR AND INDUSTRIES 4,262,050 31 2,140,811 37
2 3000-DEPARTMENT OF SOCIAL AND HEALTH SERVICES 2,007,121 15 1,027,958 18
3 1240-DEPARTMENT OF RETIREMENT SYSTEMS 1,452,969 11 796,159 14
4 3100-DEPARTMENT OF CORRECTIONS 659,169 5 329,791 6
5 5400-EMPLOYMENT SECURITY DEPARTMENT 3,127,666 23 326,933 6
6 1070-STATE HEALTH CARE AUTHORITY 406,500 3 217,103 4

Page 452 of 851
. .
# Customer FY17 ($) FY17 (%) FY18 H1 ($) FY18 H1 (%)
7 4610-DEPARTMENT OF ECOLOGY 67,757 0 25,674 0
8 4900-DEPARTMENT OF NATURAL RESOURCES 28,726 0 19,373 0
9 0550-ADMINISTRATIVE OFFICE OF THE COURTS 6,822 0 5,391 0
10 3030-DEPARTMENT OF HEALTH 7,345 0 4,631 0
Total Top 10 Billable Customers 12,026,123 88 4,893,822 84
Total for All Other Billable Customers 106,762 1 39,915 1
Total WaTech Internal Sales 1,540,975 11 895,189 15
Total Revenue 13,673,860 100 5,828,927 100 Note: Customer billing details pulled from “Billing Data - Apptio FFS Only (2018-05-16)” excel file
K. Current and Historical Usage Volumes
A wide variety of customers currently receive mainframe hosting and storage services. Some of the largest systems on the mainframe belong to the Department of Retirement Systems (DRS) and Office of Financial Management (OFM). Smaller systems include the Department of Social & Health Services’ eJAS workforce system, which hosts its back-end on the WaTech mainframe.
The Enterprise Output Solution is heavily used by both mainframe and non-mainframe users, e.g., AFRS report viewing, WaTech distribution of billing information, etc.
WaTech’s largest source of revenue for mainframe services is via tailored service agreements.
Table 179. Mainframe Current List of Service Offerings
Service Offering FY17 ($) FY17 (%) FY18 H1 ($) FY18 H1 (%)
ADABAS PROCESSING 2,632,384 19 1,402,413 24
BATCH PROCESSING 3,804,598 28 2,197,636 38
CENTRAL PROCESSOR TSO 48,577 0 24,906 0
CICS COMPUTER PROCESSING 696,067 5 389,130 7
CICS CUSTOM REGION FEE 346,500 3 112,000 2
DASD ARCHIVE S/390 76,001 1 39,103 1
DISASTER RECOVERY 4,050 0 4,050 0
DISK STORAGE - S390 2,255 0 1,230 0
L&I TAILORED SERVICE PROCESSING 3,786,720 28 1,893,360 32
ONLINE DISK - S/390 44,440 0 23,170 0
TAILORED SERVICES PROCESSING 3,212,080 23 326,340 6
VIRTUAL TAPE (V-TAPE) S/390 831,381 6 424,324 7
VOLUME DISCOUNT ADABAS CPU (740,116) (5) (393,396) (7)
VOLUME DISCOUNT CICS CPU (155,604) (1) (87,562) (2)

Page 453 of 851
. .
Service Offering FY17 ($) FY17 (%) FY18 H1 ($) FY18 H1 (%)
VOLUME DISCOUNT S/390 BATCH PROCESS (915,472) (7) (527,778) (9)
Total Revenue 13,673,860 100 5,828,927 100 Note: Customer billing details pulled from “Billing Data - Apptio FFS Only (2018-05-16)” excel file
L. Customer Satisfaction and Future Demand
The Customer Voice appendix to this report includes customer satisfaction and future demand details based on the results of agency interviews and focus groups conducted during the project.
M. High Level Architecture
WaTech runs an IBM mainframe shop, which includes a Customer Information Control System (CICS) IBM systems software. WaTech’s mainframe platform is an IBM zEnterprise BC12 (zBC12) purchased in late 2013 for $2.4 million.
WaTech currently provides its mainframe storage solutions on the VMAX but is actively considering other options. For example, an RFI is underway to seek ideas for a lease related arrangement for mainframe storage. In addition, an RFP is scheduled for April 2018 for a hardware replacement system which will include a storage component.
The Virtual Tape Library is an EMC 2100. Tape is replicated to SunGard in Philadelphia, PA. However, WaTech highlighted an ISG finding that the Sungard contract may introduce a disaster recovery risk to WaTech in the event a major disaster persists longer than a couple weeks as WaTech could lose access to the DR mainframe in Philadelphia.

Page 454 of 851
. .
7. Colocation Hosting Services
(4803) State Data Center (SDC) Facility Services
Background
This service is defined under the Colocation Olympia and Colocation Quincy entries in the online service catalog.
Data center (DC) facility services are offered in both Olympia, WA in the State Data Center (SDC) and in Quincy, WA, in the Quincy Data Center (QDC).
The State’s primary data center is the SDC located in Olympia, WA. The SDC is a Tier III state-owned facility located at 1500 Jefferson in the Olympia capitol campus.
o The SDC is a well-constructed and maintained data center that meets or exceeds all of the State’s data center facility requirements. It was designed around 2010-11 and leveraged mainstream, traditional data center design principles.
o While the design is resilient and maintainable, it does not leverage a few leading practices which were emerging at the time of the design/construction project. These practices, which are present in most data centers built afterward include the following:
Modular architecture throughout all components (UPS, GenSets, Power Distribution, Computer Room space)
Slab construction with no raised floor. Flexible, high capacity power distribution system capable of
supporting higher density racks and rows. Routine use of contained aisle heat capture or cooling distribution to
increase efficiency and density (aka closely coupled cooling). Incremental build out of power distribution to rows, regularly (quarterly
or annually) as needed as capacity and density requirements are more clearly defined.
It is worth stating again, that the overall design of the SDC is resilient and provides sufficient overall capacity to meet the State’s requirements. However, the fact that the power distribution system for Data Hall 1, and most of Data Hall 2, was built out in advance and did not anticipate the need for a large number of high density computing workloads (mostly due to smaller server form factors and the use of blade servers) has resulted in a less efficient use of data center floor space than could otherwise have been achieved. In the long run, this may result in the need to expand to Data Hall 3 or to retrofit some portion of Data Halls 1 and 2 for higher density racks and/or rows. This is not a criticism of the current SDC operations team, but rather an observation regarding the original design and decision to build out significantly more computer floor space than was immediately needed. To date, there has not been significant demand for high density rack space. However, original design decisions will make it impossible for the State to adapt the design if it becomes clear that the demand for high density racks is going to be higher than expected.
o Within Data Hall 1 and 2, the facility has the capacity to support 5 megawatts of IT workload and supporting infrastructure.
2.5 megawatts are dedicated to Data Hall 1 (Continuous Availability through A, B and C line-ups).

Page 455 of 851
. .
2.5 megawatts are dedicated to Data Hall 2 (Continuous Availability through D, E and C line-ups).
o Given a maximum Power Usage Effectiveness (PUE) of approximately 1.95 Gartner estimates that that the maximum IT workload that can be supported is ~2.56 megawatts.
5MW/1.95 = 2.56 MW (this is Gartner’s estimate of the design capacity of the current SDC infrastructure).
Gartner observed that the highest recorded PUE was about 1.89 which was in September, 2017.
o An additional constraint on the available power capacity that can be delivered is the 2 x 875 kW UPSs that are deployed for each line-up (i.e., 4 active UPSs in total). The Operations team reports that their practice is to not load either UPS beyond 80% of rated capacity.
This translates to 2*875*0.8 = 1,400 kW or 1.4 MW o A final constraint on the available power capacity that can be delivered is the
Starline Power buses which were pre-installed for Data Hall 1 and Data Hall 2 at the time of commissioning.
There are 30 rows of cabinets (22 in Data Hall 1, 8 in Data Hall 2) that can provide 65 kW of power per row through two Starline Power busses per row.
This equates to a total capacity of 1,950 kW = 30 *65 kW o According to WaTech, their estimate of the maximum raised floor reserved
power capacity is 1,484.5 kW. This is a reasonable estimate, as explained above.
Based on utility bills, only approximately 614 kW is being used today, which is less than half of aggregate power capacity available.
Based on reserve power billing records provided by WaTech, ~1.365 MW of reserved power have been allocated to customer enclosures, which is ~60% of aggregate power capacity and effectively all available power given constraints defined above.
o Data Center Infrastructure—(MEP, Cooling, Raised Floor, etc.) in Data Halls 3 and 4 has not been built out at all. These data halls and the related MEP equipment rooms that are intended to support them are empty concrete shells with no improvements.
o Due to the design and layout of the computer room infrastructure in Data Halls 1 & 2, not all of the existing power capacity may be usable without additional investments in power distribution and cooling optimization infrastructure.
o There is room for up to 685 enclosures in data halls 1 & 2 today. While power distribution has been built out to the raised floor for all data center rows, only 404 enclosures are in place today (59% of available enclosure space is built out) and of the available enclosures, only 262 are utilized by customers in production today (65% of built out enclosures).
The additional cost to add ~281 enclosures within Data Hall #2 is estimated by WaTech to be ~$4.3 million.
o The cost of power in Olympia is approximately $.11 per kilowatt-hour. This is a relatively low electricity rate by national standards, but is 3.5-4x the cost of hydropower available in Eastern Washington where Quincy and many commercial data center colocation facilities are located.
Although the SDC largely meets the state’s collocation business requirements, WaTech has struggled with adoption and cost recoverability since inception. A few background details on the history of the SDC follow below:
o In 2009 the Washington State legislature made the decision to move forward with constructing a new shared state data center and office building in the

Page 456 of 851
. .
capitol campus, and completed the construction of the building, as well as the data center shells by 2011.
o After the construction project had begun, Washington State commissioned Excipio Consulting to complete a data center study that it completed in December of 2010. The study indicated that based on the agency plans for migration, only about half of a single data hall was actually needed (assuming no wasted space), given the trend toward virtualization.
Excipio qualified their assessment as an “ideal” state estimate and not realistic given the state of agencies’ business practices, technology and security requirements and funding. The half data hall estimate was only possible if agencies virtualized 80-90% of their workloads prior to moving to the SDC and moved into a shared virtualized infrastructure. It also assumed that enclosures were packed full-- and ignored power, cooling, ownership, compliance and security requirements.
It also failed to fully account for non-server equipment such as mainframes, security and network equipment. In addition, it assumed a strategy of consolidating all agencies’ IT functions into DIS, eliminating more than 100 IT positions across the state. The estimate was proven to be completely unrealistic.
However, despite these shortcomings, the Excipio study’s major conclusion was essentially correct. Due to virtualization, an emphasis by equipment manufacturers on improved power efficiency and other factors, the State’s need for data center capacity (both in terms of power and floor space) would be dramatically less than what was projected in the business case used to justify the SDC.
These factors, coupled with the subsequent failure of most major departments to move into the SDC, despite clear direction from the Legislature to do so, is the reason why the SDC has far less usage than anticipated.
o WaTech settled on an initial pricing model for colocation services in 2013; however, the model did not incorporate a forecast for delayed customer adoption. Instead, pricing was set based on the fees WaTech would need to collect on a per customer basis to enable cost recoverability, assuming the entire facility was filled from the beginning. Fees were also set according to what agencies were already paying for colocation in the existing OB2 data center so as not to impact customer’s budgets in the middle of the fiscal year. The intent was to seek a reasonable rate increase in the following biennial budget cycle.
o When the SDC was first completed, the State CIO at the time decided to continue operating the legacy OB2 data center facility until an additional study confirmed that the current state of its electrical systems was making operations unsafe, and that needed repairs would require substantial investment.
o Following this WaTech moved forward with completing Data Hall 1 and Data Hall 2, adding equipment enclosures and end of row networking equipment needed to connect colocation customers to the core network. WaTech completed Data Hall 1 in December, 2012. Data Hall 2 was completed in February, 2014.
o When the SDC first opened for operations in 2012, prior to the first customer migration, or even completion of the data hall interior spaces, WaTech engaged a critical facilities managed services provider (MSP), McKinstry, to run all infrastructure and facilities maintenance contracts associated with the

Page 457 of 851
. .
data center. McKinstry charged WaTech a six percent fee, based on the value of each contract under management, plus the actual cost of McKinstry support staff of one critical facilities engineer and staffing associated with onsite support equal to one person full time 24x7x365, and an additional fee of 6 percent to manage the McKinstry personnel.
o Given the overhead associated with using McKinstry to maintain the data center, over the course of the last six years, WaTech has been pursuing a strategy of taking back contracts for direct WaTech management as they come up for renewal. By July of FY18, WaTech will have completed this process with the exception of the McKinstry critical facilities engineer and onsite support. WaTech will be able to rebid that final contract by the end of FY19.
o Adoption remains low and the OCIO has approved and in some cases, extended waivers for agencies to continue operating their own data centers. The rationale for the initial waivers was to allow agencies to align their normal IT equipment refresh cycles with a data center move in order to reduce the amount of incremental equipment purchases that needed to be made during the transition. More recently, agencies have put forward the argument that they cannot relocate absent specific funding from the Legislature to pay specifically for the move. In many cases, agencies have failed to request the funding from the legislature. In cases, where it has been requested, OFM and the Legislature appear to have provided it.
o Adoption has remained so low that in spite of moving the debt service costs ($~12.5 M per year) associated with construction and initial outfitting out of the data center from the colocation rate base to a separate state-wide allocation paid proportionately by all agencies, WaTech is unable to fully recover the remaining operational costs (~$7-8 M per year).
o WaTech has explored many different options for the currently empty Data Hall 3 and 4 shells. These range from an Amazon data center to a federal secure facility, but none of these alternate uses has been feasible. As they sit idle, these unused spaces represent a significant lost revenue generating opportunity. On the other hand, the incremental cost of leaving them vacant is negligible.
WaTech currently provides disaster recovery colocation data center services via the Quincy Data Center (QDC). QDC is a Tier III commercial colocation space located in Quincy WA. Before that, DIS (and subsequently CTS and WaTech) provided disaster recovery data center space for many years through the Spokane Node Site and the Tier Point contract. In 2014, the Tier Point contract expired. This event created an opportunity for the State to make a strategic investment to improve disaster preparedness and continuity of government IT services. WaTech decided to reduce costs and improve DR capabilities by shutting down the Spokane site and consolidating to a less costly and more capable Colocation provider.
Sabey won the contract and WaTech began buying colocation services from the Sabey Data Center in Quincy, Washington in early 2015. The facility is owned by Sabey Data Centers. Within this facility the State has access to 1935 square feet of caged data center space and an initial allocation of 71.5kW (48,500 kWh) of reserved power. The State’s contract allows for this capacity to be adjusted over time as needs change.
o In February, 2015, 4 enclosures and 4 temporary enclosures were built out within WaTech’s caged area.
o In May, 2015, 12 enclosures were built out and the 4 temporary enclosures were removed.
o In February, 2016, 32 additional enclosures were added.

Page 458 of 851
. .
o In July, 2017 an additional 13 enclosures were added. o Today, 53 enclosures are built out and 40 enclosures are occupied by
customer workloads (75% of currently built out racks). WaTech does not have access to any additional space in the current building. To add additional enclosures at QDC, WaTech would have to build a new caged area in a separate building, and pay to bring in new network trunks to the new building location.
o The cost of power in Quincy is approximately $.027 per kilowatt-hour. This is significantly less than Olympia power due to the availability of cheap hydro generation sources east of the Cascades.
Both the QDC and SDC have full connectivity to the same networks and there are three (3) 10 Gigabit Ethernet connections between the two data centers with a fourth 10 Gigabit connection to be added by July, 2018.
o Both DCs are redundantly and diversely connected to the public Internet o Both DCs are redundantly and diversely connected to the State Government
Network (SGN) and to the Office VPN infrastructure. o Both DCs will eventually house “Cloud Highway” connections. o None of the above network connectivity costs are part of the Colocation
Service. For qualified agencies, these costs (Cloud Highway excepted) are paid for by the Data Network Allocation and specifically by the Network Core portion of this allocation. Agencies not qualified for an allocation pay additional fees. The Cloud Highway is not currently included in any allocation.
Data Center facility services include the following active cost codes:
o State Data Center (4803) o SDC Physical Security (4805) o Quincy Data Center (3603) also referred to as Remote Data Center Node Site o OB2 Data Center (4801) o Seattle Node (3601)
Historically, data center facilities also included the following cost codes, however these facilities are no longer in use:
o Yakima Node Site (3605) o Spokane Node Site (3602)
A. Service Description
Definition – State Data Center (Olympia Colocation)
WaTech provides professionally managed data center facility services to customers who wish to locate IT equipment in the State Data Center (SDC) in Olympia, WA. WaTech provides space, power, cooling, connectivity, and physical and network security for customer-managed IT equipment (e.g., server, storage, appliance, network device, etc.).
The SDC is built to a high data center standard which generally conforms to the Uptime Institute’s Tier III level of redundancy for power and cooling reliability. This is defined as N+1 or concurrently maintainable. What this means in practical terms is that there are no single points of failure in the data center infrastructure, and in fact it is possible to take any single component (UPS, generator, PDU, Starline power bus, chilling tower, CRAH/AC unit, etc.) and still have full redundancy of N+1. This is true from the chiller plants, utility connections and generators on the supply side of the data center to the enclosures to which customer compute, storage and networks are connected for redundant “A” and “B” side power. In addition, the SDC is architected in such a way as to make it possible for it to operate on diesel power generators indefinitely, should this be necessary.

Page 459 of 851
. .
The SDC provides data center colocation services in support of WaTech provided services (e.g. email, skype, private cloud, etc.) and directly to customer agencies. WaTech supports Network connections to various networks (e.g. SGN, PGN, Public Internet, Cloud Highway, independent agency networks and third party providers).
The SDC also provides office space for onsite staff, temporary convenience office space for visitors, and small break rooms for both. The SDC has no kitchen, but a break room for both staff and customers.
Definition – Quincy Data Center (QDC)
WaTech also provides data center facilities and colocation services to customers who wish to locate IT equipment they own and operate to Quincy, WA. WaTech provides space, power, cooling, connectivity, and physical and network security for customer IT equipment. Colocation at Quincy provides enclosures for customer IT equipment, supports Network connections to either the WaTech core network or to third party providers, as well as firewall services.
The QDC is a commercial collocation facility owned and operated by Sabey Data Centers, which is also built to a high data center standard which generally conforms to the Uptime Institute’s Tier III level of redundancy for power and cooling reliability.
The QDC is used by WaTech and other state agencies to ensure continuity and recoverability for critical infrastructure and applications. Networks, Internet services and Email services are configured for active/active high availability (HA) between SDC and QDC and automatically reroute or fail over between these locations without human intervention. Some customer systems are also active/active for high availability while others use less dynamic disaster recovery technologies to ensure data is protected and recoverable after an outage.
Given the substantial distance (from Olympia) to the Quincy location, WaTech customers need to be able to leverage remote hands providers for onsite support at QDC. WaTech does not have staff at the QDC and supports this requirement using a “remote hands” contract with Sabey. WaTech also provides onsite orientation, initial equipment installation and cabling for each new customer. In this case, WaTech personnel travel onsite to provide this support.
Features
Feature SDC Details QDC Details
Customer Amenities
Meeting Spaces available in the first and second floor common areas
Technical Workbench Area Available
Vendor Parking
On Site Intercity Transit Bus Stop
Café/Retail Food Service
Loading Dock
Trash Removal
QDC is a contracted facility rather than state-owned so customer amenities are limited to:
Vendor Parking
Loading Dock
Physical Security
Restricted Access Policy and Procedures
On Site Physical Security Staff Monitor Access Control Systems 24x7x365
CCTV Recording on all Access and Egress points 24x7x365 throughout the Facility
Access History is Recorded for Audit Purposes Same as SDC

Page 460 of 851
. .
Feature SDC Details QDC Details
Fire System
Double Interlock Pre-Action Fire Suppression System (This type of system requires detection of multiple events in order to prevent accidental activation).
Very Early Smoke Detection and Alarm (VESDA) System (This is an active smoke detection system that constantly samples air in the data center to detect the presence of smoke particles suspended in the air) Same as SDC
Power and Cooling
Electrical and Mechanical Infrastructure Designed and Built to be Concurrently Maintainable. A concurrently maintainable data center has redundant capacity components and multiple independent distribution paths serving the computer equipment. Only one distribution path is required to serve the computer equipment at any time.
On Site Critical Environment Staff 24x7x365
Building Management System (BMS) and Data Center Infrastructure Management (DCIM) for Control and Monitoring Mechanical and Electrical Equipment
Uninterruptible Power Supply (UPS) System Provided for Conditioning AC Electrical Power
N+1 Power and Cooling Redundancy Design
On-site Generator Infrastructure to provide back-up power in the event of a utility power outage. Same as SDC
Enclosures
Raised Floor Area Equipped with secure pre-configured IT equipment Enclosures
Enclosure Power Standard is 208 volt (110 volt optional)
Same as SDC but with hot/cold aisle configuration
Raised Floor Connectivity
Data, Voice and Video TV Connectivity through Multiple Carriers
Standardized Copper and Fiber Cable Tray Systems
Space Management Services Including Consultation for Planning Adds, Moves and Changes to IT Equipment and Physical Connectivity
Compliant with ANSI/TIA/EIA Standards Same as SDC
Notes
QDC Data Center Facility location is in Eastern Washington State, while the SDC is located in the capitol campus in Olympia, WA.
All data center facilities are accessible and physically secure 24 hours a day, 7 days a week.
Page 461 of 851
. .
Customers typically contact their equipment vendors or a contractor directly for remote hands support, rather than the Sabey Data Center vendor. This responsibility and expense both belong solely to the customer. For general support questions regarding QDC, customers can contact the WaTech support desk.
WaTech facilities responsibilities include the following:
o Maintaining physical security in the facility, including access to facilities and enclosures.
o Providing lockable IT equipment enclosures. o Ensuring the temperature and humidity does not deviate from current data
center standards. o Providing uninterruptible power for the facilities. o Providing facilities for shipping and receiving. o Providing resources to assist with IT equipment additions, moves, changes
and configurations.
Customer Responsibilities include:
o Abiding by WaTech physical security procedures that control access to the facility including ensuring enclosures are locked prior to departure.
o Identifying the list of authorized staff to access the facility and systems collocated therein.
o Defining an escalation path outlining who should be contacted and when in the event of problems with systems that are monitored by WaTech staff.
o Providing vendor name, model number, and specifications for equipment to be collocated. Following documented communications and ticketing processes.
o Properly configuring systems to use the redundant power and network equipment provided in the facility, if the customer chooses redundant power and network connections.
o Submitting all requests for service or emergencies to the WaTech Service Desk.
Prospective customers are required to submit a Colocation Service request form via the WaTech Support Center.
WaTech provides a designated State Data Center Projects Customer Readiness page, which provides a Customer Engagement Plan and Colocation On-Boarding Guide for prospective customers.
o The Customer Engagement Plan details the method that WaTech uses for working with customers on Data Center projects.
o The Colocation On-Boarding Guide details the processes used to prepare, plan and conduct migration of customer IT equipment into the SDC.
Prospective customers meet with WaTech to capture detailed requirements and configuration details for their environment and prepare planning for the migration of equipment to the chosen data center.
There is no term limit or maximum commitment required of colocation customers; however, a 90-day notice is required, in addition to legal documentation to terminate colocation services.
SDC and QDC customers who chose to use WaTech as their network carrier also receive additional support as a part of their data network service, e.g., network connection monitoring, ongoing technical support for network connections and for managed firewalls, network vulnerability scanning (details on WaTech data network services are covered in the data network portion of the service inventory).

Page 462 of 851
. .
B. Statutory Basis for Creation of Service or Program
RCW 43.105.375 specifies that “state agencies shall locate all existing and new servers in the state data center.” However, there is an allowance for agencies that have specific service or performance requirements for servers to be located outside the data center, to submit a written request for a waiver, which is location specific rather than generic to the entire agency.
OCIO Policy 184 establishes clear expectations for agencies to locate all existing and new servers in the state data center as described in the above and is not intended to preclude agencies migration to cloud services.
Agencies must complete migration by no later than June 30, 2019 or have an approved waiver. The current list of agencies with approved waivers includes the following agencies with migration projects in flight and/or in planning:
Figure 75. Agencies with Waivers (Migrations in In Flight):
Note: Updated agency waiver list provided by the OCIO during inventory review. DSHS has approximately 8 different programs – many of which have already on-boarded to the SDC. Additionally, WaTech reports that
Status Agency End Date Destination
Schedule Lagging Puget Sound Partnership (EXPIRED) 10/31/2017 State Data Center
On Schedule
Department of Social & Health Services
(EXPIRED) 12/31/2017 State Data Center
On Schedule Secretary of State 3/31/2018 State Data Center
Planned, Not Started Human Rights Commission (start 12/2017) 4/30/2018 State Data Center
On Schedule Services for the Blind 6/30/2018 State Data Center
On Schedule Department of Corrections 6/30/2018 State Data Center
On Schedule Department of Commerce (NEW) 7/31/2018 Quincy Data Center
On Schedule Board of Industrial Insurance Appeals 10/31/2018 State Data Center
Planned, Not Started State Board of Accountancy 10/31/2018 External Cloud
On Schedule Department of Labor & Industries 11/30/2018 State Data Center
On Schedule Public Disclosure Commission 11/30/2018 State Data Center
Planned, Not Started
Transportation Improvement Board (start
06/2018) 12/31/2018 State Data Center
On Schedule State Investment Board 6/30/2019 External Cloud
Planned, Not Started
Department of Fish & Wildlife (start
1/2019) 6/30/2019 State Data Center
Planned, Not Started
Department of Veteran's Affairs (start tied
to completion of the Electronic Medical
Record Project) 6/30/2019 Hybrid
On Schedule Health Care Authority 6/30/2019 External Cloud
Planned, Not Started
Department of Retirement Systems NEW
(start 7/1/2018) 6/30/2019
On Schedule Washington's Lottery NEW 6/30/2019
On Schedule Washington State Historical Society 7/31/2019 State Data Center
On Schedule Superintendent of Public Instruction 9/30/2019 Hybrid
On Schedule Department of Revenue 7/31/2020 State Data Center
On Schedule
Liquor and Cannabis Board (tied to
completion of SMP Project) EXTENDED 2/28/2020 Decommission
On Schedule Department of Ecology 4/30/2021 Hybrid
On Schedule Employment Security Department 6/30/2021 State Data Center
Planned, Not Started
Department of Natural Resources NEW
(start 07/2018) 12/31/2022 Hybrid

Page 463 of 851
. .
Health Care Authority (HCA) is taking a “Hybrid” approach as they changed their plan and installed a considerable presence in the SDC. HCA is also moving some systems to the cloud, but will continue with SDC colocation for at least several years. WaTech also reports that the Department of Health is planning to move their DR systems to Quincy.
Figure 76. Agencies with Waivers (Migrations in Planning):
Note: Updated agency waiver list provided by the OCIO during inventory review. WaTech reports that County Roads (CRAB), School for the Blind, Department of Agriculture (AGR), and Department of Licensing have all initiated the onboard process (beyond mere consults), and the Office of the Attorney General (ATG) is currently moving, and should be done onboarding by July 9, 2018. WaTech provided additional detail that overall, agencies reaching out to WaTech to discuss onboarding has increased tenfold from six months ago, and WaTech believes many agencies appear to be losing interest in extending their waivers, or are only extending due to a lack of legislative funding.
C. How the Service Fits into the CTS Strategic Plan and Goals
WaTech reports that this service supports the strategic roadmap to ensure Washington State’s IT operations are protected.
D. Performance Measures used to Measure Effectiveness and Efficiency
WaTech tracks the following performance measures for this service:
Availability/Accessibility – Maintain staffing to enable secure access 24x7x365
Incident Response – Follows standard WaTech incident management process with targets based on ticket severity
Data Center Uptime – Follows data center tier standards to determine facility availability. WaTech has set a target uptime of > 99.982% in line with the Uptime Institute standard for Tier III data centers
Power Usage Effectiveness – Measures energy efficiency of a data center by the power used to run the equipment within it. PUE is expressed as a ratio, with overall efficiency improving as the quotient decreases toward 1. WaTech has set a target PUE of < 1.70
E. Current Cost to Maintain the Service
Staffing
Staff are fully dedicated to the delivery of this service; however, staff time is split across several data center facilities which are covered under several cost centers; therefore, WaTech uses transfer rules to assign staff to the cost centers for the purposes of tracking and forecasting costs (shown as the 11 FTEs in direct/indirect labor in the diagram below). These transfer rules were developed by estimating actual staff time spent on activities related to the service.
Agency Plan Due Date DestinationDepartment of Agriculture (EXPIRED & new request pending)12/31/2017 State Data Center
Department of Health (Extended) 5/31/2018 Hybrid
Department of Transportation (Request Pending, info needed)1/31/2018 Hybrid
School for the Blind 5/31/2018 State Data Center
Department of Corrections 5/31/2018 Quincy Data Center
Office of the Attorney General 7/31/2018 State Data Center
County Roads Administration Board 7/31/2018 State Data Center
Student Achievement Council 7/31/2018 Unknown
State Parks Department 9/30/2018 State Data Center
State Board of Community & Technical Colleges 10/31/2018 External Cloud
Board of Volunteer Fire Fighters 12/31/2018 Unknown
Department of Licensing 4/30/2019 Hybrid

Page 464 of 851
. .
In addition, 2.8 percent of total overhead costs are being transferred to this service. If you apply that total cost percentage to the 65 FTE within overhead, it would be about 1.82 overhead FTE.
Figure 77. Data Center Facility Services Staffing
Note: Staffing numbers pulled from “Estimated Overhead FM6 December”. While for most services WaTech offers an Assistant Director applies oversight time directly to service cost codes, the Assistant Director who oversees colocation applies one-hundred percent time to agency overhead.
Figure 78. Data Center Facility Services Direct/Indirect Staffing
Note: Staffing details pulled from “Org Chart - Color Coded 01.01.18” and combined with transfer rules in “FY18 Master Indexes 12-19-17”

Page 465 of 851
. .
There are three teams supporting collocation services: Critical Environment, Space Management, and Physical Security. While the Physical Security team is assigned to a dedicated cost center, the other two teams are split across two cost codes, which are then in turn split across three cost centers for specific facilities.
The WaTech Data Center Manager oversees all data center facilities (Critical Facilities, Space Management, etc.) operations, with the exception of physical security which reports directly to the Chief Technology Officer of the WaTech Infrastructure and Applications group.
The Critical Environment team is made up of a supervisor and a direct report. This team is responsible for managing the contracted data center facilities maintenance contractors
The Space Management team is a team of five overseen by a supervisor. This team is responsible for planning design for customer onboarding, developing rack elevation diagrams, supporting installation of equipment, planning and installing cable runs between enclosures (and within enclosures when requested). However, given that work associated with moving new customers into the data center is limited and sporadic, this team is currently supporting the network group with site surveys and equipment upgrade activities.
The Physical Security team is made up of a manager and a direct report. This team is responsible for managing the physical security contract service provider.
In addition, there is one person dedicated to sales for collocation services as well as hosting services. This staff person develops quotes, estimates, website changes, contractual agreements, communications, and customer SharePoint Sites. They also prepare information for various teams including data center services, the network, security, firewall, The State Private Cloud, project managers, and customer account managers (CAMs). This enables customer onboarding to run smoothly across the supporting teams. This effort is not reflected in the service costs as this person is assigned to agency overhead.
Workload Supported
The current supported workload is defined in the table below:
Table 180. Data Center Facility Services Workload Supported
Type of Workload Current Workload Supported
SDC Data Hall #1 Enclosures
199 enclosures in use (out of 263 built and available, 76% of fully built enclosures)
SDC Data Hall #2 Enclosures
63 enclosures in use (out of 141 built and available, 45% of fully built enclosures)
SDC Total Enclosures 262 enclosures in use (out of 404 built and available, 65% of fully built enclosures)
SDC Power Workload
680,090 kWH SDC Total for IT Equipment + Supporting Infrastructure (in November – an average month) This equates to an average electrical load of 945 kW (680,090 kWh / 30 days / 24 hours per day). 435,955 kWH SDC IT Equipment Only (in November – an average month) This equates to an average electrical load of 605 kW (435,955 kWh / 30 days / 24 hours per day). 256,283 kWH SDC Supporting Infrastructure Only (in November – an average month) This equates to an average electrical load of 339kW (256,283 kWh / 30 days / 24 hours per day). (annualized based on average monthly consumption for 7 months of provided data from July 2017 to January 2018)

Page 466 of 851
. .
Type of Workload Current Workload Supported
SDC Power Usage Effectiveness
1.61 (average based on 7 months of provided data)
QDC Total Enclosures 43 enclosures in use (out of 53 built and available, 81% of fully built enclosures)
QDC Power Workload
49,803 kWH for IT Equipment was billed 1/31-2/28. 0 This equates to an average electrical load of 71.55kW (49,803 kWh / 29 days / 24 hours per day). Co-lo provider includes Cooling and other overhead in their rates.
Note: SDC Workload information is current as of January 2018 and this detail was provided by WaTech in February and April in “WaTech in PSE Consumption Invoice Tool SDC” and “QDC Power Consumption Invoice” and “January 2018 enclosures”
Direct, Indirect and Overhead Costs
WaTech’s planned operational expenses for this fiscal year are provided in the tables below. These operational expenses exclude the principle and interest payments on the revenue bonds issued to raise the funds to construct the data center. These debt service payments will total $12,550,825 in FY18 and $12,549,073 in FY19, for a total of $25,099,899 this the biennium.
Table 181. Data Center Facility Services FY18 Planned Service Expenses: SDC (4803)
Cost Components FY18 Planned FY19 Planned Cost Details
A Salaries 550,746 567,918 6.50 Planned FTEs
B Benefits 170,335 174,937
E Goods & Services
4,395,200 4,135,200
1. Maintenance and support: FYI Properties; W/R Support; New - Arch Flash NFPA Certification; CMMS Plan on Maintenance Contract; Eaton STS and UPS; MVS Gear Maintenance; and, other (ACCO, DCIM, PSE, Other, Break Fix)
2. Contractors (Electrical & Mechanical) McKinstry ($420,000)
3. Utilities ($943,800), Pacific Power ($24,000) and fuel allowance ($60,000)
E Internal Purchases 24,000 24,000
G Travel 4,000 4,000
J Non-capitalized Assets
385,000 120,000
Equipment
Deferrals from 2017 - UPS Battery Replacement
T Transfers 273,000 273,000 Agency overhead
Total Planned Expenses
5,802,281 5,299,055
Note: Cost details were pulled from “SDC - 17 19 Summary 050 Spending Plan October 2017 Final” excel spend plan provide in February 2018; the salary and benefit costs assume vacancies are filled

Page 467 of 851
. .
Table 182. Data Center Facility Services FY18 Planned Service Expenses: Physical Security (4805)
Cost Components FY18 Planned FY19 Planned Cost Details
A Salaries 186,450 190,4356 2 Planned FTEs
B Benefits 65,124 66,540
E Goods & Services
816,600 790,367
1. Maintenance and support: Escort construction projects 2. Contractors (physical and security): PS operational staff/personnel; PSOC staff/personnel; Milestone Software license (3 years; Lenel/Traka software license; A-optix pedestal decommission; Vunetrix; security system T&M; consumables; and, overhead adjustment
G Travel 2,000 2,000
J Non-capitalized Assets 4,000 4,000
Equipment for physical security
T Transfers 79,000 84,000 Agency overhead
Total Planned Expenses 1,153,174 1,137,342
Note: Cost details were pulled from “SDC - 17 19 Summary 050 Spending Plan October 2017 Final” excel spend plan provide in February 2018; the salary and benefit costs assume vacancies are filled
Table 183. Data Center Facility Services FY18 Planned Service Expenses: Quincy Data Center (3603)
Cost Components FY18 Planned FY19 Planned Cost Details
A Salaries 206,589 212,012 2.50 Planned FTEs
B Benefits 66,723 68,493
E Goods & Services
638,400 588,000
1. Maintenance and support: Consumables – cabling ($72,000/ $42,000) 2. Contractors (physical security, electrical, and mechanical): Space management – other contractual services ($36,000) 3. Utilities ($26,400.00) 4. Rent ($504,000.00)
E Prepaid Monthly 2,796 2,796
Prepaid – Smart hands
G Travel 2,880 2,880
J Non-capitalized Assets 188,000 22,000
13 enclosure build outs
T Transfers 105,000 105,000 Agency overhead
Total Planned Expenses 1,398,388 1,001,181
Note: Cost details were pulled from “SDC - 17 19 Summary 050 Spending Plan October 2017 Final” excel spend plan provide in February 2018; the salary and benefit costs assume vacancies are filled

Page 468 of 851
. .
Table 184. Data Center Facility Services FY18 Planned Service Expenses: OB2 Data Center (4801)
Cost Components FY18 Planned FY19 Planned Cost Details
E Goods & Services 8,400 8,400
CSM Billing costs related to old data center OB2
P Debt - Principal Payments 1,342 1,411 Costs related to old data center OB2
Total Planned Expenses 9,742 9,811
Note: Cost details were pulled from “SDC - 17 19 Summary 050 Spending Plan October 2017 Final” excel spend plan provide in February 2018; the salary and benefit costs assume vacancies are filled
Table 185. Data Center Facility Services FY18 Planned Service Expenses: Seattle Node (3601)
Cost Components FY18 Planned FY19 Planned Cost Details
A Salaries 10,002.61 0 Drops to zero FTEs as site closed in December 2017
B Benefits 2,964.00 0
E Goods & Services 80,000 0 Rent
G Travel 880 0
Total Planned Expenses 93,847 0
Note: Cost details were pulled from “SDC - 17 19 Summary 050 Spending Plan October 2017 Final” excel spend plan provide in February 2018; the salary and benefit costs assume vacancies are filled
WaTech made large capital investments in order to deliver this service and there are currently many depreciated assets with low book value being tracked. In FY12 and FY13, WaTech invested $5,309,025.43 in the data center mechanical equipment and $16,447,419.27 in the data center electrical equipment. While these assets are listed as having a 20 to 25 years of useful life, WaTech will likely have to make significant investments in maintenance and upgrades during that time. These major assets are currently tracked as a part of cost center 1153, which is the cost code associated with the building itself.
In addition to these major electrical and mechanical infrastructure investments, WaTech has made some other investments in the SDC. Primarily these investments are in switches, cabling, DCIM equipment, and the installation costs. WaTech has a high volume of deferred maintenance and will need to make major investments to refresh equipment over the next several years.
WaTech also invested nearly $200,000 for the recent expansion of the QDC space. Only the investment in the most recent 13 enclosures is capitalized, the other 40 enclosures are not listed in the asset inventory as depreciable assets.
Table 186. Data Center Facility Services Equipment Depreciation
Acquisition Cost Accumulated Depreciation Net Book Value
QDC Colocation (3603) 196,137 23,684 172,453
SDC Colocation (4803) 2,475,878 2,018,145 457,733

Page 469 of 851
. .
Table 187. State Data Center Facility Services Annual Capital Investments
Year Investment
FY95-FY09 564,718
FY10 131,922
FY11 331,617
FY12 204,625
FY13 448,815
FY14 10,783
FY15 757,231
FY16 26,166
Equipment purchases were deferred in 2017 in both data centers because of fiscal year cash flow decisions.
Figure 79. WaTech Financial View Showing Deferred Equipment Replacement
Given near-term planned operating expenses, WaTech will have the following workload costs for this service in FY18:
Table 188. Data Center Facility Services Cost by Workload
Description Workload Cost Details
State Data Center
SDC – Total number of enclosures 262 enclosures
SDC – Data Center operational cost in FY18 (excludes debt service on building)
$ 6,955,454.18 for operations
SDC – Reserved power for IT workload 1,484.5 kW
SDC – Monthly average power draw for IT workload 578 kW
SDC – Monthly average power draw per enclosure 2.2 kW (above divided by 262)
SDC – Monthly average power cost per enclosure (for IT workload)
$555,176 total utilities cost per year for IT workload ($ 943,800 total with PUE 1.7) $2,118 per enclosure per year ($176 per month)

Page 470 of 851
. .
Description Workload Cost Details
SDC – Annual Operational cost per utilized enclosure (including power costs)
$26,547 per enclosure per year ($2,212 per month)
Quincy Data Center
QDC – Total number of enclosures 43 enclosures
QDC – Data Center operational cost in FY18 (excludes rack build out, cables, space management) $1,102,387 per year
QDC – Reserved power for IT workload 71.55 kW
QDC – Monthly average power draw for IT workload
58.56 kW
QDC – Monthly average power draw per enclosure 1.36 kW (above divided by 43)
QDC – Monthly average power cost per enclosure (for IT workload)
$26,400 total utilities cost per year $660 per enclosure per year ($55 per month)
QDC – Operational cost per utilized enclosure $25,636 per enclosure per year ($2,136 per month)
Note: SDC Workload information is current as of January 2018 and this detail was provided by WaTech in February and April in “WaTech in PSE Consumption Invoice Tool SDC” and “QDC Power Consumption Invoice” and “January 2018 enclosures”, and operational cost provided in spend plan documentation. Workload cost in the table above is calculated based on WaTech’s alignment of costs to this service without adjustment for alignment to Gartner consensus models.
F/G. Rate structure CTS is currently billing to customers
Colocation services are provided on a fee for service basis. Service rates described below apply to services provided at both the Olympia SDC and the WaTech Quincy locations.
Table 189. State Data Center Facility Services Rates
Description Rate Detail
Half-size (21RU) 2.5 kW Enclosure**
(**Only one half-size rack allowed per agency program) $650 per enclosure per month
Full-size (42RU) 5 kW Enclosure $1,000 per enclosure per month
Full-size (42RU) 7.5 kW Enclosure $1,500 per enclosure per month
Full-size (42RU) 10 kW Enclosure $2,000 per enclosure per month
Full-size (42RU) 12.5 kW Enclosure $2,500 per enclosure per month
The customer starts with a configuration based on 60% of the IT equipment tag value. Once the enclosure is turned up and in production, the enclosure is monitored for real time consumption. When the customer adds additional IT equipment which brings the 60% value over the original rate threshold, then WaTech provides a new quote to change the customer’s configuration and bills accordingly.
Built out but unoccupied enclosure space is available for reservation, or a soft lease. That is, the reserving customer has first right of refusal as the data center fills up. This enables agencies to reserve a contiguous block of enclosures without incurring any expense until the data center is filled and the space is needed, or until they have moved into the space, whichever occurs first.

Page 471 of 851
. .
Rates were last updated in July of 2015.
H. Analysis of Current Cost Recoverability
This service is not currently cost recoverable. Based on WaTech’s analysis, they would need to nearly double the service rates in order to become cost recoverable.
Table 190. Data Center Facility Services Cost Recoverability (Actual FY16-FY18)
Service Income FY16 FY17 FY18 H1
Service Revenue (4803) 3,157,400 3,263,450 1,868,150
Service Revenue (3408) 1,328,199 795,449 228,877
Service Expenses (4803) (5,195,051) (5,494,281) (2,697,103)
Service Expenses (4805) 0 0 (537,973)
Service Expenses (3408) (660) (24) 0
Service Expenses (3601) (367,231) (308,950) (122,122)
Service Expenses (3602) (323,479) (126,381) 0
Service Expenses (3603) (1,106,294) (815,948) (645,333)
Service Expenses (3605) (150,815) (510) 0
Service Expenses (4801) (38,127) (10,658) (9,916)
Net Income (2,696,058.38) (2,697,853.56) (1,915,420.44) Note: Cost recoverability detail pulled from “AFRS Financial Download (Fiscal Years 2016 – Current)”. Costs are included for all aspects of the colocation service, both current and historical
Table 191. Data Center Facility Services Cost Recoverability (Forecasted FY18-FY19)
Service Income FY18 FY19
Service Revenue (4803) 4,503,400 4,863,000
Service Expenses (4803) (5,802,281) (5,299,055)
Service Expenses (4805) (1,153,174) (1,137,342)
Service Expenses (3601) (81,521) 0
Service Expenses (3603) (1,398,388) (1,001,181)
Service Expenses (4801) (9,742) (9,811)
Net Income (3,941,705) (2,584,389) Note: Forecasted Cost recoverability detail pulled from “SDC- 17 19 Summary 050 Spending Plan October 2017 Final” excel spend plan provided in February 2018. The revenue associated with 3408 Node Site Facilities, is the $459,000 provided annually for DR funding via the Network Security Allocation. Revenue for the Quincy Data Center is included 4803 State Data Center.
I. Service Level Actually Provided Today
WaTech provided data that indicates performance is in line with targets.
Data Center Uptime – WaTech has set a target uptime of > 99.982% with an actual uptime of 100% at both Olympia and Quincy (in line with Uptime Institute’s standard for a Tier III facility)
Power Usage Effectiveness – WaTech has set a target PUE of < 1.70 with an average PUE of 1.67
Incidents – While WaTech has reported incidents that have temporarily removed redundancy, no incidents have caused downtime
WaTech uses the Data Center Infrastructure Management (DCIM) tool to monitor the load on the UPSs in the SDC, as well as humidity, temperature. Data provided indicates these are kept within a reasonable threshold.

Page 472 of 851
. .
The figures below provided sample WaTech performance reports.
Figure 80. Data Center Uptime
Note: Provided by WaTech in April 2018
Figure 81. Power Usage Effectiveness
Note: Provided by WaTech in April 2018

Page 473 of 851
. .
Figure 82. Data Center Incidents by Type
Note: Provided by WaTech in April 2018
Figure 83. Data Center Incidents by Month
Note: Provided by WaTech in April 2018
J. Current Customers
WaTech currently has 31 colocation customers. The largest 10 customers account for over 85% of the amount WaTech billed for this service in FY18.
Additionally, WaTech captures nearly $1.7M of revenue via internal sales transfers. If WaTech were a billable customer it would be the largest customer (as shown below).

Page 474 of 851
. .
WaTech does not capture revenue via internal sales transfers for OB2 Data Center (4801), Physical Security (4805), Seattle Node (3601), or Quincy Data Center (3603).
Table 192. Data Center Facility Services Current List of Customers for both the QDC and SDC: State Data Center (4803)
# Customer FY17 ($) FY17 (%) FY18 H1 ($) FY18 H1 (%)
1 3000-DEPARTMENT OF SOCIAL AND HEALTH SERVICES
545,250 17 289,400 15
2 2250-WASHINGTON STATE PATROL
195,650 6 152,400 8
3 2400-DEPARTMENT OF LICENSING
234,300 7 128,150 7
4 5400-EMPLOYMENT SECURITY DEPARTMENT
168,600 5 90,900 5
5 3100-DEPARTMENT OF CORRECTIONS
53,550 2 40,400 2
6 3570-DEPARTMENT OF EARLY LEARNING
24,300 1 36,900 2
7 1400-DEPARTMENT OF REVENUE
48,650 1 29,300 2
8 0950-OFFICE OF THE STATE AUDITOR
38,200 1 21,000 1
9 1600-OFFICE OF THE INSURANCE COMMISSIONER
17,650 1 15,900 1
10 1030-DEPARTMENT OF COMMERCE
30,000 1 15,000 1
Total Top 10 Billable Customers
1,356,150 42 819,350 44
Total for All Other Billable Customers
212,000 6 150,900 8
Total WaTech Internal Sales 1,695,300 52 897,900 48
Total Revenue 3,263,450 100 1,868,150 100
Note: Customer billing details pulled from “Billing Data - Apptio FFS Only (2018-05-16)” excel file
K. Current and Historical Usage Volumes
SDC historical power consumption is provided in the table below.
Table 193. SDC Historical Monthly Power Consumption
Month/Year Power Bill
($) $/kWH PUE
DC Total for Equipment +
Infrastructure (kWH)
DC IT Equipment Only (kWH)
DC Supporting Infrastructure
Only (kWH)
7/2017 0 0 1.57 659,390 419,994 239,396
8/2017 0 0 1.69 709,270 419,686 289,584
9/2017 64,866 0.09 1.89 700,450 370,608 329,842
10/2017 71,890 0.11 1.53 671,440 438,850 232,590
11/2017 70,312 0.10 1.56 680,090 435,955 244,135
12/2017 72,448 0.11 1.52 667,360 439,053 228,307
1/2018 75,134 0.11 1.50 690,380 460,253 230,127

Page 475 of 851
. .
Month/Year Power Bill
($) $/kWH PUE
DC Total for Equipment +
Infrastructure (kWH)
DC IT Equipment Only (kWH)
DC Supporting Infrastructure
Only (kWH)
Average 70,930 0.10 1.61 682,626 426,343 256,283
Maximum 75,134 0.11 1.89 709,270 460,253 329,842
Note: Data provided by “WaTech in PSE Consumption Invoice Tool SDC”
Table 194. SDC Estimated Monthly Power Load (kW)
Month/Year DC Total (Equipment +
Infrastructure) (kW) DC IT Equipment
Only (kW) DC Supporting
Infrastructure Only (kW)
7/2017 886 565 322
8/2017 953 564 389
9/2017 973 515 458
10/2017 902 590 313
11/2017 945 605 339
12/2017 897 590 307
1/2018 928 619 309
Average 926 578 348
Maximum 973 619 458
Note: Data provided by WaTech in “WaTech in PSE Consumption Invoice Tool SDC”
Table 195. QDC Estimated Power Consumption and Power Load (kW)
Month/Year
Power Consumption
(kWH)
DC Total (Equipment +
Infrastructure) (kW)
DC IT Equipment Only
(kW)
DC Supporting Infrastructure Only
(kW)
2/2018 49,800 N/A- included in
Sabey Rate 71.55 N/A- included in
Sabey Rate
Note: Data provided by WaTech in a sample QDC power bill
While many agencies have already migrated their server infrastructure to the SDC or are currently planning to move to these facilities. There are some agencies who continue to rely on waivers or have limited resources available to plan and migrate to the SDC, however there are many future resources that can be migrated to utilize data halls 1 and 2.

Page 476 of 851
. .
Current enclosure usage as of January 2018 are provided in the figures below:
Figure 84. Enclosure Counts for the State Data Center (Data Halls 1 & 2) and Quincy

Page 477 of 851
. .
Table 196. Data Center Facility Services Customer Usage
Service Offering FY17 ($) FY17 (%) FY18 H1 ($) FY18 H1 (%)
SDC ENCLOSURE SPACE - KWH 3,125,000 96 1,757,000 94
SDC HALF-ENCLOSURE SPACE - KWH 138,450 4 111,150 6
Total Revenue 3,263,450 100 1,868,150 100
Note: Customer billing details pulled from “Billing Data - Apptio FFS Only (2018-05-16)” excel file
Seven agencies requested funding related to SDC migrations at the beginning of the current biennium.
Agencies Requesting SDC Migration Funding
Office of Attorney General Caseload Forecast Council Department of Health Department of Retirement Systems Department of Revenue

Page 478 of 851
. .
Agencies Requesting SDC Migration Funding
Liquor & Cannabis Board Office of the Secretary of State (regular operations)
WaTech has estimated a range of likely enclosure migration schedules based on agency submitted data:
Fiscal Year Optimistic Estimate Moderate Estimate Pessimistic Estimate
FY17 11.5 6 3
FY18 35.5 18 9
FY19 37.5 19 9
FY20 10 5 2.5
FY21 9 4.5 2
FY22 0 0 0
FY23 14 7 3.5
Total 117.5 59 29
There is currently a multi-million dollar shortfall in data center operations expenses alone, as shown in the figure below.
Figure 85. Projected Losses between FY18 and FY21 Given Planned Migrations
Note: Revenue and expenses chart pulled from the OCIO Washington State Data Center Update for 2017
Based on WaTech calculations, even if data hall 1 and 2 were filled at capacity, given the current price model the colocation service would still be unable to recover operational costs.
Figure 86. Projected Losses Assuming SDC Data Hall 1 & 2 are Operating at Capacity

Page 479 of 851
. .
Note: Revenue and expenses chart pulled from the OCIO Washington State Data Center Update for 2017
L. Customer Satisfaction and Future Demand
The Customer Voice appendix to this report includes customer satisfaction and future demand details based on the results of agency interviews and focus groups conducted during the project.
M. High Level Architecture
State Data Center Architecture
The SDC building is in downtown Olympia, Washington, in the capitol campus. The location and overall building design was unable to meet every best practice. The location is along a major fault line, the Cascadia subduction zone that runs from Oregon along the west coast of Washington all the way up to Canada. The building (….Redacted….), and the building itself is open to the broader public. Additionally, the (….Redacted….),… However, beyond these considerations (and the fact that the data center has more capacity than what is currently needed by the state), and in spite of an older design that is architected with the assumption of lower power density computing equipment, the other aspects of the design are largely in line with the state’s needs.
The SDC is comprised of two data halls and two additional empty shells that could be developed into an additional two data halls with further investment. All of the required electrical and mechanical equipment has been built out for the two constructed data halls. The two shells are bare concrete and no additional investment has been made to build them out (by WaTech’s estimate it would be an additional $40 million dollar investment to complete the two remaining shells, which would largely be an investment in mechanical and electrical data center infrastructure equipment).
Between the two constructed data halls, WaTech built out the required infrastructure for five MW data center facility with 2.5 MW available per floor, including for the mechanical load.
Figure 87. SDC Building Diagram
REDACTED
Note: Diagram provided by WaTech during interviews in February
All of the cabling for each of the two data halls has been completed, and 65 kW of power is available to be distributed to all rows. However, while power is available for the entirety of the two data halls, not all enclosures have been built out. There is still space in data hall one available to build out an additional seven enclosures, and space in data hall two to build out an additional 274 enclosures.
The SDC is concurrently maintainable, with a five to make 4-power configuration (an n+1 architecture with additional reserve power). Each data hall has two power line-ups, data hall one is able to receive power from line-up A and B, as well as C in the middle, and data hall is able to receive power from line-up C in the middle, as well to line-ups D and to E. Each line-up has a separate generator, which makes a total of five 2.5 MW generators. For each data hall, one line-up is always loaded, one line-up is resting, and one line-up is ready.

Page 480 of 851
. .
Figure 88. SDC Line-Ups A through E Diagram
Note: Diagram provided by WaTech during interviews in February.
In data hall one, Line-up A and B offer fully redundant paths, with the exception of power distributed to the office space, which is only available on line-up B. In addition, Line-Up C provides two additional redundant Uninterruptible Power Supplies (UPS) and another redundant generator, which provides a continued source of power redundancy during maintenance of Line-up A or B. In data hall two, Line-up D is a mirror image of Line-up A in data hall one, and Line-up E is a mirror image of Line-up B. Line-up C offers the same additional redundancy in data hall two as in data hall one.
All power is drawn from the …(Redacted)…; however, power is brought into two separate medium voltage substations (MVS) within the SDC, that is, MVS A and MVS B.
Figure 89. SDC Power Distribution Diagram for Line-Up A and C
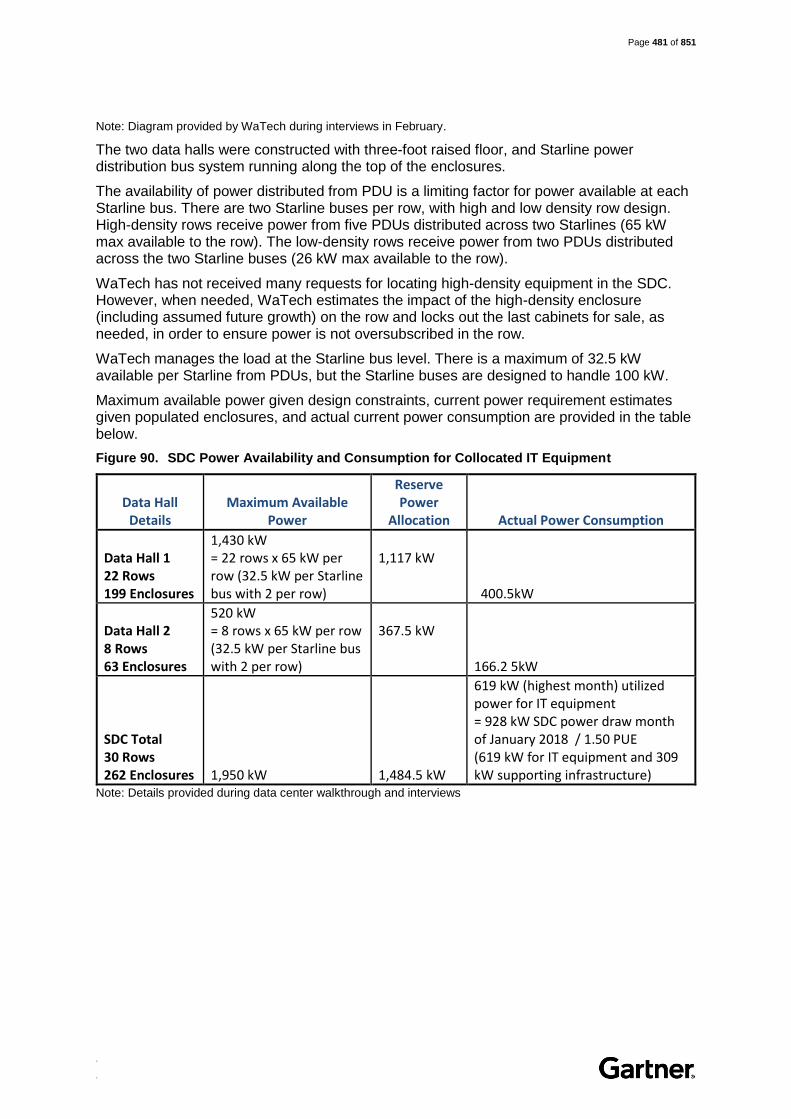
Page 481 of 851
. .
Note: Diagram provided by WaTech during interviews in February.
The two data halls were constructed with three-foot raised floor, and Starline power distribution bus system running along the top of the enclosures.
The availability of power distributed from PDU is a limiting factor for power available at each Starline bus. There are two Starline buses per row, with high and low density row design. High-density rows receive power from five PDUs distributed across two Starlines (65 kW max available to the row). The low-density rows receive power from two PDUs distributed across the two Starline buses (26 kW max available to the row).
WaTech has not received many requests for locating high-density equipment in the SDC. However, when needed, WaTech estimates the impact of the high-density enclosure (including assumed future growth) on the row and locks out the last cabinets for sale, as needed, in order to ensure power is not oversubscribed in the row.
WaTech manages the load at the Starline bus level. There is a maximum of 32.5 kW available per Starline from PDUs, but the Starline buses are designed to handle 100 kW.
Maximum available power given design constraints, current power requirement estimates given populated enclosures, and actual current power consumption are provided in the table below.
Figure 90. SDC Power Availability and Consumption for Collocated IT Equipment
Data Hall Details
Maximum Available Power
Reserve Power
Allocation Actual Power Consumption
Data Hall 1 22 Rows 199 Enclosures
1,430 kW = 22 rows x 65 kW per row (32.5 kW per Starline bus with 2 per row)
1,117 kW 400.5kW
Data Hall 2 8 Rows 63 Enclosures
520 kW = 8 rows x 65 kW per row (32.5 kW per Starline bus with 2 per row)
367.5 kW 166.2 5kW
SDC Total 30 Rows 262 Enclosures 1,950 kW 1,484.5 kW
619 kW (highest month) utilized power for IT equipment = 928 kW SDC power draw month of January 2018 / 1.50 PUE (619 kW for IT equipment and 309 kW supporting infrastructure)
Note: Details provided during data center walkthrough and interviews

Page 482 of 851
. .
Figure 91. SDC Conceptual Power Distribution Diagram for All Line-Ups
Note: Conceptual drawing created based on drawings and information provided by WaTech during interviews
WaTech monitors 65,000 alarm points in the DCIM system.
Figure 92. Data Hall 1 Row 9 and 10 South
Note: DCIM monitoring system snapshot provided by WaTech in February 2018
Page 483 of 851
. .
Quincy Data Center Architecture
WaTech received one-time funding and an additional $459,000 annually from the legislature since July 2015 to invest in standing up a disaster recovery capability. This investment was used to build out the initial 41 enclosures at the QDC data center. Other customers have filled all contiguous space in the current QDC building adjacent to WaTech’s caged area. Future expansion in the DR facility will require brining in new trunk cabling.
WaTech recently built out an additional 13 enclosures at the QDC facility in order to build up a cushion of additional disaster recovery enclosure space that will not require additional investment in network and cabling. WaTech made a $208,000 investment in maximizing the remaining available contiguous space in the QDC facility via a competitive bid. This contracted build out included overhead trays, enclosures, and security cameras. WaTech pays just over $110,000 annually in rent to Sabey for these 13 new enclosures.
WaTech has 242 sq. ft. of office space at the QDC. This is used for both WaTech Data Center Facilities and Customers. The rate is currently at $2.10 per sq.ft for a total of $508.50 per month.

Page 484 of 851
. .
8. Desktop Services
(8111) Desktop Support
Background
This service is defined under the Desktop Support Services entry in the online service catalog
WaTech Desktop Support covers a majority of the end user services an agency IT department typically provides: local LAN infrastructure, desktop hardware and software deployment/technical support/break fix support and Desk-side/Help Desk support
This service does not provide developers or agency specific server and application support
This service is not generally available. It is only offered to the following customers:
o DES o OFM o Office of the Governor o Caseload Forecast Council o WaTech o Environmental Land Use Hearings Office o Commission on African American Affairs o Commission on Asian Pacific American Affairs o Governor’s Office of Indian Affairs o Commission on Hispanic Affairs o Washington Citizens Commission on Salaries for Elected Officials
Currently, approximately 2,518 desktops are supported under this service by about 24 FTEs
o About 2,268 desktops are primary desktops for paid customers, with the remaining 250 desktops used as a part of the pending surplus for break/fix
o This service does not include support for Printer hardware. It does include technical support for printer configuration (e.g., printer queue set up)
o This service includes support only for Window Desktops. Other desktops, tablets, smartphones and devices are not supported
Historically WaTech invoiced customers for a full year of desktop support at the beginning of the year, which contributed to challenges keeping an accurate user count and unnecessary equipment refresh investments. WaTech plans to move to a quarterly billing model to help improve accuracy and provide greater customer flexibility
A. Service Description
Definition
The current WaTech Desktop Support service provides customers with design, implementation, operation, maintenance, and support for technology infrastructure and end-user services on WaTech owned and/or supported Windows desktop endpoints.
Service delivery is currently based on a standard model (i.e., DEMARC to Desktop). WaTech staff manage local customer infrastructure, serve as the customer liaison for

Page 485 of 851
. .
endpoint services, facilitate endpoint changes between the customer and enterprise services (when appropriate), and guide customers to enterprise teams when needed (e.g., applications).
Features
IT Support for end users covering the array of issues that an end user encounters. For example, peripheral (mouse, monitor, keyboard, etc.), connectivity, enterprise services support, driver, software, best practice, permission or access, hardware, etc.
Installation, configuration and functional support for COTS, customer Line of Business applications, and enterprise applications
End point hardware refreshes every 4 years
Microsoft Office Suite, operating system, and client access licenses
User and shared file daily backups
On-demand recovery services for files residing within WaTech’s File Depot environment (an unstructured file-based storage system managed under the Platform & Connectivity service)
End-user support for any WaTech add-on services (e.g., shared email, VPN, etc.) where this support would typically be provided by agency IT departments
Software and hardware components requiring IT asset security and/or for compliance with local, state, and federal regulations
Notes
When this service becomes available to additional customers, they will need to enter into a Master Service Agreement
Before WaTech provides services to an outside customer, WaTech must do an assessment of the customer’s infrastructure to determine complexity and continuity with existing WaTech requirements.
Customers must accept the Desktop Support Services Terms of Service (TOS)
Customers may engage WaTech in an effort not covered under the Desktop Support TOS; however, this type of work will only be initiated with the approval of a custom Statement of Work and pricing attached to the Desktop Support Service TOS
B. Statutory Basis for Creation of Service or Program
WaTech’s delivery of this specific service is not mandated by statute.
RCW 43.105.385 states that over time state agencies should move toward using WaTech as their central service provider for all utility-based infrastructure services including centralized PC and infrastructure support. However, WaTech struggled to execute on that vision, and never defined an executable migration strategy to become the centralized PC provider across the state.
Today, state agencies have the option to contract directly with other providers for desktop support, or to deliver the service for themselves, and many choose to do so, as WaTech never built up a scalable centralized service.

Page 486 of 851
. .
C. How the Service Fits into the CTS Strategic Plan and Goals
WaTech reports that this service is not listed as strategic at this time based on strategic plans or technology roadmaps.
However, this service is a requirement for the agency, OFM, the Governor’s Office, and a collection of small agencies.
D. Performance Measures used to Measure Effectiveness and Efficiency
WaTech has three types of performance measures for this service:
Incident Response – Follows standard WaTech incident management process with targets based on ticket severity.
Service Request Response – Follows standard WaTech service request management process with targets based on average response time.
Availability – Support of the desktop, applications, LAN, and other devices are provided with an expected availability of 99% during normal business hours. After-hours availability has a general target of 98%.
WaTech provides customers with 24/7 Tier 1 technical support via the Support Center. Support Center regular hours are Monday – Friday, 7:00 am to 5:30 pm.
WaTech aims to combine changes to minimize disruption to the customer business. WaTech acknowledges that scheduled or planned maintenance events can affect availability for customers.
Incident and Service Requests are available through WaTech’s ticketing program (EasyVista); Assistant Director of the program has historically monitored these on a monthly basis.
Additional details on availability targets are provided in the tables below:
Availability Targets Detail
Scheduled / Planned Maintenance
Scheduled maintenance activities occur outside of regular business hours and are designed to have the least amount of impact as possible to customers. Maintenance events allow WaTech to address important activities such as hardware and software upgrades, software patches, faulty hardware replacement, security patches, and application changes. Maintenance notifications will be sent via email to all affected customers at least five (5) business days in advance or more if possible.
In the event a maintenance event will affect critical business functions, WaTech asks that customers notify the WaTech Support Center. WaTech will attempt to reschedule around that activity.
Maintenance Cadence
Planned maintenance on servers generally occurs every Thursday night, 9:30 PM until midnight. During this time, the LAN and servers may not be available. Email Server Maintenance generally occurs on Sundays from 10am to 4pm. The maintenance window will only be used when necessary, and will normally not exceed this outage window. Maintenance notifications will be sent via email to all affected customers at least five (5) business days in advance or more if possible.
In the event a maintenance event will affect critical business functions, WaTech asks that customers notify the WaTech Support Center. WaTech will attempt to reschedule around that activity.

Page 487 of 851
. .
Availability Targets Detail
Maintenance Schedule Changes
WaTech will contact the Customer’s Chief Information Officer or other designee at least one week in advance to ensure that operational schedules will not be disrupted in the case of emergency maintenance. All maintenance that can be scheduled in advance will be, so that the customer can plan for operational activities and meet customer deadlines. This will be followed up with an email notification to all affected staff.
WaTech’s two primary responsibilities for its Desktop Support service are technical support via the WaTech Support Center and performance standards and reporting. WaTech is responsible for providing performance metrics to the customer monthly via the CAMs during the customer’s regularly scheduled meeting. In the event a stated standard has not been met 3 months in a row, a mitigation plan may be developed in partnership with the customer to improve either practice or re-baseline the standard.
Metrics Metric Detail
Break / Fix Response of 2-4 hours for a functioning replacement (temporary or permanent, depending on availability). If a temporary loaner is distributed, repairs will be made within 1-2 weeks, depending on parts availability.
Incident Metric Number of combined LAN and the desktop incidents the Customer reported to WaTech during prior six months, average response time, average resolution time categorized by severity number and type, and status of any open incidents.
Work Station Patch Management
Critical patches may be applied quietly (delivered on-the-fly and with little to no user interruption or awareness) during business hours, typically three to five business days after Microsoft, Adobe and other vendors release a critical update which may require an immediate or delayed reboot. All other patches and updates will begin to arrive on work stations the third Thursday of each month at 11:00 PM.
E. Current Cost to Maintain the Service
Staffing
Staff are not fully dedicated to the delivery of this service; therefore, WaTech uses transfer rules to assign staff to the service for the purposes of tracking and forecasting costs (shown as the 23.96 FTEs in direct/indirect labor in the diagram below). These transfer rules were developed by estimating actual staff time spent on activities related to the service.
These resources have the following responsibilities:
13 Full Time – Direct Desktop Technicians
6 Full Time – Back office support (Active Directory, SCCM, Group Policy, LAN, etc.)
2 Full Time – Supervisor/Manager
3.96 FTEs – Help Desk and Security
In addition, 6.1 percent of total overhead costs are being transferred to this service. If you apply that total cost percentage to the 65 FTE within overhead, it would be about 3.97 overhead FTE.

Page 488 of 851
. .
Figure 93. Desktop Support Service Staffing
Note: Staffing numbers pulled from “Estimated Overhead FM6 December”
Figure 94. Desktop Support Service Direct/Indirect Staffing
Note: Staffing details pulled from “Org Chart - Color Coded 01.01.18” and combined with transfer rules in “FY18 Master Indexes 12-19-17”. The 18 staff under desktop support are all desktop support technicians.
Workload Supported
This service is currently only available to the following customers:
DES
OFM
Office of the Governor
Caseload Forecast Council
WaTech

Page 489 of 851
. .
Environmental Land Use Hearings Office
WaTech has a legislative requirement to provide desktop services at no cost to the following agencies/Governor committees:
Commission on African American Affairs
Commission on Asian Pacific American Affairs
Commission on Hispanic Affairs
Governor’s Office of Indian Affairs
Washington Citizens Commission on Salaries for Elected Officials
The current supported workload is defined in the table below:
Table 197. Desktop Support Service Workload Supported
Type of Workload Current Workload Supported
Number of Desktops Supported 2,268 (excluding break/fix and loaner devices)
Number of LAN Switches Supported 145 LAN switches
Number of LAN Ports Supported 5,185 active LAN ports (64% of available LAN ports)
Number of Help Desk Tickets per Year 2615 tickets, including 597 incidents and 2,018 requests (in calendar year 2017)
Note: Workload information provided during inventory review in April 2018 and follow up discussions. WaTech is currently reviewing the LAN equipment inventory to verify counts and identify needed replacements.
Direct, Indirect and Overhead Costs
WaTech’s planned expenses for this fiscal year are provided in the table below.
Table 198. Desktop Support Service FY18 Planned Service Expenses
Cost Components FY18 Planned FY19 Planned Cost Details
A Salaries 1,839,564 1,925,040 25.22 Planned FTEs (assuming vacancies filled)
B Benefits 665,700 696,684
E Goods & Services 596,199 596,199
Software maintenance (11 items), training, and other (i.e., $67,260)
E Internal Purchases 894,932 894,920
Desktop infrastructure, network/servers, desktop support, project management
G Travel 18,000 18,000
J Non-capitalized Assets 1,140,000 1,140,000
Computer refresh and equipment repair/replacement
T Transfers 956,278 964,681 Agency overhead
Total Planned Expenses
6,110,673 6,235,524
Note: Cost details were pulled from “8111withreductionsandadditions” excel spend plan provide in February 2018; the salary and benefit costs assume vacancies are filled. Inclusion of Client Access Licenses (CALs) for Microsoft Services does not duplicate costs associated with the enterprise email service as WaTech requires

Page 490 of 851
. .
customers to purchase their own CALs and does not provide them as a part of that service. Budget for non-capitalized assets will be used for refresh of all equipment types, including monitors as needed, but WaTech has not yet assessed how much equipment this refresh/repair/replace budget will cover. WaTech is still working through an inventory validation process to identify remaining usable life across various assets, including monitors and switches in addition to desktops. Historically, WaTech did not inventory monitors due to their small cost but WaTech has now implemented asset tagging and they are now working on a process for identifying estimated age of monitors to enable development of a refresh plan. WaTech anticipates that this process will be very labor intensive given the volume of older equipment inherited in 2015. Other untracked and unplanned equipment refresh requirements, like the building UPSs which required replacement after they melted and caused a damaging power spike, have also increased equipment replacement spend. WaTech recently went out to bid for contractor support for LAN switch replacements due to staffing constraints, but the spending plan has not been updated to incorporate that cost at this time. WaTech expects that the cost of replacement will be around $1.2M and will need to be broken out over more than one biennium. WaTech is not able to provide an estimated percentage of the equipment refresh budget that will need to be dedicated to LAN versus desktop. WaTech is not able to provide a confidence estimate of whether the forecasted budget will enable WaTech to refresh equipment at sustainable rate, and is not able to state whether the budget will cover the required refreshes when they are needed.
WaTech has not made capital investments associated with the delivery of this service as desktops are below the capital expense threshold. WaTech also reports that this service was not established with a clear plan and well defined budget for equipment refresh, and that asset management and lifecycle cost management has generally been neglected since 2011.
Given near-term planned operating expenses, WaTech will have the following workload costs for this service in FY18:
Table 199. Desktop Support Service Cost by Workload
Description Workload Cost Details
Number of Supporting FTEs 22.96, including 12 desktop technicians, 5 back office support, 2 managers/supervisors, 3.96 security and help desk (excluding LAN tech)
Number of Desktops Supported 2518 (including 250 pending surplus)
Desktops per FTE 109 desktops per FTE
Desktops per Technician 209 desktops per technician
Note: Desktop and LAN costs are comingled and cannot be driven down to a per device estimate. Workload cost in the table above is calculated based on WaTech’s alignment of costs to this service without adjustment for alignment to Gartner consensus models.
F/G. Rate structure CTS is currently billing to customers
The service is provided on a fee for service basis; rates are listed in the table below:
Table 200. Desktop Support Service Rates
Description Rate Detail
Desktop, Network, Infrastructure Services
$3,500 per PC/Laptop
Includes hardware and cabling, operating system, Microsoft Office Productivity Tools, maintaining connectivity to SGN, includes LAN support (but not transport) and Help Desk/Desk Side Support and LOB application end user support, and the staff that support these products and services.

Page 491 of 851
. .
Description Rate Detail
Off-Site Support (outside the normal designated office address)
In the event that the customer wishes to engage WaTech in an effort not covered by this TOS, travel time and mileage will be charged at a staff time in transit rate of $85 per hour (pro-rated to the ½ hour) and a mileage rate of $0.575 per mile. This work will only be initiated with the approval of a Statement of Work subject to the Special Terms below.
Staffing Rates
In the event that the customer wishes to engage WaTech in an effort not covered by this TOS (e.g., Setting up Conferences, working on non-supported equipment, etc.), the staffing rate is $85-$250 per hour depending on the type of engagement. This work will only be initiated with the approval of a Statement of Work subject to the Special Terms.
Other items NOT currently covered in Desktop Support Terms of Service
Items that would generally be associated with providing IT Support that are currently being billed directly and/or separately and not included in the pricing of Desktop Support:
Onboarding Startup Costs (New Customers)
IT Costs Related to New Construction or Remodels
Internet Circuit Charges
Application/Database Storage
Commercial ISPs (Comcast, Verizon)
Skype for Business (Lync)
WebEx
Conference Bridges
Cell Phones/Data Plans
Printer hardware, software and supplies
Printer PM and/or break fix support
After two years of negotiations and discussions with customer agencies, WaTech recently reduced its service rate from $5,000 to $3,500 per device for the standard pricing model (as defined in the service definition section above). WaTech is continuing to evaluate desktop service options and pilot other service packages.
In order to reduce the price from $5,000 to $3,500 per device, WaTech decoupled the chargeback for backend server and core LAN support from desktop support and LAN access layer support. This server hosting and support is now provided under a separate service, the Platform & Connectivity service which is addressed within the Server (Hosting) section of the service inventory. The two groups still share some responsibilities at the network distribution layer.
Additionally, the $3,500 rate was established to provide a large buffer given unanswered questions about LAN costs and equipment refresh requirements, and the fact that WaTech needed to recover funds due to external customer short payment $1.3 million in the prior biennium. The rate was established at a point where WaTech anticipated underspending revenue by over three quarters of a million dollars as part of the target for WaTech’s financial recovery plan. WaTech also intended to set the rate at a high level that would not need to be adjusted frequently.

Page 492 of 851
. .
H. Analysis of Current Cost Recoverability
This service is not currently cost recoverable according to available FY18 (H1) AFRS financial data. However, this service is forecasting cost recoverability in FY18 and FY19 based on information provided in the FY18/19 spend plan.
Prior to FY18 in the middle of the last biennium, Desktop Support included support of servers and network which is now provided under the WaTech Platform & Connectivity service. The combined desktop, network, and server support used to be provided under charge codes 8110 Desktop and Network Support and 8112 Network Support). In FY18, these services were split into two new codes: 8111 for Desktop Support and 4231 for Platform & Connectivity (network and server support).
Table 201. Desktop Support Service Cost Recoverability (Actual FY16-FY18 H1)
Service Income FY16 FY17 FY18 (H1)
Service Revenue (8111) 0 0 2,263,164
Service Revenue (8110) 5,371,009 5,334,606 0
Service Expenses (8111) (2,009,093) (2,164,016) (2,651,343)
Service Expenses (8110) (49,021) 33,615 0
Service Expenses (8112) (3,358,913) (2,339,213) 0
Net Income (46,018) 864,992 (388,180) Note: Cost recoverability detail pulled from “AFRS Financial Download (Fiscal Years 2016 – Current)”. Service expenses are net positive in FY17 due to a refund from Hewlett Packard.
Table 202. Desktop Support Service Cost Recoverability (Forecasted FY18-FY19)
Service Income FY18 FY19
Service Revenue (8111) 6,548,500 6,548,500
Service Expenses (8111) (6,110,673) (6,235,524)
Net Income 437,827 312,976 Note: Forecasted Cost recoverability detail pulled from “8111withreductionsandadditions” excel spend plan provide in February 2018
I. Service Level Actually Provided Today
Desktop Support requires acceptance of a Terms of Services, which defines WaTech service-related support targets and outlines responsibilities for both WaTech and customers.
Metrics Metric Detail Performance Against
Target
Break / Fix
Response of 2-4 hours for a functioning replacement (temporary or permanent, depending on availability). If a temporary loaner is distributed, repairs will be made within 1-2 weeks, depending on parts availability.
Not available. WaTech does not track and report on this metric.
Incident Metric
Number of combined LAN and the desktop incidents the Customer reported to WaTech during prior six months, average response time, average resolution time categorized by severity number and type, and status of any open incidents.
Not available. WaTech does not track and report on this metric.
WaTech provides reports to customers based on customer request. Inventories, folder permissions, agency security groups, and user-installed software are available on request. Not all customers want this data or want it on a regular basis. Ticketing information is usually covered by the CAMs (Customer Account Managers) based on what the customer wants to

Page 493 of 851
. .
talk or know about. Audit and annual security compliance reports are typically provided by the WaTech security team.
J. Current Customers
WaTech has eleven customers for this service. The largest customer – DES – accounts for over 44% of the amount WaTech billed for this service in FY17.
Additionally, WaTech captures over $2.5M of revenue for Desktop Support services via internal sales transfers (based on FY17 billing data). If WaTech were a billable customer, it would be about the fourth largest (as shown in FY17 below).
Table 203. Desktop Support Service Current List of Customers
# Customer FY17 ($) FY17 (%) FY18 H1 ($) FY18 H1 (%)
1 ENTERPRISE SERVICES DEPARTMENT OF 3,465,085 44 0 0
2 OFFICE OF FINANCIAL MANAGEMENT 1,130,000 14 0 0
3 OFFICE OF THE GOVERNOR 590,000 8 0 0
4 ENVIRONMENTAL LAND USE HEARINGS OFFICE 46,987 1 0 0
5 COMMISSION ON AFRICAN AMERICAN AFFAIRS 9,980 0 0 0
6 Commission on Asian Pacific American Affairs 9,980 0 0 0
7 Governor’s office of Indian Affairs 9,980 0 0 0
8 CASELOAD FORECAST COUNCIL 5,695 0 0 0
Total Top 10 Billable Customers 5,267,707 67 0 0
Total for All Other Billable Customers 0 - 0 0
Total WaTech Internal Sales 2,591,935 33 0 0
Total Revenue 7,859,641 100 0 0
Note: Customer billing details pulled from “Apptio Download – Sales History (FFS and Allocations since 07-2016)” excel file; internal sales data pulled from “AFRS Financial Download (Fiscal Years 2016 – Current)” for Desktop Support codes 8110 and 8111. Note that FY18 has not been invoiced but WaTech confirmed that the same customers will be billed roughly the same amount as in FY17, with the exception of DES which may decline.
K. Current and Historical Usage Volumes
WaTech currently supports about twenty-five hundred devices.
Table 204. Desktop Support Service Customer Usage (Desktops Supported)
# Agency Paid
Devices Unpaid Devices
Pooled (Loaner,
Break/fix, New)
Surplus Pending
Total Comment
1 ACB 0 0 0 0 0 Onboarding
2 APA 0 2 0 0 2
3 BTA 0 0 0 0 0 Onboarding
4 CAA 0 2 0 0 2
5 CFC 13 0 0 0 13

Page 494 of 851
. .
# Agency Paid
Devices Unpaid Devices
Pooled (Loaner,
Break/fix, New)
Surplus Pending
Total Comment
6 CHA 0 3 0 0 3
7 COS 0 2 0 0 2
8 ELUHO 24 0 0 0 24
9 GOIA 0 2 0 0 2
10 OFM 305 0 0 0 305
11 GOV 79 0 0 0 79
12 DES 741 0 0 0 741
13 WaTech 691 0 403 205 1299
14 WCSC 0 1 0 0 1
Total 1853 12 403 205 2518
Note: Only current device counts are available. Historically WaTech has not maintained a regular inventory. WaTech is now in the process of migrating asset management programs. WaTech reports that the number of DES laptops may decline in 2018, the numbers reported for 2018 in the table above are uncertain.
WaTech has billed for support of just under two-thousand desktops on annual basis for the last three years.
Table 205. Desktop Support Service Customer Usage (Desktops Billed)
# Customer FY16 FY17 FY18
1 WaTech Internal Sales 839 839 755
2 ENTERPRISE SERVICES DEPARTMENT OF 693 693 756
3 OFFICE OF FINANCIAL MANAGEMENT 226 226 310
4 OFFICE OF THE GOVERNOR 118 118 81
5 ENVIRONMENTAL LAND USE HEARINGS OFFICE 18 18 23
6 CASELOAD FORECAST COUNCIL 13 13 13
7 COMMISSION ON AFRICAN AMERICAN AFFAIRS 3 3 0
8 COMMISSION ON HISPANIC AFFAIRS 3 3 0
9 COMMISSION ON ASIAN PACIFIC AMERICAN AFFAIRS 3 3 0
10 GOVERNORS OFFICE OF INDIAN AFFAIRS 2 2 0
11 COMMISSION ON ELECTED OFFICALS SALARY 2 2 0
Total Desktops Billed 1920 1920 1938
Note: Data provided during inventory review. These numbers reflect billed desktops and not total inventory.
L. Customer Satisfaction and Future Demand
The Customer Voice appendix to this report includes customer satisfaction and future demand details based on the results of agency interviews and focus groups conducted during the project.
M. High Level Architecture
WaTech Desktop Support provides workstation enterprise software (defined as software being available to all of WaTech customer’s end-users planning, purchase, installation, configuration, administration, maintenance, and upgrades).
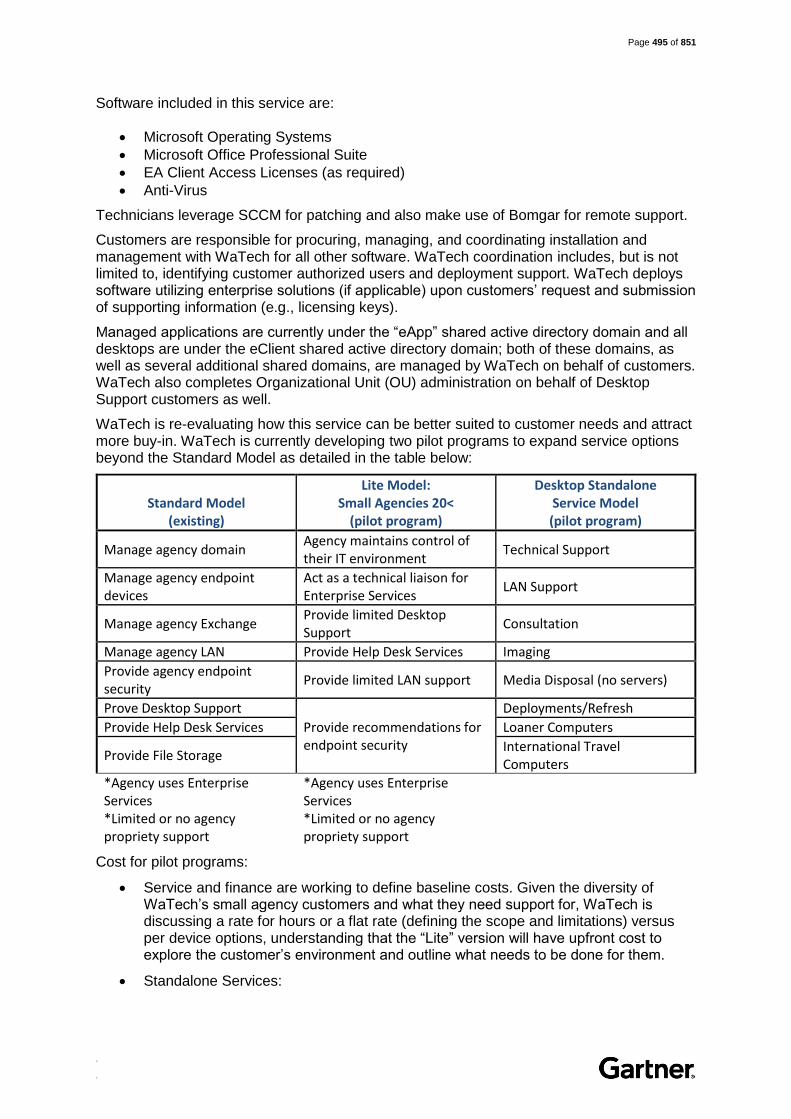
Page 495 of 851
. .
Software included in this service are:
Microsoft Operating Systems
Microsoft Office Professional Suite
EA Client Access Licenses (as required)
Anti-Virus
Technicians leverage SCCM for patching and also make use of Bomgar for remote support.
Customers are responsible for procuring, managing, and coordinating installation and management with WaTech for all other software. WaTech coordination includes, but is not limited to, identifying customer authorized users and deployment support. WaTech deploys software utilizing enterprise solutions (if applicable) upon customers’ request and submission of supporting information (e.g., licensing keys).
Managed applications are currently under the “eApp” shared active directory domain and all desktops are under the eClient shared active directory domain; both of these domains, as well as several additional shared domains, are managed by WaTech on behalf of customers. WaTech also completes Organizational Unit (OU) administration on behalf of Desktop Support customers as well.
WaTech is re-evaluating how this service can be better suited to customer needs and attract more buy-in. WaTech is currently developing two pilot programs to expand service options beyond the Standard Model as detailed in the table below:
Standard Model (existing)
Lite Model: Small Agencies 20<
(pilot program)
Desktop Standalone Service Model (pilot program)
Manage agency domain Agency maintains control of their IT environment
Technical Support
Manage agency endpoint devices
Act as a technical liaison for Enterprise Services
LAN Support
Manage agency Exchange Provide limited Desktop Support
Consultation
Manage agency LAN Provide Help Desk Services Imaging
Provide agency endpoint security
Provide limited LAN support Media Disposal (no servers)
Prove Desktop Support
Provide recommendations for endpoint security
Deployments/Refresh
Provide Help Desk Services Loaner Computers
Provide File Storage International Travel Computers
*Agency uses Enterprise Services *Limited or no agency propriety support
*Agency uses Enterprise Services *Limited or no agency propriety support
Cost for pilot programs:
Service and finance are working to define baseline costs. Given the diversity of WaTech’s small agency customers and what they need support for, WaTech is discussing a rate for hours or a flat rate (defining the scope and limitations) versus per device options, understanding that the “Lite” version will have upfront cost to explore the customer’s environment and outline what needs to be done for them.
Standalone Services:

Page 496 of 851
. .
o Technical Support – hourly or flat rate, based on customer’s needs. Example: Flat rate for four tickets monthly.
o LAN Support – Hourly or flat rate based on customer environment. o Consultation – Hourly or flat rate based on the level of expertise needed. o Imaging – Based on the customer’s requirements (one standard image no
changes, one image updated monthly, etc.). This would include software, storage, and labor.
o Media Disposal and Deployments – Hourly or flat rate based on work requirement.
o Loaner Computers – Loaners are considered a short-term option. This will be a per computer daily charge. This charge will include setup cost (labor, software percentage, etc.). We have existing loaner computers or those that are outside the 4-year SAAM requirement but still very good machines. Cost will take into consideration whether the computer is new or older. WaTech is uncertain about required investment for this given that the demand is so uncertain. To establish estimates for the spend plan, WaTech is looking at labor cost (i.e., how much time per computer to set it up), software licensing (which would be prorated), using a base estimate of two week average loan duration, and a certain percentage for the hardware (new versus old differentiated). WaTech plans to keep a percentage of inventory in reserve for the loaner pool.
WaTech reports that about a dozen agencies have expressed interest in WaTech’s desktop support service. However, WaTech also confirmed that these potential customers are not interested in pursuing the service until WaTech is able to introduce more options at lower prices. WaTech is currently working to finalize plans for lower cost and less comprehensive service options.

Page 497 of 851
. .
9. Collaboration Services
(4721) Active Directory & (4724) Identity Management
Background
Enterprise Active Directory (EAD), Active Directory Federation Services (ADFS) and Identity Management are addressed together within this section as they share a single source of revenue, and WaTech is in the process of pulling these together under one Identity Management service
Identity Management direct labor is being paid for by a permanent increase to EAD rates of $1.14 per month per FTE which was approved by OFM in 2016
The Identity Management program was reestablished as a project in 2016 with a focus on modernizing EAD and enabling single sign on by establishing existing EAD users in Azure Active Directory (AAD)
There are 2 separate service catalog entries covering these services currently provided online: Active Directory Federation Services, and Enterprise Active Directory Services
There is no separate service catalog entry that covers Identity Management; however, WaTech is in the process of updating it to address the four main components of the new consolidated Identity Management service: Microsoft Identity Manager (MIM), AAD, EAD, and ADFS
A. Service Description
Definition
Enterprise Active Directory (EAD) is a consolidated directory service built on Microsoft’s Active Directory Services and lightweight directory access protocol database technologies. It is a reference system with attribute information about end user accounts and networked devices and also provides policy enforcement for securing and managing client and server systems across the enterprise.
WaTech serves as the root administrator for EAD Services. EAD is a resource shared by multiple Agencies within the State of Washington and is also known as a forest. WaTech provides this service with multiple servers located in the WaTech State Data Center. Additional servers are located in Quincy to provide off site redundancy and recovery protection.
EAD provides directory services (authentication and authorization) as the foundation to many services provided by WaTech. EAD is the central identity store providing a single security context and access control per Customer. EAD provides the security trust function between Customers allowing access to network resources.
Within the single WaTech administered forest, agencies have the option to host their own domain, or manage their own Organization Unit within a shared WaTech managed domain, called the SSV domain. These two service offerings are referred to as, Agency Hosted Domain (referred to in Apptio as Multi-Agency), and Shared Domain (Referred to in Apptio as Hosted), respectively.
Core Services across both Agency Hosted Domain and Shared Domain, include:

Page 498 of 851
. .
Enterprise Active Directory (EAD) - Washington State’s implementation of Windows Server Directory Services
Active Directory Federation Services (ADFS) - allows identity federation for single sign-on with other forests and with cloud providers that support claims-based authentication
Microsoft Identity Manager (MIM) - enables many self-service and automation functions to the management of identities, allows agencies to track and synchronize employees and other user identities across multiple directories. It extends identities into cloud directories such as Azure Active Directory (AAD) to enable the secure use of cloud services.
Azure Active Directory (AAD) - the Microsoft Identity as a Service (IDaaS) offering that expands EAD securely to the Internet and provides a feature set that allows seamless integration with cloud providers. AAD also features many of the same self-management features available through MIM and adds additional functionality by integrating with on premise identity services such as Active Directory and ADFS.
AAD Connect - the synchronization engine that supports the integration between EAD, Azure Active Directory and Office 365
Features
Access to the shared employee directory information that includes work addresses, email addresses, phone numbers, and other information
Ability to share information and resources across the network, while still operating as individual departments
Allows agencies to work together more easily in a common environment with simplified basic business functions, such as the ability to schedule meetings
ADFS enabled single sign on allows a user to only sign on (authenticate) once and then that sign on is shared securely with other applications. (The alternative is to sign on to each application every time you wish to use them.)
MIM enabled Automated User Lifecycle Management allows users to create, change and retire identities, and create customized workflows to support agency business processes
MIM enabled User Self-Service that includes self-service password reset, distribution list and group management, and user and profile management
MIM enabled Privileged Access Management (PAM) which includes the ability to manage, control, and monitor use of elevated privileges; Customize workflows to provide elevated privileges only as required; and log and audit the use of elevated privileges
Notes
WaTech currently offers two service offerings: EAD Agency Hosted Domain and Shared Domain. (Note that within the Agency Hosted Domain there is a second WaTech-managed shared domain called eClient which covers twelve agencies, including OFM, GOV, and small agencies largely located in the capitol complex. All of the revenue and cost associated with managing the SSV domain which includes over 30 agencies, is covered under this section. The revenue and cost associated with administering the eClient shared domain, is captured under the Desktop section of this inventory.)

Page 499 of 851
. .
AAD and AAD Connect are currently being piloted with early adopters (roughly 14 agencies including but not limited to WaTech, ESD, DOC, HCA, and LCB)
Governance for this service is managed by WaTech and includes the Enterprise Active Directory Steering Committee (EADSC) which provides policy and oversight for the forest, the Forest Resource Group (FRG) which provides detailed design and engineering recommendations to the EAD Steering Committee for approval, and the Forest Application Developers (FAD) which makes strategic recommendations related to EAD use in application development (disputes between WaTech and customer agencies may be escalated to the OCIO)
WaTech provides two multi-Customer Forest Roots: Production and Pre-Production. All changes must be applied to the Pre-Production Root Forest before being applied to the Production Root. Changes to the Production and Pre-Production Roots require approval by the EADSC, FRG and/or the FAD as appropriate.
WaTech provides root directory, hosted Global Catalogs for each agency in the forest in Olympia and Quincy Data Centers, server and operating system support for the Active Directory platform, which includes providing access to customers, managing hardware and software, maintaining a pre-production environment for system upgrades, security administration, change control processes, root administration and participation in forest committees. In addition, WaTech provides change management oversight, scheduled maintenance implementation, problem management resolution, external security management, physical environment management, restoration management and disaster/outage recovery services
Agency Hosted Domain customers are responsible for managing the customer domain server environment. The responsibilities listed below pertain to the Customer Domain:
o Customer will provide hardware and software for the customer child domain
o Customer will purchase and maintain all applicable licenses and warrants to utilize the software licenses pursuant to the software owner’s license terms.
o Customer will provide designated primary and secondary technical support staff
o Customer will maintain a development environment for system upgrades. This is at least one domain controller in the Pre-Production Forest
o Customer will maintain one active Terms of Service with WaTech for the Service
o Customer will follow all Security Administration policies as approved by the EADSC
o Customer will provide system administration support of child domains; Customer will report topology changes to the FRG and EADSC; and the customer is responsible for following all security procedures as approved by the Enterprise Active Directory Steering Committee.
o Customer will follow all change control processes as approved by the EADSC
o Customer will adhere to all root administration requirements as approved by the EADSC
o Customer will provide technical support for problem management of the customer child domains using client customer personnel. The Customer will work through the problem in co-ownership with WaTech on any forest-related problems

Page 500 of 851
. .
o Shared Domain customers are responsible for administration of their Organization Unit in alignment with security policies, and WaTech is responsible for all else
B. Statutory Basis for Creation of Service or Program
As specified in RCW 43.105.265, WaTech has statutory responsibility for “developing evaluation criteria for deciding which common enterprise-wide business processes should become managed as enterprise services” or systems. In line with this RCW, OCIO established policy 185 that lays policy framework for establishing and managing enterprise services. Policy 185 states, that “an enterprise service is a service that all state government agencies with a certain business need or process are required to use, unless they have received a waiver…”
The OCIO has established that Enterprise Active Directory is an enterprise service and agencies must receive this service from WaTech rather than adopting a similar service from another provider or providing it for themselves.
C. How the Service Fits into the CTS Strategic Plan and Goals
WaTech reports that this service supports the strategic roadmap to ensure Washington State’s data and IT assets are secure.
D. Performance Measures used to Measure Effectiveness and Efficiency
The Active Directory Service Agreement requires WA Tech to maintain a 99.9% monthly service availability for the Production Root and a 99% service availability for the Pre-Production Root, excluding scheduled maintenance periods (within weekly window of Saturday 4:00 AM to Sunday 6:00 PM which is only used when necessary with customers notified in advance).
In the event of an outage, WaTech is expected to provide customers information within 72 business hours of a failure or outage on problem cause, corrective action taken, and prevention of reoccurrence.
E. Current Cost to Maintain the Service
Staffing
A subset of staff supporting these services are fully dedicated but WaTech also uses transfer rules to assign staff who are not fully dedicated to these services for the purposes of tracking and forecasting costs (shown collectively as the 6.58 FTEs in direct/indirect labor in the diagram below). These transfer rules were developed by estimating actual staff time spent on activities related to the service.
In addition, 1.7 percent of total overhead costs are being transferred to this service. If you apply that total cost percentage to the 65 FTEs within overhead, it would be about 1.09 overhead FTE.
The 4724 cost center was created specifically for the Identity & Access Management Project (phase 1 and 2) and contains the IAM program manager position as well as the two IAM automation/federation specialists. The intent was to track the implementation costs for the IAM project separately from the operational cost of the production Messaging services (EAD, mail, Skype, MDM, etc.) Two additional positions, the Enterprise Architect and the Business Analyst, were added to the project and the team, but continued to be funded from overhead until they were moved into 4724 in FY 2018. The AD administrator splits his time 75/25 between IAM and AD, but is funded out of 4721. WaTech’s plan is to consolidate all of these into 4721 for the entire set of IAM/AD services and eliminate 4724.
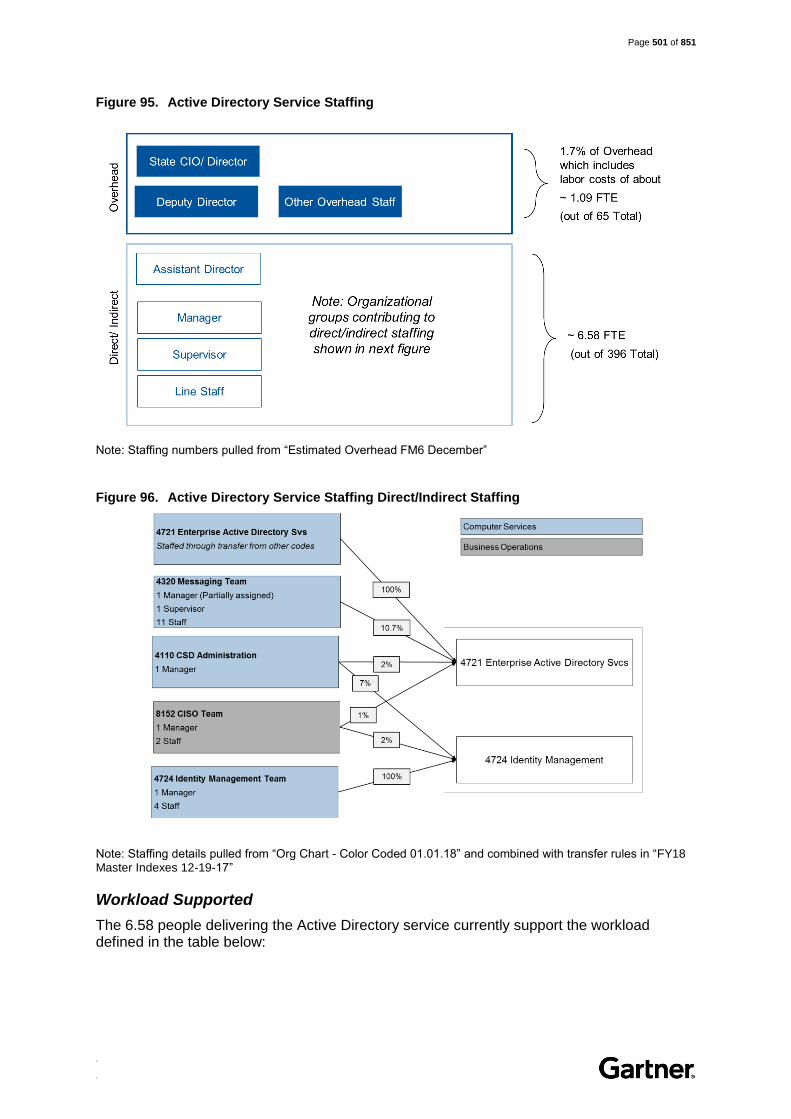
Page 501 of 851
. .
Figure 95. Active Directory Service Staffing
Note: Staffing numbers pulled from “Estimated Overhead FM6 December”
Figure 96. Active Directory Service Staffing Direct/Indirect Staffing
Note: Staffing details pulled from “Org Chart - Color Coded 01.01.18” and combined with transfer rules in “FY18 Master Indexes 12-19-17”
Workload Supported
The 6.58 people delivering the Active Directory service currently support the workload defined in the table below:

Page 502 of 851
. .
Table 206. Active Directory Workload Supported
Description Workload Supported
Production Active Directory Forests 7 Forests
Agency Hosted Domains 27 Domains
Shared Domain Organizational Units (OUs) 26 OUs
Direct, Indirect and Overhead Costs
WaTech’s planned expenses for this fiscal year are provided in the table below.
Table 207. Active Directory Planned Service Expenses (for all cost codes)
Cost Components FY18 Planned FY19 Planned Cost Details
A Salaries
625,212
642,882 6.7 Planned FTEs
B Benefits
210,360
217,806
E Goods & Services
146,989
129,235
Microsoft Premier Support, Hardware maintenance and warranty, Microsoft Select Plus agreement, Enterprise Agreement, EMS & O365 licenses, Load Balancing services, System Center Datacenter
E Internal Purchases
430,888
353,508
Desktop Support, Server Hosting and Private Cloud, Manager
G Travel
5,360
5,344
J Non-capitalized Assets
631
662 Certificates
T Transfers
316,280
319,059 Agency Overhead
Total Planned Expenses
1,735,740
1,668,496
Note: Cost details were pulled from Active Directory spend plan “4721 SP” and Identity Management “4724 SP” excel workbooks provided in February 2018; the salary and benefit costs assume vacancies are filled
Table 208. Active Directory Planned Service Expenses (4721 Enterprise Active Directory)
Cost Components FY18 Planned FY19 Planned Cost Details
A Salaries 142,236 145,464 1.53 Planned FTEs
B Benefits 47,964 49,638
E Goods & Services 89,660 93,827
Microsoft Premier Support (73k), Hardware maintenance and warranty, Microsoft Select Plus agreement
E Internal Purchases 335,968 335,988
Desktop Support, Server Hosting and Private Cloud
G Travel 1,224 1,208
J Non-capitalized Assets 263 276 SSL Certificate

Page 503 of 851
. .
Cost Components FY18 Planned FY19 Planned Cost Details
T Transfers 66,757 67,343 Overhead
Total Planned Expense 684,092 693,744
Note: Cost details were pulled from “4721 SP” excel spend plan provide in February 2018; the salary and benefit costs assume vacancies are filled
Table 209. Active Directory Planned Service Expenses (4724 Identity Management)
Cost Components FY18 Planned FY19 Planned Cost Details
A Salaries 482,976 497,418 5.17 Planned FTEs
B Benefits 162,396 168,168
E Goods & Services 57,329 35,408
Microsoft Premier Support (22k), Enterprise Agreement, EMS & O365 licenses, Load Balancing services, System Center Datacenter
E Internal Purchases 94,920 17,520
Desktop Support, Project Manager, Server Hosting, Private Cloud
G Travel 4,136 4,136
J Non-capitalized Assets 368 386
Certificate
T Transfers 249,523 251,716 Agency Overhead
Total Planned Expenses 1,051,648 974,752
Note: Cost details were pulled from “4724 SP” excel spend plan provide in February 2018; the salary and benefit costs assume vacancies are filled
WaTech made a capital investment in servers to run the active directory service. The initial investment was made in 2009, expanded in 2014 and again in FY18 (though this FY18 expense was not included in the planned budget).
Table 210. Active Directory Service Depreciation (All Associated Cost Codes)
Acquisition Cost Accumulated Depreciation Net Book Value
Active Directory (4721) 54,625 42,685 11,940
Note: Depreciation details were pulled from “FM06 Depr Details 3-16”
Note that Active Directory costs cannot be calculated by workload as the related account codes do not separate costs for each service offering. WaTech stated that account code differentiation at that level would exponentially increase the number of account codes and create a large management burden.
F/G. Rate structure CTS is currently billing to customers
The service is provided on a fee-for-service basis. Customers are billed monthly beginning after the first full month of connection to the production environment. Customers connected to the pre-production environment only will be billed monthly after 60 days of connection to the pre-production forest environment. Rates are listed in the table below:
Page 504 of 851
. .
Table 211. Active Directory Rates
Description Rate Detail
Shared Domain $2.14 per FTE per month (which includes $1.14 per FTE per month for Identity Management)
Agency Hosted Domain $1,000 per month per domain plus $1.615 per FTE per month (a portion of the current FTE rate, $1.14 was added in a decision package to
cover Identity Management and to make the service cost recoverable)
Note: WaTech provided a clarification on the development of the rate model. The multi-rate/multi-unit model was derived in order to eliminate a punitive effect on very large agencies for having a large number of units under a single-rate/single-unit model. As the number of FTEs in a customer agency increases, additional servers and therefore additional cost may be incurred, therefore a portion of each rate for each offering includes price per FTE.
Service rates were last raised in 2016 in order to accommodate an additional $1.14 per FTE per month to cover the cost of the Identity Management team charged with modernizing the current AD services and extending it to the cloud.
H. Analysis of Current Cost Recoverability
This service is not currently cost recoverable. The Active Directory service had an FY2017 deficit of about three-hundred thousand dollars in FY17 which is forecasted to grow.
Table 212. Active Directory Cost Recoverability (Actual FY16-FY18 H1)
Service Income FY16 FY17 FY18 H1
Service Revenue (4721) 1,289,732 1,311,958 666,577
Service Expense (4721) (525,088) (864,193) (347,009)
Service Expense (4724) (51,781) (770,086) (614,922)
Net Income 712,863 (322,321) (295,354)
Note: Includes both 4721 Active Directory and 4724 Identity Management. Cost recoverability detail pulled from “AFRS Financial Download (Fiscal Years 2016 – Current)”. WaTech provided clarification that the cost increased in FY17 due to hiring two additional staff hired, and payments for Microsoft EA, Microsoft Premier Support, and EMS licenses for WaTech, domain certificates, and QA. In FY 18, two additional staff started charging their time directly to 4724, and additional expenses – Project Manager and Object Level Backup Restoration Equipment were also added.
Table 213. Active Directory Cost Recoverability (Forecasted FY18-FY19)
Service Income FY18 FY19
Service Revenue (4721) 870,000 869,004
Service Revenue (4724)* 444,000 445,000
Service Expenses (4721) (684,092) (693,744)
Service Expenses (4724) (1,051,648) (974,752)
Net Income (421,740.00) (354,492) Note: Includes both 4721 Active Directory and 4724 Identity Management. Forecasted Cost recoverability detail pulled from “4721 SP” and “4724 SP” excel spend plan provide in February 2018. (*Also, revenue on 4724 Identity Management is provided via revenue received through fee-for-service billing on 4721 Active Directory.)
I. Service Level Actually Provided Today
When asked to provide SLA performance metrics WaTech responded that “In essence, Active Directory doesn’t go down. If a Global Catalog (GC) fails, all of the AD information is derived from the remaining GC’s. An ancillary service, Active Directory Federation Services (ADFS) has had two failures due to certificate errors.”
Page 505 of 851
. .
Additionally, in a couple instances, the governance structures have not worked in the way they were intended, for the customer agencies to have decision-making authority. For example, the EADSG voted to move forward with a hybrid approach to identity management in the movement to Office 365 but the State CIO overruled this decision, and the EADSG voted to put a moratorium on adding new domains to the forest but the State CIO overruled this decision.
J. Current Customers
There are 51 state agencies being billed in FY18. The largest 10 directly billable customers account for about two-thirds of the amount WaTech billed for this service in FY18. (Note that the eClient shared domain is billed separately, and all Active Directory customers are billed for Identity Management whether they are using Azure Active Directory or not so the customer list reflects those being billed for Active Directory.)
Additionally, WaTech pays over $85,000 per year via internal sales. If WaTech was a billable customer it would be about the fourth largest.
Table 214. Active Directory Current List of Customers (4721)
# Customer FY17 ($) FY17 (%) FY18 H1 ($) FY18 H1 (%)
1
3000-DEPARTMENT OF SOCIAL AND HEALTH SERVICES 363,584 28 185,430 28
2 3100-DEPARTMENT OF CORRECTIONS 173,453 13 87,759 13
3 2350-DEPARTMENT OF LABOR AND INDUSTRIES 68,245 5 34,892 5
4 3030-DEPARTMENT OF HEALTH 45,591 3 23,160 3
5 5400-EMPLOYMENT SECURITY DEPARTMENT 40,826 3 22,020 3
6 4610-DEPARTMENT OF ECOLOGY 43,031 3 21,711 3
7 4900-DEPARTMENT OF NATURAL RESOURCES 40,609 3 20,328 3
8 4770-DEPARTMENT OF FISH AND WILDLIFE 38,828 3 19,433 3
9 1790-DEPARTMENT OF ENTERPRISE SERVICES 0 0 19,299 3
10 2400-DEPARTMENT OF LICENSING 38,960 3 19,025 3
Total Top 10 Billable Customers 853,126 65 453,058 68
Total for All Other Billable Customers 372,662 28 190,123 29
Total WaTech Internal Sales 86,169 7 23,395 4
Total Revenue 1,311,958 100 666,577 100
Note: Customer billing details pulled from “Billing Data - Apptio FFS Only (2018-05-16)” excel file
K. Current and Historical Usage Volumes
The 27 Agency Hosted domains have 45,391 accounts. The 26 WaTech Hosted Active Directory Organizational Units in the shared domain (SSV) have 10,785 accounts.

Page 506 of 851
. .
As of January FY17 there were 27 Hosted Organizational Units. In August of FY18, the number of WaTech Hosted Organizational Units was reduced by one, from 27 to 26 (when Caseload Forecast Council left the service). No additional historical usage data has been provided beyond the Apptio usage data.
Table 215. Active Directory Customer Usage
Service Offering FY17 ($) FY17 (%) FY18 H1 ($) FY18 H1 (%)
HOSTED ACTIVE DIRECTORY 124,590 9 64,736 10
MULTI-AGNCY ACTIVE DIRECTORY-FOREST
1,187,367 91 601,841 90
Total Revenue 1,311,958 100 666,577 100
AAD is in production and agencies are actively onboarding. Agencies fully or partially synchronized include the following:
Blind, Department of Services for the (DSB)
Consolidated Technology Services (CTS)
Employment Security, Department of (ESD)
Enterprise Services, Department of (DES)
Financial management, Office of (OFM)
Fish and Wildlife, Department of (DFW)
Health Care Authority, Washington State (HCA)
Investment Board, Washington State (SIB)
Labor and Industries, Department of (LNI)
Military Department (MIL)
Parks and Recreation Commission, State (PARKS)
Utilities and Transportation Commission (UTC)
Veterans Affairs, Department of (DVA)
L. Customer Satisfaction and Future Demand
The Customer Voice appendix to this report includes customer satisfaction and future demand details based on the results of agency interviews and focus groups conducted during the project.
M. High Level Architecture
The Active Directory platform is primarily hosted in the state data center using virtual machines. The root directory is a three node architecture with two nodes in Olympia and one in Quincy. The architecture does not currently contain a comprehensive disaster recovery option, however a proposed disaster recovery solution was funded from the 2015-17 decision package. Maintenance has not been included in budget planning to this point, in part because the solution's not yet deployed, however the new DR solution is scheduled for a May 2018 rollout. Maintenance for both software and hardware need to be included in future budgets.
The existing WaTech Active Directory architecture is built using a single forest. Currently there are 33 domains in the forest including the root.
COM and LNI each have two domains.

Page 507 of 851
. .
Two domains (SSV and eClient) host multiple agencies.
There are 27 domains that contain user objects that consume enterprise services. To ensure HA/DR of these services WaTech maintains a Domain Controller for each of these domains in SDC and QDC.
The WAX domain contains enterprise service objects for Exchange, SfB, MIM, Vault, and MDM. The WAX domain is not included in the 27 Agency Hosted domains. There are 7 Domain Controllers in WAX with 3 in QDC.
Active Directory Federation Services (ADFS) is the WaTech enterprise federation service offering that supports single sign-on to SaaS providers for state agencies. There are 178 relying party trusts setup using ADFS.
The Microsoft Identity Manager (MIM) Synchronization Service synchronizes all changes between systems and from the MIM Service to the identity store(s) such as password changes, group management and approvals.
Azure Active Directory (AAD) Connect synchronizes account information to Azure AD. AAD Connect offers additional functionality such as device write back for device registration and group synchronization so that users can manage groups both on premises and in the cloud. There are currently 5 shared domains sync’d to Azure using Azure Active Directory Connect synchronization services.

Page 508 of 851
. .
(4730) Shared Services E-Mail
Background
Shared Services Email (SSE) includes separate service offerings for standard email, email filtering, ActiveSync Mobile Messaging, and secure mail transfer protocol (SMTP) relay.
Secure email is a separate fee-for-service offering.
AirWatch mobile device management is a separate fee-for-service offering.
Skype for business is a separate fee-for-service offering.
This section includes the following WaTech service catalog entries: Shared Services – Email, ActiveSync Mobile Messaging, Mobile Device Management, and Mobile Messaging.
A. Service Description
Definition
Shared Services Email (SSE) implements a solution (based on requirements from agencies across the state) encompassing email delivery, security filtering, and records retention. This service is designed to be highly available and includes the ability to access email from both the state network and the internet via Outlook, Outlook Web Application (OWA) and Mobile Devices. The service incorporates a delegation model that allows for the distributed administration of various components by Customers.
Enterprise email is offered using Exchange 2010 (currently being upgraded to Exchange 2016), Vault Licensing is provided for email storing/retrieval and Gateway Filtering provides spam filtering and virus protection. ActiveSync, a feature contained within the Exchange 2010 application, provides mobile device management as a part of the basic shared service email offering.
Agencies may also choose to acquire additional per-seat licensing to enable email encryption as a part of the secure email offering (currently provided via the Trustwave service provided for use in the SSE environment).
In addition, the advanced Mobile Device Management offering is provided via a Service (SaaS) offering that provides agencies with additional device controls not available in ActiveSync. AirWatch is used as the advanced Mobile Device Management (MDM) solution to allow the management of a diverse inventory of devices.
Features
Shared Services Email includes the following features:
User mailbox provisioning and management, interagency calendaring and scheduling.
Statewide global address book, web and mobile device access, public folder support.
Mail Filtering that includes anti‐spam and anti‐virus protection that prevents confidential, malicious, or inappropriate content from being distributed.
The Vault storage is the WaTech platform for storing, searching and retrieving email messages according to agency records retention requirements (also known as WaServ).

Page 509 of 851
. .
Centralized SMTP Relay - is an optional feature of SSE which is provided to support Customer applications in need of Simple Mail Transfer Protocol (SMTP) Relay to the Internet.
Physical and network security.
24x7x365 support, high availability, disaster recovery, hardware and network monitoring, operating system and utility software maintenance, patching, upgrading and monitoring, application software maintenance.
ActiveSync, which meets state security requirements for mobile device management, requires a strong authentication password and provides access to email and calendaring from approved devices.
Secure Email includes the following features:
Secure Email that protects sensitive data sent via email to recipients, both external and internal, to the State Governmental Network (SGN).
Provides DLP and encrypted email delivery to external email recipients.
Advanced Mobile Device Management includes the following features:
Includes all ActiveSync features plus the ability to support Bring Your Own Device (BYOD), ability to access agency file sharing services (such as SharePoint), customer password reset and delegated agency administration (offered using a SaaS version of AirWatch).
Notes
WaTech is currently upgrading the Shared Services Email environment to Exchange 2016 to assist with stability and provide a path to Exchange Online in the future.
The secure email services may also be a component of the migration to Office 365.
The Airwatch MDM service is contracted by WaTech as a SaaS solution, however WA Tech does not currently offer the full suite of features.
WaTech plans to explore the utilization of Intune, the Microsoft MDM equivalent to AirWatch, in the future as a component of the Office 365 migration as a potential to reduce costs and streamline mobile device administration.
WaTech maintains a pre-production environment for system upgrades and testing.
WaTech provides assistance in configuration and troubleshooting of connections to the SSE environment.
WaTech provides assistance with interoperability of agencies approved applications.
WaTech provides assistance in resolving email delivery problems.
Customers receive default storage limit of 1GB per mailbox with a default limit of 30MB per message including attachments. However, in combination with the vault (WaServ), email is vaulted after either 30 or 45 days rendering the mailbox virtually unlimited.
Vault storage is purchased as a consumable resource by State Agencies.
WaTech creates ActiveSync Policies Testing of devices for inclusion on Approved ActiveSync Device List.
WaTech maintains Approved ActiveSync Device List.
WaTech administers the Secure Email Portal.

Page 510 of 851
. .
WaTech provides Tier 1 support for Secure Email problems involving external users.
WaTech installs, manages, and upgrades server software for the SSE environment.
WaTech provides notifications and information in support of the upcoming release of Discovery Accelerator upgrades, and provides notification of planned outages and maintenance activities.
Customers must complete troubleshooting typically done by a local administrator or local desktop support staff.
Customers must manage their own centralized fax services for the sending and receiving faxes. Desktop/workstation software and hardware support.
Customers must complete installation, management and upgrade of desktop and Mobile Device software including Outlook, WaServ and Secure Email Service client software or browser add-ins
Customers must manage network connectivity installation, configuration, updates, and troubleshooting.
Customers must configure their own application software.
Customers must provide their own end-user training, complete recipient account administration, and troubleshoot any Mobile Device issues.
B. Statutory Basis for Creation of Service or Program
The previous Governor Gregoire issued Governor’s Directive 09-02 reading as follows:
‘The consolidation of email services was the first shared service scheduled for implementation. Shared Services Email consists of five core components: Email, Secure email, Clean email (includes anti-spam and anti-malware), Content-filtered outbound email, Vaulted email that stores and retrieves email messages in compliance with agency records retention requirements CTS, working in collaboration with state agencies, successfully completed the project in July of 2012. The agency migrated over 50,000 mailboxes to the new consolidated Shared Services Email offering.’
As specified in RCW 43.105.265, WaTech has statutory responsibility for “developing evaluation criteria for deciding which common enterprise-wide business processes should become managed as enterprise services” or systems. In line with this RCW, OCIO established policy 185 that lays policy framework for establishing and managing enterprise services. Policy 185 states, that “an enterprise service is a service that all state government agencies with a certain business need or process are required to use, unless they have received a waiver…”. Prior CIO Michael Cockrill designated the WaTech Shared Tenant as an enterprise service.
C. How the Service Fits into the CTS Strategic Plan and Goals
WaTech reports that this service supports the strategic roadmap to integrate office and enterprise applications with cloud services.
D. Performance Measures used to Measure Effectiveness and Efficiency
The Shared Services Email Service Level Agreement (SLA) states that WaTech will meet Service Level Performance Measurement Targets as defined in the table below:

Page 511 of 851
. .
The Email SLA requires WaTech to provide monthly reporting according to the following criteria:
Size/Scale: Volume of email traffic, Volume of blocked messages from the internet, Volume of viruses detected in messages, Number of Exchange mailboxes by Customer, Number of WaServ archives by Customer and Total amount of data stored by Customer.
Availability: Percentage of availability excluding scheduled downtimes and maintenance windows by individual services. For example, OWA, Exchange DB availability, etc.
Defect rates: Number and duration of Exchange software failures and/or errors that caused a disruption of service, Number and duration of Vault software failures and/or errors that caused a disruption of service, Number and duration of hardware failures and/or errors that caused a disruption of service, Number and duration of other failures and/or errors that caused a disruption of service.
Customer Responsiveness: Number of incidents by Customer, Average time for initial response, Number of tickets closed within 24 hours, Percentage of tickets closed within 24 hours.
Continuous Improvement: Number of Requests for Change, Number of approved Requests for Change and Number of successfully completed Requests for Change
Customer Satisfaction: Quarterly customer satisfaction survey of random sample of the current users of SSE.
E. Current Cost to Maintain the Service
Staffing
WaTech uses transfer rules to assign staff to the service for the purposes of tracking and forecasting costs (shown as the 10.47 FTEs in direct/indirect labor in the diagram below). These transfer rules were developed by estimating actual staff time spent on activities related to the service.
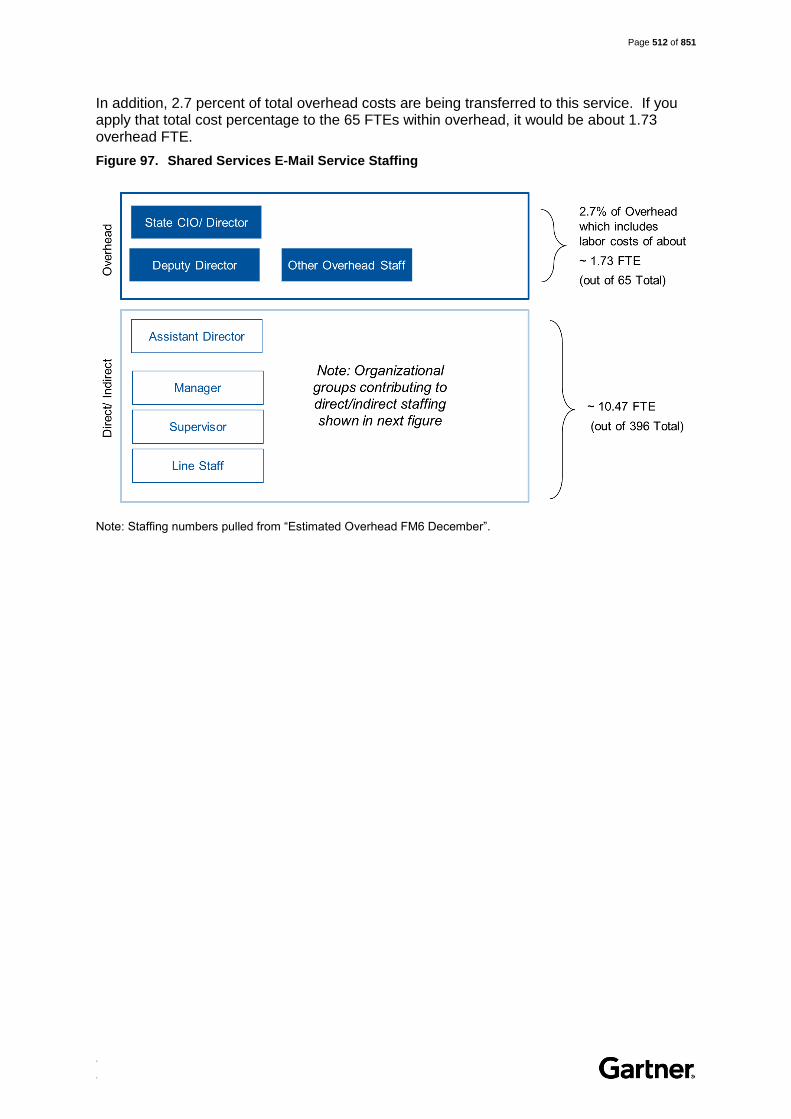
Page 512 of 851
. .
In addition, 2.7 percent of total overhead costs are being transferred to this service. If you apply that total cost percentage to the 65 FTEs within overhead, it would be about 1.73 overhead FTE.
Figure 97. Shared Services E-Mail Service Staffing
Note: Staffing numbers pulled from “Estimated Overhead FM6 December”.

Page 513 of 851
. .
Figure 98. Shared Services Email Direct/Indirect Staffing
Note: Staffing details pulled from “Org Chart - Color Coded 01.01.18” and combined with transfer rules in “FY18 Master Indexes 12-19-17”.
Workload Supported
The 10.47 people delivering the Shared Services E-Mail service currently support the estimated workload (which WaTech reports are dynamic and fluctuate monthly) as defined in the table below:
Table 216. Shared Services E-Mail Workload Supported
Description Workload Supported
Mailboxes 73,120 mailboxes
Total Active Vault Archives 120,884 archives
Secure Email 56,357 mailboxes
AirWatch Mobile Device Management (MDM) 5,217 devices
Direct, Indirect and Overhead Costs
WaTech’s planned expenses for this fiscal year are provided in the table below.

Page 514 of 851
. .
Table 217. Shared Services E-Mail Planned Service Expenses
Cost Components
FY18 Planned FY19 Planned Cost Details
A Salaries 1,035,876 1,062,822 Team of 11.07
B Benefits 349,236 365,586
C Personal Services 250,000 0 Exchange Online assessment and planning
E Goods & Services 1,506,633 1,553,429
Ironport, Passport system director, BCS for Vault, Secure email licenses, Exchange 2016 licenses, AirWatch licenses, IBM storage maintenance, Microsoft Premier Support (295k), AirWatch support (82k), Exchange maintenance
E Internal Purchases 368,976 368,976
Desktop Support, Server Hosting, Storage and Backup, Security Gateway and Colocation (174k)
E Prepaid Monthly 638,814 670,758. Enterprise Vault
E Prepaid Expense 646,509 678,834
Prepaid Elimination (646,509) (678,834.00)
G Travel 8,968 8,920
J Non-capitalized Assets 2,312 2,427
SSL Certificate
J Capitalized Assets 500,000 0 Exchange Vault Server
P Debt – Interest & Other Payments 57 0
P Debt – Principal Payments 1,143 0
T Transfers 485,206 489,470 Agency Overhead
Total Planned Expenses 5,147,251 4,522,388
Note: Cost details were pulled from “Email” excel spend plan provide in February 2018; the salary and benefit costs assume vacancies are filled. Storage for the vault is covered under "Nearline storage (also referred to as WaServ) under the Hosting - Storage section).
WaTech made sizable capital investments before 2013 associated with servers and perpetual software licensing. Over two million in acquisition costs are nearly fully depreciated. In FY18 WaTech plans to make another sizable investment in Exchange Vault Server to enable the migration from Exchange 2010 to Exchange 2016.
Table 218. Shared Services E-Mail Depreciation
Acquisition Cost Accumulated Depreciation Net Book Value
Shared Email (4730) 2,003,970 1,867,646 136,323

Page 515 of 851
. .
Note: Depreciation details were pulled from “FM06 Depr Details 3-16”
F/G. Rate structure CTS is currently billing to customers
The service is provided on a fee-for-service basis. Email storage is covered under the Storage (Hosting) section of the report. Rates are listed in the table below:
Table 219. Shared Services E-Mail Rates
Description Rate Detail
Email, Vault, and Filtering
$4.90 per mailbox per month (includes vault license but does not include storage which can be purchased for rates defined in Storage section)
Secure Email $0.56 per mailbox per month
Mobile Device Management – Advanced $5.50 per device per month
Service rates were last updated in 2014.
H. Analysis of Current Cost Recoverability
The Shared Services Email offering is cost recoverable with a FY2017 surplus of $102,028. A major capital investment in in Exchange Vault Server means the service will have a negative net income in FY18.
Table 220. Shared Services E-Mail Cost Recoverability (Actual FY16-FY18 H1)
Service Income FY16 FY17 FY18 H1
Service Revenue (4730) 4,455,509.00 4,786,089.00 2,514,054.00
Service Expense (4730) (5,363,819.00) (4,684,061.00) (2,154,688.00)
Net Income (908,310.00) 102,028.00 359,366.00
Note: Actual revenue and expenses pulled from “AFRS Financial Download (Extracted on 2018-05-15)”
Table 221. Shared Services Email Cost Recoverability (Forecasted FY18-FY19)
Service Income FY18 FY19
Service Revenue (4730) 4,950,927 5,018,220
Service Expense (4730) 5,147,251 4,522,388
Net Income (196,324.00) 495,832 Note: Forecasted Cost recoverability detail pulled from “Email” excel spend plan provide in February 2018
I. Service Level Actually Provided Today
In spite of the SLA requirement to provide detailed monthly performance reports, WaTech does not actually generate these reports. WaTech stated that they were discontinued during the transition from DIS to CTS to WaTech. The replacement for these detailed performance reports is the Quarterly Dashboard, which includes only a high-level view of uptime which incorporates the exchange servers, load balancers, and firewall uptime individually as shown below:

Page 516 of 851
. .
Note: Calculation of Shared Service Email provided by WaTech in quarterly reports
This calculation of uptime does not provide much information about availability as experienced by the customer (e.g., this uptime metric would not capture a misconfiguration of load balancers that causes lost email, etc.).
WaTech supports all infrastructure related to the Shared Services Email service, however investment in the platform has lagged as the servers are now end of life and the Exchange 2010 version is outdated. There have also been a number of customer related issues regarding the stability of the platform, inability to resolve ongoing issues and frustration with lack of customer support.
J. Current Customers
Most state agencies utilize the shared email service with over 73,120 mailboxes, 56,357 of which also utilize the secure email service. The AirWatch service has 5,217 total active devices.
WaTech also receives about $75,000 annually from internal sales on email. However, if WaTech were a billable customer it would not be one of the ten largest.
Table 222. Shared Services E-Mail Current List of Customers
# Customer FY17 ($) FY17 (%) FY18 H1 ($) FY18 H1 (%)
1
3000-DEPARTMENT OF SOCIAL AND HEALTH SERVICES 1,557,367 33 803,717 32
2 3100-DEPARTMENT OF CORRECTIONS 806,256 17 405,277 16
3 2350-DEPARTMENT OF LABOR AND INDUSTRIES 309,307 6 158,262 6
4 2400-DEPARTMENT OF LICENSING 189,449 4 110,958 4
5 3030-DEPARTMENT OF HEALTH 201,076 4 110,429 4

Page 517 of 851
. .
# Customer FY17 ($) FY17 (%) FY18 H1 ($) FY18 H1 (%)
6 1000-OFFICE OF THE ATTORNEY GENERAL 170,255 4 92,149 4
7 4610-DEPARTMENT OF ECOLOGY 160,094 3 86,653 3
8 5400-EMPLOYMENT SECURITY DEPARTMENT 160,384 3 85,242 3
9 4900-DEPARTMENT OF NATURAL RESOURCES 123,187 3 80,521 3
10 4770-DEPARTMENT OF FISH AND WILDLIFE 135,423 3 70,871 3
Total Top 10 Billable Customers 3,812,798 80 2,004,080 80
Total for All Other Billable Customers 897,468 19 477,224 19
Total WaTech Internal Sales 75,824 2 32,751 1
Total Revenue 4,786,089 100 2,514,054 100
Note: Customer billing details pulled from “Billing Data - Apptio FFS Only (2018-05-16)” excel file
K. Current and Historical Usage Volumes
There are currently 73,120 mailboxes using 156TB of storage. Secure Email includes 56,357 mailboxes. There are 120,884 active vault archives, with a total of 167TB of storage.
Shared services email makes up the bulk of the revenue earned on these services offerings.
Table 223. Shared Services E-Mail Customer Usage Across Service Offerings
Service Offering FY17 ($) FY17 (%) FY18 H1 ($) FY18 H1 (%)
MOBILE DEVICE MANAGEMENT (MDM)
255,415 5
170,363 7
SHARED SERVICES E-MAIL
4,205,381 88
2,154,290 85
SHARED SERVICES E-MAIL-SECURE
325,294 7
189,402 8
Total Revenue 4,786,089 100 2,514,054 100
Note: Customer billing details pulled from “Billing Data - Apptio FFS Only (2018-05-16)” excel file
Additionally, there are about 5,050 managed devices in the Advanced Mobile Device Management service. Service usage has ticked up slowly but fairly steadily over the past three years.

Page 518 of 851
. .
Figure 99. Mobile Device Management Usage Trend
Note: MDM historical usage pulled from the WaTech Dashboard Q1 –Fiscal Year 2018 (July-Sep 2017)
L. Customer Satisfaction and Future Demand
The Customer Voice appendix to this report includes customer satisfaction and future demand details based on the results of agency interviews and focus groups conducted during the project.
M. High Level Architecture
The current Shared Services Email platform is hosted in the primary state datacenter using Exchange 2010 with redundant infrastructure located in the Quincy Data Center. The existing infrastructure includes multiple Exchange servers, WaServ servers, Vault storage, load balancers and firewalls connected to the state network.
Given the Exchange 2010 platform is end of life the WaTech team is in the process of upgrading the Shared Services Email platform to Exchange 2016. This upgrade will assist in the transition to Office 365 due to a more direct migration path. The AirWatch MDM solution is utilizing a SaaS solution offered by the vendor.

Page 519 of 851
. .
(4742) Skype Services
Background
Some systems refer to Skype as Lync or Live Communication Server, as the historical names have not been updated across all systems
This service is covered under the WaTech service catalog entry for Skype for Business
For some use cases the Skype service is a direct replacement for another active WaTech service, WebEx Video and Web Conferencing
A. Service Description
Definition
WaTech hosts an enterprise Skype for Business platform that allows users to communicate securely and stay connected with colleagues and customers from virtually anywhere they choose to work across a variety of devices.
Skype for Business connects people on their PC or mobile devices as part of their everyday productivity experience. Skype for Business provides a consistent, single client experience for presence, instant messaging, voice, video and a great meeting experience.
Skype for Business allows users to communicate securely and stay connected with colleagues and customers from virtually anywhere they choose to work.
Features
Skype for Business provides a consistent, single client experience for:
Instant Messaging (IM)
Presence
Web conferencing
Video conferencing
Dial in conferencing
Desktop sharing
Notes
According to our discussions with WaTech staff the current Skype for Business environment is hosted using roughly a dozen dedicated servers, thus VM's are not being utilized for this service, nor is there a comprehensive disaster recovery solution in place.
WaTech supports all aspects of the infrastructure required to run Skype for Business in the primary datacenter. They offer the full suite of functionality related to Skype for Business.
B. Statutory Basis for Creation of Service or Program
WaTech delivery of this specific service is not mandated by statute or CIO policy.
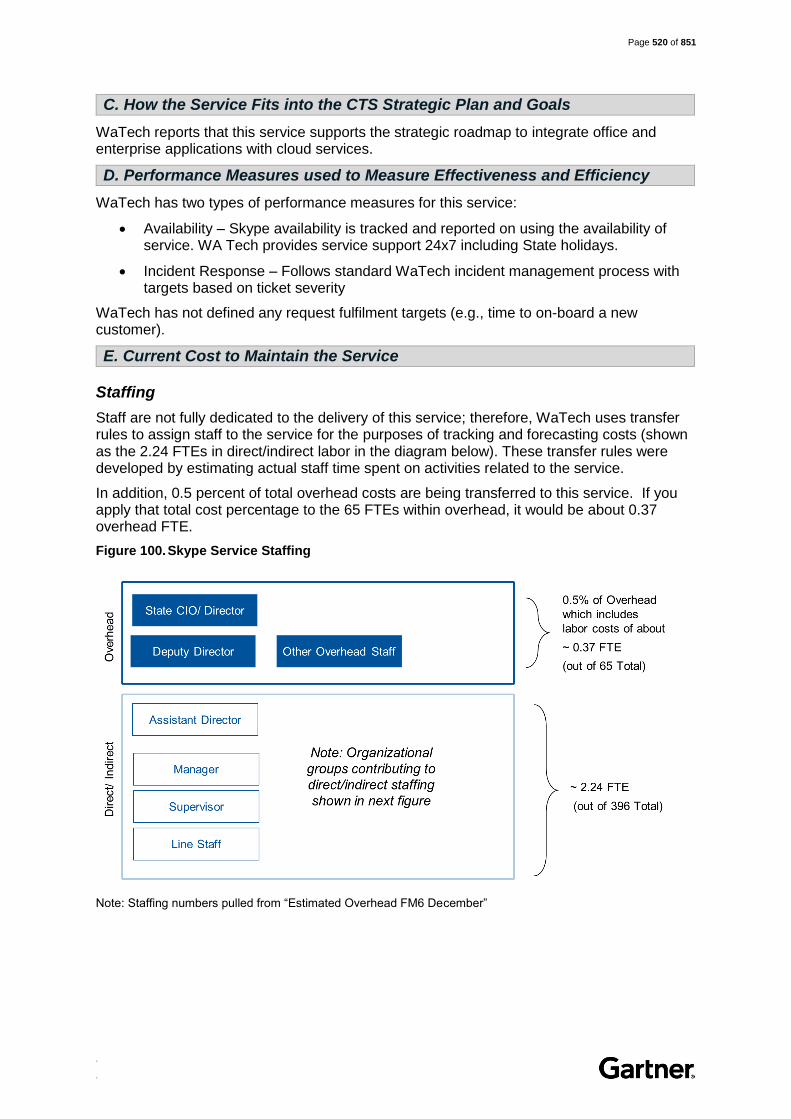
Page 520 of 851
. .
C. How the Service Fits into the CTS Strategic Plan and Goals
WaTech reports that this service supports the strategic roadmap to integrate office and enterprise applications with cloud services.
D. Performance Measures used to Measure Effectiveness and Efficiency
WaTech has two types of performance measures for this service:
Availability – Skype availability is tracked and reported on using the availability of service. WA Tech provides service support 24x7 including State holidays.
Incident Response – Follows standard WaTech incident management process with targets based on ticket severity
WaTech has not defined any request fulfilment targets (e.g., time to on-board a new customer).
E. Current Cost to Maintain the Service
Staffing
Staff are not fully dedicated to the delivery of this service; therefore, WaTech uses transfer rules to assign staff to the service for the purposes of tracking and forecasting costs (shown as the 2.24 FTEs in direct/indirect labor in the diagram below). These transfer rules were developed by estimating actual staff time spent on activities related to the service.
In addition, 0.5 percent of total overhead costs are being transferred to this service. If you apply that total cost percentage to the 65 FTEs within overhead, it would be about 0.37 overhead FTE.
Figure 100. Skype Service Staffing
Note: Staffing numbers pulled from “Estimated Overhead FM6 December”

Page 521 of 851
. .
Figure 101. Skype Direct/Indirect Staffing
Note: Staffing details pulled from “Org Chart - Color Coded 01.01.18” and combined with transfer rules in “FY18 Master Indexes 12-19-17”
Workload Supported
The 2.24 people delivering the Skype service currently support the workload defined in the table below:
Table 224. Skype Workload Supported
Description Workload Supported
Skype for Business supported users 15,117 users
Direct, Indirect and Overhead Costs
WaTech’s planned expenses for this fiscal year are provided in the table below.
Table 225. Skype Service Planned Service Expenses
Cost Components FY18 Planned FY19 Planned Cost Details
A Salaries 232,872 239,844
B Benefits 78,264 81,048
E Goods & Services 30,501 239,844
Microsoft Premier Support (20k), Microsoft Enterprise Agreement
E Internal Purchases 46,308
81,048
Desktop support, server hosting, storage and backup
G Travel 1,992 1,992
J Non-capitalized Assets 1,365 1,433 UC and EV Certificates
T Transfers 108,683 109,638 Agency overhead
Total Planned Expenses 499,985 511,914
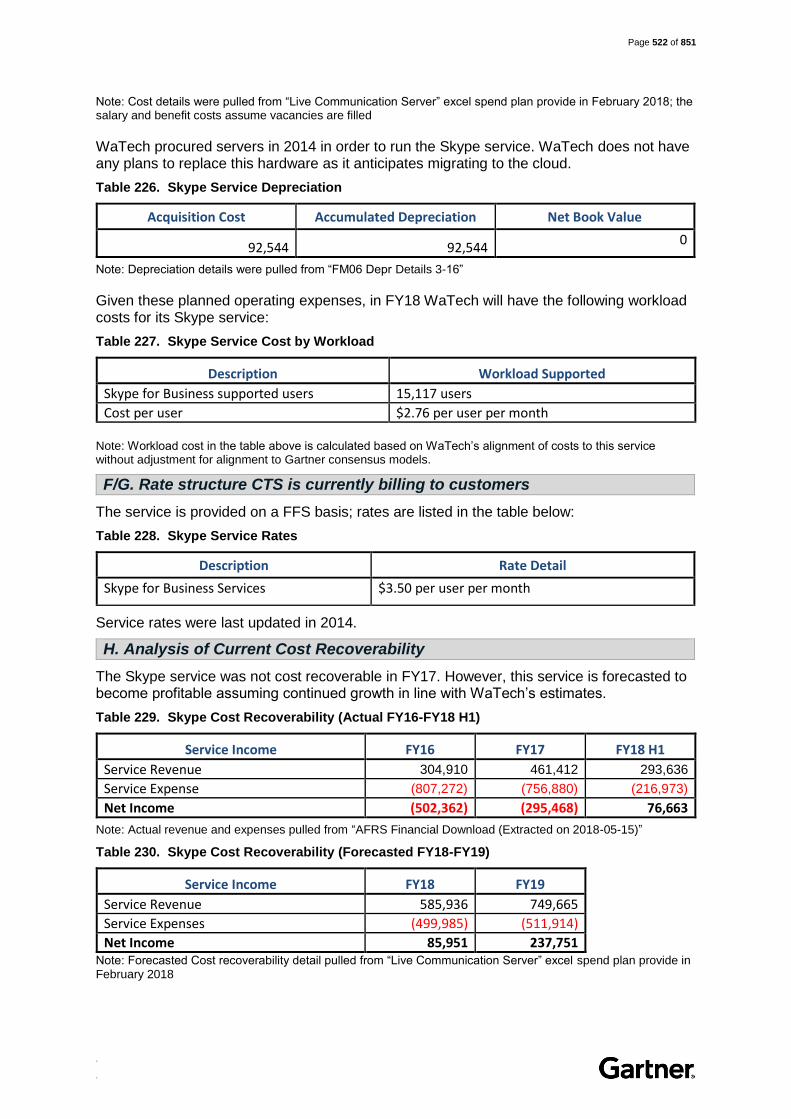
Page 522 of 851
. .
Note: Cost details were pulled from “Live Communication Server” excel spend plan provide in February 2018; the salary and benefit costs assume vacancies are filled
WaTech procured servers in 2014 in order to run the Skype service. WaTech does not have any plans to replace this hardware as it anticipates migrating to the cloud.
Table 226. Skype Service Depreciation
Acquisition Cost Accumulated Depreciation Net Book Value
92,544 92,544 0
Note: Depreciation details were pulled from “FM06 Depr Details 3-16”
Given these planned operating expenses, in FY18 WaTech will have the following workload costs for its Skype service:
Table 227. Skype Service Cost by Workload
Description Workload Supported
Skype for Business supported users 15,117 users
Cost per user $2.76 per user per month
Note: Workload cost in the table above is calculated based on WaTech’s alignment of costs to this service without adjustment for alignment to Gartner consensus models.
F/G. Rate structure CTS is currently billing to customers
The service is provided on a FFS basis; rates are listed in the table below:
Table 228. Skype Service Rates
Description Rate Detail
Skype for Business Services $3.50 per user per month
Service rates were last updated in 2014.
H. Analysis of Current Cost Recoverability
The Skype service was not cost recoverable in FY17. However, this service is forecasted to become profitable assuming continued growth in line with WaTech’s estimates.
Table 229. Skype Cost Recoverability (Actual FY16-FY18 H1)
Service Income FY16 FY17 FY18 H1
Service Revenue 304,910 461,412 293,636
Service Expense (807,272) (756,880) (216,973)
Net Income (502,362) (295,468) 76,663
Note: Actual revenue and expenses pulled from “AFRS Financial Download (Extracted on 2018-05-15)”
Table 230. Skype Cost Recoverability (Forecasted FY18-FY19)
Service Income FY18 FY19
Service Revenue 585,936 749,665
Service Expenses (499,985) (511,914)
Net Income 85,951 237,751 Note: Forecasted Cost recoverability detail pulled from “Live Communication Server” excel spend plan provide in February 2018

Page 523 of 851
. .
I. Service Level Actually Provided Today
According to the Uptime report in the quarterly dashboard, the Skype service is effectively never down. No additional details on actual performance were provided by WaTech.
Note: Performance dashboard pulled from the WaTech Quarterly dashboard
J. Current Customers
There are roughly 15,117 Skype for Business users for this service across 34 agencies in FY18. Additionally, WaTech collects about $25,000 in revenue via internal sales annually. If WaTech were a billable customer it would be about the seventh largest.
Table 231. Skype Service Current List of Customers
# Customer FY17 ($) FY17 (%) FY18 H1 ($) FY18 H1 (%)
1
3000-DEPARTMENT OF SOCIAL AND HEALTH SERVICES 223,832 49 120,953 41
2 5400-EMPLOYMENT SECURITY DEPARTMENT 44,394 10 27,311 9
3 4900-DEPARTMENT OF NATURAL RESOURCES 6,871 1 24,084 8
4 3100-DEPARTMENT OF CORRECTIONS 18,036 4 15,768 5
5 2400-DEPARTMENT OF LICENSING 19,264 4 14,711 5
6 1070-STATE HEALTH CARE AUTHORITY 22,876 5 14,343 5
7 4610-DEPARTMENT OF ECOLOGY 15,155 3 10,052 3
8 0950-OFFICE OF THE STATE AUDITOR 12,530 3 8,743 3

Page 524 of 851
. .
# Customer FY17 ($) FY17 (%) FY18 H1 ($) FY18 H1 (%)
9 3570-DEPARTMENT OF EARLY LEARNING 7,637 2 6,941 2
10 1790-DEPARTMENT OF ENTERPRISE SERVICES 8,638 2 5,303 2
Total Top 10 Billable Customers 379,232 82 248,206 85
Total for All Other Billable Customers 58,160 13 34,545 12
Total WaTech Internal Sales 24,021 5 10,885 4
Total Revenue 461,412 100 293,636 100
Note: Customer billing details pulled from “Billing Data - Apptio FFS Only (2018-05-16)” excel file
K. Current and Historical Usage Volumes
WaTech reports that customer adoption of the Skype service has been slow but consistent.
Note: Skype for Business historical usage pulled from the Quarterly dashboard dated September of FY18
L. Customer Satisfaction and Future Demand
The Customer Voice appendix to this report includes customer satisfaction and future demand details based on the results of agency interviews and focus groups conducted during the project.
M. High Level Architecture
The existing Skype for Business environment includes roughly a dozen dedicated servers in the primary datacenter. There is no disaster recovery solution currently in place.

Page 525 of 851
. .
(4365) Office 365 License Activation
Background
This section covers the following WaTech service catalog entries: Office 365 License Activation.
A. Service Description
Definition
WaTech maintains the Enterprise Shared Tenant environment for state agencies to easily and securely use Microsoft Office 365 (O365) services. Office 365 License Activation provides agencies with the ability to license and upgrade Office applications using Office 365. When upgrading to Microsoft Office, customers have the option of purchasing either:
Perpetual licenses, based on the number of devices and on premise use.
Subscription licenses, based on the number of users and used for either on premise or in Office 365 cloud services.
For customers who choose subscription licensing, each license must be activated in the Office 365 (O365) cloud and reactivated every 30 days. To automate this process, WaTech provides the means for customers with subscription licenses to activate those licenses in Enterprise Tenant.
WaTech also offers a Pre-production Tenant access service for customers to test features and changes to an application before implementing them to production.
Features
Provides activation and registration of licenses for customers to consume O365 products.
Service provider manages licenses for State Agencies to ensure that O365 resources are properly allocated.
Online reporting of synchronized license count per agency, number of licensed that have been assigned to an account per agency, and total storage consumption per agency.
Agency administrators receive the appropriate level of access to consume O365 products via delegation.
O365 products currently available include: SharePoint, OneDrive, Project Online*, Power BI*, Dynamics 365*, Enterprise Mobility + Security* (*additional license subscription purchase is required).
Offers single sign on and automated synchronization within the state’s Enterprise Active Directory (EAD) environment.
Notes
This service is currently available to all EAD users at no additional fee, however WaTech is working on rolling out a Tenant Management Service.
Customers interested in using O365 services, including the Pre-production Tenant Access service, must submit a request to the WaTech Support Center to setup a consult with the Cloud Enablement team.

Page 526 of 851
. .
WaTech monitors changes and provides notification to customers. WaTech communicates changes that will need to be remediated and new services released in the shared tenant.
B. Statutory Basis for Creation of Service or Program
WaTech delivery of this specific service is not mandated by statute.
C. How the Service Fits into the CTS Strategic Plan and Goals
WaTech reports that this service supports the strategic roadmap to integrate office and enterprise applications with cloud services.
D. Performance Measures used to Measure Effectiveness and Efficiency
No performance metrics have been defined for this service.
E. Current Cost to Maintain the Service
Staffing
No direct, indirect or overhead staffing exists for this service. A project manager obtained through internal sales is leading this effort.
Workload Supported
There is currently no workload defined for this project. This service is provided on an ad hoc basis.
Direct, Indirect and Overhead Costs
WaTech’s planned expenses for this fiscal year are provided in the table below.
Table 232. Office 365 Planned Service Expenses
Cost Components FY18 Planned FY19 Planned Cost Details
E Goods & Services 174,000 181,500
O365 user management/ delegation tool and Microsoft premier support (150k)
E Internal Purchases 218,400 202,347 Project Manager
Total Planned Expenses 392,400 383,847
Note: Cost details were pulled from “Office 365” excel spend plan provide in February 2018; the salary and benefit costs assume vacancies are filled.
F/G. Rate structure CTS is currently billing to customers
This service is provided on a fee-for-service basis. Rates are provided in the table below:
Table 233. Office 365 Rates
Description Rate Detail
Office 365 License Activation Included in Enterprise Active Directory rates
Pre-production Tenant access This service is available per quote
H. Analysis of Current Cost Recoverability
This service is not cost recoverable.

Page 527 of 851
. .
Table 234. Office 365 Cost Recoverability (Actual FY16-FY18 H1)
Service Income FY16 FY17 FY18 H1
Service Revenue (4365) 0 0 0
Service Expense (4365) 0 (1,317) (144,837)
Net Income 0 (1,317) (144,837)
Note: Actual revenue and expenses pulled from “AFRS Financial Download (Extracted on 2018-05-15)”.
Table 235. Office 365 Cost Recoverability (Forecasted FY18-FY19)
Service Income FY18 FY19
Service Revenue - -
Service Expenses 392,400 383,847
Net Income (392,400) (383,847)
Note: Forecasted Cost recoverability detail pulled from “Office 365” excel spend plan provide in February 2018.
I. Service Level Actually Provided Today
No additional details on service level provided (e.g., time to respond to requests and onboard a new customer, etc.).
J. Current Customers
WaTech stated that the agencies who have extended their identities to AAD have also registered their O365 licensing:
Blind, Department of Services for the (DSB)
Consolidated Technology Services (CTS)
Employment Security, Department of (ESD)
Enterprise Services, Department of (DES)
Financial management, Office of (OFM)
Fish and Wildlife, Department of (DFW)
Health Care Authority, Washington State (HCA)
Investment Board, Washington State (SIB)
Labor and Industries, Department of (LNI)
Military Department (MIL)
Parks and Recreation Commission, State (PARKS)
Utilities and Transportation Commission (UTC)
Veterans Affairs, Department of (DVA)
K. Current and Historical Usage Volumes
No additional data provided.
L. Customer Satisfaction and Future Demand
The Customer Voice appendix to this report includes customer satisfaction and future demand details based on the results of agency interviews and focus groups conducted during the project.

Page 528 of 851
. .
M. High Level Architecture
See Active Directory service for details.

Page 529 of 851
. .
(4741) Enterprise SharePoint
Background
This service is covered under the WaTech service catalog entry for SharePoint.
A. Service Description
Definition
WaTech currently provides a dedicated SharePoint 2013 farm as a fee-for-service to agencies on the State Government Network (SGN) that are using the Enterprise Active Directory (EAD). Agencies who sign up for this service are able to secure either a dedicated site collection or for an additional fee a dedicated web application. WaTech provides all licensing and infrastructure support for the SharePoint 2013 shared services platform however each agency is required to provide an application administrator to support their users.
In addition to the fee-for-service environment, WaTech also supports four additional SharePoint 2013 farms for OFM and an older SharePoint 2010 farm for records retention purposes. All five of these environments are covered under the charge code 8315.
Features
Agencies who sign up for this service are able to utilize capabilities found within the SharePoint platform including but not limited to:
Collaboration tools such as document sharing, version tracking, announcements, calendars, task coordination, surveys, people and workgroup lists, and site templates that can be customized for your specific use.
Customizable portal sites let you securely manage and track content development using document workflows and site templates, easily create document libraries and site directories, and store user profiles.
Search capabilities that search over 200 file types and content sources.
Notes
WaTech provides all licensing and infrastructure support for the SharePoint 2013 shared services platform
All of the current SharePoint environments are supported by a dedicated WaTech SharePoint administrator
Each customer agency is required to provide an application administrator to support the application layer for their users
B. Statutory Basis for Creation of Service or Program
WaTech delivery of this specific service is not mandated by statute.
C. How the Service Fits into the CTS Strategic Plan and Goals
WaTech reports that this service supports the strategic roadmap to integrate office and enterprise applications with cloud services.

Page 530 of 851
. .
D. Performance Measures used to Measure Effectiveness and Efficiency
No performance targets for the SharePoint service have been defined by WaTech.
E. Current Cost to Maintain the Service
Staffing
Staff are not fully dedicated to the delivery of this service; therefore, WaTech uses transfer rules to assign staff to the service for the purposes of tracking and forecasting costs (shown as the 0.55 FTEs in direct/indirect labor in the diagram below). These transfer rules were developed by estimating actual staff time spent on activities related to the service.
In addition, 0.1 percent of total overhead costs are being transferred to this service. If you apply that total cost percentage to the 65 FTEs within overhead, it would be about 0.09 overhead FTE.
Figure 102. Enterprise SharePoint Service Staffing
Note: Staffing numbers pulled from “Estimated Overhead FM6 December”

Page 531 of 851
. .
Figure 103. SharePoint Service Direct/Indirect Staffing
Note: Staffing details pulled from “Org Chart - Color Coded 01.01.18” and combined with transfer rules in “FY18 Master Indexes 12-19-17”
Workload Supported
The 0.55 people delivering the Enterprise SharePoint service currently support the workload defined in the table below:
Table 236. Enterprise SharePoint Workload Supported
Description Workload Supported
SharePoint 2013 Shared Farm 1 Farm
Direct, Indirect and Overhead Costs
WaTech’s planned expenses for this fiscal year are provided in the table below.
Table 237. Enterprise SharePoint Planned Service Expenses
Cost Components FY18 Planned FY19 Planned Cost Details
A Salaries 53,640 55,236 Roughly half of one SharePoint Administrator’s time
B Benefits 18,096 18,858
E Goods & Services 23,202 24,194
Microsoft Premier Support (9.5k) and Microsoft Enterprise Agreement
E Internal Purchases 74,232 74,232
Desktop Support, Server Hosting, Storage and Backup
G Travel 464 464
T Transfers 23,609 23,816 Agency Overhead
Total Planned Expense
193,243 196,800
Note: Cost details were pulled from “4741 SP” SharePoint excel spend plan provide in February 2018; the salary and benefit costs assume vacancies are filled.

Page 532 of 851
. .
WaTech made capital investments in perpetual licenses in 2006, 2007 and 2015, but has not invested since. WaTech does not plan to make additional capital investments as this service is slated for retirement.
Table 238. Enterprise SharePoint Depreciation
Acquisition Cost Accumulated Depreciation Net Book Value
Enterprise SharePoint (4741) 63,304 63,304 0
Note: Depreciation details were pulled from “FM06 Depr Details 3-16”.
Given these planned operating expenses, in FY18 WaTech will have the following workload costs for its Enterprise SharePoint service:
Table 239. Enterprise SharePoint Cost by Workload
Description Workload Cost Details
SharePoint 2013 Shared Farm costs $193,243
SharePoint 2013 Shared Agency Customers 18 Agency Customers
SharePoint 2013 Cost per customer $10,735 per customer per year
Note: Workload cost in the table above is calculated based on WaTech’s alignment of costs to this service without adjustment for alignment to Gartner consensus models.
F/G. Rate structure CTS is currently billing to customers
The SharePoint service is provided on a fee-for-service basis. Rates for the fee-for-service offering are listed in the table below:
Table 240. Enterprise SharePoint Rates
Description Rate Detail
Site Collection Set up fee $100 (one-time)
Site Collection $100 per month
Site Collection external access $50 per month
Storage costs over 1 GB $15 per GB, per month
Web Application set up fee $500 (one-time)
Web Application $1,500 per month
Web Application external access $250 per month
Storage costs over 20 GB $15 per GB, per month
Service rates were last updated in 2007.
H. Analysis of Current Cost Recoverability
The fee-for-service SharePoint environment is not currently cost recoverable. The FY2017 variance was about eighty-thousand dollars.
Table 241. Enterprise SharePoint Cost Recoverability (Actual FY16-FY18 H1)
Service Income FY16 FY17 FY18 H1
Service Revenue (4741) 153,820 181,655 104,760
Service Expense (4741) (284,549) (263,389) (96,493)
Net Income (130,729) (81,734) 8,267

Page 533 of 851
. .
Note: Actual revenue and expenses pulled from “AFRS Financial Download (Extracted on 2018-05-15)”
Table 242. Enterprise SharePoint Cost Recoverability (Forecasted FY18-FY19)
Service Income FY18 FY19
Service Revenue (4741) 206,696 253,059
Service Expense (4741) (193,243) ( 96,800)
Net Income 13,453 56,259 Note: Forecasted Cost recoverability detail pulled from “SharePoint” excel spend plan provide in February 2018
I. Service Level Actually Provided Today
The SharePoint 2013 farm architecture is limited to three servers, which has resulted in availability issues. None of the existing SharePoint environments have failover environments in Quincy, as they rely on backups only.
J. Current Customers
There are currently 18 agencies utilizing the fee-for-service SharePoint 2013 environment.
WaTech receives about $45,000 for this service annually via internal sales. If WaTech were a billable customer, it would be the largest.
Table 243. Enterprise SharePoint Current List of Customers
# Customer FY17 ($) FY17 (%) FY18 H1 ($) FY18 H1 (%)
1 3030-DEPARTMENT OF HEALTH 30,270 17 19,575 19
2
3000-DEPARTMENT OF SOCIAL AND HEALTH SERVICES 20,940 12 11,415 11
3 1070-STATE HEALTH CARE AUTHORITY 17,670 10 8,910 9
4 4770-DEPARTMENT OF FISH AND WILDLIFE 15,270 8 7,110 7
5
3550-DEPARTMENT OF ARCHAEOLOGY AND HISTORIC PRESERVATION 6,960 4 6,210 6
6 1000-OFFICE OF THE ATTORNEY GENERAL 10,260 6 5,760 5
7
2150-UTILITIES AND TRANSPORTATION COMMISSION 6,120 3 3,660 3
8 4950-DEPARTMENT OF AGRICULTURE 5,580 3 2,790 3
9
4670-RECREATION AND CONSERVATION FUNDING BOARD 3,330 2 2,490 2
10 1050-OFFICE OF FINANCIAL MANAGEMENT 4,320 2 2,160 2
Total Top 10 Billable Customers 120,720 66 70,080 67

Page 534 of 851
. .
# Customer FY17 ($) FY17 (%) FY18 H1 ($) FY18 H1 (%)
Total for All Other Billable Customers 15,785 9 7,980 8
Total WaTech Internal Sales 45,150 25 26,700 25
Total Revenue 181,655 100 104,760 100
Note: Customer billing details pulled from “Billing Data - Apptio FFS Only (2018-05-16)” excel file.
K. Current and Historical Usage Volumes
The enterprise farm offered on a fee-for-service basis is utilized by 18 agencies and the WaTech team noted that some agencies have their own dedicated SharePoint environments. The current shared farm has roughly 13 site collections with roughly 1.5TB of data.
WaTech is planning to shut down the fee-for-service environment over the next two years due to an inability to recover costs.
L. Customer Satisfaction and Future Demand
The Customer Voice appendix to this report includes customer satisfaction and future demand details based on the results of agency interviews and focus groups conducted during the project.
M. High Level Architecture
The fee-for-service SharePoint 2013 farm is comprised of three servers (VM's) located in the primary datacenter. Most agencies utilize a shared web application with dedicated site collections; however, the Washington Department of Health has its own dedicated web application. The total storage for this environment is roughly 1.5TB of data. There are no high availability or disaster recovery architectures in place.
Page 535 of 851
. .
(4744) Secure FTP
Background
This service is covered under the WaTech service catalog entry for Secure File Transfer.
A. Service Description
Definition
Data can be transferred securely between any two online locations with Secure File Transfer (SFT). Encryption-based SFT is a turnkey solution that delivers security, reliability and performance at competitive pricing.
Features
Available to state, local and county governments.
Requires only a Web browser.
Meets Health Insurance Portability and Accountability Act (HIPAA) requirements for transfer of sensitive data.
Provides user ID password protection and encrypted login process.
Offers firewall-protected servers.
Transfer to and from almost any type of computer including the WaTech IBM and Unisys mainframes.
Allows secure file transfer (in both directions) between the Internet and state networks.
Speed, accuracy and overall data transport security.
Able to work with existing state infrastructure and mainframes.
B. Statutory Basis for Creation of Service or Program
WaTech delivery of this specific service is not mandated by statute.
C. How the Service Fits into the CTS Strategic Plan and Goals
WaTech reports that this service is not listed as strategic at this time based on strategic plans or technology roadmaps.
D. Performance Measures used to Measure Effectiveness and Efficiency
No performance metrics have been defined for this service.
E. Current Cost to Maintain the Service
Staffing
Staff are not fully dedicated to the delivery of this service; therefore, WaTech uses transfer rules to assign staff to the service for the purposes of tracking and forecasting costs (shown as the 0.97 FTEs in direct/indirect labor in the diagram below). These transfer rules were developed by estimating actual staff time spent on activities related to the service.

Page 536 of 851
. .
In addition, 0.2 percent of total overhead costs are being transferred to this service. If you apply that total cost percentage to the 65 FTE within overhead, it would be about 0.16 overhead FTE.
Figure 104. Secure FTP Service Staffing
Note: Staffing numbers pulled from “Estimated Overhead FM6 December”
Figure 105. Secure FTP Service Direct/Indirect Staffing
Note: Staffing details pulled from “Org Chart - Color Coded 01.01.18” and combined with transfer rules in “FY18 Master Indexes 12-19-17”.
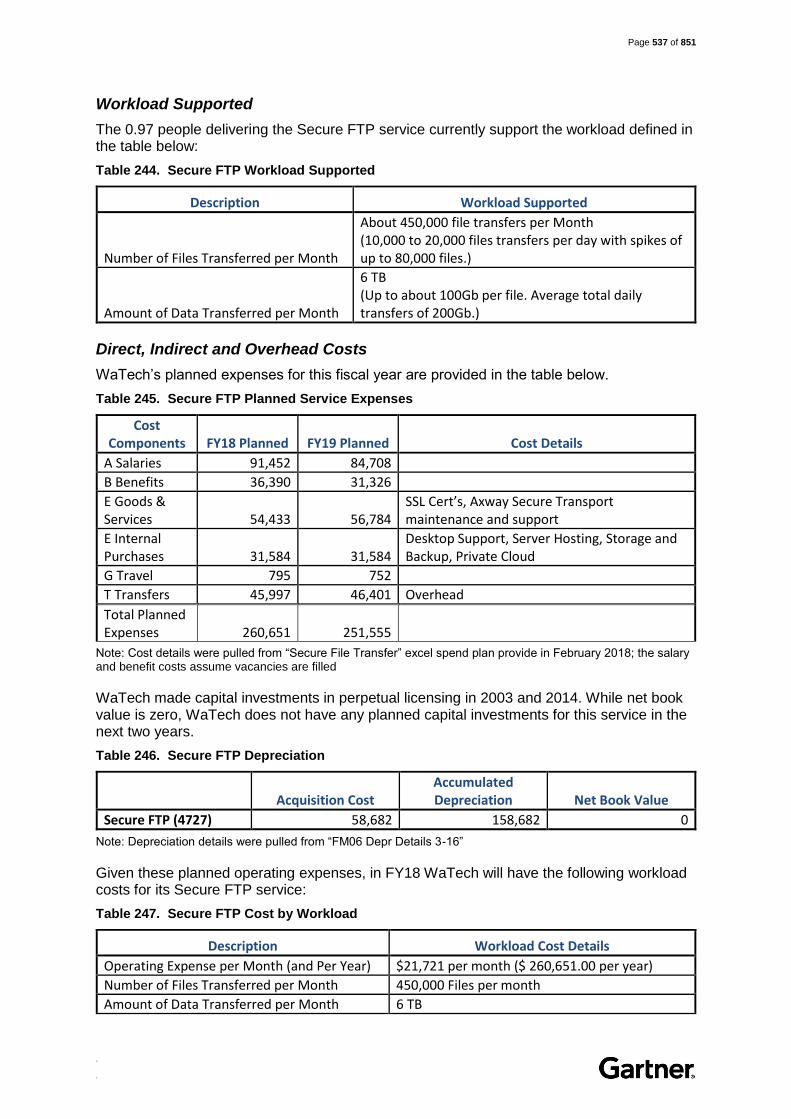
Page 537 of 851
. .
Workload Supported
The 0.97 people delivering the Secure FTP service currently support the workload defined in the table below:
Table 244. Secure FTP Workload Supported
Description Workload Supported
Number of Files Transferred per Month
About 450,000 file transfers per Month (10,000 to 20,000 files transfers per day with spikes of up to 80,000 files.)
Amount of Data Transferred per Month
6 TB (Up to about 100Gb per file. Average total daily transfers of 200Gb.)
Direct, Indirect and Overhead Costs
WaTech’s planned expenses for this fiscal year are provided in the table below.
Table 245. Secure FTP Planned Service Expenses
Cost Components FY18 Planned FY19 Planned Cost Details
A Salaries 91,452 84,708
B Benefits 36,390 31,326
E Goods & Services 54,433 56,784
SSL Cert’s, Axway Secure Transport maintenance and support
E Internal Purchases 31,584 31,584
Desktop Support, Server Hosting, Storage and Backup, Private Cloud
G Travel 795 752
T Transfers 45,997 46,401 Overhead
Total Planned Expenses 260,651 251,555
Note: Cost details were pulled from “Secure File Transfer” excel spend plan provide in February 2018; the salary and benefit costs assume vacancies are filled
WaTech made capital investments in perpetual licensing in 2003 and 2014. While net book value is zero, WaTech does not have any planned capital investments for this service in the next two years.
Table 246. Secure FTP Depreciation
Acquisition Cost Accumulated Depreciation Net Book Value
Secure FTP (4727) 58,682 158,682 0
Note: Depreciation details were pulled from “FM06 Depr Details 3-16”
Given these planned operating expenses, in FY18 WaTech will have the following workload costs for its Secure FTP service:
Table 247. Secure FTP Cost by Workload
Description Workload Cost Details
Operating Expense per Month (and Per Year) $21,721 per month ($ 260,651.00 per year)
Number of Files Transferred per Month 450,000 Files per month
Amount of Data Transferred per Month 6 TB

Page 538 of 851
. .
Description Workload Cost Details
Cost per File Transferred $.048 per file
Cost per GB of Data Transferred $3.62 per GB
Note: Workload cost in the table above is calculated based on WaTech’s alignment of costs to this service without adjustment for alignment to Gartner consensus models.
F/G. Rate structure CTS is currently billing to customers
For most agencies this is an allocated service, meaning monthly fee is pre-set for Biennium and money allocated in agency budget by OFM. The revenue for G831 Enterprise System Rates is split between several services, the Secure File Transfer service receives 1% of the revenue associated with the Enterprise System Fee.
Additionally the service is provided on a fee-for-service basis to the entities that are not part of the allocation according to the rates in the table below:
Table 248. Secure FTP Rates for FFS Offering
Description Rate Detail
Fee per Full Time Equivalents (FTEs) $0.31 per FTE
A Base Charge per Customer Agency with more than 50 FTEs is added $250
As of July 2017, the Enterprise Systems Fee allocation includes services related to Secure File Transfer.
H. Analysis of Current Cost Recoverability
This service is cost recoverable.
Table 249. Secure FTP Cost Recoverability (Actual FY16-FY18 H1)
Service Income FY16 FY17 FY18 H1
Service Revenue (4744) 343,801 343,810 169,249
Service Expense (4744) (235,851) (280,939) (102,065)
Net Income 107,950 62,871 67,184
Note: Actual revenue and expenses pulled from “AFRS Financial Download (Extracted on 2018-05-15)”
Table 250. Secure FTP Cost Recoverability (Forecasted FY18-FY19)
Service Income FY18 FY19
Service Revenue 343,500 343,500
Service Expenses (260,651) 251,555
Net Income 82,849 91,945 Note: Forecasted Cost recoverability detail pulled from “Secure File Transfer” excel spend plan provide in February 2018
I. Service Level Actually Provided Today
WaTech did not provide any details on the actual level of service provided today.

Page 539 of 851
. .
J. Current Customers
There are about six customers paying a total of about four-hundred dollars per year on a fee-for-service basis. The rest of the customers pay for this service via the Enterprise Systems Fee (calculated as one percent of the Enterprise Systems Fee) regardless of actual usage. In FY18 there are 101 agencies paying into the Enterprise Systems Fee allocation. The top ten customer payments for Secure File Transfer are shown in the table below.
Table 251. Secure FTP Current List of Customers (Enterprise Systems Fee Allocation)
# Customer FY17 ($) FY17 (%) FY18 H1 ($) FY18 H1 (%)
1 DEPARTMENT OF SOCIAL AND HEALTH SERVICES 65,189 19 47,879 28
2 DEPARTMENT OF CORRECTIONS 33,375 10 22,145 13
3 DEPARTMENT OF TRANSPORTATION 29,578 9 12,620 7
4 DEPARTMENT OF LABOR AND INDUSTRIES 13,659 4 7,684 5
5 WASHINGTON STATE PATROL 12,213 4 6,401 4
6 COMMUNITY AND TECHNICAL COLLEGE SYSTEM - 0 5,879 3
7 EMPLOYMENT SECURITY DEPARTMENT 11,744 3 3,939 2
8 DEPARTMENT OF HEALTH 9,244 3 4,572 3
9 DEPARTMENT OF ECOLOGY 9,118 3 4,346 3
10 DEPARTMENT OF FISH AND WILDLIFE 8,990 3 4,130 2
Total Top 10 Billable Customers 193,108 57 119,593 71
Total for All Other Billable Customers 144,185 43 48,338 29
Total WaTech Internal Sales - 0 1,423 1
Total Revenue 337,293 100 169,353 100
Note: Customer billing details pulled from “GARTNER – ALLOCATION” excel file. FY17 calculated based on payment directly into Secure FTP Allocation, and FY18 calculated as a percentage of the Enterprise Systems Fee allocation payment (one percent of Enterprise Systems Fee).
K. Current and Historical Usage Volumes
There are approximately ten to twenty-thousand file movements daily (upload/ download/ delete). WaTech sees spikes up to around eighty-thousand. These files range from small to 100GB. The average total movement is around 200GB daily.
Files stored at any given time ranges from 300GB to 750GB. WaTech keeps files a maximum of fourteen days, and uses a house keeping script to remove files over fourteen days. Over eighty percent of the account activity is upload-download-delete. The majority of data moving across SFT is not retained more than a day.
L. Customer Satisfaction and Future Demand
The Customer Voice appendix to this report includes customer satisfaction and future demand details based on the results of agency interviews and focus groups conducted during the project.

Page 540 of 851
. .
M. High Level Architecture
No additional details on the SFT architecture provided, including Axway server hosting environment and disaster recovery solution.

Page 541 of 851
. .
(4727) Email ListServ (Retired Service)
Background
This service has been retired as of January of 2018.
WaTech’s customers were provided a sunset date and encouraged to identify their own alternative solution.
There is no longer an enterprise managed service offering for Email ListServ.
A. Service Description
Not applicable. This service has been retired.
B. Statutory Basis for Creation of Service or Program
WaTech delivery of this specific service was not mandated by statute.
C. How the Service Fits into the CTS Strategic Plan and Goals
This service is no longer provided by WaTech.
D. Performance Measures used to Measure Effectiveness and Efficiency
Not applicable. This service has been retired.
E. Current Cost to Maintain the Service
Staffing
While this service has been retired, there was still staff assigned to it via transfer rules, and overhead costs assigned as of December 2017. The transfer rule was updated in the middle of January though a new transfer rule report has not yet posted.
Workload Supported
Not applicable. This service has been retired.
Direct, Indirect and Overhead Costs
WaTech’s planned expenses for this fiscal year are provided in the table below.
Table 252. Email ListServ Planned Service Expenses
Cost Components FY18 Planned FY19 Planned Cost Details
A Salaries 19,446 0 Service Desk and Command Center
B Benefits 8,010 0
E Goods & Services 86 0
Service Desk
E Internal Purchases 5,400 0
Server Hosting, Storage and Backup
Total Planned Expenses 32,942 0
Note: Cost details were pulled from “Listserv” excel spend plan provide in February 2018; the salary and benefit costs assume vacancies are filled

Page 542 of 851
. .
F/G. Rate structure CTS is currently billing to customers
Not applicable. This service has been retired.
H. Analysis of Current Cost Recoverability
This service was not cost recoverable. However, it has been retired.
Table 253. Email ListServ Cost Recoverability (Actual FY16-FY18 H1)
Service Income FY16 FY17 FY18 H1
Service Revenue (4727) 102,917 97,599 35,296
Service Expense (4727) (190,873) (175,788) (37,025)
Net Income (87,956) (78,189) (1,729)
Note: Actual revenue and expenses pulled from “AFRS Financial Download (Extracted on 2018-05-15)”
Table 254. Email ListServ Cost Recoverability (Forecasted FY18-FY19)
Service Income FY18 FY19
Service Revenue (4727) 23,760 0
Service Expense (4727) 32,942 0
Net Income (9,182) 0 Note: Forecasted Cost recoverability detail pulled from “ListServ” excel spend plan provide in February 2018
I. Service Level Actually Provided Today
Not applicable. This service has been retired.
J. Current Customers
At the time the service was discontinued WaTech had 42 customers and WaTech was the thirteenth largest customer through internal sales.
K. Current and Historical Usage Volumes
Not applicable. This service has been retired.
L. Customer Satisfaction and Future Demand
The Customer Voice appendix to this report includes customer satisfaction and future demand details based on the results of agency interviews and focus groups conducted during the project.
M. High Level Architecture
Not applicable. This service has been retired.
Page 543 of 851
. .
10. Project Management Services
(2120) Project Management
Background
At the time WaTech was created there were multiple project management teams that were part of the specific divisions that they supported, who focused on delivering operational projects that were needed as a natural part of service delivery (upgrades, new features, etc.). These teams counted as FTEs within their division cost centers. Enterprise Applications had 10 project managers, Network Services Division and Computer Services Division each had several project managers, and there were 3 project managers in overhead
WaTech reports that after consolidation, leadership identified an opportunity to gain more efficiencies through the consolidation of all these distributed project management teams into a single Project Management Office (PMO). Once consolidated, the manager of the PMO was then able to identify the varied skillsets of the project managers, as well as a misalignment in WaTech’s approach to staffing projects. At that time, projects were staffed by client request, rather than by matching best fit project manager to the project given capabilities alignment. WaTech estimated that it would gain additional efficiencies by matching knowledge, skills, and abilities to project needs, and by aligning the source of funding with the service recipient.
However, this required WaTech to adjust its chargeback structure to realign billing to the actual customer receiving the service. At that point, WaTech created an additional cost center to directly bill customers for project manager time instead of paying for FTE’s through division-specific charge codes
Following these changes, the size of the PMO team contracted by more than 25% between FY17 and FY18 (going from 20 to 13 project managers). Starting in FY18, WaTech began offering Project Management as a Service to manage agency-specific projects.
While the EPO tracks active and pending project status in Project Online, the EPO does not track detailed project booking information for new projects (e.g., anticipated start, duration, and projected work effort) and does not track details for project backlog (e.g., how long projects have been on hold, the reason for the delay, etc.) which would be needed to understand the changes in staffing requirements over time, both for historical trend analysis and future needs forecasting.
All project managers must meet minimum requirements to join the WaTech PMO: a certificate in Project Management from the University of Washington and at least one year of relevant project management experience.
The Project Management entry in the WaTech online service catalog aligns to the service discussed in this section
This service is called “Agency Project Managers” in AFRS under code 2120

Page 544 of 851
. .
A. Service Description
Definition
WaTech Project Management services deliver full lifecycle project management support for customer agencies and internal WaTech service development efforts, which can both engage this service. Customers who purchase Project Management services through the WaTech Enterprise Project Office (EPO) receive tailored project management services and solutions that cover a range of work activities such as application support, quality assurance, project coordination, application and software implementation, and business analysis.
Features
Project Managers with expertise in Washington government processes (including the OCS Security Design Review), and WaTech services
Alignment to project management methodologies: Waterfall, Critical Path Method, Critical Chain Project Management, Agile, Scrum, Kanban, Extreme Programming, and Adaptive Project Framework
Project Managers with expertise in a variety of skills: Agile, Business continuity, COTS, Contract management, Customer service and customer relationship building, Enterprise business architecture, Enterprise governance, Enterprise service delivery models, General administration, Hardware/Software project management, Healthcare industry, IT infrastructure, IT service management, Lean, M&O implementations, Organizational change management, Organizational readiness, Policy development and implementation, Portfolio management, Process improvement, Procurement and contract management, Project management, Project quality assurance, Quality assurance, SaaS, Security and risk assessment, Software development, Stakeholder planning and communications, Strategic planning, Vendor management
Project Managers with experience in numerous industries: Insurance industry, Aerospace industry, Transportation industry, State government (Washington and other)
The team averages fifteen years of relevant experience
Skillsets and Certifications # of PMs
Project Management Institute (PMI) Memberships 5
PMP (Project Management Professional) Certifications
3 (1 anticipated August 2018)
Information Technology Infrastructure Library (ITIL) Certifications 6
Advanced Degrees 2
University of Washington Project Management Certification 12
Lean Certifications (Yellow Belt) 2
Lean Certifications (Green Belt) 1
Certified Scrum Master (CSM) Certifications 4
IBM Iterative Software Development Certification 1
South Puget Sound Community College (SPSCC) Project Coordinator Certifications 1
SPSCC Project Schedule Certificates 1
SPSCC Project Management Certifications 1
Agile Training and Project Management Methodologies 2
Scrum Alliance Training 5
Certified Business Continuity Professional 1

Page 545 of 851
. .
Notes
Agencies wishing to obtain Project Management services are required to enter into a Master Services Agreement
WaTech service owners may email an intake form to the EPO Manager directly; inquiries are then placed into a PWA (Project Web Application) and assigned a project manager that best fits their needs
All customer inquiries including new and current customers may contact the WaTech Customer Account Managers for Project Management services; prospective customers may also contact the WaTech EPO Manager directly for consultation
Prospective customers can approach WaTech at any time to inquire about project advice or project intake
B. Statutory Basis for Creation of Service or Program
WaTech delivery of this specific service is not mandated by statute. Agencies have the option to contract project management services directly with outside vendors and many choose to do so.
C. How the Service Fits into the CTS Strategic Plan and Goals
WaTech reports that this service is not listed as strategic at this time based on strategic plans or technology roadmaps; however, project management does support other WaTech strategic services.
D. Performance Measures used to Measure Effectiveness and Efficiency
WaTech has not defined any customer-facing performance service targets for this service (e.g., on-time delivery percentage, project overruns, etc.).
WaTech conducts customer satisfaction surveys internally with project sponsor check-ins and externally with lessons learned sessions that the PMO Manager facilitates. WaTech’s goal for this process is to benchmark satisfaction levels.
WaTech only measures project manager productivity (i.e., the EPO project booking details, backlog details, etc.). The EPO has set a productivity factor of 65% to establish a labor target for cost recoverability, as well as provide a measure of effectiveness and efficiency.
E. Current Cost to Maintain the Service
Staffing
Staff are fully dedicated to the delivery of this service in support of OFM enterprise systems and projects, as well as other WaTech and other customer agency project management needs. Project managers are responsible for delivering all aspects of Agency Project Management services. As of April 2017, there were 12 project management resources (shown as the ~12 FTEs in the Direct/Indirect labor in the diagram below). As of April 2018, there are 11 project managers and a PMO Manager delivering agency project management services today, down from a peak of 19 project managers earlier in 2017.
In addition, 3.03 percent of total overhead costs are transferred to this service. If you apply that total cost percentage to the 65 FTE within overhead, it would be about 1.96 overhead FTE.

Page 546 of 851
. .
Figure 106. Project Management Service Staffing
Note: Staffing numbers pulled from “Estimated Overhead FM6 December” and subsequently modified by WaTech during document review.
Figure 107. Project Management Direct/Indirect Staffing
Note: Staffing details pulled from “Org Chart - Color Coded 01.01.18” and combined with transfer rules in “FY18 Master Indexes 12-19-17” and subsequently modified by WaTech during document review.
Workload Supported
Staff delivering the Project Management service supported the workload defined in the table below in FY17:
Table 255. Project Management Workload Supported
Description Workload Cost Details
(3 Months December 2017 to February 2018)
Total Amount Billed (3 months) 536,382 dollars
Total Hours Billed (Assuming $140/hr.) 3,831 hours
Average Billable FTEs (excluding manager) 12 FTEs
Annualized Billable Hours per FTE 1,277 billable hours per FTE Note: WaTech provided comment during review that data provided in the TTS time system is not accurate for the first several months of FY18, and in prior years, and is not aligned to the actual amount billed to customers. Therefore, workload was estimated from amount billed for December 2017 to February 2018 as that is reported
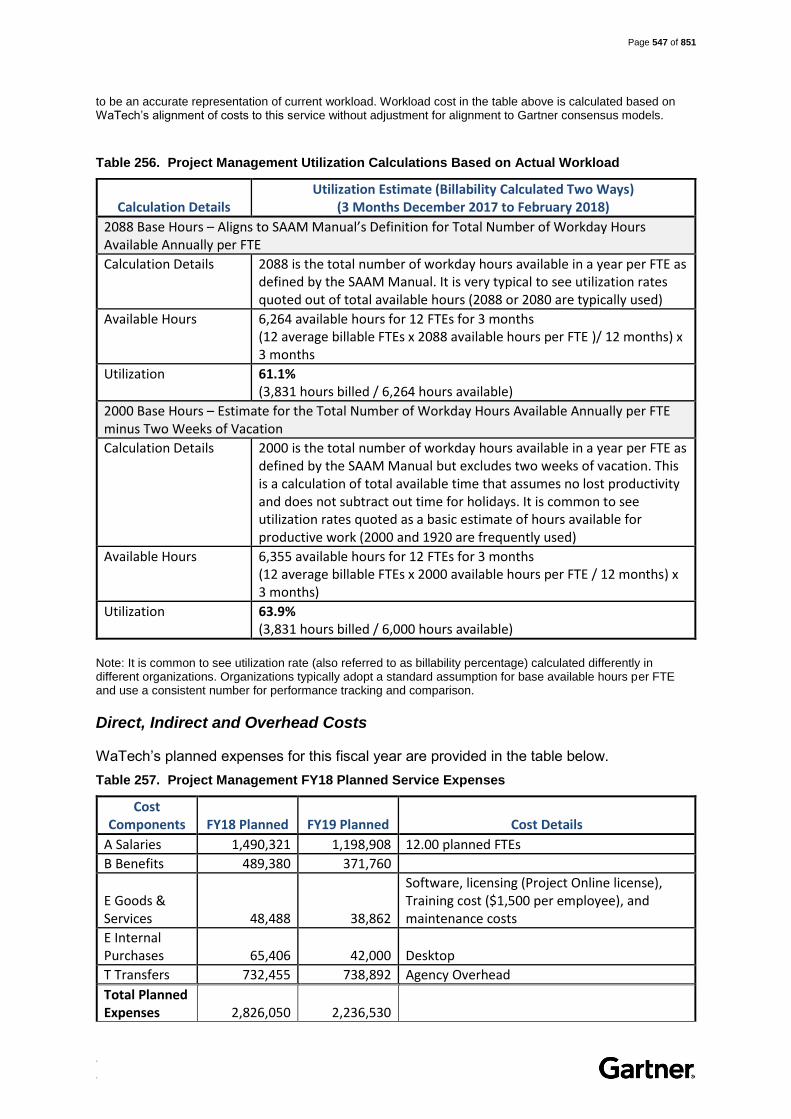
Page 547 of 851
. .
to be an accurate representation of current workload. Workload cost in the table above is calculated based on WaTech’s alignment of costs to this service without adjustment for alignment to Gartner consensus models.
Table 256. Project Management Utilization Calculations Based on Actual Workload
Calculation Details Utilization Estimate (Billability Calculated Two Ways)
(3 Months December 2017 to February 2018)
2088 Base Hours – Aligns to SAAM Manual’s Definition for Total Number of Workday Hours Available Annually per FTE
Calculation Details 2088 is the total number of workday hours available in a year per FTE as defined by the SAAM Manual. It is very typical to see utilization rates quoted out of total available hours (2088 or 2080 are typically used)
Available Hours 6,264 available hours for 12 FTEs for 3 months (12 average billable FTEs x 2088 available hours per FTE )/ 12 months) x 3 months
Utilization 61.1% (3,831 hours billed / 6,264 hours available)
2000 Base Hours – Estimate for the Total Number of Workday Hours Available Annually per FTE minus Two Weeks of Vacation
Calculation Details 2000 is the total number of workday hours available in a year per FTE as defined by the SAAM Manual but excludes two weeks of vacation. This is a calculation of total available time that assumes no lost productivity and does not subtract out time for holidays. It is common to see utilization rates quoted as a basic estimate of hours available for productive work (2000 and 1920 are frequently used)
Available Hours 6,355 available hours for 12 FTEs for 3 months (12 average billable FTEs x 2000 available hours per FTE / 12 months) x 3 months)
Utilization 63.9% (3,831 hours billed / 6,000 hours available)
Note: It is common to see utilization rate (also referred to as billability percentage) calculated differently in different organizations. Organizations typically adopt a standard assumption for base available hours per FTE and use a consistent number for performance tracking and comparison.
Direct, Indirect and Overhead Costs
WaTech’s planned expenses for this fiscal year are provided in the table below.
Table 257. Project Management FY18 Planned Service Expenses
Cost Components FY18 Planned FY19 Planned Cost Details
A Salaries 1,490,321 1,198,908 12.00 planned FTEs
B Benefits 489,380 371,760
E Goods & Services 48,488 38,862
Software, licensing (Project Online license), Training cost ($1,500 per employee), and maintenance costs
E Internal Purchases 65,406 42,000 Desktop
T Transfers 732,455 738,892 Agency Overhead
Total Planned Expenses 2,826,050 2,236,530

Page 548 of 851
. .
Note: Cost details were pulled from “010 Spending Plan Project Manager Detail 9 25 for Allotment” excel spend plan provided in February 2018; the salary and benefit costs assume vacancies are filled
Given near-term planned operating expenses, WaTech will have the following workload costs for its Project Management service in FY18:
Table 258. Project Management Cost by Workload
Description Workload Cost Details
(Months December 2017 to February 2018)
Hours Billable to Project Work 3,831 hours
Cost (3 months in FY18) $559,133 ($2,236,530 / 4 quarters) (*Note in FY18 operational costs were higher than typical given added cost associated with employee retirements/ leave payouts, therefore, the cost for FY19 was used instead as it more closely represents alignment to typical costs at the current staffing level)
Actual Cost Per Billable Hour $145.95 per hour billed
Note: Workload cost in the table above is calculated based on WaTech’s alignment of costs to this service without adjustment for alignment to Gartner consensus models.
F/G. Rate structure CTS is currently billing to customers
The service is provided on a FFS basis; rates are listed in the table below:
Table 259. Project Management Rates
Description Rate Detail
Project Management services (internal customers) $140 per hour
Project Management services (external customers) $150 to $160 per hour
As of January 2018, the external customer rate for project management labor increased to a range of $150 to $160 per hour. However, WaTech is currently evaluating the pricing model for both internal and external customers.
The key assumptions that make up this rate are:
Salary and benefits for direct project managers and indirect staffing (the PMO manager)
$1500 annual training costs per Project Manger
Fully loaded with WaTech overhead, and assumes at least 1 FTE within the group is a supervisor and will not have billable hours.
Project Managers must maximize use of all time available for billable work (1464 hours per FTE per year, or about 70% of total available workday hours)
H. Analysis of Current Cost Recoverability
This service is not currently cost recoverable. While WaTech is forecasting that increased revenue will lead to cost recoverability in FY18 and FY19 (based on spend plan estimate). In order to break even, WaTech anticipates needing to sign up at least two more external

Page 549 of 851
. .
agency customers. Assuming utilization continues at the existing level (as calculated above for the past three months), WaTech will not recover costs for this service.
WaTech does not currently have a backlog report showing whether demand will be strong enough to cover costs.
Table 260. Project Management Cost Recoverability (Actual FY16-FY18)
Service Income FY16 FY17 FY18 H1
Service Revenue (2120) 0 0 958,727 Service Expense (2120) 0 0 (1,283,263) Net Income 0 0 (324,536)
Note: Actual revenue and expenses pulled from “AFRS Financial Download (Extracted on 2018-05-15)”. FY16 and FY17 are listed as zero as these prior years were covered under a different chargeback model (both fee for service and allocated) with costs covered under various divisional cost codes, and it is therefore not possible to split out project management data for those years.
Table 261. Project Management Cost Recoverability (Forecasted FY18-FY19)
Service Income FY18 FY19
Service Revenue (2120) 2,826,050 2,280,000
Service Expense (2120) (2,826,050) (2,236,530)
Net Income 0 0 Note: Forecasted Cost recoverability detail pulled from “010 Spending Plan Project Manager Detail 9 25 for Allotment” excel spend plan provide in February 2018 and subsequently updated with revised data provided by the EPO Manager. WaTech developed this spend plan assuming vacancies are filled, which means a staff of 11 project managers and one PMO manger. While WaTech has pegged revenue forecasts at the minimum required to recover costs, this forecast is not based on actual forecasted demand, i.e., it was not developed based on a backlog report that demonstrates demand will exhaust supply.
I. Service Level Actually Provided Today
There are no service level targets associated with Project Management services. WaTech reports that all customer inquiries including new and current customers are managed by the PMO Manager and Customer Account Manager. WaTech Project Team members coordinate with potential customers to gather business requirements, answer questions, and provide cost estimates prior to beginning new projects.
However, in H1, FY18, it was reported that nearly 100% of Project Management services consumption was by internal WaTech Service Owners with little or no customer agency facing time. As of April 2018, the Board of Volunteer Fire Fighters – the only external facing customer – has received a direct bill for Project Management services.
WaTech reports that the average terms of service or engagement duration for projects ranges from 6 to 18 months.
WaTech reports that customer satisfaction surveys have been occurring internally with sponsor check-ins and externally with lessons learned sessions that the PMO Manager facilitates.
J. Current Customers
In the first half of FY18, WaTech services were the only billable customer for Project Management services.
Table 262. Project Management Current List of Customers
# Customer FY17 ($) FY17 (%) FY18 H1 ($) FY18 H1 (%)
1 N/A 0 0 0 0

Page 550 of 851
. .
# Customer FY17 ($) FY17 (%) FY18 H1 ($) FY18 H1 (%)
Total Top 10 Billable Customers
0 0 0 0
Total for All Other Billable Customers
0 0 0 0
Total WaTech Internal Sales 0 0 958,727 100
Total Revenue 0 0 958,727 100
Note: Customer billing details pulled from “Billing Data - Apptio FFS Only (2018-05-16)” excel file
WaTech reports that the Board of Volunteer Fire Fighters are also a current billable customer for this service. In addition to the one external agency customer, the list of internal customers are provided below.
Table 263. Project Management Current List of Customers (Detailed View)
# Customer FY18 H1 ($) FY18 H1 (%)
1 1129 – Agency Technology 59,850 6.2
2 1155 – Strategic Architecture 49,035 5.1
3 1165 –Wireless 65,072 6.8
4 3349 – Telephony Services (all services) 40,985 4.3
5 3466 – Site to Site VPN 5,110 0.5
6 3473 - Firewall 665 0.1
7 3489 – Network Services (all allocated services) 106,680 11.1
8 3540 - Security Gateways 25,060 2.6
9 4110 – CSD Administration 4,935 0.5
10 4231 – Platform and Connectivity 13,825 1.4
11 4365 - Office 365 Project 29,960 3.1
12 4671 - Security Gateway Support 22,155 2.3
13 4672 - Security Infrastructure Support 17,080 1.8
14 4724 – Identity Management 13,475 1.4
15 4730 - Email (2010) Services 12,110 1.3
16 4741 - SharePoint 2,170 0.2
17 4790 – Private Cloud 140 0
18 4803 - State Data Center Facility Services 100,940 10.5
19 8152 – WaTech Security 15,120 1.6
20 8213 - E-Time 31,227 3.3
21 8312 - Human Resources Mgmt. Systems (HRMS) 3,080 0.3
22 8313 - Enterprise Accounting App-Mainframe 1,400 0.1
23 8315 - Enterprise Shared Applications 102,578 10.7
24 8316 - Enterprise Budget Applications 27,230 2.8
25 8317 - Enterprise State Hr. Applications 46,466 4.8
26 8318 - Enterprise Accounting Applications 26,775 2.8
27 8319 - Enterprise Data Business Intelligence 103,334 10.8
28 8411 - DES Systems Support 4,900 0.5
29 8413 - OFM Enterprise 27,370 2.9
Total Revenue 958,727 100

Page 551 of 851
. .
Note: Customer billing details pulled from “Apptio Download – Sales History (FFS and Allocations since 07-2016)” excel file and 2018 Internal Sales 24 months Fee for Service
K. Current and Historical Usage Volumes
Historically, enterprise applications (OFM) has been the biggest customer of project management services. Beyond OFM, project management services are heavily utilized by WaTech for other internal projects and initiatives. Services purchased outside of OFM and WaTech are typically delivered to small and medium sized agencies. These types of customers often do not have project managers or a project management office in-house.
The service is not growing very quickly (demand has been consistent in FY17 and FY18) with improvement in billability coming from reduction in staffing over the last year.
Type of Workload FY16 FY17 FY18 (H1)
Number of Projects 56 60 57
Hours Billable to Project Work 9,194 hours 16,085 hours 8,228 hours (16,456 annualized)
Hours Non-Billable Activities 8,280 hours 10,540 hours 6,175 hours
Number of Project Managers (Approximate Average)
9 15 12
Total Available Hours (2088 Base Hours)
18,722 hours 31,320 hours 12,528 hours
Average Billability * 49.1% 51.2% 65.6%
Average Hours Billed per Project
164 hours per project
268 hours per project
144 hours per project (note this number should rise with full year data as some projects will continue)
Note: Workload data provided via TTS_Trending_DataSet_PM_Only” excel file. Billability is calculated as actual productive work against a project charge code, in FY16 and FY17 PMs were covered as a direct charge to services (~16 FTEs) and as overhead (~3 FTE) but still charged to specific charge codes to track time spent, billability is calculated assuming they were charged as FFS. WaTech indicated during reviews that this historical TTS data may not be accurate.
L. Customer Satisfaction and Future Demand
The Customer Voice appendix to this report includes customer satisfaction and future demand details based on the results of agency interviews and focus groups conducted during the project.
M. High Level Architecture
This service is currently managed under the WaTech Business Operations program area, led by an Assistant Director of Business Operations. Under the Assistant Director of Business Operations, the EPO Manager oversees 12 project managers who handle all aspects of service delivery.
Project Managers use Project Server Online in support of project delivery. Project Managers also record their time in the TTS time tracking system in support customer billing for project management services.
Currently, 11 out of 12 project managers have a certification from an industry leading certification authority like, Project Management Professional from Project Management Institute. In addition, the Project Managers have a variety of technical backgrounds that give them strength in specific types of project delivery (e.g., IT infrastructure, Human Resources,
Page 552 of 851
. .
etc.). However, the current leadership team is looking at opportunities to cross-train project managers to extend their skills across different project domains and industries.
This service is a professional service that is dependant on the skills and abilities of the resources delivering the service.
The EPO informally tracks project backlog, in addition to tracking in-flight projects. However, when the EPO “books” a new project opportunity, the EPO does not yet capture details that would enable effective backlog management and improved managed of resources (e.g., anticipated start, duration, and projected work effort). While the EPO tracks active and pending project status in Project Online, the EPO does not track how long projects have been on hold or the reason for the delay which would provide the data needed to improve forecasting and increase profitability.

Page 553 of 851
. .
11. App Dev and Support Services
(8310) Enterprise Systems
Background
This service is defined under the Enterprise Systems section of the online service catalog; most enterprise applications are defined in their own online service catalog entry within this section
The G831 Enterprise System Rates revenue is the source of funds for this service. This service receives 89.7% of funds from the Enterprise System Rates via transfer rules from the Enterprise Systems Fee Allocation
The G831 Enterprise System Rates revenue also supports 4562 High Capacity Computing (5.8%), 4744 Secure File Transfer Service (1%), 8610 Access Washington (2%), and this 2221 Zero Based Budget project (1.5%). These other services are covered in other sections of the services inventory
Additionally, some areas of WaTech are currently working on piloting new services with resources fully funded by the Enterprise Systems Fee. The plan is to use an accounting process to “pay back” associated expenses for staff time spent on service development activities rather than enterprise systems related work
The Enterprise Systems Rates allocation was created with the goal of simplifying and consolidating charges for all enterprise systems used by agencies into a single charge. However, merging many different services under one allocation has decreased transparency into costs and value for money of services delivered, and has been a point of confusion for customers
Changes to organizational structure, with enterprise application support now provided in a distributed manner under three different direct reports to the CIO with shared responsibility for customer satisfaction and perception of service quality, has caused further confusion.
There is organizational overlap across business analysts, systems analysts, and project managers where roles and responsibilities for each of the groups are not clearly defined, mutually understood among the groups or between the groups and the customers.
Additionally, the One Washington statewide ERP project currently in planning will likely replace the majority of the functionality in many applications in this portfolio; however, detailed requirements definition and fit-gap analysis will be required to make that determination
One Washington will begin with procurement and finance applications, and will not replace many of the statewide HR/Payroll and budgeting applications for another five to ten years
At this time, it is unclear what role WaTech will play during the One Washington project and at its completion, as the project has a stated preference for Software as a Service as the delivery model, which would significantly reduce the requirement for support from WaTech.

Page 554 of 851
. .
As of July 2017, Department of Enterprise Systems (DES) enterprise application support is no longer provided by WaTech under the ESF allocation; support for these enterprise applications is now provided by DES:
o AssetWorks/FA Suite (Fleet Management) o Client Services Contracts Database (CSCD) o Enterprise Contract Management System (ECMS) o Sole Source Contracts Database (SSCD) o Washington Electronic Business Solutions (WEBS)
A. Service Description
Definition
WaTech provides application development and support services for a portfolio of enterprise applications. This includes stand-alone applications and application suites, which are a combination of SaaS/COTS implementations and custom software developed in .NET, COBOL, ABAP, and SQL. These applications are collectively referred to as supported Enterprise Systems.
WaTech procures, designs, develops, implements, operates, maintains, and supports enterprise finance, accounting, budgeting, procurement, human resources, time, and payroll applications for the following business owners:
Office of Financial Management (OFM) Statewide Accounting
Office of Financial Management (OFM) Budget
Office of Financial Management (OFM) Statewide Human Resources (HR)
Office of Financial Management (OFM) Results Washington
Office of the Chief Information Officer (OCIO)
In addition, WaTech supports enterprise reporting across enterprise applications. As a part of the Enterprise Systems Fee, WaTech provides support for standard reporting and portals:
Standard Reporting: Pre-defined reports.
Portals: Independently query, organize, and analyze data from data sources such as AFRS using the Web Intelligence (Webi) tool or the Human Resource Management System (HRMS), using HRMS Business Explorer (BEx) or the HRMS Enterprise Portal.
WaTech divides these applications into three portfolios, Accounting and Administration, Budget, Legislative, and Executive and State HR. The following applications are supported as part of this service:
Accounting and Administration Budget and Legislative State HR
Agency Financial Reporting System (AFRS)
1099-MISC Reporting
Capital Asset Management System (CAMS)
Fiscal Note System (FNS)
Bill Analysis and Tracking System (BATS)
Budget Development System (BDS)
Capital Budget System
Employee Self Service (ESS)
Human Resource Management System (HRMS)
Salary Projection System (SPS)

Page 555 of 851
. .
Accounting and Administration Budget and Legislative State HR
Disclosure Forms Application (DF)
Enterprise Accounts Receivable System (AR)
Financial Reports (ACCT)
Financial Toolbox
Fund Reference Model
HP Records Management
Time Management System (TMS)
Travel and Expense Management System (TEMS)
Cost Allocation System (CAS)
Statewide Vendor/Payee Services (SVPS)
The Allotment System (TALS)
Results through Performance Management System (RPM)
Version Reporting System (VRS)
OFM Line of Business Applications:
Budget Summary System (Winsum)
Capital Budget Development System (BuildSum)
Fiscal Reports
Budget Outlook
Groupings
Transportation Projects
Fund Balance
Legacy counterparts slated for decommission late 2018
Compensation Impact Model (CIM)
Compensation Impact Model Agency Interface
Washington Work Force Analytics (WWA)
HRMS Business Intelligence / Data Warehouse
Classification Rating Tool
eUnion
CCJobs
Statewide Human Resource Database
Master Agreement
Director Reviews
Workforce Gaps Dashboard
Outside of these portfolios the Enterprise Systems Fee covers some additional applications:
Additional Supported Applications
ResultsWA
Apptio
In addition to providing full lifecycle support for this suite of legacy applications, WaTech executes and manages some of the actual business processes (versus IT) related to payroll processing and other functions. Additionally, WaTech, in addition to supporting the procurement and vendor registration applications, is responsible for validating and processing vendor business registrations.
The finance and accounting portion of the portfolio supports OFM during the creation of its $105.3B biennial state budget, the aggregation of financial reporting across state government, and enables state agencies to track and manage their allotted funds.
The HR/Payroll portion of the portfolio enables OFM to manage HR functions for over 60,000 state employees, processing $4.8B in payroll per year.
Features
Provides access and support for all listed systems in support of OFM business processes, including statewide (enterprise) financial, budget, contract, procurement, reporting, and payroll systems that are available to and used by most state agencies

Page 556 of 851
. .
Provides the staffing and skills to implement approved and prioritized actions within applications and systems
Provides help desk support, systems training services, and integration services, which provide a secure, reliable way to exchange data between enterprise systems and provide system data to customer agencies
Includes software licensing for SaaS systems supporting the OCIO TBM program and the Results WA program (costs for operational staff for configuration and administration of these systems are funded via the OCIO allocation and OFM respectively)
Notes
Support for enterprise reporting beyond standard reports and portals, including business intelligence (BI) professional services support, is available for an additional fee (covered under the Web, Video and BI inventory section)
AFRS Mainframe Testing Services are provided separately as a fee for service and are covered in the mainframe (hosting) portion of the service inventory
As of July 2017, the ESF allocation includes services related to Secure File Transfer and Access Washington. These services are addressed in the Collaboration section and Web, Usability, and BI section of the service inventory, respectively.
Mainframe printing is not supported by WaTech; DES maintains a print shop.
WaTech is not the business owner of these systems and applications, and must adhere to the governance process defined in the diagram below:
o Business owners are responsible for engaging with customers of these systems (agencies) to assist in determining when/if systems will be built/bought, replaced, enhanced, or decommissioned and for prioritizing all such actions.
o WaTech sends email notifications to OFM's designated contacts as negotiated with the business owner or as soon as possible in the case of emergency maintenance.
o WaTech attempts to combine changes to minimize disruption to OFM’s business.
o After hour support is available during emergencies. Additionally, during critical business cycles, WaTech ensures applications experts are available after hours (e.g., Legislative cut off dates and key budget releases).
The governance process flow for Enterprise Systems support is as follows:

Page 557 of 851
. .
Note: Governance process flow is current as of June 2017 and provided via the WaTech Allocation document

Page 558 of 851
. .
OFM Statewide Accounting Applications:
Application Functional Use Architecture
1099-MISC Reporting
This form is used to report payments for rent, services, contractors, and other miscellaneous income payments. WaTech uses the Account Ability application by Integrated Data Management Systems as an enterprise tool for preparation and transmission of the Internal Revenue Service's 1099-MISC form. This tool replaces the Agency Financial Reporting System (AFRS) 1099 reporting process. Custom developed .NET application.
Agency Financial Reporting System (AFRS)
The Agency Financial Reporting System (AFRS) is Washington State’s central hub for accounting information. It gives users the ability to pay agency bills, receive payments, reimburse travel and accomplish many other business financial processes. This system interfaces with numerous budget and accounting systems, and is one of the most widely used applications by Washington state agencies and higher education institutions. Most system users update accounting information daily. Mainframe COBOL application.
Capital Asset Management System (CAMS)
The Capital Asset Management System (CAMS) is a mainframe computer based capital asset accounting system used by most state agencies to account for their capital assets. The purpose of CAMS is to provide control of and accountability for capital assets, to provide information for management reports and financial statements, and to monitor the physical condition of capital assets. CAMS is used to account for capital assets that meet the state’s capitalization policy listed in the State Administrative and Accounting Manual (SAAM 30.20.20). Mainframe COBOL application.
Disclosure Forms Application (DF)
The Disclosure Forms Application (DF) is a web-based computer system that allows state agencies to enter financial information that is not available in the Agency Financial Reporting System (AFRS). Every state agency is required to enter data into the Disclosure Forms Application, including colleges and universities. The Office of Financial Management Statewide Accounting team (OFM SWA) uses this data to complete the Comprehensive Annual Financial Report (CAFR) and the Federal Single Audit Report.
Currently working on a legislatively mandated project to reduce complexity and upgrade technology of the DF application.

Page 559 of 851
. .
Application Functional Use Architecture
Enterprise Accounts Receivable System (AR)
The Enterprise Accounts Receivable System (AR) tracks and manages monies owed to an agency by its customers. Invoices created by the system electronically update the general ledger balances in the Agency Financial Reporting System (AFRS) and payments received are then applied to outstanding invoices. The system also has tools available for handling varying degrees of delinquent balances including reports, assessment of interest charges and collection letters. Custom developed .NET application.
Financial Reports (ACCT) - This includes Standard Reports as well as Web Intelligence (Webi)
Enterprise Reporting offers a selection of pre-defined budget and financial reports on the Enterprise Reporting Portal and Business Intelligence platform. These reports allow agencies to view budget and financial data online or print to a local printer. In addition, you can customize, schedule, email, and download reports in different file formats.
Custom developed .NET application. SAP Business Objects; Crystal Reports.
Financial Toolbox
Using this web-based application, users can prepare a batch of transactions on an Excel spreadsheet and, with a click of the mouse, send them directly to the state accounting system called the Agency Financial Reporting System (AFRS). The Financial Toolbox can be used for recurring payments, cost distributions and many other types of transactions. Users can also gain immediate notification of AFRS transactions. This product is offered free of charge to agencies. Custom developed .NET application.
Fund Reference Model
The Fund Reference Manual represents a complete inventory of all legally authorized accounts for use by state agencies. There is also a section containing inactive accounts that have been eliminated by either legislation or administrative action. This manual is updated as the data changes by virtue of legislation or administrative action. In addition, this manual is a supplement to Chapter 75: Uniform Chart of Accounts in the State Administrative & Accounting Manual (SAAM). Custom developed .NET application.
HP Records Management (TRIM)
Enterprise document and records management system targeted for meeting governance and regulatory compliance obligations. COTS application.

Page 560 of 851
. .
Application Functional Use Architecture
Time Management System (TMS)
The Time Management System (TMS) is a time collection and labor distribution system. TMS collects information from the state’s Human Resources Management System (HRMS). Within TMS, an employee codes hours for each project they work on. In addition, leave time is entered. TMS then reconciles the total hours input with actual hours, and sends data to the Agency Financial Reporting System (AFRS). Mainframe COBOL application.
Travel and Expense Management System (TEMS)
TEMS is the system that state agencies use to manage travel reimbursement requests. Once a user is authorized by their agency administrator, they can complete and submit a travel reimbursement request directly through the system for processing. TEMS automatically forwards the request to the supervisor responsible for approval, then on to the fiscal office for review and payment. TEMS can be accessed through the state intranet or the internet.
Custom developed .NET application. Currently working on a customer initiated project to upgrade the technology, lower costs, reduce complexity, improve accessibility, and improve security.
Cost Allocation System (CAS)
The Cost Allocation System (CAS) creates cost allocation plans using data in the state-owned accounting system called the Agency Financial Reporting System (AFRS). For example, the system tracks expenditures related to state assistance programs and federal grants. The system uses real data, not estimates, so an agency’s direct and overhead expenditures are cost-allocated as they occur.
Currently working on a legislatively mandated project to reduce complexity of the CAS application.
Statewide Vendor/Payee Services (SVPS)
WaTech maintains a central vendor file for Washington State agencies to use for processing vendor payments. This allows the vendor to receive payments from all participating state agencies by direct deposit, the state's preferred method of payment. No detail provided.
OFM Budget Applications:
Application Functional Use Architecture
The Allotment System (TALS)
TALS allows online development of the agency’s capital and operating allotment packages. It supports the allotment development, management, review, reporting and monitoring needs for state agencies, the Legislature, the Office of Financial Management (OFM), and the public. Agency allotments can be developed at any level of detail to allow for detailed analysis. Security levels are
Budget applications are all custom developed in C Sharp orVB.NET, with n-tier architecture and a SQL backend.

Page 561 of 851
. .
Application Functional Use Architecture
built in to ensure that only users with the appropriate level of authority have the ability to make changes after records are locked.
Bill Analysis and Tracking System (BATS)
The Bill Analysis Tracking System (BATS) is used by agencies to manage and track legislation. Agencies create and submit agency request legislation to the Office of Financial Management, manage their agency request legislation, track and analyze bills working their way through the Legislature, and assign tasks and activities related to bills. BATS also is used by OFM and the Governor’s Office to make recommendations and decisions on enrolled bills.
BATS is built on the Microsoft Dynamics 365 platform. Budget applications are all custom developed in C Sharp or VB.NET, with n-tier architecture and a SQL backend.
Budget Development System (BDS)
BDS allows for online development of the agency's operating and transportation budget requests. BDS supports multiple budget versions so agencies can easily develop various scenarios. Security levels are built in to ensure that only users with the appropriate level of authority have the ability to make changes after records are locked. BDS will be replaced by the Agency Budget System, which is currently in development. The initial release is scheduled for early June 2018.
Budget applications are all custom developed in C Sharp or VB.NET, with n-tier architecture and a SQL backend.
Capital Budget System
CBS allows for the online development of the agency's capital budget request. It supports multiple budget versions so agencies can easily develop various scenarios. A project estimation tool is available within the application that calculates the necessary costs for completing a capital project including automatic calculations for inflation factors, taxes, etc. Security levels are built in to ensure that only users with the appropriate level of authority have the ability to make changes after records are locked.
Budget applications are all custom developed in C Sharp or VB.NET, with n-tier architecture and a SQL backend.
Fiscal Note System (FNS)
The Legislature, agencies and the Office of Financial Management (OFM) use the Fiscal Note System (FNS) to request, prepare, transmit, approve, distribute and monitor the status of fiscal notes. A fiscal note is an estimate of the financial impact of a legislative bill. Agencies can prepare fiscal note content outside the FNS and then copy and paste the content into the system. The FNS must be used to transmit completed notes to OFM.
Fiscal Notes is a suite of seven applications. Budget applications are all custom developed in C Sharpor VB.NET, with n-tier architecture and a SQL backend.

Page 562 of 851
. .
Application Functional Use Architecture
Results through Performance Management System (RPM)
The Results through Performance Management (RPM) system contains information on performance measures that can indicate how much, how well, and at what level agencies are providing products or services to customers. A performance measure is based on data, and tells a story about whether an agency or activity is achieving its objectives, and if progress is being made toward reaching policy or organizational goals.
Budget applications are all custom developed in C Sharpor VB.NET, with n-tier architecture and a SQL backend.
Version Reporting System (VRS)
The Version Reporting System (VRS) provides agencies with prompt electronic access to versions of the budget proposed during the Washington state budget process. Multiple reports are available, from summary to detailed levels. Two and three-way version comparisons also are available. VRS saves time and money by allowing instant web-based access to data previously distributed in paper format.
Budget applications are all custom developed in C Sharp or VB.NET, with n-tier architecture and a SQL backend.
OFM Line of Business Applications:
Application Functional Use Architecture
Budget Summary System (Winsum)
Used by OFM to receive, analyze, manage, and transmit budget data (agency request, executive/legislative proposals, final enacted).
Windows applications written in VB.net and Transact-SQL
Capital Budget Development System (BuildSum)
Used by OFM to receive, analyze, manage, and transmit budget data (agency request, executive/legislative proposals, final enacted).
Windows applications written in VB.net and Transact-SQL
Fiscal Reports Used by OFM to receive, analyze, manage, and transmit budget data (agency request, executive/legislative proposals, final enacted).
Windows applications written in VB.net and Transact-SQL
Budget Outlook
Used by OFM to receive, analyze, manage, and transmit budget data (agency request, executive/legislative proposals, final enacted).
Windows applications written in VB.net and Transact-SQL
Groupings
Used by OFM to receive, analyze, manage, and transmit budget data (agency request, executive/legislative proposals, final enacted).
Windows applications written in VB.net and Transact-SQL
Transportation Projects
Used by OFM to receive, analyze, manage, and transmit budget data (agency request, executive/legislative proposals, final enacted).
Windows applications written in VB.net and Transact-SQL
Fund Balance Used by OFM to receive, analyze, manage, and transmit budget data (agency request, executive/legislative proposals, final enacted).
Windows applications written in VB.net and Transact-SQL

Page 563 of 851
. .
Application Functional Use Architecture
Legacy counterparts slated for decommission late 2018
Used by OFM to receive, analyze, manage, and transmit budget data (agency request, executive/legislative proposals, final enacted).
Windows applications written in VB.net and Transact-SQL
OFM Statewide Human Resources (HR) Applications:
Application Functional Use Architecture
Employee Self Service (ESS)
The Employee Self Service application provides employees the ability to request leave and managers the ability to approve leave online, through the Employee Self Service portal.
Custom .NET Application Currently working on a legislatively mandated project to increase usability of the ESS application, and a customer requested upgrade of the technology.
Human Resource Management System (HRMS)
The Human Resource Management System (HRMS) is the enterprise HR and payroll system for Washington State government. HRMS captures and distributes statewide personnel, payroll, and financial data, and processes payroll for approximately 70,000 employees in more than 100 agencies. Self-service is available for viewing earnings statements.
Highly customized COTS, SAP solution. WaTech provides custom development, testing, some user management support, data scrubbing and data loads, based on business rules, change and configuration management. Currently working on rolling out a new winshuttle/excel template process for completing mass updates. The project aims to upgrade technology, reduce complexity, and improve reporting. Currently working on a project to upgrade the SAP stack to leverage current technology, improve accessibility, and to improve security.
Compensation Impact Model (CIM)
The Compensation Impact Model (CIM) is the application used to cost the financial impact of labor negotiations and will as budget support activities. Custom .Net Application

Page 564 of 851
. .
Application Functional Use Architecture
Compensation Impact Model Agency Interface (CIMAI)
The Compensation Impact Model Agency Interface (CIMAI is used to prepare Higher Education data for labor negotiations. Custom .Net Application
eUnion eUnion is a web application that provides membership information to unions. Custom .Net Application
Master Agreement The Master Agreement application is used to manage data groupings of Master Agreement, Labor Union, Bargaining Unit, Population Group. Custom .Net Application
Directors Review Directors Review tracks personnel appeals associated with the Director’s review process. Custom .Net Application
CCJobs CCJobs is used to gather, organize, and manage job classification and compensation data. Custom .Net Application
Statewide Human Resources Database
Statewide Human Resources Database is a system to store and manage general government and higher education personal and payroll data.
Statewide HR DB is a SQL database, used to run ad hoc queries and standard reports to get to data
HRMS Business Intelligence / Data Warehouse (BI/BW)
The Business Intelligence (SAP BI/BW) application retains the historical record of ALL HRMS data which is merged with Agency Financial Reporting System (AFRS) Payroll information to generate a wide variety of agency-specific and statewide reports
BI/BW is SAP Business Objects; data comes from HRMS
HR Data Mart (HRDM)
The HR Data Mart (HRDM) provides access to data in PAY1, the former state payroll system. PAY1 was used prior to 2006. Agencies can look at payroll, employee position appointment and employee history data. Data “snapshots” for pre-defined time periods are available in the HR Data Mart. HR Datamart is a mainframe repository
Salary Projection System (SPS)
The Salary Projection System (SPS) provides estimates for salary and benefit needs. These are used to prepare budget allotments, biennial and annual budgets, fiscal note estimates for the Legislature, and for labor negotiations. Projections include provisions for new hires, terminations, salary increases, benefit changes, and other time-consuming computations. Custom .Net Application
Classification Rating Tool
The Classification Rating Tool is used to evaluate Position Descriptions to support classification and compensation and labor negotiations. SAAP – ServiceNow
OFM Results Washington Application:
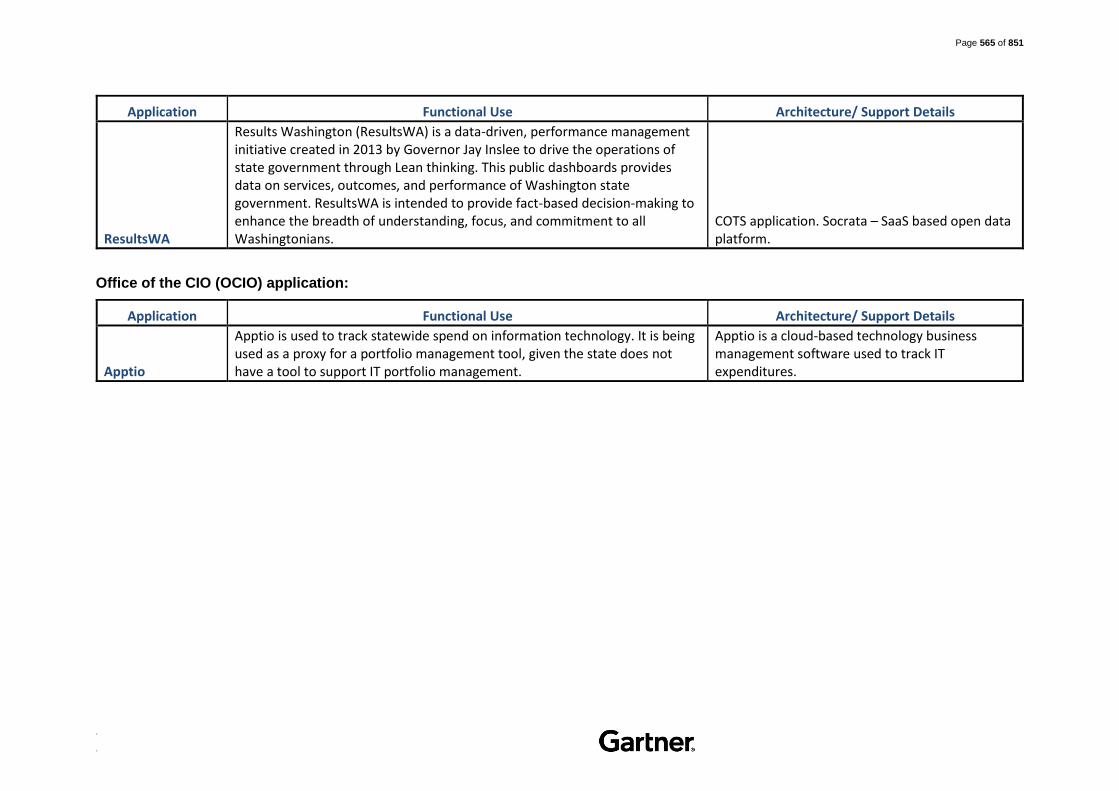
Page 565 of 851
. .
Application Functional Use Architecture/ Support Details
ResultsWA
Results Washington (ResultsWA) is a data-driven, performance management initiative created in 2013 by Governor Jay Inslee to drive the operations of state government through Lean thinking. This public dashboards provides data on services, outcomes, and performance of Washington state government. ResultsWA is intended to provide fact-based decision-making to enhance the breadth of understanding, focus, and commitment to all Washingtonians.
COTS application. Socrata – SaaS based open data platform.
Office of the CIO (OCIO) application:
Application Functional Use Architecture/ Support Details
Apptio
Apptio is used to track statewide spend on information technology. It is being used as a proxy for a portfolio management tool, given the state does not have a tool to support IT portfolio management.
Apptio is a cloud-based technology business management software used to track IT expenditures.

Page 566 of 851
. .
B. Statutory Basis for Creation of Service or Program
WaTech delivery of application support services is not mandated by statute. RCW 43.105.385 does state that WaTech should become the central provider for utility-based infrastructure services, and state-agency specific application services should remain with individual agencies. However, the RCW is silent on enterprise applications with a statewide user base.
RCW 43.88.037 provides OFM the requirements for developing and maintaining a comprehensive budgetary, accounting, and reporting systems which conform to with GAAP requirements.
For the applications WaTech supports, certain legislative mandates makes taking on additional development work a requirement.
C. How the Service Fits into the CTS Strategic Plan and Goals
WaTech reports that this service supports the strategic roadmap to maintain and evolve Enterprise Resource Planning core systems.
D. Performance Measures used to Measure Effectiveness and Efficiency
WaTech has performance measures for efficiency and quality related to this service:
Health Check – WaTech assigns and tracks application health ratings based on 11 criteria (Support Skill, Ease of Change, Application Stack, Authentication, Coding Language, Client Interface, Client OS, DBMS, IDE, Server OS, Web Interface) for all applications; ratings based on a 0 – 5 scale. WaTech’s goal is for all applications to meet a minimum score of 4.0 on their health checks
Incidents and hot fixes – WaTech aims to have zero incidents and hot fixes (assuming correct ticketing categorization)
Uptime – WaTech tracks application uptime trends via the Orion and Service Owner Tracking spreadsheet; WaTech has uptime target of 99.9%; however, expected availability is defined as 99% during normal business hours (normal business hours are Monday through Friday 7:00am to 5:30pm) in the TOS document. After hours, the general target drops to 98% (not including planned maintenance)
Reduction in M&O cost – WaTech aims to keep M&O under 60% of total hours across all enterprise applications (using TTS time tracking as the data source)
Incident Response – Follows standard WaTech incident management process with targets based on ticket severity.
Incident Resolution – requirements are defined within the TOS document as resolution for category 1 under 2 hours, for category 2 under 4 hours, category 3 under 2 business days, and category 4 and 5 within 1 week
E. Current Cost to Maintain the Service
Staffing
Several organizational groups are dedicated to the delivery of application development and support services, and some additional staff support delivery of this service part-time; therefore, WaTech uses transfer rules to assign staff to the service for the purposes of tracking and forecasting costs (shown as the 119.8 FTEs in direct/indirect labor in the diagram below). These transfer rules were developed by estimating actual staff time spent on activities related to the service.

Page 567 of 851
. .
In addition, 30.5 percent of total overhead costs are being transferred to this service. If you apply that total cost percentage to the 65 FTE within overhead, it would be about 19.84 overhead FTE.
Figure 108. Enterprise Systems Support Staffing
Note: Staffing numbers pulled from “Estimated Overhead FM6 December”
A portion of the Enterprise Systems Fee staff is a team of 60 developers, testers, configurators, and release management specialists. This team along with additional supporting staff (including systems analysts, business analysts, service desk support specialists, etc.) maintain 112 systems. The largest team supports the HRMS SAP application.
Note: Staffing data pulled from “EntAppTeam_Dec17” presentation

Page 568 of 851
. .
Figure 109. Enterprise Systems Support Direct/Indirect Staffing
Note: Staffing details pulled from “Org Chart - Color Coded 01.01.18” and combined with transfer rules in “FY18 Master Indexes 12-19-17”

Page 569 of 851
. .
Workload Supported
The current supported workload is defined in the table below:
Table 264. Enterprise Systems Support Workload Supported
Description Workload Supported
Concurrent users of SAP 2,200 Concurrent Users
75,000 Named Users
Total Applications Supported 112 applications
Time spent on Development versus Support 30% Development versus 70% Support
Note: Workload provided during interviews and inventory validation. The listed number of applications, 112, does not match the number in the TTS dataset, 91 applications, WaTech did had not provided clarification on the minor discrepancy at the time this inventory version was created.
Table 265. Enterprise Systems Support Workload Supported
Work Effort in Hours FY16 FY17 FY18 (Q1-Q3)
M&O 95,461 83,835 59,771
Enhancement 28,393 32,553 15,241
New Development 26,920 31,817 23,514
Total Hours 150,773 148,205 98,526
Note: TTS workload data. Data for FY18 is for the first 9 months of the fiscal year. New development means project work or large scale changes. Enhancements and M&O covers all other work effort. WaTech confirmed that this data reflects the ESF work effort but does not include contractor support hours.
Direct, Indirect and Overhead Costs
WaTech’s planned expenses for this fiscal year are provided in the tables below.
Table 266. Enterprise Systems FY18 Planned Service Expenses: 8312 – HRMS
Cost Components FY18 Planned FY19 Planned Cost Details
A Salaries 2,545,692 2,638,860
Salaries and benefits associated with 30.93 planned FTEs (including direct staff and management)
B Benefits 872,820 908,316
C Personal Services 330,000 330,000
E Goods & Services 173,510 173,506
1. Software maintenance: Tidal; Winshuttle; Microsoft EA agreement Visual Studio with MSDN; Amazon web services; FY Axway (Tidal) for scheduling HRMS jobs; pre-DES DOP TestTrank Pro; and, Visual Studio Test Pro with MSDN 2. Training, printing, and other 3. Contractors: Ranyu-SAP development
E Internal Purchases 842,304 842,304
Online Disk/S-390, DASA, V-Tape; HRM infrastructure (Server Port, SAN, Server Hosting); Quincy backup/disaster recovery; shared application support; MF print services;

Page 570 of 851
. .
Cost Components FY18 Planned FY19 Planned Cost Details
CTS mainframe charges; and, desktop support for delivery staff
E Prepaid Monthly 500,000 500,000
Rimini Street (until 1/1/18) and then SAP support - HRMS SAP licenses, support
T Transfers 1,221,208 1,231,940 Agency overhead
Total Planned Expenses 6,485,534 6,624,926
Note: Cost details were pulled from “8312 – HRMS” excel spend plan provide in February 2018; the salary and benefit costs assume vacancies are filled.
Table 267. Enterprise Systems FY18 Planned Service Expenses: 8313 – AFRS
Cost Components FY18 Planned FY19 Planned Cost Details
A Salaries 764,820 791,484
Salaries and benefits associated with 10.73 planned FTEs (including direct staff and management)
B Benefits 277,204 288,312
C Personal Services 115,000 115,000
E Goods & Services 61,007 61,007
1. Software maintenance: Jolly Grant/Terminal Emulation; QA batch maintenance; Microsoft EA agreement Visual Studio with MSDN; and, TRIM-HP (15 licenses) 2. Training and other
E Internal Purchases 1,801,175 1,801,175
Batch processing and volume discount; central processor TSO; CICS computer processing; online disk/S-390; DASD; virtual tape; MF print services; integration transactions and connects; shared app support; and, desktop support
T Transfers 423,652 427,375 Agency overhead
Total Planned Expense 3,442,858 3,484,353
Note: Cost details were pulled from “8313 – AFRS” excel spend plan provided in February 2018; the salary and benefit costs assume vacancies are filled
Table 268. Enterprise Systems FY18 Planned Service Expenses: 8315 – OFM Enterprise Systems
Cost Components FY18 Planned FY19 Planned Cost Details
A Salaries 1,916,196 1,987,488
Salaries and benefits associated with 21.00 planned FTEs (including direct staff and management)
B Benefits 630,156 655,608
E Goods & Services 319,806 328,806
1. Software maintenance: Jira/Confluence/Hipchat/Temp; application vulnerability scanning tool; Chronicle graphics; GitHub; Socrata – ResultsWA; MS SharePoint

Page 571 of 851
. .
Cost Components FY18 Planned FY19 Planned Cost Details
server maintenance; 3 Microsoft EA agreements 2. Training, Gartner license, other
E Internal Purchases 2,908,936 2,908,936
Business continuity; shared app support; server support; desktop support; and, project management support
E Prepaid Monthly 743,052 765,348 Apptio Annual Subscription (SaaS)
T Transfers 903,312 913,176 Agency overhead
Total Planned Expenses 7,421,458 7,559,362
Note: Cost details were pulled from “8315 – OFM Enterprise Systems” excel spend plan provided in February 2018; the salary and benefit costs assume vacancies are filled. A WaTech technical manager provided feedback that he was have difficulty matching up the items under E Goods & Services and E Internal Purchases with items that he tracks, indicating a possible misalignment between tracked cost codes.
Table 269. Enterprise Systems FY18 Planned Service Expenses: 8316 – Budget Applications
Cost Components
FY18 Planned
FY19 Planned Cost Details
A Salaries 1,015,824 1,055,796
Salaries and benefits associated with 12.61 planned FTEs (including direct staff and management)
B Benefits 351,516 366,360
E Goods & Services 214,489 214,489
1. Software maintenance: Microsoft Dynamics CRM licenses and Microsoft Visual Studio licenses
2. Training
E Internal Purchases 44,136 44,136
Shared app support, desktop support, and server support
T Transfers 497,880 502,256 Agency overhead
Total Planned Expenses
2,123,845 2,183,037
Note: Cost details were pulled from “8316 – Budget Applications” excel spend plan provided in February 2018; the salary and benefit costs assume vacancies are filled
Table 270. Enterprise Systems FY18 Planned Service Expenses: 8317 – Labor Relations Applications
Cost Components FY18 Planned FY19 Planned Cost Details
A Salaries 827,244 860,208
Salaries and benefits associated with 10.00 planned FTEs (including direct staff and management)
B Benefits 282,816 294,804
E Goods & Services 82,559 82,559
1. Software maintenance: Microsoft Visual Studio licenses; Service Now licenses (for
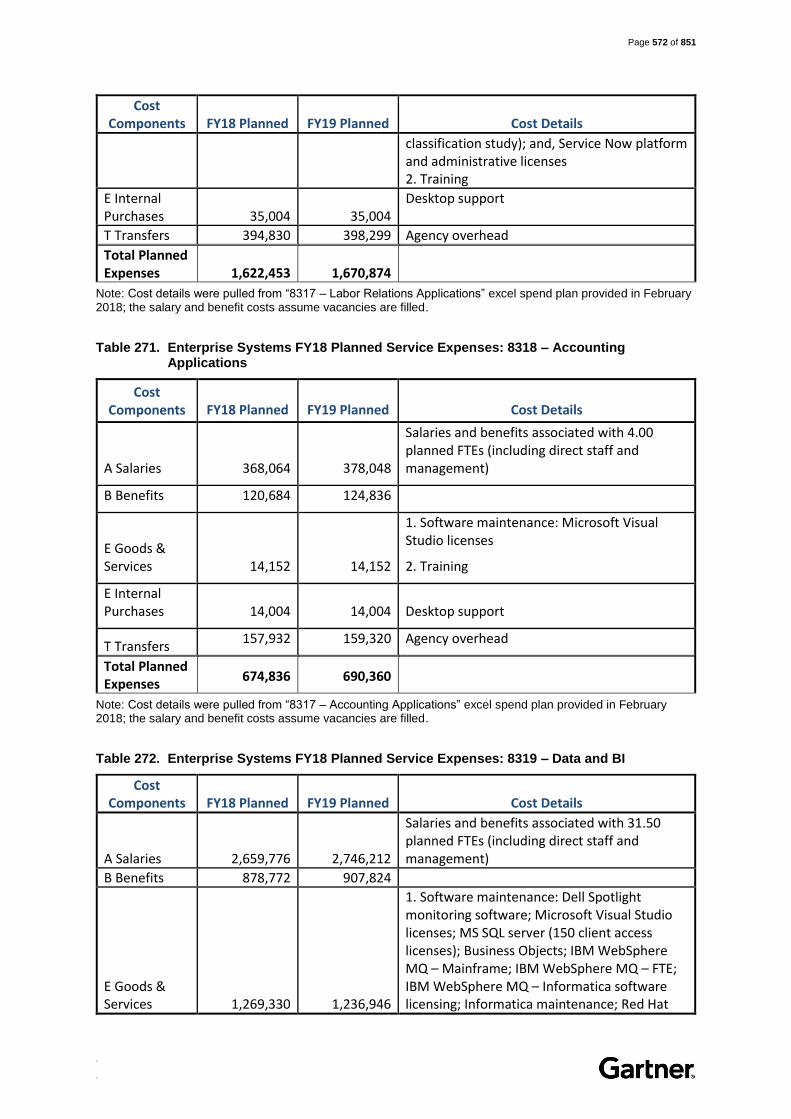
Page 572 of 851
. .
Cost Components FY18 Planned FY19 Planned Cost Details
classification study); and, Service Now platform and administrative licenses 2. Training
E Internal Purchases 35,004 35,004
Desktop support
T Transfers 394,830 398,299 Agency overhead
Total Planned Expenses 1,622,453 1,670,874
Note: Cost details were pulled from “8317 – Labor Relations Applications” excel spend plan provided in February 2018; the salary and benefit costs assume vacancies are filled.
Table 271. Enterprise Systems FY18 Planned Service Expenses: 8318 – Accounting Applications
Cost Components FY18 Planned FY19 Planned Cost Details
A Salaries 368,064 378,048
Salaries and benefits associated with 4.00 planned FTEs (including direct staff and management)
B Benefits 120,684 124,836
E Goods & Services
14,152
14,152
1. Software maintenance: Microsoft Visual Studio licenses
2. Training
E Internal Purchases
14,004
14,004 Desktop support
T Transfers 157,932 159,320 Agency overhead
Total Planned Expenses
674,836 690,360
Note: Cost details were pulled from “8317 – Accounting Applications” excel spend plan provided in February 2018; the salary and benefit costs assume vacancies are filled.
Table 272. Enterprise Systems FY18 Planned Service Expenses: 8319 – Data and BI
Cost Components FY18 Planned FY19 Planned Cost Details
A Salaries 2,659,776 2,746,212
Salaries and benefits associated with 31.50 planned FTEs (including direct staff and management)
B Benefits 878,772 907,824
E Goods & Services 1,269,330 1,236,946
1. Software maintenance: Dell Spotlight monitoring software; Microsoft Visual Studio licenses; MS SQL server (150 client access licenses); Business Objects; IBM WebSphere MQ – Mainframe; IBM WebSphere MQ – FTE; IBM WebSphere MQ – Informatica software licensing; Informatica maintenance; Red Hat

Page 573 of 851
. .
Cost Components FY18 Planned FY19 Planned Cost Details
JBoss enterprise application platform; and, Embarcadero software maintenance (all access) 2. Training, Dataman, and Microsoft Premier support
E Internal Purchases 105,348 105,348
Apptio (ITFM) data link servers, shared app support; and desktop support
T Transfers 1,268,496 1,282,368 Agency overhead
Total Planned Expenses 6,181,722 6,278,698
Note: Cost details were pulled from “8319 – Data and BI” excel spend plan provided in February 2018; the salary and benefit costs assume vacancies are filled
Table 273. Enterprise Systems FY18 Planned Service Expenses: 8320 – Business Analysts
Cost Components FY18 Planned FY19 Planned Cost Details
A Salaries 804,732 825,576
Salaries and benefits associated with 9.21 planned FTEs (including direct staff and management)
B Benefits 269,189 278,367
E Goods & Services 14,824 14,824 Training, business analyst supplies, and other
E Internal Purchases 32,256 32,256 Desktop support
T Transfers 396,336 400,668 Agency overhead
Total Planned Expenses 1,517,337 1,551,691
Note: Cost details were pulled from “8320 – Business Analysts” excel spend plan provided in February 2018; the salary and benefit costs assume vacancies are filled
WaTech recently made an investment in additional server blades and a data domain backup device.
Table 274. Enterprise Systems (8315) Depreciation
Acquisition Cost Accumulated Depreciation Net Book Value
93,240 29,965 63,283
Given changes in accounting for application portfolio costs (i.e., moving away from dedicated team) some of the costs for each of the application portfolios is comingled; insufficient data has been provided to calculate workload cost.
F/G. Rate structure CTS is currently billing to customers
Enterprise Systems support is provided via the Enterprise Systems Fee (ESF) Allocation. Enterprise Systems receives 89.7% of ESF Funds via transfer rules. ESF funds are then dispersed and organized by portfolio (i.e., enterprise systems and applications).

Page 574 of 851
. .
Allocation Goal / Methodology
The Enterprise System Rates allocation goal was to simplify and consolidate charges for all enterprise systems used by agencies into a single charge. This consolidation occurred in conjunction with the formation of the Department of Enterprise Systems (DES); more information at the rate structures in place prior to DES formation is available below.
Funding allocation for the Enterprise System Rates is based on the agency's number of budgeted FTEs. For institutions of higher education (both the four-year institutions and the community and technical college system), only FTEs that support administrative functions are counted. OFM maintains the source data for budgeted FTEs.
Evolution of the Enterprise Systems Fee
Previously, these fees were funded from various agencies that were merged in whole or part into DES, which has since been transferred into WaTech.
These fees were consolidated into a single Enterprise Systems Fee, and then reduced by about $5 million dollars per biennium, beginning in FY14. The impacts of these reductions are still felt today as the demand for, and cost of, application support continues to grow. WaTech works with OFM and the Legislature each year to adjust the ESF revenue to accommodate the changing demands for application support.
H. Analysis of Current Cost Recoverability
This service is more than cost recoverable, it is highly profitable based on AFRS financial data. However, Enterprise Systems Support is not forecasting cost recoverability in FY19 based on information provided in the FY18/19 spend plan.
Table 275. Enterprise Systems Support Cost Recoverability (Actual FY16-FY18)
Service Income FY16 FY17 FY18 H1
Service Revenue (8310) 36,797,719 31,896,885 14,588,319
Service Expense (8310) (33,701,459 (48,205) (71,264)
Service Expense (8312) (957,769 (5,868,770) (2,767,835)
Service Expense (8313) (490,886 (2,964,873) (1,681,405)
Service Expense (8314) (181,082 (1,595,455) 0
Service Expense (8315) (2,360,191 (20,636,268) (3,166,156)
Service Expense (8316) 0 0 (1,163,942)
Service Expense (8317) 0 0 (776,433)
Service Expense (8318) 0 0 (381,040)
Service Expense (8319) 0 0 (3,222,655)
Service Expense (8320) 0 0 (754,670)
Net Income (893,670) 879,725 602,918
Note: Cost recoverability detail pulled from “AFRS Financial Download (Fiscal Years 2016 – Current)”. The revenue for FY 18 has since been adjusted. Historically WaTech has collected the ESF allocation 50% the first FY and 50% the second FY but this biennium it was split differently. The current plan for FY18 is $29,164,103. The FY 19 revenue is adjusted as well to $31,388,952. The revenue reduction is for the payoff of the COP. The most significant year over year change for this service is related to the payoff of the COP. WaTech was paying $4M a year for the COP and it was paid off in June of FY 16. The COP for the HRMS System was paid off June of FY16 so the revenue for this was reduced for that in FY 17. The increase between FY17 and FY18 is for the addition of the Server costs that were added as a direct cost to ESF. Prior to FY18 this had been part of the Desktop/LAN cost and was shared amongst all of the desktop customers. In FY18 WaTech began charging all the Platform and Connectivity (Nutanix) server costs directly to the program they are associated with (it was a discovery made after the merger between DES and WaTech).

Page 575 of 851
. .
Table 276. Enterprise Systems Support Cost Recoverability (Forecasted FY18-FY19)
Service Income FY18 FY19
Service Revenue (8310) 29,794,776 29,794,776
Service Expenses (8312) (6,485,534) (6,624,926)
Service Expenses (8313) (3,442,858) (3,484,353)
Service Expenses (8315) (7,421,458) (7,559,362)
Service Expenses (8316) (2,123,845) (2,183,037)
Service Expenses (8317) (1,622,453) (1,670,874)
Service Expenses (8318) (674,836) (690,360)
Service Expenses (8319) (6,181,722) (6,278,698)
Service Expenses (8320) (1,517,337) (1,551,691)
Net Income 324,733 (248,526)
Note: Forecasted Cost recoverability detail for Service Revenue pulled from “8310 – ESF Revenue” excel spend plan provided in February 2018; Forecasted Cost recoverability detail for Service Expense(s) pulled from the following excel spend plans provided in February 2018: 8312, 8313, 8315, 8316, 8317, 8318, 8319, and 8320
I. Service Level Actually Provided Today
Most applications meet the 99.9% uptime target threshold. However, there is some variation year over year, for example, July 2017 uptime was directly related to issues upgrading ESS.
Note: Uptime data pulled from “EntAppTeam_Dec17” presentation
Customers experience a variety of incidents across supported applications. Typical incidents include the following examples cited by WaTech:
Report did not run as expected (scheduled to run but did not)
Server/system down (backend infrastructure not available)
Permission/Access issues that do not get flagged for resolution elsewhere
Assist users with understanding system functionality
Number of incidents tend to vary month to month based on business cycle, in order to get an understanding of directional trends, year over year changes must be assessed in the same month. During the first half of FY18 the number incidents decreased by nearly 15% across all enterprise applications supported.

Page 576 of 851
. .
Note: Incident data pulled from “EntAppTeam_Dec17” presentation
Over that same period, the number of planned releases increased versus unplanned releases (e.g., resolving an incident), as would be expected when the number of incidents declines.
Note: Planned versus unplanned release data pulled from “EntAppTeam_Dec17” presentation
Additionally, likely due to the smaller incident workload, tickets have closed out quicker in FY2017 than the year before.

Page 577 of 851
. .
Note: Days to close incidents data pulled from “EntAppTeam_Dec17” presentation
Applications health is scored across eleven dimensions (Support Skill, Ease of Change, Application Stack, Authentication, Coding Language, Client Interface, Client OS, DBMS, IDE, Server OS, and Web Interface). Health is slowly degrading year over year across the entire enterprise application portfolio.
Note: Application Health data pulled from “EntAppTeam_Dec17” presentation
Finally, over 70% of the labor associated with enterprise application support and development is focused on support. The aging systems in the enterprise systems portfolio require substantial investment in maintenance activities (for example, the team supporting statewide HR applications beyond HRMS, find it difficult to keep up with the change requests). While the overall split is 70-30 with 30% of time focused on new development, there is variation across groups. The budget application development team estimates that closer to 60% of their time is spent on development work. The financial application team estimates that 35% of their time is on enhancements versus 65% on maintenance.

Page 578 of 851
. .
Note: Maintenance versus development data pulled from “EntAppTeam_Dec17” presentation
J. Current Customers
Over one hundred agencies are billed the Enterprise Systems Fee. The two largest customers account for over half of the amount WaTech billed for this service in FY18.
WaTech does not capture revenue for Enterprise Systems Support via internal sales transfers.
Table 277. Enterprise Systems Support Current List of Customers
# Customer FY17 ($) FY17 (%) FY18 H1 ($) FY18 H1 (%)
1 DEPARTMENT OF SOCIAL AND HEALTH SERVICES 9,002,227 27 4,787,867 28
2 DEPARTMENT OF CORRECTIONS 4,343,719 13 2,214,440 13
3 DEPARTMENT OF TRANSPORTATION 3,030,895 9 1,262,003 7
4 DEPARTMENT OF LABOR AND INDUSTRIES 1,503,934 4 768,422 5
5 WASHINGTON STATE PATROL 1,314,926 4 640,080 4
6 COMMUNITY AND TECHNICAL COLLEGE SYSTEM 1,136,500 3 587,836 3
7 EMPLOYMENT SECURITY DEPARTMENT 1,248,012 4 393,918 2
8 DEPARTMENT OF HEALTH 890,833 3 457,187 3
9 DEPARTMENT OF ECOLOGY 886,624 3 434,558 3
10 DEPARTMENT OF FISH AND WILDLIFE 891,608 3 412,977 2
Total Top 10 Billable Customers 24,249,278 72 11,959,288 71
Total for All Other Billable Customers 8,969,621 27 4,833,780 29
Total WaTech Internal Sales 461,015 1 142,249 1

Page 579 of 851
. .
# Customer FY17 ($) FY17 (%) FY18 H1 ($) FY18 H1 (%)
Total Revenue 33,679,915 100 16,935,317 100
Note: Customer billing details pulled from “GARTNER – ALLOCATION” excel file
K. Current and Historical Usage Volumes
There are over 100 agencies billed monthly for Enterprise Support via the ESF allocation. Only certain agencies are customers of some of these applications, that is, not all supported applications are truly enterprise applications.
The list of applications by customer usage is defined in the table below.
Enterprise Systems Customers
1099-MISC Reporting All agencies
Agency Financial Reporting System (AFRS) All agencies
Capital Asset Management System (CAMS) All agencies
Disclosure Forms Application (DF) All agencies
Enterprise Accounts Receivable System (AR)
Secretary of State, FIN institutions, Department of Revenue, Washington State Patrol, Department of Health, Washington State Military Department – Active Guard Reserve
Financial Reports (ACCT) - This includes Standard Reports as well as Web Intelligence (Webi) All agencies
Financial Toolbox All agencies
Fund Reference Model All agencies
HP Records Management WaTech
Time Management System (TMS)
Department of Health, Washington State Military Department, and the Office of the Superintendent of Public Instruction
Travel and Expense Management System (TEMS) All agencies
The Allotment System (TALS) All agencies
Bill Analysis and Tracking System (BATS) All cabinet agencies for submitting Agency Request legislation
Budget Development System (BDS) All agencies
Capital Budget System All agencies with capital budget requests (see below for FY17-19 stats)
Fiscal Note System (FNS) All agencies
Results through Performance Management System (RPM) All agencies
Version Reporting System (VRS) All agencies
Employee Self Service (ESS) All agencies
Human Resource Management System (HRMS) All agencies
Compensation Impact Model (CIM) OFM
Compensation Impact Model Agency Interface (CIMAI) OFM & Higher Education Institutions
eUnion All agencies
Master Agreement All agencies

Page 580 of 851
. .
Enterprise Systems Customers
Directors Review All agencies
CCJobs OFM
Statewide Human Resources Database OFM
HRMS Business Intelligence / Data Warehouse (BI/BW) All agencies
HR Data Mart (HRDM) OFM
Salary Projection System (SPS) All agencies
Classification Rating Tool All agencies
ResultsWA All agencies
Apptio All agencies
Cost Allocation System (CAS) All agencies
Statewide Vendor/Payee Services (SVPS) All agencies
Washington Workforce Analytics All agencies
Budget Summary System (Winsum) OFM
Capital Budget Development System (BuildSum) OFM
Fiscal Reports OFM
Budget Outlook OFM
Groupings OFM
Transportation Projects OFM
Fund Balance OFM
Legacy counterparts slated for decommission late 2018 OFM
Agencies with FY17-19 Capital Budget requests that use the Capital Budget System:
Joint Legislative Audit and Review Committee
Court of Appeals
Office of the Secretary of State
Department of Commerce
Office of Financial Management
Department of Enterprise Services
Washington State Patrol
WA St Criminal Justice Train Commission
Department of Labor and Industries
WA State Military Department
Department of Social and Health Services
Department of Health
Department of Veterans Affairs
Department of Corrections
Supt of Public Instruction
State School for the Blind
WA St. Center for Child Deafness
Department of Arch and Historic Preservation
Department of Early Learning
University of Washington
Washington State University
Eastern Washington University
Central Washington University
The Evergreen State College
Western Washington University
Washington State Historical Society
East Wash State Historical Society
Department of Transportation
Department of Ecology
WA Pollution Liability Insurance Program
State Parks and Recreation Commission
Recreation and Conservation Funding Board
State Conservation Commission
Department of Fish and Wildlife
Department of Natural Resources
Department of Agriculture
Employment Security Department Community and Technical College
System

Page 581 of 851
. .
L. Customer Satisfaction and Future Demand
The Customer Voice appendix to this report includes customer satisfaction and future demand details based on the results of agency interviews and focus groups conducted during the project.
M. High Level Architecture
Most enterprise applications are hosted at the SDC either on the mainframe, or the legacy hosting environment (virtual and physical server hosting) in the SDC. WaTech is actively planning migration away from both of these environments. Some web applications have already been identified as candidates for migration to the WaTech private cloud, and the HRMS backup system is already hosted in the private cloud.
However, the enterprise applications team recently completed SQL performance testing for WWA on the private cloud, and the private cloud was unable to meet the requirements for latency (the private cloud quadrupled latency from the existing WaTech virtualized hosting environment with storage on the NetApp/VMAX storage solution.
WaTech is evaluating increased use of the public cloud for enterprise systems hosting. The team has moved to Team Foundation Server hosted on Azure.
The budget application development team is currently evaluating migration of some applications to Microsoft Azure cloud. Microsoft is being examined due to the ease of integration for the web front-end given use of Microsoft Dynamics today. These applications are also making use of Fortress Anonymous (now the F5 proxy server) and SAW to meet password reset requirements.
The suite of Budget Applications outdated, and there are browser compatibility challenges, though minimum mandated functionality is available. Therefore, in spite of One Washington, there are two major budget upgrade projects in planning. One for Budget Submittals and the other related to the line of business suite.

Page 582 of 851
. .
(8413) Governor’s Apps Support (OFM Enterprise)
Background
There is no corresponding service catalog entry for this service
OFM Enterprise (8413) only covers the application support and development of a small batch of Governor’s Office applications are provided via a Terms of Service agreement under this cost code
The TOS includes support of websites as well as applications
A. Service Description
Definition
This service covers WaTech application development and support services for a small portfolio of Governor’s Office applications. This includes the following Governor’s Office websites and applications:
Governor’s Constituent Relationship Management System (CRMS) – Boards & Commissions
Governor's Forms – public facing web form used in conjunction with Gov’s CRMS to allow board applicants to complete the application online
Intranet Quorum (Constituent relationship management tool)
Office of the Family and Children’s Ombuds (OFCO) Complaint Tracking System
Websites (were covered under this agreement until January 2018 when the website portion of this service was standardized under the Web Platform/Design service):
o Citizen Corps Website o Governor's Office of Indian Affairs Website o Governor's Website o Office of the Education Ombudsman Website o Secure Access Washington (Support site) o Office of the Family
Supported Governor’s Office Applications:
Application Functional Use Architecture
Intranet Quorum SaaS based system for managing citizen inquiry. SaaS application.
Governor’s CRMS Boards and Commissions
Governor’s CRMS Boards and Commissions – custom web form with Microsoft Dynamics 365 backend for managing board and commission appointments.
Hosted on Microsoft Dynamics 365.
OFCO complaint tracking system
OFCO complaint tracking system – custom.
Custom built external facing web forms.
OEO case management tool
OEO case management tool build on the QuickBase platform. QuickBase platform.
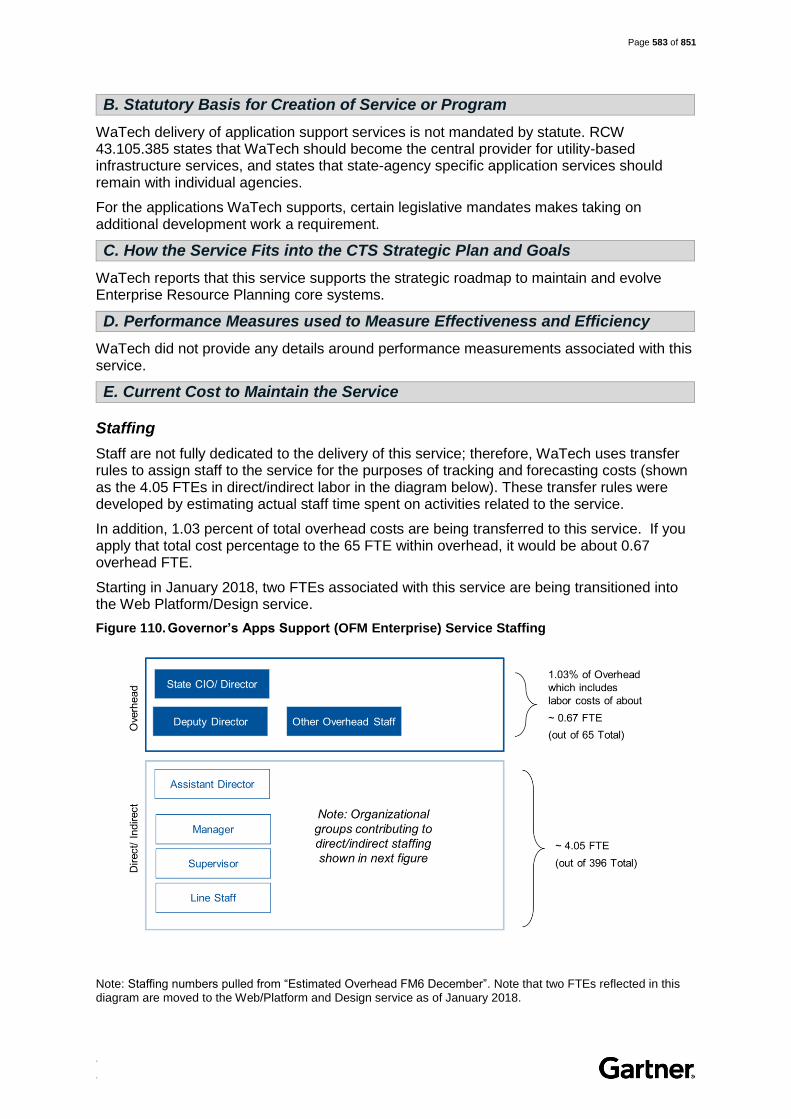
Page 583 of 851
. .
B. Statutory Basis for Creation of Service or Program
WaTech delivery of application support services is not mandated by statute. RCW 43.105.385 states that WaTech should become the central provider for utility-based infrastructure services, and states that state-agency specific application services should remain with individual agencies.
For the applications WaTech supports, certain legislative mandates makes taking on additional development work a requirement.
C. How the Service Fits into the CTS Strategic Plan and Goals
WaTech reports that this service supports the strategic roadmap to maintain and evolve Enterprise Resource Planning core systems.
D. Performance Measures used to Measure Effectiveness and Efficiency
WaTech did not provide any details around performance measurements associated with this service.
E. Current Cost to Maintain the Service
Staffing
Staff are not fully dedicated to the delivery of this service; therefore, WaTech uses transfer rules to assign staff to the service for the purposes of tracking and forecasting costs (shown as the 4.05 FTEs in direct/indirect labor in the diagram below). These transfer rules were developed by estimating actual staff time spent on activities related to the service.
In addition, 1.03 percent of total overhead costs are being transferred to this service. If you apply that total cost percentage to the 65 FTE within overhead, it would be about 0.67 overhead FTE.
Starting in January 2018, two FTEs associated with this service are being transitioned into the Web Platform/Design service.
Figure 110. Governor’s Apps Support (OFM Enterprise) Service Staffing
Note: Staffing numbers pulled from “Estimated Overhead FM6 December”. Note that two FTEs reflected in this diagram are moved to the Web/Platform and Design service as of January 2018.

Page 584 of 851
. .
Figure 111. Governor’s Apps Support (OFM Enterprise) Services Direct/Indirect Staffing
Note: Staffing details pulled from “Org Chart - Color Coded 01.01.18” and combined with transfer rules in “FY18 Master Indexes 12-19-17”. Note that two FTEs reflected in this diagram are moved to the Web/Platform and Design service as of January 2018.

Page 585 of 851
. .
Workload Supported
The current supported workload is defined in the table below:
Table 278. Governor’s Apps Support (OFM Enterprise) Workload Supported
Description Workload Supported
# of applications supported 4 applications
# of websites 6 websites
Percent effort on development versus support 80% development versus 20% M&O
Note: Workload provided during review of inventory and in TTS time system data
Table 279. Governor’s Apps Support (OFM Enterprise) Systems Support Workload Supported
Work Effort in Hours FY16 FY17 FY18 (Q1-Q3)
M&O 2,851 2,038 637
Enhancement 134 955 354
New Development 571 2,648 2,119
Total Hours 3,561 5,640 3,109
Note: TTS time system workload data referenced. Data for FY18 is for the first 9 months of the fiscal year. However, In TTS there is a concept of shared services and platforms. The hours recorded to shared services and platforms will not show under this code (i.e., the applications on the CRM platform will be included but the work on the support of the XCRM platform the applications run on will not be included).
Direct, Indirect and Overhead Costs
WaTech’s planned expenses for this fiscal year are provided in the table below.
Table 280. Governor’s Apps Support (OFM Enterprise) FY18 Planned Service Expenses
Cost Components FY18 Planned FY19 Planned Cost Details
A Salaries 121,889 212,315
Salaries and benefits associated with 4.00 planned FTEs (including direct staff and management) through January 2018, then deceases to 1.4 at the end of FY18 before increasing in FY19
B Benefits 0 0 Benefit cost included with A above
E Goods & Services 203,717 206,251
1. Software maintenance: Constituent tool IQ cloud; Sockeye; and, Microsoft EA agreement 2. Employee training and other
E Internal Purchases 44,958 47,000
Event management system; user experience service – GOV sites; website maintenance (support and hosting); desktop support; user experience services – OFM sites; and, website maintenance (support and hosting for OFM)
T Transfers 61,050 86,940 Agency overhead
Total Planned Expenses 431,614 552,506
Note: Cost details were pulled from “8413 – OFM/GOV Applications” excel spend plan provide in February 2018; and subsequently adjusted with the file “8412.5.18” to show the movement of the website portion of this agreement to the Web Platform/Design service
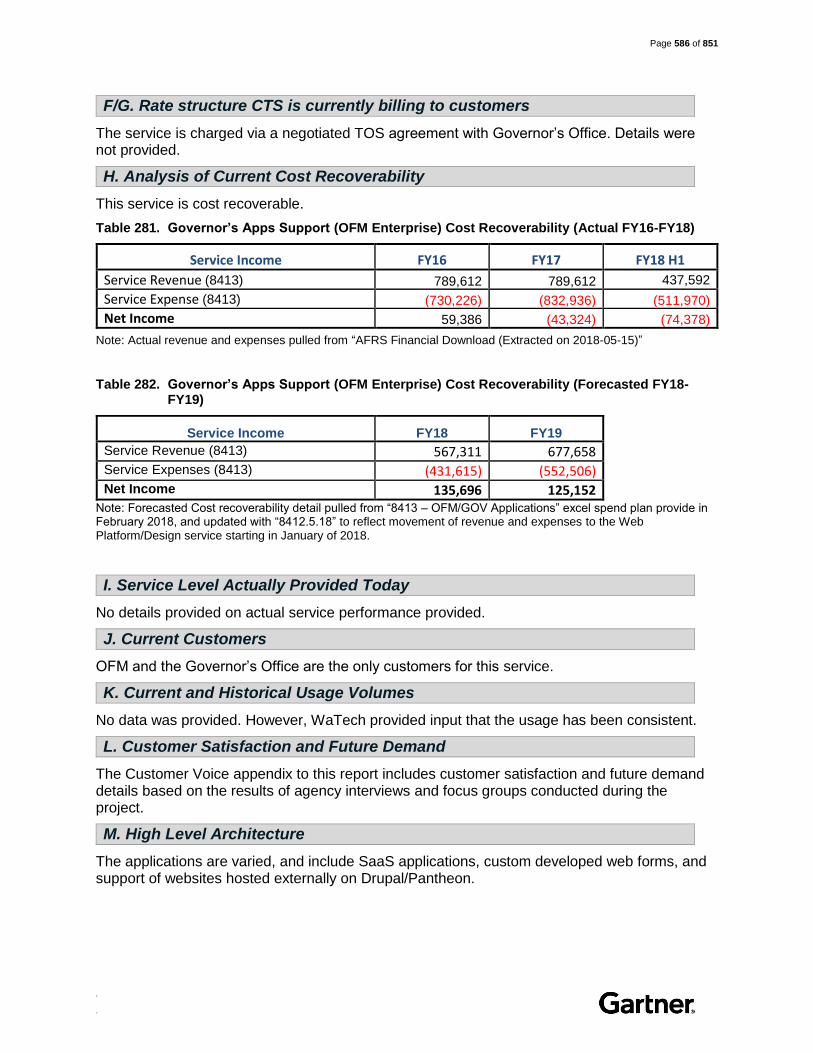
Page 586 of 851
. .
F/G. Rate structure CTS is currently billing to customers
The service is charged via a negotiated TOS agreement with Governor’s Office. Details were not provided.
H. Analysis of Current Cost Recoverability
This service is cost recoverable.
Table 281. Governor’s Apps Support (OFM Enterprise) Cost Recoverability (Actual FY16-FY18)
Service Income FY16 FY17 FY18 H1
Service Revenue (8413) 789,612 789,612 437,592
Service Expense (8413) (730,226) (832,936) (511,970)
Net Income 59,386 (43,324) (74,378)
Note: Actual revenue and expenses pulled from “AFRS Financial Download (Extracted on 2018-05-15)”
Table 282. Governor’s Apps Support (OFM Enterprise) Cost Recoverability (Forecasted FY18-FY19)
Service Income FY18 FY19
Service Revenue (8413) 567,311 677,658 Service Expenses (8413) (431,615) (552,506) Net Income 135,696 125,152
Note: Forecasted Cost recoverability detail pulled from “8413 – OFM/GOV Applications” excel spend plan provide in February 2018, and updated with “8412.5.18” to reflect movement of revenue and expenses to the Web Platform/Design service starting in January of 2018.
I. Service Level Actually Provided Today
No details provided on actual service performance provided.
J. Current Customers
OFM and the Governor’s Office are the only customers for this service.
K. Current and Historical Usage Volumes
No data was provided. However, WaTech provided input that the usage has been consistent.
L. Customer Satisfaction and Future Demand
The Customer Voice appendix to this report includes customer satisfaction and future demand details based on the results of agency interviews and focus groups conducted during the project.
M. High Level Architecture
The applications are varied, and include SaaS applications, custom developed web forms, and support of websites hosted externally on Drupal/Pantheon.

Page 587 of 851
. .

Page 588 of 851
. .
(8411) DES Systems Support
Background
There is no corresponding service catalog entry for this service
As of July 2017, DES Systems Support is no longer offered by WaTech, DES now supports these DES-specific applications:
o DES A/R System o DES Agency Billing System o DES Common Compatibility o DES Cost Allocation Rate Program o DES Electronic Voucher Form o DES Event Manager o DES Intranet o DES Online Invoices and Statements o DES Relationship Mgmt. System (ES RMS) o DES SharePoint o DES Website (External) o Enterprise Contract Management Systems o Fuel, Dairy and Propane Pricing o GovDelivery – DES o HPRM-TRIM (DES) o Learning Management System
The support provided to DES for these systems was the Tier 1 help desk support ended 1/1/2018. WaTech also paid for license fees for CRM, TRIM, Visual Studio, and MS Project. WaTech also offers integration and reporting services on an as needed basis at the professional services rate.
A. Service Description
WaTech used to provide enterprise systems support for DES Systems; however, after the organizational separation that occurred establishing DES and WaTech as separate entities, this support is no longer provided by WaTech and is now the sole responsibility of DES itself.
B. Statutory Basis for Creation of Service or Program
WaTech delivery of this specific service is not mandated by statute. This service is no longer provided by WaTech.
C. How the Service Fits into the CTS Strategic Plan and Goals
This service is no longer provided by WaTech.
D. Performance Measures used to Measure Effectiveness and Efficiency
WaTech does not measure and report on performance measures associated with this service; this service is now owned by DES.
E. Current Cost to Maintain the Service
Staff were previously assigned to this service, and the transfer rules have not yet been updated in the financial system, therefore labor is still being applied to this cost center in line with the two

Page 589 of 851
. .
diagrams shown below. This cost will have to be reassigned to other services during this fiscal year. The total cost of the support services will be reallocated to the remaining services using the support. The costs will increase for WaTech unless there has been any reduction in staffing for the decrease in workload. Currently there has not been any reduction.
Figure 112. DES Systems Support Staffing
Note: Staffing numbers pulled from “Estimated Overhead FM6 December”
Figure 113. DES Systems Support Direct/Indirect Staffing
Note: Staffing details pulled from “Org Chart - Color Coded 01.01.18” and combined with transfer rules in “FY18 Master Indexes 12-19-17”
F/G. Rate structure CTS is currently billing to customers
This service is no longer provided by WaTech.

Page 590 of 851
. .
H. Analysis of Current Cost Recoverability
This service is no longer provided by WaTech. While it was not cost recoverable in previous years, there is no forecasted spend associated with this service in the future.
Table 283. DES Systems Support Cost Recoverability (Actual FY16-FY18)
Service Income FY16 FY17 FY18 H1
Service Revenue (8411) 1,868,853 1,201,488 0
Service Expense (8411) (1,403,249) (1,396,734) (76,163)
Net Income 465,604 (195,246) (76,163)
Note: Actual revenue and expenses pulled from “AFRS Financial Download (Extracted on 2018-05-15)” Note that FY18 (H1) shows as negative as DES has not been billed yet this year. Now that this service is now longer offered, any licensing WaTech provides will be recovered from DES and the cost of the tier one support will be redistributed to the programs using the service.
I. Service Level Actually Provided Today
This service is no longer provided by WaTech.
J. Current Customers
WaTech only had one customer for this service. However, this service has been eliminated with the organizational separation from DES.
Table 284. DES Systems Support Current List of Customers
# Service Offering FY17 ($) FY17 (%) FY18 H1 ($) FY18 H1 (%)
1 ENTERPRISE SERVICES DEPARTMENT OF 1,413,104 100 0 100
Note: Customer billing details pulled from “Apptio Download – Sales History (FFS and Allocations since 07-2016)” excel file
K. Current and Historical Usage Volumes
This service is no longer provided by WaTech.
L. Customer Satisfaction and Future Demand
The Customer Voice appendix to this report includes customer satisfaction and future demand details based on the results of agency interviews and focus groups conducted during the project.
M. High Level Architecture
This service is no longer provided by WaTech.

Page 591 of 851
. .
(8840) JINDEX
Background
There is no corresponding service catalog entry for this service; however, relevant details have been pulled from Washington JINDEX program and eTRIP application online resources
JINDEX was historically supported by DIS, then DES, and now WaTech
JINDEX is not an enterprise-wide WaTech service offering and is not advertised via the service catalog; it is funded by Washington State Patrol, Department of Transportation, Department of Licensing, and general fund state appropriation to WaTech and provided to specific stakeholder agencies
A. Service Description
Definition
The Justice Information Network Data Exchange (JINDEX) program was created by the Washington Integrated Justice Information Board to support the exchange of collision and traffic violation data between criminal justice agencies and other state agencies such as the Department of Transportation, Department of Licensing, and the Office of Administrative Courts. This initiative is referred to as the Electronic Traffic Information Processing (eTRIP) Initiative.
The JINDEX program serves as the primary exchange mechanism for electronic citations, infractions, and collision reports. WaTech manages the systems administration portion of the JINDEX program, including enterprise architecture, technical, and operational support. In addition, WaTech manages onboarding and JINDEX-related programs.
Notes
JINDEX is hosted on the managed server environment but there are plans in place to migrate to the WaTech private cloud
B. Statutory Basis for Creation of Service or Program
WaTech delivery of this specific service is not mandated by statute.
C. How the Service Fits into the CTS Strategic Plan and Goals
WaTech reports that this service is not listed as strategic at this time based on strategic plans or technology roadmaps.
D. Performance Measures used to Measure Effectiveness and Efficiency
WaTech maintains a formal interagency agreement document with Washington State Patrol. WaTech measures and reports on system, network and combined availability, as well as number of incidents and time to close, and requests and time to close.
WaTech also tracks and reports on production volume system metrics – data on every message received into and sent from the JINDEX system and its stakeholders. Data includes entity names, inbound and outbound applications, application types, application ecosystems, sending entity IDs, start and end years, message types, and total number of messages received and delivered.

Page 592 of 851
. .
E. Current Cost to Maintain the Service
Staffing
One staff member is fully dedicated to the delivery of this service; however, additional teams provide backup and support. WaTech uses transfer rules to assign staff to the service for the purposes of tracking and forecasting costs (shown as the 1.79 FTEs in direct/indirect labor in the diagram below). These transfer rules were developed by estimating actual staff time spent on activities related to the service.
In addition, 0.43 percent of total overhead costs are being transferred to this service. If you apply that total cost percentage to the 65 FTE within overhead, it would be about 0.28 overhead FTE.
Figure 114. JINDEX Service Staffing
Note: Staffing numbers pulled from “Estimated Overhead FM6 December”

Page 593 of 851
. .
Figure 115. JINDEX Service Direct/Indirect Staffing
Note: Staffing details pulled from “Org Chart - Color Coded 01.01.18” and combined with transfer rules in “FY18 Master Indexes 12-19-17”. Additionally, the WaTech Data BI team supports the JINDEX database and a small % of an FTE should also be reflected in this diagram. However, precise data was not provided.
Workload Supported
The current supported workload is defined in the table below:
Table 285. JINDEX Service Workload Supported
Description Workload Supported
Number of Messages Sent (from JINDEX) 5,503,833 Messages
Note: Workload details were pulled from “JindexProdMetrics_2017” excel spreadsheet provided in February 2018; data provided for January 2017 – December 2017
Direct, Indirect and Overhead Costs
WaTech’s planned expenses for this fiscal year are provided in the table below.
Table 286. JINDEX Service FY18 Planned Service Expenses
Cost Components FY18 Planned FY19 Planned Cost Details
A Salaries 158,448 160,621 Salaries and benefits associated with 1.79 FTEs (includes direct staff and management)
B Benefits 52,278 54,156
E Goods & Services 21,685 22,561
Software maintenance (Biztalk, MSDN); training ($1000 per FTE), cell phone, miscellaneous, CSD overhead, service desk/command center, solution center (0.90 FTE), and certificates
E Internal Purchases 61,608 61,608
Network allocation, desktop support, server hosting (support and hosting), and storage and backup

Page 594 of 851
. .
Cost Components FY18 Planned FY19 Planned Cost Details
G Travel 1,432 1,432
J Non-capitalized Assets 2,018 2,119
T Transfers 61,330 61,869 Agency overhead
Total Planned Expenses 358,799 364,366
Note: Cost details were pulled from “8840 – JINDEX” excel spend plan provide in February 2018; the salary and benefit costs assume vacancies are filled
Given near-term planned operating expenses, WaTech will have the following workload costs for this service in FY18:
Table 287. JINDEX Cost by Workload
Description Workload Cost Details
Number of Directly Supporting FTEs 1.71 FTEs
Number of Messages Sent (from JINDEX) 5,503,833 Messages
Message per FTE 3,218,616 Messages per FTE
Cost per Message $0.11 per Message Sent
Note: Workload cost in the table above is calculated based on WaTech’s alignment of costs to this service without adjustment for alignment to Gartner consensus models.
F/G. Rate structure CTS is currently billing to customers
JINDEX is not an enterprise-wide, brokered service. It is solely billed to the Washington State Patrol, Department of Transportation, and Department of Licensing, and a separate general fund state appropriation, based on the fee in the table below:
Table 288. JINDEX Service Rate
Description Rate Detail
JINDEX service rate $383,000 annually (1.5 FTE + BizTalk license + virtual servers)
The Legislature typically fully funds JINDEX and related support. During the prior biennium, the Legislature did not originally fully fund JINDEX; however, at the last minute, JINDEX was fully funded. Funding was not received until the FY17 supplemental budget cycle (i.e., the end of the biennium).
There is currently no permanent funding structure for JINDEX. However, an eTRIP Executive Team is organizing a committee – made up of JINDEX stakeholders, the Washington Traffic & Safety Commission, and WaTech representatives – to develop a permanent funding structure and solution for JINDEX and the Washington State Patrol Sector application to avoid relying on the Legislature moving forward. As part of this new funding structure, JINDEX and Sector will be marketed together because they function symbiotically.

Page 595 of 851
. .
H. Analysis of Current Cost Recoverability
This service is currently anticipated to be cost recoverable in the future based on FY18/FY19 forecasts.
Table 289. JINDEX Service Cost Recoverability (Actual FY16-FY18)
Service Income FY16 FY17 FY18 H1
Service Revenue (8840) 400,000 315,939 -
Service Expense (8840) (338,310) (714,810) (179,558)
Net Income 61,690 (398,871) (179,558)
Note: Actual revenue and expenses pulled from “AFRS Financial Download (Extracted on 2018-05-15)” Note that WaTech received $350k of general fund state at the end of FY 17 to cover FY 16 expenses, and in FY 17 WaTech only spent $364,809.76, but given how OFM directed WaTech’s accounting to record the general fund state transactions, it gives the appearance of doubled expenses.
Table 290. JINDEX Service Cost Recoverability (Forecasted FY18-FY19)
Service Income FY18 FY19
Service Revenue (8840) 383,000 384,000
Service Expense (8840) (358,799) (364,366)
Net Income 24,201 19,634
Note: Cost details were pulled from “8840 – JINDEX” excel spend plan provide in February 2018; the salary and benefit costs assume vacancies are filled
I. Service Level Actually Provided Today
For Fiscal Year 2017, JINDEX reported a system and network uptime of 99.89%. JINDEX reported 4.22 average days to close service requests and 1.44 days to close incidents (as shown in the figures below).

Page 596 of 851
. .
Note: JINDEX performance data and graphs provided during inventory review.
J. Current Customers
WaTech has three paying customers for JINDEX, the Washington State Patrol, Department of Transportation and Department of Licensing, which are billed directly. WaTech also received general fund state appropriation to pay for a portion of JINDEX maintenance.
WaTech does not capture revenue for JINDEX services via internal sales transfers.
Table 291. JINDEX Service Current List of Customers
# Customer FY17 ($) FY17 (%) FY18 H1 ($) FY18 H1 (%)
1 WASHINGTON STATE PATROL 315,939 100 0 0
Total Top 10 Billable Customers 315,939 100 0 0
Total for All Other Billable Customers 0 0 0 0
Total WaTech Internal Sales 0 0 0 0
Total Revenue 315,939 100 0 0
Note: Customer billing details pulled from “Apptio Download – Sales History (FFS and Allocations since 07-2016)” excel file, and subsequently updated during review.
K. Current and Historical Usage Volumes
There currently are 39 JINDEX eTRIP partners made up of state agencies, public safety and criminal justice groups, counties, cities, and private sector entities. The three agency service

Page 597 of 851
. .
provider partners are the Washington Office of Administrative Courts, Department of Licensing, and Department of Transportation. To date, AOC is the largest beneficiary of JINDEX.
L. Customer Satisfaction and Future Demand
The Customer Voice appendix to this report includes customer satisfaction and future demand details based on the results of agency interviews and focus groups conducted during the project.
M. High Level Architecture
The JINDEX Program runs the eTrip application on the Microsoft BizTalk platform; the BizTalk server functions on existing networks for messaging services. Messages exchanged among agencies through the BizTalk messaging service are structured using XML and SOAP messaging standards. These standards have been established through the Global Justice XML Data Model (GJXDM) developed by the Department of Justice. Each eTRIP XML document utilizes a subset of the GJXDM in constructing its message schema.
The JINDEX BizTalk server is the central broker in a systems integration model built on Service Oriented Architecture (SOA). SOA is defined as an architectural style whose goal is to achieve loose coupling among interacting software agents. SOA eliminates the need for point to point connections by utilizing a central broker and web services at the data provider and consumer.
Incoming production and QA environment public internet HTTP traffic originates from the Fortress Anonymous Web Proxy. Outbound production and QA environment HTTP traffic transmits to agency services hosted in the IGN, SGN, PGN, or Public Internet.
The design includes the use of load balancing which provides failover between network components to meet the JINDEX program requirements for a high availability system for safety personnel.

Page 598 of 851
. .
(8213) E-Time
Background
WaTech first tried to implement the WorkForce time and attendance solution (referred to as E-Time) in 2014 for both Ecology and Department of Transportation as a combined project
While that implementation was unsuccessful, WaTech supported Ecology in an individual rollout of the solution, and is now supporting Department of Transportation with their implementation
This service is not available broadly and therefore there is no associated service catalog entry
A. Service Description
Definition
E-Time is a brokered Software as a Service (SaaS) solution provided by WorkForce. WaTech manages the contract with WorkForce that covers both hosting and user subscription fees, and provides project implementation support to help customer agencies get the tool configured to meet their requirements.
Once a customer agency is onboarded, WaTech provides vendor management support for the hosting and application support vendors.
Features
Project Management support services for implementation and onboarding
Vendor support for application and hosting vendors
B. Statutory Basis for Creation of Service or Program
WaTech delivery of this specific service is not mandated by statute. State agencies have the option to contract directly with other providers for their time and attendance solutions, or to deliver the service for themselves, and many choose to do so.
C. How the Service Fits into the CTS Strategic Plan and Goals
WaTech reports that this service supports the OCIO Strategic plan for enabling agencies to use E-Time as a labor replacement solution.
D. Performance Measures used to Measure Effectiveness and Efficiency
WaTech does not measure and report on performance measures associated with this service.
E. Current Cost to Maintain the Service
Staffing
WaTech does not assign any staff to the delivery of this service. Project implementation support is provided by a WaTech project manager who is assigned via internal sales.
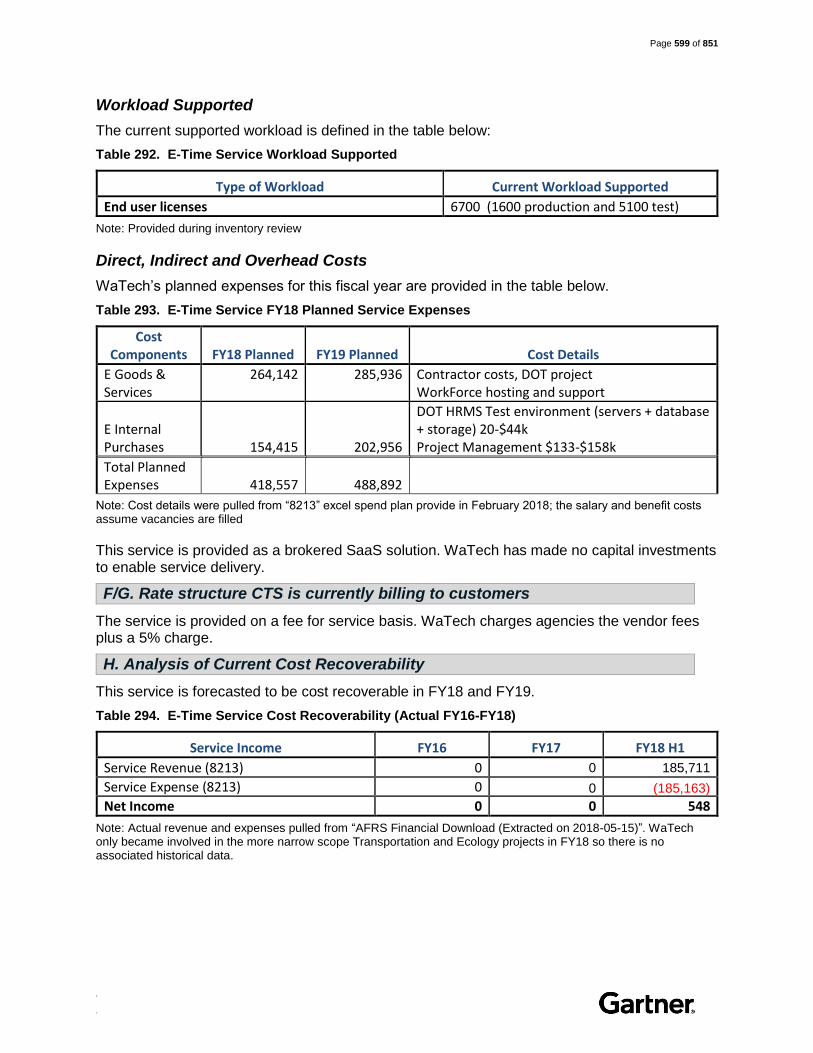
Page 599 of 851
. .
Workload Supported
The current supported workload is defined in the table below:
Table 292. E-Time Service Workload Supported
Type of Workload Current Workload Supported
End user licenses 6700 (1600 production and 5100 test)
Note: Provided during inventory review
Direct, Indirect and Overhead Costs
WaTech’s planned expenses for this fiscal year are provided in the table below.
Table 293. E-Time Service FY18 Planned Service Expenses
Cost Components FY18 Planned FY19 Planned Cost Details
E Goods & Services
264,142
285,936
Contractor costs, DOT project WorkForce hosting and support
E Internal Purchases 154,415 202,956
DOT HRMS Test environment (servers + database + storage) 20-$44k Project Management $133-$158k
Total Planned Expenses 418,557 488,892
Note: Cost details were pulled from “8213” excel spend plan provide in February 2018; the salary and benefit costs assume vacancies are filled
This service is provided as a brokered SaaS solution. WaTech has made no capital investments to enable service delivery.
F/G. Rate structure CTS is currently billing to customers
The service is provided on a fee for service basis. WaTech charges agencies the vendor fees plus a 5% charge.
H. Analysis of Current Cost Recoverability
This service is forecasted to be cost recoverable in FY18 and FY19.
Table 294. E-Time Service Cost Recoverability (Actual FY16-FY18)
Service Income FY16 FY17 FY18 H1
Service Revenue (8213) 0 0 185,711
Service Expense (8213) 0 0 (185,163) Net Income 0 0 548
Note: Actual revenue and expenses pulled from “AFRS Financial Download (Extracted on 2018-05-15)”. WaTech only became involved in the more narrow scope Transportation and Ecology projects in FY18 so there is no associated historical data.

Page 600 of 851
. .
Table 295. E-Time Service Cost Recoverability (Forecasted FY18-FY19)
Service Income FY18 FY19
Service Revenue 441,770 500,719 Service Expenses (418,557) (488,892) Net Income 23,213 11,827
Note: Forecasted Cost recoverability detail pulled from “8213” excel spend plan provide in February 2018
I. Service Level Actually Provided Today
No details provided on actual service performance.
J. Current Customers
WaTech has two customers for the E-Time project. Ecology deployed E-Time to production and DOT is currently implementing the project.
K. Current and Historical Usage Volumes
WaTech previously tried to implement E-Time as a statewide service; however, was unsuccessful in getting all agencies to agree to a single, common configuration.
This recent implementation with Ecology was completed just this year and the project with DOT is currently being implemented.
L. Customer Satisfaction and Future Demand
The Customer Voice appendix to this report includes customer satisfaction and future demand details based on the results of agency interviews and focus groups conducted during the project.
M. High Level Architecture
E-Time is a SaaS solution provided by WorkForce. WaTech integrates this solution with backend systems of record, HRMS and AFRS.

Page 601 of 851
. .
(8214) Mainframe Testing
Background
This service includes support for testing of WaTech supported mainframe applications (e.g., AFRS), specific to integration/regression testing required as a result of changes to agency-supported systems (those outside the scope of WaTech’s provider responsibilities for the mainframe application support services)
This service is covered under a new formal service offering Mainframe Testing (8214), but there is no corresponding service catalog entry for Mainframe Testing as WaTech only recently started charging for this service
Mainframe Testing is not part of Mainframe Hosting services (i.e., High Capacity Computing and Mainframe Disaster Recovery), and it is supported by WaTech Applications Development staff within the Infrastructure & Applications Program Area
Free support of Mainframe Testing is still provided to agencies who contact WaTech about WaTech supported mainframe application issues, and for WaTech initiated planned changes, WaTech began charging for agency initiated testing as it was consuming a lot of resources (both people and machine time) and it is outside the scope of WaTech’s standard provider responsibilities
A. Service Description
Definition
The scope of this service is limited to mainframe hosted application testing for agency requested testing services. When agencies require integration/regression systems testing support for agency supported applications that integrate with WaTech supported mainframe applications (e.g., AFRS), WaTech provides support and machine processing time on a fee for service basis.
Notes
Mainframe Testing required for WaTech initiated changes to WaTech supported applications is not a part of this fee-for-service offering, and is instead still covered as a standard part of the Enterprise System Fee allocation
B. Statutory Basis for Creation of Service or Program
WaTech delivery of this specific service is not mandated by statute.
C. How the Service Fits into the CTS Strategic Plan and Goals
WaTech reports that this service supports the strategic roadmap to maintain and evolve Enterprise Resource Planning core systems.

Page 602 of 851
. .
D. Performance Measures used to Measure Effectiveness and Efficiency
Beyond the standard incident response targets for all mainframe services, WaTech has not defined any service level targets or reporting requirements associated with Mainframe Testing.
Prioritization of work effort is determined by the application business owners.
E. Current Cost to Maintain the Service
Staffing
There are no staff solely dedicated to the delivery of this service; this service is supported as needed by resources within the Applications Development division within WaTech Infrastructure & Applications. All labor is paid for through the Enterprise Systems Fee allocation. In some instances contracting staff are used to support this service.
Workload Supported
Since this service became a stand-alone offering that is provided on a fee-for-service basis, demand has been limited.
Direct, Indirect and Overhead Costs
As a newly implemented service offering, WaTech does not currently forecast planned fiscal year expenses for Mainframe Testing.
F/G. Rate structure CTS is currently billing to customers
Mainframe Testing services are provided on a fee for service basis. Rates are listed in the table below:
Table 296. Mainframe Testing Rates
Description Rate Detail
S390/Mainframe Testing Support $150 per hour for personnel support in addition to machine time
Rate is new as of FY18.
H. Analysis of Current Cost Recoverability
Mainframe Testing is currently cost recoverable based on available data for FY18 (H1). There are currently no associated expenses for this service.
Table 297. Mainframe Testing Cost Recoverability (Actual FY16-FY18)
Service Income FY16 FY17 FY18 H1
Service Revenue (8214) 0 0 2,913
Service Expense (8214) 0 0 3,600
Net Income 0 0 -687
Note: Cost recoverability detail pulled from “AFRS Financial Download (Fiscal Years 2016 – Current)”. FY16 and FY17 are not applicable because the service offering did not exist at the time. Also from an expense perspective WaTech leverages a contractor to execute the vast majority of this work which goes against 8313 The rates for the
Page 603 of 851
. .
contractor have changed within this period but working on an average it was estimated to be about 30 hours at around $120 per hour = $3600. (Note that a small amount of internal staff time may be excluded.)
I. Service Level Actually Provided Today
Service Level provision is only measured internally with respect the accuracy of estimated testing efforts compared to actuals. To date all testing request have been successfully completed in alignment with customer quested timelines.
J. Current Customers
WaTech has two customers for Mainframe Testing so far in FY18.
Table 298. Mainframe Testing Current List of Customers
# Customer FY17 ($) FY17 (%) FY18 H1 ($) FY18 H1 (%)
1 DEPARTMENT OF LABOR AND INDUSTRIES
0 0 2,822 97
2 DEPARTMENT OF SOCIAL AND HEALTH SERVICES
0 0 91 3
Total Top 10 Billable Customers 0 0 1,188 100
Total for All Other Billable Customers
0 0 0 0
Total WaTech Internal Sales 0 0 0 0
Total Revenue 0 0 1,188 100
Note: Customer billing details pulled from “Apptio Download – Sales History (FFS and Allocations since 07-2016)” excel file
K. Current and Historical Usage Volumes
Current usage for Mainframe Testing is very small, as WaTech recently established this support as a chargeable service for customers. The majority of revenue collected is for machine time.
Table 299. Mainframe Testing Current List of Customers
Service Offering FY17 ($) FY17 (%) FY18 H1 ($) FY18 H1 (%)
Mainframe Testing – Compute 0 0 888 30
Mainframe – Staff Time 0 0 2025 70
Total Revenue 0 0 1188 100
Note: Customer billing details pulled from “Apptio Download – Sales History (FFS and Allocations since 07-2016)” excel file. (*) Note that FY18 billed amount is only for the first half of the year.
WaTech anticipates continued demand for this service at a similar level to past years for the next 12-18 months until the One Washington project begins its formal development and implementation phase at which time it is expected this service will end.

Page 604 of 851
. .
L. Customer Satisfaction and Future Demand
The Customer Voice appendix to this report includes customer satisfaction and future demand details based on the results of agency interviews and focus groups conducted during the project.
M. High Level Architecture
This service includes testing for mainframe hosted applications; relevant architecture information is included under the Enterprise Systems Fee application section above.

Page 605 of 851
. .
12. Web, Video, and BI Services
(8682) Web Platform/ Design
Background
This service is covered under the Website Services service catalog entry
This service currently includes over 50 websites as a part of the subscription-based delivery model. The Access Washington website is funded at a minimal level to sufficiently operate the site after the allocation was defunded. Given the significance of the Access Washington Portal, it is also addressed separately in this document under the section called Access Washington (Defunded/Formerly 8610)
WaTech decided to leverage the defunded Access Washington code 8610 (currently being used primarily for the Usability Lab) for the hosting of the AccessWa.gov website on the new Web Platform service when a positive variance enabled additional use of the 8610 code. While WaTech is leveraging leftover funding to host the website, the funding does not cover any updates or the level of support that the site really needs. WaTech currently estimates that sufficient support to update, improve, and maintain more dynamic content would require about $1000/month versus the current $400/month. To completely revamp the site, redesign, and make it more usable, would take approximately $100k in one-time costs.
As of January 2018, this service subsumed a portion of a pre-existing SLA with OFM (8413 that is covered under the Application and Development section of the inventory document) into the set of SLAs from customers, effectively standardizing the agreement model
A. Service Description
Definition
WaTech’s Web Platform service provides strategic web design solutions, development, hosting, and on-going support for agency websites. Customers are given the option to have fully managed websites on WaTech’s custom Drupal or WordPress distribution, as well as the option to purchase separate maintenance, hosting, and support packages for Drupal or WordPress sites not built within WaTech’s custom distribution.
WaTech functions as the technical team and delivers all design, development, hosting, and support services for customers. Drupal platform makes up 98% of the service; however, WaTech still supports WordPress. WaTech works with Category 1 and 2 level data only; there is no support of sensitive information.
Features
Web design, development, and maintenance
Integrated with UX and accessibility services
Drupal or WordPress Content Management System

Page 606 of 851
. .
Cloud-based web hosting
Responsive, mobile web design
Rapid deployment
Content authoring environment for customers
Ongoing monthly technical support for minor enhancements, training or troubleshooting
Web Platform Features Simple Standard Complex
Simple theme catalog
Web page search
Contact form
Content tagging
Extended theme catalog
Document search
Custom content types
Calendar
Social Media integration
Dynamic content
Custom website design
External integration
Custom modules
Notes
Customers are required to enter into a Master Service Agreement.
Customers are responsible for managing and updating all website content. WaTech can provide assistance and training for customers; however, website content is the responsibility of agencies themselves
All websites are mobile responsive
Https is now standard for all new sites. Previously built sites on the service are being migrated to https with 95% completed
Drupal platforms (templates and themes) are accessible out of the box.
B. Statutory Basis for Creation of Service or Program
WaTech delivery of this specific service is not mandated by statute. State agencies have the option to contract directly with other Web Design vendors and providers, and many choose to do so.
C. How the Service Fits into the CTS Strategic Plan and Goals
WaTech reports that this service supports the strategic roadmap to ensure a managed web service can be used by any customer group authorized by RCW and contracts.

Page 607 of 851
. .
D. Performance Measures used to Measure Effectiveness and Efficiency
WaTech only has two types of performance measures for this service:
Time – Work activity hours are tracked in JIRA and for OFM, DES and WaTech are also reported to TTS
Net Promoter System (NPS) – For all Business and Digital Media Services (including Web Platform), WaTech collects and integrates customer feedback using NPS. The NPS dashboard is available via Google Drive
WaTech has not defined any request fulfillment targets (e.g., time to onboard a new customer).
E. Current Cost to Maintain the Service
Staffing
When the service started, OFM paid for the three dedicated web developers (via an SLA which is covered under the OFM Enterprise 8413 section of App Dev and Support portion of the this service inventory). The only labor charged against the separate SLA-based Fee for Service cost code (8682) was 30% of the manager’s time and 2% of the Deputy Director’s time. Through the addition of new paying customers via service expansion, WaTech reports that they have been able to reduce OFM’s share of the cost (the amount allocated to their SLA under the cost code 8413) to more closely align to their actual usage of roughly two developers and 30% of the service owner’s time. This change occurred as of January 2018.
Figure 116. Current Web Platform Service Staffing
Note: Staffing numbers pulled from “Estimated Overhead FM6 December” and subsequently updated to reflect the resources shifted to this cost code as of January 2018

Page 608 of 851
. .
Figure 117. Current Web Platform Service Direct/Indirect Staffing
Note: Staffing details were pulled from “Org Chart - Color Coded 01.01.18” and combined with transfer rules in “FY18 Master Indexes 12-19-17”, and subsequently updated with details provided in the Web Service (8682 FFS_1852,1855) spend plan.
Workload Supported
The 3.3 FTEs who currently deliver the Web Platform service currently support the workload defined in the table below:
Table 300. Web Platform Workload Supported
Description Workload Supported
Number of New Sites Developed per Quarter 2-3 new sites developed per quarter (8-12 new sites per year) about 80% of these new sites are “Standard”
Number of Sites Supported 56 sites supported
Note: Workload information was documented during interviews conducted in February 2018 at WaTech, and was subsequently updated during document review.
Direct, Indirect and Overhead Costs
WaTech’s planned expenses for this biennium are provided in the table below.
Table 301. Web Platform FY18/19 Biennium Planned Service Expenses
Cost Components FY18 Planned FY19 Planned Cost Details
A Salaries 200,856 362,052 Covers 0.32 FTE thru January of 2018 and 3.32 thru end FY19
B Benefits 0 0 Benefit costs are included with A Salaries
E Goods & Services 34,460 48,345 Pantheon and training costs, and travel expenses
E Internal Purchases 6,360 11,610 Desktop support for delivery staff
T Transfers 78,302 142,943 Agency overhead
Total Planned Expenses 319,978 564,949

Page 609 of 851
. .
Note: Cost details were pulled from “8682 – Websites” excel spend plan provide in February 2018 and subsequently updated during review cycles with the data provided in Web Service (8682 FFS_1852, 1855).
Given these planned operating expenses, in FY18 WaTech will have the following workload costs for its Web Platform service:
Table 302. Web Platform Cost by Workload:
Description Workload Cost Details
Number of New Sites Developed per Quarter 2-3 new sites developed per quarter (8-12 per year)
Number of Directly Supporting FTEs (estimated) Approximately 3.3 FTEs
Sites per FTE About 4 new sites per FTE per year
Labor Costs Annually for 3.3 FTEs (Direct/Indirect/Overhead)
About $500,000
Percentage of time dedicated to new development 44%
Average Cost per New Site About $10,416.67 per new site for design and development work. This excludes outliers like DOR and OFM which were much larger efforts ($85,000 and $100,000 respectively) ($130,000 in labor / 12 sites per year) + one large site per year $90,000)
Note: Workload cost in the table above is calculated based on WaTech’s alignment of costs to this service without adjustment for alignment to Gartner consensus models.
F/G. Rate structure CTS is currently billing to customers
The service is provided on a FFS basis; rates are listed in the tables below:
Table 303. Web Platform Rates – Fully Managed Websites on WaTech Custom Drupal or WordPress Distribution
Description Rate Detail
Setup Fee (one-time) – Simple $5,000 - $8,000
Setup Fee (one-time) – Standard $10,000 - $13,000
Setup Fee (one-time) – Complex By quote
Monthly Fee (hosting and ongoing support) – Simple $200
Monthly Fee (hosting and ongoing support) – Standard $400
Monthly Fee (hosting and ongoing support) – Complex By quote
Table 304. Web Platform Rates – Maintenance, Hosting, and Support Packages for Drupal or WordPress sites not built with WaTech Custom Distribution
Description Rate Detail
Monthly Page Views: Up to 10,000 $300
Monthly Page Views: 10,001 – 100,000 $400 - $600
Monthly Page Views: 100,001 – 500,000 $700 - $1,500
Monthly Page Views: More than 500,000 By quote

Page 610 of 851
. .
The rates were last updated in 2016.
Included in Monthly Maintenance, Hosting and Support:
Fully managed, elastic hosting -- 99.9% reliable
Drupal and WordPress core patching
Drupal and WordPress module or plugin patching
Responsive technical support during business hours (off-hours support available for additional fee)
Troubleshooting, fixes and minor enhancements of existing site features and functionality
Excluded from Monthly Maintenance, Hosting, and Support (available per quote):
Graphic design
Theme and UI updates
New development
H. Analysis of Current Cost Recoverability
This service is currently cost recoverable.
Table 305. Web Platform Cost Recoverability (Actual FY16-FY18)
Service Income FY16 FY17 FY18 H1
Service Revenue 11,000 199,384 106,850
Service Expense 0 (75,651) (31,215)
Net Income 11,000 123,733 75,635
Note: Actual revenue and expenses pulled from “AFRS Financial Download (Extracted on 2018-05-15)”.
Table 306. Web Platform Recoverability (Forecasted FY18-FY19)
Service Income FY18 FY19
Service Revenue 408,382 649,464
Service Expenses (318,388) (564,949)
Net Income 89,994 84,515 Note: Forecasted Cost recoverability detail pulled from “8682 – Websites” excel spend plan provided in February 2018, and then subsequently updated. WaTech reports that Revenue is estimated to be $54k per month beginning in January 2018. This jump in revenue is occurring due to the service subsuming the pre-existing SLA with OFM into the set of SLAs with all customers. Effectively standardizing the agreement model and lowering OFM’s cost by over 30%.
I. Service Level Actually Provided Today
While there are no service level targets currently defined for Web Platform services today, WaTech targets this service to all agencies in the State of Washington as well as local government, educational entities and non-profits.

Page 611 of 851
. .
Current capacity is limited to 2-3 new developments at one time, in addition to the 56 websites currently being maintained.
J. Current Customers
WaTech has 23 billable Web Platform customers, which includes many state agencies of varying size and footprint. Nearly a quarter of revenue comes from the largest customer. WaTech also provides this service internally with about a quarter of revenue coming from WaTech internal sales in FY17 and the footprint going down in FY18 to 6 percent.
Table 307. Web Platform Current List of Customers
# Customer FY17 ($) FY17 (%) FY18 H1 ($) FY18 H1 (%)
1 1400-DEPARTMENT OF REVENUE 47,700 24 25,800 24
2
1470-OFFICE OF MINORITY AND WOMEN'S BUSINESS ENTERPRISES 8,800 4 13,600 13
3 1050-OFFICE OF FINANCIAL MANAGEMENT 0 0 10,924 10
4 1790-DEPARTMENT OF ENTERPRISE SERVICES 60 0 9,600 9
5 1600-OFFICE OF THE INSURANCE COMMISSIONER 850 0 7,050 7
6 3000-DEPARTMENT OF SOCIAL AND HEALTH SERVICES 6,500 3 6,300 6
7 4900-DEPARTMENT OF NATURAL RESOURCES 0 0 4,600 4
8 3050-DEPARTMENT OF VETERANS' AFFAIRS 2,000 1 3,000 3
9 0750-OFFICE OF THE GOVERNOR 800 0 2,400 2
10 0900-OFFICE OF THE STATE TREASURER 0 0 2,400 2
Total Top 10 Billable Customers 66,710 33 85,674 80
Total for All Other Billable Customers 85,499 43 14,726 14
Total WaTech Internal Sales 47,175 24 6,450 6
Total Revenue 199,384 100 106,850 100
Note: Customer billing details pulled from “Billing Data - Apptio FFS Only (2018-05-16)” excel file
K. Current and Historical Usage Volumes
Currently, there are 56 websites supported with three new development projects underway. Since the fall of 2016, WaTech Website Services has had 20-30 customer agencies.
Due to the nature of this service, there is a substantial untapped market within both the State of Washington’s 200+ agencies and other governmental entities such as counties. WaTech’s plan

Page 612 of 851
. .
for future growth is to broker and procure contractors who can provide additional capacity and support. However, there is currently not enough business demand to hire additional full-time resources.
Figure 118. Web M&O Fee for Service Usage Growth
Note: Customer usage growth pulled from WaTech Quarterly Performance Dashboard
Figure 119. Web Dev & Design Fee for Service Usage Growth
Note: Customer usage growth pulled from WaTech Quarterly Performance Dashboard
In FY17, WaTech generated a majority of this service’s revenue from new site development. In FY18, ongoing subscriptions have surpassed new site development revenue.
Service Offering FY17 ($) FY17 (%) FY18 H1 ($) FY18 H1 (%)
WEB PLATFORM--DESIGN & DEVELOPMENT 176,299 88 35,050 33
WEB PLATFORM--MAINTENANCE & SUPPORT 23,085 12 71,800 67
Total Revenue 199,384 100 106,850 100
Note: Customer billing details pulled from “Billing Data - Apptio FFS Only (2018-05-16)” excel file
L. Customer Satisfaction and Future Demand
The Customer Voice appendix to this report includes customer satisfaction and future demand details based on the results of agency interviews and focus groups conducted during the project.
$1,500
$14,100
$0
$7,000
$14,000
11/1
6
12/1
6
1/1
7
2/1
7
3/1
7
4/1
7
5/1
7
6/1
7
7/1
7
8/1
7
9/1
7
10/1
7
11/1
7
12/1
7
Web M&O and Hosting
Monthly Billed Amount
$12,900$35,050
$0
$50,000
$100,000
9/1
7
12/1
7
3/1
8
6/1
8
Web Dev & Design
Cumulative One-Time Billed Amount

Page 613 of 851
. .
M. High Level Architecture
Over 98% of Web Services are provided via the Drupal 7 platform hosted by Pantheon. WaTech is evaluating upgrading the Drupal Platform. There are still a small percentage of WordPress sites remaining; these sites were taken over from other groups.
Page 614 of 851
. .
8610 Cost Code – Related Services Introduction
Historically, the Access Washington cost code 8610 was used to forecast and manage costs associated with delivering the Access Washington website. However, in the FY13-14 biennium the program was defunded by roughly $2M (SSB 5034 Sec 726). At that time, the State made a decision to outsource support, and WaTech executed an RFP process to outsource the support and eliminated internal staff positions, but ultimately the State elected to not move forward with the outsourcing.
Therefore, since that biennium, WaTech has continued to support the website at a minimally sustainable level given the program had been defunded. Costs associated with maintaining Access Washington are not tracked separately but are instead encapsulated within the 8682 Web Platform service cost code (hosting fees/staff time). No customer currently pays into the Web Platform service for Access Washington.
The Cost Code 8610 has been repurposed to cover the State’s Open Data portal (Data.wa.gov) Socrata license fees and operational costs of the State Usability lab, which is available to any agency paying into the access.wa.gov account (other agencies can purchase lab use through a Fee-for-service)
While the Data.wa.gov licensing fees are paid under this cost code, it is a Privacy Office initiative and other associated cost are covered under the OCIO appropriation (staff time to manage the data.wa.gov website for data sharing and providing consulting support to agencies)
The services covered under cost code 8610 previously had their own allocation, but the stand-alone allocation was merged into the Enterprise Systems Fee allocation in FY18 as part of a WaTech billing simplification effort. In addition to simplifying bills, this change also has the effect of decreasing transparency and accountability as the ESF allocation is generally understood to support maintenance and operations for the State back-end accounting, budgeting, HR and time keeping systems
Given that this WaTech Services/Programs Inventory document is structured to align to revenue sources (i.e., what agencies pay for), cost elements of services are covered in multiple places. For simplicity in keeping discussion of individual services confined to one location within the inventory document to the extent feasible, the review of the Data.wa.gov service is covered within the OCIO 1200 section of the inventory, rather than in the sections below
There are two separate entries for cost code 8610-related services below. The first entry is for Access Washington which has been defunded, and the second entry is for the Usability Lab
Currently the employees that support the Fee for Service Usability Experience (UX) and Web Accessibility 8681 services are largely funded via the Access Washington/Usability Lab cost code 8610 (or partially via the ESF), but given WaTech recently signed a large contract with an agency for UX services, WaTech anticipates funding that stuff under the User Experience service in July 2018

Page 615 of 851
. .
(8610) Formerly Access Washington (Defunded)
Background
Access Washington was historically funded and managed under cost code 8610. While this cost code has been repurposed for tracking costs associated with other services (details are provided in the Cost Code 8610-Related Services Introduction section above), the service is discussed in this section given it is still a service that is provided by WaTech even though the funding has been eliminated
There is no separate entry for this service in the service catalog; Access Washington is delivered as a part of the Web Platform service now
Although access.wa.gov is the State’s primary internet portal, there is currently no business owner for this service so WaTech has been acting as a proxy business owner for several years
With only 70,000 unique visitors, 100,000 sessions and 175,000 page views per month utilization is relatively light
At the time the portal was initially created, WaTech reports that it helped Washington win the Digital State Award multiple times. However, now the design and structure of the website is fairly dated and there is not a sustainable process in place for expanding or refreshing content, creating new functions or promoting usage of the site to potential users. WaTech has not invested in the service in the past several years given that the funding was cut, though WaTech is currently planning a redesign
Many other States have developed similar portals and struggled to identify the right governance and funding models to sustain them over time. California’s CA.gov is another typical example. Effective search engines have largely replaced cumbersome state portals as the primary method citizens and businesses use to navigate to digital state services
Another related WaTech initiative, WABOS, (Washington Business One-Stop) was intended to be a unified portal where businesses could go to understand everything needed to start or maintain a business in Washington and execute necessary transactions from a single location. The portal was initially sponsored by Secretary of State, Department of Commerce, Employment Security Department and the Department of Revenue, but it was abandoned after initial deployment due to lack of clear agreement regarding the business case, revenue flow and other issues among the stakeholder agencies. WABOS still exists as a website, hosted on Amazon.com, but is no longer actively maintained
A. Service Description
Definition
Access Washington serves as the primary public facing web portal for Washingtonians and others seeking to learn about the state or do business in the state. The purpose of Access Washington is to promote public service to citizens and businesses by:
Extending business and citizen access to government services and government information

Page 616 of 851
. .
Offering an easy and convenient process to conduct online transactions with State government
Accelerating the delivery of quality online government services
Improving the level of customer service from State government
Extending online government services to all citizens in Washington State
Most, if not all, of the content on Access Washington is duplicated, usually with additional more actionable details within the various Departmental Websites. Access Washington was created to provide citizens easier access to state services through a website that does not require them to have a detailed knowledge of the structure and roles and responsibilities of the various state departments, agencies, and boards.
The Access Washington web portal hosts approximately 800 template pages and nearly 7,000 organized active links to all state agencies that attempts to offer all-encompassing access to the State’s collection of services, resources, and digital information. The intent is for citizens to use Access Washington as their primary resource for navigating state government online, conducting state business, and gaining useful information for their specific everyday needs.
Features
Access Washington provides a variety of state-related information and links to other governmental organizations, educational institutions, and (in some cases) private organization sites and resources. Sample links provided below:
About Washington
o Visitor Information o State Symbols o State History o Postcards o Population Data o Residency Information
Alerts
o Traffic o Weather o AMBER Alert o Product Recalls o Disaster News o Suspect Fraud
Quick Links
o Food Stamps o Medical Help o Financial Aid Programs o Vehicle and Boat Registration o Unclaimed Property o Buy / Dispose Surplus
Notes
WaTech recently started up UX activities to update Access Washington

Page 617 of 851
. .
The Web and User Experience team is conducting user research and plans to partner with other agencies to help contribute content
Access Washington is currently a static HTML site that is hosted on the Pantheon Hosting Platform and is maintained by the Web and User experience team.
Access Washington will be migrated to the Drupal platform in the summer – fall of 2018.
B. Statutory Basis for Creation of Service or Program
WaTech delivery of this specific service is not mandated by statute.
C. How the Service Fits into the CTS Strategic Plan and Goals
WaTech reports that this service is not listed as strategic at this time based on strategic plans or technology roadmaps.
D. Performance Measures used to Measure Effectiveness and Efficiency
WaTech does not measure and report on performance measures associated with this service. However, recent statistics for usage include 70,000 unique visitors per month, 100,000 sessions, and 170,000 page views. The number of unique visitors is low compared to the state’s population – the site is not heavily trafficked. However, the ratio of users to sessions to page views is very low, in line with Access Washington’s intended purpose of getting users to other government sites as quickly and easily as possible.
E. Current Cost to Maintain the Service
Staffing
Access Washington used to have a dedicated team to support and update the site content; however, these responsibilities are now under the Web and User Experience team.
Workload Supported
Workload is variable. It is a single website with approximately 800 template pages and nearly 7,000 organized active links. WaTech implements an average of about 1-4 changes per week, which mostly consists of updating links or contact information at the request of agencies.
Direct, Indirect and Overhead Costs
While this service is still provided, it has been defunded and WaTech no longer forecasts or tracks associated costs. The costs associated with delivering Access Washington include some staff time from the Web Platform team.
F/G. Rate structure CTS is currently billing to customers
Prior to 2014, WaTech billed agencies for Access Washington via a stand-alone allocation. When Access Washington was defunded, the allocation was repurposed. WaTech no longer bills customers for this service.
WaTech leadership has tried to regain interest in this service and formalize continuation of this service by establishing a clear business owner. However, OFM and the Governor’s Office declined to act as the business owner for this service. Currently a single WaTech employee is acting as the proxy business owner for this service.

Page 618 of 851
. .
H. Analysis of Current Cost Recoverability
This service was not historically cost recoverable and is not currently cost recoverable given continued delivery without an associated revenue stream.
I. Service Level Actually Provided Today
No details provided on actual service performance provided.
J. Current Customers
Customers for this service are the citizens, and the business owner acts as a proxy for citizens. WaTech leadership has tried to regain interest in this service and formalize continuation of this service by establishing a clear business owner. However, OFM and the Governor’s Office declined to act as the business owner for this service. Currently a WaTech employee, Marilyn Freeman Senior Strategy Advisor within Business and Digital Media Services, is acting as the proxy business owner for this service.
K. Current and Historical Usage Volumes
No additional current or historical usage volume provided.
L. Customer Satisfaction and Future Demand
The Customer Voice appendix to this report includes customer satisfaction and future demand details based on the results of agency interviews and focus groups conducted during the project.
M. High Level Architecture
Access Washington is currently static content hosted on the Web Production Services Platform.

Page 619 of 851
. .
(8610) Usability Lab
Background
While the Cost Code 8610 was historically used to fund the Access Washington Portal, since FY14 when the portal was defunded the Access Washington allocation has been used for the narrower purpose of covering Usability Lab operational expenses and the Socrata licensing fees for data.wa.gov (additional details in the introduction section above)
This section is focused on the Usability Lab, data.wa.gov and Access Washington are covered in other sections
This section aligns to the WaTech online service catalog entry for the Usability Lab
A. Service Description
Definition
The Usability Lab located at WaTech headquarters in Olympia is made available via Access Washington funding. The Usability Lab is a physical location where state and local government agencies and qualified non-profits can create and test usability of websites and applications by conducting studies involving real users. The Usability Lab service provides the space and equipment to conduct studies where users provide input during the entire development process. The WaTech Usability Lab has the capability to support a range of activities including card sorts, focus groups, paper prototype testing, and formal systems usability testing.
Features
Can accommodate up to three studies at a time
Includes onsite technical support
Is configured for mobile device testing
Is configured for accessibility testing
Notes
The lab is available Monday — Friday from 8 a.m. to 5:30 p.m.
Equipment training is provided prior to the first reserved study session
No additional fees for state agency use and technical support (use of the lab is included in the enterprise system fee) but additional usability and web accessibility design, testing, and evaluations support must be purchased separately (covered under Usability Experience 8681)
New users are required to take a lab tour and complete a training session prior to using the lab
B. Statutory Basis for Creation of Service or Program
WaTech delivery of this specific service is not mandated by statute.
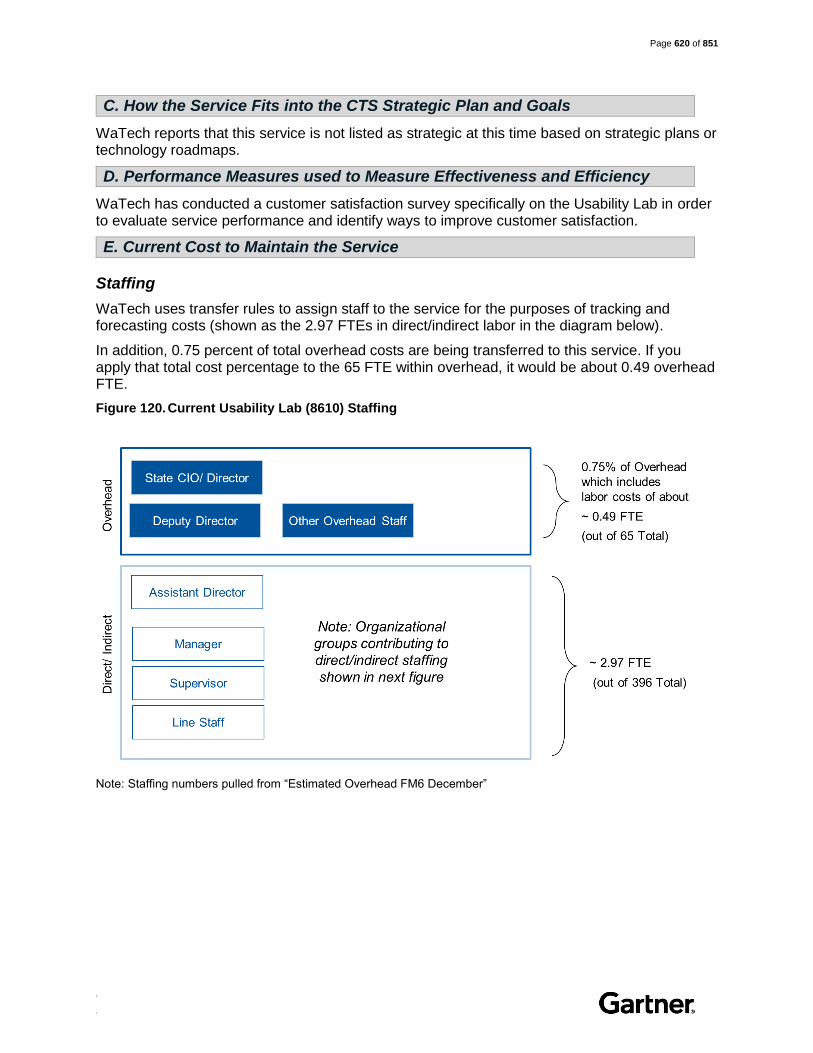
Page 620 of 851
. .
C. How the Service Fits into the CTS Strategic Plan and Goals
WaTech reports that this service is not listed as strategic at this time based on strategic plans or technology roadmaps.
D. Performance Measures used to Measure Effectiveness and Efficiency
WaTech has conducted a customer satisfaction survey specifically on the Usability Lab in order to evaluate service performance and identify ways to improve customer satisfaction.
E. Current Cost to Maintain the Service
Staffing
WaTech uses transfer rules to assign staff to the service for the purposes of tracking and forecasting costs (shown as the 2.97 FTEs in direct/indirect labor in the diagram below).
In addition, 0.75 percent of total overhead costs are being transferred to this service. If you apply that total cost percentage to the 65 FTE within overhead, it would be about 0.49 overhead FTE.
Figure 120. Current Usability Lab (8610) Staffing
Note: Staffing numbers pulled from “Estimated Overhead FM6 December”

Page 621 of 851
. .
Figure 121. Current Usability Lab (8610) Direct/Indirect Staffing
Note: Staffing details pulled from “Org Chart - Color Coded 01.01.18” and “Access WA (ESF_8610cc)”, and then combined with transfer rules in “FY18 Master Indexes 12-19-17.” Staff associated with this service operates the Usability Lab as a part of this service, and they run the Usability Experience (UX) and Accessibility services under cost code 8681 defined in the next section of this document.
Workload Supported
The WaTech Usability Lab has been utilized 30% of each month on average; however, April of 2018 saw an uptick to 60%.
Direct, Indirect and Overhead Costs
WaTech’s planned expenses for this fiscal year are provided in the table below.
Table 308. Usability Lab (8610) FY18 Planned Service Expenses
Cost Components FY18 Planned FY19 Planned Cost Details
A Salaries 249,958 249,509 2.97 Planned FTEs
B Benefits 0 0 Benefit costs are combined with A
E Goods & Services 98,734
Software maintenance: Optimal Workshop suite ($2k); Adobe Creative suite; Accessibility software; Axure Prototyping tool; Morae Suite for Usability Lab; SiteImprove; Usability Lab software and purchases; and, Socrata for open data ($75k); Training
E Internal Purchases 96,156 $ 72,575
WebEx, Web Hosting, Desktop support
T Transfers 72,575 72,575 Overhead
Total Planned Expenses 90,917 88,881
Note: Cost details were pulled from “8610 – Access WA” excel spend plan provide in February 2018 and updated based on “Access WA (ESF_8610cc)”. WaTech is working to move all web related expenses to 8682, and out of 8610 and 8413 as they occur. Some costs appear in both plans given WaTech is forecasting moving codes when the expense comes due.

Page 622 of 851
. .
F/G. Rate structure CTS is currently billing to customers
Prior to July 2017, the revenue for the Usability Lab was collected via the Access Washington stand-alone allocation. The stand-alone Access Washington allocation was consolidated into the Enterprise Systems Fee (ESF) Allocation in 2017. The Usability Lab (8610) cost code now receives 2% of ESF funds via a transfer rule.
The Enterprise System Rates allocation goal was originally to simplify and consolidate charges for all enterprise systems used by agencies into a single charge. This consolidation occurred in conjunction with the formation of the Department of Enterprise Systems (DES). Fees were consolidated into a single Enterprise Systems Fee, and then reduced by about $5 million dollars per biennium, beginning in FY14.
Funding allocation for the Enterprise System Rates is based on the agency's number of budgeted FTEs. For institutions of higher education (both the four-year institutions and the community and technical college system), only FTEs that support administrative functions are counted. OFM maintains the source data for budgeted FTEs.
State agencies that are not part of the Enterprise Systems Fee allocation, local government, and non-profit organizations are able to rent the Usability Lab on a Fee for Service basis.
Fee for service use of the lab is available at a rate of $78/hour.
H. Analysis of Current Cost Recoverability
WaTech reports that prior to FY16 this service was recoverable due to how it was funded. However, this service is not currently cost recoverable. The service is now projected to be cost recoverable based on information provided in the FY18/19 spend plan.
Table 309. Usability Lab (8610) Cost Recoverability (Actual FY16-FY18)
Service Income FY16 FY17 FY18 H1
Service Revenue (8610) 701,068 700,996 345,973
Service Expense (8610) (830,466) (834,920) (233,138)
Net Income (129,398) (133,924) 112,835
Note: Actual revenue and expenses pulled from “AFRS Financial Download (Extracted on 2018-05-15)”
Table 310. Usability Lab (8610) Cost Recoverability (Forecasted FY18-FY19)
Service Income FY18 FY19
Service Revenue (8610) 629,891 562,224
Service Expense (8610) 509,606 533,124
Net Income 120,285 29,100 Note: Forecasted Cost recoverability detail pulled from “8610 – Access WA” excel spend plan provide in February 2018. In FY18, 10% of revenue is projected to come from Fee for Service usage and 90% from the ESF, in FY19 WaTech has only forecasted revenue from the ESF.
I. Service Level Actually Provided Today
No details provided on actual service performance provided.

Page 623 of 851
. .
J. Current Customers
Over one-hundred agencies pay for access to the Usability Lab through payment into the Enterprise Systems Fee allocation in FY18. The top 10 agencies billed for this service are shown in the table below.
Table 311. Usability Lab (8610) List of Agencies Billed (FY17 Access Washington and FY18 as a percentage of the ESF Allocation)
# Customer FY17 ($) FY17 (%) FY18 H1 ($) FY18 H1 (%)
1 DEPARTMENT OF SOCIAL AND HEALTH SERVICES 193,539 28 95,757 28
2 DEPARTMENT OF CORRECTIONS 93,344 14 44,289 13
3 DEPARTMENT OF TRANSPORTATION 82,817 12 25,240 7
4 DEPARTMENT OF LABOR AND INDUSTRIES 32,275 5 15,368 5
5 WASHINGTON STATE PATROL 28,213 4 12,802 4
6 COMMUNITY AND TECHNICAL COLLEGE SYSTEM 0 0 11,757 3
7 EMPLOYMENT SECURITY DEPARTMENT 26,769 4 7,878 2
8 DEPARTMENT OF HEALTH 19,089 3 9,144 3
9 DEPARTMENT OF ECOLOGY 19,006 3 8,691 3
10 DEPARTMENT OF FISH AND WILDLIFE 19,118 3 8,260 2
Total Top 10 Billable Customers 514,170 74 239,186 71
Total for All Other Billable Customers 176,900 26 96,676 29
Total WaTech Internal Sales 0 0 2,845 1
Total Revenue 691,070 100 338,706 100
Note: Customer billing details pulled from “GARTNER – ALLOCATION” excel file. FY17 calculated based on payment directly into Access Washington Allocation, and FY18 calculated as a percentage of the Enterprise Systems Fee allocation payment.
K. Current and Historical Usage Volumes
No additional current or historical usage volume provided.
L. Customer Satisfaction and Future Demand
The Customer Voice appendix to this report includes customer satisfaction and future demand details based on the results of agency interviews and focus groups conducted during the project.
M. High Level Architecture
Access Washington content was stored in the N2 Web Content Management solution and is now migrated to the WaTech Web Service as static content in the Pantheon Hosting platform.

Page 624 of 851
. .
(8681) Usability Experience (UX)
Background
This service aligns to the service catalog entries for User Experience and Web Accessibility
This service includes both usability and accessibility professional services
While this service is provided on a Fee for Service basis (i.e., it has its own revenue source), some of the labor expense is covered under the Access Washington service
A. Service Description
Definition
WaTech provides User Experience (UX) services related to usability and web accessibility design, testing, and evaluations. Customers are provided user-centric design, testing, evaluation, and assessment support for internal application and external websites, as well as solutions to help customers meet accessibility policies mandated by the OCIO. These services are available to customers at various stages of product design and development.
Features
User-centered design
Usability and Accessibility Testing
Usability Study Design
Professional Accessibility Assessments
Code reviews
Heuristic Evaluations
Card Sorts
Web Surveys
User Interviews and Testing
Site and Application Work (when applicable)
Notes
Customers are required to enter into a Master Service Agreement.
B. Statutory Basis for Creation of Service or Program
WaTech delivery of this specific service is not mandated by statute. However, there are two Washington state policies, which outline accessibility standards and require compliance for all agencies:

Page 625 of 851
. .
OCIO Minimum Accessibility Standard – Defines the minimum level of compliance for accessibility with Web Content Accessibility Guidelines (WCAG) 2.0.
OCIO Policy 188 – Establishes the expectation for state agencies that people with disabilities have access to and use of information and data and provide similar access available to persons without disabilities.
Due to these policies and laws, every agency is required to have an Accessibility Coordinator. Agencies are able to optionally purchase WaTech’s support in gaining compliance accessibility laws.
C. How the Service Fits into the CTS Strategic Plan and Goals
WaTech reports that this service supports the strategic roadmap to ensure a managed web service can be used by any customer group authorized by RCW and contracts
D. Performance Measures used to Measure Effectiveness and Efficiency
WaTech only has two types of performance measures for this service:
Time – Work activity hours are tracked in JIRA and for OFM, DES, and WaTech, reported to TTS.
Net Promoter System (NPS) – For all Business and Digital Media Services WaTech collects and integrates customer feedback using NPS. The NPS dashboard is available via Google Drive.
WaTech has not defined any request fulfillment targets (e.g., time to onboard a new customer).
E. Current Cost to Maintain the Service
Staffing
At this time, the employees that support this service are funded in the cost code for the Usability Lab 8610 or partially via the ESF. With the recent $500K contract signed with ESD for the Paid Family Medical Leave project, those employees will be moved from 8610 to this User Experience service in July 2018.
Workload Supported
The workload associated with this service is episodic with four months in FY18 bringing in zero dollars of revenue but with May forecasted to bring in $20,000 of work.
Direct, Indirect and Overhead Costs
WaTech’s planned expenses for this fiscal year are provided in the table below.
Table 312. UX FY18 and FY19 Planned Service Expenses
Cost Components FY18 Planned FY19 Planned Cost Details
A Salaries 67,667 119,390 Limited reimbursement of 8610 in FY18; 2 Planned FTEs starting in FY19
B Benefits 0 35,818
E Goods & Services 1,990 20,190
Optimal Workshop, future plan to add accessibility testing software from 8610 in FY19 including Morae, Axure

Page 626 of 851
. .
Cost Components FY18 Planned FY19 Planned Cost Details
E Internal Purchases 5,250
Desktop support for delivery staff
T Transfers 65,208 Agency overhead
Total Planned Expenses 69,657 269,936
Note: Cost details were pulled from “8681 – Usability Experience" excel spend plan provide in February 2018; the salary and benefit costs assume vacancies are filled. WaTech noted that historically OFM has been the largest consumer of UX services for the enterprise applications supported by WaTech, and that is the reason labor had been provided separately under the Access Washington/Usability Lab 8610 cost code.
F/G. Rate structure CTS is currently billing to customers
The service is provided on a FFS basis; rates are listed in the table below:
Table 313. UX Rates
Description Rate Detail
User Experience – Usability and Accessibility $150 per hour
The key assumptions that make up this rate are:
Salary and benefits for direct and indirect staffing
Training costs
Agency overhead
60% productivity factor
H. Analysis of Current Cost Recoverability
This service is currently cost recoverable and is forecasting cost recoverability in FY18 and FY19 based on information provided in the FY18/19 spend plan. However, it appears that some cost associated with delivering this service have not been included here and are instead included under the Access Washington Service.
Table 314. UX Cost Recoverability (Actual FY16-FY18 H1)
Service Income FY16 FY17 FY18 H1
Service Revenue (8681) 0 83,950 31,850 Service Expense (8681) 0 (3,600) (108,996) Net Income 0 80,350 (77,145.98)
Note: Customer billing details pulled from “Billing Data - Apptio FFS Only (2018-05-16)” excel file
Table 315. UX Cost Recoverability (Forecasted FY18-FY19)
Service Income FY18 FY19
Service Revenue (8681) 78,096 300,000
Service Expense (8681) (31,524) (269,936) Net Income 46,572 30,064
Note: Forecasted Cost recoverability detail pulled from “8681 – Usability Experience” excel spend plan provide in February 2018

Page 627 of 851
. .
I. Service Level Actually Provided Today
The capacity of WaTech’s two UX resources may become an issue due to upcoming projects. For example, the UX Team will become fully utilized with a new $500,000 contract to conduct a UX evaluation for the Paid Family and Medical Leave portal.
Insufficient data has been collected on the Net Promoter System (NPS) to generate a reliable satisfaction score.
J. Current Customers
WaTech has eight Usability Experience customers (including WaTech through internal sales) as reported in Apptio. However, in addition to the customers shown in the table below, customers also include Evergreen State College, Labor and Industries, ESD, State Board of Community and Technical Colleges, Office of Financial Management, and Department of Enterprise Services. (WaTech reports that SBCTC was billed Jan 2018 $3,750 (Accessibility Audit), Evergreen.edu was billed May 2018, $26,250 (Accessibility Audit), LNI $2,400 (Usability Consulting), ESD, PFML Project billed $27,875 (Usability Consulting first bill).
Table 316. UX Current List of Customers
# Customer FY17 ($) FY17 (%) FY18 H1 ($) FY18 H1 (%)
1 X1E0-WA ST INSTITUTE FOR PUBLIC POLICY
- - 15,500 49
2 3570-DEPARTMENT OF EARLY LEARNING
61,500 73 15,000 47
3 0380-JOINT LEGISLATIVE SYSTEMS COMMITTEE
- - 1,350 4
4 2150-UTILITIES AND TRANSPORTATION COMMISSION
4,950 6 - 0
5 3500-SUPERINTENDENT OF PUBLIC INSTRUCTION
3,100 4 - 0
6 4770-DEPARTMENT OF FISH AND WILDLIFE
300 0 - 0
7 X220-WA HEALTH BENEFIT EXCHANGE
8,100 10 - 0
Total Top 10 Billable Customers
77,950 93 31,850 100
Total for All Other Billable Customers
- - - -
Total WaTech Internal Sales 6,000 7 - -
Total Revenue 83,950 100 31,850 100
Note: Customer billing details pulled from “Billing Data - Apptio FFS Only (2018-05-16)” excel file
K. Current and Historical Usage Volumes
Additional details were provided on the current workload. The two largest projects are the $530,000 Paid Family Medical Leave application (recently signed) and the user experience

Page 628 of 851
. .
project with the Department of Early Learning for $75,000. Most other details have been around $10,000 to $20,000 per contract.
Future growth and success of this service is dependent on marketing to reach the untapped market. Additional, flexible resources are required to increase the capacity and capabilities of this service.
L. Customer Satisfaction and Future Demand
The Customer Voice appendix to this report includes customer satisfaction and future demand details based on the results of agency interviews and focus groups conducted during the project.
M. High Level Architecture
This service is a professional service that is dependant on the skills and abilities of the resources delivering the service as well as the tools availability (i.e., usability testing, accessibility testing, software tools, and usability lab).

Page 629 of 851
. .
(8215) Agile Business Analysts
Background
Agile Business Analysts is a new service that was recently assigned an AFRS cost code
The labor cost associated with this service is currently covered under the Enterprise Systems Fee; however, WaTech has defined a process for moving the cost and effectively paying back the Enterprise Systems Fee for the time spent on this service rather than Enterprise System Fee related work
WaTech’s stated goals for developing the service are to: 1) test hypothesis about how WaTech could add unique value for agencies, 2) learn from real engagements so that they can pivot and adapt services, and 3) influence transformational outcomes for the state with WaTech services.
A. Service Description
Definition
Agile Business Analyst services provide full-scale support and delivery in the areas of agile business requirements gathering, business analysis, and agile coaching to support customer business needs. WaTech Support Center takes all customer inquiries. WaTech follows-up with all inquiries to discuss detailed requirements and necessary information for each prospective project, answer questions, and to plan for the requested service or cancellation.
Features
Knowledge of various critical Washington state enterprise systems
Deliver advice and guidance when pursuing compliance with OCIO Project Oversight standards, OCS Security Design Reviews, State's Accessibility Policy, and other applicable State IT Standards
Facilitate Agile business transformation
Determine business value and provide recommendations
Develop business requirements using agile constructs like User Stories and Acceptance Criteria
Notes
New customers must submit a Business Analyst intake form online
All customer inquiries including new customers, current customers, and service cancellations are submitted to the WaTech Support Center

Page 630 of 851
. .
B. Statutory Basis for Creation of Service or Program
WaTech delivery of this specific service is not mandated by statute. State agencies have the option to contract directly with other Business Analyst vendors and providers, and many choose to do so.
C. How the Service Fits into the CTS Strategic Plan and Goals
Agile Business Analysis is not a strategic service for WaTech based on enterprise strategic plans and organizational goals.
D. Performance Measures used to Measure Effectiveness and Efficiency
WaTech only has two types of performance measures for this service:
Time – Work activity hours are tracked in multiple applications and ultimately reported to TTS. As of March 1, 2018, Business Analysts and all other Business and Digital Media Services moved to a new cloud-based tool for time tracking and management; reporting will still be done in TTS.
Net Promoter System (NPS) – For all Business and Digital Media Services WaTech collects and integrates customer feedback using NPS. The NPS dashboard is available via Google Drive.
WaTech has not defined any request fulfillment targets (e.g., time to onboard a new customer).
E. Current Cost to Maintain the Service
Staffing
There are no FTEs formally assigned to this service, as Agile Business Analysts are primarily supporting OFM enterprise systems and projects (funded via the Enterprise Systems Fee allocation).
However, these seven Agile Business Analyst resources are providing this emerging service offering and delivering services to customers outside of OFM on an ad hoc, hourly basis (FFS).
The staff supporting this service is fully paid for via the Enterprise Systems Fee allocation. WaTech has stated that they are able to lulls in demand from these ESF funded resources to provide needed services to other departments based on a FFS model.
In speaking with OFM customers who are funding these resources, they do not appear to be fully aligned with the idea that WaTech would be repurposing resources that they are paying for to perform FFS work for WaTech’s benefit. WaTech has stated that a process will be put in place to refund OFM for any hours that an OFM funded resource spends on non OFM tasks given WaTech’s ability to leverage the Jira task tracker with associated time tracking to account for time and use the journal voucher process in the accounting system to refund the ESF for time spent on other clients, however this has not been validated or formalized with OFM.
Workload Supported
While WaTech is still testing demand and learning, the specific value agencies are looking for in purchasing Business Analyst service. The workload is governed by the episodic capacity in the Business Analyst resource used by OFM. Since the first iteration of the service launched in September 2017, there have been two customer engagements. The first with Employment Security Department (ESD) for 164 hours (two BAs for roughly two weeks) which was completed in October 2017. The second was a series of small engagements with Secretary of

Page 631 of 851
. .
State (SOS) between December through March totaling 230 hours. Criteria for engagement include: 1) resources must be available, 2) engagement duration not greater than 2-4 weeks, and 3) customer must want agile expertise in the engagement.
Workload is measured and forecasted with a publically available dashboard that has been distributed to all OFM portfolio managers within WaTech and OFM. The dashboard shows all requests, start date, assigned BAs, and customer projects. The data is updated in real time and used to forecast capacity.
Direct, Indirect and Overhead Costs
WaTech does not currently forecast costs for its emerging FFS Agile Business Analyst service offering. To account for enterprise-assigned staff providing this additional FFS work, WaTech is planning to reassign fees from the Enterprise Systems Fee allocation to this newly developed service by moving labor costs after they are incurred via the Journal Voucher (JV) process.
F/G. Rate structure CTS is currently billing to customers
The service is provided on a FFS basis; rates are listed in the table below:
Table 317. Business Analyst Rates
Description Rate Detail
Agile Business Analyst $160 per hour
Customer rates for this service recently increased to account for training and related costs for service delivery staff. The key assumptions that make up this rate are:
Salary and benefits
Training costs
Agency overhead
60% productivity factor
H. Analysis of Current Cost Recoverability
This service is currently cost recoverable. The service currently shows significant positive variance but this is expected to be closer to recoverable, rather than highly profitable, once the JV of costs from ESF cost center 8320 occurs. Currently additional revenue comes in at $160/hour. In the future, OFM will be compensated approximately $150/hour in credit for the use of and ESF funded resource. This leaves WaTech with approximately a $10 margin. The reality is that this service is intended as a clever approach of using existing WaTech capabilities to build, measure, and learn what new service offerings WaTech could provide that are of value to agencies and the enterprise.
Table 318. Business Analyst Cost Recoverability (Actual FY16-FY18)
Service Income FY16 FY17 FY18 H1
Service Revenue (8215) 0 0 40,128
Service Expense (8215) 0 0 0
Net Income 0 0 40,128 Note: Actual revenue and expenses pulled from “AFRS Financial Download (Extracted on 2018-05-15)”

Page 632 of 851
. .
I. Service Level Actually Provided Today
There are no service level targets defined for Agile Business Analyst service delivery today.
While there are seven Business Analyst resources, there is concern regarding service delivery capacity – particularly in generating too much demand. In addition, WaTech is working with sensitivity towards using ESF resources to support other agencies (and to build up this professional service). WaTech is actively working to develop skills and expertise, which are not consistent across all business analysts.
J. Current Customers
WaTech has two service customers – the Employment Security Department and Office of the Secretary of State. The largest customer accounted for a majority of the amount WaTech billed for this service in FY18.
Table 319. Business Analyst Current List of Customers
# Customer FY17 ($) FY17 (%) FY18 H1 ($) FY18 H1 (%)
1 5400-EMPLOYMENT SECURITY DEPARTMENT
0 0 24,625 61
2 0850-OFFICE OF THE SECRETARY OF STATE
0 0 3,503 9
Total Top 10 Billable Customers
0 0 28,128 70
Total for All Other Billable Customers
0 0 0 0
Total WaTech Internal Sales 0 0 12,000 30
Total Revenue 0 0 40,128 100
Note: Customer billing details pulled from “Billing Data - Apptio FFS Only (2018-05-16)” excel file
K. Current and Historical Usage Volumes
Prime customer examples of this service are ESD (a past client) and WA Secretary of State. ESD sought BA services to understand agile procurement and write business requirements in a user story format with acceptance criteria as part of their RFP release for their new Paid Family Medical Leave Program. Secretary of State wanted WaTech BAs to write user stories to do a quality assurance check to validate functionality from the vendor perspective. There is additional need and requests from the SOS for BA services but WaTech has not committed to this work since it is not forecasting excess capacity over the next couple of months.
L. Customer Satisfaction and Future Demand
The Customer Voice appendix to this report includes customer satisfaction and future demand details based on the results of agency interviews and focus groups conducted during the project.

Page 633 of 851
. .
M. High Level Architecture
This service is a professional service that is dependant on the skills and abilities of the resources delivering the service, which in turn is heavily dependent on the quality of training, and tools that are available to resources.

Page 634 of 851
. .
(8652) Business Automation as a Service
Background
Business Automation as a Service is a new service that was recently assigned an AFRS cost code
The labor cost associated with this service is currently covered under the Enterprise Systems Fee; however, WaTech has defined a process for moving the cost and effectively paying back the Enterprise Systems Fee for the time spent on this service rather than Enterprise System Fee related work
WaTech’s stated primary objective for this service is to provide a low-cost and rapid application development service for small agencies needing to automate their business processes. Additionally, the service is intended to influence transformation within the enterprise to build agile discipline within agencies and create applications that are mobile and secure per state policy and Governor’s Executive Orders.
A. Service Description
Definition
WaTech Business Automation Services is an emerging solution offering which provides rapid business requirement gathering and delivery of tailored, ServiceNow business automation platforms to customers used to develop small-scale applications. To engage this service, agencies are required to commit to following the agile practices of the WaTech service.
Features
Application design, development, and maintenance
Approved for category 3 data (4 on a case by case basis)
Compliant with OCIO policies
Responsive, mobile design
Accessible
Rapid deployment
Ongoing monthly technical support for bugs and system updates
Notes
Customers interested in purchasing this service must contact the WaTech Support Center.

Page 635 of 851
. .
B. Statutory Basis for Creation of Service or Program
WaTech delivery of this specific service is not mandated by statute. State agencies have the option to contract directly with other Business Automation vendors and providers, and many choose to do so.
C. How the Service Fits into the CTS Strategic Plan and Goals
Business Automation is not a strategic service for WaTech based on enterprise strategic plans and organizational goals.
However, Business Automation has been identified as a key emerging service (currently in a pilot phase) due to its successful deployment amongst a few customers and growing popularity among peers.
D. Performance Measures used to Measure Effectiveness and Efficiency
WaTech only has two types of performance measures for this service:
Time – Work activity hours are tracked in multiple applications and ultimately reported to TTS. As of March 1, 2018, Business Automation and all other Business and Digital Media Services moved to a new cloud-based tool for time tracking and management; reporting will still be done in TTS.
Net Promoter System (NPS) – For all Business and Digital Media Services WaTech collects and integrates customer feedback using NPS. The NPS dashboard is available via Google Drive.
Support Center – This service follows standard WaTech Support Center processes to capture new customer inquiries, current customer assistance, and service requests and cancellations.
WaTech has not defined any request fulfillment targets (e.g., time to onboard a new customer).
E. Current Cost to Maintain the Service
Staffing
There are no FTEs formally assigned to this service, as Solution Engineers are primarily supporting OFM enterprise systems and projects (funded via the Enterprise Systems Fee allocations). WaTech Business Automation as a Service is an emerging solution delivered to customers outside of OFM through negotiated SLA and established rates.
Currently, this service is provided on an ad hoc basis by two full stack developers (Business Analyst Manager, and Solutions Engineer), given existing capacity and project utilization.
Workload Supported
Workload is variable.
Direct, Indirect and Overhead Costs
WaTech did not forecast any staffing costs for this newly emerging service before the start of the biennium. However, once the legislative session completed and customer commitments for upcoming work were clarified, WaTech developed a spend plan that pulls staffing from the ESF starting at the end of FY18, and builds out other assumed costs thru the end of the biennium. Currently WaTech has committed demand for $158,709 in revenue for FY18 and $227,176 for

Page 636 of 851
. .
FY19. Given that, WaTech is planning to pull about $21,000 in staffing costs (including benefits and overhead) into this service in FY18 and $127,000 in FY19. The ESF would then be reduced by the equivalent amounts as this is incurred.
Additional non-labor cost components are included in the tables below. Given customer commitments, WaTech is now forecasting about $82,000 through three years in ServiceNow licensing and platform expenses.
Table 320. Business Automation Costs
Incremental Costs
Description Workload Cost Details
Per user licensing for access to the platform 31
Staff time to support an application. Includes implementing security patches, and bug fixes. Does not include enhancement requests. 340
Pre-sales and prototyping products for customers 680
Fixed Costs: One-Time
Description Workload Cost Details
Cost of building applications for customers. This is Professional services time and varies on a project by project basis Varies
Cost of establishing the service including contract negotiations, RFP processing, etc. 13,600
Cost to automate the account management and billing process for the service 6,800
Fixed Costs: One-Time
Description Workload Cost Details
Quality Assurance and Production (two instances) 10,000
Developer Licenses 7,000
Platform maintenance for all customers 340
Marketing (i.e., 2 hours per month) 340
Maintenance of automated user account management application 340
F/G. Rate structure CTS is currently billing to customers
Business Automation is delivered as subscription service. Customers pay for what they use and can stop using at any time. There are three costs for this service:
1. The one-time cost of building the application which varies depending on the complexity of what the customers wants to automate
2. A fixed monthly cost of operating and managing each application 3. A licensing cost for each user needing to work with the data or workflow in the
application
Professional support is provided at a rate of $170 per hour.

Page 637 of 851
. .
H. Analysis of Current Cost Recoverability
No cost data is available for this emerging service to determine its cost recoverability.
I. Service Level Actually Provided Today
No details provided on actual service performance.
J. Current Customers
There is currently no customer sales data available via Apptio for this emerging service offering. However, successful ServiceNow platforms have been delivered to OFM with the State’s IT Classification and Rating tool.
K. Current and Historical Usage Volumes
This is a brand new, emerging service offering provided by the WaTech Business and Digital Media Services division. As such, there is no historical usage volume data available.
There is a small, developing pipeline of customer agencies seeking Business Automation services: The Office of Education Ombuds, Governor’s Office, and the Human Rights Commission have already committed or received Legislative funding to purchase this Service from WaTech. WaTech has been contacted by three other organizations wanting to learn more about this service.
L. Customer Satisfaction and Future Demand
The Customer Voice appendix to this report includes customer satisfaction and future demand details based on the results of agency interviews and focus groups conducted during the project.
M. High Level Architecture
WaTech Business Automation services are provided via the ServiceNow Service Automation platform. WaTech conducts all activities necessary to deploy customer ServiceNow platforms from start to finish.

Page 638 of 851
. .
(8211) Data Management Service
Background
This service aligns to the Data Management catalog entry in the online service catalog
WaTech reports that the two catalysts for creating this as a separate service were: 1) the desire to separate this capability and costs to create better visibility into actual costs and recoverability and 2) enable WaTech to continue providing DES DBA related services as needed after DES was removed from the ESF and given their portion of the ESF money at the beginning of FY18
WaTech also reports a larger vision to provide data analytics and visualization services for the enterprise but they are not ready to test and iterate that service concept
A. Service Description
Definition
WaTech Data Management and Business Intelligence services provide customers with the full breadth of data service to help manage, integrate, and analyze data for better decision making on a fee for service (FFS) basis. This newly emerging service is developing under the WaTech Data and Business Intelligence Team, who support enterprise systems and projects such as the Human Resources Management System and AFRS reporting.
The Data Management and Business Intelligence service encompasses the following disciplines:
Self-service business intelligence
Standard reporting
Data visualization
Enterprise data warehouse
Data and application integration
Identity matching and master data management
Database administration
Data architecture and consulting
Features
Core database administration features include:
DBMS Platform Service
DBMS Full Service
Notes
Customers are required to enter into a Data Sharing Agreement and Service Level Agreement

Page 639 of 851
. .
To obtain services from WaTech, new customers must enter into a Master Service Agreement
New customers, current customers, and service cancellations are managed by the WaTech Support Center who capture detailed requirements and necessary information for requests, answer questions, and plan for requested service or cancellations
B. Statutory Basis for Creation of Service or Program
WaTech delivery of this specific service is not mandated by statute. State agencies have the option to contract directly with other vendors and providers for data management support, and many choose to do so.
C. How the Service Fits into the CTS Strategic Plan and Goals
Data Management is not a strategic service for WaTech based on enterprise strategic plans and organizational goals, and the business model for this professional service (as a FFS product) is still under development.
D. Performance Measures used to Measure Effectiveness and Efficiency
WaTech only has three types of performance measures for this service:
Time – Work activity hours are tracked in multiple applications and ultimately reported to TTS. As of March 1, 2018, the service will move to a new cloud tool under Business and Digital Media Services for time tracking and management; reporting will still be done in TTS.
Net Promoter System (NPS) – For all Business and Digital Media Services, WaTech collects and integrates customer feedback using NPS. The NPS dashboard is available via Google Drive. Due to Database Management being a new service, there currently is not enough customer feedback data available compare against longer standing services such as Web Platform.
Support Center – This service follows standard WaTech Support Center processes to capture new customer inquiries, current customer assistance, and service requests and cancellations. Since this service is primarily supporting enterprise systems and projects, it is not ticket driven (i.e., incident response, service cancellation requests, etc.).
WaTech has not defined any request fulfillment targets (e.g., time to onboard a new customer and begin service delivery).
E. Current Cost to Maintain the Service
Staffing
WaTech uses transfer rules to assign staff to the service for the purposes of tracking and forecasting costs (shown as the 1.37 FTEs in direct/indirect labor in the diagram below). These transfer rules were developed by estimating actual staff time spent on activities related to the service.
In addition, 0.34 percent of total overhead costs are being transferred to this service. If you apply that total cost percentage to the 65 FTE within overhead, it would be about 0.23 overhead FTE.

Page 640 of 851
. .
Figure 122. Database Management Service Staffing
Note: Staffing numbers pulled from “Estimated Overhead FM6 December”
Figure 123. Database Management Service Direct/Indirect Staffing
Note: Staffing details pulled from “Org Chart - Color Coded 01.01.18” and combined with transfer rules in “FY18 Master Indexes 12-19-17”
Workload Supported
Workload was only provided in the form of forecasted revenue, which is anticipated to rise to $50,000 per month at the end of FY18 and then hold steady during FY19 at about $55,000 per month.
Direct, Indirect and Overhead Costs
WaTech’s planned expenses for this fiscal year are provided in the table below.

Page 641 of 851
. .
Table 321. Database Management Planned Service Expenses
Cost Components
FY18 Planned FY19 Planned Cost Details
A Salaries 169,283 $70,694 1.37 Planned FTEs
B Benefits 0 0 Included in costs of A Salaries
E Goods & Services E Internal Purchases
300,395 304,205
Professional Development (2 trainings per year), SQL server licensing (FFS and ESF share), Spotlight, phone (off-hours support), on-call pay, desktop service, and MS Premier support
T Transfers 58,866 59,380 Agency overhead
Total Planned Expenses
528,544 534,279
Note: Forecasted Cost recoverability detail pulled from “DM: Database Management (8211 FFS: 1884, 1885, 1886” excel spend plan provide in March 2018; the salary and benefit costs assume vacancies are filled
WaTech forecasting costs are currently being evaluated and are changing frequently. The legacy CTS SQL team, along with server and licensing revenue, moved into Database Management and WaTech is still identifying revenue that needs to move to the service’s 8211 code. Last fall, the ESF allocation stopped paying for its portion of Microsoft SQL Server and WaTech is now identifying what servers should be charged and beginning to bill them to customers.
F/G. Rate structure CTS is currently billing to customers
The service is provided on a FFS basis; rates are listed in the table below:
Table 322. Database Administration Rates
Microsoft SQL Server fees:
Service DBMS
Platform Full Service Description
Monthly DBA Cost $300 $600 Per Server
Monthly DBMS Software Licensing
$75 per vCPU for SQL Server Licensing (Production Only)
Performance Management & Tuning Hours (2) Hours (4)
Per month Additional $160 per hour
Event notification Included Included Per customer request
DBMS Troubleshooting Included Included As needed
DBMS Configuration Management Included Included As needed
DBMS Monitoring Included Included
Service up/down Production off hours notification if requested
Performance Monitoring Optional Included Monthly report $50 per month, per server if optional

Page 642 of 851
. .
Service DBMS
Platform Full Service Description
DBMS SQL Language Extensions Support Optional Included
Includes T-SQL and PL-SQL $160 per hour if optional
Yearly DBMS Health Checks Optional Included
Yearly report $160 per hour if optional
DBMS Capacity Planning Optional Included As needed $160 per hour if optional
DBMS Growth Management Optional Included
As needed $160 per hour if optional
Business Data Support Included
Direct data support for customer applications Requires DBA knowledge of business provided by customer
Customer relations Included Customer meetings (pain points, planning, etc.
Monthly DBMS patching and service packs:
Service DBMS
Platform Full Service Description
Validate DBMS Vendor Patches Included Included
Validate patches in sandbox environment for negative impacts prior to applying to production systems
Apply Patches Included Included Apply patches during WaTech maintenance window(s)
Verify patching Included Included Verify patches were applied correctly and that all services are active
Event notification Included Included Per customer request
DBMS Backup Management:
Service DBMS
Platform Full Service Description
DBMS Restores Included Included
Restore DBMS servers, instances, and/or databases Max 3 per month, $160 per hour over 3
Backups onsite Optional Included
Configure, test, and monitor using WaTech Backup Service Optional cost is associated with Backup Service
Backups offsite Optional Included
Configure, test, and monitor using WaTech Backup Service Optional cost is associated with Backup Service

Page 643 of 851
. .
DBMS Backup Management:
Service DBMS
Platform Full Service Description
DBMS Permissions Management Included Included Permission groups
TSL Protocol Included Included Enable TLS 1.2 for all database communications
Security Reviews Included Included Assist in DBMS components of design reviews for customer systems
Database hardening Optional Included
Hardening to WaTech DBMS standards Optional - $160 per hour for set up, $25 per month for review
Replication Optional Included Using DBMS Vendor Supplied Replication
Disaster Recovery Optional Included Using WaTech DR Service
DBMS Auditing Optional Included DBMS Vendor Supplied Auditing or WaTech Service
Optional Services:
Service DBMS
Platform Full Service Description
Clustering Optional Optional Using DBMS Vendor Supplied Clustering, if applicable
MS SSRS Technical Support Optional Optional
Optional Service - $25 per month per instance
MS SSIS Technical Support Optional Optional $160 per hour
MS SSAS Technical Support Optional Optional $160 per hour
TDE Optional Optional $160 per hour consultation
Ad hoc DBA Support Optional Optional $160 per hour
WaTech recently increased the professional services rate to $160 per hour for labor. Currently, the labor rate is based on FTEs; however, this service is developing additional costs and models, which may affect the rate in the future (e.g., labor and licensing).
Software costs for databases are charged at the service level (e.g., CPUs).
H. Analysis of Current Cost Recoverability
This service is not currently cost recoverable and is not forecasting cost recoverability in FY18 and FY19 based on information provided in the FY18/19 spend plan. The revenue in this cost center includes DB Management services, Internal Charges and Server Hosting.
Table 323. Data Management Cost Recoverability (Actual FY16-FY18)
Service Income FY16 FY17 FY18 H1
Service Revenue (8211) 0 0 92,219
Service Expense (8211) 0 0 (388,968)
Net Income 0 0 (296,749)

Page 644 of 851
. .
Note: Actual revenue and expenses pulled from “AFRS Financial Download (Extracted on 2018-05-15)”
Table 324. Data Management Cost Recoverability (Forecasted FY18-FY19)
Service Income FY18 FY19
Service Revenue (8211) 455,360 474,152
Service Expense (8211) 528,544 534,279
Net Income (73,184) (60,127)
Note: Forecasted Cost recoverability detail pulled from “DM: Database Management (8211 FFS: 1884, 1885, 1886” excel spend plan provide in March 2018
I. Service Level Actually Provided Today
Due to the recent establishment of Data Management professional services and FFS resources, there are currently no service level targets in place.
J. Current Customers
WaTech’s current FFS Data Management service customer base is composed of five agencies who seek support for data management professional services, data integration professional services, and database licenses.
WaTech has five Data Management customers, which includes agencies of varying size and footprint. In FY18, the top two customers account for over half of the amount WaTech billed for this service.
Table 325. Data Management Current List of Customers
# Customer FY17 ($) FY17 (%) FY18 H1 ($) FY18 H1 (%)
1 2350-DEPARTMENT OF LABOR AND INDUSTRIES
0 0 3,526 27
2 1790-DEPARTMENT OF ENTERPRISE SERVICES
0 0 2,738 21
3 0850-OFFICE OF THE SECRETARY OF STATE
0 0 2,700 21
4 2150-UTILITIES AND TRANSPORTATION COMMISSION
0 0 833 6
5 1010-CASELOAD FORECAST COUNCIL
0 0 150 1
Total Top 10 Billable Customers
0 0 9,947 77
Total for All Other Billable Customers
0 0 0 0
Total WaTech Internal Sales 0 0 2,925 23
Total Revenue 0 0 12,872 100

Page 645 of 851
. .
Note: Customer billing details pulled from “Billing Data - Apptio FFS Only (2018-05-16)” excel file
K – Current and Historical Usage Volumes
Since its establishment, this service has gained several customers of significant size (e.g., Labor and Industries); however, there is little to no evidence or data to indicate whether this service will increase or decrease in the future.
So far revenue has been more concentrated in databases licenses than in the professional services offerings.
Table 326. Data Management Customer Usage
Service Offering FY17 ($) FY17 (%) FY18 H1 ($) FY18 H1 (%)
DATA INTEGRATION PROFESSIONAL SRVCS 0 0 2,738 21
DATA MANAGEMENT PROFESSIONAL SERV 0 0 2,700 21
DATABASE LICENSES 0 0 7,434 58
Total Revenue 0 0 12,872 100
Note: Customer billing details pulled from “Billing Data - Apptio FFS Only (2018-05-16)” excel file
Service leads and staff have indicated concern over the ability of WaTech to grow this service. The capacity of Database Management as a professional, FFS-based service varies greatly. For example, workloads for enterprise systems support (e.g., OFM) increase drastically during legislative sessions, which require these FFS resources to dedicate their time to enterprise support.
L – Customer Satisfaction and Future Demand
The Customer Voice appendix to this report includes customer satisfaction and future demand details based on the results of agency interviews and focus groups conducted during the project.
M – High Level Architecture
WaTech Database Management service delivery staff are housed under the Enterprise Data Administration Manager in the Business and Digital Media Services program area. This service is a professional service that is dependant on the skills and abilities of the resources delivering the service, which in turn is heavily dependent on the quality of training, and tools that are available to resources.

Page 646 of 851
. .
(8650) Video Production Services (E-Gov/ Other Services)
Background
Video Production Services is referred to as E-Gov/ Other Services in some systems
This service is defined under the Video Production entry in the online service catalog
A. Service Description
Definition
The Video Production service provides customers with fully customized video and digital media services. Customers of this service receive the expertise and knowledge of a senior-level producer and director, who guides customers through all stages of the projects. WaTech provides all end-to-end project management services and support, such as scoping project and managing the vendor on a day-to-day basis to completion support.
Features
Senior-level producer and director
Collaborative and iterative production process
Fully equipped video and audio recording services
Compliance and accessibility-driven with captioning provided
Notes
Prospective customers wishing to purchase services must first contact the Producer/Director and Senior Strategy Advisor.
Agencies can choose their level of involvement during all stages of the project (e.g., filming, production, or editing)
B. Statutory Basis for Creation of Service or Program
WaTech delivery of this specific service is not mandated by statute. State agencies have the option to contract directly with other vendors and providers for video production.
C. How the Service Fits into the CTS Strategic Plan and Goals
Video Production is not a strategic service for WaTech based on enterprise strategic plans and organizational goals.
D. Performance Measures used to Measure Effectiveness and Efficiency
WaTech only has two types of performance measures for this service:
Time – Work activity hours are tracked in multiple applications and ultimately reported to TTS. As of March 1, 2018, Video Production and all other Business and Digital Media

Page 647 of 851
. .
Services moved to a new cloud-based tool for time tracking and management; reporting will still be done in TTS.
Net Promoter System (NPS) – For all Business and Digital Media Services WaTech collects and integrates customer feedback using NPS. The NPS dashboard is available via Google Drive.
WaTech has not defined any request fulfillment targets. (e.g., time to onboard a new customer).
E. Current Cost to Maintain the Service
Staffing
There is one dedicated FTE resource – the Video Production Service Senior Strategy Advisor – managing and completing video production activities today and a manager partially assigned via transfer rules (shown as the 1.03 FTEs in direct/indirect labor in the diagram below).
In addition, 0.26 percent of total overhead costs are being transferred to this service. If you apply that total cost percentage to the 65 FTE within overhead, it would be about 0.17 overhead FTE.
Figure 124. Current Video Service Staffing
Note: Staffing numbers pulled from “Estimated Overhead FM6 December”

Page 648 of 851
. .
Figure 125. Current Video Service Direct/Indirect Staffing
Note: Staffing details pulled from “Org Chart - Color Coded 01.01.18” and combined with transfer rules in “FY18 Master Indexes 12-19-17”
Workload Supported
The one FTE delivering and managing the Video service currently supports the workload defined in the table below:
Table 327. Video Service Workload Supported
Description Workload Supported
Number of Projects (External Sales) 39 Projects
Note: Workload information is current as of January 2018 and provided by WaTech via an Apptio eGov Trend Report provided in February 2018; Number of projects reflects number of external sales for Video Production services from January FY2017 – January FY18. Billable hours by project is not available for this inventory report as it is tracked down at the individual customer invoice level and is difficult to aggregate for summary reporting.
Direct, Indirect and Overhead Costs
WaTech’s planned expenses for this fiscal year are provided in the table below.
Table 328. Video Service FY18 Planned Expenses
Cost Components FY18 Planned FY19 Planned Cost Details
A Salaries 109,092 112,386.60 1 Planned FTE
B Benefits 33,648 34,845.96
C Personal Services 127,229 142,848.00 Contractors (i.e., Finley Mimbles)
G Travel 2,400 2,400.00 Travel to video production sites and shooting locations
T Transfers 45,365 41,374.77 Agency Overhead
Total Planned Expenses 317,733 333,855.33
Note: Cost details were pulled from “8650 – Video Production” excel spend plan provide in February 2018; the salary and benefit costs assume vacancies are filled
WaTech reports that it generally does not track average cost by workload for this service (e.g., tracking average cost per project) because the projects are greatly varied and unpredictable.

Page 649 of 851
. .
WaTech generally encourages agencies to pursue multiple movies (a “series” or a “collection”) because there are economies of scale that they can achieve by doing multi-videos. For example, WaTech can perform multiple shots for multiple films at one location.
WaTech reports that about 85% of Video Production engagements are a series or collection of films. When WaTech manages a series or collection of films for one customer, the cost of each film is roughly $8k +/- $2k depending on what they need.
When WaTech manages one-off films, the cost is roughly $15k for the category of film WaTech generally produces.
F/G. Rate structure CTS is currently billing to customers
The service is provided on a FFS basis; rates are listed in the table below:
Table 329. Video Service Rates
Description Rate Detail
Video Production Service
$160 per hour plus actual/anticipated out of pocket expenses, and a margin added to vendor contracts to cover the cost of vendor management, invoicing, processing payments, and RFP/procurement costs.
The key assumptions that make up this rate are:
Salary and benefits for direct and indirect staffing
Training costs
Agency overhead
60% productivity factor
H. Analysis of Current Cost Recoverability
This service had not been cost recoverable but is now approaching cost recovery.
WaTech reports that negotiation to enter a large agreement may help bring the service into profitability next fiscal year (between $10k to $150k profit based on WaTech’s recent estimates of existing and in-progress agreements). .
Table 330. Video Service Cost Recoverability (Actual FY16-FY18)
Service Income FY16 FY17 FY18 H1
Service Revenue (8650) 27,028* 280,164 100,550
Service Expense (8650) (1,018,939)* (691,268) (133,359)
Net Income (991,911)* (411,104) (32,809)
Note: Actual revenue and expenses pulled from “AFRS Financial Download (Extracted on 2018-05-15)”.
*Video Production service launched mid FY2017 and shares the same cost code (8650) as the, now abolished, team call E-Gov. Costs for FY16 and most of FY17 are from the E-Gov group. When WaTech reorganized E-Gov, created Business Development and Media Service Division, all costs were removed into other cost centers, and all that remained was Video Production using cost code 8650. The FY16 and FY17 include other E-Gov costs unrelated to Video. The first official billing of the service occurred November 2016 (last half of FY2017) so there are no video costs included in FY2016.

Page 650 of 851
. .
Table 331. Video Service Cost Recoverability (Forecasted FY18-FY19)
Service Income FY18 FY19
Service Revenue (8650) 317,734 409,519
Service Expense (8650) (317,733) (272,705)
Net Income 1 136,814 Note: Forecasted Cost recoverability detail pulled from “8650 – Video Production” excel spend plan provide in February 2018
I. Service Level Actually Provided Today
Each project timeline varies greatly based on customer needs and project scope.
J. Current Customers
WaTech currently has six Video Production contracts with customers. The largest customer accounted for nearly half of the amount WaTech billed for this service in both FY17 and FY18.
Internal sales within WaTech accounted for over half of revenue in FY17 and nearly a quarter of FY18 revenue at the end of the first half of the year.
Table 332. Video Service Current List of Customers
# Customer FY17 ($) FY17 (%) FY18 H1 ($) FY18 H1 (%)
1 3030-DEPARTMENT OF HEALTH 50,119 24 30,503 30
2 0570-OFFICE OF CIVIL LEGAL AID
16,169 8 23,128 23
3 X310-WA STATE TRANSIT INSURANCE POOL
0 0 12,675 13
4 2350-DEPARTMENT OF LABOR AND INDUSTRIES
0 0 8,772 9
5 1000-OFFICE OF THE ATTORNEY GENERAL
24,806 12 0 0
6 1600-OFFICE OF THE INSURANCE COMMISSIONER
1,500 1 0 0
Total Top 10 Billable Customers
92,594 44 75,078 75
Total for All Other Billable Customers
0 0 0 0
Total WaTech Internal Sales 119,619 56 25,472 25
Total Revenue 212,214 100 100,550 100
Note: Customer billing details pulled from “Billing Data - Apptio FFS Only (2018-05-16)” excel file
K. Current and Historical Usage Volumes
Video Production project volume is growing. Currently, there are nine simultaneous projects underway including story-based pieces and live trainings. While a majority of WaTech service and customer-level targets include IT departments and shops, key targets for Video Production services are communication or program offices within state agencies.
Page 651 of 851
. .
WaTech is negotiating contracts with four additional customers. New customers in the pipeline include a pending service level agreement with a major agency for $250,000 to augment the work of that agency’s embedded videographer. In total, WaTech has 8 committed customers for this biennium with anticipated revenue of $129,970 across them, and another 10 customers in the pipeline with $385,000 across them.
There are 96 videos featured on the WaTech Video Production services page on Vimeo.
L. Customer Satisfaction and Future Demand
The Customer Voice appendix to this report includes customer satisfaction and future demand details based on the results of agency interviews and focus groups conducted during the project.
M. High Level Architecture
Video Production services currently have only one FTE employee who serves as the key point of contact, advisor, project manager, service broker, and liaison for customers.
Due to Video Production services brokered by one individual, coverage and capacity are key limitations for this service. Currently, WaTech is preparing a Master Contract to be able to procure from a pool of vendors to both increase the service’s existing coverage and capacity, as well as expand its service capabilities. For example, agencies have asked for video streaming services; however, there are no resources currently available to provide this for customers.
WaTech is not making capital investments in this service, e.g., on studios, video equipment, or lighting equipment. Currently, all investments are in goods and services with outside providers and vendors used for video production and editing.

Page 652 of 851
. .
13. GIS Location Based Services
GIS Location Based Services – Intro
Location Based Services is comprised of two allocations, the Geospatial Portal Allocation (8710) and Washington Master Addressing Service Allocation (8711), as well as two services paid for via fee for service, WA Geographic Council (1240), and Geospatial Initiatives / GIT Committee (1230)
Staffing for location based services includes: the OCIO Geospatial Program manager funded via the OCIO appropriation (1200) and part-time project staff that is directly coded to the projects based on actual time and effort
(8710) Geospatial Portal
Background
As of July 1, 2014 the “Allocation – GeoSpatial Portal” was established and revenue associated with this allocation flow to cost code 8710
WaTech has not developed a service catalog entry for this service due to the fact that is billed via allocation
Relevant details have been pulled from OCIO.wa.gov website and corresponding WaTech Allocation document.
A. Service Description
Definition
The Geospatial Portal enables access to 600+ geospatial and data imagery services in one location.
Objectives include:
Strategic data investments
Coordinated data acquisitions
Efficient data storage
Reduced duplication of state time
Improved coordination
Shared geospatial web services
Common data distribution platform
Geospatial Portal Governance is provided primarily through the Geographic Information Technology (GIT) Committee. The Geographic Information Technology (GIT) Committee

Page 653 of 851
. .
promotes a statewide approach to using geographic information technology. The members of this committee also provide the leadership necessary for implementing spatial data management policies and strategic recommendations.
This Committee functions as the state’s executive governance body and is comprised of the agency CIO’s who manage geospatial resources within their agencies and across state government. Two subcommittees: Geospatial Portal Steering Committee and Master Addressing (WAMAS) Steering Committee report back to the GIT on an as needed basis.
Features
Access to commonly used information like statewide parcels, county and city boundaries, address locations, trails, urban growth areas and much more
Single access point to state geospatial data (Geospatial Portal at geo.wa.gov)
Ability to access a publishing site for agency application and data services geo.wa.gov)
Coordinated access to valuable high resolution county and statewide imagery data that number close to 125+ individual imagery services (Associated Image hosting service)
Notes
Agencies are responsible for implementing and maintaining their own GIS environments. They have access to a State Master GIS Software contract that is open to state and local government entities. In addition, agencies also have access to WSCA master contracts for Cloud Hosting and Cloud Storage, if needed.
Geospatial Portal operational responsibilities are jointly supported by WaTech, OCIO and the Department of Fish & Wildlife. WaTech provides networking and infrastructure support, OCIO provides data management assistance to agencies to prepare data and services for publication on the Geospatial Portal and operational and management support for the portal, Department of Fish & Wildlife provides technical consultation and support to WaTech related to GIS software and services.,
The Geospatial Portal Steering Committee authorizes decisions and changes to the Geospatial Portal.
All agencies that pays into the allocation are invited to the Geospatial Portal Steering Committee (GPSC) meetings. There is broad support across the GIS community at the state.
Geospatial Portal and Washington Master Addressing Services (WAMAS) Steering Committees meet monthly and report back to the GIT.
B. Statutory Basis for Creation of Service or Program
RCW 43.105.351 specifies that “government records and information are a vital resource to both government operations and to the public that government serves. Broad public access to state and local government records and information has potential for expanding citizen access to that information and for improving government services.”
OCIO mandated that executive branch agencies and institutions of higher education follow Geospatial policy and standards (academic and research applications at institutions of higher education are exempt).

Page 654 of 851
. .
C. How the Service Fits into the CTS Strategic Plan and Goals
OCIO views the Geospatial Portal as a strategic enabler of open government.
D. Performance Measures used to Measure Effectiveness and Efficiency
OCIO tracks workload as measured by users, page views and sessions. OCIO and WaTech monitor service uptime and availability.
E. Current Cost to Maintain the Service
Staffing
Staffing for location based services includes: the OCIO Geospatial Program Manager funded via the OCIO appropriation (1200) and part-time project staff – who deliver technical support – directly coded to the projects based on actual time and effort. Additionally, staff time includes a small percentage of Solutions Center support (reflected in the staffing figures below).
In addition, 0.01 percent of total overhead costs are being transferred to this service. If you apply that total cost percentage to the 65 FTE within overhead, it would be about 0.01 overhead FTE.
Figure 126. Geospatial Portal Service Staffing
Note: Staffing numbers pulled from “Estimated Overhead FM6 December”. Overhead is charged to this service as it is incurred through part-time work.

Page 655 of 851
. .
Figure 127. Geospatial Portal Support Service Direct/Indirect Staffing
Note: Staffing details pulled from “Org Chart - Color Coded 01.01.18” and combined with transfer rules in “FY18 Master Indexes 12-19-17”
Workload Supported
The current supported workload is defined in the table below:
Table 333. Geospatial Portal Support Service Workload Supported
Type of Workload Current Workload Supported
Geo.wa.gov 1,200 users/month 8,000-9,000 page views/month 1,500 sessions/month
Public GIS Server Image Server 4.5 TB of imagery data Over 50 image services as REST endpoints
State GIS Server Image Server Supports WSDOT, Natural Resources, Ecology, OCIO, Fish & Wildlife, Recreation & Conservation, and Military via REST services embedded in applications to support agency business Supports 7 TB of imagery data; approximately 15 image services as REST endpoints
Note: Workload information is current as of April 2018 and this detail was provided by WaTech on 4/16/18
Direct, Indirect and Overhead Costs
WaTech’s planned expenses for this fiscal year are provided in the table below. These planned expenses do not reflect pending migration costs to AGOL, private cloud, or ESRI hosting; WaTech anticipates that migration costs will not impact this service, given an assumption that the cost of migration and the new hosting fee together will cost less than the hosting fee for the current environment.

Page 656 of 851
. .
Table 334. Geospatial Portal Service FY18 Planned Service Expenses
Cost Components FY18 Planned FY19 Planned Cost Details
A Salaries
18,000
18,000 Estimate 16-20 hours/week for part-time support
B Benefits
6,000
6,000
E Goods & Services
54,616
54,616
ESRI Public GIS Server/Image Server: software costs ($11,000/year) AGOL: software and hosting fees ($10,000/year) State GIS Server Image Server: software costs ($11,000/year) Miscellaneous expenses: $5,000
E Internal Purchases
78,384
78,384
Internal purchases: LAN server costs and desktop support ($8,000) Public GIS Server/Image Server: WaTech private cloud hosting fees ($24,000/year) State GIS Server Image Server: WaTech private cloud hosting fees ($26,400/year) Hosting charge for new imagery added to State GIS Server Image Server: $12,000/year
T Transfers
10,500
10,500 Agency overhead
Total Planned Expenses
167,500
167,500
Note: Cost details were pulled from “GIS Spend Plans (Initiatives, Portal, WAMAS, WAGIC)” excel spend plan provided in February 2018.
WaTech is currently exploring options to increase storage capacity (i.e., AGOL, private cloud, ESRI supported hosting, etc.). While future costs are not yet known, WaTech plans to request for additional funding in the next biennium for this effort.
F/G. Rate structure CTS is currently billing to customers
The service is provided via the GeoSpatial Portal Allocation. The Geospatial Portal Allocation goal is reduction of cost and complexity otherwise borne individually by state agencies for data storage, infrastructure, software and staffing costs needed to support Geographic Information System (GIS) efforts.
This service was funded by voluntary contributions from select agencies from 2006-2013. In 2014, the Geospatial Portal allocation began spreading costs to agencies based on a weighted 4-Part Index. The four pieces of data that comprise the index come from various sources from WaTech, OCIO and OFM: IP addresses of agencies using the portal; a survey of FTEs of GIS-using agencies; an OCIO survey of annual investment in GIS services; and, a point-based system based on agency size.

Page 657 of 851
. .
H. Analysis of Current Cost Recoverability
This service is currently cost recoverable based on available FY18 AFRS financial data. However, WaTech has stated that the expenses forecasted are for an absolute minimum level required for sustainment.
Table 335. Geospatial Portal Support Service Cost Recoverability (Actual FY16-FY18)
Service Income FY16 FY17 FY18 H1
Service Revenue (8710) 167,501 192,215 85,891
Service Expense (8710) (138,116) (170,794) (86,595)
Net Income 29,385 21,421 (704)
Note: Actual revenue and expenses pulled from “AFRS Financial Download (Extracted on 2018-05-15)”
Table 336. Geospatial Portal Support Service Cost Recoverability (Forecasted FY18-FY19)
Service Income FY18 FY18 H1
Service Revenue (8710) 167,500 167,500
Service Expense (8710) (167,500) (167,500)
Net Income 0 0 Note: Forecasted Cost recoverability detail pulled from “GIS Spend Plans (Initiatives, Portal, and WAMAS, WAGIC) excel spend plan provided in February 2018
I. Service Level Actually Provided Today
OCIO has stated that the performance of the WaTech managed servers has been a challenge; however, actual performance data/reports have not yet been provided for review and inclusion in this inventory. The existing server environment at WaTech is being deprecated and due to cost efficiency, appropriate services supporting the existing Geospatial Portal have been migrated to the WaTech private cloud.
J. Current Customers
Currently 26 agencies are paying for this allocation. The largest customer – Department of Natural Resources – accounts for over half of the amount WaTech billed for this service in the first half of FY18 (July 2017 – December 2017).
Table 337. Geospatial Portal Support Service Current List of Customers
# Customer FY17 ($) FY17 (%) FY18 H1 ($) FY18 H1 (%)
1 DEPARTMENT OF NATURAL RESOURCES 51,208 28 24,733 30
2 DEPARTMENT OF FISH AND WILDLIFE 26,492 15 12,337 15
3 DEPARTMENT OF TRANSPORTATION 23,167 13 10,670 13
4 DEPARTMENT OF ECOLOGY 22,132 12 10,151 12
5 DEPARTMENT OF SOCIAL AND HEALTH SERVICES 9,078 5 3,604 4
6 DEPARTMENT OF REVENUE 6,820 4 2,472 3
7 DEPARTMENT OF LABOR AND INDUSTRIES 6,214 3 2,168 3

Page 658 of 851
. .
# Customer FY17 ($) FY17 (%) FY18 H1 ($) FY18 H1 (%)
8 DEPARTMENT OF HEALTH 5,168 3 2,291 3
9 WASHINGTON STATE PATROL 3,674 2 1,842 2
10 MILITARY DEPARTMENT 4,132 2 1,124 1
Total Top 10 Billable Customers 158,084 87 71,393 86
Total for All Other Billable Customers 23,067 13 10,827 13
Total WaTech Internal Sales 1,187 1 1,187 1
Total Revenue 182,338 100 83,407 100
Note: Customer billing details pulled from “GARTNER – ALLOCATION” excel file
K. Current and Historical Usage Volumes
The Geospatial Portal enables access to 600+ geospatial and data imagery services in one location.
L. Customer Satisfaction and Future Demand
The Customer Voice appendix to this report includes customer satisfaction and future demand details based on the results of agency interviews and focus groups conducted during the project.
M. High Level Architecture
Agencies are responsible for implementing and maintaining their own GIS environments. They must prepare their data and services for publication on the common Geospatial Portal (conceptual view shown in the diagram below).

Page 659 of 851
. .
Figure 128. OCIO Geospatial Portal Diagram
Note: Conceptual diagram provided in March of 2018
Vector data shared on the Geospatial Portal is currently hosted on ArcGIS Online (AGOL).
Imagery data shared via the Geospatial Portal was migrated off the WaTech managed servers into the WaTech Private Cloud in the State Data Center. Performance testing is currently underway.

Page 660 of 851
. .
(8711) Washington Master Addressing Service – WAMAS
Background
The WAMAS allocation revenue flows to cost code 8711.
Expenditure authority for WAMAS was established in the 2014 Supplemental Operating Budget.
WaTech has not developed a service catalog entry for this service due to the fact that is billed via allocation
Relevant details have been pulled from OCIO.wa.gov website and corresponding WaTech Allocation document.
A. Service Description
Definition
WAMAS is a set of tools that allows users to accurately format and locate an address. Addresses are used throughout all levels of government to respond to emergencies, contact customers and voters, determine sales tax, place sex offenders, etc. Washington Master Addressing Services (WAMAS) serves to standardize and correct address points within precise boundaries. Information gleaned from WAMAS can help agencies keep up with the demands of a growing population in a sustainable, economical manner.
The Washington Master Addressing Service (WAMAS) is an emerging service offering. WAMAS API components include 4 constituent parts and are offered as http or https: Address correction service (ACS); Geocoding service (GCS); Geometry service (GMS); Location Finder Service (LFS).
The suite of services (API’s) have been developed to:
Correct an address to US Postal Service standard format
Add coordinates to an address (geocode) so it can be displayed and verified on a map
Locate an address in its right geographic area like a county, legislative, voting or taxing districts or other important place or area
This enterprise approach encourages government efficiencies by reducing the duplication of data storage, decreases infrastructure needs and promotes the shared development and maintenance of services that would otherwise be repeatedly done by multiple state agencies. This type of information can be used in the applications in a variety of ways, including:
Verification of an address & its associated geography
Correction of address lists to USPS standards
Correct sales tax determination, collection and distribution
Permitting & location verification
Improved public safety & emergency response
Siting of public health services

Page 661 of 851
. .
Fraud detection
Features
Reduce cost and redundant effort (borne by individual agencies’ purchase of address correction mechanisms)
Improve accuracy/reduce errors for verifying and validating address data by using a consistent, centralized data source
Can be consumed from a web page or from within a mainframe, desktop, or server application
Notes
All application, database, and user support is provided in-kind by participating agencies on an “as time allows basis”. End users and requesting organizations must have the technical knowledge or resources to support their use of WAMAS services.
In order to access the WAMAS application programming interface, first-time users must complete three access request forms, the Access Request Form, Business Use Case Form and Terms of Agreement form. After first-time users receive confirmation that their IP address has been added to the WAMAS whitelist, they may download the required Excel Add-in, Launch Batch Processing, and access the APIs
All WAMAS and third party data is licensed for use within existing state and local jurisdictions and cannot be shared or used for commercial purposes. Agency contractors are restricted from using this data outside their existing state contract(s).
Cities and counties who elect to enter into a Service Level Agreement (SLA) with WaTech to provide up-to-date address information gain free access to use this service. State agencies who are not part of the existing allocation may opt in to this service via an SLA
B. Statutory Basis for Creation of Service or Program
RCW 43.105.351 specifies that “government records and information are a vital resource to both government operations and to the public that government serves. Broad public access to state and local government records and information has potential for expanding citizen access to that information and for improving government services.”
OCIO mandated that executive branch agencies and institutions of higher education follow Geospatial policy and standards (academic and research applications at institutions of higher education are exempt).
C. How the Service Fits into the CTS Strategic Plan and Goals
OCIO views WAMAS as a strategic enabler of open government.
D. Performance Measures used to Measure Effectiveness and Efficiency
OCIO and WaTech (as an infrastructure service provider) have established Terms of Service for WAMAS. Services are guaranteed to be up and running Monday through Friday from 7:00 AM to 5:00 PM.
In addition to availability, WaTech measures and reports on batch processing speed and throughput.

Page 662 of 851
. .
WaTech tracks the total number of agencies that have been onboarded as a measure of service uptake, but does not track performance for time to complete requests, like time to complete onboarding from time of initial request. The response is typically less than 3 days.
E. Current Cost to Maintain the Service
Staffing
The Senior Program Manager for GIS is included in the OCIO appropriation (cost code 1200). Additional part-time project staff provides technical support and is charged directly to the project.
Workload Supported
The current supported workload is defined in the table below:
Table 338. WAMAS Support Service Workload Supported
Description Workload Supported
Number of addresses processed by address correction and geocoding services
70 million addresses for Q1 2018 (Jan. 1 – Mar. 31)
Number of agencies processed in Q1 2018 9 agencies
Note: Workload information is current as of January 2018 and this detail was provided by WaTech via hard copy documentation on 2/14/2018
Direct, Indirect and Overhead Costs
WAMAS is funded by a limited on-going budget, and has historically has no operational funding to hire staff to administer and support these services. OCIO/WaTech’s planned expenses for this fiscal year are provided in the table below.
Table 339. WAMAS Support Service FY18 Planned Service Expenses
Cost Components FY18 Planned FY19 Planned Cost Details
A Salaries
18,000
18,000 ITS4 at approximately 16 hours/ week of part-time support
B Benefits
6,000
6,000
E Goods & Services
49,572
49,572
Software: ESRI, Vestra and Melissa Data (USPS data) Development ($12,000/year) Production ($75-$90,000/year)
E Internal Purchases
104,928
104,928
Managed Server Hosting (Storage covered under Geospatial Portal) Development Environment (WaTech Private Cloud $18,000 per year) Production Environment (WaTech Private Cloud $42,000)
T Transfers
10,500
10,500 Agency overhead

Page 663 of 851
. .
Cost Components FY18 Planned FY19 Planned Cost Details
Total Planned Expenses
189,000
189,000
Note: Cost details were pulled from “GIS Spend Plans (Initiatives, Portal, WAMAS, WAGIC)” excel spend plan provided in February 2018; the salary and benefit costs assume vacancies are filled. Note that significant support is provided by the Department of Social and Health Services, Department of Revenue, and Department of Health to support and maintain the APIs provided by this service. This support is provided in-kind. WaTech plans to manage required migrations within the defined budget.
F/G. Rate structure CTS is currently billing to customers
The service is provided via the WAMAS Allocation. The goal of the Washington Master Addressing Services (WAMAS) allocation is reduction of cost and redundant effort (borne by individual agencies purchase of address correction mechanisms) and improve accuracy/reduce errors for verifying and validating address data by using a centralized consistent data source.
The WAMAS allocation was established in the 2014 Supplemental budget. Due to the nature of the service, agencies were expected to fund the cost through savings generated by using WAMAS.
The Washington Master Addressing Services (WAMAS) allocation is not part of the Central Service Model even though it is considered a central service billing. The WAMAS allocation is spread to agencies in the allocation based on actual agency IT FTEs. OFM provides the IT FTE counts for billing.
To gain the most value from this allocation, agencies need to eliminate use of agency or division-specific mechanisms for address validation and verification and instead use the WaTech service they are paying for as part of this allocation. Agencies may also wish to expand usage by reviewing their agency data stores for additional potential usage of these services.
There is no funding for enhancements. A user or organization may fund enhancements under a mutually negotiated contract or provide staff resources to develop and implement any approved enhancements.
H. Analysis of Current Cost Recoverability
This service is currently cost recoverable based on available FY18 financial data.
Table 340. WAMAS Support Service Cost Recoverability (Actual FY16-FY18)
Service Income FY16 FY17 FY18 H1
Service Revenue (8711) 188,998 203,998 188,998
Service Expense (8711) (121,977) (170,677) (107,384)
Net Income 67,021 33,321 81,614 Note: Actual revenue and expenses pulled from “AFRS Financial Download (Extracted on 2018-05-15)”
Table 341. WAMAS Support Service Cost Recoverability (Forecasted FY18-FY19)
Service Income FY18 FY18 H1
Service Revenue (8711) 189,000 189,000
Service Expense (8711) (189,000) (189,000)

Page 664 of 851
. .
Service Income FY18 FY18 H1
Net Income 0 0 Note: Forecasted Cost recoverability detail pulled from “GIS Spend Plans (Initiatives, Portal, and WAMAS, WAGIC) excel spend plan provided in February 2018. The expectation is that the allocation will spend up to the amount of revenue received (though it is spending less than that amount).
I. Service Level Actually Provided Today
OCIO has stated that infrastructure components provided by WaTech need to be improved. Infrastructure components managed by WaTech have limited up-time and WAMAS servers have not had GIS upgraded; current service levels are from 7 am to 5 pm, Monday through Friday. Due to budget and server administration constraints, several key agencies maintain their own systems for WAMAS. As of April 16, 2018, WAMAS is migrating to the WaTech Private Cloud with an expected completion in August of 2018. This will allow for GIS software upgrades. Following this migration, this service will be reviewed to propose improvements that will allow 24/7 uptime. Those adjustments are expected to need additional budget to implement and will better support agency needs.
WaTech monitors usage of the WAMAS service on a quarterly basis by analysing log files. WaTech can discern whether/not an agency is using the service, but each agency would need to perform further analysis in order to determine whether they are leveraging the service to its’ full possibility.
For batch processing, the average speed is 328 records/second. Eleven agencies are currently using Batch Processing: DFW, DOH, DOL, DSHS, LEG, L&I, OFM, TCOMM 911, TRPC, WaTech, and WSAC.
Throughput for address correction is roughly 900 records/second or 3.2 million/hour. Adding geocoding to the job drops the throughput down to roughly 75 records/second or 250,000/hour. Customers are advised to hold off on large geocode jobs until the weekend as processing is done First In, First Out.
J. Current Customers
WaTech bills 60 customers for the WAMAS allocation. The largest 3 customers account for nearly half of the amount WaTech billed for this service in FY18 (July 2017 – December 2017).
Table 342. WAMAS Support Service Current List of Customers
# Customer FY17 ($) FY17 (%) FY18 H1 ($) FY18 H1 (%)
1 DEPARTMENT OF SOCIAL AND HEALTH SERVICES
24,241 21% 24,241.00 20%
2 COMMUNITY AND TECHNICAL COLLEGE SYSTEM
17,191 15%
17,191 14%
3 UNIVERSITY OF WASHINGTON
15,261 13%
15,261 13%
4 DEPARTMENT OF LABOR AND INDUSTRIES
12,121 11%
12,121 10%
5 DEPARTMENT OF TRANSPORTATION
11,421 10%
11,421 10%

Page 665 of 851
. .
# Customer FY17 ($) FY17 (%) FY18 H1 ($) FY18 H1 (%)
6 EMPLOYMENT SECURITY DEPARTMENT
10,311 9%
10,311 9%
7 ENTERPRISE SERVICES DEPARTMENT OF
9,651 9%
9,651 8%
8 DEPARTMENT OF CORRECTIONS
7,340 6%
7,340 6%
9 LICENSING DEPT OF
0%
5,940 5%
10 DEPARTMENT OF HEALTH
5,770 5%
5,770 5%
Total Top 10 Billable Customers 113,307 100%
119,247
100%
Total for All Other Billable Customers
Total WaTech Internal Sales
Total Revenue
Note: Customer billing details pulled from “Apptio Download – Sales History (FFS and Allocations since 07-2016)” excel file; WaTech internal sales data pulled from “CTS Internal Sales JV Jan 2018”
K. Current and Historical Usage Volumes
WAMAS is actually used by well over a dozen state and local customers.
Both the Department of Ecology and the Department of Fish and Wildlife have integrated WAMAS into their permitting system, which handles 2,400-2,800 applications per year. The WAMAS API is also used to track the X, Y coordinates of facility locations, environmental monitoring locations, hatcheries, and water access sites.
The Office of Finance Management is using WAMAS to facilitate the 2020 Census.
The Department of Revenue has implemented WAMAS into tax calculation systems, ensuring accurate liabilities within appropriate boundaries.
The Thurston Regional Planning Council uses WAMAS to format and remove duplicate addresses for large mailings
Washington Legislative Services and Washington State Courts use WAMAS to connect constituents with their representatives and determine jury pools.
The Washington Department of Health uses WAMAS to ensure accurate addresses for medical license renewal, birth and death records, WIC resources, and epidemiological research.
L. Customer Satisfaction and Future Demand
The Customer Voice appendix to this report includes customer satisfaction and future demand details based on the results of agency interviews and focus groups conducted during the project.

Page 666 of 851
. .
M. High Level Architecture
The service is housed within the Geospatial Portal and hosted at WaTech. WAMAS is a dedicated infrastructure consisting of six virtual servers, ArcGIS Server, SQL Server, Safe Software FME Server, Melissa Data (USPS) Data Quality Components, and Esri StreetMap. However, due to poor availability, OCIO is evaluating alternative options for hosting.
Voter registration rolls, Department of Revenue databases, driver’s license databases, county parcels, and other government databases were used to create the WAMAS MAF. When WAMAS was created, 13.5 million addresses were processed and combined. However, many of these were duplicates (e.g., 98512 zip code went from 17,524 records to 5,231 after de-duplication and consolidation).
WaTech/OCIO continue to improve the MAF with the addition of authoritative address data from local entities. Users submit improvements to the WaTech/OCIO to make WAMAS addresses more reliable and accurate. Any addresses found by WAMAS services for the first time are added to the Master Address File (MAF). The third party USPS data is updated monthly. All third party components are updated as needed.

Page 667 of 851
. .
Figure 129. Architecture for WAMAS Development and Production Environments
Note: Diagram provided by WaTech in March of 2018

Page 668 of 851
. .
(1230) Geospatial Initiatives / GIT Committee
Background
The Geospatial Program Manager is responsible for assisting delivery of services approved by the GIT Committee.
Cost code 1230 funds are for the GIT Committee operations and any Geospatial portal service activities approved by the committee, Geospatial Initiatives / GIT Committee is funded via a Fee for Service model and is assessed as needed.
The GIT Committee is not funded with Geospatial Portal or WAMAS allocation funding. Any activities must be funded by participants.
This is no corresponding service catalog entry for this service. Relevant details have been pulled from OCIO.wa.gov.
A. Service Description
Definition
This Geospatial Initiatives/GIT Committee offering enables initiatives designated by the Geographic Information Technology (GIT) Committee. The primary initiative is the Acquisition of Imagery Data, other smaller initiatives have included support of the Washington Traffic Safety Commission. These two initiatives are defined below.
Acquisition of Imagery Data: High-quality 1' and 6" four-band orthoimagery are acquired and offered at reduced rates for agencies and interested parties. The OCIO purchases Imagery Data through a contract with Ascent GIS/ Hexagon. This includes Imagery Data for: 2015 (Northeast 2016) – 1 foot, and 2016 (Urban Areas) – 6 inches. More current data, 2017 – 1 foot, and 2018 (Urban Areas) – 6 inches, is not yet available. The Imagery is offered to agencies as an optional Fee for Service.
Washington Traffic Safety Commission Support: In FY18, the GIT committee approved a one-time $15,000 project to assist the Washington Traffic Safety Commission with GIS activities.
Features
Seamless imagery can be used for many different state and county business needs
All state agencies and county partners are able to use the same base information to create streams, digitize buildings, emergency management, etc.
Notes
Acquisition of Imagery Data
o This is completed via a contract with an outside vendor. o Partner agencies contribute funding for imagery acquisition. o Only contributing Washington State agencies, county and city governments, and
municipalities can have access to imagery data o Data is shared with partner agencies via hard drive copies or via streaming
services offered by the vendor.

Page 669 of 851
. .
o Within the partner agencies, there are unlimited licenses to access the data or to provide access to contractors working directly for partner agencies.
B. Statutory Basis for Creation of Service or Program
The Geographic Information Technology (GIT) Committee functions as the state's executive governance body and is comprised of the agency CIO's. The Geospatial Portal and Washington Master Addressing Services (WAMAS) Steering Committees meet regularly and report back to the GIT committee.
RCW 43.105.351 specifies that “government records and information are a vital resource to both government operations and to the public that government serves. Broad public access to state and local government records and information has potential for expanding citizen access to that information and for improving government services.”
Policy 160.00 aims to “protect the investment in geospatial data and to facilitate the efficient exchange of geospatial data across state government. This policy outlines the establishment of standards, guidelines and best practices for geospatial data, metadata, applications and services, which agencies are responsible to follow.” Agencies are required to track investments in geospatial technology and ensure geospatial data and services can be consumed and shared for the public and across all levels of government.
OCIO Geospatial Data Management policies apply to Washington State “executive branch agencies, agencies headed by separately elected officials, and institutions of higher education. Academic and research applications at institutions of higher education are exempt.”
C. How the Service Fits into the CTS Strategic Plan and Goals
WaTech reports that this service is a strategic enabler of open government.
D. Performance Measures used to Measure Effectiveness and Efficiency
This service is focused on acquisition of imagery. Tracking of service quality is provided under the geospatial portal where the data is hosted.
WaTech raised sufficient funds to pay for the second year of the imagery contract and appears to be on track for year three.
E. Current Cost to Maintain the Service
Staffing
WaTech has zero planned FTEs for GIT WaTech assigns staff on a part-time basis for project work when required. When staff are billing time against this code the service also accrues overhead expense.
For Acquisition of Imagery Data, the Department of Natural Resources provides substantial in-kind support by processing the imagery into a format useable by partner agencies and assisting with distribution of hard drives.
Workload Supported
The current supported workload is defined in the table below:

Page 670 of 851
. .
Table 343. GeoSpatial Initiative Support Service Workload Supported
Description Workload Supported
Availability of unlimited licenses
6 state agencies
18 local agencies
28 tribal entities
50+ public safety answering points (i.e., funded through the state NG911 office)
Note: Workload provided during inventory review
Direct, Indirect and Overhead Costs
WaTech’s planned expenses for this fiscal year are provided in the table below.
Table 344. Geospatial Initiative FY18 Planned Service Expenses
Cost Components FY18 Planned FY19 Planned Cost Details
E Goods & Services 235,000 235,000
Payment plan with Ascent GIS/Hexagon (three year payment complete in 2020)
Total Planned Expenses 235,000 235,000
Note: Cost details were pulled from “GIS Spending Plans (Initiatives, Portal, WAMAS, WAGIC)” excel spend plan provide in February 2018; the salary and benefit costs assume vacancies are filled
1) Acquisition of Imagery Data
a. Acquisition is completed via a contract with an outside vendor.
b. State, local and tribal entities contribute funding (pass the hat style) to pay for the
imagery acquisition and are referred to as partner agencies.
c. Partners include: 6 state agencies, 18 local agencies, 28 tribal entities and over 50
public safety answering points (funded through the generosity of the state NG911
office).
d. The current contract is for $705,000 which is paid in 3 installments of $235,000 each.
Final payment will be in May of 2019, contract ends in April 2020. This will pay for
the 2015/2016 data acquisition and provides a perpetual license for the 2015/2016
data.
e. Partner agencies are also eligible to access 2017/ 2018 data until the contract ends
in April 2020. This data will not be paid for and will need to be removed from
computer systems unless arrangements are made to pay for this data.
f. Partner agencies are also eligible to purchase larger coverage areas of 6 inch data
for an additional cost from the vendor.
g. The data is shared with partner agencies via hard drive copies or via a streaming
services offered by the vendor. Within the partner agencies, there are unlimited
licenses to access the data or to provide access to contractors working directly for
the partner agencies.
h. DNR provides substantial in-kind support by processing the imagery into a format
useable by partner agencies and assisting with distribution of hard drives.
2) This cost center has been used by the GIT to support other initiatives determined to be of
importance to GIS at the state level, though funding for additional initiatives has been
Page 671 of 851
. .
minimal. The Washington Traffic Safety Commission (WTSC) was supported in a small GIS
project as a cost effective way to complete a seatbelt evaluation study.
F/G. Rate structure CTS is currently billing to customers
The service is provided on a fee for service basis; rates are listed in the table below:
Table 345. Geospatial Initiatives Service Rates
Description Rate Detail
Data Imagery access Custom SLAs with sliding scale (i.e., agencies do not have to pay the same amount each year and payment is partially dependent on agency ability to pay)
Data Imagery storage Covered under Geospatial Portal Allocation
H. Analysis of Current Cost Recoverability
This service is cost recoverable.
Table 346. Geospatial Initiatives Service Cost Recoverability (Actual FY16-FY18)
Service Income FY16 FY17 FY18 H1
Service Revenue (1230) 60,000 247,000 0
Service Expense (1230) (31,311) (234,959) (11,335)
Net Income 28,689 12,041 (11,335) Note: Actual revenue and expenses pulled from “AFRS Financial Download (Extracted on 2018-05-15)”
Table 347. Geospatial Initiatives Service Cost Recoverability (Forecasted FY18-FY19)
Service Income FY18 FY18 H1
Service Revenue (1230) 235,000 235,000
Service Expense (1230) (235,000) (235,000)
Net Income 0 0 Note: Forecasted Cost recoverability detail pulled from “GIS Spend Plans (Initiatives, Portal, and WAMAS, WAGIC) excel spend plan provided in February 2018
I. Service Level Actually Provided Today
This service is limited to acquisition support. WaTech reports that they have been able to establish service level agreements three years of imagery data.
J. Current Customers
WaTech has 19 customers. The largest customer – Washington State Military Department – accounts for over half of the amount WaTech billed for this service in FY17. Customers have not yet been billed for FY18.

Page 672 of 851
. .
Table 348. Geospatial Initiatives Support Service Current List of Customers
# Customer FY17 ($) FY17 (%) FY18 H1 ($) FY18 H1 (%)
1 MILITARY DEPARTMENT
108,000
2 DEPARTMENT OF ECOLOGY
20,000
3 DEPARTMENT OF FISH AND WILDLIFE
20,000
4 DEPARTMENT OF TRANSPORTATION
15,000
5 DEPARTMENT OF NATURAL RESOURCES
10,000
6 ASOTIN COUNTY
6,000
7 BENTON CO PUD #1
6,000
8 CHELAN CO PUD 1--NETWORKS
6,000
9 CLALLAM COUNTY
6,000
10 GRANT COUNTY
6,000
Total Top 10 Billable Customers
Total for All Other Billable Customers
Total WaTech Internal Sales
Total Revenue
Note: Customer billing details pulled from “Apptio Download – Sales History (FFS and Allocations since 07-2016)” excel file”
K. Current and Historical Usage Volumes
The Washington Military Department and environmental related agencies are historically the largest consumers of this initiative.
Partner agencies for Acquisition of Imagery Data include:
6 state agencies
18 local agencies
28 tribal entities
50+ public safety answering points (i.e., funded through the state NG911 office)
L. Customer Satisfaction and Future Demand
The Customer Voice appendix to this report includes customer satisfaction and future demand details based on the results of agency interviews and focus groups conducted during the project.
M. High Level Architecture

Page 673 of 851
. .
Participants in the statewide imagery consortium are shown in the figure below.
Figure 130. Participants in Statewide Imagery Consortium
The image below is an example of the imagery data acquired as a part of this service; this is an image of the Thea Foss Waterway in Tacoma, WA.
Figure 131. Sample Imagery Data

Page 674 of 851
. .
(1240) WA Geographic Council – WAGIC
Background
WAGIC was established in the 1990’s, extending the prior efforts of two prior groups: Washington Geographic Group (WG2), and the Washington State Mapping Advisory Council
Cost code 1240 funds are for WAGIC operations and any activities approved by the council.
This is no corresponding service catalog entry for this service; WAGIC is a fee for service committee. Relevant details have been pulled from OCIO.wa.gov.
A. Service Description
Definition
The purpose of the Washington State Geographic Information Council (WAGIC) is to foster the advancement of the geospatial information infrastructure (data, people, technology and policy) and its use across governmental entities within and around Washington State.
WAGIC provides outreach to the state’s geospatial technology practitioners and the states user community. This outreach helps further cross-coordination and access to valuable, federal, state and county data (imagery, parcels, address files etc.) across organizations.
The WAGIC Chair reports to and has a seat at the GIT Committee, which functions as the state’s executive governance body and is comprised of the agency CIO’s who manage geospatial resources within their agencies and across the state.
WAGIC Executives coordinate the following efforts within the geospatial community:
National States Geographic Information Council – WA State Representative/Member
State GIS Policy and Standards
State’s GIS Strategic Plan: Expanding Geospatial Collaboration & Transparency
WAGIC email list
Features
WAGIC is a membership driven, volunteer organization that consists of federal, state, local, tribal, and private entities
Membership fees are voluntary; agency contributions and volunteer donations helps fund the operations and outreach that WAGIC does with the counties, federal and state governmental entities.
The primary function of WAGIC is to update and monitor progress on the Statewide GIS Strategic Plan and to provide a forum to coordinate with local government and institutions of higher education on issues of mutual interest.
NSGIC Meeting Attendance – the WAGIC Chair will attend the Mid-Year and Annual Meeting if possible; attendance cost is capped at $1800/person/meeting

Page 675 of 851
. .
Notes
Agencies interested in becoming members must contact the State Geospatial Program Office
B. Statutory Basis for Creation of Service or Program
RCW 43.105.351 specifies that “government records and information are a vital resource to both government operations and to the public that government serves. Broad public access to state and local government records and information has potential for expanding citizen access to that information and for improving government services.”
OCIO mandated that executive branch agencies and institutions of higher education follow Geospatial policy and standards (academic and research applications at institutions of higher education are exempt).
As stated in OCIO policy 162.00 (revised 2014), the provisions of RCW 43.105.041 detail the powers and duties of the Technical Services Board (TSB), including the authority to develop statewide or interagency information services and technical policies, standards, and procedures. The OCIO policy 162.00 establishes the role of WAGIC in that process.
C. How the Service Fits into the CTS Strategic Plan and Goals
OCIO views WAGIC as a strategic enabler of open government.
D. Performance Measures used to Measure Effectiveness and Efficiency
OCIO and WaTech do not measure and report on performance measures associated with this council.
E. Current Cost to Maintain the Service
Staffing
WaTech has zero planned FTEs for WAGIC. WaTech assigns staff on a part-time basis for project work when required. When staff are billing time against this code the service also accrues overhead expense.
Workload Supported
Workload is variable depending on the preferences of the current Council.
Direct, Indirect and Overhead Costs
WaTech typically has the following expenses related to WAGIC:
WebEx monthly subscription - used during GIT & WAGIC quarterly meetings & special meetings like Statewide Imagery Acquisition
Secure Box storage– provided unlimited data hosting capacity. Data provided by the counties that help make it easier for the agencies to access their data in one shared location. The data is also aggregated into statewide coverages that agencies like yours use e.g. parcels, city/uga, trails which are processed and assembled by ECY, OFM & OCIO
National States Geographic Information Council (NSGIC) - attendance at the NSGIC midyear and annual meetings by the WAGIC Chair

Page 676 of 851
. .
Special Projects - funds help with special projects that the committee chooses to undertake on behalf of the state --the last two special projects included the State GIS Strategic Plan and review of all the state GIS standards and policies
WaTech’s planned expenses for this fiscal year are provided in the table below.
Table 349. WAGIC FY18 Planned Service Expenses
Cost Components FY18 Planned FY19 Planned Cost Details
C Personal Services 19,724 19,724
E Goods & Services 678 678
E Internal Purchases 105 105
G Travel 1,309 1,309 Conference travel
Total Operating Expense
21,816 21,816
Note: Cost details were pulled from “GIS Spending Plans (Initiatives, Portal, WAMAS, WAGIC)” excel spend plan provide in February 2018; there is no associated labor as WAGIC is a membership driven, volunteer organization composed of public sector and private entities
F/G. Rate structure CTS is currently billing to customers
Membership fees are voluntary to all members. Not all state agencies that use the Geospatial Portal pay the annual WAGIC fee. While the number of agencies contributing has changed over time, eleven to twelve core GIS agencies contribute.
It is up to the individual agency to decide how much they want to voluntarily contribute. Typically, agencies contribute in proportion to their size with high contributions around $4,000 per year and lower contributions around $500 per year.
H. Analysis of Current Cost Recoverability
This service has been cost recoverable in prior years; as a result, rollover funding from prior years is expected to be spent.
Table 350. WAGIC Support Service Cost Recoverability (Actual FY16-FY18)
Service Income FY16 FY17 FY18 H1
Service Revenue (1240) 13,000 13,000 13,000
Service Expense (1240) (13,339) (26,125) (5,631)
Net Income (339) (13,125) 7,369 Note: Actual revenue and expenses pulled from “AFRS Financial Download (Extracted on 2018-05-15)”
Table 351. WAGIC Support Service Cost Recoverability (Forecasted FY18-FY19)
Service Income FY18 FY18 H1
Service Revenue (1240) 13,000 13,000
Service Expense (1240) 21,816 21,816
Net Income (8,816) (8,816) Note: Forecasted Cost recoverability detail pulled from “GIS Spend Plans (Initiatives, Portal, and WAMAS, WAGIC) excel spend plan provided in February 2018. Note that WaTech reports that this service is cost recoverable and that

Page 677 of 851
. .
the negative net income is a reflection of the timing of revenue invoices versus expense outlays, rather than an actual loss.
I. Service Level Actually Provided Today
WAGIC-related services are provided on an ad hoc basis as driven by the council’s specific agenda.
J. Current Customers
There are 8 participants in WAGIC that contributed fees thus far in FY18. The top two customers account for over 50% of the amount WaTech billed for this service in FY18.
Contribution amount is determined by each participating agency. Typically, larger agencies have contributed more than smaller agencies or organizations. For example, some contribute $4,000 a year while others contribute closer to $500 a year.
Table 352. WAGIC Support Service Current List of Customers
# Customer FY17 ($) FY17 (%) FY18 H1 ($) FY18 H1 (%)
1 DEPARTMENT OF ECOLOGY 3,000 23
2 DEPARTMENT OF TRANSPORTATION 3,000 23
3 DEPARTMENT OF FISH AND WILDLIFE 2,000 15
4 DEPARTMENT OF REVENUE 2,000 15
5 DEPARTMENT OF NATURAL RESOURCES 1,000 8
6 MILITARY DEPARTMENT 500 4
7 OFFICE OF FINANCIAL MANAGEMENT 500 4
8 UNIVERSITY OF WASHINGTON 500 4
Total Top 10 Billable Customers 13,000 100
Total for All Other Billable Customers 0 0
Total WaTech Internal Sales 0 0
Total Revenue 13,000 100
Note: Customer billing details pulled from “Apptio Download – Sales History (FFS and Allocations since 07-2016)” excel file
K. Current and Historical Usage Volumes
The number of agency contributions received has changed over time. There are currently eight GIS agencies actively contributing to funds to the WAGIC service for FY18; however, there are a core of eleven or twelve agencies that contribute in some years.
L. Customer Satisfaction and Future Demand
The Customer Voice appendix to this report includes customer satisfaction and future demand details based on the results of agency interviews and focus groups conducted during the project.

Page 678 of 851
. .
M. High Level Architecture
WAGIC falls under the Geographic Information Technology (GIT) Committee under the OCIO Geospatial Program Office.

Page 679 of 851
. .
14. Office of the CIO Services
(1200) Office of the CIO
Background
The Office of the CIO (OCIO) was originally established under the Office of Financial Management
Effective July 1, 2015, the OCIO merged with Consolidated Technology Services (CTS), and the IT services of the Department of Enterprise Services (DES) into a new agency
The RCW the created CTS, along with subsequent legislation, places the Privacy Office within the Office of the CIO. In addition, the Government Affairs & Policy Office is a function that serves agency but paid for out of OCIO.
The State CISO and OCS are also part of the OCIO as well but are currently managed as separate organization.
The rationale for this consolidation was to optimize the coordination of IT policy and central services. While the CIO tries to maintain a distinction between the service delivery portion of WaTech and the CIO’s executive offices, the OCIO is part of the same organization as the WaTech Service Provider function.
Funding for the Office of the CIO (OCIO) is appropriated by the legislature and billed to participating agencies via an allocation. The allocation currently covers three offices, the Office of the CIO, the Privacy Office, and the Office of Government Affairs and Policy, which collectively run specific programs, deliver specific services, and attempt to guide certain statewide behaviors and outcomes through policy and oversight. These areas of responsibility are described in this section of the inventory document.

Page 680 of 851
. .
A. Service Description
Definition – Office of the CIO
The functions and responsibility for the Office of the Chief Information Officer is established in statute (detailed in section B below); the OCIO exists to support those functions. The RCW also creates the Technology Services Board (TSB), and the OCIO provides staff support to the TSB.
The OCIO Allocation provides funding to meet these statutory obligations as well as others as identified by the authorizing environment.
Strategy Development
In consultation with TSB, develop, publish and maintain the Statewide Technology Strategic Plan
Monitor plan performance measures
Enterprise Architecture
Provide consultative support to agencies to increase alignment to strategic plan.
In conjunction with OFM and DES, perform Administrative/Financial System reviews to support reuse of existing or planned investments and avoid redundant investment.
Provide technology review of major project investment plans, procurement documents and similar
Develop architecture strategies, guidance and supporting material. Recent examples include development of enterprise strategy and supporting materials for IPv6 implementation, updates to integration and interoperability strategy, best practice materials on data governance
Charter workgroups and provide forums to identify future architecture work and undertake that work as planned
Policy
Develop and maintain statewide technology policy and standards (done with support of agency populated workgroups)
Develop and monitor formal and informal governance processes supporting policy/standard implementation
Provide communications about policy/standards and related
Manage and track waiver requests and dispositions
Act as a resource to state agencies on policy interpretations
Major Project Approval and Oversight
Identify means and methods used by the Office and agencies to determine major projects
Develop methods and investment plan and other templates used for approving major projects
Evaluate investment plans and conduct oversight activities on major projects:

Page 681 of 851
. .
o Read project documents over the course of the project lifecycle,
o Routinely consult with project QA providers, project managers and project
sponsors
o Independently assess project progress and status
o Provide advice, counsel, referrals or other support as warranted
o Analyze project lessons learned documents to identify areas for targeted
improvement
Maintain and administer the IT Project Dashboard
Provide briefings to the Technology Services Board, Legislature and others on individual projects or overall
IT Pool Project Approval and Oversight
While the IT Pool/related projects are considered major projects for approval and oversight as noted above, there are additional steps required.
Work with OFM to develop & maintain processes to administer and coordinate the IT Pool activities
For each project subject to the IT Pool provisions, receive, evaluate and certify projects at agreed to funding gates – generally there are a minimum of three gates.
Technology Business Management (TBM) – a component of overall portfolio management
Perform financial modeling and analysis of technology investments to:
o Provide cost transparency,
o Support decision making on future investments,
o Support linkage of technology cost to business value, and
o Provide input into the health and condition of statewide technology assets
Support 45 agencies, each spending over $250,000/year in technology, in their TBM practices
Support OFM to develop legislatively required IT Spend reports
Provide data to the Legislature or legislative committees
Support and manage the Apptio TBM tool and data used by the tool
Manage governance processes which involve customer agencies
In consultation with agencies, and the TBM advisory committee, develop strategies and plans for the ongoing maturation of the state’s TBM program
Portfolio Management
In addition to TBM activities, the OCIO performs a number of functions generally classified under the broad umbrella of portfolio management:
Decision Package Prioritization
Develop the means and methods for prioritization of decision package requests prior to each legislative session. Consult with the TSB, OFM and others
Complete prioritization activities

Page 682 of 851
. .
Meet with agencies as requested to consult and provide input on DP content and approach
Analyze and transmit the prioritization results to the Governor and Legislature
Inventory Assets
Maintain inventories and support analysis of statewide technology assets, including agency application data, cost data, major project data, etc.
Lessons Learned
Collect and analyze lessons learned from major projects to support ongoing improvements to benefit future projects
Reports & Analysis
Develop the biennial report required in the RCW. Modify policy and practice to improve progress and content of the biennial report.
Develop and periodically update the State Data Center Report and accompanying business plan
Periodically update the Legacy System report/data
Provide support as required for Legislative requests
Geospatial Program Office
The Geospatial Program Office oversees the statewide governance committees and strategic initiatives related to Geographic Information Systems. While the initiatives and governance committees are covered under the GIS Location Based Services section of the inventory document, the Geospatial Program Office is mentioned here as the manager who oversees the governance and initiatives is covered as a part of the OCIO program funding.
Definition – Privacy Office
In addition, as a part of the OCIO allocation, the statewide Privacy Office manages the following initiatives and programs:
Open Data initiative
Privacy program for state and local government
Broadband usage and Net Neutrality policy development
The Legislature created the Office of Privacy and Data Protection in May of 2016. It is governed by RCW 43.105.369 and RCW 43.105.365. These statutes enumerate the statutory duties of the office. The office was directed to be funded from the “existing resources” of the OCIO. The office has two full time employees and utilizes staff time from CTS as needed for specific projects.
The OPDP has three core missions: 1. Coordinating State Wide Privacy Policies and Programs; 2. Consulting to the Governor and Legislature on policy relating to data protection; 3. Consumer outreach and education.
The OPDP led the following projects to benefit state and local government form inception to date:

Page 683 of 851
. .
Privacy Assessment– practices and needs of state agencies
Privacy Modeling Online Tool for research of privacy law
Privacy Checklist Tool for best practices for state and local government
Broadband Report– legislative report due in 2020 (per statute)
Legislative Work Sessions
Expert Testimony– biometrics, data breach, net neutrality
Publications– A Washington Guide to Privacy
Privacy.wa.gov
Privacy and Security Summit– Feb. 2017, hosted with US Tech Policy Lab
Proposed consumer legislation; consultation of Biometrics and data broker regulation
Coordinated Drone Policy working group
In its external focus, the OPDP engaged in the following groups and forums:
Formed the state agency “Privacy Working Group” with 40 agency participants
ACCIS– Association of County and City information specialists
IAPP– International Association of Privacy Professionals
ICDPPC– International Conference of Date Protection and Privacy Commissioners
UW School of Law– Tech Policy Law clinic
Seattle U School of Law– guest lecture series
During the past year, the Governor’s policy team asked the OPDP to assist in the development of state broadband policy and state policy relating to Net Neutrality. The Legislature worked on and passed a net neutrality bill in the 2016-17 session. The OPDP continues to work with the Governor’s office and legislature on these telecommunications issues and participates in conferences and working groups across the state.
In 2018, Alex Alben, the state’s chief privacy officer, was asked to become the chair of the SIEC, State Interoperability Executive Committee. He continues to perform that function.
The Open Data initiative is led by the Office of Privacy and anchored by a Community of Practice that meets on a quarterly basis. This Community of Practice aims to enable more open data in government, in line with the 1996 statute that mandated open data. As a part of this effort, the Office of Privacy also manages the data.wa.gov website for data sharing and provides consulting support to agencies to enable them to improve their transparency in alignment with OCIO Policy 187 which requires agencies to have an open data plan.
The Privacy Office is managing the development of a statewide report on the use of Broadband by 2020 and is also working on Net Neutrality policy development for the Governor.
Definition – Office of Government Affairs and Policy
In addition, the Office of Government Affairs and Policy acts as a legislative liaison for WaTech and the State CIO executive offices.

Page 684 of 851
. .
B. Statutory Basis for Creation of Service or Program
The Office of the CIO was established by RCW 43.105.205, which mandates that the OCIO do the following:
Prepare and lead the implementation of a strategic direction and enterprise architecture for information technology for state government
Establish standards and policies for the consistent and efficient operation of information technology services throughout state government
Establish statewide enterprise architecture that will serve as the organizing standard for information technology for state agencies
Educate and inform state managers and policymakers on technological developments, industry trends and best practices, industry benchmarks that strengthen decision making and professional development, and industry understanding for public managers and decision makers
Perform all other matters and things necessary to carry out the purposes and provisions
The OCIO supports the information technology decision package review process by statutory requirement (RCW 43.105.240 and 43.88.092).
The OCIO is required to approve and monitor all major IT Projects occurring in any executive branch agency or institution (RCW 43.105.245 and RCW 43.105.255), and must also provide web-based transparency into the documents that support approval and oversight of these projects (3ESSB 5034; Section 944).
OCIO develops the biennial report as outlined in RCW 43.105.215.
The Technology Services Board was established by RCW 43.105.285. The powers and duties of the TSB defined in statute RCW 43.105.287 make clear that ultimate decision authority for standards and policies, and ultimate major project oversight authority rests with the TSB, not with the OCIO itself.
The OCIO is obligated to track and report on the business plan and migration plan for moving state agencies into the State Data Center (RCW 43.105.375).
The Office of Privacy, within the OCIO, was established by RCW 43.105.369. The Privacy Office was later moved out to a direct line reporting relationship with the CIO. The Privacy Office authorizing statute SHB 2875 from 2016, and Governor Inslee's Executive order #01 from January of 2016 collectively spell out the duties of the office.
C. How the Service Fits into the CTS Strategic Plan and Goals
The Office of the CIO is responsible for defining the statewide technology strategic plan, and providing oversight for statewide strategic program implementation. WaTech is expected to align its strategy with this overall statewide strategy.
D. Performance Measures used to Measure Effectiveness and Efficiency
OCIO does measure and report on performance measures associated with OCIO services and programs:
Policy/standard in current status, or over sunset review date
Agency spend analysis from TBM
Agency project risk assessment analysis (based on assessments submitted)

Page 685 of 851
. .
Waiver tracking (shown below)
Administrative/Financial System reviews completed
Note: Waiver report provided via email in April of 2018
The OCIO also generates additional reports in support of improved transparency:
Project Dashboard – Public facing project management dashboard that provides OCIO oversight results for major IT projects. Results include: agency and project name, description, status, budget, risk severity level, project assessment score, and ratings for scope, schedule, budget, and OCIO evaluation.
Migration plan for use of the state data center
Note that OCIO does not track and report on the effectiveness of OCIO efforts (e.g., actual performance of projects under oversight, as compared to other projects that are not under oversight).
Office of Privacy was obligated to define performance measures, a data collection plan, and an initial performance report to the legislature on June 9, 2016, to the joint legislative audit and review committee. Every four years after they must report out on performance to the legislature. These performance measures are supposed to include, the following items as stated in the RCW:
Number of state agencies and employees who have participated in the annual privacy training
Extent of the office of privacy and data protection's coordination with international and national experts in the fields of data privacy, data protection, and access equity
Implementation of data protection measures by state agencies attributable in whole or in part to the office of privacy and data protection's coordination of efforts
Consumer education efforts, including but not limited to the number of consumers educated through public outreach efforts, as indicated by how frequently educational documents were accessed, the office of privacy and data protection's participation in
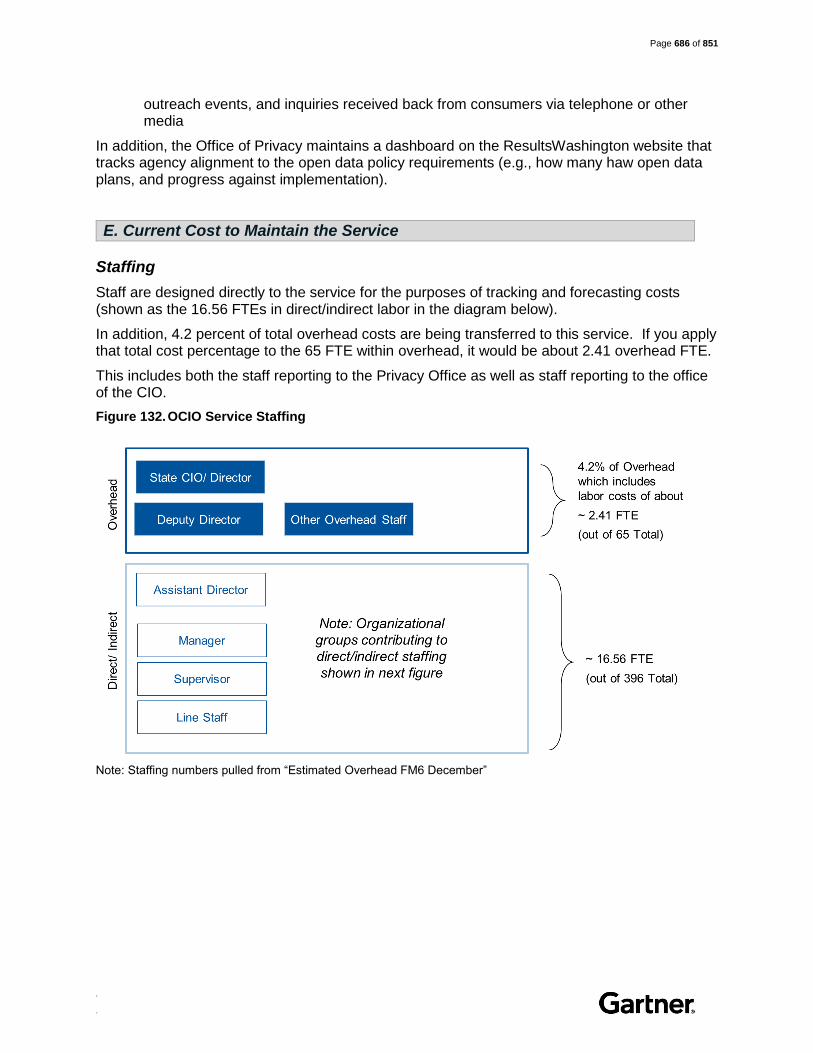
Page 686 of 851
. .
outreach events, and inquiries received back from consumers via telephone or other media
In addition, the Office of Privacy maintains a dashboard on the ResultsWashington website that tracks agency alignment to the open data policy requirements (e.g., how many haw open data plans, and progress against implementation).
E. Current Cost to Maintain the Service
Staffing
Staff are designed directly to the service for the purposes of tracking and forecasting costs (shown as the 16.56 FTEs in direct/indirect labor in the diagram below).
In addition, 4.2 percent of total overhead costs are being transferred to this service. If you apply that total cost percentage to the 65 FTE within overhead, it would be about 2.41 overhead FTE.
This includes both the staff reporting to the Privacy Office as well as staff reporting to the office of the CIO.
Figure 132. OCIO Service Staffing
Note: Staffing numbers pulled from “Estimated Overhead FM6 December”
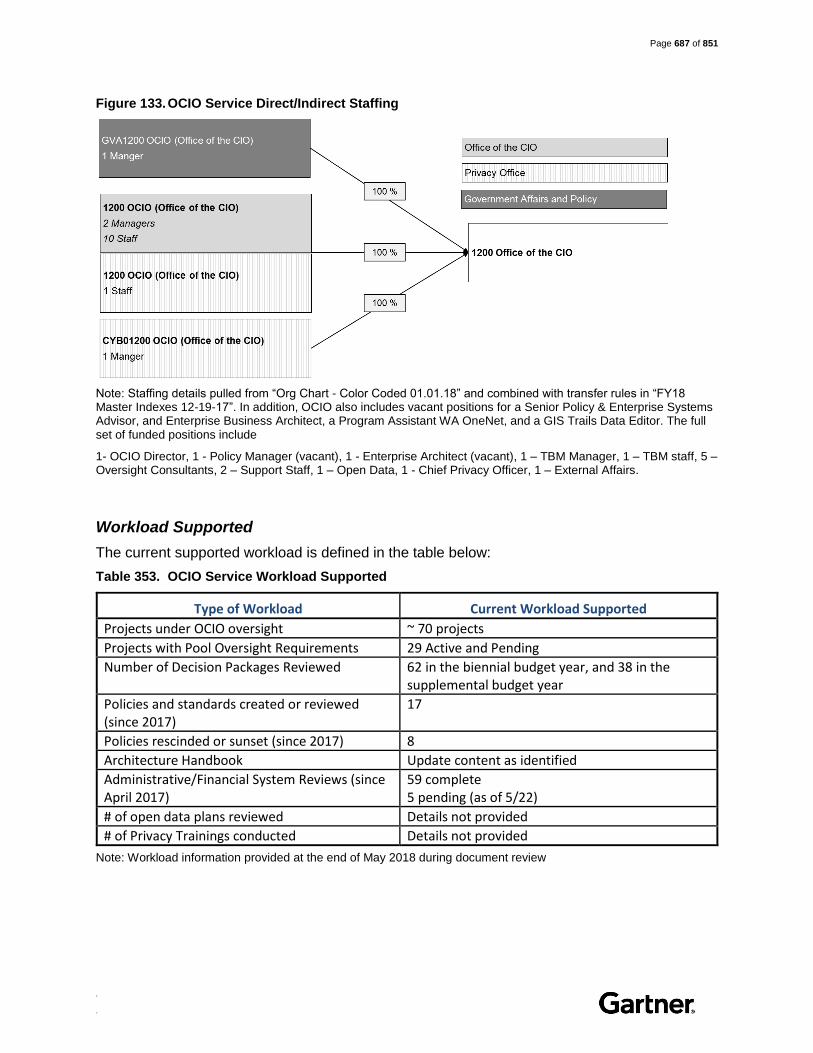
Page 687 of 851
. .
Figure 133. OCIO Service Direct/Indirect Staffing
Note: Staffing details pulled from “Org Chart - Color Coded 01.01.18” and combined with transfer rules in “FY18 Master Indexes 12-19-17”. In addition, OCIO also includes vacant positions for a Senior Policy & Enterprise Systems Advisor, and Enterprise Business Architect, a Program Assistant WA OneNet, and a GIS Trails Data Editor. The full set of funded positions include
1- OCIO Director, 1 - Policy Manager (vacant), 1 - Enterprise Architect (vacant), 1 – TBM Manager, 1 – TBM staff, 5 – Oversight Consultants, 2 – Support Staff, 1 – Open Data, 1 - Chief Privacy Officer, 1 – External Affairs.
Workload Supported
The current supported workload is defined in the table below:
Table 353. OCIO Service Workload Supported
Type of Workload Current Workload Supported
Projects under OCIO oversight ~ 70 projects
Projects with Pool Oversight Requirements 29 Active and Pending
Number of Decision Packages Reviewed 62 in the biennial budget year, and 38 in the supplemental budget year
Policies and standards created or reviewed (since 2017)
17
Policies rescinded or sunset (since 2017) 8
Architecture Handbook Update content as identified
Administrative/Financial System Reviews (since April 2017)
59 complete 5 pending (as of 5/22)
# of open data plans reviewed Details not provided
# of Privacy Trainings conducted Details not provided
Note: Workload information provided at the end of May 2018 during document review

Page 688 of 851
. .
Table 354. OCIO Service Workload Supported
Focus Total FTEs
(Hours)
Statewide Strategy & Enterprise
Arch Policy
Major Project
Oversight
Portfolio Mgmt. Process TBM
Oversight Consultants
5 FTE (7040 Hours)
0 .25 FTE (352 hours)
3.75 FTE (5280
hours)
1 FTE (1408 hours)
0
TBM/ Portfolio
2 FTE (2816
Hours)
0 .25 FTE (141 hours)
0 .4 FTE (563 hours)
1.35 FTE (2112
hours)
Policy/ Architecture
2 FTE (2816 Hours)
1 FTE (1408 hours)
.8 FTE (1126 hours)
0 .2 FTE (282 hours)
0
Note: Workload information provided following interviews in April 2018. OCIO’s estimates for hours available assumes staff only have 60% of their time to focus in these areas. Beyond Portfolio Management Process work effort included above, consultants also support other miscellaneous activities (process definition, DP prioritization, policy work, etc.).
Direct, Indirect and Overhead Costs
OCIO’s planned expenses for this fiscal year are provided in the table below.
Table 355. OCIO Service FY18 Planned Service Expenses
Cost Components FY18 Planned FY19 Planned Cost Details
A Salaries 1,787,610 1,834,476
18 planned FTEs (includes direct staff and management). Includes the privacy officer as well as the legislative liaison
B Benefits 542,916 551,028
C Personal Services 9,400 0
Contractor IT Project Training
E Goods & Services 475,216 366,538
Apptio managed service support for enhancements and related services, Dashboard, decision support software, archives and records mgmt. software, legislative tracking software, subscriptions
E Internal Purchases 63,156 63,156
Colocation, network, website, desktop services
G Travel 20,000 20,000 Conferences and training travel
J Non-capitalized Assets 2,400 2,400
Misc. equipment
T Transfers 730,802 793,902 Agency overhead
Total Planned Expenses 3,631,500 3,631,500
Note: Cost details were pulled from “120 Spending Plan Detail for Allotment 7 25” excel spend plan provided in February 2018; the salary and benefit costs assume vacancies are filled. The open data website licensing is covered

Page 689 of 851
. .
separately under the Enterprise Systems Fee. The Apptio base fee is covered under the Enterprise Systems Fee. The Privacy Office also receives additional funding through grants that is not reflected in the table above.
There have been no major capital investments in this service, and OCIO and Privacy Office do not track any assets used in the delivery of this service.
F/G. Rate structure CTS is currently billing to customers
OCIO services are provided via the OCIO Allocation. The goals and services of this allocation, as well as how to best leverage it, are still being developed and documented by the OCIO.
Allocation Methodology
The Central Services Model allocation amount was based on total costs at the time that the allocation was established. The list of the costs that would have been included at that time were not available for review and inclusion.
The chargeback mechanism is a simple allocation to agencies based on actual IT FTEs. Each agency is charged their FTE percentage times the total cost in the Central Services Model.
OFM provides a count of actual IT FTEs. For institutions of higher education (both four-year institutions and the community and technical college system), only IT FTEs that support administrative functions of the institutions are counted. Instructional staff, hospital staff, and other non-administrative portions of the agencies are exempted from the FTE counts. OFM maintains the source data for budgeted FTEs.
H. Analysis of Current Cost Recoverability
This service is currently cost recoverable as of available FY18 AFRS financial data. OCIO is forecast to breakeven based on its spend plan for FY18/19.
Table 356. OCIO Service Cost Recoverability (Actual FY16-FY18 H1)
Service Income FY16 FY17 FY18 H1
Service Revenue (1200) 3,789,214 3,752,357 1,893,515
Service Expenses (1200) (2,926,041) (3,671,747) (1,828,798)
Net Income 863,172 80,610 64,717
Note: Cost recoverability detail pulled from “AFRS Financial Download (Fiscal Years 2016 – Current)”
Table 357. OCIO Service Cost Recoverability (Forecasted FY18-FY19)
Service Income FY18 FY19
Service Revenue 3,631,500 3,631,500
Service Expenses (3,631,500) (3,631,500)
Net Income 0 0
Note: Forecasted Cost recoverability detail pulled from “120 Spending Plan Detail for Allotment 7 25” excel spend plan provided in February 2018
I. Service Level Actually Provided Today
The OCIO provided input on the actual service level provided on project oversight. Given about sixty percent of consultant staff time is available for project oversight and there are five consultants supporting 56 projects, each project only receives about eight hours of oversight

Page 690 of 851
. .
support per month. The limited availability of engagement time limits the value that OCIO consultants can add.
Additionally, given the limited staffing for enterprise architecture, the OCIO acknowledges that this is largely a gap in service today.
The Privacy Office results tracked on results.wa.gov indicate that over half of targeted agencies are reporting sustainable progress on open data, i.e., is 32 agencies out of a targeted 60 agencies. When the Privacy Office launched there were 20 agencies that had defined and published their open data plans (growth has been about one additional agency plan published every two months). Additionally, there are 1,282 open datasets available on state portals which puts the Privacy Office on track towards their target of 1,877 by 2020.
J. Current Customers
There are 64 agencies billed for the OCIO allocation. The largest three agencies account for over half of the amount billed in both FY17 and FY18. WaTech does not pay a share of the OCIO allocation.
Table 358. OCIO Service Current List of Customers
# Customer FY17 ($) FY17 (%) FY18 H1 ($) FY18 H1 (%)
1 UNIVERSITY OF WASHINGTON
406,386
12
236,133 14
2 DEPARTMENT OF SOCIAL AND HEALTH SERVICES
326,592
10
276,161 16
3 DEPARTMENT OF TRANSPORTATION
249,159
8
112,131 7
4 DEPARTMENT OF LABOR AND INDUSTRIES
223,476
7
101,866 6
5 COMMUNITY AND TECHNICAL COLLEGE SYSTEM
205,353
6
87,764 5
6 EMPLOYMENT SECURITY DEPARTMENT
215,819
7
68,720 4
7 DEPARTMENT OF CORRECTIONS
155,031
5
69,512 4
8 DEPARTMENT OF REVENUE
136,302
4
64,541 4
9 DEPARTMENT OF HEALTH
126,148
4
64,740 4
10 STATE HEALTH CARE AUTHORITY
115,691
4
50,066 3
Total Top 10 Billable Customers
2,159,956
66
1,131,636 67
Total for All Other Billable Customers
658,514
20
268,837 16
Total WaTech Internal Sales
461,015
14
284,497 17
Total Revenue
3,279,485
100
1,684,969 100

Page 691 of 851
. .
Note: Customer billing details pulled from “GARTNER – ALLOCATION” excel file
K. Current and Historical Usage Volumes
Over the period July 2012 – June 2016, the OCIO performed oversight over 143 major projects. At the time of publication, there are ~ 70 projects under oversight. The biennial budget placed 25 projects under the conditions of the IT Pool and the supplemental budget added 10 IT pool projects to the caseload. While many, but not all of these projects would have been under oversight, the provisions associated with the budget section add workload.
Open Data:
As of 2017, the state is on track with increasing the number of agencies reporting sustainable progress to open datasets.
Twelve agencies appointed individuals charged with overseeing and reporting on open data.
Fifteen agencies are in the process of assembling an inventory of their data assets which helps identify what data is publishable and how to make that data available.
The OCIO Decision Package Prioritization Criteria process included an open data assessment. In 2015, five project proposals that scored well on open data were included in the Governor’s budget, and in 2016, sixteen projects included an open data component.
The Open Data program held an internship program in partnership with local businesses and institutions to raise awareness and use of data visualization tools and techniques within agencies.
The OCIO monitors and publishes the state’s open data progress with the results available for public consumption on websites for Open Data Compliance (Identifies agency open data plans received by OCIO), Open Data Planning (Annual tracking of agencies open data progress), Open Data Maturity (Reports on agencies open data maturity progress).
L. Customer Satisfaction and Future Demand
The Customer Voice appendix to this report includes customer satisfaction and future demand details based on the results of agency interviews and focus groups conducted during the project.
M. High Level Architecture
The architecture of the OCIO and the Privacy Office is defined by the people, process, and tools used to deliver associated programs and services; they do not provide infrastructure/asset-based services.
Currently, the State CIO manages the Office of the CIO, the Privacy Office, the Office of Government Affairs and Policy, along with the state’s shared services organization, WaTech. All of these organizations share the same building and enabling infrastructure and support staff. However, they do not compete over funding as the funding for the OCIO is appropriated by the legislature.
The OCIO does not currently run a comprehensive Enterprise Architecture Program that enables the requirements of the RCW. The OCIO only has one architect position, which is currently vacant. The architecture program uses MS Office, SharePoint, Visio and a

Page 692 of 851
. .
visualization tool called Sharp Cloud. The OCIO has chartered a cross agency group, called the Statewide Enterprise Architecture Resource Team, to provide input into the overall architecture program and priorities.
OCIO leverages a decision-support software tool, called Decision Lens, to complete pairwise comparisons in development of weighted decision criteria. The weighted criteria is used to complete the statutorily required prioritization of IT funding requests. The OCIO consults with agencies on individual funding requests as requested by the agencies
The OCIO maintains a project transparency dashboard on its website. As a part of the major project oversight responsibility, the dashboard contains project artefacts (investment plans, status reports, etc.), the monthly independent Project QA reports and finding logs and the routine assessment of the project by the OCIO staff. For most projects, the Project QA reports to the project sponsor. The OCIO has the option of consulting with the QA vendor independently. The OCIO has generally elected to allow for the QA vendor to report to project sponsors rather than to the OCIO in order to reduce the risk of disrupting the agency/QA relationship.
While Apptio and Socrata are used to deliver programs under the OCIO appropriation, the funding for these tools is covered under the Enterprise Systems fee allocation, rather than the OCIO allocation. Therefore, these tools are addressed under that section of the inventory document.
Policies and standards are established using a routine process. Agency workgroups help formulate draft material, all agency CIOs are provided an opportunity to review and make comment on the draft material. Comments are documented and adjudicated by the OCIO finalizes a draft to enter into a formal process for TSB consideration and disposition.
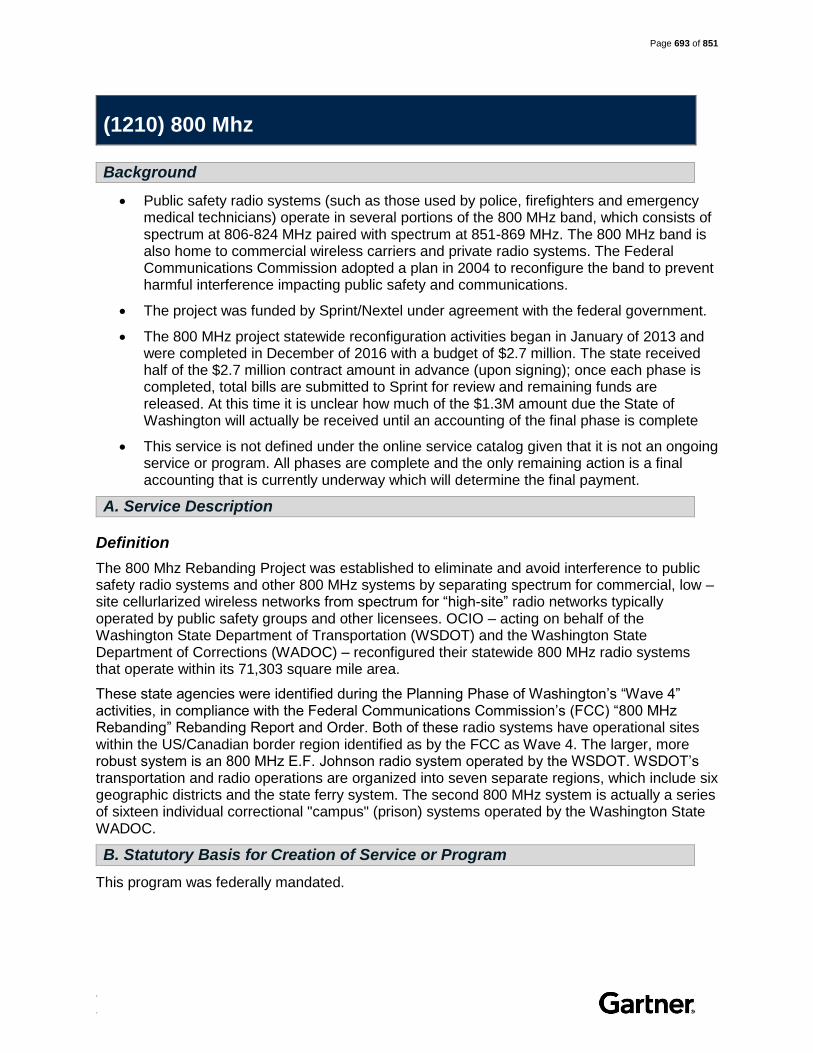
Page 693 of 851
. .
(1210) 800 Mhz
Background
Public safety radio systems (such as those used by police, firefighters and emergency medical technicians) operate in several portions of the 800 MHz band, which consists of spectrum at 806-824 MHz paired with spectrum at 851-869 MHz. The 800 MHz band is also home to commercial wireless carriers and private radio systems. The Federal Communications Commission adopted a plan in 2004 to reconfigure the band to prevent harmful interference impacting public safety and communications.
The project was funded by Sprint/Nextel under agreement with the federal government.
The 800 MHz project statewide reconfiguration activities began in January of 2013 and were completed in December of 2016 with a budget of $2.7 million. The state received half of the $2.7 million contract amount in advance (upon signing); once each phase is completed, total bills are submitted to Sprint for review and remaining funds are released. At this time it is unclear how much of the $1.3M amount due the State of Washington will actually be received until an accounting of the final phase is complete
This service is not defined under the online service catalog given that it is not an ongoing service or program. All phases are complete and the only remaining action is a final accounting that is currently underway which will determine the final payment.
A. Service Description
Definition
The 800 Mhz Rebanding Project was established to eliminate and avoid interference to public safety radio systems and other 800 MHz systems by separating spectrum for commercial, low –site cellurlarized wireless networks from spectrum for “high-site” radio networks typically operated by public safety groups and other licensees. OCIO – acting on behalf of the Washington State Department of Transportation (WSDOT) and the Washington State Department of Corrections (WADOC) – reconfigured their statewide 800 MHz radio systems that operate within its 71,303 square mile area.
These state agencies were identified during the Planning Phase of Washington’s “Wave 4” activities, in compliance with the Federal Communications Commission’s (FCC) “800 MHz Rebanding” Rebanding Report and Order. Both of these radio systems have operational sites within the US/Canadian border region identified as by the FCC as Wave 4. The larger, more robust system is an 800 MHz E.F. Johnson radio system operated by the WSDOT. WSDOT’s transportation and radio operations are organized into seven separate regions, which include six geographic districts and the state ferry system. The second 800 MHz system is actually a series of sixteen individual correctional "campus" (prison) systems operated by the Washington State WADOC.
B. Statutory Basis for Creation of Service or Program
This program was federally mandated.

Page 694 of 851
. .
C. How the Service Fits into the CTS Strategic Plan and Goals
WaTech reports that the 800 Mhz rebanding was a statewide, strategic service as mandated by the FCC and regional planning committees, and is therefore supported by the Office of the CIO.
D. Performance Measures used to Measure Effectiveness and Efficiency
No performance data has been reported in several years.
E. Current Cost to Maintain the Service
Staffing
Staff are charged directly to the service for the purposes of tracking and forecasting costs (shown as the 0.39 FTEs in direct/indirect labor in the diagram below).
In addition, 0.09 percent of total overhead costs are being transferred to this service. If you apply that total cost percentage to the 65 FTE within overhead, it would be about 0.06 overhead FTE.
The assigned staff is working on compilation of all invoices for submittal to Sprint. Once that activity is completed this service will be discontinued.
Figure 134. 800 Mhz Service Staffing
Note: Staffing numbers pulled from “Estimated Overhead FM6 December”
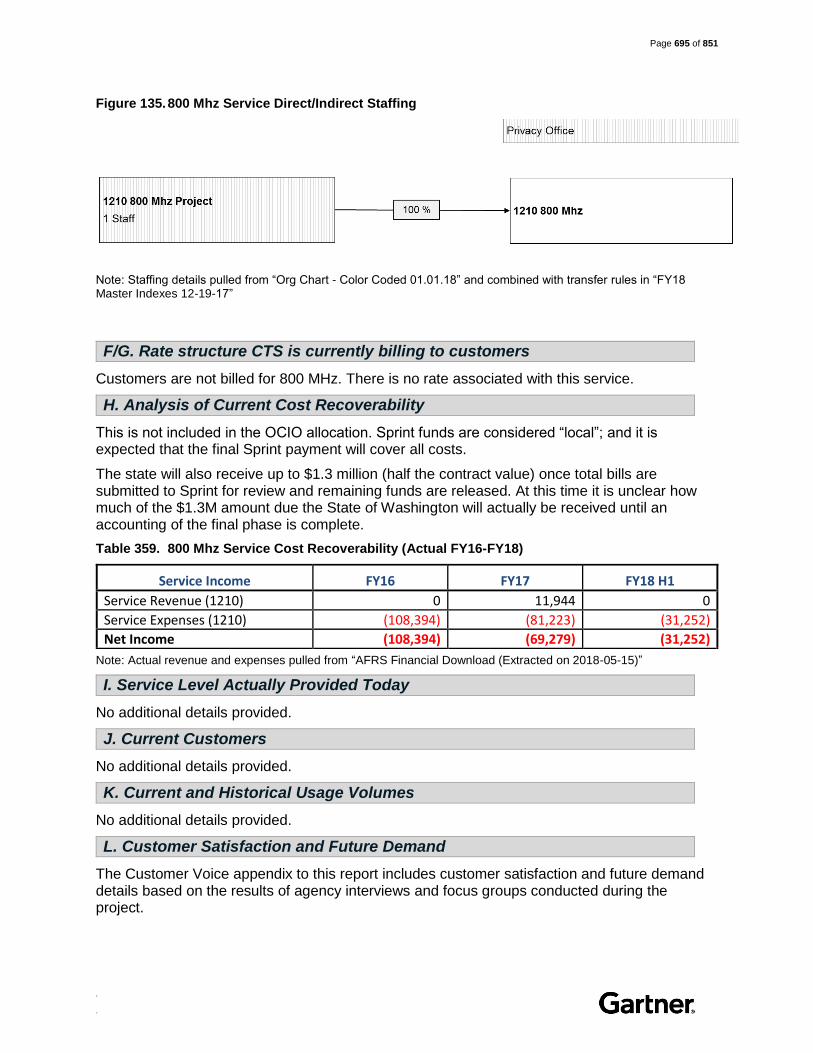
Page 695 of 851
. .
Figure 135. 800 Mhz Service Direct/Indirect Staffing
Note: Staffing details pulled from “Org Chart - Color Coded 01.01.18” and combined with transfer rules in “FY18 Master Indexes 12-19-17”
F/G. Rate structure CTS is currently billing to customers
Customers are not billed for 800 MHz. There is no rate associated with this service.
H. Analysis of Current Cost Recoverability
This is not included in the OCIO allocation. Sprint funds are considered “local”; and it is expected that the final Sprint payment will cover all costs.
The state will also receive up to $1.3 million (half the contract value) once total bills are submitted to Sprint for review and remaining funds are released. At this time it is unclear how much of the $1.3M amount due the State of Washington will actually be received until an accounting of the final phase is complete.
Table 359. 800 Mhz Service Cost Recoverability (Actual FY16-FY18)
Service Income FY16 FY17 FY18 H1
Service Revenue (1210) 0 11,944 0
Service Expenses (1210) (108,394) (81,223) (31,252)
Net Income (108,394) (69,279) (31,252)
Note: Actual revenue and expenses pulled from “AFRS Financial Download (Extracted on 2018-05-15)”
I. Service Level Actually Provided Today
No additional details provided.
J. Current Customers
No additional details provided.
K. Current and Historical Usage Volumes
No additional details provided.
L. Customer Satisfaction and Future Demand
The Customer Voice appendix to this report includes customer satisfaction and future demand details based on the results of agency interviews and focus groups conducted during the project.

Page 696 of 851
. .
M. High Level Architecture
Spectrum in the public safety 800 MHz band was ‘rebanded’ and the modified channel assignment methodology for Region 43 Plan was updated.

Page 697 of 851
. .
(1260) OneNet
Background
The creation of a nationwide, high-speed, wireless broadband network dedicated to public safety was authorized by Congress in 2012, which created the First Responder Network Authority (FirstNet)
Washington OneNet (WON) was created in September 2013 to engage stakeholders to develop a comprehensive design for of the FirstNet network in Washington State – a wireless broadband network dedicated to public safety
FirstNet is an independent authority within the U.S. Department of Commerce
FirstNet’s mission is to build, operate, and maintain the nationwide, broadband wireless network that equips first responders to save lives and protect U.S. communities
The Washington OneNet team is housed within the Office of the CIO (OCIO)
A. Service Description
Definition
The OneNet program is dedicated to ensuring that public safety has access to statewide wireless broadband services that provide ubiquitous coverage and capacity for responders. This is includes the development of policies, procedures, and best practices that assist with the use of new applications and devices and the protection of citizen data. The program will play a key role in monitoring the network performance of all public safety wireless providers services and develop a strategy for the technology transition as Long-Term Evolution (LTE) and Land Mobile Radio (LMR) converge.
The Washington OneNet program coordinates with the federal FirstNet to plan and design state-specific elements of the nationwide public safety broadband communications network. Washington OneNet is currently gathering information from public safety entities throughout the state and developing network of stakeholders.
Features
Wireless broadband network will allow first responders to use mobile devices (smartphones, tablets, computers, and other devices) in the field to respond to incidents in real-time through prioritized and preemptive services and expanded coverage and capacity
Access to prioritized 4G LTE (or greater) data communications
B. Statutory Basis for Creation of Service or Program
OCIO delivery of this specific service is not mandated by statute. However, at the Governor’s direction, a team of OCIO staff – OneNet – are dedicated to the development of public safety wireless communication technology in Washington State.
Authorized by Congress in 2012, the Middle Class Tax Relief and Job Creation Act created the First Responder Network Authority (FirstNet) as an independent authority within the National

Page 698 of 851
. .
Telecommunication and Information Administration to provide emergency responders with the first nationwide, high-speed, wireless, broadband network dedicated to public safety.
C. How the Service Fits into the CTS Strategic Plan and Goals
OneNet is viewed as a strategic project for the State of Washington, and therefore the OCIO is providing program management and oversight.
D. Performance Measures used to Measure Effectiveness and Efficiency
OCIO does not measure and report on performance measures associated with this service. However, the program is funded via a financial grant from the National Telecommunication and Information Administration (NTIA). The program must provide detailed quarterly performance reporting to the NTIA.
E. Current Cost to Maintain the Service
Staffing
WaTech dedicates staff to the service for the purposes of tracking and forecasting costs (shown as the 1.3 FTEs in direct/indirect labor in the diagram below). In FY18, there was 3 people supporting this program, 1 dedicated staff and two working 50% or less. Because this is a federal grant, time and effort reporting is required and time spent on non-grant activities is moved.
In addition, 0.34 percent of total overhead costs are being transferred to this service. If you apply that total cost percentage to the 65 FTE within overhead, it would be about 0.22 overhead FTE.
Figure 136. OneNet Service Staffing
Note: Staffing numbers pulled from “Estimated Overhead FM6 December”

Page 699 of 851
. .
Figure 137. OneNet Service Direct/Indirect Staffing
Note: Staffing details pulled from “Org Chart - Color Coded 01.01.18” and combined with transfer rules in “FY18 Master Indexes 12-19-17”. Note that In FY18, there was 3 people supporting this program, 1 dedicated staff and two working 50% or less.
Workload Supported
The current supported workload is defined in the table below:
Table 360. OneNet Service Workload Supported
Description Workload Supported
Activities are outlined in the allowable activities of the State and Local Implementation Grant program which funds the work of Washington OneNet.
Current workloads for one full-time Point of Contact/Program Manager exceed 100% Workloads for one half time FTE are maintained at .50 percent or less of billable time.
Note: Allowable activities are identified in the Notice of Funding Opportunity for the State and Local Implementation Grant Program (SLIGP) 2.0. It is estimated that 100 percent of the Point of Contacts Staff work will be billed to the SLIGP grant. >25->50 percent of the administrative assistant will be billed to the SLIGP program grant.
It is anticipated that the 20 percent grant match requirement will be met through in-kind. [In-kind matching is composed of non-cash contributions of time, equipment, space, and other items committed to the goals of the project. In-kind matching may involve the use of items already owned by the applicant or the use of items or personnel donated by a third party (e.g. volunteer labor).] The OCIO is not expected to provide any cash to meet the grant requirement.
Direct, Indirect and Overhead Costs
Program is funded via the NTIA’s State and Local Grant Implementation Program (SLIGP) 2.0. WaTech and OCIO are not providing any cash match for the required 20 percent match requirement. Instead the program will utilize volunteer stakeholder certified time for in-kind match (see definition above).
There have been no major capital investments required to enable delivery of this service.
There are no associated workload costs for the operation of the program because costs are funded via the SLIGP 2.0 grant program. The required 20 percent match will be met by the careful tracking of all in-kind contributions and will not require a supplemental cash investment by the OCIO.

Page 700 of 851
. .
F/G. Rate structure CTS is currently billing to customers
Customers are not billed for OneNet. There is no rate associated with this service.
H. Analysis of Current Cost Recoverability
The FirstNet program is funded via a contract with Military. The Military pays WaTech with funding from a federal grant (SLIGP – State and Local Implementation Grant Program). In FY17 and FY18, WaTech was reimbursed for all federal approved grant costs because WaTech met the match requirement (in FY16). The current contract with Military expired February 28, coinciding with end of the SLIGP award. The current projection shows no costs, (WaTech bills military 100% of costs). The current projection reflects an end to the program as of March 2018.
The Military has applied for and received grant funding for SLIGP2, a 2 year grant substantially lower than the first award. The Military has not yet renewed WaTech’s contract, so it’s unclear how much WaTech will be allowed to spend in FY18 and FY19; it is also unclear how of the match requirement will be WaTech’s responsibility.
Table 361. OneNet Service Cost Recoverability (Actual FY16-FY18)
Service Income FY16 FY17 FY18 H1
Service Revenue (1260) 0 0 0
Service Expenses (1260) (423,969) (21,979) (22,477)
Net Income (423,969) (21,979) (22,477)
Note: Cost recoverability detail pulled from “AFRS Financial Download (Fiscal Years 2016 – Current)”
Table 362. OneNet Service Cost Recoverability (Forecasted FY18-FY19)
Service Income FY18 FY19
Service Revenue (1260) Not yet available Not yet available
Service Expenses (1260) Not yet available Not yet available
Net Income Not yet available Not yet available
Note: Forecasted Cost recoverability detail provided via email during document reviews
I. Service Level Actually Provided Today
No details provided on actual service performance.
J. Current Customers
OCIO is leading Washington State’s involvement in the nationwide FirstNet initiative through management of the Washington OneNet program. State, County and City-level public safety organizations, and well as Washington constituents, are in effect the customers for this project. No agency is billed for this service.
K. Current and Historical Usage Volumes
Not applicable.
L. Customer Satisfaction and Future Demand
The Customer Voice appendix to this report includes customer satisfaction and future demand details based on the results of agency interviews and focus groups conducted during the project.

Page 701 of 851
. .
M. High Level Architecture
OneNet, through the Dept. of Enterprise Services, is requiring providers of public safety wireless broadband to report network performance data and user experience information to better assess the delivery of wireless broadband services to Washington’s first responders. The information will provide responder agencies with accurate data with which to base their communication need and purchasing decisions.
The information will also provide some level of analysis to determine the value of using commercial services for the delivery of critical public safety communications. The willingness of commercial service providers to provide services in un- and under serviced areas of the state must be assessed using real time data vs. provider reporting.
Currently the OneNet team is collecting data from all Washington emergency responders on locations where cellular coverage is poor in the OneNet Data Mapping Tool. The tool is also being used to identify areas where coverage is critical (i.e., infrastructure, festivals, events, etc.). To assist with identifying these areas, OneNet has created a tool that allows stakeholders "map" their coverage concerns. The OneNet Data Mapping Tool and responder input will allow the OneNet team to document coverage concerns and relay requirements to federal partners.
OneNet will develop a process for drive-testing areas of the state to determine accurate coverage mapping and service speed and capacity. This will assist responders by providing “real” up-to-date information about accessing critical data and assuring that life-critical communications are available when needed.
Note: The OneNet Mapping tool screenshot was pulled from the OCIO webpage for OneNet.

Page 702 of 851
. .
15. Cybersecurity Services
(3570) OCS Allocation Services
Background
Office of Cybersecurity (OCS) was established in 2015 by statute. Prior to the formal creation of OCS much of the staff were part of the WaTech security team which played a dual role providing
1. Operational security for WaTech-provided compute/network services 2. WaTech-provided security services (e.g., SAW/Security Gateway, Firewall &
other/related Security Infrastructure services) 3. Advice to the State CIO on statewide security policy & cyber protection posture
along with responsibility for assessing agency compliance 4. Security tools necessary to assure compliance with cyber policies and protection
posture goals
WaTech reports that OCS was created to provide independent, objective oversight of the state’s cybersecurity needs after customers raised concerns that WaTech’s security policies were designed to drive more customers to the agency’s fee-for-service lines of business.
With the formal creation of OCS, the fee-for-service responsibilities (#1 and #2) were retained by the WaTech Service Provider organization and are in the process of being reorganized under the WaTech CISO (now a separate position). Responsibility for #3 was transferred to OCS. Responsibility #4 is split, with OCS taking over the responsibility for monitoring the network perimeter (which is the separation between the trusted State Governmental Network and the Internet) while WaTech retained fee-for service responsibility for centralized security services, including operation of the firewalls, SecureAccess Washington, forward proxy and VPN. Some personnel from both OCS and WaTech acknowledged that there is still additional work to clarify specific responsibilities across groups, given there isn’t a full consensus across all players, and given that the shift to public cloud adds additional complexity and new responsibilities for some groups
This service aligns to the CERT Security Assessment, Security Design Review, and Security Operations Center entries in the service catalog
The funds for OCS are appropriated, and as of July 2017, the naming convention for this allocation in AFRS became “Allocation – Office of Cyber Security (EL L020)”, hereafter referred to as the “OCS Allocation”
A. Service Description
Definition
OCS is responsible for establishing and leading the strategic direction of cybersecurity for Washington State. The direct OCS Allocation in the state budget was established to ensure consistent funding for cybersecurity policy and technology leadership for state government, as

Page 703 of 851
. .
well as to promote cooperation and coordination between regional and national governments and corporations.
Priorities under this allocation include:
Ensuring the continuity of commerce for our state and region in the event of a cyber-attack on government services and infrastructure.
Protecting individual privacy by securing personal information stored by state agencies.
Securing the state’s networks and digital infrastructure from attack.
Engaging regional and national public and private sector organizations to form deeper partnerships and build more unified response capabilities against cyber threats.
Partnering with policy, budget, and organizational leaders to ensure a modern and coordinated approach to cybersecurity.
OCS has multiple responsibilities for cybersecurity across a range of roles, which include both preventative and reactive postures. OCS aims to enable state and local government agencies and citizens to better protect themselves from cybersecurity threats, through its role as a cybersecurity leader, trainer, and educator. OCS also aims to increase compliance with cybersecurity standards and policy, thereby reducing the probability of future security events, via security design reviews and security assessments. Finally, OCS aims to improve responses to incidents when they do happen, by actively monitoring for timely identification and ensuring defined procedures are followed. Details of each of OCS’ core operational functions and services follow below:
Cybersecurity Leadership in Government
Cybersecurity Training and Education
Threat Intelligence
IT Security Policy Analysis and Development
Security Design Review
Computer Emergency Readiness Team (CERT) Vulnerability Assessments
Security Operations Center (SOC)
Incident Response
Cybersecurity Leadership in Government
OCS works with federal, state, and regional partners to build situational awareness and create trusted relationships. The Chief Information Security Officer (CISO) currently serves on the U.S. Department of Homeland Security (DHS) State, Local, Tribal, and Private Sector Policy Advisory Committee. The CISO is also a member of the DHS Advisory Council Subcommittee on Cyber Security and Federal Chief Information Security Officer Advisory Board. She has previously served on the Executive Committee of the Multi-State Information Sharing & Analysis Center.
Cybersecurity Training and Education
OCS takes a leading role in delivering cybersecurity related training to government employees as well as citizens. OCS does extensive public outreach, with security staff participating in cybersecurity awareness events across the state. The office also runs public awareness

Page 704 of 851
. .
campaigns, including an annual month-long “Hacktober” campaign aimed at raising cybersecurity awareness for Washington State’s 65,000 employees. OCS also funds online security awareness training videos for all state employees, provides table top training exercises for executives and technical staff, produces classified and unclassified monthly “Cyber Briefs,” runs hands-on cybersecurity skills trainings and events, and provides cybersecurity tips and articles on its website, cybersecurity.wa.gov.
Threat Intelligence
The cyber threat intelligence program provides information and analysis on current threat trends and actionable information regarding ongoing cyber activities. This information is from partnerships, private feeds, and customized reporting. The program gives security analysts in detection a broader understanding of what they can expect to occur. For those in response, the information helps them understand what tools and techniques are likely to have been used in an attack. Detailed reports are produced and distributed to internal OCS customers for new threat vectors seen being commonly exploited.
IT Security Policy Analysis and Development
The Office of the Chief Information Officer has delegated authority to OCS to create IT security standards and policies that establish security controls to protect Personally Identifiable Information and Personal Health Information of Washington state residents stored on the state government network.
Security Design Review
The state Office of Cybersecurity (OCS) Security Design Review process provides agencies with a security assessment of their new or updated systems and infrastructure, and works with agencies to make sure security controls and processes are in compliance with the state’s IT security standards. This supports agency business objectives by helping ensure services are securely configured prior to being deployed.
Security Design Reviews are required when an agency project or initiative requires OCIO oversight; when an agency project or initiative impacts risk to state assets outside the agency; or when required by an agency’s IT security program.
OCS has made recent improvements to the Security Design Review process that accelerates the review process for standard design approaches.
Computer Emergency Readiness Team (CERT)
The OCS Computer Emergency Readiness Team (CERT) performs security assessments of agency assets to provide customer agencies the ability to understand their cybersecurity risk in order to make informed decisions about reducing risk exposure. OCS provides agencies an understanding of vulnerabilities, system hardening, and issues. The work is performed as an extension of each agency’s own resources to provide management with reporting information for risk mitigation planning advice. OCS provides an independent third party look at risk, where results are kept confidential.
Security Operations Center
The OCS Security Operations Center (SOC) monitors the state network perimeter points to detect, prevent, and respond to cyber-attacks. When an incident occurs, OCS alerts agencies of potential malicious activity. OCS has defined a Statewide Incident Response procedure to ensure a rapid and well-coordinated response that helps agencies quickly assess and address

Page 705 of 851
. .
an incident. Additionally, at an agency’s request, OCS provides assistance following identification through system recovery.
Incident Response
OCS deploys a CERT team to set up onsite at the agency location upon request. The CERT does forensic investigations, sets up a clean network and acts as an extension of the agency team, or as the incident commander, to work the incident through recovery.
If a data breach occurs that may require public notification, the state Chief Information Officer brings together a communications team (OCIO Policy 143) to coordinate statewide incident communications with the governor’s office and the affected state agency(s).
B. Statutory Basis for Creation of Service or Program
The office was created via statute in 2015 in response to increasing threats to individual privacy, infrastructure stability, and continuity of commerce. OCS provides policy and technology leadership for state government, as well as promotes cooperation and coordination between regional and national governments and corporations.
The state Legislature broadened OCS’ responsibility in 2016 under the Cybersecurity Jobs Act (Senate Bill 6528), defined in a new section of 43.105.801 RCW as follows:
(1) The office must evaluate the extent to which the state is building upon its existing expertise in information technology to become a national leader in cybersecurity, as described in section 1(6) of this act, by periodically evaluating the state's performance in achieving the following objectives:
(a) High levels of compliance with the state's information technology security policy and standards, as demonstrated by the attestation that state agencies make annually to the office in which they report their implementation of best practices identified by the office;
(b) Achieving recognition from the federal government as a leader in cybersecurity, as evidenced by federal dollars received for ongoing efforts or for piloting cybersecurity programs;
(c) Developing future leaders in cybersecurity, as evidenced by an increase in the number of students trained, and cybersecurity programs enlarged in educational settings from a January 1, 2016, baseline;
(d) Broad participation in cybersecurity trainings and exercises or outreach, as evidenced by the number of events and the number of participants;
(e) Full coverage and protection of state information technology assets by a centralized cybersecurity protocol; and
(f) Adherence by state agencies to recovery and resilience plans post cyber-attack.
(2) The office is encouraged to collaborate with community colleges, universities, the department of commerce, and other stakeholders in obtaining the information necessary to measure its progress in achieving these objectives.
(3) Before December 1, 2020, the office must report to the legislature:
(a) Its performance in achieving the objectives described in subsection (1) of this section; and

Page 706 of 851
. .
(b) Its recommendations, if any, for additional or different metrics that would improve measurement of the effectiveness of the state's efforts to maintain leadership in cybersecurity.
(4) This section expires October 1, 2021.
Additionally, the OCIO has established various policies related to IT Security and OCS is charged with ensuring policy alignment across state agencies:
OCIO Policy 141 – Securing IT Assets
OCIO Policy 141.10 – Securing IT Assets Standards
OCIO Policy 141.10.10 – Media Handling and Data Disposal Best Practices
OCIO Policy 141.10b – Securing IT Assets Standards – Appendix B: IT Security Risk Threatscape
OCIO Policy 141.10c – Securing IT Assets Standards – Appendix C: IT Security Non-Compliance/Deviation Form
OCIO Policy 143 – IT Security Incident Communication
C. How the Service Fits into the CTS Strategic Plan and Goals
This service supports the strategic roadmap to ensure Washington State’s data and IT assets are secure.
D. Performance Measures used to Measure Effectiveness and Efficiency
OCS is statutorily required to periodically evaluate the following:
Increase in agency compliance with IT standards (collect self-reported details)
Federal dollars received
Increase in the number of students trained, and cybersecurity programs enlarged in educational settings (from a January 1, 2016, baseline)
Number of cybersecurity events held and the number of participants
Degree of adherence to plans following cyber attacks
To report on performance OCS generates the “Office of CyberSecurity by the Numbers” and “Office of CyberSecurity Highlights” annual reports.
E. Current Cost to Maintain the Service
Staffing
Staff are fully dedicated to the delivery of this service (shown as the 19.03 FTEs in direct/indirect labor in the diagram below).
In addition, 4.85 percent of total overhead costs are being transferred to this service. If you apply that total cost percentage to the 65 FTE within overhead, it would be about 3.5 overhead FTE.
OCS line staff are divided into several teams as shown in the table below:

Page 707 of 851
. .
Area of Responsibility Team Details
SOC Operations A team of five reporting to the Deputy CISO of Operations
CERT Assessments and Incident Response A team of five staff reporting to the Chief Technology Officer
OCS Communications (Security incident communications, external media relations, OCS publications, web site, coordinates internally with other agencies and the governor’s office)
A Strategic Media Advisor reporting to the CISO directly
Security Design Review Process Three staff with the effort spearheaded by the IT Security Policy Manager
Statewide security policy and architecture One security policy analyst reporting to the IT Security Policy Manager
Figure 138. Office of Cybersecurity Staffing
Note: Staffing numbers pulled from “Estimated Overhead FM6 December”

Page 708 of 851
. .
Figure 139. Office of Cybersecurity Services Direct/Indirect Staffing
Note: Staffing details pulled from “Org Chart - Color Coded 01.01.18” and combined with transfer rules in “FY18 Master Indexes 12-19-17”
Workload Supported
The current supported workload is defined in the table below:
Table 363. Office of Cybersecurity Workload Supported
Type of Workload Current Workload Supported
Number of incidents managed per year 47 major events managed (across 19 agencies) (At any one time, the CERT has four open tickets supporting various security events/ incidents for State agencies, which only consumes approximately 30% of available team time.)
Number of cybersecurity events held per year: Agency training, Citizen training
Hacktober: month long cyber security awareness campaign for state employees. Monthly Technical & Policy presentations.
Number of security assessments completed per year
17 assessments (70% of CERT team availability is dedicated to conducting agency security assessments, for which there is a 6 to 8 month backlog.)
Security design reviews completed per year 225 security design discussions and design reviews
Number of Phishing Email Education Campaigns per year
48 campaigns
Note: Workload information is current as of 2017.
Direct, Indirect and Overhead Costs
OCS is appropriated and must remain within budget per legal and statutory requirements outlined for appropriated entities by the Washington State Legislature. OCS’ planned expenses for this fiscal year are provided in the table below.

Page 709 of 851
. .
Table 364. Office of Cybersecurity FY18 Planned Service Expenses
Cost Components FY18 Planned FY19 Planned Cost Details
A Salaries 1,928,219 1,986,588 20.38 Planned FTEs
B Benefits 683,549 697,980
E Goods & Services 940,196 874,896
Advanced Threat Detection and Prevention Tool Maintenance and Expanded Capacity ($208k), Networking Switch Maintenance ($11k), Traffic Monitoring Tool Maintenance ($60k), DDoS and IPS Maintenance ($245k), Employee training ($250k), other software less than $10k each
E Internal Purchases 236,088 236,088
Server Hosting ($7k), Shared Web Hosting ($5k), Data Center ($48k), Desktop ($125k)
G Travel 64,000 64,000
J Non-capitalized Assets 15,000 0
T Transfers 854,448 861,948 Agency Overhead
Total Planned Expenses 4,721,500 4,721,500
Note: Cost details were pulled from “Cybersecurity 3570 FM6 Dec v2” excel spend plan provide in February 2018; the salary and benefit costs assume vacancies are filled
OCS made large capital investments in a Malware Threat Detection Appliance, Intrusion Prevention/Detection appliance, and Advanced Threat Detection and Prevention Appliance. OCS is in the process of installing redundant Advanced Threat Detection and Prevention equipment at the disaster security data center in Quincy. WaTech Network Security Division reports that while the two internet connections at Quincy are not prioritized, they are live and handling traffic during normal operations (not just during a disaster). OCS has also invested in redundant DDoS and IPS tools at the Disaster Recovery data center.
The most recent investments are nearing time for lifecycle refresh. Additionally, the Advanced Threat Detection and Prevention tool has been reported as a bottleneck for network traffic due to insufficient capacity, and it is not sufficiently licensed for the capacity needed to monitor all network traffic. However, OCS is currently upgrading capacity.
F/G. Fee structure CTS is currently billing to customers
The service is provided via the Office of Cybersecurity (OCS) Allocation. WaTech recommends the allocation methodology, and OFM builds the calculations into the Central Services Model. The Legislature provides final approval through the enacted budget. The allocation is calculated as follows:
Table 365. Office of Cybersecurity Allocation Details
Description Fee Detail
Yearly Base Fee $2,000 (Agencies with 50+ FTEs)

Page 710 of 851
. .
Description Fee Detail
Remaining cost above base fee Allocated based on the agency’s number of budgeted FTEs. OFM maintains the source data for budgeted FTEs.
This allocation was last updated in 2017, effective July 1, 2017.
H. Analysis of Current Cost Recoverability
This service must be cost recoverable given the statutory requirement not to overspend an appropriation.
Table 366. Office of Cybersecurity Cost Recoverability (Actual FY16-FY18)
Service Income FY16 FY17 FY18 H1
Service Revenue (3570) 0 1,376,831 2,365,764
Service Expenses (3570) (1,887,380) (4,260,128) (2,377,244)
Net Income (1,887,380) (2,883,297) (11,480) Note: Cost recoverability detail pulled from “AFRS Financial Download (Fiscal Years 2016 – Current)”. Prior to FY17, OCS was funded via costs codes that are still used by WaTech for operational security and security service delivery today. FY16 and FY17 not reflective of actual revenue and expenses, and it is not possible to get an accurate view of cost and revenue prior to FY18 given the organizational split.
Table 367. Office of Cybersecurity Cost Recoverability (Forecasted FY18-FY19)
Service Income FY18 FY19
Service Revenue (3570) 4,721,500 4,721,500
Service Expenses (3570) (4,721,500) (4,721,500)
Net Income 0 0 Note: Forecasted Cost recoverability detail pulled from “Cybersecurity 3570 FM6 Dec v2” excel spend plan provide in February 2018
I. Service Level Actually Provided Today
OCS reports that processing times can vary greatly for Security Design Reviews depending on complexity of the design. Additionally, OCS reports that much of the delay for design reviews are due to time spent waiting on the customer to submit additional required information. OCS does not track time to fill requests via a ticketing system, however all requests and associated activities are tracked by OCS staff in SharePoint.
There is about a six-to-eight-month backlog for delivering security assessments for agencies in the target customer list (developed based on number of FTEs). Due to labor constraints, OCS is not able to conduct all security assessments that are requested. OCS reports that it takes about 960 work hours to complete each assessment over a period of about four weeks.
At any one time, the CERT has four open tickets supporting various security events/ incidents for State agencies, which consumes approximately 30% of available team time.
J. Current Customers
There are 57 agencies paying for the Office of Cybersecurity Allocation. The largest 10 customers account for almost three quarters of the amount billed for this service in FY18.

Page 711 of 851
. .
Table 368. Office of Cybersecurity Current List of Customers
# Customer FY17 ($) FY17 (%) FY18 H1 ($) FY18 H1 (%)
1 DEPARTMENT OF SOCIAL AND HEALTH SERVICES 0 0 717,683 30
2 DEPARTMENT OF CORRECTIONS 0 0 336,272 14
3 DEPARTMENT OF LABOR AND INDUSTRIES 0 0 121,669 5
4 WASHINGTON STATE PATROL 0 0 102,704 4
5 DEPARTMENT OF HEALTH 0 0 75,477 3
6 DEPARTMENT OF ECOLOGY 0 0 72,171 3
7 DEPARTMENT OF FISH AND WILDLIFE 0 0 69,030 3
8 DEPARTMENT OF NATURAL RESOURCES 0 0 67,707 3
9 EMPLOYMENT SECURITY DEPARTMENT 0 0 66,711 3
10 DEPARTMENT OF LICENSING 0 0 59,308 3
Total Top 10 Billable Customers 0 0 1,688,732 41
Total for All Other Billable Customers 0 0 677,032 59
Total WaTech Internal Sales 0 0 - -
Total Revenue 0 0 2,365,764 100
Note: Customer billing details pulled from “GARTNER – ALLOCATION” excel file. No billing details are provided for FY17 as the Cybersecurity appropriation was established in FY18. However, prior to the creation of the appropriation OCS delivered some of the services offered today via other cost codes.
K. Current and Historical Usage Volumes
No additional details on historical usage provided.
L. Customer Satisfaction and Future Demand
The Customer Voice appendix to this report includes customer satisfaction and future demand details based on the results of agency interviews and focus groups conducted during the project.
M. High Level Architecture
Security Operations Center
The State's Security Operations Center (SOC) and Enterprise Incident Response plan is owned and operated by OCS. SOC operations are conducted in a separate unmarked office area. A manager with a small team of four state employee analysts runs the OCS-managed SOC. The State SOC operates 24x7; however, the SOC is manned only during working hours, about 6:30am to 5pm, Monday through Friday. Tools used in the SOC will alert team members for anomalous activity identified during off-work hours.

Page 712 of 851
. .
While SOC operations are manned only during working hours, there is at least one SOC analyst always on call (rotating shifts) to disposition alert notifications generated by the SOC tools. As necessary, additional analysts and support staff are called in to provide incident triage and response capabilities. All SOC analysts have the capability to monitor, manage, and operate SOC tools remotely, most prefer to respond in-person if an alert is made.
Tools used to perform State SOC functions include: Distributed Denial of Service (DDoS) prevention, Intrusion Detection System (IDS), Security Information and Event Manager (SIEM), and Advanced Threat Detection and Analytics Network Monitor. All SOC tools are licensed, owned, and managed by OCS, with the exception of the SIEM. The SOC leverages the WaTech’s SIEM solution but has no position on whether agencies use it as they can integrate and ingest logs from other tools.
SOC monitoring occurs via system logs and packet data analysis provided through the SIEM software tool. The SOC maintains an external outreach program with federal partners such as MS-ISAC to monitor applicable cyber threat intelligence. Most threat intelligence consumed by the State is provided via the MS-ISAC.
OCS requires that all network traffic (inbound and outbound to the internet) be routed through its security perimeter equipment for inspection. Note that while OCS monitors all inbound and outbound internet traffic, it considers host-based security to be the purview of individual agencies and does not actively monitor Host-Based Intrusion Detection Systems. There is also no statewide data loss prevention capability, although a number of agencies leverage their own solutions. The role of the State SOC is to maintain an enterprise view of all external traffic into and out of the State network, as well as internal enterprise traffic. The SOC is logically positioned on the perimeter of the State network, which is the separation between the trusted State Governmental Network and the Internet.
OCS has identified the need for new approaches to monitoring as State agencies move more business capabilities to cloud-based functionality. In order to determine whether appropriate security policies are uniformly applied across multiple vendor platforms, as well as monitor agency traffic between external hosting providers, OCS needs tools to perform cloud-function monitoring, in addition to what cloud vendors provide.
With the significant and growing volume of activity and projects today, the primary issue challenging OCS is limited staff and the need to expand SOC coverage to full time versus the current workday model. While OCS recognizes the need for extended hours and greater coverage, it has proven difficult to justify new FTE funding within State funding parameters, it has proven equally difficult to justify State funding for new or additional SOC tools. OCS reports that they have not explored opportunities to expand coverage through support of a Managed Security Services Provider as OCS believes its staff are better positioned to perform these services, in part, because they believe an outsourced provider would not be sufficiently familiar with the State IT architecture or network topology to be as effective.
Incident Response
During an agency-specific security incident, the CERT Team functions in a cyber-firefighting role. Depending on the capabilities of an agency that reports an incident and requests assistance, the CERT is prepared to handle the event directly in its entirety, or simply to supplement agency staff with resources and select capabilities. In statewide incidents, OCS leads the incident command.
Potential security incidents identified by the State SOC are alerted to the impacted/ responsible agency. In addition to notification of the incident, the CERT offers assistance in responding to

Page 713 of 851
. .
the incident. The SOC processes thousands of alerts per year, requiring hundreds of agency-specific notifications. One or two alerts per day require escalation to a specific agency for appropriate response.
OCIO Policy 143 requires state agencies to report security incidents to OCS and the state Chief Information Security Officer. OCS operates a hotline for agencies to report incidents. Agency leaders also can contact OCS staff directly. OCS policy is clear that State agencies are not to handle security incidents without coordination and involvement by OCS, and the Governor has entrusted the State CISO with centralized control of communications during incidents, with coordination with the Attorneys General for breach-related legal advice.
OCS becomes involved in incident management when:
OCS detects a cyber-threat and alerts the agency of the incident
A trusted partner (such as law enforcement or the Multi-State Information Sharing & Analysis Center) contacts OCS with information
Or the affected agency reaches out and requests support.
However, many agencies prefer not to declare a major incident to OCS. More policy specifics (and agencies awareness) are required regarding the definition of an event versus an incident, and the escalation criteria for reporting events/ incidents.
When acting as an extension of the impacted agencies, OCS provides specific expertise like remote deployment, containment, forensic analysis, and liaison coordinating with external partners such as the MS-ISAC and State Patrol, depending on the requirements of the specific agency. CERT members have a number of professional industry certifications including digital forensics, incident handling, packet inspection, ethical hacking, and penetration testing. The alternative role for the CERT (when not fully engaged in incident response) is the comprehensive (but largely technical) assessment of State agencies.
When agencies declare an incident, about half request that OCS run the incident command, which allows trained experts to handle the response.
Computer Emergency Readiness Team (CERT) Security Assessments
An agency comprehensive security assessment is a four-week engagement which includes vulnerability scanning and asset discovery of the Agency environment (leveraging a laptop brought onsite to the agency once the agency has configured environment access to enable CERT team scanning), patching and vulnerability management process review, critical asset identification and definition, and awareness assessment including phishing tests. The assessment deliverable is a report (about 40 pages in length) that is provided within a four-week turnaround from engagement to report out. The content of the report is focused on a heat map of risk related to the agency’s security posture.
Funding for the CERT team is included as part of the OCS appropriation. CERT Security Assessments are not a service that is charged-back to the agencies that are supported. Initially, CERT did charge-back agency costs for forensic support (a stand-alone fee for service offering), but that proved to be unsuccessful, as described further in the next section of this inventory.
The CERT is not currently resourced to support all WA State agencies. The "target" agency has been identified as those with between 20 and 1000 FTE, a size that is sufficiently small to enable execution of the assessment within the target four-week period. WaTech Customer Account Managers assist in "selling" the comprehensive security assessment as a service to agencies in need. Agencies are also added to the security assessment need-list if they experience a significant security event/ incident.

Page 714 of 851
. .
Currently, the CERT maintains a six-to-eight-month backlog for agencies that have requested a security assessment. Within the "target" agency market, 40 WA State agencies have been identified and prioritized as requiring a CERT-provided comprehensive security assessment. The list is managed and tracked with expectations to perform assessments for all 40 agencies before going through the list again. Agencies outside the "target" market can request an assessment and will be factored into the prioritized list based on need and criticality. State agencies that have experienced a significant security event/ incident are prioritized for assessment above other less urgent assessments already on the backlog list.
The CERT conducted 24 comprehensive assessments during the past two years (2016-2017). The assessments provide a comprehensive (but largely technical) review of agency vulnerabilities and prioritize steps agencies should take to increase security. OCS cannot require agencies to act on its recommendations and does not audit for compliance, however high risk agencies are added back on to the backlog list for a repeat assessment one-year after the prior assessment.
The CERT does perform some trend analysis based on findings of the agency assessments, but they are not strategic and they are not reported outside of OCS.
Currently, resource and funding constraints prevent the State CISO from expanding the comprehensive security assessment process to include follow-up of Agency-specific findings to ensure recommended progress towards improvements are being made. One of the specific functions that OCS would like to add if it receives additional funding and resources is a standing Red Team to conduct a program of penetration testing for the State and agencies.
There is some confusion in the state about overlap between OCS security assessments conducted by the CERT Team, the I-900 State Auditor’s Office performance audits, and the WaTech Vulnerability Assessment tool offering, though there is some differentiation in how they are leveraged by agencies.
The WA State Auditor’s Office (SAO) is a third-party independent assessor that offers cybersecurity performance audits at agency request. The cybersecurity audits are funded through I-900. The SAO audited six state agencies for IT security in 2016 and 2017. The SAO audits bind agencies to their responsibility to follow up with an action plan to address deficiencies.
IT Security Policy Development
The Office of the Chief Information Officer has delegated authority to OCS to create IT security standards and policies that establish security controls to protect Personally Identifiable Information and Personal Health Information of Washington state residents stored on the state government network.
Security Design Review
The charter of the OCS Security Design Review (SDR) process is to review new IT projects across the State before they are put into production, to ensure that compliance and other high-risk issues are appropriately identified and addressed. Executive branch agencies, and State Boards and Commissions are within the purview of the OCS SDR process. Review/ assessment standards are considered risk-based, not simply compliance-based.
The State CIO is the ultimate decision authority for approval of non-compliant conditions identified by the SDR process. However, most exceptions to compliance do not require CIO review as the State CISO makes SDR decisions that are escalated, and simply reviews the decisions with the State CIO. Waivers/ exceptions are granted for projects undergoing the SDR

Page 715 of 851
. .
process, typically only when there are compensating controls for managing identified risk and compliance issues.
The SDR process was initially focused on in-house developed applications and systems. With most applications coming on line today, the majority of work is related to cloud-based applications. Due to this, a significant amount of time is spent with agency project managers and security personnel, and often vendors, to understand data flows to ensure the security controls that are in place to protect and monitor data moving to and from the state government network, as well as those controls implemented around and within the externally hosted environment. FedRAMP compliance or review of independently conducted security controls audits are also used to gain the necessary security posture insight. As the State modernizes business capabilities, it has driven a large increase in work for the SDR team, who still maintain the initial 4-person team. There is currently a large backlog of projects awaiting review. A tiring criterion has recently been established to identify projects for minimal review versus those that require comprehensive review, so not all projects that require SDR review go through the same steps, which has helped alleviate the backlog. While OCS recognizes the need to expand the team to reduce backlog, funding is not available to pursue further hiring.
In addition to simply reviewing projects, the SDR team also provides consultation services to projects to assist in their implementation of controls identified by the state’s IT security standards. SDR process workflow and documentation is managed through a home-built client relationship manager (CRM).
Cybersecurity Training and Education
WA is heavily invested in a sound security awareness program provided via the SANS Securing the Human offering. Awareness training for all personnel is mandatory; however, the execution of the training is manual. The State is able to customize some of the training modules to address State-specific requirements.
The State CISO lacks funding and resources to establish a comprehensive security workforce development program, e.g. staff technical training, CISO training, etc., but has still made some progress working with industry on developing the State's security workforce competencies with a listing of the top 9 position-based requirements derived from the NIST 200 competencies: computer and network defense infrastructure engineer; computer network defense analyst, incident response analyst, red team/penetration test analyst, digital forensics examiner, infosec risk analyst, risk management auditor, software developer/secure coder, and infosec architect, security server administrator.
The State Deputy CISO conducts a voluntary monthly meeting for all State agency CISOs, which is typically attended by ten to twenty CISOs. In addition to the OCS technical and management staff, OCS staff includes a media and communications coordinator who maintains an OCS web site with consumer information on cybersecurity, produces OCS reports and statewide communications related to specific security events, and handles security communications with the state Legislature, Governor, media, and public. In addition to incident response communications, the coordinator is responsible for social media and creates content for OCS events, including a web-based security awareness campaign for state employees.
The State CISO received funding via decision package in the 2018 legislative session to establish the Web Application, Certification and Accreditation Program, WACAP, which is an initiative to train application developers in secure coding practices. WACAP also will provide secure code analysis tools for developers to check web applications for coding vulnerabilities. The program is currently preparing to conduct language specific training and is in the process of purchasing code analysis tools and setting up a governance board.
Page 716 of 851
. .
Cybersecurity Leadership in Government
The WA State CISO role was created by the State Legislature in 2004. The current CISO took the role in 2005, reporting to the State CIO. The WA State CISO is appointed by the State CIO, who, in turn, is appointed by the Governor.
A key responsibility of the CISO, as defined in the RCW, is to be a leader in both Washington State and beyond. Washington wants to lead the nation in programmatic security, and as such, the State CISO has been a leader and driver of national initiatives. The State CISO is currently working with NASCIO to normalize audit criteria across the major federal audit frameworks such as IRS and HIPAA.
Given rapid advancements in technology, and sharp growth in both the volume and sophistication of cyber-attacks, the State CISO believes the State must continue to promote a culture of security. The current State CISO continues to work with WaTech and State decision makers to change the conversation from technical (technology-centric) to business enablement.
OCS reported that they do not currently have a good way to drive decisions statewide around security risk (shared risk across agencies). OCS advises the WA Technology Services Board (TSB), which is the State’s enterprise technology and services governance panel comprised of legislators, directors of large agencies and large industry vendors. The charter of the TSB is to provide oversight and policy on services provided by the State. While the TSB is not security-specific and tends to focus only on larger IT projects, the Office of the CIO reports to and participates with the TSB.
The State CISO has both delegated and assumed State authority due to her position, but stated that she tries not to use it to move the state security program forward, preferring instead to use persuasion. The State CISO has attempted to establish a state security program that provides assistance to state agencies rather than simply levying policy and monitoring for compliance. The State CISO has observed that many agencies request OCS support (e.g., SOC alerts, security assessments, etc.) and provide her with feedback that OCS helps them better prioritize their security investments.
State policy requires annual self-attestation by all agencies related to security policy compliance. Annual agency security posture self-attestations are tracked by OCS via MS Excel spreadsheet, and trends are periodically reviewed within OCS. However, there is currently no outward or upward trend reporting to either agency or State stakeholders, and OCS does not have the manpower needed to monitor and maintain pressure. OCS also noted that they are dependent on agency self-reporting for security issues, and they are incentivized to maintain a relationship with agencies that encourages them to disclose more information about their security posture.
Page 717 of 851
. .
(3571) Forensics Investigation and Consulting
Background
Forensics Investigation was established in the Office of Cybersecurity (OCS) in November FY17 to conduct forensic examinations on behalf of customer agencies for court-recognized expert-level investigations of electronic media
The Digital Forensics service provided support to agency human resources staff for just cause investigations, to agency security teams for root cause identification of incidents, and to agency public disclosure officers for objective retrieval of records in scope of request
The service was established as a one-year pilot project and was discontinued in November 2017. OCS found that the size of the market was in line with their estimates (a caseload of about one investigation per week, or 4 to 5 per month), but given high cost of WaTech agency overhead added on top of base delivery costs created an extra burden that would require processing more cases than feasible, raising rates above the market rate, or lowering staff compensation to a non-competitive level. Therefore, the service could not be provided in a cost recoverable manner
Even though the service has been discontinued, Office of Cybersecurity still receives calls from agencies who are in need of forensics investigations. These agencies now must go through a procurement process and typically pay more for their service needs
A. Service Description
Forensic Investigation included acquisition and analysis of devices capable of storing digital media utilized by an employee or because of a public disclosure request. It included analysis of the digital media provided by an agency including recovery of deleted and/or damaged files, summarizing file types and key word searches; assisting with just cause investigations, reverse engineering malware or any other investigation of devices capable of storing digital media requested by the customer (agency).
B. Statutory Basis for Creation of Service or Program
WaTech delivery of this service was not mandated by statute. This service was created because of agency requests. The cost and development of internal resources for digital investigations at an agency-level are generally unnecessary due to infrequent occurrence. However, at a state enterprise level, these cases in aggregate create a market, which can be more economically met by providing the service centrally.
C. How the Service Fits into the CTS Strategic Plan and Goals
This service is no longer provided by WaTech.
D. Performance Measures used to Measure Effectiveness and Efficiency
Not applicable this service has been discontinued.

Page 718 of 851
. .
E. Current Cost to Maintain the Service
Staffing
Prior to being discontinued, the service had one certified forensic investigator with oversight from a manager who dedicated 5% of their time.
Workload Supported
Not applicable. Service discontinued in November 2017.
Direct, Indirect and Overhead Costs
WaTech’s planned expenses for this biennium are provided in the table below.
Table 369. Forensics Investigation and Consulting Planned Service Expenses
Cost Components FY18 Planned FY19 Planned Cost Details
A Salaries 98,800 0 Service discontinued in FY18
B Benefits 20,400 0 Service discontinued in FY18
E Goods & Services 30,000 0 Service discontinued in FY18
E Internal Purchases 3,500 0 Service discontinued in FY18
T Transfers 42,721 0 Service discontinued in FY18
Total Planned Expenses 195,421 0
Note: Cost details were pulled from “060 Spending Plan 3571 Forensic Services for Allotment 7 25” excel spend plan provided in February 2018; the salary and benefit costs in FY19 assume service is terminated as of November 2017.
F/G. Rate structure CTS is currently billing to customers
Prior to the service being discontinued, customers were charged $1850 per computer/laptop device; $375 per mobile device; $475 for forensic imaging services and $185 per hour for post investigation, consulting, and data review (e.g., public disclosure forensic investigation).
H. Analysis of Current Cost Recoverability
This service was not cost recoverable and it has been discontinued.
Table 370. Forensic Investigation and Consulting Cost Recoverability (Actual FY16-FY18 H1)
Service Income FY16 FY17 FY18 H1
Service Revenue (3571) 0 31,769 18,315
Service Expenses (3571) 0 (65,683) (57,535)
Net Income 0 (33,914) (39,220) Note: Cost recoverability detail pulled from “AFRS Financial Download (Fiscal Years 2016 – Current)”
Table 371. Forensic Investigation and Consulting Cost Recoverability (Forecasted FY18-FY19)
Service Income FY18 FY19
Service Revenue (3571) 197,845 0
Service Expenses (3571) (195,421) 0
Net Income 2,424 0

Page 719 of 851
. .
Note: Forecasted Cost recoverability detail pulled from “060 Spending Plan 3571 Forensic Services for Allotment 7 25” excel spend plan provide in February 2018
I. Service Level Actually Provided Today
Not applicable. This service was discontinued in November 2017.
J. Current Customers
Prior to this service being discontinued, there were seven external customers in FY18. Additionally, the second largest source of revenue was internal sales from WaTech.
Table 372. Forensic Investigation and Consulting Current List of Customers
# Customer FY17 ($) FY17 (%) FY18 H1 ($) FY18 H1 (%)
1 DEPARTMENT OF FISH AND WILDLIFE 5,550 39 5,365
29
2 DEPARTMENT OF EARLY LEARNING 0 0 1,850
10
3 DEPARTMENT OF ECOLOGY 0 0 1,850 10
4 DEPARTMENT OF LABOR AND INDUSTRIES 0 0 1,850
10
5 DEPARTMENT OF ENTERPRISE SERVICES 0 0 1,850
10
6 OFFICE OF MINORITY AND WOMEN'S BUSINESS ENTERPRISES 0 0 1,850
10
7 DEPARTMENT OF NATURAL RESOURCES 0 0 1,203
7
8 DEPARTMENT OF AGRICULTURE 1,850 13 0 0
9 UTILITIES AND TRANSPORTATION COMMISSION 3,700 26 0 0
10 WASHINGTON STATE UNIVERSITY 3,280 23 0 0
Total Top 10 Billable Customers 14,195 51 15,818 86
Total for All Other Billable Customers 0 0 0 0
Total WaTech Internal Sales 13,664 49 2,498 14
Total Revenue 27,859 100 18,316 100
Note: Customer billing details pulled from “Apptio Download – Sales History (FFS and Allocations since 07-2016)” excel file; WaTech internal sales data pulled from “CTS Internal Sales JV Jan 2018”
K. Current and Historical Usage Volumes
The service was created in 2016 and discontinued in November 2017.
L. Customer Satisfaction and Future Demand
The Customer Voice appendix to this report includes customer satisfaction and future demand details based on the results of agency interviews and focus groups conducted during the project.

Page 720 of 851
. .
M. High Level Architecture
Not applicable. This service was discontinued in November 2017.

Page 721 of 851
. .
Addendum. Further Considerations for Zero-Based Review
In addition to the revenue and expenses outlined in the report above, WaTech also had the following current year and prior year items.
Table 373. Zero-Based Budget – Additional Revenue and Expenses (Current Year FY18)
Cost Code Service Income FY16 FY17 FY18 H1
Not Specified 900,000 1,500,000 743,732
1111 Human Resources 46,459 117,283 0
1114 CTS Facilities 112,110 106,070 32,157
1121 Finance Office 11,193 6,595 2,033
1153 Wheeler Allocation Pool 13,794,991 13,794,991 6,907,561
1154 Wheeler Office Complex 4,284,618 4,362,072 2,168,934
2221 Zero Based Budget Review 0 0 250,000
3443 Network Pass Through Services 316,933 232,301 69,114
3343 Telephone Services Chargeback 514,660 732,150 0
4240 CSD Pass Through Services 257,849 154,499 151,289
4804 Data Center Services Chargeback 39,874 970
8120 OFM/Gov Pass-Through Services 73,740 166,197 92,593
8130 DES Pass-Through Services 38,001 65,648 1,908
8510 Warrants 595,276 575,142 257,543
1111 Human Resources (39,347) (16,779) (6,501)
1114 CTS Facilities 0 0 (300,000)
1121 Finance Office 0 0 (119)
1153 Wheeler Allocation Pool (12,554,666) (12,557,271) (6,275,491)
1154 Wheeler Office Complex (4,830,527) (4,908,434) (2,475,400)
1280 Statewide Trails Project (1,571) 0 (134)
3443 Network Pass Through Services (253,715) (186,285) (45,938)
3343 Telephone Services Chargeback (354,631) (128,256)
4240 CSD Pass Through Services (160,126) (149,599) (138,229)
4804 Data Center Services Chargeback 0 (38,912) (927)
8120 OFM/Gov Pass-Through Services (71,418) (162,937) (92,385)
8130 DES Pass-Through Services (36,327) (63,311) (1,824)
8510 Warrants (430,952) (425,220) (215,999)
Revenue Total 20,945,830 21,852,822 10,677,834
Expense Total (18,733,278) (18,637,004) (9,552,947)
Net Income 2,212,552 3,215,818 1,124,887

Page 722 of 851
. .
Table 374. Additional Historical Revenue and Expenses
Cost Code Service Income FY16 FY17 FY18 H1
4438 CSD Unisys DSHS Tailored Service 3,152,583 0 0
8901 Tla DES (Ets) Cap 15,800 0 0
8670 One-Stop Portal (Wabos) 838,893 829,925 0
1123 Office of Legal Services 0 12,555 0
3523 Enterprise Security Infrastructure Pass 29,902 13,648 0
1155 Strategic Architecture 49,955 0 0
2110 Professional Services 3,358 5,058 0
4530 System 390 Metered Services 2,331,785 0 0
4561 System 390 Tailored Services 2,197,678 0 0
4438 CSD Unisys DSHS Tailored Service (3,253,159) 92,576 0
1251 State IT & Child Care SYS Plan (519,279) 0
1252 Payment Eligibility IT SYS Oversight (10,480) (220,511) 0
8901 Tla DES (Ets) Cap (17,520) 0
8670 One-Stop Portal (Wabos) (731,311) (776,527) 0
1123 Office of Legal Services 0 (26) 0
1128 Agency Desktop & Lan 0 99 0
3523 Enterprise Security Infrastructure Pass (31,215) 0 0
3521 Enterprise Security Infrastructure Rev (1,209,133) (858,561) 0
4530 System 390 Metered Services (1,610,837) 0 0
4561 System 390 Tailored Services (1,661,939) 0 0
3485 Intergovernmental Network (4) 0 0
3491 State Governmental Network (109) 0 0
3493 Public Governmental Network (2) 0 0
Revenue Total
8,619,953 861,186 0
Expense Total (9,044,758) (1,762,950) 0
Net Income (424,805) (901,764) 0

Page 723 of 851
. .
Appendix – Benchmark Results

Page 724 of 851
. .
Appendix – Current State Inventory (Benchmark Results)
Gartner has conducted two parallel benchmarks of WaTech operations, a Spending and Staffing Benchmark and a Service Catalog Rate Assessment.
The Spending and Staffing Benchmark compared WaTech against peer organizations that were selected based on industry, scale and complexity.
The Spending and Staffing Benchmark is based on Gartner Consensus Models and does not necessarily align with the WaTech accounting or organizational structure.
Spending and staffing levels have been normalized to peers based on Gartner definitions for cost elements and labor activities.
The scope of this analysis included spending in fiscal year 2018 along with forecasted spend through year end. The analysis includes $56.1M and 180.4 FTEs.
The Service Catalog Rate Assessment compared WaTech service rates to peers selected from Gartner’s cost benchmark database as well as other State Government rates for similar services.
Peer rates have been normalized to WaTech service definitions for its fiscal year 2018 rate schedule (inclusive of rate changes made in January of 2018).
Based on unit prices and forecasted service consumption, total revenue collected in the Service Catalog Rate Assessment are $61.8M.
The difference in the scope of the two benchmarks is due to Gartner definitions that require an alignment of total cost, staff and workload for defined IT functional areas. These functional areas do not align completely with WaTech service delivery that often delivers some of what would be included in Gartner’s Spending and Staffing Benchmark.
An example of this is Data Management — Gartner would include database/database management software cost in Enterprise Computing along with all database server hardware and physical database support costs, while WaTech delivers this as a stand-alone service to departments that may provide their own servers.
WaTech fiscal year 2018 actual expenditures for service delivery totaled $162M, while the scope of the Gartner Spending and Staffing benchmark included $56.1M in costs.
Note that costs are excluded from the Spending and Staffing Benchmark to align with Gartner definitions (e.g., excluding capital and including depreciation when feasible, or excluding Mainframe applications software); where workload, staffing and spending are not all inclusive (e.g., some customer site costs under Data Networks are excluded from peer data as hardware and labor are not WaTech responsibilities at a subset of sites); and where the costs were not the focus of this benchmark effort, e.g., enterprise applications.

Page 725 of 851
. .
IT Staffing and Spending Benchmark – Overview
This IT Spending and Staffing Benchmark is aligned with Gartner Consensus Models, not to the WaTech Rate Structure. Some allocations of indirect cost are similar, but service definitions, costs and organization groups do not always align.
Figure 140. Gartner Consensus Model Considerations (Cost, Staffing and Workload)
Gartner benchmarks generally provide a “total cost” perspective of IT. In order for benchmark results to be accurate, it is imperative that costs, staffing levels, and workload are reported in a balanced manner. Where workload is reported, all costs and staff must also be reported, regardless of where they are held in the organization. Cost and staff within a central IT organization as well as other lines of business all should be reported.
Consistent definitions of costs elements (and accounting methods), labor activities, measures of workload and service levels ensure comparability of performance to organizations that may have diverse accounting and reporting structures.
Gartner benchmarks are based on Consensus Models that include well-documented data definitions for each benchmarked IT tower. The consensus model for each IT tower is supported by data definitions for each data element. Gartner consultants have worked with WaTech during the project to help interpret and clarify definitions to ensure results are comparable and accurate.
Peer groups are selected for each IT tower based on workload and complexity within the IT tower. The spending and support profile of each peer group is used to simulate what the comparative group would spend to support WaTech’s workload.
Results are displayed in comparison with three peer group reference points:
Peer Average: representing the average for the comparative group
Peer 25th Pctl: representing the lowest quartile (most efficient) for the comparative group

Page 726 of 851
. .
Peer 75th Pctl: representing the highest quartile (least efficient) for the comparative group
Differences in spending and other metrics derived from the analysis provide insight into opportunities for increased cost efficiency and reduced risk.
IT Staffing and Spending Benchmark – Details
Gartner conducted a cost benchmark for the following areas: Data Network (Wide-Area Network, Internet Access Services, Inter/Intra Data Center
Connectivity)
End-User Computing and Local-Area Network
Mainframe Enterprise Computing
Windows and Linux Enterprise Computing
Voice (Premise – PBX/VoIP)
Voice (Long Distance)
Gartner focused the cost benchmark on several areas of high spend. Constraints of available benchmark data, as well as availability of WaTech data, influenced the focus areas. Some of the services that WaTech delivers cannot be isolated within the benchmark data which is part of the reason why Gartner pairs the rate analysis with the cost benchmark.
Critical elements of the relevant Consensus Models are described below.
Data Network (Wide-Area Network, Internet Access Services, Inter/Intra Data Center Connectivity):
Hardware: routers, firewall, DNS/DHCP, accelerators, IAS and proxy servers, network management/NOC, including any disaster recovery hardware.
Software: Security, and Network Management, including any disaster recovery software.
Transmission: MPLS, ATM, frame relay, leased lines, VPN, internet access and usage.
Personnel: technical support (operations and technical services), planning and process management, and administration (including management, e.g., procurement, billing, customer relationship management, etc.).
End-User Computing and Local-Area Network:
Hardware: desktops, laptops, tablets, thin clients and handhelds. VDI servers and storage, local and shared printers, including disaster recovery hardware. Also includes switches, routers, firewalls, DNS/DHCP.
Software: PC operating systems, personal productivity, personal databases, messaging and groupware, mobile device management, network management, and security, including disaster recovery software.
Personnel: technical support (operations and technical services), planning and process management, and administration (including management, e.g., procurement, billing, customer relationship management, etc.).
Mainframe Enterprise Computing:

Page 727 of 851
. .
Hardware: mainframe processors and internal disk storage, including any disaster recovery hardware.
Software: operating systems, virtualization, database/database management, middleware, messaging, and security, including any disaster recovery software.
Personnel: technical support (operations and technical services), planning and process management, and administration (including management, e.g., procurement, billing, customer relationship management, etc.).
Windows and Linux Enterprise Computing:
Hardware: server processors and internal disk storage, including any disaster recovery hardware.
Software: operating systems, virtualization, database/database management, middleware, messaging, and security, including any disaster recovery software.
Personnel: technical support (operations and technical services), planning and process management, and administration (including management, e.g., procurement, billing, customer relationship management, etc.).
Voice (Premise – PBX/VoIP):
Hardware: TDM PBX, VoIP/IPT servers, voicemail, phones, MAC Supplies, including disaster recovery hardware.
Software: voice switch, VoIP/IPT servers, voicemail, network management and billing/chargeback, including disaster recovery software.
Transmission: local calling trunk lines, and number blocks.
Personnel: technical support (operations and technical services), planning and process management, and administration (including management, e.g., procurement, billing, customer relationship management, etc.).
Voice (Long Distance):
Hardware: trunk interface cards, private network hardware, tandem switches, MUXx, channel banks, including disaster recovery hardware.
Software: Voice network management, and chargeback/billing, including disaster recovery software.
Transmission: access lines, outbound and inbound usage, leased lines, client owned and maintained transmission facilities.
Personnel: technical support (operations and technical services), planning and process management, and administration (including management, e.g., procurement, billing, customer relationship management, etc.).
Gartner made several adjustments to the data to ensure alignment to peers.
Eliminated internal sales (cross-charges) to avoid double counting cost.
Removed non-personnel overhead cost, and removed HR labor (other overhead labor aligns to benchmark personnel-related costs).

Page 728 of 851
. .
Across each of the cost benchmark areas, Gartner made additional adjustments to align WaTech cost with the peer group for an appropriate comparison. These specific adjustments are called out in the sections below.

Page 729 of 851
. .
Data Network (Wide-Area Network, Internet Access Services, Inter/Intra Data Center Connectivity)
This section covers Data Network (Data Center Connectivity, Wide-Area Network and Internet Access Services) related spending and staffing.
Data Network peer selection is based on WaTech’s workload of total sites (747), total circuits (1,263), total port bandwidth (142,460 Mbps) and total users (60,000). It also includes peer costs for data center network support based on 3,730 MIPS, 987 physical servers and 3,657 TBs raw configured storage.
The peer group includes 11 Government entities.
Table 375. Data Network Spend Details ($)
Spend Details WaTech
Cost Peer Avg
Cost Peer 25th Pctl Cost
Peer 75th Pctl Cost
Variance from Avg.
Hardware and Software 3,629,823 6,108,577 3,677,942 8,426,622 -41%
Transmission 8,516,103 10,174,413 6,361,367 13,291,543 -16%
Personnel 7,129,199 5,272,122 3,144,044 7,368,821 35%
Totals 19,275,125 21,555,112 13,183,353 29,086,986 -11% Note: Cost data is annualized for FY18. In order to align WaTech data to the consensus model, Gartner started with FY18 spend for the Data Network allocation and Cloud and Office VPN costs. Gartner made an adjustment to peer data to exclude a percentage of WAN site cost that is the responsibility of the customers (hardware, software, and labor) given shared effort between the agencies and WaTech (i.e., the 62% of CE equipment purchased by customers and therefore not reflected in WaTech costs, and estimated 62% of site labor and software costs also covered directly by agencies). Gartner used a five year average of hardware and software spend (capital expenses and maintenance) from the lifecycle cost estimate in place of the specific spend for FY18 as a more accurate straight-lined view of annual spend (accurate depreciation information was not available). The Transmission cost category includes vendor circuits and fiber leases, and pole rentals, and internet fee. Gartner made an assumption that roughly ten percent of traffic is voice traffic and realigned ten percent of data network transmission to the PBX/VoIP cost accordingly. Gartner then excluded portions of overhead and internal sales to align to the consensus model definitions.
Table 376. Data Network Staffing Details (FTEs)
Staffing Details WaTech Peer Avg Peer 25th
Pctl Peer 75th
Pctl Variance from Avg.
FTE 57.4 48.9 22.4 64.8 17% Note: In order to align WaTech FTEs to the consensus model, Gartner included staff aligned to Data Network and Office and Cloud VPN, and excluded the HR portion of overhead FTEs.

Page 730 of 851
. .
End-User Computing and Local-Area Network
This section covers End-User Computing and Local-Area Network related spending and staffing.
End-User Computing and Local-Area Network peer selection is based on WaTech’s workload of 2,518 end-user devices (desktop/laptop/tablet) and 5,185 active Local-Area Network ports. The peer group includes 13 Government entities.
Table 377. End-User Computing and Local-Area Network Spend Details ($)
Spend Details WaTech
Cost Peer Avg
Cost Peer 25th Pctl Cost
Peer 75th Pctl Cost
Variance from Avg.
Hardware 1,140,000 1,190,634 867,121 1,465,113 -4%
Software 556,875 684,894 513,685 820,194 -19%
Personnel 2,979,115 1,650,087 1,220,837 2,001,496 81%
Totals 4,675,990 3,525,615 2,601,643 4,286,803 33% Note: Cost data is annualized for FY18. In order to align WaTech data to the consensus model, Gartner started with FY18 spend for the Desktop/LAN costs and made required adjustments. WaTech was not able to provide a straight-lined five year view of life-cycle refresh equipment purchases for this service, and equipment depreciation details are not available as most purchases are under the threshold for capitalization. Therefore, the value used for capital hardware expenditure is WaTech’s annual estimate for lifecycle refresh this biennium. Gartner excluded portions of overhead and internal sales to align to the consensus model definitions.
Table 378. End-User Computing and Local-Area Network Staffing Details (FTEs)
Staffing Details WaTech Peer Avg Peer 25th
Pctl Peer 75th
Pctl Variance from Avg.
FTE 27.9 18.3 13.6 22.1 52% Note: In order to align WaTech FTEs to the consensus model, Gartner included staff aligned to Desktop, and excluded the HR portion of overhead FTEs.

Page 731 of 851
. .
Mainframe Enterprise Computing
This section covers Mainframe related spending and staffing.
Mainframe peer selection is based on WaTech’s workload of 1,639 general purpose MIPS and 2,091 IFL MIPS. zIIP MIPS have been excluded as they largely unused.
The peer group includes six Government entities.
Table 379. Mainframe Enterprise Computing Spend Details ($)
Spend Details WaTech
Cost Peer Avg
Cost Peer 25th Pctl Cost
Peer 75th Pctl Cost
Variance from Avg.
Hardware 773,382 976,321 583,638 1,262,815 -21%
Software 6,730,913 5,647,065 3,375,778 7,304,157 19%
Disaster Recovery 568,644 437,734 261,675 566,185 30%
Personnel 3,361,801 4,551,934 2,721,116 5,887,668 -26%
Totals 11,434,740 11,613,054 6,942,207 15,020,825 -2% Note: Cost data is annualized for FY18. In order to align WaTech data to the consensus model, Gartner started with FY18 spend for the Mainframe costs. Gartner replaced the debt service payment with annual depreciation for better alignment of hardware costs. The SunGard contract is aligned to disaster recovery spend. Gartner excluded portions of overhead and internal sales to align to the consensus model definitions.
Table 380. Mainframe Enterprise Computing Staffing Details (FTEs)
Staffing Details WaTech Peer Avg Peer 25th
Pctl Peer 75th
Pctl Variance from Avg.
FTE 29.1 38.9 23.2 50.3 -25% Note: In order to align WaTech FTEs to the consensus model, Gartner included staff aligned to Mainframe (High Capacity Compute), and excluded the HR portion of overhead FTEs.

Page 732 of 851
. .
Windows and Linux Enterprise Computing
This section covers Windows and Linux Servers related spending and staffing.
Windows peer selection is based on WaTech’s workload of 1,267 Operating System Instances (across all environments including the Private Cloud, Platform & Connectivity, and Managed Servers). The peer group includes 12 Government entities.
Linux peer selection is based on WaTech’s workload of 325 Operating System Instances (across all environments including the Private Cloud, Platform & Connectivity, and Managed Servers). The peer group includes 7 Government, 1 Utility, and 1 Hospital.
Table 381. Windows and Linux Enterprise Computing Spend Details ($)
Spend Details WaTech
Cost Peer Avg
Cost Peer 25th Pctl Cost
Peer 75th Pctl Cost
Variance from Avg.
Hardware 1,278,202 1,044,961 835,186 1,204,582 22%
Software 1,467,175 2,076,852 1,663,768 2,394,820 -29%
Personnel 4,672,277 3,319,968 2,653,314 3,827,068 41%
Totals 7,417,654 6,441,781 5,152,268 7,426,469 15% Note: Cost data is annualized for FY18. In order to align WaTech data to the consensus model, Gartner started with Private Cloud, Managed Server and Platform and Connectivity FY18 spend. WaTech costs were adjusted to align to the consensus model by augmenting cost to reflect full support costs on a per server basis which was estimated based on managed server environment support costs. Gartner excluded Platform and Connectivity costs that are unrelated to managed server support. Gartner excluded portions of overhead and internal sales to align to the consensus model definitions.
Table 382. Windows and Linux Enterprise Staffing Details (FTEs)
Staffing Details WaTech Peer Avg Peer 25th
Pctl Peer 75th
Pctl Variance from Avg.
FTE 36.1 29.7 23.7 34.3 22% Note: In order to align WaTech FTEs to the consensus model, Gartner included staff aligned to Private Cloud, Managed Server, and half of Platform and Connectivity. Private Cloud and Managed Server staffing was then adjusted based on the managed server cost of $243 per server for support (currently supporting 176 servers at a cost of $500k) in order to align costs to peers under a fully supported model. Finally Gartner excluded the HR portion of overhead FTEs.

Page 733 of 851
. .
Voice (Premise – PBX/VoIP)
This section covers PBX/VoIP related spending and staffing.
PBX/VoIP peer selection is based on 53,115 active PBX/VoIP lines. The peer group includes 9 Government entities.
Costs for PBX/VoIP reflect a large ongoing project to convert to VoIP.
Table 383. Voice (Local PBX/VoIP) Spend Details ($)
Spend Details WaTech
Cost Peer Avg
Cost Peer 25th Pctl Cost
Peer 75th Pctl Cost
Variance from Avg.
Hardware 879,880 1,978,633 1,691,288 2,222,572 -56%
Software 5,388,940 883,531 755,221 992,459 510%
Transmission 1,840,234 5,673,538 4,849,604 6,373,009 -68%
Personnel 3,276,554 2,011,160 1,719,091 2,259,109 63%
Personnel (Outsource) 907,000 - - -
Totals 12,292,608 10,546,862 9,015,204 11,847,149 17% Note: Cost data is annualized for FY18. In order to align WaTech data to the consensus model, Gartner started with FY18 spend for the PBX/VoIP. Costs for upgrades and conversions (almost $2M) and new site installations ($500k) were split apart into hardware, software, and outsourced labor components, and hardware depreciation was added. Gartner made an assumption that roughly ten percent of traffic is voice traffic and realigned ten percent of data network transmission to the PBX/VoIP cost accordingly. Gartner excluded portions of overhead and internal sales to align to the consensus model definitions.
Table 384. Voice (Local PBX/VoIP) Staffing Details (FTEs)
Staffing Details WaTech Peer Avg Peer 25th
Pctl Peer 75th
Pctl Variance from Avg.
FTE (Outsource) 5.4 - - -
FTE 29.9 21.1 18.0 23.7 42% Note: In order to align WaTech FTEs to the consensus model, Gartner started with the PBX/VoIP spend plan and augmented staffing with outsource FTEs (assuming 125% of the per FTE insourced cost). Finally Gartner excluded the HR portion of overhead FTEs.

Page 734 of 851
. .
Voice (Long Distance)
This section covers Voice (Long Distance) related spending and staffing.
Long Distance peer selection is based on WaTech’s workload of 21,080,916 minutes per year. The peer group includes 3 Government, 5 Utilities, and 2 Insurance.
Table 385. Voice (Long Distance) Spend Details ($)
Spend Details WaTech
Cost Peer Avg
Cost Peer 25th Pctl Cost
Peer 75th Pctl Cost
Variance from Avg.
Hardware and Software - 21,288 15,358 26,338 -100%
Transmission 576,000 596,976 355,549 785,135 -4%
Personnel 477,066 122,096 88,086 151,061 291%
Totals 1,053,066 740,360 458,993 962,534 42% Note: Cost data is annualized for FY18. In order to align WaTech data to the consensus model, Gartner started with FY18 spend for Switched Long Distance. Carrier pass-through costs are reflected in the Transmission category. Gartner excluded portions of overhead and internal sales to align to the consensus model definitions.
Table 386. Voice (Long Distance) Staffing Details (FTEs)
Staffing Details WaTech Peer Avg Peer 25th
Pctl Peer 75th
Pctl Variance from Avg.
FTE 5.0 1.1 0.8 1.4 355% Note: Note: In order to align WaTech FTEs to the consensus model, Gartner included staff aligned to Long Distance, and excluded the HR portion of overhead FTEs.

Page 735 of 851
. .
IT Service Catalog Rate Assessment – Overview
An IT Service Catalog Rate Assessment compares your WaTech service rates with the rates or equivalent unit costs of other IT service providers and peer organizations.
This comparison is made on two levels:
Charges or costs for specific services (e.g., Email)
Charges or costs for a standard market-basket of IT services (desktop, email, storage, hosting, etc.)
Peer organizations are selected using size (workload), complexity, technology and service-level factors, among others, to ensure a like-to-like rate comparison for each service.
Service rate benchmarking requires:
An IT service catalog describing WaTech services, rates, and service levels
Service volumes and other environmental information
A comprehensive set of costs from hundreds of IT service providers, which Gartner will provide via our benchmarking database
Gartner executed the following three step methodology to complete this rate assessment.
1. Understanding your environment Conducted a series of interviews with WaTech service owners and finance personnel in
order to fully understand all relevant aspects of WaTech service catalog and service rates.
Documented the services in the current state inventory section of this document in order to capture updated service descriptions, technical details and rate details to enable a more accurate rate assessment
2. Peer selection and normalization With an understanding of WaTech’s service catalog and technical environment, Gartner
selected a set of peers to use for comparison.
Gartner then performed a series of normalization processes on recent cost data in the Gartner benchmarking database, ensuring like-for-like comparison of WaTech service rates with peer service rates; these normalization processes encompass:
Scope
Geographic distribution
Employed technologies
Environment supported
Service-level commitments
Terms and conditions
Labor market factors
3. Aligning rate structures and rates Where the level of detail in Service Offerings is greater than the level of detail in the
Gartner benchmark database, Gartner calculates comparable rates using a dollar weight averaging approach.
Page 736 of 851
. .
Gartner calculates total peer costs (revenue) to support a similar overall environment (peer unit cost times WaTech billed units).
4. Final report These rate comparison details have been pulled into this comprehensive report that
compares the competitiveness of WaTech service rates with the normalized service rates of WaTech’s peers.
Not all WaTech rates are included in this analysis. Pass-through, allocation, and service agreement-based rates are generally excluded. Some rate comparisons are based on averages for a category rather than individual rates.
Long distance is compared only to the average WaTech rates.
Desktop and LAN are compared as a blended rate.
Peer rates have been drawn from two sources: Gartner’s benchmark database, using peers from the IT Spending and Staffing Benchmarks, Gartner has reallocated peer costs from the Gartner benchmark cost structure to the WaTech’s rate structure; and State Service Catalogs, where Gartner has researched other state service catalogs and rates and included rates in peer calculations where services and rates are aligned with WaTech.
Overall, total WaTech costs recovered from reported rates and billed quantities are about 25% higher than peers would generate for similar services, $61.8M vs. $49.3M.
IT Service Catalog Rate Assessment – Details
IT Service Catalog Rate Assessment details follow in the subsections below:
Network & Telephony services
Platform Services
Security & Identity Services
Workspace Services
Application Services
IT Programs
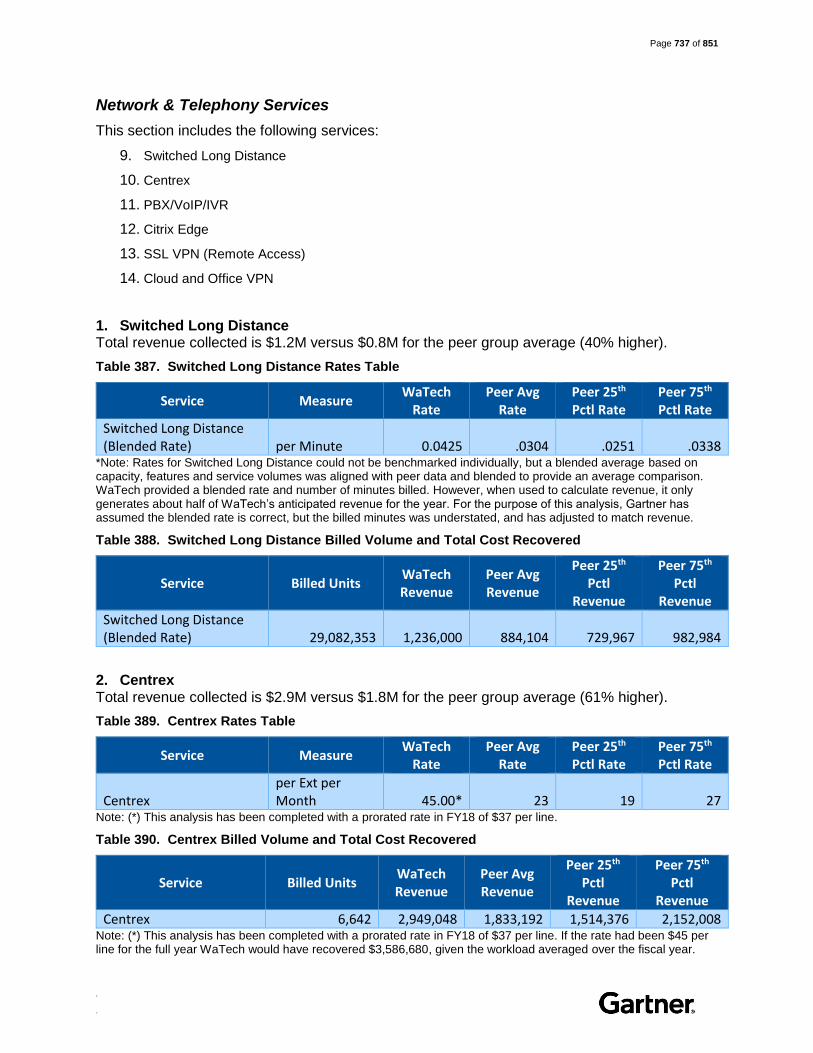
Page 737 of 851
. .
Network & Telephony Services
This section includes the following services:
9. Switched Long Distance
10. Centrex
11. PBX/VoIP/IVR
12. Citrix Edge
13. SSL VPN (Remote Access)
14. Cloud and Office VPN
1. Switched Long Distance Total revenue collected is $1.2M versus $0.8M for the peer group average (40% higher).
Table 387. Switched Long Distance Rates Table
Service Measure WaTech
Rate Peer Avg
Rate Peer 25th Pctl Rate
Peer 75th Pctl Rate
Switched Long Distance (Blended Rate) per Minute 0.0425 .0304 .0251 .0338
*Note: Rates for Switched Long Distance could not be benchmarked individually, but a blended average based on capacity, features and service volumes was aligned with peer data and blended to provide an average comparison. WaTech provided a blended rate and number of minutes billed. However, when used to calculate revenue, it only generates about half of WaTech’s anticipated revenue for the year. For the purpose of this analysis, Gartner has assumed the blended rate is correct, but the billed minutes was understated, and has adjusted to match revenue.
Table 388. Switched Long Distance Billed Volume and Total Cost Recovered
Service Billed Units WaTech Revenue
Peer Avg Revenue
Peer 25th Pctl
Revenue
Peer 75th Pctl
Revenue
Switched Long Distance (Blended Rate) 29,082,353
1,236,000
884,104
729,967
982,984
2. Centrex Total revenue collected is $2.9M versus $1.8M for the peer group average (61% higher).
Table 389. Centrex Rates Table
Service Measure WaTech
Rate Peer Avg
Rate Peer 25th Pctl Rate
Peer 75th Pctl Rate
Centrex per Ext per Month 45.00* 23 19 27
Note: (*) This analysis has been completed with a prorated rate in FY18 of $37 per line.
Table 390. Centrex Billed Volume and Total Cost Recovered
Service Billed Units WaTech Revenue
Peer Avg Revenue
Peer 25th Pctl
Revenue
Peer 75th Pctl
Revenue
Centrex 6,642 2,949,048 1,833,192 1,514,376 2,152,008 Note: (*) This analysis has been completed with a prorated rate in FY18 of $37 per line. If the rate had been $45 per line for the full year WaTech would have recovered $3,586,680, given the workload averaged over the fiscal year.

Page 738 of 851
. .
3. PBX/VoIP/IVR Total revenue collected is $16.4M versus $12.3M for the peer group average (33% higher).
Table 391. PBX/VoIP/IVR Rates Table
Service Measure WaTech
Rate Peer Avg
Rate Peer 25th Pctl Rate
Peer 75th Pctl Rate
Private Branch Exchange (PBX)/VoIP
per Ext per Month 24 (*) 18 13 20
IVR Standard per Port per Month 120 94 70 117
Note: (*) WaTech also offers a $2 per seat/month discount for lines partially managed by agency staff. Fourteen percent of lines include some agency management. This analysis has been completed assuming consistent level of support across all lines in order to align peer rates.
Table 392. PBX/VoIP/IVR Billed Volume and Total Cost Recovered
Service Billed Units WaTech Revenue
Peer Avg Revenue
Peer 25th Pctl
Revenue
Peer 75th Pctl
Revenue
Private Branch Exchange (PBX)/VoIP 53,115 15,297,120 11,472,840 8,285,940 12,747,600
IVR Standard 762 1,097,280 859,536 640,080 1,069,848
Total 53,877 16,394,400 12,332,376 8,926,020 13,817,448
4. Citrix Edge Total revenue collected is $0.042M versus $0.018M for the peer group average (77% lower).
Table 393. Citrix Edge Rates Table
Service Measure WaTech
Rate Peer Avg
Rate Peer 25th Pctl Rate
Peer 75th Pctl Rate
Citrix Account Per Account / Month 6 26 18 34
Table 394. Billed Volume and Total Cost Recovered
Service Billed Units WaTech Revenue
Peer Avg Revenue
Peer 25th Pctl
Revenue
Peer 75th Pctl
Revenue
Citrix Account 589 42,408 183,768 127,224 240,312
5. SSL VPN (Remote Access) Total revenue collected is $1.1M versus $0.67M for the peer group average (63% higher).
Table 395. SSL VPN (Remote Access) Rates Table
Service Measure WaTech
Rate Peer Avg
Rate Peer 25th Pctl Rate
Peer 75th Pctl Rate
SSL VPN with Hard Token Per Account / Month 17.45 10.22 10.31 11.18

Page 739 of 851
. .
Service Measure WaTech
Rate Peer Avg
Rate Peer 25th Pctl Rate
Peer 75th Pctl Rate
SSL VPN with Soft Token Per Account / Month 9.00 6.17 5.00 6.70
Table 396. SSL VPN (Remote Access) Billed Volume and Total Cost Recovered
Service Billed Units WaTech Revenue
Peer Avg Revenue
Peer 25th Pctl
Revenue
Peer 75th Pctl
Revenue
SSL VPN with Hard Token 792,160 463,947 468,033 507,527 792,160
SSL VPN with Soft Token 305,532 209,459 169,740 227,452 305,532
Total 1,097,692 673,406 637,773 734,979 1,097,692
6. Cloud and Office VPN Total revenue collected is $0.53M versus $0.38M for the peer group average (36% higher).
Table 397. Cloud and Office VPN Rates Table
Service Measure WaTech
Rate Peer Avg
Rate Peer 25th Pctl Rate
Peer 75th Pctl Rate
Office and Cloud VPN (Blended Rate)
Per Site-Tunnel / Month 276 197 141 231
Office VPN Site Setup Fee One Time Cost 500 557 443 669 Note: WaTech’s blended rate was calculated as an average of the different recurring rates across both Cloud and Office VPN. The workload for new sites was estimated based on WaTech’s stated growth in FY17 through FY18 and signed new customers
Table 398. Cloud and Office VPN Billed Volume and Total Cost Recovered
Service Billed Units WaTech Revenue
Peer Avg Revenue
Peer 25th Pctl
Revenue
Peer 75th Pctl
Revenue
Office and Cloud VPN Blended Rate 152 503,424 359,328 257,184 421,344
Office VPN Site Setup Fee 50 25,000 27,850 22,150 33,450
Total 528,424 387,178 279,334 454,794

Page 740 of 851
. .
Platform Services
This section includes the following services:
11. SDC/QDC Colocation
12. Mainframe
13. Backup
14. Storage
15. WaServ/Email Vault Storage
16. Server Support Services
17. DB Management Services
1. SDC/QDC Colocation Total revenue collected is $3.8M versus $4.4 for the peer group average (13% lower).
Table 399. SDC/QDC Colocation Rates Table
Service Measure WaTech
Rate Peer Avg
Rate Peer 25th Pctl Rate
Peer 75th Pctl Rate
Half-size (21RU) 2.5 kW Enclosure
Per Enclosure / Month
650
540
456
626
Full-size (42RU) 5 kW Enclosure
Per Enclosure / Month
1,000
1,202
776
1,480
Full-size (42RU) 7.5 kW Enclosure
Per Enclosure / Month
1,500
1,757
1,187
2,344
Full-size (42RU) 10 kW Enclosure
Per Enclosure / Month
2,000
1,930
1,434
2,000
Full-size (42RU) 12.5 kW Enclosure
Per Enclosure / Month
2,500
2,078
1,755
2,409
Table 400. SDC/QDC Colocation Billed Volume and Total Cost Recovered
Service Billed Units WaTech Revenue
Peer Avg Revenue
Peer 25th Pctl
Revenue
Peer 75th Pctl
Revenue
Half-size (21RU) 2.5 kW Enclosure
33
257,400
213,840
180,576
247,896
Full-size (42RU) 5 kW Enclosure
206
2,472,000
2,971,344
1,918,272
3,658,560
Full-size (42RU) 7.5 kW Enclosure
43
774,000
906,612
612,492
1,209,504
Full-size (42RU) 10 kW Enclosure
10
240,000
231,600
172,080
240,000
Full-size (42RU) 12.5 kW Enclosure
2
60,000
49,872
42,120
57,816
Total 3,803,400 4,373,268 2,925,540 5,413,776
2. Mainframe

Page 741 of 851
. .
Total revenue collected is $12.5M versus $8.7M for the peer group average (43% higher).
Table 401. Mainframe Rates Table
Service Measure WaTech
Rate Peer Avg
Rate Peer 25th Pctl Rate
Peer 75th Pctl Rate
System 390 Mainframe Platform Per CPU / Hour
333.41
233.68
139.69
341.53
Note: Only the base rate has been applied in this rate analysis and no discounts have been applied.
Table 402. Mainframe Billed Volume and Total Cost Recovered
Service Billed Units WaTech Revenue
Peer Avg Revenue
Peer 25th Pctl
Revenue
Peer 75th Pctl
Revenue
System 390 Mainframe Platform 37,394
12,467,534
8,738,230 5,223,568
12,771,173
3. Backup Total revenue collected is $0.78M versus $0.2M for the peer group average (290% higher).
Table 403. Backup Rates Table
Service Measure WaTech
Rate Peer Avg
Rate Peer 25th Pctl Rate
Peer 75th Pctl Rate
Server Backup Per GB / Month 0.50 0.13 0.07 0.15
Table 404. Backup Billed Volume and Total Cost Recovered
Service Billed Units WaTech Revenue
Peer Avg Revenue
Peer 25th Pctl
Revenue
Peer 75th Pctl
Revenue
Server Backup 130,560 783,360 203,674 109,670 235,008
4. Storage Given the mix of storage that customers purchased, total revenue collected is $1.35M versus $1.48M for the peer group average (9% lower). WaTech collected 85% more for ultra-high performance, and 6% more for commodity, but collected 20% less for high performance storage.
Table 405. Storage Rates Table
Service Measure WaTech
Rate Peer Avg
Rate Peer 25th Pctl Rate
Peer 75th Pctl Rate
Ultra-High Performance Per GB / Month 1.48 0.80 0.43 0.86
High Performance Per GB / Month 0.36 0.45 0.25 0.47
Commodity Per GB / Month 0.17 0.16 0.09 0.17
Table 406. Storage Billed Volume and Total Cost Recovered
Service Billed Units WaTech Revenue
Peer Avg Revenue
Peer 25th Pctl
Revenue
Peer 75th Pctl
Revenue
Ultra-High Performance 7,587.00 134,745.12 72,835.20 39,148.92 78,297.84

Page 742 of 851
. .
Service Billed Units WaTech Revenue
Peer Avg Revenue
Peer 25th Pctl
Revenue
Peer 75th Pctl
Revenue
High Performance 202,729.00 875,789.28 1,094,736.60 608,187.00 1,143,391.56
Commodity 165,119.00 336,842.76 317,028.48 178,328.52 336,842.76
Total 1,347,377.16 1,484,600.28 825,664.44 1,558,532.16
5. WaServ/Email Vault Storage Total revenue collected is $2.9M versus $2.2M for the peer group average (32% higher).
Table 407. WaServ/Email Vault Storage Rates Table
Service Measure WaTech
Rate Peer Avg
Rate Peer 25th Pctl Rate
Peer 75th Pctl Rate
WaServ Email Storage Fee Per GB / Month 1.27 0.96 0.91 1.04 Note: The per seat portion of this service is captured under Shared Email and is not reflected here. Some peer rates were blended to incorporate backup fees.
Table 408. WaServ/Email Vault Billed Volume and Total Cost Recovered
Service Billed Units WaTech Revenue
Peer Avg Revenue
Peer 25th Pctl
Revenue
Peer 75th Pctl
Revenue
WaServ Email Storage Fee 190,000 2,895,600 2,188,800 2,074,800 2,371,200 6. Server Support Services Total revenue collected is $0.89M versus $0.3M for the peer group average (193% higher).
Table 409. Server Support Services Rates Table
Service Measure WaTech
Rate Peer Avg
Rate Peer 25th Pctl Rate
Peer 75th Pctl Rate
Server Support Service Per Server / Month
422
144
116
175
Table 410. Server Support Services Billed Volume and Total Cost Recovered
Service Billed Units WaTech Revenue
Peer Avg Revenue
Peer 25th Pctl
Revenue
Peer 75th Pctl
Revenue
Server Support Service 176 891,264 304,128 244,992 369,600 7. DB Management Services Total revenue collected is $0.45M versus $0.41M for the peer group average (10% higher).
Table 411. DB Management Services Rates Table
Service Measure WaTech
Rate Peer Avg
Rate Peer 25th Pctl Rate
Peer 75th Pctl Rate
DBA and Data Integration Support Per Hour
160
122
111
127
Monthly DBMS Software Licensing
Per Prod vCPU / Month
75 75
62
87

Page 743 of 851
. .
Note: WaTech also offers a $300 per month (DBMS Platform) and $600 per month (Full Service) DBA service. However, all revenue has been generated through licensing and hourly fees thus far which made those rates the focus of this rate review.
Table 412. DB Management Services Billed Volume and Total Cost Recovered
Service Billed Units WaTech Revenue
Peer Avg Revenue
Peer 25th Pctl
Revenue
Peer 75th Pctl
Revenue
DBA and Data Integration Support 1138 182,080 138,836 126,318 144,526
Monthly DBMS Software Licensing 304 273,600 273,600 226,176 317,376
Total 455,680 412,436 352,494 461,902 Note: Analysis assumes that 60% of FY18 forecast will pay for licenses.

Page 744 of 851
. .
Security & Identity Services
This section includes the following services:
13. Active Directory/ IAM
1. Active Directory/ IAM Total revenue collected is $0.18M versus $0.24M for the peer group average (51% lower).
Table 413. Active Directory/ IAM Rates Table
Service Measure WaTech
Rate Peer Avg
Rate Peer 25th Pctl Rate
Peer 75th Pctl Rate
Enterprise AD (Shared Domain)
Per User / Month
2.14
4.35
3.39
4.94
Note: Analysis only examines the Shared Domain service and does not evaluate the hosted domain rate.
Table 414. Active Directory/ IAM Billed Volume and Total Cost Recovered
Service Billed Units WaTech Revenue
Peer Avg Revenue
Peer 25th Pctl
Revenue
Peer 75th Pctl
Revenue
Enterprise AD (Shared Domain) 4,605
118,256
240,381 187,331
272,984

Page 745 of 851
. .
Workspace Services
This section includes the following services:
11. Desktop/LAN Support
12. Directory Assistance (citizens)
13. Mobile Device Management
14. Shared Email
15. Skype Services
16. WebEx Video Conf.
17. Teleconferencing
18. Wireless (WIFI)
1. Desktop/LAN Support Total revenue collected is $6.5M versus $4.2M for the peer group average (53% higher).
Table 415. Desktop/LAN Rates Table
Service Measure WaTech
Rate Peer Avg
Rate Peer 25th Pctl Rate
Peer 75th Pctl Rate
Desktop/LAN Support Per Device / Month
291.67
190.55
169.07
213.03
Note: Rate comparison incorporates peer LAN and Desktop rates as a blended rate.
Table 416. Desktop/LAN Billed Volume and Total Cost Recovered
Service Billed Units WaTech Revenue
Peer Avg Revenue
Peer 25th Pctl
Revenue
Peer 75th Pctl
Revenue
Desktop/LAN Support 1,853 6,485,574 4,237,070 3,759,441 4,736,935
2. Directory Assistance (citizens) Total revenue collected is $0.1M versus $0.015M for the peer group average (586% higher).
Table 417. Directory Assistance (citizens) Rates Table
Service Measure WaTech
Rate Peer Avg
Rate Peer 25th Pctl Rate
Peer 75th Pctl Rate
Directory Assistance Per Call 14.40 2.10 1.05 4.20
Table 418. Directory Assistance (citizens) Billed Volume and Total Cost Recovered
Service Billed Units WaTech Revenue
Peer Avg Revenue
Peer 25th Pctl
Revenue
Peer 75th Pctl
Revenue
Directory Assistance 7,500 108,000 15,750 7,875 31,500
3. Mobile Device Management Total revenue collected is $0.34M versus $0.38M for the peer group average (10% lower).

Page 746 of 851
. .
Table 419. Mobile Device Management Rates Table
Service Measure WaTech
Rate Peer Avg
Rate Peer 25th Pctl Rate
Peer 75th Pctl Rate
Mobile Device Management
Per Device / Month
5.50
6.10
5.00
7.35
Table 420. Mobile Device Management Billed Volume and Total Cost Recovered
Service Billed Units WaTech Revenue
Peer Avg Revenue
Peer 25th Pctl
Revenue
Peer 75th Pctl
Revenue
Mobile Device Management 5,217
344,322
381,884 313,020
460,139
4. Shared Email Services Total revenue collected is $4.7M versus $5.9M for the peer group average (22% lower). Secure Email was 61% lower, Shared Services Email (Vault) was 20% lower, and Shared Email (Exchange) was 8% lower.
Table 421. Shared Email Services Rates Table:
Service Measure WaTech
Rate Peer Avg
Rate Peer 25th Pctl Rate
Peer 75th Pctl Rate
Shared Services - Email (Exchange)
Per Mailbox / Month 2.65 2.87 2.40 3.25
Shared Services - Email (Vault)
Per Seat / Month 2.25 2.82 2.78 2.86
Secure Email Per Mailbox / Month 0.56 1.44 1.20 1.80
Table 422. Shared Email Services Billed Volume and Total Cost Recovered:
Service Billed Units WaTech Revenue
Peer Avg Revenue
Peer 25th Pctl
Revenue
Peer 75th Pctl
Revenue
Shared Services - Email (Exchange) 2,325,216.00 2,518,252.80 2,105,856.00 2,851,680.00 2,325,216.00
Shared Services - Email (Vault) 1,974,240.00 2,474,380.80 2,439,283.20 2,509,478.40 1,974,240.00
Secure Email 378,719.04 973,848.96 811,540.80 1,217,311.20 378,719.04
Total 4,678,175.04 5,966,482.56 5,356,680.00 6,578,469.60 4,678,175.04
5. Skype Services Total revenue collected is $0.585M versus $0.519M for the peer group average (13% higher).
Table 423. Skype Services Rates Table
Service Measure WaTech
Rate Peer Avg
Rate Peer 25th Pctl Rate
Peer 75th Pctl Rate
Skype Services Per User / Month
3.50
3.10
1.86
3.80

Page 747 of 851
. .
Table 424. Skype Services Billed Volume and Total Cost Recovered
Service Billed Units WaTech Revenue
Peer Avg Revenue
Peer 25th Pctl
Revenue
Peer 75th Pctl
Revenue
Skype Services 13,951 585,942 518,977 311,386 636,166
6. WebEx Video Conf. Total revenue collected is $0.28M versus $0.34M for the peer group average (19% lower).
Table 425. WebEx Video Conf. Rates Table
Service Measure WaTech
Rate Peer Avg
Rate Peer 25th Pctl Rate
Peer 75th Pctl Rate
WebEx account fee Per User /
Month 35 45 43 49
WebEx Toll Free/ Callback (800 Service) Per Minute 0.07 0.05 0.04 0.06
Note: WaTech also charges for a bridging fee, user toll charges, and toll free minutes over 100,000 at a quoted rate, as well as additional storage fees. However, based on availability of peer data in alignment with WaTech offerings, this section is focused on account fees and toll free calling charges.
Table 426. WebEx Video Conf. Billed Volume and Total Cost Recovered
Service Billed Units WaTech Revenue
Peer Avg Revenue
Peer 25th Pctl
Revenue
Peer 75th Pctl
Revenue
WebEx account fee 603 253,260.00 325,620.00 311,148.00 354,564.00
WebEx Toll Free/ Callback (800 Service) 316,514 22,155.98 15,825.70 12,660.56 18,990.84
Total 275,415.98 341,445.70 323,808.56 373,554.84 7. Teleconferencing Total revenue collected is $1M versus $0.8M for the peer group average (29% higher).
Table 427. Teleconferencing Rates Table
Service Measure WaTech
Rate Peer Avg
Rate Peer 25th Pctl Rate
Peer 75th Pctl Rate
Audio Conferencing Call per Minute 0.09 0.07 0.04 0.10
Table 428. Teleconferencing Billed Volume and Total Cost Recovered
Service Billed Units WaTech Revenue
Peer Avg Revenue
Peer 25th Pctl
Revenue
Peer 75th Pctl
Revenue
Audio Conferencing Call 11,799,844 1,061,986 825,989 471,994 1,179,984 8. Wireless (WIFI) Total revenue collected is $0.8M versus $0.6M for the peer group average (32% higher).

Page 748 of 851
. .
Table 429. Wireless (WIFI) Rates Table
Service Measure WaTech
Rate Peer Avg
Rate Peer 25th Pctl Rate
Peer 75th Pctl Rate
Wifi Monthly Recurring Charge
Per Access Point / Month
50
38
25
40
Note: WaTech charges a one-time fee for development of a site plan. Peers charge on average about $1,061 for site design and installation services at a fixed rate, the one-time fee has been excluded from this analysis.
Table 430. Wireless (WIFI) Billed Volume and Total Cost Recovered
Service Billed Units WaTech Revenue
Peer Avg Revenue
Peer 25th Pctl
Revenue
Peer 75th Pctl
Revenue
Wifi Monthly Recurring Charge 1,396
837,600
636,576 418,800
670,080
Note: (*) Monthly recurring calculated based on January rate change. Actual revenue based on the prorated rate would be closer to 13% higher than average peer.

Page 749 of 851
. .
Application Services
This section includes the following services:
15. Project Management
16. Agile Business Analysts
17. UX & Accessibility
18. Web Platform/Design
1. Project Management Total revenue collected is $1.9M versus $1.7M for the peer group average (15% higher).
Table 431. Project Management Rates Table
Service Measure WaTech
Rate Peer Avg
Rate Peer 25th Pctl Rate
Peer 75th Pctl Rate
Project Manager (Internal Rate) Per Hour
140
122
110
130
Table 432. Project Management Billed Volume and Total Cost Recovered
Service Billed Units WaTech Revenue
Peer Avg Revenue
Peer 25th Pctl
Revenue
Peer 75th Pctl
Revenue
Project Manager (Internal Rate) 13,696 1,917,440 1,670,912 1,506,560 1,780,480
Note: Assumes only internal billing (annualized at the same rate as H1).
2. Agile Business Analysts Total revenue collected is $0.08M versus $0.05M for the peer group average (65% higher).
Table 433. Agile Business Analyst Rates Table
Service Measure WaTech
Rate Peer Avg
Rate Peer 25th Pctl Rate
Peer 75th Pctl Rate
Agile Business Analysts Per Hour 160 97 94 102
Table 434. Agile Business Analyst Billed Volume and Total Cost Recovered
Service Billed Units WaTech Revenue
Peer Avg Revenue
Peer 25th Pctl
Revenue
Peer 75th Pctl
Revenue
Agile Business Analysts 502 80,320 48,694 47,188 51,204 Note: No forecast data available. Used the amount billed for FY18 H1 and doubled.
3. UX & Accessibility Total revenue collected is $0.078M versus $0.061M for the peer group average (27% higher).
Table 435. UX & Accessibility Rates Table
Service Measure WaTech
Rate Peer Avg
Rate Peer 25th Pctl Rate
Peer 75th Pctl Rate
UX and Accessibility Consulting 150
118
105
131
150

Page 750 of 851
. .
Table 436. UX & Accessibility Billed Volume and Total Cost Recovered
Service Billed Units WaTech Revenue
Peer Avg Revenue
Peer 25th Pctl
Revenue
Peer 75th Pctl
Revenue
UX and Accessibility Consulting 521
78,150
61,478 54,705
68,251
4. Web Platform/Design One-time site design and set-up fees are higher than peers but ongoing maintenance and support fees are lower. Total revenue collected is $0.33M versus $0.31M for the peer group average (5% higher).
Table 437. Web Platform/Design Rates Table
Service Measure WaTech
Rate Peer Avg
Rate Peer 25th Pctl Rate
Peer 75th Pctl Rate
Setup Fee (one-time) - Simple (Avg Rate) 6,500
3,798
3,485
4,160
6,500
Setup Fee (one-time) - Standard (Avg Rate) 11,500
6,787
6,099
7,280
11,500
Web Hosting (Platform) - Simple (Avg Rate) 200
252
54
303
200
Web Hosting (Platform) - Standard (Avg Rate) 400
439
65
329
400
Note: WaTech also offers complex sites at negotiated pricing. The quote based rates are not included in this analysis. Some hourly peer rates converted to simple and standard site set-up fees. The conversion assumes 40 hours for simple site design and 70 hours for standard, estimated based on an assumed WaTech hourly rate for equivalency.
Table 438. Web Platform/Design Billed Volume and Total Cost Recovered
Service Billed Units WaTech Revenue
Peer Avg Revenue
Peer 25th Pctl
Revenue
Peer 75th Pctl
Revenue
Setup Fee (one-time) - Simple (Avg Rate)
1
6,500
3,798
3,485
4,160
Setup Fee (one-time) - Standard (Avg Rate)
8
92,000
54,296
48,792
58,240
Web Hosting (Platform) - Simple (Avg Rate)
6
14,400
18,144
3,888
21,816
Web Hosting (Platform) - Standard (Avg Rate)
45
216,000
237,006
35,100
177,660
Total 328,900 313,244 91,265 261,876

Page 751 of 851
. .
Appendix – Current State (Voice of the Customer)

Page 752 of 851
. .
Appendix – Current State Inventory (Voice of the Customer)
A key component of the Zero Based Budget Review included reaching out to a representative share of the WaTech customer base to gather feedback relating to customer satisfaction and future demand. The intent of this process was to document feedback from existing customers, as well as perceived advantages and deficiencies in current service offerings. Given the diversity of WaTech clients across a hundred plus Washington State agencies, both large and small, the Gartner team had numerous discussions with both WaTech leadership and the WaTech Customer Account Managers to identify a balanced and demonstrative list of agencies to interview.
The process of gathering customer feedback began by hosting six customer focus groups based on pre-identified technology areas of concentration and performing interviews with roughly twenty agency CIO’s and key staff. In performing these interviews the Gartner team explored customer themes relating to their perception of feature and service levels, perception of price considering WaTech value add and customer plans for future usage. The resulting documentation of these interviews are contained in our report, however Gartner did not associate any comments with specific customers, nor did Gartner validate any of the customer feedback for accuracy.
From the Gartner perspective, a key benefit of gathering customer feedback includes helping WaTech identify potential service gaps, as well as gaps in potential customer understanding of WaTech’s services that will need to be addressed to expand the existing customer base. It was equally important for the integrity of this report that Gartner communicate the voice of customers, both current and potential. Our discussions were intended to reflect customer perception and thus may not always reflect a fully accurate picture. Discrepancies between potential customer perception and WaTech’s perspective presents an opportunity for WaTech to better communicate with and educate this group of agencies.
The Voice of the Customer section follows the formatting of the Current State Inventory.

Page 753 of 851
. .
1. Telephony Services
(3341) Centrex
L. Customer Satisfaction and Future Demand
Perception of Features and Service Levels
Customers of the Centrex service provided largely positive feedback around service definition and service quality:
Several customers stated that they view the support technicians as responsive
A couple customers stated that they had recently stood up new services at new. buildings and they reported that cutover to the new service was a relatively smooth and well-coordinated process.
Perception of Price Considering WaTech Value Add
While customers stated that the Centrex service largely meets their needs, there was a lot of feedback provided around the recent price increase:
Focus group participants stated that they view the service as expensive. They believe the recent price increase took the existing average rate and roughly doubled it to more than twice the market rate (they stated that they believe they are able to go directly to CentryLink and receive a rate of $20/line).
Several agencies stated that they believe it is unclear as to whether or not WaTech is intending to stay in this business, and that WaTech might be using the price hike to reduce usage. Several of these agencies stated that they would go ahead and begin purchasing service directly from carriers.
Customer Plans for Future Usage
Most agencies stated that in the near term they planned to conduct audits to identify inactive lines and lower bills. Many of the agencies participating in the focus group and interviews stated that they intend to migrate away from the service given the recent increase in price. Many of these agencies stated that they intend to purchase services directly from carriers (like CentryLink) in order to keep their costs down.
(3342) Private Branch Exchange
L. Customer Satisfaction and Future Demand
Perception of Features and Service Levels
Agencies provided positive feedback on the PBX/VoIP service:

Page 754 of 851
. .
Several customers stated that they believe PBX/VoIP telephony personnel try to engage with customers as effective partners, and they believe that many of these WaTech staff have good technical skills.
A few customers stated that they have been pleased with the responsiveness of the PBX/VoIP telephony team.
One customer stated that they rarely have issues, and when they have had service issues its been the support vendor’s fault rather than WaTech’s.
Another agency stated that they believe WaTech has always had great service, and as they are now looking to move to VoIP, WaTech has acted as a good partner in helping them define a plan for conversion and in providing some of the potential savings back to them in the form of a lower quoted rate (around 10% savings as quoted).
Agencies also expressed some frustration with the existing PBX and VoIP services:
A couple agencies stated that their PBX solution is a 20 year old platform, and stated that while WaTech has bolted on SIP trunking and a few other things on top, they view Telephony as WaTech executes it as past end of life. These agencies stated that they do not believe WaTech is looking out ahead far enough and they need to refresh their strategy in regard to telephony services.
Several focus group participants stated that they believe Skype for Business has been deliberately crippled so that WaTech can effectively protect the PBX business
Several agencies expressed a desire to see WaTech contract out the PBX refresh rather than complete it slowly overtime, only as current staff are able to make time to complete migrations.
A couple agencies cited poor service quality as a challenge with PBX/VoIP. That they experience a large number of dropped calls, and also stated that they do not receive any sort of availability reports on this (service degradation is not reported effectively even though they have reliability issues). They also stated that WaTech won’t acknowledge all outages they cause and often won’t provide root cause details unless prompted. These agencies want a clear promise of good quality service and do not feel that is what they are getting today.
One agency referenced a VoIP project with a cutover process that was not smooth (citing WaTech’s failure to communicate across siloed groups that was visible to the customer). This agency stated that WaTech needs better communication between WaTech service tiers.
One agency stated that there are some areas where the service provider role is not well defined, e.g., reconciliation and E-911 forms for moves, adds, and changes requests. This agency expressed some frustration with the fact that WaTech is offering a “managed service” but the agency paying for the service still must invest significant staff time above and beyond WaTech’s support.
Perception of Price Considering WaTech Value Add
Several agencies provided feedback on PBX pricing given value added:
Participants in the focus group session stated that WaTech’s pricing model wasn’t always clear to them. Participants cited situations where WaTech had provided different per seat quotes when they had requested the same number of seats on the same PBX, in the same building).
Participants in the interviews and focus groups stated that the rate model doesn’t meet their needs given that it doesn’t include phones and does not include all equipment

Page 755 of 851
. .
refresh (e.g., an agency is responsible to fund their own upgrade from version “X” to “Y” but once they get up to version “Y” then WaTech states that they will include the upgrade from then on).
Some agencies stated that the carrier approach to rolling the capital costs into the monthly fee was more attractive than WaTech’s approach of charging for it separately.
Participants in the focus group also expressed frustration that WaTech won’t let the agencies port phone numbers to a new carrier – many of these agencies stated that WaTech owns the DID numbers and they are using that to “handcuff” them into staying (30 day self-referrals on their answering machines is the stop gap for phone number cutovers).
Some agencies participating in the focus group and interviews stated that they view this service as at risk of losing customers. That it is an area where WaTech would need to make substantial investments in order to retain current customers.
Customer Plans for Future Usage
About a half dozen agencies interviewed stated that they are finalizing plans to reduce their footprint or move away entirely from the PBX/VoIP service. Most of these agencies stated that they intend to move away from the service within the next two years (placing potentially over a million of revenue at risk):
One agency stated they are evaluating purchasing VoIP services directly from a carrier (e.g., CenturyLink) because they are viewed as a cheaper option. This agency stated that they would prefer to use WaTech but they believe WaTech needs a telecom strategy (and they believe agencies should get to participate in developing that strategy).
Several agencies said they are already planning to transition away from WaTech’s service and will cut over to their own PBX. One of these agencies stated that they did an exhaustive search, and WaTech is a little too expensive so they decided to do it themselves. This agency stated that the requirement to pay WaTech’s contracted support vendor for moves, adds and changes at a lot of the sites added too much to the cost.
One agency that said they are planning to move to an in-house solution stated that beyond the cost savings, another driver is the opportunity to establish better integration across voice service and the ability to implement a unified communications strategy.
A couple of existing customers stated that they plan to continue leveraging WaTech’s services and one stated that there is a possibility that they may expand their footprint with WaTech rather than leveraging a carrier managed VoIP service (though they were still working to finalize the decision).
Several agencies stated that they hope to take advantage of a move to a new facility to move over to VoIP.
Several of the agencies that stated they intended to keep WaTech as their provider stated that they would like to see WaTech improve rate transparency and offer more standardized rates. One of these agencies highlighted a quote from WaTech that reflected a cutover to VoIP which would not include a lower rate for the agency.

Page 756 of 851
. .
(3321) Switched Long Distance
L. Customer Satisfaction and Future Demand
Perception of Features and Service Levels
Customer feedback on the service definition was largely positive:
Nearly all customers interviewed stated that the current long distance billing process meets their business needs.
Many customers stated that they like the user pin feature of the service.
Perception of Price Considering WaTech Value Add
Customers stated that they believed WaTech’s 100% price premium was too high to be justifiable (participants in the focus group believe they can get some long distance services directly from the carrier at a rate of 2 cents per minute when WaTech sells the same service at 4.5 cents per minute).
Customer Plans for Future Usage
Several customers stated that they view the long distance service almost as a value added feature of PBX. A couple of these customers stated that when they move away from WaTech’s PBX service they may also discontinue long distance as well.
(3331) Conferencing
L. Customer Satisfaction and Future Demand
Perception of Features and Service Levels
Agency feedback on conferencing services was primarily focused on pricing, however, one large agency was concerned that the WebEx conferencing service does not accommodate sensitive data.
Perception of Price Considering WaTech Value Add
Focus group participates provided the feedback that conferencing services are perceived to be expensive (both WebEx and voice teleconferencing) compared to other external options.
Customer Plans for Future Usage
Numerous participants in the focus group and interviews stated that they are primarily using other conferencing services rather than paying for WaTech’s fee for service offerings. Those potential customers stated that they have no intention to use WaTech’s services in the future. Many existing customers stated a desire to reduce their service usage footprint in the future, though also acknowledged that they have little ability to pull back accounts from business users.

Page 757 of 851
. .
(3332) Directory Assistance/Telephone Information
L. Customer Satisfaction and Future Demand
Customers participating in the focus group and interviews did not understand what the directory assistance bill was related to and didn’t understand why they are being charged for the service.

Page 758 of 851
. .
2. Data Network Services
(3480) Network – Core, Transport and Connectivity
L. Customer Satisfaction and Future Demand
Perception of Features and Service Levels
Three of the large agencies participating in interviews and focus groups are limited users of WaTech’s Data Network services, leveraging WaTech for internet connections, connections to other government agencies through the PGN, and some remote office connections. Many of the other large agencies, as well as medium-to-small sized agencies are more dependent on WaTech’s Data Network services, typically leveraging WaTech to connect most or all of their offices. Despite the different usage patterns, feedback was largely consistent across agencies of all sizes.
Many customers expressed the opinion that the WaTech Data Network services do not meet their business requirements for availability and performance.
Agencies with life-safety (public safety, first responder, health care, etc.) requirements and agencies with important office locations outside of the State Metropolitan Optical Network (SMON) capitol campus service area, reported the most issues.
Agencies stated that circuits are frequently down for short periods (i.e., multiple times a day in some cases), and that multi-day outages have occurred periodically at many sites.
Several agencies who must support after hours operations, stated that limited network command center staffing during the night shift does not meet their business requirements as there are significant delays while on-call personnel are contacted and often remediation of the issue is deferred to the next day.
Many customers shared their perception that the network team seems to never have enough resources with the right skills to support their projects/resolve their technical issues in some key areas despite having a large team. Examples provided by these customers as evidence for this included:
WaTech does not provide regular or frequent status reports on estimated timing for planned vendor circuit installations.
WaTech is not coordinating the ongoing installation of replacement routers at the provider edge with the contracted support vendor in spite of the fact that WaTech’s responsibility for vendor coordination at the provider edge is explicitly called out in the Service Level Agreement.
Instances when WaTech network engineers had to make repeated site visits in order to configure a new service that the agency engineers considered to be a routine task.
Excessive amount of time required to diagnose the root cause of network issues.
Long delays in communicating outages to impacted customers during incidents (which a couple customers speculated may be due to limited understanding of how customers are combined into trunks on the network).

Page 759 of 851
. .
Agencies stated that WaTech’s process for procuring carrier circuits leads to suboptimal outcomes for agencies. The main issues repeated frequently were:
WaTech pools circuit procurements so some agencies must wait a couple months for a sufficient number of additional agencies to submit requests before any action is taken.
WaTech goes out to competitive bid for every new circuit procurement rather than leveraging a master services agreement.
WaTech selects the circuit that is in WaTech’s financial interest as an allocated service provider over the interest of the agencies (i.e., agencies believe that WaTech selects the lowest bidder which is perceived to contribute to quality issues, selects the lowest monthly recurring cost regardless of wait time required for installation of new last mile fiber and any one-time installation fees given any amount above $5,000 is the responsibility of the agency, and they do not give weight to the fact that agencies sometimes see the selected technology, like microwave, to be an unacceptable substitute).
Some agencies stated that WaTech is a poor business partner in network delivery. The examples most frequently cited include:
WaTech’s decision to change routing protocols from EIGRP to BGP without discussion and input from agencies.
WaTech’s decision to move to an allocated chargeback model which limits agency flexibility to control network spend within a biennium.
WaTech’s decision to use a prior base year as the year zero for the new allocation model which erased two years of effort some agencies had expended in consolidating offices to reduce network spend, codified some billing errors in the base chargeback rates and added 31% to the base year cost without explanation.
WaTech’s practice of throttling bandwidth to the baseline defined bandwidth limit without regard for agency business requirements.
WaTech does not conduct site surveys or pre-configure routers delivered to the customer site, choosing instead to rely on agency staff to do their work for them.
Exclusion of new backup circuits from the allocation.
Agencies stated that the Data Network services do not meet some of their requirements for service features, some examples cited by these agencies include:
Inability to support multi-cast.
Possible limitations with Quality of Service.
Uncertainty around the actual level of redundancy built out in the Quincy Data Center.
Firewall solution that was not architected and built to a specification that would enable agencies to use the next generation capabilities such as decryption and content inspection, and several stated that this feature and others were features they would like to use.
Failure to define an agency interconnection standard, or reference architecture.
Rollout of a high bandwidth private connection to the cloud (cloud highway) that fails to include Office 365 as a part of the initial rollout, with uncertainty around pricing that small agencies say may end up excluding them from using the feature.
A couple agencies stated that while they shared other agencies perceptions about the procurement process and communication challenges, once a circuit is in place they viewed the service as sufficiently stable to meet their business requirements.
Page 760 of 851
. .
Perception of Price Considering WaTech Value Add
The large agencies all expressed a preference to continue providing their own core network services, but acknowledged that partnering with WaTech is sometimes unavoidable (e.g., in order to receive funding, or to reach specific sites). These agencies see only limited value add at best, and in the worst case as an extra layer of management that detracts value, and they perceive WaTech to be a very expensive network provider.
One large agency stated that they had completed their own benchmark to compare their delivery cost to WaTech and found that they deliver network services at half the price, another stated that WaTech is about twenty percent higher cost.
Some medium to small size customers stated that they do not want the responsibility of managing their own network and believe that WaTech’s shared service delivery of the WAN provides value to the state as a whole. However, even these customers stated a perception that WaTech’s pricing is high, and many expressed the concern that the allocation chargeback approach further curtailed value given reduced agency flexibility and ability to control spend.
Customer Plans for Future Usage
Agencies stated that they anticipate growth in their use of WaTech’s WAN core and transport services, particularly given the movement to public cloud services and increased movement to VoIP and video conferencing services.
WaTech’s currently tracked pipeline reflects this anticipated increase.
(3466) Cloud and Office VPN
L. Customer Satisfaction and Future Demand
Perception of Features and Service Levels
Customers reported several issues with the Cloud and Office VPN service:
Customers reported that up until recently, the office VPN service did not meet the use case requirements for a backup circuit, rather than a full office VPN solution with DHCP configured.
Customers also stated that the service has not been architected for sufficient bandwidth for current usage much less future growth, it’s only a 100M circuit and customers report that WaTech is throttling bandwidth.
A few customers stated they plan to remain with the service but view the bandwidth as a limitation that needs to be addressed, and a few other agencies stated they have dropped the service due to service issues.
Customers also provided positive feedback on this service:
A few customers stated that they had not experienced any substantial service issues and stated that the service currently meets their business requirements.
Several agencies stated that they appreciate the fact that the Office VPN is currently not included in the Data Network allocation, viewing it as a welcome alternative and lower priced option.

Page 761 of 851
. .
Perception of Price Considering WaTech Value Add
Most customers stated that while the recent out of cycle price increase caused budgetary challenges for them, the service is more attractive than the network allocation and stated that these services provide value on an enterprise level. As with WAN Data Network Core and Transport services, these customers clearly state that this is something they would not want to be responsible for as an agency and feel it is an appropriate enterprise-wide shared service provided by a central service agency.
Customer Plans for Future Usage
Existing customers stated an intention to continue using WaTech for their Office and Cloud VPN service needs, despite current design challenges. A couple customers of the Data Network allocation stated that they are currently planning, or starting to plan, a migration from the allocation to the Office VPN service given budget constraints.

Page 762 of 851
. .
3. Access & Security Services
(3541) Remote Access Services
L. Customer Satisfaction and Future Demand
Perception of Features and Service Levels
Most agencies are current customers of WaTech Remote Access services in some capacity (i.e., authentication, SSL-based VPN and/or Citrix Edge). Customers stated that the SSL-based VPN remote access service meets their requirements. Customers who have transitioned from hard to soft tokens (or to certificates) have provided feedback that the transition went well and that the new solution meets their needs. In particular, customers noted that the request fulfilment turnaround for new certificates is relatively quick at a day or two.
However, several agencies stated that WaTech does not understand agency requirements for developer/contractor remote access (e.g., virtual desktop) and it has become more difficult for agencies to architect their own solution due to the security design review process challenges. Several agencies mentioned that they maintain their own Citrix environments (to provide access to various Agency legacy applications which are no longer compatible with their current network or desktop configurations) as they have perceived the WaTech Citrix service to be on the edge of deprecation for some time.
Perception of Price Considering WaTech Value Add
Customers expressed frustration that they believed the SSL-VPN service was originally positioned by WaTech as a permanently “free” service that was included as a feature of the network service covered under the preexisting rates. Customers reported that WaTech appeared to make the decision to begin charging for this service arbitrarily and without communication to customers.
Customers noted that detailed billing to differentiate divisional usage was not provided and expressed frustration with the fact that WaTech bills are based on who has access to the service (as defined by an active directory security group) rather than by actual usage. Some agencies stated that they had rolled out the service broadly while it was still cost effective to do so, and it was burdensome (damaging to their end user/business relationships and WaTech’s reputation) to pull the service back after WaTech began charging for it.
Customer Plans for Future Usage
Customers stated that they intended to continue leveraging WaTech remote access services.
A few agencies stated that a modern Virtual Desktop Infrastructure /Remote Control type solution is something they would be interested in if offered at a competitive price with appropriate service level commitments (performance, currency, responsiveness, etc.).

Page 763 of 851
. .
(3540) Security Gateway Services and (4671 / Formerly 3540) Security Gateway Support
L. Customer Satisfaction and Future Demand
Perception of Features and Service Levels
Customers provided mixed reviews of the Secure Access Washington service. Many customers felt that WaTech had made some improvements to the service features and that it meets most requirements. In spite of the improvements, several customers highlighted a few challenges:
SAW does not provide a very good user experience, and when feedback is provided WaTech does not provide any details on how user experience feedback might be accommodated in future feature rollouts, and instead highlights that the solution architecture limits ability to address any concerns.
Authentication and multifactor were tightly coupled services built in a way that they must be used together as a part of a proprietary vendor solution, and multiple agencies have requested a fix for this problem for years.
Several agencies stated that the other proxy services (that are currently delivered through the F5 server, or are planned for migration to the F5 server) seem to work fairly well. While a couple larger agencies also stated they maintain their own separate reverse proxy servers so leveraging WaTech’s service would be redundant, small to mid-sized agencies stated that they were glad to have WaTech’s service available so that they do not have to maintain the expertise.
Customers did highlight a few challenges with the F5 proxy services:
Information related to the service is not always distributed to users of the service (e.g., major cutover to a new technical solution was not communicated effectively).
WaTech didn’t complete detailed requirements analysis before making decision to change the underlying architecture for some proxy services, and customers aren’t clear whether the change impacts availability of certain features.
WaTech didn’t support migration of existing configurations into the replacement solution, instead pushing this burden to each customer agency.
Help desk tickets are not always escalated or routed correctly (an example was provided for the F5 Web Application Firewall where a ticket had been opened and pending for weeks). Customers stated that they believe lack of clarity regarding roles/responsibilities of various WaTech sub-groups may be a contributing factor. They stated that this should not be visible to them, nor should noticing and sorting it out be their responsibility or require their involvement.
Perception of Price Considering WaTech Value Add
Several agencies stated that they perceived a secure gateway service to be a valuable service provided by WaTech and it is not an area where they look to comparison shop.
However, an agency that rolled out the new LexisNexis multifactor feature complained about unbudgeted expenses that stemmed from WaTech’s decision to charge for the feature mid-budget cycle.

Page 764 of 851
. .
Customer Plans for Future Usage
Agency use of some Security Gateway services is mandated by OCIO policy 141.10 for specific use cases. Several agencies expressed frustration at perceived self-dealing by the OCIO given that the solution is a flawed proprietary solution that does not meet all agency requirements, and there are other competing solutions available on the market. Agencies grandfathered in to an exception to the mandate stated they are trying to avoid adoption in the future. Other existing customers signaled that they would continue to use the service.
(4672 / Formerly Security Infrastructure Allocation) Security Infrastructure Support – VA, SIEM, and DNS
L. Customer Satisfaction and Future Demand
Perception of Features and Service Levels
Agencies provided substantial feedback on the SIEM (Logging and Monitoring) and Vulnerability Assessment tool services. Most agencies are paying for security infrastructure via the network allocation, but only handfuls are customers today. No feedback was provided for DNS.
Participants in the security focus group provided a majority view on security service delivery challenges at WaTech: initial efforts to acquire security tools for delivery as a service did not adequately involve customers and did not involve a formal requirements elicitation phase, compounding the problem later was the fact that the bulk of security staff either went to OCS or left the WaTech organization when the OCS was created, therefore the Computer Services Division inherited a mess that was understaffed (note WaTech recently reassigned these services to the internal WaTech CISO and organizational changes are still in flight).
Agencies expressed frustration at delayed implementation and customer onboarding for both the SIEM and VA tools. Several agencies referenced the fact that they are in violation of federal requirements and that they are at risk of an audit, and expressed frustration that they do not have budget available to go to market for their own tools since they are already paying WaTech for services they can’t use.
SIEM Tool Service:
Customers expressed frustration at the timeline for implementation since it’s been over eight years since the first committee was formed, and they are on their second deployment after an initial failed effort, and customer onboarding has been substantially delayed, with some agencies noting that they have been waiting over three years to onboard to the SIEM tool.
Customers stated that not only are delays frustrating but the service is not designed in a way that meets all of their requirements. The service offered by WaTech does not meet all 141.10 requirements which states that agencies are supposed to keep 10 years of backup but barely has any disc space is included.
Agencies also expressed concern that they do not get visibility into the packet capture. They have to buy that separately. However, if you log into the tool and you do not have network data, a few agencies expressed the opinion that it is almost pointless.
Customers also stated that the solution was not architected appropriately. One customer who is already using the service stated they have been waiting for months for rules to configure alerts

Page 765 of 851
. .
(given the solution is a single tenant deployed as a multi-tenant) and WaTech only has one resource supporting.
VA Tool Service:
Agencies expressed disappointment with the multiple rounds of Vulnerability Assessment tool deployments. Not only has implementation and ultimately customer onboarding been delayed but earlier deployments were canceled with limited communication and customers who were using the tool at that time were frustrated by the deprecation of a service without discussion or assessment of the impact on their business.
Most agencies stated that they view the Vulnerability Assessment procurement and implementation as a large failure. They do not believe the tool meets requirements (web application scanning, multi-tenancy deployment). Some agencies questioned why WaTech did not just acquire Qualys as SaaS solution (for multi-tenant option that includes web application scanning) rather than trying to implement it on premise in the first place.
Agencies also expressed frustration with the fact that they were going through an RFI process to evaluate several products in 2017 to replace TripWire, when the WaTech finance group stopped the effort because of lack of funding given WaTech is still paying for Tripwire for several more years.
Perception of Price Considering WaTech Value Add
Agencies expressed some concern about the move away from a separate stand-alone security infrastructure allocation, as they will now lose visibility into it.
Several agencies expressed that adding the WaTech hosting fee as an extra fee-for-service expense the agencies are responsible for paying for the Vulnerability Assessment tool on top of the allocation they are already paying is not affordable.
Customer Plans for Future Usage
Several agencies stated that they have acquired, or are in the process of evaluating, alternative options for SIEM and VA tools.
Several agencies stated that they were provided guidance by the OCS one to two years ago that if they needed the VA tool within the next 18 months, they should go out to market and buy their own. Some agencies that are still waiting to onboard on the Vulnerability Assessment tool stated that any further delays would mean they would have to go to market and purchase their own solution.
No customer feedback provided regarding agency plans for future DNS usage.
(1165) Wireless
L. Customer Satisfaction and Future Demand
Perception of Features and Service Levels
Customer feedback on the wireless service was primarily positive but included some mixed reviews. Most customers reported that WaTech was able to turn up the service at new sites quickly, and once new sites are established, the service quality is high (reliable connectivity,

Page 766 of 851
. .
sufficient bandwidth, etc.). A few customers noted that the WaTech teams worked effectively together (project management, network, and wireless as separate supporting groups).
However, a couple customers cited challenges with flawed site installation plans and the fact that the burden fell on the customer to reconfigure the site to optimize performance.
Perception of Price Considering WaTech Value Add
Customers also had mixed opinions on service pricing. All customers expressed frustration at the off cycle service price increase, the apparent lack of appreciation for impact on agency budgets, and the limited communication around the change. Some customers were not aware of the rate increase until it was brought up during interviews and focus groups. Customers noted that equivalent behavior from a vendor would likely result in a terminated contract.
A few customers saw the $50 per month access point fee (increased from $35 per month) plus one-time installation fee as still a relatively good value. While other customers stated that they thought the pricing was high compared to the value delivered and compared to the market (one customer mentioned they believed a cost of over a thousand dollars was excessive for a site survey where no technician ever physically visited the site and instead provided a limited evaluation of building plans).
Customer Plans for Future Usage
While customers expressed a lot of concern regarding rate increases seemingly occurring overnight (and a few questioned whether it was appropriate for WaTech to have to assume profitability within 18 months), relatively few customers indicated that they were seriously evaluating alternatives, or that the increase would affect their future consumption of the service.

Page 767 of 851
. .
4. Server Hosting Services
(4790) Private Cloud
L. Customer Satisfaction and Future Demand
Perception of Features and Service Levels
Existing customers and potential customers expressed a range of viewpoints on the Private Cloud that were directionally consistent but not always entirely in agreement.
Existing customers stated that the Private Cloud generally meets their requirements, though there are only a handful of customers with significant usage today and this usage tends to have a larger test/development vs. production component. Customers did express some minor annoyances and expressed frustration with an onboarding process that can be long and labor intensive.
One customer specifically mentioned that the burden to coordinate across multiple WaTech teams, including, OCS, Project Management, Network, Firewall and the Server Group fell largely on them. This has been exacerbated by high rates of staff turnover/attrition. Customers reported that the onboarding process could sometimes take many months.
Another customer expressed the concern that while performance was adequate for their development environment, WaTech does not offer secure remote access solutions for the remote developer use case that meets all of their needs.
Among customers and potential customers, the Private Cloud has developed a reputation as an unstable platform.
Focus group participants reported hearing about multiple outages, some extending half a day to multiple days when Private Cloud was rolled out. These participants stated there is an overall lack of assurance that severe outages and service disruptions would be prevented in the future (e.g., these participants specifically called out the lack of well-defined service level targets and reports that indicate consistent reliability). Some potential customers stated that these challenges led them to cancel or postpone adoption.
One customer who had worked with WaTech to migrate a test environment to the Private Cloud indicated that it is unclear whether the Private Cloud will meet the production workload requirements. This customer believed that SQL performance tests run on the Private Cloud raise questions about the architecture and whether the platform has been designed in a way that will meet their performance requirements when transaction load increases.
The focus group discussion also highlighted the lack of a TOS/SLA that clearly defines the service and associated service levels (features, availability, responsiveness, redundancy, Mean Time to Repair, communication protocols – particularly around outages, incident tracking and prioritization and root cause analysis, etc.).
Focus group participants expressed concern that the Private Cloud had been marketed as having certain features that it turned out were not available yet, notably SQL Server
Page 768 of 851
. .
support, and integrated Disaster Recovery. Several participants referred to these features as “vaporware” and wondered what else might be missing.
Numerous agencies stated that they believe that the current service features and processes will not sufficiently meet their business needs. These agencies referenced concerns about insufficient network/firewall automation, performance issues with SQL server, lack of pre-approvals from OCS, uncertainty regarding support for Operating System patching, monitoring and break/fix.
Several agencies stated that they have deployed, or are in the process of deploying, their own “private cloud” type of virtualized server infrastructures (e.g., Nutanix, etc.). Several of these agencies stated that they had evaluated the Private Cloud as a part of their decision-making process but did not have sufficient information to be confident it would meet their needs. Many of these agencies have chosen to host their own “private could” environments in the SDC and QDC for convenience, superior resilience and DR.
Other Agencies report that they are deploying applications to public cloud options (i.e., AWS or Azure) or are actively exploring these or similar external hosting or SaaS options.
These agencies referenced concerns about long-term viability and sustainability of the service given WaTech’s perceived lateness to private cloud, a lack of confidence in current service design and management, frequent performance issues and the impact of WaTech financial difficulties on staffing and service quality—now and in the future.
Perception of Price Considering WaTech Value Add
Both current customers and potential customers viewed the Private Cloud pricing to be high.
During explanations as to why they did not use the service, several non-customer agencies acknowledged that prices have come down but stated that they are still not price competitive when compared with cloud options. A couple agencies cited the following estimates:
“3-5 times” more than what it would cost if implemented internally by the agency (e.g., implementing their own Hyper V, leveraging Nutanix environment, etc.)
The price for the State’s private cloud is “double” the price of leasing virtual machines from AWS. Although agencies participating in the focus group acknowledged that there are additional costs associated with going to the public cloud, including the cloud highway/cloud VPN, data egress, backup, archiving etc., that makes direct price comparisons between public and private cloud less straight-forward.
However, many cited that their decisions were not driven primarily by pricing. Potential customers that do not plan to adopt the service often cited the perception that the Private Cloud as an immature offering. Potential customers that say they are strongly considering using the Private Cloud often stated a preference for leveraging the shared State solution, given the opportunity to contribute to economies of scale and drive better outcomes for the State.
The focus group also discussed concerns about potential price instability, as the original discussion around Quincy DR Private Cloud pricing was that it would be half the price, and then ultimately it turned out that it would be full price. The focus participants stated this was another example of WaTech promising one thing and then delivering something different.
Customer Plans for Future Usage
Most existing customers stated a longer-term plan to get to the public cloud, but without offering details such as specific applications or a roadmap. A majority of non-customer agencies indicated they plan to either completely bypass WaTech Private Cloud services and opt for

Page 769 of 851
. .
public cloud solutions (such as AWS or Azure), or use a colocation model in which they purchase physical servers hosted within the SDC and independently manage their own virtualization/ private cloud environments.
(4722) Server Hosting Provisioning, (4723) Services Secure Web Hosting, and (4785) Server Support Services
L. Customer Satisfaction and Future Demand
Perception of Features and Service Levels
Existing customers expressed dissatisfaction with the quality of the current service. In particular, customers referenced performance issues and insufficient troubleshooting and communication around outages. Customers stated that they frequently are not provided notification of an outage, or root cause analysis in sufficient detail to have confidence that the service was fully restored. Customers were also frustrated with the lack of tangible and measurable SLAs.
Existing customers also expressed concerns about the impact of layoffs on the quality of services being provided and future service viability. These customers directly stated that discontinuing these services and support would cause a significant impact. Given that, some customers stated that they have accelerated or have executed plans to move away from these services based on WaTech informal and formal end-of life-service messaging. One large agency reported that it had planned to migrate a significant amount it its services to the Private Cloud, but is now pursuing an agency purchased/managed solution to be co-located in the SDC as they believe the Private Cloud is not a mature offering and will not meet all of their requirements.
Perception of Price Considering WaTech Value Add
Existing customers perceived pricing to be high, and stated that “SLA-based pricing” was developed to include future growth upfront, but in the end, did not provide any advantage of elasticity of scale over time.
The focus group discussed the fact that many years ago they were told that virtualization would be cheaper than physical hosting, but in the end, it turned out that was not true, these focus group participants felt that customer agencies received no real cost reduction from virtualization.
A non-customer agency that previously considered a WaTech managed server offering for physical servers (as recently as within the last two years) stated that WaTech cost quotes provided were nearly three times higher than a private sector vendor was. The agency was not clear on the cost driver as it was an equipment quote that did not include ongoing support, and the equipment specified in each quote was identical.
Customer Plans for Future Usage
WaTech has communicated to existing and potential customers that this service is end of life. One of the largest current customers stated plans to migrate off this service in the near term. Not all existing customers plan to migrate to the Private Cloud as a replacement, and expressed frustration that they have been told they will have to migrate off in the near term but they believe WaTech is not offering a mature replacement offering.
Page 770 of 851
. .
(4231) Platform & Connectivity Service
L. Customer Satisfaction and Future Demand
Given that Platform & Connectivity is not a statewide offering, there was no customer feedback provided regarding this service during interviews or focus groups.

Page 771 of 851
. .
5. Storage Hosting Services
(4589) Server and Mainframe Storage (SAN/NAS)
L. Customer Satisfaction and Future Demand
Perception of Features and Service Levels
A handful of customers leverage the SAN storage as a part of the mainframe and managed server environments. Customers did not comment directly on the features and service levels for WaTech Server and Mainframe Storage support.
Perception of Price Considering WaTech Value Add
Several agencies cited WaTech’s heavy investment in what was previously considered high performance, higher cost storage technology (e.g., EMC Software, Drive Arrays and Fiber Channel SAN technology) together with lack of scale (WaTech’s overall storage footprint is quite small) made WaTech’s storage costs prohibitively expensive as a standalone offering, especially when compared with alternatives readily available on the market.
Customer Plans for Future Usage
Potential customers stated that they have no intention of leveraging standalone WaTech storage in the future. Existing customers stated that they planned to continue leveraging the storage as long as they continue leveraging associated WaTech services (e.g., Mainframe, Hosting Services, etc.).
(4593) Nearline Storage (WaServ Vault)
L. Customer Satisfaction and Future Demand
Perception of Features and Service Levels
Customers stated that the fine-grained multi-tenant approach to archival provided by vault is a key feature of the service.
Multiple customers cited concerns about vault storage instability and lost data, with one customer stating that issues prevented them from fulfilling public disclosure requests.
Perception of Price Considering WaTech Value Add
No customer feedback was provided regarding Nearline Storage costs.
Customer Plans for Future Usage
Existing Nearline Storage customers stated that they view the service to be critically important and plan to continue using it. Many customers are concerned about potential impacts to the

Page 772 of 851
. .
vault service with the pending migration and rollout of email into Office 365. Some agencies stated with confidence that Microsoft does not meet their vaulting and archiving requirements.
A large potential customer stated that they intend to continue acquiring their email archival solution as a part of the Microsoft 365 suite.
(4595) Backup
Perception of Features and Service Levels
In general, feedback gathered during focus groups indicated that current WaTech Backup service support levels do not consistently meet customer needs and requirements. Customers cited a few concerns:
Backup solution ran out of capacity.
Backup administrator left and there was not a backup in place (one resource deep in a key service).
No process defined for self-service testing of backups (requires submission of a ticket) and it can take a day to restore a single file.
Perception of Price Considering WaTech Value Add
Customers viewed the service as on the pricey side vs. internal and externally managed/cloud solutions that are available. One customer clarified their view that it is expensive as sold by the gigabit without storage optimization features (e.g. de-duplication, advanced compression, etc.).
Customer Plans for Future Usage
No feedback provided regarding agency plans for future usage of WaTech Backup services.

Page 773 of 851
. .
6. Mainframe Hosting Services
(4562) High Capacity Computing
L. Customer Satisfaction and Future Demand
Perception of Features and Service Levels
Current customers of the s390 mainframe hosting service stated that the service is currently meeting their application hosting requirements. However, they are concerned that much of WaTech’s staff are eligible for retirement, and NATURAL/Adabas and COBOL programming skills are not easy to replace and the applications/institutional knowledge that these staff have amassed cannot be replaced. Customers are also worried about losing the benefit of the close coordination with WaTech staff, given WaTech’s plans to slowly turn support over to a vendor (starting with the hardware and then the applications and operational services, as existing software contracts expire). Customers worry that they will see a significant deprecation of service as the staff turns over and they are serviced through a generic mainframe outsourcing contract by resources who do not know they systems and context well.
Customers stated that WaTech’s struggle to recover costs, along with the continuing decline in demand for mainframe services, is a major source of concern and leads them to question the ongoing stability and viability of the service.
Perception of Price Considering WaTech Value Add
Customers have a long history of using this service and expressed that they have long been satisfied. Some customers reported that the service has degraded some over the past couple of years, given staff reductions/retirements.
Customers focused feedback on concern about price instability related to the proposed outsourcing approach, as well as potential price increases related to declining demand. Customers are concerned about becoming the last supported customer, who must bear the full cost of the mainframe and related staff.
Customer Plans for Future Usage
Most customer agencies stated that they do anticipate migrating off the WaTech mainframe. Given the One Washington project timeline, customers understand there will be a much smaller user base within the next 5 years which puts pressure on other remaining customers to identify their own timelines. Other customers have been working on intermediate plans to re-platform their applications to gain control of the cost while executing a longer term full replacement effort.
Customers expressed deep-seated concerns about ending up one of the last agencies to migrate off the mainframe. Agencies perceive near-term risk to the longevity of the service once one or more of the remaining major systems with substantial footprint migrates off the WaTech s390 mainframe; the agencies believe those remaining will face increased risk, and earlier timing for major migrations could jeopardize the service before all agencies have a chance to migrate off.

Page 774 of 851
. .
7. Colocation Hosting Services
(4803) State Data Center Facility Services
L. Customer Satisfaction and Future Demand
Perception of Features and Service Levels
Existing and potential customers of the colocation service have very different views on the service. Existing customers tend to cite the professionalism of the data center operations staff, cleanliness of the facility, and ease of access (while still remaining in line with HIPAA and other key security framework standards) as attractive features of the service.
However, existing customers did mention a couple service design issues. For example, for the Quincy Data Center (QDC) in eastern Washington, customers mentioned the service is lacking quick and easy access to onsite support personnel to perform tasks that can’t be done remotely, an early adopter mentioned WaTech failed to provide an equipment cage for sensitive equipment when it had been negotiated upfront, and a couple agencies mentioned uncertainty around WaTech’s longer term inclusion of the rack elevation planning and cabling support as a part of the base service.
In spite of the largely satisfied existing customer base, some agencies continue to pursue waivers to avoid consolidation into the SDC; agencies who have not migrated yet tend to reference concerns about loss of control that would come along with decommissioning their own data centers, doubts about the long-term viability of the service, and perceived high potential for price instability and increasing future costs.
Perception of Price Considering WaTech Value Add
In terms of rates for this service as it is currently defined, most customers agreed that WaTech colocation service is affordable. In addition, many customers recently completed their own benchmarking against a variety of commercial providers, and these customers agreed that while power is more expensive in Olympia than other areas, the overall price of WaTech collocation services is fairly aligned to market prices. However, a couple agencies expressed concern that WaTech is not charging for the rack elevation planning and cabling support because they have not yet determined the cost model for this service offering, but this will be another fee for service charge that will be added at a later time.
Non-customer agencies sometimes cite their estimates for high cost of potentially complex migrations, as well as the high price of recurring colocation rental payments, as major deterrents for migration. Many of these waivered agencies have existing data center footprints in their own facilities and state they have the staff, resources, and budgets to continue maintaining their own facilities or eventually move to the cloud.
Customer Plans for Future Usage
Many agencies with waivers in place today have stated that they will continue to submit waiver renewal requests, as they perceive the costs associated with planning the migration as a larger investment than they would like to make at this time. Several agencies (of varying size and footprint) have already defined plans to bypass the SDC by moving directly to secure public

Page 775 of 851
. .
cloud providers (e.g., Azure or AWS) from existing agency data center locations. However, a couple agencies stated they are actively planning migrations to the SDC and they anticipate moving this biennium.

Page 776 of 851
. .
8. Desktop Hosting Services
(8111) Desktop Support
L. Customer Satisfaction and Future Demand
Perception of Features and Service Levels
During interviews, existing customers stated that current features do not meet all their business needs, for example, customers referenced that a Virtual Desktop Infrastructure solution would be more appropriate for meeting their remote/field-based workforce needs.
Additionally, customers stated they were not clear on what features are included, and sometimes how they are differentiated from other WaTech services, e.g., customers were not clear whether the $3,500 per year price would fully fund their refreshes and believed there might be overlap between managed firewall and desktop services.
For existing customers, delivery quality rated high, e.g., customers stated that prior refreshes went smoothly, and that support is high touch.
Perception of Price Considering WaTech Value Add
Even with the recent price reduction, agencies characterized the WaTech desktop support service as expensive. Non-customer agencies of varying size and IT-need frequently cite the perceived high price of WaTech desktop support as a deterrent for adoption. A small non-customer agency conducted its own recent benchmarking against commercial providers and found that the price of the WaTech desktop support service is not aligned with market prices.
Customer and non-customer agencies alike consistently acknowledged that WaTech desktop support has the potential to add-value for small agencies that may lack the internal resources needed to support their own desktop needs. However, agencies were uncertain whether it makes sense for WaTech to remain in the business given the availability of alternative, more efficient contracted options, and raised the possibility that WaTech should evaluate becoming a trusted broker or advisor to smaller agencies seeking desktop support, rather than a desktop provider.
Customer Plans for Future Usage
A couple of the larger customers felt that they could perform the desktop services at a lower cost internally or with the support of a contracted vendor. Also, some non-customer agencies stated they would continue to either self-support their desktop needs or continue existing contracts with commercial providers; these agencies also tend to reference WaTech’s relatively unaffordable prices.
For some other agencies though, the recent price reduction was sufficient to pique their interest in the service. However, a couple of these agencies expressed concern about whether there is sufficient delivery resource capacity for WaTech to take on more customers, without negatively impacting delivery quality.
9. Collaboration Services

Page 777 of 851
. .
(4721) Active Directory & (4724) Identity Management
L. Customer Satisfaction and Future Demand
Perception of Features and Service Levels
Most agencies are current customers of WaTech Active Directory (AD), apart from a couple large agencies. Existing customers identified the service as a valuable, core enterprise function, and they stated the quality of the service meets their basic requirements. However, customers frequently cited WaTech’s inability to agree to a defined technical architecture for integrating existing domains within the Office 365 tenants, as well as WaTech’s stated preference for a single, shared Office 365 tenant, which several customers strongly oppose, as an ongoing challenge.
Additionally, a couple of agencies stated that WaTech does not put sufficient emphasis on AD Federation Services, and another couple of agencies expressed concern about staff depth, noting they believe WaTech only has one resource focused on AD and the email Vault solution.
Perception of Price Considering WaTech Value Add
Customers did not focus their feedback on AD service costs. The few customers that did provide feedback related to price, focused their comments on the additional fees for Azure AD Premium to meet future requirements (e.g., self-service password reset and multi-factor authentication) in the migration to Office 365; while all customers are paying for this new feature, only a few are using it.
Customer Plans for Future Usage
Many existing customers stated plans to move to Office 365 for email (Exchange Online), SharePoint (SharePoint Online), Skype (Skype for Business), and potentially Mobile Device Management (MDM via the Microsoft product Intune). A key dependency for moving to Office 365 is synchronizing the WaTech hosted Enterprise Active Directory service with Azure, using a Microsoft feature called Azure AD Connect. The Active Directory team has performed a partial domain sync using Azure AD Connect in the shared Office 365 tenant; however, most customers expressed a preference for dedicated Office 365 tenants.
(4730) Shared Services E-Mail
L. Customer Satisfaction and Future Demand
Perception of Features and Service Levels
During interviews and focus group sessions, most participating customers stated that current delivery outcomes do not meet their business requirements for email services. Customers referenced a pronounced drop in delivery quality over the past year; many stated that there have been frequent service degradations impacting their customer base. Customers emphasized that these quality issues are current and ongoing, citing recent outages within weeks, and in some cases days, of the interview date. Customers stated that they believe WaTech has immature change management processes as WaTech has provided them with

Page 778 of 851
. .
details on specific instances when outages were caused by unauthorized changes, others cited inappropriate delays in refreshing hardware and migrating to Office 2016, many agencies also stated that they believe the backend solution for email was not originally sized correctly.
Customers also stated that WaTech’s communications during email outages is typically insufficient to enable effective customer and stakeholder management. Most customers stated that WaTech often fails to provide accurate, consistent, or timely updates during outages. A couple of customers highlighted that they no longer escalate to the WaTech service desk for email incidents specifically, given these communication limitations in combination with the frequency of outages. However, a couple of agencies did state that the Services Status Dashboard (support.watech.gov) provided some improvement, particularly for identifying planned outages.
In addition, customers stated that WaTech typically does not provide clear and concise technical explanations of root cause following an outage or degradation of service; customers cited insufficient availability of root cause information as a factor contributing to their lack of confidence in WaTech’s understanding of service delivery problems, and frequent concerns that an underlying problem is not actually resolved and incidents related to the problem are likely to recur. Additionally, many of the agencies stated that they had challenges getting WaTech to listen to their concerns and partner with them to identify a root cause.
In terms of service features, many customers stated that the current solution does not meet their business requirements. They are ready to begin planning to move to Office 365, but WaTech has not provided a clear strategy to enable this migration. Many customers stated that they would expect WaTech to be able to work with all the different agencies to synchronize email addresses across State Government, regardless of any agency’s level of compliance with current Active Directory mandates. These customers stated that they believe WaTech is choosing to delay implementation of a universal Global Address List until agencies complete migration into the State Active Directory forest, to increase leverage to move all agencies into a single forest. Additionally, a large agency stated that the service features do not meet their requirements as WaTech’s office productivity solutions only support category 1 and 2 data (which is publicly releasable data).
For the advanced Mobile Device Management service (an additional fee beyond the basic version included in the standard email mailbox fee), agencies stated the feature set was limited and the support was insufficient. Given that, agencies stated that their perception is that the service is under-resourced.
Perception of Price Considering WaTech Value Add
A couple larger agencies referenced that while the original consolidation of email was intended to save the state money by eliminating the need for support staff within the agencies, the service ultimately ended up being designed around what WaTech was able to support, and the rest of the responsibilities were distributed back to the agencies – notably the administrative responsibilities that they perceived to be resource intensive – but by the time the service details and provider responsibilities were finalized, the agencies had already lost the FTEs who had been responsible for those administrative duties. One of the reasons these large agencies stated that they perceived email to be low value at the given price point, is that they retained much of the administrative duties, and by their calculations, the cost for the portion of the service that WaTech provides is higher than what they could deliver for themselves.
Additionally, many customers, from all sizes and types of agencies, highlighted their perception that they are paying twice for Email services. These costs include paying for Microsoft Office 365 licenses, (Office 365 includes cloud-based email services) which most customers are

Page 779 of 851
. .
currently unable to use until WaTech provides a migration plan, while also paying WaTech for the ongoing use of the enterprise, on-premise Email System. Customers who purchased Office 365 licensing plans for the purpose of upgrading Office desktop licenses via the Microsoft cloud delivery model expressed frustration with the inability to migrate to other Office 365 services, such as Exchange Online, while continuing to pay for existing WaTech Email services.
Customers called out the vault email storage solution as a WaTech value-added feature of the service that enables agencies to configure granular agency-specific retention policies and perform responsive public records act searches. Given that Office 365 may not meet all requirements to replace the vault solution, WaTech customers want to quickly identify potential resolutions so they are able to migrate off the WaTech email service in a timely fashion.
Customer Plans for Future Usage
Most agencies plan to discontinue the use of the WaTech provided email services and migrate to Exchange Online, a component of Office 365. The time-frame for migration is unclear as WaTech must first complete an upgrade to Exchange 2016 and other issues related to migration must be resolved either by WaTech or by the customer. These issues include:
Resolving the single vs. dedicated Office 365 tenant issue, including domain sync using Azure Active Directory Connect.
Developing a migration plan and determining any costs/charges, resources/support required of WaTech or customer to complete the migration.
Identifying requirements for email archive/e-discovery solution, as needed
Identifying email related security configurations within Office 365 (e.g. spam filtering/quarantine, phishing detection/prevention, content filtering, data loss prevention, & etc.).
Determining what residual email support, if any will be required by each customer following migration (note, distinct levels of support may be required depending on what O365 model the agency selects and how it wants to be supported by WaTech).

Page 780 of 851
. .
(4742) Skype Services
L. Customer Satisfaction and Future Demand
Perception of Features and Service Levels
During interviews and focus groups, many participating customers stated some level of dissatisfaction with the WaTech Skype service, particularly around unreliability of voice and video conferencing. For example, there were numerous examples provided that highlighted incidents where users were unable to connect to calls or conduct video conferences and were forced to turn towards other options such as WebEx or other traditional telephony and video conferencing services. However, during the focus group discussion, there was general agreement that these issues may stem as much from limitations of the Branch Office VPN solution as from Skype itself. A few agencies stated during interviews that the service had been working well for them, without any substantial issues.
Agencies noted that some needed features are missing. A large agency stated that the service does not meet their requirements as WaTech’s office productivity solutions only support security category 1 and 2 data. Additionally, agencies participating in the focus groups stated that the inability to federate (email addresses/identities) outside of agencies that use the Enterprise Active Directory (including other state agencies as well as non-state entities) was a pain point, and expressed skepticism, that configuration limitations constrained the ability to federate with external entities and WaTech chose to federate with Microsoft.
Perception of Price Considering WaTech Value Add
Many existing customers view the WaTech premise-based Skype service as more expensive than cloud-based offerings, particularly given market trends of bundling communication and collaboration tools within a larger package of services (such as Office 365). WaTech customers believe that if they were to migrate their existing WaTech services to their current E3 Office 365 licensing they would reduce their overall cost and experience increased service reliability.
Additionally, a couple of agencies stated that when the service was originally created, there was no separate charge and no stated plan to charge separately for it. Therefore, they started rolling out the service across the agency. Later, when WaTech added a separate charge, these agencies started curtailing expansion efforts or even rolling back usage as they perceived it to be expensive or lacked the budget to support keep it available to employees who may not use it immediately.
Customer Plans for Future Usage
Although moving to Office 365 is dependent on a variety of factors (e.g., Office 365 tenancy architecture, Azure AD Active Directory sync, Skype user migration approach, and Network connectivity to the Cloud), many existing customers stated they are waiting to move to Skype for Business Online – a component of Office 365 – before increasing consumption of Skype.
Additionally, several agencies noted that they are already using a variety of cloud-based collaboration and messaging tools (e.g. slack, etc.), as a low cost, reliable, multi-platform enabled alternative to WaTech’s service offering.

Page 781 of 851
. .
(4365) Office 365 License Activation
L. Customer Satisfaction and Future Demand
Perception of Features and Service Levels
Most customers who are a part of Enterprise Active Directory who have been engaged in ongoing discussion around architecture and service design, expressed concern that features of a single tenant will ultimately be dictated by the customer with the most restrictive requirements; these customers cited their inability to utilize their desired Office 365 features due to dependencies on the Office 365 tenancy model (including Azure AD connect) as key points of frustration and dissatisfaction. For example, there were numerous examples provided by customers who – despite paying for licenses – cannot consume specific Office 365 features and services such as tele-work.
These agencies also expressed concern that plans for ensuring compliance with data retention and discovery (e.g., file share indexing, and email vaulting) have not been resolved. And agencies with specific compliance requirements expressed concern that WaTech stated they are unable to accommodate Data Loss Prevention (DLP).
Perception of Price Considering WaTech Value Add
The ability to license and upgrade Office applications using Office 365 is a component of the Office 365 license. In terms of cost, many customers who currently pay for Office 365 licenses, but prefer a dedicated Office 365 tenant, are dissatisfied and unhappy that they are unable to use Office 365 services due to tenancy, yet they continue to pay for services they cannot use.
Customer Plans for Future Usage
Most existing customers confirmed plans to migrate to Office 365 (with a couple of exceptions noted below); they plan to move to the cloud licensing model for upgrading Office applications, as it can provide a greater level of patching compliance and reduced effort to maintain user Office deployments. However, these agencies stated that they still hope to move to a hybrid model rather than a single tenant. The agencies that shared this view stated that they do not see a continued role for WaTech in this service in the future.
A couple current customers offered a dissenting view, that they prefer the on-premise solution, and plan to delay adoption of Office 365 for as long as feasible.
Non-customer agencies stated that they are hoping to continue avoiding WaTech Office 365; these agencies tend to reference arguments over tenancy models (shared vs. multi vs. hybrid), an apparent lack of a migration plan or roadmap from WaTech, and a lack of confidence that Office 365 can be successful as reasons for not adopting the service.
Page 782 of 851
. .
(4741) Enterprise SharePoint
L. Customer Satisfaction and Future Demand
Perception of Features and Service Levels
There is limited use of the WaTech SharePoint shared service today. Many agencies either host their own SharePoint farms, are waiting to utilize SharePoint Online or are utilizing alternate solutions. A couple of agencies stated that WaTech was too late in implementing their solution and that most agencies had already moved forward with their own solutions before WaTech came to market, which contributed to low adoption.
An agency that uses the service but plans to migrate to SharePoint Online expressed frustration that WaTech does not plan to provide any migration support.
Perception of Price Considering WaTech Value Add
Given market trends of bundling collaboration tools within a larger package of services, such as Office 365, most customers view the WaTech SharePoint shared service as more expensive than cloud-based offerings. Some customers believe that if they migrate their existing WaTech services to their current E3 Office 365 licensing they believe they would reduce their overall cost. These customers cited the current combined cost of SharePoint services and associated storage as high relative to value delivered.
Customer Plans for Future Usage
Most customers are waiting to move to SharePoint Online, a component of Office 365, before increasing consumption of SharePoint services, however the move to Office 365 has dependencies on Office 365 Tenant architecture, Azure Active Directory sync, SharePoint migration approach and Network connectivity to the Cloud.
(4744) Secure FTP
L. Customer Satisfaction and Future Demand
Perception of Features and Service Levels
There was little customer feedback provided regarding Secure FTP features and service levels. Customer responses indicate this service is utilized as needed to address specific technical requirements for file exchange, particularly related to the enterprise mainframe applications. Customers stated that it meets the minimum requirements.
Customers also stated that SFTP is embedded deeply in many of their internal and external data sharing jobs and workflow. Consequently, replacing SFTP with any alternative file transfer solution would be a long, large, complex undertaking requiring significant coordination with many agencies.
Perception of Price Considering WaTech Value Add

Page 783 of 851
. .
There was no customer feedback provided regarding Secure FTP costs.
Customer Plans for Future Usage
Agencies that currently use the service for enterprise application file exchange stated that they plan to continue using the service. However, they also stated that while their preference would be to use a more modern solution to integration (like web services), even if WaTech were able to offer a replacement service, the complexity of the current environment and the criticality to operations would translate into a long lead time for migration from this service.
(4727) Email ListServ (Retired Service)
L. Customer Satisfaction and Future Demand
There was no customer feedback provided regarding Listserv, as this service has been discontinued.

Page 784 of 851
. .
10. Project Management Services
(2120) Project Management
L. Customer Satisfaction and Future Demand
Perception of Features and Service Levels
WaTech service owners who employ project managers in support of internal and agency-facing projects within their service areas provided most of the feedback. Agencies who have had exposure to project managers through WaTech internal projects within the services they consume and pay for also provided some commentary. The only agency that directly purchases project managers as a service in support of agency-specific projects, Board for Volunteer Firefighters and Reserve Officers, was not interviewed since WaTech has well over 100 customers it was not possible to interview all customers for this inventory (Gartner attended a CIO Forum to request volunteers, and then collaborated with WaTech to expand the volunteer list to create a representative sample of customers across multiple variables, including: agency size, funding sources, and mission-driven needs, e.g., compliance requirements.) A couple of agencies that evaluated the service for support of agency-specific projects before declining to utilize the service also provided their perspective on the offering. Both WaTech service owners and agency representatives, provided similar feedback.
Customers stated that specific project managers have attributes that they value:
personal characteristics and capabilities (e.g., initiative, work ethic, drive to make the project successful, and commitment to delivering results),
knowledge of state government business and operations, and
knowledge of WaTech product lines or internal operating models
However, customers pointed out that only a few project managers had all the attributes they were looking for and stated that some project managers had material deficiencies in one or more areas. All customers stated that their satisfaction is highly dependent on the resource assigned, and that their demand is specific to individual PMs. Customers cite this as a problem because they only want to work with more capable PMs and are sometimes forced to choose between undesirable alternatives. Current WaTech internal customers reported that they would consider the following in the event that the right PM is not available:
delay a project until the right PM is available
assign PM activities to technical resources who may lack strong PM skills
manage the project without a designated PM
use a contract PM (hard to justify, within WaTech with underutilized PMs available) or
engage the less capable PM, knowing that they will consume budget and also consume lots of management tracking/assistance time
All of these options have negative impacts on agencies, services and costs.
Potential future agency customers shared concerns that WaTech’s service isn’t well aligned for agency-specific projects. In particular they felt that the service does not include an effective mechanism for holding WaTech PMs accountable for progress or delivery quality. These

Page 785 of 851
. .
agencies stated that contracting with external providers offered advantages that are not included as a feature of WaTech’s offering:
An ability to replace PMs who are underperforming or who are perceived to be a poor fit, when/if required (given contractual definitions, and depth of provider resource pool).
An ability to hold contracted PMs accountable for results, which could include withholding payment for services, which do not meet expectations.
An ability to access project managers with specific technical skills and specific implementation experience across a wider range of projects and environments
Higher PM productivity and an ability to require additional support (longer hours, weekend work, etc.) as needed to keep projects on schedule.
Perception of Price Considering WaTech Value Add
Most of the current customers of this service are internal WaTech Service Owners. Since this service became a stand-alone offering that they must purchase through internal sales (rather than through direct control through division-based and overhead-based staffing) Service Owners reported that their demand for PM services has decreased. These Service Owners reported that they are only willing to pay the internal sales rate ($140 per hour) for PM support where it is absolutely necessary, particularly given ongoing budget pressures.
These Service Owners stated that wherever they identity opportunities to eliminate low value-added PM support they try to reduce cost by eliminating billable PM activities such as:
support provided in areas where the current PM resource pool does not have sufficient technical depth to lead and provide value beyond administrative support.
support provided by less skilled, motivated or successful PMs.
support for miscellaneous activities that do not actually require project management expertise.
Most Service Owners stated that cost reduction through elimination of PM support may have been appropriate in areas where PMs were being used for administrative work. However they feel that the cuts went too far in areas where genuine project management work was subsequently assigned to technical resources who lacked project management skills or aptitude. As a result, some projects may have stalled while project management responsibilities were sorted out, and in some cases may have had less than optimal outcomes.
A few agencies stated that WaTech cross-team responsibilities for service delivery are not always clear to them and at times infighting between groups becomes visible even when a PM is assigned. However, agencies provided several examples where they were having challenges with a WaTech technical implementation until a WaTech project manager was assigned, at which point they experienced rapid progress and ultimately successful project completion. These agencies stated that they viewed participation of WaTech PM’s (not hiring WaTech PM’s directly) as a critical component of the services that they buy and consume from WaTech.
For agency-specific projects though, nearly all agencies use their own PMs or obtain project management services through third party vendors whose hourly rates are often lower than WaTech’s. At $150 per hour these potential customers stated that they view WaTech’s price to be on the high side for very skilled PMs (a benchmark which they say many WaTech PM’s do not meet), and that therefore they do not view that rate as competitive.
Even though some WaTech PMs may add value that is in line with their price, these agencies said there are many other competing providers who can provide the service at an equivalent or

Page 786 of 851
. .
lower price, and these alternative providers offer other value-added features including greater flexibility and agency control.
Customer Plans for Future Usage
WaTech Service Owners stated that they plan to continue using PM services, but do not currently intend to increase their usage substantially.
Potential customers stated that they will likely continue to seek services from the market, which can – as stated by many of these agencies – provide better project management skills and experience for targeted projects at an equivalent or lower cost with high levels of accountability (via stringent contracts and SLAs). These agencies stated that if WaTech could lower prices, provide greater flexibility for agencies to select best fit PMs, and provide greater accountability for performance, they might be more interested in leveraging WaTech’s service in the future.
Page 787 of 851
. .
11. Application Support and Development Services
(8310) Enterprise Systems
L. Customer Satisfaction and Future Demand
Perception of Features and Service Levels
Customer agencies did not provide feedback on enterprise systems, only the application Business Owners provided comment.
Business Owners pointed out that WaTech’s organization model changed within the last couple of years. While they used to have fully dedicated development and support teams, they now work with a dedicated group of developers but only receive part-time support from business analysts, project managers, and solutions architects. When WaTech first changed the delivery model, the Business Owners reported that they went through a rough patch during which use of new/different resources with insufficient institutional background and application knowledge resulted in noticeable loss of productivity, inferior application enhancements, and major challenges successfully completing major application development projects. Business Owners noted some recent improvements but cited ongoing challenges that still require significant improvement.
Business Owners stated that they believe the shared resource model causes WaTech internal (cross-organizational) management challenges that are highly visible to the Business Owners. The Business Owners noted that the move by WaTech to the shared resources model coincided with a realignment of these resources across three different management teams, and primary business objectives of some teams do not seem to fully align with each other or with those of the Business Owners. Business Owners report that WaTech’s repeated efforts to reorganize and ongoing challenges with turnover (attrition, re-assignment, replacement, onboarding/training, etc.) causes confusion and impacts staff morale, which noticeably affects service quality.
Business Owners also reported skills gaps and a lack of clarity around roles and responsibilities. These include:
Skills gap between most experienced business analysts, with uneven experience, skills and abilities across the business analyst team readily apparent. Inexperienced BAs have required a lot of job shadowing, partnering more experienced analysts with more junior resources. The less experienced BAs at times add to the workload, both for WaTech and for the Business Owners’ staff. (Business Owners cited situations where business analysts struggled to document system requirements and that struggle placed a greater burden on the customer to define the requirements. Though one Business Owner stated that they were hopeful that analysts would mature in time given the depth of expertise of the current business analyst manager.)
Testing of enhancements by WaTech has become cursory with a lack of clear roles and responsibilities for testing enhancements between the Business Owner’s and the WaTech.
Staffing for testing has been greatly reduced, as the team used to include a couple full time skilled QA analysts/testers.

Page 788 of 851
. .
WaTech may be short of SQL skills.
Lack of strategic analysis around the business cycle, and understanding current business needs to be able to help manage the portfolio and provide meaningful, proactive functional and technical advice.
The training and change management resources that the Business Owners previously relied upon went to WaTech as part of the merger, but WaTech stopped providing the service (e.g., WaTech used to have a training division but it was apparently eliminated as part of one of the reorgs or “efficiency” efforts). Business Owners stated that it is burdensome to take on this responsibility, as they are not staffed for it.
Perception of Price Considering WaTech Value Add
Agencies expressed that the Enterprise Systems Fee allocation is a bit of a black box. Application Business Owners expressed concern that so many applications had been added to the allocation that it had diluted its original intent and created a lack of transparency into application support costs.
Customer Plans for Future Usage
Customers leverage many of the applications covered under the Enterprise Systems Fee as a mandatory part of meeting their jobs (HR, Budget, Finance, etc.). Business Owners anticipate continuing to leverage these applications until (and if) they are replaced by One Washington ERP.
(8413) Governor’s Apps Support (OFM Enterprise)
L. Customer Satisfaction and Future Demand
No feedback was provided regarding costs of OFM Enterprise support, which covers application and development work on a small set of applications under the Governor’s Office.
(8411) DES Systems Support
L. Customer Satisfaction and Future Demand
DES Systems Support is no longer provided by WaTech. No customer feedback provided on DES Systems Support.
(8840) JINDEX
Page 789 of 851
. .
L. Customer Satisfaction and Future Demand
Perception of Features and Service Levels
Customers stated that the service provided by WaTech is adequate to meet their requirements.
Perception of Price Considering WaTech Value Add
Customers did not provide any feedback on pricing.
Customer Plans for Future Usage
Customers stated that they intend to continue utilizing the JINDEX service.
(8213) E-Time
L. Customer Satisfaction and Future Demand
Perception of Features and Service Levels
Customer agencies report that the E-Time projects are agency-led efforts rather than WaTech-led. One customer stated that WaTech played an important role in application integration (i.e., integration to other WaTech supported HR applications), but assessed that WaTech did not have the ability to successfully manage the project. Because of that, the customer hired a project manager from outside of WaTech to work onsite at WaTech but take direction from the customer agency directly.
Perception of Price Considering WaTech Value Add
Customers did not provide comment on the price of this service.
Customer Plans for Future Usage
Beyond the two agencies currently leveraging the service, no other agencies provided comment on plans for adopting E-Time.
(8214) Mainframe Testing
L. Customer Satisfaction and Future Demand
No customer feedback provided on Mainframe Testing service.

Page 790 of 851
. .
12. Web, Video and BI Services
(8682) Web Platform/ Design
L. Customer Satisfaction and Future Demand
Perception of Features and Service Levels
The majority of customers and potential customers interviewed stated that they view this service positively. Customers expressed that the delivery team is professional and that they are generally satisfied with the quality of the service delivered.
However, a couple of customers and potential customers expressed a few concerns.
The most frequently cited concern was around staffing and ability to scale. Customers expressed concern that it may not be feasible to sustain future growth and new project volumes without negatively affecting service quality. For example, one current customer stated that while the team is great to work with they do not believe that they can meet the size and demand of their websites.
Another complaint centered on the service levels, particularly regarding delayed response to outages (the example cited occurred in the afternoon during the business day but the incident was not acknowledged until the following day).
Other potential customers reported that they weren’t certain whether the current service meets security or site content management requirements, and it’s something they would need to evaluate further before selecting WaTech as their provider.
Potential customers also stated that they perceived sites designed by WaTech to be relatively simple and that they were not sure that the team would be able to accommodate requirements for more advanced graphics development or greater complexity of designs.
A couple customers also expressed frustration with the deprecation of the prior service. The legacy web hosting service was maintained on a platform that was end of life and customers reported that WaTech did not begin communication around the need to discontinue the service early enough. It was also reported that cutover to the new offering was costly for existing customers who had to pay for site redesign work, and the monthly fee was doubled in some instances.
Perception of Price Considering WaTech Value Add
Feedback on pricing was mixed. Many existing customers reported that WaTech web platform service is affordable and adds value, while other existing and potential customers stated that they perceived the service to be more expensive than some external third party providers. A couple potential customers stated that they had selected other third party providers due to pricing.
Customer Plans for Future Usage
Customers and potential customers both stated that an enterprise grade web design and hosting service is something they believe is a good candidate for WaTech to deliver. Agencies largely reported that they do not have the skillset in house, and do not want to maintain

Page 791 of 851
. .
expertise, and would rather purchase the service from WaTech or another third party. Existing customers stated that they plan to continue using the web platform service. Several non-customer agencies expressed an interest in potentially consuming the service in the future.
WaTech Collected Customer Feedback Data
WaTech collects feedback on this service leveraging the Net Promoter Score survey. The survey for this service had 23 respondents across a dozen agencies plus internal WaTech respondents. Of the customers responding, 71% were promoters of the service, 21% passives, and 8% detractors of the service.
The Net Promoter survey asks three questions:
Q1. How likely are you to recommend this service to a friend or colleague? (1 being very unlikely and 10 very likely)
Q2. What is the main reason for the score you just gave?
Q3. What one thing could we do to make this service even better?
The survey responses collected by WaTech during calendar year 2018 are provided in the table below (these responses are provided verbatim and have not been edited for spelling, grammar or clarity):
Q1. Q2. Q3.
8
I appreciated the efforts to get our website up before the end of the fiscal year. However, we had asked for documentation to assist us in future updates and personnel transitions but we never received. Ultimately it is not a huge issue because we've not needed it to date.
A clear route to request assistance that ensures requests are completed. I requested some assistance informally through email, and have not received follow up. Other times I have received rapid assistance and support. I would encourage some consistency for better customer service.
1
Hosting fees and maintenance fees are cheaper elsewhere/ maintaining the new site is more cumbersome than the old site.
Lower your maintenance and hosting fees to be competitive with private sector vendors.
10
Exceptional service and support from the WaTech Web Team. Highly knowledgeable and helpful staff.
How do you improve "exceptional"? Keep doing what you're doing!
10 The team at WaTech with which I work is always positive, supportive, and helpful. [Blank]

Page 792 of 851
. .
10
Out of all the departments I have dealt with at WaTech over the years, This team is the easiest to deal with along with being the most knowledgeable about their services. Not once have I been brushed off to some other random department with someone that doesn't understand the problem. If another department gets involved, they deal with them instead of putting the burden on me. I appreciate that.
I think you are doing fine as-is. I can't think of anything that needs changing from my point of view at the moment.
10
Our project lead was good at keeping us on task and pushing us to meet deadlines. We were on a tight project deadline because our old site was being taken offline within a few months. Staff made sure we made this deadline and had a successful launch. They jumped right in when any issues arose. [Blank]
10 Quick responses, good follow through, friendly customer service
New employee quick overview (one page or less) of what WaTech does vs IT
10
This team stepped up and made what seemed impossible happen. The team knows what they are doing, they are very responsive to questions, and the work was always done on time with very little errors.
Knowing what is being billed was the only area that we struggled with. If a copy of what is being billed could be sent to the project manager, it would help better track payments.
8 Prompt service meeting my need Better points of contact for services. This one was difficult for me to find.
10
The service has been fantastic, as our bank of hours end with our contractor we plan to switch to the full version :)
Most of it is pretty intuitive, but are there any guidebooks or tutorials for using all of the features? Thank you guys! Your work on this platform made a huge difference for us! I appreciate you!
9 Responsiveness/helpfulness with requests and problems
Train me on how to create blocks/modules/templates in Drupal. In other words, "teach me to fish" instead of "bringing me a meal."

Page 793 of 851
. .
10
We are extremely pleased with our new website and the service provided regarding its planning, launch and on-going support.
A yearly check-in to see how things are going and any new products or extensions available.
10
Dan and Wendy have made the process of moving off AWS and to the Watech servers very easy. Dan is friendly, responds quickly, he is helpful and can plain talk things into non techie terms (not all teckie types come with this skill). [Blank]
10 Overall quality of service. Can't think of anything off the top of my head.
8
The platform is robust and excellent for a normal agency website. For a project site or a web app I might recommend something else.
Easier hosting of web apps in PHP, Ruby or Python -- Heroku or similar
9 Relative ease of use! [Blank]
9
The team ingrates user experience into the web development in a way that gives us a lot of confidence we're getting something that meets our users' needs.
When a request comes in, it helps to clarify the details with the customer. Sometimes I'll send in a request and it may not be urgent, but when the developer gets to it, there's perhaps not as much communication at the outset as there could be. The end product is usually great, but sometimes doesn't quite match our needs. A little communication before doing all the work would make a big difference. That's the one thing.
7 [Blank]
Better communication. Respond to requests (eg. quote, what services we're getting, TOS, etc.)
8 Very responsive, good service We are new to working with WA Tech. No improvement feedback yet.
10
Wendy and Dan have been extremely helpful and responsive to our needs in building and sustaining our Drupal website. Hire more Wendys and Dans!!

Page 794 of 851
. .
10 All service is done well and timely. [Blank]
10 Staff at DES is very helpful and really listen to our concerns. [Blank]
5
Resources seem stretched very thin at WaTech. The staff works very hard, but is clearly stretched across multiple websites for multiple agencies, making response time for non-emergency improvements lengthy.
Add more developers to make response time more nimble.
10 The facility and services provided are awesome. Very helpful to our work.
I wish…[stakeholders]…could figure out how to make this a part of the services...[the agency]…receives. I do not think we can afford it without a grant but every project should include this in the work.
(8610) Formerly Access Washington (Defunded)
L. Customer Satisfaction and Future Demand
Agencies interviewed expressed frustration that the state made a substantial investment in Access Washington but had ultimately not gotten much value from it. A couple agencies stated that WaTech has failed to acknowledge lessons learned or hold key leaders accountable.
(8610) Usability Lab
L. Customer Satisfaction and Future Demand
No customer feedback provided regarding Usability Lab.
(8681) Usability Experience (UX)

Page 795 of 851
. .
L. Customer Satisfaction and Future Demand
Perception of Features and Service Levels
A few potential customers expressed some frustrations with this service:
OCIO policy had established an unfunded mandate for accessibility services (while agencies acknowledged the importance of ADA compliance and that upgrading websites to ensure compliance is something they should do, they stated they do not have the budget available to tackle the issue). It was implied that the intent behind this policy was to drive further WaTech accessibility compliance business.
While usability and accessibility may be a good service, agencies stated that they viewed this service as a boutique offering where state agency maturity just isn't there yet.
Agencies expressed dissatisfaction with the required subsidizing for User Experience and Accessibility vs. other priorities.
Perception of Price Considering WaTech Value Add
Agencies stated that they viewed this service as expensive (it is a high-end offering whether acquired from WaTech or another provider), and while they generally might be doing some of the right things, they just do not see much value in continuing the service. Many of the agencies interviewed stated that this is a boutique offering that is not a core part of WaTech’s mission.
A large potential customer stated they considered purchasing the UX service support but they found it to be less price competitive than anticipated.
Customer Plans for Future Usage
Agencies who do not yet consume UX services did not state an intent to consume the service in the future.
(8215) Agile Business Analysts
L. Customer Satisfaction and Future Demand
Perception of Features and Service Levels
Customers provided feedback on the Business Analyst resource pool as a whole, but not specific to the Agile Business Analysts service. This feedback has been captured under the Enterprise Systems Customer Feedback section.
Business owners (Enterprise Systems) expressed the concern that the business analysts resources that they are funding are being used to deliver this service and that training, recruiting and career development within this group is focused on supporting this unproven new service versus meeting their needs.
Perception of Price Considering WaTech Value Add

Page 796 of 851
. .
Customers highlighted their perception that business analyst rates are not price competitive compared to third party providers. Customers stated that there are comparable options available from vendors at lower costs.
Customer Plans for Future Usage
Potential future customers did not indicate that they plan to use this service in the future.
WaTech Collected Customer Feedback Data
WaTech collects feedback on this service leveraging the Net Promoter Score survey. The survey for this service had two respondents across a two agencies. Of the customers responding, 100% were promoters of the service.
The Net Promoter survey asks three questions:
Q1. How likely are you to recommend this service to a friend or colleague? (1 being very unlikely and 10 very likely)
Q2. What is the main reason for the score you just gave?
Q3. What one thing could we do to make this service even better?
The survey responses collected by WaTech during calendar year 2018 are provided in the table below (these responses are provided verbatim and have not been edited for spelling, grammar or clarity):
Q1. Q2. Q3.
10
The service was fast, high quality, and collaborative. I have already recommended the service to colleagues.
If I had the forethought, I would have had a VSTS Project set up to avoid having to port over the user stories. Other than that, it was great!
10
We received the service that we needed. The deep technical knowledge in various technologies that are used in the industry outside of WA state is something we do not have. This was very helpful in analyzing the RFP responses we received.
It took us a bit to understand the layout of the services you provide. This could have been more defined. But you more than made up for this, by listening to our needs very patiently.
(8652) Business Automation as a Service
L. Customer Satisfaction and Future Demand
Perception of Features and Service Levels

Page 797 of 851
. .
One customer stated that believed they had received great value out of this service. The customer was impressed with the skills and knowledge of the WaTech experts, the speed of the rapid prototyping (about two weeks), high touch customer service, and ultimately perceived the end product to meet their business requirements.
A potential customer stated that they had explored leveraging WaTech for developing a medium sized application. However, when engaging in preliminary requirements discussions WaTech stated they would not be able to deliver something that would meet the agency’s needs due to the complexity and scale of what was needed. This potential customer stated a perception that the service can only satisfy the most basic application development requirements and provides somewhat limited value at this time.
Perception of Price Considering WaTech Value Add
The customer interviewed stated that they were impressed with the value delivered and that they viewed the service to be affordable and price competitive.
Customer Plans for Future Usage
Several agencies stated that they do not view Business Automation as a Service to be a critical part of WaTech services offerings. They stated that they perceived this service to be more of a niche offering that they fear WaTech would have difficulty sustaining or growing.
The current customer stated that they would consider engaging with WaTech for future small-scale development efforts given the success of the initial pilot project.
(8211) Data Management Services
L. Customer Satisfaction and Future Demand
Perception of Features and Service Levels
No customers of the database administration portion of the service provided comment.
Potential customers provided some comments on the services offerings and what they would potentially like to see from the service:
Some of the agencies participating in the focus group stated that WaTech’s Power BI support services are not particularly attractive given that customer agencies must join the shared tenant to take advantage of the support.
Several agencies stated that they would like to see WaTech provide agencies with access to Informatica as a tool as a service offering (agencies noted that WaTech configured Informatica as a part of a failed portal project).
One agency stated that they could potentially see value in leveraging WaTech for data warehouse/ data mart services but were not sure whether WaTech would be able to address their security requirements.
Several agencies stated that they would like to see WaTech build the web services calls to help move away from the SFTP service for enterprise system integration, but they stated they do not believe WaTech has the resources to offer that. They also cited a previous WaTech attempt to improve statewide data integration and data architecture,

Page 798 of 851
. .
but that different agendas across various stakeholder groups made it difficult for WaTech to make any real traction.
Perception of Price Considering WaTech Value Add
There was no feedback provided by customers or other agencies regarding the price of the newly emerging data management service.
Customer Plans for Future Usage
There was no feedback provided by customers or other agencies regarding plans for future usage.
(8650) Video Production Services (E-Gov/ Other Services)
L. Customer Satisfaction and Future Demand
Perception of Features and Service Levels
Customer feedback was generally positive. Customers interviewed cited staff professionalism and expertise as valued features of the service, but there are concerns about how this service would be sustained if this single individual were to take another role or leave state service.
Beyond the customer interviews and focus groups conducted by Gartner, WaTech uses a structured survey approach (Net Promoter) to collect customer feedback continuously. Customers from over a half dozen agencies provided overwhelming positive comments and universally high ratings for this service.
Perception of Price Considering WaTech Value Add
Current customers stated that Video Production is a high quality service that is delivering high value to those who need it.
A couple of potential customers viewed Video Services as a highly specialized offering not clearly aligned to WaTech’s role as an IT Shared Services provider and questioned whether it is necessary to provide the service on an enterprise-wide scale. They also referenced concerns about the long-term viability of the service, and the need to subsidize the service with revenue from other service offerings.
Customer Plans for Future Usage
Current customers stated that they would purchase more of the service in the future and would recommend the service to other agencies.
A couple potential customers interviewed stated that they do not have a strong business requirement for video services, which is the primary driver for not consuming this WaTech service.
WaTech Collected Customer Feedback Data

Page 799 of 851
. .
WaTech collects feedback on this service leveraging the Net Promoter Score survey. The survey for this service had thirteen respondents across a half a dozen agencies plus internal WaTech respondents. All of the respondents were promoters of the service.
The Net Promoter survey asks three questions:
Q1. How likely are you to recommend this service to a friend or colleague? (1 being very unlikely and 10 very likely)
Q2. What is the main reason for the score you just gave?
Q3. What one thing could we do to make this service even better?
The survey responses collected by WaTech during calendar year 2018 are provided in the table below (these responses are provided verbatim and have not been edited for spelling, grammar or clarity):
Q1. Q2. Q3.
10
Not only was the end-product better than our vision, I have, in fact, recommended this to others.
Sure, if the cost were exactly zero that would be great, but otherwise, the service the end product but by far THE PEOPLE were exceptional. The talent, the professionalism, the personalities made the process enjoyable, thought provoking and respectful.
10
There are really two main reasons. Firstly, the video produced was amazing. It evoked an emotional response for the viewer that made them feel like impressed and moved by the subject matter. Secondly, having participated in other video production work, your ability to interview me and get at the heart of the value and compelling story was extremely helpful.
If you could figure out how to create such an emotional and connected response from the viewer in a more low-fidelity way (quicker and less expensive) that would be amazing.
10
Easy to work with and professional crew. Adept at making interviewees feel comfortable. N/A
10 Teamwork approach, energetic, and respect for time all given. Offer cookies.
10
Marilyn and her team were excellent at trying to understand what we were looking for and partner to have an excellent final product. Can't think of anything.

Page 800 of 851
. .
10
Video is of enormous value to my program. It visually conveys subjects that are challenging to comprehend and leaves a memorable impression on the viewer
The internal procurement process can be challenging and often requires repeated justification about the value of the video program.
10
The editing of the videos is excellent and turns out a video that has an enormous impact on the viewer. Can't think of anything at this time.
10 Quality and effectiveness of the end product; professionalism of the team n/a
9 Excellent, professional service & outstanding work product.
Cost is a little on the higher side compared to the competition.
10 Professional work and attitude from start to finish. Nothing.
10
I had total confidence in Marilyn and her crew. I had never managed this kind of project before and it turned out to be a breeze because of Marilyn and company. I cannot think of anything.
10 Mad talent More time for us to do more-which is magical thinking
10
WaTech has been great to work with. Marilyn is flexible and has worked to produce a video that suits all our needs.
Nothing. WaTech has been easy to work with and responsive. Thanks!
13. GIS Location-Based Services
(8710) Geospatial Portal
L. Customer Satisfaction and Future Demand
Perception of Features and Service Levels
The customers that provided feedback stated that they are satisfied and typically cited the portal quality, the geospatial data provided through the portal, and recent progress made by the GIS Senior Program Manager to improve the service and coordination across agencies.

Page 801 of 851
. .
However, agencies noted limitations in WaTech’s depth of expertise and staffing levels and stated that the state’s real expertise was located within the individual agencies.
Perception of Price Considering WaTech Value Add
Agencies did not provide any feedback on the Geospatial Portal allocation costs.
Several customers stated that the Geospatial Portal provides a lot of value to the State of Washington and agencies with geospatial data and infrastructure needs.
Customer Plans for Future Usage
Customer agencies signaled their intention to continue using the service. Non-customer agencies (i.e., agencies that do not currently pay into the Geospatial Portal allocation) did not provide any feedback regarding plans for future usage.
(8711) Washington Master Addressing Service – WAMAS
L. Customer Satisfaction and Future Demand
No customer feedback provided for WAMAS.
(1230) Geospatial Initiatives / GIT Committee
L. Customer Satisfaction and Future Demand
Perception of Features and Service Levels
Customer agencies that did provide feedback cited the committee’s success in improving cross-agency collaboration in solving statewide GIS problems, standardizing GIS practices and policies, and the perceived level of influence given to customer agencies on the committee as attractive features of this initiative.
Perception of Price Considering WaTech Value Add
None of the agencies provided feedback on pricing for the GIT Committee or other geospatial initiatives.
Customer Plans for Future Usage
Participating agencies signaled their intention to continue participating on the GIT committee. Non-participating agencies did not provide any feedback regarding their intention to participate in geospatial initiatives such as the GIT committee in the future.

Page 802 of 851
. .
(1240) WA Geographic Council – WAGIC
L. Customer Satisfaction and Future Demand
No customer feedback provided for WAGIC.

Page 803 of 851
. .
14. Office of the CIO Services
(1200) Office of the CIO
L. Customer Satisfaction and Future Demand
Perception of Features and Service Levels
Customers stated that enforceable Statewide IT policies are necessary and that the State CIO/OCIO is the correct body to promulgate and enforce them. Customers perceive many OCIO issued policies to be non-controversial and stated that they are working fine. However, many customers said the OCIO policymaking process is non-transparent and the OCIO generally fails to build consensus among agencies before enacting policies. Customers stated that the OCIO does not often seek individual or collective customer input when formulating policies and standards; when it does, many customers stated that they believe that it ignores any feedback that does not reinforce its pre-determined direction. Customers provided a few examples:
For recent changes to policy 141.10, OCIO set a customer comment deadline in December 2017 despite the fact that the OCIO adopted the changes in November.
OCIO does not log objections to agency policy proposals, document a clear rationale that enables an agency to understand why the OCIO did not act upon their policy proposal or suggested change, and does not provide details on how to appeal a decision to the correct forum or individual prior to the OCIO finalizing the policy.
OCIO sponsors a few working groups and other forums where it could gather feedback. However, customers reported that the OCIO does not frequently participate in some of them and does not consistently leverage them for input into the policymaking process.
Customers characterized OCIO policy language as alternatively either too vague to be meaningful, requiring interpretation by the OCIO and the agencies which often leads to disagreement and delay, or so specific that it forces agencies to adopt specific solutions, often solutions provided by WaTech. Customers also report that OCIO policy is sometimes reactive rather than proactive, meaning that the OCIO puts in place policies, standards, and strategic guidance after agencies have already adopted practices, tools, or solutions that may not be compliant with the new policies. Agencies stated this either results in ineffectively vague policies intended to avoid rework or unfunded mandates for agencies to change their practices and deploy different architectures and technologies.
Several customers stated that the process for granting waivers and exceptions to policies was non-transparent and a couple customers perceived it to be arbitrary with favorable outcomes for large agencies, politically connected agencies and agencies with stronger ties to the OCIO. Several customers stated that rulings on policy exceptions should include detailed rationales made available to all Agencies.
Most customers expressed the perception that a significant amount of OCIO policymaking is designed to operate as a forcing mechanism to drive agencies to adopt WaTech Solutions. Most customers stated they believe that having the OCIO statewide policymaking responsibilities within the same organization as the WaTech shared services provider responsibilities makes it difficult or impossible for the CIO to put the needs of individual agencies, and the long-term needs of the state, ahead of WaTech short term financial interests. Customers offered some

Page 804 of 851
. .
examples of this practice: the mandated use of Secure Access Washington, the shared Office 365 tenant, the State Government Network and the State Data Center.
Customers expressed confusion around the organizational alignment of all of the CIO’s executive offices (Office of Cybersecurity, Privacy Office, and the Office of the CIO), stating that it is not clear whether they are still WaTech and who is directing who.
While customers stated that project oversight is important and the OCIO could play a key role helping agencies to avoid IT project missteps, customers perceive current OCIO project oversight services to be weak, ineffective, and overly burdensome. Several customers stated concern about the level of effort required to comply with oversight requirements, particularly when many of the projects are less complex or related to routine business processes (like data center migration or hiring new personnel) that are not well suited to the standard oversight process.
Customers stated three root causes of ineffectiveness related to oversight staffing.
1. Oversight personnel lack experience and have gaps in key knowledge areas (familiarity with large, statewide projects and/or with large IT projects in general). This is in stark contrast to what was available several years ago. Customers believe OCIO has lost these experienced resources and has not replaced them with resources of equivalent caliber.
2. Oversight personnel lack familiarity with agency business models, project/program requirements and delivery capabilities, which is necessary to enable valuable insights regarding risk and benefits preservation/realization. This is also, in contrast to what was available several years ago when the OCIO aligned oversight resources to portfolios of agencies within a specific business area (e.g., public safety).
3. Too few resources spread across too many complex projects, resulting in a high level “check the box” process, which does not identify or address the true risks associated with a project.
In some cases, the agencies reported that the time necessary to train the OCIO oversight analyst on their business, as well as the project goals, challenges, desired outcomes and solution approach consumed so much of the project leader’s time that it actually increased rather than decreased the overall risk.
Customers stated that third-party oversight is important. Most agencies stated that they utilize independent QA consultants; these agencies stated that they also want the OCIO to provide strong oversight in conjunction with the external QA process. However, today’s oversight offering is backwards looking (problems have already occurred) and high level (problems are missed until very late in the project process). Customers stated that they believe these oversight roles need to be consistently staffed (same resources over multiple projects) with knowledgeable, experienced staff who have the context and acumen to work collaboratively with senior agency executives and program leaders and their external QA consultants to expose and help mitigate key risks which could take a project off track. The current high-level “check the box” approach does not achieve this, and customers perceive it to be a distraction in many cases. Customers would like to see WaTech invest and improve in this area.
Beyond feedback provided on oversight and policy development, several agencies stated that they would like to see the Technology Business Management Program (centered on the Apptio software tool to enable IT cost transparency) reexamined, as they perceive it to be burdensome without much business value.

Page 805 of 851
. .
Finally, a couple customers expressed concern that OCIO is not providing clear strategic guidance to state agencies. These customers stated that OCIO is not fulfilling their legislative mandates related to enterprise architecture; they are not setting the direction for the state.
Perception of Price Considering WaTech Value Add
The OCIO funding is appropriated by the legislature and funded via a customer allocation. Therefore, customers did not provide feedback on their perception of price.
Customer Plans for Future Usage
Customers did not provide feedback regarding their plans for future usage of OCIO services; agencies must consume OCIO oversight services for all projects within the IT project pool by statutory mandate.
However, several agencies indicated they would not proactively seek OCIO oversight where it is not mandated and would continue to treat engagement as a compliance exercise, similar to an audit, rather than as an opportunity to gain additional insights and perspectives that actually help reduce project risk.
(1210) 800 Mhz
L. Customer Satisfaction and Future Demand
There was no customer feedback provided for 800 MHz.
(1260) OneNet
L. Customer Satisfaction and Future Demand
There was no customer feedback provided for OneNet.
Page 806 of 851
. .
15. Office of Cybersecurity Services
(3570) Office of Cybersecurity
L. Customer Satisfaction and Future Demand
Perception of Features and Service Levels
All agencies are customers of the Office of Cybersecurity (OCS) and provided feedback on a few of the programs and services provided: SOC/Incident Response, CERT Vulnerability Assessments, and Security Design Review. Customers provided mixed feedback with some highlighting the value delivered and others highlighting their perception of some ongoing challenges. Nearly all agencies highlighted ongoing confusion about the role of OCS and the fact that they are not clear on whether OCS directs WaTech or vice versa.
SOC/Incident Response:
Some customers cited examples of when the SOC provided support for incident identification and response (e.g., identifying irregular traffic and hacked servers and providing expertise to mitigate) where the process worked smoothly and produced a good outcome. These customers stated that they were satisfied with the support provided by OCS in resolving the security incidents.
However, a minority group stated that the process did not work well for their agency. In particular, an agency cited frustration that they had requested support from OCS but had retained the role of incident commander within the agency, and in spite of that OCS controlled communications related to the incident to the governor’s office in a manner they stated felt as if they were “playing politics.”
Focus group participants expressed frustration with the timing of SOC notifications, and the quality of the information provided. For example:
The Threat Detection Network Monitor tool generates alerts, but customers stated that they are not always provided a destination IP, and when they do receive one, it is typically the NAT address. These customers expressed frustration that they have to crawl through Firewall logs to identify the server, and instead of that manual effort, they stated they would like to see that information pulled automatically from the firewalls and provided to them with the notification.
The SOC delays notification of security events in order to do the analysis first. Customers stated that this lag between the time the alert is received at the SOC and the information is passed on is not helpful, and they would like to get the alert right away. By the time they are notified, sometimes two hours later, customers stated it is not unusual for an infection to have spread to multiple servers.
Customer agencies stated that they want OCS to share alerts for firewall egress immediately. They want OCS to provide the IP address and want OCS to forward the packet capture.
CERT Vulnerability Assessments:
Several agencies expressed confusion around the CERT Vulnerability Assessment service given they understood that OCS would no longer be a service provider organization following

Page 807 of 851
. .
the split from WaTech, the CERT Vulnerability Assessment is a service that seems to potentially overlap with WaTech’s Vulnerability Assessment tool as a service.
Several agencies stated that the service seemed to be under-resourced with only one laptop with a pre-loaded Vulnerability Assessment tool, effectively limiting the team to sequential assessments. Agencies noted that it could take up to a 12 to 18 month timeline to receive the service. However, many noted that they received some useful recommendations, and were generally satisfied with the assessment deliverable, noting that there were no associated costs charged for it.
Agencies also provided feedback that the spearfishing component of the assessment is limited to two deployment approaches,
a one-time assessment as a component of the CERT Assessment.
a recurring monthly subscription.
Several agencies expressed the concern that monthly is too frequent and they would rather leverage the service on a quarterly or ad hoc basis.
Security Design Review:
A majority of customers stated that they see the value in the security design review process and they believe it is helpful to have a second set of eyes on planned designs. Agencies acknowledged that specialized security expertise is difficult to recruit and retain within government and that a central service that provides this expertise is valuable.
Agencies also stated that they see a real work ethic in the current Security Design Review team. However, the team was viewed as both a roadblock and a value-added service.
Agencies noted that initial reviews were narrowly focused on 141.10 compliance but OCS has gotten better about accepting other compliance frameworks equivalency to speed up reviews (e.g., FedRamp and some other higher certification would meet and exceed the requirements of 141.10) and have reduced some of the repeated overhead in multiple review cycles. Agencies noted that OCS is new, and that they believe the service will continue to mature and improve.
Customers cited some features of the service that they appreciated:
Open consultations that provide insight into OCS interpretation and expectations ahead of time, that agencies stated help better prepare them for design reviews, and expedites the entire process.
Investment in policy development with emphasis on the cost of security breaches.
High quality of architects completing most design reviews.
New expedited security review process for certain low risk changes.
Customers also cited some ongoing challenges:
Design reviews that take far too long to schedule and then take a long time to complete, causing development bottlenecks.
Lack of a sense of urgency in completing reviews.
Insufficient governance: Agencies stated that they didn’t believe there is anywhere disagreements or alternative options can be appealed to that are independent of what they perceive of as a tight circle of WaTech executives running the OCIO, OCS and most other Statewide IT governance functions.

Page 808 of 851
. .
Different viewpoints between OCS and WaTech EA and other groups that spill into public displays of infighting.
Challenges with getting different answers from different people within OCS at different times and points in the process (though this seems to be improving – agencies stated that internal coordination is improving).
Several agencies also stated that they believe OCS is completely risk averse and does not collaborate effectively to enable business leaders to evaluate and where accept some levels of residual risk. They provided several examples:
Policy 141.10 is helpful but some aspects of it are problematic because it is non-specific and open to interpretation. However, OCS has positioned itself and the OCIO/CIO as the final arbiters and provide little transparency into the arbitration process when good faith disputes occur – interpretation is problematic when OCS uses it to imply that agencies have to use WaTech services.
The largest point of contention was around internet access. Over a half a dozen agencies cited federal mandates, movement to the public cloud, remote office constraints, and high volumes of field work as driving requirements to architect appropriately secured solutions for leveraging alternative connectivity strategies rather than remaining dependent on all internet traffic routing through the State Data Center and stated that OCS was simply unwilling to partner with them to develop appropriate solutions.
Instances of sacrificing “real security” to check the policy box (a couple decisions related to the bullet above were cited by customers as examples).
Perception of Price Considering WaTech Value Add
Most customers provided limited feedback on WaTech value compared to pricing; however, a couple agencies provided a substantive commentary.
One agency stated that they like the design reviews but OCS is not meeting their obligations which causes agency funding delays, which tacks on more cost to application projects due to extended schedules. The same agency suggested that OCS needed to become more proficient at identifying the areas of greatest value and more narrowly tailoring reviews to fit their ability to deliver at the available level of staffing.
Another agency stated that while they were generally satisfied with the CERT deliverable, they would have been frustrated if they had paid an external consultant directly for the equivalent service/deliverable provided.
Customer Plans for Future Usage
Customers did not provide feedback on plans for future usage. Many of these services are mandated.
(3571) Forensics Investigation and Consulting

Page 809 of 851
. .
L. Customer Satisfaction and Future Demand
No customer feedback was provided for Forensics Investigation and Consulting, as this piloted service was discontinued in November 2018 due to low customer demand.

Page 810 of 851
. .
Appendix – Reference Material

Page 811 of 851
. .
Analysis Methodology Details

Page 812 of 851
. .

Page 813 of 851
. .

Page 814 of 851
. .

Page 815 of 851
. .

Page 816 of 851
. .

Page 817 of 851
. .

Page 818 of 851
. .

Page 819 of 851
. .
List of Acronyms
AAD – Azure Active Directory
ACCT – Financial Reports
ADFS – Active Directory Federation Services
AFRS – Agency Financial Reporting System
AP – Access Point
AR – Enterprise Accounts Receivable System
ASM – Application Security Management
BATS – Bill Analysis and Tracking System
BDS – Budget Development System
BYOD – Bring Your Own Device
CAMS – Capital Asset Management System
CAS – Cost Allocation System
Centrex – Telephony Central Exchange
CERT – Computer Emergency Readiness Team
CFN - Campus Fiber Network
CICS – Customer Information Control System
CIM – Compensation Impact Model
COLO – Data Center Colocation Services
CPU – Central Processor Units
CRL - Certificate Revocation List
CRMS - Constituent Relationship Management System
CTS – Consolidated Technology Services
DCI – Data Center Interconnect
DCIM - Data Center Infrastructure Management
DF – Disclosure Forms Application
DH – Data Hall
DHCP – Dynamic Host Configuration Language
DIA –Direct Internet Access
DIS – Department of Information Services
DLP – Data Loss Prevention
DR/BC - Disaster Recovery / Business Continuity
DWDM – Dense Wavelength Division Multiplexing
EAD – Enterprise Active Directory
EADSC - Enterprise Active Directory Steering Committee
EOS – Enterprise Output Solution
EPO – Enterprise Program Office
EPS – Events Per Second
ERP – Enterprise Resource Planning
ESS – Employee Self Service
FAD – Forest Application Developers
FFS – Fee-for-Service
FNS – Fiscal Note System
FOOB - Facility Out-of-Band

Page 820 of 851
. .
FRG – Forest Resource Group
FTE – Full Time Equivalent
FW – Firewall
FY – Fiscal Year
GB – Gigabyte
GJXDM – Global Justice XML Data Model
HRMS – Human Resource Management System
IDS – Intrusion Detection System
IGN – Inter-Governmental Network
IP – Internet Protocol
IPAM – Internet Protocol Address Management
IPS – Intrusion Protection System
IVR – Interactive Voice Response
JV – Journal Voucher process
LAN – Local Area Network
LD – Long Distance
LDoS – Last Day of Support.
LMR – Land Mobile Radio
LTE – Long-Term Evolution
MAC – Moves, Adds, and Changes
MAN – Metropolitan Area Network
MDM – Mobile Device Management
MEP – Manufacturing Extension Partnership
MIM – Microsoft Identity Manager
MPLS – Multiprotocol Label Switching
MPS – Malware Protection System
MRC – Monthly Recurring Charge
MS – Microsoft
MSA – Master Services Agreement
MSSP – Managed Security Services Provider
MTTR – Mean Time to Repair
MVS – Medium voltage substations
NAS – Network Attached Storage
NLT – No Later Than (represents the last day of support, end-of-life date, and/or
NOC – Network Operations Center
NPS – Net Promoter System
NRC – Non-Recurring Charge
NSD – Network Services Division
NSX – VMware software defined networking tool
NTIA – National Telecommunication and Information Administration
O&M – Operations and Maintenance
OCIO – Office of the CIO
OCS – Office of Cybersecurity
OCSP – Online Certificate Status Protocol
OFM – Office of Financial Management

Page 821 of 851
. .
OOB – Out-of-Band
OSS – Operations Support Systems
OTV – Overlay Transport Virtualization
OWA – Outlook Web Application
PAM –Privileged Access Management
PBX – Private Branch Exchange
PDU – Power Distribution Unit
PE/CE – Provider and Customer Edge
PGN – Public-facing Government Network
PoE – Power over Ethernet
PSE – Puget Sound Energy
PSTN – Public Switched Telephone Network
PUE – Power Usage Effectiveness
QDC – Quincy Data Center
RAM – Random Access Memory
RCW – Revised Code of Washington
RFI – Request for Information
RFP – Request for Proposal
RFQ – Request for Quote
RJE – Remote Job Entry
RPM – Results through Performance Management System
SaaS – Software as a Service
SAN – Storage Area Network
SAW – Secure Access Washington
SBS – Server Backup Services
SCCM – System Center Configuration Manager
SDC – State Data Center
SEAP – SAW Enabled Agency Portal
SGN - State Government Network
SIEM – Security Information and Event Management
SIP – Session Initiation Protocol
SLA – Service Level Agreement
SLD – Switched Long Distance
SLO – Service Level Objective
SMON – State Metropolitan Optical Network
SOA – Service Oriented Architecture
SOC – Security Operation Center
SPS – Salary Projection System
SQL – Structured Query Language
SSE – Shared Services Email
SSL – Secure Sockets Layer
SVPS – Statewide Vendor/Payee Services
TALS – The Allotment System
TDM – Time Division Multiplexors
TEMS – Travel and Expense Management System

Page 822 of 851
. .
TMS – Time Management System
TOS – Terms of Service
TSB – Technology Services Board
UHP – Ultra High Performance
UPS – Uninterruptible Power Supply
UX – User Experience
VA – Vulnerability Assessment
VDA – Virtual Delivery Agent
VESDA – Very Early Smoke Detection and Alarm
VLAN – Virtual Local Area Networks.
VM – Virtual Machine
VMDK – Virtual Machine Disk
VoIP – Voice over IP
VPN – Virtual Private Network
vRealize – VMware benchmarking and billing tool
VRF – Virtual Routing and Forwarding
VRS – Version Reporting System
vSAN – VMware Storage Area Network virtualization tool
WAN – Wide Area Network
WWA – Washington Work Force Analytics

Page 823 of 851
. .
List of Participating Agencies (Interviews and Focus Groups)
Gartner worked with WaTech to ensure broad and representative agency participation in the project. As a first step Gartner attended a CIO Forum meeting in order to request volunteers, and then worked with WaTech to create a list of agencies of various sizes, and types, to invite. Twenty four agencies elected to participate in the interviews and focus groups.
Interviews targeted CIO/ IT Director level participants, though agency IT leadership often elected to pull in additional managers, both technical and business, to provide further feedback during interview sessions. Focus groups targeted the participation of Technical Managers with strong understanding of the current services; but several CIOs and their delegates also attended.
Table 439. List of Agencies Participating in Interviews and Focus Groups
# Agency # Agency
1 ACB
13 DSHS
2 AG 14 DVA
3 COM 15 ECY
4 DAHP 16 ESD
5 DEL 17 L&I
6 DES 18 OIC
7 DFI 19 OFM
8 DNR 20 SAO
9 DOC 21 SEC
10 DOH 22 WIPP
11 DOL 23 WSDOT
12 DRS 24 WSP

Page 824 of 851
. .
List of Tables and Figures
List of Tables
Table 1. Scoring Detail and Rating Key ............................................................................... 9
Table 2. Services/Programs WaTech Should Continue to Offer ..........................................12
Table 3. Services/Programs WaTech Should No Longer Offer ...........................................26
Table 4. Transformational Project Opportunity – Collaboration ...........................................34
Table 5. Transformational Project Opportunity – Enterprise Applications ............................35
Table 6. Transformational Project Opportunity – Private Cloud ...........................................35
Table 7. Transformational Project Opportunity – Telephony ...............................................36
Table 8. Transformational Project Opportunity – Security ...................................................37
Table 9. Centrex Workload Supported .............................................................................. 249
Table 10. Centrex FY18 Planned Service Expenses .......................................................... 249
Table 11. Centrex Cost by Workload .................................................................................. 250
Table 12. Centrex Rates ..................................................................................................... 250
Table 13. Centrex Cost Recoverability (Actual FY16-FY18)................................................ 251
Table 14. Centrex Cost Recoverability (Forecasted FY18-FY19) ........................................ 251
Table 15. Service Level Objectives for Telephony (Centrex, PBX, SLD, Conferencing) ...... 251
Table 16. Service Level Report for Telephony Projects (Centrex, PBX, SLD, Conferencing) ..................................................................................................... 252
Table 17. Centrex Current List of Customers ...................................................................... 253
Table 18. PBX Workload Supported ................................................................................... 261
Table 19. PBX FY18 and FY19 Forecasted Spend ............................................................. 262
Table 20. PBX Equipment Depreciation .............................................................................. 263
Table 21. PBX Cost by Workload........................................................................................ 263
Table 22. PBX Rates .......................................................................................................... 264
Table 23. PBX Cost Recoverability (Actual FY16-FY18 H1) ............................................... 264
Table 24. PBX Cost Recoverability (Forecasted FY18-FY19) ............................................. 264
Table 25. Service Level Objectives for Telephony (Centrex, PBX, SLD, Conferencing) ...... 266
Table 26. Service Level Report for Telephony Projects (Centrex, PBX, SLD, Conferencing) ..................................................................................................... 267
Table 27. PBX Current List of Customers ........................................................................... 268
Table 28. Historical PBX Usage .......................................................................................... 269
Table 29. Long Distance Workload Supported .................................................................... 274
Table 30. Long Distance FY18 Planned Service Expenses ................................................ 275
Table 31. Long Distance Cost by Workload ........................................................................ 275

Page 825 of 851
. .
Table 32. Long Distance Cost Recoverability (Actual FY16-FY18) ..................................... 276
Table 33. Long Distance Cost Recoverability (Forecasted FY18-FY19) ............................. 276
Table 34. Service Level Objectives for Telephony (Centrex, PBX, SLD, Conferencing) ...... 277
Table 35. Service Level Report for Telephony Projects (Centrex, PBX, SLD, Conferencing) ..................................................................................................... 277
Table 36. Long Distance Service Current List of Customers ............................................... 278
Table 37. Switched Long Distance Customer Usage .......................................................... 279
Table 38. Conferencing Workload Supported ..................................................................... 284
Table 39. Conferencing FY18 Planned Service Expenses .................................................. 284
Table 40. Conference Equipment Depreciation................................................................... 284
Table 41. Conferencing Cost by Workload .......................................................................... 284
Table 42. Audio Conferencing Rates .................................................................................. 285
Table 43. WebEx Conferencing Rates ................................................................................ 285
Table 44. Conferencing Cost Recoverability (Actual FY16-FY18 H1) ................................. 285
Table 45. Conferencing Cost Recoverability (Forecasted FY18-FY19) ............................... 286
Table 46. Service Level Objectives for Telephony (Centrex, PBX, SLD, Conferencing) ...... 286
Table 47. Service Level Report for Telephony Projects (Centrex, PBX, SLD, Conferencing) ..................................................................................................... 286
Table 48. Overall Conferencing (WebEx and Audio) Current List of Customers.................. 288
Table 49. Conferencing Customer Usage ........................................................................... 288
Table 50. Telephone Information FY18 Planned Service Expenses.................................... 292
Table 51. Telephone Information Cost Recoverability (Actual FY16-FY18) ......................... 292
Table 52. Telephone Information Cost Recoverability (Forecasted FY18-FY19) ................. 292
Table 53. Telephone Information Current List of Customers ............................................... 293
Table 54. Data Network Service Workload Supported ........................................................ 306
Table 55. Data Network Service FY18 Planned Service Expenses (Overall – Associated All Costs 3471, 3472, 3473, 3465, 3463, 3462, 3461) ...................... 310
Table 56. Data Network Service FY18 Planned Service Expenses (3471 Core only) ......... 310
Table 57. Data Network Service FY18 Planned Service Expenses (3472 End of Row Connectivity only) ................................................................................................ 311
Table 58. Data Network Service FY18 Planned Service Expenses (3473 Perimeter/ Firewall only) ....................................................................................................... 311
Table 59. Data Network Service FY18 Planned Service Expenses (3465 CE/PE Equipment only) .................................................................................................. 312
Table 60. Data Network Service FY18 Planned Service Expenses (3463 SMON only) ....... 313
Table 61. Data Network Service FY18 Planned Service Expenses (3462 Campus Fiber Network only) ............................................................................................. 313

Page 826 of 851
. .
Table 62. Data Network Service FY18 Planned Service Expenses (3461 Vendor Last Mile only) ............................................................................................................ 314
Table 63. WaTech Estimate of Network Lifecycle Cost and Timelines ................................ 315
Table 64. Data Network Service Cost by Workload ............................................................ 318
Table 65. Data Network Service Rates (Fee-for-Service) ................................................... 319
Table 66. Data Network Service Cost Recoverability (Actual FY16-FY18) .......................... 320
Table 67. Data Network Service Cost Recoverability (Forecasted FY18-FY19) .................. 320
Table 68. Data Network Service Current List of Customers ................................................ 323
Table 69. Office and Cloud VPN Workload Supported ........................................................ 336
Table 70. Office and Cloud VPN FY18 Planned Service Expenses .................................... 337
Table 71. Office and Cloud VPN Equipment Depreciation .................................................. 337
Table 72. Office and Cloud VPN Cost by Workload ............................................................ 337
Table 73. Office and Cloud VPN Rates ............................................................................... 338
Table 74. Office and Cloud VPN Cost Recoverability (Actual FY16-FY18 H1) .................... 338
Table 75. Office and Cloud VPN Cost Recoverability (Forecasted FY18-FY19) .................. 338
Table 76. Office and Cloud VPN Current List of Customers ................................................ 339
Table 77. Remote Access Workload Supported.................................................................. 347
Table 78. Remote Access FY18 Planned Service Expenses .............................................. 348
Table 79. Remote Access Equipment Depreciation ............................................................ 348
Table 80. Remote Access Cost by Workload ...................................................................... 348
Table 81. Remote Access Rates ........................................................................................ 349
Table 82. Remote Access Cost Recoverability (Actual FY16-FY18) ................................... 349
Table 83. Remote Access Cost Recoverability (Forecasted FY18-FY19) ........................... 350
Table 84. Remote Access Current List of Customers.......................................................... 350
Table 85. Historical SSL VPN Customer Usage .................................................................. 351
Table 86. Remote Access Customer Usage ....................................................................... 351
Table 87. Security Gateway Services (F5 Server Services) Workload Supported ............... 358
Table 88. Security Gateway Services (SAW/SEAP) Workload Supported .......................... 358
Table 89. Security Gateway Services (3540) FY18 Planned Service Expenses (cost related to SAW/SEAP and Secure Certificates) .................................................. 359
Table 90. Security Gateway Support (4671) FY18 Planned Service Expenses (costs related to F5 proxy services) ............................................................................... 359
Table 91. Security Gateway Services Equipment Depreciation ........................................... 360
Table 92. Security Gateway Services Cost by Workload .................................................... 360
Table 93. Security Gateway Services Fee for Service Rates .............................................. 361
Table 94. Security Gateway Services Cost Recoverability (Actual FY16-FY18 H1) ............ 361

Page 827 of 851
. .
Table 95. Security Gateway Services Cost Recoverability (Forecasted FY18-FY19) .......... 361
Table 96. Security Gateway Services Current List of Customers ........................................ 362
Table 97. Security Infrastructure Support Workload Supported .......................................... 371
Table 98. Security Infrastructure Support FY18 Planned Service Expenses ....................... 371
Table 99. Security Infrastructure Support Equipment Depreciation ..................................... 372
Table 100. Security Infrastructure Support Cost by Workload ............................................... 372
Table 101. DNS Fee for Service Rates ................................................................................. 373
Table 102. Security Infrastructure Support Cost Recoverability (Actual FY16-FY18) ............ 373
Table 103. Security Infrastructure Support Cost Recoverability (Forecasted FY18-FY19) .................................................................................................................. 374
Table 104. Security Infrastructure Support Current List of Customers .................................. 375
Table 105. Wireless Workload Supported ............................................................................. 381
Table 106. Wireless FY18 Planned Service Expenses ......................................................... 382
Table 107. Wireless Equipment Depreciation ....................................................................... 382
Table 108. Wireless Cost by Workload ................................................................................. 383
Table 109. Wireless Rates .................................................................................................... 383
Table 110. Wireless Cost Recoverability (Actual FY16-FY18) .............................................. 384
Table 111. Wireless Cost Recoverability (Forecasted FY18-FY19)....................................... 384
Table 112. Wireless Current List of Customers ..................................................................... 384
Table 113. Wireless Customer Usage .................................................................................. 385
Table 114. Private Cloud Workload Supported ..................................................................... 391
Table 115. Private Cloud FY18 Planned Service Expenses .................................................. 392
Table 116. Private Cloud Equipment Depreciation ................................................................ 393
Table 117. Private Cloud Cost by Workload ......................................................................... 393
Table 118. Private Cloud Rates ............................................................................................ 393
Table 119. Private Cloud Cost Recoverability (Actual FY16-FY18 H1) ................................. 394
Table 120. Private Cloud Cost Recoverability (Forecasted FY18-FY19) ............................... 394
Table 121. Private Cloud Current List of Customers ............................................................. 396
Table 122. Private Cloud Usage ........................................................................................... 397
Table 123. Private Cloud New Customer Forecasts ............................................................. 398
Table 124. Server Hosting Provisioning Services Workload Supported ................................ 406
Table 125. Managed Server Hosting (All Codes) FY18 Planned Service Expenses ............. 406
Table 126. Server Hosting Provisioning Services (4722) FY18 Planned Service Expenses ............................................................................................................ 406
Table 127. Secure Web Hosting (4723) FY18 Planned Service Expenses ........................... 407
Page 828 of 851
. .
Table 128. Server Support Services (4785) FY18 Planned Service Expenses ..................... 407
Table 129. Server Hosting Provisioning Services Equipment Depreciation ........................... 408
Table 130. Server Hosting Provisioning Services Cost by Workload..................................... 408
Table 131. Server Hosting Provisioning Services Rates ....................................................... 408
Table 132. Server Hosting Provisioning Services (4722) and Server Support (4785) Cost Recoverability (Actual FY16-FY18) ............................................................. 409
Table 133. Server Hosting Provisioning Services Cost Recoverability (Forecasted FY18-FY19) ........................................................................................................ 409
Table 134. Managed Server Hosting (4722, 4723, and 4785) Current List of Customers ...... 410
Table 135. Server Hosting Provisioning Services (4722) Current List of Customers ............. 411
Table 136. Secure Web Hosting (4723) Current List of Customers ....................................... 411
Table 137. Server Support Services (4785) Current List of Customers ................................. 412
Table 138. Server Hosting Provisioning (4722) Services Customer Usage ........................... 413
Table 139. Secure Web Hosting (4723) Usage ..................................................................... 414
Table 140. Server Support Services (4785) Usage ............................................................... 414
Table 141. Platform and Connectivity Service Workload Supported ..................................... 419
Table 142. Platform and Connectivity Service Workload Supported ..................................... 419
Table 143. Platform and Connectivity Service FY18 Planned Service Expenses .................. 420
Table 144. Platform and Connectivity Service Equipment Depreciation ................................ 420
Table 145. Platform and Connectivity Service Cost Recoverability (Actual FY16-FY18) ....... 421
Table 146. Platform and Connectivity Service Cost Recoverability (Forecasted FY18-FY19) .................................................................................................................. 421
Table 147. Platform and Connectivity Service Customer Usage ........................................... 421
Table 148. Server and Mainframe Storage Workload Supported .......................................... 426
Table 149. Server and Mainframe Storage FY18 Planned Service Expenses ....................... 426
Table 150. Server and Mainframe Storage Accumulated Depreciation Expenses ................. 427
Table 151. Server and Mainframe Storage Cost by Workload .............................................. 427
Table 152. Server and Mainframe Storage Rates ................................................................. 427
Table 153. Server and Mainframe Storage Cost Recoverability (Actual FY16-FY18) ............ 427
Table 154. Server and Mainframe Storage Cost Recoverability (Forecasted FY18-FY19) .................................................................................................................. 427
Table 155. Server and Mainframe Storage Current List of Customers .................................. 428
Table 156. Nearline Storage Workload Supported ................................................................ 434
Table 157. Nearline Workload FY18 Planned Service Expenses .......................................... 434
Table 158. Nearline Storage Accumulated Depreciation Expenses ...................................... 434
Table 159. Nearline Cost by Workload ................................................................................. 435

Page 829 of 851
. .
Table 160. Nearline Rates .................................................................................................... 435
Table 161. Nearline Storage Cost Recoverability (Actual FY16-FY18 H1) ............................ 435
Table 162. Nearline Storage Cost Recoverability (Forecasted FY18-FY19) .......................... 435
Table 163. Nearline Current List of Customers ..................................................................... 436
Table 164. Backup Service Workload Supported .................................................................. 440
Table 165. Backup Service FY18 Planned Service Expenses .............................................. 440
Table 166. Backup Service Accumulated Depreciation Expenses ........................................ 441
Table 167. Backup Service Cost by Workload ...................................................................... 441
Table 168. Backup Rates ..................................................................................................... 441
Table 169. Backup Cost Recoverability (Actual FY16-FY18) ................................................ 441
Table 170. Backup Cost Recoverability (Forecasted FY18-FY19) ........................................ 442
Table 171. Backup Current List of Customers ...................................................................... 442
Table 172. Mainframe Services Workload Supported ........................................................... 447
Table 173. Mainframe Services FY18 Planned Service Expenses ........................................ 447
Table 174. Mainframe Services Equipment Depreciation ...................................................... 449
Table 175. Mainframe Services Rates .................................................................................. 449
Table 176. Mainframe Services Cost Recoverability (Actual FY16-FY18) ............................. 451
Table 177. Mainframe Services Cost Recoverability (Forecasted FY18-FY19) ..................... 451
Table 178. Mainframe Services Current List of Customers ................................................... 451
Table 179. Mainframe Current List of Service Offerings ........................................................ 452
Table 180. Data Center Facility Services Workload Supported ............................................. 465
Table 181. Data Center Facility Services FY18 Planned Service Expenses: SDC (4803) ................................................................................................................. 466
Table 182. Data Center Facility Services FY18 Planned Service Expenses: Physical Security (4805) ................................................................................................... 467
Table 183. Data Center Facility Services FY18 Planned Service Expenses: Quincy Data Center (3603) ............................................................................................. 467
Table 184. Data Center Facility Services FY18 Planned Service Expenses: OB2 Data Center (4801) ...................................................................................................... 468
Table 185. Data Center Facility Services FY18 Planned Service Expenses: Seattle Node (3601) ........................................................................................................ 468
Table 186. Data Center Facility Services Equipment Depreciation ....................................... 468
Table 187. State Data Center Facility Services Annual Capital Investments ......................... 469
Table 188. Data Center Facility Services Cost by Workload ................................................. 469
Table 189. State Data Center Facility Services Rates .......................................................... 470
Table 190. Data Center Facility Services Cost Recoverability (Actual FY16-FY18) .............. 471

Page 830 of 851
. .
Table 191. Data Center Facility Services Cost Recoverability (Forecasted FY18-FY19) ....... 471
Table 192. Data Center Facility Services Current List of Customers for both the QDC and SDC: State Data Center (4803) .................................................................... 474
Table 193. SDC Historical Monthly Power Consumption ...................................................... 474
Note: Data provided by “WaTech in PSE Consumption Invoice Tool SDC” ............................. 475
Table 194. SDC Estimated Monthly Power Load (kW) .......................................................... 475
Table 195. QDC Estimated Power Consumption and Power Load (kW) .............................. 475
Table 196. Data Center Facility Services Customer Usage .................................................. 477
Table 197. Desktop Support Service Workload Supported ................................................... 489
Table 198. Desktop Support Service FY18 Planned Service Expenses ................................ 489
Table 199. Desktop Support Service Cost by Workload ........................................................ 490
Table 200. Desktop Support Service Rates .......................................................................... 490
Table 201. Desktop Support Service Cost Recoverability (Actual FY16-FY18 H1) ............... 492
Table 202. Desktop Support Service Cost Recoverability (Forecasted FY18-FY19) ............. 492
Table 203. Desktop Support Service Current List of Customers ........................................... 493
Table 204. Desktop Support Service Customer Usage (Desktops Supported) ...................... 493
Table 205. Desktop Support Service Customer Usage (Desktops Billed) ............................. 494
Table 206. Active Directory Workload Supported.................................................................. 502
Table 207. Active Directory Planned Service Expenses (for all cost codes) .......................... 502
Table 208. Active Directory Planned Service Expenses (4721 Enterprise Active Directory) ............................................................................................................ 502
Table 209. Active Directory Planned Service Expenses (4724 Identity Management) .......... 503
Table 210. Active Directory Service Depreciation (All Associated Cost Codes) .................... 503
Table 211. Active Directory Rates ........................................................................................ 504
Table 212. Active Directory Cost Recoverability (Actual FY16-FY18 H1) .............................. 504
Table 213. Active Directory Cost Recoverability (Forecasted FY18-FY19) ........................... 504
Table 214. Active Directory Current List of Customers (4721) .............................................. 505
Table 215. Active Directory Customer Usage ....................................................................... 506
Table 216. Shared Services E-Mail Workload Supported ..................................................... 513
Table 217. Shared Services E-Mail Planned Service Expenses ........................................... 514
Table 218. Shared Services E-Mail Depreciation .................................................................. 514
Table 219. Shared Services E-Mail Rates ............................................................................ 515
Table 220. Shared Services E-Mail Cost Recoverability (Actual FY16-FY18 H1) .................. 515
Table 221. Shared Services Email Cost Recoverability (Forecasted FY18-FY19) ................ 515
Table 222. Shared Services E-Mail Current List of Customers ............................................. 516

Page 831 of 851
. .
Table 223. Shared Services E-Mail Customer Usage Across Service Offerings ................... 517
Table 224. Skype Workload Supported ................................................................................ 521
Table 225. Skype Service Planned Service Expenses .......................................................... 521
Table 226. Skype Service Depreciation ................................................................................ 522
Table 227. Skype Service Cost by Workload ........................................................................ 522
Table 228. Skype Service Rates ........................................................................................... 522
Table 229. Skype Cost Recoverability (Actual FY16-FY18 H1) ............................................. 522
Table 230. Skype Cost Recoverability (Forecasted FY18-FY19) .......................................... 522
Table 231. Skype Service Current List of Customers ............................................................ 523
Table 232. Office 365 Planned Service Expenses ................................................................ 526
Table 233. Office 365 Rates ................................................................................................. 526
Table 234. Office 365 Cost Recoverability (Actual FY16-FY18 H1) ...................................... 527
Table 235. Office 365 Cost Recoverability (Forecasted FY18-FY19) .................................... 527
Table 236. Enterprise SharePoint Workload Supported ........................................................ 531
Table 237. Enterprise SharePoint Planned Service Expenses .............................................. 531
Table 238. Enterprise SharePoint Depreciation .................................................................... 532
Table 239. Enterprise SharePoint Cost by Workload ............................................................ 532
Table 240. Enterprise SharePoint Rates ............................................................................... 532
Table 241. Enterprise SharePoint Cost Recoverability (Actual FY16-FY18 H1) .................... 532
Table 242. Enterprise SharePoint Cost Recoverability (Forecasted FY18-FY19).................. 533
Table 243. Enterprise SharePoint Current List of Customers ................................................ 533
Table 244. Secure FTP Workload Supported ....................................................................... 537
Table 245. Secure FTP Planned Service Expenses ............................................................. 537
Table 246. Secure FTP Depreciation .................................................................................... 537
Table 247. Secure FTP Cost by Workload ............................................................................ 537
Table 248. Secure FTP Rates for FFS Offering .................................................................... 538
Table 249. Secure FTP Cost Recoverability (Actual FY16-FY18 H1) .................................... 538
Table 250. Secure FTP Cost Recoverability (Forecasted FY18-FY19) ................................. 538
Table 251. Secure FTP Current List of Customers (Enterprise Systems Fee Allocation) ...... 539
Table 252. Email ListServ Planned Service Expenses .......................................................... 541
Table 253. Email ListServ Cost Recoverability (Actual FY16-FY18 H1) ................................ 542
Table 254. Email ListServ Cost Recoverability (Forecasted FY18-FY19).............................. 542
Table 255. Project Management Workload Supported .......................................................... 546
Table 256. Project Management Utilization Calculations Based on Actual Workload ............ 547
Table 257. Project Management FY18 Planned Service Expenses ...................................... 547

Page 832 of 851
. .
Table 258. Project Management Cost by Workload .............................................................. 548
Table 259. Project Management Rates ................................................................................. 548
Table 260. Project Management Cost Recoverability (Actual FY16-FY18) ........................... 549
Table 261. Project Management Cost Recoverability (Forecasted FY18-FY19) ................... 549
Table 262. Project Management Current List of Customers .................................................. 549
Table 263. Project Management Current List of Customers (Detailed View) ......................... 550
Table 264. Enterprise Systems Support Workload Supported .............................................. 569
Table 265. Enterprise Systems Support Workload Supported .............................................. 569
Table 266. Enterprise Systems FY18 Planned Service Expenses: 8312 – HRMS ................ 569
Table 267. Enterprise Systems FY18 Planned Service Expenses: 8313 – AFRS ................. 570
Table 268. Enterprise Systems FY18 Planned Service Expenses: 8315 – OFM Enterprise Systems ............................................................................................. 570
Table 269. Enterprise Systems FY18 Planned Service Expenses: 8316 – Budget Applications ........................................................................................................ 571
Table 270. Enterprise Systems FY18 Planned Service Expenses: 8317 – Labor Relations Applications ......................................................................................... 571
Table 271. Enterprise Systems FY18 Planned Service Expenses: 8318 – Accounting Applications ........................................................................................................ 572
Table 272. Enterprise Systems FY18 Planned Service Expenses: 8319 – Data and BI ........ 572
Table 273. Enterprise Systems FY18 Planned Service Expenses: 8320 – Business Analysts .............................................................................................................. 573
Table 274. Enterprise Systems (8315) Depreciation ............................................................. 573
Table 275. Enterprise Systems Support Cost Recoverability (Actual FY16-FY18) ................ 574
Table 276. Enterprise Systems Support Cost Recoverability (Forecasted FY18-FY19) ........ 575
Table 277. Enterprise Systems Support Current List of Customers ...................................... 578
Table 278. Governor’s Apps Support (OFM Enterprise) Workload Supported ...................... 585
Table 279. Governor’s Apps Support (OFM Enterprise) Systems Support Workload Supported ........................................................................................................... 585
Table 280. Governor’s Apps Support (OFM Enterprise) FY18 Planned Service Expenses ............................................................................................................ 585
Table 281. Governor’s Apps Support (OFM Enterprise) Cost Recoverability (Actual FY16-FY18) ........................................................................................................ 586
Table 282. Governor’s Apps Support (OFM Enterprise) Cost Recoverability (Forecasted FY18-FY19) .................................................................................... 586
Table 283. DES Systems Support Cost Recoverability (Actual FY16-FY18) ......................... 590
Table 284. DES Systems Support Current List of Customers ............................................... 590
Table 285. JINDEX Service Workload Supported ................................................................. 593
Page 833 of 851
. .
Table 286. JINDEX Service FY18 Planned Service Expenses .............................................. 593
Table 287. JINDEX Cost by Workload .................................................................................. 594
Table 288. JINDEX Service Rate .......................................................................................... 594
Table 289. JINDEX Service Cost Recoverability (Actual FY16-FY18) ................................... 595
Table 290. JINDEX Service Cost Recoverability (Forecasted FY18-FY19) ........................... 595
Table 291. JINDEX Service Current List of Customers ......................................................... 596
Table 292. E-Time Service Workload Supported .................................................................. 599
Table 293. E-Time Service FY18 Planned Service Expenses ............................................... 599
Table 294. E-Time Service Cost Recoverability (Actual FY16-FY18) .................................... 599
Table 295. E-Time Service Cost Recoverability (Forecasted FY18-FY19) ............................ 600
Table 296. Mainframe Testing Rates .................................................................................... 602
Table 297. Mainframe Testing Cost Recoverability (Actual FY16-FY18) ............................... 602
Table 298. Mainframe Testing Current List of Customers ..................................................... 603
Table 299. Mainframe Testing Current List of Customers ..................................................... 603
Table 300. Web Platform Workload Supported ..................................................................... 608
Table 301. Web Platform FY18/19 Biennium Planned Service Expenses ............................. 608
Table 302. Web Platform Cost by Workload: ........................................................................ 609
Table 303. Web Platform Rates – Fully Managed Websites on WaTech Custom Drupal or WordPress Distribution ................................................................................... 609
Table 304. Web Platform Rates – Maintenance, Hosting, and Support Packages for Drupal or WordPress sites not built with WaTech Custom Distribution ................ 609
Table 305. Web Platform Cost Recoverability (Actual FY16-FY18) ...................................... 610
Table 306. Web Platform Recoverability (Forecasted FY18-FY19) ....................................... 610
Table 307. Web Platform Current List of Customers ............................................................. 611
Table 308. Usability Lab (8610) FY18 Planned Service Expenses ....................................... 621
Table 309. Usability Lab (8610) Cost Recoverability (Actual FY16-FY18)............................. 622
Table 310. Usability Lab (8610) Cost Recoverability (Forecasted FY18-FY19) ..................... 622
Table 311. Usability Lab (8610) List of Agencies Billed (FY17 Access Washington and FY18 as a percentage of the ESF Allocation) ...................................................... 623
Table 312. UX FY18 and FY19 Planned Service Expenses .................................................. 625
Table 313. UX Rates ............................................................................................................ 626
Table 314. UX Cost Recoverability (Actual FY16-FY18 H1) ................................................. 626
Table 315. UX Cost Recoverability (Forecasted FY18-FY19) ............................................... 626
Table 316. UX Current List of Customers ............................................................................. 627
Table 317. Business Analyst Rates ...................................................................................... 631
Table 318. Business Analyst Cost Recoverability (Actual FY16-FY18) ................................. 631
Page 834 of 851
. .
Table 319. Business Analyst Current List of Customers ....................................................... 632
Table 320. Business Automation Costs ................................................................................ 636
Table 321. Database Management Planned Service Expenses ............................................ 641
Table 322. Database Administration Rates ........................................................................... 641
Table 323. Data Management Cost Recoverability (Actual FY16-FY18) ............................... 643
Table 324. Data Management Cost Recoverability (Forecasted FY18-FY19) ....................... 644
Table 325. Data Management Current List of Customers ..................................................... 644
Table 326. Data Management Customer Usage ................................................................... 645
Table 327. Video Service Workload Supported .................................................................... 648
Table 328. Video Service FY18 Planned Expenses .............................................................. 648
Table 329. Video Service Rates ........................................................................................... 649
Table 330. Video Service Cost Recoverability (Actual FY16-FY18) ...................................... 649
Table 331. Video Service Cost Recoverability (Forecasted FY18-FY19) .............................. 650
Table 332. Video Service Current List of Customers ............................................................ 650
Table 333. Geospatial Portal Support Service Workload Supported ..................................... 655
Table 334. Geospatial Portal Service FY18 Planned Service Expenses ............................... 656
Table 335. Geospatial Portal Support Service Cost Recoverability (Actual FY16-FY18) ....... 657
Table 336. Geospatial Portal Support Service Cost Recoverability (Forecasted FY18-FY19) .................................................................................................................. 657
Table 337. Geospatial Portal Support Service Current List of Customers ............................. 657
Table 338. WAMAS Support Service Workload Supported ................................................... 662
Table 339. WAMAS Support Service FY18 Planned Service Expenses ............................... 662
Table 340. WAMAS Support Service Cost Recoverability (Actual FY16-FY18)..................... 663
Table 341. WAMAS Support Service Cost Recoverability (Forecasted FY18-FY19) ............. 663
Table 342. WAMAS Support Service Current List of Customers ........................................... 664
Table 343. GeoSpatial Initiative Support Service Workload Supported ................................. 670
Table 344. Geospatial Initiative FY18 Planned Service Expenses ........................................ 670
Table 345. Geospatial Initiatives Service Rates .................................................................... 671
Table 346. Geospatial Initiatives Service Cost Recoverability (Actual FY16-FY18) ............... 671
Table 347. Geospatial Initiatives Service Cost Recoverability (Forecasted FY18-FY19) ....... 671
Table 348. Geospatial Initiatives Support Service Current List of Customers ........................ 672
Table 349. WAGIC FY18 Planned Service Expenses ........................................................... 676
Table 350. WAGIC Support Service Cost Recoverability (Actual FY16-FY18) ...................... 676
Table 351. WAGIC Support Service Cost Recoverability (Forecasted FY18-FY19) .............. 676
Table 352. WAGIC Support Service Current List of Customers ............................................ 677

Page 835 of 851
. .
Table 353. OCIO Service Workload Supported .................................................................... 687
Table 354. OCIO Service Workload Supported .................................................................... 688
Table 355. OCIO Service FY18 Planned Service Expenses ................................................. 688
Table 356. OCIO Service Cost Recoverability (Actual FY16-FY18 H1) ................................. 689
Table 357. OCIO Service Cost Recoverability (Forecasted FY18-FY19) .............................. 689
Table 358. OCIO Service Current List of Customers ............................................................ 690
Table 359. 800 Mhz Service Cost Recoverability (Actual FY16-FY18) .................................. 695
Table 360. OneNet Service Workload Supported ................................................................. 699
Table 361. OneNet Service Cost Recoverability (Actual FY16-FY18) ................................... 700
Table 362. OneNet Service Cost Recoverability (Forecasted FY18-FY19) ........................... 700
Table 363. Office of Cybersecurity Workload Supported ....................................................... 708
Table 364. Office of Cybersecurity FY18 Planned Service Expenses ................................... 709
Table 365. Office of Cybersecurity Allocation Details ............................................................ 709
Table 366. Office of Cybersecurity Cost Recoverability (Actual FY16-FY18) ........................ 710
Table 367. Office of Cybersecurity Cost Recoverability (Forecasted FY18-FY19) ................ 710
Table 368. Office of Cybersecurity Current List of Customers ............................................... 711
Table 369. Forensics Investigation and Consulting Planned Service Expenses .................... 718
Table 370. Forensic Investigation and Consulting Cost Recoverability (Actual FY16-FY18 H1) ............................................................................................................ 718
Table 371. Forensic Investigation and Consulting Cost Recoverability (Forecasted FY18-FY19) ........................................................................................................ 718
Table 372. Forensic Investigation and Consulting Current List of Customers ....................... 719
Table 373. Zero-Based Budget – Additional Revenue and Expenses (Current Year FY18) .................................................................................................................. 721
Table 374. Additional Historical Revenue and Expenses ...................................................... 722
Table 375. Data Network Spend Details ($) .......................................................................... 729
Table 376. Data Network Staffing Details (FTEs) .................................................................. 729
Table 377. End-User Computing and Local-Area Network Spend Details ($) ....................... 730
Table 378. End-User Computing and Local-Area Network Staffing Details (FTEs) ............... 730
Table 379. Mainframe Enterprise Computing Spend Details ($) ........................................... 731
Table 380. Mainframe Enterprise Computing Staffing Details (FTEs) ................................... 731
Table 381. Windows and Linux Enterprise Computing Spend Details ($) ............................. 732
Table 382. Windows and Linux Enterprise Staffing Details (FTEs) ....................................... 732
Table 383. Voice (Local PBX/VoIP) Spend Details ($) .......................................................... 733
Table 384. Voice (Local PBX/VoIP) Staffing Details (FTEs) .................................................. 733
Table 385. Voice (Long Distance) Spend Details ($) ............................................................ 734

Page 836 of 851
. .
Table 386. Voice (Long Distance) Staffing Details (FTEs) .................................................... 734
Table 387. Switched Long Distance Rates Table .................................................................. 737
Table 388. Switched Long Distance Billed Volume and Total Cost Recovered ..................... 737
Table 389. Centrex Rates Table ........................................................................................... 737
Table 390. Centrex Billed Volume and Total Cost Recovered ............................................... 737
Table 391. PBX/VoIP/IVR Rates Table ................................................................................. 738
Table 392. PBX/VoIP/IVR Billed Volume and Total Cost Recovered .................................... 738
Table 393. Citrix Edge Rates Table ...................................................................................... 738
Table 394. Billed Volume and Total Cost Recovered ............................................................ 738
Table 395. SSL VPN (Remote Access) Rates Table ............................................................ 738
Table 396. SSL VPN (Remote Access) Billed Volume and Total Cost Recovered ................ 739
Table 397. Cloud and Office VPN Rates Table ..................................................................... 739
Table 398. Cloud and Office VPN Billed Volume and Total Cost Recovered ........................ 739
Table 399. SDC/QDC Colocation Rates Table ..................................................................... 740
Table 400. SDC/QDC Colocation Billed Volume and Total Cost Recovered ......................... 740
Table 401. Mainframe Rates Table ....................................................................................... 741
Table 402. Mainframe Billed Volume and Total Cost Recovered .......................................... 741
Table 403. Backup Rates Table ............................................................................................ 741
Table 404. Backup Billed Volume and Total Cost Recovered ............................................... 741
Table 405. Storage Rates Table ........................................................................................... 741
Table 406. Storage Billed Volume and Total Cost Recovered............................................... 741
Table 407. WaServ/Email Vault Storage Rates Table ........................................................... 742
Table 408. WaServ/Email Vault Billed Volume and Total Cost Recovered............................ 742
Table 409. Server Support Services Rates Table ................................................................. 742
Table 410. Server Support Services Billed Volume and Total Cost Recovered ..................... 742
Table 411. DB Management Services Rates Table .............................................................. 742
Table 412. DB Management Services Billed Volume and Total Cost Recovered .................. 743
Table 413. Active Directory/ IAM Rates Table ...................................................................... 744
Table 414. Active Directory/ IAM Billed Volume and Total Cost Recovered .......................... 744
Table 415. Desktop/LAN Rates Table ................................................................................... 745
Table 416. Desktop/LAN Billed Volume and Total Cost Recovered ...................................... 745
Table 417. Directory Assistance (citizens) Rates Table ........................................................ 745
Table 418. Directory Assistance (citizens) Billed Volume and Total Cost Recovered ............ 745
Table 419. Mobile Device Management Rates Table ............................................................ 746
Table 420. Mobile Device Management Billed Volume and Total Cost Recovered ............... 746

Page 837 of 851
. .
Table 421. Shared Email Services Rates Table: ................................................................... 746
Table 422. Shared Email Services Billed Volume and Total Cost Recovered: ...................... 746
Table 423. Skype Services Rates Table ............................................................................... 746
Table 424. Skype Services Billed Volume and Total Cost Recovered ................................... 747
Table 425. WebEx Video Conf. Rates Table ......................................................................... 747
Table 426. WebEx Video Conf. Billed Volume and Total Cost Recovered ............................ 747
Table 427. Teleconferencing Rates Table ............................................................................ 747
Table 428. Teleconferencing Billed Volume and Total Cost Recovered ................................ 747
Table 429. Wireless (WIFI) Rates Table ............................................................................... 748
Table 430. Wireless (WIFI) Billed Volume and Total Cost Recovered ................................... 748
Table 431. Project Management Rates Table ....................................................................... 749
Table 432. Project Management Billed Volume and Total Cost Recovered .......................... 749
Table 433. Agile Business Analyst Rates Table .................................................................... 749
Table 434. Agile Business Analyst Billed Volume and Total Cost Recovered ....................... 749
Table 435. UX & Accessibility Rates Table ........................................................................... 749
Table 436. UX & Accessibility Billed Volume and Total Cost Recovered .............................. 750
Table 437. Web Platform/Design Rates Table ...................................................................... 750
Table 438. Web Platform/Design Billed Volume and Total Cost Recovered .......................... 750
Table 439. List of Agencies Participating in Interviews and Focus Groups............................ 823

Page 838 of 851
. .
List of Figures
Figure 1. An abbreviated timeline of WaTech history ............................................................ 6
Figure 2. Gartner’s Project Approach .................................................................................... 7
Figure 3. Gartner Service Categorization Framework for the Analysis .................................10
Figure 4. Service-by-Service Rating Overview (Review of Services as Currently Delivered) .............................................................................................................11
Figure 5. Key Enabling Capabilities .....................................................................................38
Figure 6. Strategic Recommendation Summary ...................................................................41
Figure 7. Gartner Service Categorization Framework for the Analysis .................................46
Figure 8. Service-by-Service Rating Overview (Review of Services as Currently Delivered) .............................................................................................................47
Figure 9. Centrex Service Staffing ..................................................................................... 248
Figure 10. Centrex Direct/Indirect Staffing ........................................................................... 248
Figure 11. Service Level Report for Telephony Moves, Adds, and Changes (Centrex, PBX, SLD, Conferencing) ................................................................................... 252
Figure 12. Service Level Report for All Telephony Incidents (Centrex, PBX, SLD, Conferencing) ..................................................................................................... 253
Figure 13. PBX Service Staffing ........................................................................................... 260
Figure 14. PBX Direct/Indirect Staffing ................................................................................. 261
Figure 15. PBX Availability Report (Aggregated Across Sites) ............................................. 265
Figure 16. Example Availability Report from Orion Monitoring System ................................. 265
Figure 17. Orion IP-SLA Module View ................................................................................. 266
Figure 18. Service Level Report for Telephony Moves, Adds, and Changes (Centrex, PBX, SLD, Conferencing) ................................................................................... 267
Figure 19. Service Level Report for All Telephony Incidents (Centrex, PBX, SLD, Conferencing) ..................................................................................................... 268
Figure 20. Long Distance Service Staffing ........................................................................... 273
Figure 21. Long Distance Direct/Indirect Staffing ................................................................. 274
Figure 22. Service Level Report for Telephony Moves, Adds, and Changes (Centrex, PBX, SLD, Conferencing) ................................................................................... 277
Figure 23. Service Level Report for All Telephony Incidents (Centrex, PBX, SLD, Conferencing) ..................................................................................................... 278
Figure 24. Conferencing Service Staffing ............................................................................. 283
Figure 25. Conferencing Service Direct/Indirect Staffing ...................................................... 283
Figure 26. Service Level Report for Telephony Moves, Adds, and Changes (Centrex, PBX, SLD, Conferencing) ................................................................................... 287
Figure 27. Service Level Report for All Telephony Incidents (Centrex, PBX, SLD, Conferencing) ..................................................................................................... 287

Page 839 of 851
. .
Figure 28. Telephone Information Staffing ........................................................................... 291
Figure 29. Telephone Information Direct/Indirect Staffing .................................................... 291
Figure 30. Data Network Service Staffing ............................................................................ 303
Figure 31. Data Network Service Direct/Indirect Staffing ...................................................... 305
Figure 32. Historical Circuit Usage Provided by WaTech (Summarized by Gartner) ............ 309
Figure 33. Average Availability Aggregated across Sites (including planned maintenance) ...................................................................................................... 321
Figure 34. Data Network Service Requests ......................................................................... 322
Figure 35. Conceptual Network Architecture – State Data Center (SDC) ............................. 327
Figure 36. Conceptual Network Architecture – Quincy Data Center (QDC) .......................... 328
Figure 37. State Data Center (SDC) Network Core Topology .............................................. 329
Figure 38. Quincy Data Center (QDC) Network Core Topology ........................................... 329
Figure 39. State Data Center (SDC) Wide Area Network (WAN) Aggregation Environment ........................................................................................................ 330
Figure 40. Quincy Data Center (QDC) Wide Area Network (WAN) Aggregation Environment ........................................................................................................ 330
Figure 41. State Data Center (SDC) Edge Environment ...................................................... 331
Figure 42. Quincy Data Center (QDC) Edge Environment ................................................... 332
Figure 43. Office and Cloud VPN Staffing ............................................................................ 336
Figure 44. Office and Cloud VPN Services and Support Direct/Indirect Staffing................... 336
Figure 45. Office and Cloud VPN Conceptual Architecture (remote site connectivity natively points back to the SDC) ......................................................................... 341
Figure 46. Cloud and Office VPN Conceptual Architecture (primary connection to QDC in lieu of SDC) ..................................................................................................... 342
Figure 47. Cloud and Office VPN Conceptual Architecture (Business Continuity with Manual Intervention) ........................................................................................... 343
Figure 48. Remote Access Service Staffing ......................................................................... 346
Figure 49. Remote Access Services Direct/Indirect Staffing................................................. 347
Figure 50. Security Gateway Services and Support Staffing ................................................ 357
Figure 51. Security Gateway Services and Support Direct/Indirect Staffing ......................... 358
Figure 52. Security Infrastructure Support Staffing ............................................................... 370
Figure 53. Security Infrastructure Support Direct/Indirect Staffing ........................................ 370
Figure 54. Wireless Staffing ................................................................................................. 381
Figure 55. Security Infrastructure Support Direct/Indirect Staffing ........................................ 381
Figure 56. Private Cloud Service Staffing............................................................................. 390
Figure 57. Private Cloud Service Direct/Indirect Staffing ...................................................... 391

Page 840 of 851
. .
Figure 58. Private Cloud Usage Trend ................................................................................. 397
Figure 59. Server Hosting Provisioning Services (4722) and Support (4785) Staffing .......... 404
Figure 60. Server Hosting Provisioning Services (4722) and Support (4785) Direct/Indirect Staffing ......................................................................................... 405
Figure 61. Platform and Connectivity Service Staffing.......................................................... 418
Figure 62. Platform and Connectivity Service Direct/Indirect Staffing ................................... 418
Figure 63. Server and Mainframe Storage Staffing .............................................................. 425
Figure 64. Server and Mainframe Storage Direct/Indirect Staffing ....................................... 425
Figure 65. SAN Conceptual Architecture (view 1) ................................................................ 430
Figure 66. SAN Conceptual Architecture (view 2) ................................................................ 430
Figure 67. Nearline Storage Staffing .................................................................................... 433
Figure 68. Nearline Storage Direct/Indirect Staffing ............................................................. 433
Figure 69. Enterprise Vault Conceptual Architecture ............................................................ 437
Figure 70. Backup Service Staffing ...................................................................................... 439
Figure 71. Backup Service Direct/Indirect Staffing ............................................................... 440
Figure 72. Backup Conceptual Architecture ......................................................................... 443
Figure 73. Mainframe Service Staffing ................................................................................. 446
Figure 74. Mainframe Services Direct/Indirect Staffing......................................................... 447
Figure 75. Agencies with Waivers (Migrations in In Flight): .................................................. 462
Figure 76. Agencies with Waivers (Migrations in Planning): ................................................. 463
Figure 77. Data Center Facility Services Staffing ................................................................. 464
Figure 78. Data Center Facility Services Direct/Indirect Staffing .......................................... 464
Figure 79. WaTech Financial View Showing Deferred Equipment Replacement .................. 469
Figure 80. Data Center Uptime ............................................................................................ 472
Figure 81. Power Usage Effectiveness ................................................................................ 472
Figure 82. Data Center Incidents by Type ............................................................................ 473
Figure 83. Data Center Incidents by Month .......................................................................... 473
Figure 84. Enclosure Counts for the State Data Center (Data Halls 1 & 2) and Quincy ........ 476
Figure 85. Projected Losses between FY18 and FY21 Given Planned Migrations ............... 478
Figure 86. Projected Losses Assuming SDC Data Hall 1 & 2 are Operating at Capacity ...... 478
Figure 87. SDC Building Diagram ........................................................................................ 479
Figure 88. SDC Line-Ups A through E Diagram ................................................................... 480
Figure 89. SDC Power Distribution Diagram for Line-Up A and C ........................................ 480
Figure 90. SDC Power Availability and Consumption for Collocated IT Equipment .............. 481
Figure 91. SDC Conceptual Power Distribution Diagram for All Line-Ups ............................ 482

Page 841 of 851
. .
Figure 92. Data Hall 1 Row 9 and 10 South ......................................................................... 482
Figure 93. Desktop Support Service Staffing ....................................................................... 488
Figure 94. Desktop Support Service Direct/Indirect Staffing ................................................. 488
Figure 95. Active Directory Service Staffing ......................................................................... 501
Figure 96. Active Directory Service Staffing Direct/Indirect Staffing ..................................... 501
Figure 97. Shared Services E-Mail Service Staffing ............................................................. 512
Figure 98. Shared Services Email Direct/Indirect Staffing .................................................... 513
Figure 99. Mobile Device Management Usage Trend .......................................................... 518
Figure 100. Skype Service Staffing ........................................................................................ 520
Figure 101. Skype Direct/Indirect Staffing .............................................................................. 521
Figure 102. Enterprise SharePoint Service Staffing ............................................................... 530
Figure 103. SharePoint Service Direct/Indirect Staffing.......................................................... 531
Figure 104. Secure FTP Service Staffing ............................................................................... 536
Figure 105. Secure FTP Service Direct/Indirect Staffing ........................................................ 536
Figure 106. Project Management Service Staffing ................................................................. 546
Figure 107. Project Management Direct/Indirect Staffing ....................................................... 546
Figure 108. Enterprise Systems Support Staffing ................................................................... 567
Figure 109. Enterprise Systems Support Direct/Indirect Staffing ............................................ 568
Figure 110. Governor’s Apps Support (OFM Enterprise) Service Staffing .............................. 583
Figure 111. Governor’s Apps Support (OFM Enterprise) Services Direct/Indirect Staffing ............................................................................................................... 584
Figure 112. DES Systems Support Staffing ........................................................................... 589
Figure 113. DES Systems Support Direct/Indirect Staffing ..................................................... 589
Figure 114. JINDEX Service Staffing ..................................................................................... 592
Figure 115. JINDEX Service Direct/Indirect Staffing .............................................................. 593
Figure 116. Current Web Platform Service Staffing ................................................................ 607
Figure 117. Current Web Platform Service Direct/Indirect Staffing ......................................... 608
Figure 118. Web M&O Fee for Service Usage Growth ........................................................... 612
Figure 119. Web Dev & Design Fee for Service Usage Growth ............................................. 612
Figure 120. Current Usability Lab (8610) Staffing .................................................................. 620
Figure 121. Current Usability Lab (8610) Direct/Indirect Staffing ............................................ 621
Figure 122. Database Management Service Staffing ............................................................. 640
Figure 123. Database Management Service Direct/Indirect Staffing ...................................... 640
Figure 124. Current Video Service Staffing ............................................................................ 647
Figure 125. Current Video Service Direct/Indirect Staffing ..................................................... 648
Page 842 of 851
. .
Figure 126. Geospatial Portal Service Staffing ....................................................................... 654
Figure 127. Geospatial Portal Support Service Direct/Indirect Staffing ................................... 655
Figure 128. OCIO Geospatial Portal Diagram ........................................................................ 659
Figure 129. Architecture for WAMAS Development and Production Environments ................ 667
Figure 130. Participants in Statewide Imagery Consortium .................................................... 673
Figure 131. Sample Imagery Data ......................................................................................... 673
Figure 132. OCIO Service Staffing ......................................................................................... 686
Figure 133. OCIO Service Direct/Indirect Staffing .................................................................. 687
Figure 134. 800 Mhz Service Staffing .................................................................................... 694
Figure 135. 800 Mhz Service Direct/Indirect Staffing ............................................................. 695
Figure 136. OneNet Service Staffing ...................................................................................... 698
Figure 137. OneNet Service Direct/Indirect Staffing ............................................................... 699
Figure 138. Office of Cybersecurity Staffing ........................................................................... 707
Figure 139. Office of Cybersecurity Services Direct/Indirect Staffing ...................................... 708
Figure 140. Gartner Consensus Model Considerations (Cost, Staffing and Workload) .......... 725

. .
Any questions regarding this Report should be addressed to:
Heide Cassidy Managing Partner Gartner, Inc. Telephone: +1 206.245.8321 Email: [email protected]