City of Jacksonville Beach Annual Budget
342
City of Jacksonville Beach Annual Budget Fiscal Year ending September 30, 2017
-
Upload
khangminh22 -
Category
Documents
-
view
1 -
download
0
Transcript of City of Jacksonville Beach Annual Budget

City of Jacksonville Beach Annual Budget
Fiscal Year ending September 30, 2017
City of Jacksonville Beach Officials:
Mayor: Charlie Latham Councilmembers: Chris Hoffman Seat 1, At-large Phil Vogelsang Seat 2, At-large Keith Doherty Seat 3, At-large Bruce Thomason Seat 4, District 1 Jeanell Wilson Seat 5, District 2 Lee Buck Seat 6, District 3 City Clerk: Laurie Scott City Attorney: Susan S. Erdelyi City Manager: George D. Forbes Department Directors:
David Whitmill Chief, Fire Department Patrick K. Dooley Chief, Police Department Allen Putnam Director of Beaches Energy Services
Ann Meuse Director of Human Resources Mary Ellen Donner Director of Parks & Recreation Bill Mann Director of Planning & Development
William T. Edwards, P.E. Director of Public Works Karen Nelson, C.P.A. Chief Financial Officer
Working Together: Committed to the Citizen

2017 Annual Budget
Table of Contents City Officials Table of Contents Distinguished Budget Award: 2015-2016
Budget Message and Summaries of Changes in Revenues and Expenditures
i
Community Profile 1 Budget Overview:
Form of Government 11 Goals 12 City Services 14 Budget Process 16 Budget, Accounting & Financial Policies 19 Fund Accounting 26 Organization Chart 33 Expenditure Summary by Business Plan and Fund 34
Business Plans: Executive and Legislative 35 Community Redevelopment Agency 47 Planning & Development 59 Parks & Recreation 67 Public Works 89 Police 105 Fire 117 Beaches Energy Services 127 Finance 145 Human Resources 157
Funding Sources 169 Budget Summaries 187
Major Funds 188 Other Funds 196 Authorized Positions 200 Capital Outlay Detail 202 Debt and Capital Projects 204 Transfers to/from Other Funds 210
Capital Improvement Plan 2017-2021 211 Beaches Energy Services 214 Finance 247 Police & Fire 259 Parks & Recreation 265 Community Redevelopment Agency 276 Public Works 286
Glossary 309

The Government Finance Officers Association of the United States and Canada (GFOA) presented an award for Distinguished Budget Presentation to the City of Jacksonville Beach, Florida for its annual budget for the fiscal year beginning October 1, 2015. In order to receive this award, a government unit must publish a budget document that meets program criteria as a policy document, as an operations guide, as a financial plan and as a communications medium. This award is valid for a period of one year only. We believe our current budget continues to conform to program requirements, and we are submitting it to GFOA to determine its eligibility for another award.

City of
Jacksonville Beach
City Hall
11 North Third Street
Jacksonville Beach
FL 32250
Phone: 904.247.6268
Fax: 904.247.6276
www.jacksonvillebeach.org
OFFICE OF THE CITY MANAGER
November 15, 2016
We are pleased to present the 2017 Annual Budget and Capital Improvement Plan that was adopted by City Council on September 12, 2016. The total adopted budget of $158.7 million is $22,249 (0.01%) less than the 2016 budget and reduces the millage rate by 2.6% to $3.7947 mills. This budget funds a range of services important to our community’s quality of life without an increase in taxes.
Major items budgeted include:
Replacement of City’s business application software system
Public safety radio system replacement
Infrastructure improvements - Merge three sewer lift stations into one and replace water and sewer lines
Electric improvements – Add substation transformer, upgrades and conversions to continually improve system reliability
Addition of two police officers in the Downtown area
Facilities maintenance and roof replacement program that keeps City buildings in good condition and maintains a positive impression with our citizens
ECONOMIC AND DEMOGRAPHIC INFLUENCES
Both state and local economic outlooks show continuing signs of progress toward a full recovery. In fact, Florida’s economy and personal income grew above the national average in 2015. While we see improvements in job prospects, tourism, and personal income, foreclosures remain a concern in Florida. In the last calendar year, the State had the second highest foreclosure rate in the nation and Jacksonville specifically experienced 2.02% of housing units with a foreclosure filing*.

ii
This year Jacksonville Beach property values increased by 8% to $3.127 billion. Although we continue to see year over year growth, the City’s total taxable property values are still 2% ($71 million) lower than their 2008 peak.
Another trend with implications for the future is changes in population demographics. Florida’s population is projected to grow by 4 million to 24 million by 2030; its older population (age 60+) is expected to account for 56% of the gains*. The City’s workforce is reflecting this trend as Baby Boomers become eligible for retirement, making it important to plan for the transition and develop the next generation of the City’s workforce leaders. It has also become important to create opportunities for growth and learning through mentorship and training as our workforce changes. (*source: Florida: An Economic Overview, August 24, 2016, The Florida Legislature Office of Economic and Demographic Research, http://edr.state.fl.us)
BUDGET CONCERNS AND UNCERTAINTIES
On October 3rd, just three days after the start of the fiscal year, the Governor declared a state of emergency as Hurricane Matthew was projected to move up the east coast of the State. An evacuation order for our Beach communities was issued on October 5th, and on Friday October 7th, the hurricane passed closely by our shores as a major Category 3 storm causing wind damage, flooding, and power outages. Our Public Works and Emergency Management crews worked through the night and into early Saturday morning so that residents could return
$3,198,693,708$2,467,388,350
$3,127,362,689
$7,000,000
$7,500,000
$8,000,000
$8,500,000
$9,000,000
$9,500,000
$10,000,000
$0
$500,000,000
$1,000,000,000
$1,500,000,000
$2,000,000,000
$2,500,000,000
$3,000,000,000
$3,500,000,000
2006 2007 2008 2009 2010 2011 2012 2013 2014 2015 2016
Jacksonville Beach Taxable Value
Taxable Value Budgeted Taxes

iii
safely to their homes. Public Works ensured that water and sewer service stayed on throughout the storm.
While many residents in the area were without power for up to seven days, Beaches Energy Services employees worked hard to keep the power on during the storm and had restored most of the power to all circuits one day after the storm passed. The utility’s performance during the hurricane is a testament to its short and long range reliability project planning as well as to the dedication and commitment of its employees.
As part of the storm recovery process we have applied for FEMA public assistance, but any reimbursement monies will come long after we pay for the cost of cleanup and repairs. We expect to put forward mid-year budget adjustments for these unplanned storm related expenditures. Currently, we estimate the cost of removing debris alone to be $1.5 million. The newly refurbished dune walkovers and stormwater outfalls were heavily damaged by the storm surge and initial estimates for permanent repairs are greater than $2 million.
Because the City has been careful with its spending and maintains adequate fund balances, we are able to react quickly without the added stress of worrying how to pay for the cleanup and restoration. We will continue to be thoughtful and fiscally disciplined in the management of our City’s resources so that there will always be some funding available to pay for unforeseen emergencies and events.
CITY COUNCIL PRIORITIES
The City Council has five areas that they have chosen as priorities:
• Sound Financial Management
• Public Safety
• Parking
• Business Growth
• Community Building
The 2017 budget continues to provide funding for programs, projects and events that further these priorities. For the status of programs related to these priorities, please see the Executive and Legislative section of this document, pages 36-37.

iv
SOUND FINANCIAL MANAGEMENT
The budget process begins with the preparation of the 5-Year Capital Improvement Plan. Preparation of this plan starts with 5-year revenue projections for every major fund and a number of other, smaller funds that are used to pay for major projects or repairs. Departments identify projects to be included in the plan (minimum cost is $25,000) along with estimated costs. Revenue estimates are then matched to the cost estimates, and the project list is adjusted based on the revenue expected to be available to pay for those projects. This practice focuses attention and resources on expensive items separately from the operating budget and helps to alert managers to possible revenue deficiencies that may need to be addressed. Projects are not included in the plan if the revenue stream will not support the department’s projected total operating and capital costs over the five-year period.
Sustainability adjustments to union contracts ratified in 2014 reduced the City’s pension costs and its unfunded liabilities. By making changes to the City’s prescription drug program, utilizing wellness reimbursements, and applying Affordable Care Act rebates, health insurance rate increases were contained at 5.57% for the upcoming year. Our employees are also required to attend periodic safety and accident training to keep accident and workers’ comp insurance rates low.
Due to consistent, sound financial management and conservative spending practices, the City of Jacksonville Beach has been able to weather the recession by limiting the rate of increases in spending and hiring, by building reserves in the years leading up to the recession, and by acting early to reduce spending and authorized positions before the recession began.
PUBLIC SAFETY
With the addition of a corporal and police officer this year, there are now eleven members of the Downtown CAPE Policing Initiative, funded by the Community Redevelopment Agency (CRA). The addition helps manage the City’s popular Downtown entertainment district by dedicating police officers to the area, enabling them to interact closely with business people, residents and visitors and focus on issues of public safety and quality-of-life crimes.

v
The Police Department continues to work closely with other local agencies to identify resources and provide assistance to homeless persons who may be receptive to their efforts. In 2014, the City Council approved a pilot program to partner with other agencies to assist homeless persons through the Chronically Homeless Offender Project (CHOP). The program is designed to reduce crime by providing a residence and resources to homeless members of our community who have the willingness and desire to make a major change in their lives. Currently, 83 individuals have been identified as being eligible for this program county wide. Of the 24 people who are currently participating, 5 are from the Jacksonville Beach area. The City has elected to continue this program in 2017 and will continue to monitor its effectiveness.
Other public safety programs funded in this budget include firearms and bicycle safety, neighborhood watch and DUI prevention, fire prevention and hurricane preparation.
The Police Department’s Citizen Police Academy, its Alumni Association and the Citizens on Patrol programs all contribute to public safety efforts by educating participants about police operations and responsibilities and providing participants an opportunity to get involved in public safety. Volunteers in these programs continue to be a great asset to the Police Department and the community, providing about 12,760 hours of service to the department in 2015, the approximate equivalent of 6 full time positions.
PARKING
Issues related to downtown parking and the adjacent residential areas have been the subject of discussion for a number of years. In 2014, the contract for the management of the downtown parking program was outsourced and the current vendor has improved management of the parking lots and security in them. The Police Department, working with downtown businesses, developed a 2-hour parking program in designated downtown areas. This program is underway, with the goal of moving those seeking long-term parking to the City’s parking lots with 2-hour spaces available for downtown visitors seeking short-term parking options. Parking spaces at various locations throughout the City are marked as being specifically reserved for low-speed vehicles. In addition, the hours of operation for paid parking were successfully implemented with the consent of the

vi
downtown business community. The paid parking program and the additional security it brings to the parking lots continues to be very successful.
This year in September, a contract was awarded to construct a new surface public parking facility on the CRA owned property at 2nd Street North between 3rd and 4th Avenues North. This project will provide 92 vehicle and 3 electric cart parking spaces as well as 23 public dual bike racks. Construction is slated to be complete by the summer of 2017.
BUSINESS GROWTH
This year a vacated gas station and convenience store at the intersection of Beach Boulevard and 3rd Street South was demolished and rebuilt as a two-tenant commercial center that is now home to an AT&T retail store and the popular Burrito Gallery restaurant. Further south on 3rd Street, at the corner of 4th Avenue South, another vacated gas/convenience store is in the process of being reconstructed as a Pei Wei Asian Diner restaurant. This project is nearing completion and is expected to open soon. The Pablo Plaza shopping center on 3rd Street South is also expanding for new businesses. The demolition and rebuild of the northern portion of its center will add a Petsmart retail pet supplies store as a new major tenant in that renovated space. In the outparcels in front of the Pablo Plaza center, a new freestanding Mattress Firm store and Chipotle restaurant buildings were constructed and opened for business recently.
Concurrent with the permitting of these and other new projects, staff has been busy refining policies and identifying projects related to the six “pillars” of the City’s adopted Downtown Action Plan:
• Public Spaces
• Commercial Spaces
• Transportation
• Entertainment and Events
• Public Safety
• Quality of Life
The Downtown Action Plan contains both short and long range project and policy recommendations. Many of the short term recommendations from the Action Plan are already under way, building on efforts to revitalize downtown and

vii
broaden its appeal, a project that was initiated with the adoption of the Downtown Vision Plan in 2007.
Beaches Energy continues to offer a commercial lighting retrofit/upgrade rebate program. Interior commercial lighting upgrades may be eligible for a rebate of $150 per kilowatt reduction over its existing lighting up to a maximum of $2,500. The rebate helps our commercial customers reduce the cost of lighting upgrades that will help reduce their monthly energy costs.
Design work for improvements to the 10th Street South Industrial Park area is substantially complete and $1.8 million has been set aside for construction in the coming year. Completion of these improvements to the road, stormwater, sanitary sewer, and water distribution systems, in addition to making the infrastructure work better, will also make the area more attractive to new and existing businesses.
COMMUNITY BUILDING
Our residents are engaged in a variety of cultural, social, service and recreational activities. As a local government, part of our business is to provide attractive, inviting spaces that create opportunities for community events and neighbors to gather. Special events are one way we create opportunities for people to connect. The budget funds the City-sponsored Moonlight Movies, the annual Beaches Parade and Fourth of July fireworks. Along with the management of those City-sponsored events, the budget pays for staff time to provide logistical support to the large number of private organizations that use City facilities for privately-sponsored events and fundraising/awareness events. A partial list of these events is in the Parks and Recreation business plan. The department also provides logistical support for the large number of adult and youth sports leagues that keep the Wingate Park sports complex very busy for most of the year.
It is also important that we continue to keep all City parks and facilities well maintained. The budget includes funding to inspect City facilities regularly and schedule appropriate maintenance when it is needed. In addition to continued funding for the City’s program of infrastructure improvements, the 2016 budget includes funding for major building systems replacement projects, cemetery maintenance, additional tree trimming, and new sidewalks in various parts of the City. The Public Works budget includes funding for beach and downtown cleanup, dumpster enclosures and street sweeping to keep Jacksonville Beach clean and debris-free.

viii
Another way the City is working to build community is by encouraging more community participation. We are holding more workshops, using a variety of techniques designed to make participants more comfortable discussing sometimes politically divisive issues with the goal of obtaining as much thoughtful feedback as possible. The Downtown Action Plan is a recent example of a process that relied on a great deal of citizen participation.
Each year, following the development of the proposed budget, the City holds a budget tour, four budget review workshops, and two public hearings. This requires a significant investment of time on the part of the City Council, City staff, residents and business owners who participate in these meetings. We would like to thank everyone who gives their time in order to improve the outcome of these processes.
Sincerely,
George Forbes City Manager
Karen Nelson Chief Financial Officer
Ashlie Gossett Budget Officer

ix
Summary of Changes in Fund Balance, Revenues and Expenditures:
Budget Development:
Revenues used to develop the budget were projected (see Funding Sources tab) based on estimates from the State of Florida, Duval County Property Appraiser, current contracts, interlocal agreements, prescribed formulas and five-year cash flow projections. The estimate for property taxes was based on an assumption of a small increase in property values and a reduction in the millage rate to $3.7947 mills.
Once the initial revenue estimates were made, expenses were estimated and instructions to departments were developed.
1. Payroll was projected consistent with negotiated union contracts. The projection assumed there would be no vacancy in any authorized positions. Pension costs estimated by the pension funds’ actuary were incorporated into the payroll projection.
2. The cost of energy was estimated based on historical consumption, consumption patterns and projected pricing from the Florida Municipal Power Agency, from which Beaches Energy purchases all of its power.
3. The cost of all insurance for property, liability, workers comp and health insurance was estimated based on recent rate history and the City’s experience rates.
4. Capital outlay for items or projects costing more than $25,000 was budgeted as shown in the 5-Year Capital Improvement Plan. The development of this plan along with the identification of project funding sources is a separate process completed prior to the development of the operating budget which streamlines the incorporation of high-cost projects into the proposed budget.
Fund Balance – Unrestricted and All Other:
The City divides its funds into categories of major and nonmajor to comply with criteria established by governmental accounting standards (GASB 34). Almost 80% of 2017 budgeted revenue and expense can be found in the City’s five

x
major funds. Of the City’s fund balance, about two-thirds is restricted or has some kind of limitation on how it can be used. In conjunction with the implementation of GASB 54, the City adopted Resolutions #1887-2011, #1890-2011 and #1934-2014, to specify its fund balance classifications and permitted uses for them in the General Fund and in all capital projects funds. Many other funds have legal limitations on the use of any revenues deposited into the funds, for example, special revenues, grants, forfeiture and seizure funds, and pension funds.
Budgeted Changes in Fund Balance:
General Fund: Since budgeted revenues are almost equal to budgeted expenses, the General Fund’s budget anticipates a very small change in fund balance. Of the $9.3 million of fund balance classified as “All Other”, about half has been committed for revenue stabilization and half has been assigned for emergencies and unanticipated events as described in Resolution #1887-2011, #1890-2011 and #1934-2014.
Redevelopment Fund: The increase in fund balance in the Redevelopment Fund is the result of a timing difference between the receipt of tax increment revenue and award of bids for design and construction of projects that have been approved by the Community Redevelopment Agency. Projects are budgeted once the design is complete and the City has a construction estimate based on the design. The use of fund balance is restricted by Florida Statutes to be spent
Ending Fund Balance Unrestricted All OtherTotal Fund
Balance % of TotalGeneral Fund $852,346 $9,382,301 $10,234,647 4.5%Redevelopment - 32,564,938 32,564,938 14.2%General Capital Projects - 2,329,496 2,329,496 1.0%Electric 60,265,929 8,224,765 68,490,694 29.8%Water & Sewer 11,237,241 1,404,567 12,641,808 5.5% Total Major Funds 72,355,516 53,906,067 126,261,583 55.0%Nonmajor Governmental 15,545 5,096,772 5,112,317 2.2%Nonmajor Enterprise 12,647,695 - 12,647,695 5.5%Nonmajor Internal Service 2,931,944 - 2,931,944 1.3%Nonmajor Pension - 82,537,516 82,537,516 36.0% Total Nonmajor Funds 15,595,184 87,634,287 103,229,471 45.0%
TOTALS $87,950,700 $141,540,354 $229,491,054 100.0%Percentage of total Fund Balance 38% 62% 100%

xi
in the redevelopment district for purposes specified in its adopted redevelopment plan. Construction of the Downtown Vision Plan (in the area east of 3rd Street between Beach Boulevard and 4th Avenue South) was awarded in mid-year 2016 ($6.4 million) and is expected to be completed in late 2017. Planning estimates for the work remaining in the Downtown Plan are approximately $28.5 million. Construction of the South Beach Park Skate Park ($1.5 million) was awarded at the end of FY2016 and the new park is expected to open in late spring 2017.
General Capital Projects Fund: The General Capital Projects Fund accumulates funds necessary to perform expensive infrastructure improvements or equipment replacements or upgrades, in order to avoid having to borrow for such projects. Funding is primarily from transfers from other funds, interest earnings and occasional grants that the City may receive for such projects. Because the type and cost of these replacements varies from year to year, this budget can show big swings in expenses. This fund’s primary source of budgeted revenue is a $285,000 transfer from the General Fund for a fire truck replacement tentatively scheduled for 2017 ($75,000), the heavy vehicle equipment replacement reserve ($90,000), major building system replacement projects ($42,000), and information technology improvements ($78,000). Additional funds for the major building system and information technology replacement projects will come from the Electric Fund ($105,000) and Water and Sewer Fund ($59,000). Part of the cost of computer replacements ($40,000)
Major Fund or Nonmajor Fund Type
Revenues 2017
Expenses 2017
Budgeted Change in Fund
Balance%
ChangeGeneral Fund $20,223,059 $20,169,225 $53,834 0.5%Redevelopment 9,611,930 1,834,044 7,777,886 31.4%General Capital Projects 636,000 2,816,412 (2,180,412) -48.3%Electric 87,258,222 88,249,056 (990,834) -1.4%Water & Sewer 12,233,347 14,548,567 (2,315,220) -15.5% Total Major Funds 129,962,558 127,617,304 2,345,254 1.9%Nonmajor Governmental 3,507,032 3,630,711 (123,679) -2.4%Nonmajor Enterprise 8,510,692 8,665,492 (154,800) -1.2%Nonmajor Internal Service 11,930,449 11,930,449 - 0.0%Nonmajor Pension 9,843,630 6,836,621 3,007,009 3.8% Total Nonmajor Funds 33,791,802 31,063,272 2,728,530 2.7%
TOTALS $163,754,360 $158,680,576 $5,073,784 2.3%

xii
included in the information technology master plan will come from the Lease Facilities Fund. Also budgeted are transfers from Utility Billing and Information Systems to accumulate money to pay for future equipment replacements.
Major budgeted capital expenses are for the replacement of the City’s business applications ($925,000), radio system replacement ($716,005), information technology replacement switches ($200,000), annual computer replacements ($69,607), replacement of major building systems ($318,800), a portion of the cost of the 10th Street South Industrial Park Area Project ($810,000) and streets heavy equipment ($150,000). The use of these fund balances is assigned by Resolution #1887-2011, #1890-2011 and #1934-2014 to be used to pay for major repair and replacement of equipment and facilities.
Electric Fund: Beaches Energy Services, the City’s electric utility, expects continued stability in its power costs that will also result in stable electric prices for its customers. Since March 2010, Beaches Energy has steadily reduced the residential electric rate for the first 1,000 kilowatt hours of electricity to $117.91, $20 less than the rate at that time. Beaches Energy continues to meet its goal of keeping its rates below the State average. The decrease in fund balance is primarily due to a capital project to add a new 50 MVA transformer for increased reliability and load management ($1.2 million). Restrictions on fund balance in the Electric Fund exist to set aside balances required by bond covenants and for customer deposits.
Water & Sewer Fund: In early 2012, the City engaged a consultant to update the last water and sewer rate study and instituted 7.5% rate increases through 2014, with CPI increases thereafter. The rate increase was adopted to pay for needed water and sewer system improvements. The additional funding is enabling Public Works to move forward with projects in 2017 that include improvements to water and sewer mains, sewer lift stations, and extensions to reuse mains. Expanded programs for water valve and sewer system maintenance are also included in the budget. Restrictions on fund balance exist in compliance with bond covenants. Descriptions and estimated costs of identified projects are included in the Capital Improvement Plan.
Nonmajor Governmental Funds: Nonmajor governmental funds have dedicated revenues from taxes, grants, bond proceeds, or fines and confiscations. Revenues can vary greatly from year to year, as can the related spending in funds where the revenues are required to be spent on new equipment or programs. Ongoing grant funding for continuing programs such as

xiii
the Carver Center (partial funding from the Community Development Block Grant), and police overtime for the Community Response Team (partial funding from a Justice Assistance Grant) has been decreasing. The budgeted decrease in nonmajor governmental funds resulted from the use of Federal Equitable Sharing Funds to purchase 20 replacement radios ($105,000) in coordination with the radio system replacement project. Restrictions on most governmental funds come from state and federal law, enabling legislation, bond covenants and contractual obligations.
Nonmajor Enterprise Funds: The Stormwater fund balance is projected to grow slightly this year because of a decrease budgeted capital outlay. In 2016 a large Stormwater project in the Ocean Forest Subdivision was undertaken and substantially completed. The Sanitation Fund budgeted expenses are projected to exceed its revenues. Although contract costs have risen slightly over the past several years, the City does not anticipate increasing its garbage rates to cover the cost increases. The current contract with the City’s garbage provider expires in December 2016. The Natural Gas Fund balance is projected to decrease this year because the loan repayment to the Electric fund is being accelerated from 30 years to 15. This budget also includes funding for system expansion ($100,000).
Nonmajor Internal Service Funds: Internal service funds account primarily for the activities associated with providing services to other City departments, such as accounting, utility billing, information systems, purchasing, human resources, grounds maintenance and risk management (insurance). Budgeted revenues in internal service funds also represent budgeted expenses in the City’s other operating funds, meaning that revenues equal expense and there is normally no change in fund balance. Interest earnings on the self-insurance reserve in the Workers’ Comp Insurance Fund are used to reduce the cost for workers comp insurance charged to other departments.
Pension Funds: The City has three pension funds to account for its defined benefit pension plans for general, police and fire employees. Revenues are expected to exceed costs in 2016 by about $3 million. All of the pension fund balances are restricted to make payments for current and future retirees.

xiv
Revenues by Category:
Taxes: Increases in taxable property value provided an opportunity to reduce the millage rate. The upturn in property tax revenue is split between the General Fund ($422,007) and the Community Redevelopment Fund ($575,927). Estimates for Local Communication Service Tax were reduced this year ($137,000) to reflect the City’s portion of a refund settlement between AT&T Wireless and the State.
Permits & fees: Building permits make up the largest part of this revenue. Estimates were based on prior year collections and known major construction projects beginning in this fiscal year.
Intergovernmental: Intergovernmental revenue comes primarily from tax revenues that are collected by the State and distributed to counties and cities. The revenue is budgeted based on estimates from the Florida Department of Revenue’s Office of Tax Research and recent receipt history. Projected increases in half-cent sales taxes drive this category’s overall increase. Grant revenues, while not significant in the 2017 budget, are also included in this category. Grant revenues are budgeted based on a formal grant award that has been accepted by the City Council.
Charges for services: Changes in the cost of power are recaptured through the power cost adjustment on the customer’s monthly bill (See Beaches Energy Services). Beaches Energy Services Fund budget (73% of this category) contains a reduction in revenue estimates based on current and projected consumption. With the exception of Water & Sewer rates, all other City utilities’
RevenuesOriginal
Budget 2016Adopted
Budget 2017Increase
(Decrease)%
ChangeTaxes $21,182,469 $22,103,420 $920,951 4.3%Permits & fees 562,250 577,250 15,000 2.7%Intergovernmental 3,887,722 4,138,738 251,016 6.5%Charges for services 118,925,748 118,087,319 (838,429) -0.7%Fines & forfeitures 216,000 218,500 2,500 1.2%Interest & other 12,100,736 12,315,602 214,865 1.8%Transfers in 6,663,544 6,313,531 (350,013) -5.3% Total Revenues $163,538,469 $163,754,360 $215,891 0.1%
ALL FUNDS

xv
rates are expected to remain stable. Water and Sewer rates will increase by the percentage change in CPI on October 1. The CPI rate increase is intended to enable revenues to keep up with increases in the cost of on-going projects to rehabilitate the water and sewer system.
Fines & forfeitures: The budget anticipates a modest increase in revenue from court fines based on recent history. However, this revenue source has decreased by over half since FY2005, due to changes in the allocation of traffic fines made by the State legislature.
Interest & other: Interest earnings and gains on pension investments are expected to increase over the prior year.
Transfers in: In previous years partial funding for General Fund capital projects came from the Leased Facilities fund. Going forward Leased Facilities funds will be prioritized to technology licensing costs. Reserving funds by transfer eliminates the need to borrow money to pay for projects.
For additional information on revenues, please refer to both the Funding Sources and Budget Summaries sections of this document.
Expenditures by Category:
Personal Services: The City’s payroll budget includes merit increases as well as the addition of six positions. A Corporal and Patrol Officer are being added to the Police Downtown CAPE program to allow for adequate shift coverage. In the Finance Department, a Customer Service Representative, Associate Business Analyst, and part-time Staff Assistant will all focus on specific long-term projects such as the Enterprise Resource Planning software system conversion and meter replacement project. A part-time Construction Coordinator in Public Works is budgeted to provide inspection services for the duration of a few large redevelopment projects. Even after making these changes there will be 13 fewer full time positions than were authorized in the 2008 budget.

xvi
Operating-Energy: The City’s utility, Beaches Energy Services, serves about 34,000 electric and 220 natural gas customers in Jacksonville Beach, Neptune Beach, Ponte Vedra, and Palm Valley. This year, the utility’s budget includes $63 million for the purchase of electricity from its supplier, Florida Municipal Power Agency whose primary fuel for generation is natural gas. Due to low natural gas prices, this budget anticipates a $4.7 million savings in the cost of electricity. Savings in the cost of power are returned to our customers through reductions in the power cost portion of their rate. Since March 2010, that rate has fallen by $20 per 1,000 kilowatt hours, saving residential customers, on average, between $200 and $300 per year.
In June 2010, Beaches Energy Services began the construction of a natural gas distribution system. The system, primarily designed to serve commercial customers, began operation in 2011 and currently serves about 220 customers. As this system continues to grow, consumption is in expected to increase. Budgeted costs for this service include $1.3 million for the cost of natural gas, an increase of about $88,000.
Operating-All Other: Departments have been reducing budgets for several years, without looking at reductions in service. For this reason, finding cost savings in this category has become very difficult. Increases are budgeted for the costs of a variety of items primarily:
• Business, employee health and workers comp insurances
• As the City’s pension funds mature, there has been an expected increase in the number of retirees, this year resulting in a $260,000
Expenditures by Category
Original Budget 2016
Adopted Budget 2017
Increase (Decrease)
% Change
Personal Services $28,050,179 $29,156,660 $1,106,481 3.9%Operating-Energy 67,742,117 62,997,463 (4,744,654) -7.0%Operating-All Other 37,145,094 38,156,185 1,011,091 2.7%Capital Outlay 13,040,340 16,652,710 3,612,370 27.7%Debt Service 6,051,195 5,376,492 (674,703) -11.1%Grants to Others 10,356 27,535 17,179 165.9%Transfers out 6,663,544 6,313,531 (350,013) -5.3% Total Expenditures $158,702,825 $158,680,576 ($22,249) 0.0%
ALL FUNDS

xvii
increase in costs for pension benefits, which are paid out of the pension funds
• Enhanced levels of maintenance within the Downtown Redevelopment District including paver cleaning, tree maintenance, and other enhanced grounds upkeep ($375,000).
Capital Outlay: Capital projects are budgeted for the life of the project. Projects are normally budgeted when design is complete and a bid award has been approved by the City Council. Two major projects budgeted this year are attributable to the increase over the prior year. Beaches Energy will spend $1.2 million to add a new 50MVA transformer to the Guana Substation. And Public Works begins work merging three lift stations into one site ($2.2 million). Redevelopment projects will be budgeted upon completion of design and after the project bids have been awarded by Council. An itemized list of budgeted 2017 capital outlay can be found in the Budget Summaries section; descriptions of larger projects planned for completion between 2017 and 2021 can be found in the Capital Improvement Plan.
Debt Service: Debt service expense will decrease this year as the remaining Southend Redevelopment bonds were paid off at the end of 2016. The Infrastructure Sales Surtax bonds will be paid off in 2019 and the combined Electric/Water & Sewer bonds will be paid off in 2020 at which time the City expects to be completely debt-free. The Budget Summaries section has a more detailed discussion of the City’s debt position.
Grants to Others: The City makes an annual contribution to fund minimum monthly pension benefits for certain retirees or their beneficiaries ($7,535). Beginning this year, Public Works is offering a grease interceptor rebate program ($20,000) to promote the installation of authorized, properly sized grease interceptors outside of existing food service facilities. Qualified applicants may be reimbursed up to 50% of their installation costs.
Transfers: In previous years the Leased Facilities Fund transferred funds to the General Fund for capital outlay. No such transfer is included in this year’s budget. The Budget Summaries section has a complete list of all transfers included in the 2017 budget.

xviii
Expenditures-by Department:
The Executive & Legislative Department (which also manages the Non-departmental functions), works with the City Council to develop policy and legislation that are administered and executed by the City Manager. Operating in this department are the City Council, City Attorney, City Manager, City Clerk, and Convention Development. The department’s budget increase is largely attributable to legal services.
The Finance Department provides support services in the areas of accounting, utility billing/customer service, information systems, and purchasing. This department also provides facility management services for the City’s buildings and rental properties. The 2017 budget includes the addition of a Customer Service Representative II position in Utility Billing that will be programmed for the duration of the meter replacement project (estimated 2 years). An Associate Business Analyst in Information Systems and a part-time Staff Assistant in Accounting are also being added this year and will both be dedicated to the Enterprise Resource Planning software conversion project (estimated 4 years).
Planning & Development provides planning, building inspections, and code enforcement services. The budget increase of $30,721 is attributable to a part-time Permit Specialist added mid-year 2016 to assist with increased permit volumes and to provide coverage in the office.
The Community Redevelopment Agency is responsible for managing the City’s Downtown and South Beach redevelopment districts. The remaining
Expenditures by Department
Original Budget 2016
Adopted Budget 2017
Increase (Decrease)
% Change
Executive & Legislative $1,263,766 $1,300,649 $36,883 2.9%Finance 6,195,922 6,481,080 285,158 4.6%Planning & Development 801,510 832,231 30,721 3.8%Community Redevelopment 1,062,493 779,505 (282,988) -26.6%Parks & Recreation 4,793,636 4,780,688 (12,948) -0.3%Public Works 18,962,075 21,462,674 2,500,599 13.2%Police 9,157,351 9,855,396 698,045 7.6%Fire 3,797,512 3,823,550 26,038 0.7%Beaches Energy Services 94,265,985 91,351,444 (2,914,541) -3.1%Human Resources 11,716,414 11,766,573 50,159 0.4%Non-Departmental 6,686,161 6,246,786 (439,375) -6.6% Total Expenditures $158,702,825 $158,680,576 ($22,249) 0.0%

xix
redevelopment debt was paid off at the end of 2016, decreasing the budget from the prior year. Projects currently being designed have not been included in the 2017 budget. The project budgets will be added following the City Council’s award of the construction bid.
Parks & Recreation manages the City’s parks and recreation services which include tennis, golf, adult and youth athletic leagues, special events and all park, oceanfront restroom and lifeguard services. Budgeted payroll merit increases and health insurance increases are offset by a decrease in transfers, keeping the overall departmental budget flat. This year, special events program expenditures were moved to the Convention Development Fund from the General Fund, eliminating the need to transfer funds to cover these costs.
Public Works provides water, sewer, stormwater, and sanitation services to the citizens of Jacksonville Beach, along with street maintenance. A project merging three lift stations into one site begins this year ($2,200,000) and increases the departmental expenditures by 13% over the prior year.
The Police Department’s budget increased with the addition of two additional Downtown CAPE officers, a corporal and Patrol Officer. This budget also includes the use of equitable sharing funds to replace 20 APX radios ($105,000). Other police department spending in grant and special revenue funds was unchanged.
In addition to providing fire and rescue services, the Fire Department also manages the City’s radio system. The budget increased slightly with pension and insurance estimates.
Beaches Energy Services operates and maintains the City’s electric and natural gas distribution systems. Its overall budget decrease is due to expected decreases in the cost of power and natural gas due to low fuel prices. The City purchases its power through Florida Municipal Power Agency, whose primary generation fuel is natural gas.
Beaches Energy’s budget also reflects an increase in capital outlay spending as it adds a new 50 MVA transformer to the Guana Substation ($1.2 million). This project will allow for greater reliability and load management for the south end of the service territory. Beaches Energy has one of the highest reliability ratings in the state and its residential rates continue to remain well below the state average.

xx
Human Resources Department is responsible for personnel services, labor relations, risk management and the operation of the City’s three pension funds. The department’s budget minor increase is due to expected increases in insurance costs and increases in pension benefit payments as anticipated with an increasing number of retirees.
The Non-departmental department captures costs that are not directly attributable to any other department for items such as debt service and capital projects. The variance from the prior year is attributable to the timing of capital projects. Replacing the City’s business enterprise software is a major multi-year initiative. The project is estimated at about $2.8 million, with $925,000 being expended in 2017. The Non-departmental budget is included in the Executive & Legislative section of this document.
A summary of staffing levels by department and division since 2014 can be found in the Budget Summaries section of this book. A discussion of changes in 2017 budgeted revenues is located in the Funding Sources section. More discussion of expenditures/expenses, services provided and performance measures is in each department’s business plan.

1
Although the French Huguenots led by Capt. Jean Ribault in 1562 laid claim to the First Coast area, it was the Spanish who first settled the area around Jacksonville Beach, establishing missions from Mayport to St. Augustine. The Spanish ceded East Florida to the English by treaty in 1763 only to regain control twenty years later. In 1821 the Spanish ceded Florida to the United States of America. The area was settled by river pilots and fishermen as early as 1831 when Mayport, then known as Hazard, was established as a port. The Mayport lighthouse was erected in 1859 and still stands at the Naval Station Mayport. By 1885 Mayport had 600 inhabitants, a post office and a school. The town was also visited daily by steamships which brought beach-goers from Jacksonville down the St. Johns River. Meanwhile, a group of enterprising Jacksonville businessmen conceived the idea of a railway to the beaches east of Jacksonville. It was their plan to develop a summer resort to attract tourists to the Jacksonville area. The Jacksonville and Atlantic Railway Company was chartered in 1883 to build sixteen and a half miles of narrow gauge railway from South Jacksonville to the Ruby settlement.
The company acquired many acres of choice oceanfront property which was divided into lots. By November 12, 1884, Ruby was ready for the first buyers of the subdivided lots. About fifty prospective buyers arrived by excursion boats. In all, thirty-four lots were sold that day for a grand total of $7,514. In 1884 William E. Scull, surveyor for the railroad, and his wife Eleanor, moved to the area now known as Jacksonville
Beach. There were already several tent houses in the vicinity. The Sculls lived in one tent and ran the first general store from another. Later the Sculls applied for a post office under the name of Ruby, a name chosen in honor of their oldest daughter, and ran the post office from their store. Mail was delivered by boat once a week from Jacksonville. In 1886, Ruby was renamed Pablo Beach after the San Pablo River to the west that divides the island from the mainland.
The first sidewalk in Pablo Beach was a wooden boardwalk to the oceanfront on Ocean Avenue,
which is now known as Pablo Avenue. Photo taken around 1898.

2
Upon completion of the railway to Pablo Beach in mid 1886, the first resort hotel was built and opened to the public. The splendid multistory wooden structure, the Murray Hall hotel, had 192 rooms and could accommodate 350 guests. The Hotel advertised an elevator, electric bells, hot, cold and sulfur baths, bar, bowling and billiards. It also claimed it was located on “The Finest Beach in the World!” with “Surf Bathing the Year Round!” The construction cost was $150,000. Unfortunately, a fire in the boiler room around midnight on August 7, 1890 destroyed the hotel, the railway depot and surrounding buildings. However, the guests and their belongings were saved. The Murray Hall was followed by other resort hotels: the Adams House, the Perkins House, the Continental, the Ocean View and the Palmetto Lodge. All were eventually destroyed by fire.
Above: One of many boarding houses opened to take advantage of the tourist trade. Photo to left is Hotel Pablo.

3
Palmetto Avenue, Pablo Beach, Florida looking east from what is currently the intersection of Beach Boulevard and 2nd Street. Photograph taken around 1906.
The railway company soon met with financial difficulties and was taken over by the millionaire Henry M. Flagler as part of the Florida East Coast Railway System. Late in 1900 the railway was changed to standard gauge and extended to Mayport. Further transportation was added in 1910 when a winding oyster shell road was constructed near the present Atlantic Boulevard, dividing Neptune Beach and Atlantic Beach. Pablo Beach was incorporated on May 22, 1907. In 1925 the name was changed to Jacksonville Beach.
The boardwalk era began in 1915 and 1916 when businessman Martin Williams, Sr. established dance pavilions, shooting galleries, boxing, wrestling, restaurants and other forms of entertainment on the new boardwalk.
Auto racing on the hard-packed sand of the beaches made the area popular for this spectator sport. The boardwalk’s popularity declined in the late 1950’s with the state’s crackdown on gambling and games of chance. Driving on the beach was prohibited in 1979.

4
Photograph of the first City Hall built in Jacksonville Beach located on Pablo Avenue. Photo taken in 1927
Photograph of the second City Hall taken in 1920’s.
On September 4, 1922, Pablo Beach came into the international limelight when First Lieutenant James H. Doolittle, after a previous abortive attempt, broke the transcontinental speed record. With only one stop at Kelly Field in Texas, he flew from Pablo Beach to San Diego in less than 24 hours. For this feat he was awarded his first Distinguished Flying Cross. On September 4, 1980, he returned to unveil a marker in Jacksonville Beach’s Pablo Historical Park. James Doolittle had a distinguished military career, leaving service as a Lt. General.
Lt. James H. Doolittle on the beach before his famous transcontinental flight in 1922.
Historical information and historical photographs courtesy of The Beaches Area Historical Society.

5
Bordered by the City of Neptune Beach to the north, Ponte Vedra Beach to the south, the Intra-Coastal Waterway to the west, and the Atlantic Ocean to the east, the City of Jacksonville Beach occupies 8.06 square miles of land in northeast Florida. It is primarily a residential community located approximately 15 miles east of Jacksonville. The City’s mission statement is Working Together—Committed to Our Citizens. To keep its citizens informed about current events, the City uses Facebook and Twitter. It also publishes a monthly newsletter, Tidings, distributed to its electric customers with their utility bills. Additional information including City Council agendas and minutes, annual financial statements and budgets, employment and applications, updates about current construction projects and road closures, upcoming special events and much more can be found at: www.jacksonvillebeach.org. Information on the City’s electric utility, Beaches Energy Services, is available at www.beachesenergy.com. The City Hall is located at 11 North Third St., Jacksonville Beach, Florida 32250 and may be reached by calling (904) 247-6100.

6
From what began as a tent city for a few hardy souls, Jacksonville Beach has grown into a solid business, resort and residential community with a population over 22,000. Its location, adjacent to the Atlantic Ocean and close to historical and entertainment attractions, makes tourism an important part of the City’s economy.
The list of principal taxpayers is composed of shopping centers, hotels and apartment complexes. In addition, the City has a commercial district which contributes significantly to its economy. Major employers include The United States Navy, Baptist Medical Center-Beaches, PGA Tour, Ponte Vedra Inn & Club, and Sawgrass Marriott, among others.
The City is primarily a residential community although it has a larger proportion of commercial property than the neighboring oceanfront cities of Neptune Beach and Atlantic Beach. Even though Jacksonville Beach is the economic center of the Beaches area, housing is still the dominant land use occupying well in excess of 50 percent of the developed land areas of the City.
Approximately sixty percent of the City’s housing stock are comprised of single family homes and forty percent are multi-family dwellings. Generally, the quality of the housing is high, with approximately fifty percent of the housing built since 1960 with one third less than twenty years old. The City is a mature community which is nearly fully developed.
The City produces multiple special events that draw thousands of spectators.

7
The commercial district Jacksonville Beach
within the Downtown Redevelopment Area.
Jacksonville Beach is primarily a residential community with one-third of its housing built within the last twenty years.

8
9


11
Government and Budget Overview
City Hall, located in downtown Jacksonville Beach
Form of Government The City of Jacksonville Beach operates under the council-manager form of government. The City Council, consisting of a mayor and six council members is responsible for determining policy, passing ordinances and resolutions, adopting the annual budget, appointing committees and hiring the City Manager and City Attorney.
The City Manager is the Chief Administrative Officer of the City and is charged with carrying out the policies made by the City Council. He manages the day-to-day operations of the City, prepares the annual budget for City Council approval, and hires City employees.
City Council members are elected to four-year staggered terms with three council members elected every two years. The mayor is elected to four year terms. Three council members are elected from within their districts. The mayor and the remaining three council members are elected at-large.
The City Council meets at 7:00 P.M. on the first and third Monday of each month (except January and July, 3rd Monday of the month only) at City Hall located at Eleven North Third Street. Council agendas and minutes can be found at http://www.jacksonvillebeach.org/government/city-documents-public-records/agendas-minutes.

12
Quality of Life Goals:
The City of Jacksonville Beach’s mission is to improve our quality of life by building a strong community. This mission is defined by the quality of life goals below.
Mission Supporting Services
Public Safety To feel safe from crime and have good emergency management services
Police, Fire, Building Inspection, Ocean Rescue
Environmental Protection
To live in a community that protects my health by providing safe water to drink, reliable garbage collection and clean waterways through the treatment of stormwater and wastewater, while preserving the environment for future generations
Water, Stormwater, Wastewater, Sanitation
Sense of Community
To live in a community that provides parks, open space and recreational opportunities for all ages that give us a sense of community
Parks & Recreation, Special Events, Golf Course
Sense of Place and Neighborhood Vitality
To live in a City of vibrant neighborhoods that are clean, safe, encourage a sense of place and preserve property values
Planning & Development, Code Enforcement, Street Maintenance, Redevelopment
Responsible Government
To live in a community that has a fiscally responsible government, maximizes the use of public funds, provides great customer service, and has dedicated employees
City Manager’s Office, Finance, Legal, City Clerk, Information Systems, Human Resources
Reliable Electric Service
To live in a city that delivers reliable energy services while encouraging conservation and environmental responsibility with service that is above and beyond the expected
Beaches Energy Services

13
Long-term Goals: See the following section(s):
To maintain the level of service desired by our citizens. Budget Message; Executive
To manage the City to be competitive in all services with respect to cost, service and reliability.
Beaches Energy Services
To make redevelopment work. Planning & Development
To maintain an atmosphere in which all citizens feel safe in their homes, in public and on the beach.
Police; Fire; Parks & Recreation (Ocean Rescue)
To protect the environment through improvements to our water and sewer system, streets and sidewalks, tree protection, beach renourishment and compliance with all environmental hazard and waste regulations.
Public Works; Executive; 5-Year Capital Improvement Plan
To manage growth in a way that protects the quality of life and to maintain an ideal mix of commercial and residential uses.
Planning & Development
To promote the City as a family-oriented entertainment center of the beaches by improving the quality and scope of special events and through improved marketing of the area.
Parks & Recreation
To maintain the minimum cash balances which protect the City’s financial integrity.
Finance
To implement a comprehensive performance measurement system which will give the public, City Council and department directors the ability to evaluate the level and value of the services the City provides to the community.
Performance measures are shown in each department’s business plan.
To emphasize employee safety through proper supervision, training and equipping of all City employees at an appropriate level as to assure their safety and the safety of those around them.
Human Resources
To maintain a compensation and benefit package sufficient to attract and retain a qualified and highly motivated workforce.
Human Resources
To eliminate deferred maintenance in order to lengthen the life of City assets. Executive; Finance (Property Mgt.); 5-Year Capital Improvement Plan
Each department’s business plan contains its mission and information about its objectives and performance measures that support achieving the goals above. An overview can be found in the Budget Message section of this budget document.

14
City Services The City provides a full range of services to its citizens: • 24-Hour Police Protection
• 24-Hour Fire Protection
• Maintenance of city streets &
lighting
• Building Inspection & Permitting
Services
• Code Enforcement Services
• Animal Control Services
• 4.1 miles of lifeguard protected
beach
• Oceanfront restrooms and showers
• 86 acres of park facilities including
softball and football fields,
basketball courts, playground and
picnic equipment, South Beach
Community Center, Carver Center,
Huguenot Tennis Facility
• 18-hole professionally staffed golf
course
• 2 City Cemeteries
• Electric, Water, Stormwater, Sewer
and Sanitation services

15
Funding City Services City services are funded from a variety of sources including property taxes, local option taxes, state shared revenues and utility rates. The adopted ad valorem tax rate is $3.7947 mills per thousand dollars of property value. The adopted rate is 2.6% less than last year’s rate.
A home valued at $180,785 with a homestead exemption of $50,000 has a net taxable value of $130,785 ($155,785 for schools). Based on 2017 millage rates, that homeowner will pay $2,664 in property taxes. $496 of that household’s taxes are paid to the City of Jacksonville Beach (about $41.33 per month). By comparison, cable television and internet access can cost over $100 per month.
Current Millage Rate Adopted Millage RateMillage Property Millage PropertyRate Tax Rate Tax
$3.8947 $509 City of Jacksonville Beach $3.7947 $4960.0320 $4 Inland Navigation 0.0320 $47.1170 $1,109 Duval County School Board 6.8020 $1,0600.3023 $40 Water Management District 0.2885 $388.1512 $1,066 City of Jacksonville 8.1512 $1,066
$19.4972 $2,728 TOTAL $19.0684 $2,664
*Based on a median home assessed value of $180,785 (Property Appraiser)
Where Your Property Tax Dollars Go
Property Taxes on a home with Homestead Exemption*
City of Jacksonville
Beach, 18.63%
Inland Navigation,
0.16%
Duval County School Board,
39.78%
Water Management
District, 1.42%City of
Jacksonville, 40.02%

16
Budget Process
Approximate Date
Required Action
January 31 Completion of preliminary revenue estimates and budget projections
March 15 Mid-year budget adjustment Early March Departments submit 5-year capital improvement plans April 1 Departments submit next year budget requests April 15 through May
City Manager reviews all budget requests and business plans
June 1 Property Appraiser provides estimated preliminary taxable base for next budget year per FS 200.065
July 1 Property Appraiser submits Certificate of Taxable Value (DR420)
July 28 Proposed millage rate, calculation of rolled back rate and date for first public hearing on budget due to Property Appraiser (within 35 days of receipt of taxable value); proposed budget is finalized
August 1-14 City Council workshops to review budgets and business plans September 3-6 First public hearing on budget; adoption of tentative millage
rate and proposed operating budget September 8-16
Second (final) public hearing on budget: adoption of millage rate and operating budget
Responsibility: Section 31 of the City of Jacksonville Beach’s Charter gives the City Manager the duty to prepare and submit the annual budget estimate to the City Council. Although not required to do so, the City prepares an operating budget for all funds. The City adopts its budget in accordance with Florida Statutes, Chapter 200, commonly referred to as TRIM (Truth in Millage). The budget calendar complies with TRIM requirements. October: October 1 marks the start of the fiscal year. The previous year’s encumbrances (prior year’s purchase commitments) are reviewed and incorporated into the new budget, as appropriate. November/December: The City’s annual financial audit for the previous fiscal year takes place. January: Revenue estimates for the next fiscal year are updated using trend analysis, independent rate studies by financial advisors, known funding sources and estimates of

17
distributions from other governmental units. Five-year projections are prepared for the City’s major funds: the General Fund, Community Redevelopment Fund, General Capital Projects Fund, the Electric Fund and the Water & Sewer Fund. Five-year projections are also prepared for all nonmajor enterprise funds and certain special revenue funds. The projections include four or more years of historical data, current year original budget and five future years. One-year projections are prepared and reviewed for all remaining funds. February: Budget preparation instructions are updated to reflect changes in economic condition, citywide priorities, goals and objectives, new or revised directives from the City Council. March: Five-year Capital Improvement Plan (CIP) is prepared. This request is a tentative outline of major (cost greater than $25,000) capital needs matched to the most likely funding source. In some cases, non-capital items are included in the CIP when the expected cost is significant (greater than $100,000) or when the cost is for major on-going programs such as street resurfacing and sidewalk repair. City has established certain replacement cycles that are intended to keep the most critical equipment and infrastructure operating in reasonable repair. While there are no other recurring planning processes that affect the budget process, the CIP process is affected by other periodic planning processes related to such things as infrastructure improvements, Downtown redevelopment, utility rate adjustments or long-term capital planning. March/April: Cost allocations and payroll projections are prepared for departments to integrate into their budget requests. Lapse is not budgeted. Cost allocations are prepared for items such as payroll, insurance, internal service charges, debt service and transfers. Other operating costs are budgeted according to need and the anticipated level of service. Depreciation is not budgeted. Budget requests are completed by each department for their respective division or program along with department-wide business plans. A summary of the department’s budget request is also included in its business plan. May: Preliminary budget assessment compares projected revenues and submitted expenditure requests for the purpose of determining the initial excess or shortage of available resources for appropriation. Budget meetings provide each department the opportunity to discuss their budget request and business plan with the City Manager. In these meetings, budget requests may be adjusted based upon each department’s package of expected program service levels and anticipated funding.
July 1: Property Appraiser provides estimates of property value used to calculate millage rates (DR420).

18
August: Proposed budget document is updated for changes in state revenue estimates and posted on the City’s website. Budget workshops are conducted by the City Manager during which the City Council has the opportunity to review and revise the budgets. Budget issues are discussed along with levels of service. The workshops are open to the public. September: Two public hearings concerning the Tentative Millage Rate and Tentative Operating Budget are held in accordance with Florida’s Truth in Millage requirements (Florida Statutes, Chapter 200). The final budget must be adopted by September 30 of each year and becomes effective on October 1. Budget Adjustments: Council agendas are reviewed for any approved items that will impact the budget because the items were either not budgeted or were budgeted based on an estimate that was too low or too high. Occasionally, unexpected and unbudgeted costs will occur in amounts that are significant enough to warrant consideration for budget adjustment (for example, severe storms or hurricanes, unanticipated major infrastructure or equipment repairs or replacements). Twice per year, these budget adjustment items are aggregated and presented to the Council in the form of a resolution. The mid-year adjustment takes place in March and the year-end adjustment occurs in September. The City Council may make supplemental appropriations during the year, up to the amount available for appropriation. It must approve budget amendments that increase a fund’s total budget for all funds except the General Fund. City Council approval is required for increases to a department’s total budget within the General Fund. Rarely, due to hurricanes or due to other unusual circumstances, an additional, retroactive budget adjustment may be necessary.

19
Budget, Accounting and Financial Policies Budget Policies The Budget is the City’s plan of financial operations that provides for controlling and evaluating governmental activities. The budget process is the primary mechanism by which key decisions are made regarding the levels of service to be provided in light of the anticipated resources available. A budget policy states how this is to be accomplished in addition to addressing the need for financial strength and stability. The City prepares budgets for each of its funds; all funds are included in the City’s financial statements. No item or project is budgeted unless there are sufficient resources to pay for it. All unencumbered operating budget appropriations, except project budgets, expire at the end of each fiscal year. Basis of Budgeting - All annual operating budgets will be adopted on a basis consistent with generally accepted accounting principles (GAAP), with certain exceptions. (See also Basis of Accounting.) Governmental funds and expendable trust funds use the modified accrual basis of accounting. Under this method, revenues are recognized when they are both measurable and available. Expenditures are recognized in the accounting period in which the related liability is incurred, except that principal and interest on general long-term debt are recognized when due. Compensated absences are budgeted in the year paid but recorded for financial statement purposes in the year earned. In all funds, encumbrances outstanding at year-end are reported as reservations of fund balances and do not constitute expenditures or liabilities because the commitments will be honored during the subsequent year. Encumbered appropriations are carried forward into the subsequent year’s budget without being re-budgeted. All unencumbered appropriations, except project budgets lapse at the end of each fiscal year. Unencumbered project budgets are carried forward for the life of the project. Proprietary funds (electric, water & sewer, stormwater, sanitation, golf course, lease facilities and internal service) use the accrual basis of accounting. Under this method, revenues are recorded when earned and expenses are recorded at the time liabilities are incurred. Depreciation and accruals related to amortization of bond discounts and issuance costs are not budgeted.

20
Balanced Budget – A balanced budget will be prepared for each and every fund. Balanced budget means that total anticipated revenues plus available fund balance in excess of authorized reserves will not be less than total budgeted expenditures plus required reserves for each fund. Budgetary Level of Control - The budget is a spending plan that requires adjustment from time to time, as circumstances change. The legal level of budgetary control is at the fund level, except for the General Fund, where it is maintained at the department level. This means that for any department within the General Fund, the department’s expenditures may not exceed its total annual appropriation as adopted by the City Council. The City Manager has the authority to adjust the budget within departments as long as the adjustment does not increase the total level of appropriation approved by the City Council. A system of budgetary controls is maintained to assure adherence to the budget. Timely monthly financial reports that compare revenues, expenditures and encumbrances with budgeted amounts in line-item detail are prepared and provided to department supervisors. Monthly financial reports to the City Council include summary budget reports, which compare current year revenues and expenditures to prior year activity at the same point in time. Budget Amendment Process - When a change in funding needs such as the acquisition or loss of a revenue source or the unanticipated increase in the cost of providing a service occurs, the respective department head will make a formal request to the Budget Officer that the budget be amended. After analysis, this request is forwarded to the City Manager for approval. If the request is within the scope of the City Manager’s authority, the request may be approved or denied immediately. If the request is approved by the City Manager, but requires City Council approval, it will be placed on a City Council agenda for their approval in the form of a resolution amending the operating budget. Resolutions adjusting the budget are prepared twice each year, except in unusual circumstances. Budget Lapses at Year End - All unencumbered operating budget appropriations, except project budgets, will expire at the end of each fiscal year. In accordance with generally accepted accounting principles, the amount of budget related to purchases encumbered in the current year but not received until the subsequent year is added to the budget of the subsequent year. All purchase orders for the current year will be issued by September 15 except in unusual cases approved by the Finance Officer. Budget Guidelines – Personnel Costs - Personnel costs (payroll and benefits) will be budgeted in accordance with the City’s adopted pay plans and union contracts, using wage rates consistent with the plan’s grades

21
and steps appropriate for each employee. Cost of living adjustments, if any, will be budgeted separately and integrated into the final adopted budget. Operating Costs - Operating costs will be budgeted according to need and based on the cost of providing a certain level of service. Priority is given to expenditures for the adequate maintenance of capital equipment, facilities and infrastructure, and for their orderly repair or replacement. Capital Outlay - Capital outlay consists of costs associated with the acquisition of and improvements to land, easements, buildings, building improvements, vehicles, machinery, equipment, works of art, historical treasures, infrastructure and all other tangible assets costing $1,000 or more that are used in operations and have initial useful lives lasting more than one year. The City does not budget depreciation. 5-Year Capital Improvement Program - Expenditures in the Capital Improvement Program will include capital outlay that costs $25,000 or more. The operating expenditures associated with these items will be included in the operating budget in the current year. The future operating expenditures will be considered in the development of the time schedule for capital improvements along with resource availability. Projects will be scheduled for the current year if resources are available to cover capital outlay and the operating costs. Significant, recurring repair and maintenance items may also be included in the plan. Business Plans – Each department will prepare an annual business plan that includes the following:
1. Organization – a description of the department, its programs and functions along with a schedule of authorized positions.
2. Mission – a statement of the department’s mission. 3. Recent accomplishments – significant accomplishments during the past budget year. 4. Objectives/outcomes – the larger purpose that the department or division aims to achieve. 5. Goals – a specific listing of what the department expects to achieve in the coming budget
year. 6. Funding sources – a description of revenue sources that fund the department. 7. Financial summary – a three-year (prior year actual, current year revised budget, next year
proposed budget) summary of the department’s expenditures for personal services, operating expenditures, capital outlay, debt service and transfers.
8. Major budget changes from last year – a description of the primary causes of increases or decreases in the department’s budget.
9. Budget issues – a description of items that may impact the department’s budget now or in the future.
10. Performance measures – indicators of the department’s efficiency and effectiveness.

22
Accounting and Financial Policies Basis of Accounting – The City prepares its Comprehensive Annual Financial Report (CAFR) on the basis of Generally Accepted Accounting Principles (GAAP). Governmental funds use the modified accrual basis of accounting. Under the modified accrual basis, revenues are recognized when they become measurable and available as net current assets. Expenses are recognized when the related liability is incurred. Proprietary funds use the accrual basis of accounting. Under this method, revenues are recognized when they are earned and expenses are recognized when they are incurred. Except as noted below, this conforms to the way the City prepares its budget. Exceptions are:
a. Compensated absence liabilities are accrued as earned under GAAP, but budgeted in the year paid.
b. Principal payments on long-term debt in the Proprietary Funds are applied to the outstanding liability on a GAAP basis, but are budgeted as debt service in the year paid.
c. Capital outlay in the Proprietary Funds are recorded as assets on a GAAP basis, but budgeted in the year paid.
d. Other post-employment benefits and depreciation are only recorded on a GAAP basis and are not budgeted.
e. Fund balances reported in the City’s financial statements comply with the provisions of GASB 54. For budget reporting, however, fund balances that would be reported in the financial statements as nonspendable, restricted, committed or assigned have been combined into a single category called “All other balances”.
Funds and Account Groups - The accounts of the City are organized on the basis of funds and account groups, each of which is considered a separate accounting entity. The operations of each fund are accounted for with a separate set of self-balancing accounts that comprises its assets, liabilities, fund equity, revenue and expenditures or expenses, as appropriate. Government resources are allocated to, and accounted for in individual funds based upon the purposes for which they are to be spent and the means by which spending activities are controlled. (See the following Fund Accounting pages.) Major and Nonmajor Funds – GASB Statement No. 34 sets forth minimum criteria (percentage of assets, liabilities, revenues or expenditures/expenses of either fund category or the governmental and enterprise combined) for the determination of major funds. The City reports three major governmental funds: the General Fund, one special revenue fund, the Community Redevelopment Agency and one capital projects fund, the General Capital Projects Fund. The Electric Fund and the Water and Sewer Funds are reported as the City’s two major enterprise funds.

23
Governmental and enterprise funds which do not meet the criteria for reporting as major funds are grouped together for presentation purposes as nonmajor Governmental Funds and nonmajor Enterprise Funds, respectively. In addition, the City reports a nonmajor internal service fund type and a nonmajor fiduciary (pension) fund type. Budgets are prepared for all funds regardless of the fund’s classification as a major or nonmajor fund and all budgeted funds are included in the City’s Comprehensive Annual Financial Report (CAFR). Cash and Investments - The City’s investment policy (Resolution 1854-2010) was adopted on May 17, 2010 and revised on June 16, 2014 (Resolution 1934-2014). The policy authorizes the Finance Officer to invest public funds, contract for banking, investment and related services, establish internal controls and specifies the types of investments that may be purchased. Key objectives included in the policy are as follows:
1. Safety of principal. 2. Sufficient liquidity to allow for quick conversion of investments to cash easily and rapidly
without loss of principal. 3. Attaining a market rate of return throughout budgetary and economic cycles, taking into
account the investment risk constraints and liquidity needs. 4. Investments held should be diversified to the extent practicable to control the risk of loss
resulting from overconcentration of assets in a specific maturity, issuer, instrument, dealer, or bank through which financial instruments are bought and sold.
The policy specifies requirements for financial institutions and broker/dealers which are approved for investment purposes, maturity and liquidity requirements, and competitive selection of investment instruments. It also specifies the type of authorized investments and portfolio composition, prohibited investments, performance measurements, monthly reporting requirements and third-party custodial agreements. Debt Service - Debt service costs arise out of obligations to repay amounts borrowed (principal) with interest and any other related costs. Funds are to be borrowed for capital expenditures only. The City will not borrow funds to meet day-to-day operating expenditures. The City will seek to minimize the need for future debt through long term financial planning and capital budgeting. Neither the City Charter nor Code, nor Florida Statutes limit the amount of debt the City can issue. Decisions to issue debt will be guided by the following policies:
1. The City will restrict the use of long-term debt to capital projects that cannot be funded from current revenues. The City will not use long-term debt to meet current operating expenditures.
2. Debt payments will not extend beyond the useful life of the capital investment being financed.
3. The City may issue refunding bonds provided such refunding does not result in an

24
increase in the interest rate. 4. Issuance of General Obligation Bonds (GOB) requires the approval of the City Council
and an affirmative vote of a majority of electors voting at any specific general election. 5. The City may issue tax increment debt securities payable solely from the ad valorem tax
increment proceeds within the area of authority created in accordance with City Ordinances for the Southend and Downtown Tax Increment Districts.
6. The City Council has the authority to obligate the City’s resources for the issuance of Revenue Bonds. Issuance of additional revenue bonds for the utilities must not violate the terms of current bond covenants and comply with all the restrictions for parity, debt service coverage and reserve requirements.
7. The use of lease purchase obligations will be considered only when the useful life of the item is equal to or greater than the length of the lease. If the item becomes technologically obsolete or is likely to require extensive repairs during the lease period, then the City will purchase the item with current operating revenues.
8. As a part of the budget process, the Finance Officer annually reviews current and projected levels of debt, monitoring debt levels to assure that the City does not over-obligate its resources. Analysis of debt levels, along with long term revenue projections will both be considered when deciding if the City should incur new debt. Plans for long-term debt will vary depending upon funding source, its reliability and availability in the future and the priority of the capital project being considered. When considering if the City can afford the new debt, the City will also consider the added operating expenditures associated with the new capital asset and its long-term budget impact.
Transfers - Transfers are used to move monies from one fund to another without the intent of repayment. Transfers are made according to prescribed formula or legal requirements upon the availability of unrestricted fund balances. No transfer will be made in violation of the legal purpose or use of revenues from which the fund balance was created. Fund Balance – The City implemented the provisions of GASB 54 Fund Balance Reporting and Governmental Fund Type Definitions, in 2011 (Resolution 1887-2011, revised in Resolution 1890-2011), as required. The policy establishes fund balance classifications that comprise a hierarchy based primarily on the extent to which the City is bound to honor constraints on the specific purpose for which the amounts in the funds can be spent. For financial statement purposes, fund balance is reported in five components – nonspendable, restricted, committed, assigned and unassigned. For budget purposes, fund balance is reported as either Unrestricted/unassigned or All other balances. Fund balances that would be reported in the financial statements as nonspendable, restricted, committed or assigned have been combined for budget reporting into a single grouping designated as “All other balances”.

25
The fund balance resolutions adopted in 2011 established a revenue stabilization fund balance reserve in the General Fund in an amount equal to 25% of subsequent year’s general fund budgeted expenditures. The purpose of the stabilization fund is to provide sufficient working capital at the beginning of the fiscal year until the time the City begins receiving ad valorem taxes, usually toward the end of the first quarter. It is essentially sets a fund balance minimum. The stabilization balance can only be reduced with City Council approval or for budgeted expenditures when all other unrestricted or uncommitted fund balances have been exhausted, or there is a revenue shortfall resulting in a decrease in the stabilization fund. The resolutions also established an assigned fund balance in the General Fund for unanticipated events or emergencies calculated as up to 25% of the subsequent year’s General Fund budget (after the revenue stabilization reserve is funded). Expenditures for emergencies must be approved by the City Manager and reported to the City council within 30 working days of the emergency. Expenditures for major unanticipated, unbudgeted events require prior City Council approval and subsequent modification to the general fund budget. In general, fund balances in special revenue funds are classified as restricted. Fund balances in debt service and capital projects funds are classified as assigned. When both restricted (or committed, or assigned) and unrestricted resources are available for use, the City’s policy as established in the resolution is to use the restricted (or committed, or assigned) resources first, then unrestricted resources as they are needed. Fund Balance Reserves in Proprietary Funds – In addition to any legally restricted fund balances, the City maintains a fund balance reserve for working capital in all operating funds. The purpose of this reserve is to handle shortfalls from revenue deficiencies, costs from unforeseen emergencies, and to avoid the need for short term borrowing for cash flow purposes. This reserve is maintained at the approximate level of three to four months operating expenditures. The City’s insurance internal service funds maintain minimum reserves of $500,000 in the Property and Liability Insurance Fund and a minimum of $1,500,000 in the Workers Comp Insurance Fund. The reserves were recommended as part of a plan for the City to become partially self-insured. GFOA Award for Distinguished Budget Presentation - The City strives to improve its budget document in order to continue to meet the criteria for the Government Finance Officers’ Association (GFOA) Award for Distinguished Budget Presentation. This award signifies that the City is communicating its spending plan to its citizens, elected and administrative officials, and to outside interested parties such as bond rating agencies, in an exemplary manner.

26
Fund Accounting The City of Jacksonville Beach maintains its accounting system on a fund basis. A fund is defined as a fiscal and accounting entity with a self-balancing set of accounts. Funds are typically segregated for the purpose of carrying on specific activities or attaining certain objectives in accordance with special regulations, restrictions or limitations. The City uses three broad types of funds: governmental, proprietary and fiduciary. Governmental funds are generally used to account for tax-supported government activities. Proprietary funds are used to account for operations that are financed in a manner similar to private business enterprise; or where the periodic determination of net income is appropriate for accountability purposes. The City has two types of proprietary funds: enterprise funds which account for its utilities, golf course and lease facilities; and internal service funds, which account for centralized services that are provided on a cost-reimbursement basis. Fiduciary (pension) funds account for funds held by the government as a trustee; these assets cannot be used to support the government’s own activities. GASB Statement No. 54, Basic Financial Statements and Management’s Discussion and Analysis for State and Local Governments, sets forth minimum criteria (percentage of the assets, liabilities, revenues or expenditures/expenses of either fund category or the governmental and enterprise funds combined) for the determination of major funds. Governmental and enterprise funds which do not meet the criteria for reporting as major funds are designated as nonmajor.
Revenues Expenditures
Revenues minus
expensesExp. as a % of Total Budget
Major Funds:General Fund $20,223,059 $20,169,225 $53,834 12.7%Community Redevelopment 9,611,930 1,834,044 $7,777,886 1.2%General Capital Projects 636,000 2,816,412 ($2,180,412) 1.8%Electric 87,258,222 88,249,056 ($990,834) 55.6%Water & Sewer 12,233,347 14,548,567 ($2,315,220) 9.2%
129,962,558 127,617,304 2,345,254 80.4%
Nonmajor Funds:Governmental 3,507,032 3,630,711 (123,679) 2.3%Enterprise 8,510,692 8,665,492 (154,800) 5.5%Internal Service 11,930,449 11,930,449 0 7.5%Trust (pension) 9,843,630 6,836,621 3,007,009 4.3%
33,791,802 31,063,272 2,728,530 19.6%
TOTAL - All Funds $163,754,360 $158,680,576 $5,073,784 100.0%
Revenues and Expenditures by Major/Nonmajor Fund

27
Governmental Funds Major Governmental Funds The General Fund accounts for resources traditionally associated with governments that are not required to be accounted for in another fund. Its primary funding sources are property taxes, revenue from other governments and transfers from other funds. The General Fund provides funding for the traditional services of municipal government: elected officials, police & fire, parks & recreation, planning and development, building inspection and street maintenance. Budget objective: to provide for the general government operations of the City and maintain the working capital necessary for the fund’s financial health and stability. The Community Redevelopment Fund accounts for the receipt and expenditure of ad valorem tax increment funds in a special revenue fund because use of the revenue is limited to purposes specified in its redevelopment plan. The Community Redevelopment Agency (CRA) uses these funds to pay for capital projects and to secure debt issued to pay for those projects benefitting the City’s two redevelopment districts in accordance with adopted plans for each district: Downtown, which was created in 1984 and Southend, which was created in 1985. Other revenue sources include grant funds and interest earnings. Information about the Community Redevelopment Agency is reported in Planning & Development’s section of this document. Budget objective: to show the legally restricted revenue sources and how these sources will be utilized and to demonstrate compliance with Florida Statutes. The General Capital Projects Fund is the City’s primary capital projects fund and accounts for the costs of various nonrecurring capital projects, major equipment purchases and major repairs and renovations. Due to the nature of the fund, its budget can fluctuate significantly from one year to the next. Primary funding sources are transfers from other funds, grants and interest earnings. Its budget is itemized and discussed in the Executive and Legislative section of the budget. Budget objective: to account for all financial resources to be expended for the acquisition, construction or repair of major capital facilities or equipment used as capital assets in governmental funds. Nonmajor Governmental Funds Nonmajor Governmental Funds account for those special revenue, debt service and capital projects funds that do not meet government accounting standards criteria for inclusion as major funds.

28
Special revenue funds are used to account for specific revenues that are legally restricted to be spent for a particular purpose. Funding sources in these funds are largely grant and tax revenues. Budget objective: to show the legally restricted revenue sources, how these sources will be utilized and to demonstrate compliance with statutes, regulations and rules governing their use. Debt service funds are used to account for the accumulation of resources for and payment of governmental bond principal and interest; funding for these funds comes from the revenue pledged as support for the debt. Budget objective: to fund debt service expenditures and to provide for any cash flow deficiency that would occur prior to the receipt of tax increment revenues. Capital projects funds are used to account for the acquisition and construction of major repairs, replacements and capital facilities other than those financed by proprietary funds and trust funds; funding sources are grants, transfers from other funds, interest earnings and bond proceeds. Budget objective: to account for all financial resources to be expended for the acquisition or construction or repair of major capital facilities or equipment to be used as capital assets in governmental funds. A summary of the city’s governmental funds, budget, primary uses and the department responsible for managing the fund is on the next page.

29
Governmental Funds Budget Primary Uses Department
20,169,225
Police, Fire, Parks & Recreation, Public Works-Street Maintenance, Planning & Development, Executive, Finance-Building Maintenance, Executive, Executive-Nondepartmental All departments to the left
Special Revenue Funds
Community Redevelopment (major) 1,834,044
Infrastructure improvements in Downtown and Southend districts; downtown policing initiative
Planning & Development, Police, Public Works
Convention Development 196,678Tourism and convention development
Parks & Recreation, Executive
Court Cost Training 60,000 Police training PoliceLocal Option Gas Tax 726,571 Street and road maintenance Public WorksHalf-Cent Infrastructure Surtax 1,176,450
Infrastructure improvements specified in enabling legislation Public Works
Community Development Block Grant 145,511
CAPE, Carver Center and Utility Assistance
Police, Finance, Parks & Recreation
Radio Communication 10,000 City's radio system FireJustice Assistance Grant 52,233 Specific law enforcement uses PoliceTree Protection 3,000 Tree replacement Parks & RecreationLaw Enforcement Trust Fund 63,264 Specific law enforcement uses PoliceEquitable Sharing Fund 175,000 Specific law enforcement uses Police
Debt Service FundHalf-Cent Infrastructure Surtax 1,000,804 Principal and interest payments Executive
Capital Projects FundsGeneral Capital Projects (major) 2,816,412
Major capital projects and repair/ replacement of equipment Executive
Infrastructure Surtax Bond Proceeds 0
Infrastructure improvements specified in enabling legislation Executive
Dog Park Project 21,200 Maintenance of Dog Park Executive
$28,450,392
General Fund (major)
TOTAL GOVERNMENTAL FUNDS

30
Proprietary Funds Major Enterprise Funds: The Electric Fund and the Water & Sewer Fund are two of the City’s enterprise funds that are accounted for as major funds. Although the Water & Sewer Fund does not meet the minimum government accounting standards criteria for reporting as a major fund, because of its importance the City has elected to account for it as one. Both funds use revenues from the delivery of services to cover the costs of operating their systems. The Electric Fund’s budget is discussed under Beaches Energy Services. The Water & Sewer Fund’s is discussed under Public Works. Budget objective: to monitor revenues and control expenses. Nonmajor Enterprise Funds are used to account for operations that are financed in a manner similar to private business enterprises – where the intent of the City Council is that the cost of providing goods or services to the general public on a continuing basis be financed or recovered primarily through user charges. The primary revenue source in each of these funds is user charges. These funds account for the City’s natural gas, stormwater and sanitation utilities, golf course and its lease facilities operations. Budget objective: to monitor revenues and control expenses. Internal Service Funds are used to account for the financing of goods and services provided by one department to other departments of the government and to other government units, on a cost reimbursement basis. Departments are charged by these funds based on their usage of the goods or services provided. Revenue, rates and charges may be adjusted to cover all operating expenses, capital outlay and debt service. Budget objective is to demonstrate that these funds are self-supporting. Administrative operations providing services through internal service funds and the allocation basis used to distribute their costs are shown below.
Internal Service Fund Allocation Basis City Manager Time allocation estimate Accounting Accounting - Department/division operating
budgets; Utility Billing - Number of meters in each utility & degree of difficulty (time); Information Systems - Time and difficulty estimate; Purchasing - Number and value of purchase orders
Human Resources Number of employees Fleet Maintenance Specific vehicle maintenance costs and overhead
allocation based on number of vehicles Meter Services Number of meters read Operations & Maintenance Facility
Square footage allocated to each department
Insurance Funds Property value (general/liability); payroll costs and cost per $1,000 (worker’s comp); specific charges (employee life, health & dental insurance)

31
Proprietary Funds Budget Primary Uses Department
Enterprise
Electric (major) $88,249,056Operations of Beaches Energy Services
Beaches Energy Services
Water & Sewer (major) 14,548,567Operations of water and sewer system Public Works
Natural Gas 2,159,297 Operations of natural gas systemBeaches Energy Services
Stormwater 1,077,666 Operations of stormwater system Public Works
Sanitation 3,550,413 Garbage and sanitation operations Public Works
Golf Course 1,381,940 Golf course operations Parks & Recreation
Lease Facilities 496,176
Operations of lease facilities and funding for major projects and replacements
Beaches Energy Services
Internal Service
City Manger 510,993 City Manager's office operations Executive
Finance 4,592,542
Utility billing, accounting, purchasing and information systems operations Finance
Human Resources 557,086 Human resources operations Human ResourcesFleet Maintenance 588,644 Maintenance on City's vehicle fleet Finance
Meter Services 943,091Meter reading services for electric & water
Beaches Energy Services
Operations & Maintenance Facility 365,226
Maintenance costs of O&M buildings Finance
Insurance & Risk Retention 4,372,867
Premiums and related costs for general, liability, workers comp and employee insurance Human Resources
$123,393,564TOTAL PROPRIETARY FUNDS

32
Fiduciary Finds: Pension Trust Funds – Pension funds are the City’s only fiduciary funds. Pension Funds are used to account for assets held by the City as trustee for general, police and fire employees and retirees. Funding sources come from insurance premium taxes, City and employee contributions and investment earnings. Expenditures are used to pay retirement benefits to current and future retirees and to administer the three funds. Budget objective: to monitor revenues and control expenditures. Pension funds are reported in the Executive and Legislative department.
Pension Budget Primary Uses DepartmentGeneral $4,549,838 General employees' pension fund Executive
Police 1,416,319 Police pension fund Executive
Fire 870,463 Fire pension fund Executive
$6,836,621TOTAL PENSION FUNDS

33
City of Jacksonville Beach, FloridaOrganization Chart
Agency, Boards & Commission
Board of AdjustmentCommunity Redevelopment AgencyPension Boards (3)Planning CommissionSpecial Magistrate
Finance Fire Human Resources
Accounting Building Maintenance Fire Personnel AdministrationUtility Billing Lease Facilities Radio Communications InsuranceInformation Systems Fleet Maintenance Pension AdministrationPurchasing Administration O & M Facility
Planning & Development Parks & Recreation Police Executive & Legislative
Planning & Development Recreation Administration Police Administration City CouncilBuilding Inspection Ocean Rescue Records City AttorneyCode Enforcement Grounds Maintenance Investigations City ClerkCommunity Redevelopment Tennis Patrol City Manager Agency Ocean Front Restrooms Communications
Carver Center ServicesSB Community Ctr & Exhibit Hall ReserveConvention Development Volunteer Programs (Special Events) ParkingGolf Course Downtown PolicingTree Protection Police Special Revenue Funds
Beaches Energy Services Public Works Nondepartmental*
Purchase of Power Conservation & Renewables Streets NondepartmentalElectric Administration CARE Program Local Option Gas Tax Debt Service FundsEngineering Regulatory Compliance Public Works Administration Capital Projects FundsConstruction & Maintenance Natural Gas Water PlantCapital Improvements Meter Services Pollution Control Plant Pension FundsSystem Operations Distribution & CollectionTransmission Capital ProjectsStoreroom Stormwater
Sanitation
General FundOther Major Funds: Electric, Water & Sewer, Redevelopment, Capital Projects
* See Executive & Legislative Department for these divisions.
Residents of Jacksonville Beach
City Council
City Attorney
City Manager

34
Expenditure Summary by Business Plan and FundFiscal Year 2017
General Other Internal TrustFund Govt. Funds Enterprise Service (Pension) Total
Executive & LegislativeGovernmental Debt Service $1,000,804 $1,000,804Executive & Legislative 789,656 510,993 1,300,649Capital Projects 4,014,062 4,014,062Nondepartmental 1,231,920 1,231,920Total Executive & Legislative 2,021,576 5,014,866 510,993 7,547,435
Planning & Development 832,231 832,231
RedevelopmentDowntown Redevelopment 646,176 646,176Southend Tax Increment 133,329 133,329Total Redevelopment 779,505 779,505
Parks & RecreationRecreation Administration 629,084 629,084Ocean Rescue 708,613 708,613Grounds Maintenance 1,304,744 1,304,744Tennis 108,046 108,046Oceanfront Facilities 131,000 131,000Carver Center-CDBG 120,472 145,511 265,983Special Events-Convention Dev. 196,678 196,678Exhibition Hall 51,600 51,600Golf Course 1,381,940 1,381,940Tree Protection 3,000 3,000Total Parks & Recreation 3,053,559 345,189 1,381,940 4,780,688
Public WorksAdministration 5,743,218 5,743,218Distribution and Collection 3,364,860 3,364,860Pollution Control 2,934,960 2,934,960Water Plant 2,505,529 2,505,529Streets 1,559,457 1,559,457Local Option Gas Tax 726,571 726,571Stormwater Utility 1,077,666 1,077,666Sanitation 3,550,413 3,550,413Total Public Works 1,559,457 726,571 19,176,646 21,462,674
PoliceGeneral Fund 8,450,360 8,450,360Special Revenue Funds 1,405,036 1,405,036Total Police 8,450,360 1,405,036 9,855,396
Fire 3,813,550 10,000 3,823,550
Beaches Energy ServicesElectric 88,249,056 943,091 89,192,147Natural Gas 2,159,297 2,159,297Total Beaches Energy 90,408,353 943,091 91,351,444
Finance 438,492 496,176 5,546,412 6,481,080
Human ResourcesPersonnel Administration 557,086 557,086Insurance & Risk Management 4,372,867 4,372,867Pension Administration 6,836,621 6,836,621Total Human Resources 4,929,953 6,836,621 11,766,573
Total Adopted Budget $20,169,225 $8,281,167 $111,463,115 $11,930,449 $6,836,621 $158,680,576

Executive & Legislative Department
35
Mission Improving quality of life and building community. Organization The Executive and Legislative Services Department consists of four General Fund divisions: City Council, City Attorney, City Clerk, and Non-Departmental. This department also manages the City Manager Internal Service Fund and Capital Projects Funds. The City Council and City Manager are responsible for providing leadership that result in informed decision-making, exceptional customer service and a positive quality of life for the citizens of Jacksonville Beach.
Policy decisions and legislative actions, which are made by the City Council, are administered and executed by the City Manager. The City Attorney serves in an advisory role in the interpretation of ordinances adopted by the City Council, and other state and federal laws and regulations related to the business of City government. The City Clerk maintains City records in compliance with state and local laws.
Authorized Positions FY2015 FY2016 FY2017 City Council 7 7 7 City Manager 1 1 1 Deputy City Manager 1 1 1 Assistant to the City Manager 1 1 1 City Clerk 1 1 1 Assistant City Clerk 1 1 1 Administrative Assistant 1 1 1 Staff Assistant-part-time 1 1 1 TOTAL 14 14 14
Goals for FY2017-City Manager’s Office
• Analyze levels of service and recommend changes in City programs to improve their effectiveness.
• Lead efforts to restructure City services to meet budgetary limitations. • Provide leadership to implement business plan strategies and City Council priorities for
all departments. • Continue customer service emphasis to provide high quality services at a reasonable cost. • Focus on sound financial management.

Executive & Legislative Department
36
City Manager's Performance Measures Priorities and Goals Status Financially Sound City Sustainable pension plans Adjustments to make City pension plans sustainable
were implemented in 2014; however, new State laws adopted in May 2015 will pose additional challenges.
Provide competitive compensation & health care for employees
Adopted new pay plan in 2014.
Develop potential alternate revenue sources to supplement the General Fund
• Lease properties continue to be an important source of revenues. City seeking new ways of doing business such as contracting out the Fire Department, which could substantially improve the City's finances.
• The life of the redevelopment districts was extended by 30 years in 2014. Changes in the way the tax increment districts operate could substantially improve general fund revenue.
Ensure capital improvement planning is up to date
The 5-year capital improvement plan is updated annually and included as part of the City's budget and business plan.
Public Safety Ensure Downtown CAPE is enhancing citizen safety
Added 4 police positions to Downtown Policing Innovations Program in 2015. Program now provides a total of 9 officers.
Partner with other agencies to assist vagrants: CHOP Program (Chronically Homeless Offender Project), Mission House Programs
This program works effectively to provide options to the homeless population in Jacksonville Beach.
Work with neighborhood watch programs and other community organizations to prevent and reduce crime
On-going
Business Growth Support and work with business owners and Beaches Chamber of Commerce in developing a plan to identify, attract and retain a good mix of businesses
Ongoing discussions with business owners and developers. Beach Marine PUD and Dolphin Depot LLC (7 story residential and hotel downtown complex) approved.
Work with Beaches Chamber of Commerce, Beaches Hospitality Network and Visit Jacksonville to market our City and assist hospitality/tourism businesses
Programs, ordinance revisions and incentives being considered through the Downtown Action Plan.
Review City ordinances and develop policies to encourage business activity
Part of the Downtown Action Plan - draft ordinance changes are being reviewed and will be considered by Council this summer.

Executive & Legislative Department
37
City Manager's Performance Measures Priorities and Goals Status Parking Provide spaces for low speed vehicles Designated parking for low-speed vehicles
implemented in March 2013. Investigate the feasibility of a paid integrated parking program to encourage long-term parking in the lots and short-term parking on the streets
Development of 2-hour parking in designated downtown areas is underway. Paid parking program was approved in February 2014. Addition of parking facility to be considered as part of the Downtown Action Plan.
Provide security in City-owned parking lots Performed primarily by Community Service Officers in conjunction with the paid parking program.
Building Community Enhance web and social media presence to keep the public informed and invited to participate in decision making
Website upgrade completed in 2013, including an improved calendar function. Increased use of social media and website to notify citizens and customers about upcoming meetings and events.
Provide spaces, parks and events that create opportunities for friends and neighbors to connect with each other and with the community
Began Downtown Action Plan. Revised and updated special events policies; added and expanded "Deck the Chairs" as part of Christmas festivities.
Effectiveness Accomplish business plan goals Yes Customer Service Customer service training and standards for all departments Yes
Customer service awards program
Gift card awards of either $10 or $20 given to employees whose actions go above and beyond their required duties to improve service, reduce costs or to assist coworkers or members of the community.
Redevelopment 30-year redevelopment district renewal In 2014, the life of the Redevelopment Districts was
extended by 30 years, to 2044. Redevelopment Projects: Downtown Redevelopment-Glatting Jackson, Phase 3-C & 3-D (1st & 2nd Streets from Beach Blvd. to 16th S.), additional restroom facilities, possible facility (either surface lot or parking garage, depending on long-term financial feasibility)(see 5-year Capital Improvement Plan)
First and Second Streets and related Avenues south of Beach Boulevard from Beach Blvd to 16th Ave S currently being designed. Construction on the area from Beach Blvd to 4th Ave S is underway.
10th Street South Industrial Park Area construction Design 2016

Executive & Legislative Department
38
City Manager's Performance Measures Priorities and Goals Status Quality of Life Downtown Action Plan: Action Plan for Downtown Jacksonville Beach has been developed based on survey results and citizen comments. Plan links Community Values identified in the 2007 Downtown Vision Plan with community input to create a series of actionable items that will improve the appeal of Downtown Jacksonville Beach
DT Action Plan categories include: Public Spaces, Transportation, Public Safety, Commercial Spaces, Entertainment & Events, and Quality of Life.
Infrastructure: System improvements and maintenance for streets, sidewalks, water, sewer, stormwater, electric and natural gas as scheduled in the 5-year capital improvement plan
The 5-year capital improvement plan is updated annually and included as part the City's budget and business plans.
Water, Sewer & Stormwater Rebuild Waste Treatment Plant to comply with federal/state limits on nitrogen
Complete
Water-consumptive use permit Received 2-15-2013; Next renewal 4-9-2033 Sewer & Stormwater-NPDES permits Received 12-1-2011; Next renewal 11-30-2016 Drainage Study & Projects – North of Beach Blvd
In conjunction with FDOT project, study being conducted for a project in the area from 6th Ave. North and 18th Ave. North
Drainage Study & Projects – South of Beach Blvd
Study being conducted for the area bounded by Beach Blvd, A1A, Atlantic Ocean and 16th Ave S.
Parks & Facilities All parks and facilities in good condition; properly maintained and free of trash Yes-maintenance improvements underway
Install bus shelters at selected locations as funding is available
Phase 1 completed (5 on 9th Street South and 2 on Penman Road)
Public Safety Emergency Management On-going Marketing & Public Relations Communication with the media On-going Website management On-going Special Events: Jazz Concert Series, Moonlight Movies and others (see Parks & Recreation) On-going

Executive & Legislative Department
39
City Clerk's Performance Measures Actual 2015
As of 3/2016
Target 2017
# responses received / # surveys sent out 93 / 535 65 / 593 100 / 550
Customer survey satisfaction rating: Target is 95% Satisfactory, with at least 80% Exceeds Expectations: Internal Customer Service Survey - Satisfaction with service provided
99% 97% 95%
Local Business Tax Customer Service Survey - Satisfaction with responsiveness of Clerk's office
99% 99% 95%
Lien Certificate Customer Service Survey - Satisfaction with responsiveness of Clerk's office
99% 99% 95%
Other performance measures: Assemble and distribute Council agenda packets 4 days prior to meeting and post on website
100% 100% 100%
Transcribe Council meeting minutes within 3 days 100% 100% 100%
Research, prepare and issue lien certificates within 7-10 business days of request
75% 95% 95%
After receiving a completed application, process and issue Local Business Tax Receipt within 5 business days
95% 95% 95%
Goals for FY2017-City Clerk’s Office
• Identify, protect, and preserve essential and historic City records.
• Ensure that all City Council and Board meetings are attended and minutes are transcribed in a timely manner.
• Continue training and maintenance of document imaging program “Opti-View”.
• Successfully coordinate and manage the 2016 Municipal Election.
• Conduct annual Public Records Laws, Records Management, and Sunshine Law training.
• Ensure that Local Business Tax Renewal Notices are sent to existing businesses by August 1, 2016.

Executive & Legislative Department
40
Funding Sources: The General Fund Executive and Non-Departmental Divisions are supported by taxes, intergovernmental revenues, and transfers from other funds. The City Manager Division is funded by allocation of charges to departments served by the division. Half-Cent Infrastructure Tax Fund uses distributions from the Better Jacksonville Plan to fund:
Street reconstruction and school sidewalks Water, sewer, stormwater improvements Capital improvements to recreational facilities Purchase of property for preservation and recreational purposes
Funding Uses:
City Council13%City Attorney
24%
City Clerk24%
City Manager39%
Executive & Legislative Budget
City Council
City Attorney
City Clerk
City Manager
Division FY2016 Budget FY2017 BudgetIncrease
(Decrease)City Council $169,064 $169,570 $506City Attorney 280,755 304,020 23,265City Clerk 314,545 316,066 1,521City Manager 499,402 510,993 11,591TOTAL $1,263,766 $1,300,649 $36,883

Executive & Legislative Department
41
Funding Uses (continued) City Council This division’s expenses are essentially level in comparison to previous years. Total budget is $169,570. The City Council budget includes funding assistance for: Dial-a-Ride $2,500
Beaches Resource Center $500
City Attorney/Legal and Legislative Services The City Attorney division includes budgeted legal fees for legal matters affecting the City and its departments and for State and Federal legislative issues. This budget may require modification annually depending on the number of lawsuits. The total budget is $304,020. City Clerk The City Clerk’s office is responsible for maintaining the City’s records and documents, keeping minutes of all City meetings, coordinating all municipal elections and publishing legal notices and advertisements. It also manages the City’s business license program and lien certificate requests. The total budget is $316,066. City Manager The City Manager’s office runs the day-to-day operations of the City by overseeing the work of all City departments, manages inter-governmental (Federal, State and local) affairs, represents the Beaches Energy Services in the Florida Municipal Power Agency and on the board of the Florida Municipal Electric Association, is responsible for presenting the annual budget to the City Council and executes the directives of the City Council. The total budget is $510,993.
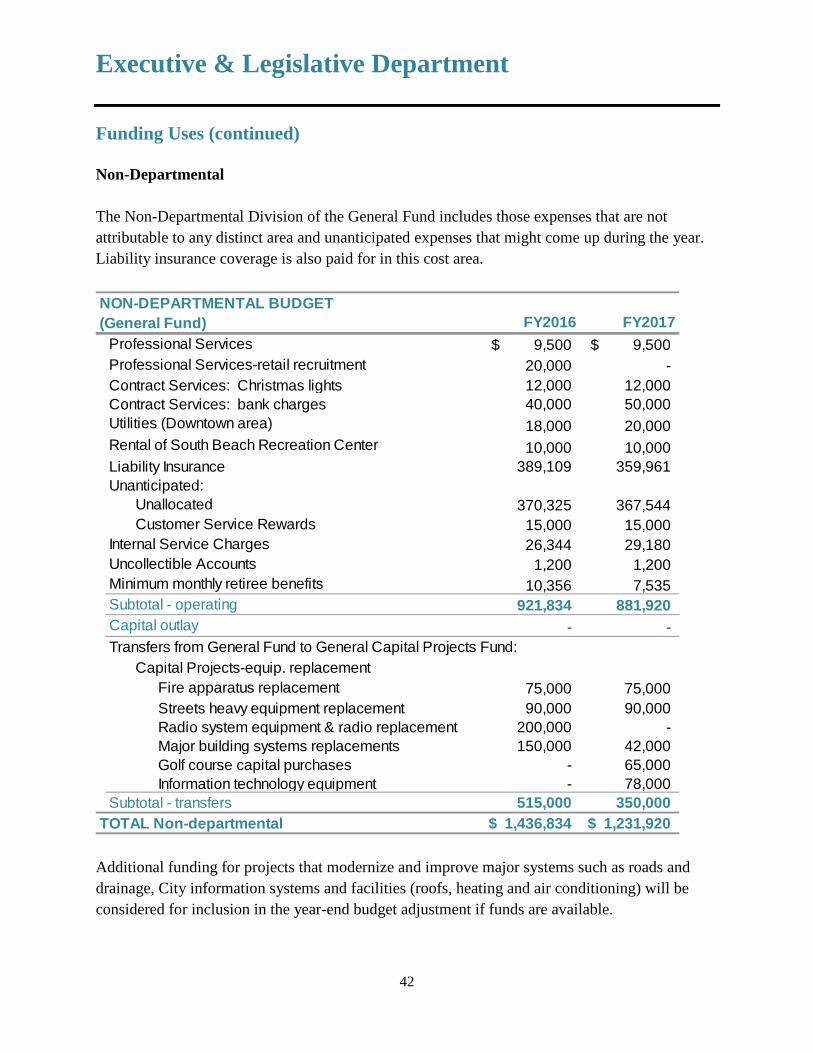
Executive & Legislative Department
42
Funding Uses (continued) Non-Departmental
The Non-Departmental Division of the General Fund includes those expenses that are not attributable to any distinct area and unanticipated expenses that might come up during the year. Liability insurance coverage is also paid for in this cost area.
Additional funding for projects that modernize and improve major systems such as roads and drainage, City information systems and facilities (roofs, heating and air conditioning) will be considered for inclusion in the year-end budget adjustment if funds are available.
FY2016 FY20179,500$ 9,500$
20,000 - 12,000 12,000
Contract Services: bank charges 40,000 50,000 18,000 20,000
Rental of South Beach Recreation Center 10,000 10,000 Liability Insurance 389,109 359,961 Unanticipated:
Unallocated 370,325 367,544 Customer Service Rewards 15,000 15,000
Internal Service Charges 26,344 29,180 Uncollectible Accounts 1,200 1,200 Minimum monthly retiree benefits 10,356 7,535 Subtotal - operating 921,834 881,920 Capital outlay - - Transfers from General Fund to General Capital Projects Fund:
Capital Projects-equip. replacementFire apparatus replacement 75,000 75,000 Streets heavy equipment replacement 90,000 90,000 Radio system equipment & radio replacement 200,000 - Major building systems replacements 150,000 42,000 Golf course capital purchases - 65,000 Information technology equipment - 78,000
Subtotal - transfers 515,000 350,000 TOTAL Non-departmental 1,436,834$ 1,231,920$
NON-DEPARTMENTAL BUDGET(General Fund)
Professional Services
Contract Services: Christmas lights
Utilities (Downtown area)
Professional Services-retail recruitment

Executive & Legislative Department
43
Funding Uses (continued) Capital Projects Funds include ½ Cent Sales Surtax (also known as the Better Jacksonville Beach Fund) which are used to pay debt service and fund improvements to streets, sidewalks and recreation facilities. ½ Cent Sales Surtax Bond Proceeds accounts for $10 million borrowed, in part, to partially fund the Waste Treatment Plant rebuild required to meet the City’s nitrogen allocation, along with the Avalon and Duval Drive projects. The remaining bond proceeds have been designated to fund downtown road and infrastructure improvements in the area east of A1A, between 13th and 16th Avenues South. After the debt is retired in 2019, these funds will be designated for street milling, repaving, and other road maintenance projects City-wide. General Capital Projects Fund uses transfers from other funds to pay for planned major capital improvements or equipment purchases and unforeseen major repairs or renovations. Paws Dog Park funds use memberships and donations to help maintain the facilities.
* The cost estimate for this high priority project is $2.5 to $2.8 million. A contract is currently being negotiated. Upon contract approval by the City Council, the City expects to pay a portion of the project cost in FY 2016, and a portion of the cost in FY 2017. For this reason, the budget may be adjusted to reflect the agreed-upon cost of the project. Changes to this project’s budget will be made in the mid-year or year-end budget adjustment.
Funding Source Projects budgeted BudgetSidewalks $70,000 Penman Road commercial area design impr. $125,000 Bank service charges $1,500 Transfer to debt service fund $979,950
$1,176,450 Professional engineering services $30,000 Bank service charges $22,000 Building maintenance, painting and misc. $50,000 Computer-related maintenance $25,000 Building systems replacement-roofs, HVAC $318,800 Radio system replacement $716,005 Replace business applications* $925,000 Replace information technology switches $200,000 Heavy equipment replacement: Streets $85,000 Heavy equipment replacement: Fire $375,000
Replace computers (annual plan) $69,607 $2,816,412
Paws Dog Park Park Maintenance $21,200 $4,014,062 TOTAL CAPITAL PROJECTS
Total General Capital Projects
Total 1/2 Cent Sales Surtax
General Capital Projects
½ Cent Sales Surtax Fund (Better Jax Beach)

Executive & Legislative Department
44
Financial Summaries
Executive and Legislative DepartmentAdopted
Resource Actual Budget Budget Increase %Allocation 2015 2016 2017 -Decrease ChangePersonal Services $790,375 $779,788 $801,604 $21,816 2.8%Operating $517,249 $483,978 $499,045 $15,067 3.1%Capital Outlay $0 $0 $0 $0 -Debt Service $0 $0 $0 $0 -Transfers $0 $0 $0 $0 -
TOTAL $1,307,624 $1,263,766 $1,300,649 $36,883 2.9%
Nondepartmental DivisionOriginal Adopted
Resource Actual Budget Budget Increase %Allocation 2015 2016 2017 -Decrease Change
Operating $568,739 $921,834 $881,920 -$39,914 -4.3%
Capital Outlay $5,800 $0 $0 $0 -
Transfers $1,564,958 $515,000 $350,000 -$165,000 -32.0%
TOTAL $2,139,497 $1,436,834 $1,231,920 -$204,914 -14.3%
Governmental Debt Service FundsOriginal Adopted
Resource Actual Budget Budget Increase %Allocation 2015 2016 2017 -Decrease Change
Principal $925,000 $935,000 $955,000 $20,000 2.1%Interest & other charges
$72,290 $62,146 $45,804 -$16,342 -26.3%
TOTAL $997,290 $997,146 $1,000,804 $3,658 0.4%
Capital Projects FundsOriginal Adopted
Resource Actual Budget Budget Increase %Allocation 2015 2016 2017 -Decrease ChangeOperating $1,616,986 $242,700 $149,700 -$93,000 -38.3%Capital Outlay $416,442 $3,105,301 $2,884,412 -$220,889 -7.1%Transfers $1,227,720 $904,180 $979,950 $75,770 8.4%TOTAL $3,261,148 $4,252,181 $4,014,062 -$238,119 -5.6%
The budget decreased in the transfers to the Capital Projects fund for the radio system replacement. A detail of these expenditures is on page 42.
The ½ Cent Infrastructure Surtax Bond Proceeds are paying for projects throughout the City. The bonds will be paid off in 2019.
An itemized listing of projects budgeted in this fund is shown on the previous page.
The budget increase funds additional legal services and increases in employee health insurance.
Executive & Legislative Department
45
Budget Issues for 2017
• Keeping a strong, well trained and highly motivated workforce while adjusting employee share of pension and health insurance costs will be an ongoing challenge.
• The LIUNA (General Employees) contract will re-open for negotiation on October 1, 2016. The FOP (Police) and IAFF (Firefighters) contracts will re-open in May, 2017 and June, 2017, respectively.
• State legislation passed in 2015 will increase the City’s pension costs by requiring the use of mortality tables used in the two most recent Florida Retirement System valuation reports. The legislation also limits the City’s flexibility in the use of insurance premium tax revenues to pay for benefits and mandates increases in minimum pension benefit levels.
• Budget pressure will come from costs associated with increasing federal and state water
resource environmental oversight such as statutory minimum flows and levels for lakes and springs, numeric nutrient criteria, pollutants and other contaminants entering the fresh and marine waters of the state.
• Although the cost of natural gas is currently low and not expected to increase significantly in the next year, future cost volatility could drive the City’s power costs higher. New regulations limiting carbon dioxide emissions could also increase those costs.
• Maintenance improvements to the City’s buildings, parks and dune walkovers along
with replacement of its business applications are included in the 2017 budget. The improvements are being done over the next 3-5 years, to help minimize the budget impact. Budgeted facilities improvements include:
o Dune walkovers: work on this project is nearing completion. 47 of 49
walkovers have been rebuilt since 2012. A reserve will need to be established for future walkover repairs and replacements.
o Business applications: $2.5 to $2.8 million is needed to replace the City’s 28-year old business enterprise software.
o Roof replacements: $318,800 for several large buildings throughout the city. Roof, HVAC and other building systems are scheduled for replacement over the next 5 years at an estimated cost of $1,273,800.
o Parks improvements are being completed at Huguenot and Cradle Creek. Projects are scheduled for Ocean Front Park, Latham Plaza, A1A landscape islands and Tall Pines Park over the next 4 years.

Executive & Legislative Department

Community Redevelopment Agency
47
The Jacksonville Beach Community Redevelopment Agency (CRA) is responsible for managing the City’s two redevelopment districts: Downtown and South Beach. The Agency receives administrative, engineering and project management support from the City’s Planning & Development and Public Works departments. Work in the two redevelopment districts is carried out in coordination with the appointed Community Redevelopment Agency board.
Authorized Positions FY2015 FY2016 FY2017
Community Redevelopment Administrator 1 1 -
Community Redevelopment Program
The five-member Jacksonville Beach Community Redevelopment Agency (CRA) was established in 1978, pursuant to Chapter 163, Part III of the Florida Statutes. The CRA was created for the purpose of carrying out a community redevelopment program for the City. The Jacksonville Beach program consists of a variety of redevelopment activities in two districts: Downtown and South Beach.
Both Community Redevelopment District programs are funded from property tax revenues generated from within the two districts. The funds derived from the tax increments are held in separate trust funds administered by the Agency. The Downtown District generated $5,371,564 for FY 2016 and the South Beach District generated $3,512,714 for the same period.
Both districts are expected to continue fully funding their operations and planned projects for the foreseeable future. The Downtown District was debt-free as of FY 2014 and the South Beach TIF revenue bonds will be retired at the end of FY 2016.
Community Redevelopment Program Management In FY 2015, to meet the increased workload, staffing for the management of the City’s redevelopment programs was reorganized with a part-time administrator working out of the Planning and Development Division; and adding in-house engineering services to be provided by the City Engineer (25%) and Project Engineer (75%). The Redevelopment Administrator position is the responsibility of the Planning & Development Director. The FY 2017 budget includes 470 hours for additional administrative support.

Community Redevelopment Agency
48
Community Redevelopment Program Management (continued) Salary and Benefits % Allocation by District:
Position Department Downtown South Beach Total
Community Redevelopment Specialist (part-time)
CRA 62% 38% 100%
Planning & Development Director
Planning & Development 15.5% 9.5% 25%
City Engineer
Public Works
15.5% 9.5% 25% Redevelopment Engineer 46.5% 28.5% 75%
Construction Coordinator (part-time temporary)
78.7% 7.1% 85.8%
In addition, the CRA continues to provide funding for operating expenses related to carrying out community redevelopment efforts, including a proportionate share of internal services such as City Administration, Human Resources, Finance, Information Technology, and Purchasing. Funding for the redevelopment program administration provided by the City is further divided between the Downtown (62%) and South Beach (38%) Tax Increment Trust Funds. This division is roughly comparable to percentages of the total annual appropriations to the trust funds for each of the two districts.
This mutually beneficial cooperative arrangement will continue with the City supplying administrative and program management support and office space for work that will include, but not be limited to the following:
• General administrative oversight of the City’s Community Redevelopment programs
• Internal service support – general City Administration, Finance and Accounting, Human Resource management, and Purchasing
• Engineering and planning services to advise and assist the CRA in attaining the objectives of the adopted plans for two Community Redevelopment districts
• Other special services, including legal services provided by the City Attorney or outside counsel in association with the City Attorney, may be required from time to time in managing the CRA activities.

Community Redevelopment Agency
49
FY 2016-2017 Budget Issues Significant changes were made in the FY 2014-2015 budget to the manner in which the City and its CRA cooperatively manage the community redevelopment program. Among the factors that generated a need for fundamental changes were:
• The legal finding that the Jacksonville Beach redevelopment trust funds have been extended for 30 years from the date of adoption of a plan amendment and may both be extended for a total of 60 years from the date of adoption of the original redevelopment plans.
• For FY 2015, the CRA agreed to fund the addition of a Redevelopment Project Engineer to
help manage the heavy ever-increasing community redevelopment workload that had been borne by the Public Works Department at no cost to the Agency for many years. This decision was made after considering the fact that the City and CRA are embarking on one of the largest public infrastructure improvement projects ever undertaken in the City. The project involves the near total reconstruction of the water, sewer, and stormwater systems; and improvements, as needed, to all of the streets, street ends, avenues, and alleyways in the area of the Downtown Community Redevelopment District bounded by Beach Boulevard, the beach, 13th Avenue South, and South 3rd Street. This and other pending redevelopment projects created a need for expanded in-house engineering support.
• The on-going update of the current Downtown Community Redevelopment Plan (“The Downtown Action Plan”) and other City activities, such as the retail recruitment program, that relate to and involve the CRA are requiring greater involvement by City administrative staff.
Original Plan Adoption
Current Expiration Date
Maximum Expiration Date
Downtown District January 19, 1987 April 20, 2044 January 18, 2047 South Beach District June 15, 1987 April 17, 2041 June 14, 2047

Community Redevelopment Agency
50
Financial Summary – Community Redevelopment Agency (both districts, combined)
The FY 2017 budget for the Department is decreased overall, primarily due to payoff of the remaining South Beach Redevelopment debt. Personal services were increased by the addition of a corporal and a police officer to the Downtown CAPE program. Operating expenses have increased by $376,365 to provide enhanced levels of maintenance within the Downtown District including paver cleaning, tree maintenance, and other enhanced grounds upkeep. An increased level of service maintenance was added to the Downtown Plan in 2015. The addition of two members to the Downtown CAPE team requires the addition of two police vehicles, increasing the capital outlay budget. The manner in which tax increment revenues are budgeted for capital projects can affect the budget by creating significant changes in this department’s budget. Reserved funds are earmarked or committed to such projects when they reach the final design stage.
Financial Summary by District
Original AdoptedResource Actual Budget Budget Increase %Allocation 2015 2016 2017 -Decrease Change
Personal Services $919,741 $977,567 $1,127,890 $150,323 15.4%
Operating $152,482 $266,789 $643,154 $376,365 141.1%
Capital Outlay $2,148,475 $29,750 $63,000 $33,250 111.8%
Debt Service $665,310 $666,362 $0 -$666,362 -100.0%
TOTAL $3,886,008 $1,940,468 $1,834,044 -$106,424 -5.5%
Original AdoptedResource Actual Budget Budget Increase %Allocation 2015 2016 2017 -Decrease Change
Downtown $1,732,426 $1,131,870 $1,700,715 $568,845 50.3%
South Beach $2,153,582 $808,598 $133,329 -$675,269 -83.5%
TOTAL $3,886,008 $1,940,468 $1,834,044 -$106,424 -5.5%

Community Redevelopment Agency
51
Downtown Redevelopment District The initial focus of the CRA was the rejuvenation of the Downtown District. The plan for the redevelopment of the Downtown District was adopted in January 1987, following the creation of the TIF District in 1984, and the implementation of the Haskell/Sleiman Plan in 1995. In 2007, the Downtown Plan was amended to incorporate the Vision Plan prepared with the assistance of the consulting firm, Glatting Jackson Kercher and Anglin (now AECOM, Inc.).
The redevelopment effort to date has been centered on improvements to the public infrastructure: Downtown Vision Plan Utility and Streetscape Project, Latham Plaza and Parking Lot, SeaWalk Pavilion, Oceanfront Park, Downtown Action Plan, Jacksonville Beach Fishing Pier, 3rd Street Landscaped Medians, and the SeaWalk Reconstruction to facilitate private investments in the area.
Community Redevelopment-Recent Program Accomplishments-Downtown During FY2016 the CRA, with assistance from City staff, continued its involvement in implementing the Vision Plan for the core of the Downtown area as follows:
• Construction has begun on the first section of a major utility and road reconstruction effort for the balance of Phase III which focuses on utility and road reconstruction south of Beach Boulevard. The initial project includes replacement of the water and sewer systems, connection of the stormwater management system to the Beach Boulevard stormwater vault, and reconstruction of all of the roadways, street ends, and alleys in the area between Beach Boulevard and 4th Avenue South from South 3rd Street to the oceanfront.
• The City’s consulting engineers continue to work to resolve stormwater management issues in the remainder of the area south of 4th Avenue South to 13th Avenue South in advance of preparing final designs and phasing plans to complete the infrastructure improvements.
• Under the Downtown Action Plan, changes to the Outdoor Seating, Alcoholic Beverage, and Noise sections of the City’s Code of Ordinances are being considered to help better manage the City’s nighttime economy. Also in conjunction with the Downtown Action Plan, an RFQ was issued requesting services to assist the City in developing a plan to coordinate the design, phasing and placement of features such as public art (murals and sculpture), wayfinding signage, landscaping, street furnishings, lighting, bicycle parking and marketing/branding. A contract has been awarded.

Community Redevelopment Agency
52
Program Goals for FY 2017 – Downtown
• Complete construction of the roadway and utility improvements in the twelve block area east of 3rd Street between Beach Boulevard and 4th Avenue South.
• Complete the drainage study of the remainder of the area south of 4th Avenue South to 13th Avenue South in advance of preparing final designs and phasing plans required to complete the infrastructure improvements planned for the area.
• Develop a phasing plan based on the annual availability of tax increment trust funds to complete the work. This includes all of the streets, alleys and street ends between South 3rd Street and the oceanfront from 4th Avenue South to 13th Avenue South.
• Enhance funding for the Downtown Community Policing Initiative (Downtown CAPE) to ensure the safety of visitors to the Downtown Community Redevelopment District.
• Continue work to improve the livability of the Downtown area by implementing the recommendations that came out of the Downtown Action Plan process.
$0.0
$100.0
$200.0
$300.0
$400.0
$500.0
$600.0
$700.0
1984
1985
1986
1987
1988
1989
1990
1991
1992
1993
1994
1995
1996
1997
1998
1999
2000
2001
2002
2003
2004
2005
2006
2007
2008
2009
2010
2011
2012
2013
2014
2015
2016
Downtown Tax Increment District Total Assessed Valuation in Millions, 1984-2016
Infrastructure projects have increased the value of property in the Downtown Redevelopment District since its inception. Following the peak year of 2009, the assessed values declined as result of national real estate economic situation. However, this trend has now reversed as there was a slight increase in 2015.

Community Redevelopment Agency
53
Financial Summary-Downtown Redevelopment
Downtown Community Policing Innovations The Downtown Community Policing Initiative, or Downtown CAPE, began a pilot project in November of 2006. The program initially consisted of two officers and was expanded to four officers in FY 2009. A fifth position, a corporal, was included in the FY 2014 budget. The five officers provided a concentrated presence in the Central Business District, but were authorized to provide police services throughout the Downtown Redevelopment District.
During FY 2014, the unit was expanded to nine officers and permanently integrated into the Downtown Community Redevelopment Plan. The unit became fully staffed and operational in FY 2015. Late in FY 2015, a supervisory sergeant and three additional patrol officers were added to the Downtown CAPE unit. The FY 2017 budget adds a police corporal and a police officer to enable the program to deploy two groups of officers throughout the downtown area, but primarily focused on the Central Business District.
Financial Summary-Downtown Community Policing Innovations
Original AdoptedResource Actual Budget Budget Increase %Allocation 2015 2016 2017 -Decrease Change
Personal Services $128,021 $133,357 $168,662 $35,305 26.5%
Operating $72,930 $120,538 $477,514 $356,976 296.2%
Capital Outlay $621,042 $0 $0 $0 -
Debt Service $0 $0 $0 $0 -
Grants $0 $0 $0 $0 -
Transfers $0 $0 $0 $0 -
TOTAL $821,993 $253,895 $646,176 $392,281 154.5%
Original AdoptedResource Actual Budget Budget Increase %Allocation 2015 2016 2017 -Decrease Change
Personal Services $718,038 $762,475 $885,789 $123,314 16.2%
Operating $50,267 $85,750 $105,750 $20,000 23.3%
Capital Outlay $142,128 $29,750 $63,000 $33,250 111.8%
Debt Service $0 $0 $0 $0 -
Grants $0 $0 $0 $0 -
Transfers $0 $0 $0 $0 -
TOTAL $910,433 $877,975 $1,054,539 $176,564 20.1%
Funding for the nine police officers who comprise the Community Policing Initiatives (“Downtown CAPE”) is authorized under Chapter 163, Florida Statutes. This financial information is also included in the Police Department’s budget.
The 2017 budget increased with the addition of a construction coordinator to assist with construction south of Beach Blvd. Operating expenses increased to meet a higher level of service in the Downtown core.

Community Redevelopment Agency
54
Downtown CAPE police officers patrol the core Downtown area and beachfront, interacting closely with business people, visitors and residents and focusing on quality-of-life crimes. The officers are trained in crime prevention and code enforcement. Additional information regarding their activities may be found in the Police Department section of this Budget and Business Plan.
Downtown FY 2017 and Future Budget Issues Planning and programming of available tax increment trust funds to ensure the continuation
of construction of the streetscape, landscaping, and infrastructure improvements for Phase III of the Vision Plan work as described in the Downtown Community Redevelopment Plan Capital Improvement Plan that are now in the engineering design stage.
Planning and programming of available tax increment trust funds to finance any program activities that might arise during the implementation of the redevelopment plan to address on-going quality of life issues and work toward implementation of the Downtown Action Plan, including, but not limited to:
• Property Acquisition • Parking garage funding • Residential infrastructure • Expanded interlocal agreement • Enhanced maintenance levels of service within the Downtown District
South Beach Redevelopment District In November of 1985, the South Beach district was designated for redevelopment. A plan for the redevelopment of the area was adopted and a tax increment trust fund was established in June 1987.
Since the adoption of the South Beach redevelopment plan, six major public-private projects have been completed (Riptide, South Beach Regional Shopping Center, South Beach Parkway Shopping Center, Ocean Cay, South Beach Mixed Use Development, and Paradise Key). In addition to the projects involving private enterprises, numerous public infrastructure projects have been constructed to support the redevelopment activity in the district, including the construction of South Beach Parkway, Jacksonville Drive, and Marsh Landing Parkway. A listing of the significant public projects is appended at the end of this section. During FY 2015, the last major private development project, Ocean Terrace Single Family Homes, was approved to begin infrastructure construction; the project continues to develop.

Community Redevelopment Agency
55
Recent Program Accomplishments - South Beach Authorized the preparation of engineering plans and specifications for the following new
capital improvement projects in the South Beach District:
• Phase 2 of the Capital Improvement Plan including planting new, “Florida Friendly” landscaping in the medians on South Beach Parkway and Jacksonville Drive. During the fiscal year, City staff added rehabilitation of the drainage canal south of Butler Boulevard and upgrading the stormwater pond behind the branch bank property on Marsh Landing Parkway. Design for this project is complete and the project will go out for bid later this year.
• Reconstruction of the segment of South Beach Parkway from north of Jacksonville Drive through the intersection of Marsh Landing Parkway south of J. Turner Butler Boulevard has begun. This congestion management and traffic safety project includes installing a dedicated right turn lane to facilitate the free flow of southbound to westbound motorists entering Sanctuary Parkway and Butler Boulevard. The project is expected to be complete in the fall of 2016.
$0.00
$50.00
$100.00
$150.00
$200.00
$250.00
$300.00
$350.00
1987
1988
1989
1990
1991
1992
1993
1994
1995
1996
1997
1998
1999
2000
2001
2002
2003
2004
2005
2006
2007
2008
2009
2010
2011
2012
2013
2014
2015
2016
South Beach Tax Increment District Total Assessed Valuation in Millions, 1987-2016
Public/private partnerships have resulted in projects that have increased the value of property in the South Beach Redevelopment District since its inception. From a peak of $320.5 million in 2009, the assessed values declined through 2012, reflective of overall national economic conditions, but over the last four years have shown signs of steady recovery.

Community Redevelopment Agency
56
Recent Program Accomplishments - South Beach (continued)
• A contract with a design/build firm has been awarded for the South Beach Park Skate Park. The project has been separated into three phases: (A) the pond abandonment and utility relocation; (B) skate park construction; and (C) general park improvements. The pond abandonment and utility relocation are currently underway.
Community Redevelopment-Program Goals for FY 2017 - South Beach
• Complete the construction of the projects described in the Accomplishments section above.
• Complete the construction of a skate park and new shade and picnic structures at South Beach Park.
• Prepare a scope of work and request for fee proposals to analyze the infrastructure and drainage improvement needs in the areas in the vicinity of Jacksonville Drive that were not redeveloped as part of the Ocean Terrace single-family residential subdivision project.
Budget Issues-South Beach • Prepare a scope of services and request for fee proposal to undertake a detailed analysis of the
stormwater management issues and other roadway and utility needs in the areas in the vicinity of Jacksonville Drive of that were not redeveloped as part of the Ocean Terrace single-family residential subdivision project.
Financial Summary-South Beach Redevelopment
Original AdoptedResource Actual Budget Budget Increase %Allocation 2015 2016 2017 -Decrease ChangePersonal Services $73,682 $81,735 $73,439 -$8,296 -10.1%
Operating $29,285 $60,501 $59,890 -$611 -1.0%
Capital Outlay $1,385,305 $0 $0 $0 -
Debt Service $665,310 $666,362 $0 -$666,362 -100.0%
Grants $0 $0 $0 $0 -
Transfers $0 $0 $0 $0 -
TOTAL $2,153,582 $808,598 $133,329 -$675,269 -83.5%
The 2017 budget decreased due to the retirement of the last South Beach Redevelopment debt.

Community Redevelopment Agency
57
South Beach Community Redevelopment District – Public Infrastructure Improvements 1987-Present Installation of city standard water and sewer trunk lines in the South Beach Parkway corridor
that initially brought these services to the land now occupied by the Rip Tide residential development. Ultimately, this helped open up the entire southwestern part of the City for development, including a hotel, offices, medical facilities, and apartments and condominiums in and around the Marsh Landing Business Park project.
Paving of Williams Street and Osceola Avenue and construction of South Beach Parkway (formerly Coastal Highway Boulevard) and Jacksonville Drive, including the acquisition of the undeveloped lots between Rip Tide and Jacksonville Drive to provide needed right of way and prevent driveway access to South Beach Parkway.
Construction of the master stormwater management system that is physically located in the South Beach District, but serves a large part of the southern part of the City. Components of the system include:
• The Osceola retention pond adjacent to Ocean Cay.
• The drainage canal between Osceola Avenue and the Paradise Key development.
• Securing a permanent public drainage easement through Paradise Key.
• Realignment of the FDOT drainage ways and installation of twin 72” drain pipes through the South Beach Regional Shopping Center site.
• The installation of a 36” drain pipe in South Beach Parkway from Rip Tide to the South Beach Parkway retention basin.
Land Acquisition for the Ocean Cay and Paradise Key subdivisions.
Land acquisition and construction of South Beach Park which includes:
• Providing land for the volunteer designed and built “Sunshine Park for Kids.”
• Installation of facilities for recreational activities for all ages – tennis courts, beach volleyball, exercise trail, splash pad, basketball court, multi-use playfield, picnic shelters, and restrooms.
• The South Beach Community Center Building that is available for community events and activities, and provides administrative space for the Parks and Recreation Department.

Community Redevelopment Agency
58
Construction of the Fire Station No. 2 providing significantly improved response times for fire and emergency calls in the entire South Jacksonville Beach area, including the South Beach Redevelopment District.
Construction of a complete sidewalk system on the major roadways within the District.
Extension of a reuse water supply line from the Wastewater Treatment Plant to provide low cost irrigation water to the South Beach Park, South Parkway, and Jacksonville Drive.
Reconstruction of the water and sewer systems and repaving of streets in the Williams Coastal Boulevard Heights and Jacksonville Beach Heights areas of the Redevelopment District.
Acquisition of vacant residential lots between South Beach Park and Rip Tide and the construction of Sunshine Court to prevent direct driveway access onto South Beach Parkway and to allow for the future sale of the lots for residential redevelopment.

Planning & Development Department
59
Mission Working together to build a better Jacksonville Beach.
Department Service Objectives
• Ensure compliance with the City’s adopted development and construction standards.
• Communicate effectively with customers regarding various code requirements while implementing processes that are responsive to their particular needs.
• Provide assistance to the general public to aid in their understanding of the land planning, development and building permit processes.
Organization The Planning & Development Department consists of three divisions: Planning & Development, Building Inspection, and Code Enforcement. In 2006, the Code Enforcement Division was formed out of the Building Inspection Division to conform to state mandates regarding financial management of permit fee revenues.
In addition to working with its external customers, the Department also provides administrative support to the Community Redevelopment Agency (CRA) for the City’s Downtown and South Beach Redevelopment Districts, and to the appointed Planning Commission, Board of Adjustment, and the Special Magistrate.
Authorized Positions FY2015 FY2016 FY2017
Planning Division 2 2 2
Building Inspection Division 5 6* 6*
Code Enforcement Division 2 2 2
TOTAL 9 10* 10*
*The increase in Building Division and Total staffing is reflective of the part-time permit specialist position approved by City Council in the FY16 mid-year budget modification.

Planning & Development Department
60
Financial Summary - All Divisions
The FY 2016 budget for the Department is increased slightly due to the addition of a part time permit specialist position for the Building Inspection Division. Otherwise, personal services and operating expenses are expected to be comparable to amounts budgeted for 2016.
Financial Summary by Division
Planning & Development Division
The Planning and Development Division is responsible for the City’s short- and long-range planning activities including administering and maintaining the 2030 Comprehensive Plan and implementing the Land Development Code. This division also provides administrative support for the City’s community redevelopment efforts. This function includes developer relations, redevelopment agreement negotiations, and monitoring the implementation of projects.
The Planning and Development Division works closely with the appointed Planning Commission, Board of Adjustment, and Community Redevelopment Agency (CRA).
Original AdoptedResource Actual Budget Budget Increase %Allocation 2015 2016 2017 -Decrease Change
Personal Services $550,397 $650,512 $672,813 $22,301 3.4%
Operating $122,115 $150,998 $159,418 $8,420 5.6%
Capital Outlay $39,751 $0 $0 $0 -
Debt Service $0 $0 $0 $0 -
Transfers $0 $0 $0 $0 -
TOTAL $712,263 $801,510 $832,231 $30,721 3.8%
Original AdoptedResource Actual Budget Budget Increase %Allocation 2015 2016 2017 -Decrease ChangePlanning $186,174 $231,204 $211,719 -$19,485 -8.4%Building Inspection
$386,487 $403,503 $445,762 $42,259 10.5%
Code Enforcement
$139,602 $166,803 $174,750 $7,947 4.8%
TOTAL $712,263 $801,510 $832,231 $30,721 3.8%

Planning & Development Department
61
Recent Accomplishments Processed 263 separate Land Development Code related applications, including nine
Development Plan (site plan) approvals, and two Concept Plat and two Final Plat applications.
Processed 41 Conditional Use applications and 130 Variance applications for public hearings by the Planning Commission and Board of Adjustment, respectively.
Approved 61 Home Occupation applications and 11 Temporary Extension of Licensed Alcoholic Beverage Premises permits.
Continued the Division’s commitment to provide a 10-day turnaround time for the initial review of land development application plan submittals.
Maintained the City’s representation on the North Florida Transportation Planning Organization (NFTPO) technical coordinating committee.
Maintained the City’s representation on the Duval County Local Mitigation Strategy (“Duval Prepares”) steering committee.
Maintained National Flood Insurance Program Class 6 Community Rating.
Planning & Development Division Goals for FY 2017
• Evaluate the City’s Land Development Code and recommend revisions to properly manage the future growth and development of the City, and encourage the development and redevelopment of the downtown consistent with Vision Plan and Downtown Action Plan goals and objectives.
• Maintain standard of distributing development plans to reviewing departments within two working days of receipt and completing the initial review of the submittal within ten working days.
• Continue working on Beaches transportation issues through participation on the North Florida Transportation Planning Organization (NFTPO) technical coordinating committee.
• Continue representing the City on the Duval County Local Mitigation Strategy steering committee.
Authorized Positions FY2015 FY2016 FY2017
Director of Planning & Development 1 1 1
Senior Planner 1 1 1
TOTAL 2 2 2

Planning & Development Department
62
Division Budget Issues for FY 2017
Workload for the Division in FY2017 is not expected to increase dramatically over that of the past year, and current staffing levels are projected to remain adequate. Division Performance Measures It is the goal of the Division to complete the initial review of all Development Plan applications within 10 working days from receipt.
0.0
2.0
4.0
6.0
8.0
10.0
12.0
14.0
Electric Engineering Fire Department Planning Public Works Police
Site Plan Review Processing Days
FY2014 FY2015 FY2016YTD
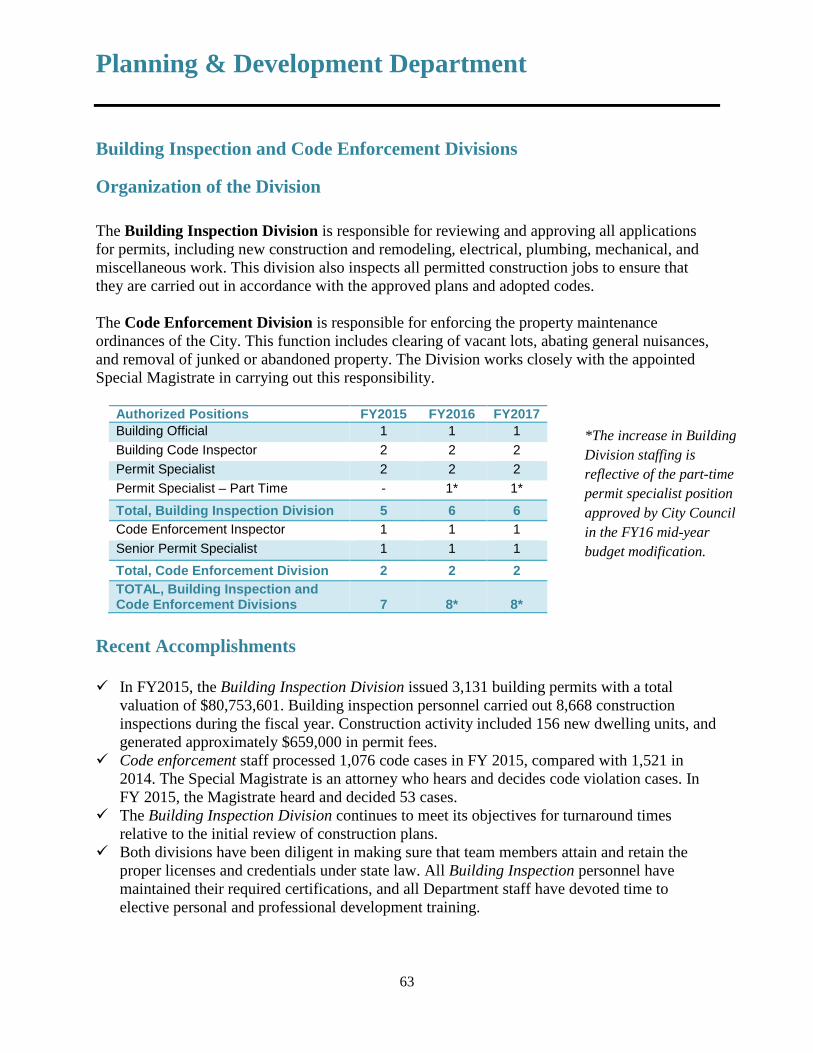
Planning & Development Department
63
Building Inspection and Code Enforcement Divisions
Organization of the Division The Building Inspection Division is responsible for reviewing and approving all applications for permits, including new construction and remodeling, electrical, plumbing, mechanical, and miscellaneous work. This division also inspects all permitted construction jobs to ensure that they are carried out in accordance with the approved plans and adopted codes. The Code Enforcement Division is responsible for enforcing the property maintenance ordinances of the City. This function includes clearing of vacant lots, abating general nuisances, and removal of junked or abandoned property. The Division works closely with the appointed Special Magistrate in carrying out this responsibility.
Authorized Positions FY2015 FY2016 FY2017 Building Official 1 1 1 Building Code Inspector 2 2 2 Permit Specialist 2 2 2 Permit Specialist – Part Time - 1* 1*
Total, Building Inspection Division 5 6 6 Code Enforcement Inspector 1 1 1 Senior Permit Specialist 1 1 1
Total, Code Enforcement Division 2 2 2 TOTAL, Building Inspection and Code Enforcement Divisions 7 8* 8*
Recent Accomplishments In FY2015, the Building Inspection Division issued 3,131 building permits with a total
valuation of $80,753,601. Building inspection personnel carried out 8,668 construction inspections during the fiscal year. Construction activity included 156 new dwelling units, and generated approximately $659,000 in permit fees.
Code enforcement staff processed 1,076 code cases in FY 2015, compared with 1,521 in 2014. The Special Magistrate is an attorney who hears and decides code violation cases. In FY 2015, the Magistrate heard and decided 53 cases.
The Building Inspection Division continues to meet its objectives for turnaround times relative to the initial review of construction plans.
Both divisions have been diligent in making sure that team members attain and retain the proper licenses and credentials under state law. All Building Inspection personnel have maintained their required certifications, and all Department staff have devoted time to elective personal and professional development training.
*The increase in Building Division staffing is reflective of the part-time permit specialist position approved by City Council in the FY16 mid-year budget modification.

Planning & Development Department
64
Building Inspection and Code Enforcement Divisions Performance Measures Annual Number of Permits Issued and Inspections Made, FY 2012-2016 YTD
Total Dollar Value of Permits (millions), FY 2012-2016YTD
- 1,000 2,000 3,000 4,000 5,000 6,000 7,000 8,000 9,000
FY2012 FY2013 FY2014 FY2015 FY2016YTD
No. of Permits No. of Inspections
$39.3
$73.2$77.0
$80.8
$34.4
$0.0
$10.0
$20.0
$30.0
$40.0
$50.0
$60.0
$70.0
$80.0
$90.0
FY2012 FY2013 FY2014 FY2015 FY2016YTD

Planning & Development Department
65
The Building Inspection Division’s primary objective is to provide a sufficient level of service for building permitting, inspections and code enforcement to maintain a high degree of customer satisfaction. Comparison of Permit Fees & Building Inspection Divisions Personnel and Operating Expenses, FY 2011-2015
Frequent Code Enforcement Cases, FY 2013-2015
$267
,203 $3
75,8
57
$571
,179
$562
,934 $6
58,9
83
$294
,247
$292
,750
$295
,249
$306
,265 $386
,487
$0
$100,000
$200,000
$300,000
$400,000
$500,000
$600,000
$700,000
FY2011 FY2012 FY2013 FY2014 FY2015Fees Collected Personnel & Operating Costs
0 100 200 300 400 500
Junk/Abndn Property
Nuisances
Lot Clearing
Heavy Vehicle Parking
Building Code Violation
FY2013 FY2014 FY2015

Planning & Development Department
66
Building Inspection and Code Enforcement Divisions
Average Initial Review Time for Selected Permit Types, FY 2014-2016 YTD
The Building Inspection Division’s goal for the initial review of major projects is 10 working days for commercial and multi-family projects and four working days for single-family residential projects. Building Inspection and Code Enforcement Division Goals for FY 2017 • Maintain required certifications for all Division personnel.
• Maintain a standard of completing the initial plan review for single-family residential construction permits within four working days of receipt.
• Complete initial plan review for large-scale projects within ten working days of receipt.
• Issue trade permits for miscellaneous work within one working day of receipt.
• Provide “next day” service for all requests for building inspections.
• Provide training opportunities for staff members to effectively manage the challenge of administering and enforcing the Florida Building Code, and providing code enforcement training and certification opportunities for new building inspectors.
1.8
3.7
1.8
2.5
3.9 4.0
1.7
2.5
2.5
3.7
2.3
1.5
3.9
2.2 2.
5
1.8
1.0
1.8 2.
2
3.1
4.0
1.9
1.6
3.5
1.8
2.3
2.0
1.0
2.2 2.
6
3.1 3.
4
2.1
0.00.51.01.52.02.53.03.54.04.5
Number of Days Average Initial Review
FY2014 FY2015 FY2016YTD

Parks & Recreation Department
67
Mission Providing safe and enjoyable recreation opportunities for our community. Organization Recreation Administration directs the City’s overall recreation and parks and grounds maintenance functions.
Funding Sources The primary funding source for Parks & Recreation is the General Fund which pays for the costs of the following divisions: Ocean Rescue, Grounds Maintenance, Tennis Center, Oceanfront Facilities, Carver Center, Community Center & Exhibition Hall, Special Events (payroll related costs only) and Golf Course. Additional funding comes from a Community Development Block Grant (Carver Center) and the Convention Development Fund (Special Events). The Golf Course is an 18-hole facility that is open year-round. Intended to be self-funding, it operates as an Enterprise Fund. Financial Summary
Authorized Positions FY2015 FY2016 Part time Full time TOTALRecreation Administration 5 6 3 4 7Ocean Rescue 87 87 86 1 87Grounds Maintenance 7 7 - 7 7Tennis Center 3 3 2 1 3Oceanfront Facilities - - - - -Carver Center 3 3 2 1 3Community Center - - - - -Special Events - - - - -Golf Course 25 25 18 7 25TOTAL 130 131 111 21 132
FY2017
Original AdoptedResource Actual Budget Budget Increase %Allocation 2015 2016 2017 -Decrease ChangePersonal Services
$2,124,166 $2,205,130 $2,296,684 $91,554 4.2%
Operating $2,073,351 $2,266,465 $2,252,524 -$13,941 -0.6%
Capital Outlay
$178,978 $63,000 $65,969 $2,969 4.7%
Transfers $253,875 $259,041 $165,511 -$93,530 -36.1%
TOTAL $4,630,370 $4,793,636 $4,780,688 -$12,948 -0.3%
Personal Services increased with the addition of a part time Project Manager (previously approved by the City Council) and increases in the cost of health insurance and pension. Capital Outlay increased for the replacement of a vehicle for Grounds Maintenance and the replacement of a point of sale system at the golf course.

Parks & Recreation Department
68
Recreation Administration Division
The Recreation Administration Division is responsible for the management of all park facilities, special events and recreation activities throughout the city. The staff manages all adult active sports and coordinates youth sports. The staff also administers the Community Development Block Grant (CDBG), which provides funding for the Carver Center, including the Pablo Beach Community Assisted Policing Effort (CAPE). The division manages the overall operation of the City’s public golf course, Ocean Rescue, Grounds & Cemetery maintenance, Carver Center Recreation Center, Tennis Center, Lee Kirkland & H. Warren Smith Cemeteries, Oceanfront Restrooms, and Exhibit Hall / Community Center.
Recent Accomplishments
Retention pond at South Beach Park was eliminated and construction has begun on the Skate Park.
Irrigation at Latham Plaza and the drainage channel in the front of the SeaWalk Pavilion stage were replaced. A building addition and bathrooms were built at the SeaWalk Pavilion.
Administered and coordinated: o Carver Center o Easter Egg Hunt o Beaches Opening Day Parade o 4th of July Celebration o Adult Softball League
o Fall 2015 33 Teams o Spring 2016 30 Teams
o Adult Flag Football League Fall 2015 – 36 Teams Coordinate youth sports programs in conjunction with the parent organization ~ Little
League, Girls Softball, Pop Warner, Pop Warner Cheerleading, and Babe Ruth 97 Special Events 22nd Annual Jacksonville Beach Lifeguarding Challenge
Administration 2015 2016 2017Director 1 1 1Recreation Superintendent 1 1 1Administrative Assistant 1 1 1Event Coordinator 0 0 1Staff Assistant (part-time) 1 2 1Recreation Program Assistant (part-time)
1 1 1
Project Manager (part-time) 0 0 1TOTAL 5 6 7

Parks & Recreation Department
69
Recreation Administration Goals for FY2017 1. Provide Recreation programs and facilities that meet the needs of the community. 2. Maintain safe facilities, parks, and playgrounds. 3. Survey customer satisfaction with league play and use of facilities.
Recreation Administration Performance Measures Performance measures are tracked on a monthly and yearly basis. In addition, performance is also measured by ratings on customer service satisfaction surveys.
Sports Programs Offered:
Estimated # of participants
Youth Spring Girls Softball 240 Youth Fall Girls Softball 175 Youth Spring Baseball 450 Youth Fall Baseball 325 Spring Babe Ruth Baseball 30 Fall Babe Ruth Baseball 30 Pop Warner Football & Cheerleading 210 Adult Fall Men Softball 594 Adult Fall/Winter Flag Football 648 Adult Spring Men’s Softball 540 Tennis Members 250 Tennis Walkups 200 Carver Center Summer Lunch Program 30 Carver Center Daily Attendance 45 children 30 adults Easter Egg Hunt 300
Survey Questions1
YTD 3-31-16
Target FY2017
% of customers who rated playing fields as being in good condition or better
100% Football 100% Softball
100% Football 100% Softball
% of customers who are satisfied with the way the leagues are run
100% Football 100% Softball
100% Football 100% Softball
1Survey responses (#returned/#distributed): 2016 (5 teams/20 teams)

Parks & Recreation Department
70
Recreation Administration (continued) Performance Measure
FY2015
YTD 3-31-16
Target FY2017
Ensure parks and other facilities are cleaned and inspected weekly
Yes Yes Yes
Playground safety inspections conducted monthly Yes Yes Yes Number of accidents at parks and other recreation facilities
1 2 0
Financial Summary
Budget Issues FY2017
• Certain costs related to Divisions such as Carver Center and Grounds Maintenance were
included in the Recreation Administration FY 2016 budget but have been moved to the appropriate Divisions’ budget for FY2017.
Original AdoptedResource Actual Budget Budget Increase %Allocation 2015 2016 2017 -Decrease ChangePersonal Services
$395,746 $390,518 $416,890 $26,372 6.8%
Operating $316,324 $418,636 $212,194 -$206,442 -49.3%Capital Outlay
$31,936 $0 $0 $0 -
Transfers $138,875 $144,041 $145,511 $1,470 1.0%
TOTAL $882,881 $953,195 $774,595 -$178,600 -18.7%
Budget changes reflect the addition of a part-time Project Manager (previously approved by Ctiy Council), and costs related to cemetery maintenance, Carver Center and Special Events have been moved to the appropriate divisions.

Parks & Recreation Department
71
Ocean Rescue Division The Ocean Rescue Division is responsible for supervising approximately 4.1 miles of municipal beach. Responsibilities include ensuring the maximum efficiency of the ocean rescue operations, beach safety and services to the public. Division personnel must have advanced knowledge of ocean tides and currents and know how to properly use lifesaving equipment. A Junior Lifeguard Program runs each summer.
Recent Accomplishments U.S. Lifesaving Association accreditation.
Certified Inflatable Rescue Boat Operators (IRB).
Certified Emergency Medical Technicians (EMT).
Successful completion of eight weeks of Junior Lifeguard Programs.
Supervisors trained in USLA “Beach Driving Safety Course”.
Delivered beach safety lectures to elementary students. Completed in-service training for lifeguards. Goals for FY2017 1. Zero drownings at the beach while lifeguards are on duty. 2. Continue in-service training hours for lifeguards. 3. Maintain training for Inflatable Rescue Craft Operators. 4. Distribute Ocean Safety Brochures to hotels. 5. Annual meeting with Jacksonville Beach Fire Rescue. 6. Distribute surveys and receive a positive approval rating.
Ocean Rescue 2015 2016 2017Supervisor 1 1 1Lieutenants (part-time) 3 3 3Rescue Swimmers (part-time) 3 3 3Beach Patrol Guards (part-time) 80 80 80TOTAL 87 87 87

Parks & Recreation Department
72
Performance Measures-Ocean Rescue
Performance Measure
FY2015
YTD 4-30-16
Target FY2017
Number of drownings while Ocean Rescue on duty 2* 1** 0
Successful first-aid cases 100% 90% 100% Respond to major surf-related rescue calls within two minutes
100%
100% 100%
Average lifeguard to tower ratio (one guard on-duty and one guard off-duty per tower)
2:1 2:1 2:1
Maintain USLA Certification Yes Yes Yes
Customer Survey Results:1 Confidence in lifeguard’s abilities 95% 95% 100% Lifeguards are kind and courteous 95% 95% 100% Lifeguards provide professional care while providing first aid 95% 95% 100% 1Survey responses (#returned/# distributed): 2016 (5/15)
* In 2015, there were 2 drownings when Ocean Rescue was not on duty. ** In April 2016 a medical event led to a beachgoer’s drowning.
Financial Summary
Budget Issues Beach Patrol Guards are budgeted for 32,100 hours per year. It takes roughly 80 part-
time employees to achieve this level of coverage.
In the future, if the Volunteer Life Saving Corp does not provide full coverage on Sundays and holidays, it will significantly increase costs.
Original AdoptedResource Actual Budget Budget Increase %Allocation 2015 2016 2017 -Decrease ChangePersonal Services
$467,667 $561,148 $564,428 $3,280 0.6%
Operating $147,596 $144,328 $144,185 -$143 -0.1%Capital Outlay
$43,742 $0 $0 $0 -
TOTAL $659,005 $705,476 $708,613 $3,137 0.4%
Performance is measured by accident report sheets and customer satisfaction surveys.

Parks & Recreation Department
73
Grounds Maintenance Division The Grounds Maintenance Division is responsible for the maintenance and upkeep of the ballfields, grounds, cemeteries and common areas throughout the City. In addition, the division assists with construction projects and special events as needed. Facilities are maintained with the use of a small staff and contracted maintenance.
Organization
Goals for FY2017
Keep all facilities well maintained and free of trash and debris. Keep facilities and equipment in good condition. Inspect parks monthly and make any necessary repairs.
Facilities Maintained Description Wingate Park 2 football, 4 baseball, 3 softball fields; dugouts; scoreboards; 3 restrooms; 3
concession stands; lights; fences; parking lots
South Beach Park Community Center; Sunshine Park; multi-purpose fields; tennis court; basketball court
Other City Parks Oceanfront Park; Gonzales; Cradle Creek; Tall Pines; Carver; Huguenot; Dog Parks; Seabreeze Field
City Cemeteries Lee Kirkland and H. Warren Smith Downtown Latham Plaza & parking lot; Seawalk; Pier Parking lot; islands & medians on
Beach Blvd and A1A (2nd Ave S to 6th Ave N); landscaping on Right of Way throughout Downtown
Grounds at City Facilities Community Services Center; Penman Park; O&M Facility; Police & Fire facilities
Streets 15th Ave N; 10th St N cul-de-sacs; Mills Lane; end of America at Butler; 10th Place & 5th Ave grass circle; 18th & Eastern; Coral Way; Tanglewood & Tallwood Roads
Medians A1A medians at Fletcher Middle School (15th to 18th Aves N) and south Jax Beach (16th Ave S to JTB); South Beach Parkway & Jacksonville Drive
Other Welcome signs (Beach & Penman; A1A & PV Blvd); Signs at City facilities
Grounds Maintenance 2015 2016 2017Maintenance Superintendent 1 1 1Crew Supervisor 2 2 2Lead Equipment Mechanic 1 1 1Maintenance Workers I, II, III (FT) 3 3 3TOTAL 7 7 7

Parks & Recreation Department
74
Recent Accomplishments
Mapping and marking of Lee Kirkland and H. Warren Smith cemeteries was completed. Completed Dog Park improvements by adding a shade shelter and benches. Huguenot Park fishing pier was rebuilt with new deck boards and railings. Repaired and replaced portions of the walkway and rails at Cradle Creek. Continued annual tree trimming program. The clay infields at all athletic fields were reconditioned.
Funding Sources and Financial Summaries Tree Protection
Grounds Maintenance
Budget Issues for FY2017
• Capital Outlay budget is the replacement of a 2001 Chevrolet C1500 truck ($25,000).
Original AdoptedResource Actual Budget Budget Increase %Allocation 2015 2016 2017 -Decrease ChangeOperating $23 $3,000 $3,000 $0 0.0%
Original AdoptedResource Actual Budget Budget Increase %Allocation 2015 2016 2017 -Decrease ChangePersonal Services
$459,737 $464,630 $518,228 $53,598 11.5%
Operating $607,974 $638,959 $761,516 $122,557 19.2%Capital Outlay
$75,173 $35,000 $25,000 -$10,000 -28.6%
TOTAL $1,142,884 $1,138,589 $1,304,744 $166,155 14.6%
Tree Protection funds are used to add or replace trees throughout the City.
Grounds Maintenance increase is primarily for the addition of costs associated with cemetery maintenance that were previously budgeted in Recreation Admin.

Parks & Recreation Department
75
Tennis Center Division Staff at the Tennis Center located at Huguenot Park is responsible for managing adult men’s and women’s tennis teams, for managing a complete junior program, and for promoting tennis throughout the beach. The Tennis Center staff is responsible for supervising seven lighted tennis courts. The division also provides free clinics for children and adults throughout the year. The free clinics are mainly for handicapped and financially less fortunate adults and children.
Tennis Center Goals for FY2017
Continue to promote the Junior Tennis Program.
Keep the courts and grounds in good condition at all times.
Receive a customer satisfaction rating of 85% or higher.
Transition to an operation with a Facility Manager.
Work toward making the Tennis Center more financially self-sustaining.
Recent Accomplishments The Tennis Center hosted approximately 9,807 players in the first six months of this year.
Offered Senior Day on Friday mornings. Offered physically-challenged tennis clinic.
Offered Adult clinics.
Continued USTA Junior tennis team.
Offered Sunday morning “Round Robin” tournaments year round.
Tennis 2015 2016 2017Facility Manager 1 1 1Court Attendant (part-time) 2 2 2TOTAL 3 3 3

Parks & Recreation Department
76
Performance Measure YTD
3-31-16 Target FY2017
Level of customer service satisfaction with tennis facilities
90%
95%
Level of customer service satisfaction with tennis programs
90%
95%
Tennis court condition rated good or better
85% 85%
Building condition rated good or better
60% 75%
Landscape condition rated good or better
50% 75%
1Survey responses (#returned/# distributed): 2016 (54/54)
Financial Summary
Tennis Center Budget Issues Revenue Summary:
Capital Outlay: $12,969 budgeted to resurface Courts 1, 2, and 3. Review rate structure to ensure operational costs are recovered to the fullest extent possible.
Original AdoptedResource Actual Budget Budget Increase %Allocation 2015 2016 2017 -Decrease ChangePersonal Services
$78,421 $74,048 $77,922 $3,874 5.2%
Operating $11,354 $17,155 $17,155 $0 0.0%
Capital Outlay
$0 $0 $12,969 $12,969 -
TOTAL $89,775 $91,203 $108,046 $16,843 18.5%
2015 2016 2016 YTDActual Budget (4-7-2016)
Tennis Court Fees 5,895 5,000 3,047
Membership Fees 24,462 26,000 14,845
Roster Fees 4,400 4,000 1,650
Concession Fees 6,500 5,000 3,000
Contributions 665 - 35
$41,922 $40,000 $22,577
Survey Results Tennis facility satisfaction was measured by customer service surveys.1

Parks & Recreation Department
77
Oceanfront Facilities Division
This division provides public restroom facilities at 2nd Avenue North, 5th Avenue North and Oceanfront Park. The facilities at 2nd Avenue North and 5th Avenue North include outdoor showers. Portable restrooms and shower facilities are located at 19th Avenue North and shower facilities are provided at 7th Avenue South. Goals for FY2017
Maintain clean restroom facilities and operating showers. Financial Summary
Expenses include cleaning services, utilities, and maintenance costs such as painting, plumbing, fixture replacement, and vandalism repairs.
Performance Measures Restrooms and showers to be in good working order; clean and sanitary for the public.
Current Hours Mar-Sep: 10 am to 7 pm (7 days per week) of Operation: Oct-Feb: 9 am to 6 pm (7 days per week)
Budget Issues New contract for cleaning and staffing. Maintenance may include painting inside and outside as well as replacing the
fixtures once per year. New restrooms at Oceanfront Park. Add showers at 16th Avenue South.
Original AdoptedResource Actual Budget Budget Increase %Allocation 2015 2016 2017 -Decrease Change
Operating $87,877 $131,000 $131,000 $0 0.0%
TOTAL $87,877 $131,000 $131,000 $0 0.0%

Parks & Recreation Department
78
Carver Center Division
The Carver Center provides activities and events to the South Pablo Beach neighborhood, focusing on wellness programs as well as summer and after school programs for low and moderate income children and families. Organization
Carver Center Program Goals Focus on coaching, mentoring, and providing activities for young people. Offer counseling on jobs, employment and career goals. In conjunction with Rhoda Martin Heritage Museum, teachers from Seabreeze
Elementary School provide help with studies to 3rd through 5th graders. Continue to provide health and wellness adult activities such as yoga, Pilates and line
dancing. Recent Accomplishments
Continued Mentor programs for both young men’s group “YMC” (Young Men of Carver) and “Ladies of Carver” to teach values and goals setting.
Events and Projects: - Partnered with Duval County Public Schools in offering a Parent Academy - Partnered with Beaches Emergency Assistance Ministry (BEAM) to provide a Single
Parent Program - Health clinic sponsored by Beaches Baptist - After school exercise program - Annual Holiday dinner for parents and children of Carver - Jacksonville Beach Elementary School 3rd grade class school supply donations - Holiday toy drive sponsored by the Beaches Women’s Club - After school healthy snacks program sponsored by Palms Presbyterian Church - Water Safety class - Halloween event - College tours - AARP classes - Father’s Day breakfast - Mother’s Day luncheon - Movie / Game night
Carver Center 2015 2016 2017Recreation Supervisor 1 1 1Tutor (part-time) 2 2 2TOTAL 3 3 3

Parks & Recreation Department
79
- University of North Florida (UNF) Mentorship Program - Health Jam co-sponsored by 3 area Rotary Clubs
Performance Measures-Carver Center
2015
2016 Estimate
2017 Avg. # children attending
45 45 45
Funding Sources The Community Development Block Grant Program is funded by an Interlocal Agreement with Jacksonville that allows Jacksonville Beach to share a per capita portion of its entitlement funding. The requested Community Development Block Grant allocation for next fiscal year will once again cover the City’s Community Assisted Policing Effort (CAPE) and Carver Center. We have received preliminary approval to continue these programs subject to budget approval by Congress. FY2017 funding request amount and priority for each program is:
Priority Program Request Department where cost is reported 1 Carver Center $82,470 Parks 2 CAPE $63,041 Police
TOTAL $145,511 Additional discussions of the Police (CAPE) programs may be found in the Police business plan.
Financial Summary
Budget Issues
The 2017 budget for the Carver Center has been revised to include the costs of operating the facility (previously budgeted in Recreation Administration). The cost of the CAPE Officer ($63,041) and costs for the maintenance of a CAPE van are included in the Police Department’s budget. In the past, Community Development Block Grant funding for this program has been reduced and may be subject to further federal budget reductions.
Original AdoptedResource Actual Budget Budget Increase %Allocation 2015 2016 2017 -Decrease ChangePersonal Services $98,457 $87,797 $91,562 $3,765 4.3%
Operating $5,280 $0 $28,910 $28,910 -
TOTAL $103,737 $87,797 $120,472 $32,675 37.2%
Operating costs have been included in this budget to reflect the costs of operating and maintaining the Carver Center Building (previously included in Recreation Admin).

Parks & Recreation Department
80
Community Center and Exhibition Hall This facility, opened in September 2007, is located at South Beach Park and houses the Recreation office. The Community Center & Exhibition Hall is available to host many types of events such as trade shows, art exhibits, wedding receptions, parties, seminars, homeowners’ associations and club meetings, school functions and shows. The facility may be rented on an hourly basis and is operated by the Recreation Department staff. Recent Accomplishments Groups renting the facility include: Weekly Business Networking groups and local
homeowners’ associations for meetings; local school for graduation, wedding receptions and Holiday parties.
Goals for FY2017 1. Rent building to reduce the facility’s operating costs. 2. Maintain a clean and professionally operated facility.
Financial Summary
Performance Measures
Objective
FY2015 YTD
3-31-16 Target FY2017
Customer Survey - % satisfaction with building, equipment and operation1
95% 100% 95%
Rental Events 158 87 150
1Survey responses (# returned/# distributed): 2015 (5/10); 2016(6/10)
Budget Issues Rent structure needs to be reviewed to more fully cover operating costs.
Original AdoptedResource Actual Budget Budget Increase %Allocation 2015 2016 2017 -Decrease ChangePersonal Services
$0 $0 $0 $0 -
Operating $35,017 $49,600 $51,600 $2,000 4.0%Capital Outlay
$0 $0 $0 $0 -
TOTAL $35,017 $49,600 $51,600 $2,000 4.0%
Revenues are estimated to cover approximately half of the facility’s expenses such as insurance, security, cleaning, set-up/tear-down and supplies.

Parks & Recreation Department
81
Special Events Division The Special Events budget includes City-produced events such as the Moonlight Movies, the Summer Jazz concert series, and the July 4th fireworks. This division also is responsible for permitting public events held on City property and ensuring that all events comply with the City’s Special Events policy. In addition, the Special Events division is responsible for the coordination and communication of beach clean-ups, non-profit road closure requests, and film requests within the City of Jacksonville Beach. One full-time position budgeted in the Recreation Administration Division manages the permitting and event oversight processes for City-produced, City-sponsored, and all other events. Funding Sources General Fund charges for event permit and setup fees, banner fees and contributions for events are used to offset most of the personnel costs related to event management. Convention Development funds are used to pay for the costs of City-sponsored events, rental of equipment to hang sound and lighting for the events, and upkeep of the SeaWalk amphitheater and grounds.
Funding Uses
General Fund
Convention Development Fund
Original AdoptedResource Actual Budget Budget Increase %Allocation 2015 2016 2017 -Decrease ChangePersonal Services $0 $0 $0 $0 -
Operating $81,479 $124,000 $0 -$124,000 -100.0%
TOTAL $81,479 $124,000 $0 -$124,000 -100.0%
Original AdoptedResource Actual Budget Budget Increase %Allocation 2015 2016 2017 -Decrease ChangePersonal Services
$0 $0 $0 $0 -
Operating $31,123 $61,709 $176,678 $114,969 186.3%Transfers $115,000 $115,000 $20,000 -$95,000 -82.6%
TOTAL $146,123 $176,709 $196,678 $19,969 11.3%
The budget for City-sponsored events has been moved to the Convention Development Fund. Those events include: Moonlight Movies, Jazz Concerts, Opening of the Beaches Parade, and 4th of July Fireworks.
The transfer to the General Fund for special events was eliminated by moving City-sponsored events to the fund. Budgeted costs for City-sponsored events increased by about 3%.

Parks & Recreation Department
82
Special Events (continued) Convention Development Fund sources and uses are detailed as follows:
In addition to City-sponsored events, the City provides in-kind contributions for the Sea & Sky Spectacular. The Special Events division provides logistical support for many other non-profit fundraising and awareness events that take place in Jacksonville Beach. Examples of logistical assistance include site setup, trash collection, traffic management and securing the event route.
2016 2017 Incr. / (Decr.) % change
Facility rentals and fees $ - $ - $ - 0.0%Contributions - - - 0.0%General Fund - - - 0.0%Convention Development Tax Revenue 176,709 196,678 19,969 11.3%
Total Sources $ 176,709 $ 196,678 $ 19,969 11.3%
Springing the Blues - 8,000 8,000 0.0%4th of July Fireworks - 40,000 40,000 0.0%Jazz Concerts (2) - 57,000 57,000 0.0%Moonlight Movies (4) - 19,000 19,000 0.0%Opening of the Beaches Parade
- 6,000 6,000 0.0%
Easter Egg Hunt - 1,000 1,000 0.0%Contingency - 1,000 1,000 0.0%SeaWalk amphitheater maintenance; special event setup and equipment costs
39,209 44,678 5,469 13.9%
Visit Jacksonville advertising
22,500 - (22,500) -100%
Transfer to General Fund; SB Community Center & Exhibition Hall maintenance partial funding
20,000 20,000 - 0.0%
Transfer to General Fund; partial funding for Special Events
95,000 - (95,000) -100.0%
Total Uses $ 176,709 $ 196,678 $ 19,969 11.3%
SPECIAL EVENTS
Funding Sources
Funding Uses

Parks & Recreation Department
83
Special Events (concluded)
Special Events held within the City of Jacksonville Beach include:
• Art Walk • Classic Car Cruise • Winter Beach Run • Chariots of Fur 5K Beach Run • San Pablo Elementary 5K Run • 26.2 with Donna the National
Marathon to Finish Breast Cancer • Fletcher Middle School 5K Beach
Run • Seabreeze Elementary Running of the
Seahorses • Seawalk Music Festival • March to Get Screened • St. Paul's Carnival • Great Atlantic Festival • Easter Sunrise Service • Springing the Blues • Surfing the Blues • COJB Beach & Bicycle Rodeo • Moonlight Movie • Sandcastle Contest • Opening of the Beaches Parade • Never Quit • Wavemasters • COJB Kids Fishing Rodeo • Best Buddies Friendship Walk • The Party • Super Grom Surf contests • Life Rolls On
• Summer Jazz concert series • Salt Life Music Festival • 4th of July Fireworks • Eastern Surfing Association surf
contests • Tour de Pain • Festival of the Chariot • Summer Beach Run • Bruval Festival • PANCAN PurpleStride • Sisters of the Sea • Surfers for Autism • Art Fest at the Beaches Museum and
History Park • Right Whale Festival • Jax Beach Fitness Fest • Volcom TCT Seacow Surf Contest • Oktoberfest • Florida Surfing Championships • Jacksonville Celtic Festival • Down Syndrome Association Buddy
Walk • Deck the Chairs • Red Bull Night Riders • Toys for Tots • Josh’s Run for Paws

Parks & Recreation Department
84
Golf Course
The Golf Course division is responsible for the daily operation of the golf course. It ensures that the use of the facility is maximized and that all revenues are collected. The division also monitors the quality of the playing conditions. The Jacksonville Beach Golf Course operates as an enterprise fund.
Recent Accomplishments Hosted the North/South Collegiate Tournament for the 15th year.
Most amount of Ladies play on a weekly basis in the greater Jacksonville area.
Continued program with “Golf Now” to promote play.
Goals for FY2017
1. Insure the Golf Course pays its own way with great customer service and well maintained playing conditions.
2. Maintain competitive position with local golf facilities.
3. Increase the Golf Course’s visibility and play through continued efforts to market the facility.
Golf Course 2015 2016 2017Golf Professional 1 1 1Golf Course Superintendent 1 1 1Equipment Mechanic 1 1 1Maintenance Workers I, II, III (full-time)
4 4 4
Maintenance Workers I, II, III (part-time)
2 2 2
Shop Attendant – part-time 8 8 8Cart Attendant - part-time 5 5 5Starter – part-time 3 3 3TOTAL 25 25 25
“A Good Product at a Good Price”

Parks & Recreation Department
85
Golf Course Performance Measures
Actual FY2015
YTD 3-31-16
Target FY2017
Course condition-survey rating of above average
8%
7%
15%
Operating Revenue Per Round Operating Cost Per Round
$23.63
$30.47
$24.99
$25.05
$27.63
$27.63 Rounds of Play
48,278
22,095
49,000
Survey Results (March 2016)
Customer Service Survey1
Above Average
Satisfactory
Needs Improvement
No Opinion
Service inside Pro Shop?
83% 16% 1% -
Service given by our starters? 67% 31% 2% -
Overall service? 69% 28% 3% -
Condition of our golf course? 6% 62% 32% -
Restaurant operation?
7% 46% 16% 31%
1Survey results (#returned/#distributed) 2016 (47/90)

Parks & Recreation Department
86
Memberships6%
Greens Fees94%
Revenues from Greens Fees & Memberships
Memberships16%
Open Play84%
Players
Walkers35%
Riders65%
Walkers and Riders
Play Statistics These charts show the composition of our players.

Parks & Recreation Department
87
Miscellaneous revenue consists of: sales of memberships, lessons, pro shop merchandise, restaurant lease, and season passes.
Financial Summary
Budget Issues Operations Issue: The Golf Course is operated as an enterprise fund and is intended to generate sufficient revenues to cover its operating costs. Maintenance and Equipment Issues: • Replace current point of sale (cash receipt) system since the vendor will no longer offer
support for the current version: ($28,000).
Greens Fee, $470,000, 33%
Cart Rental, $425,000, 30%
Driving Range, $185,000, 13%
Capital Improvement Fee,
$100,000, 7%
Miscellaneous, $177,940, 12%
Transfers In, $65,000, 5%
Golf Course Revenues: $1,422,940
Original AdoptedResource Actual Budget Budget Increase %Allocation 2015 2016 2017 -Decrease ChangePersonal Services
$624,138 $626,989 $627,654 $665 0.1%
Operating $749,304 $678,078 $726,286 $48,208 7.1%Capital Outlay
$28,127 $28,000 $28,000 $0 0.0%
TOTAL $1,401,569 $1,333,067 $1,381,940 $48,873 3.7%
Budget includes increases for irrigation repairs, clubhouse utilities, camps and fertilizer for greens. Capital outlay detail is shown below.


Public Works Department
89
Mission To protect the health, safety, environment, and quality of life in our community by:
Providing safe drinking water in volumes necessary for fire suppression.
Providing proper collection, treatment, disposal, and reuse of wastewater.
Maintaining roadways and sidewalks in good repair with appropriate traffic control signs.
Providing effective removal and treatment of stormwater runoff.
Providing for the timely removal and disposal of garbage and recyclables.
“We Make It So.” Organization The Public Works Department manages the City’s drinking water system, sewage collection system, stormwater collection system, street and rights-of-way maintenance, traffic control, signage and garbage collection.
Authorized Positions by Division FY2015 FY2016 FY2017 Distribution & Collection 14 14 14 Pollution Control Plant 15 15 15 Water Plant 13 13 13 Streets 18 18 18 Administration 6 6 7 TOTAL 66 66 67
Recent Accomplishments Rebuilt, improved and enhanced infrastructure supporting our citizens by construction of:
o Downtown Redevelopment District Master Plan Improvements Program & East of A1A - New Restrooms at the Pavilion & Oceanfront Park. - 45 Dune Walkovers to the beach rebuilt to date.
o Water, Wastewater, Stormwater Infrastructure Improvements Program - Water Main Project: 5th & 7th Sts. S., 11th & 12th Sts. N., & Palm Circle - Ocean Forest Area Stormwater Improvements Project.
Cleaned /televised 33,153 feet of storm pipe and 39,510 feet of sanitary pipe Achieved high levels of service in oceanfront cleaning, garbage collection & sweeping Maintained compliance for water state consumptive use permit, and wastewater &
stormwater federal pollutant discharge elimination permits
A part time Construction Coordinator has been added to the Administration division

Public Works Department
90
Goals for FY2017 • Design and/or construction underway:
o Downtown Redevelopment District Improvements Program - Roadway/Utilities Project 1: Beach Blvd. to 4th Ave. S. & 3rd Street S. to the beach. - Roadway/Utilities Project 2: 11th Ave. S. to 13th Ave. S. (beach to Central Basin);
Central Basin Stormwater Modeling & Downtown Storm Pump Station Upgrade.
o South Beach Redevelopment District Improvements Program - Intersection/Turn Lane Project: S. Bch Pkwy (Jax. Dr. to Marsh Landing Blvd.). - Municipal Skate Park Project: Sunshine Park. - Landscape Medians & Pedestrian Crossing Project: South Beach Pkwy & Jax Dr. - Stormwater System Project: Jacksonville Drive under Shopping Center to JTB Basin. - Stormwater Pond Project: eastside of S. Bch Pkwy (south of Marsh Landing Pkwy). - Stormwater/Roadway Project: Study/Design - area bounded by JT Butler Blvd.,
South Beach Parkway, America Ave. & Republic Dr. / Rip Tide Subdivision.
o Commercial Area Improvements Program - Roadway/Utilities Project: 10th to 9th St. S. and 5th to 12th Ave. S. - Roadway/Utilities Project: Penman Road (vicinity 12th to 18th Ave. N.).
o Water, Wastewater, Stormwater Infrastructure Improvements Program - Water Main Project: 3rd St. N. (6th to 20th Ave. N.) - Water Main Project: Oakwood Ct., 12th & 13th Ave. N., Rannie St., 8th St. S.,
Freedom Way & Republic Dr. - Wastewater Lift Station #7 Project: Rebuild at old BES site (4th St. N. at 18th Ave.);
demolish old Lift Stations #7 (18th Ave. N at 3rd St.) & #20 (4th St. N at 15th Ave.). - Demolish Wastewater Lift Station #8 Project: 18th Ave. N.; gravity pipe to new LS #7. - Water Meter Replacement Program. - Water & Sewer Extension Project: Easement on private portion of Hopson Rd. - Wastewater Lift Station Project: #2 (4th St. N. at 6th Ave.) & #17 (3351 Anhinga Ct). - Raw Water Well #11 Project to improve water quality. - Water Plant #1 Project: Repair/Recoat the Exterior of the 1 Million Gallon Raw
Water Ground Storage Tank. - Water Plant #2 Project: Rehabilitate the Interior Concrete Ceilings and Repair /
Recoat all Interior/Exterior Surfaces of the Two 500,000 Gallon Raw Water Ground Storage Tanks.
• Award and implement new solid waste collection contract by December 2016. • Maintain compliance for water state consumptive use permit, and wastewater &
stormwater federal pollutant discharge elimination permits. • Keep Jacksonville Beach beautiful via the downtown & oceanfront cleaning, graffiti
abatement, garbage collection, dumpster enclosure and sweeping programs. • Maintain performance measures as shown on the next page.

Public Works Department
91
Performance Measures Outcomes
Level of Service
Actual 2015
As of 3/2016
Target 2017
Drinking Water:: Water safe for drinking
Achieve regulatory compliance for normal operating conditions
Yes Yes Yes
Water volume & hydrants available for fire protection
Maintain unaccounted water usage below 10% total produced
15.5%1 17.1%1 10%
Replace 2,500 ft. of old 2” & larger galvanized & cast iron water mains
02
1,186 2,500
Install/replace 150 water services 192 62 150 Operate (replace) water valves 553 (8) 16 663 Conduct fire flow test on 50 hydrants N/A3 153 503 Wastewater / Stormwater: Keep our waterways clean Achieve wastewater & stormwater permit
regulatory compliance for normal operating conditions
Yes Yes Yes
Preserve our environment At the Wastewater Treatment Plant, achieve removal so that:
Total Suspended Solids (TSS): < 5mg/l <3.8 mg/L <0.9 mg/L <5 mg/L Carbonaceous Biochemical
Oxygen Demand (CBOD): < 5mg/l
<2.7 mg/L
<2.1 mg/L
<5 mg/L Total Nitrogen (N) Rolling
Year Average: < 46,233 lbs
24,413
3,833
<46,233 Clean 20,000 ft. sanitary/storm mains 72,663 9,025 20,000 Inspect (rehab) sewer manholes 482 (117) 89 (90) 400
Refurbish sewer lift stations numbered: (electric,pumps,pipes,wetwells,concrete, mechanical,generators,fencing,etc.)
1, 9 26 7 construct 2 design
Streets: Keep our streets well
maintained for driving and free of trash
Keep our sidewalks well maintained for walking
Keep our drainage system well maintained
Seal coat/resurface 7 to 10 road miles 7.4 0.3 7-10 Sweep the downtown streets an average of 4 times per month
Yes Yes Yes
Repair/construct 2,000 ft. of sidewalk 1,969 462 2,000 Achieve regulatory compliance for normal operating conditions
Yes
Yes
Yes
Mow/clean 15,000 ft. of ditch 39,300 6,550 15,000 Sanitation:: Keep our city and beach
clean Recycle/mulch 25% of residential solid waste to reduce landfill impact
35% 30% 25%
Clean the beach at least once per week by mechanical means (raking)
Yes Yes Yes
Respond to garbage inquiries by 1 day & complete by next scheduled pickup
Yes Yes Yes
1 Water Meter Replacement Program addresses under metering of water used, plus automated water meter & leak detection infrastructure technology may assist in identifying customer leakage and city water main leakage. 2 Water Main Project: 3rd St. N. (6th to 20th Ave. N.) delayed to coincide with design decisions on FDOT Drainage Project. 3 Transitioning during 2016 to performance measure for fire flow tests on the City’s fire hydrant system.

Public Works Department
92
Funding Sources The Department of Public Works is funded by the operation of three enterprise utilities: Sanitation, Water & Sewer, and Stormwater. Funding also comes from the Local Option Gas Tax and the General Fund (Streets).
Public Works Department
Financial Summary
CPI/fuel adjustments for sanitation and other continuing contracts may cause increases later in the year.
General Fund, $1,559,457, 7%
Local Option Gas Tax, $726,571, 3%
Water & Sewer, $14,548,567, 68%
Stormwater, $1,077,666, 5%
Sanitation, $3,550,413, 17%
Funding Sources: $21,462,674
Original AdoptedResource Actual Budget Budget Increase %Allocation 2015 2016 2017 -Decrease ChangePersonal Services $3,917,739 $4,178,400 $4,273,440 $95,040 2.3%
Operating $7,343,158 $8,490,323 $8,810,784 $320,461 3.8%Capital Outlay $1,997,069 $3,986,000 $6,146,029 $2,160,029 54.2%
Debt Service $1,793,753 $1,806,352 $1,801,421 -$4,931 -0.3%
Transfers $622,000 $501,000 $431,000 -$70,000 -14.0%
TOTAL $15,673,719 $18,962,075 $21,462,674 $2,500,599 13.2%
Capital Outlay increase is primarily due to budget to construct Phase A of the major project to relocate Lift Station #7.

Public Works Department
93
Budget Issues and Uncertainties
• Future unfunded mandates related to the: o Increasing federal and state restrictive standards for phosphorus and other
contaminants entering the fresh and marine waters of the state. o Growing regional demands for high quality water from the Floridan Aquifer. The
Florida Department of Environmental Protection and Water Management Districts are setting minimum flows and levels for lakes and springs.
o U.S. Environmental Protection Agency being more active in regulatory oversight of Wastewater and Stormwater National Pollutant Discharge Elimination Permits and Drinking Water Consumptive Use Permits.
• Design is underway on the FDOT project to improve drainage for State Road A1A north
of Beach Boulevard. Priority for improvements is downstream to upstream, starting from Kings Road bridge area moving south and east toward SR A1A near Beach Blvd. Project should have a positive regional impact. Construction start is planned for 2017.
• Design is underway for the infrastructure improvements program in the Downtown Redevelopment District (south of 4th Avenue South) and extending to 16th Ave. S. This reconstruction program will occur in a series of projects and last more than five years.
• Pressure on customer utility rates and taxes due to the ever increasing costs of providing
services and operating/maintaining the city’s infrastructure systems – water production and distribution; wastewater collection and treatment; stormwater collection and treatment; solid waste collection; oceanfront and downtown cleaning; street sweeping; and roadways, curbing and sidewalks.
o Stormwater rates were set in 1990 (26 years ago). o Garbage rates were set in 1993 (23 years ago). o Water & Sewer rates were set in 2012. o Local Option Gas Tax extends through 2036.
• The water meter replacement program is underway. It also includes considering
automated meter and leak detection infrastructure technology. It is anticipated that this project should reduce our percentage of unaccounted water and help our customers better manage their water consumption.

Public Works Department
94
Distribution & Collection Division The Distribution & Collection Division operates and maintains 109 miles of water mains, 85 miles of sewer mains, 18 miles of force mains, 1,990 sewer manholes, 895 fire hydrants, 2,652 water valves, 10,915 water services, and 9,261 sewer services.
Division Mission To protect the public health by providing clean drinking water with adequate pressure and volume, and to maintain sewer lines. Division Objectives Replace 2,500 feet of old deteriorated water mains. Clean 20,000 feet of sanitary and storm mains. Inspect an average 400 sewer manholes per year. Reline or reconstruct as necessary. Conduct fire flow tests on 50 fire hydrants annually. Exercise an average of 663 valves in the water distribution system per year. Repair by
replacement as necessary.
Division Organization Authorized Positions FY2015 FY2016 FY2017 Distribution & Collection Superintendent
1 1 1
General Supervisor 1 1 1 Crew Supervisor 3 3 3 Equipment Operator 1 1 1 Utility Service Worker I, II, III 8 8 8 TOTAL 14 14 14

Public Works Department
95
Division Funding Sources and Budget FY2017
The operations and programs of the Distribution & Collection Division are funded by the Water & Sewer Enterprise Utility.
Division Budget Issues Capital Outlay: - Funding $85,000 to replace 1-ton van (1994) & reinstall equipment used to video sewer pipe.
- Funding $31,000 to replace ¾-ton truck (2006) with utility body.
- Water Main Projects:
• Funding $1,200,000 for construction in area of 3rd St. N. (9th to 20th Ave. N); also included in project is 6th to 9th Ave. N. (within the Downtown Redevelopment District).
• Funding $75,000 for design to extend water & sewer mains to easement over Hopson extension.
- Funding $550,000 for first part of the Water Meter Replacement Program.
- Funding $17,000 to replace old double diaphragm pump. Operating: - Funding $25,000 for the Water Valve Maintenance Program, which includes exercising
water valves and replacing deteriorated/broken valves as necessary.
- Funding $220,000 for the Sanitary Sewer System Maintenance Program, which includes inspecting sewer manholes and cleaning/televising sewer mains/services. It also includes subsequent manhole relining/reconstructing and system point repairs as necessary.
Original AdoptedResource Actual Budget Budget Increase %Allocation 2015 2016 2017 -Decrease ChangePersonal Services $794,876 $861,506 $848,060 -$13,446 -1.6%Operating $433,510 $562,550 $558,800 -$3,750 -0.7%Capital Outlay $444,930 $2,115,000 $1,958,000 -$157,000 -7.4%
TOTAL $1,673,316 $3,539,056 $3,364,860 -$174,196 -4.9%

Public Works Department
96
Pollution Control Plant Division The Pollution Control Plant Division operates and maintains the wastewater transmission system of 38 sewage pump stations and the 4.5 million gallons per day (MGD) capacity sewage treatment facility with reuse quality effluent.
Division Objectives Maintain local, state, and federal regulatory compliance. Achieve less than 5mg/l total suspended solids, 5 mg/l carbonaceous biological oxygen
demand, and 46,233 lbs. of total nitrogen rolling 12-month average (permit requirements). Conserve drinking water by providing quality reclaimed water for irrigating the Golf Course,
the Wingate Sports Complex, the Operations & Maintenance Facility, the Police Station, South Penman Road Area, Lee Kirkland & Warren Smith Cemeteries, South Beach Park, Stormwater Central Stilling Basin, within the Wastewater Treatment Facilities and South Beach Parkway, Jacksonville Drive and future extensions of the reclaimed water main system to other areas.
Construct Replacement Lift Station #7 Project (4th St. N. & 18th Ave.).
Division Organization Authorized Positions FY2015 FY2016 FY2017 Utility Plant Supervisor 1 1 1 Utility Plant Maintenance Supervisor 1 1 1 Operations/Training Specialist 1 1 1 Utility Plant Operator/Senior Operator 6 6 6 Senior Lift Station Mechanic 1 1 1 Lift Station Mechanic 2 2 2 Utility Plant Mechanic 2 2 2 Instrumentation Technician 1 1 1 TOTAL 15 15 15
Division Mission To protect public health and the environment through the proper treatment, disposal, and reclamation of wastewater.

Public Works Department
97
Division Funding Sources and Budget FY2017
The operations and programs of the Pollution Control Plant Division are funded by the Water & Sewer Enterprise Utility.
Division Budget Issues Capital Outlay:
- Funding $74,000 to replace a truck (2000) with utility body & auto crane.
- Funding $50,000 for the rehabilitation design of Lift Station #17 (Anhinga Court).
- Funding $200,000 to install new Feed Pumps for Tertiary Final Filters at the Wastewater
Treatment Plant (10th St. S.).
- Funding $30,000 to purchase actuators, soft starts and variable frequency drive.
- Funding $3,000 to purchase new drill press.
- Funding $10,000 to purchase new 2” diaphragm pump.
Other Concerns: ⇒ Uncertainty about increasing unfunded mandates due to changes and increased restrictions
from the U.S. Environmental Protection Agency (EPA).
Original AdoptedResource Actual Budget Budget Increase %Allocation 2015 2016 2017 -Decrease ChangePersonal Services $965,128 $988,790 $1,049,960 $61,170 6.2%
Operating $1,330,398 $1,434,500 $1,518,000 $83,500 5.8%
Capital Outlay $794,738 $687,000 $367,000 -$320,000 -46.6%
TOTAL $3,090,264 $3,110,290 $2,934,960 -$175,330 -5.6%
The Capital Outlay decrease is due primarily to re-budgeting the new Filter Feed Pumps Project from 2016 to 2017.

Public Works Department
98
Water Plant Division The Water Plant Division operates and maintains the City’s water system that consists of 6 wells, 2 water treatment facilities, and 3 ground and 2 elevated water storage tanks. The water system has a total capacity to produce 7.0 million gallons of water daily. This division also operates and maintains the stormwater treatment facilities for the City consisting of 20 ponds, 2 stilling basins each with a weir, the downtown underground stormwater collection vault with 2 sand traps, 8 stormwater pump stations, and the water play feature at Sunshine Park.
Division Objectives Maintain local, state, and federal regulatory compliance. Treat, store, and protect nearly 1 billion gallons of drinking water annually. Make available
quantities of water needed for fire protection. Operate and maintain the system of stormwater treatment facilities, pumping stations and
ponds.
Division Organization Authorized Positions FY2015 FY2016 FY2017 Utility Plant Supervisor 1 1 1 Utility Plant Maintenance Supervisor 1 1 1 Operations/Training Specialist 1 1 1 Utility Plant Operator/Senior Operator 6 6 6 Utility Plant Mechanic 2 2 2 Plant Maintenance Helper 2 2 2 TOTAL 13 13 13
Division Mission To provide safe drinking water in volumes and pressures sufficient for effective fire suppression; and to improve the quality of receiving waters by effective treatment of stormwater.

Public Works Department
99
Division Funding Sources and Budget FY2017
The operations and programs of the Water Plant Division are funded by the Water & Sewer Enterprise Utility.
Division Budget Issues Capital Outlay: - Funding $500,000 to rehabilitate Raw Water Well #11 (Shetter Ave. & 6th St. S) to improve
water quality. - Funding $60,000 to repair/recoat exterior of the 1 Million Gallon Raw Water Ground Storage
Tank at Water Plant #1 (4th St. S.)
- Funding $550,000 to rehabilitate the interior concrete ceilings and repair/recoat all interior and exterior surfaces of the two (2) 500,000 Gallon Raw Water Ground Storage Tanks at Water Plant #2 (Osceola Ave.).
- Funding $5,029 to replace old chlorine scale.
- Funding $32,000 to replace ¾ ton truck (2004) with utility body. Operating: - Funding $36,500 for annual elevated tank maintenance program. - Funding $10,000 to replace high service pump valves (25 years) at both water plants.
Other Concerns: ⇒ North Florida water issues are increasing in complexity and seriousness. The issues include:
Decline of the Floridan Aquifer resource. Increasing water demand with growing central/north Florida population and businesses. State setting statutory minimum flows and levels for lakes and springs. Increasing public awareness and involvement in water resource usage and water quality. High quality water resources used for non-potable uses (irrigation, agriculture & industry). Regional Water Supply Plan development by the State Water Management Districts. The very high cost of capital investment necessary for alternate water sources.
The outcomes and their impact on the City are uncertain. Water resources unfunded mandates are likely to be in our future.
Original AdoptedResource Actual Budget Budget Increase %Allocation 2015 2016 2017 -Decrease ChangePersonal Services $717,240 $847,216 $877,526 $30,310 3.6%
Operating $379,444 $485,150 $480,974 -$4,176 -0.9%
Capital Outlay $296,367 $0 $1,147,029 $1,147,029 -
TOTAL $1,393,051 $1,332,366 $2,505,529 $1,173,163 88.1%
The Capital Outlay increase is due primarily to the projects to recoat all Raw Water Ground Storage Tanks and to rehabilitate Raw Water Well #11.

Public Works Department
100
Streets Division The Streets Division of Public Works maintains the City’s roadways, traffic control signage and markings, sidewalks, and stormwater collection system. These networks consist of 89.32 road miles including curbs and gutters, 33.7 miles of sidewalks, 1,682 street lights, 1,456 stormwater catch basins, 558 storm manholes and 1,680 curb inlets/culverts, 70 stormwater outfalls to the adjacent estuaries and ocean, 68.63 miles of stormwater gravity mains, 2.87 miles of stormwater force mains, 2.1 miles of drainage channels. The division also manages collection of garbage, recycling and yard waste, beach cleaning, and graffiti abatement. Division Mission To provide safe, well maintained road systems and an effective stormwater drainage system. Division Objectives Seal coat or resurface 7 to 10 miles of roads annually. Repair and maintain stormwater drainage system. Install and maintain traffic and pedestrian control signage and markings. Maintain pedestrian safe sidewalks. Repair 2,000 feet of sidewalk. Maintain clean and attractive community environment by collecting garbage and picking
up litter from our streets and sidewalks. Division Organization
Authorized Positions FY2015 FY2016 FY2017 Streets Superintendent 1 1 1 General Supervisor 1 1 1 Sanitation Supervisor 1 1 1 Crew Supervisor 2 2 2 Heavy Equipment Operator 1 1 1 Equipment Operator 4 4 4 Engineering Technician 1 1 1 Traffic Marking/Signage Supervisor - 1 1 Maintenance Worker I, II, III 5 5 5 Staff Assistant 1 1 1 TOTAL 18 18 18

Public Works Department
101
Division Funding Sources and Budget FY2017
The operations and programs of the Streets Division are funded by the General Fund, the Local Option Gas Tax, the Stormwater Utility, and the Sanitation Utility. General Fund
Local Option Gas Tax
Division Budget Issues General Fund: - Capital Outlay funding of $38,000 to replace 4-wheel drive, ¾-ton pickup truck (2003) - Operating funding of $30,000 for graffiti abatement. Local Option Gas Tax: - Funding transfers of $372,000 for Streets Division wages. - Funding $250,000 for roadway maintenance program, $25,000 for traffic striping, and $35,000
for sidewalk repairs. General Capital Projects Fund (Executive & Legislative Section): - Funding $85,000 to replace 12-foot flatbed truck (2000)
1/2-Cent Infrastructure Surtax Fund (Executive & Legislative Section): - Funding $125,000 for improvement design along Penman Road Commercial Area (vicinity 12th
to 18th Ave. N.) to include pedestrian safety, parking control, curbing, sidewalk & drainage.
Original AdoptedResource Actual Budget Budget Increase %Allocation 2015 2016 2017 -Decrease ChangePersonal Services $877,053 $921,249 $910,448 -$10,801 -1.2%Operating $549,550 $580,911 $611,009 $30,098 5.2%Capital Outlay $30,617 $40,000 $38,000 -$2,000 -5.0%
TOTAL $1,457,220 $1,542,160 $1,559,457 $17,297 1.1%
Original AdoptedResource Actual Budget Budget Increase %Allocation 2015 2016 2017 -Decrease ChangePersonal Services $28,800 $43,192 $43,071 -$121 -0.3%Operating $66,815 $311,000 $311,500 $500 0.2%Capital Outlay $80,749 $0 $0 $0 -Transfers $622,000 $372,000 $372,000 $0 0.0%
TOTAL $798,364 $726,192 $726,571 $379 0.1%

Public Works Department
102
Stormwater Utility Program Program Mission – Protect the environment and private property by providing funding for operating, maintaining and improving the stormwater collection and treatment system. Program Objectives Operate and maintain the stormwater collection and treatment infrastructure. Reduce localized flooding. Protect environmentally sensitive estuary and ocean waters by performing effective stormwater management. Construct localized drainage improvement projects. Program Funding Source & Budget - Stormwater utility fees fund the program.
Program Budget Issues Capital Outlay: - Funding $250,000 to construct 4th Street S. Stormwater Improvements Project (10th to 12th Ave.)
Operating: - Funding $95,000 for stormwater pipe and vault cleaning services, $20,000 for drainage system
repairs and $50,000 for erosion control repairs. - Funding $200,000 for channel cleaning and maintenance program. Other Concerns: ⇒ Stormwater utility rates were set 25 years ago. ⇒ Anticipate budget pressures due to increasing federal/state environmental regulation / over-
sight - Numeric Nutrient Criteria, Pollutant Total Maximum Daily Load limits, statutory minimum flows and levels for lakes and springs, and aging stormwater infrastructure.
⇒ Modelling analysis and design underway on the FDOT project to improve the stormwater drainage system for State Road A1A / U.S. 90 (Beach Boulevard), north of Beach Boulevard. Modelling analysis of stormwater drainage basin thru Hopkins Creek has led to drainage improvements implementation priority starting downstream at Kings Road Bridge then working upstream.
Original AdoptedResource Actual Budget Budget Increase %Allocation 2015 2016 2017 -Decrease ChangePersonal Services $147,377 $171,032 $180,687 $9,655 5.6%Operating $298,090 $539,835 $646,979 $107,144 19.8%Capital Outlay $199,564 $394,000 $250,000 -$144,000 -36.5%
TOTAL $645,031 $1,104,867 $1,077,666 -$27,201 -2.5%
The increase in the operating budget is primarily for channel cleaning & maintenance program.

Public Works Department
103
Sanitation Utility Program Program Mission – Protect the environment and the health of the community by providing funding for the collection, transportation, and disposal of garbage, yard waste, debris, litter and recyclables. Program Objectives Collect garbage, yard waste, and recyclables from residential and small commercial
customers via weekly curbside service. Collect garbage from commercial customers via dumpster and compactor service on a
weekly routine basis. Collect recyclables from commercial multiplex dwelling units on voluntary basis. Keep Jacksonville Beach beautiful through the oceanfront & downtown cleaning, graffiti
abatement, and street sweeping programs. Program Funding Source & Budget - Sanitation utility fees fund the program.
Program Budget Issues Operating: - Anticipate annual CPI increase and bi-annual fuel cost adjustments, which are included in mid-
year and year-end budget adjustments. - Funding for additional trash pickups along the beach in the Downtown area on weekends and
holidays. Other Concerns: ⇒ Transitioning to new garbage collection contract by the end of 2016.
Original AdoptedResource Actual Budget Budget Increase %Allocation 2015 2016 2017 -Decrease ChangePersonal Services $213,318 $205,846 $213,669 $7,823 3.8%Operating $3,063,389 $3,279,085 $3,336,744 $57,659 1.8%Capital Outlay $0 $0 $0 $0 -
TOTAL $3,276,707 $3,484,931 $3,550,413 $65,482 1.9%

Public Works Department
104
Administration Division Division Mission To protect public health, safety & quality of life through the delivery of Public Works services. Division Objectives Implement departmental business plan. Implement departmental capital projects as scheduled by each division. Implement capital master plans for the 2 redevelopment districts. Effectively address all customer service requests.
Division Organization
Division Funding Sources and Budget FY2017 The operations and programs administered by the Administration Division are funded by the Water & Sewer Enterprise Utility, the Stormwater Enterprise Utility, the Sanitation Enterprise Utility, the Local Option Gas Tax, and the General Fund (Streets).
Division Budget Issues - Design replacement Lift Station #7 and demolish old LS #7, #8 & #20. - Study / design improvements along Penman Rd. Commercial Area. - Funding $2,200,000 (Water/Sewer Capital Projects) to construct Phase A, Lift Station #7 Project. - Funding $186,000 for upgrade reuse irrigation pumping station at the Golf Course.
Original AdoptedResource Actual Budget Budget Increase %Allocation 2015 2016 2017 -Decrease ChangePersonal Services $173,947 $139,569 $150,019 $10,450 7.5%Operating $1,221,962 $1,297,292 $1,346,778 $49,486 3.8%Capital Outlay $150,104 $750,000 $2,386,000 $1,636,000 218.1%
Debt Service $1,793,753 $1,806,352 $1,801,421 -$4,931 -0.3%Transfers $0 $129,000 $59,000 -$70,000 -54.3%
TOTAL $3,339,766 $4,122,213 $5,743,218 $1,621,005 39.3%
Authorized Positions FY2015 FY2016 FY2017 Public Works Director 1 1 1 City Engineer 1 1 1 Project Engineer - 1 1 Administrative Assistant 1 1 1 Construction Project Manager 1 1 1 Construction Inspector part-time 1 1 1 Construction Coordinator part-time - - 1 TOTAL 5 6 7
Capital Outlay increase includes budget to construct Phase A of the project to relocate Lift Station #7.
The part time Construction Coordinator is primarily funded with Redevelopment monies to provide construction inspection services as approved by the Community Redevelopment Agency at its December 16, 2015 meeting.

Police Department
105
Mission Working with Citizens for a Safe Community Organization The police department provides law enforcement services to all citizens who live in, work in, or visit Jacksonville Beach.
Professional Standing The police department was initially accredited in 1995 by the national Commission on Accreditation for Law Enforcement Agencies, Inc. For over twenty years, the department has continued to meet the stringent standards required to maintain accredited status. In 2015, the police department was awarded their seventh award for accreditation which was the Gold Standard; the department also received the Meritorious with Excellence award.
Authorized Positions FY2015 FY2016 FY2017 Chief of Police 1 1 1 Commander 3 3 3 Sergeant/Corporal 19 19 20 Patrol Officer/Detective 42 42 43
Police Total 65 65 67 Accreditation Manager 1 1 1 Communications Supervisor 1 1 1 Communications Officer 10 10 10 Records Supervisor 1 1 1 Records Specialist 2 2 2 Records Specialist part-time 1 1 1 Parking Enforcement Coordinator 1 1 1 Community Service Officer 1 1 1 Administrative Assistant 4 4 4 Property/Evidence Officer 1 1 1 Property/Evidence Officer part-time 1 1 1 Animal Control Officer 1 1 1 School Crossing Guard part-time 9 9 9 Volunteer Coordinator part-time 1 1 1 Civilian Total 35 35 35 Total Full-time 88 88 90 Total Part-time 12 12 12 TOTAL POSITIONS 100 100 102
The Community Redevelopment Agency approved an additional Officer and Corporal for the Downtown CAPE Program.
Police Department
106
Police Department Function & Structure
Our success depends on the partnerships between the community and the police. We have worked hard to build and maintain strong community relationships. The focus of the Jacksonville Beach Police Department is to create an environment where our citizens and visitors feel safe. By working closely with our citizens, we are constantly changing to meet the needs and concerns of our customers. Our residents and visitors expect the police to be visible and to work to prevent crimes from occurring. When crimes do occur, citizens expect the police to solve those crimes. The police are the first responders to crime in our community. However, it is important to understand that there are many factors that impact crime rates, such as population demographics, number of visitors, and socioeconomics. The Police Department is only one part of the criminal justice system. The police respond to reported crimes and make arrests; the State Attorney decides whether to prosecute, and judges and juries decide guilt or innocence. Thus, each part of the criminal justice system influences the other. Because of its easy accessibility and substantial parking, Jacksonville Beach is the primary beach community in the Jacksonville metropolitan area. Consequently, it becomes more difficult for the Police Department to keep citizens safe, especially on weekends, holidays, and during special events when the City is overflowing with visitors. Over time, the Police Department has reacted with many innovative programs. Those include the Downtown CAPE and South Pablo Beach CAPE community policing programs, the Community Response Team, and specialized DUI and traffic enforcement programs. Details of these and other policing programs created specifically for the community are provided in this business plan.
Patrol Division/Costs
Patrol Division There were 63,386 calls for service in calendar year 2015. Many of those calls required a response by two or more officers (e.g., burglary and robbery alarms, crimes in progress, domestic violence, etc.) In 2015, there were 95,156 officer responses to those 63,386 calls, all this in a City with a permanent population of approximately 23,000 citizens. Many service calls are generated by non-residents who come to Jacksonville Beach to visit the beach, shops, restaurants, and nightclubs. The Patrol Division has the largest complement of police personnel (40 full-time positions), since most calls for service are handled at that level. Officers are split into two patrol groups and six squads consisting of four or five officers per squad. Each group alternates working five 10-hour shifts followed by four days off. The groups overlap four days each month, allowing time for ongoing professional development and training.

Police Department
107
FY2017 estimated budget for the Patrol Division, including salaries and benefits, overtime, operating costs, supplies, etc.: $3,644,487. Traffic Unit The unit is staffed by three patrol officers who conduct both routine and directed traffic enforcement, traffic surveys, and participate in special details such as DUI enforcement and the selective traffic enforcement program. FY2017 estimated budget for the Traffic Unit, including salaries and benefits, overtime, operating costs, supplies, etc.: $240,396. K-9 Unit The estimated budget for the K-9 Unit, staffed by two officers with two canines, including salaries and benefits, overtime, operating costs, supplies etc.: $148,009. Part-Time Police Officer Program There are currently two part-time police officers. FY2017 estimated budget for the part-time police officer program, including salaries, operating costs, supplies, etc.: $61,564.
Detective Division Units/Costs
General Investigations Team The General Investigations Team is comprised of one sergeant, one corporal, three detectives, and a staff assistant. Detectives assigned to this team investigate crimes that require substantial commitments of time to complete, including theft, burglary, robbery, and murder. The staff assistant performs typical administrative duties as well as crime analysis. FY2017 estimated budget for the General Investigations Team, including salaries and benefits, overtime, operating costs, supplies, etc.: $573,515. Community Response Team The Community Response Team is comprised of one sergeant, one corporal, and four detectives. This team of detectives addresses special problems such as illegal drugs, vice, aggressive panhandling, and serial crimes like armed robberies, smash-and-grab burglaries, etc., that fall outside the realm of traditional investigative and patrol duties. FY2017 estimated budget for the Community Response Team, including salaries and benefits, overtime, operating costs, supplies, etc.: $724,775. NOTE: A pro rata share of the division commander’s salary and benefits is included in the General Investigations Team and Community Response Team proposed FY2017 budgets.

Police Department
108
Carver Center / Community Assisted Policing Effort (CAPE) Program CAPE is a community policing project located in the Pablo Beach, South, neighborhood. One officer assigned to CAPE patrols the neighborhood in a marked patrol vehicle as well as on bicycle and on foot. Working closely with employees at the City’s Carver Center, the officer addresses crime problems and quality-of-life issues within the accepted practices of the community policing model. Also, a part-time CAPE community service officer works with Carver Center personnel to provide crime prevention and community relations services for parents and children living in the Pablo Beach, South, neighborhood. The Community Development Block Grant has reimbursed the City a substantial portion of the cost of operating the program in past years. The FY2017 estimated budget for the CAPE Program, including salaries, benefits, etc.: $94,228. Downtown CAPE Program The Jacksonville Beach Community Redevelopment Agency (CRA) provides funding for eight police officers, two corporals, and one sergeant for an innovative community policing program known as Downtown CAPE. In the FY2017 budget, the CRA approved the addition of another officer and corporal to the DT CAPE unit, bringing the total personnel in the unit to eleven. This will allow the unit to be broken into an A and B group, much like patrol. This, in conjunction with the schedule being augmented by the CRT unit, will allow for officers to work less overtime and have regularly scheduled time off, while still providing adequate shift coverage. The officers patrol the core downtown area, pier parking lot, and the beachfront on foot, bicycles, Segways, and in vehicles. They interact closely with business people, residents of the downtown area, and visitors, as they focus on issues of public safety and quality-of-life crimes. The officers are trained in crime prevention and assist with code enforcement. They also provide “responsible vendor training” to businesses in the downtown area that serve alcoholic beverages. The CRA also provides funding for additional officers working in an overtime capacity during peak workload hours. FY2017 estimated budget for the Downtown CAPE Program including salaries and benefits, overtime, equipment, operating costs, supplies, etc.: $1,054,539.
Services Division Units/Costs
Ancillary Services Section The Ancillary Services section consists of one commander, a sergeant, a community service officer and nine part-time school crossing guards that are assigned to elementary schools and Fletcher Middle School to assist children in safely crossing busy roadways. The Services Commander serves as budget officer for the police department, oversees the Records Section, Communications Section, Property/Evidence, Paid Parking program, Training & Recruiting, Animal Control, as well as grant management. FY2017 estimated budget for salaries, benefits etc.; $402,216.

Police Department
109
Communications Section The Communications Section is comprised of one supervisor and ten public safety communications officers (PSCO). PSCOs are an integral part of the services provided by the Police Department. Their primary duties include answering emergency 9-1-1 and non- emergency telephone calls from citizens and then dispatching police officers or civilian employees to handle the calls for service. They check vehicle and license registrations and also query county, state, and federal databases for wanted persons, stolen vehicles, and property, etc. FY2017 estimated budget for the Communications Section, including salaries and benefits, overtime, operating costs, supplies, etc.: $880,370. Records Section The Records Section is comprised of one supervisor, two full-time records specialists, and one part-time records specialist. Records Specialists process and file the large volume of reports generated daily by employees of the Police Department. They also compile documents in response to public records requests from citizens, media, and other criminal justice agencies. FY2017 estimated budget for the Records Section, including salaries and benefits, overtime, operating costs, supplies, etc.: $204,006. Property/Evidence Section The Property/Evidence Section is comprised of one full-time and one part-time property/evidence officer. Property/Evidence Officers are responsible for ensuring the protection of all property and evidence seized by the Police Department until statutory time limits are met or the legal system has determined there is no longer a need to hold such items. FY2017 estimated budget for the Property/Evidence Section, including salaries and benefits, overtime, operating costs, supplies, etc.: $77,102. Accreditation Unit The Accreditation Unit is comprised of one civilian accreditation manager. The employee is responsible for managing the accreditation process as established by the national Commission on Accreditation for Law Enforcement Agencies, Inc. (CALEA). The Police Department was initially accredited in 1995 and has been successfully re-accredited six times. For over twenty years, the Police Department has been in compliance with the CALEA accreditation process which ensures the Police Department is following best practices as established by the International Association of Chiefs of Police, National Sheriffs Association, National Organization of Black Law Enforcement Executives, and the Police Executive Research Forum.
FY2017 estimated budget for the Accreditation Unit, including salaries and benefits, overtime, operating costs, supplies, etc.: $85,395. ($23,045 in accreditation fees, travel and training, etc. will be paid from the Administrative Division budget.)

Police Department
110
Animal Control Officer The Animal Control Officer is responsible for enforcing all animal control ordinances in the City. This includes patrolling the beachfront during daytime hours to enforce a ban on dogs. The Animal Control Officer also responds to citizen complaints of wild animals, reptiles, and stray animals. The animals are held in pens at the Animal Control Office until a City of Jacksonville animal control officer responds to take custody of them. FY2017 estimated budget for the Animal Control Officer program, including salaries and benefits, overtime, operating costs, supplies, etc.: $50,343. Paid Parking/Security Unit The Parking Enforcement Unit is comprised of one supervisor and ten part-time community service officers (CSOII). The unit is responsible for parking enforcement throughout the City with particular emphasis on parking issues in the downtown business district. The supervisor oversees the City’s parking enforcement program in three City-owned parking lots downtown. The CSOII provide security and informational services to the visitors in the paid parking lots. The unit also includes overtime for one police officer to provide additional security, roving in the three paid parking lots during peak hours. The parking unit is under the supervision of the Services Division Commander. FY2017 estimated budget for the Parking Enforcement Unit, including salaries and benefits, overtime, operating costs, supplies, etc.: $140,081. (This program is fully funded through parking revenues.) Volunteer Programs The volunteer program consists of Citizen Police Academy Alumni members and 23 Citizens on Patrol (COP) volunteers. There is one part-time volunteer coordinator who schedules and supervises all of the volunteer programs. The coordinator is paid from the Law Enforcement Trust Fund ($15,764). The unit provided over 12,760 hours of volunteer service for the Police Department in 2015. The uniformed COPs have two vehicles used for patrol. FY2017 estimated budget for operating supplies, vehicle maintenance, fuel, uniforms, etc.: $20,000 for a combined total of $35,764. Police Administration The Police Administrative Division consists of the Chief of Police, one administrative assistant, and two staff assistants. Salaries and benefits: ($544,932). The Administrative Division is responsible for all software fees, professional services, internal service charges, utilities, legal fees, etc.:($558,941). The Court Costs Training Fund is a special revenue that helps pay for training and related costs:($60,000). Total Administration Division costs: $1,163,873.

Police Department
111
Department Highlights
Maintained exceptional response times to emergency and non-emergency calls (2.43-minute average for emergency calls, and 5.19 average for non-emergency), exemplifying the department’s commitment to customer service and improving citizens’ safety.
There has been a decrease in major crimes (theft, assault/battery, auto burglary, burglary, robbery, and homicide) overall by 7% from 2011 to 2015. These crimes fluctuate from year to year, and these changes are influenced by many other factors unrelated to law enforcement.
Benefited from Citizen Police Academy Alumni Association members, who volunteered
12,760 hours in 2015, assisting the department in its mission. Volunteers worked in the records section, vehicle maintenance, animal control, parking citation program, and beach patrol. The volunteers also worked at numerous special events including the Opening Day of the Beaches Parade and the Sea and Sky Spectacular.
Removed 165 intoxicated drivers from the roadways, making Jacksonville Beach safer for vehicles, bicyclists, and pedestrians.
Conducted 56 community relations programs directly impacting 5,447 citizens (e.g.,
firearms safety, bicycle safety, Neighborhood Watch, DUI prevention, etc.) Completed Citizen Police Academy classes XXXV and XXXVI, achieving high
approval ratings. Through 36 academies, 1,034 citizens have gained a better understanding of law enforcement and the Jacksonville Beach Police Department.
Continued the Citizens On Patrol (COP) Program. Twenty-three graduates of the COP
Training Academy assisted the Patrol Division with traffic direction, property checks, neighborhood notifications of sex offenders, and completing reports of minor offenses such as gas drive-offs, etc.
Participated for the fourth time in the annual National Night Out event. National
Night Out is an annual event designed to strengthen communities by encouraging neighborhoods to engage in stronger relationships with each other and with their local law enforcement partners.
Hosted the 22nd Annual Kids Fishing Rodeo at the Huguenot Park lagoon.
Approximately 1,000 children and parents attended the event.
Hosted the annual Kids Halloween Party and Kids Christmas Party. Approximately 1,750 children and parents attended the two events.
Note: See performance measures on the following pages for additional accomplishments.

Police Department
112
Customer Service Surveys
Chart reflects results of 120 random surveys for 2016. Crime Prevention Services The Police Department provides crime prevention services designed to make the community safer. Those services include Neighborhood Watch, sex offender and sexual predator neighborhood notifications, robbery prevention seminars, and personal, business, and home safety classes, among many others.
*The “Theft” category includes crimes such as retail theft (shoplifting), theft of bicycles, and
thefts from the beach (e.g., cell phones, backpacks, etc.).
Excellent74%
Good26%
Quarterly Customer Service Survey
2011 2012 2013 2014 2015
981838 835 798
942
454 438 442 460 450249193 1… 168 240171 147 148 139 124
56 5524 29 30
4 1 0 1 0
Selected Crime Statistics: 2011-2015Theft Assault/Battery Burglary/Auto Burglary Robbery Homicide
Each quarter, the police department conducts a random survey of 30 citizens who have encountered a member of the department within the preceding three months. The survey asks respondents to rate the employee’s professionalism and helpfulness to the citizen during the encounter.

Police Department
113
Performance Measures
Outcomes Performance Measure
Actual FY2015
FYTD through 3/15/16
Target FY2017
Continually seek new and better methods to improve citizens’ safety.
Maintain four minute or less average response time to emergency calls
2.41 minutes
2.43 minutes
4.00 minutes
Maintain six minute or less average response time to non-emergency calls
5.03 minutes
5.19 minutes
6.00 minutes
Continue strict enforcement of DUI laws to improve safety of city roadways
Arrests 165
Arrests 97
Arrests 125
Conduct quarterly neighborhood notifications of sex offenders and sexual predators living in the city
4 2 4
Notify local residents, schools, and day care facilities within 48 hours of a sexual predator moving into a neighborhood
Yes Yes Yes
Conduct strict enforcement task forces in the CAPE neighborhood
6 3 6
Maintain strong partnerships with citizens to improve public safety.
Complete two Citizen Police Academy classes with a positive rating of 95% or higher (51 surveys)
100% 100% 95%
Continue crime prevention and youth-oriented services offered through the CAPE program
Yes Yes Yes
Complete one Youth Police Academy with a positive participant rating of 95% or higher
Yes Yes Yes
Involve CPA Alumni Association members in community relations and crime prevention programs
29 16 20
Use Citizens On Patrol (COP) volunteers to enhance services
Yes Yes Yes
Develop professional employees through competent hiring practices, ongoing training and career development.
Continue emphasis on career development through training
10,383 hours
4,342 hours
8,000 hours
Attend five job fairs to expand the pool of exceptional candidates for employment
6 5 4
Number of consecutive years accredited through the national Commission on Accreditation for Law Enforcement Agencies (CALEA)
20 21 22
Continue the strong commitment to outstanding customer service.
Achieve positive ratings of 90% or higher on quarterly customer service surveys (120 surveys completed each year)
97% 98% 90%

Police Department
114
Financial Summary General Fund
Special Revenue Funds
Other Funding Sources
2016 2017 Other Funding Source Use Budget Budget Community Development Block Grant (Federal)*
CAPE Program in Pablo Beach, South Neighborhood $63,982 $63,041
Total-General Fund $63,982 $63,041 Community Redevelopment Agency
Eleven Downtown CAPE officers, operating supplies and overtime $877,975 $1,054,539
Law Enforcement Trust Fund (State)
Equipment Grant Matches and Crime Prevention Programs $62,819 $63,264
Equitable Sharing Fund (Federal)
Equipment Grant Matches and Crime Prevention Programs $26,000 $175,000
Court Costs Training Fund (State) Employee Training $60,000 $60,000 Justice Assistance Grant (State)* Street Crimes Task Force overtime $0 $52,233 Justice Assistance Grant (Local)* Equipment Purchases $12,039 $0 TOTAL OTHER FUNDING SOURCES $1,038,833 $1,405,036 * Assistance is dependent on continued Federal funding.
Original AdoptedResource Actual Budget Budget Increase %Allocation 2015 2016 2017 -Decrease ChangePersonal Services $6,325,189 $6,696,064 $7,002,864 $306,800 4.6%Operating $1,159,958 $1,272,454 $1,287,496 $15,042 1.2%Capital Outlay $242,546 $150,000 $160,000 $10,000 6.7%
TOTAL $7,727,693 $8,118,518 $8,450,360 $331,842 4.1%
Original AdoptedResource Actual Budget Budget Increase %Allocation 2015 2016 2017 -Decrease ChangePersonal Services $753,092 $777,794 $901,553 $123,759 15.9%Operating $112,738 $219,250 $239,250 $20,000 9.1%Capital Outlay $185,464 $41,789 $212,000 $170,211 407.3%Transfers $65,701 $0 $52,233 $52,233 -
TOTAL $1,116,995 $1,038,833 $1,405,036 $366,203 35.3%
The budget includes estimated increases for wages, pension and health insurance.
Additional funding sources are from grants, contractual agreements and dedicated funding sources established by Florida Statutes.
The primary special revenue funding source is the Community Redevelopment Agency. Other expenses in these funds are budgeted when notice of the grant is received and the expense has been approved by the City Council.

Police Department
115
Budget Issues Public Safety Radio System Replacement: The City’s 800 MHz Motorola radio system is composed of three 9-1-1 dispatch center consoles, radio tower, radio room with controller and repeaters, and approximately 346 radios (citywide). The major components will be 16 years old (purchased January 2001) next year and are approaching the time when the manufacturer will no longer service the items. As radios and control equipment age, they eventually lose the support of the manufacturer and have to be replaced (approximate 15-year cycle). In order to be able to communicate with radio systems in neighboring jurisdictions, to remain P-25 compliant, and because the manufacturer will no longer support our current radio components, a new radio system is required. Funding for the replacement of the radio system components can be distributed over several years. The general fund continues to make a series of transfers to the General Capital Projects Fund to build a reserve to pay for the replacement radios and radio equipment. The initial total expenditure is anticipated in FY2017 to be approximately $716,005 for the following components;
Radio System Components: Cost 9-1-1 Dispatch Consoles (3) MCC7500 $282,159 ASTRO Site Repeater (ASR) 5-Channel repeaters $233,564 Astro L-core, trunking, non-redundant controller $200,282 Total: $716,005
In addition to General Capital Projects funds, Federal Equitable Sharing funds of $105,000 will be used to replace 20 radios in FY2017. The radio replacement program will continue in future years until all radios are replaced. Vehicle Replacement: Replacement of four or five police vehicles in FY2017. Total cost for vehicles: $160,000. Community Response Team vehicles: Purchase two new vehicles for the community response team in FY 2017, from the Federal Equitable Sharing program. Total cost for two vehicles: $44,000. Downtown CAPE Program: Due to the addition of two positions to the CAPE program, one corporal and one officer, the Community Redevelopment Agency will purchase two patrol vehicles and corresponding required equipment: $63,000.

Police Department
116
Budget Issues (continued) Justice Assistance Grant/Byrne (Local): This grant is earmarked for municipalities and requires no local matching funds. Grant funds have been used in the past to purchase equipment. The grant amount for FY2017 is unknown at this time; the funding level should be announced in July. It is expected to be approximately $11,445 and will be used to pay for equipment. The budget will be adjusted when the grant is awarded. Justice Assistance Grants (State): This grant is earmarked for municipalities and routed through the state. Appropriations from this grant must be approved by a minimum of 51% of the law enforcement agencies in Duval County (Jacksonville Sheriff’s Office, Jacksonville Beach Police Department, Atlantic Beach Police Department, and Neptune Beach Police Department). In past fiscal years, the Police Department has used this grant to provide overtime funds for a downtown Street Crimes Task Force. FY2017 grant will be used to partially fund overtime for the Street Crimes Task Force. The JAG Grant amount for FY2017 is unknown at this time but estimated to be approximately $40,788. The budget will be adjusted when the grant is awarded.

Fire Department
117
Mission To protect the lives and property of citizens, by providing professional fire and life safety services to people in need. Emergency Response The Fire Department is staffed and equipped to respond to:
One single serious fire/EMS event. Three simultaneous emergency calls. A major event utilizing all fire department and city resources. Auto/mutual aid is necessary and normally available for major events. Organization The Fire Department is responsible for providing emergency services, administering prevention and inspection programs, overseeing disaster management, and handling the City’s radio system. Three shifts comprised of a Shift Commander, two Lieutenants, and six Firefighter/ Engineers provide fire/medical/rescue, and other services. The Fire Marshal is responsible for inspections, plans review, public education, and code enforcement and is assisted by the Shift Commanders when available. The Training/Safety Lieutenant is responsible for coordinating training activities, serves as the safety officer during major emergencies, maintains medical quality control, and coordinates the safety program. State certified Auxiliary Firefighters are available on a limited basis to supplement staffing and assist combat personnel.
Authorized Positions FY2015 FY2016 FY2017 Fire Chief 1 1 1 Fire Captain 3 3 3 Fire Marshal 1 1 1 Fire Lieutenant 7 7 7 Firefighter/Engineer 18 18 18 Administrative Assistant 1 1 1 TOTAL 31 31 31

Fire Department
118
Primary Services Mitigating fires, medical emergencies response, vehicle accidents, technical rescue,
and other 911 emergencies. Fire prevention and safety through plans review, code enforcement, public education
programs, and fire safety inspections. Emergency disaster management and hurricane preparedness. Managing the City’s 800 MHz radio system.
The Fire Department normally operates two engines, a quint, and a mobile command vehicle daily. Additional staffing may be available from the Auxiliary Firefighter Program. The fire department provides basic and advanced life-support with medical transport provided by the City of Jacksonville as part of an inter-local agreement. Automatic/mutual aid agreements are in place with Jacksonville Fire & Rescue, St. Johns County Fire & Rescue, and Mayport Naval Station Fire Department. The City operates its own 800 MHz radio system and radio tower located at the O&M facility. The radio system is an analogue/digital P-25 capable system having encryption for the police department, and communication abilities with Jacksonville and surrounding counties. The First Coast Radio system and the State’s mutual aid frequencies are used as a back-up system. Satellite phones are available for communication during a disaster when other means of communication are unavailable. CY2015 Accomplishments Zero fire deaths in 2015, and an average response time near 4 minutes.
All structure fires responded to were confined to the area involved upon arrival. 100% of the 213 customer surveys returned indicated excellent or good service. Conducted 888 fire safety surveys, 383 high hazard inspections and updated 1,271 pre-
plans. Conducted 363 construction/remodel inspections, reviewed 335 sets of plans, and 177
consultations. Conducted 123 fire drills in public and private schools and inspected 897 fire hydrants. Installed 144 smoke detectors in homes and checked or installed batteries in 541 smoke
detectors.
Provided education to over 6,277 adults/children in fire safety, prevention, and/or hurricane preparedness.

Fire Department
119
CY2015 Accomplishments (continued)
Members conducted over 8,515 hours of in-service training. Installed and educated 273 families on the proper installation of child safety seats. Conducted city wide training and exercises in hurricane preparedness and an active
shooter exercise in preparation for the Air Show.
Improved the City’s ISO protection class to a Class 2. Updated the City’s Municipal Comprehensive Emergency Management Plan and focused
on improving the Continuity of Operations Plan (COOP) for City Hall.
Conducted a Point of Dispensing (POD) exercise. All front-line units received smart-tablets with Streetwise software for receiving critical
CAD information, live mapping, and building pre-plan information while enroute to an emergency.
Goals for FY2016/2017 1. Zero fire related deaths in Jacksonville Beach by a quick response, commitment to
inspections and code enforcement, and an aggressive smoke detector program. 2. Confine 90 percent of all building fires to the area involved upon arrival by a quick
response, effective fire ground tactics, and trained personnel.
3. Maintain excellent fire/EMS/technical rescue capabilities and safety by expanded monthly in-house training, challenging scenarios, and technical rescue training.
4. Maintain the city’s preparedness capabilities by updating and training employees on the
City’s emergency operational and communication plans.
5. Continue the strong commitment to customer service by receiving 100% customer survey reports of excellent or good service.

Fire Department
120
Performance Measures CY2014
CY2015
FY2016 10-1-15 through 3-1-16
Target for CY2016
Prevent all fire deaths in Jacksonville Beach
Yes Yes Yes No fire deaths
Confine 90% of all building fires in Jacksonville Beach to area involved upon arrival. (17)
100% 100% 100% 90%
Provide Basic or Advanced Life Support service to all calls for Emergency Medical Services (of the 3,293 total calls in 2015, 71% were rescue).
2,132 2,333 845 2,000
Respond to emergencies within 6 minutes (m) for 90%, and within 4 minutes (m) for 70% of all 911 emergency calls.
4m/69% 6m/91%
4m/73% 6m/94%
4m/72% 6m/94%
4m/70% 6m/90%
Complete fire safety surveys and update pre-plans of commercial buildings once every 2 years (718 per year).
810 888 399 718
Conduct high hazard inspections and update pre- plans of daycares, Medical Centers, Private Schools, Group Counseling Centers, Nursing Homes and Assisted Living Facilities.
271 383 168 189
Conduct 80 fire evacuation drills in schools.
119
123
60 80
Educate 3,500 citizens/children in fire safety and/or hurricane preparedness each year.
4,447 6,277 5,109 3,500
Install or replace 80 smoke detectors in unprotected homes of elderly, disabled, or fixed income citizens.
129 144 108 80
Check, test or replace batteries in 375 existing smoke detectors.
560 541 229 375
Inspect all city and private fire hydrants annually.
912 897 898 890
Complete 7,000 in-service training hours. 9,192 8,515 3,360 7,000
Receive a 100% excellent or good evaluation by citizens1
100% 100% 100% 100%
Install/inspect/educate families on child safety seats.
181 273 96 NA
1Survey responses (# returned): 2014 (222), 2015 (213), FYTD 2016 (99) The Fire Department measures its effectiveness by tracking alarms, inspections, survey cards returned, and training records on a monthly and calendar year (CY).

Fire Department
121
Annual Calls for Service
In 2015, the Fire Department experienced an increase in call volume over 2014:
3,293 calls for service in 2015 and 3,045 in 2014.
Funding Sources Fire Department funding is primarily through the General Fund. Radio services are funded by the Radio Communications Special Revenue Fund, Capital Improvement Fund, and each individual department that utilizes the City’s 800 MHz radio system. Firefighter Auxiliary Program All current Firefighter Auxiliary members have been hired as full time. The program remains open, however there are no current members. 2015-16 Grants The fire department continues to apply for grant funding as opportunities become available. Assistance to Firefighters Grant (AFG): A diesel emission removal system for
Station 1 was approved in 2014 to remove the potential toxic by-products of diesel exhaust at the station. This project was completed in the fall of 2015.
2,600
2,800
3,000
3,200
3,400
2007 2008 2009 2010 2011 2012 2013 2014 2015
Calls for Service for the Jacksonville Beach Fire Dept.
The fire department responded to 3,293 responses in CY2015. 2% Structural Fires 71% Medical 27% Hazardous
Conditions

Fire Department
122
Financial Summary
Budget Issues Radio System Maintenance/Repairs: In an effort to expedite emergency repairs to the City’s 800 MHz radio system not covered by the maintenance contract, $10,000 in the Radio Fund will be targeted for emergency repairs. The 911 dispatch center consoles, police and fire radios, as well as the repeaters and controller will need to be replaced beginning in 2017. Fire Apparatus Replacement Program
In order to maintain an efficient fleet of fire apparatus, a planned capital improvement program is required. This replacement program has been funded annually by the City Council. Because of the cost of new apparatus and the economic conditions, the goal of this program and the life of apparatus has had to be extended. The goal of the program is to keep apparatus in front-line service for approximately 12-14 years and then place them in reserve for approximately 5-10 years. While we have two older reserve units, we have replaced the pumps on both units (E-25 and E-14), extending their life.
This schedule can be attained by committing $75,000 per year. The replacement schedule is included in the 2017 Capital Improvement plan (CIP). E-25 or Sq-13 was scheduled to be replaced in 2017. One of these units will be utilized as a spare engine.
Original AdoptedResource Actual Budget Budget Increase %Allocation 2015 2016 2017 -Decrease ChangePersonal Services $3,065,781 $3,285,322 $3,309,983 $24,661 0.8%Operating $412,729 $472,940 $477,267 $4,327 0.9%
Capital Outlay $30,603 $39,250 $36,300 -$2,950 -7.5%
TOTAL $3,509,113 $3,797,512 $3,823,550 $26,038 0.7%

Fire Department
123
Fire Apparatus Replacement Program
Engine Description Model Year Age
Q-11 Ferrara Ladder (Quint) 2010 6
E-14 Pierce Pumper (reserve) 1996 20
SQ-13 Freightliner Pumper 2001 15
E-22 E-1 Rescue/Pumper 2006 10
E-25 Pierce Pumper (reserve) 1993 23
Replacement Schedule
Year
Replace Apparatus
Cost
CIP Budget
FY2017 E-25 or Sq-13 $375,000 $75,000
FY2018 $75,000
FY2019 $75,000
FY2020 $75,000
FY2021 E-22 $375,000 $75,000
Emergency Preparedness A pro-active approach is taken to emergency preparedness activities that potentially could impact the city. Key preparedness activities include: Annual hurricane training with employees. Annually updating the municipal comprehensive emergency management plan
(MCEMP). Conducting annual city exercises on hurricane preparedness/planning and terrorism. Ensuring all National Incident Management System training requirements and
criteria are met. In the event of a major storm or other similar emergency, the City Manager may authorize the use of budget funds to pay for purchases such as: Rental equipment: Trucks/trailers, portable shelters, generators, and port-a-lets. Supplies: Fuel, food, water, and medical supplies. Staffing and communications equipment.

Fire Department
124
Comparison Survey The Jacksonville Beach Fire Department does a comparison survey annually with similar sized cities and fire departments to determine how efficient our department is in comparison to the other departments. Statistics assessed include the assessed valuation of property, fire department budget, number of calls responded to, number of firefighters, and the population. This comparison survey is based on the 2015 calendar year statistics. This data does not reflect the actual minimum staffing per shift nor the method that each department may use to determine calls. The following graphs illustrate the findings from the data and indicate that the Jacksonville Beach Fire Department operates efficiently.
130
151
118
161
173
87
132
0 100 200
St. Augustine
Port Orange
Jacksonville Beach
Ormond Beach
Titusville
Fernandina Beach
New Smyrna Beach
Calls for Service per Firefighter
$744
$1,019
$1,067
$728
$703
$1,785
$1,112
$0 $500 $1,000 $1,500 $2,000
St. Augustine
Port Orange
Jacksonville Beach
Ormond Beach
Titusville
Fernandina Beach
New Smyrna Beach
Cost per Call of Service
Calls for Service CY 2015 Average number of calls for service per firefighter: = 136. Jacksonville Beach Fire Department had 118. The Jacksonville Beach Fire Department responded to 3,293 calls for service in CY 2015. Cost per Call CY 2015 Average cost per call for service: = $1,023. Jacksonville Beach Fire Department was $1,067.

Fire Department
125
Comparison Survey (continued)
$1,700
$2,300
$1,100
$1,500
$2,700
$2,100
$1,400
$0 $1,000 $2,000 $3,000
St. Augustine
Port Orange
Jacksonville Beach
Ormond Beach
Titusville
Fernandina Beach
New Smyrna Beach
Cost per 1 million of Protected Property
2.2
0.9
1.2
1.2
1.1
2.3
1.5
0.0 1.0 2.0 3.0
St. Augustine
Port Orange
Jacksonville Beach
Ormond Beach
Titusville
Fernandina Beach
New Smyrna Beach
Firefighters per 1,000 Population
Cost per $1 million of Protected Property CY 2015 Average cost per $1 million of protected property = $1,829. Jacksonville Beach Fire Department was $1,100. Firefighters per 1,000 Population CY 2015 Average number of firefighters per 1,000 population: = 1.5. Jacksonville Beach Fire Department was 1.2.

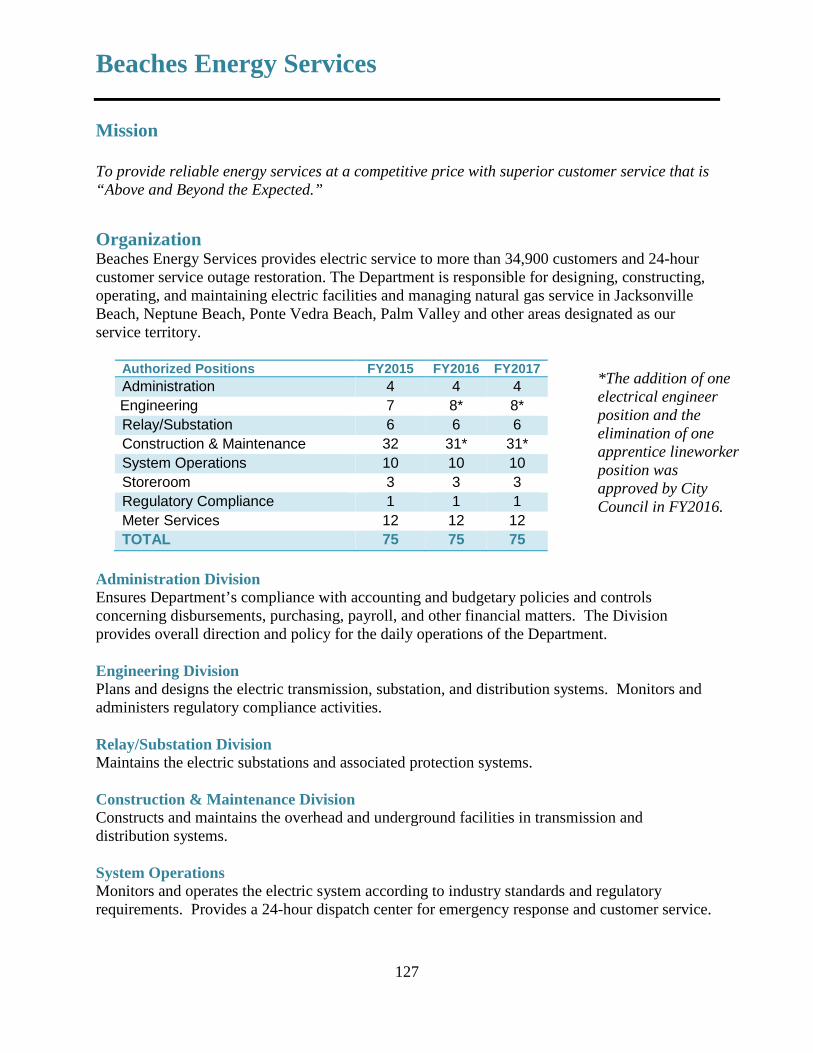
Beaches Energy Services
127
Mission To provide reliable energy services at a competitive price with superior customer service that is “Above and Beyond the Expected.”
Organization Beaches Energy Services provides electric service to more than 34,900 customers and 24-hour customer service outage restoration. The Department is responsible for designing, constructing, operating, and maintaining electric facilities and managing natural gas service in Jacksonville Beach, Neptune Beach, Ponte Vedra Beach, Palm Valley and other areas designated as our service territory.
Authorized Positions FY2015 FY2016 FY2017 Administration 4 4 4 Engineering 7 8* 8* Relay/Substation 6 6 6 Construction & Maintenance 32 31* 31* System Operations 10 10 10 Storeroom 3 3 3 Regulatory Compliance 1 1 1 Meter Services 12 12 12 TOTAL 75 75 75
Administration Division Ensures Department’s compliance with accounting and budgetary policies and controls concerning disbursements, purchasing, payroll, and other financial matters. The Division provides overall direction and policy for the daily operations of the Department. Engineering Division Plans and designs the electric transmission, substation, and distribution systems. Monitors and administers regulatory compliance activities. Relay/Substation Division Maintains the electric substations and associated protection systems. Construction & Maintenance Division Constructs and maintains the overhead and underground facilities in transmission and distribution systems. System Operations Monitors and operates the electric system according to industry standards and regulatory requirements. Provides a 24-hour dispatch center for emergency response and customer service.
*The addition of one electrical engineer position and the elimination of one apprentice lineworker position was approved by City Council in FY2016.

Beaches Energy Services
128
Organization (continued) Storeroom Division Provides supplies, materials, and services to all City Departments. Regulatory Compliance Monitors industry developments and measures required for NERC and FRCC compliance. Natural Gas Division Provides contract management administration and oversight for all activities in the delivery of natural gas. Meter Services Division Provides support services for all meter reading and meter service functions. Recent Accomplishments: FY2015-2016 • Beaches Energy Services received the Diamond designation for the years 2014-2016 from
the American Public Power Association (APPA) for our Reliable Public Power Provider (RP3) submission. We will be re-applying for the designation this fiscal year for the 2017 award year.
• Florida Municipal Electric Association (FMEA) honored Beaches Energy Services with its Building Strong Communities Award, recognizing the utility for its commitment to enhancing the quality of life in their community (November 2015).
• Beaches Energy Services personnel completed the implementation of the Transmission Operators Service with the Orlando Utilities Commission. This included training and updating processes and communications upgrades to ensure that OUC could operate our bulk electric system equipment.
• Aerial Inspections of Transmission Circuits 804 and 805 (lines run from our 230 kV Sampson substation to both Guana and Ft. Diego substations) were completed by drone this past December. This 17 mile, 259 structure inspection was very innovative and cost effective using drone technology. In fact, our project was highlighted in Transmission & Distribution World Magazine.
• The A1A loop feed for South of Mickler Road project was completed. Not only did our new design save approximately $75,000 in construction costs, but positive customer relations resulted in few complaints on this project which consisted underground boring along the east side of A1A between Mickler Road and the Guana River State Park (November 2015).
• Beaches Energy Services employees competed in the Florida Municipal Electric Association Lineman Competition in Orlando. Beaches Energy teams earned awards in the following events: Journeyman teams won 1st place in two events and 2nd place in another. Apprentice Line worker Steven Sutherlin placed 2nd in one event and 3rd in another (March 2016).

Beaches Energy Services
129
System Reliability
2015 Distribution Reliability Indices
FL Munis FPL TECO Duke Gulf FPUC Beaches
Average Minutes Out
per Customer
71.52 59.4 79.12 79.7 88.2 127.37 39.46
Average # of Times Out
per Customer
1.18 1 1.03 0.98 1.02 1.62 0.771
Customer Service
Each year, the Billing Office mails out customer service surveys. The following represents the customers’ ratings for questions that were given a response of “yes” or “no”. The 2015 surveys were sent to 720 customers and 125 customers responded. The 2016 surveys were sent to 360 customers and 70 customers responded.
Customer Service
Actual FY2014
Actual FY2015
FYTD 3/31/16
Target FY2017
The utility bill is easy to understand. 99% 100% 100% 95% Our service is reliable. 99% 100% 100% 95% I was treated courteously. 100% 100% 100% 95% The service was prompt. 99% 100% 100% 95% The employee was helpful. 100% 100% 100% 95% The employee was knowledgeable. 100% 100% 100% 95% The employee referred to me by name. 92% 92% 98% 95% The employee thanked me for my business.
99% 96% 94%
95%
Beaches Energy Services employees are committed to serving our customers and exceeding their expectations.

Beaches Energy Services
130
Customer Service (continued) Each year, Beaches Energy Services mails surveys to our energy audit customers. The 2015 surveys were sent to 361 customers and 138 responded. The 2016 surveys were sent to 138 customers and 61 responded. The following represents the customers’ ratings.
Energy Audits
Actual FY2014
Actual FY2015
FYTD 3/31/16
Target FY 2016
Energy Audit Survey
Percent Agree
Percent Agree
Percent Agree
Target Agree
Was the Utility Auditor on time for your scheduled audit?
97% 100% 100%
95%
Was the Utility Auditor polite and courteous? 100% 100% 100% 95% Was the Utility Auditor knowledgeable and helpful when explaining the results of the audit?
100% 99% 100%
95% Did the Utility Auditor provide you with tips to conserve energy?
100% 98% 98%
95%
Would you recommend this audit service for other customers?
100% 99% 98%
95%
Did you find the Beaches Energy Gift Bag and DVD useful? 88% 88% 98% 95%
In addition to the yearly surveys we send to customers via mail, Beaches Energy teamed up with the Shepherd marketing and advertising group to deploy an online survey on October 14th, 2015. The survey was created to better understand customers’ awareness and familiarity with Beaches Energy, as well as to measure key performance attributes. Results of the survey revealed that Beaches Energy ratings are very high and have improved significantly since a similar survey was conducted in 2002. Seventy-six percent (76%) of residential customers and eighty-two percent (82%) of commercial customers replied that they were “very satisfied” with Beaches Energy Services.
2015 “Agree”
Cares About Customers
84%
Handles Service Requests Quickly
83%
Well-Managed Organization
75%
Easy Phone System 69%
2002 “Agree”
Cares About Customers
64%
Handles Service Requests Quickly
67%
Well-Managed Organization
65%
Easy Phone System
54%

Beaches Energy Services
131
The number of total customers served has grown from 33,270 in 2006 to 34,900 in 2016. This increase represents a five (5) percent increase over the past ten years.
Cost • Beaches Energy Services residential rate for 1,000 kWh remains below the State average (see
rate schedule, page 11). • Beaches Energy Services provides a monthly credit for customers on the demand rate.
Customers receive a monthly credit on demand charges which ranges from $2.00/kW for a 75 percent load factor to $0.50/kW for a 60 percent load factor.
Energy Efficiency and Conservation • Electric conservation and informing customers on how to conserve has become an important
part of our business. Beaches Energy Services is working on conservation, energy efficiency, demand-side management and renewable energy initiatives so that all programs are coordinated to achieve optimal results and benefits.
• Conservation tips can be found on Beaches Energy Services website at www.beachesenergy.com and in the monthly Tidings newsletter.
• Energy saving rebates are offered for residential energy-efficient improvements. For more details about available rebates, visit our website (shown above).
• Free energy audits are available to customers upon request. Our Energy Auditors provide specific suggestions customized to the homeowners’ audit results. Alternatively, customers can perform an online self-energy audit by using the “My Energy Planner” tool accessible through the beaches energy website.
• Energy Toolkits and Energy Conservation DVDs were provided to 361 customers from October 2014 to September 2015.
32,000
32,500
33,000
33,500
34,000
34,500
35,000
35,500
2006 2007 2008 2009 2010 2011 2012 2013 2014 2015 2016
Cust
omer
s
Calendar Years
Customer Growth Trends
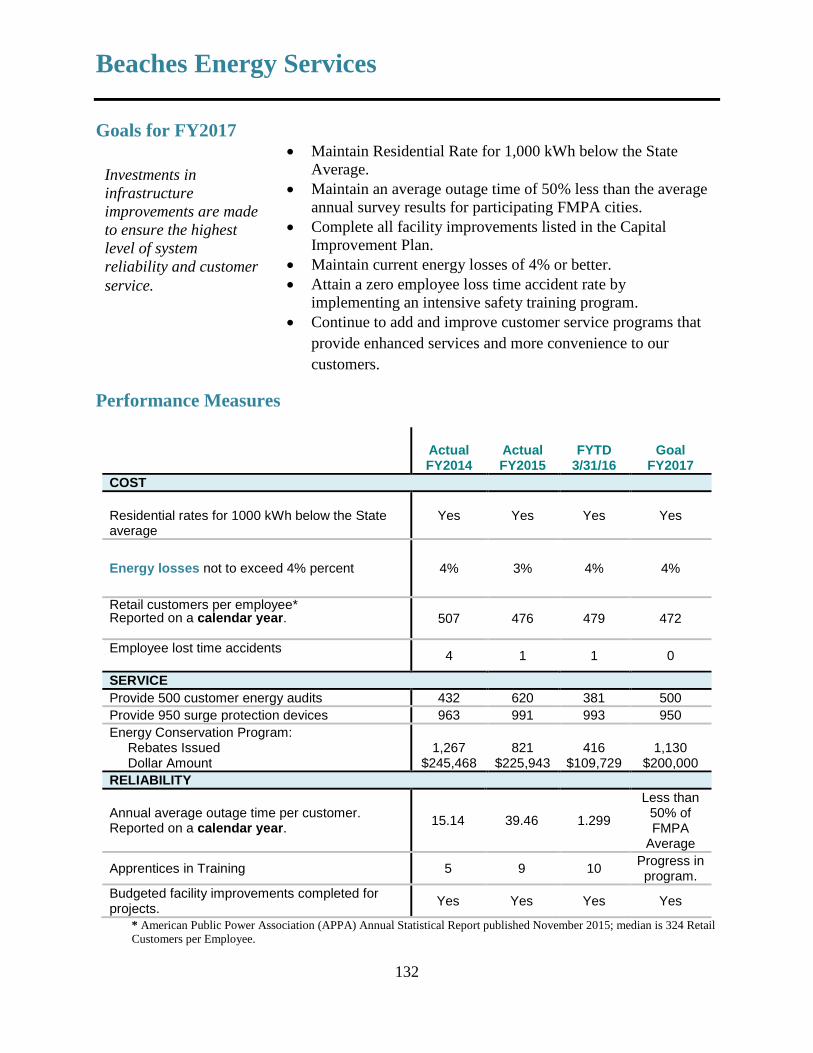
Beaches Energy Services
132
Goals for FY2017 • Maintain Residential Rate for 1,000 kWh below the State
Average. • Maintain an average outage time of 50% less than the average
annual survey results for participating FMPA cities. • Complete all facility improvements listed in the Capital
Improvement Plan. • Maintain current energy losses of 4% or better. • Attain a zero employee loss time accident rate by
implementing an intensive safety training program. • Continue to add and improve customer service programs that
provide enhanced services and more convenience to our customers.
Performance Measures
Actual FY2014
Actual FY2015
FYTD
3/31/16 Goal
FY2017 COST Residential rates for 1000 kWh below the State average
Yes Yes Yes Yes
Energy losses not to exceed 4% percent 4% 3% 4% 4%
Retail customers per employee* Reported on a calendar year.
507 476 479 472
Employee lost time accidents 4 1 1 0
SERVICE Provide 500 customer energy audits 432 620 381 500 Provide 950 surge protection devices 963 991 993 950 Energy Conservation Program: Rebates Issued Dollar Amount
1,267
$245,468
821
$225,943
416
$109,729
1,130
$200,000 RELIABILITY
Annual average outage time per customer. Reported on a calendar year. 15.14 39.46 1.299
Less than 50% of FMPA
Average
Apprentices in Training 5 9 10 Progress in program.
Budgeted facility improvements completed for projects. Yes Yes Yes Yes
* American Public Power Association (APPA) Annual Statistical Report published November 2015; median is 324 Retail Customers per Employee.
Investments in infrastructure improvements are made to ensure the highest level of system reliability and customer service.

Beaches Energy Services
133
Funding Sources: Total projected revenue for FY2016 is $91,351,444.
*Other includes internal service charges for meter reading, interest, primary fees, and streetlight maintenance charges.
Financial Summary
Residential, $51,649,786 ,
57%
Other, $2,555,786 , 3%
Commercial Non-demand,
$10,420,473 , 11%
Commercial Demand,
$21,859,559 , 24%
City Accounts, $1,017,943 , 1%
Streetlights, $762,905 , 1%
Natural Gas, $1,748,728 , 2%
Reserve for Capital Projects, $1,336,264 , 1%
Original AdoptedResource Actual Budget Budget Increase %Allocation 2015 2016 2017 -Decrease Change
Personal Services $5,709,684 $6,122,152 $6,298,850 $176,698 2.9%Purchased Power
$60,161,257 $67,742,117 $62,997,463 -$4,744,654 -7.0%
Operating $6,662,532 $8,020,058 $8,112,027 $91,969 1.1%Capital Outlay $4,343,995 $5,655,000 $7,148,000 $1,493,000 26.4%Debt Service $2,570,610 $2,584,335 $2,577,267 -$7,068 -0.3%Transfers $3,933,770 $4,142,323 $4,217,837 $75,514 1.8%TOTAL $83,381,849 $94,265,985 $91,351,444 -$2,914,541 -3.1%

Beaches Energy Services
134
Budget Issues
Florida Municipal Power Agency and the Cost of Power
Florida Municipal Power Agency (FMPA) is a wholesale power agency owned by municipal electric utilities. FMPA provides economies of scale in power generation and related services to support community-owned electric utilities. The City of Jacksonville Beach joined the FMPA May 1, 1986 and is one of the 14 all-requirements members. Current long range load projection studies indicate FMPA has adequate generation resources for the next 10 years.
Providing reliable electric services is a continuous activity that requires long-term vision. Pending governmental regulations regarding CO2 and mercury could have a major impact on deciding future power supply options. This national trend coupled with uncertainty at the federal level regarding natural gas hydraulic fracking has resulted in many electric utilities delaying decisions on capital expenditures for generation resources. Though the future of Hydraulic fracturing is uncertain, the Energy Information Administration (EIA) says that the abundance of natural gas being produced domestically will bring the Henry Hub spot price from $2.25/MBtu in 2016 to $3.02/MBtu in 2017. The price of natural gas and regulatory compliance will drive future costs.
Clean, efficient natural gas is the key cost driver of Beaches Energy’s purchase of power. In addition to weather conditions and system growth, energy consumption overall is down due to more energy-efficient appliances and conservation measures.
600
650
700
750
800
850
2005
2006
2007
2008
2009
2010
2011
2012
2013
2014
2015
Meg
awat
t Hou
rs (i
n th
ousa
nds)
Megawatt Hours Purchased

Beaches Energy Services
135
Budget Issues (continued)
Beaches Energy Services is doing everything possible to keep our electric rates below the state average and provide reliable, excellent service to our customers. Conservation and energy efficiency programs have been very successful and continue to benefit customers. We will continue monitoring these programs and investigate new measures that provide value to our customers. Additionally, we are leading change at the Florida Municipal Power Agency to update the strategic plan to focus on paying off all of the All-Requirements Project debt in 20 years or less, replacing the all-requirements model with a project based model that also utilizes purchase power agreements (PPAs) and other strategic partnerships, preparing the Agency for the future by limiting the amount of new generation built and relying on distributed generation (DG) resources when cost effective, utilizing community solar to delay, lessen or eliminate the need for securing generation assets, and ensuring that risky long-term natural gas hedging and interest rate swaps activities are no longer employed.
0%
4%
2%
11%
83%
FMPA All Requirements Project (ARP)Total Resources Fuel Mix
Calendar 2015
Purchase Contracts
Nuclear
Florida Municipal PowerPool Purchases
Coal Generation
Gas Generation

Beaches Energy Services
136
Regulatory Issues Reliability Standards Beaches Energy Services has undergone dramatic regulatory changes that continue to evolve. Regulatory mandates to improve the reliability of the bulk power system are placing more requirements on our resources. NERC (North American Electric Reliability Corporation) and FRCC (Florida Reliability Coordinating Council) work in concert for the purpose of proposing and enforcing reliability standards that impact the operations of transmission providers in Florida. Beaches Energy Services is currently solely responsible for 42 different NERC reliability standards but also has to review new and revised standards constantly to ensure that we are compliant. During the past years 74 different standards were reviewed Transmission As a transmission owner, Beaches Energy Services is obligated to comply with these standards or be subjected to financial penalties. In order to achieve zero-defect compliance to NERC and FRCC reliability standards, Beaches Energy Services must develop a comprehensive process that will continually monitor industry developments and implement cost effective measures responding to actions required by regulatory agencies. Critical Infrastructure Protection Beginning July 1, 2016, Beaches Energy Services will be responsible for operating its transmission system under the more rigid standards of Critical Infrastructure Protection (CIP) Version 5. This new version has changed the overall philosophy of previous standards in its approach and measurement. Cybersecurity assets must be identified and aligned with the specific risks – threats, vulnerabilities and tolerances of each organization. The framework includes 11 standards required to support reliable operation of the Bulk Electric System. Regulatory Requirements and Transmission Operations In order to mitigate the impact of Critical Infrastructure Protection Version 5 (CIP5), Beaches Energy Services has entered into a partnership with the Orlando Utilities Commission (OUC) and Kissimmee Utility Authority (KUA) that allows OUC to provide Transmission Operations Services for Beaches Energy Services. Modernizing Electric System Infrastructure Ensuring the reliability and security of electric service to our customers is essential to Beaches Energy Services operations. A field inventory of assets has been completed that provides an accurate assessment of age, condition, and configuration of the existing distribution system. Programs have been developed to systematically address maintenance and underground cable replacement. These programs provided the details and processes required to address our aging infrastructure and improve service reliability.

Beaches Energy Services
137
1000 kWHBase Rate
1000 kWHTotal *
Add Local Taxes &
Fees
j Total with Taxes &
FeesFlorida Public Utilities-NE ** 33.60$ 135.48$ 16.75$ 152.23$ Florida Public Utilities-NW ** 33.60 135.48 16.75 152.23Gulf Power ** 95.41 132.19 16.34 148.53Gainesville 60.40 130.40 13.04 143.44Bartow 54.70 124.70 12.47 137.17Newberry 107.50 122.50 12.25 134.75Fort Meade 89.56 120.56 12.06 132.62Bushnell 98.05 120.05 12.01 132.06Vero Beach 54.43 119.58 11.96 131.54Alachua 101.00 119.00 11.90 130.90 Leesburg 105.58 117.58 11.76 129.34Starke 75.95 115.46 11.55 127.01Lake Worth 75.73 114.73 11.47 126.20Homestead 77.60 114.23 11.42 125.65Blountstown 118.85 118.85 5.94 124.79State Average 83.21 113.02 10.34 123.35JEA **** 72.36 109.11 14.18 123.29St. Cloud 75.07 113.81 9.10 122.91Ocala 93.64 110.64 11.06 121.70Winter Park 75.80 103.94 17.25 121.19Orlando 72.18 109.43 10.94 120.37Moore Haven 83.30 109.20 10.92 120.12Mount Dora 49.24 108.80 10.88 119.68Havana 89.50 119.23 0.00 119.23Tallahassee 75.30 108.20 10.82 119.02Duke Energy ** 78.82 105.61 13.05 118.66Fort Pierce 116.84 107.84 10.78 118.62Beaches Energy 82.07 117.91 0.00 117.91Green Cove Springs 95.00 117.00 0.00 117.00New Smyrna Beach 82.10 107.06 9.90 116.96Chattahoochee 90.10 116.74 0.00 116.74Tampa Electric ** 61.94 95.55 20.81 116.36Kissimmee 133.27 94.71 19.52 114.23Key West 137.03 112.50 0.00 112.50Wauchula 87.50 101.50 10.15 111.65Lakeland 63.02 100.02 10.00 110.02Clewiston 93.20 99.82 9.98 109.80Quincy 98.41 108.01 0.00 108.01Williston 89.84 100.74 5.04 105.78Florida Power & Light ** *** 67.71 89.44 11.05 100.49
Rates Beaches Energy Services continues to meet its goal of keeping its rates below the state average. FMPA’s All Requirements Project members are highlighted in yellow. *1000kWH FMEA May published rates ** Local taxes estimated at 6%. *** FPL uses an inclining block rate over 1,000 kWh. **** JEA has a 3% franchise fee and a 10% public service tax. Source: May 2016 FMEA Published Rate Schedule

Beaches Energy Services
138
Capital Projects: 2017 Overhead Line Rebuild (Fairway Lane Phase 2) - $400,000: Replace existing wood pole line with concrete poles and underground lines from Declaration Dr. to Jacksonville Dr. Overhead Line Rebuild (Canal Blvd and Roscoe Blvd South) - $300,000: Replace existing wood pole line along Canal Blvd. from Palmetto Landing to Palm Valley Rd. with concrete poles. This will also include replacing existing wood pole line along Roscoe Blvd. South from Landrum Lane to Canal Blvd. to concrete poles. Design and Purchase and Installation of new 50 MVA transformer for Guana Substation (Phase 1) - $1,215,000: Add an additional substation transformer along with a ring bus to allow for greater reliability and load management for the south end of the service territory. This phase includes developing the transformer specifications, ordering the transformer and completing the design work. Install Fiber & Equipment: Sampson to Diego - $180,000 in FY2017, $60,000 in FY2018, and $60,000 in FY2019: Replace existing wave traps, tuners, and tone equipment that is used for current communication between substations with optical fiber. Upgrading to fiber will help ensure proper system protection, relay communication and system reliability. Transmission Line Hardware Renewal & Replacement - $500,000 in FY2017 and $500,000 in FY2018-FY2021: A recent and ongoing inspection of Beaches Energy’s transmission lines has revealed numerous minor and some medium issues. With some sections over 30 years old deterioration has started to set in. Historically, $50,000 is budgeted every year for unplanned repairs and maintenance. Beaches Energy plans to proactively repair, replace, and upgrade its entire transmission line in order to continue safe and reliable service to its customers. Cyber Physical Security $230,000 in FY 2017, $20,000 in FY 2018, $20,000 in FY 2019, $20,000 in FY 2020, and $20,000 in FY2021: NERC Standards CIP 002 through CIP 011 “Cyber Security” became effective requiring additional security measures for assets including control centers and substations. The Centralized TOP moved our Medium Impact responsibilities to OUC. However, we are responsible for the Low Impact requirements. These Low Impact facilities are defined such that if severely damaged or destroyed, would have a significant impact on the ability to serve large quantities of customers for an extended period of time and would have a detrimental impact on the reliability or operability of the electric grid, or would cause significant risk to public health and safety. Florida Municipal Power Agency (FMPA) is currently working on an assessment of the asset elements necessary to meet these requirements such as a “high tech” locks with impossible to difficult to copy keys, a “card reader” security access to substations control room doors and control center doors along with data recording, logging, and associated security systems with an electronic security perimeter in and around the substation properties.

Beaches Energy Services
139
Capital Projects: 2017 (continued) Consulting Fees $100,000 in FY 2017 and $100,000 in FY 2018-FY2021: NERC continues to develop and modify the bulk electric system requirements. Consulting services would help aid in the process of development of policies and procedures, risk assessments, CIP administration and evidence preparations and document classification policy development. These services include: inventory assessment, policy and procedure development, physical security review, electronic security and network design review, information protection review, asset ownership review, low impact facilities NERC CIP compliance gap analysis, and medium impact facilities NERC CIP compliance gap analysis. Centralized TOP (Transmission Operator): $665,000 in FY 2017-FY2018 and $470,000 FY2019-FY2021: In preparation for the enforcement of NERC CIP version 5, BES has been working with FMPA on developing a response to satisfy these requirements. As a transmission owner/operator that has critical assets that impact the bulk electric system, BES must initiate measures that are mandated by NERC and FRCC.

Beaches Energy Services
140

Beaches Energy Services
141

Beaches Energy Services
142
Natural Gas Beaches Energy Services owns the natural gas distribution system in select locations within Beaches Energy Services’ territory. The system is primarily for commercial customers along the main gas line route.
Natural gas service began in June 2010 and customers will continue to be connected as the system expands. Beaches Energy Services has contracted with Tampa Electric Company (TECO) to provide engineering design, construction management, operations and maintenance of the natural gas system. Tampa Electric Company (TECO) currently has contracts to provide natural gas management services for Beaches Energy Services. These contracts have a 5-year term with an option to renew. Renewal of the contract was exercised in early 2015 and will be evaluated again in 2020. Beaches Energy Services will continue providing management oversight to these activities as well as marketing, billing and other required services. Natural Gas Financial Summary
Infrastructure to support the addition of customers in FY2016, including service lines, main extensions, and meter sets, is budgeted in capital outlay ($100,000). The natural gas system was designed to provide approximately 3,000,000 therms annually to our customers. As of the calendar year ended December 31, 2015, there were 220 customers who purchased 1,940,211 therms during the year. The 11.7% increase in budgeted expenses is due to projected increases in the cost of natural gas, in the demand and utilization of our natural gas system, and transfers to the Electric fund for loan repayment.
Original AdoptedResource Actual Budget Budget Increase %Allocation 2015 2016 2017 -Decrease ChangePersonal Services $0 $0 $0 $0 -Purchased Gas $931,060 $1,215,770 $1,303,588 $87,818 7.2%Operating $303,376 $353,503 $336,537 -$16,966 -4.8%
Capital Outlay $220,573 $100,000 $100,000 $0 0.0%Debt Service $0 $0 $0 $0 -Transfers $263,646 $263,646 $419,172 $155,526 59.0%TOTAL $1,718,655 $1,932,919 $2,159,297 $226,379 11.7%
Transfers are made up of $312,456 to the Electric Fund to repay a construction loan and $106,716 to the General Fund.

Beaches Energy Services
143
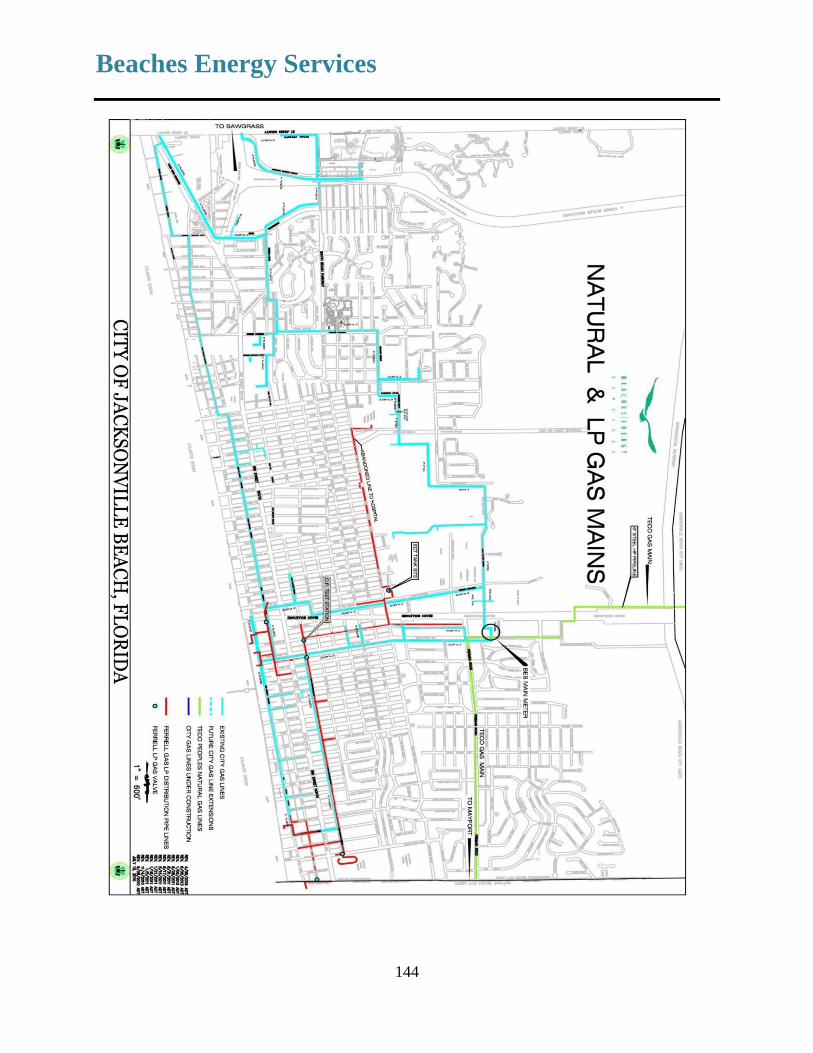
Beaches Energy Services
144

Finance Department
145
Mission To provide financial stewardship, information technology solutions and property management services with an emphasis on accountability and customer service. Organization Accounting is responsible for the administration of all financial affairs of the City. This
includes the processing of accounts payable, payroll, and financial reporting. Other responsibilities include cash and investment management as well as internal audit.
Utility Billing provides customer support including billing, receipting of payments, establishing
new utility service and meeting the needs of the City’s approximately 34,900 utility customers. Utility Billing also receipts items such as building permits, occupational licenses, recreation fees, dog tags, and other payments made to the City.
Information Systems provides the overall management of information and data processing for
all City departments. Its employees maintain the City’s servers, operating software and business computer applications, e-mail services, network and geographic information systems and provide technical support to users citywide.
Property and Procurement ensures that all purchases made by the City comply with State law
and City ordinances. This includes processing requisitions through to purchase orders and overseeing the usage of purchasing cards. This division is also responsible for the maintenance and upkeep of City buildings, managing leased facilities and supervising fleet maintenance. Fleet maintenance is provided by a private contractor.
Authorized Positions FY2015 FY2016 FY2017
Accounting 8 8 9*
Utility Billing 17 17 18**
Information Systems 6 7 8*
Property and Procurement 7 7 7
TOTAL 38 39 42
*An Associate Business Analyst (Information Systems) and a part-time Staff Assistant (Accounting) are requested as temporary positions dedicated to the implementation of the new Enterprise Resource Planning (ERP) software for the duration of the project.
**A Customer Service Representative II (Utility Billing) is being added for the duration of the meter replacement project and to provide for succession planning.

Finance Department
146
Financial Summary
Original AdoptedResource Actual Budget Budget Increase %Allocation 2015 2016 2017 -Decrease ChangePersonal Services $2,399,681 $2,678,620 $2,901,964 $223,344 8.3%
Operating $2,979,016 $3,175,302 $3,462,116 $286,814 9.0%
Capital Outlay $158,448 $0 $0 $0 -
Debt Service $0 $0 $0 $0 -
Transfers $337,000 $342,000 $117,000 -$225,000 -65.8%
TOTAL $5,874,145 $6,195,922 $6,481,080 $285,158 4.6%
Property Management
1,888,53829%
Accounting1,084,946
17%
Utility Billing2,034,658
31%
Information Systems
1,135,34618%
Purchasing337,592
5%
Funding Uses $6,481,080
Internal Service Funds Accounting Utility Billing Purchasing Information Systems Fleet Maintenance O & M Facility Maintenance Enterprise Fund Leased Facilities General Fund Building Maintenance
The increase in operating expenses is due primarily to software licensing costs in the Leased Facilities Fund.
Internal Service Funds
$5,546,41285%
General Fund$438,492
7%
Enterprise Fund$496,176
8%
Funding Sources $6,481,080

Finance Department
147
Objectives Maintain the City’s accounting records in accordance with generally accepted governmental
accounting principles.
Provide management with accurate and reliable budgetary and financial information.
Minimize the need for future debt through long-term financial planning and capital budgeting for major capital improvements.
Comply with federal, state and local laws and regulations related to purchasing and grant
activities.
Keep up with new technologies and the needs of our customers.
Provide training to employees for data processing hardware and software, such as Enterprise Resource Planning and Geographic Information Systems software.
Keep City facilities and equipment in very good condition at all times by providing ongoing
maintenance and cleanliness for safety, comfort and appearance. Recent Accomplishments Received the Government Finance Officers Association Awards for both the Comprehensive
Annual Financial Report and the Annual Budget. Received an Aa3 rating from Moody’s Investor Services and an AA- rating from Fitch
Investor Services for the 2010 Utility Revenue Bonds. Completed the upgrade to the Graphical Information System in preparation for the new
Enterprise Resource Planning system implementation beginning in FY2017. Installed Wi-Fi access in City Hall, O&M, and Parks & Recreation, providing employee and
public access to the Internet in these locations. Replaced the aging core network infrastructure, ensuring vital connectivity and maintaining
currency in technology.
Continued a free e-check program, allowing customers to pay by check, electronically and through the IVR automated phone system. This program has been highly successful. In 2015, 62,238 customer payments were received through this free service, allowing customers who made payments avoid about $310,000 in third party processing convenience fees.

Finance Department
148
Recent Accomplishments (continued)
Continued the electronic billing (e-bill) program that allows customers to receive their bill in an electronic format that displays the new bill design and provides a link to the Beaches Energy payment site. Customers can choose to pay on-line by check at no cost or pay by credit card for a fee of $4.95 through a third party credit processor. Currently, 9,693 customers receive their utility bill through this program, saving the City $45,000 a year in postage costs.
Implemented the new on-line energy audit software program, My Energy Planner, that
provides customers with on-line tools to perform a self-service energy analysis on their home, helping them to save energy and money.
Goals for FY2017
1. Select a software vendor to provide a new Enterprise Resource Planning system and complete the first phase of the project implementation.
2. Develop strategic plan for new technology and customer service programs that provide enhanced services and convenience to our customers.
3. Maintain adequate cash reserves to fund emergencies and capital purchases in order to
minimize the issuance of new debt. The exception to this goal is when the debt issued for capital improvements is to be funded by tax increment revenues.
4. Receive the Government Finance Officers Association Awards for both the Comprehensive Annual Financial Report and the Annual Budget.
5. Implement the strategic technology information plan to ensure that the City is progressing in its technological advancement in accordance with industry best practices and economic feasibility.
6. Research and develop a credit/debit card program that allows customers the convenience of
making credit/debit card payments at City Hall for all city services.

Finance Department
149
Performance Measures Accounting Actual
2015 FYTD
3/31/16 Target 2017
Percent of monthly financial reports delivered to City Council by 2nd meeting in each month 100% 100% 100%
Number of Years CAFR Awards received 22 23 24
Number of Years GFOA Budget Award received 21 22 23
Unqualified Audit Opinion Yes Yes Expected
Financial reports submitted to other government agencies accurately and on time 100% 100% 100%
Cash working capital reserves are 25% or greater as a percentage of budgeted operating expenses Yes Yes Expected
Bad debt expense as a percentage of utility revenues 0.08% 0.20% 0.20%
Purchasing and Procurement Actual 2015
FYTD 3/31/16
Target 2017
All purchases comply with City Ordinances and State Statutes
Yes
Yes
Yes
Number of published Bids/ RFPS 21 12 24
Number of Successful Bid and RFP Protests 0 0 0
Bid evaluation and acceptance processing time (from date of acceptance to date of Council approval) 21 Days 21 Days 21 Days
Number of Purchase Orders cleared for payment 4,227
2,240
4,175
Number of approved invoices exceeding net 30 days payment 0 0 0
Customer Satisfaction Survey Results: 1
Overall 90% average or above average ratings on annual internal customer service survey 94% 100% 95%
Prompt response to inquiries from other departments 100% 100% 100%
1Survey responses (# returned/# distributed): 2015 (33/71), 2016 (24/273)

Finance Department
150
Performance Measures (continued) Utility Billing Actual
2015 FYTD
3/31/16 Target 2017
Customer Service:
Avg. # monthly payments through Beaches Energy website 4,142 4,652 4,500 or >
Avg. # monthly IVR payments 2,288 2,288 2,000 or >
Avg. # monthly bank draft payments 6,358 6,712 6,000 or >
Avg. # monthly online payments made through customer’s bank 6,516 6,653 6,000 or >
Avg. # monthly mail-in payments 8,017 7,736 8,000 or <
Avg. # monthly walk-up or drive-through payments 5,335 5,253 6,000 or <
Number of monthly E-bills 8,200 9,180 10,000 or >
Average telephone customer calls per month 4,462 3,896 5,000 or <
Average answer time (in seconds) 8 8 10 or <
Energy Conservation Programs:
Online energy audits Yes Yes Yes
In-person energy audits Yes Yes Yes
Rebates for energy efficiency improvements to residences Yes Yes Yes
Distribute energy efficient light bulbs Yes Yes Yes
Distribute energy conservation gift bags Yes Yes Yes
Information Systems Actual 2015
FYTD 3/31/16
Target 2017
% of departmental customers rating service as satisfactory and better1 94% 95.74% 95%
Percentage of SunGard (HTE) Uptime 99.99% 99.99% 99.9%
Percentage of Network uptime 99.95% 99.995% 99.0%
Average response time for support requests .52 Hours 1.02 Hours 1.5 Hours or <
1Survey responses (# returned/# distributed): 2015 (73/392), 2016 (47/275)

Finance Department
151
Budget Issues Enterprise Resource Planning System (ERP). The City has been setting aside funds for the
cost of the migration of the SunGard business software applications from the IBM server to a Windows-based server platform. The consulting firm of Sciens completed a business process analysis across all City departments to assess software application needs. Once the needs were identified, the consultants assisted in creating a Request for Proposals for a new software vendor and coordinated onsite vendor demonstrations. Vendor selection is in progress and implementation of the new ERP is expected to begin in October 2016. The cost of the system is estimated at $2.8 million and implementation of the new Enterprise Resource Planning system will take 3 to 4 years.
Information Systems Division. Included in the budget is a new Associate Business Analyst position which will assist the Business Analyst throughout the implementation of the Enterprise Resource Planning system. The Associate Business Analyst will be responsible for documenting business processes and work flows, creating and maintaining project schedules and ensuring resources are allocated appropriately throughout the life of the project. The cost of the new position is $75,500 annually.
City-Wide Telephone System Replacement. The City currently has one or more telephone
systems in each of its buildings. The systems do not work the same way or have the same features. Multiple vendors service these telephone systems. Each of these telephone systems has a different city staff point of contact. Managing and coordinating service for these phone systems is difficult and time consuming. A unified communications system which encompasses all city facilities would simplify management of the system, decrease maintenance costs, improve support speed, and allow employees to be knowledgeable on a standardized telephone instrument throughout the city. It appears that the most cost effective solution expands our largest existing telephone system in Utility Billing, thereby eliminating the need to replace that equipment.
Expanding that system would provide the following benefits:
• Long-term cost savings • Centralized voicemail system • City-wide intercom, with 4-digit dialing • Voicemail messages can be sent to users as an e-mail • Ability to track phone calls • Statistical analysis of calls, to include number of calls/day, and time to answer • State of Florida contract pricing
We expect to implement the new system in Fiscal Year 2018 for a cost of approximately $160,000. A year-end transfer to the Capital Projects Fund may be considered to accumulate sufficient monies to purchase the phone system.
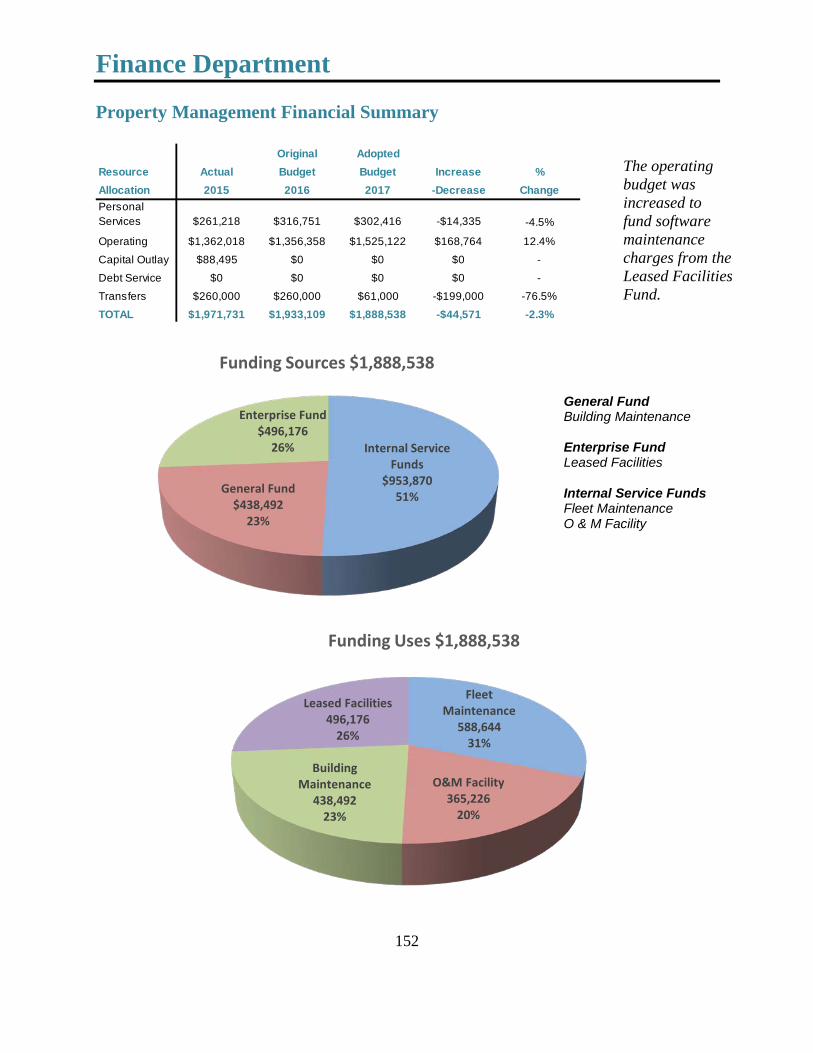
Finance Department
152
Property Management Financial Summary
Original AdoptedResource Actual Budget Budget Increase %Allocation 2015 2016 2017 -Decrease ChangePersonal Services $261,218 $316,751 $302,416 -$14,335 -4.5%
Operating $1,362,018 $1,356,358 $1,525,122 $168,764 12.4%
Capital Outlay $88,495 $0 $0 $0 -
Debt Service $0 $0 $0 $0 -
Transfers $260,000 $260,000 $61,000 -$199,000 -76.5%
TOTAL $1,971,731 $1,933,109 $1,888,538 -$44,571 -2.3%
Internal Service Funds
$953,87051%General Fund
$438,49223%
Enterprise Fund$496,176
26%
Funding Sources $1,888,538
Fleet Maintenance
588,64431%
O&M Facility365,226
20%
Building Maintenance
438,49223%
Leased Facilities496,176
26%
Funding Uses $1,888,538
General Fund Building Maintenance Enterprise Fund Leased Facilities Internal Service Funds Fleet Maintenance O & M Facility
The operating budget was increased to fund software maintenance charges from the Leased Facilities Fund.

Finance Department
153
Property Management Recent Accomplishments Conducted bi-annual inspections of City facilities and managed extensive maintenance and
cleaning services at the O&M Facility, City Hall and Police Department. Signed a lease with Franklin Electric at the Industrial Park. Extended the lease with ARC of St Johns for the Penman Park Building.
Replaced the lighting on the Golf Course driving range that had deteriorated and was unsafe.
Signed five-year janitorial contracts for custodial services for all City buildings.
Implemented an annual roof maintenance program for City buildings to ensure longest useful
life and provide an effective preventative maintenance schedule.
Implemented an annual maintenance program for all HVAC systems in all City Buildings. The program will maintain optimum operational efficiencies and unit life spans.
Installed a work-order system to optimize facilities management, to better respond to
customers, and to provide valuable historical information for budget and improvement plans.
Provided support throughout the year for the Deck the Chairs Annual Event and attended monthly meetings.
Property Management Goals for FY2017 1. Keep our City facilities looking new and in good condition at all times to maintain a positive
impression on our citizens.
2. Continue the development of the comprehensive preventative maintenance program of scheduled inspections and routine maintenance designed to identify problems in advance of failure and to ensure the building components and systems are in very good condition.
3. Assess and implement the most effective and economic methods of keeping City buildings
and services fully functional and safe.
4. Conserve energy and resources by ensuring maximum operating efficiency of equipment and systems while maintaining consistent electrical usage based on weather conditions.
5. Maintain customer relations by providing well-maintained facilities, information for employees on planned maintenance activities and prompt responses to customer needs.

Finance Department
154
Property Management Goals for FY2017 (continued)
6. Achieve highest and best occupancy for all leased facilities and renegotiate lease facility contracts as lease terms expire.
Property Management Performance Measures
Property Management and Building Maintenance Actual 2015
FYTD 3/31/16
Target 2017
Customer satisfaction surveys with a rating of good or excellent in the following categories: 1
Overall experience with Property Management and/or Building Maintenance services 95% 92% 95%
Timeliness of staff to service requests 97% 92% 97%
Overall appearance and condition of buildings 97% 100% 97%
Professionalism of staff responding to requests 97% 92% 97%
Conduct on-site inspections of all facilities and grounds twice each year and correct deficiencies. Yes Yes Yes
Except for emergencies, respond to requests for facility maintenance services within 48 hours of request. Yes Yes Yes
Fleet Maintenance Actual 2015
FYTD 3/31/16
Target 2017
Customer satisfaction surveys with a rating of good or excellent in the following categories: 1
Overall 95% average or above average ratings on annual Fleet Maintenance Services customer survey 79% 100% 85%
Quality of service provided by Fleet Maintenance 79% 100% 79%
Timeliness of service provided by Fleet Maintenance 90% 100% 90%
Knowledge and competence of Fleet Maintenance Staff 87% 100% 87%
1Survey responses (# returned/# distributed): 2015 (77/392), 2016 (14/273)

Finance Department
155
Property Management Performance Measures (continued)
Building Condition Assessment Actual 2015
FYTD 3/31/16
Target FY2017
City Hall 2 3 2
Police Station 2 3 2
Operations & Maintenance Facility (O&M) 2 3 2
Community Services Center 2 4 2
Fire Station #1 2 3 2
Fire Station #2 2 2 2
Golf Clubhouse 2 2 2
Oceanfront Restrooms 2 3 2
Carver Center 1 2 2
Sea Walk Pavilion 2 2 2
South Beach Community Center & Exhibition Hall 1 2 2
Wingate Concession North 2 3 2
Wingate Concession South 2 3 2
Archive Building 2 2 2
Building Condition Codes
1. Like New Condition: All maintenance items performed and all systems and equipment functioning properly. Landscaping in excellent condition. 2. Very Good Condition: May need minor cleaning, painting, or maintenance items performed; systems and equipment functioning properly. Landscaping in very good condition. 3. Good Condition: Needs cleaning, painting, or maintenance items performed; some systems or equipment need repair. Landscaping in good condition.
4. Poor Condition: Needs painting throughout interior areas; may need new carpeting, electrical, HVAC, or plumbing work; maintenance items are behind schedule. Landscaping in poor condition.

Finance Department
156
Property Management Performance Measures (continued)
Leased Properties Actual FY2015
Budget 2016
Target FY2017
Land Total Square Footage Leased (Avail. 183,400) 20,192 153,390 80,900
Buildings Total Square Footage Leased (Avail. 19,551) 16,431 16,431 19,551
Telecommunications Tower Leased Spaces 6 7 5
Revenue:
Industrial Park $39,874 $130,031 $142,751
Community Services Center $106,179 $107,955 $112,273
Penman Park Building $39,316 $41,559 $42,930
Safe Harbor $27,926 $45,440 $46,803
Telecommunications Tower $254,529 $232,227 $203,687
O&M Facility Tower $0 $30,000 $12,000
Total Revenue $467,824 $485,663 $560,444
Fleet Maintenance Actual FY2015
Budget FY2016
Target FY2017
Service Statistics:
Annual Average Maintenance Costs Per Vehicle $774 $858 $655
Fleet Downtime Percentage ( 3-5% Acceptable) 0.5% 1% 1%
Property Management Budget Issues We are currently working on new lease revenue potential on the Industrial Park property. The
10th Street South drainage, water, sewer and roadway improvements project will enable future infrastructure improvements that could enhance the Industrial Park property usage.
We are currently negotiating potential new leases on the Radio Tower at the O&M Facility and the Monopole Tower on South Beach Parkway.

Human Resources Department
157
Mission Supporting departments, employees, retirees and their families. Organization The Human Resources Department is responsible for recruitment, hiring, training activities, payroll, employee benefits, risk management, labor relations and administration of the City’s three retirement systems. Objectives
Recruiting and hiring qualified employees. Providing affordable, quality health, dental, vision and voluntary benefits. Providing accurate payroll services. Enhancing professional development of all employees. Maintaining stable and comprehensive property, liability and workers’ compensation
insurance coverage.
Developing and maintaining personnel policies and classification and pay plans.
Negotiating union contracts and managing labor relations.
Providing effective administration of the City’s three retirement systems. Authorized Positions FY2015 FY2016 FY2017 Human Resources Director 1 1 1
Administrative Assistant 1 1 1
Payroll/Benefits Administrator 1 1 1
Payroll Specialist 1 1 1
Human Resources Generalist 1 1 1 Staff Assistant (2 part-time converted to 1 full-time in 2016) 2 1 1 TOTAL 7 6 6

Human Resources Department
158
Recent Accomplishments
Processed 1,598 applications for employment for 73 positions (excluding seasonal
positions) which resulted in 16.08 average number of qualified candidates per position.
Processed 66 new full-time employees and 7 part-time employees (excluding seasonal employees) within an average of 2 business days per hire.
Developed and implemented a Supervisory Leadership Academy through the University of North Florida, providing a 13 week onsite supervisory and leadership training class for 25 employees.
Provided city-wide customer service training.
Issued 13,416 payroll and pension checks with an accuracy level of 99%.
Successfully negotiated labor contract for the wage re-opener for the LIUNA (general employees) labor union.
Successfully negotiated a 10% reduction in the City’s property and liability insurance and obtained a two-year agreement with no increases.
Successfully negotiated a 5.57% increase in health insurance for the 2016 plan year with minimum changes in the insurance plans, while industry standard increases were in excess of 10%.
Goals for FY2017
1. Negotiate labor contracts for Police, Fire and LIUNA labor unions. 2. Create opportunities for growth and learning for the City’s workforce through mentorship
and training programs. 3. Implement wellness initiatives to improve the health of employees and dependents and
lower the overall cost of health care plans.
4. Participate in the Enterprise Resource Planning (ERP) process and the selection and implementation of an integrated software system for the City.

Human Resources Department
159
Performance Measures
Objective
Actual FY2015
FYTD
3-31-16
Target FY2017
Recruiting and Hiring Qualified Employees
Average cost per new hire $1,584 $1,464 $1,500
Average number of qualified candidates per position 16 21 20
Average number of business days to process a new hire 2 2.4 3
Providing Affordable Quality Health Benefits Number of employees & retirees enrolled in health plans 301 299 330
City contribution for employee health benefit plans $1,916,493 $986,706 $2,151,019
Providing Accurate Payroll Services
Number of payroll and pension checks processed 13,416 5,070 13,000
Accuracy of payroll and pension checks 99.0% 99.0% 95.0%
Enhancing Employee Development
Total number of training classes offered 6 15 24
Percentage of employees completing six month probation 65% 80% 75%
Total annual employee separation rate 12.80% 5.65% (6 mo.) 15.00%
*Bureau of Labor Statistics – Government Industry 2015 18.1% 18.1% -
Maintaining Stable Comprehensive Insurance Coverage
Total liability premiums and claims paid $1,187,583 $1,011,931 $1,112,841
Total workers’ comp premiums and claims paid $376,045 $130,975 $406,539
Workers’ comp self-insurer experience modification rate .75 .75 <1.00
Providing Reliable and Accurate Pension Administration Services
Number of accurate benefit estimates provided 43 28 30
Retiree ratings of satisfactory or above1 91.4% 98.9% 95.0% 1Survey responses (# returned/#distributed) 2015 (24/350), 2016 (100/238)

Human Resources Department
160
Funding Sources Human Resources costs are funded through internal service charges to all departments. Insurance costs are charged directly to each department based on insurable interests. Financial Summary – Human Resources
Original Adopted Resource Actual Budget Budget Increase % Allocation 2015 2016 2017 -Decrease Change
Personal Services $299,471 $378,546 $372,268 -$6,278 -1.7%
Operating $167,468 $182,276 $184,818 $2,542 1.4% Capital Outlay $0 $0 $0 $0 - TOTAL $466,939 $560,822 $557,086 -$3,736 -0.7%
Human Resources Budget Issues for FY2017 Labor Relations – The LIUNA (General Employees), FOP (Police Officers) and IAFF (Firefighters) contracts expire in the 2016/2017 fiscal year and new contracts will be negotiated. Financial Summary – Insurance and Risk Management
Original Adopted Resource Actual Budget Budget Increase % Allocation 2015 2016 2017 -Decrease Change
Personal Services $67,750 $17,110 $17,206 $96 0.6%
Operating $4,060,655 $4,383,638 $4,355,661 -$27,977 -0.6% Capital Outlay $0 $0 $0 $0 -
TOTAL $4,128,405 $4,400,748 $4,372,867 -$27,881 -0.6%
All property, liability, health insurance and workers’ compensation insurance costs are paid through this fund. The City negotiated a 10% reduction in property and liability insurance and is projecting a 9% increase in health insurance costs.

Human Resources Department
161
Insurance and Risk Management Budget Issues for FY2017 Business Insurance and Workers’ Comp The City negotiated a 10% reduction with Preferred Governmental Insurance Trust (PGIT) for general liability, property, crime, police and auto policies in 2016, and PGIT agreed to hold the same rates for the 2017 calendar year with the exception of new assets constructed or acquired. This reduction in liability and property insurance helps to offset the proposed increases in health insurance and results in the City’s total insurance costs remaining relatively flat from 2016 to 2017.
Estimated Insurance Premiums & Deductibles
Coverage/Limits & Deductibles
Budgeted 2016
Premiums
Projected 2017
Premiums Increase / (Decrease)
Property ($25,000 deductible/wind separate) $687,600 $603,267 ($84,333) Liability-$2,000,000 per occurrence: $288,183 $266,245 ($21,938) Deductibles: General Liability: $10,000 Law Enforcement: $25,000 Public Officials: $25,000 Employment Practice: $25,000 Auto ($1,000,000 per occurrence/ $1,000 deductible) $128,070 $101,462 ($26,608) Workers’ Comp ($150,000 retention) $506,257 $406,539 ($99,718)
Life, Health & Dental $2,395,354 $2,610,936 $215,582 Other Insurance: Flood, faithful performance, pollution, pension, fiduciary, fuel tanks, police & fire death benefit, and deductibles. $134,303 $141,867 $7,564 Other Costs*: Personnel and professional services, coinsurance, brokerage fees and consulting services, training, professional dues and publications (increased salary allocation) $260,981 $242,551 ($18,430)
TOTAL $4,400,748 $4,372,867 ($27,881)

Human Resources Department
162
Workers’ Compensation The City is self-insured for workers’ compensation up to $150,000. The City continues to maintain a favorable workers’ compensation self-insurer experience modification rating. Due to this favorable experience, the City is projecting a reduction in its workers’ compensation claims for 2017.
Workers' Comp and Property & Liability Premiums
$0
$300,000
$600,000
$900,000
$1,200,000
$1,500,000
20122013
20142015
2016 Budget
2017 Budget
Workers' Comp Property & Liability
Health Insurance The City is projecting a 9% increase in health insurance costs for 2017. This estimate is based on industry projections; however, any actual increases in the City’s health insurance premiums will be based on the City’s claims experience, which could be more or less than the 9% budgeted. The Health Insurance Fund had a fund balance of $688,467 as of September 30, 2015. This balance may be used to offset City healthcare cost increases in future years.
$0
$1,000,000
$2,000,000
$3,000,000
$4,000,000
2011 2012 2013 2014 2015
Health Insurance Premiums
City Share Total Cost
Total health insurance costs in 2015 were $2,534,142, of which the City paid $1,916,493 and employees paid $617,649.
Actual Workers’ Comp and Property & Liability costs are shown in 2012 through 2015. Budgeted costs are shown for 2016 and 2017.

Human Resources Department
163
The City entered into its fourth year with Florida Blue for healthcare benefits. Florida Blue offers employees a base HMO Plan and a PPO Plan at an additional cost. The City continues to provide single coverage under the base plan at no cost to employees. Ensuring that employees are aware of health issues and adopt healthy lifestyles can have a significant impact on the cost of health insurance. As a part of the initial contract with Florida Blue, the City received $50,000 in funding to support its wellness program. The City has been using approximately five to seven thousand dollars of this money annually for programs such as employee health Lunch and Learn sessions, a health fair, health screenings, flu shots and a wellness passport program. The unused balance remaining is $35,000, which has been carried forward in the 2017 fiscal year budget. Fund Balance The self-insurance funds, which consist of the Property and Liability Fund and the Workers’ Compensation Fund, maintain a fund balance to cover future potential claims. A minimum fund balance for these funds is set by City policy. The total fund balance for both funds was $2,223,589 in 2015.
$453,094
$1,770,495
Self-Insurance Fund Balance
Property & Liability
Workers' Comp

Human Resources Department
164
Performance Measures – Pension Plans
Actual 2011 2012 2013 2014 2015 Percentage funded (historical)1:
General 74.2% 73.9% 79.1% 81.6% 81.4% Police 71.5% 73.8% 77.1% 88.4% 88.5%
Fire 66.8% 69.6% 73.1% 85.4% 82.4% Accrued unfunded liability (in thousands)1:
General $14,166 $14,932 $11,904 $10,608 $11,250 Police $6,172 $5,806 $5,184 $2,412 $2,529
Fire $4,149 $3,891 $3,570 $1,785 $2,386 Net assets held for pension benefits (in thousands)2:
General $37,834 $42,760 $47,024 $49,636 $47,302 Police $14,336 $16,530 $18,210 $19,317 $18,752
Fire $7,759 $8,979 $10,098 $10,946 $10,700 Market rate of return (all pension funds combined)1:
All pension funds -0.1% 16.3% 11.9% 10.1% -0.30% Number of retirees & beneficiaries receiving benefits2:
General 151 160 170 178 180 Police 40 40 42 41 41
Fire 21 21 23 24 24 Annual benefits paid (in thousands)2:
General $2,608 $3,011 $2,902 $3,670 $4,052 Police $1,120 $1,131 $1,367 $1,275 $1,263
Fire $700 $660 $670 $664 $684 1 Actuarial valuations dated October 1 2 Audited financial statements dated September 30
Annual City Contribution3 2013 2014 2015 2016 2017 General $1,490,902 $1,216,994 $1,387,165 $1,321,320 $1,591,545 Police $764,988 $326,017 $345,079 $432,758 $460,548 Fire $449,185 $222,859 $177,736 $212,178 $289,114 3 2013-2015 from audited financial statements, 2016 and 2017 from actuarial valuation report dated
10.1.14 and 10.1.15.

Human Resources Department
165
Financial Summary – Pension Plans
Funding Sources Retirement Systems’ costs are funded by City and member contributions, investment earnings and state insurance premium tax dollars for the Police Officers’ and Firefighters’ pension funds.
Original Adopted Resource Actual Budget Budget Increase % Allocation 2015 2016 2017 -Decrease Change
Personal Services $56,256 $65,649 $65,330 -$319 -0.5%
Operating $6,764,515 $6,689,195 $6,771,291 $82,096 1.2% Capital Outlay $0 $0 $0 $0 - TOTAL $6,820,771 $6,754,844 $6,836,621 $81,777 1.2%
In FY 2017 City contributions to the pension plans are projected to increase $374,951 or 19% from FY 2016. Approximately 50% of this increase is due to changes in the City’s mortality assumptions, as required by the Actuarial Standards Board. The remainder is due to payroll projections and plan experience.
Pension Budget Issues for FY2017
Impact of Legislative Changes to the Cost of City Contributions to the Pension Plans
In 2014, the City embarked on a plan to reform the City’s pension plans and was successful in reaching an agreement with all three unions (LIUNA, FOP and IAFF) to increase the employee contributions to the pension plans from 6.45% of wages to 7.95% and to reform existing benefits. These changes enabled the City to stabilize escalating pension costs and to ensure the financial sustainability of the pension plans into the future.
Although the City was successful in enacting pension reform, in 2015 the Florida legislature adopted amendments to Chapters 175 and 185 and other statutes, which have and will impact the City’s pension costs in future years.
• Senate Bill 172: This bill dictates the use of Chapter 175 and 185 excess premium tax monies if the City and the police and fire unions are unable to come to an agreement as to how these monies will be spent. The City’s collective bargaining agreements with the police and fire unions will expire in 2017, and this bill could impact negotiations and the City’s contributions to the pension plans, should the City and unions not come to an agreement.
The increase in operating expenses is due to an increase in the projected number of employees that will be retiring in 2017.

Human Resources Department
166
• House Bill 1309: This bill requires the City pension plans adopt the mortality tables used by the Florida Retirement System (FRS). Preliminary estimates indicated that the adoption of these mortality tables could substantially increase the City’s required pension contributions in excess of $400,000 a year.
Although this bill does not require adoption of the FRS mortality tables until FY 2018, the impact of this bill is being felt in FY 2017. As a result of the impending bill, the Actuarial Standards Board made changes to the actuarial standards of practice governing actuarial assumptions. In the past, the City’s pension plans utilized mortality tables which assumed “static” future mortality improvement or no changes in life expectancies. The Actuarial Standards Board changed the standards of practice requiring actuaries to incorporate mortality tables that project mortality improvements before they happen or face the possibility of a qualified report, if the standards are not adopted.
Due to the implementation of changes in mortality assumptions required by the Actuarial Standards Board, the City’s pension contributions increased approximately $186,000 in FY 2017. This should offset, but not fully reduce, the financial impact of the adoption of the FRS mortality tables in FY 2018.
Pension Charts
On the following pages are charts which show the City and the employee contributions from FY 2013 to the amount budgeted for FY 2016 and 2017, a comparison of the funding status of each of the plans from FY 2011 to FY 2015, and a comparison of the portfolio growth of the pension plan investment portfolio to the pension plans’ assumed 8% rate of return from 1987 to the 1st Quarter of 2016.

Human Resources Department
167
2013 2014 2015 2016 Budget 2017 Budget
$1,075,782 $1,157,453 $1,328,673 $1,376,670 $1,362,019
$2,705,075
$1,765,870 $1,909,980 $1,966,256$2,341,207
Pension Contributions - All Pension Plans
Employee Contributions City Contributions
0%10%20%30%40%50%60%70%80%90%
2011 2012 2013 2014 2015
General, Police and Fire Pension Plans Percentage Funded
(Actuarial Valuation Reports 2011-2015)
General Employees Police Fire

Human Resources Department
168
City of Jacksonville Beach Retirement Systems Total Portfolio Growth and Cash Flow 1987 to 1st Quarter 2016
This graph compares the actual portfolio growth for the City’s three retirement systems (blue) to the actuarial assumed rate of return of 8% (red)

169
Funding Sources The City’s revenues come from a wide variety of sources. Revenues and expenses are categorized according to the State of Florida Uniform Accounting System chart of accounts. These standard classifications help facilitate comparability with other local governments. Revenues are classified by fund and source to provide information necessary to prepare and control the budget, to record the collection of revenues, and to prepare financial statements and statistics. Major revenue categories, assumptions, estimation methods and trends are described in this section. Because revenues are budgeted with only about 6 months of current year history, the estimates for the next budget year may not reflect significant increases or decreases in a particular revenue source that occur before the end of the current year. Funds used to pay for the obligations and services provided by the City of Jacksonville Beach come from three main sources: current year revenues, transfers from other funds and beginning fund balance. Some revenues and fund balances are available only for specific purposes and may not be available to pay for general services.
Electric & Natural Gas, $87,958,394 , 54%
Taxes, $22,103,420 , 13%
Other charges for service,
$30,128,925 , 18%
Transfers, $6,313,531 , 4%
Investment earnings & other, $12,315,602 , 8%
Other governments,
$4,138,738 , 3%
All other, $795,750 , 0%

170
Total Revenues Total budgeted revenues for fiscal year 2017 are $163,754,360. 54% of total revenue is generated by Beaches Energy Services, the City’s electric utility, through sales of electricity and natural gas. Beaches Energy Services provides electricity to approximately 34,000 customers in Jacksonville Beach, Neptune Beach, Ponte Vedra and Palm Valley. Of the remaining $76 million, 29% comes from taxes (primarily ad valorem, including redevelopment) and 40% from other charges for services: water, sewer, stormwater, garbage, sales at the City’s golf course and internal service charges. Transfers include $3.8 million paid to the General Fund from Beaches Energy as a return on the City’s investment in the electric and natural gas utilities. Other amounts transferred are from Convention Development (support for tourism and parks), Local Option Gas Tax (support for street and sidewalk maintenance), Half-cent Infrastructure Surtax (supporting infrastructure projects), and a Community Development Block Grant (support for CAPE and the Carver Center). Investment earnings include $9.8 million of pension earnings that are restricted for use exclusively by the pension funds. Revenue from other governments includes state and county shared sales tax revenues. All other revenues include building-related permits ($577,250) and fines and forfeitures ($218,500).
Revenues Funding Governmental Services: Total budgeted revenues for fiscal year 2017 in governmental funds are $33,978,021. Property taxes recorded in the General Fund ($8.4 million) account for 42% of its total revenue. Redevelopment property taxes in the Redevelopment Fund ($9.4 million) are restricted for use on projects to improve the City’s two redevelopment districts: Downtown and South Beach. Transfers come primarily from Beaches Energy to the General Fund ($3.8 million) as a return on the City’s investment in the utility.
Revenues from other governments ($4.1 million) consist mainly of state shared sales taxes ($2.9 million), but also include local shared revenues and grants ($1.2 million). All other revenues include Communications Services Tax ($1.0 million), Local Business Tax ($285,000), Local Option Gas Tax ($740,000), Convention Development Tax ($295,000), Half-cent Infrastructure Surtax ($1,125,000), insurance premium tax ($440,000-for police and fire pension contributions) fines and forfeitures ($216,000), building and other permits ($562,250), recreation registrations for leagues and camps ($92,700), parking revenue ($160,000), other charges for service, interest earnings and miscellaneous revenues ($949,498).
Property taxes,
$8,423,193, 25%
Redevelopment property taxes,
$9,446,930, 28%
All other revenues,
$6,033,085, 18%
From other governments, $4,138,738, 12%
Transfers in,
$5,936,075, 17%

171
Revenues Funding Proprietary Services:
Total 2017 budgeted revenues in proprietary funds are $119,932,709. 87% of total revenue is generated by the City’s utilities, which provide electric ($86,209,666), natural gas ($1,748,728), water & sewer ($11,887,976), stormwater ($1,330,620) and garbage services ($3,287,241). Of the total utility charges for services, 84% is from sales of electricity and natural gas by Beaches Energy Services. Charges for services-other, include internal service charges ($11.9 million) and sales at the City’s golf course ($1.3 million). Transfers include $377,456 repaid to the electric utility for the initial construction of the natural gas system.
Revenues in Pension Funds:
Total 2017 budgeted pension revenues are $9,843,630. Pension fund revenues come from interest and investment earnings ($5,540,576), city contribution ($2,505,210), employee contributions ($1,362,019), state insurance premium tax for police and fire pensions ($407,288) and other ($28,537). In 2014, the City reached an agreement with its three unions to make sustainability adjustments to each of its three pension funds. The
adjustments included increasing the vesting period, increasing the employee contribution, capping the retirement benefit, and eliminating overtime and other additional pay amounts from inclusion in pensionable pay. These adjustments and others are expected to make the pension funds sustainable into the future.
Transfers in, $377,456, 0%
Interest and other,
$1,806,634, 2%
Charges for services-other,
$13,284,389, 11%
Charges for services-utilities, $104,464,231,
87%
State insurance premium tax for police and fire pensions,
407,288, 4%
Interest and investment
earnings, 5,540,575 ,
56%
Employee contributions,
1,362,019 , 14%
City contributions,
2,505,210 , 26%
Other misc. revenue,
28,537 , 0%

172
Revenue Summary - by FundMajor Funds are shaded
Permits & Charges for Fines and Interest &Taxes Governmental Services Forfeitures Other Transfers TOTAL
General Fund 10,426,490$ 4,518,244$ 313,700$ 170,500$ 404,000$ 4,390,125$ 20,223,059$
Special Revenue FundsComm. Redevelopment Agency 9,446,930 - - - 165,000 - 9,611,930 Convention Development 295,000 - - - 3,500 - 298,500 Court Costs Training - - - 6,000 1,500 - 7,500 Local Option Gas Tax 775,000 - - - 3,238 - 778,238 Half-cent Sales Surtax 1,160,000 - - - 5,000 - 1,165,000 CDBG - 145,511 - - - - 145,511 Radio Communication - - - 27,000 1,500 - 28,500 Justice Assistance Grant - 52,233 - - - - 52,233 Tree Protection - - - - 100 - 100 Law Enforcement Trust - - - 5,000 1,000 - 6,000 Equitable Sharing Trust - - - 10,000 7,000 - 17,000
Total Special Revenue 11,676,930 197,744 - 48,000 187,838 - 12,110,512
Debt Service Fund - - - - 3,000 979,950 982,950
Capital Projects FundsGeneral - - - - 70,000 566,000 636,000 Infrastructure - - - - - - - Other - - 25,000 - 500 - 25,500
Total Capital Projects - - 25,000 - 70,500 566,000 661,500
Enterprise FundsElectric - - 86,209,666 - 736,100 312,456 87,258,222 Natural Gas - - 1,748,728 - 65,139 - 1,813,867 Water & Sewer - - 11,887,976 - 345,371 - 12,233,347 Stormwater - - 1,330,620 - 25,080 - 1,355,700 Sanitation - - 3,287,241 - 65,000 - 3,352,241 Golf Course - - 1,353,940 - 4,000 65,000 1,422,940 Lease Facilities - - - - 565,944 - 565,944
Total Enterprise - - 105,818,171 - 1,806,634 377,456 108,002,261
Internal Service FundsCity Manager - - 510,993 - - - 510,993 Finance - - 4,592,542 - - - 4,592,542 Human Resources - - 557,086 - - - 557,086 Fleet Maintenance - - 588,644 - - - 588,644 Meter Services - - 943,091 - - - 943,091 Operations & Maintenance Facility - - 365,226 - - - 365,226 Grounds Maintenance - - - - - - - Insurance-Property & Liability - - 1,170,942 - - - 1,170,942 Insurance-Workers Comp - - 469,189 - - - 469,189 Insurance-Health, Life, Dental - - 2,732,736 - - - 2,732,736
Total Internal Service - - 11,930,449 - - - 11,930,449
Trust Funds (Pension)General Employees - - - - 6,015,355 - 6,015,355 Police Employees - - - - 2,383,750 - 2,383,750 Fire Employees - - - - 1,444,524 - 1,444,524
Total Trust - - - - 9,843,630 - 9,843,630
Total Revenues 22,103,420$ 4,715,988$ 118,087,319$ 218,500$ 12,315,602$ 6,313,531$ 163,754,360$

173
Revenue Summary - by Type
GeneralFund Governmental Proprietary Pension Total
TaxesAd Valorem 8,423,193 $8,423,193 5.1%Ad Valorem-Redevelopment 9,446,930 9,446,930 5.8%Convention Dev. Tax 295,000 295,000 0.2%Local Option Gas Tax 775,000 775,000 0.5%Half Cent Infrastructure Tax 1,160,000 1,160,000 0.7%Local Communications Tax 1,063,000 1,063,000 0.6%Other 940,297 - - - 940,297 0.6%
Total Taxes 10,426,490 11,676,930 - - 22,103,420 13.5%
Permits 577,250 - - - 577,250 0.4%
IntergovernmentalState 1/2 Cent Tax 2,200,000 2,200,000 1.3%Sales Tax Distribution 555,000 555,000 0.3% 8th Cent Motor Fuel Tax 177,000 177,000 0.1%Duval Cnty in Lieu of Tax 712,794 712,794 0.4%Other 296,200 197,744 - - 493,944 0.3%
Total Intergov. 3,940,994 197,744 - - 4,138,738 2.5%
Charges for ServicesElectric 86,209,666 86,209,666 52.6%Natural Gas 1,748,728 1,748,728 1.1%Water / Sewer 11,887,976 11,887,976 7.3%Stormwater 1,330,620 1,330,620 0.8%Sanitation 3,287,241 3,287,241 2.0%Recreation / Golf 92,700 1,353,940 1,446,640 0.9%Internal Services 11,930,449 11,930,449 7.3%Miscellaneous 221,000 25,000 - - 246,000 0.2%
Total Services 313,700 25,000 117,748,619 - 118,087,319 72.1%
Fines and Forfeitures 170,500 48,000 - - 218,500 0.1%
MiscellaneousDebt Proceeds - - 0.0%Interest and Other 404,000 261,338 1,806,634 9,843,630 12,315,602 7.5%
Total Miscellaneous 404,000 261,338 1,806,634 9,843,630 12,315,602 7.5%
Transfers 4,390,125 1,545,950 377,456 - 6,313,531 3.9%
Total Revenues $20,223,059 $13,754,962 $119,932,709 $9,843,630 $163,754,360
% of Total

174
Revenue Summary Tax Revenues
The City has two main sources of tax revenue: ad valorem taxes and sales taxes. Although property values citywide increased 8% ($232 million) since last year, they are still 2% ($71 million) lower than they were at their height prior to the recession. Of the $17,870,123 in budgeted property taxes, 47% ($8.4 million) supports the General Fund and 53% ($9.4 million) is legally restricted for use in the City’s two redevelopment districts. Ad valorem taxes are budgeted based on the certification of taxable value provided each year by the Duval County Property Appraiser and are calculated as a percentage of the value of real or personal property expressed in mills (dollars per $1,000 of value). Chapters 192-197 and 200, Florida Statutes govern the property tax process and require municipalities to budget at least 95% of this anticipated revenue.
The City's adopted millage rate for 2017 is $3.7947 mills per $1,000 of assessed value. This will provide approximately $17,870,123 in property tax revenue shared by the General Fund and the Community Redevelopment Fund, representing 11% of total revenues. The City has no debt service millage. Decreasing the millage rate by 2.6% resulted in an increase in property tax revenue of $422,007 in the General Fund and an increase of $575,927 in redevelopment property tax revenue due to a rise in property values and the addition of $56 million in new construction.
Local Option Gas Tax revenues are used to fund the maintenance of roads, streets and sidewalks. The tax, generated by a $0.06 tax on sales of diesel or motor fuel sold within Duval County, is distributed monthly by the Florida Department of Revenue. Allocation to the City is
Original AdoptedActual Actual Actual Actual Budget Budget
2012 2013 2014 2015 2016 2017Ad Valorem $14,412,386 $14,029,971 $15,137,150 $15,906,918 $16,872,189 $17,870,123Local Option Gas Tax 712,396 711,817 717,543 758,525 740,000 775,000Convention Development 224,402 278,858 296,319 341,240 295,000 295,000Infrastructure 995,077 1,047,321 1,104,659 1,184,904 1,125,000 1,160,000Local Communications 1,231,709 1,442,566 1,198,759 1,122,565 1,200,000 1,063,000Other 616,461 640,666 724,135 707,454 950,280 940,297Total Taxes $18,192,431 $18,151,199 $19,178,565 $20,021,606 $21,182,469 $22,103,420
$12,000,000$14,000,000$16,000,000$18,000,000$20,000,000
2011 2012 2013 2014 2015 2016 2017
PropertyTaxes

175
based on its proportionate share of the county’s population, as specified in an interlocal agreement with Duval County which expires in 2036. From a high of $836,717 in 2006, it has fallen to a 4-year annual average of about $715,000. Decreases in the Local Option Gas Tax have reduced the amount of street and sidewalk maintenance that can be performed. It supplements the General Fund by providing about $700,000 per year to pay for street and sidewalk maintenance projects. Local Option Gas Tax is budgeted based on estimates from the State of Florida Office of Economics and Demographic Research (EDR), historical trends and variance analysis. (Motor Fuel and Diesel Fuel Taxes: Sections 206.41(1) (d)-(e), 206.87(1) (b)-(c), 336.021 and 336.025 Florida Statutes.) Duval County collects Convention Development Tax revenues resulting from a 2% tax on transient rental (lodging less than 6 months) transactions. One-half of the proceeds collected within Jacksonville Beach’s municipal boundaries are returned to it by the county to be used to promote tourism and to fund the maintenance and upkeep of the SeaWalk and Amphitheater area, in accordance with Florida Statutes (Section 212.0305(4) (a)). This revenue is estimated based on historical trends as influenced by economic forecasts. In recent years, this revenue has fluctuated between $220,000 and $300,000. It is budgeted for 2017 at $295,000.
The Half-Cent Local Discretionary Sales (Infrastructure) Surtax is specifically restricted to be used for: street reconstruction, water, sewer and stormwater improvements, school sidewalks, capital improvements to recreational facilities and the purchase of property for preservation and recreational purposes. 1.5% of the gas tax collected by the county is distributed to Jacksonville Beach as stated in an interlocal agreement. These revenues are budgeted using information from the Florida Office of Economic and Demographic Research (EDR) and historical trends. Both the Local Option Gas Tax and the Half-Cent Sales Surtax have decreased with the economic downturn. See Sections 212.054-.055, Florida Statutes. During the economic downturn, the Infrastructure Surtax only generated enough revenue to pay for debt service (about $980,000 per year) on the revenue bonds it is pledged against, leaving no additional funds for infrastructure projects. In the last couple of years, we are again seeing an upward trend. Information from EDR showed an upturn in this expected revenue and the budget for 2017 has been increased to $1,160,000.

176
The Communications Services Tax (Chapter 202, Florida Statutes) simplified the way communications (telecommunications, cable, direct-to-home satellite and related services) taxes are collected and distributed by combining seven different types of communications taxes and fees into a two-tiered tax composed of a state tax and a local tax on communications services. The tax of 5.22% on retail telecommunications sales which originate and terminate within the state of Florida and/or are billed to an address within the state is collected and distributed by the Florida Department of Revenue. Revenues are budgeted to decrease this year based on an average of the past several years. Economic and Demographic Research also provides estimates for this revenue source. The 2017 budget ($1,063,000) is reduced due to a refund settlement between the Department of Revenue and AT&T. The total credit due to AT&T will be paid in 15 installments beginning June 2016 and will affect most jurisdictions in Florida.
All sales and use taxes are estimated based on projections made by the State of Florida, economic forecasts and historical trends. State shared revenues from sales taxes are discussed under intergovernmental revenues. Changes in both sales taxes and state shared revenues tend to mirror changes in the economy.
The category of “Other” taxes is primarily the Local Business Tax and the Insurance Premium Tax. The Local Business Tax (formerly called occupational license fee) is a charge by a local government to businesses operating within its jurisdiction. This revenue source is considered general revenue and is deposited into the General Fund. The Local Business Tax is budgeted based on historical trends. There are two Insurance Premium Taxes. The first imposes an excise tax of 1.85 percent on property insurance policies on property within the city limits. Proceeds are deposited into the General Fund and then transferred to the firefighters’ pension trust fund. The second imposes an excise tax of 0.85 percent of premiums on casualty insurance policies; proceeds are deposited into the General Fund and then transferred to police officers’ pension trust fund. This revenue is budgeted based on the most recently received revenue and historical trends.
Permits and Fees
Permits are primarily composed of building-related permit revenue, which make up $516,000 of this category's 2017 revenues. This revenue source was deeply affected by the recession, hitting a low of $229,565 in 2010. As seen in the table above, revenues have been increasing as the economy recovers. Fees are recorded in the General Fund and represent a fraction (3%) of its revenues. Budgets for permits and fees are based on historical trends and construction estimates from the Planning and Development Department. (Chapter 7, City of Jacksonville Beach Code of Ordinances). Intergovernmental Revenues
This category includes all revenues received from federal, state and local governmental units in the form of shared sales and fuel tax revenues, grants and payments in lieu of taxes. The state
Original AdoptedActual Actual Actual Actual Budget Budget
2012 2013 2014 2015 2016 2017 Licenses & Permits $367,856 $559,485 $582,702 $683,305 $562,250 $577,250

177
collects and distributes a portion of the taxes for half-cent sales taxes, municipal revenue sharing and alcoholic beverage licenses to the City. The Local Government Half-Cent Sales Tax Program combined with the Municipal Revenue Sharing Program provides over two-thirds of the General Fund’s intergovernmental revenue. Both revenues are administered by the state Department of Revenue (DOR) and are estimated based on information from the Florida Office of Economics and Demographic Research (EDR), and historical trends. These revenues have begun to trend upward in the last two years.
Through an interlocal agreement, the City also receives a payment in lieu of tax from Duval County to provide partial funding for beach cleanup and lifeguards. The City makes a request for these funds based on its actual eligible program expenses. The amount budgeted is equal to the amount of the request.
“Other” intergovernmental revenues consist of grants, 8th Cent Motor Fuel Tax, 9-1-1 Emergency Rebate, Alcoholic Beverage License Tax and a variety of small state and county taxes and revenue sharing. The 8th Cent Motor Fuel Tax is a $0.01 per gallon fuel deposited into the General Fund to be used for roads and road maintenance in accordance with Chapter 206.605(2)-(3), Florida Statutes. The budget for this revenue sources is $177,000, based on historical trends. The Florida Department of Revenue administers and distributes this tax.
The 9-1-1 Rebate is a charge billed to communications (phone) subscribers by their providers and is intended to provide funds to local governments to pay for costs associated with their 9-1-1 dispatch system. The 2017 budget for this charge is $160,000, based on historical trends.
The Alcoholic Beverage License Tax is levied on manufacturers, distributors, vendors, brokers, sales agents and importers of alcoholic beverages within a county or municipality (Section 561.342, Florida Statutes). Thirty-eight percent of eligible taxes collected within Jacksonville Beach are returned to it by the Division of Alcoholic Beverages and Tobacco within the Department of Business and Professional Regulation. The revenue estimated from this source is $50,000, based on historical trends.
In recent years, the City has aggressively sought grant revenue to offset part of the cost of major construction projects. After peaking in 2010 when the City received $11 million in grants to help fund the construction of a new waste treatment facility, grant revenues have fallen sharply and are not expected to increase in the near future. Intergovernmental revenues have decreased by 35% ($2.4 million) since 2009.
Original AdoptedActual Actual Actual Actual Budget Budget
2012 2013 2014 2015 2016 2017Local 1/2 Cent Tax $1,815,844 $1,937,423 $2,038,304 $2,170,325 $2,080,000 $2,200,000Sales Tax Distribution 466,002 486,316 514,448 552,579 520,000 555,000Duval Cnty in Lieu of Tax 614,864 633,309 652,308 671,877 692,033 712,794Other 1,470,808 1,095,982 783,697 685,074 595,689 670,944Total Intergovernmental $4,367,518 $4,153,030 $3,988,757 $4,079,855 $3,887,722 $4,138,738

178
The City does not normally budget grant revenue until the amount is known and the grant expenditure has been approved by the City Council. In many cases, due to the timing of grant award notifications, grant revenue is budgeted in the mid-year or year-end budget adjustment. Large grant amounts received for multi-year projects are budgeted based on estimates of the completion dates for the projects. Other grants are budgeted based on the amount requested (Community Development Block Grant) or received.
Intergovernmental revenues are budgeted based on estimates provided by the State of Florida Office of Economic and Demographic Research (EDR), interlocal agreements, grant contracts and historical trends. Most of these revenues have been flat to decreasing and are budgeted accordingly.
Fines and Forfeitures
Fines and penalties imposed for the commission of statutory offenses and violations of lawful administrative rules and regulations are included in this revenue category along with revenues from the sale of confiscated money and property and service charges on bad checks. The total revenues for this category are $218,500 and represent only a small portion (0.1%) of total City revenues. The General Fund portion of this total is $170,500 (0.8% of total General Fund revenues). Fines and forfeitures are budgeted based on historical trends and have been decreasing for many years due to changes in state law related to how the fines are allocated between state and local governments. Budgeted revenue for 2017 is less than half of the amount the City received in 2007.
Original AdoptedActual Actual Actual Actual Budget Budget
2012 2013 2014 2015 2016 2017 Fines and Forfeitures $702,393 $277,193 $305,076 $332,099 $216,000 $218,500

179
Miscellaneous Revenues Miscellaneous revenues are those that do not fit any of the above categories and include items such as interest on investments, City and employee pension contributions, rental of City property, sale of City assets, donations and debt proceeds. In the 2017 budget, these revenues are estimated to be $12,315,602, representing 7.5% of the City's budgeted revenues. 80% of this revenue is interest, investment earnings and pension contributions belonging to the pension funds. These revenues have been decreased due to historic low interest rates, decreases in earnings on pension fund investments and rental of City property. Miscellaneous revenues are budgeted based on historical trends, rental contracts and current or estimated future interest rates and cash balances.
Transfers
This category represents transfers between individual funds, which are not repayable and are not considered charges for goods or services. Transfers from enterprise funds are based on a fixed formula and availability of funds. Other transfers are made to move required funds to pay for debt service and capital projects, provide matching funds for grants or to allocate the fund balance of a discontinued fund. Because interfund transfers are revenues to one fund and expenditures to another fund, they are considered to be "paper revenue." Like internal service charges, in determining the net budget, these transfers are deducted from total expenditures.
Total budgeted transfers for 2017 are $6,313,531 (4% of total revenue); transfers into the General Fund ($4,390,125) make up 22% of its total revenue. Transfers to the General Fund include contributions from enterprise funds and special revenue (grant) funds used to provide partial funding for its programs as specified in grant agreements.
Charges for Services Charges for services are generated primarily by the operation of the City's enterprise funds: electric, water & sewer, natural gas, stormwater and sanitation and represent charges for utility services provided to customers. Charges for use of the City’s tennis and golf facilities are also included in this category. Charges for services revenues represent 72.1% of the City's total revenues, but only 1.6% of the General Fund's revenues. Total revenues from charges for services are anticipated to be $118,087,319 ($313,700 in the General Fund).
Original AdoptedActual Actual Actual Actual Budget Budget
2012 2013 2014 2015 2016 2017Debt Proceeds 6,495,000 0 0 0 0 0Interest 11,048,321 8,517,652 8,754,858 1,836,113 7,005,196 7,330,558Other 5,842,850 4,326,817 4,996,228 5,044,525 5,095,540 4,985,044Total Miscellaneous $23,386,171 $12,844,469 $13,751,086 $6,880,638 $12,100,736 $12,315,602
Original AdoptedActual Actual Actual Actual Budget Budget
2012 2013 2014 2015 2016 2017 Transfers $5,783,983 $6,951,297 $7,008,673 $8,009,097 $6,663,544 $6,313,531

180
The City's electric utility, Beaches Energy Services, provides power to more than 34,000 customers in Neptune Beach, Jacksonville Beach, Ponte Vedra and Palm Valley. Beaches Energy is a member of and obtains its power through Florida Municipal Power Agency (FMPA), a consortium of municipal utilities located throughout the state. Because its primary fuel source is natural gas, changes in the cost of natural gas significantly affect electric rates. Natural gas prices have recently been stable and are projected to remain stable in the next year.
Beaches Energy has implemented energy efficiency rebates, conservation programs, demand management and renewable resource programs in order to keep its rates below the state average and to help its customers manage their electric bills. In recent years, natural gas prices have been low resulting in reductions in power costs and savings to Beaches Energy’s residential customers of about $200-$300 per year. At this point, it is difficult to tell whether flattening consumption is a result of trends in energy conservation or the relatively mild winters and summers of recent years. Revenue estimates are based on estimated consumption, historical trends and projected power cost prices from FMPA.
Original AdoptedActual Actual Actual Actual Budget Budget
2012 2013 2014 2015 2016 2017Electric $79,748,437 $87,181,601 $86,123,701 $81,835,616 $88,135,454 $86,209,666Natural Gas 1,559,994 1,695,815 2,060,874 1,970,444 2,224,756 1,748,728Water / Sewer 9,204,727 10,084,347 10,705,820 11,568,142 10,808,415 11,887,976Stormwater 1,249,583 1,262,660 1,273,790 1,294,802 1,277,500 1,330,620Sanitation 3,116,900 3,177,369 3,218,670 3,235,626 3,246,012 3,287,241Recreation / Golf 1,472,675 1,313,852 1,270,662 1,140,335 1,426,705 1,446,640Internal Services 10,144,036 10,229,774 9,515,692 10,401,695 11,565,406 11,930,449Miscellaneous 609,851 465,176 387,081 357,538 241,500 246,000Charges for Services $107,106,203 $115,410,594 $114,556,290 $111,804,198 $118,925,748 $118,087,319

181
In 2010, the City activated a natural gas distribution system intended to primarily serve commercial customers. The first service was activated in June 2010, with construction continuing and included in the 2017 budget. Revenues for this year’s budget have been estimated by the City’s gas management consultant, reviewed and adjusted by the City.
In 1995, the City adopted an inclining block rate structure for its water and sewer rates. The intent behind these rates is to encourage conservation by charging a higher rate for customers who use higher amounts of water. Since 1995, the total number of gallons billed has decreased, despite increases in the number of customers.
In 2007, water and sewer rates were increased by 5% for the first time in 10 years. Additional 5% rate increases were approved though 2010, with increases equal to the percentage increase in the CPI after that. In 2012, an additional 7.5% rate increase was approved through 2014 with CPI rate adjustments after that. The rate increases were necessary to pay for needed maintenance and improvements to the system. Water and sewer revenues have been estimated based on historical trends, with adjustments made for this year’s rate increase and the effects of water conservation.
Stormwater results when an impervious surface covers the ground (roads and parking lots, for example), preventing it from absorbing rain or other water from storms. The stormwater system drains excess water to prevent flooding. Stormwater charges, which fund maintenance and improvements to the stormwater system, are based on the amount of each customer’s impervious area. The rate of $5.00 per equivalent residential unit (ERU) has remained constant since the charge was enacted in 1991. Commercial customers are charged a based on the percentage of impervious area at their place of business.
Sanitation rates have not increased since 1993, although the City may have to consider rate increases or adjustments in the level of service when the next garbage contract is awarded. Stormwater and sanitation revenues are budgeted based on rates expected to be in effect in the coming year and historical consumption trends.

182
In 2010, concurrent with a major drainage project, the Golf Course was improved and greens rebuilt. During that time, the combination of construction, national trends and economic conditions, have caused a decrease in the number of rounds played, resulting in the need for staffing and operating cost decreases in order to balance the budget. The City has had to transfer funds to the Golf Course to provide cash flow for operations ($262,978 in 2015; $195,000 in 2016). At this time, revenues appear to have stabilized and with careful cost management, the golf course is projected to break even. Golf revenues are estimated based on the expected number of rounds to be played and historical trends.
Revenues in the internal service funds are budgeted to cover the costs of operations and therefore are equal to the approved expenditure budget. Internal service fund expenses are allocated to other City departments based on each department’s proportionate share of those costs. Administrative operations providing services through internal service funds and the allocation basis used to distribute their costs are shown below. At the end of 2016, the Grounds Maintenance Internal Service Fund was closed to and transferred to the General Fund as a division of Parks and Recreation.
Because internal service funds usually do not spend all authorized budget, revenues in "actual" years (2012-2015) are noticeably lower than revenues in "budgeted" years (2016 and 2017). Because internal service charges, like transfers, are revenues to one fund and expenditures to another fund, they are considered to be "paper revenue". In determining the net budget, these transfers are deducted from the total expenditures.
Fund Balance Fund Balance refers to the excess of assets over liabilities and, therefore, is considered to be available for appropriation to the extent that it is not reserved. Another way of describing fund balance is the difference between all the revenue the fund has received and all the expenditures made from the fund since its inception.
Internal Service Fund
Allocation Basis
City Manager Time estimate Accounting Department/division operating budgets Utility Billing Number of meters in each utility & degree of difficulty (time) Information Systems Time and difficulty estimate Purchasing Number and value of purchase orders Human Resources Number of employees Fleet Maintenance Specific vehicle maintenance costs and overhead allocation based on number
of vehicles Meter Services Number of meters read Operations & Maintenance Facility
Square footage allocated to each department
Insurance Funds Property value (general/liability); payroll costs and cost per $1,000 (worker’s comp); specific charges (employee life, health & dental insurance)

183
The City implemented GASB 54, Fund Balance Reporting and Governmental Fund Type Definitions in 2011, as required. The statement establishes fund balance classifications that comprise a hierarchy based on the extent to which the City is bound to honor constraints on the specific purpose for which amounts in governmental funds can be spent. Under this standard, fund balance is reported in five classifications – nonspendable, restricted, committed, assigned and unassigned. A discussion of GASB 54 and its effect on fund balance classifications can be found at: http://www.gasb.org/st/summary/gstsm54.html. For simplification of presentation in the budget, beginning and ending fund balances are shown in the financial summaries as either “unrestricted/unassigned” or “all other balances”. Fund balances shown as “all other balances” have conditions attached to their use, either by federal, state or local law, grant or bond agreements or interlocal contract. Unrestricted/unassigned fund balance represents an amount available to be budgeted. When utilized in this fashion, the unreserved portion of the fund balance is considered revenue for purposes of balancing the budget. For example, because the City does not receive property tax until about a third of the way through the year, the revenue is unavailable to fund general fund operations for the first 3-4 months of the year. Unrestricted fund balance can be used to cover this temporary revenue shortage and to pay for costs for major, unexpected events, like tropical storms and hurricanes, without having to borrow money or wait for FEMA reimbursement.
The “all other balances” shown on the budget summaries are set aside for identified, specific purposes, such as special revenue, debt service, contractual and grant requirements, bond requirements, redevelopment and retiree pensions. 62% of the City's fund balance is set aside for such purposes. All of the nonmajor governmental funds have spending restrictions attached to their revenue sources. Also, many grant revenues are received on a reimbursement basis, after the City has paid for the grant-related item or project. In such instances, beginning fund balance is used to cover cash shortages due to differences in the timing of grant-funded expenses and the related grant reimbursement. In FY2017, total budgeted revenues are more than total budgeted expenditures, meaning that the City expects its total fund balance to increase. Fund balance is not normally used to pay for routine, recurring operating expenditures. The budgeted fund balance increase of $5 million, shown in the table on the following page, is expected to come from net earnings in redevelopment and pension funds. Except for the General Fund, all other funds are expected to have reductions in their fund balances. The percentage change in fund balance is calculated as the amount of revenues over (under) expenditures, divided by the beginning fund balance.
Original AdoptedActual Actual Actual Actual Budget Budget
Ending Fund Balance 2012 2013 2014 2015 2016 2017Unrestricted/unassigned $74,407,983 $75,701,675 $81,027,585 $94,624,279 $91,375,574 $87,950,700All other 114,167,373 114,928,072 123,435,409 124,957,347 133,041,696 141,540,354Total Fund Balance $188,575,356 $190,629,747 $204,462,994 $219,581,626 $224,417,270 $229,491,054
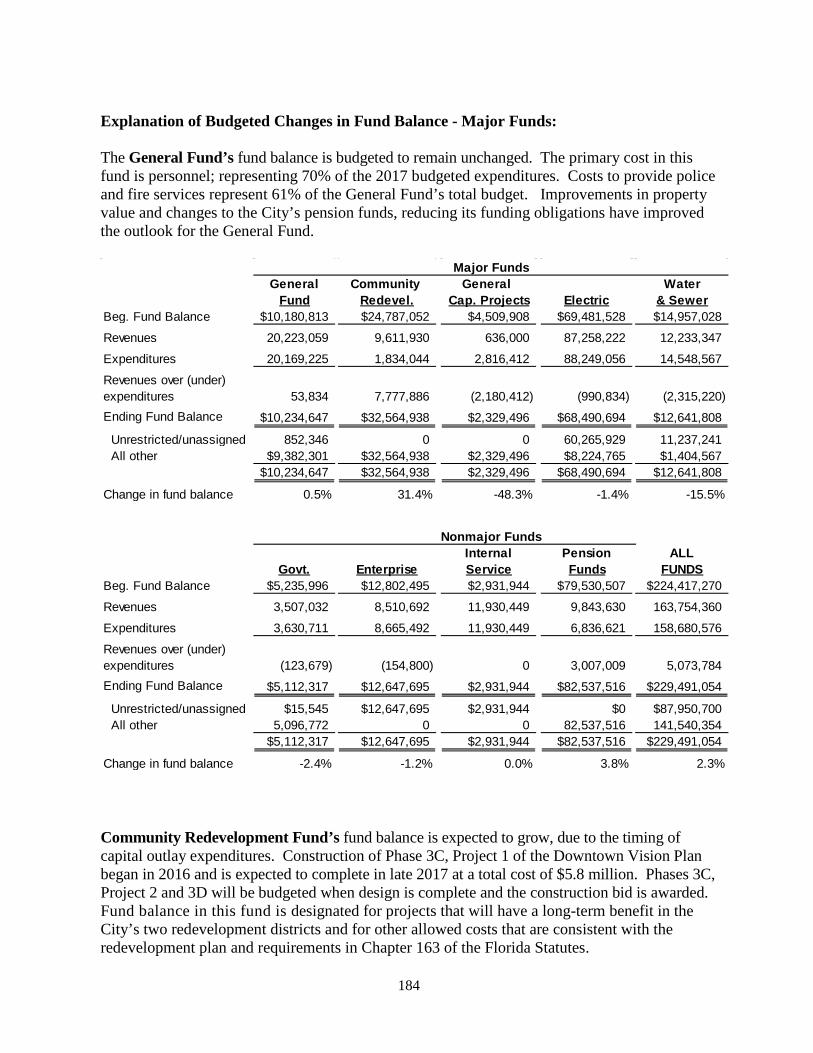
184
Explanation of Budgeted Changes in Fund Balance - Major Funds: The General Fund’s fund balance is budgeted to remain unchanged. The primary cost in this fund is personnel; representing 70% of the 2017 budgeted expenditures. Costs to provide police and fire services represent 61% of the General Fund’s total budget. Improvements in property value and changes to the City’s pension funds, reducing its funding obligations have improved the outlook for the General Fund.
Community Redevelopment Fund’s fund balance is expected to grow, due to the timing of capital outlay expenditures. Construction of Phase 3C, Project 1 of the Downtown Vision Plan began in 2016 and is expected to complete in late 2017 at a total cost of $5.8 million. Phases 3C, Project 2 and 3D will be budgeted when design is complete and the construction bid is awarded. Fund balance in this fund is designated for projects that will have a long-term benefit in the City’s two redevelopment districts and for other allowed costs that are consistent with the redevelopment plan and requirements in Chapter 163 of the Florida Statutes.
Major FundsGeneral Community General Water
Fund Redevel. Cap. Projects Electric & SewerBeg. Fund Balance $10,180,813 $24,787,052 $4,509,908 $69,481,528 $14,957,028
Revenues 20,223,059 9,611,930 636,000 87,258,222 12,233,347
Expenditures 20,169,225 1,834,044 2,816,412 88,249,056 14,548,567
Revenues over (under) expenditures 53,834 7,777,886 (2,180,412) (990,834) (2,315,220)Ending Fund Balance $10,234,647 $32,564,938 $2,329,496 $68,490,694 $12,641,808
Unrestricted/unassigned 852,346 0 0 60,265,929 11,237,241 All other $9,382,301 $32,564,938 $2,329,496 $8,224,765 $1,404,567
$10,234,647 $32,564,938 $2,329,496 $68,490,694 $12,641,808
Change in fund balance 0.5% 31.4% -48.3% -1.4% -15.5%
Nonmajor FundsInternal Pension ALL
Govt. Enterprise Service Funds FUNDSBeg. Fund Balance $5,235,996 $12,802,495 $2,931,944 $79,530,507 $224,417,270
Revenues 3,507,032 8,510,692 11,930,449 9,843,630 163,754,360
Expenditures 3,630,711 8,665,492 11,930,449 6,836,621 158,680,576
Revenues over (under) expenditures (123,679) (154,800) 0 3,007,009 5,073,784Ending Fund Balance $5,112,317 $12,647,695 $2,931,944 $82,537,516 $229,491,054
Unrestricted/unassigned $15,545 $12,647,695 $2,931,944 $0 $87,950,700 All other 5,096,772 0 0 82,537,516 141,540,354
$5,112,317 $12,647,695 $2,931,944 $82,537,516 $229,491,054
Change in fund balance -2.4% -1.2% 0.0% 3.8% 2.3%

185
General Capital Projects Fund’s fund balance is budgeted to decrease due to the timing of major expenditures and projects paid for from this fund. All budgeted projects in this fund were funded in previous years. Projects budgeted are the replacement business application software, radio system replacement, building systems replacements, one fire truck replacement, and various information systems projects. Transfers from the General Fund are this fund’s primary source of revenue. Electric Fund’s fund balance is expected to decrease due to decreases in revenues. The decrease is largely related to a timing difference between billed power costs and paid power costs and is expected to be temporary. Budgeted expenses for 2017 are 3.5% less than in 2016 because of decreases in expected power costs and transfers. The Water & Sewer Fund’s fund balance is budgeted to decrease due to the project to rebuild lift station #7 and demolish old lift stations #8 and #20. This project is expected to cost $2.2 million. Increases in capital outlay are expected for the next several years. Explanation of Budgeted Changes in Fund Balance - Nonmajor Funds: Governmental Funds will show a decrease in fund balance due to the use of accumulated fund balance to pay for allowed expenses. Included in the budgets for these funds are things such as police training, special events, road and street maintenance and equipment purchases. Grant revenues are not budgeted until formal notice is received from the grantor. This notice often does not arrive in time for the funds to be included in the original budget. In such cases, the budget is adjusted at mid-year or at the end of the year. Nonmajor Enterprise Funds consist of the Natural Gas, Stormwater, Sanitation, Golf Course and Lease Facilities Funds. These funds recover their costs through user charges and are not expected to have a major change in their fund balances from year-to-year. The minor decrease in fund balance is due to accelerated repayment of a construction loan by the Natural Gas Fund to the Electric Fund. Internal Service Funds recover their costs through charges to internal customers and are budgeted to break even. Pension (trust) Funds account for three employee pension systems: General, Police and Fire. The City uses its annual actuarial report to determine the level of funding it needs to meet in order to keep the balance in its pension funds adequately funded and able to meet obligations to current and future retirees. The budget anticipates an increase in investment earnings in 2017.


187
Combined Summary of Revenues and Expenditures
Original AdoptedActual Actual Budget Budget Increase %2014 2015 2016 2017 (Decrease) Change
Unrestricted/unassigned 74,655,855$ 81,027,585$ 94,624,279$ 91,375,574$ (3,248,705)$ -3.4%All other balances 114,344,393 123,435,409 124,957,347 133,041,696 8,084,349 6.5%Beginning Fund Balance 189,000,248 204,462,994 219,581,626 224,417,270 4,835,644 2.2%
RevenuesTaxes 19,178,565 20,021,606 21,182,469 22,103,420 920,951 4.3%Permits & fees 582,702 683,305 562,250 577,250 15,000 2.7%Intergovernmental 3,988,757 4,079,855 3,887,722 4,138,738 251,016 6.5%Charges for services 114,556,289 111,804,198 118,925,748 118,087,319 (838,429) -0.7%Fines & forfeitures 305,076 332,099 216,000 218,500 2,500 1.2%Interest & other 13,705,274 6,880,638 12,100,736 12,315,602 214,865 1.8%Transfers in 7,008,673 8,009,097 6,663,544 6,313,531 (350,013) -5.3%
Total Revenues 159,325,336 151,810,798 163,538,469 163,754,360 215,891 0.1%
Other Financing Sources 4,192,895 10,035,442
ExpendituresPersonal Services 25,133,697 26,261,284 28,050,179 29,156,660 1,106,481 3.9%Operating-Energy 64,651,960 60,161,257 67,742,117 62,997,463 (4,744,654) -7.0%Operating-All Other 31,089,013 34,654,359 37,145,094 38,156,185 1,011,091 2.7%Capital Outlay 12,985,225 9,605,443 13,040,340 16,652,710 3,612,370 27.7%Debt Service 6,419,652 6,024,814 6,051,195 5,376,492 (674,703) -11.1%Grants to Others 11,537 11,214 10,356 27,535 17,179 165.9%Transfers 6,984,116 8,005,024 6,663,544 6,313,531 (350,013) -5.3%
Total Expenditures 147,275,200 144,723,395 158,702,825 158,680,576 (22,249) -0.01%
Other Financing Uses 780,285 1,998,704
Change in Fund Balance 15,462,746 15,124,141 4,835,644 5,073,784 238,140 4.9%
Unrestricted/unassigned 81,027,585 94,624,279 91,375,574 87,950,700 (3,424,874) -3.7%All other balances 123,435,409 124,957,347 133,041,696 141,540,354 8,498,658 6.4%Ending Fund Balance 204,462,994$ 219,581,626$ 224,417,270$ 229,491,054$ 5,073,784$ 2.3%
Expenditures by Department:Executive & Legislative 893,622 1,307,624 1,263,766 1,300,649 $36,883 2.9%Finance 5,336,006 5,874,145 6,195,922 6,481,080 285,158 4.6%Planning & Development 597,241 712,263 801,510 832,231 30,721 3.8%Community Redevelopment 4,796,533 2,975,575 1,062,493 779,505 (282,988) -26.6%Parks & Recreation 4,186,490 4,630,370 4,793,636 4,780,688 (12,948) -0.3%Public Works 16,851,744 15,673,719 18,962,075 21,462,674 2,500,599 13.2%Police 8,266,995 8,844,688 9,157,351 9,855,396 698,045 7.6%Fire 3,464,881 3,509,113 3,797,512 3,823,550 26,038 0.7%Beaches Energy Services 87,556,209 83,381,848 94,265,985 91,351,444 (2,914,541) -3.1%Human Resources 10,207,567 11,416,115 11,716,414 11,766,573 50,159 0.4%Non-Departmental 5,117,912 6,397,935 6,686,161 6,246,786 (439,375) -6.6% Total Expenditures 147,275,200$ 144,723,395$ 158,702,825$ 158,680,576$ (22,249)$ 0.0%
Expenditures by Major/Nonmajor Fund:General Fund 18,464,628 19,849,420 20,037,863 20,169,225 $131,362 0.7%Redevelopment 5,353,221 3,886,008 1,940,468 1,834,044 (106,424) -5.5%General Capital Projects 981,049 1,952,080 3,070,301 2,816,412 (253,889) -8.3%Electric 85,235,815 80,935,375 91,461,059 88,249,056 (3,212,003) -3.5%Water & Sewer 10,396,769 9,496,397 12,103,925 14,548,567 2,444,642 20.2% Total Major Funds 120,431,482 116,119,280 128,613,616 127,617,304 (996,312) -0.8%Nonmajor Governmental 3,490,322 3,601,769 3,399,826 3,630,711 230,885 6.8%Nonmajor Enterprise 7,759,180 7,526,350 8,369,133 8,665,492 296,359 3.5%Internal Service 9,035,473 10,655,225 11,565,406 11,930,449 365,043 3.2%Pension 6,558,743 6,820,771 6,754,844 6,836,621 81,777 1.2% Total Nonmajor Funds 26,843,718 28,604,115 30,089,209 31,063,272 974,063 3.2% Total Expenditures 147,275,200$ 144,723,395$ 158,702,825$ 158,680,576$ (22,249)$ -0.01%
Total Expenditures $147,275,200 $144,723,395 $158,702,825 $158,680,576 ($22,249) 0.0% less: Internal Service Charges 9,035,473 10,655,225 11,565,406 11,930,449 $365,043 3.2% less: Transfers 6,984,116 8,005,024 6,663,544 6,313,531 ($350,013) -5.3%Net Budgeted Expenditures 131,255,611$ 126,063,146$ 140,473,875$ 140,436,597$ (37,278)$ -0.03%
City of Jacksonville Beach - All Funds

188
Original AdoptedActual Actual Budget Budget Increase %2014 2015 2016 2017 (Decrease) Change
Unrestricted/unassigned 4,455$ 1,037,198$ 899,959$ 798,512$ (101,447)$ -11.3%All other balances 10,020,738 9,483,088 9,382,301 9,382,301 - 0.0%Beginning Fund Balance 10,025,193$ 10,520,286$ 10,282,260$ 10,180,813$ (101,447)$ -1.0%
RevenuesTaxes 9,135,535 9,364,449 10,151,466 10,426,490 275,024 2.7%Licenses & permits 568,986 682,162 562,250 577,250 15,000 2.7%Intergovernmental 3,709,348 3,874,857 3,743,233 3,940,994 197,761 5.3%Charges for services 315,396 339,544 309,200 313,700 4,500 1.5%Fines & forfeitures 179,357 182,060 170,000 170,500 500 0.3%Interest & other 332,233 490,582 359,000 404,000 45,000 12.5%Transfers in 4,537,049 4,683,249 4,641,267 4,390,125 (251,142) -5.4%
Total Revenues 18,777,904 19,616,903 19,936,416 20,223,059 286,643 1.4%
Other Financing Sources 181,817
ExpendituresPersonal Services 12,402,591 12,846,351 13,721,312 14,147,115 425,803 3.1%Operating-All Other 4,440,344 4,839,092 5,526,945 5,392,306 (134,639) -2.4%Capital Outlay 291,357 588,663 264,250 272,269 8,019 3.0%Debt Service-Principal - - - - - 0.0%Debt Service-Interest & Other - - - - - 0.0%Grants to Others 11,537 10,356 10,356 7,535 (2,821) -27.2%
Transfers 1,318,799 1,564,958 515,000 350,000 (165,000) -32.0% Total Expenditures 18,464,628 19,849,420 20,037,863 20,169,225 131,362 0.7%
Other Financing Uses 5,509
Change in Fund Balance 495,093 (238,026) (101,447) 53,834 155,281 -153.1%
Unrestricted/unassigned 1,037,198 899,959 798,512 852,346 53,834 6.7%All other balances 9,483,088 9,382,301 9,382,301 9,382,301 - 0.0%Ending Fund Balance 10,520,286$ 10,282,260$ 10,180,813$ 10,234,647$ 53,834$ 0.5%
Expenditures by Department: 10,025,193
Executive & Legislative 576,160$ 798,420$ 764,364$ 789,656$ 25,292$ 3.3%Finance 420,004 566,898 450,146 438,492 (11,654) -2.6%Planning & Development 597,241 712,263 801,510 832,231 30,721 3.8%Parks & Recreation 2,616,727 2,943,780 3,136,819 3,053,559 (83,260) -2.7%Public Works 1,383,267 1,457,220 1,542,160 1,559,457 17,297 1.1%Police 7,452,013 7,727,693 8,118,518 8,450,360 331,842 4.1%Fire 3,422,119 3,503,649 3,787,512 3,813,550 26,038 0.7%Non-Departmental 1,997,097 2,139,497 1,436,834 1,231,920 (204,914) -14.3% Total Expenditures 18,464,628$ 19,849,420$ 20,037,863$ 20,169,225$ 131,362$ 0.7%
Combined Summary of Revenues and ExpendituresGeneral Fund

189
General Fund
Taxes-ad valorem43%
Taxes-communication & other
9%
Licenses, permits, forfeitures, interest
& other7%
Other governments & agencies
19% Transfers from other funds
22%
Where the money comes from:
Plan & Develop, Finance (Bldg Maint)…
Parks & Rec15%
Public Works8%
Police42%
Fire19%
Insurance & Other Non Dept
6%
What it pays for-by department:
Personnel70%
Supplies & services27%
Capital outlay1%
Transfer to other funds2%
What it pays for-by category:

190
General FundSummary of Revenues
Original AdoptedActual Actual Budget Budget Increase %2014 2015 2016 2017 (Decrease) Change
TaxesProperty Tax 7,212,642$ 7,534,430$ 8,221,186$ 8,643,193$ 422,007$ 5.1%Local Communications Services 1,198,759 1,122,565 1,200,000 1,063,000 (137,000) -11.4%Other taxes 724,134 707,454 730,280 720,297 (9,983) -1.4%
Total Taxes 9,135,535 9,364,449 10,151,466 10,426,490 275,024 2.7%
Licenses & PermitsBuilding permits 410,346 479,684 420,000 420,000 - 0.0%Other licenses and permits 158,640 202,478 142,250 157,250 15,000 10.5%
Total Licenses and Permits 568,986 682,162 562,250 577,250 15,000 2.7%
Intergovernmental Revenues8th cent motor fuel 176,240 179,860 175,000 177,000 2,000 1.1%Sales tax distribution 514,448 552,579 520,000 555,000 35,000 6.7%State 1/2 cent tax 2,038,304 2,170,325 2,080,000 2,200,000 120,000 5.8%Other intergovernmental revenues 168,692 158,358 136,200 136,200 - 0.0%Duval county in Lieu of Taxes 652,308 671,877 692,033 712,794 20,761 3.0%911 Rebate 159,356 141,858 140,000 160,000 20,000 14.3%
Total Intergovernmental Revenues 3,709,348 3,874,857 3,743,233 3,940,994 197,761 5.3%
Charges for ServicesLien Certificates 35,760 39,355 30,000 32,000 2,000 6.7%Cemetery services 2,550 11,100 1,500 1,500 - 0.0%Recreation programs 84,174 89,397 86,200 86,200 - 0.0%Contracted services - - - - - 0.0%Other Charges and Fees 192,912 199,692 191,500 194,000 2,500 1.3%
Total Services 315,396 339,544 309,200 313,700 4,500 1.5%
Fines & ForfeituresCourt Fines 70,346 78,423 65,000 71,000 6,000 9.2%Parking violations 61,365 60,130 54,500 56,000 1,500 2.8%Code enforcement board 16,486 14,224 12,500 12,000 (500) -4.0%Other Fines and Forfeits 31,160 29,283 38,000 31,500 (6,500) -17.1%
0.0%Total Fines & Forfeitures 179,357 182,060 170,000 170,500 500 0.3%
Interest & Other RevenueInterest on investments 156,431 256,836 200,000 225,000 25,000 12.5%Other revenues 175,802 233,746 159,000 179,000 20,000 12.6%
Total Other Revenues 332,233 490,582 359,000 404,000 45,000 12.5%
Transfers InTransfer from Electric Utility 3,608,401 3,670,124 3,688,677 3,693,665 4,988 0.1%Transfer from Gas Tax 372,000 372,000 372,000 372,000 - 0.0%Transfer from Others Misc. 556,648 641,125 580,590 324,460 (256,130) -44.1%
Total Transfers 4,537,049 4,683,249 4,641,267 4,390,125 (251,142) -5.4%
Total Revenue 18,777,904$ 19,616,903$ 19,936,416$ 20,223,059$ 286,643$ 1.4%

191
General FundSummary of Expenditures
Original AdoptedActual Actual Budget Budget Increase %2014 2015 2016 2017 (Decrease) Change
Executive & LegislativeCity Council 170,637$ 155,531$ 169,064$ 169,570$ 506$ 0.3%City Attorney 141,925 380,490 280,755 304,020 23,265 8.3%City Clerk 263,598 262,399 314,545 316,066 1,521 0.5%Total 576,160 798,420 764,364 789,656 25,292 3.3%
FinanceBuilding Maintenance 420,004 566,898 450,146 438,492 (11,654) -2.6%
Planning & DevelopmentPlanning & Development 154,619 186,174 231,204 211,719 (19,485) -8.4%Building Inspections 306,265 386,487 403,503 445,762 42,259 10.5%Code Enforcement 136,357 139,602 166,803 174,750 7,947 4.8%Total 597,241 712,263 801,510 832,231 30,721 3.8%
Parks & RecreationAdministration 589,037 744,006 809,154 629,084 (180,070) -22.3%Ocean Rescue 647,120 659,005 705,476 708,613 3,137 0.4%Grounds Maintenance 991,416 1,142,884 1,138,589 1,172,580 33,991 3.0%Cemetery Maintenance - - - 132,164 132,164 0.0%Tennis 96,475 89,775 91,203 108,046 16,843 18.5%Oceanfront Restrooms 77,047 87,877 131,000 131,000 - 0.0%Carver Center 94,447 103,737 87,797 120,472 32,675 37.2%Special Events 80,024 81,479 124,000 - (124,000) -100.0%Exhibition Hall 41,161 35,017 49,600 51,600 2,000 4.0%Total 2,616,727 2,943,780 3,136,819 3,053,559 (83,260) -2.7%
Public WorksStreets 1,383,267 1,457,220 1,542,160 1,559,457 17,297 1.1%
PoliceAdministration 989,721 1,058,692 1,091,444 1,126,918 35,474 3.3%Records 175,149 178,607 188,211 204,006 15,795 8.4%Investigative 1,309,828 1,267,171 1,329,049 1,392,517 63,468 4.8%Patrol 3,646,434 3,767,924 3,888,318 4,032,892 144,574 3.7%Communications 709,488 738,120 837,931 880,370 42,439 5.1%Ancillary Services 450,999 505,056 570,909 592,012 21,103 3.7%Police Reserves 47,586 79,192 59,925 61,564 1,639 2.7%Parking 112,026 121,684 132,731 140,081 7,350 5.5%Volunteer Programs 10,782 11,247 20,000 20,000 - 0.0%Total 7,452,013 7,727,693 8,118,518 8,450,360 331,842 4.1%
FireFire Department 3,422,119 3,503,649 3,787,512 3,813,550 26,038 0.7%
Non-departmentalNon-departmental 1,997,097 2,139,497 1,436,834 1,231,920 (204,914) -14.3%Total Expenditures 18,464,628$ 19,849,420$ 20,037,863$ 20,169,225$ 131,362$ 0.7%

192
Major Fund - Community Redevelopment Agency Combined Summary of Revenues and Expenditures
Original AdoptedActual Actual Budget Budget Increase %2014 2015 2016 2017 (Decrease) Change
Unrestricted/unassigned -$ -$ -$ -$ -$ 0.0%All other balances 9,387,215 13,694,657 17,691,517 24,787,052 7,095,535 40.1%Beginning Fund Balance 9,387,215 13,694,657 17,691,517 24,787,052 7,095,535 40.1%
RevenuesTaxes 7,924,509 8,372,488 8,871,003 9,446,930 575,927 6.5%Licenses & permits - - - - - 0.0%Intergovernmental 422 422 - - - 0.0%Charges for services - 1,501 - - - 0.0%Fines & forfeitures - - - - - 0.0%Interest & other 135,553 182,366 165,000 165,000 - 0.0%Transfers in 44,356 - - - - 0.0%
Total Revenues 8,104,840 8,556,777 9,036,003 9,611,930 575,927 6.4%
Other Financing Sources 1,555,823 -
ExpendituresPersonal Services 562,114 919,741 977,567 1,127,890 150,323 15.4%Operating-Power - - - - - 0.0%Operating-All Other 151,368 152,482 266,789 643,154 376,365 141.1%Capital Outlay 3,596,076 2,148,475 29,750 63,000 33,250 111.8%Debt Service-Principal 965,465 620,799 646,881 - (646,881) -100.0%Debt Service-Interest & Other 78,198 44,511 19,481 - (19,481) -100.0%Grants to Others - - - - - 0.0%Transfers - - - - - 0.0%
Total Expenditures 5,353,221 3,886,008 1,940,468 1,834,044 (106,424) -5.5%
Other Financing Uses - 673,909
Change in Fund Balance 4,307,442 3,996,860 7,095,535 7,777,886 682,351 9.6%
Unrestricted/unassigned - - - - - 0.0%All other balances 13,694,657 17,691,517 24,787,052 32,564,938 7,777,886 31.4%
Ending Fund Balance 13,694,657$ 17,691,517$ 24,787,052$ 32,564,938$ 7,777,886$ 31.4%
Expenditures by Department:
Executive & Legislative -$ -$ -$ -$ -$ 0.0%Finance - - - - - 0.0%Planning & Development - - - - - 0.0%Community Redevelopment 4,796,533 2,975,575 1,062,493 779,505 (282,988) -26.6%Parks & Recreation - - - - - 0.0%Public Works - - - - - 0.0%Police 556,688 910,433 877,975 1,054,539 176,564 20.1%Fire - - - - - 0.0%Beaches Energy Services - - - - - 0.0%Human Resources - - - - - 0.0%Non-Departmental - - - - - 0.0%
Total Expenditures 5,353,221$ 3,886,008$ 1,940,468$ 1,834,044$ (106,424)$ -5.5%
Expenditures by Fund:
Downtown Tax Increment 2,210,819 1,732,426 1,131,870 1,700,715 568,845 50.3%Southend Tax increment 3,142,402 2,153,582 808,598 133,329 (675,269) -83.5%
Total Expenditures 5,353,221$ 3,886,008$ 1,940,468$ 1,834,044$ (106,424)$ -5.5%

193
Major Fund: General Capital Projects Combined Summary of Revenues and Expenditures
Original AdoptedActual Actual Budget Budget Increase %2014 2015 2016 2017 (Decrease) Change
Unrestricted/unassigned -$ -$ -$ -$ -$ 0.0%All other balances 5,443,894 5,936,086 6,554,209 4,509,908 (2,044,301) -31.2%Beginning Fund Balance 5,443,894 5,936,086 6,554,209 4,509,908 (2,044,301) -31.2%RevenuesTaxes - - - - - 0.0%Permits & fees - - - - - 0.0%Intergovernmental - - - - - 0.0%Charges for services - - - - - 0.0%Fines & forfeitures - - - - - 0.0%Interest & other 67,826 131,339 70,000 70,000 - 0.0%Transfers in 1,406,471 2,389,053 956,000 566,000 (390,000) -40.8%
Total Revenues 1,474,297 2,520,392 1,026,000 636,000 (390,000) -38.0%
Other Financing Sources 49,811
ExpendituresPersonal Services - - - - - 0.0%Operating-Energy - - - - - 0.0%Operating-All Other 237,279 1,575,169 225,000 127,000 (98,000) -43.6%Capital Outlay 743,770 376,911 2,845,301 2,689,412 (155,889) -5.5%Debt Service-Principal - - - - - 0.0%Debt Service-Interest & Other - - - - - 0.0%Grants to Others - - - - - 0.0%Transfers - - - - - 0.0%
Total Expenditures 981,049 1,952,080 3,070,301 2,816,412 (253,889) -8.3%
Other Financing Uses 1,056
Change in Fund Balance 492,192 618,123 (2,044,301) (2,180,412) (136,111) 6.7%
Unrestricted/unassigned - - - - - 0.0%All other balances 5,936,086 6,554,209 4,509,908 2,329,496 (2,180,412) -48.3%Ending Fund Balance 5,936,086$ 6,554,209$ 4,509,908$ 2,329,496$ (2,180,412)$ -48.3%
Expenditures by Department:Executive & Legislative - - - - - 0.0%Finance - - - - - 0.0%Planning & Development - - - - - 0.0%
Community Redevelopment - - - - - 0.0%Parks & Recreation - - - - - 0.0%Public Works - - - - - 0.0%Police - - - - - 0.0%Fire - - - - - 0.0%Beaches Energy Services - - - - - 0.0%Personnel - - - - - 0.0%Non-Departmental 981,049 1,952,080 3,070,301 2,816,412 (253,889) -8.3%
Total Expenditures 981,049$ 1,952,080$ 3,070,301$ 2,816,412$ (253,889)$ -8.3%

194
Major Fund - Electric UtilityCombined Summary of Revenues and Expenses
Original AdoptedActual Actual Budget Budget Increase %2014 2015 2016 2017 (Decrease) Change
Unrestricted 48,504,591$ 52,161,271$ 63,693,038$ 61,256,763$ (2,436,275)$ -3.8%Restricted 8,074,928 8,224,762 8,215,898 8,224,765 8,867 0.1%Beginning Fund Balance 56,579,519 60,386,033 71,908,936 69,481,528 (2,427,408) -3.4%
RevenuesTaxes - - - - - 0.0%Permits & fees - - - - - 0.0%Intergovernmental - - - - - 0.0%Charges for services 86,123,701 81,835,616 88,135,454 86,209,666 (1,925,788) -2.2%Fines & forfeitures - - - - - 0.0%Interest & other 627,987 863,867 736,100 736,100 - 0.0%Transfers in - 162,097 162,097 312,456 150,359 92.8%
Total Revenues 86,751,688 82,861,580 89,033,651 87,258,222 (1,775,429) -2.0%
Other Financing Sources 2,290,641 9,596,698
ExpensesPersonal Services 5,255,737 5,205,438 5,483,431 5,649,688 166,257 3.0%Operating-Energy 63,519,559 59,230,197 66,526,347 61,693,875 (4,832,472) -7.3%Operating-All Other 5,445,894 6,165,263 7,473,269 7,586,561 113,292 1.5%Capital Outlay 4,820,332 4,093,743 5,515,000 6,943,000 1,428,000 25.9%Debt Service-Principal 2,037,940 2,093,895 2,167,520 2,238,200 70,680 3.3%Debt Service-Interest & Other 547,952 476,715 416,815 339,067 (77,748) -18.7%Grants to Others - - - - - 0.0%Transfers 3,608,401 3,670,124 3,878,677 3,798,665 (80,012) -2.1%
Total Expenses 85,235,815 80,935,375 91,461,059 88,249,056 (3,212,003) -3.5%
Other Financing Uses
Change in Fund Balance 3,806,514 11,522,903 (2,427,408) (990,834) 1,436,574 -59.2%
Unrestricted 52,161,271 63,693,038 61,256,763 60,265,929 (990,834) -1.6%Restricted 8,224,762 8,215,898 8,224,765 8,224,765 - 0.0%Ending Fund Balance 60,386,033$ 71,908,936$ 69,481,528$ 68,490,694$ (990,834)$ -1.4%
Expenses by DivisionPurchased Power 63,519,559$ 59,230,197$ 66,526,347$ 61,693,875$ (4,832,472)$ -7.3%Administration 9,956,444 10,653,346 11,126,375 11,097,688 (28,687) -0.3%Engineering 858,134 763,826 868,865 962,770 93,905 10.8%Relay & Substations 753,875 784,664 813,425 1,151,469 338,044 41.6%Construction & Maintenance 3,818,109 3,774,258 4,131,014 4,542,535 411,521 10.0%Capital Projects 4,378,659 2,964,235 3,850,000 2,850,000 (1,000,000) -26.0%System Operations 1,083,577 1,367,756 1,096,682 1,103,074 6,392 0.6%Transmission 345,906 721,210 1,082,500 2,960,500 1,878,000 173.5%Conservation & Renewables 231,038 145,854 496,570 494,177 (2,393) -0.5%Storeroom 214,143 218,065 230,121 215,559 (14,562) -6.3%CARE 51,371 62,242 70,000 60,000 (10,000) -14.3%Regulatory Compliance 25,000 249,722 1,169,160 1,117,409 (51,751) -4.4% Total Expenses 85,235,815$ 80,935,375$ 91,461,059$ 88,249,056$ (3,212,003)$ -3.5%

195
Major Fund - Water & Sewer UtilityCombined Summary of Revenues and Expenses
Original AdoptedActual Actual Budget Budget Increase %2014 2015 2016 2017 (Decrease) Change
Unrestricted 11,709,061$ 12,340,210$ 14,536,495$ 13,552,461$ (984,034)$ -6.8%Restricted 1,406,715 1,405,420 1,404,567 1,404,567 - 0.0%Beginning Fund Balance 13,115,776 13,745,630 15,941,062 14,957,028 (984,034) -6.2%
RevenuesTaxes - - - - - 0.0%Permits & fees - - - - - 0.0%Intergovernmental 57,339 - - - - 0.0%Charges for services 10,705,820 11,568,142 10,808,415 11,887,976 1,079,561 10.0%Fines & forfeitures - - - - - 0.0%Interest & other 358,037 505,388 311,476 345,371 33,896 10.9%Transfers in - - - - - 0.0%
Total Revenues 11,121,196 12,073,530 11,119,891 12,233,347 1,113,456 10.0%
Other Financing Sources
ExpensesPersonal Services 2,591,140 2,651,191 2,837,081 2,925,565 88,484 3.1%Operating-Power - - - - - 0.0%Operating-All Other 3,381,200 3,364,456 3,779,492 3,884,552 105,060 2.8%Capital Outlay 2,620,129 1,686,139 3,552,000 5,858,029 2,306,029 64.9%Debt Service-Principal 1,422,060 1,461,105 1,512,480 1,561,800 49,320 3.3%Debt Service-Interest & Other 382,240 332,648 293,872 239,621 (54,251) -18.5%Grants to Others - 858 - 20,000 20,000 0.0%Transfers - - 129,000 59,000 (70,000) -54.3%
Total Expenses 10,396,769 9,496,397 12,103,925 14,548,567 2,444,642 20.2%
Other Financing Uses 94,573 381,701
Change in Fund Balance 629,854 2,195,432 (984,034) (2,315,220) (1,331,186) 135.3%
Unrestricted 12,340,210 14,536,495 13,552,461 11,237,241 (2,315,220) -17.1%Restricted 1,405,420 1,404,567 1,404,567 1,404,567 - 0.0%Ending Fund Balance 13,745,630$ 15,941,062$ 14,957,028$ 12,641,808$ (2,315,220)$ -15.5%
Expenses by DivisionAdministration 3,091,001$ 3,224,766$ 3,372,213$ 3,357,218$ (14,995)$ -0.4%Water Plant 1,742,918 1,393,051 1,332,366 2,505,529 1,173,163 88.1%Pollution Conrol Plant 3,518,102 3,090,264 3,110,290 2,934,960 (175,330) -5.6%Distribution & Collection 2,185,079 1,673,316 3,539,056 3,364,860 (174,196) -4.9%Capital Projects (140,331) 115,000 750,000 2,386,000 1,636,000 218.1%
Total Expenses 10,396,769$ 9,496,397$ 12,103,925$ 14,548,567$ 2,444,642$ 20.2%

196
All Nonmajor Governmental FundsCombined Summary of Revenues and Expenditures
Original AdoptedActual Actual Budget Budget Increase %2014 2015 2016 2017 (Decrease) Change
Unrestricted/unassigned 622,921$ 631,887$ 123,365$ 33,399$ (89,966)$ -72.9%All other balances 4,792,707 4,926,164 5,159,070 5,202,597 43,527 0.8%
Beginning Fund Balance 5,415,628 5,558,051 5,282,435 5,235,996 (46,439) -0.9%
RevenuesTaxes 2,118,521 2,284,669 2,160,000 2,230,000 70,000 3.2%Licenses & permits - - - - - 0.0%Intergovernmental 221,648 204,576 144,489 197,744 53,255 36.9%Charges for services 71,685 16,493 25,000 25,000 - 0.0%Fines & forfeitures 125,719 150,039 46,000 48,000 2,000 4.3%Interest & other 135,071 170,406 73,718 26,338 (47,380) -64.3%Transfers in 986,797 477,720 904,180 979,950 75,770 8.4%
Total Revenues 3,659,441 3,303,903 3,353,387 3,507,032 153,645 4.6%
Other Financing Sources 12,913 41,756 ExpendituresPersonal Services 62,651 63,854 58,511 58,835 324 0.6%Operating-Power - - - - - 0.0%Operating-All Other 538,956 209,862 539,909 660,378 120,469 22.3%Capital Outlay 207,473 163,616 272,039 344,000 71,961 26.5%Debt Service-Principal 900,000 925,000 935,000 955,000 20,000 2.1%Debt Service-Interest & Other 85,797 70,141 59,146 42,804 (16,342) -27.6%Transfers 1,695,445 2,169,296 1,535,221 1,569,694 34,473 2.2%
Total Expenditures 3,490,322 3,601,769 3,399,826 3,630,711 230,885 6.8%
Other Financing Uses 39,609 19,506 Change in Fund Balance 142,423 (275,616) (46,439) (123,679) (77,240) 166.3%
Restricted Fund Balance 631,887 123,365 33,399 15,545 (17,854) -53.5%Unrestricted Fund Balance 4,926,164 5,159,070 5,202,597 5,096,772 (105,825) -2.0%Ending Fund Balance 5,558,051$ 5,282,435$ 5,235,996$ 5,112,317$ (123,679)$ -2.4%
Expenditures by Department:Executive & Legislative -$ -$ -$ -$ -$ 0.0%Finance - - - - - 0.0%Parks & Recreation 284,199 285,021 323,750 345,189 21,439 6.6%Public Works 765,301 798,364 726,192 726,571 379 0.1%Police 258,294 206,562 160,858 350,497 189,639 117.9%Fire 42,762 5,464 10,000 10,000 - 0.0%Non-Departmental 2,139,766 2,306,358 2,179,026 2,198,454 19,428 0.9%
Total Expenditures 3,490,322$ 3,601,769$ 3,399,826$ 3,630,711$ 230,885$ 6.8%
Expenditures by Fund:Convention Development 136,667$ 146,123$ 176,709$ 196,678$ 19,969$ 11.3%Court Cost Training 39,714 50,149 60,000 60,000 - 0.0%Local Option Gas Tax 765,301 798,364 726,192 726,571 379 0.1%Half-cent Infrastructure Surtax 986,797 884,573 1,075,680 1,176,450 100,770 9.4%Community Develop. Block Grant 146,856 138,875 144,041 145,511 1,470 1.0%Radio Communication 42,762 5,464 10,000 10,000 - 0.0%Justice Assistance Grant 74,792 65,701 12,039 52,233 40,194 333.9%Tree Protection 676 23 3,000 3,000 - 0.0%Law Enforcement Trust Fund 42,558 45,435 62,819 63,264 445 0.7%Equitable Sharing Fund 101,230 45,277 26,000 175,000 149,000 573.1%1/2 Cent Sales Surtax Debt Service 989,060 997,290 997,146 1,000,804 3,658 0.4%Infrastructure Capital Projects 128,387 372,844 90,000 - (90,000) -100.0%Beaches Park Project 1,375 17 - - - 0.0%Dog Park Project 34,147 51,634 16,200 21,200 5,000 30.9%
Total Expenditures 3,490,322$ 3,601,769$ 3,399,826$ 3,630,711$ 230,885$ 6.8%

197
All Nonmajor Enterprise FundsCombined Summary of Revenues and Expenditures
Original AdoptedActual Actual Budget Budget Increase %2014 2015 2016 2017 (Decrease) Change
Unrestricted Fund Balance 10,290,876$ 11,035,913$ 12,439,478$ 12,802,495$ 363,017$ 2.9%Restricted Fund Balance - - - - - 0.0%Beginning Fund Balance 10,290,876 11,035,913 12,439,478 12,802,495 363,017 2.9%
RevenuesTaxes - - - - - 0.0%Permits & fees 13,716 1,143 - - - 0.0%Intergovernmental - - - - - 0.0%Charges for services 7,823,995 7,641,208 8,082,273 7,720,529 (361,744) -4.5%Fines & forfeitures - - - - - 0.0%Interest & other 832,857 774,500 649,877 725,163 75,286 11.6%Transfers in - 262,978 - 65,000 65,000 0.0%
Total Revenues 8,670,568 8,679,829 8,732,150 8,510,692 (221,458) -2.5%
Other Financing Sources - 253,508
ExpendituresPersonal Services 995,016 992,360 1,036,312 1,055,562 19,250 1.9%Operating-Natural Gas 1,132,401 931,060 1,215,770 1,303,588 87,818 7.2%Operating-All Other 4,564,204 4,631,020 5,071,405 5,448,170 376,765 7.4%Capital Outlay 706,088 448,264 522,000 378,000 (144,000) -27.6%Debt Service-Principal - - - - - 0.0%Debt Service-Interest & Other - - - - - 0.0%Grants to Others - - - - - 0.0%Transfers 361,471 523,646 523,646 480,172 (43,474) -8.3%
Total Expenditures 7,759,180 7,526,350 8,369,133 8,665,492 296,359 3.5%
Other Financing Uses 166,351 3,422
Change in Fund Balance 745,037 1,403,565 363,017 (154,800) (517,817) -143%
Unrestricted Fund Balance 11,035,913 12,439,478 12,802,495 12,647,695 (154,800) -1.2%Restricted Fund Balance - - - - - 0.0%Ending Fund Balance 11,035,913$ 12,439,478$ 12,802,495$ 12,647,695$ (154,800)$ -1.2%
Expenditures by Department:Executive & Legislative -$ -$ -$ -$ -$ 0.0%Finance 473,394 484,388 513,349 496,176 (17,173) -3.3%Planning & Development - - - - - 0.0%Parks & Recreation 1,285,564 1,401,569 1,333,067 1,381,940 48,873 3.7%Public Works 4,306,407 3,921,738 4,589,798 4,628,079 38,281 0.8%Police - - - - - 0.0%Fire - - - - - 0.0%Beaches Energy Services 1,693,815 1,718,655 1,932,919 2,159,297 226,378 11.7%Human Resources - - - - - 0.0%Non-Departmental - - - - - 0.0%
Total Expenditures 7,759,180$ 7,526,350$ 8,369,133$ 8,665,492$ 296,359$ 3.5%
Expenditures by Fund:Natural Gas Fund 1,693,815$ 1,718,655$ 1,932,919$ 2,159,297$ 226,378$ 11.7%Stormwater Fund 939,365 645,031 1,104,867 1,077,666 (27,201) -2.5%Sanitation Fund 3,367,042 3,276,707 3,484,931 3,550,413 65,482 1.9%Golf Course Fund 1,285,564 1,401,569 1,333,067 1,381,940 48,873 3.7%Lease Facilities Fund 473,394 484,388 513,349 496,176 (17,173) -3.3%
Total Expenditures 7,759,180$ 7,526,350$ 8,369,133$ 8,665,492$ 296,359$ 3.5%
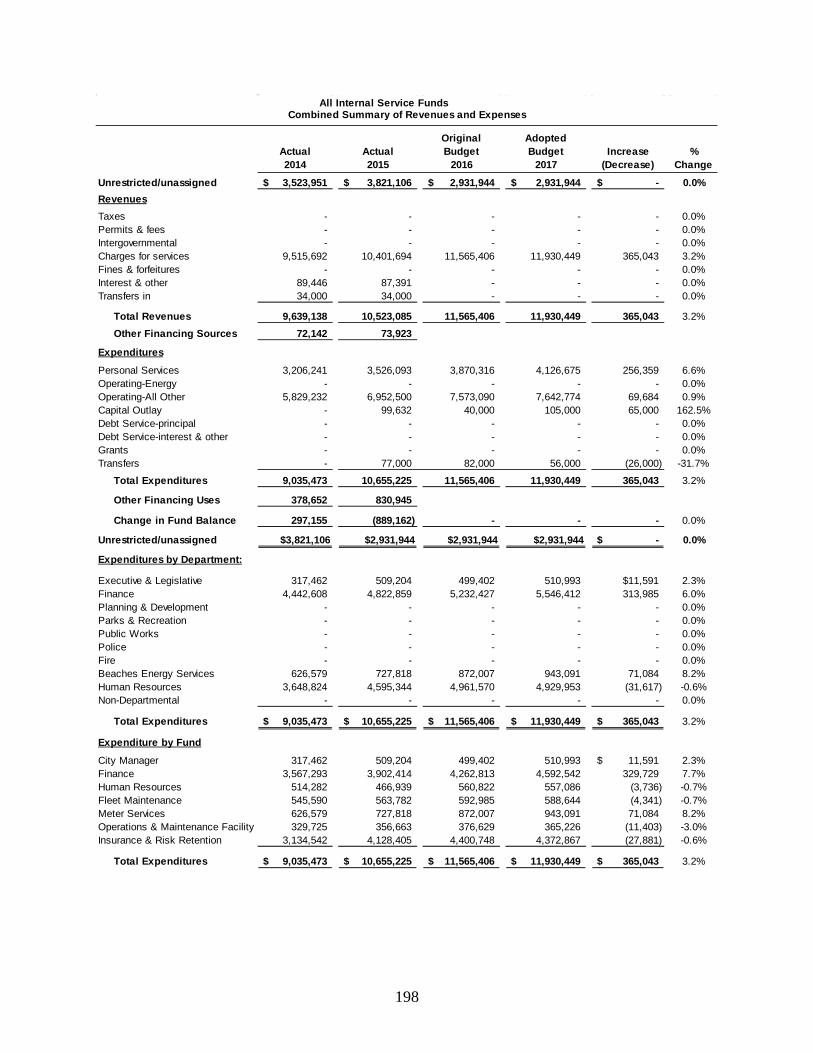
198
All Internal Service Funds Combined Summary of Revenues and Expenses
Original AdoptedActual Actual Budget Budget Increase %2014 2015 2016 2017 (Decrease) Change
Unrestricted/unassigned 3,523,951$ 3,821,106$ 2,931,944$ 2,931,944$ -$ 0.0%RevenuesTaxes - - - - - 0.0%Permits & fees - - - - - 0.0%Intergovernmental - - - - - 0.0%Charges for services 9,515,692 10,401,694 11,565,406 11,930,449 365,043 3.2%Fines & forfeitures - - - - - 0.0%Interest & other 89,446 87,391 - - - 0.0%Transfers in 34,000 34,000 - - - 0.0%
Total Revenues 9,639,138 10,523,085 11,565,406 11,930,449 365,043 3.2%
Other Financing Sources 72,142 73,923
Expenditures
Personal Services 3,206,241 3,526,093 3,870,316 4,126,675 256,359 6.6%Operating-Energy - - - - - 0.0%Operating-All Other 5,829,232 6,952,500 7,573,090 7,642,774 69,684 0.9%Capital Outlay - 99,632 40,000 105,000 65,000 162.5%Debt Service-principal - - - - - 0.0%Debt Service-interest & other - - - - - 0.0%Grants - - - - - 0.0%Transfers - 77,000 82,000 56,000 (26,000) -31.7%
Total Expenditures 9,035,473 10,655,225 11,565,406 11,930,449 365,043 3.2%
Other Financing Uses 378,652 830,945
Change in Fund Balance 297,155 (889,162) - - - 0.0%
Unrestricted/unassigned $3,821,106 $2,931,944 $2,931,944 $2,931,944 -$ 0.0%
Expenditures by Department:
Executive & Legislative 317,462 509,204 499,402 510,993 $11,591 2.3%Finance 4,442,608 4,822,859 5,232,427 5,546,412 313,985 6.0%Planning & Development - - - - - 0.0%Parks & Recreation - - - - - 0.0%Public Works - - - - - 0.0%Police - - - - - 0.0%Fire - - - - - 0.0%Beaches Energy Services 626,579 727,818 872,007 943,091 71,084 8.2%Human Resources 3,648,824 4,595,344 4,961,570 4,929,953 (31,617) -0.6%Non-Departmental - - - - - 0.0%
Total Expenditures 9,035,473$ 10,655,225$ 11,565,406$ 11,930,449$ 365,043$ 3.2%
Expenditure by Fund
City Manager 317,462 509,204 499,402 510,993 11,591$ 2.3%Finance 3,567,293 3,902,414 4,262,813 4,592,542 329,729 7.7%Human Resources 514,282 466,939 560,822 557,086 (3,736) -0.7%Fleet Maintenance 545,590 563,782 592,985 588,644 (4,341) -0.7%Meter Services 626,579 727,818 872,007 943,091 71,084 8.2%Operations & Maintenance Facility 329,725 356,663 376,629 365,226 (11,403) -3.0%Insurance & Risk Retention 3,134,542 4,128,405 4,400,748 4,372,867 (27,881) -0.6%
Total Expenditures 9,035,473$ 10,655,225$ 11,565,406$ 11,930,449$ 365,043$ 3.2%

199
All Pension Funds Combined Summary of Revenues and Expenses
Original Adopted
Actual Actual Budget Budget Increase %2014 2015 2016 2017 (Decrease) Change
Restricted Fund Balance 75,218,196$ 79,765,232$ 76,549,785$ 79,530,507$ 2,980,721$ 3.9%
RevenuesTaxes - - - - - 0.0%Permits & fees - - - - - 0.0%Intergovernmental - - - - - 0.0%Charges for services - - - - - 0.0%Fines & forfeitures - - - - - 0.0%Interest & other 11,126,264 3,674,799 9,735,565 9,843,630 108,064 1.1%Transfers in - - - - - 0.0%
Total Revenues 11,126,264 3,674,799 9,735,565 9,843,630 108,064 1.1%
Other Financing Sources 79,559 19,746
ExpendituresPersonal Services 58,207 56,256 65,649 65,330 (319) -0.5%Operating-Energy - - - - - 0.0%Operating-All Other 6,500,536 6,764,515 6,689,195 6,771,291 82,096 1.2%Capital Outlay - - - - - 0.0%Debt Service-principal - - - - - 0.0%Debt Service-interest & other - - - - - 0.0%Grants - - - - - 0.0%Transfers - - - - - 0.0%
Total Expenditures 6,558,743 6,820,771 6,754,844 6,836,621 81,777 1.2%
Other Financing Uses 100,044 89,221
Change in Fund Balance 4,547,036 (3,215,447) 2,980,721 3,007,009 26,288 0.9%
Restricted Fund Balance 79,765,232$ 76,549,785$ 79,530,507$ 82,537,516$ 3,007,009$ 3.8%
Expenditures by Department:Executive & Legislative -$ -$ - -$ -$ 0.0%Finance - - - - - 0.0%Planning & Development - - - - - 0.0%Parks & Recreation - - - - - 0.0%Public Works - - - - - 0.0%Police - - - - - 0.0%Fire - - - - - 0.0%Beaches Energy Services - - - - - 0.0%Human Resources 6,558,743 6,820,771 6,754,844 6,836,621 81,777 1.2%Non-Departmental - - - - - 0.0%
Total Expenditures 6,558,743$ 6,820,771$ 6,754,844$ 6,836,621$ 81,777$ 1.2%
Expenditures by Fund:Pension Fund-General 4,220,478$ 4,577,767$ 4,114,098$ 4,549,838$ 435,740$ 10.6%Pension Fund-Police 1,564,071 1,458,525 1,570,755 1,416,319 (154,436) -9.8%Pension Fund-Fire 774,194 784,479 1,069,991 870,463 (199,528) -18.6%
Total Expenditures 6,558,743$ 6,820,771$ 6,754,844$ 6,836,621$ 81,777$ 1.2%

200
City of Jacksonville Beach Four Year Summary of Authorized Positions by Department
Actual Actual Actual Budget 2017 Payroll2014 2015 2016 Part time Full time Total FTEs Budget
ExecutiveCity Council 7 7 7 7 0 7 0.0 125,485$ City Manager 2 3 3 0 3 3 3.0 435,233City Clerk 4 4 4 1 3 4 3.5 240,886
13 14 14 8 6 14 6.5 801,604Finance
Accounting 8 8 8 2 7 9 7.9 698,497Utility Billing 17 17 17 1 17 18 15.6 912,290Information Systems 5 6 7 0 8 8 7.8 767,926Purchasing Admin. 3 3 3 0 3 3 3.0 220,834 Building Maintenance 3 3 3 0 3 3 3.0 215,606 Lease Facilities (Tech.) 0 0 0 0 0 0 1.2 33,553 O & M Facility 1 1 1 0 1 1 1.0 53,258
37 38 39 3 39 42 39.5 2,901,964Planning & Development
Planning and Development 2 2 2 0 2 2 1.7 161,732Building Inspection 4 5 6 1 5 6 5.5 372,731Code Enforcement 2 2 2 0 2 2 2.2 138,350
8 9 10 1 9 10 9.4 672,813Recreation & Parks
Administration 5 5 7 4 3 7 5.4 416,890Ocean Rescue 87 87 87 86 1 87 18.8 564,428Grounds Maintenance 7 7 7 0 7 7 7.3 518,228Tennis 3 3 3 2 1 3 1.5 77,922Carver Center 3 3 3 2 1 3 2.0 91,562Golf Course 25 25 25 18 7 25 15.5 627,654
130 130 132 112 20 132 50.5 2,296,684Public Works
Administration 4 5 5 1 5 6 1.6 150,019Water Plant 13 13 13 0 13 13 13.3 877,526Pollution Control Plant 15 15 15 0 15 15 14.9 1,049,960Distribution and Collection 14 14 14 0 14 14 14.3 848,060Stormwater 0 0 0 0 0 0 2.2 180,687Sanitation 2 2 2 0 2 2 2.7 213,669Street Maintenance 16 16 16 0 16 16 14.7 910,448Local Option Gas Tax 1 1 1 1 0 1 0.8 43,071
65 66 66 2 65 67 64.5 4,273,440
8 3
112
--
-
6 39
9 20
65 31
1 6
90 75
ExecutiveFinance
Planning & DevelopmentRecreation & Parks
Public WorksFire
RedevelopmentHuman Resources
PoliceBeaches Energy
Employees by Department
Part time Full time

201
City of Jacksonville Beach Four Year Summary of Authorized Positions by Department
Actual Actual Actual Budget 2017 Payroll2014 2015 2016 Part time Full time Total FTEs Budget
PoliceAdministration 4 4 4 0 4 4 4.0 544,933Records 4 4 4 1 3 4 3.5 182,424Investigations 14 14 14 0 14 14 14.0 1,296,477Patrol 40 40 40 0 40 40 40.0 3,374,548Communications 11 11 11 0 11 11 11.0 848,541Ancillary 16 16 16 10 6 16 9.2 564,294Part-time Officers 0 0 0 0 0 0 0.5 61,565Parking 1 1 1 0 1 1 2.2 130,082Downtown Policing 5 9 9 0 11 11 11.0 885,789Law Enforcement Trust Fund 1 1 1 1 0 1 0.5 15,764
96 100 100 12 90 102 95.9 7,904,417Beaches Energy
Administration 4 4 4 0 4 4 4.0 382,278Engineering 8 7 8 0 8 8 8.0 762,470Relay & Substations 6 6 6 0 6 6 6.0 525,469Construct. & Maint. 32 32 31 0 31 31 31.0 2,733,410System Operations 10 10 10 0 10 10 10.0 889,625Storeroom 3 3 3 0 3 3 3.0 180,999Conservation & Renewables 0 0 0 0 0 0 1.0 68,227Regulatory Compliance 0 1 1 0 1 1 1.0 107,210Meter Services 12 12 12 0 12 12 12.0 649,163
75 75 75 0 75 75 76.0 6,298,851Fire
Fire / Rescue, Safety Services 31 31 31 0 31 31 42.7 3,309,983
Human ResourcesPersonnel Administration 7 7 6 0 6 6 5.2 372,268Insurance 0 0 0 0 0 0 0.2 17,206Pension Administration 0 0 0 0 0 0 0.6 65,330
7 7 6 0 6 6 6.0 454,804
Redevelopment 0 1 1 1 0 1 1.8 242,100
Total Authorized Positions 462 471 474 139 341 480 393 29,156,660$
Total Authorized Positions FY2016 137 337 474
Add Downtown CAPE Corporal and Officer (Police) 2 2Add part time Staff Assistant to (Finance/Accounting) 1 1Add Customer Service Representative (Finance/Utility Billing) 1 1Add Associate Business Analyst (Finance/Information Systems) 1 1Add part time Construction Coordinator (Public Works/Admin) 1 1Total Authorized Positions FY2017 139 341 480
Change in positions since 2008 1 -13 -12
Denotes divisions operating in the General Fund

202
Capital Outlay Detail by DepartmentFiscal Year 2017
Land, Buildings Computer& Improvements Equipment Vehicles Equipment Total
Executive & LegislativeNon-Departmental
1/2-cent Sales Surtax Fund (Better Jacksonville Beach)New sidewalks 70,000$ 70,000$ Study/design Penman Rd commercial area imp. 125,000 125,000
General Capital ProjectsMajor building systems replacement projects 318,800 318,800 Annual computer replacement plan 69,607 69,607 IT Master Plan-replace equipment 200,000 200,000 IT Master Plan-replace business applications (SunGard) 925,000 925,000 Replace rescue pumper (Fire) 375,000 375,000 Heavy equipment replacement (Intl 4700 flatbed truck) 85,000 85,000
716,005 716,005 Total Non-Departmental 513,800 916,005 460,000 994,607 2,884,412
Community RedevelopmentDowntown Redevelopment
Purchase Downtown CAPE vehicles (2) 63,000 63,000 Total Redevelopment - - 63,000 - 63,000
Beaches Energy ServicesAdministration
15,000 15,000 Engineering
8,000 8,000 Replace 2002 GMC Sierra 25,000 25,000
Relay & SubstationsSubstation capacitor bank upgrades 50,000 50,000 Substation 26kV breaker upgrades 150,000 150,000 Substation 26kV relay upgrades 30,000 30,000 Replace 2006 Ford E-250 30,000 30,000 Replace 2004 Ford E-350 40,000 40,000 Replace 2005 Ford F-350 45,000 45,000
Construction & MaintenanceReplace 2006 aerial bucket truck 225,000 225,000 Purchase 100ft aerial bucket truck to replace 1998 65ft truck 450,000 450,000 Mini excavator 45,000 45,000
Capital ImprovementsProjects for System Growth/Maintenance 1,250,000 1,250,000 Major Replacement Projects 1,600,000 1,600,000
Transmission225,000 225,000 230,000 230,000
Substation transformers 1,215,000 1,215,000 250,000 250,000
Install fiber & equipment: Sampson to Ft. Diego 180,000 180,000 Motor switch replacement 150,000 150,000 Transmission line hardware renew/replace 500,000 500,000
Regulatory Compliance230,000 230,000
Total Electric Fund 6,075,000 53,000 815,000 - 6,943,000 Natural Gas
Natural Gas Distribution System 100,000 100,000 Meter Services -
75,000 75,000 30,000 30,000
Total Beaches Energy Services 6,175,000 83,000 890,000 - 7,148,000
Replace 3 pickup trucks: #280, #247, #294Electric test meter
Radio system replacement
Replace 2 hand held radios
Annual projects-NERC required
Substation 230kV and 130kV relay upgrades
230kV transmission circuit breaker upgrades
Building renovations in electric training room
Transformer bushing replacements

203
Capital Outlay Detail by DepartmentFiscal Year 2017
Land, Buildings Computer& Improvements Equipment Vehicles Equipment Total
PolicePatrol
Replace patrol vehicles 160,000 160,000 Equitable Sharing Fund
Replace 2 unmarked vehicles 44,000 44,000 Replace 20 APX radios 105,000 105,000
Total Police - 105,000 204,000 - 309,000
Parks and RecreationGrounds Maintenance
Replace 2001 pickup truck 25,000 25,000 Tennis
Resurface west side courts (1, 2, and 3) 12,969 12,969 Golf Course
Point of Sale and Tee Time Software 28,000 28,000 Total Parks & Recreation 12,969 - 25,000 28,000 65,969
FireReplace 2002 Dodge Dakota crew cab 32,000 32,000 Positive Pressure Ventilation Smoke Ejector 2,500 2,500 Replace 2 bikes for special events 1,800 1,800 Total Fire - - 32,000 4,300 36,300
Public WorksStreets
Replace 2003 Ford F-250 truck 4X4 38,000 38,000 Distribution and Collection
Replace 4" double diaphragm pump 17,000 17,000 Replace 1994 1-Ton van and reinstall equipment 85,000 85,000 Replace 2006 Ford F-250 truck with utility body 31,000 31,000 Water main replacement projects 1,275,000 1,275,000 Water meter replacement program 550,000 550,000
Pollution ControlSewer rehab improvements-lift stations 50,000 50,000
200,000 200,000 Actuators, soft starts and variable frequency drives 30,000 30,000 Drill press 3,000 3,000 2" Diaphragm pump (Mud Sucker 2B Series) 10,000 10,000
74,000 74,000
Water Plant500,000 500,000
60,000 60,000 550,000 550,000
Replace chlorine scale 5,029 5,029 32,000 32,000
Capital Projects2,200,000 2,200,000
Reuse Pump Station at Golf Course 186,000 186,000 Total Water & Sewer 5,571,000 65,029 222,000 - 5,858,029
StormwaterStormwater collection & treatment improvements 250,000 250,000
Total Stormwater 250,000 - - - 250,000
Total Public Works 5,821,000 65,029 260,000 - 6,146,029
Total Projects Funded: 12,522,769$ 1,169,034$ 1,934,000$ 1,026,907$ 16,652,710$
Build new lift station #7, demolish ls #8 and #20
Replace 2000 Ford F-350 with utility body and 5005 Autocrane
Replace 2004 Ford F-250 truck with utility body
Wastewater treatment facility improvements
Raw water wells improvement program
Water plant #2 improvement programWater plant #1 repair/coat exterior ground

204
Debt and Capital Projects
Like other municipal governments, the City of Jacksonville Beach periodically uses debt financing to construct improvements that will provide services or benefits for many years. Debt financing allows the City to construct improvements when the need arises rather than delaying the projects until it has accumulated adequate funds. The use of debt financing more fairly distributes the costs of the improvements to the users of those improvements over the expected life of both the improvements and the debt. In addition to debt financing, communities may choose to use pay-as-you-go financing and public-private ventures.
The City of Jacksonville Beach minimizes the need for future debt through long-term planning and capital budgeting. Consistent with this policy, the City established and maintains capital projects funds whose purpose is to accumulate funds to pay for expenditures on governmental capital projects, including major equipment purchases, major repairs and renovations. Funds are accumulated through a series of annual transfers into the fund until a sufficient balance is accumulated to pay for budgeted items or projects. Pay-as-you-go financing is the preferred financing method and is used where possible.
Authority to borrow funds is granted to municipalities in the Florida Statutes. Issuance of general obligation bonds requires an affirmative vote of the municipality’s electorate; the City has no outstanding general obligation debt. Neither City Charter/Code nor Florida Statutes limit the amount of debt the City can issue. There are no plans to issue additional debt in the near future.
Infrastructure Tax11.8%
Electric URB52.0%
Water & Sewer URB
36.3%
OUTSTANDING DEBT 9-30-2016
2012 2013 2014 2015 2016 2017Principal paid $6,275,715 $5,613,580 $5,325,465 $5,100,799 $5,261,881 $4,755,000 Interest paid $1,566,742 $1,230,576 $1,087,507 $923,512 $764,313 $596,492 Outstanding Debt $40,992,022 $36,258,145 $30,932,680 $25,831,880 $20,570,000 $15,815,000
Debt Limit Requirement

205
The City continues to refinance existing debt and pay down principal when it is economically advantageous. As a result, the outstanding debt balance and interest expenditures on both governmental and proprietary debt have decreased by more than 81% since 2002. The City expects to be debt-free in 2020. Explanations for budgeted capital projects, their expected or committed funding source and the expected purchase or construction year are included in the City’s five-year Capital Improvement Plan (CIP) located in the back of this document.
Governmental Debt and Major Capital Projects Governments frequently incur long-term debt that they intend to repay from the financial resources of the general government rather than from those of proprietary funds. The City of Jacksonville Beach has pledged its ½ Cent Infrastructure Tax, Downtown Tax Increment and South End Tax Increment to pay principal and interest on the related long-term debt used for governmental purposes. 2012 ½ Cent Infrastructure Surtax Revenue Bonds Debt proceeds totaling $10,000,000 were borrowed in 2007 to partially fund the planned upgrades for the waste treatment plant required to meet the federally mandated nutrient allocation requirements for the St. Johns River (total maximum daily load, or TMDL). The project, budgeted at over $21 million, used about $4.9 million of the bond proceeds in combination with St. Johns River Water Management District and State grants ($11 million) and redevelopment funds ($5.5 million). This combination of funds enabled the City to pay for these mandated improvements to its wastewater treatment system without having to increase sewer rates due to the project’s cost. Without the grants, if the City had to finance the project, water and sewer customers could have faced sewer rate increases of $6-$8 per month for the next 20-30 years to pay debt service. The bonds were refinanced in 2012 to obtain more favorable interest rates.
$0
$20,000,000
$40,000,000
$60,000,000
$80,000,000
$100,000,000
Outstanding Debt History
Governmental Proprietary

206
DEBT SERVICE REQUIREMENTS: ½ Cent Infrastructure Surtax Revenue Bonds
Principal Interest Total 2017 955,000 37,804 992,804 2018 980,000 21,224 1,001,224 2019 490,000 4,227 494,227
Total $2,425,000 $63,255 $2,488,255 About $700,000 of the Infrastructure Surtax debt was used to pay for the City’s portion of the 9th Street South Improvement Project, with the bulk of the economic stimulus funding coming through the Florida Department of Transportation ($5.1 million). A separate portion of the 9th Street Project was funded by the Community Redevelopment Agency. The project dramatically improved road condition, appearance and drainage along the City’s alternate north/south corridor. Revenues from this tax have previously been used to fund the 11th Street North rebuild project, Wingate Park parking and road improvements, Duval Drive improvements, construction of school sidewalks and a new cart storage facility for the Golf Course. The debt service is reported in the Executive and Legislative section of this document. Community Redevelopment Bonds The City of Jacksonville Beach has two areas designated as Community Redevelopment Districts under Chapter 163, Florida Statutes. The statute specifically grants cities the power to issue redevelopment revenue bonds to finance community redevelopment projects. The Community Redevelopment Fund is reported as a major fund for financial statement purposes. Payment of debt service is funded by pledged tax increment funds (TIF). These revenues are calculated as 95% of the difference between ad valorem taxes levied in a given year on taxable real property within the redevelopment area and the amount of ad valorem taxes which would have been levied on the same property in the year prior to its designation as a redevelopment area.
All Downtown revenue bonds were paid off in 2014 and South Beach revenue bonds were paid off in 2016.
2012 Infrastructure 1.73% 2019 $6,495,000 $2,425,000 $2,425,000 Total Governmental Bonds
ALL OUTSTANDING GOVERNMENTAL BONDSInterest
RateYear of
MaturityOriginal
Issue Outstanding

207
Capital Projects in Governmental Funds A detailed listing of budgeted projects and purchases in governmental capital projects funds can be found in the Executive and Legislative section. The 5-Year Capital Improvement Plan also has information about planned capital projects in all funds for the next 5 years. A summary of the capital projects funds follows:
Proprietary Debt Proprietary debt includes debt that has been issued by operations that are accounted for in enterprise or internal service funds. Such operations are financed and operated in a manner similar to private business enterprises - the costs of providing goods and services to the public on a continuing basis are financed or recovered primarily through user charges. The City operates Beaches Energy Services (electric and natural gas), a Water & Sewer Utility and a Stormwater Utility, any of which may choose issue bonds to fund major system improvements. Historically, Beaches Energy Services and the Water & Sewer Utility have issued bonds as a combined entity and therefore, their outstanding utility revenue bonds contain a pledge of the combined water and sewer system and electric system revenues. The debt obligation is allocated to the Electric and Water & Sewer funds based on the distribution of debt proceeds to each utility. Stormwater debt was paid off in 2012. There are no plans to issue additional debt at this time. Each of the proprietary debt issues is accounted for in the operating fund of the obligated enterprise.
Capital Projects Fund Sources Uses 2017 Budget
General Transfers from operating funds; grants; interest
Major repairs and replacements. $2,816,412
½ Cent Infrastructure Surtax
Receipts from 1/2-Cent Infrastructure Surtax
Debt service payments on bonds; new roads and sidewalks (when funds are available).
$1,176,450
½ Cent Infrastructure Surtax Bond Proceeds
Bond proceeds; interest
Governed by interlocal agreement; pays for projects to improve public facilities, roads, infrastructure, environment, quality of life and economic development.
$0
Paws Dog Park
Donations, proceeds from community fundraisers
Small maintenance projects and purchase of supplies for the park
$21,200
$4,014,062

208
2010 Utility Revenue Bonds The City refinanced the 2002 Utility Revenue Bonds in late 2010 to take advantage of low interest rates. The bonds were issued with pledged revenues of the combined Electric and Water & Sewer utilities to defease and refinance previous debt issues. Proceeds from the previous issues were used to construct major system additions and improvements including a 17-mile electric transmission line, improvements to the electric system, new water treatment plant and well field, additional water transmission mains and refurbished wastewater pumping stations and sewer mains. The debt will be paid off in 2021. Each of the two utilities operates as a major fund for financial statement purposes.
DEBT SERVICE REQUIREMENTS: 2010 Utility Revenue Bonds Electric Water & Sewer TOTAL
Principal Interest Principal Interest Principal Interest
2017 2,238,200 329,067 1,561,800 229,621 3,800,000 558,688
2018 2,311,825 293,451 1,613,175 204,768 3,925,000 498,219
2019 2,391,340 216,119 1,668,660 150,806 4,060,000 366,925
2020 2,479,690 125,516 1,730,310 87,584 4,210,000 213,100
2021 1,266,350 25,327 883,650 17,673 2,150,000 43,000
$10,687,405 $989,480 $7,457,595 $690,452 $18,145,000 $1,679,932 The City’s outstanding proprietary debt at September 30, 2016 is:
2012 Utility Revenue Bonds – varies 2.0-4.0%
2020 $37,285,000 $18,145,000
Total Proprietary Bonds $18,145,000
Outstanding
OUTSTANDING PROPRIETARY BONDSYear of
Maturity Original Issue

209
Debt service requirements to maturity on all of the City’s bonds at September 30, 2016 are as follows:
DEBT SERVICE REQUIREMENTS TO MATURITY
Governmental Proprietary TOTAL Principal Interest Principal Interest Principal Interest
2017 $955,000 $37,804 $3,800,000 $558,688 $4,755,000 $596,492
2018 $980,000 $21,224 $3,925,000 $498,219 $4,905,000 $519,443
2019 $490,000 $4,227 $4,060,000 $366,925 $4,550,000 $371,152
2020 $0 $0 $4,210,000 $213,100 $4,210,000 $213,100
2021 $0 $0 $2,150,000 $43,000 $2,150,000 $43,000
$2,425,000 $63,255 $18,145,000 $1,679,932 $20,570,000 $1,743,187
Budgeted debt service for the current and next budget years is:
Summary of Budgeted Debt Payments
PrincipalInterest &
OtherFY2017
Total % of total
Current Year
Budget Incr / (Decr) % changeDate Paid
Off
Sales Surtax (Better Jax Beach) 955,000 42,804 997,804 18.6% 994,146 3,658 0.4% 3/31/2019SE Redevelopment 0 0 0 0.0% 666,362 (666,362) -100.0% 9/30/2016TOTAL GOVERNMENTAL 955,000 42,804 997,804 18.6% 1,660,508 (662,704) -39.9%
Electric 2,238,200 339,067 2,577,267 47.9% 2,584,335 (7,068) -0.3% 10/1/2020Water & Sewer 1,561,800 239,621 1,801,421 33.5% 1,806,352 (4,931) -0.3% 10/1/2020TOTAL PROPRIETARY 3,800,000 578,688 4,378,688 81.4% 4,390,687 (11,999) -0.3%
TOTAL DEBT SERVICE 4,755,000 621,492 5,376,492 100.0% 6,051,195 (674,703) -11.1%

210
Transfers to/from Other Funds
Transfers are used to 1) move revenues from the fund where they are collected to the appropriate debt service fund as debt service principal and interest payments become due, 2) move restricted amounts related to debt in order to establish mandatory reserve accounts, 3) move unrestricted general fund revenues to finance various programs that the government must account for in other funds in accordance with budgetary authorizations, including amounts provided as subsidies or matching funds for various grant programs, 4) move restricted special revenues to the fund from which the related expenditures will be paid or 5) to move returns on investment from City enterprise funds to the General Fund.
To:
From:General Fund
Infrastructure Surtax Debt
Svc.General Capital
Projects
Beaches Energy
Services Golf Course TotalGeneral Fund
Deposits to reserves for fire truck replacement, street maintenance heavy equipment replacement, major building maintenance, and information technology improvements
$285,000 $285,000
Partial funding for golf course irrigation system repairs and point of sale system upgrade
$65,000 $65,000
Convention DevelopmentPartial funding for maintenance of the Community Center 20,000 $20,000
Local Option Gas TaxPartial funding for street maintenance 372,000 $372,000
Half-cent Infrastructure Surtax
Payment of principal and interest on bonds 979,950 $979,950
Community Development Block GrantFunding for CAPE officer and Carver Center programs 145,511 $145,511
JAG GrantPartial funding for overtime for task force and specialized equipment purchases 52,233 $52,233
Beaches Energy ServicesReturn on investment 3,693,665 $3,693,665Partial funding for building system replacements and technology improvements 105,000 $105,000
Natural Gas FundReturn on investment 106,716 $106,716Repay advance for construction of natural gas system 312,456 $312,456
Water & Sewer Fund
Partial funding for building system replacements and technology improvements 59,000 $59,000
Lease Facilities
Partial funding for building system replacements and technology improvements 61,000 $61,000
Finance Internal Service FundFunding for Utility Billing equipment replacement 6,000 $6,000
Funding for City-wide telephone system (replacement of various current systems) 50,000 $50,000
$4,390,125 $979,950 $566,000 $312,456 $65,000 $6,313,531
Schedule of Transfers In and Transfers Out-FY2017

Capital Improvement Plan: FY2017-2021
211
The Capital Improvement Plan (CIP) is a tentative, five-year outline of capital needs matched to the
most likely funding source. It contains the requests of all departments for purchases of land,
buildings, improvements, equipment and vehicles that are expected to cost at least $25,000. In some
cases, non-capital items are included in the CIP when the amount of the dollars requested are
significant (greater than $100,000), or are for major on-going programs (such as street resurfacing
and sidewalk repair). The CIP includes five years of estimates as of the time the plan is adopted.
This plan is revised on an annual basis to reflect the changing needs and resources of the City.
The benefits of having a five-year plan include:
Advance identification of capital needs in order to arrange funding
Promotion of priority setting in the decision making process
Replacement of facilities and equipment according to an orderly plan
Education of the City Council and the public as to upcoming capital needs
The development of the Capital Improvement Plan begins each year in late January when
preliminary 5-year budget projections are prepared. Departments use the budget projections to
determine the timing and affordability of projects in their 5-year capital improvement requests. In
March, capital improvement requests are reviewed with each department by the City Manager.
Budget projections are then revised to incorporate projects approved through this process and the
projects are incorporated into each department’s annual budget request.
Significant projects are discussed on the annual budget tour in late July / early August and the plan is
included in the proposed budget considered for adoption by the City Council. The City’s Capital
Projects Team, consisting of the City Manager, Public Works Director, Planning & Development
Director, Chief Financial Officer, City Engineer and Budget Officer meet monthly to monitor the
progress of each ongoing project, identify possible future projects, and to resolve early any problems
that may arise.

Capital Improvement Plan: FY2017-2021
212
When considering items for inclusion into the Capital Improvement Program, requested purchases
are prioritized after answering the following questions:
1. Will it be needed to protect public health and safety, fulfill legal obligations, provide
facilities and services, or achieve full use of existing facilities?
2. Will it increase efficiency of use of existing facilities, prevent or reduce the need for future
capital outlay or promote development?
3. Will the project be necessary to maintain the current level of service or to aid in the
implementation of any other policy set forth in the Comprehensive Plan?
4. Is the cost of the purchase reasonable in light of the questions above and will adequate
funding be available at the time of purchase?
The following schedules are configured to show the annual and total costs of projects and the cost of
capital items that have been identified for purchase in future years. Expenditures are summarized by
department and descriptions of projects or purchases included in the plan follow each departmental
summary. Although projects listed have a currently identified funding source, over the passage of
time, the nature, amount and source of funding may change.
Summary by Department Page 213
Beaches Energy Services Page 214 Finance Page 247 Police & Fire Page 259 Parks & Recreation Page 265 Community Redevelopment Agency Page 276 Public Works Page 286

Capital Improvement Plan: FY2017-2021
213
CIP Summary, All DepartmentsFunding Sources: 2017 2018 2019 2020 2021 Total
Beaches Energy Services Operating Revenues 410 7,685,000$ 7,850,000$ 5,140,000$ 7,490,000$ 5,752,000$ 33,917,000$ Downtown Redevelopment Tax Increment Fund 181 7,800,000 7,543,500 7,331,500 3,000,000 - 25,675,000 Finance Internal Service Charges 511 - 160,000 - - - 160,000 General Capital Projects Fund 315 2,739,412 1,801,452 1,745,956 617,207 700,066 7,604,093 General Fund Operating Revenues 001 317,969 372,969 417,000 273,000 319,000 1,699,938 Golf Course Fund 440 58,000 95,000 30,000 30,000 30,000 243,000 Equitable Sharing Trust Fund 631 105,000 210,000 - - - 315,000 1/2 Cent Infrastructure Surtax 151 195,000 70,000 395,000 70,000 70,000 800,000 1/2 Cent Infrastructure Surtax Bond Proceeds 317 - - - 3,000,000 - 3,000,000 Local Option Gas Tax Revenues 150 310,000 310,000 310,000 310,000 310,000 1,550,000 Meter Division-Internal Service Charges 541 105,000 - - 25,000 - 130,000 Natural Gas Fund 411 100,000 100,000 100,000 100,000 100,000 500,000 Sanitation Fund 430 - - - 230,000 - 230,000 Southend Redevelopment Tax Increment Fund 182 2,550,000 1,750,000 300,000 2,250,000 - 6,850,000 Stormwater Operating Revenues 423 545,000 345,000 427,000 585,000 730,000 2,632,000 Unfunded - 250,000 250,000 Water & Sewer Utility Operating Revenues 420 6,038,000 3,700,000 1,375,000 1,322,000 743,000 13,178,000
Total CIP Funding Sources - All Departments 28,548,381$ 24,307,921$ 17,571,456$ 19,302,207$ 9,004,066$ 98,734,031$
Expenses: 2,017 2,018 2,019 2,020 2,021 TotalBeaches Energy Services 7,890,000 7,950,000 5,240,000 7,615,000 5,852,000 34,547,000 Finance Department 1,563,407 1,631,452 1,035,956 384,707 220,066 4,835,588 Police & Fire Departments 1,388,005 408,000 370,000 317,500 640,000 3,123,505 Parks & Recreation Department 331,969 269,969 200,000 108,000 334,000 1,243,938 Community Redevelopment Agency 10,050,000 9,293,500 7,881,500 8,250,000 - 35,475,000 Public Works Department 7,325,000 4,755,000 2,844,000 2,627,000 1,958,000 19,509,000
Total CIP - All Departments 28,548,381$ 24,307,921$ 17,571,456$ 19,302,207$ 9,004,066$ 98,734,031$

Capital Improvement Plan: FY2017-2021
214
Beaches Energy ServicesFunding Sources: 2017 2018 2019 2020 2021 Total
Beaches Energy Services Operating Revenues 410 7,685,000 7,850,000 5,140,000 7,490,000 5,752,000 33,917,000 Meter Division-Internal Service Charges 541 105,000 - - 25,000 - 130,000 Natural Gas Fund 411 100,000 100,000 100,000 100,000 100,000 500,000
Total CIP Funding Sources 7,890,000 7,950,000 5,240,000 7,615,000 5,852,000 34,547,000
Expenses: FundEngineering:
Vehicle Replacement Program 410 25,000 50,000 25,000 - - 100,000 25,000 50,000 25,000 - - 100,000
Relay / Substations:Vehicle Replacement Program 410 115,000 - - - - 115,000 Substation 26kV Breaker Upgrades 410 150,000 150,000 200,000 200,000 - 700,000 Substation 26kV Relay Upgrades 410 30,000 30,000 75,000 90,000 - 225,000 Substation Capacitor Bank Relay Upgrades 410 50,000 - - - - 50,000 Substation Capacitor Bank Upgrades 410 - - 100,000 - - 100,000 Substation Battery Bank Replacement 410 30,000 30,000
345,000 180,000 375,000 320,000 - 1,220,000 Construction & Maintenance:
Vehicle Replacement Program 410 675,000 80,000 490,000 230,000 90,000 1,565,000 Heavy Equipment Replacements 170,000 120,000 67,000 357,000 Mini Excavator 410 45,000 45,000 Bush Hog Mower 410 20,000 20,000
720,000 250,000 610,000 250,000 157,000 1,987,000 Electric Capital Projects:
Infrastructure to Support System Growth 410 1,250,000 1,250,000 1,250,000 1,250,000 1,250,000 6,250,000 Major Replacement Projects 410 1,600,000 1,600,000 1,500,000 1,500,000 1,750,000 7,950,000
Subtotal 2,850,000 2,850,000 2,750,000 2,750,000 3,000,000 14,200,000 Automated Meter Reading 410 - - - - 675,000 675,000
2,850,000 2,850,000 2,750,000 2,750,000 3,675,000 14,875,000 System Operations:
Outage Management System 410 - 200,000 - - - 200,000 SCADA Server Upgrade 410 250,000 250,000
- 200,000 - 250,000 - 450,000 Transmission:
Transformer Bushing Replacements 410 225,000 225,000 - - - 450,000 Substation 230kV and 130kV Relay Upgrades 410 230,000 230,000 230,000 230,000 230,000 1,150,000 Substation Transformers 410 1,215,000 2,420,000 - 2,600,000 400,000 6,635,000 230kV Transmission Circuit Breaker Upgrades 410 250,000 - - - 200,000 450,000 Install Fiber & Eqp: Sampson to Ft. Diego 410 180,000 60,000 60,000 - - 300,000
410 150,000 100,000 - - - 250,000 410 500,000 500,000 500,000 500,000 500,000 2,500,000
2,750,000 3,535,000 790,000 3,330,000 1,330,000 11,735,000 Regulatory Compliance:
Regulatory Compliance Plan Cyber Security 410 230,000 20,000 20,000 20,000 20,000 310,000 Regulatory Compliance Plan (not capital) 410 765,000 765,000 570,000 570,000 570,000 3,240,000
995,000 785,000 590,000 590,000 590,000 3,550,000
Total CIP - Electric 7,685,000 7,850,000 5,140,000 7,490,000 5,752,000 33,917,000 Natural Gas Fund:
Natural Gas Distribution System 411 100,000 100,000 100,000 100,000 100,000 500,000 Meter Division Internal Service Fund:
Vehicle Replacement Program 541 75,000 - - 25,000 - 100,000 Electric Test Meter 541 30,000 - - - - 30,000
Total CIP - Meter Division 105,000 - - 25,000 - 130,000
Total CIP - Beaches Energy Services 7,890,000 7,950,000 5,240,000 7,615,000 5,852,000 34,547,000
Motor Switch ReplacementTransmission Line Hardware Renewal & Replacement

Capital Improvement Plan: FY2017-2021
215
Project Title: Vehicle Replacement Program Department/Division: Beaches Energy Services / All Divisions Project Description and Reason Necessary: This is a program to replace vehicles due to annual operating expense, age, and condition. Funding Source: Beaches Energy Services Operating Revenues
Division (FY Replacement) Truck# Model
Year Description Mileage/hours 2/22/2016
Estimated Replacement
Cost Engineering (2017) 220 2002 GMC Sierra 65,357 $25,000 Relay (2017) 217 2006 Ford E-250 77,965 $30,000 Relay (2017) 271 2004 Ford E-350 85,656 $40,000 Relay (2017) 291 2005 Ford – F-350 89,905 $45,000 C&M (2017) 223 2006 Aerial Bucket Truck 4x4 53,911 $225,000 C&M (2017) 229 1988 High Aerial Bucket Truck 60,382 $450,000 Meter (2017) 280 2007 Ford F150 103,538 $25,000 Meter (2017) 247 2004 GMC Sierra 101,919 $25,000 Meter (2017) 294 2002 Chevy 1500 95,662 $25,000 Engineering (2018) 209 2004 GMC Sierra 79,107 $25,000 Engineering (2018) 210 2004 GMC Sierra 56,545 $25,000 C&M (2018) 265 2008 Ford F-150 4x4 108,466 $35,000 C&M (2018) 277 2008 F-350 85,971 $45,000 Engineering (2019) 207 2005 GMC Sierra 23,614 $25,000 C&M (2019) 202 2008 High Aerial Bucket Truck 50,267 $175,000 C&M (2019) 216 2008 Ford F-150 4x4 113,487 $35,000 C&M (2019) 236 2004 Ford F-750 Flatbed 26,322 $65,000 C&M (2019) 255 2008 Digger Derrick Truck 29,176 $215,000 C&M(2020) 230 2010 Bucket Truck 44,871 $230,000 Meter (2020) 275 2010 Ford F150 4x4 46,258 $25,000 C&M (2021) 227 2011 Ford F150 4x4 63,233 $25,000 C&M (2021) 241 2011 Ford F150 4x4 55,966 $25,000 C&M (2021) 273 2011 Ford F350 4x4 Crew Cab 52,574 $40,000 Total $1,880,000

Capital Improvement Plan: FY2017-2021
216
Vehicle Replacement Summary:
FY2017 FY2018 FY2019 FY2020 FY2021 Total Engineering $25,000 $50,000 $25,000 $100,000 Relay $115,000 $115,000 Construction & Maintenance $675,000 $80,000 $490,000 $230,000 $90,000 $1,565,000
Total Electric Fund $815,000 $130,000 $515,000 $230,000 $90,000 $1,780,000
Total Meter Fund $75,000 $25,000 $100,000
Total $890,000 $130,000 $515,000 $255,000 $90,000 $1,880,000

Capital Improvement Plan: FY2017-2021
217
Project Title: Heavy Equipment Replacement Department/Division: Beaches Energy Services / Construction & Maintenance Project Description and Reason Necessary: Beaches Energy uses various pieces of specialized equipment to install and maintain its electrical infrastructure. In spite of its high use, proper care and maintenance has allowed certain equipment to last over 40 years. With repairs becoming costly and parts becoming scarce, Beaches Energy plans to replace certain pieces of heavy equipment. Underground Cable Pulling Rig: Replacement parts for the current rig no longer exist or are hard to find. If the current rig were to break beyond repair, Beaches Energy would be very limited in what wire they could pull. 3 Phase Wire Trailer: As an outdated wire trailer, this piece of equipment does not meet current Department of Transportation standards for new trailers. The trailer wasn’t built to handle the weight of present day 3 phase wire reels. As a result, an axle broke recently and had to be repaired. Riddled with rust and covered with numerous coats of paint, it is time to replace this piece of equipment. Overhead Wire Puller: At over 40 years old, replacement parts no longer exist. All repairs are done through custom fabrication. If the wire puller were to break beyond repair, Beaches Energy would be very limited in what overhead wire they could pull. John Deere 6400: Tractor Trailer that is over 20 years old and is starting to show its age with more frequent breakdowns as well as steering failure. With increased cost and decreased reliability, a replacement will be needed in the future. Funding Source: Beaches Energy Services Operating Revenues
Description (FY Replacement)
Model Year
Mileage (Hours) 02/2016
Estimated Replacement
Cost
Estimated Trade-in
Value
Net Est. Cost
Underground Cable Pulling Rig (2018) 1997 N/A $100,000 Keep as
Backup $100,000
3 Phase Wire Trailer (2018) 1982 N/A $70,000 Scrap $70,000
Overhead Wire Puller (2019) 1975 N/A $120,000 Scrap $120,000
John Deere 6400 (2021) 1993 N/A $70,000 $3,000 $67,000
Total $357,000

Capital Improvement Plan: FY2017-2021
218
Heavy Equipment Replacement Summary:
FY2017 FY2018 FY2019 FY2020 FY2021 TOTAL
Total $170,000 $120,000 $67,000 $357,000

Capital Improvement Plan: FY2017-2021
219
Project Title: Mini Excavator Department/Division: Beaches Energy Services / Construction & Maintenance Project Description and Reason Necessary: Beaches Energy workers currently use a trencher as a mini excavator. Although this has worked in the past, it is inefficient and more dangerous. Due to its size, a trencher has a hard time reaching into tight spaces such as in between houses or around trees. Being a secondary function, digging holes requires more time with a trencher. A Mini Excavator has the ability to dig holes faster and deeper than a trencher. It’s smaller size and ability to swivel 360 degrees makes the machine a safer option for surrounding workers and for avoiding obstructions. Unlike the trencher, the Mini Excavator has tracks instead of wheels. This keeps it from getting stuck in soft dirt or mud. Having a Mini Excavator would give Beaches Energy workers the ability to repair and install pipe for customers in a timelier matter while disturbing less of the surrounding area. Funding Source: Beaches Energy Services Operating Revenues
Cost Item
FY2017
FY2018
FY2019
FY2020
FY2021
TOTAL
Mini Excavator $45,000 $45,000

Capital Improvement Plan: FY2017-2021
220
Project Title: Bush Hog Mower 15’ Department/Division: Beaches Energy Services / Construction & Maintenance Project Description and Reason Necessary: Power line easements need constant trimming to allow access to workers, protect equipment, and for aesthetics. Beaches Energy uses a 6’ mower for all areas that need trimming. Even though the 6’ mower is capable of mowing all areas and is great for heavy vegetation and brush, a 15’ mower would allow workers to mow large open area easements in a fraction of the time. With more than twice the cutting span of the current mower, Beaches Energy would save time and money by purchasing a 15’ mower. Funding Source: Beaches Energy Services Operating Revenues
Cost Item
FY2017
FY2018
FY2019
FY2020
FY2021
TOTAL
Bush Hog Mower 15’ $20,000 $20,000

Capital Improvement Plan: FY2017-2021
221
Project Title: Substation 26kV Breaker Upgrades Department/Division: Beaches Energy Services / Relay
Project Description and Reason Necessary: Circuit breakers are required to provide system protection at the distribution circuit level. The existing nineteen (19) 26kV circuit breakers are SF6 breakers that require a special interrupter located inside these units. The current interrupters can no longer be produced or rebuilt by the manufacturer. Currently three (3) spare interrupters are in inventory available for replacement until the breakers with associated relays will be replaced. The existing circuit breakers with electromechanical relays are over 25 years old and will be replaced with vacuum breakers and microprocessor relays as follows: .
FY 2017 Circuit Numbers Butler: 531 & spare FY 2018 Circuit Numbers Ft. Diego: 5C1 and 5C2 FY 2019 Circuit Numbers Butler: 5C1,5C2,533,536,539 FY 2020 Circuit Numbers Guana: 525,526,527,528,529,530
This will be a multiple year project that is coordinated with the relay upgrades project (next page). Funding Source: Beaches Energy Services Operating Revenues Cost Item
FY2017
FY2018
FY2019
FY2020
FY2021
TOTAL
Engineering and Testing $50,000 $50,000 $50,000 $50,000 $200,000
26kV Circuit Breakers $100,000 $100,000 $150,000 $150,000 $500,000
Total $150,000 $150,000 $200,000 $200,000 $0 $700,000

Capital Improvement Plan: FY2017-2021
222
Project Title: Substation 26kV Relay Upgrades Department/Division: Beaches Energy Services / Relay Project Description and Reason Necessary: Line relays provide protection from incipient faults such as lightning strikes, equipment malfunctions, and cable failures on the 26 kV distribution system. The existing electromechanical relays are over 20 years old and need to be upgraded to the more reliable microprocessor relays. As the industry has moved toward microprocessor relays, they have proven to be more versatile given the ability to customize the functionality to a specific operational application.
FY 2017 Circuit Numbers Butler: 531 & spare FY 2018 Circuit Numbers Ft. Diego: 5C1 and 5C2 FY 2019 Circuit Numbers Butler: 5C1,5C2,533,536,539 FY 2020 Circuit Numbers Guana: 525,526,527,528,529,530
This will be a multiple year project that is coordinated with the breaker upgrade project (previous page). Funding Source: Beaches Energy Services Operating Revenues Cost Item
FY2017
FY2018
FY2019
FY2020
FY2021
TOTAL
Relay Upgrades $30,000 $30,000 $75,000 $90,000 $225,000

Capital Improvement Plan: FY2017-2021
223
Project Title: Substation Capacitor Bank Relay Upgrades Department/Division: Beaches Energy Services / Relay Project Description and Reason Necessary: The relays associated with the control and protection of our substation capacitor banks have passed their expected life span of 20 years. Parts are obsolete and service is nonexistent. We currently have six (6) relays at three (3) substation controlling capacitor banks. This project will be to replace all of them (two (2) at Ft, Diego substation, two (2) at Jacksonville Beach substation and two (2) at Butler substation). Upgrading and replacement is necessary to continue reliable control of our capacitor banks for proper system power factor control. Funding Source: Beaches Energy Services Operating Revenues
Cost Item
FY2017
FY2018
FY2019
FY2020
FY2021
TOTAL
Relay Upgrades $50,000 $50,000
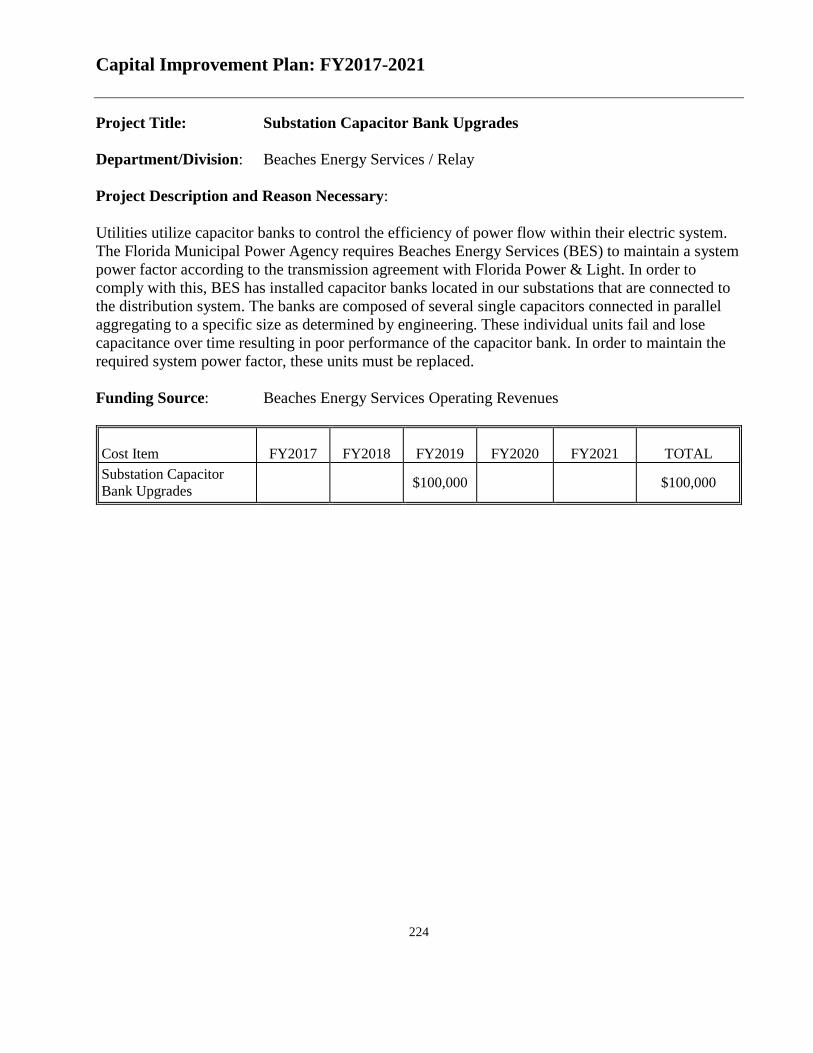
Capital Improvement Plan: FY2017-2021
224
Project Title: Substation Capacitor Bank Upgrades Department/Division: Beaches Energy Services / Relay Project Description and Reason Necessary: Utilities utilize capacitor banks to control the efficiency of power flow within their electric system. The Florida Municipal Power Agency requires Beaches Energy Services (BES) to maintain a system power factor according to the transmission agreement with Florida Power & Light. In order to comply with this, BES has installed capacitor banks located in our substations that are connected to the distribution system. The banks are composed of several single capacitors connected in parallel aggregating to a specific size as determined by engineering. These individual units fail and lose capacitance over time resulting in poor performance of the capacitor bank. In order to maintain the required system power factor, these units must be replaced. Funding Source: Beaches Energy Services Operating Revenues Cost Item
FY2017
FY2018
FY2019
FY2020
FY2021
TOTAL
Substation Capacitor Bank Upgrades $100,000 $100,000

Capital Improvement Plan: FY2017-2021
225
Project Title: Substation Battery Bank Replacement Department/Division: Beaches Energy Services / Relay Project Description and Reason Necessary: Battery Banks are used for DC Circuitry Control and Backup Power for Substations. Constant monitoring and testing of these banks are required by North American Reliability Corporation (NERC) and the Florida Reliability Coordinating Council (FRCC). Battery Bank life ranges from 12 to 20 years. Replacing Battery Banks at 15 years of age is a proactive approach to preventing failure. The Battery Banks at the other substations have been updated and installed over the recent years: Jacksonville Beach-2007; Ft. Diego-2009; Butler-2011; Guana-2012; Sampson-2015; Penman-2005. Penman substation bank will be 15 years old in 2020 and will need replacing. Funding Source: Beaches Energy Services Operating Revenues
Cost Item
FY2017
FY2018
FY2019
FY2020
FY2021
TOTAL
Battery Bank Replacement at Penman Substation $30,000 $30,000

Capital Improvement Plan: FY2017-2021
226
Project Title: Infrastructure to Support System Growth and Maintenance
Department/Division: Beaches Energy Services / Capital Improvements Project Description and Reason Necessary: Transformers: Transformers necessary for replacement or expansions to facilities. Streetlights (New and replacement materials): As of September 30, 2015 there were 5,493 rental and public streetlights located in Jacksonville Beach, Neptune Beach, Ponte Vedra Beach, and the Municipal Service District. Public streetlights total 2,082 and rental streetlights total 3,411. Residential and Commercial Improvements: Materials for the installation of new or upgraded residential or commercial improvements. Electric Meters (New and replacement): Meters for residential and commercial customers. Trouble Call and Miscellaneous: Materials such as wire, cable, poles, switchgear, enclosures, etc. necessary for the replacement of failed equipment or small capital improvements. Funding Source: Beaches Energy Services Operating Revenues
Cost Item FY2017 FY2018 FY2019 FY2020 FY2021 Total Transformers $550,000 $550,000 $550,000 $550,000 $550,000 $2,750,000 Electric Meters $50,000 $50,000 $50,000 $50,000 $50,000 $250,000 Streetlights $150,000 $150,000 $150,000 $150,000 $150,000 $750,000 Residential and Commercial $350,000 $350,000 $350,000 $350,000 $350,000 $1,750,000
Trouble Calls and Miscellaneous
$150,000 $150,000 $150,000 $150,000 $150,000 $750,000
Total $1,250,000 $1,250,000 $1,250,000 $1,250,000 $1,250,000 $6,250,000

Capital Improvement Plan: FY2017-2021
227
Project Title: Major Replacement Projects Department/Division: Beaches Energy Services / Capital Improvements Project Description and Reason Necessary: In order to provide reliable service to our customers, Beaches Energy Services (BES) annually assesses its capacity to sustain increased load requirements. BES strives to maintain and upgrade its substations, transmission facilities, and distribution facilities. Funding Source: Beaches Energy Services Operating Revenues
Overhead Line Rebuild (Fairway Lane Phase 2) - $400,000: Replace existing wood pole line with concrete poles and underground lines from Declaration Dr. to Jacksonville Dr. Overhead Line Rebuild (Canal Blvd and Roscoe Blvd South) - $300,000: Replace existing wood pole line along Canal Blvd. from Palmetto Landing to Palm Valley Rd. with concrete poles. This will also include replacing existing wood pole line along Roscoe Blvd. South from Landrum Lane to Canal Blvd. to concrete poles.
Overhead Line Rebuild (Roscoe Blvd North Phase 1) – $600,000: Replace existing wood pole line with concrete poles from Solana Road to Ft. Diego S/S Entrance. Overhead Line Rebuild (10th Avenue South) - $100,000: Replace existing wood pole line with concrete poles from 4th Street South to 9th Street South.
Overhead Line Rebuild (Roscoe Blvd North Phase 2) - $300,000: Replace existing wood pole line with concrete poles from Ft. Diego S/S Entrance to #54 Roscoe Blvd. North. Overhead Line Rebuild (Roscoe Blvd North Phase 3) - $300,000: Replace existing wood pole line with concrete poles from #54 Roscoe Blvd. North to Canal Blvd.
Overhead Line Rebuild (Landrum Lane) - $350,000: Replace existing wood pole line along Landrum Lane from South Roscoe Blvd. to Palm Valley Rd. with concrete poles.
2017
2018
2019
2020

Capital Improvement Plan: FY2017-2021
228
Overhead Line Rebuild (Isabella Blvd.) - $250,000: Replace existing wood pole line along Isabella Blvd. with concrete poles from Osceola Ave. to Jacksonville Drive.
Overhead Line Rebuild (Jacksonville Drive) - $350,000: Replace existing wood pole line along Jacksonville Drive with concrete poles from America Avenue to 3rd Street South. Overhead Line Rebuild (Solana Road) - $350,000: Replace existing wood pole line along Solana Road with concrete poles from Powerline Road to SR A1A. Overhead Line Rebuild (Roscoe Blvd. North Extension) - $150,000: Replace existing wood pole line along Roscoe Blvd. North Extension with concrete poles from Solana Road to Harbourmaster Court. Annual Projects
Cable Replacement Plan - $550,000 each year 2017/2018/2019/2020/2021: Replace existing primary cable that has reached the end of service life. An underground circuit assessment has identified the age and condition of all primary cable. The cable is prioritized and will be changed out proactively. This will enhance the overall reliability of the electric system. Distribution Renewal and Replacement Plan - $100,000 each year 2017/2018/2019/2020/2021: Replacement of underground secondary connection boxes/blocks, overhead service cable/connections, and overhead/underground arrestors. Distribution Automation Plan - $150,000 each year 2017/2018/2019/2020/2021: Install remote controlled motor operated gang switches to improve sectionalizing of power lines and provide faster power restoration. Switch Gear Replacement - $100,000 in each year 2017/2018/2019/2020/2021: Replace existing SF6 pad mounted switchgear at various locations throughout the system with oil filled Vacuum Fault Interrupters (VFI). This project will create uniformity of all switchgear on the distribution system. Infrastructure to Support System Growth and Maintenance (from previous page) – Transformers, streetlights, residential and commercial improvements, electric meters, trouble call and miscellaneous.
2021

Capital Improvement Plan: FY2017-2021
229
Summary of Major Replacement Projects:
FY2017 FY2018 FY2019 FY2020 FY2021 TOTAL Storm Hardening Plan Overhead Line Rebuild (Fairway Lane Phase 2) $400,000 $400,000 Overhead Line Rebuild (Canal Blvd and Roscoe Blvd. South) $300,000 $300,000 Overhead Line Rebuild (10th Avenue South) $100,000 $100,000 Overhead Line Rebuild (Roscoe Blvd. North Phase 1) $600,000 $600,000 Overhead Line Rebuild (Roscoe Blvd. North Phase 2) $300,000 $300,000 Overhead Line Rebuild (Roscoe Blvd. North Phase 3) $300,000 $300,000 Overhead Line Rebuild (Landrum Lane) $350,000 $350,000 Overhead Line Rebuild (Isabella Blvd.) $250,000 $250,000 Overhead Line Rebuild (Jacksonville Drive) $350,000 $350,000 Overhead Line Rebuild (Solana Road) $350,000 $350,000 Overhead Line Rebuild (Roscoe Blvd. North Extension) $150,000 $150,000 Subtotal - Storm Hardening Plan $700,000 $700,000 $600,000 $600,000 $850,000 $3,450,000 Cable Replacement Plan $550,000 $550,000 $550,000 $550,000 $550,000 $2,750,000 Distribution Renewal and Replacement Plan $100,000 $100,000 $100,000 $100,000 $100,000 $500,000 Distribution Automation Plan $150,000 $150,000 $150,000 $150,000 $150,000 $750,000 Switchgear Replacement Program $100,000 $100,000 $100,000 $100,000 $100,000 $500,000
Total Major Replacement Projects $1,600,000 $1,600,000 $1,500,000 $1,500,000 $1,750,000 $7,950,000
Total Infrastructure to Support System Growth and
Maintenance $1,250,000 $1,250,000 $1,250,000 $1,250,000 $1,250,000 $6,250,000 Total $2,850,000 $2,850,000 $2,750,000 $2,750,000 $3,000,000 $14,200,000

Capital Improvement Plan: FY2017-2021
230
Project Title: Automated Meter Reading Department/Division: Beaches Energy Services / Capital Improvements Project Description and Reason Necessary: Automated Meter Reading (AMR) enables Beaches Energy Services (BES) to remotely read its electric meters monthly without deploying an employee to each meter location. This meter replacement project will be combined with Public Works water meter upgrade program, enabling BES to eliminate the necessity for routine site visits by meter readers. This is a 2-year project that totals $1,350,000 and is scheduled to start in FY 2021. Funding Source: Beaches Energy Services Operating Revenues
Cost Item FY2017 FY2018 FY2019 FY2020 FY2021 Total
Automated Meter Reading $675,000 $675,000

Capital Improvement Plan: FY2017-2021
231
Project Title: Outage Management System Department/Division: Beaches Energy Services / System Operations Project Description and Reason Necessary: Currently outage notification relies on calls from customers. Major feeder outages are displayed by Supervisory Control and Data Acquisition System (SCADA) at System Operations. At that time crews are physically dispatched to identify and locate the problem. Given the technical complexity and proprietary nature of the computer systems, additional engineering expertise is necessary to review legacy systems and develop the interoperability requirements to integrate the existing geographic information system (GIS) with the SCADA system. With an outage management application this roadmap is critical to integrate the systems, providing real-time information for service restoration and system control. The real-time automation and analysis will satisfy North American Electric Reliability Corporation (NERC) / Florida Reliability Coordinating Council (FRCC) regulatory standards and enhance call center operations by providing system status indication instantaneously to system operators. Funding Source: Beaches Energy Services Operating Revenues Cost Item FY2017 FY2018 FY2019 FY2020 FY2021 TOTAL Outage Management System $200,000 $200,000
Future Operating Budget Impact: FY2017 FY2018 FY2019 FY2020 FY2021 TOTAL Annual Support Maintenance $10,000 $10,000 $10,000 $30,000

Capital Improvement Plan: FY2017-2021
232
Project Title: SCADA Server Upgrade Department/Division: System Operations Project Description and Reason Necessary: SCADA (supervisory control and data acquisition) is a system for remote monitoring and control that operates with coded signals over communication channels (using typically one communication channel per remote station). The control system may be combined with a data acquisition system by adding the use of coded signals over communication channels to acquire information about the status of the remote equipment for display or for recording functions. It is the type of computer-based system that allows for users to be aware of the current status of the Beaches Energy Services Transmission & Distribution System for power supply and delivery of power to our customers. Our current SCADA System hardware & software equipment will be out of warranty & support in 2020. Funding Source: Beaches Energy Services Operating Revenues Cost Item
FY2017
FY2018
FY2019
FY2020
FY2021
TOTAL
SCADA Server Upgrade $250,000 $250,000
Future Operating Budget Impact: FY2017 FY2018 FY2019 FY2020 FY2021 TOTAL Annual Support Maintenance $30,000 $30,000

Capital Improvement Plan: FY2017-2021
233
Project Title: Transformer Bushing Replacements Department/Division: Beaches Energy Services / Transmission Project Description and Reason Necessary: Transformer Bushings are essential to equipment operation. They are the means of insulating and harnessing the voltage into and out of the Substation Transformer. Recent reports (ABB oil lab tests, the inspection report from the Load Tap Changer work, and industry knowledge found thru the Substation roundtable) have indicated a potential issue with the Type U Transformer bushings. Failure to replace could cause substantial damage to the equipment and reliability of the System will be compromised. Beaches Energy Services has 5 of 12 Transformers with Type U Bushings for a total of 30 Bushings installed at our Sampson, Jacksonville Beach and Diego transformers. FY 2017 Sampson TR-1 Jacksonville Beach T-1 &T-2 FY 2018 Sampson TR-2 Diego T-1 Funding Source: Beaches Energy Services Operating Revenues Cost Item FY2017 FY2018 FY2019 FY2020 FY2021 TOTAL Transformer Bushing Replacement $225,000 $225,000 $450,000

Capital Improvement Plan: FY2017-2021
234
Project Title: Substation 230kV and 138kV Relay Upgrades Department/Division: Beaches Energy Services / Transmission Project Description and Reason Necessary: Line relays provide protection from incipient faults such as lightning strikes and equipment malfunctions on the transmission system. The existing electromechanical relays are over 30 years old and need to be upgraded to the more reliable microprocessor relays. As the industry has moved toward microprocessor relays, they have proven to be more versatile given the ability to customize the functionality to a specific operational application. This will be a multiple year project that is coordinated with the breaker replacement project. Beaches Energy Services (BES) as a transmission owner/operator is regulated by North American Electric Reliability Corporation (NERC) and Florida Reliability Coordinating Council (FRCC). Given the regulatory standards that transmission providers must comply with to secure the operation of the bulk electric system, the existing electromechanical relays must be replaced.
FY 2017 Sampson to Ft. Diego Line 805 FY 2018 Jacksonville Beach to Butler Line 802 FY 2019 Butler to Ft. Diego Line 803 FY 2020 Butler Transformer Differential Relays FY 2021 Sampson Transformer Differentia Relays
Funding Source: Beaches Energy Services Operating Revenues Cost Item
FY2017
FY2018
FY2019
FY2020
FY2021
TOTAL
Relay Upgrades $230,000 $230,000 $230,000 $230,000 $230,000 $1,150,000

Capital Improvement Plan: FY2017-2021
235
Project Title: Substation Transformers Department/Division: Beaches Energy Services / Transmission Project Description and Reason Necessary: Both 112 MVA transformers at Sampson substation were installed in 1982 and are nearing the end of their useful life. Additionally, there is load growth in the south end of our service territory and the main flow of our system will be via Sampson rather than through JEA’s Neptune Substation if we do decide to end the agreement allowing the normally closed interconnection. Also, Guana Substation is the only substation with only one 50 MVA distribution transformer. Adding a 50 MVA transformer at Guana would allow us to serve the load in the event one of the 50 MVA transformers failed at Ft. Diego. Finally, adding a spare 50 MVA substation transformer at Penman Substation under low load would provide us a spare in the event any of the 50 MVA or 56 MVA transformers failed at any of our distribution substations. Funding Source: Beaches Energy Services Operating Revenues
Design and Purchase and Installation of new 50 MVA transformer for Guana Substation (Phase 1) - $1,215,000: Add an additional substation transformer along with a ring bus to allow for greater reliability and load management for the south end of the service territory. This phase includes developing the transformer specifications, ordering the transformer and completing the design work.
Design and Purchase and Installation of new 50 MVA transformer for Guana Substation (Phase 2) - $2,420,000: This phase of the project includes purchase and installation of breakers and the physical construction to facilitate installation of the transformer and the necessary protection and controls and final commissioning.
Design and Purchase and Installation of new 224 MVA transformer for Sampson Substation (Phase 1) - $2,600,000: Install a 224MVA substation transformer to replace one of the 112 MVA transformers at Sampson Substation. In the event of the failure of one of the other two transformers at Sampson this transformer would provide us the ability to serve load reliably while allowing us the lead time to purchase a replacement. This phase includes developing the transformer specifications, ordering the transformer and completing the design work.
2017
2018
2020

Capital Improvement Plan: FY2017-2021
236
Design and Purchase and Installation of new 112 MVA or 224 MVA transformer for Sampson Substation (Phase 2) - $400,000: This phase of the project includes purchase and installation of breakers and the physical construction to facilitate installation of the transformer and the necessary protection and controls and final commissioning.
Design and Purchase and Installation of new 50 MVA transformer for Penman Substation - $1,185,000: Install a spare substation transformer attached to the current ring bus at Penman Substation This substation already includes a spare bay where this transformer can be placed. This transformer will be hooked up and operated under low load. In the event of the failure of one of any of our 50 or 56 MVA transformers at any of our distribution substations this transformer would be placed into service allowing us the lead time to purchase a replacement. Phase 1 is scheduled to begin in 2022 and Phase 2 in 2023.
Cost Item FY2017 FY2018 FY2019 FY2020 FY2021 Total Design, Purchase, and Installation of new 50 MVA Transformer for Guana Substation (Phase 1)
$1,215,000 $1,215,000
Design, Purchase, and Installation of new 50 MVA Transformer for Guana Substation (Phase 2)
$2,420,000 $2,420,000
Design, Purchase, and Installation of new 112 MVA Transformer for Sampson Substation (Phase 1)
$2,600,000 $2,600,000
Design, Purchase, and Installation of new 112 MVA Transformer for Sampson Substation (Phase 2)
$400,000 $400,000
TOTAL $1,215,000 $2,420,000 $0 $2,600,000 $400,000 $6,635,000
2021
Beyond 2021

Capital Improvement Plan: FY2017-2021
237
Guana Substation:

Capital Improvement Plan: FY2017-2021
238
Sampson Substation:

Capital Improvement Plan: FY2017-2021
239
Project Title: Sampson 230kV & 138kV Transmission Circuit Breaker Upgrades Department/Division: Beaches Energy Services / Transmission
Project Description and Reason Necessary: There are two (2) 230kV transmission oil circuit breakers located at Sampson Substation that are over 30 years old and are at the end of their useful life. There is one (1) 230kV and two (2) 138kV transmission gas (SF-6) circuit breakers that are nearing 30 years old and will be at the end of their useful life by FY2021. If a catastrophic failure were to occur rendering a breaker inoperable, replacement parts for the OCB breakers are no longer manufactured. These breakers will be upgraded to gas (SF-6) circuit breakers and are used on the transmission system for line protection and isolation. Industry recommends replacement of breakers in general after 30 years of service or 1000 operations, therefore the three SF-6 breakers are scheduled to be replaced in FY2021. Misoperations are monitored by the North American Electric Reliability Corporation (NERC) and the Florida Reliability Coordinating Council (FRCC). Failure to maintain breaker equipment can lead to misoperations of the equipment. This can lead to Fines by the NERC/FRCC. The reliability of these breakers must not be compromised.
FY 2017 Circuit Breaker Numbers: 8W40 and 8W71 FY 2021 Circuit Breaker Numbers: 8W85, 805NT1, and 805N
Funding Source: Beaches Energy Services Operating Revenues Cost Item FY2017 FY2018 FY2019 FY2020 FY2021 TOTAL
Engineering and Testing $50,000 $50,000 $100,000 Five Transmission Circuit Breakers $200,000 $150,000 $350,000
Total $250,000 $0 $0 $0 $200,000 $450,000

Capital Improvement Plan: FY2017-2021
240
Project Title: Install Fiber & Equipment: Sampson to Diego Department/Division: Beaches Energy Services / Transmission Project Description and Reason Necessary: Wave traps, tuners, and tone equipment are used for relay communications and system protection. They are currently used on the 805, 802 and 803 transmission lines. This equipment is 25 to 30 years old and is scheduled to be replaced in FY2017, FY2018 and FY2019. Parts and service for Tone equipment is unavailable and obsolete. Fiber has proven to be a more reliable means of communications. Fiber will be installed from Sampson substation to Ft. Diego substation in FY2017. Conversion from the wave traps, tuners and tone equipment to the fiber will be conducted in FY2018 and FY2019 at Sampson, Ft. Diego, Butler and Jacksonville Beach substations. This will ensure proper system protection, relay communication and system reliability. This project will be coordinated with the 138KV Relay Upgrade project for transmission lines 805, 802 and 803 scheduled in FY2017, FY2018 and FY2019. Funding Source: Beaches Energy Services Operating Revenues Cost Item FY2017 FY2018 FY2019 FY2020 FY2021 TOTAL Install Fiber and Equipment $180,000 $60,000 $60,000 $300,000

Capital Improvement Plan: FY2017-2021
241
Project Title: Motor Switch Replacement Department/Division: Beaches Energy Services / Transmission Project Description and Reason Necessary: Motor operated switches are used for substation power transformer isolation. The 14 currently in service are 20 to 30 years old. Due to high maintenance and service issues, replacement is necessary to ensure reliability of the Beaches Energy System. Improved Substation Design and Equipment has caused Beaches Energy Services to reevaluate the current Motor Switch Configuration. Engineering for this possible reconfiguration will be completed in 2016 and 2017. Installation will be completed in 2017 and 2018. Funding Source: Beaches Energy Services Operating Revenues Cost Item FY2017 FY2018 FY2019 FY2020 FY2021 TOTAL Motor Switch Replacement $150,000 $100,000 $250,000

Capital Improvement Plan: FY2017-2021
242
Project Title: Transmission Line Hardware Renewal and Replacement Department/Division: Beaches Energy Services / Transmission Project Description and Reason Necessary: Some line sections of the transmission system are 30 years old and need to be inspected for rusted/loose bolts, brackets, guy wires, and other equipment and have the identified deteriorated items replaced. Beaches Energy Services (BES) had its two longest transmission lines and supporting infrastructure inspected in 2015 which revealed numerous minor, and some medium, issues. Historically, this budget line item was $50,000 and was allocated for unplanned repairs as necessary to maintain system reliability and service. However, as a result of the inspections conducted in 2015, this budget line item has been increased to allow BES to proactively address its transmission line hardware issues. BES plans to upgrade and or repair the issues identified on the 804 & 805E transmission lines which connect our Sampson and Ft. Diego substations, as well as have the remainder of its transmission lines inspected. This approach will allow BES to proactively identify and resolve transmission hardware issues to ensure the delivery of safe and reliable electric service to our community. Funding Source: Beaches Energy Services Operating Revenues
Cost Item FY2017 FY2018 FY2019 FY2020 FY2021 Total
Transmission Line Hardware Renewal and Replacement
$500,000 $500,000 $500,000 $500,000 $500,000 $2,500,000

Capital Improvement Plan: FY2017-2021
243
Project Title: Regulatory Compliance Plan Department/Division: Beaches Energy Services / Regulatory Compliance Project Description and Reason Necessary: In order to be compliant with North American Electric Reliability Corporation (NERC) Critical Infrastructure Protection (CIP) standards which in turn will help us provide reliable service to our customers and maintain our system. Funding Source: Beaches Energy Services Operating Revenues Annual Projects
Cyber Physical Security $230,000 in FY 2017, $20,000 in FY 2018, $20,000 in FY 2019, $20,000 in FY 2020, and $20,000 in FY2021: NERC Standards CIP 002 through CIP 011 “Cyber Security” became effective requiring additional security measures for assets including control centers and substations. The Centralized Transmission Operator (TOP) moved our Medium Impact responsibilities to Orlando Utilities Commission (OUC). However, we are responsible for the Low Impact requirements. These Low Impact facilities are defined such that if severely damaged or destroyed, would have a significant impact on the ability to serve large quantities of customers for an extended period of time and would have a detrimental impact on the reliability or operability of the electric grid, or would cause significant risk to public health and safety. Florida Municipal Power Agency (FMPA) is currently working on an assessment of the asset elements necessary to meet these requirements such as a “high tech” locks with impossible to difficult to copy keys, a “card reader” security access to substations control room doors and control center doors along with data recording, logging, and associated security systems with an electronic security perimeter in and around the substation properties. Consulting Fees $100,000 in FY 2017, $100,000 in FY 2018-FY2021: NERC continues to develop and modify the bulk electric system requirements. Consulting services would help aid in the process of development of policies and procedures, risk assessments, CIP administration and evidence preparations and document classification policy development. These services include: inventory assessment, policy and procedure development, physical security review, electronic security and network design review, information protection review, asset ownership review, low impact facilities NERC CIP compliance gap analysis, and medium impact facilities NERC CIP compliance gap analysis. Centralized TOP (Transmission Operator) Agreement: $195,000 in FY 2017-FY2018: In preparation for the enforcement of NERC CIP version 5, BES has been working with FMPA on developing a response to satisfy these requirements. As a transmission owner/operator that has critical assets that impact the bulk electric system, BES must initiate measures that are mandated by NERC and FRCC. Annual operating costs of these measures is $470,000.

Capital Improvement Plan: FY2017-2021
244
Regulatory Compliance Plan Summary:
Cost Item FY2017 FY2018 FY2019 FY2020 FY2021 Total
Cyber Physical Security $230,000 $20,000 $20,000 $20,000 $20,000 $310,000 Consulting Fees $100,000 $100,000 $100,000 $100,000 $100,000 $500,000 Centralized TOP $195,000 $195,000 - - - $390,000 Centralized TOP - Annual Operating Costs
$470,000
$470,000
$470,000
$470,000
$470,000 $2,350,000
Total $995,000 $785,000 $590,000 $590,000 $590,000 $3,550,000

Capital Improvement Plan: FY2017-2021
245
Project Title: Electric Meter Tester Department/Division: Meter Project Description and Reason Necessary: A new in-house Electric Meter Tester is needed to test all single phased and three phased self-contained meters as well as all single phase and three phase CT meters. The old meter tester was over 10 years old and no longer works. An updated meter tester will also allow us to program meters through a laptop computer. Funding Source: Beaches Energy Services Operating Revenues Cost Item FY2017 FY2018 FY2019 FY2020 FY2021 TOTAL
Electric Meter Tester $30,000 $30,000

Capital Improvement Plan: FY2017-2021
246
Project Title: Natural Gas Distribution System Department/Division: Beaches Energy Services / Natural Gas Project Description and Reason Necessary: The infrastructure for the natural gas distribution system’s growth may include service lines, main extensions, meter sets, and conversions of equipment if determined feasible. Funding Source: Beaches Energy Services Operating Revenues
Cost Item FY2017 FY2018 FY2019 FY2020 FY2021 Total
Capital Improvements $100,000 $100,000 $100,000 $100,000 $100,000 $500,000

Capital Improvement Plan: FY2017-2021
247
Finance DepartmentFunding Sources: 2017 2018 2019 2020 2021 Total
General Capital Projects Fund IT Reserve 315 1,194,607 878,452 865,956 234,707 70,066 3,243,788 Finance Internal Service Charges 511 - 160,000 - - - 160,000
315 - 33,000 - - - 33,000 315 368,800 560,000 170,000 150,000 150,000 1,398,800
Total CIP Funding Sources 1,563,407 1,631,452 1,035,956 384,707 220,066 4,835,588
Expenses: FundInformation Systems:
Information Systems Master Plan, Phase 2 315 200,000 200,000 490,000 165,000 - 1,055,000 Annual Computer Replacement Plan 315 69,607 69,452 70,956 69,707 70,066 349,788 City-wide Telephone System Replacement 315 - 160,000 - - - 160,000 Enterprise Resource Planning System 315 925,000 609,000 305,000 - - 1,839,000
1,194,607 1,038,452 865,956 234,707 70,066 3,403,788 Utility Billing:
Planet Press Printer 315 33,000 33,000 - 33,000 - - - 33,000
Property & ProcurementMajor Bldg Systems repairs/replacements 315 343,800 535,000 145,000 125,000 125,000 1,273,800 Major Bldg Systems repairs/replacements (not capital) 25,000 25,000 25,000 25,000 25,000 125,000
368,800 560,000 170,000 150,000 150,000 1,398,800
Total CIP - Finance 1,563,407 1,631,452 1,035,956 384,707 220,066 4,835,588
General Capital Projects Fund Building Systems General Capital Projects Fund Utility Billing Reserve

Capital Improvement Plan: FY2017-2021
248
Project Title: Information Systems Master Plan Department/Division: Finance/Information Systems Project Description and Reason Necessary: In 2011, the City developed a master plan to guide the purchase and replacement of its information technology systems. Phase 1 of this plan included the purchase and installation of equipment at an offsite location that permits the City to continue to operate its information systems in the event of a disaster.
Phase 2 of the plan consists of the following equipment upgrades and replacements:
2017
Replace Switches - $200,000: A switch is used to move data traffic between locations within the confines of the city network. Seven of the 22 switches throughout the city were replaced at the beginning of fiscal year 2012. The newer switches have a 10 Gbps (giga-bit per second) capacity, and replaced switches with a 1Gbps capacity. The higher capacity ensures data traffic can travel between locations in a more efficient manner without causing bottlenecks. With an average lifespan of 5-6 years, the switches will need to be replaced in 2017. In order to prepare for the Telephone System Replacement project in 2018, these switches will need to have Power-over-Ethernet (PoE) capability, which increases the cost. This purchase will not produce any future operating budget impact for annual maintenance because the equipment will be purchased with a 5-year warranty. 2018
Replace Storage Area Network (SAN) - $200,000: The SANs provide consolidated power and network connections to disk drives housed inside a chassis. The current SANs were purchased in 2011 and 2012 and have a 5-year life expectancy. SANs house operational data and provide storage for the back-up system and the virtual servers, including the file server. There are no current or expected future budget impacts, as the equipment is purchased with a 5-year warranty. 2019
Replace Blade Center - $350,000: Blade centers provide consolidated power and network connections to servers (blades) housed inside a chassis. The current blade center was purchased in 2014 and has a 5-year life expectancy. The blade centers house operational servers and data over and above what is housed on the Storage Area Network (SAN). Replace EIS Server at Police Department - $140,000: The current EIS Server was purchased in 2014. The EIS server houses the Police Department’s report generating, evidence tracking and operational software and has a 5-year life expectancy. There are no current or expected future budget impacts, as the equipment is purchased with a 5-year warranty.

Capital Improvement Plan: FY2017-2021
249
2020 Replace Core Routers - $120,000: Routers control the flow and volume of data traffic between intersection points (nodes). The City’s primary nodes are City Hall, O&M Facility, Police Department, and Parks Department. The current four core routers were purchased in 2015 and have a life expectancy of 5 to 6 years. Annual maintenance costs are expected to remain unchanged. Replace Firewalls - $45,000: Firewalls are physical appliances containing software that protects data and data systems from outside intrusions such as viruses, hackers, and other destructive actions. The current firewalls were purchased in 2015. The current models will be considered end-of-life in 2020 and will need to be replaced or upgraded. Annual maintenance costs are expected to remain unchanged. Anticipated 10-year replacement cycle:
Funding Source: General Capital Projects Fund via transfers from the General Fund, Electric and Water/Sewer Funds
Project 2017 2018 2019 2020 2021 2022 2023 2024 2025 2026
Replace Blade Center X X
Replace Core Routers X X Replace EIS Servers (Police Department) X X
Replace SANs X X
Replace Firewalls X X
Replace Switches X X
Project FY2017 FY2018 FY2019 FY2020 FY2021 Total
Replace Blade Center $350,000 $350,000
Replace Core Routers $120,000 $120,000 Replace EIS Servers (Police Department) $140,000 $140,000
Replace SANs $200,000 $200,000 Replace Firewalls $45,000 $45,000
Replace Switches $200,000 $200,000
Totals $200,000 $200,000 $490,000 $165,000 $0 $1,055,000

Capital Improvement Plan: FY2017-2021
250
Project Title: Annual Computer Replacement Plan Department/Division: Finance/Information Systems Project Description and Reason Necessary: The Information Systems Master Plan includes a 5-year replacement cycle for computers in order to maintain currency in technology throughout the city. Maintaining current technology assures the interoperability of the City’s software and operating systems with those of other federal, state and local agencies with whom the City exchanges information. This also helps eliminate the need to replace computers on an emergency basis and minimizes staff downtime caused by unplanned computer replacements or repairs. The projected cost to replace computers on a 5-year schedule has increased by approximately $10,000 over prior year projections. All costs are based on FY2016 quoted/actual pricing. Funding Source: General Capital Projects Fund via transfers from the Leased Facilities Fund By Department: 2017 2018 2019 2020 2021 TOTAL
Qty. Cost Qty. Cost Qty. Cost Qty. Cost Qty. Cost Qty. Cost
BES 14 $16,663 11 $9,305 4 $3,360 8 $8,454 6 $6,578 43 $44,360
City Manager 1 $840 0 $0 1 $840 2 $1,680 0 $0 4 $3,360
City Clerk 0 $0 0 $0 0 $0 3 $3,098 1 $840 4 $3,938
Finance 17 $17,709 10 $10,134 12 $10,080 7 $6,458 6 $8,258 52 $52,639
Fire 0 $0 1 $1,418 0 $0 2 $2,836 5 $7,630 8 $11,884
HR 3 $2,520 0 $0 0 $0 4 $4,516 2 $1,680 9 $8,716
Parks 5 $4,200 10 $8,978 1 $840 2 $1,680 6 $6,053 24 $21,751
Planning 2 $1,680 4 $3,360 3 $2,520 1 $1,418 0 $0 10 $8,978
Police 15 $18,106 23 $30,061 26 $49,116 24 $31,375 18 $29,358 106 $158,016
PW 8 $7,889 6 $6,196 5 $4,200 7 $8,192 6 $9,669 32 $36,146
TOTAL 65 $69,607 65 $69,452 52 $70,956 60 $69,707 50 $70,066 292 $349,788

Capital Improvement Plan: FY2017-2021
251
By Device Type:
2017 2018 2019 2020 2021 TOTAL
Qty. Cost Qty. Cost Qty. Cost Qty. Cost Qty. Cost Qty. Cost Enhanced Desktop 2 $1,810 1 $905 0 $0 0 $0 3 $5,400 6 $8,115
Laptop 0 $0 0 $0 0 $0 0 $0 2 $2,550 2 $2,550 Laptop w/dock 8 $11,344 8 $11,344 0 $0 14 $19,852 10 $14,508 40 $57,048
Rugged 1 $3,113 1 $3,113 12 $37,356 0 $0 5 $15,570 19 $59,152 Police Laptop 15 $20,490 15 $20,490 0 $0 18 $26,335 13 $17,758 61 $85,073
Standard Desktop 39 $32,850 40 $33,600 40 $33,600 28 $23,520 17 $14,280 164 $137,850
TOTAL 65 $69,607 65 $69,452 52 $70,956 60 $69,707 50 $70,066 292 $349,788

Capital Improvement Plan: FY2017-2021
252
Project Title: City-Wide Telephone System Department/Division: Finance/Information Systems Project Description and Reason Necessary: The City currently has one or more telephone systems in each of its buildings. The systems do not work the same way or have the same features. Multiple vendors service these telephone systems and each system has a different city staff point of contact. Managing and coordinating service for these phone systems is difficult and time consuming. A unified communications system throughout the City will simplify management of the system, decrease maintenance costs, improve support speed, and allow all employees to be knowledgeable on a standardized telephone system. The Utility Billing Division is currently using the Avaya Telephone System provided by Converged Communications. During a recent upgrade of the Avaya System, the vendor was instructed to create a system that would be expandable to meet future needs. This solution will expand our largest existing telephone system (Utility Billing), thereby eliminating the need to replace the equipment in that division. Expanding the Avaya System will provide the following benefits:
• Long-term savings on maintenance costs • Centralized voicemail with indicators on the telephone signifying waiting messages • City-wide intercom with 4-digit dialing • Ability for calls to roll to an available extension on busy • Voicemail messages can be sent to users as an e-mail • Statistical analysis of calls, to include number of calls per day and time to answer • State of Florida contract pricing
Funding Source: General Capital Projects Fund via transfers from the Information Systems Internal Service Fund
FY2017 FY2018 FY2019 FY2020 FY2021 Total Unified Communication System $160,000 $160,000
Future Operating Budget Impact:
2017 2018 2019 2020 2021 TOTAL Annual Maintenance on Current Systems - $94,000 $94,000 $94,000 $94,000 $376,000
Annual Maintenance on New Systems - $53,000 $77,000 $77,000 $77,000 $284,000
Net Operating Cost (Savings) - ($41,000) ($17,000) ($17,000) ($17,000) ($92,000)

Capital Improvement Plan: FY2017-2021
253
Project Title: Enterprise Resource Planning System Department/Division: Finance/Information Systems Project Description and Reason Necessary: The City acquired the SunGard Public Sector (HTE) business software system in 1987. The system can no longer meet the City’s growing needs, especially in the areas of reporting, GIS integration and mobility. In addition, we anticipate that SunGard will cease support of its legacy business software systems in the near future. The City has been setting aside funds for the cost of migration of the SunGard applications to an integrated, Windows-based Enterprise Resource Planning system (ERP). An ERP system provides an integrated system to manage core business processes, usually in real-time. ERP systems track business resources and the status of business commitments (requisitions, purchase orders, payroll, work orders, permits, licenses, inspections, etc.). The applications that make up the system share data across the various functions (finance, human resources, public works, community development, etc.) that provide the data. ERP systems facilitate information flow between all business functions and manage communications with outside points of contact. The City is in the process of selecting a software vendor to provide the ERP. Implementation is expected to begin in October 2016 and expand over a period of approximately 3.5 years. Funding Source: General Capital Projects Fund via transfers from the General Fund
PRIOR 2017 2018 2019 2020 2021 TOTAL
Software $632,000 $316,000 - - - - $316,000
Hardware $100,000 - - - - - -
Services $305,000 $609,000 $609,000 $305,000 - - $1,523,000
Total $1,037,000 $925,000 $609,000 $305,000 $0 $0 $1,839,000
Future Operating Budget Impact: 2017 2018 2019 2020 2021 TOTAL
Annual Maintenance on SunGard Applications - - -
($103,000)
($103,000) ($206,000)
Annual Maintenance on New ERP Applications $175,000 $344,000 $357,000 $371,000 $386,000 $1,633,000
Net Operating Cost (Savings) $175,000 $344,000 $357,000 $268,000 $283,000 $1,427,000

Capital Improvement Plan: FY2017-2021
254
Project Title: Utility Billing Planet Press Printer Department/Division: Finance/Utility Billing Project Description and Reason Necessary: The Planet Press Riso Printer is necessary to print professional utility bill documents, delinquent notices and other miscellaneous billings. The current printer was put into operation in 2014 for printing the newly designed utility bills. This is an essential utility billing ink jet printer capable of printing up to 120 pages per minute. The Riso printer prints approximately 400,000 utility bills and delinquent notices per year. By 2018, approximately 2,000,000 documents will have been processed utilizing the Riso printer. There will be no future impact on the operating budget as this would be a replacement machine and monies are already included in the operating budget for maintenance. Funding Source: General Capital Project Fund Utility Billing Reserves FY2017 FY2018 FY2019 FY2020 FY2021 Total
Pitney Riso Printer $33,000 $33,000

Capital Improvement Plan: FY2017-2021
255
Project Title: Major Building Systems – Repair/Replacement/Maintenance Projects Department/Division: Finance/Property & Procurement Project Description and Reason Necessary: The Property and Procurement Division is responsible for the management and maintenance of City-owned properties.
Location Address 1 City Hall 11 North Third St 2 Police Headquarters 101 Penman Rd 3 O&M Building 1460-A Shetter Avenue 4 Animal Control-Police Bldg. 1460-B Shetter Avenue 5 Meter Shop 1460-C Shetter Avenue 6 Garage 1460-D Shetter Avenue 7 Fire Station 1 396 1st Avenue South 8 Fire Station 2 2500 South Beach Pkwy 9 Community Services Center 850 6th Avenue South 10 ARC Building 321 Penman Rd 11 Safe Harbor Restaurant 2510 2nd Avenue North 12 Archive Building 337 1st Avenue South 13 Seawalk Pavilion 75 North First Street 14 Parks and Recreation 2508 South Beach Parkway 15 Carver Center 777 5th Avenue South 16 Golf Course – Club House 605 S. Penman Rd 17 Golf Course – Maintenance Bldgs 605 S. Penman Rd 18 Wingate Park Facilities 277 S. Penman Rd
19 Ocean Front Restrooms 2nd Avenue North 5th Avenue North Oceanfront Park
20 H. Warren Smith Memorial Cemetery 1538 2nd Avenue North Each building is inspected by City staff bi-annually to achieve desired maintenance and safety standards. Inspection includes thorough examination of the major components of each building. Those components are: the roofing system; the heating ventilation and air conditioning (HVAC) system; the floor covering; the interior and exterior wall surfaces; the plumbing system and the electrical system. The first four components require replacement over time as each of these components has a limited useful life. Roofing systems and HVAC systems typically have useful lives between fifteen (15) years and twenty (20) years, whereas wall and floor surfaces can last between twenty (20) to twenty-five (25) years. Plumbing and electrical components have longer lifespans and typically do not require replacement over time. These are maintained through periodic inspection.
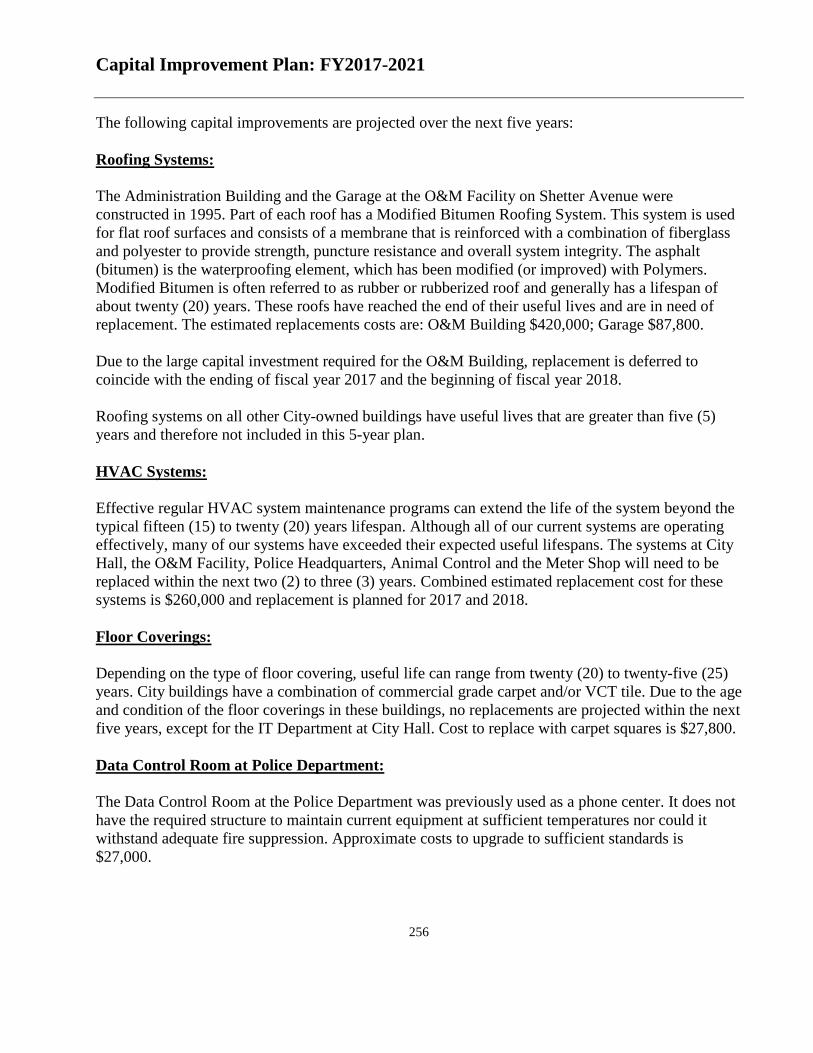
Capital Improvement Plan: FY2017-2021
256
The following capital improvements are projected over the next five years: Roofing Systems: The Administration Building and the Garage at the O&M Facility on Shetter Avenue were constructed in 1995. Part of each roof has a Modified Bitumen Roofing System. This system is used for flat roof surfaces and consists of a membrane that is reinforced with a combination of fiberglass and polyester to provide strength, puncture resistance and overall system integrity. The asphalt (bitumen) is the waterproofing element, which has been modified (or improved) with Polymers. Modified Bitumen is often referred to as rubber or rubberized roof and generally has a lifespan of about twenty (20) years. These roofs have reached the end of their useful lives and are in need of replacement. The estimated replacements costs are: O&M Building $420,000; Garage $87,800. Due to the large capital investment required for the O&M Building, replacement is deferred to coincide with the ending of fiscal year 2017 and the beginning of fiscal year 2018. Roofing systems on all other City-owned buildings have useful lives that are greater than five (5) years and therefore not included in this 5-year plan. HVAC Systems: Effective regular HVAC system maintenance programs can extend the life of the system beyond the typical fifteen (15) to twenty (20) years lifespan. Although all of our current systems are operating effectively, many of our systems have exceeded their expected useful lifespans. The systems at City Hall, the O&M Facility, Police Headquarters, Animal Control and the Meter Shop will need to be replaced within the next two (2) to three (3) years. Combined estimated replacement cost for these systems is $260,000 and replacement is planned for 2017 and 2018. Floor Coverings: Depending on the type of floor covering, useful life can range from twenty (20) to twenty-five (25) years. City buildings have a combination of commercial grade carpet and/or VCT tile. Due to the age and condition of the floor coverings in these buildings, no replacements are projected within the next five years, except for the IT Department at City Hall. Cost to replace with carpet squares is $27,800. Data Control Room at Police Department: The Data Control Room at the Police Department was previously used as a phone center. It does not have the required structure to maintain current equipment at sufficient temperatures nor could it withstand adequate fire suppression. Approximate costs to upgrade to sufficient standards is $27,000.

Capital Improvement Plan: FY2017-2021
257
Emergency Power Panel at City Hall: The current emergency generator capacity at City Hall is not sufficient to power the entire building in the event of an outage. An upgrade to the power panel would cost $26,200 and would provide sufficient energy to power the entire building. Roof and Stucco Repair at Community Services Center: Water intrusion from cracks in the stucco and from deteriorated roof flashing has resulted in significant wood rot. This project will replace the wood rot, re-roof where necessary and replace cracked stucco with 50-year fiber cement lap siding. Lightning Rod Installation: The O&M Facility requires an upgrade to the existing grounding and lightning protection. Estimated cost to upgrade is $50,000. O&M Generator Replacement: The generator at the O&M is nearing the end of its useful life and is planned for replacement in fiscal years 2020 and 2021. Estimated replacement cost is $200,000. Interior and Exterior Wall Surfaces: The combined area of the interior and exterior wall surfaces of the above-listed buildings exceeds 200,000 square feet. The City intends to paint approximately 20,000 square feet each year for the succeeding ten years. Approximate combined total cost to paint all buildings is estimated at $250,000. Annual improvement would therefore cost approximately $25,000 each year.

Capital Improvement Plan: FY2017-2021
258
Funding Sources: General Capital Projects Fund via transfers from the General Fund, Leased Facilities, Electric and Water/Sewer Funds
Project FY2017 FY2018 FY2019 FY2020 FY2021 TOTAL
Major Building Maintenance Repair/Replacement Projects Roof Replacement - Garage at O&M Facility $87,800 $87,800
Roof Replacement – O&M Building $100,000 $320,000 $420,000
HVAC Replacement - City Hall $100,000 $100,000
HVAC Replacement – Police Station $40,000 $40,000
HVAC Replacement – O&M Facility $120,000 $120,000
Flooring for I.T. Division - City Hall $27,800 $27,800
Update Data Control Room -Police Department $27,000 $27,000
Upgrade Emergency Power Panel - City Hall $26,200 $26,200
Roof and Stucco Repair at Community Services Center $50,000 $50,000
Lightning Rod Installation - O&M Facility $50,000 $50,000
Generator Replacement - O&M Facility $100,000 $100,000 $200,000
Interior and Exterior Wall Surface Painting $25,000 $25,000 $25,000 $25,000 $25,000 $125,000
SUBTOTAL $343,800 $535,000 $145,000 $125,000 $125,000 $1,273,800
Ongoing Maintenance Projects Painting, Plumbing, Electrical and HVAC repairs $25,000 $25,000 $25,000 $25,000 $25,000 $125,000
SUBTOTAL $25,000 $25,000 $25,000 $25,000 $25,000 $125,000

Capital Improvement Plan: FY2017-2021
259
Police & Fire DepartmentsFunding Sources: 2017 2018 2019 2020 2021 Total
General Fund 001 192,000 198,000 160,000 160,000 160,000 870,000 General Capital Projects Fire Apparatus Reserve 315 375,000 - - - 375,000 750,000 General Capital Projects Radio Reserve 315 716,005 - 210,000 157,500 105,000 1,188,505 Equitable Sharing Trust Fund Radio Reserve 631 105,000 210,000 - - - 315,000
Total CIP Funding Sources 1,388,005 408,000 370,000 317,500 640,000 3,123,505
Expenses: FundPolice:
Vehicle Replacement Program-Police 001 160,000 160,000 160,000 160,000 160,000 800,000 Fire:
Vehicle Replacement Program-Fire 001 32,000 38,000 70,000 Fire Apparatus Replacement/Maintenance 315 375,000 375,000 750,000 Radio System Upgrade 315/631 821,005 210,000 210,000 157,500 105,000 1,503,505
Sub-Total Fire: 1,228,005 248,000 210,000 157,500 480,000 2,323,505
Total CIP - Police & Fire 1,388,005 408,000 370,000 317,500 640,000 3,123,505
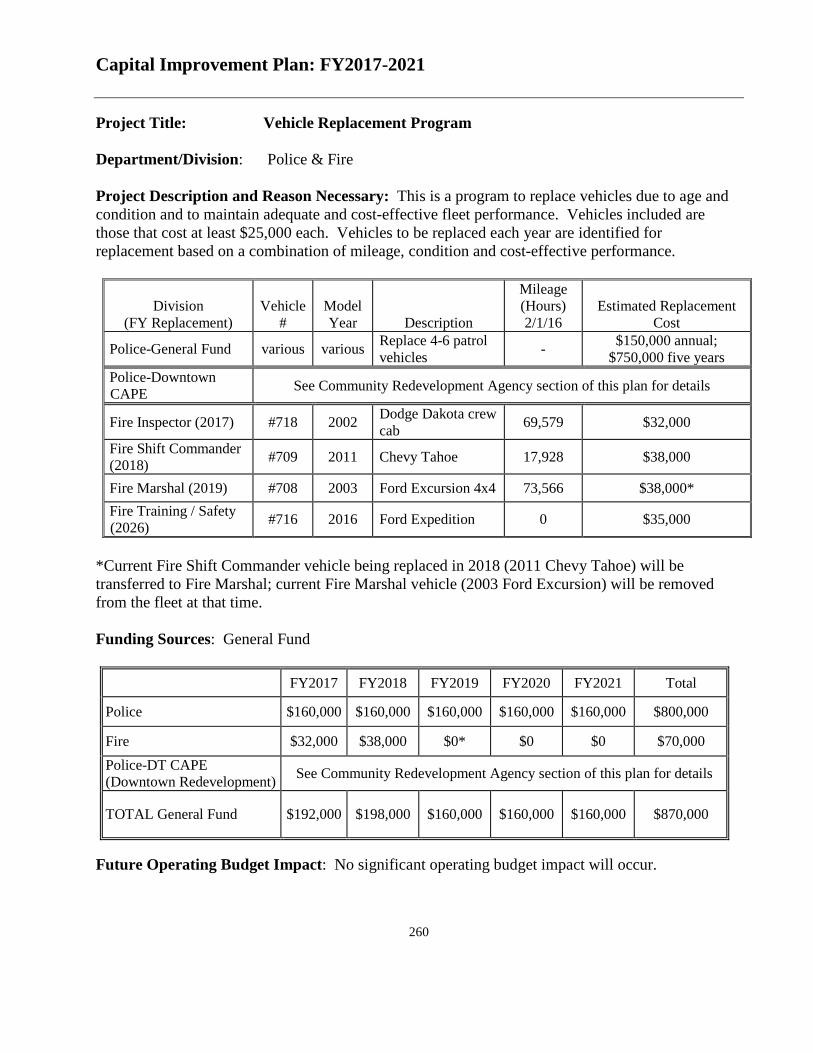
Capital Improvement Plan: FY2017-2021
260
Project Title: Vehicle Replacement Program Department/Division: Police & Fire Project Description and Reason Necessary: This is a program to replace vehicles due to age and condition and to maintain adequate and cost-effective fleet performance. Vehicles included are those that cost at least $25,000 each. Vehicles to be replaced each year are identified for replacement based on a combination of mileage, condition and cost-effective performance.
Division
(FY Replacement)
Vehicle
#
Model Year
Description
Mileage (Hours) 2/1/16
Estimated Replacement Cost
Police-General Fund various various Replace 4-6 patrol vehicles - $150,000 annual;
$750,000 five years Police-Downtown CAPE See Community Redevelopment Agency section of this plan for details
Fire Inspector (2017) #718 2002 Dodge Dakota crew cab 69,579 $32,000
Fire Shift Commander (2018) #709 2011 Chevy Tahoe 17,928 $38,000
Fire Marshal (2019) #708 2003 Ford Excursion 4x4 73,566 $38,000* Fire Training / Safety (2026) #716 2016 Ford Expedition 0 $35,000
*Current Fire Shift Commander vehicle being replaced in 2018 (2011 Chevy Tahoe) will be transferred to Fire Marshal; current Fire Marshal vehicle (2003 Ford Excursion) will be removed from the fleet at that time. Funding Sources: General Fund
FY2017 FY2018 FY2019 FY2020 FY2021 Total
Police $160,000 $160,000 $160,000 $160,000 $160,000 $800,000
Fire $32,000 $38,000 $0* $0 $0 $70,000 Police-DT CAPE (Downtown Redevelopment) See Community Redevelopment Agency section of this plan for details
TOTAL General Fund $192,000 $198,000 $160,000 $160,000 $160,000 $870,000
Future Operating Budget Impact: No significant operating budget impact will occur.

Capital Improvement Plan: FY2017-2021
261
Project Title: Fire Apparatus Replacement/Maintenance Department/Division: Fire Project Description and Reason Necessary: In order to maintain an efficient fleet of fire apparatus, a planned replacement program is essential to minimize budgetary impact. Since 1998, the Fire Department has submitted and the City Council has approved an annual vehicle replacement plan as part of its business plan in order to distribute the cost of replacement at approximately $75,000 per year. Normally each apparatus is used in front-line status for 11-12 years and then used as a reserve apparatus for approximately 4-5 years. After approximately 15-17 years, units are considered for replacement. This timetable has been extended using maintenance upgrades due to the high cost of replacement apparatus. In FY2017, a new rescue pumper will be purchased replacing either E-25 or current Sq-13 and one of the two apparatus will be moved to reserve status. The other unit will be used for a trade-in. The current Sq-13, a 2001 rear-mount pumper, which has a much shorter life span due to the commercial chassis, will have been in service 15 years. E-25, a 1993 pumper, will have been in service 23 years, but recently had the pump replaced. In FY2021, E-22 will be replaced and placed in reserve. Funding Source: General Capital Projects Fund – reserve cash on hand and annual transfers from the General Fund.
FY2017 FY2018 FY2019 FY2020 FY2021 Total Fire Apparatus Replacement $375,000 $375,000 $750,000
FY2017 FY2018 FY2019 FY2020 FY2021 5-Year Total Balance, beginning of year
$482,004 $182,004 $257,004 $332,004 $407,004 $482,004
Deposits, from General Fund $75,000 $75,000 $75,000 $75,000 $75,000 $375,000
Est. Available Balance $557,004 $257,004 $332,004 $407,004 $482,004
Withdrawals: Rescue Pumper $375,000 $375,000 $750,000
Balance, end of year $182,004 $257,004 $332,004 $407,004 $107,004 $107,004
Future Operating Budget Impact: No significant operating budget impact will occur.

Capital Improvement Plan: FY2017-2021
262
Project Title: Public Safety Radio System Replacement Department/Division: Police & Fire Project Description and Reason Necessary: The City’s 800 MHz Motorola radio system is composed of four significant parts: the 9-1-1 dispatch center consoles (3), the radio tower, the radio room with controller and five repeaters, and approximately 346 radios utilizing a 5-channel trunked digital/analogue system. The consoles, controller, and repeaters are 15 years old and are approaching the time when the manufacturer will no longer service them. In order to be able to communicate with radio systems in neighboring jurisdictions, to remain P-25 compliant, and because the manufacturer will no longer support our current radio components, a new radio system is required. Funding for the replacement of the radio system components has been set aside over several years. Components required to update the City’s radio system to comply with current standards and estimated pricing are as follows:
Required Components: P-25
Master site 9-1-1 Dispatch Consoles (3) MCC7500 $282,159 ASTRO Site Repeater (ASR) 5-Channel repeaters $233,564 Astro L-core, trunking, non-redundant controller $200,282 Total: $716,005
The three 9-1-1 dispatch consoles, controller, and five repeaters will be upgraded to an ASR 5-channel system in 2017. The ASR 5-channel system is a stand-alone system that will provide regional P-25 communication abilities, a system back-up (the same as we have now), and interoperability with other agencies. The cost for reprograming all city radios is included in the total price above. Not included in the table above is the cost of replacing radios, which can be done over a number of years, perhaps 5 years initially. Other City departments’ radios were recently replaced and will continue to be replaced by each department in their budget as needed. The Police Department has 89 radios that must be replaced. Public Safety, which includes the police and fire department and 9-1-1 Communications, has 161 radios distributed as follows:
• Police: 108 radios • 9-1-1 Dispatch: 6 • Fire: 45 • Emergency Operations Center: 2
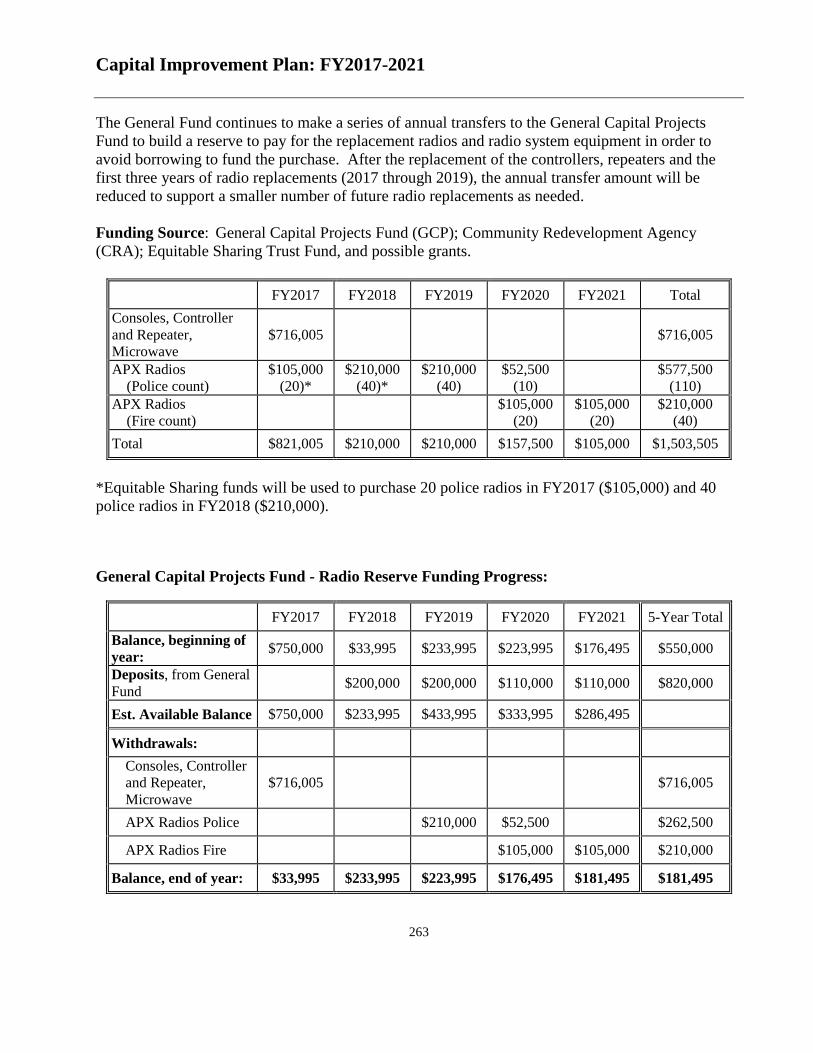
Capital Improvement Plan: FY2017-2021
263
The General Fund continues to make a series of annual transfers to the General Capital Projects Fund to build a reserve to pay for the replacement radios and radio system equipment in order to avoid borrowing to fund the purchase. After the replacement of the controllers, repeaters and the first three years of radio replacements (2017 through 2019), the annual transfer amount will be reduced to support a smaller number of future radio replacements as needed. Funding Source: General Capital Projects Fund (GCP); Community Redevelopment Agency (CRA); Equitable Sharing Trust Fund, and possible grants.
FY2017 FY2018 FY2019 FY2020 FY2021 Total Consoles, Controller and Repeater, Microwave
$716,005 $716,005
APX Radios (Police count)
$105,000 (20)*
$210,000 (40)*
$210,000 (40)
$52,500 (10) $577,500
(110) APX Radios (Fire count) $105,000
(20) $105,000
(20) $210,000
(40) Total $821,005 $210,000 $210,000 $157,500 $105,000 $1,503,505
*Equitable Sharing funds will be used to purchase 20 police radios in FY2017 ($105,000) and 40 police radios in FY2018 ($210,000). General Capital Projects Fund - Radio Reserve Funding Progress:
FY2017 FY2018 FY2019 FY2020 FY2021 5-Year Total Balance, beginning of year: $750,000 $33,995 $233,995 $223,995 $176,495 $550,000
Deposits, from General Fund $200,000 $200,000 $110,000 $110,000 $820,000
Est. Available Balance $750,000 $233,995 $433,995 $333,995 $286,495
Withdrawals: Consoles, Controller and Repeater, Microwave
$716,005 $716,005
APX Radios Police $210,000 $52,500 $262,500
APX Radios Fire $105,000 $105,000 $210,000
Balance, end of year: $33,995 $233,995 $223,995 $176,495 $181,495 $181,495

Capital Improvement Plan: FY2017-2021
264
Future Operating Budget Impact: A maintenance contract with Motorola is in place for repair to the consoles, controller and radio equipment; the cost of the maintenance contract for the new equipment is not expected to change. Radios, except base units are not part of the maintenance contract.
FY2017 FY2018 FY2019 FY2020 FY2021 Total
New consoles $22,000 $0 $0 $0 $0 $22,000 Existing consoles $0 $22,000 $22,000 $22,000 $22,000 $88,000
Total Cost $22,000 $22,000 $22,000 $22,000 $22,000 $110,000

Capital Improvement Plan: FY2017-2021
265
Parks & RecreationFunding Sources: 2017 2018 2019 2020 2021 Total
General Fund 001 87,969 174,969 170,000 78,000 54,000 564,938 Water & Sewer Utility Operating Revenues 420 186,000 - 186,000 Golf Course Fund 440 58,000 95,000 30,000 30,000 30,000 243,000 Unfunded Unfunded 250,000 250,000
Total CIP Funding Sources 331,969 269,969 200,000 108,000 334,000 1,243,938
Expenses: FundOcean Rescue:
Vehicle Replacement Program 001 34,000 34,000 - 34,000 102,000 - 34,000 34,000 - 34,000 102,000
Grounds Maintenance:Vehicle Replacement Program 001 25,000 25,000 26,000 26,000 102,000 Heavy Equipment Replacement Program 001/440 53,000 25,000 32,000 110,000
25,000 78,000 51,000 58,000 - 212,000 Administration:
Playground & Parks Replacements001/
unfunded 65,000 250,000 315,000 Playground & Parks Repairs (not capital) 001 50,000 50,000 20,000 20,000 20,000 160,000
50,000 50,000 85,000 20,000 270,000 475,000 Tennis:
Huguenot Park Tennis Facility 001 12,969 12,969 25,938 12,969 12,969 - - - 25,938
Golf Course:Point of Sale and Tee Time Software 440 28,000 28,000
440 30,000 95,000 30,000 30,000 30,000 215,000
Reuse Pump Station located at Golf Course 420 186,000 186,000 244,000 95,000 30,000 30,000 30,000 429,000
Total CIP - Parks & Recreation 331,969 269,969 200,000 108,000 334,000 1,243,938
Golf Course & Grounds Irrigation Control System (not capital)

Capital Improvement Plan: FY2017-2021
266
Project Title: Vehicle Replacement Program Department/Division: Parks & Recreation / Ocean Rescue / Grounds Maintenance Project Description and Reason Necessary: This is a program to replace vehicles due to annual operating expense, age, and condition. Funding Source: General Fund, Golf Course Operating Revenues and Fund Balance
Division (FY Replacement)
Fund. Source
Truck#
Model Year
Mileage / (Hours) Description
Estimated Replace.
Cost Ocean Rescue (2018) 001 611 2010 18,096 Chevy Silverado $34,000 Ocean Rescue (2019) 001 610 2011 13,871 Chevy Silverado $34,000 Ocean Rescue (2021) 001 601 2014 - Chevy Silverado $34,000 TOTAL $102,000
Because of the beach environment in which they are used, Ocean Rescue trucks do not normally last long enough to meet the City’s 10-year or 100,000-mile replacement test. Vehicles are evaluated annually for replacement and replacements are postponed for as long as the truck continues to operate in a cost-effective manner. The replacement cost of $34,000 includes the vehicle cost of $27,500 plus $6,500 in ancillary costs to make the vehicle ready for service.
Division (FY Replacement)
Fund. Source
Truck#
Model Year
Mileage / (Hours) Description
Estimated Replace.
Cost
Grounds Maintenance 001 907 1998 54,987 Chevrolet ½-ton truck Retired/Not Replaced
Grounds Maintenance 001 906 1999 52,804 Dodge ½-ton truck Retired/Not Replaced
Grounds Maintenance (2017) 001 908 2001 55,124 Chevrolet C1500 truck $25,000 Grounds Maintenance (2018) 001 902 2001 55,062 Chevrolet C1500 truck $25,000 Grounds Maintenance (2019) 001 904 2003 36,448 Ford F-250 truck $26,000 Grounds Maintenance (2020) 001 901 2005 28,489 Ford F-250 4x4 $26,000
TOTAL $102,000
In FY2017 or earlier, Grounds Maintenance trucks 907 and 906 will be retired from the fleet without replacement because staff has determined that five trucks are sufficient to accomplish the current workload.

Capital Improvement Plan: FY2017-2021
267
Vehicle Replacement Summary:
FY2017 FY2018 FY2019 FY2020 FY2021 Total General Fund-Ocean Rescue $34,000 $34,000 $34,000 $102,000
General Fund-Grounds Maintenance $25,000 $25,000 $26,000 $26,000 $102,000
TOTAL $25,000 $59,000 $60,000 $26,000 $34,000 $204,000

Capital Improvement Plan: FY2017-2021
268
Project Title: Grounds Maintenance Heavy Equipment Replacement Program Department/Division: Parks and Recreation / Grounds Maintenance Project Description and Reason Necessary: The Parks & Recreation Department is responsible for maintaining approximately 135 acres of grounds and turf at various City facilities, parks, ballfields and the golf course. Much of the equipment used to maintain the grounds is of a specialized nature and is replaced infrequently.
The 5-gang self-contained mower is not currently in inventory. The staff currently uses a 30-year old pull behind ground driven mower. With the self-contained mower, there is no need for a tractor to pull the equipment and only have one piece of equipment to maintain. The self-contained unit will be able to be used on all ballfields and can be used at the Golf Course, if necessary. The self-contained unit can mow in different directions whereas current tractor-pulled unit can only mow in one direction, requiring more staff to do the same job (funding source: General Fund - $53,000).
The sand pro is used to rake, drag and smooth the clay infields and warning tracks at the various ballfields throughout the City. The equipment that is currently being used to perform these tasks is approximately 12 years old and requires the assistance of a manual push broom when dragging the fields (funding source: General Fund - $25,000).
The purchase of a triplex reel mower will be to replace a 10-year old triplex mower. The triplex mower mows greens, tees, collars, and approaches. The current mower has been heavily used at 3 – 5 hours a day, 7 days a week. The life span of this piece of equipment is usually 5 years. (funding source: Golf Course - $32,000).
2018
2019
2020

Capital Improvement Plan: FY2017-2021
269
Funding Sources:
FY2017 FY2018 FY2019 FY2020 FY2021 Total General Fund $53,000 $25,000 $78,000 Golf Course Fund $32,000 $32,000 TOTAL $0 $53,000 $25,000 $32,000 $0 $110,000
FY2017 FY2018 FY2019 FY2020 FY2021 Total 5 Gang Self-Contained Mower $53,000 $53,000
Sand Pro $25,000 $25,000
Triplex Mower $32,000 $32,000
TOTAL $0 $53,000 $25,000 $32,000 $0 $110,000

Capital Improvement Plan: FY2017-2021
270
Project Title: Playgrounds, Parks and Grounds: Equipment and Facilities Repair & Replacement
Department/Division: Parks & Recreation Project Description and Reason Necessary: This is a program to periodically add to, replace and improve equipment, structures and grounds for which Parks and Recreation is responsible throughout and the City. The decision to add new equipment, or replace, repair and/or refurbish existing equipment and grounds is made after considering safety, demand for the equipment and its current condition, age and amount of use.
A1A South Landscape Islands Refurbishment ($30,000 in each year, 2017 through 2018): This is a program to rebuild and refurbish the landscape islands on South A1A. These islands were planted in 1999 and the islands are in need of an upgrade. The upgrade of the landscape islands will include: concrete shoulders around the outside of the landscape, new irrigation, xeriscaping (appropriate planting design and soil grading and mulching takes full advantage of rainfall retention and weather conditions). The existing date palms will not be removed.
Tall Pines Park – addition of playground system and swing set ($65,000): Tall Pines Park is located at corner of 9th Avenue North and 17th Street North. This neighborhood is adding new houses and families. The Tall Pines Park is becoming a popular play site for neighborhood children and also the Montessori school that is located on Penman Road. This project would add a playground system and swing set to the existing playground equipment.
Skateboard Park - 10th Street North and Seagate (unfunded): This project is the construction of a safe facility for the large and growing population of people who skateboard. The location and design of this facility are currently in the planning stages. Cost is a soft estimate pending design completion and determination of location.
2017 and 2018
2019
2020

Capital Improvement Plan: FY2017-2021
271
Cemetery Maintenance ($20,000 per year): The capital improvement plan includes funding for work to manage the City’s two cemeteries, H. Warren Smith and Lee Kirkland. Annual work will be prioritized and managed to make the best use of available funds. Work may include tree trimming, applications of fertilizer and insecticide, vegetation management, leveling of headstones where necessary, and fencing replacement and/or extensions. Funding Sources: General Fund and unfunded
Description (funding source) FY2017 FY2018 FY2019 FY2020 FY2021 Total A1A Landscape Islands (General Fund-not capital) $30,000 $30,000 $60,000
Cemetery Maintenance (General Fund-not capital) $20,000 $20,000 $20,000 $20,000 $20,000 $100,000
Tall Pines Park-playground equipment (General Fund) $65,000 $65,000
Skateboard Park (unfunded) $250,000 $250,000
TOTAL $50,000 $50,000 $85,000 $20,000 $270,000 $475,000
Annual Maintenance

Capital Improvement Plan: FY2017-2021
272
Project Title: Huguenot Park Tennis Facility Department/Division: Parks & Recreation / Tennis Facility Project Description and Reason Necessary: Huguenot Tennis Facility has seven plexi-cushion tennis courts. Three courts on the west side of the facility were rebuilt in 2010; three courts on the east side of the building were rebuilt in 2011. The court in the back of the facility was rebuilt in 2012. The courts need to be resurfaced about every 7-9 years. The courts are scraped and sanded to remove loose, uneven or damaged areas. Then, as needed, areas may be patched. A coating is then applied to the repaired surface, followed by texture, color and finishing coats. Estimated cost includes a 10% contingency in case there are sub surface problems (tree roots) that need to be addressed. Funding Source: General Fund/Tennis Capital Improvement Fees
FY2017 FY2018 FY2019 FY2020 FY2021 Total
Resurface west side (courts 1, 2 and 3) $12,969 $12,969
Resurface east side (courts 4, 5, and 6) $12,969 $12,969
Total $12,969 $12,969 $25,938

Capital Improvement Plan: FY2017-2021
273
Project Title: Golf Course Point of Sale and Tee Times Software Department/Division: Parks & Recreation / Golf Course Project Description and Reason Necessary: The City of Jacksonville Beach has a popular eighteen-hole golf course that is used by an estimated 50,000 golfers each year. The technology wave of people using smart phones, iPads, and other electronic devices is moving into the golf business. The City is currently using Vermont Systems GolfTrac software version 10.3. The upgraded version 3.1 has been completely rewritten and is now browser based. This allows staff the flexibility of accessing the data base through a web browser as opposed to the necessity of having a hard connection into the internet. It has a more user friendly look and is easier to navigate. This will be extremely helpful in improving our customers golf experience. The WebTrac Tee Times module will allow customers to reserve a tee time, check-in, and pay in real time using a browser such as Yahoo or Google and / or a smartphone. This will improve customer service and reduce City labor costs. In addition, the software will interface with the 3rd party tee time sales service that are a popular method used to sell last minute tee times. The Version 3.1 will continue to download and interface with the City’s current business application. Funding Source: Golf Course
FY2017 FY2018 FY2019 FY2020 FY2021 Total
Point of Sale Software $28,000 $28,000
Future Operating Budget Impact: No impact

Capital Improvement Plan: FY2017-2021
274
Project Title: City-wide Grounds and Golf Course Irrigation Control System Department/Division: Parks & Recreation / Golf Course and Grounds Maintenance Project Description and Reason Necessary: The grounds at City facilities, parks and the golf course cover an estimated 135 acres, of which an estimated 80 acres have irrigation sprinklers. The current system of irrigation has sprinklers at the golf course, Wingate Park, landscape at O/M and Police, and both cemeteries. These sprinklers are controlled and activated by a central computer that relays signals to the sixteen satellites. The satellites activate electric valves in the field that then supply water to the sprinkler heads. These electric valves are supplied by water from a steel fitting connected to pvc pipe beneath the ground. The existing steel fittings connecting the control valves to the PVC were installed in 1987 and have rusted to the point of failure. There are an estimated two hundred control valves that need to be replaced. There are also twelve gate valves that separate off different zones of the golf course irrigation. The existing computer control system is a Toro “Osmac”, purchased about twelve years ago. The circuit boards and connections are corroded and are in need of replacement. The replacement of this part of the system ($60,000 - $65,000) is included in the FY2018 estimated cost. Funding Source: Golf Course
FY2017 FY2018 FY2019 FY2020 FY2021 Total
Golf Course Irrigation System $30,000 $95,000 $30,000 $30,000 $30,000 $215,000
Future Operating Budget Impact: No anticipated operating budget increase.

Capital Improvement Plan: FY2017-2021
275
Project Title: Reuse Pump Station located at the Golf Course Department/Division: Parks & Recreation / Golf Course and Grounds Maintenance Project Description and Reason Necessary: As allowed under the City’s wastewater treatment plant permit, the plant produces reuse water, some of which is pumped from the plant, to drainage ponds at the golf course, and from there, the reuse pump station supplies water to the reuse irrigation system that serves the golf course, Wingate Park ballfields, the grounds at the Operations & Maintenance Facility, the Police building and both cemeteries, the Central Stormwater Basin park area, and the South Beach Park. Soon, it will supply reuse water to irrigate the medians on South Beach Parkway and Jacksonville Drive. Other facilities may be added to the system in the future. The current permitted capacity of the reuse system is 1.123 million gallons per day; the pump station currently pumps about 400,000 to 500,000 gallons of reuse water per day. The current pump station, with an estimated life of 15-20 years, is 14 years old. A normal golf course will use a pump station a couple of times a week but because water is pumped to the various parks, including South Beach throughout the City, ballfields, the police station, and the O & M building, the pump station is used daily. It is beginning to show its age by the need for expensive repairs. Funding Source: Water & Sewer
FY2017 FY2018 FY2019 FY2020 FY2021 Total
Reuse Pump Station $186,000 $186,000
Future Operating Budget Impact: No anticipated operating budget increase.

Capital Improvement Plan: FY2017-2021
276
The five-member Jacksonville Beach Community Redevelopment Agency (CRA) was established in 1978, pursuant to Chapter 163, Part III of the Florida Statutes. The CRA was created for the purpose of carrying out a community redevelopment program for the City. The Jacksonville Beach program consists of a variety of redevelopment activities in two districts: Downtown and South Beach.
The Community Redevelopment Agency (CRA) is responsible for managing the City’s two redevelopment districts: Downtown and South Beach. The Agency receives administrative, engineering and project management support from the City’s Planning & Development and Public Works departments. Work in the two redevelopment districts is carried out in coordination with the City Council and City Manager. Both Community Redevelopment District programs are funded from appropriations based on increases in property tax revenues generated from within the two districts. The funds derived from the tax increments are held in separate trust funds administered by the Agency. Unless otherwise noted, the recommended funding source for these projects is from the Downtown or South Beach Tax Increment Fund. Other projects may be added in the future from the master plans for the Downtown/Southend Redevelopment Districts. In the future, listed projects may be deleted and/or shifted on time-line due to budgetary constraints.
Community Redevelopment AgencyFunding Sources: 2017 2018 2019 2020 2021 Total
Downtown Redevelopment Tax Increment Fund 181 7,500,000 7,543,500 7,331,500 3,000,000 - 25,375,000 1/2 Cent Infrastructure Surtax Bond Proceeds - Southend Tax Increment Fund 182 2,550,000 1,750,000 300,000 2,250,000 - 6,850,000 1/2 Cent Infrastructure Surtax Bond Proceeds 317 - - - 3,000,000 - 3,000,000 Water & Sewer Utility Operating Revenues 420 - 250,000 250,000
Total CIP Funding Sources 10,050,000 9,293,500 7,881,500 8,250,000 - 35,475,000
Expenses: FundRoad & Associated Infrastructure Improvements
Downtown Redevelopment District 181 7,500,000 7,500,000 7,550,000 6,000,000 - 28,550,000 Downtown CAPE Vehicle Replacement Program 181 - 43,500 31,500 - - 75,000
South Beach Redevelopment District 182 2,050,000 1,750,000 300,000 2,250,000 - 6,350,000 South Beach Park Improvements 182 500,000 - - - - 500,000
Total CIP - Community Redevelopment Agency 10,050,000 9,293,500 7,881,500 8,250,000 - 35,475,000

Capital Improvement Plan: FY2017-2021
277
Project Title: Community Redevelopment Agency – Downtown Redevelopment District Road & Associated Infrastructure Improvements Program Focus Area: Downtown District Public Infrastructure Improvements: The initial focus of the CRA was the rejuvenation of the Downtown District. The redevelopment effort to date has been centered on improvements to the public infrastructure to facilitate private investments in the area. These projects are managed primarily by the Public Works Department.
Project Description and Reason Necessary: Within the City there are roads which need to be rebuilt because of deterioration caused by aging, compromise of the base and excess elevation due to many overlays. The degree of required rebuilding differs with the condition of each road. When roads are identified for reconstruction, Public Works reviews other utility and traffic systems (water, wastewater, stormwater, pavement and road base, sidewalk, etc.) in the right-of-way for prudent upgrades and repairs to maximize return on investment. Estimated planning costs are variable until project scope, design, bid advertisement and bid award are complete.
Recommended Funding Source – Downtown Redevelopment Tax Increment Fund (DT TIF) with Water / Sewer & ½ Cent Infrastructure Surtax (BJB) Bonds funding work adjacent to the district’s south boundary. See the summary project limits / descriptions that begin following the next table.
PROJECT (Fund Source) PRIOR FY2017 FY2018 FY2019 FY2020 FY2021 TOTAL
Phase 3A (DT TIF) 6thAvenue North
Design Construct
$152,454 $1,919,683
Phase 3B (DT TIF) Design
Construct Const. Admin.
$155,061 $867,403 $110,808
Phase 3C (DT TIF) Project 1 Design
Project 1Const. Project 2Design Project 2 Const.
Projects 3-5 Design Projects 3-5 Const.
$336,093
$6,354,864 $1,072,000
$7,000,000 $500,000
$500,000 $7,000,000
$300,000 $7,000,000
$3,000,000
$25,300,000
Phase3D Design(W/S)
Construct ( BJB)
$250,000
$3,000,000
$250,000
$3,000,000
TOTAL DT TIF
W/S BJB
$10,968,366
$7,500,000
$7,500,000
$7,300,000
$250,000
$3,000,000 $3,000,000
$25,300,000
$250,000 $3,000,000

Capital Improvement Plan: FY2017-2021
278
• Phase 3A Project: Limits are 1st St. N. from 4th Ave. N. to 6th Ave. N., 5th Ave. N. from 1st St
to 3rd St. N and 6th Ave. N. from 1st St. N. to 3rd St. N. Construction complete. • Phase 3B Project: Limits are 1st St. N. from 6th Ave. N. to 9th Ave. N. and 7th Ave. N. from 1st
St. to 2nd St. N. Construction completed. NOTE: Another project on 2nd St. N. from Beach Boulevard to 6th Ave. N. will be designed and constructed at a future date.
• Phase 3C Projects 1, 2, 3, 4 and 5: Limits include 3rd Street, Beach Boulevard, Street Ends, and 13th Avenue South and Downstream Improvements, if necessary. The scope of work for these phases includes improvements to sanitary sewer, water distribution, stormwater, roadways, alleys, street ends, stormwater modeling, permitting, reconstruction of the existing receiving stormwater pumping station at the Beach Boulevard vault, stilling basins/ponds and downstream channels, and the stormwater pumps at the Central Basin as necessary and other identified ancillary public improvements throughout the area. Due to funding and construction constraints, Phase 3C will be constructed in phases. Design phasing boundaries are currently:
Approximate Design Boundaries
North South West East Project 1: Beach Blvd. 4th Ave. S. 3rd St. Beach Street End Project 2: 11th Ave. S. 13th Ave. S. 3rd St. Beach Street End Project 3: 4th Ave. S. 8th Ave. S. 3rd St. Beach Street End Project 4: 8th Ave. S. 11th Ave. S. 3rd St. Beach Street End
Project 5:
Downstream Improvements Intracoastal
Waterway 1 The design of Project 1 also includes a new restroom at Ocean Front Park and the addition of a bathroom and renovations at Latham Plaza Pavilion. 2 The scope of downstream improvements that will be necessary are to be identified once the ongoing consultant stormwater modeling & analysis is completed. The design and construction work may be incorporated into Projects 3, 4, or 5.
• Phase 3D Project: Approximate design boundary consists of 3rd Street, 13th Avenue South,
Street Ends, and 16th Avenue South (outside of, and adjacent to the south boundary of the Downtown Redevelopment District). The scope of work for these phases include improvements to sanitary sewer, water distribution, stormwater, roadways, alleys, and street ends throughout the area plus other identified ancillary public improvements throughout the area.

Capital Improvement Plan: FY2017-2021
279
NOTES: 1. These estimated planning costs are variable until project scope, design, bid advertisement and bid
award are complete. 2. When roads are identified for reconstruction, Public Works reviews other utility and traffic systems
(water, wastewater, stormwater, pavement and road base, sidewalk, etc.) in the right-of-way for prudent upgrades and repairs to maximize return on investment.
3. Other projects may be added in the future for other necessary road reconstruction. Listed projects may be deleted and/or shifted on time-line due to budgetary constraints.

Capital Improvement Plan: FY2017-2021
280
Project Title: Community Redevelopment Agency – Downtown Redevelopment District Downtown Community Policing Initiative The Downtown Community Policing Initiative, or Downtown CAPE, began a pilot project in November of 2006. It was subsequently expanded to nine officers and permanently integrated into the Downtown Community Redevelopment Plan. The officers provide a concentrated presence in the Central Business District, but are authorized to provide police services throughout the Downtown Redevelopment District. Funding for this program is managed by the Police Department.
Vehicles dedicated to the Downtown CAPE (DT CAPE) program are tentatively scheduled for replacement every six years unless vehicle condition requires replacement sooner. Funding for these vehicles is provided by the Community Redevelopment Agency.
Division
(FY Replacement)
Vehicle
#
Model Year
Description
Mileage (Hours) 2/1/16
Estimated Replacement
Cost Police-DT CAPE (2018) 0953 2009 Chevrolet Impala 63,367 $31,500
Police-DT CAPE (2018) - 2018 ATV 1,022 (Hours) $12,000
Police-DT CAPE (2019) 1052 2010 Chevrolet Impala 39,309 $31,500 Police-DT CAPE (future year) 1343 2013 Chevrolet Impala 24,974 -
TOTAL $75,000
Fund FY2017 FY2018 FY2019 FY2020 FY2021 TOTAL
Vehicles $31,500 $31,500 $63,000
ATV $12,000 $12,000
TOTAL $0 $43,500 $31,500 $0 $0 $75,000

Capital Improvement Plan: FY2017-2021
281
Project Title: Community Redevelopment Agency – South Beach Redevelopment District Road & Associated Infrastructure Improvements
Since the adoption of the South Beach redevelopment plan in 1987, six major public-private projects have been completed (Riptide, South Beach Regional Shopping Center, South Beach Parkway Shopping Center, Ocean Cay, South Beach Mixed Use Development, and Paradise Key). In addition to the projects involving private enterprises, numerous public infrastructure projects have been constructed to support the redevelopment activity in the district. The infrastructure projects are managed primarily by the Public Works Department; parks facilities projects are managed by both the Public Works and the Parks & Recreation Departments.
Project Description and Reason Necessary: Within the City there are roads which need to be rebuilt because of deterioration caused by aging, compromise of the base and excess elevation due to many overlays. The degree of required rebuilding differs with the condition of each road. When roads are identified for reconstruction, Public Works reviews other utility and traffic systems (water, wastewater, stormwater, pavement and road base, sidewalk, etc.) in the right-of-way for prudent upgrades and repairs to maximize return on investment. Estimated planning costs are variable until project scope, design, bid advertisement and bid award are complete.
PROJECT (Fund Source) PRIOR FY2017 FY2018 FY2019 FY2020 FY2021 TOTAL Reuse/Landscape/Irrigate Imps (Ph 2) (SE TIF) Design
Construct
$211,663
$3,818,658
South Beach Parkway Road Imps (Phase 3) (SE TIF) Design
Construct Ocean Terrace Pond Const.
$190,496 $930,071 $500,000
Stormwater/ Road Imps (Phase 4) (SE TIF) Design
Construct
$300,000
$1,750,000
$1,750,000
Stormwater/Road Imps (Phase 5) (SE TIF)
Study/ Design Construct
$300,000
$1,750,000
$2,050,000
Stormwater/Reuse Imps (Phase 6) (SE TIF) Design
Construct
$300,000
$2,250,000
$2,550,000
TOTAL $5,950,888 $2,050,000 $1,750,000 $300,000 $2,250,000 $0 $6,350,000
Recommended Funding Source – Southend Tax Increment Fund (SE TIF). Foundation for project scoping is the South Beach Redevelopment Master Plan (also incorporating appropriate portions of the City’s Reuse Master Plan Study). Scope includes improvements to sanitary sewer, water distribution, reuse, stormwater and road systems throughout the area plus other identified ancillary public improvements. See summary project limits / descriptions that begin after the following table.

Capital Improvement Plan: FY2017-2021
282
Reuse, Landscaping and Irrigation Improvements Project (Phase 2): Limits include South Beach Parkway (Osceola Avenue to Jacksonville Drive) and Jacksonville Drive (South Beach Parkway to A1A). Construction to be underway in FY 2016. Project consists of constructing new landscaping, reuse irrigation system, televising and cleaning of existing storm sewer system from Jacksonville Drive to South Basin, construction of sheet pile along ditch north of Marsh Landing Parkway and south of JTB Boulevard. Also includes milling and overlay along Jacksonville Drive and Pedestrian crosswalk on South Beach Parkway and Rip Tide Subdivision.
Roadway Improvements Project (Phase 3): Limits include South Beach Parkway from Marsh Landing Parkway to Jacksonville Drive. Construction to be underway in FY 2016. Project includes a traffic study and follow-on design for widening South Beach Parkway between Jacksonville Drive and J. Turner Butler Boulevard overpass to add a dedicated southbound to westbound turn lane and other related work. Project estimate includes $650,000 for Beaches Energy Services to install two underground distribution circuits along South Beach Parkway. Construction of underground BES electrical system is complete.
The design of improvements to the South Beach Parkway Stormwater Pond (at Marsh Landing Parkway) that receives Ocean Terrace stormwater design is being reviewed by City staff, in the process of obtaining 3 temporary construction easement documents and is scheduled to be under construction in FY2016. Design fee was paid by the Ocean Terrace developer.
Stormwater Piping and Roadway Improvements Project (Phase 4): Drainage and roadway
study in the area bounded by JT Butler Boulevard, South Beach Parkway, America Avenue with outfall to the west, and Republic Drive / Rip Tide Subdivision. Study to be followed later by design on phased project(s). Anticipate significant drainage improvements in the area to reduce localized flooding coupled with reconstruction of roads to city standard to include curbing. Also, water & sewer systems are to be improved as necessary.
Stormwater/Roadway Improvements (Phase 5): Roadway improvements include Marsh
Landing Parkway, Isabella Boulevard from Jacksonville Drive to Osceola Avenue, and 34th Avenue South from Isabella Boulevard to dead end. Stormwater Improvements include South Basin Canal modifications and outfall ditch improvements from Osceola Avenue to Jacksonville Drive.
Stormwater/Reuse Improvements (Phase 6): Stormwater system improvements include
Osceola Avenue from South Beach Parkway east to Sandra Drive, and Osceola Regional Pond modifications and reconstruction necessary at the JTB Basin pumping station and pond. Reuse improvements include Osceola Avenue from South Beach Parkway to east of Sandra Drive and South Beach Parkway from Jacksonville Drive to St. Johns County Line.

Capital Improvement Plan: FY2017-2021
283
NOTES: 1. These estimated planning costs are variable until project scope, design, bid advertisement and bid
award are complete. 2. When roads are identified for reconstruction, Public Works reviews other utility and traffic systems
(water, wastewater, stormwater, pavement and road base, sidewalk, etc.) in the right-of-way for prudent upgrades and repairs to maximize return on investment.
3. Other projects may be added in the future for other necessary road reconstruction. Listed projects may be deleted and/or shifted on time-line due to budgetary constraints.

Capital Improvement Plan: FY2017-2021
284
Project Title: Community Redevelopment Agency – South Beach Redevelopment District South Beach Park Infrastructure Improvements This facility originated with the land acquisition, and construction of a neighborhood recreation facility included in the South Beach Redevelopment Plan. Skate Park / Playground Shade Structure: This project is the construction of a safe and fun public skateboarding facility, as well as other park upgrades. The Skate Park project is divided into three parts: - Part A (Site Preparation) work includes relocation/ removal of existing drainage facilities, filling
and compaction of the pond area, and relocation of water utilities. Construction of Part A has been approved by the CRA and City Council.
- Part B (Concrete Skate Park) work includes the concrete skate park itself. - Part C (General Park Amenities) work includes several new shade structures, new covered picnic
areas, and landscaping. A new shade structures will provide protection to the swing set area of the popular playground. Another shade structure will be located within the new skate park.
The CRA has approved funding of the design fee as well as Construction Part A. City will request CRA funding of Part B and Part C in April 2016. Artificial Turf Playing Field: The existing grassed playing fields are not able to support the heavy use that the fields have experienced. The result is an uneven and unsafe playing surface. This project would install a modern synthetic playing surface along with associated drainage.
Prior Years
(2016) FY2017 FY2018 FY2019 FY2020 FY2021 TOTAL
Skate Park Design Part A Part B Part C
$40,700 $396,964 $850,000 $250,000
Artificial Turf Design & Installation $500,000 $500,000
TOTAL $1,537,664 $500,000 $500,000

Capital Improvement Plan: FY2017-2021
285
Estimated Maintenance: Due to the nature of the skate park’s construction, maintenance not expected to be substantial. The artificial turf has an expected life of approximately 10 years, the estimated costs shown below include annual funding for a reserve of about $400,000 to pay for replacement of the turf in 2027 and annual recurring maintenance costs.
Fund FY2017 FY2018 FY2019 FY2020 FY2021 TOTAL Skate Park maintenance $5,000 $5,000 $5,000 $5,000 $5,000 $25,000
Artificial Turf 10-year replacement funding
$45,000 $45,000 $45,000 $45,000 $180,000
Artificial Turf maintenance
$5,000 $5,000 $5,000 $5,000 $20,000
TOTAL $5,000 $55,000 $55,000 $55,000 $55,000 $225,000

Capital Improvement Plan: FY2017-2021
286
Public WorksFunding Sources: 2017 2018 2019 2020 2021 Total
Downtown Redevelopment Tax Increment Fund 181 300,000 - - - - 300,000 General Capital Projects Heavy Vehicle Reserve 315 85,000 330,000 - 75,000 - 490,000 General Capital Projects Streets Reserve 315 - - 500,000 - - 500,000 General Fund Operating Revenues 001 38,000 - 87,000 35,000 105,000 265,000 Local Option Gas Tax Revenues 150 310,000 310,000 310,000 310,000 310,000 1,550,000 1/2 Cent Infrastructure Surtax 151 195,000 70,000 395,000 70,000 70,000 800,000 Sanitation Fund 430 - - - 230,000 - 230,000 Stormwater Operating Revenues 423 545,000 345,000 427,000 585,000 730,000 2,632,000 Water & Sewer Utility Operating Revenues 420 5,852,000 3,700,000 1,125,000 1,322,000 743,000 12,742,000
Total CIP Funding Sources 7,325,000 4,755,000 2,844,000 2,627,000 1,958,000 19,509,000
Expenses: FundStreets:
Vehicle Replacement Program 001 38,000 - 87,000 35,000 105,000 265,000 Heavy Vehicle Replacement Program 315 85,000 330,000 - 75,000 - 490,000
150 310,000 310,000 310,000 310,000 310,000 1,550,000 New Sidewalks 151 70,000 70,000 70,000 70,000 70,000 350,000 Road & Infrastructure Impr: Penman Road Area 151/315 125,000 - 825,000 - - 950,000
Total CIP - Roads & Streets 628,000 710,000 1,292,000 490,000 485,000 3,605,000 Distribution & Collection:
Vehicle Replacement 420 116,000 160,000 50,000 32,000 38,000 396,000
Water Main Replacement 181, 420 1,575,000 500,000 45,000 360,000 - 2,480,000 Water Meter Replacement Program 420 550,000 400,000 400,000 400,000 400,000 2,150,000
2,125,000 900,000 445,000 760,000 400,000 4,630,000 Water Valve/ Sewer Maint Programs (not capital) 420 245,000 245,000 245,000 245,000 245,000 1,225,000
2,486,000 1,305,000 740,000 1,037,000 683,000 6,251,000 Pollution Control Plant:
Vehicle Replacement Program 420 74,000 - 35,000 35,000 - 144,000 Sewer Rehabilitation Program-Lift Stations 420 50,000 1,250,000 50,000 250,000 60,000 1,660,000
420 200,000 50,000 300,000 - - 550,000 324,000 1,300,000 385,000 285,000 60,000 2,354,000
Water Plant:Vehicle Replacement Program 420 32,000 25,000 - - - 57,000 Raw Water Wells Improvement Program 420 500,000 - - - - 500,000 Water Plant #1 Repair 420 60,000 - - - - 60,000 Water Plant #2 Improvements 420 550,000 - - - - 550,000 Water Plant #2 Telemetry Upgrade 420 - 70,000 - - - 70,000
1,142,000 95,000 - - - 1,237,000 Capital Projects
420 2,200,000 1,000,000 - - 3,200,000 2,200,000 1,000,000 - - - 3,200,000
Total CIP - Water & Sewer 6,152,000 3,700,000 1,125,000 1,322,000 743,000 13,042,000 Stormwater
Vehicle Replacement Program 423 - 35,000 - - 130,000 165,000 Stormwater Collection & Treatment Impr. 423 250,000 15,000 132,000 290,000 305,000 992,000 Stormwater Pipe Cleaning (not capital) 423 95,000 95,000 95,000 95,000 95,000 475,000 Stormwater Channel Cleaning (not capital) 423 200,000 200,000 200,000 200,000 200,000 1,000,000
Total CIP - Stormwater 545,000 345,000 427,000 585,000 730,000 2,632,000 Sanitation
Vehicle Replacement Program 430 - - - 230,000 - 230,000 Total CIP - Public Works 7,325,000 4,755,000 2,844,000 2,627,000 1,958,000 19,509,000
Wastewater Treatment Facility Improvements
Pavement/Sidewalk Maintenance (not capital)
Build new Lift Station #7 and Demolish existing lift stations #8 & #20
Water Distribution & Sanitary Sewer Collection Systems Improvements

Capital Improvement Plan: FY2017-2021
287
Project Title: Vehicle Replacement Program Department/Division: Public Works / All Divisions Project Description and Reason Necessary: This is a program to replace vehicles due to increasing annual operating expenses, age, and condition.
Division FY Replacement
Fund Source
Truck #
Model Yr. Description
Mileage (Hours)
at 2/2016
Estimated Replacement
Cost
Streets 2017 001 503 2003 Ford 250 4X4 109,100 $38,000
Streets 2019 001 505 2003 Dodge, Durango 4X4 43,200 $40,000
Streets 2019 001 ST-88 2005 John Deere, 4320 4X4 Tractor with Box Blade 825 hrs $47,000
Streets 2020 001 511 2010 Ford F-150 106,000 $35,000 Streets 2021 001 ST-73 2003 Hamm HD-Roller 120 hrs $45,000 Streets 2021 001 515 2009 Ford Ranger 54,500 $30,000 Streets 2021 001 550 2009 Ford Ranger 67,000 $30,000 Stormwater 2018 423 591 2004 Ford F550 with flat bed 53,291 $35,000
Stormwater 2021 423 ST-91 1997 Acme Trailer Mounted 8”
Pump 1,350 hrs $65,000
Stormwater 2021 423 ST-95 2001 Acme Trailer Mounted 8”/10”
Pump 1,158 hrs $65,000
Sanitation 2020 430 546 2015 Schwarze A7 Tornado Street
Sweeper 8,400 $230,000
D&C 2017 420 522 1994 Chevy 1-Ton Van:
Truck $30,000 Equipment $55,000
5,277 $85,000
D&C 2017 420 572 2006 Ford F-250 ¾-ton Truck w/utility body 95,589 $31,000
D&C 2018 420 DC28 2008 Caterpillar Backhoe 1,420 hrs $125,000
D&C 2018 420 504 2006 Ford F-250 ¾-ton Truck w/utility body 75,840 $35,000
D&C 2019 420 502 2006 Ford F-150 1/2- ton Pickup truck 68,034 $25,000
D&C 2019 420 523 2007 Ford F-150 ½-ton Pickup Truck 68,340 $25,000
D&C 2020 420 506 2008 Ford F-250 ¾-ton Truck w/utility body 46,875 $32,000
D&C 2021 420 540 2009 Ford F-250 ¾-ton Truck w/utility body 43,843 $38,000

Capital Improvement Plan: FY2017-2021
288
PCP 2017 420 507 2000 Ford F-350 w/Utility Body and 5005 Autocrane 82,188 $74,000
PCP 2018 420 No Scheduled Truck Replacement $0
PCP 2019 420 520 2008 Ford F250 ¾-ton Pickup Truck 51,607 $35,000
PCP 2020 420 508 2005 Ford F150 ½ ton Pickup Truck 42,440 $35,000
Water 2017 420 594 2004 Ford F250 ¾ ton utility body 67,376 $32,000
Water 2018 420 596 2004 Chevy Blazer 30,719 $25,000
TOTAL: $1,257,000
Vehicle Replacement Summary: DIVISION (Fund Source) FY2017 FY2018 FY2019 FY2020 FY2021 TOTAL
STREETS DIVISION
General Fund: $38,000 $0 $87,000 $35,000 $105,000 $265,000 Stormwater Fund: $0 $35,000 $0 $0 $130,000 $165,000
Sanitation Fund: $0 $0 $0 $230,000 $0 $230,000
Streets Division Subtotal: $38,000 $35,000 $87,000 $265,000 $235,000 $660,000
WATER & SEWER FUND D&C Division: $116,000 $160,000 $50,000 $32,000 $38,000 $396,000 PCP Division: $74,000 $0 $35,000 $35,000 $0 $144,000 WP Division: $32,000 $25,000 $0 $0 $0 $57,000
Water & Sewer Fund Subtotal: $222,000 $185,000 $85,000 $67,000 $38,000 $597,000
TOTAL: $260,000 $220,000 $172,000 $332,000 $273,000 $1,257,000

Capital Improvement Plan: FY2017-2021
289
Project Title: Heavy Vehicle Replacement/Maintenance and Funding Program Department/Division: Public Works / Streets Project Description and Reason Necessary: The Streets Division of the Public Works Department operates a number of specialized vehicles funded by the General Fund that are necessary to move debris and to maintain the City’s roads and utility systems. The cost of these vehicles makes it important to plan for their replacement by reserving a portion of their replacement cost on an annual basis until the vehicle’s replacement cost has been accumulated. The estimated life for each of these vehicles is approximately 5-10 years. Vehicles included in this program are those costing more than $50,000. Due to their cost, the City only owns and operates one of each kind of vehicle. The plan below estimates most replacements on a 10-year cycle. However, in order to make the most economical use of the vehicle, its life may be extended, depending on its annual repair and maintenance costs. This planned replacement program also minimizes the need to borrow money to replace expensive vehicles. Estimated replacement costs are updated annually and it is prudent to plan for an average annual cost increase of three percent (3%) when determining annual reserves. No significant operating budget impact will occur.
Description Truck # Year Replace-ment Yr.
Mileage (hours)
at 2/2016
Estimated Replacement
Cost
Estimated Trade-in
Value
Net Est. Cost
International 4700 Flatbed 569 2000 2017 54,500 $85,000 - $85,000 International 4200 Flatbed 551 2003 2018 48,000 $85,000 - $85,000 Caterpillar 4x4 Backhoe 527 2013 2018 1,570 hrs $125,000 $35,000 $90,000 Caterpillar Excavator 534 2013 2018 260 hrs $230,000 $75,000 $155,000 John Deere Tractor & Bushhog ST-32 2005 2020 975 hrs $75,000 - $75,000
TOTAL $600,000 $110,000 $490,000

Capital Improvement Plan: FY2017-2021
290
2017 2018 2019 2020 2021 SUMMARY TOTAL
Balance, beginning of year $293,476 $298,476 $58,476 $148,476 $163,476 Begin: $293,476
Deposits (from General Fund into Streets Cap. Proj. Reserve) $90,000 $90,000 $90,000 $90,000 $90,000 Total: $450,000
Est. Available Balance $383,476 $388,476 $148,476 $238,476 $253,476
Withdrawals: • International 4700 Flatbed $85,000 • International 4200 Flatbed $85,000 • Kenworth 18yd Dump Truck • Caterpillar 4x4 Backhoe $90,000 • Caterpillar Excavator $155,000 • John Deere 5520 Tractor & Bushhog $75,000 Total: $490,000
Balance, end of year $298,476 $58,476 $148,476 $163,476 $253,476 End: $253,476

Capital Improvement Plan: FY2017-2021
291
Project Title: Pavement Maintenance, Striping, and Sidewalk Program Department/Division: Public Works / Streets Project Description and Reason Necessary: The City has an inventory of about 88 miles of road and 33.7 miles of sidewalk. The City programs annual maintenance on a portion of its public pavement (streets, parking lots, and sidewalks). • Street Maintenance:
o Roadway: Over the past decade or so, this program has consisted of a combination of hot-in-place recycling, mill & overlay, overlay, resurfacing or sealing, and asphalt rejuvenation. In the past, maintenance was programmed for an average of approximately 10% to 15 % of the inventory. In the short to intermediate term, staff anticipates that mill & overlay, overlay and asphalt rejuvenation approaches will be the primary focus.
o Traffic Striping: The City restripes streets that are resurfaced or overlaid, and restripes existing striping on streets as necessary.
• Sidewalk Maintenance: The sidewalk maintenance program consists of repairing existing sidewalks, based on the severity of deterioration.
• New Sidewalk: In the past, the City annually funded programs to construct new sidewalks for the City’s Safety Sidewalk Master Plan and other key sections that connect to the master plan or that prudently connect existing sidewalk sections.
Note: Installation of new sidewalk on 15th Avenue North (3rd Street N. to Penman Road) is delayed to integrate with Penman Road commercial area project and to coordinate with the FDOT drainage project design. Funding Source: Local Option Gas Tax (LOGT) and ½-cent Infrastructure Surtax (BJB). See next page for other road improvements.
FY2017 FY2018 FY2019 FY2020 FY2021 TOTAL
LOGT (Not Capital) Street Maintenance $275,000 $275,000 $275,000 $275,000 $275,000 $1,375,000
LOGT (Not Capital) Sidewalk Maintenance
$35,000 $35,000 $35,000 $35,000 $35,000 $175,000
BJB/LOGT (Capital) New Sidewalks $70,000 $70,000 $70,000 $70,000 $70,000 $350,000
TOTAL $380,000 $380,000 $380,000 $380,000 $380,000 $1,900,000

Capital Improvement Plan: FY2017-2021
292
Project Title: Road & Associated Infrastructure Improvements Department/Division: Public Works / Streets Project Description and Reason Necessary: Within the City there are roads which need to be rebuilt because of deterioration caused by aging, compromise of the base and excess elevation due to many overlays. The degree of required rebuilding differs with the condition of each road. It is recommended that rebuilding of roads be accomplished in conjunction with improvements to underground utilities when possible.
Penman Road Commercial Area Improvements: Recommended Project funding is General Capital Projects Fund road reserve, ½-cent Instructure Tax (BJB), Stormwater Fund, Water & Sewer Fund. The scope of work for this project includes improvements to sidewalks, curbing, driveway accesses, traffic and parking control, pedestrian crossing and drainage. Project is centered on the 15th Avenue North intersection with general north-south limits approximately 12th to 18th Avenue North. Project includes traffic study and design, followed by construction.
Penman Rd. Commercial Area FY2017 FY2018 FY2019 FY2020 FY2021 Total
Study/Design (GCP, BJB) $125,000 $125,000 Construction (GCP, BJB)
(SW,WS) $825,000 $825,000
TOTAL $125,000 $0 $825,000 $0 $0 $950,000
NOTES:
1. The above estimated planning costs are variable until project scope, design, bid advertisement and bid award are complete.
2. When roads are identified for reconstruction, Public Works reviews other utility and traffic
systems (water, wastewater, stormwater, pavement and road base, sidewalk, public right-of-way parking, etc.) in the right-of-way for prudent upgrades and repairs to maximize return on investment.
3. Other projects may be added in the future for other necessary road reconstruction. Listed
projects may be deleted and/or shifted on time-line due to budgetary constraints.

Capital Improvement Plan: FY2017-2021
293
Project Title: Relocate / Rebuild Sanitary Sewage Lift Station # 7 In order to Demolish Existing Lift Stations #7, #8 and #20 Department/Division: Public Works / Capital Projects Project Description and Reason Necessary: The City’s wastewater collection system, consisting of 1,990 sewer manholes, 85 miles of sewer mains, 18 miles of force mains, and 38 sewage lift stations, endures a harsh/corrosive environment due to hydrogen sulfide gas. • Sewer manholes are routinely being identified for rehabilitation. • Sewer mains identified in previous studies (1989 Water & Wastewater Study, 1992 & 1995
Infiltration & Inflow Studies, and 2004 Hydraulic Study) are deteriorated, cracked and leaking clay / cast iron pipes, constructed many decades ago, and are well beyond the normal life cycle. Sewer mains and services are also subject to tree/shrub root penetrations, especially those in backyard alleys / easements.
• Sewage lift stations are programmed for periodic rehabilitation which includes wet wells, electrical, mechanical and pumping systems, force main piping and other site improvements.
Existing Lift Stations #7, #8 and #20 are in the 5-year window for rehabilitation. Staff determined that a viable alternative is to invest the rehabilitation funding into merging the 3 lift stations into one station with a generator, at a nearby vacant BES site. The locations of these lift station sites are:
Lift Station Sites General Location • Existing LS #7 N. 18th Ave. and 3rd St. • Existing LS #8 N. 18th Ave. at San Pablo Elementary School • Existing LS #20 N. 15th Ave. and 4th St. • Vacant BES Site N. 18th Ave. and 4th St.
Merging 3 old sites into one (1) new site with a generator will result in more cost effective long term maintenance and continuing service during power outages. Currently, it is planned to construct the project in 2 phases. The following chart gives an overview of the scope in each phase:

Capital Improvement Plan: FY2017-2021
294
PHASE OVERVIEW Phase A: • Build New LS
#7 • Demolish Old
LS #7 and Old LS #20
Design start FY2016; Construction programmed for FY2017 o Build new LS #7 with generator on city property (N. 4th St. & 18th Ave.) o Build new wastewater gravity main on North 18th Avenue (State Road A1A to
4th Street) to discharge into new LS #7 o Replace wastewater gravity main on N. 4th Street (13th to 18th Ave.) o Build new wastewater force main on N. 4th Street o Replace & upgrade stormwater gravity mains o Replace & upgrade drinking water mains o Demolish old LS #7 & old LS #20 o Rebuild roadway and curbing o Stormwater improvements on N. 13th & 14th Avenues (3rd to 4th Streets)
Phase B: • Demolish Old
LS #8 • Construct new
gravity sewer
Design Start FY2016; Construction programmed for FY2017; to be coordinated closely with FDOT drainage project. o Build new wastewater gravity main on N. 18th Ave. (4th St. to LS #8 or possibly
to Eastern Dr.) to discharge into new Lift Station #7 o Replace / upgrade old stormwater mains o Replace / upgrade old drinking water mains o Demolish old LS #8 o Rebuild roadway and curbing
NOTE: Phasing is necessary so that project is flexible to integrate with possible route(s) for FDOT A1A Drainage Improvement Project.
Funding Source: Water & Sewer Fund
PROJECT (Fund Source) PRIOR FY2017 FY2018 FY2019 FY2020 FY2021 TOTAL
Phase A (W/S; SW) Design Construct
$190,000
$2,200,000
$2,200,000 Phase B (W/S; SW)
Design Construct
$75,000
$1,000,000
$1,000,000
TOTAL CAPITAL: $265,000 $2,200,000 $1,000,000 $3,200,000

Capital Improvement Plan: FY2017-2021
295
Project Title: Water Distribution & Sanitary Sewer Collection Systems Improvements Department/Division: Public Works / Distribution & Collection Project Description and Reason Necessary: Water Distribution System Improvements: Recommended Funding Source – Water/Sewer. The City’s water distribution system consists of approximately 109 miles of water mains, 2,652 water valves, 10,915 water service laterals, 895 fire hydrants and two (2) elevated water tanks. Various existing water mains in some areas require replacement because they are old, tuberculated, galvanized 2” and/or unlined/deteriorated cast iron 4” or larger in size. Tuberculation is the development of small mounds of corrosion products (rust) on the inside of galvanized or unlined cast iron pipes, decreasing the diameter. This causes significant loss of water pressure and volume. The water lines are to be replaced with varied sizes of PVC pipes (6” or larger when needed for firefighting requirements). Subject to available time and funding resources, the City programs a major water main replacement project to be contracted and one or two small water line replacement projects for City or contract forces to accomplish. The City has made great strides over the past years in replacing old tuberculated, galvanized and unlined cast iron lines. This is an ongoing, multi-year program. Water Main Replacement Projects at Various Locations: Recommended funding source – Water & Sewer Fund. Each project includes replacing old galvanized, old cast iron, and asbestos cement (AC) water mains with new 6” or greater PVC water mains and valves. New fire hydrants installed as necessary. Ancillary sidewalk and asphalt road crossing work as necessary.
Project Water Main Replacement Project Area
Old Type Est. Length ALONG FROM TO Phase A 2” galvanized 4,625 ft Completed Phase B 2” galvanized 11,200 ft • A1A 6th Ave. N. 20th Ave. N.
D (2013) & C (2017) 6”/8” cast iron Delayed to coordinate with the FDOT Drainage Project Phase C 2” galvanized 3,700 ft Completed Phase D 2” galvanized 3,000 ft Under Construction C (2016) • Oakwood Ct.
• 12th Ave N. Oakwood Rd. 3rd St.
Dead end 4th St.
• 12th Ave N. 2nd St. 3rd St. • 13th Ave N. 2nd St. 3rd St. • Rannie St. 9th Ave N. 11th Ave N. • 8th St S.
• Freedom Way • Republic Dr.
16th Ave in cul-de-sac in cul-de-sac
Dead end
Phase E D (2017) & C (2017)
6” cast iron Replace/install 6” & 8” water main
• Hopson Rd extension
end Hopson Rd end private road (easement needed)
2000 feet • Hopson Rd L.S. easement end Hopson Rd. See Phase E info below Sanitary Sewer
also needed Extend sanitary sewer
• Hopson Rd extension
end Hopson Rd end private road (easement needed)
Phase F D (2019) & C (2020)
2” pipe Install 2500 feet of 8” PVC pipe
• N. 2nd Avenue N. 20th Street Dead end (boat ramp)

Capital Improvement Plan: FY2017-2021
296
Phase E: Extend Water Main and Sanitary Sewer along Hopson Road (private extension). Recommended funding source – Water & Sewer Fund. The private road extension of Hopson Road is without municipal water and sewer. The six homes along this extension, which is adjacent to low lying marsh land and the Intra Coastal Waterway, have household water wells and septic tanks. Recently, the City has been approached with a possible opportunity to obtain a utility easement in order to extend water and sewer utilities along the private road extension. This would ultimately lead to very positive environmental results with the reduction in use of the 6 water wells and the abandonment of the 6 septic tanks. Water Meter Replacement Program: To increase efficiency / accuracy in reading and billing of water & sewer utility services and to reduce unaccounted water loss, the City intends to upgrade its inventory of 10,400 (+/-) water meters and implement a city-wide water meter replacement program. In FY2016, performance contractor was selected and Project Development Agreement is under development. Sanitary Sewer Collection System Improvements: Recommended Funding Source – Water/Sewer. The City’s wastewater collection system consists of approximately 85 miles of sewer mains and 1,990 manholes, 38 sewage lift stations with 18 miles of force mains. Manholes are routinely being identified for rehabilitation. Sewer mains identified in previous studies (1989 Water & Wastewater Study, 1992 & 1995 Infiltration & Inflow Studies, and 2004 Hydraulic Study) are deteriorated, cracked and leaking clay / cast iron pipes, constructed many decades ago, and are well beyond the normal life cycle. Relining and replacing as necessary reduces sewer backups and infiltration and inflow from groundwater and rains, which in turn reduces the operational load and long-term wear and tear on the sewage lift stations and the city’s wastewater treatment facility. This places less pollution load upon the environment. This is an ongoing, multi-year program.
Project (Fund Source) PRIOR FY2017 FY2018 FY2019 FY2020 FY2021 TOTAL
Water Main Replacement Phase B (W/S-78.5%, DT TIF-21.5%,)
W/S Construct DT TIF Construct
$1,200,000 $300,000
$1,200,000 $300,000
Phase E (W/S) Design Construct
$75,000
$500,000 $575,000
Phase F (W/S) Design Construct
$45,000
$360,000
$405,000
Water Meter Replacement Program 1 W/S
$250,000
$550,000
$400,000
$400,000
$400,000
$400,000
$2,150,000
TOTAL W/S DT TIF
$250,000
$1,825,000 $300,000
$900,000 $445,000 $760,000 $400,000 $4,330,000 $300,000
The above planning costs are variable until project scope, design, bid advertisement & bid award are complete. 1 Funding for this program is to be re-budgeted and moved forward after the water meter replacement schedule is developed and the performance contract is executed.

Capital Improvement Plan: FY2017-2021
297
NOT CAPITAL FY2017 FY2018 FY2019 FY2020 FY2021 TOTAL
Water Valve Maintenance Program1 (WS) $25,000 $25,000 $25,000 $25,000
$25,000
$125,000
Sanitary Sewer System Maintenance Program 2 (W/S)
$220,000 $220,000 $220,000 $220,000 $220,000 $1,100,000
TOTAL NOT CAPITAL $245,000 $245,000 $245,000 $245,000
$245,000
$1,225,000
1 The annual Water Valve Maintenance Program consists of exercising approximately 25% of the valve inventory and subsequently replacing damaged/broken valves as necessary.
2 The annual Sanitary Sewer System Maintenance Program consists of inspecting approximately 10% of the manhole inventory and subsequently relining/ reconstructing manholes as necessary. It also includes cleaning/televising sewer mains/services and making point repairs as necessary.

Capital Improvement Plan: FY2017-2021
298
Project Title: Sanitary Sewer Lift Stations Rehabilitation Program Department/Division: Public Works / Pollution Control Plant Project Description and Reason Necessary: Recommended Funding Source – Water/Sewer. The City has an inventory of 38 sewage lift stations and about 1,990 manholes. Sewage lift stations and manholes endure a harsh/corrosive environment due to hydrogen sulfide gas. Periodic rehabilitation of lift station wet wells and manholes are necessary to maintain structural integrity. Rehabilitation includes, but is not limited to, structural and surface repair and coating of the wet wells and manholes with the corrosion resistant product such as Spectrashield, having a 10-year warranty (or similar product). In addition, pumps, piping, controls, fencing, & surface improvements at the lift stations are to be replaced or maintained as necessary. The current program strategy is to rehabilitate lift stations on an average of every 10 years. • LS # 2: Design start scheduled for FY2016; construction programmed for FY2018. This lift
station is located at 6th Ave. N. at 4th St. N. It is a dry-pit submersible lift station below grade. This station needs to be replaced with a submersible type station including: modifications to the existing generator building; demolition of the existing lift station building; construction of new wet well with spectra shield coating; new flow meter; new piping and valves; new electrical controls; and new generator (generator needs to be relocated). City has recently installed new variable frequency drives and a used/refurbished generator. Also, we will consider extending the New LS force main from 13th to 6th Ave., manifolding it with LS #2 discharge force main.
• LS #17: Design start scheduled for FY2017; construction programmed for FY2018. The station is a duplex submersible pump station with two Gorman-Rupp submersible pumps located at 3351 Anhinga Court. The force main discharges to a manhole, which is located on Osceola Avenue at Merrill Boulevard, and then flows by gravity to Lift Station #14. The lift station has an 8-foot diameter wet well, which has been coated with Spectrashield and appears to be in reasonably good condition. The control cabinet is deteriorated. There is no proper access to this station. In a case of heavy rains, the station cannot be accessed by truck. Discharge piping is PVC with the exception of the discharge elbows, which are ductile/cast iron, and show signs of rust. Replace existing storm sewer pipe with larger piping and provide access and gate to lift station site. This station is in poor shape and needs a total rehabilitation including wet well, piping, pumps, valves, controls, and vehicular access.
• LS #19: Design start scheduled for FY2019; construction programmed for FY2020. This station
is located at 33 Rosewood Drive. It is a duplex submersible station which was converted in 2001. It has Hydromatic pumps that are prone to clogging due to low flow conditions. The wet well has been coated with Spectrashield and valve box is in good condition. The existing submersible pumps and motors, pump rail system, piping, valves, and control panel need to be replaced. The existing Dataflow PCU also needs to be replaced with a new TacPac. Add a new pump-out connection outside of the valve vault and a new light pole needs to be added for maintenance at night.

Capital Improvement Plan: FY2017-2021
299
• LS #23: Project programmed for FY2021. This is a duplex submersible lift station located at
1290 N. 12th Street. The pumps and control panel were replaced in 2001. This lift station has a number of problems and does not comply with Jacksonville Beach lift station or Dataflow design specifications. The wet well is in the middle of a cul de sac on 12th Street North. The Spectrashield coating in the wet well is deteriorating and needs reapplication. The wet well hatches are too small for the size of the pumps which requires the removal of the rails to get the pumps out. The control panel is nailed to a telephone pole and the (Dataflow) telemetry antennae is the improper height and is also improperly installed. Pumps/motor is being considered for downsizing because stormwater inflow has been corrected.
• LS #27: Project programmed for FY2021. This is a duplex submersible station located at 3780
Sanctuary Lane. It was built in May 1994 and was Spectrashield coated in 2006. The interior discharge piping has several holes that have been patched by our lift station mechanics. The control panel needs to be replaced. The pumps are 2 different sizes which does not afford optimum efficiency. The driveway is too narrow to allow for a vac truck to get in without driving on the grass (which is kept up by the neighborhood association).
• LS #5: located at 50 S. 37th Avenue • LS #24: located at 3750 South Third Street • LS #25: located at 1781 The Greens • LS #28: located at 1241 Blue Heron Lane • LS #21: located at 4235-50 Marsh Landing Boulevard • LS #33: located at Ocean Cay Unit 2 SD (at Isabella Boulevard) • LS #30: located at existing BES building at the substation at 4400 South Beach Parkway • LS #34: located at 323 Lions Club Road • LS #35: located at Jardin de Mer Funding Source: Water & Sewer Fund
FUTURE LIFT STATION PROJECTS:
PROJECT (Fund Source) PRIOR FY2017 FY2018 FY2019 FY2020 FY2021 TOTAL
LS #2 (W/S) Design Construct
$100,000
$1,000,000
$1,000,000
LS #17 (W/S) Design Construct
$50,000 $250,000
$300,000
LS #19 (W/S) Design Construct
$50,000
$250,000
$300,000
LS#23 (W/S) $30,000 $30,000
LS#27 (W/S) $30,000 $30,000
TOTAL CAPITAL: $100,000 $50,000 $1,250,000 $50,000 $250,000 $60,000 $1,660,000

Capital Improvement Plan: FY2017-2021
300
Project Title: Wastewater Treatment Facility Improvements Program
Department/Division: Public Works / Pollution Control Plant
Project Description and Reason Necessary: The design of the new Advanced Wastewater Treatment (AWT) Plant incorporated the existing chlorine contact tanks and chlorination system which had been in use in the old plant. The effluent from the treatment process flows to the contact tank for chlorination and the wasted sludge flows to the digesters for further reduction. The waste sludge and effluent flowed in a fairly low, continuous manner from the treatment processes of the old plant. However, the waste sludge and effluent flow in higher surges from sequential batch reactor tanks of the new plant. Subsequently, modifications are necessary to these two systems.
• New Filter Feed Pumps Station to Regulate Effluent Flow to Tertiary Filter Units: Re-scheduled FY2017. There are four (4) tertiary disk filter units, with fine mesh media screens. Three (3) serve in operational mode and one (1) serves as standby. The filter units receive treated effluent as a surge when the SBR decanter units empty by flowing through a gravity piping system, with a flow range of 6,000-10,000 GPM. Periodically when a SBR sludge blanket upsets, the effluent surge becomes non-reuse quality, impacting the filters’ fine mesh screens (clogs, becoming brittle, tears). Maintaining these filter units has become a full time job and requires the filters to be off line. Subsequently, valves are operated to have the effluent surge bypass the filters and the reclaimed water storage ponds at the Golf Course. When this happens, the City’s needs for its reclaimed water irrigated public space (750,000 to 1,250,000 gallons per day) cannot be met by the reuse water alone.
The new duplex pump station and ancillary equipment will provide an alternate method of regulating the non-reuse quality effluent flow to the tertiary filters at a constant lower rate (about 3,125 GPM). The non-reuse quality effluent surge will be bypassed into the North Contact Basin and will be able to settle out particulates. Then, the settled effluent is pumped through the tertiary filters at the constant lower rate with 2 filters operational and 2 standby. It is anticipated that this alternative will improve the tertiary treatment quality and reduce needed maintenance on the filter mesh media screens, extending life expectancy of the filter media (estimated 300% by the manufacturer’s representative.)
• Modifications to the Chlorine Contact Tanks and Chlorination System: Project reprogrammed to FY2019. It has been determined that this project should follow the new filter feed pump installation and subsequent data collection. The existing chlorination system was sized for the lower, continuous flow of the old plant. The new plant releases effluent in larger volumes, which must be chlorinated immediately, causing inefficient overuse of chlorine and thus a higher rate of deterioration of the chlorination system and contact tanks. Also, the flow inside the square tank is circular and does not efficiently mix the chlorine with the effluent. Planned improvements to the chlorination system and contact tanks will improve the efficiency of disinfection of the treated effluent, reducing chemical, repair and maintenance costs.

Capital Improvement Plan: FY2017-2021
301
Funding Source: Water & Sewer Fund
PROJECT (Fund Source) FY2017 FY2018 FY2019 FY2020 FY2021 Total Install Filter Feed Pumps (W/S) $200,000 $200,000 Replace PCP Garage Roof (W/S) $50,000 $50,000 Modifications to Chlorine Contact Tanks & Chlorination System (W/S) $300,000
$300,000
TOTAL: $200,000 $50,000 $300,000 $550,000

Capital Improvement Plan: FY2017-2021
302
Project Title: Raw Water Wells Improvements Program Department/Division: Public Works / Water Plant Project Description and Reason Necessary: • Raw Water Well #11 Improvements Project Each of the City’s two (2) water treatment plants is supplied with raw water from three (3) wells. Constructed in the late 1950s, Well #11 is the deepest of the City’s wells at a depth of 1,204 feet. The five (5) other wells average 900 feet in depth. Well #11 has become a target of concern for the Health Department, St. Johns River Water Management District and the City. Water quality has declined and is continuing to decline significantly. Chlorides are salts that are monitored as a standard for quality. The chloride levels in Well #11 averaged 51 milligrams per liter (mg/l) in year 2000, while the other wells averaged 13 mg/l. Well #11’s chlorides have increased to an average of 155 mg/l in 2011 while the remaining wells averaged 14.5 mg/l. Well #11 is being infiltrated by chlorides, from salt water intrusion, and is approaching the maximum contaminant level (MCL) of 250 mg/l. Replacing Well #11 with a new 900-feet depth well and its appurtenances, land acquisition, additions to the raw water transmission main, and abandonment of the existing well is estimated to cost over $1.5 million. A cost-effective alternative would be to modify the existing well by sand/grout filling to a depth of 900 feet, replacing the motor controls, and install a deep well submersible pump and motor assembly. Funding Source: Water & Sewer Fund
PROJECT (Fund Source) FY2017 FY2018 FY2019 FY2020 FY2021 Total
Well #11 Improvements (W/S) $500,000 $500,000

Capital Improvement Plan: FY2017-2021
303
Project Title: Water Plant #1 Repair / Coat Exterior of Ground Storage Tank Department/Division: Public Works/Water Plant Project Description and Reason Necessary: The mansard façade roof at Water Plant #1 Ground Storage Tank was removed on short notice to eliminate a critical safety hazard. A follow up inspection revealed a previously repaired crack/void was failing, with masonry materials spalling off. The location is at the vertical seam near the middle of the east wall and is nonstructural. Staff has determined that the mansard fascade roof is not to be replaced since its function is primarily appearance. Staff is considering the possibility of adding about a 2-foot green stripe at the top of the tank, which would be similar to the nearby Fire Station. This project includes the following:
• Clean and pressure wash the entire tank. • Repair (clean out and patch with waterproof mortar - Sika 1) the vertical crack / void on the
east wall of the tank. • At the top of the tank where the failing mansard fascade was removed,
o Remove / cut off flush the remaining fasteners. o Fill and patch/cover with waterproof mortar (Sika 1).
• Recoat the entire tank exterior with specialty coating (Tnemec series 156).
Funding Source: Water & Sewer Fund
PROJECT (Fund Source) FY2017 FY2018 FY2019 FY2020 FY2021 Total
Water Plant #1 Ground Storage Tank Exterior Repair / Coating $60,000 $60,000

Capital Improvement Plan: FY2017-2021
304
Project Title: Water Plant #2 Improvements Program (Osceola Ave.) Department/Division: Public Works/Water Plant Project Description and Reason Necessary: • Rehabilitate the Interior Concrete Ceilings and Repair / Recoat all of the Interior and
Exterior Surfaces of the Two 500,000 Gallon Raw Water Ground Storage Tanks
Three (3) 900-feet deep artesian wells supply raw water from the Floridan Aquifer to two (2) 500,000 gallon concrete ground storage tanks for treatment at Water Plant #2. The raw water has high contents of hydrogen sulfide as well as other sulfides and sulfates. To remove these compounds, each tank is equipped with an aerator to allow suspended gases to escape. This is supplemented with retention time and chlorination. The residual compounds accumulate in the form of acids on the interior surfaces of the tanks’ dome roofs. Even with cleaning and recoating, the acid has had a deleterious effect on the dome’s cement. The long term effect results in erosion of the reinforcement steel and at some point the roof may fail. This has been reported to have occurred on two (2) tanks operated by a neighboring utility, which also removed 2 additional tanks from service to prevent the catastrophic failure of the tank roofs. Water Plant #2’s storage tanks are exhibiting this type of erosion and are in need of advanced maintenance. All deteriorated cement and steel must be removed, repairs made, and an advanced protective coating system installed to cover all interior concrete surfaces, dome, walls, floor, including a breathable elastomeric coating applied to all exterior concrete surfaces. Funding Source: Water & Sewer Fund (W/S).
PROJECT (Fund Source) FY2017 FY2018 FY2019 FY2020 FY2021 TOTAL Rehabilitate Concrete Ceilings & Repair / Recoat Interior & Exterior Surfaces, Ground Storage Tanks (W/S)
$550,000
$550,000

Capital Improvement Plan: FY2017-2021
305
Project Title: Water Plant #2 Telemetry Upgrade Department/Division: Public Works / Water Plant Project Description and Reason Necessary: The control of Water Plant 2 and support facilities (Raw Water Wells, Water Tank Towers & Stormwater Stations) requires radio commands from Water Plant 1 via the Supervisory Control and Data Acquisition (SCADA) system with the HyperTac software to operate (telemetry).
The Remote Terminal Unit (RTU) located at Water Plant 2 was installed in 1991, now considered antiquated, non-adaptable to system upgrades and needs replacing. The RTU is a slave device that receives commands and returns data back to Water Plant 1.
In the event that the SCADA control center at Water Plant 1 is destroyed / damaged / out of commission, the automated control of all the support facilities will be lost, requiring manual operation at the respective sites. In lieu of replacing the Water Plant 2 RTU in kind, it is prudent to upgrade the RTU to a redundant SCADA system. This will allow SCADA system control to take place at either Plant as backup, if the other is out of commission.
Both Plants shall have the capability to operate independently or in combination with each other, adding a level of system redundancy. This will enable the City to maintain water distribution for both fire suppression and public use during emergency events.
The proposed upgrade will provide components and materials to create a second SCADA control center located within the pump building at Water Plant 2.
Primary benefit; maintaining Water Plant & Stormwater system control during manmade or natural disasters.
Funding Source: Water & Sewer Fund
PROJECT (Fund Source) FY2017 FY2018 FY2019 FY2020 FY2021 Total
Water Plant 2 Telemetry Upgrade (W/S) $70,000 $70,000

Capital Improvement Plan: FY2017-2021
306
Project Title: Stormwater Collection & Treatment System Improvements Program Department / Division: Public Works / Stormwater Project Description and Reason Necessary: For over a decade, the City has been steadily improving its stormwater collection systems through a program of study, design, and construction under the auspices of Phases 1, 2 & 3 of its Stormwater Master Plan and staff field experiences and history. Project priorities and design approaches may be adjusted based on field-collected data, funding availability, and estimated project costs. Projects are funded one at a time as funds are available. Project costs have continually been increasing over the past several years. Fund cash balance is carefully monitored. Some projects are anticipated to be deferred / delayed due to funding constraints. Stormwater Improvements at Various Locations:
o 4th Street South (10th to 12th Avenue): Project consists of installation of approximately 525 lf of 24-inch PVC storm sewer piping, 175 lf of 15-inch PVC storm sewer piping, nine (9) inlets, filling in existing ditches, possible public right-of-way parking, and driveway and sodding removal & replacement. This project area is to be designed and constructed during the Downtown Drainage Improvements projects.
o 4th Street South (15th to 16th Avenue): Project consists of installation of about 175 +/- lf of 48” RCP
storm sewer piping, two (2) inlets, filling in of existing ditch, and sodding removal and replacement.
o Isabella Boulevard (35th Avenue South to Jacksonville Drive): Project consists of installation of about 450 lf +/- of 42-inch RCP storm sewer piping, three (3) manholes, filling in of existing ditch, and sodding removal and replacement.
o Republic Drive (Constitution Cove Pond Outfall west to City Ditch): Extend piping (about 24” dia;
600+/- lf) from outfall of Constitution Cove Pond to westerly end of Republic Dr. continuing west to outfall into city drainage ditch. Includes investigation of route, design modification and construction.

Capital Improvement Plan: FY2017-2021
307
Funding Sources: Stormwater Fund (SW) or Southend Redevelopment District Fund (SE TIF).
PROJECT (Fund Source) FY2017 FY2018 FY2019 FY2020 FY2021 TOTAL o 4th St. S. (10th -12th Ave.) (SW) Design
Construct
$250,000 $250,000
o 4th St. S. (15th -16th Ave.) (SW) Design Construct
$15,000
$95,000
$110,000
o Isabella (35th Ave. to Jax) (SW) Design Construct
$30,000
$200,000
$230,000
o Republic Dr. (CC Pond west to City ditch) (SW)
Study, Des Construct
$37,000 $260,000
$297,000
o 4th St S. (1st - 6th Ave.) (SW) Design Construct
$105,000 Future
$105,000
TOTAL CAPITAL $250,000 $15,000 $132,000 $290,000 $305,000 $992,000
Project (NOT CAPITAL) FY2017 FY2018 FY2019 FY2020 FY2021 TOTAL
Pipe Cleaning $95,000 $95,000 $95,000 $95,000 $95,000 $475,000
Channel Cleaning and Maintenance $200,000 $200,000 $200,000 $200,000 $200,000 $1,000,000
TOTAL NOT CAPITAL $295,000 $295,000 $295,000 $295,000 $295,000 $1,475,000

Capital Improvement Plan: FY2017-2021

309
Glossary of Budgetary and Financial Terminology and Acronyms
The City's operating budget contains specialized and technical terminology and acronyms that are unique to government and to public finance and budgeting. This glossary has been included in the budget to assist the reader in understanding the more unique terms.
Accrual basis of accounting - method of accounting that recognizes the financial effect of transactions, events, and inter-fund activities when they occur, regardless of the timing of the related cash flows.
Ad valorem Tax - a tax assessed on the value of real and personal property.
Adopted (approved) budget - the financial plan of revenues and expenditures for a fiscal year, as approved by the City Council.
AFG – Aid to Firefighters Grant
AICPA – American Institute of Certified Public Accountants
ALS — Advanced Life Support
Amendment - a change to the adopted budget which may increase or decrease a fund's total appropriation.
Amortization - gradual reduction of an amount over time. An example is amortized principal and interest payments on debt. An asset or liability with a limited life is usually amortized over the period benefitted (i.e., the life of the loan).
APPA — American Public Power Association
Appropriation - a specific amount of funds authorized by the City Council with which financial obligations may be made.
ARP – All Requirements Project
ARRA – American Recovery and Reinvestment Act
Assessed Valuation - the value placed on property for the purpose of taxation. The City of Jacksonville Beach accepts the assessment of real and personal property as determined by the Duval County Property Appraiser.

Glossary and list of acronyms
310
AWT – Advanced Waste Treatment
Balanced budget - total anticipated revenues plus available fund balance in excess of authorized reserves equals total budgeted expenditures plus required reserves for each fund.
BLS — Basic Life Support
BMAP – Basin Management Action Plan
Bond - a written promise to pay a specific sum of money (called principal or face value) at a specific future date along with periodic interest paid at a percentage of the principal. Bonds are used to finance capital projects.
Bond Covenant - an agreement between the City and its lenders which specifies a payment schedule, terms and reserves to be held.
Budget Calendar - the schedule of key dates or goals which the City follows through the budget process.
Budgetary Control - the control or management of a governmental unit or enterprise in accordance with an approved budget for the purpose of keeping expenditures within the limits of revenues and approved appropriations.
Budget Message - a brief written statement presented by the City Manager to the City Council and incorporated into the budget document which highlights budget issues and policy recommendations.
Budget Process - the established procedures and calendar for the tasks which are to be completed prior to the adoption of the annual operating budget.
Budget Resolution - the official enactment by the City Council legally authorizing City officials to obligate and expend City resources.
Budgetary Solvency - a governmental unit's ability to generate sufficient cash revenues to pay its bills over a thirty to sixty day time frame.
CAD — Computer-Aided Dispatch
CAFR — Comprehensive Annual Financial Report
CALEA — Commission on Accreditation for Law Enforcement Agencies
CAPE – Community Assisted Policing Effort

Glossary and list of acronyms
311
Capital (Fixed) Asset – Land, improvements to land, easements buildings, building improvements, vehicles, machinery, equipment, works of art, historical treasures, infrastructure and all other tangible or intangible assets costing $1,000 or more that are used in operations and that have initial useful lives extending beyond a single reporting period.
Capital Expenditure/Capital Outlay - an expenditure for the acquisition of, or addition to a capital (fixed) asset. Items acquired for less than $1,000 are not considered to be capital expenditures.
Capital Improvement Plan (CIP) - a plan for capital expenditures to be incurred each year over a fixed period of several years. The plan sets forth each capital project and identifies the expected beginning and ending date for each project, the amount to be expended in each year and the method of financing for those expenditures.
Capital Project - Projects which result in the acquisition or construction of fixed assets which are of long term and permanent nature. Such assets include land, buildings and related improvements.
Cash Balance Forward - funds on hand at the end of a fiscal year resulting from collections of revenues in excess of expenditures or unexpended appropriations which are included as a revenue source in the budget of the following fiscal year.
CDBG — Community Development Block Grant
CFL – Compact Florescent Light
CIP — Capital Improvement Plan
CIS – Customer Information System
Contingency - a budgetary reserve to provide for emergency or unanticipated expenditures during the fiscal year.
COP — Citizens on Patrol
COPS – Community Oriented Policing Services
CPI — Consumer Price Index
CRA - Community Redevelopment Agency
Credit Rating - an independent rating service's evaluation of the credit worthiness of notes and bonds. Such ratings influence the cost of borrowing.

Glossary and list of acronyms
312
CRT - Community Response Team
CUP – Consumptive Use Permit
DARE - Drug Abuse Resistance Education
Debt - funds owed as a result of borrowing.
Debt Service - the payment of principal and interest on borrowed funds, such as bonds.
Debt Service Fund - the fund used to account for the accumulation of resources for the payment of principal and interest on long term debt, specifically, bond issues.
Deficit - the excess of expenditures over revenues during a fiscal year.
Department - a major administrative division of the City with overall management responsibility for an operation or a group of related operations within a related program area.
Depreciation - the periodic expiration of an asset's useful life. Depreciation is a requirement in proprietary funds such as internal service and enterprise funds.
EAR – Evaluation and Appraisal Report
EMS — Emergency Medical Services
EMT – Emergency Medical Technician
EPA – Environmental Protection Agency
EVOC – Emergency Vehicle Operators Course
Encumbrance/encumbered - a commitment of funds through appropriation in which the expenditure has not actually been made at the time of recording. It may be represented by a purchase order, purchase requisition or contract for goods and services.
Enterprise Fund - a fund in which the activities are supported wholly or primarily by charges and fees paid by the users of the services.
ESCO – Electric Service Corporation
Expenditure/Expense - the outflow of funds paid or to be paid for an asset obtained or for goods and services provided regardless of when the expense is actually paid. The term expenditure applies to governmental funds and the term expense applies to proprietary funds.

Glossary and list of acronyms
313
FCC – Federal Communications Commission
FDEP — Florida Department of Environmental Protection
FDOT – Florida Department of Transportation
FERC — Federal Energy Regulatory Commission
FMPA - Florida Municipal Power Agency
Fiduciary Fund – used to report assets held in a trustee or agency capacity for others and therefore cannot be used to support the government’s own programs. The City of Jacksonville Beach’s pension funds are accounted for and budgeted as fiduciary funds.
Fiscal Year - the time period designated by the City signifying the beginning and ending of its annual period for recording financial transactions. The City of Jacksonville Beach' s fiscal year is October 1 through September 30.
Fixed Asset – a financial resource that is tangible, has an expected life of more than one year, costs more than $1,000 and is not a repair or supply item. Items meeting the fixed asset criteria are classified by major categories: land, building, improvements other than building, equipment and vehicles and construction-in-progress.
FOP — Fraternal Order of Police
Franchise - an agreement between the City and a provider of public services, such as cable television or garbage collection, which imparts certain standards on the provider and is a contract which requires payments to the City.
FRCC — Florida Reliability Coordinating Council
FRDAP – Florida Recreation Development Assistance Program
FS - Florida Statutes
Fund - an independent fiscal and accounting entity with a self-balancing set of accounts. These accounts record cash and other assets together with all related liabilities, obligations, reserves and equities. Funds are segregated so that revenues will be used only for the purpose of carrying out specific activities in accordance with special regulations, restrictions or limitations.
Fund Balance - refers to the excess of assets over liabilities and, therefore, is generally known as the amount available for appropriation to the extent that it is not reserved.
GAAP - Generally Accepted Accounting Principles

Glossary and list of acronyms
314
GASB – Governmental Accounting Standards Board
General Fund - the governmental accounting fund supported by ad valorem property taxes, licenses and permits, service charges and other general revenues to provide City-wide operating services. This may be referred to as the Operating Fund.
General Obligation Bonds (GOB) - bonds whose principal and interest are paid from property tax for debt service and are backed by the City's full faith and credit. Approval by referendum vote is required for GOBs to be issued.
GFOA - Government Finance Officers' Association
GIS — Geographic Information System
Governmental Funds - funds used to account for the acquisition, use and balances of expendable financial resources and related liabilities. Governmental funds include the General Fund, Special Revenue Fund(s), Debt Service Fund(s) and Capital Projects Fund(s).
GPS — Geographic Positioning System
Homestead Exemption - pursuant to the Florida State Constitution, the first $25,000 of assessed value of a home which the owner occupies as principal residence is exempt from property tax.
HTE – The name of the City of Jacksonville Beach's operating software for general ledger, utility billing, building permit, occupational license and other applications.
IAFF — International Association of Firefighters
Impact Fees - monetary payments made by developers or builders to defray the public costs of providing infrastructure capital to a development.
Infrastructure - public support structures such as roads, street lighting, water and sewer lines.
Intergovernmental Revenue - Revenue received from another governmental unit in the form of entitlements, shared revenues or payment in lieu of taxes.
IRB – Inflatable Rescue Boat
JAG – Justice Assistance Grant
JTA — Jacksonville Transportation Authority
Kw, Kwh — Kilowatt, kilowatt hour, respectively

Glossary and list of acronyms
315
LAN — Local Area Network
Levy - to impose taxes, special assessments or service charges. Another term used for millage rates.
LIUNA — Laborers International Union of North America
LOGT – Local Option Gas Tax
Major Funds – Governmental Accounting Standards Board (GASB) Statement No. 34, Basic Financial Statements – and Management’s Discussion and Analysis – For State and Local Governments sets forth minimum criteria (percentage of assets, liabilities, revenue or expenditures/expenses) for the determination of major funds. Based on that criteria, the City reports the following major funds: General Fund, General Capital Projects Fund, Community Redevelopment Fund and Electric Fund. The City has elected to report the Water & Sewer Fund as a major fund.
Mandate - any responsibility, action or procedure that is imposed by one sphere of government on another through constitutional, legislative, administrative, executive or judicial action as a direct order or that which is required as a condition of aid.
Matching Requirement - a contribution to a project or program required by a funding source as a basis for the grantor's contribution. Matching requirements are frequently imposed as a proportionate share of the overall contribution.
MCP – Mobile Command Post
MGD — Million Gallons per Day
MHz — Megahertz
Mill – amount per $1,000 of value
Millage Rate - The ad valorem tax rate expressed in the amount levied per $1,000 of assessed taxable value of the property, or 1 mill = $1.00 per $1,000 of assessed value.
MPO — Metropolitan Planning Organization
Mw, Mwh — Megawatt (1,000 kilowatts), Megawatt hour (1,000 kilowatt hours)
NERC — North American Electric Reliability Corporation
NFPA – National Fire Prevention Association

Glossary and list of acronyms
316
NFTPO – North Florida Transportation Planning Organization
Nonmajor Funds – any fund that does not meet Governmental Accounting Standards Board (GASB) criteria (percentage of assets, liabilities, revenue or expenditures/expenses) for classification as a major fund or that the City does not elect to report as a major fund.
NPDES — National Pollutant Discharge Elimination System
O&M Facility – Operations and Maintenance Facility.
Operating Expenditures - also known as operating and maintenance costs, these are day-to-day expenses excluding capital outlay, debt service and transfers.
Performance Indicators - special qualitative and quantitative measures of work performed as an objective of a department.
Proprietary Funds - used to account for a government's ongoing organizations and activities that are similar to those found in the private sector. Proprietary funds include Enterprise and Internal Service Funds.
PUD – Planned Unit Development
PWRCA – Priority Water Resource Caution Area
Reserve - an account used to indicate that a portion of funds has been legally restricted for a specific purpose or not available for appropriation and subsequent spending. A reserve for working capital is a budgetary reserve set aside for cash flow needs, emergencies, unforeseen expenditures or revenue shortfalls.
Retained Earnings - a fund equity account which reflects accumulated net earnings (or losses) of a proprietary fund. As in the case of fund balance, retained earnings may include certain fund balance reserves.
RFP - Request for Proposal
RFQ — Request for Qualifications
Rolled-back Millage Rate – The millage rate calculated to provide the same amount of property taxes as the previous year, excluding new taxable value (new construction/additions) and amounts paid as the result of obligations measured by dedicated tax increment value.
Revenue - funds which the City receives as income. Revenue categories include taxes, licenses, user fees, service charges, fines and penalties, interest, loan proceeds and grants.

Glossary and list of acronyms
317
SAN — Storage Area Network
SCBA – Self-contained Breathing Apparatus
Sinking Fund - a reserve fund accumulated over a period of time used for the periodic retirement of debt.
SLEP - Service Life Extension Program
Special Assessment - a compulsory levy imposed on certain properties to defray part or all of the cost of a specific improvement or service deemed to primarily benefit those properties.
Special Revenue Fund - a governmental fund in which the revenues are designated for use for a specific purpose or activity.
STAG – State and Tribal Assistance Grant
SWAT — Special Weapons and Tactics
Taxes - compulsory charges levied by a government for the purpose of financing services performed for the common benefit.
Tax Year - the calendar year in which ad valorem taxes are levied to finance the ending fiscal year budget. For example, the tax roll for the 2009 calendar year would be used to compute the ad valorem taxes levied for the 2009-2010 budget.
TCEA – Transportation Concurrency Exception Area
TECO – Tampa Electric Company
Tentative Millage - the tax rate adopted in the first public hearing of a taxing authority. Under state law, the agency may reduce, but not increase, the millage during the final budget hearing without extensive re-advertising and property owner notification.
TIF — Tax Increment Fund(s)
TMDL – Total Maximum Daily Load. TMDL refers to the maximum amount of a pollutant such as nitrogen, copper, phosphorous or other specified nutrient that a water body can receive and still meet water quality standards, and an allocation of that amount is made to the pollutant's sources, such as wastewater plants.

Glossary and list of acronyms
318
Transfers – are used to 1) move revenues from the fund with collection authorization to the debt service fund as debt service principal and interest payments become due, 2) move restricted amounts from borrowings to the debt service fund to establish mandatory reserve accounts, 3) move unrestricted general fund revenues to finance various programs that the government must account for in other funds in accordance with budgetary authorizations, including amounts provided as subsidies or matching funds for various grant programs.
TRIM – Truth in Millage Act - a 1980 law enacted by the Florida legislature which changed the budget process for local taxing authorities. It was designed to keep the public informed about the taxing intentions of the various authorities.
Uniform Accounting System - the chart of accounts prescribed by the State of Florida, Office of the Comptroller which is designed to standardize financial information to facilitate comparison and evaluation of various reports.
User Charges/Fees - fees charged for the direct receipt of public service.
VECHS — Volunteer Employee Criminal History System
Voted Millage - property tax levies authorized by voters within a taxing authority. Bond issues that are backed by property taxes are a common form of voted millage in the State of Florida. Such issues are called general obligation bonds.
WQBEL – Water Quality Based Effluent Limit
WTP – Waste Treatment Plant
WWTP – Waste Water Treatment Plant


![JAXMSTR - [01 45 04.PRN] - Jacksonville District - U.S. Army](https://static.fdokumen.com/doc/165x107/631f671f63f0eba19606da8b/jaxmstr-01-45-04prn-jacksonville-district-us-army.jpg)