
Pompano Beach Airpark
161
Prepared for the City of Pompano Beach PREPARED BY KIMLEY-HORN 2021 Pompano Beach Airpark MASTER PLAN UPDATE p mpano at beach. Florida's Warmest Welcome
-
Upload
khangminh22 -
Category
Documents
-
view
2 -
download
0
Transcript of Pompano Beach Airpark

Prepared for the City ofPompano Beach
PREPARED BY KIMLEY-HORN2021
Pompano Beach Airpark MASTER PLAN UPDATE
p mpano atbeach. Florida's Warmest Welcome

Inventory of Existing Conditions
1-1
Chapter 1: Inventory of Existing Conditions
Contents
1 - INVENTORY OF EXISTING CONDITIONS 1-3
1.1 - Airpark Overview 1-3 1.1.1 - Airpark Location 1-3 1.1.2 - Airpark History 1-4
1.2 - Airport Activity Overview 1-7 1.2.1 - Flight Training 1-7 1.2.2 - Helicopter Activity 1-7 1.2.3 - Goodyear Blimp 1-7 1.2.4 - Aircraft Maintenance 1-7
1.3 - Airfield Facilities 1-7 1.3.1 - Runways 1-8 1.3.2 - Taxiways 1-10 1.3.3 - Lighting, Markings and Signage 1-10 1.3.4 - Navigational Aids 1-10 1.3.5 - Air Traffic Control Tower 1-11 1.3.6 - Runway Utilization 1-11
1.4 - Potential Airfield Issues 1-11 1.4.1 - Taxiway M / Taxiway L / Runway 6 1-11 1.4.2 - Runway 33 / Runway 28 Thresholds 1-12 1.4.3 - Helicopter Landing and Practice Areas 1-13
1.5 - Airspace 1-14 1.5.1 - Airspace Considerations 1-16 1.5.2 - Instrument Approaches 1-16 1.5.3 - Meteorological Conditions & Climate 1-16
1.6 - Ground Access Facilities 1-17 1.6.1 - Automobile Parking 1-17 1.6.2 - Regional and Access Roadways 1-17
1.7 - General Aviation Facilities 1-22 1.7.1 - Fixed Base Operators 1-22 1.7.2 - Aircraft Hangars 1-22 1.7.3 - Apron Space and Tiedowns 1-23
Pompano Beach Airpark
p mpano • beach. Kimley>>) Horn MASTER PLAN UPDATE
Florida's warmest Welcome

Inventory of Existing Conditions
1-2
1.8 - Support Facilities 1-23 1.8.1 - Fuel Storage 1-23 1.8.2 - Airpark Administration and Maintenance 1-23 1.8.3 - Fire Station 1-24
1.9 - Zoning and Land Use 1-24 1.9.1 - Zoning 1-24 1.9.2 - Future Land Use 1-24
1.10 - Environmental Considerations 1-27 1.10.1 - Local Areas of Particular Concern and Environmentally Sensitive Lands 1-27 1.10.2 - Wellf ield Protection Zones 1-27 1.10.3 - Section 4(f ) and 6(f) Resources 1-29 1.10.4 - Hazardous Materials 1-29 1.10.5 - Historic & Archeological Sites 1-31 1.10.6 - Farmlands 1-31 1.10.7 - Wetlands 1-31 1.10.8 - Flood Zones 1-31
1.11 - Summary 1-31
Tables Table 1-1. Vicinity Airports 1-4 Table 1-2. Existing Runway Data 1-8 Table 1-3. Hangar Space 1-23 Table 1-4. Fuel Storage Facilities 1-23
Figures Figure 1-1. Airport Location Map 1-5 Figure 1-2. Airport Vicinity Map 1-6 Figure 1-3. Airport Airf ield Facilities 1-9 Figure 1-4. Taxiway L / Taxiway M / Runway 6-24 Vicinity 1-12 Figure 1-5. Runway 33 / Runway 28 Threshold and Taxiway L / Taxiway E 1-13 Figure 1-6. Airspace Classifications 1-14 Figure 1-7. Airport Airspace Map 1-15 Figure 1-8. All Weather Wind Rose 1-18 Figure 1-9. IFR Wind Rose 1-19 Figure 1-10. VFR Wind Rose 1-20 Figure 1-11. Airport Roadway Access 1-21 Figure 1-12. Existing Zoning Map 1-25 Figure 1-13. Future Land Use Map 1-26 Figure 1-14. Local Areas of Particular Concern 1-28 Figure 1-15. Vicinity Parks and Recreation 1-30
Pompano Beach Airpark
p mpano • beach. Kimley>>) Horn MASTER PLAN UPDATE
Florida's warmest Welcome

Inventory of Existing Conditions
1-3
This Master Plan Update for the Pompano Beach Airpark (Airpark or PMP) details an assessment of existing infrastructure and provides a 20-year development program culminating with an updated Airport Layout Plan (ALP). The contract for this project was finalized in December 2017, and work began in earnest in January 2018. The analyses and recommendations outlined in this Master Plan Update follow guidance published in Federal Aviation Administration (FAA) Advisory Circular (AC) 50/5070-6B Airport Master Plans, FAA AC 150/5300-13A Airport Design, and various other airport planning publications. The Master Plan Update outlines a recommended development plan for the City of Pompano Beach, the Airpark Sponsor, that is intended to satisfy forecast demand in a safe, financially feasible manner that considers the Airpark’s environmental setting, the community’s socioeconomic conditions, and other factors.
Throughout the course of the Master Plan Update process, stakeholder input was collected via interviews with tenants and Airpark users, at public workshops and meetings with the Planning Review Committee (PRC) that were scheduled at strategic project milestones, and through coordination with the FAA and the Florida Department of Transportation Aviation Office. This document is organized as follows:
• Inventory of Existing Conditions • Forecasts of Aviation Demand • Demand/Capacity Analysis and Facility Requirements • Development Alternatives • Financial Analysis • Airport Layout Plan (appendix)
1 - Inventory of Existing Conditions This chapter presents an overview of the existing conditions at the Pompano Beach Airpark, which includes the local vicinity and setting, physical facilities, operational activity, and general services and activities supported by the Airpark. This information provides insight into opportunities and constraints of the Airpark and its surroundings from both physical and operational perspectives. In other words, this inventory establishes the baseline of this Master Plan Update. Information and data for this inventory was acquired from multiple sources, including the City of Pompano Beach (the City), the FAA, and tenant and stakeholder interviews. Web-based research and on-site data validation was performed to supplement information where needed.
1.1 - Airpark Overview
The following provides a general overview of the Airpark, including a brief history, and its role in the state and regional stage.
1.1.1 - Airpark Location
The Airpark is located in the City of Pompano Beach, FL within Broward County, as depicted in Figure 1-1. The FAA classifies the Airpark as a regional general aviation (GA) airport per the General Aviation Airports Asset Report (ASSET 2, 2014). Under this classification, such airports support regional economies by connecting communities to statewide and interstate markets. They also are located in a metropolitan statistical area (MSA), have at least 1 based jet, 1,000 annual instrument operations, and 10 annual domestic flights over 500 miles. The Florida Aviation System Plan (FASP) also classifies the Airpark as a regional general aviation airport. Figure 1-2 and Table 1-1 illustrate Pompano Beach Airpark in the context of the surrounding airports.
Pompano Beach Airpark
p mpano • beach. Kimley>>) Horn MASTER PLAN UPDATE
Florida's warmest Welcome

Inventory of Existing Conditions
1-4
Table 1-1. Vicinity Airports Airport Airport Code Distance from PMP
Fort Lauderdale Executive Airport FXE 4 NM Boca Raton Airport BCT 8 NM Fort Lauderdale/Hollywood International Airport FLL 11 NM North Perry Airport HWO 16 NM Palm Beach County Park Airport LNA 21 NM Miami-Opa Locka Executive Airport OPF 22 NM Palm Beach International Airport PBI 26 NM Miami International Airport MIA 29 NM Miami Executive Airport TMB 39 NM Source: AirNav KPMP Pompano Beach Airpark, March 2018.
1.1.2 - Airpark History
The history of the Airpark dates back to World War II when it was an auxiliary training field serving the Naval Air Station – what is now Fort Lauderdale-Hollywood International Airport. In 1947, the Airpark was acquired by the City of Pompano Beach under the Surplus Property Act of 19471. After the City acquired the Airpark in 1947, the Airpark was renamed Pompano Beach Airpark, and it is still owned and operated by the City. Since that time, several land ownership transactions have occurred. Additional lands surrounding the Airpark, including land along Copans Road and the Florida East Coast Railway tracks to the west of the Airpark, and the land that is now the City Golf Course, have been transferred to the City f rom the Airpark since 1947.
1 City of Pompano Beach; http://pompanobeachfl.gov/pages/pw_airpark/airpark
Pompano Beach Airpark
p mpano • beach. Kimley>>) Horn MASTER PLAN UPDATE
Florida's warmest Welcome

Inventory of Existing Conditions
1-5
Figure 1-1. Airport Location Map
Sources: google.com/maps. Kimley-Horn.
Pompano Beach Airpark
z ~ z
~ <,J
a > < r.:
z m w a.
z ~ m - II>
m ~ ):, < Ill
Kendall Green -1:i,;1,;,11
ij;
m
NW 10th St
mJ w NW 3rd SI
m SJ
21
.. Iff.:.7' 1 ... ,J:u.,. ~sr s,.~ ' '-';t ..-~_ ... ,.
·t.:"' .. ,., ~
p mpano • beach. Kimley>>)Horn Aofidl'I Warmest Welcome
Le sme B va ECopans Rd
N~V 1 :ith P1 NW 15th Ct
NE 10th St
Pompano Beach z ,., .,,
@) :T ~ II>
(ill)
-"·"'
~ "l ----
• -"El
u ~ •. -....... ,
z z "' "' ..
'° z -;j, m 5-> ... ):, < ~ < "' ...
> ., Ill
NE 24th St
Pompano Beach Airpark
z I'"'. -..., s-> " ..
z rr ... !,!;' :::r
z ~ r " !: ::,-
? "'
NE 26th Ct
NE 15th St
N£: 24th St NE: 23rdq;
z m ..., .,. s> < ..
i->01
NE 27th St
0 GJ
z rn
'° :r ~ z "' ...,
NE 1th St i:,i s-~
NE1MS1 111
SE 5th Ct CJ> -n ~ :::r ~ r.,
..,
Pompano Community
Park
! NE!;hSt
~ GJ
GJ
NE 8th l>'t
t:;7.;\ Pompano Beach 0 ~
A1A
., > ~ >. C:
~
MASTER PLAN UPDATE

Inventory of Existing Conditions
1-6
Figure 1-2. Airport Vicinity Map
Sources: google.com/maps. Kimley-Horn.
Pompano Beach Airpark
p mpano • beach_ AOflda'I Warmest Welcome
mile Bend
des ncis
1/or e.
@} Twentym1le
Bend
0 Royal Palm
Beach @}
Wellington
West Palm
OJeach
@) @) @)
@ LakeWorth
Delray Beach -~ Boca Rafon
Pompano Beach Airpark
@) ~ Deerfield
~ -----....._ Beach . ~ !house
Coral Springs r o,nt
§3 Pompano Q Beach Everq/ades Wildlife
Management Area .
~ Sunrise w
Andytown W ~ (§) Fort Lauderdale
Weston
(ill
0+ Pe •
Pines 51' Hollywood
Aventura
Miamil~ ©
. East Coast Francis Buffer Water
S. Taylor Preserve Area W1/dhfe ..
@) w GJ 'Aw
• D •
Hialeah ~
+ Miami Beach
W Miami Beach
Miami
§ @) Coral Gables
...&... @) T Kendall
Kimley >>> Horn
Key Biscayne
+ Airports Within 25nm Vicinity
1 Palm Beach International Airport
2 Palm Beach County Airpark
3 Boca Raton Airport
4 Fort Lauderdale Executive Airport
Fort 5 Lauderdale-Hollywood
International Airport
6 North Perry Airport
7 Mii1mi-Opi1 locki1 Executive Airport
8 Miami International Airport
9 Miami Executive Airport
"'*£ s Not to Scale
Source: google.comlmaps
.::.... - . ~ •. ~. '~
-.~
MASTER PLAN UPDATE

Inventory of Existing Conditions
1-7
1.2 - Airport Activity Overview
This section provides an overview of the general types of activity occurring at the Airpark. To establish context, there were approximately 150,000 aircraft operations in 20172, with nearly one third being itinerant operations, and two thirds local operations. The Airpark is well-positioned geographically and is established as a regional general aviation asset in a favorable, year-round flying climate. It actively caters to the general aviation sector, including corporate aviation, personal aviation, flight training, and helicopter activity. In comparison to other nearby general aviation airports, the Airpark has fewer large corporate aircraf t operations, with a heavy focus on recreational and educational aviation.
1.2.1 - Flight Training
A significant portion of the aviation activity at the Airpark is associated with flight training. The Airpark is also home to numerous flight training institutions, which heavily contribute to local aviation activity. Fixed-wing f light schools located at the Airpark currently include American Flyers, Paul Kramer’s Learn to Fly, Florida Aviation Academy, Orange Wings Aviation, Tailwheel Aviation, Florida Coast to Coast, and Dare to Dream. South Florida Aircraft Maintenance also operates a small flight training operation as an ancillary business. In addition to these institutions, helicopter training is also prevalent at the Airpark and is highlighted below in the next subsection.
1.2.2 - Helicopter Activity
There were 12 helicopters based at the Airpark as of 2017. Discussions with tenants and Airpark staff have indicated congestion, particularly in the midfield area north of Runway 10-28, due to limited practice landing area available on the Airpark property. The Airpark also sees helicopter activity from Broward Sherif f’s Office Fire Rescue.
1.2.3 - Goodyear Blimp
The Goodyear Blimp base-of-operations location is a unique attribute of the Airpark. Goodyear currently holds a lease with the Airpark, occupying approximately 32.5 acres on the west side of the Airpark. The Goodyear facilities include a 45,000-square foot hangar – which can accommodate two fully-inflated blimps – and a 3,500 square foot operations/administration building. Goodyear’s leased property includes the hangar as well as a large mooring circle for the airship. Arrival and departure activity for the blimp generally occurs to the east and northeast.
1.2.4 - Aircraft Maintenance
The Airpark is home to several aircraft maintenance organizations, the largest of which is Daher-Socata, an aircraf t manufacturer of personal turboprop aircraft. Daher-Socata operates a 30,000 square-foot hangar and office facility at the Airpark, and the majority of the active Socata aircraft fleet have scheduled maintenance performed there.
1.3 - Airfield Facilities
Airf ield facilities accommodate the takeoff and landing of aircraft and the movement of those aircraft about an airport. The following describes the primary airfield infrastructure systems at the Airpark
2 FAA Terminal Area Forecast, 2018.
Pompano Beach Airpark
p mpano • beach. Kimley>>) Horn MASTER PLAN UPDATE
Florida's warmest Welcome

Inventory of Existing Conditions
1-8
including the runways, taxiways, aprons, navigational aids, and the Air Traffic Control Tower (ATCT) as they existed at the time of this Master Plan Update. Figure 1-3 illustrates key facilities.
1.3.1 - Runways
The Airpark has three paved asphalt runways. Runway 15-33 is 4,918 feet long and 150 feet wide. Runway 6-24 provides crosswind coverage and is 4,001 feet long and 150 feet wide. The third runway, 10-28 is the smallest runway at the Airpark with a length of 3,502 feet and width of 100 feet. However, Runway 10-28 is the most heavily utilized runway, especially with touch and go operations. The runway system at the Airpark can accommodate a wide range of general aviation aircraft, including business jets and smaller recreational airplanes. The rated pavement strength of the runway system, limits aircraft to a gross weight of 30,000 pounds.
Existing runway data is presented in Table 1-2.
Table 1-2. Existing Runway Data Runway 15-33 Runway 6-24 Runway 10-28
Runway Design Code B-II B-II (Small) B-I (Small) Length (feet) 4,918 4,001 3,502 Width (feet) 150 150 100 Displaced Threshold (feet) 500/340 0/0 0/0 Ef fective Runway Gradient (%) 0.10% 0.16% 0.23% Runway Surface Type Asphalt Asphalt Asphalt Pavement Strength (lbs.)
Single Wheel 30,000 20,000 26,000 Dual Wheel N/A N/A N/A
Pavement Condition Index Good Fair Fair Runway Markings NPI/NPI VISUAL/VISUAL VISUAL/VISUAL Runway Lighting MIRL MIRL/REIL MIRL/REIL Instrument Approaches LOC/GPS-LPV GPS-LPV/GPS-LPV NONE/NONE Approach Lighting MALS/PAPI-4L PAPI-2L PAPI-2L Visibility Minimums ¾ mile / ¾ mile 1 ¼ mile / 1 mile N/A Declared Distances
TORA N/A N/A N/A TODA N/A N/A N/A ASDA N/A N/A N/A
LDA N/A N/A N/A
Sources: Form 5010, accessed 2/12/2018. FAA web data sheet published 6/22/2017. PMP Airport Layout Plan, 8/2016. Airport Pavement Evaluation Report, Florida Department of Transportation, 9/2017.
Pompano Beach Airpark
p mpano • beach. Kimley>>) Horn MASTER PLAN UPDATE
Florida's warmest Welcome

Inventory of Existing Conditions
1-9
Figure 1-3. Airport Airfield Facilities
Sources: google.com/maps. Kimley-Horn.
Pompano Beach Airpark
p mpano • beach. Kimley>>)Horn Florida's Warmest Welcome
i ...... ....,,
g
i
[ Copans Rd)
' \ ' \ ... --~
·-, .. ,_ ·, .. ,_
Legend
Rmways
Taxiways
- -- Property Line
Ru1way Pro(ection
·, ··, ..• , ) Zone
Airport Traffic Control Tower (ATCn
GRAPHIC SCALE IN FEET 0 375 750 1500
MASTER PLAN UPDATE

Inventory of Existing Conditions
1-10
1.3.2 - Taxiways
The runway system at the Airpark is served by a system of taxiways that provide access between the runways and aircraft apron areas. Taxiways allow for controlled and organized movement between areas of the airfield and allow for circulation around the runways, terminal area, cargo area, general aviation facilities, and other parking areas. The taxiway system at the Airpark is illustrated in Figure 1-3.
1.3.3 - Lighting, Markings and Signage
All three runways are equipped with Medium-Intensity Runway Lights (MIRL). As an additional visual aid, Runway 6-24, Runway 10-28 and Runway 33 are equipped with Runway End Identifier Lights (REIL), which consists of a pair of synchronized flashing lights on either side of the runway threshold.
Runway 15 is also equipped with a Medium Intensity Approach Lighting System (MALS). This system helps pilots transition from instrument flight to visual flight for landing when approach visibil ity minimums are reduced in instrument weather conditions.
The rotating beacon indicates the Airpark location at night or in adverse weather conditions. The rotating beacon is located south of the airfield and directly south of the ATCT. The optical rotating beacon system projects two beams of light, one green and one white, 180 degrees apart. The beacon continuously operates between sunset and sunrise.
All taxiways at the Airpark have visible taxiway centerline stripes with hold-short lines located at the required locations as well as enhanced centerline markings leading up to hold-short lines. These markings ensure that aircraft taxi along designated passageways for proper wingtip clearance and warn of the areas protected for runway operations.
1.3.4 - Navigational Aids
Navigational aids, or NAVAIDs, assist pilots in locating an airport and safely and efficiently maneuvering aircraf t through landing and take-off in a variety of meteorological conditions. NAVAIDs are any visual or electronic device, airborne or on the surface, that provide point-to-point guidance information or position data to aircraft in flight. In addition to the lighting system and markings previously discussed, runways are generally equipped with other navigational aids to assist pilots in takeoff and landing procedures. Some indicate weather conditions, while others give either visual or instrument course guidance.
1.3.4.1 - Precision Approach Path Indicators
Precision Approach Path Indicator Lights (PAPI) provide pilots with visual descent guidance information during an approach to a runway. All runways at the Airpark are equipped with PAPIs.
1.3.4.2 - Localizer Antenna
Runway 15 is equipped with a localizer (LOC) antenna which is used to establish and maintain an aircraf t’s horizontal position until visual contact confirms the runway alignment and location, usually as part of a localizer approach. The LOC antenna is located on the extended runway centerline of Runway 15, outside of the RSA. The Airpark does not have a glideslope antenna, which comprises the second necessary component of an instrument landing system (ILS), along with a localizer antenna.
Pompano Beach Airpark
p mpano 'llbeach. Kimley»>Horn MASTER PLAN UPDATE
Florida's warmHI WelCO/Tll

Inventory of Existing Conditions
1-11
1.3.4.3 - Automated Surface Observing System
The Automated Surface Observing System (ASOS) measures atmospheric indicators such as cloud cover, ceiling, visibility, wind speed and direction, temperature, dew point, precipitation accumulation, icing, and sea level pressure, and it detects lightning. ASOS equipment is generally installed in a location that best represents the meteorological conditions affecting operations. The Airpark’s ASOS is in the middle portion of the airfield, north of Runway 10-28 and east of Taxiway M.
1.3.4.4 - Lighted Wind Indicators
The Airpark is equipped with seven Lighted Wind Indicators, located midfield and at each runway end. The lighted wind indicators are used by pilots to discern the direction, speed, and gusts of the wind at an airport and can also be used to determine the runway in use.
1.3.5 - Air Traffic Control Tower
The ATCT is operated by Robinson Aviation, Inc. under the Federal contract tower program. The ATCT operates from 7:00AM to 9:00PM daily and is contiguous to the current administration building. Six controllers staff the ATCT.
1.3.6 - Runway Utilization
Based on information gathered from the ATCT and Airpark administration, Runway 10-28 is the most f requently utilized runway at the Airpark, comprising approximately 80% of use. Runway 15-33 is utilized approximately 20% of the time and serves the larger aircraft at the Airpark. Runway 6-24 is utilized the least, and it is generally only used sporadically throughout the year, mainly in the winter. Peak traffic periods are generally later morning hours until noon and again from early through late afternoon. All aircraf t traffic patterns are north of the runways.
1.4 - Potential Airfield Issues
During the inventory process, airfield issues and concerns were identified by Airpark Management and tenants, and they are described in further detail below. It should be noted that these areas are not designated as official FAA Hot Spots.
1.4.1 - Taxiway M / Taxiway L / Runway 6
One location of concern is in the western portion of the airfield in the vicinity of Taxiway M, Taxiway L, and the threshold of Runway 6. This area is subject to a high level of westbound taxiing traffic on Taxiway L, departing on Runway 10. The intersection of Taxiway L with Taxiway M immediately east of Runway 6 results in a wide expanse of pavement with a very gradual south jog in the Taxiway L centerline before reaching the hold line for Runway 6-24. This area is depicted in Figure 1-4.
Pompano Beach Airpark
p mpano 'llbeach. Kimley»>Horn MASTER PLAN UPDATE
Florida's warmHI WelCO/Tll

Inventory of Existing Conditions
1-12
Figure 1-4. Taxiway L / Taxiway M / Runway 6-24 Vicinity
Source: Kimley-Horn.
1.4.2 - Runway 33 / Runway 28 Thresholds
Another area of concern is in the eastern portion of the airfield in the vicinity of Taxiway L, Taxiway E, and the thresholds of Runway 33 and Runway 28. The portion of Taxiway L leading up to the Runway 33 threshold opens into a wide expanse of pavement associated with the displaced landing threshold of Runway 33 with a wide runway hold line. In order for aircraft to taxi for departure on Runway 28, aircraft must cross this wide expanse through the displaced threshold and taxi onto Taxiway E, where there is essentially no room for an aircraft to hold between the hold line for Runway 10-28 and the hold line for Runway 15-33, as the two runway safety areas overlap each other. This area is depicted in Figure 1-5.
Pompano Beach Airpark
p mpano 'llbeach. Kimley»>Horn MASTER PLAN UPDATE
Florida's warmHI WelCO/Tll

Inventory of Existing Conditions
1-13
Figure 1-5. Runway 33 / Runway 28 Threshold and Taxiway L / Taxiway E
Source: Kimley-Horn.
1.4.3 - Helicopter Landing and Practice Areas
The Airpark is heavily utilized by helicopter companies for helicopter pilot training. As such, a significant amount of hover taxiing and helicopter landings occur on taxiways north of Runway 10-28. A concern expressed during the inventory process was the congestion of helicopter operations on the taxiways in the midfield.
Pompano Beach Airpark
p mpano 'llbeach. Kimley»>Horn MASTER PLAN UPDATE
Florida's warmHI WelCO/Tll

Inventory of Existing Conditions
1-14
1.5 - Airspace
The U.S. National Airspace System (NAS) is an integrated collection of controls, procedures, and policies implemented and regulated by the FAA to ensure safe and efficient air operations. The NAS is divided into airspace classes to designate the level of service and operating rules for a given area. The following describes the airspace classifications, aeronautical charts, instrument approach capabilities, departure procedures, and air traffic control (ATC) at the Airpark.
Airspace is generally categorized as controlled, uncontrolled, or special use. Within these categories, the Federal Aviation Regulations (FAR) Parts 71 and 73 establish specific airspace classifications that impose various requirements upon the operation of aircraft, including visibility minimums, cloud clearance, communication with the ATC, and specific aircraft equipment. The general classifications are depicted in Figure 1-6.
Pompano Beach Airpark falls into Class D airspace. Class D airspace is generally cylindrical, although in the case of the Airpark, the airspace is irregular due to the close proximity of other busy airports. Aircraft are required to communicate with the ATCT in Class D airspace, which usually extends 2,500 feet above ground level (AGL) with a radius of 4 nautical miles. The sectional chart in Figure 1-7 shows the airspace in the vicinity of the Airpark.
Figure 1-6. Airspace Classifications
Sources: FAA Aeronautical Information Manual. Kimley-Horn.
Pompano Beach Airpark
FL600 MSL 18,000
14,500 MSL
p mpano • beach. Kimley>>) Horn Flortda'1 warmest Welcome
Class A
Class E
MASTER PLAN UPDATE

Inventory of Existing Conditions
1-15
Figure 1-7. Airport Airspace Map
Source: FAA National Aeronautical Charting Office.
Pompano Beach Airpark
p mpano 'llbeach. Kimley»>Horn MASTER PLAN UPDATE
Florida's warmHI WelCO/Tll

Inventory of Existing Conditions
1-16
1.5.1 - Airspace Considerations
As illustrated in Figure 1-7, Pompano Beach Airpark is located among several other busy tower-controlled airports in the vicinity serving both general aviation and commercial service operations. Fort Lauderdale/Hollywood International Airport (FLL) is approximately 11 nautical miles south of the Airpark and has class C airspace that adjoins the Airpark’s Class D airspace. Fort Lauderdale Executive Airport (FXE) is a very busy general aviation airport approximately 4 nautical miles southwest of the Airpark, and its airspace also adjoins that of the Airpark. Boca Raton Airport (BCT) is located approximately 7.5 nautical miles north of the Airpark.
The proximity of several airports with tower-controlled airspace such as Class D and Class C results in limited areas for flight training practice over land, with most flight training occurring to the west in a designated Alert Area. The overlap of neighboring airport airspaces presents local operating challenges and limitations. The ATCTs at the Airpark and FXE have established agreements on traffic pattern altitudes between the two airports to minimize conflicts and ensure safe aircraft separation. Under this agreement, traffic pattern operations at the Airpark are kept to the north of all runways.
1.5.2 - Instrument Approaches
Instrument approach procedures allow an approaching aircraft to land at an airport during inclement weather conditions. These approach procedures are established by the FAA and allow equipped aircraft and properly trained pilots to approach an airport during instrument meteorological conditions (IMC).
Visual meteorological conditions (VMC) are defined as a cloud ceiling greater than 1,000 feet AGL and visibility conditions equal to or greater than 3 statute miles. Pilots may approach an airport using visual cues under VMC conditions. Conversely, IMC is designated when cloud ceilings are lower than 1,000 feet AGL and visibility becomes less than 3 statute miles. Under these conditions, properly trained pilots with adequately equipped aircraft must follow FAA-published instrument approach procedures to land at an airport.
Pompano Beach Airpark has five published instrument approaches (refer to Table 1-2). Four GPS approaches are published for Runway 6, 15, 24 and 33. Runway 15 also has a localizer approach. Based on information from the ATCT, the Airpark is in IMC approximately 5% of the time on an annual basis.
1.5.3 - Meteorological Conditions & Climate
Local climate and meteorological conditions affect operations at an airport in a variety of ways. Winds, precipitation, and temperature characteristics of an area can influence airport development d ecisions pertaining to NAVAIDs, runway orientation, and required runway length. This section addresses the meteorological conditions at the Airpark.
1.5.3.1 - Local Weather Conditions
The average annual temperature at the Airpark is 76 degrees Fahrenheit (F), the average low is 58 degrees F (January), and the average high is 92 degrees F (July)3. Average monthly precipitation ranges f rom 2 to 8 inches.
3 The Weather Channel; Almanac Records & Averages - Pompano Beach, FL Monthly Weather; 2018;
https://weather.com/weather/monthly/l/USFL0412:1:US
Pompano Beach Airpark
p mpano 'llbeach. Kimley»>Horn MASTER PLAN UPDATE
Florida's warmHI WelCO/Tll

Inventory of Existing Conditions
1-17
1.5.3.2 - Crosswind Coverage
Wind speed and direction influence runway use. A runway is ideally oriented with the prevailing wind, as aircraf t performance is best when taking off and landing into the direction of the wind. FAA airport planning criteria indicate that the primary runway should be capable of operating under allowable wind conditions at least 95 percent of the time. Based on existing data, the crosswind coverage at the Airpark is nearly 100 percent for all weather conditions at 10 knots, including both IFR and VFR conditions. The Airpark’s Wind Roses are shown in Figure 1-8, Figure 1-9, and Figure 1-10.
1.6 - Ground Access Facilities
This section includes a general overview of the automobile parking, access roadways, and fencing facilities.
1.6.1 - Automobile Parking
Automobile parking for landside facilities is primarily accessed from NE 10th Street as well as off of Dixie Highway. A visual count of parking using aerial imagery indicates there are approximately 370 parking stalls for various Airport facilities, including ATCT, the administration building, Airpark tenants and hangars, and FBOs.
1.6.2 - Regional and Access Roadways
This section includes a brief listing of freeways, highways, and arterial roadways that provide vehicular access to the Airpark. These roadways contain high traffic volumes, as they serve densely populated urban areas and carry a large number of passenger trips. Figure 1-11 illustrates the access roadways, including the identification of regional roadways near the Airpark.
1.6.2.1 - Regional Roadways
• North Dixie Highway is a four-lane, north-south oriented highway located to the west of the Airpark. It stretches southbound until it terminates in Fort Lauderdale, Florida. It stretches north until it terminates in Deerfield Beach, Florida.
• US Highway 1 is a six-lane, north-south oriented highway located to the east of the Airpark. It stretches south parallel to the Atlantic Ocean until it terminates in Key West, Florida. It stretches north until it terminates in Jacksonville, Florida.
• Atlantic Boulevard is a four-lane, east-west oriented highway located to the south of the Airpark It stretches east until it terminates at the intersection of Pompano Beach Boulevard and Briny Avenue. It stretches west until it terminates at the intersection of West Atlantic Boulevard and Sawgrass Expressway.
• East Copans Road is a six-lane divided arterial road that runs in an east-west orientation and is located on the north side of the Airpark. It provides access to NE 5th Avenue which leads to the west side of the airfield. East Copans Road also provides access to the regional roadway system, connects west with North Dixie Highway and Interstate 95, and connects east with US Highway 1.
Pompano Beach Airpark
p mpano 'llbeach. Kimley»>Horn MASTER PLAN UPDATE
Florida's warmHI WelCO/Tll

Inventory of Existing Conditions
1-18
Figure 1-8. All Weather Wind Rose
Source: FAA AGIS Wind Analysis Tool.
Pompano Beach Airpark
p mpano • beach. Aorldl'I Wlrll'IHI Welcome
Kirnley>>> Horn MASTER PLAN UPDATE

Inventory of Existing Conditions
1-19
Figure 1-9. IFR Wind Rose
Source: FAA AGIS Wind Analysis Tool.
Pompano Beach Airpark
p mpano • beach_ flof1da'1 wa,mest Welcome
Kimley>>> Horn MASTER PLAN UPDATE

Inventory of Existing Conditions
1-20
Figure 1-10. VFR Wind Rose
Source: FAA AGIS Wind Analysis Tool.
Pompano Beach Airpark
p mpano • beach. flo,lda's warmest WtltOfflfl
Kimley>>> Horn MASTER PLAN UPDATE

Inventory of Existing Conditions
1-21
Figure 1-11. Airport Roadway Access
Sources: google.com/maps. Kimley-Horn.
Pompano Beach Airpark
P mpano • beach. Kimley>>)Horn Florida's Warmest Welcome
Legend
~ I Interstate Roadways
I Regional Roadways
I Airpo:t Access Roadways
"*" '
MASTER PLAN UPDATE

Inventory of Existing Conditions
1-22
1.6.2.2 - Airport Access Roadways
• NE 5th Avenue is a two-lane road located west of the airfield that provides access from East Copans Road to the west side of the airfield. NE 5th Avenue is north-south oriented and runs parallel to North Dixie Highway. It also provides access to the Goodyear Airship Operations building and parking facilities located west of Runway 15-33 and north of Runway 10-28.
• NE 10th Street is a two-lane road located south of the Airpark aprons and general aviation facility areas. It provides access to the parking facilities associated with the general aviation activities at the south portion of the airfield. It also provides access from the regional roadway systems, connects west to North Dixie Highway, and connects east to US Highway 1.
1.7 - General Aviation Facilities
General Aviation (GA) describes most aviation activity that is not categorized as air carrier or military. Nearly all activity at the Airpark is GA activity, with a significant portion of flight training. Other activity includes aircraft rental, corporate aviation, air taxi/charter, scenic rides, air ambulance, and mapping and surveying. Fixed base operators (FBOs) provide many of these services at the Airpark.
1.7.1 - Fixed Base Operators
An FBO refers to an organization or commercial business allowed to operate at an airport and provide aeronautical services such as fueling, hangar rentals, tie-down and parking, aircraft rental, aircraft maintenance, flight instruction, and similar services. Depending on the size of the Airpark and user demands, one or multiple FBOs are often the primary providers of support services to general aviation operators at public-use airports. In the case of the Airpark, the FBOs also sublease to tenants, such as aircraf t maintenance organizations, flight training institutions, and other private aviation businesses.
At the time of this Master Plan Update, the FBOs at the Airpark included the following:
• Sheltair Aviation is a traditional FBO that provides services such as full-service aviation fuel, aircraf t parking, a passenger terminal lounge, and flight planning rooms. It also leases conventional hangar space and T-hangars. Sheltair recently constructed two additional 20,000 square-foot conventional hangars immediately west of their existing facility.
• Pompano Aviation provides self-serve avgas and Jet-A fuel to based tenants as well as hangar leasing, but it does not provide traditional FBO services such as hangar space and tie-down spaces to itinerant aircraft.
1.7.2 - Aircraft Hangars
The Airpark has several types of hangars: T-hangars, box hangars and conventional hangars. The hangars are south of the apron and provide approximately 128 units for aircraft storage. Table 1-3 outlines the types and quantities of hangars at the Airpark. The Goodyear Blimp facility is not included in this summary below, as it is a unique operator with a specific use.
Pompano Beach Airpark
p mpano • beach. Kimley>>) Horn MASTER PLAN UPDATE
Florida's warmest Welcome

Inventory of Existing Conditions
1-23
Table 1-3. Hangar Space
FBO Conventional
Hangar Box Hangar T-Hangar
Sq Ft Number Sq Ft Number Sq Ft Number Sheltair Aviation 65,000 3 22,000 6 162,300 112 Pompano Aviation 32,000 1 33,600 7 -- -- Aviation Center of Pompano -- -- 52,800 11 16,500 11 Total 97,000 4 108,400 24 178,800 123 Sources: Tenant Interviews (2018). Airport Layout Plan dated 8/2016.
1.7.3 - Apron Space and Tiedowns
Tiedown spaces are located throughout the apron areas and are designated for various tenants as well as some tiedowns owned by the City. There are approximately 120 tiedowns across the Airpark, including 35 tiedowns owned by the City.
1.8 - Support Facilities
Support facilities are vital to the ongoing operation of an airport – these facilities for Pompano Beach Airpark include fuel storage, firefighting, administration and maintenance, and utilities.
1.8.1 - Fuel Storage
The Airpark has several fuel storage tanks and trucks that are owned by various tenants. A summary of the fuel storage facilities is presented below in Table 1-4.
Table 1-4. Fuel Storage Facilities
FBO Jet A (gal) Avgas (gal)
Tank Truck Tank Truck Sheltair Aviation 15,000 6,000 15,000 2,000 Pompano Aviation 12,000 -- 12,000 -- American Flyers -- -- 10,000 -- Total 33,000 39,000 Source: Tenant Interviews (2018).
1.8.2 - Airpark Administration and Maintenance
The administration building and maintenance facilities are located in the southern vicinity of the Airpark at the end of a road accessed from NE 10th Street. The administration building is collocated with the ATCT and is approximately 3,000 square feet in size. The administration building was renovated in 2019 and includes office and storage space, as well as a lounge/kitchen area.
Pompano Beach Airpark
p mpano • beach. Kimley>>) Horn MASTER PLAN UPDATE
Florida's warmest Welcome

Inventory of Existing Conditions
1-24
Airpark maintenance facilities are located immediately west of the administration building and include approximately 4,500 square feet of maintenance equipment and vehicle storage.
1.8.3 - Fire Station
Pompano Beach Fire Station 24 was formerly located on the property on the northeast side of 10th Street, west of US 1. It was not an official Aircraft Rescue and Firefighting (ARFF) station and was demolished in early 2018. It was rebuilt in its current location and includes one bay for an ARFF-type vehicle. The Airpark is not a FAR Part 139 certificated airport with official ARFF requirements; however, a need in the master planning process has been expressed to identify access points for city firefighting equipment to access the airfield in the event of an aircraft emergency.
1.9 - Zoning and Land Use
This section provides an overview of the City’s land use and zoning within and immediately surrounding the Airpark environs, as well as significant proposed land developments as of the writing of this Master Plan Update.
1.9.1 - Zoning
Zoning is the division of land within a municipality into multiple zones or areas in which various land uses may be permitted or prohibited. The majority of the land encompassing the Airpark property is zoned for transportation uses by the City. Some portions of the Airpark property, however, are currently zoned for parks and recreational uses, which has been an issue identified for the Master Plan Update to address. The current zoning in the Airpark vicinity is shown in Figure 1-12.
1.9.1.1 - Airpark Overlay District
The City has adopted an Airpark Overlay (APO) district that delineates zones that are consistent with airspace surfaces defined in Florida Statute Chapter 333 and FAR Part 77. The specific zones and delineations are described in Chapter 155 of the Pompano Beach Code of Ordinances.
1.9.2 - Future Land Use
The proposed future land use in the Airpark vicinity is depicted in Figure 1-13 and is consistent with the current zoning. A significant proposed development is the redevelopment of downtown Pompano Beach, approximately one mile southwest of the Airpark. A majority of the downtown area is proposed to be redeveloped as a transit oriented corridor with surrounding high density multifamily housing, known as the “Innovation District.” The implementation of this redevelopment is still in the early stages.4
4 Community Redevelopment Agency; Innovation District Presentation; http://pompanobeachfl.gov/pages/cra/cra
Pompano Beach Airpark
p mpano • beach. Kimley>>) Horn MASTER PLAN UPDATE
Florida's warmest Welcome

Inventory of Existing Conditions
1-25
Figure 1-12. Existing Zoning Map
Sources: City of Pompano Beach. Kimley-Horn.
Pompano Beach Airpark
p mpano • beach. Florida's Warmest Welcome
Kimley>>>Horn
legend
Cl Single Family Rosidonce -Multiple Family Residence -Multiple Family Residenoe -Multiple Family Residence -Community Facilities -Transil Orieolod -Parks and Reaeation -Gt.tneral Busiless -Community Busines.s
t....::] Lifrited Business -Gen8fal Industrial
Not to Scale
Source: City of Pompano Boach
MASTER PLAN UPDATE

Inventory of Existing Conditions
1-26
Figure 1-13. Future Land Use Map
Sources: City of Pompano Beach. Kimley-Horn.
Pompano Beach Airpark
p mpano • beach. Florida's Warmest Welcome
Kimley>>>Horn
Legend
D Transportation
D LOW 1•5 DU/AC -Low-Medium 5-10 OU/AC -Medium 10.16 DU/AC -Mecll!Jm-High 16-25 OU/AC -High 25-46 OU/AC -Commercial -Recteation Open Space -Downtown Pompano Transit Oriented Corridor -Communit~ F8Cilities -Industrial -UtiHies
(I] Irregular Density
Not to Scale Source City of f>on1>ano Bead1
MASTER PLAN UPDATE

Inventory of Existing Conditions
1-27
1.10 - Environmental Considerations
A cursory-level inventory of the environmental conditions on or near the Airpark was undertaken for this Master Plan Update. This included readily-available information found from existing reports, studies and environmental documents, as well as known environmental and land use restrictions based on discussions with Airpark staff.
1.10.1 - Local Areas of Particular Concern and Environmentally Sensitive Lands
Per the Broward County Land Use Plan, local areas of particular concern (LAPC) are areas that have been declared to be environmentally sensitive from the standpoint of one or several environmental characteristics, including marine resources, natural landforms and features, native vegetation, wildlife, economic resources, and cultural resources.
There are six protected natural lands on the Airpark property which are designated as the Pompano Beach Airpark Tree Preserve and also designated as LAPCs, as depicted in Figure 1-14.
1.10.2 - Wellf ield Protection Zones
There are several potable water wells on the western portion of the Airpark property. These wells provide potable water for community use from subsurface aquifers. Each wellfield is surrounded by a protection zone delineated into three sub-zones. Each zone has varying restrictions on land use and activities within the zone, as well as notification requirements. These requirements are promulgated in Chapter 27, Article XIII of the Broward County Code. Any proposed development on the airfield within these zones will need to conform to these requirements.
Pompano Beach Airpark
p mpano • beach. Kimley>>) Horn MASTER PLAN UPDATE
Florida's warmest Welcome

Inventory of Existing Conditions
1-28
Figure 1-14. Local Areas of Particular Concern
Sources: Broward County GIS. Kimley-Horn.
Pompano Beach Airpark
p mpano • beach. Kimley>>) Horn Florida's warmest Welcome
Legend
local Area of Particular Concern
" .• , s
No Seate
Source: Broward Couniy GIS
MASTER PLAN UPDATE

Inventory of Existing Conditions
1-29
1.10.3 - Section 4(f) and 6(f) Resources
According to Section 4(f) of the U.S. DOT Act of 1966 (Title 49, U.S.C. Section 1653(f); amended and recodified in 49 U.S.C. Section 303), the Secretary of Transportation will not approve any program or project that requires the use of publicly owned land from a park, recreation area, or wildlife and waterfowl refuge of national, state, or local significance or land from a historic site of national, state, or local significance unless there is no feasible alternative that would avoid such use and the program includes all possible planning efforts to minimize resultant harm.
Section 6(f) of the Land and Water Conservation Fund Act (L&WCFA) (16 U.S.C. Section 4601 et. seq.; Title 36 C.F.R. Part 59) prohibits the conversion of lands purchased with L&WCFA funds to non-recreational uses without the explicit approval of the Secretary of the Department of the Interior (DOI) through the National Park Service (NPS) and the replacement of those lands with a reasonable equivalent.
Figure 1-15 depicts the public parks and recreation areas surrounding the Airpark, including:
• Pompano Beach Baseball Park • Pompano Community Park • Kester Park • Harbor’s Edge Park • Alsdorf Park • Cresthaven Park • Lovely Park • Novelty Park • Coleman Park • Mitchell Moore Park
Additional research would be needed to determine if any L&WCFA funds were used in the development of these or other nearby recreational facilities. Future Airpark development actions must take into consideration the potential for direct and constructive-use impacts to any local Section 4(f) or Section 6(f) resources.
1.10.4 - Hazardous Materials
Hazardous materials are usually considered to be associated with industrial wastes, petroleum products, dangerous goods, or other contaminated substances. The statutory framework regarding hazardous materials in FAA actions is provided by the Resource Conservation and Recovery Act (42 U.S.C. Section 6901, et seq. (RCRA)), the Comprehensive Environmental Response Compensation and Liability Act (42 U.S.C. Section 9601 (CERCLA)), and the Community Environmental Response Facilitation Act (Public Law [P.L.] 102-426). These statutes address the use, storage, and disposal of hazardous materials and the environmental threats caused by mishandling these materials.
Hazardous substances in regular use at the Airpark include aircraft and vehicle fuels. Smaller amounts of hazardous substances are also stored on the Airpark, including lubricants and solvents, used oils, filters, cleaning residues, spent batteries, herbicides, fertilizers, paints, and fire-fighting foam. Aircraft maintenance operators and/or fixed based operators are responsible for storage compliance, disposal, and care of fluids or spills. Further analyses would be needed to determine if the Airpark or its tenants possess a threshold quantity of the regulated substances.
Pompano Beach Airpark
p mpano • beach. Kimley>>) Horn MASTER PLAN UPDATE
Florida's warmest Welcome

Inventory of Existing Conditions
1-30
Figure 1-15. Vicinity Parks and Recreation
Source: google.com/maps. Kimley-Horn.
Pompano Beach Airpark
p mpano • beach. Florida's Warmest Welcome
Kimley>>> Horn
1
2
3
4
5
6
7
8
9
10
Pompano Beach Baseball Park
Pompano Commul\lty
''"' Kest er Park
Harbor's Edge Park
Alsdorf Park
Cresthaven Park
Lovely Park
Novelty Park
M itchell Moore Park
Coleman Park
MASTER PLAN UPDATE

Inventory of Existing Conditions
1-31
1.10.5 - Historic & Archeological Sites
The National Historic Preservation Act (36 C.R.F. Part 800 (NHPA)), as amended, provides for the preservation of cultural resources eligible for inclusion in the National Register of Historic Places (NRHP). Section 106 of the NHPA directs heads of federal or independent agencies that have direct or indirect jurisdiction over a federal or federally-assisted undertaking to ‘take into account the effect on any district, site, building, structure, or object that is included in or eligible for the inclusion in the National Register.’
Currently, there are no sites, buildings, structures, or objects on or near the Airpark that are recognized by the National Register of Historic Places.
1.10.6 - Farmlands
Prime farmland – as defined by the United States Department of Agriculture (USDA) – is land that has the best combination of physical and chemical characteristics for producing food, feed, fiber, forage, oilseed, and other agricultural crops with minimum inputs of fuel, fertilizer, pesticides, and labor, without intolerable soil erosion. The soil on Airpark property is not classified as prime farmland.
1.10.7 - Wetlands
According to The U.S. Fish and Wildlife Service the Airpark property includes one identified Wetland, a Freshwater Pond located east of the Runway 24 end spanning 4.04 acres. The Freshwater Pond is classified as a PUBHx defined as a, System Paulustrine (P), Class Unconsolidated Bottom (UB), Water Regime Permanently Flooded (H), and Special Modifier Excavated (x).
1.10.8 - Flood Zones
The City of Pompano Beach Stormwater Master Plan identifies the Airpark located in a Zone “X” FEMA f lood zone and is defined as an area of minimal flood hazard, usually depicted on Flood Insurance Rate Maps (FIRMs) as above 500-year flood level.
1.11 - Summary
Information obtained during the inventory process from data sources as well as tenant and user discussions has been summarized within the preceding narrative and was used to inform subsequent ef forts in the master planning process based on the existing and anticipated Airpark activity, as well as constraints and challenges.
Pompano Beach Airpark
p mpano • beach. Kimley>>) Horn MASTER PLAN UPDATE
Florida's warmest Welcome

Aviation Activity Forecasts
2-1
Chapter 2:Aviation Activity Forecasts
Contents
2 - AVIATION ACTIVITY FORECASTS 2-4
2.1 - Historical and Existing Aviation Activity 2-4Based Aircraft 2-5Aircraft Operations 2-5Regional Activity Comparison 2-6
2.2 - National Aviation Trends 2-8FAA General Aviation Forecast Trends 2-8Active Pilots 2-9Active Hours Flown 2-10Active General Aviation Aircraft Fleet 2-10General Aviation Activity Trends 2-11National and International Pilot Shortage 2-12Business Use of Aviation 2-13NextGen 2-13Unmanned Aircraft Systems 2-14
2.3 - Socioeconomic Trends 2-14Population 2-14Economic Indicators 2-15Socioeconomic Trends - Summary 2-17
2.4 - Previous Forecasts 2-17
2.5 - Forecast Assumptions and Approach 2-18
2.6 - Based Aircraft Forecasts 2-18
2.7 - Based Aircraft Methodologies 2-19Based Aircraft Forecast - Socioeconomic Methodology 2-19Based Aircraft Forecast – Regional Market Share Methodology 2-21Based Aircraft Forecast – FAA Aerospace Forecast Methodology 2-22Based Aircraft Forecast – Preferred Methodology 2-23Based Aircraft Fleet Mix 2-24
2.8 - Aircraft Operations Forecasts 2-25General Aviation Operations Methodologies 2-25Peak Activity Forecasts 2-36
Pompano Beach Airpark
2.1.1 -2.1.2 -2.1.3 -
2.2.1 -2.2.2 -2.2.3-2.2.4 -2.2.5-2.2.6-2.2.7 -2.2.8-2.2.9-
2.3.1 -2.3.2 -2.3.3-
2.7.1 -2.7.2 -2.7.3-2.7.4 -2.7.5-
2.8.1 -2.8.2 -
p mpano I ~ .~~?,S~- Kimley>>>Horn MASTER PLAN UPDATE

Aviation Activity Forecasts
2-2
2.9 - Design Aircraft Determination 2-37
2.10 - FAA TAF Comparison 2-40
TablesTable 2-1. Historical Based Aircraft ....................................................................................................... 2-5Table 2-2. Historical Annual Aircraft Operations .................................................................................... 2-6Table 2-3. Comparison of Regional Activity at Airports with ATCTs ....................................................... 2-7Table 2-4. Historical Activity: Regional Comparison .............................................................................. 2-8Table 2-5. FAA Projected GA Forecast: Active Pilots ............................................................................ 2-9Table 2-6. FAA Projected GA Forecast: GA Hours Flown (In Thousands) ........................................... 2-10Table 2-7. FAA Projected GA Forecast: Active GA and Air Taxi Aircraft .............................................. 2-11Table 2-8. U.S. General Aviation Activity ............................................................................................. 2-12Table 2-9. Resident Population ........................................................................................................... 2-15Table 2-10. Employment ..................................................................................................................... 2-15Table 2-11. Gross Regional Product ($2018) ...................................................................................... 2-16Table 2-12. Per Capita Personal Income ($2018) ................................................................................ 2-16Table 2-13. Comparison of Previous Forecasts ................................................................................... 2-17Table 2-14. Based Aircraft Forecast: Socioeconomic Population Variable Methodology ...................... 2-19Table 2-15. Based Aircraft Forecast: Socioeconomic Employment Variable Methodology ................... 2-20Table 2-16. Based Aircraft Forecast: Socioeconomic PCPI Variable Methodology ............................... 2-20Table 2-17. Based Aircraft Forecast: Socioeconomic GRP Variable Methodology ............................... 2-21Table 2-18. Based Aircraft Forecast: Market Share Methodology ........................................................ 2-22Table 2-19. Based Aircraft Forecast: FAA Aerospace Forecast Methodology ...................................... 2-22Table 2-20. Based Aircraft Fleet Mix ................................................................................................... 2-24Table 2-21. GA Operations Forecast: Socioeconomic Population Variable Methodology ..................... 2-25Table 2-22. GA Operations Forecast: Socioeconomic Employment Variable Methodology .................. 2-26Table 2-23. GA Operations Forecast: Socioeconomic PCPI Variable Methodology ............................. 2-26Table 2-24. GA Operations Forecast: Socioeconomic GRP Variable Methodology .............................. 2-27Table 2-25. GA Operations Forecast: Market Share Methodology ....................................................... 2-28Table 2-26. GA Operations Forecast: Linear Regression Methodology ................................................ 2-28Table 2-27. GA Operations Forecast: OPBA Methodology .................................................................. 2-29Table 2-28. Military Operations Forecast ............................................................................................. 2-32Table 2-29. Aircraft Operations Forecast Summary ............................................................................. 2-32Table 2-30. Local/Itinerant Operations ................................................................................................ 2-33Table 2-31. Operational Fleet Mix ....................................................................................................... 2-34Table 2-32. Daytime/Nighttime Operations .......................................................................................... 2-35Table 2-33. Touch and Go Operations ................................................................................................ 2-35Table 2-34. Annual Instrument Approaches ........................................................................................ 2-36Table 2-35. Peak Operations Forecast ................................................................................................ 2-36Table 2-36. FAA ARC Determination .................................................................................................. 2-37Table 2-37. Historical Operations by ARC – 2021 Update ................................................................... 2-39
Pompano Beach Airpark
p mpano I ~ .~~?,S~- Kimley>>>Horn MASTER PLAN UPDATE

Aviation Activity Forecasts
2-3
FiguresFigure 2-1. Based Aircraft Forecast Methodologies Summary ............................................................. 2-23Figure 2-2. Linear Regression Model: GA Operations ......................................................................... 2-29Figure 2-3. GA Operations Forecast Methodologies Summary ............................................................ 2-31
Pompano Beach Airpark
p mpano I ~ .~~?,S~- Kimley>>>Horn MASTER PLAN UPDATE

Aviation Activity Forecasts
2-4
2 - Aviation Activity ForecastsThe following presents historical trends, assumptions, and methodologies used to assemble projectionsof future aviation demand at the Airpark. It is important to recognize that there can be short-termfluctuations in an airport’s activity due to a variety of factors that can be difficult to anticipate. Theforecasts developed in this document are intended to consider the routine ebb and flow in aviation activitylevels while projecting what the long-term trend of activity will most likely be. These resulting projectionsprovide a meaningful framework to guide the analyses for future facility needs and developmentalternatives.
This forecast analysis includes methodologies that consider historical aviation trends at the Airpark, in theMiami/Ft. Lauderdale metropolitan region, and nationwide. Data were collected from FAA sourcesincluding FAA Terminal Area Forecast (TAF) records, Air Traffic Activity System (ATADS), Traffic FlowManagement System Counts (TFMSC), Form 5010-1 Airport Master Record, and ATCT records, as wellas the 2035 Florida Aviation System Plan (FASP). In addition, socioeconomic data for the Miami/Ft.Lauderdale Metropolitan Statistical Area (MSA), Broward County, and state of Florida were examined totrack local and regional trends and conditions that could potentially influence general aviation demand atthe Airpark. Projections of aviation activity for the Airpark were prepared for near-term (2022), mid-term(2027), and long-term (2037) timeframes using 2017 as the base year for forecasts.
It should be noted that although the recommended forecasts presented in this chapter were approved bythe FAA in December 2018, final publication of this Master Plan Update occurred in 2020 during a globalCOVID-19 pandemic. Though COVID-19 had significant impacts on aviation activity at numerouscommercial and non-commercial airports throughout the U.S., aircraft operations at Pompano Beachwere approximately 15% higher in 2020 than in 2017. As such, the approved forecasts are stillconsidered valid for future planning purposes.
2.1 - Historical and Existing Aviation Activity
The FAA categorizes a wide range of GA uses including personal and recreational flying, businesstransportation, instructional flying, commercial sight-seeing operations, and on-demand operationsincluding air taxi (i.e., charter), air tours, and medical transport services. Because PMP supports each ofthese GA activities, as well as limited military activity, the Airpark is impacted by many factorsencompassing economic, social, and industrywide trends within multiple geopolitical arenas.
At GA airports such as PMP, there are two primary indicators of activity; based aircraft and aircraftoperations. A based aircraft is generally defined as an aircraft that is considered airworthy and is stored atan airport for the majority of the year. An aircraft operation represents either a take-off or landingconducted by an aircraft; as a result, a take-off and a landing—such as those that occur with flight training“touch-and-go” practice flights—count as two operations. Historical based aircraft and operations dataprovide a baseline for the consideration of projections of future activity at the Airpark. While historicaltrends do not always correlate with future levels of activity, they often provide insight into an airport’s roleat a local, regional, or national level.
The following sections summarize overall historical aviation-related activity at the Airpark in terms ofaircraft operations and the number of based aircraft.
Pompano Beach Airpark
p mpano I ~ .~~?,S~- Kimley>>>Horn MASTER PLAN UPDATE

Aviation Activity Forecasts
2-5
Based Aircraft
Several sources were consulted to obtain existing and historical based aircraft data. The FAA’s TAF is theofficial FAA forecast of aviation activity for U.S. airports and contains historic data and projections foractive airports in the National Plan of Integrated Airport Systems (NPIAS). Additional sources that wereutilized include Airpark Management inventory results, and the Form 5010 Airport Master Record. Theseadditional sources provide “snapshot” estimates of based aircraft in 2017.
An inventory of stored aircraft at the Airpark was conducted in Summer 2018. Inventory efforts includedevaluation of rental agreements and leases, and correspondence with tenants and fixed base operators.Known itinerant aircraft were excluded from the inventory process. In total, 199 based aircraft wereidentified at the Airpark. Aircraft N-numbers for these aircraft were entered into the FAA’s National BasedAircraft Inventory Program in September 2018: a total of 166 aircraft were verified. The remaining 33based aircraft were either registered at other airports, registered out-of-state, or de-registered.
For the purposes of this Master Plan Update, the 166 verified aircraft were used for the base year 2017estimate to develop based aircraft forecasts. Annual historical based aircraft estimates utilize the FAATAF to supplant estimates from 2008-2016.
Historical and existing estimates of based aircraft at PMP are presented in Table 2-1.
Table 2-1. Historical Based Aircraft
Year FAA TAF Airpark Count 5010 AirportMaster Record
FAA DatabaseVerifiedAircraft
2008 83 -- --2009 68 -- --2010 68 -- --2011 74 -- --2012 76 -- --2013 78 -- --2014 74 -- --2015 145 -- --2016 134 -- --2017 127 199 131 166
Sources:Form 5010, accessed 6/12/2018.FAA Terminal Area Forecast issued January 2018.Airpark Management.
Aircraft Operations
Annual aircraft operations represent the number of take-offs and landings occurring at the Airpark duringa calendar year. Historical operations data include operations conducted by based aircraft as well asoperations conducted by itinerant aircraft. Table 2-2 presents an overview of historical aircraft operationsat the Airpark between 2008 and 2017 as recorded in the TAF and the FAA’s ATADS database, whichreports arrivals and departures at airports as reported by ATCTs.
Pompano Beach Airpark
2.1.1 -
2.1.2 -
p mpano I ~ .~~?,S~- Kimley>>>Horn MASTER PLAN UPDATE

Aviation Activity Forecasts
2-6
Table 2-2. Historical Annual Aircraft OperationsYear FAA TAF FAA ATADS2008 116,761 116,9312009 97,815 95,3302010 108,542 111,1732011 120,728 118,4662012 129,807 135,4762013 131,915 128,7522014 133,805 138,4022015 138,564 140,7162016 149,804 145,6602017 130,234 132,489
Sources:FAA Terminal Area Forecast issued January 2018.FAA Air Traffic Activity System (ATADS) database.
Both the TAF and ATADS reported significant declines in total operations between 2008 and 2010, whichwas largely attributed to the economic recession that occurred during that time, mimicking a trend thatimpacted numerous GA airports in the U.S. Between 2009 and 2017. After 2010, the Airpark experienceda significant increase in annual operations with a peak activity year occurring in 2016.
It should be noted that the minor discrepancy between annual operations identified in the TAF andATADS is attributed to the TAF reporting data based on the FAA fiscal year while ATADS reportsoperational data based on the calendar year.
Airport forecasts conducted as part of a planning study such as this Master Plan Update are reviewed bythe FAA in terms of their divergence from the TAF. If an airport’s 5-year forecasts differ by more than 10percent of the TAF and/or 10-year forecasts differ by more than 15 percent then the forecasts must bereviewed and approved by FAA headquarters rather than by the local FAA Airports District Office (ADO)unless:
· Five and ten-year forecasts do not exceed 200 based aircraft or 200,000 total annual operations,AND
· Any related development associated with the forecasts will not require an Environmental ImpactStudy (EIS) and/or Benefit/Cost Analysis (BCA).
The FAA review and approval process is described in greater detail in subsequent sections. For thepurposes of this Master Plan Update, historical operations reported in the ATADS database were used asthe preferred source to develop forecasts.
Regional Activity Comparison
An important aspect for consideration in the forecasting process is an airport’s role within the area that itserves and how its activity compares with the local and regional markets. The Miami/Ft. Lauderdalemetropolitan area is home to many airports that serve both commercial and general aviation activity.Table 2-3 identifies historical activity at the Airpark compared with other airports in the region that areequipped with an ATCT. These airports include Boca Raton (BCT), Fort Lauderdale/HollywoodInternational (FLL), Fort Lauderdale Executive (FXE), North Perry (HWO), Palm Beach County Park(LNA), Miami International (MIA), Miami-Opa Locka Executive (OPF), Palm Beach International (PBI) and
Pompano Beach Airpark
2.1.3 -
p mpano I ~ .~~?,S~- Kimley>>>Horn MASTER PLAN UPDATE

Aviation Activity Forecasts
2-7
Miami Executive (TMB). Historically, the Airpark has accounted for 2.9 to 6.0 percent of based aircraft inthe region and 9.3 to 14.0 percent of annual GA operations.
Table 2-3. Comparison of Regional Activity at Airports with ATCTs
YearPMP* BCT FLL FXE HWO
BAC Ops BAC Ops BAC Ops BAC Ops BAC Ops2008 83 116,793 223 76,652 94 48,183 695 170,850 257 171,9372009 68 95,319 204 47,061 55 43,303 627 141,103 228 172,4042010 68 111,171 297 46,137 57 45,041 708 140,900 247 118,4722011 74 118,420 172 50,209 49 41,589 554 135,470 247 134,2722012 76 135,440 215 46,082 76 35,798 554 143,895 252 124,7742013 78 128,267 232 40,882 71 35,399 644 144,144 253 142,9162014 74 137,763 182 48,807 94 35,391 817 152,807 258 154,4412015 145 140,655 178 54,297 88 37,704 933 146,292 245 167,8832016 134 145,544 234 53,747 85 36,350 990 144,700 244 170,4412017 166 132,414 238 55,856 85 37,469 1,004 156,054 246 210,203AAGR2008-2017
10.0% 1.3% 0.7% -2.7% -1.0% -2.2% 4.4% -0.9% -0.4% 2.2%
YearLNA MIA OPF PBI TMB
BAC Ops BAC Ops BAC Ops BAC Ops BAC Ops2008 218 139,675 28 21,849 140 82,189 113 79,454 420 305,7982009 193 139,675 28 18,050 124 78,048 126 62,930 413 229,8612010 258 121,220 28 17,374 253 79,937 127 60,527 452 193,7542011 255 121,220 28 18,940 278 94,997 149 62,899 455 168,8072012 295 121,220 28 18,004 278 87,820 149 58,481 455 197,7602013 307 124,700 28 18,404 285 92,243 136 57,860 445 234,3512014 294 124,700 28 18,294 287 115,352 148 58,924 445 252,1032015 273 124,700 28 18,105 268 124,294 165 60,819 434 256,9352016 269 124,700 28 18,351 267 115,569 171 59,815 427 276,4312017 276 126,859 28 17,675 267 104,853 172 58,077 434 281,620AAGR2008-2017
2.7% -0.9% 0.0% -1.9% 9.1% 2.8% 5.2% -2.7% 0.3% -0.8%
Sources:FAA Terminal Area Forecast issued January 2018.FAA Air Traffic Activity System (ATADS) database.Airpark Management.
Notes:*2017 based aircraft at PMP is based on FAA-verified estimate, historical GA operations at PMP are based off ATADS report, allother values for other airports utilize FAA TAF.BAC = Based AircraftOps = GA OperationsAAGR = Average Annual Growth Rate
Table 2-4 presents an overview of historical activity in the region for airports listed in Table 2-3. Asshown, between 2008 and 2017 regional GA operations declined an average of 0.3 percent per year,while the number of based aircraft during that time increased 2.6 percent per year. Growth in basedaircraft and GA operations at PMP outpaced the region during that timeframe, and the Airpark’s marketshare increased in both categories.
Pompano Beach Airpark
p mpano I ~ .~~?,S~- Kimley>>>Horn MASTER PLAN UPDATE

Aviation Activity Forecasts
2-8
Table 2-4. Historical Activity: Regional Comparison
YearGA Operations Based Aircraft
RegionalAirports PMP* % PMP Regional
Airports PMP* % PMP
2008 1,213,380 116,793 9.6% 2,188 83 3.8%2009 1,027,754 95,319 9.3% 1,998 68 3.4%2010 934,533 111,171 11.9% 2,427 68 2.8%2011 946,823 118,420 12.5% 2,187 74 3.4%2012 969,274 135,440 14.0% 2,302 76 3.3%2013 1,019,166 128,267 12.6% 2,401 78 3.2%2014 1,098,582 137,763 12.5% 2,553 74 2.9%2015 1,131,684 140,655 12.4% 2,612 145 5.6%2016 1,145,648 145,544 12.7% 2,715 134 4.9%2017 1,181,080 132,414 11.2% 2,750 166 6.0%
AAGR 2008-2017 -0.3% 1.3% -- 2.6% 10.0% --Sources:FAA Terminal Area Forecast issued January 2018.FAA Air Traffic Activity System (ATADS) database.Airpark Management.
Note:*2017 based aircraft at PMP is based on FAA-verified estimate, historical GA operations at PMP are based off ATADS report,all other values for other airports utilize FAA TAF.
2.2 - National Aviation Trends
Preparation of forecasts of aviation-related demand requires a general understanding of recent andanticipated national trends in the aviation industry. The FAA’s 2017-2021 NPIAS Report identified 5,136public use airports located throughout the U.S. 65% (3,332) of those airports are included in the NPIAS,which indicates they are considered significant to the national transportation system and thus eligible forfederal funding. General aviation airports comprise 85 percent of the airports listed in the NPIAS.
Because of its role in the regional economy, level of activity, vicinity within a metropolitan area, and otherfactors, the NPIAS defines PMP as a regional general aviation airport. Regional general aviation airportshave high levels of activity with some jets and multi-engine propeller aircraft and an average of 90 totalbased aircraft, including three jets.
The following sections examine key trends most applicable to the Airpark in its role as a regional generalaviation airport. These trends are considered in the development of the forecasts of future activity.
FAA General Aviation Forecast Trends
The FAA publishes annual forecasts that summarize the primary trends affecting aviation activityincluding U.S. and international economic conditions, projected fuel costs, and emerging technologies.FAA forecasts provide detailed analyses of historical and forecasted aviation trends and provide ageneral framework for anticipated future regional and national aviation activity. The FAA AerospaceForecast Fiscal Years 2018-2038 specifically identify the historical and future trends affecting generalaviation activity.
Pompano Beach Airpark
2.2.1 -
p mpano I ~ .~~?,S~- Kimley>>>Horn MASTER PLAN UPDATE

Aviation Activity Forecasts
2-9
General aviation activity has historically experienced cyclical periods of growth and decline based onfactors such as economic conditions, pilot demographics, regulatory conditions, technologies, andindustry reliance on general aviation activity. While national general aviation activity experiencedrebounded growth during the mid- and late-1990s, the terrorist attacks of 2001 and the economicdownturn of 2008 suppressed this nationwide activity, although some pockets of the U.S. have continuedto realize growth in general aviation.
Measures of general aviation activity in the U.S. that are annually monitored and forecasted in the FAAAerospace Forecasts include active pilots, active hours flown, and active aircraft fleet. Each of thesemeasures will continue to evolve through the 21-year FAA forecast horizon as each category (and sub-category therein) aligns and realigns with current and projected future conditions.
Future growth is anticipated to be focused in the corporate and business aviation sectors that are mostoften tied to turboprop and jet general aviation aircraft, while the greatest decreases are expected tooccur within the piston aircraft category as the fleet, and its pilots, continue to age. The following sectionssummarize key findings of each measure, based on the most recent available information contained inFAA Aerospace Forecast Fiscal Years 2018–2038.
Active Pilots
The FAA defines an active pilot as a person with a pilot certificate and a valid medical certificate. Asshown in Table 2-5, between 2010 and 2017, the total number of active pilots in the U.S. decreased from508,469 to 460,185, which reflected an annual growth rate of -1.4 percent. Much of this decrease can beattributed to the aging pilot population and the rising cost to own and operate aircraft. The FAA projectsnearly flat growth in total pilots between 2018 and 2038. The historical trend of declining pilots isanticipated to halt largely because of legislation that relieved some of the limitations associated with pilotmedical certificates as well as a projected international shortage of commercial pilots, the majority ofwhich obtain airline transport licenses.
Table 2-5. FAA Projected GA Forecast: Active PilotsYear Rec. Sport
Pilot Private Commercial AirlineTransport
RotorcraftOnly
GliderOnly Total Instrument
Rated*2010 212 3,682 202,020 123,705 142,198 15,377 21,275 508,469 318,0012015 190 5,482 170,718 101,164 154,730 15,566 19,460 467,310 304,3292016 175 5,889 162,313 96,081 157,894 15,518 17,991 455,861 302,5722017 153 6,097 162,455 98,161 159,825 15,355 18,139 460,185 306,6522018 150 6,385 162,450 96,650 161,300 15,250 18,050 460,235 307,0002023 125 7,915 157,450 92,000 165,900 15,650 17,650 456,690 308,6002028 100 9,520 149,600 90,150 171,000 17,100 17,350 454,820 313,0002033 85 11,050 142,400 89,400 177,100 18,950 17,150 456,135 318,6002038 65 12,340 136,650 89,150 183,900 21,050 17,100 460,255 325,100AAGR2010-2017
-4.6% 7.5% -3.1% -3.3% 1.7% 0.0% -2.3% -1.4% -0.5%
AAGR2018-2038
-4.1% 3.3% -0.9% -0.4% 0.7% 1.6% -0.3% 0.0% 0.3%
Source:FAA Aerospace Forecast Fiscal Years 2018-2038.Note:*Instrument rated pilots should not be added to other categories in deriving total. Rec.- Recreational pilots
Pompano Beach Airpark
2.2.2 -
p mpano I ~ .~~?,S~- Kimley>>>Horn MASTER PLAN UPDATE

Aviation Activity Forecasts
2-10
Active Hours Flown
Aircraft hours flown by active aircraft reflects aircraft utilization, frequency, and duration of use. Between2010 and 2017, single-engine piston hours flown have decreased from 12,161 to 11,878, with the lowesthours reported in 2015 at 11,217. This downward trajectory is projected to continue throughout theforecast horizon at an average annual growth rate of -1.1 percent, primarily due to the retiring fleet ofsingle-engine aircraft coupled with aging owners who are no longer flying. Within these same timeframes,multi-engine piston aircraft have historically decreased at 1.2 percent and are anticipated to continue todecline at a moderate average annual growth rate of -0.3 percent through 2038. While rotorcraftoperations declined approximately -0.7 percent between 2010 and 2017, they are anticipated toexperience growth at an average annual growth rate of 2.2 percent between 2018 and 2038. A summaryof historical and projected active general aviation hours flown is provided in Table 2-6.
Table 2-6. FAA Projected GA Forecast: GA Hours Flown (In Thousands)
YearSingle-EnginePiston
Multi-EnginePiston
TurboProp
TurboJet
Rotor-Craft
Experi-mental*
LightSport* Other Total
2010 12,161 1,818 2,325 3,375 3,405 1,226 311 181 24,8022015 11,217 1,608 2,538 3,837 3,294 1,295 191 162 24,1422016 11,865 1,683 2,708 3,847 3,128 1,224 187 193 24,8342017 11,878 1,666 2,674 4,274 3,237 1,248 197 195 25,3692018 11,765 1,647 2,642 4,604 3,344 1,273 208 196 25,6792023 10,608 1,578 2,621 5,616 3,817 1,415 269 196 26,1202028 10,021 1,546 2,863 6,331 4,248 1,556 336 196 27,0972033 9,625 1,545 3,259 7,067 4,681 1,677 409 197 28,4602038 9,419 1,556 3,742 7,849 5,152 1,799 490 198 30,206AAGR2010-2017
-0.3% -1.2% 2.0% 3.4% -0.7% 0.3% -6.3% 1.1% 0.3%
AAGR2018-2038
-1.1% -0.3% 1.8% 2.7% 2.2% 1.7% 4.4% 0.1% 0.8%
Source:FAA Aerospace Forecast Fiscal Years 2018-2038.
Note:*Experimental Light-sport category that was previously shown under Sport Aircraft is moved under Experimental Aircraftcategory starting in 2012.
As total piston hours are projected to wane, turboprop and jet hours are anticipated to steadily increase.Combined turboprop and turbo jet aircraft hours increased 2.7 percent between 2010 and 2017, a trendthat is anticipated to continue at an average annual growth rate of 2.4 percent over the forecast horizon.Turbo jets are anticipated to grow most significantly, reaching 7,849 hours (in thousands) by 2038—compared to just 4,604 hours (in thousands) in 2017. Much of this growth is associated with an overallupsurge in corporate and business activity as more business enterprises realize the productivity benefitsof corporate air travel.
Active General Aviation Aircraft Fleet
In its FAA Aerospace Forecast Fiscal Years 2018–2038, the FAA reports projected growth rates of theactive general aviation and air taxi fleet for all airports in the U.S. An active aircraft is defined as one thathas a current registration and was flown at least one hour during the calendar year. As depicted in Table
Pompano Beach Airpark
2.2.3 -
2.2.4 -
p mpano I ~ .~~?,S~- Kimley>>>Horn MASTER PLAN UPDATE

Aviation Activity Forecasts
2-11
2-7, driven by turboprop, jet, and rotorcraft activity, the overall forecast for the number of general aviationaircraft in the fleet remains stable through 2038. While significant growth is not anticipated, this reversesthe historical downward trajectory reported from 2010 to 2017.
Table 2-7. FAA Projected GA Forecast: Active GA and Air Taxi Aircraft
YearSingle-EnginePiston
Multi-EnginePiston
TurboProp
TurboJet
Rotor-Craft
Experi-mental
LightSport Other Total
2010 139,519 15,900 9,369 11,484 10,102 24,784 6,528 5,684 223,3702015 127,887 13,254 9,712 13,440 10,506 27,922 2,369 4,941 210,0312016 129,652 12,986 9,779 13,751 10,577 27,585 2,478 4,986 211,7942017 130,330 12,935 9,430 14,075 10,805 27,865 2,585 5,025 213,0502018 130,500 12,895 9,195 14,390 11,030 28,140 2,705 5,050 213,9052023 125,330 12,720 9,025 16,220 12,125 25,595 3,330 5,045 213,3902028 118,740 12,465 9,870 18,120 13,235 30,980 3,995 5,060 212,4652033 112,620 12,170 11,225 20,085 14,450 32,105 4,705 5,060 212,4202038 107,800 11,845 12,855 22,195 15,785 33,105 5,440 5,065 214,090AAGR2010-2017
-1.0% -1.2% 0.1% 2.9% 1.0% 1.7% -12.4% -1.7% -0.7%
AAGR2018-2038
-1.0% -0.9% 1.7% 2.2% 1.8% 0.8% 3.6% 0.0% 0.0%
Source:FAA Aerospace Forecast Fiscal Years 2018-2038.
Note:*Experimental Light-sport category that was previously shown under Sport Aircraft is moved under Experimental Aircraftcategory, starting in 2012.
General Aviation Activity Trends
In recent years, the general aviation community, including aircraft manufacturers, suppliers, and serviceproviders, has experienced significant changes that have resulted in major shifts within the industry. Inaddition to broad shifts in the economic and political climates, the aviation industry has specifically facednew regulations; game-changing technologies such as the evolution toward more autonomous vehicles,unmanned aerial systems (UAS), and NextGen; and demographic and social transformations affectingboth pilots and the passengers they serve. Given that many of these changes are just now being realizedand will continue to evolve, it is difficult to project their long-term impacts with any certainty. Table 2-8provides a summary of historical and projected GA activity described in previous tables, as well ashistorical and forecast GA avgas and Jet A fuel consumption in the U.S.
Nationwide, general aviation activity declined following the events of September 11, 2001, and rising fuelcosts and economic volatility further accelerated this decline from 2008 to 2014. The industry began torebound by 2015 in all categories except avgas consumption, indicating that fuel consumption wasprimarily attributable to jet aircraft in accordance with associated trends in the U.S. fleet mix.
Forecast data indicate that the total number of active U.S. general aviation aircraft is projected to slightlydecrease through the forecast year of 2025, with the total number of hours flown reflecting a converselyincreasing rate. This indicates that a fewer number of aircraft will fly more hours in the coming years. GA
Pompano Beach Airpark
2.2.5 -
p mpano I ~ .~~?,S~- Kimley>>>Horn MASTER PLAN UPDATE

Aviation Activity Forecasts
2-12
fuel consumption in the U.S. is anticipated to increase through 2038, however, growth is limited to jet fuel,as avgas consumption is expected to decrease at a -0.6 percent annual rate during that timeframe.
Table 2-8. U.S. General Aviation Activity
Year Active U.S. GAAircraft
U.S. GA HoursFlown
(thousands)
U.S. AvgasConsumption(million gal.)
U.S. Jet FuelConsumption(million gal.)
U.S. GA FuelConsumption(million gal.)
2010 223,370 24,802 221 1,435 1,6562015 210,031 24,142 196 1,383 1,5782016 211,794 24,834 206 1,437 1,6432017 213,050 25,369 209 1,535 1,7442018 213,905 25,679 207 1,615 1,8232023 213,390 26,120 194 1,832 2,0262028 212,465 27,097 188 1,967 2,1552033 212,420 28,460 185 2,105 2,2902038 214,090 30,206 184 2,247 2,430AAGR2010-2017
-0.7% 0.3% -0.7% 1.0% 0.7%
AAGR2018-2038
0.0% 0.8% -0.6% 1.7% 1.4%
Source:FAA Aerospace Forecast Fiscal Years 2018-2038.
National and International Pilot Shortage
For years, analysts have been anticipating an airline pilot shortage based on changing federalrequirements and fewer numbers of trained pilots coming out of the military. Part of the shortage inexperienced pilots can be credited to the recent increase in FAA pilot qualification requirements. In 2013,the FAA published a rule requiring first officers—also known as co-pilots—to hold an Airline TransportPilot (ATP) certificate, requiring 1,500 hours of total time as a pilot. Previously, first officers were requiredto have only a commercial pilot certificate, which requires 250 hours of flight time. This new requirementhas discouraged many students from entering flight training programs due to the increased costassociated with the new training requirements or led U.S. pilots to look for jobs with foreign airlines whereflight-hour requirements are not as stringent.
The pilot population is also still responding to a 2010 FAA regulatory change that increased the durationof validity of pilot certificates under the age of 40 from 36 months to 60 months. Since this change, thenumber of student pilot licenses has increased from 119,119 in 2010 to an estimated 149,121 by the endof 2017. Pilots 40 years of age or older also must pass a comprehensive medical exam every 2 years,which can deter pilots from obtaining and renewing their licenses.
Additionally, the industry is confronting waning interest from students interested in a career as a pilot dueto high educational costs, low salary expectations post-graduation, demanding travel schedules, andgeneral industry upheaval since September 11, 2001. These issues are compounded by the decliningavailability of military-trained pilots to meet the aviation industry’s growing needs. GovernmentAccountability Office (GAO) Report 14-232: Aviation Workforce, Current and Future Availability of Airline
Pompano Beach Airpark
2.2.6 -
p mpano I ~ .~~?,S~- Kimley>>>Horn MASTER PLAN UPDATE

Aviation Activity Forecasts
2-13
Pilots noted that 70 percent of airline pilots hired had come from the military prior to 2001; fewer than 30percent were hired from the military as of February 2014.
Flight schools at the Airpark specialize in commercial and GA training. Based on commercial pilotlicensing projections identified in the FAA Aerospace Forecast Fiscal Years 2018–2038, the demand forsuch training in the U.S. is anticipated to continue through 2038. As such, it is anticipated that demand forpilot training at the Airpark will be strong both in the immediate future and long-term. Its location in agenerally sunny, year-round favorable climate also supports the notion of strong sustained demand forpilot training.
Business Use of Aviation
Business use of aviation is important at the Airpark and throughout the nation. In this Master Plan Update,references to business and corporate aircraft are used interchangeably, as they both refer to aircraft thatsupport a business enterprise. The FAA defines business use as, “Any use of an aircraft (not forcompensation or hire) by an individual for transportation required by the business in which the individualis engaged.” The agency defines corporate transportation as, “Any use of an aircraft by a corporation,company, or other organization (not for compensation or hire) for the purposes of transporting itsemployees and/or property, and employing professional pilots for the operation of the aircraft.”
While business-related aviation is often considered to specifically pertain to corporate jets or turbo props,multi- and single-engine piston aircraft are often used for regional business travel. This is particularly truein areas with high populations and limited or congested transportation connectivity outlets. Businessaviation offers companies multiple benefits associated with time savings, employee satisfaction, andschedule control among others. The National Business Aircraft Association’s (NBAA’s) 2017 AnnualReport noted that nationwide, business aviation contributes $200 billion in annual economic activity. Atthe Airpark, business use of aviation primarily consists of single- and multi-engine piston aircraft;however, PMP has experienced an increase in itinerant turboprop and jet activity in recent years.
The FAA’s 2015–2019 Report to Congress estimated that business aircraft usage annually comprises 8.7percent of all aviation activity, and an additional 9.7 percent of the nation’s general aviation activity isconsidered corporate. These figures represent a small decline in the use of business/corporate aviationcompared to 2008 and 2012, when they totaled 9.6 percent and 11.9 percent, respectively.
NextGen
NextGen is an initiative from the FAA to develop technology geared toward making air travel safer andmore efficient, and to replace older/existing air traffic management technology. There are many initiativesbeing developed specifically for airports to help accommodate the demand for additional capacity in asafe, efficient, and environmentally responsible manner, such as the FAA’s En-Route AutomationModernization (ERAM), which processes data from 64 radars and tracks 1,900 aircraft at a time.
While NextGen is an FAA-driven initiative, it requires aircraft operators of both private and airline carriersto equip aircraft and pursue NextGen practices. Specifically, the FAA initially required that aircraft beequipped with Automatic Dependent Surveillance-Broadcast Out (ADS-B) equipment by January 1, 2020,to fly in most controlled airspace. This equipment continuously transmits aircraft data, such as airspeed,altitude, and location, to ADS-B ground stations. While certain exemptions may apply, and there arerebates for the installation of this equipment, the requirement of ADSB equipment in all aircraft may be aminor deterrent to small and recreational aircraft activity in the future. In the FAA Aerospace ForecastFiscal Years 2018–2038, the FAA projects a decline in single- and multi-engine operations through 2038.
Pompano Beach Airpark
2.2.7 -
2.2.8 -
p mpano I ~ .~~?,S~- Kimley>>>Horn MASTER PLAN UPDATE

Aviation Activity Forecasts
2-14
While the requirement for aircraft to be equipped with ADS-B technology is not the sole reason for thesenegative projections, it likely has some impact.
Unmanned Aircraft Systems
Unmanned Aircraft Systems (UAS), commonly referred to as drones, have revolutionized the NationalAirspace System (NAS) in recent years. Developments in UAS technology and growth in their demandand use in several industries have increased concern due to the current NAS not being tailored toaccommodate manned and unmanned aircraft operating in the same environment. For UAS and mannedaircraft to operate safely and efficiently in an integrated system within the NAS, continued study is neededthat may affect policies at all levels.
To compound the issue, requirements and regulations regarding the operation of UAS are ever-evolving,and, in many instances, are not followed. The FAA has promoted numerous outreach efforts, such asB4UFLY to support the safe integration of UAS into the NAS, but the effects are difficult to determine dueto the complexity involved with collecting accurate data on their use. The presence of UAS in the NAS,and the expansion of their abilities based on improved battery life, improved range, and reduced cost, willultimately have an ever-increasing impact on the NAS. It is unknown at this juncture how UAS will impactfuture activity at the Airpark or at other airports throughout the U.S. This growing segment of the aviationindustry needs continued monitoring.
2.3 - Socioeconomic Trends
Depending on the role of an airport and the population base that it serves, the socioeconomic profile ofthe surrounding region can often influence existing and future aviation-related activity. The geographicalareas that were examined for this Master Plan Update included the Miami/Ft. Lauderdale MSA, BrowardCounty, and the state of Florida. This analysis examined historical trends and future projections ofpopulation, employment, per capita personal income (PCPI), and gross regional product (GRP). Datawere obtained from Woods and Poole Economics, Inc., an independent firm that specializes in long-termeconomic and demographic projections.
The role and type of activity at PMP combined with socioeconomic factors play a vital part of the masterplanning process. Socioeconomic factors provide a general understanding of the existing conditions in thearea along with developing future projections of the aviation activity for the Airpark. The following sectionsprovide a summary of socioeconomic data considered in the development of forecasts.
Population
Florida’s population experienced significant, constant growth since the 1950’s and the state isconsistently ranked as one of the fastest-growing in the U.S. Despite significant state-wide impactsassociated with the tumultuous housing market, this trend continued through the 2008-2010 economicdownturn, bolstered by a high incoming transient population and the state’s popularity as a destination forretirees. Table 2-9 shows historical population comparatively for Broward County, the Miami/Ft.Lauderdale MSA, and the state of Florida.
As shown, between 2008 and 2017, Florida experienced an average annual population growth rate of1.41 percent. The Miami/Ft. Lauderdale MSA and Broward County experienced slightly less populationgrowth during that timeframe with average annual growth rates of 1.34 percent and 1.33 percentrespectively.
Pompano Beach Airpark
2.2.9 -
2.3.1 -
p mpano I ~ .~~?,S~- Kimley>>>Horn MASTER PLAN UPDATE

Aviation Activity Forecasts
2-15
Table 2-9. Resident Population
Year Broward County Miami/Ft. LauderdaleMSA Florida
2008 1,728,984 5,474,388 18,291,2782009 1,741,282 5,530,449 18,571,7492010 1,753,580 5,586,510 18,852,2202011 1,782,493 5,672,338 19,112,4902012 1,811,405 5,758,165 19,372,7602013 1,840,318 5,843,993 19,633,0302014 1,869,230 5,929,820 19,893,3002015 1,893,550 6,004,670 20,158,7502016 1,920,276 6,087,110 20,451,1222017 1,947,002 6,169,550 20,743,494
AAGR 2008-2017 1.33% 1.34% 1.41%Source:Woods and Poole, Inc.
Economic Indicators
In addition to population, other demographic factors can influence demand for general aviation in aparticular region. Local, regional, and statewide economic performance also can significantly impactaviation demand. Economic trends are summarized in this analysis through an examination ofemployment, earnings, and economic productivity data.
Employment is often used to understand economic activity due to the availability of data from variousagencies, as well as the simplicity of data to gain a snapshot of the overall health of a specific catchmentarea. Table 2-10 summarizes the historical employment rates for Broward County, the Miami/Ft.Lauderdale MSA, and Florida from 2008 to 2017. Data show similar trends among these three areas, withemployment growth maintaining a steady, aggressive rate of increase over the past ten years.Employment growth in the Miami/Ft. Lauderdale MSA has outpaced statewide and county increasesduring this timeframe.
Table 2-10. Employment
Year Broward County Miami/Ft. LauderdaleMSA Florida
2008 958,638 3,067,558 9,685,5282009 972,459 3,104,629 9,781,4392010 986,280 3,141,700 9,877,3502011 1,016,115 3,244,805 10,135,8452012 1,045,950 3,347,910 10,394,3402013 1,075,785 3,451,015 10,652,8352014 1,105,620 3,554,120 10,911,3302015 1,128,550 3,626,250 11,132,2602016 1,151,046 3,697,536 11,349,5242017 1,173,542 3,768,822 11,566,788
AAGR 2008-2017 2.27% 2.31% 1.99%Source:Woods and Poole, Inc.
Pompano Beach Airpark
2.3.2 -
p mpano I ~ .~~?,S~- Kimley>>>Horn MASTER PLAN UPDATE

Aviation Activity Forecasts
2-16
GRP is defined as the market value of all goods and services produced within a geographic area.According to many economists, a healthy economy is defined by a 2 percent annual growth rate. Asshown in Table 2-11, the GRP of Broward County, the Miami/Ft. Lauderdale MSA, and the state ofFlorida experienced robust growth between 2008 and 2017 with average annual growth rates of 2.33,2.41, and 2.12 percent, respectively. These figures have been converted to 2018 dollars to adjust forinflation.
Table 2-11. Gross Regional Product ($2018)
Year Broward County (Mil.) Miami/Ft. LauderdaleMSA (Mil.) Florida (Bil.)
2008 $82,253 $271,139 $810.02009 $83,918 $275,618 $825.12010 $85,583 $280,097 $840.22011 $87,390 $258,184 $855.42012 $89,196 $236,272 $870.52013 $91,002 $214,360 $885.72014 $92,809 $192,448 $900.82015 $95,569 $317,989 $926.62016 $98,388 $327,042 $952.62017 $101,207 $336,095 $978.6
AAGR 2008-2017 2.33% 2.41% 2.12%Source:Woods and Poole, Inc.
PCPI offers insight to the economic potential of an area and provides a broad indicator of individualeconomic well-being. PCPI is a composite measure of market potential and indicates the general ability ofpersons to purchase products and services.
Table 2-12 summarizes the historical PCPI for Broward County, the Miami/Ft. Lauderdale MSA, andFlorida. PCPI has slowly improved in the years following the 2008–2010 economic recession. It should benoted that PCPI data obtained from Woods and Poole is reported in constant dollars (year 2018) to adjustfor inflation over time.
Table 2-12. Per Capita Personal Income ($2018)
Year Broward County Miami/Ft. LauderdaleMSA Florida
2008 $45,632 $49,052 $43,9072009 $45,825 $49,447 $44,1982010 $46,018 $49,842 $44,4882011 $46,097 $50,288 $44,8042012 $46,177 $50,734 $45,1192013 $46,256 $51,180 $45,4352014 $46,336 $51,626 $45,7512015 $47,095 $52,468 $46,5402016 $47,816 $53,273 $47,2972017 $48,537 $54,079 $48,055
AAGR 2008-2017 0.69% 1.09% 1.01%Source:Woods and Poole, Inc.
Pompano Beach Airpark
p mpano I ~ .~~?,S~- Kimley>>>Horn MASTER PLAN UPDATE

Aviation Activity Forecasts
2-17
Socioeconomic Trends - Summary
Over the past two decades, the Miami/Ft. Lauderdale metropolitan area experienced a significantpopulation increase that has changed the demographics, employment base, and economic condition ofPompano Beach and the surrounding community. This shift has also brought economic changes, as thearea continues significant development and redevelopment to a robust and diversified economic base.The City of Pompano Beach has significant employment in industries that include construction,manufacturing, retail trade, finance and insurance, real estate, professional services, educationalservices, health care, and others.
The City’s location within the Miami/Ft. Lauderdale MSA with close access to major transportationcorridors, desirable destination for tourism and retirees, and favorable climate will all contribute to thecontinued development of the region. As a result, the forecast assumptions about future Airpark activitiesare rooted in anticipated population growth and strong economic growth through the forecast horizon.
2.4 - Previous Forecasts
Prior to the development of forecasts for this Master Plan Update, previous forecasts for the Airpark wereexamined to gauge their continued validity. Forecasts of total aircraft operations and based aircraftidentified in the 2008 Master Plan Update, Florida Aviation System Plan (FASP) 2035, and the FAA TAFissued January 2018 are shown in Table 2-13.
Table 2-13. Comparison of Previous Forecasts
YearBased Aircraft Aircraft Operations
FAA TAF 2008 MasterPlan* FASP 2035* FAA TAF 2008
Master Plan* FASP 2035*
2014 74 192 74 133,805 144,930 133,8052015 145 197 75 138,564 146,940 135,5332016 134 201 76 149,804 148,950 137,2612017 127 205 77 130,234 150,960 138,9902022 138 231 82 126,110 166,025 148,0752027 140 258 87 127,681 179,900 158,2342032 140 285 93 129,273 193,775 169,0002037 140 312 99 130,882 207,650 179,767
Sources:FAA Terminal Area Forecast issued January 2018.FASP 2035.2008 Master Plan Update.
Note:*2008 Master Plan Update and FASP 2035 estimates have been extrapolated for inter-years and years that exceed theirrespective planning horizons.
According to the National Based Aircraft Inventory Program and ATCT records, there were 166 verifiedbased aircraft at the Airpark and 132,489 aircraft operations that occurred in base year 2017. As shown inTable 2-13, both the 2008 Master Plan Update and the FASP 2035 produced operations forecasts wellabove current levels of activity, and based aircraft forecasts that vary significantly from the 166 FAA-verified based aircraft. The FAA TAF estimates for based aircraft in base year 2017 are much lower thanthe number reported by Airpark Management, though total operations are roughly in line with the ATCT. Itshould be noted that the discrepancy between operations reported by the ATCT and the TAF is largelyattributed to the TAF reporting data by fiscal year, and the ATCT reporting by calendar year.
Pompano Beach Airpark
2.3.3 -
p mpano I ~ .~~?,S~- Kimley>>>Horn MASTER PLAN UPDATE

Aviation Activity Forecasts
2-18
The FAA TAF uses a time-series approach to project general aviation aircraft activity at airports that doesnot necessarily account for historical trends or anticipated changes. The TAF projects negligible growth inoperations at PMP, and an increase of 13 based aircraft over the 20-year forecast horizon.
Based on an analysis of previous forecasts, it has been determined that updated forecasts of aviationactivity are required as a specific component of this Master Plan Update. Previous forecasting effortsyielded projections that were too aggressive or too conservative given current levels of activity, and theFAA TAF projects significantly lower-than-anticipated levels of future activity due to its simplistic approachto general aviation forecasting and low estimate of based aircraft at the Airpark.
The following sections identify the assumptions, approach, and methodologies used to develop updatedforecasts of based aircraft and aircraft operations at the Airpark.
2.5 - Forecast Assumptions and Approach
Forecast assumptions have been developed based on input provided by Airpark staff, tenants, and anexamination of the trends identified in previous sections. These assumptions provide general guidelinesthat aid in the development of forecasts of aviation demand and include the following:
· The Airpark will continue to operate as a general aviation airport through the planning period.· Airports in the Miami/Ft. Lauderdale metropolitan area will remain open for the foreseeable future.· The Airpark will continue to seek general aviation, corporate, business aviation, and flight training
tenants and itinerant operations.· The aviation industry on the national level will grow as forecasted per FAA Aerospace Forecast
Fiscal Years 2018–2038.· The socioeconomic characteristics of Broward County, the Miami/Ft. Lauderdale MSA, and the
state of Florida will continue to grow as forecasted.· Both Federal and state aviation programs will be in place through the planning period to assist in
funding future capital development needs.· Facility requirements to accommodate projected demand will occur as necessary; future
development at the Airpark could be constrained based on the built-out environment surroundingthe Airpark, length of existing runways, and the lack of developable land attributed to anintersecting three-runway airfield configuration. Runway extensions and closure/redevelopment ofrunways that may not be needed within a 20-year horizon are potential options that will beaddressed in subsequent chapters of this Master Plan Update. The ability to implement suchimprovements if needed result in an unconstrained approach to the development of forecasts.
The overall approach to develop forecasts for this Master Plan Update was based on detailed analyses oflocal and regional trends in aviation activity, and a determination of how existing and future activity atPMP will be influenced by local, regional, and national aviation and non-aviation factors over a 20-yeartimeframe. This analysis entailed data collection from various resources including Airpark records, theATCT, FAA databases, Woods and Poole Inc., FASP 2035, and the 2008 Master Plan Update. Inaddition, data and information were obtained through in-person interviews with tenants and members ofthe Planning Review Committee (PRC). This information provided a thorough understanding of tenantgoals, facility needs, user demand, and potential impacts to future aviation activity at the Airpark.
2.6 - Based Aircraft Forecasts
While the FAA maintains historical records of based aircraft in the TAF for all NPIAS airports, includingPMP, Airpark Management conducted a based aircraft inventory in 2018, which identified 199 aircraft,
Pompano Beach Airpark
p mpano I ~ .~~?,S~- Kimley>>>Horn MASTER PLAN UPDATE

Aviation Activity Forecasts
2-19
166 of which were verified by the FAA’s National Based Aircraft Inventory Program. As noted previously,the FAA’s TAF reported 127 based aircraft in base year 2017. For the purposes of this Master PlanUpdate, the 166 verified aircraft in the National Based Aircraft Inventory Program are used as a base yearestimate for forecasts.
2.7 - Based Aircraft Methodologies
Several methodologies were utilized to develop forecasts of based aircraft including socioeconomiccomparisons, regional market share, and FAA forecast comparisons. Descriptions and results of thesemethodologies and the preferred forecast methodology are presented in the following sections. It shouldbe noted that because accurate historical based aircraft counts were not available, specific types offorecasting methodologies such as linear regression were not used since they are less effective indicatorsof future activity compared with variable comparison methodologies, which examine establishedprojections of data such as socioeconomic projections or regional aviation activity forecasts identified inthe TAF.
Based Aircraft Forecast - Socioeconomic Methodology
The following sections describe socioeconomic comparison methodologies for population, employment,per capita personal income, and gross regional product.
Population Variable
Socioeconomic characteristics of a community or region do not always dictate aviation-related activity at alocal airport; however, the consistent growth in population in and around the Miami/Ft. Lauderdale areaover the past several decades has had significant impacts at the Airpark.
The socioeconomic population variable methodology assumed that the number of based aircraft at theAirpark beginning in base year 2017 will mimic population projections for the compared geographic areasthrough 2037. Table 2-14 identifies forecast based aircraft based on projected populations of BrowardCounty, the Miami/Ft. Lauderdale MSA, and the state of Florida.
Table 2-14. Based Aircraft Forecast: Socioeconomic Population Variable Methodology
YearBroward County Miami/Ft. Lauderdale MSA Florida
Population BasedAircraft Population Based
Aircraft Population BasedAircraft
2017 1,947,002 166 6,169,550 166 20,743,494 1662022 2,083,756 178 6,591,466 177 22,243,254 1782027 2,227,520 190 7,035,180 189 23,829,884 1912037 2,520,641 215 7,939,947 214 27,109,773 217
AAGR2017-2037 1.30% 1.27% 1.35%
Sources:Woods and Poole, Inc.Kimley-Horn.
As shown, the socioeconomic population variable methodology produced a range of based aircraft from214 to 217 by the end of the 20-year planning period, with average annual growth rates ranging from 1.27percent to 1.35 percent.
Pompano Beach Airpark
2.7.1 -
2.7.1.1 -
p mpano I ~ .~~?,S~- Kimley>>>Horn MASTER PLAN UPDATE

Aviation Activity Forecasts
2-20
Employment Variable
Similar to the socioeconomic population variable methodology, the socioeconomic employment variablemethodology assumed that between 2017 and 2037, the number of based aircraft at the Airpark wouldincrease at the same rate as growth in employment for the compared geographic areas. Table 2-15identifies forecast based aircraft based on projected employment for Broward County, the Miami/Ft.Lauderdale MSA, and the state of Florida.
Table 2-15. Based Aircraft Forecast: Socioeconomic Employment Variable Methodology
YearBroward County Miami/Ft. Lauderdale MSA Florida
Employment BasedAircraft Employment Based
Aircraft Employment BasedAircraft
2017 1,173,542 166 3,768,822 166 11,566,788 1662022 1,286,794 182 4,128,840 182 12,661,760 1822027 1,401,628 198 4,496,460 198 13,773,922 1982037 1,631,861 231 5,240,040 231 16,008,243 230
AAGR2017-2037 1.66% 1.66% 1.64%
Sources:Woods and Poole, Inc.Kimley-Horn.
As shown, the socioeconomic employment variable methodology produced a range of based aircraft from230 to 231 by the end of the 20-year planning period, with average annual growth rates ranging from 1.64percent to 1.66 percent.
Per Capita Personal Income Variable
Individual income can be an indicator of a local population’s propensity to travel or own an aircraft.Commercial service is not provided at the Airpark. However, PMP has experienced an increase inbusiness travel and jet/turboprop operations in recent years. Table 2-16 identifies forecast based aircraftbased on projected PCPI of Broward County, the Miami/Ft. Lauderdale MSA, and the state of Florida.
Table 2-16. Based Aircraft Forecast: Socioeconomic PCPI Variable Methodology
YearBroward County Miami/Ft. Lauderdale MSA Florida
PCPI($2018)
BasedAircraft
PCPI($2018)
BasedAircraft
PCPI($2018)
BasedAircraft
2017 $48,537 166 $54,079 166 $48,055 1662022 $52,163 178 $58,146 178 $51,899 1792027 $55,717 191 $62,125 191 $55,733 1932037 $61,851 212 $69,106 212 $62,390 216
AAGR2017-2037 1.22% 1.23% 1.31%
Sources:Woods and Poole, Inc.Kimley-Horn.
As shown, the socioeconomic PCPI variable methodology produced a range of based aircraft from 212 to216 by the end of the 20-year planning period, with average annual growth rates ranging from 1.22percent to 1.31 percent. It should be noted that forecasts of PCPI were converted to constant dollars($2018) to adjust for inflation over time.
Pompano Beach Airpark
2.7.1.2-
2.7.1.3-
p mpano I ~ .~~?,S~- Kimley>>>Horn MASTER PLAN UPDATE

Aviation Activity Forecasts
2-21
Gross Regional Product Variable
The final socioeconomic variable examined to project based aircraft at the Airpark was GRP. As noted,GRP is a measurement of a geographic market’s economic output in terms of goods and servicesproduced. As with other socioeconomic methodologies presented in this section, the socioeconomic GRPvariable methodology assumed that the number of based aircraft at the Airpark will mimic growth rates forthe compared geographic areas. Results of this methodology are presented in Table 2-17.
Table 2-17. Based Aircraft Forecast: Socioeconomic GRP Variable Methodology
YearBroward County Miami/Ft. Lauderdale MSA Florida
GRP ($2018)in millions
BasedAircraft
GRP ($2018)in millions
BasedAircraft
GRP ($2018)in billions
BasedAircraft
2017 $101,207 166 $336,095 166 $978.6 1662022 $115,722 190 $382,774 189 $1,112.7 1892027 $131,302 215 $433,007 214 $1,256.8 2132037 $166,025 272 $545,055 269 $1,577.6 268
AAGR2017-2037 2.51% 2.45% 2.42%
Sources:Woods and Poole, Inc.Kimley-Horn.
As shown, the socioeconomic GRP variable methodology produced a range of based aircraft from 268 to272 by the end of the 20-year planning period, with average annual growth rates ranging from 2.42percent to 2.51 percent. Forecasts of GRP were converted to constant dollars ($2018) to adjust forinflation over time.
Based Aircraft Forecast – Regional Market Share Methodology
The second type of methodology used to project based aircraft at the Airpark entailed application of amarket share projection. Market share compares the individual share of a specific entity (based aircraft atPMP) with that of a larger market. The market selected for comparison with the Airpark included allNPIAS airports equipped with an ATCT within a 40-mile radius of PMP. These airports were describedpreviously in Section 2.1.3. These airports included Boca Raton (BCT), Fort Lauderdale/HollywoodInternational (FLL), Fort Lauderdale Executive (FXE), North Perry (HWO), Palm Beach County Park(LNA), Miami International (MIA), Miami-Opa Locka Executive (OPF), Palm Beach International (PBI) andMiami Executive (TMB).
In 2017, the Airpark accounted for 6.0 percent of based aircraft within the regional market according tothe FAA TAF. Three market share methodologies were developed to account for potential changes inbased aircraft demand at PMP. The first methodology (Market Share Low Growth Scenario) assumed thatthe Airpark’s market share of regional airport based aircraft would remain constant at 6.0 percentthroughout the 20-year planning horizon.
The second methodology (Market Share High Growth Scenario) assumed that the Airpark’s market shareof based aircraft would increase at a constant rate to 10.0 percent by 2037. This growth rate indicatesthat based aircraft at the Airpark would not only increase because of local demand, but also because theAirpark would capture some relocated based aircraft from regional airports that cater to other types ofaviation activity such as corporate/business operations.
Pompano Beach Airpark
2.7.1.4-
2.7.2 -
p mpano I ~ .~~?,S~- Kimley>>>Horn MASTER PLAN UPDATE

Aviation Activity Forecasts
2-22
The third methodology (Market Share Medium Growth Scenario) assumed that the Airpark’s market shareof regional airport based aircraft would increase at a constant rate to 8.0 percent by 2037, which is themean market share percentage of the Low Growth and High Growth scenarios.
Results of the Low Growth, High Growth, and Medium Growth market share methodologies are depictedin Table 2-18. As shown, the Low Growth methodology projected 207 based aircraft by 2037, the MediumGrowth methodology projected 275 based aircraft, and the High Growth methodology projected 342based aircraft.
Table 2-18. Based Aircraft Forecast: Market Share Methodology
YearRegionalAirportsBased
Aircraft
PMP LowGrowthBased
Aircraft
PMP LowGrowth
%
PMPMediumGrowthBased
Aircraft
PMPMediumGrowth
%
PMPHigh
GrowthBased
Aircraft
PMPHigh
Growth%
2017 2,750 166 6.0% 166 6.0% 166 6.0%2022 2,906 175 6.0% 190 6.5% 204 7.0%2027 3,084 186 6.0% 216 7.0% 247 8.0%2037 3,424 207 6.0% 275 8.0% 342 10.0%
AAGR2017-2037 1.10% 1.10% N/A 2.55% N/A 3.69% N/A
Sources:FAA Terminal Area Forecast issued January 2018.Kimley-Horn.
Based Aircraft Forecast – FAA Aerospace Forecast Methodology
The final methodology employed to forecast based aircraft at the Airpark utilized national general aviationfleet mix projections identified in the FAA Aerospace Forecast Fiscal Years 2018-2038. The AerospaceForecasts project that single-engine piston aircraft will decline one percent annually through 2038, multi-engine piston aircraft will decline 0.4 percent annually, turboprop aircraft will increase 1.7 percentannually, jet aircraft will increase 2.2 percent annually, and rotorcraft (helicopters) will increase 1.8percent annually. These projections were applied to the existing based aircraft fleet at the Airpark, andthe results are depicted in Table 2-19.
Table 2-19. Based Aircraft Forecast: FAA Aerospace Forecast Methodology
YearSingle-EnginePiston
Multi-EnginePiston
Turboprop Jet Rotorcraft Other/Experimental* Total
2017 105 36 10 3 12 1 1662022 100 35 11 3 13 1 1622027 95 35 12 4 14 1 1592037 86 33 14 5 17 1 155
AAGR2017-2037 -1.00% -0.40% 1.70% 2.20% 1.80% 0.80% -0.52%Source:FAA Aerospace Forecast Fiscal Years 2018-2038.Kimley-Horn.
Note:*Other includes blimp; not included in total or forecast
Pompano Beach Airpark
2.7.3 -
p mpano I ~ .~~?,S~- Kimley>>>Horn MASTER PLAN UPDATE

Aviation Activity Forecasts
2-23
As shown, the FAA Aerospace Forecast methodology projected a decline in based aircraft at the Airparkfrom 166 in base year 2017 to 155 in 2037, which represents an average annual growth rate of -0.52percent.
Based Aircraft Forecast – Preferred Methodology
A summary of based aircraft forecast methodology results including the FAA TAF is provided in Figure2-1. The summary presented below represents a range of potential based aircraft activity at the Airparkover the next 20 years, which can assist Airpark Management with facility planning in the event thatactivity exceeds or falls short of the preferred forecast.
Figure 2-1. Based Aircraft Forecast Methodologies Summary
Source:Kimley-Horn.
Based on known demand for additional aircraft parking hangars and ramp space at the Airpark, and thefact that the Airport identified 199 based aircraft (33 more than the number verified in the FAA’s NationalBased Aircraft Inventory Program) in 2017, the recommended forecast should project relatively stronggrowth compared to the FAA’s forecast of 140 based aircraft by 2037.
Pompano Beach Airpark
2.7.4 -
400
350
300
250
200
150
100
50
Pop. Broward County
--Emp. Broward County
--PC Pl Broward County
--GRP Broward County
--MarketShare Lo
--FAATAF
p mpano I !'!!!.:~?,S~- Kimley>>>Horn
.,,. -
- Pop. Miami/ Ft. LauderdaleMSA
- - Emp. M iami/ Ft. LauderdaleMSA
-- PC Pl Miami/ Ft. Lauderdale M SA
--GRP M iami/ Ft. Lauderdale MSA
--Market Share Med
-- Historical
,,,. .,,.
, 275 (!'referred)
- Pop.fl
--Emp.FL
PCPI FL
- GRPFL
- - Market Share Hi
--FAA Aero5Pa::e
/ 140 (FAA TAF)
MASTER PLAN UPDATE

Aviation Activity Forecasts
2-24
The forecasts assumed that factors that impact aviation demand at PMP today will likely remain relativelyconstant in the future. Based on this assumption and considering that the market share forecast approachutilized generally accepted projections of aviation activity developed by the FAA, the Market ShareMedium Growth Scenario methodology is the preferred forecast for based aircraft. This methodologyresulted in an increase in based aircraft from 166 in base year 2017 to 275 in 2037, which reflects anaverage annual growth rate of 2.55 percent.
Based Aircraft Fleet Mix
An airport’s fleet mix impacts aircraft storage and apron requirements, as well as airfield design,pavement strength needs, and airfield capacity. As with most general aviation airports, the majority of thefleet at PMP is comprised of single-engine piston aircraft. As noted, one of the basic assumptions in thedevelopment of forecasts is that facility requirements necessary to accommodate projected demand willbe implemented as needed. These facility needs could include additional runway length, apronimprovements, and others. As such, it is anticipated that the Airpark’s fleet mix will adapt over time toreflect local and national aviation trends, and the fleet mix forecast was not constrained. As identified inthe previous section, the FAA projects declines in both single- and multi-engine piston aircraft andincreases in jet, turboprop, rotorcraft and other/experimental aircraft through 2037.
The Airpark’s overall proportion of single- and multi-engine piston aircraft is projected to decline graduallyover the planning horizon, although decreases in the actual number of aircraft within these categories arenot expected. Conversely, it is anticipated that the proportion of turboprop, jet, rotorcraft, andother/experimental aircraft will increase gradually through 2037. The existing and projected fleet mix isshown in Table 2-20.
Table 2-20. Based Aircraft Fleet Mix
Year
Single-EnginePiston
Multi-EnginePiston
Turboprop Jet Rotorcraft Other/Experimental Total
# % # % # % # % # % # % #2017 105 63.3 36 21.7 10 6.0 3 1.8 12 7.2 0 0.0 1662022 120 62.1 40 21.3 12 6.5 4 1.9 14 7.6 1 0.5 1912027 133 61.0 45 21.0 15 7.0 4 2.0 17 8.0 2 1.0 2162037 163 59.0 55 20.0 22 8.0 8 3.0 24 9.0 3 1.0 275
AAGR2017-2037
2.2% N/A 2.1% N/A 4.0% N/A 5.2% N/A 3.6% N/A 100% N/A 2.6%
Sources:FAA Aerospace Forecast Fiscal Years 2018-2038.Kimley-Horn.
As shown, the percentage of single-engine piston aircraft is anticipated decline from 63.3 percent in 2017to 59.0 percent in 2037. The proportion of multi-engine piston aircraft is anticipated to decline from 21.7percent to 20.0 percent, turboprops are projected to increase from 6.0 percent of the fleet to 8.0 percent,jet aircraft are anticipated to increase from 1.8 percent of the fleet to 3.0 percent, rotorcraft are projectedto increase from 7.2 percent to 9.0 percent, and other/experimental aircraft are projected to increase from0.0 percent to 1.0 percent.
Pompano Beach Airpark
2.7.5 -
p mpano I ~ .~~?,S~- Kimley>>>Horn MASTER PLAN UPDATE

Aviation Activity Forecasts
2-25
2.8 - Aircraft Operations Forecasts
Annual aircraft operations are used to determine funding and design criteria at airports. Accuratelygauging aircraft operations can help inform the adequacy of airfield capacity and other facility needs at anairport. Aircraft operations at GA airports comprise nearly all segments of the overall aviation industry,except for commercial air carrier and military operations. GA operations incorporate flight training,corporate aviation, law enforcement, medical operations, and personal/recreational activity, amongothers. As previously noted, an operation is defined as a takeoff or a landing. The following sectionspresent forecasts of annual aircraft operations at the Airpark over the 20-year planning horizon.
General Aviation Operations Methodologies
Aircraft operations forecasts were developed using several methodologies including socioeconomic,market share, linear regression, and operations per based aircraft (OPBA). The following sectionsdescribe results of these methodologies as they pertain to GA operations. It should be noted that aforecast of military operations was also developed, which is presented following the sections applicable toGA operations forecasts.
GA Operations Forecast - Socioeconomic Methodology: Population Variable
Socioeconomic forecasts of GA operations were developed using the same methodologies employed toproject based aircraft activity. The population variable methodology for aircraft operations applied aregression analysis that utilized population projections for Broward County, the Miami/Ft. LauderdaleMSA, and the state of Florida. Results of this methodology are shown in Table 2-21.
Table 2-21. GA Operations Forecast: Socioeconomic Population Variable Methodology
YearBroward County Miami/Ft. Lauderdale MSA Florida
Population GAOperations Population GA
Operations Population GAOperations
2017 1,947,002 132,414 6,169,550 132,414 20,743,494 132,4142022 2,083,756 141,715 6,591,466 141,169 22,243,254 141,9882027 2,227,520 151,492 7,035,180 150,993 23,829,884 152,1162037 2,520,641 171,427 7,939,947 170,411 27,109,773 173,052
AAGR2017-2037 1.30% 1.27% 1.35%
Sources:Woods and Poole, Inc.Kimley-Horn.
As shown, the socioeconomic population variable methodology produced a range of GA operations from170,411 to 173,052 by the end of the 20-year planning period, with average annual growth rates rangingfrom 1.27 percent to 1.35 percent.
GA Operations Forecast - Socioeconomic Methodology: Employment Variable
The employment variable methodology assumed that GA operations at the Airpark will increase at thesame rate as employment rates within the designated geographic areas starting in base year 2017.Results of this methodology are depicted in Table 2-22.
Pompano Beach Airpark
2.8.1 -
2.8.1.1 -
2.8.1.2 -
p mpano I ~ .~~?,S~- Kimley>>>Horn MASTER PLAN UPDATE

Aviation Activity Forecasts
2-26
Table 2-22. GA Operations Forecast: Socioeconomic Employment Variable Methodology
YearBroward County Miami/Ft. Lauderdale MSA Florida
Employment GAOperations Employment GA
Operations Employment GAOperations
2017 1,173,542 132,414 3,768,822 132,414 11,566,788 132,4142022 1,286,794 145,193 4,128,840 145,063 12,661,760 144,9492027 1,401,628 158,150 4,496,460 157,979 13,773,922 157,6812037 1,631,861 184,127 5,240,040 184,104 16,008,243 183,259
AAGR2017-2037 1.66% 1.66% 1.64%
Sources:Woods and Poole, Inc.Kimley-Horn.
As shown, the socioeconomic employment variable methodology projected a range of GA operationsfrom 183,259 to 184,127 by 2037, with average annual growth rates ranging from 1.64 percent to 1.66percent.
GA Operations Forecast - Socioeconomic Methodology: Per Capita Personal IncomeVariable
The PCPI variable methodology assumed that GA Operations at PMP will increase at the same rate asPCPI with Broward County, the Miami/Ft. Lauderdale MSA, and the state of Florida between 2017 and2037. Results are depicted in Table 2-23. Monetary values have been converted to 2018 dollars to adjustfor inflation over time.
Table 2-23. GA Operations Forecast: Socioeconomic PCPI Variable Methodology
YearBroward County Miami/Ft. Lauderdale MSA Florida
PCPI($2018)
GAOperations
PCPI($2018)
GAOperations
PCPI($2018)
GAOperations
2017 $48,537 132,414 $54,079 132,414 $48,055 132,4142022 $52,163 142,307 $58,146 142,372 $51,899 143,0062027 $55,717 152,000 $62,125 152,115 $55,733 153,5702037 $61,851 168,734 $69,106 169,210 $62,390 171,915
AAGR2017-2037 1.22% 1.23% 1.31%
Sources:Woods and Poole, Inc.Kimley-Horn.
As shown, the socioeconomic PCPI variable methodology produced a range of GA operations between168,734 and 171,915 by 2037, with average annual growth rates between 1.22 percent and 1.31 percent.
GA Operations Forecast - Socioeconomic Methodology: Gross Regional Product Variable
The fourth socioeconomic methodology to forecast GA operations utilized GRP projections for BrowardCounty, the Miami/Ft. Lauderdale MSA, and Florida. GRP for the geographic regions has been convertedto constant dollars ($2018) to adjust for inflation. Results of this methodology are depicted in Table 2-24.
Pompano Beach Airpark
2.8.1.3 -
2.8.1.4 -
p mpano I ~ .~~?,S~- Kimley>>>Horn MASTER PLAN UPDATE

Aviation Activity Forecasts
2-27
Table 2-24. GA Operations Forecast: Socioeconomic GRP Variable Methodology
YearBroward County Miami/Ft. Lauderdale MSA Florida
GRP ($2018)in millions
GAOperations
GRP ($2018)in millions
GAOperations
GRP ($2018)in billions
GAOperations
2017 $101,207 132,414 $336,095 132,414 $978.6 132,4142022 $115,722 151,405 $382,774 150,804 $1,112.7 150,5572027 $131,302 171,789 $433,007 170,595 $1,256.8 170,0482037 $166,025 217,219 $545,055 214,739 $1,577.6 213,456
AAGR2017-2037 2.51% 2.45% 2.42%
Sources:Woods and Poole, Inc.Kimley-Horn.
As shown, the GRP variable methodology projected a range of GA operations between 213,456 and217,219 by 2037, reflecting average annual growth rates between 2.42 percent and 2.51 percent.
GA Operations Forecast - Regional Market Share Methodology
The regional market share methodology for GA operations employed a similar approach to themethodology utilized to project based aircraft, however, some of the assumptions were modified becauseaccurate historical annual GA operations data were available from the ATCT at the Airpark as well asfrom FAA databases for nearby airports. Three market share methodologies were developed whichincluded Low Growth, Medium Growth, and High Growth scenarios.
In 2017, the Airpark’s share of GA operations compared with the surrounding region (which includes thesame nine airports identified previously in Section 2.1.3) was 11.2 percent. The Low Growth Scenarioassumed that the Airpark’s market share would remain constant throughout the 20-year planning horizon.This percentage was applied to projections of GA operations for airports in the region reported in the FAATAF.
Between 2008 and 2017, the Airpark’s share of GA operations increased from 9.6 percent to 11.2percent. The High Growth Scenario assumed that the annual rate of change during that timeframe wouldcontinue through 2037.
The Medium Growth Scenario assumed that the Airpark’s market share would increase at the averagerate of the combined High Growth and Low Growth scenarios. Results of the market share methodologiesare depicted in Table 2-25.
Pompano Beach Airpark
2.8.1.5 -
p mpano I ~ .~~?,S~- Kimley>>>Horn MASTER PLAN UPDATE

Aviation Activity Forecasts
2-28
Table 2-25. GA Operations Forecast: Market Share Methodology
YearRegional
Airports GAOperations
PMP LowGrowth GAOperations
PMPLow
Growth%
PMPMedium
Growth GAOperations
PMPMediumGrowth
%
PMP HighGrowth GAOperations
PMPHigh
Growth%
2017 1,181,080 132,414 11.2% 132,414 11.2% 132,414 11.2%2022 1,211,574 135,833 11.2% 140,636 11.6% 145,440 12.0%2027 1,240,211 139,043 11.2% 148,877 12.0% 158,711 12.8%2037 1,302,184 145,991 11.2% 166,642 12.8% 187,292 14.4%
AAGR2017-2037
0.49% 0.50% N/A 1.16% N/A 1.77% N/A
Sources:FAA Terminal Area Forecast issued January 2018.FAA Air Traffic Activity System (ATADS) database.Kimley-Horn.
As shown, the Low Growth Scenario projected 145,991 GA operations by 2037, the Medium GrowthScenario projected 166,642 GA operations, and the High Growth Scenario projected 187,292, whichrepresent average annual growth rates between 0.49 percent and 1.77 percent.
GA Operations Forecast – Linear Regression Methodology
Because of the availability of accurate historical GA operations data provided by the Airpark’s ATCT (andin the FAA’s ATADS database), a linear regression methodology was developed. Linear regression (alsoreferred to as trend analysis) utilizes historical data (annual GA operations at PMP) to project futureactivity by creating a linear model. Results of the trend analysis methodology are depicted in Table 2-26and Figure 2-2.
Table 2-26. GA Operations Forecast: Linear Regression MethodologyYear GA Operations2008 116,7932009 95,3192010 111,1712011 118,4202012 135,4402013 128,2672014 137,7632015 140,6552016 145,5442017 132,4142022 165,9312027 186,8542037 228,698
AAGR 2017-2037 2.77%Sources:FAA Air Traffic Activity System (ATADS) database.Kimley-Horn.
Pompano Beach Airpark
2.8.1.6 -
p mpano I ~ .~~?,S~- Kimley>>>Horn MASTER PLAN UPDATE

Aviation Activity Forecasts
2-29
Figure 2-2. Linear Regression Model: GA Operations
Sources:FAA Air Traffic Activity System (ATADS) database.Kimley-Horn.
As shown, the linear regression methodology projected 228,698 GA operations by 2037, whichrepresents an average annual growth rate of 2.77 percent.
GA Operations Forecast – Operations per Based Aircraft Methodology
The final methodology employed to forecast GA operations examined OPBA. In base year 2017, theAirpark had 166 based aircraft and 132,414 GA operations, which translated to 798 OPBA. Withoutaccurate historical based aircraft data to identify if OPBA has increased or decreased in recent years, thismethodology assumed that this figure would remain constant through the 20-year planning horizon, andthis figure was applied to the preferred forecast for based aircraft (Market Share Medium GrowthScenario). Results of this methodology are depicted in Table 2-27.
Table 2-27. GA Operations Forecast: OPBA MethodologyYear OPBA Preferred Forecast
Based Aircraft GA Operations
2017 798 166 132,4142022 798 190 151,3052027 798 216 172,6492037 798 275 218,996
AAGR 2017-2037 N/A 2.55%Sources:FAA Air Traffic Activity System (ATADS) database.Airpark Management.Kimley-Horn.
Pompano Beach Airpark
2.50,000
230,000
210,000
190,000
170,000
150,000
116,793 130,000 I 110,000
90,000
70,000
50,000
2.8.1.7 -
p mpano I !'!!!.:~?.S~· Kimley>>>Horn
132,414 , ...... ····· ... -····· ··••'
····· ........ -· ····· ---··
- Historical •· · · · · ·· · Linear (H&oric:;aj)
_ ...... ...... ····· ····· .... , ..
... -... ..
·••' ··· · ··•···•·• 228,698
MASTER PLAN UPDATE

Aviation Activity Forecasts
2-30
As shown, the OPBA methodology projected 218,996 GA operations by 2037, which reflects an averageannual growth rate of 2.55 percent.
General Aviation Operations Forecast – Preferred Methodology
Between 2000 and 2004, the Airpark regularly experienced over 175,000 annual operations beforeactivity declined through 2009 attributed to a combination of increasing costs of aircraft ownership andoperation, and the economic downturn that occurred between 2008 and 2010. From 2010 to 2017, annualGA operations have fluctuated on a year-to-year basis, but overall, they have increased at an averageannual rate of 1.4 percent. While the FAA projects that GA operational activity will remain relativelystagnant through 2037, there are several factors that indicate the Airpark will continue to see incremental,positive growth in GA operations.
Socioeconomic indicators for Broward County, the Miami/Ft. Lauderdale MSA, and the state of Floridaproject strong growth over the next 20-years. Similar to forecast based aircraft, though positive growth inGA operations is anticipated, it is unlikely to keep pace with local economic and demographic conditions.
Between 2008 and 2017, the Airpark’s market share of regional GA operations fluctuated between 9.3percent and 14.0 percent; while its market share overall has increased approximately 1.2 percentannually during that timeframe. Although turboprop and jet operations are anticipated to experience themost significant growth in GA activity nationwide, PMP will likely see an increase of smaller piston-powered aircraft relocating from other nearby airports that cater to larger corporate activity. This isevidenced by the Airpark’s increasing historical share of operational activity in the region and severalnearby airports experiencing decreases in based aircraft and annual GA operations. As such, it isanticipated that future GA operations at PMP will continue to follow patterns that have occurred between2008 and 2017. This anticipated growth is best demonstrated by the Regional Market Share MediumGrowth Methodology, which projects an increase from 132,414 GA operations in 2017 to 166,642operations in 2037, and an average annual growth rate of 1.16 percent. Projections of this methodologywill be used to identify facility needs in the subsequent chapter.
A summary of GA operations forecast methodologies including the FAA TAF is shown in Figure 2-3.Similar to the based aircraft summary, the preferred methodology for GA operations was developed as a“most likely to occur”. The summary presented below represents a range of potential operational activityat the Airpark over the next 20 years, which can assist Airpark Management with facility planning in theevent that activity exceeds or falls short of the preferred forecast.
Pompano Beach Airpark
2.8.1.8 -
p mpano I ~ .~~?,S~- Kimley>>>Horn MASTER PLAN UPDATE

Aviation Activity Forecasts
2-31
Figure 2-3. GA Operations Forecast Methodologies Summary
Source:Kimley-Horn.
Military Operations Forecast
Between 2008 and 2017, an average of approximately 160 annual military operations occurred at theAirpark. Military activity at most general aviation airports is not contingent on the same factors that driveGA activity, and therefore, forecasting military operations is difficult. As a result of this uncertainty, theFAA’s TAF forecast is the preferred methodology for military operations at PMP. The TAF projects 15local military operations, 72 itinerant military operations, and 87 total military operations annually through2037 (see Table 2-28).
Pompano Beach Airpark
250,000
230,000
210,000
190,000
170,000
150,000
130,000
110,000
90,000
70,000
50,000
- Pop. Miclll i/ Ft. Lauderdale MSA.
- Emp. M iclll i/ Ft. Lauderdale MSA
- - - f>CPI Miclll i/ Ft. Lauderdale MSA
--GRP Miami/ Ft. Lauderdale MSA
- Regional Market - Low
OPBA
- Historical
2.8.1.9-
p mpano I !'!!!.:~?,S~- Kimley>>>Horn
- Pop. Broward County
- Emp. Broward County
- PCPI Broward County
--- GRPBrowcrdCounty
Regional Market - Med.
- Trend Analysis
130,795 (FAA TAF)
- Pop.FL
- Emp.FL
- PCF'I FL
--- GRPFL
Reg ional Market - Hi
- FM TAF
MASTER PLAN UPDATE

Aviation Activity Forecasts
2-32
Table 2-28. Military Operations ForecastYear Local Military
OperationsItinerant Military
OperationsTotal MilitaryOperations
2017 4 71 752022 15 72 872027 15 72 872037 15 72 87
AAGR 2017-2037 6.83% 0.07% 0.74%Source:FAA Terminal Area Forecast issued January 2018.
Aircraft Operations Summary
A summary of total aircraft operations is presented in Table 2-29. As shown, total aircraft operations areanticipated to increase from 132,489 in 2017 to 166,729 in 2037, which represents an average annualgrowth rate of 1.16 percent.
Table 2-29. Aircraft Operations Forecast SummaryYear Military Operations General Aviation
Operations Total Operations
2017 75 132,414 132,4892022 87 140,636 140,7232027 87 148,877 148,9642037 87 166,642 166,729
AAGR 2017-2037 0.74% 1.16% 1.16%Sources:FAA Terminal Area Forecast issued January 2018.FAA Air Traffic Activity System (ATADS) database.Kimley-Horn.
Local/Itinerant Operations
General aviation and military operations are classified as either local or itinerant. Local operations arethose that remain within a 20-mile radius of an airport and include touch-and-go and most training activity.Itinerant operations are performed by an aircraft that lands at an airport, arriving from outside the airportarea, or that departs an airport and leaves the airport’s 20-mile radius prior to its return.
Between 2008 and 2017, the Airpark averaged 64.6 percent local operations and 35.4 percent itinerantoperations based on information provided in the FAA’s ATADS database. While local/itinerantpercentages have fluctuated from year-to-year during this timeframe, they have remained relativelyconsistent over the course of 10 years. As such, it was assumed that the 64.6/35.4 percent split of localand itinerant traffic will remain consistent throughout the forecasting period. Local and itinerant operationsforecasts are presented in Table 2-30.
Pompano Beach Airpark
2.8.1.10-
2.8.1.11 -
p mpano I ~ .~~?,S~- Kimley>>>Horn MASTER PLAN UPDATE

Aviation Activity Forecasts
2-33
Table 2-30. Local/Itinerant OperationsYear Total
OperationsLocal
Operations % Local ItinerantOperations % Itinerant
2008 116,931 73,934 63.2% 42,997 36.8%2009 95,330 61,059 64.1% 34,271 35.9%2010 111,173 73,115 65.8% 38,058 34.2%2011 118,466 80,327 67.8% 38,139 32.2%2012 135,476 91,480 67.5% 43,996 32.5%2013 128,752 83,142 64.6% 45,610 35.4%2014 138,402 89,891 64.9% 48,511 35.1%2015 140,713 90,325 64.2% 50,388 35.8%2016 145,660 93,037 63.9% 52,623 36.1%2017 132,489 79,761 60.2% 52,728 39.8%2022 140,723 90,931 64.6% 49,793 35.4%2027 148,964 96,256 64.6% 52,708 35.4%2037 166,729 107,735 64.6% 58,994 35.4%
AAGR 2017-2037 1.16% 1.51% N/A 0.56% N/A
Sources:FAA Air Traffic Activity System (ATADS) database.Kimley-Horn.
Operational Fleet Mix
An airport’s operational fleet mix impacts airside and itinerant aircraft parking needs, and other facilities.An analysis of historical data provided in the FAA’s TFMSC database was utilized to identify operationalfleet mix trends and to project the Airpark’s future operational fleet mix. The TFMSC database groupsaircraft operations into three types; piston (which includes piston rotorcraft), turbine (also referred to asturboprop, which includes turbine rotorcraft), and jet.
Between 2008 and 2017, the proportion of annual piston operations at the Airpark declined from 99.7percent to 98.9 percent. This coincided with an increase of turbine operations from 0.2 percent to 0.9percent, and an increase of jet operations from 0.1 percent to 0.3 percent during the same timeframe. Toproject the future operational fleet mix, a linear regression was applied to activity by aircraft type between2008 and 2017. Results of this methodology are depicted in Table 2-31.
Pompano Beach Airpark
2.8.1.12 -
p mpano I ~ .~~?,S~- Kimley>>>Horn MASTER PLAN UPDATE

Aviation Activity Forecasts
2-34
Table 2-31. Operational Fleet MixYear Total
OperationsPiston
Operations # TurbineOperations # Jet
Operations #
2008 116,931 116,541 99.7% 233 0.2% 157 0.1%2009 95,330 95,020 99.7% 197 0.2% 113 0.1%2010 111,173 110,679 99.6% 254 0.2% 240 0.2%2011 118,466 117,828 99.5% 262 0.2% 376 0.3%2012 135,476 134,672 99.4% 317 0.2% 487 0.4%2013 128,752 127,581 99.1% 373 0.3% 798 0.6%2014 138,402 137,232 99.2% 452 0.3% 718 0.5%2015 140,713 139,414 99.1% 849 0.6% 450 0.3%2016 145,660 144,351 99.1% 942 0.6% 367 0.3%2017 132,489 130,974 98.9% 1,127 0.9% 388 0.3%2022 140,723 138,534 98.4% 1,442 1.0% 747 0.5%2027 148,964 145,973 98.0% 2,032 1.4% 959 0.6%2037 166,729 161,872 97.1% 3,405 2.0% 1,452 0.9%
AAGR 2008-2017 1.40% 1.31% N/A 19.14% N/A 10.58% N/A
AAGR 2017-2037 1.16% 1.06% N/A 5.68% N/A 6.82% N/A
Sources:FAA Traffic Flow Management Systems (TFMSC) Database.Kimley-Horn.
As shown, piston operations are anticipated to increase at a 1.06 percent average annual growth rate,and turbine and jet operations are anticipated to increase at 5.68 percent and 6.82 percent averageannual growth rates, respectively.
Daytime/Nighttime Operations
Another component of the forecast is the development of forecasts of daytime/evening operations. This isan important element to include in the planning process because noise impacts created by aircraftarriving or departing at night are greater than during the day. The FAA defines nighttime operations asthose that are conducted between 10:00PM and 7:00AM. According to the FAA’s TFMSC database,which creates a summary of traffic by day and hour based on the DZ (departure) and AZ (arrival)message times received by the FAA Air Traffic Airspace (ATA) lab, 93.7 percent of operations at theAirpark in 2017 were conducted during daytime hours. The remaining 6.3 percent were conducted duringnighttime hours. As shown in Table 2-32, this split is anticipated to remain constant throughout theprojection period.
Pompano Beach Airpark
2.8.1.13-
p mpano I ~ .~~?,S~- Kimley>>>Horn MASTER PLAN UPDATE

Aviation Activity Forecasts
2-35
Table 2-32. Daytime/Nighttime OperationsYear Total
OperationsDaytime
Operations % Daytime NighttimeOperations % Nighttime
2017 132,489 124,181 93.7% 8,308 6.3%2022 140,723 131,899 93.7% 8,824 6.3%2027 148,964 139,623 93.7% 9,341 6.3%2037 166,729 156,274 93.7% 10,455 6.3%
Sources:FAA Traffic Flow Management Systems (TFMSC) Database.Kimley-Horn.
Touch and Go Operations
A touch-and-go operation is defined as an operation conducted by an aircraft that lands and departs on arunway without stopping or exiting the runway. This type of operation is typically associated with flighttraining. Based on conversations with the Airpark manager, approximately 85 percent of local operations(including those categorized as military) are considered touch-and-go operations. This figure was appliedto forecasts of local operations described in Section 2.8.1.11 and held constant throughout the projectionperiod. Based on these estimates, touch-and-go operations are anticipated to increase from 67,797 in2017 to 91,574 in 2037, which represents an average annual growth rate of 1.51 (see Table 2-33).
Table 2-33. Touch and Go OperationsYear Total Operations Local Operations % Local Touch
and GoTouch and Go
Operations2017 132,489 79,761 85.0% 67,7972022 140,723 90,931 85.0% 77,2912027 148,964 96,256 85.0% 81,8172037 166,729 107,735 85.0% 91,574
AAGR 2017-2037 1.16% 1.51% N/A 1.51%Sources:FAA Air Traffic Activity System (ATADS) database.Airpark Management.Kimley-Horn.
Annual Instrument Approaches
As defined by the FAA, an Instrument Approach Procedure (IAP) is a series of predetermined maneuversfor the orderly transfer of an aircraft under instrument flight conditions from the beginning of the initialapproach to a landing or to a point from which a landing may be visually made. All operations that are notcategorized as instrument operations are considered visual operations. According to the FAA’s ATADSdatabase, 4.4 percent of total operations at the Airpark were instrument operations in 2017. It wasassumed that 50 percent of these operations were IAPs. To forecast instrument operations andapproaches, these figures were held constant throughout the planning period, as depicted in Table 2-34.
Pompano Beach Airpark
2.8.1.14-
2.8.1.15-
p mpano I ~ .~~?,S~- Kimley>>>Horn MASTER PLAN UPDATE

Aviation Activity Forecasts
2-36
Table 2-34. Annual Instrument Approaches
Year TotalOperations
VisualOperations % Visual Instrument
Operations%
InstrumentInstrumentApproach
Procedures2017 132,489 126,689 95.6% 5,800 4.4% 2,9002022 140,723 134,563 95.6% 6,160 4.4% 3,0802027 148,964 142,443 95.6% 6,521 4.4% 3,2612037 166,729 159,430 95.6% 7,299 4.4% 3,649
Sources:FAA Air Traffic Activity System (ATADS) database.Kimley-Horn.
Peak Activity Forecasts
The capacity of an airport relates to the activity levels during a peak, or design, period. Aviation demandforecasts were used to determine operational peaking characteristics and determine facility requirements.
To ensure that a facility isn’t overbuilt, several factors are used to analyze airport facilities. The averageday of the peak month, or the design day, is an accepted industry methodology used in evaluatingpeaking characteristics. Metrics such as average annual day do not adequately take into considerationincreased activity at certain times of the year. Considering only the busy or peak day of the peak month,however, may result in facilities that are overbuilt.
The following factors were used to develop peaking characteristics for PMP:
· Peak Month — the calendar month when peak volumes of aircraft operations occur· Design Day — the average day in the peak month; derived by dividing peak month operations by
the number of days in that month (also referred to as Peak Month Average Day, abbreviated asPMAD)
· Design Hour — the peak hour within the design day; derived by averaging the 20 busiest hours interms of aircraft operations during the peak month
The FAA’s ATADS database was used to determine peak month and design hour operations for theAirpark. It was assumed that peaking characteristics would remain consistent with projected growth oftotal operations throughout the 20-year planning horizon. Peak monthly, daily, and hourly operationsprojected for the Airpark are summarized in Table 2-35.
Table 2-35. Peak Operations ForecastYear Total
OperationsPeak Month
%Peak MonthOperations*
Design DayOperations
Peak HourOperations
2017 132,489 10.6% 14,075 454 842022 140,723 10.6% 14,950 482 892027 148,964 10.6% 15,825 510 942037 166,729 10.6% 17,712 571 106
Sources:FAA Air Traffic Activity System (ATADS) database.Kimley-Horn.
Note:*Peak month was determined to be May
Pompano Beach Airpark
2.8.2 -
p mpano I ~ .~~?,S~- Kimley>>>Horn MASTER PLAN UPDATE

Aviation Activity Forecasts
2-37
2.9 - Design Aircraft Determination
Facility planning for general aviation airports is impacted by existing and anticipated levels of aviation-related demand, both based aircraft and annual aircraft operations, as well as the size and type of aircraftthat currently operate and are projected to operate. The FAA classifies airports by Airport ReferenceCode (ARC), which identifies the overall planning and design criteria for an airport. Per FAA AC 150-5300-13A, the ARC is assigned based on the size of the largest aircraft that generally records at least500 operations annually at an airport; this aircraft is known as the airport’s “design aircraft.” However, thisdocument further adds that, “The first consideration of the airport planner should be the safe operation ofaircraft likely to use the airport. Any operation of an aircraft that exceeds design criteria of the airport mayresult in either an unsafe operation or a lesser safety margin unless air traffic control (ATC) StandardOperating Procedures (SOPs) are in place for those operations.”
The ARC is comprised of the Aircraft Approach Category (AAC) and the Aircraft Design Group (ADG).The AAC is based on the approach speed of the airport’s critical aircraft, and the ADG is based on thecritical aircraft’s wingspan and tail height. The ARC consists of a letter and a numeric identifier. The first isthe letter, which represents the AAC; the second is the number which represents the ADG.
Aircraft approach speeds included in AAC categories A and B typically correspond to small, piston-engineor turboprop aircraft, whereas C, D, and E apply to larger turboprop or turbine powered aircraft. Similarly,the wingspan and tail height of small, piston-engine aircraft normally correspond to ADG I. Typical aircraftin ADG II include aircraft models such as a Beechcraft King Air 300, Cessna Citation, or smaller businessjets. Design groups III, IV, and V represent larger corporate jets and air carrier aircraft. Group VI includeslarge commercial air carrier and cargo aircraft such as Airbus A-380 or C-5 military cargo aircraft. Table2-36 summarizes the classifications for determining AAC and ADG, which combine to identify the ARC.
Table 2-36. FAA ARC DeterminationAircraft
ApproachCategory (AAC)
Approach Speed(knots)
Airplane DesignGroup (ADG) Wingspan (feet) Tail Height (feet)
A Less than 91 I Less than 49 Less than 20B 91 to 120 II 49 to 78 21 to 29C 121 to 140 III 79 to 117 30 to 44D 141 to 165 IV 118 to 170 45 to 59E 166 or Greater V 171 to 213 60 to 65
VI 214 up to but lessthan 262
66 up to but lessthan 80
Source:FAA Advisory Circular 150/5300-13A, Change 1, Airport Design.
The design aircraft can consist of multiple aircraft that are considered collectively as a “family” of aircraft.The design aircraft is used to determine the appropriate design standards for pavement surfaces, safetyarea dimensions, runway lengths, separation standards, and taxiway criteria in an attempt to ensure thatthe airfield layout and geometry provide a safe and efficient operating environment for the aircraft thattypically use an airport.
The 2008 Airport Master Plan Update recommended an existing (2008) and future ARC designation of B-II, represented by a design aircraft grouping that included the Beechcraft King Air 200, 300, 350, and theCessna Citation II.
Pompano Beach Airpark
p mpano I ~ .~~?,S~- Kimley>>>Horn MASTER PLAN UPDATE

Aviation Activity Forecasts
2-38
An analysis of the FAA’s TFMSC database was initially conducted using base year 2017 data to identifythe recommended existing and future design aircraft for this Master Plan Update. Based on the results atthat time, the recommended existing ARC was B-I with a design aircraft of the Beechcraft King Air A90,and the Beechcraft Baron 58. A regression analysis identified that annual operations conducted byaircraft with ARC designations that exceed B-II were anticipated to surpass 500 by 2022. As such, it wasrecommended that the future ARC for the Airpark be B-II, with a design aircraft represented by acombination of the Beechcraft Super King Air 200 and the Cessna Citation Sovereign, which regularlyoperate at PMP.
The FAA approved the submitted forecast for this Master Plan Update in December 2018. A reevaluationof operational activity was conducted in March 2020, which has impacted the existing and future ARC anddesign aircraft. Consecutive 12-month operations data by ARC and aircraft type reported in the FAA’sTFMSC database were analyzed for January 2017 through January 2021. It was identified that startingwith the 12-month timeframe of August 2019 through July 2020, annual activity conducted by aircraft withARCs of B-II and greater (B-II, B-III, C-II, C-III, D-II, and D-III) consistently exceeded the FAA’s thresholdof 500 operations that delineate substantial use of an Airport (see Table 2-37). As such, based onoperational activity, the Airpark’s existing and future ARC should be B-II.
Although several B-II aircraft models including the Beechcraft Super King Air 90/200/300/350, CessnaCitation CJ3/CJ4, Citation II//III/IV/V/XLS, Citation Sovereign, Embraer Phenom 300, Dassault Falcon2000, and other models composed the majority of B-II operations during the assessed timeframe, themost frequent aircraft type in operation was identified as the King Air 350. It is recommended that thisaircraft be utilized as the existing and future Design Aircraft at the Airpark and for primary Runway 15-33.
Pompano Beach Airpark
p mpano I ~ .~~?,S~- Kimley>>>Horn MASTER PLAN UPDATE

Aviation Activity Forecasts
2-39
Table 2-37. Historical Operations by ARC – 2021 Update12-Month Period B-II+ Operations
Jan-17 Dec-17 252Feb-17 Jan-18 219Mar-17 Feb-18 204Apr-17 Mar-18 193May-17 Apr-18 177Jun-17 May-18 173Jul-17 Jun-18 176Aug-17 Jul-18 185Sep-17 Aug-18 195Oct-17 Sep-18 183Nov-17 Oct-18 188Dec-17 Nov-18 205Jan-18 Dec-18 206Feb-18 Jan-19 241Mar-18 Feb-19 273Apr-18 Mar-19 291May-18 Apr-19 321Jun-18 May-19 330Jul-18 Jun-19 339Aug-18 Jul-19 339Sep-18 Aug-19 337Oct-18 Sep-19 332Nov-18 Oct-19 350Dec-18 Nov-19 389Jan-19 Dec-19 422Feb-19 Jan-20 437Mar-19 Feb-20 464Apr-19 Mar-20 469May-19 Apr-20 463Jun-19 May-20 477Jul-19 Jun-20 493Aug-19 Jul-20 515Sep-19 Aug-20 527Oct-19 Sep-20 546Nov-19 Oct-20 552Dec-19 Nov-20 534Jan-20 Dec-20 554Feb-20 Jan-21 542
Sources:FAA Traffic Flow Management Systems (TFMSC) Database.Kimley-Horn.
Operational activity and existing pavement strength and design were considered in recommending ARCdesignations for individual runways at the Airpark. Primary Runway 15-33 receives the majority of aircraftoperations by larger aircraft (those weighing 12,500 lbs. or more). As such, it’s recommended existing
Pompano Beach Airpark
p mpano I ~ .~~?,S~- Kimley>>>Horn MASTER PLAN UPDATE

Aviation Activity Forecasts
2-40
and future ARC is B-II, consistent with the Airpark’s future ARC. Runway 10-28 is limited to small aircraft(weighing less than 12,500 lbs.) and is therefore recommended to be designated a B-I (small) facilitycurrently, and a B-II (small) facility in the future. Runway 6-24 is capable of accommodating both largeand small aircraft, however, because it is the least frequently utilized runway at the Airpark, from anoperational standpoint its existing and recommended future ARC is B-II (small).
In summary, the Airpark’s existing and future ARC is B-II with a design aircraft represented by aBeechcraft Super King Air 350.
2.10 - FAA TAF Comparison
FAA ADOs or Regional Airports Divisions are responsible for forecast approvals. When reviewing asponsor’s forecast, the FAA must ensure the forecast is based on reasonable planning assumptions,uses current data, and is developed using appropriate methodologies. Additional discussion onassumptions and methodologies can be found in the APO report, Forecasting Aviation Activity by Airport.After a thorough review of the forecast, FAA then determines if the forecast is consistent with the TAF.
For all classes of airports, forecasts for based aircraft and total operations are considered consistent withthe TAF if they meet the following criteria: forecasts differ by less than 10 percent in the 5-year forecastperiod and 15 percent in the 10-year forecast period. If the forecast is not consistent with the TAF,differences must be resolved if the forecast is to be used in FAA decision making. This may involverevisions to the airport sponsor’s submitted forecasts, adjustments to the TAF, or both. Forecasts that arenot consistent with the TAF are reviewed at FAA headquarters unless five and ten-year forecasts do notexceed 200 based aircraft or 200,000 total annual operations, and any related development associatedwith the forecasts will not require an EIS and/or BCA.
Based on these criteria, forecasts developed for this Master Plan Update have been determined to beinconsistent with the TAF. This is attributed to the following factors:
· The TAF identified an estimate of 127 based aircraft at PMP in base year 2017; 166 basedaircraft were verified by the National Based Aircraft Inventory Program in 2018, a figure that isutilized as the base year estimate for 2017. Management and tenants have identified significantdemand for development of additional tie-downs and aircraft storage hangars, which suggeststhat the number of based aircraft will increase in the future if/when development to accommodateadditional aircraft occurs.
· Total operations at PMP have increased from approximately 117,000 in 2008 to 134,000 in 2017,which reflects an average annual growth rate of 1.4 percent. The preferred forecast in the MasterPlan Updates identified that total annual operations were anticipated to increase 1.16 percentthrough 2037. The TAF projects 0.02 percent average annual growth between 2017 and 2037,reflecting an increase of only 648 annual operations by 2037. Based on historical trends anddemand for additional based aircraft at PMP, an annual growth rate of 0.02 percent wasestimated to be significantly lower than what is likely to occur.
A comparison of forecasts of aviation with TAF forecasts are presented in the FAA template tables below.Based on conversations with staff at the FAA Orlando ADO, it was identified that forecasts did not need tobe forwarded to FAA headquarters for review and approval.
Pompano Beach Airpark
p mpano I ~ .~~?,S~- Kimley>>>Horn MASTER PLAN UPDATE

Aviation Activity Forecasts
2-41
Pompano Beach Airpark
Appendix B Template for Summarizing and Documenting Airport Planning Forecasts (1)
Airport Name: Pompano Beach Airpark (PMP)
2017
A. Forecast Levels and Growth Rates Specify base year:
2017
2022 2027
Average Annual Compound Growth Rates
2032
Base Yr. Level Base Base Base Base Yr. to +5 Base Yr. to +10 Base Yr. to +15 Yr.+5yrs. Yr.+10yrs. Yr.+15yrs.
Operations
erani
Gener 52,657 49,nt 52,636 55,700 -1.1% 0.0% 0.4%
71 72 72 72 0.3% 0.1% 0.1%
ocal
Gener avia:,on 79,757 90,916 96,241 10 ,835 2.7% 1.9% 1.6%
wy 4 15 5 15 30.3% 14.1% 9.2%
0 A OPERA ,I() S 132,489 40,723 148,964 57,623 .2% 1.2% 1.2%
Instrument Operations 5,800 6,160 6,52 6,900 1.2% 1.2% 1.2%
Peak Hour Operations 84 89 94 00 1.2% 1.2% 1.2%
Based Aircraft
105 119 132 146 2.5% 2.3% 2.2%
36 40 45 50 2.4% 2.4% 2.2%
0 12 15 18
3 4 4 6 3.8% 3.7% 4.9%
12 14 17 21 3.6% 3.6% 3.7%
°'1er 0 2 2 0.0% 0.0% 0.0%
OA 166 191 216 244 2.8% 2.7% 2.6%
B. Operational Factors
Base Yr. Level Base Base Base
Yr.+5yrs. Yr.+10yrs. Yr.+15yrs.
GA operations per based aircraft 798 738 689 647
{1} . ~tomAl)l)ell s· e FM Repoo\ ' Forec.1SCng A .• - . 8Y .
p mpano I !'!!!.:~?,S~- Kimley>>>Horn MASTER PLAN UPDATE

Aviation Activity Forecasts
2-42
Pompano Beach Airpark
Appendix C Template for Comparing Airport Planning and TAF Forecasts <I)
PMP PMP/TAF %
Based Aircraft Year Forecast TAF Difference
Base yr. 2017 166 127 30.7%
Base yr. + 5yrs. 2022 190 138 37.5%
Base yr. + 10yrs. 2027 216 140 54.6%
Base yr. + 15yrs. 2032 245 140 74.7%
Itinerant Operations
Base yr. 2017 52,728 50,441 4.5%
Base yr. + 5yrs. 2022 49,793 49,430 0.7%
Base yr. + 1 Oyrs. 2027 52,708 50,179 5.0%
Base yr. + 15yrs. 2032 55,772 50,940 9.5%
Local Operations Base yr. 2017 79,761 79,416 0.4%
Base yr. + 5yrs. 2022 90,931 76,303 19.2%
Base yr. + 1 Oyrs. 2027 96,256 77,125 24.8%
Base yr. + 15yrs. 2032 101,850 77,956 30.7%
Total Operations
Base yr. 2017 132,489 130,234 1.7%
Base yr. + 5yrs. 2022 140,723 126,110 11.6%
Base yr. + 1 Oyrs. 2027 148,964 127,681 16.7%
Base yr. + 15yrs. 2032 157,623 129,273 21.9%
No:e: TAF data o a U.S. goverrme • iscal year basis (October roug Sep: ber).
() c · e FAA epor., "F - By - .
p mpano I !'!!!.:~?,S~- Kimley>>>Horn MASTER PLAN UPDATE

Facility Requirements
3-1
Chapter 3:Facility Requirements
Contents
3 - FACILITY REQUIREMENTS 3-3
3.1 - Airfield Demand and Capacity 3-3Airfield Capacity 3-3
3.2 - FAA Design Standards 3-7
3.3 - Airside Facilities 3-10Runway Requirements 3-10Taxiway Requirements 3-13NAVAID and Lighting Requirements 3-13Airfield Pavement 3-14Helicopter Landing Areas 3-15Air Traffic Control Tower 3-16
3.4 - Airspace Protection 3-16Part 77 Requirements 3-16Hazardous Wildlife 3-17
3.5 - Landside Facilities 3-18General Aviation Administration Building 3-18Aircraft Parking Apron and Tie-Down Requirements 3-18Aircraft Storage Hangar Requirements 3-20Airport Access and Vehicle Parking 3-22Airport Fencing and Security 3-22
3.6 - Support Facilities 3-23Aviation Fuel Storage 3-23Maintenance and Storage 3-23
3.7 - Facility Requirements Summary 3-24
Pompano Beach Airpark
3.1.1 -
3.3.1 -3.3.2 -3.3.3-3.3.4 -3.3.5 -3.3.6-
3.4.1 -3.4.2 -
3.5.1 -3.5.2 -3.5.3-3.5.4 -3.5.5-
3.6.1 -3.6.2 -
p mpano I ~ .~~?,S~- Kimley>>>Horn MASTER PLAN UPDATE

Facility Requirements
3-2
TablesTable 3-1. Forecast Summary 3-3Table 3-2. Airfield Capacity Summary 3-7Table 3-3. Visibility Minimums 3-8Table 3-4. FAA Runway Design Standards 3-9Table 3-5. FAA Taxiway Design Standards 3-10Table 3-6. Runway Protection Zones 3-13Table 3-7. Based Aircraft Apron and Tie-Down Requirements 3-19Table 3-8. Itinerant Aircraft Apron and Tie-Down Requirements 3-20Table 3-9. Total Aircraft Apron and Tie-Down Requirements 3-20Table 3-10. Aircraft Storage Hangar Requirements 3-21Table 3-11. Vehicle Parking Requirements 3-22Table 3-12. Facility Requirements Summary 3-25
FiguresFigure 3-1. Runway Length Requirements by Aircraft Type 3-11Figure 3-2. Airpark Pavement PCI Values 3-15
Pompano Beach Airpark
p mpano I ~ .~~?,S~- Kimley>>>Horn MASTER PLAN UPDATE

Facility Requirements
3-3
3 - Facility RequirementsThe purpose of this chapter is to identify the Airpark’s facility development needs over a 20-year planninghorizon. Recommendations have been developed to ensure that the Airpark can support current andprojected future aviation demand.
The demand, capacity, design standards and overall airport facility requirements at the Airpark wereevaluated using guidance sourced from several FAA publications: AC 150/5060-5, Airport Capacity andDelay; AC 150/5300-13A Airport Design; AC 150/5325-4B Runway Length Requirements for AirportDesign; AC 150/5360-13 Planning and Design Guidelines for Airport Terminal Facilities; Federal Aviationregulation (FAR) Part 77 Objects Affecting Navigable Airspace; and Order 5090.3C Field Formulation ofthe National Plan of Integrated Airport Systems (NPIAS).
Forecasts described in Chapter 2 were utilized to develop facility requirements for PMP. A summary ofthese forecasts is presented in Table 3-1.
Table 3-1. Forecast SummaryYear Based
AircraftAnnual
OperationsPeak MonthOperations
Design DayOperations
Peak HourOperations
2017 166 132,489 14,075 454 842022 191 140,012 14,950 482 892027 216 148,964 15,825 510 942037 275 166,729 17,712 571 106
AAGR 2017-2037 1.10%
Sources:FAA Air Traffic Activity System (ATADS) Database.FAA Terminal Area Forecast Issued January 2018.Kimley-Horn.
3.1 - Airfield Demand and Capacity
Airfield and airspace capacity requirements were based on the following objectives:
· Confirm that the airfield provides sufficient capacity throughout the planning horizon.· Confirm that access to runways, taxiways, and aprons can meet operational demand, future
requirements, and FAA design criteria.
Airfield Capacity
Airfield capacity refers to the maximum number of aircraft operations (takeoff and landings) an airfield canaccommodate in a specified amount of time (i.e. hourly or annually). Delay is the difference betweenconstrained and unconstrained aircraft operating times. As demand approaches capacity, congestion andthe average amount of delay per aircraft can increase. While specific aircraft maintenance and weather-related delays are unavoidable, optimizing airfield configuration to enhance traffic flow efficiency can helpreduce the overall amount of aircraft delay.
Using methodologies described in FAA AC 150/5060-5, Airport Capacity and Delay (effective September23, 1983), an assessment of airfield capacity was performed to evaluate the Airpark’s ability toaccommodate current and projected levels of aircraft activity. This evaluation is used in long-rangeplanning to help identify and justify any capacity-related airfield improvements that may be needed over
Pompano Beach Airpark
3.1.1 -
p mpano I ~ .~~?,S~- Kimley>>>Horn MASTER PLAN UPDATE

Facility Requirements
3-4
the planning horizon. The analysis also determined the average amount of aircraft delay that could beexpected during peak periods of activity. The estimated airfield capacity and delay at PMP can beexpressed in the following measurements:
· Hourly Capacity is the maximum number of aircraft operations the airfield can safelyaccommodate under continuous demand in a one-hour period.
· Annual Service Volume (ASV) is the maximum number of aircraft operations the airfield canaccommodate in a one-year period without excessive delay.
· Peak Period Delay is the total amount of aircraft delay, expressed in minutes, that could beexperienced during the average peak hour of the peak month.
Airfield Capacity Calculation Factors
Calculations of airfield capacity and delay consider variations in six key operational factors andassumptions specific to PMP, which are described below.
Meteorological Conditions
Meteorological conditions influence the utilization of runways. Variations in wind and visibility minimumscan reduce airfield capacity since operating aircraft require more separation during IMC conditions thanthey do during VMC conditions. As noted in Chapter 1, the ATCT identified that the Airpark operatesunder IMC approximately 5 percent of the time and under VMC 95 percent of the time.
Runway Use Configurations
An airfield’s capacity is directly related to the number and orientation of runways available during variousoperating conditions. An airfield may have multiple operating configurations dependent on weatherconditions, time of day, and/or the type of approach procedures available. Based on information gatheredfrom the ATCT and Airpark administration, Runway 10-28 is the most frequently utilized runway at theAirpark, comprising approximately 80 percent of use. Runway 15-33 is utilized approximately 20 percentof the time and serves the larger aircraft at the Airpark. Runway 6-24 is utilized the least amount of thetime and is generally only used sporadically throughout the year, mainly in the winter and early springmonths.
Aircraft Fleet Mix
The aircraft fleet mix index is a ratio of the various classes of aircraft operating at an airport based onweight. Due to differing performance characteristics, the size of aircraft operating at an airport have asignificant impact on an airfield’s capacity. The FAA states that heavier aircraft operating at an airfieldrequire greater separation between other aircraft upon approach and departure to avoid wake turbulence.The FAA has established four classes of aircraft based on their maximum certificated takeoff weight(MTOW):
· Class A – 12,500 lbs. or less, single engine· Class B – 12,500 lbs. or less, multi-engine· Class C – 12,500 to 300,000 lbs.· Class D – over 300,000 lbs.
Pompano Beach Airpark
3.1.1.1 -
p mpano I ~ .~~?,S~- Kimley>>>Horn MASTER PLAN UPDATE

Facility Requirements
3-5
A mix index is then calculated for each of the runway-use configurations by adding the percentage ofclass C aircraft to three-times the percentage of class D aircraft (C+3D). Operations by aircraft weightclass data were collected from the FAA’s Traffic Flow Management System Counts (TFMSC) database todevelop mix index calculations. According to the database, there were approximately 1,100 operationsconducted by Class C aircraft in 2017, which represented 0.66 percent of total operations. There were noClass D operations conducted at the Airpark in 2017. Therefore, according to the FAA AC 150/5060-5,during VFR and IFR conditions at the Airpark the aircraft mix index is zero (0).
Percentage of Touch-and-Go Operations
A touch-and-go (T&G) operation is defined as a landing followed by an immediate takeoff without comingto a stop or exiting the runway. It is a practice maneuver typically associated with flight training activity.This factor is the ratio of T&G operations to total aircraft operations at an airport. An airfield with a higherpercentage of T&Gs typically has a greater airfield capacity than one with a higher percentage of itinerant(or origin and destination) flight operations. Based on feedback provided by Airpark Management and theATCT, it was estimated that approximately 85 percent of local operations at the Airpark in 2017 weretouch-and-go, which translates to approximately 51 percent of total operations.
Location of Taxiway Exits
The location and number of exit taxiways affect airfield capacity because they directly relate to runwayoccupancy time. Runway capacities are highest when the runways are complimented with full-length,parallel taxiways, ample runway entrance and exit taxiways, and no active runway crossings. Thesecomponents reduce the amount of time an aircraft remains on the runway. FAA AC 150/5060-5 identifiesthe criteria for determining taxiway exit factors based on the mix index, percentage of aircraft arrivals, thenumber of exit taxiways, and an exit taxiway’s distance from the landing threshold. At PMP, Runway 10-28 is equipped with a full-length parallel taxiway and 6 connector taxiways, and Runway 15-33 isequipped with a full-length parallel taxiway and 5 connector taxiways. While intersecting runways mayoccasionally be used for taxiing purposes when not in use, they were not considered in the determinationof taxiway exit factor.
Peak Activity Characteristics
As noted previously, peak month activity at the Airpark typically occurs in May and representsapproximately 10.6 percent of annual operations. In 2017, the Airpark experienced 14,075 operationsduring the peak month. Design day operations were determined by dividing peak month operations by thenumber of days in the peak month (30), which resulted in 454 design day operations in 2017. Peak houroperations were determined via an analysis of historical peak hour activity during the peak month andresulted in 84 peak hour operations in 2017.
Annual Service Volume and Weighted Hourly Airfield Capacity
The weighted runway capacity is a function of the different annual runway use configurations, the percentof time each runway use configuration is used, the hourly capacity for each runway use configuration, andthe ASV weighted factor – as demonstrated in the following equation:
=( ∙ ∙ ) + ( ∙ ∙ ) +⋯+ ( ∙ ∙ )
( ∙ ) + ( ∙ ) +⋯+ ( ∙ )
Pompano Beach Airpark
3.1.1.2 -
p mpano I ~ .~~?,S~- Kimley>>>Horn MASTER PLAN UPDATE

Facility Requirements
3-6
Where:
· cw = weighted hourly capacity· pn = percent of time configuration “n” is used· cn = hourly capacity of configuration “n”· wn = ASV weighting factor (based on the percent of maximum capacity)
The result of the weighted hourly capacity is approximately 138 aircraft operations. The ASV is therebydetermined using the following equation:
Annual Service Volume = (cw x D x H) where:
· cw = weighted hourly capacity· D = ratio of annual demand to the average daily demand during the peak month· H = ratio of average daily demand to the design hour demand during the peak month
There were 132,489 total operations at the Airpark in 2017. The average daily demand during the peakmonth in 2017 was approximately 454 operations per day. The ratio of annual demand to average dailydemand during the peak month was 292 (132,489 ÷ 454). The ratio of average daily demand during thepeak month to the average peak hour demand during the peak month was 5.4 (454 ÷ 84).
The resultant ASV for the Airpark in 2017 equals 217,601 aircraft operations (138 x 292 x 5.4) for thepredominant dual runway configuration. Because the taxiway exit factor is equal for all dual runwayconfigurations at PMP, this calculation is accurate whenever two runways are in operation.
This equation was repeated for forecast activity levels to identify future ASV at the Airpark and isdescribed in Table 3-2. A single-runway configuration was also calculated, which, because all runwayshave the same taxiway exit factors, can be applied to all runways. A configuration where all threerunways were in operation was not considered as demand has not historically merited it, and Runway 6-24 operates as a crosswind facility rendering one of the other runways inoperable.
As shown in Table 3-2, a single-runway configuration actually has a higher capacity than a dual-runwayconfiguration. This is attributed to a lower touch-and-go factor when multiple runways are in operation.
The preceding information was used to calculate the capacity of the Airpark in accordance with acceptedindustry methodologies. These calculations were based on the specific airfield configuration, andoperational and meteorological characteristics of the Airpark on a typical day.
Pompano Beach Airpark
p mpano I ~ .~~?,S~- Kimley>>>Horn MASTER PLAN UPDATE

Facility Requirements
3-7
Table 3-2. Airfield Capacity SummaryYear Weighted Hourly
CapacityAnnual
OperationsAnnual Service
Volume Percent Capacity
Dual Use Runway Configuration2017 138 132,489 217,601 61%2022 138 140,723 217,038 65%2027 138 148,964 218,073 68%2037 138 166,729 216,738 76%
Single Use Runway Configuration2017 138 132,489 223,875 59%2022 138 140,723 223,296 63%2027 138 148,964 224,361 66%2037 138 166,729 222,987 74%
Sources:FAA AC 150/5060-5.FAA Report No. FAA-RD-74-I24.Kimley-Horn.
A demand that exceeds the annual service volume will likely result in significant delays on the airfield.However, regardless of how substantial an airport’s capacity may appear, delays can occur even beforean airport reaches its stated capacity. According to FAA Order 5090.3C, Field Formulation of the NationalPlan of Integrated Airport Systems (NPIAS), for most every type of capacity enhancing project, the FAArecommends beginning to plan for such improvements when the activity levels reach 60 to 75 percent ofthe annual capacity. Based on the existing airfield configurations and the results of the capacity analysis,it is recommended that the Airpark examine development options that enhance airfield capacity. Suchimprovements will be presented in subsequent chapters of this Master Plan Update.
3.2 - FAA Design Standards
FAA design standards are determined by an airport’s most demanding aircraft or grouping of aircraft thatconduct 500 annual operations. As described in Chapter 2, this aircraft or grouping of aircraft is referredto as the design aircraft. At PMP, the existing and future design aircraft is represented by the BeechcraftKing Air 350, which is classified as B-II.
It should be noted that the Airpark’s previous ALP identified that Runway 10-28 was designed toaccommodate small aircraft exclusively (those that weigh less than 12,500 lbs.). Since this facility isprimarily used for training operations conducted by smaller single and twin-engine aircraft, it wasrecommended that Runway 10-28 be a B-I (small) existing and B-II (small) future ARC. Additionally,because Runway 6-24 experiences a small percentage of operations compared with overall Airparkactivity, it’s existing and future ARC is recommended as B-II (small).
Design standards, as identified in the FAA AC 150/5300-13A Airport Design, describe dimensions andseparation criteria that apply to runways, taxiways and other related airfield facilities to provide clearancefrom potential hazards affecting routine aircraft movements on the airfield. Application of these standardsis determined by the Runway Design Code (RDC) and relate to separation distances for aircraft holdlines, taxiways, aircraft parking areas, obstacle free areas, and safety areas. The RDC is comprised of theAircraft Approach Category (AAC) and Airplane Design Group (ADG) – as described Chapter 2 – alongwith the runway’s visibility minimums. The minimums and applicability for each runway at the Airpark aredescribed in feet of Runway Visibility Range (RVR), shown in Table 3-3.
Pompano Beach Airpark
p mpano I ~ .~~?,S~- Kimley>>>Horn MASTER PLAN UPDATE

Facility Requirements
3-8
Table 3-3. Visibility Minimums
RunwayRunwayVisibilityRange (in
feet)
Flight Visibility Category(statute miles)
ExistingRunway/Designation
UltimateRunway/Designation
6 5000 Not lower than 1 mile 6/ B-I((S)-5000 6/ B-II(S)-500024 5000 Not lower than 1 mile 24/ B-II(S)-5000 24/ B-II(S)-500010 VIS Visual approach 10/ B-I(S)-VIS 10/ B-II(S)-VIS28 VIS Visual approach 28 B-I(S)-VIS 28/ B-II(S)-VIS
15 4000 Lower than 1 mile but notlower than ¾ mile 15/ B-II-4000 15/ B-II-4000
33 4000 Lower than 1 mile but notlower than ¾ mile 33/ B-II-4000 33/ B-II-4000
Source:FAA AC 150/5300-13A.
Note:(S) indicates small aircraft designation.
Table 3-4 compares existing conditions of all runways at PMP with FAA design standards as published inFAA AC 150/5300-13A Airport Design. As shown, the only non-standard condition at the Airpark is the200’ of separation between Runway 6-24 and parallel Taxiway M.
Pompano Beach Airpark
p mpano I ~ .~~?,S~- Kimley>>>Horn MASTER PLAN UPDATE

Facility Requirements
3-9
Table 3-4. FAA Runway Design Standards
Design Criteria FAA B-IIStandards RWY 15-33
FAA B-II(Small)
StandardsRWY 6-24 Runway
10-28
Runway Design:Runway Width 75 150 75 150 100
Shoulder Width 10 N/A 10 N/A 10Blast Pad Width 95 N/A 95 N/A 95
Blast Pad Length 150 N/A 150 N/A 150Runway Protection:
RSA Length beyond runway end 300 300 300 300 300RSA Length prior to threshold 300 300 300 300 300
RSA Width 150 150 150 150 150ROFA Length beyond runway end 300 300 300 300 300
ROFA Length prior to threshold 300 300 300 300 300ROFA Width 500 500 500 500 500
ROFZ Length beyond runway 200 200 200 200 200ROFZ Width 250 250 250 250 250
Approach RPZ Length 1000 1700* 1000 1000 1000Approach RPZ Inner Width 500 1000* 250 250 250Approach RPZ Outer Width 700 1510* 450 450 450
Approach RPZ Area (Acres) 13.770 48.987* 8.035 8.035 8.035Departure RPZ Length 1000 1000 1000 1000 1000
Departure RPZ Inner Width 500 500 250 250 250Departure RPZ Outer Width 700 700 450 450 450
Departure RPZ Area (Acres) 13.770 13.770 8.035 8.035 8.035Runway Separation:
Holding Position 200 200 125 200 125Parallel Taxiway/Taxilane Centerline 240 240 240 200 240
Aircraft Parking 250 250 250 250 250Sources:FAA AC 150/5300-13A.2008 Approved Airport Layout Plan.2017 Airport Layout Drawing.Kimley-Horn.
Notes:Red – indicates non-standard conditionBlack – indicates standard condition*FAA design standard for approach RPZ for runways with not lower than ¾ miles (includes RWY 15-33) is: Length = 1700’, Inner Width =1000’, Outer Width = 1510’, Acreage = 48.978ac
Taxiway Design Group (TDG) is a classification administered to aircraft based on outer-to-outer maingear width (MGW) and cockpit to main gear (CMG) distance. Based on the anticipated future criticalaircraft (Beechcraft Super King Air 200 and the Cessna Citation Sovereign) the Airpark should plan forTDG 2 design standards. This translates to the following design standards found in Table 3-5.
Pompano Beach Airpark
p mpano I ~ .~~?,S~- Kimley>>>Horn MASTER PLAN UPDATE

Facility Requirements
3-10
Table 3-5. FAA Taxiway Design StandardsDesign Criteria FAA Design Standard for TDG 2 and ADG II
Taxiway Centerline to Parallel Taxiway Centerline 105Taxiway Centerline to Fixed or Movable Object 65.5Taxiway Width 35Taxiway Safety Area (TSA) 79Taxiway Object Free Area (TOFA) 131Taxiway Shoulder Width 15Source:FAA AC 150/5300-13A.
Although taxiways and taxiway connectors at the Airpark meet all standard geometry requirementsdescribed by the FAA, Taxiway C provides direct access from an aircraft parking apron to Runway 10-28.Direct access between an apron and a runway increases the risk of runway incursions. Another area ofconcern is the intersection of Taxiways K, L, and M, where a large expanse of pavement exists. Wideexpanses of pavement can cause confusion to pilots and should be eliminated when possible. Additionaldiscussion of non-standard taxiways and mitigation of wide expanses of pavement are presented in asubsequent subsection.
3.3 - Airside Facilities
Airside facilities consist of those related to aircraft arrival, departure, and ground movement, along with allassociated navigational aids, airfield lighting, pavement markings, and signage. This section presents therequired facilities in both a quantitative and qualitative manner for the airside portion of the Airpark. Theresults of forecasted aviation demand provided quantitative findings, whereas interviews, discussions,and a survey with Airpark personnel, Planning Review Committee (PRC) members, tenants, and usersprovided qualitative findings.
Runway Requirements
This section summarizes requirements, standards, and recommendations for runways at the Airpark.
Runway Length and Width
Runway 15-33 is 4,918 feet long and 150 feet wide, Runway 10-28 is 3,502 feet long and 100 feet wide,and Runway 6-24 is 4,001 feet long and 150 feet wide. Recommended runway lengths are determinedusing charts published in FAA AC 150/5325-4B Runway Length Requirements for Airport Design.Runway length is based on several factors including elevation, aircraft seat capacity, aircraft weight of theoperational fleet, and mean daily maximum temperature of the hottest month of the year at an airport.
According to the FAA’s TFMSC database, there were over 1,000 operations at PMP in 2017 conductedby aircraft weighing between 12,500lbs. and 41,000lbs. It was assumed that most of these operationswere conducted on Runway 15-33.
According to 2008-2018 data from the National Climatic Data Center, the mean daily maximumtemperature of the hottest month of the year was 90.2° Fahrenheit. Application of this factor to Figure 3-1(75 percent of the active general aviation fleet at 90 percent useful load) in FAA AC 150/5325-4B resultsin a recommended length of 6,800 feet for Runway 6-24 and Runway 15-33. Application of Figure 2-1
Pompano Beach Airpark
3.3.1 -
3.3.1.1 -
p mpano I ~ .~~?,S~- Kimley>>>Horn MASTER PLAN UPDATE

Facility Requirem
ents
3-11
(100 percent of the active general aviation fleet weighing less than 12,500 lbs.) results in a recom
mended
length of 3,700 feet for Runw
ay 10-28. While R
unway 10-28 is long enough to accom
modate existing and
projected aircraft activity, Runw
ays 6-24 and 15-33 do not meet runw
ay length recomm
endationsidentified in FAA AC
150/5325-4B.
The Airpark is unlikely to require a runway 6,800 feet long and extending either R
unway 6-24 or 15-33 to
such a length would have costly im
plications including relocation of housing, roads, land acquisition ofR
PZs and others. Based on feedback from Airpark M
anagement, tenants, and m
embers of the PR
C, an
extension of Runw
ay 15-33 is desired to accomm
odate more m
edium sized corporate jet aircraft.
Early in the master planning process, stakeholders identified that an “ideal” length for R
unway 15-33 w
as5,000 feet. A runw
ay length analysis of aircraft operations in 2018 by make and m
odel was conducted
using operational information reported in the FAA’s TFM
SC database. This analysis included the m
ostdem
anding jet and turboprop aircraft that regularly operate at PMP in term
s of runway length required for
takeoffs. As shown in
Figure 3-1, all the analyzed aircraft are able to takeoff with less than 5,000 feet of
runway length at 80 percent of M
TOW
. At 90 percent MTO
W, a BAE H
awker 800 requires 5,750 feet of
runway length for takeoff. At M
TOW
, the Learjet 55 requires 5,600 feet of runway, the Bom
bardierC
hallenger 600 requires 5,700 feet of runway, and the H
awker 800 requires 7,550 feet of runw
ay. Itshould be noted that these three aircraft accounted for 90 total operations in 2018.
Figure 3-1. Runw
ay Length Requirem
ents by Aircraft Type
Source:M
anufacturer Aircraft Planning Manuals.
Based on recent operational data, there is not adequate justification for a 6,800-foot runway per FAA AC
150/5325-4B, however, it is recom
mended that the ALP depict an extension to R
unway 15-33 to the
length possible without causing significant off-Airpark im
pacts. Developm
ent alternatives for an extensionto R
unway 15-33 are presented in C
hapter 4.
As noted inTable 3-4, all three runw
ays at the Airpark exceed the FAA design standard for width.
Although excess width m
ay provide an additional safety benefit for operating aircraft and negate the needfor paved shoulders, it also increases m
aintenance and rehabilitation costs. The FAA may elect to not
fund maintenance or reconstruction projects specific to the portions of the runw
ays that exceed design
""Cl 1-0 0 3
'O O'" :3 C co-O ::::, ~~ Runway Length Required (ft.) 0
§ § § "' § § § § CCI ;:::,a § (1) 0 C n :;:o::: ~ 3' Hawker800 I )> ii> Challer,gruQ<J =1 ... -<
~ 'O ~ Learjet 55 C ... :I: E' J9.!,_g Air 350 ~ 0 ::,
Gullit ream ~pg_ -, i ::::, <
Cessna Citation Excel :. ::,
Cessna Citation 02 ca ;:,-
® Cessna Citation Sovereign ;::
Falcon 50 ., 0 :E Cessna Citation 01
-KlngAir90
King Air 200
Beech 58
Hawker800
Challenger 600
E' J.mjel,55 ~ King Air 350
< Gulfstream G400 i Cessna Citation Excel
® Cessna Citation 02
~ Cessna Citation Sovereign
;:: Falcon 50
~ Ces_s.na__Cl t.i_UQILCJ~ ~ gAlr90
King Air 200
Beecli 58
Hawker800
Cliallenger 600
::0 Learjet55
C: King Air 350 ::,
3: i Gulfstream G400 <
• :. Cessna Citation Ex~I ::,
"' ca ~ ..., ® Cessna Citation 02 m
"' 00 .,, ii! ,-
• ~ z c:: :E .,, C King Air 200 • ...,
Beecli58 m

Facility Requirements
3-12
standard. In that event, additional funding would have to come from either State or local funds. If suchfunds are not anticipated to be readily available in the future, the City may desire to reduce the width of itsrunways to meet FAA standards prior to the next significant rehabilitation project.
Runway Orientation
Primary runways should be oriented with the prevailing wind direction of an airport, and crosswindrunways should be oriented to provide maximum crosswind coverage. As depicted in the wind roses inSection 1.6, the three runways at PMP provide 99.96 percent wind coverage for all weather conditionsand a 10-knot crosswind component. During IFR conditions, the runways provide 99.48 percentcoverage, and in VFR conditions, the runways provide 99.98 percent coverage.
The previous master plan update completed in 2008 recommended an ultimate closure of Runway 6-24.Doing so would provide additional land for aviation-related development at a geographically constrainedairfield. As noted previously, Runway 6-24 is infrequently used compared to Runway 15-33 and Runway10-28.
The FAA maintains that the desirable wind coverage of an airport be 95 percent. Based on an analysis of2008-2017 wind data at PMP, if Runway 6-24 were closed, remaining Runways 15-33 and 10-28 wouldprovide 99.97 percent wind coverage during all weather conditions and a 13-knot crosswind component,100.00 percent coverage during VFR conditions, and 99.21 percent during IFR conditions. As such, theAirpark’s remaining two runways would provide adequate wind coverage should Runway 6-24 be closed.The adequacy of wind coverage is a considered factor for development alternatives presented in Chapter4, though the Airpark could utilize local or State funding to maintain a third runway.
Runway Protection Zones
Runway Protection Zones (RPZs) are designated areas beyond the runway ends mandated by the FAAto maintain compatible land use and enhance the protection of people and property on the ground. Theseareas begin 200 feet beyond the runway end (unless there is a displaced threshold), are trapezoidal inshape, and are centered on the extended runway centerline. When an RPZ begins at a location otherthan 200 feet beyond the end of runway, two RPZs are required, i.e., a departure RPZ and an approachRPZ.
With a displaced threshold, the approach RPZ extends 200 feet from the runway threshold, and thedeparture RPZ begins 200 feet beyond the runway end or, if the Takeoff Run Available (TORA) and therunway end are not the same, 200 feet beyond the far end of the TORA.
Airports should maintain control of approach and departure RPZs through fee-simple acquisition,easements, or use-restrictions/agreements. Areas within the RPZ should be cleared of incompatibleobjects and activities, which includes habitable buildings and congregations of people.
Since Runway 15-33 has displaced landing thresholds on both ends, two RPZs are required (anapproach and departure RPZ). Table 3-6 identifies dimensions for each approach and departure RPZ atthe Airpark and their ownership status.
Pompano Beach Airpark
3.3.1.2 -
3.3.1.3 -
p mpano I ~ .~~?,S~- Kimley>>>Horn MASTER PLAN UPDATE

Facility Requirements
3-13
Table 3-6. Runway Protection ZonesRunway Approach RPZ
Dimensions Airpark Owned? Departure RPZDimensions
AirparkOwned?
6 1000x250x450 Partial 1000x250x450 Y24 1000x250x450 Y 1000x250x450 Partial10 1000x250x450 Partial 1000x250x450 Partial28 1000x250x450 Partial 1000x250x450 Partial15 1700x1000x1510 Partial 1700x1000x1510 Partial33 1700x1000x1510 Partial 1700x1000x1510 Y
Sources:2008 Approved Airport Layout Plan.FAA AC 150/5300-13A.
Significant portions of the Airpark’s RPZs are not owned or controlled by the Sponsor. It is recommendedthat the Airpark pursue control of these areas via fee simple land acquisition or avigation easements.
Taxiway Requirements
The Airpark has full-length parallel taxiways on all three of its runways. All parallel taxiways andconnectors adhere to FAA design standards. However, beyond the standard criteria, the FAA alsoprovides additional guidance on taxiway geometry intended to enhance safety and reduce the risk ofrunway incursions. These runway incursion mitigation (RIM) criteria are meant to prevent incursions,which are the unauthorized presence of an aircraft, vehicle, or person in the runway environment. Arunway incursion is not a collision or accident but could result in one. Incursions can occur from a pilot’sloss of situational awareness, poor communication, an error by ATC personnel, inadequate or confusingairfield marking and signage, or complex or non-standard taxiway geometries.
Taxiway C provides direct access from an apron to Runway 10-28. It is recommended that portions ofTaxiway C be removed or relocated to comply with RIM criteria. As previously noted, the wide expanse ofpavement where Taxiways K, L, and M converge should also be reconfigured. Mitigation alternatives arepresented in subsequent chapters.
NAVAID and Lighting Requirements
Navigational Aids (NAVAIDs) are any visual or electronic devices airborne or on the surface that providepoint-to-point guidance information or position data to aircraft in flight. As noted in Chapter 1, PMP isequipped with the following NAVAIDs:
· Precision Approach Path Indicator Lights (PAPIs)· Localizer Antenna· Medium Intensity Approach Lighting System (MALS) – Runway 15· Automated Surface Observing System (ASOS)· Lighted Wind Indicators· Rotating Beacon· Runway End Identifier Lights (REILs) – Runway 6-24, 10-28, 33
All NAVAIDs are in functioning condition. Based on projected levels of aviation activity, it is anticipatedthat existing NAVAIDs are adequate.
Pompano Beach Airpark
3.3.2 -
3.3.3 -
p mpano I ~ .~~?,S~- Kimley>>>Horn MASTER PLAN UPDATE

Facility Requirements
3-14
All runways are equipped with Medium Intensity Runway Lights (MIRLs), and all taxiways are equippedwith edge lights. Airfield lighting is anticipated to be adequate throughout the 20-year planning horizon.
Airfield Pavement
Pavement strength rating is related to the operating weight of aircraft anticipated to operate at an airport,the landing gear type and geometry, and the volume of annual aircraft operations, by type. Aircraftweighing more than the certified strength can operate on the runways on an infrequent basis. However,frequent activity by heavier aircraft can reduce the useful life of the pavement.
Runway 15-33 is constructed of asphalt and has a single wheel loading (SWL) strength of 30,000 pounds.Runway 6-24 and Runway 10-28 are also constructed of asphalt and have a SWL strength of 20,000pounds and 26,000 pounds, respectively. Runway 6-24 and 10-28 are limited to 12,500 lbs. gross weight.According to FAA Form 5010-1 Airport Master Record, all runway pavements are in good condition.
According to the Airpark’s 2017 FDOT Airport Pavement Evaluation Report, Runway 15-33 had pavementcondition index (PCI) values that ranged between 84 (satisfactory) to 94 (good). Runway 6-24 had PCIvalues ranging from 63 (fair) to 94, and Runway 10-28 had PCI values ranging from 66 to 87. Mosttaxiway segments had “fair” to “good” PCI designations except for portions of Taxiways A and M on thewestern portion of the airfield that were in “poor” condition. Apron areas and taxilanes received PCIdesignations between 30 (serious) and 100. Specific areas in need of rehabilitation or reconstructionincluded the apron north of Sheltair and all aircraft storage hangar access taxilanes between NE 10 th
Street and Sheltair Aviation. A graphical representation of PCI values for Airpark pavements is presentedin Figure 3-2. It is recommended that the Airpark continue to maintain and resurface as needed;additionally, further evaluation of the pavement condition should take place in the future.
Pompano Beach Airpark
3.3.4 -
p mpano I ~ .~~?,S~- Kimley>>>Horn MASTER PLAN UPDATE

Facility Requirements
3-15
Figure 3-2. Airpark Pavement PCI Values
Source:2017 FDOT Statewide Airfield Pavement Management Program.
Helicopter Landing Areas
As noted in Chapter 1, there is significant helicopter training activity that occurs on taxiways north ofRunway 10-28, however, the Airpark does not have designated helipads. It is anticipated that the numberof based helicopters at PMP will increase over the next 20-years, although, based on interviews withAirpark Management and ATCT staff, it was identified that designated helicopter landing areas are notneeded at this time. If future demand changes, Airpark Management should examine potential locationsfor designated helicopter landing areas that provide access to landside and tenant areas but do notinterfere with fixed wing aircraft operations.
It is important to note that helipads require FAA-approved approach and departure procedures; helicopterlanding areas do not.
Pompano Beach Airpark
(,,
3.3.5 -
p mpano I !'!!!.:~?,S~- Kimley>>>Horn
[;:;] - - G9 ~ [;:] - G7:] B 1111 G:;J G:J C£J ~ G::J G::] @:]
@:] [£;]
~ ~IIJ ....... T M.AAICHO
~ ITPIC.Al. TAlll•V,TIRA.-.CIIID
~-~ 1"~ OUHQ! 0 -Cl l'OTt-~SAfl7'ACTOIIY
C] l'0~-10,,...
c:::::J l'O ll - ol()YDtf POOII
- l'Ol1 - ~$(ft(IIJS
C] l'00-10 TM.CO
MASTER PLAN UPDATE

Facility Requirements
3-16
Air Traffic Control Tower
The ATCT is operated by Robinson Aviation, Inc. under the Federal contract tower program. The facility iscollocated with the existing Airpark administration building located on the north side of Access Road,situated between T-hangars to the east and a maintenance building to the west. The ATCT’s heightprovides clearance over these structures, and based on discussions with the ATCT manager, there areno existing line of sight issues. However, the structure needs significant rehabilitation due to its aginginfrastructure. Due to the potential costs of a thorough renovation of the facility, it is recommended thatalternative locations be identified for a new facility. It is recommended that an ATCT siting and feasibilitystudy be conducted to identify costs associated with renovating the existing facility and identify potentialalternate locations.
3.4 - Airspace Protection
This section identifies existing obstructions to airspace as well as mitigation options for any obstructions.
Data from aerial surveys and the FAA Digital Obstacle Files (DOF) dated August 14, 2018 were used toanalyze potential threats to airspace at PMP. The analysis considered Part 77 Surfaces, Runway EndSiting Requirements, Glide Path Qualification Surfaces (GQS) and hazardous wildlife attractants. ThePart 77 surface analysis offers a basic screening for potential threats. In conjunction with this, theRunway End Siting Requirements and GQS provide a secondary level of screening and are stricter in thesense that there is less tolerance for potential airspace obstructions. Additionally, wildlife can also presentchallenges to airspace protection, primarily as it pertains to bird strikes. This section identifies potentialairspace threats at the Airpark and offers recommendations for mitigation. The analysis is based offexisting conditions at the Airpark and is subject to change in the future. A detailed graphicalrepresentation of airspace issues is presented in the Airport Layout Plan.
Part 77 Requirements
FAR Part 77 establishes imaginary surfaces around an airfield to identify potential hazards to airnavigation. These standards promote compatible land use and limit the height of objects on and near anairport. The surfaces can vary in shape, size and slope depending on the available approach proceduresto the runway ends. The Part 77 surfaces are described as follows:
· Primary Surface – The surface is longitudinally centered on the runway and extends 200 feetbeyond the end of that runway. The elevation of any point on the surface is the same as theelevation of the nearest point on the runway centerline. For Runway 15-33, the primary surface is1,000 feet wide; for Runway 10-28, it is 250 feet, and for Runway 6-24, it is 500 feet wide.
· Approach Surface – The surface is longitudinally centered on the extended runway centerline andextends outward from the end of the primary surface. Approach surfaces for runways at PMPhave the following characteristics:
o Runway 15-33: inner width = 1,000 feet, outer width = 4,000 feet, length = 10,000 feet,slope = 34:1
o Runway 10-28: inner width = 250 feet, outer width = 1,250 feet, length = 5,000 feet, slope= 20:1
o Runway 6-24: inner width = 500 feet, outer width = 2,000 feet, length = 5,000 feet, slope= 20:1
· Transitional Surface – The surface extends outward and upward from the sides of the primarysurface and from the sides of the approach surfaces at a 7:1 slope to the height of the horizontalsurface.
Pompano Beach Airpark
3.3.6 -
3.4.1 -
p mpano I ~ .~~?,S~- Kimley>>>Horn MASTER PLAN UPDATE

Facility Requirements
3-17
· Horizontal Surface – The surface is a horizontal plane, 150 feet above the established airportelevation. The horizontal surface extends 5,000 feet from the ends of the primary surface onRunways 10-28 and 6-24, and 10,000 feet on Runway 15-33.
· Conical Surface – The surface extends upward and outward from the outer limits of the horizontalsurface for a horizontal distance of 4,000 feet. The slope of the conical surface is 20:1 measuredin a vertical plane.
Penetrations to these imaginary surfaces, either natural or manmade, are identified as obstructions andmust be evaluated by the FAA. If not removable, obstacles can be mitigated through appropriate markingand/or lighting. If not mitigated appropriately, obstacles could adversely affect approach and departureminimums and/or operational procedures.
In total, there were 228 identified obstacles to Part 77 surfaces. 41 of these were in the primary surface,68 were in the runway approach surfaces, 16 were in the horizontal surface, 102 in the transitionalsurface, and 1 in the conical surface. These obstructions include trees, towers and poles that will need tobe mitigated in accordance with FAA guidance. Refer to the ALP for a detailed summary of obstructionsand recommendations to address the areas of concern.
It should be noted that in June 2021, the Airport requested an amendment to LPV approach procedureson Runway 15 and 33 that would change the visibility minimums from ¾ mile to 1 mile. At the time thisdocument was completed, the status of that amendment was still pending. Once adopted, theamendment would shrink the Part 77 primary surface width to 500 feet, inner width of the approachsurface to 500 feet, outer width of the approach surface to 2,000 feet, approach surface length to 5,000feet, and the approach slope to 20:1.
Hazardous Wildlife
The Airpark’s proximity to the Atlantic Ocean, inlets, lakes, ponds, and golf course water hazards result innumerous birds within the surrounding area. According to the FAA’s Wildlife Strike Database, there wereseven bird strikes at PMP between 2009 and 2018, only one of which resulted minor damage. TheAirpark completed a wildlife hazard management plan in 2018. The report noted that on-Airpark wildlifeattractants included airfield turf, wooded areas, an existing pond, and landscape areas on and off theAirpark. The primary off-site attractant was the adjacent golf course pond east of Runway 24.
These attractant areas were identified as conducive to the presence of wading birds, waterfowl,shorebirds, doves, pigeons, raptors, and coyotes. Based on the existing attractants and wildlife identifiedat the Airpark, the following recommendations were established in the Report:
· Repair or block breaches under the existing perimeter fence.· Adjust gates to minimize openings less than 6 inches.· Where permitted, remove or exclude all forested areas within the perimeter fence.· Maintain a consistent intermediate grass height throughout the Air Operations Area (AOA).· Remove carrion from the AOA promptly.· Remove unnecessary perch sites or install exclusionary devices on known perch sites on Airpark
property.· Reduce attractiveness of the stormwater pond east of Runway 24.· Maintain landscaping around off-site parks and parking lots to reduce attractiveness to wildlife.· Consider installing signage at off-site parks to discourage wildlife utilization.· Wildlife that pose a threat to aviation should be dispersed from the AOA (via harassment) if
permitted.
Pompano Beach Airpark
3.4.2 -
p mpano I ~ .~~?,S~- Kimley>>>Horn MASTER PLAN UPDATE

Facility Requirements
3-18
· If repeated harassment attempts are unsuccessful, hazardous wildlife should be removed fromthe AOA (lethal control or trapping if permitted).
· Gopher tortoises and burrowing owls within the AOA should be relocated and borrows should befilled.
· Airpark staff should communicate with neighbors to aid in reducing wildlife hazards.· Airpark should obtain a US Fish and Wildlife Migratory Bird Depredation Permit.· Airpark staff involved in the wildlife hazard management program should complete wildlife hazard
management training as outlined in FAA AC 150/5200-36A, Appendix D.· Airpark staff should consult an FAA-Qualified Airport Wildlife Biologist during major planning
efforts and prior to development of construction plans on Airpark property that could createadditional wildlife attractants.
In order to minimize safety hazards and disruptions to aviation operations, the Airpark should adhere tothe recommendations identified in the 2018 Wildlife Hazard Management Plan to the extent possible.
3.5 - Landside Facilities
This section includes evaluation of the general aviation terminal building, aircraft parking aprons, aircraftstorage hangars, vehicle access and parking, and FBO requirements.
General Aviation Administration Building
The Airpark does not have a public terminal building. The general aviation terminal is owned andoperated by Sheltair Aviation and provides basic pilot accommodations and services. The Airparkadministration building at PMP (renovated in 2019) is approximately 2,600 square feet in size andincludes space for administrative offices and the ATCT. As the majority of itinerant pilots utilize FBOamenities, it is anticipated that the existing administration building is adequate to accommodate projectedlevels of demand.
Aircraft Parking Apron and Tie-Down Requirements
The configuration and sizes of aircraft parking aprons are dependent on the aircraft that frequent theairport, aircraft circulation needs, and FAA airfield design standards. ACRP Report 113 provides designcriteria for apron layout and capacity. For the purpose of calculating the required aircraft apron size, thefollowing planning criteria and assumptions were used:
Area Requirements
· 1,000 SF of apron for each based single engine-piston and experimental/other category aircraftand peak hour itinerant aircraft.
· 1,800 SF of apron for each based multi engine-piston aircraft and peak hour itinerant aircraft.· 2,400 SF of apron for each based turboprop aircraft and peak hour itinerant aircraft.· 3,600 SF of apron for each based jet aircraft and peak hour itinerant aircraft.· 800 SF of apron for each based helicopter and peak hour itinerant aircraft.
Utilization Assumptions
· 20 percent of based single engine-piston aircraft and experimental/other category aircraft willrequire apron parking.
· 50 percent of based multi-engine, turboprop, jet, and helicopter aircraft will require apron parking.
Pompano Beach Airpark
3.5.1 -
3.5.2 -
p mpano I ~ .~~?,S~- Kimley>>>Horn MASTER PLAN UPDATE

Facility Requirements
3-19
· Itinerant aircraft apron requirements are based on design hour operations; itinerant operationswere anticipated to account for 25 percent of peak hour operations presented in the AviationActivity Forecasts chapter.
· 50 percent of itinerant aircraft will require apron parking; 50 percent will require hangar storage.
The primary aircraft parking apron is situated south of Taxiway L and measures approximately 560,000SF or roughly 13 acres. This apron is utilized by both based aircraft and itinerant aircraft. There areadditional aircraft parking aprons and designated spaces located south of the primary apron. As noted inthe Inventory of Existing Conditions chapter, the Airpark has an estimated 120 designated aircraft tie-downs, 35 of which are owned by the City. Based on current demand, it was determined that the Airparkis at capacity for aircraft parking. Any additional increases in based aircraft or peak period activity willrequire additional apron space.
Based on the assumptions described previously, based aircraft, itinerant aircraft, and total aircraft parkingapron and tie-down requirements are depicted in Table 3-7 through Table 3-9.
Table 3-7. Based Aircraft Apron and Tie-Down RequirementsAdditional Apron Required (SF) Additional Tie-Downs Required
Aircraft Type ApronRequired (SF) 2017* 2022 2027 2037 2017 2022 2027 2037
Single-Engine 1,000 -- 3,000 5,600 11,600 -- 3 6 12Multi-Engine 1,800 -- 3,600 8,100 17,100 -- 2 5 10Turboprop 2,400 -- 2,400 6,000 14,400 -- 1 3 6
Jet 3,600 -- 1,800 1,800 9,000 -- 1 1 3Helicopter 800 -- 800 2,000 4,800 -- 1 3 6
Experimental/Other 1,000 -- 200 400 600 -- 0 0 1
Total AdditionalRequired 11,800 23,900 57,500 8 16 36
Sources:ACRP Report 113, Guidebook on General Aviation Facility Planning.Kimley-Horn.
Note:*Airpark is currently at capacity.
Pompano Beach Airpark
p mpano I ~ .~~?,S~- Kimley>>>Horn MASTER PLAN UPDATE

Facility Requirements
3-20
Table 3-8. Itinerant Aircraft Apron and Tie-Down RequirementsAdditional Apron Required (SF) Additional Tie-Downs Required
Aircraft Type ApronRequired (SF) 2017* 2022 2027 2037 2017 2022 2027 2037
Single-Engine 1,000 -- 1,000 2,500 6,000 -- 1 3 6Multi-Engine 1,800 -- - 900 3,600 -- - 1 2Turboprop 2,400 -- 1,200 1,200 3,600 -- 1 1 2
Jet 3,600 -- - - - -- - - -Helicopter 800 -- - 400 400 -- - 1 1
Experimental/Other 1,000 -- - 500 500 -- - 1 1
Total AdditionalRequired 2,200 5,500 14,100 2 5 11
Sources:ACRP Report 113, Guidebook on General Aviation Facility Planning .Kimley-Horn.
Note:*Airpark is currently at capacity.
Table 3-9. Total Aircraft Apron and Tie-Down RequirementsAdditional Apron Required (SF) Additional Tie-Downs Required
Aircraft Type ApronRequired (SF) 2017* 2022 2027 2037 2017 2022 2027 2037
Single-Engine 1,000 -- 4,000 8,100 17,600 -- 4 8 18Multi-Engine 1,800 -- 3,600 9,000 20,700 -- 2 5 12Turboprop 2,400 -- 3,600 7,200 18,000 -- 2 3 8
Jet 3,600 -- 1,800 1,800 9,000 -- 1 1 3Helicopter 800 -- 800 2,400 5,200 -- 1 3 7
Experimental/Other 1,000 -- 200 900 1,100 -- 0 1 1
Total AdditionalRequired 14,000 29,400 71,600 9 21 47
Sources:ACRP Report 113, Guidebook on General Aviation Facility Planning .Kimley-Horn.
Note:*Airpark is currently at capacity.
As shown, the analysis indicated that an additional 47 tie-downs and 71,600 SF of aircraft parking apronwill be needed for based and itinerant aircraft by 2037. It should be noted that these projections do notinclude aircraft taxilanes and movement areas. Development alternatives for apron expansion arepresented in the subsequent chapter.
Aircraft Storage Hangar Requirements
Based and itinerant aircraft that are not accounted for in the analysis presented in Section 3.5.2 can bestored in a variety of ways beyond tie-down/apron storage. These include T-hangars, conventional (box)hangars, or T-shades.
Pompano Beach Airpark
3.5.3 -
p mpano I ~ .~~?,S~- Kimley>>>Horn MASTER PLAN UPDATE

Facility Requirements
3-21
Storage hangar requirements were determined using guidelines suggested in ACRP Report 113. Thefollowing was assumed for conventional storage hangars:
Area Requirements
· 1,000 SF of box hangar space for each based single engine-piston and experimental/othercategory aircraft and peak hour itinerant aircraft.
· 1,800 SF of box hangar space for each based multi engine-piston aircraft and peak hour itinerantaircraft.
· 2,400 SF of box hangar space for each based turboprop aircraft and peak hour itinerant aircraft.· 3,600 SF of box hangar space for each based jet aircraft and peak hour itinerant aircraft.· 800 SF of box hangar space for each based helicopter and peak hour itinerant aircraft.
Utilization Assumptions
· 80 percent of based single engine-piston aircraft will require hangar space. 80 percent of thosewill require T-hangars, 20 percent will require box hangars.
· 50 percent of based multi-engine, turboprop, experimental/other, and helicopter aircraft willrequire hangar space. 50 percent of those will require T-hangars, 50 percent will require boxhangars.
· 100 percent of based jets will require hangars, all will be stored in box hangars.
For T-hangar storage requirements, 1,250 SF was assumed for all types of applicable aircraft (single-engine, multi-engine, turboprop, helicopter, and experimental aircraft).
The Airpark has 123 T-hangar units that encompass approximately 178,800 square feet and 24 boxhangars that encompass approximately 108,400 square feet. It was assumed that aircraft hangar storageat PMP is currently at capacity. Based on the spatial assumptions described above, the Airpark willrequire an additional 54,970 square feet of box hangar space and 61,250 square feet (49 units) of T-hangar space by 2037 (see Table 3-10). Development alternatives for apron and storage hangars arepresented in the subsequent chapter.
Table 3-10. Aircraft Storage Hangar RequirementsHangar Requirement 2017* 2022 2027 2037
Aircraft Requiring Box Hangars -- 8 14 36Aircraft Requiring T-Hangars -- 12 13 49
Total -- 20 27 85Box Hangar Space Required (SF) -- 13,200 22,400 54,970T-Hangar Space Required (SF) -- 15,000 16,250 61,250
Total Hangar Space Required (SF) -- 28,200 38,650 116,220Sources:ACRP Report 113, Guidebook on General Aviation Facility Planning.Kimley-Horn.
Note:*Airpark is currently at capacity.
Pompano Beach Airpark
p mpano I ~ .~~?,S~- Kimley>>>Horn MASTER PLAN UPDATE

Facility Requirements
3-22
Airport Access and Vehicle Parking
Road access to the Airpark’s west airfield area is provided by NE 5 th Avenue and access to the southairfield area is provided by NE 10th Street. Based on projected levels of aviation-related demand, it isanticipated that existing Airpark access and the surrounding transportation network is adequate over the20-year planning horizon. It should be noted that undeveloped areas of the Airpark property, such as anapproximately 11-acre parcel north of Runway 15 will require additional access if demand meritsdevelopment in the future.
As noted in the Inventory of Existing Conditions chapter, the Airpark has approximately 370 designatedvehicle parking stalls for various facilities including the ATCT, the administration building, Airpark tenantsand hangars, and FBOs. ACRP Report 113 identifies recommended vehicle parking spaces by type offacility. For the purposes of this Master Plan Update, parking requirements have been identified for theadministration building, conventional hangar storage space, T-hangars, and the based aircraft apron.While pilots and tenants often park vehicles in aircraft storage hangars or on non-movement apron areas,designated parking spaces are desirable. The following assumptions were used to develop vehicleparking facility requirements:
· All applicable future facility improvements will require additional designated parking spaces.· Conventional (box) hangars require one parking space per 1,000 SF of floor space.· T-hangars require one parking space per two units.· Terminal building requires 2.5 spaces per peak hour (design hour) operation.· Based aircraft parking apron requires one space for every two tie-downs.
Vehicle parking requirements for the applicable facilities are depicted in Table 3-11. As shown, by 2037, itis anticipated that the Airpark will require 152 additional parking spaces.
Table 3-11. Vehicle Parking RequirementsParking Facility 2017* 2022 2027 2037
Conventional (Box) Hangars -- 14 23 55T-hangars -- 6 7 18
Aircraft Tie-Downs -- 5 11 24Admin/Public -- 13 25 55
Total Additional Spaces -- 38 66 152Sources:ACRP Report 113, Guidebook on General Aviation Facility Planning .Kimley-Horn.
Note:*Airpark is currently at capacity.
Airport Fencing and Security
The primary purpose of airport fencing is to restrict inadvertent entry to an airport by unauthorized peopleand wildlife. Airpark management and tenants have noted multiple incidents when unauthorized vehicleshave entered portions of the airfield. The Airpark does have a full 7-foot tall perimeter fence (except for asmall portion that is protected by the adjacent municipal golf course’s lake), however, portions of theperimeter road that access restricted locations and tenant areas only have signage indicating restrictedareas. As such, it is recommended that secure access gates be installed on the perimeter road on both
Pompano Beach Airpark
3.5.4 -
3.5.5 -
p mpano I ~ .~~?,S~- Kimley>>>Horn MASTER PLAN UPDATE

Facility Requirements
3-23
east and west locations that enter restricted airfield areas. Because this is a security issue, it isrecommended that secure access gates be a near-term (0-5 year) improvement.
The Airpark is also equipped with limited closed-circuit TV monitoring. Each of the Airpark’s access gatesis equipped with a monitoring device, but there is no coverage around the fence line. A general aviationairport security assessment was conducted at PMP by the Florida Department of Transportation in 2018.The assessment identified the following security recommendations for PMP:
· Access control - The Airpark should upgrade the existing gate operators with new hydraulic gateoperators. The gate operators have been known to malfunction and not close as programmedafterhours. This would require two (2) new operators at the electric vehicle access gates alongNE 10th Street.
· The Airpark should also install one (1) pedestrian gate, secured with a cipher lock, near the mainairport building to allow authorized pedestrian access to the AOA.
· The Airpark should expand its CCTV coverage to include monitoring of the fence line, fuelingarea, apron, and hangar area. This will include at least three (3) new cameras.
· The Airpark should provide additional high mast lighting for the aircraft parking areas. The Airparkwould need approximately ten (10) high mast light poles.
These recommendations should be pursued by the Airpark to the extent possible.
Another security measure examined in this Master Plan Update is identification of access points for Cityfirefighting vehicles to enter the airfield in the event of an aircraft emergency. Pompano Beach FireRescue Station 24 is located immediately east of the Airpark at the intersection of NE 10 th Street andNorth Federal Highway. To minimize the time required to access the airfield, it is recommended that asecure access point for emergency vehicles be located on NE 10 th Street between the fire stationentrance and NE 18th Avenue. This location provides adequate turning capabilities for larger vehicles andimmediate access to the perimeter road.
3.6 - Support Facilities
Support facilities include those that assist the functionality and operational capability of the Airpark. Theseinclude aviation fuel storage, maintenance and storage facilities, and utilities.
Aviation Fuel Storage
Fueling and fuel storage at the Airpark is provided by various tenants. Tank and truck storage for Jet Afuel totals 33,000 gallons and avgas storage totals 39,000 gallons. It is typically recommended thatgeneral aviation airports have sufficient fuel storage capacity for up to a week of fueling demands. Basedon fleet mix and operational forecasts, it is not anticipated that additional fueling facilities will be needed inthe 20-year planning horizon, however, expansion of services will be demand-driven and tenant-funded.As such, unless the Airpark intends to provide fueling capabilities in the future, tenants will need toindividually assess their fueling capabilities and requirements, and coordinate with the Airpark regardingany facility improvements.
Maintenance and Storage
Typical maintenance equipment at a GA airport includes landscaping and mowing vehicles and chemicalapplications, tools, basic pavement repair materials, sweeping vehicles, storage containers, and othervarious implements to assist with the operations of the airport. Airpark maintenance facilities are located
Pompano Beach Airpark
3.6.1 -
3.6.2 -
p mpano I ~ .~~?,S~- Kimley>>>Horn MASTER PLAN UPDATE

Facility Requirements
3-24
immediately west of the administration building and include approximately 4,500 square feet ofmaintenance equipment and vehicle storage.
ACRP Report 113 describes general size requirements of maintenance and storage buildings based onoverall acreage of an airport. PMP has an overall footprint of approximately 600 acres, 100 acres of whichare occupied by the municipal golf course and Sand & Spurs Equestrian Park. Based on the Airpark’ssize, ACRP Report 113 recommends an equipment and storage building of approximately 4,000 squarefeet in size. As the Airpark is unlikely to expand its boundary in the future, the existing maintenancebuilding is anticipated to accommodate projected demand.
3.7 - Facility Requirements Summary
A summary of facility improvements by type is presented in Table 3-12. Development alternatives forthese facility requirements are presented in Chapter 4, Alternatives Analysis.
Pompano Beach Airpark
p mpano I ~ .~~?,S~- Kimley>>>Horn MASTER PLAN UPDATE
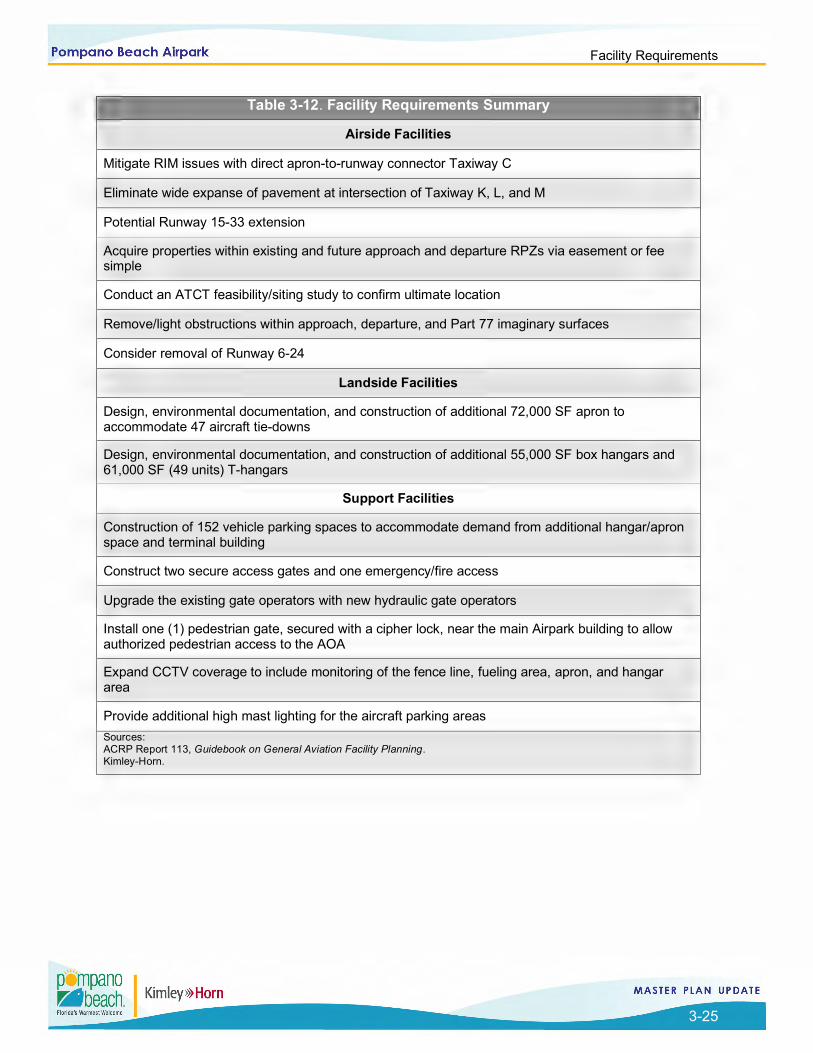
Facility Requirements
3-25
Table 3-12. Facility Requirements Summary
Airside Facilities
Mitigate RIM issues with direct apron-to-runway connector Taxiway C
Eliminate wide expanse of pavement at intersection of Taxiway K, L, and M
Potential Runway 15-33 extension
Acquire properties within existing and future approach and departure RPZs via easement or feesimple
Conduct an ATCT feasibility/siting study to confirm ultimate location
Remove/light obstructions within approach, departure, and Part 77 imaginary surfaces
Consider removal of Runway 6-24
Landside Facilities
Design, environmental documentation, and construction of additional 72,000 SF apron toaccommodate 47 aircraft tie-downs
Design, environmental documentation, and construction of additional 55,000 SF box hangars and61,000 SF (49 units) T-hangars
Support Facilities
Construction of 152 vehicle parking spaces to accommodate demand from additional hangar/apronspace and terminal building
Construct two secure access gates and one emergency/fire access
Upgrade the existing gate operators with new hydraulic gate operators
Install one (1) pedestrian gate, secured with a cipher lock, near the main Airpark building to allowauthorized pedestrian access to the AOA
Expand CCTV coverage to include monitoring of the fence line, fueling area, apron, and hangararea
Provide additional high mast lighting for the aircraft parking areasSources:ACRP Report 113, Guidebook on General Aviation Facility Planning.Kimley-Horn.
Pompano Beach Airpark
p mpano I ~ .~~?,S~- Kimley>>>Horn MASTER PLAN UPDATE

Alternatives Analysis
4-1
Chapter 4: Alternatives Analysis
Contents
4 - ALTERNATIVES ANALYSIS 4-3
Summary of Facility Needs 4-3
Non-Development Alternatives 4-4
No Analysis Alternatives 4-4
Airside Development Alternatives 4-5 Runway 15-33 Extension Alternatives 4-5 Runways 28 and 33 Intersection Alternatives 4-13 Taxiway M Alternatives 4-17 Runway Incursion Mitigation: Taxiway K, L, and M Intersection 4-23 Runway Incursion Mitigation: Direct Apron-Runway Connector Taxiway C 4-28
General Aviation Development Alternatives and Land Use 4-31 Aircraft Parking Apron and Storage Hangar Expansion 4-31 Recommended On-Airport Land Use 4-37
Support Facility Improvements 4-39 Airpark Access 4-39
Development Alternatives – Preferred Alternative 4-41
Pompano Beach Airpark
4.1 -
4.2 -
4.3 -
4.4 -4.4.1 -4.4.2 -4.4.3 -4.4.4 -4.4.5 -
4.5 -4.5.1 -4.5.2 -
4.6 -4.6.1 -
4.7 -
p mpano I ~ .~~?,S~- Kimley>>>Horn MASTER PLAN UPDATE

Alternatives Analysis
4-2
Tables
Table 4-1. Runway 15-33 Alternatives Declared Distances 4-12 Table 4-2. Runway 15-33 Alternatives Evaluation Matrix 4-12 Table 4-3. Runway 28-33 Intersection Alternatives Evaluation Matrix 4-17 Table 4-4. Taxiway M Alternatives Evaluation Matrix 4-22 Table 4-5. Reconstruct Standard Intersection of Taxiway M, L, and Runway 6-24 4-27 Table 4-6. Landside Development Alternatives Evaluation Matrix 4-36 Table 4-7. Land Use Categories Error! Bookmark not defined.
Figures
Figure 4-1. Runway 15-33 Extension Alternative 1 4-7 Figure 4-2. Runway 15-33 Extension Alternative 2 4-9 Figure 4-3. Runway 15-33 Extension Alternative 3 4-11 Figure 4-4. Intersecting Runway 28 and 33 Alternative 1 4-14 Figure 4-5. Intersecting Runway 28 and 33 Alternative 2 4-16 Figure 4-6. Taxiway M Alternative 1 4-19 Figure 4-7. Taxiway M Alternative 2 4-21 Figure 4-8. Runway Incursion Mitigation: Wide Expanses of Pavement Alternative 1 4-24 Figure 4-9. Runway Incursion Mitigation: Wide Expanses of Pavement Alternative 2 4-26 Figure 4-10. Runway Incursion Mitigation: Direct Apron-Runway Alternative 1 4-29 Figure 4-11. Runway Incursion Mitigation: Direct Apron-Runway Alternative 2 4-30 Figure 4-12. Landside Development Alternative 1 4-33 Figure 4-13. Landside Development Alternative 2 4-35 Figure 4-14. Recommended On-Airpark Land Use 4-38 Figure 4-15. Airpark Access Improvements 4-40 Figure 4-16. Consolidated Preferred Alternative 4-42
Pompano Beach Airpark
p mpano I ~ .~~?,S~- Kimley>>>Horn MASTER PLAN UPDATE

Alternatives Analysis
4-3
4 - Alternatives Analysis
Development alternatives presented in this chapter are intended to accommodate aviation demand forecasts and facility requirements discussed in previous chapters of this Master Plan Update. Feedback from the Planning Review Committee, Airpark Management, and the public were also incorporated. The following sections present alternatives that were considered. The preferred alternatives are summarized in Section 4.7 and depicted on the Airport Layout Plan (ALP).
Summary of Facility Needs
This section summarizes the recommended physical facility requirements described in Chapter 3 that accommodate forecast demand and describes the evaluation criteria used to identify preferred development alternatives. The following facilities were examined:
Airside Facilities o Mitigate various RIM issues
- Non-standard Taxiway C - Wide expanse of pavement at the intersection of Taxiways K, L, M and Runway
6-24 - Safety enhancements at the intersection of runway ends 28 and 33
o Address Runway 15-33 length needs o Reconstruct/reconfigure Taxiway M to meet standard FAA B-II separation requirements o Reconfigure Taxiway B to meet FAA standard and install holding pad/run-up area o Install/complete full perimeter vehicle service road (VSR) o Re-grade Runway 24 RSA to FAA standard
General Aviation Facilities o Construct approximately 72,000 SF of additional aircraft parking apron that includes 47
aircraft tie-downs o Construct additional 55,000 SF of box hangars o Construct 61,000 additional SF of T-hangars (49 units)
Support Facilities o Construct 152 vehicle parking spaces o Install two secure access gates, additional emergency vehicle access gates, and new
hydraulic gate operators for all secure gates o Incorporate enhanced security (apron lighting, pedestrian gate, CCTV expansion) o Construct additional roadway access to existing tenant areas
Evaluation criteria were established to compare the development alternatives. Alternatives were evaluated based on:
Ability to enhance safety
Ability to satisfy forecast demand Environmental impacts (local areas of particular concern)
Ability to foster revenue generation and future development
Off-Airpark impacts (land acquisition, safety areas, road relocations, etc.)
Impacts to existing facilities
Cost of implementation
Pompano Beach Airpark
4.1 -
p mpano I ~ .~~?,S~- Kimley>>>Horn MASTER PLAN UPDATE

Alternatives Analysis
4-4
Non-Development Alternatives
Non-development alternatives were identified to establish a baseline of effects that could occur as a result of inaction regarding needed facilities at the Airpark. The evaluation considers whether facility improvements should occur at the Airpark, or if another scenario would better serve existing and potential future Airpark tenants and users. The non-development alternatives that were examined include:
No-build
Relocation/transfer of aviation activities Construction of a new airport
The no-build alternative considers no additional airside, landside, or support facilities being constructed at the Airpark. No additional physical enhancements would be implemented except for routine maintenance for the operational functionality of the Airpark. This alternative does not satisfy projected levels of aviation demand identified in Chapter 2 and subsequent facility requirements presented in Chapter 3. As such, the no-build alternative is not recommended as a viable development strategy.
The second non-development alternative examined is the relocation or transfer of specific or all aviation activities at the Airpark to another airport. Previous chapters of this Master Plan Update detailed the unique mix of tenants and users at the Airpark that includes flight schools, fixed-base operators, a blimp operator, and others. Relocation of these tenants has been identified as an undesirable option. Additionally, the Airpark is situated in an area within the Miami/Fort Lauderdale metropolitan area that has several airports that are at or near capacity in terms of airfield operations and development potential, which limits the ability to relocate tenants or services currently provided at the Airpark.
In addition to the direct economic benefits provided by users and tenants, the Airpark acts as an economic driver within the community and provides a valuable service as a general aviation facility. The relocation/transfer of aviation activities is not recommended as a viable option.
In rare situations, new airports may be constructed to alleviate congestion or enhance operational safety or might be considered if the cost of redeveloping an existing airport exceeds the cost of building new facilities. Based on projected levels of activity and availability of developable land in the vicinity of Pompano Beach, construction of a new airport is not recommended as a viable development alternative for the Airpark.
No Analysis Alternatives
Several of the recommended facility improvements identified in Section 4.1 do not require additional analysis using the developed evaluation criteria. These facilities represent “action or no-action” options and include:
Acquire properties within existing and future RPZs o The Airpark should actively continue to acquire control of RPZs via fee simple acquisition
or easements
Remove/light obstructions (continual) Construct 152 vehicle parking spaces
o Existing vehicle parking should expand in current location as demand merits; future development should have requisite designated vehicle spaces included in design and construction
Pompano Beach Airpark
4.2 -
4.3 -
p mpano I ~ .~~?,S~- Kimley>>>Horn MASTER PLAN UPDATE

Alternatives Analysis
4-5
Install two secure access gates, additional emergency vehicle access gates, and new hydraulic gate operators for all secure gates
Incorporate enhanced security o Apron lighting, pedestrian gate, CCTV expansion
Construct additional roadway access to existing tenant areas
Realign portions of Taxiway M to satisfy FAA-standard separation criteria
Reconfigure Taxiway B to meet FAA standard and install run-up area/holding pad Install/complete full perimeter vehicle service road (VSR)
Re-grade Runway 24 RSA to FAA standard
Assumptions were developed to establish a baseline for analysis and inform the feasibility of various facility implementation strategies. These assumptions include:
The Airpark will not expand its physical boundary through fee simple acquisition or easements to implement physical improvements. The only exception to this assumption is the establishment of Airpark control of critical safety areas including approach and departure RPZs.
Any closure or removal of runway and taxiway pavements should only occur when grant assurances have been satisfied unless the primary funding source authority is willing to forgive a significant portion of the outstanding balance of those assurances.
Broward County will require an Environmental Impact Review (EIR) for any development that could potentially impact Local Areas of Particular Concern (LAPCs), of which, there are four Areas encompassing six parcels on Airpark property (Sites 42 A, B, C, and D).
Existing or proposed Airpark tenant developments that include hangar construction and apron expansion will occur as planned and will satisfy that portion of demand identified in the summary of facility needs presented in Section 4.1 of this chapter.
Airside Development Alternatives
Alternatives were developed for the following airside facilities:
Runway 15-33 Extension
Runway Ends 28 and 33 Intersection Reconfiguration
Taxiway M
RIM Issue: Taxiway K, L, and M Intersection
RIM Issue: Direct Apron-Runway Connector Taxiway C
Runway 15-33 Extension Alternatives
As described in Chapter 3, it was recommended that Runway 15-33 be extended to the extent practicable without incurring significant off-Airpark impacts. Extensions to runway end 15, 33, or both would better accommodate the existing and projected aircraft fleet mix, particularly for takeoffs while reducing the runway’s noise footprint due to shifts in departure locations. Development alternatives for an extension to Runway 15-33 incorporate declared distances and do not relocate existing landing thresholds on either runway end due to a desire to not introduce lower flying aircraft over the nearby residential communities. The following sections describe extension alternatives to Runway 15-33.
Pompano Beach Airpark
4.4 -
4.4.1 -
p mpano I ~ .~~?,S~- Kimley>>>Horn MASTER PLAN UPDATE

Alternatives Analysis
4-6
Alternative 1 – Extend Runway 15
Alternative 1 includes a 422-foot extension to Runway 15 with a displaced threshold (see Figure 4-1). The entirety of the extension could be used for southbound departures. For northbound departures, the departure RPZ would remain on-Airpark property and would require departure threshold lighting. An extension to Runway 15 would require a corresponding extension to Taxiway G. The following bullets identify benefits and constraints associated with Alternative 1:
Alternative 1 – Benefits
Provides additional takeoff length for southbound departures
Provides additional landing length for northbound arrivals
Minimal off-Airpark impacts No changes to existing RPZs
No land acquisition or easements for RPZs
Alternative 1 – Constraints
Requires the use of declared distances
Extended portions of Runway 15 and Taxiway G create line-of-sight issues with ATCT o ATCT siting study recommended
Extension of Taxiway G requires clearing of vegetation within a LAPC, triggering an EIR
Requires departure threshold lighting Requires relocation of airfield lighting including relocation/embedding of MALS
Does not fully satisfy runway length recommendation identified in Chapter 3
Runway extension expands Runway Visibility Zone (RVZ), requiring approximately 51,000 SF of vegetation removal east of the runway
Pompano Beach Airpark
4.4.1 .1
p mpano I ~ .~~?,S~- Kimley>>>Horn MASTER PLAN UPDATE

Alternatives Analysis
4-7
Figure 4-1. Runway 15-33 Extension Alternative 1
Source: Kimley-Horn.
Pompano Beach Airpark
/ ./
DRAWING LEGEIJD
c:::::=J R11no1,1;a,y P~MTWII -- Rlll'M'..iy S.,tic,ty Area -- Rummy Cfl:i~ Frffl Al"m - - Run.vi)' ProtectiOn zone
LOeali?er Ctlllcal. AfM - - TSXM"Sy otijeefi Free .Ar@EI - - •-Bound...,
p mpano • beach. Kimley>>)Horn Florida's Warmest Walcome
~utur• fb.u1w4y P.MamQlnl i:=J Future T:11:,uway P.1..,,emr.nl - Future P~t Renavm
ASOA: 5,340'
LDA· 5,000'
GR~HIC SCALE IN FEET GRAPHIC SCALE IN FEET 0 200 400 800 0 200 400 800
~ ~
MASTER PLAN UPDATE

Alternatives Analysis
4-8
Alternative 2 – Extend Runway 33
Alternative 2 includes a 295-foot extension to Runway 33 that requires a displaced threshold (see Figure 4-2). The entirety of the extension could be used for northbound takeoffs. For southbound departures, the departure RPZ would remain on-Airpark and would require departure threshold lighting. An extension to Runway 33 would require a corresponding extension to Taxiway G. In order to implement an extension to Runway 33, the localizer antenna would have to be relocated or blast protection would be required, due to the proximity of the antenna to the existing end of full-strength runway pavement. Relocation of NE10th Street could be required for this purpose.
Any action that impacts the localizer also requires significant coordination with the FAA in the form of a National Change Proposal if the distance between the runway end and the localizer antenna is less than 600 feet. The following bullets identify benefits and constraints associated with Alternative 2:
Alternative 2 – Benefits
Provides additional takeoff length for northbound departures
No changes to existing RPZs
Minimal land acquisition (0.3 acres for RPZ)
Minimal environmental impacts (no LAPCs affected)
Alternative 2 – Constraints
Requires declared distances
Extended portions of Runway 33 and Taxiway G create line-of-sight issues with ATCT o ATCT siting study recommended
Requires departure threshold lighting
Requires relocation of airfield lighting
Requires localizer relocation or blast protection, which merits significant coordination with FAA
May require relocation of NE 10th Street
Does not fully satisfy runway length recommendation identified in Chapter 3
Pompano Beach Airpark
4.4.1.2
p mpano I ~ .~~?,S~- Kimley>>>Horn MASTER PLAN UPDATE

Alternatives Analysis
4-9
Figure 4-2. Runway 15-33 Extension Alternative 2
Source: Kimley-Horn.
Pompano Beach Airpark
/ _./
~ Ftunw31YP.;1~ -- Runway Safely Area - Run.v..,y Obji,ci1 Free:.Ar'N -- Runwa,' P«Jt;ection Zon~
I.Oe&Hzer- CrlUcal, ArH -- T8XfNaf Otlject Ffee Area - - P~ Boundary
p mpano • beach. Kimley>>>Horn Florida's Warmest Walcome
TODA & ASDA: 5,212
c:::::::::I Futur(I lb.u1w,11y P:rvorrqnl ~ Fulurtt Tui\V#)' Pavcmen'I - Future Pav.ernMI Rtfn'.Nnl
TORA, TODA & ASDA; 5,212'
GRAPHIC SCALE !N FEET 0 100 200 400
~
MASTER PLAN UPDATE

Alternatives Analysis
4-10
Alternative 3 – Extend Runway 15 and Runway 33
As noted in Chapter 3, based on the existing and projected operational fleet at PMP, it was recommended that Runway 15-33 be extended to the extent practicable without causing significant off-Airpark impacts. Alternative 1 and Alternative 2 propose extensions to Runway 15 or Runway 33 without acquisition of land solely for the purpose of providing additional runway length. Land acquisition as it pertains to Alternative 2 was only needed to accommodate the existing Runway 33 RPZ.
Alternative 3 implements a combination of the extensions described for Alternative 1 and Alternative 2 to provide the maximum attainable runway length while limiting significant off-Airpark impacts to the extent practicable. While this option does not fully accommodate runway length needs identified in Chapter 3, it better accommodates a greater proportion of the existing and projected operational fleet compared with Alternatives 1 and 2.
The 422-foot extension to Runway 15 and 295-foot extension to Runway 33 would result in at total runway length of 5,634 feet (see Figure 4-3).
As shown, Alternative 3 provides 5,212 feet of takeoff run available (TORA) departing Runway 33 and 5,000 feet of TORA departing Runway 15. The following bullets identify benefits and constraints associated with Alternative 3:
Alternative 3 – Benefits
Provides maximum takeoff length in both directions without introducing significant off-Airpark impacts
No changes to existing RPZs
Maximum extension of primary runway could have secondary benefits such as elevated jet activity and increased fuel sales
Alternative 3 – Constraints
Requires declared distances
Does not fully satisfy runway length recommendation identified in Chapter 3, but better accommodates nearly all existing and projected operational aircraft in the fleet
Extended portions of Runway 15-33 and Taxiway G create line-of-sight issues with ATCT o ATCT siting study recommended
Extension of Taxiway G would require clearing of vegetation within a LAPC, triggering an EIR Requires departure threshold lighting on Runway 15 and Runway 33
Requires relocation of airfield lighting including relocation/embedding of MALS
Acquisition of 0.3 acres for RPZ
Runway extension expands RVZ, requiring approximately 51,000 SF of vegetation removal east of the runway
May require relocation of NE 10th Street
Pompano Beach Airpark
4.4.1.3
p mpano I ~ .~~?,S~- Kimley>>>Horn MASTER PLAN UPDATE

Alternatives Analysis
4-11
Figure 4-3. Runway 15-33 Extension Alternative 3
Source: Kimley-Horn.
Pompano Beach Airpark
_,.. ,;
,•
DRAWING LEGEIJO
c:::::::::::J R:unwiiy Polllfflfflef'II - - Runw:ay Safaty Arcil - - RuNN.tiy Objed Free Arffl - - Runw~Protiec:lkltllotl~
LOcllliZflf Criticaf AtU - Ta.;Ntay C)l)j&a Ftee Arae
Propr.rty8ouDdll,ry
p mpano • beach. Kimley>>>Horn Florida's Warmest Walcome
Futura R\Jl"M'.ay ~mQnl ~ Future Turw~ P.wcmt!nl - Future Plll\'emeril ReMOYal
LDA: 5,000'
GRAPHIC SCALE IN FEET GRAPHIC SCALE 1N FEET 0 200 400 800
~ ~ o
MASTER PLAN UPDATE

Alternatives Analysis
4-12
Recommended Alternative
Alternatives 1, 2, and 3 all provide additional length to accommodate the existing and future operational fleet at the Airpark. Declared distances for Alternatives 1, 2, and 3 are described in Table 4-1. As noted in Chapter 3, application of Figure 3-1 of FAA AC 150/5325-4B to existing ambient conditions at the Airpark results in a recommended runway length of 6,800 feet for takeoffs, though the majority of the existing and projected fleet at PMP requires approximately 5,500 feet or less of runway for takeoffs.
Table 4-1. Runway 15-33 Alternatives Declared Distances
Alternative Runway Runway
Length (ft.) LDA ASDA TORA TODA
1 15 5,340 4,417* 5,340 5,000 5,340
1 33 5,340 5,000 5,340 4,918 4,918
2 15 5,212 4,711* 5,212 4,578 5,212
2 33 5,212 4,578 5,212 5,212 5,212
3 15 5,634 4,711* 5,634 5,000 5,634
3 33 5,634 5,000 5,634 5,212 5,212 Source: Kimley-Horn. Notes: LDA = Landing Distance Available ASDA = Accelerated Stop Distance Available TORA = Takeoff Run Available TODA = Takeoff Distance Available *Contingent on Quantum Spatial Data, may. Threshold may shift based on obstacle clearance.
A matrix comparing each alternative to the evaluation criteria identified in Section 4.1 is presented in Table 4-2. Alternative 1 receives the highest score compared with Alternatives 2 and 3. Based on the results of this analysis, as well as feedback received from the PRC, Airpark Management, and the FAA, Alternative 1 is recommended as the preferred alternative for future improvements for Runway 15-33.
Table 4-2. Runway 15-33 Alternatives Evaluation Matrix Evaluation Criteria Alternative 1 Alternative 2 Alternative 3
Ability to satisfy forecast demand 0 0 1
Minimizes environmental impacts 1 2 1
Safety enhancement 2 1 2 Ability to enhance revenue/future development
2 2 3
Minimizes off-Airpark impacts 2 0 0
Impacts to existing facilities 2 1 1
Project Cost 2 1 0
Total 11 7 8 Source: Kimley-Horn. Notes: 0 = Does not satisfy evaluation criteria 1 = Satisfies evaluation criteria, with minor challenges 2 = Satisfies evaluation criteria 3 = Exceeds evaluation criteria
Pompano Beach Airpark
4.4.1.4
p mpano I ~ .~~?,S~- Kimley>>>Horn MASTER PLAN UPDATE

Alternatives Analysis
4-13
Runways 28 and 33 Intersection Alternatives
The primary purpose of proposed modifications to the intersection of Runways 28 and 33 is to enhance safety and to a lesser extent, to provide additional runway length to Runway 10-28 without incurring any significant off-Airpark impacts. The existing configuration of the intersection requires aircraft entering Runway 28 to hold inside of the Runway 33 RSA. Pilot coordination with the ATCT alleviates this condition, however, a permanent solution is recommended. As such, two alternatives have been developed and are described in the following sections.
Alternative 1 – De-Couple Runway 10-28
Alternative 1 proposes de-coupling Runway 10-28 and Runway 15-33 by removing 870 feet of pavement from Runway 28 (see Figure 4-4). This distance reflects the point at which the RSAs of Runway 10-28 and Runway 15-33 do not overlap. The loss of 870 feet would shorten Runway 10-28 to 2,632 feet. While eliminating safety issues pertaining to the intersection of Runway 28 and Runway 33, Alternative 1 significantly constrains the functionality of Runway 10-28, especially when use of Runway 15-33 is limited by strong crosswinds.
To mitigate the loss of useable pavement attributed to de-coupling the runway, Alternative 1 includes a 363-foot extension to Runway 10 to provide a total runway length of 2,996 feet. This extension is the maximum allowable distance that keeps the RPZ from extending over North Dixie Highway and adjacent railroad tracks. NE 5th Avenue is currently within the Runway 10 RPZ, which would continue to be the case if an extension were constructed. A 363-foot extension to Runway 10 results in a net loss of 507 feet of runway pavement compared to existing conditions. A concurrent extension of parallel Taxiway K would also be required for access to Runway 10.
The following bullets identify benefits and constraints associated with Alternative 1:
Alternative 1 – Benefits
Permanent separation of intersecting runways 10-28 and 15-33 enhances safety
Eliminates portion of Runway 10-28 ROFA that currently extends over the adjacent golf course Provides potential development opportunity on areas currently occupied by Runway 28 and
associated safety areas
Reduces the amount of coordination needed between pilots and ATCT
Alternative 1 – Constraints
Land acquisition or easement required for Runway 10 RPZ (5.14 acres)
Loss of useable runway pavement, with or without extension to Runway 10
May require relocation of NE 5th Avenue and other facilities between NE 5th Avenue and NE 3rd
Avenue
Potential environmental impacts associated with extension to Runway 10 (LAPCs and existing well heads)
Pompano Beach Airpark
4.4.2 -
4.4.2 .1
p mpano I ~ .~~?,S~- Kimley>>>Horn MASTER PLAN UPDATE

Alternatives Analysis
4-14
Figure 4-4. Intersecting Runway 28 and 33 Alternative 1
Source: Kimley-Horn.
Pompano Beach Airpark
DRAWING LEGEIJD
t:=l' R11nwi)"r P..ivlH'Tlmll -- RutM'ay S., &tty Area - - Rum.,ay Olljec:f Free Are-a -- Rllf'Molly~tiMZbn&
Locall1« Crlllc&I ArN -- Ta,;,.,..gy(X)je(:t f rae .Aree
• -Bnu.-,J..y
p mpano • beach. Kimley>>)Horn Florida's Warmest Walcome
Futuro R\1nw..iy P.:NeiftQJll C=1 Future T:rnway Pa.,,ement - Future Pavement Renova!
'GRAPHIC ~ E IN FEET .,
~ 00
MASTER PLAN UPDATE

Alternatives Analysis
4-15
Alternative 2 – Mitigate Runway 28 and Runway 33 Intersection
Alternative 2 includes a 185-foot extension to Runway 28, which allows for a reconfiguration of Taxiway E that provides enough space for most aircraft types that operate at PMP to hold outside the Runway 33 RSA before taxiing onto Runway 28.
The extension to Runway 28 does not incorporate any change to the location of the approach threshold but provides an additional 185 feet of takeoff distance for westward departures. The extended portion of the runway would also be usable for eastbound arrivals.
Alternative 2 provides two different Taxiway E reconfiguration options (see Figure 4-5). Option 1 includes an extension of Taxiway K as a full parallel taxiway with Taxiway E being relocated to the ultimate end of Runway 28. In this configuration, taxiing aircraft would continue straight on Taxiway K and cross Runway 33. Option 2 would relocate Taxiway E to the end of Runway 33 in an angled configuration. This configuration would require aircraft to utilize Taxiway L, cross Runway 33, then continue along Taxiway E to Runway 28.
The primary differences between Option 1 and Option 2 are the routes that aircraft would take to access Runway 28, and that Option 2 provides additional pavement for holding aircraft. The following bullets identify benefits and constraints associated with Alternative 2:
Alternative 2 – Benefits
Provides additional takeoff length for westbound departures and eastbound arrivals
Relocation of Taxiway E enhances operational capacity by relocating holding aircraft outside Runway 15-33 RSA
Reduces level of coordination needed between pilots and ATCT
No significant environmental impacts Eliminates wide expanse of pavement (RIM issue)
Alternative 2 – Constraints
Requires additional land acquisition or easement for Runway 28 departure RPZ compared with existing conditions (5.12 acres total)
Runway 28 ROFA extends over adjacent golf course
Requires departure threshold lighting for eastbound departures
Does not mitigate two runway thresholds in close proximity (RIM issue)
Pompano Beach Airpark
4.4.2.2
p mpano I ~ .~~?,S~- Kimley>>>Horn MASTER PLAN UPDATE

Alternatives Analysis
4-16
Figure 4-5. Intersecting Runway 28 and 33 Alternative 2
Source: Kimley-Horn.
Pompano Beach Airpark
---=-~--~ "----(3,707' X 100') - - - ~
c:::::::J Runway~ - - RUfM'S)' S8Ae~ A,ea
Runway CCIIOOI Free Ar9s - Runwlr)' Prot«uan lotte
Loca11Z6' Crihc.ill ArN - - Tru:wayCltiJ«1 F~Am1 --- P fOC)et'ty Bovndaty
DRAWING LEGEJJD
Fuluff! Rtn•r.way Pavefflenl ~ future Ta:~h~B)' Pavl't'nenl - Future P8'Vilffla"II RSfTICJYal -- Futurl!!: Rurwii>' Proltdlor, Zonet
p mpano • beach. Kimley>>>Horn Florida's Warmest Walcome
\
TORA, TODA, & ASOA: 3,707'
LDA: 3,523'
Option 2
\ \.
185'
~PHIC $(:ALE IN FEET .. ,~ o
MASTER PLAN UPDATE

Alternatives Analysis
4-17
Recommended Alternative
The primary objective in reconfiguring the intersection of Runways 28 and 33 is to enhance operational safety and situational awareness. Both Alternative 1 and Alternative 2 achieve this objective. However, Alternative 1 significantly reduces the useable length of Runway 10-28, limiting its overall functionality. Alternative 2 enhances operational safety with the added benefit of a runway extension that can be utilized for westbound departures and eastbound arrivals. A matrix comparing each alternative to the evaluation criteria identified in Section 4.1 is presented in Table 4-3. As shown, Alternative 2 receives the higher score between the two alternatives.
Based on discussions with Airpark Management, PRC members, and the FAA, Alternative 2 was identified as the preferred alternative to mitigate safety issues at the intersection of Runway 28 and Runway 33 with Option 2 being the recommended taxiway configuration.
Table 4-3. Runway 28-33 Intersection Alternatives Evaluation Matrix Evaluation Criteria Alternative 1 Alternative 2
Ability to satisfy forecast demand 1 2
Minimizes environmental impacts 1 2
Safety enhancement 3 2
Ability to enhance revenue/future development 1 2
Minimizes off-Airpark impacts 0 1
Impacts to existing facilities 2 2
Project Cost 1 2
Total 9 13 Source: Kimley-Horn. Notes: 0 = Does not satisfy evaluation criteria 1 = Satisfies evaluation criteria, with minor challenges 2 = Satisfies evaluation criteria 3 = Exceeds evaluation criteria
Taxiway M Alternatives
As noted in previous chapters, the FAA standard separation between Runway 6-24 and Taxiway M should be 240 feet. Portions of Taxiway M meet this standard, as improvements have been made incrementally over the course of several airfield improvement projects in recent years. The remainder of the taxiway is situated 200 feet from the Runway 6-24 centerline. Segments of Taxiway M between Runway end 6 and Taxiway D need to be reconstructed to meet FAA design standards and do not require additional analysis. However, the segment of Taxiway M between the Runway 24 end and Runway 15-33 is used less frequently than other segments and requires additional analysis to determine if it is necessary and if so, what it’s optimal configuration should be. This section presents development alternatives pertaining to the portion of Taxiway M between Runway 24 and Runway 15-33 that does not currently meet FAA recommended runway-taxiway separation criteria.
Alternative 1 - Reconstruct Standard Taxiway M
Alternative 1 proposes shifting Taxiway M 40 feet to the south to create a standard 240-foot separation from Runway 6-24. A small portion of the existing Taxiway could be repurposed in its current location. The primary impact associated with Alternative 1 is that the Taxiway M Object Free Area (OFA) would
Pompano Beach Airpark
4.4.2.3
4.4.3 -
4.4.3.1
p mpano I ~ .~~?,S~- Kimley>>>Horn MASTER PLAN UPDATE

Alternatives Analysis
4-18
extend over the adjacent golf course (see Figure 4-6). Because this is a non-compatible use, the golf course would require reconfiguration and the Airpark’s perimeter fence would need to be relocated. The following bullets identify benefits and constraints associated with Alternative 1:
Alternative 1 – Benefits
Satisfies FAA design standards
Maintains airfield operational capacity and enhances operational capacity of Taxiway M with the added bypass taxiway connector
Minimal environmental impacts (no LAPCs or well heads)
Portion of existing Taxiway M pavement can be reused
Alternative 1 – Constraints
Requires relocation of perimeter fence
TOFA expands over golf course; requires gold course reconfiguration Requires relocation of taxiway lighting
Requires reconfiguration of Runway 24 run-up area
Pompano Beach Airpark
p mpano I ~ .~~?,S~- Kimley>>>Horn MASTER PLAN UPDATE

Alternatives Analysis
4-19
Figure 4-6. Taxiway M Alternative 1
Source: Kimley-Horn.
Pompano Beach Airpark
• \ .. ··
.,.
\ \
11------...__ _______ __:_::;;._ ____ -'I'/,,;/ DRAWING LEGEND
\ ' \
p mpano • beach. Florida's Warmest Walcome
R'unw~P.i¥Ql'TIClf1f Rur,,wy Safoty Area Rurw.:i:,, Objcd Free, ArtRJ RUl'r,yay Pfo~liM Zttt~ loc81izM c,rnr.ai Aree T~ay Objea Ftee Aree Prq>terty Qoundnry
Kimley>>> Horn
- Fl1lur9 T.i)IJW-')' PtWllm10f tt'.}!21 Fu\UM PillVtlmMI Remnv•I - Ful1n1 Mold &t-- Fi.Jha'e Taxiway l!ll!Jnd - Fulure ~urtNa~ E,,1ert~ - -..g1<o~e.,
/ / _,,,,..
\ ~
..
/ ;
/ ,
.. \.
\
,, .,.
;
~
,
'\..
., ... ., .. ,, '\
•' ,!J_ .,. ? .. / / \
/ .,, / I .,
/ ,,
/
, ,r
~· .,r
• GRAPHIC SCALE IN FEET
0 100 200 400
MASTER PLAN UPDATE

Alternatives Analysis
4-20
Alternative 2 – Remove Taxiway M
Alternative 2 includes removal of the entire portion of Taxiway M between Runway 15-33 and the Runway 24 end (see Figure 4-7). As noted in previous chapters of this Master Plan Update, Runway 6-24 is the least frequently used of the three runways at the Airpark. While removal of Taxiway M would reduce airfield operational capacity, it would also decrease the amount of pavement the Airpark would need to maintain and perform routine rehabilitation on. Taxiway F could also be used to access Runway 24 in its existing configuration. Additionally, the adjacent golf course would not incur any impacts.
The following bullets identify benefits and constraints associated with Alternative 2:
Alternative 2 – Benefits
Reduces Airpark’s impervious surface (lower maintenance and rehabilitation costs)
No impacts to off Airpark facilities, including golf course Streamlines taxiing aircraft to single entrance point, reducing ATCT-pilot coordination
No environmental impacts or impacts to existing facilities
Alternative 2 – Constraints
Reduces airfield capacity
Additional costs associated with removal of lighting
Requires taxiing aircraft to cross the active arrival flow on Runway 24
Pompano Beach Airpark
4.4.3.2
p mpano I ~ .~~?,S~- Kimley>>>Horn MASTER PLAN UPDATE

Alternatives Analysis
4-21
Figure 4-7. Taxiway M Alternative 2
Source: Kimley-Horn.
Pompano Beach Airpark
• \ \ ..
~ "1is
c&-~
~ Iv e:,'?> , ,9
~ '6>, + .,
"& V,
~ ../
' 0
~x \ ~ \ \
' \
, ____ ~~.._ ________ __;..._. _____ /✓/ DRAWING LEGEtJD
Runwil)' P,?l,l,l)fflffl'lf - Futur41: TallJWil)' Pt1,1,1°"""' Ru,,....ay Snloty Area t.lilP.e Fulurft Pavamail Rr.mcw11I Rumn1:,, Objed Free ArN Runway Ptoliec:liOn ZMe Localiz« Critical Area T e:u,yay OIJjecl F<ee Area Pmpmy Bound.-.;
p mpano • beach. Kimley>>>Horn Florida's Warmest Walcome
/ <~ \
~· .I-
~
.,
'-\ <,
.t
., .,. ...,. - ..... '\
; TWYF ~·
.,, .
/ /
;' ~ / / ;'
/ / .,
/
\ • GRAPHIC SCALE IN FEET
0 100 200 400
MASTER PLAN UPDATE

Alternatives Analysis
4-22
Recommended Alternative
A matrix comparing each alternative to the evaluation criteria identified in Section 4.1 is presented in Table 4-4. Based on discussions with Airpark Management and representatives from the ATCT, it was identified that the northeast portion of Taxiway M was considered an important asset, and removal would have a significant negative impact on the operational flow of the airfield. As such, Alternative 1 is the preferred long-term development option for Taxiway M.
Table 4-4. Taxiway M Alternatives Evaluation Matrix Evaluation Criteria Alternative 1 Alternative 2
Ability to satisfy forecast demand 2 2
Minimizes environmental impacts 2 2
Safety enhancement 2 1
Ability to enhance revenue/future development 2 2
Minimizes off-Airpark impacts 1 2
Impacts to existing facilities 2 1
Project Cost 2 2
Total 13 12 Source: Kimley-Horn. Notes: 0 = Does not satisfy evaluation criteria 1 = Satisfies evaluation criteria, with minor challenges 2 = Satisfies evaluation criteria 3 = Exceeds evaluation criteria
Pompano Beach Airpark
4.4.3.3
p mpano I ~ .~~?,S~- Kimley>>>Horn MASTER PLAN UPDATE

Alternatives Analysis
4-23
Runway Incursion Mitigation: Taxiway K, L, and M Intersection
The intersections where Taxiways K and L intersect with Runway 6-24 and Taxiway M are configured such that there are multiple wide expanses of pavement and non-standard conditions that have the potential to inhibit pilot awareness. These intersections should be reconfigured to meet FAA standards and minimize the potential for incursions. The following sections describe alternatives that satisfy these requirements.
Alternative 1 – Reconstruct Intersection of Taxiway M, Taxiway L, and Runway 6-24
Alternative 1 proposes shifting Taxiway M to the south to satisfy a B-II small standard 240-foot separation from Runway 6-24 (see Figure 4-8). A small portion of the existing Taxiway M could be retained in its current location. The alternative also proposes a relocation of the western portion of Taxiway L that will retain the separation distance of 128 feet to Taxiway K along the entirety of Taxiway L. The 128-foot separation will still allow for aircraft to hold prior to the Runway 10 hold bars. In compliance with design standards set forth in AC 150/5300-13A, green painted taxiway islands are proposed to mitigate wide expanses of pavement between the intersections of Taxiways M, L, and K. Green painted taxiway islands are also proposed to delineate a bypass taxiway to both Runway 10 and Runway 6.
The following bullets identify benefits and constraints associated with Alternative 1:
Alternative 1 – Benefits
Satisfies FAA design standards
Maintains operational capacity
Portions of existing Taxiway M and Taxiway L can be retained
Enhances safety through standard geometry No impact to existing facilities
Reduces level of coordination needed between pilots and ATCT
No significant environmental impacts
No off-Airpark impacts
Mitigates wide expanses of pavement
Painted islands provide space for additional taxiway signage
Alternative 1 – Constraints
Additional associated costs with pavement removal
Requires relocation of lighting
Painted islands require routine maintenance
Pompano Beach Airpark
4.4.4-
4.4.4 .1
p mpano I ~ .~~?,S~- Kimley>>>Horn MASTER PLAN UPDATE

Alternatives Analysis
4-24
Figure 4-8. Runway Incursion Mitigation: Wide Expanses of Pavement Alternative 1
Source: Kimley-Horn.
Beach Airpark Pompano
•
-• r-____
~ -.. ~ / , Q
--I
/ -~~
• I
.J
~ ., .,. ,,
/ > ., " •
---:-OR;;-:A,VW~II ING LEGEtJO p,_,.,, Fulurci T.;tll,1:-n~I Rr.m:JYal
~ Fulurc Pav .Oar
- : ~:: =tw,Bylilal'd
p mpano Kimley>>>Horn • beach. Florida's Warmest Walcome
,, ,
/
--\ / I - -
-Runway 10/28 (3,502' X 100')
\ \
- - - \
PLAN UPDATE

Alternatives Analysis
4-25
Alternative 2 – Reconstruct Standard Intersection of Taxiway M, Taxiway L, and Runway 6-24
Alternative 2 maintains the shift of Taxiway M and Taxiway L and the green taxiway islands as proposed in Alternative 1 (see Figure 4-9). The difference between the alternatives exists at the intersection of Taxiway K, Taxiway M, and Runway 6-24. Alternative 2 does not allow eastbound taxiing aircraft to gain access to Taxiway M from Taxiway K. Removal of excess pavements at this intersection enhances pilot situational awareness.
The following bullets identify benefits and constraints associated with Alternative 2:
Alternative 2 – Benefits
Satisfies FAA design standards
Maintains operational capacity
Portions of existing Taxiway M and Taxiway L can be retained
Enhances safety through standard geometry
No impact to existing facilities Reduces level of coordination needed between pilots and ATCT
No significant environmental impacts
No off-airport impacts
Mitigates wide expanses of pavement
Mitigates direct apron access
Painted islands provide space for additional signage Enhances pilot situational awareness
Reduces impervious surface
Alternative 2 – Constraints
Additional associated costs with pavement removal
Requires relocation of lighting Painted islands require routine maintenance
Pompano Beach Airpark
4.4.4.2
p mpano I ~ .~~?,S~- Kimley>>>Horn MASTER PLAN UPDATE

Alternatives Analysis
4-26
Figure 4-9. Runway Incursion Mitigation: Wide Expanses of Pavement Alternative 2
Source: Kimley-Horn.
A• ark Beach irp Pompano
•
-c:::::a -- I ... •
..__ I _::_
!
--_, /
• / ~
-I
/
_,, ,
/ > , .. , •
...
-/
-- """NG LEGEIJD
DR/\WI '""'" T,,,w~~= ~ Fulwa~~
p mpano Kimley>>>Horn • beach. Florida's Warmest Walcome
/
-\ / I - -
-
·-------------------------.. ----~
Runway 10128 (3,502' X 100') - - -\
\

Alternatives Analysis
4-27
Recommended Alternative
A matrix comparing each alternative to the evaluation criteria identified in Section 4.1 is presented in Table 4-5. Based on discussions with Airpark Management and representatives from the ATCT, it was identified that the turning movement on Taxiway K onto Taxiway M from Runway 6-24 was not highly utilized. The removal of the turning movement would not drastically hinder airfield operational capacity and would ultimately enhance safety in the area. As such, Alternative 2 is the preferred long-term development option for the intersection of Taxiway M, Taxiway L, and Runway 6-24.
Table 4-5. Reconstruct Standard Intersection of Taxiway M, L, and Runway 6-24 Evaluation Criteria Alternative 1 Alternative 2
Ability to satisfy forecast demand 2 2
Minimizes environmental impacts 2 2
Safety enhancement 1 2
Ability to enhance revenue/future development 2 2
Minimizes off-Airpark impacts 2 2
Impacts to existing facilities 2 2
Project Cost 1 2
Total 12 14 Source: Kimley-Horn. Notes: 0 = Does not satisfy evaluation criteria 1 = Satisfies evaluation criteria, with minor challenges 2 = Satisfies evaluation criteria 3 = Exceeds evaluation criteria
Pompano Beach Airpark
4.4.4.3
p mpano I ~ .~~?,S~- Kimley>>>Horn MASTER PLAN UPDATE

Alternatives Analysis
4-28
Runway Incursion Mitigation: Direct Apron-Runway Connector Taxiway C
The FAA stipulates that taxiways that lead directly from an apron to a runway are not recommended as they may create the false expectation of a parallel taxiway prior to the runway. At the Airpark, Taxiway C connects the main apron to Runway 10-28 as it traverses across Taxiway K and Taxiway L. The following sections describe development alternatives that mitigate direct apron-runway connectivity. It should be noted that these development concepts are relatively simple in terms of analysis and implementation. As such, they are not subject to the same level of analysis in terms of the evaluation criteria as other alternatives presented in this chapter.
Alternative 1 – Remove Portion of Taxiway C
Alternative 1 includes relocation of the portion of Taxiway C that connects Taxiway L to Runway 10-28 to the north (see Figure 4-10). Relocation of this connector taxiway permanently mitigates the direct apron-runway connectivity without significantly impacting airfield connectivity.
Alternative 2 – Relocate Portion of Taxiway C
Alternative 2 includes relocation of the portion of Taxiway C that connects to Taxiway L and the apron to the south (see Figure 4-11). The primary difference of Alternative 2 compared to Alternative 1 is that the relocated connector taxiway shifts slightly to the west of where a greater concentration of aircraft tie-downs are located and would require additional re-striping.
Recommended Alternative
Based on feedback provided by Airpark Management, the PRC, and representatives from the ATCT, it was identified that Alternative 2 was preferable with respect to operational functionality, airfield safety, and congestion reduction near the apron area.
Pompano Beach Airpark
4.4.5 -
4.4.5.1
4.4.5.2
4.4.5.3
p mpano I ~ .~~?,S~- Kimley>>>Horn MASTER PLAN UPDATE

Alternatives Analysis
4-29
Figure 4-10. Runway Incursion Mitigation: Direct Apron-Runway Alternative 1
Source: Kimley-Horn.
A• ark Beach irp Pompano
., ,,
,,;
... ..,
,, • ,, I• ,, -, ~~ ~ ,,
~~ -< '/ ,., /
,,, .., 0
... ... -
... --- .. Runway 10/28 (3,502' X 100')
...
-
... -- -
TWYK
DRAWING LEGEND - ay P"""""""
Future Taxiw t Remo,,8' m::::J Future ~e:;:1
- ~:~g Hold Bar
TWYL
p mpano Kimley>>>Horn • beach. Florida's Warmest Walcome
...
...

Alternatives Analysis
4-30
Figure 4-11. Runway Incursion Mitigation: Direct Apron-Runway Alternative 2
Source: Kimley-Horn.
Pompano
• .,,
1• ,;
,,
-, F
~~ ,,,
~
,.,
/ ,,,
~~ -< '/ ,,,
()
,, ,,,
"' - "'- ... -- ~ - ..,.
.... Runway 10/28 (3,502' X 100') ------
...
TWYK
--AWING LEGEND . P....-
DR Future Ta,ow~, """'°"at ~ =~:::r.:te:,, - Existing Hold Bar
p mpano Kimley>>>Horn • beach. Florida's Warmest Walcome

Alternatives Analysis
4-31
General Aviation Development Alternatives and Land Use
This section presents development alternatives for landside facility needs pertaining to general aviation demand as well as recommended on-Airpark land uses based on the preferred alternatives presented in this chapter.
Aircraft Parking Apron and Storage Hangar Expansion
The Facility Requirements chapter identified a need for an additional 72,000 SF (47 tie-downs) of aircraft parking apron, 55,000 SF of box hangars, and 61,000 SF (49 units) of T-hangars. At the time that this chapter was completed, there were two development proposals that, if constructed, would address the entirety of anticipated box hangar need and a portion of the apron need. However, areas that can be developed to accommodate the remaining deficit need to be identified.
An important issue to detail is that portions of the Airpark’s property are zoned for “Public Recreation” use and are not currently used for any aviation purpose. Ideally, the Airpark could repurpose these areas that are needed for aeronautical use as demand for development warrants. In order to do this, the City would have to re-zone such areas for “Transportation” use. It should be noted that the alternatives presented in this section identify potential development options under the assumption that zoning constraints will remain in effect.
Alternative 1 – South General Aviation Development
Alternative 1 proposes general aviation development on approximately 18 acres south of Taxiway L that are currently occupied by Runway 6 (see Figure 4-12). This alternative would require closure of Runway 6-24 or significant shortening to provide additional area for aeronautical development. With the exception of the Goodyear facility, all tenants and services are situated in the south portion of the Airpark. Opening this area would create a contiguous pattern of development, and closure of Runway 6-24 would not significantly impact the overall capacity of the airfield. The primary advantage of Alternative 1 is that it would allow for future development to occur in a seamless configuration in proximity to existing infrastructure and services.
As noted, Runway 6-24 is the least used of the three runways at the Airpark, and adequate crosswind coverage is provided by Runway 15-33 and Runway 10-28. Additionally, the runway width design standard for a B-II runway is 75 feet, so at a width of 150 feet, Runway 10-28 is twice the FAA design standard and incurs additional costs associated with maintenance and rehabilitation.
The following bullets identify benefits and constraints associated with Alternative 1:
Alternative 1 – Benefits
Minimal impact to airfield capacity (two active-runway configuration is predominant at the Airpark)
The proposed development area has access to existing infrastructure and services as well as NE 10th Street
Removal or shortening Runway 6-24 would reduce maintenance costs
Removal or shortening Runway 6-24 would reduce noise impacts at the Airpark
Alternative 1 – Constraints
Removal or shortening Runway 6-24 would reduce airfield capacity if Runway 10-28 or 15-33 are closed for rehabilitation or reconstruction
Pompano Beach Airpark
4.5 -
4.5.1 -
4.5.1 .1
p mpano I ~ .~~?,S~- Kimley>>>Horn MASTER PLAN UPDATE

Alternatives Analysis
4-32
Potential environmental issues and impacts with well heads and vegetation
If future demand exceeds available land development envelope, other areas will need to be identified to accommodate demand
Pompano Beach Airpark
p mpano I ~ .~~?,S~- Kimley>>>Horn MASTER PLAN UPDATE

Alternatives Analysis
4-33
Figure 4-12. Landside Development Alternative 1
Source: Kimley-Horn.
Pompa no Beach A. irpark
DRAWING LEGEND
- GenM al AYiabon Gene1al AYlabOn g:e1opment Boun~ elopm!!n!:
~ pano Florida's w,beach.
rmest Walcome
Kimley»> Horn MASTER PLAN

Alternatives Analysis
4-34
Alternative 2 – West General Aviation Development
General Aviation Alternative 2 proposes development on the Airpark’s west side, north of the Goodyear facility. There are approximately 42 acres of land that could be made available for aircraft parking apron, hangars, and other aeronautical development (see Figure 4-13). Much of the existing area is currently used for recreational purposes and there are two parcels that are primarily designated as LAPCs.
The primary advantage of locating future development in this area is that the land envelope available is significantly larger than the area identified in Alternative 1, and the entirety of the parcel is owned by the Airpark or the City. Though a significant amount of property in this area is currently owned by the Airpark and subleased to a non-aeronautical tenant, development on other parcels would require environmental permitting and rezoning.
Despite the area’s location on the Airpark’s west side, the area has excellent access to Taxiway B and all three runways.
The following bullets identify benefits and constraints associated with Alternative 2:
Alternative 2 – Benefits
Entire property is owned by the Airpark or the City
Access to Taxiway B and all runways
42 acres provides more than adequate land for anticipated demand within 20-year horizon
Road access provided by NE 5th Avenue
Alternative 2 – Constraints
Environmental impacts associated with LAPCs Portions of the property would require rezoning
Development not in proximity to existing infrastructure and services
Existing tenants may require relocation
Pompano Beach Airpark
4.5.1.2
p mpano I ~ .~~?,S~- Kimley>>>Horn MASTER PLAN UPDATE

Alternatives Analysis
4-35
Figure 4-13. Landside Development Alternative 2
Source: Kimley-Horn.
Pompa no Beach A. irpark
DRAWING LEGEND
~ pano Florida's w,beach.
rmest Walcome
Kimley»> Horn MASTER PLAN

Alternatives Analysis
4-36
Recommended Alternative
Alternative 1 presents a general aviation development option that provides a contiguous configuration in proximity to existing facilities and services at the cost of removing a portion or all of Runway 6-24. Although this runway is the least used of the three at the Airpark and adequate crosswind coverage is provided by Runways 10-28 and 15-33, pilots and members of the PRC have identified it as an important asset. Alternative 2 proposes development on the Airpark’s west side where there are fewer existing facilities and services for aircraft, though development of a fuel station, wash rack, or other amenities could be constructed in this location as demand merits.
An evaluation matrix comparing each of the general aviation development alternatives is presented in Table 4-6. Based on the results of this analysis and feedback provided by Airpark Management and the PRC, Alternative 2 is the recommended option for landside development at the Airpark. As noted previously, it is also recommended that the Airpark work with the City to reclaim parcels on Airpark property that are zoned for recreational purposes within the Airpark’s property line. Rezoning these areas would provide the Airpark greater flexibility to determine optimal locations for development and redevelopment that could have fewer impacts than those associated with Alternatives 1 and 2 presented in this Master Plan Update.
Table 4-6. Landside Development Alternatives Evaluation Matrix
Evaluation Criteria Alternative 1 Alternative 2 Ability to satisfy forecast demand
1 3
Minimizes environmental impacts
1 1
Safety enhancement 2 2 Ability to enhance revenue/future development
2 3
Minimizes off-Airpark impacts 2 2
Impacts to existing facilities 1 1
Project Cost 1 1
Total 10 13 Source: Kimley-Horn. Notes: 0 = Does not satisfy evaluation criteria 1 = Satisfies evaluation criteria, with minor challenges 2 = Satisfies evaluation criteria 3 = Exceeds evaluation criteria
Pompano Beach Airpark
4.5.1.3
p mpano I ~ .~~?,S~- Kimley>>>Horn MASTER PLAN UPDATE

Alternatives Analysis
4-37
Recommended On-Airport Land Use
To promote logical future on-Airpark development, it is important to identify a land use plan that provides a framework for development that is compatible with existing and proposed facilities. The initial step in the identification of future land uses is to establish land use planning goals. Recommended land uses should:
Enhance revenue/future development Maximize compatibility with existing facilities
Minimize impacts to the surrounding community
Satisfy long-term development needs
Provide optimal use of land and existing/future access points
The next step in the land use planning process is identification of recommended land uses. In total, eight land uses were identified that include permitted activities and general requirements for potential development within each category as shown Table 4-7.
Table 4-7. Land Use Categories
Land Use Recommended Activities General Requirements
Educational/ Vocational
Flight schools, flight training, airframe and powerplant mechanic training,
satellite campus
Apron access, hangars and storage, office/ administrative space, student
housing Industrial/ Aviation
Specialized aviation services, parts storage, commercial aircraft storage
Apron access, large aircraft hangars, office/ administrative space
Corporate/ FBO FBO, itinerant aircraft parking apron,
auto parking, conventional aircraft hangars, fuel truck parking
Parallel taxiway access, apron access, corporate hangar space, auto parking,
building/ administrative space
Based Aircraft Accommodation
Aircraft apron, taxilanes, T-shades, conventional hangars, T-hangars, auto
parking
Aircraft taxiing and maneuvering areas, aircraft parking apron (light apron),
small hangars, auto parking
Aviation Support General equipment storage,
maintenance facilities, terminal building, ATCT
Apron access, taxiway access, vehicle service road access
Aviation Business
Aviation-related businesses not associated with FBO or aircraft repair/
maintenance, retail, office, auto parking
Aircraft hangars, office/ administrative space, auto parking
Potential Future Aviation Development
To be determined None
Non-Aviation Revenue Generation
Commercial or light industrial uses not specific to aviation demand
Vehicle access, parking, utilities
Source: Kimley-Horn.
It should be noted that land uses reflect categories pertaining to both aviation and non-aviation uses. The Recommended On-Airpark Land Use map presented in Figure 4-14 was developed based on input from Airpark Management and considers the ultimate conditions of the airfield and proposed developments that are in the initial planning and design phase.
Pompano Beach Airpark
4.5.2 -
p mpano I ~ .~~?,S~- Kimley>>>Horn MASTER PLAN UPDATE

Alternatives Analysis
4-38
Figure 4-14. Recommended On-Airpark Land Use
Source: Kimley-Horn.
Pompano Beach Airpark
DRAWING LEGEND c::::::J Runwa:, Pavemen1 ---- Property Boundary -- Airport Operations Area c::::::J Futire Taxiway Pavement c::::::J Fut\se No-Taxi llsand
Futwe Runway Pa'lernent c::::::J Funn Runway Should« G::J Future Pavement Removal - Industrial Aviation IJse
[:::=J Based Aira"aft Accommodation Use - Avia1:ion Support Use c:::::::J Avfation Busine-ss Use c::::::J Potential future Alilia tion Development c:::J Non-Aviation Re'-'enue Generac:on Use c::::::J Corporate/FSO Use c:::J EducaEonalNocafional Use
p mpano • beach. Kimley>>> Horn Florlda's WarmestWelcoma
MASTER PLAN UPDATE

Alternatives Analysis
4-39
As shown, the Recommended On-Airpark Land Use map identifies approximately 158 acres for future potential aviation development use, 26 acres for based aircraft accommodation, 28 acres for aviation business use, 39 acres for industrial aviation, 15 acres for corporate/FBO, 5 acres for educational/vocational, 2 acres for aviation support, and 60 acres for mixed use industrial aviation/aviation business. The land use map is also included as a sheet in the ALP.
Support Facility Improvements
Support facilities are generally ancillary items that aid in the operational functionality of an airport. As it pertains to this Master Plan Update, the roadway network was analyzed for adequate tenant access and emergency vehicle access, which are summarized in the following section.
Airpark Access
A specific recommendation outlined in Chapter 3 of this Master Plan Update is that the Airpark should install secure gate areas to enhance airfield security, allow emergency vehicle access, and provide additional roadway access to tenant areas. These improvements were vetted with Airpark Management and the PRC to identify optimal locations. The recommended locations of these access improvements are presented in Figure 4-15.
Pompano Beach Airpark
4.6 -
4.6.1 -
p mpano I ~ .~~?,S~- Kimley>>>Horn MASTER PLAN UPDATE

Alternatives Analysis
4-40
Figure 4-15. Airpark Access Improvements
Source: Kimley-Horn.
Pompano Beach Airpark
Q Secure Gate Access Emergency Access Roadway Access
p mpano • beach. Kimley>>>Horn MASTER PLAN UPDATE
Florlda'sWarmestWelcome

Alternatives Analysis
4-41
Development Alternatives – Preferred Alternative
A summary of the recommended developments described in this chapter is presented in Figure 4-16. This consolidated Preferred Alternative represents all physical improvements (excluding maintenance projects) that are anticipated over the planning horizon. A phased implementation plan for these improvements as well as cost estimates and funding sources are presented in the following chapter.
It should be noted that based on the significant level of proposed airfield reconfiguration, the Airpark’s taxiway nomenclature will require updating. Recommended nomenclature is described in FAA Engineering Brief No. 89 Taxiway Nomenclature Convention. Preliminary future taxiway designations are presented in Figure 4-16. Airpark Management and ATCT staff were consulted to assist with establishing preferred future taxiway designations as depicted in the ALP.
Additionally, all previous exhibits presented in this chapter depict the Airpark’s runway widths in their existing condition. All runways at PMP exceed the FAA’s recommended B-II design standard (Runway 15-33) and B-II small design standard (Runway 10-28, Runway 6-24) for width. Airpark Management has identified that it would be desirable to maintain the existing runway widths that exceed FAA standard and seek local and State funding assistance for future maintenance of any non-FAA grant eligible pavements and associated facilities if needed. As such, Figure 4-16 presents Preferred Alternative projects with existing runway widths.
Pompano Beach Airpark
4.7 -
p mpano I ~ .~~?,S~- Kimley>>>Horn MASTER PLAN UPDATE

Alternatives Analysis
4-42
Figure 4-16. Consolidated Preferred Alternative
Source: Kimley-Horn.
Pompano Beach Airpark
n i' . I
\I :•
DRAWING LEGEND
p mpano • beach. Florlda'sWarmestWelcome
Kimley»>Horn
- Futu,e Grade & FIi Future Taxiway P8Y(lffllnl
- Fuh..-e RurMtty Extension - Existing Hold Bar -··- P-,ty~
··, .. , .. , .. , ..
\ \ \ \ \ \ \ \ \ \ \ \ )
("' \ \ \ \
,_,....,.\, ,\ .... --~
·v •' - ••--i
) / -- - _/.,..,.,,,_./ ·
··-··- ,... - ·•--··__,. .. - -,-··- ··- ··- ··- ··
MASTER PLAN UPDATE

Implementation and Financial Plan
5-1
Chapter 5: Implementation and Financial Plan
Contents
5 - IMPLEMENTATION AND FINANCIAL PLAN 5-2
5.1 - Recommended Development Plan 5-2 Phase I Improvements (2021-2025) 5-4 Phase II Improvements (2026-2030) 5-4 Phase III Improvements (2031-2040) 5-5
5.2 - Environmental Documentation Requirements 5-6
5.3 - Project Cost and Schedule 5-7 Funding Assumptions 5-8 Funding Sources 5-8 Capital Improvement Program 5-10
5.4 - Financial Plan 5-15 Airpark Revenues 5-15 Airpark Expenditures 5-15 Cash Flow Analysis 5-16 Summary and Recommendations 5-19
Tables Table 5-1. ACIP Environmental Documentation Requirements 5-7 Table 5-2. 20-year Airport Capital Improvement Program (ACIP) 5-11 Table 5-3. Funding Sources 5-13 Table 5-4. 5-Year ACIP 5-14 Table 5-5. Airpark Cash Flow Analysis 5-17
Figures Figure 5-1. Recommended Master Plan Improvements 5-3
Pompano Beach Airpark
5.1.1 -5.1.2 -5.1.3 -
5.3.1 -5.3.2 -5.3.3-
5.4.1 -5.4.2 -5.4.3 -5.4.4 -
p mpano • beach. Kimley>>) Horn Florida's warmest Welcome
MASTER PLAN UPDATE

Implementation and Financial Plan
5-2
5 - Implementation and Financial Plan Previous chapters of this Master Plan Update documented analysis of the Airpark’s facility needs based on existing infrastructure and forecasts of aviation demand. Various development alternatives to address these facility needs were presented and preferred alternatives were selected. The combined Preferred Alternative identified all improvements recommended to be implemented within the 20-year planning horizon.
In addition to the improvements in the Preferred Alternative, Airpark staff identified other previously planned or recommended projects in the City of Pompano Beach Adopted Capital Improvement Plan (CIP) for fiscal year (FY) 2021-2025 and the Airport Pavement Management Plan (APMP) that are incorporated into the overall program. The combination of projects identified in the Master Plan Update, the City’s CIP, and the APMP represent the Recommended Development Plan (RDP).
This chapter summarizes the RDP and presents the Airpark’s anticipated phasing plan, environmental documentation requirements, an updated 5-year and 20-year Airport Capital Improvement Plan (ACIP), likely funding sources, and a cash flow analysis.
5.1 - Recommended Development Plan
The recommended facility improvements developed for the Preferred Alternative were presented in Chapter 4. These improvements included airfield and landside components that considered on-Airpark land uses, Airpark access, and other aviation and support facilities. As noted, the RDP includes recommended facilities from the Preferred Alternative and Airpark Sponsor planned and programmed projects. Projects from the RDP that came from this Master Plan Update are depicted in Figure 5-1. Non-infrastructure projects such as planning studies, construction design, and equipment upgrades are not shown in the figure, but these costs are included in the estimates and financial analysis presented in subsequent sections of this chapter.
The RDP considers the phasing and timing for the implementation of individual projects and the dependence of projects on one another. Implementation of the RDP is planned to occur in three phases, as described below.
Pompano Beach Airpark
p mpano • beach. Kimley>>) Horn MASTER PLAN UPDATE
Florida's warmest Welcome

Implementation and Financial Plan
5-3
Figure 5-1. Recommended Master Plan Improvements
Source:Kimley-Horn.
Pompano Beach Airpark
MASTER PLAN RECOMMENDED PROJECTS
AIRFIELD STANDARDIZATION
1) TAXIWAY SEPARATION STANDARDIZATION
2) TAXIWAY FIUET STANDARDIZATION
3) DIRECT APRON ACCESS TD RUNWAY MITIGATION
4) RUNWAY SAFETY AREA MITIGATION
5) RUNWAYfTAXIWAY INTERSECTION STANDARDIZATION
AIRFIELD IMPROVEMENTS
1) ADDITIONAL CONNECTOR TAXIWAYS
2) RUN-UP AREA EXPANSION
3) RUNWAY EXTENSION (NO CHANGE TO THRESHOLDS)
LA\JDSIDE FACILITY UPDATES
1) ONGOING/ FUTURE HANGAR & APRON DEVELOPMENT
2) SECURITY GATE/ ACCESS ENHANCEMENTS
3) NEW VEHICLE SERVICE ROAD
DRAWING LEGEND O!!!!!!!!!!!l Runway Pavement c:EJ Future Pavomont Romoval - Future Hotd Bar - Future Taxiway lsl8nd - Future Perime ter Road
p mpano • beach. Florlda's Warmest Welcome
Kimley>>>Horn
Fult.e Grade & Fil Futuro Taxiway Pavomont
- Full.we RunWay Extension - Existing Hokt Bar - • · - Froperty Bound&ry
GRAPHIC SCALE IN FEET 0 300 600 1200
MASTER PLAN UPDATE

Implementation and Financial Plan
5-4
Phase I Improvements (2021-2025)
The following sections describe the phasing of Master Plan-recommended projects as well as projects identified in the City’s current CIP and projects presented in the Airpark’s APMP. The following projects from the RDP, with project descriptions as necessary, are recommended to be implemented in Phase I (0- to 5-year timeframe, FY 2021-2025):
• Airpark Security Gate Enhancements and Upgrades: Construct four additional security gates; two for airfield access, two for emergency access.
• New Air Traffic Control Tower Design: Design for potential improvements or relocation of the ATCT (ATCT Study to identify potential improvements to be conducted in 2020).
• 5th Avenue Landside Access Parcel Y, Access Road: Design and construct access from North-East 5th Avenue to airfield Parcel Y.
• Design and Construction of Taxiway B Run-up Apron: Design and construct an additional 25,500 SF of asphalt, painting and striping, and edge lighting for the Taxiway B run-up apron.
• Design and Construction of Runway 10-28 Extension: Design and construct 185-foot extension of Runway 28 (18,500 SF). Extension will be asphalt, grooved, 26,000 lbs., single-wheel strength. Also includes relocation of runway end identifier lights (REILs), painting and striping, and additional MIRLs.
• Apron N Segment 4205 Restoration: Rehabilitate Apron N at north end of Taxiway B (~63,000 SF).
• Runway 33 Segment 5110 Restoration: Rehabilitate apron area leading to Runway 33 (~20,500 SF).
• Air Traffic Control Tower Construction: Pending results of ATCT Study, construct new ATCT on the Airpark or improvements to existing structure.
• Restoration of Apron S Segments 4105, 4110 and 4125: Rehabilitate apron area south of Taxiway L (~348,000 SF).
• Design and Construction of Standard Grade RSA on Runway 6-24: Design and construct 35,100 SF of surface area with compacted fill to meet FAA grading standard.
• Design and Construction of Taxiway G6/G7 Improvements: Design and construct 3,800 SF of new asphalt, including restriping, relocation of taxiway lights, painted island. Includes 24,300 SF of pavement removal.
Phase II Improvements (2026-2030)
The following projects, with project descriptions as necessary, are recommended to be implemented in Phase II (6- to 10-year timeframe, FY 2026-2030):
• Design and Construction of Direct Apron-Runway Access on Taxiways L3, L4, and L5: Design and construct three new connectors (51,700 SF) including new taxiway edge lighting, and painting and striping. Also includes removal of 13,300 SF of existing asphalt.
• Design and Construction of Realigned Taxiways K and L (Phase I): Phase I of realignment of Taxiways K and L east of Runway 6-24. Includes design and construction of 34,300 SF of new asphalt, removal of 7,700 SF of pavement, and painting and striping. Phase I also includes relocation of taxiway lighting on Taxiway L and removed fillets, and new taxiway lighting around three painted islands.
• Restoration of Runway 10-28 Segment 6105: Rehabilitate Runway 10-28 (~271,000 SF).
Pompano Beach Airpark
5.1.1 -
5.1.2 -
p mpano • beach. Kimley>>) Horn MASTER PLAN UPDATE
Florida's warmest Welcome

Implementation and Financial Plan
5-5
• Design and Construction of Paved Vehicle Service Road (Phase I): Phase I of design and construction of the paved vehicle service road, including construction of 37,200 SF of 12-foot wide roadway.
• Restoration of Runway 6-24 Segments 6205 and 6210: Narrow Runway 6-24 to 75 feet, rehabilitate pavement (~250,000 SF), and relocate lighting.
• Restoration/Reconstruction of Taxilane Segments 4305, 4310, 4315, and 4320: Reconstruct taxilane areas (~180,000 SF).
Phase III Improvements (2031-2040)
Recommended Phase III (11- to 20-year timeframe, FY 2031-2040) projects, with project descriptions as necessary, include the following:
• Design and Construction of New Taxiway Q and End Connector Q1 (Phase I): Phase I of design and construction of the new taxiway Q and end connector Q1 to Taxiway B. Phase I includes design and construction of 27,300 SF of taxiway plus painting and striping and taxiway lighting.
• Design and Construction of Taxiway M Relocation (Phase I): Phase I of the relocation of Taxiway M is north of Runway 10-28 and includes design and construction of 30,700 SF of new asphalt to Taxiway M and connector fillets, removal of 29,900 SF of asphalt, and repainting and restriping. Phase I also includes relocation of taxiway lighting on the northwest side of Taxiway M, the west side of Taxiway C, and the northeast side of Taxiway D.
• Design and Construction of Realigned Taxiways K and L (Phase II): Phase II of the realignment of Taxiways K and L west of Runway 6-24. Includes design and construction of 6,600 SF of new asphalt, removal of 14,700 SF of pavement, and painting and striping. In addition, Phase II includes relocation of taxiway lighting on Taxiway L and removed fillets and new taxiway lighting around two painted islands.
• Design and Construction of Paved Vehicle Service Road (Phase II): Phase II of design and construction of the paved vehicle service road, including construction of 49,800 SF of 12-foot wide roadway.
• Restoration of Taxiway F Segment 610: Rehabilitate Segment 610 of Taxiway F (~118,000 SF).
• Design and Construction of Taxiway M Relocation (Phase II): Phase II of the relocation of Taxiway M is north of Runway 10-28 and includes design and construction of 15,500 SF of new asphalt to the taxiway and end connectors, removal of 13,700 SF of asphalt, and repainting and restriping, as well as relocation of taxiway lighting on the northwest side of the taxiway, new taxiway edge lighting around the island, and painting the island.
• Design and Construction of New Taxiway Q and End Connector Q1 (Phase II): Phase II of design and construction of the new taxiway Q and end connector Q1 to Runway 6-24. Phase II includes design and construction of 34,800 SF of taxiway plus painting and striping and taxiway lighting.
• Restoration of Taxiway B Segment 210: Rehabilitate Taxiway B (~118,000 SF). • Restoration of Taxiway L Segment 1210: Rehabilitate Taxiway L (~153,000 SF). • Restoration of Taxiway D Segment 420: Rehabilitate Segment 420 of Taxiway D (~23,100 SF). • Design and Construction of Taxiway M Relocation (Phase III): Phase III of the relocation of
Taxiway M is north of Runway 15-33 and includes design and construction of 44,400 SF of new asphalt for the taxiway plus 4,900 SF for the connector, removal of 77,100 SF of asphalt plus an additional 2,500 SF for the Taxiway F fillet, and painting and striping. It also includes relocating taxiway lighting and island painting.
Pompano Beach Airpark
5.1.3 -
p mpano • beach. Kimley>>) Horn MASTER PLAN UPDATE
Florida's warmest Welcome

Implementation and Financial Plan
5-6
• Design and Construction of Runway 15-33 Extension: Design and construct 422-foot extension of Runway 15-33, including 31,650 SF of grooved, 30,000lbs. single-wheel strength asphalt, relocation of MALS, installation of additional MED Edge Lights, relocation of REILs, and painting and striping.
• Design and Construction of Paved Vehicle Service Road (Phase III): Phase III of design and construction of the paved vehicle service road, including construction of 67,800 SF of 12-foot wide roadway.
5.2 - Environmental Documentation Requirements
Several of the projects included in the RDP require environmental documentation under the National Environmental Policy Act (NEPA) prior to design and construction. Therefore, it is important to have a strategy for obtaining required environmental approvals for these projects. It is anticipated that for certain projects, FAA approval of the ALP will be conditional upon environmental review. In addition, other NEPA-related environmental considerations at the Airpark may include drainage and impacts to sensitive habitat or hazardous waste sites on Airpark property.
There are the three primary types of environmental documentation requirements associated with airport improvement projects:
• Environmental Assessment (EA): a public document prepared by an airport Sponsor providing sufficient evidence to determine whether a proposed action would require preparation of an Environmental Impact Statement (EIS) or a finding of no significant impact (FONSI). The average completion timeframe for an EA is six months to two years.
• Environmental Impact Statement (EIS): a public document required for airport development actions that may "significantly affect the quality of the human environment." An EIS describes the impacts on the environment as a result of a proposed action, the impacts of alternatives, and plans to mitigate impacts. The average completion timeframe for an EIS is two to three years.
• Categorical Exclusion (CatEx): some actions do not individually or cumulatively have a significant effect on the human environment and therefore do not require either an EA or an EIS. If an action falls within one of the categorical exclusion groups and the FAA approves a CatEx, then the action can proceed without an EA and EIS. The typical timeframe to document a CatEx and receive FAA approval is two to six months.
The projects included in the RDP that are anticipated to require environmental review are presented in Table 5-1. It should be noted that the cost estimates developed for the ACIP and presented in Section 5.3 include contingency costs for anticipated environmental documentation needs. It was assumed that environmental documentation would be included in federal and state grants for specific projects.
Pompano Beach Airpark
p mpano • beach. Kimley>>) Horn MASTER PLAN UPDATE
Florida's warmest Welcome

Implementation and Financial Plan
5-7
Table 5-1. ACIP Environmental Documentation Requirements
Project Anticipated Documentation
RDP Phase I
Design and Construction of Taxiway B Run-up Apron CatEx
Design and Construction of Runway 10-28 Extension CatEx
Design and Construction of Standard Grade RSA on Runway 6-24 CatEx
Design and Construction of Taxiway G6/G7 Improvements CatEx
Design and Construction of Taxiway B Run-up Apron CatEx
RDP Phase II
Design and Construction of Direct Apron-Runway Access on Taxiways L3, L4, and L5 CatEx
Design and Construction of Realigned Taxiways K and L (Phase I) CatEx
Design and Construction of Paved Vehicle Service Road (Phase I) CatEx
Restoration of Runway 6-24 Segments 6205 and 6210 CatEx
RDP Phase III
Design and Construction of New Taxiway Q and End Connector Q1 (Phase I) CatEx
Design and Construction of Taxiway M Relocation (Phase I) CatEx
Design and Construction of Realigned Taxiways K and L (Phase II) CatEx
Design and Construction of Paved Vehicle Service Road (Phase II) CatEx
Design and Construction of Taxiway M Relocation (Phase II) CatEx
Design and Construction of New Taxiway Q and End Connector Q1 (Phase II) CatEx
Design and Construction of Taxiway M Relocation (Phase III) CatEx
Design and Construction of Runway 15-33 Extension EA
Design and Construction of Paved Vehicle Service Road (Phase III) CatEx Source: Kimley-Horn. Notes: CatEx = categorical exclusion EA = environmental assessment
5.3 - Project Cost and Schedule
The funding plan identifies likely funding sources for projects included in the RDP. In support of the development of the funding plan, an ACIP was developed coincident with the RDP; the ACIP presents funding sources expected to be available through the planning period for projects in the RDP. The ACIP describes the Airpark’s capital improvement plan developed for this Master Plan Update and is separate from the City’s CIP, although there may be some overlap in projects.
Pompano Beach Airpark
p mpano • beach. Kimley>>) Horn MASTER PLAN UPDATE
Florida's warmest Welcome

Implementation and Financial Plan
5-8
Funding Assumptions
The funding plan was developed according to information and assumptions that provide a reasonable basis for analysis at a level appropriate for an airport master plan. The actual results will vary, and the differences could be material. These variations may be the result of unanticipated events and circumstances that may occur, or some of the assumptions used to project funding sources may not be realized and therefor impact the actual outcomes.
The funding plan is preliminary in nature and is not intended to be used to support the sale of bonds or to obtain any other forms of financing. More detailed cost estimates and financial analyses are required to implement individual projects. It is also important to note that some projects in the RDP could be postponed if changes occur, including if forecast aviation activity is not realized, construction costs rise significantly, or projected funding is not available.
Cost estimates for projects in the RDP were prepared based on criteria specific to the region and assumed the following:
• Cost estimates identified in the City of Pompano Beach Adopted CIP 2021-2025 were not adjusted.
• Projects identified in the APMP were adjusted to calculate estimated costs in year of expenditure dollars and updated to reflect construction cost changes since the APMP was published.
• Initial cost estimates were calculated in year 2020 dollars. Projects identified in Phase II (6-10 year) and Phase III (11-20 year) included a two percent annual escalator to adjust for potential inflation.
• Unless indicated otherwise, all cost estimates included a 10 percent contingency for design costs and environmental documentation (reference Table 5-1 for environmental documentation requirements).
Conservative assumptions were used to avoid overestimating the financial capacity of the Airpark Sponsor during the planning period. It was assumed that FAA Airport Improvement Program (AIP) discretionary grants, Florida Department of Transportation (FDOT) grants, and other State capital outlay funds will be available for specific eligible projects at or below the average annual historical levels for projects with similar eligibility.
Funding Sources
Assumed funding sources are described in detail below. Each of the funding sources available to the Airpark has unique availability, eligibility, and timing constraints. While funding availability is discussed, it should not be assumed that all funds projected to be available would be allocated to projects in the RDP.
Airport Improvement Program (AIP) Grants
The AIP is the FAA’s grant program to fund planning and development of public-use airports. Airports must be listed in the NPIAS to be eligible for AIP grants. These grants can be used for projects related to enhancing airport safety, capacity, security, and environmental concerns. Most airfield capital improvements or rehabilitation projects are eligible for AIP funding, and in some cases terminals, hangars and nonaviation development may be eligible. While most grants are focused on construction, some professional services to support projects are eligible, for example planning and design.
Pompano Beach Airpark
5.3.1 -
5.3.2 -
5.3.2.1 -
p mpano • beach. Kimley>>) Horn MASTER PLAN UPDATE
Florida's warmest Welcome

Implementation and Financial Plan
5-9
AIP grants fall into two categories: entitlement grants and discretionary grants. Further information on the two types of grants and the funds available to the Airpark under each is provided below.
Entitlement Grants
AIP funds are first distributed to major entitlement categories such as primary, cargo and general aviation. Primary commercial service airports receive a guaranteed minimum level of annual federal funds based on enplaned passengers. The Airpark receives entitlement funds as a nonprimary airport. Since the Airpark does not have scheduled or unscheduled air service from a large certificated air carrier or more than 10,000 annual enplanements, the Airpark receives a fixed $150,000 of entitlement funds annually. In 2020, the Airpark had a balance of $585,703 in unused entitlement grant monies.
Discretionary Grants
After funding entitlement grants, remaining AIP funds are distributed as discretionary grants. After set-aside projects including airport noise mitigation and the Military Airport Program, discretionary funds are distributed according to a national prioritization formula. As a general aviation airport, the Airpark can finance 90 percent of eligible project costs using discretionary funds, though this percentage may differ based on the amount of available discretionary funds that are administered. Projects anticipated to be eligible for AIP discretionary grants are presented in the subsequent section. It is anticipated that a total of approximately $5.8M of discretionary funding will be needed through the 20-year planning horizon.
Florida Department of Transportation
The FDOT Aviation Office developed the Aviation Grant Program to provide for a safe, cost-effective, and efficient statewide aviation transportation system. The Aviation Grant Program can fund projects related to planning, designing, constructing, or maintaining public-use aviation facilities. The Program is intended to provide financial assistance in the areas of safety, security, preservation, capacity improvement, land acquisition, planning, and economic development.
For general aviation airports such as the Airpark, FDOT may provide up to 80 percent of the local share of project costs when federal funding is available. For example, FDOT provides up to eight percent of project costs when the FAA provides 90 percent funding. When no federal funding is available, FDOT provides up to 80 percent of total project costs. FDOT may also provide up to 50 percent of the costs to build on-airport revenue-producing capital improvements. It is anticipated that a total of approximately $18.9M of state grants will be needed through the 20-year planning horizon.
Local Funding
Local funding is provided by the Airpark Sponsor, which is the City of Pompano Beach. Local funding is needed to support projects that are not eligible for federal or state grant funding, or to match a portion of projects that are eligible for other funding. Based on anticipated availability of federal and state grants, approximately $4.0M of local funding will be needed over the course of the 20-year planning horizon.
Third Party / Private Funding
Projects identified in the RDP that provide direct benefit to a tenant or that are anticipated to occur on private leaseholds may not be eligible for AIP or state grants. As such, the Airpark Sponsor has indicated that it will seek third-party financing where appropriate as a funding source for specific projects in the RDP. Approximately $726,000 in private funding is anticipated throughout the 20-year planning horizon.
Pompano Beach Airpark
5.3.2.2 -
5.3.2.3 -
5.3.2.4 -
p mpano • beach. Kimley>>) Horn MASTER PLAN UPDATE
Florida's warmest Welcome

Implementation and Financial Plan
5-10
Capital Improvement Program
The Airpark’s updated 20-year ACIP is summarized in Table 5-2, including near-term (FY 2021–2025), mid-term (FY 2026–2030), and long-term (FY 2031–2040) projects. Estimated capital expenditures total approximately $33.0M (in escalated dollars) for all projects in the RDP.
Pompano Beach Airpark
5.3.3 -
p mpano • beach. Kimley>>) Horn MASTER PLAN UPDATE
Florida's warmest Welcome

Implementation and Financial Plan
5-11
Table 5-2. 20-year Airport Capital Improvement Program (ACIP)
Project Grant /
Funding Type
Project Cost1
Federal Share State Share Local Share Private
Share Near-Term (FY 2021–2025) Airpark Security Gate Enhancements and Upgrades SL $500,000 $0 $400,000 $100,000 $0
New Air Traffic Control Tower Design SL $450,000 $0 $360,000 $90,000 $0 5th Avenue Landside Access Parcel Y, Access Road SLP $950,000 $0 $760,000 $95,000 $95,000
Design and Construction of Taxiway B Run-up Apron SL $357,280 $0 $285,824 $71,456 $0
Design and Construction of Runway 10-28 Extension
FSL Entitlement $819,280 $737,352 $65,542 $16,386 $0
Apron N Segment 4205 Restoration SL $654,885 $0 $523,908 $130,977 $0 Runway 33 Segment 5110 Restoration SL $213,840 $0 $171,072 $42,768 $0 Air Traffic Control Tower Construction SL TBD - - - - Restoration of Apron S Segments 4105, 4110 and 4125 SLP $3,721,410 $0 $2,977,128 $372,141 $372,141
Design and Construction of Standard Grade RSA on Runway 6-24
FSL Entitlement $239,580 $215,622 $19,166 $4,792 $0
Design and Construction of Taxiway G6/G7 Improvements
FSL Entitlement $656,497 $590,847 $52,520 $13,130 $0
Subtotal $8,562,772 $1,543,821 $5,615,161 $936,649 $467,141 Mid-Term (FY 2026–2030) Design and Construction of Direct Apron-Runway Access on Taxiways L3, L4, and L5
FSL Discretionary $1,247,400 $1,122,660 $99,792 $24,948 $0
Design and Construction of Realigned Taxiways K and L (Phase I)
FSL Discretionary $1,150,779 $1,035,701 $92,062 $23,016 $0
Restoration of Runway 10-28 Segment 6105 FSL Discretionary $2,876,415 $2,588,774 $230,113 $57,528 $0
Design and Construction of Paved Vehicle Service Road (Phase I) SL $339,693 $0 $271,754 $67,939 $0
Restoration of Runway 6-24 Segments 6205 and 6210 SL $957,513 $0 $766,010 $191,503 $0
Restoration/Reconstruction of Taxilane Segments 4305, 4310, 4315, and 4320 SLP $2,590,076 $0 $2,072,061 $259,008 $259,008
Subtotal $9,161,877 $4,747,135 $3,531,793 $623,941 $259,008
Pompano Beach Airpark
p mpano • beach. Kimley>>)Horn MASTER PLAN UPDATE
Florida's Warmest Welcome

Implementation and Financial Plan
5-12
Table 5-2. 20-year Airport Capital Improvement Program (ACIP)
Project Grant /
Funding Type
Project Cost1
Federal Share State Share Local Share Private
Share Long-Term (FY 2031–2040) Design and Construction of New Taxiway Q and End Connector Q1 (Phase I) SL $737,923 $0 $590,339 $147,585 $0
Design and Construction of Taxiway M Relocation (Phase I) SL $1,465,971 $0 $1,172,777 $293,194 $0
Design and Construction of Realigned Taxiways K and L (Phase II)
FSL Discretionary $1,146,614 $1,031,952 $91,729 $22,932 $0
Design and Construction of Paved Vehicle Service Road (Phase II) SL $472,443 $0 $377,954 $94,489 $0
Restoration of Taxiway F Segment 610 SL $1,408,989 $0 $1,127,191 $281,798 $0 Design and Construction of Taxiway M Relocation (Phase II) SL $1,151,437 $0 $921,149 $230,287 $0
Design and Construction of New Taxiway Q and End Connector Q1 (Phase II) SL $883,675 $0 $706,940 $176,735 $0
Restoration of Taxiway B Segment 210 SL $1,334,261 $0 $1,067,409 $266,852 $0 Restoration of Taxiway L Segment 1210 SL $1,938,731 $0 $1,550,985 $387,746 $0
Restoration of Taxiway D Segment 420 FSL Entitlement $293,253 $263,928 $23,460 $5,865 $0
Design and Construction of Taxiway M Relocation (Phase III) SL $1,667,718 $0 $1,334,174 $333,544 $0
Design and Construction of Runway 15-33 Extension
FSL Entitlement $1,942,727 $1,748,455 $155,418 $38,855 $0
Design and Construction of Paved Vehicle Service Road (Phase III) SL $808,032 $0 $646,426 $161,606 $0
Subtotal -- $15,251,775 $3,044,335 $9,765,952 $2,441,488 $0 Grand Total -- $32,976,424 $9,335,291 $18,912,906 $4,002,078 $726,149
Source: Kimley-Horn. Notes: 1. Projects in 6-20-year timeframe include 10% escalator to account for anticipated inflation. F = Federal L = Local P = Private S = State
Pompano Beach Airpark
p mpano • beach. Kimley>>)Horn MASTER PLAN UPDATE
Florida's Warmest Welcome

Implementation and Financial Plan
5-13
Table 5-3 summarizes costs for projects in the ACIP grouped by RDP phase and funding source. Approximately 11 percent of total project costs could be funded by FAA entitlement grants, 18 percent by FAA discretionary grants, 57 percent by state grants, two percent by private sources, and 12 percent by local funds.
Table 5-3. Funding Sources RDP
Phase Project
Cost Federal AIP Grants State
Grants Local Funds
Private Funds Entitlement Discretionary
Phase I $8,562,772 $1,543,821 $0 $5,615,161 $936,649 $467,141 Phase II $9,161,877 $0 $4,747,135 $3,531,793 $623,941 $259,008 Phase III $15,251,775 $2,012,383 $1,031,952 $9,765,952 $2,441,488 $0
Total $32,976,424 $3,556,204 $5,779,087 $18,912,906 $4,002,078 $726,149 Source: Kimley-Horn. Note: Projects in 6-20-year timeframe include 10% escalator to account for anticipated inflation.
The Airpark’s 5-year ACIP details funding sources and the anticipated starting year for each project in Phase I of the RDP and is presented in Table 5-4. While a 20-year ACIP identifies anticipated needs throughout the planning horizon, projects identified within a 5-year timeframe typically reflect more immediate needs or facilities where potential funding is being requested or has already been secured. Additionally, the 5-year ACIP can be used to inform the FAA and FDOT of proposed near-term improvements and grant funding implications.
Pompano Beach Airpark
p mpano • beach. Kimley>>) Horn MASTER PLAN UPDATE
Florida's warmest Welcome

Implementation and Financial Plan
5-14
Table 5-4. 5-Year ACIP
Project Grant /
Funding Type
Start Year
Project Cost
Federal AIP Grants State Grants
Local Funds
Private Funds Entitlement Discretionary
5-Year ACIP Project Airpark Security Gate Enhancements and Upgrades SL 2021 $500,000 $0 $0 $400,000 $100,000 $0
New Air Traffic Control Tower Design SL 2021 $450,000 $0 $0 $360,000 $90,000 $0 5th Avenue Landside Access Parcel Y, Access Road SLP 2022 $950,000 $0 $0 $760,000 $95,000 $95,000
Design and Construction of Taxiway B Run-up Apron SL 2022 $357,280 $0 $0 $285,824 $71,456 $0
Design and Construction of Runway 10-28 Extension FSL 2023 $819,280 $737,352 $0 $65,542 $16,386 $0
Apron N Segment 4205 Restoration SL 2023 $654,885 $0 $0 $523,908 $130,977 $0 Runway 33 Segment 5110 Restoration SL 2023 $213,840 $0 $0 $171,072 $42,768 $0 Air Traffic Control Tower Construction SL 2023 TBD - - - - - Restoration of Apron S Segments 4105, 4110 and 4125 SLP 2024 $3,721,410 $0 $0 $2,977,128 $372,141 $372,141
Design and Construction of Standard Grade RSA on Runway 6-24 FSL 2025 $239,580 $215,622 $0 $19,166 $4,792 $0
Design and Construction of Taxiway G6/G7 Improvements FSL 2025 $656,497 $590,847 $0 $52,520 $13,130 $0
Subtotal $8,562,772 $1,543,821 $0 $5,615,161 $936,649 $467,141 Total by Fiscal Year
2021 $950,000 $0 $0 $760,000 $190,000 $0 2022 $1,307,280 $0 $0 $1,045,824 $166,456 $95,000 2023 $1,688,005 $737,352 $0 $760,522 $190,131 $0 2024 $3,721,410 $0 $0 $2,977,128 $372,141 $372,141 2025 $896,077 $806,469 $0 $71,686 $17,922 $0
Subtotal $8,562,772 $1,543,821 $0 $5,615,161 $936,649 $467,141 Source: Kimley-Horn. Notes: F = Federal L = Local P = Private S = State
Pompano Beach Airpark
p mpano • beach. Kimley>>)Horn MASTER PLAN UPDATE
Florida's Warmest Welcome

Implementation and Financial Plan
5-15
5.4 - Financial Plan
This section presents the anticipated funding plan for implementation of projects identified in the ACIP and assesses the City’s ability to fund these projects. While an implementation schedule is identified, the actual execution of specific projects and the resulting financial requirements may change based on local economic conditions, actual aviation-related activity, or other factors.
The City of Pompano Beach is the Airpark Sponsor and is therefore responsible for management and budgeting of all Airpark-generated revenues and expenditures. This includes providing local match for federal and state grants.
The following sections provide a summary of the Airpark’s revenues and expenditures, as well as a comparison of anticipated cash flow and local grant matching requirements as previously identified in Section 5.3.
Airpark Revenues
The Airpark receives operating revenues from tenant leases and rental agreements and from concessions such as fuel flowage fees. Revenues are deposited into the Airport Enterprise Fund, which operates on a balanced budget for revenues and expenses for operations and maintenance. Below are descriptions of 2020 Airpark revenues and assumptions for calculations of any future escalators:
• Project Balance Fund: 2020 revenue = $50,000. Annual fund to be used for pavement maintenance and local matching grants if necessary. Cash flow analysis assumed $50,000 annually throughout the 20-year planning horizon.
• Interest Earnings: 2020 revenue = $8,000. Interest earned on the Airpark’s general operating and capital improvement funds. Cash flow analysis assumed $8,000 annually throughout the 20-year planning horizon.
• Concessions and Royalties: 2020 revenue = $32,957. Airpark receives $0.05 per gallon of fuel sold. Cash flow analysis assumed $0.05 per gallon constant throughout 20-year planning horizon, volume commensurate with growth in forecast operations.
• Land Rent Utility Fund: 2020 revenue = $273,954. Airpark’s revenues associated with City well heads and other utilities on property. Cash flow analysis assumed 3.0% annual increase throughout the 20-year planning horizon.
• Land Rent: 2020 revenue = $788,820. Airpark’s revenues from tenant land leases. Cash flow analysis assumed 3.0% annual increase throughout the 20-year planning horizon.
• Land Rent City Facilities: 2020 revenue = $432,036. Airpark’s revenues associated with City facilities on property (golf course, equestrian tenant). Cash flow analysis assumed 3.0% annual increase throughout the 20-year planning horizon.
Airpark Expenditures
Descriptions of 2020 Airpark expenditures and assumptions for calculations of future escalators are presented below:
• Personal Services: 2020 expenditure = $522,822. Includes employee payroll, benefits, and pensions. Cash flow analysis assumed 3.0% annual increase throughout the 20-year planning horizon.
Pompano Beach Airpark
5.4.1 -
5.4.2 -
p mpano • beach. Kimley>>) Horn MASTER PLAN UPDATE
Florida's warmest Welcome

Implementation and Financial Plan
5-16
• Operating Expenses: 2020 expenditure = $647,793. Includes insurance, administrative fees, utilities, supplies, maintenance fees, and other operating expenses. Cash flow analysis assumed 3.0% annual increase throughout the 20-year planning horizon.
• Other Expenses: 2020 expenditure = $41,834. Includes all expenses not categorized as Personal Services or Operating Expenses. Cash flow analysis assumed 3.0% annual increase throughout the 20-year planning horizon.
Cash Flow Analysis
The cash flow analysis compares forecast Airpark revenues and expenditures with local matching grant requirements for recommended improvements identified in the 20-year ACIP. Results of the 20-year Airpark cash flow analysis are presented in Table 5-5. As shown, it is anticipated that the Airpark will have adequate resources to satisfy local matching requirements and is projected to accumulate a surplus of approximately $9.1M by the end of the 20-year planning horizon.
Pompano Beach Airpark
5.4.3 -
p mpano • beach. Kimley>>) Horn MASTER PLAN UPDATE
Florida's warmest Welcome

Implementation and Financial Plan
5-17
Table 5-5. Airpark Cash Flow Analysis Revenues 2021 2022 2023 2024 2025 2025 2027 2028 2029 2030 2031 FAA Primary Entitlements $585,703 $150,000 $150,000 $150,000 $150,000 $150,000 $150,000 $150,000 $150,000 $150,000 $150,000
Project Fund Balance $50,000 $350,000 $50,000 $50,000 $50,000 $50,000 $50,000 $50,000 $50,000 $50,000 $50,000
Interest Earnings $8,000 $8,000 $8,000 $8,000 $8,000 $8,000 $8,000 $8,000 $8,000 $8,000 $8,000 Land Rent Utility Fund $273,954 $282,173 $290,638 $299,357 $308,338 $317,588 $327,116 $336,929 $347,037 $357,448 $368,172
Fuel Sales (Concessions and Royalties)
$32,957 $33,485 $34,020 $34,565 $35,118 $35,680 $36,251 $36,831 $37,420 $38,019 $38,627
Land Rent $788,820 $806,893 $831,100 $856,033 $881,714 $908,165 $935,410 $963,472 $992,377 $1,022,148 $1,052,812 Land Rent City Facilities $432,036 $444,997 $458,347 $472,097 $486,260 $500,848 $515,873 $531,349 $547,290 $563,708 $580,620
Total Revenues $2,171,470 $2,075,547 $1,822,105 $1,870,052 $1,919,429 $1,970,281 $2,022,650 $2,076,582 $2,132,123 $2,189,323 $2,248,231 Expenditures 2021 2022 2023 2024 2025 2025 2027 2028 2029 2030 2031 ACIP Local Match $190,000 $166,456 $190,131 $372,141 $17,922 $24,948 $23,016 $57,528 $259,441 $259,008 $147,585 Personal Services (est.) $522,822 $538,507 $554,662 $571,302 $588,441 $606,094 $624,277 $643,005 $662,295 $682,164 $702,629
Operating Expenses $647,793 $667,227 $687,244 $707,861 $729,097 $750,970 $773,499 $796,704 $820,605 $845,223 $870,580
Other Expenses and Reserves $41,834 $43,089 $44,382 $45,713 $47,085 $48,497 $49,952 $51,451 $52,994 $54,584 $56,221 Total Expenditures $1,402,449 $1,415,278 $1,476,418 $1,697,017 $1,382,544 $1,430,509 $1,470,743 $1,548,688 $1,795,335 $1,840,979 $1,777,015
Surplus/Deficit $769,021 $660,269 $345,687 $173,035 $536,886 $539,772 $551,906 $527,894 $336,788 $348,345 $471,216
Pompano Beach Airpark
p mpano • beach. Kimley>>>Horn MASTER PLAN UPDATE
Florida's Warmest Welcome

Implementation and Financial Plan
5-18
Table 5-5. Airpark Cash Flow Analysis Revenues 2032 2033 2034 2035 2036 2037 2038 2039 2040 Total FAA Primary Entitlements $150,000 $150,000 $150,000 $150,000 $150,000 $150,000 $150,000 $150,000 $150,000 $3,435,703
Project Fund Balance $50,000 $50,000 $50,000 $50,000 $50,000 $50,000 $50,000 $50,000 $50,000 $1,300,000
Interest Earnings $8,000 $8,000 $8,000 $8,000 $8,000 $8,000 $8,000 $8,000 $8,000 $160,000 Land Rent Utility Fund $379,217 $390,593 $402,311 $414,380 $426,812 $439,616 $452,805 $466,389 $480,381 $7,361,254
Fuel Sales (Concessions and Royalties)
$39,245 $39,873 $40,511 $41,159 $41,818 $42,487 $43,166 $43,857 $44,559 $769,646
Land Rent $1,084,397 $1,116,929 $1,150,436 $1,184,950 $1,220,498 $1,257,113 $1,294,826 $1,333,671 $1,373,681 $21,055,446 Land Rent City Facilities $598,038 $615,979 $634,459 $653,493 $673,097 $693,290 $714,089 $735,512 $757,577 $11,608,957
Total Revenues $2,308,897 $2,371,374 $2,435,717 $2,501,982 $2,570,225 $2,640,506 $2,712,887 $2,787,429 $2,864,198 $45,691,006 Expenditures 2032 2033 2034 2035 2036 2037 2038 2039 2040 Total ACIP Local Match $316,126 $376,286 $230,287 $443,587 $393,611 $0 $0 $333,544 $200,461 $4,002,078 Personal Services (est.) $723,708 $745,419 $767,782 $790,815 $814,540 $838,976 $864,145 $890,069 $916,772 $14,048,423 Operating Expenses $896,697 $923,598 $951,306 $979,845 $1,009,240 $1,039,518 $1,070,703 $1,102,824 $1,135,909 $17,406,441
Other Expenses and Reserves $57,908 $59,645 $61,435 $63,278 $65,176 $67,131 $69,145 $71,220 $73,356 $1,124,095
Total Expenditures $1,994,439 $2,104,949 $2,010,810 $2,277,525 $2,282,567 $1,945,625 $2,003,993 $2,397,657 $2,326,498 $36,581,037 Surplus/Deficit $314,457 $266,425 $424,908 $224,456 $287,657 $694,881 $708,893 $389,772 $537,700 $9,109,970 Sources: City of Pompano Beach. Kimley-Horn. Note: Other revenues include state grants, net fair value, interest realized, building rent, sale of fixed assets, other revenues, and budgetary retained earnings.
Pompano Beach Airpark
p mpano • beach. Kimley>>>Horn MASTER PLAN UPDATE
Florida's Warmest Welcome

Implementation and Financial Plan
5-19
Summary and Recommendations
According to the cash flow analysis, the Airpark’s anticipated revenues are expected to cover the local match requirements for recommended improvements over the 20-year planning horizon. However, this analysis assumed that all projects would be eligible for state funding, federal funding, private funding, or a combination thereof. Additionally, Airpark revenues may fluctuate over time, which could result in occasional funding shortfalls and increase the amount of reserves that the City would need to allocate in the Enterprise Fund. If these shortfalls become more frequent, the City may desire to conduct a rates and charges analysis to assess the adequacy of its collections from tenants and other sources of revenue.
Pompano Beach Airpark
5.4.4 -
p mpano • beach. Kimley>>>Horn MASTER PLAN UPDATE
Florida's warmtst Welcome

Airport Layout Plan
Appendix A: Airport Layout Plan
Pompano Beach Airpark
p mpano • beach. Kimley>>) Horn MASTER PLAN UPDATE
Florida's warmest Welcome