Budget Perspectives 2009
80
RESEARCH SERIES NUMBER 4 OCTOBER 2008 BUDGET PERSPECTIVES 2009 Tim Callan (ed.) Ray Barrell, Alan Barrett, Noel Casserly, Frank Convery, Jean Goggin, Ide Kearney, Simon Kirby, Pete Lunn, Martin O’Brien, Lisa Ryan Copies of this paper may be obtained from The Economic and Social Research Institute (Limited Company No. 18269). Registered Office: Whitaker Square, Sir John Rogerson’s Quay, Dublin 2. www.esri.ie Price €15.00 (Special rate for students, €7.50)
Transcript of Budget Perspectives 2009
RESEARCH SERIES
NUMBER 4
OCTOBER 2008
BUDGET PERSPECTIVES
2009
Tim Callan (ed.)
Ray Barrell, Alan Barrett, Noel Casserly, Frank Convery,
Jean Goggin, Ide Kearney, Simon Kirby, Pete Lunn,
Martin O’Brien, Lisa Ryan
Copies of this paper may be obtained from The Economic and Social Research Institute (Limited Company No. 18269).
Registered Office: Whitaker Square, Sir John Rogerson’s Quay, Dublin 2. www.esri.ie
Price €15.00
(Special rate for students, €7.50)

Tim Callan is Research Professor, Alan Barrett is Senior Research Officer, Ide Kearney is Research Associate, Pete Lunn is Post Doctoral Fellow, Martin O’Brien and Jean Goggin are Research Assistants at the Economic and Social Research Institute (ESRI). Ray Barrell is Senior Research Fellow, Simon Kirby is Research Fellow at the National Institute of Economic and Social Research (NIESR), London. Noel Casserly is Director, Comhar, Lisa Ryan is Director of Research, Comhar - the Sustainable Development Council. Frank Convery is Professor of Environmental Studies at University College Dublin.
These papers have been accepted for publication by the Institute, which does not itself take institutional policy positions. Accordingly, the authors are solely responsible for the content and the views expressed.
RESEARCH SERIES
NUMBER 4
OCTOBER 2008
BUDGET PERSPECTIVES
2009
Tim Callan (ed.)
Ray Barrell, Alan Barrett, Noel Casserly, Frank Convery,
Jean Goggin, Ide Kearney, Simon Kirby, Pete Lunn,
Martin O’Brien, Lisa Ryan
© THE ECONOMIC AND SOCIAL RESEARCH INSTITUTE DUBLIN, 2008
ISBN 0 7070 0273 7
ACKNOWLEDGEMENTS
Thanks are due to the referees and to research staff at the ESRI for comments which have helped to improve the papers included in this volume. Thanks are also due to Donal de Buitléir, Chair of the FFS Projects Committee, and to Frances Ruane, for their valuable inputs into the planning of the conference. Conference organisation was handled ably and efficiently by Patricia Byrne and Mary Dowling. All authors, and particularly the editor, are indebted to Mary Cleary, Regina Moore and Deirdre Whitaker for their excellent work in preparing the volume for publication.
CONTENTS
Page Acknowledgements iv INTRODUCTION Frances Ruane 1 Chapter 1. THE BUDGETARY IMPLICATIONS OF GLOBAL SHOCKS TO CYCLE AND TRENDS IN OUTPUT: Impacts of Housing, Financial and Oil Shocks Ray Barrell and Simon Kirby 4 2. MOBILISING MARKET-BASED INSTRUMENTS FOR CLIMATE CHANGE IN IRELAND Lisa Ryan, Frank Convery and Noel Casserly 16 3. GETTING OUT WHAT YOU PUT IN: An Evaluation of Public Investment in Irish Sport Pete Lunn 51

INTRODUCTION
The context for this year’s Budget differs sharply from most of those in the past decade and a half. The global economy has been buffeted by crises in financial markets. Oil prices, even after recent falls, are at very high levels. Furthermore, the sharp decline in housing activity in Ireland carries negative implications both for employment and for tax revenues. A consequence of the changed situation is that the date of the 2009 Budget has been brought forward by eight weeks. This year’s Budget Perspectives Conference, co-hosted by The Economic and Social Research Institute and the Foundation for Fiscal Studies, provides several inputs to inform macroeconomic decision making in these challenging times. In addition, two longer-term issues are addressed. The first of these deals with the policy framework for climate change, an issue that has risen rapidly on the Irish policy horizon in recent years. The second issue is the effectiveness of public spending in achieving its objectives in the area of sport, which is now recognised as an important contributor to health and quality of life in modern society.
Developments in the global economy are of particular importance to Ireland, given the importance of trade in both goods and services to the Irish economy. In the first paper, Ray Barrell and Simon Kirby, of the National Institute of Economic and Social Research (NIESR) in London, provides an overview of the shocks which are besetting the global economy at present. After a long period of stability, the world economy is currently going through a period of financial turmoil, as banks face the consequences of poor lending decisions in a context of inadequate global regulation. At the same time, oil prices have risen to unprecedented levels. In a number of countries, and especially in Ireland, Spain, the United Kingdom and the United States, these factors are compounded by developments in the housing market. House prices that were buoyed by a credit boom in many countries over a number of years have now started to fall. The impacts on consumption and on housing investment are leading these economies into recession. Risk premia have risen in many markets, and investment is faltering as a consequence. Budget deficits have increased as a result of the unexpected slowdown in economic growth. While some of this is cyclical, trend growth has also been significantly reduced by factors such as the oil price rise and the increase in risk premia. While public policy can seek to smooth over the cyclical element, public spending plans will have to be reined back to remain in line with trend growth, if tax rates are not to rise significantly.
International Situation
1

2 BUDGET PERSPECTIVES 2009
The implications of these global factors for the Irish economy, and of domestic factors such as the slowdown in housing activity, are dealt with in a presentation by Alan Barrett, Ide Kearney, Jean Goggin and Martin O’Brien based on the ESRI’s Autumn Quarterly Economic Commentary. As this is to be published on the day of the conference, details are not available at the time of writing. The Commentary and the presentation will give particular attention to the state of the public finances, and the appropriate stance for fiscal policy in 2009.
Outlook for Ireland
One issue that is of central importance in the Irish economy today is the
appropriate size of the budget deficit for 2009. Four speakers will contribute to a roundtable on this issue: Ray Barrell (NIESR), Joe Durkan (UCD), Patrick Honohan (TCD) and Philip Lane (TCD). These papers and/or presentations will be available on the ESRI website. In their paper, Lisa Ryan (Comhar), Frank Convery (UCD) and Noel Casserly (Comhar) point out that Irish policy on climate change is substantially shaped at EU level, with national targets and some key mechanisms coming to us from the European Union. For example, the EU Emissions Trading Scheme (ETS) has created scarcity in the market place for the power and heavy industry sectors, and they face a price signal per tonne of CO2 ‘allowance’ that tells them that reduction at a cost per tonne below the market price will be profitable, and that increased emissions will incur a heavy cost penalty. Ryan, Convery and Casserly argue that auctioning of allowances – not present in the current system, but included in proposals to revise the system post-2012 – would represent an improvement in the efficiency of the policy.
Climate Change
There is, however, some freedom of action open to Ireland in
responding to new and demanding targets (to be achieved by 2020) proposed by the EU for sectors not covered by the ETS (agriculture, transport, waste, heat and process related emissions from residential, commerce and industry not in the trading scheme). Ryan, Convery and Casserly argue that a central element of policy in this area should be the introduction of a carbon levy to reach the level of the allowance price in the EU ETS They also suggest that if costs of reducing carbon emissions are substantially higher in the non-ETS sector, efficiency in achieving the overall target would require some flexibility between the ETS and the non-ETS sectors; this would require a decision at European Commission level. Achieving value for money in public expenditure is another key issue, whatever the state of the economic cycle. Its importance is even more marked in the present situation. In order to attain this, we must have a clear idea of the objectives of particular expenditure programmes, and of the extent to which the expenditures contribute to these objectives. This is the approach taken by Pete Lunn (ESRI) in assessing the economic returns to public investment in sport, which have increased very substantially over the past decade. The stated aims of Irish sports policy emphasise improvements in health and quality of life. There is, indeed, considerable empirical support for the view that there are significant health and social benefits to be had from participation in sport. However, the
Sports Expenditure: Hitting the Target?

INTRODUCTION 3
analysis challenges the way current policy addresses three trade-offs in the allocation of resources: the balance between “elite” and “grassroots” sport; the trade-off between investment in sporting facilities (physical capital) and participation programmes (human and social capital); and the allocation of public money across the range of different sporting activities. In each case, the evidence base suggests that the aims of policy could be better served by a reallocation of sports investment which takes recent research findings on sports participation into account.
THE BUDGETARY IMPLICATIONS OF GLOBAL SHOCKS TO CYCLES AND TRENDS IN OUTPUT: Impacts of Housing, Financial and Oil Shocks
Ray Barrell and Simon Kirby* After nearly two decades of stability the world economy is going through a period of financial turmoil as banks face the consequences of poor lending decisions. House prices were buoyed by a credit boom in many countries, but they have started to fall. The impacts on consumption and on housing investment are leading many economies into recession. Risk premia have risen in many markets, and investment is faltering as a consequence. At the same time oil prices have risen to unprecedented levels. Budget deficits have increased as a result of the unexpected slowdown in economic growth. Some of this is cyclical, and can be ignored. However, the rise in risk premia and the oil price have together reduced trend growth by half to one percentage point for four to six years in many countries. Public spending plans will have to be reined back to remain in line with trend incomes, or tax rates will have to rise. Not all of the recent increases in budget deficits can be ignored, and they will have to be addressed once the dust has settled.
Abstract
The OECD economies are facing three severe negative shocks to growth. Housing markets have been badly affected by the ending of their booms and house prices and housing investment are falling in a number of countries. Housing market problems have severe cyclical effects, but it is not clear they have a sustained impact on output. Of the two remaining shocks, one is emanating directly from financial markets whilst the other is in the form of
1. Introduction
* NIESR, 2 Dean Trench Street, London SW1P 3HE.
4
THE BUDGETARY IMPLICATIONS OF GLOBAL SHOCKS TO CYCLES AND TRENDS IN OUTPUT 5
an unanticipated surge in oil and other commodity prices. These shocks are likely to have an impact over a longer period of time, and they will have an impact on the sustainable level of output as well as on the cyclical component in economic activity around sustainable, or equilibrium, output. When the rate of growth of an economy slows, tax receipts will be reduced and expenditure on social support programmes will increase. These automatic stabilisers are built in to the fiscal frameworks in use in Europe, and should help to offset the negative impacts of the shocks on output growth.
Output falling below capacity is reasonably associated with increased budget deficits, and the faster the rate of increase in the output gap the greater the budgetary allowance that can be taken under the Stability and Growth Pact. Medium-term expenditure planning is best isolated from changes in the cyclical position of the economy. If shocks also reduce trend output growth then medium-term expenditure plans should change. Hence, it is important to be able to distinguish between the cyclical and structural elements in the effects of a set of shocks when looking at the budgetary response.
We discuss the evolution of recent financial market turmoil and its effects on house prices. We evaluate the impacts of falling house prices on the economy and discuss the impact of recent declines in housing investment. We also look at the impact of increased credit spreads on the economy with an emphasis on their long term effects. We also discuss the impacts of the recent increase in oil prices. We conclude by arguing that the housing market crisis is cyclical and its impacts on the fiscal position can largely be ignored. However, increased risk premia and higher real oil prices impact on the longer-term prospects, and in most countries they require an adjustment to spending plans or an increase in tax rates.
House prices have been rising in almost all European countries (with the notable exception of Germany) and they have also risen in North America, as Barrell and Kirby (2008) discuss. Housing bubbles have been common in the UK, and were also major factors behind the Nordic banking crises of the early 1990s. House price bubbles are commonly associated with financial liberalisation and innovation and with subsequent financial crises. The recent bubble probably stemmed from increased lending given income levels and from low real interest rates on that lending. Large volumes of saving, especially from China and the rest of East Asia, were holding down real interest rates. Partly as a consequence of these low real rates we have seen a wave of financial innovation. Low real rates squeeze the rents banks get on their zero interest deposits and hence put pressure on them to innovate in order to maintain their profit margins. Developments in our understanding of risk, in combination with the pressure to innovate, have led to the production of new styles of assets that share and spread risk. Bundling mortgages into securities spreads risk, and this raises the welfare of society and increase the capacity to borrow.
2. The Genesis of the Financial Crisis and Housing Bubble
However, the innovations in types of assets did little to reduce the
underlying level of risk. This may not have been apparent, and risk probably became under priced. The under pricing of risk became clear as default rates on various US issued sub prime assets began to rise, putting pressure on the balance sheets of the banking sector. The international nature of banking markets meant that many of the risky assets had been bought by European

6 BUDGET PERSPECTIVES 2009
banks, and losses have been larger than initially anticipated. This was perhaps because US banks had a better understanding of lax US bankruptcy and housing loan laws and they were hence, willing to pay less for these new assets than the less well informed Europeans. As soon as loans began to become more expensive, with lower loan to value ratios, in order to take account of higher perceived risk, house prices began to weaken. Housing investment had begun to fall in the US in the first quarter of 2006, but as credit constraints tightened in mid-2007 its decline was accelerated. Uncertainty over the location of the bad debts meant that banks were unwilling to trust each other, and interbank transactions dropped and the spread on wholesale borrowing has risen. This has further tightened credit conditions and has contributed to the cyclical slowdown of many economies.
Figure 1: Housing Wealth as a Proportion of Disposable Income
0.00
1.00
2.00
3.00
4.00
5.00
6.00
France Germany Ireland Spain UK US
1995 2006
Rising real house price can mean that the value of the owner occupied
housing stock might rise relative to incomes (Figure 1). It can also rise if there is a great deal of housing investment, as in Ireland, where investment in housing was around 12 per cent of GDP (Table 1). If housing wealth falls then consumption may be affected, and hence the economy may slow down. There is reasonably clear evidence that housing wealth affects consumption in many countries, as Barrell and Davis (2007) show. Although a change in housing wealth driven by a change in house prices may not be national wealth, if individuals are myopic and do not value the inheritance they leave their children as much as their children would value it then housing wealth might be perceived as individual wealth.1 In the long run individuals appear to react no more to their housing than their financial wealth. However, there is clear evidence that there is significantly more signal in a rise in housing wealth driven by asset prices than in a rise in financial wealth driven by the same factors.
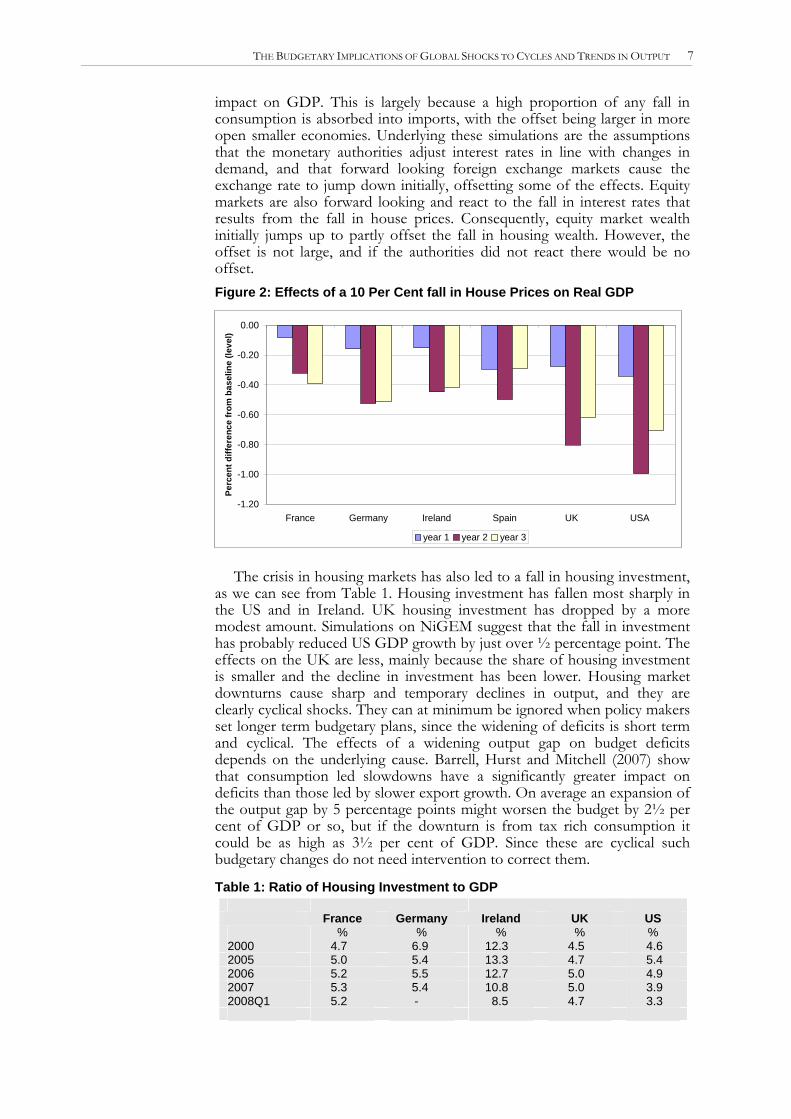
It is possible to use the National Institute Global Econometric Model, NiGEM to evaluate the impacts of a fall in house prices, and Figure 2 reports on the effects of a 10 per cent concerted fall. In each of these countries there is strong evidence that consumption depends on housing wealth, As Barrell and Kirby (2008) show, the impacts on consumption of a fall in housing wealth are between two and three times larger than the 1 This is the same argument as made over whether government bonds are net wealth.
THE BUDGETARY IMPLICATIONS OF GLOBAL SHOCKS TO CYCLES AND TRENDS IN OUTPUT 7
impact on GDP. This is largely because a high proportion of any fall in consumption is absorbed into imports, with the offset being larger in more open smaller economies. Underlying these simulations are the assumptions that the monetary authorities adjust interest rates in line with changes in demand, and that forward looking foreign exchange markets cause the exchange rate to jump down initially, offsetting some of the effects. Equity markets are also forward looking and react to the fall in interest rates that results from the fall in house prices. Consequently, equity market wealth initially jumps up to partly offset the fall in housing wealth. However, the offset is not large, and if the authorities did not react there would be no offset. Figure 2: Effects of a 10 Per Cent fall in House Prices on Real GDP
-1.20
-1.00
-0.80
-0.60
-0.40
-0.20
0.00
France Germany Ireland Spain UK USA
Perc
ent d
iffer
ence
from
bas
elin
e (le
vel)
year 1 year 2 year 3
The crisis in housing markets has also led to a fall in housing investment,
as we can see from Table 1. Housing investment has fallen most sharply in the US and in Ireland. UK housing investment has dropped by a more modest amount. Simulations on NiGEM suggest that the fall in investment has probably reduced US GDP growth by just over ½ percentage point. The effects on the UK are less, mainly because the share of housing investment is smaller and the decline in investment has been lower. Housing market downturns cause sharp and temporary declines in output, and they are clearly cyclical shocks. They can at minimum be ignored when policy makers set longer term budgetary plans, since the widening of deficits is short term and cyclical. The effects of a widening output gap on budget deficits depends on the underlying cause. Barrell, Hurst and Mitchell (2007) show that consumption led slowdowns have a significantly greater impact on deficits than those led by slower export growth. On average an expansion of the output gap by 5 percentage points might worsen the budget by 2½ per cent of GDP or so, but if the downturn is from tax rich consumption it could be as high as 3½ per cent of GDP. Since these are cyclical such budgetary changes do not need intervention to correct them.
Table 1: Ratio of Housing Investment to GDP
France Germany Ireland UK US % % % % % 2000 4.7 6.9 12.3 4.5 4.6 2005 5.0 5.4 13.3 4.7 5.4 2006 5.2 5.5 12.7 5.0 4.9 2007 5.3 5.4 10.8 5.0 3.9 2008Q1 5.2 - 8.5 4.7 3.3
8 BUDGET PERSPECTIVES 2009
Given that house prices were well above fundamentals in many countries, and perhaps as much as 30 per cent overvalued in the UK, the fall in house prices is to be welcomed, and not offset as in the recent announcements by the UK government. In addition, the wealth effect from high and rising house prices has been a major factor behind low levels of savings in countries such as the UK and the US, and a rise in the savings ratio that will result from lower housing wealth is also to be welcomed in these two low saving countries. If politicians requiring re-election feel a need to react, or if they think they should stabilise the economy by taking action, then programmes to offset the employment effects of lower housing investment would make more sense than policies designed to stop house prices adjusting back to their equilibrium level. Financial crises are episodic and frequent, and are difficult to avoid without major impacts on the prospects for financial innovation and economic growth. Financial innovation can reduce borrowing costs which lowers the user cost of capital, and hence for a period at least it can be important for raising growth. However, it is difficult to distinguish between sustainable innovation and excessive risk taking. Regulators have to ensure they encourage the former and discourage the latter. Financial sector regulation is extremely difficult, and financial innovation often finds ways round regulation. However, good regulation frequently revised to keep up with markets is essential if financial markets are to be constrained from generating a depression of the scale seen between 1929 and 1933.
3. Financial Crises and the Impacts of Increased Risk Related Spreads
Table 2: Selected Banking Crises and Their Effects
Date
Duration
Direct Cost to Taxpayers*
Output Loss (% of GDP)
Japan 1991-2001 10 years 14.0 Norway 1989-1992 4 years 3.4 27.1 Sweden 1991-1994 4 years 2.1 3.8 Finland 1991-1994 4 years 10.0 44.9
* Per cent of annual GDP at end of episode. Source: Barrell and Hurst (2008).
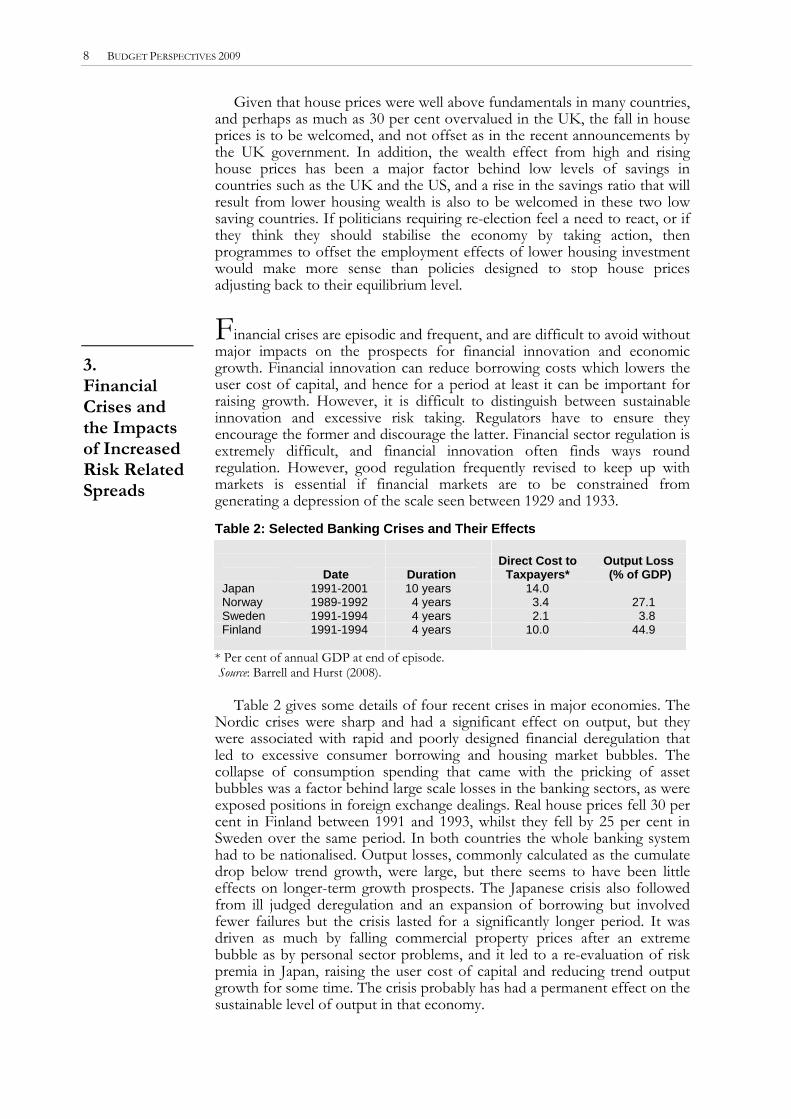
Table 2 gives some details of four recent crises in major economies. The Nordic crises were sharp and had a significant effect on output, but they were associated with rapid and poorly designed financial deregulation that led to excessive consumer borrowing and housing market bubbles. The collapse of consumption spending that came with the pricking of asset bubbles was a factor behind large scale losses in the banking sectors, as were exposed positions in foreign exchange dealings. Real house prices fell 30 per cent in Finland between 1991 and 1993, whilst they fell by 25 per cent in Sweden over the same period. In both countries the whole banking system had to be nationalised. Output losses, commonly calculated as the cumulate drop below trend growth, were large, but there seems to have been little effects on longer-term growth prospects. The Japanese crisis also followed from ill judged deregulation and an expansion of borrowing but involved fewer failures but the crisis lasted for a significantly longer period. It was driven as much by falling commercial property prices after an extreme bubble as by personal sector problems, and it led to a re-evaluation of risk premia in Japan, raising the user cost of capital and reducing trend output growth for some time. The crisis probably has had a permanent effect on the sustainable level of output in that economy.
THE BUDGETARY IMPLICATIONS OF GLOBAL SHOCKS TO CYCLES AND TRENDS IN OUTPUT 9
Figure 3 Spread between BAA corporate and government bonds
00.5
11.5
22.5
33.5
44.5
05 M
arch
200
0
05 S
epte
mbe
r 200
0
05 M
arch
200
1
05 S
epte
mbe
r 200
1
05 M
arch
200
2
05 S
epte
mbe
r 200
2
05 M
arch
200
3
05 S
epte
mbe
r 200
3
05 M
arch
200
4
05 S
epte
mbe
r 200
4
05 M
arch
200
5
05 S
epte
mbe
r 200
5
05 M
arch
200
6
05 S
epte
mbe
r 200
6
05 M
arch
200
7
05 S
epte
mbe
r 200
7
05 M
arch
200
8
05 S
epte
mbe
r 200
8
US Euro Area UK
The recent crisis that has hit Europe and North America is probably
more similar to that experienced by Japan in the 1990s than the quick and deep crises in the Nordic countries. There has been a housing market element, as we have discussed above, but excessive lending and an under-estimate of default risk, especially within the US, led to low risk premia for all borrowers. As Figure 3 shows, the spread between risk free government borrowing and corporate borrowing costs has risen in the US and Europe, as have equity premia and consumer borrowing costs. This looks like a medium to long term re-evaluation of risk, and it will raise the user cost of capital, and reduce the equilibrium level of the capital stock and hence sustainable output.
Table 3: Impacts of a 2.0 Sustained Rise in Risk Premia on Output Euro
Area France Germany Ireland UK US
2008 -0.3 -0.3 -0.3 -0.1 -0.3 -0.4 2009 -0.8 -0.6 -0.7 -0.3 -0.9 -0.8 2010-13 -1.2 -1.0 -1.0 -1.3 -1.7 -0.8
NiGEM simulation – per cent difference from baseline. Interest rate rules in place, forward looking financial and labour markets.
Barrell and Hurst (2008) discuss the impacts of a rise of spreads of this scale on output, but look only at the effects of a temporary change. It looks increasingly as if the crisis in financial markets will have a long-term impact on risk premia, as in Japan in the 1990s. Hence, we have repeated the simulations, but have extended them into the medium term to investigate the impacts on sustainable output. In this scenario risk premia were raised by 2 percentage points over the medium to long term in Europe and North
10 BUDGET PERSPECTIVES 2009
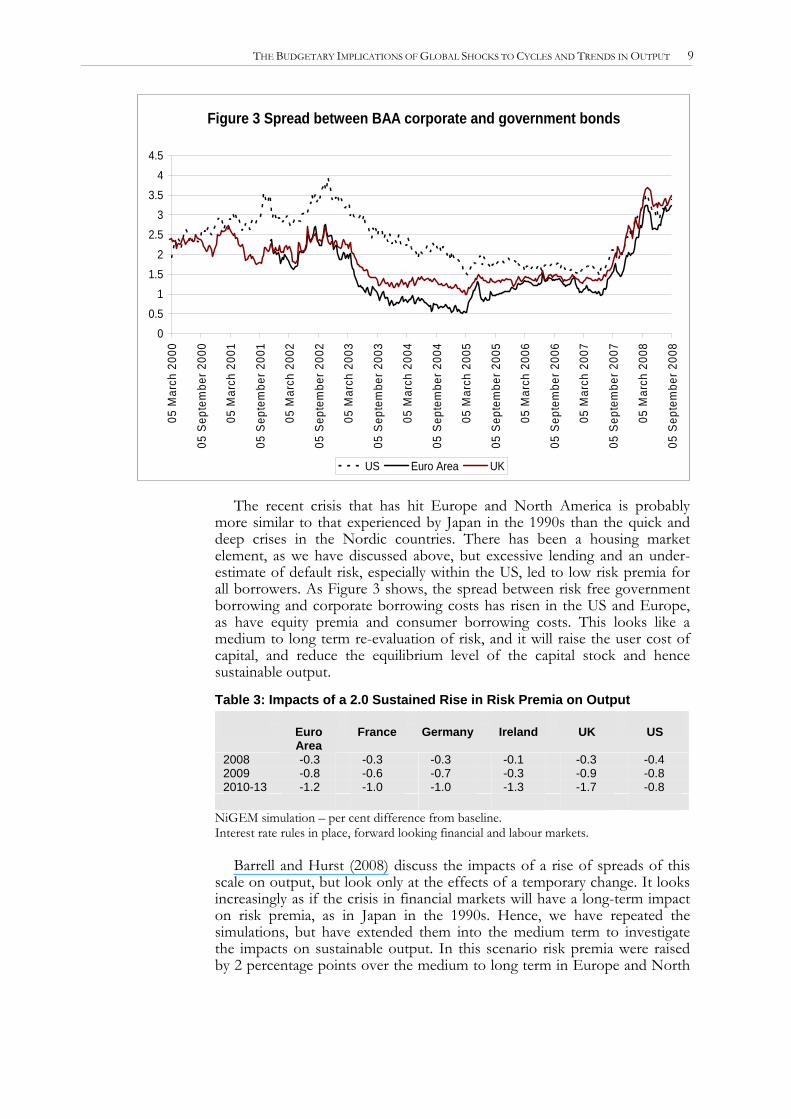
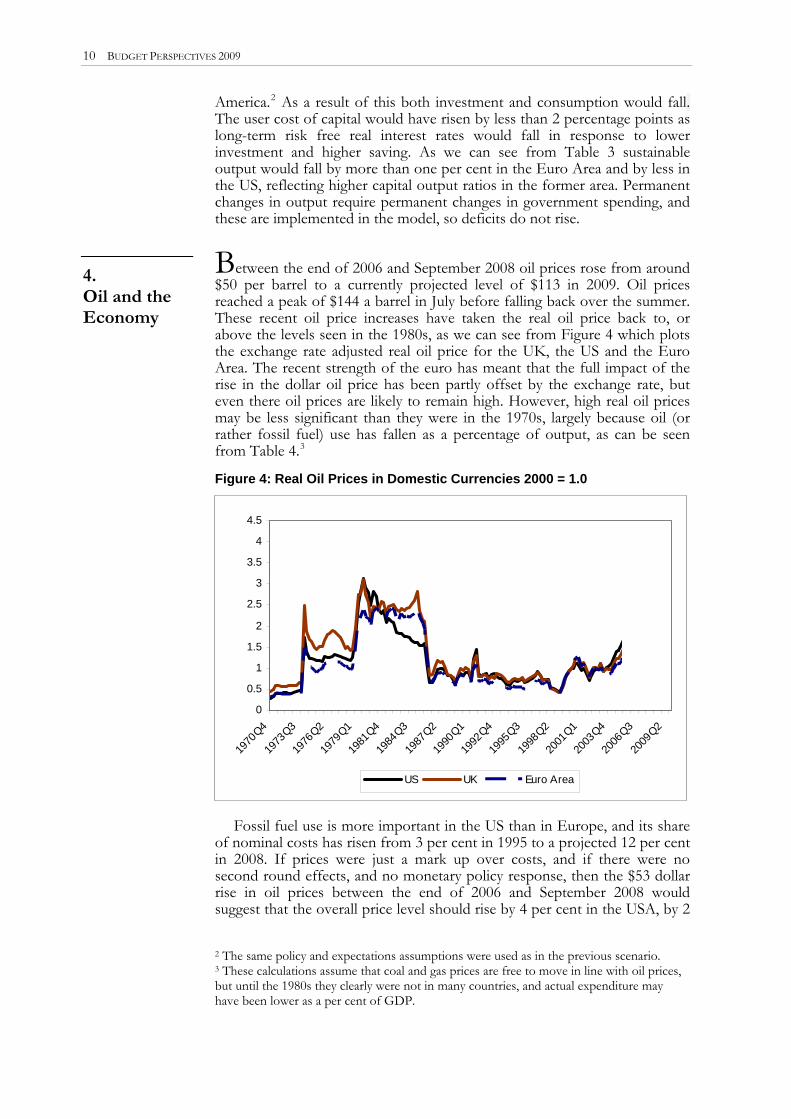
America.2 As a result of this both investment and consumption would fall. The user cost of capital would have risen by less than 2 percentage points as long-term risk free real interest rates would fall in response to lower investment and higher saving. As we can see from Table 3 sustainable output would fall by more than one per cent in the Euro Area and by less in the US, reflecting higher capital output ratios in the former area. Permanent changes in output require permanent changes in government spending, and these are implemented in the model, so deficits do not rise. Between the end of 2006 and September 2008 oil prices rose from around $50 per barrel to a currently projected level of $113 in 2009. Oil prices reached a peak of $144 a barrel in July before falling back over the summer. These recent oil price increases have taken the real oil price back to, or above the levels seen in the 1980s, as we can see from Figure 4 which plots the exchange rate adjusted real oil price for the UK, the US and the Euro Area. The recent strength of the euro has meant that the full impact of the rise in the dollar oil price has been partly offset by the exchange rate, but even there oil prices are likely to remain high. However, high real oil prices may be less significant than they were in the 1970s, largely because oil (or rather fossil fuel) use has fallen as a percentage of output, as can be seen from Table 4.3
4. Oil and the Economy
Figure 4: Real Oil Prices in Domestic Currencies 2000 = 1.0
0
0.5
1
1.5
2
2.5
3
3.5
4
4.5
1970
Q4
1973
Q3
1976
Q2
1979
Q1
1981
Q4
1984
Q3
1987
Q2
1990
Q1
1992
Q4
1995
Q3
1998
Q2
2001
Q1
2003
Q4
2006
Q3
2009
Q2
US UK Euro Area
Fossil fuel use is more important in the US than in Europe, and its share of nominal costs has risen from 3 per cent in 1995 to a projected 12 per cent in 2008. If prices were just a mark up over costs, and if there were no second round effects, and no monetary policy response, then the $53 dollar rise in oil prices between the end of 2006 and September 2008 would suggest that the overall price level should rise by 4 per cent in the USA, by 2
2 The same policy and expectations assumptions were used as in the previous scenario. 3 These calculations assume that coal and gas prices are free to move in line with oil prices, but until the 1980s they clearly were not in many countries, and actual expenditure may have been lower as a per cent of GDP.
THE BUDGETARY IMPLICATIONS OF GLOBAL SHOCKS TO CYCLES AND TRENDS IN OUTPUT 11
per cent in the UK, and somewhere between the two in the Euro Area and Japan. Second round effects on prices could increase the impact of the increase in oil prices if nominal wage growth rose markedly because real wages were not adjusting quickly to their new, lower, equilibrium trajectory.
Table 4: Share of Fossil Fuels in GDP Euro
Area France Germany Japan UK USA
% % % % % % 1975 6.0 4.0 3.0 4.8 6.7 7.8 1980 10.1 7.1 7.5 8.1 9.7 16.3 1985 7.9 4.8 8.2 4.6 8.1 7.5 1990 2.7 1.7 2.8 1.9 3.1 4.9 1995 1.5 1.0 1.4 0.9 2.1 3.1 2000 3.1 2.2 3.0 1.8 2.8 4.2 2005 3.8 2.6 3.8 3.6 3.5 6.4 2006 4.4 3.0 4.5 4.6 4.0 7.3 2007 4.1 2.8 4.2 5.1 3.7 7.9 2008 5.8 3.8 5.9 7.4 5.7 12.1
Oil, coal gas in oil equivalents, valued at world market prices. Increases in oil prices change the terms of trade between oil producers
and oil consumers, and also affect the productive capacity of the economy to produce output as fewer non-labour inputs are likely to be used. In countries that do not produce fossil fuels this change in the terms of trade is reflected in the balance of payments, and both real wages and real incomes must adjust. If they do not then unemployment will rise noticeably, as it did after the oil price shocks of the 1970s. In the Euro Area the rise in the price of oil between 2006 and 2008 means that the terms of trade have changed by 1.8 per cent (the rise in the nominal share of fossil fuels over that period) and real wages and real incomes must grow less rapidly than they otherwise would. For instance real wage growth would have to be ½ a percentage point lower for four years than had been anticipated in 2006 in order to accommodate the oil price increase.
The change in the terms of trade is much more important in the US, where real wages would have to grow one percentage point less rapidly than had been anticipated in 2006. The US is a significant fossil fuel producer, and real income growth would not have to slow down so much, but real incomes would still have to be around three percentage points lower than they would otherwise have been in four years time. The UK remains almost self sufficient in fossil fuels, and real incomes would fall only marginally. However, real (producer price adjusted) wage growth would still have to fall by around half a percentage point a year for four years. The rate of growth of incomes of pensioners and other who are dependent on oil rents (including the average tax payer) would not decline anywhere near as much.
If oil prices had stayed at their April 2008 levels then output growth would have been stronger, and the rate of inflation lower. The exact magnitudes depend upon the policy reactions of the monetary authorities and on how wage bargainers respond. In the 1970s neither policy makers nor wage bargainers seemed to take account of the need for lower real wage growth, and as a result the rate of inflation rose markedly as bargains attempted to keep real wage growth on track and the monetary authorities tried to keep real interest rates constant.
12 BUDGET PERSPECTIVES 2009
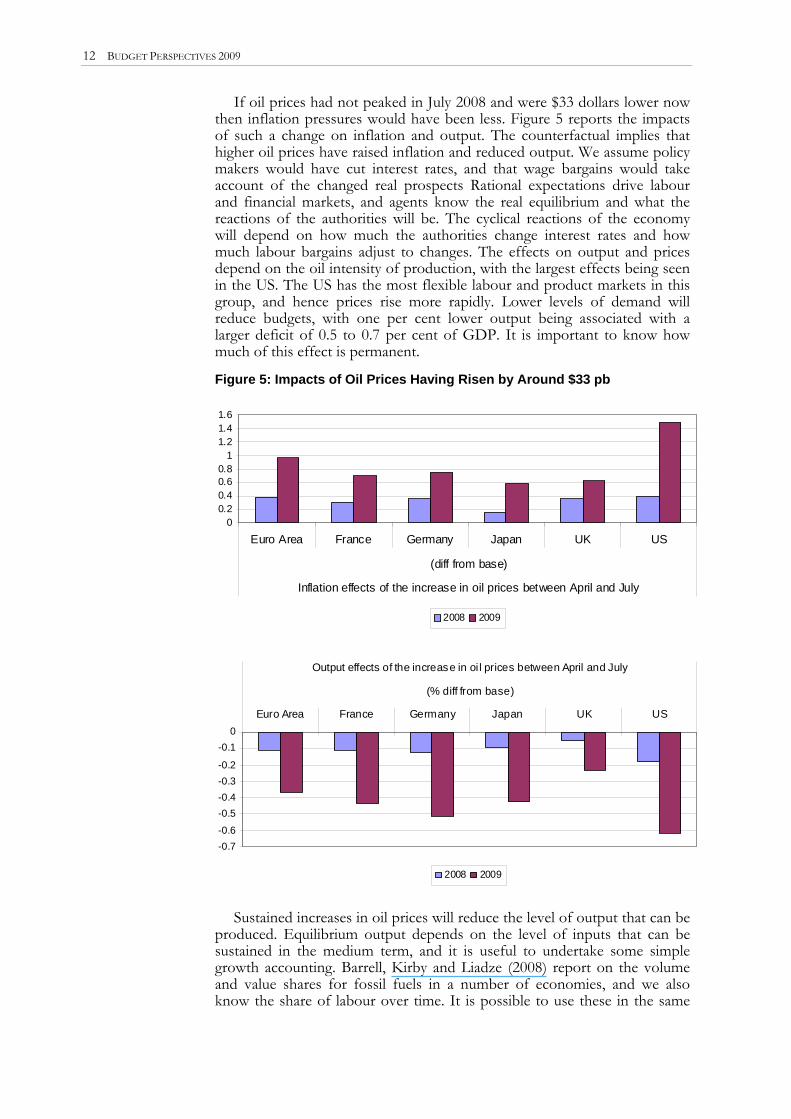
If oil prices had not peaked in July 2008 and were $33 dollars lower now then inflation pressures would have been less. Figure 5 reports the impacts of such a change on inflation and output. The counterfactual implies that higher oil prices have raised inflation and reduced output. We assume policy makers would have cut interest rates, and that wage bargains would take account of the changed real prospects Rational expectations drive labour and financial markets, and agents know the real equilibrium and what the reactions of the authorities will be. The cyclical reactions of the economy will depend on how much the authorities change interest rates and how much labour bargains adjust to changes. The effects on output and prices depend on the oil intensity of production, with the largest effects being seen in the US. The US has the most flexible labour and product markets in this group, and hence prices rise more rapidly. Lower levels of demand will reduce budgets, with one per cent lower output being associated with a larger deficit of 0.5 to 0.7 per cent of GDP. It is important to know how much of this effect is permanent.
Figure 5: Impacts of Oil Prices Having Risen by Around $33 pb
00.20.40.60.8
11.21.41.6
Euro Area France Germany Japan UK US
(diff from base)
Inflation effects of the increase in oil prices between April and July
2008 2009
-0.7-0.6
-0.5-0.4-0.3-0.2
-0.10
Euro Area France Germany Japan UK US
(% diff from base)
Output effects of the increase in oi l prices between April and July
2008 2009
Sustained increases in oil prices will reduce the level of output that can be
produced. Equilibrium output depends on the level of inputs that can be sustained in the medium term, and it is useful to undertake some simple growth accounting. Barrell, Kirby and Liadze (2008) report on the volume and value shares for fossil fuels in a number of economies, and we also know the share of labour over time. It is possible to use these in the same

THE BUDGETARY IMPLICATIONS OF GLOBAL SHOCKS TO CYCLES AND TRENDS IN OUTPUT 13
way as Barrell et al. (2008) to look at the impact of oil prices on output. Output growth in an accounting framework is explained by the share inputs take in output multiplied by the rate of change in the input, and moving average shares of fossil fuel, labou
0.0%
0.5%
1.0%
1.5%
2.0%
2.5%
US Japan UK Germany France Italy Spain
r and capital in output allow us to onstruct a Tornquist output index.
uro Area than it otherwise would have been as a result of higher oil prices.
Figure 6: s by 2010 of an Increase of $50 in Oil Prices from $63 in
2006)
d wage pressures will be higher and unemployment will rise, as in the 1970s.
c
Over time fossil fuel inputs change, and they do so in part because their prices change. Weale (2008) suggests that the long-run elasticity of demand for fossil fuels has to be around minus one. It is clear, however, that adjustment is slow. We estimate it can take 4 years for 66 per cent of any adjustment to take place. If oil prices had not risen from their 2006 levels then more oil would be used as an input into production, and more goods could be produced. We have calculated the change in fossil fuel use that would take place between 2006 and 2010 in the light of these assumptions and used it in a growth accounting exercise. We first assume that oil usage drops in line with price increases, and calculate a trajectory for output. We then assume prices and shares do not change, and hence usage remains at 2006 levels. Figure 6 plots the impacts of these changes on the projected level of equilibrium output in 2010. The impacts are highest in the oil intensive USA and lowest in nuclear intensive France. In the very long run we would expect equilibrium output to be up to 2 per cent lower in the E
Oil Price Impacts on Equilibrium Output (Effect
Our results on the short, medium and long-term impacts of higher oil
prices suggest that much of the impact, even in the short term, must be seen as structural and not cyclical. If sustainable output is likely to be 2 per cent lower than it would otherwise have been, then optimally organised government spending also needs to be 2 per cent lower than currently, otherwise government budgets would deteriorate. Ignoring the impacts of oil prices on trend output is as serious as ignoring its effects on real wages. If spending plans do not adjust then taxes will have to rise, and this will put downward pressure on real consumption wages. If bargainers resist the effects of oil price increases they will also resist the impacts of increased taxes, and for a perio
14 BUDGET PERSPECTIVES 2009
0.0%
0.5%
1.0%
1.5%
2.0%
2.5%
3.0%
3.5%
4.0%
4.5%
1986
1988
1990
1992
1994
1996
1998
2000
2002
2004
2006
2008
Value Volume
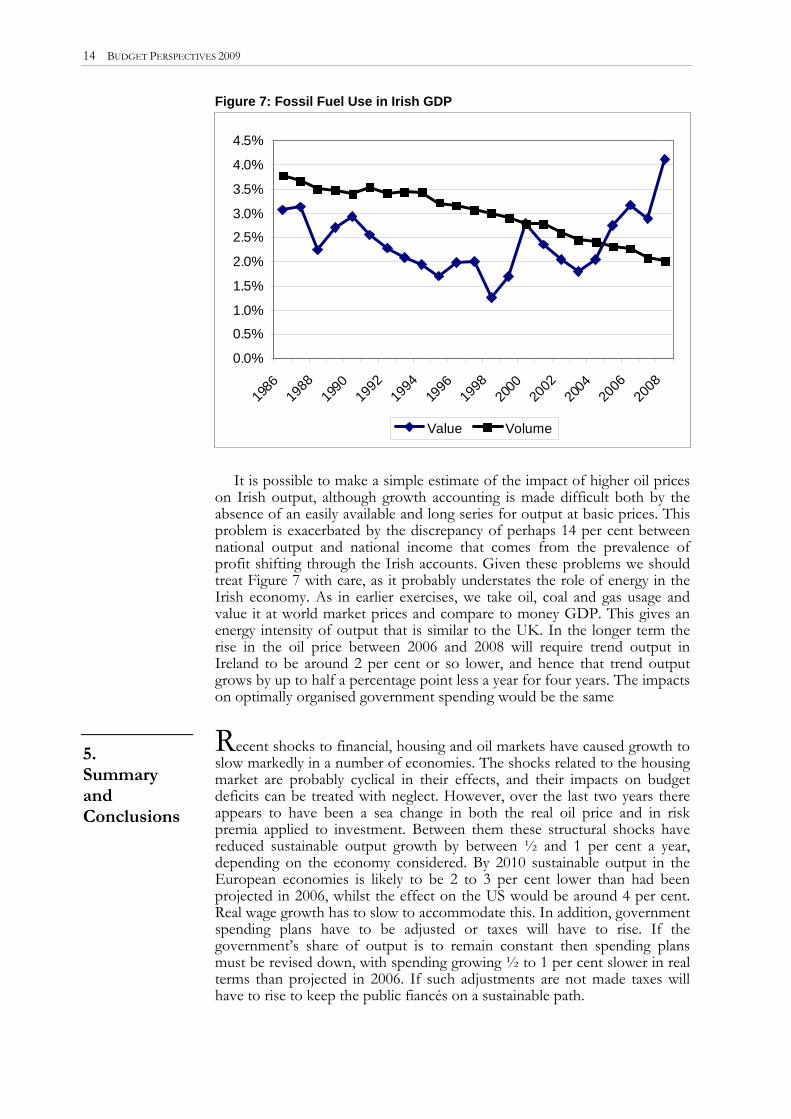
Figure 7: Fossil Fuel Use in Irish GDP
he impacts ending would be the same
made taxes will have to rise to keep the public fiancés on a sustainable path.
It is possible to make a simple estimate of the impact of higher oil prices
on Irish output, although growth accounting is made difficult both by the absence of an easily available and long series for output at basic prices. This problem is exacerbated by the discrepancy of perhaps 14 per cent between national output and national income that comes from the prevalence of profit shifting through the Irish accounts. Given these problems we should treat Figure 7 with care, as it probably understates the role of energy in the Irish economy. As in earlier exercises, we take oil, coal and gas usage and value it at world market prices and compare to money GDP. This gives an energy intensity of output that is similar to the UK. In the longer term the rise in the oil price between 2006 and 2008 will require trend output in Ireland to be around 2 per cent or so lower, and hence that trend output grows by up to half a percentage point less a year for four years. Ton optimally organised government sp Recent shocks to financial, housing and oil markets have caused growth to slow markedly in a number of economies. The shocks related to the housing market are probably cyclical in their effects, and their impacts on budget deficits can be treated with neglect. However, over the last two years there appears to have been a sea change in both the real oil price and in risk premia applied to investment. Between them these structural shocks have reduced sustainable output growth by between ½ and 1 per cent a year, depending on the economy considered. By 2010 sustainable output in the European economies is likely to be 2 to 3 per cent lower than had been projected in 2006, whilst the effect on the US would be around 4 per cent. Real wage growth has to slow to accommodate this. In addition, government spending plans have to be adjusted or taxes will have to rise. If the government’s share of output is to remain constant then spending plans must be revised down, with spending growing ½ to 1 per cent slower in real terms than projected in 2006. If such adjustments are not
5. Summand
ary
Conclusions
REFERENCES
BARRELL, R. and E.P. DAVIS, 2005. “Policy Design and Macroeconomic Stability in Europe”, National Institute Economic Review, No. 191, pp. 94-105.
BARRELL, R. and E.P. DAVIS, 2007. “Financial Liberalisation, Consumption and Wealth Effects in 7 OECD Countries”, Scottish Journal of Political Economy, May.
BARRELL, R., D. HOLLAND, I. LIADZE and O. POMERANTZ, 2008. “EMU and Its Impact on Growth and Employment”. Forthcoming in EMU at 10 Buti and van den Noord (eds.), European Commission, NIESR Discussion Paper No. 314.
BARRELL, R. and A.I. HURST, 2008. “Financial Crises and the Prospects for Recession” National Institute Economic Review, No. 204, pp. 33-38.
BARRELL, R., A.I. HURST and J. MITCHELL, 2007. “Uncertainty Bounds for Cyclically Adjusted Budget Balances” in M. Larch and L.N. Martins (ed.), Fiscal Indicators, Brussels: European Commission, pp. 187-206.
BARRELL, R. and S. KIRBY, 2008. “Consumption, Housing, Wealth and Financial Crises”, National Institute Economic Review, No. 205, pp. 57-60.
BARRELL, R., S. KIRBY and I. LIADZE, 2008. “The Oil Intensity of Output”, National Institute Economic Review, No. 205, pp. 34-38.
WEALE, M., 2008. “High Oil Prices: Implications and Prospects”, National Institute Economic Review, No. 205, pp. 4-7.
15
MOBILISING MARKET-BASED INSTRUMENTS FOR CLIMATE CHANGE IN IRELAND
Lisa Ryan, Frank Convery and Noel Casserly
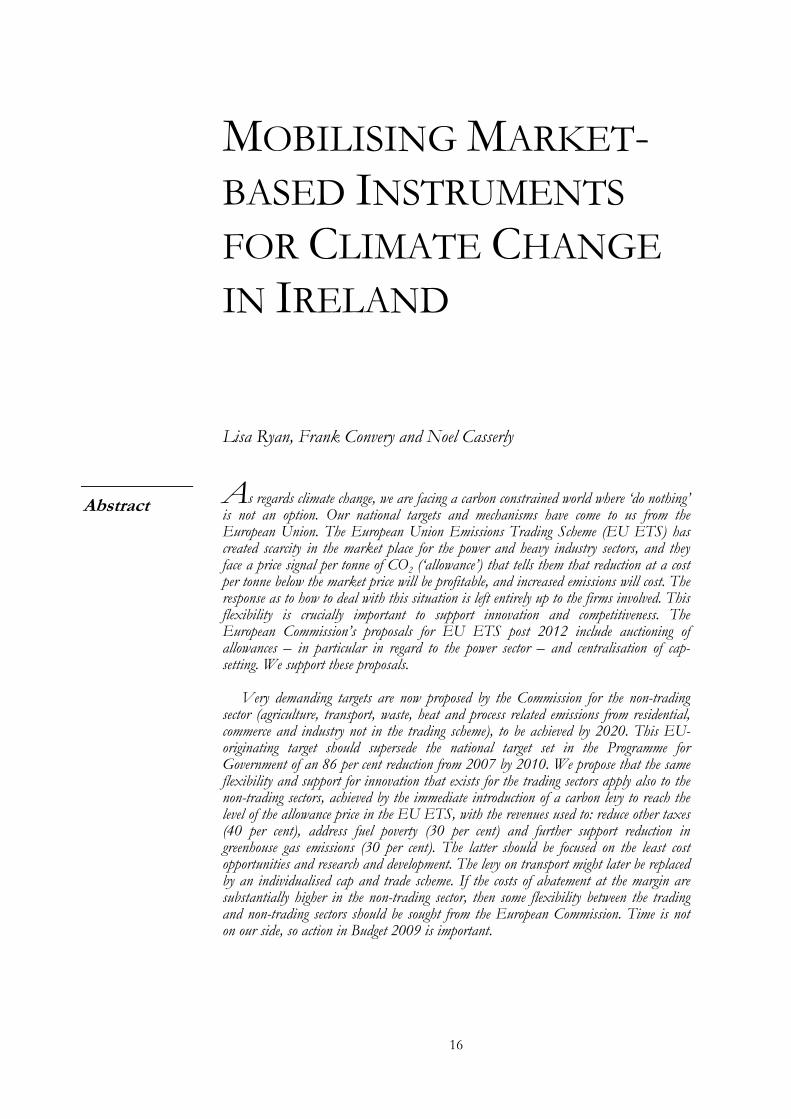
As regards climate change, we are facing a carbon constrained world where ‘do nothing’ is not an option. Our national targets and mechanisms have come to us from the European Union. The European Union Emissions Trading Scheme (EU ETS) has created scarcity in the market place for the power and heavy industry sectors, and they face a price signal per tonne of CO2 (‘allowance’) that tells them that reduction at a cost per tonne below the market price will be profitable, and increased emissions will cost. The response as to how to deal with this situation is left entirely up to the firms involved. This flexibility is crucially important to support innovation and competitiveness. The European Commission’s proposals for EU ETS post 2012 include auctioning of allowances – in particular in regard to the power sector – and centralisation of cap-setting. We support these proposals.
Abstract
Very demanding targets are now proposed by the Commission for the non-trading
sector (agriculture, transport, waste, heat and process related emissions from residential, commerce and industry not in the trading scheme), to be achieved by 2020. This EU-originating target should supersede the national target set in the Programme for Government of an 86 per cent reduction from 2007 by 2010. We propose that the same flexibility and support for innovation that exists for the trading sectors apply also to the non-trading sectors, achieved by the immediate introduction of a carbon levy to reach the level of the allowance price in the EU ETS, with the revenues used to: reduce other taxes (40 per cent), address fuel poverty (30 per cent) and further support reduction in greenhouse gas emissions (30 per cent). The latter should be focused on the least cost opportunities and research and development. The levy on transport might later be replaced by an individualised cap and trade scheme. If the costs of abatement at the margin are substantially higher in the non-trading sector, then some flexibility between the trading and non-trading sectors should be sought from the European Commission. Time is not on our side, so action in Budget 2009 is important.
16
MOBILISING MARKET-BASED INSTRUMENTS FOR CLIMATE CHANGE IN IRELAND 17
The excessive emission of greenhouse gases is a manifestation of market failure which arises as a result of the public good nature of greenhouse gas emissions. In a well-functioning market resources are allocated efficiently1 but well-defined property rights are necessary for this to occur, which is generally not the case with public goods such as greenhouse gas emissions.
1. Introduction
The essence of markets is that they clear – a price emerges that brings
demand and supply into equilibrium. If demand increases and supply does not, then the market price rises to bring them into equilibrium. If supply increases and demand does not, then the price falls. The market fails when a price does not emerge that reflects relative scarcity. This is typically the case with environmental endowments. They are often not ‘owned’ and as use intensifies, no price signal emerges to alert consumers to use them more parsimoniously, or bring use into balance with assimilative capacity. In regard to climate change, we emit gases into the atmosphere that warm the globe, and we do not get a price signal telling us that the capacity to assimilate these gases without the risk of substantive adverse effect is limited and is being overused.
This paper is about ways in which we correct for market failure by
creating a price that signals scarcity, and what the implications are for fiscal and budgetary policy. Specifically, we address two choices: limiting quantity of emissions, and allowing trading amongst emitters, thereby producing a price, or introducing the price directly in the form of a tax per unit of pollution emitted. Although historically the most common instrument implemented in the area of environmental policy has been command and control policies, these have been found to frequently be inefficient. Standard regulation can be statically inefficient in that it may not achieve environmental objectives at minimum cost, and it may be dynamically inefficient, since there may be no incentive for polluters to continually improve. In latter years demand-side market-based instruments such as taxes, green subsidies, and emissions trading have become more popular, as they provide an incentive to continually improve environmental performance at least cost. The revenue generated by market-based instruments can provide a double dividend if they are used to reduce other taxes which may be slowing economic growth2 or creating inequity in society.
2. Market-based Policy Instruments for Greenhouse Gas Mitigation
There are several features that distinguish greenhouse gas emissions
from other problems. First, the pollutants act globally and, therefore, a successful abatement strategy requires a large majority of emitting countries to cooperate and abate, which complicates the political implementation of policy measures. Additionally, CO2 emissions3 are mainly a direct result of
1We may define efficiency in terms of Pareto optimality, which is the situation where we are unable to reallocate resources without making at least one person worse off. 2An example is the eco tax in Germany where a tax was levied on fossil fuels and the revenue was used to reduce labour taxes. 3There are six groups of greenhouse gases listed under the United Nations Framework Convention for Climate Change and CO2 emissions are estimated to be responsible for 60 per cent of the ‘greenhouse effect’ (www.UNFCCC.org).
18 BUDGET PERSPECTIVES 2009
the combustion of fossil fuels and, therefore, are essentially a by-product of the industrial world. Abatement is different to that of other pollutants since end-of-pipe abatement of greenhouse gas emissions is expensive and, therefore, modifications to the combustion process are usually necessary, such as improvement in energy efficiency or fuel switching. However, this kind of abatement can provide side benefits, since more efficient combustion also saves the operator energy or fuel costs, and may also reduce other pollutants. A third feature of greenhouse gas emissions is that the consequences of abatement or lack of it will not be felt in the present but in the future.
In an ideal world the optimal emissions abatement level can be
estimated by comparing the marginal cost and marginal benefit of the best available abatement technology. However, there is generally great uncertainty with respect to the shape and position of the marginal benefit and marginal abatement cost curves. Often the abatement costs are not known to the policymaker, due to incomplete information on abatement technologies. In many cases also the technology has not been fully developed and, therefore, the future costs of abatement may not yet be known even to the manufacturer. The marginal cost of abatement curve may be neither smooth nor linear, since abatement technologies may be much more costly for increasing abatement levels. Furthermore, as private agents are not faced with the full social costs of greenhouse gas emissions, the private damage costs usually do not equal the social damage costs. It may be very difficult to estimate the damage costs, both social and private, since the cost function in the real world is most likely non-linear and dependent on the number of ‘victims’, time, pollutant composition and perhaps location (Sterner, 2003). An important consideration in the estimation of greenhouse gas emissions costs is uncertainty regarding the future concentration of greenhouse gases in the atmosphere as a result of current emissions, and the implications. The intertemporal dimension adds complexity to the issue since it is not certain what the impact of any given greenhouse gas concentration will have on future global and regional climates. Weitzman4 poses the intellectual and empirical challenge when catastrophe is a possibility:
Societies and ecosystems whose mean ambient temperature has changed in the geologically instantaneous time of two centuries or so by 11c-20c are located in terra incognita, since such high average temperatures have not existed for hundreds of millions of years and such a rate of global temperature change might be unprecedented even on a time scale of billions of years. Standard conventional Cost Benefit Analyses (CBAs) of climate change do not come even remotely close to grappling seriously with this kind of potential for disasters. When comprehensive CBA includes plausible, if unknown, probabilities of (and plausible, if unknown, damages from) catastrophic climate change, the policy implications can be radically different from the conventional advice coming out of a standard economic analysis that essentially ignores this kind of potential for disasters.
4Weitzman, Martin, 2008. “On Modelling and Interpreting the Economics of Catastrophic Climate Change”, Harvard University May 2008. See: http://www.economics. harvard.edu/faculty/weitzman/files/REStatModeling.pdf

MOBILISING MARKET-BASED INSTRUMENTS FOR CLIMATE CHANGE IN IRELAND 19
Standard environmental economics textbooks tell us that the optimal level of greenhouse gas emissions abatement is at the point where the marginal abatement cost is equal to the marginal damage cost. In the case of optimal regulation, the pollution standards could be set to the optimal level. Similarly, if a policy instrument of taxes or charges were preferred, the charge would be set at optimal t*5 to produce the optimal abatement level or if a system of permits were implemented the quantity of permits issued would be equal to the same emissions level. So, theoretically at least, under ideal conditions the optimal abatement level can be achieved with either a tax or permit-based system.
In the real world, conditions are rarely ideal and policymakers must
settle for a second or even third best policy solution. This is because, even if it were possible to estimate the optimal abatement level, there are often political constraints related to the implementation of the first best policy selected using the criteria above. Particular conditions, for example the socio-economic situation, information availability and structure, technology availability, environmental problem at hand, and political system demand different policy instruments.
Our perspective takes as given the European Union policy framework in
which we find ourselves in Ireland in 2008. This is far from what many economists would regard as optimal if we could design and implement policy from a tabula rasa. Going back to Weitzman (1974), there is a literature which makes the case for the use of environmental taxes rather than emissions trading as a means of addressing climate change. There is also a very convincing case that, on grounds of both economic efficiency and environmental effectiveness, if emissions trading is to be used, it should apply to all emissions. Our reality is that there is no EU-wide greenhouse gas tax and little prospect of same, and the emissions trading scheme is only partial in coverage.
Given this context, the next sections describe the market-based policy
options available for Ireland and outline their potential to efficiently and effectively reduce greenhouse gas emissions while improving competitiveness and social equity. The first of these approaches is called ‘emissions trading’ to which we now turn. In Annex A, we discuss what emissions trading is, the context and pressures which produced a European Union Emissions Trading Scheme (EU ETS) for carbon dioxide, the main greenhouse gas, how it has been implemented and how it has operated in terms of price effects, abatement, creation of markets etc. Readers who are not familiar with trading in general, and the European scheme in particular, should read this annex before proceeding.
3. Emissions Trading in Ireland
The questions that are interesting to address in regard to Ireland’s
performance and potential vis-à-vis EU ETS include the following:
5When the charge or tax is set at the intersection of the marginal abatement cost and marginal damage cost the tax is referred to as a Pigouvian tax.
20 BUDGET PERSPECTIVES 2009
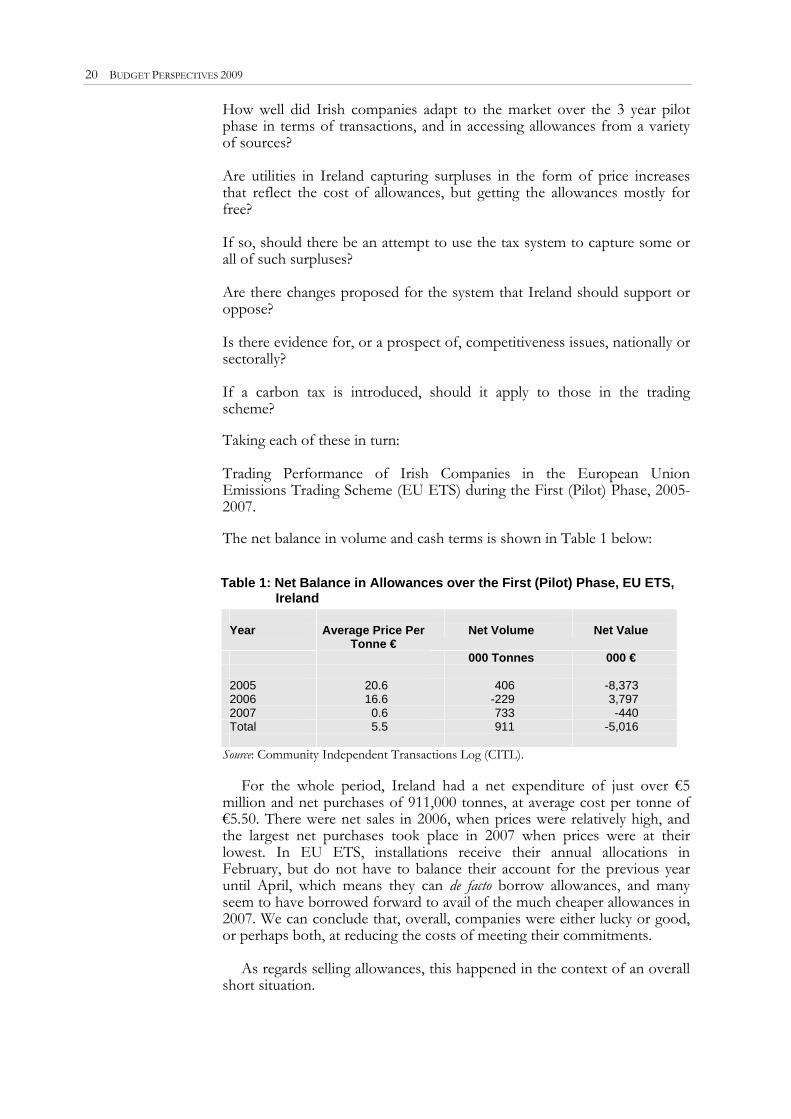
How well did Irish companies adapt to the market over the 3 year pilot phase in terms of transactions, and in accessing allowances from a variety of sources? Are utilities in Ireland capturing surpluses in the form of price increases that reflect the cost of allowances, but getting the allowances mostly for free? If so, should there be an attempt to use the tax system to capture some or all of such surpluses? Are there changes proposed for the system that Ireland should support or oppose? Is there evidence for, or a prospect of, competitiveness issues, nationally or sectorally? If a carbon tax is introduced, should it apply to those in the trading scheme? Taking each of these in turn: Trading Performance of Irish Companies in the European Union Emissions Trading Scheme (EU ETS) during the First (Pilot) Phase, 2005-2007. The net balance in volume and cash terms is shown in Table 1 below:
Table 1: Net Balance in Allowances over the First (Pilot) Phase, EU ETS, Ireland
Year Average Price Per
Tonne € Net Volume Net Value
000 Tonnes 000 € 2005 20.6 406 -8,373 2006 16.6 -229 3,797 2007 0.6 733 -440 Total 5.5 911 -5,016
Source: Community Independent Transactions Log (CITL).
For the whole period, Ireland had a net expenditure of just over €5 million and net purchases of 911,000 tonnes, at average cost per tonne of €5.50. There were net sales in 2006, when prices were relatively high, and the largest net purchases took place in 2007 when prices were at their lowest. In EU ETS, installations receive their annual allocations in February, but do not have to balance their account for the previous year until April, which means they can de facto borrow allowances, and many seem to have borrowed forward to avail of the much cheaper allowances in 2007. We can conclude that, overall, companies were either lucky or good, or perhaps both, at reducing the costs of meeting their commitments.
As regards selling allowances, this happened in the context of an overall
short situation.

MOBILISING MARKET-BASED INSTRUMENTS FOR CLIMATE CHANGE IN IRELAND 21
ELECTRICITY PRICE PASS THROUGH
For the pilot phase, the Commission on Energy Regulation (CER) only allowed the marginal cost – the cost of the net purchases of allowances – to be passed on to consumers. However, the situation changed in regard to the second phase (2008-2012) and thereafter. This is in the context that, overall, utilities were left short in the sense that allocations were lower than historic emissions in this second phase.
A good sense of the key issues and challenges for the future can be discerned by examining the Environmental Protection Agency (EPA) publication, Ireland’s National Allocation Plan Second Consultation, October 2 2007,6 which applies to the 2008-2012 period.
The total quantity of allowances to be allocated in the period represents
87 per cent of forecasted emissions in that period. Of the total 9 per cent has been ‘held back’ to cover new entrants. This provision in the EU scheme is controversial, as it is held by some to de facto discriminate in favour of polluting incumbents, on the following basis: a new entrant who proposes to build an emission-free plant will get no allowances, while an incumbent who wishes to develop a new plant with emissions can use the asset value of their existing free allowances to get cheap credit for the expansion, and get the additional emissions ‘covered’ by receipt of more free allowances.
A total of 22.262 million allowances annually are allocated. This
compares with 22.32 million annually allocated in the first period, a reduction of less than one per cent. Holders are capped as regards the extent to which each installation can meet their needs using linking mechanisms to 12, 11, and 1 per cent respectively in the power generation, cement and general sectors. Only 0.5 per cent of allowances will be sold, “to defray the expenses of administering the emissions trading scheme”.
There are over 100 installations included, and we can divide them into
power generation, cement, and the rest. The bulk of allowances go to electricity generating stations and cement plants. (See Annex Table 1 for top 17 installations, ranking based on proposed allocation for 2008-2012.)
All 12 electricity installations have been allocated 68 per cent of their
‘relevant emissions’, the latter comprising mainly their historic emissions (with 2003 as the key year in this regard), or their projected emissions. It is assumed that the contribution of renewables grows from 4.3 per cent in 2003 to 15 per cent in 2020 and 33 per cent by 2030, and this expectation was accounted for in making allocations to the powergen sector.
The companies involved will need to bridge whatever gap exists
between their free allocation and their prospective emissions by a combination of abatement, fuel switching, purchase of allowances, and purchase of project-based credits from Joint Implementation (developed countries) or Clean Development Mechanism (CDM).
6http://www.epa.ie/downloads/pubs/air/etu/name,23524,en.html
22 BUDGET PERSPECTIVES 2009
With the emergence of the all-island electricity market, it is clear that generators in this new market will be expected, as a condition of their generation licences, to bid into the all-island wholesale market at prices that fully factor in their short-run marginal costs (SRMC) for each half-hourly dispatch period. Such costs explicitly include the full opportunity cost7 of EUAs for each half-hour period,8 a provision which did not apply during the pilot (2005-07) phase. It is likely that any ‘must run’ status peat-fired stations would be allowed to include any Public Service Obligation (PSO) subvention as a negative marginal cost.
However, the overall bidding principle of SRMC is quite clear. Under
this system, electricity consumers will pay at least some of the opportunity-cost value of allowances, even where the utilities have not had to pay for them. It is important from an environmental performance point of view that households will face and experience the costs of emitting CO2 into the atmosphere associated with their consumption of electricity. It is also appropriate that the charge will vary depending on the carbon intensity of electricity generation. Under a system where permits are issued without cost to the electricity companies, it was the pass through of the opportunity cost of free allowances in the pilot phase that encouraged Germany, the UK and Italy to auction a significant proportion of their allowances (up to 10 per cent is allowed under EU ETS regulation). But Ireland is only selling 0.5 per cent of its allocation, so there is not a direct substantial flow to the Exchequer.
Where does the public interest lie in regard to the pass through? Pass
through encourages reduction in electricity consumption, and should be allowed; it confronts the consumer with the marginal costs of abatement. But should the government claw back some or all of this pass through to the extent that it occurs as ‘unearned’ profit by the company?
In considering this issue, it is useful to distinguish between the State-
owned Electricity Supply Board (ESB) and the rest. The ESB is the dominant incumbent, with a proposed allocation over the five year phase 2 (2008-12) period of 38.5 million tonnes of CO2, which is just over two and a half times the allocation to the rest of the utility sector.
ESB The value of the pass through to the ESB is estimated for two scenarios – assuming a price of €23 per tonne and pass through of 50 per cent and average price of €25 – and pass through of 70 per cent – is shown in Table 2. The total value for the five year second phase is €438-668 million range.
7‘Opportunity cost’ is the value foregone in using an asset and is independent of whether one paid for it or not. Thus, an allowance in EU ETS for delivery in 2008 is today trading at €26.00 per tonne of CO2. If – as will be the case in Ireland – emitters get these valuable allowances for free, they will still recognise their full value as they make decisions. Just because an indulgent aunt gives you a house for free, you do not give it away or rent it for free – you recognise its full opportunity cost. 8See: All Island Project – the Bidding Code of Practice – A Response and Decision Paper AIP-SEM 07-430, 30 July 2007. We are grateful to Neil Walker for alerting us to this document.

MOBILISING MARKET-BASED INSTRUMENTS FOR CLIMATE CHANGE IN IRELAND 23
Table 2: Estimated Value of Pass Through of CO2 Price Accruing to the ESB, Two Scenarios, 2008-12
Operator Name Location Proposed Annual
Allocation (2008-12)
Million Tonnes
Value of Price Pass Through
Scenario 19 Million €
Value of Pass Through
Scenario 210 Million €
1. ESB Moneypoint Powergen 3.735 42.95 65.36 2. ESB Poolbeg Powergen 1.536 17.66 26.88 6 ESB Tarbert Powergen 1.001 11.50 17.50 14 ESB Aghada Powergen 0.526 6.05 9.20 15 ESB Lanesboro Powergen 0.512 5.89 8.96 17 ESB North Wall Powergen 0.325 3.74 5.69 Total Annual 7.635 87.79 133.59 Total 5 years 2008-12 38.175 438.95 667.95
Since the ESB is wholly government owned, as a shareholder it should
in any event benefit from any surplus. However, the policy context is rapidly evolving. In July 2008, the Commission on Energy Regulation (CER) welcomed the joint announcement by the Spanish utility Endesa and the ESB that the former was purchasing a number of ESB power generation stations as part of the Commission’s CER-ESB Asset Strategy Agreement aimed at reducing ESB’s share of the power generation market to 40 per cent by 2010. On March 27, 2008, the ESB and the government announced a major investment programme, whereby between now and 2020, €22 billion will be invested, including networks (€11 billion) that will facilitate the development of 6,000 MW of wind power island wide development on its own account of 1,400 MW of wind power investment in energy efficiency, including smart metering. The ESB proposes to halve its carbon emissions within 12 years, delivering one-third of its electricity from renewable generation, and achieve carbon net zero by 2035. It seems likely that some of this investment will correct for market failures e.g. in energy efficiency via smart meters, and that there is a case for allowing all of the value of the pass through to be held by the company to help fund this investment However, it is important to formalise the analysis to see that such is the case. This would also help decide what policy should be in relation to the surplus likely to accrue to the other companies.
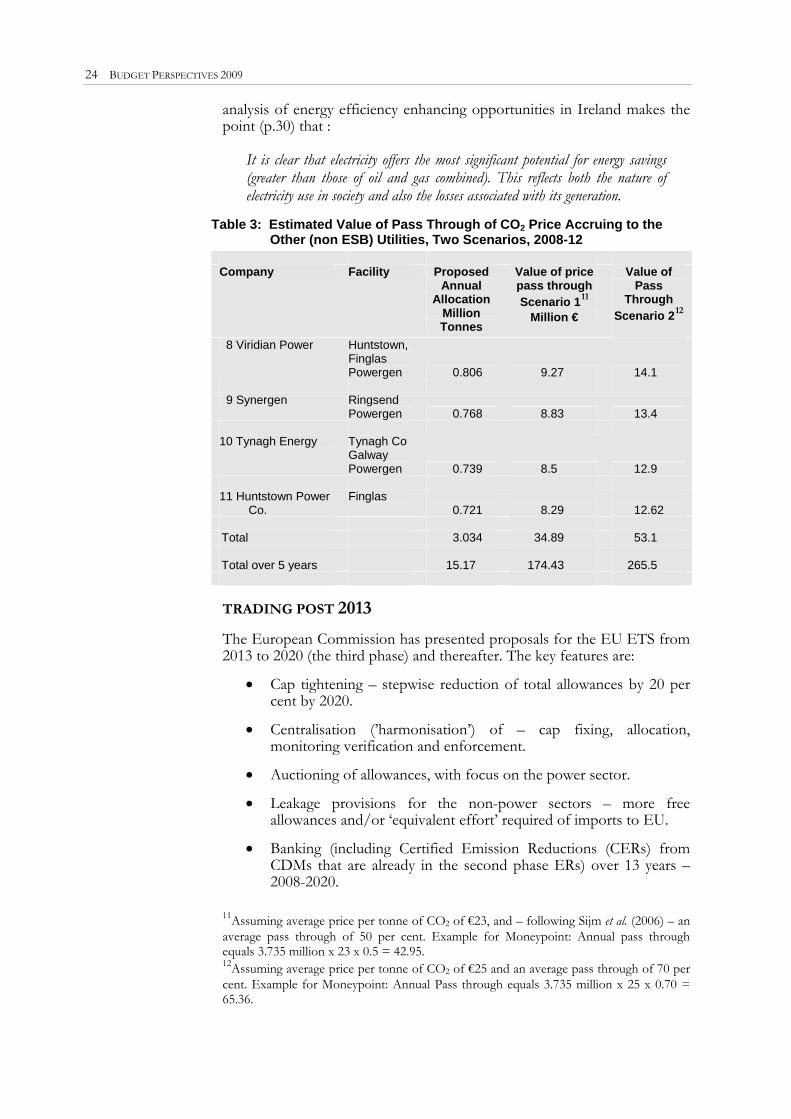
Other Utilities A similar logic applies to the other utilities. The aggregate surplus accruing over 5 years is estimated to fall in the €174-269 million range (Table 3). The CER has been struggling to encourage sufficient capacity to provide competition to the ESB, so there may be reluctance to impose requirements on those new entrants who have come into the market. However, this needs to be balanced by the fact that consumers are providing them with a gain for which they have not paid, and a quid pro quo is appropriate, perhaps with a focus on energy efficiency. The Kema (2008)
9Assuming average price per tonne of CO2 of €23, and – following Sijm et al. (2006) – an average pass through of 50 per cent. Example for Moneypoint: Annual pass through equals 3.735 million x 23 x 0.5 = 42.95. 10Assuming average price per tonne of CO2 of €25 and an average pass through of 70 per cent. Example for Moneypoint: Annual Pass through equals 3.735 million x 25 x 0.70 = 65.36.
24 BUDGET PERSPECTIVES 2009
analysis of energy efficiency enhancing opportunities in Ireland makes the point (p.30) that :
It is clear that electricity offers the most significant potential for energy savings (greater than those of oil and gas combined). This reflects both the nature of electricity use in society and also the losses associated with its generation.
Table 3: Estimated Value of Pass Through of CO2 Price Accruing to the Other (non ESB) Utilities, Two Scenarios, 2008-12
Company Facility Proposed
Annual Allocation
Million Tonnes
Value of price pass through Scenario 111
Million €
Value of Pass
Through Scenario 212
8 Viridian Power Huntstown,
Finglas Powergen 0.806 9.27 14.1
9 Synergen Ringsend
Powergen 0.768 8.83 13.4 10 Tynagh Energy Tynagh Co
Galway Powergen 0.739 8.5 12.9
11 Huntstown Power
Co. Finglas
0.721
8.29
12.62 Total 3.034 34.89 53.1 Total over 5 years 15.17 174.43 265.5
TRADING POST 2013
The European Commission has presented proposals for the EU ETS from 2013 to 2020 (the third phase) and thereafter. The key features are:
• Cap tightening – stepwise reduction of total allowances by 20 per cent by 2020.
• Centralisation (’harmonisation’) of – cap fixing, allocation,
monitoring verification and enforcement.
• Auctioning of allowances, with focus on the power sector.
• Leakage provisions for the non-power sectors – more free allowances and/or ‘equivalent effort’ required of imports to EU.
• Banking (including Certified Emission Reductions (CERs) from
CDMs that are already in the second phase ERs) over 13 years – 2008-2020.
11Assuming average price per tonne of CO2 of €23, and – following Sijm et al. (2006) – an average pass through of 50 per cent. Example for Moneypoint: Annual pass through equals 3.735 million x 23 x 0.5 = 42.95. 12Assuming average price per tonne of CO2 of €25 and an average pass through of 70 per cent. Example for Moneypoint: Annual Pass through equals 3.735 million x 25 x 0.70 = 65.36.

MOBILISING MARKET-BASED INSTRUMENTS FOR CLIMATE CHANGE IN IRELAND 25
• CERs post 2012 parked pending UN agreement.
• Exclude small-scale installations (but require “equivalent effort”?).
• Effort sharing – distribute 10 per cent of auctioned allowances to poorer Member States.
These measures are to be welcomed for a number of reasons:
Auctioning will remove the advantage which free allocation gives to incumbents. It will also generate revenues which will accrue to the member states and can be used inter alia to reduce other taxes, intensify carbon reduction effort elsewhere and provide support for poorer people who are particularly disadvantaged by higher prices.
The long period of banking and borrowing will allow smoothing of the
market thereby reducing price swings. Innovation in new carbon reducing technologies will be stimulated by
the longer time horizon, the more stable prices and the guarantee that there will be an immediate cash payoff to reductions.
The ESB’s strategy of investing in carbon reducing technologies will
have the commercial benefit to them of reducing the volume of allowances that they will need to buy to cover their emissions, to the point that they may become exporters of allowances.
COMPETITIVENESS ISSUES
No significant issue in this regard has arisen during the pilot phase, with net outgoings being less than would be paid for an acre of land in Dublin’s city centre.
Short Term (2008-2012) There are short-term issues in the second period arising from the free allocations. When low carbon competitors come into the Irish market, it is crucial that the incumbent advantage of free allocation not be allowed to disadvantage such new entrants.
There is a systematic tendency for the non-utility firms to be treated generously. Excluding cement, their emissions are small: generally a lot less than 100,000 tonnes annually. Those of some significance as regards volume are the Conoco Phillips Whitegate Refinery (Relevant Emission of 372,094; allocation 389,164), Bord na Móna briquette factories at Derrinlough (relevant emission 68,343; allocation 71,478) and Littleton (relevant emission 67,180; allocation 70,261), Diageo Dublin (relevant emission 70,681; allocation 73,924).
Each of the four largest cement installations received 96 per cent of
their relevant emissions, based on a pro rata allocation of the sectoral envelope. If the construction industry grows, and cement holds or grows its share, then these firms – CRH and Quinn – will have to buy allowances to cover their emissions at the margin. Conversely, if construction declines and/or they lose market share, then they could end up with more allowances than they need, and be able to sell these in the market place.

26 BUDGET PERSPECTIVES 2009
Longer Term (2013-2020) While allowances to the utility sector will be auctioned, the issue of auctioning allowances for the non-utility sectors in the scheme is left more open, depending in part on the credibility of the evidence regarding competitiveness issues. Going forward, the Commission proposes a two step approach. Identify the extent to which such issues are relevant at the sectoral level. If there is evidence of negative competitive effects, two possible solutions – requiring ‘equivalent effort’ from companies selling into the EU, in the sense of buying allowances to cover the emissions that were emitted, or giving European producers free allowances. These options are currently being debated.
CARBON TAX AND TRADING
The firms in the trading scheme have shown that they can adapt to the market. They are faced with a price signal in the Euro 20-30 range that tells them 24 hours a day, 365 days a year, that, if they reduce emissions at a cost below this level, they can sell the allowances released at a profit. It would be redundant and economically inefficient to apply a carbon tax to those in the trading sector, for the following reasons: individuals and firms adjust at the margin to approximately make the costs and benefits at the margin equal, and diminishing returns sets in – the more you do, the more expensive it becomes. Efficiency for a particular objective is maximised if the returns at the margin across all the abators is equal. So we recommend that the carbon tax only be applied to those not in the trading scheme. The scale of the challenge, in terms of meeting the Commission’s target of a 20 per cent reduction in the non-trading sectors is clear from the Table below.
Table 4: Emissions from the Non-Trading Sector in 2005, and Hypothetical Targets for 2020 to Meet the EU Cap
Sector Emissions in
2005 Million Tonnes of CO2
Equivalent
Per Cent of Total
Target if Each Sector Reduced Pro Rata by 20
Per Cent in Tonnes of CO2e
Reduction Needed in
Million Tonnes of
CO2e Agriculture13
19.6 41.3 15.7 -3.9 Transport 13.0 27.4 10.4 -2.6 Residential (non-electric only) 6.9 14.6 5.5 -1.4 Service Premises (private offices and
public buildings) 2.9 6.1 2.3 -0.6 Waste 1.8 3.8 1.4 -0.4 Other (industry not in EU ETS, tourism
etc. 3.2 6.8 2.6 -0.6 Total 47.4 100 37.9 -9.5
13Most emissions from agriculture and waste are methane.

MOBILISING MARKET-BASED INSTRUMENTS FOR CLIMATE CHANGE IN IRELAND 27
Note that this scenario assumes that emissions in 2020 will equal those in 2005, which is a highly conservative assumption.14 But even with this context, we have to squeeze almost 10 million tonnes of emissions out of the system over 12 years, in a context where emissions from agriculture only reduced by 0.7 million tonnes (from 20.3 to 19.6 million) over the 1993-2005 period, and emissions from transport rose by 7.2 million tonnes (from 5.8 to 13.0 million) over the same period.
What role can a carbon tax play in meeting this challenge? This is the
topic to which we now turn. A carbon tax is a tax on the emissions of carbon or carbon dioxide and is
a favoured instrument for economists to reduce CO2 emissions due to its cost-effectiveness. Unlike international oil price rises, which benefit foreign producers, the revenues from carbon taxes can enable other taxes to be reduced, vulnerable households to be helped and the energy-efficiency of their homes to be upgraded.
4. Carbon Tax in the Non-Trading Sectors
As with all market-based instruments the relative increase in the cost of emitting carbon coaxes people to adjust their habits to dearer energy. The goal is to ultimately reduce carbon emissions by sending a price signal to businesses and consumers so that they change their behaviour. By giving users the choice to either reduce their emissions or to pay the tax, carbon taxes are cost effective since generally firms and users with the least abatement costs undertake abatement first. There is also dynamic efficiency, as carbon taxes incentivise firms to invest in technological innovation that will allow them to continually improve their emissions reductions. Inventors of clever ways to reduce energy use now face customers whose interest is enhanced by the true value of the savings that efficiency will bring them.
Carbon taxes are a price-based instrument, compared with emissions
trading which is based on emissions quantities.15 There are advantages and disadvantages to both in their implementation but theoretically, if emissions permits are auctioned in perfect market conditions then both instruments can be equivalent. As with all policy, it is the design of policy measures which determine their success or failure under the usual criteria of static and dynamic economic efficiency, environmental effectiveness, socio-economic impacts, and political/public feasibility.
Taxes on income and labour have a tendency to discourage work while
taxes on pollution discourage pollution. Therefore, raising the same amount of revenue but via more pollution taxes and lower labour taxes helps make the economy more efficient while lowering pollution. Aggregate taxes do not rise but they are raised in a smart manner. Similar arguments can be made for emissions trading systems where emissions permits are auctioned and the revenue used to reduce other taxes. There
14Recent EPA projections suggest that in 2020 the non-ETS sectors will generate 53.3, 52.0, and 44.9 Mt CO2 under their baseline, “with measures”, and “with additional measures” scenarios respectively. 15In the cap-and-trade version of ETS, a cap is set on the total emissions permitted from the sectors included in the scheme.
28 BUDGET PERSPECTIVES 2009
are now several Member States with Environmental Tax Reform (ETR) in place and the COMETR project has carried out an ex-post assessment of the experiences of seven EU Member States with ETR and finds that there are largely positive effects (see Box 1).
The Programme for Government agreed in July 2007 states that:
Appropriate fiscal instruments, including a carbon levy, will be phased in on a revenue-neutral basis over the lifetime of this Government. The environment subgroup of the Commission on Taxation was established in March 2008 …to investigate fiscal measures to protect and enhance the environment including the introduction of a carbon tax.
A carbon tax has been discussed in the Irish context repeatedly since
Fitz Gerald and McCoy first explored the options for implementation of a carbon tax in Ireland in their seminal paper in 1992. Further work was carried out subsequently on the impact of a carbon tax on the Irish economy (Bergin et al., 2004; Smith, 2003; Wissema and Dellink, 2007; Fitz Gerald et al., 2008; and Tol et al., 2008) and examining the distributive effect on households (Scott and Eakins, 2004; Tol et al., 2008). The Department of Finance considered the introduction of a carbon tax in 2003 and opened a public consultation on the issue.16 Subsequently, a report was produced summarising the 117 submissions and in September 2004 the Minister for Finance, Charlie McCreevy, announced that the carbon tax would not be implemented. The reason given was that …the environmental benefits would not justify the difficulties that would arise, particularly for households, from the introduction of such a tax. There was insufficient political will to implement a policy with such a high level of public unpopularity.
Box 1: Evidence from Other EU Member States The COMETR project examined the experience of six countries on the issues of competitiveness, carbon leakage, mitigation, and compensation with respect to Environmental Tax Reform (ETR). The study concludes that while the environmental taxes implemented were “relatively modest”, they have contributed to greenhouse gas emissions reduction of between 1.5 and 6 per cent in 2004 compared to business as usual. It is estimated that by 2012 the effect will comprise a reduction of up to 7 per cent below the outcome without the tax reform. In addition it is calculated that the tax reform has produced a modest but significant positive effect on economic growth. This has arisen because carbon taxes have led to energy efficiency gains and lower wage costs.
The study found that there are winning and losing sectors under the
reform and that overall there has been an economic advantage for five of the six countries studied. In the UK the reform was found to have a neutral effect on the economy, but it was noted that the scale of the tax rates levied there has been modest and it is also the most recent environmental tax reform.
It appears to make a difference whether energy prices or taxes increase.
The main reason for this is that with energy price rises the additional revenue does not return to the public domain but is exported whereas domestic taxes can be used to lower other taxes. In addition, domestic 16http://www.finance.gov.ie/viewdoc.asp?DocID=1778

MOBILISING MARKET-BASED INSTRUMENTS FOR CLIMATE CHANGE IN IRELAND 29
taxes are not levied on non-fuel imported raw materials and intermediate goods and this can have implications for firm competitiveness.17 Figure 1: The Effect* of Green Tax Reform (ETR) on Economic Growth
*The effect is measured as the difference between the baseline and the reference case of ETR. Slovenia has not introduced green tax reform, but has adjusted energy taxes in the industrial sector according to CO2-content. Source: Cambridge Econometrics.18
A Commission on Taxation has been re-formed in 2008 with an
environmental subgroup to examine again the potential introduction of a carbon tax and it is interesting to consider how to resolve the perceived obstacles from 2003. The following concerns are often raised in arguments against a carbon tax:
• Not effective in terms of CO2 emissions reduced – while energy prices have risen over the past years, energy consumption has also risen;
• Most of industry is already part of the EU ETS and carbon taxation
would lead to double taxation;
• Reduction in industry competitiveness;
• Issue of fuel poverty among low income households;
• Inequitable burden on rural dwellers due to high price of transport fuels.
Carbon taxation is a contentious issue, particularly in a world of high
energy prices. An important argument in its favour is our high level of greenhouse gas emissions and the fact that we have legally binding commitments under European Union law which are proving expensive to meet. In the last budget the government set aside €270 million in addition to the previous €20 million in 2005 in order that the government be able to 17COMETR website http://www.dmu.dk/International/News/Archive/2007/CO2tax. htm. The full report is available on the COMETR website http://www2.dmu.dk/ cometr/ 18Ibid.
30 BUDGET PERSPECTIVES 2009
purchase up to 18 million tonnes of carbon allowances over the period 2008-2012. This assumes a purchase price of approximately €15/tCO2 emissions; if this price rises appreciably or Ireland requires even more allowances to meet rising emissions, then the amount required to buy credits could become significantly higher. As noted earlier, these obligations are expected to become more demanding post 2012. Instead of raising general taxes on all taxpayers to buy out our obligations, it makes sense to face every emitter with the cost of their emissions, and encourage them automatically to reduce. This is fair because those who emit most pay most, and it is efficient because the abatement response is left to the emitter.
LEVEL AND TIMING OF THE CARBON TAX
In the Programme for Government, there is a commitment to reduce emissions to 86 per cent of 2007 levels by 2010. Since this commitment was agreed, the Commission has proposed that Ireland’s emissions from the non-traded sector be reduced by 20 per cent by 2020, perhaps rising to 30 per cent in the event of international agreement. We propose that this Commission target should supercede the programme for government commitment for the following reasons: it ensures consistency between Irish and EU policy, and it allows more time for government business and households to bring forward and implement reduction strategies that are cost effective.
When should a tax be introduced, and at what level? Greenhouse gas emissions continue to rise in the non-trading sectors and policies are needed with immediate effect that begin to arrest this trend and raise awareness as soon as possible. Therefore, the carbon tax should be implemented forthwith, modified if necessary thereafter to ensure consistency with the Commission for Taxation’s proposals. A carbon tax could be phased in, starting with the budget for 2009, initially at a low level, to give businesses and households time to adjust, rising to approximately equal the price of carbon in the emissions trading market so that all sectors are equally treated. This is estimated to be about €25/tCO2 in 2012. It takes 3-5 years for most of the incentive effects of a carbon levy to be reflected on the ground and therefore, the tax could be introduced now, even at a low level.
SCOPE OF THE CARBON TAX
We agree with Tol (2007), Tol et al. (2008) and Fitz Gerald et al. (2008) that sectors already included in the ETS should be exempt from the carbon tax. The scope of the EU ETS is fixed for now and unlikely to be extended to other sectors in the near future. Although most allowances were grandfathered to the sectors in the EU ETS, there is evidence to suggest that carbon prices will be passed through to consumers and, therefore, as discussed in the previous section we do not propose that ETS sectors be liable for a carbon tax. It can be expected that the cost to firms in the ETS of ‘acquiring’ permits will mean the cost of using permits by emitting CO2 and these costs will be passed through to consumers even if extra permits are not purchased. As noted, it is proposed that allowances in EU ETS be auctioned from 2013. While the tax in principle should cover all of the non-traded emissions, there would be difficulties in implementing such a tax to diffuse non-point sources, such as agriculture. So we propose that the tax initially apply to the rest of the non-traded sectors – transport,

MOBILISING MARKET-BASED INSTRUMENTS FOR CLIMATE CHANGE IN IRELAND 31
residential, services, waste industry not in EU ETS – with a separate ‘equivalent effort’ provisions to apply to agriculture.
Concerns with social equity should be addressed through the use of revenue from the tax and we will discuss this in a later section.
POTENTIAL CO2 EMISSIONS REDUCTIONS
A study by Kema (2008) for Sustainable Energy Ireland focused on opportunities to achieve energy efficiency in the residential, commercial and industrial sectors. It identifies substantial economic potential for carbon savings in electricity, oil and gas, where ‘economic’ is defined as “those measures that are cost effective under current conditions.”19 It does not address agriculture and transport, and does not distinguish between the traded and the non-traded sectors. Estimates of the costs and potential for emissions reduction are also found in ICF Byrne Ó Cléirigh (2006) in their analysis of the marginal costs of abatement prepared for the Department of the Environment, Heritage and Local Government as background for the development of the National Allocation Plans for EU ETS. Their analysis does recognise the distinction between trading and non-trading sectors, and includes agriculture and transport. Although they are difficult to compare, because of the different focus and scope, the ICF Byrne Ó Cléirigh analysis seems to be much more conservative as to what can be achieved at what cost. An estimate of the impact of a carbon tax of 20€/tCO2 on emissions from the non-trading sectors excluding agriculture was included in the Comhar SDC submission to Budget 2008. CO2 emissions reductions were estimated using long run (3-5 years) elasticities and resulting CO2 percentage changes for households (-3.1 per cent) and industry (-4.3 per cent) from ESRI, road haulage transport using elasticities from Bjørner, (1999) (-0.1),20 road transport (cars) (-0.17) from Ryan et al. (2007)21 and it is assumed that the elasticity for service premises is equal to that of industry. This led to estimated savings of 469kt CO2 emissions based on 2005 values, which is similar to the 500kt estimated in the Department of Finance consultation document produced in 2003.
The literature in this area has examined the impact of different carbon
price levels on Irish CO2 emissions. Bergin et al. (2004) found that a carbon tax of €20/tCO2 emissions would not reduce emissions sufficiently to meet Ireland’s target in 2012 of 13 per cent emissions increase compared with 1990 under the EU burden-sharing agreement. However, Wissema and Dellink (2007) find that a carbon tax of approximately €10-15/tCO2 would result in a reduction of 25.8 per cent compared with 1998 levels, which would achieve Ireland’s 2012 target. More recently FitzGerald et al. (2008) and Tol et al. (2008) find that a carbon tax set approximately equal to the emissions trading price, i.e. €20/tCO2 in 2012 and €38/tCO2 in 2020 would reduce CO2 emissions from the non-ETS sectors by a modest amount
19Amounting to 3.759, 1.868 and 0.714 million tonnes of CO2 respectively. 20Bjørner, T.B. (1999). “Environmental Benefits from Better Freight Transport Management: Freight Traffic in a VAR Model,” Transportation Research D, Vol. 4, No. 1, January, pp. 45-64. 21Ryan, L., S. Ferreira, and F. Convery (2007). “The impact of fiscal and other measures on new passenger car sales and CO2 emissions intensity: Evidence from Europe”, ongoing research.
32 BUDGET PERSPECTIVES 2009
(523kt) and would not achieve the proposed 2020 CO2 emissions target. However, these are in part a function of the use to which the carbon tax revenue is put, which is the subject of the next section.
The announcement of the introduction of a carbon tax has an important
impact on reducing carbon emissions in advance of the actual implementation of such a scheme. In the UK, study of the impact of the climate change levy (CCL) shows that there is a much stronger “announcement effect” than “price effect” on emissions reductions.22 They estimate that the announcement effect of the CCL on its own (i.e. without price effects from the imposition of the CCL) caused a reduction in energy demand from other final users of 4.0 per cent in 2001, then 8.4 per cent in 2002, and this is expected to rise to 13.8 per cent in 2010. This includes the feedback effect of lower demand causing lower electricity prices, which reduced the announcement effect’s impact. The modelling work described above regarding an Irish carbon tax does not include any additional effects such as the “announcement” effect and therefore, it may be that the introduction of a carbon tax in Ireland would have a stronger impact on CO2 emissions than the models have indicated.
Box 2: UK Climate Change Levy and Agreements In the UK a climate change levy was announced in 1999 and implemented in 2001. We have examined this levy for comparison with a potential carbon tax in Ireland. First, there is a fundamental difference in that the UK climate change levy is only applied to industry, commerce and the public sector. It does not apply to fuels used by the domestic or transport sector, fuels used for the production of other forms of energy (e.g. electricity generation) or for non-energy purposes; it also does not apply to energy used by registered charities for non-business uses, and energy used by very small firms.23 The levy is not charged as a function of the carbon content of fuels but is levied directly on the energy type. Businesses that are part of the climate change negotiated agreements and who meet their energy reduction targets are eligible for an 80 per cent rebate in the climate change levy. Businesses that are part of the negotiated climate change agreements are also eligible to join the emissions trading scheme to buy allowances beyond their target. In this way firms either meet their agreement target through their abatement efforts or by purchase of emissions allowances and pay 20 per cent of the climate change levy, or they do not and pay the tax.
22Cambridge Econometrics (2005). “Modelling the initial effects of the climate change levy”. Available at http://customs.hmrc.gov.uk/channelsPortalWebApp/channelsPortalWebApp .portal?_nfpb=true&_pageLabel=pageImport_ShowContent&propertyType=document&columns=1&id=HMCE_PROD1_023971#P15_3004 [Accessed 8/10/2007] 23Rates of levy are 0.15p/kWh for gas, 0.98/kg (equivalent to 0.07p/kWh) for liquefied petroleum gas (LPG), 0.44/kWh for electricity and, 0.12p for any other taxable commodity. The levy is expected to raise around £1 billion in its first full year (2001/02). The levy package is expected to lead to reductions in carbon dioxide emissions of at least 2.5 million tonnes of carbon a year by 2010. http://www.defra.gov.uk/environment/climatechange/uk/business/ccl/intro.htm [accessed October 8, 2007].

MOBILISING MARKET-BASED INSTRUMENTS FOR CLIMATE CHANGE IN IRELAND 33
REVENUE USE
The Medium-Term Review estimates the CO2 emissions from the non-traded sector in 2010 to be approximately 28 MtCO2.
24 This equates to a revenue stream of around €550 million (for a carbon tax of €20/tCO2) and is forecast to grow annually by between 7.2 per cent and 8.2 per cent, depending on whether all greenhouse gas emissions are included or just CO2 emissions and whether ETS permits are auctioned. Therefore, the revenue from a carbon tax is expected to be significant and there are several options for its use. The Programme for Government states that the carbon levy or tax should be revenue neutral which means that the revenues from the levy should be recycled back to the citizens – taxes should not be increased but rather the tax base shifted in favour of carbon emission reducing activities, or the money should be returned. How exactly this is done is a key determinant of (a) environmental performance, (b) economic competitiveness, and (c) public acceptability. The latter is becoming increasingly important in the face of rising energy prices. There are three broad categories of use for carbon tax revenue generally discussed – hypothecation for investment in environmental activities, macroeconomic adjustment such as a reduction in labour taxes, and finally, compensation to households for distributive effects.
The first option is to recycle some or all of the revenues from the carbon tax to the different sectors in approximate proportion to their payments, and in manners that further intensifies and incentivises actions to reduce emissions and to address some of the equity and competitiveness concerns associated with a carbon tax. In general, economists prefer that the revenue from environmental taxes not be set aside or hypothecated for greenhouse gas emissions saving activities. The argument is mainly that it reduces the flexibility of the government budget and also that if an activity is not worth subsidising from the national budget then it is also not worth subsidising with the carbon tax revenue (Tol et al., 2008). The latter point assumes that government already has in place a system for the efficient allocation of public expenditure. There is the risk that if significant funds are earmarked for investment in specific activities then they may be wastefully spent in order to “use up” the funds.
However, there are some advantages associated with a decision that
some of the carbon tax revenue should be invested in further greenhouse gas emissions savings activities. The experience of Sustainable Energy Ireland through the pilot negotiated agreements programme with industry in 2002 showed that the emissions savings were almost doubled if a carbon tax was linked with an industry agreement providing energy-saving expertise and services. There is a case to be made that there may currently be underinvestment of the government budget in public good activities such as energy technology R&D, centres providing expertise and advice to firms in energy efficiency and other greenhouse gas emissions mitigation and adaptation activities, which are of little commercial value at this time. In addition, investment in developing alternative energy sources such as renewable energies may reduce the burden of the carbon levy in the long run. 24Note that the emissions forecast is calculated including a carbon tax and, therefore, the emissions have been adjusted to take this into account.
34 BUDGET PERSPECTIVES 2009
Another significant advantage of investment of the revenue in the sectors that have paid the taxes is that it is likely to increase the public acceptability and hence, political feasibility of implementing a carbon tax. There is also a fairness aspect; if all the revenue is spent on individuals’ income tax reductions and welfare benefits, then it might be argued that business sectors facing the carbon tax such as road haulage, services sectors etc. also deserve a share of the revenue directly.25
There may be a case for using some of the revenue to increase
stakeholder buy-in to a carbon tax scheme and also to maximise the greenhouse gas emissions savings that could be achieved through investment in public good activities such as provision of centres of expertise etc. In order to identify the best means to utilise the revenue in each sector, the government could engage with each sector to identify expenditure within the sector that will further reduce emissions. This is consistent with the partnership model that has worked well for Ireland, and should encourage ‘buy in’ as well as increasing the effect on emissions reduction yielded by the incentive effects of the levy alone. The key requirement of any sectoral agreement would be that it significantly and cost-effectively further reduces emissions. While we do not argue that all carbon tax revenue should be spent on investment in climate change-related activities, we believe that more government spending is needed in certain public good activities relating to climate change and that a portion of the carbon tax revenue could be used to fund this. Further study is needed to examine the gaps in current spending and to assess the amounts needed to develop opportunities and technologies to reduce greenhouse gas emissions cost effectively. Regular review would be needed of the amounts spent to ensure efficiency. The Kema (2008) and ICF Byrne Ó Cléirigh (2006) analyses provide contrasting menus of opportunities which need to be investigated further to identify (a) the hierarchy of reduction opportunities that exist, ranked on the basis of cost effectiveness, (b) the government or market failures that are inhibiting the take up of these opportunities and (c) the role, if any, of public expenditure in facilitating abatement.
Another option is to use the funds to reduce other taxes and charges,
e.g. PRSI, or to provide a lump sum rebate to households. Classical ETR protagonists favour the use of environmental tax revenue to lower other taxes such as on labour. Since carbon tax raises prices and therefore the cost of living too, it would normally be expected that wage demands would also rise. Therefore the revenue from carbon tax could be used to offset some of the increased costs people face by for example reducing income taxes, social insurance contributions, or giving a lump sum to all households. This could be done in line with the Agreed Programme for Government, which has the stated goal of reducing PRSI at 2 per cent to 4 per cent over the term of government. However, the programme also plans to raise the ceiling on PRSI rates so that PRSI can be levied on all income in which case the additional revenue raised would cover the reduction in rates. Wages on the other hand have risen in Ireland significantly over the last years with 5.5 per cent growth in 2007 and exceed that of many of our trading partners. While the Spring ESRI Quarterly Economic Commentary 25Although they would benefit indirectly through stable wage demands as a result of the income tax reduction.

MOBILISING MARKET-BASED INSTRUMENTS FOR CLIMATE CHANGE IN IRELAND 35
forecasts this to decrease over 2008 and 2009 to 4 per cent and 3.5 per cent respectively (Barrett et al. 2008), the use of carbon tax revenue to reduce labour costs further could be significant in improving Ireland’s competitiveness.
The Medium-Term Review and Tol et al. (2008) model the effect of
different uses of revenue on the economy and CO2 emissions. They compare the impact of using carbon tax revenue to invest in health and education, reductions in income tax, social insurance or national debt, distribute lump sums to householders, and buy permits internationally. They find that investment in health and education has the largest positive effect on GNP and employment but that in the long run causes a reduction in the output of the private sector due to crowding out by the public sector. A reduction in income tax is beneficial to the economy and employment, however, only those who have a taxed income are included and therefore, other mechanisms such as increased welfare benefits would also need to be included for those not in the tax net.
Scott and Eakins (2004) and Tol et al. (2008) examine the impact of a
carbon tax on household income and find that it is regressive as expected,26 the lower income deciles of the population spend a higher share of their incomes on fuels. Scott and Eakins (2004) considered various forms of compensation27 to lower income households and found that a strategy which delivers lump sum compensation to the bottom five income deciles of the order of the average annual expenditure on carbon tax (estimated at €246) would be best. They also recommend setting aside approximately €50 million for energy efficiency enhancing schemes such as house insulation and fuel switching. There were an estimated 100,000 households or 6.5 per cent of the population in 2005, who went “without heating at some stage during the year” because they could not afford it.28 It costs on average €1,000 to install attic or wall cavity insulation in a home (which improves energy efficiency by 20 per cent); therefore, a significant budget is required to perform this task in all homes classified as at risk of fuel poverty.
The modelling work by Fitz Gerald et al. (2008) and Tol et al. (2008)
estimates that the increased cost of living due to the carbon tax could be fully compensated by reducing labour taxes and increased welfare benefits with 65-80 per cent of the revenue, leaving 20-35 per cent of the revenue available for other uses. From this it seems that there is scope to make room for use of the revenue for both macroeconomic and greenhouse gas emissions mitigation benefits. In line with the literature discussed here, we propose that 40 per cent of carbon revenues be utilised to reduce income taxes, 25-30 per cent be used to compensate lower income households, and the remaining amount be invested in public good activities to reduce greenhouse gas emissions in the affected sectors.
26Interestingly, Scott and Eakins find that while a carbon tax would be regressive for expenditure on residential fuels, expenditure on transport fuels as a share of disposable income is highest for middle income families and, therefore, may need some form of compensation for the increased costs. 27In particular they investigated VAT reduction and different strategies of lump sum compensation. 28CSO (2006). EU Survey on Income and Living Conditions (EU-SILC) 2005.
36 BUDGET PERSPECTIVES 2009
CAP AND SHARE SCHEME
An alternative to a carbon levy has been proposed in some quarters as a ‘Cap and Share’ scheme (c&s) for some or all of the non-trading sectors, whereby each citizen would be given an allowance allocation, with the total of such allocations amounting to the desired cap.29. Essentially, the scheme would operate similarly to a carbon levy but would address the problem of public acceptability since the cap is placed on upstream emissions. There is a significant difference between the carbon levy and a cap and share scheme in terms of the revenue use. Whereas a carbon levy would generate revenue to the Exchequer, a cap and share scheme effectively awards each citizen the revenue associated with average per capita greenhouse gas emissions. Comhar SDC commissioned research in 2007 on c&s as a policy instrument to reduce greenhouse gas emissions from Irish residential and transport sectors which are not covered by the EU emissions trading scheme. Both represent a significant source of greenhouse gas emissions in Ireland, making up 10.7 per cent and 19.4 per cent respectively of Irish greenhouse gas emissions in 2006.30 At the time of writing AEA Technology have completed a qualitative analysis of the scheme and this section is based on that work; further modelling analysis is ongoing with Cambridge Econometrics.31
Cap and share is an idea proposed in Ireland by the Foundation for the Economics of Sustainability (FEASTA) which is based on the argument that each individual should get an equal share of the benefits from the limited amount of fossil fuels that will be burned and the associated greenhouse gas emissions released to the atmosphere.32 Accordingly, a cap would be set for the greenhouse gas emissions emitted by primary fossil fuel suppliers to the sectors included in the scheme and certificates issued to all adults entitling them to an equal share of the emissions permitted under that year’s cap. These certificates could then be sold to the fossil fuel suppliers via an intermediary such as a bank or post office. By capping emissions upstream the price of emissions is built into the price of fossil fuels which are passed through to the consumer. The consumer has an incentive to use less fossil fuel than the average amount for which he is compensated through the sale of the certificates. There are no examples in other countries of such a scheme in operation.
A simple example may better illustrate how this scheme works. The
government decides the level of a cap on emissions from fuels supplied to the household and transport sectors. This amount of emissions is divided 29FEASTA report, 2006. Using Cap and Share to control emissions from the EU transport sector. Available at http://www.feasta.org/documents/energy/Transport_emissions_in_EU_ proposal2.pdf. More information at www.capandshare.org 30EPA (2008). “Ireland’s Emissions of Greenhouse Gases for the period 1990-2006”. Available at http://www.epa.ie/downloads/pubs/air/airemissions/name,23960,en.html 31The qualitative analysis is available in the interim report at http://www.comharsdc.ie/ publications/index.aspx 32Progress of the cap-and-share idea can be traced through various papers published by FEASTA on their website. Contraction and Convergence was the original concept and Richard Douthwaite worked with Aubrey Meyer over 12 years up to about 2005 developing it and also producing a Schumacher Briefing on it. http://greenbooks.co.uk/store/product_info.php?cPath=33&ref=159&products_id=184&osCsid=7b2ef78582fa1fe15fdaa88cc3689cfe
MOBILISING MARKET-BASED INSTRUMENTS FOR CLIMATE CHANGE IN IRELAND 37
equally between all citizens and each citizen is sent a certificate representing credits for the average amount of CO2 emissions. Fuel importers now come under the emissions cap upstream and are required to buy emissions credits from banks; they then pass-through the cost to consumers. The consumers, facing this extra cost, bring their certificates to the intermediary, maybe a bank, and cash in the whole amount or perhaps just enough to cover their current expenditure while withholding the rest in the belief that prices may rise in the future. They are encouraged to reduce their CO2 emissions to minimise their exposure to the increased fuel costs.
DESIGN ISSUES
Scope The Cap and Share scheme could in principle apply to the whole economy as a means of driving down emissions in all sectors. However, in practice there would be interactions with existing measures and it may be desirable to focus on certain emitting sectors.
Emissions from the transport sector represent the largest growing source of CO2 emissions and this suggests that the focus of a Cap and Share scheme could be emissions from the transport sector. The benefits of restricting the scheme to the transport sector would be a focused move towards a more sustainable transport system, and provide the opportunity for learning before any further expansion. The advantages of wider initial implementation would be economies of scale and the opportunity to understand more about the interaction between the scheme and the wider economy. A second further area of potential coverage is domestic use of energy, although the EU ETS does already regulate emissions from the electricity sector.
Equity There are winners and losers with all price-based carbon emissions schemes. With the Cap and Share scheme these effects would be no more significant than any other mechanism that places a cost on carbon emissions and again it is the design of the scheme that will determine the extent of the effects. The effects in general are similar to those described above for a carbon tax combined with lump sum compensation for all citizens. Under c&s lower income households, on average, would benefit since they have lower than average energy consumption and would receive emissions certificates worth more than the increased fuel costs they incur. However, due to variability within income bands, some low income households would be worse off, and may be less able to find energy savings or absorb increased costs compared with their wealthier counterparts.
Those living in rural communities could also be disadvantaged, relative to those in towns and cities, because they are likely to need to travel greater distances for basic amenities. They would also have less access to low carbon public transport alternatives to using a car. Also, the distribution of certificates to single-person households may not fully compensate them for the increased costs they would incur.
There are a number of possible ways to address these equity concerns.
The preferred approach would be to address them through alternative measures, such as increases in the Children’s Allowance, the domestic
38 BUDGET PERSPECTIVES 2009
heating allowance or funding for public transport. These measures could be funded through general taxation or through the auction of a proportion of the emissions allowances. If the national budget were used this would decouple the revenue through carbon emissions from investments in environmental activities, as recommended for the carbon tax above. However, in this case extra revenue may be required and, therefore, general taxes may have to be raised. Reducing each individual’s allocation for the purpose of auctioning could be seen to worsen the issue as lower income groups would be compensated less than before. A further possibility would be to allocate more to those who would otherwise stand to lose, although this would appear to undermine the principle of the scheme.
Population Coverage A register of eligible individuals could be complied through a combination of the electoral roll and the Personal Public Service number system, to capture the majority of people residing in Ireland.
A question on the treatment of children arises, since they are consumers of energy but not necessarily purchasers. Literature regarding personal trading schemes generally suggests not allocating allowances to children, although consideration would need to be given to the age at which individuals are treated as an adult for the purpose of the scheme. Consideration should also be given to other mechanisms to support families regarding the increased carbon costs. Less favoured alternatives would include partial allocation to children or allocation on a household basis (Starkey and Anderson (2005), Dresner and Ekins (2004), DEFRA (2006)).
Short stay visitors would not be included in the scheme, although longer
stay residents that register for a PPS number should be included. If this were the case then consideration of eligibility or something similar would be needed in order to avoid exploitation of the scheme by visitors who receive and sell certificates and then leave.
Institutional Arrangements A Government body would need to be responsible for setting the framework, the objectives and dealing with any policy issues. The Department of Environment, Heritage and Local Government, as the department responsible for climate policy, would be the most likely choice. Cap setting could either be carried out by Government or an independent body. In either case, however, the cap should be consistent with the national target in the National Climate Change Strategy and the strategy it sets for individual sectors.
The scheme would need to be run by a single administrative body. This would ensure consistent accountability for all aspects and clarity from the perspective of participants. It would also ensure the effects of any changes to approach could be managed throughout the process. The Environmental Protection Agency, as scheme administrator for the EU ETS, would be the logical choice. It could also draw on its experience from being responsible for the National Emissions Inventory. The responsibilities of this body would be to: maintain the register of fuel suppliers; define the standards by which emissions must be reported and
MOBILISING MARKET-BASED INSTRUMENTS FOR CLIMATE CHANGE IN IRELAND 39
verified and produce guidance documents; and maintain the trading registry.
In addition to the above activities there would be a number of other
functions for which the scheme administrator must maintain an overview but which may be carried out by other bodies. These would include: maintaining a list of participating individuals and issuing them with certificates (for which the Department of Social and Family Affairs would have a role); determination and verification/audit of emissions (for which Customs and Excise would have a role); market regulation and; training and capacity building.
Transaction Costs The costs of designing the Cap and Share scheme in relation to other measures would in general be higher than introducing a carbon tax. For the Cap and Share scheme the cost of administering the fuel suppliers is likely to be secondary to the costs associated with issuing certificates to the general public.
The cost to the members of the public is very sensitive to a number of design issues. The simple bottom up estimate of AEA Technology, which included the value of people’s time, puts the transaction costs for a system where certificates are cashed in remotely in the range 8-11 per cent of the value of the certificates. This range depends on income and assumes an allowance price of €20/tCO2 and a bank direct transaction charge of 5 per cent. At higher carbon prices the relative cost effectiveness would be better, with transaction costs around 6-7 per cent for a price of €50/tCO2. However, if participants were required to cash in allowances in person then the costs could be significantly higher. To minimise transaction costs for individuals to a level that will be considered acceptable consideration would need to be given to the following:
• Allowing on-line and postal facilities for converting certificates.
• Minimising the amount of material that an individual must
understand, possibly making use of passive media such as television and radio broadcasts.
• Allowing individuals to delegate the authority to cash in allowances.
• Simplifying the requirements on banks and post offices to minimise
their costs and the changes that they may charge for transactions.
• Considering the cost impacts when deciding whether to distribute certificates more frequently than yearly.
Finally, the administration costs to those industries that would be
required to register, trade and surrender allowances would be small in comparison with the costs to Government and the general population as a whole.
Legal Aspects On legal aspects the European Commission is unlikely to prohibit the scheme on the basis of it constituting State aid, primarily because the scheme as a whole would not give rise to a net benefit to any commercial
40 BUDGET PERSPECTIVES 2009
undertakings. However, cases that may have relevance to Cap and Share where State aid has been upheld have been identified in the AEA Technology report. Therefore, it was not possible to be fully conclusive on this issue. Similarly, internal market rules should not be prohibitive.
CAP AND SHARE CONCLUSIONS
Overall, this research has outlined a number of key design issues relating to the Cap and Share scheme, and suggested possible ways forward. In particular:
• A cautious approach would suggest initial implementation for the transport sector only, with subsequent consideration to sectoral and geographical expansion.
• But note that the cap and share approach involves transferring the
value of allowances directly to the citizenry, i.e. compared to the carbon levy, no revenue accrues directly to the Exchequer.
• The scheme is not inherently inequitable, but measures would be
needed to shield the vulnerable from increased costs.
• The scheme should be based on the PPS system and electoral role, with consideration given to the treatment of children. Evidence suggests not allocating to children, although again consideration will be needed for increasing support to families.
• The roles of various institutions have been suggested, with a key
element being the scheme administrator that would have an overview of the whole scheme.
• Transaction costs to individuals can be acceptably low, provided
they can cash in their certificates remotely (on-line or by post). We are facing a carbon constrained world, where our ability to use the
atmosphere to dispose of greenhouse gas emissions in limitless quantities for free no longer applies. ‘Do nothing’, or ‘let the others do it’ is not available as an option. In practical terms, the constraints we face come to us from our share of the European Union’s commitments, and these come in two forms: the power sector and heavy industry (cement, refining, glass and ceramics etc.) which are already in the European Union Emissions Trading Scheme (EU ETS), and the rest – the non-traded sectors – comprising agriculture, industry not in EU ETS (heating and process energy only), households (heating only), transport, commerce, waste.
5. Discussion and Conclusions
As regards the trading sectors, the evidence we have from the pilot
phase is that Irish participants in the EU ETS have managed their obligations with considerable skill, and they are likely to continue to do so. Since they already face a carbon price, we recommend no further policy intervention, and we conclude that it would be inefficient and counterproductive to include them in a taxation scheme. For the period 2008-12, the utilities will capture an ‘unearned’ gain, as they will be able to pass through most of the value of allowances for which they have not paid. We support the pass through, but the fiscal issue arises – should a windfall gain tax be imposed to capture some of this gain over the 2008-12 period? We propose that such a tax not be imposed, but only on condition that the

MOBILISING MARKET-BASED INSTRUMENTS FOR CLIMATE CHANGE IN IRELAND 41
utilities demonstrate that they are undertaking activities that are in the wider public interest, such as funding the installation of time of day meters. The definition of ‘the ESB’ is changing as the organisation divests itself of generating capacity to meet the regulator’s requirements. The company has announced a major investment programme focused on grid development, renewable and efficiency measures. The specific payoffs to the public interest need to be documented, and related to the subsidy implicit in the pass through. The same principle should apply to the other utilities. The Commission proposals for the 2013-2020 period are to auction allowances, at least for the power sector, with the revenues accruing to the government; we support this proposal.
As regards the non-trading sectors, the European Commission has
proposed a legally binding cap on emissions of minus 20 per cent by 2020 compared with 2005 emissions. The challenge we face in Ireland is how best to meet these targets at minimum cost, and in fashions that encourage new business and innovation, and that are fair. Additionally, energy prices are very high with uncertainty regarding future prices and this already provides an incentive to reduce our energy consumption. We strongly favour the use of market based approaches, which allow maximum flexibility which in turn will minimise costs and will also allow encourage innovation. They also make use of other policies such as regulation of building standards, and information on the environmental performance of cars and buildings, to operate more effectively.
Using command and control regulation to meet this very stringent target
would likely be extremely demanding as regards administration and bureaucracy, and very inefficient as regards the burden on the economy because of loss of flexibility. So we are left with the need to introduce a price that signals scarcity but allows a flexible response. There are two broad options: apply a carbon levy that incentives reduction, or create a trading market that caps emissions, and allows participants to buy and sell. The advantages of the levy are as follows: it is easy to implement, with minimal transactions costs; it generates revenues that are then available for re-cycling for some combination of reduction in other taxes, supporting further reductions, and helping vulnerable groups adjust to the price changes – the annual revenues of applying a levy at roughly the rate that reflects the price of allowances would amount to about €0.5 billion annually; it has been done in other countries, so we have experience to draw on as regards reduction responses and economic impacts. Disadvantages are that particularly in a world of high energy prices it evokes public and sectoral opposition, the mitigation of which may require ‘side payments’ in terms of revenue recycling, and uncertainty as regards emissions reductions.
As regards creating a local trading market in what is now the non-
trading sectors, we are at present exploring the potential for a cap and share scheme, whereby a cap is decided upon, individual citizens are given allowances where the sum of such allocations does not exceed the cap. Up-stream suppliers of energy will have to buy allowances from the citizenry to cover their emissions, and these costs will be factored into the price of their energy supplies. This price will increase to the point where demand and supply are in equilibrium. The advantages of this scheme are that: it gives each citizen an asset which has value in the market place, and establishes an identity between the citizen and meeting the climate change challenge, and
42 BUDGET PERSPECTIVES 2009
compensates him or her for the rise in fuel prices – to the extent that one can control emissions, either a net profit (value of allowances exceeds rise in fuel bill) or loss is incurred; it ensures that the target is met. It is very difficult to quantify this sense of ownership and identity, but it is likely to be important in mobilising public understanding of the climate change issue, and support for measures to address it. The disadvantages are that: the transactions costs of setting up and operating the scheme are considerable, because it is new and so there is uncertainty as to how it would work in practice; it does not generate revenues for government, and the inevitable demands for ‘special case’ compensations would have to be funded out of general taxation. If the cap and share scheme were to be used, it seems that it would be most appropriate in the transport sector, where constraining emissions is especially difficult.
Our recommendations are that the carbon tax be phased in immediately
for the non-trading sectors exclusive of agriculture at rates approximately comparable to the price of allowances faced in the trading sector, with revenues used to support a national programme of fuel poverty reduction, to support further reductions in emissions where it is clear that (a) the benefits of doing so exceeds the costs and (b) the market on its own will fail to achieve such reductions, and to fund research and development and innovation that enhances business opportunities in energy efficiency, abatement and adaptation. There is some confusion in the evidence available as regards the energy efficiency and abatement opportunities and their cost in Ireland. These need further interrogation and updating so as to ensure that policy and funding can be directed towards the least cost mix of strategies.
If, as seems to be the case, that the marginal costs of abatement in the
non-trading sectors are much higher than that which prevails in the trading sectors, this asymmetry will impose an economic drag on the economy – we will end up spending more resources than necessary to achieve any given overall combined reductions from the trading and non-trading sectors. This is a weakness of the dichotomy between trading and non-trading in EU climate change policy. Achieving some flexibility between the two pillars – doing more in the trading sectors, and less in the others – would enhance cost effectiveness and competitiveness.
If the research underway indicates a clear advantage to cap and share in
the transport area, the levy on this sector should be removed and replaced by the cap and share mechanism. We note that agriculture, which accounts for almost half of the non-trading sector emissions, will not be included in either scheme at present, as its main emission is methane from livestock. A separate parallel abatement strategy is needed for this sector.
REFERENCES
BARRETT, A., I. KEARNEY and M. O’BRIEN, 2008. Quarterly Economic Commentary, Spring. Dublin: The Economic and Social Research Institute.
BERGIN, A., J. FITZ GERALD and I. KEARNEY, 2004. “The Macro-Economic Effects of Using Fiscal Instruments to Reduce Greenhouse Gas Emissions”, EPA Final Report 2001-EEP/DS8-M1, Environmental RTDI Programme 2000-2006.
BJØRNER, T.B. 1999. “Environmental Benefits from Better Freight Transport” Management: Freight Traffic in a VAR Model,” Transportation Research D, Vol. 4, No. 1, pp. 45-64.
CONVERY, F.J. and L. REDMOND, 2007. “Market and Price Developments in the European Union Emissions Trading Scheme”, Review of Environmental Economics and Policy, Volume 1, Issue 1 Oxford University Press.
CONVERY, F., C. De PERTHUIS, D. ELLERMAN, 2008. “The European Carbon Market in Action: Lessons from the First Trading Period – Intermediate Report,” March 39p. See: http://www.aprec.net/documents/08-03-25_interim_report_en.pdf
CENTRAL STATISTICS OFFICE, 2006. EU Survey on Income and Living Conditions (EU-SILC) 2005.
DELARUE, E., K. VOORSPOOLS and W. D’HAESELEER, 2008. (forthcoming) “Fuel Switching in the Electricity Sector under the EU ETS,” Journal of Energy Engineering.
DRESNER, S. and P. EKINS, 2004. The Distributional Impacts of Economic Instruments to Limit Greenhouse Gas Emissions from Transport, London: Studies Institute.
EEA, 2002. “Annual European Community Greenhouse Gas Inventory 1990-2000 and Inventory Report 2002”, Technical Report Number 75, Copenhagen.
ELLERMAN, A.D. and B. BUCHNER, 2008. “Over-allocation or Abatement: a Preliminary Analysis of the EU ETS based on the 2005-06 Emissions Data”, Environmental and Resource Economics, Vol. 39 (online first).
ELLERMAN, A.D. and P.L. JOSKOW, 2008. The European Union’s Emissions Trading System in Perspective, Pew Center on Global Climate Change, Washington DC, May 54p. Available at: http://www.pewclimate.org/docUploads/EU-ETS-In-Perspective-Report.pdf
ELLERMAN, A.D., P. L. JOSKOW, R. SCHMALENSEE, J.-P. MONTERO and E. M. BAILEY, 2000. Markets for Clean Air: The U.S. Acid Rain Program, New York: Cambridge University Press.
EUROPEAN ENVIRONMENT AGENCY 2007. “Greenhouse Gas Emission Trends and Projections in Europe 2007 – tracking progress towards Kyoto targets” EEA report Number 5/2007. Available at http://reports.eea.europa.eu/eea_report_2007_5/en/Greenhouse_gas_emission_trends_and_projections_in_Europe_2007.pdf
FITZ GERALD, J. and D. McCOY, 1992. Economic Effects of Carbon Taxes, Policy Research Series 14, Dublin: The Economic and Social Research Institute.
FITZ GERALD, J., A. BERGIN, T. CONEFREY, S. DIFFNEY, D. DUFFY, I. KEARNEY, S. LYONS, L. MALAGUZZI VALERI, K. MAYOR, and R.S.J. TOL, 2008. Medium-Term Review 2008-2015, Dublin: The Economic and Social Research Institute.
43
44 BUDGET PERSPECTIVES 2009
ICF BYRNE Ó CLÉIRIGH, 2006. “Determining the Share of Greenhouse Gas Emissions for Emissions Trading in Ireland 2008-2012,” Department of Environment, Heritage and Local Government, Dublin March. Available at: http://www.epa.ie/downloads/pubs/air/etu/epa_ per cent20icf_and_boc_final_report_2006.pdf
JOHNSON, M., M. HARFOOT, C. MUSSER, T. WILEY, 2008. Cap and Share: Phase 1 – Policy Options for Reducing Greenhouse Gas Emissions. AEA Technology report for Comhar Sustainable Development Council.
KEMA, 2008. Demand Side Management in Ireland – Evaluating the Energy Efficiency Opportunities, Dublin: Sustainable Energy Ireland.
McCARTHY, C. and S. SCOTT, 2008. “Controlling the Cost of Controlling the Climate: The Irish Government’s Climate Change Strategy”, ESRI Working Paper No. 229, Dublin: The Economic and Social Research Institute.
ROBERTS, S. and J. THUMIM, 2006. A Rough Guide to Individual Carbon Trading, Centre of Sustainable Energy. Report for UK Department of Environment Food Rural Affairs, November.
RYAN, L., S. FERREIRA and F. CONVERY, 2007. “The impact of fiscal and other measures on new passenger car sales and CO2 emissions intensity: Evidence from Europe”, ongoing research.
SCOTT, S. and J. EAKINS, 2004. “Carbon Taxes: Which Households Gain or Lose?” EPA 2001-EEP/DS7-M1, Environmental RTDI Programme 2000-2006.
SIJM, J., K. NEUHOFF, and Y. CHEN, 2006. “CO2 Cost Pass Through and Windfall Profits in the Power Sector”, Climate Policy, June.
SKJAERSETH, J. B. and J. WETTESTAD, 2008. EU Emissions Trading – Initiation, Decision-making and Implementation, Aldershot: Ashgate.
SMITH S., 2003. “Carbon Tax and Climate Change Strategy”, Budget Perspectives 2004, Dublin: The Economic and Social Research Institute.
STERNER, T., 2003. Policy Instruments for Environmental and Natural Resource Management, RFF Press, Washington DC. 504 pp. ISBN 1-891853-13-9.
STARKEY, R. and K. ANDERSON, 2005. Domestic Tradable Quotas: A Policy Instrument for Reducing Greenhouse Gas Emissions from Energy Use, Technical Report 39. Tyndall Centre for Climate Change Research.
TOL, R.S.J., 2007. “Irish Climate Policy for 2012: An Assessment”, Special Article in Quarterly Economic Commentary, Winter, Dublin: The Economic and Social Research Institute.
TOL, R.S.J., T. CALLAN, T. CONEFREY, J. FITZ GERALD, S. LYONS, L. MALAGUZZI VALERI, and S. SCOTT, 2008. “A Carbon Tax for Ireland”, ESRI Working Paper No. 246, Dublin: The Economic and Social Research Institute.
WEITZMAN, M. L, 1974. “Prices vs. Quantities”, Review of Economic Studies, Blackwell Publishing, Vol. 41, No. 4, pp. 477-491, October.
WEITZMAN, M., 2008. “On Modelling and Interpreting the Economics of Catastrophic Climate Change”, Harvard University May 2008. See: http://www.economics.harvard.edu/faculty/weitzman/files/REStatModeling.pdf
WISSEMA, W. and R. DELLINK, 2007. “AGE analysis of the impact of a carbon energy tax on the Irish economy”, Ecological Economics, Vol. 61, p.p. 671-683.
ANNEX A: TRADING AND THE EUROPEAN UNION EMISSIONS TRADING SCHEME
The European Union has pioneered the development and implementation of the European Union Emissions Trading Scheme (EU ETS), the world’s first trans-national greenhouse gas trading scheme.33 The EU ETS gives a price signal that penalises increased emissions and rewards reductions for those sectors and organisations in the scheme.
The EU ETS involves making allocations of tonnes of carbon dioxide (CO2) emissions (called European Union Allowances or EUAs) per year to installations, with the proviso that at the end of the year, they must ‘hold’ sufficient allowances to cover their emissions in this period. In order to meet this condition, if they are short of allowances, they can enter the market and buy from others who have more than they need (‘long’). A price per tonne of CO2 emerges from these trades, which represents in some sense a cost to emitters of the scarce capacity of the atmosphere to absorb this greenhouse gas. If they can reduce emissions, they can sell those allowances that are surplus to requirements into the market; if they are short, they have to buy in order to cover their requirements. This price signal, therefore, constitutes a continuing incentive: reduce and you will be rewarded, increase and you will have to pay. The EU ETS is sometimes critiqued because it is not ‘as good as’ a carbon tax, and/or that particular design features are perverse and inappropriate. In the context below, we show that a tax is not politically feasible, and the design features of EU ETS in the short run are a product in part of the political necessity, where the choices come down to achieving an imperfect carbon price signal versus none at all. 33Details available at: http://ec.europa.eu/environment/climat/emission.htm. See discussion on characteristics and performance in: Frank J. Convery and Luke Redmond “Market and Price Developments in the European Union Emissions Trading Scheme,” Review of Environmental Economics Policy 2007, Vol. 1, No. 1, pp. 88-111.
45

46 BUDGET PERSPECTIVES 2009
The context of this development is the following34: Following the Rio Environment and Development Conference in 2002, at which the European Commission had pressed for quantitative caps on greenhouse gas emissions, it brought forward a proposal for a European Union (EU) wide carbon energy tax. This was universally opposed by the various industry lobbies, epitomised by UNICE, the European Employers Federation with which the Irish Business and Employers Confederation (IBEC) and their equivalents in the other member states are affiliated. A number of member states also opposed the tax on principle. Since fiscal measures require unanimity, the initiative failed, and was formally withdrawn in 1997. There may be circumstances under which an EU-wide tax would be politically feasible, but it is difficult for us to imagine this as a realistic policy choice.
A1. Context
At the negotiations on the Kyoto Protocol in 1997, the US delegation
insisted on including emissions trading as a flexible measure, and prevailed in spite of strong opposition from the European Union. In 1998, the Commission had a change of heart; the team which had failed to secure the carbon tax was now given a lead role in the development of climate change policy, and charged with progressing an EU-wide emissions trading scheme. Commission support was achieved in part because of the Single market and associated competitiveness concerns; the UK and Denmark had initiated their own (quite different) national trading schemes, and there was a fear that the environmental market would be balkanised, with many trading schemes with different rules, and associated potential for inhibition of trade and high transactions costs. Also, over time, it became clear that ‘business as usual’ would probably not achieve the Kyoto target (EEA, 2002), and there was no other Europe-wide policy measure that was likely to deliver a change in the emissions trajectory.
However, the EU ETS concept was initially vigorously opposed by Germany industry and government on the basis that they had already a voluntary agreement and did not need another policy layer dictated by the Union. Some business elsewhere in Europe was in favour, but argued for a voluntary scheme. Unlike the carbon tax proposals, the EU ETS was proposed as an environmental measure, and, therefore, only required a qualified majority vote by the Member States to secure legal approval. However, there was reluctance to proceed without a degree of German support, since they emit about 25 per cent of covered emissions. The compromise was to agree, but only on the basis that allowances were allocated for free at member state level, with guidance and final approval from the Commission, with monitoring, reporting and verification also at member state level, and with provision to allow ‘opt out’ with equivalent effort in the pilot phase and pooling in the pilot and second (2008-12) phases, with both of these features included to meet needs in the UK and Germany. What emerged was not what should be, but what could be. Importantly, a 3 year pilot phase with review was part of the design, so that substantive weaknesses could be identified and corrected on a ‘learning by doing’ basis.
34The contextual material that follows is drawn from Skjaerseth and Wettestad (2008).
ANNEX A. TRADING AND THE EUROPEAN UNION EMISSIONS TRADING SCHEME 47
The operation of EU ETS in its pilot phase has recently been assessed in Ellerman and Joskow (2008) and Convery, De Perthuis and Ellerman (2008). What follows draws from these sources.
A2. Operation
The EU ETS35 started its first phase – the three-year pilot phase – in
January 2005 and this came to an end in December 2007. We can address coverage, trading, allowance prices, and abatement in the pilot phase. Coverage: Participation was limited to CO2 emissions from combustion installations with a rated thermal input in excess of 20 MW (except municipal or hazardous waste incinerators); oil refineries; production and processing of ferrous metals; manufacture of cement (capacity of over 500 tonnes per day); manufacture of lime (capacity of over 50 tonnes per day); ceramics, including brick and glass; and pulp, paper and board (over 20 tonnes per day). On this basis, EU ETS covered over 40 per cent of greenhouse gas emissions in the Union. Why did the coverage go ‘down stream’? It is notable that the European scheme does not include road transport, which is recognised as the main source of growth in emissions. This is because excise duties on petrol (gasoline) and diesel are high in Europe [The excise duties on gasoline in Germany is equivalent to €275.20 per tonne of CO2]. Governments did not wish to risk the loss of this revenue, and environmentalists worried that if trading were substituted for the tax, the environmental achievements of the tax would be compromised. Competitiveness: Sectoral work shows that, at least in the short run, only sectors not in the trading scheme – and therefore not benefiting from free allowances – but importing electricity prices that reflected in part CO2 allowance prices, such as smelters, would suffer competitive disadvantage. The ex post work supports this conclusion – so far, there is no evidence of negative effects on capped sectors, but high commodity prices and free allocation may mask potential effects. Allowance Price per tonne of CO2 per annum: In the pilot period, the combination of member state originating generous allowances, and abatement produced an initial price of up to €30 per tonne, but this fell over time to close to zero at the end of the period as it became clear in April 2006 that the market was over-supplied. The high price at the outset was a product of: willing buyers – utilities who had been left short, and unwilling sellers – the rest of industry, who had been left ‘long’; inadequate information – real data on supply demand balance only became available in April 2006; inability to carry forward – bank – surplus allowances to Phase 2 (2008-12). Allowance value pass-through in Electricity prices: Another feature of the pilot phase of the EU ETS was the ‘passing through’ in unregulated markets of some of the market value of allowances into electricity prices, even though the allowances were given free of charge. This had the merit of signalling to consumers that they had to pay for the CO2 emissions associated with their consumption, but provided some utilities – notably those in Germany, the UK and the Netherlands, where the markets were unregulated – with
35Directive 2003/87/EC of the European Parliament and of the Council establishing a scheme for greenhouse gas emission allowance trading within the Community and amending Council Directive 96/61/EC.
48 BUDGET PERSPECTIVES 2009
windfall gains. There is evidence that some utilities were capturing significant rents – some being able to pass 40-70 per cent of opportunity cost of allowances through in electricity price. (Sijm, Neuhoff and Chen, 2006). Abatement: As the pilot phase took off, natural gas prices rose sharply – in the EU they are linked to oil prices – while coal prices did not increase proportionately. In the absence of the requirement for allowances, there was a strong incentive for utilities that could do so to bring relatively carbon intensive coal fired plant on line and move them up the dispatch order. But this required the acquisition of more allowances, which increased the costs of operating this plant, and this in turn in some cases changed the tradeoffs. So the CO2 market acted as wedge, limiting the extent of the default to coal, the calculus in some cases in favour of less carbon intensive natural gas. Or shifting from lignite (more carbon) to less carbon intensive hard coal. Independent estimates by Ellerman and Buchner (2008) and Delarue et al (2008) indicate that annual reductions from the counterfactual of about 50-100 million tonnes of CO2 were achieved, and this is consistent with the overall performance documented by the European Environment Agency (2007). Trading Volumes: These grew from 262 million tonnes, valued at €5.97 billion in 2005 to 24.1 billion tonnes, valued at €1,500 billion in 2007. Allocation: it was mainly free, with only Denmark (5 per cent), Hungary (2.5 per cent), Lithuania (1.5 per cent and Ireland (0.75 per cent) doing any auctioning. Inter-country Trades: The transfers between member states are maintained by the European Commission in the independent Community Transaction Log (ICTL). The UK and Spain were the big net buyers in the first Phase, while France, the Czech Republic and Poland were the big net sellers. But of course countries per se do not trade. They represent the aggregate of individual firm decisions.
Table A1: Net Purchases and Sales of Allowances, by Value, During the First Phase (2005-07), EU ETS
Country Net Purchases Country Net Sales
Million € Million € UK -695 France +285 Spain -353 Czech Republic +272 Italy -294 Poland +176 Austria -53 Netherlands +109
Source: Phase 1 € Matrix, CITL European Commission. The major net buyers and sellers are presented in Table A1. The major
net buyers were the UK and Spain, while France and the Czech Republic were the biggest sellers by value.
ANNEX A. TRADING AND THE EUROPEAN UNION EMISSIONS TRADING SCHEME 49
The European Commission reacted to this situation by reducing the allowance allocation by about 6.5 per cent for the second period 2007-2012 and this has tightened up the market, yielding a price for 2008 vintage allowances of over €20 per tonne. A few member states substantially increased auctioning for the 2007-2012 phase, with major countries Germany (8.8 per cent), UK (7 per cent) and the Netherlands (4.0 per cent) leading the way (percentage to be auctioned in brackets).36 The Linking Directive allows firms to meet some of their obligations by purchasing certified emission reductions achieved in projects in developing countries and other developed countries.37
A3. The Policy Response
The Commission has tabled proposals for revision of the emissions
trading Directive38 which include: cap tightening – stepwise reduction to achieve 20 per cent reduction by 2020; centralisation (’harmonisation’) of – cap fixing, allocation, monitoring verification and enforcement; auctioning of allowances (power and...); leakage provisions for the non-power sectors – more free allowances and/or ‘equivalent effort’ required of imports to EU; banking (including CERs) over 13 years – 2008-2020; new certified emission reductions (CERs) from the Clean Development Mechanism post-2012 parked pending UN agreement; exclude small-scale installations (but equivalent effort?); effort sharing – distribute 10 per cent of auctioned allowances to poorer Member States; central control of any new entrant reserve.
Thus the policy response has been to address the weaknesses that became manifest in the pilot phase.
36Ellerman and Joskow (2008), p. 38. 37Directive of the European Parliament and of the Council of Ministers amending the Directive establishing a scheme for greenhouse gas emission allowance trading within the Community, in respect of the Kyoto Protocol’s project mechanisms - COM (2003) 403 final. 38See: footnote 5 above and http://ec.europa.eu/environment/climat/emission/ pdf/com_2008_16_en.pdf
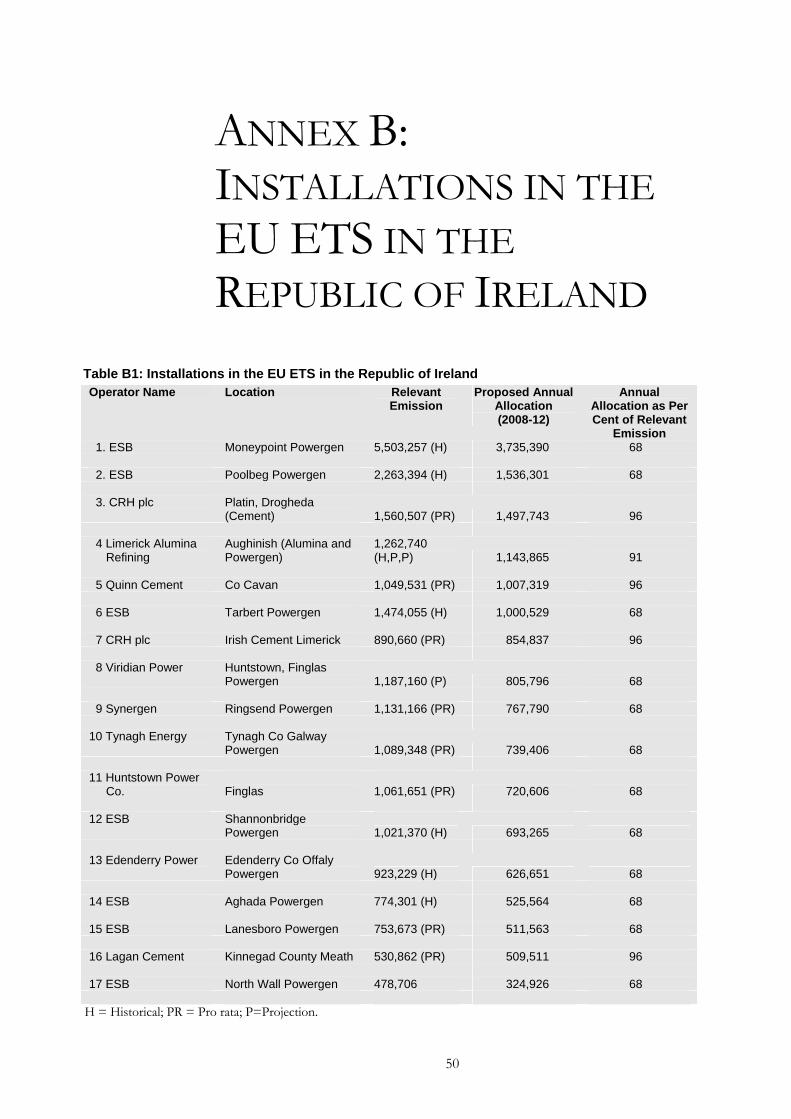
ANNEX B: INSTALLATIONS IN THE EU ETS IN THE REPUBLIC OF IRELAND
Table B1: Installations in the EU ETS in the Republic of Ireland Operator Name Location Relevant
Emission Proposed Annual
Allocation (2008-12)
Annual Allocation as Per Cent of Relevant
Emission 1. ESB Moneypoint Powergen 5,503,257 (H) 3,735,390 68 2. ESB Poolbeg Powergen 2,263,394 (H) 1,536,301 68 3. CRH plc Platin, Drogheda
(Cement) 1,560,507 (PR) 1,497,743 96 4 Limerick Alumina
Refining Aughinish (Alumina and Powergen)
1,262,740 (H,P,P) 1,143,865 91
5 Quinn Cement Co Cavan 1,049,531 (PR) 1,007,319 96 6 ESB Tarbert Powergen 1,474,055 (H) 1,000,529 68 7 CRH plc Irish Cement Limerick 890,660 (PR) 854,837 96 8 Viridian Power Huntstown, Finglas
Powergen 1,187,160 (P) 805,796 68 9 Synergen Ringsend Powergen 1,131,166 (PR) 767,790 68 10 Tynagh Energy Tynagh Co Galway
Powergen 1,089,348 (PR) 739,406 68 11 Huntstown Power
Co. Finglas 1,061,651 (PR) 720,606 68 12 ESB Shannonbridge
Powergen 1,021,370 (H) 693,265 68 13 Edenderry Power Edenderry Co Offaly
Powergen 923,229 (H) 626,651 68 14 ESB Aghada Powergen 774,301 (H) 525,564 68 15 ESB Lanesboro Powergen 753,673 (PR) 511,563 68 16 Lagan Cement Kinnegad County Meath 530,862 (PR) 509,511 96 17 ESB North Wall Powergen 478,706 324,926 68
H = Historical; PR = Pro rata; P=Projection.
50
GETTING OUT WHAT YOU PUT IN An Evaluation of Public Investment in Irish Sport
Pete Lunn This paper presents an economic analysis of the returns to public investment in Irish sport, which has increased dramatically over the past decade. It combines figures on spending by central government and state agencies with a relatively new and rapidly expanded body of research on participation in sport. The aim is to use what has become a substantial evidence base to assess whether Irish sports policy is likely to meet its stated aims of improving health and quality of life. Empirical findings support the view that there are significant health and social benefits to be had from participation in sport. However, the analysis challenges the way current policy addresses three trade-offs in the allocation of resources: the balance between “elite” and “grassroots” sport; the trade-off between investment in sporting facilities (physical capital) and participation programmes (human and social capital); and the allocation of public money across the range of different sporting activities. In each case, given the stated aims of policy and the evidence base, it is difficult to justify the current position. The paper concludes that the allocation of public investment in sport needs to be updated in light of recent findings.
Abstract
This paper is motivated by a number of developments that have taken place in sports policy. First, successive budgets have delivered substantial and sustained increases in the level of public funding for sport over the past ten years. According to the Revised Estimates for Public Services 2008, the total allocation of central government funds to the sport budget of the Department of Arts, Sport and Tourism (DAST) in 2008 amounts to €311 million.1 Second, as the benefits of increased physical activity are becoming more apparent, governments and academics are taking sport more seriously. An expanding international research effort is seeking to understand the forces that drive participation in sport and the potential of policy to increase participation. Third, there has been an accumulation of evidence regarding grassroots sport in Ireland over the past five years, largely as a result of the
1. Introduction
1 The focus of this Budget Perspectives paper is on central government funding of sport. Local authorities also provided additional public funding for sport and recreation, estimated to be €122 million in 2005 (Fitzpatrick Associates, 2005).
51
52 BUDGET PERSPECTIVES 2009
research programme funded by the Irish Sports Council. This programme is itself a creation of sports policy, since conducting such research was made a statutory obligation of the Council when it was established in 1999. The focus of the research programme has been, primarily, to improve understanding of the social and economic forces that surround various kinds of involvement in sport.
The body of research that has now accumulated, internationally and domestically, is sufficient that it is possible to analyse Ireland’s much expanded investment in sport in the light of evidence; to make use of information and insights that were not available when the majority of current policy mechanisms were designed. The aim is to employ the available empirical evidence to assess returns to the increased public investment in sport.
The domestic research base draws heavily on three data sources. The Survey of Sport and Physical Exercise (SSPE) surveyed a nationally representative sample of 3,080 adults over 18 years of age in 2003 (see Fahey, Layte and Gannon, 2004, for details). The Quarterly National Household Survey (QNHS) module on Sport and Physical Exercise surveyed approximately 40,000 people aged 15 years and over (Central Statistics Office, December 2007). The Irish Sports Monitor (ISM) is a survey of over 10,000 respondents carried out for the first time in 2007 and described at length in Lunn, Layte and Watson (forthcoming). These surveys and the research reports based upon them have adopted a broad definition of “sport”, taken from the Irish Sports Council Act, 1999, which covers all kinds of recreational exercise activities, such as swimming, jogging and going to the gym, as well as traditional field games like soccer and Gaelic games.
The structure of the paper is as follows. Section 2 describes the scale and objectives of public funding for sport, raises three relevant research questions and outlines some theoretical and methodological issues that arise in trying to employ evidence to answer them. Sections 3, 4 and 5 address each question in turn. Section 6 concludes.
The scale of increases in public funding of sport delivered by successive budgets over the past decade is apparent from Figure 1, which charts the total DAST sport budget over the period 1998-2008. Although the budget is expressed in nominal terms, the more than ten-fold increase in ten years is pronounced, even by the standards of public spending increases during this period of economic boom. Particularly large increases in spending are apparent in 2002 and 2007.
2. Public Investment in Sport: Scale, Aims and Evaluation
Given this substantial rise in funding, it is natural to examine the aim of the additional investment and to look for evidence regarding returns on that investment; or, more simply, to what degree sports policy meets its objectives.
The current stated goal of sports policy, adopted in the DAST Statement of Strategy 2008-2010 is:
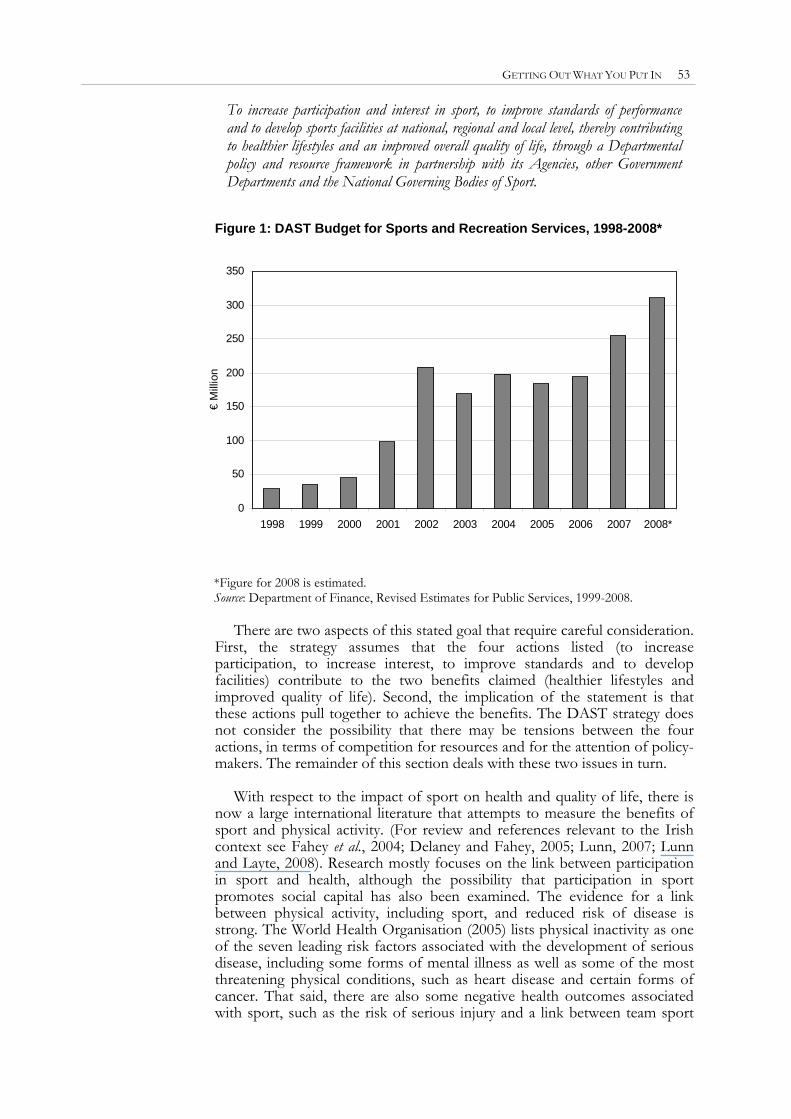
GETTING OUT WHAT YOU PUT IN 53
To increase participation and interest in sport, to improve standards of performance and to develop sports facilities at national, regional and local level, thereby contributing to healthier lifestyles and an improved overall quality of life, through a Departmental policy and resource framework in partnership with its Agencies, other Government Departments and the National Governing Bodies of Sport.
Figure 1: DAST Budget for Sports and Recreation Services, 1998-2008*
0
50
100
150
200
250
300
350
1998 1999 2000 2001 2002 2003 2004 2005 2006 2007 2008*
€ M
illio
n
*Figure for 2008 is estimated. Source: Department of Finance, Revised Estimates for Public Services, 1999-2008.
There are two aspects of this stated goal that require careful consideration. First, the strategy assumes that the four actions listed (to increase participation, to increase interest, to improve standards and to develop facilities) contribute to the two benefits claimed (healthier lifestyles and improved quality of life). Second, the implication of the statement is that these actions pull together to achieve the benefits. The DAST strategy does not consider the possibility that there may be tensions between the four actions, in terms of competition for resources and for the attention of policy-makers. The remainder of this section deals with these two issues in turn.
With respect to the impact of sport on health and quality of life, there is
now a large international literature that attempts to measure the benefits of sport and physical activity. (For review and references relevant to the Irish context see Fahey et al., 2004; Delaney and Fahey, 2005; Lunn, 2007; Lunn and Layte, 2008). Research mostly focuses on the link between participation in sport and health, although the possibility that participation in sport promotes social capital has also been examined. The evidence for a link between physical activity, including sport, and reduced risk of disease is strong. The World Health Organisation (2005) lists physical inactivity as one of the seven leading risk factors associated with the development of serious disease, including some forms of mental illness as well as some of the most threatening physical conditions, such as heart disease and certain forms of cancer. That said, there are also some negative health outcomes associated with sport, such as the risk of serious injury and a link between team sport
54 BUDGET PERSPECTIVES 2009
and drinking alcohol (e.g. Fahey, Layte and Gannon, 2004). But the balance of evidence is overwhelmingly in favour of the idea that playing sport is good for health.
In the Irish context, Lunn and Layte (2008) employ a statistical model to estimate the physical health premium associated with regular participation in sport.2 They find that the better health enjoyed by those who currently play some form of sport is, on average, equivalent to the health benefit of being 14 years younger.3 Hence the health benefit of playing sport may be very significant. A further aspect worth emphasising is that the gap in measured health status between people who play no sport and those who play some regular sport is considerably larger than the gap in health status between those who play at differing levels of intensity (Fahey et al., 2004). That is, the evidence suggests that the greatest health gains may be had where people make the transition from playing no sport to playing some sport, rather than where people who are already active participants increase their involvement further. These findings, therefore, suggest that the biggest health gains occur when sport attracts new participants.
The social benefits of sport are much more difficult to define and measure. The case is usually made in terms of the contribution of sport to ‘social capital’, meaning that the aesthetic side of sport, such as the simple pleasure of watching “the beautiful game”, is underplayed. Moreover, there is no agreed definition of ‘social capital’, nor method of measuring it. Roughly speaking, social capital refers to the degree of social interaction and shared understanding enjoyed by individuals within communities. Because sport mostly brings people together, it is usually assumed (especially by proponents of active sports policy) that sport enhances social capital. Any such increase in social capital would accrue not only to players, but to other types of participant; the volunteers, club members and spectators who also come within the social circle of sport. Based on the 2003 SSPE, Delaney and Fahey (2005) record that, in the year prior to the survey, 15 per cent of Irish adults volunteered for sport-related activity, 30 per cent were members of sports clubs and 46 per cent had attended some kind of sports fixture. It is this last group that may have enjoyed not only a social event, but an aesthetically pleasing one – although, admittedly, there is no guarantee of that. The numbers compare with 43 per cent in the same survey who had played sport during the same period (excluding walking). Hence, any social benefits associated with these non-active forms of participation accrue to proportions of people that are comparable with the proportion obtaining the health benefits associated with playing sport.
Still, it is also possible that sport may enhance some social divisions. In Ireland, the assumption that “sport is good” has been questioned by Liston (2007), who argues that Irish researchers are ideologically inspired and hence prone to look for and measure only positive aspects of sport, ignoring negative aspects such as gender and class divisions, or the economic cost of 2 Health benefits were measured using the SF-12 measure of physical health (Jenkinson and Magee, 1998). 3 It is not possible to determine the degree to which this association is due to the effect of playing sport on health, as opposed to the effect of being healthy on the likelihood of playing sport. In reality, causality is likely to run in both directions. However, Lunn and Layte (2008) also show that there is a significant association between current health and the amount of sport played in the past.

GETTING OUT WHAT YOU PUT IN 55
physical injury. It may well be true that personal attitudes and beliefs partly determine the questions researchers ask, but such sociological theorising is no substitute for empirical evidence. As outlined above, the case for health benefits derived from sporting activity is very strong. Delaney and Fahey (2005), meanwhile, offer a balanced discussion of evidence relating to social benefits and costs associated with sport, including those Liston (2007) claims to be ignored by researchers. They conclude that the positive social contribution of participation in sport is likely to outweigh the negative. The onus is on those who argue otherwise to do so with workable evidence rather than idle theory.
Some insight into the balance between the health and social benefits associated with sport can be had simply by asking those who play sport what they get out of it. Figure 2 shows that health is the primary motivation for the majority of participants, while social benefits also rank well ahead of narrower sporting goals, such as improving performance or participating in competitions.
Returning to the stated aim of policy in light of this discussion, the
contention that increased participation in sport provides benefits is in accordance with evidence. This is especially true in relation to the health gains from playing sport, but likely to be the case for social benefits also. The evidence, therefore, supports the idea that public investment in sport is very likely to bring health benefits where it increases the number of active participants, and likely to provide social benefits too, including for volunteers, club members and spectators. The contention regarding the benefits of sport, as laid down in the DAST strategy, is consequently accepted for the remainder of this paper.
Figure 2: Main Motivation for Active Participation
0
10
20
30
40
50
60
Health Performance Competition Social Other
% a
ctiv
e pe
ople
Source: QNHS module on Sport and Physical Exercise, 2006.
The second issue raised above must now be addressed: are the strategic
actions of policy, as stated, mutually supportive rather than in competition with one another? On one level, arguments can be made that increasing the level of participation, heightening interest in sport, raising the standard of
56 BUDGET PERSPECTIVES 2009
sport and improving the quality of facilities are all complementary actions. Each could, in principle, have a positive knock on effect for the others. Economic theory, on the other hand, leads us to a colder view. Resources spent on one type of policy are resources not spent on another – investment in one area comes with the opportunity cost of not investing elsewhere. The way priorities are balanced against one another is therefore crucial. Thus arises the central question: is the range of policy mechanisms funded out of the DAST sport budget an efficient way to capture the benefits associated with sport?
There are three types of trade-off, in particular, that policymakers must grapple with. The first is the balance between funding allocated to elite sport, which primarily benefits top sportspeople and the spectators who enjoy watching them, and funding given to grassroots sport, which benefits participants at all levels. The second concerns the level of support directed at different types of programme for developing grassroots sport; more specifically, what exactly the public money pays for (pitches, salaries, buildings, marketing etc.). Lastly, there is the balance that must be struck when deciding levels of funding for specific sporting activities.
Economic theory provides a framework for how these trade-offs might be
resolved efficiently. In principle, the marginal return on each different type of investment should be equated. Thus, if funding is allocated optimally, an additional sum spent on, for instance, support for elite athletes, should bring the same benefit as the same additional sum spent on, say, employing a development officer to encourage sport among the socially disadvantaged. If marginal returns on different types of investment are not equated, then there is a strong case for transferring resources to fund the policy with the higher marginal return. Of course, this nugget of economic theory is good in principle, but less valuable in practice. Taking the example above, how can one measure and compare the positive impact on a small group of elite sportspeople and those who enjoy watching them with the positive effect of getting a group of disadvantaged people active in sport? An element of subjective judgement is inevitably involved.
Furthermore, while such orthodox economic theory focuses on efficiency, there are also issues of equity. Men are more likely to play sport and are hence greater beneficiaries of public money invested therein. Lunn (2007) finds that people with higher educational attainment and income are many times more likely to play sport. Indeed, socio-economic status turns out to be at least as significant as gender and age in determining who plays sport. Moreover, strong socio-economic gradients are not confined to sports often perceived as the preserves of higher social classes, such as sailing and golf. Participants in Gaelic games and soccer are also disproportionately better educated and better off. These findings are important, because where public funds are used primarily for the benefit of those who are already involved in sport, especially where the funding is drawn from the National Lottery rather than general taxation, policy is very likely to be regressive – a transfer of resources from the worse off to the better off. In summary, considerations of equity place even greater weight on the importance of using public funding to attract new participants, in particular those in less advantageous socio-economic positions.
There is one further consideration to take into account when making
judgements about the relative benefits of different streams of public funding.

GETTING OUT WHAT YOU PUT IN 57
In addition to the health and social benefits of participants, a case can (and often is) made for investing in elite sport in order to gain national prestige. That is, there may be benefits to many citizens arising from the performance of Irish nationals on prominent sporting stages. Where public funding increases the haul of Olympic medals or boosts the performance of a national team, a large number of people may take pleasure from watching or reading about the events, or even simply from being aware of them. Such benefits are, of course, very hard to measure.
Still, evidence is available to assist comparison of sports policy mechanisms. The example above, comparing a scheme for supporting elite sportspeople with a scheme for getting disadvantaged people to take up sport is particularly difficult, because it requires us to consider both efficiency and equity, and to compare the experiences of active participants with those of spectators, potentially involving large audiences and a contribution to national pride. These more tricky issues arise primarily where returns to funding for elite sport must be compared with those from funding grassroots sport. When comparing different policy mechanisms directed specifically at grassroots sport, the conceptual problems are not so severe and objective evidence can play a greater part.
For present purposes, “elite” sport refers to competitive sport that occurs
on a national or international level – top national leagues, international competitions and so on. “Grassroots” sport refers to local competitions and people who play recreationally. Of course, the distinction is blurred not clear. Lesser leagues and competitions feed higher profile ones; players who start out participating for fun with a local club end up as international stars. But the distinction is workable for present purposes and sheds much light on the current allocation of public funding for sport.
3. Elite v. Grassroots: An Uneven Contest?
The appropriate balance between the funding of elite and grassroots sport
is, as described in the previous section, partly down to subjective judgement. However, whatever one’s view on the matter, it is important to know how the balance is struck at present. Establishing this is a non-trivial task, which requires us to disentangle the different streams of public funding.
Figure 3 provides a breakdown of the DAST sport budget for the period 1998-2008 (left) and for 2008 alone (right). The two separate charts are provided to show that, while the level of funding has increased dramatically, there has been relatively little change in its structure over the period. Proceeding clockwise from the top, the Sports Capital Programme (SCP) provides money for the construction or improvement of sporting assets – pitches, changing facilities, sports halls etc. Grants are given out to clubs or community groups (schools may only apply in conjunction with such groups) in response to applications. The great majority of grants are given to sports clubs and community organisations of long standing. There is a separate fund, the Local Authority Swimming Pools Programme (LASPP), which pays for the restoration or building of public swimming pools. These two programmes, each dedicated solely to the provision of facilities, have accounted between them for over one-third of all spending on sport over the last ten years. By comparison, the chart reveals that the Irish Sports Council receives less than one-fifth of the total sport budget. Moving on to major venues, three one-off projects have accounted for a substantial share of available funds: Croke Park, Sports Campus Ireland and the redevelopment
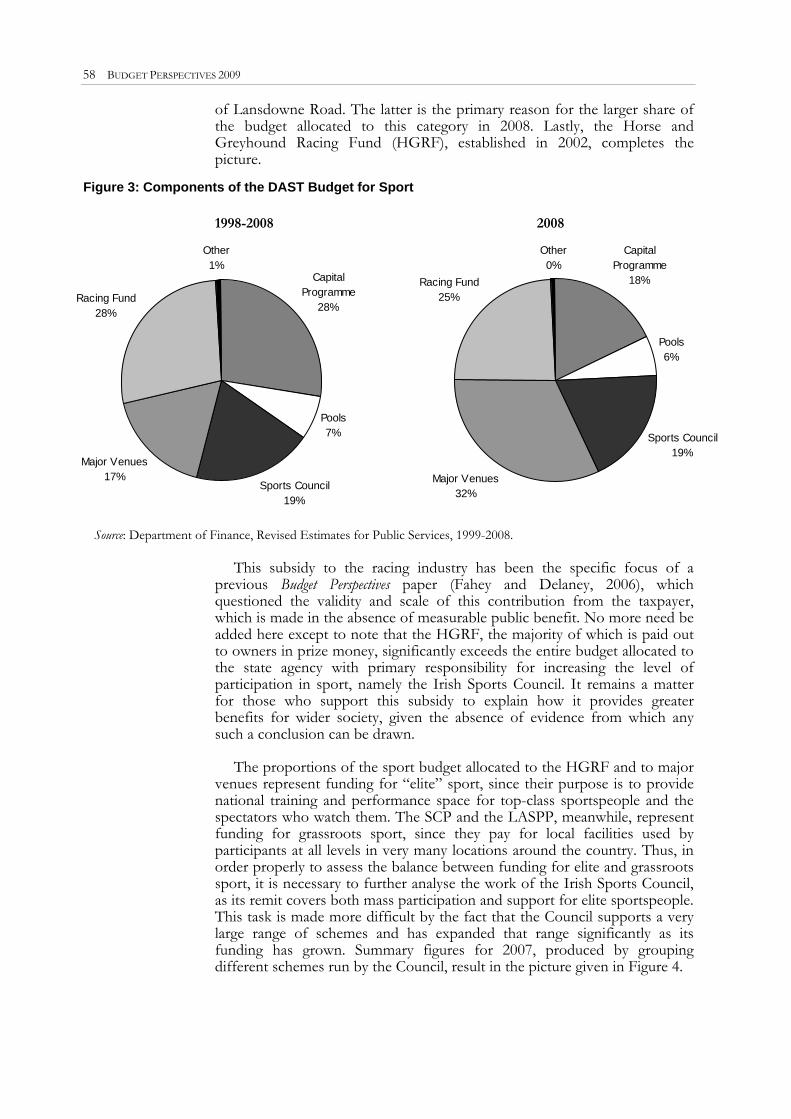
58 BUDGET PERSPECTIVES 2009
of Lansdowne Road. The latter is the primary reason for the larger share of the budget allocated to this category in 2008. Lastly, the Horse and Greyhound Racing Fund (HGRF), established in 2002, completes the picture.
Figure 3: Components of the DAST Budget for Sport 1998-2008 2008
Capital Programme
28%
Pools7%
Sports Council19%
Major Venues17%
Racing Fund28%
Other1%
Capital Programme
18%
Pools6%
Sports Council19%
Major Venues32%
Racing Fund25%
Other0%
Source: Department of Finance, Revised Estimates for Public Services, 1999-2008.
This subsidy to the racing industry has been the specific focus of a
previous Budget Perspectives paper (Fahey and Delaney, 2006), which questioned the validity and scale of this contribution from the taxpayer, which is made in the absence of measurable public benefit. No more need be added here except to note that the HGRF, the majority of which is paid out to owners in prize money, significantly exceeds the entire budget allocated to the state agency with primary responsibility for increasing the level of participation in sport, namely the Irish Sports Council. It remains a matter for those who support this subsidy to explain how it provides greater benefits for wider society, given the absence of evidence from which any such a conclusion can be drawn.
The proportions of the sport budget allocated to the HGRF and to major venues represent funding for “elite” sport, since their purpose is to provide national training and performance space for top-class sportspeople and the spectators who watch them. The SCP and the LASPP, meanwhile, represent funding for grassroots sport, since they pay for local facilities used by participants at all levels in very many locations around the country. Thus, in order properly to assess the balance between funding for elite and grassroots sport, it is necessary to further analyse the work of the Irish Sports Council, as its remit covers both mass participation and support for elite sportspeople. This task is made more difficult by the fact that the Council supports a very large range of schemes and has expanded that range significantly as its funding has grown. Summary figures for 2007, produced by grouping different schemes run by the Council, result in the picture given in Figure 4.
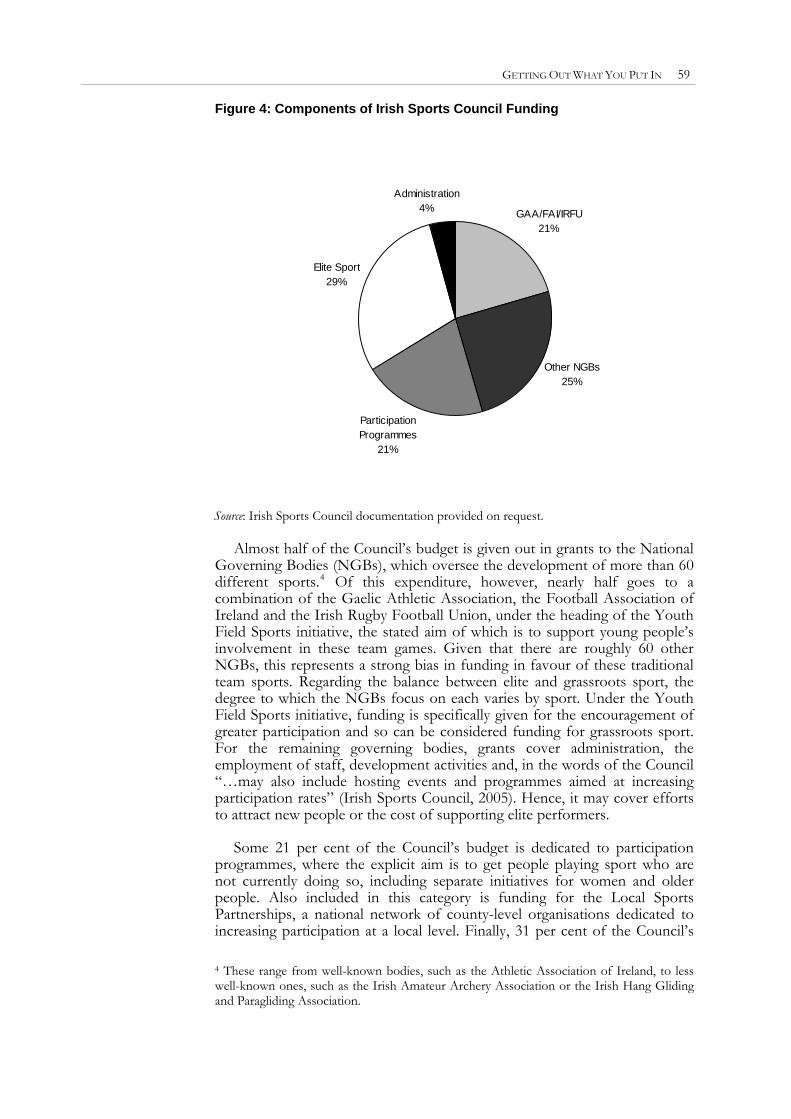
GETTING OUT WHAT YOU PUT IN 59
Figure 4: Components of Irish Sports Council Funding
GAA/FAI/IRFU21%
Other NGBs25%
Participation Programmes
21%
Elite Sport29%
Administration4%
Source: Irish Sports Council documentation provided on request.
Almost half of the Council’s budget is given out in grants to the National Governing Bodies (NGBs), which oversee the development of more than 60 different sports.4 Of this expenditure, however, nearly half goes to a combination of the Gaelic Athletic Association, the Football Association of Ireland and the Irish Rugby Football Union, under the heading of the Youth Field Sports initiative, the stated aim of which is to support young people’s involvement in these team games. Given that there are roughly 60 other NGBs, this represents a strong bias in funding in favour of these traditional team sports. Regarding the balance between elite and grassroots sport, the degree to which the NGBs focus on each varies by sport. Under the Youth Field Sports initiative, funding is specifically given for the encouragement of greater participation and so can be considered funding for grassroots sport. For the remaining governing bodies, grants cover administration, the employment of staff, development activities and, in the words of the Council “…may also include hosting events and programmes aimed at increasing participation rates” (Irish Sports Council, 2005). Hence, it may cover efforts to attract new people or the cost of supporting elite performers.
Some 21 per cent of the Council’s budget is dedicated to participation programmes, where the explicit aim is to get people playing sport who are not currently doing so, including separate initiatives for women and older people. Also included in this category is funding for the Local Sports Partnerships, a national network of county-level organisations dedicated to increasing participation at a local level. Finally, 31 per cent of the Council’s 4 These range from well-known bodies, such as the Athletic Association of Ireland, to less well-known ones, such as the Irish Amateur Archery Association or the Irish Hang Gliding and Paragliding Association.
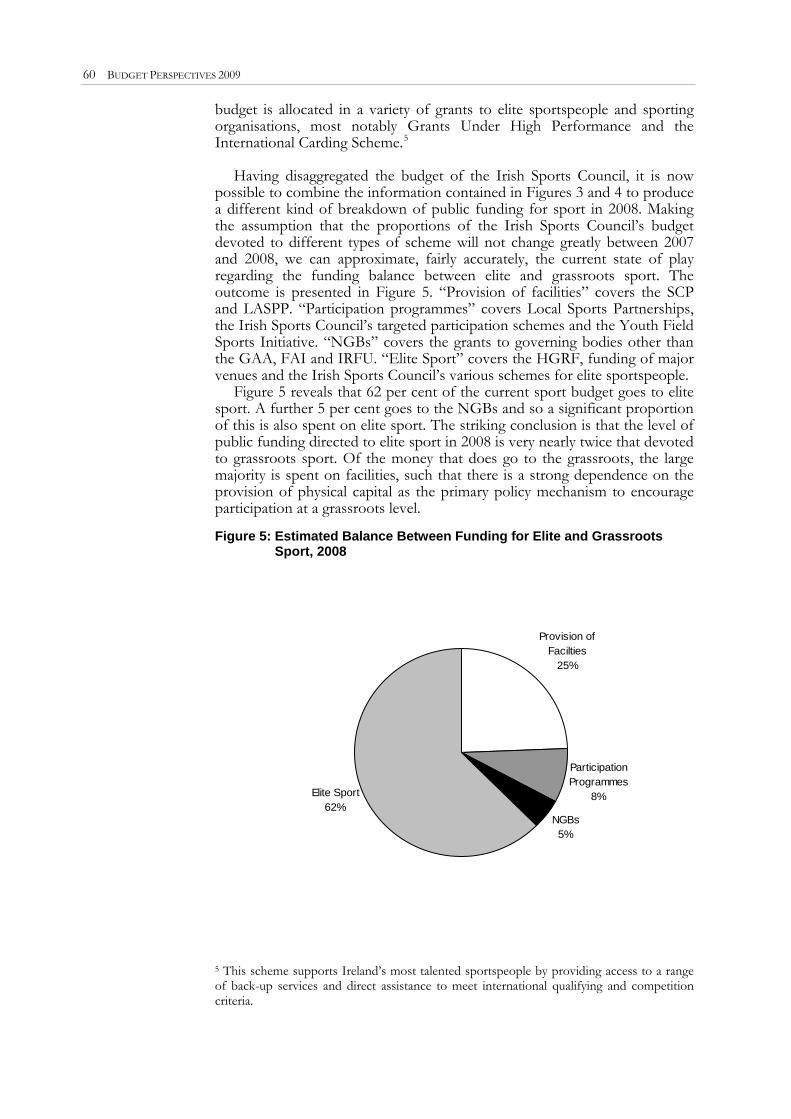
60 BUDGET PERSPECTIVES 2009
budget is allocated in a variety of grants to elite sportspeople and sporting organisations, most notably Grants Under High Performance and the International Carding Scheme.5
Having disaggregated the budget of the Irish Sports Council, it is now possible to combine the information contained in Figures 3 and 4 to produce a different kind of breakdown of public funding for sport in 2008. Making the assumption that the proportions of the Irish Sports Council’s budget devoted to different types of scheme will not change greatly between 2007 and 2008, we can approximate, fairly accurately, the current state of play regarding the funding balance between elite and grassroots sport. The outcome is presented in Figure 5. “Provision of facilities” covers the SCP and LASPP. “Participation programmes” covers Local Sports Partnerships, the Irish Sports Council’s targeted participation schemes and the Youth Field Sports Initiative. “NGBs” covers the grants to governing bodies other than the GAA, FAI and IRFU. “Elite Sport” covers the HGRF, funding of major venues and the Irish Sports Council’s various schemes for elite sportspeople.
Figure 5 reveals that 62 per cent of the current sport budget goes to elite sport. A further 5 per cent goes to the NGBs and so a significant proportion of this is also spent on elite sport. The striking conclusion is that the level of public funding directed to elite sport in 2008 is very nearly twice that devoted to grassroots sport. Of the money that does go to the grassroots, the large majority is spent on facilities, such that there is a strong dependence on the provision of physical capital as the primary policy mechanism to encourage participation at a grassroots level.
Figure 5: Estimated Balance Between Funding for Elite and Grassroots Sport, 2008
Provision of
Facilties25%
Participation Programmes
8%
NGBs5%
Elite Sport62%
5 This scheme supports Ireland’s most talented sportspeople by providing access to a range of back-up services and direct assistance to meet international qualifying and competition criteria.
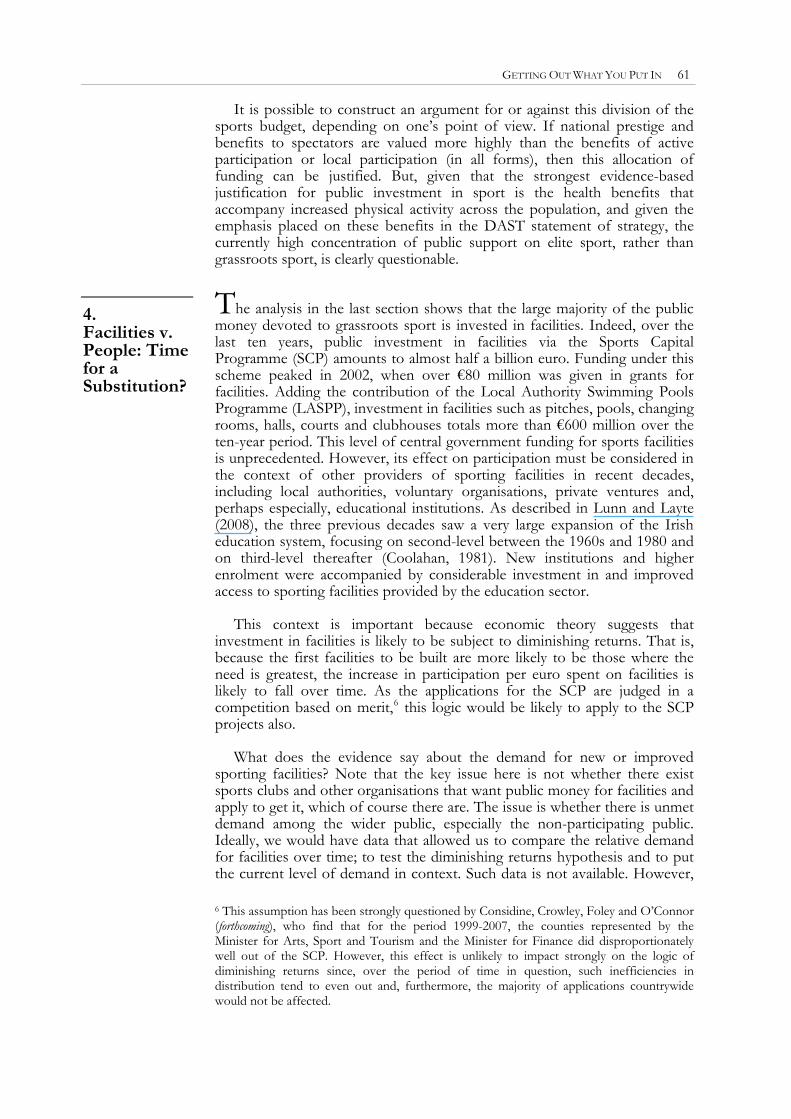
GETTING OUT WHAT YOU PUT IN 61
It is possible to construct an argument for or against this division of the sports budget, depending on one’s point of view. If national prestige and benefits to spectators are valued more highly than the benefits of active participation or local participation (in all forms), then this allocation of funding can be justified. But, given that the strongest evidence-based justification for public investment in sport is the health benefits that accompany increased physical activity across the population, and given the emphasis placed on these benefits in the DAST statement of strategy, the currently high concentration of public support on elite sport, rather than grassroots sport, is clearly questionable. The analysis in the last section shows that the large majority of the public money devoted to grassroots sport is invested in facilities. Indeed, over the last ten years, public investment in facilities via the Sports Capital Programme (SCP) amounts to almost half a billion euro. Funding under this scheme peaked in 2002, when over €80 million was given in grants for facilities. Adding the contribution of the Local Authority Swimming Pools Programme (LASPP), investment in facilities such as pitches, pools, changing rooms, halls, courts and clubhouses totals more than €600 million over the ten-year period. This level of central government funding for sports facilities is unprecedented. However, its effect on participation must be considered in the context of other providers of sporting facilities in recent decades, including local authorities, voluntary organisations, private ventures and, perhaps especially, educational institutions. As described in Lunn and Layte (2008), the three previous decades saw a very large expansion of the Irish education system, focusing on second-level between the 1960s and 1980 and on third-level thereafter (Coolahan, 1981). New institutions and higher enrolment were accompanied by considerable investment in and improved access to sporting facilities provided by the education sector.
4. Facilities v. People: Time for a Substitution?
This context is important because economic theory suggests that
investment in facilities is likely to be subject to diminishing returns. That is, because the first facilities to be built are more likely to be those where the need is greatest, the increase in participation per euro spent on facilities is likely to fall over time. As the applications for the SCP are judged in a competition based on merit,6 this logic would be likely to apply to the SCP projects also.
What does the evidence say about the demand for new or improved sporting facilities? Note that the key issue here is not whether there exist sports clubs and other organisations that want public money for facilities and apply to get it, which of course there are. The issue is whether there is unmet demand among the wider public, especially the non-participating public. Ideally, we would have data that allowed us to compare the relative demand for facilities over time; to test the diminishing returns hypothesis and to put the current level of demand in context. Such data is not available. However, 6 This assumption has been strongly questioned by Considine, Crowley, Foley and O’Connor (forthcoming), who find that for the period 1999-2007, the counties represented by the Minister for Arts, Sport and Tourism and the Minister for Finance did disproportionately well out of the SCP. However, this effect is unlikely to impact strongly on the logic of diminishing returns since, over the period of time in question, such inefficiencies in distribution tend to even out and, furthermore, the majority of applications countrywide would not be affected.
62 BUDGET PERSPECTIVES 2009
all three of the recent large-scale national surveys of sporting participation include questions that shed light on demand for facilities in recent years and presently. The SSPE in 2003 recorded that just 1 per cent of non-participants in sport cited lack of local facilities as the main reason for not participating (Fahey et al., 2004). Time, motivation and health problems were the main reasons cited. Given the emphasis in sports policy on the provision of facilities, this finding may well have come as something of a surprise to policymakers.
We now have evidence from two other national surveys involving even larger samples. Figure 6 charts the main reasons for non-participation as given by non-participants in the 2006 QNHS module. The pattern is strikingly similar to that found in the SSPE. These findings do not preclude the possibility that building more sporting facilities will increase the level of participation in sport, but they certainly suggest that there is not excess demand for sporting facilities waiting to be met.
Figure 6: Main Reason Given for Non-Participation in Sport and Exercise
0
5
10
15
20
25
30
Time(w ork)
Time(caring)
Facilities Motivation Health Age Other
% n
on-p
artic
ipan
ts
Source: QNHS module on Sport and Physical Exercise, 2006.
The QNHS survey also asked respondents whether the provision of certain specific facilities in their area might encourage them to participate, or to increase their levels of participation if they already played some sport. The answers are summarised in Figure 7. For nearly three-quarters of non-participants and half of participants, the provision of more facilities appears to be an irrelevancy. Where there is any measurable demand for facilities at all, it seems to be for swimming pools, places to walk and gyms/fitness centres. This offers a potential justification for the LASPP, as it suggests there may be some return to building more swimming pools. But its implications for the effectiveness of the much larger public investment via the SCP are uncomfortable, especially given the specific types of sporting facilities that it funds (see below).
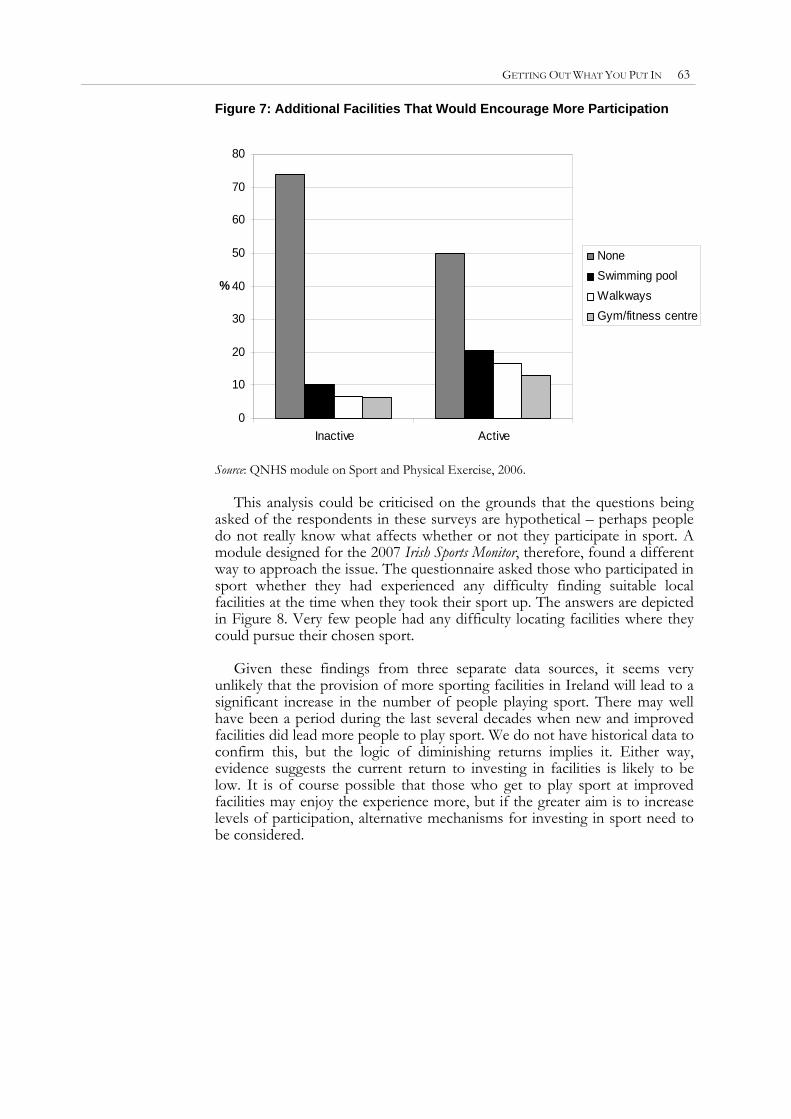
GETTING OUT WHAT YOU PUT IN 63
Figure 7: Additional Facilities That Would Encourage More Participation
0
10
20
30
40
50
60
70
80
Inactive Active
%
NoneSwimming poolWalkwaysGym/fitness centre
Source: QNHS module on Sport and Physical Exercise, 2006.
This analysis could be criticised on the grounds that the questions being asked of the respondents in these surveys are hypothetical – perhaps people do not really know what affects whether or not they participate in sport. A module designed for the 2007 Irish Sports Monitor, therefore, found a different way to approach the issue. The questionnaire asked those who participated in sport whether they had experienced any difficulty finding suitable local facilities at the time when they took their sport up. The answers are depicted in Figure 8. Very few people had any difficulty locating facilities where they could pursue their chosen sport.
Given these findings from three separate data sources, it seems very unlikely that the provision of more sporting facilities in Ireland will lead to a significant increase in the number of people playing sport. There may well have been a period during the last several decades when new and improved facilities did lead more people to play sport. We do not have historical data to confirm this, but the logic of diminishing returns implies it. Either way, evidence suggests the current return to investing in facilities is likely to be low. It is of course possible that those who get to play sport at improved facilities may enjoy the experience more, but if the greater aim is to increase levels of participation, alternative mechanisms for investing in sport need to be considered.
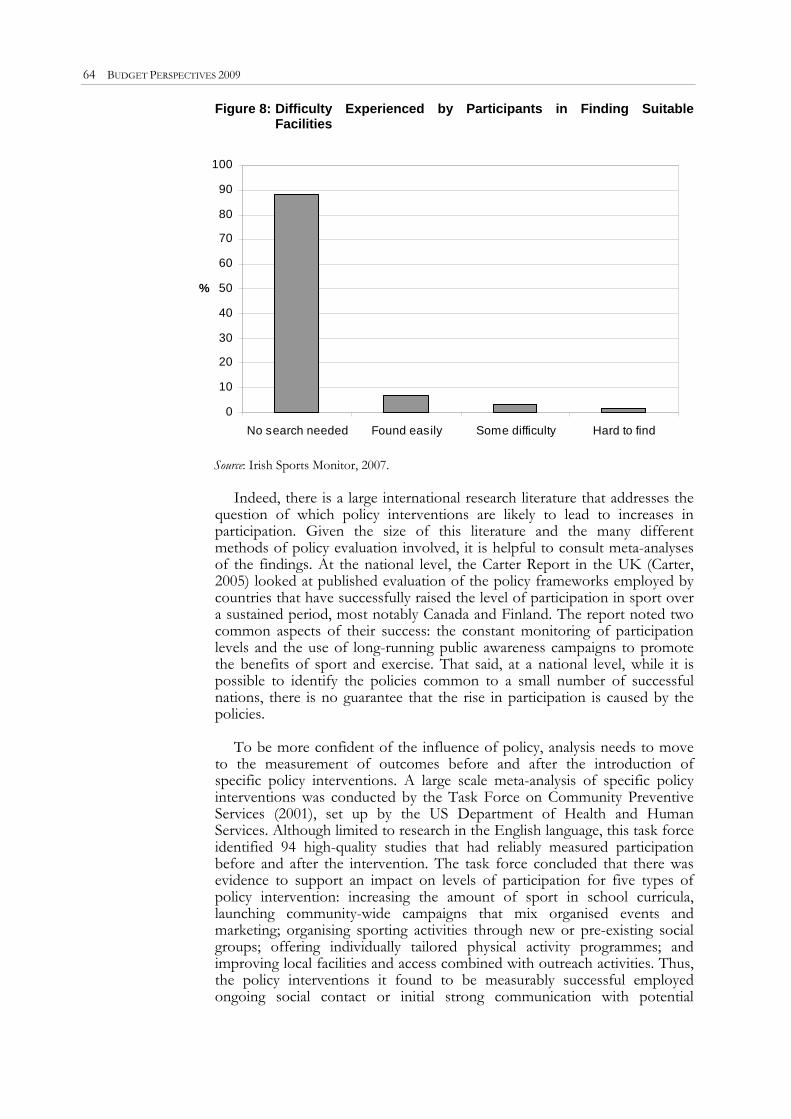
64 BUDGET PERSPECTIVES 2009
Figure 8: Difficulty Experienced by Participants in Finding Suitable Facilities
0
10
20
30
40
50
60
70
80
90
100
No search needed Found easily Some difficulty Hard to find
%
Sou
o identify the policies common to a small number of successful nations, there is no guarantee that the rise in participation is caused by the po
l strong communication with potential
rce: Irish Sports Monitor, 2007.
Indeed, there is a large international research literature that addresses the question of which policy interventions are likely to lead to increases in participation. Given the size of this literature and the many different methods of policy evaluation involved, it is helpful to consult meta-analyses of the findings. At the national level, the Carter Report in the UK (Carter, 2005) looked at published evaluation of the policy frameworks employed by countries that have successfully raised the level of participation in sport over a sustained period, most notably Canada and Finland. The report noted two common aspects of their success: the constant monitoring of participation levels and the use of long-running public awareness campaigns to promote the benefits of sport and exercise. That said, at a national level, while it is possible t
licies. To be more confident of the influence of policy, analysis needs to move
to the measurement of outcomes before and after the introduction of specific policy interventions. A large scale meta-analysis of specific policy interventions was conducted by the Task Force on Community Preventive Services (2001), set up by the US Department of Health and Human Services. Although limited to research in the English language, this task force identified 94 high-quality studies that had reliably measured participation before and after the intervention. The task force concluded that there was evidence to support an impact on levels of participation for five types of policy intervention: increasing the amount of sport in school curricula, launching community-wide campaigns that mix organised events and marketing; organising sporting activities through new or pre-existing social groups; offering individually tailored physical activity programmes; and improving local facilities and access combined with outreach activities. Thus, the policy interventions it found to be measurably successful employed ongoing social contact or initia
GETTING OUT WHAT YOU PUT IN 65
pa
they face. In other words, the evidence suggests that ccessful policy to raise participation requires investment in human and
so
the size, goes to those who already participate. Given the socio-conomic profile of participants revealed in Lunn (2007), this transfer, much
of
of funding). LSPs will e more effective if they devote resources to providing alternative and vidence-based programmes for increasing participation, rather than acting to
reduce the efficiency of pre-existing national policies.
rticipants. Provision of facilities or opportunities in the absence of such communication was not effective.
Taking all of the Irish evidence on facilities in combination with the international evidence on successful policies, the strong reliance of sports policy on the provision of facilities is at odds with the evidence base. The primary barriers to involvement faced by non-participants are time, motivation and health. There appears to be very little demand among the wider public for extra sporting facilities. Solutions that have worked in other countries involve communication with non-participants, which may well help in tackling the barriers su
cial capital rather than physical capital – people and communication, not buildings and pitches.
Placing this conclusion in the context of the breakdown in public funding provided in Section 3, it is apparent that only a small fraction of the overall sport budget effectively targets new active participants. Even if one makes optimistic assumptions regarding the proportion of their budgets that NGBs spend on programmes to encourage and assist new participants to get involved, only around 10 per cent of the total sport budget is spent on schemes that the evidence base suggests are most likely to produce the highest returns in terms of increased participation. Furthermore, the evidence suggests that the proportion of the budget spent on facilities, which is more than twice e
which originates from the sale of lottery tickets, is likely to be substantially regressive.
Part of the 10 per cent spent on participation programmes is allocated to the newly formed national network of Local Sports Partnerships (LSPs); county-level organisations that aim to coordinate local resources and marketing, so as to increase participation in sport. In principle, such organisations are the kind of policy mechanism that evidence suggests has the best chance of raising participation. A recent review of LSP performance (Fitzpatrick Associates, 2005) produced some encouraging findings in terms of levels of LSP activity and international precedents, but noted what a small fraction of the budget LSPs account for. Furthermore, a note of caution is warranted regarding LSPs. One role many of them have taken on is to help organisations in the preparation of application forms for grants under the SCP. From an individual club’s point of view, this may appear helpful, but from a national perspective, this activity is almost certainly wasteful. Not only does it again prioritise the provision of facilities rather than programmes for increasing participation but, more importantly, the process of applying for SCP grants is a zero-sum game. If all areas improve the quality of applications then the same grants will be awarded at the cost of greater effort in preparing applications. If areas where greater effort goes in to applications for SCP grants actually do receive a higher level of funding, then facilities are allocated not on the basis of need but on the basis of where LSPs assist applicants (although the DAST review of LSPs concluded in 2005 that such assistance did not, in any case, seem to increase levelsbe
66 BUDGET PERSPECTIVES 2009
The primary measure used to assess returns to investment in sport in the international literature and in this paper is the participation rate for playing: the proportion of people who actively participate in a given sport within a given time window. The measure has the particular advantage that it is easy to define and to measure with surveys. It also has a number of disadvantages. First, it measures only whether people have had an experience, not the quality of that experience. Second, it measures only whether people have taken part, not how frequently or how intensively they have taken part, both of which would be likely to impact upon associated health and social benefits. Third, by focusing on playing rather than volunteering, spectating or club membership, it is probably a better proxy for health benefits than for social benefits. On the other hand, where investment in sport improves only the quality of the sporting experience rather than the numbers who benefit from it, the participation rate remains an indication of how widely those benefits are distributed. Furthermore, increases in the participation rate for playing can be expected to be positively correlated with increases in other forms of participation. Thus, the level of participation is a very useful but somewhat limited
5. Sport v. Sport: WhTops th
o e
Table?
proxy for measuring the benefits associated with vestment in sport.
w participants. The first of these is clearly easier to measure than e second.
HS survey). Both appear to have increased in relative popularity since 2003.
in
Moreover, the rate of participation for specific sporting activities is an important indicator of intrinsic popularity, while changes in the participation rate indicate whether the popularity of a specific activity is rising or falling. From the point of view of public investment, this is important information. To increase levels of participation requires either increasing the rate at which people take up sport, or decreasing the rate at which they drop out. Thus, to maximise participation, funding for each sporting activity should be influenced by the numbers who participate, because that is also the number of potential dropouts. Funding should also account for the likelihood of attracting neth
Again, all three surveys of sporting participation offer information regarding the relative popularity of different activities. Figure 9 provides participation rates for the most popular eight sporting activities (excluding walking) in the SSPE 2003, QNHS 2006 and ISM 2007 surveys. Despite the differences in survey methodologies (see Figure 9 notes), a consistent picture emerges. The four most popular activities (exercise, swimming, golf and soccer) are the same for the four surveys. The biggest differences between the surveys surround the relative popularity of two particular activities: exercise (a category that includes going to the gym, “working out”, aerobics and keep-fit) and jogging (counted as athletics in the QN
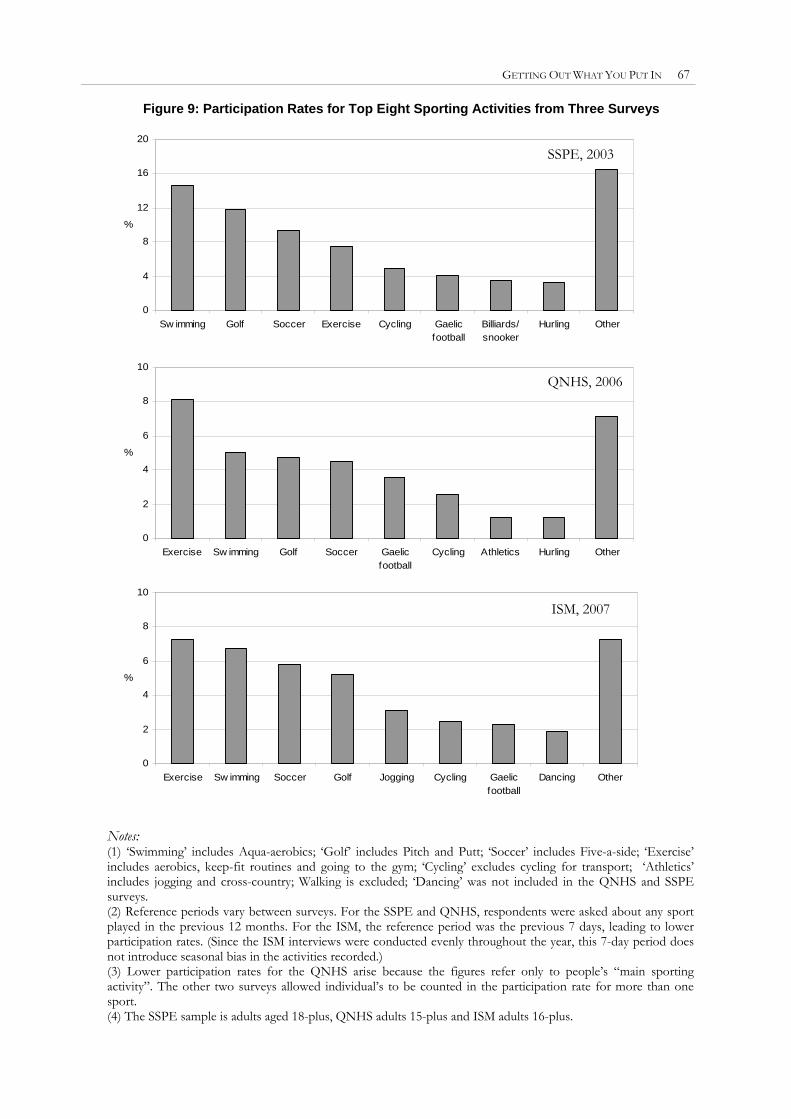
GETTING OUT WHAT YOU PUT IN 67
Figure 9: Participation Rates for Top Eight Sporting Activities from Three Surveys
0
4
8
12
16
20
Sw imming Golf Soccer Exercise Cycling Gaelicfootball
Billiards/snooker
Hurling Other
%
0
2
4
6
8
10
Exercise Sw imming Golf Soccer Gaelicfootball
Cycling Athletics Hurling Other
%
0
2
4
6
8
10
Exercise Sw imming Soccer Golf Jogging Cycling Gaelicfootball
Dancing Other
%
ISM, 2007
QNHS, 2006
SSPE, 2003
Notes: (1) ‘Swimming’ includes Aqua-aerobics; ‘Golf’ includes Pitch and Putt; ‘Soccer’ includes Five-a-side; ‘Exercise’ includes aerobics, keep-fit routines and going to the gym; ‘Cycling’ excludes cycling for transport; ‘Athletics’ includes jogging and cross-country; Walking is excluded; ‘Dancing’ was not included in the QNHS and SSPE surveys. (2) Reference periods vary between surveys. For the SSPE and QNHS, respondents were asked about any sport played in the previous 12 months. For the ISM, the reference period was the previous 7 days, leading to lower participation rates. (Since the ISM interviews were conducted evenly throughout the year, this 7-day period does not introduce seasonal bias in the activities recorded.) (3) Lower participation rates for the QNHS arise because the figures refer only to people’s “main sporting activity”. The other two surveys allowed individual’s to be counted in the participation rate for more than one sport. (4) The SSPE sample is adults aged 18-plus, QNHS adults 15-plus and ISM adults 16-plus.

68 BUDGET PERSPECTIVES 2009
Lunn and Layte (2008) conducted further analysis on trends in participation, employing a particular section of the SSPE 2003 survey, which collected information about individual sporting histories. Respondents were asked about any sporting activities they used to participate in regularly, including when they started the activity and when they stopped. From this information, individual sporting histories were constructed that allowed the effective reconstruction of the recent history of grassroots sporting participation over several decades. (For detail on the methodology and associated problems and controls, see especially Lunn and Layte, 2008, pages 5–9). Surprisingly, strong trends in participation emerge from this analysis, which are summarised in Figure 10.
Figure 10:Mean Annual Participation Growth for Adults (Age 20-39 Years) 1984-2003
-2
0
2
4
6
8
10
12
14
Exercise Jogging Sw imming Golf Soccer Hurling Gaelicfootball
Cycling
%
Source: SSPE, 2003 (Lunn and Layte, 2008).
Growth in exercise activities and jogging far outstrips that in other sporting activities. From the perspective of consistency between the surveys, this result is pleasing, as a continuation of these trends explains the changes in relative popularity recorded across the different surveys. There are two other notable aspects to the trends identified. First, participation in sport is rising. Second, it is rising much faster for individual sport and exercise activities than for traditional team sports. Broadly similar trends were also found for children’s sport, although the traditional team sports generally account for a larger proportion of children’s participation.
Greater insight into the forces of change at work here can be had by looking at how participation in sport varies across the life course. Lunn and Layte (2008) compared the individual sporting histories collected in the SSPE 2003 by cohort, separately for team and individual sports. Figure 11 plots participation rates for three cohorts in the two types of sport across the life course.
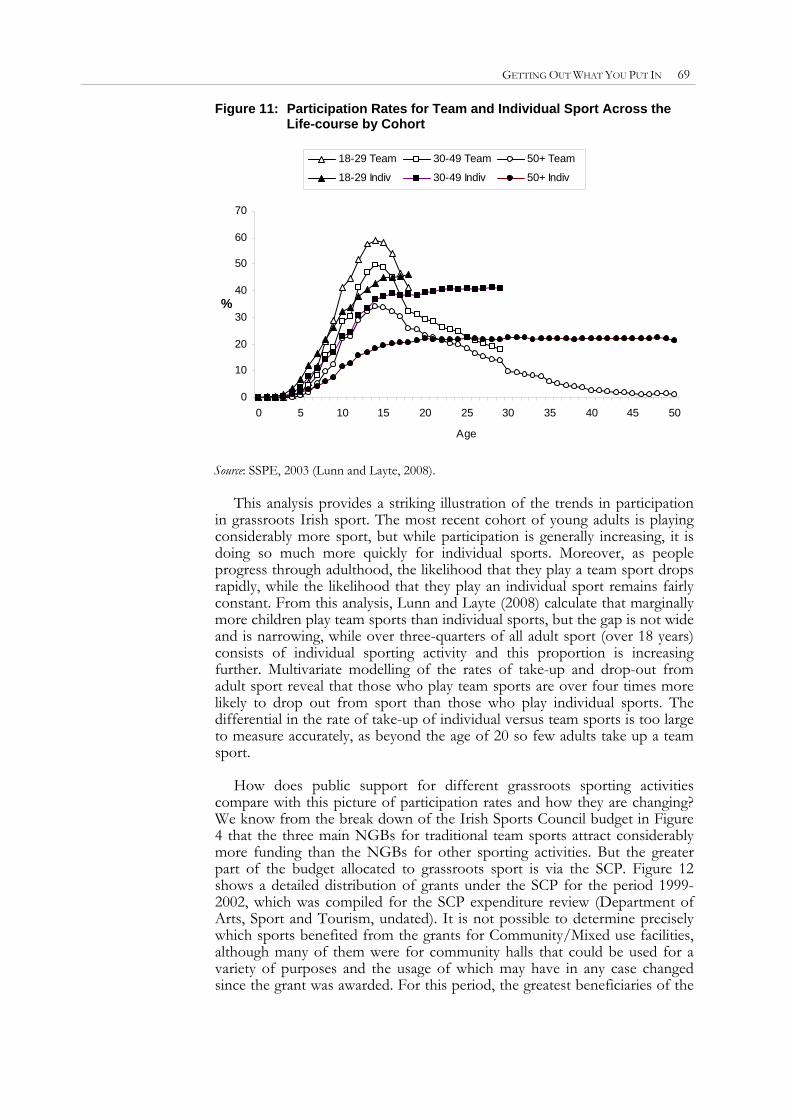
GETTING OUT WHAT YOU PUT IN 69
Figure 11: Participation Rates for Team and Individual Sport Across the Life-course by Cohort
0
10
20
30
40
50
60
70
0 5 10 15 20 25 30 35 40 45 50
Age
%
18-29 Team 30-49 Team 50+ Team
18-29 Indiv 30-49 Indiv 50+ Indiv Source: SSPE, 2003 (Lunn and Layte, 2008).
This analysis provides a striking illustration of the trends in participation in grassroots Irish sport. The most recent cohort of young adults is playing considerably more sport, but while participation is generally increasing, it is doing so much more quickly for individual sports. Moreover, as people progress through adulthood, the likelihood that they play a team sport drops rapidly, while the likelihood that they play an individual sport remains fairly constant. From this analysis, Lunn and Layte (2008) calculate that marginally more children play team sports than individual sports, but the gap is not wide and is narrowing, while over three-quarters of all adult sport (over 18 years) consists of individual sporting activity and this proportion is increasing further. Multivariate modelling of the rates of take-up and drop-out from adult sport reveal that those who play team sports are over four times more likely to drop out from sport than those who play individual sports. The differential in the rate of take-up of individual versus team sports is too large to measure accurately, as beyond the age of 20 so few adults take up a team sport.
How does public support for different grassroots sporting activities compare with this picture of participation rates and how they are changing? We know from the break down of the Irish Sports Council budget in Figure 4 that the three main NGBs for traditional team sports attract considerably more funding than the NGBs for other sporting activities. But the greater part of the budget allocated to grassroots sport is via the SCP. Figure 12 shows a detailed distribution of grants under the SCP for the period 1999- 2002, which was compiled for the SCP expenditure review (Department of Arts, Sport and Tourism, undated). It is not possible to determine precisely which sports benefited from the grants for Community/Mixed use facilities, although many of them were for community halls that could be used for a variety of purposes and the usage of which may have in any case changed since the grant was awarded. For this period, the greatest beneficiaries of the
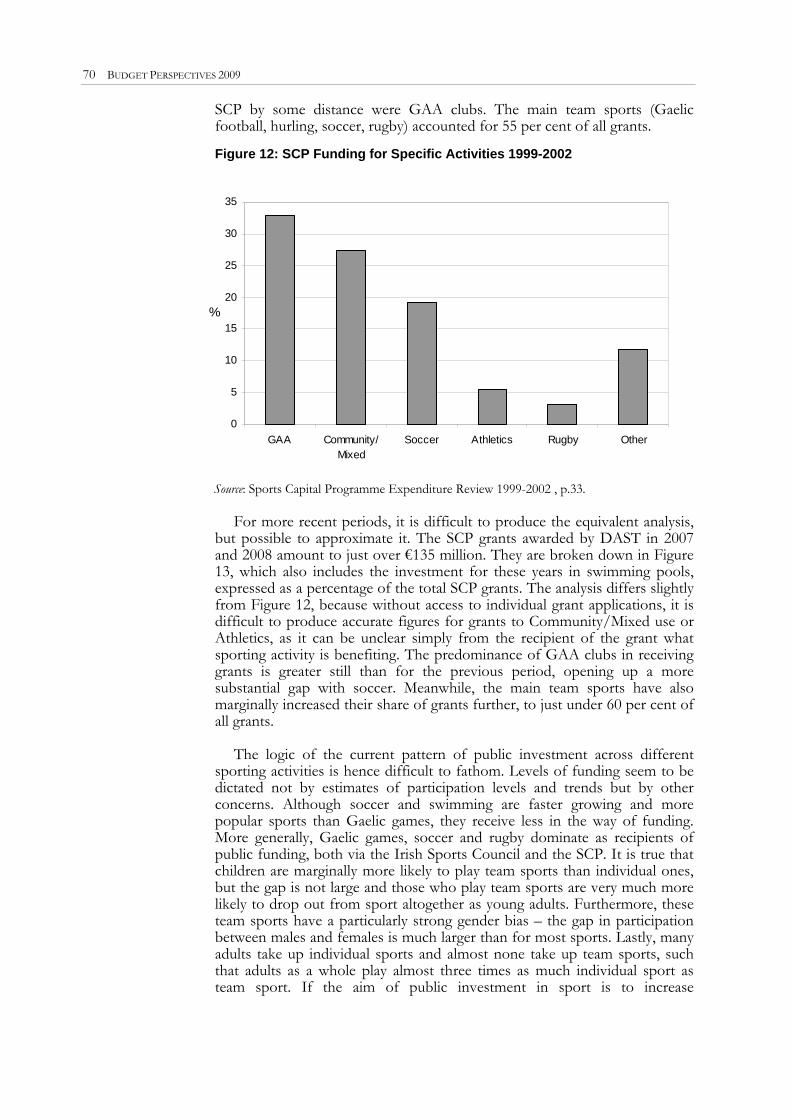
70 BUDGET PERSPECTIVES 2009
SCP by some distance were GAA clubs. The main team sports (Gaelic football, hurling, soccer, rugby) accounted for 55 per cent of all grants.
Figure 12: SCP Funding for Specific Activities 1999-2002
0
5
10
15
20
25
30
35
GAA Community/Mixed
Soccer Athletics Rugby Other
%
Source: Sports Capital Programme Expenditure Review 1999-2002 , p.33.
For more recent periods, it is difficult to produce the equivalent analysis, but possible to approximate it. The SCP grants awarded by DAST in 2007 and 2008 amount to just over €135 million. They are broken down in Figure 13, which also includes the investment for these years in swimming pools, expressed as a percentage of the total SCP grants. The analysis differs slightly from Figure 12, because without access to individual grant applications, it is difficult to produce accurate figures for grants to Community/Mixed use or Athletics, as it can be unclear simply from the recipient of the grant what sporting activity is benefiting. The predominance of GAA clubs in receiving grants is greater still than for the previous period, opening up a more substantial gap with soccer. Meanwhile, the main team sports have also marginally increased their share of grants further, to just under 60 per cent of all grants.
The logic of the current pattern of public investment across different
sporting activities is hence difficult to fathom. Levels of funding seem to be dictated not by estimates of participation levels and trends but by other concerns. Although soccer and swimming are faster growing and more popular sports than Gaelic games, they receive less in the way of funding. More generally, Gaelic games, soccer and rugby dominate as recipients of public funding, both via the Irish Sports Council and the SCP. It is true that children are marginally more likely to play team sports than individual ones, but the gap is not large and those who play team sports are very much more likely to drop out from sport altogether as young adults. Furthermore, these team sports have a particularly strong gender bias – the gap in participation between males and females is much larger than for most sports. Lastly, many adults take up individual sports and almost none take up team sports, such that adults as a whole play almost three times as much individual sport as team sport. If the aim of public investment in sport is to increase
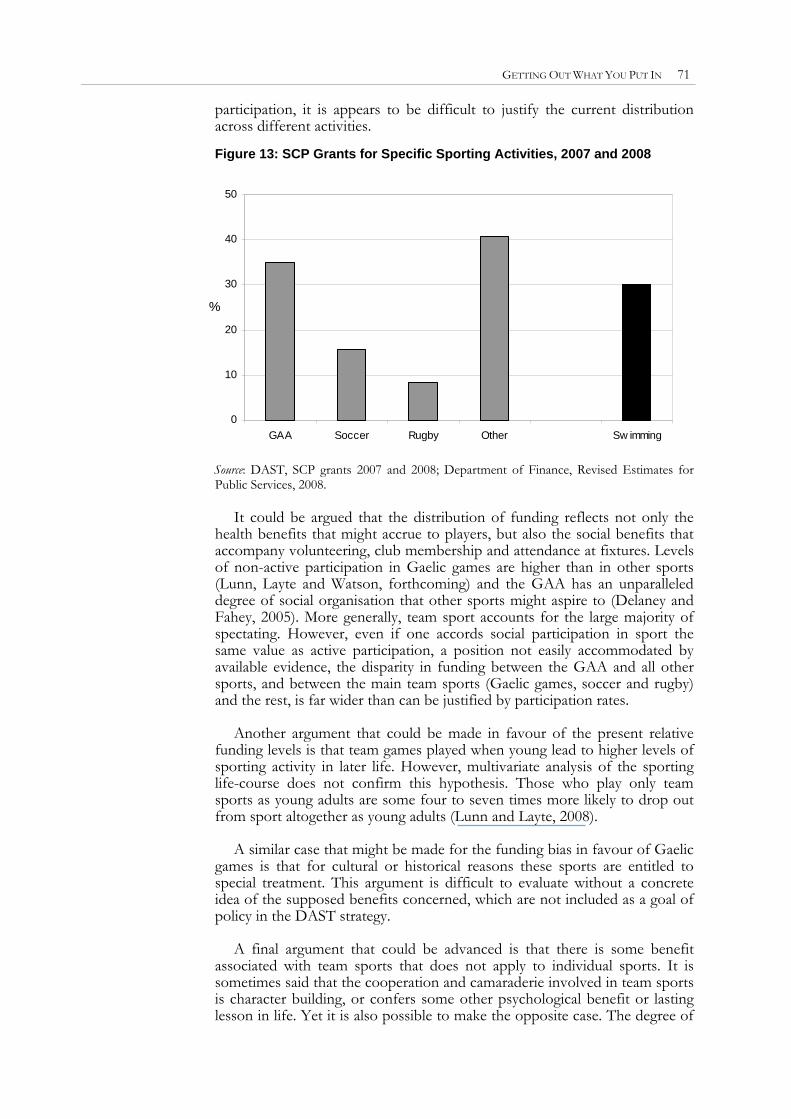
GETTING OUT WHAT YOU PUT IN 71
participation, it is appears to be difficult to justify the current distribution across different activities.
Figure 13: SCP Grants for Specific Sporting Activities, 2007 and 2008
0
10
20
30
40
50
GAA Soccer Rugby Other Sw imming
%
Source: DAST, SCP grants 2007 and 2008; Department of Finance, Revised Estimates for Public Services, 2008.
It could be argued that the distribution of funding reflects not only the health benefits that might accrue to players, but also the social benefits that accompany volunteering, club membership and attendance at fixtures. Levels of non-active participation in Gaelic games are higher than in other sports (Lunn, Layte and Watson, forthcoming) and the GAA has an unparalleled degree of social organisation that other sports might aspire to (Delaney and Fahey, 2005). More generally, team sport accounts for the large majority of spectating. However, even if one accords social participation in sport the same value as active participation, a position not easily accommodated by available evidence, the disparity in funding between the GAA and all other sports, and between the main team sports (Gaelic games, soccer and rugby) and the rest, is far wider than can be justified by participation rates.
Another argument that could be made in favour of the present relative funding levels is that team games played when young lead to higher levels of sporting activity in later life. However, multivariate analysis of the sporting life-course does not confirm this hypothesis. Those who play only team sports as young adults are some four to seven times more likely to drop out from sport altogether as young adults (Lunn and Layte, 2008).
A similar case that might be made for the funding bias in favour of Gaelic games is that for cultural or historical reasons these sports are entitled to special treatment. This argument is difficult to evaluate without a concrete idea of the supposed benefits concerned, which are not included as a goal of policy in the DAST strategy.
A final argument that could be advanced is that there is some benefit associated with team sports that does not apply to individual sports. It is sometimes said that the cooperation and camaraderie involved in team sports is character building, or confers some other psychological benefit or lasting lesson in life. Yet it is also possible to make the opposite case. The degree of
72 BUDGET PERSPECTIVES 2009
active participation in team sports can vary across the team, with the better players getting the lion’s share of the play and a number of people participating primarily as substitutes. The problem with these arguments is that they are speculative. They are no foundation for evidence-based policy.
More straightforwardly, whatever basis determines funding should be
explicit. As things stand, the DAST strategy states clearly that the aim of policy is healthier lifestyles and improved quality of life. Given the evidence presented here, it is difficult to reconcile this aim with the present funding allocation across different sports. The analysis presented here has questioned whether the current allocation of public investment in sport produces the desired returns, in terms of the potential benefits associated with participation. Evidence supports the stated justification for public investment in sport, namely the health and social benefits of participation, especially with respect to the health benefits of active participation. However, three specific research questions were raised regarding whether the current allocation is likely to capture these benefits. Each was addressed using the available evidence.
6. Conclusions
First, current policy devotes almost twice the amount of public money to
elite sport it devotes to grassroots sport. This places a very high emphasis on the social benefits associated with spectating and with national pride in the achievements of top players. It is hard to see how these benefits can be judged to be greater than the health and social benefits associated with mass participation, both active and non-active.
Second, of the funding that is allocated to grassroots sport, the large majority is spent on facilities. Empirical evidence, on the other hand, suggests that there is little demand among the wider public for more facilities and that provision of more facilities is not the best way to increase levels of participation. There is a strong case for moving away from the provision of physical capital to funding the human and social capital associated with sport. International evidence suggests that communication with non-participants (through for example the organisation and marketing of events, targeted programmes and new opportunities) is more likely to raise levels of participation.
Third, by far the biggest share of public investment goes to traditional team sports, especially Gaelic games. Yet these are not the most popular sports, nor the fastest growing, and they suffer from very high rates of dropout in early adulthood compared with individual sporting activities, many of which receive little or no public support. It is not at all clear what rationale is responsible for this distribution of funds, which is not in keeping with the stated aims of policy.
If the primary aim of sports policy is to capture the benefits of sport for the wider public, these three balances within the allocation of public spending on sport need to be re-examined.
To a degree, however, the current situation whereby policy is at odds with the evidence base is not surprising. Although the level of funding for sport has increased dramatically over the past ten years, the policy mechanisms it supports have not. Moreover, much of the research is relatively new and it
GETTING OUT WHAT YOU PUT IN 73
takes time to absorb and respond to the messages it contains. The information and insights of this new research have resulted from sports policy itself, which specifically set out to learn more about sporting activity in Ireland when it established the Irish Sports Council and gave it the duty of carrying out such investigation.
Nevertheless, the picture provided by the research findings is now consistent across several large-scale surveys and is also in keeping with international evidence. There is, therefore, a strong argument for revisiting the fundamental basis for public investment in sport and bringing policy more into line with its evidence base and stated aims. It is up to policy-makers whether and how they choose to respond.
REFERENCES
CARTER, P., 2005. Review of National Sport Effort and Resources. Report for HM Treasury and The Department of Culture, Media and Sport, London, UK.
CENTRAL STATISTICS OFFICE, 2007. Quarterly National Household Survey, Sport and Physical Exercise, Quarter 3 2006. Statistical Release, 14 December 2007.
CONSIDINE, J., F. CROWLEY, S. FOLEY and M. O’CONNOR (forthcoming). “Irish National Lottery Sports Capital Grant Applications 1999-2007: Natural Experiments on Political Influence”, Economic Affairs.
COOLAHAN, J., 1981. Irish Education: history and structure. Dublin: Institute of Public Administration.
DEPARTMENT OF ARTS, SPORT AND TOURISM, undated. Sport Capital Programme 1999-2002 Spending Review, Dublin: Department of Arts, Sport and Tourism.
DEPARTMENT OF FINANCE, 2008. Revised Estimates for Public Services 2008. Dublin: Department of Finance.
DELANEY, L. and T. FAHEY, 2005. Social and Economic Value of Sport in Ireland, Books and Monographs, No. 180, Dublin: The Economic and Social Research Institute.
FAHEY T., L. DELANEY, 2006. “State Financial Support for Horse Racing in Ireland” in T. Callan (ed.), Budget Perspectives 2007, Dublin: The Economic and Social Research Institute.
FAHEY T., R. LAYTE and B. GANNON, 2004. Sports Participation and Health Among Adults in Ireland, Books and Monographs, No. 178. Dublin: The Economic and Social Research Institute.
FAHEY T., L. DELANEY and B. GANNON, 2005. School Children and Sport in Ireland. Books and Monographs, No. 182, Dublin: The Economic and Social Research Institute.
FITZPATRICK ASSOCIATES, 2005. Review of the Local Sports Partnerships, Dublin: Department of Arts, Sport and Tourism.
IRISH SPORTS COUNCIL, 2005. Report and Financial Statements. Dublin: Irish Sports Council.
JENKINSON, C. and H. McGEE, 1998. Health Status Measurement: A Brief But Critical Introduction. Oxford: Radcliffe Medical Press.
LISTON, K., 2007. “A Question of Sport” in S. O’Sullivan et al. (eds.), Contemporary Ireland: A Sociological Map, Dublin: University College Dublin Press.
LUNN, P., 2007. Fair Play? Sport and Social Disadvantage in Ireland, Dublin: The Economic and Social Research Institute.

74 BUDGET PERSPECTIVES 2009
LUNN, P. and R. LAYTE, 2008. Sporting Lives: An Analysis of A Lifetime of Irish Sport, ESRI Research Series, No. 2. Dublin: The Economic and Social Research Institute.
LUNN, P., R. LAYTE and D. WATSON (forthcoming). The Irish Sports Monitor: First Annual Report, 2007. Dublin: The Irish Sports Council/ESRI.
US DEPARTMENT OF HEALTH AND HUMAN SERVICES, 1996. Physical Activity and Health. A Report for the US Surgeon General. Atlanta, GA: US Department of Health and Human Services, Centers for Disease Control and Prevention, National Center for Chronic Disease Prevention and Health Promotion.
WORLD HEALTH ORGANISATION, EUROPE, 2005. The European Health Report 2005: Public Health Action for Healthier Children and Populations, Copenhagen: WHO Regional Office for Europe.