Adopted FY 2021 Budget
614
Adopted FY 2021 Budget ARLINGTON COUNTY budget.arlingtonva.us
-
Upload
khangminh22 -
Category
Documents
-
view
5 -
download
0
Transcript of Adopted FY 2021 Budget

Adopted FY 2021 Budget
ARLINGTON COUNTY
budget.arlingtonva.us
Department of Management and Finance2100 Clarendon Boulevard, Suite 501
Arlington, VA 22201703-228-3415
budget.arlingtonva.us
ARLINGTON COUNTY VISION
Arlington will be a diverse and inclusive world-class urban community with secure, attractive
residential and commercial neighborhoods where people unite to form a caring, learning, participating, sustainable community in which
each person is important.
COUNTY BOARD MEMBERS
County Board Members
Libby Garvey Chair
Katie Cristol
Matt de Ferranti Christian Dorsey

This page intentionally left blank

ARLINGTON COUNTY VISION
"Arlington will be a diverse and
inclusive world-class urban community with secure, attractive residential and
commercial neighborhoods where people unite to form a caring,
learning, participating, sustainable community in which each person is
important."
— Adopted by the Arlington County Board January 26, 2002

The FY 2021 Adopted Budget is printed on paper consisting of 30% recycled content (post-consumer fiber) and SSI certified.

CONTENTS GUIDE TO READING THE ADOPTED BUDGET ...................................................................... 1 TRANSMITTAL LETTER ....................................................................................................... 3 ARLINGTON COUNTY PROFILE .......................................................................................... 9 BUDGET SUMMARY County Budget Resolution ............................................................................................... 21 Budget Decisions ............................................................................................................. 25 FY 2021 Revised Proposed Budget .................................................................................. 29 Expenditure Summary (All Funds) .................................................................................. 47 All Funds Revenue and Expenditure Detail ...................................................................... 48 General Fund Summary ................................................................................................... 50 General Fund Expenditure and Revenue Pie Charts ......................................................... 51 County Government Summary ......................................................................................... 52 Expenditure Comparison ................................................................................................. 53 Adopted Budget Position Changes ................................................................................... 54 COMPENSATION SUMMARY Budgeted Compensation – General Fund and All Funds ................................................... 59 Pay Enhancements, Retirement Rates, and Health Insurance Rates ............................... 60 REVENUE SUMMARY ........................................................................................................ 67 GENERAL FUND County Board Office ...................................................................................................... 127 County Manager’s Office ............................................................................................... 133 Department of Management and Finance ...................................................................... 139 Department of Technology Services .............................................................................. 145

CONTENTS
Human Resources Department ...................................................................................... 153 Office of the County Attorney ........................................................................................ 159 Circuit Court .................................................................................................................. 163 Clerk of the Circuit Court ............................................................................................... 169 General District Court .................................................................................................... 175 Juvenile and Domestic Relations District Court ............................................................. 179 Office of the Magistrate ................................................................................................. 185 Office of the Public Defender ......................................................................................... 189 Commonwealth's Attorney ............................................................................................ 193 Sheriff's Office .............................................................................................................. 199 Office of the Commissioner of Revenue ......................................................................... 207 Office of the Treasurer .................................................................................................. 213 Office of the Electoral Board and Voter Registration ..................................................... 219 Department of Public Safety Communications and Emergency Management ................. 225 Police Department ......................................................................................................... 233 Fire Department ............................................................................................................ 243 Department of Environmental Services ......................................................................... 251 Department of Human Services ..................................................................................... 273 Department of Libraries ................................................................................................ 295 Department of Parks and Recreation ............................................................................. 301 Arlington Economic Development .................................................................................. 317 Department of Community Planning, Housing and Development................................... 325 Non-Departmental......................................................................................................... 333 Debt Service .................................................................................................................. 337 Regionals/Contributions ............................................................................................... 343 Washington Metropolitan Area Transit Authority - Metro .............................................. 353

CONTENTS
ENTERPRISE, SPECIAL REVENUE and INTERNAL SERVICE FUNDS
Ballston Quarter Tax Increment Financing Area Fund ................................................... 359
Travel and Tourism Promotion Fund.............................................................................. 363
Ballston Business Improvement District ....................................................................... 369
Rosslyn Business Improvement District ........................................................................ 373
Crystal City Business Improvement District .................................................................. 377
Housing and Community Development Fund ................................................................ 381
Housing Choice Voucher Fund ....................................................................................... 397
Stormwater Management Fund ..................................................................................... 405
Transportation Capital Fund .......................................................................................... 415
Crystal City, Potomac Yard, and Pentagon City Tax Increment Financing Area Fund ..... 425
Columbia Pike Tax Increment Financing Area Fund ....................................................... 433
Utilities Fund ................................................................................................................. 439
Ballston Public Parking Garage ..................................................................................... 453
Ballston Public Parking Garage – Eighth Level ............................................................. 459
CPHD Development Fund ............................................................................................... 463
Automotive Equipment Fund ......................................................................................... 471
Printing Fund ................................................................................................................ 479
PAY-AS-YOU-GO CAPITAL BUDGET AND SHORT-TERM FINANCING
General Capital Projects Fund ....................................................................................... 487
General Obligation (GO) Bonds ..................................................................................... 499
Capital Program Project Lists ........................................................................................ 501
Short-Term Financing .................................................................................................... 509
Utility Capital Projects Fund .......................................................................................... 513
PAY PLAN FOR COUNTY EMPLOYEES ............................................................................. 519
GLOSSARY AND APPENDIX
Budget Calendar ............................................................................................................ 559

CONTENTS
Budget Process ............................................................................................................. 561 Selected Fiscal Indicators ............................................................................................. 565 Governmental Operating Fund Summaries .................................................................... 566 One-time Funding Summary .......................................................................................... 571 Prior Year Closeout (FY 2019) & Fund Balance Carryover Summary ............................. 573 Financial and Debt Management Policies ....................................................................... 575 Comprehensive Plan Summary ...................................................................................... 583 Housing Summary ......................................................................................................... 591 Tax and Fee Compendium…………………………………………………………………………………… 595 Glossary ........................................................................................................................ 597

GUIDE TO READING THE ADOPTED BUDGET
The Adopted Budget is presented in a format that provides several levels of financial detail. The focus of the Adopted Budget Document is to summarize major policy and program directions and initiatives that are funded in departmental budgets. More detailed descriptions of the various programs and activities in the County are included in the County Manager’s Proposed Budget, which is available on Arlington County’s web site, Department of Management and Finance https://budget.arlingtonva.us/
The Transmittal Letter, starting on the ivory pages, provides an overview of the Adopted Budget, highlighting strategic priorities for the upcoming fiscal year, major revenue and expenditure decisions made to implement those priorities, and changes affecting County staff.
Following the Transmittal Letter is a brief Profile of Arlington County, which includes both organizational and demographic information.
The Budget Summary section includes the Budget Resolution, budget decisions made by the County Board after the proposed budget was presented, summary charts and comparisons, and the County Manager’s Revised Proposed Budget, which was released at the beginning of April to respond to changing conditions resulting from the coronavirus pandemic.
The Compensation Summary includes highlights of the compensation changes included in the adopted budget, the total budget for salaries and fringe benefits, and additional information about pay enhancements, health insurance changes, and retirement rate changes in recent fiscal years.
The Revenue Summary section follows on the ivory pages. The tables included in this section provide historical and current year data, in addition to the approved revenue budget. Descriptions of the revenue sources are also provided.
General Fund departmental budget summaries start on the white pages. For each department, a mission statement is presented, along with a budget description explaining significant budget changes from FY 2020 to FY 2021.
Departmental financial summaries detail expenditure, revenue, net tax support and staffing levels for FY 2019 (Actual); current year FY 2020 (Adopted Budget); and FY 2021 (Adopted Budget). Aggregation of expenses and revenues by category are defined as follows:
Personnel - This category includes expenses for salaries, wages, and employee fringe benefits such as retirement, health, and life insurance.
Non-Personnel - This category includes expenses for goods or services provided to the County by vendors or by County internal service funds (see Glossary for definition of internal service funds); expenses for items that are used or consumed in the course of operation of the program or department; and expenses for initial, additional, or replacement items of office or operating equipment not funded through the capital budget.
Intra-County Charges and Inter-Departmental Credit - These categories represent charges by one unit of County government to support another unit's activities.
Fees - These are monies received by the County as payment for services, goods, or use of a facility. Examples are residential refuse disposal fees, user fees for recreation facilities, and various permit and inspection fees.
1

FY 2021 ADOPTED BUDGET GUIDE TO READING THE ADOPTED BUDGET
Grants - Grants are a contribution of funding, usually from state or federal agencies, to be used for a specific purpose or activity. Examples include state highway aid and the HIDTA (High Intensity Drug Trafficking Area) grant.
Net Tax Support - The funds that the County Board may allocate from local tax revenues to fully finance or to supplement revenues received by a department or program. Net tax support is the remainder determined by subtracting all department specific state and federal aid, fees, and charges from the total cost of the programs.
The Position Summary (FTEs) shows authorized permanent positions and temporary positions by full-time equivalent (see glossary for further information on how FTEs are calculated).
Except in the smallest departments, the department summary narrative also includes a table which summarizes the breakout of the departmental expenditure budget by lines of business, reflecting FY 2019 actual expenditures, FY 2020 adopted budget, FY 2021 adopted budget, and FY 2021 Adopted FTE count.
The Ten-Year History for each department reflects actual expenses and revenues prior to FY 2020 and adopted budget amounts for FY 2020 and FY 2021. The program history summarizes significant budget changes over a ten-year period.
Other operating funds (non-General Fund) are presented on the blue pages.
Summaries and project detail for Pay-As-You-Go Capital are exhibited on the grey pages.
The FY 2021 pay schedule for County employees is on the yellow pages.
The Appendix, on the white pages, includes the Budget Calendar, Budget Process, One-Time Funding Summary, Governmental Operating Fund Summaries, Selected Fiscal Indicators, Prior Year Closeout & Fund Balance Carryover Summary, Financial and Debt Management Policies, Comprehensive Plan Summary, the Housing Summary, which provides information in one place about the wide variety of housing-related programs provided in the County, and the Glossary.
2

TRANSMITTAL LETTER:
Coming soon!
3

This page intentionally left blank
4

ARLINGTON COUNTY PROFILE
9

This page intentionally left blank
10

ARLINGTON COUNTY PROFILE
OVERVIEW OF ARLINGTON
Arlington County is located in northern Virginia, directly across the Potomac River from Washington, D.C. The County encompasses 25.8 square miles of land, which was originally split off from Fairfax County in 1801 and ceded by Virginia to be included in the ten-mile square Federal District. In 1847, however, Congress allowed the land to return to the jurisdiction of Virginia following a vote in favor of retrocession by its members. This area was then known as Alexandria City and Alexandria County. In 1920, to avoid confusion, the county was renamed Arlington County.
Annexation of any part of Arlington County by neighboring jurisdictions is prohibited by present law unless the entire County is annexed with the approval of County voters. There are no jurisdictions with overlapping debt or taxing powers. The water and sewage systems are operated on a self-supporting basis by the County government.
Arlington’s location in the center of the Washington metropolitan region, just five minutes from Washington by car or Metrorail, has made the County a highly desirable business and residential location. Arlington has maintained high-quality residential neighborhoods while supporting well-managed growth. High-density commercial and residential development is focused around Metro stations in the Rosslyn-Ballston corridor and the Richmond Highway corridor, which includes both Pentagon City and Crystal City.
Arlington County has an estimated 2020 population of 228,400, an increase of 10 percent over the 2010 population. Additionally, Arlington is home to an estimated 234,800 jobs, as of January 1, 2020.
Almost all land in Arlington County has been developed. This development consists of extensive single-family residential areas, as well as commercial, office, and multi-family residential structures.
Economic activity in Arlington County has historically been closely associated with numerous governmental activities of the Washington Metropolitan region. In 2020 about 20.9 percent (or about 49,000) of the jobs in Arlington County are with the numerous federal, state or local government agencies. In recent years, however, the private employment base, particularly in the service sector, has increased substantially. The 2020 estimates show that sectors of the professional and technical services (24.3 percent and 57,000 jobs) and other services (22.4 percent and 52,500 jobs) have become the top industries for employment in Arlington County.
11

ARLINGTON COUNTY PROFILE
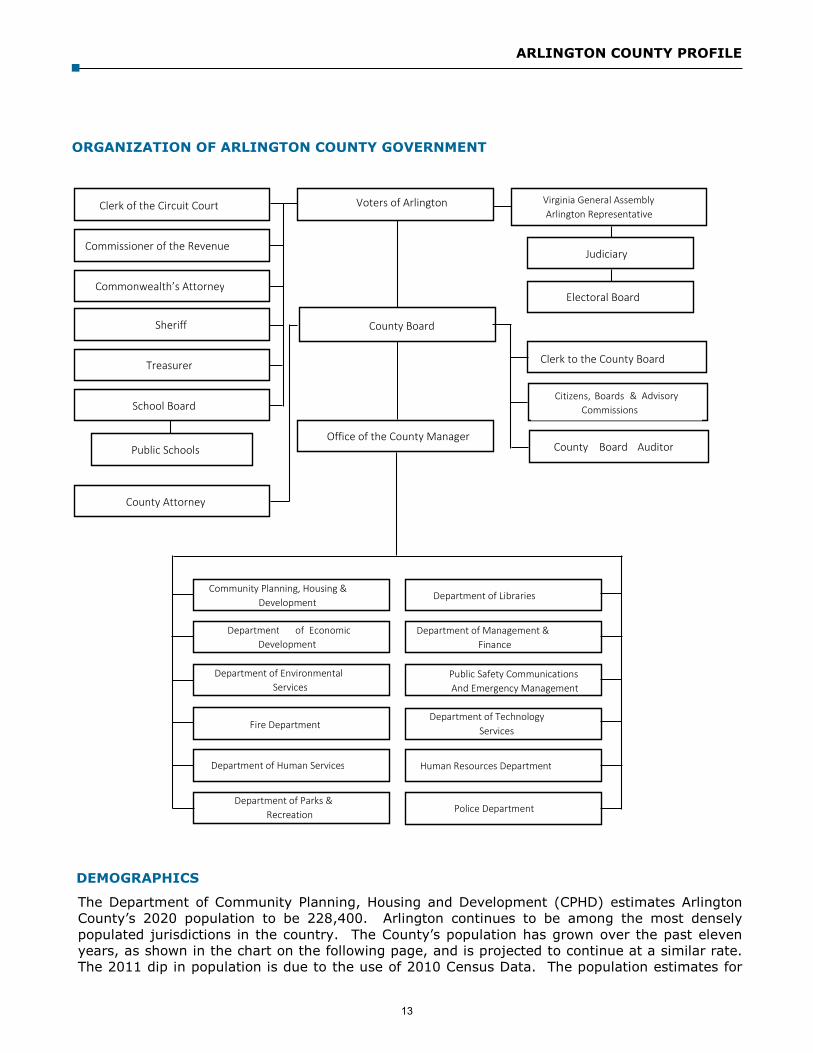
ORGANIZATION OF ARLINGTON COUNTY GOVERNMENT
The government of Arlington County has been organized according to the County Manager Plan of Government since 1932. Arlington County was the first jurisdiction in the United States to adopt a manager form of government by popular vote.
The five members of the County Board are elected at large for staggered, four-year terms. No more than two members are elected at one time. The Chairman of the County Board is elected annually by the members.
The County Board is responsible for several appointments. The County Board appoints a County Manager to serve as the chief executive and administrator of the County. The County Manager serves at the pleasure of the County Board, implements its policies, directs business and administrative procedures, and appoints department directors.
Assisting the County Manager are four Deputy County Managers, three Assistant County Managers and the Directors of 12 departments: Fire; Police; Public Safety Communications and Emergency Management; Environmental Services; Human Services; Economic Development; Community Planning, Housing and Development; Parks and Recreation; Management and Finance; Libraries; Human Resources; and Technology Services.
The County Board also appoints an Auditor to complement and augment the County’s existing internal auditing program. The auditor, and an advisory committee, report directly to the County Board and focuses on tightening financial oversight and deepening program performance review.
Finally, the County Board appoints a County Attorney. The County Attorney provides legal services to the County Board, County agencies and personnel, elected County officials, independent County boards and commissions, and the Arlington School Board.
The operation of public schools in Arlington County is the responsibility of a five-member School Board. School Board members serve staggered, four-year terms in a sequence similar to that of County Board members.
A 1992 revision of the State Code provided a local option to elect the School Board; Arlington voters chose to exercise that option via a November 1993 referendum. As of November 1994 and continuing each year thereafter, School Board members are elected.
The Superintendent of Schools is appointed by the School Board for a four-year term; the Superintendent administers the operations of the County’s public schools. The local share of the cost of operating public schools in the County is met with an appropriation and transfer by the County Board from the County’s General Fund. Operations of the School Board, however, are independent of the County Board and the County administration as prescribed by Virginia law.
In addition to the County Board, other elected County officials include the Commonwealth’s Attorney, Sheriff, Commissioner of the Revenue, Treasurer, and Clerk of the Circuit Court. The Judges of the Circuit Court, the General District Court and the Juvenile and Domestic Relations District Court are appointed by the State legislature.
The structure of Arlington County’s Government is depicted in an organizational chart on the following page.
12
ARLINGTON COUNTY PROFILE
ORGANIZATION OF ARLINGTON COUNTY GOVERNMENT
DEMOGRAPHICS
The Department of Community Planning, Housing and Development (CPHD) estimates Arlington County’s 2020 population to be 228,400. Arlington continues to be among the most densely populated jurisdictions in the country. The County’s population has grown over the past eleven years, as shown in the chart on the following page, and is projected to continue at a similar rate. The 2011 dip in population is due to the use of 2010 Census Data. The population estimates for
County Board
Voters of Arlington Virginia General Assembly Arlington Representative
Office of the County Manager
Clerk of the Circuit Court
Commissioner of the Revenue
Commonwealth’s Attorney
Sheriff
Treasurer
School Board
County Attorney
Public Schools
Judiciary
Electoral Board
Clerk to the County Board
Citizens, Boards & Advisory Commissions
County Board Auditor
Community Planning, Housing & Development
Department of Economic Development
Department of Environmental Services
Fire Department
Department of Human Services
Department of Parks & Recreation
Department of Libraries
Department of Management & Finance
Public Safety Communications And Emergency Management
Department of Technology Services
Human Resources Department
Police Department
13

ARLINGTON COUNTY PROFILE
2002-2009 used the 2000 Census as a base. The new 2010 Census data were used to recalibrate the CPHD’s method for estimating Arlington’s population for 2011 and beyond. Estimates for 2007-2009 and 2011-2020 are provided by CPHD and are based on new residential construction and estimates of average household size and vacancy rates. The 2010 number is based on the 2010 Census. CPHD estimates that 19.5 percent (43,530 persons) of the population are under the age 20. Individuals between the ages of 20-24 make up 6.8 percent or 15,590 persons. Those between the ages of 25-34 make up the largest share of the population at 24.1 percent or 54,960 persons. Persons between the ages of 35-44 represent 16.6 percent of the population (or 38,020 persons), those between the ages 45-64 make up 22.4 percent (or 51,060), those between the ages of 65-84 include 9.3 percent (or 21,280 persons) and those 85 and over represent 1.3 percent of the population (or 2,960 persons).
RACIAL/ETHNIC COMPOSITION
Arlington County takes pride in, and gains vitality from, the diversity of its population. According to the 2010 Census, 64.0 percent of Arlington residents are white, 15.1 percent are Hispanic, 8.2 percent are black or African-American, 9.6 percent are Asian or Other Pacific Islanders, and 3.0 percent identified as another race or two or more races. (Note: percentages may not add due to rounding.)
CPHD estimates that the aggregate population of Arlington increased by 9.6 percent between 2000 and 2010. (Note that staff believes the Census 2000 figure to be a bit lower than the actual population.) From 2000 to 2010 the largest increase in population among the racial/ethnic groups was an increase of about 18,472 among the white population. Among other groups, the Asian-Pacific Islander population also increased substantially, by 3,549 persons. The Hispanic population decreased by 3,886 persons and the African-American population decreased by 156 persons between 2000 and 2010. The following table shows the change in population among various racial/ethnic groups from 2000 to 2010. The 2000 and 2010 figures are from the Decennial Censuses. Race and ethnicity data from the 2020 Census will be included in this section once available.
195,000
200,000
205,000
210,000
215,000
220,000
225,000
230,000
2009 2010 2011 2012 2013 2014 2015 2016 2017 2018 2019 2020
Population
14

ARLINGTON COUNTY PROFILE
Racial/Ethnic Group 2000 2010 % Change
Non-Hispanic/Latino White alone 114,489 132,961 16.1% Black or African American alone 17,244 17,088 -0.9% Asian/Pacific Islander 16,346 19,895 21.7% Other/MultiRacial 6,106 6,301 3.2%
Total Non-Hispanic/Latino 154,185 176,245 14.3%
Hispanic/Latino 35,268 31,382 -11.0%
TOTAL 189,453 207,627 9.6%
EDUCATION
Arlington’s population is among the most highly educated in the country. According to the U.S. Census Bureau 2018 American Community Survey, 94.5 percent of all household residents age 25 and older were high school graduates, 74.6 percent were college graduates, and 39.7 percent had graduate or professional degrees. Of the Arlington Public School (APS) class of 2019-2020, 88 percent planned to pursue higher education, and the average expenditure per pupil was expected to be $19,921 in the 2020 fiscal year.
PERSONAL INCOME
The educational achievements of Arlington’s population are reflected in the County’s income statistics as well. In 2018, the Bureau of Economic Analysis reported that Arlington’s per capita personal income was $95,198. According to the U.S. Census American Community Survey, the median household income in Arlington County in 2018 was $117,374. The Per Capita Income graph above shows the growth in per capita personal income since 2002. Income figures for 2004 through 2018 are from the U.S. Bureau of Economic Analysis.
HOUSING
According to CPHD estimates, there are 117,300 total housing units in Arlington as of January 2020. A housing unit is a multi-family dwelling or a single-family dwelling attached to other dwellings or a single-family detached dwelling. The majority (66.1 percent or 77,500) of housing units in Arlington are multi-family. There are an estimated 28,500 single-family detached (24.3 percent), 11,200 single-family attached housing units (9.2 percent) and 100 other types of housing units in Arlington. Since 2000, growth in housing units has been largely due to multi-family development. Between 2000 and January 2020, 25,167 new multi-family units have been completed (an increase of 48.0 percent), compared to 918 single family attached units. There has been a net gain of 851 single family detached units during the same time span. According to the
$0
$10,000
$20,000
$30,000
$40,000
$50,000
$60,000
$70,000
$80,000
$90,000
$100,000
2004
2005
2006
2007
2008
2009
2010
2011
2012
2013
2014
2015
2016
2017
2018
Per Capita Income
15

ARLINGTON COUNTY PROFILE
2018 American Community Survey, owners occupy 43.5 percent and renters occupy 56.5 percent of occupied housing units.
HOUSEHOLD COMPOSITION
All persons living in a housing unit are termed a household. As of January 2020, CPHD estimates that there are 108,000 households in Arlington County. According to the 2010 Census the average household size is 2.09 persons. The 2010 Census also reports that an estimated 42.4 percent of Arlington households were family households and 57.6 percent were non-family households.
COMMUNITY FACILITIES IN ARLINGTON
County Owned Parkland 925 acres
Synthetic Fields 15
NOVA Parks 136 acres
Libraries 8
Multi-Use Trails (Off-Street) 52 Nature Centers 3 County Owned Parks 148 Senior Centers 5 Tennis and Basketball Courts 180 Community Centers 13 Natural Grass Fields 82 Fire Stations 10
AT-PLACE EMPLOYMENT
According to Arlington County estimates, the total number of jobs in the County increased by about 16.7 percent between 2000 and 2020. The service sector comprises a significant share of jobs in Arlington. About 24.3 percent of all jobs are in the professional and technical services sector. Another 22.4 percent of jobs are in other service sectors, including administrative, education, and health. The government sector also continues to comprise a large share of Arlington jobs. About 20.9 percent (49,000 jobs) of the County’s January 2020 employment is estimated to be in government. 2017 was the first year in which a sector (professional and technical services) other than government held the highest percentage of at-place jobs in Arlington County.
16

ARLINGTON COUNTY PROFILE
At-Place Employment Construction 3,800 Retail Trade 10,800 Transportation and Warehousing 13,200 Information 6,800 Finance Insurance 6,400 Real Estate and Rental/Leasing 9,100 Professional and Technical Services 57,000 Hospitality and Food Services 17,200 Other Services 52,500 Government 49,000 All Other 9,000
TOTAL 234,800
Source: Sector employment are Arlington County CPHD estimates based on data from the U.S. Bureau ofEconomic Analysis for the year 2018 (most current available). Unemployment data is from the U.S.Bureau of Labor Statistics Local Area Unemployment Statistics (LAUS).
Note: Jobs by sector may not add due to rounding.
17

ARLINGTON COUNTY PROFILE
TOP 10 PRINCIPAL PRIVATE EMPLOYERS
COMPANY NATURE OF BUSINESS ARLINGTON EMPLOYEES
1 Accenture Consulting Services 2,500 – 4,999 2 Deloitte Consulting Services 2,500 – 4,999 3 Virginia Hospital Center Healthcare 2,500-4,999 4 Booz Allen Hamilton Consulting Services 1,000 – 2,499 5 Gartner Consulting Services 1,000 – 2,499 6 Bloomberg BNA Information Services 750-9997 LIDL Supermarket 750-9998 Marriott International, Inc. Hotel 750-9999 CACI Consulting Services 500-749
10 Marymount University Education 500-749
TOTAL 12,750-24,490
Source: QCEW 2Q 2019
SELECTED SERVICE INDICATORS
FY 2019 FY 2020 FY 2021Actual Estimate Estimate
General Obligation Bond Rating Aaa/AAA/AAA Aaa/AAA/AAA Aaa/AAA/AAANew Voters Registered by Electoral Board (Calendar Year) 11,905 25,000 12,000Inspections Conducted for Fire Code Enforcement, fireprotection system, and hazardous materials inspections 3,159 3,400 3,400Percentage of Fire Emergencies Reached Within Four Minutesof Dispatch 60% 60% 60%Fire/EMS/Public Service Responses 60,851 63,000 63,000Refuse Collected on County and Contracted Routes (Tons) 27,367 28,534 29,675Total Curbside Recycling Tonnage Collected 12,968 10,437 10,437Licensed Child Care Facilities (Family Day Care Homes) 138 138 138Number of registrations in Parks and Recreation programs 60,260 61,000 61,000Number of individuals registered with the Office for Senior Adult Programs (OSAP) 6,905 7,000 7,200Police response time for Priority 1 calls (minutes from dispatch to arrival) 4:55 4:50 5:00
18
BUDGET SUMMARY
19

This page intentionally left blank
20

ATTACHMENT I
GENERAL FUND:
County Board 1,704,263
County Manager 5,134,115
Management and Finance 8,569,554
Technology Services 26,039,370
Human Resources 9,658,006
County Attorney 3,264,500
Circuit Court 1,253,184
Clerk of the Circuit Court 3,492,403
General District Court 406,355
Juvenile and Domestic Relations Court 7,335,007
Commonwealth's Attorney 4,632,228
Office of the Magistrate 29,986
Office of the Public Defender 181,239
Sheriff 46,192,674
Commissioner of the Revenue 5,949,123
Treasurer 7,298,502
Electoral Board 1,835,477
Public Safety Communications and Emergency Management 13,629,582
Police 72,274,292
Fire 66,430,066
Environmental Services 109,182,243
Human Services 146,126,784
Libraries 14,758,386
Economic Development 8,669,102
Community Planning, Housing & Development 11,624,696
Parks and Recreation 44,685,251
Non‐Departmental 54,235,363
Debt Service 68,962,748
Regionals / Contributions 6,724,786
METRO 47,808,764
TOTAL GENERAL FUND BUDGET: $798,088,049
OTHER FUNDS:
Ballston Quarter Tax Increment Financing 2,018,464
Travel and Tourism 1,209,582
Ballston Business Improvement District 1,569,935
Rosslyn Business Improvement District 4,053,393
Crystal City Business Improvement District 4,739,568
Community Development 3,378,470
Section 8 Housing Assistance 19,473,520
General Capital PAYG 24,274,441
General Obligation Bonds (Street & Highway,
Neighborhood Conservation, Government Facility,
Public Recreation, & Transit Facilities Bonds) 14,500,000
Stormwater Management 11,729,047
FISCAL YEAR 2021 COUNTY BUDGET RESOLUTION
Be it resolved by the County Board of Arlington County, Virginia, that the
following Budget is hereby adopted for the Fiscal Year 2021 and that any surplus
for general County purposes remaining at the end of the Fiscal Year shall return
to the General Fund of the County.
21

ATTACHMENT I
Transportation 34,436,800
Crystal City Tax Increment Financing 5,759,940
Columbia Pike Tax Increment Financing 1,014,000
Utilities 103,667,295
Utilities Capital 23,422,000
Ballston Public Parking Garage 4,144,996
Ballston Public Parking Garage ‐ 8th Level 92,841
CPHD Development 24,200,894
Automotive Equipment 18,574,340
Printing 2,384,695
TOTAL OTHER OPERATING FUNDS BUDGET: $304,644,221
TOTAL COUNTY GOVERNMENT BUDGET: $1,102,732,270
Facilities to be expended on order of the School Board
School Operating Fund 560,562,109
School Children's Services Act Fund 4,225,000
School Capital Projects Fund 2,040,843
School Debt Service Fund 56,905,740
School Food Services Fund 11,325,152
School Grants & Restricted Programs Fund 16,245,544
Total School and other funds appropriations $651,304,388
Total Community Activities Fund $19,756,037
TOTAL BUDGET FOR COUNTY $1,773,792,694
GENERAL FUND REVENUES:
Real Estate Tax 795,118,440
Personal Property Tax 120,052,147
Business License Tax 63,000,000
Other Local Taxes 138,065,778
Licenses, Permits and Fees 13,115,693
Fines 8,211,282
Interest, Rents 13,303,309
Charges for Services 64,253,949
Miscellaneous 1,855,329
State Revenue 79,146,009
Federal Revenue 16,145,620
Other Transfers In 10,937,655
Prior Year Balance (Revenue & County Exp. Savings) 22,239,239
TOTAL GENERAL FUND REVENUES: $1,345,444,450
Total Other Operating Fund Revenues $428,348,244
TOTAL REVENUES FOR COUNTY $1,773,792,694
For the operation and maintenance of Public Schools and Community Activities
22

ATTACHMENT II
GENERAL FUND:
County Board 1,704,263
County Manager 5,134,115
Management and Finance 8,569,554
Technology Services 26,039,370
Human Resources 9,658,006
County Attorney 3,264,500
Circuit Court 1,253,184
Clerk of the Circuit Court 3,492,403
General District Court 406,355
Juvenile and Domestic Relations Court 7,335,007
Commonwealth's Attorney 4,632,228
Office of the Magistrate 29,986
Office of the Public Defender 181,239
Sheriff 46,192,674
Commissioner of the Revenue 5,949,123
Treasurer 7,298,502
Electoral Board 1,835,477
Public Safety Communications and Emergency Management 13,629,582
Police 72,274,292
Fire 66,430,066
Environmental Services 109,182,243
Human Services 146,126,784
Libraries 14,758,386
Economic Development 8,669,102
Community Planning, Housing & Development 11,624,696
Parks and Recreation 44,685,251
Non‐Departmental 54,235,363
Debt Service 68,962,748
Regionals / Contributions 6,724,786
METRO 47,808,764
TOTAL GENERAL FUND APPROPRIATIONS: 798,088,049
FISCAL YEAR 2021 COUNTY APPROPRIATIONS RESOLUTION
Be it resolved by the County Board of Arlington County, Virginia, that the following
appropriations are hereby made for the Fiscal Year 2021, and that any surplus for general
County purposes remaining at the end of the Fiscal Year shall return to the General Fund
of the County. For other funds, such as capital funds and certain restricted funds, the
appropriations designated for these funds, unexpended as of June 30, 2020, are hereby
reappropriated to those funds to the following fiscal year. The reappropriation of the
funds is in addition to the appropriations listed in Attachment II. This section applies to all
existing appropriations for the capital and restricted funds on June 30, 2020 noted below
with an asterisk (*) and for all Bond Funds and the Urban Area Security Initiative (UASI)
fund.
23

ATTACHMENT II
OTHER FUNDS:
Ballston Quarter Tax Increment Financing $2,018,464
Travel and Tourism 1,209,582
Ballston Business Improvement District 1,569,935
Rosslyn Business Improvement District 4,053,393
Crystal City Business Improvement Dist. 4,739,568
Community Development 3,378,470
Section 8 Housing Assistance 19,473,520
* General Capital PAYG 24,274,441
* Stormwater Management 11,729,047
* Transportation 34,436,800
* Crystal City Tax Increment Financing 5,759,940
* Columbia Pike Tax Increment Financing 1,014,000
Utilities 103,667,295
* Utilities Capital 23,422,000
* Ballston Public Parking Garage 4,144,996
* Ballston Public Parking Garage ‐ 8th Level 92,841
CPHD Development 24,200,894
Automotive Equipment 18,574,340
Printing 2,384,695
TOTAL OTHER OPERATING FUNDS APPROPRIATIONS: $290,144,221
TOTAL COUNTY GOVERNMENT APPROPRIATIONS: $1,088,232,270
Facilities to be expended on order of the School Board
School Operating Fund $560,562,109
School Children's Services Act Fund 4,225,000
School Capital Projects Fund 2,040,843
School Debt Service Fund 56,905,740
School Food Services Fund 11,325,152
School Grants & Restricted Programs Fund 16,245,544
Total School and other funds appropriations $651,304,388
Total Community Activities Fund $19,756,037
TOTAL APPROPRIATIONS FOR COUNTY $1,759,292,694
For the operation and maintenance of Public Schools and Community Activities
24

FY 2021 BUDGET DECISIONS
FY 2021 BUDGET DECISIONS
The FY 2021 Adopted Budget incorporates funding levels for County programs and services which were determined after a detailed review of revenue and expenditure options contained in the FY 2021 Revised Proposed Budget. A summary of County Board actions is provided on the following pages. This list details expenditure and revenue changes between the FY 2021 Revised Proposed and the FY 2021 Adopted Budgets, as well as all changes in tax and fee rates from the FY 2020 adopted levels (including those previously cited in the FY 2021 Proposed and FY 2021 Revised Proposed Budgets).
TAXES
The base real estate tax rate remains at the CY 2019 rate of $1.013 per one hundred dollars of assessed value, no change.
A County-wide sanitary district tax for stormwater management, originally adopted in CY 2008, is reaffirmed at a rate of $0.013, bringing the combined base and sanitary real estate rate to $1.026 per one hundred dollars of assessed value.
An additional real estate tax, originally adopted in CY 2008, is reaffirmed at a rate of $0.125 per one hundred dollars of assessed value on properties used for or zoned to permit commercial and industrial purposes. Revenue from this tax is used to fund transportation initiatives.
The Rosslyn Business Improvement Service District tax rate remains unchanged at $0.078 per one hundred dollars of assessed value. This service district tax rate is in addition to the real estate tax rate.
The Crystal City Business Improvement Service District tax rate remains unchanged at $0.043 per one hundred dollars of assessed value. This service district tax rate is in addition to the real estate tax rate.
The Ballston Business Improvement Service District tax rate remains unchanged at $0.045 per one hundred dollars of assessed value. This service district tax rate is in addition to the real estate tax rate.
The Crystal City, Potomac Yard, and Pentagon City Tax Increment Financing District is projected to total $5,759,940 based on 25 percent of the incremental tax payments generated by the projected assessment tax base increase for properties in the defined Crystal City, Potomac Yard and Pentagon City area.
The Columbia Pike Tax Increment Financing District funding is projected to total $1,014,000 based on the increment of real estate tax revenue generated above the CY 2018 baseline.
The Ballston Quarter Tax Increment Financing District funding is projected to total $2,018,464 based on incremental tax growth of real property values as well as sales and meals taxes in the TIF district compared to the 2015 base year. Funding in an amount up to 65 percent of the incremental base value will be transferred to the trustee for the Ballston Quarter Community Development Authority (CDA) to fund the project stabilization fund as part of the Ballston Quarter CDA Series 2016A & Series 2016 B bond issuance.
25

FY 2021 BUDGET DECISIONS
Other local tax rates, including Personal Property, Business Professional & Occupational License (BPOL), meals, utility, and transient occupancy taxes remain unchanged.
REVENUES - GENERAL FUND
In the Department of Environmental Services (DES), the household solid waste rate increases from $306 to $319.03. The fee is charged per refuse unit and achieves the County’s objective of 100 percent recovery of household refuse collection, disposal and recycling costs, leaf collection costs, and overtime costs associated with brush and metal collection.
The Department of Human Services (DHS) is implementing new fees for new course offerings from the Arlington Employment Center related to childcare and computer training and certifications and new fees for newly offered certified vital event (eg. birth, death, marriage, divorce) certificates.
In the Department of Libraries, fines for overdue materials have been eliminated to make the collections more accessible to all library users.
In the Police Department, new fees have been established for alarm registrations and false alarm fines have been increased.
In the Department of Parks and Recreation (DPR), new fees have been adopted for nature summer camps extended day options, adult 3-verses-3 basketball tournaments, and lifeguard classes. Other fee adjustments have been made to more accurately reflect costs and DPR fee policy. These changes include fee adjustments for aquatics and gymnastics teams, creative arts programs, summer camps, and youth sports leagues.
In the Department of Community Planning, Housing and Development, development services fees including site plan fees have been increased by 2.5 percent.
In Arlington Economic Development (AED), Scenic Studio use fees have been increased.
REVENUES - OTHER FUNDS
In the Utilities Fund the water/sewer rate increased to $14.20 per thousand gallons. The rate represents an increase of $0.40 per thousand gallons, or 2.9 percent, above the current rate. At the new rate, the average single-family house will pay $24 more per year for water and sewer service based on an estimated household consumption of 60,000 gallons of water per year.
The FY 2021 adopted budget includes a 2.5 percent inflationary increase to all Development Fund fees to reflect increases to the costs of employee wages and benefits.
EXPENDITURES/OTHER ADJUSTMENTS
NOTE: All funding is ongoing unless otherwise noted. Reductions are changes to net tax support unless otherwise noted.
NON-DEPARTMENTAL/REGIONALS/OTHER Increased funding for Arlington Independent Media ($70,000 one-time) bringing total support for that organization to $397,978.
Allocated $25,000 in one-time funding for Lee Highway Alliance bringing total support for that organization to $85,500.
26

FY 2021 BUDGET DECISIONS
SCHOOLS The FY 2021 adopted transfer is $524,631,091 in ongoing funding. The revenue sharing percentage remains at 47.0 percent of ongoing local tax revenues.
27

This page intentionally left blank
28

COUNTY MANAGER’S OFFICE
2100 Clarendon Boulevard, Suite 314, Arlington, VA 22201 TEL 703.228.3120 FAX 703.228.3218 www.arlingtonva.us
Revised FY 2021 Budget MemorandumTo: County Board of Arlington, Virginia Date: April 6, 2020
From: Mark Schwartz, County Manager
Subject: Revised FY 2021 Proposed Budget
Members of the Board: Given the extraordinary circumstances facing our community, I am providing, for your consideration, a revised Fiscal Year (FY) 2021 Proposed budget.
With the COVID-19 virus altering our way of life, we have seen the personal toll borne by countless Americans and many here in Arlington. Our community’s physical and mental health has been challenged as never before. The economic impact has been unprecedented.
What was unthinkable two months ago is now in front of us. Businesses have laid off staff, residents have lost jobs, schools have closed and only the most essential functions continue. In over 30 years of my public service, I have seen nothing like this.
Our amazing staff have, in less than two weeks, prepared a new budget for your consideration. These same staff have juggled this work with their own concerns for their health and the need to care for their families. In the pages that follow, we have done our best to assess our anticipated revenues and expenditures. I know that I will be back to you many times in the coming months with revisions to today’s proposal. I fear that we are all being too optimistic. As actual receipts and expenses are tallied, we will have a better sense of the choices in front of us.
Under the Code of Virginia, we are still required to submit a budget and the Board must adopt one for the year beginning July 1. To ensure that real estate tax bills can be provided to residents in May, the proposed budget should serve as a good guide through at least the first few months of FY 2021 (July, August, September).
Update on FY 2020
Before moving into my revised proposal for FY 2021, I wanted to give you an update on the COVID efforts made to date and that are on the horizon for the next few days and weeks and the initial budget impacts.
This crisis hit with close to 75% of the fiscal year complete. As described in more detail below, we remain concerned about those economically sensitive tax sources, specifically sales, meals and transient occupancy taxes. We also recognize that we will experience declines in non-tax sources such as parking meter revenues, fees for services, among others. Much of this data is reported on a lagging basis, so we will not have a better sense of these impacts until late April / early May.
29

Memorandum Page 2 of 17
That said, we have many levers to address these near-term impacts (and the investments noted below) to ensure that we do not face a shortfall for the last three months of the fiscal year.
• We have instituted a hiring slowdown that will continue into FY 2021.• We have contingents available:
o The County Manager’s Contingent of which approximately $0.75 million remainsunallocated.
o Stabilization Reserve – while I am proposing that $4.0 million of this reserve beutilized in FY 2021, a balance of $7.8 million remains that could be available inFY 2020 or later in a worst-case scenario.
• Capital projects could be deferred or cancelled beyond what I have already recommendeddoing for FY 2021 as noted below.
We are monitoring revenues and expenditures on a daily basis and will provide periodic reports as data becomes available.
Initial Investments to Address COVID-19
While mindful of the financial impacts, over the last month, we have taken a series of actions critical to addressing the pandemic:
• Purchase of personal protective equipment (PPE) and additional cleaning supplies for ourfront-line employees and non-profit partners.
• Invested in technology (laptops, etc.) to move as much of the workforce to telework aspossible with a focus on standing up virtual call centers for COVID-19 response and forremote ECC call intake and dispatch and allowing case workers and other services to beprovided remotely.
• Provided initial support to front-line non-profits:o Set up telehealth capabilities to connect the Virginia Hospital Center and the
Arlington Free Clinic.o Provided $100,000 for food purchases to the Arlington Food Assistance Center.
• Stood up the COVID-19 testing center with Virginia Hospital Center, including technology,facilities and logistical assistance.
• Identified back-up quarantine housing for congregate care settings.
In the coming days and weeks, I will also be proposing other initiatives:
• Premium pay for those front-line employees who cannot work remotely and must be on-site.The City of Alexandria and the State of Maryland have implemented similar hourlypremiums.
• Small business support through a grant program and exploring the possibility of a revolvingloan fund. The remaining balance of the Gazelle grant program (approximately $650,000)can be reallocated to at least partially fund this business support.
• Delaying required repayments by recipients of County AHIF loans.
30
Memorandum Page 3 of 17
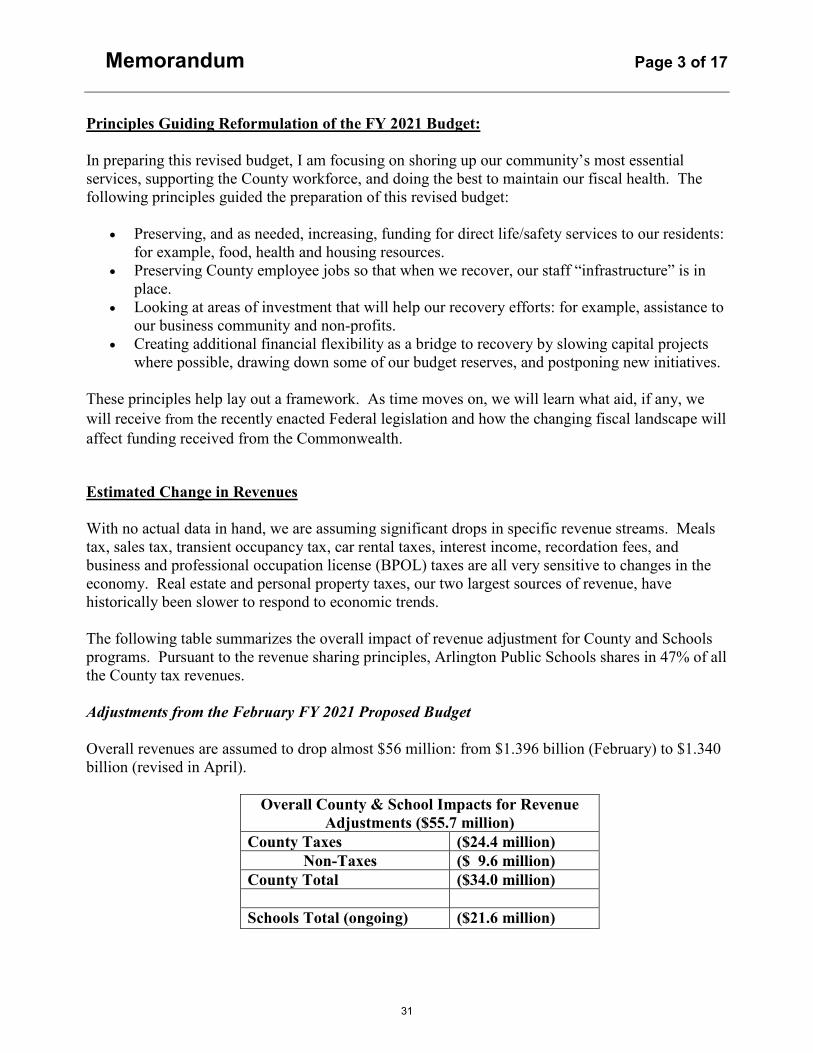
Principles Guiding Reformulation of the FY 2021 Budget:
In preparing this revised budget, I am focusing on shoring up our community’s most essential services, supporting the County workforce, and doing the best to maintain our fiscal health. The following principles guided the preparation of this revised budget:
• Preserving, and as needed, increasing, funding for direct life/safety services to our residents:for example, food, health and housing resources.
• Preserving County employee jobs so that when we recover, our staff “infrastructure” is inplace.
• Looking at areas of investment that will help our recovery efforts: for example, assistance toour business community and non-profits.
• Creating additional financial flexibility as a bridge to recovery by slowing capital projectswhere possible, drawing down some of our budget reserves, and postponing new initiatives.
These principles help lay out a framework. As time moves on, we will learn what aid, if any, we will receive from the recently enacted Federal legislation and how the changing fiscal landscape will affect funding received from the Commonwealth.
Estimated Change in Revenues
With no actual data in hand, we are assuming significant drops in specific revenue streams. Meals tax, sales tax, transient occupancy tax, car rental taxes, interest income, recordation fees, and business and professional occupation license (BPOL) taxes are all very sensitive to changes in the economy. Real estate and personal property taxes, our two largest sources of revenue, have historically been slower to respond to economic trends.
The following table summarizes the overall impact of revenue adjustment for County and Schools programs. Pursuant to the revenue sharing principles, Arlington Public Schools shares in 47% of all the County tax revenues.
Adjustments from the February FY 2021 Proposed Budget
Overall revenues are assumed to drop almost $56 million: from $1.396 billion (February) to $1.340 billion (revised in April).
Overall County & School Impacts for Revenue Adjustments ($55.7 million)
County Taxes ($24.4 million) Non-Taxes ($ 9.6 million) County Total ($34.0 million)
Schools Total (ongoing) ($21.6 million)
31

Memorandum Page 4 of 17
Schools: In the February Proposed budget, Arlington Public Schools would have received $546.3 million in ongoing funding based on the Principles of Revenue Sharing for the split of local tax dollars, an increase of $23.9 million from the adopted FY 2020 level. With that revenue transfer, the Schools proposed a needs-based budget which created a funding gap of over $27 million; however, APS outlined a variety of program and compensation choices to balance the School budget for FY 2021. The revised revenue projections outlined in this memo reduce the projected School transfer by $21.6 million to a total of $524.6 million in ongoing funding. Similar to the County, the Schools will need to make some very difficult choices due to the pandemic crisis.
Comparison to the FY 2020 Adopted Budget
With this revised Proposed Budget, overall revenues are assumed to drop almost $16 million below the FY 2020 adopted totals. The events of this spring are significantly impacting FY 2020 and FY 2021. Updates on the FY 2020 budget, both revenue and expense, will be provided later this month as a part of the 3rd Quarter review.
Revised assumptions for both FY 2020 and FY 2021 assume a variety of impacts on our revenue sources. Depending on the timing of revenue receipts to the County, revenue sources are impacted differently. Generally, for revenue received on a daily or monthly basis (e.g., sales, meals, and transient occupancy tax), drops in anticipated revenue receipts are assumed beginning in mid-March and continuing through June where a recovery period is expected until activity resumes to normal. This impact and curve to recovery varies based on the tax source. It will impact sales, meals, and transient occupancy tax (hotel tax) most immediately. Hotel taxes (Transient Occupancy Tax, or TOT) will see the most significant declines in FY 2020 with up to 75% loss in monthly revenue.
Business license taxes (BPOL) in the spring of CY 2020 (impacting FY 2021 revenue) will see significant impacts with recovery beginning in the first quarter of FY 2021. For other tax revenue received annually or bi-annually (e.g., real estate and personal property taxes) different assumptions are made.
Our expectations of recovery change from day to day. The estimates in this revised budget proposal may be too optimistic and as I mentioned earlier, I will likely be back to the County Board and community with revisions to this proposal.
32

Memorandum Page 5 of 17
Revenue
FY 2020 Adopted Budget
FY 2021 Originally Proposed Budget
FY 2021 Revised
Proposed Budget
FY 2021 Percent Change (original
to revised)
FY 2021 $ Change
(original to revised)
FY 2020 Adopted to
Revised FY 2021
% Change
Real Estate Tax $771,036,860 $806,680,276 $795,118,440 -1.4% ($11,561,836) 3.1% Personal Property Tax 119,052,147 122,252,147 120,052,147 -1.8% (2,200,000) 0.9% BPOL Tax 69,020,000 74,860,000 63,000,000 -15.8% (11,860,000) -8.7%Sales Tax 44,700,000 47,500,000 43,127,695 -9.2% (4,372,305) -3.5%Meals Tax 40,900,000 42,310,000 36,772,563 -13.1% (5,537,437) -10.1%Transient Occupancy Tax 26,000,000 26,000,000 19,257,639 -25.9% (6,742,361) -25.9%Car Rental Tax 6,300,000 6,300,000 4,342,881 -31.1% (1,957,119) -31.1%Recordation Tax 5,500,000 6,000,000 4,200,000 -30.0% (1,800,000) -23.6%Other Taxes 29,112,000 30,365,000 30,365,000 0.0% - 4.3% Total Taxes 1,111,621,007 1,162,267,423 1,116,236,365 -4.0% (46,031,058) 0.4%
License, Permits & Fees 12,382,803 14,330,893 13,115,693 -8.5% (1,215,200) 5.9% Fines, Interest & Leases 23,663,266 26,354,543 21,542,350 -18.3% (4,812,193) -9.0%Charges for Service 64,252,642 66,035,658 64,231,949 -2.7% (1,803,709) 0.0% State & Federal 92,063,641 95,861,629 95,291,629 -0.6% (570,000) 3.5% Other 11,153,921 9,342,428 8,096,333 -13.3% (1,246,095) -27.4%Fund Balance 41,108,294 21,978,940 21,978,940 0.0% - -46.5% Non-Tax Revenue 244,624,567 233,904,091 224,256,894 -4.1% (9,647,197) -8.3%
TOTAL REVENUE BUDGET 1,356,245,574 1,396,171,514 1,340,493,259 -4.0% (55,678,255) -1.2%
SCHOOL TRANSFER (ongoing funding) $522,426,668 $546,265,689 $524,631,091 -3.9% ($21,634,597) -0.7%
Fiscal Year 2021 revised proposed revenues are estimated to be $56 million lower than the originally proposed FY 2021 budget and $16 million lower than the Fiscal Year 2020 adopted budget due to the lingering impacts of social distancing and state-imposed business restrictions amid the COVID-19 outbreak, along with the greater macroeconomic effects from the global pandemic and potential future waves of the virus.
Real Estate – Real estate tax revenue is forecasted to be $11.6 million lower than originally budgeted due to changes in assumptions related to the growth of the County’s real estate assessment tax base in January 2021. The original proposed budget assumed a three percent growth rate for property values for CY 2021. The current revision assumes no growth in the tax base.
33

Memorandum Page 6 of 17
Personal Property – Personal property tax revenue is composed of vehicle personal property and business tangibles. A slightly lower assumption is being made to business tangible revenue as a result of slower business equipment purchases through the remainder of the calendar year. Total tax revenue is forecasted to be $2.2 million (1.8%) lower than originally budgeted.
Business, Professional and Occupational License Tax (BPOL) – BPOL tax revenue is expected to see a significant decline in FY 2021. BPOL tax is calculated based on gross receipts from the previous calendar year. For FY 2021, these will include the business receipts from this spring and summer (CY 2020), significantly impacted by the slowdown of business operations. The original estimate was based on a trend of steady growth in revenue receipts, including an 11 percent increase in FY 2019. The revised lower tax projection is almost a $12 million decrease from the originally proposed projections.
Sales – Business closures and social distancing measures have also impacted the sales tax revenue estimate as in-person purchases begin to slowly recover while online sales remain relatively more stable. Revised sales tax revenue is forecasted to be $4.4 million lower than the original estimate.
Meals – Meals tax receipts are expected to follow a similar pattern to sales tax but decease slightly more as restaurants begin to build back up from temporary partial or full closures. This tax revenue is forecasted to decrease $5.5 million from the original estimate.
Transient Occupancy (TOT) – TOT is expected to see the most significant impact from the COVID-19 outbreak due to sudden decreases in both business and personal travel. Hotel occupancy rates have plunged since the beginning of March. So, while receipts for FY 2021 are expected to rebound some, they are forecasted to remain well below FY 2020 levels. This tax revenue is forecasted to decrease $6.7 million from the original estimate.
Car Rental – Car rental tax income is in large part related to travel and tourism. With the decline in travel and tourism expected to continue into the fall of CY 2020, this revenue tax source has been reduced $2.0 million from the original proposed budget projections.
Recordation – Recordation taxes are received by the County on the transfer and refinancing of residential and commercial properties. With the uncertain economic environment, sale transactions, specifically large commercial properties, is expected to slow. This tax revenue is forecasted to decrease $1.8 million from the original estimate.
Other Local Taxes – The remaining tax categories (utility taxes, communication, cigarette, bank stock) are expected to remain at the original FY 2021 budget projection levels.
County Non-Tax revenues are projected to be $9.6 million lower than originally proposed. Highlights include:
• License, Permits & Fees: There are a variety of fees that deal with development relatedactivity which are expected to slow during the beginning of the fiscal year. They include,among others, right of way fees, highway permits, site plan fees, and assembly permits.
34

Memorandum Page 7 of 17
• Fines, Interest, and Leases: Fine revenues that will be impacted include parking ticketsand photo red light due to changes in traffic patterns. Interest income may see a decline dueto the reduction in interest rates resulting from the Federal Reserve lowering rates in March2020. Depending on the length of the economic recovery at the national level, a lowerinterest rate environment will result in lower interest income on cash balances invested bythe Treasurer.
• Charges for Services: A variety of Charges for Service revenues will be impacted due tothe revised service and programming offered throughout a number of County agencies. Parkand Recreation program changes, ART transportation ridership, and parking meter revenuewill all be affected through the first quarter of the fiscal year.
• State and Federal Revenue have been held steady with the expectation that moreinformation will be forthcoming from various state and federal agencies. One adjustmentwas made to Grantor’s tax revenue. This revenue is received as a percentage of real estatetransactions similar to the County’s receipt of Recordation taxes noted above.
Proposed Expense Changes in the Revised FY 2021 Proposed Budget
In order to balance declining revenues and fund critical needs, my revised budget makes expenditure adjustments in several areas as described below.
The most difficult choice was foregoing compensation increases for our workforce, but I make this recommendation in order to preserve jobs for our employees. I have not made any changes to benefit levels but will be deferring the Consumer Driven High Deductible health insurance plan until the middle of FY 2021. Preservation of jobs is the surest way, in my mind to ensure that we lessen the shocks to the economy and that we have a reliable framework in place once we escape the grip of the pandemic. I watch with dismay the furloughs in other local governments in the Commonwealth and we are fortunate that we are not yet at that point.
This revised proposed budget keeps most service levels intact.
35

Memorandum Page 8 of 17
FY 2020 Adopted
Level
FY 2021 Proposed
Level
FY 2021 New Level
$ Change - Original
Proposed to New Level
Compensation Increase n/a $16.0 million $2.7 million ($13.3 million) Delay in Opening Long Bridge & Lubber Run
- $4.2 million in new funding
$1.0 million in new funding
($3.2 million)
New or Augmentation of Existing Programs
n/a $14.7 million $7.3 million ($7.4 million)
Metro $47.6 million $49.3 million $47.8 million ($1.5 million) Debt Service $72.2 million $75.0 million $69.0 million ($6.0 million) Transfer to Capital (Ongoing)*
$6.8 million $6.8 million $3.8 million ($3.0 million)
Stabilization Reserve** $4.0 million $13.5 million $7.8 million ($5.7 million) Contingents for added services or additional loss in revenue
n/a n/a $10.2 million $10.2 million
*In addition to the reallocation of $3.0 million of FY 2021 funding for PAYG, this revised budgetalso proposes the redirection of $5.0 million of capital projects deferrals and project balanceswhere the funding was provided in multiple prior fiscal years.**Stabilization Reserve is 1.0% of the General Fund. Some funding was utilized for emergencytechnology needs after the February proposed budget. This revised budget utilizes an additional$4.0 million.
What Hasn’t Changed from the Proposed Budget
My revised budget proposal continues support in the following areas:
Compensation, Recruitment & Benefits
While I am proposing no compensation increase at this time, I am not proposing any changes to the County’s pension, health care program or other existing benefits (I am delaying the new health care option of the Consumer Driven Health Plan (CDHP)).
There are several compensation enhancements which remain in the FY 2021 revised budget. • Continued hiring for our public safety agencies: recruitment funding for Police ($129,000,
one-time) and Sheriff ($75,000, one-time)• Increase to Fire staffing (9 FTEs) to continue the implementation of Fire’s Kelly Day and a
second recruit class ($2.4 million). Continuation of this effort is extremely important sowhen we exit from these difficult times, Arlington’s Fire Service will continue to beappropriately staffed.
36

Memorandum Page 9 of 17
• Increase in dependent care subsidy ($500 to $1,000), increase to vacation leave accrual fornew/recent hires, increase in paid parental leave from 4 to 6 weeks, one-time Election Dayholiday, and an additional floating holiday.
Affordable Housing
• Housing Grants: $10.1 million total, including an $0.8 million increase, to meet theestimated increase in demand prior to COVID.
• Permanent Supportive Housing: $2.5 million, including an $0.4 million increase, to meetthe estimated increase in demand. In addition, two additional positions were added tosupport this at-risk population and the growing demand in this program ($200k). Theprogram has grown 9% since 2018 and approximately 46% over the last five years.
• Affordable Housing Investment Fund: Revised budget matches the FY 2020 level of $16.0million.
Safety Net Non-Profits: Continuing to fund the same level of support as in the proposed budget, including contractual services levels for the Residential Program Center, the Homeless Services Center and various group homes as well as other base budget contributions for organizations like Offender Aid & Restoration (OAR) and others.
Other Services and Programs: The rest of my revised budget assumes continuing the same level of day to day services as provided prior to COVID. This may be overly optimistic depending on the recovery trajectory, but it is too early to consider full-scale program and service reductions.
I did want to highlight areas where my original budget included additional funding to: 1) meet contract increases due to the results of new procurements; 2) areas where we have been experiencing an increase in demand or we were falling behind; or 3) maintaining filled staff positions that had been funded with one-time funds in prior years; and 4) prior commitments or legally mandated new programs that are underway and likely cannot be eliminated, like election funding. These include:
• Contractual cost increases: A number of base budget increases remain due to the increasedcost of procured services. One of the most significant increases in FY 2021 was due to thenew operator contract for the County’s ART bus service ($4.4 million full year impact).Other increases include rent costs for the County occupying leased space, technologysoftware increases, and other services provided to County residents and businesses.
• Service demand & County infrastructure:o Additional staffing for Transportation Engineering and Operations: $0.2 milliono Procurement: $0.1 milliono Concrete maintenance: $0.3 milliono Facilities maintenance: $0.1 million
• Maintaining filled staff positions in Cultural Affairs, Human Services, Parks & Recreation,CPHD, Technology Services and Commonwealth Attorney’s Office: $1.4 million, 13.5FTEs
• Prior commitments or legally required:
37

Memorandum Page 10 of 17
o New Mental health docket positions: $0.2 milliono One-time funds for the November election: $0.3 milliono Commitments to regional partners (e.g. NOVA Park Authority, COG)
Proposed Reductions: In February, I proposed a budget that added back targeted investments in areas that were falling behind after two years of reductions. My revised budget now proposes that $10.5 million of program adjustments be postponed: $4.8 million in new services and $5.7 million in enhancements to existing programs. The following tables outline those items.
Dept. Expense Adjustment Ongoing One-time Total AED Signature Costume Shop Management $ 70,000 $ 70,000 Clerk CCT Marriage license request portal $ 75,000 $ 75,000 CMO Innovation funding $ 200,000 $ 200,000 CPHD Historic Preservation Master Plan $ 35,000 $ 35,000
DES Pilot low cost flood sensors for 300 high risk homes $ 9,000 $ 9,000
DHS Housing Support to those aging out of foster care $ 251,736 $ 251,736 DHS Case Manager for Housing Support for foster care $ 91,923 $ 91,923 DPR & DES Lubber Run Community Center* $ 1,141,000 $ 180,000 $ 1,321,000 DPR Long Bridge Aquatics and Fitness Center** $ 1,600,000 $ 285,000 $ 1,885,000 DPR Community Engagement Position $ 100,000 $ 100,000 LIB Courthouse Library staffing & materials $ 75,000 $ 75,000 POL Traffic Control Officers $ 453,992 $ 104,012 $ 558,004
Non-DGARE equity training($25,000 remains)
$ 75,000 $ 75,000
Non-D Northern VA Economic Development Consortium $ 75,000 $ 75,000 $ 3,838,651 $ 983,012 $ 4,821,663
Postponed Program Adjustments: New Programs
* Note: $0.3 million of new funding remains in the revised budget for Lubber Run Community Center to cover basic building maintenance and to fund the maintenance of the outdoor park.
**Note: Elimination of funding for Long Bridge Aquatics & Fitness Center does not result in net tax support savings, as these operations were offset by program revenue and Boeing grant funding. $0.7 million of new funding remains in the revised budget for the General Manager & Maintenance Tech positions for facility management, minimal cleaning and utilities, pool chemicals, and outdoor park maintenance
38

Memorandum Page 11 of 17
Dept. Expense Adjustment Ongoing One-time Total Remaining Services AED Lee Highway Alliance $ 25,500 $ 25,500 Base budget of $60,500 included in revised budget AED Clarendon Alliance $ 15,000 $ 10,000 $ 25,000 Base budget of $80,000 included in revised budget AED Columbia Pike Revitalization $ 60,000 $ 60,000 Base budget of $350,000 included in revised budget
AED Arts Grants $ 30,000 $ 30,000 Arts Grants funding will remain at the base budget level of approximately $215,810.
CBO Audit consulting funds $ 60,000 $ 60,000 The Board Auditor base budget of $235,000 remains funded.
CBO Salary increase $ 58,480 $ 58,480 Salaries remain flat, consistent with staff compensation
Clerk CCT
Court Clerk $ 68,000 $ 68,000 The Court will continue to operate with four Court Clerks.
CPHD Housing Arlington $ 248,750 $ 248,750
CPHD Principle Planner, Housing $ 147,000 $ 147,000
CPHD Principle Planner $ 147,000 $ 147,000 Comprehensive Planning staffing will only increase by 0.5 FTE, which fully funds an existing position.
DES Facilities Planner/Architect $ 81,254 $ 81,254 DES Facilities Planning base budget remains at the FY 2020 Adopted level.
DESWater/Sewer/Streets Training Specialist
$ 28,020 $ 28,020 Admin and training work for the Water/Sewer/Streets Bureau will continue to be supported centrally within DES.
DES Streetlight Support $ 111,643 $ 23,000 $ 134,643 Major repairs remain at 45 days instead of improving to 30 days, and minor repairs remain at 14 days instead of improving to 7 days.
DMFCommercial Real Estate Appraiser
$ 103,846 $ 103,846 Existing Commercial Real Estate Appraisal team (4.0 FTEs) remains unchanged.
DMF Internal Audit $ 50,000 $ 50,000 Revised proposal retains 1.5 FTEs and consulting support.
DPRRestructure Roving Monitor Program
$ 70,000 $ 70,000 Roving monitor program will be restructured by reallocating existing budget
DPR Additional Urban Forester $ 135,000 $ 53,000 $ 188,000 Urban Forestry team remains at 3.0 FTEs. DPR Tree Maintenance (pruning) $ 200,000 $ 200,000
DPRDisease/Pest Maintenance for trees
$ 50,000 $ 50,000
DPR Temp Employee Conversion $ 596,875 $ 596,875 Existing staff will remain temporary employees.
HRD Business Partner $ 121,366 $ 121,366
Human Resources and the departments impacted will continue handling human resources issues although less optimally than would be possible with this additional resource.
HRD Class & Compensation position $ 140,000 $ 140,000
With the pause in classification studies, Classification & Compensation will continue studying positions although they will not be completed as quickly without this additional resource.
LIB Collections materials $ 100,000 $ 100,000 Libraries collection budget increases from $1.5 million in FY 20 adopted budget to $1.6 million in revised proposal (instead of $1.7 million).
Non-D AHIF $ 2,700,000 $ 2,700,000 AHIF funding remains at the FY 20 Adopted Budget level of $16.0 million.
Non-DProbation & Parole: increase supplement to 15%
$ 97,225 $ 97,225 Supplement for Probation and Parole remains at 7.5%.
Non-D Transfer to Capital $ 119,795 $ 119,795 In addition to this reduction in PAYG funding, the base is reduced by an additional $3 million resulting in total FY 21 funding of $3.8 million.
$ 2,196,209 $ 3,454,545 $ 5,650,754
TOTAL EXPENSE ADJUSTMENT $ 6,034,860 $ 4,437,557 $ 10,472,417
Tree pruning cycle remains unchanged at 17 years instead of improving to 10 years.
The Housing Arlington staff budget remains unchanged from the FY 2020 Adopted budget.
Postponed Program Adjustments: Enhancements of Existing Programs
39
Memorandum Page 12 of 17
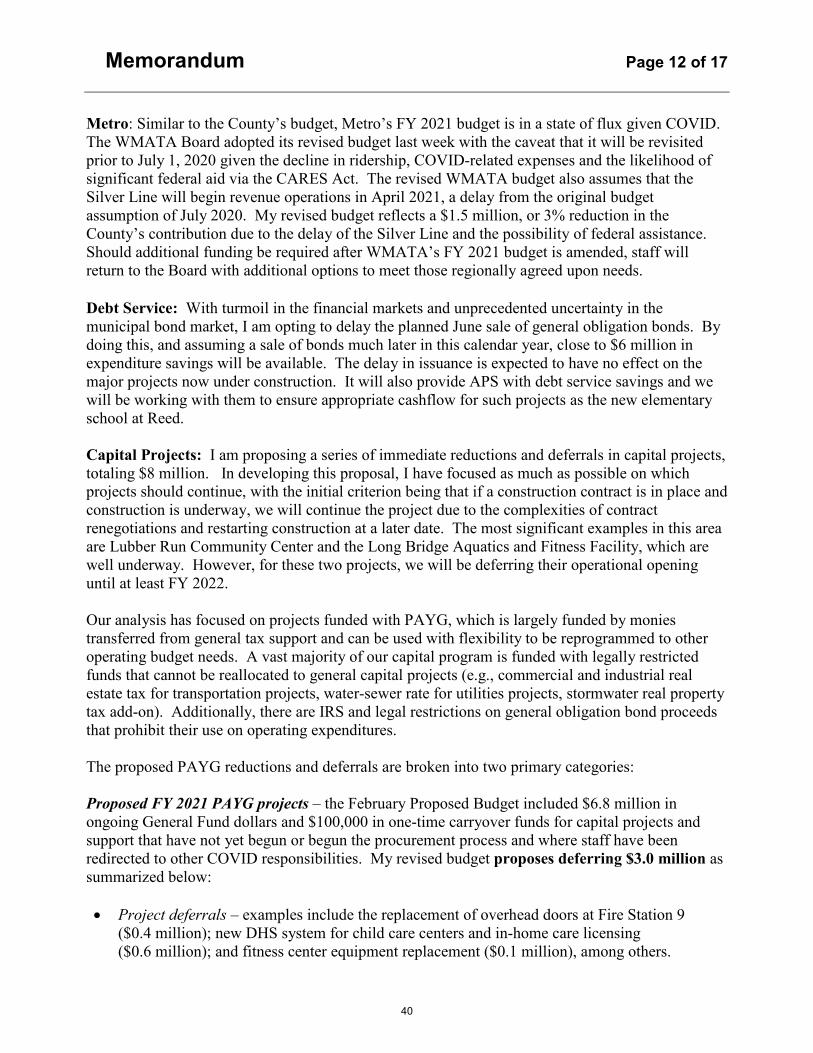
Metro: Similar to the County’s budget, Metro’s FY 2021 budget is in a state of flux given COVID. The WMATA Board adopted its revised budget last week with the caveat that it will be revisited prior to July 1, 2020 given the decline in ridership, COVID-related expenses and the likelihood of significant federal aid via the CARES Act. The revised WMATA budget also assumes that the Silver Line will begin revenue operations in April 2021, a delay from the original budget assumption of July 2020. My revised budget reflects a $1.5 million, or 3% reduction in the County’s contribution due to the delay of the Silver Line and the possibility of federal assistance. Should additional funding be required after WMATA’s FY 2021 budget is amended, staff will return to the Board with additional options to meet those regionally agreed upon needs.
Debt Service: With turmoil in the financial markets and unprecedented uncertainty in the municipal bond market, I am opting to delay the planned June sale of general obligation bonds. By doing this, and assuming a sale of bonds much later in this calendar year, close to $6 million in expenditure savings will be available. The delay in issuance is expected to have no effect on the major projects now under construction. It will also provide APS with debt service savings and we will be working with them to ensure appropriate cashflow for such projects as the new elementary school at Reed.
Capital Projects: I am proposing a series of immediate reductions and deferrals in capital projects, totaling $8 million. In developing this proposal, I have focused as much as possible on which projects should continue, with the initial criterion being that if a construction contract is in place and construction is underway, we will continue the project due to the complexities of contract renegotiations and restarting construction at a later date. The most significant examples in this area are Lubber Run Community Center and the Long Bridge Aquatics and Fitness Facility, which are well underway. However, for these two projects, we will be deferring their operational opening until at least FY 2022.
Our analysis has focused on projects funded with PAYG, which is largely funded by monies transferred from general tax support and can be used with flexibility to be reprogrammed to other operating budget needs. A vast majority of our capital program is funded with legally restricted funds that cannot be reallocated to general capital projects (e.g., commercial and industrial real estate tax for transportation projects, water-sewer rate for utilities projects, stormwater real property tax add-on). Additionally, there are IRS and legal restrictions on general obligation bond proceeds that prohibit their use on operating expenditures.
The proposed PAYG reductions and deferrals are broken into two primary categories:
Proposed FY 2021 PAYG projects – the February Proposed Budget included $6.8 million in ongoing General Fund dollars and $100,000 in one-time carryover funds for capital projects and support that have not yet begun or begun the procurement process and where staff have been redirected to other COVID responsibilities. My revised budget proposes deferring $3.0 million as summarized below:
• Project deferrals – examples include the replacement of overhead doors at Fire Station 9($0.4 million); new DHS system for child care centers and in-home care licensing($0.6 million); and fitness center equipment replacement ($0.1 million), among others.
40

Memorandum Page 13 of 17
• Ongoing program reduction & deferrals – There are a number of ongoing programs across theCounty’s facilities, parks and transportation infrastructure that receive annual PAYG fundingbut also bond funding and in some cases developer funding. The revised budget assumes thatthese programs are reduced in part but not in whole given the other sources of funding andprior years’ balances, which will allow some level of effort to continue, yet focus will be oncritical needs. I am also conscious that our procurement and project managementinfrastructure will be backlogged as our efforts have been prioritized on COVID. Programexamples include facilities and parks planning; interior maintenance and furniture replacementprojects; and energy management.
• What projects and programs remain funded — Many of the staff that support and managecapital projects across the County are charged directly to PAYG funds; I have continued thoseallocations to ensure that staff retain their jobs. I have continued to fund projects where anasset is at risk of operational failure, such as deferred investments in the Court Square Westand Courts-Police building and the initial phases of a child welfare management system. I amalso continuing to fund voting machine and election-related investments.
A full list of project deferral detail will be published in the coming week.
Prior Years’ PAYG projects – I am proposing reallocation of $5 million in prior year’s PAYG projects.
• Contingencies and leftover project balances – $1.8 million - Staff has conducted an initialreview of all program and project contingencies and is recommending $1.1 million inallocation from transportation PAYG and energy management contingents. While there issome risk in utilizing these contingents, if emergency needs arise, we will utilize the CountyManager’s contingent or delay other projects. Staff has also done an initial evaluation ofprojects that have recently concluded or will conclude shortly and identified $0.7 million thatcan be reallocated to the operating budget. This review of balances would normally occur aspart of the close-out process.
• Project deferrals – $3.2 million - examples include the initial planning funds for VirginiaHighlands Park ($0.6 million) and where construction funding had not yet been allocated in theCIP; deferral of new furniture for Central Library ($0.5 million); delay in replacement of theAurora Hills Library and Community Center roof ($0.6 million) and delay in intersection androadway improvements at N. Sycamore and Lee Highway together totaling $1.2 million,among others.
Utilization of Reserves: The Stabilization Reserve is funded to address unexpected events, such as major weather events or a local/regional emergency requiring immediate spending in response, revenue declines, and local or regional economic stress. Over the past few fiscal years, the County has increased the funds in the Stabilization Reserve to further our ability to weather such events. If there is ever a time to tap reserves, this is it. I am recommending using $4.0 million of the Stabilization Reserve to fill a portion of the gap created by the significant revenue declines noted above. This leaves about $7.8 million in the Stabilization Reserve should there be further economic impacts or another major event such as weather in the future. Our financial policies require any use of reserves to be replenished within the subsequent two (2) fiscal years.
41

Memorandum Page 14 of 17
The County has weathered significant financial downturns, such as September 11, 2001 and the Great Recession of 2008, without utilizing our General Fund Operating Reserve. As I said above, I fear we are being optimistic in our assumptions for how quickly we will rebound economically from this pandemic and we won’t know the real economic impact for some time. While appropriate to tap into our Stabilization Reserve for this proposed budget, utilizing funds in the General Operating Reserve to fund FY 2021 ongoing costs at this time would not be prudent.
New COVID Contingency Funding
In order to address the ever-evolving nature of this crisis and our recovery efforts in FY 2021, I am recommending a $10.2 million COVID contingent funded by the reductions discussed above. I am intentionally, with one exception, not recommending specific allocations to any particular use given how rapidly our assessments of needs is changing. There are four major areas where I envision the COVID contingent could be used.
1. Safety Net & Housing – $2.7 million – Our first and foremost priority is to ensure that thebasic needs of food and shelter are met for our residents, particularly those who have losttheir jobs. In the area of direct housing assistance, my original budget proposal($68.5 million total; $45.0 million net tax support) included funding to meet prior yearlevels and proposed increases to meet new demand; these continue in my revised budget asdiscussed earlier in this memo.
Consistent with the Board’s direction, I included an option in my proposed budget toincrease the allocation to AHIF by $2.7 million with one-time funding, reaching a total of$18.7 million, a 17% increase over the FY 2020 budget. I am now recommending that this$2.7 million increase be allocated to a contingent to address housing stabilization needs andother life-safety needs as we move into recovery. I am mindful of the key role that oursafety-net non-profits play and will continue to play as we move into recovery and so someof this allocation and/or the balance of the COVID contingent may be used to meet theirneeds.
2. Community Resiliency – Small Business and Recovery Investments – Additional support forour small businesses, tourism industry and the non-profit network of arts and other culturalorganizations will likely be needed.
3. Service Delivery Recovery & Employee Support – There will also likely be many costs torestart our programs and reopen our facilities or even new services and programming neededpost-COVID that we have not yet envisioned. We will need to replenish our inventory ofpersonal protective equipment and cleaning supplies and likely will have additionaltechnology refreshment needs. The impact on our healthcare expenses and future pensionobligations are also unknown at this time. Finally, I am mindful of the toll that COVID hastaken on our entire workforce, and our front-line employees in particular, who may needadditional mental health resources as we go through and emerge from this crisis.
42

Memorandum Page 15 of 17
4. Revenue loss – We do not know if there will be future phases of this pandemic or how andwhen the economy will bounce back. This contingent may also be used to make up foradditional revenue shortfalls not yet known.
Future Funding Options If the current economic circumstances persist and worsen there are other potential tools that could be used to bridge the gap. We could further cut back on capital projects, reduce program levels, draw more money into the General Fund by reducing the percentage for the Crystal City Tax Increment Financing District, and redirect balances set aside in the Development Fund. We will also continue to monitor possible additional aid from the federal government and the Commonwealth including how funding from the CARES act will be distributed.
The core General Fund Operating Reserve (5.5% of the General Fund) is not an option I am considering now, but I would review that option if the community should suffer through multiple waves of COVID-19 infections.
Revised Budget Process As I mentioned previously, the FY 2021 budget may need to be amended several times during the fiscal year to recognize the changing fiscal conditions (revenue and expenditures). This FY 2021 revised budget proposal to the County Board is a high-level overview of the impacts to revenue and expense along with recommendations to utilize existing County resources in contingent accounts, reserves, and capital project budgets. A compressed budget adoption schedule has been proposed with a delayed tax & fee hearing and budget adoption date. Current revised budget process dates are as follows.
• April 6th (Monday) Revised Proposed Budget• April 16th (Thursday) Work Session• April 23rd (Thursday) Budget Hearing and Tax & Fee hearing• April 27th (Monday) Wrap-up• April 30th (Thursday) Budget Adoption
43

Memorandum Page 16 of 17
Other Fund Adjustments
The following funds do not need to be adjusted from the February Proposed Budget at this time.
Fund FY 2021 Revenue
Budget FY 2021 Expense
Budget 203 - Ballston BID 1,569,935 1,569,935 204 - Rosslyn BID 4,053,393 4,053,393 205 - Crystal City BID 4,739,568 4,739,568 208 – Housing Choice Vouchers 19,688,410 19,473,520 503 - Utilities 104,667,295 103,667,295 519 - PAYG 23,422,000 23,422,000 570 - CPHD Development Fund 26,363,154 24,200,894 609 - Auto Fund 18,636,065 18,574,340 611 - Printing Fund 2,611,841 2,384,695
The revenue receipts in each fund will be closely monitored for any needed adjustments throughout the fiscal year. If additional federal funding is available for Arlington’s Housing Choice Voucher program, I will come back to the Board with an adjustment for that fund.
Several other funds require funding adjustments based on changing tax assumptions or revised activity projections based on a variety of other market conditions (detailed in the table below). Funds have been balanced on the expenditure side through the hiring freeze to ensure personnel savings and non-personnel budgets have also been adjusted; in some cases, the funds are utilizing existing fund balance from prior years.
Originally Proposed
Revised Proposed
Change Originally Proposed
Revised Proposed
Change
Fund FY 2021 Revenue Budget FY 2021 Expense Budget 201 - Ballston Quarter TIF 2,889,318 2,018,464 (870,854) 2,889,318 2,018,464 (870,854) 202 - Travel & Tourism 1,546,700 1,209,582 (337,118) 1,546,700 1,209,582 (337,118) 206 - Community Development 3,231,142 3,378,470 147,328 3,231,142 3,378,470 147,328 313 - General Capital 6,952,022 3,952,022 (3,000,000) 6,952,022 3,952,022 (3,000,000) 321 - Stormwater Fund 12,026,019 11,729,047 (296,972) 12,026,019 11,729,047 (296,972) 330 - TCF NVTA 30% Local 8,668,304 7,870,399 (797,905) 8,668,304 7,870,399 (797,905) 331 - TCF C&I Tax
26,882,741 26,566,401 (316,340) 26,882,741 26,566,401 (316,340)
44
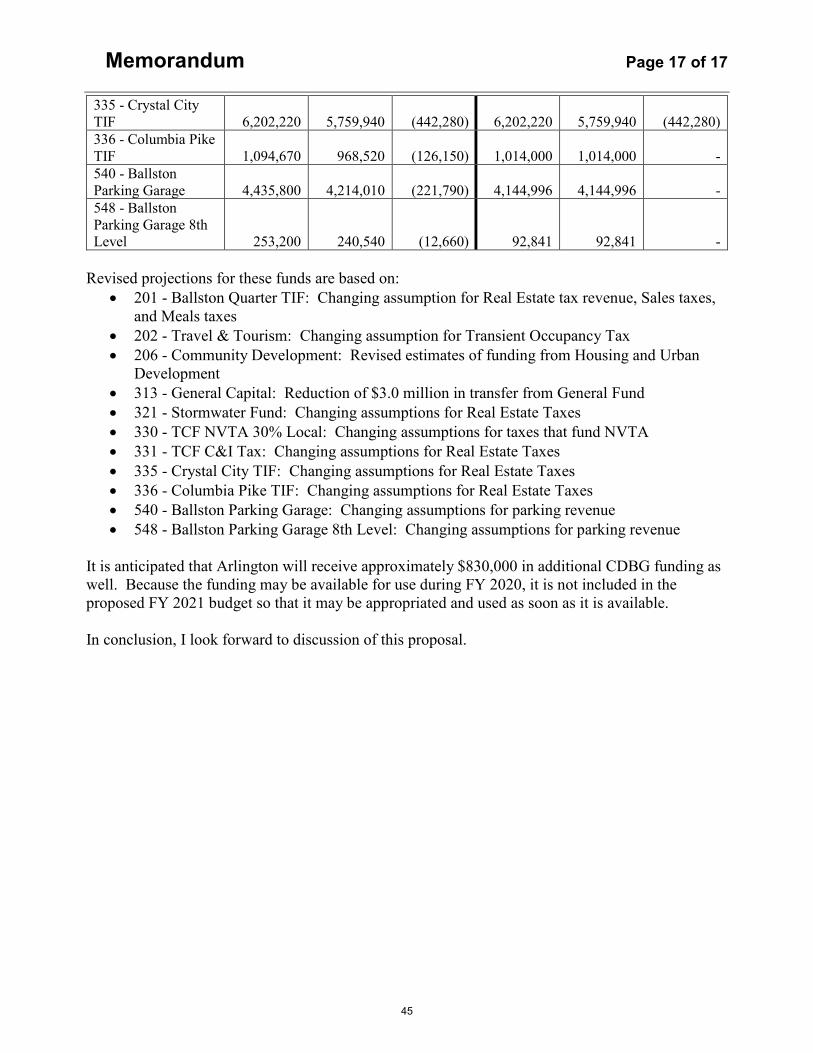
Memorandum Page 17 of 17
335 - Crystal City TIF 6,202,220 5,759,940 (442,280) 6,202,220 5,759,940 (442,280) 336 - Columbia Pike TIF 1,094,670 968,520 (126,150) 1,014,000 1,014,000 - 540 - Ballston Parking Garage 4,435,800 4,214,010 (221,790) 4,144,996 4,144,996 - 548 - Ballston Parking Garage 8th Level 253,200 240,540 (12,660) 92,841 92,841 -
Revised projections for these funds are based on: • 201 - Ballston Quarter TIF: Changing assumption for Real Estate tax revenue, Sales taxes,
and Meals taxes• 202 - Travel & Tourism: Changing assumption for Transient Occupancy Tax• 206 - Community Development: Revised estimates of funding from Housing and Urban
Development• 313 - General Capital: Reduction of $3.0 million in transfer from General Fund• 321 - Stormwater Fund: Changing assumptions for Real Estate Taxes• 330 - TCF NVTA 30% Local: Changing assumptions for taxes that fund NVTA• 331 - TCF C&I Tax: Changing assumptions for Real Estate Taxes• 335 - Crystal City TIF: Changing assumptions for Real Estate Taxes• 336 - Columbia Pike TIF: Changing assumptions for Real Estate Taxes• 540 - Ballston Parking Garage: Changing assumptions for parking revenue• 548 - Ballston Parking Garage 8th Level: Changing assumptions for parking revenue
It is anticipated that Arlington will receive approximately $830,000 in additional CDBG funding as well. Because the funding may be available for use during FY 2020, it is not included in the proposed FY 2021 budget so that it may be appropriated and used as soon as it is available.
In conclusion, I look forward to discussion of this proposal.
45

This page intentionally left blank
46

FY 2019Actuals
FY 2020Adopted
FY 2021Proposed
FY 2021Adopted
% Change'20 Adopted to
'21 AdoptedCOUNTY GOVERNMENT
Operating Expenses $677.5 $687.5 $727.5 $714.0 3.9%Capital Outlay 5.7 23.6 7.0 3.8 -83.8%Debt Service 67.7 72.2 75.0 69.0 -4.4%Other Post Employment Benefits (OPEB) 1 19.1 18.4 18.4 18.4 -Contingents - General, Housing, Budget Stabilization - 22.3 18.3 15.7 -29.8%
Subtotal 769.9 823.9 846.2 820.8 -
OTHER FUNDS3
Ballston Quarter Tax Increment Financing 0.1 1.7 2.9 2.0 21.0%Travel & Tourism Promotion 1.5 1.5 1.5 1.2 -21.8%Ballston Business Improvement District 1.6 1.5 1.6 1.6 4.8%Rosslyn Business Improvement District 3.7 3.9 4.1 4.1 2.9%Crystal City Business Improvement District 2.5 2.8 4.7 4.7 71.5%Community Development 5.1 3.1 3.2 3.4 9.5%Housing Choice Voucher Program 18.4 18.9 19.5 19.5 2.9%General Capital - PAYG 2 32.5 8.6 7.0 34.0 293.7%Stormwater Management 11.7 11.2 12.0 11.7 4.6%Transportation Capital 2 52.9 34.4 35.6 34.4 -Crystal City Tax Increment Financing 2 4.5 6.0 6.2 5.8 -3.4%Columbia Pike Tax Increment Financing 0.05 0.5 1.1 1.0 104.2%Utilities (including Utilities capital) 129.4 123.6 127.1 127.1 2.8%Ballston Parking Garage 4 6.5 4.4 4.2 4.2 -3.0%CPHD Development 18.2 23.0 24.2 24.2 5.1%Automotive Equipment 26.8 17.9 18.6 18.6 3.5%Printing 3.2 2.4 2.4 2.4 -1.1%
Subtotal 318.5 265.5 275.8 299.9 13.0%
Less Transfers to Other Funds (6.7) (24.1) (7.4) (4.3) -82.0%Less Other Fund Transfers (19.4) (17.1) (15.2) (20.2) 18.1%
COUNTY GOVERNMENT SUBTOTAL 1,062.4 1,048.2 1,099.4 1,096.2 4.6%
SCHOOL BOARD 6
School Operating Fund 517.8 553.3 577.9 560.6 1.3%School Comprehensive Services (CSA) 3.4 4.2 4.2 4.2 -School Debt Service 58.4 59.2 60.6 56.9 -3.8%School Capital Projects 17.6 6.5 7.8 2.0 -68.4%School Food Services Fund 11.2 10.7 11.5 11.3 5.6%School Grants and Restricted Programs 19.9 15.5 16.2 16.2 5.1%Community Activities Fund 17.9 20.2 20.2 19.8 -2.4%
School Board Subtotal 646.1 669.6 698.4 671.1 -
TOTAL COUNTY GOVERNMENT AND SCHOOL BOARD 1,708.5$ 1,717.8$ 1,797.7$ 1,767.3$ 2.9%
1 Other Post Employment Benefits (OPEB) includes Pay-As-You-Go retiree health and life insurance, and transfer to the OPEB Trust Fund.
4 Ballston Parking Garage includes the 8th level internal service fund.5 Includes Other Fund transfers to General Fund and inter-fund transfers.
Numbers may not add due to rounding.
EXPENDITURE SUMMARY (ALL FUNDS)(Figures in Millions of Dollars)
2 Expenses do not include utilization of fund balance for FY 2020 and FY 2021. Refer to fund narrative for total expenditures.3 General Obligation Bond (GO bond) funding is not included above. FY 2021 GO bond funding totals $14.5 million and is included in the FY 2021 Adopted Budget.
6 The FY 2020 and FY 2021 School Board budget reflects the actions taken by APS following County Board adoption in April 2019 and April 2020. The County Board will amend the School Board changes during the FY 2020 closeout process for FY 2021 as it did for FY 2020 during the closeout of FY 2019.
47
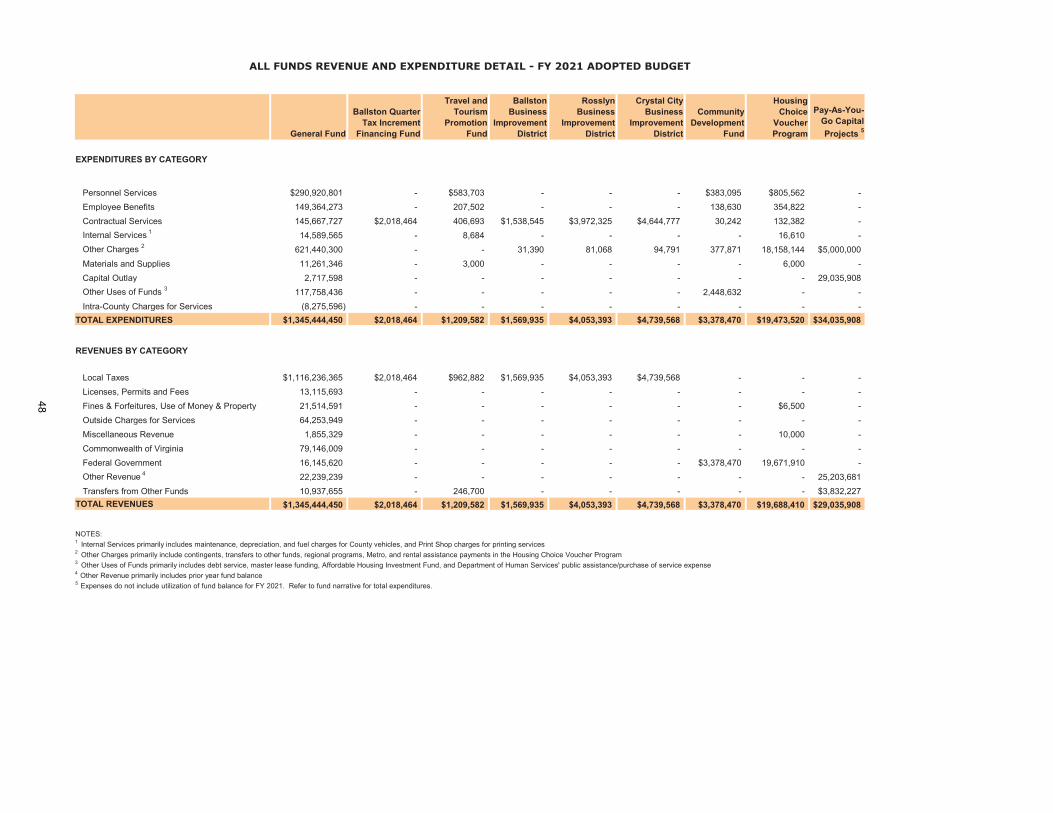
General Fund
Ballston Quarter Tax Increment
Financing Fund
Travel and Tourism
Promotion Fund
Ballston Business
Improvement District
Rosslyn Business
Improvement District
Crystal City Business
Improvement District
Community Development
Fund
Housing Choice
Voucher Program
Pay-As-You-Go Capital Projects 5
EXPENDITURES BY CATEGORY
Personnel Services $290,920,801 - $583,703 - - - $383,095 $805,562 -Employee Benefits 149,364,273 - 207,502 - - - 138,630 354,822 -Contractual Services 145,667,727 $2,018,464 406,693 $1,538,545 $3,972,325 $4,644,777 30,242 132,382 -Internal Services 1 14,589,565 - 8,684 - - - - 16,610 -Other Charges 2 621,440,300 - - 31,390 81,068 94,791 377,871 18,158,144 $5,000,000Materials and Supplies 11,261,346 - 3,000 - - - - 6,000 -Capital Outlay 2,717,598 - - - - - - - 29,035,908 Other Uses of Funds 3 117,758,436 - - - - - 2,448,632 - -Intra-County Charges for Services (8,275,596) - - - - - - - -
TOTAL EXPENDITURES $1,345,444,450 $2,018,464 $1,209,582 $1,569,935 $4,053,393 $4,739,568 $3,378,470 $19,473,520 $34,035,908
REVENUES BY CATEGORY
Local Taxes $1,116,236,365 $2,018,464 $962,882 $1,569,935 $4,053,393 $4,739,568 - - -Licenses, Permits and Fees 13,115,693 - - - - - - - -Fines & Forfeitures, Use of Money & Property 21,514,591 - - - - - - $6,500 -Outside Charges for Services 64,253,949 - - - - - - - -Miscellaneous Revenue 1,855,329 - - - - - - 10,000 -Commonwealth of Virginia 79,146,009 - - - - - - - -Federal Government 16,145,620 - - - - - $3,378,470 19,671,910 -Other Revenue 4 22,239,239 - - - - - - - 25,203,681 Transfers from Other Funds 10,937,655 - 246,700 - - - - - $3,832,227
TOTAL REVENUES $1,345,444,450 $2,018,464 $1,209,582 $1,569,935 $4,053,393 $4,739,568 $3,378,470 $19,688,410 $29,035,908
NOTES:1 Internal Services primarily includes maintenance, depreciation, and fuel charges for County vehicles, and Print Shop charges for printing services2 Other Charges primarily include contingents, transfers to other funds, regional programs, Metro, and rental assistance payments in the Housing Choice Voucher Program3 Other Uses of Funds primarily includes debt service, master lease funding, Affordable Housing Investment Fund, and Department of Human Services' public assistance/purchase of service expense4 Other Revenue primarily includes prior year fund balance5 Expenses do not include utilization of fund balance for FY 2021. Refer to fund narrative for total expenditures.
ALL FUNDS REVENUE AND EXPENDITURE DETAIL - FY 2021 ADOPTED BUDGET
48

Stormwater Management
FundTransportation Capital Fund 5
Crystal City Tax Increment
Financing Fund 5
Columbia Pike Tax Increment
Financing Fund
UtilitiesFund
Utilities Capital
Ballston Public
Parking Garage
Ballston Public Pkg
Garage - 8th Level
CPHD Development
Fund
Automotive Equipment
FundPrinting
Fund
EXPENDITURES BY CATEGORY
Personnel Services $4,090,670 $1,827,755 $192,499 - $19,116,613 - - - $10,660,417 $4,849,464 $563,063Employee Benefits 1,636,711 639,992 49,607 - 7,430,994 - - - 3,635,762 1,887,037 246,164 Contractual Services 2,457,213 305,541 13,780 - 20,766,847 - $1,973,415 $42,306 5,877,606 1,471,851 1,356,740 Internal Services 1 1,332,350 26,733 7,500 - 7,081,559 - - - 2,808,804 46,784 28,073 Other Charges 2 132,099 3,026,062 - $1,014,000 12,155,000 - 593,803 25,035 335,102 130,000 - Materials and Supplies 212,305 18,925 8,000 - 7,614,659 - 200,600 25,500 104,806 1,698,771 190,655 Capital Outlay 1,867,699 28,591,792 5,488,554 - 284,078 $23,422,000 800,000 - 778,397 7,048,735 - Other Uses of Funds 3 - - - - 31,553,742 - 577,178 - - 1,441,698 - Intra-County Charges for Services - - - - (2,336,197) - - - - - -
TOTAL EXPENDITURES $11,729,047 $34,436,800 $5,759,940 $1,014,000 $103,667,295 $23,422,000 $4,144,996 $92,841 $24,200,894 $18,574,340 $2,384,695
REVENUES BY CATEGORY
Local Taxes $10,423,354 $26,566,401 $5,759,940 $968,520 - - - - - - - Licenses, Permits and Fees - - - - - - - - $26,304,499 - - Fines & Forfeitures, Use of Money & Property - - - - $304,400 $350,000 - - - $300,000 - Outside Charges for Services 1,305,693 - - - 104,240,326 10,917,000 $4,214,010 $240,540 6,917 17,725,065 $2,365,459Miscellaneous Revenue - 7,870,399 - - 122,569 - - - 51,738 581,000 - Commonwealth of Virginia - - - - - - - - - - - Federal Government - - - - - - - - - - - Other Revenue 4 - - - - - - - - - - - Transfers from Other Funds - - - - - 12,155,000 - - - 30,000 246,382
TOTAL REVENUES $11,729,047 $34,436,800 $5,759,940 $968,520 $104,667,295 $23,422,000 $4,214,010 $240,540 26,363,154 $18,636,065 $2,611,841
NOTES:1 Internal Services primarily includes maintenance, depreciation and fuel charges for County vehicles, and Print Shop charges for printing services2 Other Charges primarily include contingents, transfers to other funds, regional programs, Metro, and rental assistance payments in the Housing Choice Voucher Program3 Other Uses of Funds primarily includes debt service, master lease funding, Affordable Housing Investment Fund, and Department of Human Services' public assistance/purchase of service expense4 Other Revenue primarily includes prior year fund balance5 Expenses do not include utilization of fund balance for FY 2021. Refer to fund narrative for total expenditures.
ALL FUNDS REVENUE AND EXPENDITURE DETAIL - FY 2021 ADOPTED BUDGET
49

FY 2019Actual
FY 2020 Adopted
FY 2021 Proposed
FY 2021 Adopted
% Change'20 Adopted to
'21 Adopted
EXPENDITURES
County Services 1 $634.9 $639.9 $678.2 $666.2 4.1%Metro Operations 42.6 47.6 49.3 47.8 -County Debt Service 67.7 72.2 75.0 69.0 -4.4%Other Post Employment Benefits (OPEB) 2 19.1 18.4 18.4 18.4 -Contingents General - 0.3 0.3 0.3 - Stabilization Reserve 3 - 6.7 0.0 0.0 -100.0% Affordable Housing Investment Fund (AHIF) 4 - 15.4 18.1 15.4 -Subtotal County Services 764.3 800.3 839.2 817.0 2.1%
Capital 5.7 23.6 7.0 3.8 -83.8%Subtotal County 769.9 823.9 846.2 820.8 -0.4%
Schools Transfer (ongoing) 491.7 522.4 546.3 524.6 -Schools Transfer (one-time) - 9.9 3.7 - -100.0%Subtotal Schools 491.7 532.3 550.0 524.6 -1.4%
TOTAL EXPENDITURES $1,261.7 $1,356.2 $1,396.2 $1,345.4 -0.8%
REVENUES
Real Estate Tax $745.9 $771.0 $806.7 $795.1 3.1%Personal Property Tax 118.0 119.1 122.3 120.1 0.8%BPOL Tax 69.9 69.0 74.9 63.0 -8.7%Sales Tax 44.0 44.7 47.5 43.1 -3.5%Transient Tax 24.6 26.0 26.0 19.3 -25.9%Utility Tax 16.5 16.2 17.2 17.2 6.5%Meals Tax 40.2 40.9 42.3 36.8 -10.1%Communications Sales Tax 6.5 6.3 6.1 6.1 -3.2%Other Local Taxes 19.1 18.5 19.4 15.6 -15.5%Subtotal Taxes 1,084.6 1,111.6 1,162.3 1,116.2 -
Licenses, Permits and Fees 12.2 12.4 14.3 13.1 5.9%Fines, Interest and Other 40.5 23.7 26.4 21.5 -9.1%Charges for Services 62.4 64.3 66.0 64.3 -Miscellaneous 19.0 11.2 9.3 12.8 14.8%Revenue from State 76.4 76.0 79.7 79.1 4.1%Revenue from Federal Government 17.6 16.1 16.1 16.1 -Subtotal Other 228.1 203.5 211.9 207.0 1.7%
Total Revenue (excluding Fund Balance) 1,312.8 1,315.1 1,374.2 1,323.2 0.6%
Prior Year Fund Balance 93.1 41.1 22.0 22.2 -45.9%
TOTAL REVENUES & FUND BALANCE $1,405.8 $1,356.2 $1,396.2 $1,345.4 -0.8%1 Includes General Fund transfers to other operating funds.2 Includes Pay-As-You-Go retiree health and life insurance, and transfer to the OPEB Trust Fund.
Numbers may not add due to rounding.
GENERAL FUND SUMMARY(Figures in Millions of Dollars)
4 Beginning in FY 2019 the HOME portion of AHIF is budgeted in the Community Development Fund.
3 In the FY 2021 Adopted Budget, the County Board changed the reserves policy to make the Budget, Economic, and Revenue Stabilization Contingent the Stabilization Reserve. While the Contingent was appropriated on an annual basis, the Stabilization Reserve is not appropriated similar to the County's General Operating Reserve.
50

FY 2021 Adopted Budget General Fund Expenditures
FY 2021 Adopted Budget General Fund Revenues
Management & Administration, 4%
Courts & Constitutionals, 5%
Public Safety, 11%
Environmental Services, 8%
Human Services, 11%
Community Services, 4%
Planning & Development, 2%
Non-Departmental, Regionals, Metro,
9%
Debt/Capital, 5%
Schools, 39%
Personal Property9%
Federal1%
Misc. Revenue2%Service Charges
5%Transient
Occupancy Tax1%
Real Estate59%
Other Local Taxes
3%
Local Sales Tax3%
BPOL5%
Fines>0%
Fees/Permits1%
State6%
Meals Tax3%
Fund Balance2%
51

FY 2019 FY 2020 FY 2021 FY 2021 FY 2019 FY 2020 FY 2021 FY 2021Adopted Adopted Proposed Adopted Actual Adopted Proposed Adopted
FTE FTE FTE FTE Expense Expense Expense ExpenseGENERAL FUND
County Board 10.00 10.00 10.00 10.00 $1,632,038 $1,642,161 $1,837,179 $1,704,263County Manager 33.00 31.00 31.00 31.00 5,335,137 5,234,421 5,404,392 5,134,115Management and Finance 58.50 58.50 60.50 59.50 8,004,496 8,584,601 8,915,874 8,569,554Technology Services 74.00 80.00 85.00 85.00 22,028,662 23,057,137 26,332,140 26,039,370Human Resources 53.00 53.00 55.00 53.00 9,324,435 9,747,306 10,075,744 9,658,006County Attorney 16.00 16.00 16.00 16.00 3,044,995 3,219,699 3,286,418 3,264,500Circuit Court Judiciary 10.30 11.30 10.30 10.30 1,183,285 1,337,361 1,281,389 1,253,184Clerk of the Circuit Court 27.00 27.00 30.00 29.00 3,295,794 3,448,325 3,677,404 3,492,403General District Court 1.00 1.00 1.00 1.00 352,711 387,064 407,675 406,355Juvenile and Domestic Relations Court 59.80 60.30 60.30 60.30 7,030,385 7,564,087 7,424,158 7,335,007Commonwealth's Attorney 35.00 36.00 38.00 38.00 4,257,707 4,494,369 4,686,029 4,632,228Office of the Magistrate - - - - 25,929 29,986 29,986 29,986Office of the Public Defender - - - - 163,717 181,239 181,239 181,239Sheriff 293.00 295.00 296.00 296.00 47,698,889 45,331,117 47,406,605 46,192,674Commissioner of Revenue 53.00 53.00 53.00 53.00 5,964,215 5,912,908 6,006,950 5,949,123Treasurer 62.66 62.66 62.66 62.66 7,048,516 7,254,724 7,343,231 7,298,502Electoral Board 8.40 8.80 9.80 9.80 1,144,229 1,528,593 1,853,991 1,835,477Public Safety Comms. & Emergency Mgmt. 74.50 74.50 75.50 75.50 13,252,362 13,631,309 13,840,581 13,629,582Police 477.00 479.00 487.00 481.00 68,703,892 72,068,068 74,669,607 72,274,292Fire 340.00 349.00 359.00 359.00 62,821,768 64,948,843 68,544,157 66,430,066Environmental Services 400.50 397.50 408.50 404.50 94,053,744 100,909,216 110,904,844 109,182,243Human Services 697.82 701.87 715.62 714.62 135,256,946 141,975,137 147,612,087 146,126,784Libraries 133.85 130.67 131.67 130.67 14,458,512 14,704,271 15,154,838 14,758,386Economic Development 52.90 51.90 50.90 50.90 8,788,089 8,735,645 8,964,301 8,669,102Community Planning, Housing & Devel. 83.50 82.00 84.50 82.50 10,684,954 11,858,193 12,413,973 11,624,696Parks and Recreation 368.14 359.86 405.70 368.66 41,865,624 43,103,220 49,207,342 44,685,251Non-Departmental/Other 68,302,233 71,738,870 70,235,363 72,635,363Debt Service 67,686,380 72,153,342 74,962,748 68,962,748Regionals/Contributions 7,227,028 7,443,092 6,752,011 6,724,786Metro 42,601,029 47,597,637 49,308,764 47,808,764
SUBTOTAL FOR FUND 3,422.87 3,429.86 3,536.95 3,481.91 763,237,699 799,821,941 838,721,020 816,488,049
TRANSFERS TO OTHER FUNDSUtilities 400,000 - - - Travel & Tourism Promotion 246,700 246,700 246,700 246,700Community Development 94,981 - - - Automotive Equipment - - - - Printing 242,337 246,382 246,382 246,382Trust & Agency - - - - Other Post Employment Benefits Trust 45,567 - - -
SUBTOTAL 1,029,585 493,082 493,082 493,082
Schools Transfer 491,718,375 532,329,006 550,005,390 524,631,092General Capital Projects 5,667,108 23,601,546 6,952,022 3,832,227 TOTAL TRANSFERS TO OTHER FUNDS 498,415,068 556,423,634 557,450,494 528,956,401
GENERAL FUND TOTAL 3,422.87 3,429.86 3,536.95 3,481.91 $1,261,652,767 $1,356,245,575 $1,396,171,514 $1,345,444,450
OTHER FUNDS - OPERATING AND CAPITALBallston Quarter Tax Increment Financing - - - - 65,420 1,668,740 2,889,318 2,018,464Travel & Tourism Promotion 7.00 7.00 7.00 7.00 1,478,290 1,546,700 1,546,700 1,209,582 Ballston Business Improvement District - - - - 1,614,759 1,497,516 1,569,935 1,569,935Rosslyn Business Improvement District - - - - 3,704,779 3,938,338 4,053,393 4,053,393Crystal City Business Improvement Dist. - - - - 2,520,507 2,763,656 4,739,568 4,739,568Community Development 4.50 4.50 4.50 4.50 5,055,524 3,086,612 3,231,142 3,378,470Housing Choice Voucher Program 12.35 11.60 11.60 11.60 18,384,976 18,929,431 19,473,520 19,473,520General Capital - PAYG [1] - - - - 32,536,348 8,645,689 6,952,022 34,035,908Stormwater Management 44.00 44.00 47.00 47.00 11,650,777 11,211,095 12,026,019 11,729,047Transportation Capital [1] 29.00 29.00 29.00 29.00 52,936,446 34,358,518 35,551,045 34,436,800Crystal City Tax Increment Financing [1] 6.50 7.00 7.00 7.00 4,478,775 5,964,730 6,202,220 5,759,940Columbia Pike Tax Increment Financing - - - - 45,128 496,660 1,094,670 1,014,000Utilities 247.95 253.95 254.95 253.95 102,751,289 103,457,806 103,667,295 103,667,295Utility Capital - - - - 26,674,927 20,179,000 23,422,000 23,422,000Ballston Public Parking Garage - - - - 6,402,031 4,281,318 4,144,996 4,144,996Ballston Public Parking Garage - 8th Level - - - - 76,692 85,666 92,841 92,841CPHD Development 106.00 113.00 117.50 113.00 18,191,004 23,036,970 24,200,894 24,200,894Automotive Equipment 63.00 60.00 60.00 60.00 26,790,769 17,944,108 18,574,340 18,574,340Printing 8.00 8.00 8.00 8.00 3,155,945 2,410,763 2,384,695 2,384,695
TOTAL OTHER FUNDS 528.30 538.05 546.55 541.05 318,514,385 265,503,316 275,816,613 299,905,688
LESS GENERAL FUND TRANSFERS (498,415,068) (556,423,634) (557,450,494) (528,956,401)LESS OTHER FUND TRANSFERS [2] (19,364,538) (17,086,422) (15,177,311) (20,177,311)
TOTAL COUNTY GOVERNMENT 3,951.17 3,967.91 4,083.50 4,022.96 $1,062,387,546 $1,048,238,835 $1,099,360,322 $1,096,216,426
[2] Includes Other Fund transfers to General Fund and inter-fund transfers.[1] Expenses do not include utilization of fund balance for FY 2020 and FY 2021. Refer to fund narrative for total expenditures.
COUNTY GOVERNMENT SUMMARY
52
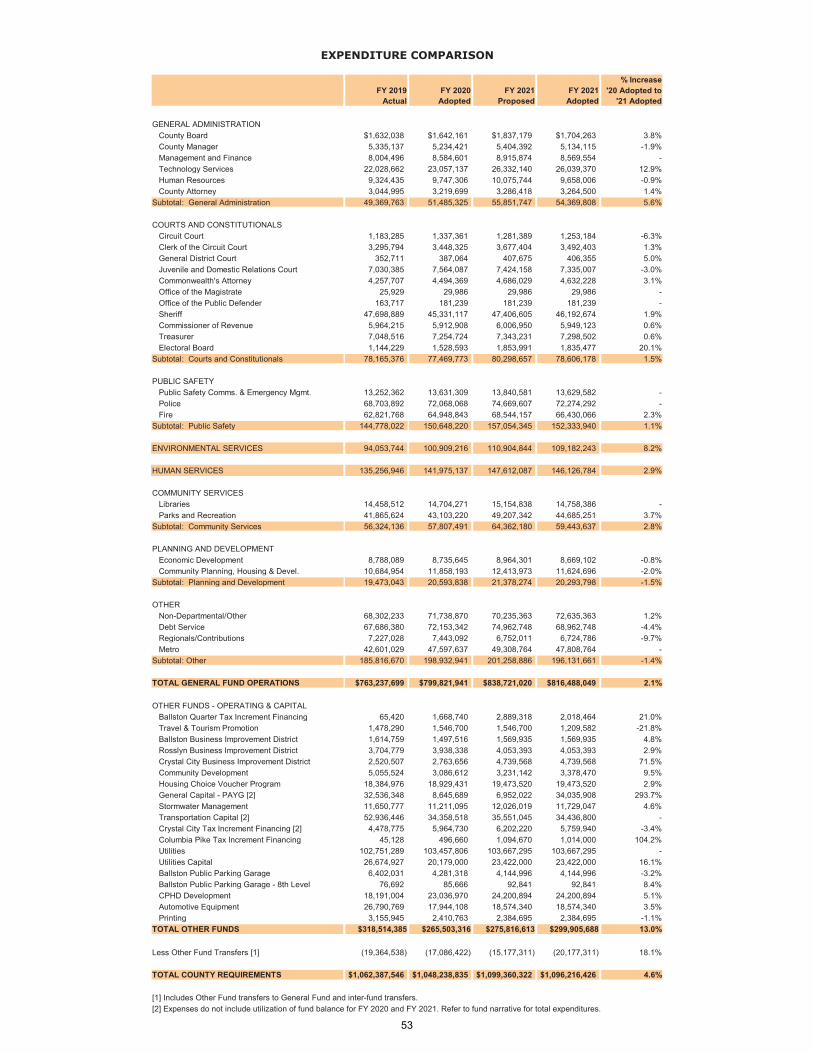
% IncreaseFY 2019 FY 2020 FY 2021 FY 2021 '20 Adopted to
Actual Adopted Proposed Adopted '21 Adopted
GENERAL ADMINISTRATIONCounty Board $1,632,038 $1,642,161 $1,837,179 $1,704,263 3.8%County Manager 5,335,137 5,234,421 5,404,392 5,134,115 -1.9%Management and Finance 8,004,496 8,584,601 8,915,874 8,569,554 -Technology Services 22,028,662 23,057,137 26,332,140 26,039,370 12.9%Human Resources 9,324,435 9,747,306 10,075,744 9,658,006 -0.9%County Attorney 3,044,995 3,219,699 3,286,418 3,264,500 1.4%
Subtotal: General Administration 49,369,763 51,485,325 55,851,747 54,369,808 5.6%
COURTS AND CONSTITUTIONALSCircuit Court 1,183,285 1,337,361 1,281,389 1,253,184 -6.3%Clerk of the Circuit Court 3,295,794 3,448,325 3,677,404 3,492,403 1.3%General District Court 352,711 387,064 407,675 406,355 5.0%Juvenile and Domestic Relations Court 7,030,385 7,564,087 7,424,158 7,335,007 -3.0%Commonwealth's Attorney 4,257,707 4,494,369 4,686,029 4,632,228 3.1%Office of the Magistrate 25,929 29,986 29,986 29,986 -Office of the Public Defender 163,717 181,239 181,239 181,239 -Sheriff 47,698,889 45,331,117 47,406,605 46,192,674 1.9%Commissioner of Revenue 5,964,215 5,912,908 6,006,950 5,949,123 0.6%Treasurer 7,048,516 7,254,724 7,343,231 7,298,502 0.6%Electoral Board 1,144,229 1,528,593 1,853,991 1,835,477 20.1%
Subtotal: Courts and Constitutionals 78,165,376 77,469,773 80,298,657 78,606,178 1.5%
PUBLIC SAFETYPublic Safety Comms. & Emergency Mgmt. 13,252,362 13,631,309 13,840,581 13,629,582 -Police 68,703,892 72,068,068 74,669,607 72,274,292 -Fire 62,821,768 64,948,843 68,544,157 66,430,066 2.3%
Subtotal: Public Safety 144,778,022 150,648,220 157,054,345 152,333,940 1.1%
ENVIRONMENTAL SERVICES 94,053,744 100,909,216 110,904,844 109,182,243 8.2%
HUMAN SERVICES 135,256,946 141,975,137 147,612,087 146,126,784 2.9%
COMMUNITY SERVICESLibraries 14,458,512 14,704,271 15,154,838 14,758,386 -Parks and Recreation 41,865,624 43,103,220 49,207,342 44,685,251 3.7%
Subtotal: Community Services 56,324,136 57,807,491 64,362,180 59,443,637 2.8%
PLANNING AND DEVELOPMENTEconomic Development 8,788,089 8,735,645 8,964,301 8,669,102 -0.8%Community Planning, Housing & Devel. 10,684,954 11,858,193 12,413,973 11,624,696 -2.0%
Subtotal: Planning and Development 19,473,043 20,593,838 21,378,274 20,293,798 -1.5%
OTHERNon-Departmental/Other 68,302,233 71,738,870 70,235,363 72,635,363 1.2%Debt Service 67,686,380 72,153,342 74,962,748 68,962,748 -4.4%Regionals/Contributions 7,227,028 7,443,092 6,752,011 6,724,786 -9.7%Metro 42,601,029 47,597,637 49,308,764 47,808,764 -
Subtotal: Other 185,816,670 198,932,941 201,258,886 196,131,661 -1.4%
TOTAL GENERAL FUND OPERATIONS $763,237,699 $799,821,941 $838,721,020 $816,488,049 2.1%
OTHER FUNDS - OPERATING & CAPITALBallston Quarter Tax Increment Financing 65,420 1,668,740 2,889,318 2,018,464 21.0%Travel & Tourism Promotion 1,478,290 1,546,700 1,546,700 1,209,582 -21.8%Ballston Business Improvement District 1,614,759 1,497,516 1,569,935 1,569,935 4.8%Rosslyn Business Improvement District 3,704,779 3,938,338 4,053,393 4,053,393 2.9%Crystal City Business Improvement District 2,520,507 2,763,656 4,739,568 4,739,568 71.5%Community Development 5,055,524 3,086,612 3,231,142 3,378,470 9.5%Housing Choice Voucher Program 18,384,976 18,929,431 19,473,520 19,473,520 2.9%General Capital - PAYG [2] 32,536,348 8,645,689 6,952,022 34,035,908 293.7%Stormwater Management 11,650,777 11,211,095 12,026,019 11,729,047 4.6%Transportation Capital [2] 52,936,446 34,358,518 35,551,045 34,436,800 -Crystal City Tax Increment Financing [2] 4,478,775 5,964,730 6,202,220 5,759,940 -3.4%Columbia Pike Tax Increment Financing 45,128 496,660 1,094,670 1,014,000 104.2%Utilities 102,751,289 103,457,806 103,667,295 103,667,295 -Utilities Capital 26,674,927 20,179,000 23,422,000 23,422,000 16.1%Ballston Public Parking Garage 6,402,031 4,281,318 4,144,996 4,144,996 -3.2%Ballston Public Parking Garage - 8th Level 76,692 85,666 92,841 92,841 8.4%CPHD Development 18,191,004 23,036,970 24,200,894 24,200,894 5.1%Automotive Equipment 26,790,769 17,944,108 18,574,340 18,574,340 3.5%Printing 3,155,945 2,410,763 2,384,695 2,384,695 -1.1%
TOTAL OTHER FUNDS $318,514,385 $265,503,316 $275,816,613 $299,905,688 13.0%
Less Other Fund Transfers [1] (19,364,538) (17,086,422) (15,177,311) (20,177,311) 18.1%
TOTAL COUNTY REQUIREMENTS $1,062,387,546 $1,048,238,835 $1,099,360,322 $1,096,216,426 4.6%
[1] Includes Other Fund transfers to General Fund and inter-fund transfers.[2] Expenses do not include utilization of fund balance for FY 2020 and FY 2021. Refer to fund narrative for total expenditures.
EXPENDITURE COMPARISON
53

FTE Changes: FY 2020 Adopted to FY 2021 Proposed
FTE Changes: FY 2021 Proposed
to FY 2021 Adopted
GENERAL FUND
Department of Management & FinanceAdd a Procurement Officer 1.00Add a Commercial Real Estate Appraiser 1.00 (1.00)
Total Department of Management & Finance 2.00 (1.00)
Department of Technology ServicesConvert three contractor positions to FTEs for network administration 3.00Add one limited-term Project Manager for the Enterprise Resource Planning system upgrade 1.00Convert one audio visual support position to a permanent position 1.00
Total Department of Technology Services 5.00 -
Human ResourcesAdd a Human Resources Business Partner 1.00 (1.00)Add a Compensation Specialist 1.00 (1.00)
Total Human Resources 2.00 (2.00)
Circuit Court JudiciaryTransfer a Human Services Specialist to the Department of Human Services (1.00)
Total Circuit Court (1.00) -
Clerk of the Circuit CourtReclassify two Court Assistants to permanent positions 2.00Add a Courtroom Clerk 1.00 (1.00)
Total Circuit Court 3.00 (1.00)
Commonwealth AttorneyAdd an Information Systems Analyst 1.00 Add a Management Analyst responsible for office administration 1.00
Total Commonwealth Attorney 2.00 -
SheriffAdd an Inmate Service Counselor position for the new Behavioral Health Court 1.00
Total Sheriff 1.00 -
Electoral BoardAdd a temporary Absentee Voting & Operations Coordinator 1.00
Total Electoral Board 1.00 -
Public Safety Communications & Emergency ManagementAdd a Community Resiliency Advocate position 1.00
Total Public Safety Communications & Emergency Management 1.00 -
PoliceAdd five Traffic Control Officers and a Traffic Control Supervisor 6.00 (6.00)Add an Administrative Specialist position to expand the Business Outreach Unit 1.00Add a Business Systems Analyst position to assist with public safety payroll technology 1.00
Total Police 8.00 (6.00)
FY 2021 ADOPTED BUDGET POSITION CHANGES
This table details the added and eliminated full-time equivalent positions (FTEs) in the FY 2021 Adopted Budget. Interdepartmental reorganizations are shown as transfers.
54

FTE Changes: FY 2020 Adopted to FY 2021 Proposed
FTE Changes: FY 2021 Proposed
to FY 2021 Adopted
FireAdd nine Firefighter/EMT I positions for Kelly Day implementation 9.00Add a Human Resources Administrative Specialist 1.00
Total Fire 10.00 -
Department of Environmental Services (DES)
Add an Engineering Program Coordinator, a Permit Coordinator, and a Design Engineer 3.00Transfer in of three limited-term permit counter positions from the CPHD Development Fund 3.00Add a Traffic Engineer to support the Customer Care and Communications Center 1.00Add a Traffic Engineer and a Streetlight Technician to support the Streetlight Program, partially funded by capital projects 2.00 (2.00)Add a Facilities Planner Architect, partially funded by capital projects 1.00 (1.00)Add a Building Engineer for the Lubber Run Community Center 1.00 (1.00)
Total Department of Environmental Services 11.00 (4.00)
Department of Human Services (DHS)Add a Human Services Specialist 1.00Add two Clinic Aides 2.00 Add four Mental Health Therapists 4.00 Add an Administrative Tech I 1.00 Add partial FTEs for Administrative Assistance (0.25), a Management Specialist (0.25), a Human Services Clinician II (0.25), and a Facilities Mechanic (0.25) 1.00 Add a Human Services Clinician II 1.00 Add a Case Manager for the Transition-Aged-Youth pilot program 1.00 (1.00)Add a Case Manager for Permanent Supportive Housing 1.00 Add a housing locator for Permanent Supportive Housing 1.00Add a Developmental Disability Specialist II 1.00Replacement of one-time funding with ongoing for the Youth Mental Health Therapist II -Technical adjustments to temporary FTEs (0.25)
Total Department of Human Services 13.75 (1.00)
LibrariesAdd a Children's Librarian for the expanded Courthouse Library 1.00 (1.00)
Total Libraries 1.00 (1.00)
Economic DevelopmentRestoration of ongoing funding for the Scenic Studio Manager and the Facilities Manager -Elimination of the vacant Facility Technical Services Director position (1.00)
Total Economic Development (1.00) -
Community Planning, Housing and DevelopmentAdd a Principal Planner in Comprehensive Planning 1.00 (1.00)Increase a 0.5 FTE Associate Planner to a 1.0 FTE in Comprehensive Planning 0.50Add a Principal Planner in the Housing Division 1.00 (1.00)
Total Community Development, Housing and Development 2.50 (2.00)
55

FTE Changes: FY 2020 Adopted to FY 2021 Proposed
FTE Changes: FY 2021 Proposed
to FY 2021 Adopted
Parks and Recreation Add a Principal Planner and Associate Planner 2.00Add one Community Engagement position funded partially with reallocated funds 1.00 (1.00)Add an Urban Forester 1.00 (1.00)Add staff for the new Lubber Run Community Center 6.18 (6.00)Add staff for the new Long Bridge Aquatics & Fitness Center 39.40 (35.00)Conversion of temporary community center positions to permanent positions 15.62 (15.62)Reallocate funding to create two new Roving Monitor positions 2.00Technical correction of FTEs based on staff hours (0.01)Increasing temporary employees in various revenue producing programs 0.69Addition of 1.0 FTE in Conservation and Interpretation by reallocating temporary FTEs (1.46) (0.46)
Total Parks and Recreation 67.42 (58.62)
NET POSITION CHANGES: GENERAL FUND 128.67 (76.62)
OTHER FUNDS
StormwaterAdd two Stormwater Inspectors 2.00Add a Senior Program Manager to manage and oversee maintenance capital and storm drainage improvements 1.00
Total Stormwater 3.00 -
Utilities FundAdd a Human Resources Administrative Specialist for training support 1.00 (1.00)
Total Utilities Fund 1.00 (1.00)
CPHD Development FundAdd an Associate Planner 1.00Add a Customer Experience Manager 1.00Add a Receptionist (partially funded by DES General Fund) 1.00Add a Zoning Technician 1.00 (1.00)Add a limited term Human Resources Training Specialist (1.0) and a limited term Human Resources Specialist (0.5) 1.50 (1.50)Add a Mechanical Inspector 1.00 (1.00)Add an Associate Planner 1.00 (1.00)Transfer three permit counter positions to DES General Fund (3.00)
Total CPHD Development Fund 4.50 (4.50)
NET POSITION CHANGES: OTHER FUNDS 8.50 (5.50)
NET POSITION CHANGES: ALL FUNDS 137.17 (82.12)
56

COMPENSATION SUMMARY
57

This page intentionally left blank
58

COMPENSATION SUMMARY
Notes: Percentages may not add to 100 percent due to rounding.
FY 2021 Percent FY 2021 PercentAdopted of Total Adopted of Total
Pay (Salaries) $333,993,642 66.85% $290,920,801 66.08%Retirement 74,791,263 14.97% 67,317,580 15.29%FICA 23,185,064 4.64% 20,370,365 4.63%Health Insurance - Employees 39,020,386 7.81% 33,586,794 7.63%Health/Life Insurance - Retirees 11,400,000 2.28% 11,400,000 2.59%Life Insurance - Employees 508,387 0.10% 443,671 0.10%Commuting & Transportation 2,959,585 0.59% 2,538,120 0.58%Tuition Reimbursement 325,500 0.07% 325,500 0.07%Unemployment/Short-Term Disability 280,000 0.06% 280,000 0.06%Workers Compensation 4,700,000 0.94% 4,700,000 1.07%Transfer to OPEB Trust Fund 7,000,000 1.40% 7,000,000 1.59%Miscellaneous 1,423,058 0.28% 1,403,992 0.32%
Total $499,586,885 100% $440,286,823 100%
ALL FUNDS GENERAL FUND
Compensation
59

COMPENSATION SUMMARY
Pay Enhancements – FY 2004 to FY 2021
The following provides a history of key pay enhancements.
Fiscal Year
COLA/Market Pay Adjustment
Other Changes
FY 2021 None No compensation increases Increased paid parental leave from 4 to 6 weeks Increase dependent care match from $500 to $1,000 Increased vacation leave accrual for new/recent hires from 13
days to 16.25 days Add a one-time Election Day holiday Eliminate Presidents Day holiday and add a floating holiday Introduction of a Consumer Driven Health Plan
FY 2020 None Merit increases included 2.0% increase to the minimum and maximum of each pay
range Increased public safety compensation in Fire, Police and
Sheriff by 5.5% as part of the continued implementation of the maintenance study completed in FY 2018.
Expansion of dental plan options Introduction of a voluntary, employee paid, long term
disability insurance plan FY 2019 None Merit increases included
1.0% increase to the minimum and maximum of each grade/range
Increased public safety compensation in Fire, Police and Sheriff as part of the first-year of a five-year classification and maintenance study for all job classes in the County.
Lowest base pay rate / living wage increasing to $15.00/hour from $14.50/hour for all permanent and temporary employees, excluding student assistants
Added Adoption Assistance ($5,000/child) Increased volunteer leave from 4 hours to 8 hours Increased location pay from $80/month to $110/month for
uniformed Sheriff and Police positions FY 2018 None Merit increases included
Increasing Transit Subsidy by $50 per month Implementing a Dependent Care Flexible Spending Account
(FSA) employer match of $500 per employee
60

COMPENSATION SUMMARY
Fiscal Year
COLA/Market Pay Adjustment
Other Changes
FY 2017 None Merit increases included 1.75% increase to the maximum of each grade/range and
implementation of open pay ranges Lowest base pay rate increasing to $14.50/hour from
$13.13/hour for all permanent employees Eliminating steps 2 & 3 Implementing a Commercial Driver’s License (CDL) bonus
program Increasing New Parent Leave from 2 weeks to 4 weeks
FY 2016 None Merit/step increases included FY 2015 1.00% for
Step 19 employees
Merit/step increases included Added extra Christmas and New Year’s holidays, CY 2014
only, due to timing of the holidays FY 2014 None Merit/step increases included
Eliminate 1 County Holiday (Columbus Day) FY 2013 None Added Step 19, dropped Step 1
Added Christmas Eve and New Year’s Eve holidays, CY 2012 only, due to timing of the holidays
Merit/step increases included Living wage increased to $13.13 per hour
FY 2012 None 1% One-time lump sum payment for employees at step 18 Merit/step increases included
FY 2011 None Merit/step increases restored 2% one-time lump sum payment for employees at step 18 Increased County-provided life insurance to one times salary,
eliminating $50,000 cap One-day furlough for all employees [NOTE: the furlough day
was cancelled through the use of FY 2010 one-time carryover funds]
FY 2010 Mid-Year
1.00% As part of FY 2009 close-out, County Board approved a 1% MPA effective January 1, 2010 and added for calendar year 2009 only Christmas Eve and New Year’s Eve holidays
FY 2010 Adopted
None No merit/step increases $500 one-time bonus
61
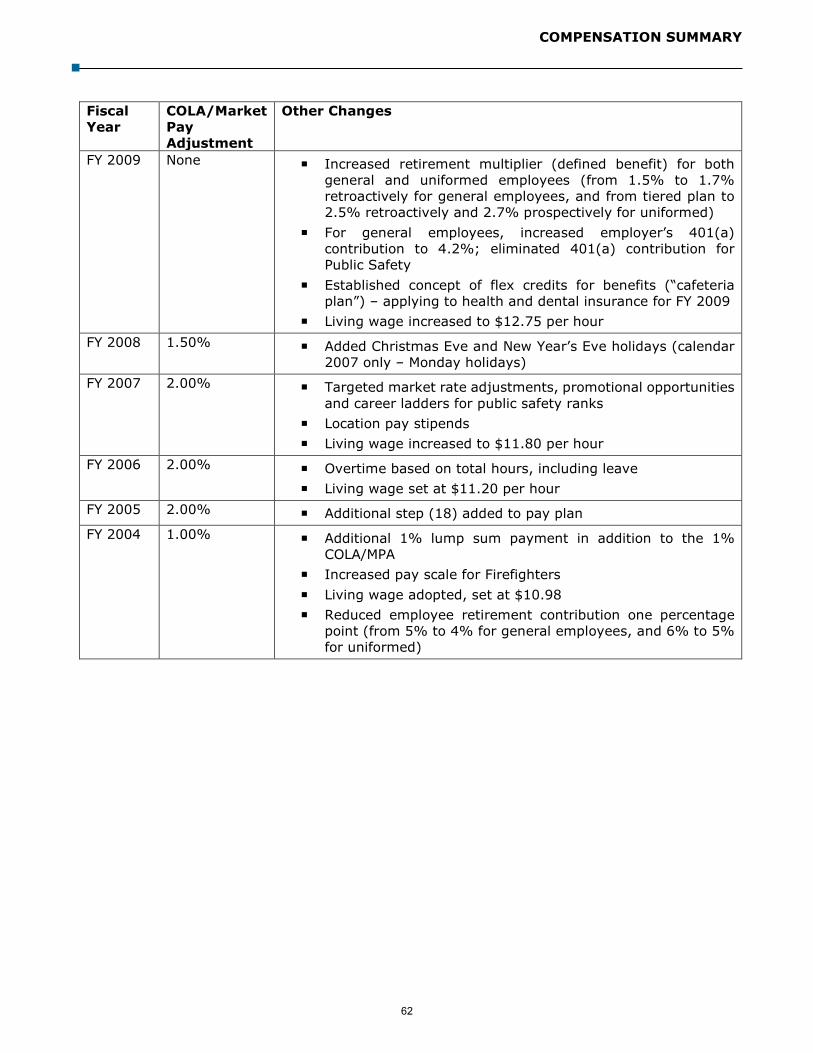
COMPENSATION SUMMARY
Fiscal Year
COLA/Market Pay Adjustment
Other Changes
FY 2009 None Increased retirement multiplier (defined benefit) for both general and uniformed employees (from 1.5% to 1.7% retroactively for general employees, and from tiered plan to 2.5% retroactively and 2.7% prospectively for uniformed)
For general employees, increased employer’s 401(a) contribution to 4.2%; eliminated 401(a) contribution for Public Safety
Established concept of flex credits for benefits (“cafeteria plan”) – applying to health and dental insurance for FY 2009
Living wage increased to $12.75 per hour FY 2008 1.50% Added Christmas Eve and New Year’s Eve holidays (calendar
2007 only – Monday holidays) FY 2007 2.00% Targeted market rate adjustments, promotional opportunities
and career ladders for public safety ranks Location pay stipends Living wage increased to $11.80 per hour
FY 2006 2.00% Overtime based on total hours, including leave Living wage set at $11.20 per hour
FY 2005 2.00% Additional step (18) added to pay plan FY 2004 1.00% Additional 1% lump sum payment in addition to the 1%
COLA/MPA Increased pay scale for Firefighters Living wage adopted, set at $10.98 Reduced employee retirement contribution one percentage
point (from 5% to 4% for general employees, and 6% to 5% for uniformed)
62

COMPENSATION SUMMARY
Retirement Plans and County Contribution Rates
Employer Contribution Rates – FY 2021 Adopted Budget
Plan Employee Type County Contribution Rate Defined Benefit General Employees 14.6% of pay
Uniformed Employees 38.4% of pay
Defined Contribution (Chapter 46 only)
General Employees 4.2% of base pay only
Uniformed Employees None
Deferred Compensation Employer Match
Chapter 46 Employees Up to $20/pay ($520/year)
Chapter 21 Employees Up to $10/pay ($260/year) NOTES: Chapter 21 employees were hired before 2/8/1981 Chapter 46 employees were hired on or after 2/8/1981
Defined Benefit Plan – Funding History Percent of Salary Contributed to Retirement Plan
Fiscal Year General Employees Uniformed Employees County
Contribution Employee
Contribution County
Contribution Employee
Contribution FY 2021 14.6% 4% 38.4% 7.5% FY 2020 15.1% 4% 38.7% 7.5% FY 2019 15.0% 4% 38.1% 7.5% FY 2018 14.9% 4% 37.9% 7.5% FY 2017 14.4% 4% 35.9% 7.5% FY 2016 15.9% 4% 37.8% 7.5%
FY 2015, revised 17.9% 4% 39.7% 7.5% FY 2014 16.6% 4% 38.4% 7.5% FY 2013 14.6% 4% 36.4% 7.5% FY 2012 14.6% 4% 36.5% 7.5% FY 2011 14.4% 4% 35.5% 7.5% FY 2010 13.8% 4% 35.1% 7.5%
FY 2009 (effective 1/1/09)
13.8% 4% 35.1% 7.5%
FY 2008 9.8% 4% 19.4% 5% FY 2007 8.3% 4% 16.3% 5% FY 2006 6.4% 4% 13.6% 5% FY 2005 4.9% 4% 10.5% 5% FY 2004 3.5% 4% 7.2% 5%
NOTE: In all fiscal years through December 2008 the contribution amount was calculated against gross salary. Effective January, 2009 overtime and premiums are excluded for Chapter 46 employees.
63

COMPENSATION SUMMARY
Defined Contribution Plan (Chapter 46 ONLY) – Funding History Percent of Base Pay Contributed to Retirement Plan
Fiscal Year General Employees Uniformed Employees County
Contribution Employee
Contribution County
Contribution Employee
Contribution FY 2010 through FY 2021 4.2% - - -
FY 2009 (as of 1/1/09)
4.2% - - -
FY 2003 through FY 2008 2% - 1% -
Employee Health Insurance
Plans include a 2.5% increase to the overall health and dental insurance budget. Actual premiums increases will vary by plan.
Consumer-Driven Health Plan: As part of its commitment to offer more choice to employees, the County will implement a Consumer-Driven Health Plan (CDHP) with a Health Savings Account (HSA) in FY 2021. A CDHP has lower premiums thereby offering a more affordable choice for our employees. The CDHP is paired with an HSA, a tax-advantaged savings plan for health expenses. The CDHP has a high deductible that the employee must meet before the insurance plan provides coverage. This can be accomplished using the HSA that is funded by both employee and County dollars. Experience shows that employees use these spending account dollars wisely and these plans often lead to decreased expenses for all. Unused HSA dollars roll forward for future use. All of our regional peers have already implemented a CDHP.
64

Employee Contribution
County Contribution
Employee Contribution
County Contribution
Employee Contribution
County Contribution
Employee Contribution
County Contribution
Employee Contribution
County Contribution
Employee Contribution
County Contribution
Full-time (30-40 hours/week)
Single 54.16$ 216.62$ 70.23$ 280.92$ 63.85$ 255.39$ 208.12$ 255.39$ 3.40$ 13.59$ 14.43$ 14.43$ Employee + Spouse orAdult Dependent 142.55$ 427.65$ 179.97$ 539.90$ 163.61$ 490.84$ 459.38$ 490.84$ 8.49$ 25.46$ 28.86$ 28.86$
Employee + Child(ren) 125.59$ 376.76$ 153.63$ 460.88$ 139.67$ 419.02$ 415.27$ 419.02$ 9.24$ 27.73$ 31.43$ 31.43$
Family 206.60$ 619.81$ 263.37$ 790.10$ 239.42$ 718.28$ 672.23$ 718.28$ 12.95$ 38.84$ 44.03$ 44.03$
Part-time (20-29 hours/week)
Single 135.39$ 135.39$ 175.58$ 175.58$ 159.62$ 159.62$ 303.89$ 159.62$ 8.50$ 8.50$ 21.65$ 7.22$ Employee + Spouse orAdult Dependent 285.10$ 285.10$ 359.94$ 359.94$ 327.23$ 327.23$ 623.00$ 327.23$ 16.98$ 16.98$ 43.29$ 14.43$
Employee + Child(ren) 251.17$ 251.18$ 307.27$ 307.26$ 279.35$ 279.35$ 554.95$ 279.35$ 18.48$ 18.49$ 47.15$ 15.72$
Family 413.20$ 413.21$ 526.75$ 526.74$ 478.85$ 478.85$ 911.66$ 478.85$ 25.90$ 25.90$ 66.05$ 22.02$
Part-time (10-19 hours/week)
Single 189.55$ 81.23$ 245.82$ 105.35$ 223.47$ 95.77$ 367.74$ 95.77$ 11.89$ 5.10$ 25.97$ 2.89$
Employee + Spouse orAdult Dependent 399.14$ 171.06$ 503.91$ 215.96$ 458.12$ 196.34$ 753.89$ 196.34$ 23.76$ 10.19$ 51.95$ 5.77$
Employee + Child(ren) 351.64$ 150.71$ 430.16$ 184.35$ 391.08$ 167.61$ 666.68$ 167.61$ 25.88$ 11.09$ 56.57$ 6.29$
Family 578.49$ 247.92$ 737.43$ 316.04$ 670.39$ 287.31$ 1,103.20$ 287.31$ 36.25$ 15.54$ 79.25$ 8.81$
Per Pay Period
Delta DentalPremium
Per Pay PeriodPer Pay Period
* The OAP Plan will be discontinued on December 31, 2020. It will be replaced with a consumer driven health plan, Cigna Choice + HSA, effective January 1, 2021
Active Employee Biweekly Health and Dental PremiumsEffective July 1, 2020 — June 30, 2021
Per Pay Period
Delta Dental Standard
Copay Plans: Coinsurance Plans:
Per Pay Period
Cigna OAP-IN Cigna OAP*Cigna OAP-INKaiserPer Pay Period
65

This page intentionally left blank
66
REVENUE SUMMARY
67

This page intentionally left blank
68
R E V E N U E S
OVERVIEW
Fiscal Year (FY) 2021 revenues reflect extraordinary and changing circumstances in the Northern Virginia economy. Arlington’s proximity to the nation’s capital, balanced economy, smart growth planning, and highly-educated workforce help produce Arlington’s revenues which have been significantly impacted by the impacts of social distancing, public gathering restrictions, and greater macroeconomic effects amid the COVID-19 outbreak.
Real estate tax revenues make up 59 percent of all General Fund revenues. In Calendar Year (CY) 2020, the County expects measured revenue growth from real estate taxes, driven by a 4.6 percent increase in Arlington’s property values in January 2020.
Arlington’s residential property tax base grew 4.3 percent, demonstrating the continued attractiveness of our community. New construction represented 0.1 percentage points of the overall residential growth. Detached home and townhome assessments increased by 4.6 percent while condominium assessments increased by 3.5 percent. The average value of existing residential properties, including condominiums, townhouses, and detached homes, increased from $658,600 in CY 2019 to $686,300 in CY 2020, an increase of 4.2 percent.
Commercial property assessments increased by 4.9 percent over the previous year with the general commercial, apartment, and office segments all increasing in value. Apartment values grew 8.9 percent and general commercial properties increased by 1.8 percent. Office property assessments maintained their measured growth, increasing 2.5 percent over the previous year mainly due to a gradually declining office vacancy rate and continued demand for rental properties. New construction, largely in apartments, contributed 1.5 percentage points to the overall commercial growth. Growth was partially offset by lower hotel assessed values which were down 1.7 percent from the previous year.
Meanwhile, other revenue streams are experiencing a variety of changes. A number of local taxes other than real estate are expected to decrease, 5.7 percent in the aggregate. Local fees are expected to increase by 5.9 percent while local fines are forecasted to decrease 4.1 percent. Interest revenue is also expected to decrease due to declining interest rates. Revenue from the Commonwealth is up 4.1 percent while funds from the federal government are expected to be fairly flat.
General Fund Revenues
Excluding fund balance, General Fund revenues for FY 2021 are forecast to be $1,323,205,211, an increase of 0.6 percent over the FY 2020 adopted budget levels. This change reflects the increase in the assessment base, increases in some fines and fees, and a decrease in revenue from other taxes combined. Total General Fund revenues including fund balance total $1,345,444,450.
Marginal Gains in Local Tax Revenues
For the FY 2021 adopted budget, General Fund tax revenues are forecast to increase by 0.4 percent. This gain is driven primarily by overall real estate assessment increases of 4.6 percent.
Other taxes combined are forecast to decrease 5.7 percent in FY 2021. Personal property tax (including business tangible tax) is up 0.8 percent. Sales tax is down 3.5 percent and transient
69

REVENUES
occupancy tax is down 25.9 percent reflecting expected drops in consumer spending and tourism. Business, Professional and Occupational License Tax (BPOL) is projected to decrease 8.7 percent.
State and Federal Budget Adjustments
FY 2021 revenue from the Commonwealth is expected to be up 4.1 percent while federal government revenues are expected to be up 0.5 percent. The increase in the Commonwealth revenue can be attributed to additional funding for commuter assistance and mental health grants and increases in Northern Virginia Transportation Commission and Compensation Board funding. These increases are offset by a reduction to social services grants and grantor’s tax.
The slight increase in federal funds is primarily driven by an increase in social service grants.
Staff is monitoring the continued development of the state budget as well as any federal government actions that might impact the County’s budget.
Real Estate Tax Rate Remains among the Lowest in Northern Virginia
The FY 2021 adopted budget reflects a CY 2020 real estate tax rate of $1.026, which includes the current base rate of $1.013 and the County-wide sanitary district rate of $0.013 for stormwater management. Arlington will continue to have one of the lowest real estate tax rates in the Northern Virginia region, maintaining its history of providing excellent value. Because of assessment growth, the average homeowner will pay $284 more in real estate taxes in CY 2020 than in CY 2019 at existing rates, an increase of 4.2 percent.
Revenue Sharing with Arlington Public Schools (APS)
The FY 2021 adopted transfer to APS at existing tax rates is $524,631,091 in ongoing FY 2021 local tax revenues – a $2.2 million increase over the FY 2020 adopted budget. These funds are generated from a 47.0 percent share of ongoing local tax revenues.
Comparison between Budgeted Revenues and Expenditures
County budget information compares budgeted revenues and expenditures from the current fiscal year to the next fiscal year. Most of the growth calculations in this section, derived from historical trends and other data, are calculated against revised estimates for the current year. This is especially important for real estate revenue since the County’s assessment of real estate occurs each January 1, or halfway through the current fiscal year. The value of real estate, determined in the middle of a fiscal year, has a significant impact on the current fiscal year’s revenue since the first payment is due in June, prior to the end of the current fiscal year, and drives the forecast for the subsequent fiscal year. Other tax revenue forecasts are revised in the current year if the tax receipts indicate higher or lower year-end revenues although this revenue surplus or deficit is typically not recognized in the budget in the mid-year or third quarter review of the current fiscal year.
Fiscal Outlook
Arlington continues to economically surpass much of the region and the nation but has not been spared from the impacts of the global pandemic. Before the COVID-19 outbreak, Arlington's unemployment rate remained the lowest in the Commonwealth. The County’s per capita income remained among the highest in the state. Home prices continued to have measured growth and the commercial real estate sector was showing signs of positive momentum, including the uptick in the development pipeline coinciding with the Amazon headquarters development in the County. However, the economic outlook has changed dramatically since the FY 2021 budget was originally proposed. In response to the rapid spread of COVID-19, the State issued a stay at home order prohibiting public gatherings in excess of ten individuals. In Arlington there have been over 13,000 claims of unemployment, 12 hotels that have temporarily suspended operations, and more than 300
70

REVENUES
restaurants that have switched to exclusively take out/delivery services. The County is now poised to begin FY 2021 with changing revenue streams, an uncertain real estate market, and increasing unemployment levels.
Economic Indicators
CY 2017 CY 2018 CY 2019 Consumer Price Index (national CPI-U average) 2.1% 1.9% 2.3% Employment Cost Index (private industry workers) 2.6% 3.0% 2.7% Unemployment – US / Arlington (December) 4.4% / 2.2% 3.9% / 1.7% 3.7% / 1.6% Mortgage Rate (annual average – 30 year fixed rate) 3.99% / 0.5 pts. 4.54% / 0.5 pts. 3.94% / 0.5 pts. Federal Fund Rate (annualized) 1.00% 1.79% 2.16% Retail Sales (based on 1% of Arlington tax revenue) $4.2 billion $4.3 billion $4.6 billion Office Vacancy Rate – (including sublets) 18.5% 17.4% 14.8% Tourism – Hotel Occupancy Rate 77% 75% 75% Tourism – Average Hotel room rate $167.42 $163.70 $168.29
Sources: Bureau of Labor Statistics, Freddie Mac, Federal Reserve, Smith Travel Research, Costar
TAX COMPETITIVENESS
Arlington County continues to have a tax structure that is highly competitive with the region and with the nation. The adopted real estate tax rate for calendar year (CY) 2020, which includes a base rate of $1.013 plus a $0.013 stormwater tax, is one of the lowest in the Northern Virginia region. Charts comparing current (CY 2020) tax rates and tax bills for various Northern Virginia jurisdictions can be found later in this section.
FINANCIAL STANDING
Arlington is one of approximately 48 counties in the United States to be awarded a triple Aaa/AAA/AAA credit rating. As of October 2019, the three primary rating agencies all reaffirmed the highest credit rating attainable for jurisdictions. Ratings issued by Fitch, Inc. (AAA), Moody’s Investors Service (Aaa), and Standard & Poor’s (AAA) validate that Arlington’s financial position is outstanding, and it reflects the strong debt position, stable tax base, and sound financial position.
71

REVENUES
TAX RATES, USER CHARGES, AND PERMIT FEE CHANGES FOR FY 2021
The following adopted changes for FY 2021 are reflected in total revenue amounts.
General Fund
In the General Fund, changes in revenue are reflected in the department narratives and the General Fund total revenues. The FY 2021 adopted budget includes the following:
In line with County Board guidance, an adopted CY 2020 base real estate tax rate of $1.013per $100 of assessed value, no change over the adopted CY 2019 base real estate tax rate.
In Arlington Economic Development (AED), an increase to Scenic Studio use fees.
In the Department of Community Planning, Housing, and Development (CPHD) and theDepartment of Environmental Services (DES), a 2.5 percent inflationary increase todevelopment services fees including site plan fees.
In DES, an increase in the household solid waste rate from $306.00 to $319.03 per year.
In the Department of Human Services (DHS), new fees for new course offerings from theArlington Employment Center related to childcare and computer training and certifications.
In DHS, new fees for newly offered certified vital event (eg. birth, death, marriage, divorce)certificates.
In the Department of Libraries, elimination of overdue fees to make the collections moreaccessible to all library users.
In the Police Department, establishment of an annual alarm registration fee and increasedfines for false alarms.
In the Department of Parks and Recreation (DPR), new fees associated with the offerings fornature summer camps extended day options, adult 3-verses-3 basketball tournaments, andlifeguard classes.
In DPR, fee adjustments to more accurately reflect costs and DPR fee policy. These changesinclude fee adjustments for aquatics and gymnastics teams, creative arts programs, summercamps, and youth sports leagues.
Stormwater Fund
The FY 2021 adopted budget maintains the sanitary district tax for stormwater at $0.013 per$100 of assessed value to manage and improve the County’s stormwater system.
Utilities Fund
The FY 2021 adopted budget includes a water/sewer rate of $14.20 per thousand gallons. Theadopted rate represents an increase of $0.40 per thousand gallons, or 2.9 percent, above thecurrent rate. At the new rate, the average single-family house will pay $24 more per year forwater and sewer service based on an estimated household consumption of 60,000 gallons ofwater per year.
72

REVENUES
Crystal City, Potomac Yard, Pentagon City Tax Increment Financing (TIF) Fund
The FY 2021 adopted budget funds the Crystal City, Potomac Yard, and Pentagon City TIFarea using CY 2011 district assessments as the base year for valuation. Funding in FY 2021is 25 percent of the incremental tax payment generated by the projected assessment tax baseincrease for properties in the defined Crystal City, Potomac Yard, and Pentagon City area.Total FY 2021 revenue for the TIF is projected to be $5.8 million.
Columbia Pike Tax Increment Financing (TIF) Fund
In the FY 2018 adopted budget, the Columbia Pike TIF baseline assessed value was reset bythe County Board from CY 2014 to CY 2018. Funding for FY 2021 is expected to total $1.0million.
Ballston Quarter Tax Increment Financing (TIF) Fund
The FY 2021 adopted budget reflects the CY 2020 assessed values in the TIF district comparedto the 2015 base year. Funding in an amount up to 65 percent of the incremental realproperty, sales and use, and meals tax revenues will be transferred to the trustee for theBallston Quarter Community Development Authority (CDA) to fund the project stabilizationfund as part of the Ballston Quarter CDA Series 2016A and Series 2016B bond issuance.Funding for FY 2021 totals $2.0 million.
Transportation Capital Fund
The FY 2021 adopted budget maintains the tax rate for the Transportation Capital Fund at$0.125 for each $100 of real estate assessed value to fund major transportation infrastructureprojects. This tax rate is in addition to the real estate tax rate and is assessed to commerciallyzoned properties in Arlington. Total FY 2021 real estate tax revenue for the TransportationCapital Fund is projected to be $26.6 million in addition to $7.9 million of Northern VirginiaTransportation Authority (NVTA) local share funding.
Special Assessment District Funds
The Ballston Business Improvement Service District CY 2020 tax rate remains at $.045 foreach $100 of real estate assessed value, no change from the CY 2019 tax rate. This tax isimposed to fund additional services in the Ballston area. This service district tax rate is inaddition to the real estate tax rate and is assessed to commercially zoned properties in theDistrict.
The Crystal City Business Improvement Service District CY 2020 tax rate remains at $0.043for each $100 of real estate assessed value, no change from the CY 2019 rate. This tax isimposed to fund additional services in the downtown Crystal City area. This service districttax rate is in addition to the real estate tax rate.
The Rosslyn Business Improvement Service District CY 2020 tax rate remains at $0.078 foreach $100 of real estate assessed value, no change from CY 2019 rate. This tax is imposedto fund additional services in the downtown Rosslyn area. This service district tax rate is inaddition to the real estate tax rate.
CPHD Development Fund
The FY 2021 adopted budget includes a 2.5 percent inflationary increase to all DevelopmentFund fees in addition to changes to building permit fees, new fees for home occupationpermits, and increased fees for sign permit fees to more accurately reflect and recover costs.
73

REVENUES
GENERAL FUND REVENUE SUMMARY
The FY 2021 General Fund budget is financed by a variety of revenue sources, which include local taxes, service charges, fees, and state and federal revenue.
General Fund revenues total $1.35 billion, a decrease of $10.8 million (0.8 percent) over theadopted FY 2020 budget. Net of fund balance, General Fund revenues are projected to total$1.32 billion, an increase of $8.1 million (0.6 percent).
Local tax revenues are projected to total $1,116,236,365, an increase of $4.6 million(0.4 percent) over the FY 2020 adopted budget.
▫ Local taxes represent 84 percent of total General Fund revenue.▫ Real estate assessments are up 4.6 percent over last year.▫ In line with County Board guidance, the adopted real estate tax rate has not changed
compared to the FY 2020 adopted level of $1.013 per $100 of assessed value.
License, Permits, and Fee revenue is projected to total $13.1 million, a 5.9 percent increaseover FY 2020 adopted budget levels. This increase is primarily due to anticipated site planfee revenue associated with the increase in the development pipeline expected to coincidewith the Amazon headquarters development.
Fines and parking tickets are estimated to generate $6.9 million, a 4.1 percent decrease,primarily due to a decrease in traffic related fines.
Interest income is forecasted at $6 million, a decrease of 31 percent from FY 2020 to reflectthe decreasing interest rate environment as a response to the COVID-19 outbreak.
Charges for services revenue is projected to total $64.3 million, which is flat compared to FY2020.
State revenue is estimated to total $79.1 million, a 4.1 percent increase from the FY 2020adopted budget.
Federal Government revenue is forecast to total $16.1 million, a 0.5 percent increase fromthe FY 2020 adopted budget.
Previous year fund balance carryover totals $22.2 million funded by a combination ofadditional revenue and expense savings identified from previous fiscal years.
The pie chart on the next page illustrates the major sources of General Fund revenues.
74

REVENUES
FY 2021 General Fund Revenues
Real Estate, 59%
Personal Property, 9%
BPOL, 5%
Sales Tax, 3%
Meals Tax, 3%
Transient Tax, 1%
Other Local Taxes, 3%
Service Charges,5%
Licenses/Fees, 1%
Fines, <1%
Misc. Revenue,2%
Commonwealth, 6%
Federal, 1%Fund Balance, 2%
75

REVENUES
The pie chart below illustrates the local taxes that the County collects. As demonstrated by the chart, real estate and personal property taxes are the largest tax categories. Together, they account for almost 80 percent of local tax revenue. A description of the local taxes and a discussion of the FY 2021 revenue projections follow.
FY 2021 Local Taxes
Real Estate: Commercial, 19%
Real Estate: Apartments, 16%
Meals Tax, 3%
Utility Tax, 1%Transient Occupancy Tax, 2%
Local Sales Tax, 4%
Communication Tax, 1%
Other, 1%
BPOL, 6%
Personal Property:
Vehicles, 7%
Personal Property: Bus. Tangible, 4%
Real Estate: Condominium, 9% Real Estate:
Residential, 27%
76

REVENUES
REAL ESTATE TAX
Real estate taxes are the largest source of County revenues, generating $795.1 million or 59 percent of all revenues for the FY 2021 General Fund budget and 71 percent of all local tax revenues. The FY 2021 General Fund revenues reflect the real estate tax rate of $1.013 for each $100 of assessed real property value, no change from CY 2019.
Arlington County prorates real estate taxes for the value increase on new construction, a policy adopted in FY 1986. Previously, a property owner paid real estate taxes based on the January 1 value of a structure. No additional tax was assessed if the building was completed during the course of the year. With proration, property owners pay a prorated share of the real estate tax increase during the calendar year, based on when the building is substantially completed.
CY 2020 assessments reflected measured growth in property values with an overall increase of 4.6 percent over CY 2019 – driven by growth of both residential and commercial property values. New construction in the County contributed to 0.8 percent of the overall property tax growth.
The combined value of commercial and apartment assessments increased 4.9 percent. Apartment buildings grew by 8.9 percent, which included a 2.8 percent increase from new construction. After decreasing last year, general commercial (malls, retail stores, gas stations, etc.) property assessments increased 1.8 percent. Office property values continued to grow, increasing 2.5 percent due to gradually declining office vacancy rates and Amazon-related leasing activity. Growth was partially offset by hotels, which were down 1.7 percent from the previous year.
CY 2020 residential assessments increased 4.3 percent in the aggregate. Including new construction, single-family houses (including townhomes) increased 4.6 percent, while condominium assessment totals increased by 3.5 percent. The average value of a single-family property increased by 4.2 percent; from $658,600 in CY 2019 to $686,300 in CY 2020. At the existing real estate tax rate of $1.026 per assessed value, which includes the base rate of $1.013 plus the $0.013 sanitary district “stormwater” tax, the average single-family residential tax bill will increase by about $284, or 4.2 percent, in CY 2020.
Houses Condominium Apartment Commercial TotalPercentage of CY 2019 Tax Base 38% 14% 21% 27% 100%CY 2019 Tax Base $29,512 $10,480 $16,574 $21,024 $77,590Assessed Value Change $1,309 $367 $1,017 $290 $2,983CY 2020 Tax Base (Excluding New Growth) $30,821 $10,847 $17,592 $21,314 $80,573Percent Change 4.4% 3.5% 6.1% 1.4% 3.8%New Construction $36 - $460 $91 $587Percent Change 0.1% - 2.8% 0.4% 0.8%CY 2020 With New Construction $30,857 $10,847 $18,052 $21,405 $81,160Percent Change CY 2019 to CY 2020 4.6% 3.5% 8.9% 1.8% 4.6%
Single-Family
CHANGE IN ASSESSED VALUE OF REAL ESTATE IN ARLINGTON COUNTY
(In millions, numbers may not add due to rounding)Calendar Year 2019 to Calendar Year 2020
77
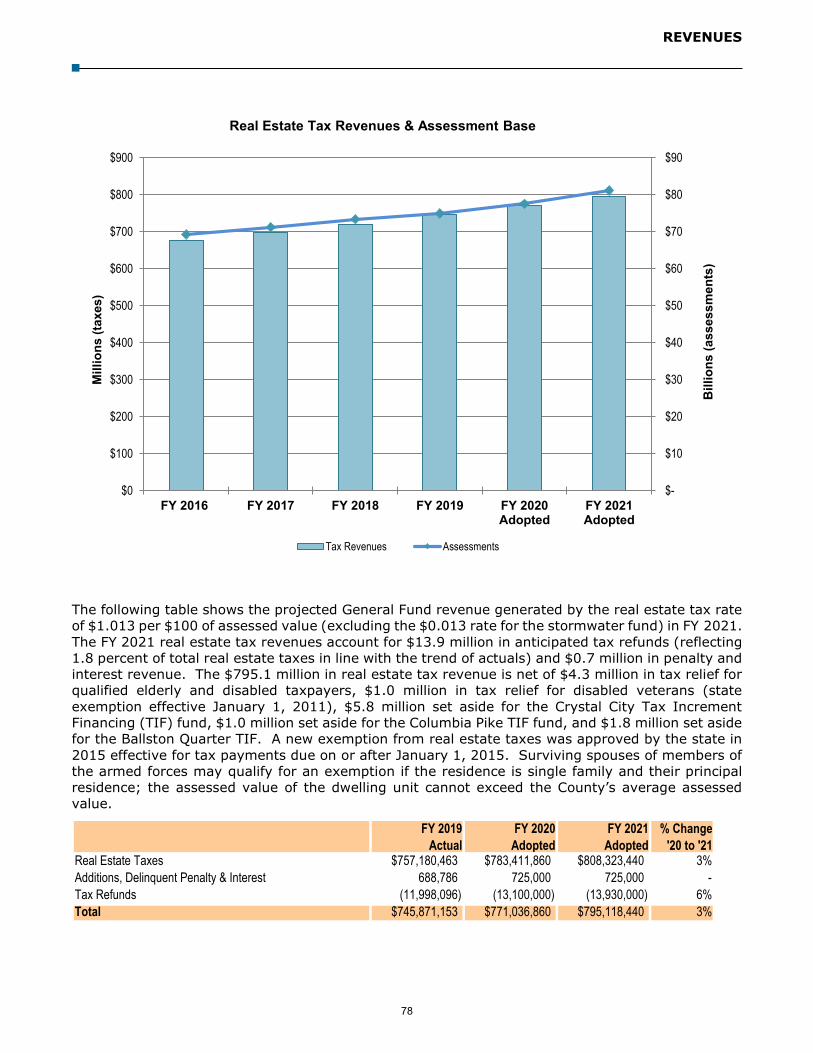
REVENUES
The following table shows the projected General Fund revenue generated by the real estate tax rate of $1.013 per $100 of assessed value (excluding the $0.013 rate for the stormwater fund) in FY 2021. The FY 2021 real estate tax revenues account for $13.9 million in anticipated tax refunds (reflecting 1.8 percent of total real estate taxes in line with the trend of actuals) and $0.7 million in penalty and interest revenue. The $795.1 million in real estate tax revenue is net of $4.3 million in tax relief for qualified elderly and disabled taxpayers, $1.0 million in tax relief for disabled veterans (state exemption effective January 1, 2011), $5.8 million set aside for the Crystal City Tax Increment Financing (TIF) fund, $1.0 million set aside for the Columbia Pike TIF fund, and $1.8 million set aside for the Ballston Quarter TIF. A new exemption from real estate taxes was approved by the state in 2015 effective for tax payments due on or after January 1, 2015. Surviving spouses of members of the armed forces may qualify for an exemption if the residence is single family and their principal residence; the assessed value of the dwelling unit cannot exceed the County’s average assessed value.
FY 2019Actual
FY 2020Adopted
FY 2021Adopted
% Change '20 to '21
Real Estate Taxes $757,180,463 $783,411,860 $808,323,440 3%Additions, Delinquent Penalty & Interest 688,786 725,000 725,000 -Tax Refunds (11,998,096) (13,100,000) (13,930,000) 6%Total $745,871,153 $771,036,860 $795,118,440 3%
$-
$10
$20
$30
$40
$50
$60
$70
$80
$90
$0
$100
$200
$300
$400
$500
$600
$700
$800
$900
FY 2016 FY 2017 FY 2018 FY 2019 FY 2020Adopted
FY 2021Adopted
Bill
ions
(ass
essm
ents
)
Mill
ions
(tax
es)
Real Estate Tax Revenues & Assessment Base
Tax Revenues Assessments
78

Percent Assessed Tax Tax Percent Total for Total forDescription Change Value Rate* Levy Collected Tax Year Fiscal Year
REAL ESTATECounty Property, CY 2018 $74,983,635,100Net Change in Assessments 3.5% 2,606,503,100County Property as of April 2019 77,590,138,200 $1.013 $785,988,100 99.8% $784,337,525
PSC Property in Tax Year 2018 $177,363,100PSC Estimated Net Change in Assessments 1.5% 2,624,100PSC Property in Tax Year 2019 $179,987,200 $1.013 $1,823,270 100.0% $1,823,270
Total Taxable Base, Fall 2019 $77,770,125,400 $786,160,795
Taxes Due October 5, 2019 $393,080,400Less Tax Relief for Elderly and Disabled (2,100,000) Less Tax Relief for Disabled Veterans (495,030) Less Tax Increment for Crystal City TIF (2,771,170) Less Tax Increment for Columbia Pike TIF (189,070) Less Tax Increment for Ballston CDA TIF (344,640)
ESTIMATED REVENUE FOR FY 2020 - FALL 2019 $387,180,490
County Property as of April 2019 $77,590,138,200Net Change in Assessments 4.6% 3,569,901,000County Property as of January 1, 2020 81,160,039,200 $1.013 $822,151,200 99.8% $820,424,680
PSC Property in Tax Year 2020 (prior to Fall 2020 adjustment) $176,265,400 $1.013 $1,785,569 100.0% $1,785,569
Total Taxable Base, Spring 2020 $81,336,304,600 $822,210,249
Taxes Due June 15, 2020 $411,105,120Less Tax Relief for Elderly and Disabled (2,142,000) Less Tax Relief for Disabled Veterans (504,940) Less Tax Increment for Crystal City TIF (2,879,970) Less Tax Increment for Columbia Pike TIF (484,260) Less Tax Increment for Ballston CDA TIF (905,770)
ESTIMATED REVENUE FOR FY 2019 - SPRING 2020 $404,188,180
TOTAL ESTIMATED ASSESSMENT TAX REVENUE FOR FISCAL YEAR 2020 $791,368,670* The tax rate is per $100 of assessed value.* The tax rate excludes $0.013 stormwater tax, $0.125 commercial transportation tax, and tax rates for other special assessment districts.
FY 2020 REVISED - REAL ESTATE TAX REVENUES
79

Percent Assessed Tax Tax Percent Total for Total forDescription Change Value Rate (1) Levy Collected Tax Year Fiscal Year
REAL ESTATECounty Property as of CY 2019 Land Book $77,590,138,200Net Change in Assessments 4.6% $3,569,901,000County Property as of January 1, 2020 $81,160,039,200 $1.013 $822,151,200 99.8% $820,424,680
PSC Property in Tax Year 2019 $179,987,200PSC Estimated Net Change in Assessments -2.1% ($3,721,800)PSC Property in Tax Year 2020 $176,265,400 $1.013 $1,785,570 100% $1,785,570
Total Taxable Base, Fall 2020 $81,336,304,600 $822,210,250
Taxes Due October 5, 2020 $411,105,120Less Tax Relief for Elderly and Disabled (2,142,000)Less Tax Relief for Disabled Veterans (504,930)Less Tax Increment for Crystal City TIF (2,879,970)Less Tax Increment for Columbia Pike TIF (484,260) Less Tax Increment for Ballston CDA TIF (905,770)
ESTIMATED REVENUE FOR FY 2021 - FALL 2020 $404,188,190
County Property as of January 1, 2020 $81,160,039,200Net Change in Assessments 0.0% $0County Property as of January 1, 2021 $81,160,039,200 $1.013 $822,151,200 99.8% $820,424,680
PSC Property in Tax Year 2020 (prior to Fall 2020 adjustment) $176,265,400PSC Estimated Net Change in Assessments $0PSC Property in Tax Year 2021 $176,265,400 $1.013 $1,785,570 100% $1,785,570
Total Taxable Base, Spring 2021 $81,336,304,600 $822,210,250
Taxes Due June 15, 2021 $411,105,120Less Tax Relief for Elderly and Disabled (2,184,840)Less Tax Relief for Disabled Veterans (515,030)Less Tax Increment for Crystal City TIF (2,879,970)Less Tax Increment for Columbia Pike TIF (484,260)Less Tax Increment for Ballston CDA TIF (905,770)
ESTIMATED REVENUE FOR FY 2021 - SPRING 2021 $404,135,250
TOTAL ESTIMATED ASSESSMENT TAX REVENUE FOR FISCAL YEAR 2021 $808,323,440
FY 2021 ADOPTED - REAL ESTATE TAX REVENUES
(1) The tax rate is per $100 of assessed value and excludes the $0.013 stormwater tax, $0.125 commercial transportation tax, and tax rates for otherspecial assessment districts.
80

REVENUES
PERSONAL PROPERTY TAX
This tax is levied on the tangible property of individuals and businesses. For individuals, personal property tax is primarily assessed on automobiles. For businesses, examples of tangible property include machines, furniture, computer equipment, fixtures, and tools. Personal property taxes are projected to generate nine percent of the General Fund revenues in FY 2021.
It is anticipated that the County’s personal property tax revenues will increase to $120.1 million in FY 2021. Business tangible property tax is expected to increase while motor vehicle property tax is expected to remain flat, reflecting trends in actuals.
FY 2021 motor vehicle personal property tax revenue is projected to be flat compared to FY 2020 adopted amounts. The County bases its vehicle assessments on the National Automobile Dealer’s Association’s (NADA) assessment figures from January. However, the precise value of the assessment base is not known until July when the Commissioner of Revenue completes its primary assessment of vehicles on the tax rolls. Business tangible tax assessments are expected to increase by 2.5 percent in FY 2021.
The personal property tax rate remains unchanged for FY 2021. The personal property tax rate was last increased in CY 2006 from $4.40 to $5.00 per $100 of assessed valuation in order to fund public safety compensation enhancements.
Personal Property and Business Tangible Assessments
The assessed value of personal property in the County (excluding Public Service Corporations) for CY 2019 totaled approximately $2.4 billion. FY 2021 personal property tax revenue is projected to increase by 0.8 percent compared to the FY 2020 adopted levels.
$-
$20.0
$40.0
$60.0
$80.0
$100.0
$120.0
FY 2014 FY 2015 FY 2016 FY 2017 FY 2018 FY 2019 FY 2020Adopted
FY 2021Adopted
$ M
illion
s
Personal Property Tax Revenue
Vehicles Business Tangible
81

REVENUES
Vehicle Assessment
Vehicles in Arlington County are assessed using the average loan value from the NADA Used Car Guide, whereas other neighboring jurisdictions (except for Loudoun County) use the average trade-in value. Because the average loan value is ten percent less than the average trade-in value, Arlington’s effective personal property tax rate is 4.5 percent. This effective tax rate is among the lowest in the Northern Virginia region. If vehicles are in the County for only part of the year, the tax is prorated for the time the vehicle is located in Arlington.
The CY 2020 estimated average assessed value (average loan value) of vehicles in the County is estimated to be $10,488, up six percent from $9,935 last year. The table shows the ten-year history for average assessed value, tax rate, and average total tax per vehicle.
*Does not reflect the State’s rebates per the Personal Property Tax Relief Act (priorto CY 2006) or the State’s fixed block grant distribution (after CY 2006). The taxrate is per $100 of assessed value.
FY 2019Actual
FY 2020Adopted
FY 2021Adopted
% Change '20 to '21
Personal Property Taxes $118,736,967 $119,852,147 $120,852,147 1%Penalty & Interest 1,536,163 1,700,000 1,700,000 -Tax Refunds - Personal Property (2,278,471) (2,500,000) (2,500,000) -Total $117,994,659 $119,052,147 $120,052,147 1%
In June 2004, the State General Assembly fundamentally changed the Personal Property Tax Relief Act (PPTRA) originally enacted in 1998. Beginning in CY 2006, Arlington is no longer reimbursed for 70 percent of vehicle taxes for automobiles assessed below $20,000. Rather, the State reimburses Arlington County a fixed amount ($31.3 million) annually as a fixed block grant for vehicle tax reductions.
The State requires localities to distribute the fixed block grant to qualifying vehicle values below $20,000. The State allows localities wide discretion in determining how the money should be spread among the qualifying vehicle value range. For CY 2020, the County will provide 100 percent tax relief for assessed vehicle value at or below $3,000. For assessed value between $3,001 and $20,000
CalendarYear
AverageAssessed Value
TaxRate
TotalTax
2011 $7,735 $5.00 $387
2012 $8,421 $5.00 $421
2013 $8,842 $5.00 $4422014 $9,284 $5.00 $464
2015 $9,399 $5.00 $4702016 $9,493 $5.00 $475
2017 $9,682 $5.00 $4842018 $10,235 $5.00 $512
2019 $9,935 $5.00 $497
2020 (projected) $10,488 $5.00 $524
82

REVENUES
for conventional vehicles, it is projected that the taxpayer will pay 72 percent of the tax liability, with the State block grant funds contributing the remaining 28 percent. However, the exact amount of the CY 2020 subsidy on the portion of conventional fuel value between $3,001 and $20,000 will not be known until July 2020, when the Commissioner of Revenue releases vehicle assessment data.
Owners of cars that the Virginia Department of Motor Vehicles has designated as “clean special fuel” vehicles—a designation that includes most hybrid vehicles—will receive 50 percent tax relief on the portion of vehicle value between $3,001 and $20,000. It is estimated that the average clean fuel vehicle in the County will have an assessed value of roughly $13,762 in CY 2020. Thus, under the adopted tax relief formula, the owner of an average clean fuel vehicle would have a tax bill of $269. This CY 2020 bill is $118 less than what the owner of a comparably priced conventional fuel vehicle would pay.
Finally, vehicles equipped to transport disabled persons may qualify for additional tax relief. The FY 2020 adopted budget provides that the owners of qualifying vehicles will receive 50 percent tax relief on the portion of vehicle value between $3,001 and $20,000. It is estimated that there are less than 35 of this type of vehicle owned by individuals and registered in Arlington County. Because additional tax relief is being applied through PPTRA, it does not apply to commercially owned vehicles that have been modified to transport the disabled. With the relatively few vehicles anticipated to qualify for this enhanced tax relief, the impact to the average Arlington tax payer is negligible. If a qualifying, altered vehicle is valued at $14,000, then the vehicle owner is estimated to realize a reduction of $121 in their portion of the personal property tax bill compared to a similarly assessed conventional fuel vehicle.
The tables on the following page illustrate the projected amount of tax that vehicle owners of conventional fuel vehicles, clean fuel vehicles, and vehicles modified to transport the disabled would be responsible for and the portion of the total tax paid by state grant monies in FY 2021, based on preliminary estimates.
83

VEHICLE ASSESSMENT TOTAL TAX
PORTION PAID BY STATE
PORTION PAID BY
TAXPAYER
% OF TAX BILL PAID BY
TAXPAYERPORTION PAID
BY STATEPORTION PAID BY TAXPAYER
% OF TAX BILL PAID BY
TAXPAYER
$1,000 $50 $50 $0 0% $50 $0 0%$2,000 $100 $100 $0 0% $100 $0 0%$3,000 $150 $150 $0 0% $150 $0 0%$4,000 $200 $164 $36 18% $175 $25 13%$5,000 $250 $178 $72 29% $200 $50 20%$6,000 $300 $192 $108 36% $225 $75 25%$7,000 $350 $206 $144 41% $250 $100 29%$8,000 $400 $220 $180 45% $275 $125 31%$9,000 $450 $234 $216 48% $300 $150 33%
$10,000 $500 $248 $252 50% $325 $175 35%$11,000 $550 $262 $288 52% $350 $200 36%$12,000 $600 $276 $324 54% $375 $225 38%$13,000 $650 $290 $360 55% $400 $250 38%$14,000 $700 $304 $396 57% $425 $275 39%$15,000 $750 $318 $432 58% $450 $300 40%$16,000 $800 $332 $468 59% $475 $325 41%$17,000 $850 $346 $504 59% $500 $350 41%$18,000 $900 $360 $540 60% $525 $375 42%$19,000 $950 $374 $576 61% $550 $400 42%$20,000 $1,000 $388 $612 61% $575 $425 43%$21,000 $1,050 $388 $662 63% $575 $475 45%
CY 2020 State Block Grant Distribution (Based on Current Projections)
Conventional Vehicles Qualified Clean Fuel Vehicles and Qualified Vehicles to Transport the
Disabled
Tax on first $3,000 of value paid by State at 100%. Tax on value from $3,001 - $20,000 paid by the State
at 28%.
Tax on first $3,000 of value paid by State at 100%. Tax on value from $3,001 -
$20,000 paid by the State at 50%.
84

REVENUES
BUSINESS, PROFESSIONAL, AND OCCUPATIONAL LICENSE (BPOL) TAX
(State Code Section §58.1-3700, et al / County Code Section §11-57 through §11-84)
These taxes are levied on entities doing business in the County and are in the form of fixed fees or a percentage of gross receipts. For the first year of business, a firm is required to obtain a business license within 75 days of operation. The business license tax is based on the previous year's gross receipts (except in the case of new businesses, which must estimate their receipts until they have been in business a full calendar year). All licenses that are paid based on estimates are subject to adjustment when the actual receipts are known. Effective in 2001, the due date for filing and renewal of business licenses is March 1. A comparison of selected BPOL rates for Arlington and neighboring jurisdictions can be found at the end of this section.
For the FY 2021 budget, BPOL revenues are anticipated to decrease nine percent as result of the COVID-19 outbreak.
FY 2019Actual
FY 2020Adopted
FY 2021Adopted
% Change '20 to '21
BPOL Taxes $71,921,455 $71,400,000 $65,380,000 -8%Penalty & Interest 365,756 420,000 420,000 -Tax Refunds - BPOL (2,373,344) (2,800,000) (2,800,000) -Total $69,913,867 $69,020,000 $63,000,000 -9%
$59.0 $60.2
$63.8 $63.0
$69.9 $69.0
$63.0
$50.0
$55.0
$60.0
$65.0
$70.0
$75.0
$80.0
FY 2015 FY 2016 FY 2017 FY 2018 FY 2019 FY 2020Adopted
FY 2021Adopted
$ M
illio
ns
Business, Professional, and Occupational License Tax
85

REVENUES
LOCAL SALES TAX
(State Code Section §58.1-605 & 606 / County Code Section §27-6)
In Arlington, the total non-food sales tax is currently six percent, of which one percent is a local option tax that is returned to localities by the Commonwealth and supports General Fund expenditures. The sales tax rate on food is currently 2.5 percent, of which one percent is remitted to localities. Food items are defined under the Food Stamp Act of 1977 (7 U.S.C. § 2012) to be food for home consumption by humans. This classification includes most grocery food items and cold prepared foods. Excluded from the definition of food are alcoholic beverages, tobacco, and prepared hot foods sold for immediate consumption. FY 2021 local sales tax revenue is anticipated to decrease four percent compared to the FY 2020 adopted budget, as a result of the COVID-19 outbreak.
FY 2019Actual
FY 2020Adopted
FY 2021Adopted
% Change '20 to '21
Sales Tax $44,047,335 $44,700,000 $43,127,695 -4%
TRANSIENT OCCUPANCY TAX (TOT)
(State Code Section §58.1-3819, 3822 & 3833.3B / County Code Section §40, et al)
A five percent local tax is levied by Arlington on the amount paid for hotel and motel rooms. The FY 2021 TOT projections reflect occupancy rates and room rates and are projected to decrease substantially from FY 2020.
In March 2016, the General Assembly voted to allow Arlington County to impose an additional transient occupancy tax of 0.25 percent to be designated and spent for the purpose of promoting tourism and business travel in the County. The County Board adopted this additional TOT in May 2016. The revenue from this increment of TOT is deposited into a separate Travel and Tourism Fund; thus, there is no General Fund impact. In the 2020 legislative session, there was a bill passed and signed by the Governor to extend the sunset for this increment of the tax permanently.
FY 2019Actual
FY 2020Adopted
FY 2021Adopted
% Change '20 to '21
Transient Occupancy Tax $24,623,589 $26,000,000 $19,257,639 -26%
86

REVENUES
MEALS TAX
(State Code Section §58.1-3833 & 3840 / County Code Section §65, et al)
The restaurant meals tax was enacted effective June 1, 1991. The tax of four percent is charged on most prepared foods offered for sale. The tax is in addition to the six percent sales tax. Meals taxes have been common in most Virginia cities and a number of Virginia counties for many years. Airline catering services are assessed at a rate of two percent. In FY 2021, meals tax revenue is expected to decrease 10 percent compared to the FY 2020 adopted levels.
FY 2019Actual
FY 2020Adopted
FY 2021Adopted
% Change '20 to '21
Meals Tax $40,168,158 $40,900,000 $36,772,563 -10%
OTHER LOCAL TAXES
The chart below lists other sources of local taxes.
FY 2019Actual
FY 2020Adopted
FY 2021Adopted
% Change '20 to '21
Car Rental $6,188,708 $6,300,000 $4,342,881 -31%Bank Stock 4,125,274 3,700,000 4,250,000 15%Recordation 5,750,294 5,500,000 4,200,000 -24%Cigarette 2,115,530 2,050,000 1,900,000 -7%Utility 16,462,272 16,152,000 17,200,000 6%Short-Term Rental 57,437 50,000 55,000 10%Wills & Adminstration 58,682 60,000 60,000 -Consumption 788,931 800,000 800,000 -Communication 6,460,606 6,300,000 6,100,000 -3%Total $42,007,734 $40,912,000 $38,907,881 -5%
Car Rental Tax
(State Code Section §58.1-2402)
The local car rental tax is collected by the State and remitted to localities where the rental transaction occurred. Arlington local car rental tax is four percent, which is in addition to the State’s tax. In 2005, the State General Assembly increased the State tax portion from four percent to six percent. The revenue increase from the additional two percent tax increase was dedicated to the Virginia Public Building Authority for the Statewide Agencies Radio System. FY 2021 car rental tax revenue is expected to decrease 31 percent over FY 2020 adopted levels.
Bank Stock Tax
(State Code Section §58.1-1208 - 1211 / County Code Section §28, et al)
The bank stock tax is a franchise tax on the net capital gains of banks and trust companies. The tax is assessed at a rate of $0.80 per $100 of capital. FY 2021 bank stock tax total revenue is expected to increase by 15 percent based on recent actual receipts.
87

REVENUES
Recordation Tax
(State Code Section §58.1-3800 / County Code Section §27-1)
The local recordation tax is assessed at the rate of $0.0833 per $100 of value for all transactions including the recording of deeds, deeds of trust, mortgages, leases, contracts, and agreements admitted to record by the Circuit Court Clerk's Office. In Virginia, localities can charge up to one third of the State rate. Recordation tax revenues fluctuate due to the volume of home sales and mortgage refinancing as a result of lower or higher interest rates and other real estate market conditions.
The State increased recordation tax from $0.10 to $0.25 per $100 effective September 1, 2004. With the State’s legislation change, Arlington’s locally imposed recordation tax increased $0.033 to $0.0833 per $100 of transaction value. FY 2021 recordation tax revenue is expected to decrease by 24 percent over FY 2020 adopted revenue.
Cigarette Tax
(State Code Section §58.1-3831 / County Code Section §39, et al)
The local cigarette tax on every pack of 20 cigarettes sold in Arlington County is $0.30. The State increased cigarette tax from $0.025 to $0.20 per pack effective September 1, 2004, and to $0.30 per pack effective July 1, 2005.
In July 2004, the Arlington County Board adopted an ordinance increasing the local cigarette tax commensurate with the State’s rate. Beginning July 1, 2005 (FY 2006), the rate was increased to $0.30 per package of 20 cigarettes. FY 2021 revenues are anticipated to decrease seven percent based on a continued downward trend.
Commercial and Residential Utility Tax
(State Code Section §58.1-3814 / County Code Section §63, et al)
Arlington charges a utility tax on commercial users of electricity and natural gas. This tax is based on kilowatt hours (kWh) for electricity and hundred cubic feet (CCF) for natural gas delivered monthly to commercial consumers. The state froze utility tax rates in 2002 to allow supply companies to convert locality taxation from a percentage of cost to a tax rate per unit of utility consumed. This cap was lifted in January 2004, allowing the County flexibility on this local tax revenue.
The current rates for commercial and industrial consumers are $0.00681 /kWh for electricity and $0.06848/CCF for natural gas. Rates were last increased in FY 2019. At these rates, the commercial utility tax is projected to generate $11.2 million in FY 2021.
A residential utility tax was imposed on consumers of electricity and natural gas in FY 2008. The tax on residential consumers is capped at $3.00 per month for each utility. In addition, the first 400 kWh of electricity and the first 20 CCF of natural gas have been excluded from taxation.
The current tax rate for residential consumers for electricity is $0.0111 /kWh for electricity and $1.0380 /CCF for natural gas, effectively charging all consumers the maximum $3 per month per utility. At these rates, the total revenue projected from the residential utility tax in FY 2021 is $6 million.
88

REVENUES
Short-term Rental Tax
(State Code Section §58.1-3510 / County Code Section §64, et al)
A person is engaged in the short-term rental business if no less than 80 percent of the gross rental receipts of such business in any year arise from transactions involving rental periods between 31 and 92 consecutive days, including all extensions and renewals to the same person or a person affiliated with the lessee. The rate of the tax is one percent on the gross receipts of such business. Total revenues in FY 2021 are expected to increase based on trends in recent actual receipts.
Wills and Administration Tax
(State Code Section §58.1-3805 / County Code Section §27-19)
This tax, which is collected by the Circuit Court Clerk’s Office, is imposed on the probate of every will or grant of administration. The tax rate is $0.033 per $100 of estate value. Total revenues in FY 2021 are expected to remain flat based on trends in recent actual receipts.
Consumption Tax
(State Code Section §58.1-2900 & 2904 / County Code Section §63, et al)
The deregulation of electric and gas utilities, enacted during the 1999 and 2000 General Assembly, eliminated the Business, Professional, and Occupational License (BPOL) tax on electric and natural gas companies and created a new tax charged to consumers based on usage. This consumption tax is collected by the utilities and remitted back to localities. Consumption tax revenue is projected to be flat in FY 2021.
Communications Tax
(State Code Section §58.1-651)
Effective January 1, 2007, the State adopted a communications sales tax that is imposed on customers of communication services at the rate of five percent of the sales price of the service. This tax was adopted as part of the 2006 House Bill 568 (Acts of Assembly 2006, Chapter 780) and replaces many of the prior State and local communications taxes and fees with a centrally-administered communications sales and use tax. Communications tax revenue is projected to decrease three percent in FY 2021.
Repeal of the Partial Exemption for Certain Rehabilitated Residential Real Estate
Along with the FY 2021 Budget, the County Board adopted the repeal of the Partial Exemption for Certain Rehabilitated Residential Real Estate. Repeal of the ordinance does not impact the FY 2021 Budget. It is estimated that the collection of otherwise foregone revenue will not be realized until FY 2022 or FY 2023. This is due to the normal delay which occurs from the filing of the application, construction and rehabilitation, and the ultimate assessment and billing for the approved exemption.
89

REVENUES
Revenue Sharing with Arlington Public Schools (APS)
The County and Schools entered into a cooperative effort in FY 2001 to design a revenue sharing agreement as a way to fairly and appropriately apportion revenue for budget development purposes. Over the succeeding years, the structure and revenue sharing calculations were adjusted to reflect the changing economic and resource demands of both the County and Schools. Since FY 2002, various adjustments were made for enrollment, funding retiree healthcare (OPEB), maintenance capital, affordable housing, and other County and School priority initiatives.
From FY 2002 to FY 2012, the structure of the revenue sharing was modified for various reasons as noted above. By FY 2012, over $58 million was excluded from the local tax revenue calculation adding confusion and complexity to the annual calculation of revenue sharing. Beginning in FY 2013, the base calculation was reset to include all local tax revenue. Increasing the base amount led to an adjustment – not in total of funds shared – but in the percentage shared. The following illustrates the adjustment in FY 2013 to local tax revenues between the County and Schools.
Prior to Adjustment
Revised Revenue Sharing %
FY 2013 Tax Revenue $873 million $873 million Tax Revenue Exclusions ($58 million) $0 Shared Tax Revenues $815 million $873 million Revenue Share % 49.1% 45.8% Revenue to Schools $400 million $400 million
The table below shows the percentage of local tax revenue that has been allocated to the County and the Schools since FY 2002, the first year that a revenue sharing agreement was in effect.
Fiscal Year County’s Share School’s Share 2002 52.2% 47.8% 2003 51.4% 48.6% 2004 51.4% 48.6% 2005 51.4% 48.6% 2006 51.9% 48.1% 2007 52.3% 47.7% 2008 52.2% 47.8% 2009 51.9% 48.1% 2010 50.9% 49.1% 2011 50.9% 49.1% 2012 53.9% 46.1% 2013 54.2% 45.8% 2014 54.4% 45.6% 2015 54.1% 45.9% 2016 53.5% 46.5% 2017 53.4% 46.6% 2018 53.4% 46.6% 2019 53.4% 46.6% 2020 53.0% 47.0% 2021 53.0% 47.0%
90

REVENUES
During 2014, the County Board and School Board worked collaboratively to structure revenue sharing principles that provide a framework for sharing local tax revenues in a predictable and flexible way. In January 2015, both Boards adopted principles that emphasize the community priority of high quality education and utilizing community resources in a balanced and fiscally responsible way. The agreement outlines four main principles:
1) Revenue sharing provides a transparent, predictable, and flexible framework for developingthe County and School budgets.
2) The planning for the next budget year will begin with the revenue sharing allocation adoptedfor the current fiscal year and that any critical needs identified by the Schools, includingenrollment growth, will be considered as a top funding priority.
3) One-time funding (shortfalls or gains) will be shared between the County and Schools basedon the current year’s allocated tax revenue percentage. One-time funds from bond premiumswill be allocated to either the County or Schools based on the bonds issued and will be usedsolely for capital projects.
4) Funds available from the close-out of the fiscal year will be used to contribute to the County’srequired operating reserve based on the revenue sharing percentage for that fiscal year andAPS will also contribute to a limited joint infrastructure reserve fund to meet the infrastructureneeds with school expansions and new school construction.
These principles will be the basis for budget development and will be a starting point for collaborative funding discussions as both entities begin to develop their proposed budgets for their respective board.
The adopted FY 2021 transfer is $524,631,091. This is a 0.4 percent increase over the FY 2020 transfer.
91

REVENUES
LICENSES, PERMITS, AND FEES
Revenues in this category are levied to offset the cost of licensing certain trades, inspecting various types of construction, and providing other services.
FY 2019Actual
FY 2020Adopted
FY 2021Adopted
% Change '20 to '21
Motor Vehicle License Fees $4,615,769 $5,000,000 $5,000,000 -Highway Permits 2,789,558 1,752,840 1,937,300 11%Site Plan Fees 1,613,149 1,987,263 2,353,289 18%Right-of-Way Fees 926,679 1,200,000 1,200,000 -Other 2,205,425 2,442,700 2,625,104 7%Total $12,150,580 $12,382,803 $13,115,693 6%
Motor Vehicle License Fees
The annual motor vehicle license fee increased $8 to $33 per vehicle in FY 2011. A portion of the funds generated from this incremental rate increase are dedicated to pedestrian and bike safety PAYG projects. Based on trends in actual recent receipts, motor vehicle license fee revenue is expected to be flat in FY 2021 at $5.0 million.
Highway Permits
Highway permits are charged to contractors and utilities for right-of-way on County streets when necessary for construction projects, underground utilities repairs, and other purposes. For FY 2021, this revenue stream is expected to increase by 11 percent over the FY 2020 adopted budget levels.
Site Plan Fees
Site plan fee revenue is anticipated to be $2.4 million in FY 2021, an 18 percent increase over the FY 2020 adopted budget. Projected growth is primarily due to site plan fee revenue associated with a short-term increase in the new development pipeline expected to coincide with the Amazon headquarters development.
Right-of-Way Fees
Revenues from right-of-way fees are based on the FY 2020 rate imposed by the State at $1.15 line/month. This fee covers the use of highway and street right-of-way by certified providers of telecommunication services and is charged to the ultimate end user. For FY 2021, revenues are projected to be flat over FY 2020.
Other
Other license, permit, and fee revenue comes from rezoning permits, fire system fees, child care permits, and other miscellaneous use permits and fees. In FY 2021, “other” revenues are forecast to increase seven percent driven primarily by the new residential alarm registration fees.
92

REVENUES
FINES, INTEREST, RENTS
These revenues include fines, interest, building rents, lease agreements, paid parking, rental, and sale of surplus properties.
FY 2019Actual
FY 2020Adopted
FY 2021Adopted
% Change '20 to '21
Fines/Tickets $7,637,316 $7,155,924 $6,862,872 -4%Interest 23,387,649 7,700,000 6,000,000 -22%Rent & Other Revenue 8,359,116 7,679,342 7,518,679 -2%Paid Parking 1,119,883 1,128,000 1,133,040 -Total $40,503,964 $23,663,266 $21,514,591 -9%
Fines/Tickets
This category is comprised of traffic moving violations, parking tickets, photo red light fines, arrest fees, false alarm fines, and civil penalties. For FY 2021, this category is projected to decrease four percent primarily due to lower projections for traffic related fines.
Interest
Interest is earned on County General Fund and bond fund balances, which are invested on a short-term basis until needed to pay for County expenditures. Interest earned varies due to changing balances and interest rates.
Rent & Other Revenues
Rentals, sales of surplus property, and lease agreements – including the ground lease rent for land under 2100, 2110, and 2150 Clarendon Boulevard – are included in this revenue category. The County receives payments from JBG Smith (formerly Vornado) for this land and shares in the net profit on the buildings’ operations. In FY 2021, revenues are expected to decrease primarily due to the end of a number of lease agreements in the previous fiscal year.
Paid Parking
This revenue is generated by the monthly parking charges in various government buildings. FY 2021 revenue is projected to fairly flat over FY 2020 adopted levels.
93
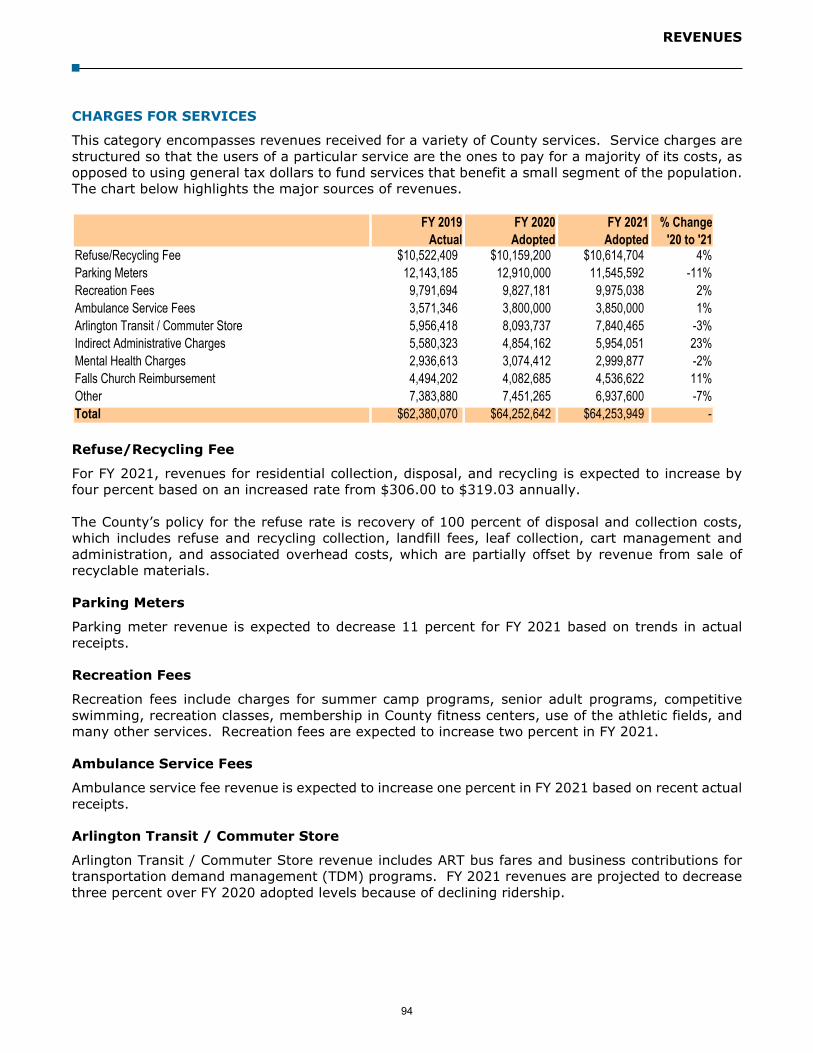
REVENUES
CHARGES FOR SERVICES
This category encompasses revenues received for a variety of County services. Service charges are structured so that the users of a particular service are the ones to pay for a majority of its costs, as opposed to using general tax dollars to fund services that benefit a small segment of the population. The chart below highlights the major sources of revenues.
FY 2019Actual
FY 2020Adopted
FY 2021Adopted
% Change '20 to '21
Refuse/Recycling Fee $10,522,409 $10,159,200 $10,614,704 4%Parking Meters 12,143,185 12,910,000 11,545,592 -11%Recreation Fees 9,791,694 9,827,181 9,975,038 2%Ambulance Service Fees 3,571,346 3,800,000 3,850,000 1%Arlington Transit / Commuter Store 5,956,418 8,093,737 7,840,465 -3%Indirect Administrative Charges 5,580,323 4,854,162 5,954,051 23%Mental Health Charges 2,936,613 3,074,412 2,999,877 -2%Falls Church Reimbursement 4,494,202 4,082,685 4,536,622 11%Other 7,383,880 7,451,265 6,937,600 -7%Total $62,380,070 $64,252,642 $64,253,949 -
Refuse/Recycling Fee
For FY 2021, revenues for residential collection, disposal, and recycling is expected to increase by four percent based on an increased rate from $306.00 to $319.03 annually.
The County’s policy for the refuse rate is recovery of 100 percent of disposal and collection costs, which includes refuse and recycling collection, landfill fees, leaf collection, cart management and administration, and associated overhead costs, which are partially offset by revenue from sale of recyclable materials.
Parking Meters
Parking meter revenue is expected to decrease 11 percent for FY 2021 based on trends in actual receipts.
Recreation Fees
Recreation fees include charges for summer camp programs, senior adult programs, competitive swimming, recreation classes, membership in County fitness centers, use of the athletic fields, and many other services. Recreation fees are expected to increase two percent in FY 2021.
Ambulance Service Fees
Ambulance service fee revenue is expected to increase one percent in FY 2021 based on recent actual receipts.
Arlington Transit / Commuter Store
Arlington Transit / Commuter Store revenue includes ART bus fares and business contributions for transportation demand management (TDM) programs. FY 2021 revenues are projected to decrease three percent over FY 2020 adopted levels because of declining ridership.
94

REVENUES
Indirect Administrative Charges
Indirect administrative charges are reimbursements from the Utilities Fund, the CPHD Development Fund, and the Stormwater Fund for administrative functions (e.g. payroll, technology help desk, accounts payable) performed by County staff on behalf of the fund.
Mental Health Service Charges
The Department of Human Services provides counseling, case management, and psychiatric services to individuals needing mental health, substance abuse, and intellectual/developmental disability support services. Fees for services are paid by individuals receiving services or Medicaid, if applicable. In FY 2021, mental health service charges are decreasing two percent based on recent actuals.
City of Falls Church Reimbursement Revenue
Arlington County provides a number of services to residents of the City of Falls Church (the City), including fire, judicial, emergency communication services, and jailing of prisoners. Fire Station No. 6 is a joint-use facility, which is staffed by Arlington County firefighters but owned by the City. The County manages the facility maintenance and capital improvements at the station. The City reimburses the County for a portion of fire/EMS expenses and the capital expenses.
Under the terms of the County’s judicial and public safety services agreement with the City, the City uses the County’s alcohol safety program, Circuit Court, General District Court, Juvenile and Domestic Relations Court, Argus House, and community corrections. The County generally charges the City based on the City’s proportionate use of these services. The County’s Commonwealth Attorney also prosecutes cases on behalf of the City. Finally, the County answers all emergency 911 calls from the City. The County’s Emergency Communications Center staff dispatches fire and ambulance crews for emergencies in the City. Emergency 911 calls necessitating police-related services are routed back to the City’s police department.
In addition, the City of Falls Church utilizes the Arlington County detention facility to house prisoners and is charged a daily prisoner rate.
The table below provides greater detail on revenue from Falls Church. Under the terms of the County’s agreements with the City, the budgeted revenue from Falls Church is based on the upcoming fiscal year’s budget with an adjustment—either upwards or downwards—to account for the differences between the City’s share of the County’s budgeted and actual costs from the most recently-ended fiscal year. This reconciliation process explains the substantial swings for some departments’ budgeted revenue from one year to the next.
95
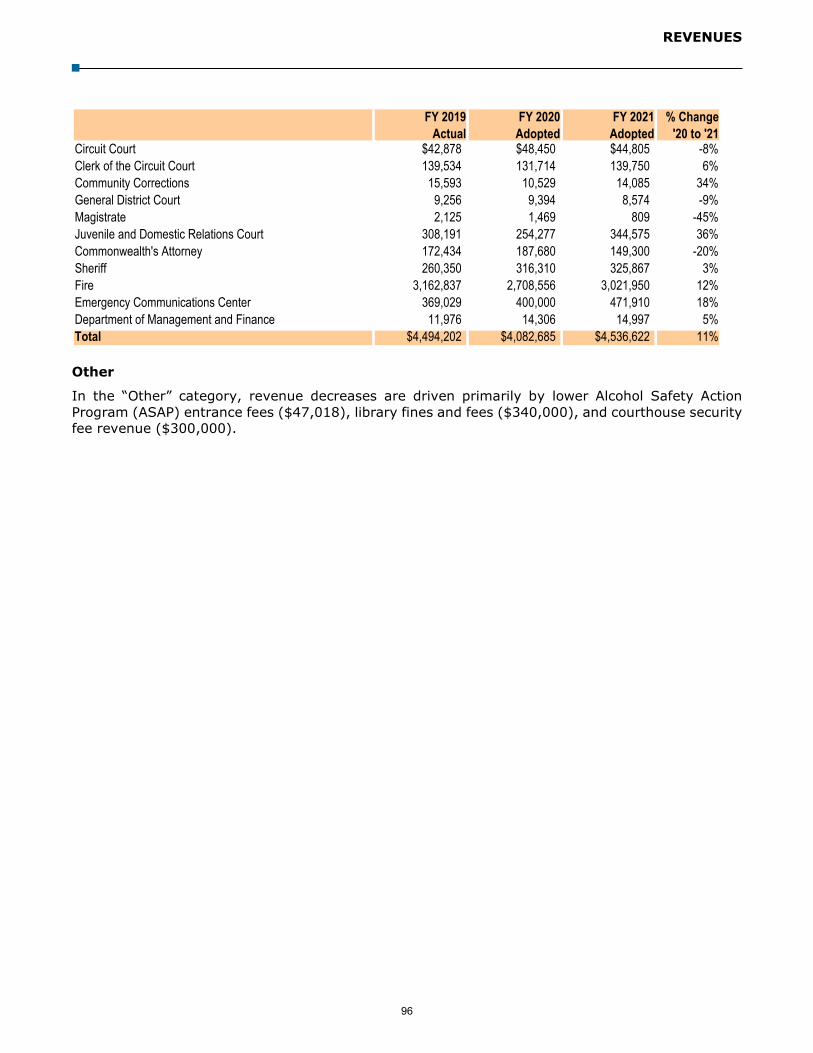
REVENUES
FY 2019Actual
FY 2020Adopted
FY 2021Adopted
% Change '20 to '21
Circuit Court $42,878 $48,450 $44,805 -8%Clerk of the Circuit Court 139,534 131,714 139,750 6%Community Corrections 15,593 10,529 14,085 34%General District Court 9,256 9,394 8,574 -9%Magistrate 2,125 1,469 809 -45%Juvenile and Domestic Relations Court 308,191 254,277 344,575 36%Commonwealth's Attorney 172,434 187,680 149,300 -20%Sheriff 260,350 316,310 325,867 3%Fire 3,162,837 2,708,556 3,021,950 12%Emergency Communications Center 369,029 400,000 471,910 18%Department of Management and Finance 11,976 14,306 14,997 5%Total $4,494,202 $4,082,685 $4,536,622 11%
Other
In the “Other” category, revenue decreases are driven primarily by lower Alcohol Safety Action Program (ASAP) entrance fees ($47,018), library fines and fees ($340,000), and courthouse security fee revenue ($300,000).
96

REVENUES
REVENUE FROM THE COMMONWEALTH
Arlington receives funds from the Commonwealth of Virginia for a variety of State-mandated and supported functions and services. The County also receives a portion of some revenues collected by the State. The chart below highlights the total amount received from the Commonwealth of Virginia and details the sources that comprise the total.
FY 2019Actual
FY 2020Adopted
FY 2021Adopted
% Change'20 to '21
Highway Aid $19,720,958 $20,220,300 $20,774,545 3%Law Enforcement Aid 6,582,500 6,815,000 6,839,220 -Health Reimbursement 3,366,924 3,320,144 3,382,191 2%Social Services 3,962,860 4,420,441 4,113,788 -7%Mental Health/ Intellectual Disability 9,646,166 8,256,661 9,273,556 12%Sheriff / Detention 7,916,976 7,992,330 8,349,245 4%Prisoner Expense Reimbursement 834,266 1,250,000 1,250,000 -Commuter Assistance 6,488,277 5,762,235 6,778,473 18%Comprehensive Services Act 923,569 1,715,082 1,784,308 4%Other 16,992,188 16,244,085 16,600,683 2%Total $76,434,684 $75,996,278 $79,146,009 4%
Highway Aid
The County receives Highway Aid as a result of Arlington's decision not to join the Commonwealth's secondary road system in 1932. The County assumed maintenance responsibilities for the secondary roads in Arlington and receives State highway aid for that function. These funds are derived primarily from the Commonwealth's collection of new car sales and gasoline taxes, and other vehicle-related fees and taxes. For the FY 2021 budget, highway aid is projected to increase three percent based on an anticipated increase in the reimbursement rate from the state.
Law Enforcement Aid
Law Enforcement Aid is provided to the County to partially fund salaries of law enforcement officers and to provide funds for their training in order to comply with the Code of Virginia Section 9.1-165. Arlington receives a percentage of law enforcement aid (“HB599”) funding each year based on population, crime rates, and social service rates. For the FY 2021 budget, the County is projecting law enforcement aid at $6.8 million with a slight increase based on actual reimbursements received.
Health Reimbursement
These funds are primarily from the Virginia Department of Health and allow Arlington to operate as one of two locally administered public health clinics in the Commonwealth. The County works with the community and regional organizations to prepare for public health emergencies, to control and prevent the spread of infectious diseases in the community, and to prevent disease and promote optimum health for at-risk populations.
Social Services
Social service funds from the State are used to provide services to qualifying families, adults, and children. These funds help support a variety of services such as adoption, foster care, public assistance, and senior assistance. The state’s formula for funding is based on variables including population, incident rates, and state program reviews.
97
REVENUES
Mental Health / Intellectual Disability
The Commonwealth provides funding to support community-based mental health and support services, which includes residential services, case and care management services, individual therapy, specialized psychological testing, and family support and education.
Sheriff / Detention Center
The Compensation Board of the Commonwealth provides annual support toward the total cost of operations of the Sheriff’s Office and the Arlington County Detention Facility.
Prisoner Expense Reimbursement
The Commonwealth reimburses localities for a portion of the cost to house inmates in local correctional facilities. The County receives a per diem amount ($4/day for inmates held on misdemeanor convictions or felony sentences under one year; $12/day for inmates held for felony convictions exceeding a one-year sentence) for each inmate held.
Commuter Assistance
Commuter Assistance funding provided by the State is used to support local programs and efforts such as ridesharing and telecommuting programs, transit friendly site planning, on-site transit ticket sales, transportation demand management planning, and Clean Air Act compliance.
Comprehensive Services Act (CSA)
The Comprehensive Services Act for At-Risk Youth and Families (CSA) provides a pool of state funds to purchase services for at-risk youth and their families. The state funds, combined with local community funds, are managed by our Department of Human Services in collaboration with other County agencies to plan and oversee services to youth.
Other
The “Other” state revenue category includes transit aid, traffic signal reimbursements, the County’s share of the grantor’s tax, which is imposed on sellers of real property, and Compensation Board funding for support of elected officials who perform State-mandated and local functions, such as the Circuit Court Clerk, Commissioner of the Revenue, Treasurer, Sheriff, and Commonwealth's Attorney. Compensation Board revenue is expected to increase based on actual reimbursements received.
98

REVENUES
REVENUE FROM THE FEDERAL GOVERNMENT
The federal government provides funding for employment assistance, housing programs, drug enforcement, aid to the elderly, and other programs.
FY 2019Actual
FY 2020Adopted
FY 2021Adopted
% Change '20 to '21
WIA / JTPA $591,199 $615,608 $566,390 -8%Mental Health 1,578,374 1,683,009 1,752,270 4%Social Services 10,832,499 10,142,434 10,756,886 6%Substance Abuse 922,588 761,541 761,541 -Other 3,724,373 2,864,771 2,308,533 -19%Total $17,649,033 $16,067,363 $16,145,620 -
WIA / JTPA
The Workforce Investment Act (WIA)/Job Training Partnership Act (JTPA) funding is based on unemployment data, poverty levels, and the current year’s allocation by the state.
Mental Health
Federal pass through revenue (i.e. federal grants to the state) from the Department of Mental Health, Mental Retardation, and Substance Abuse Services. Programs funded from the agency provide residential treatment for the seriously mentally ill, early intervention, and emergency response to mental health crises as well as the People Assisting the Homeless (PATH) Program.
Social Services
Social services revenue represents the largest single category of General Fund federal funds—accounting for approximately $10.8 million—and is passed through the State’s budget to Arlington County. Since some of the federal social service programs are 100 percent reimbursable, revenue will change with changes in caseloads.
Substance Abuse
Federal substance abuse funds are used to prevent adverse social, legal, and medical conditions in individuals resulting from alcohol and drug dependency. Outpatient programs provide assessment, individual and group therapy, alcohol and drug education courses, relapse prevention services, psychological evaluations, urinalysis, and referral to community-based support groups. Residential programs provide individuals with initial assessments, referrals to appropriate programs, support during and after treatment, and connecting to other community resources. In FY 2021, substance abuse funding is flat.
Other
The remaining federal revenue includes grant funding through the Older Americans Act (OAA), emergency management grants, prisoner reimbursements, and other miscellaneous grant and reimbursement funding. The 19 percent decline in other federal funding is driven primarily by a decrease in miscellaneous federal grants ($151,979) and federal emergency management grants ($437,643).
99

REVENUES
MISCELLANEOUS REVENUE
These include revenue sources that do not fall under any other category and include one-time or pass through funds. Included in these payments is a decrease in revenue from the sale of land and buildings from FY 2020 adopted levels which included an anticipated $4.0 million for the land swap between Virginia Hospital Center and the County. The “Other” category includes revenue to the Department of Human Services for a lease agreement with Cherrydale Nursing Center, the Arlington Employment Center’s One Stop Comprehensive Services Team, and loan repayments from Signature Theater.
FY 2019Actual
FY 2020Adopted
FY 2021Adopted
% Change'20 to '21
Sale of Land and Buildings $2,006,039 $4,015,000 $15,000 -100%Affordable Housing Investment Fund 9,382,935 - - -Gifts & Donations - 5,000 5,000 -Treasurer's Returned Checks 31,203 30,000 30,000 -Other 2,020,434 1,728,008 1,805,329 4%Total $13,440,611 $5,778,008 $1,855,329 -68%
TRANSFERS FROM OTHER FUNDS & PRIOR YEAR FUND BALANCE
Transfers to the General Fund include the Automotive Fund transfer to cover its share of insurance costs, funding for the administration of the business improvement districts (Rosslyn, Crystal City, and Ballston), and funding from various Trust and Agency accounts. Furthermore, there is a budgeted transfer of $2.4 million from the Industrial Development Authority (IDA) to the County from the collection of user fees in the Ballston skating facility to pay the debt on the taxable revenue bonds that the County issued in CY 2006.
$68.4 $71.8 $75.1 $76.3 $76.4 $76.0 $79.1
$16.8 $17.0 $18.3 $16.6 $17.6 $16.1 $16.1
$-
$10.0
$20.0
$30.0
$40.0
$50.0
$60.0
$70.0
$80.0
$90.0
FY 2015 FY 2016 FY 2017 FY 2018 FY 2019 FY 2020Adopted
FY 2021Adopted
State and Federal Government Revenue(in millions)
State Federal
100

REVENUES
Funds unspent (under-expenditures or increased revenues) from previous fiscal years have been used to support one-time expenses in subsequent year’s budgets. The FY 2021 adopted budget includes $22,239,239 in carryover funds, funded by a combination of additional revenue and/or expense savings identified from the current and previous fiscal years.
FY 2019Actual
FY 2020Adopted
FY 2021Adopted
% Change '20 to '21
Transfers $5,570,078 $5,375,913 $10,937,655 103%Prior Year Adjusted Balance 93,057,070 41,108,294 22,239,239 -46%Total $98,627,148 $46,484,207 $33,176,894 -29%
TOTAL GENERAL FUND REVENUES
Below is a summary of the revenue categories previously described as well as total revenues for the General Fund in Fiscal Years 2019 (actual), 2020 (adopted), and 2021 (adopted).
General Fund RevenuesFY 2019
ActualFY 2020
AdoptedFY 2021
Adopted% Change
'20 to '21Real Estate Tax $745,871,153 $771,036,860 $795,118,440 3%Personal Property Tax 117,994,659 119,052,147 120,052,147 1%BPOL Tax 69,913,867 69,020,000 63,000,000 -9%Local Sales Tax 44,047,335 44,700,000 43,127,695 -4%Recordation Tax 5,750,294 5,500,000 4,200,000 -24%Transient Occupancy Tax 24,623,589 26,000,000 19,257,639 -26%Cigarette Tax 2,115,530 2,050,000 1,900,000 -7%Meals Tax 40,168,158 40,900,000 36,772,563 -10%Utility Tax 16,462,272 16,152,000 17,200,000 6%Communications Tax 6,460,606 6,300,000 6,100,000 -3%Other Taxes 11,219,032 10,910,000 9,507,881 -13%Total Local Taxes 1,084,626,495 1,111,621,007 1,116,236,365 -
Licenses, Permits & Fees 12,150,580 12,382,803 13,115,693 6%Fines, Interest, Rents 40,503,964 23,663,266 21,514,591 -9%Charges for Services 62,380,070 64,252,642 64,253,949 -Commonwealth 76,434,684 75,996,278 79,146,009 4%Federal Government 17,649,033 16,067,363 16,145,620 -Miscellaneous Revenue 13,440,611 5,778,008 1,855,329 -68%Transfer 5,570,078 5,375,913 10,937,655 103%Total Non-tax Revenue 228,129,020 203,516,273 206,968,846 2%
TOTAL (excluding prior year balance) 1,312,755,515 1,315,137,280 1,323,205,211 1%
Prior Year Adjusted Balance 93,057,070 41,108,294 22,239,239 -46%Total (including Prior Year Balance) $1,405,812,585 $1,356,245,574 $1,345,444,450 -1%
101

REVENUES
BALLSTON QUARTER TAX INCREMENT FINANCING FUND (Fund 201)
In July 2016, the County Board approved the Ballston Quarter Community Development Authority (CDA), the first CDA to be created in Arlington. Creation of the CDA gives the County a financing mechanism to fund certain public infrastructure costs associated with the Ballston Quarter public-private redevelopment. To fund the bonds issued for public infrastructure improvements, the Ballston Quarter Development and Financing Agreement created the Ballston Quarter Tax Increment Financing (TIF) district, which dedicates funding in an amount up to 65 percent of the incremental real property, sales and use, and meals tax revenues generated within the TIF district boundaries with a base year of 2015. The baseline CY 2015 TIF values are: Real estate tax of $158,050,200; sales tax of $55,241,900; and meals of $14,366,400.
The FY 2021 adopted budget reflects the CY 2020 assessed values in the TIF district. Because TIF revenues are based on the incremental growth over the base year, revenues grow more quickly than assessments. FY 2021 revenue is expected to increase due to the opening of new businesses in the TIF district. Funds will be transferred to the trustee for the Ballston Quarter CDA to fund the project stabilization fund as part of the Ballston Quarter CDA Series 2016A and Series 2016 B bond issuance.
FY 2019Actual
FY 2020Adopted
FY 2021Adopted
% Change'20 to '21
Real Estate Tax $410,060 $1,168,740 $1,811,540 55%Local Sales Tax - 20,000 - -100%Meals Tax - 480,000 206,924 -57%Total $410,060 $1,668,740 $2,018,464 21%
TRAVEL AND TOURISM PROMOTION FUND (Fund 202)
Arlington County’s enabling legislation to levy an additional Transient Occupancy Tax add-on (0.25 percent) to support this fund was reinstated by the Virginia General Assembly for the FY 2017 budget year with a sunset effective June 30, 2018. In the 2020 legislative session, there was a bill passed and signed by the Governor to extend the sunset for this increment of the tax permanently. Funds are used to market and promote tourism in Arlington County.
FY 2019Actual
FY 2020Adopted
FY 2021Adopted
% Change'20 to '21
Transient Occupancy Tax $1,231,590 $1,300,000 $962,882 -26%Transfer In 246,700 246,700 246,700 -Total $1,478,290 $1,546,700 $1,209,582 -22%
BALLSTON SPECIAL ASSESSMENT DISTRICT FUND (Fund 203)
In December 2010, the Arlington County Board established a service district in the Ballston area. The purpose of the district is to provide supplemental services to those already provided by the County government. In CY 2011, an additional real estate tax levy on commercially zoned properties was approved to fund additional services and programs within the district’s boundaries. A non-profit organization, representing owners and tenants of properties in the district, was established to manage the additional services and related activities in the district.
The CY 2020 adopted real estate tax rate is $0.045 for each $100 of assessed value, no changefrom the CY 2019 rate.
BID expenditures and revenues are increasing by five percent due to higher assessments.
102

REVENUES
FY 2019Actual
FY 2020Adopted
FY 2021Adopted
% Change'20 to '21
Service District Revenue $1,658,339 $1,497,516 $1,569,935 5%
ROSSLYN SPECIAL ASSESSMENT DISTRICT FUND (Fund 204)
In December 2002, the Arlington County Board established a service district in the downtown Rosslyn area. The purpose of the district is to provide supplemental services to those already provided by the County government. Each year an additional real estate tax levy is approved to fund the additional services and programs within the district’s boundaries. The Rosslyn Business Improvement Corporation, an organization whose board of directors and committee membership includes owners and tenants of properties in the district as well as County and neighborhood representatives, submits a work program and budget for the Arlington County Board’s consideration.
The CY 2020 adopted real estate tax rate is $0.078 for each $100 of assessed value, no changefrom the CY 2019 rate.
BID expenditures and revenues increase by three percent due to higher assessments.
FY 2019Actual
FY 2020Adopted
FY 2021Adopted
% Change'20 to '21
Service District Revenue $3,637,271 $3,938,338 $4,053,393 3%
CRYSTAL CITY SPECIAL ASSESSMENT DISTRICT FUND (Fund 205)
In April 2006, the Arlington County Board established a service district in the downtown Crystal City area. The purpose of the district is to provide supplemental services to those already provided by the County government. Each year an additional real estate tax levy is approved to fund the additional services and programs within the district’s boundaries. The Crystal City Business Improvement Corporation, an organization whose board of directors and committee membership includes owners and tenants of properties in the district as well as County representatives, submits a work program and budget for Arlington County Board consideration. In September 2019, the County Board passed an ordinance to expand the boundaries of the BID to include an additional 80 parcels from the Pentagon City and Potomac Yard submarkets.
The CY 2020 adopted real estate tax rate is $0.043 for each $100 of assessed value, no changefrom the CY 2019 tax rate.
BID expenditures and revenues increase by 71 percent due to higher assessments and thegeographic expansion.
FY 2019Actual
FY 2020Adopted
FY 2021Adopted
% Change'20 to '21
Service District Revenue $2,553,659 $2,763,656 $4,739,568 71%
103

REVENUES
COMMUNITY DEVELOPMENT FUND (Fund 206)
The Community Development Fund is used to address low- and moderate-income housing needs and other community projects. The Community Development Block Grant (CDBG) program was established as a separate special revenue fund in FY 1987 to comply with requirements of the federal Department of Housing and Urban Development (HUD). FY 2021 revenue is expected to increase by nine percent.
FY 2019Actual
FY 2020Adopted
FY 2021Adopted
% Change'20 to '21
CDBG $4,596,784 $1,713,320 $1,910,969 12%Federal Rental Rehab 348,387 1,373,292 1,467,501 7%Transfer in from General Fund 94,981 - - - Miscellaneous Revenue 15,372 - - - Total $5,055,524 $3,086,612 $3,378,470 9%
SECTION 8 HOUSING ASSISTANCE FUND (Fund 208)
This program provides vouchers for housing to eligible Arlington County residents. The federal funds are used for the administrative costs of the program as well as for the rental subsidy payments.
FY 2019Actual
FY 2020Adopted
FY 2021Adopted
% Change'20 to '21
Housing Assistance $16,882,870 $17,510,765 $17,962,831 3%Administrative Fees 1,207,443 1,575,996 1,613,766 2%Interest 5,056 5,000 6,500 30%HOPWA Grant 94,848 95,313 95,313 -Miscellaneous 194,759 20,000 10,000 -50%Total $18,384,976 $19,207,074 $19,688,410 3%
GENERAL CAPITAL PROJECTS FUND (Fund 313)
The General Capital Projects Fund accounts for the capital projects for general government functions, which are financed under the County's Pay-As-You-Go (PAYG) Capital Program. The program areas include local parks and recreation, transportation, community conservation, government facilities, technology, and regional contributions. In the FY 2021 budget, the County’s ongoing funding for PAYG capital projects is $3.8 million and one-time funding is $8.6 million which includes $6.6 million from bond premium. Note that FY 2019 and FY 2020 bond premium is not included in the table below as it will be carried over as fund balance and not received as new FY 2021 revenue.
104

REVENUES
FY 2019Actual
FY 2020Adopted
FY 2021Adopted
% Change'20 to '21
Developer Contributions $3,356,301 - - - Miscellaneous Revenue 1,383,666 - - - Cable TV 1,210,837 - - - State Grant - Misc. 310,275 - - - Federal Revenue - Misc. 2,455,924 - - - Bond Premium 18,396,431 $7,000,000 - -100%Proceeds for Lease Purchase 1,871,651 12,178,410 - -100%Transfer In 5,667,108 23,601,546 $3,832,227 -84%Line of Credit Proceeds 8,585,749 - - - Total $43,237,942 $42,779,956 $3,832,227 -91%
STORMWATER FUND (Fund 321)
Under the Sanitary District Act of 1929 (Chapter 161, Acts of Assembly, as amended), local governments in Virginia are authorized to establish sanitary districts to fund a variety of infrastructure needs, including stormwater drainage. The County established its own sanitary district in 1930 that encompassed the entire jurisdiction.
As part of the FY 2009 budget process (CY 2008), the County Board adopted a sanitary district tax of $0.01 per $100 of assessed value in order to fund stormwater management initiatives. For CY 2010, this tax was increased to $0.013 per $100.
This $0.013 tax is included in the semi-annual real estate bills and, when combined with the adopted CY 2020 base real estate rate of $1.013, brings the total blended real estate rate to $1.026 per $100 of assessed real property value. The anticipated $11.7 million in FY 2021 revenue will help ensure the future sustainability of the County’s aging stormwater infrastructure and compliance with federal and State stormwater management requirements.
FY 2019Actual
FY 2020Adopted
FY 2021Adopted
% Change'20 to '21
Sanitary District Tax $9,747,498 $10,093,595 $10,423,354 3%Fines 18,364 - - -Permit Fees 994,640 1,117,500 1,305,693 17%Misc. State & Federal Grants - - - -
Total $10,760,502 $11,211,095 $11,729,047 5%
TRANSPORTATION CAPITAL FUND (Funds 330 & 331)
In April 2007, the General Assembly passed HB 3202, which authorized northern Virginia localities to impose a tax of up to $0.25 per $100 of assessed real property on properties used or zoned for commercial or industrial purposes in order to fund transportation initiatives. As part of the FY 2009 budget deliberations, the County Board adopted a commercial real estate tax of $0.125 per $100, with revenue to be deposited in the new Transportation Capital Fund. In 2010, the General Assembly capped this tax rate at $0.125 per $100 of assessed real property value. For the FY 2021 adopted budget, revenue for the transportation capital fund is projected at $34.4 million, with the tax rate remaining at $0.125 and commercial property assessments increasing.
105

REVENUES
FY 2019Actual
FY 2020Adopted
FY 2021Adopted
% Change'20 to '21
Commercial Real Estate Tax $25,048,572 $26,419,757 $26,566,401 1%Developer Contributions 2,336,389 - - -NVTA Local Share 8,710,709 7,938,761 7,870,399 -1%NVTA Regional Share 3,192,235 - - -State Aid 8,524,945 - - -State Transportation Grants 401,222 - - -Federal Transportation Grants 699,793 - - -Miscellaneous 868,897 - - -Total $49,782,762 $34,358,518 $34,436,800 -
CRYSTAL CITY, POTOMAC YARD, AND PENTAGON CITY TAX INCREMENT FINANCING FUND (Fund 335)
In October 2010, the Arlington County Board established a tax increment financing area in support of the Crystal City Sector Plan and infrastructure that will benefit Potomac Yard and Pentagon City. Tax increment financing (TIF) is a mechanism used to support development and redevelopment by capturing the projected increase in property tax revenues in the area and investing those funds in improvements located in the designated area. Unlike a special district, it is not an additional or new tax. Rather, it redirects and segregates the increase in property tax revenues that would normally flow to the General Fund so that it can be used for a specified purpose. The amount of the tax increment revenue is determined by setting a baseline assessed value of all property in the area on January 1, 2011. In each subsequent year, the incremental increase in assessed values relative to the base year is determined and a portion of this incremental tax revenue is segregated and deposited to a separate fund.
The adopted CY 2020 base real estate tax rate is $1.013 for each $100 of assessed property value. The FY 2021 adopted budget maintains the increment of the tax allocated to the TIF at 25 percent of the projected tax revenue generated from the incremental assessment growth between January 2011 and January 2020 in the Crystal City TIF area at the adopted CY 2020 tax rate. Total assessed value in the Crystal City TIF district increased by 0.7 percent from CY 2019 to CY 2020. Because TIF revenues are based on the incremental growth over the base year, revenues grow more quickly than assessments.
FY 2019Actual
FY 2020Adopted
FY 2021Adopted
% Change'20 to '21
Real Estate $5,040,366 $5,964,730 $5,759,940 -3%Developer Contributions 500,000 - - -NVTA Regional Share 641,854 - - -State Aid NVTC 31 - - -Federal Grants 187,403 - - -Total $6,369,654 $5,964,730 $5,759,940 -3%
106

REVENUES
COLUMBIA PIKE TAX INCREMENT FINANCING FUND (FUND 336)
In December 2013, the Arlington County Board established a tax increment financing area in support of the Columbia Pike Neighborhoods Area Plan that will benefit affordable housing initiatives and other public services and improvements. Tax increment financing (TIF) is a mechanism used to support development and redevelopment by capturing the projected increase in property tax revenues in the area and investing those funds in improvements located in the designated area. Unlike a special district, it is not an additional or new tax. Rather, it redirects and segregates the increase in property tax revenues that would normally flow to the General Fund so that it can be used for a specified purpose. The amount of the tax increment revenue is determined by setting a baseline assessed value of all property in a County Board determined calendar. In each subsequent year, the incremental increase in assessed values relative to the base year is determined and a portion of this incremental tax revenue is segregated and deposited to a separate fund. In the adopted FY 2018 budget, the County Board adjusted the TIF’s baseline from the CY 2014 to the CY 2018 assessed value. The County Board has allocated 25 percent of the incremental tax revenue above the base year be deposited into the Columbia Pike TIF Fund.
In FY 2021, funding for the district is $1.0 million based on 7.3 percent growth in the real estate tax assessments in the TIF area. Because TIF revenues are based on the incremental growth over the base year, revenues grow more quickly than assessments.
FY 2019Actual
FY 2020Adopted
FY 2021Adopted
% Change'20 to '21
Real Estate Tax Total $189,070 $496,660 $968,520 95%
UTILITIES FUND (Fund 503)
The revenues for this self-supporting enterprise fund are derived from water/sewer service charges, water service connection fees, sewage treatment service charges, interest earnings, and other fees for service.
Water/sewer service charges are the largest source of revenue for the Utilities Fund and are derived from quarterly utility bills paid by residents and monthly or quarterly bills paid by commercial establishments. The FY 2021 adopted budget includes a water/sewer rate of $14.20 per thousand gallons. The rate represents an increase of $0.40 per thousand gallons, or 2.9 percent, above the current rate. At the new rate, the average single-family house will pay $24 more per year for water and sewer service based on an estimated household consumption of 60,000 gallons of water per year.
Water service connection fees are paid by new users to connect to the water system. The fee amount is based on the size of the pipe being connected into the water system. Sewage treatment charges are revenues received for operations and maintenance cost reimbursements from neighboring jurisdictions (Falls Church, Alexandria, and Fairfax County) and federal government installations and other entities, including the Pentagon and Reagan National Airport, which use the County sewage system but receive drinking water from other sources.
In the FY 2021 adopted budget, Utilities Fund revenues are projected to total $104.3 million.
107

REVENUES
FY 2019Actual
FY 2020Adopted
FY 2021Adopted
% Change'20 to '21
Interest $270,000 $75,000 $125,000 67%Hazardous Household Material Fee 8,570 8,000 8,000 -Utility Marking Fee 225,791 195,000 215,000 10%Water Sewer Service 92,757,659 97,107,970 98,626,926 2%Water Service Connection Fees 1,016,035 1,265,000 1,265,000 -Sewage Treatment 4,044,812 4,005,200 4,105,200 2%Flow Test Fees 22,600 15,500 20,200 30%Miscellaneous Revenue 361,615 265,175 301,967 14%Total $98,707,082 $102,936,845 $104,667,293 2%
UTILITIES CAPITAL PROJECTS FUND (Fund 519)
The Utilities Capital Projects Fund accounts for capital projects for the sanitary sewer collection system, water distribution system, and wastewater treatment plant. The projects are funded through interest earnings from fund balance, infrastructure availability fees paid by developers for capital costs necessary to upgrade the water distribution and sewage collection systems, and transfers from the Utilities Operating Fund. Sewage treatment charges are revenues received from neighboring jurisdictions (Falls Church, Alexandria, and Fairfax County) for reimbursement of a portion of the maintenance capital costs at the Water Pollution Control Plant.
FY 2019Actual
FY 2020Adopted
FY 2021Adopted
% Change'20 to '21
Interest $1,372,367 $100,000 $350,000 250%Water / Sewer Hook-up 6,158,068 5,000,000 8,000,000 60%Sewage Treatment Charges 1,397,982 888,500 2,917,000 228%Miscellaneous 6,428 - - -Transfer In 14,425,300 14,190,500 12,155,000 -14%Total $23,360,145 $20,179,000 $23,422,000 16%
BALLSTON GARAGE (Funds 540 & 548)
Revenues received from the Ballston Garage Fund are used to offset costs of operating the garage. Interest accrues from earnings on the fund balance. Parking revenues are payments by the users of the public parking facility, which are collected by the County’s contract operator. In FY 2007, the eighth level of the parking garage was completed in part to support the Kettler Capitals Iceplex. Revenue from the operation of the lower seven levels of the parking garage is posted to a separate fund from revenue from the operation of eighth floor. However, for the purposes of the table below, the revenues from the two funds are combined.
In May 2012, the County raised parking rates at the garage in order to make capital improvements and to pay down principal on the outstanding bonds. The approved pay structure keeps the $1 rate for the first three hours of parking and increases the graduated hourly rates over three hours anywhere from $0.50 to $1.00. The graduated hourly rate also applies on the weekends. The five-day monthly rate is $105 and the maximum daily rate is $10.
108

REVENUES
FY 2019Actual
FY 2020Adopted
FY 2021Adopted
% Change'20 to '21
Parking Revenue $4,457,184 $4,426,500 $4,454,550 1%Miscellaneous 39,360 - - -Total $4,496,544 $4,426,500 $4,454,550 1%
CPHD DEVELOPMENT FUND (Fund 570)
In September 2007, the County Board established the self-supporting CPHD Development Fund to provide a dedicated funding source for all building, trade, zoning and other development-related fee services. Beginning on July 1, 2008, revenue from a variety of fees that had previously gone to the General Fund began posting to this new fund, including building, electrical, plumbing, occupancy, and elevator certificate permits.
A decline in FY 2021 revenues is expected based on historical trends but is partially offset by the inflationary increase of 2.5 percent for all Development Fund fees.
FY 2019Actual
FY 2020Adopted
FY 2021Adopted
% Change'20 to '21
Building Permits $9,356,869 $15,254,787 $15,281,374 -Electrical Permits 2,702,704 3,234,834 3,157,414 -2%Plumbing Permits 1,903,081 2,366,536 2,313,190 -2%Mechanical Permits 1,001,243 1,339,550 1,309,354 -2%Occupancy Permits 884,302 1,137,838 1,115,507 -2%Elevator Certificate Fees 931,876 1,518,156 1,483,934 -2%Plan Review - Walk Throughs 802,182 1,322,403 1,296,450 -2%Other Revenue 964,902 337,659 405,931 20%Total $18,547,159 $26,511,763 $26,363,154 -1%
AUTOMOTIVE EQUIPMENT FUND (Fund 609)
The Automotive Equipment Division of the Department of Environmental Services operates as an internal service fund and supports the County's automotive fleet.
FY 2019Actual
FY 2020Adopted
FY 2021Adopted
% Change'20 to '21
Sales of Surplus Equipment $1,920,868 $300,000 $300,000 -Services from Other Agencies 19,170,894 16,854,974 17,725,065 5%Miscellaneous Revenue 489,225 581,000 581,000 -Transfer In - 47,000 30,000 -36%Total $21,580,987 $17,782,974 $18,636,065 5%
109
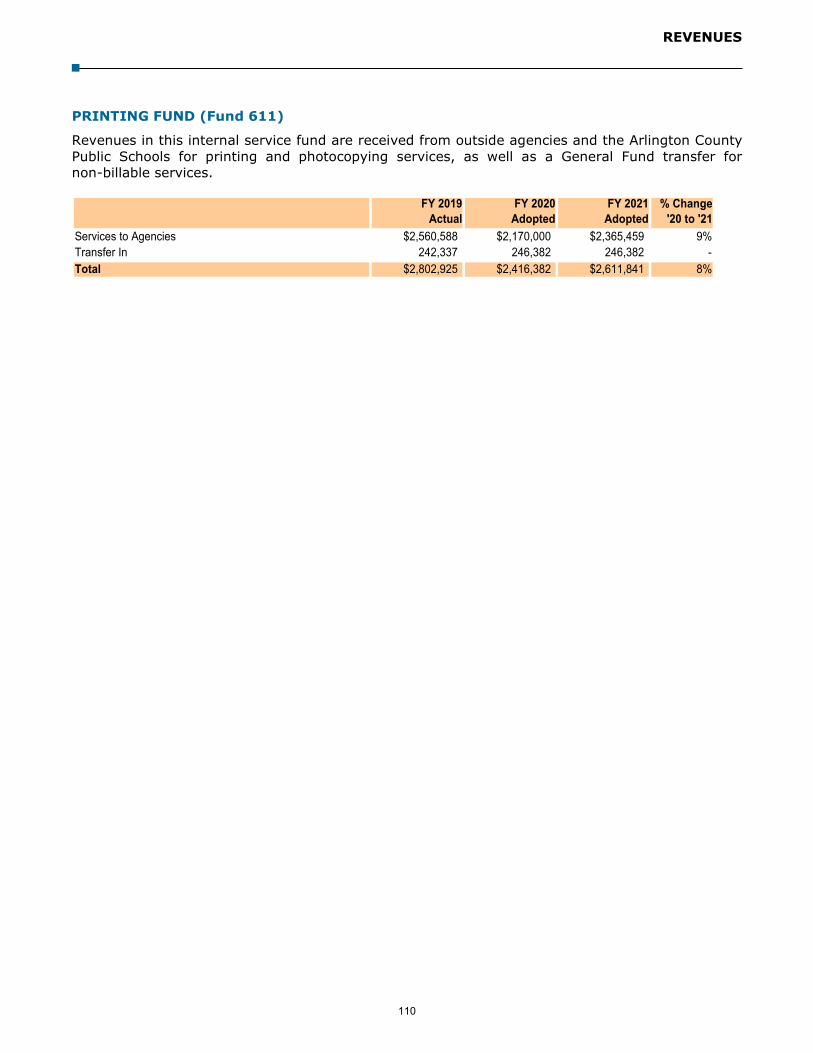
REVENUES
PRINTING FUND (Fund 611)
Revenues in this internal service fund are received from outside agencies and the Arlington County Public Schools for printing and photocopying services, as well as a General Fund transfer for non-billable services.
FY 2019Actual
FY 2020Adopted
FY 2021Adopted
% Change'20 to '21
Services to Agencies $2,560,588 $2,170,000 $2,365,459 9%Transfer In 242,337 246,382 246,382 -Total $2,802,925 $2,416,382 $2,611,841 8%
110

REVENUES
RESIDENTIAL TAXATION AND FEE TRENDS
During each budget cycle, tax and fee rate changes are reviewed in light of the costs of providing services to County residents. The following section is a brief analysis of the residential tax burden in Arlington County and other area jurisdictions. Arlington's tax rates continue to be very competitive with other Washington metropolitan area jurisdictions.
Real Estate Tax
At the adopted tax rate of $1.026 per $100 of assessed value, includes the base rate of $1.013 plus the $0.013 sanitary district tax rate for stormwater management, the real estate tax bill for the average residential home will increase $284, or 4.2 percent, in CY 2020. The average assessment for a single-family home increased 4.2 percent, from $658,600 in CY 2019 to $686,300 in CY 2020.
Personal Property Tax
For residents, vehicles are generally the item for which the personal property tax is paid. In CY 2006, the personal property tax rate was increased from $4.40 per $100 of assessed valuation to $5.00. The valuation method uses the average loan value, which is approximately ten percent lower than the trade-in value, and results in an effective personal property tax rate of $4.50. The following chart illustrates the average assessed value of motor vehicles in the County over the past decade.
CalendarYear
Average Assessed
Value Tax Rate Tax
PaymentTax Payment
Increase2010 $503,200 $0.958 $4,821 $2702011 $510,200 $0.958 $4,888 $672012 $519,400 $0.971 $5,043 $1552013 $524,700 $1.006 $5,278 $2352014 $552,700 $0.996 $5,505 $2272015 $587,100 $0.996 $5,848 $3432016 $603,500 $0.991 $5,981 $1332017 $617,200 $1.006 $6,209 $2282018 $640,900 $1.006 $6,447 $2382019 $658,600 $1.026 $6,757 $310
2020 Adopted $686,300 $1.026 $7,041 $284
REAL ESTATE TAX PAYMENTAverage Single Family Home
111

REVENUES
CalendarYear
Average Assessed Value per Car
TaxRate
Tax PaymentFor 2 Cars
2010 $7,264 $5.00 $7262011 $7,409 $5.00 $7412012 $8,421 $5.00 $8422013 $8,842 $5.00 $8842014 $9,284 $5.00 $9282015 $9,399 $5.00 $9402016 $9,493 $5.00 $9492017 $9,682 $5.00 $9682018 $10,235 $5.00 $1,0242019 $9,935 $5.00 $994
2020 Adopted $10,488 $5.00 $1,049
PERSONAL PROPERTY TAX BILL FOR TYPICAL HOUSEHOLD*(Assumes 2.0 Cars Per Household)
*Does not reflect the State’s fixed block grant distribution, which reduces theamount each household pays.
Refuse Collection and Disposal Fees
The annual residential charge for refuse and recycling increases from $306.00 to $319.03. This rate achieves the County’s objective of 100 percent recovery of household refuse collection, disposal and recycling costs, leaf collection costs and overtime costs associated with brush and metal collection.
Fiscal YearRefuse/
Recycling Fee2012 $325.722013 $293.922014 $293.76
2015* $271.042016 $271.042017 $307.282018 $314.162019 $316.162020 $306.00
2021 Adopted $319.03
*Reflects revised rate adopted in July 2014.
112

REVENUES
Water/Sewer Service Fees
As costs for water and sanitary sewer projects have risen, additional funding is required to sustain the self-supporting Utilities Fund. The adopted FY 2021 water/sewer rate is $14.20 per thousand gallons, increase of $0.40 per thousand gallons, or 2.9 percent.
Major Residential Taxes and Fees
The following chart summarizes the major residential taxes and fees for Arlington County for the average household. The chart uses the adopted tax and fee rates for CY 2017 through CY 2020. Due primarily to the real estate assessment increase, the average tax and fee burden on County households is expected to increase four percent over CY 2019.
CY 2017 CY 2018 CY 2019 CY 2020% Change
'19 to '20
Real Estate Tax (includes sanitary district tax) $6,209 $6,447 $6,757 $7,041 4%Personal Property* 968 1,024 994 1,049 6%Vehicle License Fee* 66 66 66 66 -Refuse Fee** 314 316 306 319 4%Water / Sewer Service** 817 817 828 852 3%Residential Utility Tax** 72 72 72 72 -
Total $8,446 $8,742 $9,023 $9,399 4%
** Reflects the next fiscal year. Water/sewer rate reflects 60 thousand gallons of water consumption. Residential utility tax assumptions are based on the ceiling tax rates.
* Assumes two conventional vehicles per household, the approximate average number of vehicles owned per Arlington household.The personal property tax figures do not reflect the PPTRA subsidy for personal property tax relief. For CY 2020, it is projected that28% of vehicle value between $3,000 and $20,000 will be exempt from taxation; values below $3,000 are 100% exempt.
FiscalYear
Water/Sewer Service Rate*
Average Annual Residential Cost
2012 $12.19 $731.402013 $12.61 $756.602014 $12.61 $756.602015 $13.04 $782.402016 $13.27 $796.202017 $13.27 $796.202018 $13.62 $817.202019 $13.62 $817.202020 $13.80 $828.00
2021 Adopted $14.20 $852.00*Per thousand gallons; average usage equals 60,000
113

REVENUES
The following chart compares the estimated major residential taxes and fees for the Northern Virginia jurisdictions for the average household using Calendar Year 2020 rates and assessments.
City of PrinceArlington City of Fairfax Falls City of William LoudounCounty Alexandria County Church Fairfax County County
Average Residential Assessment $686,300 $582,636 $580,272 $759,500 $522,243 $383,520 $516,600
Estimated TaxesReal Estate 1 $7,041 $6,584 $6,868 $10,291 $5,614 $4,631 $5,347Personal Property 2 1,048 1,118 958 1,048 866 776 880Residential Consumer Utility 3 72 72 96 120 54 72 65
Subtotal $8,161 $7,774 $7,922 $11,459 $6,534 $5,479 $6,292
Estimated FeesWater/Sewer 4 $852 $1,119 $845 $951 $819 $815 $752Solid-Waste/Recycling 5 319 460 370 n/a n/a 383 383Decal/Registration Fee2 66 - 66 66 66 48 50
TOTAL $9,398 $9,353 $9,203 $12,476 $7,419 $6,725 $7,477Amount more (less) than Arlington ($45) ($195) $3,078 ($1,979) ($2,673) ($1,921)Percent more or less than Arlington -0.5% -2.1% 32.8% -21.1% -28.4% -20.4%
Calendar Year 2020 Regional ComparisonEstimated Annual Local Taxes and Fees Per Average Household
1 Represents the estimate real estate tax bill based on each locality's average single family home value and the adopted tax rate(s). Rates include the base real estate tax rate plus jurisdiction wide add-on rates for stormwater, pest control, fire and rescue services, etc. as appropriate for each jurisdiction. See table on next page.
2 Estimate based upon 2.0 cars per household, and assumes the same average vehicle value of $10,488. However, given that Arlington and Loudoun uses a lower assessment, the actual average car value for the other jurisdictions may be higher. Taxes do not reflect the State's fixed block grant to localities for vehicle tax relief and the adopted method of distribution.
3 Average household utility tax bills are based on the ceiling tax rate. 4 Assumes average single family residence uses 60,000 gallons of water per year. Estimates are based on adopted FY 2021 rates. 5 Residents in Falls Church and Fairfax City pay for the solid-waste/recycling fee as part of their real estate taxes. Loudoun & Prince William Counties
do not offer this service. Instead, residents pay private haulers, such as BFI, directly. Most Fairfax County residents also pay a private hauler, but County collection is available in designated areas. For Loudoun and Prince William County, the amounts shown represent the average fees charged in Arlington, Alexandria and Fairfax County. For Prince William County, a $70 annual solid waste fee is charged to single-family homeowners.
114

Change in Change inAverage Estimated Average Estimated Change Average Change Change Average Change
Tax Assessed Tax Tax Assessed Tax in Tax Assessed in Tax in Tax Assessed in Tax Rate Value Payment Rate Value Payment Rate Value Payment Rate Value Payment
Arlington3 $1.0260 $658,600 $6,757 $1.0260 $686,300 $7,041 $0.000 $27,700 $284 0.0% 4.2% 4.2%
Alexandria $1.1300 $555,002 $6,272 $1.1300 $582,636 $6,584 $0.000 $27,634 $312 0.0% 5.0% 5.0%
City of Fairfax3 $1.0750 $511,678 $5,501 $1.0750 $522,243 $5,614 $0.000 $10,565 $113 0.0% 2.1% 2.1%
City of Falls Church4 $1.3550 $695,500 $9,424 $1.3550 $759,500 $10,291 $0.000 $64,000 $867 0.0% 9.2% 9.2%
Fairfax County5 $1.1835 $562,601 $6,658 $1.1500 $580,272 $6,673 ($0.033) $17,671 $15 -2.8% 3.1% 0.2%
Loudoun County $1.0450 $495,800 $5,181 $1.0350 $516,600 $5,347 ($0.010) $20,800 $166 -1.0% 4.2% 3.2%
Prince William Co.6 $1.2075 $371,309 $4,484 $1.2075 $383,520 $4,631 $0.000 $12,211 $147 0.0% 3.3% 3.3%
1 Real Estate tax bill is calculated at each jurisdiction's current real estate tax rate per $100 of the jurisdiction's average single-family home value.2 Average single-family home value is based on all residential property including single family detached, semi-detached dwellings, condominiums, cooperatives, and townhouse residences.3 Tax rates listed for Arlington and the City of Fairfax include the levy for stormwater funds. 4 City of Falls Church uses the median home value. 5 Tax rate for Fairfax County includes additional levies for stormwater and pest control.
6 Prince William's tax rate includes additional levies for fire and rescue and moth/mosquito control.
COMPARISON OF NORTHERN VIRGINIA JURISDICTIONS' REAL ESTATE TAX BILL (1)
FOR THE AVERAGE SINGLE-FAMILY HOME (2)
TAX YEAR 2019 TAX YEAR 2020 CHANGE FROM 2019 TO 2020 PERCENT CHANGE
115

Arlington City of City of Fairfax Fairfax Loudoun Prince WilliamCounty Alexandria Falls Church City County County County
FINANCIAL, REAL ESTATE, AND PROFESSIONAL SERVICES
Professional Occupations 0.36 0.58 0.52 0.40 0.31 0.33 0.33Real Estate Occupations 0.36 0.58 0.50 0.40 0.31 0.33 0.33Renting 0.43 Com 0.35 Com 0.52 Com 0.23 Com 0.26 0.16 0.00
0.28 Res 0.50 Res 0.38 Res 0.50 Res
REPAIR, PERSONAL, AND BUSINESS SERVICES
Special Occupational 0.36 0.35 0.36 0.27 0.31 0.33 N/APersonal Services 0.35 0.35 0.36 0.27 0.19 0.23 0.21Business Services 0.35 0.35 0.36 0.27 0.19 0.17 0.21Repair Services 0.35 0.35 0.36 0.27 0.19 0.16 0.21Amusements 0.25 0.36 0.36 0.27 0.26 0.21 0.21Parking Lots 0.36 0.35 0.36 0.27 0.19 0.17 0.21
RETAIL SALESRetail Merchants 0.20 0.20 0.19 0.20 0.17 0.17 0.17Restaurants 0.20 0.20 0.19 0.20 0.17 0.17 0.17Filling Stations 0.10 0.20 0.19 0.20 0.17 0.17 0.17
CONTRACTING AND CONSTRUCTINGContractors 0.16 0.16 0.16 0.16 0.11 0.13 0.13Builders/Developers 0.16 0.16 0.16 0.16 0.05 *** 0.13 0.13Wholesalers 0.08 0.05 0.08 0.05 0.04 ** 0.05 ** 0.05
* Based on each $100 of gross receipts, unless otherwise noted.** Based on each $100 of gross purchases.*** Based on each $100 of gross expenditures.
CALENDAR YEAR 2020 SELECTED BUSINESS, PROFESSIONAL, AND OCCUPATIONAL LICENSE TAX RATES*
116

Arlington City of City of City of Fairfax Loudoun Pr. WilliamTax County Alexandria Falls Church Fairfax County County CountyReal Estate Tax Rate (base) $1.013 $1.130 $1.355 $1.045 $1.150 $1.035 $1.125
Additional Real Estate Tax Rates (all properties) $0.0130 - - $0.0300 $0.0335 - $0.0825Special Districts Add-on Tax Rate $0.043 - $0.078 $0.10 - $0.20 - - $0.012 - $0.47 $0.18-$0.20 $0.02 - $0.165
Commercial Real Estate Add-on Tax Rate $0.125 - - $0.125 $0.125 - -Personal Property
Vehicle Rate $5.00 $5.33 $5.00 $4.13 $4.57 $4.20 $3.70Effective Vehicle Rate $4.50 $4.80 $5.00 $4.13 $3.88 $3.78 $3.70Business Rate $5.00 $4.75 $5.00 $4.13 $4.57 $4.20 $3.70
Newly Registered Vehicle Tax (state) 4.15% 4.15% 4.15% 4.15% 4.15% 4.15% 4.15%
Car Rental TaxState 6.0% 6.0% 6.0% 6.0% 6.0% 6.0% 6.0%Local 4.0% 4.0% 4.0% 4.0% 4.0% 4.0% 4.0%
Motor Fuel TaxGasoline $0.212 per gallon $0.212 per gallon $0.212 per gallon $0.212 per gallon $0.212 per gallon $0.212 per gallon $0.212 per gallonDiesel $0.202 per gallon $0.202 per gallon $0.202 per gallon $0.202 per gallon $0.202 per gallon $0.202 per gallon $0.202 per gallonDistributor Sales 2.1% 2.1% 2.1% 2.1% 2.1% 2.1% 2.1%
Sales TaxState (see note) 5.0% 5.0% 5.0% 5.0% 5.0% 5.0% 5.0%Local 1.0% 1.0% 1.0% 1.0% 1.0% 1.0% 1.0%
Meals Tax 4.0% 5.0% 4.0% 4.0% - - - Transient Occupancy Tax
State 2.0% 2.0% 2.0% 2.0% 2.0% 2.0% 2.0%
Local 5.25%
6.5% plus $1.25 per
night/room 6.0% 4.0% 4.0% 5.0% 5.0%BPOL
Business Services $0.35 $0.35 $0.36 $0.27 $0.19 $0.17 $0.21Professionals $0.36 $0.58 $0.52 $0.40 $0.31 $0.33 $0.33Contractors $0.16 $0.16 $0.16 $0.16 $0.11 $0.13 $0.13Retail $0.20 $0.20 $0.19 $0.20 $0.17 $0.17 $0.17Repair Services $0.35 $0.35 $0.36 $0.27 $0.19 $0.16 $0.21
Recordation TaxState (see note) $0.25 $0.25 $0.25 $0.25 $0.25 $0.25 $0.25Local (see note) $0.0833 $0.0833 $0.0833 $0.0833 $0.0833 $0.0833 $0.0833
Grantor's TaxState $2.00 $2.00 $2.00 $2.00 $2.00 $2.00 $2.00Local $0.50 $0.50 $0.50 $0.50 $0.50 $0.50 $0.50
Bank Stock TaxState $0.20 $0.20 $0.20 $0.20 $0.20 $0.20 $0.20Local $0.80 $0.80 $0.80 $0.80 $0.80 $0.80 $0.80
Cigarette Tax, per 20 CigarettesState (see note) $0.60 $0.60 $0.60 $0.60 $0.60 $0.60 $0.60Local $0.30 $1.26 $0.85 $0.85 $0.30 - -
Utility Tax on Commercial UsersElectricity $1.15 plus
$0.00681/kWh$1.18 plus
$0.005578/kWh $0.92 plus
$0.004807/kWh$1.72 plus
$0.010112/kWh max=$75.00
$1.15 plus $0.00594/kWh
max=$1,000
$0.92 per mo. +$.005393/kWh
max=$72.00
$2.29 plus $0.013487/kWh max=$100/mo.
Gas $0.845 plus $0.06848/CCF
$1.42 plus $0.050213/CCF
$0.676 plus $0.04098/CCF
$1.27 plus $0.05295/CCF
max=$75.00
$0.845 plus $0.04794/CCF
max=$300
$0.676 per mo. + $0.0304/CCF max=$72.00
$3.35 plus $0.085/CCF
max=$100/mo.
Water - 20% /1st $150 8% 15% /1st $500 - - -
Utility Tax on Residential UsersElectricity $0.0 plus
$0.01110/kWh max=$3.00
$1.12 plus $0.012075/kWh
max=$3.00
$0.70 plus $0.007535/kWh
max=$5.00
$1.05 plus $0.01136/kWh
max=$2.25
$0.56 plus $0.00605/kWh
max=$4.00
$0.63 per mo. +$.006804/kWh
max=$2.70
$1.40 plus $0.01509/kWh
max=$3.00/mo.
Gas $0.0 plus $1.038/CCF max = $3.00
$1.28 plus $0.124444/CCF
max=$3.00
$0.70 plus $0.0039/CCF
max=$5.00
$1.05 plus $0.05709/CCF
max=$2.25
$0.56 plus $0.05259/CCF
max=$4.00
$0.63 plus $0.06485/CCF
max=$2.70
$1.60 plus $0.06/CCF max=$3.00
Water - 15% of monthly bill 10% /1st $50 15% /1st $15 - - -
Communications Sales TaxState 5.0% 5.0% 5.0% 5.0% 5.0% 5.0% 5.0%Local - - - - - - -
Wireless E-911 TaxState $0.75 $0.75 $0.75 $0.75 $0.75 $0.75 $0.75
CALENDAR YEAR 2020 TAX RATES IN NORTHERN VIRGINIA JURISDICTIONS
117

GRANTOR'S TAX (§58.1-802): This is a tax on the grantor and is imposed. $1.00 per $1,000 of the tax is split evenly between the state and the locality. The state rate increased by $1.50 per $1,000 effective July 1, 2013, in the Northern Virgina Planning District. The additional revenues generated from this increase will be deposited in the Northern Virginia Transportation Authority Fund, with 30% of the funds distributed to the member localities for use on transportation projects and the remainder to be used for regional transportation projects.
BANK STOCK TAX: This is a franchise tax on the net capital gains of banks and trust companies. In Virginia, the rate is $1.00 per $100 of taxable value as of January 1. In Northern Virginia, localities receive 80% of this collection and the State receives 20%.
CIGARETTE TAX: On June 3, 2004, the Governor signed HB 5018 which is the revenue budget for the FY 2004 - FY 2006 biennium. As part of this bill, the state increased the state imposed cigarette tax from $0.025 to $0.20 effective September 1, 2004, and $0.30 effective July 1, 2005. On May 21, 2020, the Governor signed the budget for the FY 2020 - FY 2022 biennium which increased the cigarette tax rate from $0.30 to $0.60 per pack effective July 1, 2020.
UTILITIES TAX: In FY 2008, Arlington imposed a residential utility tax rate on electricity and natural gas, the funds to be dedicated for environmental initiatives. Effective July 1, 2018, the commercial utility tax rates for electricity and natural gas were increased to $1.15 plus $0.00681/kWh and $0.845 plus $0.6848/CCF respectively; the residential utility tax rates for electricity and natural gas were increased to $0.01110/kWh with a $3 maximum per month and $1.038/CCF with a $3 maximum per month. Beginning in January 2007, the State eliminated local authority to impose a utility tax on telephones instead imposing a 5% tax on the sale price of all services provided. This tax law change affected all other local jurisdictions except Arlington since the other jurisdictions imposed a tax on telephones prior to CY 2007.
COMMUNICATIONS SALES TAX: Effective January 1, 2007, the State adopted a communications sales tax that is imposed on customers of communication services at the rate of 5% of the sales price of the service. This tax was adopted as part of the 2006 House Bill 568 (Acts of Assembly 2006, Chapter 780) and replaces many of the prior state and local communications taxes and fees with a centrally administered communications sales and use tax. Local authority to impose a utility tax on telephones was repealed by the State and replaced with a 5% communications tax. Arlington was not affected by this change since there was no tax in place at the time.
RECORDATION TAX: In Virginia, localities can impose a tax of up to one third of the state rate. The state rate increased from $0.15 per $100 of recorded value to $0.25 effective September 1, 2004. Arlington's current rate is $0.0833 (1/3 of the state rate).
COMMERCIAL REAL ESTATE RATE: HB 3202, which was passed in 2007, allows Northern Virginia localities to impose an additional real estate tax on properties zoned or used for commercial and industrial purposes in order to fund transportation initiatives.
EFFECTIVE VEHICLE PERSONAL PROPERTY TAX RATE COMMERCIAL AND CONSUMER: Vehicles in Arlington County and Loudoun County are assessed using the average loan value from the N.A.D.A. Used Car Guide. Other neighboring jurisdictions use the average trade-in value. This results in a lower assessment (about 10% less) for vehicles or an effective rate in Arlington of approximately $4.50 and $3.78 in Loudoun County. All vehicles including those of businesses are included in this category.
PERSONAL PROPERTY: Several of the jurisdictions have separate classes of vehicle rates for personal property (e.g. vehicles owned by elderly or disabled) which charge reduced rates. Arlington does not classify personal property via this method.
NEWLY REGISTERED VEHICLE TAX (STATE): The State of Virginia phased in a 1.15% increase to the newly registered vehicle, or "titling," tax over a four-year period. A 4% rate was effective July 1, 2013; each year, the rate increased by 0.05% until it reached 4.15% on July 1, 2016. The revenue generated by the incremental increase in this tax rate is deposited into the State Highway Maintenance and Operating Fund.
CAR RENTAL: In July 1992, the locality portion of the Virginia car rental tax was increased from 2.5% to 4.0% of gross proceeds. Beginning July 2004, the state increased its portion of the car rental tax to 6% with the additional 2% dedicated to the Virginia Public Building Authority for the Statewide Agencies Radio System (STARS).
MOTOR FUEL TAX: Effective July 1, 2013, the $0.175 per gallon tax on motor fuels was being replaced with a percentage-based tax of 3.5% for gasoline and 6% for diesel fuel. Users of passenger cars, pickup or panel trucks, and trucks having a gross vehicle weight rating of 10,000 pounds or less can receive a refund of an amount equal to a 2.5% tax paid on diesel fuel.
In accordance with Code of Virginia § 58.1-2217 effective January 1, 2015, the per gallon tax on gasoline increased to 5.1%. Effective July 1, 2020, the DMV Commissioner is no longer required to determine the statewide average wholesale price of a gallon of unleaded regular gasoline and diesel fuel for the purpose of determining the applicable cents per gallon in accordance with applicable tax rates. The tax will be converted back to a cents-per-gallon tax with a rate of $0.262 per gallon phased in over two years and then indexed SALES TAX: In 2004, sales tax was increased 1/2 percent from 3.5% to 4.0% (State portion excluding local option 1%). One-half of this rate change goes to the Schools in the various jurisdictions. Effective July 1, 2013, the statewide sales and use tax increases from 4.0% to 4.3% with the increased revenues dedicated to the Highway Maintenance and Operating Fund, the Intercity Passenger Rail Operating and Capital Fund, and the Commonwealth Mass Transit Fund. Further, the adoption of House Bill 2313 also established a 0.70% retail sales tax applicable to the Northern Virginia Planning District, which includes the counties of Arlington, Fairfax, Loudon, and Prince William Counties; the cities of Alexandria, Fairfax, Falls Church, Manassas, and Manassas Park Cities; and the towns of Dumfries, Herndon, Leesburg, Purcellville, and Vienna. The additional revenues generated from this 0.70% increase in retail sales tax will be deposited in the Northern Virginia Transportation Authority Fund, with 30% of the funds distributed to the member localities for use on transportation projects and the remainder to be used for regional transportation projects.
SALES TAX (Food): Effective July 1, 2006 the tax rate on food was reduced 0.5 percent to 2.0 percent. Effective July 1, 2007, the tax rate is reduced from 2.0 percent to 1.5 percent (State portion). Food items are defined under the Food Stamp Act of 1977 (7 U.S.C. § 2012) to be food for home consumption by humans. This includes most grocery food items and cold prepared foods. Excluded from the definition of food are alcoholic beverages, tobacco, and prepared hot foods sold for immediate consumption. The food tax described above does not include the local option 1.0 percent.
MEALS TAX: The meals tax is paid in addition to sales tax. In 1991, Arlington instituted a 4% restaurant meals tax on most prepared foods offered for sale.
TRANSIENT OCCUPANCY TAX: This tax is paid in addition to sales tax; the local rate is 5%. A 2% state rate for the Northern Virginia Planning District has been in effect for July 1, 2013. The additional revenues generated from this new 2% transient occupancy tax are deposited in the Northern Virginia Transportation Authority Fund, with 30% of the funds distributed to the member localities for use on transportation projects and the remainder to be used for regional transportation projects. In March 2016, the General Assembly voted to allow Arlington County to impose an additional transient occupancy tax of 0.25% to be designated and spent for the purpose of promoting tourism and business travel in the County. The County Board adopted this additional TOT in May to be effective beginning July 1, 2016.
BPOL TAX: For CY 1997 Virginia jurisdictions changed the BPOL thresholds to comply with state law so that businesses with gross receipts under $10,000 would not pay BPOL tax, and businesses with gross receipts between $10,000 and $100,000 would pay a flat fee of $50 or less. Effective January 1, 2001, the BPOL on electric and natural gas is eliminated and replaced with a consumption tax.
SPECIAL DISTRICTS ADD-ON TAX RATES: There are three special taxing districts in Arlington: in the Rosslyn, Crystal City, and Ballston business districts. The additional tax is used to fund additional services and programs within the districts' boundaries. Other jurisdictions have special tax districts related to transportation, sanitary sewers, water services, leaf collection, etc.
NOTES
ADDITIONAL REAL ESTATE TAX RATE: Arlington ($0.013), Fairfax City ($0.03), and Fairfax County ($0.0325) impose or dedicate a tax rate on all properties for stormwater management. Prince William County charges a flat fee for stormwater managment ranging from $19.12 per thousand square feet for a business to $39.36 for a single family housing unit. As a part of the FY 2014 budget adoption, the City of Falls Church established a Stormwater Utility Fund; their Stormwater Fees are based on the square footage of impervious surface per parcel. Since the FY 2017 adopted budget, that stormwater fee has been $18.36 per 200 square feet of impervious surface. Fairfax County imposes a county-wide levy for pest control ($0.0010). Prince William imposes a near county-wide tax rate for mosquito and gypsy moth control ($0.0025) and fire and rescue services ($0.08).
118

SIX-YEAR REVENUE SUMMARY FY 2016 FY 2017 FY 2018 FY 2019 FY 2020 FY 2021CODE DESCRIPTION ACTUAL ACTUAL ACTUAL ACTUAL ADOPTED ADOPTED
FUND: 001 GENERAL101 REAL ESTATE TAX 684,254,232 707,500,617 734,680,378 757,180,463 783,411,860 808,323,440105 REAL ESTATE PENALTY 504,034 649,731 659,331 594,047 650,000 650,000106 REAL ESTATE INTEREST 105,263 50,168 113,485 94,739 75,000 75,000
TAX REFUNDS - REAL ESTATE (9,145,654) (9,298,986) (14,741,393) (11,998,096) (13,100,000) (13,930,000)SUBTOTAL 675,717,874 698,901,530 720,711,801 745,871,153 771,036,860 795,118,440
121 PERSONAL PROPERTY TAX 81,323,816 84,396,305 85,272,562 87,484,820 88,600,000 89,600,000STATE REIMBURSEMENT 31,252,147 31,252,147 31,252,147 31,252,147 31,252,147 31,252,147
123 PERSONAL PROPERTY PENALTY 1,460,903 1,451,396 1,362,152 1,315,910 1,380,000 1,380,000 125 PERSONAL PROPERTY INTEREST 276,300 285,448 250,565 220,253 320,000 320,000
TAX REFUNDS - PERSONAL PROP (2,544,675) (2,549,245) (2,268,298) (2,278,471) (2,500,000) (2,500,000)SUBTOTAL 111,768,491 114,836,051 115,869,128 117,994,659 119,052,147 120,052,147
131 BPOL TAX 62,049,916 64,860,882 67,167,337 71,921,455 71,400,000 65,380,000133 BPOL TAX PENALTY 84,241 92,665 126,444 64,961 100,000 100,000134 BPOL TAX INTEREST 356,128 318,859 380,275 300,795 320,000 320,000
TAX REFUNDS - BPOL (2,308,899) (1,434,480) (4,687,736) (2,373,344) (2,800,000) (2,800,000)SUBTOTAL 60,181,386 63,837,926 62,986,320 69,913,867 69,020,000 63,000,000
140 CAR RENTAL GROSS RECEIPTS TAX 6,222,399 6,890,584 6,528,308 6,188,708 6,300,000 4,342,881141 LOCAL SALES TAX 39,683,462 41,197,357 42,007,601 44,047,335 44,700,000 43,127,695143 BANK STOCK TAX 3,340,501 3,705,205 3,845,997 4,125,274 3,700,000 4,250,000144 RECORDATION TAX 6,049,809 7,048,071 6,022,870 5,750,294 5,500,000 4,200,000145 CIGARETTE TAX 2,412,224 2,384,534 2,370,175 2,115,530 2,050,000 1,900,000146 TRANSIENT TAX 24,106,373 25,267,916 25,026,707 24,623,589 26,000,000 19,257,639147 UTILITY TAX 11,459,470 11,426,615 12,048,319 16,462,272 16,152,000 17,200,000148 SHORT TERM RENTAL 64,907 52,244 49,489 57,437 50,000 55,000149 MEALS TAX 37,332,584 39,047,018 39,469,397 40,168,158 40,900,000 36,772,563151 WILLS AND ADMINISTRATION TAX 69,902 64,757 57,618 58,682 60,000 60,000152 CONSUMPTION TAX 762,229 768,786 790,547 788,931 800,000 800,000153 COMMUNICATION TAX 7,314,146 7,114,814 6,934,062 6,460,606 6,300,000 6,100,000
SUBTOTAL 138,818,006 144,967,901 145,151,090 150,846,816 152,512,000 138,065,778
TOTAL LOCAL TAXES 986,485,758 1,022,543,408 1,044,718,339 1,084,626,495 1,111,621,007 1,116,236,365
REVENUE CATEG: LICENSES, PERMITS, & FEES215 CONCEALED WEAPONS 35,544 28,623 33,818 32,766 20,000 30,000219 USE PERMITS 122,784 114,783 114,821 125,745 120,000 157,242220 RIGHT OF WAY FEES 616,292 1,471,442 1,015,969 926,679 1,200,000 1,200,000221 HIGHWAY PERMITS 1,239,067 1,802,405 2,013,730 2,789,558 1,752,840 1,937,300222 BUILDING PERMITS 1,302 - - - - - 240 MOTOR VEHICLE LICENSE TAGS 4,934,901 5,001,539 4,943,439 4,615,769 5,000,000 5,000,000241 LICENSE PLATE PENALTY FEES 268,015 291,326 283,399 289,167 270,000 270,000243 SITE PLAN FEES 819,817 1,102,876 718,007 1,613,149 1,987,263 2,353,289244 TRANSFER FEES 4,909 5,042 4,810 4,841 5,000 4,800245 ZONING ADVERTISING 81,478 113,085 76,617 99,133 307,500 102,242251 BUILDING PLANS/WALK-THROUGH - (50) - - 259 MISC LICENSES, PERMITS & FEES 1,722,449 1,528,038 1,295,885 1,653,823 1,720,200 2,060,820
TOTAL REV CATEG 9,846,558 11,459,159 10,500,495 12,150,580 12,382,803 13,115,693
REVENUE CATEG: FINES301 FINES 2,703,140 2,741,646 2,636,246 2,574,759 2,616,900 2,314,620302 PARKING TICKETS 4,274,212 4,141,927 4,455,500 4,814,697 4,230,000 4,239,228305 CIVIL PENALTIES 81,788 176,167 203,590 247,860 309,024 309,024
TOTAL REV CATEG 7,059,140 7,059,740 7,295,336 7,637,316 7,155,924 6,862,872
REVENUE CATEG: INTEREST, RENTS & SURPLUS SALES311 INTEREST ON GENERAL FUND 4,480,448 2,167,722 2,584,811 16,156,300 7,250,000 5,000,000312 INTEREST ON BOND FUNDS 1,443,695 527,085 3,941,476 7,231,349 450,000 1,000,000320 COURTHOUSE PLAZA 2,763,149 3,196,185 - - - - 321 RENTALS & SALES OF SURPLUS 433,308 428,154 287,967 228,770 385,370 215,370322 PAID PARKING 1,086,510 1,031,644 1,067,139 1,119,883 1,128,000 1,133,040
334/5 DES LEASE AGREEMENTS 379,164 437,758 3,861,848 8,130,346 7,293,972 7,303,309 TOTAL REV CATEG 10,586,274 7,788,548 11,743,241 32,866,648 16,507,342 14,651,719
119

SIX-YEAR REVENUE SUMMARY FY 2016 FY 2017 FY 2018 FY 2019 FY 2020 FY 2021CODE DESCRIPTION ACTUAL ACTUAL ACTUAL ACTUAL ADOPTED ADOPTED
REVENUE CATEG: CHARGES FOR SERVICES
400 INMATE MEDICAL COSTS 22,485 24,763 24,531 25,274 9,000 9,000401 COURT COSTS 444,999 411,058 473,713 182,271 403,535 403,535402 COMMONWEALTH'S ATTORNEY FEES 10,312 9,415 10,350 10,598 10,500 10,500403 A S A P ENTRANCE FEES 424,592 329,539 307,838 242,304 325,733 278,715404 IMPOUNDED VEHICLES STORAGE FEE 11,593 12,324 17,612 26,246 15,000 20,000405 FALLS CHURCH REIMBURSEMENT 4,158,476 3,846,127 4,082,283 4,494,202 4,082,685 4,536,622406 AMBULANCE SERVICE FEES 2,863,686 3,566,548 3,636,492 3,571,346 3,800,000 3,850,000407 JAIL SERVICE CHARGES 4,386 4,250 2,261 6,376 6,500 6,500408 DOG LICENSE FEES 65,179 66,296 79,640 77,409 69,720 131,220409 SIDEWALK FRONTAGE ASSESSMENTS 51,293 79,358 46,122 60,070 55,000 55,000410 PARKING METER CHARGES 8,511,265 9,063,713 9,135,966 12,143,185 12,910,000 11,545,592411 ENGINEERING SERVICES CHARGES 1,599,070 1,413,174 1,045,991 1,478,019 1,035,800 1,088,276412 REFUSE\RECYCLING FEES 8,985,066 10,217,857 10,455,293 10,522,409 10,159,200 10,614,704413 MULCH FEES 156,432 133,762 183,847 202,250 216,000 191,000414 RECYCLED MATERIALS SALES 32,119 154,309 115,476 43,940 60,000 60,000415 MENTAL HEALTH CLINIC CHARGES 2,474,982 2,151,931 2,847,295 2,936,613 3,074,412 2,999,877416 DRUG & ALCOHOL PROG. PAYMENTS 46,083 64,927 68,812 75,492 62,500 79,500417 MADISON CENTER CHARGES 140,424 158,490 171,983 130,353 179,500 179,500420 RECREATION INSTRUCTION SRVCS. 3,609,383 3,667,114 3,657,540 3,603,608 3,580,131 3,596,770421 SUPPLEMENTAL RECREATION FEES 6,387,429 6,453,950 7,214,507 7,162,663 7,207,050 7,338,268422 LIBRARY FEES & FINES 472,631 433,302 424,722 412,783 425,000 85,000423 OLDER AMERICANS ACT PROGS. 19,252 20,701 20,198 19,779 20,513 20,513424 GROUP HOME CHARGES ARGUS 2,520 818 635 19,685 750 10,250425 FEE REDUCTIONS (694,283) (660,294) (959,251) (974,577) (960,000) (960,000)426 APPLIANCE PICK UP FEE 19,320 16,505 19,888 14,845 20,000 20,000430 INDIRECT ADMIN CHARGES 4,201,799 4,933,742 5,179,937 5,580,323 4,854,162 5,954,051431 HEALTH SERVICES FEES 12 - - - 1,000 1,000 443 WIRELESS E-911 SURCHARGE 876,464 982,815 931,859 776,090 754,663 754,663 445 GIS PROGRAM REVENUES 4,991 1,780 694 1,835 5,000 5,000 447 SERVICES TO OUTSIDE AGENCIES 161,554 173,530 61,166 69,233 145,000 170,000449 MISC SERVICE CHARGES 2,673,520 2,635,319 2,651,351 2,482,226 2,394,194 2,439,530450 ARLINGTON TRANSIT / COMMUTER STORE 5,787,294 6,403,957 6,270,609 5,956,418 8,093,737 7,840,465453 COURT HOUSE SECUR.-COURT FEE 413,434 360,966 375,126 441,672 678,000 378,000 455 CHESAPEAKE BAY FEE 221,655 202,344 218,735 102,845 35,000 35,875 460 PROJECT RECEIPTS 329,121 253,753 463,567 348,326 323,500 356,726 471 PUBLIC HEALTH FEES 655,679 643,275 747,230 665,194 758,257 706,731 472 CREDIT CARD FEES - TREAS. (653,237) (710,590) (721,419) (531,235) (558,400) (558,434)
TOTAL REV CATEG 54,490,980 57,520,828 59,262,599 62,380,070 64,252,642 64,253,949
REVENUE CATEG: MISCELLANEOUS REVENUE501 SALE OF LAND & BUILDINGS 840,667 1,221,919 57,589 2,006,039 4,015,000 15,000509 MISCELLANEOUS REVENUES 1,925,612 1,447,613 7,370,131 2,020,434 1,728,008 1,805,329525 CABLE TV ADMINISTRATION 245,065 226,462 - - - - 570 AHIF 8,898,414 10,424,305 14,378,385 9,382,935 - - 595 CABLE TV SCHOOL ANNUAL PAYMENTS - 25,736 (25,736) - - - 599 GIFTS AND DONATIONS 2,912 3,584 5,704 - 5,000 5,000
TOTAL REV CATEG 11,912,670 13,349,619 21,786,073 13,409,408 5,748,008 1,825,329
REVENUE CATEG: COMMONWEALTH OF VIRGINIA612 MOTOR VEHICLE CARRIERS TAX 17,722 21,853 18,241 19,977 19,000 19,000 613 TAX ON DEEDS-GRANTOR'S TAX 1,821,824 2,140,163 1,634,204 1,730,395 1,600,000 1,330,000 621 COMMONWEALTH'S ATTORNEY 1,189,177 1,279,850 1,306,772 1,329,697 1,435,720 1,461,581 622 SHERIFF 7,667,223 7,644,284 7,950,450 7,916,976 7,992,330 8,349,245 623 COMMISSIONER OF THE REVENUE 452,139 452,902 462,770 463,487 473,420 487,995 624 TREASURER 491,538 494,252 511,727 515,939 545,615 562,615 625 REGISTRAR/ELECTORAL BOARD 154,391 85,164 86,025 86,262 159,742 83,907 626 LAW ENFORCEMENT AID 6,149,640 6,347,640 6,347,640 6,582,500 6,815,000 6,839,220 627 CLERK -COMP BOARD FUNDS 907,050 892,452 1,103,095 845,906 961,257 975,468 628 DCJS FORFEITED ASSETS 33,508 15,082 31,597 111,260 - - 629 VICTIM WITNESS GRANT 196,952 219,270 249,063 203,777 270,353 275,923 631 HIGHWAY AID 16,896,925 18,339,530 18,929,606 19,720,958 20,220,300 20,774,545 632 TRANSIT AID 4,581,461 5,440,771 5,877,104 5,598,977 5,388,857 6,005,279 633 JUVENILE DETENTION-ARGUS 270,059 270,059 488,423 293,054 390,738 390,738 634 JUVENILE & DOMESTIC RELATIONS 720,490 768,238 793,219 793,979 897,311 897,311 635 PRISONER EXPENSE REIMBURSE. 1,114,762 1,196,261 1,335,258 834,266 1,250,000 1,250,000 638 COMP COMM CORRECTIONS ACT 416,144 313,034 528,698 424,987 424,987 424,987 640 COMMUTER ASSISTANCE GRANTS 5,800,804 6,042,888 6,100,891 6,488,277 5,762,235 6,778,473641 HEALTH REIMBURSEMENTS 3,265,147 3,316,349 3,368,541 3,366,924 3,320,144 3,382,191 642 LIBRARY SUPPLEMENTS 176,777 182,231 182,139 184,510 182,231 193,218 643 FIRE PROGRAMS 658,050 673,776 694,126 718,659 694,126 718,659 644 HIGHWAY SAFETY GRANTS 6,546 4,978 9,432 6,743 - - 645 MENTAL HEALTH/ INTELLECTUAL DISAB. 11,032,342 11,143,210 11,172,614 9,646,166 8,256,661 9,273,556 646 SUBSTANCE ABUSE 1,159,115 1,120,462 1,249,326 1,223,490 1,167,295 1,238,491 647 SOCIAL SERVICES 3,637,792 3,725,612 3,452,869 3,962,860 4,420,441 4,113,788 648 SIGNAL REIMBURSEMENT 756,484 - - - - - 649 MISC STATE GRANTS 951,835 1,035,682 846,192 1,517,019 1,248,246 1,219,221 652 STATE EMERGENCY MGMT GRANTS 16,763 22,455 3,080 550,509 6,000 6,000 654 COMPREHENSIVE SERVICES ACT (CSA) 1,072,485 1,553,797 1,284,982 923,569 1,715,082 1,784,308 655 DEPARTMENT OF AGING 175,569 333,758 268,799 373,561 379,187 310,290
TOTAL REV CATEG 71,790,714 75,076,003 76,286,883 76,434,684 75,996,278 79,146,009
120
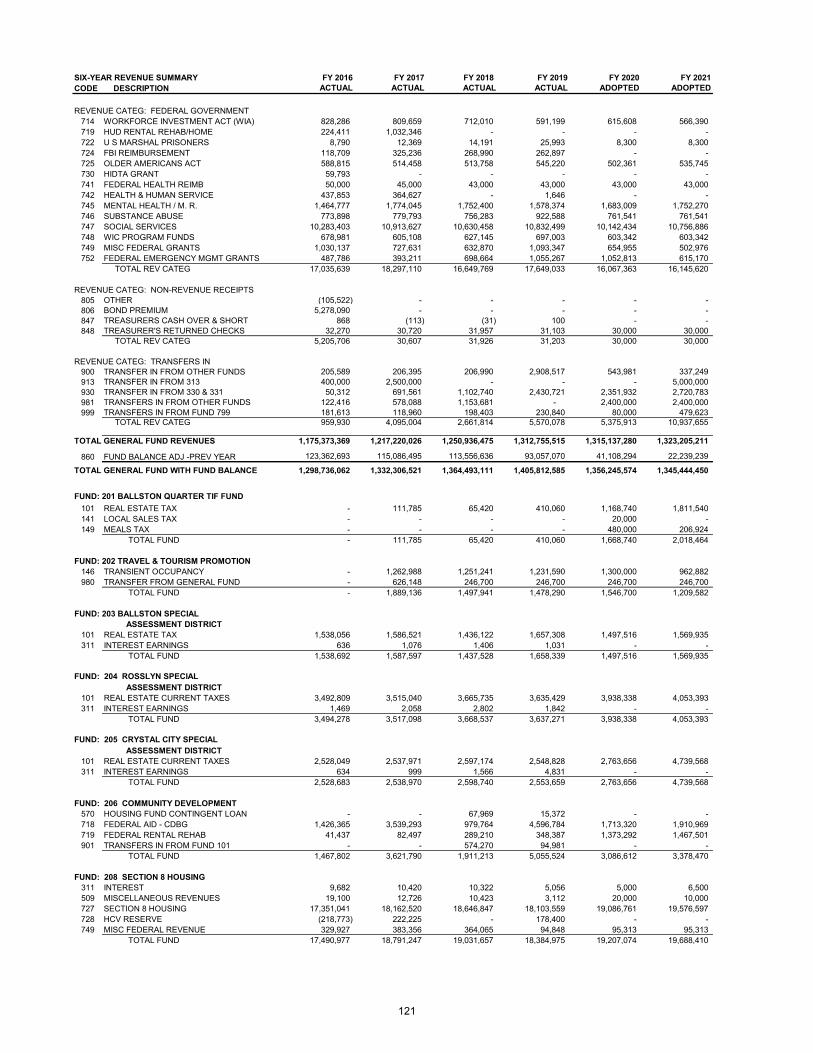
SIX-YEAR REVENUE SUMMARY FY 2016 FY 2017 FY 2018 FY 2019 FY 2020 FY 2021CODE DESCRIPTION ACTUAL ACTUAL ACTUAL ACTUAL ADOPTED ADOPTED
REVENUE CATEG: FEDERAL GOVERNMENT714 WORKFORCE INVESTMENT ACT (WIA) 828,286 809,659 712,010 591,199 615,608 566,390719 HUD RENTAL REHAB/HOME 224,411 1,032,346 - - - - 722 U S MARSHAL PRISONERS 8,790 12,369 14,191 25,993 8,300 8,300 724 FBI REIMBURSEMENT 118,709 325,236 268,990 262,897 - - 725 OLDER AMERICANS ACT 588,815 514,458 513,758 545,220 502,361 535,745730 HIDTA GRANT 59,793 - - - - - 741 FEDERAL HEALTH REIMB 50,000 45,000 43,000 43,000 43,000 43,000742 HEALTH & HUMAN SERVICE 437,853 364,627 - 1,646 - - 745 MENTAL HEALTH / M. R. 1,464,777 1,774,045 1,752,400 1,578,374 1,683,009 1,752,270746 SUBSTANCE ABUSE 773,898 779,793 756,283 922,588 761,541 761,541 747 SOCIAL SERVICES 10,283,403 10,913,627 10,630,458 10,832,499 10,142,434 10,756,886 748 WIC PROGRAM FUNDS 678,981 605,108 627,145 697,003 603,342 603,342749 MISC FEDERAL GRANTS 1,030,137 727,631 632,870 1,093,347 654,955 502,976752 FEDERAL EMERGENCY MGMT GRANTS 487,786 393,211 698,664 1,055,267 1,052,813 615,170
TOTAL REV CATEG 17,035,639 18,297,110 16,649,769 17,649,033 16,067,363 16,145,620
REVENUE CATEG: NON-REVENUE RECEIPTS805 OTHER (105,522) - - - - - 806 BOND PREMIUM 5,278,090 - - - - - 847 TREASURERS CASH OVER & SHORT 868 (113) (31) 100 - - 848 TREASURER'S RETURNED CHECKS 32,270 30,720 31,957 31,103 30,000 30,000
TOTAL REV CATEG 5,205,706 30,607 31,926 31,203 30,000 30,000
REVENUE CATEG: TRANSFERS IN900 TRANSFER IN FROM OTHER FUNDS 205,589 206,395 206,990 2,908,517 543,981 337,249913 TRANSFER IN FROM 313 400,000 2,500,000 - - - 5,000,000 930 TRANSFER IN FROM 330 & 331 50,312 691,561 1,102,740 2,430,721 2,351,932 2,720,783 981 TRANSFERS IN FROM OTHER FUNDS 122,416 578,088 1,153,681 - 2,400,000 2,400,000999 TRANSFERS IN FROM FUND 799 181,613 118,960 198,403 230,840 80,000 479,623
TOTAL REV CATEG 959,930 4,095,004 2,661,814 5,570,078 5,375,913 10,937,655
TOTAL GENERAL FUND REVENUES 1,175,373,369 1,217,220,026 1,250,936,475 1,312,755,515 1,315,137,280 1,323,205,211
860 FUND BALANCE ADJ -PREV YEAR 123,362,693 115,086,495 113,556,636 93,057,070 41,108,294 22,239,239
TOTAL GENERAL FUND WITH FUND BALANCE 1,298,736,062 1,332,306,521 1,364,493,111 1,405,812,585 1,356,245,574 1,345,444,450
FUND: 201 BALLSTON QUARTER TIF FUND101 REAL ESTATE TAX - 111,785 65,420 410,060 1,168,740 1,811,540 141 LOCAL SALES TAX - - - - 20,000 - 149 MEALS TAX - - - - 480,000 206,924
TOTAL FUND - 111,785 65,420 410,060 1,668,740 2,018,464
FUND: 202 TRAVEL & TOURISM PROMOTION146 TRANSIENT OCCUPANCY - 1,262,988 1,251,241 1,231,590 1,300,000 962,882 980 TRANSFER FROM GENERAL FUND - 626,148 246,700 246,700 246,700 246,700
TOTAL FUND - 1,889,136 1,497,941 1,478,290 1,546,700 1,209,582
FUND: 203 BALLSTON SPECIAL ASSESSMENT DISTRICT
101 REAL ESTATE TAX 1,538,056 1,586,521 1,436,122 1,657,308 1,497,516 1,569,935311 INTEREST EARNINGS 636 1,076 1,406 1,031 - -
TOTAL FUND 1,538,692 1,587,597 1,437,528 1,658,339 1,497,516 1,569,935
ASSESSMENT DISTRICT101 REAL ESTATE CURRENT TAXES 3,492,809 3,515,040 3,665,735 3,635,429 3,938,338 4,053,393311 INTEREST EARNINGS 1,469 2,058 2,802 1,842 - -
TOTAL FUND 3,494,278 3,517,098 3,668,537 3,637,271 3,938,338 4,053,393
ASSESSMENT DISTRICT101 REAL ESTATE CURRENT TAXES 2,528,049 2,537,971 2,597,174 2,548,828 2,763,656 4,739,568311 INTEREST EARNINGS 634 999 1,566 4,831 - -
TOTAL FUND 2,528,683 2,538,970 2,598,740 2,553,659 2,763,656 4,739,568
FUND: 206 COMMUNITY DEVELOPMENT570 HOUSING FUND CONTINGENT LOAN - - 67,969 15,372 - - 718 FEDERAL AID - CDBG 1,426,365 3,539,293 979,764 4,596,784 1,713,320 1,910,969 719 FEDERAL RENTAL REHAB 41,437 82,497 289,210 348,387 1,373,292 1,467,501901 TRANSFERS IN FROM FUND 101 - - 574,270 94,981 - -
TOTAL FUND 1,467,802 3,621,790 1,911,213 5,055,524 3,086,612 3,378,470
FUND: 208 SECTION 8 HOUSING311 INTEREST 9,682 10,420 10,322 5,056 5,000 6,500 509 MISCELLANEOUS REVENUES 19,100 12,726 10,423 3,112 20,000 10,000 727 SECTION 8 HOUSING 17,351,041 18,162,520 18,646,847 18,103,559 19,086,761 19,576,597728 HCV RESERVE (218,773) 222,225 - 178,400 - - 749 MISC FEDERAL REVENUE 329,927 383,356 364,065 94,848 95,313 95,313
TOTAL FUND 17,490,977 18,791,247 19,031,657 18,384,975 19,207,074 19,688,410
FUND: 204 ROSSLYN SPECIAL
FUND: 205 CRYSTAL CITY SPECIAL
121

SIX-YEAR REVENUE SUMMARY FY 2016 FY 2017 FY 2018 FY 2019 FY 2020 FY 2021CODE DESCRIPTION ACTUAL ACTUAL ACTUAL ACTUAL ADOPTED ADOPTED
FUND: 313 CAPITAL301 FINES 7,411 36,382 7,316 52,748 - - 321 RENTAL & SALES OF SURPLUS - - - 3,925 - - 335 LEASE AGREEMENTS - - - 118,865 - - 405 FALLS CHURCH REIMBURSEMENTS 271 - 53,510 - - - 460 DEVELOPERS STREET LIGHTS 271,450 25,693 - - - - 461 DEVELOPER/PROJECT RECEIPTS 1,248,920 628,775 4,193,456 3,356,301 - - 509 MISCELLANEOUS 1,928,682 5,394,418 255,440 1,033,406 - - 520 CABLE TV - PEG 885,364 855,346 568,797 1,210,837 - - 521 CABLE TV - INET 221,277 736,587 422,742 - - - 531 NVTA REGIONAL SHARE - - 1,731,405 174,722 - - 632 STATE AID NVTC 2,459,532 1,006,413 2,441,603 310,275 - - 640 STATE TRANSPORTATION GRANTS 56,035 (10,357) (3,953) - - - 648 SIGNAL REIMBURSEMENT 2,475,059 - - - - - 649 MISC STATE GRANTS 5,201 - - - - - 655 VA GENERAL FUND-FED FUND MATCH 321,237 - - - - - 660 VA TRANS DEPT GRANTS 2,470,767 - - - - - 714 FEDERAL GRANTS - 871,158 2,741,387 2,455,924 - - 771 REVENUE FROM FEDERAL GOVT 10,578 - - - - - 806 BOND PREMIUM - 17,846,867 10,929,844 18,396,431 7,000,000 - 808 PROCEEDS FROM LEASE PURCHASE 5,418,570 9,530,658 3,759,718 1,871,651 12,178,410 - 809 LINE OF CREDIT PROCEEDS - - - 8,585,749 - 980 TRANSFER FROM GENERAL FUND 19,890,523 20,191,849 14,619,903 5,667,108 23,601,546 3,832,227999 TRANSFER FROM FUND 799 - 21,650 - - - -
TOTAL FUND 37,670,877 57,135,439 41,721,169 43,237,942 42,779,956 3,832,227
FUND: 321 STORMWATER FUND101 REAL ESTATE TAX 9,013,936 9,276,017 9,459,705 9,747,498 10,093,595 10,423,354301 FINES 9,829 7,982 19,117 18,364 - - 411 SEDIMENT/EROSION CONTROL 129,980 450,000 594,461 834,640 907,500 1,111,968 428 MISC REVENUE - - - - - - 455 CHESAPEAKE BAY FEE - - - 160,000 210,000 193,725 649 MISC STATE GRANTS 31,295 1,143,567 365,009 - - -
TOTAL FUND 9,185,040 10,877,566 10,438,292 10,760,502 11,211,095 11,729,047
FUNDS: 330 & 331 TRANSPORTATION CAPITAL FUND101 REAL ESTATE TAX 24,423,284 25,031,364 24,742,753 25,048,572 26,419,757 26,566,401 334 BASE RENT - - 162,957 - - - 461 DEVELOPER CONTRIBUTIONS 777,356 3,084,202 857,214 2,336,389 - - 509 MISC REVENUES 845,417 1,471,551 894,394 629,784 - - 530 NVTA LOCAL SHARE 11,796,879 12,297,156 10,171,860 8,710,709 7,938,761 7,870,399 531 NVTA REGIONAL SHARE 978,701 1,329,694 1,630,252 3,192,235 - - 532 REGIONAL TOLL REVENUE - 9,767 131,716 239,113 - - 632 STATE AID 7,238,834 4,488,580 7,683,039 8,524,945 - - 640 STATE TRANSPORTATION GRANTS 1,292,412 128,886 34,197 401,222 - - 660 VDOT/REVENUE SHARING FUNDS 145 - - - - - 714 FEDERAL GRANTS - 427,544 1,900,968 699,793 - -
TOTAL FUND 47,353,028 48,268,744 48,209,350 49,782,762 34,358,518 34,436,800
FUND: 335 CRYSTAL CITY TIF FUND101 REAL ESTATE TAX 3,980,241 5,396,172 5,157,771 5,040,366 5,964,730 5,759,940 461 DEVELOPER CONTRIBUTIONS - 780,000 - 500,000 - - 531 NVTA REGIONAL SHARE - 1,167,669 221,893 641,854 - - 632 STATE AID NVTC 537 3,612 8,578 31 - - 655 VIRGINIA GENERAL FUND - FED FUND MATCH 215,446 - - - - - 714 FEDERAL GRANTS - 168,250 171,337 187,403 - -
TOTAL FUND 4,196,224 7,515,703 5,559,579 6,369,654 5,964,730 5,759,940
FUND 336: COLUMBIA PIKE TIF FUND101 REAL ESTATE TAX 308,369 601,844 - 189,070 496,660 968,520
TOTAL FUND 308,369 601,844 - 189,070 496,660 968,520
FUND: 503 UTILITIES OPERATING311 INTEREST 135,520 106,547 73,843 270,000 75,000 125,000 321 RENTALS & SALES OF SURPLUS 161,370 164,908 168,675 170,372 174,120 179,400426 APPLIANCE FEE RECYCLING 7,700 10,660 7,770 8,570 8,000 8,000444 UTILITY MARKING FEE 182,094 224,217 226,120 225,791 195,000 215,000482 WATER SEWER SERVICE 93,056,953 97,263,095 94,465,529 92,757,659 97,107,970 98,626,926484 WATER SERVICE CONNECTIONS 1,282,297 1,249,315 1,193,850 1,016,035 1,265,000 1,265,000486 SEWAGE TREAT. SERVICE CHARGES 3,781,654 3,182,544 3,699,669 4,044,812 4,005,200 4,105,200488 FLOW TEST FEES 15,800 20,100 21,900 22,600 15,500 20,200509 MISCELLANEOUS REVENUES 86,665 96,901 114,915 191,243 91,055 122,569848 TREASURER'S RETURNED CHECK - 300 - - - -
TOTAL FUND 98,710,053 102,318,587 99,972,271 98,707,082 102,936,845 104,667,295
122

SIX-YEAR REVENUE SUMMARY FY 2016 FY 2017 FY 2018 FY 2019 FY 2020 FY 2021CODE DESCRIPTION ACTUAL ACTUAL ACTUAL ACTUAL ADOPTED ADOPTED
FUND: 519 UTILITIES CAPITAL311 INTEREST ON GENERAL FUND 290,252 145,473 221,375 1,176,228 100,000 350,000312 INTEREST ON BOND FUNDS 38,615 58,534 123,622 196,139 - - 484 WATER SERVICE CONNECTION - - 500 - - - 485 WATER SEWER HOOK-UP CHARGES 5,474,991 4,822,363 8,710,176 6,158,068 5,000,000 8,000,000486 SEWAGE TREATMENT SERVICE CHRG 60,110 464,789 432,223 1,397,982 888,500 2,917,000509 MISCELLANEOUS 31,572 68,745 34,556 6,428 - - 771 REVENUE FROM FEDERAL GOVT - (134,176) - - - 901 TRANSFER FROM FUND 101 - 400,000 600,000 400,000 - - 953 TRANSFER FROM FUND 503 13,525,850 13,910,500 15,571,640 14,025,300 14,190,500 12,155,000
TOTAL FUND 19,421,390 19,870,404 25,559,916 23,360,145 20,179,000 23,422,000
FUND: 540 BALLSTON GARAGE312 INTEREST 4,431 25,231 21,992 - - - 428 PARKING REVENUES 3,871,490 3,263,871 3,314,739 4,193,751 4,163,100 4,214,010428 MISCELLANEOUS REVENUE 15,833 8,970 (24,612) 39,360 - - 449 MISC SERVICE CHARGES 107,313 - - - - -
TOTAL FUND 3,999,067 3,298,072 3,312,119 4,233,111 4,163,100 4,214,010
FUND: 548 BALLSTON GARAGE - 8th LEVEL428 PARKING REVENUES 374,270 267,492 307,289 263,433 263,400 240,540
TOTAL FUND 374,270 267,492 307,289 263,433 263,400 240,540
FUND: 570 CPHD DEVELOPMENT FUND211 HOME IMPROVEMENT CONTRACT - 50 75 - - - 221 HIGHWAY PERMITS - - - 256 - - 222 BUILDING PERMITS 8,039,077 8,837,919 10,212,492 9,356,869 15,254,787 15,281,374223 ELECTRICAL PERMITS 2,207,204 2,079,902 3,099,797 2,702,704 3,234,834 3,157,414224 PLUMBING PERMITS 1,375,746 1,382,552 1,797,206 1,903,081 2,366,536 2,313,190225 MECHANICAL PERMITS 940,069 770,390 784,749 1,001,243 1,339,550 1,309,354226 OCCUPANCY PERMITS 585,355 760,549 637,566 884,302 1,137,838 1,115,507228 SIGN PERMITS 44,151 40,293 47,203 54,221 89,593 130,065242 ELEVATOR CERTIFICATE FEES 821,164 1,106,671 1,189,586 931,876 1,518,156 1,483,934243 ADMINISTRATIVE CHANGE - - 289 (736) - - 245 REZONING - - - 23,567 - - 247 VARIANCES/S F EXISTING 92,820 75,660 58,264 60,405 89,593 87,833248 ZONING COMPLIANCE LETTERS 31,419 38,165 38,931 40,201 54,896 53,818251 PLAN REVIEW - WALK THROUGHS 786,853 808,290 861,226 802,182 1,322,403 1,296,450252 SUBDIVISION PLAT REVIEW 10,734 11,826 7,920 12,684 21,502 21,080259 MISC LICENSES PERMITS & FEES 6,721 8,850 15,193 45,901 22,235 54,480311 INTEREST 152,994 84,889 103,126 633,199 - - 321 RENTALS & SALES OF SURPLUS - - - 8,019 - - 422 CASH OVER/SHORT 275 (30) (6) (2) - - 449 MISC SERVICE CHARGES (7,066) 7,386 4,570 3,519 7,066 6,917509 MISC REVENUE 8,280 294 83,297 83,668 52,774 51,738 999 TRANSFER IN FROM 799 - - 284,701 - - -
TOTAL FUND 15,095,796 16,013,656 19,226,185 18,547,159 26,511,763 26,363,154
FUND: 609 AUTOMOTIVE EQUIPMENT321 RENTALS & SALES OF SURPLUS 688,564 575,264 486,220 1,920,868 300,000 300,000405 FALLS CHURCH REIMBURSEMENT - 231,324 - - - - 448 SERVICES TO OUTSIDE AGENCIES 20,365,432 19,673,398 19,971,263 19,170,894 16,854,974 17,725,065509 MISCELLANEOUS REVENUE 776,521 510,131 528,709 489,225 521,000 521,000512 THIRD PARTY RECOVERY 0 75,665 27,909 - 60,000 60,000808 PROCEEDS FROM LEASE PURCHASE 1,535,518 - - - - - 901 TRANSFER FROM GENERAL FUND - 100,500 - - - - 903 TRANSFER IN FROM FUND 503 100,624 - - - 47,000 - 980 TRANSFER FROM GENERAL FUND - - 229,500 - - 30,000
TOTAL FUND 23,466,659 21,166,282 21,243,601 21,580,987 17,782,974 18,636,065
FUND: 611 PRINTING446 SERVICES TO AGENCIES 2,364,659 2,815,381 2,662,456 2,560,588 2,170,000 2,365,459980 TRANSFER FROM GENERAL FUND 231,484 241,769 249,600 242,337 246,382 246,382
TOTAL FUND 2,596,143 3,057,150 2,912,056 2,802,925 2,416,382 2,611,841
ARLINGTON PUBLIC SCHOOLS FUNDS*FUND: 880 SCHOOL OPERATING FUND
400 CHARGES FOR SERVICES 9,903,997 3,027,924 3,100,882 3,965,921 4,016,800 3,737,300500 CARRYOVER AND OTHER (8,441,947) - (2,000,000) (2,600,000) 10,229,808 18,931,586692 VIRGINIA SALES TAX 23,067,985 24,458,713 26,332,866 28,417,611 30,377,851 31,905,594690 COMMONWEALTH 35,122,440 37,206,067 39,034,873 42,366,817 44,585,780 45,828,863700 FEDERAL FUNDS - 309,052 646,080 973,071 800,000 800,000 808 PROCEEDS FROM LEASE PURCHASE 2,663,295 1,991,412 3,357,475 5,139,346 - - 900 TRANSFERS IN 400,039,915 395,568,221 424,655,754 436,949,407 463,264,169 458,730,510
TOTAL FUND 462,355,685 462,561,389 495,127,930 515,212,173 553,274,408 559,933,853
FUND: 881 FOOD AND NUTRITION SERVICES FUND300 INTEREST - - 58,162 - - - 400 CHARGES FOR SERVICES 4,044,090 4,503,088 4,686,471 5,351,526 4,810,000 5,501,748 500 CARRYOVER AND OTHER - 180,000 - 600 COMMONWEALTH 97,425 231,007 129,552 119,523 183,000 120,000 700 FEDERAL FUNDS 4,828,771 5,444,180 5,681,988 5,759,159 5,555,000 5,700,000
TOTAL FUND 8,970,286 10,178,275 10,556,173 11,230,208 10,728,000 11,321,748
123

SIX-YEAR REVENUE SUMMARY FY 2016 FY 2017 FY 2018 FY 2019 FY 2020 FY 2021CODE DESCRIPTION ACTUAL ACTUAL ACTUAL ACTUAL ADOPTED ADOPTED
FUND: 882 COMMUNITY ACTIVITIES FUND400 CHARGES FOR SERVICES 10,498,647 11,344,954 12,054,571 12,750,112 14,119,568 13,999,462 500 CARRYOVER/OTHER - - 75,296 5,137,867 - - 900 TRANSFERS IN 5,232,405 5,510,043 5,422,007 (150,613) 6,125,305 5,756,574
TOTAL FUND 15,731,052 16,854,997 17,551,874 17,737,366 20,244,873 19,756,036
FUND: 883 SPECIAL GRANTS400 CHARGES FOR SERVICES 2,849,633 1,859,731 2,386,205 2,307,007 1,551,384 1,859,429 600 COMMONWEALTH 3,604,498 3,490,772 3,590,683 3,693,143 4,373,583 4,458,428 700 FEDERAL FUNDS 8,945,982 9,437,992 10,078,552 13,872,931 9,538,400 9,773,551 900 TRANSFERS IN 957,755 - - - -
TOTAL FUND 15,400,113 15,746,250 16,055,440 19,873,081 15,463,367 16,091,408
FUND: 886 SCHOOL CONSTRUCTION AND CAPITAL FUND500 CARRYOVER AND OTHER - - - - 4,616,362 772,500 600 COMMONWEALTH - 131,429 713,467 - - - 808 PROCEEDS FROM LEASE PURCHASE - 11,714,732 15,442,463 - - - 900 TRANSFERS IN 19,558,240 23,498,197 14,789,645 428,930 1,842,133 1,268,343
TOTAL FUND 19,558,240 35,344,358 30,945,576 428,930 6,458,495 2,040,843
FUND: 888 SCHOOL DEBT SERVICE FUND500 CARRYOVER AND OTHER 100,000 - - - 303,088 270,000 900 TRANSFERS IN 44,430,851 46,243,129 50,311,876 53,695,031 58,857,474 56,635,740
TOTAL FUND 44,530,851 46,243,129 50,311,876 53,695,031 59,160,562 56,905,740
FUND: 889 SCHOOL COMPREHENSIVE SERVICES FUND600 COMMONWEALTH 1,747,556 1,972,244 1,795,411 1,458,278 1,985,075 1,985,075 900 TRANSFERS IN 1,905,932 2,251,267 1,775,415 1,947,142 2,239,925 2,239,925
TOTAL FUND 3,653,488 4,223,511 3,570,826 3,405,420 4,225,000 4,225,000
TOTAL ARLINGTON PUBLIC SCHOOLS 570,199,715 591,151,909 624,119,694 621,582,209 669,554,705 670,274,628
124

GENERAL FUND
125

This page intentionally left blank
126
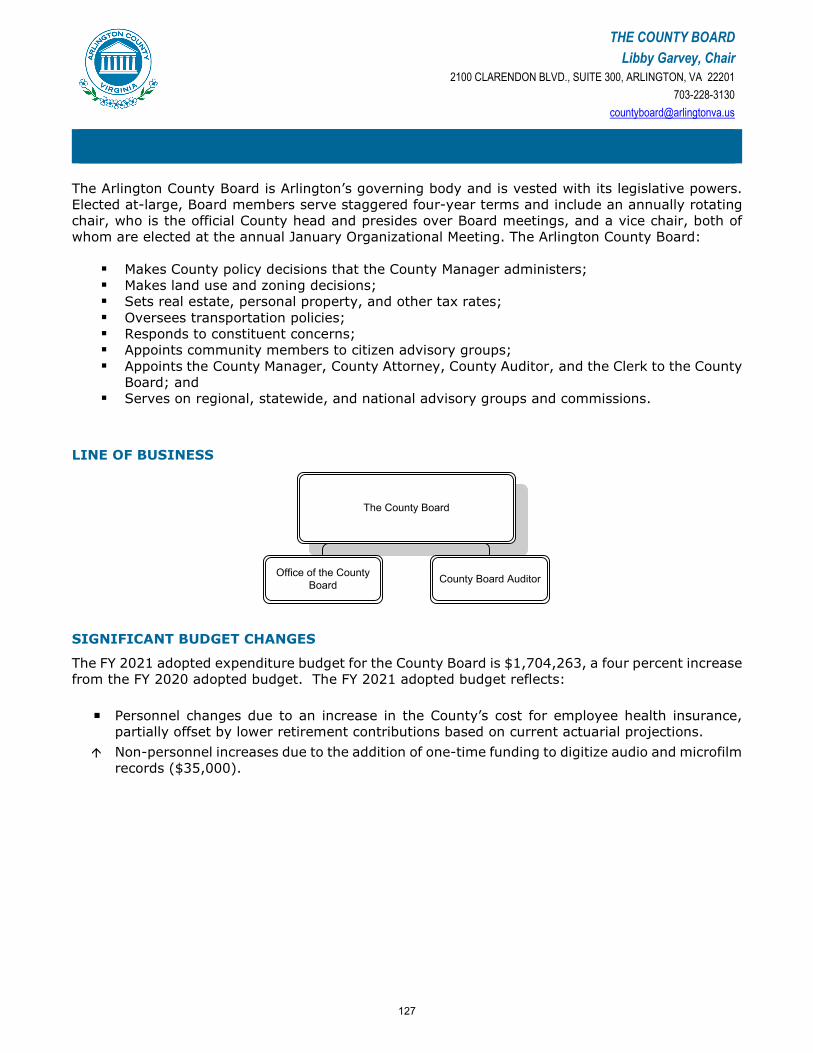
THE COUNTY BOARD Libby Garvey, Chair
2100 CLARENDON BLVD., SUITE 300, ARLINGTON, VA 22201 703-228-3130
The Arlington County Board is Arlington’s governing body and is vested with its legislative powers. Elected at-large, Board members serve staggered four-year terms and include an annually rotating chair, who is the official County head and presides over Board meetings, and a vice chair, both of whom are elected at the annual January Organizational Meeting. The Arlington County Board:
Makes County policy decisions that the County Manager administers; Makes land use and zoning decisions; Sets real estate, personal property, and other tax rates; Oversees transportation policies; Responds to constituent concerns; Appoints community members to citizen advisory groups; Appoints the County Manager, County Attorney, County Auditor, and the Clerk to the County
Board; and Serves on regional, statewide, and national advisory groups and commissions.
LINE OF BUSINESS
SIGNIFICANT BUDGET CHANGES
The FY 2021 adopted expenditure budget for the County Board is $1,704,263, a four percent increase from the FY 2020 adopted budget. The FY 2021 adopted budget reflects:
Personnel changes due to an increase in the County’s cost for employee health insurance, partially offset by lower retirement contributions based on current actuarial projections.
Non-personnel increases due to the addition of one-time funding to digitize audio and microfilmrecords ($35,000).
The County Board
County Board AuditorOffice of the County Board
127

THE COUNTY BOARD DEPARTMENT BUDGET SUMMARY
DEPARTMENT FINANCIAL SUMMARY
FY 2019 FY 2020 FY 2021 % ChangeActual Adopted Adopted ‘20 to ‘21
Personnel $1,518,677 $1,598,029 $1,625,131 2%Non-Personnel 113,361 44,132 79,132 79%Total Expenditures 1,632,038 1,642,161 1,704,263 4%
Total Revenues - - - -
Net Tax Support $1,632,038 $1,642,161 $1,704,263 4%
Permanent FTEs 10.00 10.00 10.00Temporary FTEs - - - Total Authorized FTEs 10.00 10.00 10.00
Expenses by Line of Business
FY 2019 FY 2020 FY 2021 % Change FY 2021 FTEsActual Adopted Adopted ‘20 to ‘21 Adopted
County Board Office $1,405,734 $1,414,418 $1,469,609 4% 9.00County Board Auditor 226,304 227,743 234,654 3% 1.00Total Expenditures $1,632,038 $1,642,161 $1,704,263 4% 10.00
128

THE COUNTY BOARD TEN-YEAR HISTORY
EXPENDITURE, REVENUE, NET TAX SUPPORT, AND FULL-TIME EQUIVALENT TRENDS
$ in 000sFY 2012
ActualFY 2013
ActualFY 2014
ActualFY 2015
ActualFY 2016
ActualFY 2017
ActualFY 2018
ActualFY 2019
Actual
FY 2020 Adopted Budget
FY 2021 Adoted Budget
EXP $1,013 $1,033 $1,078 $1,235 $1,327 $1,406 $1,737 $1,632 $1,642 $1,704REV - - - - - - - - - - NTS $1,013 $1,033 $1,078 $1,235 $1,327 $1,406 $1,737 $1,632 $1,642 $1,704FTEs 8.00 8.00 7.75 8.25 9.25 10.00 10.00 10.00 10.00 10.00
0
2
4
6
8
10
$0
$200
$400
$600
$800
$1,000
$1,200
$1,400
$1,600
$1,800
$2,000
FTEs EXP REV NTS
129

THE COUNTY BOARD TEN-YEAR HISTORY
Fiscal Year Description FTEs
FY 2012 The County Board restored an Aide position to full-time ($17,671). The County Board set a new maximum salary ceiling for the period January
1, 2012 through December 31, 2015 of $57,337 for Board members and$63,071 for the Board Chairman. Actual Board salaries for FY 2012 arethe same as FY 2011.
0.25
FY 2013 The County Board approved a 2.3 percent increase in County Boardsalaries ($7,268). The Chair’s salary will increase from $53,900 to $55,140, and Member salaries will increase from $49,000 to $50,127.
FY 2014 Eliminated a portion of an Administrative Assistant position ($14,170). (0.25)
FY 2015 The County Board added ongoing funding for a Policy Analyst position($45,000).
0.50
FY 2016 The County Board added an internal auditor position that will report to theCounty Board ($200,000).
1.0
FY 2017 Converted a part-time Policy Analyst position to full-time. 0.50
Added non-personnel funding for the County Board Auditor to continuefunding at the same level as FY 2016 ($18,498).
The FY 2017 budget includes a technical adjustment to correct theauthorized FTE count for the Office of the County Board, there was noimpact to net tax support.
0.25
FY 2018 The County Board approved a 3.5 percent increase in County Board salaries. The Chair’s salary will increase from $56,629 to $58,610, and Member salaries will increase from $51,480 to $53,282.
Added $50,000 in one-time funding to begin digitizing historical CountyBoard records.
FY 2019 The County Board approved a 3.5 percent increase in County Board salaries.
Removed $50,000 in one-time funding to begin digitizing historical CountyBoard records.
Reduced the non-personnel expenditure budget by $40,000
FY 2020 Reduced the non-personnel budget by $20,000. The County Board Office focused on reducing discretionary spending in areas such as travel and training, printing, and office supplies and shift the costs of advertising, as appropriate, to the Development Fund for activities under its responsibility.
130

THE COUNTY BOARD TEN-YEAR HISTORY
Fiscal Year Description FTEs
Reduced wireless service charges as part of a County-wide review ofwireless service providers ($1,197).
FY 2021 Added $35,000 in one-time funding to begin digitizing audio and microfilm historical County Board records.
131

This page intentionally left blank
132

OFFICE OF THE COUNTY MANAGER Mark Schwartz, County Manager
2100 CLARENDON BLVD., SUITE 302, ARLINGTON, VA 22201 703-228-3120
Our Mission: To assure that Arlington's government works
The County Manager's Office provides professional recommendations to, and implements the vision and policies of, the County Board; ensures high quality services, with outstanding customer service, at a good value to taxpayers; fosters economic and fiscal sustainability; and enhances Arlington's reputation as a high performing, learning, caring organization that operates in a manner consistent with its mission and values, making Arlington an employer of choice.
LINES OF BUSINESS
Office of the County Manager
Communications & Public Engagement Human Rights OfficeMain Office
Office of Human RightsMain Office Communications & Public Engagement
SIGNIFICANT BUDGET CHANGES
The FY 2021 adopted expenditure budget for the County Manager’s Office is $5,134,115, a two percent decrease from the FY 2020 adopted budget. The FY 2021 adopted budget reflects:
Personnel changes due to an increase in the County’s cost for employee health insurance,partially offset by lower retirement contributions based on current actuarial projections.
Revenue decreases due to an accounting adjustment for Freedom of Information Act (FOIA)reimbursements ($514) and an anticipated decrease in the Equal Employment Opportunity(EEO) grant ($8,300).
133

OFFICE OF THE COUNTY MANAGER DEPARTMENT BUDGET SUMMARY
DEPARTMENT FINANCIAL SUMMARY
FY 2019 FY 2020 FY 2021 % ChangeActual Adopted Adopted ‘20 to ‘21
Personnel $5,015,116 $4,874,229 $4,805,314 -1%Non-Personnel 320,021 360,192 328,801 -9%Total Expenditures 5,335,137 5,234,421 5,134,115 -2%
Fees 3,511 3,000 2,486 -17%Grants 22,400 28,500 20,200 -29%Total Revenues 25,911 31,500 22,686 -28%
Net Tax Support $5,309,226 $5,202,921 $5,111,429 -2%
Permanent FTEs 33.00 31.00 31.00 Temporary FTEs - - - Total Authorized FTEs 33.00 31.00 31.00
Expenses by Line of Business
FY 2019 FY 2020 FY 2021 % Change FY 2021 FTEs Actual Adopted Adopted ‘20 to ‘21 Adopted
Main Office $2,611,346 $2,334,699 $2,432,280 4% 13.00Communications and Public Engagement 1,768,518 2,027,506 1,852,788 -9% 13.00Office of Human Rights 955,273 872,216 849,047 -3% 5.00Total Expenditures $5,335,137 $5,234,421 $5,134,115 -2% 31.00
134

OFFICE OF THE COUNTY MANAGER TEN-YEAR HISTORY
EXPENDITURE, REVENUE, NET TAX SUPPORT, AND FULL-TIME EQUIVALENT TRENDS
$ in 000sFY 2012
ActualFY 2013
ActualFY 2014
ActualFY 2015
ActualFY 2016
ActualFY 2017
ActualFY 2018
ActualFY 2019
Actual
FY 2020 Adopted Budget
FY 2021 Adopted Budget
EXP $4,947 $5,199 $5,192 $5,287 $5,579 $5,426 $5,282 $5,335 $5,234 $5,134REV $141 $183 $227 $220 $216 $34 $32 $26 $31 $23NTS $4,806 $5,016 $4,965 $5,067 $5,363 $5,392 $5,250 $5,309 $5,203 $5,111FTEs 36.85 37.11 35.85 35.85 37.35 33.35 36.00 33.00 31.00 31.00
0
5
10
15
20
25
30
35
40
$0
$1,000
$2,000
$3,000
$4,000
$5,000
$6,000FTEs EXP REV NTS
135

OFFICE OF THE COUNTY MANAGER TEN-YEAR HISTORY
Fiscal Year Description FTEs
FY 2012 Eliminated funding for the Fair Housing Survey ($47,000). On March 12, 2011, as part of the revision to the goals and targets for affordable housing, the County Board set a goal of conducting the survey every other year; it will next be conducted in FY 2013.
Decreased revenue due to the state’s elimination of grants to localDisability Services Boards ($7,750) and reduction in communitycorrections funding ($1,417). Equal Employment Opportunity revenuereduced based on estimated number of complaints ($4,500).
FY 2013 The County Board added one-time funding for two walking town meetings ($29,600 personnel, $11,400 non-personnel, 0.26 temporary FTE).
0.26
The County Board added $100,000 in one-time funding for civicengagement.
Personnel includes the transfer of funding supporting a position in the MainOffice from the Pay-As-You-Go Capital fund ($130,000).
One-time funding is included for the Fair Housing Survey in the Office ofHuman Rights ($50,000). The survey was last conducted during FY 2011and is now scheduled to take place every two years instead of the previousschedule of every three years.
New fee revenue is included for fees for copying and postage for Freedomof Information Act (FOIA) requests ($3,000) not previously budgeted.
Fee revenue includes Falls Church reimbursements for CommunityCorrections ($12,786), not previously budgeted.
FY 2014 Personnel includes the transfer of 0.5 FTE to the Department of Human Resources ($45,836) and the elimination of 0.26 temporary FTE added in FY 2013 with one-time funds to initiate the PLACE Walking Town Meetings ($29,600).
Eliminated one-time funding for the FY 2013 PLACE initiative project($11,400) and the County fair housing study ($50,000).
Eliminated an Administrative Specialist position ($45,836). Reduced funding for travel ($1,500) and print shop ($2,500) accounts. Reduced funding in unclassified services ($1,035), consultants ($2,000),
and operating supplies ($1,500). Reduced funding for printing ($2,000).
(0.76)
(0.5)
FY 2015 Eliminated one-time funding for civic engagement ($100,000). Added one-time funding for the Fair Housing Study in the Office of Human
Rights ($50,000). The survey was last conducted in FY 2013 and isscheduled to take place every two years.
Intra-County charges decreased due to a projected drop in agency requestsfor Citizen newsletter inserts ($7,000).
FY 2016 The County Board eliminated one issue of the Citizen ($28,056).
136
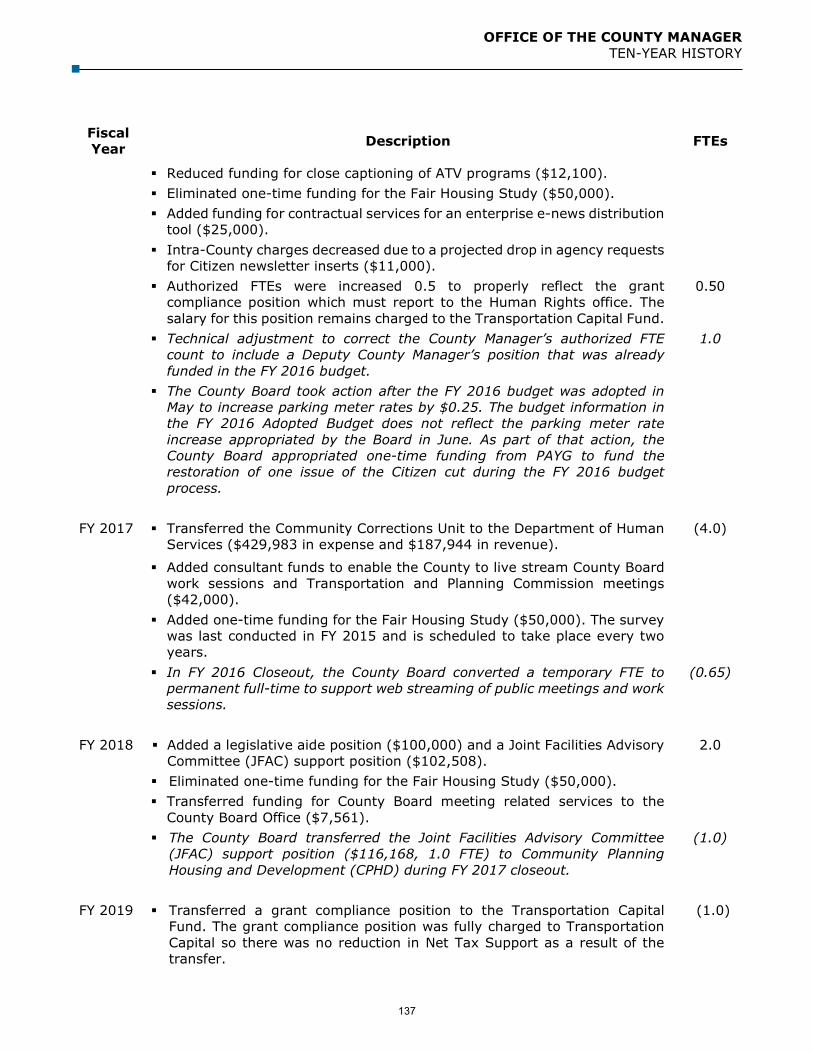
OFFICE OF THE COUNTY MANAGER TEN-YEAR HISTORY
Fiscal Year Description FTEs
Reduced funding for close captioning of ATV programs ($12,100). Eliminated one-time funding for the Fair Housing Study ($50,000). Added funding for contractual services for an enterprise e-news distribution
tool ($25,000). Intra-County charges decreased due to a projected drop in agency requests
for Citizen newsletter inserts ($11,000). Authorized FTEs were increased 0.5 to properly reflect the grant
compliance position which must report to the Human Rights office. Thesalary for this position remains charged to the Transportation Capital Fund.
0.50
Technical adjustment to correct the County Manager’s authorized FTEcount to include a Deputy County Manager’s position that was alreadyfunded in the FY 2016 budget.
1.0
The County Board took action after the FY 2016 budget was adopted inMay to increase parking meter rates by $0.25. The budget information inthe FY 2016 Adopted Budget does not reflect the parking meter rateincrease appropriated by the Board in June. As part of that action, theCounty Board appropriated one-time funding from PAYG to fund therestoration of one issue of the Citizen cut during the FY 2016 budgetprocess.
FY 2017 Transferred the Community Corrections Unit to the Department of Human Services ($429,983 in expense and $187,944 in revenue).
(4.0)
Added consultant funds to enable the County to live stream County Boardwork sessions and Transportation and Planning Commission meetings($42,000).
Added one-time funding for the Fair Housing Study ($50,000). The surveywas last conducted in FY 2015 and is scheduled to take place every twoyears.
In FY 2016 Closeout, the County Board converted a temporary FTE topermanent full-time to support web streaming of public meetings and worksessions.
(0.65)
FY 2018 Added a legislative aide position ($100,000) and a Joint Facilities Advisory Committee (JFAC) support position ($102,508).
2.0
Eliminated one-time funding for the Fair Housing Study ($50,000). Transferred funding for County Board meeting related services to the
County Board Office ($7,561). The County Board transferred the Joint Facilities Advisory Committee
(JFAC) support position ($116,168, 1.0 FTE) to Community PlanningHousing and Development (CPHD) during FY 2017 closeout.
(1.0)
FY 2019 Transferred a grant compliance position to the Transportation Capital Fund. The grant compliance position was fully charged to Transportation Capital so there was no reduction in Net Tax Support as a result of the transfer.
(1.0)
137

OFFICE OF THE COUNTY MANAGER TEN-YEAR HISTORY
Fiscal Year Description FTEs
Added one-time funding for the Fair Housing Study ($50,000). The surveywas last conducted in FY 2017 and is scheduled to take place every twoyears.
Added one-time funding for the resident satisfaction survey ($50,000). Eliminated the Citizen Newsletter ($82,088). Eliminated a vacant ATV Producer. The net savings is $83,215 as a portion
of the salary savings was reallocated to fund additional contractor support($32,240).
(1.0)
Reduced contractor support for Public Webcasting / Cablecasting($47,081).
FY 2020 Eliminated a filled Government Affairs Liaison position ($187,725). (1.0) Eliminated a filled Administrative Assistant V position in the Human Rights
Office ($95,431).(1.0)
Reduced wireless service charges as part of a County-wide review ofwireless service providers ($3,192).
Eliminated $100,000 in biannual one-time funding for a ResidentSatisfaction Survey and the Fair Housing Survey conducted in FY 2019.
Added $36,000 in one-time funding for an online civic engagement tool.
FY 2021 Accounting adjustment for Freedom of Information Act (FOIA) reimbursements ($514).
Anticipated decrease in the Equal Employment Opportunity (EEO) grant($8,300).
138
DEPARTMENT OF MANAGEMENT AND FINANCE Maria Meredith, Director
2100 CLARENDON BLVD., SUITE 501, ARLINGTON, VA 22201 703-228-0757
Our Mission: To ensure the prudent use of County resources
The Department of Management and Finance (DMF) provides sound, accurate, and timely financial analysis to ensure the prudent use of County resources and enable the delivery of high quality services. Specific services include: financial management, innovative problem-solving and policy support, annual real property assessments, project finance assistance, economic analysis, purchasing, internal auditing, accounting, and providing financial information for the County Board, the public, the County Manager, and County departments.
LINES OF BUSINESS
DMF Director
Management & Budget PurchasingAccounting, Reporting and Control Real Estate Assessment
Management & Budget Accounting, Reporting and Control Purchasing Department of Real
Estate Assessments
Internal Audit
Internal Audit
Management, Leadership & Administration
SIGNIFICANT BUDGET CHANGES
The FY 2021 adopted expenditure budget for the Department of Management and Finance is $8,569,554, less than a one percent decrease from the FY 2020 adopted budget. The FY 2021 budget reflects:
Personnel changes due to the addition of a Procurement Officer position in the Purchasing division ($124,615, 1.0 FTE) and an increase in the County’s cost for employee health insurance, partially offset by lower retirement contributions based on current actuarial projections.
Non-personnel increases due to the contractual maintenance and licensure of the budgetingsoftware ($61,010) and real estate mobile assessor software ($9,650).
Fee revenue increases due to higher projections in the County’s Purchase Card rebates basedon the reconciliation of prior year actual revenue ($20,000).
Transfers from other funds increase due to administrative fees to the Business ImprovementDistricts for the County-wide administrative support ($43,268).
139

DEPARTMENT OF MANAGEMENT AND FINANCE DEPARTMENT BUDGET SUMMARY
DEPARTMENT FINANCIAL SUMMARY
FY 2019 FY 2020 FY 2021 % ChangeActual Adopted Adopted '20 to '21
Personnel $7,168,642 $7,723,489 $7,637,782 -1%Non-Personnel 835,854 861,112 931,772 8%Total Expenditures 8,004,496 8,584,601 8,569,554 -
Fees 389,878 319,000 339,000 6%Transfers From Other Funds 366,831 373,981 417,249 12%Total Revenues 756,709 692,981 756,249 9%
Net Tax Support $7,247,787 $7,891,620 $7,813,305 -1%
Permanent FTEs 58.50 58.50 59.50Temporary FTEs - - - Total Authorized FTEs 58.50 58.50 59.50
Expenses by Lines of Business
FY 2019 FY 2020 FY 2021 % Change FY 2021 FTEsActual Adopted Adopted '20 to '21 Adopted
Management and Budget $2,144,358 $2,628,434 $2,663,117 1% 16.00Accounting, Reporting & Control 1,387,903 1,426,495 1,403,823 -2% 9.00Internal Audit 384,139 460,908 425,926 -8% 1.50Purchasing 1,300,984 1,223,020 1,274,192 4% 10.00Real Estate Assessments 2,787,112 2,845,744 2,802,496 -2% 23.00Total Expenditures $8,004,496 $8,584,601 $8,569,554 - 59.50
140

DEPARTMENT OF MANAGEMENT AND FINANCE TEN-YEAR HISTORY
EXPENDITURE, REVENUE, NET TAX SUPPORT AND FULL-TIME EQUIVALENT TRENDS
Adopted FY 2007
$ in 000sFY 2012
Actual FY 2013
Actual FY 2014
ActualFY 2015
ActualFY 2016
ActualFY 2017
ActualFY 2018
ActualFY 2019
Actual
FY 2020 Adopted Budget
FY 2021 Adopted Budget
EXP $5,805 $5,797 $6,018 $6,781 $6,480 $7,428 $7,725 $8,005 $8,585 $8,569REV $204 $492 $474 $273 $419 $326 $443 $757 $693 $756NTS $5,601 $5,305 $5,544 $6,508 $6,061 $7,102 $7,282 $7,248 $7,892 $7,813FTEs 55.00 55.00 55.50 56.50 57.50 57.50 58.50 58.50 58.50 59.50
0
10
20
30
40
50
60
70
$0
$1,000
$2,000
$3,000
$4,000
$5,000
$6,000
$7,000
$8,000
$9,000
$10,000
$11,000FTEs EXP REV NTS
141

DEPARTMENT OF MANAGEMENT AND FINANCE TEN-YEAR HISTORY
Fiscal Year Description FTEs
FY 2012 The County Board added 1.0 FTE to the Purchasing Division to assist with the increase in capital project solicitations ($108,551).
1.0
Non-personnel expenses increased due to the operating costs of theDepartment of Real Estate Assessment’s new computer system to supportthe County’s appraisal, assessment, and administrative processes($84,040), which is launching in the third quarter of FY 2012, partiallyoffset by decreasing vehicle costs ($1,925).
Revenues increased due to higher revenue from the business improvementdistricts (BIDs), as well as the creation of the Ballston businessimprovement district in FY 2011 ($20,712). Fees charged to BIDS are apercentage of BID revenues generated by an additional tax on commercialproperties.
FY 2013 No significant changes.
FY 2014 The County Board added one-time funding for a Capital Projects Coordinator in the Management and Budget Division ($131,645).
1.0
Eliminated 0.5 of 1.0 FTE Assistant Director, Real Estate Assessment($80,241) as part of the County-wide budget reductions.
(0.5)
Non-personnel expenses increased due to the addition of one-time fundingfor internal audit services and adjustments to the annual expense for themaintenance and replacement of County vehicles ($254,730).
FY 2015 Removed FY 2014 one-time funding for the Capital Project Coordinator ($131,645).
Removed FY 2014 one-time funding for internal audit ($250,000) andadjustments to the annual expense for maintenance and replacement ofCounty vehicles ($337).
Added a Procurement Officer position in the Purchasing Division($120,000).
1.0
The County Board added one-time funding for internal audit as part ofFY 2014 closeout ($200,000).
During FY 2015, reallocated a 0.5 FTE position from the Real EstateAssessment line of business to serve as a budget and financial analyst inthe Management and Budget line of business.
FY 2016 Converted temporary Internal Audit Position to permanent ($50,912). 0.5 Converted previously authorized overstrength employee to permanent
Financial Analyst to continue capital project monitoring in support of theCounty’s growing CIP ($55,212).
0.5
Converted previously authorized limited term full-time employee topermanent Financial Analyst to continue capital project financialmonitoring. The salary for this position remains fully charged toPay-As-You-Go Fund and does not change the authorized FTE count.
142

DEPARTMENT OF MANAGEMENT AND FINANCE TEN-YEAR HISTORY
Fiscal Year Description FTEs
Reallocated funds and personnel within the department to create theInternal Audit line of business and added $200,000 in ongoingnon-personnel funding to support the internal audit operations.
Reclassified 2.0 limited term full-time employees to 2.0 permanentfull-time County funded positions in the Department of Real EstateAssessments Line of Business.
FY 2017 No significant changes.
FY 2018 Added a purchasing position to support the increasing demands of capital projects (no general fund support – salary charged to capital projects).
1.0
Fee revenue increases for the addition of administrative fees and annualproperty tax payment related to the Arlington/Alexandria Waste-to-EnergyPlant ($94,000).
FY 2019 The County Board adopted a one-time tax rate increase for the Ballston Business Improvement District which increased the Transfers from Other Funds revenue derived from administrative fees ($5,176).
Transfers from other funds increased due to the County increasingadministrative fees to the Business Improvement Districts ($75,218) fromone percent to two percent for County-wide administrative support.
Elimination of a vacant limited-term Staff Support Technician ($90,076). (1.0) The adopted budget reflects the transfer in of resources from DTS to
support the PRISM Enterprise System through the addition of an IT analystposition in DMF ($144,488).
1.0
Reclassified 1.0 limited term full-time employee to 1.0 permanent full-timeCounty funded positions in the Management and Budget Line of Business.
FY 2020 Reduced wireless service charges as part of a County-wide review of wireless service providers ($1,729).
Reduced consultant funding used to help implement county-wide auditing($50,000).
Increased projection for the real estate taxes paid by the operator of theAlexandria Waste to Energy plant ($10,000).
FY 2021 Added a Procurement Officer position in the Purchasing Division ($124,615).
1.0
Added non-personnel funding due to increases for the contractualmaintenance and licensure of the budgeting software ($61,010) and thereal estate mobile assessor software ($9,650).
Increased fee revenue due to higher projections in the County’s PurchaseCard rebates based on the reconciliation of prior year actual revenue($20,000).
143

DEPARTMENT OF MANAGEMENT AND FINANCE TEN-YEAR HISTORY
Fiscal Year Description FTEs
Transfers from other funds increased due to administrative fees to theBusiness Improvement Districts for the County-wide administrativesupport ($43,268).
144

DEPARTMENT OF TECHNOLOGY SERVICES Jack Belcher, Chief Information Officer
2100 CLARENDON BLVD., SUITE 612, ARLINGTON, VA 22201 703-228-3220
Our Mission: To provide technology resources for the County and set the vision for future technology investments
LINES OF BUSINESS
SIGNIFICANT BUDGET CHANGES
The FY 2021 adopted expenditure budget for the Department of Technology Services is $26,039,370, a thirteen percent increase from the FY 2020 adopted budget. The FY 2021 adopted budget reflects:
Personnel changes due to an increase in the County’s cost for employee health insurance, partially offset by lower retirement contributions based on current actuarial projections and the following changes below. Conversion of an existing un-budgeted overstrength position to provide audio visual
support to the Bozman County Government Center ($111,560, 1.0 FTE); Conversion of non-personnel funds to create three Network Administrator positions
($529,485 including $40,422 in additional net tax support, 3.0 FTEs); and The addition of one limited-term FTE to serve as the Project Manager for the Enterprise
Resource Planning (ERP) system (PRISM) upgrade.
145

DEPARTMENT OF TECHNOLOGY SERVICES DEPARTMENT BUDGET SUMMARY
Non-personnel increases primarily due to: Strategic security investments ($2,036,349); On-going funding for software licensing costs ($180,175), maintenance costs for the
County’s revenue and collection system ($56,000), electronic document storage system ($25,000), and Enterprise Resource Planning System ($10,118), data and cloud storage costs ($61,598), increased costs to continue migration from the County’s Networks Operations Center to a cloud platform ($54,000), and one-time funding for warranty extensions ($21,235).
Increases are partially offset by the conversion of contractor funds to fund the positions listed above ($489,063) and the removal of FY 2020 one-time funds for the Technology Asset Management System ($250,000); County website refresh ($100,000); and migration from the County’s Network Operations Center to a cloud platform ($32,500).
The Department of Technology Services underwent a reorganization to reallocate existing security and data privacy resources into a separate line of business due to their increased level of importance and visibility. Additionally, the digital innovation function is now included in the Enterprise Technology and Applications Services line of business to better incorporate the digital innovation development process into the department’s day-to-day operations. The budget and actuals by line of business shown below have been revised to reflect this internal reorganization.
DEPARTMENT FINANCIAL SUMMARY
FY 2019 FY 2020 FY 2021 % ChangeActual Revised Adopted ‘20 to ‘21
Personnel $11,706,711 $13,235,977 $14,645,231 11%Non-Personnel 14,452,178 13,317,024 14,890,003 12%Subtotal 26,158,889 26,553,001 29,535,234 11%Intra County Charges (4,130,227) (3,495,864) (3,495,864) - Total Expenditures 22,028,662 23,057,137 26,039,370 13%
Total Revenues - - - -
Net Tax Support $22,028,662 $23,057,137 $26,039,370 13%
Permanent FTEs 74.00 80.00 85.00 Temporary FTEs - - - Total Authorized FTEs 74.00 80.00 85.00
Expenses by Line of Business
FY 2019 FY 2020 FY 2021 % Change FY 2021 FTEsActual Revised Adopted ‘20 to ‘21 Adopted
Office of the Chief Information Officer $1,549,737 $1,668,038 $1,742,367 4% 7.00 Enterprise Infrastructure and Applications Services 18,545,930 19,298,957 20,070,027 4% 69.00 Security 1,932,995 2,090,142 4,226,976 102% 9.00 Total Expenditures $22,028,662 $23,057,137 $26,039,370 13% 85.00
146
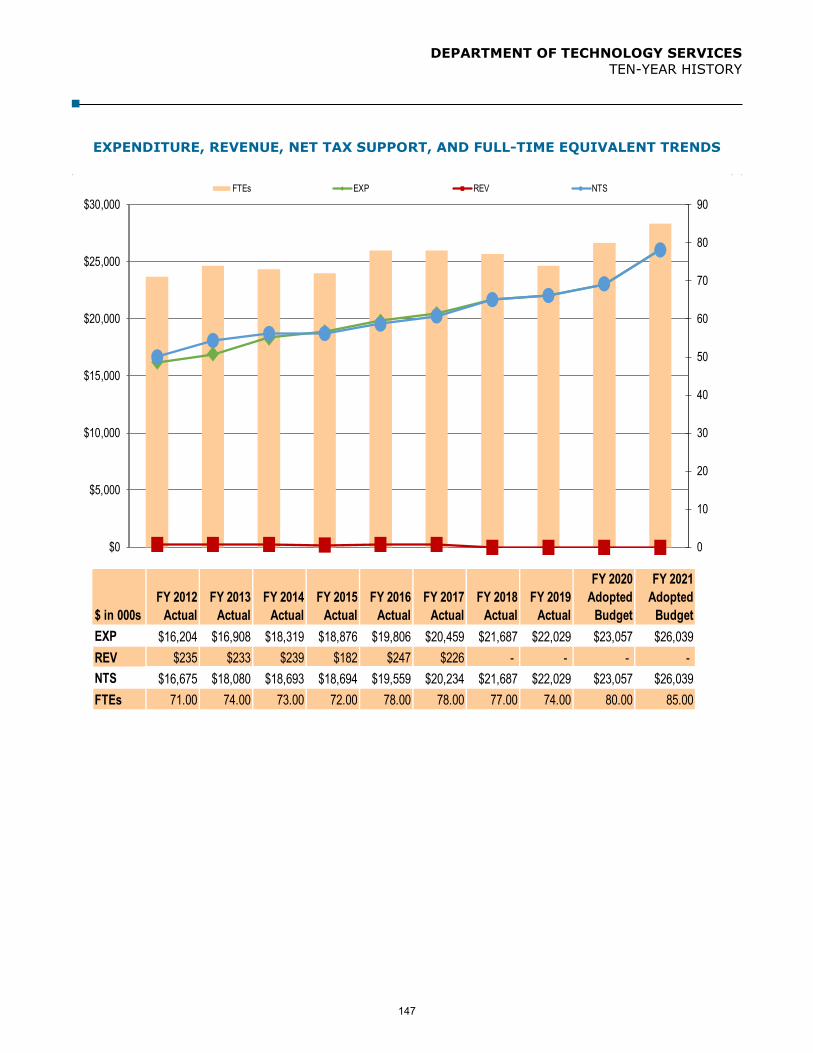
DEPARTMENT OF TECHNOLOGY SERVICES TEN-YEAR HISTORY
EXPENDITURE, REVENUE, NET TAX SUPPORT, AND FULL-TIME EQUIVALENT TRENDS
$ in 000sFY 2012
ActualFY 2013
ActualFY 2014
ActualFY 2015
Actual FY 2016
Actual FY 2017
Actual FY 2018
Actual FY 2019
Actual
FY 2020 Adopted
Budget
FY 2021 Adopted
BudgetEXP $16,204 $16,908 $18,319 $18,876 $19,806 $20,459 $21,687 $22,029 $23,057 $26,039REV $235 $233 $239 $182 $247 $226 - - - - NTS $16,675 $18,080 $18,693 $18,694 $19,559 $20,234 $21,687 $22,029 $23,057 $26,039FTEs 71.00 74.00 73.00 72.00 78.00 78.00 77.00 74.00 80.00 85.00
0
10
20
30
40
50
60
70
80
90
$0
$5,000
$10,000
$15,000
$20,000
$25,000
$30,000FTEs EXP REV NTS
147

DEPARTMENT OF TECHNOLOGY SERVICES TEN-YEAR HISTORY
Fiscal Year Description FTEs
FY 2012 The County Board restored 1.0 FTE to support mission-critical systems ($137,500).
1.0
Reallocated two positions - one from the Treasurer’s office and one fromthe Commissioner of Revenue – to support ACE operations ($260,311).
2.0
Non-personnel costs increased primarily due to operating costs related tomoving the County’s email system to a hosted provider ($283,552), costsfor server support and offsite data back-up for the new Real EstateAssessment and Appraisal system ($60,000), contract increases($10,252), and increased network operations costs for the new Artispherefacility ($20,000). These increases are partially offset by a transfer ofNetwork Operating Center maintenance costs to the Department ofEnvironmental Services ($49,000) and deduction of one-time support inFY 2011 for the ACE system ($128,000).
FY 2013 The County Board added $10,000 of one-time funding and $20,000 of ongoing funding to support electronic court records.
Increased licensing costs related to the County’s email system ($53,000),data backup system ($38,000), and initial implementation of an encryptedemail system ($30,000).
Increased bandwidth costs for one of the County’s internet circuits($86,820).
Increased support costs for the County’s Emergency CommunicationsCenter ($100,000).
Added a security engineer contractor ($244,400). One position was transferred from the Printing Fund to create a Chief
Records Management Officer. 1.0
One position was transferred from the Office of Emergency Management tocreate the Public Safety Technology Coordinator.
1.0
FY 2014 Increased software license and maintenance costs ($133,215). Increased network support costs related to the new Arlington Mill
Community Center ($14,439). Eliminated the SharePoint Administrator position ($128,912). (1.0) Eliminated a Senior IT Analyst/Project Manager position ($166,050). (1.0) Eliminated the Electronic Records Management (ERMS) OnBase Technical
lead position ($185,768).(1.0)
Eliminated after hours support for the Help Desk ($25,000). Removal of FY 2013 one-time funding for electronic court records
($10,000). Decreased revenue due to the expiration of the cable franchise agreement
with Comcast.
148

DEPARTMENT OF TECHNOLOGY SERVICES TEN-YEAR HISTORY
Fiscal Year Description FTEs
In FY 2014, the County entered an enterprise agreement with Microsoft tomore efficiently purchase currently-used Office software and to add severalcollaboration and productivity software products to the suite of tools($538,438).
FY 2015 A Public Safety Technology Coordinator position was transferred from DTS to Police ($171,805).
Reallocated ConnectArlington maintenance costs from Non-Departmentalto DTS ($300,000) and added additional funding ($115,879).
Added ongoing funding for Systems Center Configuration Management,Mobile Device Management, and Network Security Audits ($305,440).
(1.0)
FY 2016 The County Board reduced non-personnel funding for the Electronic Records Management System (ERMS) ($38,250).
The County Board approved the conversion of contractor positions toCounty Staff to realize net non-personnel savings ($152,939).
4.0
Addition of a Project Manager and Administrative Specialist associated withthe operation of the second phase of Connect Arlington ($208,000).
Addition of operating costs for the second phase of Connect Arlington($292,000).
2.0
FY 2017 Added expenses for software licensing and contractor costs ($344,939), maintenance to the County’s revenue and collection system ($130,000), and increased data storage costs ($90,000).
FY 2018 The County Board approved a decrease in non-personnel funding due to efficiency realized between the County and Arlington Public School’s to reduce the number of connections to external data centers needed for operation ($120,000).
Transferred out the ConnectArlington Fiber Network Sales and Marketingposition and additional sales and marketing funding to Arlington Economic Development ($130,000 personnel; $50,000 non-personnel).
(1.0)
Increased software licensing costs ($88,000 one-time, $37,372 ongoing),maintenance costs for the County’s revenue and collection system($60,000) and data storage costs ($63,000).
Decreased annual expense for maintenance and replacement of Countyvehicles ($6,629).
FY 2019 Increased software licensing costs ($82,620), maintenance costs for the County’s revenue and collection system ($70,000), data and cloud storage costs ($115,000), and contractor costs ($205,200).
Increased operations funding for the Connect Arlington Fiber Network($330,000).
Transferred in existing non-departmental funds for the Litigation Holdprogram ($200,000), and the Open Data program ($192,000).
149

DEPARTMENT OF TECHNOLOGY SERVICES TEN-YEAR HISTORY
Fiscal Year Description FTEs
Decreased funding due to the removal of FY 2018 one-time costs forsoftware licensing ($88,800), and an adjustment to the annual expense formaintenance and replacement of County vehicles ($1,896).
Elimination of a filled Cable Administrator position ($181,340). (1.0) Removal of 24/7 desktop support service for County employees ($27,000). Reorganized Prism Enterprise System Functional Support and eliminated
2.0 filled FTEs; redistributed work between the Departments ofManagement and Finance (DMF) and Technology Services. A portion of thecost of the position reductions shifted to contract support within DTS($220,000), and a portion transferred to augment support required by DMF($144,488). The remaining balance is provided as expenditure savings forFY 2019 ($25,000).
(2.0)
FY 2020 Eliminated a vacant IT Network Analyst Position ($86,733). (1.0) Transfer in from capital (Fund 313) and conversion of three
ConnectArlington contractor positions ($367,390, 3.0 FTEs); conversion ofan existing Technology Manager (1.0 FTE) with the addition of budgetedcontractor funding into two Senior Network Engineers ($244,386, 1.0 FTE);and the conversion of an existing position and non-personnel contractorfunds to create a Staff Infrastructure Support Specialist position, SeniorNetwork Engineer, and Management Intern position (469,861).
7.0
Reduced the department’s membership to Gartner from five licenses tothree licenses ($70,000)Eliminated a vacant IT Network Analyst position ($86,733). (1.0)
Reduced wireless service charges as part of a County-wide review ofwireless service providers ($14,098).
Added one-time funds for a Technology Asset Management System($250,000).
Added one-time funds for a County website refresh ($100,000).
Added one-time and on-going funding to begin migration from the County’sNetwork Operations Center to a cloud platform ($94,440 on-going funds;$32,500 one-time).
Added on-going funding for security training for all County employees($60,000), software licensing costs ($546,828), maintenance costs for theCounty’s revenue and collection system ($70,000), data and cloud storagecosts ($52,136), and contractor costs ($19,200).
FY 2021 Converted an existing un-budgeted overstrength position to provide audio visual support to the Bozman County Government Center ($111,560).
1.0
Converted non-personnel funds to create three Network Administratorpositions ($529,485) by utilizing non-personnel funding ($489,063) andadditional funding ($40,422).
3.0
Added one limited term FTE to serve as the Project Manager for theEnterprise Resource Planning (ERP) system (PRISM) upgrade.
1.0
150

DEPARTMENT OF TECHNOLOGY SERVICES TEN-YEAR HISTORY
Fiscal Year Description FTEs
Removed FY 2020 one-time funds for the Technology Asset ManagementSystem ($250,000), County website refresh ($100,000), and migrationfrom the County’s Network Operations Center to a cloud platform($32,500).
Added funding for strategic security investments ($2,036,349).
Added funding for software licensing costs ($180,175), maintenance costsfor the County’s revenue and collection system ($56,000), electronicdocument storage system ($25,000), and Enterprise Resource PlanningSystem ($10,118), and data and cloud storage costs ($61,598).
Increased costs to continue migration from the County’s NetworksOperations Center to a cloud platform ($54,000).
Added one-time funding for warranty extensions ($21,235).
151

This page intentionally left blank
152
HUMAN RESOURCES DEPARTMENT Marcy Foster, Director
2100 CLARENDON BLVD., SUITE 511, ARLINGTON, VA 22201 703-228-3500
Our Mission: To provide leadership and expertise to attract, develop, and retain a high performing and diverse workforce
The Human Resources Department accomplishes its mission by continuing to be Arlington’s organizational leader in managing human resources in the pursuit and achievement of the County’s mission.
LINES OF BUSINESS
SIGNIFICANT BUDGET CHANGES
The FY 2021 adopted expenditure budget for the Human Resources Department is $9,658,006 a one percent decrease from the FY 2020 adopted budget. The FY 2021 adopted budget reflects:
Personnel changes due to an increase in the County’s cost for employee health insurance,partially offset by lower retirement contributions based on current actuarial projections.
Non-personnel decreases due to reallocation of Pension Gold contractual costs from theHuman Resources Department to the Retirement Board ($120,365).
Employee benefits and county-wide programs increase due to contracted services increases($33,472).
153

HUMAN RESOURCES DEPARTMENT DEPARTMENT BUDGET SUMMARY
DEPARTMENT FINANCIAL SUMMARY FY 2019 FY 2020 FY 2021 % Change
Actual Adopted Adopted '20 to '21Personnel $7,112,677 $7,351,234 $7,348,827 - Non-Personnel 598,796 577,806 457,441 -21%Employee Benefits and County-wide Programs 1,612,962 1,818,266 1,851,738 2%Total Expenditures 9,324,435 9,747,306 9,658,006 -1%
Total Revenues - - - -
Net Tax Support $9,324,435 $9,747,306 $9,658,006 -1%
Permanent FTEs 53.00 53.00 53.00 Temporary FTEs - - - Total Authorized FTEs 53.00 53.00 53.00
EXPENSES BY LINE OF BUSINESS
FY 2019 FY 2020 FY 2021 % Change FY 2021 FTEsActual Adopted Adopted '20 to '21 Adopted
Office of the Director $2,394,217 $2,619,616 $2,084,163 -20% 11.80Risk Management 616,021 625,799 474,862 -24% 4.00Employee Management Relations 220,721 443,648 272,274 -39% 2.00Employee Benefits and County-wide Programs 1,612,962 1,818,266 1,851,738 2% - Training and Organizational Development 533,316 500,529 817,156 63% 6.00Staffing and Compensation 2,525,447 2,368,867 2,425,987 2% 16.58Benefits and Wellness Services 1,421,751 1,370,581 1,731,826 26% 12.63Total Expenditures $9,324,435 $9,747,306 $9,658,006 -1% 53.00
154

HUMAN RESOURCES DEPARTMENT TEN-YEAR HISTORY
Adopted FY 2007
$ in 000sFY 2012
Actual FY 2013
Actual FY 2014
ActualFY 2015
ActualFY 2016
ActualFY 2017
ActualFY 2018
ActualFY 2019
Actual
FY 2020 Adopted
Budget
FY 2021 Adopted
BudgetEXP $7,384 $7,818 $7,909 $8,354 $8,784 $8,919 $9,185 $9,324 $9,747 $9,658REV $120 $116 $123 $132 $132 $138 $144 - - - NTS $7,264 $7,702 $7,786 $8,222 $8,652 $8,781 $9,041 $9,324 $9,747 $9,658FTEs 51.00 52.00 52.00 52.00 52.00 53.00 53.00 53.00 53.00 53.00
0
10
20
30
40
50
60
70
$0
$1,000
$2,000
$3,000
$4,000
$5,000
$6,000
$7,000
$8,000
$9,000
$10,000
$11,000FTEs EXP REV NTS
EXPENDITURE, REVENUE, NET TAX SUPPORT AND FULL-TIME EQUIVALENT TRENDS
155

HUMAN RESOURCES DEPARTMENT TEN-YEAR HISTORY
Fiscal Year Description FTEs
FY 2012 Restored a Staff Specialist III in Director’s Office to meet growing demands relating to retiree services, federal regulations, and the compensation maintenance plan. ($122,000).
1.0
Restored Tuition Reimbursement Program that was suspended in FY 2010 ($287,500).
County-wide Safety Coordination increased to provide funding for online defensive driving ($31,500) for employees who either do not need the instructor-led training or cannot attend an instructor led class because of work schedules.
County-wide Safety Coordination increased to provide funding for online safety training ($11,000) that will be tailored to employees’ work schedules and job descriptions as well as augment generic training.
FY 2013 Personnel budget reflects the addition of a diversity outreach position ($115,000).
1.0
The revenue decrease reflects the salary and benefits of the Safety Specialist that is funded by Arlington Public Schools ($3,162).
FY 2014 Transferred 0.5 FTE ($45,836) from the County Manager’s Office to the Staffing Section of the Talent Management Division to support recruitment activities.
0.5
Eliminated 0.5 FTE ($61,817) from the Staffing Section of the Talent Management Division.
(0.5)
County-wide Employee Development increased one-time only funding for Civic Engagement Training to support the County Board PLACE Initiative ($50,000).
HealthSmart Program increased one-time only funding for additional programming ($25,000).
The revenue increase reflects the salary and benefits of the Safety Specialist that is funded by Arlington Public Schools ($6,388).
FY 2015 Eliminated FY 2014 one-time funding for HealthSmart Program enhancements ($25,000).
Eliminated FY 2014 one-time funding for Civic Engagement Training ($50,000).
Added ongoing funding for the County Ethics Initiative ($20,000).
FY 2016 Live Where You Work Grants were restored ($133,012). The revenue increase reflects the salary and benefits of the Safety
Specialist that is funded by Arlington Public Schools ($4,657).
FY 2017 Live Where You Work Grant Funding was increased ($22,000). Tuition Reimbursement Funding was increased ($38,000).
156

HUMAN RESOURCES DEPARTMENT TEN-YEAR HISTORY
Fiscal Year Description FTEs
Revenue increased to reflect the salary and benefits of the Safety Specialist that is funded by Arlington Public Schools ($5,500).
Personnel increased to reflect the addition of a Human Resources/OD Specialist ($131,230).
1.0
FY 2018 County Ethics Initiative Funding was transferred to Non-Departmental ($20,000).
Revenue increased to reflect the salary and benefits of the Safety Specialist that is funded by Arlington Public Schools ($4,649).
FY 2019 Contractual services increased related to the County’s Retirement software ($2,250).
Employee Benefits and County-wide Programs increased due to the addition of an Adoption Assistance Program for employees ($50,000), contractual increases in the Employee Assistance Program (EAP) shared with Arlington Public Schools ($3,522), and other contractual increases ($12,150).
Revenue increased to reflect the salary and benefits increase of the Safety Specialist funded by Arlington Public Schools ($6,351).
Reduced funding for County-wide employee recruitment and outreach ($25,000) and County-wide employee training ($25,000).
FY 2020 Reduced wireless service charges as part of a County-wide review of wireless service providers ($1,729).
Reduced unclassified and consultant services in the Office of the Director and Employee Benefits and County-wide Programs ($99,312).
Personnel and revenue decreased due to Arlington Public Schools (APS) taking over management of Safety Specialist work on schools’ facilities ($148,964).
Contractual costs increased for maintenance of the County’s Retirement software and related system modifications ($13,400).
County-wide programs contracted services increased for the county-wide learning management services ($14,400).
FY 2021 Pension Gold contractual costs were reallocated from the Human Resources Department to the Retirement Board ($120,365).
Employee benefits and county-wide programs contracted services increased ($33,472).
157

This page intentionally left blank
158

COUNTY ATTORNEY Stephen A. MacIsaac
2100 CLARENDON BLVD., SUITE 403, ARLINGTON, VA 22201 703-228-3100
Our Mission: To ensure that all County transactions are conducted in a legal and ethical manner
The County Attorney’s Office provides legal counsel and advice to the County Board, County Manager, County departments and their staff, and County Board appointed agencies, boards and commissions, and provides representation for them in state and federal court, as well as before various administrative agencies.
LINE OF BUSINESS
County Attorney
Office of the County Attorney
SIGNIFICANT BUDGET CHANGES
The FY 2021 adopted expenditure budget for the Office of the County Attorney is $3,264,500, a one percent increase from the FY 2020 adopted budget. The FY 2021 adopted budget reflects:
Personnel changes due to an increase in the County’s cost for employee health insurance,partially offset by lower retirement contributions based on current actuarial projections.
Non-personnel increases due to software maintenance cost increase and training andeducation requirements for County Attorney staff ($16,000).
DEPARTMENT FINANCIAL SUMMARY
FY 2019 FY 2020 FY 2021 % ChangeActual Adopted Adopted ‘20 to ‘21
Personnel $2,750,616 $2,976,890 $3,005,691 1%Non-Personnel 377,633 325,809 341,809 5%Subtotal 3,128,249 3,302,699 3,347,500 1%Intra County Charges (83,254) (83,000) (83,000) -Total Expenditures 3,044,995 3,219,699 3,264,500 1%
Fees 105,000 105,000 105,000 -Total Revenues 105,000 105,000 105,000 -
Net Tax Support $2,939,995 $3,114,699 $3,159,500 1%
Permanent FTEs 16.00 16.00 16.00Temporary FTEs - - -Total Authorized FTEs 16.00 16.00 16.00
159

OFFICE OF THE COUNTY ATTORNEY TEN-YEAR HISTORY
EXPENDITURE, REVENUE, NET TAX SUPPORT, AND FULL-TIME EQUIVALENT TRENDS
$ in 000s FY 2012
Actual FY 2013
ActualFY 2014
ActualFY 2015
Actual FY 2016
ActualFY 2017
ActualFY 2018
Actual FY 2019
Actual
FY 2020 Adopted Budget
FY 2021 Adopted Budget
EXP $2,306 $3,016 $2,653 $2,542 $2,767 $3,142 $2,989 $3,045 $3,220 $3,265REV $70 $70 $70 $70 $105 $105 $105 $105 $105 $105NTS $2,236 $2,946 $2,583 $2,472 $2,662 $3,037 $2,885 $2,940 $3,115 $3,160FTEs 14.00 14.00 14.00 14.00 15.00 15.00 15.00 16.00 16.00 16.00
0
5
10
15
20
$0
$500
$1,000
$1,500
$2,000
$2,500
$3,000
$3,500FTEs EXP REV NTS
160

OFFICE OF THE COUNTY ATTORNEY TEN-YEAR HISTORY
Fiscal Year Description FTEs
FY 2012 The County Board added funding for a one percent one-time lump sum payment for employees at the top step.
FY 2013 Personnel increases include reclassification of positions identified to be substantially below comparative pay studies.
FY 2014 Personnel increases include reclassification of positions identified to be substantially below comparative pay studies.
Non-personnel reductions include reduced funding for consultants($30,000).
FY 2015 No significant changes.
FY 2016 Conversion of an over strength Assistant County Attorney position added during FY 2015 to permanent status ($166,000, 1.0 FTE).
1.0
Increase for additional consultant workload in the County Attorney’s Office($35,000).
Intra-County charges increase due to the Assistant County Attorney,referenced above, being partially charged to the CPHD Development Fund($83,000).
Revenue increases from Northern Virginia Transportation Commission forlegal services provided by Arlington County Counsel ($35,000).
FY 2017 No significant changes.
FY 2018 Addition of a County Attorney I position to ensure legally compliant responses by County staff to the increasing number of FOIA requests ($139,455).
1.0
FY 2019 One-time hiring freeze of a vacant County Attorney III position ($165,299).
Non-personnel increase due to an annual license subscription for County’se-discovery litigation tool ($18,000).
FY 2020 Reduced wireless service charges as part of a County-wide review of wireless service providers ($1,064).
Funded a County Attorney III position that was frozen in FY 2019($173,073).
FY 2021 Non-personnel increases due to software maintenance cost increase and training and education requirements for County Attorney staff ($16,000).
161

This page intentionally left blank
162

CIRCUIT COURT William T. Newman, Jr.
1425 N. COURTHOUSE RD.,SUITE 12-100, ARLINGTON, VA 22201
703-228-7000
Our Mission: To Provide an Independent, Accessible, Responsive Forum for Just Resolution of Disputes in Order to Preserve the Rule of Law and to Protect All Rights and Liberties Guaranteed
by the United States and Virginia Constitutions.
The 17th Judicial Circuit is comprised of four judges with jurisdiction over Arlington County and the City of the Falls Church. The Circuit Court is a trial court of general jurisdiction and the highest court in the County for both civil and criminal cases. The Circuit Court has jurisdiction concerning civil claims exceeding $4,500, with exclusive original jurisdiction for claims exceeding $25,000. The Circuit Court also has jurisdiction over all equity related matters, which include, but are not limited to, divorce, child custody, child and spousal support and maintenance, guardianship, conservatorship, and disputes concerning wills and estates. Additionally, the court has jurisdiction over all civil cases appealed from the General District Court. The appellate jurisdiction is de novo which means that, notwithstanding a final civil judgment in the General District Court, once the case is appealed to the Circuit Court, there is a new or de novo trial in the Circuit Court, as if the trial below never occurred.
For criminal cases, the Circuit Court has original jurisdiction over all felonies and misdemeanors originally charged in Circuit Court, plus all misdemeanor cases, criminal bond motions, and traffic cases previously adjudicated by the General District Court but appealed to the Circuit Court. Additionally, the Circuit Court has jurisdiction over juveniles aged 15 years and older who are charged with felonies and whose cases have been certified by a Judge of the Juvenile and Domestic Relations District Court for trial in Circuit Court and all properly appealed cases previously adjudicated by the Juvenile and Domestic Relations District Court.
The Circuit Court operates an Adult Drug Treatment Court (Drug Court) for probation violators. The Drug Court is an intensive, community-based treatment, rehabilitation, and supervision program for felony drug defendants. The mission of the drug treatment court is to enhance public safety by providing a cost-effective, integrated system of treatment and judicial supervision in order to reduce recidivism.
LINES OF BUSINESS
Circuit Court
Judiciary Drug Court
163
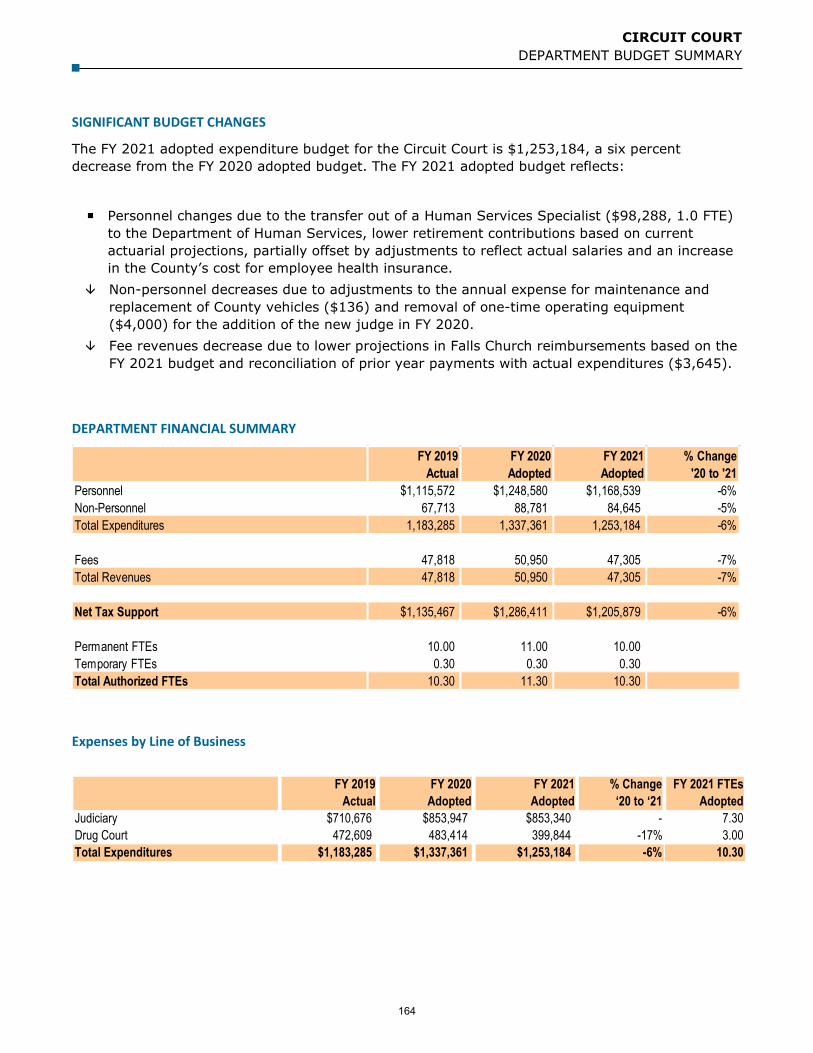
CIRCUIT COURT DEPARTMENT BUDGET SUMMARY
SIGNIFICANT BUDGET CHANGES
The FY 2021 adopted expenditure budget for the Circuit Court is $1,253,184, a six percent decrease from the FY 2020 adopted budget. The FY 2021 adopted budget reflects:
Personnel changes due to the transfer out of a Human Services Specialist ($98,288, 1.0 FTE) to the Department of Human Services, lower retirement contributions based on current actuarial projections, partially offset by adjustments to reflect actual salaries and an increase in the County’s cost for employee health insurance.
Non-personnel decreases due to adjustments to the annual expense for maintenance andreplacement of County vehicles ($136) and removal of one-time operating equipment($4,000) for the addition of the new judge in FY 2020.
Fee revenues decrease due to lower projections in Falls Church reimbursements based on theFY 2021 budget and reconciliation of prior year payments with actual expenditures ($3,645).
DEPARTMENT FINANCIAL SUMMARY
FY 2019 FY 2020 FY 2021 % ChangeActual Adopted Adopted '20 to '21
Personnel $1,115,572 $1,248,580 $1,168,539 -6%Non-Personnel 67,713 88,781 84,645 -5%Total Expenditures 1,183,285 1,337,361 1,253,184 -6%
Fees 47,818 50,950 47,305 -7%Total Revenues 47,818 50,950 47,305 -7%
Net Tax Support $1,135,467 $1,286,411 $1,205,879 -6%
Permanent FTEs 10.00 11.00 10.00 Temporary FTEs 0.30 0.30 0.30 Total Authorized FTEs 10.30 11.30 10.30
Expenses by Line of Business
FY 2019 FY 2020 FY 2021 % Change FY 2021 FTEsActual Adopted Adopted ‘20 to ‘21 Adopted
Judiciary $710,676 $853,947 $853,340 - 7.30Drug Court 472,609 483,414 399,844 -17% 3.00Total Expenditures $1,183,285 $1,337,361 $1,253,184 -6% 10.30
164

CIRCUIT COURT TEN-YEAR HISTORY
EXPENDITURE, REVENUE, NET TAX SUPPORT AND FULL-TIME EQUIVALENT TRENDS
$ in 000sFY 2012
ActualFY 2013
ActualFY 2014
ActualFY 2015
ActualFY 2016
ActualFY 2017
ActualFY 2018
ActualFY 2019
Actual
FY 2020 Adopted Budget
FY 2021 Adopted Budget
EXP $421 $489 $580 $703 $978 $1,053 $1,168 $1,183 $1,337 $1,253REV $20 $26 $27 $161 $134 $85 $69 $48 $51 $47NTS $401 $462 $553 $543 $844 $968 $1,099 $1,135 $1,286 $1,206FTEs 5.30 5.30 5.30 6.80 9.80 9.80 10.30 10.30 11.30 10.30
0
10
20
30
40
$0
$200
$400
$600
$800
$1,000
$1,200
$1,400
$1,600
FTEs EXP REV NTS
165

CIRCUIT COURT TEN-YEAR HISTORY
Fiscal Year
Description FTEs
FY 2012 The County Board added funding for a one percent one-time lump sum payment for employees at the top step.
Added funding for maintenance and support fees for the audio/videorecording system installed in the courts ($45,000) and for day forwardredaction of social security and other sensitive information from courtrecords ($57,000).
Increased revenues in Falls Church reimbursements ($57,227) andState reimbursements for technology ($55,000) partially offset by adecrease in the State Compensation Board reimbursements ($19,710)and court fines ($3,000).
FY 2013 The County Board added funding for replacement of the land record system ($450,000 one-time funding, $70,000 ongoing funding), partially offset with $70,000 in anticipated new fee revenue.
The County Board added funding for an electronic court records system($326,000 one-time funding, $95,000 ongoing funding), partiallyoffset with $40,000 in anticipated new fee revenue.
The County Board added one-time funding for a Jury Coordinatorposition ($79,000 one-time funding).
A limited term position was eliminated. Falls Church revenue decreased ($13,068). Decreases are included for State Compensation Board reimbursements
($4,900) and Technology Trust Fund grant funding ($6,000).
1.0
(1.0)
FY 2014 The County Board added ongoing funding for a Jury Coordinator / Information Clerk position ($80,378).
Eliminated FY 2013 one-time funding for a Jury Coordinator /Information Clerk position ($79,000).
Eliminated FY 2013 one-time funding for replacement of the landrecords system ($450,000) and electronic court records system($326,000).
Fee revenue decreased for the land records ($70,000). Fee revenues increased for reimbursement to the locality of excess
copy fees ($14,000) and interest on criminal fees ($3,000). Fee revenues increased for Falls Church reimbursements ($4,131). Grant revenues increased for State Compensation Board
reimbursements ($66,460). Reduced contractual maintenance for microfilm equipment ($8,960). Eliminated non-personnel funding in the Clerk’s Office for equipment
purchase ($15,104).
1.0
(1.0)
FY 2015 The County Board added funding for a part-time Administrative Assistant ($21,752).
0.5
The County Board added one-time funding for travel and training
166

CIRCUIT COURT TEN-YEAR HISTORY
Fiscal Year
Description FTEs
supplies ($17,500). Added a limited term grant funded Drug Court Coordinator ($89,495)
funded by a Bureau of Justice Assistance Grant. 1.0
Added funding ($22,907) for operating supplies and miscellaneouscosts funded by the Bureau of Justice Assistance grant.
Fall Church revenue increased ($1,626). Grant revenue increased due to a Bureau of Justice Assistance grant
($112,402).
FY 2016 The County Board added funding for 1.5 FTEs to support the Circuit Court’s high performing court initiative ($100,000).
1.5
The County Board added one-time funding to continue to grow theArlington County Drug Court Program ($250,000). In addition to the1.5 FTEs, the $250,000 one-time funding added by the County Boardalso funds a Deputy Sheriff added in the Sheriff’s Office to support theexpansion of the Drug Court Program. The salary for this position willbe fully charged to the Circuit Court.
1.5
Eliminated one-time funding for travel and training and office supplies($17,500).
Increased funding to miscellaneous costs ($2,250) due to the Bureauof Justice Assistance grant for Arlington County Drug Court.
Fee revenue increased for Falls Church reimbursements ($7,935). Grant revenue increased due to the Bureau of Justice Assistance grant
for Arlington County Drug Court ($3,722).
FY 2017 Increased fee revenue due to higher projections in Falls Church reimbursements based on the FY 2016 budget and reconciliation of prior year payments with actual expenditures ($7,247).
Grant revenue decreased due to the September 2016 expiration of theBureau of Justice Assistance grant for the Arlington County Drug Court($89,394).
FY 2018 The County Board adding $15,000 for office supplies, travel, and training.
Converted an Administrative Assistant from part-time to full-time andreclassified that position to a Drug Court Probation Officer ($55,482). Prior to 2016, this service was provided in-kind by the state.
Increased fee revenue due to higher projections in Falls Churchreimbursements based on the FY 2018 budget and reconciliation ofprior year payments with actual expenditures ($822) and the additionof Drug Court participant fees not previously budgeted ($2,500).
Decreased grant revenue due to the September 2016 expiration of theBureau of Justice Assistance grant for the Arlington County Drug Court($26,730).
0.5
167

CIRCUIT COURT TEN-YEAR HISTORY
Fiscal Year
Description FTEs
FY 2019 Decreased fee revenue due to lower projections in Falls Church reimbursements based on the FY 2019 budget and reconciliation of prior year payments with actual expenditures ($1,490).
FY 2020 Added a Law Clerk to support the fourth judge which was added by the Commonwealth of Virginia due to the caseload of the Circuit Court ($95,480).
Added funding for one-time operating equipment ($4,000) andon-going operating expenses ($1,000) for the addition of the fourthjudge.
Increased fee revenues due to higher projections in Falls Churchreimbursements based on the FY 2020 budget and reconciliation ofprior year payments and actual expenditures ($5,572).
1.0
In FY 2019 Closeout, the County Board transferred a Human ServicesSpecialist position to the Department of Human Services for theconsolidation of the clinical and administrative supervision of the DrugCourt Treatment Team ($98,288).
(1.0)
FY 2021 Removal of one-time funding for operating equipment for the addition of a fourth judge in FY 2020 ($4,000).
Fee revenues decrease due to lower projections in Falls Churchreimbursements based on the FY 2021 budget and reconciliation ofprior year payments with actual expenditures ($3,645).
168

CLERK OF THE CIRCUIT COURT Paul Ferguson, Clerk
1425 N. COURTHOUSE RD., SUITE 6700, ARLINGTON, VA 22201 703-228-7010
Our Mission: To ensure that Circuit Court records are easily accessible and maintained in an orderly and secure fashion; that the public is fully and fairly served; and that justice is administered
promptly and without favor to any party.
The Clerk of the Circuit Court (the Clerk) is an elected constitutional office in each county and large city in Virginia. The Clerk of Court handles a variety of functions necessary for the efficient administration of justice in the Circuit Court for Arlington County and the City of Falls Church.
The Clerk is the official recorder of Circuit Court civil and criminal court proceedings. The Clerk issues marriage licenses, notary certifications, concealed handgun permits, and similar documents and admits wills and other testamentary documents to probate. The Clerk creates and maintains all civil, criminal, and probate court files and records of proceedings; issues summons and court process; prepares court orders; and summons petit and grand jurors for jury service. The Clerk collects and disseminates criminal fines, costs, and restitution.
The Land Records Division of the Clerk’s Office is responsible for recording and maintaining deeds, judgments, and other documents affecting title to real property located in Arlington County and the City of Falls Church. In addition, the Land Records Division assesses and collects required recordation taxes and fees and is responsible for filing and maintaining records of judgments and Uniform Commercial Code Financing Statements.
The Clerk’s Office utilizes an electronic records management system for both its court and land records systems which provide users with the ability to e-file case documents and pleadings and e-record land records documents.
LINES OF BUSINESS
Clerk of the Circuit Court
Circuit Court Clerk’s Office
SIGNIFICANT BUDGET CHANGES
The FY 2021 adopted expenditure budget for the Clerk of the Circuit Court is $3,492,403, a one percent increase from the FY 2020 adopted budget. The adopted budget reflects:
Personnel changes due to the reclassification of two full-time, temporary Court Assistant positions during FY 2019 Closeout and an increase in the County’s cost for employee health insurance, partially offset by lower retirement contributions based on current actuarial projections.
169

CLERK OF THE CIRCUIT COURT DEPARTMENT BUDGET SUMMARY
Non-personnel decreases due to the removal of one-time operating equipment for theaddition of a fourth judge in FY 2020 ($8,000), partially offset by contractual increases($1,602).
Fee revenues increase primarily due to higher projections in Falls Church reimbursementsbased on the FY 2021 budget and reconciliation of prior year payments with actualexpenditures ($8,036).
Grant revenues decrease due to a decrease in miscellaneous State grants ($56,838) to alignbudget with prior year actuals, partially offset by an expected increase in StateCompensation Board reimbursements ($14,211).
DEPARTMENT FINANCIAL SUMMARY
FY 2019 FY 2020 FY 2021 % ChangeActual Adopted Adopted ‛20 to ‛21
Personnel $2,800,925 $2,730,984 $2,781,460 2%Non-Personnel 494,869 717,341 710,943 -1%Total Expenditures 3,295,794 3,448,325 3,492,403 1%
Fees 356,977 610,449 618,285 1%Grants 1,369,682 1,038,306 981,468 -5%Total Revenues 1,726,659 1,648,755 1,599,753 -3%
Net Tax Support $1,569,135 $1,799,570 $1,892,650 5%
Permanent FTEs 27.00 27.00 29.00Temporary FTEs - - -Total Authorized FTEs 27.00 27.00 29.00
170

CLERK OF THE CIRCUIT COURT TEN-YEAR HISTORY
EXPENDITURE, REVENUE, NET TAX SUPPORT AND FULL-TIME EQUIVALENT TRENDS
$ in 000sFY 2012
ActualFY 2013
ActualFY 2014
ActualFY 2015
ActualFY 2016
ActualFY 2017
Actual FY 2018
ActualFY 2019
Actual
FY 2020 Adopted
Budget
FY 2021 Adopted
BudgetEXP $2,703 $3,179 $2,871 $3,129 $3,167 $3,195 $3,177 $3,296 $3,448 $3,493REV $1,618 $1,702 $1,483 $1,524 $1,653 $1,560 $1,749 $1,727 $1,649 $1,600NTS $1,085 $1,477 $1,388 $1,605 $1,514 $1,635 $1,427 $1,569 $1,799 $1,893FTEs 26.00 27.00 27.00 27.00 27.00 27.00 27.00 27.00 27.00 29.00NOTE: For comparative purposes, prior to FY 2015 the expense and revenue associated with the Circuit Court Judiciary has been excluded. For FY 2015, the Clerk of the Circuit Court has been established as a separate department.
0
10
20
30
40
$0
$1,000
$2,000
$3,000
$4,000FTEs EXP REV NTS
171

CLERK OF THE CIRCUIT COURT TEN-YEAR HISTORY
Fiscal Year Description FTEs
FY 2012 The County Board added funding for a one percent one-time lump sum payment for employees at the top step.
Added funding for maintenance and support fees for the audio/videorecording system installed in the courts ($45,000) and for day forwardredaction of social security and other sensitive information from courtrecords ($57,000).
Increased revenues in Falls Church reimbursements ($57,227) and Statereimbursements for technology ($55,000), partially offset by a decrease inthe State Compensation Board reimbursements ($19,710) and court fines($3,000).
FY 2013 The County Board added funding for replacement of the land records system ($450,000; one-time funding, $70,000; ongoing funding), partially offset with $70,000 in anticipated new fee revenue.
The County Board added funding for an electronic court records system($326,000; one-time funding, $95,000; ongoing funding), partially offsetwith $40,000 in anticipated new fee revenue.
The County Board added one-time funding for a Jury Coordinator position($79,000; one-time funding).
1.0
A limited term position was eliminated. (1.0) Falls Church revenue decreased ($13,068). Decreases are included for State Compensation Board reimbursements
($4,900) and Technology Trust Fund grant funding ($6,000).
FY 2014 The County Board added ongoing funding for a Jury Coordinator / Information Clerk position ($80,378).
Eliminated FY 2013 one-time funding for replacement of the land recordssystem ($450,000) and electronic courts records system ($326,000).
Fee revenues decreased for the land records ($70,000). Fee revenues increased for reimbursement to the locality for excess copy
fees ($14,000) and interest on criminal fees ($3,000). Fee revenues increased for Falls Church reimbursements ($4,131). Grant revenues increased for State Compensation Board reimbursements
($66,460). Reduced contractual maintenance for microfilm equipment. Eliminated non-personnel funding in the Clerk’s Office for equipment
purchases ($15,104).
1.0
172

CLERK OF THE CIRCUIT COURT TEN-YEAR HISTORY
Fiscal Year Description FTEs
FY 2015 Fee revenues increased for Falls Church reimbursements ($32,443). Grant revenues increased for State Compensation Board reimbursements
($9,008). Non-personnel increased due to operating system upgrades related to the
jury management system ($12,000). Fee revenue decreased in the land records due to reduced activity in
re-financings; partially offset by excess copy fees and local fines andinterest ($189,500).
Grant revenue decreased due to lower projections in State CompensationBoard reimbursements ($21,235) and technology reimbursements basedon state formula ($26,306).
FY 2016 Fee revenue decreased due to decline in number of land records documents recorded related to the leveling of mortgage refinancing ($200,000), offset by increased fines ($10,500) and increased Falls Church reimbursements ($1,546).
FY 2017 The County Board added one-time funding to upgrade jury phone and questionnaire scanning systems ($55,000).
Decreased fee revenue due to a reduction in miscellaneous fees ($40,000). Increased fee revenue due to higher projections in excess copy fees
($10,000). Increased fee revenue due to higher projections in Falls Church
reimbursements based on the FY 2017 budget and reconciliation of prioryear payments with actual expenditures ($6,170).
Increased revenue due to higher projections in e-ticket fees ($2,200). Increased grant revenue due to an expected increase in Compensation
Board reimbursements ($18,406), offset by a decrease in state technologyreimbursements ($4,000).
FY 2018 The County Board added funding for postage and printing expenses associated with the one-day, one-trial jury program that began in January 2017 ($45,000).
Removed the one-time funding for the upgrade jury phone and applicationscanning systems ($55,000).
Increased fee revenue due to expected state excess fees reimbursement($50,000), e-ticket fees ($1,800), and copy fees ($15,000).
Decreased fee revenue due to lower projections in Falls Churchreimbursements based on the FY 2018 budget and reconciliation of prioryear payments with actual expenses ($14,864).
Increased grant revenue due to adjustments in State Compensation Boardreimbursements ($10,650).
173

CLERK OF THE CIRCUIT COURT TEN-YEAR HISTORY
Fiscal Year Description FTEs
FY 2019 No significant changes.
FY 2020 Eliminated a Business Systems Analyst I position ($129,341). A portion of these savings were apportioned to temporary staffing ($69,340).
(1.0)
Added a Courtroom Clerk to support the fourth judge which was added bythe Commonwealth of Virginia due to the caseload of the Circuit Court($88,546).
1.0
Added funding for one-time operating equipment ($8,000) and on-goingtraining and operating expenses ($17,000) for the addition of the fourthjudge.
Increased fee revenue due to expected interest income on criminal fees($15,500), e-ticket fines ($200), and court costs ($3,535), offset by feerevenue decreases due to decreased projections in Falls Churchreimbursements based on the FY 2020 budget and reconciliation of prioryear payments with actual expenses ($7,820).
Increased grant revenue due to an increase in State Compensation Boardreimbursements as a result of the State’s two percent increase for stateemployees ($32,216) and miscellaneous state grants ($14,049).
In FY 2019 Closeout, the County Board reallocated temporary personnelfunds for the creation of two permanent Court Assistant positions.
2.0
FY 2021 Non-personnel decreases due to the removal of one-time funding for operating equipment for the addition of a fourth judge in FY 2020 ($8,000), partially offset by contractual increases ($1,602).
Fee revenues increase primarily due to higher projections in Falls Churchreimbursements based on the FY 2021 budget and reconciliation of prioryear payments with actual expenditures ($8,036).
Grant revenues decrease due to a decrease in miscellaneous State grants($56,838) to align budget with prior year actuals, partially offset by anexpected increase in State Compensation Board reimbursements($14,211).
Note: The ten-year history through FY 2014 includes the Circuit Court Judicial Chambers. Since FY 2015, the Clerk of the Circuit Court has been established as a separate department.
174
GENERAL DISTRICT COURT Brian P. Henshaw, Clerk
1425 N. COURTHOUSE RD. SUITE 2400, ARLINGTON, VA 22201 703-228-7900
Our Mission: To administer justice in a fair, timely, and efficient manner in the areas of criminal, traffic, civil, small claims, and involuntary civil commitment
The General District Court is the court with the greatest public contact. It has the largest and most varied caseload of the three courts in Arlington County. The General District Court has five divisions: criminal, traffic, civil, small claims, and involuntary civil commitment.
LINES OF BUSINESS
Judiciary
Judges’ OfficeClerk’s Office
Clerk’s Office Judges’ Office
SIGNIFICANT BUDGET CHANGES
The FY 2021 adopted expenditure budget for the General District Court is $406,355, a five percent increase from the FY 2020 adopted budget. The FY 2021 adopted budget reflects:
Personnel changes due to an increase in the County’s cost for employee health insurance, partially offset by lower retirement contributions based on current actuarial projections.
Fee revenues decrease due to a reduction in fine revenue ($14,000) and lower projections inFalls Church reimbursements based on the FY 2021 budget and reconciliation of prior yearpayments with actual expenditures ($820).
175

GENERAL DISTRICT COURT DEPARTMENT BUDGET SUMMARY
DEPARTMENT FINANCIAL SUMMARY
FY 2019 FY 2020 FY 2021 % ChangeActual Adopted Adopted ‘20 to ‘21
Personnel $253,005 $241,825 $261,116 8%Non-Personnel 99,706 145,239 145,239 -Total Expenditures 352,711 387,064 406,355 5%
Fees 173,436 149,394 134,574 -10%Total Revenues 173,436 149,394 134,574 -10%
Net Tax Support $179,275 $237,670 $271,781 14%
Permanent FTEs 1.00 1.00 1.00Temporary FTEs - - -Total Authorized FTEs 1.00 1.00 1.00
EXPENSES BY LINE OF BUSINESS
FY 2019 FY 2020 FY 2021 % ChangeActual Adopted Adopted '20 to '21
Clerk's Office $202,609 $184,664 $204,043 10% -Judiciary 150,102 202,400 202,312 - 1.00Total Expenditures $352,711 $387,064 $406,355 5% 1.00
FY 2021 FTEs Adopted
176

GENERAL DISTRICT COURT TEN-YEAR HISTORY
EXPENDITURE, REVENUE, NET TAX SUPPORT, AND FULL-TIME EQUIVALENT TRENDS
$ in 000s FY 2012
ActualFY 2013
ActualFY 2014
ActualFY 2015
ActualFY 2016
ActualFY 2017
ActualFY 2018
ActualFY 2019
Actual
FY 2020 Adopted
Budget
FY 2021 Adopted
BudgetEXP $198 $261 $365 $352 $345 $333 $360 $353 $387 $406REV $20 $21 $23 $37 $24 $26 $180 $174 $149 $134NTS $178 $240 $342 $315 $321 $307 $180 $179 $238 $272FTEs 1.50 1.50 1.50 1.50 1.50 1.50 1.50 1.00 1.00 1.00
0
2
4
$0
$100
$200
$300
$400
$500FTEs EXP REV NTS
177

GENERAL DISTRICT COURT TEN-YEAR HISTORY
Fiscal Year
Description FTEs
FY 2012 Decreased revenue due to lower projections in Falls Church reimbursements ($6,132).
FY 2013 Increase in revenues is due to higher projections in Falls Church reimbursements based on the FY 2013 budget and reconciliation of FY 2011 reimbursements with the corresponding expenditures ($788).
FY 2014 Personnel increased due to a full year funding of a salary supplement for state court clerks adopted by the County Board in FY 2013 ($125,581).
Increase in revenues due to higher projections in Falls Churchreimbursements based on the FY 2014 budget and reconciliation of FY 2012reimbursements with the corresponding expenditures ($1,784).
Reduced funding for rental communication equipment ($3,333). Reduced funding for print shop charges ($269).
FY 2015 Decreased revenue due to lower projections in Falls Churchreimbursements ($1,063).
FY 2016 Increased revenue due to higher projections in Falls Church reimbursement($2,987).
FY 2017 No significant changes.
FY 2018 No significant changes.
FY 2019 Decreased fee revenue due to lower projections in Falls Churchreimbursements based on the FY 2019 budget and reconciliation of prior year payments with actual expenditures ($563).
Decreased personnel due to the removal of long-term County vacancies toachieve budgetary savings in FY 2019 ($27,970).
(0.5)
FY 2020 Lower revenue projections for e-ticketing ($32,800), offset by higher projections in Falls Church reimbursements based on the FY 2020 budget and reconciliation of prior year payments with actual expenditures ($139).
FY 2021 Reduced fine revenue ($14,000) and lower projections in Falls Church reimbursements based on the FY 2021 budget and reconciliation of prior year payments with actual expenditures ($820).
178

JUVENILE AND DOMESTIC RELATIONS DISTRICT COURT Earl J. Conklin, Director of Court Services
1425 N. COURTHOUSE RD., SUITE 5100, ARLINGTON, VA 22201 703-228-4600
Our Mission: To provide effective, efficient and quality services, programs, and interventions for juveniles, adults, and families while addressing public safety, victim impact, offender accountabil-
ity, and competency development in conformance with court orders, provisions of the Code of Virginia, and standards set forth by the Department of Juvenile Justice.
LINES OF BUSINESS
Juvenile and Domestic Relations District Court
Judiciary Court Services Unit
Judiciary- Judges’ Chambers- Clerk’s Office
Probation/Intake- Administration- Juvenile Probation Unit- Adult Probation Unit- Intake Unit- Psychological Services- Falls Church Court Services
Community-Based Programs and Grants- Andrew B. Ferrari Argus House- Girls Outreach- Young Achievers Program
Multi-Jurisdictional Programs- Aurora House- Safe Havens- Intervention, Prevention, and
Education Program- Sheltercare
SIGNIFICANT BUDGET CHANGES
The FY 2021 adopted expenditure budget for the Juvenile and Domestic Relations Court is $7,335,007, a three percent decrease from the FY 2020 adopted budget. The FY 2021 adopted budget reflects:
Personnel chages due to the conclusion of the U.S. Department of Justice (USDOJ) Violence Against Women Office’s Safe Havens grant ($64,904) and retirement contributions based on current actuarial projections, partially offset by an increase in the County’s cost for employee health insurance.
Non-personnel decreases due to the conclusion of the USDOJ Violence Against WomenOffice’s Safe Havens grant ($63,279) and adjustments to the annual expense for maintenanceand replacement of County vehicles ($1,883).
Fee revenues increase due to higher projections in Falls Church reimbursements based on theFY 2021 budget and reconciliation of prior payments with actual expenditures ($90,298) anda projected increase in parental payment amounts at the Argus House group home ($9,500).
179
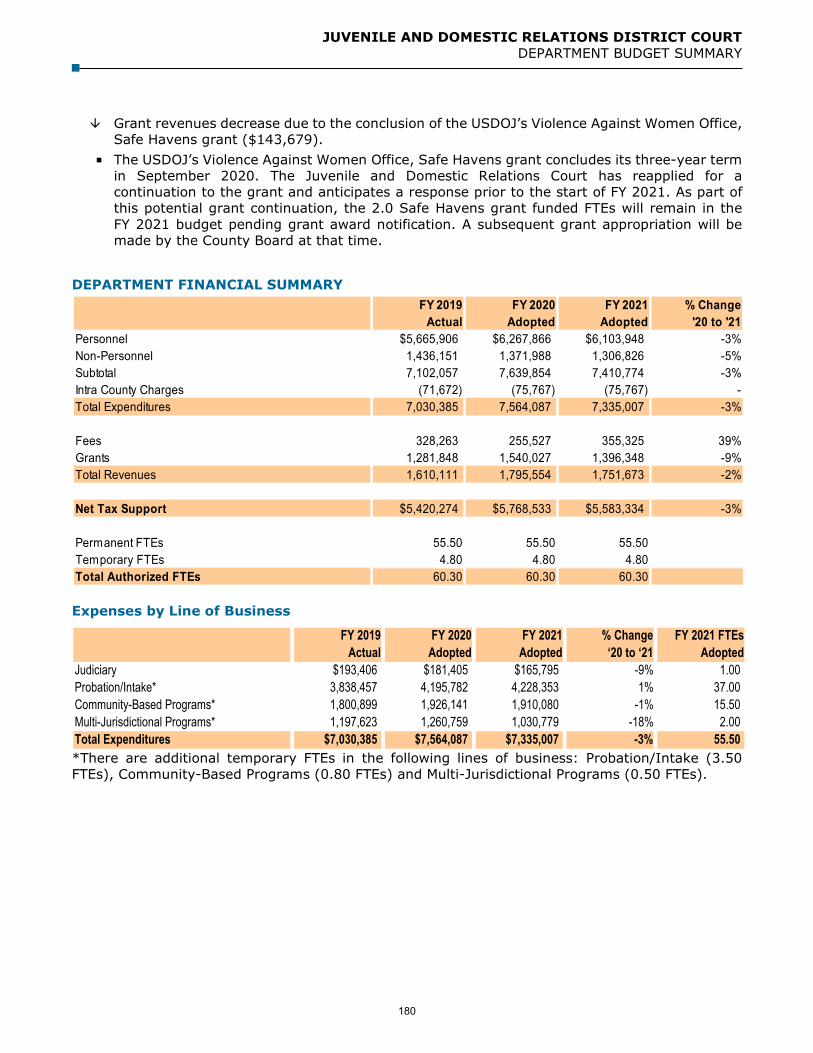
JUVENILE AND DOMESTIC RELATIONS DISTRICT COURT DEPARTMENT BUDGET SUMMARY
Grant revenues decrease due to the conclusion of the USDOJ’s Violence Against Women Office,Safe Havens grant ($143,679).
The USDOJ’s Violence Against Women Office, Safe Havens grant concludes its three-year term in September 2020. The Juvenile and Domestic Relations Court has reapplied for a continuation to the grant and anticipates a response prior to the start of FY 2021. As part of this potential grant continuation, the 2.0 Safe Havens grant funded FTEs will remain in the FY 2021 budget pending grant award notification. A subsequent grant appropriation will be made by the County Board at that time.
DEPARTMENT FINANCIAL SUMMARY
Expenses by Line of Business
FY 2019 FY 2020 FY 2021 % Change FY 2021 FTEsActual Adopted Adopted ‘20 to ‘21 Adopted
Judiciary $193,406 $181,405 $165,795 -9% 1.00Probation/Intake* 3,838,457 4,195,782 4,228,353 1% 37.00Community-Based Programs* 1,800,899 1,926,141 1,910,080 -1% 15.50Multi-Jurisdictional Programs* 1,197,623 1,260,759 1,030,779 -18% 2.00Total Expenditures $7,030,385 $7,564,087 $7,335,007 -3% 55.50 *There are additional temporary FTEs in the following lines of business: Probation/Intake (3.50FTEs), Community-Based Programs (0.80 FTEs) and Multi-Jurisdictional Programs (0.50 FTEs).
FY 2019 FY 2020 FY 2021 % ChangeActual Adopted Adopted '20 to '21
Personnel $5,665,906 $6,267,866 $6,103,948 -3%Non-Personnel 1,436,151 1,371,988 1,306,826 -5%Subtotal 7,102,057 7,639,854 7,410,774 -3%Intra County Charges (71,672) (75,767) (75,767) -Total Expenditures 7,030,385 7,564,087 7,335,007 -3%
Fees 328,263 255,527 355,325 39%Grants 1,281,848 1,540,027 1,396,348 -9%Total Revenues 1,610,111 1,795,554 1,751,673 -2%
Net Tax Support $5,420,274 $5,768,533 $5,583,334 -3%
Permanent FTEs 55.50 55.50 55.50Temporary FTEs 4.80 4.80 4.80Total Authorized FTEs 60.30 60.30 60.30
180

JUVENILE AND DOMESTIC RELATIONS DISTRICT COURT TEN-YEAR HISTORY
EXPENDITURE, REVENUE, NET TAX SUPPORT, AND FULL-TIME EQUIVALENT TRENDS
$ in 000sFY 2012
ActualFY 2013
ActualFY 2014
ActualFY 2015
ActualFY 2016
ActualFY 2017
ActualFY 2018
ActualFY 2019
Actual
FY 2020 Adopted Budget
FY 2021 Adopted Budget
EXP $5,449 $5,570 $5,731 $5,995 $6,211 $6,004 $6,530 $7,030 $7,564 $7,335REV $1,139 $993 $1,105 $1,033 $1,091 $1,237 $1,747 $1,610 $1,796 $1,752NTS $4,310 $4,577 $4,626 $4,962 $5,120 $4,767 $4,783 $5,420 $5,768 $5,583FTEs 55.80 55.80 55.80 55.80 55.80 56.80 58.80 60.30 60.30 60.30
0
20
40
60
80
100
$0
$1,000
$2,000
$3,000
$4,000
$5,000
$6,000
$7,000
$8,000
FTEs EXP REV NTS
181

JUVENILE AND DOMESTIC RELATIONS DISTRICT COURT TEN-YEAR HISTORY
Fiscal Year
Description FTEs
FY 2012 The County Board added funding for the continuation of a position previously funded with the Gang Task Force Grant ($86,109).
The County Board added funding for a one percent one-time lump sumpayment for employees at the top step.
Decreased revenues primarily due to the loss of the Northern Virginia GangTask Force grant ($77,490), partially offset by an increase in the JuvenileAccountability Block Grant ($2,607) and higher projections in Falls Churchreimbursements ($46,337).
FY 2013 The County Board added one-time funding for the Northern Virginia Family Service’s Gang Prevention Program for two years ($180,000).
Expenses and revenue increased for the Probation and Curfew Enforcement(PACE) grant ($13,324).
Non-personnel expenses increase due to additional funding for AuroraHouse Girls’ Group Home ($75,307) and for food expenses at Argus House($10,000).
Decrease in fee revenues is due to lower projections for Falls Churchreimbursements based on the FY 2013 proposed budget and reconciliationof FY 2011 reimbursements with the corresponding actual expenditures($3,905).
Decrease in grant revenue reflects a cut by the Commonwealth of Virginiato the Virginia Juvenile Community Crime Control funds ($25,927).
Decrease in Juvenile Accountability Block Grant ($13,221). Increase in Virginia State Probation reimbursement ($18,310).
FY 2014 Personnel increased primarily due to the full year funding of a salary supplement for state court clerks adopted by the County Board in FY 2013 ($50,521), partially offset by the elimination of grant-funded overtime ($13,324) due to the Regional Gang Task Force Grant ending.
Non-personnel expenses decreased primarily due to the reduction of theFY 2013 one-time two-year funding for the Intervention, Prevention andincrease in funding for Aurora House Girls’ Group Home ($64,643).
Intra-County Charges increased to reflects an accounting adjustmentrelated to Comprehensive Services Act (CSA) revenue received for servicesprovided by Argus House ($68,500).
Fee revenues decreased due to lower projections in Falls Churchreimbursements ($84,393).
Grant revenues decreased due to a decrease in CSA revenue from theaccounting treatment described above ($68,500), as well as theelimination of both the Regional Gang Task Force Grant ($13,324) and theJuvenile Accountability Block Grant ($36,324), partially offset by increasesin Virginia Juvenile Community Crime Control Act ($15,034) and Juvenileand Domestic Relations Probation ($28,700) revenues.
FY 2015 Non-personnel increased due to an increase in funding for Aurora House Girls’ Group Home ($17,162).
182
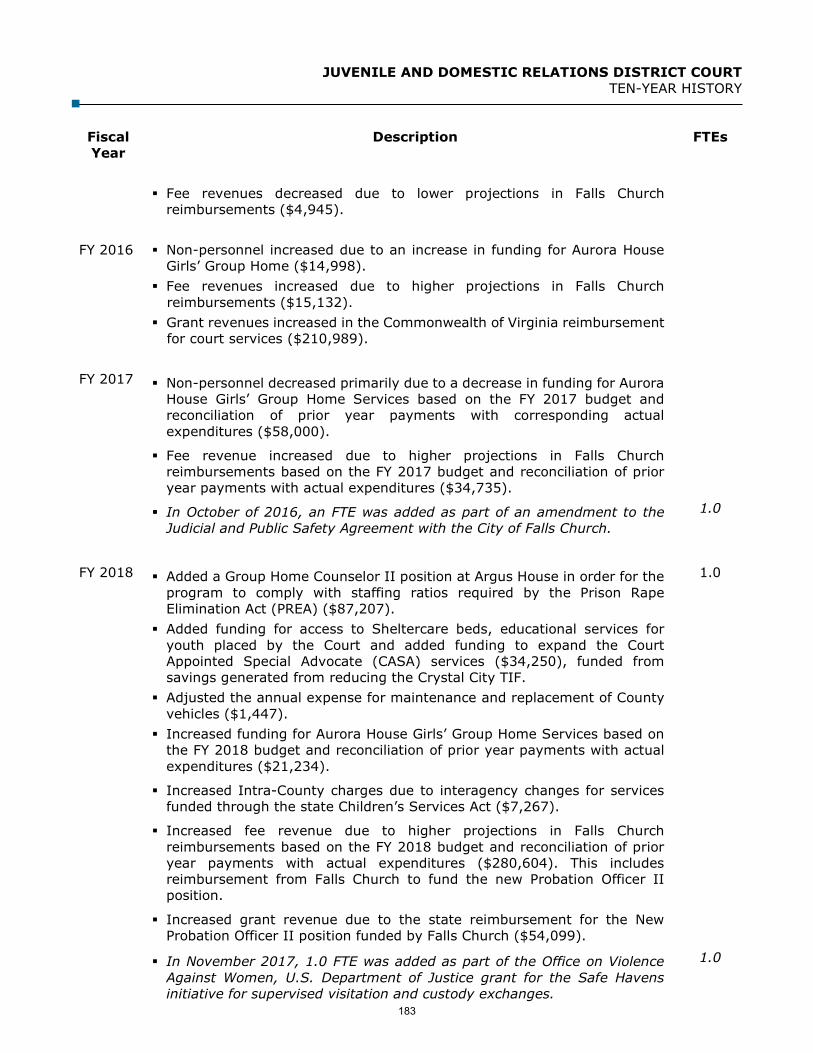
JUVENILE AND DOMESTIC RELATIONS DISTRICT COURT TEN-YEAR HISTORY
Fiscal Year
Description FTEs
Fee revenues decreased due to lower projections in Falls Churchreimbursements ($4,945).
FY 2016 Non-personnel increased due to an increase in funding for Aurora House Girls’ Group Home ($14,998).
Fee revenues increased due to higher projections in Falls Churchreimbursements ($15,132).
Grant revenues increased in the Commonwealth of Virginia reimbursementfor court services ($210,989).
FY 2017 Non-personnel decreased primarily due to a decrease in funding for Aurora House Girls’ Group Home Services based on the FY 2017 budget and reconciliation of prior year payments with corresponding actual expenditures ($58,000).
Fee revenue increased due to higher projections in Falls Churchreimbursements based on the FY 2017 budget and reconciliation of prioryear payments with actual expenditures ($34,735).
In October of 2016, an FTE was added as part of an amendment to theJudicial and Public Safety Agreement with the City of Falls Church.
1.0
FY 2018 Added a Group Home Counselor II position at Argus House in order for the program to comply with staffing ratios required by the Prison Rape Elimination Act (PREA) ($87,207).
1.0
Added funding for access to Sheltercare beds, educational services foryouth placed by the Court and added funding to expand the CourtAppointed Special Advocate (CASA) services ($34,250), funded fromsavings generated from reducing the Crystal City TIF.
Adjusted the annual expense for maintenance and replacement of Countyvehicles ($1,447).
Increased funding for Aurora House Girls’ Group Home Services based onthe FY 2018 budget and reconciliation of prior year payments with actualexpenditures ($21,234).
Increased Intra-County charges due to interagency changes for servicesfunded through the state Children’s Services Act ($7,267).
Increased fee revenue due to higher projections in Falls Churchreimbursements based on the FY 2018 budget and reconciliation of prioryear payments with actual expenditures ($280,604). This includesreimbursement from Falls Church to fund the new Probation Officer IIposition.
Increased grant revenue due to the state reimbursement for the NewProbation Officer II position funded by Falls Church ($54,099).
In November 2017, 1.0 FTE was added as part of the Office on ViolenceAgainst Women, U.S. Department of Justice grant for the Safe Havensinitiative for supervised visitation and custody exchanges.
1.0
183

JUVENILE AND DOMESTIC RELATIONS DISTRICT COURT TEN-YEAR HISTORY
Fiscal Year
Description FTEs
FY 2019 Added grant funding for the Safe Havens program including two grant funded positions, one of which was authorized during FY 2018 ($104,608 non-personnel, $156,272 personnel, $260,880 revenue).
1.0
Non-personnel funding and grant revenue both increase due to the transferof Falls Church’s Virginia Community Crime Control Act (VJCCCA) fundsfrom the state as part of the two localities’ combined VJCCCA plan($119,179).
Decreased fee revenue due to lower projections in Falls Churchreimbursements based on the FY 2019 budget and reconciliation of prioryear payments with actual expenditures ($100,376).
In September 2018, non-personnel contractual funding for the Safe HavensGrant Program was transferred to temporary personnel funding to supportthe addition of a Supervised Visitation Monitor grant funded position($27,099, 0.5 temporary FTE).
0.5
FY 2020 Reduced wireless service charges as part of a County-wide review of wireless service providers ($2,793).
Reduced payment to Falls Church for the Aurora House girls group home($15,000).
Fee revenue decreased due to lower projections in Falls Churchreimbursements based on the FY 2020 budget and reconciliation of prioryear payments with actual expenditures ($65,913) and a projectedreduction of parental fees paid to the Argus House ($1,000), offset by anincrease in Argus House revenue due to increased use of ComprehensiveServices for At-Risk Youth (CSA) funding and placements of youth from theCity of Alexandria ($12,000).
Grant revenue increased due to reimbursements from the VirginiaDepartment of Juvenile Justice for probation expenses ($116,937), offsetby a decrease in the U.S. Department of Justice’s Violence Against WomenOffice, Safe Havens program ($13,402).
FY 2021 The USDOJ Violence Against Women Office’s Safe Havens grant concluded its three-year term resulting in expense and revenue reductions ($64,904 personnel; $63,279 non-personnel; and $143,679 in grant revenue). The Juvenile and Domestic Relations Court reapplied for a continuation to the grant and as part of the potential grant continuation, 2.0 Safe Havens grant funded FTEs remained in the FY 2021 budget pending grant award notification.
Fee revenues increased due to higher projections in Falls Churchreimbursements ($90,298) and an increase in parental payment amountsat the Argus House group home ($9,500).
184

OFFICE OF THE MAGISTRATE Bruce Adam, Chief Magistrate
2020 15TH STREET N., ARLINGTON, VA 22201 703-228-3693
Our Mission: To protect and preserve the rights and liberties of all of the people, as guaranteed by the Constitution and laws of the United States and the County, by providing a fair, independent,
and accessible forum to the resolution of their legal rights.
The Office of the Magistrate issues warrants for the arrest of violators of state law and County ordinances; admits to bail or commits to jail all persons charged with offenses subject to the limitations and in accordance with the general laws on bail; and issues civil warrants, temporary detention orders, and emergency protective orders. The Magistrate administers oaths, takes acknowledgements, and acts as conservators for the peace.
LINES OF BUSINESS
Office of the Magistrate
Office of the Magistrate
SIGNIFICANT BUDGET CHANGES
The FY 2021 adopted expenditure budget for the Office of the Magistrate is $29,986, no change from the FY 2020 adopted budget. The FY 2021 adopted budget reflects:
Fee revenues decrease due to lower projections in Falls Church reimbursements based on theFY 2021 budget and reconciliation of prior year payments with actual expenditures ($660).
DEPARTMENT FINANCIAL SUMMARY
FY 2019 FY 2020 FY 2021 % ChangeActual Adopted Adopted ‘20 to ‘21
Personnel $18,710 $18,808 $18,808 -Non-Personnel 7,219 11,178 11,178 -Total Expenditures 25,929 29,986 29,986 -
Fees 2,125 1,469 809 -45%Total Revenues 2,125 1,469 809 -45%
Net Tax Support $23,804 $28,517 $29,177 2%
Permanent FTEs - - - Temporary FTEs - - - Total Authorized FTEs - - -
185

OFFICE OF THE MAGISTRATE TEN-YEAR HISTORY
EXPENDITURE, REVENUE, AND NET TAX SUPPORT
Adopted FY 2007
$ in 000s
Y 19
FY 2012 Actual
FY 2013 Actual
FY 2014 Actual
FY 2015 Actual
FY 2016 Actual
FY 2017 Actual
FY 2018 Actual
FY 2019 Actual
FY 2020 Adopted
Budget
FY 2021 Adopted
BudgetEXP $54 $40 $41 $42 $40 $39 $39 $26 $30 $30REV $2 $2 $2 $2 $2 $1 $2 $2 $1 $1NTS $52 $38 $39 $40 $37 $38 $37 $24 $29 $29
$0
$10
$20
$30
$40
$50
$60
$70
$80
$90
$100EXP REV NTS
186

OFFICE OF THE MAGISTRATE TEN-YEAR HISTORY
Fiscal Year Description FTEs
FY 2012 Decreased revenue from Falls Church reimbursements based on the FY 2012 budget and reconciliation of prior year payments with actual expenditures ($1,916).
FY 2013 Personnel changed due to a County supplement to the salaries of eligible Magistrate’s staff, who are state employees, and are unaffected by changes to County salary and fringe benefit levels. In FY 2013, the supplement decreased due to there being one fewer state employee receiving the County’s salary supplement ($12,200).
Increased revenue due to higher projections in Falls Churchreimbursements based on the FY 2013 budget and reconciliation of prioryear payments with actual expenditures ($1,828).
FY 2014 Personnel changed due to a County supplement to the salaries of eligible Magistrate’s staff, who are state employees, and are unaffected by changes to County salary and fringe benefit levels. In FY 2014, the supplement decreased due to there being one fewer state employee receiving the County’s salary supplement ($13,796).
Decreased revenue is due to lower projections in Falls Churchreimbursements based on the FY 2014 budget and reconciliation of prioryear payments with actual expenditures ($1,860).
Reduced funding for rental of operating equipment ($819).
FY 2015 Higher projections in Falls Church reimbursements ($193).
FY 2016 Higher projections in Falls Church reimbursements ($215).
FY 2017 No significant changes.
FY 2018 No significant changes.
FY 2019 No significant changes.
FY 2020 Adjustment to the salary supplement and payroll taxes ($11,446) due to arecent staff retirement.
Lower projections in Falls Church reimbursements based on the FY 2020budget and reconciliation of prior year payments with actual expenditures($656).
FY 2021 Lower projections in Falls Church reimbursements based on the FY 2021 budget and reconciliation of prior year payments with actual expenditures ($660).
187

This page intentionally left blank
188

OFFICE OF THE PUBLIC DEFENDER Bradley Haywood
2200 Wilson Blvd #501, ARLINGTON, VA 22201 703-875-1111
Our Mission: The Office of the Public Defender provides holistic, client-centered representation to indigent persons charged with offenses in Arlington County or the City of Falls Church.
The Office of the Public Defender represents individuals in the General District Court, Juvenile and Domestic Relations District Court, Circuit Court, Court of Appeals, and Supreme Court. It engages in community outreach, criminal justice education, and reentry programing and has spearheaded the initiation and development of problem-solving courts in Arlington County. It also zealously protects the liberty interests of justice-involved clients, while also partnering with community agencies and organizations to reduce recidivism and promote public safety.
LINES OF BUSINESS
Office of the Public Defender
Office of the Public Defender
SIGNIFICANT BUDGET CHANGES
The FY 2021 adopted expenditure budget for the Office of the Public Defender is $181,239, no change from the FY 2020 adopted budget.
DEPARTMENT FINANCIAL SUMMARY
FY 2019 FY 2020 FY 2021 % ChangeActual Adopted Adopted ‘20 to ‘21
Personnel $163,717 $181,239 $181,239 -Non-Personnel - - - - Total Expenditures 163,717 181,239 181,239 -
Total Revenues - - - -
Net Tax Support $163,717 $181,239 $181,239 -
Permanent FTEs - - - Temporary FTEs - - - Total Authorized FTEs - - -
189

OFFICE OF THE PUBLIC DEFENDER TEN-YEAR HISTORY
EXPENDITURE, REVENUE, AND NET TAX SUPPORT
Adopted FY 2007
$ in 000s
Y 19
FY 2012 Actual
FY 2013 Actual
FY 2014 Actual
FY 2015 Actual
FY 2016 Actual
FY 2017 Actual
FY 2018 Actual
FY 2019 Actual
FY 2020 Adopted
Budget
FY 2021 Adopted
BudgetEXP - - - - $82 $157 $150 $164 $181 $181REV - - - - - - - - - - NTS - - - - $82 $157 $150 $164 $181 $181Note: The County Board began supplemental funding of the Public Defender in FY 2016.
$40
$60
$80
$100
$120
$140
$160
$180
$200EXP REV NTS
190

OFFICE OF THE PUBLIC DEFENDER TEN-YEAR HISTORY
Fiscal Year Description FTEs
FY 2016 Added funding for a Public Defender salary supplement, phased in overtwo years ($80,000).
FY 2017 Added funding for year two of the Public Defender phase-in salarysupplement, bringing the total supplement to 15 percent ($86,111).
FY 2018 Added funding for the supplement increase based on state salary increases($5,565) and adjustments for payroll taxes ($13,734).
FY 2019 Added funding for the supplement increase based on prior year state salaryincreases ($6,009) and adjustments for payroll taxes ($194).
FY 2020 Supplement decreased based on prior year state salary levels, staffturnover, and adjustments for payroll taxes ($10,374).
FY 2021 No significant changes.
191

This page intentionally left blank
192

COMMONWEALTH’S ATTORNEY Parisa Dehghani-Tafti, Commonwealth’s Attorney
1425 N. COURTHOUSE RD., SUITE 5200, ARLINGTON, VA 22201 703-228-4410
Our Mission: The Office of the Commonwealth’s Attorney for Arlington and the City of Falls Church pursues justice, broadly, on behalf of victims, defendants, and all of the members of our
community. We prioritize public safety, transparency, and accountability. We strive to incorporate data-driven practices to inform our policies, while also seeking restoration by engaging with victims
of crime and the community to repair harm.
The Commonwealth’s Attorney, a Constitutional Officer for the Commonwealth of Virginia, is responsible for the prosecution of all criminal offenses occurring within Arlington County, Ronald Reagan Washington National Airport, and the City of Falls Church. In addition, this function also entails the review of criminal complaints and the rendering of legal assistance to police officers. The Commonwealth’s Attorney and Deputies assign and schedule all cases as well as oversee their evaluation and preparation. The Commonwealth’s Attorney, or her Assistants, appear in the General District Court, Juvenile and Domestic Relations District Court, and the Circuit Court.
LINE OF BUSINESS
Commonwealth’s Attorney
Office of the Commonwealth’s Attorney
SIGNIFICANT BUDGET CHANGES
The FY 2021 adopted expenditure budget for the Office of the Commonwealth’s Attorney is $4,632,228, a three percent increase from the FY 2020 adopted budget. The budget reflects:
Personnel changes due to an increase in the County’s cost for employee health insurance, the addition of an Information Systems Analyst position to assist with technology support ($135,000, 1.0 FTE) and a Management Analyst position responsible for office administration ($110,000, 1.0 FTE), partially offset by lower retirement contributions based on current actuarial projections and adjustments to reflect actual salaries. Fee revenues decrease due to lower projections in Falls Church reimbursements based on the FY 2021 budget and reconciliation of prior year payments with actual expenditures ($38,380).
Grant revenues increase due to an increase in State Compensation Board reimbursements($25,861) and an increase in the Department of Criminal Justice Services (DCJS) VictimWitness Grant ($5,570).
193
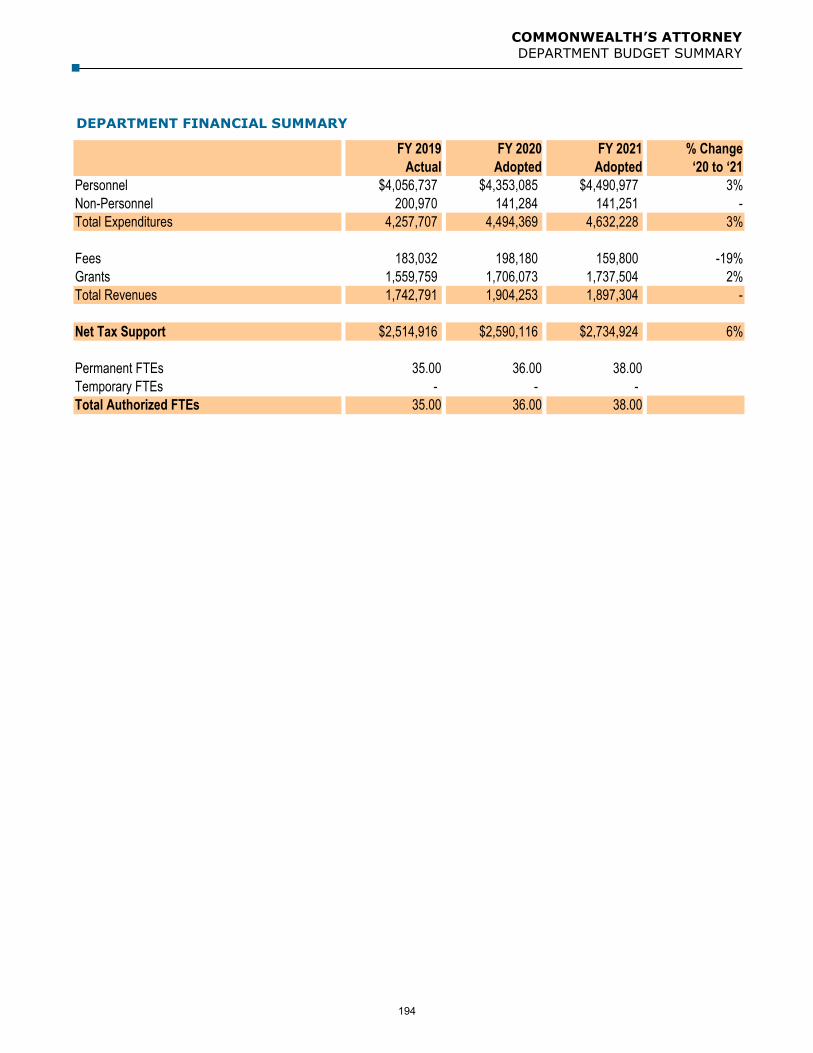
COMMONWEALTH’S ATTORNEY DEPARTMENT BUDGET SUMMARY
DEPARTMENT FINANCIAL SUMMARY
FY 2019 FY 2020 FY 2021 % ChangeActual Adopted Adopted ‘20 to ‘21
Personnel $4,056,737 $4,353,085 $4,490,977 3%Non-Personnel 200,970 141,284 141,251 -Total Expenditures 4,257,707 4,494,369 4,632,228 3%
Fees 183,032 198,180 159,800 -19%Grants 1,559,759 1,706,073 1,737,504 2%Total Revenues 1,742,791 1,904,253 1,897,304 -
Net Tax Support $2,514,916 $2,590,116 $2,734,924 6%
Permanent FTEs 35.00 36.00 38.00Temporary FTEs - - - Total Authorized FTEs 35.00 36.00 38.00
194

COMMONWEALTH’S ATTORNEY TEN-YEAR HISTORY
EXPENDITURE, REVENUE, NET TAX SUPPORT, AND FULL-TIME EQUIVALENT TRENDS
Adopted FY 2007
$ in 000sFY 2012
ActualFY 2013
Actual FY 2014
ActualFY 2015
Actual FY 2016
Actual FY 2017
Actual FY 2018
ActualFY 2019
Actual
FY 2020 Adopted
Budget
FY 2021 Adopted
BudgetEXP $3,809 $3,790 $3,981 $4,215 $4,153 $4,050 $4,167 $4,258 $4,494 $4,632REV $1,358 $1,667 $1,745 $1,908 $1,603 $1,653 $1,731 $1,743 $1,904 $1,897NTS $2,451 $2,103 $2,237 $2,307 $2,550 $2,396 $2,436 $2,515 $2,590 $2,735FTEs 35.00 35.00 35.00 35.00 36.00 34.00 35.00 35.00 36.00 38.00
0
10
20
30
40
50
$0
$1,000
$2,000
$3,000
$4,000
$5,000FTEs EXP REV NTS
195

COMMONWEALTH’S ATTORNEY TEN-YEAR HISTORY
Fiscal Year Description FTEs
FY 2012 The County Board added funding for a position previously funded with the Grants to Encourage Arrest Policies and Enforcement of Protective Orders (GEAP) program ($64,590, 1.0 FTE).
1.0
The County Board added funding for a one percent one-time lump sumpayment for employees at the top step.
Increased revenues in Falls Church projections ($2,427), CompensationBoard reimbursements as a result of partial restoration of funding($56,318), and High Intensity Drug Trafficking Area (HIDTA) grantreimbursements ($26,578).
FY 2013 Increased revenues in Falls Church reimbursements based on the FY 2013 proposed budget and reconciliation of FY 2011 reimbursements with the corresponding actual expenditures ($107,876).
Decreased revenues in Compensation Board reimbursements ($5,849)based on a reduction in Aid to Localities.
Decreased revenues in the High Intensity Drug Trafficking Area (HIDTA)grant reimbursements ($9,751) based on projected personnel expendituresfor the grant funded positions.
Increased revenues in the Department of Criminal Justice Services (DCJS)Victim Witness Grant ($3,407).
FY 2014 Increased fee revenues due to higher projections in Falls Church reimbursements ($2,619).
Increased grant revenues due to an increase in State Compensation Boardreimbursements ($77,298) as a result of restoration of previous state aidreductions and salary increases.
Decreased grant revenues in the High Intensity Drug Trafficking Area(HIDTA) grant reimbursements ($3,758) based on projected personnelexpenditures for the grant funded positions.
FY 2015 Decreased fee revenues due to lower projections in Falls Church reimbursements ($14,096), offset by an increase in revenue for services related to Commonwealth’s Attorney’s costs ($5,000).
Increased grant revenues due to an increase in State Compensation Boardreimbursements ($159,811) and an increase in the High Intensity DrugTrafficking Area (HIDTA) grant reimbursements ($12,149).
FY 2016 The County Board added ongoing funding for an Administrative Assistant position ($50,000).
1.0
Fee revenues increased due to higher projections in Falls Churchreimbursements ($8,114) and revenue for services related toCommonwealth’s Attorney’s costs ($1,000).
Grant revenues increased due to an increase in State Compensation Boardreimbursements ($79,611) and an increase in the Department of CriminalJustice Services Victim Witness Program Grant ($5,213).
196
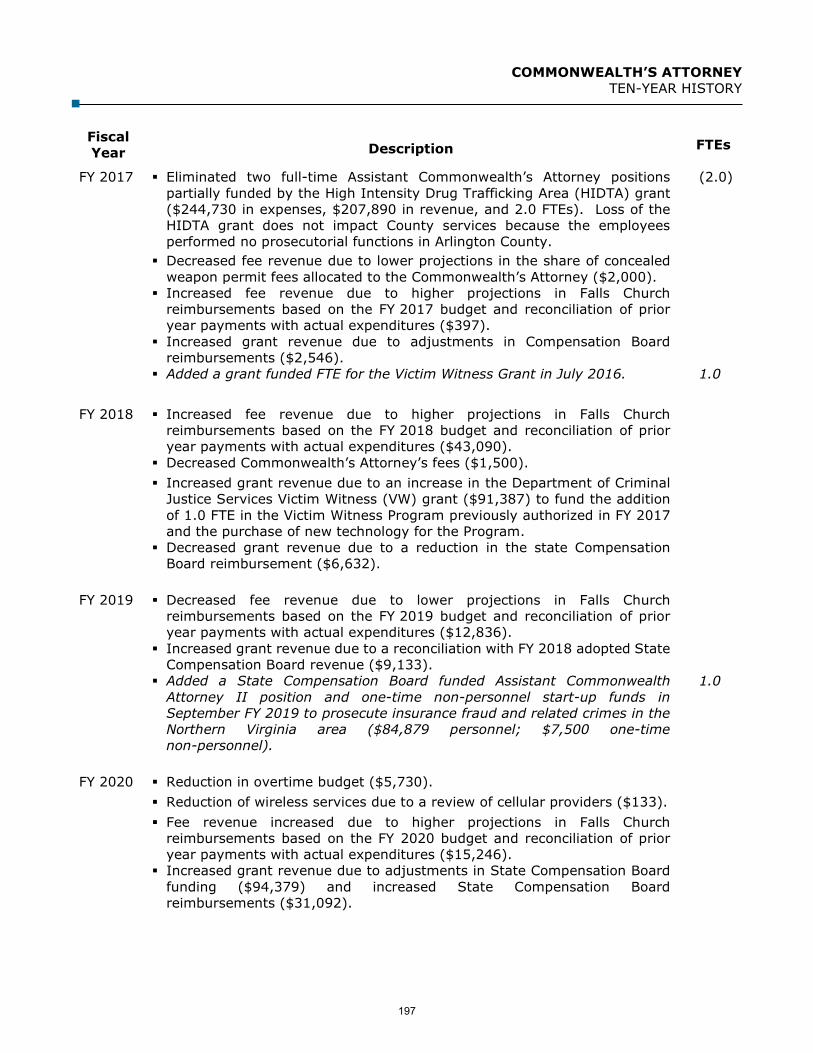
COMMONWEALTH’S ATTORNEY TEN-YEAR HISTORY
Fiscal Year Description FTEs
FY 2017 Eliminated two full-time Assistant Commonwealth’s Attorney positions partially funded by the High Intensity Drug Trafficking Area (HIDTA) grant ($244,730 in expenses, $207,890 in revenue, and 2.0 FTEs). Loss of the HIDTA grant does not impact County services because the employees performed no prosecutorial functions in Arlington County.
(2.0)
Decreased fee revenue due to lower projections in the share of concealedweapon permit fees allocated to the Commonwealth’s Attorney ($2,000).
Increased fee revenue due to higher projections in Falls Churchreimbursements based on the FY 2017 budget and reconciliation of prioryear payments with actual expenditures ($397).
Increased grant revenue due to adjustments in Compensation Boardreimbursements ($2,546).
Added a grant funded FTE for the Victim Witness Grant in July 2016. 1.0
FY 2018 Increased fee revenue due to higher projections in Falls Church reimbursements based on the FY 2018 budget and reconciliation of prior year payments with actual expenditures ($43,090).
Decreased Commonwealth’s Attorney’s fees ($1,500). Increased grant revenue due to an increase in the Department of Criminal
Justice Services Victim Witness (VW) grant ($91,387) to fund the additionof 1.0 FTE in the Victim Witness Program previously authorized in FY 2017and the purchase of new technology for the Program.
Decreased grant revenue due to a reduction in the state CompensationBoard reimbursement ($6,632).
FY 2019 Decreased fee revenue due to lower projections in Falls Church reimbursements based on the FY 2019 budget and reconciliation of prior year payments with actual expenditures ($12,836).
Increased grant revenue due to a reconciliation with FY 2018 adopted StateCompensation Board revenue ($9,133).
Added a State Compensation Board funded Assistant CommonwealthAttorney II position and one-time non-personnel start-up funds inSeptember FY 2019 to prosecute insurance fraud and related crimes in theNorthern Virginia area ($84,879 personnel; $7,500 one-timenon-personnel).
1.0
FY 2020 Reduction in overtime budget ($5,730). Reduction of wireless services due to a review of cellular providers ($133). Fee revenue increased due to higher projections in Falls Church
reimbursements based on the FY 2020 budget and reconciliation of prioryear payments with actual expenditures ($15,246).
Increased grant revenue due to adjustments in State Compensation Boardfunding ($94,379) and increased State Compensation Boardreimbursements ($31,092).
197

COMMONWEALTH’S ATTORNEY TEN-YEAR HISTORY
Fiscal Year Description FTEs
FY 2021 Added an Information Systems Analyst position ($135,000) to assist with technology support and a Management Analyst position ($110,000) responsible for office administration.
2.0
Decreased fee revenue due to lower projections in Falls Churchreimbursements based on the FY 2021 budget and reconciliation of prioryear payments with actual expenditures ($38,380).
Increased grant revenue due to an increase in State Compensation Boardreimbursements ($25,861) and an increase in the Department of CriminalJustice Services (DCJS) Victim Witness Grant ($5,570).
198
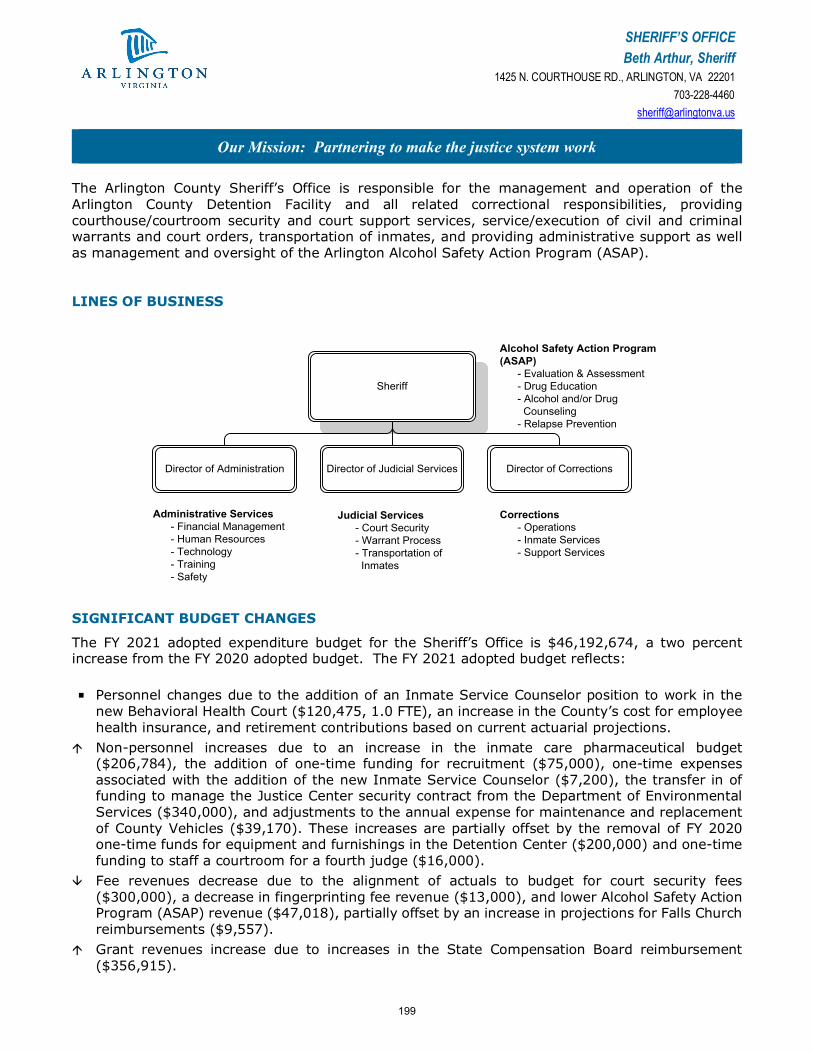
SHERIFF’S OFFICE Beth Arthur, Sheriff
1425 N. COURTHOUSE RD., ARLINGTON, VA 22201 703-228-4460
Our Mission: Partnering to make the justice system work
The Arlington County Sheriff’s Office is responsible for the management and operation of the Arlington County Detention Facility and all related correctional responsibilities, providing courthouse/courtroom security and court support services, service/execution of civil and criminal warrants and court orders, transportation of inmates, and providing administrative support as well as management and oversight of the Arlington Alcohol Safety Action Program (ASAP).
LINES OF BUSINESS
Sheriff
Director of Judicial Services Director of CorrectionsDirector of Administration
Alcohol Safety Action Program (ASAP)
- Evaluation & Assessment- Drug Education- Alcohol and/or Drug
Counseling- Relapse Prevention
Judicial Services- Court Security- Warrant Process- Transportation of
Inmates
Corrections- Operations- Inmate Services- Support Services
Administrative Services- Financial Management- Human Resources- Technology- Training- Safety
SIGNIFICANT BUDGET CHANGES
The FY 2021 adopted expenditure budget for the Sheriff’s Office is $46,192,674, a two percent increase from the FY 2020 adopted budget. The FY 2021 adopted budget reflects:
Personnel changes due to the addition of an Inmate Service Counselor position to work in the new Behavioral Health Court ($120,475, 1.0 FTE), an increase in the County’s cost for employee health insurance, and retirement contributions based on current actuarial projections.
Non-personnel increases due to an increase in the inmate care pharmaceutical budget($206,784), the addition of one-time funding for recruitment ($75,000), one-time expensesassociated with the addition of the new Inmate Service Counselor ($7,200), the transfer in offunding to manage the Justice Center security contract from the Department of EnvironmentalServices ($340,000), and adjustments to the annual expense for maintenance and replacementof County Vehicles ($39,170). These increases are partially offset by the removal of FY 2020one-time funds for equipment and furnishings in the Detention Center ($200,000) and one-timefunding to staff a courtroom for a fourth judge ($16,000).
Fee revenues decrease due to the alignment of actuals to budget for court security fees($300,000), a decrease in fingerprinting fee revenue ($13,000), and lower Alcohol Safety ActionProgram (ASAP) revenue ($47,018), partially offset by an increase in projections for Falls Churchreimbursements ($9,557).
Grant revenues increase due to increases in the State Compensation Board reimbursement($356,915).
199

SHERIFF’S OFFICE DEPARTMENT BUDGET SUMMARY
DEPARTMENT FINANCIAL SUMMARY
FY 2019 FY 2020 FY 2021 % ChangeActual Adopted Adopted ‘20 to ‘21
Personnel $38,381,078 $37,497,347 $37,906,750 1%Non-Personnel 9,423,439 8,053,740 8,505,894 6%Intra-County Charges (105,628) (219,970) (219,970) -Total Expenditures 47,698,889 45,331,117 46,192,674 2%
Fees 955,253 1,347,643 997,182 -26%Grants 9,114,325 9,499,709 9,856,624 4%Total Revenues 10,069,578 10,847,352 10,853,806 -
Net Tax Support $37,629,311 $34,483,765 $35,338,868 2%
Permanent FTEs 281.00 289.00 290.00Permanent Unfunded FTEs 6.00 - -Temporary FTEs 6.00 6.00 6.00Total Authorized FTEs 293.00 295.00 296.00
Expenses by Line of Business FY 2019 FY 2020 FY 2021 % Change
Actual Adopted Adopted ‘20 to ‘21Administrative Services* $5,501,130 $4,743,325 $5,386,516 14% 26.40Judicial Services 6,966,447 6,012,423 6,072,832 1% 42.00Corrections* 34,561,045 33,801,179 33,964,075 - 220.60Alcohol Safety Action Program* 670,267 774,190 769,251 -1% 7.00Total Expenditures $47,698,889 $45,331,117 $46,192,674 2% 296.00
FY 2021 FTEs Adopted
*There are additional temporary FTEs in the following lines of business: Administrative Services(2.40 FTEs), Corrections (2.60 FTEs) and the Alcohol Safety Action Program (1.00 FTEs).
200

SHERIFF’S OFFICE TEN-YEAR HISTORY
EXPENDITURE, REVENUE, NET TAX SUPPORT, AND FULL-TIME EQUIVALENT TRENDS
$ in 000sFY 2012
Actual FY 2013
ActualFY 2014
ActualFY 2015
ActualFY 2016
ActualFY 2017
ActualFY 2018
ActualFY 2019
Actual
FY 2020 Adopted Budget
FY 2021AdoptedBudget
EXP $34,780 $36,148 $36,728 $38,527 $41,005 $43,703 $45,919 $47,699 $45,331 $46,193REV $10,518 $10,855 $11,051 $11,159 $10,500 $10,504 $10,685 $10,070 $10,847 $10,854NTS $24,262 $25,293 $25,677 $27,368 $30,505 $33,198 $35,234 $37,629 $34,484 $35,339FTEs 266.40 266.00 267.00 271.00 272.00 279.00 293.00 293.00 295.00 296.00
0
50
100
150
200
250
300
$0
$10,000
$20,000
$30,000
$40,000
$50,000
$60,000FTEs EXP REV NTS
201

SHERIFF’S OFFICE TEN-YEAR HISTORY
Fiscal Year Description FTEs
FY 2012 The County Board restored a Deputy Sheriff position ($72,583, 1.0 FTE) and added one-time funding for one overstrength Deputy Sheriff position ($72,583).
1.0
The County Board approved a one percent one-time lump sum paymentfor employees at the top step.
Added contractual increase for inmate care ($75,683). Increased revenues in Falls Church reimbursement ($333,002) and State
prisoner reimbursement ($450,000), partially offset by decreases inCompensation Board reimbursement ($100,000) and federal prisonerreimbursement ($494,826).
FY 2013 The County Board restored three Deputy Sheriff Positions ($219,617) to help alleviate staffing issues at the Detention Center.
3.0
The County Board restored a Warrant Processor position ($45,000). 1.0 The County Board approved two additional holidays for FY 2013 ($80,000). Eliminated FY 2012 one-time funding for an overstrength position
($72,853). Decrease in the annual expense for the maintenance and replacement of
County vehicles ($13,421). Eliminated State Criminal Alien Assistance Program (SCAAP) expenses
($350,000) and corresponding grant revenues ($350,000) due touncertainty of the federal grant funds.
Fuel expenses increased ($26,000).
Increased revenue from miscellaneous fees ($60,927).
Reduced fee revenue from the City of Falls Church ($51,309). Decrease in State Compensation Board revenue ($70,471) that anticipates
ongoing reductions in aid to localities. State prisoner reimbursement revenue increases ($51,000) based on the
projected number of prisoners to be held for the state; federal prisonerreimbursement decreased ($9,000).
FY 2014 The County Board added one-time funding in additional overtime funding to help reduce detention facility lockdowns ($80,000).
Personnel increases included reclassification of uniform positions($842,336).
Removed one-time funding for FY 2013 additional County Board approvedholidays ($80,000).
Increased annual expense for the maintenance and replacement of Countyvehicles ($17,693) and contractual increases in Inmate Medical Services($77,117) and Pharmaceutical ($9,329) contracts.
Increased Courthouse security fee revenue ($40,000), fingerprinting fees($2,500), and ASAP fees ($68,077), partially offset by lower projections inFalls Church reimbursements ($4,950).
202

SHERIFF’S OFFICE TEN-YEAR HISTORY
Fiscal Year Description FTEs
Increased State Compensation Board reimbursements ($611,403), federalprisoner reimbursements ($48,300), and Comprehensive Correction Actrevenue ($12,507).
Reduced Inmate Medical Services ($100,000).
Added a PREA Coordinator position for the Corrections division as part ofFY 2013 closeout.
1.0
FY 2015 Added funding for a Prison Rape Elimination Act (PREA) Coordinator ($166,508).
1.0
Increase in annual expense for operating equipment for Telestaffmaintenance charges ($25,000) and contractual agreements for inmatemedical and pharmaceutical services ($34,126).
Fee revenue increases due to higher projections in Courthouse securityfees ($24,830), ASAP fees ($2,432), electronic monitoring and otheroutside service fees ($13,700) and an increase in Falls Churchreimbursements ($24,277).
Grant revenue increases due to State Compensation Boardreimbursements ($206,323), Highway Safety Grants ($7,150), andComprehensive Correction Act revenue ($6,920) as a result of an increasein salaries and tuition, which is offset by decreasing federal prisonerreimbursements ($163,300).
FY 2016 The County Board added funding to begin to address ongoing Sheriff staffing issues ($325,000 personnel, $25,000 non-personnel).
5.0
The County Board added one-time funding for a Deputy Sheriff (1.0 FTE)to expand the Drug Court Program. The salary for this position will be fullycharged to the Circuit Court.
1.0
Swapped contractual services budget ($50,900) to personnel in theconversion of part-time contractors to temporary employees in ASAP($50,900).
1.0
Increase due to contractual agreements for inmate medical andpharmaceutical services ($102,835).
Decreased Falls Church reimbursements ($172,361), concealed weaponsrevenue ($2,500), and other miscellaneous fees ($3,450), which are offsetby an increase in ASAP referrals ($10,824).
Increased prisoner expense reimbursement ($150,000) and CompensationBoard reimbursements including salary increases for some deputies($157,151), offset by a decrease in Federal prisoner reimbursement($25,000) and Highway Safety Grants ($6,525).
FY 2017 Added seven new positions including five Deputy positions, one Americans with Disabilities Coordinator (ADA) position, and one Human Resource position ($499,740). The Deputies will be hired half-way through the year.
7.0
203

SHERIFF’S OFFICE TEN-YEAR HISTORY
Fiscal Year Description FTEs
Increased funding for contractual services for inmate medical andpharmaceutical services ($52,446).
Increased one-time funding for consultant services to assist in any facilitiesredesign efforts in either the Detention Center or Courts facilities($50,000).
Increased one-time funding for the purchase of wearing apparel andequipment for the new deputy positions added ($44,644).
Decreased Falls Church reimbursements based on the FY 2017 budget andreconciliation of prior year payments with actual expenditures ($60,308).
Decreased fee revenue in courthouse security ($14,830), fingerprinting($3,000), electronic monitoring ($8,000), and ASAP program revenue($61,015).
Increased grant revenue due to an expected increase in CompensationBoard reimbursements ($169,330) and an increase in the ComprehensiveCorrections Act grant ($4,174).
Decreased grant revenue due to reduced Federal Prisoner reimbursement($33,400) and the elimination of the Highway Safety Grant ($625).
FY 2018 Added seven Sheriff Deputies positions ($295,078); the two Sergeants will be hired in January of 2018, while the five Sheriff Deputies will be hired in two phases: December 2017 and May 2018.
7.0
Added one-time funding for new uniforms ($400,000). Added one-time funding for wearing apparel and equipment for the new
deputy positions ($62,502). Increased armory funding, through a reallocation of funds from the closure
of Peumansend Creek Regional Jail (PCRJ) ($50,000). Added funding for contractual increases for inmate medical services
($71,967) and pharmaceutical supplies ($7,499). Decreased fingerprinting fees revenue ($3,000) and ASAP program fees
($48,013), Increased Falls Church reimbursements based on the FY 2018 budget and
reconciliation of prior year payments with actual expenses ($4,557) andcorrection fee increases ($490).
Increased Prisoner Expense Reimbursement grant ($150,000), partiallyoffset by adjustments in State Compensation Board reimbursements($58,798) and a decrease in Federal Prisoner reimbursement ($58,100).
FY 2019 The County Board froze six vacant deputy sheriff positions ($510,000) and added $491,000 to fund an additional 3.0 percent market pay adjustment for the Deputy Sheriff, Corporal and Sergeant positions. Entry pay for the Deputy Sheriff job class increased from $50,419 to $51,938, or 3.0 percent.
Added one-time funding to complete the detention center lock project($500,000).
204

SHERIFF’S OFFICE TEN-YEAR HISTORY
Fiscal Year Description FTEs
Added funding for contractual increases in inmate medical services($73,036).
Decreased court security fees revenue ($125,000) and ASAP program fees($35,566).
Increased fee revenue due to higher projections in Falls Church prisonerreimbursements ($41,682).
Increased Prisoner Expense Reimbursement grant ($143,300),Compensation Board reimbursements ($6,978), and the ComprehensiveCorrections grant ($4,828).
Decreased Federal Prisoner reimbursement ($6,700).
FY 2020 Added two deputy sheriff positions to staff a courtroom for a fourth judge which was added by the Commonwealth of Virginia due to the caseload of the Circuit Court ($180,251 personnel, 2.0 FTEs; $2,000 in ongoing funds and $16,000 in one-time non-personnel funds).
2.0
Funded six Sheriff Deputies positions that were frozen in FY 2019($543,201).
Added one-time funding for equipment and furnishings in the DetentionCenter ($200,000).
Increased funding for the inmate medical contract ($108,298) and utilities($196,252).
Increased court security fee revenue ($300,000).
Decreased Falls Church reimbursements ($280,065) and Alcohol SafetyAction Program (ASAP) fees ($13,074).
Increased Compensation Board reimbursement ($184,492), PrisonerExpense reimbursements ($6,500), miscellaneous State grants ($8,120),and the Comprehensive Community Corrections grant ($373).
FY 2021 Added an Inmate Service Counselor position to work in the new Behavioral Health Court ($120,475).
1.0
Increased the inmate care pharmaceutical budget ($206,784) and addedone-time funding for recruitment ($75,000) and one-time expensesassociated with the addition of the new Inmate Service Counselor($7,200).
Management of the Justice Center security contract and associated budgetwas transferred to the Sheriff’s Office from the Department ofEnvironmental Services ($340,000).
Decreased court security fee revenue to align budget with actuals($300,000), fingerprinting fee revenue ($13,000), and Alcohol SafetyAction Program (ASAP) revenues ($47,018), partially offset by an increasein projections for Falls Church reimbursements ($9,557).
Increased Compensation Board reimbursement ($356,915).
205

This page intentionally left blank
206

OFFICE OF THE COMMISSIONER OF REVENUE Ingrid H. Morroy, Commissioner of Revenue
2100 CLARENDON BLVD., SUITE 200, ARLINGTON, VA 22201 703-228-3033
Our Mission: To provide Arlington County residents and businesses with high quality service in meeting their tax obligations.
The Office of the Commissioner of Revenue provides Arlington County residents and businesses with high-quality service in meeting their tax obligations by applying Virginia State and Arlington County tax laws with uniformity, fairness, and integrity. The Office is committed to providing customer advocacy to protect the rights of individual and business taxpayers and resolving those issues not satisfactorily addressed through normal channels.
LINES OF BUSINESS
Commissioner of Revenue
Business Tax Personal Property TaxAdministration Compliance
Administration- Administration- Legal Counsel- Customer Advocacy
Business Tax Personal Property- Personal Property
Registration &Assessment
- DMV Select
Compliance- Personal Property
Enforcement- State Income Tax
Assistance
SIGNIFICANT BUDGET CHANGES
The FY 2021 adopted expenditure budget for the Commissioner of Revenue is $5,949,123, a one percent change compared to the FY 2020 adopted budget. The FY 2021 budget reflects:
Personnel changes due to an increase in the County’s cost for employee health insurance, partially offset by lower retirement contributions based on current actuarial projections.
Grant revenue increases to align budget with more accurate projections of StateCompensation Board reimbursements.
207

OFFICE OF THE COMMISSIONER OF REVENUE DEPARTMENT BUDGET SUMMARY
DEPARTMENT FINANCIAL SUMMARY
FY 2019 FY 2020 FY 2021 % ChangeActual Adopted Adopted ‘20 to ‘21
Personnel $5,561,720 $5,676,665 $5,712,921 1%Non-Personnel 402,495 236,243 236,202 -Total Expenditures 5,964,215 5,912,908 5,949,123 1%
Fees 355,174 340,000 340,000 -Grants 463,487 473,420 487,995 3%Total Revenues 818,661 813,420 827,995 2%
Net Tax Support $5,145,554 $5,099,488 $5,121,128 -
Permanent FTEs 53.00 53.00 53.00Temporary FTEs - - -Total Authorized FTEs 53.00 53.00 53.00
208

OFFICE OF THE COMMISSIONER OF REVENUE TEN-YEAR HISTORY
EXPENDITURE, REVENUE, NET TAX SUPPORT, AND FULL-TIME EQUIVALENT TRENDS
$ in 000sFY 2012
ActualFY 2013
ActualFY 2014
ActualFY 2015
ActualFY 2016
ActualFY 2017
ActualFY 2018
ActualFY 2019
Actual
FY 2020 Adopted
Budget
FY 2021 Adopted
BudgetEXP $5,085 $4,959 $4,995 $5,176 $5,410 $5,458 $5,902 $5,964 $5,913 $5,949REV $691 $718 $793 $697 $794 $826 $808 $819 $813 $828NTS $4,394 $4,241 $4,202 $4,479 $4,616 $4,632 $5,094 $5,145 $5,100 $5,121FTEs 52.00 52.00 52.00 52.00 52.00 52.00 53.00 53.00 53.00 53.00
0
20
40
60
80
$0
$1,000
$2,000
$3,000
$4,000
$5,000
$6,000
$7,000
FTEs EXP REV NTS
209

OFFICE OF THE COMMISSIONER OF REVENUE TEN-YEAR HISTORY
Fiscal Year Description FTEs
FY 2012 Eliminated an Information System Analyst III position ($120,483). (1.0) Small decrease in non-personnel expenses due to the adjustments to the
annual expense for the maintenance and replacement of County vehicles($663).
FY 2013 Fee revenue increased ($25,000) to more closely align with previous years’ actual revenue for out-of-state license plate fees for vehicles garaged in the County.
FY 2014 Fee revenue increased ($15,000) to more closely align with previous years’ actual revenue for various service fees.
Grant revenues increased due to a partial restoration of cuts in local aidfrom the State ($18,300) and an increase in State Compensation Boardreimbursements ($12,699).
Held Assistant Deputy of Business Tax position vacant for six months($59,971).
FY 2015 Fee revenue increased ($80,000) to more closely align with previous years’ actual revenue for out-of-state license plate fees for vehicles garaged in the County.
Grant revenues decreased to realign State Compensation Boardreimbursements with actual levels ($1,647).
FY 2016 Fee revenue increased due to an increase in the license plate penalty fee revenue based on recent actual receipts ($50,000) and the transfer of and an increase in DMV select revenue from the Treasurer’s Office ($25,000). The DMV Select is now solely operated by the Commissioner’s Office.
Grant revenue increased due to an increase in State Compensation Boardreimbursements ($22,350).
FY 2017 Fee revenue increased due to increased revenue from the Department of Motor Vehicles for satellite office services provided by the Commissioner of Revenue ($15,000).
Grant revenue increased due to an increase in State Compensation Boardreimbursements ($3,423).
FY 2018 Added a limited term Business Tax auditor position that is offset by an increase in tax audit revenue ($95,091).
1.0
Increased fee revenue from the Department of Motor Vehicles for satelliteoffice services provided by the Commissioner of Revenue ($10,000).
Increased grant revenue due to an adjustment to the State CompensationBoard reimbursements ($2,677).
210
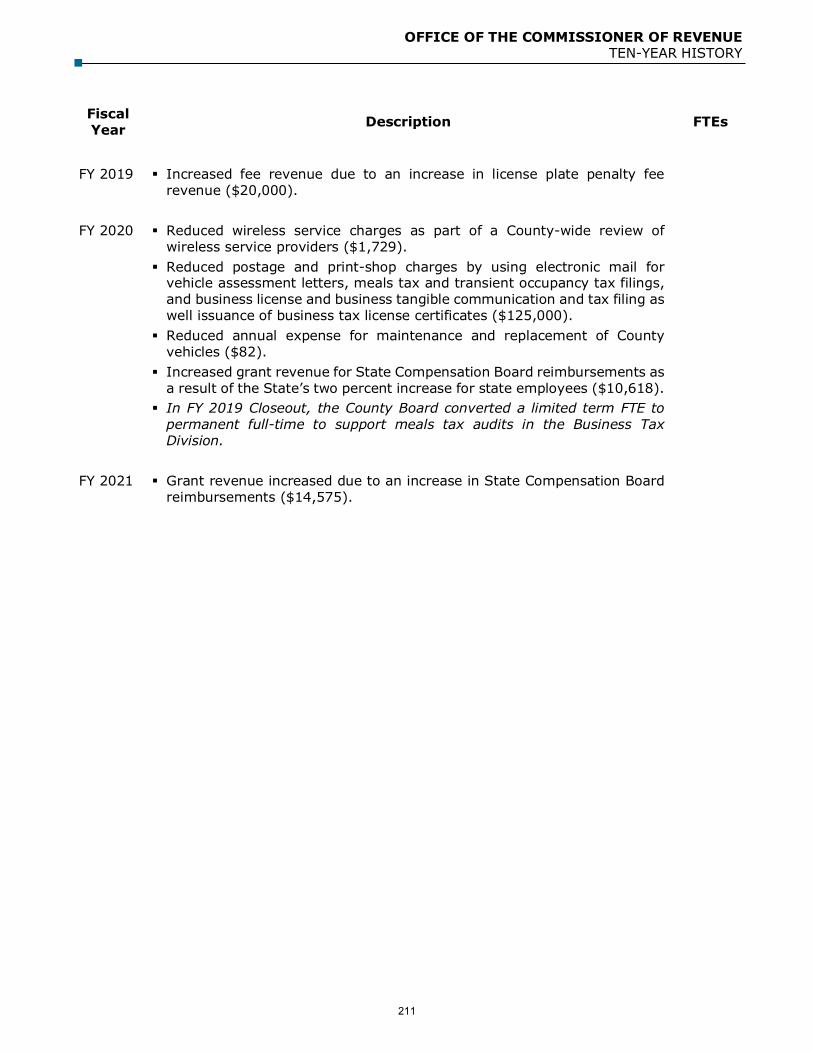
OFFICE OF THE COMMISSIONER OF REVENUE TEN-YEAR HISTORY
Fiscal Year Description FTEs
FY 2019 Increased fee revenue due to an increase in license plate penalty fee revenue ($20,000).
FY 2020 Reduced wireless service charges as part of a County-wide review of wireless service providers ($1,729).
Reduced postage and print-shop charges by using electronic mail forvehicle assessment letters, meals tax and transient occupancy tax filings,and business license and business tangible communication and tax filing aswell issuance of business tax license certificates ($125,000).
Reduced annual expense for maintenance and replacement of Countyvehicles ($82).
Increased grant revenue for State Compensation Board reimbursements asa result of the State’s two percent increase for state employees ($10,618).
In FY 2019 Closeout, the County Board converted a limited term FTE topermanent full-time to support meals tax audits in the Business TaxDivision.
FY 2021 Grant revenue increased due to an increase in State Compensation Board reimbursements ($14,575).
211

This page intentionally left blank
212

OFFICE OF THE TREASURER Carla de la Pava, Treasurer
2100 CLARENDON BLVD., SUITE 201, ARLINGTON, VA 22201 703-228-3255
Our Mission: To receive, safeguard, and disburse County funds
In order that society can conduct itself in a civilized manner, that the ends of justice can be served, and that government can ensure the provision of services to its citizenry, it is the mission of the Treasurer’s Office, as defined by the Constitution of Virginia, to receive or collect state and local taxes and other revenues, to safeguard the funds, and to disburse the funds in accord with the dictates of the local governing body.
LINES OF BUSINESS
Treasurer
Accounting & Treasury Management Division Operations DivisionAdministration & Special
Projects DivisionCompliance & Litigation
Division
Administration & Special Projects
- Administration- Special Projects &
Information Systems
Accounting- Accounting- Treasury Management
Operations- Customer Service- Management Information
& Billing
Compliance- Collections- Liens- Enforcement- Litigation
SIGNIFICANT BUDGET CHANGES
The FY 2021 adopted expenditure budget for the Treasurer’s Office is $7,298,502, a one percent increase from the FY 2020 adopted budget. The FY 2021 adopted budget reflects:
Personnel changes due to an increase in the County’s cost for employee health insurance, partially offset by lower retirement contributions based on current actuarial projections.
Fee revenue decreases due to the continuing impact of Supreme Court of Virginia ruling inFY 2019 that further decreased the number of delinquent court accounts referred to theTreasurer for collection ($61,500) and a decrease in Easy Park revenue ($8,485). Thesedecreases are partially offset by an increase in dog license revenues due to the demand forlifetime licenses ($61,500).
Grant revenue increases to align budget with more accurate projections of StateCompensation Board reimbursements ($17,000).
213

OFFICE OF THE TREASURER DEPARTMENT BUDGET SUMMARY
DEPARTMENT FINANCIAL SUMMARY
FY 2019 FY 2020 FY 2021 % ChangeActual Adopted Adopted '20 to '21
Personnel $6,266,182 $6,661,661 $6,705,377 1%Non-Personnel 782,335 593,063 593,125 -Total Expenditures 7,048,517 7,254,724 7,298,502 1%
Fees 1,163,217 1,125,720 1,117,235 -1%Grants 515,939 545,615 562,615 3%Total Revenues 1,679,156 1,671,335 1,679,850 1%
Net Tax Support $5,369,361 $5,583,389 $5,618,652 1%
Permanent FTEs 62.00 62.00 62.00Temporary FTEs 0.66 0.66 0.66 Total Authorized FTEs 62.66 62.66 62.66
214
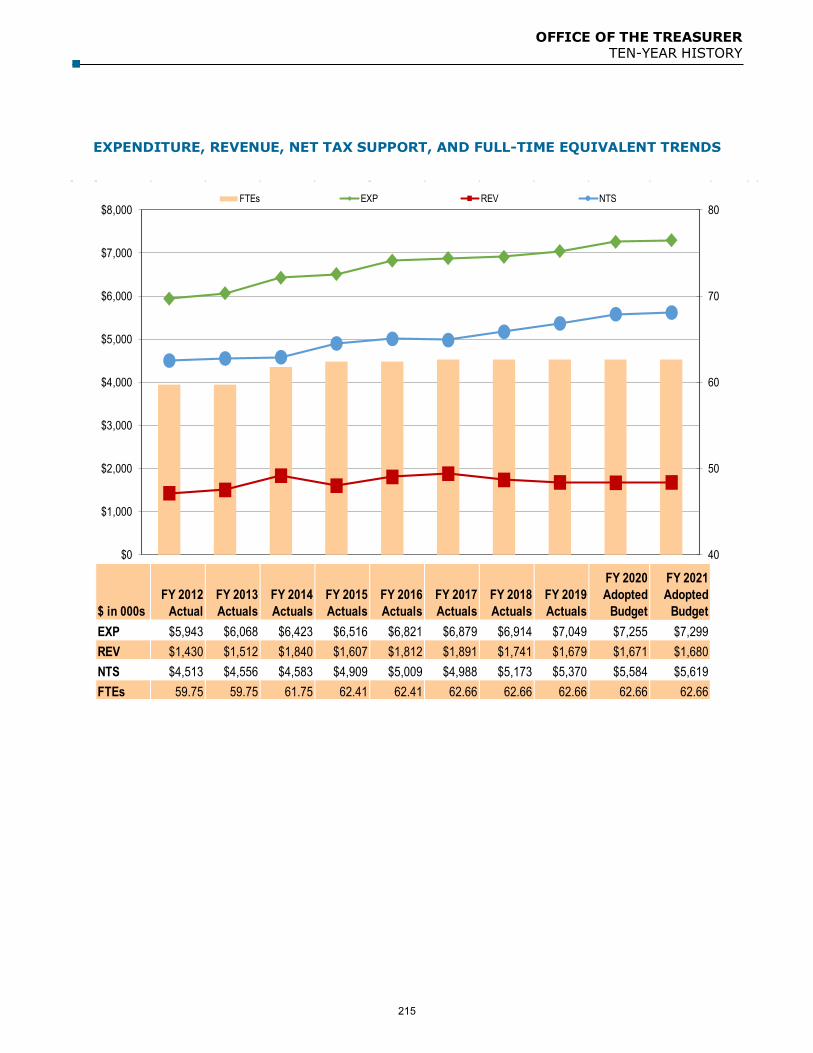
OFFICE OF THE TREASURER TEN-YEAR HISTORY
EXPENDITURE, REVENUE, NET TAX SUPPORT, AND FULL-TIME EQUIVALENT TRENDS
$ in 000sFY 2012
ActualFY 2013Actuals
FY 2014Actuals
FY 2015Actuals
FY 2016Actuals
FY 2017Actuals
FY 2018Actuals
FY 2019Actuals
FY 2020Adopted
Budget
FY 2021 Adopted
BudgetEXP $5,943 $6,068 $6,423 $6,516 $6,821 $6,879 $6,914 $7,049 $7,255 $7,299REV $1,430 $1,512 $1,840 $1,607 $1,812 $1,891 $1,741 $1,679 $1,671 $1,680NTS $4,513 $4,556 $4,583 $4,909 $5,009 $4,988 $5,173 $5,370 $5,584 $5,619FTEs 59.75 59.75 61.75 62.41 62.41 62.66 62.66 62.66 62.66 62.66
40
50
60
70
80
$0
$1,000
$2,000
$3,000
$4,000
$5,000
$6,000
$7,000
$8,000FTEs EXP REV NTS
215

OFFICE OF THE TREASURER TEN-YEAR HISTORY
Fiscal Year Description FTEs
FY 2012 Transfer of 1.0 FTE to the Department of Technology Services for support of the ACE system.
(1.0)
FY 2013 No significant changes.
FY 2014 Added two limited-term collector positions ($119,426), non-personnel and consultant expenses ($25,950), and revenue ($445,376) to enable the Treasurer’s office to collect over $15.0 million in overdue Circuit Court and General District Court debt. The positions will be eliminated when the fees generated from court collections do not fully offset the costs associated with program.
2.0
Held Management Specialist position vacant for six months ($57,926). Increased grant funds due to a partial restoration of cuts in local aid from
the State ($21,135) and an increase in State Compensation Boardreimbursements ($13,666).
FY 2015 Increased fee revenues due to increased compliance collections ($250,000), a change in the methodology of court collections ($99,624), additional dog licensing fee revenue ($10,000), and iPark device fee revenue ($1,200).
Increased grant funds due to an increase in State Compensation Boardreimbursements ($7,290).
Added 0.66 FTEs to the Compliance division in order to convert threeenforcement agents from contractors to part-time employees.
0.66
FY 2016 Decreased fee revenues due to lower delinquent court fine collections ($139,055), a reduction in court fine collection fees to the County due to General Assembly action ($114,000), decreased iPark fees ($45,700), and a transfer of DMV select revenue to the Commissioner of Revenue’s Office ($22,000), partially offset by an increase in administrative compliance fees ($75,000) and returned check fees ($10,000).
Increased grant revenues due to an increase in State CompensationBoard reimbursements ($24,656).
The County Board reduced the Real Estate late payment penalty fortaxpayers who pay after but within 30 days of the due date to 5 percent.Taxpayers who are more than 30 days delinquent continue to incur a 10percent late payment penalty.
FY 2017 The County Board added a partial FTE to assist with Court Fines and Fee collections.
0.25
The two limited-term collector positions were converted to permanentFTEs.
216

OFFICE OF THE TREASURER TEN-YEAR HISTORY
Fiscal Year Description FTEs
Decreased fee revenues due to lower administrative compliance fees($200,000), decreased iPark fees ($60,000), reload fees ($8,500) anddeposits ($4,000), partially offset by an increase in court collections($157,892) and Easy Park revenue ($48,000).
Decreased grant revenues due to a decrease in State CompensationBoard reimbursements ($1,170).
FY 2018 Increased fee revenue due to a higher anticipated administrative compliance and court collections fees ($162,163) and an increase in dog licensing fee revenue ($10,000), partially offset by decreased iPark fees ($32,249), reload fees ($1,000), and a decrease in Easy Park meter revenue ($6,694).
Decreased grant revenue due to an adjustment in the StateCompensation Board reimbursements ($6,522).
FY 2019 Decreased fee revenue as administrative collection fees return to more normal levels following collection of a large account in the prior two fiscal years ($40,000), and as the new rules enacted by the Supreme Court of Virginia continue to decrease the number of delinquent court accounts referred to the Treasurer for collection ($59,000). Revenues also decreased due to decreased iPark fees ($17,751) and reload fees ($500); a decrease in Easy Park meter revenue ($6,056), reload fees ($400) and device fees ($350); and a decrease in dog license revenues ($3,780).
Increased grant revenue due to a reconciliation with FY 2018 adoptedState Compensation Board revenue ($9,869) and additionalCompensation Board funding ($27,037) for the Treasurer and four of herDeputies participating in the Treasurer’s Association of Virginia’s CareerDevelopment Program having earned certifications from the University ofVirginia’s Weldon Cooper Center for Public Service.
FY 2020 Reduced printing charges with elimination of the requirement to display a personal property tax decal. Every vehicle registered in Arlington County is required to display a County Decal that is sent to residents annually ($80,615). In September 2018, the County Board voted to eliminate the County Decal effective FY 2020 and move towards license plate reading technology to enforce vehicle registration.
Reduced annual expense for maintenance and replacement of Countyvehicles ($1,308).
Decreased administrative collection fees revenue based on a return tomore normal levels following collection of a large account in the prior twofiscal years, and as the rules enacted by the Supreme Court of Virginia inFY 2018 continue to decrease the number of delinquent court accountsreferred to the Treasurer for collection ($44,000).
Increased dog license revenue ($3,500) and other compliance fees($2,000).
217
OFFICE OF THE TREASURER TEN-YEAR HISTORY
Fiscal Year Description FTEs
FY 2021 Increased dog license revenue ($61,500) based on the demand for lifetime licenses and grant revenue ($17,000) for increase in State Compensation Board reimbursements.
Decreased court collections ($61,500) due to the continuing impact of theSupreme Court of Virginia ruling in FY 2019 that further decreased thenumber of delinquent court accounts referred to the Treasurer forcollection.
218

OFFICE OF THE ELECTORAL BOARD AND VOTER REGISTRATION
Gretchen Reinemeyer, Registrar 2100 CLARENDON BLVD., SUITE 320, ARLINGTON, VA 22201
703-228-3455 [email protected]
Our Mission: To maintain an accurate list of registered voters and to administer elections fairly and efficiently in an open, transparent, and equitable manner
The Electoral Board maintains an accurate list of registered voters and administers elections fairly and efficiently in an open, transparent, and equitable manner.
LINE OF BUSINESS
Office of the Electoral Board and Voter Registration
Office of the Electoral Board and Voter Registration
SIGNIFICANT BUDGET CHANGES
The FY 2021 adopted expenditure budget for the Electoral Board is $1,835,477, a twenty percent increase from the FY 2020 adopted budget. The FY 2021 adopted budget reflects:
Personnel increases due to the addition of one-time funding for an Absentee Voting & Operations Coordinator ($75,000, 1.0 temporary FTE), one-time funding related to the CY 2020 Presidential Election ($89,065), and an increase in the County’s cost for employee health insurance, partially offset by lower retirement contributions based on current actuarial projections.
Non-personnel expenses increase to reflect one-time funding related to the CY 2020Presidential Election ($141,835).
Revenue decreases to reflect the removal of a one-time State reimbursement for a PresidentialPrimary Election ($76,510), partially offset by an increase based on prior year actuals ($675).
219

OFFICE OF THE ELECTORAL BOARD AND VOTER REGISTRATION DEPARTMENT BUDGET SUMMARY
DEPARTMENT FINANCIAL SUMMARY
FY 2019 FY 2020 FY 2021 % ChangeActual Adopted Adopted ‘20 to ‘21
Personnel $778,341 $898,789 $1,063,838 18%Non-Personnel 365,888 629,804 771,639 23%Total Expenditures 1,144,229 1,528,593 1,835,477 20%
Fees 6,111 200 200 - Grants 86,262 159,742 83,907 -47%Total Revenues 92,373 159,942 84,107 -47%
Net Tax Support $1,051,856 $1,368,651 $1,751,370 28%
Permanent FTEs 6.60 7.00 7.00Temporary FTEs 1.80 1.80 2.80Total Authorized FTEs 8.40 8.80 9.80
220

OFFICE OF THE ELECTORAL BOARD AND VOTER REGISTRATION TEN-YEAR HISTORY
EXPENDITURE, REVENUE, NET TAX SUPPORT, AND FULL-TIME EQUIVALENT TRENDS
$ in 000s
Y 19
FY 2012 Actual
FY 2013 Actual
FY 2014 Actual
FY 2015 Actual
FY 2016 Actual
FY 2017 Actual
FY 2018 Actual
FY 2019 Actual
FY 2020 Adopted
Budget
FY 2021 Adopted
BudgetEXP $1,164 $1,172 $1,020 $960 $1,130 $1,479 $1,109 $1,144 $1,529 $1,835REV $144 $77 $84 $89 $157 $85 $88 $92 $160 $84NTS $1,020 $1,095 $936 $871 $973 $1,394 $1,021 $1,052 $1,369 $1,751FTEs 8.40 8.40 8.40 8.40 8.40 8.40 8.40 8.40 8.80 9.80
0
5
10
15
20
25
-$100
$100
$300
$500
$700
$900
$1,100
$1,300
$1,500
$1,700
$1,900FTEs EXP REV NTS
221

OFFICE OF THE ELECTORAL BOARD AND VOTER REGISTRATION TEN-YEAR HISTORY
Fiscal Year Description FTEs
FY 2012 Personnel includes the County Board's approval of a one percent one-time lump sum payment for employees at the top step ($561). Personnel expenses also increase because additional temporary staff and overtime are needed to implement the four primaries/elections and redistricting in FY 2012 ($109,339), employee step increases, a six percent increase in the County’s cost for employee health insurance, and adjustments to retirement contributions based on current actuarial projections, partially offset by a decrease in some position salaries due to turnover.
Non-personnel expenses increased to include the printing and mailing costsfor redistricting ($137,750) as well as the additional costs for the fourprimaries/elections in FY 2012 including Electoral Board, Election Officers,operating supplies, building rental, and software costs ($203,435).On-going costs for automated systems and equipment have also increased($20,483).
The FY 2012 budget included revenue from the state for reimbursement ofthe presidential primary ($90,000), which is partially offset by a decreasein state revenue for reimbursement of salaries ($4,793).
FY 2013 The County Board added one-time funding related to the CY 2012 Presidential election ($342,407).
Decreased revenue due to a reduction in state aid ($4,400). Removal of FY 2012 revenue for the Presidential Primary election
($44,752).
FY 2014 Increased revenue due to the restoration of state aide cuts ($4,400) and an increase in the salary reimbursement level ($2,264).
Reduced funding for election officers ($16,800). Eliminated CY 2013 one-time funding for the Presidential election
($342,407).
FY 2015 Revenue decreased based on the projected reimbursement percentage from the State ($30,456).
FY 2016 Revenue increased based on State reimbursement for the 2016 Presidential Primary ($65,700) and a two percent increase for State Compensation Board reimbursements ($1,700).
FY 2017 The County Board added one-time funding related to the CY 2016 Presidential Election ($479,691).
Revenue decreased due to the removal of one-time revenue for thePresidential Primary election in June 2016 ($72,400), offset by a twopercent increase for State Compensation Board reimbursements ($1,600).
FY 2018 Expenses decreased due to the elimination of one-time funding for the CY 2016 Presidential Election ($479,691).
222

OFFICE OF THE ELECTORAL BOARD AND VOTER REGISTRATION TEN-YEAR HISTORY
Fiscal Year Description FTEs
Revenue increased due to an increase for State Compensation Boardreimbursements ($1,632).
FY 2019 No significant changes.
FY 2020 The County Board added ongoing funding to increase an existing Assistant Registrar position from 0.60 FTE to 1.0 FTE to assist in managing poll workers and to support a growing number of absentee voters ($22,500).
0.40
One-time funding was included for a Presidential Primary Election ($10,765personnel; $116,626 non-personnel).
Reduced wireless service charges as part of a County-wide review ofwireless service providers ($798).
Revenue included a State reimbursement for a Presidential PrimaryElection ($76,510).
FY 2021 One-time funding was added for an Absentee Voting & Operations Coordinator ($75,000, 1.0 temporary FTE).
1.0
One-time funding was added for the CY 2020 Presidential Election ($89,065in personnel; $141,835 in non-personnel).
A one-time State reimbursement for a Presidential Primary Election wasremoved ($76,510), partially offset by an increase based on prior yearactuals ($675).
223

This page intentionally left blank
224

Department of Public Safety Communications and Emergency Management
Aaron Miller, Director 1400 NORTH UHLE ST., SUITE 300, ARLINGTON, VA 22201
703-228-7935 [email protected]
Our Mission: To coordinate emergency preparedness and response capabilities, resources and outreach for the Arlington Community
The mission of the Department of Public Safety Communications and Emergency Management (DPSCEM) is to coordinate emergency preparedness and response capabilities, resources and outreach for the Arlington community. The mission will be achieved through the success of the outcome areas defined in the FY 2019 – FY 2021 departmental strategic plan: enhancing core capabilities to achieve organizational readiness; building, strengthening, and sustaining community resiliency; providing an adaptive and agile environment for the collection and dissemination of public safety information; and improving organizational efficiencies for the delivery of departmental priorities and initiatives.
To accomplish these goals, DPSCEM programs include: emergency planning and emergency exercises/drills, 24/7 public safety communication, coordination and dispatch, public education, and volunteer management. DPSCEM provides the leadership, coordination, and operational planning that enables the County’s response to, and recovery from, the impact of natural, man-made, and technological hazards.
LINES OF BUSINESS
Department of Public Safety Communications and Emergency
Management
Emergency Management- Organizational Readiness- Community Resilience
Emergency Communications - Public Safety Communications- Public Safety Systems andAdministration
Emergency Communications CenterEmergency Management Program
SIGNIFICANT BUDGET CHANGES
The FY 2021 adopted expenditure budget for the Department of Public Safety Communications and Emergency Management (DPSCEM) is $13,629,582, a less than one percent decrease from the FY 2020 adopted budget. The FY 2021 adopted budget reflects:
In September, the Department of Homeland Security’s grant program to Prepare Communities for a Complex Coordinated Terrorist Attack (CCTA) will expire, leaving only two months of funding in FY 2021. As a result, the total grant program funding will be reduced by $445,000 ($300,000 personnel, $145,000 non-personnel) from $480,000 to $35,000 to close out the grant and its deliverables.
Personnel changes due to the completion of the CCTA grant ($300,000) and lower retirement contributions based on current actuarial projections. These decreases are partially offset by the addition of a Community Resiliency Advocate position that will start halfway through the
225

DEPARTMENT OF PUBLIC SAFETY COMMUNICATIONS AND EMERGENCY MANAGEMENT DEPARTMENT BUDGET SUMMARY
fiscal year ($67,000, 1.0 FTE), an increase overtime budget needed to facilitate 24/7 coverage of the Emergency Management Watch Desk program ($56,147), an increase in the County’s cost for health insurance, and the reclassification of five vacant positions described below to achieve strategic department initiatives. o The creation of Community Education position in Emergency Management ($38,867);o Two Emergency Management Watch Officers to staff the 24/7 Watch Desk program
($43,649); ando Two Emergency Coordinator positions to create a new internal Emergency
Communications training cohort for new hires and existing staff development in an effortto improve recruitment and retention ($32,552).
Non-personnel increases primarily due to a new contract that encompasses all public safetymobile and portable radio units ($264,500) and maintenance of the radio system ($39,058),partially offset by the completion of the CCTA grant program ($145,000), removal ofFY 2020 one-time funds for a technology pilot program focused on cloud computing services($69,446), and the re-allocation of the Urban Areas Security Initiative (UASI) regionalpreparedness grant program costs to personnel ($16,866).
Fee revenues increase due to higher projections in Falls Church reimbursements based onthe FY 2021 budget and reconciliation of prior year payments with actual expenditures($71,910).
Grant revenue decreases due to a reduced grant amount for the CCTA grant ($445,000),partially offset by increases to the UASI regional preparedness grant program ($7,357).
DEPARTMENT FINANCIAL SUMMARY
FY 2019 FY 2020 FY 2021 % ChangeActual Adopted Adopted ‘20 to ‘21
Personnel $9,187,632 $9,437,662 $9,363,032 -1%Non-Personnel 4,142,280 4,271,197 4,344,100 2%Sub-total Expenditures 13,329,912 13,708,859 13,707,132 - Intra-County Charges (77,550) (77,550) (77,550) - Total Expenditures 13,252,362 13,631,309 13,629,582 -
Fees 1,145,836 1,324,145 1,396,055 5%Grants 1,147,626 1,125,330 687,687 -39%Total Revenues 2,293,462 2,449,475 2,083,742 -15%
Net Tax Support $10,958,900 $11,181,834 $11,545,840 3%
Permanent FTEs 74.50 74.50 75.50Temporary FTEs - - -Total Authorized FTEs 74.50 74.50 75.50
Expenses by Line of Business
FY 2019 FY 2020 FY 2021 % ChangeActual Adopted Adopted ‘20 to ‘21
Emergency Management $2,707,134 $2,802,530 $2,750,122 -2% 20.00Emergency Communications 10,545,228 10,828,779 10,879,460 - 55.50Total Expenditures $13,252,362 $13,631,309 $13,629,582 - 75.50
FY 2021 FTEs Adopted
226

DEPARTMENT OF PUBLIC SAFETY COMMUNICATIONS AND EMERGENCY MANAGEMENT TEN-YEAR HISTORY
EXPENDITURE, REVENUE, NET TAX SUPPORT, AND FULL-TIME EQUIVALENT TRENDS
$ in 000sFY 2012
ActualFY 2013
ActualFY 2014
ActualFY 2015
ActualFY 2016
ActualFY 2017
ActualFY 2018
ActualFY 2019
Actual
FY 2020 Adopted Budget
FY 2021 Adopted Budget
EXP $10,386 $11,071 $10,966 $11,242 $11,342 $11,662 $12,455 $13,252 $13,631 $13,630REV $1,628 $2,339 $2,340 $1,819 $1,993 $1,990 $2,040 $2,293 $2,449 $2,084NTS $8,758 $8,732 $8,626 $9,423 $9,349 $9,672 $10,415 $10,959 $11,182 $11,546FTEs 79.50 79.50 76.50 74.50 74.50 74.50 76.50 74.50 74.50 75.50
0
10
20
30
40
50
60
70
80
90
$0
$2,000
$4,000
$6,000
$8,000
$10,000
$12,000
$14,000
$16,000
FTEs EXP REV NTS
227

DEPARTMENT OF PUBLIC SAFETY COMMUNICATIONS AND EMERGENCY MANAGEMENT TEN-YEAR HISTORY
Fiscal Year
Description FTEs
FY 2012 The County Board added a one percent, one-time lump sum payment for employees at the top step.
Converted 4.0 overstrength FTEs into permanent positions andreallocated 4.0 permanent FTEs from Non-Departmental ($473,861) and added funding for overtime ($174,747) and for upgrading supervisory positions ($89,000).
8.0
Added funding for contractual increases ($58,217) partially offset by areduction in the electricity budget based on reduced usage ($10,273).
FY 2013 Increased revenues in reimbursement for wireless service costs ($352,380) based on actual receipts and grant revenues due to adjustments made for grant-funded positions ($44,833).
Decreased fee revenue reflects a change in the Commonwealth’smethodology in calculating disbursements to jurisdictions related towireless calls to 9-1-1, resulting in a projected loss of $307,505.
Increased the reimbursement from the City of Falls Church for servicesprovided by the County ($190,603).
FY 2014 Transferred out National Incident Management System (NIMS) Grant Coordinator position and associated grant revenue from OEM to the Fire Department ($125,000).
(1.0)
Transferred out a position to the Department of Technology Services forthe role of Public Safety Technology Officer ($56,784).
(1.0)
Added funding for contractual increases ($9,137), maintenance andreplacement of County vehicles ($1,530) and increased maintenancecosts of the County 9-1-1 telephone systems ($144,437).
Revenues increased from the City of Falls Church for emergency callcenter services under a newly negotiated agreement ($202,101).
Eliminated an Emergency Communications Specialist ($102,780) servingthe ECC Training Unit as part of the County-wide budget reductions.
(1.0)
FY 2015 Eliminated grant funded positions for Virginia Department of Emergency Management (VDEM) and the Metropolitan Medical Response System (MMRS) programs ($260,054).
(3.0)
Increased funding for rental space for public safety radio sites ($7,673),public safety radio operations ($418,738), and Local EmergencyManagement Program Grant (LEMPG) ($23,537).
Fee revenues increased due to higher projections in Falls Churchreimbursements ($60,234), as well as an increase to the wireless E-911revenue from the Commonwealth of Virginia ($127,865).
228

DEPARTMENT OF PUBLIC SAFETY COMMUNICATIONS AND EMERGENCY MANAGEMENT TEN-YEAR HISTORY
Fiscal Year
Description FTEs
Grant revenues decreased due to the loss of the Virginia Department ofEmergency Management (VDEM) and the Metropolitan Medical ResponseSystem (MMRS) grants ($260,054), which are partially offset byincreases to Federal Homeland Security grant revenue ($71,804).
FY 2016 Added on-going funding for in-building wireless connectivity maintenance ($10,000) and the full appropriation of UASI grant non-personnel ($62,753).
Fee revenue increased due to higher projections in Falls Churchreimbursements based on the FY 2016 budget and reconciliation of prioryear payments with actual expenditures ($102,336), as well as anincrease to the wireless E-911 reimbursement from the Commonwealth ofVirginia ($37,208).
Grant revenue increased due to UASI grants expected to be received inFY 2016 ($66,073).
FY 2017 Increased contractual obligations for 9-1-1 phone and radio costs ($97,753), adjustments to the annual expense for maintenance and replacement of County vehicles ($803), offset by a transfer of funds to the Police Department for Public Safety Information Technology (PSIT) activities ($11,151), and a re-allocation of grant funds from non-personnel expenses to personnel expenses to cover the cost of regular salary increases and new hires ($17,541).
Fee revenue decreased due to lower projections in Falls Churchreimbursements based on the reconciliation of prior year payments withactual expenditures ($53,004), offset by an increase to the wirelessE-911 reimbursement from the Commonwealth of Virginia ($36,242).
Grant revenue decreased due to UASI grants expected to be received inFY 2017 ($3,543).
FY 2018 Reallocated one Police Lieutenant position ($200,281; 1.0 FTE) into three new Emergency Communications Technicians (call takers) in the Emergency Communication Center in order to provide increased staffing to handle existing call volume and to prepare the organization for emerging 9-1-1 staffing demands.
3.0
Transferred funds from the Police Department to the EmergencyCommunications Center for Computer Aided Dispatch (CAD) contractmanagement ($215,551).
Increased funding for contractual obligations with the 9-1-1 phonesystem and radio system maintenance ($50,825), emergencycommunications contracts ($1,100), rental building increases ($772), andadjustments to the annual expense for maintenance and replacement ofCounty vehicles ($463).
Fee revenue decreased for Falls Church reimbursements ($153,781).
229

DEPARTMENT OF PUBLIC SAFETY COMMUNICATIONS AND EMERGENCY MANAGEMENT TEN-YEAR HISTORY
Fiscal Year
Description FTEs
Grant revenue increased due to Urban Area Security Initiative grants(UASI) across four grant programs ($41,660).
The Office of Emergency Management (OEM) changed its name tobecome the Department of Public Safety Communications and EmergencyManagement (DPSCEM). The two divisions supporting the department,Emergency Management and Emergency Communications, remained thesame.
During FY 2017 closeout, the County Board transferred a position to thePolice Department to support the Public Safety Information Technologyprogram ($96,356).
FY 2019 Increased personnel costs for the acceptance of a new grant program, Complex Coordinated Terrorist Attack (CCTA) grant in FY 2018 ($619,890), as well as increases in Urban Area Securities Initiative (UASI) grant personnel costs ($103,257).
Transfer out of one position to the Police Department to support thePublic Safety Information Technology program ($96,356, 1.0 FTE).
(1.0)
Eliminated one vacant Emergency Management Specialist that providedcommunity outreach and education services ($175,321).
(1.0)
Increased fee revenue from the City of Falls Church for 9-1-1 services($2,176) and the City of Alexandria’s portion of expenses related to the9-1-1 system maintenance ($169,482).
Lower Commonwealth of Virginia’s jurisdictional allocation for 9-1-1revenue beginning in FY 2019 due to a re-structuring of the program($169,707).
Increased grant revenue for UASI grant awards to be received in FY 2019($145,290) and receipt of the CCTA grant ($619,890).
FY 2020 Reduction of personnel costs in the CCTA grant ($319,890) and Volunteer Management Grant ($3,947).
Increased personnel expenses for several UASI grants including theExercise and Training Grant ($3,175), the National Incident ManagementGrant ($5,377), and the Regional Planner Grant ($9,434).
Added one-time funds for a technology pilot program focused on cloudcomputing services that allow staff virtual access to County applicationsand documents from any device in any location ($69,446).
Transferred Complex Coordinated Terrorist Attack (CCTA) program costsfrom personnel to non-personnel budget ($180,000).
Increased contractual costs for radio system maintenance ($37,191) and9-1-1 phone system ($62,762).
Decreased UASI grant program costs ($24,637). Decreased grant revenue for both the CCTA grant ($139,890) and the
Volunteer Management Grant ($3,947). Increased several UASI grants including the Exercise and Training Grant
($3,175), the National Incident Management Grant ($5,377), and theRegional Planner Grant ($9,434).
230

DEPARTMENT OF PUBLIC SAFETY COMMUNICATIONS AND EMERGENCY MANAGEMENT TEN-YEAR HISTORY
Fiscal Year
Description FTEs
Fee revenues increased for Falls Church reimbursements based on theFY 2020 budget and reconciliation of prior year payments with actualexpenditures ($30,971).
FY 2021 In September 2020, the Department of Homeland Security’s grant program to Prepare Communities for a Complex Coordinated Terrorist Attack (CCTA) expired, leaving only two months of remaining funding in FY 2021 and resulting in expense and revenue decreases ($300,000 personnel; $145,000 non-personnel; and $445,000 in grant revenue).
A Community Resiliency Advocate position was added and was authorizedto start halfway through the fiscal year ($67,000).
1.0
Overtime budget increased to support 24/7 coverage of the EmergencyManagement Watch Desk program ($56,147).
Five vacant positions described below were reclassified to achievestrategic department initiatives:o The creation of Community Education position in Emergency
Management ($38,867);o Two Emergency Management Watch Officers to staff the 24/7 Watch
Desk program ($43,649); ando Two Emergency Coordinator positions to create a new internal
Emergency Communications training cohort for new hires and existingstaff development ($32,552).
Contractual service expenses increased due to a new contract thatencompasses all public safety mobile and portable radio units ($264,500)and maintenance of the radio system ($39,058).
FY 2020 one-time funds were removed for a technology pilot programfocused on cloud computing services ($69,446).
Fee revenues increased due to higher projections in Falls Churchreimbursements ($71,910).
Grant revenue increases due to the UASI regional preparedness grantprogram ($7,357).
231

This page intentionally left blank
232

POLICE DEPARTMENT M. Jay Farr, Chief
1425 N. COURTHOUSE RD., ARLINGTON, VA 22201 703-228-4040
Our Mission: To reduce the incidence of crime and to improve the quality of life in Arlington County by making it a place where all people can live safely and without fear
LINES OF BUSINESS
Chief of Police
Operations Division Criminal Investigations Division
Systems Management Division
Management and Administration
Criminal Investigations
Organized Crime
Homeland Security
Management and Administration
Patrol Section
Operational Support
Community Resources: School Resource Officers
Community Resources: Outreach
Tactical Operations
Special Operations
Management and Administration
Human Resources Management
Support Management Section
SIGNIFICANT BUDGET CHANGES
The FY 2021 adopted expenditure budget for the Police Department is $72,274,292, a less than one percent increase from the FY 2020 adopted budget. The FY 2021 adopted budget reflects:
Personnel changes due to the addition of a Business Systems Analyst II position to assist with public safety payroll technology ($114,713, 1.0 FTE), the addition of an Administrative Specialist position to assist with the Department’s Business Outreach Unit ($87,230, 1.0 FTE), an increase in the County’s cost for employee health insurance, and retirement contributions based on current actuarial projections.
Non-personnel decreases due to the removal of FY 2020 one-time funds for operatingequipment funding for School Resource Officers ($180,000) and recruitment ($200,000), andadjustments to the annual expense for maintenance and replacement of County vehicles($25,092), partially offset by the addition of one-time funds to continue the Department’sstrategic recruiting efforts ($129,000), the addition of one-time funding for training andoperating supplies in the Business Outreach Unit ($110,000), and increases to variouscontractual services ($6,814).
Fee revenues increase primarily due to the establishment of an annual alarm registration feeto include residential and commercial properties ($335,860), an increase in the false alarmfine fee schedule ($28,010), increased secondhand license fee revenue ($9,400), concealed
233

POLICE DEPARTMENT DEPARTMENT BUDGET SUMMARY
weapons permits ($10,000), and increased photo red light fines based on recent trending ($40,000), partially offset by a decrease in Taxicab Licenses ($4,640) and summer camp revenue ($5,700).
In May 2018, the Arlington County Police Department implemented a major staffing re-structure to create appropriate staffing levels and reach efficiency of operations. This resulted in numerous movements within the agency and necessitated structural changes throughout the agency. Staff spent a considerable amount of time reassigning positions to the remaining sections and units while also working to create new sections. Some of these new sections include: adding a new Management and Administration line of business within each of the three divisions to represent the resources allocated at the division Deputy-Chief level and reallocating resources to create new lines of business such as the Community Resources: School Resource Officers and a Tactical Operations Section. As a result of this overhaul, a very large number of position movements occurred in order to ensure our budgeted funds still matched the current operating structure of the Police Department.
DEPARTMENT FINANCIAL SUMMARY
FY 2019 FY 2020 FY 2021 % ChangeActual Adopted Adopted ‘20 to ‘21
Personnel $61,368,607 $64,244,611 $64,610,113 1%Non-Personnel 7,348,352 7,833,457 7,674,179 -2%Intra-County Charges (13,068) (10,000) (10,000) -Total Expenditures 68,703,892 72,068,068 72,274,292 -
Fees 930,447 693,800 1,107,230 60%Grants 245,305 - - -Seized Assets/Reimbursements 347,872 - - -Total Revenues 1,523,624 693,800 1,107,230 60%
Net Tax Support $67,180,268 $71,374,268 $71,167,062 -
Permanent FTEs 460.00 472.00 474.00 Permanent Unfunded FTEs 10.00 - -Temporary FTEs 7.00 7.00 7.00 Total Authorized FTEs 477.00 479.00 481.00
Note: Seized Assets/Reimbursements are appropriated annually through the closeout process and are not included in the proposed/adopted budgets.
234

POLICE DEPARTMENT DEPARTMENT BUDGET SUMMARY
Expenses by Line of Business
FY 2019 FY 2020 FY 2021 % Change FY 2021 FTEsActual Adopted Adopted ‘20 to ‘21 Adopted
Office of the Chief $3,347,959 $3,304,239 $3,907,835 18% 21.00Systems Management Division - Management and Administration* 1,417,719 1,596,567 1,735,339 9% 14.00Human Resources Management 4,576,192 4,305,360 7,885,762 83% 63.00Records Management Unit & Deputy Director, NVCJTA 1,370,607 1,544,443 - -100% - Support Management 5,299,282 5,810,047 6,305,043 9% 23.00Criminal Investigations Division - Management and Administration 82,915 1,046,789 1,005,159 -4% - Criminal Investigations Section 9,537,215 8,701,089 9,195,222 6% 61.00Organized Crime Section 3,492,087 3,291,272 3,234,781 -2% 18.00Operations Division - Management and Administration 1,013,981 3,291,069 3,122,794 -5% 2.00Patrol Section 24,908,825 25,007,411 21,716,159 -13% 172.00Operational Support - - 1,212,209 - 6.00Community Resources: School Resource Officers Unit 2,562,908 2,658,791 2,794,771 5% 18.00Community Resources: Outreach 3,534,842 3,891,866 1,281,343 -67% 9.00Special Operations Section 6,302,506 6,602,661 6,284,859 -5% 58.00Tactical Operations 180,943 13,280 1,445,804 - 8.00Homeland Security 1,075,911 1,003,184 1,147,212 14% 8.00Total Expenditures $68,703,892 $72,068,068 $72,274,292 - 481.00
*Temporary FTEs (7.0 FTEs) are included in the Systems Management Division – Management andAdministration line of business.
235
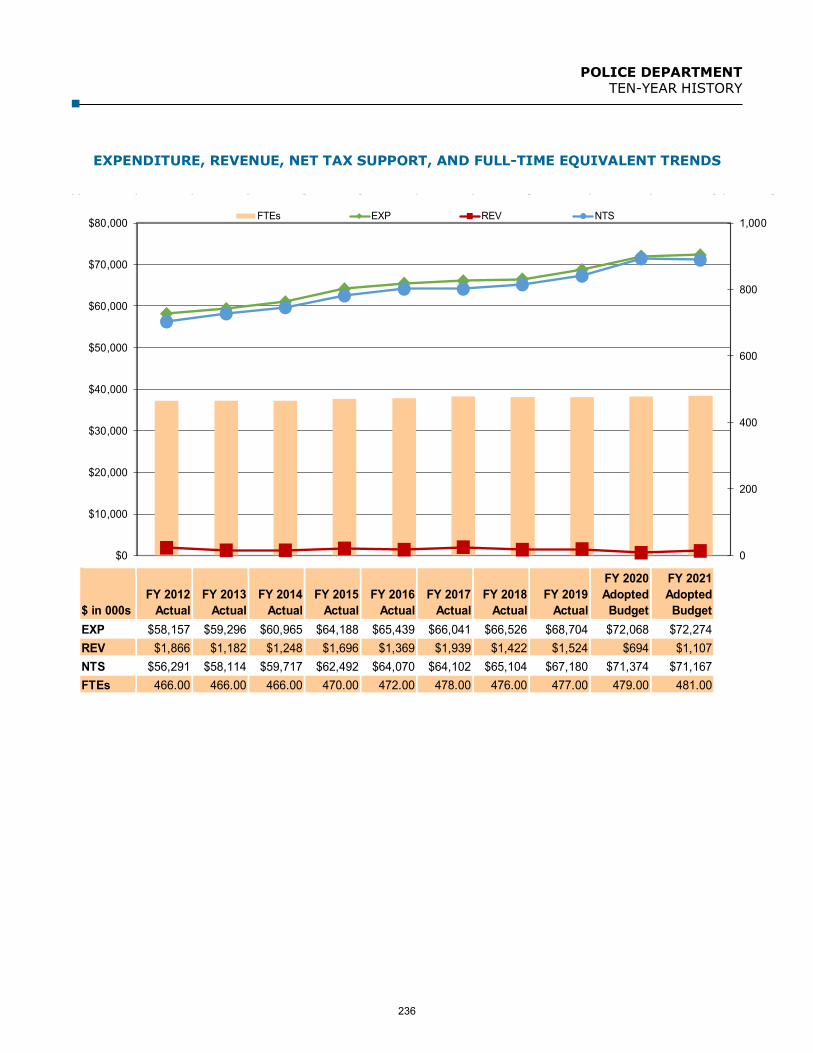
POLICE DEPARTMENT TEN-YEAR HISTORY
EXPENDITURE, REVENUE, NET TAX SUPPORT, AND FULL-TIME EQUIVALENT TRENDS
$ in 000sFY 2012
ActualFY 2013
ActualFY 2014
ActualFY 2015
ActualFY 2016
ActualFY 2017
ActualFY 2018
ActualFY 2019
Actual
FY 2020 Adopted Budget
FY 2021 Adopted Budget
EXP $58,157 $59,296 $60,965 $64,188 $65,439 $66,041 $66,526 $68,704 $72,068 $72,274REV $1,866 $1,182 $1,248 $1,696 $1,369 $1,939 $1,422 $1,524 $694 $1,107NTS $56,291 $58,114 $59,717 $62,492 $64,070 $64,102 $65,104 $67,180 $71,374 $71,167FTEs 466.00 466.00 466.00 470.00 472.00 478.00 476.00 477.00 479.00 481.00
0
200
400
600
800
1,000
$0
$10,000
$20,000
$30,000
$40,000
$50,000
$60,000
$70,000
$80,000 FTEs EXP REV NTS
236

POLICE DEPARTMENT TEN-YEAR HISTORY
Fiscal Year Description FTEs
FY 2012 The County Board increased authorized over-strength positions from five to ten and provided one-time funding for 50 percent of the cost of the positions ($354,645).
The County Board approved funding for the continuation of two positionspreviously funded with grant funds: the Grants to Encourage Arrest Policies and Enforcement of Protective Orders (GEAP) program ($67,718, 1.0 FTE) and the Gang Task Force grant (115,339).
1.0
The County Board approved a one percent one-time lump sum paymentfor employees at the top step.
Increased funding for critical maintenance services of public safetyinformation technology systems ($307,946), annual maintenance andreplacement of County vehicles ($213,989), and normal contractualincreases ($2,039), partially offset by adjustments to fuel ($150,000),contract expenses for the Photo Red Light Enforcement Program($184,800), and the deduction of one-time funding added in FY 2011 foroperating supplies related to the parking ticket fee increase ($20,000).
Decreased revenues in Photo Red Light Enforcement Program to reflectcurrent number of intersections monitored ($369,600), othermiscellaneous fees ($4,000), grant revenue due to the loss of the GangTask Force grant ($108,025), and elimination of prisoner travel expensereimbursements ($1,000), which are now credited to travel expense.
Increased revenues in taxicab licenses ($25,000) and concealed weapons($900).
FY 2013 The County Board added funding for enhanced weekend and holiday staffing for the entertainment districts ($60,000).
The County Board approved two additional holidays for FY 2013($107,500).
One-time funding included for overstrengths ($339,170 in personnel,$40,830 in non-personnel).
One position was added for the Photo Red Light program ($66,794). 1.0 A grant funded position was eliminated. (1.0) Increased funding for vehicle fuel ($106,500). Increased funding for maintenance services of public safety information
technology (IT) systems ($26,625) and Public Safety Network ($65,000). Added equipment funding for new recruits ($40,830). Increased contract funding for Photo Red Light for eight additional
cameras ($371,308). Reduced the annual expense for the maintenance and replacement of
County vehicles ($94,902). Revenue increased for higher projections for the Photo Red Light
Enforcement Program based on the current number of intersectionsmonitored and prior year actual revenues ($125,000), and additionalPhoto Red Light revenues for eight new cameras ($558,688).
237

POLICE DEPARTMENT TEN-YEAR HISTORY
Fiscal Year Description FTEs
Taxicab license revenue increased based on prior year actuals ($20,000).
FY 2014 Revenue from impound vehicles storage fees increased ($10,000). Removed one-time funding for overstrength positions ($339,170) and
recruit equipment ($40,830). Added funding for pay reclassifications for public safety positions
($1,032,677). Reduced the annual expense for the maintenance and replacement of
County vehicles ($5,947). Added funding for maintenance of public safety information technology
systems ($48,416). Increased Intra-county charges reflecting an administrative fee to cover
costs associated with staffing special events ($10,000). Increased hourly rate from $50 to $60 per hour charged for sworn staff
working special events ($100,000).
FY 2015 The County Board added one-time funding for additional overtime to address the costs associated with pub crawl events ($42,000).
The County Board added one-time funding to continue participation in theRegional Gang Task Force ($25,000).
Added funding for three Police Officer positions ($373,789) for theimplementation of a Community Oriented Policing Services (COPS) Grant.
3.0
Transferred a Public Safety Technology Manager ($171,805) from theDepartment of Technology Services to the Police Department.
Added one-time funding for non-personnel expenses related to the COPSgrant ($113,156).
Increased fees for accident reports, background checks, and police reportverifications ($31,920).
Grant revenue increased due to the receipt of a COPS Grant ($245,669).
1.0
FY 2016 The County Board reduced the personnel budget to adjust for expected vacancies ($189,619).
Transferred 2.0 FTEs from the Fire Department for the consolidation ofpublic safety information technology ($248,473).
2.0
Added one-time funding for additional overtime for the RosslynPedestrian Safety Initiative during peak traffic congestion period($176,400).
Fee revenue increased due to an increased concealed weapons revenue($18,000), partially offset by reductions in storage/boot fees ($10,000)and taxicab license revenue ($5,000) based on prior year actuals.
Grant revenue decreased due to adjustments to the Community OrientedPolicing Services (COPS) grant ($60,795).
238
POLICE DEPARTMENT TEN-YEAR HISTORY
Fiscal Year Description FTEs
Included ongoing funding for continued participation in the regional gangtask force ($25,000) and additional overtime to provide staffing in theClarendon business district ($113,378), both of which had been funded inprior fiscal years by the County Board with one-time funds.
FY 2017 Added funding for the addition of six patrol officers ($491,500) to provide support to the Operations Division in order to help maintain minimum staffing levels to ease call-back overtime and mandatory hold-overs so Police can carry out day-to-day core Police services.
6.0
Added one-time funds for wearing apparel and equipment for the newpatrol officers ($124,722, one-time).
Added funds for contractual increases in the parking ticket system($149,000) and transportation by others ($23,384).
Transferred funds for Public Safety Information Technology (PSIT)activities from the Office of Emergency Management, Fire Department,and the Sheriff’s Department ($38,453).
Decreased funds for adjustments to the annual expense for maintenanceand replacement of County vehicles ($125,038).
Revenue increases in false alarm fines ($15,000), solicitor permit revenue($3,500), and taxicab license revenue ($5,000).
Revenue decreased due to a reduction in the Community OrientedPolicing Sources Grant (COPS) ($161,783) and a decrease in the impoundvehicle storage fee revenue ($10,000).
FY 2018 Added funding for the reclassification of three vacant Public Service Aide positions to free up uniform resources for additional patrol support ($40,544).
Transferred funds to the Office of Emergency Management and the FireDepartment for their portions of the Records ManagementSystem/Computer Aided Dispatch Costs (291,485).
Removed one-time funding for wearing apparel and equipment for theofficers hired in FY 2017 ($124,032).
Decreased fuel charges ($274,145). Added funds for the new Criminal Justice Records Management System
for Police and Sheriff ($163,365). Added funds for contractual increases ($60,343). Added funds for the adjustment to the annual expense for maintenance
and replacement of County vehicles ($152,140). Added funds for training and armory associated with the opening of the
new firing range, which is partially funded by the reallocation ofPeumansend Creek Regional Jail closure savings ($148,700).
Decreased grant revenue due to the conclusion of the CommunityOriented Policing Sources (COPS) Grant ($15,907).
239

POLICE DEPARTMENT TEN-YEAR HISTORY
Fiscal Year Description FTEs
Increased patrol camp fees from $65 to $95 ($10,400) and increasedvarious charges associated with second hand license fees ($4,800).
During FY 2017 closeout, the County Board took action to transfer aposition from the Department of Public Safety Communications andEmergency Management to the Police Department to support the PublicSafety Information Technology program ($96,356).
1.0
FY 2019 The County Board froze 10.0 Police Officer I positions ($890,000) and added an additional $442,000 to fund an additional 1.25 percent market pay adjustment for sworn uniformed employees in the Police Officer, Corporal, and Sergeant job classes above the Manager’s proposed increase of 6.0 percent, for a total increase of 7.25 percent.
Entry pay for the Police Officer job class increases from $52,936 to$54,933, or 3.75 percent.
Eliminated two vacant Public Service Aides that help with school crossingand special events, when needed, and other duties as assigned.
(2.0)
Transferred a Senior Public Safety Technology Specialist ($131,147) fromthe Department of Public Safety Communications and EmergencyManagement as part of the Public Safety Information Technologypersonnel re-organization.
1.0
Non-personnel increased due to contractual increases for Tasers($132,178), partially offset by decreases to the adjustment andconsolidation of maintenance and replacement expenses for Policevehicles ($47,792).
Revenue decreased due to in the conclusion of the Community OrientedPolicing Sources (COPS) Grant ($7,184).
FY 2020 Retained a filled Administrative Technician II position with one-time funds ($87,928, 1.0 FTE).
(1.0)
Added one Sergeant and two Police Corporal positions ($396,214) toserve as School Resource Officers to staff the additional schools comingonline in FY 2020.
3.0
Funded ten Police Officer positions that were frozen in FY 2019($951,957).
Funded a second year of public safety pay enhancements ($530,000). Added funds to staff the Clarendon Detail ($168,000). Added funds for the Rosslyn Pedestrian Safety Initiative funded by the
Rosslyn BID ($89,920). Increased funding for vehicles and equipment associated with adding
three sworn positions to the department ($180,000 one-time; $92,646on-going), one-time funding for recruitment efforts ($200,000),contractual cost increases ($231,607), and adjustments to the annualexpense for maintenance and replacement of County vehicles ($11,454).
240

POLICE DEPARTMENT TEN-YEAR HISTORY
Fiscal Year Description FTEs
Decreased Photo Red Light camera revenue ($250,000), false alarm fines($80,000), taxicab licensing fee revenue ($27,000), and backgroundchecks ($6,000).
FY 2021 Added a Business Systems Analyst II position to assist with public safety payroll technology ($114,713).
1.0
Added an Administrative Specialist position ($87,230) and one-timefunding for training and operating supplies to assist with theDepartment’s Business Outreach Unit ($110,000).
1.0
Added one-time funding to continue the department’s strategic recruitingefforts ($129,000).
Increased fee revenues primarily due to the establishment of an annualalarm registration fee to include residential and commercial properties($335,860), an increased false alarm fine fee schedule ($28,010),increased second hand license fees ($9,400), concealed weapons permits($10,000), and increased photo red light fines ($40,000).
Decreased fee revenues for taxi cab licenses ($4,640) and Summer Camprevenue ($5,700).
241

This page intentionally left blank
242

FIRE DEPARTMENT David Povlitz, Chief
2100 CLARENDON BLVD., SUITE 400, ARLINGTON, VA 22201 703-228-3362
Our Mission: We serve the community with compassion, integrity, and commitment through prevention, education, and a professional response to all hazards.
LINES OF BUSINESS
Fire Chief
Support Services Personnel ServicesEmergency Services
Logistics
Fire Marshall’s Office
Special Operations
Emergency Services
Operation FireSafe
Professional Standards & Compliance
Human Resources, Health & Safety
Recruitment, Outreach & Training
Office of the Fire Chief
SIGNIFICANT BUDGET CHANGES
The FY 2021 adopted expenditure budget for the Fire Department is $66,430,066, a two percent increase from the FY 2020 adopted budget. The FY 2021 adopted budget reflects:
Personnel changes due to the addition of a human resources administrative specialist position ($111,836, 1.0 FTE), an increase in the County’s cost for employee health insurance, and retirement contributions based on current actuarial projections. In addition, nine Firefighter/EMT I positions were added to continue staffing for the implementation of a Kelly Day schedule (9.0 FTEs), and a second recruit school was added to accommodate a recruit class of 25 funded with one-time funds ($1,141,271, one-time).
Non-personnel increases due to increases in the Fire Programs Grant ($24,533) and the Fourfor Life Emergency Medical Services Grant ($9,020), adjustments to the annual expense forthe maintenance and replacement of County vehicles ($78,261), contractual increases($15,066) and one-time increases associated with the addition of a second recruit class forrecruit physicals, background checks, and psychological exams ($89,836 one-time), and theone-time purchase of personal protective equipment and operating supplies ($281,198 one-time).
Fee revenues increase due to increased Falls Church reimbursements ($313,394), ambulancebilling treasurer collections ($50,000), and Fire Marshall fee revenue ($15,000), partially offsetby a decrease in special events revenue ($5,000).
Grant revenue increases due to the increase in revenue from the Fire Programs Grant($24,533) and the Four for Life Emergency Medical Services Grant ($9,020).
The FY 2021 adopted budget reflects a strategic resource reorganization to better align with the Fire Department’s initiatives. The FY 2019 and FY 2020 numbers within each line of business that is affected by the reorganization are shown as revised to detail the organizational changes that occurred within the Department.
243
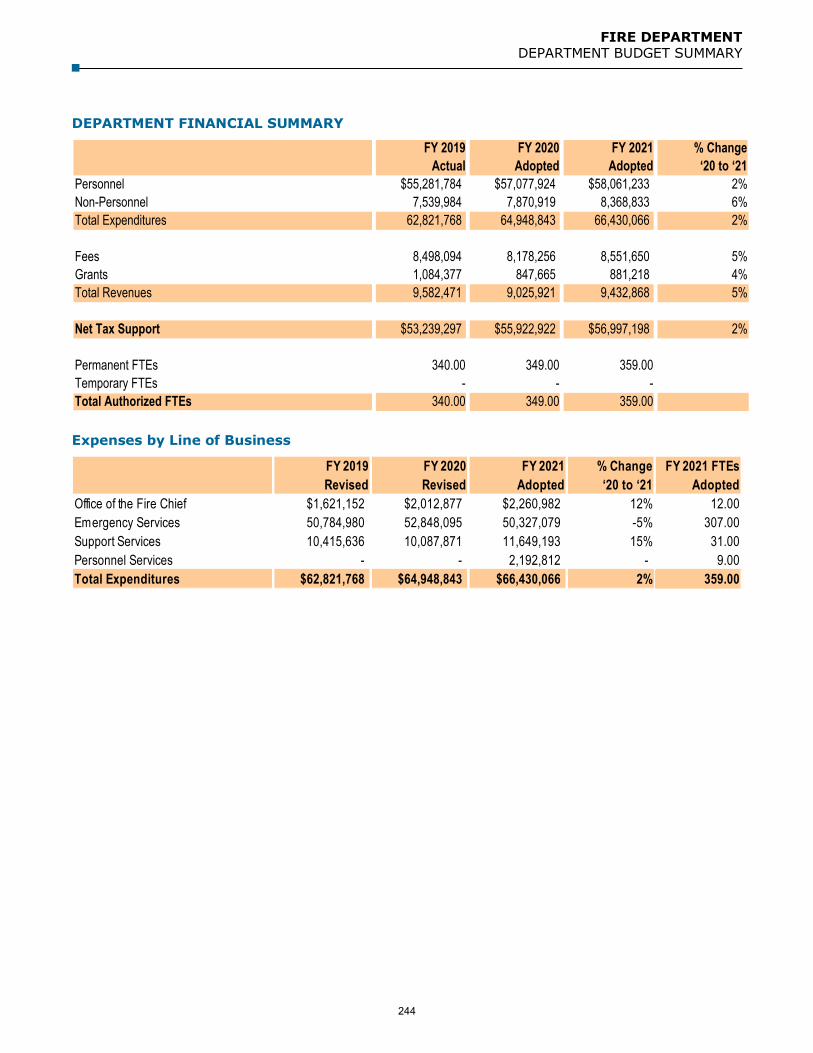
FIRE DEPARTMENT DEPARTMENT BUDGET SUMMARY
DEPARTMENT FINANCIAL SUMMARY
FY 2019 FY 2020 FY 2021 % ChangeActual Adopted Adopted ‘20 to ‘21
Personnel $55,281,784 $57,077,924 $58,061,233 2%Non-Personnel 7,539,984 7,870,919 8,368,833 6%Total Expenditures 62,821,768 64,948,843 66,430,066 2%
Fees 8,498,094 8,178,256 8,551,650 5%Grants 1,084,377 847,665 881,218 4%Total Revenues 9,582,471 9,025,921 9,432,868 5%
Net Tax Support $53,239,297 $55,922,922 $56,997,198 2%
Permanent FTEs 340.00 349.00 359.00Temporary FTEs - - -Total Authorized FTEs 340.00 349.00 359.00
Expenses by Line of Business
FY 2019 FY 2020 FY 2021 % ChangeRevised Revised Adopted ‘20 to ‘21
Office of the Fire Chief $1,621,152 $2,012,877 $2,260,982 12% 12.00Emergency Services 50,784,980 52,848,095 50,327,079 -5% 307.00Support Services 10,415,636 10,087,871 11,649,193 15% 31.00Personnel Services - - 2,192,812 - 9.00Total Expenditures $62,821,768 $64,948,843 $66,430,066 2% 359.00
FY 2021 FTEs Adopted
244

FIRE DEPARTMENT TEN-YEAR HISTORY
EXPENDITURE, REVENUE, NET TAX SUPPORT, AND FULL-TIME EQUIVALENT TRENDS
$ in 000sFY 2012
ActualFY 2013
ActualFY 2014
ActualFY 2015
ActualFY 2016
ActualFY 2017
ActualFY 2018
ActualFY 2019
Actual
FY 2020 Adopted Budget
FY 2021 Adopted Budget
EXP $50,813 $49,378 $52,274 $53,390 $56,349 $58,035 $58,874 $62,822 $64,949 $66,430REV $8,182 $7,873 $8,614 $9,029 $8,234 $8,192 $8,175 $9,582 $9,026 $9,433NTS $42,631 $41,505 $43,660 $44,361 $48,115 $49,842 $50,699 $53,239 $55,923 $56,997FTEs 319.00 320.00 321.00 321.00 319.00 332.00 332.00 340.00 349.00 359.00
0
100
200
300
400
-$5,000
$5,000
$15,000
$25,000
$35,000
$45,000
$55,000
$65,000
$75,000FTEs EXP REV NTS
245

FIRE DEPARTMENT TEN-YEAR HISTORY
Fiscal Year Description FTEs
FY 2012 The County Board restored the Battalion Chief position in Logistics that was eliminated in FY 2010 ($197,913).
1.0
The County Board approved a one percent one-time lump sum paymentfor employees at the top step.
Added funding for three Community Inspector positions for fire protectionsystems testing ($298,124) and for a recruit class in FY 2012 ($264,860).
3.0
Increased funding for computers, phones, uniforms, and auto fund chargesfor the new Community Inspector positions ($12,889).
Decreased annual expenses for County vehicle charges ($196,929), fuelcharges ($100,000), and personal protective clothing ($11,466).
Increased fee revenues in systems testing ($332,800) due to the additionof the three Community Inspectors, and higher projections for ambulancetransport fees ($35,000), partially offset by lower projections for permittedbuildings inspections ($158,269) and Falls Church reimbursements($106,259).
FY 2013 The County Board approved two additional holidays for FY 2013 ($55,000). Decreased personnel expenses due to a decrease in the number of recruits
from 26 to 13. Eliminated of overtime expense funded by the National Medical Response
Team (NMRT) contract. Converted an NMRT funded position into a County funded Inspector
position to review site plans in conjunction with the Department ofCommunity Planning, Housing and Development (CPHD). The full cost ofthis position is reimbursed by CPHD.
Added funding for fuel ($74,700). Increased annual expenses for the maintenance and replacement of County
vehicles ($325,392). Increased expense for protective clothing for recruits ($48,558). Reallocated funding from the Fire Department to the Department of
Environmental Services for station bay door maintenance and repairs($50,000).
Increased fee revenues due to higher projections in the fire code permit,inspection fees, and other miscellaneous fees ($261,334), and ambulancetransport fees ($50,000).
Decreased grant revenues due to the elimination of the National MedicalResponse Team grant ($339,527).
FY 2014 Personnel increased primarily due to reclassification of uniform positions ($948,615), and the transfer of a grant funded National Incident Management System (NIMS) position ($125,000) from the Office of Emergency Management (OEM) to the Fire Department, partially offset by the removal of one-time funding for FY 2013 additional County Board approved holidays ($55,000).
246

FIRE DEPARTMENT TEN-YEAR HISTORY
Fiscal Year Description FTEs
Increased operating equipment funded by the Four-For-Life grant($76,842).
Decreased annual expense for the maintenance and replacement of Countyvehicles ($45,368).
Decreased protective clothing charges for recruit class ($4,889). Fee revenues increased due to higher projections in Falls Church
reimbursements based on the FY 2014 budget for services provided by theCounty ($117,532).
Grant revenues increased due to the Four-For-Life grant ($76,842) and thetransfer of the NIMS grant from OEM to the Fire Department ($125,000).
Increased ambulance transport fee revenue ($300,000).
FY 2015 Non-personnel increased due to changes to the operating agreement for Fire Station Six ($56,330).
Increased wearing apparel funded by the Fire Programs grant ($83,890)and operating supplies funded by the Four-For-Life grant ($4,187).
Increased recruit class costs ($13,895) and contractual increases forwearing apparel ($27,314).
Added a full-year of funding to continue implementing the PhysicianAssistant (PA) pilot program started in FY 2014 ($155,272).
Decreased annual expense for the maintenance and replacement of Countyvehicles ($67,012).
Fee revenues increased due to higher Falls Church reimbursements($231,367).
Grant revenues increased due to the Fire Programs grant ($83,890) andthe Four-For-Life grant ($4,187).
FY 2016 Transferred out 2.0 FTEs to the Police Department for the consolidation of public safety information technology ($248,473).
(2.0)
Increased wearing apparel funded by the Fire Programs grant ($40,260). Increased annual expense for the maintenance and replacement of County
vehicles ($454,379). Fee revenues increased due to higher Falls Church reimbursements
($394,409). Grant revenues increased due to the Fire Programs grant ($40,260).
FY 2017 The County Board added funding for an additional four Firefighter/EMT I positions to staff a peak time medic unit ($332,468).
4.0
The County Board also added one-time funding for wearing apparel for theadditional positions ($73,584).
Added funding for eight Firefighter/EMT I positions ($664,936) to addressthe remaining staffing needs to meet national standards for four personstaffing of all County Fire units, and the conversion of a contract PhysicianAssistant (PA) to a permanent position ($137,327).
9.0
247

FIRE DEPARTMENT TEN-YEAR HISTORY
Fiscal Year Description FTEs
Increased funding for wearing apparel funded by the Fire Programs grant($34,484), increased wearing apparel for the additional Firefighter/EMT Ipositions ($147,168, one-time funding), and recruit class costs ($19,245).
Increased funding for operating equipment funded by Four-for-Life grant($4,101).
Transferred funding to the Police Department for Public Safety InformationTechnology (PSIT) activities ($16,151).
Decreased contractual services funding due to conversion of a contractPhysician Assistant (PA) to a permanent position ($137,327).
Increased fee revenue because of a rate increase in ambulance fees($750,000), partially offset by a projected decrease in volume ofambulance transports ($200,000).
Increased miscellaneous fee revenues ($150,000). Fee revenue decreased due to lower Falls Church reimbursement
($132,664). Decreased System Testing fee revenue due to an adjustment to the
number of annual tests completed ($540,000). Increased grant revenue due to increases to the Fire Programs grant
($34,484), offset by decreases to the Four-for-Life Grant ($6,928).
FY 2018 Increased personnel funding ($176,173 ongoing, $759,286 one-time) and non-personnel funding ($277,970 ongoing, $268,120 one-time) for costs associated with the two recruit schools.
Increased grant revenue due to increases to the Fire Programs grant($34,484) offset by decreases to the Four-for-Life Grant ($6,928).
Increased emergency medical services funded by revenue increases to theFour-for-Life grant ($5,309).
Increased funding to the Business Services Division for the FireDepartment’s portion of Computer Aided Dispatch costs ($75,934),transferred from the Police Department.
Increased funding for adjustments to the accounting method for themedical billing management fee ($180,000).
Removed one-time funding for wearing apparel and equipment for the 8.0FTEs added in FY 2017 ($147,169).
Increased annual expenses for the maintenance and replacement of Countyvehicles ($171,284).
Increased fee revenue due to projected increases in System Testing Fees($290,000), increase in Assembly Permit Fees ($20,000).
Increased Falls Church reimbursements for firefighter salaries andovertime ($95,114).
Increased ambulance fee collections ($150,000).
FY 2019 The County Board added funding for an additional 1.5 percent market pay adjustment for the Firefighter, Lieutenant and Captain job classes above
248
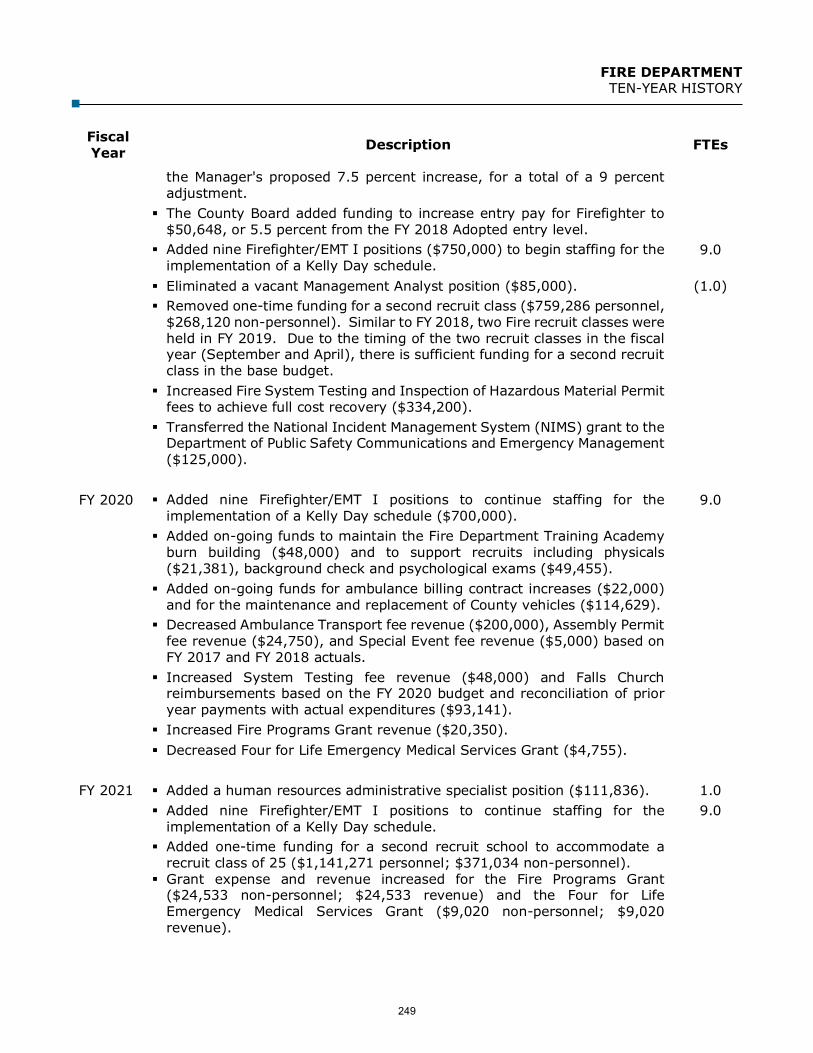
FIRE DEPARTMENT TEN-YEAR HISTORY
Fiscal Year Description FTEs
the Manager's proposed 7.5 percent increase, for a total of a 9 percent adjustment.
The County Board added funding to increase entry pay for Firefighter to$50,648, or 5.5 percent from the FY 2018 Adopted entry level.
Added nine Firefighter/EMT I positions ($750,000) to begin staffing for theimplementation of a Kelly Day schedule.
9.0
Eliminated a vacant Management Analyst position ($85,000). (1.0) Removed one-time funding for a second recruit class ($759,286 personnel,
$268,120 non-personnel). Similar to FY 2018, two Fire recruit classes wereheld in FY 2019. Due to the timing of the two recruit classes in the fiscalyear (September and April), there is sufficient funding for a second recruitclass in the base budget.
Increased Fire System Testing and Inspection of Hazardous Material Permitfees to achieve full cost recovery ($334,200).
Transferred the National Incident Management System (NIMS) grant to theDepartment of Public Safety Communications and Emergency Management($125,000).
FY 2020 Added nine Firefighter/EMT I positions to continue staffing for the implementation of a Kelly Day schedule ($700,000).
9.0
Added on-going funds to maintain the Fire Department Training Academyburn building ($48,000) and to support recruits including physicals($21,381), background check and psychological exams ($49,455).
Added on-going funds for ambulance billing contract increases ($22,000)and for the maintenance and replacement of County vehicles ($114,629).
Decreased Ambulance Transport fee revenue ($200,000), Assembly Permitfee revenue ($24,750), and Special Event fee revenue ($5,000) based onFY 2017 and FY 2018 actuals.
Increased System Testing fee revenue ($48,000) and Falls Churchreimbursements based on the FY 2020 budget and reconciliation of prioryear payments with actual expenditures ($93,141).
Increased Fire Programs Grant revenue ($20,350). Decreased Four for Life Emergency Medical Services Grant ($4,755).
FY 2021 Added a human resources administrative specialist position ($111,836). 1.0 Added nine Firefighter/EMT I positions to continue staffing for the
implementation of a Kelly Day schedule.9.0
Added one-time funding for a second recruit school to accommodate arecruit class of 25 ($1,141,271 personnel; $371,034 non-personnel).
Grant expense and revenue increased for the Fire Programs Grant($24,533 non-personnel; $24,533 revenue) and the Four for LifeEmergency Medical Services Grant ($9,020 non-personnel; $9,020revenue).
249

FIRE DEPARTMENT TEN-YEAR HISTORY
Fiscal Year Description FTEs
Increased fee revenues due to Falls Church reimbursements ($313,394),ambulance billing treasurer collections ($50,000), and Fire Marshall feerevenue ($15,000), partially offset by a decrease in special events revenue($5,000).
250

DEPARTMENT OF ENVIRONMENTAL SERVICES Greg Emanuel, Director
2100 CLARENDON BLVD., SUITE 900, ARLINGTON, VA 22201 703-228-5022
Our Mission: To make Arlington County a vibrant, accessible and sustainable community through strategic transportation, environmental and capital investment projects, while providing excellent
customer service, operations, and maintenance in a safe and healthy environment for all.
LINES OF BUSINESS
251
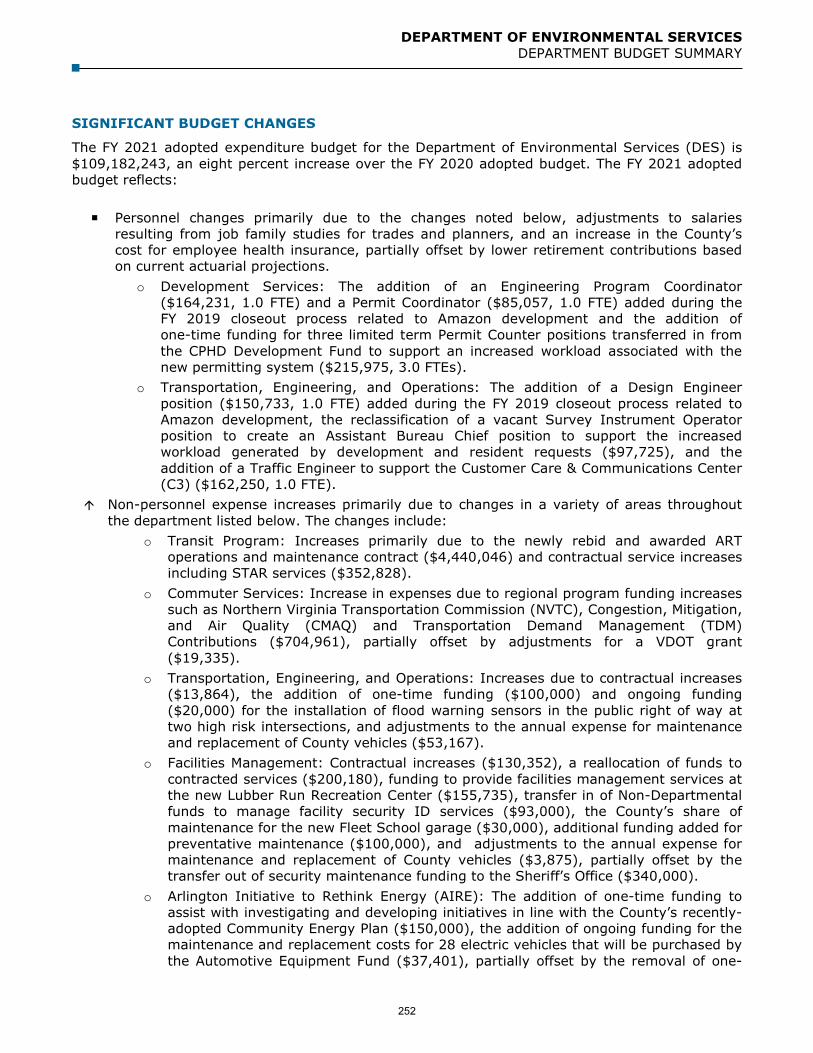
DEPARTMENT OF ENVIRONMENTAL SERVICES DEPARTMENT BUDGET SUMMARY
SIGNIFICANT BUDGET CHANGES
The FY 2021 adopted expenditure budget for the Department of Environmental Services (DES) is $109,182,243, an eight percent increase over the FY 2020 adopted budget. The FY 2021 adopted budget reflects:
Personnel changes primarily due to the changes noted below, adjustments to salaries resulting from job family studies for trades and planners, and an increase in the County’s cost for employee health insurance, partially offset by lower retirement contributions based on current actuarial projections.
o Development Services: The addition of an Engineering Program Coordinator($164,231, 1.0 FTE) and a Permit Coordinator ($85,057, 1.0 FTE) added during theFY 2019 closeout process related to Amazon development and the addition ofone-time funding for three limited term Permit Counter positions transferred in fromthe CPHD Development Fund to support an increased workload associated with thenew permitting system ($215,975, 3.0 FTEs).
o Transportation, Engineering, and Operations: The addition of a Design Engineerposition ($150,733, 1.0 FTE) added during the FY 2019 closeout process related toAmazon development, the reclassification of a vacant Survey Instrument Operatorposition to create an Assistant Bureau Chief position to support the increasedworkload generated by development and resident requests ($97,725), and theaddition of a Traffic Engineer to support the Customer Care & Communications Center(C3) ($162,250, 1.0 FTE).
Non-personnel expense increases primarily due to changes in a variety of areas throughoutthe department listed below. The changes include:
o Transit Program: Increases primarily due to the newly rebid and awarded ARToperations and maintenance contract ($4,440,046) and contractual service increasesincluding STAR services ($352,828).
o Commuter Services: Increase in expenses due to regional program funding increasessuch as Northern Virginia Transportation Commission (NVTC), Congestion, Mitigation,and Air Quality (CMAQ) and Transportation Demand Management (TDM)Contributions ($704,961), partially offset by adjustments for a VDOT grant($19,335).
o Transportation, Engineering, and Operations: Increases due to contractual increases($13,864), the addition of one-time funding ($100,000) and ongoing funding($20,000) for the installation of flood warning sensors in the public right of way attwo high risk intersections, and adjustments to the annual expense for maintenanceand replacement of County vehicles ($53,167).
o Facilities Management: Contractual increases ($130,352), a reallocation of funds tocontracted services ($200,180), funding to provide facilities management services atthe new Lubber Run Recreation Center ($155,735), transfer in of Non-Departmentalfunds to manage facility security ID services ($93,000), the County’s share ofmaintenance for the new Fleet School garage ($30,000), additional funding added forpreventative maintenance ($100,000), and adjustments to the annual expense formaintenance and replacement of County vehicles ($3,875), partially offset by thetransfer out of security maintenance funding to the Sheriff’s Office ($340,000).
o Arlington Initiative to Rethink Energy (AIRE): The addition of one-time funding toassist with investigating and developing initiatives in line with the County’s recently-adopted Community Energy Plan ($150,000), the addition of ongoing funding for themaintenance and replacement costs for 28 electric vehicles that will be purchased bythe Automotive Equipment Fund ($37,401), partially offset by the removal of one-
252

DEPARTMENT OF ENVIRONMENTAL SERVICES DEPARTMENT BUDGET SUMMARY
time funding for the Minor Hill pumping station solar array feasibility study ($50,000).
o Solid Waste: Disposal cost increases driven primarily by the recycling markets($409,832), adjustments to the annual expense for maintenance and replacement ofCounty vehicles ($194,394), contractual services ($58,507), operation andmaintenance costs for Covanta WTE facility ($8,075), and charges by the Utility Fundto support the Call Center ($13,755).
o Water, Sewer, and Streets: Increases due to the addition of one-time funds tosupport a sidewalk condition assessment ($300,000), additional funding added forconcrete maintenance ($250,000), and contractual service increases ($35,600),partially offset by adjustments to the annual expense for maintenance andreplacement of County vehicles ($90,671).
Intra-county charges increase primarily due to filling street sweeper staff vacancies ($97,761)and adjustments in eligible reimbursable expenses in the Facilities Management Bureau($103,554) and Operations Management ($16,107) for services provided within theorganization. These increases are partially offset by the allocation of costs for reimbursableservices to the Utilities Fund in the Director’s Office ($39,207) and Engineering Bureau($5,566) and the addition of a Receptionist position in the CPHD Development Fund that willbe partially funded by Development Services in the General Fund ($19,705).
Fee revenue adjustments in the following areas:o Solid Waste: Increases primarily due to an increase in the Household Solid Waste
Rate ($455,504), partially offset by a decrease in mulch fees ($25,000) and rentalincome for Waste to Energy Facility ($48,515) based on aligning budget with actuals.The adopted Household Solid Waste Rate increases from $306.00 to $319.03primarily as a result of the increase in disposal costs for recycling.
o Transit: Decline in projected ART bus fare revenue ($338,741), partially offset by anincrease in ART business contributions ($33,076).
o Development Services: Increase due to an inflationary increase of 2.5 percent tofees ($35,442), an increase in Sediment/Erosion control ($9,287), an increase toSite Plan fees ($46,250) based on anticipated construction, Small Wireless fees($25,000) based on anticipated applications, partially offset by a decrease toHighway Permits ($24,686), Surveys ($8,026), Community Program fees ($44,280),and Bond Processing fee revenues ($4,151).
o Transportation, Engineering, and Operations: Decreases primarily due to meterrevenue ($1,355,957), partially offset by an inflationary increase of 2.5 percent tofees ($46,479) and an increase to Highway Permits ($156,646) based on aligningbudget with actuals.
Grant revenue increases primarily due to additional CMAQ funding ($598,980), NorthernVirginia Transportation Commission funding ($707,185), and an adjustment based on aligningbudget with actuals in CMAQ funding ($330,612).
Transfer from other funds increases due to the increased operations and maintenance costsfor ART. The Transportation Capital Fund funds specific ART routes ($368,852).
253

DEPARTMENT OF ENVIRONMENTAL SERVICES DEPARTMENT BUDGET SUMMARY
DEPARTMENT FINANCIAL SUMMARY
FY 2019 FY 2020 FY 2021 % ChangeActual Adopted Adopted ‘20 to ‘21
Personnel $39,101,067 $41,554,538 $42,113,125 1%Non-Personnel 58,106,212 61,655,872 69,523,360 13%Subtotal 97,207,279 103,210,410 111,636,485 8%Intra-County Charges (2,753,535) (2,301,194) (2,454,242) 7%Total Expenditures 94,453,744 100,909,216 109,182,243 8%
Fees 37,295,155 36,331,765 35,250,794 -3%Grants 12,117,677 11,151,092 12,783,752 15%Transfer In From Other Funds 2,430,721 2,351,932 2,720,783 16%Total Revenues 51,843,553 49,834,789 50,755,329 2%
Net Tax Support $42,610,191 $51,074,427 $58,426,914 14%
Permanent FTEs 393.00 390.00 397.00 Temporary FTEs 7.50 7.50 7.50 Total Authorized FTEs 400.50 397.50 404.50
EXPENSES BY LINE OF BUSINESS
FY 2019 FY 2020 FY 2021 % Change FY 2021 FTEsActual Adopted Adopted ‘20 to ‘21 Adopted
Office of the Director $2,841,145 $3,102,367 $1,934,407 -38% 20.50Decision Support/Mapping Program (GIS) 1,140,300 1,159,276 2,061,709 78% 12.00AIRE 1,659,985 1,688,065 1,789,203 6% 8.00Transportation Program Support 1,057,947 939,413 956,684 2% 7.00Planning Program 1,281,239 1,546,797 1,539,789 - 15.00Transit Program 17,815,001 20,438,495 25,735,910 26% 7.00Development Services 3,435,905 3,724,310 4,227,338 14% 37.00Commuter Services 8,487,159 10,420,834 11,116,320 7% 4.00Transportation Engineering and Operations* 11,705,245 11,730,518 12,384,613 6% 61.60Facilities Design and Construction 1,317,492 1,113,184 1,122,313 1% 10.00Engineering Bureau* 3,146,788 2,941,965 2,918,783 -1% 49.30Real Estate Bureau 1,260,576 1,177,641 1,260,697 7% 10.00Capital Assets Support 530,736 462,456 462,655 - 3.00Facilities Management Services 17,336,483 17,483,085 17,806,288 2% 58.00Operations Management 166,638 192,093 155,471 -19% 2.00Solid Waste Bureau* 12,964,158 13,769,665 14,225,151 3% 46.10Water, Sewer and Streets Bureau* 8,306,947 9,019,052 9,484,912 5% 54.00Total Expenditures $94,453,744 $100,909,216 $109,182,243 8% 404.50
* There are temporary FTEs in the following lines of business: Transportation Engineering, andOperations (0.10), Engineering Bureau (0.30), Water, Sewer, and Streets Bureau (1.00), and SolidWaste Bureau (6.10).
254

DEPARTMENT OF ENVIRONMENTAL SERVICES TEN-YEAR HISTORY
EXPENDITURE, REVENUE, NET TAX SUPPORT, AND FULL-TIME EQUIVALENT TRENDS
$ in 000sFY 2012
ActualFY 2013
ActualFY 2014
ActualFY 2015
Actual FY 2016
Actual FY 2017
Actual FY 2018
Actual FY 2019
Actual
FY 2020 Adopted
Budget
FY 2021 Adopted
BudgetEXP $75,750 $77,420 $80,534 $85,162 $90,929 $93,100 $95,403 $94,454 $100,909 $109,182REV $41,117 $37,145 $40,257 $38,503 $42,005 $45,605 $46,475 $51,844 $49,835 $50,755NTS $34,633 $40,275 $40,277 $46,659 $48,924 $47,495 $48,928 $42,610 $51,074 $58,427FTEs 390.50 395.70 395.70 400.20 400.00 401.00 405.00 400.50 397.50 404.50
350
360
370
380
390
400
410
420
430
440
450
$0
$30,000
$60,000
$90,000
$120,000FTEs EXP REV NTS
255

DEPARTMENT OF ENVIRONMENTAL SERVICES TEN-YEAR HISTORY
Fiscal Year Description FTEs
FY 2012 Personnel includes the County Board's approval of a one percent one-time lump sum payment for employees at the top step ($64,981).
The County Board approved 2.0 FTE for capital project staffing: 1.0 FTEDesign Engineer in Engineering and 1.0 FTE Capital Projects Manager inTransportation Planning (positions will be charged to the capital funds;there will be no cost to the General Fund). Operating expenses ($14,690)for those positions are included in the non-personnel expense andreimbursed through Intra-County Charges.
2.0
The County Board restored 2.0 FTEs in Development services: aConstruction Management Specialist ($113,137) and a Planner position($123,336).
2.0
The County Board added support of the Community Energy Plan (CEP) byadding a two-year limited term FTE ($204,000 over two years) for CEPimplementation planning and $365,000 in one-time funding forimplementation consulting services.
1.0
The County Board added 0.5 FTE in Facilities Management Services forsupport of additional square footage added to the County ($40,918).
0.5
The County Board added direct ART bus service from Columbia HeightsWest to the Warren G. Stambaugh Human Services Center on WashingtonBoulevard. Funding will be reallocated from Metro contingency funds.
Conversion of 0.5 Temporary FTE to 0.5 Permanent FTE in FacilitiesManagement Services for support of additional square footage added tothe County.
Reallocation of 3.0 FTE from Non-Departmental for transportation capitalproject staffing: 1.0 FTE Senior Capital Projects Coordinator, 1.0 FTEStreetcar Program Manager, and 1.0 FTE Design Team Engineer(Complete Streets). These positions will be charged to the capital fundsand there will be no cost to the General Fund.
3.0
In FreshAire, two overstrength positions continue to be funded. Transfer of 1.0 FTE from the Printing Fund for the Safety Program. 1.0 Transfer of 1.0 FTE from the Utilities Fund to centralize the
Communications effort.1.0
Reallocation of 5.0 FTE from Non-Departmental for converting theHeating, Ventilation, and Air Conditioning (HVAC) preventativemaintenance from contract to in-house personnel.
5.0
256

DEPARTMENT OF ENVIRONMENTAL SERVICES TEN-YEAR HISTORY
Fiscal Year Description FTEs
Non-personnel expense includes the County Board approved one-timefunding of $365,000 for Community Energy Plan (CEP) implementationconsultants and operating expenses related to 2.0 FTE approved by theCounty Board for capital projects ($14,690). The non-personnel categoryas a whole decreases less than one percent due to a change inresponsibility for HVAC preventative maintenance ($549,280), eliminationof FY 2011 one-time capital expenses for multi-space parking meters($77,000), elimination of FY 2011 one-time snow removal equipmentfunding ($100,000), reduction in the costs of refuse collection ($232,210)and disposal fees at the Waste-To-Energy Plant ($379,306) due to thesuccess of single stream recycling, electricity savings due to upgradinglighting to LED ($82,353) and energy efficiencies in facilities ($50,000),and reallocating funds to personnel in Fresh Aire ($162,290). Thesedecreases are partially offset by increases related to Fire Station 3maintenance ($66,326), transferring responsibility of maintenance fromDepartment of Technology Services (DTS) to DES for the NetworkOperations Center (NOC) ($279,000), addition of mandated weekly firepump testing ($42,224), an adjustment to the annual expense for themaintenance and replacement of County vehicles including additionalexpenses for new HVAC maintenance staff vehicles ($16,109), monthlyweb service fees for additional multi-space meters ($88,744), operatingexpenses related to staffing for capital projects ($22,160), additionalrecycling carts ($10,268), increase in the master lease payment for thetub grinder ($45,974), and non-discretionary contractual increases($187,837).
Transit-specific non-personnel increases reflect non-discretionarycontractual increases related to bus operations ($274,693), the balanceof full year costs for improvements to ART 41, 42, 74, 75, and 87($95,542), additional costs for maintenance and support of the ART bussystem real-time information system ($18,330), fuel services at theWMATA facility ($10,944), and maintenance at the ART facility ($15,859).
Intra-County Charges increase due to personnel expenses for thosepositions being charged back to other funds and departments, as well asfor the Communications effort, Safety Program, and non-personnelexpenses related to the 3.0 FTEs reallocated for capital projects.
Revenue increases include higher fare box receipts from new andexpanded ART routes ($245,766), and increases in recycling revenuesincluding plastic, cans and glass recycling revenue ($11,136), sale ofwhite goods ($10,728), and curbside recycling ($105,500), which ispartially offset by a reduction in construction related permit revenues($75,000), recycling civil penalties decrease due to increased compliance($33,540), and decrease in lease agreements managed ($11,244).
The parking meter revenue reflects a rate increase of $0.25 per hour onlong- and short-term parking as well as the installation of additionalmulti-space meters ($2,043,230). The rate for short term parking(4 hours or less) will increase from $1.00/hour to $1.25/hour. The ratefor long term parking (4 or more hours) will increase from $0.75/hour to$1.00/hour.
257

DEPARTMENT OF ENVIRONMENTAL SERVICES TEN-YEAR HISTORY
Fiscal Year Description FTEs
The Household Solid Waste Rate (HSWR) reflects a decrease of $18.52($582,811), or 5.38 percent less than the FY 2011 rate, resulting in a newannual rate of $325.72. The rate reflects a decrease in the number oftons of refuse disposed of at the Waste-To-Energy Plant and a decreasein the cost of refuse collection.
Appliance pick-up fee decreased from $20 per appliance to a $10administrative fee per site visit (regardless of the number of appliances)($27,250).
FY 2013 2.0 FTEs were added in the Engineering Bureau to provide critical staffing needed to implement capital projects (positions will be charged to capital funds; there is no cost to the General Fund).
2.0
1.0 FTE was added for a Parking Planner in Transportation Engineering andOperations through a reallocation of non-personnel consultant funding forparking planning services ($64,407).
1.0
Six months of one-time funding was added to fund the addition of 2.0 FTEsin Development Services for the Permitting and Customer Service Section($92,526).
2.0
0.2 FTE was transferred from the Utilities Fund to the Office of the Directorin the General Fund for expanded human resource service support.
0.2
Personnel increases reflect the reclassification of positions identified to besubstantially below comparative pay studies.
Transit expenses increase to reflect an increase in fuel costs for expandedbus service and rate increase ($186,743), rent for the ARTHOUSE busmaintenance facility ($72,835), and bus operating maintenance expenses($75,477). Transit revenue includes higher fare box receipts fromexpanded ART routes ($200,000) and higher business contributions forART service ($91,940).
Non-personnel expenses increase for the master lease payment for the tubgrinder ($22,274), inflationary increases for operating supplies ($25,892)and operating equipment ($9,331), fuel for back-up generators ($5,000),and non-discretionary contractual increases ($533,564).
Increased costs for maintenance and replacement of County vehicles($42,259).
FY 2012 one-time funding for the Community Energy Plan implementation($465,000) was eliminated in FY 2013.
The Fire Department transferred $50,000 to the Facilities ManagementBureau within DES for fire station bay door maintenance and repairs.
Expenditures and revenues related to Commuter Services grants increase($2,049,540) to properly reflect state grant awards. The addition ofregional program expenses related to Commuter Services ($960,000) isentirely offset by the associated commission revenue ($960,000).
Intra-County Charges decrease primarily due to a change in accountingpractices and is offset by a reduction in non-personnel expenses($263,803) in the Water, Sewer and Streets Bureau. Other adjustments toIntra-County Charges are due to various personnel changes in the variousbureaus.
258

DEPARTMENT OF ENVIRONMENTAL SERVICES TEN-YEAR HISTORY
Fiscal Year Description FTEs
Fee revenue increases include meter parking revenues due to theinstallation of more multi-space meters and new parking spaces($271,330), right-of-way permits ($72,940), environmental plan reviewfees ($175,000), and an increase in the value of lease agreementsmanaged ($63,147).
Increased recycling revenue ($30,000), including plastic, cans and glassrecycling; and, sale of recycled paper from Arlington County offices($19,485).
Increased revenue due to implementation of a new courthousemaintenance fee for civil actions filed with General District Court andCircuit Court ($15,000).
Fee revenue is reduced for construction related permit revenues($175,000), topographic map sales ($16,256), and plat and engineeringplan review fees ($37,500).
Increase in the state reimbursement for maintenance of state trafficsignals ($29,834).
The Household Solid Waste Rate (HSWR) reflects an adopted decrease of$31.80 ($1,031,910), or 9.76 percent less than the FY 2012 rate, resultingin a new annual household rate of $293.92. The rate reflects a decreasein the disposal rate at the Waste-To-Energy Plant due to a new contract.Expenditures for disposal fees are reduced by $1,051,180.
FY 2014 The County Board added one-time funding for six months of a limited term position associated with the Community Energy Plan (CEP) implementation ($52,000).
1.0
The County Board restored funding for the County Manager’s proposedreduction for Green Home Choice Program ($23,125 one-time; $50,000ongoing).
0.5
Full-year funding is included for 2.0 FTEs added in Development Services’Permitting and Customer Service in the FY 2013 budget ($94,756).
2.0
Arlington Mill Community Center additions include maintenance workers($184,508), non-personnel facility maintenance expense ($721,894),parking garage management contract ($170,000), and parking feerevenue associated with partial year operations of the parking garage atArlington Mill Community Center ($73,000).
An Emergency Power Manager was added for work on the critical systemsinfrastructure (CSI) ($123,307), as well as non-personnel costs related tocritical systems infrastructure ($452,782).
1.0
Removal of FY 2013 one-time funding for a two-year limited term positionin Fresh AIRE for the Community Energy Plan (CEP) implementation($104,000).
(1.0)
259

DEPARTMENT OF ENVIRONMENTAL SERVICES TEN-YEAR HISTORY
Fiscal Year Description FTEs
Non-personnel expenses increase to reflect an adjustment to the annualexpense for the maintenance and replacement of County vehicles($152,756), an increase in fuel services at the Washington MetropolitanArea Transit Authority (WMATA) facility ($46,364), rent for the ARTHOUSEbus maintenance facility ($1,436), contractual increases associated withthe transit program ($374,994), operating equipment for PermittingCustomer Service ($13,576), electricity rate increase on streetlights($75,000), operating expenses for additional multi-space parking metersfunded in PAYG ($23,224), lease costs for storage space at CourthousePlaza ($31,476), and non-discretionary contractual increases ($760,380).These increases are partially offset by the reduction in the funds availablefor contractual services in Fresh AIRE ($232,028), master lease paymentfor the rock crusher ($8,923), and disposal fees at the Waste-To-EnergyPlant (WTE) ($600,681).
Added funding for the WTE Plant Facility Monitoring Group (FMG)($41,400).
The Household Solid Waste Rate (HSWR) reflects an adopted decrease of$0.16 per year, a less than one percent decrease from the FY 2013 rate,resulting in a new annual household rate of $293.76. The revenueincreases $38,872 due to an increase in the number of households payingfor service through the HSWR. The rate reflects ongoing effects from thenew contract implemented in FY 2012 for the disposal rate at the WTEPlant.
Eliminated the Neighborhood Traffic Calming program ($111,921). (1.0) Reduced special service hours on ART from 300 to 150 ($8,075). Adjusted the ART 75 bus schedule to eliminate unproductive/low ridership
mid-day service ($94,956). Increased STAR participant Zone 2 and Zone 3 co-payments on
January 1, 2014, in order to recover increases in operating costs and taxirates ($22,453). Zone 2 co-payments rise from $4 to $5 per trip and Zone3 co-payments rise from $8.50 to $9.00 per trip.
Fee updates to Chapter 22 and 23 of the County Code to cover more ofthe costs of processing development-related permit applications willgenerate $205,000 in revenue.
Reduced electricity expense for streetlights ($30,000). Eliminated one Space Planner position ($64,780). (1.0) Eliminated one County vehicle in the Real Estate Bureau ($5,171) and one
vehicle in the Engineering Bureau ($5,171). Eliminated a Design Standards Engineer ($151,809). (1.0)
Reduced security system on-site maintenance contractual personnel at theDetention Center from two technicians to one technician ($81,420).
Transferred the 1.0 FTE Co-Manager of the AIRE program to the FreshAIRE within DES ($130,970).
Reduced non-personnel expenses in the EPO unit ($15,208).
Transferred the regional contribution to Arlingtonians for a CleanEnvironment (ACE) to the Stormwater Fund ($69,705).
Eliminated the contribution to ACE for special litter events ($10,000).
260

DEPARTMENT OF ENVIRONMENTAL SERVICES TEN-YEAR HISTORY
Fiscal Year Description FTEs
Reduced contingent budget for disposal of street sweeping related to stormactivities ($20,295).
Increased Intra-County Charges for reimbursement of a portion of thestreet sweeping program costs from the Stormwater Fund ($240,000).
Reduced landfill expenses due to better tracking capabilities ($17,870).
FY 2015 Added partial year funding for an Equipment Mechanic ($64,803) and facility maintenance expenses ($125,750) for the Homeless Services Center.
1.0
Added funding for a Permit Parking Technician ($33,491) and associatedoperational expenses ($9,320).
0.5
Residential utility tax receipts increase ($100,000) which funds theongoing addition of a Community Energy Plan (CEP) position ($82,657)and associated operating expenses ($17,343).
1.0
Reallocated funding to add a Design Standards Engineer ($145,436). 1.0
Reallocated funding to add a Street Light Technician ($81,436). 1.0 Reallocated funding to enhance the Rosslyn-Ballston Corridor Cleaning
program ($42,941 personnel; $19,526 non-personnel). Eliminated one-time funding for the two-year limited term CEP position
($52,000).(1.0)
Added funding for facility maintenance expenses at Falls Church FireStation ($108,971).
Added consultant funds for the parking program ($100,000). Added one-time funding for contractual program management support for
the conversion to Permits Plus ($150,000). It is expected thatone-time funding may also be required in FY 2016.
Reallocated funding for contractor support for the coordination ofElectronic Plan Review ($52,442).
Funding is reallocated from the elimination of unproductive hours on ART52, 53, and 62 ($57,060); elimination of daytime contractor support atArlington Mill Community Center parking garage ($50,000); reductions incustodial levels at the Trades Center ($19,000), Edison Center ($16,000),and overall custodial management ($23,000); and other reductions due tooperating efficiencies.
Non-personnel expenses increase primarily to reflect non-discretionarycontractual increases ($847,044), an adjustment to the annual expensefor the maintenance and replacement of County vehicles ($182,160),funding to maintain the current level of support for program marketing andoperation of the Shirlington Transit Center ($37,217), outside clericalsupport for permitting customer services ($30,000), software license,maintenance, and subscription fees ($115,273), replacement ofEngineering equipment ($43,700), disposal charges at theWaste-to-Energy (WTE) plant ($44,466), funding for the WTE FacilityMonitoring Group (FMG) ($29,400), and higher costs of leaf bags and cartreplacements ($11,374).
261

DEPARTMENT OF ENVIRONMENTAL SERVICES TEN-YEAR HISTORY
Fiscal Year Description FTEs
Arlington County Commuter Services (ACCS) programming increases($489,791) and is offset by corresponding federal and state grant revenue($489,791).
New (ART 43 and 92) and expanded (ART 45) Arlington Transit (ART)routes ($1,111,550) are being funded through new fares associated withthe routes and an increased reimbursement from the state for transitoperations ($805,065) and the associated fare revenue ($306,485).
The Household Solid Waste Rate (HSWR) reflects an adopted increase of$13.28 per year, a 4.5 percent decrease from the FY 2014 rate, resultingin a new annual household rate of $307.04. The revenue increases($586,448) due to an increase in the fee and the number of householdspaying for service through the HSWR. The rate reflects addingyear-round yard waste collection.
Eliminated one-time funding which delayed the implementation date fromJuly 1, 2013 to January 1, 2014 for STAR zone 2 and 3 rate increases inparticipant co-payments ($22,453).
Eliminated one-time funding for the purchase of vehicles for Arlington MillCommunity Center ($74,140).
Intra-County Charges reflects an increase in the allocation based oneligible reimbursable expenses for services provided within theorganization ($66,309) and the additional allocation to the Utilities Fundfor the Design Standards Engineer ($7,272).
The County Board adopted an ART fare increase of $0.25 per trip, which isexpected to generate $300,000 in additional fare revenue.
Fee revenues increased due to the new form based code permits ($3,498),additional taxicab license fees ($15,000), reviews related to theChesapeake Bay Preservation Ordinance ($15,000), use of the publicright-of-way ($70,468), court fees used for the maintenance of facilities($5,000), and sale of mulch and wood chips ($14,940). These increasesare partially offset by a decline in parking meter revenue ($337,000),projected parking fees at Arlington Mill Community Center parking garage($68,000), decrease in the value of leases currently under agreement withthe County ($38,464), and a net decrease in revenue from various typesof recycling ($40,000).
The state reimbursement for maintenance of state traffic signals decreases($24,092).
FY 2016 The County Board approved the conversion of a portion of WMATA’s 3A bus route to Arlington’s ART transit service, which will take place in mid-year FY 2016 and will generate a net savings to the General Fund of $446,622. In DES, this conversion results in contractual increases ($533,406) and an increase in ART fare revenue ($201,686). The savings are reflected in the WMATA budget ($778,342).
The County Board reduced DES’ expenditure budget due to electricitysavings in County buildings ($35,000).
Transfer of a Management and Budget Specialist from the Facilities Designand Construction Bureau to the Utilities Fund ($25,696).
(0.2)
Added one-time funding for contractual program management support forGIS ($50,000).
262

DEPARTMENT OF ENVIRONMENTAL SERVICES TEN-YEAR HISTORY
Fiscal Year Description FTEs
Added partial year funding for facility maintenance expenses ($83,750)related to the Homeless Services Center.
Included partial year maintenance savings as a result of the Departmentof Human Services move to Sequoia ($121,963).
Reduction in the annual expense for the maintenance and replacement ofCounty vehicles ($61,513).
Arlington County Commuter Services (ACCS) contractual increases due tothe addition of a contract for MTA Commuter Bus fare media sales($248,379).
Arlington County Commuter Services (ACCS) revenue increases due to theaddition of a contract for MTA Commuter Bus fare media sales as well asan increase in MTA MARC commuter rail fare media sales ($625,000),partially offset by a decrease in corresponding federal and state grantrevenue ($376,619).
Reduced revenue from curbside recycling ($134,000), partially offset by anet increase in the County in the value of leases currently under agreementwith the County ($33,849).
Eliminated FY 2015 one-time funding for contractual programmanagement support for the conversion to Permits Plus ($150,000).
The state reimbursement for maintenance of state traffic signals increases($352,972).
In FY 2016, Transportation Program Support is presented as a new line ofbusiness created by internal reallocations of personnel ($628,058) andnon-personnel ($15,000) from various lines of business.
As part of FY 2015 closeout, the County Board appropriated funding fortransit and for a new refuse contract in the Solid Waste division. ARTtransit funding was transferred from Transportation Capital to the GeneralFund ($578,702) and revenue was increased for Farebox collections($260,721) in Transit Operations. With the award of a new refuse andsolid waste contract, an additional $454,608 (revenue and expense) wasappropriated to the Solid Waste division.
The County Board took action after the FY 2016 budget was adopted inMay to increase parking meter rates by $0.25. The revised FY 2016revenue budget for parking meters will be increased by $950,000. Thebudget information in the FY 2016 Adopted Budget does not reflect theparking meter rate increase appropriated by the Board in June 2015.
FY 2017 The Household Solid Waste Rate (HSWR) reflects an adopted increase of $36.24, resulting in a new annual household rate of $307.28 due to a new contract for refuse and recycling collection and the addition of year-round yard waste collection from single family, duplexes, and townhouses.
Converted previously authorized overstrength position to a permanentBudget & Finance Specialist in the Commuter Services Program. Thisposition is fully funded by existing grants and does not increase net taxsupport.
1.0
Eliminated FY 2016 one-time funding for contractual programmanagement support for GIS ($50,000).
Added ongoing funding for streetlight maintenance ($282,998) andongoing funding for residential concrete maintenance ($150,000).
263
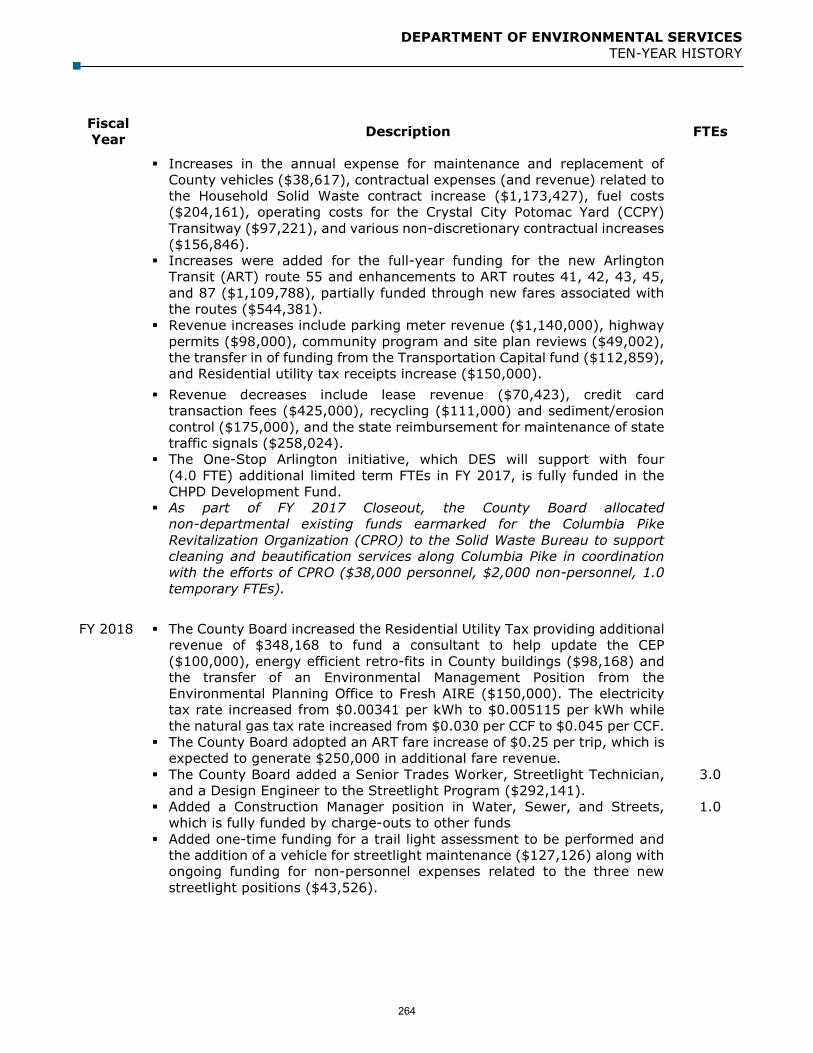
DEPARTMENT OF ENVIRONMENTAL SERVICES TEN-YEAR HISTORY
Fiscal Year Description FTEs
Increases in the annual expense for maintenance and replacement ofCounty vehicles ($38,617), contractual expenses (and revenue) related tothe Household Solid Waste contract increase ($1,173,427), fuel costs($204,161), operating costs for the Crystal City Potomac Yard (CCPY)Transitway ($97,221), and various non-discretionary contractual increases($156,846).
Increases were added for the full-year funding for the new ArlingtonTransit (ART) route 55 and enhancements to ART routes 41, 42, 43, 45,and 87 ($1,109,788), partially funded through new fares associated withthe routes ($544,381).
Revenue increases include parking meter revenue ($1,140,000), highwaypermits ($98,000), community program and site plan reviews ($49,002),the transfer in of funding from the Transportation Capital fund ($112,859),and Residential utility tax receipts increase ($150,000).
Revenue decreases include lease revenue ($70,423), credit cardtransaction fees ($425,000), recycling ($111,000) and sediment/erosioncontrol ($175,000), and the state reimbursement for maintenance of statetraffic signals ($258,024).
The One-Stop Arlington initiative, which DES will support with four(4.0 FTE) additional limited term FTEs in FY 2017, is fully funded in theCHPD Development Fund.
As part of FY 2017 Closeout, the County Board allocatednon-departmental existing funds earmarked for the Columbia PikeRevitalization Organization (CPRO) to the Solid Waste Bureau to supportcleaning and beautification services along Columbia Pike in coordinationwith the efforts of CPRO ($38,000 personnel, $2,000 non-personnel, 1.0temporary FTEs).
FY 2018 The County Board increased the Residential Utility Tax providing additional revenue of $348,168 to fund a consultant to help update the CEP ($100,000), energy efficient retro-fits in County buildings ($98,168) and the transfer of an Environmental Management Position from the Environmental Planning Office to Fresh AIRE ($150,000). The electricity tax rate increased from $0.00341 per kWh to $0.005115 per kWh while the natural gas tax rate increased from $0.030 per CCF to $0.045 per CCF.
The County Board adopted an ART fare increase of $0.25 per trip, which isexpected to generate $250,000 in additional fare revenue.
The County Board added a Senior Trades Worker, Streetlight Technician,and a Design Engineer to the Streetlight Program ($292,141).
Added a Construction Manager position in Water, Sewer, and Streets,which is fully funded by charge-outs to other funds
3.0
1.0
Added one-time funding for a trail light assessment to be performed andthe addition of a vehicle for streetlight maintenance ($127,126) along withongoing funding for non-personnel expenses related to the three newstreetlight positions ($43,526).
264

DEPARTMENT OF ENVIRONMENTAL SERVICES TEN-YEAR HISTORY
Fiscal Year Description FTEs
Increases in contractual expenses (and revenue) related to the HouseholdSolid Waste contract increase ($215,246), operating costs for theShirlington Lease site ($187,895), contractual increases due to the Countytaking over operations of the facility at 2020 14th Street North ($343,312),the addition of funding for preventative and corrective maintenance of theCounty radio sites which is half funded through internal reallocations withinDES ($95,517), and various non-discretionary contractual increases($299,520), offset by a decrease in the annual expense for maintenanceand replacement of County vehicles ($75,433).
Solid Waste Revenues: Increases due to the Household Solid Waste rateincrease ($228,416), fee changes for the replacement of damaged carts($100), hauler permitting fees ($21,450), and delivery fees for leaf andwood mulch ($72,000), which are further explained in the Solid WasteBureau line of business.
Transit Revenues: Increase in fare revenue due to the expansion of ARTroutes 43 and 92 ($88,762), the transfer in of funding from theTransportation Capital Fund ($411,179), and an increase in the ARTBusiness contribution ($34,516).
Other increases include parking meter revenue ($410,000), theChesapeake Bay fee ($70,000), highway permits ($25,000), communityprogram and site plan reviews ($70,000), Waste-to-Energy rental of land($45,170), and an increase in revenue from the residential utility tax($50,000). These increases are partially offset by a net decrease in surveys($10,500), taxi cab fees ($10,500), white goods ($10,000), civil penalties($13,160), topography receipts ($3,000), and credit card transaction fees($75,000).
The Household Solid Waste Rate (HSWR) reflects an adopted increase of$6.88, resulting in a new annual household rate of $314.16, due to costincreases for refuse, recycling, and yard waste collection from singlefamily, duplexes, and townhouses, and contractual increases related to theGeneral Fund’s share of the Utility Billing System.
FY 2019 The County Board added one-time funding to restore monthly paper shredding services that were a proposed budget reduction by the County Manager ($20,000).
Personnel increases partially due to the transfer in of an Assistant PermitAdministration Manager from the Development Fund ($127,444), theaddition of a Building Engineer position for maintenance of the Buckproperty ($96,260), and the conversion of a Trades Worker from atemporary to permanent position to assist with cleaning along ColumbiaPike ($6,026).
3.0
Personnel increases are partially offset by the transfer out of two BudgetAnalyst positions to Transportation Capital Funds ($191,859), aTransportation Program Manager to Transportation Capital Funds($163,678), the transfer out of an Administrative Assistant position to theStormwater Fund ($93,972), an increase of personnel charges to capitalfunds as a result of an increased emphasis on scoping new capital projects($247,062), and an increase in personnel charges out to capital funds forreal estate projects ($116,600).
(4.0)
265

DEPARTMENT OF ENVIRONMENTAL SERVICES TEN-YEAR HISTORY
Fiscal Year Description FTEs
Contractual increases for both ART and STAR services ($1,140,505), ARTservice enhancements including expanding Sunday service until midnighton ART route 41 ($103,544), expanding Sunday service until 11 p.m. onART route 45 ($43,489), the addition of a Metro Route 22 overlay service($1,537,325), the cost of operating supplies for the light maintenancefacility ($20,000), consultant expenses ($12,333), and equipment repair($115,710), and one-time funding for a residential parking permit study($223,232).
Transit service non-personnel costs are partially offset by a decrease infuel expenses ($64,086), the removal of one-time funding for a trail lightassessment ($80,000), removal of one-time funding for operatingequipment and software ($5,150), and the cost of credit card transitionfees ($50,000).
Contractual increases ($312,058) and funding for preventive andcorrective maintenance at the Buck property ($136,500).
Contractual increases ($22,961) and funding to support additional cleaningservices on Columbia Pike ($10,359).
Increase of maintenance funding to cover additional costs that resultedfrom the transfer of lane miles along Fairfax Drive from the VirginiaDepartment of Transportation to the County ($90,000).
Added one-time funding for a consultant study to update the CommunityEnergy Plan (CEP) in the AIRE program ($100,000).
Non-personnel increases are partially offset by adjustments to the annualexpense for maintenance and replacement of County vehicles ($201,565).
Increase in the Household Solid Waste Rate ($66,400), an increase incommercial and multi-family recycling inspection fee ($142,947), and anincrease in commercial and multi-family recycling inspection fee revenue,exclusive of the fee increase ($87,727).
Increase in ART fare revenue due to the enhancement of ART routes 41and 45 and the addition of a Metro 22-line overlay service ($358,445), andan accounting adjustment to move the sale of STAR discount coupons froman expenditure credit to a revenue account ($209,000).
Other increases include a parking meter rate increase of $0.25 per hourand an extension of enforcement hours from 6 p.m. to 8 p.m.($3,775,000), a fee increase for right-of-way permits ($17,840),engineering plan review fees ($32,000), bond processing fees ($3,000),and plat fees ($5,800).
Exclusive of the rate increases, is an increase in anticipated revenue fromengineering plan reviews ($75,000), and site plan reviews ($60,000),partially offset by a decrease in the value of real estate leases currentlyunder agreement with the County ($70,702), Stormwater fee revenue($185,000), and a reduction in credit card transaction fees ($50,000).
Grant revenue decreases due to a reduction in reimbursement from theVirginia Department of Transportation for maintenance of state ownedsignals on Fairfax Drive ($83,000).
Eliminated a vacant Chief of Staff Position in the Director’s Office($85,000). (1.0)
Eliminated a part-time, filled Communications Specialist ($34,906). (0.5)
266

DEPARTMENT OF ENVIRONMENTAL SERVICES TEN-YEAR HISTORY
Fiscal Year Description FTEs
Eliminated Arlington Transit (ART) Route 92 ($348,457 non-personnel;$27,084 fee revenue; $61,602 transfer from other funds).
Eliminated Arlington Transit (ART) Route 54 ($121,801 non-personnel;$24,801 fee revenue).
Eliminated filled Administration/ Front Desk Support position in TE&0($74,000). (1.0)
Eliminated evening porter at Arlington Mill Community Center ($25,000)and a vacant Custodian position ($44,000). (1.0)
Eliminated a second window cleaning each year in all County Buildings($48,000).
Conduct a custodial services pilot program in Courts Police Buildingreducing cleaning in nonpublic areas from five days to three days a week($90,000).
Reduction of Facility energy projects, rebates, and consultant funding inthe AIRE program ($554,312).
Transfer of street sweeping expenses to the Stormwater Fund ($399,290).
As part of FY 2018 Closeout, the County Board approved the transfer ofthree positions ($285,062) to the Utility Fund as part of a reorganizationin DES, the DES Call Center, which was enmeshed in the Solid WasteBureau, and the Utilities Service Office (USO) was merged into anewly-formed DES Customer Service Office. The transfer was funded from$225,129 in net tax support and $96,484 in Household Solid Wasterevenue.
(3.0)
FY 2020 The County Board added one-time funding for the Minor Hill pumping station solar array feasibility study ($50,000).
Reduced wireless service charges as part of a County-wide review ofwireless service providers ($54,929).
Eliminated a vacant after hours building maintenance shift supervisorposition ($141,295).
(1.0)
Reduced County Residential and Bike Lane Street Sweeping Passes($62,679 personnel; $72,471 non-personnel; $135,150 intra-Countycharges).
(1.0)
Eliminated Solid Waste Bureau fleet emergency equipment ($109,955).
Eliminated a vacant Environmental Planner I position ($133,945).(1.0)
Non-personnel savings due to the conversion of County owned HighPressure Sodium (HPS) lights to LED ($18,000).
Eliminated Arlington Transit (ART) Route 53 midday service and Westoverrush hour extension ($261,203 non-personnel; $17,256 fee revenue).
Eliminated Arlington Transit (ART) Route 43 weekend service ($195,879non-personnel; $195,879 transfer from other funds).
Transferred fifty-percent of a space planner position to Capital projects($67,808).
267

DEPARTMENT OF ENVIRONMENTAL SERVICES TEN-YEAR HISTORY
Fiscal Year Description FTEs
Transferred a utility underground program coordinator position to theUtility Fund ($165,956).
(1.0)
Reduction in overtime budget for the leaf collection program ($100,000personnel).
Added two positions to incrementally improve the level of service in LandDisturbing Activity (LDA) permit reviews ($266,000).
2.0
Converted two previously unbudgeted, long-term space planners topermanent positions through increasing the DES budget that accounts forstaff vacancies ($173,795).
2.0
Non-personnel increase due to adjustments to the annual expense formaintenance and replacement of County vehicles ($161,178).
Increase in Commuter services non-personnel expenses and fee revenuedue to a technical adjustment to accurately account for Virginia RailwayExpress ticket commission revenue and associated expenses ($1,500,000non-personnel; $1,500,000 fee revenue).
Contractual increases for both ART and STAR services ($159,934).
Removal of one-time funding for the Residential Parking Permit Study($223,232).
Increase in facilities maintenance contractual obligations ($269,421).
Increases in Solid Waste contractual obligations ($47,725), licenses for thenew Utility Billing system ($29,200) and increases in charges by the UtilityFund to support the Call Center consolidation ($289,110).
Decrease in the Solid Waste transfer to the Utilities Fund due to thecompletion of payments for the new Utility Billing system ($199,200).
A decrease in recycling charges due to no longer recycling glass ($57,680non-personnel).
Elimination of the Solid Waste lease payment budget due to equipmenthaving been paid off ($114,222 non-personnel)
Increase in Water Sewer and Streets contractual services obligations($33,250).
Removal of one-time funding for a consultant study to update theCommunity Energy Plan (CEP) ($100,000).
Intra-county charges decrease due to delaying replacement of some streetsweeping equipment ($114,484).
Intra-county charges increase due to adjustments to the allocation of costsfor reimbursable services to the Utilities Fund in the Director’s Office($157,012).
Transit fee revenue decreased due to a decline in projected ART bus farerevenue ($295,819).
Development services fee revenue decreased due to the transfer of aportion of sediment/ erosion control fees and Chesapeake Bay fees to theStormwater Fund ($155,000).
Transfer in from other funds increased due to the costs of existing ARTroutes funded by the Transportation Capital Fund increasing ($116,739).
268

DEPARTMENT OF ENVIRONMENTAL SERVICES TEN-YEAR HISTORY
Fiscal Year Description FTEs
Real Estate fee revenue increased due to the value of leases currentlyunder agreement with the County primarily due to increased rent from1559 Wilson Blvd ($199,960).
Solid Waste fee revenue decreased primarily due to a decrease in theadopted Household Solid Waste Rate from $316.16 to $306 ($337,312).
As part of FY 2019 closeout, the County Board approved the addition of anEngineering Program Coordinator ($164,231) and a Permit Coordinator($85,057) in the Development Services Bureau and a Design Engineer($150,733) in the Transportation Engineering & Operations Bureau for theanticipated increase workload due to Amazon.
3.0
FY 2021 Added one-time funding for three limited term Permit Counter positions transferred in from the CPHD Development Fund to support an increased workload associated with the new permitting system ($215,975).
3.0
Reclassified a vacant Survey Instrument Operator position to create anAssistant Bureau Chief position to support the increased workloadgenerated by development and resident requests ($97,725).
Added a Traffic Engineer to support the Customer Care & CommunicationsCenter (C3) ($162,250).
1.0
Increased ART funding due to the newly rebid and awarded operations andmaintenance contract ($4,440,046) and contractual services increasesincluding STAR services ($352,828).
Increase due to regional program funding increases such as NorthernVirginia Transportation Commission (NVTC), Congestion, Mitigation, andAir Quality (CMAQ), and Transportation Demand Management (TDM)Contributions ($704,961), partially offset by adjustments for a VDOT grant($19,335).
Added one-time funding ($100,000) and ongoing funding ($20,000) forthe installation of flood warning sensors in the public right of way at twohigh risk intersections.
Reallocated funds within the Facilities Management Bureau to contractedservices ($200,180).
Added funding to provide facilities management services at the new LubberRun Recreation Center ($155,735).
Transferred in Non-Departmental funds to manage facility security IDservices ($93,000).
Added funding for the County’s share of maintenance for the new FleetSchool garage ($30,000).
Added funding for facilities’ preventative maintenance ($100,000).
Transferred out security maintenance funding to the Sheriff’s Office($340,000).
Added one-time funding to assist with investigating and developinginitiatives in line with the County’s recently-adopted Community EnergyPlan ($150,000).
269

DEPARTMENT OF ENVIRONMENTAL SERVICES TEN-YEAR HISTORY
Fiscal Year Description FTEs
Added ongoing funding for the maintenance and replacement costs for 28electric vehicles that were purchased in FY 2020 by the AutomotiveEquipment Fund ($37,401).
An increase to disposal costs driven primarily by the recycling markets($409,832).
Added funding for operation and maintenance costs for Covanta WTEfacility ($8,075).
An increase to charges by the Utility Fund to support the Call Center($13,755).
Added one-time funds to support a sidewalk condition assessment($300,000) and additional funding added for concrete maintenance($250,000).
Intra-county charges increased due to filling street sweeper staff vacancies($97,761), Facilities Management Bureau ($103,554) and OperationsManagement ($16,107) due to an adjustment in eligible reimbursableexpenses for services provided within the organization.
Intra-county charges decrease due to the allocation of costs forreimbursable services to the Utilities Fund in the Director’s Office($39,207) and Engineering Bureau ($5,566).
Intra-county charges decrease due to the addition of a Receptionistposition in the CPHD Development Fund that will be partially funded byDevelopment Services in the General Fund ($19,705).
Solid Waste fee revenue increased due to an increase in the HouseholdSolid Waste Rate ($455,504). The Household Solid Waste Rate increasedfrom $306.00 to $319.03 as a result of the increase in disposable costs forrecycling.
Solid Waste fee revenue decreased due to a decrease in mulch fees($25,000) and rental income for Waste to Energy Facility ($48,515) basedon aligning budget with actuals.
Transit fee revenue decreased due to a decline in projected ART bus farerevenue ($338,741), partially offset by an increase in ART businesscontributions ($33,076).
Development Services and Transportation, Engineering, and Operationsfee revenue increased due to an inflationary increase of 2.5 percent to fees($81,921).
Development Services fee revenue increased due to increased Site Planfees ($46,250) based on anticipated construction and Small Wireless fees($25,000) based on anticipated applications.
Development Services fee revenue increased due to an increase inanticipated Sediment/Erosion control revenue ($9,287).
Development Services fee revenue decreased due to an anticipateddecrease in Highway Permits ($24,686), Surveys ($8,026), CommunityProgram fees ($44,280), and Bond Processing Fees ($4,151).
Transportation, Engineering, and Operations fee revenue decreased due toan anticipated decrease in meter revenue ($1,355,957).
Transportation, Engineering, and Operations fee revenue increased due toincreased Highway Permits ($156,646) based on aligning budget withactuals.
270

DEPARTMENT OF ENVIRONMENTAL SERVICES TEN-YEAR HISTORY
Fiscal Year Description FTEs
Grant revenue increased primarily due to additional CMAQ funding($598,980), Northern Virginia Transportation Commission funding($707,185), and an adjustment based on aligning budget with actuals inCMAQ funding ($330,612).
Transfer from other funds increased due to the increased operations andmaintenance costs for ART ($368,851).
271

This page intentionally left blank
272

DEPARTMENT OF HUMAN SERVICES Anita Friedman, Director
2100 WASHINGTON BLVD., ARLINGTON, VA 22204 703-228-1322
Our Mission: Strengthen, protect, and empower those in need
The Department of Human Services (DHS) assesses the diverse range of human needs and implements strategies to deliver innovative human services that produce customer-centered outcomes.
LINES OF BUSINESS
Director’s Office
Behavioral Healthcare Child & Family ServicesPublic Health Aging & Disability ServicesEconomic Independence
Management and Administration- Customer Service Center
Community Assistance - Clinical Coordination- Community Outreach- Community Corrections
Housing Assistance and Homeless Programs
- Housing Grants- Real Estate Tax Relief- Homeless and Shelter Services- Supportive Housing- Rapid Re-Housing
Public Assistance- General Relief- Auxiliary Grants- Supplemental Nutrition Assistance
Program- Medicaid- Temporary Assistance to Needy Families
- Energy Assistance- Refugee Services- Title IV-E
Employment Services- Job Search and Placement- Skills Training- English as Second Language Training- Workforce Board and Consortium
Management and Administration- Emergency Planning and
Response- Occupational Health
Community Health Services- Family Planning- Maternity Care- Immunization Clinic- Medical Case Management- Maternal-Child Nutrition [Women,
Infant and Children Program(WIC)]
- HIV/AIDS/Sexually TransmittedInfections (STI) and AIDS DrugAssistance Program (ADAP)
- Dental Clinic
School Health- School Based Health Clinics- Health Appraisal Clinics- Parent and Infant Education (PIE)
Community Health Protection- Restaurant Inspection- Pool Inspection- Hotel Inspection- Animal and Rodent Control- Disease Surveillance and
Investigation- Tuberculosis Medical Case
Management
Laboratory Services
Management and Administration- Customer Service Center- Recovery Program- CSB Medical Records
Client Services Entry- Assessment and Intake - Emergency Services- Discharge Planning, Assistance,
and Regional Diversion Project- Jail Diversion/Forensic Case
Management- Homeless Case Management- Project Peace
Psychiatric Services- Wellness- Psychiatric Clinical Services
Outpatient Services- Program for Assertive Community
Treatment (PACT)- Mental Health Community
Supportive Services- Employment Services- Substance Abuse Outpatient
Services
Specialized & Residential Services- Abusers Intervention Program
(AIP)- Behavioral Health Residential
Treatment- Clarendon House- Drug Court- Jail/Addictions, Corrections and
Treatment (ACT)- Jail/Mental Health Treatment- Office Based Opioid Treatment
Management and Administration
Planning and Support Services- Early Childhood Development- Parent Education & Project Family- Partnership for Children, Youth
and Parents- Child Services Act (CSA)
Child Welfare- Child Protective Services- Foster Care- Family Partnership Meetings- Adoption
Behavioral Healthcare- Intake Services- Assessment and Child Advocacy Center
- Outpatient Therapy- Outpatient Case Management
Management and Administration
Community Supports and Coordination
- Agency on Aging- Adult Social Services- Adult Protective Services- Nursing Case Management- In-Home Services- Volunteer Guardianship and Personal Advocate Services
- Adult Day Healthcare Center
Senior Adult Mental Health Program
- Geriatric Mental Health- Regional Older Adult
Facilities Mental HealthSupport Team (RAFT)
- Mary Marshall Assisted LivingResidence
Developmental Disability Services- Support Coordination- Habilitation and Supported
Employment- Transportation- Residential Services
Departmental Management and Leadership-Human Resources-Financial Management-Information Systems-Performance Review and Compliance-Facilities Operations
Housing Choice Voucher Fund- Housing Choice Vouchers- Project-Based Assistance
Housing Choice Vouchers- Housing Opportunities
for Persons with AIDS- Milestones- Family Unification
Section 8 Housing Assistance is in the Housing Choice Voucher Fund
273

DEPARTMENT OF HUMAN SERVICES DEPARTMENT BUDGET SUMMARY
SIGNIFICANT BUDGET CHANGES
The FY 2021 adopted expenditure budget for the Department of Human Services (DHS) is $146,126,785, a three percent increase over the FY 2020 adopted budget. The FY 2021 adopted budget reflects:
Personnel changes due to the addition of 13.25 FTEs (13.0 permanent, 0.25 temporary) and an increase in the County’s cost for employee health insurance, partially offset by lower retirement contributions based on current actuarial projections and a technical adjustment to eliminate a temporary FTE (0.50 FTE) in the Economic Independence Division’s Management and Administration line of business.
Non-personnel increases primarily due to Children’s Services Act (CSA) for anticipated rateincreases by the state ($184,848), Sequoia Plaza rent ($243,995), Department of BehavioralHealth and Developmental Services (DBHDS) Grants ($165,313), the Auxiliary Grants Program($50,000), Virginia Quality Childcare Grant ($24,000), Virginia Homeless Solutions Program(VHSP) Grant ($33,504), Residential Program Center Contract ($165,031), Homeless ServicesCenter Contract ($130,034), contractual services ($230,170), RAFT Program for DischargePlanning ($179,690), Title IV-E Adoption ($217,789), Special Needs Adoption ($52,342),Malpractice Insurance ($67,500), and Agency on Aging Area Plan allocations ($40,186).
Non-personnel increases are partially offset by the removal of one-time funding for Arlington Food Assistance Center ($37,500), decreases in Title IV-E Foster Care ($100,095), the elimination of Crisis Stabilization Grant ($273,852), and the reallocation of VOCA grants from non-personnel ($124,174).
The total funding for the Housing Grant Program in the FY 2021 adopted budget is $10,130,374 after the addition of $737,623 to fund the annual ongoing increase and $64,158 to fund the increase in Maximum Allowable Rent. This is a total addition of $801,781 to the $9,328,593 base budget.
The total local funding for the Permanent Supportive Housing Program in the FY 2021 adopted budget is $2,477,424 after the addition of $412,554 to the $2,064,870 base budget to fund the annual ongoing increase.
The FY 2021 budget for the Behavioral Healthcare Division reflects an internal reorganization to better align services along the sequential intercept model. This includes jail diversion, jail-based services, and re-entry programming. The Forensic and Homeless Case Management programs, along with drug court and the behavioral health docket are integrated into the Specialized and Residential Services Bureau.
Revenue projections do not include supplemental state allocations that are routinely received but at unpredictable levels. Other changes represent a wide variety of fluctuations in multiple sources of state and federal funding. Specific changes include the following: Increase due to Virginia Department of Social Services (VDSS) Programs ($244,249). Increase due to the Virginia Department of Behavioral Health and Developmental
Services (VDBHDS) unrestricted state funding for mental health allocation ($817,584). Increase due to the Virginia Homeless Solutions Program (VHSP) Grant ($33,504). Increase due to the projected increase in several of the Department of Behavioral Health
and Developmental Services (DBHDS) Grants (Pharmacy Grant $100,000, STEP-VA$54,736, STEP-VA Primary Care $164,095, STEP-VA Outpatient $224,250).
Increase due to Virginia Quality Childcare Grant ($24,000). Increase due to the state portion of the Auxiliary Grants Program ($40,000). Increase due to Virginia Department of Health Cooperative Award for mandated programs
($62,047).
274

DEPARTMENT OF HUMAN SERVICES DEPARTMENT BUDGET SUMMARY
Increase due to VOCA Grant ($116,674). Increase due to new fees for workforce development services ($26,050) and issuing vital
statistics ($3,600). Decrease in Workforce Innovation and Opportunity Act (WIOA) Grant ($49,218). Decrease due to the phase-out of the One-Stop Center Cost Allocation Plan as a result of
Employment Services reorganization ($41,592). Decrease due to the elimination of the Crisis Stabilization Grant ($273,852). Decrease due to reductions in PIE Medicaid/Part C Clinic Option ($64,483).
The FY 2021 adopted permanent staffing level is 711.87 FTEs, an increase of 13.0 FTEs over the FY 2020 adopted budget. The FTE changes are due to the increases below:
Management Specialist ($91,923, 1.0 FTE) to serve as a case manager for Permanent Supportive Housing in Economic Independence Division’s Housing Assistance line of business.
Management Analyst ($105,618, 1.0 FTE) to serve as a housing locator for Permanent Supportive Housing in Economic Independence Division’s Housing Assistance line of business.
Developmental Disability Specialist II ($92,484 personnel, $80,000 revenue, 1.0 FTE) to serve as a support coordinator in the Aging and Disability Division’s Developmental Disability Services line of business.
Replacement of one-time funding with ongoing for a Youth Mental Health Therapist II ($111,362) in the Behavioral Health Division’s Specialized and Residential Services line of business.
Mental Health Therapist II ($111,362, 1.0 FTE) for the Behavioral Health Docket in the Behavioral Health Division’s Specialized and Residential Services line of business.
Re-allocated non-personnel funds for the addition of an Administrative Assistant ($12,203, 0.25 FTE) in the Behavioral Health Division’s Psychiatric Services line of business.
Grant-funded Management Specialist ($21,762, 0.25 FTE) for VICAP coordination (Virginia Insurance Counseling and Assistance Program) in the Aging and Disability Division’s Agency on Aging line of business.
Grant-funded Mental Health Therapist II ($10,965, 1.0 FTE) for the Diversion First Program in the Behavioral Health Division’s Client Service Entry line of business.
Grant-funded Administrative Technician I ($65,423, 1.0 FTE) in the Behavioral Health Division’s Management line of business.
Grant-funded Mental Health Therapists II ($222,726, 2.0 FTE) for implementation of foundational outpatient services as part of the STEP-VA initiative in the Behavioral Health Division’s Outpatient Services line of business.
Grant-funded Clinic Aides ($148,274, 2.0 FTE) for implementation of primary care screening and monitoring as part of the STEP-VA initiative in the Behavioral Health Division’s Psychiatric Services line of business.
Transfer of a Human Services Specialist ($100,427, 1.0 FTE) from the Circuit Court Judicial Office to the Behavioral Health Division’s Specialized and Residential Services line of business.
Re-classification and increase of a Human Services Clinician II position to a Management Specialist ($26,440, 0.25 FTE) for the Project PEACE program in the Director’s Office.
Facilities Mechanic ($13,317, 0.25 FTE) in the Director’s Office. Grant-funded Human Services Clinician II ($73,400, 1.0 FTE) for the Child Advocacy Center
in the Child and Family Services Division’s Behavioral Healthcare line of business.
275

DEPARTMENT OF HUMAN SERVICES DEPARTMENT BUDGET SUMMARY
DEPARTMENT FINANCIAL SUMMARY
FY 2019 FY 2020 FY 2021 % ChangeActual Adopted Adopted ‘20 to ‘21
Personnel $72,505,393 $77,172,835 $78,708,090 2%Nonpersonnel 63,117,822 65,113,372 67,785,797 4%Intra-County Charges (366,269) (311,070) (367,102) 18%Total Expenditures 135,256,946 141,975,137 146,126,785 3%
Fees 4,627,381 4,884,492 4,885,037 -Federal Share 15,830,523 14,615,772 15,318,387 5%State Share 20,550,532 20,330,859 21,208,177 4%Other 848,733 707,803 822,284 16%Total Revenues 41,857,169 40,538,926 42,233,885 4%
Net Tax Support $93,399,777 $101,436,211 $103,892,900 2%
Permanent FTEs 700.07 698.87 711.87Temporary FTEs 2.55 3.00 2.75Total Authorized FTEs 702.62 701.87 714.62
276

DEPARTMENT OF HUMAN SERVICES DEPARTMENT BUDGET SUMMARY
EXPENSES BY LINE OF BUSINESS
FY 2019 FY 2020 FY 2021 % Change FY 2021 FTEsActual Adopted Adopted ‘20 to '21 Adopted
Departmental Management and Leadership 10,786,352 12,206,136 12,385,715 1% 63.10
Economic Independence Division (EID) EID Management and Administration* 3,952,781 4,016,287 4,584,706 14% 26.00 Community Assistance 2,905,682 3,067,298 2,555,652 -17% 16.75 Housing Assistance and Homeless Programs 18,560,254 18,627,893 20,291,881 9% 17.15 Public Assistance 5,065,350 5,633,476 5,637,282 - 51.25 Employment Services 3,955,914 3,406,224 3,283,201 -4% 19.00EID Subtotal 34,439,981 34,751,178 36,352,722 5% 130.15
Public Health Division (PHD) PHD Management and Administration* 5,691,082 5,623,532 5,953,730 6% 22.50 Community Health Services 6,247,261 6,616,805 6,582,032 -1% 55.50 School Health Clinics 7,145,960 7,696,716 7,736,322 1% 66.07 Community Health Protection 3,419,661 3,528,086 3,518,093 - 28.50 Laboratory Services 3,673 - - 0.00PHD Subtotal*** 22,507,636 23,465,139 23,790,177 1% 172.57
Behavioral Health Division (BHD) BHD Management and Administration 3,775,887 4,039,949 4,268,408 6% 16.00 Client Service Entry* 5,196,508 5,258,104 4,515,580 -14% 28.50 Psychiatric Services 3,736,207 3,968,523 4,187,302 6% 21.95 Outpatient Services 6,855,105 7,333,316 7,662,283 4% 62.80 Specialized and Residential Services 8,236,670 8,098,307 8,854,810 9% 44.50BHD Subtotal 27,800,377 28,698,199 29,488,383 3% 173.75
Child and Family Services Division (CFSD) CFSD Management and Administration 3,913,105 4,165,180 4,317,566 4% 21.00 Planning and Support Services 3,127,120 5,261,094 5,434,261 3% 9.50 Child Welfare 6,073,787 6,004,985 6,149,442 2% 33.50 Behavioral Healthcare* 4,528,874 4,810,014 4,828,749 - 26.75CFSD Subtotal 17,642,886 20,241,273 20,730,018 2% 90.75
Aging and Disability Services Division (ADSD) ADSD Management and Administration 851,048 840,736 847,084 1% 5.50 Agency on Aging 2,059,261 2,055,037 2,171,101 6% 8.30 Adult Day Programs** 509 - - - - Community Supports & Coordination* 5,240,792 5,397,702 5,528,025 2% 29.75 Senior Adult Mental Health Program 5,482,053 5,431,043 5,674,733 4% 14.50 Developmental Disability Services 8,446,051 8,888,694 9,158,827 3% 23.50ADSD Subtotal 22,079,714 22,613,212 23,379,770 3% 81.55
Total Expenditures $135,256,946 $141,975,137 $146,126,785 3% 711.87*There are additional temporary FTEs in the following lines of business: PHD Management and Administration (1.5 FTE), BHD Client ServiceEntry (0.5 FTE), CFSD Behavioral Healthcare (0.6 FTE), ADSD Community Supports and Coordination (0.15 FTE).
**The ADSD Adult Day Program line of business was reorganized in FY 2019.
***The PHD FY 2019 Actuals do not add up due to rounding.
277

DEPARTMENT OF HUMAN SERVICES TEN-YEAR HISTORY
EXPENDITURE, REVENUE, NET TAX SUPPORT, AND FULL-TIME EQUIVALENT TRENDS
$ in 000s
Y 19
FY 2012 Actual
FY 2013 Actual
FY 2014 Actual
FY 2015 Actual
FY 2016 Actual
FY 2017 Actual
FY 2018 Actual
FY 2019 Actual
FY 2020 Adopted
Budget
FY 2021 Adopted
BudgetEXP $115,347 $113,480 $117,358 $122,965 $127,949 $134,525 $136,105 $135,257 $141,975 $146,127REV $38,166 $34,337 $37,826 $37,653 $40,559 $42,234 $42,322 $41,857 $40,539 $42,234NTS $77,181 $79,143 $79,532 $85,312 $87,390 $92,291 $93,783 $93,400 $101,436 $103,893FTEs 683.09 685.84 680.54 681.54 688.79 700.82 709.02 702.62 701.87 714.62
0
200
400
600
800
1000
$0
$20,000
$40,000
$60,000
$80,000
$100,000
$120,000
$140,000
$160,000FTEs EXP REV NTS
278

DEPARTMENT OF HUMAN SERVICES TEN-YEAR HISTORY
Fiscal Year Description FTEs
FY 2012 Increased rent for services relocated from 3033 Wilson Boulevard to Sequoia Plaza ($1,373,661).
Additional safety net funds were appropriated in the areas of rental subsidies and general relief ($1,259,832).
Contractually obligated increases ($52,893) combined with reductions associated with the move to Sequoia in the areas of service costs ($117,244) and lower electricity costs ($266,357) were realized in the base budget.
Transfer of a position in the School Health Clinics back to Arlington Public Schools ($116,032).
(1.0)
The County Board added funding to serve children with serious emotional, mental, and substance abuse issues ($327,003).
4.0
The County Board added funding for a Mental Health Therapist in the jail ($80,000).
1.0
The County Board added funding for mental health and substance abuse vocational services (one-time $100,000).
The County Board added ongoing funding for Doorways shelter funding gap ($163,054).
The County Board added funding for Aging Services Vertical Village Concierge pilot program (one-time $30,000 to cover two years).
The County Board added funding for pilot program to combat adolescent substance abuse (one-time $130,000 to cover two years).
The County Board added funding for safety net programs, including $224,561 for housing grants in addition to the FY 2011 base (one-time funding), additional funding for emergency housing needs ($200,000 one-time) and pilot for homeless single adults ($50,000 one-time), support for A-Span outreach worker ($70,000), and support for the Healthy Families Program Restoration ($59,000).
The County Board added funding for development grant for Arlington Free Clinic (one-time $40,000 to cover two years).
The County Board added funding for primary care/behavioral healthcare integration for Alexandria Neighborhood Health Systems Inc (one-time $40,000 to cover two years).
Increased grant funded position to support jail diversion for individuals identified with mental health issues.
1.0
Transferred position from Section 8 fund to Department of Human Services General Fund.
0.80
Transfer of one FTE in School Health Clinics to the Arlington Public Schools.
(1.0)
FY 2013 The County Board added ongoing funding for Permanent Supportive Housing ($248,064).
The County Board added one-time funding for the Homeless Prevention and Rapid Re-Housing Program ($200,000).
The County Board added one-time funding for a second year of the housing grants pilot for singles program ($50,000).
The County Board added ongoing funding for an additional 0.5 FTE psychiatrist for children ($97,500, 0.5 FTE).
0.50
The County Board added ongoing funding for an additional 1.0 FTE to develop and conduct an independent living program for young adults ($70,000, 1.0 FTE).
1.0
279
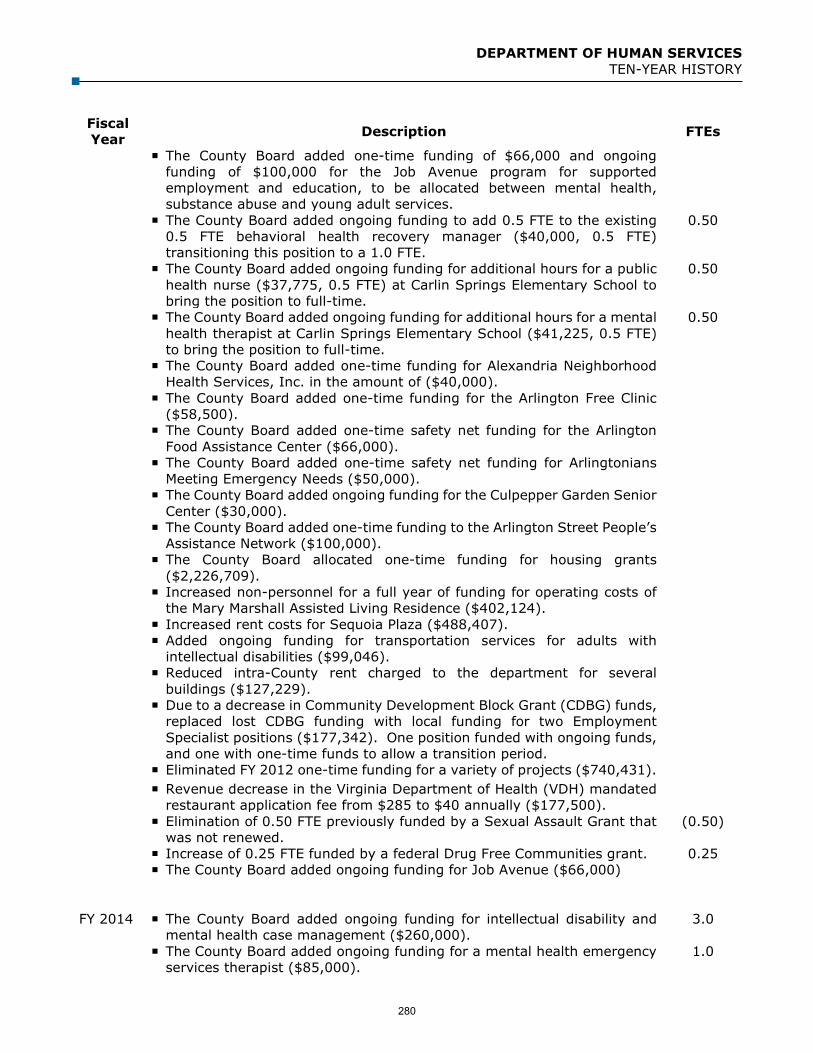
DEPARTMENT OF HUMAN SERVICES TEN-YEAR HISTORY
Fiscal Year Description FTEs
The County Board added one-time funding of $66,000 and ongoing funding of $100,000 for the Job Avenue program for supported employment and education, to be allocated between mental health, substance abuse and young adult services.
The County Board added ongoing funding to add 0.5 FTE to the existing 0.5 FTE behavioral health recovery manager ($40,000, 0.5 FTE) transitioning this position to a 1.0 FTE.
0.50
The County Board added ongoing funding for additional hours for a public health nurse ($37,775, 0.5 FTE) at Carlin Springs Elementary School to bring the position to full-time.
0.50
The County Board added ongoing funding for additional hours for a mental health therapist at Carlin Springs Elementary School ($41,225, 0.5 FTE) to bring the position to full-time.
0.50
The County Board added one-time funding for Alexandria Neighborhood Health Services, Inc. in the amount of ($40,000).
The County Board added one-time funding for the Arlington Free Clinic ($58,500).
The County Board added one-time safety net funding for the Arlington Food Assistance Center ($66,000).
The County Board added one-time safety net funding for Arlingtonians Meeting Emergency Needs ($50,000).
The County Board added ongoing funding for the Culpepper Garden Senior Center ($30,000).
The County Board added one-time funding to the Arlington Street People’s Assistance Network ($100,000).
The County Board allocated one-time funding for housing grants ($2,226,709).
Increased non-personnel for a full year of funding for operating costs of the Mary Marshall Assisted Living Residence ($402,124).
Increased rent costs for Sequoia Plaza ($488,407). Added ongoing funding for transportation services for adults with
intellectual disabilities ($99,046). Reduced intra-County rent charged to the department for several
buildings ($127,229). Due to a decrease in Community Development Block Grant (CDBG) funds,
replaced lost CDBG funding with local funding for two Employment Specialist positions ($177,342). One position funded with ongoing funds, and one with one-time funds to allow a transition period.
Eliminated FY 2012 one-time funding for a variety of projects ($740,431). Revenue decrease in the Virginia Department of Health (VDH) mandated
restaurant application fee from $285 to $40 annually ($177,500). Elimination of 0.50 FTE previously funded by a Sexual Assault Grant that
was not renewed. (0.50)
Increase of 0.25 FTE funded by a federal Drug Free Communities grant. 0.25 The County Board added ongoing funding for Job Avenue ($66,000)
FY 2014 The County Board added ongoing funding for intellectual disability and mental health case management ($260,000).
3.0
The County Board added ongoing funding for a mental health emergency services therapist ($85,000).
1.0
280

DEPARTMENT OF HUMAN SERVICES TEN-YEAR HISTORY
Fiscal Year Description FTEs
The County Board added ongoing funding for nursing services to mental health group homes as well as outpatient nursing care for children ($149,000).
The County Board added ongoing funding for Permanent Supportive Housing ($388,850).
The County Board added ongoing funding for residential substance abuse treatment ($50,000).
The County Board added one-time funding for a capacity building grant to the Bonder and Amanda Johnson contract serving the Nauck community ($10,000).
The County Board added one-time funding for the 2nd Chance Program ($90,000) to be utilized over two years.
The County Board added one-time funding for Culpepper Gardens Senior Center ($400,000) to be utilized over three years.
The County Board added one-time funding for the Arlington Food Assistance Center ($25,870).
The County Board added one-time funding for Arlingtonians Meeting Emergency Needs ($50,000).
The County Board added one-time funding for the Arlington Free Clinic ($50,000).
The County Board added one-time funding for the Arlington Street People’s Assistance Network for a case manager for the 100 Homes Program ($50,000).
The County Board added one-time funding for Doorways for Women ($54,000).
The County Board added one-time funding for the Vertical Village program ($15,000).
Added an Administrative Assistant ($46,887) and a Human Services Aide ($54,949) as well as operating expenses ($298,164) for the integrated primary care-behavioral healthcare partnership grant.
2.0
Eliminated grant funded Management Specialist ($92,674) from the RAFT program.
(1.0)
Added non-personnel costs ($9,967), an Employment Services Specialist ($77,191) and a Social Worker ($83,326) for the Arlington Mill Community Center.
2.0
Eliminated state funding for the Child Care Subsidy Payment system, which was transferred back to the state from the County ($2,969,150).
Eliminated Defense Base Closure and Realignment (BRAC) center funding ($167,025).
Eliminated FY 2013 one-time funding for a variety of projects ($2,957,209).
Eliminated Virginia Tobacco Grant funding ($175,414). Increase operating expenses for the Parent-Infant Education (PIE)
Program ($174,000). Increased rent costs for Sequoia Plaza ($174,684). Increased one-time funding for housing grants ($1,586,493), Homeless
Prevention and Rapid Re-Housing Program (HPRP) ($200,000) and ongoing funding for vocational services for adults with intellectual disabilities ($175,000).
Intra-County Charges increased due to transfer of administrative fee payment for the RAFT program ($47,250), Northern Virginia Family
281

DEPARTMENT OF HUMAN SERVICES TEN-YEAR HISTORY
Fiscal Year Description FTEs
Services rent at Arlington Mill Community Center ($39,920) and reimbursement for two positions in Public Health ($31,438).
Reduced consulting costs for training ($20,000). Hold a Management Specialist and an Accounting Assistant position vacant
for six months ($58,383). Eliminated one Management Specialist position ($87,276) from the
Volunteer Arlington Program. (1.0)
Hold an Eligibility Worker position vacant for six months ($38,890). Eliminated one Human Service Aide ($78,548) from Public Assistance
Division. (1.0)
Reduced local day care funding for teen parents and families ($100,000). Eliminated two Administrative Technicians ($110,607) from the Fenwick
Center. (2.0)
Hold a Public Health Nurse position, a Clinic Aide position, and an Environmental Health Specialist position vacant for six months ($141,573).
Eliminated one Epidemiology Specialist ($40,394) from Community Health Services.
(0.50)
Eliminated two Public Health Nurses ($179,622) providing community-based medical case management services.
(2.0)
Eliminated one Public Health Nurse ($103,651) providing health education to teens at the Reed Center/Career Center who are pregnant or have children.
(1.0)
Eliminated two Public Health Nurses ($193,282) providing services to Arlington Public elementary schools.
(2.0)
Eliminated one Public Health Nurse ($108,067) and one Clinic Aide ($63,052) providing on-site health screening and immunizations for non-English speaking children.
(2.0)
Hold a Psychiatric Nurse position vacant for six months ($44,013). Reduced funding for contracted sheltered employment workshop services
for seriously mental ill adults ($32,000). Eliminated one Substance Abuse Lead Case Manager ($125,983)
providing supervision to case managers and substance abuse services at residential facilities and homeless shelters.
(0.80)
Hold a Social Worker position vacant for six months ($38,521). Hold a Management Specialist position vacant for six months ($58,716). Reduced funding for community care program that links private
homeowners with seniors who need residential and personal care services ($14,061).
Reduced contracted home health aide services for seniors and adults with disabilities ($50,000).
The County Board added ongoing funding for the Arlington Free Clinic ($75,000).
FY 2015 The County Board added one-time funding to establish the domestic and sexual violence hotline ($52,000), start up costs for Arlington Villages ($30,000), and Food for Others ($21,551).
The County Board shifted funding from ongoing to one-time for the
282

DEPARTMENT OF HUMAN SERVICES TEN-YEAR HISTORY
Fiscal Year Description FTEs
Homeless Prevention and Rapid Re-Housing Program (HPRP) ($200,000) and Housing Grants ($1,000,000).
The County Board added one-time funding for the Crisis Intervention Team (CIT) Coordinator ($72,606).
1.0
The County Board added ongoing funding for a Clinic Aide ($66,614) for the Career Center/H-B Woodlawn.
1.0
Eliminated a grant-funded Administrative Coordinator position from the Behavioral Healthcare Division ($72,231).
(1.0)
Added $500,000 in one-time funding from FY 2013 closeout for Housing Grants.
Increased non-personnel for the new Crisis Intervention Team Grant ($281,000), Crisis Stabilization Grant ($825,000), Child Advocacy Center Grant ($47,822), Parent-Infant Education Program (PIE) ($318,181), and Sequoia Plaza rent ($182,134).
The addition of pro-rated expenses for the first year of operations of the Comprehensive Homeless Services Center ($708,488).
Added funding for leadership development ($22,500 ongoing; $75,000 one-time) and ongoing funding for the Bonder and Amanda Johnson program ($79,253).
Intra-County charges decrease due to the elimination of the Resource Mother’s Program in the Public Health Division ($42,789).
Eliminated state funding for the Comprehensive Health Investment Project (CHIP) ($126,109).
Reduced federal funding for the Refugee Assistance Program ($30,000). Eliminated Family Planning Grant ($45,954). Increased grant funding for Crisis Stabilization ($825,000) and the Parent
and Infant Education (PIE) Program ($318,181), and a net increase in grant funding for the Crisis Intervention Center ($209,750).
Increased fees for Nursing Case Management ($13,000). Reductions were taken in several lines of business and reallocated within
DHS for new or expanded program offerings: Doorways for Women and Families Program ($54,200), client management software ($103,000), non-profit partner organizations ($147,088), and contractual costs for Psychiatrists ($33,916).
Removed FY 2014 one-time funding for HPRP ($200,000), Housing Grants ($86,493), Second Chance Program ($90,000), the Bonder and Amanda Johnson Contract ($89,253), Culpepper Gardens ($400,000), ASPAN Homeless Case Manager ($50,000), Doorways for Women and Families ($54,000), Arlington Free Clinic ($50,000), AFAC ($25,870), Arlington Thrive ($50,000), Food for Others ($21,551), and Vertical Village ($15,000).
The County Board added a Mental Health Therapist for Jail Based Services ($85,339).
1.0
FY 2016 The County Board added a Psychiatric Nurse Practitioner ($67,672). 0.50 The County Board reduced CSA matching funds ($300,000).
The County Board shifted funding from ongoing to one-time for the Housing Grants program ($1,500,000).
283

DEPARTMENT OF HUMAN SERVICES TEN-YEAR HISTORY
Fiscal Year Description FTEs
Replaced one-time funding with ongoing for the Crisis Intervention Team (CIT) Coordinator ($74,746).
1.0
Added Mental Health Therapists for the Homeless Services Center and emergency mental health services ($216,894).
2.5
Clinic Aide ($52,887) and a Public Health Nurse ($44,607) for the new Discovery Elementary School.
1.25
Added grant funded Eligibility Workers ($128,072) for state funded programs.
2.0
Removed one-time funding for the Crisis Intervention Team (CIT) Coordinator ($72,606).
(1.0)
Removed FY 2015 one-time funding for leadership development ($75,000), the Arlington Villages project ($30,000), and the Food for Others contract ($21,551).
Added one-time funding for the Housing Grants program ($1,500,000) to replace the FY 2015 one-time funding that was dedicated during the FY 2014 closeout process.
Added one-time funding for the replacement of the County’s antibiotics cache ($50,000).
Added ongoing funding for the domestic and sexual violence hotline ($85,000).
Added ongoing funding for the Homeless Prevention and Rapid Re-Housing Program (HPRP) ($200,000).
Increased grant funding for Women, Infants, and Children (WIC) Program ($116,990), CSB Substance Abuse Prevention grant ($172,614), Residential Drug Abuse Program (RDAP) funding ($462,262), Title IV-E Adoption Subsidy ($247,076), and Promoting Safe and Stable Families Grant ($60,513).
Added additional ongoing funding for the Arlington Food Assistance Center (AFAC) ($135,000).
Increased rent for Sequoia Plaza and Gates of Ballston ($200,043). Added ongoing funding for the cost of the consolidation of DHS offices to
the Sequoia Plaza complex ($1,661,234). Added funding for a full-year of expenses for the first year of operations
of the comprehensive Homeless Services Center ($413,950). Increased funding for the Home Delivered Meal Program and Culpepper
Garden ($10,774). Revenues increased for Women, Infants, and Children (WIC) Program
($116,990), CSB Drug Prevention Program ($172,614), Residential Drug Abuse Program (RDAP) ($462,262), IV-E Adoption ($123,538), and the departmental managed care initiative ($224,487).
Eliminated funding for operating expenses to senior programs ($100,000), and a net decrease for several state and federally sponsored programs ($709,522).
Eliminated funding for the Drug Free Communities Grant ($198,887), state and federal homelessness prevention grants ($339,675), and the VIEW and Project Discovery Programs ($49,985).
Intra-County charges increase due to the number clients participating in the Intellectual and Developmental Disability Program ($41,038).
The County Board took action after the FY 2016 budget was adopted in May to increase parking meter rates by $0.25. The budget information in the FY 2016 Adopted Budget does not reflect the parking meter rate
284

DEPARTMENT OF HUMAN SERVICES TEN-YEAR HISTORY
Fiscal Year Description FTEs
increase approved by the Board in June. As part of that action, the County Board appropriated one-time funding from PAYG to fund NOVASalud ($25,000).
The County Board added four County-funded FTEs to serve as Peer Counselors ($286,000). This includes three existing grant-funded Peer Counselors and a fourth Youth Peer Counselor beginning in January 2017.
4.0
FY 2017 The County Board added hours to 20 School Health Clinic Aide positions in order to accommodate increasing school enrollment and clinic visits by students with chronic health conditions ($142,836). The increase will raise the hours for 20 clinic aides from 30 hours per week to 35 for the ten month school year.
2.4
The County Board shifted funding for Housing Grants added during the proposed budget process from one-time to ongoing funds ($600,000) resulting in $6,513,507 in total ongoing funding and $3,164,248 remaining in one-time funding for FY 2017. The total funding for Housing Grants in the FY 2017 adopted budget is $9,677,755.
Added a Human Services Specialist and Mental Health Therapist for the CIT Assessment Site Expansion Grant ($173,972)
2.0
Transferred the Community Corrections Unit from the County Manager’s Office to the Economic Independence Division of DHS.
4.0
Decreased positions due to staffing efficiencies gained through reallocation and reclassification of existing positions.
(0.37)
The County Board added ongoing funding for Culpepper Gardens ($107,930).
The County Board added one-time funding for the Arlington Food Assistance Center ($50,000).
Added ongoing funding for increased rent ($998,287) and contracted services ($527,710) associated with the Sequoia Plaza Complex.
Removed one-time funding for the replacement of the County’s antibiotics cache ($50,000).
Removed one-time funding NOVA Salud ($25,000). The non-profit will continue to be funded in FY 2017 with reallocated base budget funds.
Revenue increased for Medicaid/Medicare and Direct Client Fees ($805,037), the Mobile Children’s Crisis Stabilization Allocation Program ($414,117), PIE Program ($145,878), and increased funding for Virginia Department of Social Services Programs ($138,198). The increases are offset by decreases to Substance Abuse and Mental Health Programs ($322,500), Virginia Department of Health Grant ($207,054), federal and state Adoption Assistance Grants ($88,421), Parent-Infant Education Grant ($48,172),
Increased grant funding for the Workforce Innovation and Opportunity Act (WIOA)-Alexandria Dislocated Grant ($37,500), Crisis Intervention Team (CIT) security budget ($57,749), Parent-Infant Education (PIE) Grant ($145,878), Mobile Children’s Crisis Stabilization Allocation ($414,117), Title IV-E Adoption Assistance ($62,295), and Title IV-E Foster Care Assistance ($157,263).
285
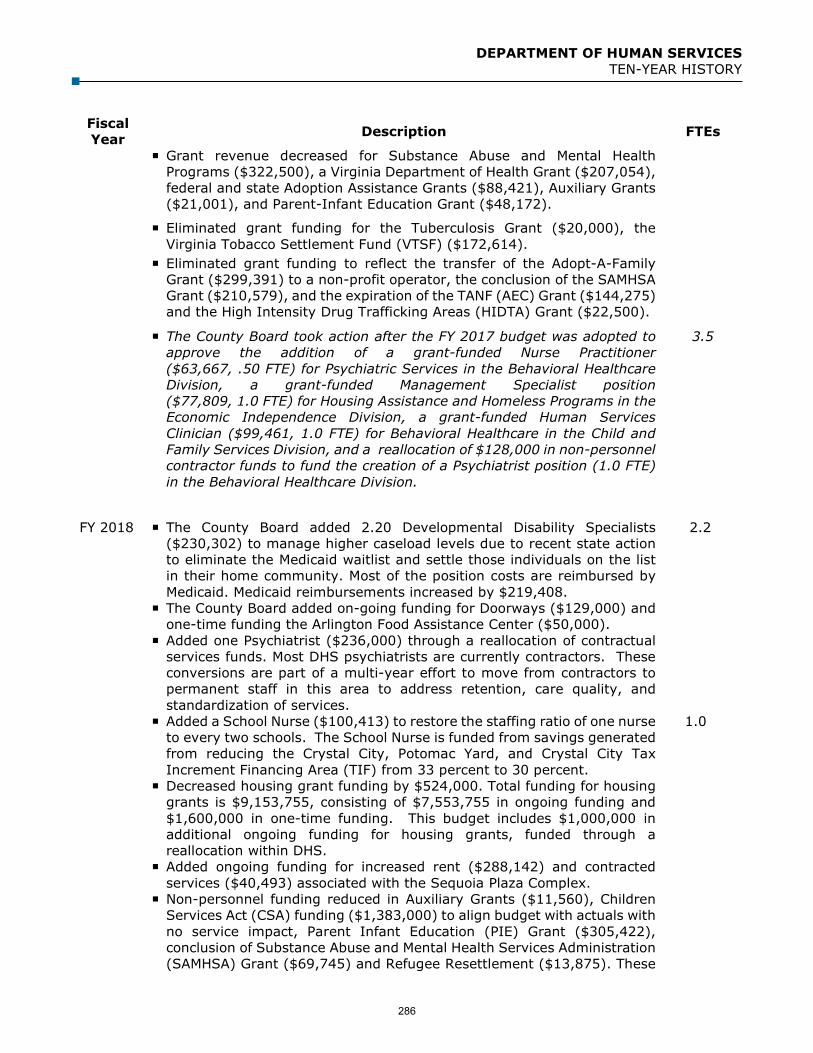
DEPARTMENT OF HUMAN SERVICES TEN-YEAR HISTORY
Fiscal Year Description FTEs
Grant revenue decreased for Substance Abuse and Mental Health Programs ($322,500), a Virginia Department of Health Grant ($207,054), federal and state Adoption Assistance Grants ($88,421), Auxiliary Grants ($21,001), and Parent-Infant Education Grant ($48,172).
Eliminated grant funding for the Tuberculosis Grant ($20,000), the Virginia Tobacco Settlement Fund (VTSF) ($172,614).
Eliminated grant funding to reflect the transfer of the Adopt-A-Family Grant ($299,391) to a non-profit operator, the conclusion of the SAMHSA Grant ($210,579), and the expiration of the TANF (AEC) Grant ($144,275) and the High Intensity Drug Trafficking Areas (HIDTA) Grant ($22,500).
The County Board took action after the FY 2017 budget was adopted to approve the addition of a grant-funded Nurse Practitioner ($63,667, .50 FTE) for Psychiatric Services in the Behavioral Healthcare Division, a grant-funded Management Specialist position ($77,809, 1.0 FTE) for Housing Assistance and Homeless Programs in the Economic Independence Division, a grant-funded Human Services Clinician ($99,461, 1.0 FTE) for Behavioral Healthcare in the Child and Family Services Division, and a reallocation of $128,000 in non-personnel contractor funds to fund the creation of a Psychiatrist position (1.0 FTE) in the Behavioral Healthcare Division.
3.5
FY 2018 The County Board added 2.20 Developmental Disability Specialists ($230,302) to manage higher caseload levels due to recent state action to eliminate the Medicaid waitlist and settle those individuals on the list in their home community. Most of the position costs are reimbursed by Medicaid. Medicaid reimbursements increased by $219,408.
2.2
The County Board added on-going funding for Doorways ($129,000) and one-time funding the Arlington Food Assistance Center ($50,000).
Added one Psychiatrist ($236,000) through a reallocation of contractual services funds. Most DHS psychiatrists are currently contractors. These conversions are part of a multi-year effort to move from contractors to permanent staff in this area to address retention, care quality, and standardization of services.
Added a School Nurse ($100,413) to restore the staffing ratio of one nurse to every two schools. The School Nurse is funded from savings generated from reducing the Crystal City, Potomac Yard, and Crystal City Tax Increment Financing Area (TIF) from 33 percent to 30 percent.
1.0
Decreased housing grant funding by $524,000. Total funding for housing grants is $9,153,755, consisting of $7,553,755 in ongoing funding and $1,600,000 in one-time funding. This budget includes $1,000,000 in additional ongoing funding for housing grants, funded through a reallocation within DHS.
Added ongoing funding for increased rent ($288,142) and contracted services ($40,493) associated with the Sequoia Plaza Complex.
Non-personnel funding reduced in Auxiliary Grants ($11,560), Children Services Act (CSA) funding ($1,383,000) to align budget with actuals with no service impact, Parent Infant Education (PIE) Grant ($305,422), conclusion of Substance Abuse and Mental Health Services Administration (SAMHSA) Grant ($69,745) and Refugee Resettlement ($13,875). These
286

DEPARTMENT OF HUMAN SERVICES TEN-YEAR HISTORY
Fiscal Year Description FTEs
decreases were partially offset by increases for operating and contractual services ($158,003), Project Planning Grant ($72,200), Crisis Intervention Team (CIT) security budget ($12,531), Mobile Children’s Crisis Stabilization Allocation ($208,929), Title IV-E Adoption Assistance ($35,934), and Title IV-E Foster Care Assistance ($296,037).
Fee revenue increased for new Substance Abuse Case Management and Office Based Opioid Treatment fees ($66,000), increased Agency on Aging revenue ($104,772).
Grant revenue increased for Mobile Children’s Crisis Stabilization Allocation Program ($208,929), CIT Security ($12,531), Virginia Department of Social Services (VDSS) Programs ($396,597 Project Planning Grant ($72,200)m Medicaid Waiver Design ($54,157), Title IV-E Adoption Assistance ($35,934), Title IV-E Foster Care Assistance ($296,037), Auxiliary Grants funding ($11,560).
Grant revenue decreased in CSA funding ($1,410,293) to align budget with actuals with no service impact, Parent-Infant Education Grant ($143,832), Tuberculosis Grant ($5,000), Senior Adult Mental Health reimbursement ($49,509), Refugee Resettlement funding based on FY 2016 service levels ($13,875), One-Stop Workforce Center co-location funding from the Northern Virginia Community College ($25,000) and the conclusion of the SAMHSA Grant ($100,000).
The County Board took action after the FY 2018 budget was adopted to approve the addition of an Administrative Assistant IV position ($3,800, 0.05 FTE) which was approved by the County Board in FY 2017 closeout.
0.05
The County Board took action after the FY 2018 budget was adopted to approve the addition of a temporary grant funded Management Specialist through the conversion on non-personnel funds ($37,240, 0.5 temporary FTE) which was approved by the County Board in FY 2017 closeout.
0.5
The County Board took action after the FY 2018 budget was adopted to approve the conversion of non-personnel grant funds into a Mental Health Therapist III position ($46,000, 1.0 temporary FTE) which were approved by the County Board in FY 2017 closeout.
1.0
The County Board took action after the FY 2018 budget was adopted to approve a Mental Health Therapist II position ($102,061, 1.0 FTE) and an Administrative Specialist position ($43,686, 0.50 FTE) for the RAFT Program which were approved in October 2017.
1.50
FY 2019 The County Board added $184,000 in one-time funding to fund a Youth Mental Health Therapist for two years ($184,000).
1.0
Added a grant-funded Nurse Practitioner for the Office Based Opioid Treatment Program through the reallocation of existing non-personnel funds ($70,000).
0.5
Added a Psychiatrist position ($207,042) through a reallocation of contractual services funds. Most DHS psychiatrists are currently contractors. These conversions are part of a multi-year effort to move from contractors to permanent staff in this area to address retention, care quality, and standardization of services.
1.0
Added an Administrative Technician I ($50,484) that was transferred from the Housing Choice Voucher Program to the Economic Independence
0.75
287

DEPARTMENT OF HUMAN SERVICES TEN-YEAR HISTORY
Fiscal Year Description FTEs
Division’s Management & Administration. Eliminated non-essential contingency funding for Behavioral Health
Division contracts ($80,000). Reduced funding for the residential program that provides adults with
developmental disabilities with independent living options, supervised apartments, and group homes ($300,000).
Eliminated an unfunded Volunteer Services Program Coordinator temporarily transferred to the Community Planning & Housing Development Fund for the One-Stop Arlington Permitting Initiative.
(1.0)
Eliminated a filled Administrative Technician responsible for tracking, retrieving and delivering archived records ($81,017). DHS will enlist a County contractor for approximately $12,000 per year to deliver and pick up files from offsite storage as needed. The net reduction is $69,017.
(1.0)
Eliminated a vacant Eligibility Worker ($105,493) that evaluates whether clients qualify for a variety of public assistance programs.
(1.0)
Eliminated six positions ($653,683) and a reduction in funding to the REEP program ($171,901). The positions to be eliminated include a filled Management Specialist ($104,402, 1.0 FTE), a filled Administrative Program Manager ($163,121, 1.0 FTE), a filled Employment Services Supervisor ($116,680, 1.0 FTE), and three Employment Services Specialist (two filled and one vacant) ($269,480, 3.0 FTEs) at the Arlington Employment Center (AEC). The reduction in the level of funding to REEP, the English as a Second Language Program operated by Arlington Public Schools totals $171,901.
(6.0)
Eliminated a filled Office Supervisor position in the Financial and Administrative Support Services ($95,603).
(1.0)
Eliminated a vacant Administrative Technician that manages all the medication orders for clients with Latent TB Infection (LTBI) and for clients with Active TB Disease (TB) ($80,121).
(1.0)
Eliminated a vacant Management Specialist ($105,727) which serves as the Clinic Practice Manager for all Public Health clinics including: family planning, maternity care, immunization, and sexually transmitted infections.
(1.0)
Eliminated the Laboratory Services Program. Of the six current positions, four have been eliminated ($449,359) and the two remaining positions and contracted services funding ($83,238) have been transferred to other lines of business.
(4.0)
Eliminated a vacant Administrative Technician that provides pharmacy services to BHD clients including managing the sample medication program, as well as stocking medication orders and applications for the Patient Assistance Programs (PAP) ($79,032). This action includes a reduction in funds for a contract Pharmacist ($17,200).
(1.0)
Non-personnel decreased primarily due to the removal of FY 2018 one-time funding for: The Housing Grants Program ($1,600,000); Arlington Food Assistance Center ($50,000); Reductions in Fostering Futures ($72,533); Special Needs Adoption ($135,889); Auxiliary Grants ($65,158); The Workforce Innovation and Opportunity Act (WIOA) Grant
($147,462); and
288

DEPARTMENT OF HUMAN SERVICES TEN-YEAR HISTORY
Fiscal Year Description FTEs
The homemaker program allocation in the Agency on Agency Area Plan ($129,008).
Non-personnel decreases were partially offset by increases for: Contracted Services ($48,442); Sequoia Plaza rent ($160,643); Children Services Act (CSA) ($102,551); A three-year grant from the Virginia Foundation for Healthy Youth
($149,999); IV-E Adoption ($204,181); Fostering Futures ($72,533); The addition of a Pre-employment physicals budget ($176,269); Additional funding for the RAFT Program for Discharge Planning
($373,443); and, The addition of $446,465 in ongoing funding and $707,109 in one-time
funding for housing grants. Fee revenue increased due to new client fees for sexually transmitted
infections testing, pharmaceuticals and clinic visits ($12,000). Grant revenue increased due to additional funding for: RAFT Program for Discharge Assistance Planning ($500,000); the WIC Breastfeeding Peer Counselor grant ($9,060); A Virginia Department of Health Cooperative award ($41,736); Child Welfare Substance Abuse ($18,671); A three-year grant from Virginia Foundation for Healthy Youth
($149,999); Title IV-E Adoption Assistance ($102,091); Adjustments to the projected amounts for the Agency on Aging Area
Plan ($56,298); Medicaid Prescreening ($10,000); Virginia Department of Social Services (VDSS) Programs ($568,739).
Revenue increases were partially offset by reductions to the: Emergency and Preparedness Program grant ($17,594); Parent-Infant Education Grant ($18,438); Tuberculosis Grant ($2,000); Customer Service Center from the Agency on Aging Area Plan
($76,481); Refugee Resettlement ($16,125); Title IV-E Foster Care Assistance ($38,571); Special Needs Adoption ($135,889); Community living home based care program ($41,657) as part of the
Agency on Aging Area Plan, Virginia Department of Behavioral Health and Developmental Services (VDBHDS) allocation ($49,623); and,
The conclusion of the Childcare Quality Initiative Grant ($20,914). The County Board took action after the FY 2019 budget was adopted to
accept and appropriate grant funds from the Virginia Department of Social Services to partially fund Medicaid eligibility determination ($277,057) and to approve the addition of six positions for Medicaid expansion in September 2018, including four Eligibility Workers ($366,432), one Administrative Technician I ($76,296), and one Eligibility Supervisor ($110,850).
6.0
289

DEPARTMENT OF HUMAN SERVICES TEN-YEAR HISTORY
Fiscal Year Description FTEs
FY 2020 The County Board added one-time funding to the Arlington Food Assistance Center ($37,500) for total funding of $515,425, or 98 percent of their request.
The County Board increased funding to Doorways by $46,000 for the Domestic and Sexual Violence Hotline ($16,172 in one-time and $29,828 in ongoing).
The County Board approved the creation of 1.50 FTEs that the Community Services Board requested ($162,172). It will be at their discretion working with DHS on which positions will be filled.
1.5
Added a Public Health Nurse ($100,113) and Clinic Aide positions ($96,129) in Public Health Division’s School Health line of business for two new schools scheduled to open in the fall of 2019.
2.55
Reduced wireless service charges as part of a County-wide review of wireless service providers ($30,856).
Eliminated an unfunded Human Services Clinician II ($98,991) and a Human Services Specialist ($97,245) in Economic Independence Division’s Community Assistance line of business.
(2.0)
Added a grant funded Management Specialist ($66,150) transferred from the Housing Choice Voucher Program to the Economic Independence Division’s Housing Assistance and Homeless line of business.
0.75
Eliminated an Employment Services Supervisor ($116,680, 1.0 FTE) and two Employment Services Specialists ($150,575, 2.0 FTEs), partially offset by the increase of an Employment Services Specialist ($93,232, 1.0 FTE) and an Employment Services Administrator ($196,579, 1.0 FTE) in Economic Independence Division’s Employment Services line of business, which was approved by the County Board in the FY 2019 adopted budget.
(1.0)
Added a Mental Health Therapist III ($86,849) and a Nurse Practioner ($140,000) through reallocations of non-personnel funds in Behavioral Health Division’s Psychiatric Services line of business.
2.0
Added a Mental Health Therapist III ($86,000, 1.0 FTE) through a reallocation of overtime funds previously budgeted for temporary staff, a technical correction to increase a Management Analyst ($27,795, 0.25 FTE), partially offset by the decrease of an unfunded Mental Health Therapist (0.50 FTE) in Behavioral Health Division’s Client Services Entry.
0.75
Added a grant funded Human Services Aide ($35,467) through a conversion of a temporary position in Aging and Disability Division’s Agency on Aging line of business.
0.50
Eliminated an unfunded Management Specialist in Child and Family Services Division’s Planning and Support Services line of business.
(0.75)
Eliminated a vacant Human Resources/OD Specialist ($29,478). (0.25) Re-aligned the Arlington Employment Center from a bureau to a program.
Eliminated the following positions: Two filled Employment Services Specialist ($190,167) A filled Employment Development Specialist ($94,418) A vacant Employment Center Director position ($196,579) A filled Management Specialist position ($118,364)
(5.0)
Eliminated a vacant Human Services Aide position ($39,387) who provides clinical and administrative support to Clarendon House’s nursing
(0.5)
290

DEPARTMENT OF HUMAN SERVICES TEN-YEAR HISTORY
Fiscal Year Description FTEs
and clinic staff. Reduced the Director’s Office training budget by $50,000. Reduced the Sequoia Plaza Common Area Maintenance budget by
$100,000. Reduced the Adult Services program in ADSD by $30,000. Eliminated the $10,000 local portion of the Developmental Disability
Services Residential Program. Increased funding for the Housing Grant Program ($621,264), including
support for raising the maximum allowable rent limits which have not changed since 2010, and replaces the share of one-time dollars with ongoing funding.
Increased the projection for the Children’s Services Act funds ($176,047). Increased Sequoia Plaza rent ($259,574). Revenue changes include: Increased Community Services Board ($49,379) for increases in
Medicaid and client fees for mental health services. Increased Agency on Aging Area Plan ($39,519). Increased Virginia Department of Social Services (VDSS) Programs
($90,216). Increased Medicaid Prescreening ($15,000). Increased the RAFT Program for Discharge Assistance Planning
($225,652) due to additional funding. Increased the Virginia Department of Behavioral Health and
Developmental Services (VDBHDS) allocation ($30,741). Increased the Virginia Homeless Solutions Program VHSP Grant
($67,709). Increased the projection for the Department of Behavioral Health and
Developmental Services DBHDS Grant ($696,930). Increased the state portion of the Auxiliary Grants Program ($22,490). Increased projected revenue from PIE Medicaid ($48,312). Increased PIE Medicaid/Part C Clinic Option ($42,283). Increased Vital statistics revenue ($63,836). Decreased the Community Services Board Mental Health Outpatient
Grant ($12,753). Eliminated the three-year grant from Virginia Foundation for Healthy
Youth ($149,999). Reduced the Refugee Resettlement Program ($10,000). Decreased Women, Infant and Children grant award ($93,144). Decreased PIE Medicaid/Part C State Plan Option ($46,620).
The County Board took action after the FY 2020 budget was adopted to approve the addition of two grant-funded Clinic Aides ($74,588, 2.0 FTE) for STEP-VA implementation and two grant-funded Mental Health Therapists ($224,250, 2.0 FTE) in the Behavioral Health Division; a grant-funded Human Services Clinician (1.0 FTE) and temporary Management Specialist (0.1 FTE) for the Child Advocacy Center in the Child and Family Services Division ($118,674); and a reallocation of grant-funded non-personnel funds to create an Administrative Technician ($65,423, 1.0 FTE) position in the Behavioral Health Division and to increase the hours of a Facilities Maintenance Mechanic ($13,317, 0.25 FTE) in the Director’s Office; and authorized the transfer of a Human Services Specialist
7.35
291
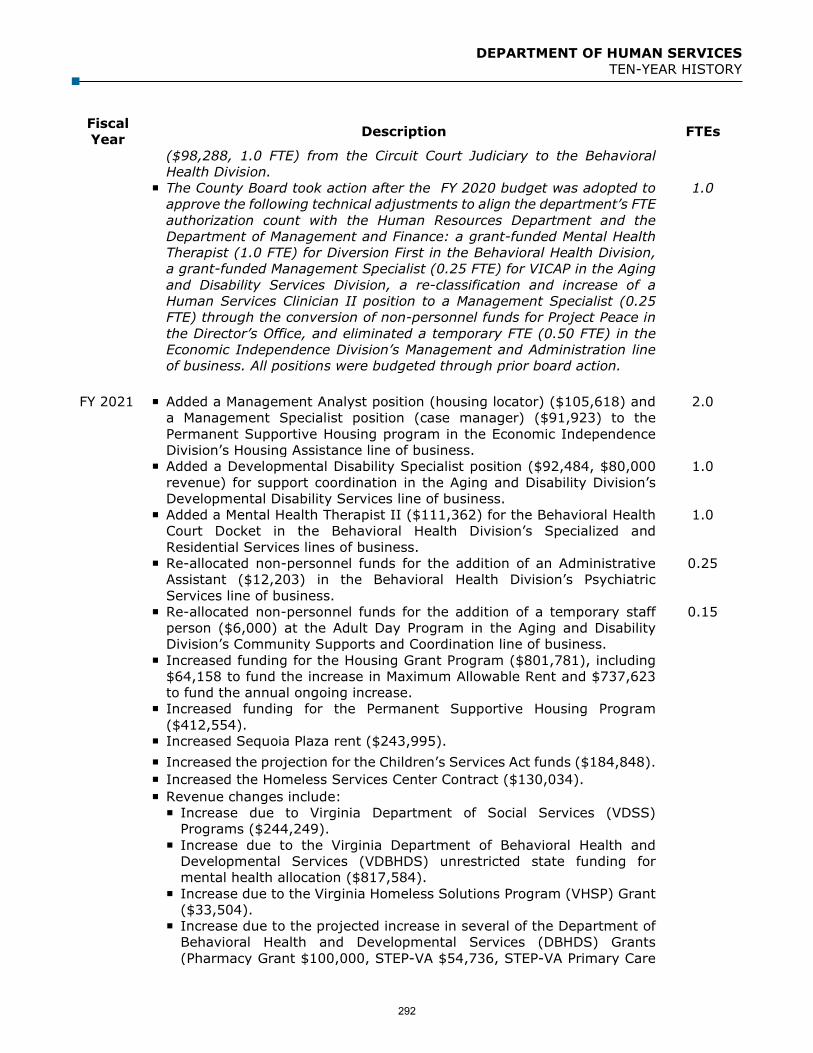
DEPARTMENT OF HUMAN SERVICES TEN-YEAR HISTORY
Fiscal Year Description FTEs
($98,288, 1.0 FTE) from the Circuit Court Judiciary to the Behavioral Health Division.
The County Board took action after the FY 2020 budget was adopted to approve the following technical adjustments to align the department’s FTE authorization count with the Human Resources Department and the Department of Management and Finance: a grant-funded Mental Health Therapist (1.0 FTE) for Diversion First in the Behavioral Health Division, a grant-funded Management Specialist (0.25 FTE) for VICAP in the Aging and Disability Services Division, a re-classification and increase of a Human Services Clinician II position to a Management Specialist (0.25 FTE) through the conversion of non-personnel funds for Project Peace in the Director’s Office, and eliminated a temporary FTE (0.50 FTE) in the Economic Independence Division’s Management and Administration line of business. All positions were budgeted through prior board action.
1.0
FY 2021 Added a Management Analyst position (housing locator) ($105,618) and a Management Specialist position (case manager) ($91,923) to the Permanent Supportive Housing program in the Economic Independence Division’s Housing Assistance line of business.
2.0
Added a Developmental Disability Specialist position ($92,484, $80,000 revenue) for support coordination in the Aging and Disability Division’s Developmental Disability Services line of business.
1.0
Added a Mental Health Therapist II ($111,362) for the Behavioral Health Court Docket in the Behavioral Health Division’s Specialized and Residential Services lines of business.
1.0
Re-allocated non-personnel funds for the addition of an Administrative Assistant ($12,203) in the Behavioral Health Division’s Psychiatric Services line of business.
0.25
Re-allocated non-personnel funds for the addition of a temporary staff person ($6,000) at the Adult Day Program in the Aging and Disability Division’s Community Supports and Coordination line of business.
0.15
Increased funding for the Housing Grant Program ($801,781), including $64,158 to fund the increase in Maximum Allowable Rent and $737,623 to fund the annual ongoing increase.
Increased funding for the Permanent Supportive Housing Program ($412,554).
Increased Sequoia Plaza rent ($243,995). Increased the projection for the Children’s Services Act funds ($184,848). Increased the Homeless Services Center Contract ($130,034). Revenue changes include: Increase due to Virginia Department of Social Services (VDSS)
Programs ($244,249). Increase due to the Virginia Department of Behavioral Health and
Developmental Services (VDBHDS) unrestricted state funding for mental health allocation ($817,584).
Increase due to the Virginia Homeless Solutions Program (VHSP) Grant ($33,504).
Increase due to the projected increase in several of the Department of Behavioral Health and Developmental Services (DBHDS) Grants (Pharmacy Grant $100,000, STEP-VA $54,736, STEP-VA Primary Care
292
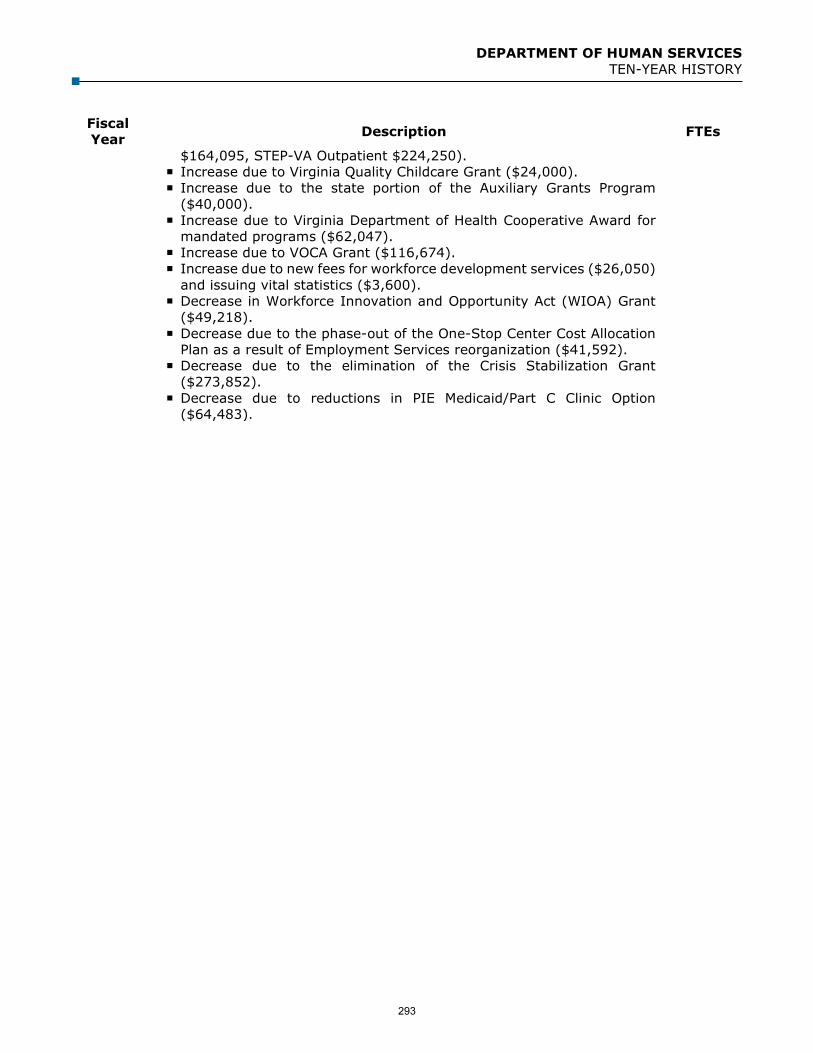
DEPARTMENT OF HUMAN SERVICES TEN-YEAR HISTORY
Fiscal Year Description FTEs
$164,095, STEP-VA Outpatient $224,250). Increase due to Virginia Quality Childcare Grant ($24,000). Increase due to the state portion of the Auxiliary Grants Program
($40,000). Increase due to Virginia Department of Health Cooperative Award for
mandated programs ($62,047). Increase due to VOCA Grant ($116,674). Increase due to new fees for workforce development services ($26,050)
and issuing vital statistics ($3,600). Decrease in Workforce Innovation and Opportunity Act (WIOA) Grant
($49,218). Decrease due to the phase-out of the One-Stop Center Cost Allocation
Plan as a result of Employment Services reorganization ($41,592). Decrease due to the elimination of the Crisis Stabilization Grant
($273,852). Decrease due to reductions in PIE Medicaid/Part C Clinic Option
($64,483).
293

This page intentionally left blank
294

DEPARTMENT OF LIBRARIES Diane Kresh, Director
1015 N. Quincy Street, ARLINGTON, VA 22201 703-228-3348
Our Mission: To provide access to information, create connections to knowledge, and promote the joy of reading for every Arlingtonian
LINES OF BUSINESS
SIGNIFICANT BUDGET CHANGES
The FY 2021 adopted expenditure budget for the Department of Libraries is $14,758,386, less than one percent change over the FY 2020 adopted budget. The FY 2021 adopted budget reflects:
Personnel changes due to an increase in the County’s cost for employee health insurance,partially offset by lower retirement contributions based on current actuarial projections.
Non-personnel increases due to the addition of funding for materials ($30,000 ongoing,$50,000 one-time) to grow the children’s collection across the system, add resources to thelibrary’s database and e-book collections, and adjustments to the annual expense formaintenance and replacement of County vehicles ($5,582).
Revenue decreases due to the elimination of overdue fines ($345,000) to make the library’scollections more accessible to all users, partially offset by higher projections in printing andcopying fees ($5,000) and an increase in the state’s grant allocation ($10,987).
Director
Materials Management Division Public Services DivisionAdministrative Services
Division
Administrative Services- Financial Oversight- Personnel Management- Program Management
& Strategic Planning- Training- Facilities Management- Technology- Special Collections
Materials Services- Acquisitions- On-line Services- Technical Processing
of Materials
Public Services- Central Library- Shirlington Library- Westover Library- Columbia Pike Library- Aurora Hills Library- Cherrydale Library- Glencarlyn Library- Plaza Library
295

DEPARTMENT OF LIBRARIES DEPARTMENT BUDGET SUMMARY
DEPARTMENT FINANCIAL SUMMARY
FY 2019 FY 2020 FY 2021 % ChangeActual Adopted Adopted ‘20 to ‘21
Personnel $11,733,213 $11,906,252 $11,874,785 -Non-Personnel 2,725,299 2,798,019 2,883,601 3%Total Expenditures 14,458,512 14,704,271 14,758,386 -
Fees 412,502 425,000 85,000 -80%Grants 184,510 182,231 193,218 6%Total Revenues 597,012 607,231 278,218 -54%
Net Tax Support $13,861,500 $14,097,040 $14,480,168 3%
Permanent FTEs 120.66 117.48 117.48Temporary FTEs 13.19 13.19 13.19Total Authorized FTEs 133.85 130.67 130.67
Expenses by Line of Business
FY 2019 FY 2020 FY 2021 % Change FY 2021Actual Adopted Adopted ‘20 to ‘21 Adopted FTEs
Administrative Services* $3,973,529 $3,757,814 $3,826,895 2% 26.95Materials Management* 2,891,278 2,999,677 2,994,859 - 12.87Public Services* 7,593,705 7,946,780 7,936,632 - 90.85Total Expenditures $14,458,512 $14,704,271 $14,758,386 - 130.67 *FTE count includes temporary FTEs: Administrative Services (0.70), Materials Management (0.62), Public Services (11.87)
296

DEPARTMENT OF LIBRARIES TEN-YEAR HISTORY
EXPENDITURE, REVENUE, NET TAX SUPPORT, AND FULL-TIME EQUIVALENT TRENDS
$ in 000sFY 2012
Actual FY 2013
ActualFY 2014
ActualFY 2015
Actual FY 2016
Actual FY 2017
Actual FY 2018
Actual FY 2019
Actual
FY 2020 Adopted
Budget
FY 2021 Adopted
BudgetEXP $11,889 $12,395 $12,493 $13,007 $12,999 $13,649 $14,466 $14,459 $14,704 $14,758REV $743 $676 $710 $688 $649 $616 $607 $597 $607 $278NTS $11,146 $11,719 $11,783 $12,319 $12,350 $13,033 $13,859 $13,862 $14,097 $14,480FTEs 127.55 135.55 133.85 133.85 133.85 133.85 134.85 133.85 130.67 130.67
0
50
100
150
200
$0
$2,000
$4,000
$6,000
$8,000
$10,000
$12,000
$14,000
$16,000FTEs EXP REV NTS
297

DEPARTMENT OF LIBRARIES TEN-YEAR HISTORY
Fiscal Year Description FTEs
FY 2012 The County Board funded a partial restoration of some branch library hours ($93,461, 2.45 temporary FTE).
2.45
The County Board restored $50,000 for print materials. The County Board added one-time funding for E-books ($115,000). The County Board approved a one percent one-time lump sum payment
for employees at the top step ($16,464).
FY 2013 The restoration of library branch hours reduced in FY 2010 and FY 2011 added 8.0 FTEs ($442,996).
8.0
Non-personnel expenses decreased due to the reduction of one-timefunding for materials ($115,000).
Revenues decreased due to a reduction in the amount of fees and finescollected ($50,076), reimbursements from Signature Theatre for theirportion of utilities at the Shirlington Library/Signature Theatre facility(15,000), and the amount of State aid received ($5,063).
FY 2014 Eliminated a Human Resources/Organization Development (OD) Specialist position and a part-time Administrative Technician I position ($147,521).
(1.5)
Reduced the budget for temporary employees ($7,088). (0.2) Reduced the consultant budget in Administrative Services Division
($10,000) and Materials Management Division ($10,000). Held 0.5 FTE Library Assistant II position vacant for 6 months ($18,180). Intra-County charges increased ($45,000) for the reimbursement from
Schools for their share of the Integrated Library System (ILS). Revenues decreased due to changes in reimbursements from Signature
Theatre for their portion of utilities at the Shirlington Library/SignatureTheatre facility ($70,000), partially offset by the restoration of a previousState aid cut ($7,196).
FY 2015 Reduced data processing expense due to Arlington Public Schools (APS) reduction of participation in the County’s contract for the Integrated Library System (ILS) ($34,000).
Intra-County Charges decreased due to changes with APS participation onthe County’s contract for the ILS ($34,000).
Revenues decreased based on the historical downward trend of fines,partially due to the increased usage of E-materials which do not incur latefees ($25,000).
FY 2016 Increased funds for the Integrated Library System (ILS) ($15,000).
FY 2017 The County Board converted proposed ongoing materials funding to one-time funding ($123,077).
One-time funding added for Pop-Up space ($250,000).
298

DEPARTMENT OF LIBRARIES TEN-YEAR HISTORY
Fiscal Year Description FTEs
Ongoing funding added for the County’s Open Data Initiative for recordarchiving ($50,000), which will be used to implement recommendations ofthe Arlington History Task Force and digitize priority Central for LocalHistory collections, providing improved public access.
Library fees were adjusted in FY 2017 for overdue items. The daily feesincreased from $0.20 to $0.30 per day for juvenile/young adult (YA)materials, remain the same for adult materials ($0.30 per day), anddecreased from $1.00 to $0.30 per day for all DVDs.
FY 2018 The County Board added one-time funding for the Pop-Up space in Crystal City to remain open through December of 2017 ($19,000).
Eliminated one-time funding added in FY 2017 for the creation of thePop-Up space ($250,000) and materials ($123,077).
Added a Youth Services Librarian ($99,500), funded from savingsgenerated from reducing the Crystal City TIF percentage from 33 percentto 30 percent.
1.0
One-time funding added for materials ($250,000).
FY 2019 Eliminated of a filled Library Assistant II position that handles tasks associated with processing physical materials ($74,086).
(1.0)
Removed of one-time funding for materials ($250,000) and the Pop-UpLibrary in Crystal City ($19,000).
Non-personnel decreased due to adjustments to the annual expense formaintenance and replacement of County vehicles ($2,424).
Fee revenue decreased to better align budget to actuals ($30,000). A technical adjustment was made to align the County’s Human Resource
system with Libraries’ FY 2019 budget. 0.02
FY 2020 Reduced wireless service charges as part of a County-wide review of wireless service providers ($1,330).
Eliminated of a filled Infrastructure Support Specialist II position thatprovides computer assistance and support ($114,579).
(1.0)
Eliminated of a filled Library Associate position that handles bill payment,invoicing, and assistance with contracts for the Materials ManagementDivision ($76,545).
(1.0)
Eliminated of a vacant Library Associate that manages the Talking Booksprogram. ($72,053).
(0.7)
Eliminated of a vacant Librarian position that manages the Library’selectronic services database ($50,136).
(0.5)
Added on-going funding for materials ($300,000). Increased to the annual expense for maintenance and replacement of
County vehicles ($15,266).
FY 2021 Added funding for materials ($30,000 ongoing, $50,000 one-time). Fee revenue decreased due to eliminating overdue fines ($345,000),
299

DEPARTMENT OF LIBRARIES TEN-YEAR HISTORY
Fiscal Year Description FTEs
partially offset by higher projections in printing and copying fees ($5,000). Grant revenue increased due to an increase in the state’s grant allocation
($10,987).
300

DEPARTMENT OF PARKS AND RECREATION Jane Rudolph, Director
2100 CLARENDON BLVD., SUITE 414, ARLINGTON, VA 22201 703-228-7529
Our Mission: The Department of Parks and Recreation promotes wellness and vitality through dynamic programs and attractive public spaces.
LINES OF BUSINESS
Community & Recreation Park DevelopmentParks & Natural Resources
Park Management & Construction
- Park Management- Park Construction &Facilities
- Athletic FieldMaintenance
Forestry & Landscaping- Forestry Unit- Landscaping Unit- Invasive Plant Control
Conservation & Interpretation
- Nature CenterProgramming
- Historical InterpretationProgramming
- Environmental Education& Park Safety
- EnvironmentalStewardship
Youth and Family Programs
Teen Programs
Senior Adult Programs
Therapeutic Recreation Programs
Community Arts Programs
Planning, Design & Construction Management
- Planning- Design- Development
Departmental Management & Leadership- Human Resources- Finance & Budget- Public Relations- Workplace Development- Technology Resources- Urban Agriculture and Consumer Education- Safety
Cooperative Extension
Supplemental Fees Program
Supplemental Fees Program
- Sports & Recreation- Parks & NaturalResources
- Community Recreation
Director’s Office
Athletic & Facility Services
Facilities & Operations
Classes, Sports and Camp Programs
SIGNIFICANT BUDGET CHANGES
The FY 2021 adopted expenditure budget for the Department of Parks and Recreation (DPR) is $44,685,251 a four percent increase from the FY 2020 adopted budget. The FY 2021 adopted budget reflects:
Personnel changes due to the permanent and temporary staff additions listed below,adjustments to salaries resulting from job family studies for trades and planner positions, anincrease in the County’s cost for employee health insurance, partially offset by lowerretirement contributions based on current actuarial projections.
Addition of temporary staff to support the expanded outdoor operations at Lubber Run Community Center ($11,680, 0.175 temporary FTEs).
Addition of temporary staff to support the Long Bridge Park Outdoor Operations ($63,501, 4.40 temporary FTEs).
Addition of two Planner positions added during FY 2020 to support Amazon and ancillary development ($248,233, 2.0 FTEs).
301

DEPARTMENT OF PARKS AND RECREATION DEPARTMENT BUDGET SUMMARY
General Fund support added ($240,000) to support Planner positions previously funded by capital projects.
Realignment of funds to establish two additional Roving Monitor positions to provide on-site supervision and communication for outdoor facilities and indoor programs (2.0 FTEs).
Addition of 1.0 FTE in Conservation and Interpretation ($50,000, 1.0 FTE) by reallocating temporary FTEs in Parks and Natural Resources (1.46 temporary FTEs).
Addition of 0.69 temporary FTEs due to increased capacity in various revenue-producing programs ($60,452, 0.69 temporary FTEs), partially offset by the reduction of 0.01 FTEs (0.01 permanent FTEs) due to a variety of administrative cleanup.
The continuation of one-time funding for Lee Center program operations for six additional months ($100,000).
Non-personnel increases primarily due to the minimal increases to maintain Lubber RunCommunity Center and Park as its opening has been delayed until FY 2022 ($87,000 ongoing),minimal expenses to maintain Long Bridge Park Outdoor facility ($130,000), one-timeequipment ($55,000) and maintenance costs ($30,000) and the Long Bridge Aquatics &Fitness Center ($174,223 ongoing), increased resident participation in variousrevenue-producing programs ($55,102), adjustments to the annual expense for maintenanceand replacement of County vehicles ($60,043), new costs for ongoing maintenance associatedwith recent capital improvements for parks ($137,000), and a variety of Departmentalcontractual increases ($306,677), partially offset by a decrease in grant-funded expenditures($12,736).
Revenue increases primarily due to increased resident participation in revenue-producingprograms ($138,849) and increases related to summer camp fees ($41,000), partially offsetby decreases in revenue related to the County-wide travel program ($23,526), communitycenter rentals ($10,000), and a decrease in anticipated grant funds ($12,736).
Other Revenue increases due to a donation from the Boeing Company ($399,623) to supportthe maintenance and operations of Long Bridge Aquatics & Fitness Center.
302

DEPARTMENT OF PARKS AND RECREATION DEPARTMENT BUDGET SUMMARY
DEPARTMENT FINANCIAL SUMMARY
EXPENSES BY LINE OF BUSINESS
FY 2019 FY 2020 FY 2021 % Change FY 2021 FTEsActual Adopted Adopted ‘20 to ‘21 Adopted
Departmental Management and Leadership* $7,142,752 $7,540,626 $7,747,950 3% 39.09Cooperative Extension 226,118 251,051 257,178 2% 1.00Planning, Design, and Construction Manageme 1,303,011 1,294,450 1,919,820 48% 22.00Park Management and Construction* 9,025,804 9,337,696 9,968,196 7% 74.33Forestry and Landscaping* 3,183,208 3,516,008 3,537,289 1% 30.77Conservation and Interpretation* 1,103,681 1,131,453 1,186,680 5% 12.13Youth and Family Programs* 1,740,972 1,799,152 1,801,886 0% 21.54Teen Programs* 1,081,378 1,080,621 1,077,663 0% 13.13Senior Adult Programs* 1,687,795 1,899,479 1,918,692 1% 18.73Therapeutic Recreation Programs* 822,506 810,717 786,586 -3% 9.99Program Resources* 776,859 784,893 789,741 1% 8.67Facilities Coordination and Operations* 6,139,625 6,013,220 6,143,922 2% 65.15Classes, Sports, and Camps* 1,234,721 1,362,999 1,417,543 4% 6.20Supplemental Fees* 6,397,194 6,280,855 6,132,105 -2% 45.93Total Expenditures $41,865,624 $43,103,220 $44,685,251 4% 368.66*There are temporary FTEs included in the following lines of business: Departmental Management and Leadership (0.09 FTE), ParkManagement and Construction (11.33 FTEs), Forestry and Landscaping (1.77 FTEs), Conservation and Interpretation (1.13 FTEs), Youth andFamily Programs (8.32 FTEs), Teen Programs (6.13 FTEs), Senior Adult Programs (5.16 FTEs), Therapeutic Recreation Programs (3.99 FTEs), Program Resources (3.17 FTEs), Facilities Coordination and Operations (30.15 FTEs), Classes, Sports, and Camps (0.20 FTE), andSupplemental Fees (17.93 FTEs).
FY 2019 FY 2020 FY 2021 % ChangeActual Adopted Adopted ‘20 to ‘21
Personnel $29,921,291 $30,857,498 $31,417,220 2%Non-Personnel 11,944,333 12,275,967 13,298,276 8%Subtotal 41,865,624 43,133,465 44,715,496 4%Intra-County Charges - (30,245) (30,245) - Total Expenditures 41,865,624 43,103,220 44,685,251 4%
Fees 9,982,139 9,984,564 10,130,887 1%Grants 36,991 88,000 75,264 -14%Other 275,346 250,531 650,154 160%Total Revenues 10,294,476 10,323,095 10,856,305 5%
Net Tax Support $31,571,148 $32,780,125 $33,828,946 3%
Permanent FTEs 274.81 274.30 279.29Temporary FTEs 93.33 85.56 89.37Total Authorized FTEs 368.14 359.86 368.66
303

DEPARTMENT OF PARKS AND RECREATION TEN-YEAR HISTORY
EXPENDITURE, REVENUE, NET TAX SUPPORT, AND FULL-TIME EQUIVALENT TRENDS
$ in 000sFY 2012
ActualFY 2013
ActualFY 2014
ActualFY 2015
ActualFY 2016
ActualFY 2017
ActualFY 2018
ActualFY 2019
Actual
FY 2020 Adopted Budget
FY 2021 Adopted Budget
EXP $31,625 $32,469 $34,273 $35,939 $37,974 $40,082 $40,416 $41,866 $43,103 $44,685REV $7,507 $8,616 $9,672 $9,430 $9,706 $9,931 $10,421 $10,294 $10,323 $10,856NTS $24,118 $23,853 $24,601 $26,509 $28,268 $30,151 $29,995 $31,571 $32,780 $33,829FTEs 330.97 345.91 365.86 371.22 370.91 379.04 379.07 368.14 359.86 368.66
*Note that in FY 2012, Cultural Affairs, Cultural Affairs’ Supplemental Fee Programs, and Artisphere were transferred to Arlington Economic Development (AED).
0
100
200
300
400
500
$0
$5,000
$10,000
$15,000
$20,000
$25,000
$30,000
$35,000
$40,000
$45,000
$50,000
$55,000 FTEs EXP REV NTS
304

DEPARTMENT OF PARKS AND RECREATION TEN-YEAR HISTORY
Fiscal Year Description FTEs
FY 2012 The County Board added a Natural Resources Manager to implement the Natural Resources Management Plan ($99,492).
1.00
The County Board restored Friday night operating hours at the Lubber RunCommunity Center (0.20 temporary FTE, $8,200).
0.20
The County Board restored seasonal programming at Lubber RunAmphitheatre and other locations with $20,000 of on-going funding and$25,000 of one-time funding ($45,000).
0.25
The County Board restored park and tree maintenance funding, which willalso help with snow removal efforts ($152,614).
3.00
The County Board restored winter hours for twelve park restrooms($34,508).
The County Board restored park operating repairs for parks and outdoorfacilities including tennis/basketball courts, kiosks, shelters, and walkways($130,000).
The County Board provided one-time funding for tree planting ($90,000). The County Board provided additional one-time funding of Artisphere which
decreased revenue ($183,094) and increased expenses ($316,906). The County Board approved a one percent one-time lump sum payment
for employees at the top step.
4.5 FTEs (3.0 permanent and 1.5 temporary FTEs, $158,529) werereallocated from Non-Departmental for the maintenance of the new LongBridge Park Phase I Outdoor facility, which is projected to open in the fallof 2011.
4.50
Non-personnel increased primarily due to one-time equipment ($58,905)and maintenance costs ($167,205) for Long Bridge Park Phase I Outdoorfacility; Virginia Highlands Park maintenance ($6,000); Parks and NaturalResources non-discretionary contractual increases for mowing, parkrestroom cleaning, irrigation and fence repairs, herbicide and pesticidetreatments, tree pruning, and stump removal ($19,549); TherapeuticRecreation Program classes in Supplemental Fees ($5,000); RosslynSpectrum utilities ($13,565); Artisphere ticketing service contract for boxoffice operations ($115,000); and Artisphere scheduling software hostingand maintenance ($21,000). These increases were partially offset byremoval of one-time arts challenge grant funding from FY 2011 ($30,000)and one-time support to the non-profit organization Sister CitiesInternational ($10,000).
Fee revenues increased primarily due to new synthetic turf field rentals atLong Bridge Park ($155,143); increased fees for preschool, elementaryafter school, most summer camps, rental fees for the use of Countyfacilities, Senior Adult Registration fee, and Farmers’ Market ($120,152);and supplemental fees increases in recreation and leisure program fees inorder to recover full projected direct costs and an expected increase inparticipation levels in these programs ($142,241). These increases werepartially offset by changes in the community fitness membership, somecamp and sports league revenues based on historic data ($105,269) as
305

DEPARTMENT OF PARKS AND RECREATION TEN-YEAR HISTORY
Fiscal Year Description FTEs
well as the conversion of some camp programs to contract camps ($13,342) and elimination of holiday therapeutic recreation camps ($19,393).
Other revenues decreased due to a scheduled reduction in the amountprovided to Artisphere by the Rosslyn BID for direct support of centeroperations ($185,000), offset by an increase in gifts and donationssupporting Artisphere ($50,000).
Cultural Affairs, Cultural Affairs’ Supplemental Fee Programs, andArtisphere were transferred to Arlington Economic Development (expense$5,284,614, revenue $1,883,658).
(33.77)
FY 2013 The County Board added funding to restore some weekend hours at Long Branch ($13,000) and Gulf Branch ($13,000) nature centers.
0.46
The County Board added one-time funding for invasive plant removal($100,000).
The County Board added one-time funding for additional tree watering($40,304).
1.38
The County Board added one-time funding for tree planting ($52,500). The County Board added funding for the Northern Virginia Conservation
Trust ($4,500). Increased funding for a full year of operation for Long Bridge Park
($76,470), partially offset by the removal of one-time equipment for LongBridge Park Phase I Outdoor facility ($58,905). Fee revenue increases foran adjustment for full-year’s synthetic turf field rentals for Long BridgePark ($4,143).
Addition of a Fourth of July event at Long Bridge Park ($63,285, 0.60temporary FTE).
0.60
Added personnel and non-personnel expenses for new and renovatedfacilities including Penrose Square, James Hunter Park and CommunityCanine Area, Barcroft #6 Baseball Field, and Nauck Town Square($177,610, 2.20 temporary FTEs).
2.20
Increased maintenance costs related to picnic shelter rental facilities addedduring FY 2011 ($13,564, 0.30 temporary FTE), offset by increasedrevenue based on FY 2011 actuals ($30,000).
0.30
Increased to the Sports and Recreation base budget for transportation’sbus driver ($25,592, 0.70 temporary FTE), offset by increased revenue($26,000).
0.70
Increased to Supplemental Fees Program’s budget for classes andprograms to bring the budget in line with actual activity ($605,469, 1.0permanent FTE and 8.30 temporary FTEs), offset by an increase in revenue($756,170).
9.30
Added funding for vehicle fuel ($40,600). Added funding for non-discretionary contractual increases ($100,813). Removal of one-time FY 2012 funding for tree planting ($90,000).
306

DEPARTMENT OF PARKS AND RECREATION TEN-YEAR HISTORY
Fiscal Year Description FTEs
Added on-going ($5,000) and one-time ($25,500) funding for theOut-of-School program implemented in coordination with Arlington PublicSchools.
Decrease in County vehicle charges ($41,466). Increased revenue due to higher fees for preschool programs ($9,576),
summer camps ($28,041), Junior Jam ($832), and sports leagues($7,887).
Increased revenue due to an increase in the number of Site Plan reviewsbased on FY 2011 ($24,905).
Decreased credit card fees ($70,000). Decreased revenue due to fewer community fitness memberships
($47,836). Decreased revenue due to lower participation in group exercise classes
($114,634). Increased grant revenues due to higher Senior Adult congregate meal
donations ($27,567).
FY 2014 The County Board added ongoing funding for a departmental Deputy Director ($128,402).
1.00
The County Board added one-time funding for invasive plant removal($100,000).
The County Board added ongoing funding for tree planting ($22,500). The County Board added ongoing funding for tree watering ($40,304). 1.38 The County Board adopted a new Senior Golf program fee to fully recover
the cost of the senior golf program coordinator temporary position($8,795).
Added of partial year funding for the new Arlington Mill Community Center($910,452 personnel; $570,562 non-personnel; $94,911 revenue).
20.40
Increased funding for maintenance at Long Bridge Park for amenities nolonger under warranty ($6,961 personnel; $114,006 non-personnel).
0.02
Added of operating expenses for the new Washington-Lee softball field($39,615 personnel; $36,741 non-personnel) and revenue as areimbursement of operating expenses from Arlington Public Schools fortheir use of the field ($45,000).
0.50
Added maintenance funding for the new sprayground at Virginia Highlands($35,500).
Adjusted to fully capture TEAM programming in the teen line of business($55,372 personnel; $36,628 non-personnel; $92,000 revenue)
1.44
Adjustment to fully capture sports programming within that line of business($405,100 non-personnel; $483,070 revenue).
Removed FY 2013 one-time funding including tree watering ($40,304),invasive plant removal ($100,000), tree planting ($52,500), and the out ofschool time survey ($25,500).
(1.38)
Non-discretionary contractual increases ($28,180). Increased County vehicle charges ($2,233).
307

DEPARTMENT OF PARKS AND RECREATION TEN-YEAR HISTORY
Fiscal Year Description FTEs
Increased field rental ($31,818) and community center rental ($58,000)revenue due to increased usage.
Increased the tennis court rental fee from $5 per hour to $10 per hour($15,195) and increased the synthetic field rental fee of $5 per hour forresidents and $10 per hour for non-residents ($15,093).
Adjusted program revenue based on expected increases in participationincluding the gymnastics programs ($115,083) and swimming programs($92,805), partially offset by decreases in fitness memberships ($60,263)and judo and martial arts programs ($40,730) due to lower participation.
Increased grant revenue due to an increase of I-66 Bike TrailReimbursement from the State ($15,000), partially offset by a decrease incongregate meals revenue ($2,405).
Reduced the department-wide electricity budget ($120,000). Reduced the Parks and Natural Resources division’s fleet by two vehicles
($12,000). Closed fifteen park restrooms between November 15 and March 15
($42,600). Increased trail permit fees from $50 to $150 ($4,500). Eliminated full funding for one of three Trades Worker III Landscaping
positions ($72,792). (1.00)
Reduced landscaping and forestry supplies ($7,000). Moved the tree distribution program ($11,000) to the Tree Canopy Fund. Created a new rental Bocce court fee at $10 per hour ($3,000). Increased grass field rentals by $5 per hour for residents and $10 per hour
for non-residents ($17,200). Held the Recreation Supervisor for Preschool Programs, the Planning Team
Supervisor, and one Management and Budget Specialist position vacant forsix months ($185,434).
Eliminated the County-wide Halloween party ($1,149 personnel; $1,300non-personnel).
(0.03)
Eliminated the Area Manager position in Program Resources ($132,886). (1.00) Transferred the management of the Arlington Sports Camp to a contractor
due to low enrollment ($44,103 personnel; $3,372 non-personnel;$35,500 revenue).
(1.38)
Established a $100 per team adult league field assessment fee withproceeds dedicated to the Field Fund ($50,800).
Eliminated the subsidy to the Macedonia Baptist Church for communityswim at their pool ($10,500).
Reduced the consulting budget for web support ($6,000). Established a $20 program cancellation fee for any participant requesting
a refund ($36,000). Increased the non-resident fee for Enjoy Arlington classes from $10 to $20
($16,400).
308

DEPARTMENT OF PARKS AND RECREATION TEN-YEAR HISTORY
Fiscal Year Description FTEs
FY 2015 The County Board added one-time funding for snow removal ($390,900) and tree planting ($34,500).
Transferred the management and administration activities of all divisionsto Departmental Management and Leadership in order to show the overallcost of management in a central line of business, with no change in net taxsupport.
Adjusted fee revenue to account for revenue formerly directed toadministrative overhead, with no change in net tax support.
Ongoing funding replaced one-time funding for invasive plant removal($100,000).
Removed FY 2014 one-time funding for Arlington Mill Community Center($108,244).
Removed FY 2014 one-time funding for Elementary Summer Express($10,824 personnel; $1,600 non-personnel; $2,437 revenue), Gunston TotCamps ($12,291 personnel; $960 non-personnel; $7,659 revenue),Summer Street Theater Program ($500 personnel; $11,500non-personnel), Tyrol Hills Park Evening programs ($4,533 personnel;$300 non-personnel), Teen Program after school director ($24,000personnel), Junior Jam Camps at Barcroft Center and Woodbury Park($13,700 personnel; $5,750 non-personnel; $600 revenue), WoodburyPark Teen Club ($7,900 personnel; $400 non-personnel), Senior Art Club($19,185 personnel); Therapeutic Recreation Winter and Spring BreakCamps ($7,468 personnel; $490 non-personnel; $2,756 revenue).
(2.77)
Decreased fee revenues to capture the reduction in revenue associatedwith special events fee reductions ($30,000).
Increased fee revenues for various programs based on actual revenuesreceived in prior years ($20,478).
Added expenses and revenue related to increasing capacity in pavilionrental ($3,151 non-personnel; $3,707 revenue).
Adjusted expenses and revenues to fully capture County mowing expenses($89,000 non-personnel; $89,000 revenue) and services to the County FairBoard ($30,000 non-personnel; $30,000 revenue).
Added expenses and revenue related to an increase in site survey revenuebased on actual revenue received during previous years ($11,585non-personnel; $11,585 revenue).
Added ongoing funding for management of urban agricultural initiatives($100,000), approved during FY 2013, with corresponding operatingexpenses ($15,000).
Added expenses and fee revenue related to increasing capacity inenvironmental camps ($2,804 non-personnel; $3,299 revenue).
Added expenses and fee revenue related to increasing capacity incommunity center and outdoor facility rental ($154,955 personnel;$182,300 revenue).
3.34
Added expenses and fee revenue related to increasing capacity in senioradult programs ($177,169 non-personnel; $180,708 revenue).
309
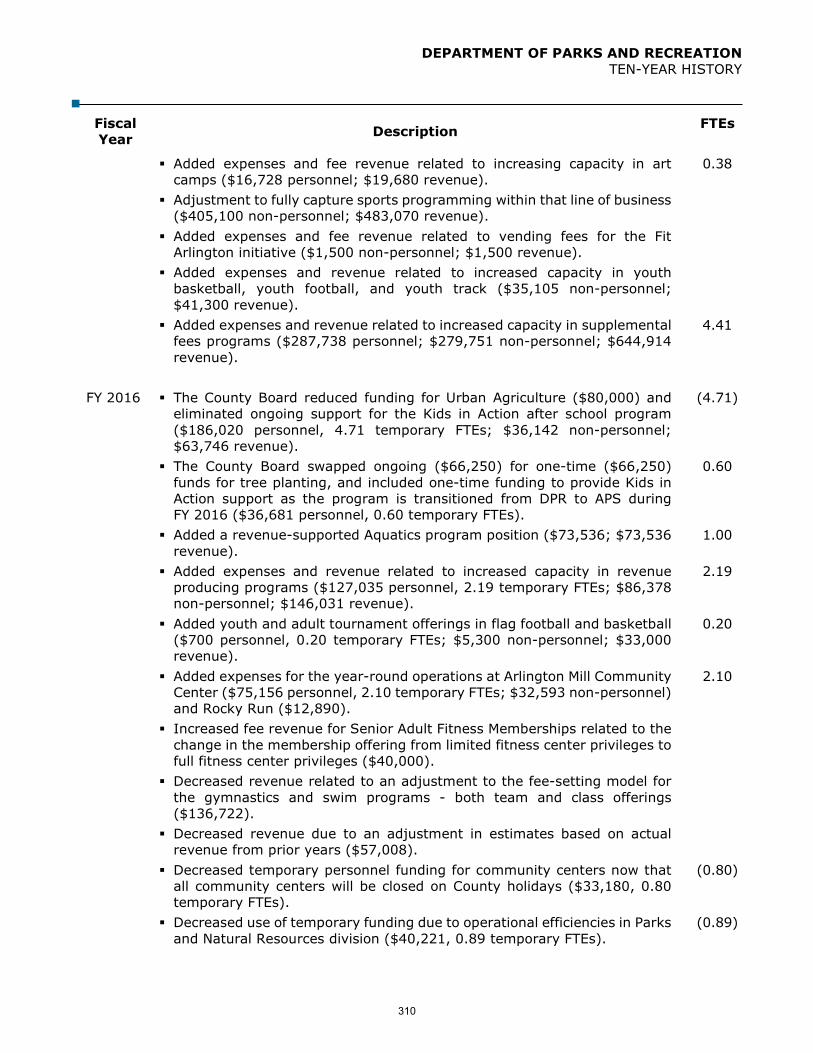
DEPARTMENT OF PARKS AND RECREATION TEN-YEAR HISTORY
Fiscal Year Description FTEs
Added expenses and fee revenue related to increasing capacity in artcamps ($16,728 personnel; $19,680 revenue).
0.38
Adjustment to fully capture sports programming within that line of business($405,100 non-personnel; $483,070 revenue).
Added expenses and fee revenue related to vending fees for the FitArlington initiative ($1,500 non-personnel; $1,500 revenue).
Added expenses and revenue related to increased capacity in youthbasketball, youth football, and youth track ($35,105 non-personnel;$41,300 revenue).
Added expenses and revenue related to increased capacity in supplementalfees programs ($287,738 personnel; $279,751 non-personnel; $644,914revenue).
4.41
FY 2016 The County Board reduced funding for Urban Agriculture ($80,000) and eliminated ongoing support for the Kids in Action after school program ($186,020 personnel, 4.71 temporary FTEs; $36,142 non-personnel; $63,746 revenue).
(4.71)
The County Board swapped ongoing ($66,250) for one-time ($66,250)funds for tree planting, and included one-time funding to provide Kids in Action support as the program is transitioned from DPR to APS during FY 2016 ($36,681 personnel, 0.60 temporary FTEs).
0.60
Added a revenue-supported Aquatics program position ($73,536; $73,536revenue).
1.00
Added expenses and revenue related to increased capacity in revenueproducing programs ($127,035 personnel, 2.19 temporary FTEs; $86,378non-personnel; $146,031 revenue).
2.19
Added youth and adult tournament offerings in flag football and basketball($700 personnel, 0.20 temporary FTEs; $5,300 non-personnel; $33,000revenue).
0.20
Added expenses for the year-round operations at Arlington Mill CommunityCenter ($75,156 personnel, 2.10 temporary FTEs; $32,593 non-personnel)and Rocky Run ($12,890).
2.10
Increased fee revenue for Senior Adult Fitness Memberships related to thechange in the membership offering from limited fitness center privileges tofull fitness center privileges ($40,000).
Decreased revenue related to an adjustment to the fee-setting model forthe gymnastics and swim programs - both team and class offerings($136,722).
Decreased revenue due to an adjustment in estimates based on actualrevenue from prior years ($57,008).
Decreased temporary personnel funding for community centers now thatall community centers will be closed on County holidays ($33,180, 0.80temporary FTEs).
(0.80)
Decreased use of temporary funding due to operational efficiencies in Parksand Natural Resources division ($40,221, 0.89 temporary FTEs).
(0.89)
310

DEPARTMENT OF PARKS AND RECREATION TEN-YEAR HISTORY
Fiscal Year Description FTEs
Removed one-time funding for snow removal trail equipment ($309,900)and tree planting ($30,000).
FY 2017 The County Board added ongoing funding for Trail Maintenance ($116,580 non-personnel).
Removed one-time funding for the Elementary After-School Program($36,681, 0.60 temporary FTEs).
(0.60)
Added expenses, personnel, and fee revenue in various revenue producingprograms ($40,259 personnel, 0.37 temporary FTEs; $45,250non-personnel; $159,560 revenue).
0.37
Added expenses, personnel and fee revenue in competitive teamparticipation ($29,422 personnel, 1.01 temporary FTEs; $3,200non-personnel; $68,564 revenue).
1.01
Added expenses and fee revenue in youth basketball ($41,176non-personnel; $35,000 revenue).
Increased capacity, personnel, and fee revenue in facilities scheduling andcoordination ($13,600 personnel, 0.35 temporary FTEs; $16,000 revenue).
0.35
Increased capacity, personnel, and fee revenue in teen programs ($10,935personnel, 0.24 temporary FTEs; $10,000 revenue).
0.24
Added new dedicated expense and revenue for Lubber Run Invasive Plantremoval as a result of community donations ($5,000 non-personnel;$5,000 revenue).
Fee revenue increases for general contract camps ($13,665), PicnicPavilion rentals ($27,189), and youth sports leagues ($60,000).
Decreased expenses and fee revenue in Youth and Family Programs($45,012 non-personnel; $38,260 revenue).
Decreased revenue in voluntary contributions in the Congregate MealsProgram ($2,170).
Decreased revenue due to a shift in the Farmers Market Managementmodel ($13,000).
Reduced revenue due to the Department’s Cost Recovery Philosophy($32,107) and the transfer of additional credit card transaction fees fromthe Treasurers line of business to the Department ($140,000).
Converted various temporary positions to full time including temporaryteacher positions in Youth and Family Programs ($49,544; conversion of2.30 temporary FTEs to 1.26 FTEs), and a Senior Center Director position($8,944; conversion of 0.80 temporary FTEs to 0.60 FTEs).
(1.24)
Converted seven Capital funded overstrength positions to permanentstatus ($12,928; 7.0 FTEs).
7.00
Authorized a Capital Asset Manager position to be funded byPay-As-You-Go Capital with no increase to the General Fund.
1.00
Transferred ongoing funding of $205,000 for tree planting to the County’sStormwater Fund. The Department of Parks and Recreation will continueto manage this program but the funding source has changed for FY 2017.
Added a Stormwater Program Specialist position to support the ParkManagement and Construction Division with practices and regulations of
311

DEPARTMENT OF PARKS AND RECREATION TEN-YEAR HISTORY
Fiscal Year Description FTEs
MS4 Stormwater compliance. The position will be funded in the Stormwater fund with no net tax support to the General Fund.
FY 2018 The County Board added funding for the Virginia Cooperative Education’s Financial Education Program ($32,583).
The County Board eliminated a Health and Movement Programmer position($50,473, 0.50 permanent FTE) and a Departmental Management Intern Position ($49,725, 1.00 temporary FTE).
(1.50)
The County Board reduced mowing contractual services ($50,000). Converted revenue-supported gymnastics and aquatics class staff from
temporary to permanent status ($207,355 personnel; conversion of 12.27temporary FTEs to 11.22 permanent FTEs; $261,955 revenue).
(1.05)
Converted revenue-supported gymnastics and aquatics team staff fromtemporary to permanent status ($65,455 personnel; conversion of 8.84temporary FTEs to 9.78 FTEs; $71,799 revenue), partially offset byadjustments to projected non-personnel expenses ($3,699).
0.94
Increased capacity, personnel, and fee revenue in facilities scheduling andcoordination ($46,750 personnel; 1.12 temporary FTEs; $55,000 revenue)
1.12
Increased capacity, personnel, non-personnel and fee revenue in Youth andFamily Programs ($37,250 personnel; 0.62 temporary FTEs; $1,710non-personnel; $65,835 revenue).
0.62
Increased capacity, personnel and fee revenue in teen programs ($10,625personnel; 0.22 temporary FTEs; $12,500 revenue).
0.22
Decreased capacity in a variety of DPR programs ($23,236 personnel; 0.32temporary FTEs), increased capacity in various revenue producingprograms ($60,488 non-personnel), and increased fee revenue ($35,600),offset by reduced revenue due to a decreased capacity in camps ($20,000).
(0.32)
Increased capacity in sports programs and fee revenue ($19,550non-personnel; $26,000 revenue).
Increased capacity in age-based programs ($8,500 non-personnel). Contractual increases are related to a new GIS based Work Order
Management System ($106,000), and other non-discretionary contractualincreases ($224,522), offset by adjustments to the annual expense formaintenance and replacement of County vehicles ($30,173).
FY 2019 Converted revenue-supported preschool program that currently operates as a Teacher without Aide to a Teacher with Paid Aide format, eliminating the parent volunteer co-op requirement ($65,512 personnel; $65,512 revenue; 3.10 permanent FTEs; reduction of 0.39 temporary FTEs).
2.71
Reallocated personnel funding based on program needs ($117,654, 1.33temporary FTEs) and decreased capacity in various revenue-producing programs ($47,178, 0.55 temporary FTEs).
(1.88)
Non-personnel increased due to increased capacity in sports programs($7,225), age-based programs ($5,525), various other revenue-producingprograms ($77,665), the reallocation of funds from personnel tonon-personnel based on program needs changing from a staff-delivery
312

DEPARTMENT OF PARKS AND RECREATION TEN-YEAR HISTORY
Fiscal Year Description FTEs
model to a contractor-delivery model for various programs ($122,438), an increase in expenses for field maintenance offset by revenue listed below ($12,000), an increase in anticipated grant-funded expenditures ($43,249), and non-discretionary contractual increases ($141,818). These increases are partially offset by adjustments to the annual expense for maintenance and replacement of County vehicles ($60,913), and the removal of a rent expense budget for a location no longer utilized by DPR ($79,110).
Revenue decreased due to an increase in the fee reduction budget basedon prior years’ actuals ($529,381), a decrease in site plan fee revenue($2,000), decreases in anticipated revenues based on prior year’s actuals($20,425), a change in the vending program that eliminated any salesrevenue received ($2,000), and the realignment of camp offerings andrelated revenues ($4,618). These decreases are partially offset byincreased capacity in sports programs ($8,500), increased capacity inage-based programs ($1,500), increased capacity in various otherrevenue-producing programs ($216,586), an increase in revenue-sharingrelated to field maintenance expenses ($12,000), an increase in anticipatedgrant funds ($43,249), and the implementation of a 2.5 percent credit cardconvenience fee for all credit card transactions ($160,000).
Eliminated two large vehicles from the fleet in departmental managementand leadership ($46,576) and one daily use vehicle in planning, design,and construction management ($5,865).
Reduced the Northern Virginia Conservation Trust (NVCT) budget tooperating support only with no open space preservation funding in the basebudget ($37,600).
Eliminated the Volunteer Development Office ($190,600 personnel, 2.00filled permanent FTEs; $8,633 non-personnel; $2,100 revenue).
(2.00)
Eliminated the free entertainment and programs associated with the 4th ofJuly Celebration @ Long Bridge Park, with the park remaining as aviewing-only location for the Washington, D.C. fireworks ($30,000, 0.74vacant temporary FTEs; $20,000 non-personnel).
(0.74)
Eliminated support for a Virginia Cooperative Extension financial educatorposition ($32,583).
Eliminated the snow blower loaner program ($20,000, 0.50 vacanttemporary FTEs; $10,000 non-personnel).
(0.50)
Converted program participant transportation services to contract services($119,606, 1.50 filled permanent FTEs, 0.99 filled temporary FTEs;reallocated $52,470 from personnel to non-personnel; $9,474 revenue).
(2.49)
Closed Carver Center for Daytime Drop-In hours ($41,172, 1.00 filledtemporary FTE).
(1.00)
Eliminated the Office of Community Health ($453,097, 4.00 filledpermanent FTEs, 0.13 vacant temporary FTEs; $30,141 non-personnel).
(4.13)
Eliminated the Boxing Program ($84,373, 0.90 filled permanent FTEs; $185non-personnel).
(0.90)
Converted program participant transportation services to contract services($5,208).
313

DEPARTMENT OF PARKS AND RECREATION TEN-YEAR HISTORY
Fiscal Year Description FTEs
FY 2020 The County Board added one-time funding for ASPIRE! to offset construction costs to develop a program site at the Arlington Mill Center ($90,000).
Reduced wireless service charges as part of a County-wide review ofwireless service providers ($26,600).
Reduced the level of temporary staff across the Community RecreationDivision ($245,000).
(4.72)
Eliminated a Program Specialist Position in Facilities and Operations($145,016 personnel, 1.00 filled permanent FTE).
(1.00)
Reduced the Facility Monitor Program ($110,000 personnel, 2.32 filled andvacant temporary FTEs).
(2.32)
Eliminated one Trades Manager/Leader I in Park Management andConstruction ($109,482 personnel, 1.00 vacant permanent FTE).
(1.00)
Recognized efficiencies in Supply Room and Lending program ($31,445personnel, 0.50 filled permanent FTE, $10,000 non-personnel).
(0.50)
Increased capacity in various revenue producing programs ($100,655,0.23 temporary FTEs).
0.23
Added 2.00 positions in the Facilities and Operations Division in preparationfor the opening of Long Bridge Aquatics and Fitness Center ($110,000).
2.00
Reallocated funding from personnel to non-personnel based on programneeds ($46,317, 0.96 temporary FTE) and realigned camp offerings in linewith demand ($41,217, 0.73 temporary FTE).
(1.69)
Increased transfer to APS for community use of pools ($239,527) andadded new fee for aquatics participants to cover pool maintenance costs.
Increased the annual expense for maintenance and replacement of Countyvehicles ($15,832).
Added new costs for ongoing maintenance associated with recent capitalimprovements for parks ($145,000).
Added funds for contractual increases ($158,801). Removed expense budget due to new operational efficiencies in DPR
($100,000), efficiencies in utilities and fuel ($190,000). Decreased anticipated grant-funded expenditures and revenue ($20,717)
and expenses due to participation decreases in sports programs ($6,800). Increased revenue for picnic shelter rentals ($5,000) and increased
capacity in age-based programs ($5,000), camps ($55,000), and otherrevenue-producing programs ($268,614).
Reduced revenue due to an increase in the fee reduction budget based onprior years’ actuals ($260,040).
Added a Principal Planner and Associated Planner to support increases inAmazon and ancillary development activities.
2.00
Added funds for field maintenance ($139,426).
314
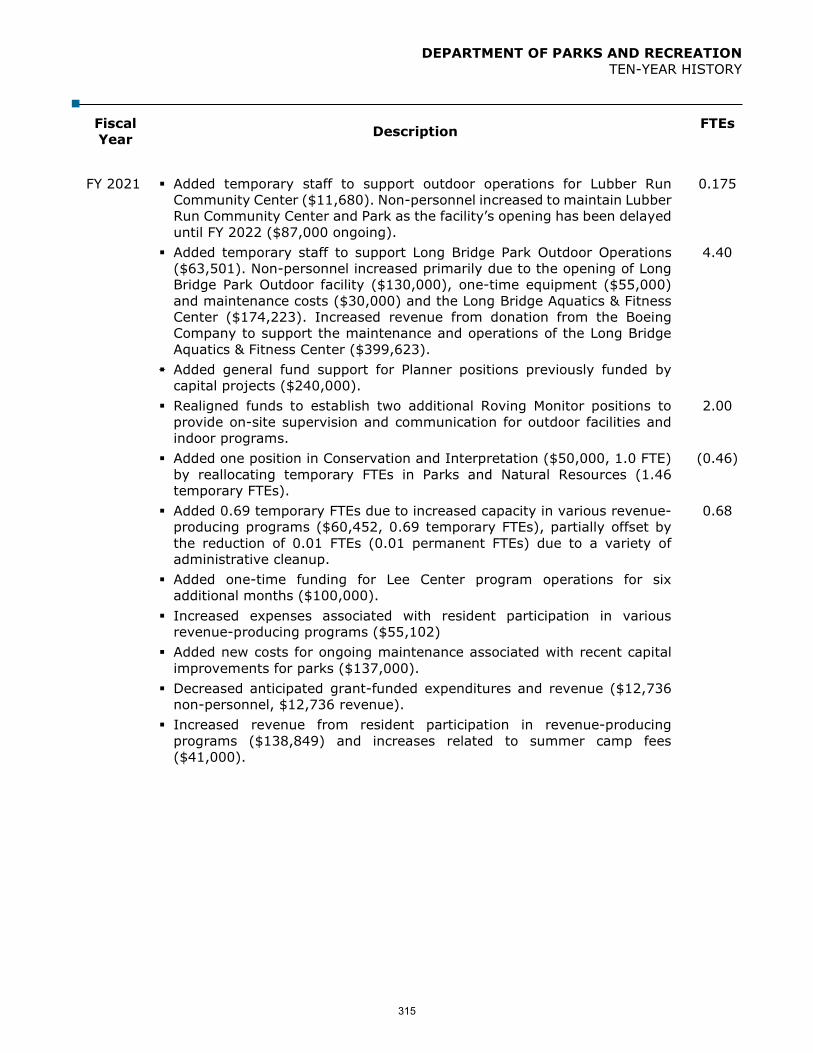
DEPARTMENT OF PARKS AND RECREATION TEN-YEAR HISTORY
Fiscal Year Description FTEs
FY 2021 Added temporary staff to support outdoor operations for Lubber Run Community Center ($11,680). Non-personnel increased to maintain Lubber Run Community Center and Park as the facility’s opening has been delayed until FY 2022 ($87,000 ongoing).
0.175
Added temporary staff to support Long Bridge Park Outdoor Operations($63,501). Non-personnel increased primarily due to the opening of Long Bridge Park Outdoor facility ($130,000), one-time equipment ($55,000) and maintenance costs ($30,000) and the Long Bridge Aquatics & Fitness Center ($174,223). Increased revenue from donation from the Boeing Company to support the maintenance and operations of the Long Bridge Aquatics & Fitness Center ($399,623).
4.40
Added general fund support for Planner positions previously funded bycapital projects ($240,000).
Realigned funds to establish two additional Roving Monitor positions toprovide on-site supervision and communication for outdoor facilities andindoor programs.
2.00
Added one position in Conservation and Interpretation ($50,000, 1.0 FTE)by reallocating temporary FTEs in Parks and Natural Resources (1.46temporary FTEs).
(0.46)
Added 0.69 temporary FTEs due to increased capacity in various revenue-producing programs ($60,452, 0.69 temporary FTEs), partially offset bythe reduction of 0.01 FTEs (0.01 permanent FTEs) due to a variety ofadministrative cleanup.
0.68
Added one-time funding for Lee Center program operations for sixadditional months ($100,000).
Increased expenses associated with resident participation in variousrevenue-producing programs ($55,102)
Added new costs for ongoing maintenance associated with recent capitalimprovements for parks ($137,000).
Decreased anticipated grant-funded expenditures and revenue ($12,736non-personnel, $12,736 revenue).
Increased revenue from resident participation in revenue-producingprograms ($138,849) and increases related to summer camp fees($41,000).
315

This page intentionally left blank
316

ARLINGTON ECONOMIC DEVELOPMENT Telly Tucker, Director
1100 NORTH GLEBE RD., SUITE 1500, ARLINGTON, VA 22201 703-228-0808
Our Mission: To continue to develop Arlington County as an economically vital, competitive, and sustainable community by providing leadership and services to the business, real estate
development, and visitors services sectors of the Arlington economy
LINES OF BUSINESS
Director’s Office/Operations Group
Real Estate Development Convention & Visitors Service Business Investment Arlington Arts &
Cultural Affairs
Business Investment- Business Recruitment- Business Retention- International Trade &Development
- Partnership and AllianceDevelopment
- Small Business Support & High Growth Entrepreneurs
- Business Intelligence - Marketing
Real Estate Development- Planning ProcessSupport and Input
- Policy Formation- Regulations andIncentives Analysis
- Economic and FiscalAnalysis
- Project Management- Outreach and information
Convention & Visitors Service- Destination Marketing &Promotion
- Meetings and ConventionsSales
- Visitor and ConventionServices
- Small Business and ArtsPromotion
- Tourism Infrastructure- Hospitality CommunityEngagement
Arlington Arts & Cultural Affairs
- Cultural Development- Arts Enterprise- Facilities Management &Technical Support
- Creative Placemaking & Engagement
- Marketing - Public Art
Strategic Partnerships
Strategic Partnerships- Urban Resiliency Program- Creative Economy Initiative- Partnerships and BIDS
Director’s Office/ Operations Group- Management & Administration - Economic Research & Policy Analysis- Liaison & Support- Creative Economy - Communications
Shaded program is located in the Travel and Tourism Fund
SIGNIFICANT BUDGET CHANGES
The FY 2021 adopted expenditure budget for Arlington Economic Development is $8,669,102, a one percent decrease from the FY 2020 adopted budget. The FY 2021 adopted budget reflects:
The County Board added one-time funding for the Lee Highway Alliance ($25,000) for total funding of $85,500.
Personnel changes due to the restoration of ongoing funding for the Cultural Affairs Scenic Studio Manager ($107,625) and Facilities Manager ($101,350) and due to an increase in the County’s cost for employee health insurance, partially offset by the elimination of one-time funding for a now vacant Facility Technical Services Director position ($138,135, 1.0 FTE) and lower retirement contributions based on current actuarial projections.
Non-personnel increases due to the addition of one-time funding for Columbia Pike smallbusiness support ($20,000), an increase of ongoing funding to the Biz Launch program forsmall business support ($35,000), and contractual increases for data subscriptions ($17,980).These increases are partially offset by adjustments to the annual expense for maintenanceand replacement of County vehicles ($1,058) and due to the removal of prior year one-timefunding for the mobile stage towing services ($4,550), Lee Highway Alliance ($20,000),Clarendon Alliance ($10,000), and Columbia Pike Revitalization Organization ($20,000).
Revenue decreases due to lower revenue projections based on prior year actuals ($21,366)and a reduction in the Virginia Commission for the Arts grant award ($500), partially offset byan increase in Scenic Studio fees ($12,900).
317

ARLINGTON ECONOMIC DEVELOPMENT DEPARTMENT BUDGET SUMMARY
DEPARTMENT FINANCIAL SUMMARY
FY 2019 FY 2020 FY 2021 % ChangeActual Adopted Adopted ‘20 to ‘21
Personnel $6,464,755 $6,556,667 $6,447,752 -2%Non-Personnel 2,325,384 2,178,978 2,221,350 2%Subtotal 8,790,139 8,735,645 8,669,102 -1%Intra-County Charges (2,050) - - -Total Expenditures 8,788,089 8,735,645 8,669,102 -1%
Fees (Earned Income) 161,316 181,000 172,534 -5%Grants 29,500 5,000 4,500 -10%Total Revenues 190,816 186,000 177,034 -5%
Net Tax Support $8,597,273 $8,549,645 $8,492,068 -1%
Permanent FTEs 47.40 46.40 45.40Temporary FTEs 5.50 5.50 5.50Total Authorized FTEs 52.90 51.90 50.90
EXPENSES BY LINE OF BUSINESS
FY 2019 FY 2020 FY 2021 % Change FY 2021 FTEsActual Adopted Adopted ‘20 to ‘21 Adopted
Director's Office - Operations $2,764,330 $2,816,821 $2,854,957 1% 15.00Business Investment 2,138,939 2,256,191 2,308,789 2% 13.80Real Estate Development 463,886 466,060 469,440 1% 3.00Strategic Partnerships 652,226 595,500 570,500 -4% -Arlington Arts & Cultural Affairs* 2,768,708 2,601,073 2,465,416 -5% 19.10Total Expenditures $8,788,089 $8,735,645 $8,669,102 -1% 50.90*FTE count includes temporary FTEs: Arlington Arts & Cultural Affairs (5.50)
STRATEGIC PARTNERSHIPS FUNDING SUMMARY
FY 2019 FY 2020 FY 2021 % ChangeActual Adopted Adopted ‘20 to ‘21
Ballston Business Improvement District $1,614,759 $1,497,516 $1,569,935 5%Crystal City Business Improvement District 2,520,507 2,763,656 4,739,568 71%Rosslyn Business Improvement District 3,704,779 3,938,338 4,053,393 3%Clarendon Alliance 80,000 90,000 80,000 -11%Columbia Pike Revitalization Organization (CPRO) 355,000 370,000 350,000 -5%Lee Highway Alliance 85,500 80,500 85,500 6%Washington Board of Trade 10,000 10,000 10,000 -Arlington Sister Cities Association 45,000 45,000 45,000 -Total Expenditures $8,415,545 $8,795,010 $10,933,396 24%
318

ARLINGTON ECONOMIC DEVELOPMENT TEN-YEAR HISTORY
EXPENDITURE, REVENUE, NET TAX SUPPORT, AND FULL-TIME EQUIVALENT TRENDS
$ in 000sFY 2012
ActualFY 2013
ActualFY 2014
ActualFY 2015
ActualFY 2016
ActualFY 2017
ActualFY 2018
ActualFY 2019
Actual
FY 2020 Adopted
Budget
FY 2021 Adopted
BudgetEXP $9,587 $9,818 $10,829 $11,085 $10,523 $8,525 $8,401 $8,788 $8,736 $8,669REV $1,829 $1,448 $1,939 $1,254 $712 $320 $165 $191 $186 $177NTS $7,758 $8,370 $8,890 $9,831 $9,811 $8,205 $8,236 $8,597 $8,550 $8,492FTEs 51.77 61.57 61.57 63.57 56.67 54.20 56.20 52.90 51.90 50.90
0
10
20
30
40
50
60
70
$0
$2,000
$4,000
$6,000
$8,000
$10,000
$12,000
FTEs EXP REV NTS
319

ARLINGTON ECONOMIC DEVELOPMENT TEN-YEAR HISTORY
Fiscal Year
Description FTEs
FY 2012 The County Board approved a one-time allocation of $450,000 for promoting and marketing businesses and cultural events within Arlington County, as well as enhancing small business initiatives. The employees from the Travel and Tourism Promotion Fund will be carrying out these activities from January 1, 2012 through June 30, 2012.
Non-personnel expenses decreased due to the elimination of funding for the Ballston Partnership ($65,000) due to the creation of the Ballston Business Improvement District, the decrease in funding for the Rosslyn Renaissance ($10,000) and decrease in lease expense for the Base Realignment and Closure (BRAC) Transition Center ($23,588). This is partially offset by the restoration of funding for Greater Washington Initiative ($25,000) and increase in the annual expense for maintenance and replacement of County vehicles ($765).
Revenues decreased due to the reduction in funding from the Rosslyn Fund trust and agency account for the Rosslyn Renaissance ($10,000) and the end of grant funding from the Virginia National Defense Industrial Authority (VNDIA) ($28,448). An extension to the length of the grant has been awarded which will keep the BRAC Transition Center open through mid-FY 2012.
Cultural Affairs, Cultural Affairs’ Supplemental Fee Programs, and Artisphere were transferred to Arlington Economic Development from the Department of Parks and Recreation (expense $5,284,614, revenue $1,883,658).
33.77
FY 2013 The County Board added an Information Technology position ($125,000). 1.0 The County Board added one-year funding for the Base Realignment and
Closure (BRAC) Coordinator position ($148,137) which had been previously grant funded.
1.0
The County Board added $30,000 in one-time arts challenge grant funding.
The County Board added matching grant funding for the Clarendon Alliance ($15,000).
The County Board added base operating funds ($15,000) and matching grant funding ($5,000) for Columbia Pike Revitalization Organization.
Personnel expenses increased due to the County Board’s addition of funding for a new Step 19 and an increase in the living wage.
Personnel included the transfer of 3.0 FTEs from the Travel & Tourism Promotion Fund (TTPF) to the General Fund for organizational demands in the Director’s Office and the Business Investment Group ($284,790).
3.0
Convention and Visitors Service transferred from the Travel & Tourism Promotion Fund (TTPF) to the General Fund ($385,624 personnel, $114,376 non-personnel, 4.8 FTEs).
4.8
Eliminated FY 2012 one-time funding for retail and small business promotion ($450,000).
Eliminated FY 2012 one-time funding for programming at Lubber Run ($25,000).
320

ARLINGTON ECONOMIC DEVELOPMENT TEN-YEAR HISTORY
Fiscal Year
Description FTEs
Eliminated funding for the Rosslyn Renaissance ($30,000) and the associated transfer of funding from the Rosslyn Fund trust and agency account ($30,000).
Revenues decreased to reflect the relocation of the Virginia Export Assistance Center ($30,000) and changes in Artisphere operations ($228,519).
FY 2014 The County Board added one-time funding for the Base Realignment and Closure (BRAC) Coordinator position ($142,137).
1.0
The County Board added one-time funding for nonprofit capacity building for two additional grants ($20,000) and arts challenge grants ($30,000).
Removed FY 2013 one-time funding for the BRAC Coordinator ($148,137).
(1.0)
Removed FY 2013 one-time funding for arts challenge grants ($30,000). The County Board added $900,000 in one-time funding for Artisphere to
support personnel and non-personnel expenses, which is partially offset by the elimination of ongoing funding in the amount of $748,028.
Revenue increased based on changes in Artisphere operational estimates for gifts and donations ($20,000), facility rental ($40,600), admission and ticket income ($118,531), which is partially offset by reductions in catering income ($132,753).
Reduced the Arlington Arts Grants Program funding from $249,100 to $199,100 ($50,000).
The County Board approved 2.0 marketing management FTEs as part of FY 2013 closeout ($294,983).
2.0
FY 2015 The County Board added one-time funding for arts challenge grants ($30,000) and tourism promotion ($200,000).
Removed FY 2014 one-time funding for the Base Realignment and Closure (BRAC) Coordinator position ($142,137).
(1.0)
Removed FY 2014 one-time funding for arts challenge grants ($30,000) and nonprofit capacity building ($20,000).
Added additional funding for the Hispanic Business Counselor ($50,000). Added ongoing funding ($158,273) for the Base Realignment and Closure
(BRAC) Coordinator position. 1.0
Replaced ongoing funding with one-time for nonprofit capacity building ($45,000).
Added personnel approved at FY 2014 close-out to correct the allocation for a Cultural Affairs Specialist ($9,589, 0.1 FTE).
0.1
FY 2016 The County Board eliminated funding for Artisphere ($946,659, 14.5 FTEs, 1.0 temporary FTE) and Ballston Science and Technology Alliance (BSTA) ($25,000). $1.3 million in one-time funding remains in net tax support for Artisphere as a contingency in order to cover costs associated with the closure of that facility.
(15.5)
321

ARLINGTON ECONOMIC DEVELOPMENT TEN-YEAR HISTORY
Fiscal Year
Description FTEs
The County Board, using a portion of the savings from the closure of Artisphere, reallocated funding to the Cultural Affairs Division in an effort to improve artistic programming across the county and particularly along its metro corridors ($331,000 personnel, 3.5 FTEs; $165,659 non-personnel).
3.5
The County Board added on-going funding for business investment ($600,000, 5.0 FTEs), marketing ($300,000), arts grants ($16,710), and the Columbia Pike Revitalization Organization (CPRO) ($100,000).
5.0
The County Board restored one-time funding for tourism promotion ($200,000) and added one-time funding for TandemNSI ($200,000).
Removed one-time funding for nonprofit capacity building ($45,000) and arts challenge grants ($30,000).
Decreased one-time funding for the closure of Artisphere at FY 2015 close-out due to lower than anticipated closure costs ($400,000).
FY 2017 The County Board added one-time funding for the Marymount Non-Profit Resource Center to work with the Clarendon Alliance ($25,000).
The County Board shifted $379,000 of Convention and Visitor Services funding from ongoing to one-time. This funding shift maintains the same level of support for the Travel and Tourism program.
Increased fee revenue to align budget to actuals and anticipated receipts in Cultural Affairs programs ($9,000).
The temporary FTE count was adjusted to reflect the number of budgeted hours already funded within the Department’s budget. There was no change to net tax support (3.33 FTEs).
3.33
After budget adoption, the County Board transferred Arlington Conventionand Visitor Services from the General Fund to the Travel and Tourism Fund ($626,148, 5 FTEs, 0.80 Temporary FTEs).
5.80
FY 2018 The County Board added one-time funding for Arts Challenge Grants ($30,000) and one-time funding for AED to conduct a retail and market study along the Columbia Pike corridor on behalf of the Columbia Pike Revitalization Organization ($150,000).
Converted a temporary employee from the Travel and Tourism Promotion Fund to a permanent full-time to support the front desk and operations (conversion of non-personnel to personnel $60,000, 1.0 FTEs).
1.0
Transferred in a position from the Department of Technology Services to support the sales and marketing efforts of ConnectArlington and the transfer in of sales and marketing non-personnel funding for the promotion of ConnectArlington ($130,000 personnel; $50,000 non-personnel).
1.0
Removed FY 2017 one-time funding for the Marymount Non-Profit Resource Center ($25,000).
322

ARLINGTON ECONOMIC DEVELOPMENT TEN-YEAR HISTORY
Fiscal Year
Description FTEs
FY 2019 The County Board added one-time funding for the Columbia Pike Revitalization Organization (CPRO) ($5,000) and one-time funding for the Lee Highway Alliance (LHA) ($25,000).
Eliminated one vacant Strategic Partnerships Executive Liaison ($143,231).
(1.0)
Eliminated funding for the Greater Washington Hispanic Chamber of Commerce ($6,000) and decreased the ongoing commitment to Arlington Sister Cities Association ($5,000).
Eliminated the Cultural Affairs humanities program and its associated vacant position ($77,172).
(0.8)
Eliminated a vacant Cultural Affairs new Media Curator position ($36,225).
(0.5)
Eliminated the Connect Arlington marketing program ($50,000) and associated vacant business development position ($115,964).
(1.0)
Removed one-time funding for the Columbia Pike Retail Market Study ($150,000) and Arts Challenge Grants ($30,000).
Removed expenses ($160,825) associated with the closure of Spectrum Theatre.
Transferred partnership funding (CPRO and LHA) from Non-Departmental ($210,500).
FY 2020 The County Board replaced ongoing funding with one-time funding for the Scenic Studio program ($108,621).
The County Board replaced ongoing funding with one-time funding for the facility manager at 3700 South Four Mile Run Drive ($96,663).
The County Board added one-time funding for the Mobile Stage ($4,550) The County Board added ongoing funding for the Cultural Affairs literary
arts program ($31,000). The County Board added one-time funding to the Lee Highway Alliance
($20,000), the Clarendon Alliance ($10,000), and the Columbia Pike Revitalization Organization ($20,000).
The County Board approved one-time funding to retain the Facility Technical Services Director ($151,202).
Added ongoing funding for a small business support position ($110,285). 1.0 Reduced funding for administrative support services ($11,000). Reduced funding for data subscription licenses ($35,500). Eliminated a vacant Audio Production Specialist position ($108,143). (1.0) Eliminated a filled Cultural Affairs Specialist position in the Costume Lab
($70,761). (1.0)
Reduced wireless service charges as part of a County-wide review of wireless service providers ($4,921).
FY 2021 The County Board added one-time funding to the Lee Highway Alliance ($25,000).
323

ARLINGTON ECONOMIC DEVELOPMENT TEN-YEAR HISTORY
Fiscal Year
Description FTEs
Restored ongoing funding for the Scenic Studio program and the facility manager at 3700 South Four Mile Run Drive ($208,975).
Eliminated one-time funding for the vacant Facility Technical Services Director position ($138,135).
(1.0)
Added one-time funding for Columbia Pike small business support ($20,000).
Increased ongoing funding to the Biz Launch program for small business support ($35,000).
Increased funding for data subscription licenses ($17,980). Removed prior year one-time funding for mobile stage towing services
($4,550), Lee Highway Alliance ($20,000), Clarendon Alliance ($10,000), and Columbia Pike Revitalization Organization ($20,000).
Increased Scenic Studio fees ($12,900). Decreased other fee revenues based on prior year actuals ($21,366).
324

DEPARTMENT OF COMMUNITY PLANNING, HOUSING AND DEVELOPMENT
Claude Williamson, Director 2100 CLARENDON BLVD., SUITE 700, ARLINGTON, VA 22201
703-228-3535 [email protected]
Our Mission: To promote the improvement, conservation, and revitalization of Arlington’s physical and social environment
LINES OF BUSINESS
SIGNIFICANT BUDGET CHANGES
The FY 2021 adopted expenditure budget for the Department of Community Planning, Housing and Development is $11,624,696, a two percent decrease from the FY 2020 adopted budget. The FY 2021 adopted budget reflects:
Personnel changes due to an increase in the County’s cost for employee health insurance, adjustments to salaries resulting from job family studies for trades and planners, and the increase of an Associate Planner from a 0.5 FTE to a 1.0 FTE in the Comprehensive Planning Program ($64,400, 0.5 FTE), partially offset by lower retirement contributions based on current actuarial projections.
Non-personnel decreases due to the removal of one-time funding associated with thesupport of the FY 2020 Census ($100,000), the transfer of the Shirlington Employment andEducation Center (SEEC) funding to the Department of Human Services ($222,550), andadjustments to the annual expense for maintenance and replacement of County vehicles($940), partially offset by an increase to the Historic Preservation program for legaladvertising ($5,000).
Revenue increases due to an inflationary increase of 2.5 percent to Current Planning fees($74,773) and an anticipated increase in development activity and ancillary developmentactivity associated with Amazon ($133,236).
325
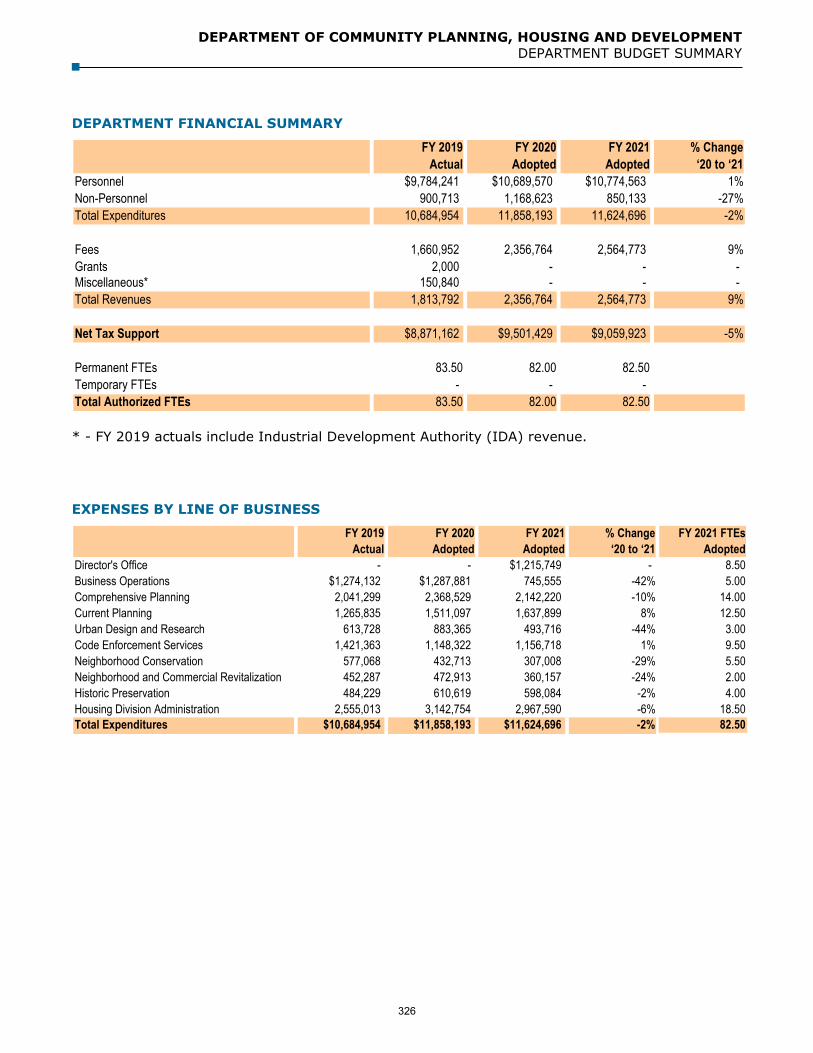
DEPARTMENT OF COMMUNITY PLANNING, HOUSING AND DEVELOPMENT DEPARTMENT BUDGET SUMMARY
DEPARTMENT FINANCIAL SUMMARY
FY 2019 FY 2020 FY 2021 % ChangeActual Adopted Adopted ‘20 to ‘21
Personnel $9,784,241 $10,689,570 $10,774,563 1%Non-Personnel 900,713 1,168,623 850,133 -27%Total Expenditures 10,684,954 11,858,193 11,624,696 -2%
Fees 1,660,952 2,356,764 2,564,773 9%Grants 2,000 - - - Miscellaneous* 150,840 - - - Total Revenues 1,813,792 2,356,764 2,564,773 9%
Net Tax Support $8,871,162 $9,501,429 $9,059,923 -5%
Permanent FTEs 83.50 82.00 82.50Temporary FTEs - - - Total Authorized FTEs 83.50 82.00 82.50
* - FY 2019 actuals include Industrial Development Authority (IDA) revenue.
EXPENSES BY LINE OF BUSINESS
FY 2019 FY 2020 FY 2021 % Change FY 2021 FTEsActual Adopted Adopted ‘20 to ‘21 Adopted
Director's Office - - $1,215,749 - 8.50Business Operations $1,274,132 $1,287,881 745,555 -42% 5.00Comprehensive Planning 2,041,299 2,368,529 2,142,220 -10% 14.00Current Planning 1,265,835 1,511,097 1,637,899 8% 12.50Urban Design and Research 613,728 883,365 493,716 -44% 3.00Code Enforcement Services 1,421,363 1,148,322 1,156,718 1% 9.50Neighborhood Conservation 577,068 432,713 307,008 -29% 5.50Neighborhood and Commercial Revitalization 452,287 472,913 360,157 -24% 2.00Historic Preservation 484,229 610,619 598,084 -2% 4.00Housing Division Administration 2,555,013 3,142,754 2,967,590 -6% 18.50Total Expenditures $10,684,954 $11,858,193 $11,624,696 -2% 82.50
326

DEPARTMENT OF COMMUNITY PLANNING, HOUSING AND DEVELOPMENT TEN-YEAR HISTORY
EXPENDITURE, REVENUE, NET TAX SUPPORT, AND FULL-TIME EQUIVALENT TRENDS
$ in 000sFY 2012
ActualFY 2013
ActualFY 2014
ActualFY 2015
ActualFY 2016
ActualFY 2017
ActualFY 2018
ActualFY 2019
Actual
FY 2020 Adopted
Budget
FY 2021 Adopted
BudgetEXP $9,174 $9,908 $10,377 $11,116 $11,051 $10,978 $10,981 $10,685 $11,858 $11,625REV $1,953 $1,601 $1,542 $1,922 $1,172 $1,464 $932 $1,814 $2,357 $2,565NTS $7,221 $8,307 $8,835 $9,194 $9,879 $9,514 $10,049 $8,871 $9,501 $9,060FTEs 83.50 89.00 87.50 88.00 87.00 86.00 86.00 83.50 82.00 82.50
0
50
100
150
200
$0
$2,000
$4,000
$6,000
$8,000
$10,000
$12,000
$14,000FTEs EXP REV NTS
327

DEPARTMENT OF COMMUNITY PLANNING, HOUSING AND DEVELOPMENT TEN-YEAR HISTORY
Fiscal Year Description FTEs
FY 2012 The County Board restored a planner position to address an expected increase in site plans ($105,000).
1.0
Eliminated FY 2011 one-time funds for capacity building activities forBuyers and Renters Arlington Voice ($10,000).Increased the Clean-up of Property Program ($50,000).
Increased funds ($15,000) for the Shirlington Education and EmploymentCenter (SEEC). The additional funds added for SEEC fully offset areduction in federal funding for SEEC (see the Community DevelopmentFund narrative) and kept the overall County contribution to SEEC flat.
Decreased revenue due to a decline in permitting activity ($179,000) anda decrease in the Community Services Block Grant ($63,730). Thisdecrease is partially offset by an increase in federal grant revenue($9,685).
FY 2013 The County Board added funding for enhanced planning capacity ($296,812).
2.50
The County Board added one-time funding to support BUGATA in itsefforts to enhance tenant participation in County activities and processes($50,000).
Transferred in a Home Ownership Coordinator from the CommunityDevelopment Fund with one-time funding ($112,577).
1.0
Transferred in one Planner from the Community Development Fund($104,633).
1.0
Added one Senior Housing Planner ($94,747) and operating expenses forthis position ($14,700).
1.0
Added funding for the staff and operating costs of the ShirlingtonEmployment and Education Center ($85,000).
Reduced the Community Services Block Grant ($13,053) due to declininggrant revenue.
Fees increased due to higher projected fee permitting activity($210,000).
Grants decreased due to decreases in the Community Services BlockGrant ($13,053) and in the County’s annual federal HOME Fund allocation($71,356).
FY 2014 The County Board restored one-time funding for the Homeownership Coordinator position ($114,943).
1.0
Eliminated one part-time Principal Planner position ($61,134). (0.5) Eliminated one Associate Planner position ($102,737). (1.0)
Restored one-time funding ($18,575) for the Shirlington Education andEmployment Center (SEEC).
Restored one-time funding ($50,000) for BUGATA. Restored one-time funding ($50,000) for ECDC.
328

DEPARTMENT OF COMMUNITY PLANNING, HOUSING AND DEVELOPMENT TEN-YEAR HISTORY
Fiscal Year Description FTEs
Decreased revenue due to a decrease in the Community Services BlockGrant ($9,930).
FY 2015 The County Board added funding to the base budget for the Homeownership Coordinator position, previously funded with one-time funding ($116,116).
Added funding for a Principal Planner position for planning anddevelopment activities related to Crystal City and Pentagon City ($112,349).
1.0
Transferred half of a Business Systems Analyst position to the CPHDDevelopment Fund.
(0.5)
Removed one-time funding ($18,575) for the Shirlington Education andEmployment Center (SEEC).
Removed one-time funding ($50,000) for ECDC. Restored one-time funding ($50,000) for BUGATA.
FY 2016 The County Board eliminated a Housing Assistant position ($47,977). The County Board restored the FY 2015 one-time funding for BU-GATA
($50,000). Transferred half a Business Systems Analyst position to the CPHD
Development Fund ($71,739). Added ongoing funding ($18,275) for the Shirlington Education and
Employment Center (SEEC). Increased fee revenue for anticipated permits and development activity
($94,958). Decreased revenue and expense due to a decrease in the state allocation
of the Community Services Block Grant ($15,979).
(0.5)
(0.5)
FY 2017 The County Board added ongoing funding for the BU-GATA Promotora Program ($50,000).
Grant expenses and revenue increased due to additional CommunityServices Bock Grant income ($32,000).
FY 2018 The County Board added an Associate Planner ($115,698) which was added to Arlington Economic Development by the County Manager in the Proposed Budget and then transferred to CPHD to focus on zoning ordinance changes or other planning work, primarily related to child care facilities.
The County Board eliminated an Office Supervisor based on ananticipated staff retirement ($88,527).
1.0
(1.0)
329

DEPARTMENT OF COMMUNITY PLANNING, HOUSING AND DEVELOPMENT TEN-YEAR HISTORY
Fiscal Year Description FTEs
FY 2018 Transferred a Communications Specialist II ($147,770) from the Business Operations Division to the Permits Administration Division in the CPHD Development Fund.
Non-personnel decreased primarily due to an accounting adjustment forhow non-personnel and intra-County charges to capital projects areexpensed ($47,660) and adjustments to the annual expense for themaintenance and replacement of County vehicles ($1,240), offset by anincrease in Community Services Block Grant expenses ($38,550).
Grant revenue increased due to additional Community Services BlockGrant income ($38,550).
The County Board took action after the FY 2018 budget was adopted totransfer the Joint Facilities Advisory Committee (JFAC) support position($116,168) from the County Manager’s Office into the Planning Division.
(1.0)
1.0
FY 2019 The County Board eliminated a filled Administrative V position ($82,250). The County Board eliminated a filled Planning Supervisor position
($182,885). The County Board eliminated a vacant Principal Planner ($177,483). The County Board reduced a full-time vacant Code Enforcement
Supervisor position into a half-time position ($68,294). The County Board reduced consultant funding used to implement a
department-wide training program ($35,550). The County Board added one-time funding to restore consultant services
for the Neighborhood College Program, a free civic leadershipdevelopment program for people who live in Arlington and want to getmore involved in their community ($40,000).
(1.0) (1.0)
(1.0) (0.50)
FY 2020 The County Board added $40,000 in ongoing funding to the Neighborhood College Program, no change from the FY 2019 adopted level of funding.
Transferred three code enforcement positions to the Development Fund($353,219).
(3.0)
Reduced wireless service charges as part of a County-wide review ofwireless service providers ($8,379).
Reduced consultant funds used to implement in department-wide trainingprograms ($11,850).
Reduced consultant funds within the Historic Preservation line of business($8,164).
Added one and a half principal planner positions to support increasedactivity associated with Amazon ($225,000).
1.50
FY 2021 Increased an existing Associate Planner from 0.5 FTE to a 1.0 FTE in the Comprehensive Planning Program ($64,400).
0.5
One-time funding associated with the support of the FY 2020 Census($100,000) was removed.
330

DEPARTMENT OF COMMUNITY PLANNING, HOUSING AND DEVELOPMENT TEN-YEAR HISTORY
Fiscal Year Description FTEs
Funding for the Shirlington Employment and Education Center (SEEC)was transferred to the Department of Human Services ($222,550).
Increased funding for the Historic Preservation program for legaladvertising ($5,000).
Current Planning fees were increased 2.5% ($74,773), and revenueassociated with those fees was increased due to an anticipated increasein development activity and ancillary development activity associatedwith Amazon ($133,236).
331

This page intentionally left blank
332

NON-DEPARTMENTAL BUDGET SUMMARY
Non-departmental accounts include County-wide costs for insurance premiums and claims (including workers’ compensation), fringe benefits for retirees (health and life insurance premiums), miscellaneous expenses, County building rent, overhead charges to certain County agencies, and contingents held for future County Board actions, such as the General Contingent and Affordable Housing Investment Fund.
NON-DEPARTMENTAL FINANCIAL SUMMARY
FY 2019 FY 2020 FY 2021 % ChangeActual Adopted Adopted '20 to '21
Insurance $5,383,824 $5,600,000 $5,600,000 -Retiree Benefits/Health Plan Adjustment 14,119,605 17,700,000 18,400,000 4%Miscellaneous 44,896,324 23,544,552 20,402,650 -13%Contingents 3,902,481 24,894,318 28,232,713 13%Total Expenditures $68,302,234 $71,738,870 $72,635,363 1%
INSURANCE COSTS
The County’s risk financing program is comprised of commercially purchased insurance coverage and retained risks paid for through a program of self-insurance. The liability program is self-insured up to $1 million per occurrence. The program includes general liability, police legal liability, public officials’ liability, and automobile liability. The County has a commercially purchased excess liability policy with limits of $10 million per occurrence with no annual aggregate. The County has exposure for property losses to a current deductible of $50,000. Losses above the deductible level are covered by a commercially purchased policy.
The County also maintains a Self-Insurance Reserve ($5,000,000) and a General Fund Operating Reserve funded at five and one-half percent of General Fund expenditures. Insurance is purchased primarily for property, general liability, and automobile liability exposures subject to prudent deductible/retention levels. Insurance is provided for real and personal property, crime, garage keepers, professional liability, and constitutional office coverage. Retained exposures include general liability, automobile damage, and related liability up to specific retention levels.
FY 2019 FY 2020 FY 2021 % ChangeActual Adopted Adopted '20 to '21
Insurance Cost $5,383,824 $5,600,000 $5,600,000 -Total Expenditures $5,383,824 $5,600,000 $5,600,000 -
333

NON-DEPARTMENTAL BUDGET SUMMARY
RETIREE BENEFITS and HEALTH PLAN ADJUSTMENT
This account includes the employer's share of retirees' health and life insurance premiums and adjustments related to the employer’s share of health plan expenses for general employees.
FY 2019 FY 2020 FY 2021 % ChangeActual Adopted Adopted '20 to '21
Retirees' Health & Life Insurance $12,094,968 $11,400,000 $11,400,000 -Other Post Employment Benefits (OPEB - trust) 7,000,000 7,000,000 7,000,000 -Health Plan Adjustment (4,975,363) (700,000) - -100%Total Expenditures $14,119,605 $17,700,000 $18,400,000 4% OPEB funding levels are based on the most recent actuarial study and ensure that the County
is fully meeting its annual required contribution to the fund. The total funding for OPEB (current costs plus future liability) is $18.4 million in FY 2021.
The total County employee healthcare costs are expected to increase 2.5 percent for Cigna and Kaiser participants. The health plan adjustment in FY 2020 was the result of revisions to the projected health care costs during the adopted FY 2020 budget process. This adjustment was allocated to departments in the fall of CY 2019.
MISCELLANEOUS EXPENSES
These County expenses include: rent, overhead charge-backs to some County agencies, the cost of the County's annual external audit and other consulting fees, national and state association memberships (National League of Cities, National Association of Counties, Virginia Municipal League, and Virginia Association of Counties), and other miscellaneous expenses not allocated to County departments.
FY 2019 FY 2020 FY 2021 % ChangeActual Adopted Adopted '20 to '21
Facility Rent and Operating Charges $6,020,355 $10,082,104 $13,132,397 30%Intra-County Charges (721,087) (1,346,958) (1,461,856) 9%Consultants 1,599,728 774,514 660,088 -15%Contracted Services 667,399 478,000 478,000 -Memberships 131,360 157,523 157,523 -Special Events & Unclassified Services 118,818 148,000 150,000 1%Employer of Choice 3,640,850 3,182,700 (2,476,300) -178%Housing Projects 28,245,541 - - -Early Retirement - (300,000) - -100%Fuel & Utility Savings - (138,474) (744,345) 438%Short-term Financing 5,193,360 8,107,143 8,107,143 -IDA Debt Service on Ballston Skating Facility - 2,400,000 2,400,000 -Total Expenditures $44,896,324 $23,544,552 $20,402,650 -13%
The rent costs and operating expenses in various County facilities increased for FY 2021primarily due to the free rent in FY 2020 associated with the renegotiated lease terms for 2100Clarendon Boulevard.
334
NON-DEPARTMENTAL BUDGET SUMMARY
Intra-County charges increase due to adjustments to the rent chargeback for theTransportation Capital Fund and CPHD Development Fund.
Consultant expenses decrease due to the transfer out of $139,426 to the Department of Parksand Recreation for field maintenance, offset by the addition of $25,000 in one-time fundingfor Equity training
Employer of Choice program funding decreases due to the elimination of FY 2020 one-timefunding for pay enhancements and budgetary adjustments made in FY 2021 which centrallylowers departmental costs for anticipated budgetary savings from a countywide hiring freezein FY 2021.
Early Retirement adjustment for the employee cost savings is not included in the FY 2021budget due to the County Manager not proposing any buyouts to employees this fiscal year.
Fuel & Utility savings increase due to the realignment of costs to department utility budgetsand the projected demand/costs for utilities in the FY 2021 General Fund budget.
The Ballston Skating Facility, the practice facility for the National Hockey League’s Washington Capitals ice hockey team, which opened in November 2006, was financed with Industrial Development Authority (IDA) taxable revenue bonds. It is projected that lease payments to the IDA from the Capitals will be sufficient to pay the debt service on the bonds.
CONTINGENTS
The non-departmental accounts also hold the County Board's contingents. These contingents are appropriated funds established to cover unforeseen expense items, new projects initiated after a fiscal year has begun (General Contingent), or for a particular purpose (Affordable Housing Investment Fund).
The budget includes a $250,000 General Fund General Contingent, $16.0 million in funding for the Affordable Housing Investment Fund (AHIF), and $2.4 million in Economic Development incentive funds.
Additionally, in FY 2021, a $10.2 million reserve contingent has been set aside to address any unforeseen impacts of the economic and health crisis. A portion of this contingent ($2.7 million) is set aside to address any additional needs in housing and safety net services with the balance available to aid with community resilience including support for our small businesses, tourism industry, and nonprofit partners; service delivery recovery and employee support such as new services and programming needed post-COVID and help for employees who worked through the COVID response; and additional unanticipated revenue loss.
The Affordable Housing Investment Fund (AHIF) totals $16.0 million, consistent with the FY 2020 adopted budget. Total AHIF funding includes base ongoing and one-time funds, ongoing federal HOME funding budgeted in the Housing and Community Development Fund, and portion of recordation tax revenue earmarked by the County Board when the recordation tax rate increased from $0.05 to $0.0833 in FY 2005 (after setting aside the incremental recordation tax funds for previously approved affordable housing programs).
335
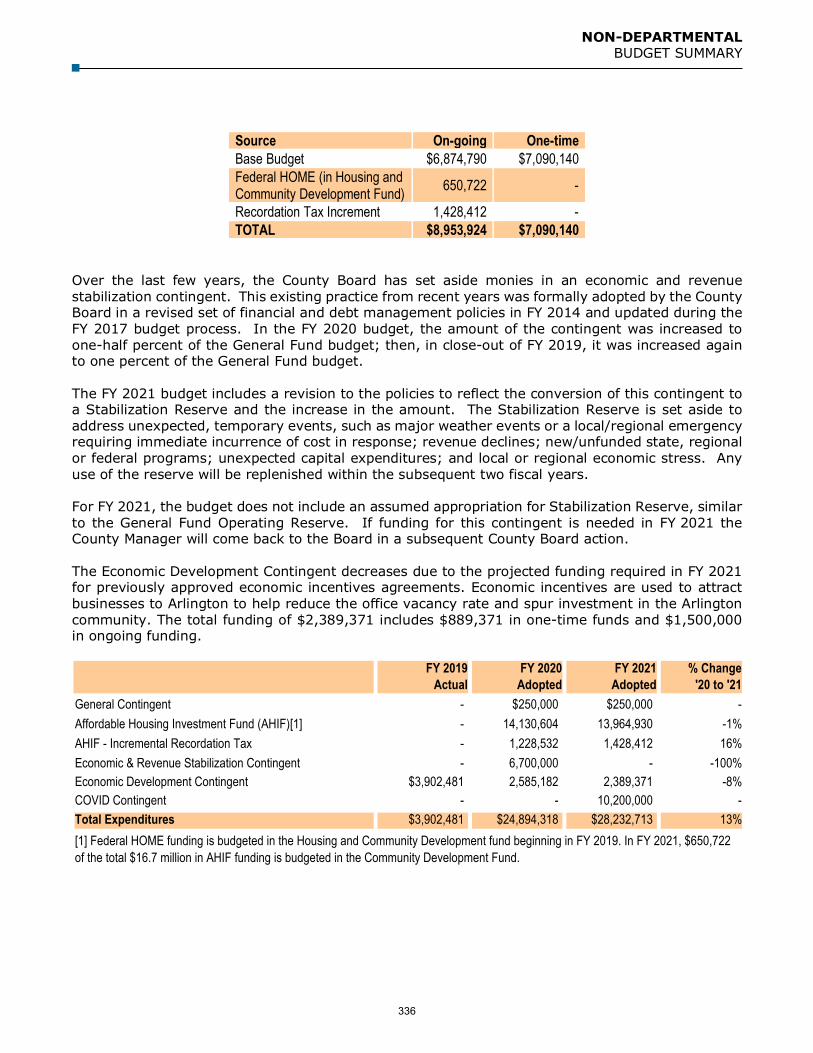
NON-DEPARTMENTAL BUDGET SUMMARY
Source On-going One-time Base Budget $6,874,790 $7,090,140 Federal HOME (in Housing and Community Development Fund) 650,722 -
Recordation Tax Increment 1,428,412 - TOTAL $8,953,924 $7,090,140
Over the last few years, the County Board has set aside monies in an economic and revenue stabilization contingent. This existing practice from recent years was formally adopted by the County Board in a revised set of financial and debt management policies in FY 2014 and updated during the FY 2017 budget process. In the FY 2020 budget, the amount of the contingent was increased to one-half percent of the General Fund budget; then, in close-out of FY 2019, it was increased again to one percent of the General Fund budget.
The FY 2021 budget includes a revision to the policies to reflect the conversion of this contingent to a Stabilization Reserve and the increase in the amount. The Stabilization Reserve is set aside to address unexpected, temporary events, such as major weather events or a local/regional emergency requiring immediate incurrence of cost in response; revenue declines; new/unfunded state, regional or federal programs; unexpected capital expenditures; and local or regional economic stress. Any use of the reserve will be replenished within the subsequent two fiscal years.
For FY 2021, the budget does not include an assumed appropriation for Stabilization Reserve, similar to the General Fund Operating Reserve. If funding for this contingent is needed in FY 2021 the County Manager will come back to the Board in a subsequent County Board action.
The Economic Development Contingent decreases due to the projected funding required in FY 2021 for previously approved economic incentives agreements. Economic incentives are used to attract businesses to Arlington to help reduce the office vacancy rate and spur investment in the Arlington community. The total funding of $2,389,371 includes $889,371 in one-time funds and $1,500,000 in ongoing funding.
FY 2019 FY 2020 FY 2021 % ChangeActual Adopted Adopted '20 to '21
General Contingent - $250,000 $250,000 -Affordable Housing Investment Fund (AHIF)[1] - 14,130,604 13,964,930 -1%AHIF - Incremental Recordation Tax - 1,228,532 1,428,412 16%Economic & Revenue Stabilization Contingent - 6,700,000 - -100%Economic Development Contingent $3,902,481 2,585,182 2,389,371 -8%COVID Contingent - - 10,200,000 -Total Expenditures $3,902,481 $24,894,318 $28,232,713 13%[1] Federal HOME funding is budgeted in the Housing and Community Development fund beginning in FY 2019. In FY 2021, $650,722of the total $16.7 million in AHIF funding is budgeted in the Community Development Fund.
336

DEBT SERVICE
The FY 2021 adopted budget includes outstanding and new money debt service on the County’s General Obligation (GO) bonds, Industrial Development Authority (IDA) bonds issued for County projects, and expenses associated with bond program administration. Total General Fund debt service is projected at $70,748,654, which includes $1.8 million for debt service on Buckingham Village 3. The Buckingham debt service has been budgeted in Non-Departmental and will be paid for from the Affordable Housing Investment Fund (AHIF). The FY 2021 adopted General Fund debt service budget to be supported by non-AHIF revenues totals $68,962,748.
Payment of School bonded indebtedness is provided for in the School Debt Service Fund and is supported by a transfer from the County’s General Fund. Payment of Utility bonded indebtedness (which includes sewer, advanced wastewater, and water bonds) is provided for in the Utilities Enterprise Fund and supported by user fees.
FY 2021 PRIORITIES
The FY 2021 priorities for debt management are:
To preserve the County’s credit ratings at Aaa/AAA/AAA from Moody’s, Standard & Poor’s, and Fitch Ratings, respectively.
To continue adhering to the County’s prudent debt management policies. To issue approximately $121 million in new money GO bonds in CY 2020 as approved in the
referenda from CY 2012, CY 2014, CY 2016, and CY 2018.
DEBT POLICY AND CREDIT RATINGS
The County’s debt service budget reflects County fiscal policies regarding the prudent use of bond financing. There is no legal limit as to the amount of indebtedness that the County can incur; however, the County maintains and frequently updates a set of policies addressing fiscal integrity and sustainability (see budget.arlingtonva.us). These policies help ensure maintenance of the County’s triple-A ratings. The policies include the following ratios:
Ratio of Tax supported Debt Service to General Expenditures (10%); Ratio of Tax supported General Obligation Debt and Subject to Appropriation Financing to
Market Value of County Taxable Real and Personal Property (3%); Ratio of Tax supported General Obligation Debt to Resident Per Capita Income (6%); and Ratio of growth in debt service should be consistent with the projected growth of revenues and
not exceed the average ten-year historical revenue growth.
The general obligation bonds planned in CY 2020 are based on the approved projects in the Adopted FY 2019 – FY 2028 Capital Improvement Program (CIP). The issuance that was originally scheduled for the spring of 2020 has been delayed and rescheduled for late 2020 or early 2021 depending upon project funding needs. The FY 2020 debt service budget has been reduced $6 million due to this delayed issuance schedule and reduction of debt service due in FY 2021. Outstanding debt service is based on completed bond sales and required principal and interest payments due to bondholders.
337

DEBT SERVICE BUDGET SUMMARY
The Board’s policies also include guidelines regarding the use of variable-rate debt:
Variable rate debt exposure should not exceed approximately 20 percent of total outstanding fixed rate debt;
Debt service on variable rate bonds will be budgeted at a conservative rate; Before issuing variable rate bonds, the County will determine how potential spikes in the debt
service will be funded; and Before issuing any variable rate bonds, the County will determine the impact of the bonds on
the County’s total debt capacity under various interest rate scenarios; evaluate the risks inherent in the County’s capital structure, giving consideration to both the County’s assets and its liabilities; and develop a method for budgeting for debt service.
In addition to the County Board debt policies, Arlington County must follow the requirements set out by Article VII of the Constitution of Virginia, the Public Finance Act, and any local charter, resolution, or ordinance in order to incur debt. The issuance of Arlington County GO bonds must also be approved by public referendum. Certain types of debt are excluded from the referendum requirement, including revenue and refunding bonds.
By continually observing these policies, the County has maintained its credit ratings of Aaa/AAA/AAA from Moody’s Investors Services, Standard & Poor’s Corporation, and Fitch Ratings. These ratings were reaffirmed in 2019 as part of the issuance of the Series 2019 GO bonds and Series 2019B GO refunding bonds. These are the highest credit ratings awarded and reflect the confidence that the rating agencies share in the County’s prudent debt management, economic environment, sound financial position, and stable tax base.
2020 NEW MONEY BONDS
The adopted debt service budget was developed assuming a County GO bond sale of approximately $121 million in the fall of 2020. The initial debt service payments due in FY 2021 are approximately $1.5 million in the General Fund and $0.2 million in the School Debt Service Fund for their issuance of approximately $42 million of bonds.
SPRING 2020 NEW MONEY BOND ISSUANCE AND AUTHORIZED BUT UNISSUED BONDS
Referendum Category Amount Issued
Authorized Unissued
Bonds Local Parks & Recreation 35.22 0.00
Metro 20.52 0.00 Transportation 16.04 8.50
Metro & Transportation 36.56 8.50
Community Infrastructure 49.70 14.30
County General Obligation Bonds $121.47 $22.81
School General Obligation Bonds 42.35 11.98
Utility General Obligation Bonds - -
Total General Obligation Bonds $163.82 $34.79 In $ millions, numbers may not add due to rounding
338

DEBT SERVICE BUDGET SUMMARY
INTEREST EARNINGS
Interest earned on unexpended bond proceeds is used to pay debt service. The cash balances that produce interest earnings are based on the timing of bond sales and the cash demand of the construction schedules. Interest earned on unexpended bond proceeds began to slowly increase in FY 2019 after years of extremely low rates, however it has begun to decline again due to recent decreases to the federal funds target rate.
SUBJECT TO APPROPRIATION OBLIGATIONS
A “subject to appropriation” pledge represents a promise by the County to seek future appropriation, if needed, for debt service payments on certain financing. The County utilized this type of pledge for a variety of projects that are not financed under voter approved general obligation bond referenda. In the majority of cases, the County’s support pledge has been used as credit enhancement, thereby allowing the project to be financed at a lower cost. In these cases, actual debt repayment will be made from project revenues and should not require General Fund support.
SIGNIFICANT BUDGET CHANGES
The FY 2021 adopted General Fund debt service budget is $68,962,748, a four percent decrease over the FY 2020 adopted budget. This excludes debt service for bonds issued for Buckingham Village 3 and paid for from AHIF funds (budgeted accordingly in Non-Departmental).
FY 2019 FY 2020 FY 2021 % Change Actual Adopted Adopted '20 to '21
Principal $45,619,171 $45,049,985 $42,936,034 (5%) Interest 23,756,039 28,810,415 27,687,620 (4%) Other (1) 98,453 78,342 125,000 60% Total Expenditures (2) 69,473,663 73,938,742 70,748,654 (4%) Less: Debt Service Supported by AHIF (1,787,282) (1,785,400) (1,785,906) - Total Non-AHIF Supported Debt Service $67,686,381 $72,153,342 $68,962,748 (4%)
(1) Includes trustee fees and other fees related to bond transactions. Expenditures related to cost of issuance are paid withproceeds of the bonds being issued.
(2) Includes the debt service for the IDA Revenue Bonds (2011/2013/2017)
339

DEBT SERVICE BUDGET SUMMARY
Outstanding General Fund Debt Service and Estimated FY 2021 GO Bond Debt Service (1)(2)
Existing FY2021 GO Bond Total New and Existing
General Fund Debt Service(1) Debt Service(2) General Fund Debt Service
Fiscal Total Debt Total Debt Total Debt
Year Principal Interest Service Principal Interest Service Principal Interest Service
2020 $46,068,185 $27,732,940 $73,801,125 $46,068,185 $27,732,940 $73,801,125
2021 42,936,034 26,184,720 69,120,754 $1,502,900 $1,502,900 42,936,034 27,687,620 70,623,654
2022 43,725,352 24,375,690 68,101,042 $3,412,500 6,398,438 $9,810,938 47,137,852 30,774,128 77,911,980
2023 44,039,501 22,407,876 66,447,376 6,825,000 8,360,625 15,185,625 50,864,501 30,768,501 81,633,001
2024 43,510,000 20,461,858 63,971,858 8,910,417 8,019,375 16,929,792 52,420,417 28,481,233 80,901,649
2025 42,145,000 18,445,827 60,590,827 8,910,417 7,573,854 16,484,271 51,055,417 26,019,681 77,075,098
2026 38,600,000 16,556,142 55,156,142 8,910,417 7,128,333 16,038,750 47,510,417 23,684,476 71,194,892
2027 38,970,000 14,772,311 53,742,311 8,910,417 6,682,813 15,593,229 47,880,417 21,455,123 69,335,540
2028 36,635,000 13,000,822 49,635,822 8,910,417 6,237,292 15,147,708 45,545,417 19,238,114 64,783,530
2029 34,820,000 11,443,522 46,263,522 8,910,417 5,791,771 14,702,188 43,730,417 17,235,293 60,965,710
2030 35,035,000 10,003,697 45,038,697 8,910,417 5,346,250 14,256,667 43,945,417 15,349,947 59,295,364
2031 34,635,000 8,545,890 43,180,890 8,910,417 4,900,729 13,811,146 43,545,417 13,446,619 56,992,036
2032 32,940,000 7,172,001 40,112,001 8,910,417 4,455,208 13,365,625 41,850,417 11,627,209 53,477,626
2033 29,365,000 5,901,725 35,266,725 8,910,417 4,009,688 12,920,104 38,275,417 9,911,412 48,186,829
2034 24,285,000 4,767,679 29,052,679 8,910,417 3,564,167 12,474,583 33,195,417 8,331,845 41,527,262
2035 23,020,000 3,721,229 26,741,229 8,910,417 3,118,646 12,029,063 31,930,417 6,839,875 38,770,291
2036 19,100,000 2,763,704 21,863,704 8,910,417 2,673,125 11,583,542 28,010,417 5,436,829 33,447,246
2037 17,975,000 1,959,980 19,934,980 8,910,417 2,227,604 11,138,021 26,885,417 4,187,584 31,073,000
2038 12,310,000 1,297,792 13,607,792 8,910,417 1,782,083 10,692,500 21,220,417 3,079,875 24,300,292
2039 8,230,000 851,289 9,081,289 8,910,417 1,336,563 10,246,979 17,140,417 2,187,852 19,328,268
2040 2,880,000 505,715 3,385,715 8,910,417 891,042 9,801,458 11,790,417 1,396,757 13,187,173
2041 2,945,000 374,067 3,319,067 8,910,417 445,521 9,355,938 11,855,417 819,587 12,675,004
2042 3,010,000 239,744 3,249,744 3,010,000 239,744 3,249,744
2043 3,080,000 102,645 3,182,645 3,080,000 102,645 3,182,645
Total $660,259,072 $243,588,863 $903,847,934 $170,625,000 $92,446,025 $263,071,025 $830,884,072 $336,034,888 $1,166,918,959 1 Includes both general obligation and subject to revenue bonds 2 Includes the issuance of the delayed FY 2020 GO bond sale ($121.5MM), and the planned FY 2021 GO bond issuance ($57.1MM)
340
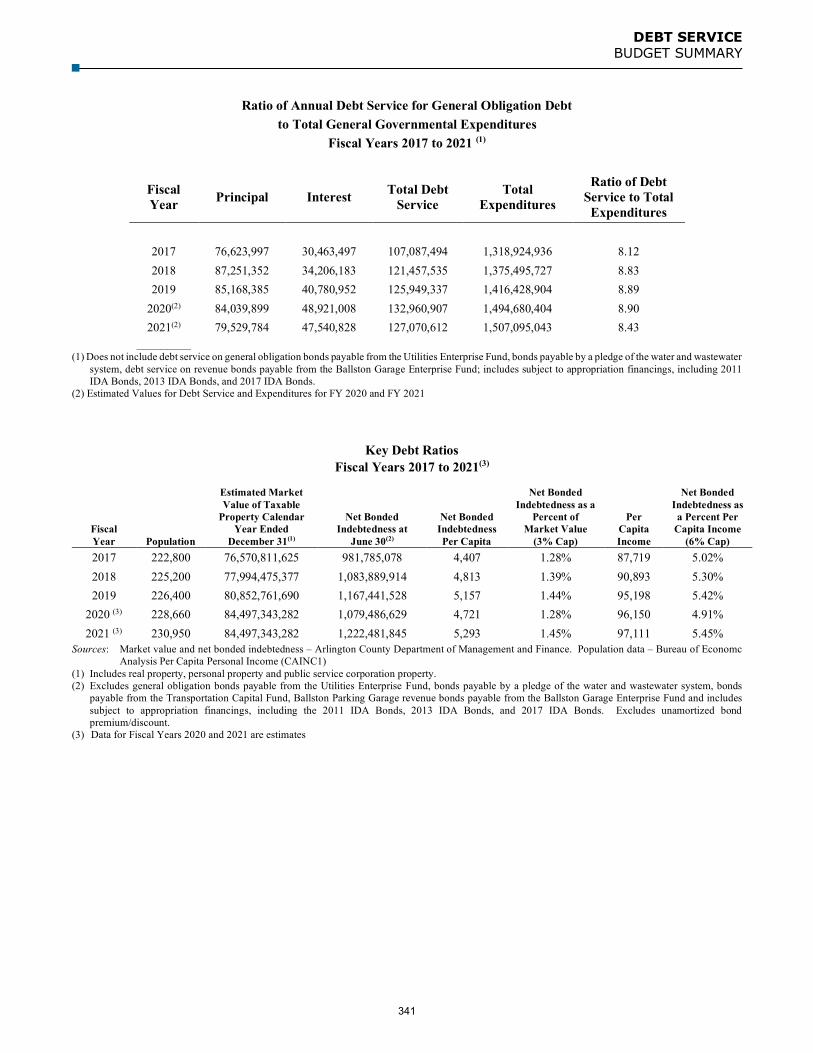
DEBT SERVICE BUDGET SUMMARY
Ratio of Annual Debt Service for General Obligation Debt to Total General Governmental Expenditures
Fiscal Years 2017 to 2021 (1)
Fiscal Year Principal Interest Total Debt
Service Total
Expenditures
Ratio of Debt Service to Total
Expenditures
2017 76,623,997 30,463,497 107,087,494 1,318,924,936 8.12 2018 87,251,352 34,206,183 121,457,535 1,375,495,727 8.83 2019 85,168,385 40,780,952 125,949,337 1,416,428,904 8.89
2020(2) 84,039,899 48,921,008 132,960,907 1,494,680,404 8.90 2021(2) 79,529,784 47,540,828 127,070,612 1,507,095,043 8.43
_________ (1) Does not include debt service on general obligation bonds payable from the Utilities Enterprise Fund, bonds payable by a pledge of the water and wastewater
system, debt service on revenue bonds payable from the Ballston Garage Enterprise Fund; includes subject to appropriation financings, including 2011IDA Bonds, 2013 IDA Bonds, and 2017 IDA Bonds.
(2) Estimated Values for Debt Service and Expenditures for FY 2020 and FY 2021
Key Debt Ratios Fiscal Years 2017 to 2021(3)
Fiscal Year Population
Estimated Market Value of Taxable
Property Calendar Year Ended
December 31(1)
Net Bonded Indebtedness at
June 30(2)
Net Bonded Indebtedness Per Capita
Net Bonded Indebtedness as a
Percent of Market Value
(3% Cap)
Per Capita Income
Net Bonded Indebtedness as a Percent Per
Capita Income (6% Cap)
2017 222,800 76,570,811,625 981,785,078 4,407 1.28% 87,719 5.02% 2018 225,200 77,994,475,377 1,083,889,914 4,813 1.39% 90,893 5.30% 2019 226,400 80,852,761,690 1,167,441,528 5,157 1.44% 95,198 5.42%
2020 (3) 228,660 84,497,343,282 1,079,486,629 4,721 1.28% 96,150 4.91% 2021 (3) 230,950 84,497,343,282 1,222,481,845 5,293 1.45% 97,111 5.45%
Sources: Market value and net bonded indebtedness – Arlington County Department of Management and Finance. Population data – Bureau of Economc Analysis Per Capita Personal Income (CAINC1)
(1) Includes real property, personal property and public service corporation property.(2) Excludes general obligation bonds payable from the Utilities Enterprise Fund, bonds payable by a pledge of the water and wastewater system, bonds
payable from the Transportation Capital Fund, Ballston Parking Garage revenue bonds payable from the Ballston Garage Enterprise Fund and includessubject to appropriation financings, including the 2011 IDA Bonds, 2013 IDA Bonds, and 2017 IDA Bonds. Excludes unamortized bondpremium/discount.
(3) Data for Fiscal Years 2020 and 2021 are estimates
341

This page intentionally left blank
342

REGIONALS / CONTRIBUTIONS
MISSION STATEMENT
To supplement organizations that provide beneficial services to Arlington residents and visitors.
Arlington County contributes to government, government-related, and non-profit organizations, which address issues and problems that have regional impacts. In addition, a number of non-profit Arlington-based organizations are funded in this account. Varied methods are applied in determining the level of funding provided to these agencies and organizations. They have been grouped into the following four categories according to their funding criteria:
Group I Organizations whose contributions are based on a population or land use formula. These are all governmental or quasi-governmental organizations.
Group II Organizations whose contributions are based on Arlington County's usage of the organization’s services. These are all governmental organizations.
Group III Non-profit organizations - General. These organizations are required to present a budget to the County. Requests are reviewed and decided upon individually.
Group IV Non-profit organizations - Disability. Recommendations for funding for these organizations are made after a bi-annual competitive review by the County’s Disability Advisory Commission. The most recent review was held in January 2020, with the next to be held in 2022.
The following section describes the purpose of these organizations and their adopted level of funding for FY 2021.
343

REGIONALS/CONTRIBUTIONS BUDGET SUMMARY
ADOPTED FY 2021 REGIONALS/CONTRIBUTIONS
FY 2019 Actuals
FY 2020 Adopted
FY 2021 Adopted
% Change '20 to '21
Metro Washington Council of Governments $286,839 $429,103 $437,977 2%Northern Virginia Regional Commission 142,015 143,444 144,619 1%Northern Virginia Community College 43,222 36,591 36,559 -
Health Systems Agency of Northern Virginia 20,600 20,600 20,600 -Northern Virginia Regional Park Authority 434,795 448,783 463,166 3%
Northern Virginia Transportation Commission 57,815 61,616 64,369 4%
Northern Virginia Criminal Justice Academy 582,560 652,669 660,004 1%
Northern Virginia Juvenile Detention Home 2,011,960 2,075,878 1,438,797 -31%Friends of Guest House 46,643 46,643 46,643 -Arlington Independent Media 433,410 415,240 397,978 -4%CrisisLink 130,526 130,526 130,526 -Northern Virginia Family Service 295,626 197,084 98,632 -50%Animal Welfare League of Arlington 1,419,517 1,419,517 1,419,517 -Legal Services of Northern Virginia 430,455 430,455 430,455 -Virginia Adult Probation and Parole 52,343 96,241 96,241 -Offender Aid and Restoration 456,145 456,145 456,145 -Literacy Council of Northern Virginia 23,457 23,457 23,457 -Capital Caring (formerly Capital Hospice) 14,051 14,051 14,051 -Ethiopian Community Development Council 140,573 140,573 140,573 -Endependence Center 92,566 92,566 92,566 -Northern Virginia Resource Center for the Deaf and Hard of Hearing Persons 48,354 48,354 52,649 9%Brain Injury Services 22,921 22,921 27,543 20%National Rehabilitation and Rediscovery Foundation, Inc. 11,059 11,059 15,223 38%Columbia Lighthouse for the Blind 29,576 29,576 - -100%Washington Metropolitan Ear - - 16,496 -
Total Regional Expenditure $7,227,028 $7,443,092 $6,724,786 -10%
Gro
up I
Gro
up
IIG
roup
III
Gro
up IV
344

REGIONALS/CONTRIBUTIONS BUDGET SUMMARY
GROUP I: CONTRIBUTION IS BASED ON A POPULATION-DRIVEN OR LAND USE FORMULA
Metropolitan Washington Council of Governments (COG)
Arlington County’s FY 2021 adopted share of the operating expenses of COG is based on its percentage of the total population for the entire metropolitan area. Starting in FY 2020, four previously grant funded programs under the federal Urban Area Security Initiative (UASI) transitioned to local funding sources. In addition, a Public Safety Fund was established to help administer these projects. The FY 2021 adopted contribution of $171,155 is the total cost of maintaining these programs ($147,098) and the Public Safety Fund ($24,057).
FY 2019 FY 2020 FY 2021 % ChangeActual Adopted Adopted ‘20 to ‘21
Membership Dues and Fees $286,839 $257,095 $266,822 4%Regional Emergency Preparedness Programs (formerly funded by UASI grants) - 172,008 171,155 -
Program Administration (Public Safety Fund) - 23,134 24,057 4%Programs - 148,874 147,098 -1%
Total Expenditures $286,839 $429,103 $437,977 2%
Northern Virginia Regional Commission (NVRC)
Arlington County's FY 2021 adopted contribution to NVRC includes only the general contribution. Beginning in the FY 2014 adopted budget, the contribution for Four-Mile Run has been transferred to the Stormwater Fund. The general contribution continues programs such as environmental and fiscal impact assistance, physical planning, human resources, and public safety. The general contribution requested by the Commission for FY 2021 is based on a $0.60 per capita rate.
FY 2019 FY 2020 FY 2021 % ChangeActual Adopted Adopted '20 to '21
Total Contribution $142,015 $143,444 $144,619 1%
Northern Virginia Community College (NVCC) Arlington County's FY 2021 adopted contribution to NVCC supports maintenance and operational costs not financed by General Assembly appropriations. In addition, funding of $12,600 is included for the Educational Foundation. In 1994, the Arlington County Board approved the establishment of the Mary Marshall Scholarship Fund at NVCC to honor the memory of Mary Marshall, who served Arlington County in the Virginia General Assembly. The funds support scholarships and tuition assistance for part-time students. The FY 2019 actual amount is higher due to FY 2018 funds being paid at the start of FY 2019 to correct an accounting error.
FY 2019 FY 2020 FY 2021 % ChangeActual Adopted Adopted '20 to '21
General Contribution $18,022 $23,991 $23,959 -Scholarship 25,200 12,600 12,600 -Total Contribution $43,222 $36,591 $36,559 -
345

REGIONALS/CONTRIBUTIONS BUDGET SUMMARY
Health Systems Agency of Northern Virginia
Northern Virginia jurisdictions are requested to contribute based on the percentage of the population represented by the jurisdiction. Arlington contributes 6.2 percent of the total operating budget.
FY 2019 FY 2020 FY 2021 % ChangeActual Adopted Adopted '20 to '21
Total Contribution $20,600 $20,600 $20,600 -
Northern Virginia Regional Park Authority (NVRPA)
The population-based contribution supports the Authority’s non-revenue producing programs. FY 2019 FY 2020 FY 2021 % Change
Actual Adopted Adopted '20 to '21
Total Contribution $434,795 $448,783 $463,166 3%
Northern Virginia Transportation Commission (NVTC)
Arlington County's FY 2021 adopted contribution to NVTC continues regional transportation efforts. The total NVTC budget is funded through contribution by the Commonwealth of Virginia as well as through direct contribution by member jurisdictions, including Arlington County. This direct contribution amount is apportioned to jurisdictions based on the percentage share of state assistance received through NVTC as specified in the Virginia Code. The remainder of NVTC's budget is derived from miscellaneous revenues, interest earnings, project chargebacks, and the re-appropriation of surplus funds.
FY 2019 FY 2020 FY 2021 % ChangeActual Adopted Adopted '20 to '21
Total Contribution $57,815 $61,616 $64,369 4%
GROUP II: CONTRIBUTION IS BASED ON A USAGE FORMULA
Northern Virginia Criminal Justice Academy
The Academy provides law enforcement training to police and sheriff recruits. The allocation of operating costs to participating jurisdictions is determined by a formula based on the number of sworn police officers and sheriff deputies.
FY 2019 FY 2020 FY 2021 % ChangeActual Adopted Adopted '20 to '21
Total Contribution $582,560 $652,669 $660,004 1%
Northern Virginia Juvenile Detention Home (NVJDH)
The County’s contribution is based on the percentage of beds used at the facility over the last three fiscal years. The remainder of NVJDH’s budget is derived from miscellaneous revenues, interest earnings, federal grants, state reimbursements, and other sources.
346
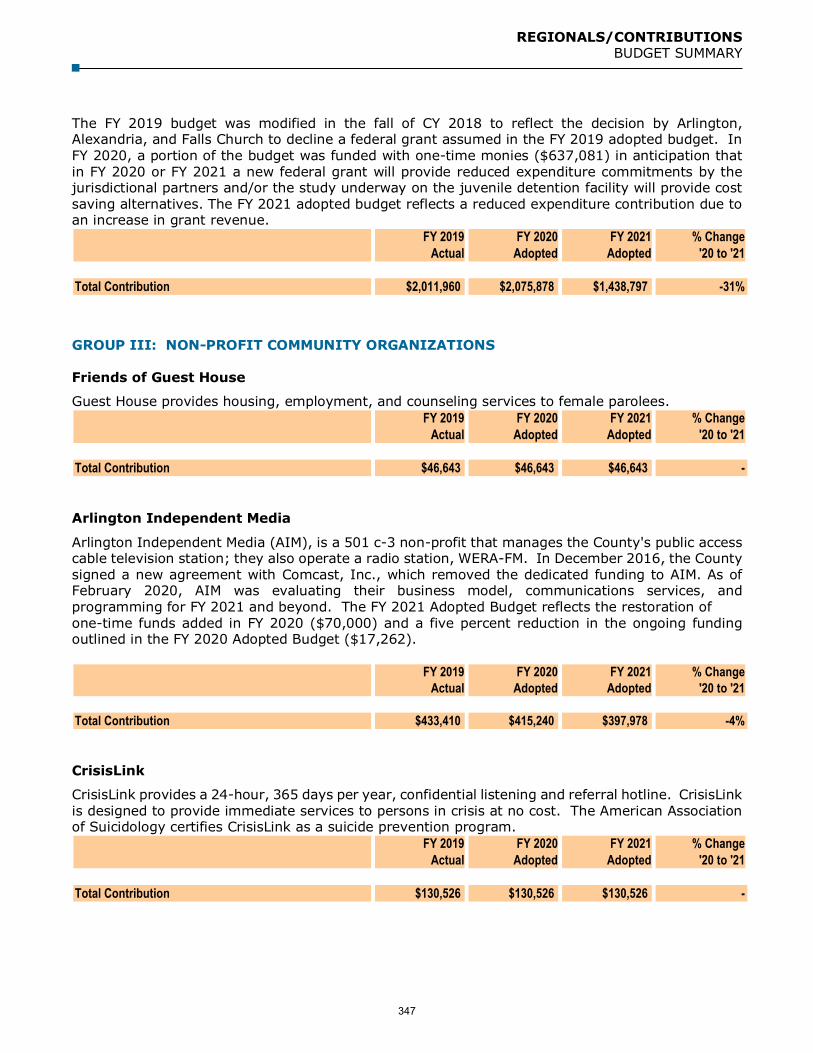
REGIONALS/CONTRIBUTIONS BUDGET SUMMARY
The FY 2019 budget was modified in the fall of CY 2018 to reflect the decision by Arlington, Alexandria, and Falls Church to decline a federal grant assumed in the FY 2019 adopted budget. In FY 2020, a portion of the budget was funded with one-time monies ($637,081) in anticipation that in FY 2020 or FY 2021 a new federal grant will provide reduced expenditure commitments by the jurisdictional partners and/or the study underway on the juvenile detention facility will provide cost saving alternatives. The FY 2021 adopted budget reflects a reduced expenditure contribution due to an increase in grant revenue.
FY 2019 FY 2020 FY 2021 % ChangeActual Adopted Adopted '20 to '21
Total Contribution $2,011,960 $2,075,878 $1,438,797 -31%
GROUP III: NON-PROFIT COMMUNITY ORGANIZATIONS
Friends of Guest House
Guest House provides housing, employment, and counseling services to female parolees. FY 2019 FY 2020 FY 2021 % Change
Actual Adopted Adopted '20 to '21
Total Contribution $46,643 $46,643 $46,643 -
Arlington Independent Media
Arlington Independent Media (AIM), is a 501 c-3 non-profit that manages the County's public access cable television station; they also operate a radio station, WERA-FM. In December 2016, the County signed a new agreement with Comcast, Inc., which removed the dedicated funding to AIM. As of February 2020, AIM was evaluating their business model, communications services, and programming for FY 2021 and beyond. The FY 2021 Adopted Budget reflects the restoration of one-time funds added in FY 2020 ($70,000) and a five percent reduction in the ongoing funding outlined in the FY 2020 Adopted Budget ($17,262).
FY 2019 FY 2020 FY 2021 % ChangeActual Adopted Adopted '20 to '21
Total Contribution $433,410 $415,240 $397,978 -4%
CrisisLink
CrisisLink provides a 24-hour, 365 days per year, confidential listening and referral hotline. CrisisLink is designed to provide immediate services to persons in crisis at no cost. The American Association of Suicidology certifies CrisisLink as a suicide prevention program.
FY 2019 FY 2020 FY 2021 % ChangeActual Adopted Adopted '20 to '21
Total Contribution $130,526 $130,526 $130,526 -
347

REGIONALS/CONTRIBUTIONS BUDGET SUMMARY
Northern Virginia Family Service
Northern Virginia Family Services provides referral and information services for Spanish-speaking residents of Arlington County. Additionally, the agency provides clients access to a range of legal services including employment services, social services, information and referral, immigration legal assistance, entrepreneurship program, foreclosure prevention counseling, and financial education and homeownership program.
The Northern Virginia Family Services (NVFS) contract will be eliminated over a three-year period with an annual reduction of $98,452 starting FY 2020. The contract will be eliminated in its entirety by FY 2022. These services will be transitioned to the Department of Human Services’ Community Assistance Bureau’s 6.25 FTE human services specialists over a three-year period with no reduced or delayed service delivery.
FY 2019 FY 2020 FY 2021 % ChangeActual Adopted Adopted '20 to '21
Total Contribution $295,626 $197,084 $98,632 -50%
Animal Welfare League of Arlington (AWLA)
The AWLA provides animal control, impoundment, and animal sheltering services for the County pursuant to a contract between the County and the AWLA.
FY 2019 FY 2020 FY 2021 % ChangeActual Adopted Adopted '20 to '21
Total Contribution $1,419,517 $1,419,517 $1,419,517 -
Legal Services of Northern Virginia This agency provides legal services to low-income, disabled, and elderly residents of Arlington who face the loss of critical need, such as personal safety, income, housing, medical benefits, education, or family stability. A portion of these services are earmarked for clients above 65 years of age, offset by a federal grant revenue source ($22,000) budgeted in the Department of Human Services.
FY 2019 FY 2020 FY 2021 % ChangeActual Adopted Adopted '20 to '21
Total Contribution $430,455 $430,455 $430,455 -
Virginia Adult Probation and Parole
Arlington County's contribution supplements the state-set salaries of 23 Commonwealth of Virginia Adult Parole employees.
In FY 2020, the Virginia Adult Probation and Parole employees received a supplement which equates to a 7.5 percent increase to salaries. The FY 2021 budget maintains the same level of funding.
FY 2019 FY 2020 FY 2021 % ChangeActual Adopted Adopted '20 to '21
Total Contribution $52,343 $96,241 $96,241 -
348

REGIONALS/CONTRIBUTIONS BUDGET SUMMARY
Offender Aid and Restoration (OAR)
OAR provides community-based correction and rehabilitation services to adult offenders and ex-offenders as well as community service placement and supervision for juveniles and adults.
FY 2019 FY 2020 FY 2021 % ChangeActual Adopted Adopted '20 to '21
Total Contribution $456,145 $456,145 $456,145 -
Literacy Council of Northern Virginia (LCNV)
LCNV provides one-on-one tutoring in reading and writing for functionally illiterate adults. The County’s contribution supports the literacy services and the Council’s general operating expenses.
FY 2019 FY 2020 FY 2021 % ChangeActual Adopted Adopted '20 to '21
Total Contribution $23,457 $23,457 $23,457 -
Capital Caring (formerly Capital Hospice)
Capital Caring provides care for patients with serious, progressive illnesses and their families with a comprehensive program of medical and psychosocial care. Programs include home care, inpatient care, and bereavement counseling. In addition to the General Fund support for Capital Caring stated below, the County will provide approximately $50,000 in annual financial support by exempting the organization’s Arlington property from real and personal property taxes.
FY 2019 FY 2020 FY 2021 % ChangeActual Adopted Adopted '20 to '21
Total Contribution $14,051 $14,051 $14,051 -
Ethiopian Community Development Council (ECDC)
ECDC provides information and referral, employment, housing, translation/interpretation, social, and support services to the Ethiopian refugee and immigrant community.
FY 2019 FY 2020 FY 2021 % ChangeActual Adopted Adopted '20 to '21
Total Contribution $140,573 $140,573 $140,573 -
Endependence Center
The Endependence Center of Northern Virginia (ECNV) is a community-based resource and advocacy center promoting independent living and equal access for all persons with disabilities in Northern Virginia.
FY 2019 FY 2020 FY 2021 % ChangeActual Adopted Adopted '20 to '21
Total Contribution $92,566 $92,566 $92,566 -
349

REGIONALS/CONTRIBUTIONS BUDGET SUMMARY
GROUP IV: CONTRIBUTION IS DETERMINED AFTER A COMPETITIVE REVIEW OF REGIONAL DISABILITY ORGANIZATIONS
Northern Virginia Resource Center for the Deaf and Hard of Hearing Persons
The Agency provides information and referral, case management, advocacy, and education services to individuals in the Northern Virginia metropolitan area who are deaf and hard of hearing to enhance their quality of life and to remove barriers to services in the community.
FY 2019 FY 2020 FY 2021 % ChangeActual Adopted Adopted '20 to '21
Total Contribution $48,354 $48,354 $52,649 9%
Brain Injury Services
This agency provides assistance to survivors of traumatic brain injury throughout Northern Virginia. Services include long-term case management, employment assistance, independent living skills training, transportation, respite care, and recreational/socialization programs. The funding from Arlington specifically supports the cost of a part-time case manager for Arlington residents with brain injuries.
FY 2019 FY 2020 FY 2021 % ChangeActual Adopted Adopted '20 to '21
Total Contribution $22,921 $22,921 $27,543 20%
National Rehabilitation and Rediscovery Foundation, Inc.
This agency provides dance and movement workshops to Arlington County residents with mobility and sensory-based disabilities to increase their physical and psychosocial health and recreational opportunities. The agency specializes in adapting to the individual needs of people with disabilities and focusing on abilities.
FY 2019 FY 2020 FY 2021 % ChangeActual Adopted Adopted '20 to '21
Total Contribution $11,059 $11,059 $15,223 38%
Columbia Lighthouse for the Blind
In FY 2021, the Disability Advisory Commission recommended to no longer provide funding for the Columbia Lighthouse for the Blind as part of the Regionals/ Contributions budget.
FY 2019 FY 2020 FY 2021 % ChangeActual Adopted Adopted '20 to '21
Total Contribution $29,576 $29,576 - -100%
Washington Metropolitan EAR
In FY 2021, the Disability Advisory Commission recommended funding for a new organization, the Metropolitan Washington EAR, Inc. (MWE). MWE provides reading and information services for blind, visually impaired, and physically disabled people who cannot effectively read print, see plays, watch
350

REGIONALS/CONTRIBUTIONS BUDGET SUMMARY
television programs and films, or view museum exhibits. MWE strives to substitute hearing for seeing; improving the lives of people with limited or no vision by enabling them to be well-informed, fully productive members of their families, their communities, and the working world.
FY 2019 FY 2020 FY 2021 % ChangeActual Adopted Adopted '20 to '21
Total Contribution - - $16,496 -
351

This page intentionally left blank
352

WASHINGTON METROPOLITAN AREA TRANSIT AUTHORITY - METRO
MISSION STATEMENT
To provide financial contributions, on behalf of Arlington County, to satisfy the formula-based subsidy requirements of Metrorail, Metrobus, and MetroAccess services provided by the Washington Metropolitan Area Transit Authority (WMATA) throughout the region.
WMATA is a regional public transportation partnership among the area’s state and local governments and the federal government. WMATA’s member jurisdictions are: Arlington and Fairfax counties, the cities of Alexandria, Fairfax, and Falls Church in Virginia, the District of Columbia, and Montgomery and Prince George’s counties in Maryland. Originally planned for FY 2020 but delayed until FY 2021, Loudoun County will become a member jurisdiction in Virginia once operations of Silver Line Phase II begin. The Authority’s major budgetary programs are Metrorail, Metrobus, and MetroAccess operations and the WMATA Capital Improvement Program (CIP).
FY 2021 PRIORITIES
WMATA’s priorities in FY 2021 are to continue to improve the safety, reliability, and affordability of the system; to begin operations of Silver Line Phase II; and to remain fiscally accountable by adhering to mandated subsidy growth caps required by the State of Maryland and the Commonwealth of Virginia.
SIGNIFICANT BUDGET CHANGES
The FY 2021 adopted General Fund transfer for WMATA is $47,808,764. This includes $46,622,208 of ongoing General Fund tax support and $1,186,556 of one-time funding for startup costs related to Silver Line Phase II. An increase to the County’s available state transit aid balances offsets a reduction in projected regional gas tax receipts. Together, these revenues offset some of the net increase to General Fund tax support for WMATA.
Major drivers for the FY 2021 operating budget are increases to labor and fringe costs, an ongoing reduction in ridership on Metrobus and Metrorail that is now also impacted by COVID-19, new customer initiatives to attract riders back to the system, and the startup and operating costs related to Silver Line Phase II. New to FY 2021 is the addition of federal funding provided to assist transit agencies nationwide that were impacted due to COVID-19. These funds can be used by agencies to address expenditures or revenues that were directly impacted by the stay at home orders and other steps taken to address the virus.
BUDGET DESCRIPTION
The Metro General Manager adopted a revised FY 2021 budget in May 2020 due to both the delay in planned opening of Silver Line Phase II and COVID-19. The revised Metro operating budget totals $2.1 billion, while the capital budget totals $1.8 billion. The operating budget is funded primarily from passenger fares and other revenues, with the balance paid by the local funding jurisdictions. In FY 2021, federal CARES act funding is included as a one-time funding source to offset revenue and expenditure impacts of the COVID-19 pandemic. Arlington’s share of the local jurisdictional operating subsidy, net of revenues, is approximately seven percent of the total. WMATA’s policy is to adjust fares biennially based on inflation. Fares were increased on average by six percent in FY 2015, and by approximately fourteen percent in FY 2018. A mix of fare increases were approved as part of the
353
WASHINGTON METROPOLITAN AREA TRANSIT AUTHORITY METRO
FY 2021 operating budget including a four percent increase to the base Metrorail fare, an increase in the per-mile charge after mile six from $0.288 to $0.326, increasing the max fare from $6 to $7, and a cash surcharge of $0.25 on Metrobus. Implementation of these increases has been deferred six months as part of the revised adopted FY 2021 budget.
Metrorail provides over 175 million passenger trips annually and serves 11 stations in Arlington along four lines (Orange, Silver, Yellow, and Blue). Metrobus provides over 120 million trips and has over 10,000 bus stops throughout the region. Many transit services in Arlington operate seven days per week providing up to 18 hours of daily coverage. Metro serves an overall population of approximately four million within a 1,500 square mile jurisdiction.
Capital Program Metro’s Adopted FY 2021 - FY 2026 Capital Improvement Program (CIP) financial plan relies on a forecasted investment of $10.4 billion funded by the federal government, state and local governments, and other sources. Of the $10.4 billion six-year plan: $2.3 billion comes from federal funding; state and local jurisdiction contributions total $2.6 billion including a match to PRIIA funding; other sources constitute $6 million; $283 million from reimbursable local projects; $3.0 billion comes from new dedicated funding approved in 2018 by the District of Columbia, Maryland, and the Commonwealth of Virginia; $2.2 billion comes from revenue bonds paid from the new dedicated funding.
Arlington’s share of WMATA’s Adopted CIP for FY 2021 is $21 million of baseline funding. As part of Virginia’s new $155 million of dedicated funding for WMATA’s capital program, Arlington must also contribute $7.2 million of capital funding to the Commonwealth of Virginia. The County’s contributions are funded with a combination of County General Obligation (GO) bonds, state transit aid, and gas tax revenues.
Funding Passenger and system revenues historically funded over half of the annual cost of operations. In FY 2021, it is projected that fare revenues will experience further declines and only cover approximately 18 percent of Metrobus and 60 percent of Metrorail related expenditures. The federal government approved the Coronavirus Aid, Relief, and Economic Security (CARES) Act in March 2020 that will help WMATA to offset some of the revenue and expenditure impacts due to the COVID-19 pandemic. The balance of operating funding comes from local jurisdictional subsidies.
The Northern Virginia Transportation Commission (NVTC) serves as fiscal agent for the Northern Virginia jurisdictions. NVTC receives state transit funds from the Department of Rail and Public Transit (DRPT) on behalf of Northern Virginia jurisdictions, and also federal funds not directly allocated to WMATA. In addition, the state collects a regional gas tax on behalf of NVTC jurisdictions to be used for payment to WMATA for qualifying operating and capital costs. These revenues are reflected as State Transit Aid and Regional Gas Tax receipts in the County budget description. Local governments provide the balance of required funding for transit operating programs. Arlington County uses General Fund dollars to finance this portion of its share of WMATA operations.
354

WASHINGTON METROPOLITAN AREA TRANSIT AUTHORITY METRO
METRO FINANCIAL SUMMARY
FY 2019 FY 2020 FY 2021 % ChangeActual Adopted Adopted ‘20 to ‘21
Metrobus 1 $34,497,793 $35,075,275 $35,151,115 -Metrorail 37,132,077 41,807,790 42,803,062 2%
Silver Line Phase II 3 - - 7,321,818 -MetroAccess 794,372 1,171,480 1,221,480 4%FY 2019 Labor and MetroAccess Costs 2 2,001,029 2,838,033 - -Total WMATA Subsidy 74,425,271 80,892,578 86,497,475 7%
Source of ContributionsState Transit Aid 29,025,399 29,253,799 28,163,330 -4%Regional Gas Tax 2,475,000 3,700,000 1,000,000 -73%
Subtotal, NVTC REVENUES 31,500,399 32,953,799 29,163,330 -12%Transportation Capital Fund - New Bus Operating Costs 1 323,843 341,142 341,142 - CARES Act Funding - - 9,184,239 -Total Revenues/Other Sources 31,824,242 33,294,941 38,688,711 16%
One-Time Funding 2,3 2,001,029 2,838,033 1,186,556 -58%Ongoing General Fund Tax Support 40,600,000 44,759,604 46,622,208 4%
TOTAL NET GENERAL FUND TAX SUPPORT 2 $42,601,029 $47,597,637 $47,808,764 -1 Beginning in FY 2019, the operating costs associated with new or increased service to bus routes as laid out in the County’s adopted Transit Development Plan (TDP) are partially funded from the Transportation Capital Fund. $341,142 in associated costs are included in FY 2021. 2 In November 2018, the WMATA board approved amendments to their fiscal year 2018 and 2019 budgets for increases to personal and contracted services. Payment for the FY 2019 budget amendment was due in two installments in FY 2019 & FY 2020 and were paid from one-time funds identified in the County’s budget. 3 Costs are based on an operational start date in Q4 FY 2021, resulting in required funding for nine months of startup costs and three months of operations.
355

This page intentionally left blank
356

ENTERPRISE, SPECIAL REVENUE
AND INTERNAL SERVICE
FUNDS
357

This page intentionally left blank
358

BALLSTON QUARTER TAX INCREMENT FINANCING AREA
Our Mission: To utilize strategic public investments in a private development project that benefits the community as a whole and results in a net positive fiscal impact to the County.
In July 2016, the County Board approved the Ballston Quarter Community Development Authority (CDA), the first CDA to be created in Arlington. This was the first step in creating a public-private partnership with the intent to transform the Ballston Common Mall into Ballston Quarter, a mixed-use urban retail center in the heart of the Ballston neighborhood. Creation of the CDA gives the County a financing mechanism to fund certain public infrastructure costs associated with the Ballston Quarter public-private redevelopment. The CDA boundaries include the parcels of the Ballston Common Mall owned by Forest City Realty Trust, Inc.
The Ballston Quarter CDA issued its $59.87 million Series 2016A and Series 2016B Revenue bonds on November 17, 2016. The bonds funded $43.4 million of public infrastructure improvements, as well as a debt service reserve fund, capitalized interest through project stabilization, and certain costs of issuance.
To fund these bonds issued for public infrastructure improvements, the Ballston Quarter Development and Financing Agreement created the Ballston Quarter Tax Increment Financing (TIF) district. TIF funding of up to 65 percent of the incremental real property, sales and use, and meals tax revenues generated within the TIF district boundaries is pledged, in each year following the base year set as of January 1, 2015 and until the earlier of the final maturity of the bonds, March 1, 2046, or the date on which all of the bonds have been paid in full.
SIGNIFICANT BUDGET CHANGES
The FY 2021 adopted expenditure budget for the Ballston Quarter Tax Increment Financing Area is $2,018,464. The funds will be transferred to the trustee for the Ballston Quarter CDA to fund the project stabilization fund and to pay debt service as part of the Ballston Quarter CDA Series 2016A & Series 2016B bond issuance. The FY 2021 budget reflects:
Revenue increases based on higher CY 2020 real estate assessments generating additionalreal estate taxes offset by lower projected sales and meals tax revenues due to the impact ofCOVID-19.
Expenditures increase due to the requirement to transfer all collected TIF revenues to theBallston Quarter CDA to pay debt service.
359

BALLSTON QUARTER TAX INCREMENT FINANCING AREA FUND SUMMARY
PROGRAM FINANCIAL SUMMARY
FY 2019 FY 2020 FY 2021 % Change Actual Adopted Adopted ‘20 to ‘21
Debt Service $65,420 $1,668,740 $2,018,464 21% Total Expenditures 65,420 1,668,740 2,018,464 21%
Total Revenues 410,060 $1,668,740 $2,018,464 21%
Change in Fund Balance $344,640 - - -
Permanent FTEs - - - - Temporary FTEs - - - - Total Authorized FTEs - - - -
BALLSTON QUARTER TAX INCREMENT FINANCING AREA FUND STATEMENT
FY 2019 FY 2020 FY 2020 FY 2021 ACTUAL ADOPTED RE-ESTIMATE ADOPTED
BALANCE, JULY 1 $65,420 - $410,060 -
REVENUE Real Estate Tax 410,060 $1,168,740 1,250,405 $1,811,540 Sales Tax - 20,000 112,767 - Meals Tax - 480,000 529,568 206,924 TOTAL REVENUE 410,060 1,668,740 1,892,740 2,018,464
TOTAL REVENUE & BALANCE 475,480 1,668,740 2,302,800 2,018,464
EXPENSES Transfer to Ballston Quarter CDA Trustee 65,420 1,668,740 2,302,800 2,018,464 TOTAL EXPENSES - $1,668,740 $2,302,800 $2,018,464
BALANCE, JUNE 30 $410,060 - - - The FY 2020 re-estimate column reflects staff’s current estimate that $905,767 of real estate tax revenues will be collected for the June 15, 2020 payment, and $642,335 of sales and meals taxes. These funds will be transferred, along with $410,060 of revenues collected in FY 2019 but disbursed in FY 2020, to the Ballston Quarter CDA Trustee to fund debt service.
360

BALLSTON QUARTER TAX INCREMENT FINANCING AREA TEN-YEAR HISTORY
EXPENDITURE, REVENUE AND FULL-TIME EQUIVALENT TRENDS
Note: The FY 2019 transfer to the Ballston Quarter CDA did not occur until August 2019, increasing FY 2019 fund balance by $344,640.
$ in 000sFY 2012
ActualFY 2013
ActualFY 2014
Actual FY 2015
ActualFY 2016
ActualFY 2017
ActualFY 2018
ActualFY 2019
Actual
FY 2020 Adopted Budget
FY 2021 Adopted Budget
EXP - - - - - $112 - $65 $1,669 $2,018
REV - - - - - $112 $65 $410 $1,669 $2,018
Change in Fund Balance - - - - - - $65 $345 - -
-
500
1,000
1,500
2,000
2,500EXP REV
361

BALLSTON QUARTER TAX INCREMENT FINANCING AREA TEN-YEAR HISTORY
Fiscal Year
Description FTEs
FY 2017 The Ballston Quarter CDA was created in July 2016, setting aside 65 percent of incremental personal property tax, sales tax, and meals taxes generated within the TIF district. A baseline value for these three taxes was set as of January 1, 2015. Expenditures increased based on increases in real estate assessments in the TIF district in FY 2016 compared to CY 2015.
FY 2018 Revenue projections in the tax district decreased due to decreases in real estate tax assessments in CY 2017 compared to CY 2016.
FY 2019 Revenue projections in the tax district increased due to increases in real estate tax assessments in CY 2018 compared to CY 2017.
FY 2020 Revenue projections increased in the tax district due to increases in real estate assessments, the County Board adopted real estate tax rate increase in CY 2019 and increases to the sales and meals taxes generated in the TIF district in FY 2020.
FY 2021 Revenue increases based on higher CY 2020 real estate assessments generating additional real estate taxes offset by lower projected sales and meals tax revenues due to the impact of COVID-19.
362

TRAVEL AND TOURISM PROMOTION FUND ARLINGTON CONVENTION & VISITORS SERVICE
Our Mission: The Arlington Convention and Visitors Service (ACVS) is a destination marketing organization that works to attract, inform, and serve Arlington visitors and hospitality partners
while supporting an exceptional visitor experience.
CONVENTION AND VISITORS SERVICE
ACVS’s success is reflected in continually growing shares of the Washington area’s meeting, convention, and leisure markets as well as in increased visitor spending and repeat visitation. ACVS strategically targets meeting/group professionals and domestic/international leisure travelers to build awareness of, and drive bookings to, Arlington hotels – particularly during the off-peak periods of late summer, mid-winter, and weekends year-round. ACVS also partners closely with local hotels, restaurants, stores, attractions, and arts organizations to bring visitors the best and latest information, ensuring they have an excellent local experience that inspires increased spending and repeat visitation. ACVS marketing and client/partner engagement is directly tied to increased Transient Occupancy Tax revenue and Sales and Meals Tax revenues that support County initiatives through the General Fund.
Important Strategic Objectives for ACVS include: 1. Visitor Attraction: Aggressively market Arlington as a premier destination for domestic
and international leisure travel, meetings, and conventions, and as the best place to stay,shop, dine, and be entertained when visiting the nation’s capital. Apply best practices indestination marketing, meetings and conventions sales, and small business/arts promotionto attract business travelers, vacationers, meetings, and groups to Arlington resulting inincreased hotel occupancy.
2. Increased Visitor Spending: Creatively and proactively provide compelling, high-qualityinformation to Arlington guests, influencing them to dine, shop, and be entertained in ourlively, walkable urban villages. Strategically inform local hospitality employees aboutArlington stores, restaurants, arts organizations, and transportation options to drivespending and repeat visitation.
Programs and primary activities of ACVS include:
Destination marketing and promotion Meetings and conventions sales Visitor and convention services Small business and arts promotion Tourism infrastructure Hospitality community engagement
Arlington County’s enabling legislation to levy a Transient Occupancy Tax add-on (0.25 percent) to support this fund was made permanent by the Virginia General Assembly in the 2020 legislative session.
363

TRAVEL AND TOURISM PROMOTION FUND
ARLINGTON CONVENTION & VISITORS SERVICE
SIGNIFICANT BUDGET CHANGES
The FY 2021 adopted expenditure budget for the Travel and Tourism Promotion Fund is $1,209,582, a 22 percent decrease from the FY 2020 adopted budget. The FY 2021 adopted budget reflects:
Personnel changes due to an increase in the County’s cost for employee health insurance, offset by lower retirement contributions based on current actuarial projections and staff costs due to turnover.
Non-personnel decreases due to the decrease in trade and promotion funding as a result oflower revenue projections ($288,940) and a reduction in annual expense for maintenance andreplacement of County vehicles ($1,068).
Revenue decreases due to lower revenue projections in transient occupancy taxes ($337,118)as a result of the COVID-19 outbreak.
PROGRAM FINANCIAL SUMMARY
FY 2019 FY 2020 FY 2021 % ChangeActual Adopted Adopted ‘20 to ‘21
Personnel $739,810 $838,315 $791,205 -6%Non-Personnel 738,480 708,385 418,377 -41%Total Expenditures 1,478,290 1,546,700 1,209,582 -22%
Transient Occupancy Tax 1,231,590 1,300,000 962,882 -26%Transfer from the General Fund 246,700 246,700 246,700 -Total Revenues $1,478,290 $1,546,700 $1,209,582 -22%
Change in Fund Balance - - - -
Permanent FTEs 7.00 7.00 7.00Temporary FTEs - - - Total Authorized FTEs 7.00 7.00 7.00
364

TRAVEL AND TOURISM PROMOTION FUND
ARLINGTON CONVENTION & VISITORS SERVICE
TRAVEL AND TOURISM PROMOTION FUND FUND STATEMENT
FY 2019 FY 2020 FY 2020 FY 2021ACTUAL ADOPTED RE-ESTIMATE* ADOPTED
Beginning Balance, July 1 - - - -
Transient Occupancy Tax Revenue $1,231,590 $1,300,000 $1,300,000 $962,882General Fund Transfer In 246,700 246,700 246,700 246,700 Total Revenues 1,478,290 1,546,700 1,546,700 1,209,582
Total Balance, Revenues and Transfers In 1,478,290 1,546,700 1,546,700 1,209,582
Personnel 739,810 838,315 838,315 791,205 Operating 738,480 708,385 708,385 418,377 Total Expenditures $1,478,290 $1,546,700 $1,546,700 $1,209,582
Closing Balance, June 30 - - - - *FY 2020 re-estimate excludes the anticipated revenue shortfall due to the COVID-19 outbreak.
365

TRAVEL AND TOURISM PROMOTION FUND TEN-YEAR HISTORY
EXPENDITURE, REVENUE, AND FULL-TIME EQUIVALENT TRENDS
$ in 000sFY 2012
ActualFY 2013
ActualFY 2014
ActualFY 2015
ActualFY 2016
ActualFY 2017
ActualFY 2018
ActualFY 2019
ActualFY 2020
AdoptedFY 2021
AdoptedEXP $862 - - - - $1,711 $1,673 $1,478 $1,547 $1,210REV $771 - - - - $1,889 $1,498 $1,478 $1,547 $1,210FTEs 10.80 - - - - 7.80 7.00 7.00 7.00 7.00
0
5
10
15
$0
$200
$400
$600
$800
$1,000
$1,200
$1,400
$1,600
$1,800
$2,000FTEs EXP REV
366

TRAVEL AND TOURISM PROMOTION FUND TEN-YEAR HISTORY
Fiscal Year Description FTEs
FY 2012 Personnel expenses decreased primarily due to reduction in operations based on lower Transient Occupancy Tax (TOT) which supports this fund. The County Board has directed staff beginning January 1 to focus on other Arlington Economic Development (AED) activities such as promoting and marketing businesses and cultural events within Arlington County, as well as enhancing small business initiatives.
Transient Occupancy Tax (TOT) revenues decreased by 52 percent due tothe loss of the TOT for hotel stays beginning January 1, 2012. The statelegislation that authorizes Arlington County to assess this additional 0.25percent transient occupancy tax was not renewed by the State Assemblyand expires on December 31, 2011.
Miscellaneous revenues decreased ($2,500) due to the closure of theVisitor Center at Pentagon Row which sold County merchandise. The newMobile Visitor Center is purely informational with no merchandise or retailsales. County merchandise can now be purchased at the Plaza Librarybranch location.
FY 2013 The additional Transient Occupancy Tax add-on (0.25 percent) which has supported the fund since January 1, 1991, was not re-established by the State Assembly in the spring of CY 2011. Arlington County’s enabling legislation to impose this add-on tax expired on January 1, 2012.
For FY 2013, the Travel and Tourism Promotion Fund did not exist as aSpecial Revenue fund. The County Board adopted a reduced conventionand visitor services program in Arlington Economic Development’s GeneralFund budget.
FY 2017 Arlington’s enabling legislation to levy the additional Transient Occupancy Tax add-on (0.25%) was re-established by the General Assembly for the FY 2017 budget year. The County Board adopted an ordinance after budget adoption to amend Chapter 40 (Transient Occupancy Tax) of the Code of Arlington County to add an additional 0.25 percent transient occupancy tax levy for the purpose of promoting tourism and business travel in Arlington County. The County Board appropriated $1.25 million in revenue and expense to the Travel and Tourism Promotion Fund along with 2.0 limited term positions.
2.0
After budget adoption, the County Board transferred Arlington Conventionand Visitor Services from the General Fund to the Travel and Tourism Fund($626,148, 5 FTEs, 0.80 Temporary FTEs).
5.8
FY 2018 A 0.80 temporary FTE was transferred to the AED Director’s Office line of business in the General Fund.
(0.8)
367

TRAVEL AND TOURISM PROMOTION FUND TEN-YEAR HISTORY
Fiscal Year Description FTEs
FY 2019 Decreased trade and promotion funding ($159,163) and reallocated a portion of this funding for contracted services related to website maintenance ($110,000).
Revenue increased due to projections of hotel occupancy and rates hotel($27,500).
Arlington’s enabling legislation to levy the additional Transient OccupancyTax add-on (0.25%) was re-established by the General Assembly for theFY 2019 budget year with a sunset effective July 1, 2021.
FY 2020 Arlington’s enabling legislation to levy the additional Transient Occupancy Tax add-on (0.25%) was made permanent by the General Assembly in the 2020 legislative session.
FY 2021 Decreased trade and promotion funding ($288,940) as a result of lower revenue projections.
Revenue decreased due to lower revenue projections in TransientOccupancy Taxes ($337,118) as a result of the COVID-19 outbreak.
368

BALLSTON BUSINESS IMPROVEMENT DISTRICT FUND Arlington Economic Development
Our Mission: To provide supplemental services in support of successful revitalization of Ballston and its economic development
In December 2010, the Arlington County Board, authorized by state enabling legislation, passed an ordinance to establish a Business Improvement District (BID) in Ballston as of January 1, 2011. The property owners within this geographic area have a separate and additional tax rate to fund the BID’s programs. The Ballston Business Improvement Corporation (BBIC), an organization whose Board of Directors and committee membership includes owners and tenants of property located in the District, oversees the work program.
The Ballston BID provides funding for:
Marketing & Promotion Public Realm Community Events Transportation Economic Development Administration & Management
SIGNIFICANT BUDGET CHANGES
The FY 2021 adopted budget for the Ballston Business Improvement District is $1,569,935, a five percent increase from the FY 2020 adopted budget. This expenditure budget includes $39,248 budgeted contribution to the BID’s reserve fund balance, which is the maximum contribution of two and a half percent of fiscal year revenues.
The adopted CY 2020 real estate tax rate is $0.045 per $100 of assessed value, no changefrom the CY 2019 tax rate. Due to an increase in real estate assessed values, revenueincreases five percent ($72,419).
PROGRAM FINANCIAL SUMMARY
FY 2019 FY 2020 FY 2021 % ChangeActual Adopted Adopted ‘20 to ‘21
Personnel - - - - Non-Personnel $1,614,759 $1,497,516 $1,569,935 5%Total Expenditures 1,614,759 1,497,516 1,569,935 5%
Total Revenues 1,658,339 1,497,516 1,569,935 5%
Change in Fund Balance $43,580 $37,438 $39,248 5%
369

BALLSTON BUSINESS IMPROVEMENT DISTRICT FUND FUND BUDGET SUMMARY
Notes:
1) A five percent reserve for uncollected taxes and assessment appeals reductions is required forthe fund. This reserve is reflected in the “Delinquency or Appeals Reserve” portion of the fundbalance in combination with the Delinquency or Appeals expense. However, there is an annualcap of 2.5 percent of budgeted revenues in contributions to the reserve. The FY 2021 adoptedbudget reflects adherence to this reserve balance policy.
2) The FY 2020 re-estimate is the current projection of expenses and revenues.3) Revenue is credited to the BID each year on a calendar year, rather than fiscal year basis. For
example, the FY 2020 revenue is from the June 2019 and October 2019 tax payments.Therefore, the FY 2020 re-estimated revenue is not impacted by the January 2020assessments.
FY 2019 FY 2020 FY 2020 FY 2021ACTUAL ADOPTED RE-ESTIMATE ADOPTED
ADJUSTED BALANCE, JULY 1Delinquency or Appeals Reserve $14,621 $58,329 $58,201 $63,465TOTAL BALANCE 14,621 58,329 58,201 63,465
REVENUESInterest Earned on Fund Balance 1,031 - - - Special Assessment District Revenue 1,657,308 1,497,516 1,464,686 1,569,935 TOTAL REVENUES 1,658,339 1,497,516 1,464,686 1,569,935
TOTAL BALANCE AND REVENUES 1,672,960 1,555,845 1,522,887 1,633,400
EXPENSESOperating Budget (incl. Admin Fee) 1,614,759 1,460,078 1,459,422 1,530,687 Drawdown Requests - - - -TOTAL EXPENSES 1,614,759 1,460,078 1,459,422 1,530,687
Budgeted Contribution to Delinquency or Appeals - 37,438 5,264 39,248
CLOSING BALANCE, JUNE 30 $58,201 $95,767 $63,465 $102,713
BALLSTON BUSINESS IMPROVEMENT DISTRICTFUND STATEMENT
370

BALLSTON BUSINESS IMPROVEMENT DISTRICT FUND TEN-YEAR HISTORY
EXPENDITURE AND REVENUE TRENDS
$ in 000sFY 2012
Actual FY 2013
Actual FY 2014
Actual FY 2015
Actual FY 2016
Actual FY 2017
ActualFY 2018
Actual FY 2019
Actual
FY 2020 Adopted
Budget
FY 2021 Adopted
BudgetEXP $1,211 $1,445 $1,500 $1,540 $1,515 $1,582 $1,500 $1,615 $1,498 $1,570REV $1,235 $1,473 $1,495 $1,541 $1,538 $1,588 $1,438 $1,658 $1,498 $1,570
$1,200
$1,300
$1,400
$1,500
$1,600
$1,700
EXP
REV
371

BALLSTON BUSINESS IMPROVEMENT DISTRICT FUND TEN-YEAR HISTORY
Fiscal Year Description FTEs
FY 2012 The County Board adopted the Ballston Business Improvement DistrictFund with a real estate assessment tax set at $0.045 for each $100 of assessed value.
FY 2013 The County Board set the Ballston BID tax rate at $0.045 for each $100 ofassessed value.
FY 2014 The County Board set the Ballston BID tax rate at $0.045 for each $100 ofassessed value.
FY 2015 The County Board set the Ballston BID tax rate at $0.045 for each $100 ofassessed value.
FY 2016 The County Board set the Ballston BID tax rate at $0.045 for each $100 ofassessed value.
FY 2017 The County Board set the Ballston BID tax rate at $0.045 for each $100 ofassessed value.
FY 2018 The County Board set the Ballston BID tax rate at $0.045 for each $100 ofassessed value.
FY 2019 The County Board adopted a one-time tax rate increase for the BallstonBID at $0.053 for $100 of assessed value.
FY 2020 The County Board set the Ballston BID tax rate at $0.045 for each $100 ofassessed value.
FY 2021 The County Board set the Ballston BID tax rate at $0.045 for each $100 ofassessed value.
372

ROSSLYN BUSINESS IMPROVEMENT DISTRICT FUND Arlington Economic Development
Our Mission: To provide supplemental services in support of successful revitalization of Rosslyn and its economic development
In December 2002, the Arlington County Board, authorized by state enabling legislation, passed an ordinance to establish a Business Improvement District (BID) in Rosslyn. The property owners within this geographic area have a separate and additional tax rate to fund the BID’s programs. The County Board adopted the Rosslyn Business Improvement District in FY 2004. Rosslyn Business Improvement Corporation (RBIC), an organization whose Board of Directors and committee membership includes owners and tenants of property located in the District, oversees the work program.
The Rosslyn BID provides funding for:
Marketing & Promotion Public Realm Community Events Transportation Economic Development Administration & Management
SIGNIFICANT BUDGET CHANGES
The FY 2021 adopted budget for the Rosslyn Business Improvement District is $4,053,393, a three percent increase from the FY 2020 adopted budget. The expenditure budget includes $89,692 budgeted contribution to the BID’s reserve fund balance to achieve the target of five percent of the fiscal year revenues.
The adopted CY 2020 real estate tax rate is $0.078 for each $100 of assessed value, no changefrom the CY 2019 tax rate. Due to an increase in assessed real estate values, revenueincreases three percent ($115,055).
PROGRAM FINANCIAL SUMMARY
FY 2019 FY 2020 FY 2021 % ChangeActual Adopted Adopted ‘20 to ‘21
Personnel - - - - Non-Personnel $3,749,849 $3,938,338 $4,053,393 3%Total Expenditures 3,749,849 3,938,338 4,053,393 3%
Total Revenues 3,637,271 3,938,338 4,053,393 3%
Change in Fund Balance ($112,578) $80,000 $89,692 12%
373

ROSSLYN BUSINESS IMPROVEMENT DISTRICT FUND FUND BUDGET SUMMARY
FY 2019 FY 2020 FY 2020 FY 2021ACTUAL ADOPTED RE-ESTIMATE ADOPTED
ADJUSTED BALANCE, JULY 1Delinquency or Appeals Reserve $225,555 $184,473 $115,966 $115,966TOTAL BALANCE 225,555 184,473 115,966 115,966
REVENUESInterest Earned on Fund Balance 4,831 - - - Special Assessment District Revenue 3,635,429 3,938,338 3,833,090 4,053,393TOTAL REVENUES 3,640,260 3,938,338 3,833,090 4,053,393
TOTAL BALANCE AND REVENUES 3,865,815 4,122,811 3,949,056 4,169,359
EXPENSESOperating Budget (incl. Admin Fee) 3,704,779 3,858,338 3,833,090 3,963,701Drawdown Requests 45,070 - - - TOTAL EXPENSES 3,749,849 3,858,338 3,833,090 3,963,701
Budgeted Contribution to Delinquency or Appeals - 80,000 - 89,692
CLOSING BALANCE, JUNE 30 $115,966 $264,473 $115,966 $205,658
ROSSLYN BUSINESS IMPROVEMENT DISTRICTFUND STATEMENT
Notes: 1) A five percent reserve for uncollected taxes and assessment appeals reductions is required for
the fund. This reserve is reflected in the “Delinquency or Appeals Reserve” portion of the fundbalance in combination with the Delinquency or Appeals expense. The FY 2021 adopted budgetreflects adherence to this reserve balance policy.
2) The FY 2020 re-estimate is the current projection of expenses and revenues.3) Revenue is credited to the BID each year on a calendar year, rather than fiscal year basis. For
example, the FY 2020 revenue is from the June 2019 and October 2019 tax payments.Therefore, the FY 2020 re-estimated revenue is not impacted by the January 2020assessments.
374

ROSSLYN BUSINESS IMPROVEMENT DISTRICT FUND TEN-YEAR HISTORY
EXPENDITURE AND REVENUE TRENDS
$ in 000s FY 2012
Actual FY 2013
Actual FY 2014
Actual FY 2015
Actual FY 2016
Actual FY 2017
Actual FY 2018
Actual FY 2019
Actual
FY 2020 Adopted
Budget
FY 2021 Adopted
BudgetEXP $3,210 $3,491 $3,508 $3,654 $3,449 $3,489 $3,624 $3,750 $3,938 $4,053REV $3,146 $3,524 $3,524 $3,583 $3,494 $3,517 $3,669 $3,637 $3,938 $4,053
$1,000
$1,500
$2,000
$2,500
$3,000
$3,500
$4,000
$4,500
EXP REV
375
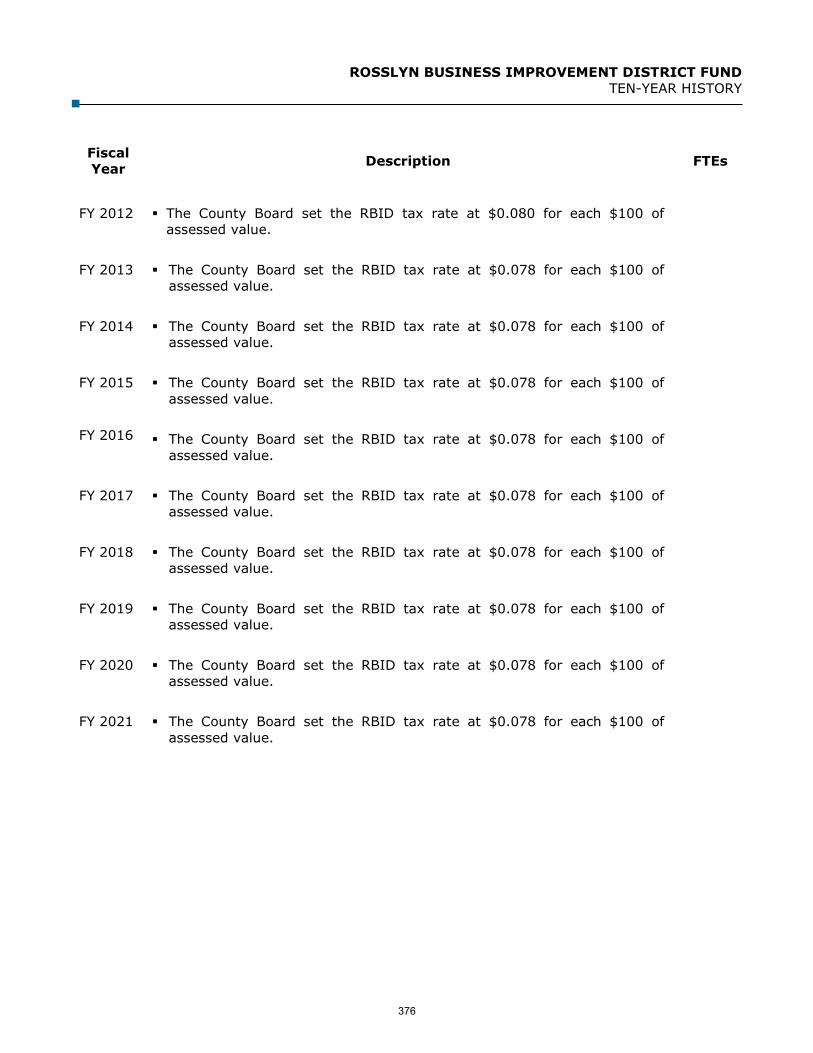
ROSSLYN BUSINESS IMPROVEMENT DISTRICT FUND TEN-YEAR HISTORY
Fiscal Year Description FTEs
FY 2012 The County Board set the RBID tax rate at $0.080 for each $100 ofassessed value.
FY 2013 The County Board set the RBID tax rate at $0.078 for each $100 ofassessed value.
FY 2014 The County Board set the RBID tax rate at $0.078 for each $100 ofassessed value.
FY 2015
FY 2016
The County Board set the RBID tax rate at $0.078 for each $100 ofassessed value.
The County Board set the RBID tax rate at $0.078 for each $100 ofassessed value.
FY 2017 The County Board set the RBID tax rate at $0.078 for each $100 ofassessed value.
FY 2018 The County Board set the RBID tax rate at $0.078 for each $100 ofassessed value.
FY 2019 The County Board set the RBID tax rate at $0.078 for each $100 ofassessed value.
FY 2020 The County Board set the RBID tax rate at $0.078 for each $100 ofassessed value.
FY 2021 The County Board set the RBID tax rate at $0.078 for each $100 ofassessed value.
376

CRYSTAL CITY BUSINESS IMPROVEMENT DISTRICT FUND Arlington Economic Development
Our Mission: To provide supplemental services in support of successful revitalization of Crystal City and its economic development
In April 2006, the Arlington County Board, authorized by state enabling legislation, passed an ordinance to establish a Business Improvement District (BID) in Crystal City. The property owners within this geographic area have a separate and additional tax rate to fund the BID’s programs. The BID’s Board of Directors and committee membership, who oversee the work program, includes owners and tenants of the properties located in the District. In September 2019, the Arlington County Board passed an ordinance to expand the boundaries of the BID to include parcels from the Arlington portion of Potomac Yard and Pentagon City submarkets which expanded its geographic boundaries by 76 percent.
The Crystal City BID provides funding for:
Marketing & Promotion Public Realm Community Events Transportation Economic Development Administration & Management
SIGNIFICANT BUDGET CHANGES
The FY 2021 adopted expenditure budget for the expanded Crystal City Business Improvement District is $4,739,568, a 71 percent increase from the FY 2020 adopted budget. This expenditure budget includes $118,489 budgeted contribution to the BID’s reserve fund balance, which is the maximum contribution of two and a half percent of fiscal year revenues.
The adopted CY 2020 real estate tax rate is $0.043 for each $100 of assessed value, nochange from the CY 2019 tax rate. Revenue increased 71 percent due to higher assessedvalues for the pre-expansion parcels ($126,925) and the addition of the expansion parcels($1,848,987).
PROGRAM FINANCIAL SUMMARY
FY 2019 FY 2020 FY 2021 % ChangeActual Adopted Adopted ‘20 to ‘21
Personnel - - - -Non-Personnel $2,520,507 $2,763,656 $4,739,568 71%Total Expenditures 2,520,507 2,763,656 4,739,568 71%
Total Revenues 2,553,659 2,763,656 4,739,568 71%
Change in Fund Balance $33,152 $69,091 $118,489 71%
377

CRYSTAL CITY BUSINESS IMPROVEMENT DISTRICT FUND FUND BUDGET SUMMARY
FY 2019 FY 2020 FY 2020 FY 2021ACTUAL ADOPTED RE-ESTIMATE ADOPTED
ADJUSTED BALANCE, JULY 1Delinquency or Appeals Reserve $37,940 $59,869 $68,103 $25,756TOTAL BALANCE 37,940 59,869 68,103 25,756
REVENUESInterest Earned on Delinquency/Appeals Reserve 1,842 - - - Special Assessment District Revenue 2,548,828 2,763,656 2,649,907 4,739,568 TOTAL REVENUES 2,550,670 2,763,656 2,649,907 4,739,568
TOTAL BALANCE AND REVENUES 2,588,610 2,823,525 2,718,010 4,765,324
EXPENSESOperating Budget (Admin Fee) 2,520,507 2,694,565 2,692,254 4,621,079 Drawdown Requests - - - - TOTAL EXPENSES 2,520,507 2,694,565 2,692,254 4,621,079
Budgeted Contribution to Delinquency or Appeals - 69,091 - 118,489
CLOSING BALANCE, JUNE 30 $68,103 $128,960 $25,756 $144,245
CRYSTAL CITY BUSINESS IMPROVEMENT DISTRICTFUND STATEMENT
Notes: 1) A five percent reserve for uncollected taxes and assessment appeals reductions is required
for the fund. This reserve is reflected in the “Delinquency or Appeals Reserve” portion of thefund balance in combination with the Delinquency or Appeals expense. However, there is anannual cap of 2.5 percent of budgeted revenues in contributions to the reserve. TheFY 2021 adopted budget reflects adherence to this reserve balance policy.
2) The FY 2020 re-estimate is the current projection of expenses and revenues.3) Revenue is credited to the BID each year on a calendar year, rather than fiscal year basis.
For example, the FY 2020 revenue is from the June 2019 and October 2019 tax payments.Therefore, the FY 2020 re-estimated revenue is not impacted by the January 2020assessments.
378

CRYSTAL CITY BUSINESS IMPROVEMENT DISTRICT FUND TEN-YEAR HISTORY
EXPENDITURE AND REVENUE TRENDS
$ in 000s FY 2012
Actual FY 2013
Actual FY 2014
Actual FY 2015
Actual FY 2016
Actual FY 2017
Actual FY 2018
Actual FY 2019
Actual
FY 2020 Adopted
Budget
FY 2021 Adopted
BudgetEXP $2,295 $2,540 $2,526 $2,560 $2,514 $2,523 $2,614 $2,521 $2,764 $4,740REV $2,270 $2,532 $2,523 $2,551 $2,529 $2,539 $2,599 $2,554 $2,764 $4,740
$0
$500
$1,000
$1,500
$2,000
$2,500
$3,000
$3,500
$4,000
$4,500
$5,000
EXP REV
379

CRYSTAL CITY BUSINESS IMPROVEMENT DISTRICT FUND TEN-YEAR HISTORY
Fiscal Year Description FTEs
FY 2012 The County Board set the Crystal City BID tax rate at $0.043 for each $100of assessed value.
FY 2013 The County Board set the Crystal City BID tax rate at $0.043 for each $100of assessed value.
FY 2014 The County Board set the Crystal City BID tax rate at $0.043 for each $100of assessed value.
FY 2015 The County Board set the Crystal City BID tax rate at $0.043 for each $100of assessed value.
FY 2016 The County Board set the Crystal City BID tax rate at $0.043 for each $100of assessed value.
FY 2017 The County Board set the Crystal City BID tax rate at $0.043 for each $100of assessed value.
FY 2018 The County Board set the Crystal City BID tax rate at $0.043 for each $100of assessed value.
FY 2019 The County Board set the Crystal City BID tax rate at $0.043 for each $100of assessed value.
FY 2020 The County Board set the Crystal City BID tax rate at $0.043 for each $100of assessed value.
FY 2021 The County Board set the Crystal City BID tax rate at $0.043 for each $100of assessed value.
380

HOUSING AND COMMUNITY DEVELOPMENT FUND
Department of Community Planning, Housing and Development
Our Mission: To improve the housing, neighborhood, and economic conditions of Arlington County's low and moderate-income residents by effectively administering the Community
Development Block Grant (CDBG), HOME Investment Partnerships Program (HOME) grant, and Community Services Block Grant (CSBG).
Housing and Community Development staff responsibilities include:
Develop the annual Community Development Fund grant recommendations. Provide technical assistance, coordinate, monitor, and evaluate community development
activities in Arlington. Ensure compliance of CDBG, CSBG, and HOME- eligible activities with federal regulations (e.g.
environmental, labor standards, Section 3 employment opportunities and acquisition) through financial management and oversight.
Promote citizen participation in the planning, implementation, and evaluation of these programs.
Provide staff support for the Community Development Citizens Advisory Committee (CDCAC).
SIGNIFICANT BUDGET CHANGES
The FY 2021 Adopted budget totals $3,378,470 and includes funding from program income ($900,000), Community Development Block Grant (CDBG) funds ($1,410,969), federal HOME program funds ($763,647), and CSBG grant funds ($303,854). The City of Falls Church will receive $59,811 of the CDBG grant funds and $32,302 of the HOME grant funds under a Cooperation Agreement with the County.
Personnel changes due to lower retirement contributions based on current actuarial projections and the reclassification of an FTE funded with federal dollars, partially offset by an increase in the County’s cost for employee health insurance.
Non-personnel increases from the FY 2020 revised budget due to an increase in CDBG, HOME,and CSBG funding.
The Program Financial Summary on the following page includes revised FY 2020 revenue and expenses from County Board actions taken in September 2019 and May 2020 (Community Development Action Plans). The table provides a comparative percent change based on the FY 2020 revised budget to FY 2021 adopted budget.
381

HOUSING AND COMMUNITY DEVELOPMENT FUND FUND SUMMARY
PROGRAM FINANCIAL SUMMARY
1 FY 2019 actuals include revenue from prior grant years as well as carry-over funds. 2 FY 2020 Revised reflects the final 2020 Community Development Action Plan which was approved by the County Board on September 21, 2019. In addition, $6,383 in CSBG funds are also included from the Amended FY 2020 Annual Action Plan which was approved by the County Board on May 19, 2020. 3 The Amended FY 2020 Annual Action Plan includes $830,027 in federal CARES Act CDBG funds and $239,159 in CSBG funds for COVID-19 relief which are not accounted for in the table above. Any unspent funds will be carried over into FY 2021. 4 FY 2020 Revised includes $500,000 in CDBG program income and $400,000 for HOME program income. 5 FY 2021 Adopted reflects the final 2021 Community Development Action Plan which was approved by the County Board on April 25, 2020.
FY 2019 FY 2020 FY 2021 % ChangeActual1 Revised 2,3 Adopted5 ‘20 Revised to ‘21
Personnel $391,575 $586,770 $521,725 -11%Non-Personnel 4,663,949 2,650,755 2,856,745 8%Total Expenditures 5,055,524 3,237,525 3,378,470 4%
Program Income4/Revolving Loan 1,925,082 900,000 900,000 - Grants - CDBG 2,782,055 1,345,258 1,410,969 5%Grants - HOME 100,138 712,272 763,647 7%Grants - CSBG 248,249 279,995 303,854 9%Total Revenues $5,055,524 $3,237,525 $3,378,470 4%
Net Tax Support - - - Permanent FTEs 4.50 4.50 4.50Temporary FTEs - - -Total Authorized FTEs 4.50 4.50 4.50
382

HOUSING AND COMMUNITY DEVELOPMENT FUND FUND SUMMARY
FY 2019 FY 2020 FY 2021 % ChangeActual Revised Adopted '20 Revised to '21
Beginning Balance, July 1 - - - - Program Income/Revolving Loan $1,925,082 $900,000 $900,000 - Federal Revenue (CDBG) 2,782,055 1,345,258 1,410,969 5%Federal Revenue (HOME) 100,138 712,272 763,647 7%Federal/State Revenue (CSBG) 248,249 279,995 303,854 9%Total Balance and Revenues 5,055,524 3,237,525 3,378,470 4%
Total Expenditures $5,055,524 $3,237,525 $3,378,470 4%
Closing Balance, June 30 - - - -
CPHD COMMUNITY DEVELOPMENT FUND, FUND STATEMENT
383

HOUSING AND COMMUNITY DEVELOPMENT FUND PROGRAM DESCRIPTION
DESCRIPTION OF FY 2021 HOUSING AND COMMUNITY DEVELOPMENT FUND PROGRAMS
The Housing and Community Development Fund is used to support a variety of affordable housing and community development programs. These programs support the goals of the County’s FY 2016-2021 Consolidated Plan, which include the following:
1. Create and sustain affordable housing;2. Promote healthy and self-sufficient families;3. Stabilize households at risk of homelessness; and,4. Foster vibrant and sustainable neighborhoods.
In addition to affordable housing and community development programs, a portion of Housing and Community Development Fund dollars support administrative and planning functions for these programs, including funds for 4.5 FTEs within the Housing Division of the Department of Community Planning, Housing and Development. Further, as a result of a cooperation agreement, the City of Falls Church also receives a portion of the County’s CDBG and HOME funds for housing and community development programs administered within that jurisdiction.
Housing and Community Development Fund programs and costs for FY 2021 may be summarized as follows:
PROGRAMS FY 2019 TOTAL
FY 2020 TOTAL
REVISED2 FY 2021 TOTAL
FY 2021 CDBG
FY 2021 CSBG & TANF3
FY 2021 AHIF4
FY 2021 HOME
FY 2021 General Fund4
GOAL 1: CREATE AND SUSTAIN AFFORDABLE HOUSING
Community Development Grant Funds 125,000 125,000 125,000 125,000 - - - -
Multifamily Loan Fund1 3,770,548 1,882,068 $1,958,590 943,610 - - 1,014,980 -
TOTAL, GOAL 1 $3,895,548 $2,007,068 $2,083,590 $1,068,610 - - $1,014,980 -
GOAL 2: PROMOTE HEALTHY AND SELF-SUFFICIENT FAMILIES
Community Development Grant Funds 854,111 1,068,501 845,750 315,000 330,750 150,000 - 50,000
TOTAL, GOAL 2 $854,111 $1,068,501 $845,750 $315,000 $330,750 $150,000 - $50,000
GOAL 3: STABILIZE HOUSEHOLDS AT RISK OF HOMELESSNESS
Community Development Fund Grants 105,000 50,000 75,000 25,000 - 50,000 - -
TOTAL, GOAL 3 $105,000 $50,000 $75,000 $25,000 - $50,000 - -
GOAL 4: FOSTER VIBRANT AND SUSTAINABLE NEIGHBORHOODS
NSA Small Grants - NSD 5,000 5,000 5,000 5,000 - - - -
Housing Outreach Program CPHD-HD (public services funds only) 5 117,478 62,000 62,000 62,000 - - - -
TOTAL, GOAL 4 $122,478 $67,000 $67,000 $67,000 - - - -
384
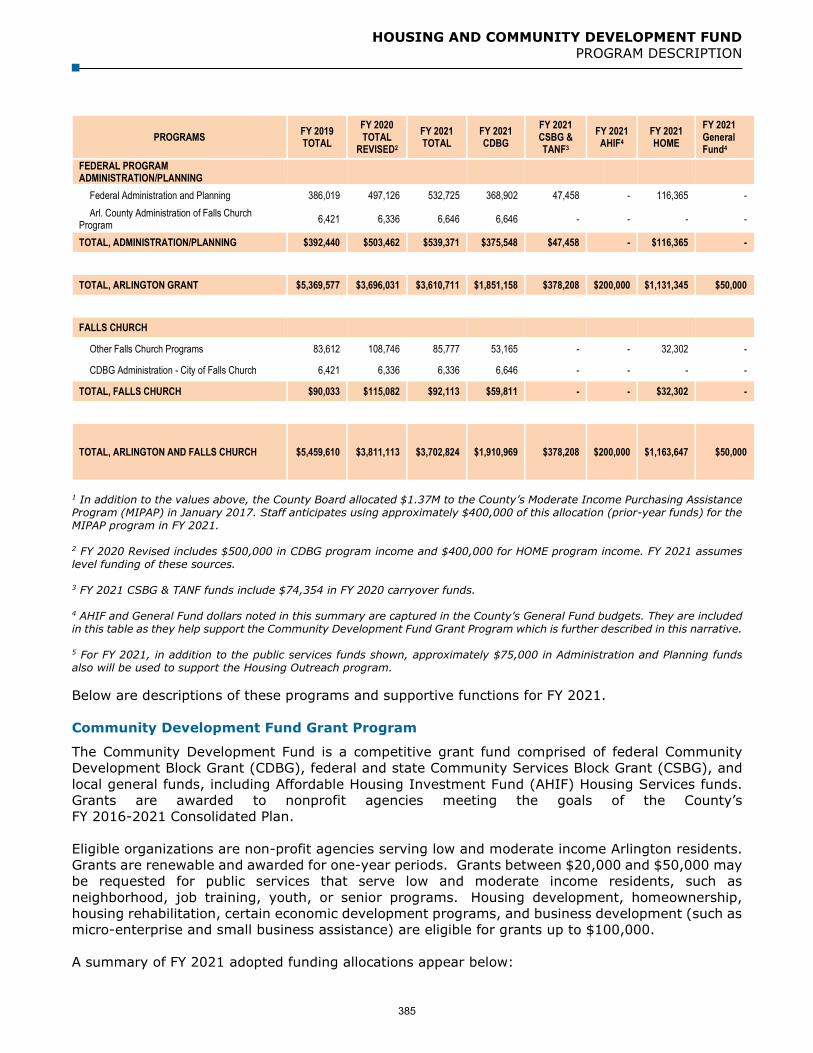
HOUSING AND COMMUNITY DEVELOPMENT FUND PROGRAM DESCRIPTION
PROGRAMS FY 2019 TOTAL
FY 2020 TOTAL
REVISED2 FY 2021 TOTAL
FY 2021 CDBG
FY 2021 CSBG & TANF3
FY 2021 AHIF4
FY 2021 HOME
FY 2021 General Fund4
FEDERAL PROGRAM ADMINISTRATION/PLANNING
Federal Administration and Planning 386,019 497,126 532,725 368,902 47,458 - 116,365 - Arl. County Administration of Falls Church
Program 6,421 6,336 6,646 6,646 - - - -
TOTAL, ADMINISTRATION/PLANNING $392,440 $503,462 $539,371 $375,548 $47,458 - $116,365 -
TOTAL, ARLINGTON GRANT $5,369,577 $3,696,031 $3,610,711 $1,851,158 $378,208 $200,000 $1,131,345 $50,000
FALLS CHURCH
Other Falls Church Programs 83,612 108,746 85,777 53,165 - - 32,302 -
CDBG Administration - City of Falls Church 6,421 6,336 6,336 6,646 - - - -
TOTAL, FALLS CHURCH $90,033 $115,082 $92,113 $59,811 - - $32,302 -
TOTAL, ARLINGTON AND FALLS CHURCH $5,459,610 $3,811,113 $3,702,824 $1,910,969 $378,208 $200,000 $1,163,647 $50,000
1 In addition to the values above, the County Board allocated $1.37M to the County’s Moderate Income Purchasing Assistance Program (MIPAP) in January 2017. Staff anticipates using approximately $400,000 of this allocation (prior-year funds) for the MIPAP program in FY 2021.
2 FY 2020 Revised includes $500,000 in CDBG program income and $400,000 for HOME program income. FY 2021 assumes level funding of these sources.
3 FY 2021 CSBG & TANF funds include $74,354 in FY 2020 carryover funds.
4 AHIF and General Fund dollars noted in this summary are captured in the County’s General Fund budgets. They are included in this table as they help support the Community Development Fund Grant Program which is further described in this narrative.
5 For FY 2021, in addition to the public services funds shown, approximately $75,000 in Administration and Planning funds also will be used to support the Housing Outreach program.
Below are descriptions of these programs and supportive functions for FY 2021.
Community Development Fund Grant Program
The Community Development Fund is a competitive grant fund comprised of federal Community Development Block Grant (CDBG), federal and state Community Services Block Grant (CSBG), and local general funds, including Affordable Housing Investment Fund (AHIF) Housing Services funds. Grants are awarded to nonprofit agencies meeting the goals of the County’s FY 2016-2021 Consolidated Plan.
Eligible organizations are non-profit agencies serving low and moderate income Arlington residents. Grants are renewable and awarded for one-year periods. Grants between $20,000 and $50,000 may be requested for public services that serve low and moderate income residents, such as neighborhood, job training, youth, or senior programs. Housing development, homeownership, housing rehabilitation, certain economic development programs, and business development (such as micro-enterprise and small business assistance) are eligible for grants up to $100,000.
A summary of FY 2021 adopted funding allocations appear below:
385

HOUSING AND COMMUNITY DEVELOPMENT FUND PROGRAM DESCRIPTION
GOAL 1: CREATE AND SUSTAIN AFFORDABLE HOUSING Total: $125,000 (all CDBG)
Achieve Your Dream: $35,000 CDBG for Latino Economic Development Corporation (LEDC) to conduct outreach and provide workshops to eligible prospective home buyers that will promote homeownership and prevent foreclosure for low and moderate income and minority households. EXPECTED OUTCOME: One-on-one counseling and educational workshops will result in 30 families becoming first-time Arlington homebuyers.
Arlington Energy Masters: $20,000 CDBG for EcoAction Arlington to train volunteers to weatherize apartments occupied by low-income Arlington residents and educate residents about energy efficiency measures. EXPECTED OUTCOME: 30 volunteers will be trained; 50 units will receive energy and water conservation improvements; and 25 will receive energy and water conservation supplies and educational information through one-on-one sessions and/or workshops.
Volunteer Home Repair Program: $70,000 CDBG to Rebuilding Together for staff and related costs to manage a single-family home repair program for seniors and persons with disabilities. Volunteers conduct energy audits and repair houses owned and occupied by low and moderate-income persons. EXPECTED OUTCOME: 15 properties will be rehabilitated.
GOAL 2: PROMOTE HEALTHY AND SELF-SUFFICIENT FAMILIES Total: $845,750 ($315,000 CDBG; $227,000 CSBG; $103,750 CSBG-TANF; $150,000 AHIF Housing Services, $50,000 General Fund)
Aspiring. Skills. Determined.: $25,000 CDBG to ServiceSource, Inc. to assist individuals with autism spectrum disorder (ASD) in achieving improved self-sufficiency, quality of life and community integration through employment opportunities. EXPECTED OUTCOME: Eight individuals will attend the ASD Soft Skills Club; five will receive situational assessments, work experience, or internship opportunities; and six individuals will be placed in jobs.
Bringing Technology Prosperity to Residents: $20,000 in AHIF Housing Services funds (first year of two-year grant) for Arlington Partnership for Affordable Housing (APAH) to increase access to technology related programming for low-income residents. EXPECTED OUTCOME: Enroll nearly 400 residents in various technology-related programming across the organization’s 1,700-unit portfolio.
Buckingham Youth Brigade: $25,000 CDBG for BU-GATA to encourage civic involvement and develop leadership among youth and their families in the Buckingham neighborhood. EXPECTED OUTCOME: 15-20 youth will be trained to access community services and educational resources, make positive decisions, and develop interpersonal and cultural competencies.
Career Readiness and Job Placement: $25,000 CSBG-TANF to La Cocina to develop a 17-week bilingual culinary arts job training and vocational English instruction job-readinessprogram. The program will connect clients with paid internships and wrap-around services.EXPECTED OUTCOME: 60 individuals will be trained for jobs in the culinary-arts field and 57individuals will be placed in jobs.
Caregiver Education Workshops and Resource Fair: $30,000 AHIF Housing Services funds (first year of two-year grant) to Arlington Retirement Housing Corporation (ARHC) to partner with the Area Agency on Aging and other partners to present quarterly educational workshops featuring programming to enhance older adults’ care, as well as connecting caregivers experiencing similar challenges to increase knowledge of services and resources available in Arlington. EXPECTED OUTCOMES: Organize a Resource Fair for 100 caregivers and older adults and implement four caregiver workshops with an average of 15 new participants per quarter.
Client Services Specialist: $20,000 CSBG-TANF to Bonder and Amanda Johnson Community Development Corporation to fund a Client Services Specialist position that will connect
386

HOUSING AND COMMUNITY DEVELOPMENT FUND PROGRAM DESCRIPTION
residents with social services in the Green Valley neighborhood. EXPECTED OUTCOME: Approximately 600 low-income clients will be connected with services.
Emerging Leaders: $25,000 CDBG to Edu Futuro to empower immigrant youth to achieve academically and enhance their leadership abilities through after-school programming. EXPECTED OUTCOME: 115 immigrant youth will be served through the Emerging Leaders Program (ELP), and 70 will complete the program and stay on track towards applying for college. Five high school seniors who graduate from program will enroll in college.
Employment and Training Program: $30,000 CDBG, $50,000 CSBG, and $28,750 CSBG-TANF to Arlington Employment Center (AEC) in DHS for employment training and job skills development programs including Individualized Training program, Computer Training, and the Homeless Services program to provide homeless or at-risk of being homeless residents with work experiences. EXPECTED OUTCOME: 37 residents receive Microsoft Office A+ certification, 15 residents receive CompTia A+ certification, 20 residents receive CDA certification, 70 residents receive workforce and career coaching.
Empowering Immigrant Youth: $25,000 CDBG to Liberty’s Promise to provide an internship and after-school civic engagement program for low-income immigrant youth at Wakefield High School. EXPECTED OUTCOME: 40 youth will participate in the civic engagement and job skills training program, with 30 participating in job skills training and creating a resume/cover letter and nine participants completing an internship or job experience program.
Escala: $30,000 CDBG to Northern Virginia Family Service to integrate its small business development program, Escala, with La Cocina VA’s Kitchen Incubator program as part of the latter agency’s establishment of the Zero Barriers Training and Entrepreneurship Center (TEC) in Arlington County. EXPECTED OUTCOMES: 15 prospective entrepreneurs are enrolled in incubator program and 12 will register for a tax ID number and make a sale.
Fathers in Touch: $20,000 CSBG-TANF to Capital Youth Empowerment Program (CYEP) to bring awareness to the topics of child support, the impact of domestic violence, and substance abuse and mental health to strengthen protective factors within the father and to help eliminate the barriers between parents and children. EXPECTED OUTCOMES: 23 at-risk fathers will decrease risk for child abuse and neglect.
Gilliam Place & Fisher House Resident Services: $50,000 AHIF Housing Services funds (second year of a two-year grant) to Arlington Partnership for Affordable Housing (APAH) to provide onsite resident services programs at Gilliam Place and Fisher House apartments. These programs will focus on four core areas: improving health and wellness; developing job or promotion readiness; enhancing financial literacy; and fostering civic engagement. EXPECTED OUTCOMES: 100 residents receive eviction prevention support; 70 residents attend financial management courses; 70 residents attending rights and responsibilities workshops or counseling; 40 adults and 40 children attend healthy cooking classes; 35 children enroll in read out loud or homework club; 40 residents enrolled in employment mentoring or counseling.
Immigrant Advocacy Program: $25,000 CSBG to Legal Aid Justice Center to help low-income immigrant workers and their families build assets and increase self-sufficiency by offering legal assistance and information. EXPECTED OUTCOME: 60 residents will participate in in-depth seminars; 60 residents will be referred to appropriate services; 30 cases will be opened and 25 closed in client’s favor.
Immigration Legal Services - Ayuda: $20,000 CSBG to Ayuda to provide immigration legal services to low-income immigrants eligible for humanitarian remedies, including consultations, case representation, and information. EXPECTED OUTCOME: At least 60 low-income people will be served, with an estimated 10 clients receiving long-term representation.
Immigration Legal Services – Just Neighbors: $25,000 CSBG to Just Neighbors for on-site legal clinics to help immigrants receive work authorizations, facilitate family unification, and assist with domestic violence issues. EXPECTED OUTCOME: 26 low income residents will
387

HOUSING AND COMMUNITY DEVELOPMENT FUND PROGRAM DESCRIPTION
secure work authorization; 13 immigrant women and their children will become free from domestic violence through improved legal status; and 16 individuals will be assisted in applying for a green card or citizenship.
Innovations in Healthy Aging Program: $50,000 AHIF Housing Services funds (second year of two-year grant) for Arlington Retirement Housing Corporation (ARHC) to partner with entrepreneurs to develop and produce actual technology innovations that enhance the health, independence and engagement for lower income older persons in independent living at Culpepper Garden. EXPECTED OUTCOMES: Implement 2-3 demonstration projects that will enhance resident lives at Culpepper.
Job Placement and Employment Program: $25,000 CSBG and $10,000 CSBG-TANF to Offender Aid and Restoration (OAR) to provide employment support to individuals pre-release (while they are still incarcerated) and post-release (within the first year after release). EXPECTED OUTCOME: At least 42 Arlington clients will be enrolled pre-release and complete employment-focused courses pre-release; and 14 clients will be provided with employment assistance post-release, with 7 securing permanent employment.
Learning Rocks! Program: $30,000 CSBG for Aspire! Afterschool Learning to provide daily afterschool program for low-income 3rd-5th grade students who are at risk of falling into the achievement gap. EXPECTED OUTCOME: 36 youth will improve their academic skills by one grade level.
Micro-Enterprise Loan Program: $45,000 CDBG to Enterprise Development Group (EDG) for local matching funds to provide micro-enterprise development services including technical assistance and business loans. Local match funding is necessary for EDG to leverage federal Small Business Administration (SBA) micro-loan program funds. EXPECTED OUTCOME: 13 loans will be made to micro-enterprises; $300,000 in micro-business loans will be made and 30 small businesses will receive technical assistance.
Money Smarts Program: $25,000 CDBG to Virginia Cooperative Extension (VCE) to help families build assets, increase well-being, empower economically vulnerable Arlington residents to make sound money management decisions, meet financial obligations, save for their short and long-term goals and prevent households from becoming homeless. EXPECTED OUTCOME: 60 individuals served through program with 40 graduating and 24 participants achieving short-term savings goals.
Northern Virginia Dental Clinic: $22,000 CSBG to Northern Virginia Dental Clinic (NVDC) to fill critical gap in oral health care services for low-income, uninsured and underserved residents in Arlington. EXPECTED OUTCOME: 120 Arlington residents will be enrolled in program; 100 clients will achieve an improved state of oral health.
Project Discovery: $30,000 CSBG to AHC, Inc. for Project Discover for academic support, mentoring and college visits for low-income high school students. EXPECTED OUTCOME: 110 low- and very low-income students participate, including 10 program graduates in their freshman year of college.
Promising Futures – Housing Stability: $25,000 CDBG to Wesley Housing Development Corporation (WHDC) for on-site programs to promote self-sufficiency, including eviction prevention/intervention, counseling, job training, referrals, food assistance, and other services for low-income adults at Whitefield Commons and Knightsbridge Apartments in Buckingham. EXPECTED OUTCOME: 100 households will access linkage/referral support, 15 adults will improve computer literacy and seven adults will achieve new or improved employment.
Tenant Outreach Program: $50,000 in General Fund support to BUGATA for outreach services to low-income renters. This will include one-on-one outreach and referrals, as well as workshops that will educate tenants about available services and programs. EXPECTED OUTCOME: 40 tenants will access services and programs they learned about at a BU-GATA hosted workshop.
388

HOUSING AND COMMUNITY DEVELOPMENT FUND PROGRAM DESCRIPTION
Small Business Development & Microlending: $40,000 CDBG to Latino Economic Development Corporation (LEDC) to provide linguistically and culturally competent economic development services such as small business financing assistance, pre- and post-loan technical assistance, and educational workshops for low and moderate-income aspiring entrepreneurs and existing small business owners in Arlington County. EXPECTED OUTCOME: 15 loans will be made to small businesses and three educational workshops will be held, with 60 workshop participants.
Training Futures: $20,000 CDBG to Northern Virginia Family Services for a six-month program that teaches marketable job skills and offers post-secondary education credentials to economically disadvantaged unemployed or underemployed, high-potential adults. EXPECTED OUTCOME: 10 residents enrolled with nine completing the program and seven participants acquiring or improving employment.
GOAL 3: STABILIZE HOUSEHOLDS AT RISK OF HOMELESSNESS Total: $75,000 ($25,000 CDBG; $50,000 AHIF)
Case Management Pilot Program: $20,000 AHIF Housing Services (first year of a two year grant) to Arlington Thrive to provide intensive case management support for at-risk clients who have routinely relied upon Thrive emergency assistance or who have faced eviction and required a combination of Thrive funding sources. The goal of the program will be to identity challenges and barriers for this at-risk population to eventually help lead to policy changes. EXPECTED OUTCOMES: 50 clients provided additional intensive case management support.
HOMES for Underserved Residents: $25,000 CDBG to AHC, Inc. to provide group classes and one-on-one counseling services to keep families at risk of eviction in their homes and on the path to a more stable financial future. EXPECTED OUTCOME: Eviction prevention services will be provided to 100 families at risk of eviction, and 50 families will receive one-on-one financial coaching.
Supportive Housing Project: $30,000 AHIF Housing Services (first year of a two year grant) funds to Arlington Street People’s Assistance Network (ASPAN) to expand the provision of housing and onsite supports at APAH’s Westover property for chronically homeless individuals and veterans who have the most significant barriers for housing placement and retention. EXPECTED OUTCOME: 16 chronically homeless persons will be placed in permanent supportive housing with supports.
GOAL 4 - FOSTER VIBRANT AND SUSTAINABLE NEIGHBORHOODS Total: $5,000 (all CDBG)
Neighborhood Small Grants Program: $5,000 CDBG for a set-aside fund to respond to neighborhood needs. EXPECTED OUTCOME: five to seven small grants for projects or activities located in Arlington’s low-income neighborhoods.
389
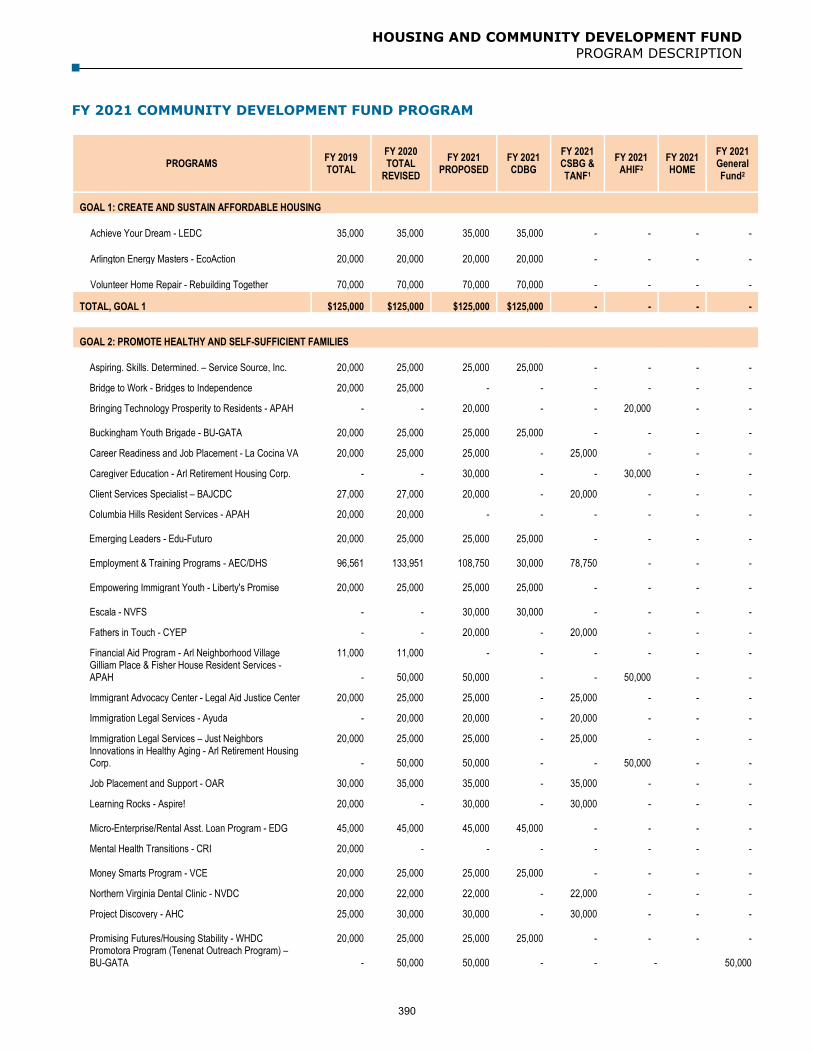
HOUSING AND COMMUNITY DEVELOPMENT FUND PROGRAM DESCRIPTION
FY 2021 COMMUNITY DEVELOPMENT FUND PROGRAM
PROGRAMS FY 2019 TOTAL
FY 2020 TOTAL
REVISED FY 2021
PROPOSED FY 2021 CDBG
FY 2021 CSBG & TANF1
FY 2021 AHIF2
FY 2021 HOME
FY 2021 General Fund2
GOAL 1: CREATE AND SUSTAIN AFFORDABLE HOUSING
Achieve Your Dream - LEDC 35,000 35,000 35,000 35,000 - - - -
Arlington Energy Masters - EcoAction 20,000 20,000 20,000 20,000 - - - -
Volunteer Home Repair - Rebuilding Together 70,000 70,000 70,000 70,000 - - - -
TOTAL, GOAL 1 $125,000 $125,000 $125,000 $125,000 - - - -
GOAL 2: PROMOTE HEALTHY AND SELF-SUFFICIENT FAMILIES
Aspiring. Skills. Determined. – Service Source, Inc. 20,000 25,000 25,000 25,000 - - - -
Bridge to Work - Bridges to Independence 20,000 25,000 - - - - - -
Bringing Technology Prosperity to Residents - APAH - - 20,000 - - 20,000 - -
Buckingham Youth Brigade - BU-GATA 20,000 25,000 25,000 25,000 - - - -
Career Readiness and Job Placement - La Cocina VA 20,000 25,000 25,000 - 25,000 - - -
Caregiver Education - Arl Retirement Housing Corp. - - 30,000 - - 30,000 - -
Client Services Specialist – BAJCDC 27,000 27,000 20,000 - 20,000 - - -
Columbia Hills Resident Services - APAH 20,000 20,000 - - - - - -
Emerging Leaders - Edu-Futuro 20,000 25,000 25,000 25,000 - - - -
Employment & Training Programs - AEC/DHS 96,561 133,951 108,750 30,000 78,750 - - -
Empowering Immigrant Youth - Liberty's Promise 20,000 25,000 25,000 25,000 - - - -
Escala - NVFS - - 30,000 30,000 - - - -
Fathers in Touch - CYEP - - 20,000 - 20,000 - - -
Financial Aid Program - Arl Neighborhood Village 11,000 11,000 - - - - - - Gilliam Place & Fisher House Resident Services - APAH - 50,000 50,000 - - 50,000 - -
Immigrant Advocacy Center - Legal Aid Justice Center 20,000 25,000 25,000 - 25,000 - - -
Immigration Legal Services - Ayuda - 20,000 20,000 - 20,000 - - -
Immigration Legal Services – Just Neighbors 20,000 25,000 25,000 - 25,000 - - - Innovations in Healthy Aging - Arl Retirement Housing Corp. - 50,000 50,000 - - 50,000 - -
Job Placement and Support - OAR 30,000 35,000 35,000 - 35,000 - - -
Learning Rocks - Aspire! 20,000 - 30,000 - 30,000 - - -
Micro-Enterprise/Rental Asst. Loan Program - EDG 45,000 45,000 45,000 45,000 - - - -
Mental Health Transitions - CRI 20,000 - - - - - - -
Money Smarts Program - VCE 20,000 25,000 25,000 25,000 - - - -
Northern Virginia Dental Clinic - NVDC 20,000 22,000 22,000 - 22,000 - - -
Project Discovery - AHC 25,000 30,000 30,000 - 30,000 - - -
Promising Futures/Housing Stability - WHDC 20,000 25,000 25,000 25,000 - - - - Promotora Program (Tenenat Outreach Program) – BU-GATA - 50,000 50,000 - - - 50,000
390

HOUSING AND COMMUNITY DEVELOPMENT FUND PROGRAM DESCRIPTION
PROGRAMS FY 2019 TOTAL
FY 2020 TOTAL
REVISED FY 2021
PROPOSED FY 2021 CDBG
FY 2021 CSBG & TANF1
FY 2021 AHIF2
FY 2021 HOME
FY 2021 General Fund2
Providing Internet to Arlington Mill Residents - APAH 10,000 10,000 - - - - - -
Shirlington Employment & Education Center (SEEC) 222,550 222,550 - - - - - -
Small Business Development & Microlending - LEDC 40,000 40,000 40,000 40,000 - - - -
Technology for Independence - CRI 20,000 - - - - - - -
Technology Literacy - APAH 15,000 - - - - - - -
Training Futures - NVFS - 20,000 20,000 20,000 - - - -
Volunteer Management - Arl Retirement Housing Corp. 32,000 32,000 - - - - - -
TOTAL, GOAL 2 $854,111 $1,068,501 $845,750 $315,000 $330,750 $150,000 - $50,000
GOAL 3: STABILIZE HOUSEHOLDS AT RISK OF HOMELESSNESS
Case Management Pilot – Arlington Thrive - - 20,000 - - 20,000 - -
Daily Fund Program- Arlington Thrive 20,000 - - - - - - -
HOMES for Underserved Residents - AHC 20,000 25,000 25,000 25,000 - - - -
Supportive Housing Project – A-SPAN 45,000 25,000 30,000 - - 30,000 - -
Targeted Prevention Program – VoAC 20,000 - - - - - - -
TOTAL, GOAL 3 $105,000 $50,000 $75,000 $25,000 - $50,000 - -
GOAL 4: FOSTER VIBRANT AND SUSTAINABLE NEIGHBORHOODS
NSA Small Grants - NSD 5,000 5,000 5,000 5,000 - - - -
TOTAL, GOAL 4 $5,000 $5,000 $5,000 $5,000 - - - -
TOTAL CDF GRANTS $1,089,111 $1,248,501 $1,050,750 $470,000 $330,750 $200,000 - $50,000 1 FY 2021 CSBG & TANF funds include $74,354 in FY 2020 carryover funds; $60,000 of this carryover funding is recommended for FY 2020 CDF grants. 2 AHIF and General Fund dollars noted in this summary are captured in the County’s General Fund budgets. They are included in this table as they help support the Community Development Fund Grant Program which is further described in this narrative.
Other FY 2021 Housing and Community Development Programs Supported with Federal Funds
As shown below, the County uses Fund 206 to support other housing and community development programs that address Consolidated Plan goals. Note that in addition to the programs shown below, the County intends to support its Moderate Income Purchase Assistance Program (MIPAP), which provides down payment and closing cost assistance to qualified low-income first-time homebuyers, using prior-year funds.
GOAL 1: CREATE AND SUSTAIN AFFORDABLE HOUSING
Multifamily Revolving Loan Fund: $943,610 CDBG, $1,014,980 HOME allocated to the Arlington County Multifamily Revolving Loan Fund for the purposes of acquiring, rehabilitating and/or building new multifamily affordable housing. EXPECTED OUTCOME: To be determined housing development project using available CDBG and HOME funds.
391

HOUSING AND COMMUNITY DEVELOPMENT FUND PROGRAM DESCRIPTION
GOAL 4 - FOSTER VIBRANT AND SUSTAINABLE NEIGHBORHOODS
Housing Outreach Program: $62,000 in CDBG public services funds (as well as approximately $75,000 in federal CDBG administrative funds) are recommended for allocation to County staff to provide housing counseling, education, clean-up events, and technical assistance to residents of HUD-designated areas, to improve their homes and neighborhood conditions. This includes $5,500 for two neighborhood cleanups. EXPECTED OUTCOME: 26 tenant workshops held on property maintenance, tenant rights and responsibilities, and fair housing; two neighborhood cleanup events held in the Nauck and Arlington Mill neighborhoods; two Countywide events such as the Home Show and Expo for homeowners and the Health and Housing Fair for tenants.
PROGRAMS FY 2019 TOTAL
FY 2020 TOTAL
REVISED FY 2021 TOTAL
FY 2021 CDBG
FY 2021 HOME
GOAL 1: CREATE AND SUSTAIN AFFORDABLE HOUSING 1Multifamily Loan Fund 3,770,548 1,882,068 1,958,590 943,610 1,014,980
TOTAL, GOAL 1 $3,770,548 $1,882,068 $1,958,590 $943,610 $1,014,980
GOAL 4: FOSTER VIBRANT AND SUSTAINABLE NEIGHBORHOODS 2Housing Outreach Program - CPHD-HD (public service funds only) 117,478 62,000 62,000 62,000 -
TOTAL, GOAL 4 $117,478 $62,000 $62,000 $62,000 -
TOTAL, OTHER PROGRAMS $3,888,026 $1,944,068 $2,020,590 $1,005,610 $1,014,980
1In addition to the values above, the County Board allocated $1.37M to the County’s Moderate Income Purchasing Assistance Program (MIPAP) in January 2017. Staff anticipates using approximately $400,000 of this allocation (prior-year funds) for the MIPAP program in FY 2021.
2For FY 2021, in addition to the public services funds shown, approximately $75,000 in Administration and Planning funds also will be used to support the Housing Outreach program.
Administration and Planning of Federal Programs
In addition to funding affordable housing and community development programs, a portion of federal funds are available to support County planning and administration of these programs. These include both entitlement (grant) funds and program income. For FY 2021, $375,548 in CDBG funds, $47,458 in CSBG funds, and $116,365 in HOME funds are recommended for County Housing Division staff to provide the following planning and administration functions:
a) administer the Community Participation Plan for the CDBG/CSBG Program, includingstaffing the Community Development Citizens Advisory Committee (CDCAC);b) conduct outreach to low and moderate income multicultural communities;c) manage the CDBG, CSBG, and HOME programs in accordance with the Federalrequirements and County priorities detailed in the Consolidated Plan, including administrationand oversight of the City of Falls Church Cooperation Agreement;d) implement program planning and development;e) provide financial management and oversight for federal programs; andf) monitor program performance and assess program effectiveness in producing desiredoutcomes.
The expected outcome of using funds for this purpose is that these programs will be administered effectively and efficiently, within Federal and local regulations.
392

HOUSING AND COMMUNITY DEVELOPMENT FUND PROGRAM DESCRIPTION
PROGRAMS FY 2019 TOTAL
FY 2020 TOTAL
REVISED FY 2021 TOTAL
FY 2021 CDBG
FY 2021 CSBG
FY 2021 HOME
FEDERAL PROGRAM ADMINISTRATION/PLANNING
Federal Administration and Planning – EN & PI 386,019 497,126 532,725 368,902 47,458 116,365
County Administration of Falls Church Program 6,421 6,336 6,646 6,646 - -
TOTAL ADMINISTRATION/PLANNING $392,440 $503,462 $539,371 $375,548 $47,458 $116,365
City of Falls Church CDBG and HOME Program Budgets
Through a cooperation agreement, the City of Falls Church receives a portion of the County’s CDBG and HOME funds, estimated in FY 2021 to be $59,811 in FY 2021 CDBG funds and $32,302 in HOME funds, to conduct the following activities:
CDBG Program Administration: $6,646 in CDBG funds to the City of Falls Church Housing and Human Services Division for program administration, including program management, monitoring and assessment, environmental review, and technical assistance to sub-recipients.
Emergency Assistance: $4,384 in CDBG funds to the Community Services Council to provide emergency financial rental and utility assistance to low-income residents.
Falls Church Housing Corp.: $35,484 in CDBG funds to the Falls Church Housing Corporation for a deck replacement project at Winter Hill Apartments, a senior apartment community for low-income residents.
Mt. Daniels Family Literacy Program: $4,484 in CDBG funds to Falls Church Public Schools so that adults may enroll in the literacy program and homework tutoring is available for eligible youth.
Transitional Housing Homeless Rental Program: $32,302 in HOME funds for Homestretch to provide rental assistance to transitional low-income families.
Other Falls Church Programs: $8,813 in CDBG funds to be allocated to other Falls Church programs.
PROGRAMS FY 2019 TOTAL
FY 2020 TOTAL REVISED
FY 2021 TOTAL
FY 2021 CDBG
FY 2021 HOME
FALLS CHURCH
CDBG Administration – City of Falls Church 6,421 6,336 6,646 6,646 -
ECDC Enterprise Development Group 8,730 - - - -
Emergency Assistance- Community Services Council 3,994 4,000 4,384 4,384 -
Falls Church Housing Corp. 33,008 63,028 35,484 35,484 -
Mt. Daniels Even Start Family Literacy Program 5,638 4,100 4,484 4,484 - Transitional Hsg. Homeless Rental Prog. – Homestretch 32,242 23,000 32,302 - 32,302
Other Falls Church Programs - 14,618 8,813 8,813 -
TOTAL, FALLS CHURCH $90,033 $115,082 $92,113 $59,811 $32,302
393
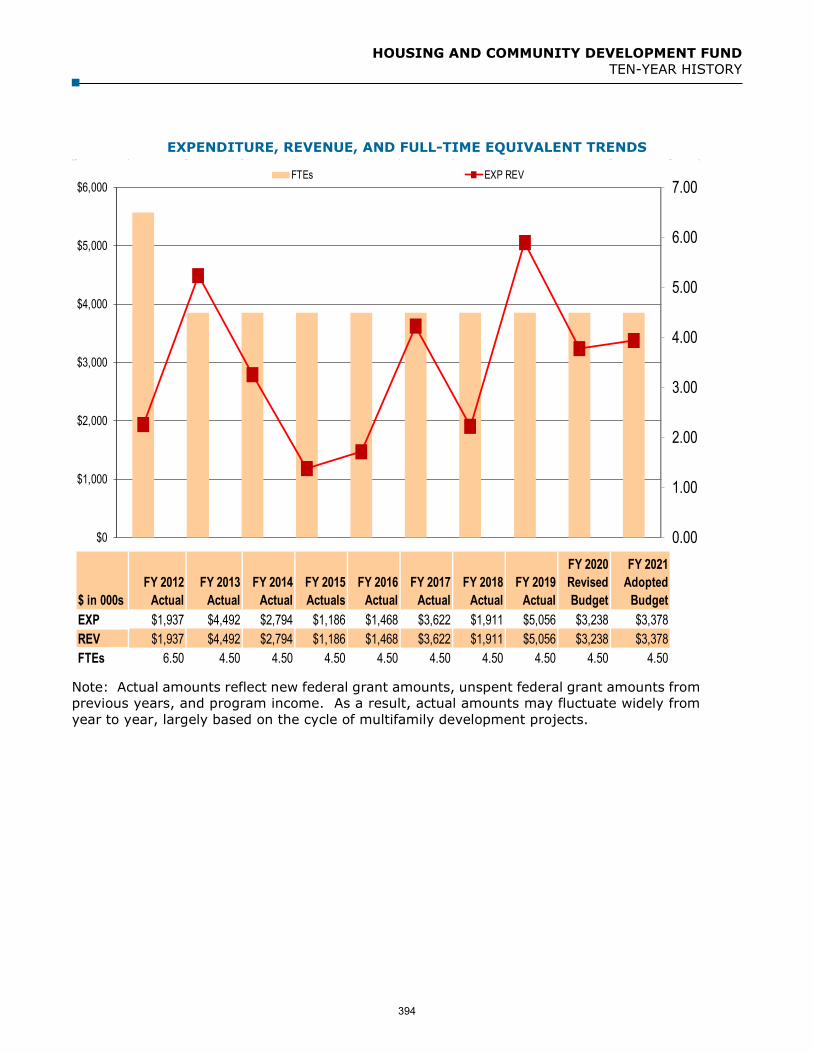
HOUSING AND COMMUNITY DEVELOPMENT FUND TEN-YEAR HISTORY
EXPENDITURE, REVENUE, AND FULL-TIME EQUIVALENT TRENDS
Note: Actual amounts reflect new federal grant amounts, unspent federal grant amounts from previous years, and program income. As a result, actual amounts may fluctuate widely from year to year, largely based on the cycle of multifamily development projects.
$ in 000sFY 2012
ActualFY 2013
ActualFY 2014
ActualFY 2015 Actuals
FY 2016 Actual
FY 2017 Actual
FY 2018 Actual
FY 2019 Actual
FY 2020 Revised Budget
FY 2021 Adopted
BudgetEXP $1,937 $4,492 $2,794 $1,186 $1,468 $3,622 $1,911 $5,056 $3,238 $3,378REV $1,937 $4,492 $2,794 $1,186 $1,468 $3,622 $1,911 $5,056 $3,238 $3,378FTEs 6.50 4.50 4.50 4.50 4.50 4.50 4.50 4.50 4.50 4.50
0.00
1.00
2.00
3.00
4.00
5.00
6.00
7.00
$0
$1,000
$2,000
$3,000
$4,000
$5,000
$6,000FTEs EXP REV
394
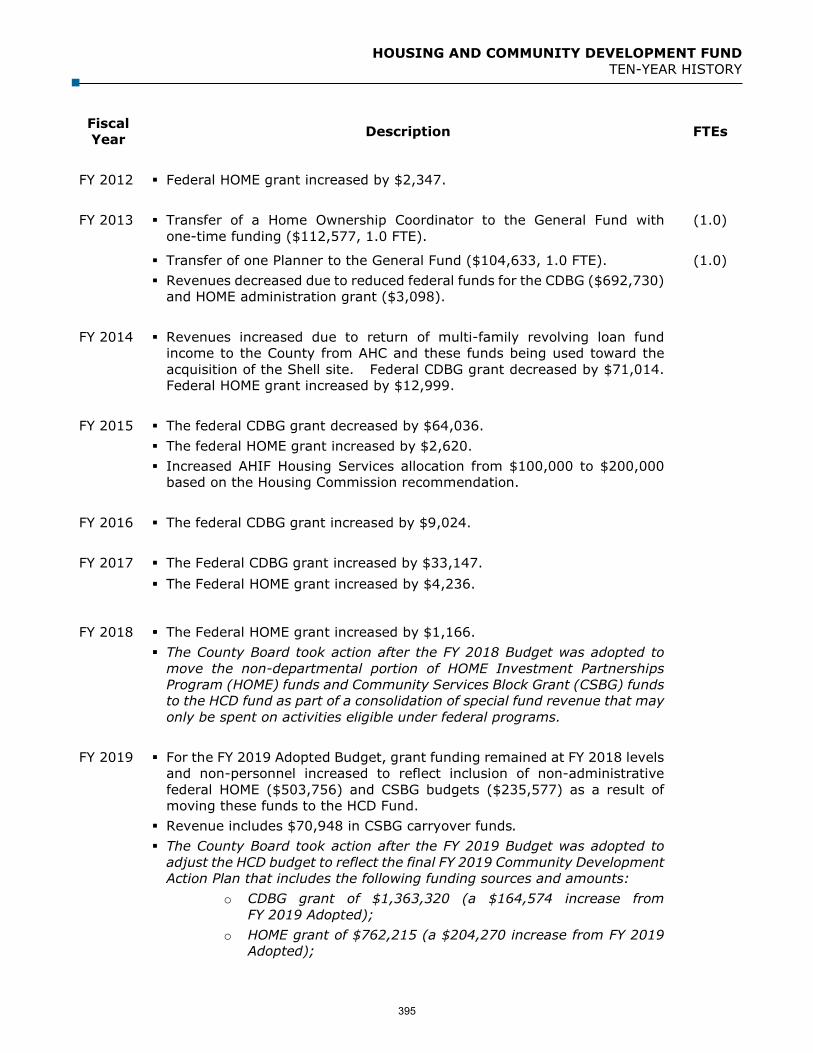
HOUSING AND COMMUNITY DEVELOPMENT FUND TEN-YEAR HISTORY
Fiscal Year Description FTEs
FY 2012 Federal HOME grant increased by $2,347.
FY 2013 Transfer of a Home Ownership Coordinator to the General Fund with one-time funding ($112,577, 1.0 FTE).
(1.0)
Transfer of one Planner to the General Fund ($104,633, 1.0 FTE). (1.0) Revenues decreased due to reduced federal funds for the CDBG ($692,730)
and HOME administration grant ($3,098).
FY 2014 Revenues increased due to return of multi-family revolving loan fund income to the County from AHC and these funds being used toward the acquisition of the Shell site. Federal CDBG grant decreased by $71,014. Federal HOME grant increased by $12,999.
FY 2015 The federal CDBG grant decreased by $64,036. The federal HOME grant increased by $2,620. Increased AHIF Housing Services allocation from $100,000 to $200,000
based on the Housing Commission recommendation.
FY 2016 The federal CDBG grant increased by $9,024.
FY 2017 The Federal CDBG grant increased by $33,147. The Federal HOME grant increased by $4,236.
FY 2018 The Federal HOME grant increased by $1,166. The County Board took action after the FY 2018 Budget was adopted to
move the non-departmental portion of HOME Investment PartnershipsProgram (HOME) funds and Community Services Block Grant (CSBG) fundsto the HCD fund as part of a consolidation of special fund revenue that mayonly be spent on activities eligible under federal programs.
FY 2019 For the FY 2019 Adopted Budget, grant funding remained at FY 2018 levels and non-personnel increased to reflect inclusion of non-administrative federal HOME ($503,756) and CSBG budgets ($235,577) as a result of moving these funds to the HCD Fund.
Revenue includes $70,948 in CSBG carryover funds. The County Board took action after the FY 2019 Budget was adopted to
adjust the HCD budget to reflect the final FY 2019 Community DevelopmentAction Plan that includes the following funding sources and amounts:
o CDBG grant of $1,363,320 (a $164,574 increase fromFY 2019 Adopted);
o HOME grant of $762,215 (a $204,270 increase from FY 2019Adopted);
395
HOUSING AND COMMUNITY DEVELOPMENT FUND TEN-YEAR HISTORY
Fiscal Year Description FTEs
o CSBG grant of $268,777 (a $33,200 increase from FY 2019Adopted); and
o The Action Plan includes $2,645,000 in ProgramIncome/Revolving Loan funds which were not included in theFY 2019 Adopted Budget. These funding sources will beincluded in the budget going forward.
FY 2020 Grant and CDBG program income revenue remained at FY 2019 levels for FY 2020 Adopted.
HOME Program income decreased from the FY 2019 Revised Budget due toinclusion of a $1.9M HOME loan payoff in FY 2019.
The County Board took action after the FY 2020 Budget was adopted toadjust the HCD budget to reflect the final FY 2020 Community DevelopmentAction Plan that includes the following funding sources and amounts:
o CDBG grant of $1,345,258 (a $18,062 decrease from FY 2019revised);
o HOME grant of $712,272 (a $49,943 decrease from FY 2019revised);
o CSBG grant of $279,995 (an $11,218 increase from FY 2019revised).
The County Board approved the Amended FY 2020 Annual Action Planwhich included $830,027 in federal CARES Act CDBG funds, $239,159 inCSBG funds for COVID-19 relief, and an additional $6,383 in CSBG funds.Any unspent funds will be carried over into FY 2021.
FY 2021 The County Board approved the final 2021 Community Development Action Plan.
o Federal CDBG grant of $1,410,969 (a $65,711 increase fromFY 2020 revised);
o Federal HOME grant of $763,647 (a $51,375 increase from FY2020 revised);
o Federal and state CSBG grant of $303,854 (a $23,859 increasefrom FY 2020 revised).
Program income levels remained at the FY 2020 levels for FY 2021adopted.
396

HOUSING CHOICE VOUCHER FUND FUND SUMMARY
Our Mission: To assist low and moderate income families with affordable housing opportunities as they strive to achieve stability and improve their quality of life.
Housing Choice Vouchers (HCV) Provide housing to low and moderate-income renters through a housing voucher that can be
used by the tenant anywhere in the County or nationwide. Entirely federally-funded through the United States Department of Housing and Urban
Development (HUD).
Project-Based Assistance Housing Choice Vouchers Provide housing and supportive services to low and moderate-income renters through a
payment contract for designated existing housing units in the County.
Housing Opportunities for Persons with AIDS (HOPWA) Provide housing assistance, through a monthly rental subsidy, to families where the head of
household or a family member has been diagnosed with HIV/AIDS.
Family Unification Program Promote family unification by providing rental assistance to families where the lack of
affordable housing is a primary factor in the separation of children from their families.
Mainstream Vouchers Provide housing assistance to non-elderly and disabled households transitioning out of
institutional or other segregated settings at risk of institutionalization, homeless, or at risk of becoming homeless.
Veterans Affairs Supportive Housing (VASH) Vouchers Provide rental subsidies to homeless and disabled veterans in partnership with the Department
of Veterans Affairs.
SIGNIFICANT BUDGET CHANGES
Personnel changes due to an increase in the County’s cost for employee health insurance, partially offset by lower retirement contributions based on current actuarial projections.
Non-personnel increases due to increases in housing assistance payments based on theprojected 93 percent voucher lease-up rate of 1,643 vouchers ($452,066), software licenses($41,700), memberships ($3,000), Sequoia Plaza rent ($3,303), consultants ($1,000), printshop charges ($1,000), and office supplies ($2,000). The increases were offset by a decreasein the annual expense for maintenance and replacement of County vehicles ($198) anddepartmental subscriptions/books ($6,000).
Revenue increases due to the projected 93 percent voucher lease-up rate of 1,643 vouchers($452,066), administrative fees ($22,770), investment earnings ($1,500), and tenantrepayment ($15,000) offset by a decrease in treasury collections ($10,000).
397

HOUSING CHOICE VOUCHER FUND FUND SUMMARY
PROGRAM FINANCIAL SUMMARY
FY 2019 FY 2020 FY 2021 % ChangeActual Revised Adopted '20 to '21
Beginning Fund Balance $672,653 $1,297,388 $1,575,031 21%
Personnel 1,036,296 1,114,166 1,160,384 4%Non-Personnel 17,348,680 17,815,265 18,313,136 3%Total Expenditures 18,384,976 18,929,431 19,473,520 3%
Total Revenues 19,009,711 19,207,074 19,688,410 3%
Change in Fund Balance $624,735 $277,643 $214,890 -23%
Permanent FTEs 11.60 11.60 11.60Temporary FTEs - - - Total Authorized FTEs 11.60 11.60 11.60
398

HOUSING CHOICE VOUCHER FUND FUND SUMMARY
FY 2019 FY 2020 FY 2020 FY 2021
ACTUAL ADOPTED RE-ESTIMATE ADOPTED
Beginning Fund Balance July 1 $672,653 $895,509 $1,297,388 $1,575,031
REVENUE Housing Assistance 16,882,870 17,510,765 17,510,765 17,585,359 Mainstream Housing Assistance - - - 377,472 Housing Assistance Pymt Admin Fees 1,207,443 1,575,996 1,575,996 1,563,806 Mainstream Administrative Fees - - - 34,960 Housing Assistance Payment Interest 5,056 5,000 5,000 5,500 Mainstream Interest - - - 1,000 Miscellaneous Revenue (Collections) 16,359 20,000 20,000 25,000 HOPWA 94,848 95,313 95,313 95,313Fund Balance Used 178,400 - - - Fund Balance Change 624,735 - - - TOTAL REVENUE 19,009,711 19,207,074 19,207,074 19,688,410
TOTAL BALANCE & REVENUE 19,682,364 20,102,583 20,504,462 21,263,441
EXPENDITURES Rental Assistance Payments 17,069,446 17,510,765 17,510,765 17,585,359 Mainstream Assistance Payments - - - 377,472 HOPWA 94,848 95,313 95,313 95,313 Administration & Operations 1,220,682 1,323,353 1,323,353 1,415,376 TOTAL EXPENDITURES 18,384,976 18,929,431 18,929,431 19,473,520
Ending Fund Balance June 30 $1,297,388 $1,173,152 $1,575,031 $1,789,921
HOUSING CHOICE VOUCHER PROGRAMFUND STATEMENT
Note: $1,297,388 in revenue was deferred from FY 2019 to FY 2020. Therefore, the FY 2019 CAFR reflects a fund balance of zero.
399

HOUSING CHOICE VOUCHER FUND TEN-YEAR HISTORY
EXPENDITURE, REVENUE, AND FULL-TIME EQUIVALENT TRENDS
$ in 000sFY 2012
ActualFY 2013
ActualFY 2014
ActualFY 2015
ActualFY 2016
ActualFY 2017
ActualFY 2018
ActualFY 2019
ActualFY 2020
Adopted FY 2021
AdoptedEXP $17,738 $17,734 $17,413 $17,219 $17,491 $18,791 $19,032 $18,385 $18,929 $19,474REV $16,366 $16,448 $17,139 $15,644 $17,710 $18,569 $19,494 $19,010 $19,207 $19,688FTEs 17.40 16.60 16.60 16.60 17.10 17.10 17.10 11.60 11.60 11.60Change in Fund Balance ($1,372) ($1,286) ($274) ($1,575) $219 ($222) $462 $625 $278 $214
0
2
4
6
8
10
12
14
16
18
20
$0
$5,000
$10,000
$15,000
$20,000
$25,000 FTEs EXP REV
400

HOUSING CHOICE VOUCHER FUND TEN-YEAR HISTORY
Fiscal Year Description FTEs
FY 2012 50 vouchers awarded for participants in the Family Unification Program, which promotes family unification by providing rental assistance to families where the lack of affordable housing is a primary factor in the separation of children from their families.
Transferred of 0.8 FTE to the Management and Administration section ofthe Economic Independence Division.
(0.80)
FY 2013 Housing assistance payments increased by $925,356 due to a 100 percent voucher lease-up rate, and because of the allocations for the Family Unification Program (50 vouchers) and the Moderate Rehabilitation 2 Program (35 vouchers).
Revenue decreased due to the Department of Housing and UrbanDevelopment instructions to significantly spend down the FY 2012 FundBalance.
FY 2014 Housing Assistance Payments increased by $385,192 due to a 100 percent voucher lease-up rate ($362,988), and also because of the increased allocation for Shelter Plus Care (Milestones Program) ($22,204).
Revenue increased by $949,671 due to a 100 percent voucher lease-uprate ($908,771) and additional Treasury collections ($40,900).
FY 2015 Reduced the annual expense for maintenance and replacement of County vehicles ($5,767); increased Sequoia plaza rent ($2,240).
Housing Assistance Payments decreased due to a 95 percent voucherlease-up rate of 1,469 vouchers ($1,264,026).
Revenue decreased to include administrative revenue ($87,651) andHousing Assistance Payments ($1,264,026). These decreases were basedon a 95 percent voucher lease-up rate, due to Department of Housing andUrban Development sequestration reductions, as well as the Departmentof Housing and Urban Development’s directive to spend down the FundBalance.
FY 2016 Added a Housing Specialist ($44,628) based on additional funding for the Shelter Plus Care (Milestones Program).
0.50
Removed the Family Unification Program administrative budget ($60,354);increased Sequoia Plaza rent ($2,241).
Housing Assistance Payments increased based upon a 95 percent voucherlease-up rate of 1,469 vouchers ($969,110), as well as a Shelter Plus Care(Milestone Program) increase ($50,680).
Decreased HOPWA expenses based on the FY 2015 grant award ($24,935).
401

HOUSING CHOICE VOUCHER FUND TEN-YEAR HISTORY
Fiscal Year Description FTEs
Revenue increased to include Housing Assistance Payments based on a 95percent voucher lease-up rate of 1,469 ($969,110) and the Shelter PlusCare (Milestones Program) ($95,308). Decrease in revenue for HOPWAbased on the FY 2015 grant award ($424,935) and administrative revenue($354,622) based on the 95 percent voucher lease-up rate.
FY 2017 Increased Sequoia plaza rent ($1,453) and the annual expense for maintenance and replacement of County vehicles ($237).
Housing assistance payments decreased based on a projected 92 percentvoucher lease-up rate of 1,588 vouchers ($124,756), a Shelter Plus Care(Milestones Program) decrease ($27,344), and HOPWA decrease ($15,042)based on the FY 2016 grant award.
Revenue decreased to include Housing Assistance Payment based on aprojected 92 percent voucher lease-up rate of 1,588 vouchers ($124,756),reductions in Shelter Plus Care (Milestones Programs) ($5,778) andHOPWA ($12,465) based upon FY 2016 grant awards. Revenue increaseddue to increased administrative revenue ($29,093) based on the 92percent voucher lease-up rate.
FY 2018 Increased Sequoia plaza rent ($2,401), offset by a decrease in the annual expense for maintenance and replacement of County vehicles ($458).
Housing assistance payments increased based on the projected 94 percentvoucher lease-up rate of 1,588 vouchers ($1,005,860), increases to theHOPWA ($14,338), and the Shelter Plus Care (Milestones) Programs($16,732).
Revenue increased due to the projected 94 percent voucher lease-up rateof 1,588 vouchers ($1,005,860), administrative revenue ($148,733), andHOPWA ($11,761). These increases were partially offset by a decrease inthe Shelter Plus Care (Milestones) Program ($9,916).
FY 2019 Several reductions were made as a result of administrative funding reductions implemented to produce administrative efficiencies and ensure financial sustainability. These included the elimination of a Housing Choice Supervisor ($121,654, 1.0 FTE), a Housing Inspector ($66,807, 1.0 FTE), two Housing Assistance Program Specialists ($180,618, 2.0 FTEs), the transfer out of an Administrative Technician I ($80,199, 1.0 FTE) to the Economic Independence Division in the Department of Human Services General Fund, partially offset by a transfer of an Administrative Assistant from Employment Services in the Economic Independence Division ($23,521, 0.25 FTE).
(4.75)
Non-personnel decreased due to adjustments made as a result ofadministrative funding reductions ($89,031).
Housing assistance payments increased based on the projected 96 percentvoucher lease-up rate of 1,588 vouchers ($458,623) and an increase tothe HOPWA Program ($37,347), partially offset by the elimination of theShelter Plus Care (Milestones) Program ($290,272).
402

HOUSING CHOICE VOUCHER FUND TEN-YEAR HISTORY
Fiscal Year Description FTEs
Revenue increased due to the projected 96 percent voucher lease-up rateof 1,588 vouchers ($458,623) and HOPWA Program ($37,347), partiallyoffset by the elimination of the Shelter Plus Care (Milestones) Program($329,818), decrease in administrative revenue ($116,998), andelimination of the budget for Fund Balance used due to a change in thereporting process ($119,906).
FY 2020 Transferred a Management Specialist ($66,150) to the Housing Assistance Bureau in the Economic Independence Division.
(0.75)
Decreased Sequoia plaza rent ($33,873), contracted services ($4,000),telephone and communication ($1,200), memberships ($6,000),consultants ($18,000), office supplies ($4,000), operating equipment($1,000), and the HOPWA Program ($6,395).
Increased departmental subscriptions ($6,000), an increase in the annualexpense for maintenance and replacement of County vehicles ($2,918),port-out admin fee payments ($100,000), and housing assistancepayments based on the projected 93 percent voucher lease-up rate of1,643 vouchers ($186,574).
Revenue increased due to the projected 93 percent voucher lease-up rateof 1,643 vouchers ($186,574), administrative fees ($148,854), andinvestment earnings ($5,000). These increases are offset by a decreasein the HOPWA Program ($6,395) and Treasury collections ($20,900).
FY 2021 Increased housing assistance payments based on the projected 93 percent voucher lease-up rate of 1,643 vouchers ($452,066), software licenses ($41,700), memberships ($3,000), Sequoia Plaza rent ($3,303), consultants ($1,000), print shop charges ($1,000), and office supplies ($2,000).
Decreased the annual expense for maintenance and replacement of Countyvehicles ($198) and departmental subscriptions/books ($6,000).
Revenue increased due to the projected 93 percent voucher lease-up rateof 1,643 vouchers ($452,066), administrative fees ($22,770), investmentearnings ($1,500), and tenant repayment ($15,000) offset by a decreasein treasury collections ($10,000).
403

This page intentionally left blank
404

STORMWATER MANAGEMENT FUND Department of Environmental Services
Mission: To implement a comprehensive stormwater management program that balances the following goals: 1) to reduce the potential for stormwater threats to public health, safety, and
property; 2) to reduce the impacts of new and existing urban development on Arlington streams, the Potomac River, and the Chesapeake Bay; and, 3) to comply with State and federal stormwater, water
quality, and floodplain management regulations.
STORMWATER MANAGEMENT PROGRAM OBJECTIVES
Integrate traditional stormwater infrastructure capacity needs with watershed management,environmental protection objectives, and regulatory compliance requirements, including thoseof the County’s Municipal Separate Storm Sewer System (MS4) permit, issued in June 2013.The permit has been administratively continued by the Virginia Department of EnvironmentalQuality (DEQ) beyond its 2018 expiration date (due to DEQ workload) and is anticipated to bereissued in CY 2020.
Implement critical infrastructure, stream restoration and repair, and water quality mitigationprojects consistent with the goals and strategies in the Stormwater Master Plan that wasadopted as an element of the County’s Comprehensive Plan in September 2014.
Provide routine preventative maintenance of the County’s stormwater infrastructure assets aswell as emergency repair or replacement actions when needed.
Ensure the County’s floodplains are managed in accordance with local, State, and Federal lawsand regulations.
OVERALL PROGRAM SCOPE
Since the adoption of a dedicated funding source for stormwater management in April 2008, the Department has established a comprehensive Stormwater Management Program that: Conducts rigorous floodplain management activities to ensure compliance with state and federal
floodplain regulations, accuracy of mapped floodplains, and favorable flood insurance rates forresidents;
Develops long-term infrastructure planning for capacity, sufficiency, and risk management forfuture demand and conditions;
Implements an infrastructure capital program to ensure needed capacity enhancements aremade and the system is maintained in a state of good repair (SGR);
Administers capital maintenance, emergency response, and complaint operations; Ensures regulatory compliance for both County and private sector operations and activities; Installs green infrastructure and stream, pond, and wetland restoration projects to support local
environmental recovery and restoration, protect public safety and infrastructure, and meet theaggressive requirements for the cleanup of the Chesapeake Bay;
Maintains both the traditional and green infrastructure assets of the Program; Conducts education and training activities for employees, businesses, developers, and
residents; Monitors streams; and, Conducts tracking, monitoring, and reporting for local, regional, and state/national bodies and
agencies.
405
STORMWATER MANAGEMENT FUND FUND SUMMARY
SIGNIFICANT BUDGET CHANGES
The FY 2021 adopted expenditure budget for the Stormwater Management Fund is $11,729,047, a five percent increase from the FY 2020 adopted budget. The FY 2021 adopted budget reflects:
Personnel changes due to the addition of two Stormwater Inspectors to meet the County’smandated MS4 permit obligations and workload ($248,514, 2.0 FTEs), a Senior ProgramManager to manage and oversee the maintenance capital and storm drainage improvements($203,285, 1.0 FTE), adjustments to salaries resulting from job studies for trades and plannerpositions, an increase in the County’s cost for employee health insurance, partially offset bylower retirement contributions based on current actuarial projections.
Non-personnel increases in operations are primarily due to contractual increases related tooperating maintenance costs for DES and DPR stormwater facilities ($329,752), one-timefunding for the utility feasibility study ($250,000), inter-departmental charges for overhead($231,383), County facility parking lot sweeping ($70,000), tree planting ($4,809), andadjustments to the annual expense for maintenance and replacement of existing Countyvehicles ($12,887) as well as the addition of vehicles for the two new Stormwater Inspectors($44,000 one-time; $15,310 on-going), and operating expenses for the new Senior ProgramManager ($2,652 one-time; $2,860 on-going).
Capital program funding decreases due to increases in the operating budget for personnel andnon-personnel expenses ($996,598).
Revenue increases due to the increase in the CY 2020 real estate assessment tax base($329,759), inflationary increase of 2.5 percent to fees ($27,938), a planned increase inSediment and Erosion Control plan fees to support the addition of the two StormwaterInspectors ($328,020), and Chesapeake Bay Preservation fee increase ($5,250), partially offsetby projected reductions to Chesapeake Bay Preservation fee revenue ($21,525), and otherrevenues based on resulting economic conditions from the pandemic ($145,077).
To increase resilience in response to intense rain events and flooding, the County is undertakinga comprehensive review of ways to mitigate flood risks. Design work is already underway forsignificant investments in watershed-scale solutions in critical areas that have experiencedflooding and are identified in the Stormwater Master Plan. The Adopted Capital ImprovementPlan (CIP) seeks to strike the right investment balance between water quality, improvedmaintenance of assets, education, and capacity improvements. To fund this substantial need,the County will be going to the voters for a $50.84 million Bond Referenda in November 2020to provide the authority to issue bonds to fund Stormwater capital projects in FY 2021 andFY 2022 and funding for key projects that will be constructed over a number of years. It isimportant to note that annual rate increases will be required in order to fund the debt serviceon the bonds that will be issued over the 10-year planning period. More detail can be found inthe County Manager’s Adopted FY 2021 CIP.
406

STORMWATER MANAGEMENT FUND FUND SUMMARY
PROGRAM FINANCIAL SUMMARY
FY 2019 FY 2020 FY 2021 % ChangeActual Adopted Adopted ‘20 to ‘21
Personnel $4,798,036 $5,126,484 $5,727,381 12%Non-Personnel 2,885,375 3,334,866 4,248,519 27%Capital Projects 3,967,366 2,749,745 1,753,147 -36%Total Expenditures 11,650,777 11,211,095 11,729,047 5%
Total Revenues $10,759,822 $11,211,095 $11,729,047 5%
Change in Fund Balance ($890,955) - - -
Permanent FTEs 44.00 44.00 47.00Temporary FTEs - - - Total Authorized FTEs 44.00 44.00 47.00
CAPITAL PROGRAM SUMMARY
The adopted CY 2020 Sanitary District Tax of $0.013 per $100 of assessed real property value remains unchanged from CY 2019. For CY 2020, it is estimated to generate a total of $10,423,354 in revenue, of which $1,753,147 will go towards executing the capital program. Recognizing the significance of the stormwater investment that is needed, the County Manager will be proposing a November 2020 bond referendum for stormwater and watershed infrastructure. This will be a substantial, long-term investment in the County’s stormwater management system, with multiple generations of taxpayers benefitting.
The capital is invested in the following: ‘Storm Drainage Improvements,’ ‘Maintenance Capital,’ and ‘Streams and Water Quality,’ capital programs. The County Manager Adopted FY 2021 Capital Improvement Plan (CIP) provides more detail.
Storm Drainage Improvements The Storm Drainage Improvements program addresses infrastructure improvements to the stormwater sewer system. Improvements are designed and executed on watershed, localized, and parcel-based scales to: 1) mitigate flood risks; 2) maintain system infrastructure in a state of good repair; 3) install tertiary system elements; 4) construct drainage projects where under capacity; 5) develop overland relief; 6) advance resiliency goals; and 7) otherwise implement the adopted Stormwater Master Plan and underlying studies.1
FY 2020 Program highlights: Extreme Event Response (July 8, 2019 Storm):
1 Arlington County’s stormwater sewer system is increasingly vulnerable due to under-capacity, age, and condition of certain pipe sections and/or network elements. More than half of the network is at least 60-80 years old and includes assets constructed from corrugated metal and terracotta. In addition, the system lacks sufficient tertiary infrastructure. Also, the community continues to experience robust redevelopment and recently (2018 and 2019) experienced intense storm events that caused significant flooding and damage of both public infrastructure and private property.
407

STORMWATER MANAGEMENT FUND FUND SUMMARY
o Nearly 1,000 calls for flooding assistance were logged and 250 drainage complaints wereinvestigated related to unusually intense rainfall and the flood. These investigationsresulted in a renewed focus on capacity infrastructure investment.
o More than 90 individualized flood proofing and technical site visits were performed forresidents who experienced flooding of more than three feet of water in their homes. Onlythose residents who specifically requested the visits participated.
o Two (2) Flood Resiliency Workshops were held in October 2019, featuring engineering andindustry experts in flood-resistant design (dry- and wet-flood-proofing), flood riskmitigation, and flood insurance options and limitations. More than 200 people attendedboth workshops.
o Expansion of DES-Stormwater Communications Platforms, including: New webpage section on flood-proofing, flood resilience, and risk mitigation
(https://www.arlingtonva.us/flooding/). Design and launch of an Arlington County Stormwater Story Map (active November
2019). Development and launch of the Risk Assessment and Management Project (RAMP), which will:
o Inform Flood Resilient Arlington. Arlington is working toward flooding resilience throughdefining balance between private and public responsibility, scaling levels of floodprotection and mitigation, and needs based investment.
o Create mid and long-term climate mitigation and adaptation plans and actions.o Inform current and future CIP planning.o Provide certain project cost-benefit analyses.o Perform pre-disaster mitigation planning (with the Department of Public Safety
Communications and Emergency Management).o Explore potential grant and alternative funding efforts.o Use data to support relevant future code and ordinance updates.
Spout Run Watershed Infrastructure Project design phase began in FY 2019 and is expected tocontinue into FY 2021. This project has been identified as one of several critical priority areasthat experience flooding as a result of system under-capacity, insufficiency, or age-relatedconditions on a watershed scale (other similar critical priority sites across local or sub-regionalized scales have also been identified). The current design phase funding includessurveys, engineering design, design phase outreach, and analytics.
After the July 8, 2019 flood, watershed scale projects for four additional watersheds wereaccelerated and design phases were initiated, including: Torreyson Run, Lubber Run, CrossmanRun, and Westover. Multiple other large-scale projects were also accelerated. These weretargeted in the watersheds with the most severe flooding. These watersheds include but arenot limited to: Spout Run (exclusive of Waverly Hills), Donaldson Run, and Four Mile Run.
Four Mile Run Flood Control Project – Letter of Intent executed with the US Army Corps ofEngineers (USACE), in coordination with the City of Alexandria, for the development of dredgingand maintenance plans to remediate USACE identified deficiencies in Four Mile Run-ArlingtonEast and Arlington West Levees.
Engineering design for the replacement of the Dumbarton Street culverts began in FY 2020. Woodmont Swale repair and stabilization, between the 2400 block of North Kenmore Street
and the 2900 block of 24th Road North: construction was initiated in FY 2018 andsubstantially completed in early FY 2019. Project was closed out in FY 2020.
Phase I of the Donaldson Run outfall and channel repair and stabilization at 24th Road North:construction was initiated and completed in early FY 2019. After acquisition of a large easementa second phase was constructed in mid-FY 2020. Additional phases will proceed in FY 2021 andbeyond.
Windy Run outfall repair, at North Nelson Street: construction was initiated in late FY 2018 andcompleted in early FY 2019.
Installed 700 linear feet of small diameter storm sewers, which repaired existing storm sewersor addressed local drainage.
408

STORMWATER MANAGEMENT FUND FUND SUMMARY
Maintenance Capital Much of Arlington County's stormwater infrastructure was built during the 1940's and 1950's. It is approaching the end of its useful life and a regular repair and replacement program is necessary to ensure the continued functioning of the storm drainage network during storm events in order to prevent flooding and property damage.
This program provides for the regular replacement of storm sewer mains, catch basins, and endwalls (with their associated outfalls). Particular attention will be paid to the approximate 11 miles of corrugated metal pipes and plate arch culverts that have deteriorated more quickly than other materials. Associated master plans include the Watershed Management Plan and the Stormwater Master Plan.
Streams and Water Quality This program addresses regulatory requirements and adopted policy objectives to reduce stormwater pollution, rehabilitate and restore natural infrastructure, protect public safety, and promote environmental recovery and restoration in the County’s stream valleys which have been impacted by stormwater runoff from the County’s increases in impervious surfaces.
Arlington County exceeded the five (5) percent Bay cleanup pollution reduction requirement for the permit cycle that ended in June 2018. The next permit cycle (anticipated to end in 2025) will require a cumulative 40 percent pollution reduction, with the subsequent permit requiring the full 100 percent reduction by 2030. Progress to date has been made through public investments in green infrastructure and stream restoration as well as water quality credit from redevelopment activity regulated under the Stormwater Management Ordinance.
Increased program drivers to repair eroded streams and failed stormwater outfalls emerged from the July 8, 2019, extreme flooding event. Also, continued increases in impervious surfaces from land development activity (both regulated and unregulated) add to the mitigation pressures on the program.
Program highlights: Forty-two (42) watershed retrofit projects have been constructed, most recently green
infrastructure projects at North Kirkwood Road at 13th Street North and two projects alongWilliamsburg Boulevard.
Four Mile Run emergency streambank repair along the W&OD Trail completed Winter 2019(withstood July 2019 extreme flooding event).
Windy Run stream restoration project completed Fall 2018. Four Mile Run tidal restoration project completed Fall 2017 (received multiple awards: The
Virginia Governor’s Environmental Excellence Award; 2018 Dave Pearson Watershed ExcellenceAward from the Virginia Lakes and Watershed Association; and the Virginia Park and RecreationSociety – Best New Environmental Sustainability Award, November 2018).
Donaldson Run Tributary B stream restoration project is expected to start construction inFY 2021.
Ballston Pond watershed retrofit project is expected to start construction in FY 2022. Planning, design, and community engagement for the Sparrow Pond retrofit project and Gulf
Branch stream restoration project are underway with construction expected to start in FY 2023and FY 2024 respectively.
409

STORMWATER MANAGEMENT FUND FUND SUMMARY
STORMWATER MANAGEMENT FUND FUND STATEMENT
FY 2019 FY 2020 FY 2020 FY 2021 ACTUAL ADOPTED RE-ESTIMATE ADOPTED
ADJUSTED BALANCE, JULY 1 $15,162,201 $14,438,224 $14,271,926 $11,279,058
REVENUE Sanitary District Tax ($0.013 real estate tax) 9,747,498 10,093,595 10,194,119 10,423,354
Fines & Fees 1,013,004 1,117,500 1,117,500 1,305,693 TOTAL REVENUE 10,760,502 11,211,095 11,311,619 11,729,047
TOTAL REVENUE & BALANCE 25,922,703 25,649,319 25,583,545 23,008,105
EXPENSES Operating and Maintenance 7,683,411 8,461,350 8,107,742 9,975,900 Capital Projects - Current Year 1,990,900 2,749,745 2,749,745 1,753,147
Capital Projects - Carry-Over 1,976,466 4,500,000 3,447,000 2,854,000 TOTAL EXPENSES 11,650,777 15,711,095 14,304,487 14,583,047
BALANCE, JUNE 30 14,271,926 9,938,224 11,279,058 8,425,058 Operating Reserve 1,920,853 2,115,338 2,026,935 2,493,975
Capital Fund Balance 12,351,073 7,822,886 9,252,124 5,931,083 TOTAL BALANCE $14,271,926 $9,938,224 $11,279,058 $8,425,058 Notes: (1) The FY 2020 re-estimate is the current projection of expenses and revenues.(2) Most capital projects span multiple years, from design to construction completion. The FY 2019 Actual and FY 2020Re-Estimate columns reflect that funding for capital projects are carried forward each fiscal year, and ending balancesfluctuate, reflecting the carryover of these funds. The FY 2021 Adopted budget column is presented in a similar fashion toshow planned execution of projects in the fiscal year. These are staff's best estimates based on preliminary plans and designand construction schedules.(3) As of January 31, 2020, there are $4.1 million in encumbrances for multi-year capital construction projects(4) Based on County financial policies, the operating reserve is a 90-day reserve based on the Operating and Maintenancebudget.
410

STORMWATER MANAGEMENT FUND TEN-YEAR HISTORY
EXPENDITURE, REVENUE, AND FULL-TIME EQUIVALENT TRENDS
The Stormwater Management Fund was established by the County Board in CY 2008 byadopting a Sanitary District Tax of $0.01 per $100 of assessed real property value. InCY 2010, the Sanitary District tax rate was increased to $0.013 per $100 of assessed realproperty value.
$ in 000sFY 2012
ActualFY 2013
ActualFY 2014
ActualFY 2015
ActualFY 2016
ActualFY 2017
Actual FY 2018
ActualFY 2019
Actual
FY 2020 Adopted
Budget
FY 2021 Adopted
BudgetEXP $6,427 $5,627 $5,868 $7,557 $8,430 $14,999 $13,259 $11,651 $11,211 $11,729REV $7,896 $9,136 $8,492 $8,833 $9,185 $10,878 $10,438 $10,760 $11,211 $11,729FTEs 25.00 26.00 26.00 37.00 37.00 42.00 42.00 44.00 44.00 47.00
0
10
20
30
40
50
$0
$1,000
$2,000
$3,000
$4,000
$5,000
$6,000
$7,000
$8,000
$9,000
$10,000
$11,000
$12,000
$13,000
$14,000
$15,000FTEs EXP REV
411

STORMWATER MANAGEMENT FUND TEN-YEAR HISTORY
Fiscal Year Description FTEs
FY 2012 Non-personnel expenses increased to cover maintenance of stormwater quality retrofits ($203,886).
Funding for capital projects increased ($335,837) in FY 2012 as a result ofa projected increase in revenue due to higher real estate assessments.
Revenue increased due to higher real estate assessments ($541,764).
FY 2013 Added an Environmental Planner to address the increased stormwater site plan reviews and workload related to the County’s MS4 stormwater permit (1.0 FTE; $107,537).
1.0
Non-personnel expenses increased to cover maintenance for streamrestoration projects ($20,000), creation of a stream and storm sewermonitoring network ($100,000), and an increase in the operatingcontingent ($107,615).
Funding for capital projects increased ($45,556) as a result of a projectedincrease in revenue due to higher real estate assessments.
Revenue increased due to higher real estate assessments ($456,488).
FY 2014 Non-personnel expenses increased based on higher contract costs anticipated with the new MS4 permit ($89,726), an adjustment to the annual expense for the maintenance and replacement of County vehicles ($6,019), funding the County’s share of the Northern Virginia Regional Commission’s work on Four Mile Run ($60,156) which was previously funded by the General Fund, higher administrative overhead contributions to the General Fund based on prior years’ actual ($100,000), and other changes itemized below. This is partially offset by a reduction in operating contingency ($130,824).
Funding for capital projects decreased ($461,035) in FY 2014 as a resultof higher operating expenses and transfer of projects previously supportedin the General Fund.
Revenues increased ($2,000) due to a slight increase in the projected realestate assessments.
Increased Inter-Department Charges for the reimbursement to the GeneralFund for a portion of the street sweeping program costs ($240,000).
Transferred the contribution for Arlingtonians for a Clean Environment(ACE) from the General Fund ($69,705).
FY 2015 Added personnel for stormwater management regulations. The 11 positions are a critical foundational step for stormwater program delivery and compliance.
11.0
412
STORMWATER MANAGEMENT FUND TEN-YEAR HISTORY
Fiscal Year Description FTEs
Non-personnel increased primarily due to an increase in inter-departmentalcharges for overhead ($60,364), operating expenses related to the newFTEs ($67,643), and reimbursement of a portion of the street sweepingprogram costs ($50,896), which was partially offset by an adjustment tothe annual expense for maintenance and replacement of County vehicles($64,059).
Funding for capital projects decreased ($1,022,970) in FY 2015 as a resultof adding 11.0 FTEs and other personnel expense increases.
Revenues increased due to a projected increase in real estate assessmentvalues ($569,200).
FY 2016 Non-personnel increased primarily due to an increase in inter-departmental charges for overhead ($20,714) and an adjustment to the annual expense for maintenance and replacement of County vehicles ($89,070).
Revenues increased due to a projected increase in real estate assessmentvalues ($450,750) and fees from site plan review ($250,000).
FY 2017 Added personnel for stormwater management regulations. The five positions ($628,983) were a critical foundational step for stormwater program delivery and compliance.
5.0
Non-personnel increased due to the transfer of the responsibility of newtree planting from DRP to the Stormwater Management Fund ($205,000).
Revenues increased due to a projected increase in real estate assessmentvalues ($329,520) and fees from sediment/erosion control plan review($200,000).
FY 2018 Elimination of one-time cost for purchase of a new vehicle in FY 2017 ($24,100).
Non-personnel increased due to the transfer of the responsibility ofoperating maintenance costs for DES and DPR stormwater facilities to theStormwater Management Fund ($265,130), an increase in operatingsupplies ($60,331), and adjustments to the annual expense formaintenance and replacement of County vehicles ($8,776).
Revenues increased due to a projected increase in real estate assessmentvalues ($258,190) and fees from sediment/erosion control plan review($100,000).
FY 2019 Added a position that supports critical Stormwater Infrastructure program priorities, including managing the small drainage projects program ($127,354).
1.0
Transferred an Administrative Assistant position from the General Fund tothe Stormwater Management Fund ($62,686).
1.0
Street sweeping expenses were transferred in from the DES General Fundto the Stormwater Management Fund ($397,290).
413

STORMWATER MANAGEMENT FUND TEN-YEAR HISTORY
Fiscal Year Description FTEs
Increased contractual expenses ($91,182), partially offset by a reductionin other operating expenses ($44,473).
Capital program funding decreased due to an increase in the operatingbudget for personnel and non-personnel expenses ($146,381).
Revenue increased due to the increase in the CY 2018 real estateassessment tax base ($78,500), an increase in projected Sediment andErosion Control plan revenue ($282,500) and Chesapeake Bay Preservationfee revenue ($160,000).
FY 2020 Non-personnel decreased in operations due to a reduction in residential street sweeping frequency ($135,150), a reduction in inlet cleaning and inspection maintenance ($100,000), and inter-departmental charges for overhead ($70,320); offset by adjustments to the annual expense for maintenance and replacement of County vehicles ($7,972), and a contribution to Northern Virginia Regional Commission ($875).
Capital program funding increased due to the reallocation of reductions inoperations taken in for street sweeping and inlet cleaning ($235,150) andincreased revenue.
Revenue increased due to the increase in the CY 2019 real estateassessment tax base ($405,435), an increase in Sediment and ErosionControl plan revenue ($75,000), and Chesapeake Bay Preservation feerevenue ($50,000).
FY 2021 Added two Stormwater Inspectors to meet the County’s mandated MS4 permit obligations and workload ($248,514) and a Senior Program Manager to manage and oversee the maintenance capital and storm drainage improvements ($203,285). Non-personnel funding includes the addition of vehicles for the two new Stormwater Inspectors ($44,000 one-time; $15,310 on-going) and operating expenses for the new Senior Program Manager ($2,652 one-time; $2,860 on-going).
3.0
Added funding for contractual increases related to operating maintenancecosts for DES and DPR stormwater facilities ($329,752), one-time fundingfor the utility feasibility study ($250,000), inter-departmental charges foroverhead ($231,383), County facility parking lot sweeping ($70,000), andtree planting ($4,809).
Capital program funding decreased due to increases in the operatingbudget for personnel and non-personnel expenses ($996,598).
Revenue increased due to the increase in the CY 2020 real estateassessment tax base ($329,759), inflationary increase of 2.5 percent tofees ($27,938), a planned increase in Sediment and Erosion Control planfees to support the addition of the two Stormwater Inspectors ($328,020),and Chesapeake Bay Preservation fee increase ($5,250), partially offset byprojected reductions to Chesapeake Bay Preservation revenue ($21,525)and other revenues based on resulting economic conditions from thepandemic ($145,077).
414

TRANSPORTATION CAPITAL FUND Department of Environmental Services
Our Mission: To provide critical transportation infrastructure to enhance the community’s long-term economic and environmental sustainability.
Transportation Capital Fund Allows the County to make major ongoing investments in multimodal transportation
infrastructure that supports the function, competitive position, and ongoing development ofArlington’s commercial and mixed-use districts such as the Rosslyn-Ballston Corridor, CrystalCity, Pentagon City, Columbia Pike, Lee Highway, and Shirlington. These commercial mixed-use districts make up almost half of the County’s tax base, and include most of the County’soffice, hotel, retail, and multi-family housing stock.
Provides a stream of capital funding for transportation projects that is over and above whatwould be available from County general obligation bond and Pay-As-You-Go sources.
Provides the opportunity to leverage outside sources of funding from federal, state, andregional transportation programs as well as private sector partners.
The 2013 Virginia General Assembly enacted legislation (House Bill 2313), which raised newtransportation revenues for Northern Virginia through a series of state imposed regional taxesand fees1. Of these revenues, 70 percent (“Regional Funds”) are retained by the NorthernVirginia Transportation Authority (NVTA) to fund regional transportation projects. Theremaining 30 percent (“Local Share”) are returned on a pro rata basis to the memberlocalities, based on the amount of revenue generated by the taxes and fees within the locality,to be used for locally selected transportation projects.
As part of the HB 2313 legislation, localities must enact a Commercial and Industrial Property(“C&I”) tax at $0.125 per $100 of real estate value or dedicate an equivalent amount fortransportation. Localities that do not fully implement this tax or an equivalent amount willhave revenues reduced by a corresponding amount, the proceeds of which would beredistributed regionally. The Arlington County Board adopted the required $0.125 per $100valuation C&I tax, known as the Transportation Capital Fund (TCF) in 2008, and therefore,meets this requirement.
SIGNIFICANT BUDGET CHANGES
The FY 2021 adopted budget for the Transportation Capital Fund (TCF) is $34,436,800, based on projected current year revenues. The complete spend down plan reflects utilization of current year revenues and fund balance as capital projects are rarely completed in a single year and require carryover of funds to be fully executed. The complete FY 2021 implementation plan compared to the revised FY 2020 plan is shown in the fund statement. The FY 2021 budget reflects:
Revenues increased based on commercial real estate assessment projections ($146,644). Revenues decreased based on Northern Virginia Transportation Authority (NVTA) revenue projections ($68,362).
1 The 2018 Virginia General Assembly enacted legislation that redirected a portion of these revenues to WMATA (Senate Bill 856).
415

TRANSPORTATION CAPITAL FUND FUND SUMMARY
PROGRAM FINANCIAL SUMMARY FY 2019 FY 2020 FY 2021 % Change
Actual Adopted Adopted '20 to '21Capital Projects $52,936,447 $34,358,518 $34,436,800 -Total Expenditures 52,936,447 34,358,518 34,436,800 -
Total Revenues 49,782,761 $34,358,518 $34,436,800 -
Change in Fund Balance ($3,153,686) - - -
Total Authorized FTEs 29.0 29.0 29.0 -There are a total of 36 FTEs to support the transportation capital program. 29 FTEs are funded by the Transportation Capital Fund and 7 FTEs are funded by the Crystal City Tax Increment Fund (TIF).
This table reflects the FY 2021 spending plan of current year revenues and does not show theuse of fund balance for the total projected FY 2021 expenditures. See the Fund Statementfor the execution plan.
FY 2021 MAJOR PROJECTS Complete Streets Rosslyn-Ballston Corridor Improvements: multimodal street improvements throughout the
corridor that meet the planning goals outlined in the Master Transportation Plan (MTP) and areasector plans. These projects will provide significant street and sidewalk safety and functionalityimprovements. Projects include:
o Washington Boulevard Improvements (Wilson to Kirkwood): Improvements to traffic lanesand associated traffic signals and development of an adjacent property into a County DPR-maintained open space. Update sidewalks and other streetscape elements to matchimprovements being made at Clarendon Circle.
o Clarendon Circle Improvements (Wilson Boulevard and Washington Boulevard):Construction began in September of FY 2020 and is expected to be completed by the endof FY 2021.
Crystal City, Pentagon City, Potomac Yard Street Improvements: Multimodal street improvementsthroughout the area that will improve connectivity, access, and enhance private redevelopmentopportunities. The 18th Street South (Fern Street to Eads Street) project will start construction inFY 2021 and will utilize significant TCF funding.
Boundary Channel Interchange Improvements: The project will upgrade the Boundary ChannelDrive/I-395 interchange to improve traffic operations and safety for all users. The existinginterchange is inadequate for current demands and for future planned growth in Crystal City. Theinterchange project also includes a connection to Long Bridge Park Drive and a bicycle connectionfrom the Humpback Bridge (Mount Vernon Trail) to Long Bridge Park. Boundary Channel Drivewill be reduced from four lanes to two lanes and all existing ramp terminals along BoundaryChannel Drive will be converted to roundabouts. The eastern side of the interchange will bereconfigured to better separate various movements and provide an improved connection betweenLong Bridge Drive and I-395 northbound. Project elements include new curb and gutter, shared-use paths, bicycle facilities, street trees and street lighting.
Columbia Pike Multimodal Street Improvements: Multimodal improvements along the entirecorridor will increase pedestrian safety and access with consistent and wider sidewalks, provideimproved bicycle facilities mostly on adjacent bicycle boulevards, improve traffic flow through theintroduction of turn lanes and a consistent cross section, and increase pedestrian safety at
416

TRANSPORTATION CAPITAL FUND FUND SUMMARY
intersections. Engineering drawings have been developed for four segments of Columbia Pike. Construction is underway on the west end segment between Four Mile Run and the County line and is expected to be completed in FY 2021. Design is progressing towards completion on the remaining segments and construction is anticipated to commence in FY 2021, contingent on successful negotiation of right-of-way acquisition and easements.
Improvements Outside Major Corridors:o Lee Highway at Glebe Road Intersection Improvements: Sidewalk improvements,
installation of left turn lanes along Glebe Road, upgraded traffic signals, streetlighting,and improved bus stops to follow the utility undergrounding. Construction is expected tostart in FY 2020 and be completed by FY 2022.
o Walter Reed Drive – 5th Street to Columbia Pike and 6th Street to Columbia Pike (2 phases):Pedestrian safety and access improvements that include construction of sidewalks, bikelanes, curb extensions, crosswalks, and bus stop improvements. These improvements willcreate a safer corridor and have been coordinated with new developments occurring atthe schools, apartments, community facilities, commercial properties, and residenceslocated along Walter Reed Drive. Construction is expected to start in FY 2021 and becompleted in FY 2021.
o Pershing Drive – N. Barton Street to N. Piedmont Street: Will improve bus / transitefficiency by consolidating and enhancing bus stops to better support riders and meet ADArequirements. Construction is expected to start in FY 2020 and be completed in FY 2021.
Transportation Systems and Traffic Signals: This program includes the upgrade andreconstruction of existing outdated traffic signals and also allows for the implementation oftransportation operations and management systems components such as backup power and mid-block flashing beacons. Typically, the County rebuilds around 10 signals per year with varyingdegrees of intersection-related improvements such as accessible curb ramps.
Intelligent Transportation System (ITS): This program will allow the County to expand ITS systemcapabilities/upgrades with the help of recently installed fiber in the County. These projects includeupgrading the County's traffic signal system to allow for integration of existing components suchas video detection, uninterrupted power supply (UPS), and Polara pedestrian push buttons intothe central Traffic Management Center (TMC). Additionally, in FY 2021, this program will continueto work towards designing and installing new ITS strategies such as data sharing and collection,and security enhancements.
Strategic Network Analysis and Planning: This program supports multimodal traffic data collectionand analysis services used for traffic engineering and operations projects including:
o Traffic volume/speed/classification data collection at intersections and along corridors forall modes of transportation (vehicle, heavy truck, pedestrian, bike) to inform varioustransportation analyses.
o Crash data organization and record upkeep, which allows for transportation safetyanalyses throughout the County and subsequent implementation of safety measures onidentified problem areas. This supports the Vision Zero safety initiative.
o Travel demand model data program to collect/purchase data useful in understandingtravel patterns and travel behavior. This data will be used in modeling the impacts ofpotential infrastructure improvement projects or policy changes on the transportationsystem.
The data programs listed above also support travel demand forecasting model development efforts. The modeling program includes developing and updating an Arlington County travel demand model that can be used for multimodal service analysis and strategic planning for Arlington County as a whole. This program also supports additional customized modeling at a more detailed level for subareas—including Crystal City/Pentagon City, the Rosslyn/Ballston Corridor, and the Columbia Pike Corridor. These models will allow the County to test multimodal
417

TRANSPORTATION CAPITAL FUND FUND SUMMARY
impacts on the County's roadways and assist in decision-making by ensuring that investments will yield significant positive impacts on the countywide transportation system.
Street Safety Improvements (SSI): This is a new program that will support the Vision ZeroResolution the County Board adopted in July 2019. The resolution identified safety as a priorityand called for eliminating fatal and severe injury crashes. This program supports projects atintersections and streets where safety improvements are needed for pedestrians, bicyclists,transit riders, or motorists as determined through a comprehensive investigation, including crashanalysis. It will focus on safety improvements that can be deployed or implemented in a relativelyshort amount of time with lower capital cost. For example, tactical treatments such as tighteningintersection configuration through marking and vertical delineators to address elevated crash rateat certain intersections; marking stop bars at every stop sign location county wide; installingPedestrian Flashing Beacons at certain crosswalks; installing Speed Feedback Indicator Signs;etc. The program will also collect before and after data to establish a baseline of effectiveness,and in turn allow the development of an up-to-date Transportation Safety Toolbox. The periodicupdates of Vision Zero action plan will be part of the scope as well.
Transit ART Operations and Maintenance Facility: Will provide a necessary facility to maintain and store
Arlington’s growing fleet of ART buses. The County has increased the number of ART routes andhours of service significantly during the past 10 years. The local bus fleet currently totals 78. Theplan is for ART to continue expanding over the next 20 years requiring a fleet of over 100 buses.The site in Shirlington will be used to ground the ART fleet, with construction of an operationsand administration building, an 8-bay transit bus maintenance facility, parts storage room,maintenance offices, and garage parking area. Design started in FY 2020.
Ballston Multimodal Improvements: Improvements to the bus bays, curb space, bike parking,crosswalks, and plaza area around the entrance of Ballston-MU Metrorail station. The project willreconfigure and increase the number of bus bays, modernize and enlarge bus shelters andseating, improve pedestrian circulation, and establish a kiss-n-ride area to relieve crowdedconditions. The project started construction in FY 2020 and will complete in FY 2022.
Pentagon City Metro Station Second Elevator: The elevator will improve access to the stationfrom the west side of S Hayes Street, as well as creating redundancy if one elevator is out ofservice. The project is expected to enter construction in FY 2020 and complete construction inFY 2022.
Transit Intelligent Transportation System: This program will use technology to improve transitoperations, including but not limited to reliability of service, rider information, and identify andmitigate security and safety issues. It builds on and expands technologies in place as well asintroduces new technologies as recommended in the Transit ITS master plan. It further providesfunding for replacement of existing technology as it reaches its useful life.
418

TRANSPORTATION CAPITAL FUND FUND SUMMARY
Most capital projects span multiple years, from design to construction completion. The FY 2019 Actual and FY 2020 Re-Estimate columns reflect that funding for capital projects
is carried forward each fiscal year, and ending balances fluctuate, reflecting the carryover ofthese funds.
The FY 2021 adopted budget column is presented in a similar fashion to show plannedexecution of projects in the fiscal year.
These are estimates based on preliminary plans and design and construction schedules.
Note: 1. Balances equivalent to a minimum of ten percent of annual budgeted TCF revenues are held
in a reserve in accordance with the County Board’s financial and debt policies.
FY 2019 FY 2020 FY 2020 FY 2021ACTUAL ADOPTED RE-ESTIMATE ADOPTED
ADJUSTED BALANCE, JULY 1Construction Reserve $170,883,749 $157,733,721 $168,230,063 $142,601,751Reserve 3,900,000 3,300,000 3,400,000 3,400,000TOTAL BALANCE 174,783,749 161,033,721 171,630,063 $146,001,751
REVENUESCommercial Real Estate Revenues 25,048,572 26,419,757 26,330,158 26,566,401 Developer Contributions 2,336,389 - - - Capital Bikeshare - User Revenue 629,784 - - - Miscellaneous Revenues - - - -Grant Revenues 13,057,308 - - - NVTA Revenues - Local 8,710,709 7,938,761 8,157,330 7,870,399 TOTAL REVENUES 49,782,761 34,358,518 34,487,488 34,436,800
TOTAL REVENUE & BALANCE 224,566,510 195,392,239 206,117,551 180,438,551
EXPENSESCapital Projects - Current Year 52,936,447 34,358,518 34,358,518 34,436,800Capital Projects - Carry-Over - 23,653,158 25,757,282 36,030,555TOTAL EXPENSES 52,936,447 58,011,676 60,115,800 70,467,355
BALANCE, JUNE 30Construction Reserve 168,230,063 133,980,563 142,601,751 106,371,196Reserve1 3,400,000 3,400,000 3,400,000 3,600,000TOTAL BALANCE $171,630,063 $137,380,563 $146,001,751 $109,971,196
TRANSPORTATION CAPITAL FUNDFUND STATEMENT
419

TRANSPORTATION CAPITAL FUND TEN-YEAR HISTORY
EXPENDITURE, REVENUE AND FULL-TIME EQUIVALENT TRENDS
The FY 2021 Adopted Budget includes a total of 36 FTEs to support major street and transit program elements. 29.0 FTEs are funded by Transportation Capital Fund and 7.0 FTEs are funded by the Crystal City Tax Increment Fund.
$ in 000s FY 2012
Actual FY 2013
Actual FY 2014
Actual FY 2015
Actual FY 2016
Actual FY 2017
Actual FY 2018
Actual FY 2019
Actual
FY 2020 Adopted Budget
FY 2021 Adopted Budget
EXP $10,818 $14,883 $17,742 $24,894 $31,329 $27,419 $41,991 $52,936 $34,359 $34,437REV $41,007 $29,278 $38,012 $51,360 $47,353 $48,269 $48,209 $49,783 $34,359 $34,437FTEs 0.00 0.00 5.00 15.50 15.00 18.00 22.00 29.00 29.00 29.00
0
5
10
15
20
25
30
$0
$10,000
$20,000
$30,000
$40,000
$50,000
$60,000
FTEs EXP REV
420
TRANSPORTATION CAPITAL FUND TEN-YEAR HISTORY
Fiscal Year Description FTEs
FY 2012 The adopted FY 2012 revenues and expenditures increased by 14.6percent from the FY 2011 adopted budget and 6.8 percent from theFY 2011 re-estimate, based on projections for the commercial real estatetax. The adopted commercial real estate tax rate is $0.125 per $100 ofassessed value, which is expected to generate $21,082,282 in FY 2012.
FY 2013 The adopted FY 2013 revenues and expenditures increased by 13.8percent from the FY 2012 adopted budget and 4.4 percent from theFY 2012 re-estimate, based on projections for the commercial real estatetax. The adopted commercial real estate tax rate is $0.125 per $100 ofassessed value, which is expected to generate $24,000,000 in FY 2013.
FY 2014 The adopted FY 2014 revenues and expenditures increased by 0.5 percentfrom the FY 2013 adopted budget and FY 2013 re-estimate, based onprojections for the commercial real estate tax. The adopted commercialreal estate tax rate is $0.125 per $100 of assessed value, which isexpected to generate $23,862,600 in FY 2014.
There are a total of 8.0 authorized FTEs in FY 2014, of which 5.0 FTEs arefunded by Transportation Capital Fund (TCF) and 3.0 FTEs are funded byCrystal City Tax Increment Fund (TIF).
5.0
As part of the FY 2013 closeout appropriation, 10.0 new FTEs wereauthorized from Transportation Capital Fund to support major street andtransit program elements.
10.0
FY 2015 Revenues and expenditures increased based on commercial real estateprojections ($1,399,057) and the addition on local Northern VirginiaTransportation Authority (NVTA) revenue approved by the GeneralAssembly in 2013 ($11,400,000).
FY 2016 Revenues and expenditures decrease based on commercial real estateprojections ($558,195), and Northern Virginia Transportation Authority(NVTA) revenue projections ($57,218).
The authorized FTEs were decreased 0.5 to properly reflect the grantcompliance position reporting to the Human Rights Office. The salary forthis position remains fully charged to the Transportation Capital Fund.
(0.5)
As part of budget adoption, $412,000 of funding for bike-pedestrianprojects were shifted from decal fees (PAYG) to HB2313 local.
ART Service Enhancements ($155,638) and Supplemental ART service($425,000) are funded by HB 2313 local funds.
FY 2017 Revenues and expenditures increase based on commercial real estateprojections ($79,849), and Northern Virginia Transportation Authority(NVTA) revenue projections ($471,659). The revenue will be used tosupport major approved capital projects.
421

TRANSPORTATION CAPITAL FUND TEN-YEAR HISTORY
Fiscal Year Description FTEs
Personnel and non-personnel increases due to the addition of two DesignEngineer Team Supervisors in the Engineering Bureau and one PrincipalPlanner for the Neighborhood Complete Streets Program. Otherpersonnel changes are a reallocation of a previously approved 1.0 positionin County Attorney’s Office to a 1.0 Capital Programs ManagementCoordinator and reallocation of a previously approved 1.0 position in DESReal Estate to a 1.0 Engineering Design Section Manager.
3.0
FY 2018 Revenues increase based on commercial real estate projections($1,640,387), and Northern Virginia Transportation Authority (NVTA)revenue projections ($85,559).
Increase of 4.0 FTEs including a Neighborhood Complete Streets TrafficEngineer position ($133,000) in the Traffic Engineering & OperationsBureau, a Design Engineer position ($133,000) in the Engineering Bureauto support the Neighborhood Complete Streets program, a Management& Budget Specialist position ($113,050) to support the overalltransportation capital program, and the transfer of an existing position inthe Real Estate Bureau from the Crystal City, Potomac Yard, and PentagonCity Tax Increment Financing Area (TIF) fund.
4.0
FY 2019 Revenues decrease based on a reduction in commercial real estateassessments ($1,246,745), and a reduction in Northern VirginiaTransportation Authority (NVTA) revenues due to the 2018 GeneralAssembly action to provide dedicated funding to Metro ($4,307,391).
Increase of two Engineering positions ($276,000) in the TrafficEngineering & Operations Bureau; The first FTE will support theTransportation Systems & Traffic Signals and Intelligent TransportationSystems CIP programs. The second FTE will support delivery of theComplete Streets CIP program.
2.0
A Community Relations Specialist position ($133,000) to support theoverall transportation capital program.
1.0
Three positions transferred from the DES General Fund. The positionsinclude two Budget Analysts and a Transportation Capital ProgramManager ($427,000). A portion of the time for these positions had alreadybeen charged to capital projects and the Transportation Capital Fund (netimpact $257,000).
3.0
A Grants Compliance Specialist position currently charged to theTransportation Capital Fund but previously authorized in the CountyManager’s Office (1.0 FTE).
1.0
As part of the FY 2018 closeout appropriation, revenue and expenses werereduced based on Virginia General Assembly action to dedicate funds toWMATA ($4,455,768).
422

TRANSPORTATION CAPITAL FUND TEN-YEAR HISTORY
Fiscal Year Description FTEs
FY 2020 Revenues increased based on commercial real estate assessmentprojections ($1,242,804) and Northern Virginia Transportation Authority(NVTA) revenue projections ($346,152).
FY 2021 Revenues increased based on commercial real estate assessmentprojections ($146,644).
Revenues decreased based on Northern Virginia Transportation Authority(NVTA) revenue projections ($68,362).
423

This page intentionally left blank
424

CRYSTAL CITY, POTOMAC YARD, AND PENTAGON CITY TAX INCREMENT FINANCING AREA
Our Mission: To provide a supplemental financial mechanism for the revitalization of Crystal City, Potomac Yard, and Pentagon City streets, transit, and public open spaces
Crystal City, Potomac Yard, and Pentagon City serves as one of Arlington’s largest commercial office, retail, and hotel districts and includes over 14,500 housing units. The commercial building stock in this area is aging, with some buildings dating back to the 1960s, and experiencing higher vacancy rates than historical averages. These trends have been recently reversed as this area is experiencing a rapid transition with intensive commercial and residential development. With Amazon’s selection of Arlington’s Pentagon City and Crystal City neighborhoods for its second headquarters in November 2018, the pace of commercial redevelopment has accelerated. The company has leased almost 600,000 square feet of office space in Crystal City which is currently being occupied or renovated, and additional supporting retail development is also under construction along three blocks of Crystal Drive. In December 2019, Arlington approved the first new construction for the Company’s Headquarters, 2.15 million square feet of commercial development in Pentagon City. Over 435 new multifamily residential units were added to the Pentagon City neighborhood in 2019 and there are over 250 additional housing units in the development pipeline. To learn more about the Amazon agreement, visit the website at https://www.arlingtonva.us/amazon/.
The Crystal City Sector Plan (The Plan) established a vision for supporting the revitalization of this important district. The Plan envisioned significant public infrastructure improvements in streets, transit, and public open spaces to support construction and reconstruction of office, retail, and residential spaces in Crystal City. The near-term infrastructure improvements include realignment of streets and intersections as well as investments in existing parks. Longer term improvements include a second entrance to the Crystal City Metrorail station, enhanced surface transit, and open spaces, including parks and plazas. The essential infrastructure needs in the adjacent areas of Potomac Yard and Pentagon City are captured in the Phased Development Site Plans (PDSPs) for these areas. As Crystal City, Potomac Yard, and Pentagon undergo large-scale redevelopment, timely investments in public infrastructure are important.
In October 2010, the Arlington County Board established a tax increment financing area in support of the Crystal City Sector Plan and infrastructure that will also support Potomac Yard and Pentagon City. Tax increment financing (TIF) is a mechanism used to support development and redevelopment by capturing the projected increase in property tax revenues in the area and investing those funds in improvements in that area. Unlike a special district, it is not an additional or new tax; rather, it redirects and segregates the increased property tax revenues that would normally flow to the General Fund so that it can be used for a specified purpose. The amount of the tax increment revenue was determined by setting a baseline assessed value of all property in the area on January 1, 2011, tracking the incremental increase in assessed values relative to the base year in each subsequent year, and segregating the incremental value in a separate fund.
The County Board policy that established the TIF requires the County Manager to revisit the percentage of incremental revenues going to the TIF each budget cycle and at other key milestones during the infrastructure planning process. The current TIF increment is 25 percent, which was last adjusted during the FY 2020 budget process. This increment provides the funding stream necessary to deliver the CIP commitments in the TIF area using a combination of TIF and other local and outside funding sources.
SIGNIFICANT BUDGET CHANGES
The FY 2021 adopted expenditure budget for the Crystal City, Potomac Yard, and Pentagon City Tax Increment Financing Area is $5,759,940, based on current year revenues. The complete spend down
425

CRYSTAL CITY, POTOMAC YARD, AND PENTAGON CITY TAX INCREMENT FINANCING AREA
FUND SUMMARY
plan reflects utilization of current year revenues and fund balance as capital projects are rarely completed in a single year and require carryover of funds to be fully executed. The complete FY 2021 execution plan compared to the revised FY 2020 plan is shown in the fund statement. The FY 2021 budget reflects:
Revenues decrease based on real estate assessments ($204,790) in CY 2020 compared toCY 2019.
PROGRAM FINANCIAL SUMMARY
FY 2019 FY 2020 FY 2021 % ChangeActual Adopted Adopted '20 to '21
Capital Projects $4,478,775 $5,964,730 $5,759,940 -3%Total Expenditures 4,478,775 5,964,730 5,759,940 -3%
Total Revenues 6,369,654 $5,964,730 $5,759,940 -3%
Utilization of Fund Balance $1,890,879 - - -
Permanent FTEs 6.50 7.00 7.00 Temporary FTEs - - - Total Authorized FTEs* 6.50 7.00 7.00
*There is a total of 36 FTEs to support the transportation capital program of which 29 FTEs are funded byTransportation Capital Fund and 7 FTEs are funded by Crystal City Tax Increment Fund (TIF).
The baseline CY 2011 real estate assessment tax base for the TIF is $9.8 billion. Revenue will be used to supplement other funding sources, examples of which include grant
funds, commercial real estate revenue, and bonds. The majority of capital transportation projects are funded from multiple sources.
This table reflects the FY 2021 spending plan of current year revenues and does not show the use of fund balance for the total projected FY 2021 expenditures. See the Fund Statement for the execution plan.
FY 2021 MAJOR PROJECTS
A significant portion of the TIF funds will be used for the Crystal City, Pentagon City, Potomac Yard Streets program, which is focused on the implementation of the board-adopted Crystal City Sector Plan.
The goals of the Streets program are to re-connect the Crystal City street grid, allow for increased accessibility and mobility by all forms of travel, and create opportunities for new development. This work program also includes a significant amount of utility relocation and utility upgrades in support of plan implementation. Specific projects are as follows:
Boundary Channel Drive Interchange Improvements: The project will upgrade the Boundary Channel Drive/I-395 interchange to improve traffic operations and safety for all users. The existing interchange is inadequate for current demands and for future planned growth in Crystal City. The interchange project also includes a connection to Long Bridge Park Drive and a bicycle connection from the Humpback Bridge (Mount Vernon Trail) to Long Bridge Park. Boundary Channel Drive will be reduced from four lanes to two lanes and all existing ramp terminals along Boundary Channel Drive will be converted to roundabouts.
426

CRYSTAL CITY, POTOMAC YARD, AND PENTAGON CITY TAX INCREMENT FINANCING AREA
FUND SUMMARY
The eastern side of the interchange will be reconfigured to better separate various movements and provide an improved connection between Long Bridge Drive and I-395 northbound. Project elements include new curb and gutter, shared-use paths, bicycle facilities, street trees and street lighting.
Army Navy Drive Complete Street Improvements: The project will re-build Army Navy Drive within the existing right-of-way as a multimodal complete street featuring enhanced bicycle, transit, environmental and pedestrian facilities. The goal of the project is to improve the local connections between the Pentagon and the commercial, residential and retail services of Pentagon City and Crystal City. The reconstruction will provide a physically separated two-way protected bicycle lane facility along the south side of Army Navy Drive, in addition to shorter and safer pedestrian crossings, and will accommodate future high-capacity transit. Motor vehicle travel lanes will be reduced in number where appropriate and will be narrowed to dimensions appropriate for a slower urban context. The existing raised medians will be removed and re-built as a planted median. The traffic signal equipment at the five-project corridor signalized intersections will be replaced with all new equipment. The new street design will incorporate best practices of environmental sustainability, including green landscaping treatments to reduce stormwater runoff and recharge groundwater.
Crystal City, Pentagon City Potomac Yard Streets: o Eads Street Bicycle and Pedestrian Improvements: The South Eads Street Complete Street
project implemented new bicycle facilities along the entire corridor (Army Navy Drive to FourMile Run). This project includes small-scale projects along the corridor to improve on theexisting bicycle and pedestrian facilities. It could include installing permanent physicalbarriers, bus stop islands, sidewalk and crosswalk improvements, trail connections, and otherrevisions and adjustments to the existing facilities.
o South 12th Street – Eads to Clark Bell: This project will create the cross-section on 12th StreetSouth called for in the Crystal City Sector Plan. In addition to the standard Sector Planstreetscape, including landscaping, sidewalks, pedestrian ramps, and street lighting, theproject will implement the eastbound and westbound lanes of the Crystal City-Potomac YardTransitway.
o South Clark Street realignment and 15th Street: This project will connect South Clark Streetto South Bell Street at 15th Street South to form a standard 4-way intersection and completethe street grid in the northern area of Crystal City. The project will also create space for the15th Street South Garden Park, to be located between South Clark Street and Crystal Drivein the median of 15th Street South. Finally, this project will implement the southbound CrystalCity-Potomac Yard Transitway segment on South Clark Street between 12th Street South and15th Street South. The project is funded with grant funding in FY 2021, fronted by TIF, andwill rely on TIF in FY 2023.
o 18th Street South – Fern to Eads: This project will rebuild 18th Street between South FernStreet and South Eads Street to continue the existing South Hayes Street Protected Bike Lane.Additionally, the project will rebuild the intersection of 18th Street South and South FernStreet to decrease crossing distances and decrease the existing impervious area.
o 23rd Street @ Route 1: This project will shift the northern (westbound) lanes of 23rd StreetSouth to the south to create more developable space in keeping with the Crystal City SectorPlan. Additionally, the project will realign and rebuild the intersections along 23rd Street Southwith South Eads Street, Route 1, and South Clark Street to simplify and improve the existingtraffic operations. New streetscape and lighting will be provided throughout the project'slimits. The project will also make safety and pedestrian improvements on 23rd Street Southbetween South Eads Street and Route 1. The existing pedestrian tunnel has been closed and
427
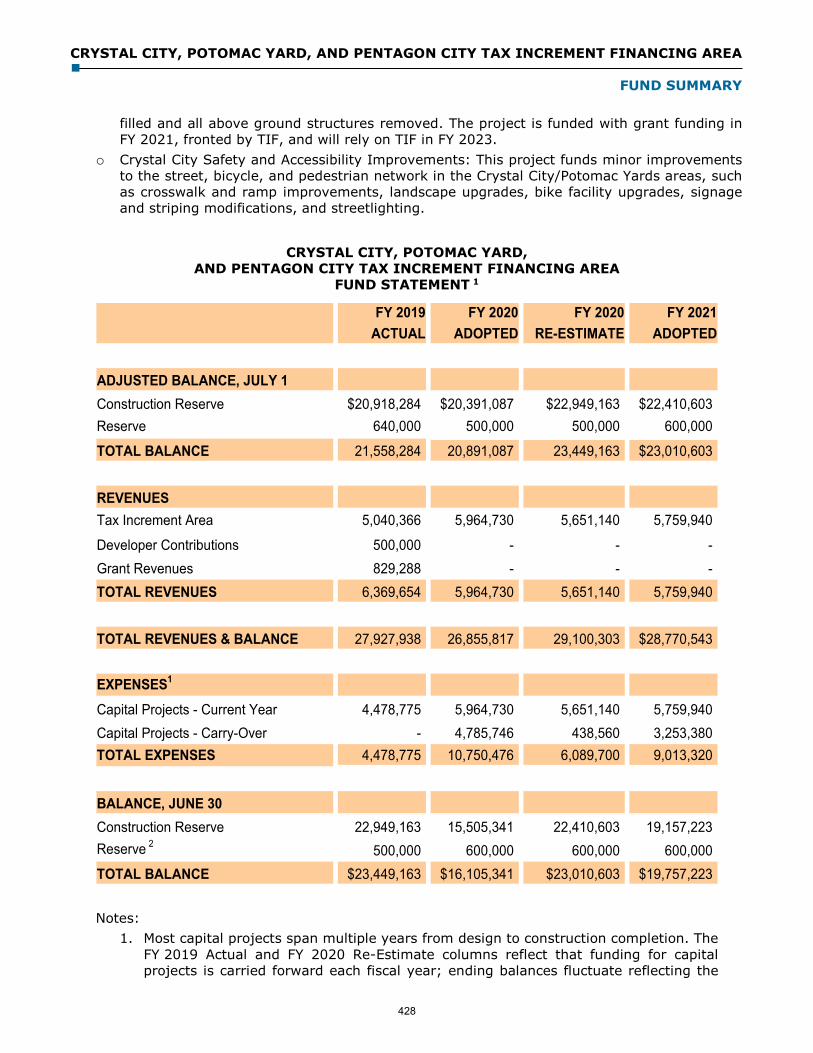
CRYSTAL CITY, POTOMAC YARD, AND PENTAGON CITY TAX INCREMENT FINANCING AREA
FUND SUMMARY
filled and all above ground structures removed. The project is funded with grant funding in FY 2021, fronted by TIF, and will rely on TIF in FY 2023.
o Crystal City Safety and Accessibility Improvements: This project funds minor improvementsto the street, bicycle, and pedestrian network in the Crystal City/Potomac Yards areas, suchas crosswalk and ramp improvements, landscape upgrades, bike facility upgrades, signageand striping modifications, and streetlighting.
CRYSTAL CITY, POTOMAC YARD, AND PENTAGON CITY TAX INCREMENT FINANCING AREA
FUND STATEMENT 1
FY 2019 FY 2020 FY 2020 FY 2021ACTUAL ADOPTED RE-ESTIMATE ADOPTED
ADJUSTED BALANCE, JULY 1Construction Reserve $20,918,284 $20,391,087 $22,949,163 $22,410,603Reserve 640,000 500,000 500,000 600,000 TOTAL BALANCE 21,558,284 20,891,087 23,449,163 $23,010,603
REVENUESTax Increment Area 5,040,366 5,964,730 5,651,140 5,759,940 Developer Contributions 500,000 - - - Grant Revenues 829,288 - - - TOTAL REVENUES 6,369,654 5,964,730 5,651,140 5,759,940
TOTAL REVENUES & BALANCE 27,927,938 26,855,817 29,100,303 $28,770,543
EXPENSES1
Capital Projects - Current Year 4,478,775 5,964,730 5,651,140 5,759,940 Capital Projects - Carry-Over - 4,785,746 438,560 3,253,380 TOTAL EXPENSES 4,478,775 10,750,476 6,089,700 9,013,320
BALANCE, JUNE 30Construction Reserve 22,949,163 15,505,341 22,410,603 19,157,223 Reserve 2 500,000 600,000 600,000 600,000 TOTAL BALANCE $23,449,163 $16,105,341 $23,010,603 $19,757,223
Notes: 1. Most capital projects span multiple years from design to construction completion. The
FY 2019 Actual and FY 2020 Re-Estimate columns reflect that funding for capitalprojects is carried forward each fiscal year; ending balances fluctuate reflecting the
428

CRYSTAL CITY, POTOMAC YARD, AND PENTAGON CITY TAX INCREMENT FINANCING AREA
FUND SUMMARY
carryover of these funds. The FY 2021 adopted budget column is presented in a similar fashion to show planned execution of projects in the fiscal year. These are staffs’ best estimates based on preliminary plans, and design and construction schedules.
2. Balances equivalent to a minimum of ten percent of annual budgeted TIF revenues areheld in a reserve in accordance with the County Board’s financial and debt policies.
429
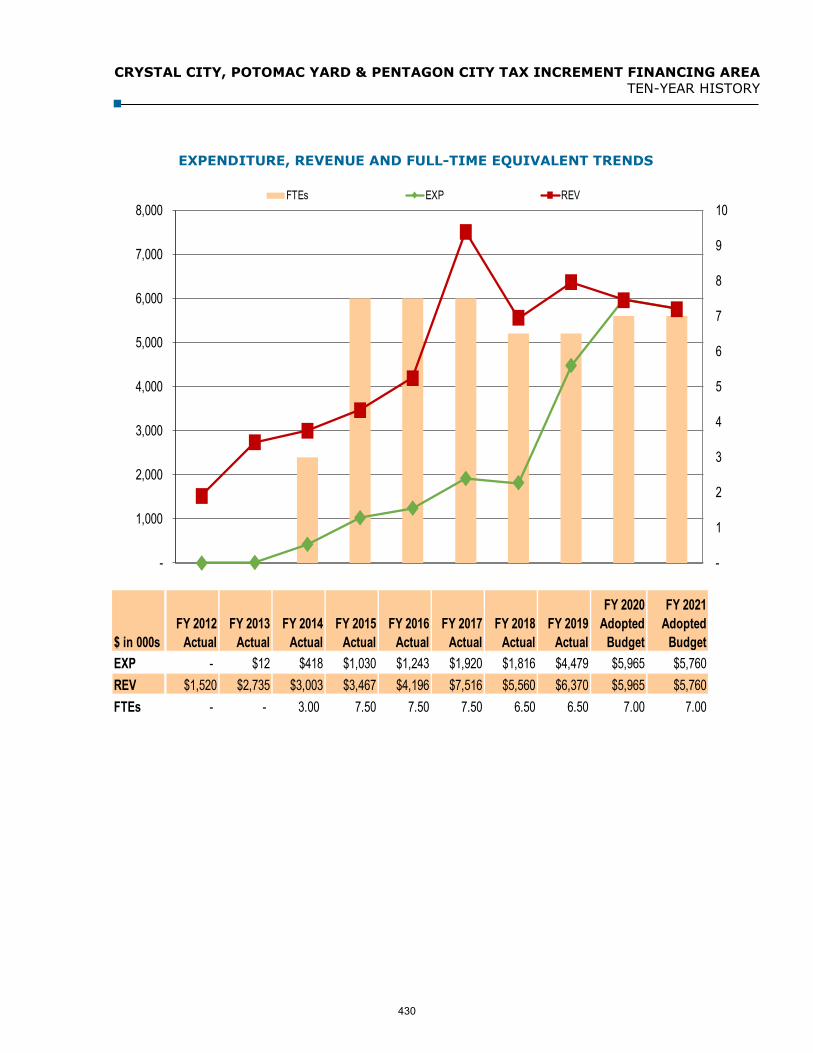
CRYSTAL CITY, POTOMAC YARD & PENTAGON CITY TAX INCREMENT FINANCING AREA TEN-YEAR HISTORY
EXPENDITURE, REVENUE AND FULL-TIME EQUIVALENT TRENDS
$ in 000s
FY 2
FY 2012 Actual
FY 2013 Actual
FY 2014 Actual
FY 2015 Actual
FY 2016 Actual
FY 2017 Actual
FY 2018 Actual
FY 2019 Actual
FY 2020 Adopted
Budget
FY 2021 Adopted
BudgetEXP - $12 $418 $1,030 $1,243 $1,920 $1,816 $4,479 $5,965 $5,760REV $1,520 $2,735 $3,003 $3,467 $4,196 $7,516 $5,560 $6,370 $5,965 $5,760FTEs - - 3.00 7.50 7.50 7.50 6.50 6.50 7.00 7.00
-
1
2
3
4
5
6
7
8
9
10
-
1,000
2,000
3,000
4,000
5,000
6,000
7,000
8,000FTEs EXP REV
430

CRYSTAL CITY, POTOMAC YARD & PENTAGON CITY TAX INCREMENT FINANCING AREA TEN-YEAR HISTORY
Fiscal Year
Description FTEs
FY 2012 The Tax Increment Financing Area (TIF) was established by the County Board in October 2010, with an initial allocation of 33 percent of the incremental real estate tax revenue over the base of $9.8 billion going to the TIF. The adopted General Fund CY 2011 real estate tax rate is $0.945 (excluding the stormwater tax) for each $100 of assessed value, and 33 percent of the estimated tax base of the FY 2012 increment of $292 million, or $455,449 will initiate this fund. The revenue includes only a partial year (the June 2012 tax payment). The adopted budget assumes a three percent growth in the real estate tax base. Subsequent to adoption of the FY 2012 budget, real estate values increased 9.8 percent between CY 2011 and CY 2012, yielding a revised revenue estimate of $1,520,200.
FY 2013 The budget increased due to: a full year of revenue collection compared to a partial year’s revenues in FY 2012; an increase in the real property tax rate from $0.945 to $0.958 per $100 of assessed value (excluding the stormwater tax); and, an assumed increase of three percent over the CY 2012 assessed value of property in the area.
The portion of real estate revenue dedicated to the TIF in the area remainsat 33 percent in FY 2013.
FY 2014 Revenue projections in the tax district decreased due to a decline in real estate assessments in CY 2013 compared to CY 2012. The program can accommodate decreased funding due to recent adjustments to project timelines. As a result, the impact on project development in the short-term is negligible.
There are a total of 8.0 authorized FTEs, of which 3.0 FTEs are funded bythe Crystal City Tax Increment Fund and 5.0 FTEs are funded by the Transportation Capital Fund.
3.0
There are a total of 23.0 FTEs to support major street and transit programelements of which 15.5 FTEs are funded by the Transportation Capital Fund and 7.5 FTEs are funded by the Crystal City Tax Increment Fund. Of the total Crystal City TIF FTE’s, 3.0 FTEs were funded at FY 2014 adoption and 4.5 FTEs were funded at FY 2013 closeout.
4.5
FY 2015 Revenue projections in the tax district increased due to increases in real estate tax assessments in CY 2014 compared to CY 2013, as well as some adjustments to the CY 2013 assessments that increased revenue estimates for FY 2014.
FY 2016 Revenue projections in the tax district decreased due to decreases in real estate tax assessments in CY 2015 compared to CY 2014.
FY 2017 Revenues and expenditures increased based on the tax district increase due to increases in real estate assessments in CY 2016 compared to CY 2015.
431
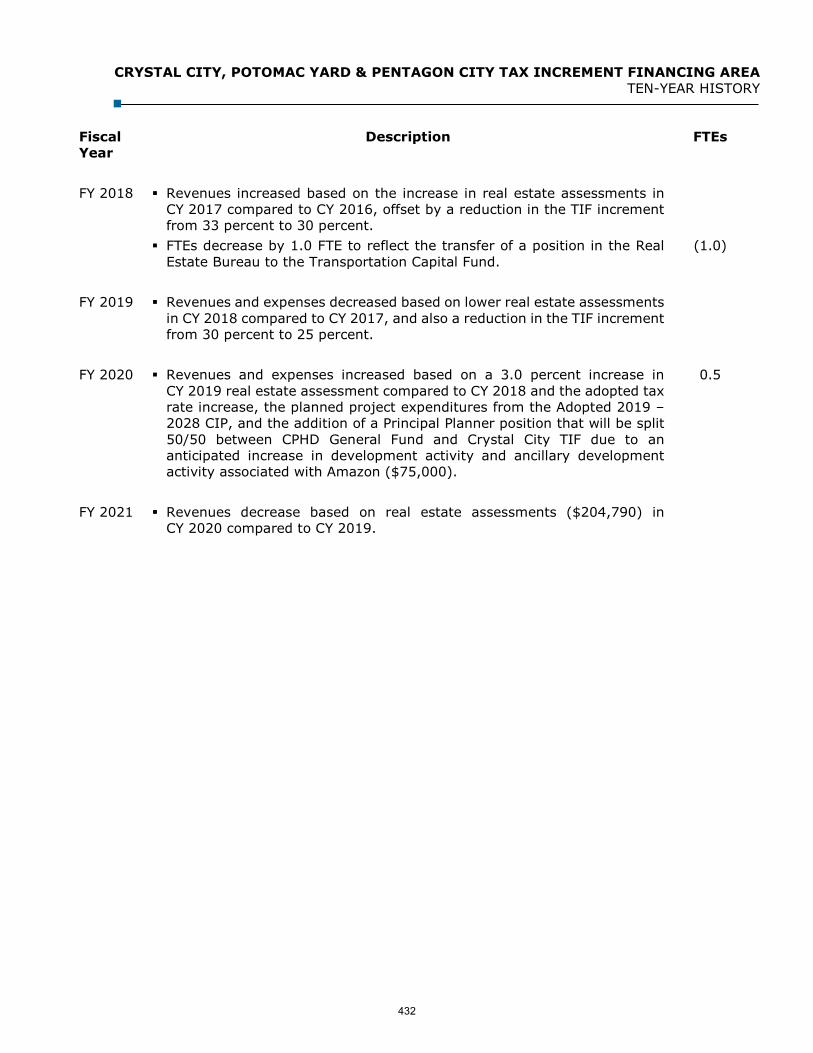
CRYSTAL CITY, POTOMAC YARD & PENTAGON CITY TAX INCREMENT FINANCING AREA TEN-YEAR HISTORY
Fiscal Year
Description FTEs
FY 2018 Revenues increased based on the increase in real estate assessments in CY 2017 compared to CY 2016, offset by a reduction in the TIF increment from 33 percent to 30 percent.
FTEs decrease by 1.0 FTE to reflect the transfer of a position in the RealEstate Bureau to the Transportation Capital Fund.
(1.0)
FY 2019 Revenues and expenses decreased based on lower real estate assessments in CY 2018 compared to CY 2017, and also a reduction in the TIF increment from 30 percent to 25 percent.
FY 2020 Revenues and expenses increased based on a 3.0 percent increase in CY 2019 real estate assessment compared to CY 2018 and the adopted tax rate increase, the planned project expenditures from the Adopted 2019 – 2028 CIP, and the addition of a Principal Planner position that will be split 50/50 between CPHD General Fund and Crystal City TIF due to an anticipated increase in development activity and ancillary development activity associated with Amazon ($75,000).
0.5
FY 2021 Revenues decrease based on real estate assessments ($204,790) in CY 2020 compared to CY 2019.
432

COLUMBIA PIKE TAX INCREMENT FINANCING AREA
Our Mission: To provide a supplemental financial mechanism to fund affordable housing initiatives needed to mitigate the impact of redevelopment along Columbia Pike.
In December 2013, the Arlington County Board established a tax increment financing area to help finance affordable housing initiatives in support of the Columbia Pike Neighborhoods Area Plan.
In 2009, the Land Use and Housing Study process began to study the multi-family housing areas along Columbia Pike with the goal of producing the next major plan for Columbia Pike. The process was completed in July 2012 and resulted in the adoption of the Columbia Pike Neighborhoods Area Plan (the Plan). This 30-year plan establishes the future vision for the primarily multi-family residential areas located between the commercial nodes along the Columbia Pike corridor. The Plan established a goal of preserving all existing 6,200 market rate affordable units (MARKS). Columbia Pike Tax Increment Financing Area (TIF) revenues are utilized to fund affordable housing initiatives needed to mitigate the impact of redevelopment along Columbia Pike, particularly related to the preservation of affordable housing. TIF revenues are used to fund the Transit Oriented Affordable Housing Fund (TOAH Fund). The TOAH Fund is a tool designed to help affordable housing developers utilizing the Low-Income Housing Tax Credit program pay for certain County fees and infrastructure costs of these projects.
TIF is a mechanism used to support development and redevelopment by capturing the projected increase in property tax revenues in the area and investing those funds in improvements or mitigation efforts associated with the project. Unlike a special district, it is not an additional or new tax; rather, it redirects and segregates a portion of the increased property tax revenues that would normally flow to the General Fund to be used for a specified purpose. The amount of the tax increment revenue is determined by setting a baseline assessed value of all property in the area on January 1, 2014, and in each subsequent year, tracking the incremental increase in assessed values relative to the base year and segregating the incremental real estate tax revenue generated in a separate fund. The Board approved allocating 25 percent of the incremental real estate tax revenues to the Columbia Pike TIF area. This percentage can be revisited as part of the annual budget process. The TIF area includes the Columbia Pike Neighborhoods Special Revitalization District and the Columbia Pike Special Revitalization District as noted on the General Land Use Plan.
In the adopted FY 2018 budget, the County Board adjusted the TIF’s baseline to the CY 2018 assessed value of $3,066,510,900. In FY 2021, revenues are based on a 7.3 percent growth in real estate tax assessments in the TIF area.
In response to the County Board’s direction for significant investments in affordable housing, the FY 2021 adopted budget includes a dedication of Columbia Pike TIF balances and future funding to affordable housing investments.
433

COLUMBIA PIKE TAX INCREMENT FINANCING AREA
FUND SUMMARY
SIGNIFICANT BUDGET CHANGES
The FY 2021 adopted expenditure budget for the Columbia Pike Tax Increment Financing Area is $1,014,000. FY 2021 revenue projections reflect a 7.3 percent growth in real estate tax assessments in the TIF area.
Revenue projection increases in the tax district due to increases in real estate assessmentsfrom CY 2019 to CY 2020.
PROGRAM FINANCIAL SUMMARY
FY 2019 FY 2020 FY 2021 % ChangeActual Adopted Adopted ‘20 to ‘21
Personnel - - - -Non-Personnel $45,128 $496,660 $1,014,000 104%Total Expenditures 45,128 496,660 1,014,000 104%
Total Revenues 189,070 $496,660 968,520 95%
Change in Fund Balance $143,942 - ($45,480) -
Permanent FTEs - - -Temporary FTEs - - - Total Authorized FTEs - - -
434

COLUMBIA PIKE TAX INCREMENT FINANCING AREA
FUND SUMMARY
COLUMBIA PIKE TAX INCREMENT FINANCING AREA FUND STATEMENT
FY 2019 FY 2020 FY 2020 FY 2021ACTUAL ADOPTED RE-ESTIMATE ADOPTED
ADJUSTED BALANCE, JULY 1 $374,083 $507,838 $518,025 $1,191,355
REVENUETax Increment Area 189,070 496,660 673,330 968,520
189,070 496,660 673,330 968,520
563,153 1,004,498 1,191,355 2,159,875
EXPENDITURESTOAH Fund - Current Year 45,128 496,660 - 1,014,000TOTAL EXPENDITURES 45,128 496,660 - 1,014,000
BALANCE, JUNE 30 $518,025 $507,838 $1,191,355 $1,145,875
The FY 2021 expenditures column reflects staff's current estimate that $30,000 will be used for the Arlington Mill Dark Fiber Project and $984,000 will be used for a proposed Arlington View Terrace East affordable housing development.
TOTAL REVENUE
TOTAL REVENUE & BALANCE
435

COLUMBIA PIKE TAX INCREMENT FINANCING AREA TEN-YEAR HISTORY
EXPENDITURE AND REVENUE TRENDS
Y 19
FY 2012 Actual
FY 2013 Actual
FY 2014 Actual
FY 2015 Actual
FY 2016 Actual
FY 2017 Actual
FY 2018 Actual
FY 2019 Actual
FY 2020 Adopted
Budget
FY 2021 Adopted
BudgetEXP - - $633 $112 $45 $497 $1,014REV $209 $309 $602 - $189 $497 $969Change in Fund Balance $209 $309 -$31 -$112 $144 - -$45
-$200
$0
$200
$400
$600
$800
$1,000
$1,200EXP REV Change in Fund Balance
436

COLUMBIA PIKE TAX INCREMENT FINANCING AREA TEN-YEAR HISTORY
Fiscal Year Description FTEs
FY 2015 In December 2013, the Arlington County Board established a tax increment financing area to help finance affordable housing initiatives in support of the Columbia Pike Neighborhoods Area Plan. The baseline assessment for the TIF area is $2.7 billion. A two percent increase in assessments between CY 2014 and CY 2015 will yield approximately $119,950 in partial year revenues in the spring of FY 2015. This estimate is based on capturing the full 25 percent of the tax increment for FY 2015.
FY 2016 Revenue projections in the tax district increased due to a full year of tax collections and increases in real estate assessments.
FY 2017 Revenue projections in the tax district increased due to increases in real estate assessments.
FY 2018 The County Board adjusted the TIF’s baseline assessed value to CY 2018 and adjusted the funding allocation to the district in FY 2018. By resetting the calculated tax base for the district, no new FY 2018 funding will be directed to the district. However, existing fund balances will remain in the fund and future real estate tax revenue over the CY 2018 base year will be allocated to the Columbia Pike TIF based on the incremental real estate tax revenue percentage adopted by the County Board.
FY 2019 Revenue projections in the tax district increased due to increases in real estate assessments.
FY 2020 Revenue projections in the tax district increased due to increases in real estate assessments and the County Board adopted tax rate increase.
FY 2021 Revenue projections in the tax district increased due to increases in real estate assessments.
437

This page intentionally left blank
438
UTILITIES FUND Department of Environmental Services
Our Mission: To build and maintain water delivery, sanitary sewer collection, and wastewater treatment systems that provide high-quality water and sewer services and products
SIGNIFICANT BUDGET CHANGES
The FY 2021 adopted expenditure budget for the Utilities Fund is $91,512,295, a three percent increase from the FY 2020 adopted budget. The FY 2021 budget reflects:
Personnel changes due to employee salary increases, retirement contributions decreased based on current actuarial projections, decreased charge-backs to capital, adjustments to salaries resulting from job family studies for trades and planners ($738,518), partially offset by a decrease in the County’s cost for employee health insurance and an increase in charges to the Solid Waste Bureau (DES-General Fund) to pay their pro-rata share of the Customer Services Office ($13,754).
Non-personnel increases due to purchased water ($900,000), non-discretionary contractualincreases for chemicals ($201,150), biosolids hauling ($78,315), and various contracts($16,130), projected demand for utility markings ($30,000), budget reallocations as identifiedbased on historical spending and operational needs ($20,866), operating expenses associatedwith the new position ($2,550 one-time and $1,360 ongoing), and one-time funding for largevalve inspections ($300,000), partially offset by the elimination of FY 2020 one-time expenses($22,005), elimination of annual maintenance costs for the decommissioned billing informationsystem ($32,425), budget reductions and reallocations as identified based on historical spendingand operational needs ($5,700), and adjustments to the annual expense for maintenance andreplacement of County vehicles ($30,796).
Debt service decreases due to repayment of General Obligation Bonds for various Utilities Fundcapital projects ($31,211).
Other expenses increase for the contingency due to the reclassification of positions identified tobe substantially below comparative pay studies ($414,117), fund-wide benefit changes($14,095), higher overhead charges based on FY 2021 projections ($176,181), and consultantfunding ($18,110), partially offset by the elimination of Bozman Government Center rent due torelocation of the Customer Services Office ($59,059).
Intra-county revenue increases based on historic trend analysis of water and sewer revenue fromcounty departments and the increase in the water and sewer rate ($100,000).
Revenues increase due to the adopted water and sewer rate increase ($1,521,958), sewagetreatment charges from neighboring jurisdictions ($100,000), interest income ($50,000),projected demand for utility marking fees ($20,000), increases for Lee Pumping Station leaseagreements ($5,280), miscellaneous revenues ($31,512), and historic trend analysis ofwater-sewer engineering fees ($2,500) and flow test fees ($2,200); partially offset by a decreasein turn-on fees ($3,000).
Fund balance utilized decreases from the prior year by $520,961 and reflects the current deficitin the 90-day operating reserve. There is a planned addition to the reserve of $1,000,000 inFY 2021.
On July 1, 2020, the total water/sewer rate increases $0.40, from $13.80 to $14.20 per thousand gallons (TG). This is a 2.9 percent increase projected to produce $1.5 million of additional revenue. The water rate increases $0.21, from $4.70/TG to $4.91/TG and sewer rate increases is $0.19, from $9.10/TG to $9.29/TG respectively. The rate effective date will be July 1, 2020. The average
439Updated 10/12/2020
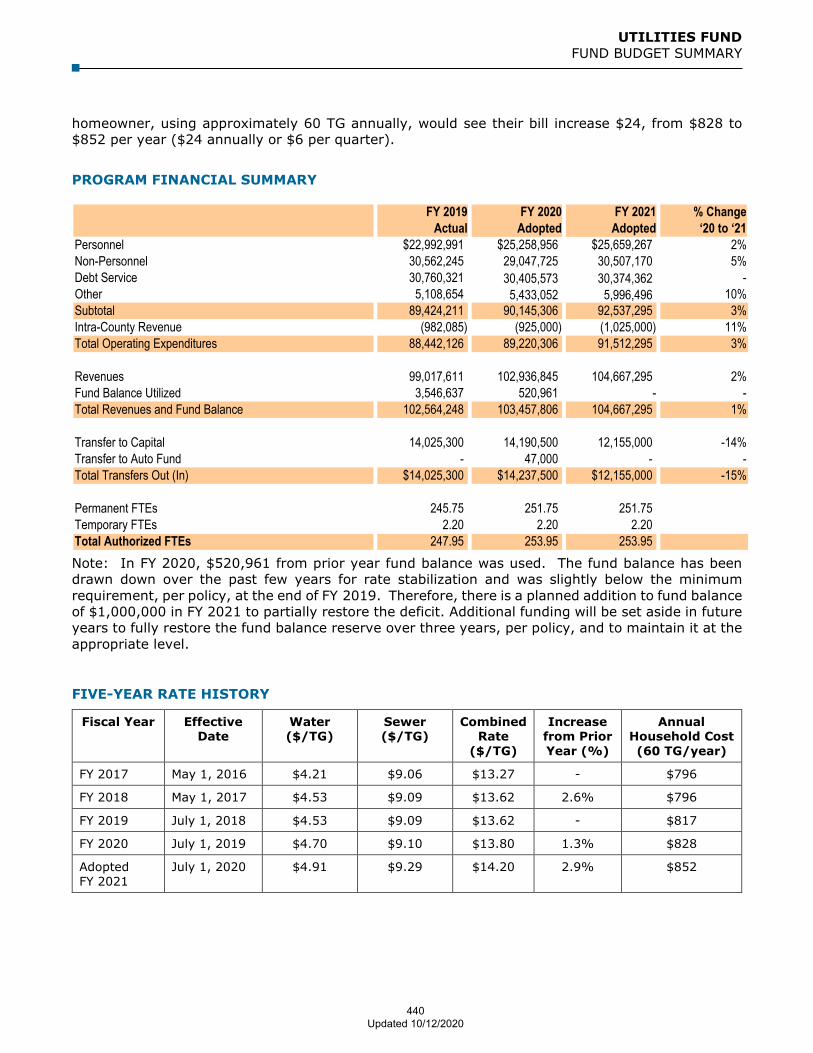
UTILITIES FUND FUND BUDGET SUMMARY
homeowner, using approximately 60 TG annually, would see their bill increase $24, from $828 to $852 per year ($24 annually or $6 per quarter).
PROGRAM FINANCIAL SUMMARY
FY 2019 FY 2020 FY 2021 % ChangeActual Adopted Adopted ‘20 to ‘21
Personnel $22,992,991 $25,258,956 $25,659,267 2%Non-Personnel 30,562,245 29,047,725 30,507,170 5%Debt Service 30,760,321 30,405,573 30,374,362 -Other 5,108,654 5,433,052 5,996,496 10%Subtotal 89,424,211 90,145,306 92,537,295 3%Intra-County Revenue (982,085) (925,000) (1,025,000) 11%Total Operating Expenditures 88,442,126 89,220,306 91,512,295 3%
Revenues 99,017,611 102,936,845 104,667,295 2%Fund Balance Utilized 3,546,637 520,961 - -Total Revenues and Fund Balance 102,564,248 103,457,806 104,667,295 1%
Transfer to Capital 14,025,300 14,190,500 12,155,000 -14%Transfer to Auto Fund - 47,000 - -Total Transfers Out (In) $14,025,300 $14,237,500 $12,155,000 -15%
Permanent FTEs 245.75 251.75 251.75Temporary FTEs 2.20 2.20 2.20 Total Authorized FTEs 247.95 253.95 253.95Note: In FY 2020, $520,961 from prior year fund balance was used. The fund balance has been drawn down over the past few years for rate stabilization and was slightly below the minimum requirement, per policy, at the end of FY 2019. Therefore, there is a planned addition to fund balance of $1,000,000 in FY 2021 to partially restore the deficit. Additional funding will be set aside in future years to fully restore the fund balance reserve over three years, per policy, and to maintain it at the appropriate level.
FIVE-YEAR RATE HISTORY
Fiscal Year Effective Date
Water ($/TG)
Sewer ($/TG)
Combined Rate
($/TG)
Increase from Prior Year (%)
Annual Household Cost (60 TG/year)
FY 2017 May 1, 2016 $4.21 $9.06 $13.27 - $796
FY 2018 May 1, 2017 $4.53 $9.09 $13.62 2.6% $796
FY 2019 July 1, 2018 $4.53 $9.09 $13.62 - $817
FY 2020 July 1, 2019 $4.70 $9.10 $13.80 1.3% $828
Adopted FY 2021
July 1, 2020 $4.91 $9.29 $14.20 2.9% $852
440Updated 10/12/2020

UTILITIES FUND FUND BUDGET SUMMARY
FY 2019 FY 2020 FY 2020 FY 2021ACTUAL ADOPTED RE-ESTIMATE ADOPTED
BALANCE JULY 1 $17,345,388 $18,601,528 $13,895,573 $14,127,555
REVENUEInterest 270,001 75,000 75,000 125,000 Water/Sewer Billing 92,288,914 96,579,970 96,579,970 98,101,928Water Service Connection Fee 868,140 1,100,000 1,100,000 1,100,000Water Service Discontinuation 129,195 140,000 140,000 140,000 Meter Installation 18,700 25,000 25,000 25,000 Sewage Treatment Charges 4,279,551 4,000,000 4,000,000 4,100,000Late Fee 414,241 410,000 410,000 410,000New Account Fee 110,275 105,000 105,000 105,000Turn-On Fee 9,450 13,000 11,500 10,000Flow Test Fee 10,200 8,000 9,500 10,200Pretreatment Fee 10,569 5,200 5,200 5,200Utility Marking Fee 225,791 195,000 195,000 215,000Hazardous Household Material Fee 8,570 8,000 8,000 8,000Miscellaneous Revenue 374,014 272,675 272,675 311,967 TOTAL REVENUE 99,017,611 102,936,845 102,936,845 104,667,295
OPERATING EXPENSESCustomer Services Office (net of intra-county billing revenue)
498,781 789,951 629,203 725,350
WSS Operations 18,488,782 19,169,131 19,169,131 19,944,661Water Purchase 8,114,102 7,200,000 8,100,000 8,100,000Water/Sewer Records 680,736 752,268 714,655 782,664Water Pollution Control 24,602,775 25,209,264 23,948,801 26,112,102Debt Service 30,760,321 30,405,573 30,405,573 30,374,362Other 5,296,629 5,694,119 5,500,000 5,473,156TOTAL EXPENSES 88,442,126 89,220,306 88,467,363 91,512,295
BALANCE (SUBTOTAL) 27,920,873 32,318,067 28,365,055 27,282,555TRANSFERS OUTUtility Construction (Fund 519 ) 14,025,300 14,190,500 14,190,500 12,155,000Auto Fund - 47,000 47,000 - TOTAL TRANSFERS 14,025,300 14,237,500 14,237,500 12,155,000
TOTAL EXPENSE AND TRANSFERS 102,467,426 103,457,806 102,704,863 103,667,295
BALANCE, JUNE 30 13,895,573 18,080,567 14,127,555 15,127,555
Board-adopted Three-month Operating Reserve (excludes debt service)
$14,690,178 $14,934,933 $14,765,447 $15,445,227
Water/Sewer Rate per 1,000 gallons $13.62 $13.80 $13.80 $14.20
Note: Fund balance fell below the 90-day operating reserve at the end of FY 2019. It is planned to add $1m to the reserve in FY 2021 to begin to restore reserve levels per policy.
UTILITIES FUND OPERATING STATEMENT
441

UTILITIES FUND FUND BUDGET SUMMARY
The following fees and other revenue are used to fund operating and capital costs for the Utilities Fund. The capital costs are reflected in the Pay-As-You-Go Capital portion of the budget, found in Tab E.
Fund Balances From Prior Years: The County maintains a fund balance, consistent with the Board-adopted financial policy to maintain an operating reserve equal to three months of expenses, to cover emergency events that might impact water and sewer services. If utilized, the reserve will be replenished over a three year period to the minimum reserve level. Interest Earnings: Interest earned on the fund balance accrues to the Utilities Fund monthly. Water/Sewer Billing: Charges for water/sewer service based on consumption of water as reflected by periodic readings of water meters serving the property. These charges generate approximately 93 percent of the income for the Utilities Fund. This category also includes sewer revenue from government facilities and authorities and other organizations (such as the Pentagon and Reagan National Airport) that use the County’s sewage system but receive their drinking water from other sources. Set by County Code, Chapter 26; effective date July 1 each fiscal year. Water Service Connection Fee: This fee is paid by new water users for a physical connection and meter installation to the water system. The fee recovers 100 percent of personnel, materials, and equipment rental costs. The fee varies by meter size, ranging from $3,200 for a 1” connection line with a ¾” meter up to $25,300 for an 8” line with an 8” meter. Set by County Code, Chapter 26; effective date July 1, 2008. Sewage Treatment Charges: These charges are paid by neighboring jurisdictions (Fairfax County and the Cities of Falls Church and Alexandria). Consistent with memoranda of understanding that the County has signed with Fairfax County and the Cities of Falls Church and Alexandria, the neighboring jurisdictions are charged both for their share of costs associated with operating the County’s sewage system as well as with making necessary capital improvements to it. Water/Sewer Late Fee: The County imposes a six percent (6%) fee on any water and sewer charges if, 30 days after the billing date, there is an outstanding balance on the account. Set by County Code, Chapter 26; effective date July 1, 1992. New Account Fee: This $25 fee is charged to new customers when they set up a new utilities account. Set by County Code, Chapter 26; effective date July 1, 1992. Discontinuation Fee: Fee to discontinue a public way service. Fee is $500. Set by County Code, Chapter 26; effective date July 1, 2008. Reactivation Fee: This $25 fee is charged when the County turns on a customer’s water service after it had previously been shut off either at the customer’s request or for non-payment. Set by County Code, Chapter 26; effective date July 1, 1992. Flow Test Fee: This $300 fee is charged when developers request fire flow information necessary to do sprinkler system design. Set by County Code, Chapter 26; effective date July 1, 2008. DFU Credit Inspection Fee: This fee is charged when developers request an inspection to certify the existing drainage fixture units (DFUs) at properties that will be demolished. The credit offsets the Infrastructure Availability Fees (IAF) that a developer will be charged for new construction DFUs. The fee is $175 for inspections of 1-24 fixtures; $275 for 25 plus fixtures. Set by County Code, Chapter 26; effective date July 1, 2008. Pretreatment Fee: This fee is assessed on certain businesses that introduce pollutants into the sewer system, or “Significant Industrial Users,” to recover the costs of the industrial pretreatment program, which ensures compliance with state and federal standards. Annual fee of $1,560 plus $3,640 for each monitoring point. Set by County Code, Chapter 26; effective date October 2, 2004. Utility Marking Fee: This fee is charged to developers to have utility lines marked before construction begins. $45 fee. Set by County Code, Chapter 22; effective date July 1, 2013.
442

UTILITIES FUND FUND BUDGET SUMMARY
Hazardous Household Material Fee/ Appliance Fee: This fee is charged for the safe disposal of household waste products that contain cathode ray tubes (CRTs). Fee is $20 per television and $15 per monitor. Set by County Code, Chapter 10; effective date April 30, 2005. Infrastructure Availability Fee: This fee is charged to developers for the capital costs associated with adding new demand on the water and sewer systems, based on the number of drainage fixtures units (DFUs) added to the system. DFUs are established by the Plumbing Code to service as a proxy for water usage and range from 5 DFUs for a full bathroom to ½ for a drinking fountain. For a renovation or tear-down, full credit is granted for any pre-existing DFUs. Revenues for this fee are accounted for in the Utilities Capital Pay-As-You-Go Fund. Fees are $200 per DFU combined water and sewer service. For structures which have water-only service, it is $85 per fixture. For structures with sewer-only service, it is $115 per fixture. Set by County Code, Chapter 26; effective date July 1, 2013.
443

UTILITIES FUND TEN-YEAR HISTORY
EXPENDITURE, REVENUE, AND FULL-TIME EQUIVALENT TRENDS
$ in 000s FY 2012
Actual FY 2013
Actual FY 2014
Actual FY 2015
Actual FY 2016
Actual FY 2017
Actual FY 2018
Actual FY 2019
Actual
FY 2020 Adopted
Budget
FY 2021 Adopted
BudgetEXP $80,054 $86,146 $87,020 $86,157 $86,735 $84,326 $90,478 $88,442 $89,220 $91,512REV $98,395 $101,522 $95,637 $100,996 $98,710 $102,319 $99,972 $99,018 $102,937 $104,667FTEs 222.70 229.50 231.50 235.75 243.95 243.95 246.95 247.95 253.95 253.95
200
210
220
230
240
250
260
$0
$20,000
$40,000
$60,000
$80,000
$100,000
$120,000FTEs EXP REV
444Updated 10/12/2020

UTILITIES FUND TEN-YEAR HISTORY
Fiscal Year Description FTEs
FY 2012 The total water/sewer rate increases $0.45 to a total of $12.19 perthousand gallons (TG), a 3.8 percent increase, which will produce $2.0million of additional revenue. The water rate increases by $0.18/TG to$3.68/TG. The sewer rate will increase by $0.27/TG to $8.51/TG.
The FTE count in the adopted FY 2012 budget is 222.7, compared to 223.7in the FY 2011 adopted budget. This reflects the transfer of a positionfrom the WPCP in the Utilities Fund to the Directors Office in the GeneralFund.
(1.0)
Personnel includes an increase of $511,593 for overtime and standby payfor additional tank cleaning efforts at the Water Pollution Control Plant(WPCP) related to the Master Plan 2001 (MP01) project, and for theanticipated impact of the Department’s Safety Policy for Maximum HoursAllowed to Work for the Water, Sewer, Streets Bureau (WSS).
Non-personnel expenditures include an increase of $449,463 for a full yearof fuel for the new standby generator facility at the WPCP; an increase of$318,925 for chemicals at the WPCP; an increase of $305,438 forcontractual services associated with engineering services, tank cleaning,and water sampling; an increase of $287,284 for grit and solids hauling;an increase of $224,197 for operating and maintenance equipment andsupplies; an increase of $144,705 for vehicle and equipment charges; anincrease of $79,100 for safety and other training; and, an increase of$39,101 for operating costs at the recently acquired property at2900 S. Eads Street. Debt Service increases by $2.4 million in FY 2012primarily for repayment of funds borrowed through the VirginiaWastewater Revolving Loan Fund for the Master Plan 2001 project at theWPCP.
Increases are partially offset by a decrease of $477,873 in electricity costs,a decrease of $335,700 in the cost of water purchases from theWashington Aqueduct, and a decrease of $149,000 for water consumedby the WPCP.
FY 2013 The total water/sewer rate increases $0.42 to a total of $12.61 perthousand gallons (TG), a 3.4% increase, which will produce $5.0 millionof additional revenue. The water rate increases by $0.30/TG to $3.98/TG.The sewer rate will increase by $0.12/TG to $8.63/TG.
Personnel includes seven new FTE’s (a water quality engineer and a newsix-person water maintenance crew).
7.0
A partial FTE is transferred to the Department of Environmental ServicesGeneral Fund budget.
(0.2)
Non-personnel expenditures increased $861,100 for chemicals, supplies,and contractual services for the process control system at the WaterPollution Control Plant.
County vehicle charges increase $161,392 for new equipment approved inthe FY 2011 closeout process and for the new vehicles and equipmentfor the new water maintenance crew. The transfer to the Auto Fundincreases $502,500 for the purchase of vehicles and equipment for thenew Water Maintenance Crew.
Utilities increase by $144,200 for water and electricity at the WPCP.
445

UTILITIES FUND TEN-YEAR HISTORY
Fiscal Year Description FTEs
Wholesale water purchases from the Washington Aqueduct increase by$100,000.
Other WPCP increases include $100,000 for safety consulting at the plantand $80,651 for increased level of security guards required duringcontinued construction at the WPCP.
Debt service increases $635,758 for repayment of General Obligationbonds and VRA bonds for various Utilities Fund capital projects.
The transfer to PAYG capital decreases $897,282, based on the plannedFY 2013 maintenance capital program.
FY 2014 Personnel includes two new positions, a Construction Manager and aSanitary Sewer Engineer ($799,040).
2.0
Non-personnel increases include $639,400 for maintenance supplies at theWater Pollution Control Plant (WPCP), $400,000 in consulting for variousstudies and ongoing capital project support at the Water Sewer StreetBureau (WSS), $476,141 for electricity, Contracted Services and theapprenticeship and succession planning programs at the WPCP, $100,000for wholesale water purchases from the Washington Aqueduct, theaddition of $52,000 for the replacement of an existing server for the UtilityServices Office (USO), $30,419 for operating supplies and $7,725 forlandfill charges at WSS, $22,000 to purchase a vehicle for the newConstruction Manager at WSS, the addition of $10,000 for automation ofreal estate agreement records, $7,662 for printing and mailing of utilitybills, $2,037 for charges from the County’s print shop to USO, and $1,000for the utilities share of base map maintenance.
Non-personnel expenses decrease by $498,440 for generator fuel at theWPCP, decrease for the transfer of Water / Sanitary Sewer Frames andCovers to the Utilities PAYG budget ($400,000), solids hauling ($295,497),chemicals at the WPCP ($154,274), based on updated volume and pricingassumptions, gas at the WPCP ($40,500), based on an anticipated pricedecrease, water at the WPCP ($29,050), County vehicle charges($26,710), and elimination of the Telecom & Communications budget forWater Sewer Records ($2,773).
Debt service decreased by $590,424 for repayment of general obligationbonds for various Utilities capital projects.
Total revenues include revenue from Inter-jurisdictional Partners($624,433), revenue from the County’s participation in Dominion VirginiaPower’s Demand Side Management program ($68,985), Utility Markingrevenue ($50,000), and Lee Pumping Station lease revenue ($5,725).
The Infrastructure Availability Fee (IAF) increases by $18 per drainagefixture unit (DFU) to a total of $200 per DFU, a 10 percent increase. Thewater IAF increases by $13/DFU to $85/DFU. The sewer IAF increases by$5/DFU to $115/DFU.
The transfer to the Auto Fund decreased to zero.
446

UTILITIES FUND TEN-YEAR HISTORY
Fiscal Year Description FTEs
FY 2015 Added a Chief Engineer, a Control Systems Engineer, an Electrical PowerTechnician, and a Control Systems Technician ($580,648).
4.0
Increased a Records Assistant position from 0.50 to 0.75 FTE ($12,458). 0.25 Reduced generator fuel expenses based on lower than anticipated use
($394,200). Eliminated sixteen over-strength positions ($391,020). Non-personnel decreases include equipment repair expenses ($165,910),
payments for leased equipment ($31,911), and wholesale waterpurchases from the Washington Aqueduct ($200,000).
Non-personnel decreases are partially offset by increases in maintenancesupplies ($446,796), contracted services ($92,775), insurance claims($31,464), operating equipment and supplies ($61,854), inspection andrepair of water valves ($350,000), and adjustment to the annual expensefor maintenance and replacement of County vehicles ($6,389).
Debt service decreased due to repayment of General Obligation Bonds forvarious Utilities Fund capital projects ($644,644) and repayment of fundsborrowed through the Virginia Wastewater Revolving Loan Fund for theMaster Plan 2001 project at the WPCP ($81,507).
Other expenses increased include higher overhead charges based onFY 2015 projections ($230,863), funding for over-strength positions tomeet succession planning and other needs ($150,000), and the annualpayment to the Virginia Waterworks Fund ($35,631).
Increased the water/sewer rate by $0.43, from $12.61 to $13.04 perthousand gallons (TG).
Revenue increased due to water consumption estimates and the adoptedrate increase ($3,091,257).
Revenue increases also include water service connections ($100,000),water service discontinuations ($20,000), meter installations ($10,000),pretreatment revenue ($340), and the Lee Pumping Station leaseagreements with Sprint and Omnipoint ($4,425).
Revenue increases were partially offset by decrease in interest($100,000), a decrease in household hazardous material revenue($5,000), and the County’s participation in Dominion Virginia Power’s(DVP) Demand Side Management program ($394,200).
FY 2016 Transfer in of a Management and Budget Specialist from the FacilitiesDesign and Construction Bureau in the General Fund to increase from 0.80to 1.0 FTE ($25,696, 0.20 FTE)
0.2
Added a Capital Projects Engineer ($113,533, 1.0 FTE), a Large WaterMeter Service Team ($165,921, 3.0 FTEs), and a Valve Exercise Team($221,228, 4.0 FTEs) replacing contractors for budget savings.
8.0
Non-personnel increased primarily due to increases in maintenancesupplies ($71,066), contracted services ($51,762), chemicals ($36,572),redundant (wireless) SCADA service at lift stations ($30,688), securitysystem monitoring ($30,000), adjustments to the annual expense formaintenance and replacement of County vehicles ($26,609), one-timeexpenses for the Utility Billing System replacement project management
447

UTILITIES FUND TEN-YEAR HISTORY
Fiscal Year Description FTEs
($99,842), one-time equipment expenses for the new FTEs ($63,000), and operating expenses for the new FTEs ($32,902).
Non-personnel decreased due to the elimination of contractual valve work($350,000).
Debt service decreased due to repayment of General Obligation Bonds forvarious Utilities Fund capital projects ($736,502) and repayment andrefinancing of a portion of funds borrowed through the Virginia WastewaterRevolving Loan Fund for the Master Plan 2001 project at the WPCP($293,746).
Other expenses increased due to higher overhead charges based onFY 2016 projections ($75,594).
Intra-county revenues increase based on historic trend analysis of waterrevenue from county departments ($57,600).
Revenues increased due to the adopted water and sewer rate increase($974,847), sewage treatment charges from neighboring jurisdictions($325,531), late fees ($100,000), interest earnings ($50,000), waterservice connections ($50,000), water service discontinuations ($10,000),utility marking fees ($10,000), meter installations ($7,000), turn on fees($6,000), fire flow test fees ($4,000), pretreatment revenue ($3,550), andLee Pumping Station lease agreements with Sprint and Omnipoint($2,832).
FY 2017 Non-personnel increased due to the addition of costs for licensing andoperating costs for asset management software ($229,950), mobile metermanagement software ($35,000), and capital project tracking software($27,093), redundant (wireless) SCADA service at pumping stations($22,320), offset by adjustments to the annual expense for maintenanceand replacement of County vehicles ($26,739).
Debt service decreased due to repayment of General Obligation Bonds forvarious Utilities Fund capital projects ($261,145) and repayment andrefinancing of a portion of funds borrowed through the Virginia WastewaterRevolving Loan Fund for the Master Plan 2001 project at the WPCP($176,147).
Other expenses increased are due to higher overhead charges based onFY 2017 projections ($418,512).
Revenues decreased due to lower pretreatment revenue ($10,650) andappliance fees ($7,500), offset by an increase in Lee Pumping Stationlease agreements with Sprint and Omnipoint ($4,643).
FY 2018 Added a Contract Specialist ($119,466), Engineering Technician($63,476), and a Trades Worker ($59,743).
3.0
Non-personnel decreased due to the elimination of contractual equipmentrental and operation ($200,000), elimination of FY 2017 one-timeexpenses ($134,842), decreased operating costs associated with assetmanagement software ($127,989), adjustments to the annual expense for
448

UTILITIES FUND TEN-YEAR HISTORY
Fiscal Year Description FTEs
the maintenance and replacement of County vehicles ($15,927), partially offset by one-time equipment for new FTEs ($37,999), operating expenses associated with new FTEs ($35,414), increases due to Security Information and Event Management (SIEM) ($7,000), and insurance claims ($3,536).
Debt service decreased due to repayment of General Obligation Bonds forvarious Utilities Fund capital projects ($577,747) and repayment andrefinancing of a portion of funds borrowed through the Virginia WastewaterRevolving Loan Fund for the Master Plan 2001 project at the WaterPollution Control Plant (WPCP) ($64,000).
Other expenses increased due to the higher overhead charges based onFY 2018 projections ($23,284) and Courthouse Plaza rent ($5,133).
Revenues increased due to the increase in the water and sewer rate($2,443,503), water discontinuation fees ($10,000), meter installationfees ($8,000), Lee Pumping Station lease agreements ($4,180),inspections ($7,000), and miscellaneous revenue ($3,720), offset bydecreases in sewage treatment charges from neighboring jurisdictions($311,269), water service connections ($50,000), late fees ($35,000),appliance fees ($2,500), utility marking fees ($15,000), and fire flow testfees ($6,500).
FY 2019 Added a Public Engagement Specialist ($127,381). 1.0
Non-personnel decreased due to the reduction for purchased water($800,000) and elimination of FY 2018 one-time expenses ($37,999),partially offset by sewer preventative maintenance equipment funding($144,000), Trades Center optimization study funding ($100,000), andadjustments to the annual expense for the maintenance and replacementof County vehicles ($18,301).
Debt service decreased due to repayment of General Obligation Bonds forvarious Utilities Fund Capital projects and the repayment of a portion offunds borrowed through the Virginia Wastewater Revolving Loan Fund forthe Master Plan 2001 project at the Water Pollution Control Plant (WPCP)($613,007).
Other expenses increased due to higher overhead charges based onFY 2019 projections ($343,061).
Revenue decreased due to a projected decrease in sewage treatmentcharges from neighboring jurisdictions ($454,147), offset by increases forLee Pumping Station lease agreements ($5,495) and the interest income($25,000).
Fund Balance Utilized increased from the prior year by $598,448 andreflects the planned drawdown of fund balance, consistent with theCounty’s financial policies.
449

UTILITIES FUND TEN-YEAR HISTORY
Fiscal Year Description FTEs
FY 2020 Transfer in of three employees from the Solid Waste Bureau to supportthe consolidated Customer Service Office now budgeted within the UtilitiesFund ($285,154), offset by an increase in interdepartmental charges tothe Solid Waste Bureau (DES-General Fund) to support the call centerconsolidation ($289,110).
3.0
Transfer in of a utility underground program coordinator position from theGeneral Fund ($165,956).
1.0
Added a Heating Ventilation and Air Conditioning (HVAC) Technician at thePlant ($129,563).
1.0
Added two employees to expand Call Center hours ($139,198). 2.0
Eliminated an Instrumentation supervisory position due to theconsolidation of the Electrical and Instrumentation division at the Plant($135,195).
(1.0)
Reduced overtime and standby pay for tank cleaning efforts at the WaterPollution Control Plant ($429,160).
Eliminated FY 2019 one-time expenses ($105,220). Elimination of HVAC preventative maintenance contractual activities
($456,099), contractual changes for utility markings ($94,000), budgetreductions and reallocations as identified based on historical spending andoperational needs ($263,225), elimination of the lease payment budgetdue to equipment having been paid off ($34,412), and adjustments to theannual expense for maintenance and replacement of County vehicles($55,174).
Increased funding for new positions ($22,005 one-time, $62,549ongoing), meter replacements ($346,362), annual maintenance costs forthe newly implemented billing information system ($146,238), contractualincreases ($325,141), and an increase in various overhead line itemswhich were transferred from the Solid Waste Bureau to support theconsolidation of the call center ($36,551).
Debt service decreased due to repayment of General Obligation Bonds forvarious Utilities Fund capital projects ($517,970) and the repayment of aportion of funds borrowed through the Virginia Wastewater Revolving LoanFund for the Master Plan 2001 project at the Water Pollution Control Plant(WPCP) ($272,437).
Other expenses increased are due to higher overhead charges based onFY 2020 projections ($483,729), offset by a decrease of BozmanGovernment Center rent ($74,401).
Intra-county revenue increased based on historic trend analysis of waterand sewer revenue from county departments and the increase in the waterand sewer rate ($75,000).
Revenues increased due to the adopted water and sewer rate increase($973,399), sewage treatment charges from neighboring jurisdictions($529,147), increases for Lee Pumping Station lease agreements($5,040), and miscellaneous revenues ($14,500); partially offset by adecrease in hazardous household material fees ($2,000).
450

UTILITIES FUND TEN-YEAR HISTORY
Fiscal Year Description FTEs
FY 2021
Fund Balance Utilized decreased from the prior year by $1,579,039 and reflects the continued drawdown of fund balance, as planned, and consistent with the County’s financial policies.
Personnel increases due to employee salary increases, retirement contributions decreased based on current actuarial projections, decreased charge-backs to capital, adjustments to salaries resulting from job family studies for trades and planners ($738,518), partially offset by a decrease in the County’s cost for employee health insurance and an increase in charges to the Solid Waste Bureau (DES-General Fund) to pay their pro-rata share of the Customer Services Office ($13,754).
Non-personnel increases due to purchased water ($900,000), non-discretionary contractual increases for chemicals ($201,150), biosolids hauling ($78,315), and various contracts ($16,130), projected demand for utility markings ($30,000), budget reallocations as identified based on historical spending and operational needs ($20,866), operating expenses associated with the new position ($2,550 one-time and $1,360 ongoing), and one-time funding for large valve inspections ($300,000), partially offset by the elimination of FY 2020 one-time expenses ($22,005), elimination of annual maintenance costs for the decommissioned billing information system ($32,425), budget reductions and reallocations as identified based on historical spending and operational needs ($5,700), and adjustments to the annual expense for maintenance and replacement of County vehicles ($30,796).
Debt service decreases due to repayment of General Obligation Bonds for various Utilities Fund capital projects ($31,211).
Other expenses increase for the contingency due to the reclassification of positions identified to be substantially below comparative pay studies ($414,117), fund-wide benefit changes ($14,095), higher overhead charges based on FY 2021 projections ($176,181), and consultant funding ($18,110), partially offset by the elimination of Bozman Government Center rent due to relocation of the Customer Services Office ($59,059).
Intra-county revenue increases based on historic trend analysis of water and sewer revenue from county departments and the increase in the water and sewer rate ($100,000).
Revenues increase due to the adopted water and sewer rate increase ($1,521,958), sewage treatment charges from neighboring jurisdictions ($100,000), interest income ($50,000), projected demand for utility marking fees ($20,000), increases for Lee Pumping Station lease agreements ($5,280), miscellaneous revenues ($31,512), and historic trend analysis of water-sewer engineering fees ($2,500) and flow test fees ($2,200); partially offset by a decrease in turn-on fees ($3,000).
Fund balance utilized decreases from the prior year by $520,961 and reflects the current deficit in the 90-day operating reserve. There is a planned addition to the reserve of $1,000,000 in FY 2021.
451Updated 10/12/2020

This page intentionally left blank
452
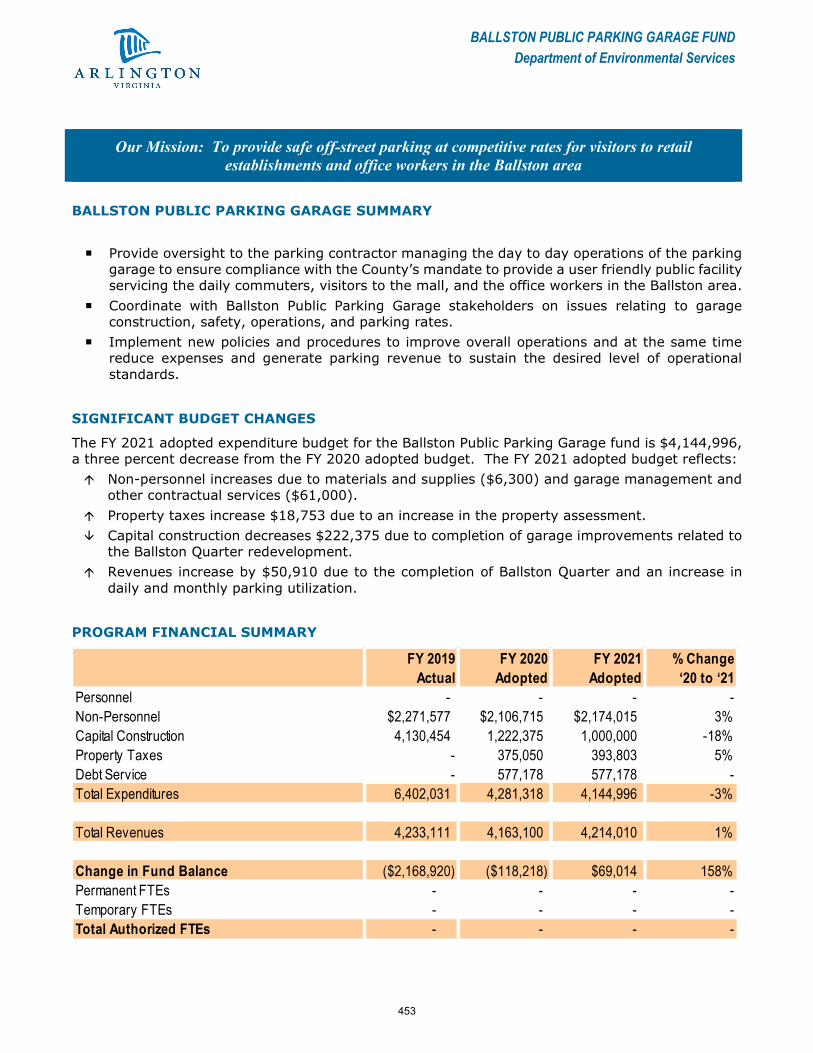
BALLSTON PUBLIC PARKING GARAGE FUND Department of Environmental Services
Our Mission: To provide safe off-street parking at competitive rates for visitors to retail establishments and office workers in the Ballston area
BALLSTON PUBLIC PARKING GARAGE SUMMARY
Provide oversight to the parking contractor managing the day to day operations of the parking garage to ensure compliance with the County’s mandate to provide a user friendly public facility servicing the daily commuters, visitors to the mall, and the office workers in the Ballston area.
Coordinate with Ballston Public Parking Garage stakeholders on issues relating to garage construction, safety, operations, and parking rates.
Implement new policies and procedures to improve overall operations and at the same time reduce expenses and generate parking revenue to sustain the desired level of operational standards.
SIGNIFICANT BUDGET CHANGES
The FY 2021 adopted expenditure budget for the Ballston Public Parking Garage fund is $4,144,996, a three percent decrease from the FY 2020 adopted budget. The FY 2021 adopted budget reflects: Non-personnel increases due to materials and supplies ($6,300) and garage management and
other contractual services ($61,000). Property taxes increase $18,753 due to an increase in the property assessment. Capital construction decreases $222,375 due to completion of garage improvements related to
the Ballston Quarter redevelopment. Revenues increase by $50,910 due to the completion of Ballston Quarter and an increase in
daily and monthly parking utilization.
PROGRAM FINANCIAL SUMMARY
FY 2019 FY 2020 FY 2021 % ChangeActual Adopted Adopted ‘20 to ‘21
Personnel - - - -Non-Personnel $2,271,577 $2,106,715 $2,174,015 3%Capital Construction 4,130,454 1,222,375 1,000,000 -18%Property Taxes - 375,050 393,803 5%Debt Service - 577,178 577,178 -Total Expenditures 6,402,031 4,281,318 4,144,996 -3%
Total Revenues 4,233,111 4,163,100 4,214,010 1%
Change in Fund Balance ($2,168,920) ($118,218) $69,014 158%Permanent FTEs - - - -Temporary FTEs - - - -Total Authorized FTEs - - - -
453

BALLSTON PUBLIC PARKING GARAGE FUND SUMMARY
BALLSTON PUBLIC PARKING GARAGE FUND FUND STATEMENT
FY 2019 FY 2020 FY 2020 FY 2021ACTUAL ADOPTED RE-ESTIMATE ADOPTED
ADJUSTED BALANCE, JULY 1Debt Service Reserve Fund 1 - $577,178 - $577,178Economic Stability Reserve2 $500,000 750,000 $500,000 750,000Maintenance Reserve 2,738,595 449,053 569,674 83,225TOTAL BALANCE 3,238,595 1,776,231 1,069,674 1,410,403
REVENUEParking Revenue 4,233,111 4,163,100 4,163,100 4,214,010TOTAL REVENUE 4,233,111 4,163,100 4,163,100 4,214,010
TOTAL REVENUE & BALANCE 7,471,706 5,939,331 5,232,774 5,624,413
EXPENSESGarage Operations 2,271,577 2,481,765 2,481,765 2,567,818Capital Replacement3 4,130,454 1,222,375 763,428 1,000,000Debt Repayment and Debt Service - 577,178 577,178 577,178TOTAL EXPENSES 6,402,031 4,281,318 3,822,371 4,144,996
BALANCE, JUNE 30Debt Service Reserve Fund 1 577,175 577,178 577,178 577,178Economic Stability Reserve2 492,500 750,000 750,000 1,100,000Maintenance Reserve - 330,835 83,225 (197,761)TOTAL BALANCE $1,069,675 $1,658,013 $1,410,403 $1,479,417
1 The Debt Service Reserve Fund is a usual and customary revenue bond requirement in order to provide additional assurance to bond holders. Beginning in FY 2019, the debt service reserve includes funding for a portion of the Ballston Quarter CDA debt service due and payable in the following fiscal year. 2 The Economic Stability Reserve equals three months of annual parking revenues. The reserve ramped up to this level over four fiscal years started in FY 2018. All remaining funds after funding the Debt Service Reserve and Economic Stability Reserve will be deposited in the Maintenance Reserve for ongoing maintenance and capital replacement. 3 FY 2020 re-estimate includes the remaining portion of $4 million of planned capital contributions for garage improvements as part of the Ballston Quarter redevelopment, as well as the completion of concrete repairs to the existing garage.
454
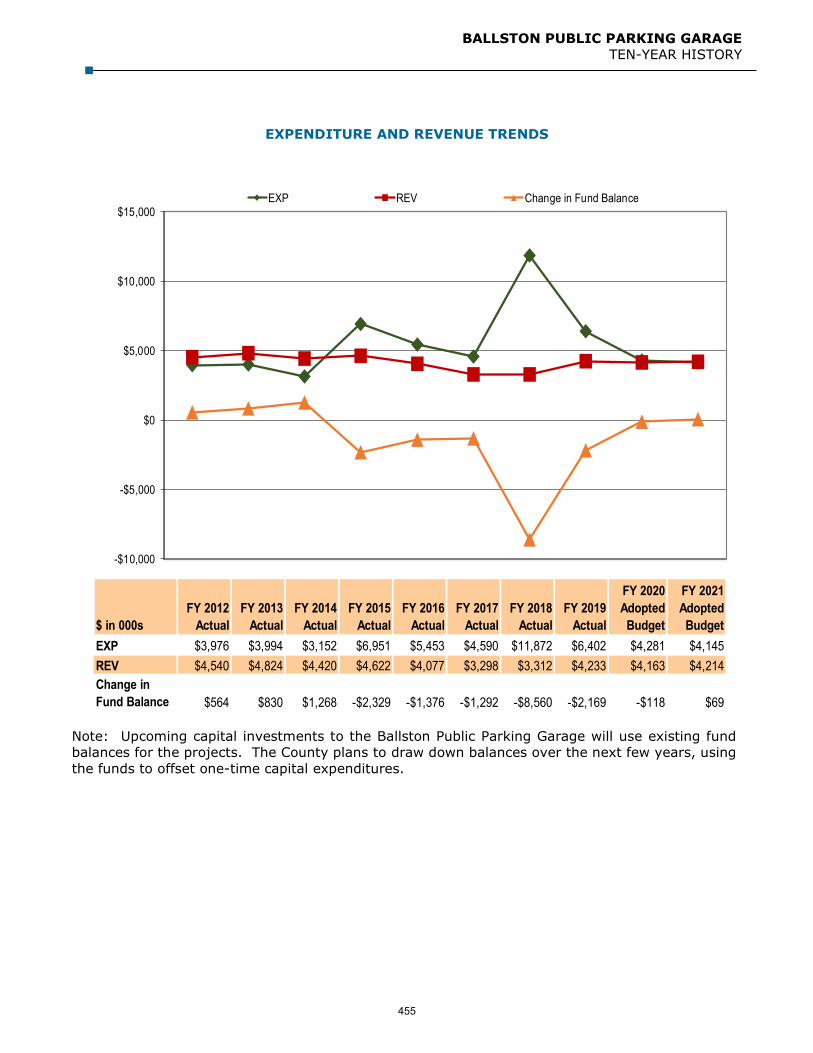
BALLSTON PUBLIC PARKING GARAGE TEN-YEAR HISTORY
EXPENDITURE AND REVENUE TRENDS
Note: Upcoming capital investments to the Ballston Public Parking Garage will use existing fund balances for the projects. The County plans to draw down balances over the next few years, using the funds to offset one-time capital expenditures.
$ in 000sFY 2012
ActualFY 2013
ActualFY 2014
ActualFY 2015
ActualFY 2016
ActualFY 2017
ActualFY 2018
ActualFY 2019
Actual
FY 2020 Adopted Budget
FY 2021 Adopted Budget
EXP $3,976 $3,994 $3,152 $6,951 $5,453 $4,590 $11,872 $6,402 $4,281 $4,145REV $4,540 $4,824 $4,420 $4,622 $4,077 $3,298 $3,312 $4,233 $4,163 $4,214Change in Fund Balance $564 $830 $1,268 -$2,329 -$1,376 -$1,292 -$8,560 -$2,169 -$118 $69
-$10,000
-$5,000
$0
$5,000
$10,000
$15,000EXP REV Change in Fund Balance
455

BALLSTON PUBLIC PARKING GARAGE TEN-YEAR HISTORY
Fiscal Year Description FTEs
FY 2012 Non-personnel expenses increased $66,761 primarily due to increases infunding for general custodial supplies ($55,138), contractual services forgarage operations ($46,047), and funding for equipment repair ($4,551).These increases are partially offset by a decrease in electricity ($30,681)and office supplies ($8,757).
Capital construction increased $950,000 to provide funding for garageimprovements and to repair and/or replace the façade.
Debt service increased $740,650 for additional payments needed to payoff outstanding bonds in FY 2017.
Revenue projections increased by $1,632,895, based on usageprojections and a potential parking fee rate increase that could produce$1,752,895, offset by a $120,000 decline in interest income. The parkingrate increase was implemented on May 1, 2012 (see FY 2013 below.)
FY 2013 Non-personnel expenses increased by $7,679 which reflects an increasein utilities ($33,411) and miscellaneous services and supplies ($15,344),offset by a decrease in the cost of garage operations that was partiallyoffset by a potential increase in the County’s living wage ($41,076).
The capital construction budget increased by $377,375 to provide fundingfor garage improvements. Debt service decreases by $203,220 to reflectlower amount of principal on which interest payments will be made.
Revenue projections decreased by $203,220 to reflect a lower amount ofprincipal on which interest payments will be made.
The County raised parking rates at the garage on May 1, 2012 in orderto make capital improvements and to pay down principal on theoutstanding bonds. The structure that went into effect keeps the $1 ratefor the first three hours of parking and increases the graduated hourlyrates over three hours anywhere from $0.50 to $1.00. The weekend ratewas previously a $1 flat rate daily, and the same graduated weekdayrates are now in effect on weekends. Monthly rates were also increased.
FY 2014 Non-personnel expenses decreased by $118,585 which reflects adecrease in the cost of garage operations ($94,360) due to contractualsavings and savings for office supplies and postage ($28,091), partiallyoffset by an increase in miscellaneous services ($3,866).
Debt service decreased by $36,920 due to lower debt service related fees. Revenue increased by $56,492, due in part to the additional number of
patrons parking on Levels 1-7 during construction on Level 8 of thegarage and offset by a decrease in interest income ($23,000).
FY 2015 Non-personnel expenses increased by $10,063 for non-discretionarycontractual increases.
Overall revenue decreased by $474,962 due to completion of work onLevel 8 and less revenue from hourly parking.
456

BALLSTON PUBLIC PARKING GARAGE TEN-YEAR HISTORY
Fiscal Year Description FTEs
FY 2016 Non-personnel expenses decreased by $11,917 for non-discretionarycontractual decreases.
Capital construction expense decreased to reflect the capital projects tobe implemented within the fiscal year ($347,042).
Overall revenue decreased by $452,686 due to loss of tenants duringplanned mall redevelopment.
FY 2017 Non-personnel expenses decreased for the garage management contract($306,334), general custodial supplies ($70,620), office supplies($11,196), utilities ($42,156) and fuel ($221), partially offset byincreases for consultant services for design review, wayfinding and tomitigate construction impacts ($200,000), signage ($80,000),miscellaneous services ($14,379) and equipment repair ($67,611).
Capital Construction increased by 198 percent due to planned repairs tothe 4th and 5th floor concrete slabs, and a planned $4 million contributionas part of the Ballston Quarter redevelopment.
Debt service decreased by $137,700 due to lower interest payments. Revenues decreased by $612,003 due to loss of tenants during mall
redevelopment.
FY 2018 Non-personnel decreased due to the garage management and othercontractual services ($168,520), custodial services ($215,630), and fuel($979), partially offset by increased office supplies ($3,648).
Capital Construction decreased due to the elimination of the one-timecontribution as part of the Ballston Quarter redevelopment and adecrease of available funds for capital constructions projects($4,631,098).
Debt service increased by $3,329,800 to make final payments to retirerevenue bonds.
Revenues decreased by $318,376 due to loss of tenants during mallredevelopment.
FY 2019 Non-personnel increased primarily due to the garage management andother contractual services ($121,226), repairs and maintenance($126,000), and materials and supplies ($8,400), partially offset bydecreased consultants ($120,000) and signage ($80,000).
Capital Construction decreased due to the planned completion of thegarage improvements in FY 2018 ($1,344,044).
Debt service decreased by $4,904,100 after the revenue bonds wereredeemed in full on August 1, 2017.
Revenues increased by $1,290,029 due to completion of the mallredevelopment in November 2018 and a planned increase in parkingutilization.
457

BALLSTON PUBLIC PARKING GARAGE TEN-YEAR HISTORY
Fiscal Year Description FTEs
FY 2020 Increase in materials and supplies ($41,600). Decrease in garage management costs and other contractual services
($33,068). Capital Construction increased due to ongoing garage improvements as
outlined in the Adopted FY 2019 – FY 2028 CIP ($1,000,000). Property taxes increased $75,050 due to an increase in the property
assessment. Debt service increased by $577,178 due to the first payment of the Series
2017A and Series 2017B Ballston Quarter CDA bonds. A portion of thesebonds was issued for improvements to the garage and will be paid fromavailable revenues.
Revenues decreased by $389,700 due to the delayed completion ofBallston Quarter and a phased opening of new restaurants andbusinesses.
FY 2021 Increases in materials and supplies ($6,300). Increases in garage management costs and other contractual services
($61,000). Property taxes increase $18,753 due to an increase in the property
assessment. Capital construction decreases $222,375 due to completion of garage
improvements related to the Ballston Quarter redevelopment. Revenue increases of $50,910 due to the completion of Ballston Quarter
and an increase in daily and monthly parking utilization.
458

BALLSTON PUBLIC PARKING GARAGE 8TH LEVEL FUND Department of Environmental Services
Our Mission: To provide safe off-street parking at competitive rates for visitors to retail establishments, the MedStar Capitals Iceplex, and office workers in the Ballston area
BALLSTON PUBLIC PARKING GARAGE – EIGHTH LEVEL SUMMARY
Provide parking for the MedStar Capitals Ice Rink and the Ballston Common Mall. Revenue from 8th level covers operation and maintenance costs.
SIGNIFICANT BUDGET CHANGES
The FY 2021 adopted budget for the Ballston Public Parking Garage Eighth Level is $92,841, an eight percent increase from the FY 2020 adopted budget. The FY 2021 adopted budget reflects:
Non-personnel expenses increase primarily due to increase in maintenance and repairs($6,000) and real estate taxes ($1,175).
Revenue decreases due to the forecasted decrease in parking ($22,860).
PROGRAM FINANCIAL SUMMARY
FY 2019 FY 2020 FY 2021 % ChangeActual Adopted Adopted '20 to '21
Personnel - - - -Non-Personnel $76,692 $85,666 $92,841 8%Capital Construction - - - -Total Expenditures 76,692 85,666 92,841 8%
Fees 263,433 263,400 240,540 -9%Total Revenues 263,433 263,400 240,540 -9%
Change in Fund Balance $186,741 $177,734 $147,699 -17%
459

BALLSTON PUBLIC PARKING GARAGE – 8TH LEVEL FUND FUND SUMMARY
FY 2019 FY 2020 FY 2020 FY 2021ACTUAL ADOPTED RE-ESTIMATE ADOPTED
BALANCE, JULY 1Construction Reserve $1,208,055 $1,380,299 $1,394,796 $1,572,530Operating Reserve 40,000 40,000 40,000 40,000TOTAL BALANCE 1,248,055 1,420,299 1,434,796 1,612,530
REVENUEParking Revenue 263,433 263,400 263,400 240,540TOTAL REVENUE 263,433 263,400 263,400 240,540
TOTAL REVENUE & BALANCE 1,511,488 1,683,699 1,698,196 1,853,070
EXPENSESEighth Level Garage Operations 76,692 85,666 85,666 92,841 Eighth Level Capital Expense - - - - TOTAL EXPENSES 76,692 85,666 85,666 92,841
BALANCE, JUNE 30Construction Reserve 1,394,796 1,558,033 1,572,530 1,720,229Operating Reserve 40,000 40,000 40,000 40,000TOTAL BALANCE $1,434,796 $1,598,033 $1,612,530 $1,760,229
BALLSTON PUBLIC PARKING GARAGE - EIGHTH LEVELOPERATING STATEMENT
A portion of the fund balance will be reserved for capital expenses in the garage and a portion of the balance will be retained as an operating reserve.
460
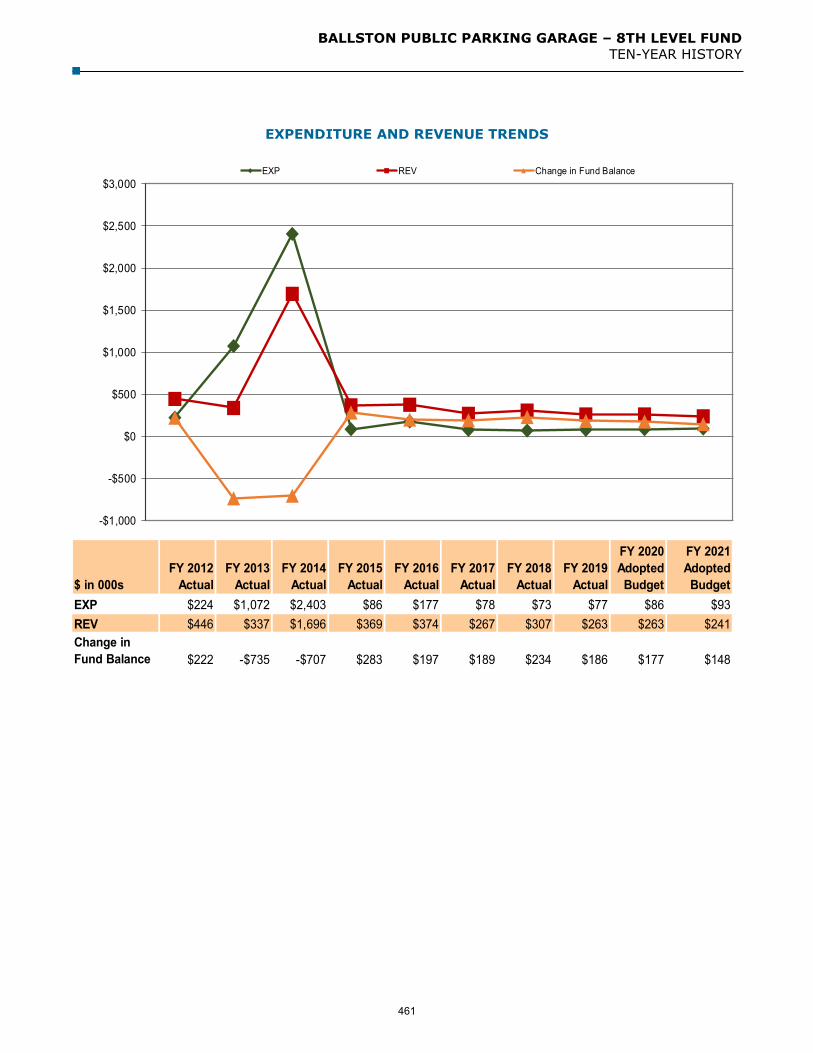
BALLSTON PUBLIC PARKING GARAGE – 8TH LEVEL FUND TEN-YEAR HISTORY
EXPENDITURE AND REVENUE TRENDS
$ in 000sFY 2012
ActualFY 2013
ActualFY 2014
ActualFY 2015
ActualFY 2016
ActualFY 2017
ActualFY 2018
ActualFY 2019
Actual
FY 2020 Adopted Budget
FY 2021 Adopted Budget
EXP $224 $1,072 $2,403 $86 $177 $78 $73 $77 $86 $93REV $446 $337 $1,696 $369 $374 $267 $307 $263 $263 $241Change in Fund Balance $222 -$735 -$707 $283 $197 $189 $234 $186 $177 $148
-$1,000
-$500
$0
$500
$1,000
$1,500
$2,000
$2,500
$3,000EXP REV Change in Fund Balance
461

BALLSTON PUBLIC PARKING GARAGE – 8TH LEVEL FUND TEN-YEAR HISTORY
Fiscal Year
Description FTEs
FY 2012 Revenue projections increased by $107,789 based on a proposed parkingfee rate increase that was ultimately approved on May 1, 2012.
FY 2013 Revenue projections decreased ($63,709) in FY 2013 due to plannedconstruction on the eighth level reducing the number of parking spaces available.
FY 2014 No significant changes.
FY 2015 Revenue increased due to the completion of garage construction onthe 8th Level ($37,768).
FY 2016 Revenue increased based on revised estimates ($10,080).
FY 2017 Non-personnel expenses increased due to an increase in the cost ofmaintenance contract ($14,371) and funds for snow removal ($20,000).
Revenue decreases due to the planned renovation of the mall ($43,276).
FY 2018 Non-personnel expenses decreased due to the lower cost of contractualservices ($31,990) and office supplies ($1,178), partially offset by an increase in custodial supplies ($13,090).
Revenue decreased due to the renovation of the mall ($15,502).
FY 2019 Non-personnel expenses decreased primarily due to the lower cost of custodial supplies ($3,200).
Decrease in capital construction due to completion of garage repairs andimprovements in FY 2018 ($1,000,000).
Revenue increased due to the completion of mall renovations andforecasted increases in parking ($15,000).
FY 2020 Decrease in cost for custodial supplies ($15,000). Increase in real estate taxes ($5,400) and garage management and other
contractual services ($5,910). Revenue increased due to completion of mall renovations and forecasted
increases in parking ($1,800).
FY 2021 Increase in maintenance and repairs ($6,000) and real estate taxes ($1,175).
Revenue decreased due to forecasted decreases in parking fee revenue($22,860).
462

CPHD DEVELOPMENT FUND Department of Community Planning, Housing and
Development
Our Mission: To set the standard for excellence in public service by providing consistent quality and timely permitting, plan review, and inspection services both in building construction and zoning.
DEVELOPMENT FUND SUMMARY
The fee-supported units that comprise the CPHD Development Fund are the Zoning Division: Zoning Administration, Counter Services, Zoning Enforcement, Zoning Plan Review, and Board of Zoning Appeals; and the following sections of the Inspection Services Division: Construction Permit Administration Services, Construction Field Inspection Services, and Construction Plan Review Services.
SIGNIFICANT BUDGET CHANGES
The FY 2021 adopted expenditure budget for the CPHD Development Fund is $24,200,894, a five percent increase over the FY 2020 adopted budget. The FY 2021 adopted budget reflects:
Personnel changes primarily due to the addition of the positions noted below, adjustments to salaries resulting from job family studies for trades and planners, an increase in the County’s cost for employee health insurance, partially offset by the transfer out of three permit positions to DES General Fund and other adjustments associated with Permit Arlington ($265,798, 3.0 FTEs) and lower retirement contributions based on current actuarial projections.
Zoning Administration: The addition of an Associate Planner added during theFY 2019 Closeout process ($127,589, 1.0 FTE) and the addition of a Receptionistposition which will be partially funded by DES General Fund ($59,114, 1.0 FTE).
Counter Services: The addition of a Customer Experience Manager added during theFY 2019 Closeout process ($100,375, 1.0 FTE).
Non-personnel increases primarily due to the increase in overhead costs related to GeneralFund operational support ($291,563), the addition of one-time funds to support the Board ofZoning Appeals (BZA) ($100,000), and adjustments to the annual expense for maintenanceand replacement of County vehicles ($4,819), partially offset by a decrease associated withPermit Arlington ($17,120).
Revenue decreases primarily due to projected permit activity ($1,097,896), partially offsetby an inflationary increase of 2.5 percent ($508,414), the addition of a Home OccupationalPermit fee ($27,682), increases to Sign Permit fees to align fees with the level of reviewrequired ($42,231), and adjustments to Building Permit fees to align fees with the level ofreview required ($365,960).
463

DEVELOPMENT FUND FUND SUMMARY
FINANCIAL SUMMARY
FY 2019 FY 2020 FY 2021 % ChangeActual Adopted Adopted ‘20 to 21
Personnel $11,721,936 $13,539,277 $14,296,179 6%Non-Personnel 6,469,068 9,497,693 9,904,715 4%Total Expenditures 18,191,004 23,036,970 24,200,894 5%
Fees 18,547,159 26,511,763 26,363,154 -1%Total Revenues $18,547,159 $26,511,763 $26,363,154 -1%
Permanent FTEs 106.00 113.00 113.00Temporary FTEs - - - Total Authorized FTEs 106.00 113.00 113.00
CPHD Development Fund Statement
FY 2019 FY 2020 FY 2020 FY 2021 Actual Adopted Re-estimate Adopted
ADJUSTED BALANCE, JULY 1 Contingent Fund Reserve $5,380,841 $6,628,132 $5,457,301 $6,928,634 Capital Reserve 11,751,353 10,447,789 12,031,048 13,976,031 TOTAL BALANCE 17,132,194 17,075,921 17,488,349 20,904,665
REVENUE Fees 18,547,159 26,511,763 26,511,763 26,363,154 TOTAL REVENUE 18,547,159 26,511,763 26,511,763 26,363,154
TOTAL REVENUE & BALANCE 35,679,353 43,587,684 44,000,112 47,267,819
EXPENSES Personnel 11,721,936 13,539,277 12,987,213 14,296,179 Non-personnel 6,469,068 9,497,693 10,108,234 9,904,715 TOTAL EXPENSES 18,191,004 23,036,970 23,095,447 24,200,894
BALANCE, JUNE 30 17,488,349 20,550,714 20,904,665 23,066,925 Contingent Fund Reserve 5,457,301 6,165,214 6,928,634 7,260,268 Capital Reserve 12,031,048 14,385,500 13,976,031 15,806,657 TOTAL BALANCE $17,488,349 $20,550,714 $20,904,665 $23,066,925
464

DEVELOPMENT FUND FUND SUMMARY
Beginning in FY 2013, the CPHD Development Fund maintains a contingent reserve, which is a 30 percent balance of the total fiscal year’s operating budget; this amount is equivalent to three to four months of annual operating expenditures. The CPHD Development Fund is not authorized to spend from this contingent without the County Board’s approval.
The Capital Reserve is a funding source for planned and unanticipated needs that exceed the amount available in the annual operating budget. The multi-year technology and one-time projects utilizing the Capital Reserve monies are: implementation of the County Manager’s Permit Arlington initiative which includes replacement of the enterprise-wide permitting system and business process re-engineering; website improvements; creation of a customer service center enhanced case management; and enabling the submission of electronic plans through E-Plan Review.
In FY 2020, a Future Development Contingency Fund of $300,000 was added to allow for flexibility in planning and development capacities related to Amazon.
465

CPHD DEVELOPMENT FUND TEN-YEAR HISTORY
EXPENDITURE, REVENUE, AND FULL-TIME EQUIVALENT TRENDS
$ in 000sFY 2012
ActualFY 2013
ActualFY 2014
Actual FY 2015
ActualFY 2016
ActualFY 2017
ActualFY 2018
ActualFY 2019
Actual
FY 2020 Adopted
Budget
FY 2021 Adopted
BudgetEXP $11,902 $11,564 $13,258 $14,376 $15,984 $17,663 $17,936 $18,191 $23,037 $24,201REV $16,627 $14,415 $14,695 $13,990 $15,095 $16,014 $19,226 $18,547 $26,512 $26,363Change in Fund Balance $4,725 $2,851 $1,437 -$386 -$889 -$1,649 $1,290 $356 $3,475 $2,162FTEs 87.00 87.00 90.00 89.50 93.00 97.00 104.00 106.00 113.00 113.00
0
50
100
150
200
-$5,000
$0
$5,000
$10,000
$15,000
$20,000
$25,000
$30,000FTEs EXP REV Change in Fund Balance
466

CPHD DEVELOPMENT FUND TEN-YEAR HISTORY
Fiscal Year Description FTEs
FY 2012 Revenue increased based on a projected increase in permitting activity. There were no fee increases for FY 2012.
FY 2013 Increased personnel costs to support the cost of a Fire Department Inspector position for site plan reviews ($103,768). The FTE for the position is in the Fire Department.
Increased payment to the County that covers internal services providedby County staff ($241,900).
Increased building rent for the 10th floor of Courthouse Plaza ($43,630). Revenue increased based on a projected increase in permitting activity
($569,300). There are no fee increases in FY 2013.
FY 2014 Increased personnel costs due to the addition of a Sign Coordinator position ($106,020), a Zoning Plan Reviewer position ($84,169), and a Business Systems Analyst position ($102,737).
3.0
Non-personnel expenditures decreased due to the following items:reduction in consultant services ($210,000), elimination of the contingentfunding ($210,000), reduction in other non-personnel costs to reflectactual spending ($167,000), partially offset by an increase in buildingrent for the 10th floor of Courthouse Plaza ($130,588).
Revenue decreased based on three fee reductions: the automation feedecreases from ten to five percent ($590,920), the permitting fees forresidential construction and residential additions to one-and two-familybuildings decreased by $0.05 per square foot from $0.54 to $0.49 persquare foot ($79,071), and the minimum permit fee and application filingfee for new construction, alteration and addition to one-and two-familyresidential buildings decreased by $25 from $92 per application to $57per application ($76,950). These three fee changes also reduced theamount of indirect cost revenue ($23,404). The reduction in revenuefrom these fee changes is partially offset by a projected increase inpermitting activity ($570,000).
FY 2015 Transferred a Business Systems Analyst from the CPHD General Fund ($72,110).
0.5
Converted an Elevator Inspector ($106,910) as well as positionreclassification savings ($43,090) to contractual services for the elevatorinspection program.
(1.0)
Increased building rent for the 10th floor of Courthouse Plaza ($13,643). Reduced annual expense for maintenance and replacement of County
vehicles ($927).
467

CPHD DEVELOPMENT FUND TEN-YEAR HISTORY
Fiscal Year
Description FTEs
FY 2016 Transferred a Business Systems Analyst from the CPHD General Fund ($72,739).
0.5
Added a Plan Reviewer ($84,711), Records Technician ($74,079), and aZoning Planner ($79,382).
3.0
Added $83,000 for Zoning related expense in the Office of the CountyAttorney for an Assistant County Attorney.
Non-personnel expenses increased for consulting expenses ($18,297) andfor the ongoing costs of records management and scanning ($225,000).
Revenue increased due to projected increase in permitting activity($1,202,541). There are no fee increases for FY 2016.
FY 2017 Expenses increased due to One-Stop Arlington including implementation of a new business permitting system, project management, system support, space reconfiguration, and the addition of four limited term positions ($3,986,042).
4.0
Non-personnel increased for adjustments to rent costs associated withthe tenth-floor office space ($30,193).
FY 2018 Added an Associate Planner position to serve as the Assistant Counter Services Manager in Zoning Administration ($124,686).
1.0
Added a Principal Planner to serve as the Zoning AdministrativeSupervisor in Zoning Administration ($141,730).
1.0
Added positions related to One Stop Arlington including: ProductionSupport Manager ($148,500), GIS Systems Administrator ($155,997),two Help Desk support positions for the second half ofFY 2018 (141,730). Changes include a conversion of a limited termAssistant Permit Processing Manager position to a full-time position.
4.0
Transferred a Communications Specialist II ($147,770) from the BusinessOperations Division to the Permits Administration Division in theDevelopment Fund.
1.0
Non-personnel decreased due to the removal of one-time costsassociated with the implementation of the business permitting system aspart of the One-Stop Arlington Initiative ($949,250), and adjustments tothe annual expense for maintenance and replacement of County vehicles($13,928). The decrease is partially offset by non-personnel increases foradjustments to rent costs associated with the 10th floor office space($63,832) and indirect costs related to General fund operational support($62,134).
Revenue increased due to the creation of a new permit type for AccessoryHomestay home occupation at a rate of $60 per application ($29,452)and increased utilization of fund balance to cover projected expenses($282,662).
468
CPHD DEVELOPMENT FUND TEN-YEAR HISTORY
Fiscal Year
Description FTEs
FY 2019 Transferred in a position from the Department of Human Services for the creation of Program Manager position in the Construction Permit Administration section to support the One Stop Arlington initiative ($173,478).
1.0
Added a Mechanical Code Inspector position in Construction FieldInspection Services ($82,954).
1.0
Added a Permit Processing Specialist in the Inspection Services Division($71,481).
1.0
Transferred out an Assistant Permit Administration Manager to theDepartment of Environmental Services ($106,037).
(1.0)
Personnel expenses also reflect an adjustment to account for savings dueto staff vacancies and turnover ($254,493).
Non-personnel increased due to the increase of one-time costs associatedwith the implementation of the enterprise permitting system as part ofthe One-Stop Arlington initiative ($810,284), increases to overhead costsrelated to General Fund operational support ($391,087), andnon-personnel funds added for the Mechanical Code Inspector and PermitProcessing Specialist positions ($26,900). The increase is partially offsetby adjustments to rent costs associated with the 10th floor office space($131,479) and adjustments to the annual expense for maintenance andreplacement of County vehicles ($49,523).
Revenue increased primarily due to the application of an EmploymentCost Index increase of 2.5 percent to all existing fees ($309,252) andincreasing the existing Automation Enhancement Surcharge from five to10 percent based upon the successful implementation of the first phase ofthe One-Stop Arlington on-line permitting system ($316,983).
FY 2020 Eliminated a Deputy Building Official ($198,829). (1.0) Added positions due to an anticipated increase in development activity
and ancillary development activity associated with Amazon, including a:o Zoning Plan Reviewer in the Zoning Division ($90,000), and ao Fire Protection Engineer in the Construction Plan Review
Services Division ($125,000).
1.0 1.0
Transferred in three Code Enforcement positions from the CPHD GeneralFund to the Construction Permit Administration Services Division($401,395).
3.0
Added a Business System Analyst in the Construction PermitAdministration Services Division ($101,131).
1.0
Added a Permit Processing Specialist in the Construction PermitAdministration Services Division ($75,322).
1.0
Added a Fire Inspector in the Construction Field Inspection ServicesDivision ($116,896).
1.0
469

CPHD DEVELOPMENT FUND TEN-YEAR HISTORY
Fiscal Year
Description FTEs
Personnel increased due to adjustments to overstrength positionsassociated with Permit Arlington ($84,492).
Added non-personnel funding for a Future Development ContingencyFund that will allow for flexibility in planning and development capacitiesrelated to Amazon ($300,000).
Added overhead costs related to General Fund operational support($170,529), operating expenses associated with new position adds($29,000), and increased rent associated with the 10th floor office space($16,798).
Reduced non-personnel budget for Permit Arlington ($148,626). Reduced the annual expense for maintenance and replacement of County
vehicles ($7,428). As part of FY 2019 closeout, the County Board approved the addition of
an Associate Planner ($127,589) and a Customer Experience Manager($100,375) in the Zoning Division.
2.0
FY 2021 Transferred out three permit positions to DES General Fund and other adjustments associated with Permit Arlington ($265,798).
(3.0)
Added a Receptionist position which will be partially funded by the DESGeneral Fund ($59,114).
1.0
Non-personnel increases due to the increase in overhead costs related toGeneral Fund operational support ($291,563), the addition of one-timefunds to support the Board of Zoning Appeals (BZA) ($100,000), partiallyoffset by a decrease associated with Permit Arlington ($17,120).
470

AUTOMOTIVE EQUIPMENT FUND Department of Environmental Services
Our Mission: To ensure that safe, energy-efficient, and environmentally friendly vehicles are available to agency staff to accomplish their work/missions
The Automotive Equipment Fund provides cost efficient and environmentally sound management support services for the vehicle fleet of Arlington County. These support services include procurement of vehicles, repair and maintenance, fuel and alternative fuels, repair parts inventory, and disposal.
SIGNIFICANT BUDGET CHANGES
The FY 2021 adopted expenditure budget for the Department of Environmental Services’ (DES) Automotive Equipment Fund is $18,574,340, a four percent increase from the FY 2020 adopted budget. The FY 2021 budget reflects: Personnel changes due to an adjustment that accounts for the compensation study for
trades/planners and an increase in the County’s cost for employee health insurance, partially offset by lower retirement contributions based on current actuarial projections.
Vehicle addition expenses decrease due to the removal of one-time funding added in FY 2020for the addition of a vehicle in the Utilities Fund ($56,740), partially offset by one-time fundingadded for new vehicle purchases ($30,000).
Vehicle replacement expenses increase primarily due to the current rental book replacementschedule ($44,224).
Lease purchases increases due to higher payments for the lease of the Fire Apparatuses($236,091).
Revenue increases due to adjustments to the charges to other departments for the maintenanceand replacement of County vehicles ($870,091), partially offset by a decrease in revenuetransferred in from other funds based on the change in vehicle additions noted above ($17,000).
471

AUTOMOTIVE EQUIPMENT FUND FUND SUMMARY
FUND FINANCIAL SUMMARY
FY 2019 FY 2020 FY 2021 % ChangeActual Adopted Adopted ‘20 to ‘21
Personnel $6,159,602 $6,360,135 $6,736,501 6%Non-Personnel 2,654,164 2,936,104 2,936,385 -Accident Repairs 313,323 291,200 291,200 -Additions 27,152 56,740 30,000 -47%Replacement 10,137,661 6,964,332 7,008,556 1%Transfer to General Fund and School 3,363,663 - - -Lease Purchase 1,076,972 1,205,607 1,441,698 20%Subtotal 23,732,537 17,814,118 18,444,340 4%Insurance/Other Transfers 130,000 130,000 130,000 -Total Net Expenditures 23,862,537 17,944,118 18,574,340 4%
County & School Revenues 17,155,762 17,374,974 18,245,065 5%Sales of Surplus Equipment 1,920,867 300,000 300,000 -Miscellaneous Revenues - 61,000 61,000 -Transfer from General Fund - - 30,000 -Transfer from Utilities Fund - 47,000 - -100%Total Revenues 19,076,629 17,782,974 18,636,065 5%
Change in Fund Balance ($4,785,908) ($161,144) $61,725 -138%
Permanent FTEs 63.00 60.00 60.00Temporary FTEs - - -Total Authorized FTEs 63.00 60.00 60.00
472

AUTOMOTIVE EQUIPMENT FUND FUND SUMMARY
Note: Fund Balance is reserved for financing encumbrances and incomplete projects carried over from the previous fiscal year.
FY 2019 FY 2020 FY 2020 FY 2021ACTUAL ADOPTED RE-ESTMATE ADOPTED
ADJUSTED BALANCE, JULY 1 $13,436,089 $11,022,051 $8,650,182 $3,557,084
OPERATING RECEIPTSMaintenance/Operating Rental Book 5,763,666 5,470,398 5,470,398 5,515,936Other Maintenance - Non Rental Book 438,618 400,000 400,000 400,000Temporary Loan Vehicles - 130,000 130,000 130,000Schools Maint./ Operating 2,021,099 2,107,029 2,107,029 2,740,687Other Maintenance - Non Rental Book Schools 86,646 120,000 120,000 120,000 Subrogation Revenues - 60,000 60,000 60,000Miscellaneous - 1,000 1,000 1,000CAPITAL RECEIPTSCounty Fleet Replacement & Lease Purchase 7,360,603 7,460,604 7,460,604 7,622,891Schools Replacement 1,485,130 1,686,943 1,686,943 1,715,551Sales of Surplus Equipment 1,920,868 300,000 300,000 300,000TOTAL RECEIPTS 19,076,630 17,735,974 17,735,974 18,606,065OTHER FINANCING SOURCESTransfers in from General Fund - - - 30,000Transfers in from Other Funds - 47,000 47,000 - Transfers in from General Capital Fund - - 4,925,000 - TOTAL TRANSFERS IN - 47,000 4,972,000 30,000
TOTAL RECEIPTS AND TRANSFERS IN 19,076,630 17,782,974 22,707,974 18,636,065
TOTAL BALANCE, CAPITAL RESERVE,RECEIPTS AND TRANSFERS IN 32,512,719 28,805,025 31,358,156 22,193,149OPERATING EXPENSESAdministration, Maintenance 7,144,989 7,169,720 7,169,720 7,399,281Schools 1,982,099 2,417,719 2,417,719 2,564,805Subtotal 9,127,088 9,587,439 9,587,439 9,964,086CAPITAL EXPENSESEncumbrance/ Incomplete Projects - - 4,931,964 - Transfer In from General Capital Fund - - 4,925,000 - Replacements to Fleet (County) 8,550,114 5,871,712 5,871,712 5,530,093Replacements to Fleet (Schools) 1,587,548 1,092,610 1,092,610 1,478,463Additions to Fleet 27,152 56,740 56,740 30,000 Lease Purchase 1,076,972 1,205,607 1,205,607 1,441,698 Subtotal 11,241,786 8,226,669 18,083,633 8,480,254
TOTAL EXPENSES 20,368,874 17,814,108 27,671,072 18,444,340Transfer Out to Fund 101 2,621,686 - - - Transfer Out to School Operating 741,977 - - - Transfer to General Fund - Insurance 130,000 130,000 130,000 130,000TOTAL TRANSFERS 3,493,663 130,000 130,000 130,000
TOTAL OPERATING EXPENSES ANDTRANSFERS OUT 23,862,537 17,944,108 27,801,072 18,574,340BALANCE, JUNE 30 $8,650,182 $10,860,917 $3,557,084 $3,618,809
AUTOMOTIVE EQUIPMENT FUND: FUND STATEMENT
473

AUTOMOTIVE EQUIPMENT FUND TEN-YEAR HISTORY
EXPENDITURE, REVENUE, AND FULL-TIME EQUIVALENT TRENDS
$ in 000sFY 2012
Actual FY 2013
Actual FY 2014
Actual FY 2015
Actual FY 2016
Actual FY 2017
Actual FY 2018
Actual FY 2019
Actual
FY 2020 Adopted
Budget
FY 2021 Adopted
BudgetOPERATING EXP $9,431 $8,832 $8,716 $8,558 $8,825 $8,964 $9,393 $9,127 $9,587 $9,964VEHICLE EXP $11,698 $8,533 $13,239 $8,333 $9,359 $7,265 $10,127 $14,735 $8,357 $8,610TOTAL $21,129 $17,365 $21,955 $16,891 $16,229 $19,520 $19,520 $23,862 $17,944 $18,574REVENUE $18,398 $20,907 $20,760 $18,117 $19,742 $18,755 $18,945 $19,077 $17,783 $18,636FTEs 61.00 61.00 61.00 61.00 63.00 63.00 63.00 63.00 60.00 60.00
0
20
40
60
80
$0
$5,000
$10,000
$15,000
$20,000
$25,000
$30,000
FTEs OPERATING EXP VEHICLE EXP TOTAL REVENUE
474

AUTOMOTIVE EQUIPMENT FUND TEN-YEAR HISTORY
Fiscal Year Description FTEs
FY 2012 Non-personnel expenses increased due to repair/renovation of the vehicle service lifts ($256,000), increases in materials and supplies ($83,600), contractual services ($27,958), and internal services ($917), partially offset by the decrease in operating equipment ($40,000).
Additions and the transfer from the General Fund increased for the purchaseof new vehicles for the conversion of HVAC maintenance from contract toCounty staff in the Department of Environmental Services (3 vehicles:$104,145), additional fire protection systems inspectors in the FireDepartment (1 vehicle: $28,830), and staffing reallocated within theDepartment of Environmental Services for maintenance of new/remodeledfacilities (1 vehicle: $38,399).
Replacement expenses increased ($983,690) due to unit cost increases invehicle replacements, adjustments in vehicle configurations, parts and labor.The number of units being replaced increased from the prior year due tomeeting mileage and age criteria, as well as the replacement of units whichwere part of the planned purchase delay in FY 2011. Included in this increaseis the lease purchase of a fire vehicle ($213,233).
Revenue increased due to adjustments to the charges to other departmentsfor the maintenance and replacement of County vehicles ($699,618) and newvehicles being added to the fleet ($171,374).
The one-time transfer credit in FY 2011 to the General Fund ($375,000) waseliminated in FY 2012.
FY 2013 Non-personnel expenses decreased due to reductions in building repairs for the FY 2012 replacement of the vehicle service lifts ($100,000).
Additions expenses increased ($331,126) from FY 2012 for new vehicles beingadded to the County fleet for the additional water crew being added in theUtility Fund for FY 2013.
Replacement expenses increase ($535,537) primarily due to a greater numberof School buses being replaced in FY 2013 than in the prior fiscal year($986,899), which is partially offset by fewer County vehicles being scheduledfor replacement in FY 2013 ($451,362). The FY 2012 budget includedreplacement of County vehicles that were part of the one-time plannedpurchase delay in FY 2011 in addition to the normally scheduled replacements.
Revenue increased due to adjustments to the charges to other departmentsfor the maintenance and replacement of County vehicles ($203,217),adjustments to Schools for the maintenance and replacement of the Schoolfleet ($469,411), and for new vehicles being added to the fleet for the UtilityFund ($331,126).
FY 2014 Replacement expenses increased due to the off-cycle lease purchase of fire equipment (two heavy rescue units, one loader and four pumpers) ($1,980,953).
475
AUTOMOTIVE EQUIPMENT FUND TEN-YEAR HISTORY
Fiscal Year Description FTEs
Revenues increased due to new vehicle purchases funded through leasepurchase ($1,842,205) and for the charges to other departments for themaintenance and replacement of County and School vehicles ($1,326,348).
Additions expense and the related transfer from other funds both decreasedsince there are no additions to the fleet funded in the Automotive EquipmentFund ($502,500).
FY 2015 Additions expense and the related transfer from the General Fund increased for the purchase of a new vehicle for the DES ($42,000).
Replacement expenses decreased due to the number of configuration ofvehicles slated to be replaced in FY 2015 ($1,954,202).
Revenues decreased due to there being no lease proceeds ($1,842,205). Revenues decreased from charges to other departments for the maintenance
and replacement of County vehicles ($230,097).
FY 2016 The County Board added two Auto Mechanic positions for maintenance of school buses needed for APS.
2.0
The County Board reduced the size of the County’s vehicle fleet acrossdepartments, resulting in a decrease in revenue to the Auto fund ($50,000).
Addition to fleet expense and the related transfer from the Utilities Fundincreased for the purchase of two new vehicles for DES ($100,624), offset bythe removal of the cost of the purchase of a new vehicle for DES in FY 2015($42,000).
Lease purchase expense increased ($223,422), partially offset by replacementexpense decreases due to the number of configuration of vehicles slated to bereplaced in FY 2016 ($135,682).
Revenue increased due to adjustments to the charges to other departmentsfor the maintenance and replacement of County vehicles ($1,012,251).
FY 2017 Additions to fleet expense and the related transfer from the Utilities Fund decrease for the purchase of two new vehicles for the DES, which occurred in FY 2016 ($100,624).
Revenues decreased from charges to other departments for the maintenanceand replacement of County vehicles ($341,969).
Replacement expenses increased due to the number and configuration ofvehicles slated to be replaced in FY 2017 ($995,357).
FY 2018 Additions expense increased due to the purchase of vehicles for DES’ Streetlights program and a new Construction Manager in Water, Sewer, and Streets ($185,835).
Transfer from other funds increased due to transfers from the General Fund($156,835) and the General Capital Projects Fund ($29,000) for the purchaseof additions to the fleet.
Vehicle replacement expenses decreased ($1,503,879) relative to the numberand configuration of vehicles replaced in FY 2017 based on mileage, condition,
476

AUTOMOTIVE EQUIPMENT FUND TEN-YEAR HISTORY
Fiscal Year Description FTEs
age, and departmental needs.
FY 2019 Non-personnel decreased due to adjustments to the annual expense for maintenance and replacement of County vehicles ($26,112).
Vehicle replacement expenses increased ($668,818), partially offset by adecrease ($251,411) in Lease Purchase expenses.
Increased the Sales of Surplus Equipment ($50,000).
FY 2020 Eliminated two vacant Mechanic positions and a vacant Trades Worker IV position ($276,947).
(3.0)
Vehicle replacement expenses increased primarily due to the current rentalbook replacement schedule ($1,744,972), and the addition of a vehicle tosupport a new position in the Utilities Fund ($47,000)
Decreased Lease Purchase expenses ($94,393). Revenue increased due to adjustments to the charges to other departments
for the maintenance and replacement of County vehicles ($101,020) and atransfer from the Utilities Fund for a vehicle addition ($47,000).
FY 2021 Vehicle addition expenses decreased due to the removal of one-time funding added in FY 2020 for the addition of a vehicle in the Utilities Fund ($56,740), partially offset by one-time funding added for new vehicle purchases ($30,000).
Vehicle replacement expenses increased primarily due to the current rentalbook replacement schedule ($44,224).
Lease purchases increased due to higher payments for the lease of the FireApparatuses ($236,091).
Revenue increased due to adjustments to the charges to other departmentsfor the maintenance and replacement of County vehicles ($870,091), partiallyoffset by a decrease in revenue transferred in from other funds based on thechange in vehicle additions ($17,000).
477

This page intentionally left blank
478

PRINTING FUND Department of Environmental Services
Our Mission: To provide County agencies a single location for cost effective services and technical advice that will meet their printing, copying, graphic design, and mail services needs
Printing and Mail Services Produce high volume copies for County agencies using high production digital machines that
produce the best quality at the lowest price. Provide critical printing, graphics, and bindery services to meet the needs across the County. Manage all walk-up copiers and mobile printing applications for all County departments to meet
their copying needs. By holding a master contract for copiers, the County achieves cost savings and provides better services.
Handle outgoing and interoffice mail, as well as special mailing projects for the County. Provide County departments and Arlington Public Schools (APS) with postage savings on large
mail jobs using the latest technology and smart mail applications. Utilize 30 percent post-consumer recycled paper for all print jobs.
SIGNIFICANT BUDGET CHANGES
The FY 2021 adopted expenditure budget for the Department of Environmental Services’ Printing Fund is $2,384,695, a one percent decrease from the FY 2020 adopted budget. The FY 2021 budget reflects:
Personnel changes due to an increase in the County’s cost for employee health insurance and adjustments to salaries resulting from job family studies for trades and planners, partially offset by lower retirement contributions based on current actuarial projections.
Non-personnel decreases primarily due to contractual obligations related to the County’scontract with Xerox ($71,000), partially offset by anticipated higher paper costs ($6,311).
County revenue increases from County departments due to the addition of a 15% increase toprinting fees to adjust for inflationary increases for paper and salary increases ($195,459),partially offset by decreases due to a slight decline in print production and mail services asCounty departments move to more online notifications ($39,839) and aligning budget withactuals ($40,161).
Outside revenue increases due to aligning budget with actuals ($80,000).
479
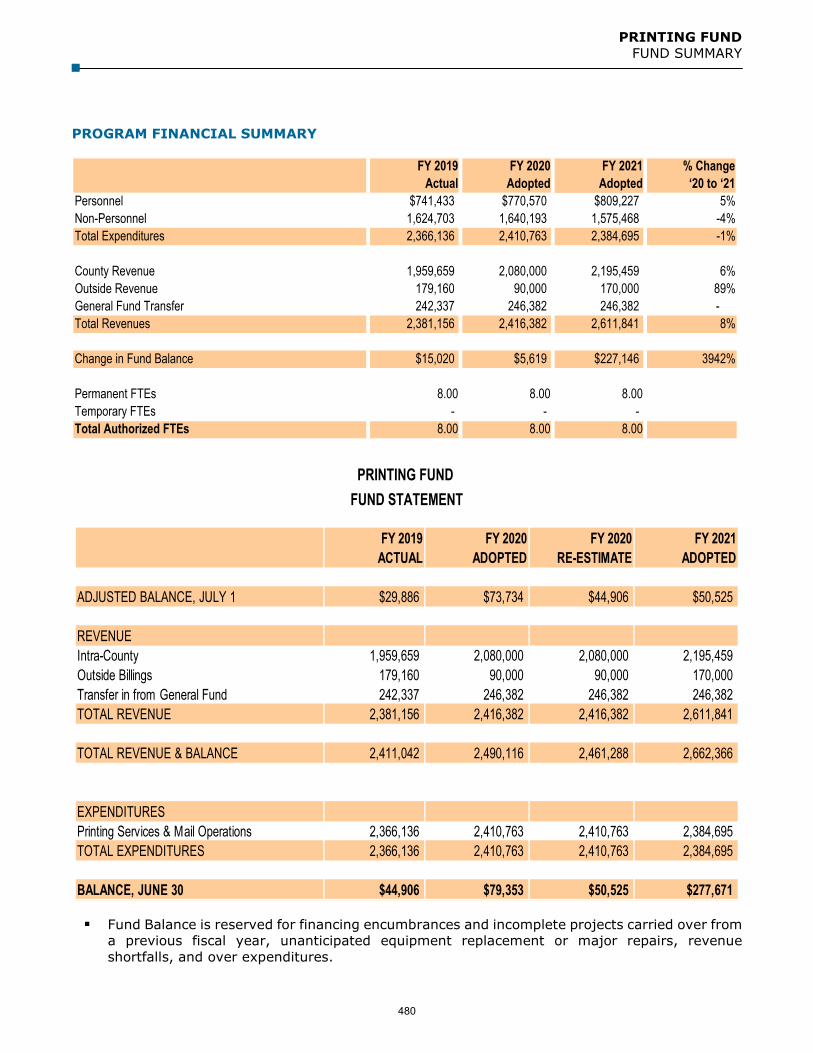
PRINTING FUND FUND SUMMARY
PROGRAM FINANCIAL SUMMARY
FY 2019 FY 2020 FY 2021 % ChangeActual Adopted Adopted ‘20 to ‘21
Personnel $741,433 $770,570 $809,227 5%Non-Personnel 1,624,703 1,640,193 1,575,468 -4%Total Expenditures 2,366,136 2,410,763 2,384,695 -1%
County Revenue 1,959,659 2,080,000 2,195,459 6%Outside Revenue 179,160 90,000 170,000 89%General Fund Transfer 242,337 246,382 246,382 - Total Revenues 2,381,156 2,416,382 2,611,841 8%
Change in Fund Balance $15,020 $5,619 $227,146 3942%
Permanent FTEs 8.00 8.00 8.00Temporary FTEs - - - Total Authorized FTEs 8.00 8.00 8.00
Fund Balance is reserved for financing encumbrances and incomplete projects carried over froma previous fiscal year, unanticipated equipment replacement or major repairs, revenueshortfalls, and over expenditures.
FY 2019 FY 2020 FY 2020 FY 2021ACTUAL ADOPTED RE-ESTIMATE ADOPTED
ADJUSTED BALANCE, JULY 1 $29,886 $73,734 $44,906 $50,525
REVENUEIntra-County 1,959,659 2,080,000 2,080,000 2,195,459Outside Billings 179,160 90,000 90,000 170,000Transfer in from General Fund 242,337 246,382 246,382 246,382
2,381,156 2,416,382 2,416,382 2,611,841
2,411,042 2,490,116 2,461,288 2,662,366
EXPENDITURESPrinting Services & Mail Operations 2,366,136 2,410,763 2,410,763 2,384,695TOTAL EXPENDITURES 2,366,136 2,410,763 2,410,763 2,384,695
BALANCE, JUNE 30 $44,906 $79,353 $50,525 $277,671
TOTAL REVENUE
TOTAL REVENUE & BALANCE
FUND STATEMENTPRINTING FUND
480

PRINTING FUND TEN-YEAR HISTORY
EXPENDITURE, REVENUE, AND FULL-TIME EQUIVALENT TRENDS
$ in 000sFY 2012
Actual FY 2013
Actual FY 2014
Actual FY 2015
Actual FY 2016
Actual FY 2017
Actual FY 2018
Actual FY 2019
Actual
FY 2020 Adopted
Budget
FY 2021 Adopted
BudgetEXP $2,051 $1,926 $2,368 $2,224 $2,285 $2,353 $2,484 $2,366 $2,411 $2,385REV $2,064 $1,967 $2,266 $2,247 $2,222 $2,581 $2,270 $2,381 $2,416 $2,612FTEs 9.00 9.00 8.00 8.00 8.00 8.00 8.00 8.00 8.00 8.00
0
2
4
6
8
10
12
$1,000
$1,250
$1,500
$1,750
$2,000
$2,250
$2,500
$2,750
FTEs EXP REV
481
PRINTING FUND TEN-YEAR HISTORY
Fiscal Year Description FTEs
FY 2012 Transferred a vacant position to the General Fund for support of the DES Safety Program.
(1.0)
Non-personnel increased to reflect contractual obligations for equipment($2,843), funding for assistance with special projects ($40,953), andreplacement of County vehicles ($295).
Revenue from County Departments for work by the Print Shop increasedbased on FY 2010 revenues and the FY 2011 re-estimate ($62,000).
Transfer from the General Fund decreased due to elimination of the PrintShop subsidy ($52,278). The General Fund transfer will continue tosupport the mail operation.
FY 2013 Increased funding for contractual obligations for equipment ($116,318).
Decreased funding for consultant services ($40,953).
Decreased funding for operating supplies ($10,158).
Revenue from County Departments increased due to an increase in incomefrom leased equipment used by departments throughout the County($51,483).
Transfer from the General Fund, which supports the mail operation,increased due to an increase in contractual obligations for equipment andsoftware ($16,782).
One position was transferred to the Department of Technology Services(DTS) for records management related activities by the County Board atFY 2012 closeout.
(1.0)
FY 2014 Non-personnel increased for contractual obligations for equipment ($64,324).
Revenue from County departments decreased due to loss in revenue frommanagement of the archives since records management activities are nowmanaged by DTS ($65,640).
Revenue from leased equipment used by departments throughout theCounty increased ($21,041).
Transfer from the General Fund, which supports the mail operation,increased ($23,650) due to an increase in contractual obligations forequipment, address verification, and smart mail software applications.
FY 2015 Non-personnel increased for contractual obligations for equipment ($136,753).
Revenue from County departments and Arlington Public Schools (APS)increased due to increased volume of jobs ($178,899).
Transfer from the General Fund, which supports the mail operation,increased primarily due to increases in personnel costs ($30,646).
482

PRINTING FUND TEN-YEAR HISTORY
Fiscal Year Description FTEs
FY 2016 Non-personnel increased for contractual obligations for equipment ($126,440).
Revenue from County departments and Arlington Public Schools (APS)increased due to increased volume of jobs ($130,973).
Transfer from the General Fund, which supports the mail operation,increased primarily due to increases in personnel costs ($4,985).
FY 2017 Non-personnel increased due to contractual obligations for equipment and supplies ($27,915), purchase of services ($60,000), and presort mail services for special projects ($100,000).
Revenue from County departments and Arlington Public Schools (APS)increased due to volume of jobs and special services including presort mailservices ($213,633).
Transfer from the General Fund, which supports the mail operation,increased primarily due to increases in personnel costs ($3,901) and anincrease in equipment lease costs ($6,384).
FY 2018 Non-personnel increased primarily due to contractual obligations for equipment and supplies as a result of new photocopier/printer contract that requires all County photocopiers and printers be leased through the Print Shop ($351,344), an increase in operating supplies ($45,000), primarily offset by a decrease in internal services ($50,000).
County revenue increased from County departments due to the newprinter/photocopier contract ($315,482), and an increase in printingrevenue outside of County departments ($20,000).
Transfer from the General Fund, which supports the mail operation,increased due to an increase in equipment lease costs ($7,831).
FY 2019 Non-personnel increased due to contractual obligations for equipment and supplies ($20,129), offset by a decrease in internal services ($30,000).
County revenue increased from County departments due to an increase inphotocopier leases and printing services ($47,412).
Outside revenue increased to align with FY 2017 outside revenue actuals($20,000).
Transfer from the General Fund, which supports the mail operation,decreased due to eligible personnel expenses ($7,263).
FY 2020 Decreased funding for contractual obligations related to the County’s contract with Xerox ($60,000).
Decreased non-personnel funding for outside print shop charges($40,000).
County revenue decreased due to a slight decline in print production andmail services ($135,000).
General Fund Transfer increased due to an increase in eligible personnelexpenses ($4,045).
483

PRINTING FUND TEN-YEAR HISTORY
FY 2021 Non-personnel decreases primarily due to contractual obligations related to the County’s contract with Xerox ($71,000), partially offset by anticipated higher paper costs ($6,311).
County revenue increases from County departments due to the addition ofa 15% increase to printing fees to adjust for annual inflationary increasesfor paper and salary increases ($195,459), partially offset by decreasesdue to a slight decline in print production and mail services as Countydepartments move to more online notifications ($39,839) and aligningbudget with actuals ($40,161).
Outside revenue increases due to aligning budget with actuals ($80,000).
484

PAY-AS-YOU-GO
CAPITAL
AND
SHORT-TERM
FINANCING
485

This page intentionally left blank
486
PAY-AS-YOU-GO CAPITAL GENERAL CAPITAL PROJECTS FUND
HOW THE COUNTY PAYS FOR CAPITAL PROJECTS
Arlington County plans for capital projects throughout the community in the Capital Improvement Plan (CIP), which is adopted by the County Board. The CIP is a comprehensive plan for capital spending including projects paving streets, constructing and modernizing public buildings, renovating parks, and much more. The County pays for these projects using a combination of tax revenue, general obligation (GO) bond proceeds, and other dedicated revenue sources. Due to these multiple funding sources and the multi-year nature of project execution, not all of the County’s planned spending on capital projects appears in the operating budget. For a complete overview of planned capital spending, refer to the adopted Capital Improvement Plan.
This section is a summary of the capital projects funded either entirely or partly by cash and financed dollars in FY 2021. Cash for capital projects comes from tax revenue and is referred to in the CIP as “pay-as-you-go” or “PAYG” funding because it represents the current financial resources the County has committed to capital needs, as opposed to the future financial resources represented by bond proceeds and associated debt service.
The County normally uses PAYG and short-term financing to fund assets with useful lives of 10 years or less. Financed dollars, whether short or long-term, are set on repayment schedules concurrent with the expected useful lives of the financed assets. Short-term financing is used mostly for replacement of technology and equipment assets with expected useful lives from three to seven years. Long-term financing (e.g., GO bonds) is used mostly for the County’s large capital infrastructure investments, such as buildings or roads, with expected useful lives of ten or more years. Refer to the Debt Service section of this document and the current adopted Capital Improvement Plan for more detailed information on the County’s long-term capital financing strategy.
TYPES OF CAPITAL PROJECTS
At their most basic level, capital projects fall into one of two categories: maintenance capital projects or general capital projects. Maintenance capital projects involve work on existing capital assets that is intended to either ensure the asset remains operational for its full expected useful life or to extend a capital asset’s operations beyond its expected useful life. The County’s long-stated goal for the overall Maintenance Capital Program is to “maintain what we have.” To this end, the County regularly conducts condition assessments of capital assets to establish an inventory of capital needs and associated prioritization plans. Maintenance capital activities differ from operating maintenance activities described elsewhere in this document in that maintenance capital activities are normally larger scale in terms of cost, size, nature, and frequency of maintenance activity.
General capital projects, on the other hand, refers to all other capital projects and includes those considered “new work,” such as when the County constructs a new community center or rebuilds and reconfigures a street intersection. This distinction between maintenance and general capital projects is helpful because the two types have different goals. Maintenance capital projects protect the County’s past investments in capital assets and ensure that Arlington residents get maximum use out of those assets. General capital projects aim to meet emerging community needs by creating
487

PAY-AS-YOU-GO GENERAL CAPITAL PROJECTS FUND
new capital assets or modifying current assets to such a degree that the work cannot be considered only maintenance.
Beyond this distinction between maintenance and general, the County further categorizes capital projects into programs which correspond to the teams of County staff charged with executing the projects. The capital projects discussed in the following pages are are organized into the following programs:
Regional Partnerships Transportation Facilities Parks and Recreation Technology Neighborhood Conservation.
OVERVIEW OF FY 2021
The adopted FY 2021 PAYG budget for capital projects is $13.6 million. The ongoing funding is $3.8 million with additional funds in the amount of $9.8 million from fund balance. The adopted FY 2021 short-term financing budget for capital projects is $15.4 million.
County capital project descriptions, PAYG appropriation charts, and fund statements are included on the following pages. Because projects are often multi-year in nature, appropriations rather than actual expenditures are presented. Appropriations more accurately reflect the County Board’s intent, priorities, decisions, and PAYG funding levels than actual expenditures. Fiscal impact is the net increase in annual operating costs associated with a capital funding decision. Capital funding decisions that expand or significantly change the nature and quality of an asset typically increase future operating budgets over the life of the asset. However, some capital funding decisions that replace current assets with efficient, low maintenance assets or extend the useful life of an asset can reduce future operating budgets.
In addition to the PAYG dollars in the General Capital Projects budget, there are PAYG investments in other funds and operations:
The Utilities Fund FY 2021 Adopted PAYG budget of $23.4 million includes funding forWastewater Treatment Plant capital maintenance and improvements to the WashingtonAqueduct, which supplies the County with 100 percent of its drinking water.
488

PAY-AS-YOU-GO GENERAL CAPITAL PROJECTS FUND
The School Superintendent’s adopted FY 2021 PAYG budget is $7.8 million, which includesmajor maintenance and minor construction funding.
$6,809 $7,055 $6,875 $5,322 $6,786 $3,832
12,157 13,137 10,803
223
31,458
9,761
5,618 6,4386,458
6,458
6,458
7,803
17,808 18,282 19,427
19,980
20,179
23,422
$-
$20,000
$40,000
$60,000
$80,000
FY 2016 FY 2017 FY 2018 FY 2019 FY 2020 FY 2021
PAY-AS-YOU-GO APPROPRIATION HISTORYFY 2016 - FY 2021
($ in 000's)
County Capital Fund (Ongoing)County Capital Fund (One-Time/Fund Balance)Schools Capital FundUtilities Capital Fund
489
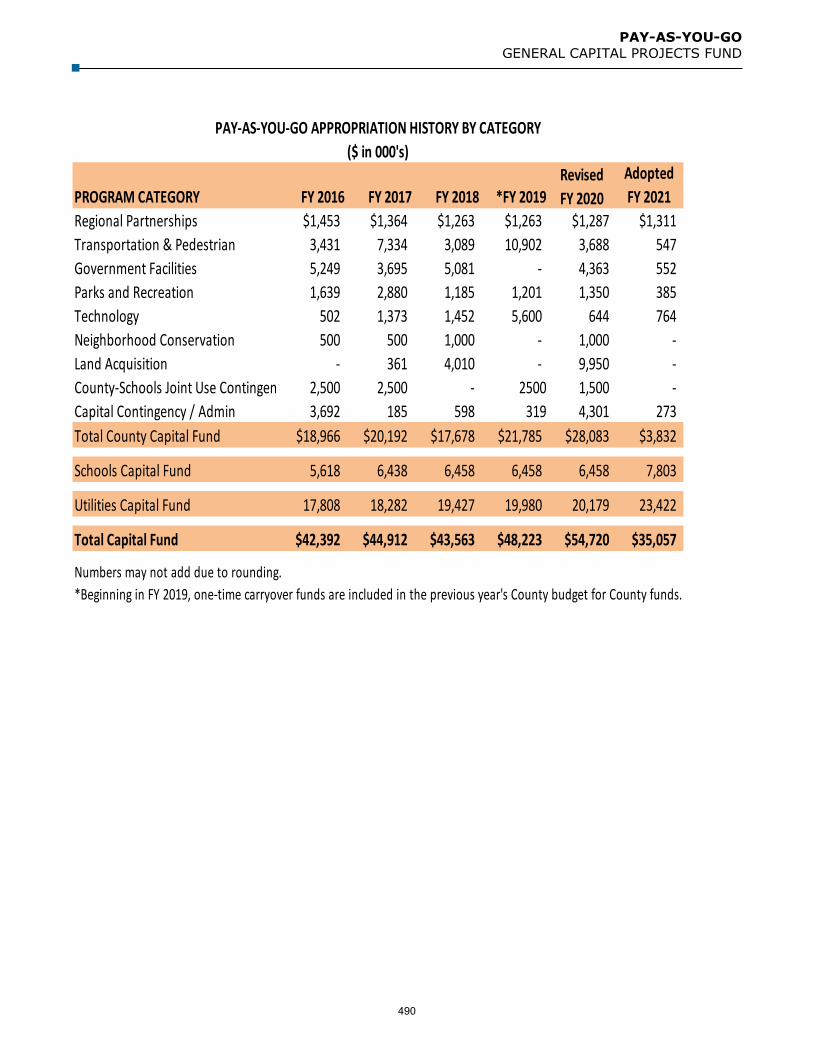
PAY-AS-YOU-GO GENERAL CAPITAL PROJECTS FUND
PROGRAM CATEGORY FY 2016 FY 2017 FY 2018 *FY 2019RevisedFY 2020
AdoptedFY 2021
Regional Partnerships $1,453 $1,364 $1,263 $1,263 $1,287 $1,311Transportation & Pedestrian 3,431 7,334 3,089 10,902 3,688 547 Government Facilities 5,249 3,695 5,081 - 4,363 552 Parks and Recreation 1,639 2,880 1,185 1,201 1,350 385 Technology 502 1,373 1,452 5,600 644 764 Neighborhood Conservation 500 500 1,000 - 1,000 - Land Acquisition - 361 4,010 - 9,950 - County-Schools Joint Use Contingen 2,500 2,500 - 2500 1,500 - Capital Contingency / Admin 3,692 185 598 319 4,301 273 Total County Capital Fund $18,966 $20,192 $17,678 $21,785 $28,083 $3,832
Schools Capital Fund 5,618 6,438 6,458 6,458 6,458 7,803
Utilities Capital Fund 17,808 18,282 19,427 19,980 20,179 23,422
Total Capital Fund $42,392 $44,912 $43,563 $48,223 $54,720 $35,057
Numbers may not add due to rounding.*Beginning in FY 2019, one-time carryover funds are included in the previous year's County budget for County funds.
PAY-AS-YOU-GO APPROPRIATION HISTORY BY CATEGORY($ in 000's)
490

PAY-AS-YOU-GO GENERAL CAPITAL PROJECTS FUND
PROGRAM CATEGORY Base Funds
One-Time/Fund
Balance Funds
**FY 19 Bond Premium Funds
FY21 Adopted
Regional Partnerships 1,311 - - 1,311 Transportation Maintenance Capital 547 259 1,439 2,245 Transportation Multi-Modal - 505 - 505 Transportation Street Safety - 225 - 225 Facilities Maintenance Capital - 380 1,775 2,155 Energy Management 221 - 200 421 Facilities Design and Construction 331 350 74 755 Parks Maintenance Capital 385 150 - 535 Technology 620 - - 620 Neighborhood Conservation - - 500 500 Public Safety 144 - - 144 County-Schools Joint Use Projects - - 1,500 1,500 Capital Contingency/Admin 273 1,247 1,157 2,677 Total Projects $3,832 $3,116 $6,645 $13,593Numbers may not add due to rounding.
Total fund balance is a combination of one-time dollars from fund balance as well as FY19 bond premium
**Reflects FY 2019 close-out funds received from County bond sale that is restricted in use to capital projects.
PAYG PROJECTS ($ in 000s)
Regional Partnerships $1,311,475
Arlington County is a member of several regional organizations which provide services to Arlington residents and visitors. The Regional Partnerships program funds the County’s annual contributions to support these organizations’ capital needs. This funding is separate from the County’s annual operating contribution to these organizations, which is discussed in the Regionals narrative in this document. The amount the County contributes every year for capital needs is determined by each organization’s allocation formula.
Northern Virginia Regional Park Authority $629,431The Northern Virginia Regional Park Authority (NVRPA) is a multi-jurisdictional agency comprisedof Arlington County, Fairfax County, Loudoun County, and the Cities of Alexandria, Falls Church,and Fairfax which owns and operates over 10,000 acres of parklands with 21 major parks,including Potomac Overlook, Upton Hill, and the W&OD Regional Parks in Arlington.The FY 2021 contribution formula is $2.65 per Arlington resident.
Northern Virginia Community College $542,320This funding represents the County's ongoing capital contribution to the Northern VirginiaCommunity College (NVCC) program for land acquisition and site development of all campuses.Arlington is one of nine jurisdictions that share costs associated with NVCC’s capital program.The FY 2021 budget is based on a $2.25 allocation per capita.
491

PAY-AS-YOU-GO GENERAL CAPITAL PROJECTS FUND
Northern Virginia Criminal Justice Academy $139,724In 2006, the principal members agreed to fund the construction of the Emergency VehicleOperations Center (EVOC). The initial payments began in FY 2007 and will continue throughFY 2026. The FY 2021 budget reflects Arlington’s contribution towards the annual debt paymentsof the EVOC.
Transportation – Maintenance Capital $2,245,000
The Transportation Maintenance Capital program in the Department of Environmental Services (DES) maintains transportation infrastructure by repaving streets and bike lanes, maintaining pedestrian and vehicular bridges, maintaining sidewalks, signals, and signal infrastructure, maintaining and replacing street and trail lights, maintaining and replacing parking meters, and replacing bus shelters. The program also maintains and develops transportation data assets and systems to support analysis, such as trail monitoring, Intelligent Transportation Systems (ITS), and management systems for physical transportation assets (e.g. signs) and transportation data assets (collected observed traffic data and crash data, for example).
Street Lighting Management $380,000The County streets are lit with a total of about 18,900 streetlights: about 7,700 owned by theCounty and about 11,200 owned by Dominion Energy (DE, formerly Dominion Virginia Power).Since 2010, the County has been deploying state of the art smart Light Emitting Diode (LED)streetlight technology throughout the County. The County is saving 75 percent on electric utilitycharges for the areas converted into smart LED streetlights. These lights can be centrally andremotely controlled for dimming by time of the day and can be used to support emergencyevacuation.
The LED conversion of County-owned streetlights is almost complete. Conversion of 2,250Dominion Energy street lights per year will be converted over a five-year period starting inFY 2021.
Bridge Maintenance $937,000This ongoing program provides funds to continue inspection, maintenance, and rehabilitation of36 vehicular and pedestrian bridges in Arlington County to assure an adequate level of safety forpedestrians and vehicular traffic. All 36 bridges are inspected at least biannually in accordancewith Federal Highway Administration (FHWA) National Bridge Inventory (NBI) standards forinspection and reporting, where applicable. This program provides funding to cover the cost ofannual inspections, maintenance, and repair projects for County owned bridges in the publicright-of-way. The program plans to inspect 22 bridges during FY 2021.
Paving Program $928,000The County currently maintains 1,059 lane miles of roadway by a combination of mill and overlay,full depth rebuilding, micro-surfacing, and slurry sealing. The County utilizes a PavementCondition Index (PCI) to assess the road conditions. The County has established a desiredaverage PCI range of 75-80 (with 100 representing the best possible condition) and has raisedoverall PCI to 75.9 in 2019 from an average PCI of 66.9 in 2015. The PAYG funds along withanticipated GO bond funds will maintain the PCI level as long as changes in winter weather,contracting costs, and oil prices do not negatively impact the anticipated paving program.Arterials are repaved more often due to the traffic volumes and type of vehicles using them whileneighborhood streets get slurry seal treatment every seven to ten years to extend their life ratherthan re-paving them as often. Approximately 125 lane miles will be addressed in FY 2021 throughthe various paving maintenance strategies. In addition to these PAYG funds, $6,400,000 of GO
492

PAY-AS-YOU-GO GENERAL CAPITAL PROJECTS FUND
bond funds will be sold in FY 2021 to execute the more in-depth paving strategies for the County’s roads.
Transportation Multi-Modal Programs $505,000
The Transportation Multi-Modal program provides accessibility and various options for movement throughout the County and the rest of the region. This is achieved by providing a high-quality transit system, a robust bicycle and pedestrian network, and effective transportation demand management approaches.
Parking Technology $245,000This project is currently in progress. The additional funds in FY 2021 will complete the originalscope of work to upgrade the residential permit parking program’s (RPP) administration softwarewith an easier program to administer and access to third party support.
Transportation Asset Management–Traffic Data Management & Integration $60,000The transportation program includes a wide array of assets including signals and signs installedin the right-of-way, inventory assets housed in warehouses, and traffic data assets. A centralizedtraffic database is currently in development. The amount of data involved along with the varioussystems to link to is proving to be a longer process than originally anticipated. The final databasewill be able to provide: open data accessibility to staff and public; integration with the work ordersystem; integration with County’s Geographic Information System (GIS); integration withCartegraph, the transportation asset management system; linkage to collision reports and trafficcameras; trend analysis; safety analysis; report and map generation; and system performancemonitoring. The completed program will also help track and manage assets by integrating withthe current inventory system associated with the County’s warehouse storage facility.
Neighborhood Complete Streets $200,000The Neighborhood Complete Streets (NCS) program was established by the Arlington CountyBoard in January 2016 to allow safe and comfortable access by all users and ensure street designis compatible with surrounding land uses. It addresses safety and accessibility problems on local(non-arterial) streets through physical improvement projects. This funding allows for thecontinuation of implementing tactical measures as an economical way to address some projectlocations as well as test innovative treatments, two uses that are not eligible for transportationcapital or bond funding. Examples of these tactical treatments include the use of pavementmarkings, bollards, and signs to modify intersections, streets and crossings. In addition to thesePAYG funds, $100,000 of GO bond dollars will be sold for the execution of projects such assidewalk installation, street lighting and speed management.
Transportation Street Safety $225,000
In July 2019, the County Board adopted the “Vision Zero Resolution.” The resolution identified safety as a priority and called for eliminating fatal and severe injury crashes. While safety is considered in almost all street improvement projects, this is a new, dedicated program to address safety as the focus.
Street Safety Improvements $225,000The Street Safety Improvement (SSI) Program will implement safety improvements atintersections and streets for pedestrians, small mobility device (SMD) users, bicyclists, transitriders, and motorists as determined through a comprehensive investigation, including crash
493

PAY-AS-YOU-GO GENERAL CAPITAL PROJECTS FUND
analysis. Improvements may include signage, pavement markings, and other types of delineation to achieve greater separation and awareness of pedestrians and bicyclists. Minor changes to the curb may also be included. Locations demonstrating high crash rates will be a priority. Potential projects include installing protected bike lanes or separated bike lanes on arterial and principal neighborhood streets, pedestrian crossing enhancements across arterial and principal neighborhood streets, minor lighting upgrades, and enhancements around high-conflict areas such as locations with high transit ridership.
Facilities Maintenance Capital Program $2,155,000
Arlington County operates more than 90 public facilities, including office buildings, fire stations, recreation centers, courts, and more. The Facilities Maintenance Capital Program is a collection of major facility maintenance projects designed to keep County facilities operating in a safe, efficient, and reliable manner. This program and the Facilities Design and Construction Program are closely integrated to address the County’s facility maintenance and space planning needs.
Facilities Management Maintenance Capital $1,675,000The FY 2021 Facilities Maintenance Capital Program funds will be used to address maintenanceitems identified in facility condition assessment studies and staff reports. The FacilitiesManagement Bureau (FMB) maintains 90 facilities totaling more than 2,200,000 square feetvalued at over $750 million. Projects will include:
o Roof, generator, and transfer switch replacement along with the addition of buildingautomation controls to existing fan coil units at Court Square West;
o Electrical upgrades to replace all automatic transfer switches and generator controlsat the Courts Police building;
o Overhead door replacement at Fire Station 9;o Roof replacement at Fort CF Smith; ando Upper mechanical room roof replacement including the installation of new drains at
2020 Thomas Building.
Critical Systems Infrastructure (CSI) $480,000This ongoing project strengthens the County’s ability to keep essential operations up and running24/7/365 by installing improved building systems at mission critical facilities. The FY 2021funding will be used to replace the uninterruptible power supply (UPS) at the Trade CenterNetwork Operating Center (NOC).
Energy Management Program $421,000
The Energy Management program is guided by the Community Energy Plan and funds capital projects which monitor and improve energy use in County facilities. These projects both lower County facility operating costs and improve overall energy reliability.
Energy Management – Energy Assurance Plan $221,000This project will fund a consultant to prepare an essential planning document for improvingresilience to energy outages and cascading events in the County. This work is important for publichealth and safety, with ramifications for County operations and the community at large.
Fire Station 8 – Solar Panels $200,000This project will install a 60kW solar panel array on the roof of Fire Station 8. Fire stations are inoperation 24/7 and therefore utilize more energy than other, similar-sized County facilities that
494
PAY-AS-YOU-GO GENERAL CAPITAL PROJECTS FUND
are only open during the day. This new solar panel array will enable Fire Station 8 to decrease its reliance on energy from the grid, making it both more environmentally friendly and more self-sufficient in the event of an emergency.
Facilities Design and Construction Program $755,000
The Facilities Design and Construction Program is a collection of small- to medium-sized capital projects designed to maintain and modernize current County facilities as well as plan for the County’s future facility needs. This program and the Facilities Maintenance Capital Program are closely integrated to address the County’s facility maintenance and space planning needs.
Master Planning and Feasibility Studies $350,000This ongoing project funds studies of the County’s short-, intermediate-, and long-term facilityand space planning needs by outside experts. These studies enable the County to thoughtfullymanage current facilities, properly scope future capital improvement projects, and accuratelyestimate future cost impacts in facilities across the community.
Americans with Disabilities Act (ADA) Remediation $200,000This ongoing project funds small-to-medium sized construction projects at County facilities toimprove accessibility for people with disabilities, in accordance with the Americans withDisabilities Act (ADA). For FY 2021, the County will construct ADA improvements at the DetentionFacility garage entrances, lower level offices, and Level 1 public and staff accessible restrooms.Any funding remaining after these improvements have been completed will address additionalaccessibility-related needs at the Detention Facility.
Gender Neutral Restroom Signage $145,000This ongoing project funds the replacement of existing, gendered signage on single-occupancyrestrooms in County facilities with new, all-gender signage. The project will modify the signageon approximately 500 single-occupancy restrooms and is budgeted at $145,000/year for threeyears ($435,000 total). FY 2021 is year one of this project.
Fire Station 10 $60,000This project funds County staff personnel costs to manage the construction of the new Fire Station10, occupying the first two stories of a new mixed-use building in Rosslyn. The more than $20Mconstruction portion of this project is funded by local developer contributions, so the only cost forthe fire station borne by the County is this staff time, budgeted as $60,000/year over five years($300,000 total). FY 2021 is year three of this project.
Parks Maintenance Capital Program $535,000
Arlington County currently maintains an extensive inventory of park and recreation assets on approximately 942 acres of parkland, including playgrounds, athletic fields, athletic courts, field and court lighting, picnic shelters, comfort stations, site furnishings, parking lots, and other assets. The Parks maintenance capital program provides capital funding to maintain these valuable assets by proactively replacing inefficient and outmoded infrastructure and preventing premature failure. Additional maintenance capital projects will be funded with new GO bonds as part of the adopted Capital Improvement Plan FY2021 – FY2030.
Capital Asset Manager $160,000 This funding is for the staff position that manages the Parks Capital Asset Program.
495

PAY-AS-YOU-GO GENERAL CAPITAL PROJECTS FUND
Parks Field Fund $225,000The Parks field fund is supported by an annual fee assessed on official affiliated youth and adultsports teams playing on Arlington County rectangular and diamond fields. The fees assessed forrectangular fields are directed to support replacement and construction of synthetic turf fields inthe County ($160,000). The fees assessed on diamond fields ($65,000) are to be used each yearfor specific diamond field enhancements, such as improved irrigation, batting cages oraccelerated sod replacement. The FY 2021 PAYG budget reflects the projected annual revenuefrom the fees.
Feasibility Studies (PAYG) $150,000These funds will provide the ability to conduct timely and relevant analysis and studies asopportunities arise. The program is meant for new planning initiatives that are outside currentCIP projects. Examples are potential planning and analysis needs for parks and sites associatedwith site plan proposals, Arlington Public Schools proposals, or affordable housing proposals.
Technology $620,000
Voting Machines $120,000 Additional Digital Scan Voting Machines are needed to accommodate an anticipated increase in the volume of early voters and to process paper ballots as part of the November Presidential Election. The request for additional voting machines and precinct scanners is in response to directive 52 U.S.C. § 20701 from the Department of Justice requiring ballot images be retained for 22 months from the date of a federal election. The current machines are limited in the number of digital images they can store over the course of an election.
DHS Child Welfare Purchase of Service Software $500,000This project is to replace the current staff supported and maintained system in operation since1995. At 25 years old, the system is beyond its useful life and is not capable of meeting changingprogrammatic or reporting requirements. The system connects the department with third partyservice providers to manage the authorization and payment of adoption and foster care servicespurchased on behalf of eligible children and families. The total cost for the system is $1.2 million.The FY 2021 funding is for initial planning and procurement for the system and the balance offunding will be provided as part of the FY 2022 budget.
Neighborhood Conservation $500,000 This ongoing program funds a diverse set of infrastructure construction projects across the community. Since the 1960s, Arlington residents and civic associations have collaborated with the County to identify and plan infrastructure projects in their own neighborhoods. These projects have included everything from street light installation to street intersection reconfiguration to tree and landscape restoration to new sidewalk, curb, and gutter. The construction projects associated with this program are typically funded using GO bond proceeds and can be reviewed in the GO bond section of this document. The $500,000 noted here comes from current PAYG funds and covers County staff personnel costs to manage project implementation.
Public Safety $144,200
Electronic Summons System $144,200 In FY 2015, the County began assessing a $5.00 fee as part of the costs each criminal or traffic case in the district or circuit courts to purchase and implement an electronic summons system.
496
PAY-AS-YOU-GO GENERAL CAPITAL PROJECTS FUND
With an electronic summons system, citation data would be automatically scanned and electronically entered at the point of activity, improving efficiency and accuracy in the processing of issued citations for Courts and Police personnel. Once the citation is complete, the transaction data is sent electronically to the Court’s case management systems, allowing violators to prepay their fines promptly and aid the Courts in managing their dockets while tracking their caseloads. The costs of the system include the software and hosting costs, peripheral equipment such as handheld devices, portable printers, installation, training and the maintenance required for the system. The FY 2021 PAYG budget reflects the projected annual revenue from the fees. The revenue accumulated across upcoming fiscal years will design and procure the electronic summons system.
County-Schools Joint Use Contingent $1,500,000 As Schools pursues its aggressive capital program to meet enrollment growth, the community has identified numerous site-specific needs in transportation infrastructure, utility undergrounding, traffic circulation, pedestrian and bike safety, recreation and other areas. This funding contingent will allow the County to collaboratively address these needs and to make improvements at some joint-use facilities.
Since FY 2014, $18.1 million PAYG funds have been allocated to the joint fund. Of this amount, $17.3 million has been paid for projects at Thomas Jefferson, Discovery Elementary School at Williamsburg, Ashlawn Elementary School, McKinley Elementary School, Abingdon Elementary School, Fleet Elementary School, and The Heights Building.
Capital Contingency/Administration $2,677,428 The FY 2021 adopted budget continues funding for administrative support of capital projects tracking and reporting in the Department of Management and Finance ($273,000). Remaining balances ($2,404,428) are one-time contingency funds for unplanned or unforeseen issues.
497

PAY-AS-YOU-GO GENERAL CAPITAL PROJECTS FUND
FY 2019 FY 2020 FY 2020 FY 2021ACTUAL ADOPTED RE-ESTIMATE ADOPTED
ADJUSTED BALANCE, JULY 1 $104,016,887 $114,718,482 $114,718,482 $79,718,482
REVENUES: Commonwealth of Virginia 310,275 - - - Federal Government 2,455,924 - - - City of Falls Church - - - - Charges for Services 3,531,840 - - - Miscellaneous Revenue 2,418,965 - - - Proceeds from Lease Purchase 1,871,651 - - - Proceeds for bond premium 18,396,431 - - - Proceeds from line of credit 8,585,749 TOTAL REVENUE 37,570,835 - - -
Transfers In (Out): Transfers In (Ongoing) 5,667,108 6,786,074 6,786,074 3,832,227 Transfers In (One-time) 16,815,472 16,815,472 TOTAL TRANSFERS IN (OUT) 5,667,108 23,601,546 23,601,546 3,832,227
147,254,830 138,320,028 138,320,028 83,550,709
EXPENDITURES: Capital Projects - Current Year 32,536,348 8,645,689 23,601,546 3,832,227 Capital Projects - Carry-Over 35,000,000 35,000,000 35,000,000
TOTAL CAPITAL EXPENDITURES 32,536,348 43,645,689 58,601,546 38,832,227
BALANCE, JUNE 30 $114,718,482 $94,674,339 $79,718,482 $44,718,482
TOTAL BALANCE, REVENUES AND TRANSFERS IN
GENERAL CAPITAL PROJECTS FUND
FUND STATEMENT
Most capital projects span multiple years, from design to construction completion. The FY 2019 Actual and FY 2020 Re-Estimate columns reflect that funding for capital projects are carried forward each fiscal year, and ending balances fluctuate, reflecting the carryover of these funds. The FY 2021 Adopted budget column is presented in a similar fashion to show planned execution of projects in the fiscal year. These are staffs’ best estimates based on preliminary plans and design and construction schedules.
498

GENERAL OBLIGATION (GO) BONDS GENERAL CAPITAL PROJECTS FUND
The County issues General Obligation (GO) bonds annually to fund capital improvements for County, Schools, and Utilities fund projects though the use of debt financing. These projects are prioritized and approved biennially as part of the County’s Capital Improvement Plan (CIP), the current version being the Adopted FY 2019 – FY 2028 CIP. The CIP is a planning document that identifies the capital needs of the community over a ten-year period. GO Bond financing is one component of the overall funding plan in the CIP and is generally used to finance capital projects with average useful lives of greater than 10 years, matching or exceeding the average maturity of the bonds issued. Full detail of the CIP can be found at https://budget.arlingtonva.us/cip.
Prior to FY 2020, GO bond funding was appropriated at the time of bond issuance, typically in the spring of each fiscal year. Consistent with other capital funds, the appropriation of general obligation (GO) bond funded projects is now included as part of the operating budget. The GO bond funded projects are those approved as part of the FY 2021 capital program in the adopted FY 2019 – FY 2028 CIP, with changes where appropriate for changes to project timing or cashflow needs.
As individual projects approved in the CIP advance and become more defined, the timing of when bonds are issued may shift from the adopted CIP to align with changes to the timing or cashflow needs of the project. The projects presented below are consistent with the FY 2021 bond finance projects recommended in the Adopted FY 2019 – FY 2028 CIP, with adjustments where appropriate for projects whose timing and / or funding needs have changed since CIP adoption.
FY 2021 General Obligation Program Costs ($ in 000’s)
Debt service on bonds issued in FY 2021 to finance the projects below will not begin until FY 2022 and will be included in that year’s operating budget. The adopted FY 2021 debt service budget includes debt service on bonds issued through FY 2020. The bonds are also in adherence with the County’s financial and debt management policies.
Fund Program General Obligation (GO) Bond Funding
316 Neighborhood Conservation 6,000
314 Transportation 8,500
Total FY 2021 GO Bond Funding $14,500
499

This page intentionally left blank
500

CAPITAL PROGRAM PROJECT LISTS GENERAL CAPITAL PROJECTS FUND
GO Bond Referenda Year
Project Name - Description PAYG GO Bond TOTAL
Street Lighting Management - This project will address some of the chronic major repair locations where one or more lights have been inoperable due to underground utility-related issues throughout the County.
380 - 380
Bridge Maintenance - This is an ongoing program that provides funds to continue inspection, maintenance and rehabilitation of 36 vehicular and pedestrian bridges in Arlington County in order to assure an adequate level of safety for pedestrians and vehicular traffic.
937 - 937
2018
Hot Mix Overlay - Paving has been increased toover 75 lane miles annually. This includes aboutthree lane miles of streets without curb andgutter (five percent of funding).
178 6,400 6,578
Slurry Seal - Slurry Seal extends the life ofpavement on residential streets at a much lowerper square yard cost. Program is based onapproximately 40 lane miles being slurry sealedannually.
350 - 350
Microsurfacing - Microsurfacing extends the lifeof pavement for arterial streets at a lower persquare yard cost. Program is based onapproximately 10 lane miles being microsurfacedannually.
400 - 400
Transportation and Pedestrian ProgramFY 2021 Capital Program Project List
($ in 000s)
Paving Program: The County currently maintains 1,059 lane miles of roadway by a combination of mill and overlay, full depth rebuilding, micro-surfacing, and slurry sealing. The inventory of streets is as follows: 25 percent are arterial streets, 11 percent are collector streets and 64 percent are residential streets. The Pavement Condition Index (PCI) is updated annually and Arlington’s average PCI is currently 75.9. The County uses a variety of strategies to maintain streets as detailed below.
501

CAPITAL PROGRAM PROJECT LISTS GENERAL CAPITAL PROJECTS FUND
GO Bond Referenda Year
Project Name - Description PAYG GO Bond TOTAL
Parking Technology - This project supports the upgrade of the residential permit parking program's (RPPP) administration software. These additional funds will help complete the project.
245 - 245
Transportation Asset Management - This program will continue the development of a central database that can house both historic and recent transportation data.
60 - 60
2018
Neighborhood Complete Streets - Multiple County programs exist to address parts of our neighborhood. Neighborhood Complete Streets (NCS) complements those efforts and allows additional projects to be completed based on objective criteria, and through a process that engages the community.
200 100 300
Street Safety Improvements (SSI) - This program will implement safety improvements at intersections and streets for pedestrians, small mobility device users, bicyclists, transit riders, or motorists as determined through a comprehensive investigation, including crash analysis.
225 - 225
2018
Boundary Channel Drive Interchange - The project will upgrade the Boundary Channel Drive/I-395 interchange to improve traffic operations and safety for all users.
2,000 2,000
$2,975 $8,500 $11,475
Transportation and Pedestrian ProgramFY 2021 Capital Program Project List, continued
Total Transportation Capital Program
502

CAPITAL PROGRAM PROJECT LISTS GENERAL CAPITAL PROJECTS FUND
GO Bond Referenda Year
Project Name - Description PAYG GO Bond TOTAL
Court Square West - Roof replacement, generator and transfer switch replacement and add building automation controls to existing fan coil units.
540 - 540
Courts Police Bldg. - Design & Construction: Electrical upgrade design to replace all six Automatic Transfer Switches (ATS's) and generator controls.
550 - 550
Fire Station #9 - Replace overhead doors 380 - 380
Fort CF Smith - Roof replacement 50 - 50
Building 2020 -Upper mechanical room roof replacement including the installation of new drains. 155 - 155
Critical Systems Infrastructure - Trade Center NOC - Replace two UPS at the Trade Center NOC. 480 - 480
Energy Management - Energy Assurance Plan - This project will fund a consultant to prepare an essential planning document for improving resilience to energy outages and cascading events in the County. This work is important for public health and safety, with ramifications for county operations and the community at large.
221 - 221
Energy Management - Fire Station 8 Solar Panels -This is a Board-initiated project related to County goals for renewable electricity. Due to the 24/7 operations of a fire station, the building’s carbon footprint will always be larger than other similar sized facilities. The installation of a 60kW solar PV panel system at Fire Station 8 will be a strong statement that the County continues to advance its sustainable practices.
200 - 200
$2,576 $0 $2,576
Facilities Maintenance and Energy Management ProgramsFY 2021 Capital Project List
($ in 000s)
Total Facilities Maintenance and Energy Management Programs
503

CAPITAL PROGRAM PROJECT LISTS GENERAL CAPITAL PROJECTS FUND
GO Bond Referenda Year
Project Name - Description PAYG GO Bond TOTAL
Facility Master Planning and Feasibility Studies - In order to better understand project costs, timelines and spending plans, 30 percent schematic design drawings will be completed. The schematics will include, but not limited to, development of program requirements, Zoning, transportation, and code compliance impacts, cost estimates, phasing, and construction durations. ($350k). Project management for Fire Station 10 is included ($60k).
410 - 410
ADA Remediation - FY 2021 ADA remediation will include ADA improvements at the Detention Facility garage entrances, lower level offices, and Level 1 public and staff accessible restrooms. Any funding remaining after these improvements will address additional deficiencies in the Detention Facility.
200 - 200
Gender Neutral Restroom Signage - It is Arlington County Government's obligation to ensure that employees, contractors, guests, and customers have adequate access to a restroom or locker room that affords them privacy and dignity. Individuals should use the restroom and locker room facilities that correspond with their gender identity or expression. Where possible, Arlington County Government has provided single-occupancy, all-gender restrooms. Estimates include replacing approximately 500 single use restroom signs, 500 men’s, and 500 women’s restroom signs. This is the first year of a three year program.
145 - 145
$755 $0 $755
Facilities Design and Construction ProgramFY 2021 Capital Program Project List
($ in 000s)
Total Facilities Design and Construction Capital Program
504

CAPITAL PROGRAM PROJECT LISTS GENERAL CAPITAL PROJECTS FUND
GO Bond Referenda Year
Project Name - Description PAYG GO Bond TOTAL
Capital Asset Manager – Staff resources to manage theParks Capital Asset Program. 160 - 160
Field Fund Program – The Parks Field Fund is supported byan annual fee assessed on official affiliated youth and adultsports teams playing on Arlington County rectangular anddiamond fields. The fees assessed for rectangular fields aredirected to support replacement and construction of syntheticturf fields in the County ($160,000). The fees assessed ondiamond fields ($65,000) are to be used each year for specificdiamond field enhancements, such as improved irrigation,batting cages or accelerated sod replacement. The FY 2020PAYG budget reflects the projected annual revenue from thefees.
225 - 225
Feasibility Studies – These funds will provide the ability toconduct timely and relevant analysis and studies asopportunities arise. The program is meant for new planninginitiatives that are outside current CIP projects. Examples arepotential planning and analysis needs for parks and sitesassociated with site plan proposals, Arlington Public Schoolsproposals or affordable housing proposals.
150 - 150
$535 $0 $535
Parks and Recreation ProgramFY 2021 Capital Project List
($ in 000s)
Total Parks and Recreation Capital Program
505

CAPITAL PROGRAM PROJECT LISTS GENERAL CAPITAL PROJECTS FUND
GO Bond Referenda Year
Project Name - Description PAYG GO BOND TOTAL
Voting Machines - FY 2021 funds are needed to accomodate an anticipated increase in early voters and to purchase additional voting machines to meet Department of Justice ballot image retention requirements for federal elections.
120 - 120
DHS Child Welfare Purchase of Service Software - FY 2021 funds will fund the first year of a two year project to replace the current staff operated and maintained system in operation since 1995. At 25 years old, the system is beyond its useful life and is not capable of meeting changing programmatic or reporting requirements. The system connects the department with third party service providers to manage the authorization and payment of adoption and foster care services purchased on behalf of eligible children and families.
500 - 500
Electronic Summons System - In FY 2015, the County began assessing a $5.00 fee as part of the costs of each criminal or traffic case in the district or circuit courts for the use of purchasing and implementation of an electronic summons system. The FY 2020 PAYG budget reflects the projected annual revenue from the fees. Accumulated revenue over previous and upcoming fiscal years will purchase the system.
144 - 144
$764 $0 $764
Technology ProgramFY 2021 Capital Project List
($ in 000s)
Technology Capital Program
506

CAPITAL PROGRAM PROJECT LISTS GENERAL CAPITAL PROJECTS FUND
Neighborhood Conservation Program FY 2021 Capital Project List
($ in 000s)
GO Bond Referenda Year
Project Name - Description PAYG GO BOND TOTAL
Project management funding to execute NC projects.
500 500
2014 N559-N. Oakland Street - 700 700 2014 N557-12th St N - 300 300 2014 Z261-N. Highland St - 850 850 2014 Z284-George Mason Drive - 1,200 1200 2016 Z290-N. Monroe St - 750 750 2016 z280-4th St S - 1,200 1200 2016 Z272-N Larrimore St - 1,000 1000
Total NC Capital Program $500 $6,000 $6,500
Capital Program Contingents ($ in 000s)
Project PAYG Costs County-Schools Joint Use Contingent - This funding will allow the County to collaboratively address needed improvements and renovations in joint-use facilities.
$1,500
Capital Program Contingency - Funding for administrative support of capital projects as well as coverage for unforeseen or unplanned projects. $2,677
Total Metro Capital Program $4,177
507

This page intentionally left blank
508

MASTER LEASE / SHORT-TERM FINANCING
The County plans for capital projects in the biennial, 10-year Capital Improvement Plan (CIP). The CIP is a comprehensive guide to planned capital spending, including projects paving streets, constructing and modernizing public buildings, renovating parks, and much more. The County pays for these projects using a combination of tax revenue, general obligation (GO) bond proceeds, and other dedicated revenue sources. Due to these multiple funding sources and the multi-year nature of project execution, not all of the County’s planned spending on capital projects appears in the operating budget. For a complete view of planned capital spending, refer to the current adopted 10-year Capital Improvement Plan.
The FY 2021 list of short-term finance funded projects will replace aged and critical technology infrastructure, public safety equipment, and a synthetic turf field at the end of their useful life. The FY 2021 debt service budget of $8.1 million is included in the General Fund Non-Department budget for short-term financing. This annual debt service budget level covers the financing costs (principal and interest) of the General Fund’s base program projects listed in the table.
FY 2021 Short-Term Financing Project Costs ($ in 000’s)
Total Funding
PC Systems & Services 2,699 Network Equipment, Worker Mobility, Power Systems, Data Center and Security & Software 2,335
Server Hardware & Data Storage 1,265
Enterprise Resource Planning (ERP) System Upgrade (PRISM) (1) 8,000
Subtotal Enterprise Technology and Equipment $14,299
Police Computer Forensic Equipment 85
Sheriff’s Office Wireless Access Assessment 100
Fire Command Vehicle Technology 120
Police In-Car Camera Servers 65
Subtotal Public Safety $370
Virginia Highlands Park Field 773 Subtotal Parks Synthetic Turf Replacement Program $773
TOTAL Project Costs $15,442 (1) The Enterprise Resource Planning System upgrade was reduced to$1,500,000 in the FY 2021 Adopted Capital Improvement Plan in July 2020
509
SHORT-TERM FINANCING
Enterprise Technology and Equipment $14,299,000 Funding for the FY 2021 Enterprise Technology and Equipment program is for maintenance capital and hardware and application refreshment. Maintenance capital is for the ongoing replacement of aging computers, servers, networks and other equipment. The hardware and application refreshment category is to support and refresh software and management systems that provide the tools, capabilities, and processes that enable the County workforce to meet internal and external demands.
PC Systems and Services (previously Endpoint Replacement) $2,699,000This program supports the cyclical replacement and refreshment of end user computing devicesthat have reached the end of their usable life. End user devices have a usable life of three yearsor four years, depending on device type.
Network Equipment, Worker Mobility, Power Systems, $2,335,000Data Center, and Security & SoftwareThese funds are to support the County network including cyclical refreshment of County networkequipment; software and hardware systems supporting worker mobility and telework technology;replacement of end-of-life power protection equipment supporting data center infrastructure andin-building digital infrastructure throughout the County; refreshment of equipment and cablingsupporting the data center infrastructure, and; software and monitoring tools supporting networkaccess and access security.
Server Hardware Refreshment and Data Storage $1,265,000These funds will be used to replace server equipment that have reached or exceeded the end oftheir useful life. These systems are required to support critical line of business applications.Refreshment of data storage hardware that have reached the end of their useful life are fundedat $65,000.
Enterprise Resource Planning (ERP) System Upgrade (PRISM) $8,000,000PRISM is the County’s current ERP system. This system includes the County’s Finance and HumanResource support systems. The refresh project will replace the existing PRISM (based on Oracle’se-Business Suite) which is now over 13 years old, lacks modern technology and functionality, andwill no longer be supported by the vendor. The new system will ensure ongoing vendor support,automation of additional business processes, utilization of modern cloud-based technology,hardened security capabilities, and improved efficiency of County operations. This funding is foryear one of a project that will be crossing two years.
The FY 2021 Adopted Capital Improvement Plan reduced funding for this project by $6.5 million. The County deferred the comprehensive replacement of the County’s financial and human resources system; funding will support a technical upgrade of the existing system as vendor support of the current release is ending.
Public Safety $370,000 The Public Safety program funds will be used to fund key projects that will keep existing information technology systems refreshed or replaced on a reasonable life cycle so that the systems remain useful, operable, and responsive to public safety needs. There is also funding for a new initiative to help improve building functionality.
510

SHORT-TERM FINANCING
Police Computer Forensic Equipment $85,000The forensic servers and workstation infrastructure are scheduled for refreshment every fiveyears. Upgraded servers have the latest firmware and patching updates, keeping devices secureand in compliance with our specifications and needs. Modern servers can reduce data spacerequirements, maintenance time and licensing costs. Management tools offered by newerhardware also allow better workload tracking and performance analysis.
Sheriff’s Office Wireless Access Assessment $100,000These funds will be used for an analysis of the existing wireless system in the Detention Facility.This analysis will identify the areas where new access points are needed to ensure completecoverage throughout the building.
Fire Department Command Vehicle Technology $120,000The Arlington County Police Department (ACPD) sold their command vehicle in FY 2020 in orderto purchase a more suitable vehicle in the future. During this gap, ACPD will be sharing the FireDepartment’s command vehicle. The Fire Department’s vehicle is due for a technology refresh(computers, wireless technology, audio/video conferencing systems, etc.). The currenttechnology is 10 years old.
Police In-Car Camera Video System – Server Refresh $65,000The existing servers for the in-car camera video system used in Police vehicles are scheduled forrefreshment every five years. The system itself has a ten-year life, and during the mid-cycle ofthe existing system, the servers require a replacement as they cycle out of warranty.Refreshment of this hardware ensures maintaining the health of the overall system and meetinga ten-year useful life.
Parks Synthetic Turf Replacement Program $773,200 The synthetic turf program for FY 2021 is for the replacement of an existing synthetic turf field that is approaching the end of its useful life. Synthetic turf has outstanding field performance characteristics and has proven to be an effective surface that can sustain significant hours of play all year round.
Virginia Highlands Park Synthetic Field Replacement $773,200These funds will be used for the design and construction for the rectangular community syntheticfield at Virginia Highlands Park, which has reached the end of its useful life. Work includesreplacement of synthetic turf and infill and repairs to the field base layer.
511

This page intentionally left blank
512

PAY-AS-YOU-GO CAPITAL UTILITY CAPITAL PROJECTS FUND
Our Mission: To provide and maintain a water distribution system, a sewage collection system, and a wastewater treatment plant
The Department of Environmental Services is responsible for managing the Utility Fund, which includes providing and maintaining a water distribution system, a sewage collection system, and a wastewater treatment plant. The Adopted FY 2021 Utility Fund Pay-As-You-Go Budget Summary, program budget appropriation distribution graph, project descriptions, and fund statement are included on the following pages.
System Non-Expansion
Capital63%
Water Distribution (Expansion)
12%
Sanitary Sewer System
(Expansion)5%
Wastewater Treatment
Plant Capital20%
Distribution of Fund Budget
513
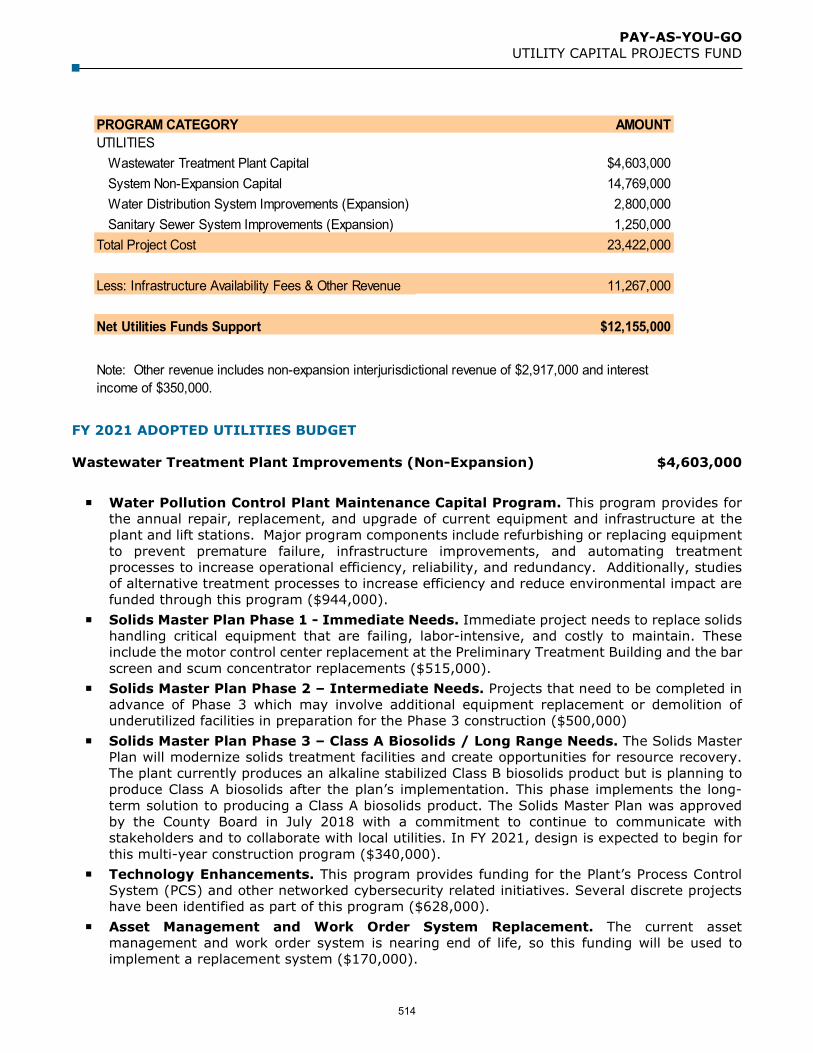
PAY-AS-YOU-GO UTILITY CAPITAL PROJECTS FUND
FY 2021 ADOPTED UTILITIES BUDGET
Wastewater Treatment Plant Improvements (Non-Expansion) $4,603,000
Water Pollution Control Plant Maintenance Capital Program. This program provides for the annual repair, replacement, and upgrade of current equipment and infrastructure at the plant and lift stations. Major program components include refurbishing or replacing equipment to prevent premature failure, infrastructure improvements, and automating treatment processes to increase operational efficiency, reliability, and redundancy. Additionally, studies of alternative treatment processes to increase efficiency and reduce environmental impact are funded through this program ($944,000).
Solids Master Plan Phase 1 - Immediate Needs. Immediate project needs to replace solids handling critical equipment that are failing, labor-intensive, and costly to maintain. These include the motor control center replacement at the Preliminary Treatment Building and the bar screen and scum concentrator replacements ($515,000).
Solids Master Plan Phase 2 – Intermediate Needs. Projects that need to be completed in advance of Phase 3 which may involve additional equipment replacement or demolition of underutilized facilities in preparation for the Phase 3 construction ($500,000)
Solids Master Plan Phase 3 – Class A Biosolids / Long Range Needs. The Solids Master Plan will modernize solids treatment facilities and create opportunities for resource recovery. The plant currently produces an alkaline stabilized Class B biosolids product but is planning to produce Class A biosolids after the plan’s implementation. This phase implements the long-term solution to producing a Class A biosolids product. The Solids Master Plan was approved by the County Board in July 2018 with a commitment to continue to communicate with stakeholders and to collaborate with local utilities. In FY 2021, design is expected to begin for this multi-year construction program ($340,000).
Technology Enhancements. This program provides funding for the Plant’s Process Control System (PCS) and other networked cybersecurity related initiatives. Several discrete projects have been identified as part of this program ($628,000).
Asset Management and Work Order System Replacement. The current asset management and work order system is nearing end of life, so this funding will be used to implement a replacement system ($170,000).
PROGRAM CATEGORY AMOUNTUTILITIES
Wastewater Treatment Plant Capital $4,603,000System Non-Expansion Capital 14,769,000Water Distribution System Improvements (Expansion) 2,800,000Sanitary Sewer System Improvements (Expansion) 1,250,000
Total Project Cost 23,422,000
Less: Infrastructure Availability Fees & Other Revenue 11,267,000
Net Utilities Funds Support $12,155,000
Note: Other revenue includes non-expansion interjurisdictional revenue of $2,917,000 and interest income of $350,000.
514

PAY-AS-YOU-GO UTILITY CAPITAL PROJECTS FUND
Improvements to Eads St. Property. Funding for improvements to a property near the Water Pollution Control Plant that the County purchased in March 2010. This facility serves as the plant's off-site warehouse ($493,000).
Primary Clarifier Upgrades. This project will evaluate and rehabilitate / improve equipment and facilities associated with the primary clarifiers to ensure alignment with industry best practices. The last upgrade to the system was approximately twenty years ago. A holistic assessment of the equipment, facilities, process, and future needs is desirable to determine what improvements are needed to ensure the continued reliability and sustainability of this system ($85,000).
Secondary Clarifiers. Rehabilitation and / or replacement of secondary clarifiers 1, 2, and 3 is necessary to restore the tanks to full working condition and help assure compliance with the permit ($170,000).
Odor Control Upgrades. This project will design and construct improvements to the three odor control systems at the WPCP to address capacity, efficiency, and maintenance issues ($128,000).
Blue Plains Plant Capital. The District of Columbia Water and Sewer Authority Blue Plains Plant processes a portion of Arlington County’s sewage after transmission through Fairfax County mains. The capital program funds Arlington’s annual payment through Fairfax County to the Blue Plains Plant for capital improvements. It also funds improvements to the transmission system. Payment is due under the terms of the October 3, 1994, Sewage Conveyance, Treatment, and Disposal Agreement with Fairfax County ($630,000).
System Non-Expansion Capital $14,769,000
The funding for these projects comes primarily from a transfer from the Utilities Operating Fund, which is an enterprise fund. The revenues for this enterprise fund are derived primarily from water and sewer utility billings. Infrastructure Availability Fees (IAF) charged to new users who increase demands on the system are an additional funding source for these projects. The following projects and programs are planned to replace and rehabilitate the County’s water distribution and sewage collection system, and to pay for the County’s share of planned capital improvements at the Washington Aqueduct.
Water main replacement program ($4,500,000) Non-expansion inflow and infiltration sanitary sewer capital repairs and replacements
($3,500,000) Water main cleaning and re-lining projects ($1,800,000) Sewer main replacement program ($600,000) Water / sewer frames and covers ($800,000) Large diameter sewer rehabilitation / replacement ($650,000) Manhole rehabilitation ($500,000) Water Tank Rehabilitation ($375,000) Technology enhancements ($300,000) Small diameter valve rehabilitation and replacement ($250,000) Large meter vault rehabilitation and replacement ($200,000) Large diameter water main rehabilitation / replacement ($450,000) Capital improvements at the Washington Aqueduct ($844,000), from which the County
purchases drinking water. Arlington County pays approximately 16.25 percent of the capital costs for this organization.
515

PAY-AS-YOU-GO UTILITY CAPITAL PROJECTS FUND
Water Distribution System Improvements (Expansion) $2,800,000
The water main projects in this program are designed to improve overall capacity or operation of the water distribution system. These projects are part of the Water Master Plan. Funding for these projects is generated from fees charged to new users who increase demands on the water distribution system.
Improvements for development ($550,000) Fort Myer Heights ($1,000,000) Pump station improvements ($500,000) Source water reliability and interconnections ($500,000) Gravity transmission mains - B2 and B3 ($250,000)
Sanitary Sewer System Improvements $1,250,000
The sanitary sewer improvements are intended to provide additional capacity to existing sanitary sewer lines to accommodate new development in Arlington County. These projects are part of the Sanitary Sewer Master Plan. Funding for this program is generated from fees charged to new users who increase demands on the sewer system.
Improvements for development ($250,000) Potomac Interceptor: Phase 2 ($1,000,000)
TOTAL UTILITIES BUDGET $23,422,000
516

PAY-AS-YOU-GO UTILITY CAPITAL PROJECTS FUND
Most capital projects span multiple years, from design to construction completion. The FY 2019 Actual and FY 2020 Re-Estimate columns reflect that funding for capital projects are carried forward each fiscal year, and ending balances fluctuate, reflecting the carryover of these funds. The FY 2021 Adopted Budget column is presented in a similar fashion to show planned execution of projects in the fiscal year. These are staff’s best estimates based on preliminary plans and design and construction schedules.
FY 2019 ACTUAL
FY 2020 ADOPTED
FY 2020 RE-ESTIMATE
FY 2021 ADOPTED
ADJUSTED BALANCE, JULY 1 $53,281,205 $46,982,005 $49,966,423 $26,066,423
REVENUES:Infrastructure Availability Fees 6,158,068 5,000,000 7,000,000 8,000,000 Sewage Treatment Service Charges 1,397,982 888,500 888,500 2,917,000 Interest 1,372,367 100,000 325,000 350,000 Misc. Revenue 6,428 - - - TOTAL REVENUE 8,934,845 5,988,500 8,213,500 11,267,000
Transfers In (Out): Transfer in from General Fund 400,000 - - - Transfer In from Utilities Operating Fund 14,025,300 14,190,500 14,190,500 12,155,000 TOTAL TRANSFERS IN 14,425,300 14,190,500 14,190,500 12,155,000
TOTAL BALANCE, REVENUES AND TRANSFERS IN 76,641,350 67,161,005 72,370,423 49,488,423
EXPENDITURES:Capital Projects - Current Year 19,979,500 20,179,000 20,179,000 23,422,000 Capital Projects - Carry-Over 6,695,427 7,731,000 26,125,000 16,495,000 TOTAL CAPITAL EXPENDITURES: 26,674,927 27,910,000 46,304,000 39,917,000
BALANCE, JUNE 30 $49,966,423 $39,251,005 $26,066,423 $9,571,423
UTILITIES CAPITAL PROJECTS FUNDFUND STATEMENT
517

This page intentionally left blank
518
Fiscal Year 2021 Pay Schedule For County Employees July 1, 2020 – June 30, 2021
Human Resources Department 2100 Clarendon Boulevard, Suite 511
Arlington, Virginia 22201 (703) 228-3500
www.arlingtonva.us
519

Under The Provisions Of The Arlington County Flexible Benefit Plan The Amounts Within May Be Reduced
520
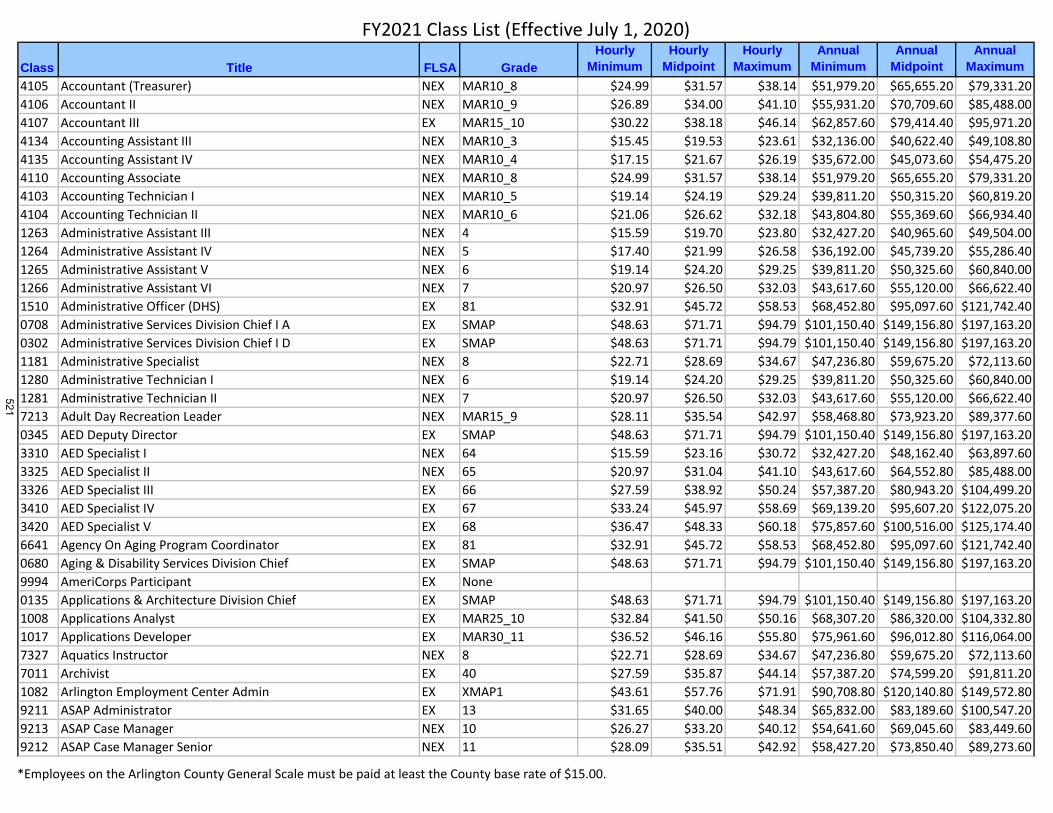
Class Title FLSA Grade
Hourly
Minimum
Hourly
Midpoint
Hourly
Maximum
Annual
Minimum
Annual
Midpoint
Annual
Maximum
4105 Accountant (Treasurer) NEX MAR10_8 $24.99 $31.57 $38.14 $51,979.20 $65,655.20 $79,331.20
4106 Accountant II NEX MAR10_9 $26.89 $34.00 $41.10 $55,931.20 $70,709.60 $85,488.00
4107 Accountant III EX MAR15_10 $30.22 $38.18 $46.14 $62,857.60 $79,414.40 $95,971.20
4134 Accounting Assistant III NEX MAR10_3 $15.45 $19.53 $23.61 $32,136.00 $40,622.40 $49,108.80
4135 Accounting Assistant IV NEX MAR10_4 $17.15 $21.67 $26.19 $35,672.00 $45,073.60 $54,475.20
4110 Accounting Associate NEX MAR10_8 $24.99 $31.57 $38.14 $51,979.20 $65,655.20 $79,331.20
4103 Accounting Technician I NEX MAR10_5 $19.14 $24.19 $29.24 $39,811.20 $50,315.20 $60,819.20
4104 Accounting Technician II NEX MAR10_6 $21.06 $26.62 $32.18 $43,804.80 $55,369.60 $66,934.40
1263 Administrative Assistant III NEX 4 $15.59 $19.70 $23.80 $32,427.20 $40,965.60 $49,504.00
1264 Administrative Assistant IV NEX 5 $17.40 $21.99 $26.58 $36,192.00 $45,739.20 $55,286.40
1265 Administrative Assistant V NEX 6 $19.14 $24.20 $29.25 $39,811.20 $50,325.60 $60,840.00
1266 Administrative Assistant VI NEX 7 $20.97 $26.50 $32.03 $43,617.60 $55,120.00 $66,622.40
1510 Administrative Officer (DHS) EX 81 $32.91 $45.72 $58.53 $68,452.80 $95,097.60 $121,742.40
0708 Administrative Services Division Chief I A EX SMAP $48.63 $71.71 $94.79 $101,150.40 $149,156.80 $197,163.20
0302 Administrative Services Division Chief I D EX SMAP $48.63 $71.71 $94.79 $101,150.40 $149,156.80 $197,163.20
1181 Administrative Specialist NEX 8 $22.71 $28.69 $34.67 $47,236.80 $59,675.20 $72,113.60
1280 Administrative Technician I NEX 6 $19.14 $24.20 $29.25 $39,811.20 $50,325.60 $60,840.00
1281 Administrative Technician II NEX 7 $20.97 $26.50 $32.03 $43,617.60 $55,120.00 $66,622.40
7213 Adult Day Recreation Leader NEX MAR15_9 $28.11 $35.54 $42.97 $58,468.80 $73,923.20 $89,377.60
0345 AED Deputy Director EX SMAP $48.63 $71.71 $94.79 $101,150.40 $149,156.80 $197,163.20
3310 AED Specialist I NEX 64 $15.59 $23.16 $30.72 $32,427.20 $48,162.40 $63,897.60
3325 AED Specialist II NEX 65 $20.97 $31.04 $41.10 $43,617.60 $64,552.80 $85,488.00
3326 AED Specialist III EX 66 $27.59 $38.92 $50.24 $57,387.20 $80,943.20 $104,499.20
3410 AED Specialist IV EX 67 $33.24 $45.97 $58.69 $69,139.20 $95,607.20 $122,075.20
3420 AED Specialist V EX 68 $36.47 $48.33 $60.18 $75,857.60 $100,516.00 $125,174.40
6641 Agency On Aging Program Coordinator EX 81 $32.91 $45.72 $58.53 $68,452.80 $95,097.60 $121,742.40
0680 Aging & Disability Services Division Chief EX SMAP $48.63 $71.71 $94.79 $101,150.40 $149,156.80 $197,163.20
9994 AmeriCorps Participant EX None
0135 Applications & Architecture Division Chief EX SMAP $48.63 $71.71 $94.79 $101,150.40 $149,156.80 $197,163.20
1008 Applications Analyst EX MAR25_10 $32.84 $41.50 $50.16 $68,307.20 $86,320.00 $104,332.80
1017 Applications Developer EX MAR30_11 $36.52 $46.16 $55.80 $75,961.60 $96,012.80 $116,064.00
7327 Aquatics Instructor NEX 8 $22.71 $28.69 $34.67 $47,236.80 $59,675.20 $72,113.60
7011 Archivist EX 40 $27.59 $35.87 $44.14 $57,387.20 $74,599.20 $91,811.20
1082 Arlington Employment Center Admin EX XMAP1 $43.61 $57.76 $71.91 $90,708.80 $120,140.80 $149,572.80
9211 ASAP Administrator EX 13 $31.65 $40.00 $48.34 $65,832.00 $83,189.60 $100,547.20
9213 ASAP Case Manager NEX 10 $26.27 $33.20 $40.12 $54,641.60 $69,045.60 $83,449.60
9212 ASAP Case Manager Senior NEX 11 $28.09 $35.51 $42.92 $58,427.20 $73,850.40 $89,273.60
FY2021 Class List (Effective July 1, 2020)
*Employees on the Arlington County General Scale must be paid at least the County base rate of $15.00.
521

Class Title FLSA Grade
Hourly
Minimum
Hourly
Midpoint
Hourly
Maximum
Annual
Minimum
Annual
Midpoint
Annual
Maximum
FY2021 Class List (Effective July 1, 2020)
9120 ASAP Instructor NEX 9 $24.44 $30.90 $37.36 $50,835.20 $64,272.00 $77,708.80
6667 Assistance Payments Supervisor EX XMAP1 $43.61 $57.76 $71.91 $90,708.80 $120,140.80 $149,572.80
4100 Assistant Comptroller EX 54 $37.98 $51.00 $64.02 $78,998.40 $106,080.00 $133,161.60
0110 Assistant County Manager EX EMAP $61.40 $89.77 $118.13 $127,712.00 $186,711.20 $245,710.40
3621 Assistant Director CPHD EX MAP_A $47.42 $59.91 $72.40 $98,633.60 $124,612.80 $150,592.00
0201 Assistant Director Transportation EX SMAP $48.63 $71.71 $94.79 $101,150.40 $149,156.80 $197,163.20
8212 Assistant Engineering Bureau Chief EX XMAP1 $43.61 $57.76 $71.91 $90,708.80 $120,140.80 $149,572.80
0146 Assistant Human Resources Director EX SMAP $48.63 $71.71 $94.79 $101,150.40 $149,156.80 $197,163.20
7410 Assistant Parks & Natural Resources Division Chief EX XMAP1 $43.61 $57.76 $71.91 $90,708.80 $120,140.80 $149,572.80
5405 Assistant Permit Administration Manager NEX 10 $26.27 $33.20 $40.12 $54,641.60 $69,045.60 $83,449.60
9122 Assistant Probate Clerk NEX 9 $24.44 $30.90 $37.36 $50,835.20 $64,272.00 $77,708.80
1330 Assistant Purchasing Agent EX 54 $37.98 $51.00 $64.02 $78,998.40 $106,080.00 $133,161.60
1090 Assistant To DHS Director I EX 81 $32.91 $45.72 $58.53 $68,452.80 $95,097.60 $121,742.40
8120 Assistant Transit Bureau Chief EX 90 $43.32 $56.34 $69.36 $90,105.60 $117,187.20 $144,268.80
1215 Asst Registrar Chief Deputy EX MAR10_11 $30.90 $39.06 $47.22 $64,272.00 $81,244.80 $98,217.60
1212 Asst Registrar II NEX 4 $15.59 $19.70 $23.80 $32,427.20 $40,965.60 $49,504.00
1213 Asst Registrar III NEX 5 $17.40 $21.99 $26.58 $36,192.00 $45,739.20 $55,286.40
1214 Asst Registrar IV NEX 6 $19.14 $24.20 $29.25 $39,811.20 $50,325.60 $60,840.00
7200 Asst To Department Director/Admin EX XMAP1 $43.61 $57.76 $71.91 $90,708.80 $120,140.80 $149,572.80
0722 Athletic & Facilities Services Division Chief EX SMAP $48.63 $71.71 $94.79 $101,150.40 $149,156.80 $197,163.20
2812 Auto Mechanic I NEX MAR25_6 $23.93 $30.25 $36.57 $49,774.40 $62,920.00 $76,065.60
2813 Auto Mechanic II NEX MAR25_7 $26.22 $33.13 $40.04 $54,537.60 $68,910.40 $83,283.20
6451 Automation Services Bureau Chief EX XMAP2 $47.07 $64.06 $81.04 $97,905.60 $133,234.40 $168,563.20
6312 Behavioral Health (Resident/Supervisee) NEX MAR15_9 $28.11 $35.54 $42.97 $58,468.80 $73,923.20 $89,377.60
6322 Behavioral Health Specialist EX MAR5_10 $27.59 $34.86 $42.13 $57,387.20 $72,508.80 $87,630.40
6347 Behavioral Health Therapist (Licensed) EX MAR15_10 $30.22 $38.18 $46.14 $62,857.60 $79,414.40 $95,971.20
6360 Behavioral Health Therapist (Non-VA Licensed) NEX MAR15_9 $28.11 $35.54 $42.97 $58,468.80 $73,923.20 $89,377.60
0640 Behavioral Healthcare Division Chief EX SMAP $48.63 $71.71 $94.79 $101,150.40 $149,156.80 $197,163.20
6335 Behavioral Specialist NEX MAR5_9 $25.67 $32.45 $39.23 $53,393.60 $67,496.00 $81,598.40
6336 Behavioral Specialist Senior EX MAR5_10 $27.59 $34.86 $42.13 $57,387.20 $72,508.80 $87,630.40
0442 Budget & Management Division Chief EX SMAP $48.63 $71.71 $94.79 $101,150.40 $149,156.80 $197,163.20
4414 Budget and Finance Specialist NEX 86 $20.97 $31.04 $41.10 $43,617.60 $64,552.80 $85,488.00
4418 Budget Coordinator EX 54 $37.98 $51.00 $64.02 $78,998.40 $106,080.00 $133,161.60
2413 Building Engineer I NEX MAR25_7 $26.22 $33.13 $40.04 $54,537.60 $68,910.40 $83,283.20
2414 Building Engineer II NEX MAR30_8 $29.53 $37.31 $45.08 $61,422.40 $77,594.40 $93,766.40
2537 Building Maintenance Operations Supv NEX MAR25_13 $39.57 $50.00 $60.43 $82,305.60 $104,000.00 $125,694.40
2836 Bus Driver NEX 4 $15.59 $19.70 $23.80 $32,427.20 $40,965.60 $49,504.00
*Employees on the Arlington County General Scale must be paid at least the County base rate of $15.00.
522
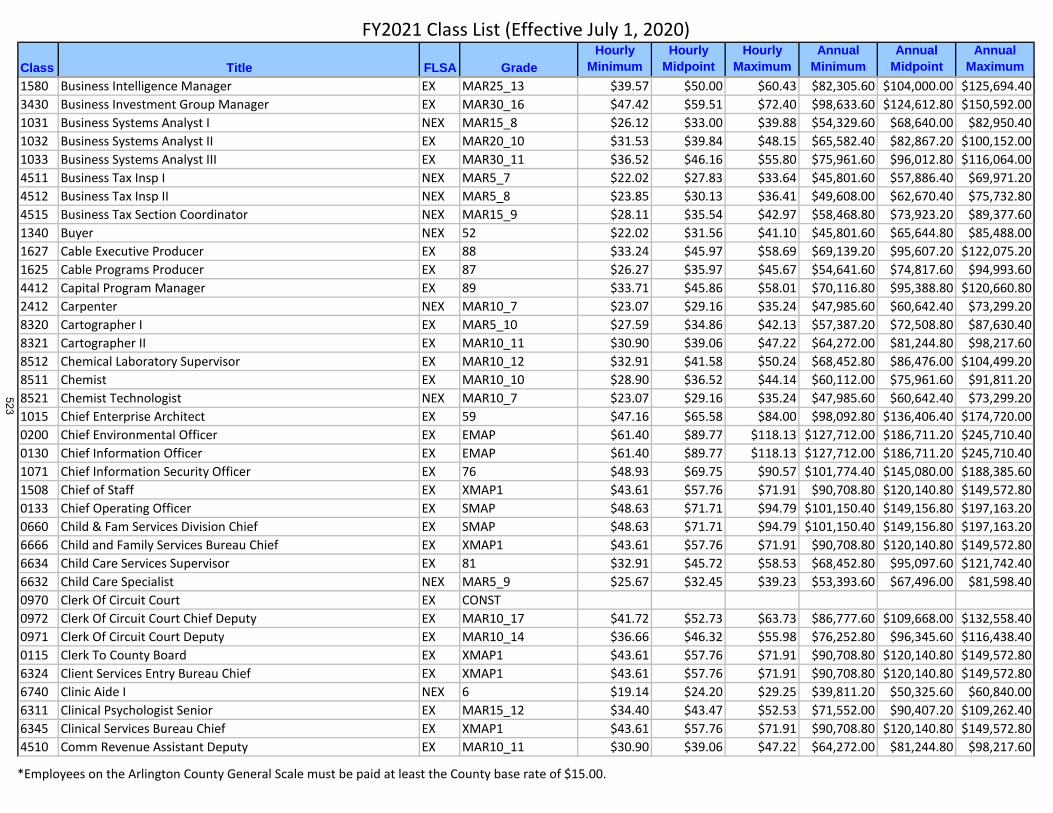
Class Title FLSA Grade
Hourly
Minimum
Hourly
Midpoint
Hourly
Maximum
Annual
Minimum
Annual
Midpoint
Annual
Maximum
FY2021 Class List (Effective July 1, 2020)
1580 Business Intelligence Manager EX MAR25_13 $39.57 $50.00 $60.43 $82,305.60 $104,000.00 $125,694.40
3430 Business Investment Group Manager EX MAR30_16 $47.42 $59.51 $72.40 $98,633.60 $124,612.80 $150,592.00
1031 Business Systems Analyst I NEX MAR15_8 $26.12 $33.00 $39.88 $54,329.60 $68,640.00 $82,950.40
1032 Business Systems Analyst II EX MAR20_10 $31.53 $39.84 $48.15 $65,582.40 $82,867.20 $100,152.00
1033 Business Systems Analyst III EX MAR30_11 $36.52 $46.16 $55.80 $75,961.60 $96,012.80 $116,064.00
4511 Business Tax Insp I NEX MAR5_7 $22.02 $27.83 $33.64 $45,801.60 $57,886.40 $69,971.20
4512 Business Tax Insp II NEX MAR5_8 $23.85 $30.13 $36.41 $49,608.00 $62,670.40 $75,732.80
4515 Business Tax Section Coordinator NEX MAR15_9 $28.11 $35.54 $42.97 $58,468.80 $73,923.20 $89,377.60
1340 Buyer NEX 52 $22.02 $31.56 $41.10 $45,801.60 $65,644.80 $85,488.00
1627 Cable Executive Producer EX 88 $33.24 $45.97 $58.69 $69,139.20 $95,607.20 $122,075.20
1625 Cable Programs Producer EX 87 $26.27 $35.97 $45.67 $54,641.60 $74,817.60 $94,993.60
4412 Capital Program Manager EX 89 $33.71 $45.86 $58.01 $70,116.80 $95,388.80 $120,660.80
2412 Carpenter NEX MAR10_7 $23.07 $29.16 $35.24 $47,985.60 $60,642.40 $73,299.20
8320 Cartographer I EX MAR5_10 $27.59 $34.86 $42.13 $57,387.20 $72,508.80 $87,630.40
8321 Cartographer II EX MAR10_11 $30.90 $39.06 $47.22 $64,272.00 $81,244.80 $98,217.60
8512 Chemical Laboratory Supervisor EX MAR10_12 $32.91 $41.58 $50.24 $68,452.80 $86,476.00 $104,499.20
8511 Chemist EX MAR10_10 $28.90 $36.52 $44.14 $60,112.00 $75,961.60 $91,811.20
8521 Chemist Technologist NEX MAR10_7 $23.07 $29.16 $35.24 $47,985.60 $60,642.40 $73,299.20
1015 Chief Enterprise Architect EX 59 $47.16 $65.58 $84.00 $98,092.80 $136,406.40 $174,720.00
0200 Chief Environmental Officer EX EMAP $61.40 $89.77 $118.13 $127,712.00 $186,711.20 $245,710.40
0130 Chief Information Officer EX EMAP $61.40 $89.77 $118.13 $127,712.00 $186,711.20 $245,710.40
1071 Chief Information Security Officer EX 76 $48.93 $69.75 $90.57 $101,774.40 $145,080.00 $188,385.60
1508 Chief of Staff EX XMAP1 $43.61 $57.76 $71.91 $90,708.80 $120,140.80 $149,572.80
0133 Chief Operating Officer EX SMAP $48.63 $71.71 $94.79 $101,150.40 $149,156.80 $197,163.20
0660 Child & Fam Services Division Chief EX SMAP $48.63 $71.71 $94.79 $101,150.40 $149,156.80 $197,163.20
6666 Child and Family Services Bureau Chief EX XMAP1 $43.61 $57.76 $71.91 $90,708.80 $120,140.80 $149,572.80
6634 Child Care Services Supervisor EX 81 $32.91 $45.72 $58.53 $68,452.80 $95,097.60 $121,742.40
6632 Child Care Specialist NEX MAR5_9 $25.67 $32.45 $39.23 $53,393.60 $67,496.00 $81,598.40
0970 Clerk Of Circuit Court EX CONST
0972 Clerk Of Circuit Court Chief Deputy EX MAR10_17 $41.72 $52.73 $63.73 $86,777.60 $109,668.00 $132,558.40
0971 Clerk Of Circuit Court Deputy EX MAR10_14 $36.66 $46.32 $55.98 $76,252.80 $96,345.60 $116,438.40
0115 Clerk To County Board EX XMAP1 $43.61 $57.76 $71.91 $90,708.80 $120,140.80 $149,572.80
6324 Client Services Entry Bureau Chief EX XMAP1 $43.61 $57.76 $71.91 $90,708.80 $120,140.80 $149,572.80
6740 Clinic Aide I NEX 6 $19.14 $24.20 $29.25 $39,811.20 $50,325.60 $60,840.00
6311 Clinical Psychologist Senior EX MAR15_12 $34.40 $43.47 $52.53 $71,552.00 $90,407.20 $109,262.40
6345 Clinical Services Bureau Chief EX XMAP1 $43.61 $57.76 $71.91 $90,708.80 $120,140.80 $149,572.80
4510 Comm Revenue Assistant Deputy EX MAR10_11 $30.90 $39.06 $47.22 $64,272.00 $81,244.80 $98,217.60
*Employees on the Arlington County General Scale must be paid at least the County base rate of $15.00.
523

Class Title FLSA Grade
Hourly
Minimum
Hourly
Midpoint
Hourly
Maximum
Annual
Minimum
Annual
Midpoint
Annual
Maximum
FY2021 Class List (Effective July 1, 2020)
6640 Comm Supports & Coord Services Bureau Chief EX XMAP1 $43.61 $57.76 $71.91 $90,708.80 $120,140.80 $149,572.80
0420 Commissioner Of The Revenue EX CONST
0421 Commissioner Of The Revenue Chief Deputy (Admin) EX MAR10_18 $43.34 $54.77 $66.20 $90,147.20 $113,921.60 $137,696.00
0422 Commissioner Of The Revenue Deputy (Legal Counsel) EX MAR10_17 $41.72 $52.73 $63.73 $86,777.60 $109,668.00 $132,558.40
0424 Commissioner Of The Revenue Deputy (Pers Prop & Comp EX MAR10_17 $41.72 $52.73 $63.73 $86,777.60 $109,668.00 $132,558.40
0423 Commissioner Of The Revenue Deputy (Programs) EX MAR10_16 $40.12 $50.69 $61.26 $83,449.60 $105,435.20 $127,420.80
0920 Commonwealth Attorney EX CONST
0921 Commonwealth Attorney Chief Deputy EX MAR40_19 $57.31 $72.43 $87.55 $119,204.80 $150,654.40 $182,104.00
0922 Commonwealth Attorney Deputy EX MAR40_17 $53.09 $67.10 $81.11 $110,427.20 $139,568.00 $168,708.80
9601 Commonwealth Atty I EX MAR25_10 $32.84 $41.50 $50.16 $68,307.20 $86,320.00 $104,332.80
9602 Commonwealth Atty II EX MAR40_12 $41.88 $52.91 $63.94 $87,110.40 $110,052.80 $132,995.20
9603 Commonwealth Atty III EX MAR45_14 $48.32 $61.06 $73.80 $100,505.60 $127,004.80 $153,504.00
1623 Communications Manager EX 88 $33.24 $45.97 $58.69 $69,139.20 $95,607.20 $122,075.20
1604 Communications Specialist I NEX 86 $20.97 $31.04 $41.10 $43,617.60 $64,552.80 $85,488.00
1608 Communications Specialist II EX 87 $26.27 $35.97 $45.67 $54,641.60 $74,817.60 $94,993.60
6602 Community Assistance Bureau Chief EX XMAP1 $43.61 $57.76 $71.91 $90,708.80 $120,140.80 $149,572.80
5302 Community Codes Inspector II NEX 9 $24.44 $30.90 $37.36 $50,835.20 $64,272.00 $77,708.80
5303 Community Codes Inspector III NEX 10 $26.27 $33.20 $40.12 $54,641.60 $69,045.60 $83,449.60
5304 Community Codes Inspector IV NEX 11 $28.09 $35.51 $42.92 $58,427.20 $73,850.40 $89,273.60
5511 Community Codes Supervisor EX 12 $29.91 $37.79 $45.67 $62,212.80 $78,603.20 $94,993.60
0300 Community Planning, Housing & Development Dir EX EMAP $61.40 $89.77 $118.13 $127,712.00 $186,711.20 $245,710.40
0727 Community Recreation Division Chief EX SMAP $48.63 $71.71 $94.79 $101,150.40 $149,156.80 $197,163.20
8128 Commuter Services Bureau Chief EX XMAP1 $43.61 $57.76 $71.91 $90,708.80 $120,140.80 $149,572.80
7302 Comp Park Projects Section Supervisor EX MAR30_14 $43.32 $54.74 $66.16 $90,105.60 $113,859.20 $137,612.80
3605 Comp Planning Section Supervisor EX MAR30_14 $43.32 $54.74 $66.16 $90,105.60 $113,859.20 $137,612.80
0144 Compensation Division Chief EX SMAP $48.63 $71.71 $94.79 $101,150.40 $149,156.80 $197,163.20
0441 Comptroller EX SMAP $48.63 $71.71 $94.79 $101,150.40 $149,156.80 $197,163.20
5311 Construction Codes Inspector I NEX 8 $22.71 $28.69 $34.67 $47,236.80 $59,675.20 $72,113.60
5312 Construction Codes Inspector II NEX 10 $26.27 $33.20 $40.12 $54,641.60 $69,045.60 $83,449.60
5313 Construction Codes Inspector III NEX 11 $28.09 $35.51 $42.92 $58,427.20 $73,850.40 $89,273.60
5320 Construction Codes Manager EX XMAP1 $43.61 $57.76 $71.91 $90,708.80 $120,140.80 $149,572.80
5314 Construction Codes Supervisor EX MAR15_12 $34.40 $43.47 $52.53 $71,552.00 $90,407.20 $109,262.40
5401 Construction Inspector Supervisor EX MAR5_13 $33.24 $42.00 $50.76 $69,139.20 $87,360.00 $105,580.80
5404 Construction Management Specialist NEX 80 $26.27 $35.97 $45.67 $54,641.60 $74,817.60 $94,993.60
5400 Construction Management Supervisor EX MAR10_14 $36.66 $46.32 $55.98 $76,252.80 $96,345.60 $116,438.40
5458 Construction Plan Review Supervisor EX MAR20_12 $35.90 $45.36 $54.81 $74,672.00 $94,338.40 $114,004.80
5318 Construction Plans Examiner I NEX MAR20_10 $31.53 $39.84 $48.15 $65,582.40 $82,867.20 $100,152.00
*Employees on the Arlington County General Scale must be paid at least the County base rate of $15.00.
524

Class Title FLSA Grade
Hourly
Minimum
Hourly
Midpoint
Hourly
Maximum
Annual
Minimum
Annual
Midpoint
Annual
Maximum
FY2021 Class List (Effective July 1, 2020)
5322 Construction Plans Examiner II NEX MAR20_11 $33.71 $42.61 $51.51 $70,116.80 $88,628.80 $107,140.80
1088 Contract Specialist EX MAR15_10 $30.22 $38.18 $46.14 $62,857.60 $79,414.40 $95,971.20
2100 Control System Technician I NEX MAR25_8 $28.39 $35.87 $43.34 $59,051.20 $74,599.20 $90,147.20
2683 Control System Technician II NEX MAR25_9 $30.55 $38.63 $46.70 $63,544.00 $80,340.00 $97,136.00
8107 Control Systems Engineer EX MAR45_12 $43.37 $54.80 $66.23 $90,209.60 $113,984.00 $137,758.40
0940 County Attorney EX None
9704 County Attorney (Treasurer) EX MAR10_17 $41.72 $52.73 $63.73 $86,777.60 $109,668.00 $132,558.40
0941 County Attorney Deputy EX SMAP $48.63 $71.71 $94.79 $101,150.40 $149,156.80 $197,163.20
9703 County Attorney I EX MAR45_10 $38.10 $48.14 $58.18 $79,248.00 $100,131.20 $121,014.40
9702 County Attorney II EX MAR45_12 $43.37 $54.80 $66.23 $90,209.60 $113,984.00 $137,758.40
9701 County Attorney III EX MAR55_14 $51.65 $65.27 $78.88 $107,432.00 $135,751.20 $164,070.40
9700 County Attorney IV EX MAR55_16 $56.53 $71.43 $86.32 $117,582.40 $148,564.00 $179,545.60
0116 County Auditor EX XMAP1 $43.61 $57.76 $71.91 $90,708.80 $120,140.80 $149,572.80
9960 County Board Chairman EX Chairman $95,734.00
9950 County Board Member EX Board Member $89,851.00
9910 County Manager EX None
8203 County Standards Engineer EX 89 $33.71 $45.86 $58.01 $70,116.80 $95,388.80 $120,660.80
8358 County Surveyor EX 79 $37.98 $49.67 $61.36 $78,998.40 $103,313.60 $127,628.80
9126 Court Assistant NEX 5 $17.40 $21.99 $26.58 $36,192.00 $45,739.20 $55,286.40
9411 Court Clerk NEX 8 $22.71 $28.69 $34.67 $47,236.80 $59,675.20 $72,113.60
6710 Court Operations Administrator EX XMAP1 $43.61 $57.76 $71.91 $90,708.80 $120,140.80 $149,572.80
0900 Court Services Director EX SMAP $48.63 $71.71 $94.79 $101,150.40 $149,156.80 $197,163.20
1285 Court Specialist I NEX 7 $20.97 $26.50 $32.03 $43,617.60 $55,120.00 $66,622.40
1286 Court Specialist II NEX 8 $22.71 $28.69 $34.67 $47,236.80 $59,675.20 $72,113.60
5081 Crime Analysis Technician NEX MAR10_8 $24.99 $31.57 $38.14 $51,979.20 $65,655.20 $79,331.20
5007 Crime Analyst EX MAR10_11 $30.90 $39.06 $47.22 $64,272.00 $81,244.80 $98,217.60
3421 Cultural Affairs Specialist I NEX 85 $15.59 $23.16 $30.72 $32,427.20 $48,162.40 $63,897.60
3422 Cultural Affairs Specialist II NEX 86 $20.97 $31.04 $41.10 $43,617.60 $64,552.80 $85,488.00
3423 Cultural Affairs Specialist III EX 87 $26.27 $35.97 $45.67 $54,641.60 $74,817.60 $94,993.60
3424 Cultural Affairs Specialist IV EX 88 $33.24 $45.97 $58.69 $69,139.20 $95,607.20 $122,075.20
2222 Custodial Worker II NEX MAR10_3 $15.45 $19.53 $23.61 $32,136.00 $40,622.40 $49,108.80
1000 Cybersecurity Engineer EX 75 $41.15 $55.26 $69.36 $85,592.00 $114,930.40 $144,268.80
1072 Data Architect EX 75 $41.15 $55.26 $69.36 $85,592.00 $114,930.40 $144,268.80
1070 Database Administrator EX 57 $31.53 $46.60 $61.66 $65,582.40 $96,917.60 $128,252.80
1061 Database Analyst EX MAR25_11 $35.12 $44.39 $53.65 $73,049.60 $92,320.80 $111,592.00
1022 Decision Support Chief EX XMAP2 $47.07 $64.06 $81.04 $97,905.60 $133,234.40 $168,563.20
2833 Delivery Driver NEX MAR15_3 $16.15 $20.42 $24.68 $33,592.00 $42,463.20 $51,334.40
*Employees on the Arlington County General Scale must be paid at least the County base rate of $15.00.
525
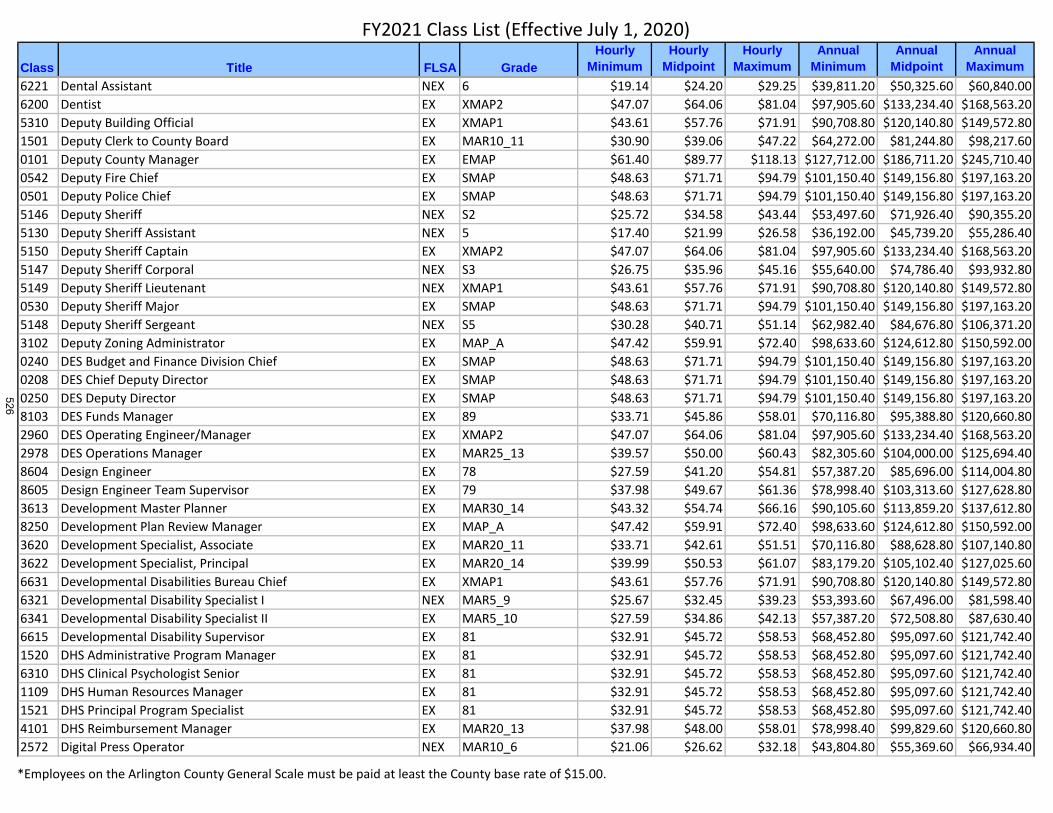
Class Title FLSA Grade
Hourly
Minimum
Hourly
Midpoint
Hourly
Maximum
Annual
Minimum
Annual
Midpoint
Annual
Maximum
FY2021 Class List (Effective July 1, 2020)
6221 Dental Assistant NEX 6 $19.14 $24.20 $29.25 $39,811.20 $50,325.60 $60,840.00
6200 Dentist EX XMAP2 $47.07 $64.06 $81.04 $97,905.60 $133,234.40 $168,563.20
5310 Deputy Building Official EX XMAP1 $43.61 $57.76 $71.91 $90,708.80 $120,140.80 $149,572.80
1501 Deputy Clerk to County Board EX MAR10_11 $30.90 $39.06 $47.22 $64,272.00 $81,244.80 $98,217.60
0101 Deputy County Manager EX EMAP $61.40 $89.77 $118.13 $127,712.00 $186,711.20 $245,710.40
0542 Deputy Fire Chief EX SMAP $48.63 $71.71 $94.79 $101,150.40 $149,156.80 $197,163.20
0501 Deputy Police Chief EX SMAP $48.63 $71.71 $94.79 $101,150.40 $149,156.80 $197,163.20
5146 Deputy Sheriff NEX S2 $25.72 $34.58 $43.44 $53,497.60 $71,926.40 $90,355.20
5130 Deputy Sheriff Assistant NEX 5 $17.40 $21.99 $26.58 $36,192.00 $45,739.20 $55,286.40
5150 Deputy Sheriff Captain EX XMAP2 $47.07 $64.06 $81.04 $97,905.60 $133,234.40 $168,563.20
5147 Deputy Sheriff Corporal NEX S3 $26.75 $35.96 $45.16 $55,640.00 $74,786.40 $93,932.80
5149 Deputy Sheriff Lieutenant NEX XMAP1 $43.61 $57.76 $71.91 $90,708.80 $120,140.80 $149,572.80
0530 Deputy Sheriff Major EX SMAP $48.63 $71.71 $94.79 $101,150.40 $149,156.80 $197,163.20
5148 Deputy Sheriff Sergeant NEX S5 $30.28 $40.71 $51.14 $62,982.40 $84,676.80 $106,371.20
3102 Deputy Zoning Administrator EX MAP_A $47.42 $59.91 $72.40 $98,633.60 $124,612.80 $150,592.00
0240 DES Budget and Finance Division Chief EX SMAP $48.63 $71.71 $94.79 $101,150.40 $149,156.80 $197,163.20
0208 DES Chief Deputy Director EX SMAP $48.63 $71.71 $94.79 $101,150.40 $149,156.80 $197,163.20
0250 DES Deputy Director EX SMAP $48.63 $71.71 $94.79 $101,150.40 $149,156.80 $197,163.20
8103 DES Funds Manager EX 89 $33.71 $45.86 $58.01 $70,116.80 $95,388.80 $120,660.80
2960 DES Operating Engineer/Manager EX XMAP2 $47.07 $64.06 $81.04 $97,905.60 $133,234.40 $168,563.20
2978 DES Operations Manager EX MAR25_13 $39.57 $50.00 $60.43 $82,305.60 $104,000.00 $125,694.40
8604 Design Engineer EX 78 $27.59 $41.20 $54.81 $57,387.20 $85,696.00 $114,004.80
8605 Design Engineer Team Supervisor EX 79 $37.98 $49.67 $61.36 $78,998.40 $103,313.60 $127,628.80
3613 Development Master Planner EX MAR30_14 $43.32 $54.74 $66.16 $90,105.60 $113,859.20 $137,612.80
8250 Development Plan Review Manager EX MAP_A $47.42 $59.91 $72.40 $98,633.60 $124,612.80 $150,592.00
3620 Development Specialist, Associate EX MAR20_11 $33.71 $42.61 $51.51 $70,116.80 $88,628.80 $107,140.80
3622 Development Specialist, Principal EX MAR20_14 $39.99 $50.53 $61.07 $83,179.20 $105,102.40 $127,025.60
6631 Developmental Disabilities Bureau Chief EX XMAP1 $43.61 $57.76 $71.91 $90,708.80 $120,140.80 $149,572.80
6321 Developmental Disability Specialist I NEX MAR5_9 $25.67 $32.45 $39.23 $53,393.60 $67,496.00 $81,598.40
6341 Developmental Disability Specialist II EX MAR5_10 $27.59 $34.86 $42.13 $57,387.20 $72,508.80 $87,630.40
6615 Developmental Disability Supervisor EX 81 $32.91 $45.72 $58.53 $68,452.80 $95,097.60 $121,742.40
1520 DHS Administrative Program Manager EX 81 $32.91 $45.72 $58.53 $68,452.80 $95,097.60 $121,742.40
6310 DHS Clinical Psychologist Senior EX 81 $32.91 $45.72 $58.53 $68,452.80 $95,097.60 $121,742.40
1109 DHS Human Resources Manager EX 81 $32.91 $45.72 $58.53 $68,452.80 $95,097.60 $121,742.40
1521 DHS Principal Program Specialist EX 81 $32.91 $45.72 $58.53 $68,452.80 $95,097.60 $121,742.40
4101 DHS Reimbursement Manager EX MAR20_13 $37.98 $48.00 $58.01 $78,998.40 $99,829.60 $120,660.80
2572 Digital Press Operator NEX MAR10_6 $21.06 $26.62 $32.18 $43,804.80 $55,369.60 $66,934.40
*Employees on the Arlington County General Scale must be paid at least the County base rate of $15.00.
526

Class Title FLSA Grade
Hourly
Minimum
Hourly
Midpoint
Hourly
Maximum
Annual
Minimum
Annual
Midpoint
Annual
Maximum
FY2021 Class List (Effective July 1, 2020)
6651 Disability Resource Coord EX 73 $28.90 $39.57 $50.24 $60,112.00 $82,305.60 $104,499.20
1150 Diversity Coordinator EX 73 $28.90 $39.57 $50.24 $60,112.00 $82,305.60 $104,499.20
0730 DPR Deputy Director EX SMAP $48.63 $71.71 $94.79 $101,150.40 $149,156.80 $197,163.20
7108 DPR Program Assistant NEX MAR10_7 $23.07 $29.16 $35.24 $47,985.60 $60,642.40 $73,299.20
7325 DPR Program Manager EX 92 $28.90 $41.04 $53.18 $60,112.00 $85,363.20 $110,614.40
7102 DPR Program Specialist EX MAR20_10 $31.53 $39.84 $48.15 $65,582.40 $82,867.20 $100,152.00
7101 DPR Program Supervisor EX 92 $28.90 $41.04 $53.18 $60,112.00 $85,363.20 $110,614.40
7105 DPR Programmer I NEX MAR20_8 $27.26 $34.44 $41.61 $56,700.80 $71,624.80 $86,548.80
7104 DPR Programmer II NEX MAR20_9 $29.34 $37.09 $44.84 $61,027.20 $77,147.20 $93,267.20
7122 DPR Section Manager EX 88 $33.24 $45.97 $58.69 $69,139.20 $95,607.20 $122,075.20
9200 Drug Court Coordinator EX 11 $28.09 $35.51 $42.92 $58,427.20 $73,850.40 $89,273.60
0136 DTS Division Chief EX SMAP $48.63 $71.71 $94.79 $101,150.40 $149,156.80 $197,163.20
7109 Early Childhood Assistant NEX MAR5_6 $20.10 $25.41 $30.72 $41,808.00 $52,852.80 $63,897.60
0560 ECC Administrator EX SMAP $48.63 $71.71 $94.79 $101,150.40 $149,156.80 $197,163.20
5030 ECC Deputy Administrator EX 91 $34.82 $48.09 $61.36 $72,425.60 $100,027.20 $127,628.80
0370 Economic Development Director EX EMAP $61.40 $89.77 $118.13 $127,712.00 $186,711.20 $245,710.40
0675 Economic Independence & Assistance Div Chief EX SMAP $48.63 $71.71 $94.79 $101,150.40 $149,156.80 $197,163.20
8113 Electrical and Instrumentation Supervisor NEX MAR25_12 $37.39 $47.24 $57.09 $77,771.20 $98,259.20 $118,747.20
2622 Electrical Power Technician I NEX MAR25_8 $28.39 $35.87 $43.34 $59,051.20 $74,599.20 $90,147.20
2688 Electrical Power Technician II NEX MAR25_9 $30.55 $38.63 $46.70 $63,544.00 $80,340.00 $97,136.00
2426 Electrician NEX MAR15_7 $24.12 $30.48 $36.84 $50,169.60 $63,398.40 $76,627.20
6660 Eligibility Supervisor EX MAR10_11 $30.90 $39.06 $47.22 $64,272.00 $81,244.80 $98,217.60
6663 Eligibility Worker NEX MAR5_8 $23.85 $30.13 $36.41 $49,608.00 $62,670.40 $75,732.80
5033 Emergency Communications Assistant Supervisor NEX MAR10_10 $28.90 $36.52 $44.14 $60,112.00 $75,961.60 $91,811.20
5031 Emergency Communications Coordinator (Staffing) NEX MAR10_11 $30.90 $39.06 $47.22 $64,272.00 $81,244.80 $98,217.60
5032 Emergency Communications Supervisor NEX MAR10_11 $30.90 $39.06 $47.22 $64,272.00 $81,244.80 $98,217.60
5035 Emergency Communications Systems Spec NEX 11 $28.09 $35.51 $42.92 $58,427.20 $73,850.40 $89,273.60
5036 Emergency Communications Technician I NEX MAR15_6 $22.02 $27.83 $33.64 $45,801.60 $57,886.40 $69,971.20
5037 Emergency Communications Technician II NEX MAR15_7 $24.12 $30.48 $36.84 $50,169.60 $63,398.40 $76,627.20
5034 Emergency Communications Technician III NEX MAR15_8 $26.12 $33.00 $39.88 $54,329.60 $68,640.00 $82,950.40
1177 Emergency Management Specialist I NEX 86 $20.97 $31.04 $41.10 $43,617.60 $64,552.80 $85,488.00
1178 Emergency Management Specialist II EX 83 $26.27 $37.12 $47.96 $54,641.60 $77,199.20 $99,756.80
5023 Emergency Management Watch Officer NEX MAR5_10 $27.59 $34.86 $42.13 $57,387.20 $72,508.80 $87,630.40
0141 Employee Services Division Chief EX SMAP $48.63 $71.71 $94.79 $101,150.40 $149,156.80 $197,163.20
1084 Employment Development Specialist NEX 9 $24.44 $30.90 $37.36 $50,835.20 $64,272.00 $77,708.80
1087 Employment Services Section Supervisor EX MAR5_11 $29.50 $37.29 $45.07 $61,360.00 $77,552.80 $93,745.60
1083 Employment Services Specialist NEX 9 $24.44 $30.90 $37.36 $50,835.20 $64,272.00 $77,708.80
*Employees on the Arlington County General Scale must be paid at least the County base rate of $15.00.
527

Class Title FLSA Grade
Hourly
Minimum
Hourly
Midpoint
Hourly
Maximum
Annual
Minimum
Annual
Midpoint
Annual
Maximum
FY2021 Class List (Effective July 1, 2020)
8108 Engineering Bureau Chief EX XMAP2 $47.07 $64.06 $81.04 $97,905.60 $133,234.40 $168,563.20
8217 Engineering Program Coordinator EX 89 $33.71 $45.86 $58.01 $70,116.80 $95,388.80 $120,660.80
8300 Engineering Support Associate I NEX 6 $19.14 $24.20 $29.25 $39,811.20 $50,325.60 $60,840.00
8301 Engineering Support Associate II NEX 7 $20.97 $26.50 $32.03 $43,617.60 $55,120.00 $66,622.40
8302 Engineering Support Associate III NEX 8 $22.71 $28.69 $34.67 $47,236.80 $59,675.20 $72,113.60
8105 Engineering Support Coordinator EX 10 $26.27 $33.20 $40.12 $54,641.60 $69,045.60 $83,449.60
8312 Engineering Tech II NEX 6 $19.14 $24.20 $29.25 $39,811.20 $50,325.60 $60,840.00
8313 Engineering Tech III NEX 7 $20.97 $26.50 $32.03 $43,617.60 $55,120.00 $66,622.40
8314 Engineering Tech IV NEX 9 $24.44 $30.90 $37.36 $50,835.20 $64,272.00 $77,708.80
1042 Enterprise Records Manager EX 59 $47.16 $65.58 $84.00 $98,092.80 $136,406.40 $174,720.00
6511 Environmental Health Specialist I NEX MAR15_9 $28.11 $35.54 $42.97 $58,468.80 $73,923.20 $89,377.60
6512 Environmental Health Specialist II EX MAR15_10 $30.22 $38.18 $46.14 $62,857.60 $79,414.40 $95,971.20
6510 Environmental Health Supervisor EX 81 $32.91 $45.72 $58.53 $68,452.80 $95,097.60 $121,742.40
6553 Environmental Health Technician NEX MAR15_8 $26.12 $33.00 $39.88 $54,329.60 $68,640.00 $82,950.40
3810 Environmental Management Bureau Chief EX XMAP2 $47.07 $64.06 $81.04 $97,905.60 $133,234.40 $168,563.20
3114 Environmental Management Specialist, Associate EX MAR20_11 $33.71 $42.61 $51.51 $70,116.80 $88,628.80 $107,140.80
3117 Environmental Management Specialist, Principal EX MAR20_14 $39.99 $50.53 $61.07 $83,179.20 $105,102.40 $127,025.60
6121 Epidemiologist EX 11 $28.09 $35.51 $42.92 $58,427.20 $73,850.40 $89,273.60
6131 Epidemiology Specialist NEX 9 $24.44 $30.90 $37.36 $50,835.20 $64,272.00 $77,708.80
0220 Equipment Bureau Chief EX SMAP $48.63 $71.71 $94.79 $101,150.40 $149,156.80 $197,163.20
2525 Equipment Mechanic I NEX MAR25_6 $23.93 $30.25 $36.57 $49,774.40 $62,920.00 $76,065.60
2526 Equipment Mechanic II NEX MAR25_7 $26.22 $33.13 $40.04 $54,537.60 $68,910.40 $83,283.20
9996 Executive Director Retirement Office EX None
7301 Facilities Assistant I NEX R1 $13.54 $15.42 $17.30 $28,163.20 $32,073.60 $35,984.00
7304 Facilities Assistant II NEX R2 $14.40 $18.89 $23.38 $29,952.00 $39,291.20 $48,630.40
7310 Facilities Assistant III NEX R3 $16.07 $21.10 $26.12 $33,425.60 $43,888.00 $54,329.60
2003 Facilities Design & Construction Bureau Chief EX XMAP2 $47.07 $64.06 $81.04 $97,905.60 $133,234.40 $168,563.20
2007 Facilities Design & Construction Program Manager EX XMAP1 $43.61 $57.76 $71.91 $90,708.80 $120,140.80 $149,572.80
3210 Facilities Interior Design Supervisor EX MAR20_11 $33.71 $42.61 $51.51 $70,116.80 $88,628.80 $107,140.80
2516 Facilities Maintenance Mechanic II NEX MAR10_5 $19.14 $24.19 $29.24 $39,811.20 $50,315.20 $60,819.20
2005 Facilities Maintenance Section Manager EX MAP_A $47.42 $59.91 $72.40 $98,633.60 $124,612.80 $150,592.00
2515 Facilities Maintenance Worker NEX MAR10_4 $17.15 $21.67 $26.19 $35,672.00 $45,073.60 $54,475.20
2004 Facilities Management Bureau Chief EX XMAP2 $47.07 $64.06 $81.04 $97,905.60 $133,234.40 $168,563.20
8600 Facilities Management Program Manager EX XMAP1 $43.61 $57.76 $71.91 $90,708.80 $120,140.80 $149,572.80
3640 Facilities Planning Manager EX MAR30_14 $43.32 $54.74 $66.16 $90,105.60 $113,859.20 $137,612.80
2002 Facilities Project Specialist EX MAR20_12 $35.90 $45.36 $54.81 $74,672.00 $94,338.40 $114,004.80
0615 Finance and Information Systems Division Chief EX SMAP $48.63 $71.71 $94.79 $101,150.40 $149,156.80 $197,163.20
*Employees on the Arlington County General Scale must be paid at least the County base rate of $15.00.
528

Class Title FLSA Grade
Hourly
Minimum
Hourly
Midpoint
Hourly
Maximum
Annual
Minimum
Annual
Midpoint
Annual
Maximum
FY2021 Class List (Effective July 1, 2020)
4416 Financial Analyst II EX MAR10_12 $32.91 $41.58 $50.24 $68,452.80 $86,476.00 $104,499.20
6668 Financial Management Bureau Chief EX XMAP1 $43.61 $57.76 $71.91 $90,708.80 $120,140.80 $149,572.80
5020 Fingerprint Specialist I NEX MAR10_6 $21.06 $26.62 $32.18 $43,804.80 $55,369.60 $66,934.40
5021 Fingerprint Specialist II NEX MAR10_7 $23.07 $29.16 $35.24 $47,985.60 $60,642.40 $73,299.20
5022 Fingerprint Specialist III NEX MAR15_9 $28.11 $35.54 $42.97 $58,468.80 $73,923.20 $89,377.60
5070 Fingerprint Specialist Supervisor NEX MAR20_10 $31.53 $39.84 $48.15 $65,582.40 $82,867.20 $100,152.00
0540 Fire Chief EX EMAP $61.40 $89.77 $118.13 $127,712.00 $186,711.20 $245,710.40
0541 Fire Division Chief II EX SMAP $48.63 $71.71 $94.79 $101,150.40 $149,156.80 $197,163.20
5240 Fire Inspector NEX 9 $24.44 $30.90 $37.36 $50,835.20 $64,272.00 $77,708.80
5215 Fire Marshal I NEX F3 $28.07 $37.75 $47.42 $58,385.60 $78,509.60 $98,633.60
5324 Fire Protection Engineer I NEX MAR20_10 $31.53 $39.84 $48.15 $65,582.40 $82,867.20 $100,152.00
5325 Fire Protection Engineer II NEX MAR20_11 $33.71 $42.61 $51.51 $70,116.80 $88,628.80 $107,140.80
5200 Fire/EMS Battalion Chief NEX XMAP2 $47.07 $64.06 $81.04 $97,905.60 $133,234.40 $168,563.20
5220 Fire/EMS Captain I NEX F6 $35.52 $47.76 $59.99 $73,881.60 $99,330.40 $124,779.20
5201 Fire/EMS Captain II NEX F7 $39.61 $53.26 $66.90 $82,388.80 $110,770.40 $139,152.00
5210 Fire/EMS Lieutenant NEX F5 $32.23 $43.34 $54.44 $67,038.40 $90,136.80 $113,235.20
5232 Firefighter/EMT NEX F2 $26.79 $36.02 $45.24 $55,723.20 $74,911.20 $94,099.20
5233 Firefighter/EMT III NEX F4 $29.51 $39.70 $49.89 $61,380.80 $82,576.00 $103,771.20
6721 Food Service Coordinator NEX 6 $19.14 $24.20 $29.25 $39,811.20 $50,325.60 $60,840.00
7503 Forestry Section Supervisor EX 60 $28.09 $38.22 $48.34 $58,427.20 $79,487.20 $100,547.20
2929 Gardener NEX MAR10_5 $19.14 $24.19 $29.24 $39,811.20 $50,315.20 $60,819.20
9992 General District Court EX None
0102 General Registrar EX XMAP1 $43.61 $57.76 $71.91 $90,708.80 $120,140.80 $149,572.80
1018 GIS Analyst EX MAR20_11 $33.71 $42.61 $51.51 $70,116.80 $88,628.80 $107,140.80
1010 GIS Applications Developer EX MAR20_11 $33.71 $42.61 $51.51 $70,116.80 $88,628.80 $107,140.80
8325 GIS Bureau Chief EX XMAP1 $43.61 $57.76 $71.91 $90,708.80 $120,140.80 $149,572.80
1019 GIS Database Administrator EX MAR20_12 $35.90 $45.36 $54.81 $74,672.00 $94,338.40 $114,004.80
0113 Government Affairs Liaison EX SMAP $48.63 $71.71 $94.79 $101,150.40 $149,156.80 $197,163.20
1155 Grant Compliance Specialist EX 73 $28.90 $39.57 $50.24 $60,112.00 $82,305.60 $104,499.20
6711 Group Home Counselor I NEX MAR10_8 $24.99 $31.57 $38.14 $51,979.20 $65,655.20 $79,331.20
6712 Group Home Counselor II NEX MAR15_9 $28.11 $35.54 $42.97 $58,468.80 $73,923.20 $89,377.60
9311 Group Home Manager EX MAR15_12 $34.40 $43.47 $52.53 $71,552.00 $90,407.20 $109,262.40
7314 Gymnastics Instructor NEX 8 $22.71 $28.69 $34.67 $47,236.80 $59,675.20 $72,113.60
6411 Health Educator EX 10 $26.27 $33.20 $40.12 $54,641.60 $69,045.60 $83,449.60
3610 Historic Preservation Section Supervisor EX MAR30_14 $43.32 $54.74 $66.16 $90,105.60 $113,859.20 $137,612.80
6655 Homeless Program Coord EX 81 $32.91 $45.72 $58.53 $68,452.80 $95,097.60 $121,742.40
3617 Housing Assistance Program Specialist NEX MAR5_9 $25.67 $32.45 $39.23 $53,393.60 $67,496.00 $81,598.40
*Employees on the Arlington County General Scale must be paid at least the County base rate of $15.00.
529

Class Title FLSA Grade
Hourly
Minimum
Hourly
Midpoint
Hourly
Maximum
Annual
Minimum
Annual
Midpoint
Annual
Maximum
FY2021 Class List (Effective July 1, 2020)
6650 Housing Bureau Chief EX XMAP1 $43.61 $57.76 $71.91 $90,708.80 $120,140.80 $149,572.80
3625 Housing Choice Supervisor EX MAR10_11 $30.90 $39.06 $47.22 $64,272.00 $81,244.80 $98,217.60
3623 Housing Development Section Supervisor EX MAR30_14 $43.32 $54.74 $66.16 $90,105.60 $113,859.20 $137,612.80
0332 Housing Division Chief EX SMAP $48.63 $71.71 $94.79 $101,150.40 $149,156.80 $197,163.20
4415 Housing Finance Section Supervisor EX MAR30_14 $43.32 $54.74 $66.16 $90,105.60 $113,859.20 $137,612.80
3624 Housing Inspections Coordinator NEX MAR5_9 $25.67 $32.45 $39.23 $53,393.60 $67,496.00 $81,598.40
3618 Housing Inspector NEX MAR5_8 $23.85 $30.13 $36.41 $49,608.00 $62,670.40 $75,732.80
3116 Housing Master Planner EX MAR30_14 $43.32 $54.74 $66.16 $90,105.60 $113,859.20 $137,612.80
3631 Housing Program Manager EX 33 $36.68 $50.37 $64.05 $76,294.40 $104,759.20 $133,224.00
3611 Housing Specialist I NEX MAR5_9 $25.67 $32.45 $39.23 $53,393.60 $67,496.00 $81,598.40
3614 Housing Specialist II EX MAR5_10 $27.59 $34.86 $42.13 $57,387.20 $72,508.80 $87,630.40
1103 Human Resources Administrative Specialist NEX 86 $20.97 $31.04 $41.10 $43,617.60 $64,552.80 $85,488.00
0140 Human Resources Director EX EMAP $61.40 $89.77 $118.13 $127,712.00 $186,711.20 $245,710.40
1105 Human Resources Section Manager EX XMAP1 $43.61 $57.76 $71.91 $90,708.80 $120,140.80 $149,572.80
1101 Human Resources/OD Specialist EX 70 $26.27 $39.40 $52.53 $54,641.60 $81,952.00 $109,262.40
1152 Human Rights Supervisor EX 12 $29.91 $37.79 $45.67 $62,212.80 $78,603.20 $94,993.60
6735 Human Services Aide III NEX 3 $14.04 $17.75 $21.46 $29,203.20 $36,920.00 $44,636.80
6736 Human Services Aide IV NEX 5 $17.40 $21.99 $26.58 $36,192.00 $45,739.20 $55,286.40
6737 Human Services Aide V NEX 6 $19.14 $24.20 $29.25 $39,811.20 $50,325.60 $60,840.00
6738 Human Services Aide VI NEX 7 $20.97 $26.50 $32.03 $43,617.60 $55,120.00 $66,622.40
6600 Human Services Clinical Supervisor EX 81 $32.91 $45.72 $58.53 $68,452.80 $95,097.60 $121,742.40
6614 Human Services Clinician II EX MAR5_10 $27.59 $34.86 $42.13 $57,387.20 $72,508.80 $87,630.40
6618 Human Services Clinician III EX MAR10_11 $30.90 $39.06 $47.22 $64,272.00 $81,244.80 $98,217.60
0601 Human Services Deputy Director EX SMAP $48.63 $71.71 $94.79 $101,150.40 $149,156.80 $197,163.20
0600 Human Services Director EX EMAP $61.40 $89.77 $118.13 $127,712.00 $186,711.20 $245,710.40
6332 Human Services Specialist NEX MAR5_9 $25.67 $32.45 $39.23 $53,393.60 $67,496.00 $81,598.40
2535 HVAC Mechanic II NEX MAR50_8 $34.07 $43.04 $52.01 $70,865.60 $89,523.20 $108,180.80
1113 I/O Psychologist EX 58 $44.99 $61.03 $77.07 $93,579.20 $126,942.40 $160,305.60
6636 Infant & Child Development Supervisor EX 81 $32.91 $45.72 $58.53 $68,452.80 $95,097.60 $121,742.40
6637 Infant Development Specialist EX MAR5_10 $27.59 $34.86 $42.13 $57,387.20 $72,508.80 $87,630.40
1012 Infrastructure Support Specialist II NEX MAR10_9 $26.89 $34.00 $41.10 $55,931.20 $70,709.60 $85,488.00
5155 Inmate Services Counselor I NEX 10 $26.27 $33.20 $40.12 $54,641.60 $69,045.60 $83,449.60
5156 Inmate Services Counselor II NEX 11 $28.09 $35.51 $42.92 $58,427.20 $73,850.40 $89,273.60
5157 Inmate Services Supervisor EX 13 $31.65 $40.00 $48.34 $65,832.00 $83,189.60 $100,547.20
0350 Inspection Services Division Chief EX SMAP $48.63 $71.71 $94.79 $101,150.40 $149,156.80 $197,163.20
1151 Investigator HR/EEO EX 73 $28.90 $39.57 $50.24 $60,112.00 $82,305.60 $104,499.20
4442 Investment Portfolio Manager EX MAR15_15 $40.17 $50.77 $61.36 $83,553.60 $105,591.20 $127,628.80
*Employees on the Arlington County General Scale must be paid at least the County base rate of $15.00.
530

Class Title FLSA Grade
Hourly
Minimum
Hourly
Midpoint
Hourly
Maximum
Annual
Minimum
Annual
Midpoint
Annual
Maximum
FY2021 Class List (Effective July 1, 2020)
1006 IT Analyst NEX 56 $20.97 $32.91 $44.84 $43,617.60 $68,442.40 $93,267.20
1040 IT Program Manager EX MAR30_13 $41.15 $52.00 $62.85 $85,592.00 $108,160.00 $130,728.00
2760 ITS Network Analyst NEX MAR45_9 $35.45 $44.82 $54.18 $73,736.00 $93,215.20 $112,694.40
2731 ITS Systems Analyst NEX MAR45_9 $35.45 $44.82 $54.18 $73,736.00 $93,215.20 $112,694.40
2722 ITS Technician I NEX MAR15_7 $24.12 $30.48 $36.84 $50,169.60 $63,398.40 $76,627.20
2726 ITS Technician II NEX MAR15_8 $26.12 $33.00 $39.88 $54,329.60 $68,640.00 $82,950.40
9425 Judicial Law Clerk EX MAR10_10 $28.90 $36.52 $44.14 $60,112.00 $75,961.60 $91,811.20
9993 Juvenile & Domestic Relations Court EX None
9305 Juvenile Program Coordinator NEX MAR20_10 $31.53 $39.84 $48.15 $65,582.40 $82,867.20 $100,152.00
6750 Laboratory Assistant NEX 6 $19.14 $24.20 $29.25 $39,811.20 $50,325.60 $60,840.00
6552 Laboratory Section Supervisor EX 81 $32.91 $45.72 $58.53 $68,452.80 $95,097.60 $121,742.40
6555 Laboratory Technologist I EX 10 $26.27 $33.20 $40.12 $54,641.60 $69,045.60 $83,449.60
6556 Laboratory Technologist II EX 11 $28.09 $35.51 $42.92 $58,427.20 $73,850.40 $89,273.60
8352 Land Surveyor I NEX MAR10_10 $28.90 $36.52 $44.14 $60,112.00 $75,961.60 $91,811.20
8353 Land Surveyor Supervisor EX MAR10_12 $32.91 $41.58 $50.24 $68,452.80 $86,476.00 $104,499.20
7552 Landscape Architect EX MAR20_12 $35.90 $45.36 $54.81 $74,672.00 $94,338.40 $114,004.80
7553 Landscape Architect Supervisor EX 32 $34.40 $46.47 $58.53 $71,552.00 $96,647.20 $121,742.40
7520 Landscape Specialist NEX MAR25_7 $26.22 $33.13 $40.04 $54,537.60 $68,910.40 $83,283.20
9420 Law Clerk NEX 9 $24.44 $30.90 $37.36 $50,835.20 $64,272.00 $77,708.80
7315 Lead Aquatics Instructor NEX 10 $26.27 $33.20 $40.12 $54,641.60 $69,045.60 $83,449.60
7270 Lead Gymnastics Instructor NEX 10 $26.27 $33.20 $40.12 $54,641.60 $69,045.60 $83,449.60
2952 Lead Trades Worker I NEX MAR5_7 $22.02 $27.83 $33.64 $45,801.60 $57,886.40 $69,971.20
2954 Lead Trades Worker II NEX MAR5_9 $25.67 $32.45 $39.23 $53,393.60 $67,496.00 $81,598.40
9124 Legal Administrative Specialist NEX MAR25_8 $28.39 $35.87 $43.34 $59,051.20 $74,599.20 $90,147.20
9125 Legal Administrative Supervisor NEX MAR55_9 $37.89 $47.90 $57.91 $78,811.20 $99,632.00 $120,452.80
1190 Legislative Liaison EX EMAP $61.40 $89.77 $118.13 $127,712.00 $186,711.20 $245,710.40
7012 Librarian EX 40 $27.59 $35.87 $44.14 $57,387.20 $74,599.20 $91,811.20
7002 Librarian Supervisor EX 71 $32.31 $43.96 $55.60 $67,204.80 $91,426.40 $115,648.00
7020 Library Assistant Coordinator NEX 41 $22.02 $30.08 $38.14 $45,801.60 $62,566.40 $79,331.20
7021 Library Assistant I NEX MAR10_4 $17.15 $21.67 $26.19 $35,672.00 $45,073.60 $54,475.20
7023 Library Assistant II NEX MAR5_5 $18.27 $23.09 $27.91 $38,001.60 $48,027.20 $58,052.80
7019 Library Assistant Supervisor NEX 41 $22.02 $30.08 $38.14 $45,801.60 $62,566.40 $79,331.20
7018 Library Associate NEX 41 $22.02 $30.08 $38.14 $45,801.60 $62,566.40 $79,331.20
0713 Library Deputy Director EX SMAP $48.63 $71.71 $94.79 $101,150.40 $149,156.80 $197,163.20
0700 Library Director EX EMAP $61.40 $89.77 $118.13 $127,712.00 $186,711.20 $245,710.40
0710 Library Division Chief EX SMAP $48.63 $71.71 $94.79 $101,150.40 $149,156.80 $197,163.20
0712 Library Division Chief (Materials Management) EX SMAP $48.63 $71.71 $94.79 $101,150.40 $149,156.80 $197,163.20
*Employees on the Arlington County General Scale must be paid at least the County base rate of $15.00.
531

Class Title FLSA Grade
Hourly
Minimum
Hourly
Midpoint
Hourly
Maximum
Annual
Minimum
Annual
Midpoint
Annual
Maximum
FY2021 Class List (Effective July 1, 2020)
7303 Long Range Park Planning Section Supervisor EX MAR30_14 $43.32 $54.74 $66.16 $90,105.60 $113,859.20 $137,612.80
9991 Magistrate EX None
4411 Management & Budget Specialist EX 70 $26.27 $39.40 $52.53 $54,641.60 $81,952.00 $109,262.40
0450 Management & Finance Deputy Director EX SMAP $48.63 $71.71 $94.79 $101,150.40 $149,156.80 $197,163.20
0440 Management & Finance Director EX EMAP $61.40 $89.77 $118.13 $127,712.00 $186,711.20 $245,710.40
1506 Management Analyst EX MAR10_11 $30.90 $39.06 $47.22 $64,272.00 $81,244.80 $98,217.60
1505 Management Specialist NEX MAR10_9 $26.89 $34.00 $41.10 $55,931.20 $70,709.60 $85,488.00
1628 Media Relations/Communications Manager EX XMAP1 $43.61 $57.76 $71.91 $90,708.80 $120,140.80 $149,572.80
6346 Mental Health Supervisor EX 81 $32.91 $45.72 $58.53 $68,452.80 $95,097.60 $121,742.40
6331 Mental Health Therapist (Emerg Svcs) EX MAR15_10 $30.22 $38.18 $46.14 $62,857.60 $79,414.40 $95,971.20
6343 Mental Health Therapist (Emerg Svcs/Licensed) EX MAR15_10 $30.22 $38.18 $46.14 $62,857.60 $79,414.40 $95,971.20
6323 Mental Health Therapist III EX MAR10_11 $30.90 $39.06 $47.22 $64,272.00 $81,244.80 $98,217.60
1513 Mgt Intern I (Cohort) NEX MI_3 $24.00 $29.00 $34.00 $49,920.00 $60,320.00 $70,720.00
1530 Mgt Intern I (Non-Cohort) NEX MI_1 $17.00 $22.00 $27.00 $35,360.00 $45,760.00 $56,160.00
1514 Mgt Intern II (DTS Cohort) NEX MI_4 $29.00 $34.00 $39.00 $60,320.00 $70,720.00 $81,120.00
1531 Mgt Intern II (DTS Non-Cohort) NEX MI_2 $20.00 $25.00 $30.00 $41,600.00 $52,000.00 $62,400.00
2822 Motorized Vehicle Operator II NEX MAR10_5 $19.14 $24.19 $29.24 $39,811.20 $50,315.20 $60,819.20
2823 Motorized Vehicle Operator III NEX MAR10_6 $21.06 $26.62 $32.18 $43,804.80 $55,369.60 $66,934.40
2824 Motorized Vehicle Operator IV NEX MAR10_7 $23.07 $29.16 $35.24 $47,985.60 $60,642.40 $73,299.20
2623 Multi Skilled Wastewater Plant Operator (Senior) NEX MAR20_9 $29.34 $37.09 $44.84 $61,027.20 $77,147.20 $93,267.20
2621 Multi-Skilled Wastewater Plant Operator NEX MAR10_8 $24.99 $31.57 $38.14 $51,979.20 $65,655.20 $79,331.20
7510 Natural Resources Specialist EX MAR10_10 $28.90 $36.52 $44.14 $60,112.00 $75,961.60 $91,811.20
3601 Neighborhood Conservation Section Supervisor EX MAR30_14 $43.32 $54.74 $66.16 $90,105.60 $113,859.20 $137,612.80
0335 Neighborhood Services Division Chief EX SMAP $48.63 $71.71 $94.79 $101,150.40 $149,156.80 $197,163.20
1024 Network Analyst EX 57 $31.53 $46.60 $61.66 $65,582.40 $96,917.60 $128,252.80
1027 Network Control Specialist NEX 56 $20.97 $32.91 $44.84 $43,617.60 $68,442.40 $93,267.20
6111 Nurse Manager EX 81 $32.91 $45.72 $58.53 $68,452.80 $95,097.60 $121,742.40
6116 Nurse Practitioner EX 84 $33.71 $45.86 $58.01 $70,116.80 $95,388.80 $120,660.80
6741 Nutrition Assistant NEX 7 $20.97 $26.50 $32.03 $43,617.60 $55,120.00 $66,622.40
6684 Nutritionist II NEX 9 $24.44 $30.90 $37.36 $50,835.20 $64,272.00 $77,708.80
6685 Nutritionist III EX 10 $26.27 $33.20 $40.12 $54,641.60 $69,045.60 $83,449.60
1259 Office Aide I NEX 1 $11.53 $14.58 $17.62 $23,982.40 $30,316.00 $36,649.60
1260 Office Aide II NEX 2 $12.51 $15.81 $19.11 $26,020.80 $32,884.80 $39,748.80
1277 Office Supervisor I NEX 8 $22.71 $28.69 $34.67 $47,236.80 $59,675.20 $72,113.60
1278 Office Supervisor II NEX 9 $24.44 $30.90 $37.36 $50,835.20 $64,272.00 $77,708.80
2415 Painter Industrial NEX MAR10_7 $23.07 $29.16 $35.24 $47,985.60 $60,642.40 $73,299.20
9412 Paralegal I B NEX 8 $22.71 $28.69 $34.67 $47,236.80 $59,675.20 $72,113.60
*Employees on the Arlington County General Scale must be paid at least the County base rate of $15.00.
532

Class Title FLSA Grade
Hourly
Minimum
Hourly
Midpoint
Hourly
Maximum
Annual
Minimum
Annual
Midpoint
Annual
Maximum
FY2021 Class List (Effective July 1, 2020)
9414 Paralegal II NEX 9 $24.44 $30.90 $37.36 $50,835.20 $64,272.00 $77,708.80
7505 Park Manager EX 60 $28.09 $38.22 $48.34 $58,427.20 $79,487.20 $100,547.20
7511 Park Naturalist NEX MAR15_8 $26.12 $33.00 $39.88 $54,329.60 $68,640.00 $82,950.40
7516 Park Naturalist Aide NEX MAR5_4 $16.38 $20.69 $24.99 $34,070.40 $43,024.80 $51,979.20
7507 Park Ranger I NEX MAR20_5 $20.88 $26.39 $31.90 $43,430.40 $54,891.20 $66,352.00
7508 Park Ranger II NEX MAR10_9 $26.89 $34.00 $41.10 $55,931.20 $70,709.60 $85,488.00
0720 Parks & Recreation Director EX EMAP $61.40 $89.77 $118.13 $127,712.00 $186,711.20 $245,710.40
7565 Parks Capital Program Manager EX MAR15_13 $36.40 $46.00 $55.60 $75,712.00 $95,680.00 $115,648.00
0724 Parks Planning Division Chief EX SMAP $48.63 $71.71 $94.79 $101,150.40 $149,156.80 $197,163.20
0725 Parks/Natural Resources Division Chief EX SMAP $48.63 $71.71 $94.79 $101,150.40 $149,156.80 $197,163.20
5307 Permit Administration Manager EX 14 $33.32 $42.11 $50.89 $69,305.60 $87,578.40 $105,851.20
8214 Permit Coordinator NEX 9 $24.44 $30.90 $37.36 $50,835.20 $64,272.00 $77,708.80
5316 Permit Processing Specialist I NEX 6 $19.14 $24.20 $29.25 $39,811.20 $50,325.60 $60,840.00
5317 Permit Processing Specialist II NEX 7 $20.97 $26.50 $32.03 $43,617.60 $55,120.00 $66,622.40
5315 Permit Processing Specialist III NEX 8 $22.71 $28.69 $34.67 $47,236.80 $59,675.20 $72,113.60
7236 Personal Trainer II NEX MAR20_8 $27.26 $34.44 $41.61 $56,700.80 $71,624.80 $86,548.80
6100 Physician EX XMAP3 $82.50 $113.38 $144.25 $171,600.00 $235,820.00 $300,040.00
6370 Physician Assistant EX 81 $32.91 $45.72 $58.53 $68,452.80 $95,097.60 $121,742.40
0621 Physician Supervisor EX XMAP3 $82.50 $113.38 $144.25 $171,600.00 $235,820.00 $300,040.00
3115 Planner, Associate EX MAR20_11 $33.71 $42.61 $51.51 $70,116.80 $88,628.80 $107,140.80
3119 Planner, Principal EX MAR20_14 $39.99 $50.53 $61.07 $83,179.20 $105,102.40 $127,025.60
3612 Planning & Community Dev Section Supervisor EX MAR30_14 $43.32 $54.74 $66.16 $90,105.60 $113,859.20 $137,612.80
0310 Planning Division Chief EX SMAP $48.63 $71.71 $94.79 $101,150.40 $149,156.80 $197,163.20
3100 Planning Manager EX MAP_A $47.42 $59.91 $72.40 $98,633.60 $124,612.80 $150,592.00
3153 Planning Technician NEX 7 $20.97 $26.50 $32.03 $43,617.60 $55,120.00 $66,622.40
0205 Plant (WPC) Bureau Chief EX SMAP $48.63 $71.71 $94.79 $101,150.40 $149,156.80 $197,163.20
2682 Plant Machinist NEX MAR15_9 $28.11 $35.54 $42.97 $58,468.80 $73,923.20 $89,377.60
8112 Plant Maintenance Manager EX XMAP1 $43.61 $57.76 $71.91 $90,708.80 $120,140.80 $149,572.80
8111 Plant Operations Manager EX XMAP1 $43.61 $57.76 $71.91 $90,708.80 $120,140.80 $149,572.80
8116 Plant Planning and Reliability Supervisor EX MAR15_12 $34.40 $43.47 $52.53 $71,552.00 $90,407.20 $109,262.40
2689 Plant Planning Specialist EX MAR20_10 $31.53 $39.84 $48.15 $65,582.40 $82,867.20 $100,152.00
2522 Plumber NEX MAR10_8 $24.99 $31.57 $38.14 $51,979.20 $65,655.20 $79,331.20
5001 Police Captain EX XMAP2 $47.07 $64.06 $81.04 $97,905.60 $133,234.40 $168,563.20
5050 Police Central Records Supervisor NEX 9 $24.44 $30.90 $37.36 $50,835.20 $64,272.00 $77,708.80
0500 Police Chief EX EMAP $61.40 $89.77 $118.13 $127,712.00 $186,711.20 $245,710.40
5006 Police Corporal NEX P3 $28.84 $38.82 $48.80 $59,987.20 $80,745.60 $101,504.00
5002 Police Lieutenant NEX XMAP1 $43.61 $57.76 $71.91 $90,708.80 $120,140.80 $149,572.80
*Employees on the Arlington County General Scale must be paid at least the County base rate of $15.00.
533

Class Title FLSA Grade
Hourly
Minimum
Hourly
Midpoint
Hourly
Maximum
Annual
Minimum
Annual
Midpoint
Annual
Maximum
FY2021 Class List (Effective July 1, 2020)
5004 Police Officer NEX P2 $26.94 $36.27 $45.60 $56,035.20 $75,441.60 $94,848.00
5003 Police Sergeant NEX P5 $31.74 $42.73 $53.71 $66,019.20 $88,868.00 $111,716.80
2687 Power and Control Technician NEX MAR30_9 $31.78 $40.18 $48.57 $66,102.40 $83,564.00 $101,025.60
8515 Pretreatment Program Coordinator EX MAR10_11 $30.90 $39.06 $47.22 $64,272.00 $81,244.80 $98,217.60
2560 Print Section Supervisor EX MAR10_13 $34.82 $44.00 $53.18 $72,425.60 $91,520.00 $110,614.40
1043 PRISM Analyst EX 58 $44.99 $61.03 $77.07 $93,579.20 $126,942.40 $160,305.60
1025 PRISM System Specialist EX 59 $47.16 $65.58 $84.00 $98,092.80 $136,406.40 $174,720.00
9130 Probate Clerk EX 12 $29.91 $37.79 $45.67 $62,212.80 $78,603.20 $94,993.60
9998 Probation and Parole Office EX None
9310 Probation Counselor (Schools) NEX None
9302 Probation Counselor I NEX MAR10_8 $24.99 $31.57 $38.14 $51,979.20 $65,655.20 $79,331.20
9303 Probation Counselor II NEX MAR15_9 $28.11 $35.54 $42.97 $58,468.80 $73,923.20 $89,377.60
9300 Probation Counselor Supervisor EX MAR20_11 $33.71 $42.61 $51.51 $70,116.80 $88,628.80 $107,140.80
2685 Process Control Systems Technician NEX MAR40_9 $34.22 $43.27 $52.31 $71,177.60 $89,991.20 $108,804.80
1300 Procurement Officer EX 53 $27.59 $41.20 $54.81 $57,387.20 $85,696.00 $114,004.80
8602 Project Management Coordinator EX MAR15_13 $36.40 $46.00 $55.60 $75,712.00 $95,680.00 $115,648.00
0555 PS Communications & Emergency Management Dep Director EX SMAP $48.63 $71.71 $94.79 $101,150.40 $149,156.80 $197,163.20
0550 PS Communications & Emergency Management Director EX EMAP $61.40 $89.77 $118.13 $127,712.00 $186,711.20 $245,710.40
7030 PSCEM Integrated Programs Manager EX XMAP1 $43.61 $57.76 $71.91 $90,708.80 $120,140.80 $149,572.80
6114 Psychiatric Nurse EX 82 $30.22 $38.72 $47.22 $62,857.60 $80,537.60 $98,217.60
6300 Psychiatrist EX XMAP3 $82.50 $113.38 $144.25 $171,600.00 $235,820.00 $300,040.00
9997 Public Defender EX None
6115 Public Health Assistant Division Chief EX XMAP2 $47.07 $64.06 $81.04 $97,905.60 $133,234.40 $168,563.20
6140 Public Health Bureau Chief EX XMAP1 $43.61 $57.76 $71.91 $90,708.80 $120,140.80 $149,572.80
0625 Public Health Division Chief EX SMAP $48.63 $71.71 $94.79 $101,150.40 $149,156.80 $197,163.20
6113 Public Health Nurse EX 82 $30.22 $38.72 $47.22 $62,857.60 $80,537.60 $98,217.60
6110 Public Health Nurse Supervisor EX 81 $32.91 $45.72 $58.53 $68,452.80 $95,097.60 $121,742.40
6501 Public Health Planning Officer EX 81 $32.91 $45.72 $58.53 $68,452.80 $95,097.60 $121,742.40
5060 Public Safety Support Supervisor NEX MAR10_8 $24.99 $31.57 $38.14 $51,979.20 $65,655.20 $79,331.20
1023 Public Safety Technology Manager EX SMAP $48.63 $71.71 $94.79 $101,150.40 $149,156.80 $197,163.20
1003 Public Safety Technology Specialist EX MAR20_10 $31.53 $39.84 $48.15 $65,582.40 $82,867.20 $100,152.00
1014 Public Safety Technology Supervisor EX MAR30_13 $41.15 $52.00 $62.85 $85,592.00 $108,160.00 $130,728.00
5025 Public Service Aide I NEX MAR35_3 $18.96 $23.97 $28.98 $39,436.80 $49,857.60 $60,278.40
5026 Public Service Aide II NEX MAR35_4 $21.05 $26.59 $32.13 $43,784.00 $55,307.20 $66,830.40
0481 Purchasing Division Chief EX SMAP $48.63 $71.71 $94.79 $101,150.40 $149,156.80 $197,163.20
0616 Quality and Administration Division Chief EX SMAP $48.63 $71.71 $94.79 $101,150.40 $149,156.80 $197,163.20
6371 Quality Assurance Manager EX 81 $32.91 $45.72 $58.53 $68,452.80 $95,097.60 $121,742.40
*Employees on the Arlington County General Scale must be paid at least the County base rate of $15.00.
534
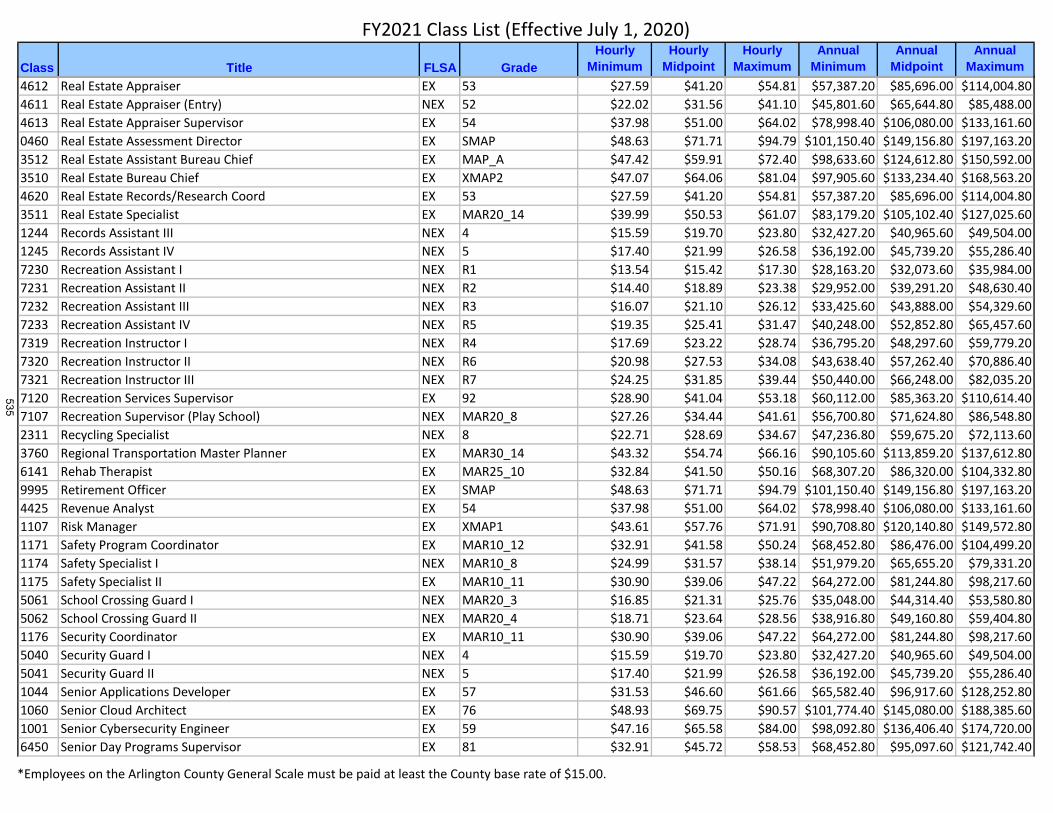
Class Title FLSA Grade
Hourly
Minimum
Hourly
Midpoint
Hourly
Maximum
Annual
Minimum
Annual
Midpoint
Annual
Maximum
FY2021 Class List (Effective July 1, 2020)
4612 Real Estate Appraiser EX 53 $27.59 $41.20 $54.81 $57,387.20 $85,696.00 $114,004.80
4611 Real Estate Appraiser (Entry) NEX 52 $22.02 $31.56 $41.10 $45,801.60 $65,644.80 $85,488.00
4613 Real Estate Appraiser Supervisor EX 54 $37.98 $51.00 $64.02 $78,998.40 $106,080.00 $133,161.60
0460 Real Estate Assessment Director EX SMAP $48.63 $71.71 $94.79 $101,150.40 $149,156.80 $197,163.20
3512 Real Estate Assistant Bureau Chief EX MAP_A $47.42 $59.91 $72.40 $98,633.60 $124,612.80 $150,592.00
3510 Real Estate Bureau Chief EX XMAP2 $47.07 $64.06 $81.04 $97,905.60 $133,234.40 $168,563.20
4620 Real Estate Records/Research Coord EX 53 $27.59 $41.20 $54.81 $57,387.20 $85,696.00 $114,004.80
3511 Real Estate Specialist EX MAR20_14 $39.99 $50.53 $61.07 $83,179.20 $105,102.40 $127,025.60
1244 Records Assistant III NEX 4 $15.59 $19.70 $23.80 $32,427.20 $40,965.60 $49,504.00
1245 Records Assistant IV NEX 5 $17.40 $21.99 $26.58 $36,192.00 $45,739.20 $55,286.40
7230 Recreation Assistant I NEX R1 $13.54 $15.42 $17.30 $28,163.20 $32,073.60 $35,984.00
7231 Recreation Assistant II NEX R2 $14.40 $18.89 $23.38 $29,952.00 $39,291.20 $48,630.40
7232 Recreation Assistant III NEX R3 $16.07 $21.10 $26.12 $33,425.60 $43,888.00 $54,329.60
7233 Recreation Assistant IV NEX R5 $19.35 $25.41 $31.47 $40,248.00 $52,852.80 $65,457.60
7319 Recreation Instructor I NEX R4 $17.69 $23.22 $28.74 $36,795.20 $48,297.60 $59,779.20
7320 Recreation Instructor II NEX R6 $20.98 $27.53 $34.08 $43,638.40 $57,262.40 $70,886.40
7321 Recreation Instructor III NEX R7 $24.25 $31.85 $39.44 $50,440.00 $66,248.00 $82,035.20
7120 Recreation Services Supervisor EX 92 $28.90 $41.04 $53.18 $60,112.00 $85,363.20 $110,614.40
7107 Recreation Supervisor (Play School) NEX MAR20_8 $27.26 $34.44 $41.61 $56,700.80 $71,624.80 $86,548.80
2311 Recycling Specialist NEX 8 $22.71 $28.69 $34.67 $47,236.80 $59,675.20 $72,113.60
3760 Regional Transportation Master Planner EX MAR30_14 $43.32 $54.74 $66.16 $90,105.60 $113,859.20 $137,612.80
6141 Rehab Therapist EX MAR25_10 $32.84 $41.50 $50.16 $68,307.20 $86,320.00 $104,332.80
9995 Retirement Officer EX SMAP $48.63 $71.71 $94.79 $101,150.40 $149,156.80 $197,163.20
4425 Revenue Analyst EX 54 $37.98 $51.00 $64.02 $78,998.40 $106,080.00 $133,161.60
1107 Risk Manager EX XMAP1 $43.61 $57.76 $71.91 $90,708.80 $120,140.80 $149,572.80
1171 Safety Program Coordinator EX MAR10_12 $32.91 $41.58 $50.24 $68,452.80 $86,476.00 $104,499.20
1174 Safety Specialist I NEX MAR10_8 $24.99 $31.57 $38.14 $51,979.20 $65,655.20 $79,331.20
1175 Safety Specialist II EX MAR10_11 $30.90 $39.06 $47.22 $64,272.00 $81,244.80 $98,217.60
5061 School Crossing Guard I NEX MAR20_3 $16.85 $21.31 $25.76 $35,048.00 $44,314.40 $53,580.80
5062 School Crossing Guard II NEX MAR20_4 $18.71 $23.64 $28.56 $38,916.80 $49,160.80 $59,404.80
1176 Security Coordinator EX MAR10_11 $30.90 $39.06 $47.22 $64,272.00 $81,244.80 $98,217.60
5040 Security Guard I NEX 4 $15.59 $19.70 $23.80 $32,427.20 $40,965.60 $49,504.00
5041 Security Guard II NEX 5 $17.40 $21.99 $26.58 $36,192.00 $45,739.20 $55,286.40
1044 Senior Applications Developer EX 57 $31.53 $46.60 $61.66 $65,582.40 $96,917.60 $128,252.80
1060 Senior Cloud Architect EX 76 $48.93 $69.75 $90.57 $101,774.40 $145,080.00 $188,385.60
1001 Senior Cybersecurity Engineer EX 59 $47.16 $65.58 $84.00 $98,092.80 $136,406.40 $174,720.00
6450 Senior Day Programs Supervisor EX 81 $32.91 $45.72 $58.53 $68,452.80 $95,097.60 $121,742.40
*Employees on the Arlington County General Scale must be paid at least the County base rate of $15.00.
535

Class Title FLSA Grade
Hourly
Minimum
Hourly
Midpoint
Hourly
Maximum
Annual
Minimum
Annual
Midpoint
Annual
Maximum
FY2021 Class List (Effective July 1, 2020)
1507 Senior Management Analyst EX MAR25_12 $37.39 $47.24 $57.09 $77,771.20 $98,259.20 $118,747.20
1004 Senior Network Engineer EX 75 $41.15 $55.26 $69.36 $85,592.00 $114,930.40 $144,268.80
1331 Senior Procurement Officer EX 54 $37.98 $51.00 $64.02 $78,998.40 $106,080.00 $133,161.60
1002 Senior Public Safety Technology Specialist EX MAR35_11 $37.93 $47.94 $57.95 $78,894.40 $99,715.20 $120,536.00
1047 Senior Systems Administrator EX 57 $31.53 $46.60 $61.66 $65,582.40 $96,917.60 $128,252.80
1455 Services Assistant IV NEX 5 $17.40 $21.99 $26.58 $36,192.00 $45,739.20 $55,286.40
0520 Sheriff EX CONST
0521 Sheriff Chief Deputy EX SMAP $48.63 $71.71 $94.79 $101,150.40 $149,156.80 $197,163.20
6700 Sign Language Interpreter NEX SLI $25.00 $37.50 $50.00
3606 Site Plan Review Section Supervisor EX MAR30_14 $43.32 $54.74 $66.16 $90,105.60 $113,859.20 $137,612.80
0204 Solid Waste Bureau Chief EX SMAP $48.63 $71.71 $94.79 $101,150.40 $149,156.80 $197,163.20
3154 Space Planner EX 30 $26.27 $34.60 $42.92 $54,641.60 $71,957.60 $89,273.60
1013 Sr Infrastructure Support Specialist EX 57 $31.53 $46.60 $61.66 $65,582.40 $96,917.60 $128,252.80
1007 Sr IT Analyst EX 57 $31.53 $46.60 $61.66 $65,582.40 $96,917.60 $128,252.80
1511 Sr Staff Admin/Management Specialist EX 53 $27.59 $41.20 $54.81 $57,387.20 $85,696.00 $114,004.80
4417 Sr Staff Financial Analyst EX 54 $37.98 $51.00 $64.02 $78,998.40 $106,080.00 $133,161.60
1016 Sr Staff Program Manager EX 54 $37.98 $51.00 $64.02 $78,998.40 $106,080.00 $133,161.60
4212 Staff Accounting/Auditing Specialist EX 53 $27.59 $41.20 $54.81 $57,387.20 $85,696.00 $114,004.80
1509 Staff Admin/Management Specialist NEX 52 $22.02 $31.56 $41.10 $45,801.60 $65,644.80 $85,488.00
4421 Staff Financial Analyst EX 53 $27.59 $41.20 $54.81 $57,387.20 $85,696.00 $114,004.80
1102 Staff Human Resources Manager EX 54 $37.98 $51.00 $64.02 $78,998.40 $106,080.00 $133,161.60
1104 Staff Human Resources/OD Specialist EX 53 $27.59 $41.20 $54.81 $57,387.20 $85,696.00 $114,004.80
1011 Staff Infrastructure Support Specialist NEX 56 $20.97 $32.91 $44.84 $43,617.60 $68,442.40 $93,267.20
1005 Staff IT Technician NEX 55 $19.14 $28.79 $38.44 $39,811.20 $59,883.20 $79,955.20
4413 Staff Management & Budget Specialist EX 53 $27.59 $41.20 $54.81 $57,387.20 $85,696.00 $114,004.80
1173 Staff Safety Specialist EX 53 $27.59 $41.20 $54.81 $57,387.20 $85,696.00 $114,004.80
1124 Staff Senior Human Resources Specialist EX 54 $37.98 $51.00 $64.02 $78,998.40 $106,080.00 $133,161.60
1125 Staff Support Technician NEX 51 $17.15 $25.40 $33.64 $35,672.00 $52,821.60 $69,971.20
2529 Stationary Watch Engineer NEX MAR30_8 $29.53 $37.31 $45.08 $61,422.40 $77,594.40 $93,766.40
8355 Structural Engineer I NEX MAR20_10 $31.53 $39.84 $48.15 $65,582.40 $82,867.20 $100,152.00
8359 Structural Engineer II NEX MAR25_11 $35.12 $44.39 $53.65 $73,049.60 $92,320.80 $111,592.00
1983 Student Assistant I NEX SA_1 $9.50 $12.25 $15.00 $19,760.00 $25,480.00 $31,200.00
1984 Student Assistant II NEX SA_2 $11.00 $14.75 $18.50 $22,880.00 $30,680.00 $38,480.00
1985 Summer Recreation Assistant I NEX SRA1 $13.40 $15.36 $17.31 $27,872.00 $31,938.40 $36,004.80
1986 Summer Recreation Assistant II NEX SRA2 $14.25 $18.70 $23.15 $29,640.00 $38,896.00 $48,152.00
1324 Supply Assistant III NEX 3 $14.04 $17.75 $21.46 $29,203.20 $36,920.00 $44,636.80
1325 Supply Assistant IV NEX 4 $15.59 $19.70 $23.80 $32,427.20 $40,965.60 $49,504.00
*Employees on the Arlington County General Scale must be paid at least the County base rate of $15.00.
536
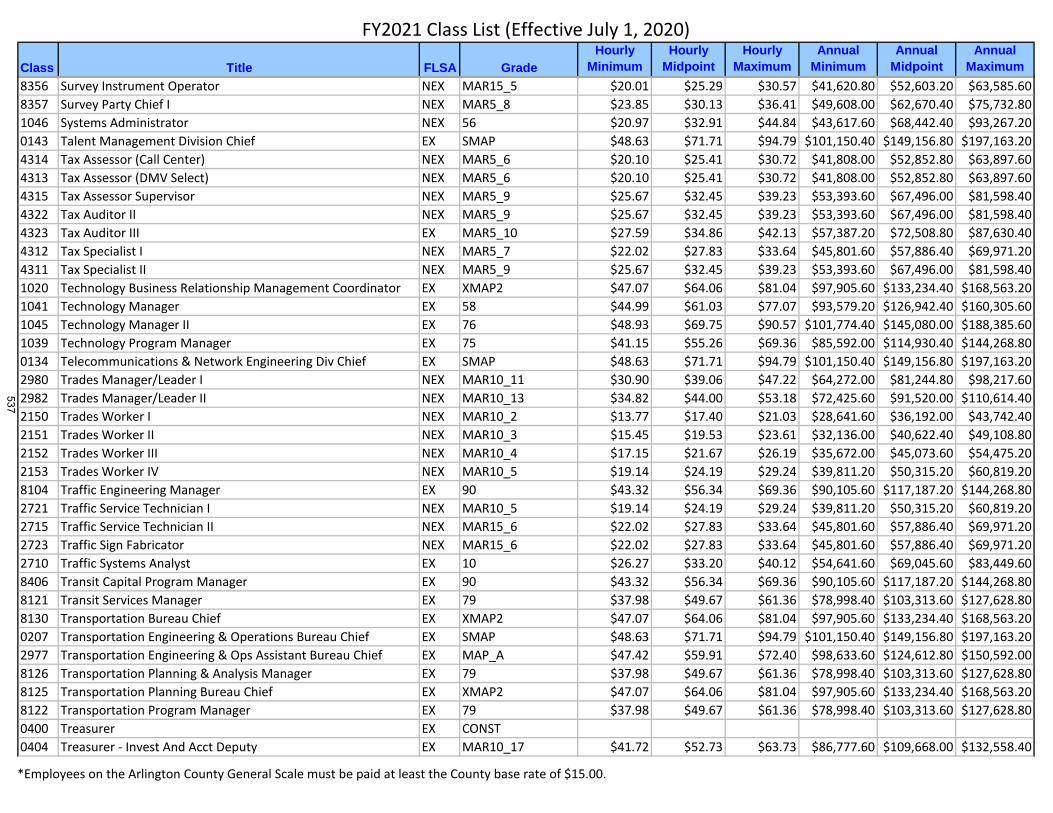
Class Title FLSA Grade
Hourly
Minimum
Hourly
Midpoint
Hourly
Maximum
Annual
Minimum
Annual
Midpoint
Annual
Maximum
FY2021 Class List (Effective July 1, 2020)
8356 Survey Instrument Operator NEX MAR15_5 $20.01 $25.29 $30.57 $41,620.80 $52,603.20 $63,585.60
8357 Survey Party Chief I NEX MAR5_8 $23.85 $30.13 $36.41 $49,608.00 $62,670.40 $75,732.80
1046 Systems Administrator NEX 56 $20.97 $32.91 $44.84 $43,617.60 $68,442.40 $93,267.20
0143 Talent Management Division Chief EX SMAP $48.63 $71.71 $94.79 $101,150.40 $149,156.80 $197,163.20
4314 Tax Assessor (Call Center) NEX MAR5_6 $20.10 $25.41 $30.72 $41,808.00 $52,852.80 $63,897.60
4313 Tax Assessor (DMV Select) NEX MAR5_6 $20.10 $25.41 $30.72 $41,808.00 $52,852.80 $63,897.60
4315 Tax Assessor Supervisor NEX MAR5_9 $25.67 $32.45 $39.23 $53,393.60 $67,496.00 $81,598.40
4322 Tax Auditor II NEX MAR5_9 $25.67 $32.45 $39.23 $53,393.60 $67,496.00 $81,598.40
4323 Tax Auditor III EX MAR5_10 $27.59 $34.86 $42.13 $57,387.20 $72,508.80 $87,630.40
4312 Tax Specialist I NEX MAR5_7 $22.02 $27.83 $33.64 $45,801.60 $57,886.40 $69,971.20
4311 Tax Specialist II NEX MAR5_9 $25.67 $32.45 $39.23 $53,393.60 $67,496.00 $81,598.40
1020 Technology Business Relationship Management Coordinator EX XMAP2 $47.07 $64.06 $81.04 $97,905.60 $133,234.40 $168,563.20
1041 Technology Manager EX 58 $44.99 $61.03 $77.07 $93,579.20 $126,942.40 $160,305.60
1045 Technology Manager II EX 76 $48.93 $69.75 $90.57 $101,774.40 $145,080.00 $188,385.60
1039 Technology Program Manager EX 75 $41.15 $55.26 $69.36 $85,592.00 $114,930.40 $144,268.80
0134 Telecommunications & Network Engineering Div Chief EX SMAP $48.63 $71.71 $94.79 $101,150.40 $149,156.80 $197,163.20
2980 Trades Manager/Leader I NEX MAR10_11 $30.90 $39.06 $47.22 $64,272.00 $81,244.80 $98,217.60
2982 Trades Manager/Leader II NEX MAR10_13 $34.82 $44.00 $53.18 $72,425.60 $91,520.00 $110,614.40
2150 Trades Worker I NEX MAR10_2 $13.77 $17.40 $21.03 $28,641.60 $36,192.00 $43,742.40
2151 Trades Worker II NEX MAR10_3 $15.45 $19.53 $23.61 $32,136.00 $40,622.40 $49,108.80
2152 Trades Worker III NEX MAR10_4 $17.15 $21.67 $26.19 $35,672.00 $45,073.60 $54,475.20
2153 Trades Worker IV NEX MAR10_5 $19.14 $24.19 $29.24 $39,811.20 $50,315.20 $60,819.20
8104 Traffic Engineering Manager EX 90 $43.32 $56.34 $69.36 $90,105.60 $117,187.20 $144,268.80
2721 Traffic Service Technician I NEX MAR10_5 $19.14 $24.19 $29.24 $39,811.20 $50,315.20 $60,819.20
2715 Traffic Service Technician II NEX MAR15_6 $22.02 $27.83 $33.64 $45,801.60 $57,886.40 $69,971.20
2723 Traffic Sign Fabricator NEX MAR15_6 $22.02 $27.83 $33.64 $45,801.60 $57,886.40 $69,971.20
2710 Traffic Systems Analyst EX 10 $26.27 $33.20 $40.12 $54,641.60 $69,045.60 $83,449.60
8406 Transit Capital Program Manager EX 90 $43.32 $56.34 $69.36 $90,105.60 $117,187.20 $144,268.80
8121 Transit Services Manager EX 79 $37.98 $49.67 $61.36 $78,998.40 $103,313.60 $127,628.80
8130 Transportation Bureau Chief EX XMAP2 $47.07 $64.06 $81.04 $97,905.60 $133,234.40 $168,563.20
0207 Transportation Engineering & Operations Bureau Chief EX SMAP $48.63 $71.71 $94.79 $101,150.40 $149,156.80 $197,163.20
2977 Transportation Engineering & Ops Assistant Bureau Chief EX MAP_A $47.42 $59.91 $72.40 $98,633.60 $124,612.80 $150,592.00
8126 Transportation Planning & Analysis Manager EX 79 $37.98 $49.67 $61.36 $78,998.40 $103,313.60 $127,628.80
8125 Transportation Planning Bureau Chief EX XMAP2 $47.07 $64.06 $81.04 $97,905.60 $133,234.40 $168,563.20
8122 Transportation Program Manager EX 79 $37.98 $49.67 $61.36 $78,998.40 $103,313.60 $127,628.80
0400 Treasurer EX CONST
0404 Treasurer - Invest And Acct Deputy EX MAR10_17 $41.72 $52.73 $63.73 $86,777.60 $109,668.00 $132,558.40
*Employees on the Arlington County General Scale must be paid at least the County base rate of $15.00.
537

Class Title FLSA Grade
Hourly
Minimum
Hourly
Midpoint
Hourly
Maximum
Annual
Minimum
Annual
Midpoint
Annual
Maximum
FY2021 Class List (Effective July 1, 2020)
0402 Treasurer Chief Deputy EX MAR10_18 $43.34 $54.77 $66.20 $90,147.20 $113,921.60 $137,696.00
0403 Treasurer Compliance Deputy EX MAR10_16 $40.12 $50.69 $61.26 $83,449.60 $105,435.20 $127,420.80
0401 Treasurer Operations Deputy EX MAR10_16 $40.12 $50.69 $61.26 $83,449.60 $105,435.20 $127,420.80
0405 Treasurer Technology Deputy EX MAR10_16 $40.12 $50.69 $61.26 $83,449.60 $105,435.20 $127,420.80
4811 Treasury Program Specialist I NEX 7 $20.97 $26.50 $32.03 $43,617.60 $55,120.00 $66,622.40
4812 Treasury Program Supervisor II NEX MAR5_8 $23.85 $30.13 $36.41 $49,608.00 $62,670.40 $75,732.80
4822 Treasury Specialist I NEX MAR5_5 $18.27 $23.09 $27.91 $38,001.60 $48,027.20 $58,052.80
4823 Treasury Specialist II NEX MAR5_6 $20.10 $25.41 $30.72 $41,808.00 $52,852.80 $63,897.60
2923 Tree Maintenance Worker NEX MAR10_7 $23.07 $29.16 $35.24 $47,985.60 $60,642.40 $73,299.20
3609 Urban Design Section Supervisor EX MAR30_14 $43.32 $54.74 $66.16 $90,105.60 $113,859.20 $137,612.80
7560 Urban Forester EX MAR10_10 $28.90 $36.52 $44.14 $60,112.00 $75,961.60 $91,811.20
1454 Utility Billing & Customer Service Manager EX 33 $36.68 $50.37 $64.05 $76,294.40 $104,759.20 $133,224.00
9416 Victim Specialist I NEX 9 $24.44 $30.90 $37.36 $50,835.20 $64,272.00 $77,708.80
9150 Victim Specialist II NEX 10 $26.27 $33.20 $40.12 $54,641.60 $69,045.60 $83,449.60
7004 Virtual Library Services Manager EX XMAP1 $43.61 $57.76 $71.91 $90,708.80 $120,140.80 $149,572.80
6671 Volunteer Services Program Coordinator EX 10 $26.27 $33.20 $40.12 $54,641.60 $69,045.60 $83,449.60
1310 Warehouse Coordinator NEX 7 $20.97 $26.50 $32.03 $43,617.60 $55,120.00 $66,622.40
1321 Warehouse Supervisor NEX 8 $22.71 $28.69 $34.67 $47,236.80 $59,675.20 $72,113.60
1326 Warehouse Technician I NEX 5 $17.40 $21.99 $26.58 $36,192.00 $45,739.20 $55,286.40
2662 Wastewater Maintenance Technician NEX MAR5_9 $25.67 $32.45 $39.23 $53,393.60 $67,496.00 $81,598.40
0203 Water, Sewer and Streets Bureau Chief EX SMAP $48.63 $71.71 $94.79 $101,150.40 $149,156.80 $197,163.20
8230 Water/Sewer Records Coordinator NEX 8 $22.71 $28.69 $34.67 $47,236.80 $59,675.20 $72,113.60
3750 Watershed Programs Manager EX MAP_A $47.42 $59.91 $72.40 $98,633.60 $124,612.80 $150,592.00
1009 Web Developer EX MAR30_10 $34.16 $43.16 $52.16 $71,052.80 $89,772.80 $108,492.80
2431 Welder NEX MAR10_7 $23.07 $29.16 $35.24 $47,985.60 $60,642.40 $73,299.20
6687 WIC Program Supervisor EX MAR10_11 $30.90 $39.06 $47.22 $64,272.00 $81,244.80 $98,217.60
2605 WPCP Operations Specialist EX MAR25_11 $35.12 $44.39 $53.65 $73,049.60 $92,320.80 $111,592.00
2973 WSS Chief Support Engineer EX MAP_A $47.42 $59.91 $72.40 $98,633.60 $124,612.80 $150,592.00
2350 WSS Control Center Technician I NEX MAR20_6 $22.97 $29.04 $35.10 $47,777.60 $60,392.80 $73,008.00
2355 WSS Control Center Technician II NEX MAR20_7 $25.17 $31.81 $38.44 $52,353.60 $66,154.40 $79,955.20
2347 WSS Crew Leader NEX MAR10_9 $26.89 $34.00 $41.10 $55,931.20 $70,709.60 $85,488.00
2351 WSS Equipment Mechanic I NEX MAR25_6 $23.93 $30.25 $36.57 $49,774.40 $62,920.00 $76,065.60
2352 WSS Equipment Mechanic II NEX MAR25_7 $26.22 $33.13 $40.04 $54,537.60 $68,910.40 $83,283.20
2361 WSS Equipment Operator NEX 50 $22.97 $29.91 $36.84 $47,777.60 $62,202.40 $76,627.20
2346 WSS Master Technician NEX MAR20_7 $25.17 $31.81 $38.44 $52,353.60 $66,154.40 $79,955.20
2343 WSS Service Technician NEX MAR20_5 $20.88 $26.39 $31.90 $43,430.40 $54,891.20 $66,352.00
2342 WSS Service Technician-Trainee NEX MAR20_4 $18.71 $23.64 $28.56 $38,916.80 $49,160.80 $59,404.80
*Employees on the Arlington County General Scale must be paid at least the County base rate of $15.00.
538

Class Title FLSA Grade
Hourly
Minimum
Hourly
Midpoint
Hourly
Maximum
Annual
Minimum
Annual
Midpoint
Annual
Maximum
FY2021 Class List (Effective July 1, 2020)
2345 WSS Sr Service Technician NEX MAR20_6 $22.97 $29.04 $35.10 $47,777.60 $60,392.80 $73,008.00
0311 Zoning Division Chief EX SMAP $48.63 $71.71 $94.79 $101,150.40 $149,156.80 $197,163.20
5610 Zoning Inspector I NEX 9 $24.44 $30.90 $37.36 $50,835.20 $64,272.00 $77,708.80
5611 Zoning Inspector II NEX 10 $26.27 $33.20 $40.12 $54,641.60 $69,045.60 $83,449.60
3151 Zoning Plan Reviewer NEX 9 $24.44 $30.90 $37.36 $50,835.20 $64,272.00 $77,708.80
3111 Zoning Technician NEX 8 $22.71 $28.69 $34.67 $47,236.80 $59,675.20 $72,113.60
*Employees on the Arlington County General Scale must be paid at least the County base rate of $15.00.
539

FY 2021 Arlington County Pay Scales (Effective July 1, 2020)
Grade MAR Minimum Midpoint Maximum Minimum Midpoint Maximum
1 0% $11.53 $14.58 $17.62 $23,982.40 $30,316.00 $36,649.60
2 0% $12.51 $15.81 $19.11 $26,020.80 $32,884.80 $39,748.80
3 0% $14.04 $17.75 $21.46 $29,203.20 $36,920.00 $44,636.80
4 0% $15.59 $19.70 $23.80 $32,427.20 $40,965.60 $49,504.00
5 0% $17.40 $21.99 $26.58 $36,192.00 $45,739.20 $55,286.40
6 0% $19.14 $24.20 $29.25 $39,811.20 $50,325.60 $60,840.00
7 0% $20.97 $26.50 $32.03 $43,617.60 $55,120.00 $66,622.40
8 0% $22.71 $28.69 $34.67 $47,236.80 $59,675.20 $72,113.60
9 0% $24.44 $30.90 $37.36 $50,835.20 $64,272.00 $77,708.80
10 0% $26.27 $33.20 $40.12 $54,641.60 $69,045.60 $83,449.60
11 0% $28.09 $35.51 $42.92 $58,427.20 $73,850.40 $89,273.60
12 0% $29.91 $37.79 $45.67 $62,212.80 $78,603.20 $94,993.60
13 0% $31.65 $40.00 $48.34 $65,832.00 $83,189.60 $100,547.20
14 0% $33.32 $42.11 $50.89 $69,305.60 $87,578.40 $105,851.20
15 0% $34.93 $44.14 $53.35 $72,654.40 $91,811.20 $110,968.00
16 0% $36.47 $46.08 $55.69 $75,857.60 $95,846.40 $115,835.20
17 0% $37.92 $47.93 $57.93 $78,873.60 $99,684.00 $120,494.40
18 0% $39.40 $49.79 $60.18 $81,952.00 $103,563.20 $125,174.40
19 0% $40.93 $51.73 $62.53 $85,134.40 $107,598.40 $130,062.40
20 0% $42.54 $53.76 $64.98 $88,483.20 $111,820.80 $135,158.40
21 0% $44.20 $55.87 $67.53 $91,936.00 $116,199.20 $140,462.40
22 0% $45.96 $58.09 $70.21 $95,596.80 $120,816.80 $146,036.80
23 0% $48.05 $60.73 $73.40 $99,944.00 $126,308.00 $152,672.00
24 0% $51.56 $65.16 $78.75 $107,244.80 $135,522.40 $163,800.00
1 5% $12.11 $15.31 $18.51 $25,188.80 $31,844.80 $38,500.80
2 5% $13.14 $16.61 $20.07 $27,331.20 $34,538.40 $41,745.60
3 5% $14.75 $18.65 $22.54 $30,680.00 $38,781.60 $46,883.20
4 5% $16.38 $20.69 $24.99 $34,070.40 $43,024.80 $51,979.20
5 5% $18.27 $23.09 $27.91 $38,001.60 $48,027.20 $58,052.80
6 5% $20.10 $25.41 $30.72 $41,808.00 $52,852.80 $63,897.60
7 5% $22.02 $27.83 $33.64 $45,801.60 $57,886.40 $69,971.20
8 5% $23.85 $30.13 $36.41 $49,608.00 $62,670.40 $75,732.80
9 5% $25.67 $32.45 $39.23 $53,393.60 $67,496.00 $81,598.40
10 5% $27.59 $34.86 $42.13 $57,387.20 $72,508.80 $87,630.40
11 5% $29.50 $37.29 $45.07 $61,360.00 $77,552.80 $93,745.60
12 5% $31.41 $39.69 $47.96 $65,332.80 $82,544.80 $99,756.80
13 5% $33.24 $42.00 $50.76 $69,139.20 $87,360.00 $105,580.80
14 5% $34.99 $44.22 $53.44 $72,779.20 $91,967.20 $111,155.20
15 5% $36.68 $46.35 $56.02 $76,294.40 $96,408.00 $116,521.60
16 5% $38.30 $48.39 $58.48 $79,664.00 $100,651.20 $121,638.40
17 5% $39.82 $50.33 $60.83 $82,825.60 $104,676.00 $126,526.40
18 5% $41.37 $52.28 $63.19 $86,049.60 $108,742.40 $131,435.20
19 5% $42.98 $54.32 $65.66 $89,398.40 $112,985.60 $136,572.80
20 5% $44.67 $56.45 $68.23 $92,913.60 $117,416.00 $141,918.40
21 5% $46.41 $58.66 $70.91 $96,532.80 $122,012.80 $147,492.80
22 5% $48.26 $61.00 $73.73 $100,380.80 $126,869.60 $153,358.40
23 5% $50.46 $63.77 $77.07 $104,956.80 $132,631.20 $160,305.60
24 5% $54.14 $68.42 $82.69 $112,611.20 $142,303.20 $171,995.20
Hourly Rates Annual Rates
*Some grade minimums fall below the County base rate of $15.00. The base rate should be applied in these cases.540
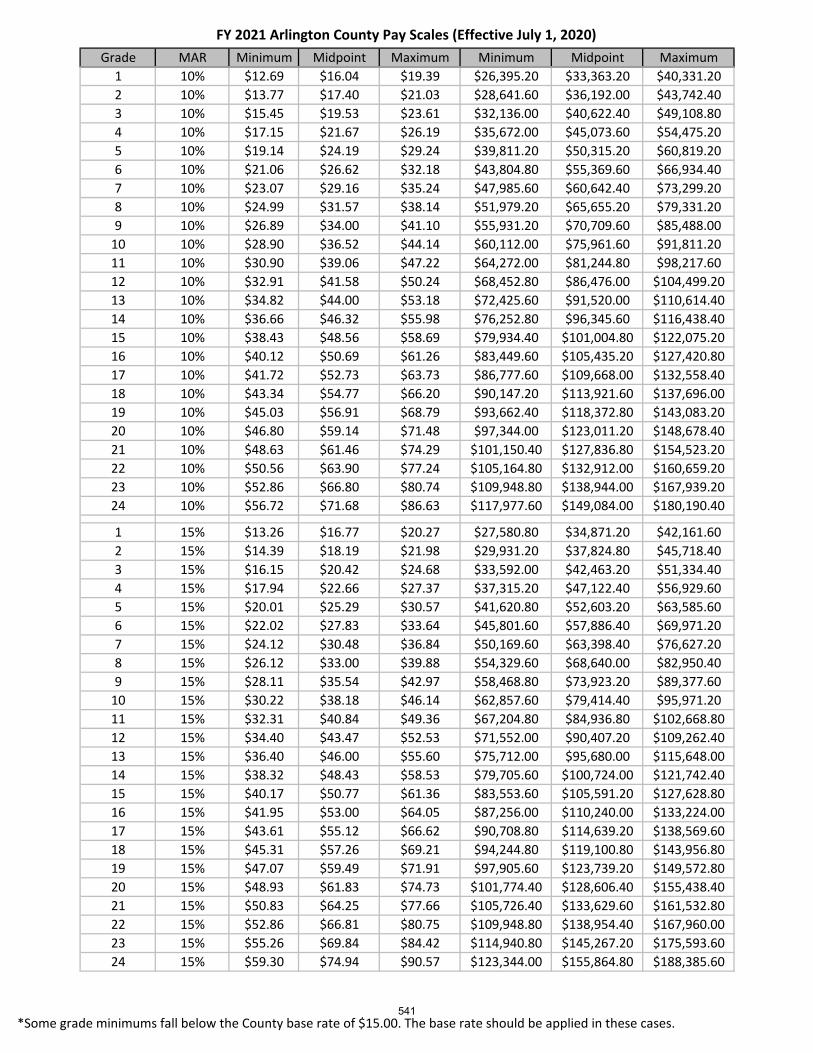
FY 2021 Arlington County Pay Scales (Effective July 1, 2020)
Grade MAR Minimum Midpoint Maximum Minimum Midpoint Maximum
1 10% $12.69 $16.04 $19.39 $26,395.20 $33,363.20 $40,331.20
2 10% $13.77 $17.40 $21.03 $28,641.60 $36,192.00 $43,742.40
3 10% $15.45 $19.53 $23.61 $32,136.00 $40,622.40 $49,108.80
4 10% $17.15 $21.67 $26.19 $35,672.00 $45,073.60 $54,475.20
5 10% $19.14 $24.19 $29.24 $39,811.20 $50,315.20 $60,819.20
6 10% $21.06 $26.62 $32.18 $43,804.80 $55,369.60 $66,934.40
7 10% $23.07 $29.16 $35.24 $47,985.60 $60,642.40 $73,299.20
8 10% $24.99 $31.57 $38.14 $51,979.20 $65,655.20 $79,331.20
9 10% $26.89 $34.00 $41.10 $55,931.20 $70,709.60 $85,488.00
10 10% $28.90 $36.52 $44.14 $60,112.00 $75,961.60 $91,811.20
11 10% $30.90 $39.06 $47.22 $64,272.00 $81,244.80 $98,217.60
12 10% $32.91 $41.58 $50.24 $68,452.80 $86,476.00 $104,499.20
13 10% $34.82 $44.00 $53.18 $72,425.60 $91,520.00 $110,614.40
14 10% $36.66 $46.32 $55.98 $76,252.80 $96,345.60 $116,438.40
15 10% $38.43 $48.56 $58.69 $79,934.40 $101,004.80 $122,075.20
16 10% $40.12 $50.69 $61.26 $83,449.60 $105,435.20 $127,420.80
17 10% $41.72 $52.73 $63.73 $86,777.60 $109,668.00 $132,558.40
18 10% $43.34 $54.77 $66.20 $90,147.20 $113,921.60 $137,696.00
19 10% $45.03 $56.91 $68.79 $93,662.40 $118,372.80 $143,083.20
20 10% $46.80 $59.14 $71.48 $97,344.00 $123,011.20 $148,678.40
21 10% $48.63 $61.46 $74.29 $101,150.40 $127,836.80 $154,523.20
22 10% $50.56 $63.90 $77.24 $105,164.80 $132,912.00 $160,659.20
23 10% $52.86 $66.80 $80.74 $109,948.80 $138,944.00 $167,939.20
24 10% $56.72 $71.68 $86.63 $117,977.60 $149,084.00 $180,190.40
1 15% $13.26 $16.77 $20.27 $27,580.80 $34,871.20 $42,161.60
2 15% $14.39 $18.19 $21.98 $29,931.20 $37,824.80 $45,718.40
3 15% $16.15 $20.42 $24.68 $33,592.00 $42,463.20 $51,334.40
4 15% $17.94 $22.66 $27.37 $37,315.20 $47,122.40 $56,929.60
5 15% $20.01 $25.29 $30.57 $41,620.80 $52,603.20 $63,585.60
6 15% $22.02 $27.83 $33.64 $45,801.60 $57,886.40 $69,971.20
7 15% $24.12 $30.48 $36.84 $50,169.60 $63,398.40 $76,627.20
8 15% $26.12 $33.00 $39.88 $54,329.60 $68,640.00 $82,950.40
9 15% $28.11 $35.54 $42.97 $58,468.80 $73,923.20 $89,377.60
10 15% $30.22 $38.18 $46.14 $62,857.60 $79,414.40 $95,971.20
11 15% $32.31 $40.84 $49.36 $67,204.80 $84,936.80 $102,668.80
12 15% $34.40 $43.47 $52.53 $71,552.00 $90,407.20 $109,262.40
13 15% $36.40 $46.00 $55.60 $75,712.00 $95,680.00 $115,648.00
14 15% $38.32 $48.43 $58.53 $79,705.60 $100,724.00 $121,742.40
15 15% $40.17 $50.77 $61.36 $83,553.60 $105,591.20 $127,628.80
16 15% $41.95 $53.00 $64.05 $87,256.00 $110,240.00 $133,224.00
17 15% $43.61 $55.12 $66.62 $90,708.80 $114,639.20 $138,569.60
18 15% $45.31 $57.26 $69.21 $94,244.80 $119,100.80 $143,956.80
19 15% $47.07 $59.49 $71.91 $97,905.60 $123,739.20 $149,572.80
20 15% $48.93 $61.83 $74.73 $101,774.40 $128,606.40 $155,438.40
21 15% $50.83 $64.25 $77.66 $105,726.40 $133,629.60 $161,532.80
22 15% $52.86 $66.81 $80.75 $109,948.80 $138,954.40 $167,960.00
23 15% $55.26 $69.84 $84.42 $114,940.80 $145,267.20 $175,593.60
24 15% $59.30 $74.94 $90.57 $123,344.00 $155,864.80 $188,385.60
*Some grade minimums fall below the County base rate of $15.00. The base rate should be applied in these cases.541

FY 2021 Arlington County Pay Scales (Effective July 1, 2020)
Grade MAR Minimum Midpoint Maximum Minimum Midpoint Maximum
1 20% $13.84 $17.50 $21.15 $28,787.20 $36,389.60 $43,992.00
2 20% $15.02 $18.98 $22.94 $31,241.60 $39,478.40 $47,715.20
3 20% $16.85 $21.31 $25.76 $35,048.00 $44,314.40 $53,580.80
4 20% $18.71 $23.64 $28.56 $38,916.80 $49,160.80 $59,404.80
5 20% $20.88 $26.39 $31.90 $43,430.40 $54,891.20 $66,352.00
6 20% $22.97 $29.04 $35.10 $47,777.60 $60,392.80 $73,008.00
7 20% $25.17 $31.81 $38.44 $52,353.60 $66,154.40 $79,955.20
8 20% $27.26 $34.44 $41.61 $56,700.80 $71,624.80 $86,548.80
9 20% $29.34 $37.09 $44.84 $61,027.20 $77,147.20 $93,267.20
10 20% $31.53 $39.84 $48.15 $65,582.40 $82,867.20 $100,152.00
11 20% $33.71 $42.61 $51.51 $70,116.80 $88,628.80 $107,140.80
12 20% $35.90 $45.36 $54.81 $74,672.00 $94,338.40 $114,004.80
13 20% $37.98 $48.00 $58.01 $78,998.40 $99,829.60 $120,660.80
14 20% $39.99 $50.53 $61.07 $83,179.20 $105,102.40 $127,025.60
15 20% $41.92 $52.97 $64.02 $87,193.60 $110,177.60 $133,161.60
16 20% $43.77 $55.30 $66.83 $91,041.60 $115,024.00 $139,006.40
17 20% $45.51 $57.52 $69.52 $94,660.80 $119,631.20 $144,601.60
18 20% $47.28 $59.75 $72.22 $98,342.40 $124,280.00 $150,217.60
19 20% $49.12 $62.08 $75.04 $102,169.60 $129,126.40 $156,083.20
20 20% $51.05 $64.52 $77.98 $106,184.00 $134,191.20 $162,198.40
21 20% $53.04 $67.04 $81.04 $110,323.20 $139,443.20 $168,563.20
22 20% $55.16 $69.71 $84.26 $114,732.80 $144,996.80 $175,260.80
23 20% $57.66 $72.88 $88.09 $119,932.80 $151,580.00 $183,227.20
24 20% $61.88 $78.19 $94.50 $128,710.40 $162,635.20 $196,560.00
1 25% $14.42 $18.23 $22.03 $29,993.60 $37,908.00 $45,822.40
2 25% $15.64 $19.77 $23.89 $32,531.20 $41,111.20 $49,691.20
3 25% $17.55 $22.19 $26.83 $36,504.00 $46,155.20 $55,806.40
4 25% $19.49 $24.63 $29.76 $40,539.20 $51,220.00 $61,900.80
5 25% $21.75 $27.49 $33.23 $45,240.00 $57,179.20 $69,118.40
6 25% $23.93 $30.25 $36.57 $49,774.40 $62,920.00 $76,065.60
7 25% $26.22 $33.13 $40.04 $54,537.60 $68,910.40 $83,283.20
8 25% $28.39 $35.87 $43.34 $59,051.20 $74,599.20 $90,147.20
9 25% $30.55 $38.63 $46.70 $63,544.00 $80,340.00 $97,136.00
10 25% $32.84 $41.50 $50.16 $68,307.20 $86,320.00 $104,332.80
11 25% $35.12 $44.39 $53.65 $73,049.60 $92,320.80 $111,592.00
12 25% $37.39 $47.24 $57.09 $77,771.20 $98,259.20 $118,747.20
13 25% $39.57 $50.00 $60.43 $82,305.60 $104,000.00 $125,694.40
14 25% $41.65 $52.64 $63.62 $86,632.00 $109,480.80 $132,329.60
15 25% $43.67 $55.18 $66.69 $90,833.60 $114,774.40 $138,715.20
16 25% $45.59 $57.61 $69.62 $94,827.20 $119,818.40 $144,809.60
17 25% $47.40 $59.91 $72.42 $98,592.00 $124,612.80 $150,633.60
18 25% $49.25 $62.24 $75.23 $102,440.00 $129,459.20 $156,478.40
19 25% $51.17 $64.67 $78.17 $106,433.60 $134,513.60 $162,593.60
20 25% $53.18 $67.21 $81.23 $110,614.40 $139,786.40 $168,958.40
21 25% $55.26 $69.84 $84.42 $114,940.80 $145,267.20 $175,593.60
22 25% $57.45 $72.61 $87.77 $119,496.00 $151,028.80 $182,561.60
23 25% $60.07 $75.91 $91.75 $124,945.60 $157,892.80 $190,840.00
24 25% $64.45 $81.45 $98.44 $134,056.00 $169,405.60 $204,755.20
*Some grade minimums fall below the County base rate of $15.00. The base rate should be applied in these cases.542

FY 2021 Arlington County Pay Scales (Effective July 1, 2020)
Grade MAR Minimum Midpoint Maximum Minimum Midpoint Maximum
1 30% $14.99 $18.95 $22.91 $31,179.20 $39,416.00 $47,652.80
2 30% $16.27 $20.56 $24.85 $33,841.60 $42,764.80 $51,688.00
3 30% $18.26 $23.08 $27.90 $37,980.80 $48,006.40 $58,032.00
4 30% $20.27 $25.61 $30.94 $42,161.60 $53,258.40 $64,355.20
5 30% $22.62 $28.59 $34.56 $47,049.60 $59,467.20 $71,884.80
6 30% $24.89 $31.46 $38.03 $51,771.20 $65,436.80 $79,102.40
7 30% $27.27 $34.46 $41.64 $56,721.60 $71,666.40 $86,611.20
8 30% $29.53 $37.31 $45.08 $61,422.40 $77,594.40 $93,766.40
9 30% $31.78 $40.18 $48.57 $66,102.40 $83,564.00 $101,025.60
10 30% $34.16 $43.16 $52.16 $71,052.80 $89,772.80 $108,492.80
11 30% $36.52 $46.16 $55.80 $75,961.60 $96,012.80 $116,064.00
12 30% $38.89 $49.14 $59.38 $80,891.20 $102,200.80 $123,510.40
13 30% $41.15 $52.00 $62.85 $85,592.00 $108,160.00 $130,728.00
14 30% $43.32 $54.74 $66.16 $90,105.60 $113,859.20 $137,612.80
15 30% $45.41 $57.39 $69.36 $94,452.80 $119,360.80 $144,268.80
16 30% $47.42 $59.91 $72.40 $98,633.60 $124,612.80 $150,592.00
17 30% $49.30 $62.31 $75.31 $102,544.00 $129,594.40 $156,644.80
18 30% $51.22 $64.73 $78.24 $106,537.60 $134,638.40 $162,739.20
19 30% $53.21 $67.25 $81.29 $110,676.80 $139,880.00 $169,083.20
20 30% $55.31 $69.90 $84.48 $115,044.80 $145,381.60 $175,718.40
21 30% $57.46 $72.63 $87.79 $119,516.80 $151,060.00 $182,603.20
22 30% $59.75 $75.52 $91.28 $124,280.00 $157,071.20 $189,862.40
23 30% $62.47 $78.95 $95.42 $129,937.60 $164,205.60 $198,473.60
24 30% $67.03 $84.71 $102.38 $139,422.40 $176,186.40 $212,950.40
1 35% $15.57 $19.68 $23.79 $32,385.60 $40,934.40 $49,483.20
2 35% $16.90 $21.35 $25.80 $35,152.00 $44,408.00 $53,664.00
3 35% $18.96 $23.97 $28.98 $39,436.80 $49,857.60 $60,278.40
4 35% $21.05 $26.59 $32.13 $43,784.00 $55,307.20 $66,830.40
5 35% $23.49 $29.69 $35.89 $48,859.20 $61,755.20 $74,651.20
6 35% $25.84 $32.67 $39.49 $53,747.20 $67,943.20 $82,139.20
7 35% $28.31 $35.78 $43.25 $58,884.80 $74,422.40 $89,960.00
8 35% $30.66 $38.74 $46.81 $63,772.80 $80,568.80 $97,364.80
9 35% $33.00 $41.72 $50.44 $68,640.00 $86,777.60 $104,915.20
10 35% $35.47 $44.82 $54.17 $73,777.60 $93,225.60 $112,673.60
11 35% $37.93 $47.94 $57.95 $78,894.40 $99,715.20 $120,536.00
12 35% $40.38 $51.02 $61.66 $83,990.40 $106,121.60 $128,252.80
13 35% $42.73 $54.00 $65.26 $88,878.40 $112,309.60 $135,740.80
14 35% $44.99 $56.85 $68.71 $93,579.20 $118,248.00 $142,916.80
15 35% $47.16 $59.60 $72.03 $98,092.80 $123,957.60 $149,822.40
16 35% $49.24 $62.22 $75.19 $102,419.20 $129,407.20 $156,395.20
17 35% $51.20 $64.71 $78.21 $106,496.00 $134,586.40 $162,676.80
18 35% $53.19 $67.22 $81.25 $110,635.20 $139,817.60 $169,000.00
19 35% $55.26 $69.84 $84.42 $114,940.80 $145,267.20 $175,593.60
20 35% $57.43 $72.58 $87.73 $119,454.40 $150,966.40 $182,478.40
21 35% $59.67 $75.42 $91.17 $124,113.60 $156,873.60 $189,633.60
22 35% $62.05 $78.42 $94.79 $129,064.00 $163,113.60 $197,163.20
23 35% $64.87 $81.98 $99.09 $134,929.60 $170,518.40 $206,107.20
24 35% $69.61 $87.97 $106.32 $144,788.80 $182,967.20 $221,145.60
*Some grade minimums fall below the County base rate of $15.00. The base rate should be applied in these cases.543

FY 2021 Arlington County Pay Scales (Effective July 1, 2020)
Grade MAR Minimum Midpoint Maximum Minimum Midpoint Maximum
1 40% $16.15 $20.41 $24.67 $33,592.00 $42,452.80 $51,313.60
2 40% $17.52 $22.14 $26.76 $36,441.60 $46,051.20 $55,660.80
3 40% $19.66 $24.86 $30.05 $40,892.80 $51,698.40 $62,504.00
4 40% $21.83 $27.58 $33.33 $45,406.40 $57,366.40 $69,326.40
5 40% $24.36 $30.79 $37.22 $50,668.80 $64,043.20 $77,417.60
6 40% $26.80 $33.88 $40.95 $55,744.00 $70,460.00 $85,176.00
7 40% $29.36 $37.11 $44.85 $61,068.80 $77,178.40 $93,288.00
8 40% $31.80 $40.17 $48.54 $66,144.00 $83,553.60 $100,963.20
9 40% $34.22 $43.27 $52.31 $71,177.60 $89,991.20 $108,804.80
10 40% $36.78 $46.48 $56.17 $76,502.40 $96,668.00 $116,833.60
11 40% $39.33 $49.71 $60.09 $81,806.40 $103,396.80 $124,987.20
12 40% $41.88 $52.91 $63.94 $87,110.40 $110,052.80 $132,995.20
13 40% $44.31 $56.00 $67.68 $92,164.80 $116,469.60 $140,774.40
14 40% $46.65 $58.95 $71.25 $97,032.00 $122,616.00 $148,200.00
15 40% $48.91 $61.80 $74.69 $101,732.80 $128,544.00 $155,355.20
16 40% $51.06 $64.52 $77.97 $106,204.80 $134,191.20 $162,177.60
17 40% $53.09 $67.10 $81.11 $110,427.20 $139,568.00 $168,708.80
18 40% $55.16 $69.71 $84.26 $114,732.80 $144,996.80 $175,260.80
19 40% $57.31 $72.43 $87.55 $119,204.80 $150,654.40 $182,104.00
20 40% $59.56 $75.27 $90.98 $123,884.80 $156,561.60 $189,238.40
21 40% $61.89 $78.22 $94.55 $128,731.20 $162,697.60 $196,664.00
22 40% $64.35 $81.33 $98.30 $133,848.00 $169,156.00 $204,464.00
23 40% $67.27 $85.02 $102.76 $139,921.60 $176,831.20 $213,740.80
24 40% $72.19 $91.22 $110.25 $150,155.20 $189,737.60 $229,320.00
1 45% $16.72 $21.14 $25.55 $34,777.60 $43,960.80 $53,144.00
2 45% $18.14 $22.93 $27.71 $37,731.20 $47,684.00 $57,636.80
3 45% $20.36 $25.74 $31.12 $42,348.80 $53,539.20 $64,729.60
4 45% $22.61 $28.56 $34.51 $47,028.80 $59,404.80 $71,780.80
5 45% $25.23 $31.89 $38.55 $52,478.40 $66,331.20 $80,184.00
6 45% $27.76 $35.09 $42.42 $57,740.80 $72,987.20 $88,233.60
7 45% $30.41 $38.43 $46.45 $63,252.80 $79,934.40 $96,616.00
8 45% $32.93 $41.61 $50.28 $68,494.40 $86,538.40 $104,582.40
9 45% $35.45 $44.82 $54.18 $73,736.00 $93,215.20 $112,694.40
10 45% $38.10 $48.14 $58.18 $79,248.00 $100,131.20 $121,014.40
11 45% $40.74 $51.49 $62.24 $84,739.20 $107,099.20 $129,459.20
12 45% $43.37 $54.80 $66.23 $90,209.60 $113,984.00 $137,758.40
13 45% $45.90 $58.00 $70.10 $95,472.00 $120,640.00 $145,808.00
14 45% $48.32 $61.06 $73.80 $100,505.60 $127,004.80 $153,504.00
15 45% $50.65 $64.01 $77.36 $105,352.00 $133,130.40 $160,908.80
16 45% $52.89 $66.83 $80.76 $110,011.20 $138,996.00 $167,980.80
17 45% $54.99 $69.50 $84.00 $114,379.20 $144,549.60 $174,720.00
18 45% $57.13 $72.20 $87.27 $118,830.40 $150,176.00 $181,521.60
19 45% $59.35 $75.01 $90.67 $123,448.00 $156,020.80 $188,593.60
20 45% $61.69 $77.96 $94.23 $128,315.20 $162,156.80 $195,998.40
21 45% $64.09 $81.01 $97.92 $133,307.20 $168,490.40 $203,673.60
22 45% $66.65 $84.23 $101.81 $138,632.00 $175,198.40 $211,764.80
23 45% $69.68 $88.06 $106.44 $144,934.40 $183,164.80 $221,395.20
24 45% $74.77 $94.48 $114.19 $155,521.60 $196,518.40 $237,515.20
*Some grade minimums fall below the County base rate of $15.00. The base rate should be applied in these cases.544

FY 2021 Arlington County Pay Scales (Effective July 1, 2020)
Grade MAR Minimum Midpoint Maximum Minimum Midpoint Maximum
1 50% $17.30 $21.87 $26.43 $35,984.00 $45,479.20 $54,974.40
2 50% $18.77 $23.72 $28.67 $39,041.60 $49,337.60 $59,633.60
3 50% $21.06 $26.63 $32.19 $43,804.80 $55,380.00 $66,955.20
4 50% $23.39 $29.55 $35.70 $48,651.20 $61,453.60 $74,256.00
5 50% $26.10 $32.99 $39.87 $54,288.00 $68,608.80 $82,929.60
6 50% $28.71 $36.30 $43.88 $59,716.80 $75,493.60 $91,270.40
7 50% $31.46 $39.76 $48.05 $65,436.80 $82,690.40 $99,944.00
8 50% $34.07 $43.04 $52.01 $70,865.60 $89,523.20 $108,180.80
9 50% $36.66 $46.35 $56.04 $76,252.80 $96,408.00 $116,563.20
10 50% $39.41 $49.80 $60.18 $81,972.80 $103,573.60 $125,174.40
11 50% $42.14 $53.26 $64.38 $87,651.20 $110,780.80 $133,910.40
12 50% $44.87 $56.69 $68.51 $93,329.60 $117,915.20 $142,500.80
13 50% $47.48 $60.00 $72.51 $98,758.40 $124,789.60 $150,820.80
14 50% $49.98 $63.16 $76.34 $103,958.40 $131,372.80 $158,787.20
15 50% $52.40 $66.22 $80.03 $108,992.00 $137,727.20 $166,462.40
16 50% $54.71 $69.13 $83.54 $113,796.80 $143,780.00 $173,763.20
17 50% $56.88 $71.89 $86.90 $118,310.40 $149,531.20 $180,752.00
18 50% $59.10 $74.69 $90.27 $122,928.00 $155,344.80 $187,761.60
19 50% $61.40 $77.60 $93.80 $127,712.00 $161,408.00 $195,104.00
20 50% $63.81 $80.64 $97.47 $132,724.80 $167,731.20 $202,737.60
21 50% $66.30 $83.80 $101.30 $137,904.00 $174,304.00 $210,704.00
22 50% $68.94 $87.13 $105.32 $143,395.20 $181,230.40 $219,065.60
23 50% $72.08 $91.09 $110.10 $149,926.40 $189,467.20 $229,008.00
24 50% $77.34 $97.74 $118.13 $160,867.20 $203,288.80 $245,710.40
1 55% $17.88 $22.60 $27.32 $37,190.40 $47,008.00 $56,825.60
2 55% $19.40 $24.52 $29.63 $40,352.00 $50,991.20 $61,630.40
3 55% $21.77 $27.52 $33.27 $45,281.60 $57,241.60 $69,201.60
4 55% $24.17 $30.54 $36.90 $50,273.60 $63,512.80 $76,752.00
5 55% $26.97 $34.09 $41.20 $56,097.60 $70,896.80 $85,696.00
6 55% $29.67 $37.51 $45.34 $61,713.60 $78,010.40 $94,307.20
7 55% $32.51 $41.08 $49.65 $67,620.80 $85,446.40 $103,272.00
8 55% $35.21 $44.48 $53.75 $73,236.80 $92,518.40 $111,800.00
9 55% $37.89 $47.90 $57.91 $78,811.20 $99,632.00 $120,452.80
10 55% $40.72 $51.46 $62.19 $84,697.60 $107,026.40 $129,355.20
11 55% $43.54 $55.04 $66.53 $90,563.20 $114,472.80 $138,382.40
12 55% $46.37 $58.58 $70.79 $96,449.60 $121,846.40 $147,243.20
13 55% $49.06 $62.00 $74.93 $102,044.80 $128,949.60 $155,854.40
14 55% $51.65 $65.27 $78.88 $107,432.00 $135,751.20 $164,070.40
15 55% $54.15 $68.43 $82.70 $112,632.00 $142,324.00 $172,016.00
16 55% $56.53 $71.43 $86.32 $117,582.40 $148,564.00 $179,545.60
17 55% $58.78 $74.29 $89.80 $122,262.40 $154,523.20 $186,784.00
18 55% $61.07 $77.18 $93.28 $127,025.60 $160,524.00 $194,022.40
19 55% $63.45 $80.19 $96.93 $131,976.00 $166,795.20 $201,614.40
20 55% $65.94 $83.33 $100.72 $137,155.20 $173,326.40 $209,497.60
21 55% $68.52 $86.60 $104.68 $142,521.60 $180,128.00 $217,734.40
22 55% $71.24 $90.04 $108.83 $148,179.20 $187,272.80 $226,366.40
23 55% $74.48 $94.13 $113.77 $154,918.40 $195,780.00 $236,641.60
24 55% $79.92 $101.00 $122.07 $166,233.60 $210,069.60 $253,905.60
*Some grade minimums fall below the County base rate of $15.00. The base rate should be applied in these cases.545
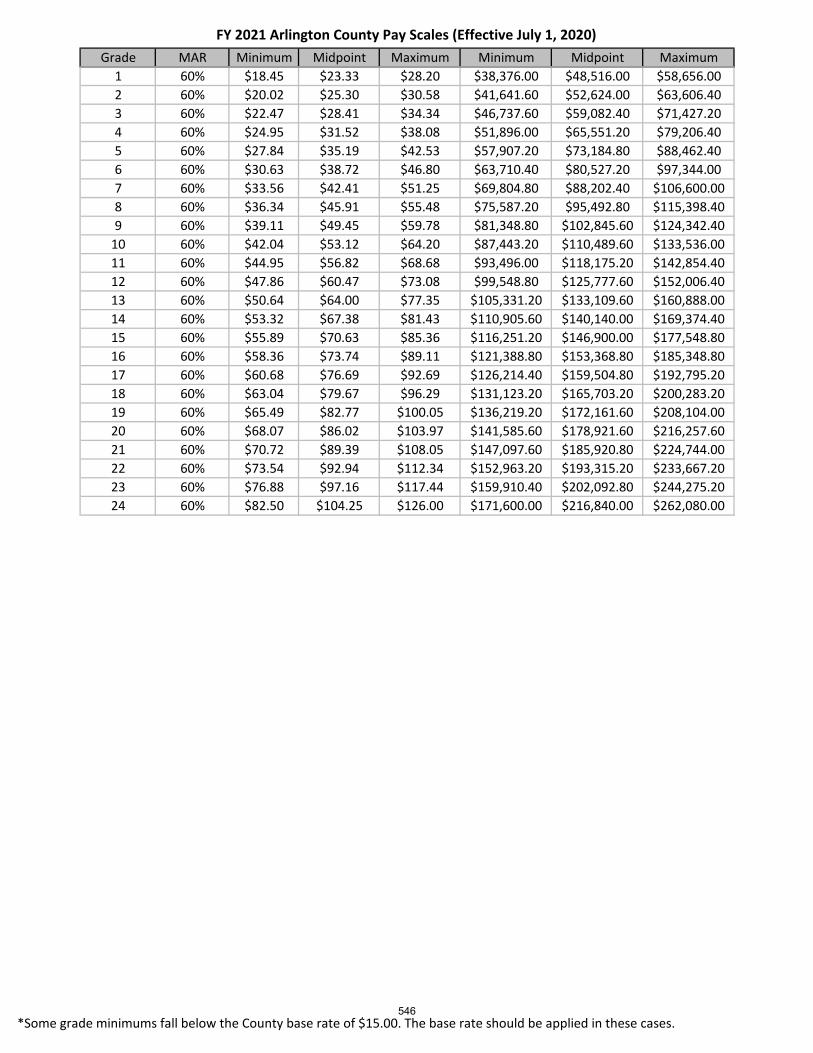
FY 2021 Arlington County Pay Scales (Effective July 1, 2020)
Grade MAR Minimum Midpoint Maximum Minimum Midpoint Maximum
1 60% $18.45 $23.33 $28.20 $38,376.00 $48,516.00 $58,656.00
2 60% $20.02 $25.30 $30.58 $41,641.60 $52,624.00 $63,606.40
3 60% $22.47 $28.41 $34.34 $46,737.60 $59,082.40 $71,427.20
4 60% $24.95 $31.52 $38.08 $51,896.00 $65,551.20 $79,206.40
5 60% $27.84 $35.19 $42.53 $57,907.20 $73,184.80 $88,462.40
6 60% $30.63 $38.72 $46.80 $63,710.40 $80,527.20 $97,344.00
7 60% $33.56 $42.41 $51.25 $69,804.80 $88,202.40 $106,600.00
8 60% $36.34 $45.91 $55.48 $75,587.20 $95,492.80 $115,398.40
9 60% $39.11 $49.45 $59.78 $81,348.80 $102,845.60 $124,342.40
10 60% $42.04 $53.12 $64.20 $87,443.20 $110,489.60 $133,536.00
11 60% $44.95 $56.82 $68.68 $93,496.00 $118,175.20 $142,854.40
12 60% $47.86 $60.47 $73.08 $99,548.80 $125,777.60 $152,006.40
13 60% $50.64 $64.00 $77.35 $105,331.20 $133,109.60 $160,888.00
14 60% $53.32 $67.38 $81.43 $110,905.60 $140,140.00 $169,374.40
15 60% $55.89 $70.63 $85.36 $116,251.20 $146,900.00 $177,548.80
16 60% $58.36 $73.74 $89.11 $121,388.80 $153,368.80 $185,348.80
17 60% $60.68 $76.69 $92.69 $126,214.40 $159,504.80 $192,795.20
18 60% $63.04 $79.67 $96.29 $131,123.20 $165,703.20 $200,283.20
19 60% $65.49 $82.77 $100.05 $136,219.20 $172,161.60 $208,104.00
20 60% $68.07 $86.02 $103.97 $141,585.60 $178,921.60 $216,257.60
21 60% $70.72 $89.39 $108.05 $147,097.60 $185,920.80 $224,744.00
22 60% $73.54 $92.94 $112.34 $152,963.20 $193,315.20 $233,667.20
23 60% $76.88 $97.16 $117.44 $159,910.40 $202,092.80 $244,275.20
24 60% $82.50 $104.25 $126.00 $171,600.00 $216,840.00 $262,080.00
*Some grade minimums fall below the County base rate of $15.00. The base rate should be applied in these cases.546

Grade Minimum Midpt Maximum
EMAP $127,712.00 $186,711.20 $245,710.40
SMAP $101,150.40 $149,156.80 $197,163.20
XMAP1 $90,708.80 $120,140.80 $149,572.80
XMAP2 $97,905.60 $133,234.40 $168,563.20
XMAP3 $171,600.00 $235,820.00 $300,040.00
MAP_A $98,633.60 $124,612.80 $150,592.00
MAP_B $110,676.80 $139,880.00 $169,083.20
Grade Actual Annual
Annual
Maximum
Chairman $62,785.20 $95,734
Board Member $57,077.40 $89,851
FY 2021 Special Schedule - Eff July 1, 2020
547

FY 2021 Special Schedule (Effective July 1, 2020)
Class Title FLSA Grade Description
Hourly
Min
Hourly
Mid
Hourly
Max Annual Min Annual Mid Annual Max
1510 Administrative Officer (DHS) EX 81 Grades 12 to 14, 10% min & 15% max $32.91 $45.72 $58.53 $68,452.80 $95,097.60 $121,742.40
3310 AED Specialist I NEX 64 Grades 4 to 6, 5% max $15.59 $23.16 $30.72 $32,427.20 $48,162.40 $63,897.60
3325 AED Specialist II NEX 65 Grades 7 to 9, 10% max $20.97 $31.04 $41.10 $43,617.60 $64,552.80 $85,488.00
3326 AED Specialist III EX 66 Grades 10 to 12, 5% min & 10% max $27.59 $38.92 $50.24 $57,387.20 $80,943.20 $104,499.20
3410 AED Specialist IV EX 67 Grades 13 to 15, 5% min & 10% max $33.24 $45.97 $58.69 $69,139.20 $95,607.20 $122,075.20
3420 AED Specialist V EX 68 Grades 16 to 18 $36.47 $48.33 $60.18 $75,857.60 $100,516.00 $125,174.40
6641 Agency On Aging Program Coordinator EX 81 Grades 12 to 14, 10% min & 15% max $32.91 $45.72 $58.53 $68,452.80 $95,097.60 $121,742.40
7011 Archivist EX 40 Grade 10, 5% min & 10% max $27.59 $35.87 $44.14 $57,387.20 $74,599.20 $91,811.20
4100 Assistant Comptroller EX 54 Grades 13 to 15, 20% min & max $37.98 $51.00 $64.02 $78,998.40 $106,080.00 $133,161.60
1330 Assistant Purchasing Agent EX 54 Grades 13 to 15, 20% min & max $37.98 $51.00 $64.02 $78,998.40 $106,080.00 $133,161.60
1090 Assistant To DHS Director I EX 81 Grades 12 to 14, 10% min & 15% max $32.91 $45.72 $58.53 $68,452.80 $95,097.60 $121,742.40
8120 Assistant Transit Bureau Chief EX 90 Grades 14 to 15, 30% min & max $43.32 $56.34 $69.36 $90,105.60 $117,187.20 $144,268.80
4414 Budget and Finance Specialist NEX 86 Grades 7 to 9, 10% max $20.97 $31.04 $41.10 $43,617.60 $64,552.80 $85,488.00
4418 Budget Coordinator EX 54 Grades 13 to 15, 20% min & max $37.98 $51.00 $64.02 $78,998.40 $106,080.00 $133,161.60
1340 Buyer NEX 52 Grades 7 to 9, 5% min & 10% max $22.02 $31.56 $41.10 $45,801.60 $65,644.80 $85,488.00
1627 Cable Executive Producer EX 88 Grades 13 to 15, 5% min & 10% max $33.24 $45.97 $58.69 $69,139.20 $95,607.20 $122,075.20
1625 Cable Programs Producer EX 87 Grades 10 to 12 $26.27 $35.97 $45.67 $54,641.60 $74,817.60 $94,993.60
4412 Capital Program Manager EX 89 Grades 11 to 13, 20% min & max $33.71 $45.86 $58.01 $70,116.80 $95,388.80 $120,660.80
1015 Chief Enterprise Architect EX 59 Grades 15 to 17, 35% min & 45% max $47.16 $65.58 $84.00 $98,092.80 $136,406.40 $174,720.00
1071 Chief Information Security Officer EX 76 Grades 20 to 24, 15% min & max $48.93 $69.75 $90.57 $101,774.40 $145,080.00 $188,385.60
6634 Child Care Services Supervisor EX 81 Grades 12 to 14, 10% min & 15% max $32.91 $45.72 $58.53 $68,452.80 $95,097.60 $121,742.40
1623 Communications Manager EX 88 Grades 13 to 15, 5% min & 10% max $33.24 $45.97 $58.69 $69,139.20 $95,607.20 $122,075.20
1604 Communications Specialist I NEX 86 Grades 7 to 9, 10% max $20.97 $31.04 $41.10 $43,617.60 $64,552.80 $85,488.00
1608 Communications Specialist II EX 87 Grades 10 to 12 $26.27 $35.97 $45.67 $54,641.60 $74,817.60 $94,993.60
5404 Construction Management Specialist NEX 80 Grades 10 to 12 $26.27 $35.97 $45.67 $54,641.60 $74,817.60 $94,993.60
8203 County Standards Engineer EX 89 Grades 11 to 13, 20% min & max $33.71 $45.86 $58.01 $70,116.80 $95,388.80 $120,660.80
8358 County Surveyor EX 79 Grades 13 to 15, 20% min & 15% max $37.98 $49.67 $61.36 $78,998.40 $103,313.60 $127,628.80
3421 Cultural Affairs Specialist I NEX 85 Grades 4 to 6, 5% max $15.59 $23.16 $30.72 $32,427.20 $48,162.40 $63,897.60
3422 Cultural Affairs Specialist II NEX 86 Grades 7 to 9, 10% max $20.97 $31.04 $41.10 $43,617.60 $64,552.80 $85,488.00
3423 Cultural Affairs Specialist III EX 87 Grades 10 to 12 $26.27 $35.97 $45.67 $54,641.60 $74,817.60 $94,993.60
3424 Cultural Affairs Specialist IV EX 88 Grades 13 to 15, 5% min & 10% max $33.24 $45.97 $58.69 $69,139.20 $95,607.20 $122,075.20
1000 Cybersecurity Engineer EX 75 Grades 13 to 15, 30% min & max $41.15 $55.26 $69.36 $85,592.00 $114,930.40 $144,268.80
1072 Data Architect EX 75 Grades 13 to 15, 30% min & max $41.15 $55.26 $69.36 $85,592.00 $114,930.40 $144,268.80
1070 Database Administrator EX 57 Grades 10 to 12, 20% min & 35% max $31.53 $46.60 $61.66 $65,582.40 $96,917.60 $128,252.80
8103 DES Funds Manager EX 89 Grades 11 to 13, 20% min & max $33.71 $45.86 $58.01 $70,116.80 $95,388.80 $120,660.80
8604 Design Engineer EX 78 Grades 10 to 12, 5% min & 20% max $27.59 $41.20 $54.81 $57,387.20 $85,696.00 $114,004.80
8605 Design Engineer Team Supervisor EX 79 Grades 13 to 15, 20% min & 15% max $37.98 $49.67 $61.36 $78,998.40 $103,313.60 $127,628.80
6615 Developmental Disability Supervisor EX 81 Grades 12 to 14, 10% min & 15% max $32.91 $45.72 $58.53 $68,452.80 $95,097.60 $121,742.40
1520 DHS Administrative Program Manager EX 81 Grades 12 to 14, 10% min & 15% max $32.91 $45.72 $58.53 $68,452.80 $95,097.60 $121,742.40
6310 DHS Clinical Psychologist Senior EX 81 Grades 12 to 14, 10% min & 15% max $32.91 $45.72 $58.53 $68,452.80 $95,097.60 $121,742.40
1109 DHS Human Resources Manager EX 81 Grades 12 to 14, 10% min & 15% max $32.91 $45.72 $58.53 $68,452.80 $95,097.60 $121,742.40
1521 DHS Principal Program Specialist EX 81 Grades 12 to 14, 10% min & 15% max $32.91 $45.72 $58.53 $68,452.80 $95,097.60 $121,742.40

FY 2021 Special Schedule (Effective July 1, 2020)
Class Title FLSA Grade Description
Hourly
Min
Hourly
Mid
Hourly
Max Annual Min Annual Mid Annual Max
6651 Disability Resource Coord EX 73 Grades 10 to 12, 10% min & max $28.90 $39.57 $50.24 $60,112.00 $82,305.60 $104,499.20
1150 Diversity Coordinator EX 73 Grades 10 to 12, 10% min & max $28.90 $39.57 $50.24 $60,112.00 $82,305.60 $104,499.20
7325 DPR Program Manager EX 92 Grades 10 to 13, 10% min & max $28.90 $41.04 $53.18 $60,112.00 $85,363.20 $110,614.40
7101 DPR Program Supervisor EX 92 Grades 10 to 13, 10% min & max $28.90 $41.04 $53.18 $60,112.00 $85,363.20 $110,614.40
7122 DPR Section Manager EX 88 Grades 13 to 15, 5% min & 10% max $33.24 $45.97 $58.69 $69,139.20 $95,607.20 $122,075.20
5030 ECC Deputy Administrator EX 91 Grade 13 to 15, 10% min & 15% max $34.82 $48.09 $61.36 $72,425.60 $100,027.20 $127,628.80
1177 Emergency Management Specialist I NEX 86 Grades 7 to 9, 10% max $20.97 $31.04 $41.10 $43,617.60 $64,552.80 $85,488.00
1178 Emergency Management Specialist II EX 83 Grades 10 to 12, 5% max $26.27 $37.12 $47.96 $54,641.60 $77,199.20 $99,756.80
8217 Engineering Program Coordinator EX 89 Grades 11 to 13, 20% min & max $33.71 $45.86 $58.01 $70,116.80 $95,388.80 $120,660.80
1042 Enterprise Records Manager EX 59 Grades 15 to 17, 35% min & 45% max $47.16 $65.58 $84.00 $98,092.80 $136,406.40 $174,720.00
6510 Environmental Health Supervisor EX 81 Grades 12 to 14, 10% min & 15% max $32.91 $45.72 $58.53 $68,452.80 $95,097.60 $121,742.40
7503 Forestry Section Supervisor EX 60 Grades 11 to 13 $28.09 $38.22 $48.34 $58,427.20 $79,487.20 $100,547.20
1155 Grant Compliance Specialist EX 73 Grades 10 to 12, 10% min & max $28.90 $39.57 $50.24 $60,112.00 $82,305.60 $104,499.20
6655 Homeless Program Coord EX 81 Grades 12 to 14, 10% min & 15% max $32.91 $45.72 $58.53 $68,452.80 $95,097.60 $121,742.40
3631 Housing Program Manager EX 33 Grades 15 to 16, 5% min & 15% max $36.68 $50.37 $64.05 $76,294.40 $104,759.20 $133,224.00
1103 Human Resources Administrative Specialist NEX 86 Grades 7 to 9, 10% max $20.97 $31.04 $41.10 $43,617.60 $64,552.80 $85,488.00
1101 Human Resources/OD Specialist EX 70 Grades 10 to 12, 15% max $26.27 $39.40 $52.53 $54,641.60 $81,952.00 $109,262.40
6600 Human Services Clinical Supervisor EX 81 Grades 12 to 14, 10% min & 15% max $32.91 $45.72 $58.53 $68,452.80 $95,097.60 $121,742.40
1113 I/O Psychologist EX 58 Grades 14 to 23, 35% min & 5% max $44.99 $61.03 $77.07 $93,579.20 $126,942.40 $160,305.60
6636 Infant & Child Development Supervisor EX 81 Grades 12 to 14, 10% min & 15% max $32.91 $45.72 $58.53 $68,452.80 $95,097.60 $121,742.40
1151 Investigator HR/EEO EX 73 Grades 10 to 12, 10% min & max $28.90 $39.57 $50.24 $60,112.00 $82,305.60 $104,499.20
1006 IT Analyst NEX 56 Grades 7 to 9, 20% max $20.97 $32.91 $44.84 $43,617.60 $68,442.40 $93,267.20
6552 Laboratory Section Supervisor EX 81 Grades 12 to 14, 10% min & 15% max $32.91 $45.72 $58.53 $68,452.80 $95,097.60 $121,742.40
7553 Landscape Architect Supervisor EX 32 Grades 11 to 13, 15% min & max $34.40 $46.47 $58.53 $71,552.00 $96,647.20 $121,742.40
7012 Librarian EX 40 Grade 10, 5% min & 10% max $27.59 $35.87 $44.14 $57,387.20 $74,599.20 $91,811.20
7002 Librarian Supervisor EX 71 Grades 11 to 13, 15% min & max $32.31 $43.96 $55.60 $67,204.80 $91,426.40 $115,648.00
7020 Library Assistant Coordinator NEX 41 Grades 7 to 8, 5% min & 10% max $22.02 $30.08 $38.14 $45,801.60 $62,566.40 $79,331.20
7019 Library Assistant Supervisor NEX 41 Grades 7 to 8, 5% min & 10% max $22.02 $30.08 $38.14 $45,801.60 $62,566.40 $79,331.20
7018 Library Associate NEX 41 Grades 7 to 8, 5% min & 10% max $22.02 $30.08 $38.14 $45,801.60 $62,566.40 $79,331.20
4411 Management & Budget Specialist EX 70 Grades 10 to 12, 15% max $26.27 $39.40 $52.53 $54,641.60 $81,952.00 $109,262.40
6346 Mental Health Supervisor EX 81 Grades 12 to 14, 10% min & 15% max $32.91 $45.72 $58.53 $68,452.80 $95,097.60 $121,742.40
1024 Network Analyst EX 57 Grades 10 to 12, 20% min & 35% max $31.53 $46.60 $61.66 $65,582.40 $96,917.60 $128,252.80
1027 Network Control Specialist NEX 56 Grades 7 to 9, 20% max $20.97 $32.91 $44.84 $43,617.60 $68,442.40 $93,267.20
6111 Nurse Manager EX 81 Grades 12 to 14, 10% min & 15% max $32.91 $45.72 $58.53 $68,452.80 $95,097.60 $121,742.40
6116 Nurse Practitioner EX 84 Grades 11 to 13, 20% min & max $33.71 $45.86 $58.01 $70,116.80 $95,388.80 $120,660.80
7505 Park Manager EX 60 Grades 11 to 13 $28.09 $38.22 $48.34 $58,427.20 $79,487.20 $100,547.20
6370 Physician Assistant EX 81 Grades 12 to 14, 10% min & 15% max $32.91 $45.72 $58.53 $68,452.80 $95,097.60 $121,742.40
1043 PRISM Analyst EX 58 Grades 14 to 23, 35% min & 5% max $44.99 $61.03 $77.07 $93,579.20 $126,942.40 $160,305.60
1025 PRISM System Specialist EX 59 Grades 15 to 17, 35% min & 45% max $47.16 $65.58 $84.00 $98,092.80 $136,406.40 $174,720.00
1300 Procurement Officer EX 53 Grades 10 to 12, 5% min & 20% max $27.59 $41.20 $54.81 $57,387.20 $85,696.00 $114,004.80
6114 Psychiatric Nurse EX 82 Grades 10 to 11, 15% min & 10% max $30.22 $38.72 $47.22 $62,857.60 $80,537.60 $98,217.60
6113 Public Health Nurse EX 82 Grades 10 to 11, 15% min & 10% max $30.22 $38.72 $47.22 $62,857.60 $80,537.60 $98,217.60

FY 2021 Special Schedule (Effective July 1, 2020)
Class Title FLSA Grade Description
Hourly
Min
Hourly
Mid
Hourly
Max Annual Min Annual Mid Annual Max
6110 Public Health Nurse Supervisor EX 81 Grades 12 to 14, 10% min & 15% max $32.91 $45.72 $58.53 $68,452.80 $95,097.60 $121,742.40
6501 Public Health Planning Officer EX 81 Grades 12 to 14, 10% min & 15% max $32.91 $45.72 $58.53 $68,452.80 $95,097.60 $121,742.40
6371 Quality Assurance Manager EX 81 Grades 12 to 14, 10% min & 15% max $32.91 $45.72 $58.53 $68,452.80 $95,097.60 $121,742.40
4612 Real Estate Appraiser EX 53 Grades 10 to 12, 5% min & 20% max $27.59 $41.20 $54.81 $57,387.20 $85,696.00 $114,004.80
4611 Real Estate Appraiser (Entry) NEX 52 Grades 7 to 9, 5% min & 10% max $22.02 $31.56 $41.10 $45,801.60 $65,644.80 $85,488.00
4613 Real Estate Appraiser Supervisor EX 54 Grades 13 to 15, 20% min & max $37.98 $51.00 $64.02 $78,998.40 $106,080.00 $133,161.60
4620 Real Estate Records/Research Coord EX 53 Grades 10 to 12, 5% min & 20% max $27.59 $41.20 $54.81 $57,387.20 $85,696.00 $114,004.80
7120 Recreation Services Supervisor EX 92 Grades 10 to 13, 10% min & max $28.90 $41.04 $53.18 $60,112.00 $85,363.20 $110,614.40
4425 Revenue Analyst EX 54 Grades 13 to 15, 20% min & max $37.98 $51.00 $64.02 $78,998.40 $106,080.00 $133,161.60
1044 Senior Applications Developer EX 57 Grades 10 to 12, 20% min & 35% max $31.53 $46.60 $61.66 $65,582.40 $96,917.60 $128,252.80
1060 Senior Cloud Architect EX 76 Grades 15 to 17, 35% min & 45% max $48.93 $69.75 $90.57 $101,774.40 $145,080.00 $188,385.60
1001 Senior Cybersecurity Engineer EX 59 Grades 15 to 17, 35% min & 45% max $47.16 $65.58 $84.00 $98,092.80 $136,406.40 $174,720.00
6450 Senior Day Programs Supervisor EX 81 Grades 12 to 14, 10% min & 15% max $32.91 $45.72 $58.53 $68,452.80 $95,097.60 $121,742.40
1004 Senior Network Engineer EX 75 Grades 13 to 15, 30% min & max $41.15 $55.26 $69.36 $85,592.00 $114,930.40 $144,268.80
1331 Senior Procurement Officer EX 54 Grades 13 to 15, 20% min & max $37.98 $51.00 $64.02 $78,998.40 $106,080.00 $133,161.60
1047 Senior Systems Administrator EX 57 Grades 10 to 12, 20% min & 35% max $31.53 $46.60 $61.66 $65,582.40 $96,917.60 $128,252.80
6700 Sign Language Interpreter NEX SLI Flat Hourly Rate $25.00 $37.50 $50.00
3154 Space Planner EX 30 Grades 10 to 11 $26.27 $34.60 $42.92 $54,641.60 $71,957.60 $89,273.60
1013 Sr Infrastructure Support Specialist EX 57 Grades 10 to 12, 20% min & 35% max $31.53 $46.60 $61.66 $65,582.40 $96,917.60 $128,252.80
1007 Sr IT Analyst EX 57 Grades 10 to 12, 20% min & 35% max $31.53 $46.60 $61.66 $65,582.40 $96,917.60 $128,252.80
1511 Sr Staff Admin/Management Specialist EX 53 Grades 10 to 12, 5% min & 20% max $27.59 $41.20 $54.81 $57,387.20 $85,696.00 $114,004.80
4417 Sr Staff Financial Analyst EX 54 Grades 13 to 15, 20% min & max $37.98 $51.00 $64.02 $78,998.40 $106,080.00 $133,161.60
1016 Sr Staff Program Manager EX 54 Grades 13 to 15, 20% min & max $37.98 $51.00 $64.02 $78,998.40 $106,080.00 $133,161.60
4212 Staff Accounting/Auditing Specialist EX 53 Grades 10 to 12, 5% min & 20% max $27.59 $41.20 $54.81 $57,387.20 $85,696.00 $114,004.80
1509 Staff Admin/Management Specialist NEX 52 Grades 7 to 9, 5% min & 10% max $22.02 $31.56 $41.10 $45,801.60 $65,644.80 $85,488.00
4421 Staff Financial Analyst EX 53 Grades 10 to 12, 5% min & 20% max $27.59 $41.20 $54.81 $57,387.20 $85,696.00 $114,004.80
1102 Staff Human Resources Manager EX 54 Grades 13 to 15, 20% min & max $37.98 $51.00 $64.02 $78,998.40 $106,080.00 $133,161.60
1104 Staff Human Resources/OD Specialist EX 53 Grades 10 to 12, 5% min & 20% max $27.59 $41.20 $54.81 $57,387.20 $85,696.00 $114,004.80
1011 Staff Infrastructure Support Specialist NEX 56 Grades 7 to 9, 20% max $20.97 $32.91 $44.84 $43,617.60 $68,442.40 $93,267.20
1005 Staff IT Technician NEX 55 Grades 5 to 7, 10% min & 20% max $19.14 $28.79 $38.44 $39,811.20 $59,883.20 $79,955.20
4413 Staff Management & Budget Specialist EX 53 Grades 10 to 12, 5% min & 20% max $27.59 $41.20 $54.81 $57,387.20 $85,696.00 $114,004.80
1173 Staff Safety Specialist EX 53 Grades 10 to 12, 5% min & 20% max $27.59 $41.20 $54.81 $57,387.20 $85,696.00 $114,004.80
1124 Staff Senior Human Resources Specialist EX 54 Grades 13 to 15, 20% min & max $37.98 $51.00 $64.02 $78,998.40 $106,080.00 $133,161.60
1125 Staff Support Technician NEX 51 Grades 4 to 6, 10% min & 15% max $17.15 $25.40 $33.64 $35,672.00 $52,821.60 $69,971.20
1046 Systems Administrator NEX 56 Grades 7 to 9, 20% max $20.97 $32.91 $44.84 $43,617.60 $68,442.40 $93,267.20
1041 Technology Manager EX 58 Grades 14 to 23, 35% min & 5% max $44.99 $61.03 $77.07 $93,579.20 $126,942.40 $160,305.60
1045 Technology Manager II EX 76 Grades 20 to 24, 15% min & max $48.93 $69.75 $90.57 $101,774.40 $145,080.00 $188,385.60
1039 Technology Program Manager EX 75 Grades 13 to 15, 30% min & max $41.15 $55.26 $69.36 $85,592.00 $114,930.40 $144,268.80
8104 Traffic Engineering Manager EX 90 Grades 14 to 15, 30% min & max $43.32 $56.34 $69.36 $90,105.60 $117,187.20 $144,268.80
8406 Transit Capital Program Manager EX 90 Grades 14 to 15, 30% min & max $43.32 $56.34 $69.36 $90,105.60 $117,187.20 $144,268.80
8121 Transit Services Manager EX 79 Grades 13 to 15, 20% min & 15% max $37.98 $49.67 $61.36 $78,998.40 $103,313.60 $127,628.80
8126 Transportation Planning & Analysis Manager EX 79 Grades 13 to 15, 20% min & 15% max $37.98 $49.67 $61.36 $78,998.40 $103,313.60 $127,628.80

FY 2021 Special Schedule (Effective July 1, 2020)
Class Title FLSA Grade Description
Hourly
Min
Hourly
Mid
Hourly
Max Annual Min Annual Mid Annual Max
8122 Transportation Program Manager EX 79 Grades 13 to 15, 20% min & 15% max $37.98 $49.67 $61.36 $78,998.40 $103,313.60 $127,628.80
1454 Utility Billing & Customer Service Manager EX 33 Grades 15 to 16, 5% min & 15% max $36.68 $50.37 $64.05 $76,294.40 $104,759.20 $133,224.00
Class Title FLSA Grade Description
Hourly
Min
Hourly
Mid
Hourly
Max Annual Min Annual Mid Annual Max
1983 Student Assistant I NEX SA_1 Doesn't meet requirements for living wage $9.50 $12.25 $15.00
1984 Student Assistant II NEX SA_2 Doesn't meet requirements for living wage $11.00 $14.75 $18.50
1985 Summer Recreation Assistant I NEX SRA1 Doesn't meet requirements for living wage $13.40 $15.36 $17.31
1986 Summer Recreation Assistant II NEX SRA2 Doesn't meet requirements for living wage $14.25 $18.70 $23.15
551

Grade
Hourly
Minimum
Hourly
Midpoint
Hourly
Maximum
Salary
Minimum
Salary
Midpoint
Salary
Maximum
MI_1 $17.00 $22.00 $27.00 $35,360.00 $45,760.00 $56,160.00
MI_2 $20.00 $25.00 $30.00 $41,600.00 $52,000.00 $62,400.00
MI_3 $24.00 $29.00 $34.00 $49,920.00 $60,320.00 $70,720.00
MI_4 $29.00 $34.00 $39.00 $60,320.00 $70,720.00 $81,120.00
FY 2021 Management Intern Pay Scale - Effective July 1, 2020
552

Grade
Hourly
Minimum
Hourly
Midpoint
Hourly
Maximum
Salary
Minimum
Salary
Midpoint
Salary
Maximum
R1 $13.54 $15.42 $17.30 $28,163.20 $32,073.60 $35,984.00
R2 $14.40 $18.89 $23.38 $29,952.00 $39,291.20 $48,630.40
R3 $16.07 $21.10 $26.12 $33,425.60 $43,888.00 $54,329.60
R4 $17.69 $23.22 $28.74 $36,795.20 $48,297.60 $59,779.20
R5 $19.35 $25.41 $31.47 $40,248.00 $52,852.80 $65,457.60
R6 $20.98 $27.53 $34.08 $43,638.40 $57,262.40 $70,886.40
R7 $24.25 $31.85 $39.44 $50,440.00 $66,248.00 $82,035.20
FY 2021 Recreation Pay Scale - Effective July 1, 2020
553

Rank Grade
Hourly
Minimum
Hourly
Maximum
Annual
Minimum
(2080 Hours)
Annual
Maximum
(2080 Hours)
Deputy Sheriff S2 $25.72 $43.44 $53,497.60 $90,355.20
Deputy Sheriff Corporal S3 $26.75 $45.16 $55,640.00 $93,932.80
Deputy Sheriff Sergeant S5 $30.28 $51.14 $62,982.40 $106,371.20
Deputy Sheriff Lieutenant XMAP1 $43.61 $71.91 $90,708.80 $149,572.80
Deputy Sheriff Captain XMAP2 $47.07 $81.04 $97,905.60 $168,563.20
FY2021 Sheriff's Department Pay ScaleFor Sworn Sheriff Employees
554

Rank Grade
Hourly
Minimum
Hourly
Maximum
Annual
Minimum
(2080 Hours)
Annual
Maximum
(2080 Hours)
Police Officer P2 $26.94 $45.60 $56,035.20 $94,848.00
Police Corporal P3 $28.84 $48.80 $59,987.20 $101,504.00
Police Sergeant P5 $31.74 $53.71 $66,019.20 $111,716.80
Police Lieutenant XMAP1 $43.61 $71.91 $90,708.80 $149,572.80
Police Captain XMAP2 $47.07 $81.04 $97,905.60 $168,563.20
FY2021 Police Department Pay ScaleFor Sworn Police Employees
555

Rank Grade
Hourly
Minimum
(2080 Hours)
Hourly
Maximum
(2080 Hours)
Hourly Shift Rate
Minimum*
(2912 Hours)
Hourly Shift Rate
Maximum*
(2912 Hours)
Annual
Minimum
Annual
Maximum
Firefighter/EMT F2 $26.79 $45.24 $19.14 $32.31 $55,723.20 $94,099.20
Fire Marshal F3 $28.07 $47.42 $20.05 $33.87 $58,385.60 $98,633.60
Firefighter/EMT III F4 $29.51 $49.89 $21.08 $35.64 $61,380.80 $103,771.20
Fire/EMS Lieutenant F5 $32.23 $54.44 $23.02 $38.89 $67,038.40 $113,235.20
Fire/EMS Captain I F6 $35.52 $59.99 $25.37 $42.85 $73,881.60 $124,779.20
Fire/EMS Captain II F7 $39.61 $66.90 $28.29 $47.79 $82,388.80 $139,152.00
Fire/EMS Battalion Chief XMAP2 $47.07 $81.04 $33.62 $57.89 $97,905.60 $168,563.20
*Shift Rate values are approximate due to rounding
FY2021 Fire Department Pay ScaleFor Uniformed Fire Employees
556

GLOSSARY AND APPENDIX
557

This page intentionally left blank
558

FY 2021 BUDGET CALENDAR
The calendar for development of the FY 2021 budget is provided below. The fiscal year begins July 1, 2020 and ends June 30, 2021.
September 2019 Budget kickoff for departmental staff. This includes policy and line item direction, and fiscal parameters for developing requests.
October, November Departments submit budgets to the Department of Management and Finance, Management and Budget Section. Department of Management staff reviews submissions. Various public outreach events including Budget Virtual Town Hall.
December, January County Manager develops budget recommendations.
February 25 County Manager’s FY 2021 Proposed Budget is submitted to the County Board.
February 27 School Superintendent submits Superintendent’s Proposed Budget to the School Board.
February - April County Board holds a series of budget work sessions with County departments, Constitutional Offices, and the School Board.
April 6 County Manager submits revised proposed budget reflecting the impacts of COVID-19 to the County Board.
April 16 & 23 County Board holds a public hearings on the proposed FY 2021 budget including County expenses and real estate tax, personal property tax rates, and other taxes and fees.
April 30 County Board adopts FY 2021 Budget and Appropriations Resolutions for the County government, the public schools, and Pay-As-You-Go Capital. County Board adopts the CY 2020 real estate tax rate and other FY 2021 taxes and fees.
May 7 School Board adopts FY 2021 school budget.
July 1 FY 2021 begins.
559

This page intentionally left blank
560

BUDGET PROCESS
The County Manager develops budget guidelines for operating departments for the upcoming fiscal year. These guidelines are based, in part, on revenue and expenditure estimates developed by the Department of Management and Finance (DMF), Budget Section. This Section also prepares the necessary instructions and forms for use by departments in preparing budgets and distributes budget preparation forms to the departments. The budget preparation forms are completed in Oracle’s budgeting cloud solution, known as Enterprise Planning and Budgeting Cloud Service (EPBCS).
Operating departments prepare expenditure and revenue budgets. The DMF Budget Section is chiefly responsible for developing revenue budgets for taxes and other revenues not directly under the control of an operating department.
The County Board develops budget planning estimates which set limits on expenditure levels based on preliminary revenue and expenditure forecasts developed by the Budget Section of DMF. The County Manager is in charge of presenting a proposed budget within the planning estimates established by the County Board.
After proposed budgets are submitted by departments, the DMF Budget Section, the County Manager, the Deputy County Managers, and the Executive Leadership Team review and discuss the proposed departmental budgets and, after negotiations, agree on a final amount for presentation to the County Board in the County Manager's proposed budget.
The proposed budget includes a pay-as-you-go capital budget funded from current operations. A multi-year capital improvement program is developed and approved separately from the operating budget. The School Board prepares a separate operations budget, supported to a large degree by transfers from the County’s General Fund.
The County Board conducts budget work sessions with the departments and advisory commissions and holds public hearings prior to final adoption of the budget for the upcoming fiscal year, and setting of tax rates for the current calendar year.
After adoption, the budget is updated in the budget system and then loaded to the accounting system into a chart of accounts. Annual appropriations are adopted for the general, enterprise, special revenue, capital projects, and internal service funds. Appropriations are controlled at the department level in the General Fund, although appropriations are loaded to cost center, natural account, project, source of funds, and task levels within the department.
The County Board must approve changes to adopted appropriation levels. These changes can be in the form of allocations from previously established contingent accounts, appropriations from new or additional revenues, especially grants from the state or federal government, and from reappropriations from a previous fiscal year. These changes, when approved by the County Board, are loaded to the financial system by doing budget revisions which are approved through DMF, which acts as the control for supplemental appropriations. Approved supplemental appropriations are noted in the County Board minutes for the particular County Board meeting. DMF tracks these adjustments on a balancing spreadsheet.
Operating departments, as well as DMF staff, regularly monitor financial reports and on-line financial tables by comparing actual results to budgeted amounts. Special detailed financial reviews are completed and presented to the County Board at mid-year (mid-year review),
561

BUDGET PROCESS
third-quarter (third-quarter review) and at the end of the fiscal year (closeout report). Funds not spent in one fiscal year may be reappropriated in a subsequent fiscal year.
Departments are charged with making sure that approved budget levels reflect any supplemental appropriations approved by the County Board. In addition, with DMF concurrence, funds may be moved within a department’s budget as long as the total departmental appropriation is not changed. No County Board approval is required for these internal reallocations.
A graphical representation of the annual budget cycle is shown on the following page.
Budgetary Basis:
The budgets of the general government fund types, which include the General Fund, Special Revenue Funds, and General Capital Projects Funds, are prepared on a modified-accrual basis of accounting. Under this basis, expenditures are recorded when the associated liabilities are incurred, but revenues are generally recognized if they are measurable and available. For this purpose, the County considers revenues to be available if they are received within 45 days of the end of the fiscal year.
The Enterprise Funds (such as Utilities, Ballston Public Parking Garage, and CPHD Development Fund), Internal Service Funds, and Trust and Agency Funds are recorded using the accrual basis of accounting – where revenues are recorded when earned and expenditures are recorded when the associated liabilities are incurred.
The Comprehensive Annual Financial Report (CAFR) shows the status of the County’s finances on the basis of Generally Accepted Accounting Principles (GAAP). In accordance with the GAAP basis and GASB standards, the County is required to display its financial statements in two ways. In one set of statements, the “Government-wide Financial Statements,” all funds are reported using the accrual basis of accounting, similar to the Enterprise Funds. In the other set of statements, the “Fund Financial Statements,” the governmental fund types (General, Special Revenue Funds, and Capital Projects Funds) are reported using the modified-accrual basis of accounting.
In most cases, the Government-wide financial statements conform to the way the County prepares its budget. Exceptions include the following:
Depreciation expense is recorded on a GAAP basis only. Compensated absence liabilities, expected to be liquidated with expendable available financial
resources, are accrued as earned by employees (GAAP) as opposed to being expended when paid (budget).
Principal payments on long-term debt are applied to the outstanding liability on a GAAP basis as opposed to being expended on a budgetary basis.
Capital outlays within the Enterprise Funds are recorded as assets on a GAAP basis and expended on a budgetary basis.
562

563

This page intentionally left blank
564

FY 2012Actual
FY 2013Actual
FY 2014 Actual
FY 2015 Actual
FY 2016 Actual
FY 2017 Actual
FY 2018 Actual
FY 2019 Actual
FY 2020 Adopted
FY 2021 Adopted
DOLLARS (IN MILLIONS)
Total All Operating Funds $1,304.0 $1,360.4 $1,416.2 $1,479.3 $1,528.2 $1,580.2 $1,725.6 $1,708.5 $1,717.8 $1,767.3
General Fund Expenditures 1,014.5 1,082.4 1,101.4 1,173.0 1,184.4 1,222.0 1,255.5 1,261.7 1,356.2 1345.4State/Federal Revenue 88.5 80.1 86.0 85.2 88.8 93.4 92.9 94.1 92.1 95.3
METRO Operating Subsidy 24.5 25.5 28.2 29.9 30.3 30.3 36.2 42.6 47.6 47.8
County Govt. Debt Service 53.9 54.2 55.9 68.0 62.9 60.3 62.3 67.7 72.2 69.0
School Operating Fund 365.4 417.7 405.9 434.8 462.4 462.6 495.1 515.2 553.3 559.9
Operating Transfer 317.0 357.4 355.8 386.9 400.0 395.6 424.7 436.9 463.3 458.7
School Debt Service 34.8 35.4 42.9 44.1 44.5 46.2 50.3 58.4 59.2 56.4
Utilities Enterprise Fund 80.1 86.1 87.0 86.2 86.7 84.3 90.6 88.4 89.2 91.5
Housing and Community Development 1.9 4.5 2.8 1.2 1.5 3.6 1.9 5.1 3.1 3.4
Bonded Indebtedness (1) 802.0 892.4 886.5 898.5 882.5 990.3 1,083.9 1,167.4 1,247.2 1200.7
SHARESSchool Operating Fund as a Percentage of Total Funds 28.0% 30.7% 28.7% 29.4% 30.3% 29.3% 28.7% 30.2% 32.2% 31.7%
School Operating Transfer as a Percentage of General Fund 31.2% 33.0% 32.3% 33.0% 33.8% 32.4% 33.8% 34.6% 34.2% 34.1%
Total Debt service as a Percentage of General Fund Expenditures 8.1% 8.3% 8.4% 8.5% 8.2% 8.1% 8.8% 8.7% 8.9% 8.3%
Debt as a Percentage of Est. Actual Property Value (1) 1.3% 1.4% 1.3% 1.2% 1.2% 1.3% 1.4% 1.5% 1.6% 1.5%
PEOPLE
Resident Population (2) 211,700 212,900 215,000 216,700 220,400 222,800 225,200 226,400 228,400 230,600
At Place Employment (2) (3) 227,500 228,700 220,600 221,700 211,000 222,300 224,200 227,000 234,800 236,000
County FTE's 3,858.1 3,768.5 3,790.0 3,838.7 3,872.8 3,931.3 3,976.4 3,951.2 3,967.9 4,023.0
School Operating Fund FTE's 3,614.2 3,726.6 3,794.8 3,914.8 4,271.7 4,414.8 4,897.4 4,629.4 4,617.9 4,678.4
School Enrollment (4) 21,841 22,613 23,316 24,529 25,238 26,152 26,941 27,436 28,020 29,142
NOTES:(1) Includes County and Schools General Obligation and Subject to Appropriation bonded debt but excludes debt paid from Enterprise Funds.
(4) School enrollment as of September 30 during the FY; enrollment is projected for the upcoming FY.
(2) Resident Population and At-Place Employment are taken from the Arlington County Profile for FY 2012 through FY 2018. FY 2019 through FY 2021 population estimates reflect Arlington County CPHD Planning Division Estimates.
SELECTED FISCAL INDICATORS: FY 2012 - FY 2021
(3) At Place Employment numbers for FY 2021 do not reflect the impact from COVID-19. The methods of estimating population and employment have not changed due to insufficient data to inform any changes.
565

GOVERNMENTAL FUNDS' SUMMARIES
General Operating Fund 1 Other Funds 2 Total Government Funds3
FY 2019 FY 2020 FY 2021 FY 2019 FY 2020 FY 2021 FY 2019 FY 2020 FY 2021Actual Adopted Adopted Actual Adopted Adopted Actual Adopted Adopted
BEGINNING BALANCE $181,910,989 233,125,098 $233,125,097 $422,622,946 $409,739,301 $330,710,652 $604,533,935 $642,864,399 $563,835,749REVENUESReal Estate Tax $745,871,153 $771,036,860 $795,118,440 $745,871,153 $771,036,860 $795,118,440Personal Property Tax 117,994,658 119,052,147 120,052,147 117,994,658 119,052,147 120,052,147BPOL Tax 69,913,868 69,020,000 63,000,000 69,913,868 69,020,000 63,000,000Sales Tax 44,047,335 44,700,000 43,127,695 44,047,335 44,700,000 43,127,695Transient Tax 24,623,589 26,000,000 19,257,639 24,623,589 26,000,000 19,257,639Utility Tax 16,462,272 16,152,000 17,200,000 16,462,272 16,152,000 17,200,000Consumption Usage Tax 788,931 800,000 800,000 788,931 800,000 800,000Meals Tax 40,168,158 40,900,000 36,772,563 40,168,158 40,900,000 36,772,563Communications Tax 6,460,605 6,300,000 6,100,000 6,460,605 6,300,000 6,100,000Other Local Taxes 18,295,925 17,660,000 14,807,881 18,295,925 17,660,000 14,807,881Subtotal Taxes 1,084,626,494 1,111,621,007 1,116,236,365 1,084,626,494 1,111,621,007 1,116,236,365
Licenses, Permits and Fees 12,150,581 12,382,803 13,115,693 12,150,581 12,382,803 13,115,693 Fines, Interest, Other 35,239,927 23,663,266 21,514,591 35,239,927 23,663,266 21,514,591Charges for Services 62,380,067 64,252,642 64,253,949 62,380,067 64,252,642 64,253,949Miscellaneous 13,440,611 46,886,302 24,094,568 13,440,611 46,886,302 24,094,568Revenue from State 76,434,686 75,996,278 79,146,009 76,434,686 75,996,278 79,146,009Revenue from Federal Govt. 17,649,033 16,067,363 16,145,620 17,649,033 16,067,363 16,145,620Subtotal Other 217,294,905 239,248,654 218,270,430 217,294,905 239,248,654 218,270,430
TOTAL REVENUES 1,301,921,399 1,350,869,661 1,334,506,795 290,348,591 245,262,521 257,028,952 1,592,269,990 1,596,132,182 1,591,535,747
TRANSFERS IN 10,945,477 5,375,913 10,937,655 20,676,426 38,332,128 16,510,309 31,621,903 43,708,041 27,447,964
TOTAL BALANCES, REVENUES,& TRANSFERS IN $1,494,777,865 1,589,370,672 $1,578,569,547 $733,647,963 $693,333,950 $604,249,913 $2,228,425,828 $2,282,704,622 $2,182,819,460
EXPENDITURESOperating Expenses 653,350,290 657,761,826 673,873,196 $256,950,162 $221,453,954 $225,165,727 910,300,452 879,215,780 899,038,923 Metro Operations 42,601,029 47,597,637 47,808,764 42,601,029 $47,597,637 47,808,764Capital Outlay 5,667,108 23,601,546 3,832,227 5,667,108 $23,601,546 3,832,227Contingents - General/Other - 6,950,000 10,450,000 - 6,950,000 10,450,000 Contingents - Housing Fund - 15,359,136 15,393,342 - 15,359,136 15,393,342 Subtotal 701,618,427 751,270,145 751,357,529 256,950,162 221,453,954 225,165,727 958,568,589 972,724,099 976,523,256
Debt Service 67,686,380 72,153,342 68,962,748 30,760,321 30,982,751 30,951,540 98,446,701 103,136,093 99,914,288
Subtotal County 769,304,807 823,423,487 820,320,277 287,710,483 252,436,705 256,117,267 1,057,015,290 1,075,860,192 1,076,437,544
Schools Transfer 491,718,375 532,329,006 524,631,092 491,718,375 532,329,006 524,631,092Subtotal Schools 491,718,375 532,329,006 524,631,092 491,718,375 532,329,006 524,631,092
TOTAL EXPENDITURES 1,261,023,182 1,355,752,493 1,344,951,369 287,755,611 252,933,365 257,131,267 1,548,778,793 1,608,685,858 1,602,082,636
TOTAL CARRYOVER - - - 6,695,427 71,169,904 90,778,935 6,695,427 - 90,778,935
TRANSFERS OUT 629,585 493,082 493,082 20,106,516 16,883,422 15,177,311 20,736,101 17,376,504 15,670,393
1,261,652,767 1,356,245,575 $1,345,444,451 $314,557,554 $340,986,691 $363,087,513 1,576,210,321 1,697,232,266 $1,708,531,964
ENDING BALANCE $233,125,098 233,125,097 $233,125,096 $419,090,409 $352,347,259 $241,162,400 $652,215,507 585,472,356 $474,287,496
Footnotes:1 Certain portions of fund balance have been reserved or designated by the County Board for specific purposes (See CAFR).2 Revenue and expenditure detail for Other Funds can be found in the fund statements contained in the Enterprise, Special Revenue, and Internal Service Fund section of this budget book.3 Governmental Funds' Summaries adjusted in the FY 2020 Adopted Budget to include General Obligation Bonds for FY 2018, FY 2019, and FY 2020
TOTAL EXP., CARRYOVER, & TRANSFERS
566

GOVERNMENTAL FUNDS' SUMMARIES
Ballston Business Improvement District Rosslyn Business Improvement District Crystal City Business Improvement DistrictFY 2019 FY 2020 FY 2021 FY 2019 FY 2020 FY 2021 FY 2019 FY 2020 FY 2021
Actual Adopted Adopted Actual Adopted Adopted Actual Adopted AdoptedBEGINNING BALANCE $14,621 $58,329 $63,465 $225,555 $184,473 $115,966 $38,081 $59,869 $25,756
TOTAL REVENUES 1,658,339 1,497,516 1,569,935 3,640,260 3,938,338 4,053,393 2,553,659 2,763,656 4,739,568
TRANSFERS IN - - - - - - - - -
TOTAL BALANCE & REVENUES& TRANSFERS IN $1,672,960 $1,555,845 $1,633,400 $3,865,815 $4,122,811 $4,169,359 $2,591,740 $2,823,525 4,765,324
EXPENDITURESOperating Expenses 1,581,613 1,430,128 1,499,297 3,677,140 3,779,571 3,882,633 2,469,530 2,639,292 4,526,288 Debt Service - - - - - - - - -
TOTAL EXPENDITURES 1,581,613 1,430,128 1,499,297 3,677,140 3,779,571 3,882,633 2,469,530 2,639,292 4,526,288
TOTAL CARRYOVER - - - - - - - - -
TRANSFERS OUT 33,146 29,950 31,390 72,709 78,767 81,068 50,977 55,273 94,791
1,614,759 1,460,078 1,530,687 3,749,849 3,858,338 3,963,701 2,520,507 2,694,565 4,621,079
ENDING BALANCE $58,201 $95,767 $102,713 $115,966 $264,473 $205,658 $71,233 $128,960 $144,245
Community Development Fund Housing Choice Voucher Fund Utilities FundFY 2019 FY 2020 FY 2021 FY 2019 FY 2020 FY 2021 FY 2019 FY 2020 FY 2021
Actual Adopted Adopted Actual Adopted Adopted Actual Adopted Adopted BEGINNING BALANCE - - - $672,653 $895,509 $1,575,031 $17,345,388 $18,601,528 $14,127,555
TOTAL REVENUES $4,960,543 $3,086,612 $3,378,470 19,009,710 19,207,074 19,688,410 99,017,611 102,936,845 104,667,295
TRANSFERS IN 94,981 - - - - - - - -
TOTAL BALANCE & REVENUES& TRANSFERS IN 5,055,524 3,086,612 3,378,470 $19,682,363 $20,102,583 $21,263,441 $116,362,999 121,538,373 $118,794,850
EXPENDITURESOperating Expenses 5,055,524 3,086,612 3,378,470 18,384,976 18,929,431 19,473,520 57,681,805 58,814,733 61,137,933 Debt Service - - - - - - 30,760,321 30,405,573 30,374,362
TOTAL EXPENDITURES 5,055,524 3,086,612 3,378,470 18,384,976 18,929,431 19,473,520 88,442,126 89,220,306 91,512,295
TOTAL CARRYOVER - - - - - - - - -
TRANSFERS OUT - - - - - - 14,025,300 14,237,500 12,155,000
$5,055,524 $3,086,612 $3,378,470 18,384,976 18,929,431 19,473,520 102,467,426 103,457,806 103,667,295
ENDING BALANCE - - - $1,297,387 $1,173,152 $1,789,921 $13,895,573 $18,080,567 $15,127,555
TOTAL EXP., CARRYOVER, & TRANSFERS
TOTAL EXP., CARRYOVER, & TRANSFERS
567

GOVERNMENTAL FUNDS' SUMMARIES
Automotive Equipment Fund Printing Fund Stormwater FundFY 2019 FY 2020 FY 2021 FY 2019 FY 2020 FY 2021 FY 2019 FY 2020 FY 2021
Actual Adopted Adopted Actual Adopted Adopted Actual Adopted AdoptedBEGINNING BALANCE $13,436,089 $11,022,051 $3,557,084 $29,886 $73,734 $50,525 $15,162,201 $14,438,224 $11,279,058
TOTAL REVENUES 19,076,630 17,735,974 18,606,065 2,138,819 2,170,000 2,365,459 10,760,502 11,211,095 11,729,047
TRANSFERS IN - 47,000 30,000 242,337 246,382 246,382 - - -
TOTAL BALANCE & REVENUES& TRANSFERS IN $32,512,719 28,805,025 22,193,149 $2,411,042 $2,490,116 $2,662,366 $25,922,703 25,649,319 23,008,105
EXPENDITURESOperating Expenses 20,368,874 17,814,108 18,444,340 2,366,136 2,410,763 2,384,695 11,650,777 15,711,095 14,583,047 Debt Service - - - - - - - - -
TOTAL EXPENDITURES 20,368,874 17,814,108 18,444,340 2,366,136 2,410,763 2,384,695 11,650,777 15,711,095 14,583,047
TOTAL CARRYOVER - - - - - - - - -
TRANSFERS OUT 3,493,663 130,000 130,000 - - - - - -
23,862,537 17,944,108 18,574,340 2,366,136 2,410,763 2,384,695 11,650,777 15,711,095 14,583,047
ENDING BALANCE $8,650,182 $10,860,917 $3,618,809 $44,906 $79,353 $277,671 $14,271,926 9,938,224 $8,425,058
Ballston Garage Ballston Garage - 8th Level CPHD Development FundFY 2019 FY 2020 FY 2021 FY 2019 FY 2020 FY 2021 FY 2019 FY 2020 FY 2021
Actual Adopted Adopted Actual Adopted Adopted Actual Adopted AdoptedBEGINNING BALANCE $3,238,595 $1,776,231 $1,410,403 $1,248,055 $1,420,299 $1,612,530 $17,132,194 $17,075,921 $20,904,665
TOTAL REVENUES 4,233,111 4,163,100 4,214,010 263,433 263,400 240,540 18,547,159 26,511,763 26,363,154
TRANSFERS IN - - - - - - - - -
TOTAL BALANCE & REVENUES& TRANSFERS IN 7,471,706 5,939,331 5,624,413 $1,511,488 1,683,699 1,853,070 $35,679,353 43,587,684 47,267,819
EXPENDITURESOperating Expenses 6,402,032 3,704,140 3,567,818 76,692 85,666 92,841 18,191,004 23,036,970 24,200,894 Debt Service - 577,178 577,178 - - - - - -
TOTAL EXPENDITURES 6,402,032 4,281,318 4,144,996 76,692 85,666 92,841 18,191,004 23,036,970 24,200,894
TOTAL CARRYOVER - - - - - - - - -
TRANSFERS OUT - - - - - - - - -
6,402,032 4,281,318 4,144,996 76,692 85,666 92,841 18,191,004 23,036,970 24,200,894
ENDING BALANCE $1,069,674 $1,658,013 1,479,417 $1,434,796 $1,598,033 $1,760,229 $17,488,349 $20,550,714 $23,066,925
TOTAL EXP., CARRYOVER, & TRANSFERS
TOTAL EXP., CARRYOVER, & TRANSFERS
568

GOVERNMENTAL FUNDS' SUMMARIES
Transportation Capital Fund Utilities Fund Capital General Capital - PAYGFY 2019 FY 2020 FY 2021 FY 2019 FY 2020 FY 2021 FY 2019 FY 2020 FY 2021
Actual Adopted Adopted Actual Adopted Adopted Actual Adopted AdoptedBEGINNING BALANCE $174,783,749 $161,033,721 $146,001,751 $53,281,205 $46,982,005 $26,066,423 $104,016,887 $114,718,482 $79,718,482
TOTAL REVENUES 49,782,761 34,358,518 34,436,800 8,934,845 5,988,500 11,267,000 37,570,835
TRANSFERS IN - - - 14,425,300 14,190,500 12,155,000 5,667,108 23,601,546 3,832,227
TOTAL BALANCE & REVENUES& TRANSFERS IN $224,566,510 195,392,239 180,438,551 $76,641,350 $67,161,005 $49,488,423 $147,254,830 $138,320,028 $83,550,709
EXPENDITURESOperating Expenses 50,505,726 32,006,586 31,751,738 19,979,500 20,179,000 23,422,000 32,536,348 8,645,689 3,832,227 Debt Service - - - - - - - - -
TOTAL EXPENDITURES 50,505,726 32,006,586 31,751,738 19,979,500 20,179,000 23,422,000 32,536,348 8,645,689 3,832,227
TOTAL CARRYOVER - 23,653,158 36,030,555 6,695,427 7,731,000 16,495,000 - 35,000,000 35,000,000
TRANSFERS OUT 2,430,721 2,351,932 2,685,062 - - - - - -
52,936,447 58,011,676 70,467,355 26,674,927 27,910,000 39,917,000 32,536,348 43,645,689 38,832,227
ENDING BALANCE $171,630,063 $137,380,563 $109,971,196 $49,966,423 $39,251,005 $9,571,423 $114,718,482 $94,674,339 $44,718,482
Columbia Pike TIF Crystal City TIF Travel & Tourism Promotion FundFY 2019 FY 2020 FY 2021 FY 2019 FY 2020 FY 2021 FY 2019 FY 2020 FY 2021
Actual Adopted Adopted Actual Adopted Adopted Actual Adopted AdoptedBEGINNING BALANCE $374,083 $507,838 $1,191,355 $21,558,284 $20,891,087 $23,010,603 - - -
TOTAL REVENUES 189,070 496,660 968,520 6,369,654 5,964,730 5,759,940 $1,231,590 $1,300,000 $962,882
TRANSFERS IN - - - - - - 246,700 246,700 246,700
TOTAL BALANCE & REVENUES& TRANSFERS IN 563,153 1,004,498 $2,159,875 $27,927,938 $26,855,817 $28,770,543 1,478,290 1,546,700 1,209,582
EXPENDITURESOperating Expenses - - - 4,478,775 5,964,730 5,759,940 1,478,290 1,546,700 1,209,582 Debt Service - - - - - - - - -
TOTAL EXPENDITURES 45,128 496,660 1,014,000 4,478,775 5,964,730 5,759,940 1,478,290 1,546,700 1,209,582
TOTAL CARRYOVER - - - - 4,785,746 3,253,380 - - -
TRANSFERS OUT - - - - - - - - -
45,128 496,660 1,014,000 4,478,775 10,750,476 9,013,320 1,478,290 $1,546,700 $1,209,582
ENDING BALANCE $518,025 $507,838 $1,145,875 $23,449,163 $16,105,341 $19,757,223 - - -
TOTAL EXP., CARRYOVER, & TRANSFERS
TOTAL EXP., CARRYOVER, & TRANSFERS
569

GOVERNMENTAL FUNDS' SUMMARIES
Ballston Quarter TIFFY 2019 FY 2020 FY 2021
Actual Adopted AdoptedBEGINNING BALANCE 65,420 - -
TOTAL REVENUES 410,060 $1,668,740 $2,018,464
TRANSFERS IN - - -
TOTAL BALANCE & REVENUES& TRANSFERS IN 475,480 1,668,740 2,018,464
EXPENDITURESOperating Expenses 65,420 1,668,740 2,018,464 Debt Service - - -
TOTAL EXPENDITURES 65,420 1,668,740 2,018,464
TOTAL CARRYOVER - - -
TRANSFERS OUT - - -
65,420 $1,668,740 $2,018,464
ENDING BALANCE 410,060 - -
TOTAL EXP., CARRYOVER, & TRANSFERS
570

COVID-19 Contingent 10,200,000$ Arlington Housing Investment Fund 7,090,140$ Metro 1,186,556$ Economic Incentive Agreements 889,371$ Reduction in Debt Service (6,000,000)$ Public Safety: Fire Second Recruit Class ($1,512,305), Police recruitment ($129,000), Police business outreach ($110,000), and Sheriff recruitment and support for new personnel ($82,200) 1,833,505$ Technology Upgrades: warranties and security 255,235$ Arlington Independent Media 70,000$ Business Support: Columbia Pike Revitalization Organization ($20,000) and Small Business Support ($20,000) 45,000$ Sidewalk Condition Assessment 300,000$ Community Energy Plan 150,000$ Right-of-Way Flood Sensors 100,000$ Presidential Election 305,900$
Miscellaneous One-time Items: CBO Digitization ($30,000), Permit Counter Specialists ($215,975), Lee Community Center operations ($100,000), equipment and maintenance for Long Bridge ($85,000), Library materials ($50,000), equity training ($25,000) 510,975$
Total Expense 16,936,682$
FY 2021 ADOPTED BUDGETONE-TIME FUNDING SUMMARY
571

This page intentionally left blank
572

Total Fund Balance from FY 2019 233,013,739$
FY 2020 ALLOCATION / APPROPRIATION Allocation to Reserves
- General Fund Operating Reserve (committed) 74,593,507 - General Fund Operating Reserve (assigned)- Self Insurance Reserve (committed) 5,000,000 - Economic & Revenue Stabilization Reserve (committed) 6,700,000 - Economic & Revenue Stabilization Reserve (assigned) 6,781,228
Allocation to Housing- Allocation to Specific Projects (committed) 26,113,904 - Unallocated to Specific Projects (committed) 7,255,814 - Unallocated to Specific Projects (assigned) 15,313,904
Allocation to Schools- School FY 2019 Expenditure Savings (committed) 18,375,639 - School Share of Revenue (committed) 6,344,694
Allocation to Capital- Land Acquisition (committed)- Maintenance Capital / Other (committed) 16,776,098 - Maintenance Capital / Other (assigned) 15,968,901
Allocation to FY 2020 Operating Budget- Incomplete or New Projects (committed) 5,884,062 - Incomplete or New Projects (assigned) 7,016,220
GASB Adjustment for Unrealized Gains 4,882,159
Restricted for Seized Assets & Grants and Nonspendable Prepaid 1,764,279 FY 2020 TOTAL 218,770,409
UNALLOCATED BALANCES 14,243,330
Total Carryover 233,013,739$
PRIOR YEAR CLOSEOUT (FY 2019) &FUND BALANCE CARRYOVER SUMMARY
573

This page intentionally left blank
574

FINANCIAL AND DEBT MANAGEMENT POLICIES
Budgeting, Planning, and Reserves
Balanced Budget: Arlington County will adopt an annual General Fund budget in which the budgeted revenues and expenditures are equal (a balanced budget). Any one-time revenues will be used for one-time, non-recurring expenses such as capital, equipment, special studies, debt reduction, and reserve contributions.
Long-Term Financial Planning: The County will annually develop a six year forecast of General Fund revenues, expenditures and will maintain a biennially updated, ten-year Capital Improvement Plan (CIP). The ten-year forecast will incorporate projected reserve levels and impact of the CIP on the County’s debt ratios.
General Fund Operating Reserve: An Operating Reserve will be maintained at no less than five and one-half percent of the County’s General Fund budget. The Operating Reserve shall be shown as a designation of total General Fund balance. Appropriations from the Operating Reserve require County Board approval and may only be made to meet a critical, unpredictable financial need. Any draw on the operating reserve will be replenished within the subsequent three (3) fiscal years.
Self-Insurance Reserve: The County will also maintain a self-insurance reserve equivalent to approximately one to two months’ claim payments based on a five-year rolling average. Any draw on the self-insurance reserve requires County Board approval and will be replenished within the subsequent two (2) fiscal years.
Stabilization Reserve: Consistent with past practice, the County will maintain a stabilization reserve to address unexpected, temporary events, such as major weather events or a local/regional emergency requiring immediate incurrence of cost in response; revenue declines; new/unfunded state, regional or federal programs; unexpected capital expenditures; and local or regional economic stress. Amounts, in most instances, would be used for one-time (vs. on-going) needs in the course of a fiscal year, and are not intended to be a source of funds to balance the budget during the annual budget development process.
Use of contingent monies requires approval by the County Board. The minimum amount of the contingent will be 1% of the General Fund Budget and will be revisited annually as part of the budget process. Any draw on the stabilization reserve will be replenished within the subsequent two (2) fiscal years.
General Fund General Contingent: Each year’s budget will include a General Fund General Contingent appropriation to be used to cover unforeseen expense items or new projects initiated after a fiscal year has begun. Funding allocated from this contingent requires County Board approval.
Retirement System Funding: The County will use an actuarially accepted method of funding its pension system to maintain a fully-funded position. The County’s contribution to employee retirement costs will be adjusted annually as necessary to maintain full funding. If the County reaches its actuarial-required contribution (defined as County and employee contributions that when expressed as a percent of annual covered payroll are sufficient to accumulate assets to pay benefits when due), the County may reduce its contribution provided that the amount reduced from the annual actuarial requirement will only be used for one-time, non-recurring expenses in order to provide the ability to increase contributions as may be required by future market conditions.
575
FINANCIAL AND DEBT MANAGEMENT POLICIES
Other Post-Employment Benefits (OPEB) Funding: The County will use an actuarially accepted method of funding its other post-employment benefits to maintain a fully-funded position. The County’s contribution to other post-employment benefit costs will be adjusted annually as necessary to maintain full funding. If the County reaches its actuarial-required contribution (defined as County and employee contributions that when expressed as a percent of annual covered payroll are sufficient to accumulate assets to pay benefits when due), the County may reduce its contribution provided that the amount reduced from the annual actuarial requirement will only be used for one-time, non-recurring expenses in order to provide the ability to increase contributions as may be required by future market conditions.
Capital Improvement Plan
1. The County Manager will biennially submit a ten-year Capital Improvement Plan (CIP) to theCounty Board. The CIP will address all known facility and infrastructure needs of the County,including the needs of the Arlington County Public Schools.
2. The CIP shall include a detailed description of each capital project, identifying every source offunding, including pay-as-you-go (PAYG), bond financing, and master lease financing. Thesource of funding will largely be determined based on the useful life of the project.Bond-funded projects will typically have a useful life at least as long as the period over whichthe bonds will be repaid (generally twenty years). Master lease-financed projects willgenerally have useful lives of three to ten years and typically include furniture, equipment,rolling stock and technology purchases. PAYG funds provide greater flexibility and will beappropriated annually from general fund revenues.
3. Each project budget shall identify the financial impact on the operating budget, if any.
4. In general, capital projects estimated to cost $100,000 or more should be included in the CIP,including technology and equipment purchases.
5. The County will balance the use of debt financing sources against the ability to utilize PAYGfunding for capital projects. While major capital facility projects will generally be fundedthrough bonds, the County will attempt to maintain an appropriate balance of PAYG versusdebt, particularly in light of the County’s debt capacity and analysis of maintenance capitalneeds. As part of each biennial CIP process, the County will conduct a comprehensiveassessment of its maintenance capital needs.
6. The CIP will include an analysis of the impact the CIP has on the County’s debt capacity, debtratios and long-term financial plan.
7. Voter referenda to authorize general obligation bonds should only be presented to voterswhen the analysis of the County’s debt capacity demonstrates the ability of the County tofund the debt service for the bonds based on the County’s “Financial and Debt ServicePolicies.” Absent a compelling reason to do otherwise, the County should have the capacityto initiate construction projects within the two-year period before the next bond referendum.There should also be a demonstrated capability for the County to complete any projectapproved by referendum within the eight-year time period mandated under state law for saleof authorized bonds. The term “County” in this specific policy includes the Arlington CountyGovernment and any entity that receives bond funding from the County (such as the ArlingtonCounty Public Schools and the Washington Metropolitan Area Transit Authority).
576

FINANCIAL AND DEBT MANAGEMENT POLICIES
8. In the off-years of the biennial CIP process, the County will conduct a needs assessment thatwill reflect, as appropriate, existing master plans and assessments (e.g., the MasterTransportation Plan and others.) Given the significant size and diversity of the County’sinfrastructure responsibilities, this assessment process will be implemented over the next fourto six years.
Debt Management
The County will prudently use debt instruments, including general obligation bonds, revenue bonds, industrial development authority (IDA) revenue bonds, and master lease financing in order to provide re-investment in public infrastructure and to meet other public purposes, including inter-generational tax equity in capital investment. The County will adhere to the following debt affordability criteria (excluding overlapping and self-supporting debt).
1. The ratio of net tax-supported debt service to general expenditures should not exceed tenpercent, within the ten-year projection.
2. The ratio of net tax-supported debt to full market value should not exceed three percent,within the ten-year projection.
3. The ratio of net tax-supported debt to income should not exceed six percent, within theten-year projection.
4. Growth in debt service should be sustainable and consistent with the projected growth ofrevenues. Debt service growth over the ten-year projection should not exceed the averageten-year historical revenue growth.
5. The term and amortization structure of County debt will be based on an analysis of the usefullife of the asset(s) being financed and the variability of the supporting revenue stream. TheCounty will attempt to maximize the rapidity of principal repayment where possible. In nocase will debt maturity exceed the useful life of the project.
6. The County will refund debt when it is in the best financial interest of the County to do so.When a refunding is undertaken to generate interest rate cost savings, the minimumaggregate present value savings will be three percent of the refunded bond principal amount.
Variable Rate Debt
1. Variable rate debt exposure should not exceed twenty percent of total outstanding debt.
2. Debt service on variable rate bonds will be budgeted at a conservative rate.
3. Before issuing variable rate bonds, the County will determine how potential spikes in the debtservice will be funded.
4. Before issuing any variable rate bonds, the County will determine the impact of the bonds onthe County’s total debt capacity under various interest rate scenarios; evaluate the riskinherent in the County’s capital structure, giving consideration to both the County’s assetsand its liabilities; and develop a method for budgeting for debt service.
577

FINANCIAL AND DEBT MANAGEMENT POLICIES
Moral Obligation Debt or Support
On an infrequent basis, the County provides its “moral obligation” support for partners, including regional public safety agencies and affordable housing partners, among others. A moral obligation exists when the County Board has made a commitment to support the debt of another entity to prevent a potential default. The County’s moral obligation will only be authorized after an evaluation of the risk to the County’s balance sheet and stress testing of the financial assumptions underlying the proposed project.
Derivatives
Interest rate swaps and options (Swaps or Derivatives) are appropriate management tools that can help the County meet important financial objectives. Properly used, these instruments can help the County increase its financial flexibility, provide opportunities for interest rate savings or enhanced investment yields, and help the County reduce its interest rate risk through better matching of assets and liabilities. The County must determine if the use of any Swap is appropriate and warranted given the potential benefit, risks, and objectives of the County.
1. The County may consider the use of a derivative product if it achieves one or more of thefollowing objectives:
Provides a specific benefit not otherwise available; Produces greater than expected interest rate savings or incremental yield over other
market alternatives; Results in an improved capital structure or better asset/liability matching.
2. The County will not use derivative products that are speculative or create extraordinaryleverage or risk; lack adequate liquidity; provide insufficient price transparency; or are usedas investments.
3. The County will only do business with highly rated counterparties or counterparties whoseobligations are supported by highly rated parties.
4. Before utilizing a Swap, the County, its financial advisor and legal counsel shall review theproposed Swap and outline any associated considerations. Such review shall be provided tothe Board and include analysis of potential savings and stress testing of the proposedtransaction; fixed versus variable rate and swap exposure before and after the proposedtransaction; maximum net termination exposure; and legal constraints.
5. Financial transactions using Swaps or other derivative products used in lieu of a fixed ratedebt issue should generate greater projected savings than the typical structure used by theCounty for fixed rate debt.
6. The County will limit the total notional amount of derivatives to an amount not to exceedtwenty percent of total outstanding debt.
7. All derivatives transactions will require County Board approval.
578

FINANCIAL AND DEBT MANAGEMENT POLICIES
Special Revenue / Enterprise Funds
It is the general policy of the County to avoid designation of discretionary funds in order to maintain maximum financial flexibility. The County may, however, create dedicated funding sources when there are compelling reasons based on state law or policy objectives, as described below. The Utilities Fund was created as a self-sustaining, fee-based enterprise fund under state code to support and maintain development of the County’s water and sewer infrastructure. The Transportation Capital Fund was adopted pursuant to state legislation for new transportation funding. The Stormwater Management Fund was adopted in lieu of a self-supporting, user fee-based enterprise fund. The CPHD Development Fund was created as a self-sustaining, fee-based enterprise fund. Tax Increment Funds were established to support redevelopment and preservation objectives associated with the County’s adoption of master plans, (e.g., the Crystal City Sector Plan adopted in 2010 and the Columbia Pike Neighborhoods Plan adopted in 2013).
Utilities Fund
1. The County will annually develop a six year forecast of projected water consumption, revenue,operating expenditures, reserve requirements and capital needs for the Utilities Fund. Thesix-year forecast will show projected water-sewer rate increases over the planning period.
2. The County will implement water-sewer rate increases in a gradual manner, avoiding spikeincreases whenever possible.
3. The County will meet or exceed all requirements of any financing agreements or trustindentures.
4. The Utilities Fund will maintain a reserve equivalent to three months’ operations andmaintenance expenses. The reserve may be used to address emergencies and unexpecteddeclines in revenue. If utilized, the reserve will be replenished over a three year period tothe minimum reserve level. This reserve is in addition to any financing agreement-requireddebt service reserve funds.
5. The Utilities Fund will maintain debt service coverage of at least 1.25 times on all debt serviceobligations.
6. The Utilities Fund will be self-supporting.
Transportation Capital Fund
1. New revenue shall not be used to supplant existing transportation funding commitments, andcapital investments shall be compliant with state law restrictions on non-supplanting andmaintenance of effort requirements.
2. Operating program enhancements (outside base program) that clearly documenttransportation benefits may be eligible for support from the Transportation Capital Fund.
3. No more than three to five percent of annual funding should be used for projectadministration, indirect & overhead costs to support capital projects.
4. A reserve equivalent of ten to twenty percent of annual budgeted revenue will be established.
579

FINANCIAL AND DEBT MANAGEMENT POLICIES
5. A five to ten-year financial plan and model will be developed that integrates project cashflowforecasts, revenue projections, and financial / debt management policies and will factor inother non-County funding sources, including federal, state, regional, and private funding.
6. The County will prudently balance the use of new transportation funding sources betweenpay-as-you-go funding and leveraging through new bond issuance. Use of leveraging will bedependent on project size, cash flow, and timing projections.
7. If the County chooses to issue debt supported by dedicated transportation funding sources,such debt will be structured to be self-supporting and will not count against the County’sgeneral tax supported obligation debt ratios or capacity. Debt service coverage on such debtwill range from 1.10 to 1.50 times, depending on the type of debt issued. The term on suchbonds will not exceed the average useful life of the assets financed, and amortization will bestructured to match the supporting revenue stream.
8. The Transportation Capital Fund will be self-supporting.
Tax Increment Funds
1. The intended use of TIF monies will be specified at the time of TIF creation; changes oradditional uses will be determined as part of the annual budget process.
2. The assessed value of TIF areas will not exceed 25 percent of the County’s total assessedvaluation. As of January 1, 2016, existing TIF assessed valuation totaled 20 percent ofCounty-wide assessed valuation.
3. The percent of TIF revenue available for the intended uses within a TIF area will be establishedat the creation of the TIF and will be less than or equal to 40 percent. This percent will beevaluated annually as part of the budget process.
4. The County will prudently balance the use of PAYG funding and leveraging through TIF bondissuances. Use of leveraging will be dependent on project type, size, cashflow and timingprojections. Leveraging will only be used for capital projects that meet useful life and otherrequirements for bond issuance.
5. If the County leverages TIF revenue on its own behalf, it will target a minimum debt servicecoverage ratio of 2.0 times and establish an appropriate level of debt service reserves and /or other contingencies.
6. The County will establish additional policies pertaining to the leverage of TIF revenue by aprivate development entity prior to any such issuance.
7. A reserve equivalent to ten percent of annual budgeted revenue will be established.
Stormwater Fund
1. The County will annually develop a six-year projection of stormwater operating and capitalexpenses.
2. The County will prudently balance the use of new stormwater funding sources betweenpay-as-you-go funding and leveraging through new bond issuance. Use of leveraging will be
580

FINANCIAL AND DEBT MANAGEMENT POLICIES
dependent on project size, cashflow, and timing projections. If debt is issued for stormwater projects, it will generally follow the debt issuance guidelines contained in this policy.
3. The Stormwater Fund will maintain a reserve equivalent to three months’ expenses.
4. Stormwater financial policies will be reviewed as part of the Municipal Separate Storm SewerSystem (MS4) permit renewal cycle (every five years).
5. The Stormwater Fund will be self-supporting.
CPHD Development Fund
1. A contingent reserve will be established equivalent to thirty percent of the Fund’s totaloperating budget based on the fiscal year. This amount is equivalent to three to four monthsof annual operating expenditures. The reserve may be used to address emergencies andunexpected declines in revenue only after authorization from the County Board.
2. The CPHD Development Fund will be self-supporting.
Ballston Garage and Ballston Garage 8th Level Funds
1. The County will annually develop a multi-year forecast of garage revenue, operatingexpenses, and capital maintenance costs to be updated with each County CIP cycle.
2. An economic stability reserve equivalent to three months of annual parking revenues will beestablished to address potential revenue variability, ramping up to this level over a four-yearperiod beginning in FY 2019. Any draws upon this reserve will be replenished within thesubsequent three (3) fiscal years.
3. A maintenance reserve will be established based on an assessment of expected capitalrenewal needs over a 10-year period.
4. A reserve will be established for the ensuing year of debt service on the Series 2016B BallstonQuarter CDA bonds allocable to garage improvements.
5. The County will meet or exceed all requirements of any financing agreements or trustindentures.
6. The County will target self-sufficiency in consideration of limits imposed on parking user feeraising ability in the garage by the 1984 documents governing original and ongoingdevelopment of the garage.
581

This page intentionally left blank
582

COMPREHENSIVE PLAN SUMMARY
Background
The Code of Virginia requires all governing bodies in the Commonwealth to have an adopted Comprehensive Plan. Arlington County’s Comprehensive Plan was established by resolution of the County Board on August 27, 1960. This resolution called for the preparation of Arlington County’s Comprehensive Plan, which originally included the following five elements: General Land Use Plan, Water Distribution System Master Plan, Sanitary Sewer System Master Plan, Storm Sewer Plan, and Major Thoroughfare and Collector Streets Plan. In later years, additional elements were added to the Comprehensive Plan and some were replaced by new plans. For example, the Major Thoroughfare and Collector Streets Plan was replaced in 1986 by the Master Transportation Plan. Elements added to the Comprehensive Plan over time include the Recycling Program Implementation Plan and Map, the Chesapeake Bay Preservation Plan and Preservation Area Map, the Open Space Master Plan (now the Public Spaces Master Plan), the Historic Preservation Master Plan, the Community Energy Plan, and the Affordable Housing Master Plan.
The Comprehensive Plan provides guidance during the year for County efforts in conjunction with the annual budget and the Management Plan.
Goals and Objectives
The Comprehensive Plan was established in order that Arlington County may remain a safe, healthy, convenient, and prosperous community and an attractive place in which to live, work, and play, with stable or expanding values and potentialities for growth and continued economic health. The purpose of the Comprehensive Plan is to guide the coordinated and harmonious development of Arlington County through the provision of high standards of public services and facilities based on general principles adopted by the County Board in 1960. Updates to various Plan elements adopted by the Board since 1960 have greatly expanded and modernized these principles, goals, and objectives, responding to more advanced and comprehensive community expectations about program delivery and sustainability; local, state, and federal regulatory requirements; and other factors—as highlighted in the Plan element summary section below.
These are the general principles adopted by the Board in 1960:
Retention of the predominantly residential character of the County, and limitation of intense development to limited and defined areas;
Promotion of sound business, commercial, and light industrial activities in designated areas appropriately related to residential neighborhoods;
Development of governmental facilities which will promote efficiency of operation and optimum public safety and service, including the areas of health, welfare, culture, and recreation;
Provision of an adequate supply of water effectively distributed; Maintenance of sewage disposal standards acceptable to the immediate County area and its
neighbors in the entire Washington Metropolitan Area and consistent with the program of pollution abatement of the Potomac River;
Provision of an adequate storm water drainage system; and Provision of an adequate system of traffic routes which is designed to form an integral part of
the highway and transportation system of the County and region, assuring a safe, convenient flow of traffic, thereby facilitating economic, and social interchange in the County.
583
COMPREHENSIVE PLAN SUMMARY
In addition, the County Board has endorsed a land use policy which has evolved from an extensive citizen participation process and is designed to ensure that Arlington is a balanced community which provides residential, recreational, educational, health, shopping, and employment opportunities with good transportation supported by a strong tax base and the effective use of public funds. An overarching theme of many of Arlington’s initiatives, from land use to transportation to stormwater management, is that of sustainability and transit-oriented development. In support of Arlington’s overall policy goals, the following adopted land use goals and objectives have been incorporated into the Comprehensive Plan:
Concentrate high density residential, commercial, and office development within designated Metro Station Areas in the Rosslyn-Ballston and Jefferson Davis Metrorail transit corridors. This policy encourages the use of public transit and reduces the use of motor vehicles.
Promote mixed-use development in Metro Station Areas to provide a balance of residential, shopping, and employment opportunities. The intent of this policy is to achieve continuous use and activity in these areas.
Increase the supply of housing by encouraging construction of a variety of housing types and prices at a range of heights and densities in and near Metro Station Areas. The Plan allows a significant number of townhouses, mid-rise, and high-rise dwelling units within designated Metro Station Areas.
Preserve and enhance existing single-family and apartment neighborhoods. Within Metro Station Areas, land use densities are concentrated near the Metro Station, tapering down to surrounding residential areas to limit the impacts of high-density development. Throughout the County, the Neighborhood Conservation Program and other community improvement programs help preserve and enhance older residential areas and help provide housing at a range of price levels and densities.
Preserve and enhance neighborhood retail areas. The County encourages the preservation and revitalization of neighborhood retail areas that serve everyday shopping and service needs and are consistent with adopted County plans. The Arlington County Retail Plan (2015) provides the policies and guidance to support retail in Arlington County.
Other goals and objectives have been incorporated into the Comprehensive Plan through the years, including the provision of an adequate supply of beneficial open space which is safe, accessible, and enjoyable, as outlined in the Public Spaces Master Plan, energy goals as described in the Community Energy Plan, and targets for affordable housing, as set forth in the Affordable Housing Master Plan.
Elements of the Comprehensive Plan
Arlington County’s Comprehensive Plan is currently comprised of the following eleven elements:
General Land Use Plan Master Transportation Plan Storm Water Master Plan Water Distribution System Master Plan Sanitary Sewer System Master Plan Recycling Program Implementation Plan and Map Chesapeake Bay Preservation Ordinance and Plan Public Spaces Master Plan Historic Preservation Master Plan
584

COMPREHENSIVE PLAN SUMMARY
Community Energy Plan Affordable Housing Master Plan
Although the Planning Division in the Department of Community Planning, Housing and Development is responsible for the overall coordination and review of the Comprehensive Plan, several agencies within Arlington County are responsible for the review of the specific elements that make up the Comprehensive Plan. A web version which includes the plan elements, can be found on the Department of Community Planning, Housing, and Development website. The “Essential Guide to Arlington County’s Comprehensive Plan” was produced in 2017 and provides specific details on how the Comprehensive Plan is used, reviewed, the relationship of the individual elements and sub-elements to the overarching goals of the Comprehensive Plan, and the purpose, goals, history, and implementation of each element/sub-element. This is accompanied by a one-page overview and 84-page technical resource compiling the specific goals and objectives from each ComprehensivePlan element and sub-element.
A description of each element and the name of the department responsible for that element follows:
General Land Use Plan
The General Land Use Plan (GLUP) is the primary guide for the future development of the County. The plan establishes the overall character, extent, and location of various land uses and serves as the guide to communicate the policy of the County Board to citizens, businesses, developers, and others involved in the development of the County. In addition, the General Land Use Plan serves as a guide for the County Board in its decisions concerning future development.
The County first adopted a General Land Use Plan in 1961. Since then, the plan has been updated and periodically amended to more clearly reflect the intended use for a particular area. The plan is amended either as part of a long-term planning process for a designated area or as the result of an individual request for a specific change, typically evaluated through a Special GLUP Study. Since its initial printing, there have been numerous updates and amendments to the General Land Use Plan. The County Board adopted an updated General Land Use Plan map and booklet in February 2020, and the web version will continue to show amendments and other minor updates on a bi-annual basis. More information on the GLUP can be found on the GLUP webpage.
Department: CPHD
Master Transportation Plan
Arlington’s original transportation plan was the Major Thoroughfare and Collector Streets Plan. Since its adoption in 1941, the plan has been updated and expanded to address multiple travel modes. For streets, the initial plan of 1941 was updated in 1960 and 1975, and became part of the 1986 Master Transportation Plan. For bikeways, the initial plan adopted in 1974 was updated in 1977, 1986, and again in 1994, as part of the Master Transportation Plan. The initial Master Transit Plan adopted in 1976 was partially updated in 1989 with the inclusion of the Paratransit Plan. The 1978 Master Walkways Policy Plan was also updated in 1986 as a part of the Master Transportation Plan and in 1997 as the Pedestrian Transportation Plan.
The Master Transportation Plan establishes the principles to guide the implementation of transportation facilities to address future transportation needs and challenges in Arlington County. The Master Transportation Plan provides:
585

COMPREHENSIVE PLAN SUMMARY
The overall rationale for developing transportation facilities (transit networks, roads, walkways and/or bikeways) to meet future travel needs;
A basis for establishing County transportation-related program priorities; A framework for offering advice to other agencies responsible for transportation in this area;
and An overall direction to guide transportation projects in Arlington County.
A comprehensive update of the Master Transportation Plan began in 2004 with the following eight sub-elements adopted by the County Board and now comprise the Master Transportation Plan: 1) Goals and Policies Element (2007), 2) Map Element (2007), 3) Bicycle Element (2008, updated 2019), 4) Pedestrian Element (2008), 5) Transportation Demand and System Management Element (2008), 6) Transit Element (2009, updated 2017), 7) Parking and Curb Space Management Element (2009), and 8) Streets Element (2011).
Amendments to the MTP Map have frequently been made, largely in conjunction with other County land use and transportation planning efforts. A comprehensive update to the MTP is planned to begin in FY 2021, which would span multiple years and could result in a plan reorganization from the current element-based structure, as well as lead to a series of corridor plans to facilitate implementation of policy updates.
Department: DES
Storm Water Master Plan
Originally adopted in 1957 with a primary focus on drainage, the Storm Water Master Plan has been updated in both 1996 and 2014 to incorporate water quality and regulatory goals, objectives, and requirements. The Board adopted a comprehensive update to the Plan in 2014 that included an evaluation of the elements that make up the County’s built and natural stormwater conveyance systems as well as challenges and strategies to respond to the aggressive regulatory requirements to clean up the Chesapeake Bay. These elements include: 1) a storm sewer capacity analysis to assess the County’s storm sewer infrastructure and prioritize capacity, 2) a County-wide stream assessment to evaluate and prioritize stream and storm sewer outfall conditions, and 3) a watershed retrofit assessment that identifies locations to add new stormwater treatment facilities and assets to help slow down and filter stormwater runoff.
The overall goals of the County are to provide a comprehensive stormwater management system that balances the following goals: 1) to reduce the potential for stormwater threats to public health, safety, and property; 2) to mitigate the impacts of new and existing urban development on Arlington streams, the Potomac River, and the Chesapeake Bay; and, 3) to comply with State and federal stormwater, water quality, and floodplain management regulations.
To build on the adopted Stormwater Master Plan with more advanced analysis, a comprehensive risk assessment and mitigation plan is under development for 2020-2021 to articulate more fully and respond to the growing challenges and needs of the program driven by continued rapid increase in impervious surfaces from redevelopment, steep topography, aging and limited drainage infrastructure, changes in rainfall patterns, neighborhood- and watershed-scale chronic flood risks, and stringent regulatory requirements. This effort will include an asset inventory and condition assessment, a challenges and risk matrix, a gaps analysis and sensitivity review, and recommended strategies and measures to prioritize the County’s investments in this critical utility infrastructure.
Department: DES
586

COMPREHENSIVE PLAN SUMMARY
Water Distribution System Master Plan
The Water Distribution System Master Plan, adopted by the County Board in September 1992, is the policy document that guides the operation, maintenance, and expansion of the County water system. The plan evaluates the existing water distribution system facilities and operation practices and determines the policy and facility improvements that will be necessary to provide and maintain the desired quality of service. In September 2014, the Plan was updated to address the challenges of an aging infrastructure by setting recommended investment and policy guidance.
Department: DES
Sanitary Sewer System Master Plan
The Arlington County sanitary sewer system collects and treats wastewater produced in Arlington County and some adjoining portions of Fairfax County, the City of Alexandria, and the City of Falls Church. The Sanitary Sewer Collection System Master Plan, adopted by the County Board in December 2002, evaluates the current sanitary sewer system facilities, practices, and programs and determines the policies and facility improvements needed to provide and maintain adequate service now and in the future. An update to the Sanitary Sewer System plan is expected in FY 2021.
Department: DES
Recycling Program Implementation Plan and Map
The Recycling Program Implementation Plan was prepared in compliance with a requirement in the Code of Virginia to include the location of existing recycling centers in the Comprehensive Plan. The purpose of the plan is to provide a guide for the development of effective recycling programs in Arlington. The plan includes major recommendations related to the implementation of multi-material curbside collection of source separated recyclables from single-family dwellings; the implementation of a multi-material source separation recycling in the multifamily and commercial waste segments; planning of a materials recovery facility to serve the County; and the implementation of a public education/promotion program which stresses source reduction and recycling. The plan also includes a map that shows the location of existing recycling centers. In 2004, at the direction of the State of Virginia, a twenty-year Solid Waste Management Plan (SWMP) that serves as the blueprint for waste reduction, recycling and waste management was prepared. Adopted by the County Board in 2004, the SWMP in many ways replaced the Recycling Program Implementation Plan. However, the Recycling Program Implementation Plan still serves as the relevant Comprehensive Plan element. Since its implementation, the County has achieved nearly all its objectives ahead of schedule. The next update to the SWMP will be needed by 2024.
Department: DES
Chesapeake Bay Preservation Plan and Preservation Area Map
Arlington County was required to adopt a new Chesapeake Bay element of its Comprehensive Plan, under the provisions of 9 VAC 10-20-220(A)(2). The purpose of the Chesapeake Bay Preservation Plan is to satisfy this requirement of the Chesapeake Bay Preservation Area Designated and Management Regulations. The plan mirrors the key recommendations of the adopted Watershed Management Plan, focusing on recommended actions to mitigate stormwater impacts from development activity and the protection and restoration of stream valleys.
587

COMPREHENSIVE PLAN SUMMARY
In 2017, the County Board adopted an updated Chesapeake Bay Preservation Area Map, based on the information gathered from the field assessments for the Stormwater Master Plan (2014) and the Natural Resource Management Plan (2010).
Department: DES
Public Spaces Master Plan
The County Board first adopted the Open Space Master Plan in 1994, updated and renamed it to the Public Spaces Master Plan (PSMP) in 2005, and adopted the most recent PSMP update in April 2019.
The 2019 PSMP provides policy guidance for the future of Arlington's public space and outlines the vision, policies and tools for the development and management of the diverse public spaces system, including parks, natural resources and recreational assets. The plan is designed to establish the overall character, extent, and location of public space. The PSMP includes over 200 recommendations organized around six Strategic Directions: Public Spaces, Trails, Resource Stewardship, Fiscal Sustainability and Partnerships, Programs and Operations and Maintenance. Additionally, the plan includes policies for land acquisition and level of service, athletic fields synthetic turf and lighting, dog parks & dog runs, and privately owned public space design guidelines. The PSMP also includes inventories of existing public spaces and amenities and adopted park master plans, definitions and an action plan. The Action Plan lays out a plan for moving each of the 200 plus specific recommendations forward, and identifies responsible parties, potential partners, funding sources, estimated time frames, and cost ranges.
Department: DPR
There are three sub-elements of the PSMP; the Urban Forest Master Plan, the Natural Resources Management Plan, and the Public Art Master Plan.
Arlington’s Urban Forest Master Plan (UFMP), was initiated by the Department of Parks and Recreation and Arlington’s Urban Forestry Commission, under the direction of the Arlington County Board, to facilitate the County’s ongoing commitment to enhance and preserve Arlington’s tree canopy. The plan was adopted by the County Board in July 2004. The Master Plan has the following components: a Geographic Information Systems (GIS) street tree inventory, a tree canopy satellite analysis, long-range goals and recommendations, along with a final Urban Forest Master Plan report including GIS-based planting plans. In October 2009, Arlington County received an updated satellite analysis of tree canopy coverage. The analysis also provides Arlington with a GIS layer that enables staff to calculate tree canopy coverage in any geographical area of the County, including individual civic associations, land use areas, residential neighborhoods, and business corridors. Additional tree canopy analysis was performed in 2011, and again in 2017 (using 2016 data). In 2016, an i-Tree Eco analysis was performed, to understand the species and size composition of the urban forest.
Department: DPR
The purpose of the Natural Resources Management Plan (NRMP) is to provide Arlington County staff and residents with the knowledge, methods and tools necessary to assume the role of a world-class steward of the local environment. The primary goal of the Plan is to bring together the various elements of field research, current practice, existing plans and policies, and best management practices to create an achievable set of actionable recommendations relating to the protection of those natural resources under the control of County government. Completed as an outstanding component of the 2005 Public Spaces Master Plan and utilizing data from the Natural Heritage Resources Inventory, the NRMP “emphasizes the importance of managing natural resources as a unified system rather than as a set of unrelated natural features”.
588

COMPREHENSIVE PLAN SUMMARY
An update to both the UFMP and NRMP is underway and is anticipated to take until late 2021.
Department: DPR
The Public Art Master Plan, another element of the Public Spaces Master Plan, outlines a strategy for how public art, with elevated standards for design, architecture, and landscape architecture, will improve the quality of public spaces and the built environment in Arlington for civic placemaking. The creation of Arlington’s first Public Art Master Plan (2004) was stipulated by the Public Art Policy adopted by the County Board in September 2000 to help refine the policy’s direction that public art should be sited in “prominent locations.” The Public Art Master Plan defines prominent as areas that are a focus for economic development and civic life as well as public and private investment. The master plan provides guidance for project prioritization and implementation processes for public art associated with County-funded projects, site plan/special exception projects, and community-initiated projects. The master plan’s development included a survey of other planning processes and initiatives, including sector plans, Neighborhood Conservation Plans, and studies to ensure that its recommendations would be in support of these other policy tools. An update is expected to be completed in 2020.
Department: AED
Historic Preservation Master Plan
The Historic Preservation Master Plan is the primary guide for historic resources in the County. The purpose of this plan is to establish proactive priorities, goals, and objectives for County historic preservation activities that involve the historic built environment, cultural heritage, and County history in general. The document also serves as a guide to communicate the historic preservation policy of the County Board to property owners, residents, businesses, developers, and others. Additionally, the Historic Preservation Master Plan guides the County Board in its decisions concerning historic resources. Included in the Historic Preservation Master Plan is an implementation strategy outline to guide the various programs to be developed. The County adopted the Historic Preservation Master Plan in 2006. Work to begin on the first update to the Historic Preservation Master Plan will get underway in 2020.
Department: CPHD
Community Energy Plan
In June 2013, the County Board adopted the original Community Energy Plan (CEP) and adopted a CEP update in September 2019. The purpose of the CEP is to define Arlington’s energy goals and identify energy policies and practices that will drive Arlington to remain economically competitive, environmentally committed, and strategically served by secure, consistent and reliable energy sources and programs that are equitably available to all constituents. The plan sets broad goals and policies for a sustainable community over the next thirty years. It is intended to ensure that development in the County occurs in a coordinated manner that best promotes the health, safety, prosperity, and general welfare of the County’s residents and businesses.
CEP implementation is guided by the Community Energy Plan Implementation Framework (CEP Implementation Framework), which lays out the strategies to achieve the CEP’s goals and objectives. The County reviews and updates the CEP and Implementation Framework every five years. The energy sector is rapidly evolving on a functional, operational, resource diversification, financial, and
589

COMPREHENSIVE PLAN SUMMARY
technological basis. The five-year update cycle engages stakeholders to integrate these developments and resources.
The CEP secures the County’s leadership role in the sector for services to constituents and ensures that execution of the CEP improves Arlington’s economic competitiveness, energy security, resilience, energy equity, and environmental commitment. County staff will begin a 5-year CEP review in 2023, scheduled for completion in 2024. This will involve updating the County’s energy use inventory, energy modelling, and incorporation of emerging technologies and developments in the energy sector. The CEP update will include civic engagement to reflect the CEP’s broad and deep relationship with all aspects of government and the community.
Department: DES
Affordable Housing Master Plan
In September 2015, the County Board adopted the Affordable Housing Master Plan (AHMP). The purpose of the AHMP is to define the County’s affordable housing policy and enable Arlington to respond to the current and future needs of residents of all levels of income in the County. The plan includes the context for affordable housing in Arlington, an analysis of current and future housing needs, and the affordable housing policy. The policy is organized around three goals: having an adequate supply of housing for the community’s needs; ensuring that all segments of the community have access to housing; and ensuring that housing efforts contribute to a sustainable community. The AHMP fulfills the Code of Virginia requirement that comprehensive plans address affordable housing to meet the current and future needs of residents of all levels of income in the locality. Accompanying the AHMP is the Affordable Housing Implementation Framework (AHI Framework). The AHI Framework describes the existing and potential tools that will be the mechanisms for fulfilling the goals, objectives and policies of the AHMP. The framework provides guidance from the County Manager to staff for developing and overseeing specific policies and programs to meet the County’s affordable housing needs. As part of Housing Arlington, the Affordable Housing Master Plan will undergo a review starting in 2020. The County Board launched Housing Arlington in March 2019, it is an umbrella program that takes a proactive, expanded approach to reach an equitable, stable, adaptive community. In addition to the review of the AHMP, it includes planning and implementation tools, housing policy, financial resources, and innovative local and regional public-private partnerships. The AHMP review will update the current needs and projections in the AHMP and engage the community to ensure that the AHMP continues to comprehensively address the future housing affordability needs of Arlington. The final outcomes will be reflected in an Affordable Housing Master Plan Review Report expected to be completed in 2021.
Department: CPHD
590

HOUSING PROGRAMS SUMMARY
SUMMARY OF HOUSING PROGRAMS
In keeping with its vision for a diverse and inclusive community, Arlington County supports a variety of housing programs to ensure a range of housing choices for households of all types and income levels. This section pulls information about housing programs from throughout the budget and consolidates summary information on all housing programs in one place. The Funding Summary shows that approximately $66.4 million in funding is being allocated for FY 2021 programs to preserve affordable housing and assist persons to meet their housing needs. Local tax dollar support for these programs totals approximately $43.0 million, or 5.3 percent of County government operations (General Fund excluding School’s transfer). These figures do not include additional funds outside the County budget that contribute to the affordable housing effort.
Indications are that Arlington continues to experience losses in its market-rate affordable housing units, due to redevelopment and increased rents. County residents continue to struggle to meet rising housing costs, especially in difficult economic times. Pressures on the supply of market-rate affordable housing units continue to grow, primarily due to rent increases. In addition, projected development in the Rosslyn-Ballston, Jefferson Davis, and Columbia Pike corridors will make it even more critical for the County to be strategic in allocating resources.
All of these housing programs are part of a comprehensive County effort to preserve and enhance affordable housing, governed by Arlington’s Affordable Housing Principles and Goals. Affordable housing has for many years been a budget priority and the different County programs target different aspects of the housing challenge, ranging from rental assistance to acquisition of committed affordable housing to homeownership to code enforcement and tenant assistance. This summary provides Arlington’s Affordable Housing Principles and Goals and multi-year budgeted expenditures. In FY 2018, several housing categories were consolidated to better reflect overall programs rather than individual activities that these programs support.
The Affordable Housing Master Plan (AHMP) was adopted in 2015 as an element of the County’s Comprehensive Plan. Its overarching goals of increasing housing supply, facilitating access to housing, and promoting sustainability of the County’s housing stock and financial portfolio are being implemented through a variety of programs and projects. A review of the AHMP will begin in 2020 and will include a report on the progress made towards the Plan’s goals, an update of the needs analysis, and community engagement to ensure that the AHMP reflects community priorities and needs.
In addition to the progress made with the Affordable Housing Master Plan (AHMP), significant investments in FY 2021 to various housing programs include:
1) Arlington’s Affordable Housing Investment Fund (AHIF) is funded at a level of $16.0 million, ofwhich, $7.1 million is one-time funding and $8.9 million is on-going funding.
2) Operational costs for the Comprehensive Homeless Services Center ($1,618,428) are includedin the adopted FY 2021 budget. The center opened in early FY 2016 and provides a year-roundshelter with comprehensive services to move homeless persons to permanent housing andsupport additional County office space.
3) The total funding for the Housing Grant Program in the FY 2021 adopted budget is $10,130,374after the addition of $801,781 to fund the annual ongoing increase and the increase in MaximumAllowable Rent.
591

HOUSING SUMMARY
4) The FY 2021 adopted budget includes a total of $2,727,980 to support the Mary Marshall AssistedLiving Residence which opened in November 2011. This 52-bed facility provides supportivehousing with assisted living services for low-income seniors with serious mental,intellectual/developmental, and/or physical disabilities.
ARLINGTON’S AFFORDABLE HOUSING PRINCIPLES & GOALS
Adopted by the County Board in September 2015
The Affordable Housing Master Plan is consistent with, and contributes to, achievement of the Vision for Arlington County. The Housing Principles form the core philosophical foundation of Arlington’s approach to affordable housing within the context of the County’s total housing stock, economic base, and social fabric. These principles provide direction for Arlington’s affordable housing goals, objectives, and policies. The Affordable Housing Master Plan can be found at the link below:
http://arlingtonva.s3.amazonaws.com/wp-content/uploads/sites/15/2015/12/AHMP-Published.pdf
Principle 1: Housing affordability is essential to achieving Arlington’s vision.
Principle 2: Arlington County government will take a leadership role in addressing the community’s housing needs.
Principle 3: A range of housing options should be available throughout the County affordable to persons of all income levels and needs.
Principle 4: No one should be homeless.
Principle 5: Housing discrimination should not exist in Arlington.
Principle 6: Affordable housing should be safe and decent.
The Affordable Housing Policy responds to the current and future needs and is articulated in goal, objective and policy statements. Three broad goal areas aid in organizing the various policies into a framework which is further detailed by objectives that respond to these goals, and policies which will direct County efforts in fulfilling each objective.
The first goal relates to housing supply, which is fundamental to addressing all housing needs. However, housing supply alone is not sufficient to ensure that the housing needs of households of all incomes can be met; the second goal addresses access to housing. And finally, it is imperative that as housing needs are addressed that these efforts contribute to a sustainable community.
Goal 1: Arlington County shall have an adequate supply of housing available to meet community needs.
Goal 2: Arlington County shall ensure that all segments of the community have access to housing.
Goal 3: Arlington County shall ensure that its housing efforts contribute to a sustainable community.
592

HOUSING SUMMARY
FUNDING SUMMARY
The County’s housing programs are funded with a variety of local, state, and federal funding, and are managed through the Department of Human Services and the Department of Community Planning, Housing, and Development. Housing funding totals approximately $66.4 million for all funds in FY 2021. The General Fund net tax support equals approximately $43.0 million of the General Fund budget. This section provides a comprehensive summary of the housing program efforts and the funding dedicated to them including summary charts and table as well as descriptions of each program area.
FY 2021 Expense Budget for Housing Programs
Multi-Family Development
and Affordable Housing
Investment Fund (AHIF),
$16,044,064 , 24%
Housing Grants Rental Assistance
Program, $10,130,374 , 15%
Centralized Access System Homeless
Prevention, $374,595 , 1%
Permanent Supportive Housing (PSH), $3,174,471 , 5%
Housing Choice Voucher Rental Assistance, $19,473,520 , 29%
Real Estate
Tax Relief for the Elderly
and Disabled
& Disabled Veteran , $4,326,84
0 , 7%
Homeless Shelter
Programs, $2,212,694
, 3%
Transitional Housing Grants,
$341,338 , 1%
Comprehensive Homeless
Services Center, $1,618,428 , 2%
Assisted Living Residence (to
Mary Marshall in FY 2012),
$2,727,980 , 4%
Housing and Community Development Fund,
$1,823,721 , 3%
Housing Division Development, Planning, Finance and Operations, $3,160,772 ,
5%
Fair Housing, $42,452 , <1% Columbia Pike Tax
Increment Financing Area, $968,520 , 1%
593

HOUSING SUMMARY
PROGRAM SUMMARY
PROGRAM FY 2016 ADOPTED
FY 2017 ADOPTED
FY 2018 ADOPTED
FY 2019 ADOPTED
FY 2020 ADOPTED
FY 2021 ADOPTED
HOUSING
Multi-Family Development and Affordable Housing Investment Fund (AHIF) 12,456,017 13,719,786 15,016,412 14,339,414 15,960,181 16,044,064 Housing Grants Rental Assistance Program 8,913,507 9,677,755 9,153,755 8,707,329 9,328,593 10,130,374 Centralized Access System Homeless Prevention 200,000 200,000 200,000 200,000 150,000 374,595 Permanent Supportive Housing (PSH)5 2,064,870 2,064,870 2,064,870 2,064,870 2,761,800 3,174,471 Housing Choice Voucher Rental Assistance 18,002,351 17,870,843 18,964,693 18,671,085 18,929,431 19,473,520 Real Estate Tax Relief for the Elderly and Disabled & Disabled Veteran 4,870,200 4,250,000 4,400,000 4,200,000 4,242,000 4,326,840 Homeless Shelter Programs1 1,819,900 1,819,900 1,819,900 1,846,686 2,045,287 2,212,694 Homeless Subsidized Supportive Housing1 299,391 - - - - - Transitional Housing Grants1 341,338 341,338 341,338 341,338 341,338 341,338 Comprehensive Homeless Services Center 1,478,647 1,486,146 1,487,143 1,509,941 1,488,394 1,618,428 Assisted Living Residence (to Mary Marshall in FY 2012) 2,432,458 2,432,458 2,533,752 2,571,383 2,648,524 2,727,980 Single-Family Homeownership and Repair Programs 2 242,711 382,338 - - - - Housing and Community Development Fund 3 7 110,000 255,603 1,208,588 1,373,598 2,106,606 1,823,721 Housing Division Development, Planning, Finance and Operations 4 2,330,875 2,328,465 3,157,094 2,812,435 3,088,740 3,160,772 Fair Housing6 47,019 92,278 43,410 96,826 43,611 42,452 Columbia Pike Tax Increment Financing Area8 - - - - - 968,520
Total Program 55,609,284 56,921,780 60,390,955 58,734,905 63,134,505 66,419,769
Net Tax Support (A) $36,847,959 $38,253,921 $39,109,444 $37,352,018 43,290,748$ 42,961,633$
(1) Homeless Shelter Programs, Homeless Subsidized Supportive Housing, and Transitional Housing Grants are the components of Homeless Shelters/Transitional Housing.(2) Single-family Homeownership and Repair Programs have been capitalized in prior years and therefore do not show County support beyond FY 2017.(3) The increase in Community Development Fund costs between FY 2017 and FY 2018 is a result of including additional housing-related programs from Fund.(4) FY 2018 Adopted reflects a reorganization of Housing Division staff. The increase in Housing Division costs between FY 2017 and FY 2018 is a result of including housing-related personnel from Fund 206 to this summary.(5) Local PSH and State funded PSH (Virginia Department of Behavioral Health & Developmental Services Grant).(6) The County conducts a Fair Housing study every two years which costs approximately $50,000. The last study was performed in FY 2019. The FY 2021 study was not funded.(7) The Amended FY 2020 Annual Action Plan includes $830,027 in federal CARES Act CDBG funds and $239,159 in CSBG funds for COVID-19 relief which are not accounted for in the table above. Any unspent funds will be carried over into FY 2021.(8) Beginning in FY 2021, Columbia Pike TIF balances and future funding will be dedicated to affordable housing investments. NOTE: (A) "Net Tax Support" is program expense less revenue; revenue is not shown but has been factored into the calculation.
HOUSING MULTI-DEPARTMENTAL PROGRAMS - FY 2016 ADOPTED TO FY 2021 ADOPTED
594

TAX & FEE COMPENDIUM
Arlington County provides services benefitting the entire community, individual residents, and businesses – all of which are funded through a variety of revenue streams including taxes, fees, rents, grants, and Federal and State aid.
In the FY 2016 Adopted Budget Guidance to the County Manager, the County Board directed the Manager to provide a compilation of tax and fee tools that the Board has at its disposal, either on its own authority or as governed by the Commonwealth.
In response to the County Board’s direction, the Department of Management and Finance worked with each department to obtain detailed information on the fees charged and managed by the department. The compilation of taxes and fees, (available in more detail online) includes information on fees in both the General Fund and the Development Fund. This continues to be a work in progress as we refine the information received.
Local Taxes In the FY 2021 Adopted Budget, local taxes total $1.1 billion, 84% of the General Fund budget. More detail on each of these local taxes can be found in the Revenue section. Because Virginia is a Dillon law state, on many of the taxes, the State dictates what taxes can be charged and the tax rates. Arlington County has rates set either at the maximum rate or at rates that help us maintain our economic competitiveness in the region.
The only local tax that the County has not adopted, but legally could, is the Admissions tax. This is a tax on admissions paid for particular events including admissions on events sponsored by public and private educational institutions, admissions charged for sporting events, etc. Very few jurisdictions across the Commonwealth charge this tax and receipts are negligible for those that do. Staff believes this would generate minimal revenue for the County and could be administratively burdensome.
Fees The fees listed in the compilation of taxes and fees (found online) include funds collected for Licenses, Permits, General Fees, Fines, Rent, and Fees for Charges for Services. Fees more often relate directly to payment for a service or product. The County uses fees to help fund services that meet particular criteria:
1. Fall within statutory or regulatory restrictions;2. Contribute to providing efficient services; and3. Either provide some individual benefit or promote common community values including
safety (i.e., building and fire permits).
County fees are set based on many factors including the level of individual benefit, the cost of the service being provided, and the fee levels in comparable jurisdictions. Fees charged for services bear a reasonable relationship to the service for which the fee is imposed. Each department conducts an annual review of their fee levels and proposes changes when appropriate during the annual budget process.
595

This page intentionally left blank
596
GLOSSARY
ACVS Arlington Convention and Visitors Service
ACA Affordable Care Act
ADA Americans with Disabilities Act
ACFD Arlington County Fire Department
AEC Arlington Employment Center
AED Arlington Economic Development
AHC Arlington Housing Corporation
AHIF Affordable Housing Investment Fund
AID TO LOCALITIES Financial assistance in the form of grants, reimbursements for personnel services, local portions of fee and tax revenues, and any other monies allocated to local jurisdictions by the Commonwealth of Virginia.
AIRE Arlington Initiative to Rethink Energy
ALLOCATE To set apart or earmark for a specific purpose.
APPROPRIATION A legal authorization approved by the County Board to expend or obligate a specific level of funds for an approved program. The County Board appropriates funds for programs by department or agency, and the County Manager has the authority to approve transfer of funds within a department or agency. The County Board sets an initial appropriation for each fiscal year and then may amend that appropriation during the course of the fiscal year, as it deems necessary (see Supplemental Appropriation).
APS Arlington Public Schools
ART Arlington Transit
ASSESS OR ASSESSMENT
(1) As a verb, the process of making the official valuation ofproperty for purposes of taxation. (2) As a noun, the value set fora particular piece of property by the assessor.
AUTHORIZED FTEs The full count of staff positions approved by the County Board.
597

GLOSSARY
BALANCED BUDGET The County Manager annually proposes, and the County Board adopts, a budget or financial plan for the upcoming year in which the revenues available (including any available fund balance from prior years) match or exceed the projected expenditures. The County also executes the budget each year so that expenditures will not exceed revenues.
BASE BUDGET Terminology used in the Proposed Budget document referring to the budget as proposed by the County Manager. It does not include Program Change Proposals, Strategic Initiatives, or Policy Priorities that have not been funded within the base budget.
BID Business Improvement District. A designated portion of the County in which the property owners are levied a special tax assessment to fund improvements and enhancements in that area. The first BID to be designated was in Rosslyn in 2002. A second BID in Crystal City was designated in 2006, and a third in Ballston was established in January 2011.
BOND FINANCING Refers to the method of financing capital improvement projects. Arlington County generally sells capital improvement general obligation bonds. The bonds are issued for a 20-year period and repaid on a level principal basis. Arlington County must seek voter approval to issue general obligation bonds in November of even-numbered calendar years.
BPOL Business, Professional, and Occupational License tax
BUDGET A specific plan which identifies a plan of operations for the fiscal year, states the expenditures required to meet that plan of operations, as well as identifies the revenues necessary to finance the plan. The annual County budget is established by County Board resolution.
BUDGET GUIDELINE The explicit dollar amount given to each department or agency for its operating budget ceiling. The budget guidelines are calculated initially by the Department of Management and Finance (DMF), and approved and agreed upon by each department or agency. Each guideline is developed considering the issues facing the department as well as the overall financial position of the County government.
BUDGET PLANNING ESTIMATE
Budget guidance founded upon projected revenues, established by the County Board, directing the County Manager's preparation of the Proposed Budget, including a transfer for the School Board.
BUDGET REDUCTION Items, programs, or positions specifically identified within a department or division which have been removed from the department or division's base budget to generate savings to the General Fund or other funds. Budget reductions may also be achieved through revenue increases, which reduce the reliance on net tax support.
CAFR Comprehensive Annual Financial Report – the County’s annual audit report.
598

GLOSSARY
CAPITAL PROJECT Purchase or construction of an item or system that generally has a value of at least $100,000 and has a useful life of 10 years, or purchase of an information technology system enhancement with a value of at least $25,000.
CARRYOVER Refers to the process of transferring specific funds, encumbrances, and obligations previously approved by the Board from the end of one fiscal year to the next fiscal period.
CDCAC Community Development Citizens Advisory Committee
CDBG
C&I
CMO
Refers to the Community Development Block Grant program funded by the United States Department of Housing and Urban Development (HUD) to improve the housing, neighborhood, and economic conditions of Arlington County's low- and moderate-income residents through a comprehensive approach to planning and implementing programs and activities.
Commercial and Industrial Property Tax
County Manager’s Office
CSBG Community Services Block Grant
CHARGE OUT/BACK Refers to the process by which departments assess the costs that pertain to capital project design and implementation contained in their budgets to pay-as-you-go and bond funds. This procedure removes the expense from the department's budget.
CIP Capital Improvement Plan
COLA Cost of Living Adjustment
CONSTITUTIONAL OFFICES Refers to the offices or agencies directed by elected officials whose positions are established by the Constitution of the Commonwealth of Virginia or its statutes. In Arlington, the Sheriff, Treasurer, Commissioner of Revenue, Clerk of the Circuit Court, and Commonwealth’s Attorney are the five Constitutional Officers.
CONTINGENT Funds set aside to provide for unforeseen expenditures or new projects initiated after the fiscal year has begun, e.g., General Fund General Contingent or Affordable Housing Investment Fund Contingent.
COOP BUDGET Referring to the State Cooperative Health Budget, it is a revenue paid to the County by the Virginia Department of Health as set forth in the contract for the local administration of health services.
CPHD Department of Community Planning, Housing and Development
CPI Consumer Price Index. This measure, which is produced by the United States Bureau of Labor Statistics, estimates the average price of consumer goods and services purchased by households.
599

GLOSSARY
CRITICAL MEASURE A type of outcome measure that indicates how well a program is performing key services to achieve program goals and objectives.
CSA Comprehensive Services Act for Youth and Families
CSB Community Services Board (also known as the ACSB, Arlington Community Services Board). A County Board appointed board which has by authority of the code of Virginia oversight over mental health, intellectual disability, and substance abuse services in the County.
CY Calendar Year
DCJS Department of Criminal Justice Services
DEBT SERVICE The amount of principal and interest that the County pays on its bond financing.
DEPARTMENT An entity, such as the Department of Human Services, that coordinates services in a particular area.
DEPRECIATION A systematic accounting method used to decrease an assets’ value on the books in pace with its condition as its used over its expected life span.
DES Department of Environmental Services
DHS Department of Human Services
DMF Department of Management and Finance
DPR Department of Parks and Recreation (formerly called the Department of Parks, Recreation, and Cultural Resources – PRCR)
DPSCEM Department of Public Safety Communications and Emergency Management (formerly called the Office of Emergency Management - OEM)
DROP Deferred Retirement Option Program
DTS Department of Technology Services
ELIMINATED FTE A full-time equivalent position specifically identified within a department or division which has been removed from the department or division's base budget, reducing the authorized staffing level.
ENCUMBRANCES Funds set aside to pay for contracted goods and services. Encumbrances represent the dollar amount to be paid upon completion of the contract.
600
GLOSSARY
ENTERPRISE FUND Enterprise funds are used to account for the financing of services to the general public where the operating expenses involved are usually recovered in the form of charges to users. The Utilities Fund and the CPHD Development Fund are the County’s two primary enterprise funds.
ERMS Electronic Records Management System
EXPENDITURES Outflows of cash or liabilities incurred as a result of rendering services or carrying out other activities that constitute the entity's ongoing or major operations.
FISCAL YEAR In Arlington County, the 12 months beginning July 1 and ending the following June 30th. (The federal government's fiscal year begins October 1.)
FRINGE BENEFITS The fringe benefit expenditures included in the budget are the County's share of the costs above base salary for employees, due to additional benefits provided or federally mandated costs. Major fringe benefits provided by Arlington County include: retirement, FICA, health insurance, life insurance, and transit subsidies. The amount of the fringe benefit is based on a percentage of an employee's salary or a set amount. Other County benefits include unemployment and worker's compensation and disability insurance. Fringe benefits costs are borne by the County and the employee in most cases.
FROZEN FTE In order to meet guideline reductions, some departments elect to hold positions vacant for the coming fiscal year. In doing this, the authorization for the position remains with the department, but the dollars needed to fund the position have been removed from the base budget.
FSA A flexible spending account (FSA) is an account that allows an employee to set aside a portion of earnings to pay for qualified expenses, most commonly for medical expenses and dependent care. Money deducted from an employee’s pay into an FSA is not subject to payroll taxes.
FULL-TIME EQUIVALENT (FTE)
The measure of authorized personnel. It is calculated by equating 2,080 hours of work per year (2,912 for uniformed firefighters) with the full-time equivalent of one position (referred to in the budget as an FTE).
601
GLOSSARY
FUND A separate accounting unit comprised of its own specific revenues and expenditures, and assets and liabilities. Each fund in the County's accounting structure is established to segregate a particular set of fiscal activities. Separate funds, established by the County, include the General Fund, which is the general operating fund of the County and is used to account for general government revenues and expenditures; the School Operating Fund, which details revenues and expenditures for the County's public school system; and the Utilities Fund, which details the fiscal activities of the County's water, sewer, and wastewater treatment plant. Other funds are established to isolate capital expenditures as well as inter-governmental service organizations, which sell their services (as would private enterprise) to other County agencies.
FUND BALANCE The balance of resources remaining at the end of a fiscal year, calculated by taking the beginning balance as of the beginning of the fiscal year, adding in all revenues received during the year, and subtracting that year’s expenditures. Fund balance is available to support the spending needs of the fund.
FUNDED FTEs The number of full-time equivalent positions for which the resources to support the positions have been included in the budget. The count of funded FTEs is calculated as the number of authorized FTEs less the number of frozen FTEs.
FUND TRANSFER Movement of resources from one fund to another, which is authorized by the County Board. This is primarily done between the General Fund and other operating funds, for example, General Fund transfer to the Automotive Equipment Fund for new vehicles authorized by the County Board.
FY Fiscal Year
GENERAL FUND (GF) A fund type used to account for the ordinary operations of County government that are financed from taxes and other general revenues and are not accounted for in other funds. This is the most important fund in the Arlington County budget, and it is comprised primarily of local tax revenues and fees.
GRANTS Contributions or gifts of cash or other assets from another government or private entity to be used or expended for a specified purpose or activity.
HCD Housing and Community Development
HCV Housing Choice Vouchers
HIV Human Immunodeficiency Virus
HOME The HOME Investment Partnership Act, a federal housing program
HRD Human Resources Department
602

GLOSSARY
HUD U. S. Department of Housing and Urban Development
IDA Industrial Development Authority
INDIRECT COST Expenditures that are required in the production of a good or service which cannot be directly traceable to the good or service.
INTERNAL SERVICE FUNDS Funds established to finance and account for services furnished by a designated County agency to other agencies, where the service is provided on a cost reimbursement basis. Internal Service Funds include Printing and Automotive Equipment.
JFAC
JTPA
LIB
Joint Facilities Advisory Committee
Job Training Partnership Act
Department of Libraries
LINE OF BUSINESS A subset of a County department that has a uniquely identifiable budget, staff, and function.
LIVING WAGE The living wage is a strategy used to raise the incomes of low-paid employees to a level sufficient to provide adequate food, housing, and health care. Arlington implemented a living wage policy for County employees and certain contractors in FY 2004 and was updated in FY 2017 (to $14.50 per hour) and in FY 2019 (to $15.00 per hour). The living wage rate is reviewed on an annual basis as part of the budget process.
MARKET PAY ADJUSTMENT
An overall increase in the County’s employee pay scale, expressed on a percentage basis, based on an assessment of the County’s pay scale in relation to other area jurisdictions.
MARKS Market Rate Affordable Units MC Maintenance Capital, previously called Capital Assets Preservation
Program (CAPP), is funded through the capital portion of the budget. This is a program intended to prolong the useful life of existing capital assets by ensuring they are maintained, updated and renewed as necessary.
METRO Washington Metropolitan Area Transit Authority
MISSION STATEMENT A short, succinct statement that describes why a program or department exists.
NEIGHBORHOOD CONSERVATION (NC)
The Neighborhood Conservation Program provides a mechanism for funding capital projects to address the needs of participating County neighborhoods. The Program is overseen by the Neighborhood Conservation Advisory Committee (NCAC), made up of representatives from all participating neighborhoods.
603

GLOSSARY
NET TAX SUPPORT (NTS) The amount of local taxes required to finance a particular program or set of programs. The net tax support is determined by subtracting all state and federal aid, fees, charges and other directly attributable revenues from the total cost of the program or set of programs.
NON-PERSONNEL EXPENSES
See “Operating Expenses”
NSA Neighborhood Strategy Area
NVTA Northern Virginia Transportation Authority
OBJECTIVE Refers to a strategic position to be attained or a purpose to be achieved.
OPEB Other Post-Employment Benefits
OPERATING EXPENSES Includes the cost of contractual services, supplies, and materials and equipment. Also referred to as “Non-Personnel Expenses.”
OPERATING RESERVE A portion of County revenues that are received and set aside for use in financing unforeseen major revenue shortfalls.
OSHA Occupational Safety and Health Administration
OUTCOME MEASURE Results oriented measure that demonstrates the achievement of a department or program’s mission.
PAY-AS-YOU-GO (PAYG) Refers to the method of financing capital projects. The Pay-As-You-Go Capital projects are funded from annual appropriations as part of the adopted operating budget.
PCI Pavement Condition Index
PERFORMANCE MEASURES A listing of a department, division, or program’s measures that reflect information pertaining to relative overall outcomes or customer, process, financial, or work force measurements.
PERSONAL PROPERTY A category of property, other than real estate, identified for purposes of taxation. It is comprised of personally owned vehicles as well as corporate property and business equipment. Examples include automobiles, motorcycles, trailers, boats, airplanes, business furnishings, and manufacturing equipment. Goods held for sale by manufacturers, wholesalers, or retailers are not included in this category.
PERSONNEL EXPENSES Refers to the costs of salaries, wages, and fringe benefits such as the employer's share of retirement contributions, Social Security (FICA) contributions, health insurance, life insurance, and employee transit subsidies.
604

GLOSSARY
POLICY PRIORITY Program enhancements identified by the County Manager for County Board consideration as part of the proposed budget. These are not funded within the base budget but are proposed as options to add to the base budget. Also referred to in some years as “Program Change Proposals.”
PPTRA Personal Property Tax Relief Act
PREA
PRODUCTIVITY/EFFICIENCY SAVINGS
Prison Rape Elimination Act
Items, programs, and tasks identified by each department or agency that have been altered or eliminated to produce a more efficient use of resources.
PRIIA The Passenger Rail Investment and Improvement Act of 2008
PROGRAM A part of an organization with definable and unique functions, goals, or objectives. Two examples are the Residential Refuse and Recycling Program within the Department of Environmental Services and the Madison Adult Day Health Care Center within the Department of Human Services.
PROGRAM CHANGE PROPOSAL (PCP)
A policy or program alternative (representing a change from current operations) identified by the County Manager for County Board consideration. PCPs are not included as recommended items financed within the base budget; rather, these proposals are options to add or subtract from the budget as proposed. Also referred to in some years as “Policy Priorities” or “Strategic Initiatives.”
PROGRAM GOAL A general statement of purpose. A goal provides an operating framework for each program unit and reflects realistic constraints upon the unit providing the service.
PSC Public Service Corporation REAL PROPERTY Real estate, including land and improvements (buildings, fences,
pavements, etc.) classified for purposes of assessment.
REEP Arlington Education and Employment Program
REVENUE Income that Arlington County collects and receives into the treasury for public use. Taxes, fees for services, and grants are sources of revenue, for example.
REVISED BUDGET A presentation of the budget sometimes used for comparative purposes, which includes the budget adopted by the County Board, plus specific supplemental appropriations approved by the Board during the course of the fiscal year.
SCAAP State Criminal Alien Assistance Program
605

GLOSSARY
SHORT-TERM FINANCING Short-term financing is a financing mechanism with a short maturing rate used to acquire equipment, rolling stock, furniture and technology purchases that have useful lives ranging from three to ten years. The County had previously used master lease financing as the tool for these types of purchases.
SPECIAL REVENUE FUND Funds established to segregate resources restricted to expenditures for a specific purpose. The Rosslyn Business Improvement District fund is an example of a special revenue fund.
STATE SHARE Revenue in the Department of Human Services which flows through a variety of state agencies to the County in support of human service programs. The funding may originate as state or federal funds, but all comes through the state, often on a block grant or formula basis.
SUPPLEMENTAL APPROPRIATION
An increase to a department’s budget (spending authority) approved by the County Board during the course of the fiscal year. It generally involves appropriation of a grant or other outside revenue.
SUPPORTING MEASURE A type of output measure that indicates the amount of services a program provides and supports the achievement of critical measures. Outputs are the amount of services a program provides. These services support the program achieving its desired results or the outcome.
TANF Temporary Assistance for Needy Families
TAX BASE The total market value of real property (land, buildings, and related improvements), public service corporation property, and personal property (cars, boats, and business tangible equipment) in the County.
TAX RATE The level of taxation stated in dollars. For example, the adopted FY 2020 real estate tax rate of $1.013 per $100 of assessed valuation (excluding the stormwater tax) on a $400,000 house would result in a real estate tax bill of $4,052 per year ($400,000 X 0.01013 = $4,052).
TCF Transportation Capital Fund
TIF Tax Increment Financing
TOAH Transit Oriented Affordable Housing
TRUST AND AGENCY ACCOUNT
Accounts used for contributions from private donors and other miscellaneous sources which are restricted for various purposes. Funds in these accounts are not reflected in the County’s operating budget.
VHDA Virginia Housing & Development Authority
606

GLOSSARY
WIA Workforce Investment Act
WMATA Washington Metropolitan Area Transit Authority
WORKLOAD MEASURES Represent the numerical inputs, outputs and/or outcomes of County operating programs.
607

This page intentionally left blank
608