FY-2009 Executive Budget - Oklahoma Digital Prairie
322
FY-2009 Executive Budget Governor Brad Henry February 4, 2008
-
Upload
khangminh22 -
Category
Documents
-
view
1 -
download
0
Transcript of FY-2009 Executive Budget - Oklahoma Digital Prairie

FY-2009
Executive Budget
Governor Brad Henry
February 4, 2008

Brad Henry Office of the Governor
State of Oklahoma
STATE CAPITOL BUILDING 2300 N. LINCOLN BOULEVARD, SUITE 212 OKLAHOMA CITY, OKLAHOMA 73105 (405) 521-2342 (405) 521-3353
February 4, 2008
To the citizens of the Great State of Oklahoma and the Oklahoma Legislature: I am pleased to submit for your consideration the FY-2009 executive budget. As required by state law, I have presented a balanced budget. The recommendations in this budget build on our recent success, and will ensure a strong and prosperous Oklahoma into the next century. Oklahoma and the nation are faced with challenging economic conditions, but our state’s economy continues to outpace much of the nation. Much of that credit is due to our thriving energy industry. We must take advantage of this prosperity by investing in our future. Through innovative programs such as the EDGE Endowment, OCAST and Oklahoma Bioenergy Center, we can take decisive steps to diversify our economy and spur further job growth. Oklahoma’s future lies with our children, who must be prepared for the jobs of the future. We are already a national leader in early childhood education and have put in place a secure funding mechanism for the OHLAP college scholarship program. Now, we must fulfill our commitment to our hard-working classroom teachers and raise their salaries to the regional average. In this year’s budget, knowing the funding constraints we face, I have included programs to improve government efficiency in purchasing, information technology and service delivery. I ask the Legislature and the Citizens of Oklahoma to support this agenda for a strong and prosperous Oklahoma. I am confident that all Oklahomans can agree on these common goals to achieve excellence and carry our state forward.
Sincerely, Brad Henry Governor

February 4, 2008 Governor Henry: Please accept this, your executive budget for the FY-2009 budget year. The budget is balanced as required by law. The budgets of all state agencies, boards and commissions were thoroughly reviewed in the preparation of this budget. Staff of the Budget Division of OSF, the Secretary of Finance and Revenue and I met with directors of major state agencies to examine and analyze agency programs and expenditures. State agency administrators and their staff provided information necessary for this rigorous budget review. They also made suggestions to improve the efficiency and effectiveness of the delivery of services by their agencies. Our examination also included a review of management efficiencies and innovations, alternative funding methods, tax policies, expenditures and revenue enhancement ideas. Thank you for all of your time and attention in the development of the budget. To others involved in this process, I extend my appreciation for their input. I also want to thank analysts with the Budget Division for their diligence, hard work and dedication. Respectfully, Tony Hutchison Director, Office of State Finance

OKLAHOMA OFFICE OF STATE FINANCE
February 4, 2008
Citizens of the State of Oklahoma
Members of the Second Regular Session of the Fifty-first Legislature
Governor Brad Henry’s FY-2009 budget consists of the following two documents. Both are available on the Internet. You can view them by accessing the Oklahoma Home Page, the Home Page of the Office of the Governor, or the Home Page of the Office of State Finance. The Oklahoma Home Page address is: http://www.ok.gov. These documents are distributed to the State Legislature, the media and the State Publications Clearinghouse.
“FY-2009 EXECUTIVE BUDGET, Volume I” This document contains Governor Henry’s budget recommendations to the 2008 Legislature. It includes a discussion of state revenues, a summary of his proposed budget and explanations of budget recommendations for state agencies. “FY-2009 EXECUTIVE BUDGET, Volume II- HISTORICAL DATA”
This document is available on CD and includes detailed historical financial information about each agency of state government. The information is arranged by Cabinet Department and Branch of Government. The individual display for each agency/entity of government includes the following:
Mission of the Agency Description of the Board/Commission that governs the agency Description of agency Duties/Responsibilities Constitutional and Statutory References related to the entity Information regarding agency workload or performance criteria Expenditure and personnel data for FY-2006, FY-2007 and FY-2008
2300 North Lincoln Boulevard, Room 122, Oklahoma City, OK 73105-4801 Telephone (405) 521-2141 FAX (405) 521-3902
FY-2009 Executive Budget
Table of Contents
A. Governor’s FY-2009 Executive Budget
Executive Summary....................................................................... A-1 Summary of FY-2009 Recommendations...................................... A-22
B. FY-2009 Budget Recommendations
Governor .......................................................................................B-1 Lieutenant Governor......................................................................B-3 Agriculture ....................................................................................B-5 Commerce and Tourism...............................................................B-17 Education....................................................................................B-39 Energy.........................................................................................B-85 Environment................................................................................B-91 Finance and Revenue................................................................. B-101 Health ....................................................................................... B-133 Human Resources and Administration....................................... B-149 Human Services......................................................................... B-163 Military Affairs........................................................................... B-195 Safety and Security.................................................................... B-197 Science and Technology Development ........................................ B-227 Secretary of State ...................................................................... B-233 Transportation........................................................................... B-239 Veterans Affairs ......................................................................... B-245 Legislature................................................................................. B-247 Judiciary ................................................................................... B-249
C. State Budget Information
FY-2009 Recommendations by Committee .....................................C-1 Oklahoma State Budget Process ....................................................C-4 State Revenues ............................................................................C-15 Constitutional Reserve Fund........................................................C-22 Appropriation History ..................................................................C-23 Higher Education Allocations.......................................................C-29 Non-Appropriated Agency Budgets and FTE.................................C-31
TABLE OF CONTENTS

FY-2008 Executive Budget
D. Appendix Budget Staff...................................................................................D-1 State Organization Chart ...............................................................D-3 State Agencies Listed by Cabinet....................................................D-4 Summary of FTE Changes .............................................................D-5 Glossary ......................................................................................D-11
Index............................................................................................ Index 1
TABLE OF CONTENTS

FY-2009 Executive Budget
EXECUTIVE SUMMARY A-1
Executive Summary
Economic uncertainty at the national level, coupled with moderating growth in Oklahoma’s economy, provide an interesting backdrop to the 2009 budget year. Governor Henry’s 2009 budget continues a focus on long term transformation of our state’s educational system, infrastructure and state government operations while re-emphasizing the fiscal prudence that has been a hall mark of this administration. Oklahoma’s bond debt remains among the lowest in nation, the State’s constitutional reserve fund is full and the economy is diversified. The 2009 budget continues to lay the foundation for Oklahoma’s future growth and prosperity. A new, permanent funding mechanism for the Economic Development Generating Excellence (EDGE) program is outlined in this budget. The 2009 executive budget also builds on prior successes such as “Achieving Classroom Excellence”, early childhood education initiatives, as well as health care and transportation funding reforms. In this year’s Budget Governor Henry has proposed a variety of innovative programs to position Oklahoma state government to deliver services in a more efficient and cost effective manner. There is a new emphasis on ensuring that State programs effectively leverage human capital and technology to deliver value to the citizens of the state.
Strong economic fundamentals and prudent fiscal management mean that there are resources to fund current operations and still make an investment in the future even during challenging times. Some of these investments include:
Education –completion of a commitment to raise teacher salaries to the regional
average, enhancing access to higher education and remaining on the cutting edge of early childhood education policy;
Health Care –addressing the loss of emergency and ambulance services in many
rural areas and finding ways to continue support for Oklahoma’s improvements in health care despite loss of federal revenues;
Economic Development – Continued development of new economic opportunities
through a new permanent funding mechanism for the EDGE endowment, provision of new funds for Seed Capital at the Oklahoma Center for the Advancement of Science and Technology and continued support for initiatives in the area of Bioenergy;
Safety and Security – Protecting Oklahomans by being smart on crime as well as
tough, proposing a more appropriate level of funding for Corrections and addressing significant facility needs for youthful offenders;
Transportation – Continued support for the building, repair and maintenance of
Oklahoma’s Roads and Bridges;

FY-2009 Executive Budget
EXECUTIVE SUMMARY A-2
Summary of FY-2009 Balanced Budget
Revenue
1. Total Amount Available from Certification Packet* 7,062,130,759$
Potential Additional Revenues
2. OTA Transfer to DPS for Overhead Costs 3,200,000$
3. Taxpayer Compliance Initiative 30,000,000$
4. Compsource Market Adjustment 7,500,000$
Total Potential Additional Revenues 40,700,000$
Changes to Revolving Funds/Special Cash Fund
5. Cash Flow Reserve Fund 104,000,000$
6. Agency Transfers to Special Cash 17,000,000$
7. Lapsed Funds and Other Revenue 1,000,000$
8. 1017 Fund Cash Flow 7,000,000$
9. Gross Production Spillover 10,000,000$
Total Changes to Revolving Funds/Special Cash Fund: 139,000,000$
Efficiencies and Savings
10. Government Efficiency Initiative 33,300,000$
Enhance Financial Shared Services - $15,800,000
Enhance IT Shared Services - $7,000,000
Purchasing Reform - $10,500,000
11. Enterprise Agencies 26,000,000$
12. Benefit Allowance Adjustments 22,000,000$
Total Efficiencies and Savings 81,300,000$
Expenditures:
1. FY-2008 Appropriations 7,044,915,861$
2. Less: FY-2007 Supplementals (116,063,211)$
3. Less: One-Times (59,204,003)$
5. Governor 53,984$
6. Lieutenant Governor 10,724$
7. Agriculture Cabinet 567,151$
8. Commerce/Tourism Cabinets 6,293,202$
9. Education Cabinet 196,407,255$
10. Energy/Environment Cabinet 146,268$
11. Finance and Revenue Cabinet 2,364,309$
12. Health Cabinet 100,677,636$
13. Human Resources and Administration Cabinet 1,226,024$
14. Human Services Cabinet 29,457,671$
15. Military Cabinet 298,819$
16. Safety and Security Cabinet 56,226,294$
17. Science and Technology 12,039,706$
18. Secretary of State Cabinet 413,121$
19. Transportation Cabinet 2,172,831$
20. Veterans' Cabinet 1,465,060$
21. Legislature 543,141$
22. Judiciary 957,180$
23. FY-2008 Supplementals 41,141,548$
Total Recommended Expenditures 7,322,110,571$
Balance / (shortage) of funds available 1,020,188$
* Amount has been reduced by the increased CLO certification of $4,140,768

FY-2009 Executive Budget
EXECUTIVE SUMMARY A-3
Potential Additional Revenues
OTA Transfer to DPS for Overhead Costs The Oklahoma Turnpike Authority currently reimburses the Department of Public Safety for direct costs associated with state troopers who patrol Oklahoma turnpikes. The Governor’s budget includes increasing the percentage of overhead costs from 3.75% to 16.5%, which is the percentage that the federal government reimburses. Taxpayer Compliance Initiative Revenues from enhanced tax compliance and taxpayer accountability will generate $30 million additional dollars in FY-2009. The Tax Compliance Initiative is a three pronged effort to close unfair corporate loopholes, give citizens a chance to fairly come into compliance and provide taxpayer transparency on corporate and personal taxpayers who are unwilling to pay.
Tax Compliance - Governor Henry is proposing a tax compliance program for FY-2009. It would include both income and sales tax for individuals, and corporate income, sales and use taxes. Taxpayers who have a delinquency prior to the start of this program would be able, for a period of three months, to pay their past due tax liability and one-half of the interest owed and receive a no fault waiver of all penalties and the remainder of the interest. The Oklahoma Tax Commission anticipates the program would bring in an additional $21.8 million in revenue: 50% ($10.8 million) as a result of increased individual income tax collections, 25% ($5.4 million) as a result of increased sales tax collections and the remaining 25% as a result of increased corporate income and use tax collections. The revenue generated by this program would become available for appropriation in FY-2009. Open Taxes - Governor Henry is proposing a program that would publish a list of delingquent taxpayers on the State’s OpenBooks website. Taxpayers would only be listed on the website after the State has made its standard attempts at collection and has issued a notice to the taxpayer. It would apply to all delinquent taxpayers for any delinquent tax. At least 19 other states have found this a successful way to encourage delinquent taxpayers to pay their tax obligation. This program would enhance efforts made by the taxpayer amnesty program and further increase revenue by approximately $2.2 million. Closure of Corporate Tax Loophole - The Governor is proposing to close a tax loophole that allows certain income to completely escape state taxation. In cases in which a corporation owns a controlling interest in a Real Estate Investment Trust (REIT), Oklahoma automatically passes through the federal “dividend paid deduction” allowing the REIT to avoid state taxation. At the Federal level, the distributed REIT income is taxed when the REIT owners are taxed. This does not occur at the state level and, thus, the income is never taxed at the state level. Simply removing the deduction from the Oklahoma tax code would restore fairness to Oklahoma’s tax system and raise $6.0 million in FY-2009.
CompSource Market Equalization Currently, insurance carriers in the State of Oklahoma are required to remit an annual 2.25% premium tax to the Insurance Commissioner based on direct written premiums. CompSource Oklahoma is not assessed under present state law. CompSource, a state agency, currently has the largest share of the workers compensation market in Oklahoma. The Governor’s budget proposes a market equalization assessment on this agency of 2.25% to improve market place competition. This assessment would be charged

FY-2009 Executive Budget
EXECUTIVE SUMMARY A-4
to CompSource on its direct written premiums and would result in $7.5 million being collected within the General Fund of the State Of Oklahoma. As long as regulatory processes CompSource currently follows as a state agency are modified simultaneously, actuarial cost increases will not be passed on to policyholders due to this assessment. This proposal assumes that CompSource will receive legislative authorization to develop new financial, administrative and human resource policies in line with their mission as a state authorized enterprise which will provide cost savings in excess of the cost of the market equalization assessment. Cash Flow Reserve Fund This budget proposes a transfer of $104 million from the FY-2008 Cash Flow Reserve Fund (CFRF) to the Special Cash fund for the FY-2009 budget. Currently, the balance in the CFRF is over $104.6 million. Through December, actual collections for FY-2007 exceed estimated collections by $90.7 million with a balance in the FY-2008 General Revenue fund of over $136 million after allocations to agencies in January. Current projections by the Office of State Finance indicate that the balance in the General Revenue Fund far exceeds the amount necessary for cash flow purposes for the remainder of FY-2008. A transfer of funds from the CFRF, as this budget proposes, is a prudent measure to help fund vital state services. Lapsed Funds and Other Revenue Every year, funds not encumbered or expended by November 15 lapse to the original fund they were appropriated from. For FY-2009, these lapsed funds will total an additional $1 million more in special cash for appropriation and expenditure authority. Special Cash Fund Transfers One component of the FY-2009 budget involved identifying a variety of agency revolving funds that exceed the amount needed to balance FY-2008 expenditures. These funds can be re-directed to cover agency operating costs for FY-2009. This proposal transfers a total of $17 million to the special cash fund. This proposed transfer of funds is based on a careful analysis of budgeted versus actual receipts and disbursements. Efficiencies and Savings
Government Efficiency Initiative The Governor proposes $22.8 million in state government operating efficiencies in FY-2009. The implementation of many of these efficiencies is already underway throughout many areas of state government and can be complete during FY-2009. In June of 2007, the Office of State Finance (OSF) participated in a multi-state analysis sponsored by the National Association of State Auditors, Controllers and Treasurers (NASACT). Because of NASACT sponsorship, OSF was able to engage the services of the Hackett Group, a global leader in corporate consulting. The analysis was extensive—data was provided by finance staff in 288 data locations and included 107 web based stakeholder surveys. Hackett has consulted with more than 2,700 organizations worldwide, including 97% of companies listed on the Dow Jones, and currently has clients ranging from Wal-Mart to FedEx to Bank of America. The involvement of Hackett provided OSF the ability to analyze a vast array of private and public sector benchmarks. The first phase of the NASACT/Hackett study was completed on December 20th, 2007, and established Oklahoma’s savings benchmarks relative to peer states and world class organizations. Phase I included an analysis of cash disbursements, travel expenses, customer billing, interagency accounting, and fixed assets. The results of the first phase identified Oklahoma’s statewide financial transaction costs to be 1.16% of total operating costs. The analysis established that the current operating model has a number of opportunities to achieve significant efficiencies and savings in cash management,

FY-2009 Executive Budget
EXECUTIVE SUMMARY A-5
transaction costs and technology leverage. The study highlights more than $65 million in savings in 10 separate areas that can be realized by the state. Total process cost savings of $45.1 million and technology cost savings of $21 million comprise the largest cost savings categories. This budget envisions a three year plan to implement these process and technology recommendations. Approximately one-third of the total savings will be recognized in FY-2009. Some of the projects already underway include personnel and function streamlining between OSF and the Office of the Treasurer and numerous shared services contracts between OSF and smaller agencies, such as the already successful contract between OSF and the Nursing . Also in progress is a major shared services project between OSF and the Tourism Department where that Department will be entering into a shared services agreement for its finance and payroll function with OSF. In the technology area, cost effective Voice over Internet Protocol (VOIP) availability for the Capitol Campus and agencies operating independently of the campus are becoming available later this year. After completing a telecommunications rate study, OSF will lower costs to traditional telecom users in state government. The current rate is $17 for each line and $4 for voice mail. The new rates are $13.25 for each line and $2 for voice mail. This will result in almost $1 million of savings to state agencies. New private sector contracts for data center space and OSF’s data center provision will also realize significant savings both in economy of scale and in reduction of duplication of plant, equipment, personnel and software licenses. OSF is also evaluating migrating the state to a common e-mail platform. The state spends more than $370 million a year on Information Technology; this budget reduces that amount by approximately $7 million or 2% in FY-2009. Oklahoma is clearly not the only public entity searching for new ways to leverage technology to control costs.
• The Commonwealth Connect project in which Pennsylvania partnered with Microsoft to migrate 65,000 users to a common e-mail platform that saved $18 million in software and ownership during the project’s initial three-year period;
• Oregon is in the process of consolidating 11 major data centers into 1 single data center and second data center for recovery. This consolidation, which represents 80% of the state’s data, will save the state more than $20 million; and
IBM Purchasing, Review, Analysis and Saving Plan Development Project - Governor Henry’s budget includes savings of $10.5 million from implementing part of the IBM “Spend” Study. An extensive analysis of the Oklahoma Central Purchasing Act and its current implementation was completed by IBM Business Consulting Services this past year and identified $2.1 billion of state “spend” that could be targeted for savings. This budget anticipates that many of the recommendations of the IBM report can be put into practice both administratively and if necessary by legislative action. Governor Henry’s budget conservatively estimates savings of just ½ of 1% of this “spend” for FY-2009. A new state government document handling/copier contract that has been negotiated by the Department of Central Services will achieve this level of savings. Enterprise Agencies Governor Henry proposes the development of an “Enterprise Agency” initiative based on the pioneering Iowa Charter Agency Initiative. The Oklahoma Enterprise initiative is projected to return at least $26 million to the general fund by streamlining government processes in procurement, financial transactions, travel costs, and human resources.

FY-2009 Executive Budget
EXECUTIVE SUMMARY A-6
When Iowa’s Charter Agency Initiative was developed in 2004, it was projected to save nearly $15 million dollars. A year later the program was the recipient of Harvard University’s Ash Institute Award for Innovation in Government and has saved the taxpayers of Iowa more than $22 million in the first year. More importantly, the program improved the delivery of services at key agencies such as the Department of Corrections, where 225 prison beds were added on time and under budget. The program expedited competitive bidding at the Iowa Department of Human Services to save time and money and to capture more federal matching funds. The Department of Natural Resources saved significant resources by using alternative travel providers and implementing a sole source contract for water monitoring. The Department of Revenue increased collections by enhancing e-file and e-pay programs and by contracting out to subject matter experts on tax litigation matters. The Oklahoma Enterprise Agency Initiative is modeled heavily after the Iowa experience. Non-appropriated agencies such as CompSource Oklahoma and the Turnpike Authority are considered strong candidates for the program, as well as larger appropriated agencies such the Department of Transportation, Department of Human Services and the Department of Mental Health. To begin the program, agencies will sign an enterprise agreement – a type of intergovernmental contract – with the Governor’s Office and their Cabinet Secretary. The agreement will be negotiated based on each agencies’ needs and will allow each agency and the general fund to split savings achieved by the program on a dollar for dollar basis. The agreements will contain exemptions from many of the statutory limitations relating to central purchasing, travel, personnel and hiring, and financial transactions. The agreements will not exempt agencies from the intent of these laws, but customize agreements to fit the agencies’ needs and capacities. Agencies may be able to purchase goods or services from vendors not on state contracts if they can document that the cost is less. They may be freed up from FTE limits to achieve important departmental initiatives or they may be freed from OPM regulations regarding classified employees if they have job classes that are unique to their agencies. Develop Comprehensive Strategic Employee Compensation Plan - Market competition, an aging workforce moving rapidly toward retirement and the need to modernize employee pay and benefit packages prompted Governor Henry to establish a group to study state employee compensation. The Governor’s Task Force on State Employee Compensation was established by Executive Order 2007-13 in April of 2007 to determine strategic direction for compensation for State of Oklahoma employees. Members were appointed from the public and private sectors and met October through December, 2007, to develop recommendations for the State. The Task Force recommended that the Governor submit, as part of his annual budget a multi‐year plan to bring State employee compensation and benefits in parity to the market. The Task Force recommended contracting with an independent Human Resources consulting firm to conduct a comprehensive study of the entire Executive Branch work force, both classified and unclassified service. The study would include recommendations on internal equity and external competitiveness; an evaluation of the State’s benefits package, including the ratio between salary and benefits allowance; and a comprehensive overview of defined benefit and defined contribution retirement plans in the public sector. This study will make it possible to compare unclassified jobs to the market on a regular, consistent basis, and for the Office of Personnel Management to include a comparison of

FY-2009 Executive Budget
EXECUTIVE SUMMARY A-7
unclassified service pay rates to the market in its Annual Compensation Report. The Governor is requesting that the legislature appropriate $725,000.00 for this study. The Governor is also recommending a 5% pay increase for state employees to be implemented beginning January 1, 2009. State employee pay currently falls 12% below the market average according to the Office of Personnel Management’s 2007 Annual Compensation Report. This would be the beginning of a multi-year pay plan to make state employee compensation competitive with the market. The total cost of this plan is $32.7 million in FY-2009. State Employee Compensation Equalization - The costs of Health Care have been increasing rapidly and state agencies have not been exempt from these costs increases. State employee benefits costs are determined by a formula that calculates each employees benefit allowance. Since 2001, the benefit allowance has been calculated by the following formula; the average of the high option health plan costs, plus the average of the dental plan costs, plus the cost of life insurance, plus the cost of disability insurance, plus 75% of the dependent health costs. This formula does not take into account which health plan state employees choose and has therefore artificially driven up the costs of state employees’ benefits. The following is a chart showing the increases in the benefit allowance since 1995.
$100$200$300$400$500$600$700$800$900
$1,000$1,100$1,200$1,300$1,400
1995 1996 1997 1998 1999 2000 2001 2002 2003 2004 2005 2006 2007 2008Proj
Increase from $187.19 to $224.69
Increase to $262.19. Dependent allowance to $224.69 plus 50% of cost.
Change to average of high and 75% of dependent cost.
Cost in millions $ 87.8 $85.5 $85.6 $98. $127.2 $128. $129.6 $163.7 $186. $217.6 $244.5 283.1 357.1 393.6
The law changed in July 1, 2001 after PY2001 enrollment had closed so the effect was not experienced until PY2002.
Employee Only Benefit AllowanceFamily Coverage Benefit Allowance
% Employee 100% 100% 100% 100% 91% 91% 89 74% 72% 72% 71% 67% 67% 64%% Dependent 0% 0% 0% 0% 9% 9% 11% 26% 28% 28% 29% 33% 33% 36%
$525.59$525.59
$1,443.33$1,443.33
($252 million)
($142 million)
$554.48$554.48
$1,342.54$1,342.54
Benefit Allowance The current formula gives equal weight to all the high option health plans regardless of how many employees are enrolled in each plan. The following chart shows that for plan year 2008 64% of state employees were enrolled in one of the HealthChoice options provided by the Oklahoma State and Education Employees Group Insurance Board.
Health Plan Membership by Type as of 1/1/2008Total = 36,872
64%
36%HealthChoice
HMO
Source: EBC

FY-2009 Executive Budget
EXECUTIVE SUMMARY A-8
The Governor is proposing a new formula that will better represent the choices of state employees. Under the new calculation, the HealthChoice high option plan will be given a 40% weight. This change will ensure that growth in the benefit allowance is tied to the growth in the health insurance plan that a majority of employees and their dependents are enrolled in. The change in the benefit calculation will lead to an initial half year savings in FY-2009, the change will be effective January 1st, 2009. Expenditure Proposals The first step in developing this budget involved reviewing individual agency budgets. Office of State Finance staff utilized performance based budgeting techniques to evaluate programs and services. The Governor places a strong emphasis on performance and efficiency measures for agencies. Agencies have been and will continue to be challenged to improve services and outcomes. Citizens must have confidence that tax dollars are being spent efficiently and effectively. A more detailed explanation of each of these items is in the appropriate pages for the agency listed. Note that a summary of these funding adjustments by Cabinet Department is located later in this section. The starting point for expenditure proposals is FY-2008 appropriations. Subtracting one time expenditures and FY-2007 supplementals from this amount produces a base level of expenditures. Adding proposed changes in expenditures yields the total Executive Budget. FY-2007 Supplementals The following table lists FY-2007 supplemental appropriations subtracted from the FY-2008 state expenditure base:
FY-2007 Supplementals
a. Education, Board of $60,300,000
b. Higher Education, Regents for 5,500,000
c. Career and Technical Education 2,757,806
d. Juvenile Affairs, Office of 4,300,000
e. Central Services, Department of 3,200,000
f Health, Department of 100,000
g. Corporation Commission 3,100,000
h. Tourism and Recreation Department 1,600,000
i. Corrections, Department of 32,664,573
j. Court of Criminal Appeals 125,000
k. Public Safety, Department of 100,000
l. Council on Law Enforcement 815,832
n Military Department 1,500,000
Total FY-2007 Supplementals: 116,063,211$

FY-2009 Executive Budget
EXECUTIVE SUMMARY A-9
One-Time Expenditures Over $59 million was appropriated for one-time FY-2008 expenditure items:
One-Time Expenditures
a. Election Board: Presidential Primary 980,000$
b. DOE: RISE and Small School Incentive Grant 530,590$
c. Regents: OU: $1 million and OSU-Tulsa" $1.2 million 2,200,000$
d. LSB: Corrections Audit 1,000,000$
e. JM Davis: Replace AC 150,000$
f. Historical Society: Choctaw Capitol Bldg Windows 100,000$
g. Agriculture: REI Set up Offices, Tulsa State Fair and Made In OK 492,864$
h. DCS: One-Time Repairs 2,296,400$
i. Military: BRAC Upgrades and Sand Springs Armory 522,638$
k. DMHSAS: Forensics Center Equipment 100,000$
l. Commerce: 2nd Century Entreprenuer 250,000$
m. Centennial Commission: Sunset 06/30/2008 1,066,511$
n. DPS: Trooper Headquarters 1,200,000$
o. Regents: Remove OHLAP Funding from Base 48,100,000$
p. Emergency Management: Civil Air Patrol 30,000$
q. Merit Protection: Computer Upgrades 35,000$
r. Will Rogers Commission: Capital 150,000$ Total One-Time Expenditures: 59,204,003$ Subtracting these one-time expenditure items from the FY-2008 expenditure base yields the baseline budget for FY-2009.
FY-2008 Supplementals The following list includes supplemental appropriations proposed in the FY- 2008 Executive Budget:
FY-2008 Supplementals
a. Office of Juvenile Affairs - L.E. Rader Facility 2,092,950$
b. Department of Corrections 21,000,000$
c. Medicolegal: Salary Adjustments 980,598$
d. State Fire Marshal: Retirement Costs 68,000$
e. Department of Education: Ad Valorem 17,000,000$
Total FY-2008 Supplementals 41,141,548$ Please see individual agency sections for more detail.
FY-2009 Key Funding Issues
Annualizations The Governor’s budget includes $67 million to address ongoing programs funded with a one-time revenue source. Another significant annualization obligation in FY-2009 is the income tax reduction. In 2006, the Legislature passed and the Governor approved the largest tax cut package in history. House Bill 1172 lowers the individual income tax rate and increases the standard deduction

FY-2009 Executive Budget
EXECUTIVE SUMMARY A-10
over several years. In the 2007 Legislative session, Senate Bill 861 was passed and signed by the Governor, accelerating the rate decrease to 5.50% for calendar year 2008, and to 5.25% in calendar year 2009 and subsequent years based on a sufficient amount of growth revenue for the coming fiscal year as determined by the Board of Equalization. A preliminary finding by the Board of Equalization in December of 2007 has determined that growth was not sufficient to trigger the decrease to 5.25% for the 2009 calendar year. A final determination will be made at the upcoming Board of Equalization meeting in February, and a new determination will be made at the February 2009 meeting concerning a decrease to 5.25% for calendar year 2010. The increase in the standard deduction is a gradual increase. By the year 2010, the standard deduction will equal the federal standard deduction if the Board of Equalization determines there is sufficient growth revenue. The table below shows the individual income tax rates and corresponding standard deduction increase.
Fiscal Year Tax Rate
Married Filing Jointly
Head of Household Single
2006 6.25% $3,000 $3,000 $2,0002007 5.65% $5,500 $4,125 $2,7502008 5.50% $6,500 $4,875 $3,2502009 5.50% $8,500 $6,375 $4,250
2010* 5.25% Match Federal Deduction*Based on the amount of growth revenue determined by the Board of Equalization.
Standard Deductions
HB1172 also extended the same tax treatment to collateral heirs and lineal heirs. The following table shows the cumulative effects of House Bill 1172 and Senate Bill 861 from FY-2008 to FY-2010 as reported by the Oklahoma Tax Commission. The revenue reductions are reflected in the amount certified by the Board of Equalization.
OTC Estimate GR Fund 1017 FundTeacher's
Retirement Ad ValoremFY-2008Income Tax ($273,702,400) ($234,453,475) ($22,826,781) ($13,685,120) ($2,737,024)Estate Tax ($29,088,000) ($29,088,000)FY-2008 Total ($302,790,400) ($263,541,475) ($22,826,781) ($13,685,120) ($2,737,024)FY-2009Income Tax ($352,195,800) ($301,690,922) ($29,373,130) ($17,609,790) ($3,521,958)Estate Tax ($42,568,000) ($42,568,000)FY-2009 Total ($394,763,800) ($344,258,922) ($29,373,130) ($17,609,790) ($3,521,958)FY-2010Income Tax ($457,427,400) ($391,832,311) ($38,149,445) ($22,871,370) ($4,574,274)Estate Tax ($47,600,000) ($47,600,000)FY-2010 Total ($505,027,400) ($439,432,311) ($38,149,445) ($22,871,370) ($4,574,274)
Total Impact of Income and Estate Tax Amendments
Education The Governor’s Budget proposes almost $200 million in additional funding for education. Common Education receives $65 million to implement an average $1,200 pay raise for teachers to bring them to the regional average. The Governor’s budget also includes over $17 million to fund the increased employer contributions to the teacher’s retirement system, $10 million for

FY-2009 Executive Budget
EXECUTIVE SUMMARY A-11
school operations through the state aid funding formula, $4 million for ACE remediation, $3 million for Sooner Start, $2.5 million for graduation coaches and $1.5 million for middle school math labs. The Governor also includes $31.6 million to replace one-time funding for ongoing operations. The Governor proposes that CareerTech receive the following funding items: $3.1 million to implement the teacher pay raise, $1.2 million to address the increased employer contributions to the teacher’s retirement system, $1 million for current operations and enhanced programs and $1 million for the purchase of a hangar at Altus Municipal Airport for the Grow Your Own Mechanic Program. The Governor also includes $1.4 million to replace one-time funding for ongoing operations. The Governor’s budget includes the following for Higher Education: $13 million for institutions, $10 million for urban education and $6.1 million for the increased employer contributions to the teacher’s retirement system. The Governor also includes $22.8 million to replace one-time funding for ongoing operations. Health Care For FY-2009, the Governor’s Budget includes $50.4 million for the decrease in the Federal Medical Assistance percentage, costs associated with premiums for Medicare Part A and B, hospital and anesthesiologist rate increases, and the Medicare Prescription Drug Phased-down State Contribution (clawback). Also included in the Governor’s proposal are:
• $22 million to replace one-time funding;
• $17.7 million for expenses associated with increased Medicaid enrollees and the services they are expected to access during FY-2009;
• $2.5 million for the Money Follows the Person program; and
• $250,000 for fiscal agent contract increases;
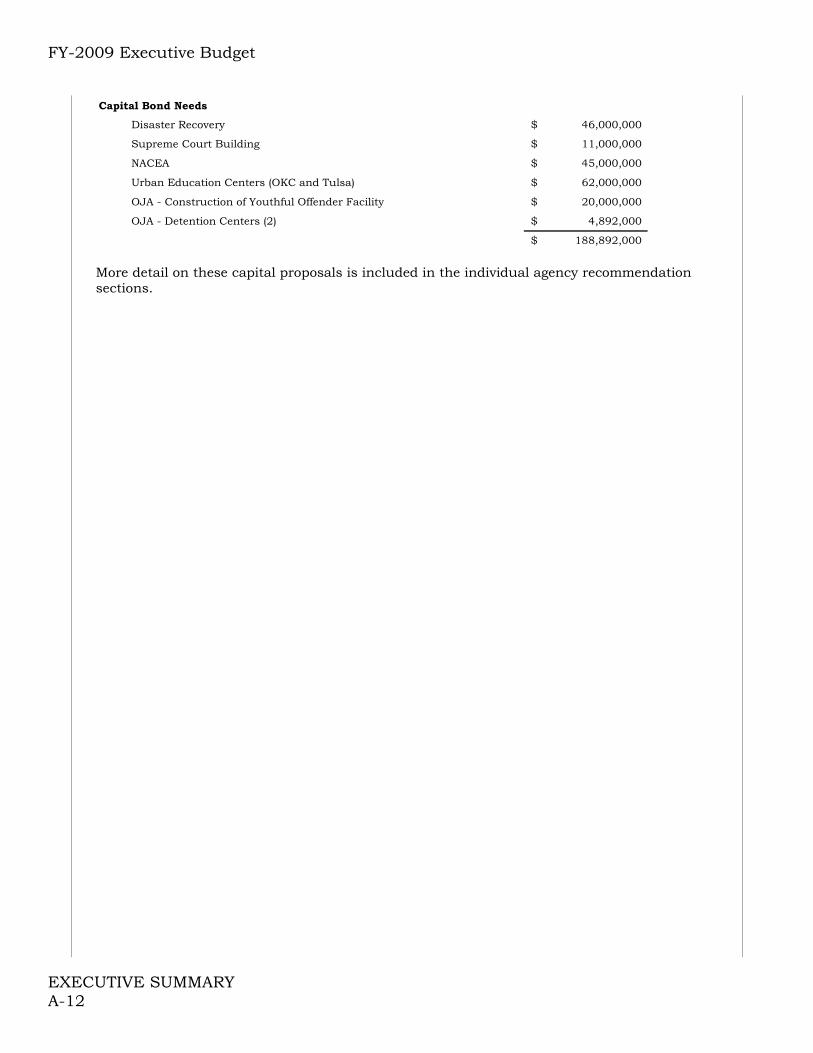
Safety and Security The Governor’s Budget recommends a $32.4 million increase to the Department of Corrections for annualizing their recommended supplemental, a 2.7% population growth and expanding treatment and rehabilitation services for inmates. The Governor’s Budget also includes $815,000 for the Attorney General’s VINE program and $500,000 for the Domestic Violence Unit. Human Services The Governor’s Budget includes a $20.7 million increase to the Department of Human Services for the decrease in the Federal Medical Assistance percentage, funds lost due to the Deficit Reduction Act, and the Advantage waiver program. Capital Budget Proposal The Governor’s budget includes a capital spending plan to address recent natural disasters, completion of current capital projects, improving access to higher education and providing safe and appropriate housing for Oklahoma’s juveniles in residential settings.
FY-2009 Executive Budget
EXECUTIVE SUMMARY A-12
Capital Bond Needs
Disaster Recovery 46,000,000$
Supreme Court Building 11,000,000$
NACEA 45,000,000$
Urban Education Centers (OKC and Tulsa) 62,000,000$
OJA - Construction of Youthful Offender Facility 20,000,000$
OJA - Detention Centers (2) 4,892,000$
188,892,000$
More detail on these capital proposals is included in the individual agency recommendation sections.
FY-2009 Executive Budget
EXECUTIVE SUMMARY A - 13
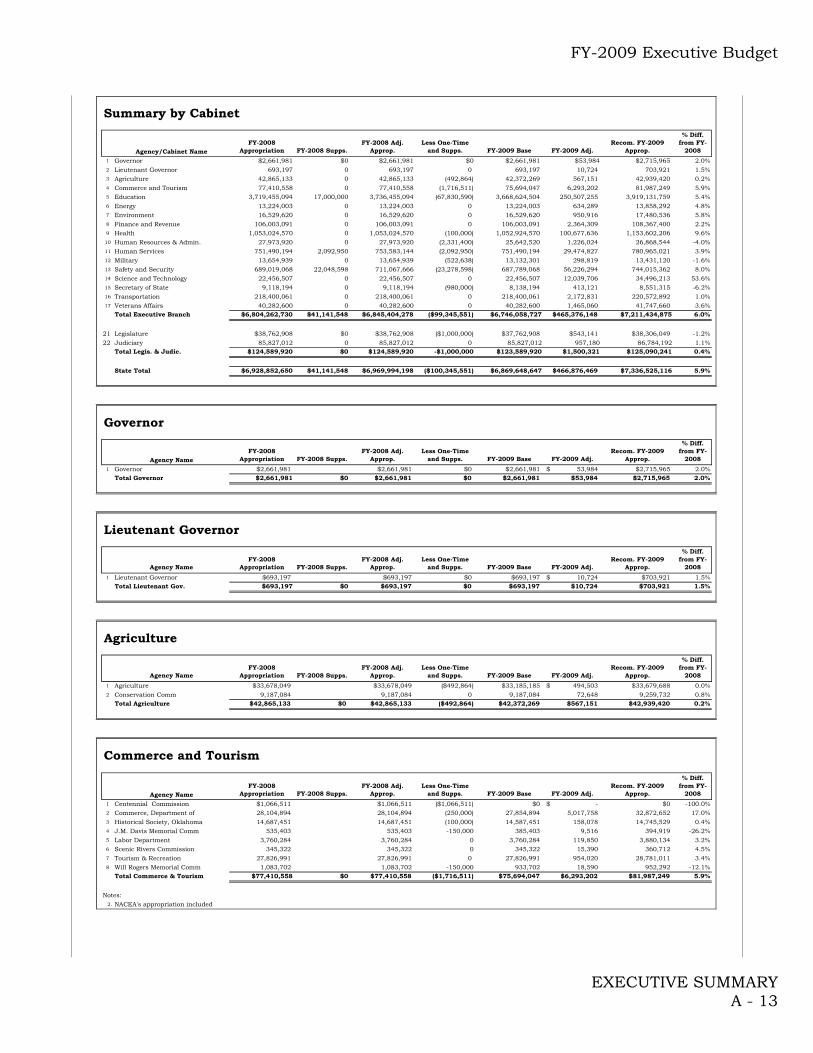
Summary by Cabinet
Agency/Cabinet NameFY-2008
Appropriation FY-2008 Supps.FY-2008 Adj.
Approp.Less One-Time
and Supps. FY-2009 Base FY-2009 Adj.Recom. FY-2009
Approp.
% Diff. from FY-
20081 Governor $2,661,981 $0 $2,661,981 $0 $2,661,981 $53,984 $2,715,965 2.0%2 Lieutenant Governor 693,197 0 693,197 0 693,197 10,724 703,921 1.5%3 Agriculture 42,865,133 0 42,865,133 (492,864) 42,372,269 567,151 42,939,420 0.2%4 Commerce and Tourism 77,410,558 0 77,410,558 (1,716,511) 75,694,047 6,293,202 81,987,249 5.9%5 Education 3,719,455,094 17,000,000 3,736,455,094 (67,830,590) 3,668,624,504 250,507,255 3,919,131,759 5.4%6 Energy 13,224,003 0 13,224,003 0 13,224,003 634,289 13,858,292 4.8%7 Environment 16,529,620 0 16,529,620 0 16,529,620 950,916 17,480,536 5.8%8 Finance and Revenue 106,003,091 0 106,003,091 0 106,003,091 2,364,309 108,367,400 2.2%9 Health 1,053,024,570 0 1,053,024,570 (100,000) 1,052,924,570 100,677,636 1,153,602,206 9.6%10 Human Resources & Admin. 27,973,920 0 27,973,920 (2,331,400) 25,642,520 1,226,024 26,868,544 -4.0%11 Human Services 751,490,194 2,092,950 753,583,144 (2,092,950) 751,490,194 29,474,827 780,965,021 3.9%12 Military 13,654,939 0 13,654,939 (522,638) 13,132,301 298,819 13,431,120 -1.6%13 Safety and Security 689,019,068 22,048,598 711,067,666 (23,278,598) 687,789,068 56,226,294 744,015,362 8.0%14 Science and Technology 22,456,507 0 22,456,507 0 22,456,507 12,039,706 34,496,213 53.6%15 Secretary of State 9,118,194 0 9,118,194 (980,000) 8,138,194 413,121 8,551,315 -6.2%16 Transportation 218,400,061 0 218,400,061 0 218,400,061 2,172,831 220,572,892 1.0%17 Veterans Affairs 40,282,600 0 40,282,600 0 40,282,600 1,465,060 41,747,660 3.6%
Total Executive Branch $6,804,262,730 $41,141,548 $6,845,404,278 ($99,345,551) $6,746,058,727 $465,376,148 $7,211,434,875 6.0%
21 Legislature $38,762,908 $0 $38,762,908 ($1,000,000) $37,762,908 $543,141 $38,306,049 -1.2%22 Judiciary 85,827,012 0 85,827,012 0 85,827,012 957,180 86,784,192 1.1%
Total Legis. & Judic. $124,589,920 $0 $124,589,920 -$1,000,000 $123,589,920 $1,500,321 $125,090,241 0.4%
State Total $6,928,852,650 $41,141,548 $6,969,994,198 ($100,345,551) $6,869,648,647 $466,876,469 $7,336,525,116 5.9%
Governor
Agency NameFY-2008
Appropriation FY-2008 Supps.FY-2008 Adj.
Approp.Less One-Time
and Supps. FY-2009 Base FY-2009 Adj.Recom. FY-2009
Approp.
% Diff. from FY-
20081 Governor $2,661,981 $2,661,981 $0 $2,661,981 53,984$ $2,715,965 2.0%
Total Governor $2,661,981 $0 $2,661,981 $0 $2,661,981 $53,984 $2,715,965 2.0%
Lieutenant Governor
Agency NameFY-2008
Appropriation FY-2008 Supps.FY-2008 Adj.
Approp.Less One-Time
and Supps. FY-2009 Base FY-2009 Adj.Recom. FY-2009
Approp.
% Diff. from FY-
20081 Lieutenant Governor $693,197 $693,197 $0 $693,197 10,724$ $703,921 1.5%
Total Lieutenant Gov. $693,197 $0 $693,197 $0 $693,197 $10,724 $703,921 1.5%
Agriculture
Agency NameFY-2008
Appropriation FY-2008 Supps.FY-2008 Adj.
Approp.Less One-Time
and Supps. FY-2009 Base FY-2009 Adj.Recom. FY-2009
Approp.
% Diff. from FY-
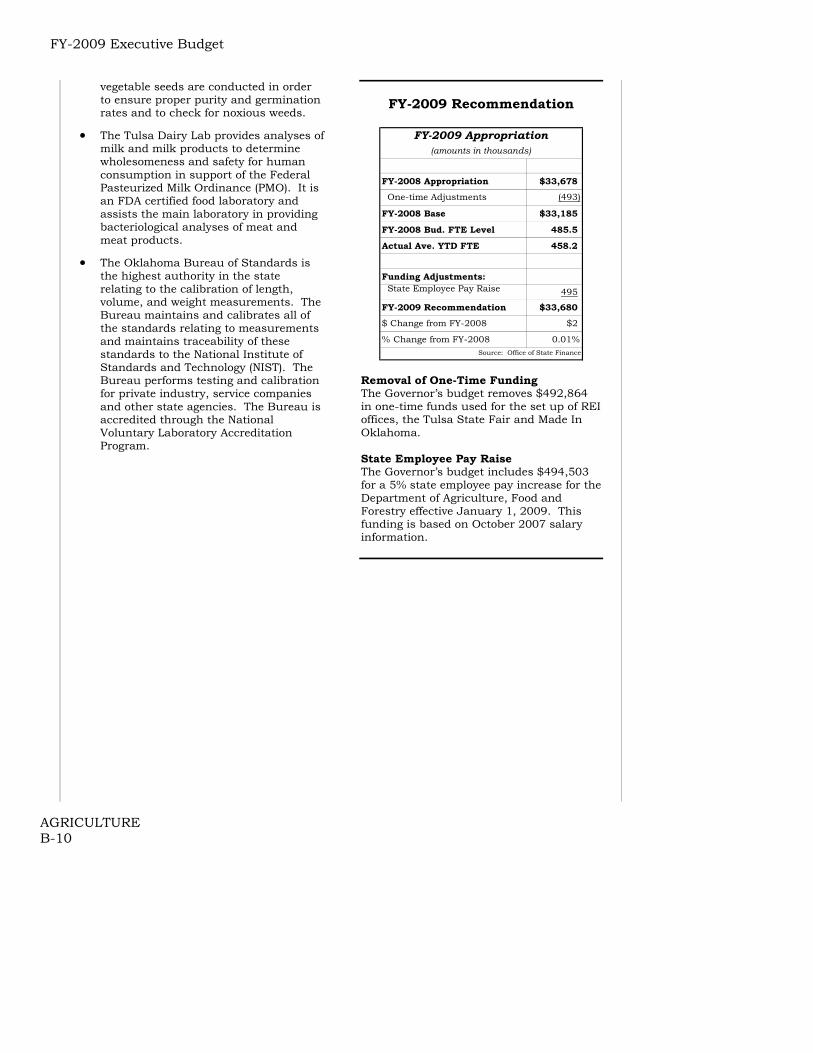
20081 Agriculture $33,678,049 $33,678,049 ($492,864) $33,185,185 494,503$ $33,679,688 0.0%2 Conservation Comm 9,187,084 9,187,084 0 9,187,084 72,648 9,259,732 0.8%
Total Agriculture $42,865,133 $0 $42,865,133 ($492,864) $42,372,269 $567,151 $42,939,420 0.2%
Commerce and Tourism
Agency NameFY-2008
Appropriation FY-2008 Supps.FY-2008 Adj.
Approp.Less One-Time
and Supps. FY-2009 Base FY-2009 Adj.Recom. FY-2009
Approp.
% Diff. from FY-
20081 Centennial Commission $1,066,511 $1,066,511 ($1,066,511) $0 -$ $0 -100.0%2 Commerce, Department of 28,104,894 28,104,894 (250,000) 27,854,894 5,017,758 32,872,652 17.0%3 Historical Society, Oklahoma 14,687,451 14,687,451 (100,000) 14,587,451 158,078 14,745,529 0.4%4 J.M. Davis Memorial Comm 535,403 535,403 -150,000 385,403 9,516 394,919 -26.2%5 Labor Department 3,760,284 3,760,284 0 3,760,284 119,850 3,880,134 3.2%6 Scenic Rivers Commission 345,322 345,322 0 345,322 15,390 360,712 4.5%7 Tourism & Recreation 27,826,991 27,826,991 0 27,826,991 954,020 28,781,011 3.4%8 Will Rogers Memorial Comm 1,083,702 1,083,702 -150,000 933,702 18,590 952,292 -12.1%
Total Commerce & Tourism $77,410,558 $0 $77,410,558 ($1,716,511) $75,694,047 $6,293,202 $81,987,249 5.9%
Notes:2. NACEA's appropriation included

FY-2009 Executive Budget
EXECUTIVE SUMMARY A - 14
Education
Agency NameFY-2008
Appropriation FY-2008 Supps.FY-2008 Adj.
Approp.Less One-Time
and Supps. FY-2009 Base FY-2009 Adj.Recom. FY-2009
Approp.
% Diff. from FY-
20081 Arts Council $5,150,967 $5,150,967 $0 $5,150,967 $20,799 $5,171,766 0.4%2 Career Tech 154,864,391 154,864,391 0 154,864,391 8,106,740 162,971,131 5.2%3 Educational TV Auth., Oklahoma 8,394,383 8,394,383 0 8,394,383 82,867 8,477,250 1.0%4 Education, Dept. of 2,480,155,207 17,000,000 2,497,155,207 (17,530,590) 2,479,624,617 135,231,671 2,614,856,288 5.4%5 Higher Educ., Regents for 1,053,949,576 1,053,949,576 (50,300,000) 1,003,649,576 106,871,093 1,110,520,669 5.4%6 Libraries, Dept. of 7,294,856 7,294,856 0 7,294,856 59,843 7,354,699 0.8%8 School of Science & Math 7,585,732 7,585,732 0 7,585,732 117,415 7,703,147 1.5%9 Teacher Prep, Commission for 2,059,982 2,059,982 0 2,059,982 16,827 2,076,809 0.8%
Total Education $3,719,455,094 $17,000,000 $3,736,455,094 ($67,830,590) $3,668,624,504 $250,507,255 $3,919,131,759 5.4%
Regents Adjustment and Recommended FY-2009 Appropriation includes the $54.1 million for the OHLAP program received through Individual Income Tax apportionment.
Energy
Agency NameFY-2008
Appropriation FY-2008 Supps.FY-2008 Adj.
Approp.Less One-Time
and Supps. FY-2009 Base FY-2009 Adj.Recom. FY-2009
Approp.
% Diff. from FY-
20081 Corporation Commission $12,210,417 $12,210,417 $0 $12,210,417 $599,780 $12,810,197 4.9%2 Mines, Department of 1,013,586 1,013,586 0 1,013,586 34,509 1,048,095 3.4%
Total Energy $13,224,003 $0 $13,224,003 $0 $13,224,003 $634,289 $13,858,292 4.8%
Environment
Agency NameFY-2008
Appropriation FY-2008 Supps.FY-2008 Adj.
Approp.Less One-Time
and Supps. FY-2009 Base FY-2009 Adj.Recom. FY-2009
Approp.
% Diff. from FY-
20081 Environmental Quality, Dept. of $9,728,096 $9,728,096 $0 $9,728,096 $804,648 $10,532,744 8.3%2 Water Resources Board 6,801,524 6,801,524 $0 6,801,524 146,268 6,947,792 2.2%
Total Environment $16,529,620 $0 $16,529,620 $0 $16,529,620 $950,916 $17,480,536 5.8%
Finance and Revenue
Agency NameFY-2008
Appropriation FY-2008 Supps.FY-2008 Adj.
Approp.Less One-Time
and Supps. FY-2009 Base FY-2009 Adj.Recom. FY-2009
Approp.
% Diff. from FY-
20081 Auditor & Inspector $6,315,269 $6,315,269 $0 $6,315,269 $186,209 $6,501,478 2.9%2 Auditor & Inspector - REAP 15,500,000 15,500,000 0 15,500,000 15,500,000 0.0%3 Bond Advisor, State 186,419 186,419 0 186,419 6,529 192,948 3.5%4 Consumer Credit Commission 669,042 669,042 0 669,042 17,908 686,950 2.7%5 Finance, Office of State 23,081,434 23,081,434 0 23,081,434 468,656 23,550,090 2.0%6 Insurance Department 2,515,943 2,515,943 0 2,515,943 185,156 2,701,099 7.4%7 Land Office, Commissioners 4,864,881 4,864,881 0 4,864,881 78,643 4,943,524 1.6%9 Tax Commission 48,201,340 48,201,340 0 48,201,340 1,358,103 49,559,443 2.8%10 Treasurer 4,668,763 4,668,763 0 4,668,763 63,105 4,731,868 1.4%
Total Finance and Revenue $106,003,091 $0 $106,003,091 $0 $106,003,091 $2,364,309 $108,367,400 2.2%
Health
Agency NameFY-2008
Appropriation FY-2008 Supps.FY-2008 Adj.
Approp.Less One-Time
and Supps. FY-2009 Base FY-2009 Adj.Recom. FY-2009
Approp.
% Diff. from FY-
20081 Health Care Authority $771,709,298 $771,709,298 $0 $771,709,298 $82,934,888 $854,644,186 10.7%2 Health Department 73,786,143 73,786,143 0 73,786,143 5,187,103 78,973,246 7.0%3 Mental Health Department 207,529,129 207,529,129 -100,000 207,429,129 12,555,645 219,984,774 6.0%
Total Health $1,053,024,570 $0 $1,053,024,570 ($100,000) $1,052,924,570 $100,677,636 $1,153,602,206 9.6%
FY-2009 Executive Budget
EXECUTIVE SUMMARY A - 15
Human Resources and Administration
Agency NameFY-2008
Appropriation FY-2008 Supps.FY-2008 Adj.
Approp.Less One-Time
and Supps. FY-2009 Base FY-2009 Adj.Recom. FY-2009
Approp.
% Diff. from FY-
20081 Central Services, Dept. of $19,053,697 $19,053,697 ($2,296,400) $16,757,297 $304,107 $17,061,404 -10.5%2 Horse Racing Commission 2,669,568 2,669,568 0 2,669,568 86,180 2,755,748 3.2%3 Human Rights Commission 710,226 710,226 0 710,226 13,465 723,691 1.9%4 Merit Protection Commission 648,684 648,684 -35,000 613,684 13,343 627,027 -3.3%5 Personnel Management, Office of 4,891,745 4,891,745 0 4,891,745 808,929 5,700,674 16.5%
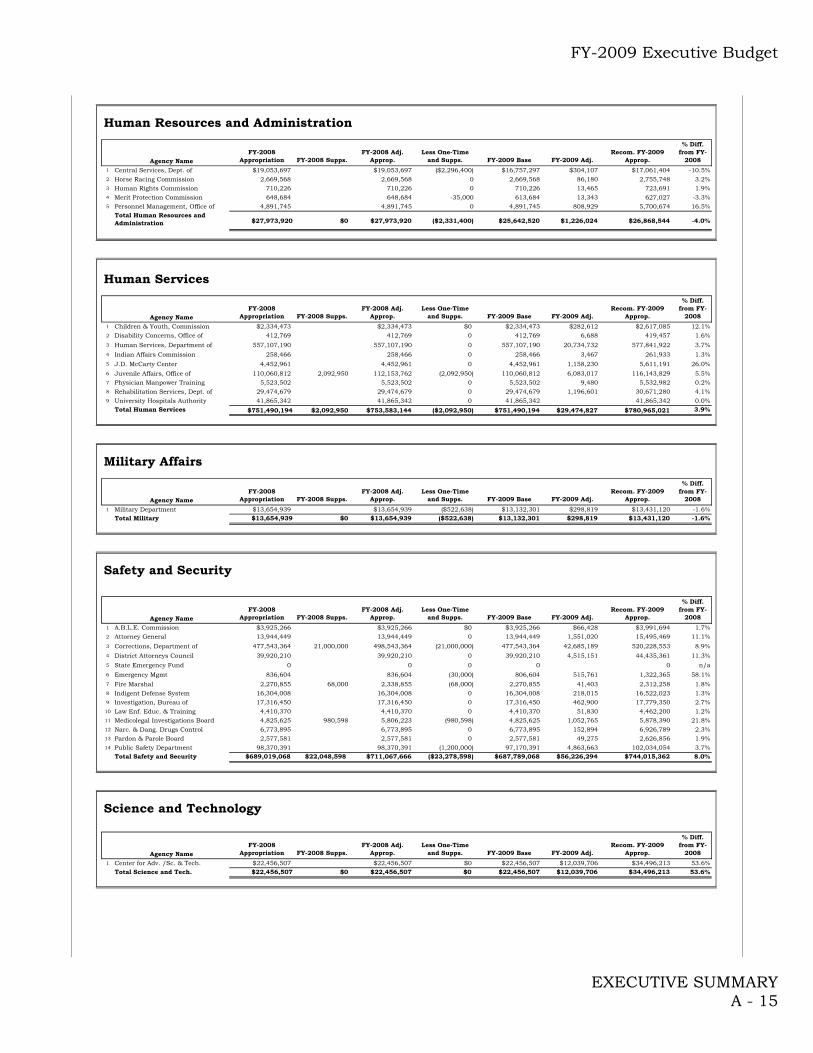
Total Human Resources and Administration $27,973,920 $0 $27,973,920 ($2,331,400) $25,642,520 $1,226,024 $26,868,544 -4.0%
Human Services
Agency NameFY-2008
Appropriation FY-2008 Supps.FY-2008 Adj.
Approp.Less One-Time
and Supps. FY-2009 Base FY-2009 Adj.Recom. FY-2009
Approp.
% Diff. from FY-
20081 Children & Youth, Commission $2,334,473 $2,334,473 $0 $2,334,473 $282,612 $2,617,085 12.1%2 Disability Concerns, Office of 412,769 412,769 0 412,769 6,688 419,457 1.6%3 Human Services, Department of 557,107,190 557,107,190 0 557,107,190 20,734,732 577,841,922 3.7%4 Indian Affairs Commission 258,466 258,466 0 258,466 3,467 261,933 1.3%5 J.D. McCarty Center 4,452,961 4,452,961 0 4,452,961 1,158,230 5,611,191 26.0%6 Juvenile Affairs, Office of 110,060,812 2,092,950 112,153,762 (2,092,950) 110,060,812 6,083,017 116,143,829 5.5%7 Physician Manpower Training 5,523,502 5,523,502 0 5,523,502 9,480 5,532,982 0.2%8 Rehabilitation Services, Dept. of 29,474,679 29,474,679 0 29,474,679 1,196,601 30,671,280 4.1%9 University Hospitals Authority 41,865,342 41,865,342 0 41,865,342 41,865,342 0.0%
Total Human Services $751,490,194 $2,092,950 $753,583,144 ($2,092,950) $751,490,194 $29,474,827 $780,965,021 3.9%
Military Affairs
Agency NameFY-2008
Appropriation FY-2008 Supps.FY-2008 Adj.
Approp.Less One-Time
and Supps. FY-2009 Base FY-2009 Adj.Recom. FY-2009
Approp.
% Diff. from FY-
20081 Military Department $13,654,939 $13,654,939 ($522,638) $13,132,301 $298,819 $13,431,120 -1.6%
Total Military $13,654,939 $0 $13,654,939 ($522,638) $13,132,301 $298,819 $13,431,120 -1.6%
Safety and Security
Agency NameFY-2008
Appropriation FY-2008 Supps.FY-2008 Adj.
Approp.Less One-Time
and Supps. FY-2009 Base FY-2009 Adj.Recom. FY-2009
Approp.
% Diff. from FY-
20081 A.B.L.E. Commission $3,925,266 $3,925,266 $0 $3,925,266 $66,428 $3,991,694 1.7%2 Attorney General 13,944,449 13,944,449 0 13,944,449 1,551,020 15,495,469 11.1%3 Corrections, Department of 477,543,364 21,000,000 498,543,364 (21,000,000) 477,543,364 42,685,189 520,228,553 8.9%4 District Attorneys Council 39,920,210 39,920,210 0 39,920,210 4,515,151 44,435,361 11.3%5 State Emergency Fund 0 0 0 0 0 n/a6 Emergency Mgmt 836,604 836,604 (30,000) 806,604 515,761 1,322,365 58.1%7 Fire Marshal 2,270,855 68,000 2,338,855 (68,000) 2,270,855 41,403 2,312,258 1.8%8 Indigent Defense System 16,304,008 16,304,008 0 16,304,008 218,015 16,522,023 1.3%9 Investigation, Bureau of 17,316,450 17,316,450 0 17,316,450 462,900 17,779,350 2.7%10 Law Enf. Educ. & Training 4,410,370 4,410,370 0 4,410,370 51,830 4,462,200 1.2%11 Medicolegal Investigations Board 4,825,625 980,598 5,806,223 (980,598) 4,825,625 1,052,765 5,878,390 21.8%12 Narc. & Dang. Drugs Control 6,773,895 6,773,895 0 6,773,895 152,894 6,926,789 2.3%13 Pardon & Parole Board 2,577,581 2,577,581 0 2,577,581 49,275 2,626,856 1.9%14 Public Safety Department 98,370,391 98,370,391 (1,200,000) 97,170,391 4,863,663 102,034,054 3.7%
Total Safety and Security $689,019,068 $22,048,598 $711,067,666 ($23,278,598) $687,789,068 $56,226,294 $744,015,362 8.0%
Science and Technology
Agency NameFY-2008
Appropriation FY-2008 Supps.FY-2008 Adj.
Approp.Less One-Time
and Supps. FY-2009 Base FY-2009 Adj.Recom. FY-2009
Approp.
% Diff. from FY-
20081 Center for Adv. /Sc. & Tech. $22,456,507 $22,456,507 $0 $22,456,507 $12,039,706 $34,496,213 53.6%
Total Science and Tech. $22,456,507 $0 $22,456,507 $0 $22,456,507 $12,039,706 $34,496,213 53.6%

FY-2009 Executive Budget
EXECUTIVE SUMMARY A - 16
Secretary of State
Agency NameFY-2008
Appropriation FY-2008 Supps.FY-2008 Adj.
Approp.Less One-Time
and Supps. FY-2009 Base FY-2009 Adj.Recom. FY-2009
Approp.
% Diff. from FY-
20081 Election Board $7,785,988 $7,785,988 ($980,000) $6,805,988 $236,918 $7,042,906 -9.5%2 Ethics Commission, Okla. 517,960 517,960 0 517,960 160,423 678,383 31.0%3 Judicial Complaints, Council on 283,729 283,729 0 283,729 3,600 287,329 1.3%4 Secretary of State 530,517 530,517 0 530,517 12,180 542,697 2.3%
Total Secretary of State $9,118,194 $0 $9,118,194 ($980,000) $8,138,194 $413,121 $8,551,315 -6.2%
Transportation
Agency NameFY-2008
Appropriation FY-2008 Supps.FY-2008 Adj.
Approp.Less One-Time
and Supps. FY-2009 Base FY-2009 Adj.Recom. FY-2009
Approp.
% Diff. from FY-
20081 Space Industry Development $530,340 $530,340 $0 $530,340 $6,707 $537,047 1.3%2 Transportation, Department of 217,869,721 217,869,721 0 208,391,003 2,166,124 210,557,127 -3.4%
Total Transportation $218,400,061 $0 $218,400,061 $0 $208,921,343 $2,172,831 $211,094,174 -3.3%
Veterans Affairs
Agency NameFY-2008
Appropriation FY-2008 Supps.FY-2008 Adj.
Approp.Less One-Time
and Supps. FY-2009 Base FY-2009 Adj.Recom. FY-2009
Approp.
% Diff. from FY-
20081 Veterans Affairs, Department of $40,282,600 $40,282,600 $0 $40,282,600 $1,465,060 $41,747,660 3.6%
Total Veterans $40,282,600 $0 $40,282,600 $0 $40,282,600 $1,465,060 $41,747,660 3.6%
Legislature
Agency NameFY-2008
Appropriation FY-2008 Supps.FY-2008 Adj.
Approp.Less One-Time
and Supps. FY-2009 Base FY-2009 Adj.Recom. FY-2009
Approp.
% Diff. from FY-
20081 House of Representatives $19,176,434 $19,176,434 $0 $19,176,434 $251,471 $19,427,905 1.3%2 Legislative Service Bureau 4,887,349 4,887,349 (1,000,000) 3,887,349 43,316 3,930,665 -19.6%3 Senate 14,699,125 14,699,125 0 14,699,125 248,354 14,947,479 1.7%
Total Legislature $38,762,908 $0 $38,762,908 ($1,000,000) $37,762,908 $543,141 $38,306,049 -1.2%
Judiciary
Agency NameFY-2008
Appropriation FY-2008 Supps.FY-2008 Adj.
Approp.Less One-Time
and Supps. FY-2009 Base FY-2009 Adj.Recom. FY-2009
Approp.
% Diff. from FY-
20081 Court of Criminal Appeals $3,489,631 $3,489,631 $0 $3,489,631 $37,742 $3,527,373 1.1%2 District Courts 57,674,778 57,674,778 0 57,674,778 490,959 58,165,737 0.9%3 Supreme Court 19,420,570 19,420,570 0 19,420,570 305,031 19,725,601 1.6%4 Workers' Compensation Court 5,242,033 5,242,033 0 5,242,033 123,448 5,365,481 2.4%
Total Judiciary $85,827,012 $0 $85,827,012 $0 $85,827,012 $957,180 $86,784,192 1.1%
Notes:2 The District Courts' appropriation includes income to the State Judicial Revolving Fund.
The Department of Transportation's FY-2009 base includes the $9.5 million estimated reduction to the State Transporation Revolving Fund as certified by the Board of Equalization

FY-2009 Executive Budget
GOVERNOR B-1
Governor As Chief Magistrate of the State, the Governor is vested by the Oklahoma Constitution with “the Supreme Executive power.” At the beginning of each session of the Legislature, the Governor presents the budget recommendations for the various state agencies and reports on the condition of the State. Every bill passed by the Legislature during regular session and prior to adjournment, before it becomes a law, is presented to the Governor. If the Governor approves the bill, he signs it, if not; he vetoes it and returns it with his objections to the Legislature, which can override his objections by a two-thirds vote. When any State office becomes vacant, the Governor, unless otherwise provided by law, appoints a person to fill such vacancy, in certain instances by and with advice and consent of the Senate. The Governor is Commander in Chief of the state militia. Additional duties of the Governor include:
• Conduct the business of Oklahoma with other states;
• Grant commutations, pardons and paroles;
• Approve agency rules;
• Negotiate tribal compacts;
• Sign or veto legislation; and
• Conserve the peace throughout the state.
The Governor presides over or is a member of the following state boards and commissions:
• State Board of Equalization (Article 10, Section 21)
• Interstate Oil Compact (52 O.S. 201)
• Oklahoma Historical Society (53 O.S. 1.6)
• School Land Commission (64 O.S. 156)
• Capital Improvement Authority (73 O.S. 98.2)
• Oklahoma Capitol Complex Centennial Commission (73 O.S. 98.2)
• Transportation Commission (69 O.S. 302)
• Educational Commission (70 O.S. 506.1)
• Commissioners of the Land Office (70 O.S. 611)
• Southern Regional Educational Compact (70 O.S. 2127)
• Oklahoma Transportation Authority (69 O.S. 1703)
• Indian Affairs Commission (74 O.S. 1201)
• Southern Growth Policy Board (74 O.S. 3501)
• Contingency Review Board (74 O.S. 1201)
FY-2009 Recommendation
FY-2008 Appropriation $2,662
FY-2008 Bud. FTE Level 32.7
Actual Ave. YTD FTE 32.7
Funding Adjustments: State Employee Pay Raise 54
FY-2009 Recommendation $2,716% Change from FY-2008 2.03%
FY-2009 Appropriation(amounts in thousands)
Source: Office of State Finance State Employee Pay Raise The Governor’s budget includes $53,984 for a 5% state employee pay increase for the Governor’s office effective January 1, 2009. This funding is based on October 2007 salary information.

FY-2009 Executive Budget
GOVERNOR B-2

FY-2009 Executive Budget
LIEUTENANT GOVERNOR B-3
Lieutenant Governor
Oklahoma’s Lieutenant Governor serves in place of the Governor when the Governor leaves the state. Also, the Lieutenant Governor serves as the President of the Oklahoma State Senate, casting a vote in the event of a tie and presiding over joint sessions of the State Legislature. In addition, the Lieutenant Governor presides over or is a member of the following 8 state boards and commissions:
• State Insurance Fund (CompSource) 85 O.S. 131(A)(2)
• Tourism and Recreation Commission 74 O.S. 1804)
• State Board of Equalization 68 O.S. 2864 (A)
• School Land Commission 64 O.S. 1
• Oklahoma Linked Deposit Board 62 O.S. 88.3 (A)(2)
• Capital Improvement Authority
• Native American Cultural and Education Authority (ex-officio member) 74 O.S. 1226.2 (B)(2)
• Film and Music Advisory Commission 74 O.S. 5026
• Oklahoma Capitol Complex Centennial Commission 73 O.S. 98.2 (A)
FY-2009 Recommendation
FY-2008 Appropriation $693
FY-2008 Bud. FTE Level 6.5
Actual Ave. YTD FTE 6.5
Funding Adjustments: State Employee Pay Raise 11
FY-2009 Recommendation $704
% Change from FY-2008 1.55%
FY-2009 Appropriation(amounts in thousands)
Source: Office of State Finance State Employee Pay Raise The Governor’s budget includes $10,724 for a 5% state employee pay increase for the Lieutenant Governor’s office effective January 1, 2009. This funding is based on October 2007 salary information.

FY-2009 Executive Budget
LIEUTENANT GOVERNOR B-4

FY-2009 Executive Budget
AGRICULTURE B-5
Department of Agriculture, Food and Forestry (ODAFF)
Notable Achievements • No major food borne outbreak has
occurred in the state of Oklahoma during the past 4 years.
Mission The Department of Agriculture, Food, and Forestry is the lead agency in the state for improvement and regulation of the agricultural industry in Oklahoma. The Department of Agriculture’s budget consists of state, federal and revolving funds. For FY-2007, state appropriated dollars were 61% of the Department’s total funding of $51,671,000.
Department of Agriculture FY-2007 Actual Expenditures (In 000s)
Food Safety/Ag lab,
$8,077,16%
Admin, $11,869,
23%
Agr'l Env'l Mgmt Svcs,
$1,197,2%
Pub Info/Lgl/Stat/
Mkt Dev, $ 3,420,
7%
Wildlife, $1,855,
4%
Forestry, $18,804,
36%
Consumer Protection Svcs/Anml Ind Svcs, $6,449,
12%
Source: Office of State Finance
Animal Industry Services (AIS) One of the agency’s most important functions is to ensure the quality and safety of the state’s agricultural products. This division is responsible for the detection, eradication and control of livestock, poultry and aquaculture diseases. The introduction of disease, foreign or domestic, can have a negative economic impact on Oklahoma producers. In addition, some animal diseases have the potential to infect humans. AIS works with State and Federal laboratories, the Oklahoma Office of the Federal Area Veterinarian in Charge, and Oklahoma Veterinary Practitioners in conducting surveillance to avert outbreaks.
Specific responsibilities of the Animal Industry Services Division include:
• detecting, controlling and eradicating livestock diseases in farms, ranches, auction markets, slaughter plants, feedlots and other concentration points throughout the state;
• monitoring the movement of animals and poultry into, through and out of Oklahoma to verify compliance with state and federal laws and regulations;
• controlling the use of vaccines and biologics;
• preventing the spread of diseases transmissible to man; and
• surveillance of wildlife that have contact with domestic animals.
The following chart shows the Department’s commitment to the control and prevention of diseases. Key Performance Measure
Percent of Livestock, Poultry and Aquaculture Population Under Surveillance
96%
97%
98%
99%
100%
FY-2005 FY-2006 FY-2007 Bud. FY-2008
Source: ODAFF Forestry Services There are more than 10 million acres of forests in Oklahoma. This natural system includes cedar, oak, hickory, pine, juniper and bottomland hardwoods. The forests of Oklahoma provide multiple public benefits including clean air, clean water, recreation, habitat for wildlife and wood products. Oklahoma has numerous sawmills and paper mills as well as an oriented standboard plant, a fiber board plant, and many other manufacturing plants that

FY-2009 Executive Budget
AGRICULTURE B-6
require forest products. These industries contribute more than $2.3 billion annually to the state’s economy. The Department provides:
• Firefighters and specialized equipment for wildfire suppression stationed throughout eastern Oklahoma and available state-wide;
• Equipment, financial assistance and technical support for rural fire departments to help them improve fire services; and
• Assistance in forest management and regeneration, community forestry, water quality protection and education to protect and develop the state’s forest resources.
The Department also provides assistance in forest protection and law enforcement. The Department provides environmental education to the State through the Forestry Youth Camp, Project Learning Tree and various programs at the Forest Heritage Center in Beaver’s Bend State park. State/Local/Federal Partnership for Fire Protection The Rural Fire Defense program works with local fire departments to improve fire services by administering the following programs:
• Purchase and placement of 247 one-ton trucks with fire departments in FY-2007 and 125 trucks in FY-2008. These trucks have been converted into fire engines to improve the initial response time and attack capacity of more than 1/3 of the rural fire departments in Oklahoma;
• Increased operational grant support for rural fire departments from $2 million in FY-2005 to $4.4 million in FY-2008;
• 80/20 (state/local matching grant) Capital Grants; and
• Implementation of the Federal Firefighter Property Program, improving the quality of federal excess property acquired and providing for title to such property to be passed to the receiving fire department.
Operational Grants The operational grants, first funded in FY-1990, provide funds for expenses of local fire-fighting associations. The grants help cities, towns, fire districts and rural fire departments pay for insurance, protective clothing and equipment. The grants are 100% state funded.
History of Operational GrantsYear No. Per Entity Funding
FY-2003 860 2,326 2,000,000FY-2004 869 2,301 2,000,000FY-2005 874 2,288 2,000,000FY-2006 874 7,437 6,500,000 FY-2007 0 - - FY-2008 877 5,100 4,500,000
Total 4,354 19,452$ $17,000,000Source: ODAFF
80/20 Grant Funding First funded in FY-1992, the 80/20 grants (state/local funding) provide equipment and building needs for rural fire departments. Approximately 84 fire departments received grants in FY-2008.
History of 80/20 GrantsYear FundingFY-2002 3,766,219$ FY-2003 5,321,097$ FY-2004 816,500$ FY-2005 800,000$ FY-2006 870,000$ FY-2007 800,000$
Total $12,373,816Source: ODAFF
Equipment and Vehicles for Firefighters and Other Agency Divisions Wildfire containment depends on firefighters and equipment arriving in a timely manner. Reliable equipment is imperative for protecting lives, natural resources and property. The Forestry Division has been acquiring excess federal property from the USDA-Forest Service and placing it on loan to Oklahoma fire departments. Oklahoma’s current inventory of Federal Excess Personal Property ranks third among all states. In

FY-2009 Executive Budget
AGRICULTURE B-7
FY-2007 and FY-2008, $2.5 million in state funds were used to purchase new trucks for placement with rural fire departments.
History of Federal Excess Prop.Year No. Est. Value
FY-2002 547 7,735,437$ FY-2003 145 2,899,028$ FY-2004 214 5,823,083$ FY-2005 186 4,677,108$ FY-2006 150 5,121,344$ FY-2007 180 6,659,075$
Total 1,422 32,915,075$ Source: ODAFF
Equipment Funding for Local Fire Departments Forestry Services also purchased items in bulk for resale at cost to local fire departments. This revolving fund was created with $100,000 in FY-1990. Surplus State Equipment State wildfire fire-fighting units can loan surplus property to local fire departments. This equipment typically includes radios, tanks, pumps, backpack blowers, hose reels, etc. The following graph shows the four-year average for structures lost to fire in the protection area, which covers most of the eastern part of the state.
Average Structures Lost to Fire in the Protection Area
0
20
40
60
80
100
FY-2004 FY-2005 FY-2006 FY-2007
Source: ODAFF
Natural Resources Management The Forest Stewardship Program educates landowners and provides management plans to help conserve our forests. The Urban and Community Forestry Program educates community leaders on the economic value provided by trees in our cities and towns. 80% of Oklahoma’s citizens now reside in a certified Tree City USA community.
History of Forest Stewardship ProgramYear Plans Acres
FY-2002 121 20109FY-2003 148 22108FY-2004 89 18756FY-2005 112 17858FY-2006 86 11291FY-2007 104 5799Total 660 95921
Source ODAFF Consumer Protection Services (CPS) This program was formerly known as the Plant Industry & Consumer Services (PICS). This division is involved in keeping our citizens and food safe, protecting crops, homes, the environment and safeguarding against dishonest business practices. • CPS samples and tests animal feed,
fertilizer, and crop seed to ensure they meet label guarantee. Inspectors verify product prices are the same as advertised. Food package weights are checked for accuracy, as well as scales that are used to weigh large trucks at various locations.
• Environmental protection programs are enforced through yearly inspections that require fertilizer producers to use good management practices. This helps safeguard the waters of Oklahoma from pollution by pesticides and fertilizers.
• Commercial and private pesticide applicators are trained and certified through written and practical tests and commercial companies are required to be licensed to operate within the state. Complaints concerning improper pesticide application are investigated

FY-2009 Executive Budget
AGRICULTURE B-8
and compliance actions are taken when appropriate.
• Inspections are conducted of all anhydrous ammonia fertilizer tanks and anhydrous safety training is provided by this division.
• Crops are protected by routine inspections for diseases, insect trapping and detection, and detection programs that identify newly arrived weed species or pests.
• Grain producers who store grain in public grain warehouses are protected by this division through financial and grain inventory audits that insure compliance.
In addition to the programs listed above, this division has cooperative agreements with several Federal agencies. ODAFF Agricultural Environmental Management Services (AEMS) The ODAFF AEMS was created in 1997 to help develop, coordinate and oversee animal and poultry environmental policies and programs. Their mission is to work with producers and concerned citizens to protect the environment of Oklahoma from animals, poultry and their wastes. The ODAFF Lab in Oklahoma City helps to accomplish this mission through its water quality and food safety testing. The AEMS is responsible for implementing the Oklahoma Concentrated Animal Feeding Operations Act and the Oklahoma Registered Poultry Feeding Operations Act, the Oklahoma Poultry Waste Applicators Certification, and the Agriculture Compost Facilities Rules. Duties include the licensing, regulation and inspection of beef, swine and poultry breeding, growing and feeding facilities and licensed managed feeding operations, registrations of poultry feeding operations and licensing of poultry waste applicators. During the past 15 years the number of Concentrated Animal Feeding Operations (CAFOs) and poultry operations has
increased. In 1994 the number of licensed CAFOs was 184. By 2007 the number of licensed CAFOs had reached 302 with an animal capacity of 5,477,801. In 2001, there were 51 million chickens in Oklahoma, and in 2007 there were 57.5 million. The Oklahoma State Legislature has placed strong statutory requirements on investigations of environmental complaints, and each agency must develop rules for the resolution of complaints. The ODAFF places complaint response and resolution among its highest priorities. Complaints help identify problems allowing the AEMS to direct resources to correct the pollution through its enforcement program. The following table shows a recent history of the activities of the AEMS.
FY-2004 FY-2005 FY-2006 FY-2007Complaints Received 255 224 195 192Complaints Closed 270 247 247 194Routine Inspections 2482 1974 2277 2225Complaint Follow-ups 697 498 771 739Water Samples Collected 410 986 647 667Soil Samples Collected 190 40 29 57
Source: ODAFF
CAFO and LMFO Activities
Wildlife Services Wildlife Services is a cooperative program between the ODAFF and the Animal and Plant Health Inspection Service of the USDA. This division provides service to Oklahoma citizens and communities by protecting agriculture, public and private property, natural resources and human health and safety from damage or threats from wildlife. Wildlife Services protects pasture, rangelands, forests, public roads and other valuable resources from flooding by beavers. The division protects livestock, endangered species and desirable wildlife from predatory animals. Feral swine is an ongoing problem in the state. Wild and free ranging hogs root pastures, consume and destroy crops, degrade habitat and compete for resources with native wildlife species. Wildlife Services monitors feral hog diseases that can be

FY-2009 Executive Budget
AGRICULTURE B-9
transmitted to livestock, wildlife and humans by routinely taking blood samples for analysis. Diseases transmitted by wildlife, such as Avian Influenza, Swine Brucellosis, pseudorabies, plague and tularemia, are monitored by Wildlife Services. Market Development Services This division assists the Oklahoma food and agriculture industry to produce, process, and merchandise agricultural products. This is accomplished through technical assistance, trade leads, promotional activities, market research, commodity price information and other activities that enhance the production of domestic and international sales of agricultural products. Market Development also coordinates rural economic development activities, the states’ agritourism program, farm to school program plus distribution and implementation of K-8 educational materials designed to improve agricultural literacy. Food Safety This division provides services to its constituents by providing regulatory oversight of food and food products produced and consumed in the state to ensure that they are produced under sanitary conditions, are safe and are truthfully labeled. The major emphasis of this oversight is focused on food and food products that are derived from animals. The responsibility for this oversight is divided into three sections: • Egg, Poultry and Organic Section –
provides retail safety inspections of eggs and grading services for egg producers; poultry grading services to poultry processors and organic certification for livestock and crop producers as well as food processors in Oklahoma;
• Dairy Section – provides oversight of dairies and producers/processors of dairy products; and the
• Meat and Poultry Inspection Section – provides continuous inspection during the production of meat and poultry products.
Laboratory Services The Agriculture Laboratory directly supports the regulatory enforcement and surveillance activities of the Oklahoma Department of Agriculture, Food, and Forestry and provides services that benefit consumers as well as agriculture producers. The mission of the Laboratory is to provide, in a timely manner, accurate and precise analytical results to the Department, other agencies and the general public. To accomplish this mission, the Laboratory maintains nine certifications or accreditations and participates in 20 separate and independent proficiency-testing programs. The Division consists of the Headquarters Laboratory in Oklahoma City, the Tulsa Dairy, Food and Water Laboratory and the Oklahoma Bureau of standards. These will be consolidated into one facility upon completion of a new laboratory in 2008.
• The Headquarters Laboratory, through its general chemistry, pesticide, inorganic, animal health and seed sections, provides chemical, microbiological, serological and biological analyses of various substances in order to ensure that agricultural products sold and produced within the state are compliant with label laws and are wholesome and safe. The Laboratory is the only entity in the state that checks label compliance on livestock and pet feeds, fertilizers, pesticides, meat and meat products. The Agricultural Laboratory is the lead entity in the state for testing related to the Federal Insecticide, Fungicide and Rodenticide Act (FIFRA). Through a cooperative agreement with U. S. EPA the pesticide section performs all pesticide testing in the state related to FIFRA activities. Chemical and microbiological testing of ground and surface water is performed in order to determine the presence of pollution related to agricultural activities. The Laboratory performs food safety testing on meat and meat products. It provides serological testing for various livestock diseases. Biological examinations of crop, forage, and
FY-2009 Executive Budget
AGRICULTURE B-10
vegetable seeds are conducted in order to ensure proper purity and germination rates and to check for noxious weeds.
• The Tulsa Dairy Lab provides analyses of milk and milk products to determine wholesomeness and safety for human consumption in support of the Federal Pasteurized Milk Ordinance (PMO). It is an FDA certified food laboratory and assists the main laboratory in providing bacteriological analyses of meat and meat products.
• The Oklahoma Bureau of Standards is the highest authority in the state relating to the calibration of length, volume, and weight measurements. The Bureau maintains and calibrates all of the standards relating to measurements and maintains traceability of these standards to the National Institute of Standards and Technology (NIST). The Bureau performs testing and calibration for private industry, service companies and other state agencies. The Bureau is accredited through the National Voluntary Laboratory Accreditation Program.
FY-2009 Recommendation
FY-2008 Appropriation $33,678 One-time Adjustments (493)
FY-2008 Base $33,185
FY-2008 Bud. FTE Level 485.5
Actual Ave. YTD FTE 458.2
Funding Adjustments: State Employee Pay Raise 495
FY-2009 Recommendation $33,680
$ Change from FY-2008 $2
% Change from FY-2008 0.01%
FY-2009 Appropriation(amounts in thousands)
Source: Office of State Finance Removal of One-Time Funding The Governor’s budget removes $492,864 in one-time funds used for the set up of REI offices, the Tulsa State Fair and Made In Oklahoma. State Employee Pay Raise The Governor’s budget includes $494,503 for a 5% state employee pay increase for the Department of Agriculture, Food and Forestry effective January 1, 2009. This funding is based on October 2007 salary information.
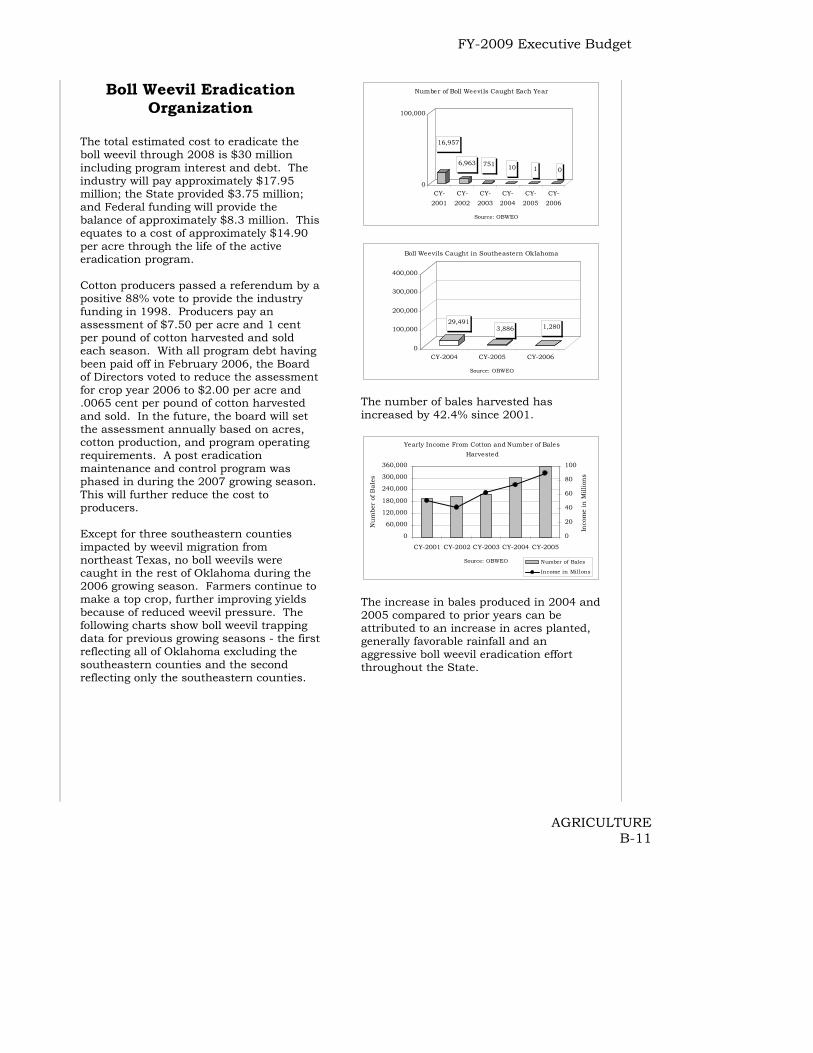
FY-2009 Executive Budget
AGRICULTURE B-11
Boll Weevil Eradication Organization
The total estimated cost to eradicate the boll weevil through 2008 is $30 million including program interest and debt. The industry will pay approximately $17.95 million; the State provided $3.75 million; and Federal funding will provide the balance of approximately $8.3 million. This equates to a cost of approximately $14.90 per acre through the life of the active eradication program. Cotton producers passed a referendum by a positive 88% vote to provide the industry funding in 1998. Producers pay an assessment of $7.50 per acre and 1 cent per pound of cotton harvested and sold each season. With all program debt having been paid off in February 2006, the Board of Directors voted to reduce the assessment for crop year 2006 to $2.00 per acre and .0065 cent per pound of cotton harvested and sold. In the future, the board will set the assessment annually based on acres, cotton production, and program operating requirements. A post eradication maintenance and control program was phased in during the 2007 growing season. This will further reduce the cost to producers. Except for three southeastern counties impacted by weevil migration from northeast Texas, no boll weevils were caught in the rest of Oklahoma during the 2006 growing season. Farmers continue to make a top crop, further improving yields because of reduced weevil pressure. The following charts show boll weevil trapping data for previous growing seasons - the first reflecting all of Oklahoma excluding the southeastern counties and the second reflecting only the southeastern counties.
16,957
6,963 751 10 1 0
0
100,000
CY-2001
CY-2002
CY-2003
CY-2004
CY-2005
CY-2006
Source: OBWEO
Number of Boll Weevils Caught Each Year
29,4913,886 1,280
0
100,000
200,000
300,000
400,000
CY-2004 CY-2005 CY-2006
Source: OBWEO
Boll Weevils Caught in Southeastern Oklahoma
The number of bales harvested has increased by 42.4% since 2001.
Yearly Income From Cotton and Number of Bales Harvested
0
60,000
120,000
180,000
240,000
300,000
360,000
CY-2001 CY-2002 CY-2003 CY-2004 CY-2005
Source: OBWEO
Nu
mbe
r of
Bal
es
0
20
40
60
80
100
Inco
me
in M
illio
ns
Number of Bales
Income in Millons
The increase in bales produced in 2004 and 2005 compared to prior years can be attributed to an increase in acres planted, generally favorable rainfall and an aggressive boll weevil eradication effort throughout the State.

FY-2009 Executive Budget
AGRICULTURE B-12
Conservation Commission Notable Achievements • During 2007 Oklahoma experienced
significant natural disasters from ice storms to record precipitation that resulted in flooding that impacted many parts of the state. The federal government issued a record eight disaster declarations during the year. Because of Oklahoma’s 2105 upstream flood control dams, many areas in the state were successfully protected from catastrophic damage during the spring and summer flood events. USDA economists determined that over $300 million in flood damages to homes, cities, towns, roads, bridges and agricultural lands was prevented because of the state’s flood control infrastructure.
• The first Conservation Reserve Enhancement Program (CREP) in the state was authorized in 2007 by Governor Henry and USDA Deputy Secretary Chuck Conner. Success in achieving phosphorus reductions of at least 31% in the Beaty Creek subwatershed of the Lake Eucha Watershed and 70% in the Peacheater Creek subwatershed of the Illinois River Watershed led to the award of a $20.6 million (CREP) from the USDA Farm Services Agency (FSA).
• Work was completed on two lead and zinc reclamation projects in the Tar Creek area. The West Commerce project, at $2.3 million, is the largest single construction project in the history of the Commission. To date the Commission has reclaimed nearly 300 acres of hazardous and unsafe land in the Tar Creek area at a cost of $4.9 million.
• The Commission’s Abandoned Mine Land (AML) Division completed reclamation work on four projects in the past year. The projects reclaimed 91.5 acres of abandoned coal mine land and eliminated dangerous high walls and hazardous water bodies. The Commission also addressed four
emergency projects involving the subsidence of underground mines.
Mission The Conservation Commission provides technical assistance, financial incentives and educational information through Oklahoma’s 88 conservation districts to promote and sustain private land conservation, prevent flooding and protect the state’s water resources. The State Conservation Cost Share program, Flood Control Dam Operation, Maintenance and Rehabilitation program and Scarred Land Reclamation program are integral and valuable components of this unique service delivery system. The Conservation Commission’s largest funding source is federal funds, which totaled 55% of the Commission’s FY-2007 funding. The chart below shows the total expenditures for FY-2007, totaling $19,735,000.
Conservation Commission FY-2007 Actual Program Expenditures (In Millions)
Water Qlty/ Wetland $5.084,
28%
Abandoned Mine Land Reclam., $3.958,
18%
Field Service, $6.934,
38%
Watershed Ops. And Maint., $2.950,
14%
Admin., $.809,
5%
Source: Office of State Finance
Cost-Share Program The Conservation Cost-Share Program is a public-private partnership between the State and private land users. The program encourages implementation of best management conservation practices on Oklahoma lands. This aids in the reduction of soil erosion and the improvement of water quality. Since the program’s inception in FY-1999, it has received $7.1 million in state appropriations. Of this amount, the Conservation Commission

FY-2009 Executive Budget
AGRICULTURE B-13
allocated $6.9 million to Oklahoma’s 88 conservation districts for locally determined conservation priorities. The program has generated an additional $9.1 million in private landowner investments, as well.
History of Funding for the Cost Share ProgramAmount to
Appropriation Each District (88)FY-1999 $1,320,000 $15,000FY-2000 500,000 7,500FY-2001 1,165,000 15,500FY-2002 1,500,000 18,100FY-2003 1,000,000 10,227FY-2004 500,000 5,682FY-2005 750,000 8,523FY-2006 400,000 4,545 Total $7,135,000 $85,077
Cost-Share Program - Contribution Source
$0.00
$500,000.00
$1,000,000.00
$1,500,000.00
$2,000,000.00
$2,500,000.00
$3,000,000.00
$3,500,000.00
Year 1 Year 2 Year 3 Year 4 Year 5 Year 6 Year 7 Year 8
State Contribution Landowner Contribution Key Performance Measure
Cost-Share Program - Number of Practices Installed
903798 872
1,1971,414
1,0471,261
1,007
0200400600800
1,0001,2001,4001,600
Year 1 Year 2 Year 3 Year 4 Year 5 Year 6 Year 7 Year 8
Conservation Reserve Enhancement Program The Conservation Reserve Enhancement Program (CREP) is a joint buffer establishment conservation program between the state and federal government (20/80). This program targets state and nationally significant agriculture-related environmental effects. CREP is a voluntary program that provides financial incentives to farmers and ranchers in order to protect streams. Producers enter into contracts (10 to 15 years in length) to set aside portions
of their land to provide protective stream buffers. Participants in the program receive incentive payments and cost-share assistance for installing specific conservation practices and establishing nutrient reducing stream buffers. The Conservation Commission, partnering with the city of Tulsa/Tulsa Metropolitan Utilities Authority, the Oklahoma Scenic Rivers Commission), local Conservation Districts, EPA, and USDA have begun a $20.6 million program for the Eucha/Spavinaw and Illinois River Watersheds. This program will protect approximately 9,000 acres of riparian area with $16.5 million federal funds matched by $4.1 million state funds. In addition to protecting water quality in these important watersheds, the program will put at least $17.6 million into the local economies in the form of payments to landowners. Upstream Flood Control Program Since 1948, the federal government, through the USDA’s Natural Resources Conservation Service (NRCS) has constructed 2,105 upstream flood control dams in the State of Oklahoma (20% of the nation’s total). The dams were designed and built with federal funds. Local sponsors (68 of Oklahoma’s 88 conservation districts) were responsible for obtaining the necessary land rights and have continuing responsibility for the operation and maintenance of these dams. The federal government’s estimated public investment in these dams is $2.1 billion in present value and $71 million in annual flood protection benefits. The primary purpose of the dams is to capture floodwater and release it in a controlled fashion to minimize damage to agricultural land, homes, towns and transportation infrastructure. The dams also provide water resources for drinking water, recreation, agriculture, fire protection and significant wildlife habitat. The fitness of these structures has degraded as they have aged. For example, concrete and metal draw-down structures

FY-2009 Executive Budget
AGRICULTURE B-14
deteriorate and must be replaced; earthen dams may need to be raised to restore flood storage capacity; and development downstream of the dam can occur which changes the safety classification of a structure. Federal legislation in 2000 authorized the NRCS to rehabilitate the nation’s upstream flood control dams. The following chart reflects the history of funds appropriated by the Federal Government since FY-2002.
Funding from Federal Government(In Millions)
10
30 29.627.3 27.3
9
05
101520253035
FY-2002 FY-2003 FY-2004 FY-2005 FY-2006 FY-2007
To be eligible for rehabilitation, the state and/or local sponsors must provide a 35% match to federal dollars. Since FY-2002, the Oklahoma Legislature has appropriated $3 million to the Conservation Commission for use in matching federal rehabilitation dollars. Because of the state’s commitment to rehabilitation, the Oklahoma NRCS received an allocation of $3.5 million for rehabilitation in the 2006 federal fiscal year, and that number doubled to $7 million for the federal fiscal year 2007. The NRCS, Conservation Commission and local district sponsors have completed nine rehabilitation projects. By the conclusion of the current fiscal year, an additional five projects will be under construction. Federal 319 Grant for Non-Point Source Pollution FY-2007 federal funding from the Clean Water Act Section 319 for Oklahoma’s Non-point Source management program has increased compared to FY-2006 funding in recognition of Oklahoma's program successes. The funds are used to implement targeted programs to abate
water quality impacts from non-point source pollution. Key Performance Measure
Tons of Pollutant Removed
9.797.24 8 8
21.21
32.76 35 35
0
10
20
30
40
FY-2005 FY-2006 Bud FY-2007
Est. FY-2008
Phosphorus
Nitrogen
Federal funds must be matched with 40% state and local funds, much of which comes from the Commission’s Conservation Cost-Share Program. Since 1999 the Conservation Commission received approximately $3 million in appropriations, as a state match for federal “EPA 319 Funds” to reduce nutrient impacts in the Beaty Creek, Illinois River, Lake Wister, Ft. Cobb, Honey Creek (Grand Lake), and Stillwater Creek and Spavinaw Creek priority watersheds. Key Performance Measure
Reduction of Nonpoint Source Pollution
6%5% 5% 5%
0%
2%
4%
6%
8%
FY-2005 FY-2006 Bud FY-2007 Est FY-2008Source: Conservation Commission
The programs target sources of non-point source pollution include nutrients, agriculture, silviculture, rural unpaved roads, rural waste systems, non-regulated construction activities and stream bank destabilization. Ongoing and completed Priority Watershed Non-point Source Projects and the totals for best management practice implementation include: • Beaty Creek Watershed ($2.1 million)
within the Lake Eucha Watershed completed in FY-2005;
• Illinois River Watershed ($2.0 million) completed in FY-2005;

FY-2009 Executive Budget
AGRICULTURE B-15
• Lake Wister Watershed ($1.9 million);
• Fort Cobb Watershed ($4.3 million);
• Stillwater Creek Watershed ($1.1 million);
• Spavinaw Creek Watershed ($2.8 million) except for Beaty Creek;
• Grand Lake Watershed – Phase I ($2.1 million);
• Honey Creek (Grand Lake) Watershed (1.7 million);
• Illinois River Watershed Riparian Project ($1.6 million); and
• North Canadian River Watershed Riparian Project ($1.1 million).
These Priority Watershed Projects include implementation and demonstration of best management practices. The projects also include education programs to encourage watershed residents to help reduce non-point source pollution. Other grant tasks include: • Technical support of the Non-point
Source Management Program;
• Funding for a Rotating Basin Monitoring Program;
• Non-point Source Total Maximum Daily Load Development;
• Development of watershed-based plans for priority watersheds;
• Continuation of Statewide Blue Thumb Educational Programs; and
• Task coordination and management by the Office of the Secretary of Environment.
FY-2009 Recommendation
FY-2008 Appropriation $9,187
FY-2008 Bud. FTE Level 62.0
Actual Ave. YTD FTE 60.8
Funding Adjustments: State Employee Pay Raise 73
FY-2009 Recommendation $9,260% Change from FY-2008 0.79%
FY-2009 Appropriation(amounts in thousands)
Source: Office of State Finance State Employee Pay Raise The Governor’s budget includes $72,648 for a 5% state employee pay increase for the Conservation Commission effective January 1, 2009. This funding is based on October 2007 salary information. Capital Spending Proposal The Governor’s budget includes $30 million in a capital bond issue. This amount will be used for flood control maintenance issues.

FY-2009 Executive Budget
AGRICULTURE B-16

FY-2009 Executive Budget
COMMERCE AND TOURISM B-17
Oklahoma Capitol Complex and Centennial
Commemoration Commission
Notable Achievements
• In 2005, Oklahoma became the first state to be represented in the Macy’s Thanksgiving Day Parade. The float has since appeared in the 2006 and 2007 parades. The state had two floats at the Tournament of Roses Parade on Jan. 1, 2007.
• The nation’s post offices will offer a commemorative stamp for 2007 in celebration of Oklahoma’s centennial.
• Over 50 centennial projects have been completed statewide.
Mission Oklahoma celebrated the state’s centennial birthday on November 16, 2007. The Commission was formed to coordinate centennial celebrations throughout the state. The Commission encourages and supports participation from all geographical areas of the state.
FY-2009 Recommendation
FY-2008 Appropriation $1,066,511 One-time Adjustments (1,066,511)
FY-2008 Base $0FY-2008 Bud. FTE Level 7.0Actual Ave. YTD FTE 7.0
Funding Adjustments: None 0
FY-2009 Recommendation $0$ Change from FY-2008 ($1,066,511)% Change from FY-2008 -100.00%
FY-2009 Appropriation(amounts in thousands)
Source: Office of State Finance
The Capitol Complex and Centennial Commemoration Commission sunsets June 30, 2008. Annual bond payments of $475,000 will be funded through an appropriation to the Department of Commerce.

FY-2009 Executive Budget
COMMERCE AND TOURISM B-18
Department of Commerce
Notable Achievements
• The Oklahoma Department of Commerce assisted 49 companies with business start-up and expansion projects. Over 6,000 new jobs are projected with 33% in rural areas. The Department also worked directly with 31 companies to relocate business operations to Oklahoma resulting in a total planned investment of $1.4 billion. Of the 9,403 projected jobs, 41% are in rural areas.
• Fifty business and government leaders serve on the Governor’s Council for Workforce and Economic Development. The Council leads state efforts to enhance the workforce delivery system and increase the skills and availability of Oklahoma’s workforce. The initial phase of work has been completed.
• One-hundred and Fifty-nine Community Development Block Grants and/or loans were awarded to communities across the state. $17 million in federal funds was used to support infrastructural improvements.
• The Main Street Program generated $25.9 million in private sector reinvestment from 53 participating communities.
Mission The mission of the Oklahoma Department of Commerce is to increase the quantity and quality of jobs in Oklahoma by attracting new businesses, promoting the development and availability of a skilled workforce, supporting communities, and supporting the growth of existing businesses and entrepreneurs. The Department’s primary funding sources are federal and state appropriations. The following graph shows FY-2008 funding sources for the Department for a total budget of $148.1 million.
The graph below shows actual program expenditures for FY-2007 in the total amount of $103.1 million.
Department of Commerce FY-2007 Actual Program Expenditures (in 000s)
Global Business,
$3,620,4%
Contracts for Comm and Econ
Dev., $56,278,
54%
Oper'l Support, $7,347,
7%
Comm. Dev.,
$35,885,35%
Source: OSF
Programs Rural Action Partnership The Rural Action Partnership Program connects economic development resources with the needs of rural Oklahoma. Rural development specialists service communities and regions to encourage alliances and support economic development programs. The program assists rural communities in the effort to help grow and recruit businesses and identify ways for communities to effectively market their products and services.
Department of Commerce FY-08 Budget By Funding Source
(in 000s) Appropriated
$28,105, 19%
Revolving, $55,538,
38%
Federal, $64,415,
43%Source: OSF

FY-2009 Executive Budget
COMMERCE AND TOURISM B-19
Community Development The Office of Community Development manages the state Community Development Block Grant Program and other federally funded initiatives. Federal funding is the main source utilized to support projects; however, programs also receive support through the state energy office and state appropriations. In the past, private sector funds have also been received to support Oklahoma’s weatherization initiatives for people in need. Oklahoma Fast Forward, Business Site Location Team The Oklahoma Fast Forward Team works with corporate executives and national site location consultants to recruit business location and expansion projects to Oklahoma. Business Solutions Division The Business Solutions division works with statewide partners to promote and support economic development. The division has three core service areas: business retention and expansion, start-up and entrepreneurial assistance, and rural economic development. Each area contributes to the delivery of the Rural Action Partnership Program which connects economic development resources to the needs of rural Oklahoma. Rural development specialists service communities and regions to encourage strategic alliances and increase economic opportunities. Global Division Commerce serves as the first responder for small and medium size companies seeking to explore international business opportunities. Team members positioned in Oklahoma and international trade offices in China, Israel, Mexico and Vietnam deliver programs assisting businesses in trade counseling, market research, trade show assistance and other related services. Oklahoma Main Street Program Through affiliation with the National Main Street Center and in cooperation with the State Arts Council, the Main Street Program provides training and technical assistance
for preservation-based commercial district revitalization. Workforce Development The Governor’s Council on Workforce and Economic Development leads state efforts to ensure the development of a skilled and available workforce. Key stakeholders include state workforce and education agencies, local workforce investment boards, workforce program service providers, public/private and faith- based workforce program operators, business leaders and economic development entities. Pass-Through Funding The Department’s budget consists of funds dedicated to operations and those passed through the agency to support other entities, as directed by the State Legislature. The chart below provides a summary of the fluctuating funding levels over a six-year period.
Appropriations Used for Operations and Pass-Throughs
$13.85$12.40$11.09$9.90$9.59$10.55$11.42
$14.
26
$12.
69
$13.
09
$23.
44
$12.
61
$18.
18
$18.
93
$0$5
$10$15$20$25$30$35$40
FY-2002 FY-2003 FY-2004 FY-2005 FY-2006 FY-2007 FY-2008
Tho
usan
ds
Operations Pass-Through Sub-state Planning Districts Oklahoma has 11 sub-state planning districts, also known as Council of Governments, or COGs. These organizations were established to provide economic development leadership in their assigned areas. COGs operate independently and are funded by state appropriations, membership dues from member towns and grants from state and federal sources.
Substate Planning District Appropriations(In $000's)
$10,300
$9,368
$5,413
$12,149
$550
$550
$550
$- $3,000 $6,000 $9,000 $12,000
2002
2004
2006
2008
COGS Appropriations
Source: OSFFiscal Year

FY-2009 Executive Budget
COMMERCE AND TOURISM B-20
Native American Cultural & Educational Authority Senate Bill 746 created the Native American Cultural and Educational Authority (NACEA) on September 1, 1994. The Bill authorized the establishment of the American Indian Cultural Center which will include an interpretive center, resource center, a native languages institute and museum. The Cultural Center site is located at the junction of Interstate 35 and Interstate 40, considered by many to be the crossroads of America. Phase I of the Cultural Center will include an 86,000 square foot building that will have permanent and traveling exhibits that tell the story of Oklahoma’s 39 Indian tribes. An application has been submitted for the Cultural Center to become a Smithsonian affiliate, and through this affiliation, the Center will have access to over one million exhibits from the National Museum of the American Indian in Washington, D.C. Total project funding to date is $50 million. The U.S. Congress has appropriated $7 million for the Cultural Center. In addition, the Oklahoma Capital Improvement Authority has issued $33 million of state bonds for construction of the project. In partnership with the State of Oklahoma, a number of Oklahoma Indian tribes have contributed funds amounting to the first two years of debt service for the state bond issue. The City of Oklahoma City has transferred approximately 250 acres of land to the NACEA and has also agreed to provide the Authority $5 million in CDBG (Community Development Block Grant) funds. Future funding for the Cultural Center is depicted in the following graph.
FY-2009 Recommendation
FY-2008 Appropriation $28,105 2nd Century Entrepreneur (250)
FY-2008 Base $27,855FY-2008 Bud. FTE Level 157.0Actual Ave. YTD FTE 151.4
Funding Adjustments: State Employee Pay Increase 243 NACEA 2,300 Cent. Comm. Bond Payment 475 Creativity Project 2,000 Total Adjustments 5,018
FY-2009 Recommendation $32,873$ Change from FY-2008 $4,768% Change from FY-2008 16.96%
(amounts in thousands)FY-2009 Appropriation
Source: Office of State Finance Removal of One-Time Funding The Governor’s budget removes one-time funding of $250,000 for the 2nd Century Entrepreneurship Program. State Employee Pay Raise The Governor’s budget includes $242,758 for a 5% state employee pay increase for the Department of Commerce effective January 1, 2009. This funding is based on October 2007 salary information.
Native American Cultural Center & MuseumFuture Funding By Source
(in 000s)
State of OK,
$45,000, 45%
Private/Tribal/Other,$40,500,
40%
City of OKC,
$12,000,12%
Centennial Funding, $2,500,
3%Source: OSF

FY-2009 Executive Budget
COMMERCE AND TOURISM B-21
Native American Cultural and Educational Authority The Governor’s budget includes $2,300,000 for operations for the Native American Cultural and Educational Authority as preparation is made for the opening of the new American Indian Cultural Center and Museum. Creativity Project The Governor’s budget proposes $2,000,000 for the Oklahoma Creativity Project. This project is a collaborative, statewide initiative that brings together leaders from business, education and cultural sectors to support a mission to establish Oklahoma as a world-renowned center of creativity and innovation in commerce, culture and education. Oklahoma Capitol Complex and Centennial Commission Bond Payments Because of the sunset of the Oklahoma Capitol Complex and Centennial Commission on June 30, 2008, money for bond payments in the amount of $475,000 is included for the Department of Commerce to make those payments. Capital Spending Proposal The Governor’s budget proposes $45,000,000 in bonds for the Native American Cultural and Educational Authority for construction of the new American Indian Cultural Center and Museum that will celebrate the history and Native cultures of Oklahoma.
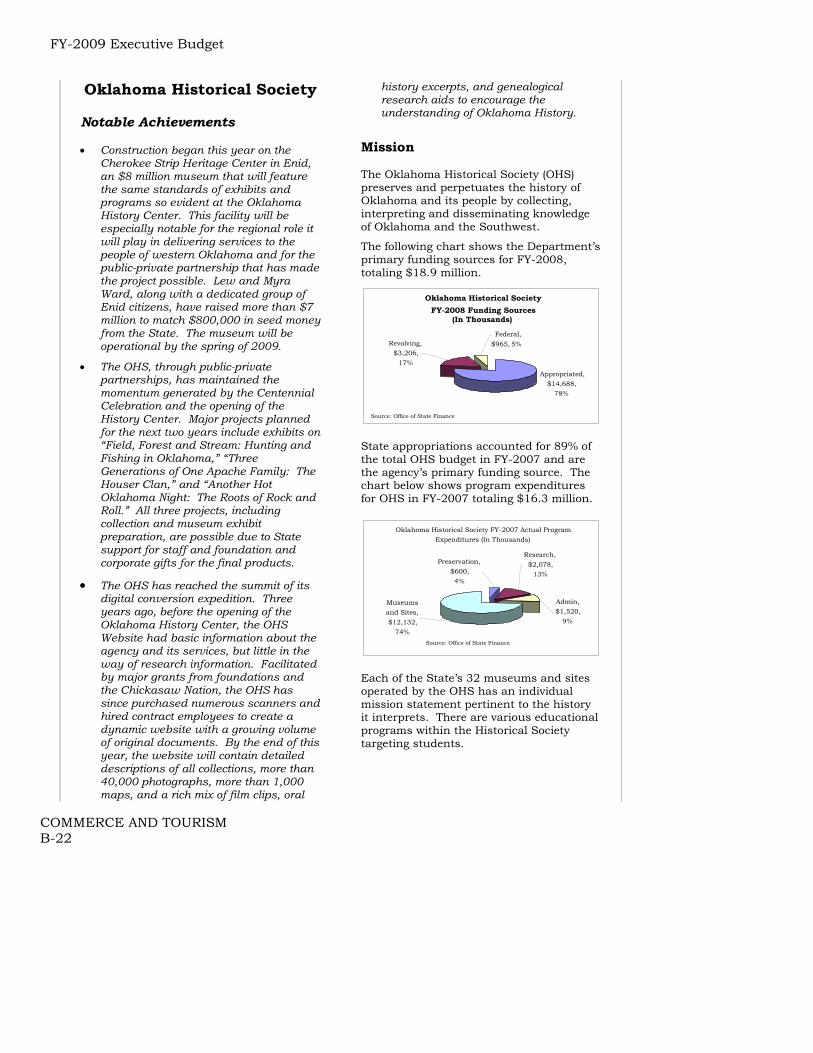
FY-2009 Executive Budget
COMMERCE AND TOURISM B-22
Oklahoma Historical Society
Notable Achievements • Construction began this year on the
Cherokee Strip Heritage Center in Enid, an $8 million museum that will feature the same standards of exhibits and programs so evident at the Oklahoma History Center. This facility will be especially notable for the regional role it will play in delivering services to the people of western Oklahoma and for the public-private partnership that has made the project possible. Lew and Myra Ward, along with a dedicated group of Enid citizens, have raised more than $7 million to match $800,000 in seed money from the State. The museum will be operational by the spring of 2009.
• The OHS, through public-private partnerships, has maintained the momentum generated by the Centennial Celebration and the opening of the History Center. Major projects planned for the next two years include exhibits on “Field, Forest and Stream: Hunting and Fishing in Oklahoma,” “Three Generations of One Apache Family: The Houser Clan,” and “Another Hot Oklahoma Night: The Roots of Rock and Roll.” All three projects, including collection and museum exhibit preparation, are possible due to State support for staff and foundation and corporate gifts for the final products.
• The OHS has reached the summit of its digital conversion expedition. Three years ago, before the opening of the Oklahoma History Center, the OHS Website had basic information about the agency and its services, but little in the way of research information. Facilitated by major grants from foundations and the Chickasaw Nation, the OHS has since purchased numerous scanners and hired contract employees to create a dynamic website with a growing volume of original documents. By the end of this year, the website will contain detailed descriptions of all collections, more than 40,000 photographs, more than 1,000 maps, and a rich mix of film clips, oral
history excerpts, and genealogical research aids to encourage the understanding of Oklahoma History.
Mission The Oklahoma Historical Society (OHS) preserves and perpetuates the history of Oklahoma and its people by collecting, interpreting and disseminating knowledge of Oklahoma and the Southwest.
The following chart shows the Department’s primary funding sources for FY-2008, totaling $18.9 million.
State appropriations accounted for 89% of the total OHS budget in FY-2007 and are the agency’s primary funding source. The chart below shows program expenditures for OHS in FY-2007 totaling $16.3 million.
Each of the State’s 32 museums and sites operated by the OHS has an individual mission statement pertinent to the history it interprets. There are various educational programs within the Historical Society targeting students.
Oklahoma Historical Society FY-2007 Actual Program Expenditures (In Thousands)
Preservation, $600, 4%
Museums and Sites, $12,132,
74%
Admin, $1,520,
9%
Research, $2,078,
13%
Source: Office of State Finance
Oklahoma Historical Society
FY-2008 Funding Sources (In Thousands)
Revolving, $3,206,
17%
Federal, $965, 5%
Appropriated, $14,688,
78%
Source: Office of State Finance

FY-2009 Executive Budget
COMMERCE AND TOURISM B-23
Key Performance Measure
Number of Students Participating In Programs
112,000104,00098,869
76,918
010,00020,00030,00040,00050,00060,00070,00080,00090,000
100,000110,000120,000
FY-2006 FY-2007 Bud FY-2008 Est FY-2009
Source: Historical Society
The Oklahoma History Center The Oklahoma History Center is a 215,000 square foot museum and research facility located across the street from the State Capitol. Sitting on an 18-acre site, the facility serves more than 200,000 visitors a year and offers a unique learning experience to more than 100,000 school students from across the state. The institution is affiliated with both the Smithsonian Institution and the National Archives. Admission to the Center is $5 for adults, $4 for seniors, $3 for students, and children five and under are free. Built at a cost of $59 million, the Oklahoma History Center offers a range of features as follows: • Four permanent museum galleries with
more than 40 topics, 52 films, 200 interactive exhibits and 2,500 artifacts;
• A research library with more than 30
million pages of newspapers published in the state and twin territories since 1844, more than four million document pages of Indian history, more than five million photographs and one of the best genealogical collections in the region for both beginners and serious family historians;
• Special event opportunities for
receptions up to 1,000 guests, formal banquets for up to 250 people and meeting space for families, class reunions and business groups;
• The Winnie Mae Café, offering full food
service seven days a week;
• An outdoor interpretive park that
includes four-acres dedicated to oil and gas in Oklahoma, a bronze statue by Allen Houser and the “Red River Journey”, a scaled reproduction of the landscape along Oklahoma’s southern border with mountain ranges, plant life and historic markers; and
• A special museum gallery for temporary
exhibits that can travel statewide at venues such as libraries, community centers and local museums.
FY-2009 Recommendation
FY-2008 Appropriation $14,687 Choctaw Capitol Bldg. (100)
FY-2008 Base $14,587FY-2008 Bud. FTE Level 156.0Actual Ave. YTD FTE 169.8
Funding Adjustments: State Employee Pay Increase 158
FY-2009 Recommendation $14,745$ Change from FY-2008 $58% Change from FY-2008 0.39%
Source: Office of State Finance
FY-2009 Appropriation(amounts in thousands)
Removal of One-Time Funding The Governor’s budget removes one-time funding of $100,000 for Choctaw capitol building windows. State Employee Pay Increase The Governor’s budget includes $158,078 for a 5% state employee pay increase for the Historical Society effective January 1, 2009. This funding is based on October 2007 salary information.

FY-2009 Executive Budget
COMMERCE AND TOURISM B-24
J. M. Davis Memorial Commission
Notable Achievements • The museum was featured on the PBS
television network program “History Detectives.” The program highlighted a story about a Colt pistol once owned by the 1930s gangster “Pretty Boy” Floyd and his life of crime.
• In concert with the Cherokee Nation, the museum has developed a display area featuring the arts, crafts and history of the Cherokee Nation. This display will be further researched and expanded.
• A children’s area has been built, funded with a grant from the National Rifleman’s Association, to teach children firearms safety utilizing an old-fashioned arcade setting that allows children to test their shooting skills.
Mission The mission of the J.M. Davis Memorial Commission is to house, protect, preserve, display and update the unique collection of firearms and historical artifacts collected by Mr. J.M. Davis, and to provide educational and historical information about the unique, historically significant artifacts to each visitor to the museum. The Commission’s primary funding source is state funds. The chart below shows the breakdown of appropriated and revolving funds for FY-2008 totaling $605,000.
Key Performance Measure
Estimated Number of Visitors to the JM Davis Museum
23,20022,45421,80025,300
0
15,000
30,000
45,000
FY-2006 FY-2007 Bud FY-2008 Est. FY-2009
Source: JM Davis
The museum houses an extensive collection of firearms, knives, swords, steins, saddles, Indian artifacts, music boxes, World War I posters and more. John Monroe Davis, former owner and operator of the Mason Hotel in Claremore, originally amassed the collection. J.M. Davis’s collection became so large that he no longer could keep it at the Mason Hotel. In 1965, Davis transferred his collection to the J.M. Davis Foundation, Inc. The Foundation, in turn, entered into an agreement with the State for preservation and display of the collection. The collection is housed today in a 40,000 sq. ft. facility.
FY-2009 Recommendation
FY-2008 Appropriation $535 Replace AC (150)
FY-2008 Base $385FY-2008 Bud. FTE Level 8.3Actual Ave. YTD FTE 6.5
Funding Adjustments: State Employee Pay Increase 10
FY-2009 Recommendation $395$ Change from FY-2008 ($140)% Change from FY-2008 -26.17%
FY-2009 Appropriation(amounts in thousands)
Source: Office of State Finance Removal of One-Time Funding The Governor’s budget removes one-time funding of $150,000 for air-conditioning replacement.
J. M. Davis Memorial CommissionFY-2008 Funding Sources
(In Thousands)
Appropriated, $535, 88%
Revolving, $70, 12%
Source: Office of State Finance

FY-2009 Executive Budget
COMMERCE AND TOURISM B-25
State Employee Pay Raise The Governor’s budget includes $9,516 for a 5% state employee pay increase for the J.M. Davis Memorial Commission effective January 1, 2009. This funding is based on October 2007 salary information.
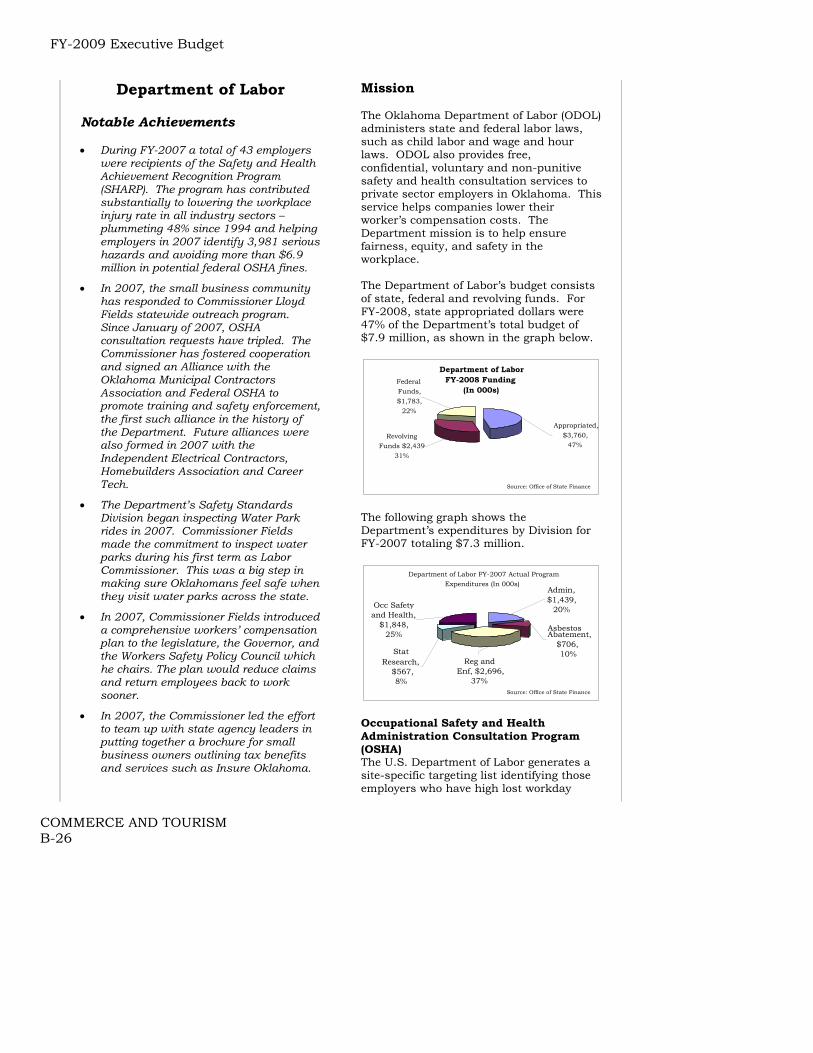
FY-2009 Executive Budget
COMMERCE AND TOURISM B-26
Department of Labor Notable Achievements • During FY-2007 a total of 43 employers
were recipients of the Safety and Health Achievement Recognition Program (SHARP). The program has contributed substantially to lowering the workplace injury rate in all industry sectors – plummeting 48% since 1994 and helping employers in 2007 identify 3,981 serious hazards and avoiding more than $6.9 million in potential federal OSHA fines.
• In 2007, the small business community has responded to Commissioner Lloyd Fields statewide outreach program. Since January of 2007, OSHA consultation requests have tripled. The Commissioner has fostered cooperation and signed an Alliance with the Oklahoma Municipal Contractors Association and Federal OSHA to promote training and safety enforcement, the first such alliance in the history of the Department. Future alliances were also formed in 2007 with the Independent Electrical Contractors, Homebuilders Association and Career Tech.
• The Department’s Safety Standards Division began inspecting Water Park rides in 2007. Commissioner Fields made the commitment to inspect water parks during his first term as Labor Commissioner. This was a big step in making sure Oklahomans feel safe when they visit water parks across the state.
• In 2007, Commissioner Fields introduced a comprehensive workers’ compensation plan to the legislature, the Governor, and the Workers Safety Policy Council which he chairs. The plan would reduce claims and return employees back to work sooner.
• In 2007, the Commissioner led the effort to team up with state agency leaders in putting together a brochure for small business owners outlining tax benefits and services such as Insure Oklahoma.
Mission The Oklahoma Department of Labor (ODOL) administers state and federal labor laws, such as child labor and wage and hour laws. ODOL also provides free, confidential, voluntary and non-punitive safety and health consultation services to private sector employers in Oklahoma. This service helps companies lower their worker’s compensation costs. The Department mission is to help ensure fairness, equity, and safety in the workplace. The Department of Labor’s budget consists of state, federal and revolving funds. For FY-2008, state appropriated dollars were 47% of the Department’s total budget of $7.9 million, as shown in the graph below.
The following graph shows the Department’s expenditures by Division for FY-2007 totaling $7.3 million.
Occupational Safety and Health Administration Consultation Program (OSHA) The U.S. Department of Labor generates a site-specific targeting list identifying those employers who have high lost workday
Department of Labor FY-2007 Actual Program Expenditures (In 000s)
Reg and Enf, $2,696,
37%
Stat Research,
$567, 8%
Abatement, $706, 10%
Admin, $1,439,
20%Occ Safety and Health,
$1,848, 25%
Source: Office of State Finance
Asbestos
Department of Labor FY-2008 Funding
(In 000s) Federal Funds, $1,783,
22%
Revolving Funds $2,439
31%
Appropriated, $3,760,
47%
Source: Office of State Finance

FY-2009 Executive Budget
COMMERCE AND TOURISM B-27
injury and illness rates. Through the Department’s Safety Pays® program, each employer is contacted to ensure they are aware of OSHA’s targeted inspection list and to offer ODOL consultation services. The graph below shows real OSHA consultation visits for FY-2007 as compared with agency projections. Additional training and assistance visits are also shown, as well as follow-up visits provided. Key Performance Measure FY-2007 OSHA Consultation Visits Real vs. Projected This free, voluntary, non-punitive and confidential program helps small (250 employees or less) high-hazard employers prevent injuries and illnesses. Federal funds cover 90% of the department’s funding for this program. The OSHA consultant first identifies hazardous conditions and practices without the costly, adversarial impact often associated with federal OSHA rulings. Boiler Inspections The Safety Standards Division regulates the installation, operation and maintenance of boilers, pressure vessels, hot water heaters, elevators, amusement rides and water parks, as well as welding practices. State statutes require ODOL to inspect boilers and pressure vessels on an annual basis. Boilers and pressure vessels must be inspected because of the potential for explosions and fires. Many boilers and pressure vessels are in highly trafficked
places such as schools, churches and hospitals. Overdue inspections Insurance companies are certified as Authorized Inspection Agencies (AIA) and assume responsibility for conducting inspections on those boilers and pressure vessels the company insures. If these inspections are over 90 days past due, the ODOL assumes the responsibility and conducts these inspections. Key Performance Measure
Number of Boilers in 90-day Overdue Status
181225 264 230 220
0
200
400
FY-2004 FY-2005 FY-2006 FY-2007 Bud FY-2008
Source: Dept of Labor
Elevator Safety Program The “Elevator Safety Program” was added to the Department of Labor in FY-2007. The Legislature appropriated $250,000 for FY-2007 to begin the program. Under the program all elevator contractors, mechanics, and inspectors are licensed by the State. Fees are assessed for licensing and inspections. Fines are administered for non-compliance.
0
200
400
600
800
1000
1200
Jul
Aug
Sep Oct
Nov
Dec Ja
nFe
bM
arA
prM
ay Jun
YTD totals by month
F/UT&AInitialProj.

FY-2009 Executive Budget
COMMERCE AND TOURISM B-28
FY-2009 Recommendation
FY-2008 Appropriation $3,760FY-2008 Bud. FTE Level 102.0Actual Ave. YTD FTE 96.1
Funding Adjustments: State Employee Pay Increase 120
FY-2009 Recommendation $3,880% Change from FY-2008 3.19%
(amounts in thousands)
Source: Office of State Finance
FY-2009 Appropriation
State Employee Pay Raise The Governor’s budget includes $119,850 for a 5% state employee pay increase for the Department of Labor effective January 1, 2009. This funding is based on October 2007 salary information.

FY-2009 Executive Budget
COMMERCE AND TOURISM B-29
Oklahoma Employment Security Commission
Notable Achievements
• An extensive business process redesign throughout the entire Unemployment Insurance Benefits division reduced duplication and streamlined processes to enable OESC to better serve the unemployment benefit recipients throughout Oklahoma. The information gathered was also used as a guideline in the design of a new integrated system.
• Huge strides have been made in the adjudication of unemployment claims in the OESC Call Centers. With the focus on training, tools and personal accountability, the Unemployment Insurance division met and exceeded federal performance standards related to the quality of decisions made for six consecutive quarters, an accomplishment that is unmatched in recent history of the agency.
The Oklahoma Employment Security Commission (OESC) strives to provide employment security and promote the economic well-being of the state of Oklahoma. The OESC operates under the guidelines of federal-state grant agreements. OESC serves Oklahoma by providing labor market information, employment services, unemployment insurance and veterans’ service. Agency Services Finding jobs for people and people for jobs is the purpose of each office of OESC. Since 1933, the public employment service has matched job seekers with job openings. The unemployment insurance system is designed to provide workers with insurance against involuntary unemployment by partial replacement of lost wages. Also, the system is designed to facilitate the reemployment of such workers. Qualified
unemployed wage earners receive weekly unemployment benefits. The unemployment tax rate is based on an experience factor per employer. For example, a business that has a 100% turnover rate in a year would pay a higher tax rate than a business that only has a 2% turnover rate even if the two businesses were in the same industry.
Oklahoma Unemployment Rate January 1998-January 2006
4.4 4.5
3.83.93
2.9
5.2 5.2
3.9
4.1
0
1
2
3
4
5
6
Jan
-98
Jan
-99
Jan
-00
Jan
-01
Jan
-02
Jan
-03
Jan
-04
Jan
-05
Jan
-06
Jan
-07
The ratio of the balance in the unemployment trust fund to the five year average of net benefit payments is another condition affecting the unemployment tax rate. The Oklahoma unemployment rate has fluctuated dramatically over the past few years.
Net Ratio of TrustBenefit Balance to five
Description Payments year average
Trust fund Balance at 6/30/2007 807,457 Less Net Reed Act Funds set aside for Admin. 4 Balance applied 807,461
TOTAL NET BENEFIT PAYMENTS 944,110
AVERAGE BENEFIT PAYMENT 188,822 188,822
TRUST FUND BALANCE RATIO 4.28
( $ in 000's)
Even though Oklahoma’s unemployment rate has been above its long run average, it remains the lowest in the region.

FY-2009 Executive Budget
COMMERCE AND TOURISM B-30
State Oct-04 Oct-05 Oct-06 Oct-07
Oklahoma 4.7 4.4 3.8 4.4Arkansas 5.4 4.9 5.1 5.7Kansas 5.5 5 4.3 3.8New Mexico 5.6 5.1 4.3 3.1Texas 5.7 5.4 4.8 4.1Colorado 5.5 4.9 4.4 3.7Missouri 5.9 5.2 5.4 5.6
(seasonally adjusted)Unemployment Rates by Southwest State
While the Oklahoma unemployment rate was higher than normal, the balance in the trust fund rapidly climbed to $807 million in 2007. Oklahoma’s October Unemployment rate of 4.4% is the highest it’s been since 2005.
Trust Fund Balance (millions)2002 - 2007
450.6352.8
450.5611.9
700807
0
200
400
600
800
1000
2002 2003 2004 2005 2006 2007
The following table illustrates the inverse relationship of tax rates and benefits. The trust fund balance must be adequate to pay benefits even when unemployment is high. When the ratio of trust fund balance to average benefit payment decreases, tax rates increase and the maximum benefits decrease. As the trust fund balance increases the reverse is true.
EFFECT OF TRUST FUND CONDITION ON CONTRIBUTIONS AND BENEFITS PER EMPLOYEE
Ratio of Fund Balance to Over 3.00 2.50 2.00 Less thanaverage benefit payments 3.50% 3.49 2.99 2.49 2.00
Condition NONE A B C DMinimum Rate 0.1% 0.2% 0.2% 0.2% 0.3%Maximum Rate 5.5% 5.8% 7.3% 8.3% 9.2%
Taxable Wage Base $13,600 $14,500 $15,300 $16,200 $17,000
Minimum UI Contribution Per Employee $14 $29 $31 $32 $51
Average UI Contribution Per Employee $140 $189 $230 $275 $374
Maximum UI Contribution Per Employee $748 $841 $1,117 $1,345 $1,564
Maximum Weekly Benefit Per Claimant $392 $376 $359 $343 $326
Maximum Total Benefit Per Claimant $8,500 $8,100 $7,700 $7,200 $6,800
Source: OESC Overview 09/11/2007
Other Programs The veterans’ services division addresses the specific employment and training needs of veterans through special programs. Through its various programs, veterans are assisted in their efforts to find employment opportunities. These programs are all inclusive for veterans of any of the U.S. military services and not just for those who are disabled Economic Research and Analysis regarding employment and employees is core to OESC. Labor market information is gathered and reported on the state and national level. The goal of this program is to provide quality information that will improve the functioning of labor markets by serving the needs of workers, employers, economic developers, planners, and policy makers. OESC, in conjunction with the Department of Commerce, provides administrative support to the Governor’s Council. The Governor’s Council is a council of statewide decision-makers who work collaboratively toward a common workforce development system to ensure that workforce development is supporting economic development and growth of the Oklahoma economy.

FY-2009 Executive Budget
COMMERCE AND TOURISM B-31
The Oklahoma Scenic Rivers Commission (OSRC)
Mission The Oklahoma Scenic Rivers Commission is vested with the power to establish minimum standards for planning and other ordinances necessary to carry out the provisions of the Scenic Rivers Act. The primary emphasis of the Commission is to preserve and protect the aesthetic, scenic, historic, archaeological and scientific features of the Illinois River and its tributaries [Barren (Baron) Fork Creek and Flint Creek]. The Oklahoma Scenic Rivers Commission (OSRC) is a state commission established in 1977 in accordance with the Scenic Rivers Act (1970). The OSRC separated from the Tourism and Recreation Department in 2002 and became an independent agency. As illustrated in the chart below, the Commission is funded by state general revenue appropriations and revolving funds, at 27% and 73% respectively for FY-2008 for a total budget of $1.3 million.
Scenic Rivers CommissionFY-08 Budget By Funding Source
(in 000s)
Appropriated, $345,27%
Revolving, $920,73%
Source: Office of State Finance
FY-2009 Recommendation
FY-2008 Appropriation $345FY-2008 Bud. FTE Level 16.0Actual Ave. YTD FTE 14.7
Funding Adjustments: State Employee Pay Increase 15
FY-2009 Recommendation $360% Change from FY-2008 4.35%
Source: Office of State Finance
FY-2009 Appropriation(amounts in thousands)
State Employee Pay Raise The Governor’s budget includes $15,390 for a 5% state employee pay increase for the Oklahoma Scenic Rivers Commission effective January 1, 2009. This funding is based on October 2007 salary information.

FY-2009 Executive Budget
COMMERCE AND TOURISM B-32
Oklahoma Tourism and Recreation Department
Notable Achievements • Tourism is the third largest industry in
Oklahoma. The “Travel Industry Association of America” reported that tourism provides an estimated economic impact of about $5.3 billion per year in travel and tourism-related spending. Travel spending supports about 72,000 jobs throughout the state. Domestic travel spending brought in over $842 million in local, state and federal tax revenue.
• The OklaRaves campaign has been awarded a Mercury Award, the highest honor in the Best Film/Audio Visual category, by the Travel Industry Association of America (TIA). This award brings Oklahoma’s total tourism marketing awards to 22 – more than any other state.
• Upon entering the state, those visiting Oklahoma’s unique travel destinations and attractions will soon be greeted by two newly updated Tourism Information Centers welcoming travelers from the west along Interstate 40 and from the north on I-35. The Oklahoma Department of Transportation and the Oklahoma Tourism and Recreation Department have partnered to design, build and operate the facilities. The Capitol Information Center was recently enhanced, as well, with a new gift shop and orientation theater on the first floor on the south side of the Capitol.
• The Centennial Statewide Comprehensive Outdoor Recreation Plan has been recognized by the National Park Service for its quality and unique approach to understanding opinions about outdoor recreation. The Oklahoma SCORP combines the traditional facts and figures analysis with a statewide essay and drawing contest that asked citizens to answer “What do parks mean to me?” Researchers conducted a qualitative analysis of the huge response from people of all ages and racial/ethnic
groups. The responses, especially from Oklahoma’s youth, create a compelling image of the importance of outdoor experiences in building healthy relationships, creating memories and hope for the future, and enhancing personal development and quality of life.
• Oklahoma Today magazine launched the Oklahoma Today Archive, an official Centennial project eighteen months in the making. To date, nearly 16,000 pages spanning fifty-one years are available online, free to the public. This vast archive is an invaluable resource for students, researchers, citizens of Oklahoma and people everywhere. The archive is available at www.oklahomatoday.com.
Mission The Tourism and Recreation Department is the steward of the state’s park system. The Department also advances economic development through the promotion of travel and tourism in Oklahoma. The agency mission is to advance the exceptional quality of life in Oklahoma by preserving, maintaining, and promoting our natural assets and cultural richness. The Department is primarily funded by state general revenue appropriations and revolving funds, 42% and 53% respectively in FY-2008, totaling $65.9 million.
The majority of the Department’s expenditures are devoted to State Parks, which are 72% of the FY-2008 budgeted expenditures and 74% of the FY-2007 actual expenditures.
FY-08 (in 000s)
Revolving Funds,
$35,086, 53%
Federal Funds $2,980, 5%
State Funds, $27,827, 42%
Source: Office of State Finance
Funding Sources for Tourism and Recreation

FY-2009 Executive Budget
COMMERCE AND TOURISM B-33
The chart below shows the appropriated dollars and the estimated economic impact of travel and tourism-related spending over a three year period.
Programs State Parks Oklahoma’s State Park system is made up of 50 state parks, 5 lodges, 8 golf courses, 388 cabins as well as numerous campsites, scenic trails, boating, and other recreation facilities statewide that provide visitors incomparable examples of Oklahoma’s natural resources. The land features contained in the state parks range from the lush, tree covered hills of the southeast to the mesas and sand dunes of the northwest; and from the tall grass prairies of the north to the rugged mountainsides of the southwest. The State Parks division also administers the federal Land and Water Conservation Fund (LWCF) and Recreation Trails Program (RTP) grants. These programs are an essential component in the development of socially and economically healthy communities. Since 1964, the Department has provided matching grants to 1,163 community and state sponsored projects in the amount of over $51 million. Projects include playgrounds, ball-fields, campgrounds, accessibility improvements and support facilities such as restrooms and walkways. The chart below shows the self-sufficient status of the Oklahoma State Parks system over the last five years.
Park Attendance
Park Revenue
State Approp.
Total Park Exp.
% of Self-Sufficiency
FY-2002 14.1 $11.3 $9.1 $20.4 55.4%FY-2003 14.1 $11.1 $10.2 $21.3 52.1%FY-2004 13.8 $11.1 $10.2 $21.2 52.4%FY-2005 12.7 $11.1 $10.4 $21.5 51.6%FY-2006 13.8 $12.2 $14.4 $26.6 45.9%FY-2007 13.5 $13.1 $16.2 $29.3 44.7%
Source: Tourism and Recreation Dept.
Oklahoma State Parks(in millions)
State Lodges The five state lodges have gradually increased their self-sufficiency rate through more efficient management. However, as the facilities continue to age and deteriorate the occupancy rate has declined.
Occupancy Rate
Resort Revenue
State Approp.
Total Resort Exp.
% of Self-Sufficiency
FY-2002 43% $8.0 $3.0 $11.0 72.7%FY-2003 43% $7.0 $1.1 $8.1 86.4%FY-2004 36% $7.2 $1.0 $8.2 87.8%FY-2005 36% $7.2 $1.9 $9.1 79.1%FY-2006 34% $7.3 $1.2 $8.6 84.9%FY-2007 39% $7.6 $1.9 $9.6 79.2%
Source: Tourism and Recreation Dept.
Oklahoma State Lodges(in millions)
Lake Texoma Lodge The Department has operated the Lake Texoma Park since 1951 and the lodge since its opening in 1958. Due to the serious maintenance needs of the lodge, the Department entered into a partnership with the Commissioners of Land Office (CLO) to address these issues. The CLO determined that private development was a viable option for the resort properties. In August of 2005, the Department and the CLO reached an agreement to proceed with the development of the property. This process resulted in the submission of private development proposals and the transfer of property to the private developer’s control. The Department will continue to operate the state park and the lease concessions on the property. The lodge closed to the public on December 1, 2006. The Department continues to operate the golf facilities until development begins. Golf Courses Use of the golf courses has increased as have revenues and expenditures.
Appropriated Dollars vs. Economic Impact (In Millions)
20,000 21,000 22,000 23,000 24,000 25,000 26,000 27,000 28,000 29,000
FY-06 FY-07 FY-08 4,000 4,500 5,000 5,500 6,000
Appropriated Dollars Economic Impact

FY-2009 Executive Budget
COMMERCE AND TOURISM B-34
Golf Rounds
(thousands)Golf
RevenueState
Approp.Total Golf
Exp.% of Self-Sufficiency
FY-2002 182.7 $4.9 $0.1 $5.0 98.0%FY-2003 161.6 $4.5 $1.3 $5.8 77.6%FY-2004 158.0 $4.3 $0.7 $5.0 86.0%FY-2005 158.1 $4.4 $1.0 $5.5 80.0%FY-2006 158.0 $4.3 $0.9 $5.2 82.7%FY-2007 138.0 $4.7 $0.8 $5.6 83.9%
Source: Tourism and Recreation Dept.
Oklahoma State Golf Courses($ in millions)
When most of the state golf courses were constructed there was little competition. Originally, state courses were well attended and generally were self-supporting. This was a result of the state courses’ ability to charge a much lower rate than private, city and county golf courses. As competitors drastically reduced rates, the state golf courses began to lose their competitive edge. Many state golf courses sell 30% to 38% fewer rounds than competitors. Capital Maintenance Funding Beginning in FY-2008, the Legislature is providing the Department with an estimated $10 million in capital maintenance funding from an apportionment of sales and use taxes. The Department currently has in excess of $92 million in identified needs. The following categories and allocations are noted below: Facility Renovation $3,800,000 Comfort Stations $1,200,000 Campgrounds $1,500,000 Accessibility/Trails $ 700,000 Playgrounds $1,700,000 Playgrounds $ 500,000 Docks/Piers/Ramps $ 800,000 Master Plan/Assessments $ 300,000 Total $10,000,000 This year’s program emphasizes renovating significant and revenue-based assets (cabins, campgrounds, nature centers), elimination of safety problems (playgrounds, docks, ramps), accessibility improvements (walkways, trails) and improvements to facilities that are most heavily used (restrooms). For FY-2008, the Legislature has provided the Department with a portion of the REAP Water Projects Funds to fund infrastructure
and environmental improvements estimated to be $2.9 million. The Department currently has in excess of $6.8 million in identified environmental needs. Types of projects funded include potable water, wastewater and erosion control work. The Department is using the list of environmental needs that was developed cooperatively with the Department of Environmental Quality. The certainty of dedicated funds will allow the Department to realistically plan for park preservation and the systematic elimination of long standing facility needs. Travel and Tourism This division develops information, marketing plans and programs designed to attract tourists to the state and to encourage Oklahomans to vacation in-state. It disseminates information related to the state's public and private attractions, facilities and events to support increased economic development and awareness of Oklahoma as a travel destination. The division operates 11 tourism information centers located at various points of entry into the state and at the State Capitol. These centers are designed to provide travel information to visitors traveling through and to our state and, ultimately, to encourage travelers to extend their stay in Oklahoma. The Traveler Response Information Program (TRIP) operates Oklahoma’s official travel Web site and a toll-free call center for information. TRIP also maintains the destination database for more than 9,000 attractions, events, restaurants, accommodations and other tourism-related businesses around the state. The web site, www.travelok.com, is the official state site for Oklahoma travel and tourism information.

FY-2009 Executive Budget
COMMERCE AND TOURISM B-35
Oklahoma Today Magazine Oklahoma Today is a general interest consumer magazine, published continuously by the Sate of Oklahoma since 1956. The magazine has an average paid circulation (subscribers and newsstand readers) of approximately 45,000 and an estimated readership of 157,500 for every issue. Oklahoma Today provides its readers the best of Oklahoma’s people, places, travel, culture, food, and outdoors in an attractive and engaging publication that enhances The Oklahoma Experience. The magazine is also an essential component in the development of tourism in Oklahoma. Every issue encourages travel in the state, and articles and advertisements appearing in the magazine influence travel and purchasing decisions that generate a substantial economic impact in real dollars for the state and its communities. As an advertising vehicle, Oklahoma Today is nurturing the growth of a variety of cottage industries. Subscription renewals for the publication exceed the industry average of 55% as shown in the following chart. Key Performance Measure
Oklahoma Today Subscription Renewal Rate
70% 71% 72% 72% 73%
40%
50%
60%
70%
80%
FY-2004 FY-2005 FY-2006 FY-2007 Bud FY-2008Source: Tourism and Recreation Dept
Industry
Avg=55%
Discover Oklahoma Integris Discover Oklahoma is in its 17th year on Oklahoma television. This award winning television program reaches over 150,000 viewers weekly and produces approximately 39 episodes each year. It is the only locally produced travel television program in the state and one of the few in the country. With a long track record of success in the promotion of Oklahoma
tourism, the show has more episodes than Gunsmoke and has been on the air longer than Bonanza. In addition to the weekly broadcast, the Discover Oklahoma staff also produces video content for local newscasts including an “Oklahoma Road Trip” segment featuring one-day itineraries and a weekly segment focusing on current topics such as events and new attractions. Oklahoma Film and Music Office The Oklahoma Film & Music Office (OF&MO) is committed to promoting the state as a desirable, film-friendly environment for producing motion pictures, TV shows and videos. The OF&MO assists both in-state and out-of-state companies by providing assistance with locations, equipment, crew, permits and facts about Oklahoma and its communities. The OF&MO must be able to respond to a location request very quickly or run the risk of missing out on the opportunity. The office provides prospective film and music production companies with information on location sites, permits, crew member availability, equipment and any other general information needed. Once a location is chosen, OF&MO serves as a liaison between the production company and the selected community or city and the state to ensure that everything runs smoothly. The long-term goal of the office is to increase film and television productions in Oklahoma for economic development.

FY-2009 Executive Budget
COMMERCE AND TOURISM B-36
FY-2009 Recommendation
FY-2008 Appropriation $27,827FY-2008 Bud. FTE Level 926.0Actual Ave. YTD FTE 840.4
Funding Adjustments:
State Employee Pay Increase 704 Promotion/Product Dvlpmt 250 Total Adjustments 954
FY-2009 Recommendation $28,781% Change from FY-2008 3.43%
Source: Office of State Finance
FY-2009 Appropriation(amounts in thousands)
State Employee Pay Raise The Governor’s budget includes $704,020 for a 5% state employee pay increase for the Department of Tourism and Recreation effective January 1, 2009. This funding is based on October 2007 salary information. Promotion and Product Development The Governor’s budget includes $250,000 to provide seed funds for local tourism product development and promotion programs. Funds will be distributed via a competitive grant process, open to communities and associations to develop tourism events or products to a point at which either the single event objective is accomplished or the project or product becomes self-sustaining. Capital Spending Proposal The Governor’s budget proposes $1 million in bonds for the Department of Tourism and Recreation for flood damage recovery.
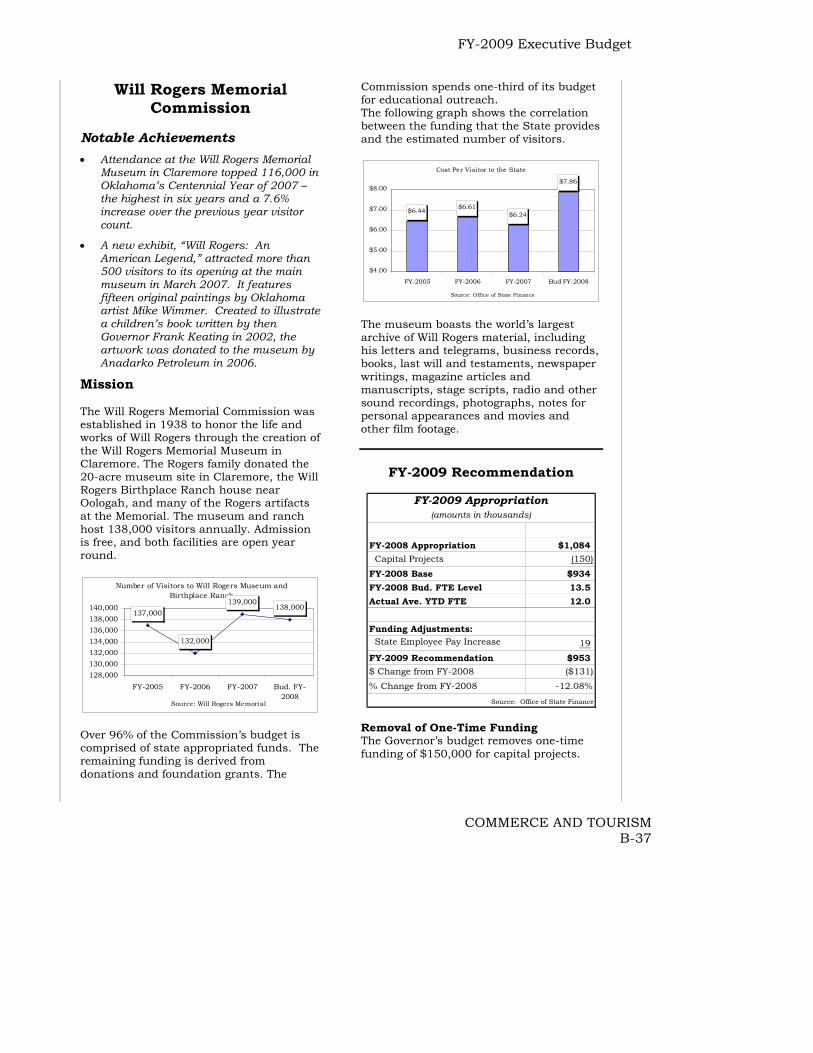
FY-2009 Executive Budget
COMMERCE AND TOURISM B-37
Will Rogers Memorial Commission
Notable Achievements
• Attendance at the Will Rogers Memorial Museum in Claremore topped 116,000 in Oklahoma’s Centennial Year of 2007 – the highest in six years and a 7.6% increase over the previous year visitor count.
• A new exhibit, “Will Rogers: An American Legend,” attracted more than 500 visitors to its opening at the main museum in March 2007. It features fifteen original paintings by Oklahoma artist Mike Wimmer. Created to illustrate a children’s book written by then Governor Frank Keating in 2002, the artwork was donated to the museum by Anadarko Petroleum in 2006.
Mission The Will Rogers Memorial Commission was established in 1938 to honor the life and works of Will Rogers through the creation of the Will Rogers Memorial Museum in Claremore. The Rogers family donated the 20-acre museum site in Claremore, the Will Rogers Birthplace Ranch house near Oologah, and many of the Rogers artifacts at the Memorial. The museum and ranch host 138,000 visitors annually. Admission is free, and both facilities are open year round.
Number of Visitors to Will Rogers Museum and Birthplace Ranch
137,000
132,000
139,000138,000
128,000130,000132,000134,000136,000138,000140,000
FY-2005 FY-2006 FY-2007 Bud. FY-2008
Source: Will Rogers Memorial
Over 96% of the Commission’s budget is comprised of state appropriated funds. The remaining funding is derived from donations and foundation grants. The
Commission spends one-third of its budget for educational outreach. The following graph shows the correlation between the funding that the State provides and the estimated number of visitors.
Cost Per Visitor to the State
$6.44 $6.61$6.24
$7.86
$4.00
$5.00
$6.00
$7.00
$8.00
FY-2005 FY-2006 FY-2007 Bud FY-2008
Source: Office of State Finance The museum boasts the world’s largest archive of Will Rogers material, including his letters and telegrams, business records, books, last will and testaments, newspaper writings, magazine articles and manuscripts, stage scripts, radio and other sound recordings, photographs, notes for personal appearances and movies and other film footage.
FY-2009 Recommendation
FY-2008 Appropriation $1,084 Capital Projects (150)
FY-2008 Base $934FY-2008 Bud. FTE Level 13.5Actual Ave. YTD FTE 12.0
Funding Adjustments: State Employee Pay Increase 19
FY-2009 Recommendation $953$ Change from FY-2008 ($131)% Change from FY-2008 -12.08%
FY-2009 Appropriation(amounts in thousands)
Source: Office of State Finance Removal of One-Time Funding The Governor’s budget removes one-time funding of $150,000 for capital projects.
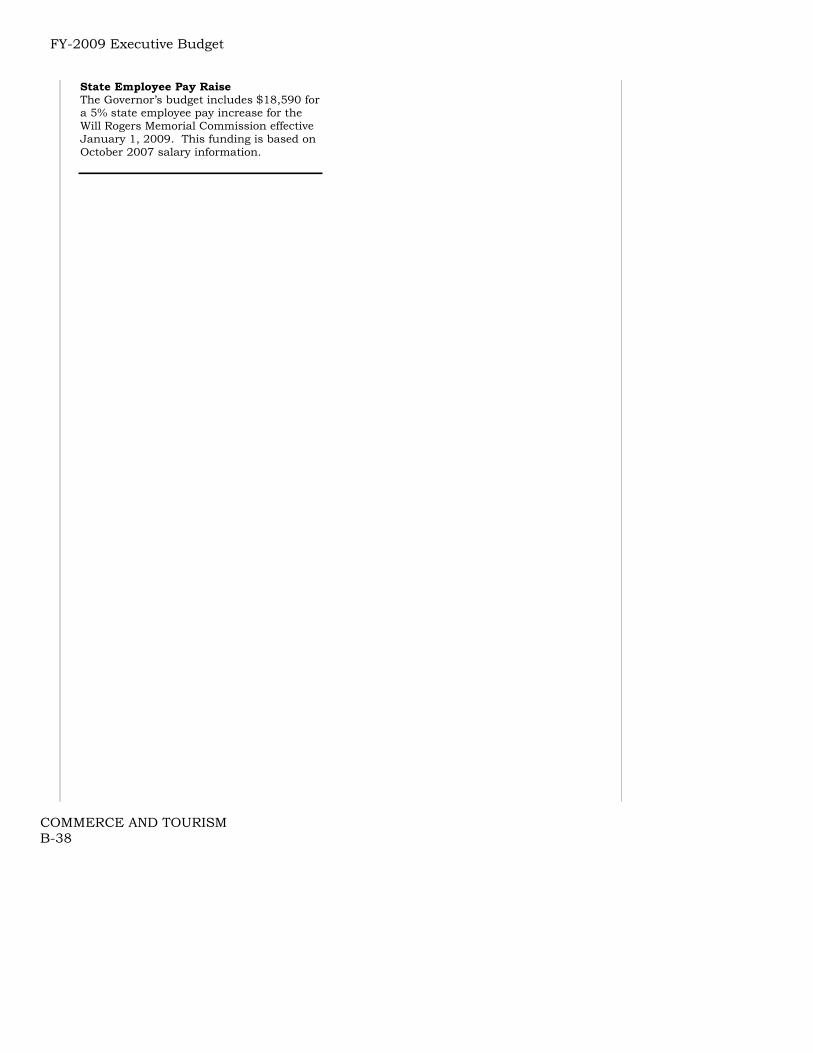
FY-2009 Executive Budget
COMMERCE AND TOURISM B-38
State Employee Pay Raise The Governor’s budget includes $18,590 for a 5% state employee pay increase for the Will Rogers Memorial Commission effective January 1, 2009. This funding is based on October 2007 salary information.

FY-2009 Executive Budget
EDUCATION B-39
Oklahoma Arts Council Notable Achievements • In FY-2007, the Oklahoma Arts Council
served 111 communities and provided 558 grants to 349 cultural organizations, schools and local governments. This increased resources available to non-profit organizations producing community arts and arts education programs throughout Oklahoma. The Council streamlined the grant process during this fiscal year in order to give organizations the opportunity to apply for grants based on programming needs and reduce administration of multiple grant applications.
• The Oklahoma Arts Council, in
partnership with Lyric Theatre and the National Endowment for the Arts, brought Lyric’s presentation of the Broadway classic Oklahoma! to school children and offered interactive educational activities about the history, culture, and the arts of musical theatre in our state. Lyric offered this American Masterpieces program throughout FY-2007 serving over 60,000 students in 136 schools in 49 different communities across the state at no cost to the schools.
• The Oklahoma Arts Council’s 5th
annual Cultural Crossroads Conference was held in Ardmore for communities, arts organizations and artists interested in building and maintaining a thriving arts community. Presenters at the statewide conference addressed the critical ingredients necessary to build long-term vitality for the arts in rural and metro communities.
Mission The Oklahoma Arts Council was established in 1965 by the Oklahoma Legislature following the creation of the National Endowment for the Arts by the federal government. Each of the 50 states
has created a state arts agency funded with state appropriations to support excellence and access to the arts. The Council’s mission is to lead, cultivate and support a thriving arts environment, which is essential to quality of life, education and economic vitality for all Oklahomans. The Oklahoma Arts Council meets this mission by providing grants and technical assistance for arts activities statewide. The National Endowment for the Arts and the State of Oklahoma are the sources of funding. The following graph illustrates how those funds are spent.
FY-2008 Budgeted Expenditures by Activity
66%
11%
9%
10%4%
Community ArtsPrograms
Arts Education inSchools
Arts Learning inCommunities
Public Awareness
Core Operations
The Oklahoma Arts Council is primarily a grant making entity, as evidenced by the following table. Key Performance Measure
Direct grants costs 3,950,272$ 75.3% 4,595,673$ 77.0%Indirect grants costs 694,439$ 13.2% 782,526$ 13.1%Administration 603,156$ 11.5% 589,063$ 9.9%Total 5,247,867$ 5,967,262$ Source: Arts Council 1/14/2008
in 000'sFY-2007 Actual FY-2008 Bud
The Council awards matching grants to nonreligious, nonprofit, tax exempt 501(c)(3) organizations; agencies of government; sovereign Indian tribes; public libraries; public schools; colleges and universities. All grants must be matched by the grantee. Last year, the average match was $9.65 to every dollar granted, as represented in the chart below.

FY-2009 Executive Budget
EDUCATION B-40
Project Expenditures FY-2007
Grantee 90.6%
$37,927,512
Arts Council 9.4%
$3,930,098
So urce: Arts Co uncil 1/14/2008
Financial assistance for art programs is granted through three program areas: Community Arts Programs, Arts Education in Schools and Arts Learning in Communities. Following is a summary of each program. Community Arts Programs Community Arts Programs provide support for community arts activities to advance the cultural and economic development of Oklahoma. More than 400 organizations receive support annually through Community Arts Programs. They support Oklahoma’s major symphonies, ballets and museums. In addition, the OAC funds festivals, community theatres, performing arts and local museums throughout rural Oklahoma that contribute to the enrichment and vitality of each community. Community Arts Programs also supports cultural development outreach through funding and technical assistance to rural and urban underserved communities. This assistance is designed to assist communities in development of cultural leadership and improvement of their administrative and programming skills. Two Circuit Riders facilitate cultural and economic development in two underserved regions of the state: 15 counties in the southeast region and 16 counties in the northwest/panhandle region. In addition to direct support to non-profit organizations, Community Arts Programs support local city and county governments through Local Government Challenge Grants. This unique program provides matching funds of up to $5,000 to local
governments to support local community cultural programs. In FY-2002, the Arts Council met 58% of the requests in Community Arts Programs; 50.6% of requests were met in FY-2007. Key Performance Measure
Dollars Requested vs. Dollars Funded in Community Programs
$0
$1,000,000
$2,000,000
$3,000,000
$4,000,000
$5,000,000
$6,000,000
FY-2003 FY-2004 FY-2005 FY-2006 FY-2007
$ Requested $ Fund edSource: OAC 1/14/2008
Arts Education in Schools Arts Education in Schools program supports the efforts of schools and school districts, including alternative education programs, in providing quality and meaningful arts education to their students. Projects introduce and develop skills, knowledge and understanding in dance, drama, music, visual art, traditional arts and creative writing. Instruction is delivered by qualified arts instructors, including community artists who are trained and experienced in their art form and adept in sharing this art form with students. Arts Education in Schools is designed to: • Help school districts develop an arts
education plan; • Support student learning in the arts
and invigorate learning in other subject areas;
• Provide resources for classroom
instruction, demonstrations and performances that insure student understanding of the arts in real-world application;
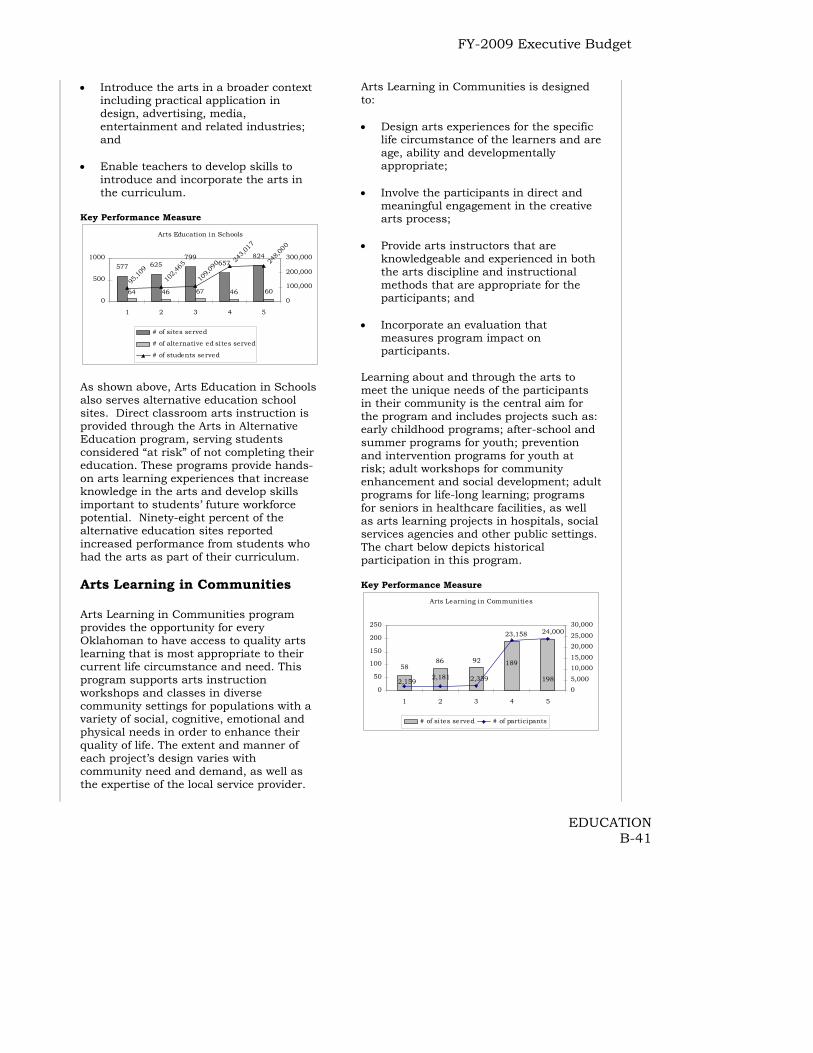
FY-2009 Executive Budget
EDUCATION B-41
• Introduce the arts in a broader context including practical application in design, advertising, media, entertainment and related industries; and
• Enable teachers to develop skills to
introduce and incorporate the arts in the curriculum.
Key Performance Measure
Arts Education in Schools
577 625799
657824
64 46 67 46 6095
,109
102,
465
109,
090 24
3,01
7
248,
000
0
500
1000
1 2 3 4 5
0
100,000
200,000
300,000
# of sites served
# of alternative ed sites served
# of students served
As shown above, Arts Education in Schools also serves alternative education school sites. Direct classroom arts instruction is provided through the Arts in Alternative Education program, serving students considered “at risk” of not completing their education. These programs provide hands-on arts learning experiences that increase knowledge in the arts and develop skills important to students’ future workforce potential. Ninety-eight percent of the alternative education sites reported increased performance from students who had the arts as part of their curriculum. Arts Learning in Communities Arts Learning in Communities program provides the opportunity for every Oklahoman to have access to quality arts learning that is most appropriate to their current life circumstance and need. This program supports arts instruction workshops and classes in diverse community settings for populations with a variety of social, cognitive, emotional and physical needs in order to enhance their quality of life. The extent and manner of each project’s design varies with community need and demand, as well as the expertise of the local service provider.
Arts Learning in Communities is designed to: • Design arts experiences for the specific
life circumstance of the learners and are age, ability and developmentally appropriate;
• Involve the participants in direct and
meaningful engagement in the creative arts process;
• Provide arts instructors that are
knowledgeable and experienced in both the arts discipline and instructional methods that are appropriate for the participants; and
• Incorporate an evaluation that
measures program impact on participants.
Learning about and through the arts to meet the unique needs of the participants in their community is the central aim for the program and includes projects such as: early childhood programs; after-school and summer programs for youth; prevention and intervention programs for youth at risk; adult workshops for community enhancement and social development; adult programs for life-long learning; programs for seniors in healthcare facilities, as well as arts learning projects in hospitals, social services agencies and other public settings. The chart below depicts historical participation in this program. Key Performance Measure
Arts Learning in Communities
198
1899258
86
2,1592,181 2,359
23,158 24,000
0
50
100
150
200
250
1 2 3 4 5
05,000
10,00015,000
20,00025,000
30,000
# of sites served # of participants

FY-2009 Executive Budget
EDUCATION B-42
FY-2009 Recommendation
FY-2008 Appropriation $5,151FY-2008 Bud. FTE Level 16.0Actual Ave. YTD FTE 15.5
Funding Adjustments: State Employee Pay Raise 21
FY-2009 Recommendation $5,172% Change from FY-2008 0.41%
Source: Office of State Finance
FY-2009 Appropriation(amounts in thousands)
State Employee Pay Raise The Governor’s budget includes $20,799 for a 5% state employee pay increase for the Oklahoma Arts Council effective January 1, 2009. This funding is based on October 2007 salary information.

FY-2009 Executive Budget
EDUCATION B-43
Career and Technology Education
Notable Achievements • The Center for Applied Economic
Research at Oklahoma State University reports that: o Oklahoma CareerTech graduates
add $2 billion annually to the state’s economy;
o CareerTech graduates have higher starting salaries, higher lifetime earnings and save more money than high school only graduates; and
o CareerTech graduates advance more quickly in their careers than high school only graduates.
• The Oklahoma CareerTech system
provided training to employees of over 6,900 Oklahoma companies during FY-2007.
• The Southern Region Education Board
(SREB) reported that: o A quality CareerTech program can
reduce a school’s dropout rate by as much as 6%;
o CareerTech students are less likely to fail a course or to be absent from school; and
o High-risk students are eight to ten times less likely to drop out in the 11th and 12th grade if they enroll in CareerTech courses.
• In FY-2007, Oklahoma CareerTech
students enrolled in over 60,000 college credit hours taught in CareerTech classes at technology centers and local high schools.
• For every $1 CareerTech spends on
minimum-security inmate training, there is a return to Oklahoma taxpayers of $2.99 within five years. The Agency served 1,789 students through its Skills Centers School System during FY-2007. The Skills Centers positive placement rate for graduates was 94.7%.
Mission Providing customized business training for industries and preparing secondary students for postsecondary educational opportunities are just two ways the career-technology system contributes to Oklahoma’s economy. Oklahoma’s career and technology education system offers a wide variety of educational opportunities to a diverse client base from youth in high school to senior citizens and incarcerated individuals. The system received 2.24% of appropriations made by the legislature for FY-2008, making it the 8th largest appropriation in state government. CareerTech provides career-guidance and economic development through the following programs: Comprehensive Schools These programs help students in high school develop the technical, academic and employability skills needed to become financially independent citizens.
Technology Centers These 29 centers provide Oklahoma businesses with skilled, competent employees. Business and Industry Training This area includes customized training for specific employers, open enrollment classes for adults that want to enhance their job skills on a part-time basis, consulting services for entrepreneurs and small businesses, management development training and bid assistance services. Skills Centers Programs at these centers help incarcerated individuals realize their potential by creating opportunities for them to experience and apply a quality education. Skills center training helps prepare over 1,700 inmates and juveniles per year for life outside the confines of prison and detention. Funding for these programs is as follows:

FY-2009 Executive Budget
EDUCATION B-44
FY-2008 Budgeted Expenditures by Activity
Local Schools Financial
Support 77%
Administration 3%Inmate and
Skills Centers 3%
Contingency 1%
Business / Industry / Adult 5%
Statewide Services 11%
The State Board of Career and Technology Education supervises career and technology education programs in comprehensive schools, technology centers and skills centers. It also administers the Carl Perkins program of the United States Department of Education in matters relating to career and technology education, and Tech Prep. The Department is responsible for formulating and adopting curricula, courses of study and other instructional aids necessary for the adequate instruction of students in all career and technology education programs. Student Demographics The CareerTech system offers programs and services in 29 technology center districts across 56 campuses, 400 comprehensive school districts and 22 skill centers including 3 juvenile facilities. This allows citizens in all 77 counties easy access to career-technology programs. Total enrollment for FY-2007 including all programs is 585,087. From FY-2000 to FY-2007 student population has done the following: • Adult enrollment in technology center
full-time and statewide programs increased 10% from 10,802 to 11,922.
• Business and Industry enrollments increased 19% from 345,965 to 411,825.
• Enrollment in comprehensive schools increased 19% from 119,570 to 142,804.
• Skills Centers enrollment increased 38% from 1,295 to 1,789.
Comprehensive Schools Comprehensive school programs offered in high schools include agricultural education, business and information technology, family and consumer science, health careers education, marketing education, technology education, and trade and industrial education. These programs provide students with hands-on experiences and opportunities to apply academic concepts in context. While school districts utilize state and local funding provided to common education school districts to fund a large portion of these programs, state funds appropriated through CareerTech supplement them. The detail in the following chart shows program and student costs. Key Performance Measure
Comprehensive SchoolsProgram Information
FY-2007 Final
Total Students
Student FTE* Total Cost
Avg. Cost per Student
Avg. Cost per FTE
Agricultural Education 26,316 26,936 9,245,500 351.33$ 343.24$ Business and Information Technology 20,069 19,081 2,813,750 140.20$ 147.46$ Family and Consumer Sciences 54,538 39,141 3,418,550 62.68$ 87.34$ Health Occupations Education 1,244 1,094 127,500 102.49$ 116.54$ Marketing Education 4,510 4,803 403,750 89.52$ 84.06$ Technology Education 35,564 22,123 2,794,700 78.58$ 126.33$ Trade & Industry Education 563 944 195,500 347.25$ 207.10$ Total** 142,804 114,122 18,999,250$ 133.04$ 166.48$ *One student FTE is equivalent to one student for a single class for a full academic year.
Source: CareerTech 1/7/2008 The following chart shows the placement rates for occupational programs in comprehensive schools.
Comprehensive SchoolsFollow Up Occupational Programs
4% 4% 3% 3% 3%
17% 15% 14% 14% 13%5% 4% 5%
72% 75% 75%
4% 4% 4% 4% 4%4%4%
69% 75%
0%
20%
40%
60%
80%
FY-2002 FY-2003 FY-2004 FY-2005 FY-2006
Military Employed Related to Training
Employed Not Related to Training Continuing Education
Unemployed or Not in Labor Force The chart below shows the completion and retention rates for occupational programs in comprehensive schools.
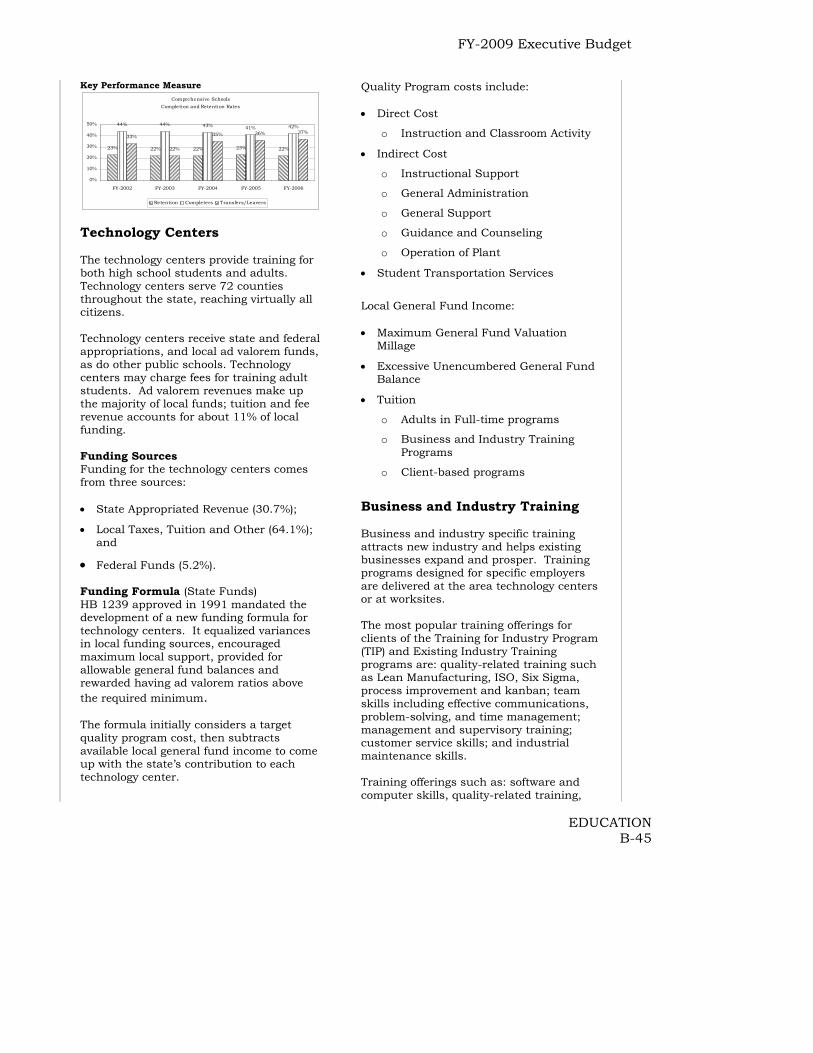
FY-2009 Executive Budget
EDUCATION B-45
Key Performance Measure Comprehensive Schools
Completion and Retention Rates
23% 22% 22% 23% 22%
44% 44% 43% 41% 42%
33%
22%
35% 36% 37%
0%
10%
20%
30%
40%
50%
FY-2002 FY-2003 FY-2004 FY-2005 FY-2006
Retention Completers Transfers/Leavers Technology Centers The technology centers provide training for both high school students and adults. Technology centers serve 72 counties throughout the state, reaching virtually all citizens. Technology centers receive state and federal appropriations, and local ad valorem funds, as do other public schools. Technology centers may charge fees for training adult students. Ad valorem revenues make up the majority of local funds; tuition and fee revenue accounts for about 11% of local funding. Funding Sources Funding for the technology centers comes from three sources: • State Appropriated Revenue (30.7%);
• Local Taxes, Tuition and Other (64.1%); and
• Federal Funds (5.2%). Funding Formula (State Funds) HB 1239 approved in 1991 mandated the development of a new funding formula for technology centers. It equalized variances in local funding sources, encouraged maximum local support, provided for allowable general fund balances and rewarded having ad valorem ratios above the required minimum. The formula initially considers a target quality program cost, then subtracts available local general fund income to come up with the state’s contribution to each technology center.
Quality Program costs include: • Direct Cost
o Instruction and Classroom Activity
• Indirect Cost
o Instructional Support
o General Administration
o General Support
o Guidance and Counseling
o Operation of Plant
• Student Transportation Services
Local General Fund Income: • Maximum General Fund Valuation
Millage
• Excessive Unencumbered General Fund Balance
• Tuition
o Adults in Full-time programs
o Business and Industry Training Programs
o Client-based programs
Business and Industry Training Business and industry specific training attracts new industry and helps existing businesses expand and prosper. Training programs designed for specific employers are delivered at the area technology centers or at worksites. The most popular training offerings for clients of the Training for Industry Program (TIP) and Existing Industry Training programs are: quality-related training such as Lean Manufacturing, ISO, Six Sigma, process improvement and kanban; team skills including effective communications, problem-solving, and time management; management and supervisory training; customer service skills; and industrial maintenance skills. Training offerings such as: software and computer skills, quality-related training,

FY-2009 Executive Budget
EDUCATION B-46
management and supervisory skills, and team skills are very popular for Industry Specific Training clients. Safety training runs the gamut from Forklift Driver Certifications and Blood Bourne Pathogens to Lock Out/Tag Out, Confined Space Entry and HAZMAT. Popular Adult and Career Development programs include: software or computer classes, and continuing education for industries such as real estate and accounting. Training for Industry Program (TIP) In existence since 1968, TIP is an economic development incentive available to qualifying companies that create new jobs in Oklahoma. TIP provides customized start-up training for "wealth generating" companies, i.e. companies that are generally exporters of goods and services out of the state and, therefore, importers of new dollars into the state. Eligible businesses are ones that are exporters of goods and services and are creating new full-time jobs in: • Manufacturing; • Processing; • Business services; and • Warehouse and distribution.
Key Performance Measure
Number of TIP Enrollments
35.7
17.5 21.128
41
23.4
44.9
0.05.0
10.015.020.025.030.035.0
40.045.050.0
FY-2001 FY-2002 FY-2003 FY-2004 FY-2005 FY-2006 FY-2007
This program has been a successful tool for recruiting business. Demand for training by businesses is cyclical. CareerTech has experienced strong growth in the past three years and expects to have another busy year in FY-2008.
Key Performance Measure Average Wage for TIP Businesses per hour
$13.56$13.72$13.38$13.34$13.32
12.42$12.20$11.96
$11.68
$10.50$11.00$11.50$12.00$12.50$13.00$13.50$14.00
FY-2003 FY-2004 FY-2005 FY-2006 FY-2007
TIP All OK (median wage)
Below is the funding history for TIP.
TIP Appropriation and Expenditure History (in 000's)
$3.8
$3.8 $4
.3 $5
.1$5.1
$2.9 $3
.1
$5.4
$5.4
$4.7
$0.0
$1.0
$2.0
$3.0
$4.0
$5.0
$6.0
FY-2003 FY-2004 FY-2005 FY-2006 FY-2007
Appropriations ExpendituresSource: CareerTech Existing Industry Training Oklahoma companies can make sure existing employees are up-to-date with the latest skills and knowledge by taking advantage of the Existing Industry Training Program. This program is intended to serve businesses that need to retrain incumbent workers in order to retool existing processes or expand a product line. CareerTech and existing industries frequently partner when specific training is required. The participating business pays no tuition but frequently provides classroom space or unique materials. Oklahoma Bid Assistance Network The Oklahoma Bid Assistance Network (OBAN) is part of a nationwide effort of Procurement Technical Assistant Centers (PTACs). OBAN was established in 1986 through the Oklahoma Department of Career and Technology Education. Congress initiated the PTAC program to help companies across the nation participate in the defense market. OBAN centers are located in 15 Technology Centers across the state. Bid assistance personnel help businesses locate and bid

FY-2009 Executive Budget
EDUCATION B-47
on federal, state and local government contacts as well as subcontracting opportunities. OBAN coordinators also help clients identify business improvements needed for more successful marketing to government agencies, and provide a daily list of targeted bidding opportunities. The primary purpose of OBAN is to create jobs and increase the economy in Oklahoma by assisting Oklahoma businesses in obtaining and performing in federal, state, and local government contracts. OBAN helps a broad range of businesses. Some recent examples include aircraft maintenance and parts machining, equipment maintenance, mower repair companies, utilities contractors, automotive dealers and automotive parts, facilities maintenance companies including janitorial services, fence builders, gate keepers, road maintenance, audio and video services, office supplies, flight simulators, welding, all types of construction, advertising, embroidery work and engravers. OBAN works closely with Tinker Air Force Base, other military and commercial organizations and industry associations in support of Oklahoma's aeronautics and aerospace industries. OBAN also offers the construction community a unique biweekly construction summary of business opportunities that helps keep small and rural construction firms competitive. During FY-2007, OBAN served 1,591 clients who secured more than $527 million in contracts for Oklahoma companies. Safety Training Safety and Health training programs are intended to help organizations plan and implement safety processes and procedures to assure a safe work environment. Through the technology centers, these programs are available statewide. The Safety allocation provided to the CareerTech system provides customized safety training, serving business and industry across the state. This training has helped reduce and prevent work related
injuries, and has helped reduce worker's compensation costs for the participating industries. Skills Centers Programs at these centers help incarcerated individuals realize their potential by creating opportunities for them to experience and apply a quality education. Skills Center training helps prepare inmates and juveniles for life outside the confines of prison and detention. The Skills Centers School System provides comprehensive educational services to incarcerated individuals. Skills Center training is designed to help students become successful in the workplace and in their community. The skills centers operate industry-focused academies and registered apprenticeship programs for offenders. Some of the programs offered include Electricity Technology, Plumbing Technology, US Department of Labor Apprenticeship Training, Commercial Building Maintenance, Equine Management, Construction Trades, Basic Computer Technology, Hospitality/Food Services and Metal Manufacturing. The school system operates 22 sites. In FY-2007, skills centers served 1,789 students with a positive placement rate of 94.7%. The following table provides information on the number of students and where they are served.
FY-2006 FY-2007State prisons 1,380 1,246Private prisons 614 282Juvenile centers 113 110Community corrections 231 151 Total 2,338 1,789Source: Career Tech January 2008
CareerTech Skills Centers
• Inmates who are trained in CareerTech
Skills Centers are 11% less likely to reoffend.
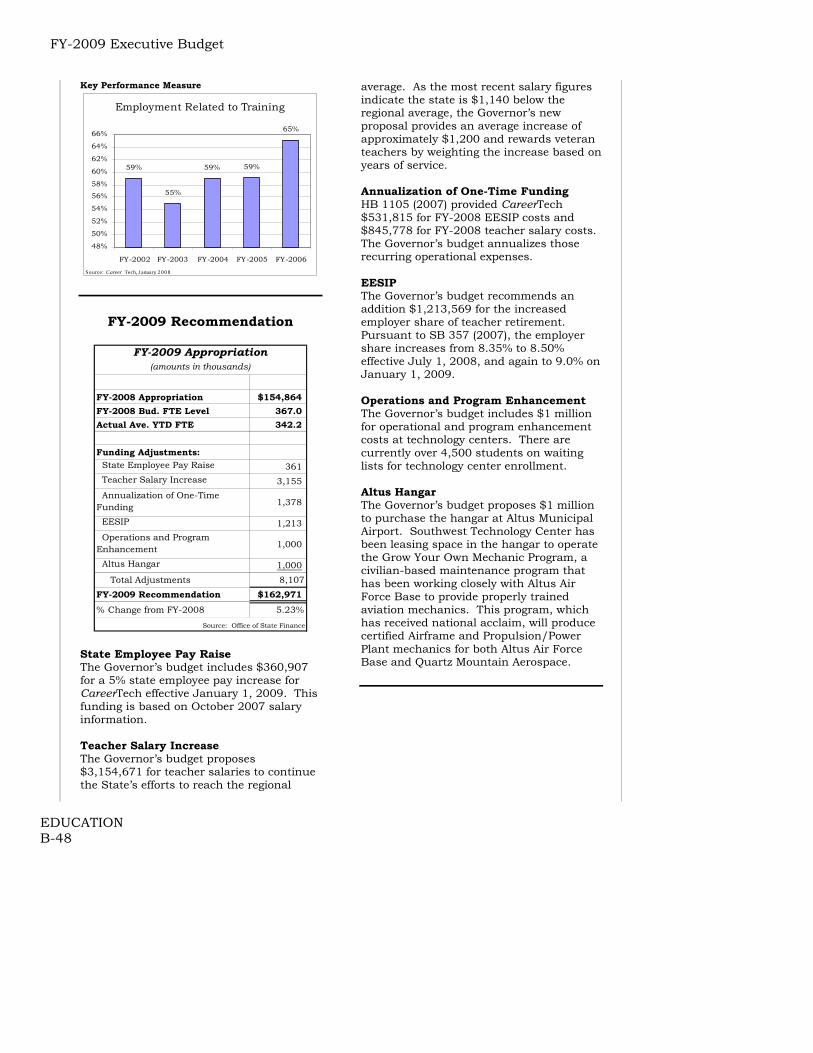
FY-2009 Executive Budget
EDUCATION B-48
Key Performance Measure
Employment Related to Training
59%
55%
59% 59%
65%
48%
50%
52%
54%
56%
58%
60%
62%
64%
66%
FY-2002 FY-2003 FY-2004 FY-2005 FY-2006
Source: Career Tech, J anuary 2 00 8
FY-2009 Recommendation
FY-2008 Appropriation $154,864FY-2008 Bud. FTE Level 367.0Actual Ave. YTD FTE 342.2
Funding Adjustments: State Employee Pay Raise 361 Teacher Salary Increase 3,155 Annualization of One-Time Funding 1,378
EESIP 1,213 Operations and Program Enhancement 1,000
Altus Hangar 1,000 Total Adjustments 8,107
FY-2009 Recommendation $162,971% Change from FY-2008 5.23%
Source: Office of State Finance
FY-2009 Appropriation(amounts in thousands)
State Employee Pay Raise The Governor’s budget includes $360,907 for a 5% state employee pay increase for CareerTech effective January 1, 2009. This funding is based on October 2007 salary information. Teacher Salary Increase The Governor’s budget proposes $3,154,671 for teacher salaries to continue the State’s efforts to reach the regional
average. As the most recent salary figures indicate the state is $1,140 below the regional average, the Governor’s new proposal provides an average increase of approximately $1,200 and rewards veteran teachers by weighting the increase based on years of service. Annualization of One-Time Funding HB 1105 (2007) provided CareerTech $531,815 for FY-2008 EESIP costs and $845,778 for FY-2008 teacher salary costs. The Governor’s budget annualizes those recurring operational expenses. EESIP The Governor’s budget recommends an addition $1,213,569 for the increased employer share of teacher retirement. Pursuant to SB 357 (2007), the employer share increases from 8.35% to 8.50% effective July 1, 2008, and again to 9.0% on January 1, 2009. Operations and Program Enhancement The Governor’s budget includes $1 million for operational and program enhancement costs at technology centers. There are currently over 4,500 students on waiting lists for technology center enrollment. Altus Hangar The Governor’s budget proposes $1 million to purchase the hangar at Altus Municipal Airport. Southwest Technology Center has been leasing space in the hangar to operate the Grow Your Own Mechanic Program, a civilian-based maintenance program that has been working closely with Altus Air Force Base to provide properly trained aviation mechanics. This program, which has received national acclaim, will produce certified Airframe and Propulsion/Power Plant mechanics for both Altus Air Force Base and Quartz Mountain Aerospace.
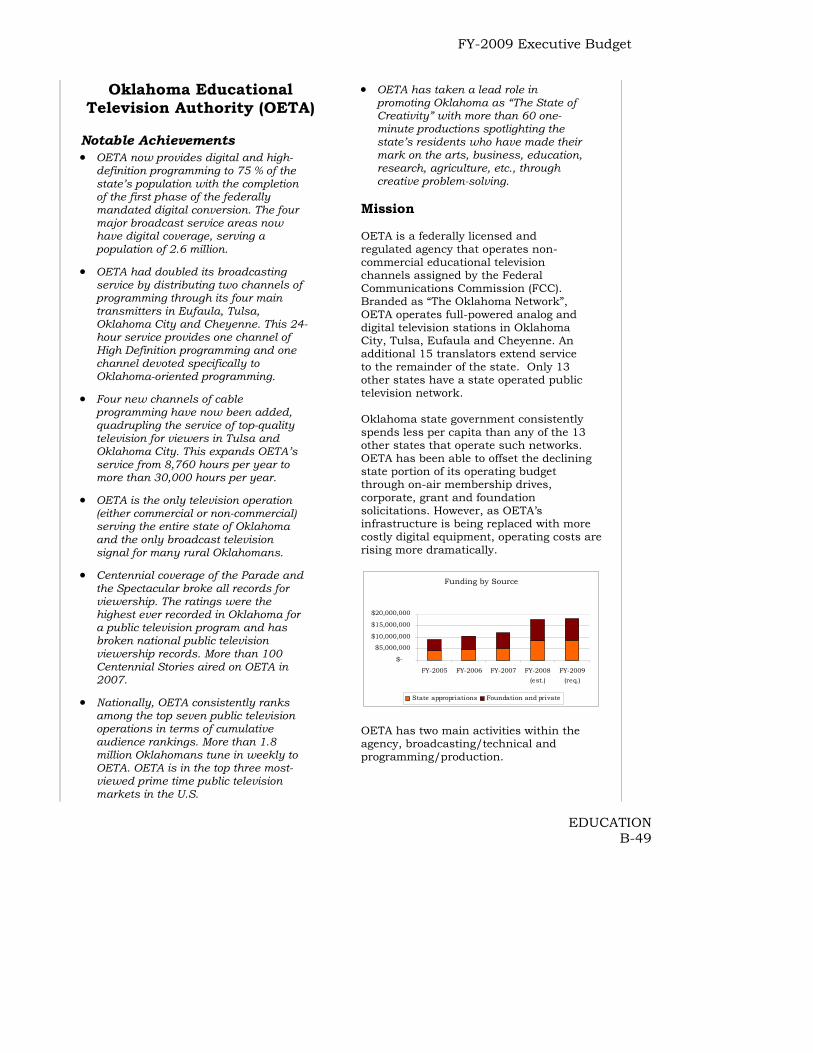
FY-2009 Executive Budget
EDUCATION B-49
Oklahoma Educational Television Authority (OETA)
Notable Achievements • OETA now provides digital and high-
definition programming to 75 % of the state’s population with the completion of the first phase of the federally mandated digital conversion. The four major broadcast service areas now have digital coverage, serving a population of 2.6 million.
• OETA had doubled its broadcasting service by distributing two channels of programming through its four main transmitters in Eufaula, Tulsa, Oklahoma City and Cheyenne. This 24-hour service provides one channel of High Definition programming and one channel devoted specifically to Oklahoma-oriented programming.
• Four new channels of cable programming have now been added, quadrupling the service of top-quality television for viewers in Tulsa and Oklahoma City. This expands OETA’s service from 8,760 hours per year to more than 30,000 hours per year.
• OETA is the only television operation (either commercial or non-commercial) serving the entire state of Oklahoma and the only broadcast television signal for many rural Oklahomans.
• Centennial coverage of the Parade and the Spectacular broke all records for viewership. The ratings were the highest ever recorded in Oklahoma for a public television program and has broken national public television viewership records. More than 100 Centennial Stories aired on OETA in 2007.
• Nationally, OETA consistently ranks among the top seven public television operations in terms of cumulative audience rankings. More than 1.8 million Oklahomans tune in weekly to OETA. OETA is in the top three most-viewed prime time public television markets in the U.S.
• OETA has taken a lead role in promoting Oklahoma as “The State of Creativity” with more than 60 one-minute productions spotlighting the state’s residents who have made their mark on the arts, business, education, research, agriculture, etc., through creative problem-solving.
Mission OETA is a federally licensed and regulated agency that operates non-commercial educational television channels assigned by the Federal Communications Commission (FCC). Branded as “The Oklahoma Network”, OETA operates full-powered analog and digital television stations in Oklahoma City, Tulsa, Eufaula and Cheyenne. An additional 15 translators extend service to the remainder of the state. Only 13 other states have a state operated public television network. Oklahoma state government consistently spends less per capita than any of the 13 other states that operate such networks. OETA has been able to offset the declining state portion of its operating budget through on-air membership drives, corporate, grant and foundation solicitations. However, as OETA’s infrastructure is being replaced with more costly digital equipment, operating costs are rising more dramatically.
Funding by Source
$-
$5,000,000
$10,000,000
$15,000,000
$20,000,000
FY-2005 FY-2006 FY-2007 FY-2008(est.)
FY-2009(req.)
State appropriations Foundation and private
OETA has two main activities within the agency, broadcasting/technical and programming/production.

FY-2009 Executive Budget
EDUCATION B-50
Broadcasting/Technical Division The Oklahoma Network is a complex technical installation in more than 30 locations around the state, reaching from Boise City and Altus to Ponca City and Idabel and all points in between. All sites are serviced and managed from the network headquarters in the state's capitol. Programming/Production This division is charged with the design, development, production and delivery of the large local production output of OETA. A needs assessment of the audience is supported by the annual member survey and this instrument joins other research data in supporting the design of the program service. This leads to opportunities for cooperative initiatives with other state agencies, offices, and organizations. The ten most popular programs viewed on OETA are: • Antiques Roadshow • NOVA • Oklahoma News Report • Nature • Frontline • This Old House • Stateline • Gallery • American Experience • Sesame Street
Conversion to Digital Transmission The four major broadcast service areas now have digital coverage serving a population of 2.6 million. Through the end of FY-2008, OETA will have invested more than $20.7 million for the first two phases of the federally mandated conversion to digital broadcasting. This includes $8.6 million in State appropriations made in the 2001 and 2007 Legislative Sessions. OETA is now completing its second phase, which allows the Oklahoma City master control operations to remotely program and monitor the four sites. This streamlines the system and saves considerable expenses in
operation. OETA will add the necessary studio and editing equipment to efficiently produce programs in the digital and high-definition formats. The final phase of the conversion will allow for replacement of the state’s 15 translator (low power television) stations. The rural stations serve residents outside of the main broadcast signal areas of Tulsa, Eufaula, Oklahoma City and Cheyenne. Citizens in 36 rural counties depend on the translator signals either for reception with either a home antenna or retransmission through a local cable system. This final phase will also provide a new studio location for the Tulsa and northeastern Oklahoma broadcast area. The OETA Foundation matched both state appropriations for digital conversion and will continue to raise private funds to match state appropriated money for the completion of Phase Two and Phase Three of the digital conversion.
Digital Television Conversion Costs (in millions)
Project cost to date,
$13.3, 40%Remaining upgrade
expenses, $20.2, 60%
OETA Foundation The Oklahoma Educational Television Authority Foundation, Inc. is a non-profit organization operating for the purpose of receiving, investing and expending privately donated funds which support public broadcasting. The Foundation provides a portion of the operating budget for the network. The Foundation matched the earlier state appropriation of $5.6 million for the first phase of the conversion to DTV, and will raise private funds to match state appropriated money for Phase Two and Phase Three of the digital conversion.

FY-2009 Executive Budget
EDUCATION B-51
FY-2009 Recommendation
FY-2008 Appropriation $8,394FY-2008 Bud. FTE Level 73.0Actual Ave. YTD FTE 70.8
Funding Adjustments: State employee pay raise 83
FY-2009 Recommendation $8,477% Change from FY-2008 0.99%
(amounts in thousands)
Source: Office of State Finance
FY-2009 Appropriation
State Employee Pay Raise The Governor’s budget includes $82,867 for a 5% state employee pay increase for OETA effective January 1, 2009. This funding is based on October 2007 salary information.
FY-2009 Executive Budget
EDUCATION B-52
Elementary and Secondary Education
Notable Achievements • Oklahoma’s early childhood education
program for four-year-old children has been named number one in access by the National Institute for Early Education Research for the past three years. In FY-2008, nearly 70% of Oklahoma four-year-olds are attending Pre-Kindergarten programs in public schools, an historic high of 35,334 students.
• The National Board for Professional
Teaching Standards reported in January 2008 that Oklahoma again had the 9th highest number of National Board Certified teachers in the U.S. and, for 2007, the 6th greatest growth in number of nationally certified teachers compared to 2006. Nationally certified teachers comprise 4% of all Oklahoma teachers, double the national average rate. The state has 1,996 National Board Certified Teachers while Missouri has 413, Arkansas has 844, Colorado has 332, Kansas has 268, Texas has 393 and New Mexico has 309.
• Per ACE, Oklahoma Mathematics
Laboratories were provided to 10 middle schools with low student achievement in math. The median scores of 8th grade students tested at the 10 original grant schools participating in the Oklahoma Mathematics Laboratories program in 2006 went up 20.4% the first year; the new schools added in 2007 posted a 19.1% increase.
• According to the first ten years of
Education Week's "Quality Counts" report cards, Oklahoma has always been in the top half of states in “Standards and Accountability” (13th in 2007) and in the top 10 states in “Improving Teacher Quality” (10th in 2007). The 12th annual report “Quality Counts 2008” ranked Oklahoma 28th overall on 150 measures of policy and performance.
• The number of high schools with Advanced Placement programs has climbed from 81 in 1997 to 337 in 2007. The number of AP exams taken in 2007 (19,808 taken by 11,888 public school students) was over six times greater than the number of exams taken in 1996-97 when the AP Incentives Program began.
• Oklahoma was one of only 14 states in
the U.S. to improve mathematics scores at both Grade 4 and 8 in 2007 on the National Assessment of Educational Progress (NAEP), also called “The Nation’s Report Card,” compared to the previous test in 2005. NAEP scores also improved for Grade 4 reading, but were statistically unchanged in Grade 8 reading, which remained at the national average.
The Governor has been working to strengthen Oklahoma’s school system since elected to office. For the past few years, the Governor’s initiatives have included working for fair compensation for teachers and support personnel. This included a pay increase plan for teachers to reach the regional average over four years. Additionally, the state appropriated funds to pay 100% of teacher and support personnel health insurance. The Governor also created two new funding sources for education – the Education Lottery and Gaming Regulation Act. The past three years, the Governor has also worked to improve educational quality to ensure that every child has the strong academic skills necessary for success. This was accomplished through the Achieving Classroom Excellence (ACE) Act of 2005, and was more finely honed in the 2006 legislative session. ACE is a multi-faceted approach to improving the state’s education system, with a focus on every student succeeding. The provisions span the entire public school system and include: • Requiring districts to offer full day
kindergarten;
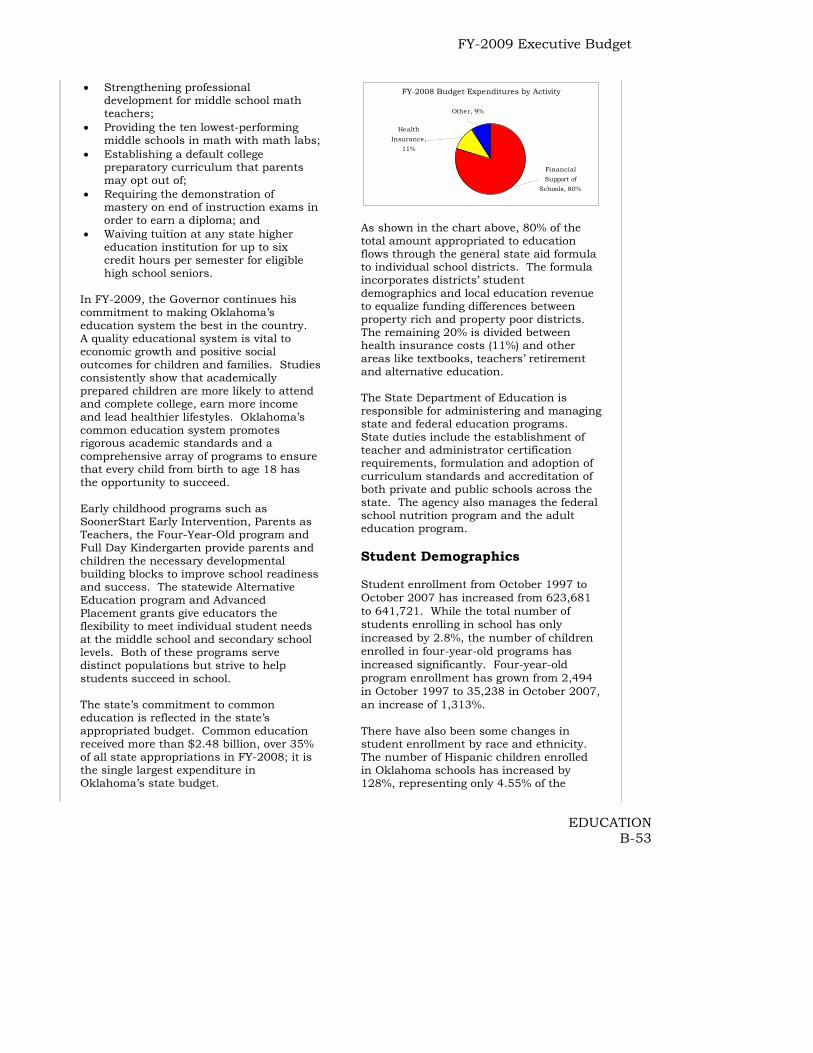
FY-2009 Executive Budget
EDUCATION B-53
• Strengthening professional development for middle school math teachers;
• Providing the ten lowest-performing middle schools in math with math labs;
• Establishing a default college preparatory curriculum that parents may opt out of;
• Requiring the demonstration of mastery on end of instruction exams in order to earn a diploma; and
• Waiving tuition at any state higher education institution for up to six credit hours per semester for eligible high school seniors.
In FY-2009, the Governor continues his commitment to making Oklahoma’s education system the best in the country. A quality educational system is vital to economic growth and positive social outcomes for children and families. Studies consistently show that academically prepared children are more likely to attend and complete college, earn more income and lead healthier lifestyles. Oklahoma’s common education system promotes rigorous academic standards and a comprehensive array of programs to ensure that every child from birth to age 18 has the opportunity to succeed. Early childhood programs such as SoonerStart Early Intervention, Parents as Teachers, the Four-Year-Old program and Full Day Kindergarten provide parents and children the necessary developmental building blocks to improve school readiness and success. The statewide Alternative Education program and Advanced Placement grants give educators the flexibility to meet individual student needs at the middle school and secondary school levels. Both of these programs serve distinct populations but strive to help students succeed in school. The state’s commitment to common education is reflected in the state’s appropriated budget. Common education received more than $2.48 billion, over 35% of all state appropriations in FY-2008; it is the single largest expenditure in Oklahoma’s state budget.
FY-2008 Budget Expenditures by Activity
Other, 9%
Health Insurance,
11%
Financial Support of
Schools, 80%
As shown in the chart above, 80% of the total amount appropriated to education flows through the general state aid formula to individual school districts. The formula incorporates districts’ student demographics and local education revenue to equalize funding differences between property rich and property poor districts. The remaining 20% is divided between health insurance costs (11%) and other areas like textbooks, teachers’ retirement and alternative education. The State Department of Education is responsible for administering and managing state and federal education programs. State duties include the establishment of teacher and administrator certification requirements, formulation and adoption of curriculum standards and accreditation of both private and public schools across the state. The agency also manages the federal school nutrition program and the adult education program.
Student Demographics
Student enrollment from October 1997 to October 2007 has increased from 623,681 to 641,721. While the total number of students enrolling in school has only increased by 2.8%, the number of children enrolled in four-year-old programs has increased significantly. Four-year-old program enrollment has grown from 2,494 in October 1997 to 35,238 in October 2007, an increase of 1,313%. There have also been some changes in student enrollment by race and ethnicity. The number of Hispanic children enrolled in Oklahoma schools has increased by 128%, representing only 4.55% of the

FY-2009 Executive Budget
EDUCATION B-54
student population in October 1997 to 10% in October 2007, representing 10% of Oklahoma’s total student population. Closing the achievement gap among minorities is a priority for Oklahoma. Oklahoma’s graduation rates and ACT scores are above the national average for most racial and ethnic groups when compared nationally, depicted in the graph below. Key Performance Measure
2007 ACT Scores for OK compared to Nation, by Ethnicity
17.219.5
21.918.9
21.317 18.9
22.618.7
22.1
05
10152025
AfricanAmerican
AmericanIndian
AsianAmerican
Hispanic Caucasian
OK Nation
Funding Sources for Local School Districts Oklahoma has 539 school districts with 1,019 elementary schools, 293 middle and junior high schools and 482 high schools. Public funding for Oklahoma’s public schools comes from four sources: FY2007: • Local and county revenue (34%) • State dedicated revenue (7%) • Federal funds (12%); and • State appropriated revenue (47%) Local governments assess ad valorem taxes on property owners to support schools. The Oklahoma Constitution provides parameters for local millage assessments. Schools also receive the following state dedicated revenue: • Gross Production Tax; • Motor Vehicle Collections; • Rural Electrification Association
Cooperative Tax;
• State School Land Earnings; • Vehicle Tax Stamp; • Farm Implement Tax Stamp; • Oklahoma Education Lottery Trust
Fund; and • Other Dedicated Revenue. All federal funds for school districts are dedicated to specific programs for target populations. Examples are school lunch programs, special education programs, low income programs and technology grants. The State Department of Education is responsible for disbursing funds to school districts through the State Aid Funding Formula. It rests upon two concepts, fiscal neutrality and vertical equity. The State Aid Funding Formula is set in statute and distributes funds through three categories: Foundation Aid, Incentive Aid and Transportation Aid. Foundation Aid is calculated on the basis of the highest weighted average daily membership (WADM) of students in each district for the preceding two years or the first nine weeks of the current school year. Weights are added based on certain characteristics (eg: Special Education, Bilingual, Gifted and Economically Disadvantaged) to determine the weighted ADM. The weighted ADM for a district is then multiplied by the Statutory Foundation Support Level. A portion of a district’s local revenues and all of its state-dedicated revenues are subtracted to arrive at the Foundation Aid amount (mid-term amount is $1,602 per weighted ADM for the 2007-2008 school year.) The Incentive Aid Factor guarantees each district a minimum amount of funding per weighted student for each mill up to 20 mills. For the 2007-2008 school year, the mid-term amount is $78.65. To calculate a school’s Incentive Aid Factor, the weighted ADM is multiplied by the Incentive Aid guarantee. A factored amount of local
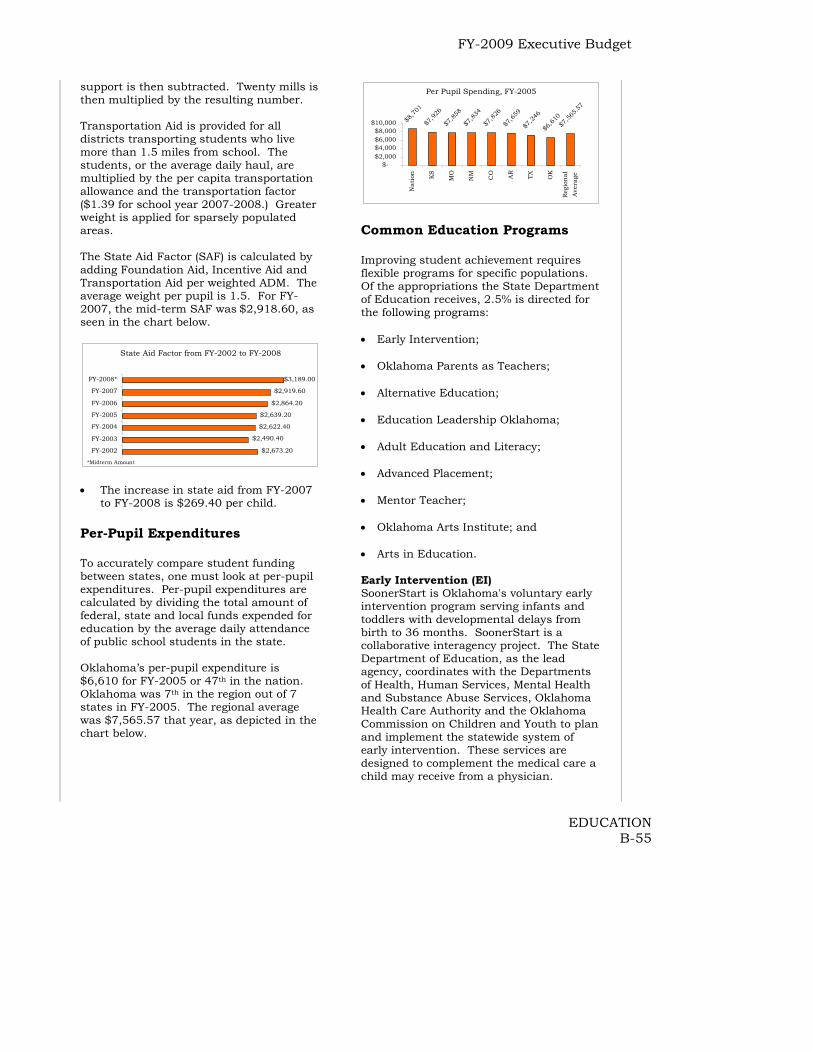
FY-2009 Executive Budget
EDUCATION B-55
support is then subtracted. Twenty mills is then multiplied by the resulting number. Transportation Aid is provided for all districts transporting students who live more than 1.5 miles from school. The students, or the average daily haul, are multiplied by the per capita transportation allowance and the transportation factor ($1.39 for school year 2007-2008.) Greater weight is applied for sparsely populated areas. The State Aid Factor (SAF) is calculated by adding Foundation Aid, Incentive Aid and Transportation Aid per weighted ADM. The average weight per pupil is 1.5. For FY-2007, the mid-term SAF was $2,918.60, as seen in the chart below.
State Aid Factor from FY-2002 to FY-2008
$2,673.20
$2,490.40
$2,622.40
$2,639.20
$2,864.20
$2,919.60
$3,189.00
FY-2002
FY-2003
FY-2004
FY-2005
FY-2006
FY-2007
FY-2008*
*Midterm Amount • The increase in state aid from FY-2007
to FY-2008 is $269.40 per child. Per-Pupil Expenditures To accurately compare student funding between states, one must look at per-pupil expenditures. Per-pupil expenditures are calculated by dividing the total amount of federal, state and local funds expended for education by the average daily attendance of public school students in the state. Oklahoma’s per-pupil expenditure is $6,610 for FY-2005 or 47th in the nation. Oklahoma was 7th in the region out of 7 states in FY-2005. The regional average was $7,565.57 that year, as depicted in the chart below.
Per Pupil Spending, FY-2005
$8,
701
$7,9
26
$7,8
58
$7,8
34
$7,8
26
$7,6
59
$7,2
46
$6,6
10
$7,5
65.57
$-$2,000$4,000$6,000$8,000
$10,000
Nat
ion KS
MO
NM CO AR
TX OK
Reg
ion
alA
vera
ge
Common Education Programs Improving student achievement requires flexible programs for specific populations. Of the appropriations the State Department of Education receives, 2.5% is directed for the following programs: • Early Intervention; • Oklahoma Parents as Teachers; • Alternative Education; • Education Leadership Oklahoma; • Adult Education and Literacy; • Advanced Placement; • Mentor Teacher; • Oklahoma Arts Institute; and • Arts in Education. Early Intervention (EI) SoonerStart is Oklahoma's voluntary early intervention program serving infants and toddlers with developmental delays from birth to 36 months. SoonerStart is a collaborative interagency project. The State Department of Education, as the lead agency, coordinates with the Departments of Health, Human Services, Mental Health and Substance Abuse Services, Oklahoma Health Care Authority and the Oklahoma Commission on Children and Youth to plan and implement the statewide system of early intervention. These services are designed to complement the medical care a child may receive from a physician.

FY-2009 Executive Budget
EDUCATION B-56
The program staff provides caregivers the skills and support they need to help them work with their childen to attain essential developmental skills and accomplish the goals developed on an Individualized Family Service Plan (IFSP). An IFSP is designed for each child. Depending on a child's and family's individual needs, SoonerStart offers one or a combination of services, some of which include, counseling, nutrition and physical therapy to name a few. The four most common diagnoses of infants and toddlers served by SoonerStart are Down Syndrome, Failure to Thrive, Hydrocephalus and Cerebral Palsy. The SoonerStart program will work with approximately 13,548 children in FY-2008. Oklahoma Parents as Teachers Parents are children’s most important and effective teachers. Children’s academic success is in most instances dependent on parents’ active involvement in their child’s early years. Recognizing the importance of this relationship, Parents as Teachers (OPAT) is a free and voluntary program which provides parents of children ages zero to three the skills to maximize their child’s potential. Services are based on early childhood development research. School districts apply for grants to fund OPAT programs. Qualifications to receive an OPAT program grant are based on enrollment history (if applicable), district Average Daily Membership (ADM) and new or expanded programs. As with other service programs, multiple districts can join to create an OPAT program. For FY-2007, 5,454 children, or 4784 families, in 97 districts were served.
Year Appropriation# of
Districts# of families
served
1991-92 650,000 13 377 1998-99 2,959,144 219 6,800 2002-03 2,591,418 168 6,676 2003-04 1,295,709 55 2,835 2004-05 1,295,000 68 4,235 2005-06 2,045,709 162 4,762 2006-07 2,045,709 97 4,784
Source: SDE Four-Year Old Program Oklahoma is one of only three states that require teachers of four-year-olds to have a degree in early childhood education. Georgia and New York are the only other states requiring this quality indicator. Requiring this certification improves the quality of teaching and learning in the classroom and increases the probability children will be prepared for school in later years. Approximately 70% of the four-year-old population in Oklahoma participates in this voluntary program. The basis for Oklahoma’s high participation rate lies in the unique partnerships schools are creating with private child care providers. The State Department of Education encourages schools to provide certified teachers to private child care facilities to expand access. Lawton, Norman and Putnam City School districts are just a few of the districts involved in this initiative. Alternative Education The purpose of this program is to provide alternative education choices to prevent dropouts and increase the number of high school graduates. The Juvenile Justice Reform Act of 1994 established the Statewide Academy System that began with eight pilot programs in three counties. State law now requires all districts reporting dropouts and juvenile justice referrals to offer alternative education in Grades 6-12. More than 11,802 students from 467school districts were served in 257 Statewide Alternative Education Academies in 2006-2007.

FY-2009 Executive Budget
EDUCATION B-57
At-risk youth are individuals who might fail to successfully complete their secondary education because of economic, socio-cultural, academic or disciplinary reasons. The following chart demonstrates performance outcomes for children enrolled in alternative education programs versus those for children who were eligible but on waiting lists. Key Performance Measure
Alternative Change
Students on Alternative Ed.
Waiting List Change
Pre 13.55 -16.4 10.47 22.5%Post 11.33 12.83Pre 1.46 76.0 1.50 3.3%Post 2.57 1.55Pre 2.61 -53.3 1.31 88.5%Post 1.22 2.47Pre 2.61 -93.1 2.31 16.0%Post 0.18 2.68
2007 Statewide Alternative Education Program OutcomesPre-post means by group:
Variable
Group
Days absent per weekSemester GPADays suspended per weekCourses failed On each variable measured, students in alternative education programs showed more improvement than students in the comparison group. Since FY-1998, Oklahoma’s event drop-out rate has decreased by 2.3% from 5.5% in FY-1998 to 3.2% in FY-2007, as shown below. Event drop out rate is the proportion of students from grades 7 to 12 who leave school each year without completing the school year. Key Performance Measure
Event Dropout Rates
5.5% 5.1% 5.2% 4.7%3.9% 3.6% 3.5% 3.2% 3.3% 3.20%
0.0%1.0%2.0%3.0%4.0%5.0%6.0%
FY-1
998
FY-1
999
FY-2
000
FY-2
001
FY-2
002
FY-2
003
FY-2
004
FY-2
005
FY-2
006
FY-2
007
Staff Development Professional development programs strive to improve teachers’ subject matter knowledge, teaching methodology and classroom management skills. There are several types of statewide Staff Development programs, including the Great
Expectations program, the Neuro-developmental Learning Differences program and the Literacy First reading program. This line-item also provides funds for reading remediation in grades one through three. Approximately $2.33 million is disbursed to districts for general professional development activities at the school level. Great Expectations This program’s fundamental philosophy is, “All children can learn” when teachers have the attitude, knowledge and skill to set high expectations, build self-esteem and create a climate of mutual respect.
Funds appropriated provide $1,000 scholarships to teachers and principals for summer institutes and follow-up training. To qualify for scholarships, each qualifying school must be willing to send up to five teachers and a principal to the summer institute. To date, approximately 14,000 teachers have had this training. Great Expectations has begun an initiative to broaden the focus of training to middle and high school faculty. Neuro-developmental Learning Differences This program recognizes that children process information differently from one another. Some children form images, others form words and others form sentences. Educating teachers on children’s different learning styles and how to effectively teach to these styles is the primary goal of this professional development institute. Funds provide $1,500 scholarships for teachers to attend a 39 hour course and participate in a year-long practicum. Since the program’s inception in FY-2001, 3,294 teachers have participated from 202 school districts and 12 agencies. Literacy First The Reading Sufficiency Act, funded by the Legislature in 1997, provides reading and literacy training for all elementary teachers using the "Literacy First" program as its training base. The Literacy Professional Development Institute (PDI) provides a balanced approach to teaching reading by incorporating the latest phonics and
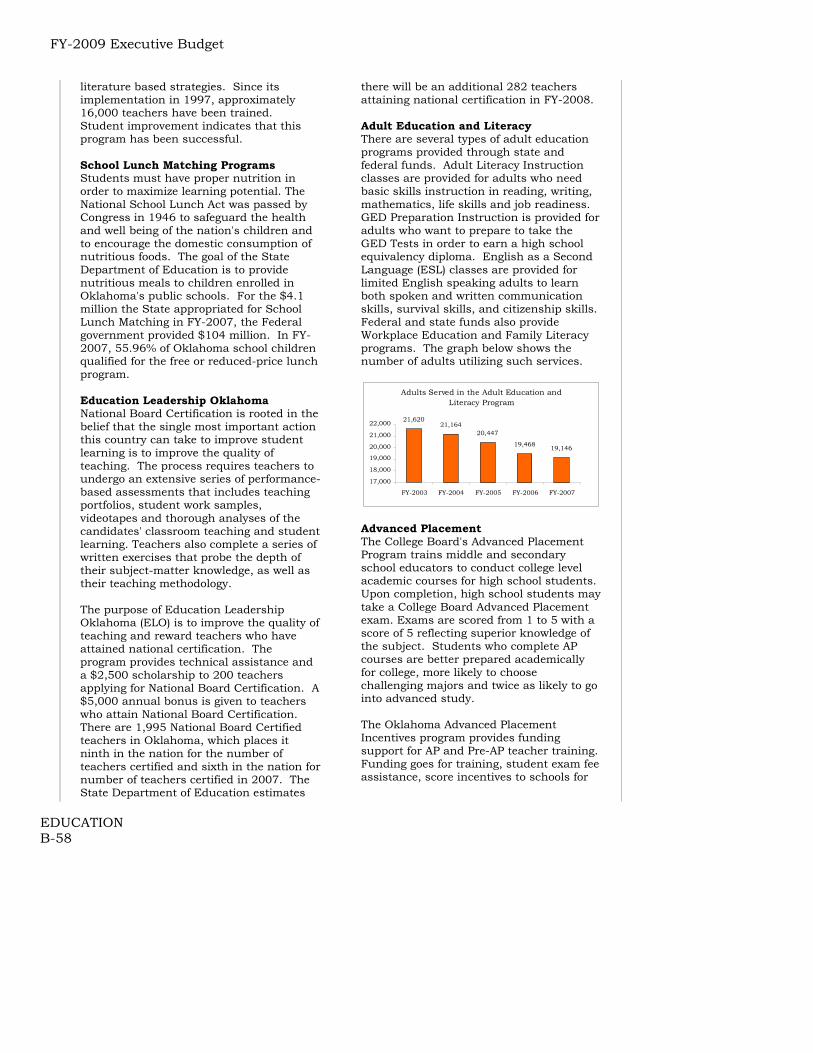
FY-2009 Executive Budget
EDUCATION B-58
literature based strategies. Since its implementation in 1997, approximately 16,000 teachers have been trained. Student improvement indicates that this program has been successful. School Lunch Matching Programs Students must have proper nutrition in order to maximize learning potential. The National School Lunch Act was passed by Congress in 1946 to safeguard the health and well being of the nation's children and to encourage the domestic consumption of nutritious foods. The goal of the State Department of Education is to provide nutritious meals to children enrolled in Oklahoma's public schools. For the $4.1 million the State appropriated for School Lunch Matching in FY-2007, the Federal government provided $104 million. In FY-2007, 55.96% of Oklahoma school children qualified for the free or reduced-price lunch program. Education Leadership Oklahoma National Board Certification is rooted in the belief that the single most important action this country can take to improve student learning is to improve the quality of teaching. The process requires teachers to undergo an extensive series of performance-based assessments that includes teaching portfolios, student work samples, videotapes and thorough analyses of the candidates' classroom teaching and student learning. Teachers also complete a series of written exercises that probe the depth of their subject-matter knowledge, as well as their teaching methodology. The purpose of Education Leadership Oklahoma (ELO) is to improve the quality of teaching and reward teachers who have attained national certification. The program provides technical assistance and a $2,500 scholarship to 200 teachers applying for National Board Certification. A $5,000 annual bonus is given to teachers who attain National Board Certification. There are 1,995 National Board Certified teachers in Oklahoma, which places it ninth in the nation for the number of teachers certified and sixth in the nation for number of teachers certified in 2007. The State Department of Education estimates
there will be an additional 282 teachers attaining national certification in FY-2008. Adult Education and Literacy There are several types of adult education programs provided through state and federal funds. Adult Literacy Instruction classes are provided for adults who need basic skills instruction in reading, writing, mathematics, life skills and job readiness. GED Preparation Instruction is provided for adults who want to prepare to take the GED Tests in order to earn a high school equivalency diploma. English as a Second Language (ESL) classes are provided for limited English speaking adults to learn both spoken and written communication skills, survival skills, and citizenship skills. Federal and state funds also provide Workplace Education and Family Literacy programs. The graph below shows the number of adults utilizing such services.
Adults Served in the Adult Education and Literacy Program
21,62021,164
20,447
19,468 19,146
17,000
18,000
19,000
20,000
21,000
22,000
FY-2003 FY-2004 FY-2005 FY-2006 FY-2007
Advanced Placement The College Board's Advanced Placement Program trains middle and secondary school educators to conduct college level academic courses for high school students. Upon completion, high school students may take a College Board Advanced Placement exam. Exams are scored from 1 to 5 with a score of 5 reflecting superior knowledge of the subject. Students who complete AP courses are better prepared academically for college, more likely to choose challenging majors and twice as likely to go into advanced study. The Oklahoma Advanced Placement Incentives program provides funding support for AP and Pre-AP teacher training. Funding goes for training, student exam fee assistance, score incentives to schools for

FY-2009 Executive Budget
EDUCATION B-59
AP program development and AP course grants. Data from the College Board’s AP program shows 11,888 Oklahoma public school students took 19,808 exams last school year. The number of exams taken is more than four times the number of exams taken in 1996-97, the year Oklahoma’s AP Incentives program began. Students score a grade of 3, 4 or 5 on almost half of the exams taken, or 8,952, as seen below. Key Performance Measure
AP Scores of 3 and Above
50%49%
45% 45%
45%
0
5,000
10,000
15,000
20,000
25,000
2003 2004 2005 2006 2007
30%
35%
40%
45%
50%
55%
3 and Ab o ve Exams Taken % o f To tal with scoring 3 and Abo veSo urce: SDE
Mentor Teacher Teachers who have quality mentors during their first years of teaching are more likely to be better teachers and remain in the profession. Since 1981, Oklahoma has required all first year teachers to participate in a residency program. Every first-year teacher is assigned to a committee comprised of a mentor teacher, a higher education professor and the principal. At the end of the school year, the committee recommends whether the first year teacher should receive state certification. The mentor teacher plays the most active role in a teacher’s residency year, providing 72 hours of consultation. State law provides that teacher consultants may receive an annual stipend of not more than $500. The FY-2008 budget included funding for the program in the amount of $700,000.
Statewide Assessments and Outcomes The National Assessment of Educational Progress (NAEP) is the only measure of student achievement in the United States that compares the performance of students in one state with the performance of students across other states. NAEP, sponsored by the U.S. Department of Education, has been conducted for over 30 years. The test is not administered to every student in the country. Instead, a sample size of students representing different socioeconomic, racial and ethnic backgrounds is tested in each state. Results are then extrapolated for aggregate state scores. Reading and writing tests in grades 4 and 8 are administered every other year, with the next administration scheduled for 2009. The following charts are from the National Assessment of Education Progress Report for 2007.
NAEP Grade 4 Reading % Proficient
63 69 66 67 6451
60 646370 72 67 65
58 64 65
0
20
40
60
80
AR CO KS MO Nation NM OK TX
2005 2007
In the 4th grade reading category, Oklahoma finished 5th in the region and 1% below the national average.
NAEP Grade 8 Reading % Proficient
69 75 78 76 7362
72 696978 80 76 72
6372 73
020406080
100
AR CO KS MO Nation NM OK TX
2005 2007
In the 8th grade reading category, Oklahoma finished 5th in the region and equal to the national average.

FY-2009 Executive Budget
EDUCATION B-60
NAEP Grade 4 Math % Proficient
78 81 8879 80
6579 87
7087838182898280
020406080
100
AR CO KS MO Nation NM OK TX
2005 2007
In the 4th grade Math category, Oklahoma finished 3rd in the region and 2% above the national average.
NAEP Grade 8 Math % Proficient
77 72 70 69 68 64 6353
82 78 76 70 72 65 6657
020406080
100
KS TX CO Nation MO AR OK NM
2005 2007
In the 8th grade Math category, Oklahoma finished 5th in the region and 4% below the national average. Criterion-Referenced Tests Criterion-referenced tests measure student performance as compared to the state's own curriculum standards. In Oklahoma, the two state CRT tests required are the Oklahoma Core Curriculum test administered to children in grades five and eight and the High School End of Instruction tests. All subject areas are tested in grades five and eight, including art. The High School End of Instruction Test is administered to students as they complete English I, English II, US History, Biology I, Algebra I, Geometry and Algebra II. Individual student scores allow educators and parents to track educational achievement over time. These tests are not nationally normed and do not provide a basis for comparing students to their national counterparts. Oklahoma’s curriculum standards are defined in the Priority Academic Student
Skills (PASS). PASS represents the basic skills and knowledge all Oklahoma students are expected to learn in the elementary and secondary grades. State law requires PASS to be re-evaluated every three years. In FY-2002, the State Department of Education, the Oklahoma State Regents for Higher Education, the Oklahoma Business and Education Coalition (OBEC) and the Governor's office requested a national organization, Achieve, to review Oklahoma's policies and practices related to school improvement efforts. Achieve produced a two-part study in conjunction with nationally respected experts. Achieve focused on overall progress made in the areas of standards, assessment, and accountability. It found that Oklahoma has consistently maintained efforts to raise achievement for over ten years, establishing a firm foundation for standards-based reform. It determined that the PASS standards were comprehensive, measurable and rigorous. Achieve found that Oklahoma's English and math standards were comprehensive, clear and measurable; the math standards in grades K-5 were particularly well-developed.
Grade 5 Statewide Results
75 58 59 5172
1522
273011
020406080
100
Reading -2007
Math - 2007 Science -2007
Social Studies- 2007
Writing - 2007
Satisfactory Advanced
Between the 2006 and 2007 school year, Oklahoma students in fifth grade scores increased in Reading, Math and Social Studies, and decreased slightly in Science and Writing.

FY-2009 Executive Budget
EDUCATION B-61
Grade 8 Statewide Results
75 57 75 61 78
1412
132610
020406080
100
Reading -2007
Math - 2007 Science -2007
History -2007
Writing -2007
Satisfactory Advanced
Between the 2006 and 2007 school year, Oklahoma students in eighth grade increased their scores in all categories except writing, where they maintained performance levels. High School End of Instruction Tests (EOIs) were administered for the first time during the 2000-01 school year. Per ACE, students in the class of 2011-2012 will have to score satisfactory or above on English II, Algebra I, and two additional EOIs, or approved alternative tests, in order to receive a high school diploma. Results from the existing and previously administered tests are shown in the charts below.
EOI Exams % Scoring Satisfactory and Above (Regular Students)
3249
3854
72
51
0
20
40
60
80
Algebra I Biology I
2005 2006 2007
EOI Exams % Scoring Satisfactory and Above (Regular Students)
69 7072 73
6966
60
65
70
75
English II U.S. History
2005 2006 2007
The ACT Assessment is a national college admission and placement examination. The exam tests students’ subject knowledge of Reading, English, Mathematics and Science. ACT results are accepted by
virtually all U.S. colleges and universities and the ACT is the test most often used for admission to Oklahoma public colleges and universities.
Regional Comparison of 2007 Composite ACT Scores
19
19.5
20
20.5
21
21.5
22
22.5
KS MO
Natio
n OK AR TX CO NM
0
20
40
60
80
100
120
Average ACT Composite Scores % of Graduates TestedSo urce: ACT Oklahoma ranks 3rd in the region with an average ACT score of 20.7; Kansas ranks first with a score of 21.9. The national average is 21.2, as seen above. No Child Left Behind Act (NCLB) The NCLB Act was signed into law January 8, 2002. It is the latest revision of the 1965 Elementary and Secondary Education Act (ESEA) and is regarded as the most significant federal education policy initiative in a generation. The overall purpose of the law is to ensure that each child in America is able to meet the high learning standards of the state where he or she lives. The specific goals of the law, as spelled out in the Federal Register issued on March 6, 2002, are: • All students will reach high standards,
at a minimum attaining proficiency or better in reading and mathematics by 2013-2014;
• By 2013-2014, all students will be proficient in reading by the end of the third grade;
• All limited English proficient students will become proficient in English;
• By 2005-2006, all students will be taught by highly qualified teachers;
• All students will be educated in learning environments that are safe, drug free and conducive to learning; and

FY-2009 Executive Budget
EDUCATION B-62
• All students will graduate from high school.
To help schools and districts meet these goals, the law provides a number of different mandates, incentives and resources. Mandates include: • Annual testing of all students against
state standards in reading, mathematics and science in grades three through eight or at least three times in a student’s school career (including once in high school);
• Required participation in “Verification” of each state’s assessment system (every other year) by selected districts in the NAEP test;
• Aggregate and disaggregate analysis and reporting of student achievement results by race, ethnicity, special education status and limited English proficiency;
• A state definition and timeline for determining whether a school, district and the state are making “adequate yearly progress” (AYP) toward the goal of 100% of students meeting state standards by the 2013-2014 school year;
• Technical assistance and then sanctions for schools, districts and the state for failure to make AYP;
• Highly qualified teachers in core academic subjects by 2005-2006;
• Highly qualified aides or paraprofessionals;
• Support for students not meeting standards and/or for those who have special needs (e.g., homeless, limited-English-proficiency); and
• The use of “scientifically-based” programs and strategies.
NCLB will provide nearly $1 billion annually in additional funding over the next five years to help states and districts strengthen K-3 reading programs, before and after-school programs, charter schools, reading readiness for preschool children, teacher professional development and education technology.
In March 2004, Education Commission of the States (ECS) released the ECS Report to the Nation: State Implementation of the No Child Left Behind Act. Only 3 states had met more requirements than Oklahoma – Kentucky, Colorado and Maryland. Currently, Oklahoma is one of only three states that has all 38 NCLB requirements. State Student Information System (“The Wave”) With the passage of the federal “No Child Left Behind Act of 2001”, additional accountability and reporting requirements were added to already growing state-level demands for additional and higher quality education data. During the 2003 legislative session, HB 1646 defined standards for the state student record system being developed by the State Department of Education. The bill also required that all schools in Oklahoma comply with extensible markup language (XML) standards and the most current version of the Schools Interoperability Framework (SIF) specifications. Implementation of the new secure electronic data system, the Wave, is reducing the reporting burden of schools while making more accurate information more readily available for decision-making purposes. This has revolutionized the manner in which student data is collected, managed and analyzed by local school districts and the State Department of Education. Districts reporting information to meet state and federal requirements now have the capability to provide data via SIF. The Wave has integrated reporting requirements into a seamless exchange of information from the district’s student information system to a centralized system of secure information using standard data elements, definitions, and reporting formats. As SIF expands development, so will the Wave. The Governor and the Legislature will work with the State Department of Education to maximize and leverage all state and federal resources to keep up with

FY-2009 Executive Budget
EDUCATION B-63
these expansions. The first year (federally funded) of a five-year contract for design and implementation of the Wave was approved by Central Purchasing in June 2004.
FY-2008 Supplemental
FY-2008 Appropriation $2,480,155 Ad Valorem Reimbursement 17,000
FY-2008 Adj. Appropriation $2,497,155% Change from FY-2007 5.51%
% Change from Original FY-2008 0.69%
(amounts in thousands)
Source: Office of State Finance
FY-2008 Supplemental
Ad Valorem Reimbursement The Governor’s budget provides $17 million to reimburse school districts for a reduction in ad valorem local revenue as a result of companies receiving the five year manufacturer’s exemption. This funding is directed for common education, but will be appropriated to the Oklahoma Tax Commission.
FY-2009 Recommendation
FY-2008 Appropriation $2,480,155 One-time Adjustments (531)
FY-2008 Base $2,479,624FY-2008 Bud. FTE Level 404.0Actual Ave. YTD FTE 372.0
Funding Adjustments: State Employee Pay Raise 350 Teacher Salary Increase 64,911 State Aid Funding Formula 10,000 EESIP 17,216 Annualization of One-Time Funding 31,575 ACE Remediation 4,000 ACE Intervention 120 ACE Graduation Coaches 2,500 ACE Middle School Math Labs 1,500 Early Intervention Services 3,000 Teacher Working Condition Survey 60 Total Adjustments 135,232
FY-2009 Recommendation $2,614,856$ Change from FY-2008 $134,701% Change from FY-2008 5.43%
FY-2009 Appropriation(amounts in thousands)
Source: Office of State Finance One-Time Adjustments The Governor’s budget removes $530,590 from the agency’s budget, with $130,590 representing removal of the Small School Incentive Grant and $400,000 from the agency’s FY-2008 appropriation for RISE. State Employee Pay Raise The Governor’s budget includes $350,315 for a 5% state employee pay increase for the State Department of Education effective January 1, 2009. This funding is based on October 2007 salary information. Teacher Salary Increase The Governor’s budget proposes $64,910,938 for teacher salaries to continue the State’s efforts to reach the regional average. As the most recent salary

FY-2009 Executive Budget
EDUCATION B-64
figures indicate the state is $1,140 below the regional average, the Governor’s new proposal provides an average increase of approximately $1,200 and rewards veteran teachers by weighting the increase based on years of service. State Aid Funding Formula The Governor’s budget provides an additional $10 million to go through the state aid funding formula. This money will pass through the State Department via the state aid formula and go to the classroom. EESIP The Governor’s budget recommends an addition $17,215,817 for the increased employer share of teacher retirement. Pursuant to SB 357 (2007), the employer share increases from 8.35% to 8.50% effective July 1, 2008, and again to 9.0% on January 1, 2009. Annualization of One-Time Funding HB 1105 (2007) provided Common Education $6,621,468 for FY-2008 EESIP costs and $19,953,133 for FY-2008 teacher salary costs. The Governor’s budget annualizes those recurring operational expenses. The Governor’s budget also makes permanent a $10 million investment in an early childhood program that provides grants, which require a private match and focus on early childhood programs that focus on at-risk children, such as EduCare, in both urban and rural areas. $5 million of the $10 million in the FY-2008 budget for this program was appropriated in HB 1105. The Governor recommends annualizing that amount, and further recommends that, should additional funds become available throughout the legislative session, an additional $5 million be appropriated for this purpose, bringing the total state investment to $15 million. ACE Remediation Pursuant to SB 1792 (2006), the Governor’s budget includes an additional $4 million to begin remediation for students scoring below satisfactory on the 7th and 8th grade CRTs taken this spring. Current 8th graders will be the first class required to
score satisfactory or above on the EOIs in order to earn a high school diploma. The ACE Steering Committee is charged with making recommendations to the State Board of Education on intervention and remediation strategies and delivery methods. The State Department of Education is required to provide information about best practices for intervention and remediation, and districts are required to monitor results and report the findings to the State Department of Education. ACE Intervention The Governor’s budget provides $120,000 for intervention measures related to ACE. The law requires intervention for students who score below the satisfactory level on the Oklahoma Core Curriculum Tests in 7th and 8th grade reading and math or on ACE End-Of-Instruction exams. ACE Graduation Coaches The Governor’s budget recommends $2.5 million for ACE Graduation Coaches, who would be responsible for motivating and supporting students in completing their high school education. ACE Middle School Math Labs The Governor’s budget provides $1.5 million to expand the Middle School Math Labs. Initiated in the ACE Act of 2005, funding was initially provided for 10 labs in middle schools with low math performance, and was expanded the following year because the high success rate of the labs. Early Intervention Services The Governor’s budget proposes an increase of $3 million for Early Intervention Services. This funding will provide for program maintenance and enhancement, enabling SoonerStart to continue providing direct early intervention services to infants and toddlers with disabilities and their families. SoonerStart expects to serve 13,540 eligible infants and toddlers and their families in FY-2009. Teacher Working Condition Survey The Governor’s budget recommends $60,000 to fund a teacher working condition survey. This amount will be
FY-2009 Executive Budget
EDUCATION B-65
supplemented by the National Education Association to provide the approximate $100,000 necessary to accomplish the survey. Using a model developed under the leadership of North Carolina Governor Mike Easley, this research will gather school level data that allows school and community leaders to understand what educators think about working conditions. The data will also help schools consider programs and policies that address the specific concerns of their unique teaching corps, as such conditions are closely related to teacher turnover and difficulties in recruiting and retaining teachers.

FY-2009 Executive Budget
EDUCATION B-66
Oklahoma State Regents for Higher Education
Notable Achievements • Since 2000-01, a total of 4,668
additional degrees have been awarded across the State System. The number of degrees conferred have increased by 25%, while enrollment over the same time frame increased 8 – 10%.
• From 2000 to 2004, Oklahoma increased the percent of bachelor’s degrees for Oklahomans age 25 and older from 20.2% to 22.4% and from 47th to 42nd in State Rankings; the national average moved from 25% to 27.2%.
• Eight regional universities across the state will soon complete the first full year of Reach Higher – Oklahoma’s degree completion program. Already, more than 175 adults are enrolled in this program that provides them with the opportunity to complete their baccalaureate degree. The program is a collaboration among institutions and uses distance learning technologies as well as classroom instruction.
• In April 2007, the State Regents
launched www.OKcollegestart.org, a website for students to plan for college. Using searchable tools and interactive databases, www.OKcollegestart.org offers online admission applications, campus information about all of Oklahoma’s public and independent colleges and universities, career exploration, financial aid information, and ACT preparation. It makes exploring and applying to Oklahoma’s colleges and universities quick and easy, saving both time and money. Already, a total of 13,000 students from every county in the state have created personal accounts on the site.
• Higher Education institutions
have Cooperative Alliance agreements with 28 Technology Centers. These are voluntary partnerships that increase
access to technical college-credit programs for high school and adult students in Oklahoma. In Fall 2007, a total of 4,565 students (2127 high school and 2,438 adult students) have been reported as enrolled in a total of 37,555 credit hours (14,070 by high school and 23,485 by adult students).
• The Achieving Classroom Excellence Act
of 2005 (ACE) provides for high school seniors who meet the criteria for concurrent enrollment to receive a tuition waiver for up to six credit hours per semester. The program continues to see significant growth, with a 36% increase in the total number of credit hours waived from 2006 to 2007.
• The State Regents are making a concerted effort to address the growing shortages in Oklahoma's health care workforce by dedicating $4.5 million to institutions offering nursing and allied health care programs. The initiative is expected to annually produce an additional 300 registered nurses, 130 allied health professionals, and 15 additional masters level nursing faculty members. Preliminary reports from institutions indicate they have added the necessary faculty and infrastructure to accomplish these goals, and expect to see increased graduates in the 2007-08 academic years.
• Oklahoma’s Promise/OHLAP now has a
permanent funding source, providing certainty to the scholarship recipients and their families. Approximately 17,000 students will receive $45 million in financial aid through the program in 2007-08.
FY-2008 Total Budgeted Income
Budgeted Carryover
1%Other Income
3%
Gifts and Grants
5%
Local Appropriated
2%
Tuition and Student Fees
37%
State Appropriation
s50%
Other Activities
2%
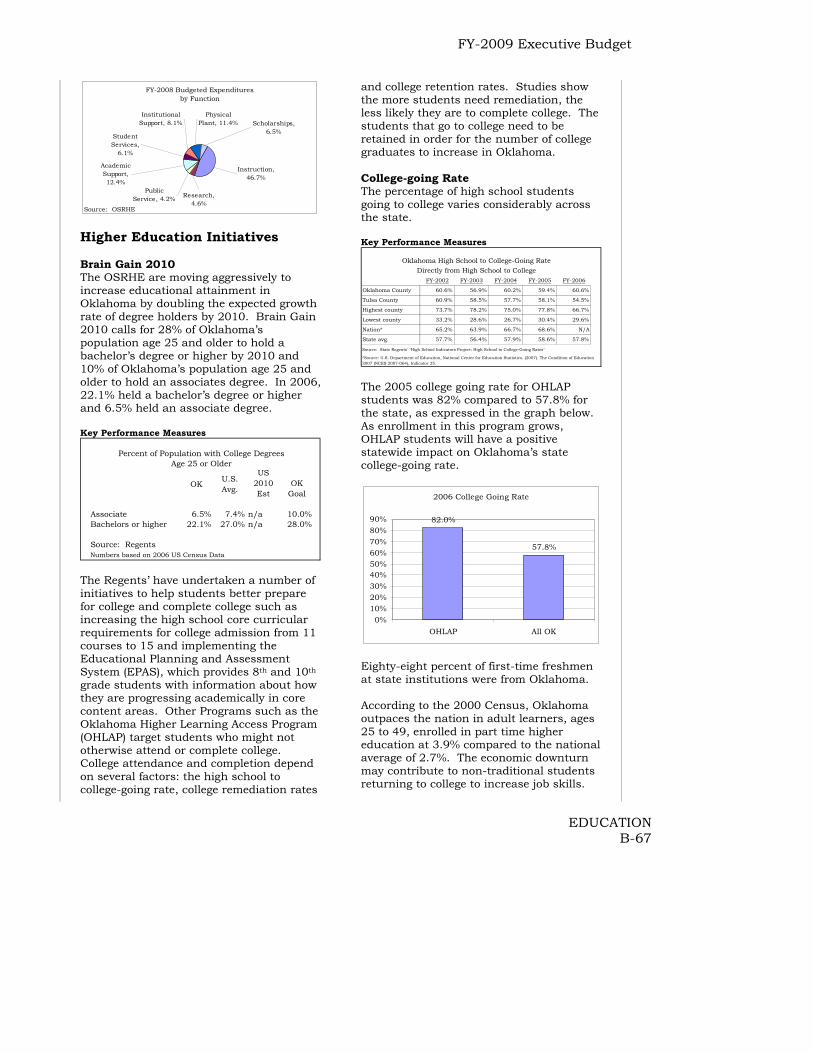
FY-2009 Executive Budget
EDUCATION B-67
FY-2008 Budgeted Expenditures by Function
Scholarships, 6.5%
Physical Plant, 11.4%
Institutional Support, 8.1%
Student Services,
6.1%
Academic Support, 12.4%
Research, 4.6%
Public Service, 4.2%
Instruction, 46.7%
Source: OSRHE Higher Education Initiatives Brain Gain 2010 The OSRHE are moving aggressively to increase educational attainment in Oklahoma by doubling the expected growth rate of degree holders by 2010. Brain Gain 2010 calls for 28% of Oklahoma’s population age 25 and older to hold a bachelor’s degree or higher by 2010 and 10% of Oklahoma’s population age 25 and older to hold an associates degree. In 2006, 22.1% held a bachelor’s degree or higher and 6.5% held an associate degree. Key Performance Measures
Percent of Population with College DegreesAge 25 or Older
OKU.S. Avg.
US 2010 Est
OK Goal
Associate 6.5% 7.4% n/a 10.0%Bachelors or higher 22.1% 27.0% n/a 28.0%
Source: RegentsNumbers based on 2006 US Census Data
The Regents’ have undertaken a number of initiatives to help students better prepare for college and complete college such as increasing the high school core curricular requirements for college admission from 11 courses to 15 and implementing the Educational Planning and Assessment System (EPAS), which provides 8th and 10th grade students with information about how they are progressing academically in core content areas. Other Programs such as the Oklahoma Higher Learning Access Program (OHLAP) target students who might not otherwise attend or complete college. College attendance and completion depend on several factors: the high school to college-going rate, college remediation rates
and college retention rates. Studies show the more students need remediation, the less likely they are to complete college. The students that go to college need to be retained in order for the number of college graduates to increase in Oklahoma. College-going Rate The percentage of high school students going to college varies considerably across the state. Key Performance Measures
Oklahoma High School to College-Going RateDirectly from High School to College
FY-2002 FY-2003 FY-2004 FY-2005 FY-2006
Oklahoma County 60.6% 56.9% 60.2% 59.4% 60.6%
Tulsa County 60.9% 58.5% 57.7% 58.1% 54.5%
Highest county 73.7% 78.2% 75.0% 77.8% 66.7%
Lowest county 33.2% 28.6% 26.7% 30.4% 29.6%
Nation* 65.2% 63.9% 66.7% 68.6% N/A
State avg. 57.7% 56.4% 57.9% 58.6% 57.8%
Source: State Regents' "High School Indicators Project: High School to College-Going Rates"
*Source: U.S. Department of Education, National Center for Education Statistics. (2007). The Condition of Education 2007 (NCES 2007-064), Indicator 25. The 2005 college going rate for OHLAP students was 82% compared to 57.8% for the state, as expressed in the graph below. As enrollment in this program grows, OHLAP students will have a positive statewide impact on Oklahoma’s state college-going rate.
2006 College Going Rate
82.0%
57.8%
0%10%20%30%40%50%60%70%80%90%
OHLAP All OK
Eighty-eight percent of first-time freshmen at state institutions were from Oklahoma. According to the 2000 Census, Oklahoma outpaces the nation in adult learners, ages 25 to 49, enrolled in part time higher education at 3.9% compared to the national average of 2.7%. The economic downturn may contribute to non-traditional students returning to college to increase job skills.

FY-2009 Executive Budget
EDUCATION B-68
Remediation rate College graduation rates are also a function of college remediation. A study conducted by the Education Commission of the States concluded students who require more than one remediation class are two times less likely to complete college than those students requiring no remedial courses. In the fall of 2005, 32.6% of first-time freshmen were enrolled in at least one remedial mathematics course, 17.9% in a remedial English course and 4.3% in a remedial Reading course. Key Performance Measure
Remediation Rates by Subject FY-2006 Fall Freshmen
1.8%
17.9%
32.6%
4.3%
37.8%
0.0%
10.0%
20.0%
30.0%
40.0%
50.0%
Science English Math Reading TotalUnduplicated
S R t "R di ti R t " Source: State Regents "Annual Remediation Report" February 2007
In FY-2006, first-time freshmen direct from Oklahoma high schools had a remediation rate of 36.7%, compared to 37.8% for all first-time freshmen.
Remediation Rates for all Fall Freshmen
38.8%
38.4%
37.4%
38.7%
37.8%
36.5%
37.0%
37.5%
38.0%
38.5%
39.0%
FY-2002 FY-2003 FY-2004 FY-2005 FY-2006
Retention and Graduation rate College retention rates also play a critical role in college completion. Students need to return for their sophomore year after successful completion of their freshman year. Six-year graduation rates of entering freshmen at the colleges and universities continue to improve; however, Oklahoma lags behind the nation.
Key Performance Measure First Year Persistence Rates Within the State
79.1
%
64.9%
78.2%
90.8%
77.9%
67.3
%91
.3%
91.2%
67.0
%
0%
20%
40%
60%
80%
100%
Comprehensive Regional Two-Year
FY-2004 FY-2005 FY-2006Surce: Reg ents "200 5-20 06 Stud ent Data Rep ort" Oklahoma graduation rates at the regional and two-year institutions are especially low. Key Performance Measure
Degrees Conferred
6,522 6,806 7,425 8,002 8,184 8,290
12,476 12,682 13,148 13,767 14,649 15,218
-2,0004,0006,0008,000
10,00012,00014,00016,000
FY-2001 FY-2002 FY-2003 FY-2004 FY-2005 FY-2006
Associate Degree Bachelor's Degree Keeping Oklahoma graduates in Oklahoma and attracting others goes beyond the realm of higher education. It involves complex interactions between quality of life issues as well as income levels and job opportunities. A higher percentage of graduates who were Oklahoma residents remain in the state one year after graduation: approximately 88% of bachelor degree holders, 91% of associates and 82% of doctorates. Of the graduates who were non residents, about 22% are still in Oklahoma five years after graduation. Scholarships and Grants Oklahoma Higher Learning Access Program – Oklahoma’s Promise A 2001 study (Postsecondary Education Opportunity, September 2003) indicated that nationally only 4.5% of dependents in households with family incomes between $35,000-$65,000 per year attain a bachelor’s degree by age 24. Recognizing the need to establish a program focused on this population, the Legislature created the Oklahoma Higher Learning Access Program (OHLAP).

FY-2009 Executive Budget
EDUCATION B-69
Created in 1992, OHLAP provides academically prepared students in low to moderate income households five years of tuition at any public education institution in Oklahoma or a portion of tuition at any private college in Oklahoma. In the 2007 Legislative Session, the Governor and the Legislature established a dedicated revenue source for Oklahoma’s Promise to ensure reliable and sufficient funding for future students. The Regents are required to submit a funding estimate for the upcoming fiscal year to the Board of Equalization prior to November 1 of each year. The estimate is removed from the total amount of General Revenue before the official certification is made by the Board of Equalization, reserving the necessary funds for Oklahoma’s Promise to be fulfilled. The above average college-going rates of OHLAP students indicate that OHLAP is expanding college access to more Oklahoma students To qualify students must: • enroll in the 8th, 9th or 10th grade and
have a family income below $50,000/year;
• earn a minimum 2.5 grade point average and take a college preparatory curriculum which includes two years of a foreign language or two years of computer science;
• remain drug and alcohol free; and
• not be adjudicated for any criminal offense.
Nine years of data show that OHLAP has the potential to increase the number of Oklahoma students attending and completing higher education. Compared to Oklahoma’s current student population, data has shown that OHLAP students: • Earn higher-than-average high school
GPA’s;
Key Performance Measure
High School GPA OHLAP vs. OK Seniors
3.49 3.49 3.47 3.46 3.45 3.42
3.003.003.003.003.00
2.60
2.80
3.00
3.20
3.40
3.60
FY-2002 FY-2003 FY-2004 FY-2005 FY-2006 FY-2007
OHLAP OK Seniors
• Earn higher than average ACT scores; • Have higher college-going rates; • Require less remediation in college; Key Performance Measure
OHLAP Co llege Remedia tio n Ra tes
29.8%31.8%
32.3%30.4%
32.5%33.1%
27.5%
36.7%36.1%
35.0%36.2%
36.5%
34.1%
20%
22%
24%
26%
28%
30%
32%
34%
36%
38%
FY-2000 FY-2001 FY-2002 FY-2003 FY-2004 FY-2005 FY-2006
OHLAP HS GradsSo urce : OSRHE
• Enroll full-time in college at higher-than-
average rates; • Persist in college at high rates; and • Are initially completing college degrees at
a higher-than-average rate. Key Performance Measure
5 Year Degree Completion Rate - 2002 Class (within the state)
40.3 37.8
25%
1025%
2025%
3025%
4025%
5025%
2002 OHLAP 2000 1st Time FreshmenSource: OSRHE

FY-2009 Executive Budget
EDUCATION B-70
Key Performance Measure
High School Students Enrolled in OHLAP vs. Completing
7,185
7,758
8,181
9,
521
9,664
5,049
5,357
5,648
6,265
6,400
-
2,000
4,000
6,000
8,000
10,000
12,000
FY-2004 FY-2005 FY-2006 FY-2007 FY-2008*
Enrolled Completing* Completing number is an estimate.
• In FY-2007, 65.8% of students enrolled
in OHLAP completed the program. Academic Scholars Created in 1988 to encourage the state's and the nation's best students to attend higher education institutions in Oklahoma, this program provides scholarships to students meeting criteria established by the Oklahoma Legislature and the OSRHE. Students qualify by receiving an official national designation, achieving outstanding ACT or SAT scores or receiving a nomination by a college or university. The amount of the award ranges from $3,500 per year to $5,500, according to the type of institution, and includes a tuition waiver. For FY-2008, scholarships in the amount of approximately $9.3 million will be awarded to 2,100 students. Oklahoma Tuition Aid Grant (OTAG) This need-based program provides a maximum annual award of 75% of enrollment costs or $1,000, whichever is less, to low-income students residing in Oklahoma enrolled full- or part-time in a public higher education institution or career tech school. The criteria to be eligible for OTAG is Expected Family Contribution of no more that $1,500, as calculated by the Free Application for Federal Student Aid. For students enrolled in private institutions, the maximum award is $1,300. For FY-2008, funding was sufficient for an estimated 23,500 awards.
GEAR UP Gaining Early Awareness and Readiness for Undergraduate Programs (GEAR UP) is a federal program designed to better prepare middle and high school students for college through mentoring programs and scholarships as well as new academic preparations and awareness programs for students and parents. This national initiative began in 1998 to encourage more American youth to have high expectations, stay in school, study hard and take the right courses to prepare for college. Nationwide, more than 670 partnerships applied for GEAR UP funds. Oklahoma GEAR UP was one of the 164 successful applicants and was awarded a total of $25.1 million for six years. Oklahoma received another six year GEAR UP award on September 1, 2005. The Phase II amount was $20.6 million over the next five years and will enable the state to expand the number of districts and students served. The State Regents GEAR UP project has implemented activities that focus on providing college access information, teacher and counselor professional development, and developing partnerships with local community and faith-based organizations to raise college aspirations. Since the beginning of its current grant, GEAR UP has provided nearly $1,550,000 in sub grant funding to 47 Oklahoma public school sites and 26 community organizations to help increase the number of low-income students who are prepared to enter and succeed in postsecondary education. An average of 90,000 students are served each year. Since its inception in 1999, Oklahoma GEAR UP has provided sub grants to 191 school districts and school sites. In the 2006-2007 school year, GEAR UP has focused its efforts in 23 school districts to provide comprehensive training opportunities for teachers, counselors and school administrators designed to improve student learning and retention across three areas: curriculum/instruction, guidance and educational leadership.
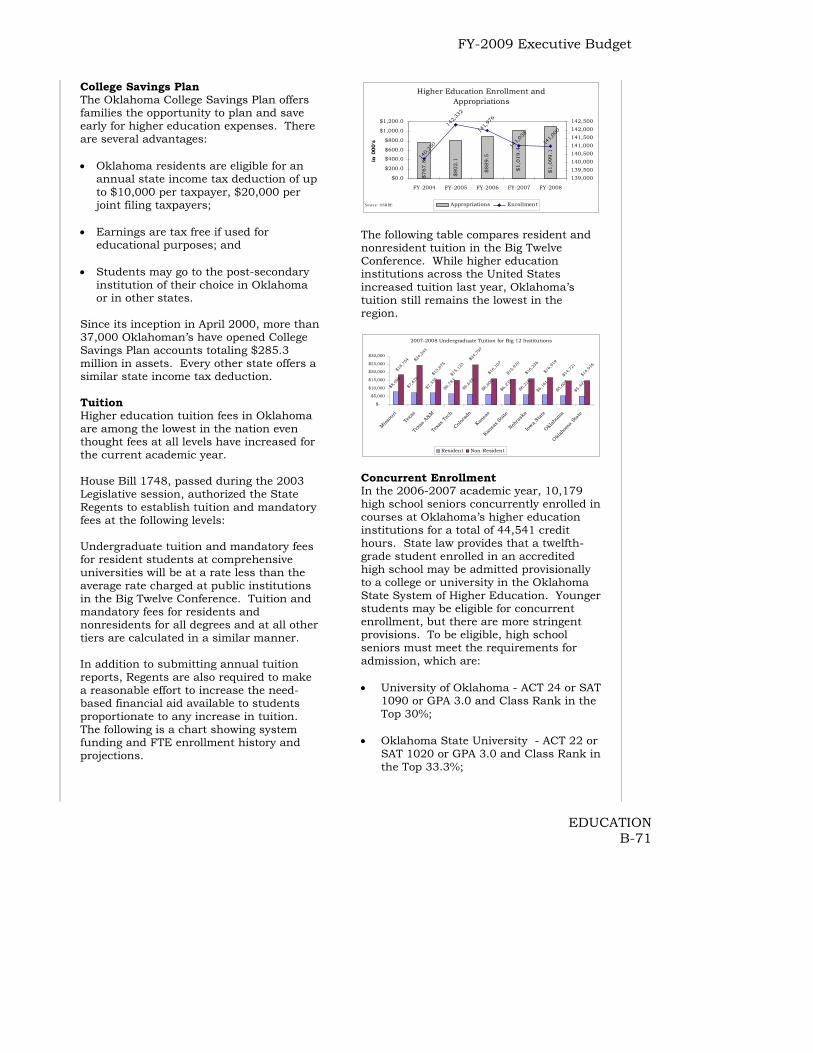
FY-2009 Executive Budget
EDUCATION B-71
College Savings Plan The Oklahoma College Savings Plan offers families the opportunity to plan and save early for higher education expenses. There are several advantages: • Oklahoma residents are eligible for an
annual state income tax deduction of up to $10,000 per taxpayer, $20,000 per joint filing taxpayers;
• Earnings are tax free if used for
educational purposes; and • Students may go to the post-secondary
institution of their choice in Oklahoma or in other states.
Since its inception in April 2000, more than 37,000 Oklahoman’s have opened College Savings Plan accounts totaling $285.3 million in assets. Every other state offers a similar state income tax deduction. Tuition Higher education tuition fees in Oklahoma are among the lowest in the nation even thought fees at all levels have increased for the current academic year. House Bill 1748, passed during the 2003 Legislative session, authorized the State Regents to establish tuition and mandatory fees at the following levels: Undergraduate tuition and mandatory fees for resident students at comprehensive universities will be at a rate less than the average rate charged at public institutions in the Big Twelve Conference. Tuition and mandatory fees for residents and nonresidents for all degrees and at all other tiers are calculated in a similar manner. In addition to submitting annual tuition reports, Regents are also required to make a reasonable effort to increase the need-based financial aid available to students proportionate to any increase in tuition. The following is a chart showing system funding and FTE enrollment history and projections.
Higher Education Enrollment and Appropriations
$767
.8
$802
.1
$889
.5
$1,0
99.1
$1,0
19.4
141,0
3814
1,976
142,3
32
140,2
50 141,0
00
$0.0
$200.0
$400.0
$600.0
$800.0
$1,000.0
$1,200.0
FY-2004 FY-2005 FY-2006 FY-2007 FY-2008
in 0
00's
139,000139,500140,000140,500141,000141,500142,000142,500
Appropriations EnrollmentSo urce: OSRHE The following table compares resident and nonresident tuition in the Big Twelve Conference. While higher education institutions across the United States increased tuition last year, Oklahoma’s tuition still remains the lowest in the region.
2007-2008 Undergraduate Tuition for Big 12 Institutions
$15
,675
$15
,123
$2
4,79
7
$16,
107
$15,
970
$16,
236
$16,
919
$14
,721
$14
,916
$5,4
91
$5,6
07
$6,1
61
$6,2
16
$6,2
35
$6,6
00
$6,6
35
$6,7
83
$7,
335
$7,
670
$8,
098
$18
,754
$2
4,54
4
$-
$5,000
$10,000
$15,000
$20,000
$25,000
$30,000
Miss
ouri
Texa
s
Texa
s A&M
Texa
s Tec
h
Colora
do
Kansa
s
Kansa
s Sta
te
Nebra
ska
Iowa S
tate
Oklah
oma
Oklah
oma S
tate
Resident Non-Resident Concurrent Enrollment In the 2006-2007 academic year, 10,179 high school seniors concurrently enrolled in courses at Oklahoma’s higher education institutions for a total of 44,541 credit hours. State law provides that a twelfth-grade student enrolled in an accredited high school may be admitted provisionally to a college or university in the Oklahoma State System of Higher Education. Younger students may be eligible for concurrent enrollment, but there are more stringent provisions. To be eligible, high school seniors must meet the requirements for admission, which are: • University of Oklahoma - ACT 24 or SAT
1090 or GPA 3.0 and Class Rank in the Top 30%;
• Oklahoma State University - ACT 22 or
SAT 1020 or GPA 3.0 and Class Rank in the Top 33.3%;
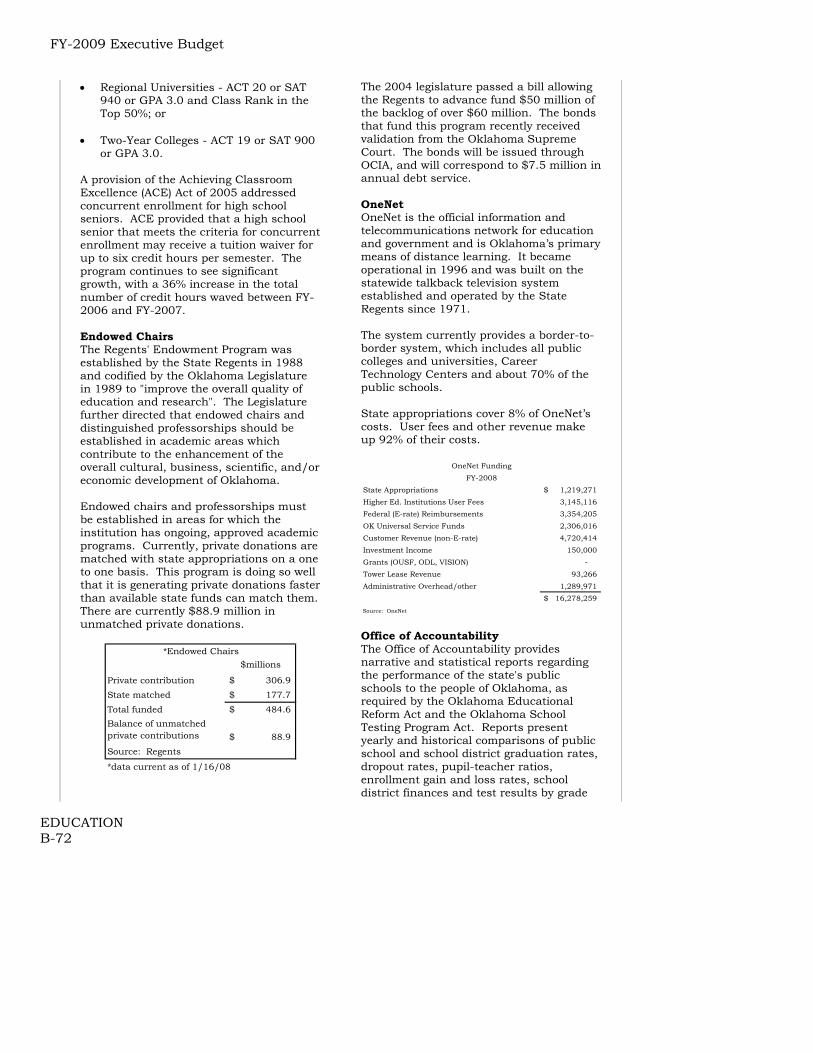
FY-2009 Executive Budget
EDUCATION B-72
• Regional Universities - ACT 20 or SAT 940 or GPA 3.0 and Class Rank in the Top 50%; or
• Two-Year Colleges - ACT 19 or SAT 900
or GPA 3.0. A provision of the Achieving Classroom Excellence (ACE) Act of 2005 addressed concurrent enrollment for high school seniors. ACE provided that a high school senior that meets the criteria for concurrent enrollment may receive a tuition waiver for up to six credit hours per semester. The program continues to see significant growth, with a 36% increase in the total number of credit hours waved between FY-2006 and FY-2007. Endowed Chairs The Regents' Endowment Program was established by the State Regents in 1988 and codified by the Oklahoma Legislature in 1989 to "improve the overall quality of education and research". The Legislature further directed that endowed chairs and distinguished professorships should be established in academic areas which contribute to the enhancement of the overall cultural, business, scientific, and/or economic development of Oklahoma. Endowed chairs and professorships must be established in areas for which the institution has ongoing, approved academic programs. Currently, private donations are matched with state appropriations on a one to one basis. This program is doing so well that it is generating private donations faster than available state funds can match them. There are currently $88.9 million in unmatched private donations.
$millions
Private contribution 306.9$ State matched 177.7$ Total funded 484.6$ Balance of unmatched private contributions 88.9$ Source: Regents
*data current as of 1/16/08
*Endowed Chairs
The 2004 legislature passed a bill allowing the Regents to advance fund $50 million of the backlog of over $60 million. The bonds that fund this program recently received validation from the Oklahoma Supreme Court. The bonds will be issued through OCIA, and will correspond to $7.5 million in annual debt service. OneNet OneNet is the official information and telecommunications network for education and government and is Oklahoma’s primary means of distance learning. It became operational in 1996 and was built on the statewide talkback television system established and operated by the State Regents since 1971. The system currently provides a border-to-border system, which includes all public colleges and universities, Career Technology Centers and about 70% of the public schools. State appropriations cover 8% of OneNet’s costs. User fees and other revenue make up 92% of their costs.
State Appropriations 1,219,271$ Higher Ed. Institutions User Fees 3,145,116 Federal (E-rate) Reimbursements 3,354,205 OK Universal Service Funds 2,306,016 Customer Revenue (non-E-rate) 4,720,414 Investment Income 150,000 Grants (OUSF, ODL, VISION) - Tower Lease Revenue 93,266 Administrative Overhead/other 1,289,971
16,278,259$ Source: OneNet
OneNet FundingFY-2008
Office of Accountability The Office of Accountability provides narrative and statistical reports regarding the performance of the state's public schools to the people of Oklahoma, as required by the Oklahoma Educational Reform Act and the Oklahoma School Testing Program Act. Reports present yearly and historical comparisons of public school and school district graduation rates, dropout rates, pupil-teacher ratios, enrollment gain and loss rates, school district finances and test results by grade

FY-2009 Executive Budget
EDUCATION B-73
and subject/section in a socioeconomic context. The Office of Accountability oversees the Educational Indicators Program. This program provides reports on school performance at the State, District, and School level. In all, over 100 statistical measures of curriculum, budget, programs, student performance, and community characteristics are provided to educational stakeholders. Reports are provided to parents, educators, researchers, grant writers, and policy makers. The office has distributed nearly 10 million school report cards over the last 15 years and now averages over 100,000 report card downloads per month from its www.SchoolReportCard.org web site. The Office of Accountability also oversees the School Performance Review Program, authorized by legislation passed in 2001. A school performance review evaluates every aspect of school district operation. Districts may request a review or a review may be triggered by a district overspending in the area of Administration, as determined by the State Department of Education. The program’s goal is to identify specific ways to reduce costs, enhance efficiency and reallocate savings into the classroom. The law requires that all realized savings to school districts as a result of a review be directed into additional funding of classroom services. Since FY-2003, the Office has completed 14 School performance reviews. During the last year the office completed reviews of Broken Bow Public Schools, Idabel Public Schools, Frederick Public Schools, Springer Public Schools, Wynnewood Public Schools, and Felt Public Schools. It is currently working on reviews at Weleetka Public Schools, Wetumka Public Schools, Justice Public Schools, Sasakwa Public Schools, and Okmulgee Public Schools. Later this year the office will start reviews at Mounds, Tipton, and Cement. Since its inception, the School Performance Review Program has identified over $12.5 million of savings for the participating districts.
Quartz Mountain The Quartz Mountain Arts and Conference Center is the chosen destination for various State and private business conferences in addition to being the home of the summer and fall fine arts institutes conducted by the Oklahoma Arts Institute. Quartz Mountain Arts and Conference Center and Nature Park offers a variety of recreational options for the resort and park visitor. Water-skiing, fishing and jet skiing are popular summer sports. The park includes a system of hiking and biking trails, an 18-hole golf course and paddleboats. It is a favorite spot for rock-climbers, photographers and bird-watchers. The north fork of the Red River runs through the park. The Oklahoma Summer Arts Institute is a two-week residential school providing pre-professional training to Oklahoma's artistically talented students, ages 14-18. This year 270 students participated. Students are chosen through a competitive audition process. The Oklahoma Fall Arts Institutes are an annual series of four-day workshop retreats for amateur and professional artists, public school teachers and college and university instructors. Anyone age 21 or over is welcome to attend these intensive, hands-on workshops. Class sizes are limited to ensure close working relationships between participants and artists. This year 400 participants including teachers, professors and artists attended the Fall Arts Institutes.

FY-2009 Executive Budget
EDUCATION B-74
FY-2009 Recommendation
FY-2008 Appropriation $1,053,950Removal of One-Time Capital (2,200)OHLAP Line Item (48,100.0)
FY-2008 Base $1,003,650FY-2008 Bud. FTE Level 315.0Actual Ave. YTD FTE 296.8
Funding Adjustments: Institutional Operations 13,000 EESIP 6,100 CLASS Task Force 500 Urban Education 10,000 Concurrent Enrollment 350 Annualization of One-Time Funding 22,821 Total Adjustments 52,771
OHLAP Dedicated Funding 54,100
FY-2009 Recommendation $1,110,521$ Change from FY-2008 $56,571% Change from FY-2008 5.37%
FY-2009 Appropriation(amounts in thousands)
Source: Office of State Finance
Removal of One-Time Capital The Governor’s budget removes a $1 million appropriation for capital purposes at OU and a $1.2 million appropriation for capital purposes at OSU-Tulsa. Removal of OHLAP Line Item Pursuant to SB 820, 2007, the Governor’s budget removes the line item appropriation for OHLAP. This funding will be replaced to fill the estimated need in FY-2009 with dedicated funding from the General Revenue Fund. Institutional Operations The Governor’s budget includes $13 million for institutional budgets. This money will be distributed among institutions for mandatory costs (health and risk management insurance), operating costs for new facilities, replacement of faculty positions, new faculty positions and other support staff positions.
EESIP The Governor’s budget includes $6.1 million to fund the increased employer share of teacher retirement contributions pursuant to SB 357, passed by the 2007 Legislature. The employer’s contribution rate increases from 8.35% to 8.5% on July 1, 2008, and then to 9.0% on January 1, 2009. CLASS Task Force The Governor’s budget provides $500,000 to implement the initial recommendations of the Campus Life and Safety and Security (CLASS) Task Force. Created by an Executive Order from Governor Henry in April 2007, the purpose of the task force was to review and evaluate current safety and security plans and student counseling services already in place for higher education and career technology institutions and to make recommendations for any needed changes. Urban Education The Governor’s budget includes $10 million to enhance the urban education mission of Langston University in Oklahoma City and Tulsa. These additional funds will enable the University to expand faculty positions and program offerings. Concurrent Enrollment The Governor’s provides an additional $350,000 to fund increased participation in the Concurrent Enrollment Waiver Program. In the 2006-2007 academic year, 10,179 high school seniors concurrently enrolled in courses at Oklahoma’s higher education institutions for a total of 44,541 credit hours. Annualiziation of One-Time Funding HB 1105 provided a one-time revenue source to the Regents for certain recurring obligations. The Governor’s budget includes $20 million to replace operation funding and $2,821,093 to replace funding for EESIP costs, both provided for FY-2008 from these one-time revenues. Dedicated Funding Source for OHLAP Pursuant to Oklahoma Statutes Title 62-10.4, the Governor’s budget includes a

FY-2009 Executive Budget
EDUCATION B-75
$54.1 million transfer of General Revenue to OHLAP to ensure Oklahoma keeps its promise to Oklahoma students. Capital Spending Proposal The Governor's budget proposes including $62 million in a capital bond issue for Urban Education Centers in Oklahoma City and Tulsa. This funding will enable Langston University to build or purchase facilities, furniture and equipment, helping fulfill the University’s urban education mission.

FY-2009 Executive Budget
EDUCATION B-76
Oklahoma Department of Libraries (ODL)
Notable Achievements • ODL’s successful First Book/Ready to
Learn initiative began its second decade by providing more than 19,200 books to at-risk pre-school children at 42 sites around the state. Approximately 1,600 children now participate in the program each year, and each child receives 12 free books. In most cases, the books are the first for these children to call their very own. Having reading materials in the home is one of the most powerful indicators of future literacy success. In addition to serving 35 elementary schools in the state, the project has incorporated seven Temporary Assistance to Needy Families (TANF) literacy sites, where parents are improving their own reading skills and are able to read aloud to their children.
• ODL published one of its most successful
editions of the Oklahoma Almanac in FY-2007. Positive feedback has come from individuals in both government and business, and sales have reflected this excitement with 70% of the stock distributed and sold just nine months into the biennial publication’s shelf life.
• ODL’s partnership with the state's web
portal consultant, NIC, provides the only web search service that captures all of state government. ODL’s SoonerSearch service currently examines and indexes web pages and documents found on Oklahoma state agency websites and helps citizens locate them through strategically placed search pages. NIC provides hardware and software from Google Corporation, and the ODL staff manages the indexing activities and day-to-day quality control. Over 1.2 million searches were performed during FY-2007 via the OK.gov web portal and individual agency search sites.
• Oklahoma’s land surveyors, engineers,
businesses and interested citizens have
easier access to the state’s public land corner records, thanks to an on-going partnership with HubTack, Inc., a subscription-based service that provides online access to the records. In FY-2007, ODL staff provided 8,286 images of newly filed records to HubTack for uploading to the Internet so that users can retrieve the images in their offices or in the field. At the end of FY-2007, more than 125,000 records were filed and imaged.
Mission The Oklahoma Department of Libraries (ODL) serves the citizens of Oklahoma by providing information services and preserving unique government information resources. As a comprehensive state library agency, the Oklahoma Department of Libraries provides public library development services to the library community, as well as archives and records management services to the public and state government. The agency also maintains law and legislative reference resources, as well as state and federal government information resources. Through a combination of traditional print and online web services, the ODL provides convenient public access to state publications and information. The agency also provides access to and retention of state records of temporary and permanent value. Information resources are preserved for future generations. The Department also publishes Oklahoma’s official bluebook of state government information, the Oklahoma Almanac. The graph below shows a breakdown of the agency’s budgeted expenditures for FY-2008.
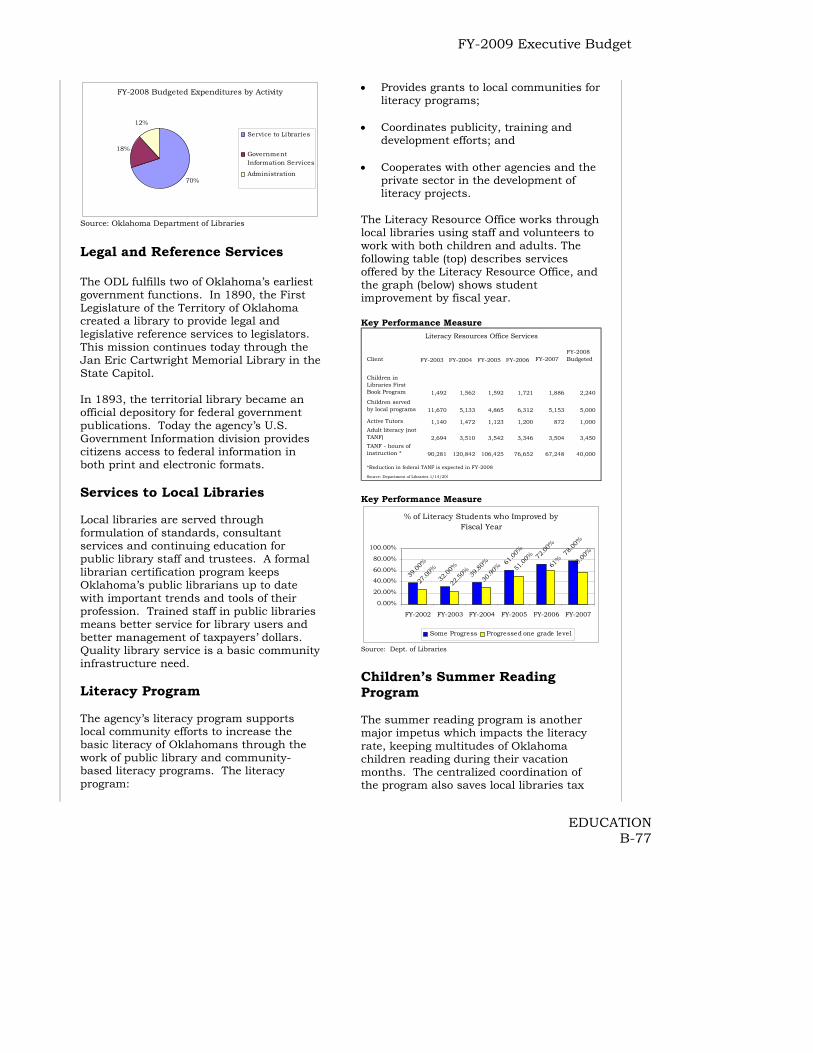
FY-2009 Executive Budget
EDUCATION B-77
FY-2008 Budgeted Expenditures by Activity
70%
18%
12%
Service to Libraries
GovernmentInformation Services
Administration
Source: Oklahoma Department of Libraries
Legal and Reference Services The ODL fulfills two of Oklahoma’s earliest government functions. In 1890, the First Legislature of the Territory of Oklahoma created a library to provide legal and legislative reference services to legislators. This mission continues today through the Jan Eric Cartwright Memorial Library in the State Capitol. In 1893, the territorial library became an official depository for federal government publications. Today the agency’s U.S. Government Information division provides citizens access to federal information in both print and electronic formats. Services to Local Libraries Local libraries are served through formulation of standards, consultant services and continuing education for public library staff and trustees. A formal librarian certification program keeps Oklahoma’s public librarians up to date with important trends and tools of their profession. Trained staff in public libraries means better service for library users and better management of taxpayers’ dollars. Quality library service is a basic community infrastructure need. Literacy Program The agency’s literacy program supports local community efforts to increase the basic literacy of Oklahomans through the work of public library and community-based literacy programs. The literacy program:
• Provides grants to local communities for literacy programs;
• Coordinates publicity, training and
development efforts; and • Cooperates with other agencies and the
private sector in the development of literacy projects.
The Literacy Resource Office works through local libraries using staff and volunteers to work with both children and adults. The following table (top) describes services offered by the Literacy Resource Office, and the graph (below) shows student improvement by fiscal year. Key Performance Measure
Client FY-2003 FY-2004 FY-2005 FY-2006 FY-2007FY-2008 Budgeted
Children in Libraries First Book Program 1,492 1,562 1,592 1,721 1,886 2,240Children served by local programs 11,670 5,133 4,865 6,312 5,153 5,000
Active Tutors 1,140 1,472 1,123 1,200 872 1,000Adult literacy (not TANF) 2,694 3,510 3,542 3,346 3,504 3,450TANF - hours of instruction * 90,281 120,842 106,425 76,652 67,248 40,000
Literacy Resources Office Services
Source: Department of Libraries 1/14/200
*Reduction in federal TANF is expected in FY-2008
Key Performance Measure
% of Literacy Students who Improved by Fiscal Year
78.00
%
58.00
%
32.00
%39
.80% 61
.00%
72.00
%
39.00
% 61%
51.00
%
30.90
%
22.50
%
27.00
%
0.00%
20.00%
40.00%
60.00%
80.00%
100.00%
FY-2002 FY-2003 FY-2004 FY-2005 FY-2006 FY-2007
Some Progress Progressed one grade level
Source: Dept. of Libraries
Children’s Summer Reading Program The summer reading program is another major impetus which impacts the literacy rate, keeping multitudes of Oklahoma children reading during their vacation months. The centralized coordination of the program also saves local libraries tax

FY-2009 Executive Budget
EDUCATION B-78
dollars, while providing quality materials and programs that would not otherwise be available to many children. The number of children participating in the summer reading program has dramatically increased in the last few years, as shown in the table below. Key Performance Measure
# of children enrolled
% of eligible children enrolled
FY-2003 86,868 25%FY-2004 97,820 28%FY-2005 84,250 26%FY-2006 86,331 27%FY-2007 87,331 25%FY-2008 Bud. 88,331 26%
Summer Reading Program
Source: Department of Libraries 1/14/2008
FY-2009 Recommendation
FY-2008 Appropriation $7,295FY-2008 Bud. FTE Level 65.9Actual Ave. YTD FTE 61.1
Funding Adjustments: State Employee Pay Raise 60
FY-2009 Recommendation $7,355% Change from FY-2008 0.82%
(amounts in thousands)
Source: Office of State Finance
FY-2009 Appropriation
State Employee Pay Raise The Governor’s budget includes $59,843 for a 5% state employee pay increase for the Department of Libraries effective January 1, 2009. This funding is based on October 2007 salary information.
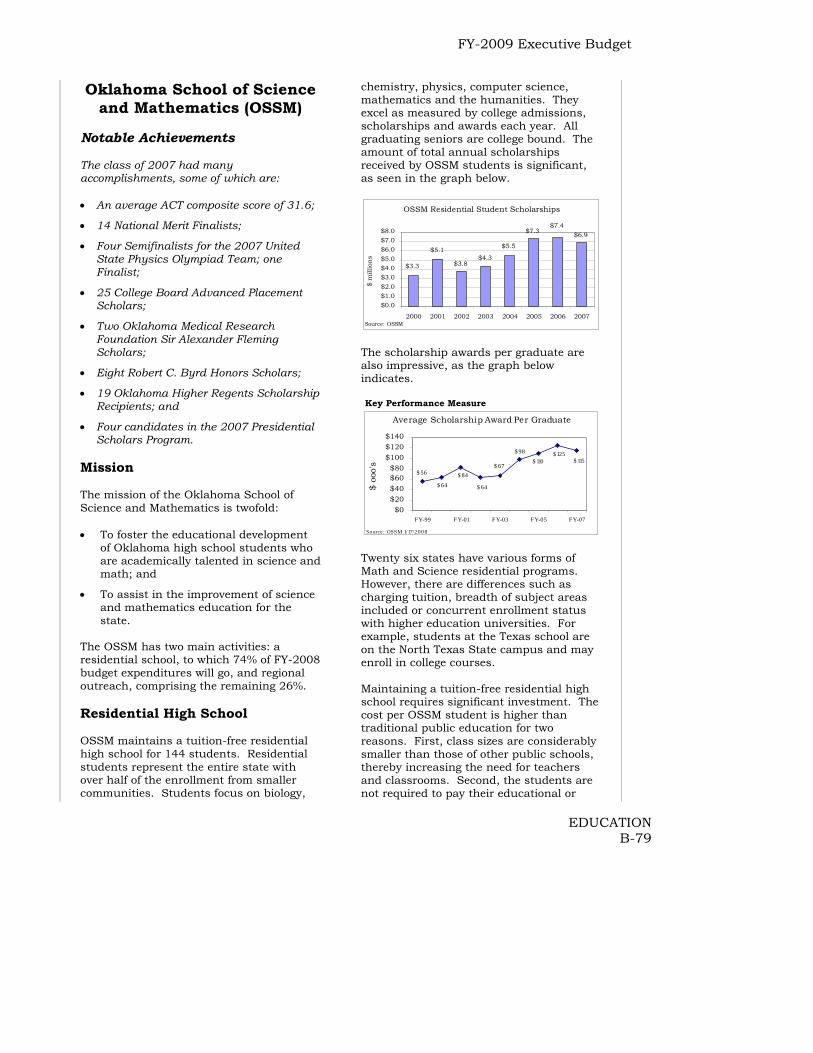
FY-2009 Executive Budget
EDUCATION B-79
Oklahoma School of Science and Mathematics (OSSM)
Notable Achievements The class of 2007 had many accomplishments, some of which are: • An average ACT composite score of 31.6;
• 14 National Merit Finalists;
• Four Semifinalists for the 2007 United State Physics Olympiad Team; one Finalist;
• 25 College Board Advanced Placement Scholars;
• Two Oklahoma Medical Research Foundation Sir Alexander Fleming Scholars;
• Eight Robert C. Byrd Honors Scholars;
• 19 Oklahoma Higher Regents Scholarship Recipients; and
• Four candidates in the 2007 Presidential Scholars Program.
Mission The mission of the Oklahoma School of Science and Mathematics is twofold: • To foster the educational development
of Oklahoma high school students who are academically talented in science and math; and
• To assist in the improvement of science and mathematics education for the state.
The OSSM has two main activities: a residential school, to which 74% of FY-2008 budget expenditures will go, and regional outreach, comprising the remaining 26%. Residential High School OSSM maintains a tuition-free residential high school for 144 students. Residential students represent the entire state with over half of the enrollment from smaller communities. Students focus on biology,
chemistry, physics, computer science, mathematics and the humanities. They excel as measured by college admissions, scholarships and awards each year. All graduating seniors are college bound. The amount of total annual scholarships received by OSSM students is significant, as seen in the graph below.
OSSM Residential Student Scholarships
$3.3
$5.5
$6.9$7.4
$7.3
$4.3$3.8
$5.1
$0.0$1.0$2.0$3.0$4.0$5.0$6.0$7.0$8.0
2000 2001 2002 2003 2004 2005 2006 2007
$ m
illio
ns
Source: OSSM The scholarship awards per graduate are also impressive, as the graph below indicates. Key Performance Measure
Average Scholarship Award Per Graduate
$ 56
$ 64
$ 84
$ 64
$ 67
$ 98
$ 110$ 125
$ 115
$0$20$40$60$80
$100$120$140
FY-99 FY-01 FY-03 FY-05 FY-07
$ oo
o's
Source: OSSM 1/17/2 00 8 Twenty six states have various forms of Math and Science residential programs. However, there are differences such as charging tuition, breadth of subject areas included or concurrent enrollment status with higher education universities. For example, students at the Texas school are on the North Texas State campus and may enroll in college courses. Maintaining a tuition-free residential high school requires significant investment. The cost per OSSM student is higher than traditional public education for two reasons. First, class sizes are considerably smaller than those of other public schools, thereby increasing the need for teachers and classrooms. Second, the students are not required to pay their educational or
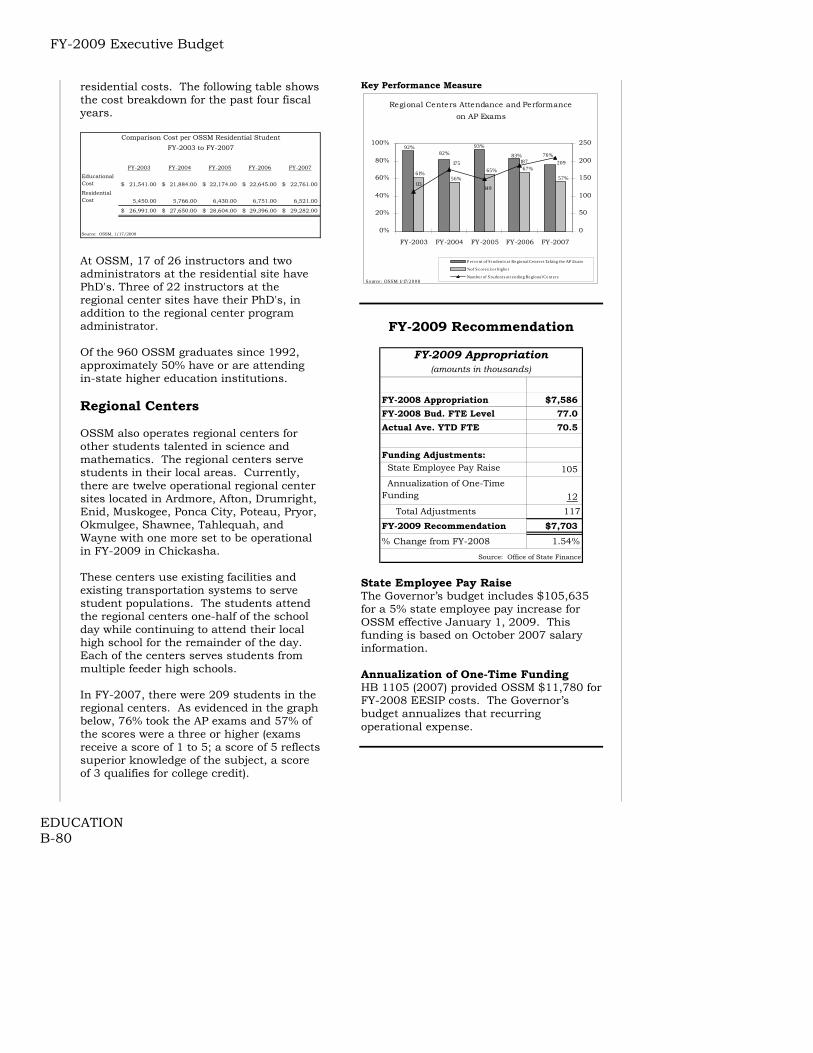
FY-2009 Executive Budget
EDUCATION B-80
residential costs. The following table shows the cost breakdown for the past four fiscal years.
FY-2003 FY-2004 FY-2005 FY-2006 FY-2007Educational Cost 21,541.00$ 21,884.00$ 22,174.00$ 22,645.00$ 22,761.00$ Residential Cost 5,450.00 5,766.00 6,430.00 6,751.00 6,521.00
26,991.00$ 27,650.00$ 28,604.00$ 29,396.00$ 29,282.00$
Source: OSSM, 1/17/2008
Comparison Cost per OSSM Residential StudentFY-2003 to FY-2007
At OSSM, 17 of 26 instructors and two administrators at the residential site have PhD's. Three of 22 instructors at the regional center sites have their PhD's, in addition to the regional center program administrator. Of the 960 OSSM graduates since 1992, approximately 50% have or are attending in-state higher education institutions. Regional Centers OSSM also operates regional centers for other students talented in science and mathematics. The regional centers serve students in their local areas. Currently, there are twelve operational regional center sites located in Ardmore, Afton, Drumright, Enid, Muskogee, Ponca City, Poteau, Pryor, Okmulgee, Shawnee, Tahlequah, and Wayne with one more set to be operational in FY-2009 in Chickasha. These centers use existing facilities and existing transportation systems to serve student populations. The students attend the regional centers one-half of the school day while continuing to attend their local high school for the remainder of the day. Each of the centers serves students from multiple feeder high schools. In FY-2007, there were 209 students in the regional centers. As evidenced in the graph below, 76% took the AP exams and 57% of the scores were a three or higher (exams receive a score of 1 to 5; a score of 5 reflects superior knowledge of the subject, a score of 3 qualifies for college credit).
Key Performance Measure
Regional Centers Attendance and Performance on AP Exams
82%93%92%
83% 76%
61%56%
65% 67%
57%113
175
149
187 209
0%
20%
40%
60%
80%
100%
FY-2003 FY-2004 FY-2005 FY-2006 FY-2007
0
50
100
150
200
250
P e rc e nt of S t ude nt s a t Re giona l Cent e rs Taking t he AP Exam
% of S c ore s 3 or higher
Numbe r of S t udent s a t t e nding Re giona l Cent e rsSource: OSSM 1/17/2008
FY-2009 Recommendation
FY-2008 Appropriation $7,586FY-2008 Bud. FTE Level 77.0Actual Ave. YTD FTE 70.5
Funding Adjustments: State Employee Pay Raise 105 Annualization of One-Time Funding 12 Total Adjustments 117
FY-2009 Recommendation $7,703% Change from FY-2008 1.54%
Source: Office of State Finance
FY-2009 Appropriation(amounts in thousands)
State Employee Pay Raise The Governor’s budget includes $105,635 for a 5% state employee pay increase for OSSM effective January 1, 2009. This funding is based on October 2007 salary information. Annualization of One-Time Funding HB 1105 (2007) provided OSSM $11,780 for FY-2008 EESIP costs. The Governor’s budget annualizes that recurring operational expense.

FY-2009 Executive Budget
EDUCATION B-81
Oklahoma Commission for Teacher Preparation (OCTP)
Notable Achievement • Oklahoma is recognized by the National
Council for the Accreditation of Teacher Education (NCATE) for having an NCATE/state partnership that serves as a national model for other states.
• Over 300 programs at Oklahoma’s 22 teacher education institutions have received national recognition from the National Council for Accreditation of Teacher Education or have met strengthened state standards.
• Oklahoma is ranked in the top ten states in the nation in teacher preparation according to the "Quality Counts" report issued by Education Week in January of 2008.
• Oklahoma ranks 9th in the nation in the percentage of teachers attaining National Board Certification, with 4% of teachers (1,996 teachers) having achieved that milestone.
• Oklahoma serves as a national model for other states in the developing of licensure and certification tests. The re-developed elementary education test is recognized as one of the finest in the nation according to the Buros Center for Testing and National Evaluation Systems testing company.
• Mission The OCTP serves as an independent standards board for teacher education. This competency based system of teacher preparation includes an evaluation of teacher education programs, a teacher assessment system and professional development institutes. Eighteen other states have an independent standards board of some form. All other standards boards are under the individual state’s Department of Education. The charts below illustrate OCTP’s FY-2007 budgeted expenditures.
FY-2008 Budgeted Expenditures
Assessment7%
Administrative Operations
10%
PDI57%Other Expenses
related to PDI16%
Program Accreditation
10%
So urce: OCTP 1/15/2 0 0 8 Accreditation of Teacher Education Programs The Commission is responsible for accrediting the state’s 22 teacher education programs. The three phases of the accreditation process are: • Evaluation of each program at an
institution to ensure that state and national standards are met;
• Assessment of teacher candidate portfolios; and
• Site visits by trained examiners to institutions to ensure compliance with the standards established by the National Council for Accreditation of Teacher Education.
Teacher Assessment The OCTP developed and administers a competency-based assessment system for teacher candidates that tests knowledge in three areas: general education, professional teaching knowledge and subject area knowledge. Candidates for teacher licensure and certification must successfully complete all three components. The Certification Examinations for Oklahoma Educators are reviewed annually and undergo redevelopment as changes occur in national and/or state standards. OCTP is committed to ensuring that the tests are rigorous and fulfill their purpose — to ensure that individuals seeking an initial Oklahoma teaching license possess the subject matter knowledge and skills needed to teach effectively in Oklahoma public schools. In 2006-2007, exams that underwent redevelopment were: English, US History /OK History / Government / Economics

FY-2009 Executive Budget
EDUCATION B-82
and World History /Geography. Over 23,000 certification exams were administered in 2006-2007. In addition, a new certification test was developed for Cherokee, with plans to develop one for Mandarin Chinese in 2008. Professional Development Institutes (PDI’s) The Commission sponsors professional development institutes in literacy, science, middle school math and mentoring of teachers. Literacy PDI The Reading Sufficiency Act, funded by the Legislature in 1997, provides reading professional development for all elementary teachers and administrators using Literacy First as the model. Student reading achievement is dependent on the knowledge and skills of both the teacher and principal. The scientifically researched based reading elements of phonemic awareness, phonics, vocabulary, fluency and comprehension are the frameworks for the skills and strategies taught. A key to the Literacy First process is assessment driven, systematic explicit instruction in each student’s “zone of proximal development.” The Literacy First PDI occurs in four Phases. Phase I and II provide 7 days of professional development for teachers. Phase III focuses on literacy and leadership professional development for administrators. Phase IV three year reading reform is a process whereby the school makes a total commitment by including coaching and mentoring for support and follow up. Literacy First has made a difference for many students, teachers, schools and districts across Oklahoma, as evidenced in the table below.
Comparison of Reading Academic Performance Index
1172
1263 1282
1171
1270
1336
10501100
11501200
12501300
1350
FY-2005 FY-2006 FY-2007
State Average Reading API PHASE IV Average Reading API
Science PDI The Science PDI, “Improving Science Across Oklahoma,” assists teachers in improving science instruction by providing intensive training in science content and inquiry processes with follow-up coaching and lesson study. Additionally, it helps teachers improve learning, as shown by increased student science scores. It includes 10 days of professional development for teachers and administrators. Interaction of technology into the teaching of science and inquiry will create new opportunities for student engagement. Middle School Math PDI The math PDI is founded on a three-year system’s approach to teaching mathematical concepts, focusing on grades 5 to 8. Connected Math, one of five programs recently recognized by the United States Department of Education as being effective, is the vehicle used in this research-based teacher training. The National Council for the Teaching of Mathematics’ (NCTM) mathematical strands is the core of the content used. The outcomes indicate that this professional development program does impact student learning, as indicated below.
Comparison of Oklahoma Core Currirulum Testing 8th Grade Math Outcomes
77% 76% 71%83%
74% 79%89% 84%
0%
20%
40%
60%
80%
100%
FY-2004 FY-2005 FY-2006 FY-2007
State Average Connected Math Average

FY-2009 Executive Budget
EDUCATION B-83
As teaching mathematics requires a special set of skills, teachers are trained in the understanding of mathematics, as well as the application, based on the TIMSS research for successful academic achievement in mathematics. Mentoring PDI Oklahoma has had a nationally recognized induction program in place for over 20 years. Realizing that Oklahoma loses 50% of the State’s teachers during the first five years of the profession, OCTP has provided two mentoring PDIs to enhance the induction process by providing consistent mentor training in the essential skills necessary to support beginning teachers. OCTP has contracted with the Oklahoma Technical Assistance Center for an independent and on-going evaluation of each of the Professional Development Institutes. Results of the evaluation indicate that quality professional development is making a difference in Oklahoma classrooms. Education Leadership Oklahoma Education Leadership Oklahoma provides scholarships and training for teachers going through the National Board for Professional Teachers certification process. OCTP provides technical assistance, training and a scholarship of $2,500 for candidates to pay for the application process, assessment and preparation costs. Upon successful completion, classroom teachers receive $5,000 annually for the life of the certificate. Teachers that earn certification, but do not receive the scholarship, qualify for reimbursement equivalent to the amount of the scholarship.
Top 10 States with Total National Board Certified Teachers: 2007-2008
10875
5729
179219962441249226852757
3878
12770
0
2000
4000
6000
8000
10000
12000
14000
NC FL SC CA OH MS IL GA OK WASo urce: NBPTS
As indicated above, in FY-2007 there were 1,996 National Board Certified Teachers in Oklahoma, making Oklahoma ninth in the nation in the number of teachers achieving this high honor. Further, NBCTs make up nearly 5% of the state’s teaching force and 58% of the state’s NBCTs teach in Title I schools. Even more important is the research that indicates that students taught by National Board Teachers are making significant gains in achievement test scores.
FY-2009 Recommendation
FY-2008 Appropriation $2,060FY-2008 Bud. FTE Level 10.0Actual Ave. YTD FTE 10.0
Funding Adjustments: State Employee Pay Raise 17
FY-2009 Recommendation $2,077% Change from FY-2008 0.83%
(amounts in thousands)
Source: Office of State Finance
FY-2009 Appropriation
State Employee Pay Raise The Governor’s budget includes $16,827 for a 5% state employee pay increase for OCTP effective January 1, 2009. This funding is based on October 2007 salary information.

FY-2009 Executive Budget
EDUCATION B-84
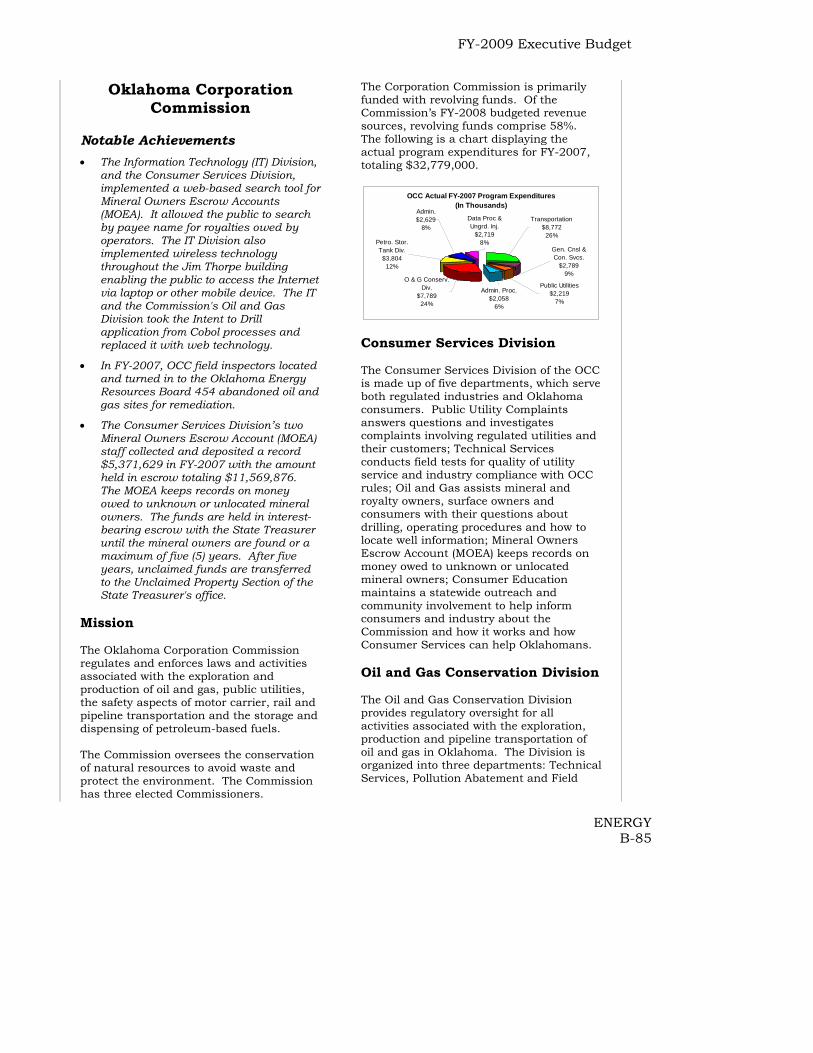
FY-2009 Executive Budget
ENERGY B-85
Oklahoma Corporation Commission
Notable Achievements
• The Information Technology (IT) Division, and the Consumer Services Division, implemented a web-based search tool for Mineral Owners Escrow Accounts (MOEA). It allowed the public to search by payee name for royalties owed by operators. The IT Division also implemented wireless technology throughout the Jim Thorpe building enabling the public to access the Internet via laptop or other mobile device. The IT and the Commission's Oil and Gas Division took the Intent to Drill application from Cobol processes and replaced it with web technology.
• In FY-2007, OCC field inspectors located and turned in to the Oklahoma Energy Resources Board 454 abandoned oil and gas sites for remediation.
• The Consumer Services Division’s two Mineral Owners Escrow Account (MOEA) staff collected and deposited a record $5,371,629 in FY-2007 with the amount held in escrow totaling $11,569,876. The MOEA keeps records on money owed to unknown or unlocated mineral owners. The funds are held in interest-bearing escrow with the State Treasurer until the mineral owners are found or a maximum of five (5) years. After five years, unclaimed funds are transferred to the Unclaimed Property Section of the State Treasurer's office.
Mission The Oklahoma Corporation Commission regulates and enforces laws and activities associated with the exploration and production of oil and gas, public utilities, the safety aspects of motor carrier, rail and pipeline transportation and the storage and dispensing of petroleum-based fuels. The Commission oversees the conservation of natural resources to avoid waste and protect the environment. The Commission has three elected Commissioners.
The Corporation Commission is primarily funded with revolving funds. Of the Commission’s FY-2008 budgeted revenue sources, revolving funds comprise 58%. The following is a chart displaying the actual program expenditures for FY-2007, totaling $32,779,000.
OCC Actual FY-2007 Program Expenditures(In Thousands)
Admin.$2,629
8%Data Proc & Ungrd. Inj.
$2,7198%Petro. Stor.
Tank Div.$3,804
12%
O & G Conserv. Div.
$7,78924%
Public Utilities$2,219
7%
Admin. Proc.$2,058
6%
Gen. Cnsl & Con. Svcs.
$2,7899%
Transportation$8,772
26%
Consumer Services Division The Consumer Services Division of the OCC is made up of five departments, which serve both regulated industries and Oklahoma consumers. Public Utility Complaints answers questions and investigates complaints involving regulated utilities and their customers; Technical Services conducts field tests for quality of utility service and industry compliance with OCC rules; Oil and Gas assists mineral and royalty owners, surface owners and consumers with their questions about drilling, operating procedures and how to locate well information; Mineral Owners Escrow Account (MOEA) keeps records on money owed to unknown or unlocated mineral owners; Consumer Education maintains a statewide outreach and community involvement to help inform consumers and industry about the Commission and how it works and how Consumer Services can help Oklahomans. Oil and Gas Conservation Division The Oil and Gas Conservation Division provides regulatory oversight for all activities associated with the exploration, production and pipeline transportation of oil and gas in Oklahoma. The Division is organized into three departments: Technical Services, Pollution Abatement and Field

FY-2009 Executive Budget
ENERGY B-86
Operations. The recent activities of the Division can be found in the following table. Oil and Gas Conservation Division
FY-05 FY-06 FY-07
Intent to Drill applications Filed 5,474 6,242 6,177 Well Plugging Reports 2,090 1,943 2,014 Well Completions 5,629 6,876 6,200 Gas Well Tests Filed 3,087 3,417 4,192 Tax Incentives Filed 2,674 3,294 1,939 OG Total Applications Filed 18,954 21,772 20,522 Well Site Inspections 58,226 66,122 67,666 NonPollution/Pollution Complaints 2,403 3,068 2,168 Incidents/Inspection Discoveries 1,286 1,282 1,150 Pluggin/Well Test/MIT Fld Witness 5,506 5,318 4,613 OG Total Field Activity 67,421 75,790 75,597 In addition to issuing regulatory permits, the Technical Services department is also the official repository and point of access for all information on oil and gas wells and related activity in Oklahoma. The Pollution Abatement department protects the surface, surface waters and ground waters of the state from pollution attributable to oil and gas activities. If pollution occurs, this department oversees the remediation efforts. The department also administers the Federal Underground Injection Control Class II program mandated under the Federal Safe Drinking Water Act and the Commission's portion of the federally mandated Clean Water Act. The Field Operations department investigates complaints from the public, witnesses all field tests and operations and provides instructions for well plugging operations. Field Operations personnel investigate and initiate enforcement procedures when appropriate. The following chart shows the progress with plugging wells. Key Performance Measure
Number of Wells Plugged
1,725
2,0161,825 1,825
1,4001,5001,6001,7001,8001,9002,0002,100
FY-2006 FY-2007 Bud FY-08 Est FY-09
Source: Corporation Commission
Petroleum Storage Tank Division The Petroleum Storage Tank Division is responsible for state and federal regulations regarding the storage, quality and delivery of refined petroleum products. The following chart shows the number of pumps and tanks the Division has inspected. Key Performance Measure
Number of Well and Tank Inspections
0
15,000
30,000
45,000
60,000
75,000
FY-2005 FY-2006 FY-2007 Bud FY-08
Source: Corporation CommissionPump Inspections
Tank Inspections
This Division administers the Oklahoma Storage Tank Release Indemnity Fund. The funds are used to remediate contaminated sites and seal leaking tanks. For every gallon of gasoline sold in the state, a one cent fee is assessed to support this fund. The Division works in conjunction with the national Brownfields program to clean up abandoned, polluted industrial sites and return the sites to productive use. Public Utility Division The Public Utility Division provides technical support and policy analysis to:
• Assure reliable public utility services at the lowest reasonable cost;
• Administer and enforce Commission orders concerning public utilities (electric, gas, water, cotton gin and telecommunciations service providers); and
• Fulfill constitutional and statutory obligations.
Staff is responsible for developing and presenting objective, independently

FY-2009 Executive Budget
ENERGY B-87
researched, fact-based findings and recommendations to the Commission. In FY-2007 the Division was responsible for regulating 631 public utilities. Transportation Division The Transportation Division administers licensing and certification of private and for-hire trucks that operate within and through Oklahoma. The Division also enforces motor carrier licensing requirements, federal motor carrier safety standards, some federal and state railroad regulations and pipeline safety regulations. Oklahoma has more than 6,330 for-hire and private motor carriers licensed to operate in intrastate commerce, 24 railroads that operate in Oklahoma and almost 40,000 miles of natural gas and hazardous liquid pipeline within the state. The table that follows documents the recent fiscal year activities and progress made by the Division and the graph shows the percentage of pipeline operators inspected. TransportationPerformance Measures
FY05 FY06 FY07Motor Carrier Licenses/Permits Issued 5,917 4,794 5,134 Interstate Registration Certificates Issued 134 153 107 Single State Registrations Issued 3,621 3,234 622 Insurance Filings Received 14,801 13,629 14,870 Identification Devices Issued 80,044 96,339 62,432 Letters of notification to Motor Carriers 9,517 12,185 12,049 DOT Numbers Issued 353 431 361 Hazardous Waste Credentials Issued 45 51 50 IRP applications processed 13,749 12,185 IFTA applications processed 2,685 3,752 Vehicles Registered 171,591 156,895 IRP and IFTA audits conducted 266 405 Total Applications Activity 114,432 319,107 268,862
Vehicle Checks 123,014 101,198 190,088 Citations Issued 22,863 26,743 20,937 Warnings Issued 1,929 2,666 2,764 Vehicle Inspections 509 506 386 Educational Contacts 842 986 1,129 Railroad Complaints/Queries Investigated 87 124 214 Pipeline Gas/Liquid Units Inspected 281 280 368 Pipeline Gas/Liquid Operators Inspected 228 222 143 Total Field Activity 149,753 132,725 216,029
Key Performance Measure
Percentage of Pipeline Operators Inspected
55%55%55%
89%
40%
50%
60%
70%
80%
90%
100%
FY-2006 FY-2007 Budgeted FY-08
Estimated FY-09
Office of Administrative Proceedings The Office of Administrative Proceedings is the court division of the Corporation Commission. It includes administrative law judges, legal secretaries, court reporters and the Court Clerk's Office. Filings are made and hearings are conducted in the Western Regional Office in Oklahoma City and in the Eastern Regional Office in Tulsa. Testimony and evidence may be presented by phone instead of appearing in person before an administrative law judge. In FY-2007, ten full time administrative law judges, two part time Administrative law judges and one appellate referee conducted 33,523 hearings. Key Performance Measure
Administrative Proceedings Hearings Conducted
34,32839,021
33,523
0
10,000
20,000
30,000
40,000
50,000
FY-05 FY-06 FY-07

FY-2009 Executive Budget
ENERGY B-88
FY-2009 Recommendation
FY-2008 Appropriation $12,210
FY-2008 Bud. FTE Level 506.7
Actual Ave. YTD FTE 478.1
Funding Adjustments: State Employee Pay Raise 600
FY-2009 Recommendation $12,810% Change from FY-2008 4.91%
FY-2009 Appropriation(amounts in thousands)
Source: Office of State Finance State Employee Pay Raise The Governor’s budget includes $599,780 for a 5% state employee pay increase for the Corporation Commission effective January 1, 2009. This funding is based on October 2007 salary information.

FY-2009 Executive Budget
ENERGY B-89
Department of Mines Mission The Oklahoma Department of Mines is the regulatory authority for surface and sub-surface mining in Oklahoma. The Department is empowered to implement and enforce state and federally mandated programs in health, safety, mining and land reclamation practices. The agency issues mining permits and performs inspections of all mining and mining-related land reclamation activities in the state. The Department of Mines relies on state appropriations, federal funds and revolving funds to fund the Department’s expenditures. For FY-2007, Federal dollars were 38.5% of the Department’s total funding of $2,699,000.
Department of Mines FY-2007 Actual Program Expenditures (in 000s)
Admin., $600,20%
OK Miner Trng., $154,
7%Noncoal
Prgms., $862,33%
Coal Prgms., $1,083,
40%Source: OSF
The table below shows the Department’s focus on inspection of blasting sites to determine if they are in compliance with the approved blasting plan. Key Performance Measure
Percentage of Blasting Sites Investigated
100%100%93%100%100%
0%
25%
50%
75%
100%
FY-2005 FY-2006 FY-2007 Bud. FY-2008
Est. FY-2009
Source: Dept of Mines
Programs Oklahoma Miner Training The Oklahoma Miner Training Institute (OMTI), located in Wilburton, provides free classroom and on-site training for mine operators. Courses delve into such topics as first-aid, mine safety and accident prevention. Miners are required to have training in using explosives and in health and safety. Existing miners receive refresher training here as well. Key Performance Measure
Number of Miners Trained
1,334 1,481 1,515 1,550
230419 475 480
0
500
1,000
1,500
2,000
2,500
FY-2006 FY-2007 Bud. FY-2008
Est. FY-2009
Source: Dept of Mines New Miner Training
Refresher Training Coal Division The Coal Division is essential for the implementation of state and federal laws regarding coal mining. Coal mining inspections are conducted to protect the environment, adjacent landowners and the public from the adverse effects of mining operations. The Coal Division contains three subdivisions: Technical Services, Permitting and Inspection and Enforcement. Minerals (Non-Coal) Division The Minerals Division is responsible for protecting the environment of the state, the health and safety of miners, and the life, health and property of the citizens who are affected by mining activities.
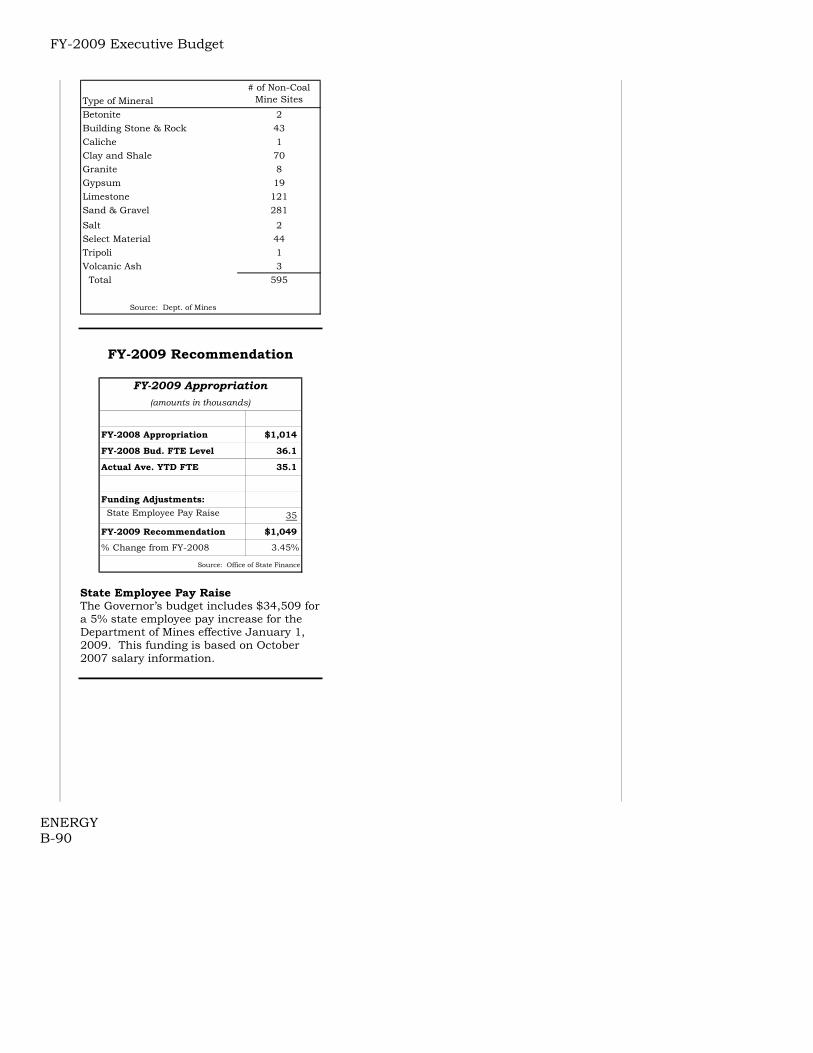
FY-2009 Executive Budget
ENERGY B-90
Type of Mineral# of Non-Coal
Mine SitesBetonite 2Building Stone & Rock 43Caliche 1Clay and Shale 70Granite 8Gypsum 19Limestone 121Sand & Gravel 281Salt 2Select Material 44Tripoli 1Volcanic Ash 3 Total 595
Source: Dept. of Mines
FY-2009 Recommendation
FY-2008 Appropriation $1,014
FY-2008 Bud. FTE Level 36.1
Actual Ave. YTD FTE 35.1
Funding Adjustments: State Employee Pay Raise 35
FY-2009 Recommendation $1,049
% Change from FY-2008 3.45%
FY-2009 Appropriation(amounts in thousands)
Source: Office of State Finance State Employee Pay Raise The Governor’s budget includes $34,509 for a 5% state employee pay increase for the Department of Mines effective January 1, 2009. This funding is based on October 2007 salary information.

FY-2009 Executive Budget
ENVIRONMENT B-91
Department of Environmental Quality
Notable Achievements • All of Oklahoma meets the National
Ambient Air Quality Standards.
• Through the Drinking Water State Revolving Fund (DWSRF) Program approximately $155 million in funding has been provided to 28 communities for drinking water system improvements.
• Environmental cleanups have begun at 17 former National Guard Armories and 30 more are planned for 2009. These will be deeded to small towns when remediation is complete.
Mission The Department of Environmental Quality (DEQ) is responsible for ensuring state and federal compliance with environmental programs. The DEQ’s mission focuses on three major areas of responsibility:
• Air Quality • Water Quality • Land Protection
The Department of Environmental Quality has three sources of funding; state appropriations, federal funds and revolving funds. Revolving funds are a significant source of funding for the DEQ, representing 59% of the agency’s total budgeted funding sources for FY-2007. The following chart shows how the agency disbursed $45,189,000 in funds for FY-2007.
Department of Environmental Quality FY-2007 Actual Expenditures (In Millions)
Land P rotection Div, $6.848,
15%
Water Quality Div, $10.545,
24% Air Quality Div, $8.648,
19%
Env Complnts & Local Svcs , $6.963, 15%
Cus tomer Serv Div,
$5.301, 12%
Admin Serv Div, $6.884,
15%
Source: OSF
The Environmental Complaints & Local Services (ECLS) Division provides the staffing for 30 local offices across the state; is primarily responsible for complaint response, media specific inspections and/or enforcement, and response to citizen requests for local services. In 2007, ECLS was able to eliminate 24 million gallons of improperly treated sewage and 26 thousand cubic yards of illegally dumped solid waste from the environment. Within the Customer Services Division the Customer Assistance Program offers non-regulatory approaches to compliance through technical assistance to industries seeking permits to locate or operate in Oklahoma. CSD provides compliance assistance to small communities, including over $500,000 offsetting community costs for laboratory analysis in the Public Water Supply (PWS) program. In FY-2007, 855 systems benefited from this assistance. In addition, the CSD houses the State Environmental Laboratory (SEL) which provides analytical support for the agency’s programs, as well as most PWS systems and those of other environmental agencies. CSD is the focal point for efforts to track the harmful effects of blue green algae blooms in lakes of the state, develop strategies to protect public water supply sources and advise the public when severe blooms occur. Air Quality Air quality attainment is determined by the National Ambient Air Quality Standards (NAAQS) as set by the Environmental Protection Agency (EPA). EPA has proposed creating a stricter standard for ozone. This would jeopardize the attainment status of Oklahoma City and Tulsa metro areas as well as other areas of the state requiring action to reduce ozone, and develop a State Implementation Plan (SIP), which will impact industry and individual citizens.

FY-2009 Executive Budget
ENVIRONMENT B-92
Key Performance Measure
Number of Air Compliance Inspections
663
507
600 600
450
500
550
600
650
700
FY-2006 FY-2007 Bud. FY-2008
Est. FY-2009
Source: Dept of Environmental Quality
EPA has established a voluntary eight-hour Ozone Flex Program to reduce ground level ozone emissions and avoid a non-attainment designation. This requires implementing at least one measurable, enforceable emission reduction project. If certain milestone events are triggered additional enforceable measures would be required. The Oklahoma City and Tulsa metropolitan areas are consulting with the DEQ to participate in this program. The proposed Oklahoma Energy Efficiency and Emission Reduction Program, is designed as a match to fund public and private projects to implement strategies to control vehicle emissions in Oklahoma, promote innovations in fuel and energy use, support appropriate bio-fuel proposals, and support energy efficiency and emissions reduction programs. Many of the potential projects of this program could be implemented as part of the eight hour Ozone Flex Program and could count as credits in the SIP, resulting in cleaner healthier air for the citizens of Oklahoma, and helping the state avoid non-attainment designation and resulting economic impacts. Water Quality The regulation of Oklahoma’s water quality is divided into three major areas: • The regulatory control of municipal and
industrial wastewater;
• The evaluation of beneficial uses of Oklahoma’s water bodies; and
• The monitoring and regulatory management of Public Water Supply (PWS) systems.
Wastewater permits are issued to limit the impact of pollutants to both ground water and surface water, which protects the beneficial uses identified in Oklahoma’s Water Quality Standards. Total Maximum Daily Load studies are conducted to determine the amount of pollutants that can enter a water body and still meet beneficial uses. The Public Water Supply (PWS) program monitors more than 2,000 PWS systems, serving in excess of three million residents. Historically, PWS facilities have maintained a high level of compliance. However, as the result of recent implementation of new federal standards (e.g. Arsenic Rule and Disinfection By-Product (DBP) Rules) many systems have struggled with compliance. DEQ has taken steps to provide additional technical assistance by increasing onsite technical visits by 50% over previous years. DEQ is seeing improvements in compliance rates and anticipates this trend to continue. Key Performance Measure
Public Water Supply Facilities in Compliance With Drinking Water Requirements
8488
8284
75
80
85
90
FY-2006 FY-2007 Bud. FY-2008
Est. FY-2009
Source: Dept of Environmental Quality
The SEL monitors drinking water for about 90 contaminants. New federal regulations are increasing the number of regulated components and the number of systems that must be monitored. The Legislature has provided funding to assist systems serving 10,000 people or less so they will be held harmless for laboratory fee increases. The EPA is requiring states to incorporate its 2001 mercury criterion into their water quality standards. This requires more fish

FY-2009 Executive Budget
ENVIRONMENT B-93
tissue monitoring to issue fish consumption advisories to protect human health. It also aids in determining if there is a correlation between air emission sources of mercury and levels found in fish from area lakes. Land Protection The activities of the Land Protection Division (LPD) are focused principally on four broad areas:
• Hazardous waste management,
• Site cleanup,
• Solid waste management, and
• Radiation protection. Hazardous Waste Management Hazardous waste management is operated under delegation of the federal Resource Conservation Recovery Act (RCRA) and issues permits and monitors regulated hazardous waste facilities. The primary funding comes from fees, established by state law at $9/ton, for commercial disposal of hazardous waste at permitted facilities within the state. The following graph shows the number of hazardous waste site inspections completed. Key Performance Measure
Number of Hazardous Waste Sites Inspected
131 125 125127
120125130135
FY-2006 FY-2007 Bud. FY-2008
Est. FY-2009
Source: Dept of Environmental Quality
The reduction in the number of yearly inspections is due to the DEQ’s effort to concentrate on larger waste generators with the greatest potential hazard to the environment.
Site Clean-up The Site Cleanup Assistance Program has evaluated 17 former National Guard Armories that are scheduled to be returned to local communities for health and environmental risks. All 17 armories are in various phases of work from investigation to remediation of asbestos and lead. In addition, two abandoned hazardous waste sites are under investigation with one beginning cleanup in spring 2008. These funds will also provide a long-term revenue source for the required match of Superfund cleanup costs, which are expected to escalate substantially over the next five years. In the Superfund program, Oklahoma is able to leverage 90% federal funding by providing a 10% match for National Priorities List site actions. Solid Waste Management DEQ’s solid waste program establishes and regulates the generation and disposal of solid waste. It also works in partnership with county and local governments to improve local solid waste infrastructure by cleaning illegal dumps, developing convenience centers for bulky waste, obtaining equipment for managing disaster debris and increasing recycling. Where enhancements have been implemented, it has allowed local jurisdictions to take a more holistic approach to the management of wastes. Local governmental assistance includes cleaning trash dumps, recycling (including storm debris management) and land restoration projects. In an effort to help ensure roadways near landfills are free of mud tracked from the sites, the Legislature established a provision whereby landfills could be reimbursed for the cost of installation of wheel wash systems.
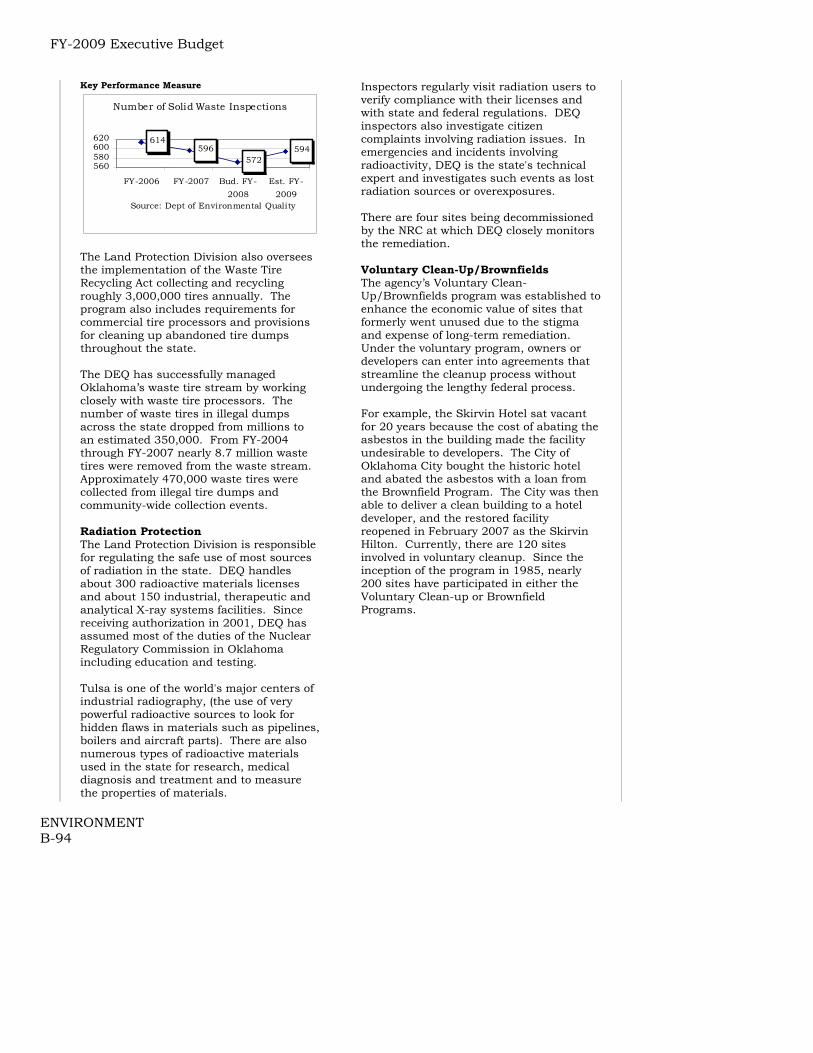
FY-2009 Executive Budget
ENVIRONMENT B-94
Key Performance Measure
Number of Solid Waste Inspections
614596
572594
560580600620
FY-2006 FY-2007 Bud. FY-2008
Est. FY-2009
Source: Dept of Environmental Quality
The Land Protection Division also oversees the implementation of the Waste Tire Recycling Act collecting and recycling roughly 3,000,000 tires annually. The program also includes requirements for commercial tire processors and provisions for cleaning up abandoned tire dumps throughout the state. The DEQ has successfully managed Oklahoma’s waste tire stream by working closely with waste tire processors. The number of waste tires in illegal dumps across the state dropped from millions to an estimated 350,000. From FY-2004 through FY-2007 nearly 8.7 million waste tires were removed from the waste stream. Approximately 470,000 waste tires were collected from illegal tire dumps and community-wide collection events. Radiation Protection The Land Protection Division is responsible for regulating the safe use of most sources of radiation in the state. DEQ handles about 300 radioactive materials licenses and about 150 industrial, therapeutic and analytical X-ray systems facilities. Since receiving authorization in 2001, DEQ has assumed most of the duties of the Nuclear Regulatory Commission in Oklahoma including education and testing. Tulsa is one of the world's major centers of industrial radiography, (the use of very powerful radioactive sources to look for hidden flaws in materials such as pipelines, boilers and aircraft parts). There are also numerous types of radioactive materials used in the state for research, medical diagnosis and treatment and to measure the properties of materials.
Inspectors regularly visit radiation users to verify compliance with their licenses and with state and federal regulations. DEQ inspectors also investigate citizen complaints involving radiation issues. In emergencies and incidents involving radioactivity, DEQ is the state's technical expert and investigates such events as lost radiation sources or overexposures. There are four sites being decommissioned by the NRC at which DEQ closely monitors the remediation. Voluntary Clean-Up/Brownfields The agency’s Voluntary Clean-Up/Brownfields program was established to enhance the economic value of sites that formerly went unused due to the stigma and expense of long-term remediation. Under the voluntary program, owners or developers can enter into agreements that streamline the cleanup process without undergoing the lengthy federal process. For example, the Skirvin Hotel sat vacant for 20 years because the cost of abating the asbestos in the building made the facility undesirable to developers. The City of Oklahoma City bought the historic hotel and abated the asbestos with a loan from the Brownfield Program. The City was then able to deliver a clean building to a hotel developer, and the restored facility reopened in February 2007 as the Skirvin Hilton. Currently, there are 120 sites involved in voluntary cleanup. Since the inception of the program in 1985, nearly 200 sites have participated in either the Voluntary Clean-up or Brownfield Programs.

FY-2009 Executive Budget
ENVIRONMENT B-95
FY-2009 Recommendation
FY-2008 Appropriation $9,728FY-2008 Bud. FTE Level 572.0Actual Ave. YTD FTE 568.3
Funding Adjustments:State Employee Pay Raise 805
FY-2009 Recommendation $10,533
% Change from FY-2008 8.28%
FY-2009 Appropriation(amounts in thousands)
Source: Office of State Finance State Employee Pay Raise The Governor’s budget includes $804,648 for a 5% state employee pay increase for the Department of Environmental Quality effective January 1, 2009. This funding is based on October 2007 salary information.

FY-2009 Executive Budget
ENVIRONMENT B-96
Oklahoma Water Resources Board (OWRB)
Notable Achievements
• From April through November, 42
public meetings were held across the state as part of the Oklahoma Comprehensive Water Plan (OCWP). More than 2,200 Oklahomans attended these meetings and submitted more than 2,000 comments about water in Oklahoma.
• OWRB published the Centennial Edition of the Oklahoma Water Atlas, which includes detailed maps containing recreational features, topography, bathymetry, access points, and other important information about 146 of the state's most popular lakes, through partnerships with the Oklahoma Department of Wildlife Conservation, Oklahoma Department of Tourism and Recreation, and the Kerr Foundation.
• The OWRB’s loan programs have consistently provided financing at up to 40% below the market interest rate with up to a 30-year repayment term. In 2007, the Clean Water State Revolving Fund (CWSRF) program generated a cumulative return of $2.32 for every federal dollar expended.
• The CWSRF and Drinking Water State Revolving Fund (DWSRF) loans in 2007, approved of $26.1 million and $13.1 million, respectively. These funds will be used to construct wastewater and water system improvements required to comply with Oklahoma Department of Environmental Quality and US Environmental Protection Agency (EPA) permit orders to eliminate contaminants discharged into state waters as well as to comply with human health criteria.
• OWRB’s Financial Assistance Program was presented the Public Works Project of the Year award by the American Public Works Association for excellence in the management and administration of the Bethany Water Treatment Plant expansion.
• Several Water Quality Division employees were selected to serve on national committees such as the Association of State and Interstate Water Pollution Administrators (ASIWPCA), EPA's National Lakes Survey Advisory Group, and the National Flowing Waters Survey Steering Committee.
Mission The mission of the OWRB is to manage and protect the water resources of the state and plan for Oklahoma’s long-range water needs in a responsive, innovative, and professional manner to ensure that all Oklahomans have adequate quantities of good water. Water Resources Management The foundation of the state’s water management activities is the use of stream and ground waters in Oklahoma, which is overseen by the OWRB's Permitting Section. Permit applications for the use of fresh water for any purpose other than domestic are considered for approval by the nine-member Board. The OWRB’s Technical Section cooperates with various organizations in studies to determine the amount of water available in Oklahoma's stream and groundwater basins. The OWRB provides critical information on existing surface and groundwater supplies with a multi-faceted monitoring network that provides real-time data to enhance and complements Oklahoma's existing flood forecasting and warning capabilities; guides the operation of state lakes and reservoirs; contributes vital information to the state's drought monitoring and response efforts; and facilitates agreement in interstate stream compacts. To help ensure that future water supplies are available and used wisely, all OWRB activities are centered on the Oklahoma Comprehensive Water Plan, a dynamic document published and continually updated by the OWRB that establishes

FY-2009 Executive Budget
ENVIRONMENT B-97
guidelines for the present and future use of the state's water resources and outlines policy recommendations for water resources management. The document is currently being updated through a five-year undertaking initiated by legislative action in 2006. Water Quality Programs The OWRB develops and maintains Oklahoma's Water Quality Standards and routinely collects physical, chemical and biological data to support the document. The OWRB directs Oklahoma's Beneficial Use Monitoring Program (BUMP) to document beneficial use impairments, identify impairment sources, detect water quality trends, provide needed information for the Water Quality Standards and facilitate the prioritization of pollution control activities. Other water quality monitoring activities provide background data for Total Maximum Daily Loading (TMDL) studies, including both stream gauge and water quality data, much of which is related to confirming 303(d) listings and determining allocations. The 303(d) list is a federally mandated list of waters that have threatened or impaired beneficial uses. Stream water is also monitored by the OWRB for the Federal Energy Regulatory Commission (FERC) permitting process for hydroelectric power generation activities. The OWRB samples approximately 850 groundwater wells to track movement of pollutants from Confined Animal Feeding Operations (CAFO) in support of regulation by the Oklahoma Department of Agriculture, Food and Forestry. As part of its Clean Lakes Program, the OWRB conducts water quality assessments to determine the relative health of state lakes and the problems impairing them. OWRB also coordinates an extremely successful volunteer water quality monitoring program and implements diagnostic and feasibility studies which seek to ensure the recreational benefits of public lakes throughout the state. The OWRB also participates with municipal governments and federal agencies to assess
and control various water quality problems impacting Oklahoma waters. Financial Assistance Program OWRB’s Financial Assistance Program (FAP) consists of the following loan programs: SRF Clean Water (Wastewater) Loan Program, SRF Drinking Water Loan Program, and the Bond Issue Loan Program. In addition to these loan programs, the OWRB also administers two grant programs for water and wastewater infrastructure. These are the Emergency Grant Program and the Rural Economic Action Plan (REAP) Grant Program. From the original $25 million seed money allocated to the OWRB in 1982 and additional direct appropriations totaling almost $16 million, the FAP is currently responsible for almost $1.7 billion in water and wastewater projects in Oklahoma, including construction and improvement of water supplies, storage facilities, pump stations, pipelines, and treatment works, as well as for refinancing outstanding loans. This equates to a $41 return on investment for every dollar appropriated to the FAP. Low interest rates available through FAP loan offerings have resulted in an estimated savings of $530,724,228 to Oklahoma communities and water systems. In addition, loans and grants from the FAP are often used in conjunction with funding from other sources, thus leveraging additional infrastructure dollars. It is estimated that since its inception, the FAP has been directly responsible for the creation of almost 68,000 jobs in Oklahoma. The OWRB provides approximately 65% of the state’s total water/wastewater financing needs. According to the American Public Works Association, 40,000 jobs are created for every $1 billion invested in water and wastewater infrastructure construction.
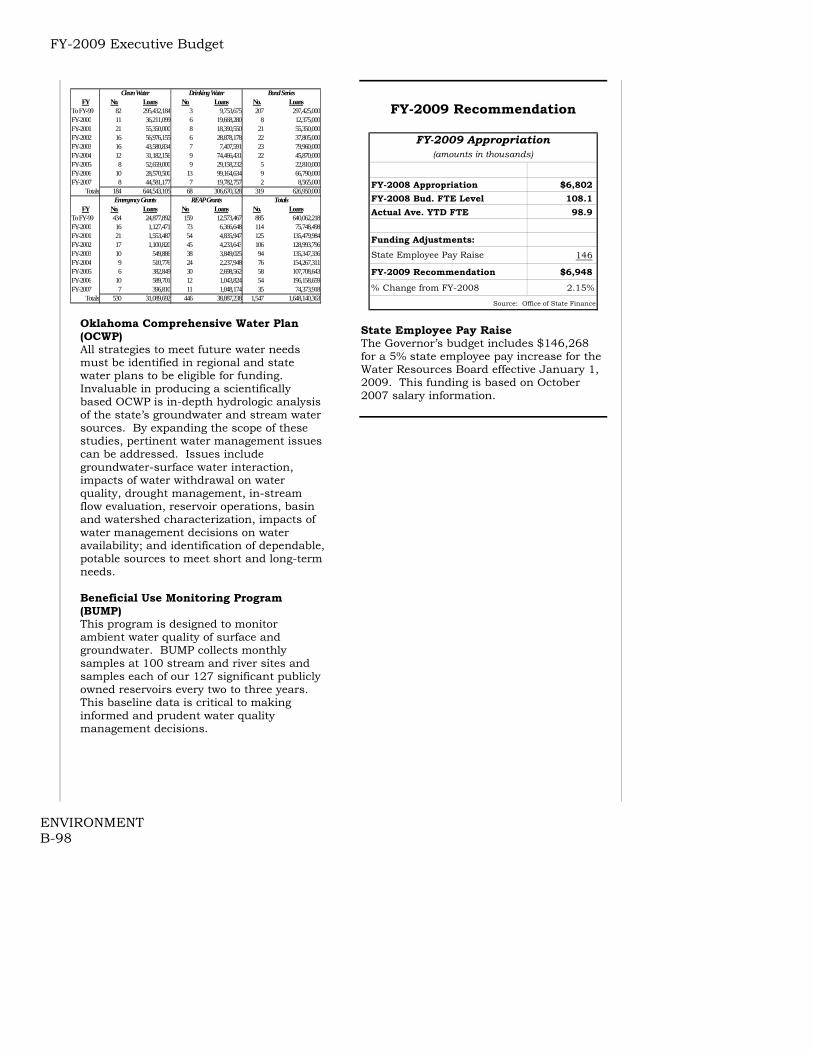
FY-2009 Executive Budget
ENVIRONMENT B-98
Oklahoma Comprehensive Water Plan (OCWP) All strategies to meet future water needs must be identified in regional and state water plans to be eligible for funding. Invaluable in producing a scientifically based OCWP is in-depth hydrologic analysis of the state’s groundwater and stream water sources. By expanding the scope of these studies, pertinent water management issues can be addressed. Issues include groundwater-surface water interaction, impacts of water withdrawal on water quality, drought management, in-stream flow evaluation, reservoir operations, basin and watershed characterization, impacts of water management decisions on water availability; and identification of dependable, potable sources to meet short and long-term needs. Beneficial Use Monitoring Program (BUMP) This program is designed to monitor ambient water quality of surface and groundwater. BUMP collects monthly samples at 100 stream and river sites and samples each of our 127 significant publicly owned reservoirs every two to three years. This baseline data is critical to making informed and prudent water quality management decisions.
FY-2009 Recommendation
FY-2008 Appropriation $6,802FY-2008 Bud. FTE Level 108.1Actual Ave. YTD FTE 98.9
Funding Adjustments:State Employee Pay Raise 146
FY-2009 Recommendation $6,948
% Change from FY-2008 2.15%
FY-2009 Appropriation(amounts in thousands)
Source: Office of State Finance State Employee Pay Raise The Governor’s budget includes $146,268 for a 5% state employee pay increase for the Water Resources Board effective January 1, 2009. This funding is based on October 2007 salary information.
FY No. Loans No. Loans No. LoansTo FY-99 82 295,432,184 3 9,753,675 207 297,425,000FY-2000 11 36,211,099 6 19,668,280 8 12,375,000FY-2001 21 55,350,000 8 18,390,550 21 55,350,000FY-2002 16 56,976,155 6 28,878,178 22 37,805,000FY-2003 16 43,580,834 7 7,407,591 23 79,960,000FY-2004 12 31,182,156 9 74,466,431 22 45,870,000FY-2005 8 52,659,000 9 29,158,232 5 22,810,000FY-2006 10 28,570,500 13 99,164,634 9 66,790,000FY-2007 8 44,581,177 7 19,782,757 2 8,565,000
Totals 184 644,543,105 68 306,670,328 319 626,950,000
FY No. Loans No. Loans No. LoansTo FY-99 434 24,877,892 159 12,573,467 885 640,062,218FY-2000 16 1,127,471 73 6,366,648 114 75,748,498FY-2001 21 1,553,487 54 4,835,947 125 135,479,984FY-2002 17 1,100,820 45 4,233,643 106 128,993,796FY-2003 10 549,886 38 3,849,025 94 135,347,336FY-2004 9 510,776 24 2,237,948 76 154,267,311FY-2005 6 382,849 30 2,698,562 58 107,708,643FY-2006 10 589,701 12 1,043,824 54 196,158,659FY-2007 7 396,810 11 1,048,174 35 74,373,918
Totals 530 31,089,692 446 38,887,238 1,547 1,648,140,363
Clean Water Drinking Water Bond Series
Emergency Grants REAP Grants Totals

FY-2009 Executive Budget
ENVIRONMENT B-99
Department of Wildlife Conservation
Mission The Oklahoma Department of Wildlife Conservation (ODWC) is responsible for managing the wildlife and habitat of Oklahoma to provide scientific, educational, aesthetic, economic and recreational benefits for hunters, anglers and others who appreciate wildlife throughout the state. In FY-2007, ODWC reported $41.2 million in total receipts, primarily from sales of licenses and federal payments. The last hunting and fishing license fee increase was July 1, 2003. Federal payments are derived from federal excise taxes on guns and ammunition. States that provide all hunting license revenue for wildlife management receive allocations through a formula based on the state’s land area, population and the number of hunting licenses. More than 60 types of hunting and fishing licenses are sold by ODWC through 1,100 license dealers. All license revenue, except lifetime license revenue, is used for operations of ODWC. The Department of Wildlife Conservation is a non-appropriated agency. The Department’s two sources of funding are revolving funds and federal funds.
ODWC Funding Sources (In Mill ions)
Federal Funds , 14018, 34%
Revolving Funds , 27100,
66%
Federal Funds Revolving Funds Source: ODWC
Lifetime Hunting & Fishing Licenses Revenues from the sale of lifetime licenses are placed in a trust fund and the earnings from that fund are used for operations. The current balance in the trust is approximately $67 million, including principal and earnings. Over the last three years, revenues from the lifetime fishing and hunting licenses have averaged $2.6 million annually.
FY-2002 FY-2003 FY-2004 FY-2005 FY-2006Hunting 1,473 1,774 974 594 534Fishing 1,278 3,078 2,419 1,093 1,197Combination 3,958 6,468 3,710 2,021 2,271
Total 6,709 11,320 7,103 3,708 4,002Source: Deparmtent of Wildlife Conservation
Number of Lifetime Licenses Sold
Wildlife Management ODWC manages the wildlife and 1.6 million acres (3.6 % of total state acreage) of public wildlife preserves. Private landowners (including farmers and ranchers) own most of the wildlife habitat and often suffer decreased income from their crops and grasslands as a result of foraging or use as habitat by wildlife. The opportunities for hunting wildlife on these habitats decline as landowners use the land for agricultural and other revenue producing purposes. Fee hunting on private lands has shown there is a demand for higher quality hunts. It is important to encourage private landowners to provide quality habitat for wildlife.

FY-2009 Executive Budget
ENVIRONMENT B-100

FY-2009 Executive Budget
FINANCE AND REVENUE B-101
State Auditor and Inspector
Required Audits The Constitution (Article VI, Section 19) and/or statutes require the Auditor and Inspector (A&I) to audit the following entities: • State and County Treasurers twice each
year;
• Each Emergency Medical Services District;
• All 77 Counties including all Commissioners, Assessors, Clerks and Court Clerks
• County Solid Waste Management Operations;
• State Officers who Collect Money;
• District Attorney’s and District Attorney’s Council (continuous);
• Department of Corrections (continuous); and
• OSEEGIB (contracted out).
The Auditor and Inspector’s office is generally responsible for auditing all state agencies unless an agency has specific legislative authority to contract its audit outside (e.g. Higher Ed., trust authorities and Commerce),. The table below shows the number of audits issued and the number of inquiries received and resolved. Inquiries are calls from Oklahoma citizens regarding questions or complaints about state and or local financing issues.
Total Audits 341Inquiries Received and Resolved 3,400
FY-2007
Source: State Auditor & Inspector The graph below shows the FY-2008 Budget for the State Auditor and Inspector. The total budget is $12.5 million. This excludes a $15.5 million REAP appropriation which passes through the Auditor and Inspector’s office.
FY-2008 Budget by ActivityTotal: $13,922 ($ in 000s)
Local Government
Services36%
Administrative
12%
Ancillary Services
3%Special
Services14%
State Agency Services
35%
Source: State Auditor and Inspector
Funding Sources The Auditor and Inspector’s budget is funded in large part from monies collected from counties, towns, and school districts for audit services, abstractor licensing, auditor registration, and other payments for services rendered. The graph below shows the Auditor and Inspector’s budget by fund for FY-07.
FY-2008 Funding BreakdownTotal: $14,084 ($ in 000s)
Federal2%
Revolving49%
State49%
Source: State Auditor and Inspector
Financial Audits The Single Audit of the Comprehensive Annual Financial Report (CAFR) is prepared by the Auditor & Inspector’s Office to meet the requirements of the Single Audit Act. The federal funds expended by all State agencies (excluding higher education and civil emergency management) are included within the scope of the Single Audit. Performance Audits Since FY-2002, the Office of the State Auditor and Inspector has conducted performance audits as authorized by 74 O.S. Supp 2001, 213.2 A performance
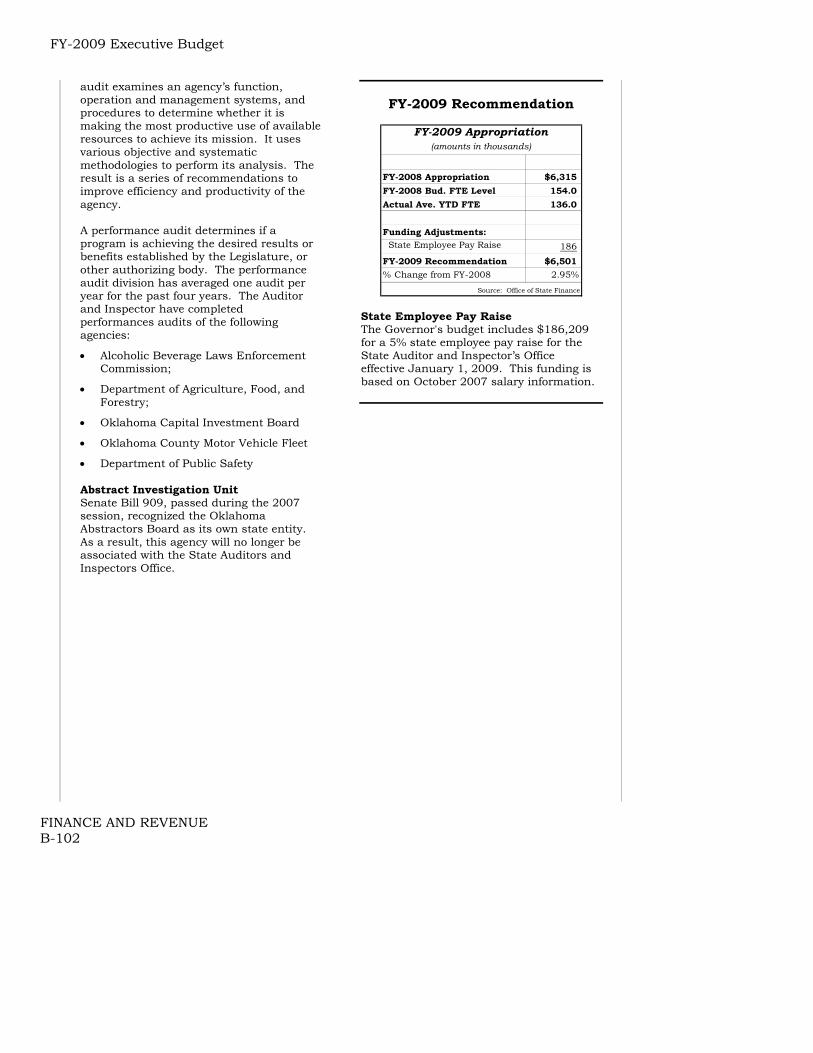
FY-2009 Executive Budget
FINANCE AND REVENUE B-102
audit examines an agency’s function, operation and management systems, and procedures to determine whether it is making the most productive use of available resources to achieve its mission. It uses various objective and systematic methodologies to perform its analysis. The result is a series of recommendations to improve efficiency and productivity of the agency. A performance audit determines if a program is achieving the desired results or benefits established by the Legislature, or other authorizing body. The performance audit division has averaged one audit per year for the past four years. The Auditor and Inspector have completed performances audits of the following agencies:
• Alcoholic Beverage Laws Enforcement Commission;
• Department of Agriculture, Food, and Forestry;
• Oklahoma Capital Investment Board
• Oklahoma County Motor Vehicle Fleet
• Department of Public Safety Abstract Investigation Unit Senate Bill 909, passed during the 2007 session, recognized the Oklahoma Abstractors Board as its own state entity. As a result, this agency will no longer be associated with the State Auditors and Inspectors Office.
FY-2009 Recommendation
FY-2008 Appropriation $6,315FY-2008 Bud. FTE Level 154.0Actual Ave. YTD FTE 136.0
Funding Adjustments: State Employee Pay Raise 186
FY-2009 Recommendation $6,501% Change from FY-2008 2.95%
FY-2009 Appropriation(amounts in thousands)
Source: Office of State Finance State Employee Pay Raise The Governor's budget includes $186,209 for a 5% state employee pay raise for the State Auditor and Inspector’s Office effective January 1, 2009. This funding is based on October 2007 salary information.

FY-2009 Executive Budget
FINANCE AND REVENUE B-103
Banking Department Mission The State Banking Department preserves and promotes sound, constructive competition among financial institutions and ensures the security of deposits. It regulates State-chartered/licensed: • Banks
• Savings and loan associations
• Credit unions
• Trust companies
• Perpetual care cemeteries
• Money Order Companies
• Money Transfer Companies The Conference of State Bank Supervisors (CSBS) accredits the Department. The CSBS evaluates the Department in the areas of administration and finance, personnel, training, examination, supervision and legislation. The Banking Department has two activities, administration and examinations. The primary expenditures are devoted to bank examinations. During FY-2007, examinations were 77% of the Department’s total expenditures.
Banking Department Actual FY-2007 Program Expenditures (In Millions)
Admin, $.988,23%
Exams, $3.24477%
Source: Banking Department
State chartered banks There are approximately 177 state chartered banks in Oklahoma. The Banking Department views the decline of the state chartered banking system as a
concern for Oklahoma because state charters better fit the economic needs of smaller banking institutions. For example, a state chartered bank can lend 30% of its capital assets, whereas a national chartered bank can only lend 15%. State chartered banks are also able to deal with in-state banking officials who are familiar with their local circumstances.
End of Calendar Year Number of
Banks2003 1842004 1852005 1852006 1852007 177
Oklahoma State Chartered Banks
Source: Banking Department Revenue from Banks and other Regulated Entities Banks pay assessments based on a percentage rate of the bank’s total assets. The Department deposits 10% of Bank and Credit Union assessments into the General Revenue Fund and the remainder directly into agency revolving funds. The Department deposited $512,076 into the General Revenue Fund for FY-2007 and estimates they will deposit $550,000 in FY-2008.
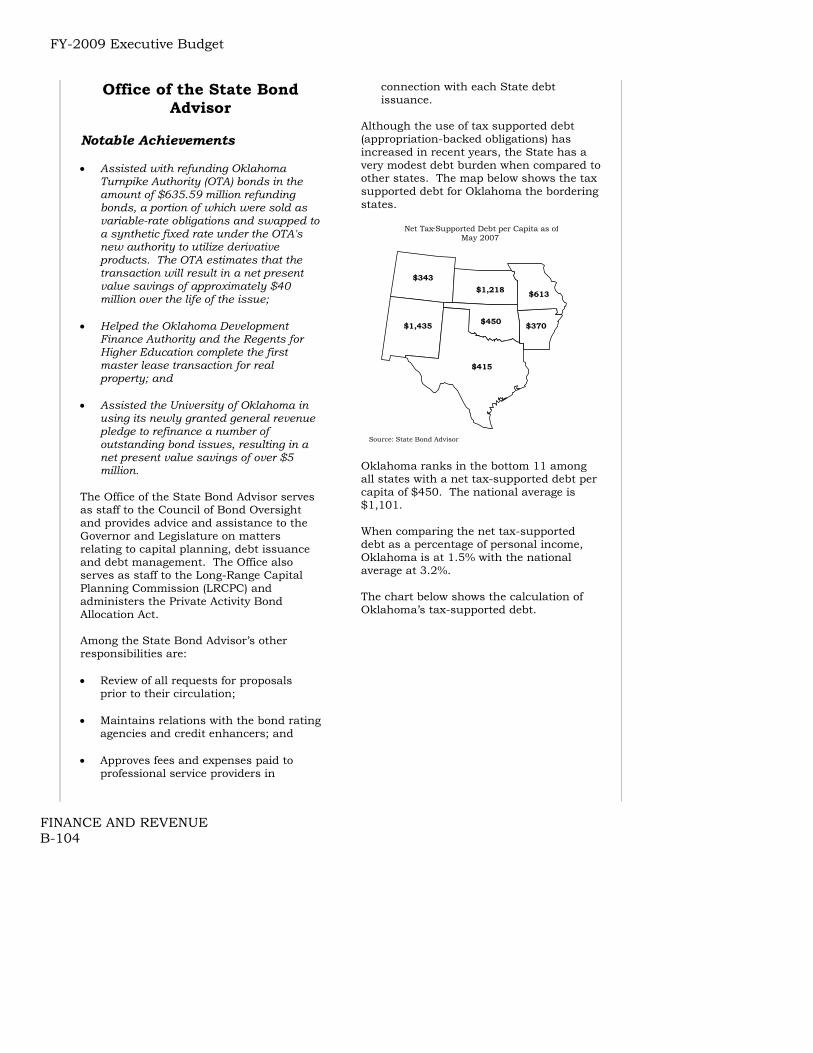
FY-2009 Executive Budget
FINANCE AND REVENUE B-104
Office of the State Bond Advisor
Notable Achievements • Assisted with refunding Oklahoma
Turnpike Authority (OTA) bonds in the amount of $635.59 million refunding bonds, a portion of which were sold as variable-rate obligations and swapped to a synthetic fixed rate under the OTA's new authority to utilize derivative products. The OTA estimates that the transaction will result in a net present value savings of approximately $40 million over the life of the issue;
• Helped the Oklahoma Development
Finance Authority and the Regents for Higher Education complete the first master lease transaction for real property; and
• Assisted the University of Oklahoma in
using its newly granted general revenue pledge to refinance a number of outstanding bond issues, resulting in a net present value savings of over $5 million.
The Office of the State Bond Advisor serves as staff to the Council of Bond Oversight and provides advice and assistance to the Governor and Legislature on matters relating to capital planning, debt issuance and debt management. The Office also serves as staff to the Long-Range Capital Planning Commission (LRCPC) and administers the Private Activity Bond Allocation Act. Among the State Bond Advisor’s other responsibilities are: • Review of all requests for proposals
prior to their circulation; • Maintains relations with the bond rating
agencies and credit enhancers; and • Approves fees and expenses paid to
professional service providers in
connection with each State debt issuance.
Although the use of tax supported debt (appropriation-backed obligations) has increased in recent years, the State has a very modest debt burden when compared to other states. The map below shows the tax supported debt for Oklahoma the bordering states. Oklahoma ranks in the bottom 11 among all states with a net tax-supported debt per capita of $450. The national average is $1,101. When comparing the net tax-supported debt as a percentage of personal income, Oklahoma is at 1.5% with the national average at 3.2%. The chart below shows the calculation of Oklahoma’s tax-supported debt.
Source: State Bond Advisor
$1,435
$415
$450
$1,218 $613
$370
Net Tax - Supported Debt per Capita as of May 2007
$343

FY-2009 Executive Budget
FINANCE AND REVENUE B-105
General Obligation Debt 276,710 OCIA Lease Revenue Bonds 980,415 ODFA Master Lease Program-Personal Property 135,145 ODFA Master Lease Program-Real Property 57,385 ODFA Lease Revenue Bonds-Public Sales 154,920 Direct college Lease Purchase Debt 13,170 Lease Purchase Debt Private ly Sold 2,429 Contractual Obligation Debt 37,900
Total Gross Tax-Supported Debt 1,658,074 Less: Se lf-Supported bonds 167,922
Total Ne t Tax-Supported Debt 1,490,152
Source : State Bond Advisor, "2007 Annual Report"
Gross & Ne t Tax-Supported Debtas of December 31, 2007
($ in thousands)
The State continues to provide for the rapid repayment of its outstanding obligations. Virtually all of the lease purchase financings done by agencies and authorities are repaid in five to ten years. Of all tax backed debt, more than 90% is retired within 20 years and 100% is paid off in less than 25 years. The following is a summary of key debt ratios as of May 1, 2007.
Net tax-supported debt per capita $412
Tax-supported debt service as percent of General Revenue Fund appropriations 3.38%
Per capita debt as percent of 2007 per capita personal income 1.28%
Key Debt Ratios
Source: State Bond Advisor As staff for the LRCPC, the Office of the State Bond Advisor reviewed 3,527 capital project requests. In 2007, the most recent plan (for fiscal years 2009-2013) recommended total capital spending of $4.8 billion, of which $4.5 billion is self funded. A total of $60 million is recommended for funding from general appropriations. Revenue bond activity for 2007 totaled $720.9 million. The following table includes the outstanding debt of Oklahoma’s largest revenue bond issuers.
Oklahoma Turnpike Authority (1) 1,160,720 Oklahoma Student Loan Authority (2) 1,080,031 Oklahoma Housing Finance Authority 739,282 Oklahoma Water Resources Board 559,420 Grand Rive r Dam Authority 496,086 Oklahoma Municipal Power Authority 508,475 Oklahoma Deve lopment Finance Authority (CERF) (3) 131,189
4,675,204 Source : State Bond Advisor, "2007 Annual Report"
Revenue Bond Issuers as of December 31, 2007 ($ in 000s)Outstanding Bond Indebtness of Oklahoma's Largest
FY-2009 Recommendation
FY-2008 Appropriation $186FY-2008 Bud. FTE Level 3.0Actual Ave. YTD FTE 3.0
Funding Adjustments: State Employee Pay Raise 7
FY-2009 Recommendation $193% Change from FY-2008 3.76%
FY-2009 Appropriation(amounts in thousands)
Source: Office of State Finance State Employee Pay Raise The Governor’s budget includes $6,529 for a 5% state employee pay increase for the State Bond Advisor effective January 1, 2009. This funding is based on October 2007 salary information.

FY-2009 Executive Budget
FINANCE AND REVENUE B-106
Capitol Improvement Authority
The Oklahoma Capitol Improvement Authority (OCIA) is primarily responsible for acquiring and maintaining buildings for other state agencies. OCIA also issues bonds to obtain buildings when authorized by the Legislature. Participating agencies make lease payments from their appropriations to the OCIA. The OCIA then makes debt service payments through a Trustee/Paying Agent to the bondholders. Outstanding Issues As of December 31, 2007, the OCIA had 29 series of obligations outstanding. The total outstanding principal amount of these obligations was $1.1 billion. The following table lists OCIA obligations authorized and issued in FY-2006.
General Obligation Bonds There are two types of general obligation bonds issued by the State. The first are government-purpose issues to fund legislatively identified capital projects. All of these bonds are secured by cigarette tax revenue initially and, ultimately, by the full faith and credit of the State. The general obligation bonds are set to retire in 2018. In 2005, the state paid the remaining debt on the General Obligation Bond Series 2003B of $7.1 million. The table below shows the principal amount and balance of
the General Obligation Bond Series 2003A in FY-2006 and FY-2007.
The second type of general obligation bonds are issued by the Oklahoma Industrial Finance Authority (OIFA) to fund industrial loans, and are secured initially by loan repayments from the private-sector industrial borrowers and then by OIFA reserves. As of December 31, 2006, there were 11 series of these bonds, with a total principal amount outstanding at that date of $60,400,000.
Obligations Issued Amount
FY-2008 Annual Debt
Service($ in 000's)
Attorney General 3,000 226Higher Education 333,610 18,096Higher Education 6,040 6,329Higher Education 50,000 7,500Dept. of Agriculture 24,410 1,811Dept. of Mental Health 18,900 1,398Supreme Court 22,040 1,677Higher Education 125,700 6,285OSBI 6,430 487Total $590,130 $43,809Source: OCIA
7/15/2005 7/15/2006Principal 6,635 13,990Balance 247,500 233,510Source: State Bond Advisor
General Obligation Bond PaymentsSeries 2003A ($ in 000's)
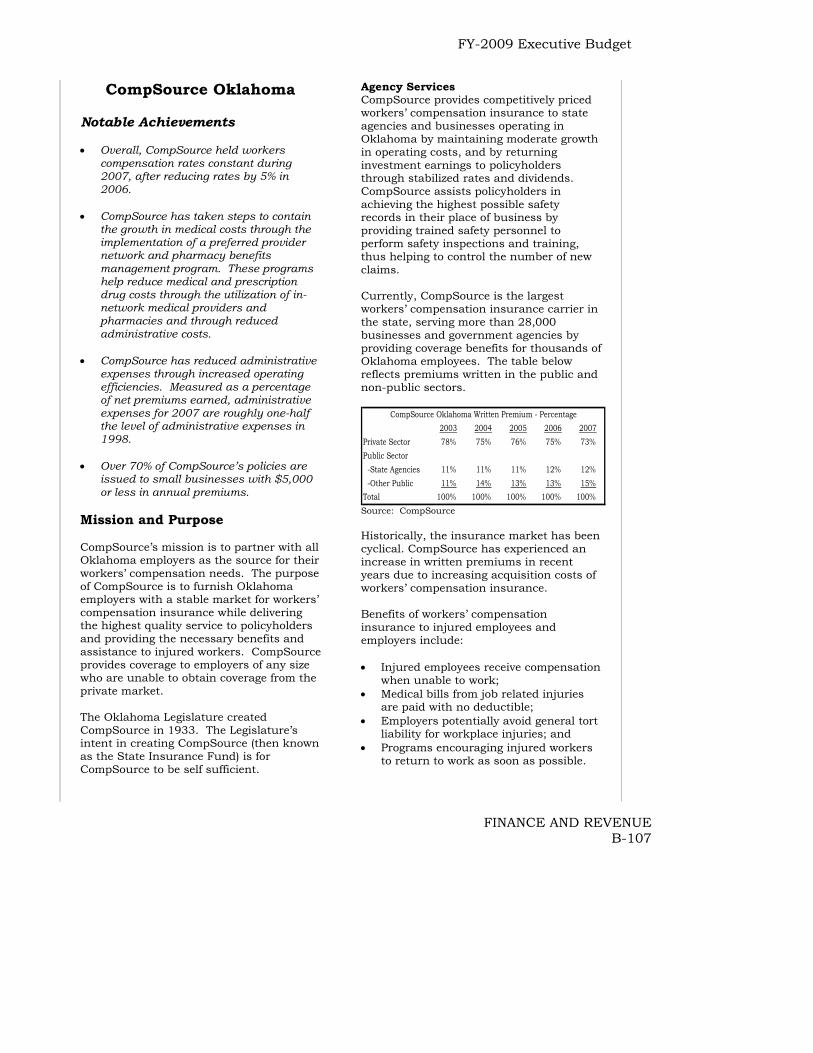
FY-2009 Executive Budget
FINANCE AND REVENUE B-107
CompSource Oklahoma Notable Achievements • Overall, CompSource held workers
compensation rates constant during 2007, after reducing rates by 5% in 2006.
• CompSource has taken steps to contain
the growth in medical costs through the implementation of a preferred provider network and pharmacy benefits management program. These programs help reduce medical and prescription drug costs through the utilization of in-network medical providers and pharmacies and through reduced administrative costs.
• CompSource has reduced administrative
expenses through increased operating efficiencies. Measured as a percentage of net premiums earned, administrative expenses for 2007 are roughly one-half the level of administrative expenses in 1998.
• Over 70% of CompSource’s policies are
issued to small businesses with $5,000 or less in annual premiums.
Mission and Purpose CompSource’s mission is to partner with all Oklahoma employers as the source for their workers’ compensation needs. The purpose of CompSource is to furnish Oklahoma employers with a stable market for workers’ compensation insurance while delivering the highest quality service to policyholders and providing the necessary benefits and assistance to injured workers. CompSource provides coverage to employers of any size who are unable to obtain coverage from the private market. The Oklahoma Legislature created CompSource in 1933. The Legislature’s intent in creating CompSource (then known as the State Insurance Fund) is for CompSource to be self sufficient.
Agency Services CompSource provides competitively priced workers’ compensation insurance to state agencies and businesses operating in Oklahoma by maintaining moderate growth in operating costs, and by returning investment earnings to policyholders through stabilized rates and dividends. CompSource assists policyholders in achieving the highest possible safety records in their place of business by providing trained safety personnel to perform safety inspections and training, thus helping to control the number of new claims. Currently, CompSource is the largest workers’ compensation insurance carrier in the state, serving more than 28,000 businesses and government agencies by providing coverage benefits for thousands of Oklahoma employees. The table below reflects premiums written in the public and non-public sectors.
2003 2004 2005 2006 2007Private Sector 78% 75% 76% 75% 73%Public Sector -State Agencies 11% 11% 11% 12% 12% -Other Public 11% 14% 13% 13% 15%Total 100% 100% 100% 100% 100%
CompSource Oklahoma Written Premium - Percentage
Source: CompSource Historically, the insurance market has been cyclical. CompSource has experienced an increase in written premiums in recent years due to increasing acquisition costs of workers’ compensation insurance. Benefits of workers’ compensation insurance to injured employees and employers include: • Injured employees receive compensation
when unable to work; • Medical bills from job related injuries
are paid with no deductible; • Employers potentially avoid general tort
liability for workplace injuries; and • Programs encouraging injured workers
to return to work as soon as possible.

FY-2009 Executive Budget
FINANCE AND REVENUE B-108
CompSource provides stability to the state’s economy because it provides a source of workers’ compensation insurance coverage to businesses that may not otherwise be able to obtain coverage through the private market.

FY-2009 Executive Budget
FINANCE AND REVENUE B-109
Commission on Consumer Credit
Mission The Commission on Consumer Credit administers the Uniform Consumer Credit code and regulates the following entities: • Lending institutions other than banks
or credit unions (AKA: Supervised Lenders);
• Deferred Deposit Lenders; • Pawnbrokers; • Credit service organizations charging a
fee to provide assistance in repairing credit problems;
• Rent-to-own stores; • Health Spas; • Precious Metal And Gem Dealers; • Mortgage Brokers; and • Mortgage Loan Originators. The Commission actively protects consumers against unfair credit practices of lenders and pprroovviiddeess iinnffoorrmmaattiioonn ttoo aassssiisstt tthhee rreegguullaatteedd iinndduussttrriieess iinn uunnddeerrssttaannddiinngg aanndd ccoommppllyyiinngg wwiitthh tthheeiirr rreessppeeccttiivvee llaawwss aanndd rreegguullaattiioonnss.. The Commission determines if lending institutions are assessing excessive interest, late fees, penalties or service fees. The Commission also monitors advertising and works with lenders to resolve consumer complaints. Key Performance Measure
Consumer Credit Complaint Investigations
6,523
8,232 8,628
420402373384262
9,924
5,882
0
2,000
4,000
6,000
8,000
10,000
12,000
FY-2003 FY-2004 FY-2005 FY-2006 FY-2007
Source: Consumer Credit Comm.
Formal Complaints(written complaints)
Informal Complaints(received by phone)
FY-2009 Recommendation
FY-2008 Appropriation $669
FY-2008 Bud. FTE Level 16.0
Actual Ave. YTD FTE 16.0
Funding Adjustments: State Employee Pay Raise 18
FY-2009 Recommendation $687
% Change from FY-2008 2.69%
FY-2009 Appropriation(amounts in thousands)
Source: Office of State Finance State Employee Pay Raise The Governor’s budget includes $17,908 for a 5% state employee pay increase for the Commission on Consumer Credit effective January 1, 2009. This funding is based on October 2007 salary information.

FY-2009 Executive Budget
FINANCE AND REVENUE B-110
Office of State Finance
Notable Achievements • Successfully installed a back-up
generator at the Tulsa office building that will power the telephone system in emergencies.
• Expanded information technology services to other agencies. OSF now provides firewall services to 40 agencies, local area network services to 76 agencies and PC and server services to 12 agencies and procurement services to 9 agencies.
• Conducted a statewide standard security risk assessment as required by HB 2935.
• Collaborated with Oklahoma Office of Homeland Security (OKOHS) to organize a statewide cyber security awareness program.
• Collaborated with the Oklahoma Computer Crime Alliance and OKOHS to develop and implement a Cyber Security Incident Reporting and Management system.
• Extended contract to audit past communications invoices, resulting in additional one-time refunds to state agencies of $230,000. This is total one-time refunds of $470,000 over two (2) years.
The Office of State Finance (OSF) is part of the Executive Branch. It is under the administrative control of the Director of State Finance who is appointed by the Governor, with the advice and consent of the Senate. The Oklahoma Budget Law of 1947 (Title 62, Section 41.3) created the Division of the Budget and the Division of Central Accounting and Reporting (Office of the State Comptroller). OSF has two other divisions; the Information Services Division and the Telecommunications Division. The Division of Central Accounting and Reporting (DCAR) DCAR reviews and processes claims for payroll and payments to vendors from most
state agencies. DCAR is also responsible for preparing statewide financial reports, reconciliation functions, preparation of W-2’s and 1099’s reporting to the federal government, and managing the State accounting system. State-Tribal Gaming Compliance OSF is the State Compliance Agency (SCA) for the State-Tribal Gaming Compacts. As such, OSF is responsible for working with the tribes to ensure compliance with the Compacts provisions and to ensure that the State is receiving the revenues required by the Compacts. Since January 27, 2005, 32 Tribal Compacts have been approved by the Secretary of the Interior and published in the Federal Register. Budget Division The Budget Division prepares the Governor's budget and assists in drafting supporting legislation for the Governor's proposals. Budget Division staff manages the state's budget system and make appropriate allotments and transfers as authorized by law. The division conducts fiscal policy research and analysis to improve the cost-efficiency of current financial practices. Developing and monitoring performance measures are another integral function of this division. Budget Division personnel also prepare analyses of appropriation and substantive legislation and make recommendations based on their research to the Governor. In addition, the Budget Division prepares revenue certification information for the Board of Equalization, which sets the appropriations limit for the Legislature. To ensure the State is able to make 100% allocations based on legislative appropriations, division personnel monitor collections to the General Revenue Fund and other funds authorized for expenditure. Information Services Division (ISD) The mission of ISD is to provide Oklahoma State agencies with quality, cost effective and secure information technology and telecommunications products and services. ISD manages the state’s data processing and telecommunications infrastructures.

FY-2009 Executive Budget
FINANCE AND REVENUE B-111
ISD sets standards for these areas to ensure compatibility of voice and data communications. They manage the local area networks for OSF, the Governor and several other state agencies. The communications infrastructure includes a state backbone of fiber-optic cable connecting the most populous areas of the state to high-speed internet capabilities. ISD also manages the State telephone system; negotiating long-distance and local services for the majority of state agencies. Improving security for the network as well as implementing a disaster recovery plan is a priority for this division. ISD sets security guidelines and procedures for all agencies. OSF works with Homeland Security, the Federal Bureau of Investigation, and OSBI to continually evaluate the system and propose changes to improve IT security. Communications Operations Reporting Enterprise (CORE) The Office of State Finance, the Office of Personnel Management and the Department of Central Services serve as the lead agencies in the CORE project. The CORE project, an enterprise resource planning system, is a 7 year project that began in 2002. The purchasing and financial components of CORE/PeopleSoft went “live” November 3, 2003. These components of CORE/PeopleSoft, replaced antiquated systems with an integrated computer system that will permit user agencies to more easily access vital data. The project is multi-phased with various modules being made available during the different phases. Phase I included the implementation of the financial and procurement module, the human resources and payrolls system, and the budget module. Phase II is estimated to be available to all agencies by December of 2008 and includes asset management, contract management, an account receivable and bill module, the help desk module, and a module that will manage
grants and projects. The total anticipated cost of CORE to the State is $45.85 million.
FY-2009 Recommendation
FY-2008 Appropriation $23,081FY-2008 Bud. FTE Level 162.2Actual Ave. YTD FTE 96.5
Funding Adjustments: State Employee Pay Raise 249 Federal Charges 220 Total Adjustments 469
FY-2009 Recommendation $23,550% Change from FY-2008 2.03%
Source: Office of State Finance
FY-2009 Appropriation(amounts in thousands)
State Employee Pay Raise The Governor’s budget includes $248,656 for a 5% state employee pay increase for the Office of State Finance effective January 1, 2009. This funding is based on October 2007 salary information. Federal Changes OSF, using its appropriated funds, from time to time, must make payments to federal agencies on behalf of state agencies. During the current fiscal year, such a payment was made in the amount of $220,000. This adjustment reimburses the Office of State Finance for that payment.

FY-2009 Executive Budget
FINANCE AND REVENUE B-112
Insurance Department Mission The Insurance Department provides service, protection, education and oversight in insurance and related industries in Oklahoma. The Department’s responsibility is to assure the solvency of insurers, foster healthy competition to keep insurance rates low, and to act as a reliable resource to policymakers. The Department's major source of funding is deposited to the agency revolving fund, which consist mostly of fees collected for various licenses. Of the Department's FY-2007 actual funding, 70% was by way of revolving funds. The following graph shows how the Department used its funds for FY-2007. The total expenditures for FY-2007 were $9.9 million.
Insurance Department FY-2007 Actual Expenditures (In Thousands)
Sr. Health Ins Cnsl Prgm., $484,5%
Admin., $2,279,
23%
Reg./Enf., $7,158,
72%Source: Office of State Finance
The Department regulates insurance agents, real estate appraisers and bail bondsmen. The following graph shows the progress in processing and issuing licenses to the various agents with that of the prior year.
Key Performance Measure
15 14
4
0
5
10
15
FY-06 FY-07 Bud. FY-08
Producer Licensure Processing and Issuance Days
Financial Oversight The Department is accredited by the National Association of Insurance Commissioners (NAIC). The purpose of accreditation is to promote uniformity in the regulation of insurance companies. To maintain accreditation the Department must comply with NAIC standards as they relate to financial examinations, financial analysis, and legislation. Each insurance company domiciled in Oklahoma must file financial statements and other documents with the Department as required by statute to demonstrate the company’s solvency. Insurance departments in each state examine companies domiciled in their respective states. NAIC accreditation assures that all companies in every state are examined by applicable uniform standards. Medicare/Medicaid Fraud Prevention The Department received a grant from the U.S. Department of Health and Human Services’ Administration on Aging to educate senior citizens how to protect themselves from becoming victims of healthcare fraud. Training provided through the grant teaches seniors, advocates, and those working in the aging services field how to protect, detect, and report possible healthcare fraud. HMO Regulation The Insurance Department is responsible for regulating all HMOs that operate in the state of Oklahoma.

FY-2009 Executive Budget
FINANCE AND REVENUE B-113
FY-2009 Recommendation
FY-2008 Appropriation $2,516
FY-2008 Bud. FTE Level 153.0
Actual Ave. YTD FTE 153.0
Funding Adjustments: State Employee Pay Raise 185
FY-2009 Recommendation $2,701
% Change from FY-2008 7.36%
FY-2009 Appropriation(amounts in thousands)
Source: Office of State Finance State Employee Pay Raise The Governor’s budget includes $185,156 for a 5% state employee pay increase for the Insurance Department effective January 1, 2009. This funding is based on October 2007 salary information.
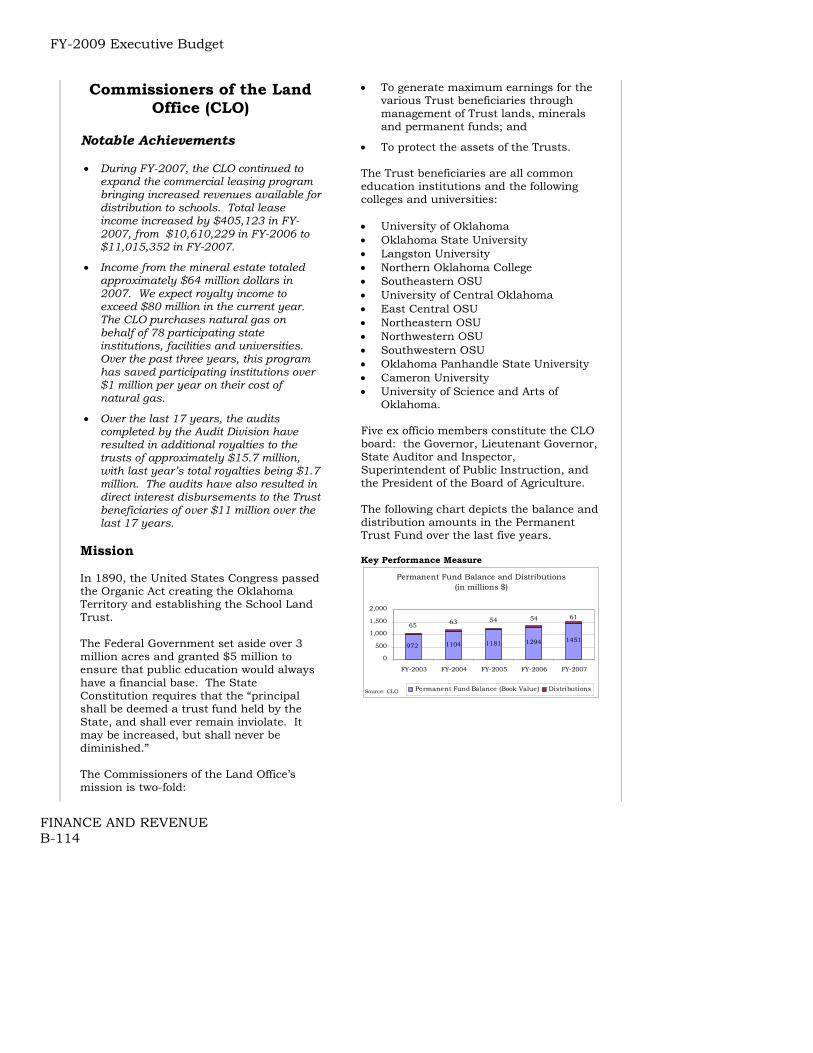
FY-2009 Executive Budget
FINANCE AND REVENUE B-114
Commissioners of the Land Office (CLO)
Notable Achievements • During FY-2007, the CLO continued to
expand the commercial leasing program bringing increased revenues available for distribution to schools. Total lease income increased by $405,123 in FY-2007, from $10,610,229 in FY-2006 to $11,015,352 in FY-2007.
• Income from the mineral estate totaled approximately $64 million dollars in 2007. We expect royalty income to exceed $80 million in the current year. The CLO purchases natural gas on behalf of 78 participating state institutions, facilities and universities. Over the past three years, this program has saved participating institutions over $1 million per year on their cost of natural gas.
• Over the last 17 years, the audits completed by the Audit Division have resulted in additional royalties to the trusts of approximately $15.7 million, with last year’s total royalties being $1.7 million. The audits have also resulted in direct interest disbursements to the Trust beneficiaries of over $11 million over the last 17 years.
Mission In 1890, the United States Congress passed the Organic Act creating the Oklahoma Territory and establishing the School Land Trust. The Federal Government set aside over 3 million acres and granted $5 million to ensure that public education would always have a financial base. The State Constitution requires that the “principal shall be deemed a trust fund held by the State, and shall ever remain inviolate. It may be increased, but shall never be diminished.” The Commissioners of the Land Office’s mission is two-fold:
• To generate maximum earnings for the various Trust beneficiaries through management of Trust lands, minerals and permanent funds; and
• To protect the assets of the Trusts. The Trust beneficiaries are all common education institutions and the following colleges and universities: • University of Oklahoma • Oklahoma State University • Langston University • Northern Oklahoma College • Southeastern OSU • University of Central Oklahoma • East Central OSU • Northeastern OSU • Northwestern OSU • Southwestern OSU • Oklahoma Panhandle State University • Cameron University • University of Science and Arts of
Oklahoma. Five ex officio members constitute the CLO board: the Governor, Lieutenant Governor, State Auditor and Inspector, Superintendent of Public Instruction, and the President of the Board of Agriculture. The following chart depicts the balance and distribution amounts in the Permanent Trust Fund over the last five years. Key Performance Measure
Permanent Fund Balance and Distributions (in millions $)
972 1104 1181 1294 1451
6154546365
0
500
1,000
1,500
2,000
FY-2003 FY-2004 FY-2005 FY-2006 FY-2007
Permanent Fund Balance (Book Value) DistributionsSource: CLO

FY-2009 Executive Budget
FINANCE AND REVENUE B-115
Key Performance Measure
Net Gains (losses) from Investments ($ in millions)
(55.8)
91.7
28.443.7
93.7
-80-60-40-20
020406080
100120
FY-2003 FY-2004 FY-2005 FY-2006 FY-2007
Source: CLO The Trusts managed by the CLO are: the Common School Fund, the Education Institutions Fund, the University of Oklahoma Fund, the University Preparatory School Fund, the Oklahoma State University Fund, the Normal Schools Fund, the Langston University Fund, the Public Building Fund and the Greer 33 Fund. The CLO is also charged with the sale, rental, disposal and management of School Trust lands and assets, and of the funds and proceeds derived from these assets. The principle functions of the agency consist of the following: • Leasing lands for agricultural,
commercial and grazing purposes; • Leasing lands for oil, gas and other
minerals including water rights; • Investing permanent funds as
authorized by law; • Sale of lands as prescribed by law; • Improving, protecting and preserving
lands owned by the Trusts; and • Distributing the revenues of the various
Trusts to the institutions to which the funds belong.
Real Estate Management The real estate management division is responsible for the lease, sale and management of approximately 750,000 acres of Trust Lands along with the
maintenance and care of all of the agency’s current and historical records. Annual income is in excess of $11 million. The majority of this income is derived from the agricultural leasing program. This does not include a $1.6 million increase in the permanent fund from other real estate activities. The table below provides a detailed inventory of Trust Lands
ORIGINAL LAND ACQUIRED TOTAL ACRESTRUST FUND GRANT LAND BY FORECLOSURE OWNED
Common School 325,942.17 40,895.52 366,837.69 State Education Institutions 75,690.72 6,726.43 82,417.15 University of Oklahoma 62,456.96 1,147.16 63,604.12 University Preparatory 21,080.75 400.00 21,480.75 Oklahoma State University 75,572.92 1,112.96 76,685.88 Normal Schools 74,152.38 478.50 74,630.88 Langston University 18,678.10 316.99 18,995.09 Public Buildings 36,261.34 - 36,261.34 Greer 3,239.30 - 3,239.30
Total Acres Owned 693,074.64 51,077.56 744,152.20
Source: CLO
(Unaudited)
School Land TrustAcreage Inventory
State Owned School LandsYear Ended June 30, 2007
Minerals Management The various trusts under the direction of the CLO own about 1.35 million gross and 1.1 million net mineral acres throughout 74 of Oklahoma’s 77 counties. The division is responsible for oversight of approximately 5,000 oil and gas wells and administration of approximately 6,600 leases. Income from the mineral estate in FY-2007 was approximately $64 million. Income from the fund is deposited in the Permanent Trust. In FY-2007, 285 wells were drilled on CLO property. The chart below depicts mineral revenue for the past five fiscal years. Key Performance Measure
Mineral Revenue (in millions $)
28
4349
66 64
0
10
20
30
40
50
60
70
FY-2003 FY-2004 FY-2005 FY-2006 FY-2007
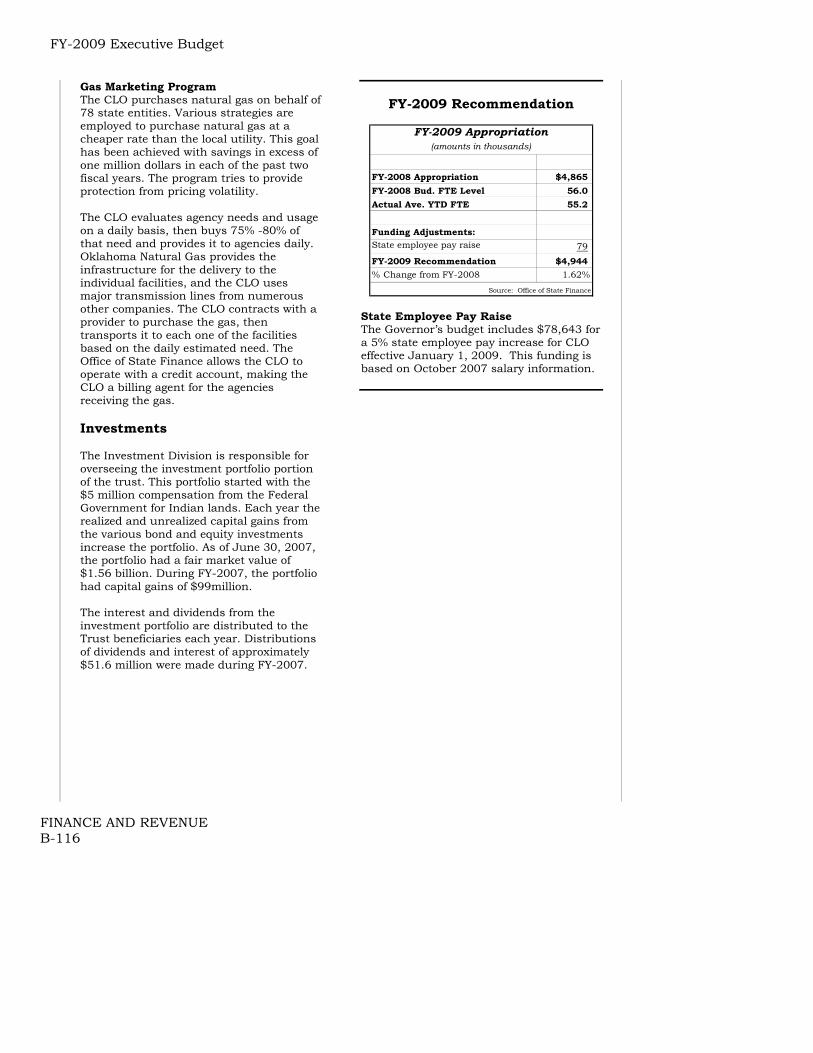
FY-2009 Executive Budget
FINANCE AND REVENUE B-116
Gas Marketing Program The CLO purchases natural gas on behalf of 78 state entities. Various strategies are employed to purchase natural gas at a cheaper rate than the local utility. This goal has been achieved with savings in excess of one million dollars in each of the past two fiscal years. The program tries to provide protection from pricing volatility. The CLO evaluates agency needs and usage on a daily basis, then buys 75% -80% of that need and provides it to agencies daily. Oklahoma Natural Gas provides the infrastructure for the delivery to the individual facilities, and the CLO uses major transmission lines from numerous other companies. The CLO contracts with a provider to purchase the gas, then transports it to each one of the facilities based on the daily estimated need. The Office of State Finance allows the CLO to operate with a credit account, making the CLO a billing agent for the agencies receiving the gas. Investments The Investment Division is responsible for overseeing the investment portfolio portion of the trust. This portfolio started with the $5 million compensation from the Federal Government for Indian lands. Each year the realized and unrealized capital gains from the various bond and equity investments increase the portfolio. As of June 30, 2007, the portfolio had a fair market value of $1.56 billion. During FY-2007, the portfolio had capital gains of $99million. The interest and dividends from the investment portfolio are distributed to the Trust beneficiaries each year. Distributions of dividends and interest of approximately $51.6 million were made during FY-2007.
FY-2009 Recommendation
FY-2008 Appropriation $4,865FY-2008 Bud. FTE Level 56.0Actual Ave. YTD FTE 55.2
Funding Adjustments:State employee pay raise 79
FY-2009 Recommendation $4,944% Change from FY-2008 1.62%
(amounts in thousands)
Source: Office of State Finance
FY-2009 Appropriation
State Employee Pay Raise The Governor’s budget includes $78,643 for a 5% state employee pay increase for CLO effective January 1, 2009. This funding is based on October 2007 salary information.

FY-2009 Executive Budget
FINANCE AND REVENUE B-117
The Retirement Systems The Systems The State retirement systems consist of the following seven defined benefit pension plans: • Oklahoma Public Employees Retirement
System (OPERS);
• Uniform Retirement System for Justices and Judges (URSJJ);
• Oklahoma Teachers Retirement System (OTRS);
• Oklahoma Police Pension and Retirement System (Police);
• Oklahoma Firefighters Pension and Retirement System (Firefighters);
• Oklahoma Law Enforcement Retirement System (OLERS); and
• Retirement Plan for Full-time Employees of the Department of Wildlife (Wildlife).
Systems are funded with employee contributions, employer contributions, return on investments and, in some cases, dedicated revenue streams. There are two main types of plans in the system. Police, Firefighters, and OLERS are referred to as “twenty and out” plans. Additionally, within the structure of OPERS a “twenty and out” plan is maintained for correctional officers, probation and parole officers and fugitive apprehension officers in the Department of Corrections as well as for firefighters in the Military Department. OPERS, URSJJ, OTRS and Wildlife are defined benefit plans. These plans have a guaranteed benefit that is a function of years of service and salary. In order to be entitled to these benefits, there is a requirement for a certain number of years of service before a member becomes vested. The “twenty and out” plans are aimed at public safety services where it is in the interest of the public to have the active members made up of younger, healthier individuals. These individuals often serve
in areas that are defined as hazardous duty. These plans are extremely generous in their benefits and are designed to allow retired members to go on to other careers. The relative size of the systems can best be understood by looking at their membership numbers. The overwhelming size of OTRS compared to the other systems becomes readily apparent when viewed in this context. The graph on the following page illustrates the membership by system in FY-2007.
FY-2007 Retirement M embership
144,889
75,582
21,743
7,1022,475 483
0
20,000
40,000
60,000
80,000
100,000
120,000
140,000
160,000
OTRS OP ERS OFP RS OPP RS OLERS URSJJ
Mem
bers
The financial health of retirement systems is measured by a ratio of projected benefit payments to funds available for benefit payments. Calculations of projected benefit payments are based on a number of factors including age of employees, estimated retirement age, number of years credited in system, marital status, mortality rate tables and COLA increases. OTRS’s large relative size is a concern because the system carries an Unfunded Actuarial Accrued Liability (UAAL) of approximately $7.6 billion. UAAL reflects the excess amount of liability to provide benefits over the amount of assets available to pay those benefits. This accrual reflects an actuary’s best estimate of costs that will be incurred for future benefits promised as of a certain date.

FY-2009 Executive Budget
FINANCE AND REVENUE B-118
The simplest way to understand the health of any retirement system is to view its funded ratio, which is a ratio of debt to assets. The term fully-funded applies to a retirement system in which contributions are sufficient to pay for the benefits of existing and new employees. The table to the right lists funded ratios for each agency over the past four fiscal years.
2004 2005 2006 2007OTRS 47.3% 49.5% 49.3% 52.6%OPERS 76.1% 72.0% 71.4% 72.6%OFPRS 66.0% 63.7% 58.5% 62.6%OPPRS 81.1% 78.6% 78.0% 0.0%OLERS 87.6% 84.0% 84.4% 83.0%URSJJ 121.0% 108.7% 102.5% 98.9%
Source: Annual Financial/Actuarial Reports
Funded Ratios by System
OTRS’ funding ratio is one of the lowest in the nation. This gap in funding of OTRS liabilities is an absolute obligation of the State according the Attorney General’s. Ultimately, therefore, the responsibility for this debt falls on the shoulders of all Oklahomans. In 2007, the legislature passed and Governor Henry signed Senate Bill 357 into law. This legislation increases the employer contribution rates into the Teachers Retirement System. Current estimates show this legislation will bring the system to an 80% funded ratio over the next 20 years. A sensible combination of asset classes is another determinant of soundness of retirement funds. The allocation by asset class of the Oklahoma retirement funds are within prudent guidelines. The only unusual allocation is in the alternative assets of Police with investment in venture capital; however, the investment in alternative assets is within prudent guidelines. Police is the only state retirement fund that invests in venture capital.
Dedicated Revenues The State systems differ from many other defined benefit retirement plans since several of the systems receive contributions other than employer and employee contributions. OTRS, Firefighters, OLERS, and Police are all recipients of dedicated revenue streams. The insurance premium tax provides all the dedicated revenue for Firefighters and Police and approximately half of the dedicated revenue to OLERS. These state revenues flow to Police and Firefighters although the members are employed primarily by cities and counties rather than the state. The amount dedicated to the retirement plans through FY-2009 will increase above previous levels. The General Revenue Fund will decrease to provide for the increase to the retirement funds. The retirement systems exist for the benefit of employees and their beneficiaries. All of the systems provide a benefit for their members with varying provisions for their beneficiaries in the event of the death of the member.
% $ millions % $ millions % $ millions % $ millionsOFPRS 41.70% $60.47 41.70% $62.55 41.70% $58.38 34.00% $47.60OPPRS 17.00% $24.65 17.00% $25.50 17.00% $23.80 14.00% $19.60OLERS 6.10% $8.85 6.10% $9.15 6.10% $8.54 5.00% $7.00GRF 35.20% $51.04 35.20% $52.80 35.20% $49.28 47.00% $65.80HB1017 0.00% $0.00 0.00% $0.00 0.00% $0.00
Total $145.00 $150.00 $140.00 $140.00
Insurance Premium Tax ApportionmentFY-2010 and laterFY-2006 FY-2007 FY-2008 - FY-2009
Spouse beneficiaries generally receive a lifetime benefit which varies from being the same amount as the employee to half. Minor children beneficiaries receive a benefit as long as they are minors or, in some cases, while enrolled in higher education. The table below shows the average regular benefit of retirees only. This table does not include any amounts that may be received from Deferred Retirement Option Plans (DROP) programs, disability programs or payments to beneficiaries.

FY-2009 Executive Budget
FINANCE AND REVENUE B-119
System Avg. Benefit*
OTRS 17,028OPERS 14,625OFPRS
Paid 26,467Volunteer 1,681
OPPRS 28,352OLERS 32,439URSJJ 58,217
*Avg. benefit includes service retirees only.
Retiree Annual Benefits
Source: FY-2007 Actuarial and Financial Reports
Oklahoma Public Employees Retirement System (OPERS)
Notable Achievements • Government Finance Officers Association
(GFOA) has recognized OPERS for outstanding achievement in financial reporting for eight years in a row.
• Investment returns consistently exceed benchmarks.
• Implemented a web-based payroll reporting system for local employers.
• Reversed a seven-year trend of falling funded ratios by (1) achieving solid investment returns for five straight years, (2) obtaining legislative increases in contribution rates.
Mission The mission of OPERS is to provide and promote accountable and financially sound retirement plans for its members. OPERS administers a defined benefit retirement plan for public employees as well as for judges and justices (URSJJ). OPERS’ clients are composed of:
• State and county employees, except for Oklahoma and Tulsa counties, and
• Local governments that choose to participate.
Contribution Rates
2004 2005 2006 2007State Agencies 119 121 123 124County Governments
75 75 75
75Local Towns and Cities
28 28 28
28Other Local Gov. Units
38 42 45
46Total 260 266 271 273
OPERS Participating Employers
Source: OPERS Financial statements, June 30, 2004, 2005, 2006 and 2007 Effective July 1, 2007, the state, county and local agency employer contribution rates increase as follows: State agency employer contribution rates increased by 1.0% from 12.5% to 13.5% for FY 2008 and will increase 1.0% each year thereafter until it reaches 16.5% in FY 2011. • Employee contributions for most state
employees are now a level 3.5% of salary; and
• The combined employee and employer contribution rate for county and local agencies increased by 1.0% to 17% in FY 2008 and will increase 1.0% each year thereafter until it reaches 20% in FY 2011.
OPERS’ Funded Status The funded ratio of OPERS has been in a steady decline since 1998, but posted an increase at the end of 2007. It has gone from a funded ratio of 91% in 1998 and was 72.6% at the end of FY 2007. The total “required contribution rate” is now 26.13% of salaries while the System is only projected to take in 17% of salaries in employer and employee contributions in the coming fiscal year. The employer contribution rate is 13.5% of salary for FY 2008 and increases to only 14.5% in FY 2009. If the scheduled contribution rate increases remain intact, and all actuarial assumptions are met, OPERS could reach a
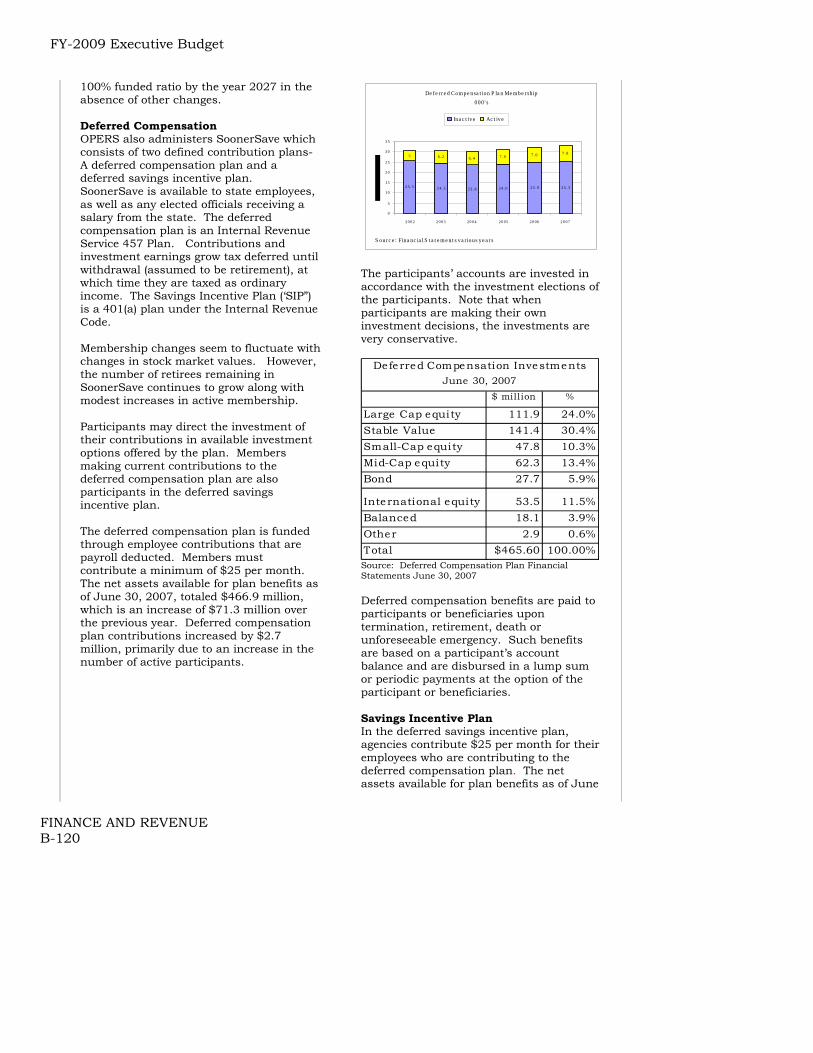
FY-2009 Executive Budget
FINANCE AND REVENUE B-120
100% funded ratio by the year 2027 in the absence of other changes. Deferred Compensation OPERS also administers SoonerSave which consists of two defined contribution plans- A deferred compensation plan and a deferred savings incentive plan. SoonerSave is available to state employees, as well as any elected officials receiving a salary from the state. The deferred compensation plan is an Internal Revenue Service 457 Plan. Contributions and investment earnings grow tax deferred until withdrawal (assumed to be retirement), at which time they are taxed as ordinary income. The Savings Incentive Plan (‘SIP”) is a 401(a) plan under the Internal Revenue Code. Membership changes seem to fluctuate with changes in stock market values. However, the number of retirees remaining in SoonerSave continues to grow along with modest increases in active membership. Participants may direct the investment of their contributions in available investment options offered by the plan. Members making current contributions to the deferred compensation plan are also participants in the deferred savings incentive plan. The deferred compensation plan is funded through employee contributions that are payroll deducted. Members must contribute a minimum of $25 per month. The net assets available for plan benefits as of June 30, 2007, totaled $466.9 million, which is an increase of $71.3 million over the previous year. Deferred compensation plan contributions increased by $2.7 million, primarily due to an increase in the number of active participants.
De fe r re d Com pe nsa t ion P la n Me mbe r sh ip000 ' s
2 5 . 5 2 4 . 5 2 3 . 8 2 4 . 0 2 5 . 0 2 5 . 3
5 6 . 2 6 . 4 7 . 0 7 . 0 7 . 8
0
5
1 0
1 5
2 0
2 5
3 0
3 5
2 0 0 2 2 0 0 3 2 0 0 4 2 0 0 5 2 0 0 6 2 0 0 7
Ina c t ive Ac t ive
S ourc e : Fina nc ia l S t a t e m e nt s va r ious ye a r s
The participants’ accounts are invested in accordance with the investment elections of the participants. Note that when participants are making their own investment decisions, the investments are very conservative.
$ million %
Large Cap equity 111.9 24.0%Stable Value 141.4 30.4%Small-Cap equity 47.8 10.3%Mid-Cap equity 62.3 13.4%Bond 27.7 5.9%
International equity 53.5 11.5%Balanced 18.1 3.9%Other 2.9 0.6%Total $465.60 100.00%
Deferred Compensation InvestmentsJune 30, 2007
Source: Deferred Compensation Plan Financial Statements June 30, 2007 Deferred compensation benefits are paid to participants or beneficiaries upon termination, retirement, death or unforeseeable emergency. Such benefits are based on a participant’s account balance and are disbursed in a lump sum or periodic payments at the option of the participant or beneficiaries. Savings Incentive Plan In the deferred savings incentive plan, agencies contribute $25 per month for their employees who are contributing to the deferred compensation plan. The net assets available for plan benefits as of June
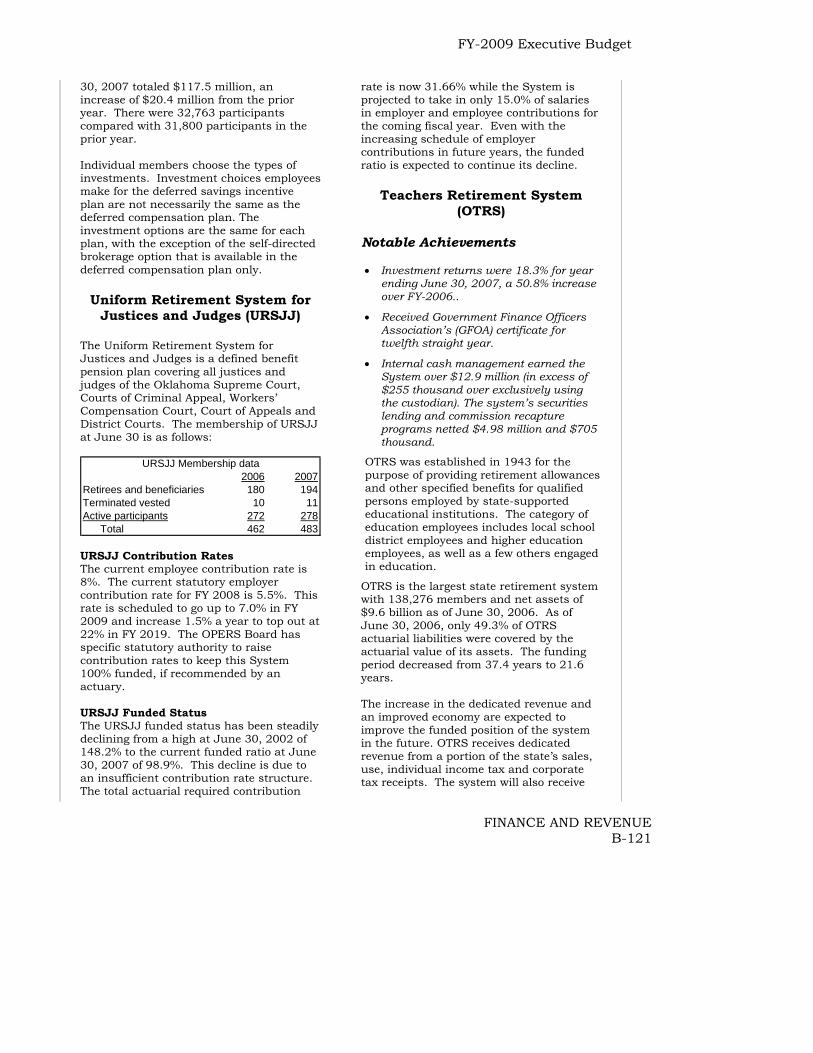
FY-2009 Executive Budget
FINANCE AND REVENUE B-121
30, 2007 totaled $117.5 million, an increase of $20.4 million from the prior year. There were 32,763 participants compared with 31,800 participants in the prior year. Individual members choose the types of investments. Investment choices employees make for the deferred savings incentive plan are not necessarily the same as the deferred compensation plan. The investment options are the same for each plan, with the exception of the self-directed brokerage option that is available in the deferred compensation plan only.
Uniform Retirement System for Justices and Judges (URSJJ)
The Uniform Retirement System for Justices and Judges is a defined benefit pension plan covering all justices and judges of the Oklahoma Supreme Court, Courts of Criminal Appeal, Workers’ Compensation Court, Court of Appeals and District Courts. The membership of URSJJ at June 30 is as follows:
2006 2007Retirees and beneficiaries 180 194Terminated vested 10 11Active participants 272 278 Total 462 483
URSJJ Membership data
URSJJ Contribution Rates The current employee contribution rate is 8%. The current statutory employer contribution rate for FY 2008 is 5.5%. This rate is scheduled to go up to 7.0% in FY 2009 and increase 1.5% a year to top out at 22% in FY 2019. The OPERS Board has specific statutory authority to raise contribution rates to keep this System 100% funded, if recommended by an actuary. URSJJ Funded Status The URSJJ funded status has been steadily declining from a high at June 30, 2002 of 148.2% to the current funded ratio at June 30, 2007 of 98.9%. This decline is due to an insufficient contribution rate structure. The total actuarial required contribution
rate is now 31.66% while the System is projected to take in only 15.0% of salaries in employer and employee contributions for the coming fiscal year. Even with the increasing schedule of employer contributions in future years, the funded ratio is expected to continue its decline.
Teachers Retirement System (OTRS)
Notable Achievements • Investment returns were 18.3% for year
ending June 30, 2007, a 50.8% increase over FY-2006..
• Received Government Finance Officers Association’s (GFOA) certificate for twelfth straight year.
• Internal cash management earned the System over $12.9 million (in excess of $255 thousand over exclusively using the custodian). The system’s securities lending and commission recapture programs netted $4.98 million and $705 thousand.
OTRS was established in 1943 for the purpose of providing retirement allowances and other specified benefits for qualified persons employed by state-supported educational institutions. The category of education employees includes local school district employees and higher education employees, as well as a few others engaged in education.
OTRS is the largest state retirement system with 138,276 members and net assets of $9.6 billion as of June 30, 2006. As of June 30, 2006, only 49.3% of OTRS actuarial liabilities were covered by the actuarial value of its assets. The funding period decreased from 37.4 years to 21.6 years. The increase in the dedicated revenue and an improved economy are expected to improve the funded position of the system in the future. OTRS receives dedicated revenue from a portion of the state’s sales, use, individual income tax and corporate tax receipts. The system will also receive
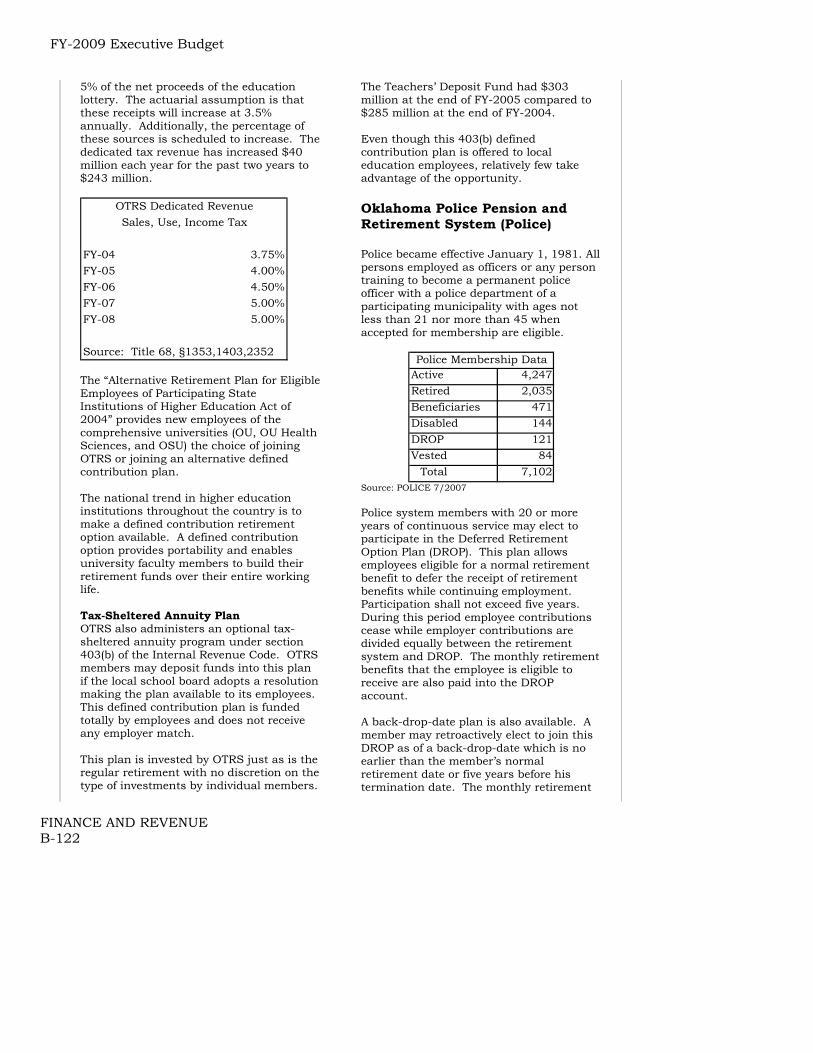
FY-2009 Executive Budget
FINANCE AND REVENUE B-122
5% of the net proceeds of the education lottery. The actuarial assumption is that these receipts will increase at 3.5% annually. Additionally, the percentage of these sources is scheduled to increase. The dedicated tax revenue has increased $40 million each year for the past two years to $243 million.
FY-04 3.75%FY-05 4.00%FY-06 4.50%FY-07 5.00%FY-08 5.00%
Source: Title 68, §1353,1403,2352
OTRS Dedicated RevenueSales, Use, Income Tax
The “Alternative Retirement Plan for Eligible Employees of Participating State Institutions of Higher Education Act of 2004” provides new employees of the comprehensive universities (OU, OU Health Sciences, and OSU) the choice of joining OTRS or joining an alternative defined contribution plan. The national trend in higher education institutions throughout the country is to make a defined contribution retirement option available. A defined contribution option provides portability and enables university faculty members to build their retirement funds over their entire working life. Tax-Sheltered Annuity Plan OTRS also administers an optional tax-sheltered annuity program under section 403(b) of the Internal Revenue Code. OTRS members may deposit funds into this plan if the local school board adopts a resolution making the plan available to its employees. This defined contribution plan is funded totally by employees and does not receive any employer match. This plan is invested by OTRS just as is the regular retirement with no discretion on the type of investments by individual members.
The Teachers’ Deposit Fund had $303 million at the end of FY-2005 compared to $285 million at the end of FY-2004. Even though this 403(b) defined contribution plan is offered to local education employees, relatively few take advantage of the opportunity. Oklahoma Police Pension and Retirement System (Police) Police became effective January 1, 1981. All persons employed as officers or any person training to become a permanent police officer with a police department of a participating municipality with ages not less than 21 nor more than 45 when accepted for membership are eligible.
Active 4,247Retired 2,035Beneficiaries 471Disabled 144DROP 121Vested 84
Total 7,102
Police Membership Data
Source: POLICE 7/2007 Police system members with 20 or more years of continuous service may elect to participate in the Deferred Retirement Option Plan (DROP). This plan allows employees eligible for a normal retirement benefit to defer the receipt of retirement benefits while continuing employment. Participation shall not exceed five years. During this period employee contributions cease while employer contributions are divided equally between the retirement system and DROP. The monthly retirement benefits that the employee is eligible to receive are also paid into the DROP account. A back-drop-date plan is also available. A member may retroactively elect to join this DROP as of a back-drop-date which is no earlier than the member’s normal retirement date or five years before his termination date. The monthly retirement

FY-2009 Executive Budget
FINANCE AND REVENUE B-123
benefits and employee contributions that would have been payable had the member elected to join the DROP are credited to the member’s account with interest. When the member actually terminates employment, the DROP account balance may be paid in a lump sum or to an annuity provider. Monthly retirement benefits are then paid directly to the retired member. Oklahoma Law Enforcement Retirement System (OLERS) The plan was established July 1, 1947. Qualified law enforcement officers of various state agencies and departments are members. The normal retirement date for retirement benefits eligibility is 20 years of service or age 62 with 10 years of service.
Agency Active RetiredABLE 26 27OSBI 150 76OSBN 52 34Board of Pharmacy 1 5Tourism 57 52DPS 927 973Quartz Mt. 2 1OU 36 0OSU 28 0Grand River Dam 5 0
Total Members 1,284 1,168
OLERS Membership Data
Source: OLERS 01/08
Department of Wildlife Retirement Plan (Wildlife)
The DWR is a single-employer defined benefit plan. All permanent, full-time employees of the Department of Wildlife are eligible to participate on the date of their employment. This retirement system is unique since a single agency manages the retirement system for its own employees. The retirement system has 315 active participants and 163 retired and inactive participants. It has a funded ratio of 80.4%.The revenue source for the retirement fund is the Department's contribution and the employee's contributions. The funds are held and invested through a trust account. The employer contribution is based on the annual valuation report and is currently set on a 15 year amortization schedule to fund the liability. The Department has increased the annual contribution to 2.8 million based on the actuarial valuation report. Employees contribute 3% of salary. The vesting period is 10 years.

FY-2009 Executive Budget
FINANCE AND REVENUE B-124
OPERS URSJJ OTRS OPPRS OFPRS OLERSActive members 45,472 272 88,133 4,247 11,409 1,170Retired Members* 24,372 180 43,506 2,035 5,223 775Vested Members 52,254 10 6,637 84 1,070 26Deferred Option Plan (DROP) - - - 121 1,667 105Employee Contribution %:
State-not elected 3.0% to 6.4% 8.00% 7.00% 8% 8% 8&State-elected 4.5% to 10% - 4.50% - - -Hazardous Duty 8 - - - - -County & Local 3.5% to 11.41% 5.00% 7.6% 12.70% 12.9%** 10.50%
Employee Contribution $: $55,989 $1,717 $258,409 $17,671 $16,337 $4,569Actuarial Value of Assets $5,654,276 $210,376 $8,421,867 $1,627,476 $1,546,486 $651,671Actuarial Accrued Liability $7,914,658 $205,305 $16,024,394 $2,035,653 $2,666,306 $772,269* Includes regular retirees and disabled retirees as well as beneficiaries and spouses** Volunteers receive 0%
Source: Annual Financial Reports, Actuarial Reports as of July 1, 2007
Plan Year Ending 6/30/2007 ($ in 000's)Retirement Systems - Number of Members and Employee Contribution Amounts

FY-2009 Executive Budget
FINANCE AND REVENUE B-125
Securities Commission Mission The Securities Commission deters and remedies securities fraud on behalf of Oklahoma’s citizens. To accomplish this mission, the agency: • Enforces the Securities, Business
Opportunity Sales, Subdivided Land Sales and Take-Over Disclosure Acts;
• Registers offerings and sales of securities, business opportunities and subdivided land;
• Registers securities sales and adviser professionals;
• Performs on-site examinations of securities professionals and issuers; and
• Provides investor education. The Securities Commission is a non-appropriated agency. Beginning in FY-2005 all agency expenditures were funded by revolving fund revenue. The Securities Commission contributes 70% to 80% of fee assessments to the General Revenue Fund depending on the correlation between the filings and statute requirements.

FY-2009 Executive Budget
FINANCE AND REVENUE B-126
Oklahoma Tax Commission (OTC)
Notable Achievements • Implemented use of an outsourcing firm
to collect income and business tax, which increased collections from ($19 million to $30.2 million from FY-1999 to FY-2006.
• The Commission has seen a 270% increase (226,000 to 839,189) in on-line income tax return filers from FY-2000 to FY-2007. This system increases the agency's efficiency by eliminating in-house data entry and the time and errors inherent in the manual data entry process.
• The Professional License Compliance program has significantly increased compliance. Since inception in FY-2000 through FY-2007, the OTC has collected $ 83 million from delinquent license holders.
• The agency’s compliance and enforcement efforts of Oklahoma’s cigarette and tobacco tax laws was significantly augmented by the addition of audit staff in both the office and field. Over the past year, cigarette tax collections increased $3.5 million while, according to statistics, overall smoking has decreased.
• With a special appropriation, a Digital License Plate Production System will be implemented in late fiscal year 2008. The system uses current technology to produce on-demand license plates at a faster rate and lower operating costs. The weight of the finished product allows for lower postage costs when mailing. The initial implementation will include special order plates and then move to general issue license plates.
The primary responsibilities of the Tax Commission include the collection and distribution of approximately 75 different taxes, fees and licenses. The Commission allocates revenues to state funds and local government units, and collects and distributes local sales taxes levied by cities and towns in Oklahoma.
The Oklahoma Tax Commission consists of three distinct departments: Taxpayer Services, Revenue Administration and Support Services. Income Tax Return Processing Since 1997, the Tax Commission has greatly reduced the amount of time required to process income tax refunds. The Commission utilizes temporary seasonal employees from February through June to process returns. Key Performance Measure
Average Time to Process an Income Tax Refund
1112
14
1011
12
6
0
2
4
6
8
10
12
14
16
FY-01 FY-02 FY-03 FY-04 FY-05 FY-06 FY-07
Day
s
Source: Oklahoma Tax Commission Professional License Compliance The OTC is required to review professional license applicants for income tax compliance. This tax review is conducted before a state license is issued. The Commission established a section, the Professional Licensing Compliance Unit, to assist taxpayers with this new law. OTC reviews the following professions through this program: Doctors Nurses Attorneys Insurance agents Teachers Architects Accountants All medical related licenses Engineers Abstractors Cosmetologists Process servers All Health Department licenses such as
plumbers, electricians, etc.

FY-2009 Executive Budget
FINANCE AND REVENUE B-127
Abstractors Funeral directors Securities brokers
The graph below shows the collections from the Professional License Compliance Program through FY-2007. Key Performance Measure
$9,000
$14,000
$12,500
$10,000 $10,000
$5,000
$-
$2,000
$4,000
$6,000
$8,000
$10,000
$12,000
$14,000
FY-02 FY-03 FY-04 FY-05 FY-06 FY-07
Pofressional License Compliance Program Collections($ in 000s)
Tobacco Enforcement The Tax Commission has undertaken a variety of compliance and enforcement efforts in order to insure that all cigarette and tobacco taxes are being accurately reported and paid. These efforts include, but are not limited to: • Assessed over $404,457 on taxes owed
but not paid from purchases of cigarette products over the internet since the project began in October 2005;
• Increased compliance and enforcement efforts of Oklahoma’s cigarette and tobacco tax laws with additional staff. Over the past year, cigarette tax collections increased $3.5 million while, according to statistics, overall smoking has decreased.
• Established a phone hotline in 2005 in which wholesalers may report violations of cigarette and tobacco laws. The OTC continues to use this resource as one of its primary ways to identify violators of the state’s tobacco laws.
• Conducted 10 statewide compliance sweeps-to-date on retail establishments with approximately 6,200 visits resulting in 527 confiscations of
cigarette and tobacco products (8.5% of all visits);
• Conducted compliance sweeps on several Cigarette & Tobacco wholesale businesses located in Oklahoma that have resulted in confiscation of cigarette and tobacco products that are over $334,000 in retail value; and
• Continued daily routine compliance inspection.
Customer Service Center Construction to renovate the first floor of the Connors building for the Tax Commission’s one-stop customer service center is complete. The project added 12 customer service stations and additional personnel to the first floor. Seating and private consultation areas have also been added to provide a more comfortable and discreet environment. Now that the renovation is complete, taxpayers will no longer have to shuttle between different locations to do business with the Tax Commission.
FY-2009 Recommendation
FY-2008 Appropriation $48,201FY-2008 Bud. FTE Level 935.0Actual Ave. YTD FTE 902.5
Funding Adjustments: State Employee Pay Raise 1,053 Data Security Enhancement 205 Info. Security & Network Assessment 100
Total Adjustments 1,358
FY-2009 Recommendation $49,559% Change from FY-2008 2.82%
Source: Office of State Finance
FY-2009 Appropriation(amounts in thousands)
State Employee Pay Raise The Governor’s budget includes $1,053,103 for a 5% state employee pay increase for the Oklahoma Tax Commission effective
FY-2009 Executive Budget
FINANCE AND REVENUE B-128
January 1, 2009. This funding is based on October 2007 salary information. Data Security Enhancement The Governor's budget includes $205,000 to enable the purchase of a new firewall and other network security infrastructure components. Information Security & Network Assessment The Governor’s budget includes $100,000 to establish a Quarterly Information Security and Network Assessment Program to assist in ensuring that confidential information contained within the Agency's computer system is not inappropriately obtained and misused.

FY-2009 Executive Budget
FINANCE AND REVENUE B-129
State Treasurer Notable Achievements • During the first two years of the current
administration, investment earnings for the General Revenue Fund were tripled – generating almost $100 million during FY 2006 and almost $150 million during FY 2007. For FY 2008, earnings are projected to be $160 million;
• New investments in US Agency senior securities, which yield more than comparable US Treasury securities, enhanced earnings in FY 2007 by $18.2 million. During FY 2008, US Agency investments were further diversified to include mortgage-backed securities. The increase attributable to this new strategy is projected to be $22.8 million for FY 2008;
• Investment in highest-quality commercial paper for short-term liquidity will generate more than $540,000 in additional income during FY 2008;
• Online trading was implemented during FY 2007 and expanded to include Agency issues in FY 2008. During FY 2007, online trading saved $82,000. Savings will total $440,000 during FY 2008;
• Two contracts renegotiated by Treasurer Meacham for banking services reduced the cost of banking services to the state by one-third or $250,000 per year;
• By implementing several initiatives, including a “fast track” claims process, the amount of unclaimed property returned to its rightful owners has been greatly enhanced. In the past two years, the number of claims paid has jumped 52 percent and the amount of money returned has increased by 26 percent.
• The SEED for Oklahoma Kids initiative was launched in January 2008. The multi-year study, funded by the Ford Foundation, will measure the effectiveness of matching grants, totaling up to $2 million, in encouraging low to moderate income households to save for
a child's education with the Oklahoma College Savings Plan:
• A restructuring of the investments of the Oklahoma Tobacco Settlement Endowment Trust Fund and negotiated reductions in investment fees will help the state realize a total added benefit of more than $17.9 million over the next five years.
• Staffing within the treasurer’s office has been reduced by 13.5 FTE in the past two years to save more than $400,000 per year.
Mission The mission of the State Treasurer's Office is to serve the people of Oklahoma and state agencies by providing sound financial services, reuniting citizens with their unclaimed property, and promoting economic development opportunities in a fiscally responsible and efficient manner while adhering to the highest professional and ethical standards. Finding ways to save money and generate more income for the state is part of the culture in the State Treasurer’s Office. Due to these efforts, taxpayers are realizing a benefit of more than $116 million each year. Investment Portfolio The Treasurer directs the investment of approximately $5 billion for the state’s General Revenue Fund and for state agencies. Due to several initiatives designed to increase earnings while maintaining safety and liquidity, the treasurer has been able to maintain income levels from the portfolio during the falling interest rate cycle the economy as been experiencing.

FY-2009 Executive Budget
FINANCE AND REVENUE B-130
Direct Deposit/PayCard Contract Legislation requested by the Treasurer’s Office, effective July 1, 2007, requires all state employee pay be done with direct deposit. Employees that are unable to have a banking relationship can use a pay card. Annual savings, once fully implemented, will be approximately $250,000 for state government. Record Storage Efficiency By eliminating the need to store paper records and moving to more electronic imaging, the Treasurer’s Office is saving approximately $17,000 per year. In future years, savings will increase as the need for storage space continued to be reduced. Unclaimed Property Division The Treasurer’s Office maintains unclaimed funds for 350,000 Oklahomans. These funds total $260 million. In the past two years, the number of claims paid has increased by more than 50 percent. A fast track claims process, implemented in March 2007, has resulted in the payment of more than 5,600 claims totaling $1.3 million. Booths operated by Treasurer’s staff at the Oklahoma City and Tulsa state fairs have identified more than 7,600 Oklahomans with $2.9 million in unclaimed property.
Number of Paid Claims by Fiscal Year
-
2,000
4,000
6,000
8,000
10,000
12,000
14,000
16,000
18,000
Fiscal Year
Num
ber o
f Pai
d C
laim
s
Number of Fast Track PaidClaism
- - 1,472 4,144
Number of Regular PaidClaims
10,877 16,458 14,222 4,173
2005 2006 2007 2008
Security Improvements Using funds saved through various efficiency projects, the office has reinvested $370,000 to enhance security within its financial operations including upgraded hardware and software to help protect private bank account and social security numbers. College Savings Plan The Oklahoma College Savings Plan offers families the opportunity to plan and save for higher education expenses. There are several advantages: • Oklahoma residents are eligible for an
annual state income tax deduction of up to $10,000 per taxpayer, $20,000 per joint filing taxpayers;
• Earnings are tax free if used for
educational purposes; and • Students may go to the post-secondary
institution of their choice in Oklahoma or in other states.
Since its inception in April 2000, more than 37,000 Oklahomans have opened College Savings Plan accounts totaling $285.3 million in assets. This represents an increase in assets under management of 115 percent since July 2005.

FY-2009 Executive Budget
FINANCE AND REVENUE B-131
Tobacco Settlement Endowment Trust Fund The Oklahoma Tobacco Settlement Endowment Trust Fund permanently invests a majority of Oklahoma’s share of the National Settlement Agreement. Investments are controlled by a board of investors, chaired by the Treasurer and staffed by the Treasurer’s Office. • In early 2007, the board made a change
in investment policy to generate $12.7 million in additional income during the next five years while protecting the fund for generations to come. The changes generate more cash and ensure the value of the fund will continue to grow faster than inflation.
• In the first year after the investment policy was changed, the board of investors certified $10.3 million for expenditure. This reflects a $3.5 million or 52 percent increase from the previous year.
• The Treasurer also renegotiated all investment contracts to generate an additional $5.2 million – reflecting a 27.5 percent reduction in fees – during the next five years.
• The total benefit is more than $17.9 million for spending on programs to improve the health of Oklahomans.
The trust fund currently contains $382 million.
FY-2009 Recommendation
FY-2008 Appropriation $4,669FY-2008 Bud. FTE Level 76.0Actual Ave. YTD FTE 70.1
Funding Adjustments:State Employee Pay Raise 63
FY-2009 Recommendation $4,732% Change from FY-2008 1.35%
FY-2009 Appropriation(amounts in thousands)
Source: Office of State Finance State Employee Pay Raise The Governor’s budget includes $63,105 for a 5% state employee pay increase for the Treasurer’s Office effective January 1, 2009. This funding is based on October 2007 salary information.

FY-2009 Executive Budget
FINANCE AND REVENUE B-132
Oklahoma Lottery Commission
The Oklahoma Lottery Commission is governed by a seven member Board of Trustees appointed by the Governor with the advice and consent of the Senate. Proceeds from the lottery are used to pay prizes to the players, commissions to the lottery retailers, costs of creating and maintaining a gaming system and to fund the Commission’s operating costs. The State appropriated one-time funding of $500,000 to cover costs associated with starting the lottery in FY-05 and FY-06. These funds were repaid to the State in FY-07, and through December of 2007, the Lottery has provided more than $160 million to the State to benefit education in Oklahoma. Oklahomans who enjoy playing the lottery can choose from several fun and entertaining games: Scratcher / Instant tickets where the players scratch a ticket to see if they are a winner, and several online games where the player chooses numbers, or has the gaming system choose numbers for them, and waits until the next drawing to see if they are a winner. The online games offered by the Lottery are Pick 3 (sales started November 10, 2005), Powerball (sales started January 12, 2006); Cash 5 (sales started September 1, 2006) and Hot Lotto (sales started January 3, 2008). All net proceeds from the Oklahoma Lottery Commission benefit Oklahoma education.

FY-2009 Executive Budget
HEALTH B-133
The Oklahoma Health Care Authority
Notable Achievements
• Insure Oklahoma Individual Plan Implemented; Employer-Sponsored Insurance Plan Expands The Insure Oklahoma (Oklahoma Employer/employee Partnership for Insurance Coverage - O-EPIC) program is making affordable health coverage available to adults throughout the state. The Insure Oklahoma Individual Plan (IP), implemented in March 2007, extends coverage to qualified individuals and groups. In 2007 Legislation was passed that will expand both Insure Oklahoma programs to businesses with 250 or fewer employees and increase the household income threshold to 250 percent of the federal poverty level.
• Dental Services Added for Pregnant Women Women who are pregnant or have recently delivered and are enrolled in a SoonerCare program qualify for the perinatal dental benefit effective May 1, 2007. Basic dental care such as examinations, cleanings and fillings are some examples of dental benefits offered. Pregnant women can continue this benefit for up to 60 days following the end of the pregnancy. This represents the first time adult members have had access to dental benefits other than emergency extractions.
• All Kids Act Passed In an effort to extend access to health care coverage to uninsured Oklahoma children, the Oklahoma Legislature passed the “All Kids Act.” The All Kids Act allows SoonerCare to increase qualification for children from 185 percent of the federal poverty level up to 300 percent – the maximum allowed by the federal government. It is anticipated this will enable OHCA to provide coverage for as many as 42,000 additional uninsured Oklahoma children.
• OHCA Receives Third Performance Reporting Award OHCA’s Service Efforts and accomplishments (SEA) FY-2006 report received the Certificate of Excellence from the Association of Government Accountants. This is the third consecutive year OHCA has received the award. The SEA report details the goals and objectives of the agency and outlines the progress toward achieving them using key performance measures, trends and benchmarks.
Mission The mission of the Oklahoma Health Care Authority is to purchase state and federally funded health care in the most efficient and comprehensive manner possible and to study and recommend strategies for optimizing the accessibility and quality of health care. The appropriation to the Health Care Authority has grown from 6.74% of total appropriations in FY-2000 to 11.13% of total appropriations in FY-2008. OHCA’s FY-2007 operational revenues and total expenditures include: State Appropriations $701,964,163 Federal Funds—OHCA $1,766,494,172 FF for Other State Agencies $515,391,765 Ref. from Other State Agencies $240,677,151 Tobacco Tax Funds $87,512,146 Drug Rebate $86,667,403 Medical Refunds $22,402,344 Prior Year Carryover $69,466,124 Other Revenue $18,521,188 Quality of Care Fees $53,253,512 Total Actual Revenue – FY-2007 $3,562,349,968 The following chart shows Medicaid enrollment by categorical type compared to Medicaid expenditures by categorical type. It is significant that the Aged, Blind and Disabled category comprises only 18% of Medicaid recipients by type but accounts for 58% of total Medicaid expenditures. Therefore, a minority of Medicaid recipients account for the majority of the expenditures.
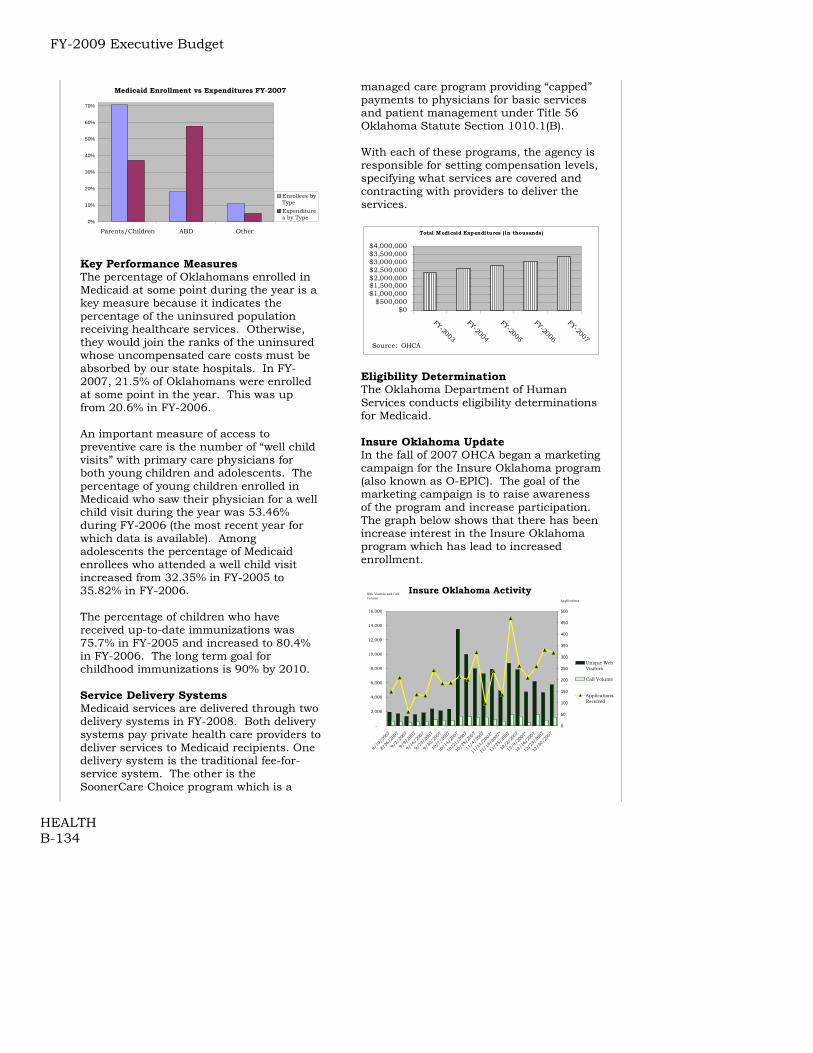
FY-2009 Executive Budget
HEALTH B-134
Medicaid Enrollment vs Expenditures FY-2007
0%
10%
20%
30%
40%
50%
60%
70%
Parents/Children ABD Other
Enrollees byTypeExpenditures by Type
Key Performance Measures The percentage of Oklahomans enrolled in Medicaid at some point during the year is a key measure because it indicates the percentage of the uninsured population receiving healthcare services. Otherwise, they would join the ranks of the uninsured whose uncompensated care costs must be absorbed by our state hospitals. In FY-2007, 21.5% of Oklahomans were enrolled at some point in the year. This was up from 20.6% in FY-2006. An important measure of access to preventive care is the number of “well child visits” with primary care physicians for both young children and adolescents. The percentage of young children enrolled in Medicaid who saw their physician for a well child visit during the year was 53.46% during FY-2006 (the most recent year for which data is available). Among adolescents the percentage of Medicaid enrollees who attended a well child visit increased from 32.35% in FY-2005 to 35.82% in FY-2006. The percentage of children who have received up-to-date immunizations was 75.7% in FY-2005 and increased to 80.4% in FY-2006. The long term goal for childhood immunizations is 90% by 2010. Service Delivery Systems Medicaid services are delivered through two delivery systems in FY-2008. Both delivery systems pay private health care providers to deliver services to Medicaid recipients. One delivery system is the traditional fee-for-service system. The other is the SoonerCare Choice program which is a
managed care program providing “capped” payments to physicians for basic services and patient management under Title 56 Oklahoma Statute Section 1010.1(B). With each of these programs, the agency is responsible for setting compensation levels, specifying what services are covered and contracting with providers to deliver the services.
Total Medicaid Expenditures (in thousands)
$0$500,000
$1,000,000$1,500,000$2,000,000$2,500,000$3,000,000$3,500,000$4,000,000
FY-2003
FY-2004
FY-2005
FY-2006
FY-2007Source: OHCA
Eligibility Determination The Oklahoma Department of Human Services conducts eligibility determinations for Medicaid. Insure Oklahoma Update In the fall of 2007 OHCA began a marketing campaign for the Insure Oklahoma program (also known as O-EPIC). The goal of the marketing campaign is to raise awareness of the program and increase participation. The graph below shows that there has been increase interest in the Insure Oklahoma program which has lead to increased enrollment.
Insure Oklahoma Activity
-
2,000
4,000
6,000
8,000
10,000
12,000
14,000
16,000
8/19
/200
7
8/26
/200
7
9/2/
2007
9/9/
2007
9/16
/200
7
9/23
/200
7
9/30
/200
7
10/7
/200
7
10/1
4/20
07
10/2
1/20
07
10/2
8/20
07
11/4
/200
7
11/1
1/20
07*
11/1
8/20
07*
11/2
5/20
07
12/2
/200
7
12/9
/200
7*
12/1
6/20
07
12/2
3/20
07
12/3
0/20
07
0
50
100
150
200
250
300
350
400
450
500
Unique WebVisitors
Call Volume
ApplicationsReceived
Applications
Web Visitors and Call Volume
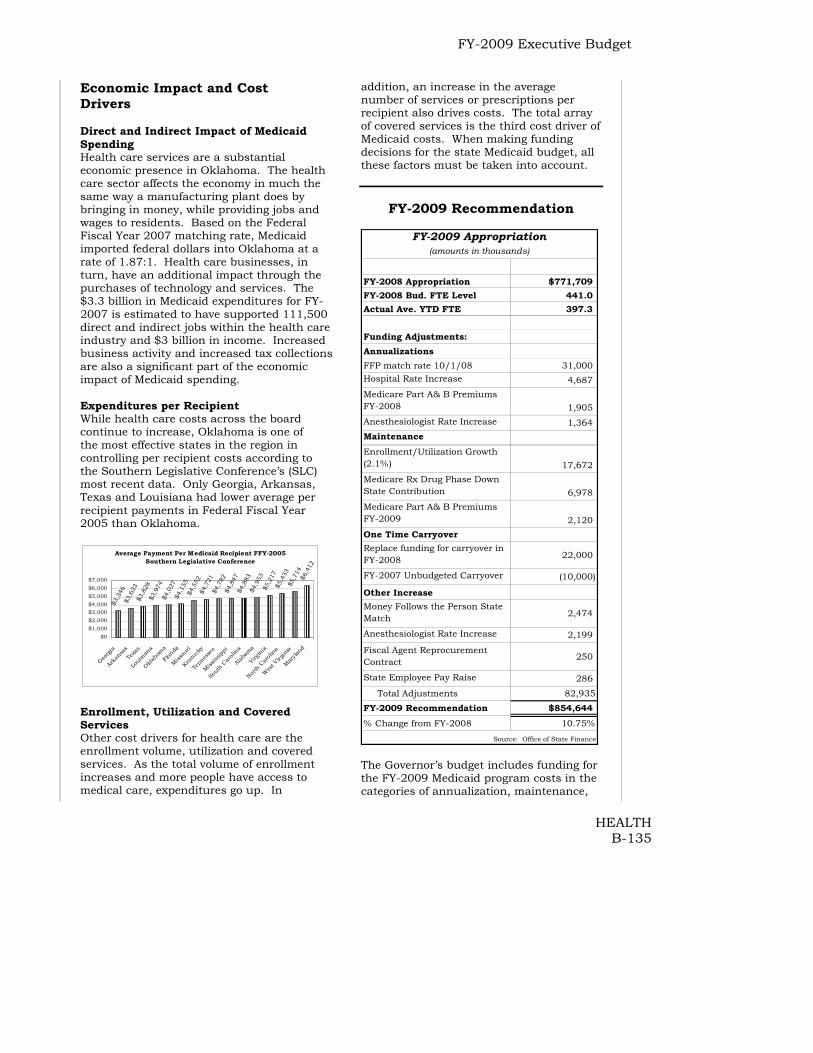
FY-2009 Executive Budget
HEALTH B-135
Economic Impact and Cost Drivers Direct and Indirect Impact of Medicaid Spending Health care services are a substantial economic presence in Oklahoma. The health care sector affects the economy in much the same way a manufacturing plant does by bringing in money, while providing jobs and wages to residents. Based on the Federal Fiscal Year 2007 matching rate, Medicaid imported federal dollars into Oklahoma at a rate of 1.87:1. Health care businesses, in turn, have an additional impact through the purchases of technology and services. The $3.3 billion in Medicaid expenditures for FY-2007 is estimated to have supported 111,500 direct and indirect jobs within the health care industry and $3 billion in income. Increased business activity and increased tax collections are also a significant part of the economic impact of Medicaid spending. Expenditures per Recipient While health care costs across the board continue to increase, Oklahoma is one of the most effective states in the region in controlling per recipient costs according to the Southern Legislative Conference’s (SLC) most recent data. Only Georgia, Arkansas, Texas and Louisiana had lower average per recipient payments in Federal Fiscal Year 2005 than Oklahoma.
Average Payment Per Medicaid Recipient FFY-2005 Southern Legislative Conference
$3,3
46$3
,623
$3,8
28$3
,974
$4,0
27
$4,5
52$4
,721
$4,7
82$4
,847
$4,8
83$4
,953
$5,2
17
$5,7
14
$4,1
55 $5,4
33 $6,4
12
$0$1,000$2,000$3,000$4,000$5,000$6,000$7,000
Georgi
a
Arka
nsas
Texa
s
Loui
siana
Oklahom
a
Florida
Missou
ri
Kentu
cky
Tenn
esse
e
Mississ
ippi
Sout
h Car
olina
Alabam
a
Virg
inia
North
Car
olina
Wes
t Virg
inia
Maryla
nd
Enrollment, Utilization and Covered Services Other cost drivers for health care are the enrollment volume, utilization and covered services. As the total volume of enrollment increases and more people have access to medical care, expenditures go up. In
addition, an increase in the average number of services or prescriptions per recipient also drives costs. The total array of covered services is the third cost driver of Medicaid costs. When making funding decisions for the state Medicaid budget, all these factors must be taken into account.
FY-2009 Recommendation
FY-2008 Appropriation $771,709FY-2008 Bud. FTE Level 441.0Actual Ave. YTD FTE 397.3
Funding Adjustments:AnnualizationsFFP match rate 10/1/08 31,000Hospital Rate Increase 4,687Medicare Part A& B Premiums FY-2008 1,905Anesthesiologist Rate Increase 1,364MaintenanceEnrollment/Utilization Growth (2.1%) 17,672Medicare Rx Drug Phase Down State Contribution 6,978Medicare Part A& B Premiums FY-2009 2,120One Time CarryoverReplace funding for carryover in FY-2008 22,000
FY-2007 Unbudgeted Carryover (10,000)
Other IncreaseMoney Follows the Person State Match 2,474
Anesthesiologist Rate Increase 2,199
Fiscal Agent Reprocurement Contract 250
State Employee Pay Raise 286
Total Adjustments 82,935
FY-2009 Recommendation $854,644% Change from FY-2008 10.75%
Source: Office of State Finance
(amounts in thousands)FY-2009 Appropriation
The Governor’s budget includes funding for the FY-2009 Medicaid program costs in the categories of annualization, maintenance,

FY-2009 Executive Budget
HEALTH B-136
one time carryover and other increases. The annualization funding adjustments are the cost of full year funding. Maintenance is primarily growth in enrollment and utilization in services and pharmacy, and one time carryover represents the combined effect of the prior fiscal year’s carryover and other increases in cost of any other specific spending recommendations. Annualizations Federal Medical Assistance Percentage (FMAP) Change The FMAP for each state is determined by a federally prescribed formula which compares the change in Per Capita Personal Income (PCPI) by state to the average PCPI for all states. This budget provides $31 million to fund the annualization (3 months) of the FMAP change from 67.1 % to 65.99%. Hospital Rate Increase The Governor’s Budget includes $4,686,888 to annualize the hospital rate increase which went into effect for the last half of FY-2008. Medicare Part A & B Premiums State Medicaid programs are required by federal law to pay Medicare Part A&B premiums for Medicaid clients who are also eligible for Medicare. The state dollar cost to annualize these premiums for FY-2009 is $1,905,356. Anesthesiologist Rate Increase The Governor’s Budget includes $1,364,000 to annualize the anesthesiologist rate increase which went into effect for the last half of FY-2008. Maintenance FY-2009 Enrollment Growth and Utilization Increase The Governor’s budget includes $17,672,632 to meet expenses associated with increased Medicaid enrollees and the services they are expected to access during FY-2009. The growth rate for increased enrollment and utilization is funded at approximately 2.1%.
Medicare Prescription Drug Phased-down State Contribution Also known as the “clawback” provision of the Medicare Part D Prescription Drug program, this state payment to CMS is intended to help pay for the cost of prescription drugs for “dual eligibles”, those eligible for both Medicaid and Medicare. These payments help to offset the cost of prescription drugs for the dual eligible population because that cost has now moved from the Medicaid program to the Medicare program. The cost of this state payment is $6,977,789 for state FY-2009. FY-2009 Coverage for Medicaid Recipients in Long Term Care Medicare Part A & B premiums for FY-2009 are funded at $2,119,174. One Time Carryover The Governor’s budget includes a total of $12 million to replace the One Time Carryover funds in the FY-2008 budget. Other Proposed Increases Money Follows the Person State Match In OHCA's effort to rebalance the Long Term Care System, OHCA submitted and was awarded a $52 million grant over a 5 year period. This funding will allow OHCA to access 12 million federal dollars (in the first year) for the purpose of transitioning individuals from nursing facilities into the community. The Governor’s budget includes $2,474,000 for the state match portion of this grant. Anesthesiologist Rate Increase The Governor’s budget includes $2,199,231 to increase the reimbursement rates for anesthesiologists. The OHCA currently is paying providers either 100% of cost or 100% of Medicare fee schedule. This request will maintain rates at this level, keeping current with inflation.

FY-2009 Executive Budget
HEALTH B-137
Fiscal Agent Reprocurement Contract The Governor’s budget includes $250,000 for the Design, development, installation or enhancement of mechanized claims processing and information retrieval systems and the Operation of mechanized claims processing and information retrieval systems which will increase efficiency in claims processing. State Employee Pay Raise The Governor’s budget includes $285,818 for a 5% state employee pay increase for the Oklahoma Health Care Authority effective January 1, 2009. This funding is based on October 2007 salary information.

FY-2009 Executive Budget
HEALTH B-138
The Department of Health Notable Achievements • Governor Henry’s Strong and
Healthy Oklahoma Initiative Begins The Strong and Healthy Oklahoma Web site was launched in February 2007, and the Web site, along with the companion book, "Guide to a Strong and Healthy Oklahoma" have provided valuable information to Oklahomans on eating right, moving more and being tobacco free.
• Consumption of cigarettes in Oklahoma down 13% since 2004 This statistic from the Oklahoma Tax Commission shows that increasing the tax on tobacco products does result in decreased use and ultimately a healthier population. A preliminary survey indicates that for the first time ever, there are now more former smokers than current smokers in Oklahoma.
• Infant mortality rate down for infants born to mothers in the Children First program A mortality study released in 2007 found that among children born into Oklahoma's "Children First Program" between 1997 and 2004, the infant mortality rate for these young participants is approximately half of the rate for other first-time births in Oklahoma (3.4 vs. 8.2 deaths for every 1,000 live births).
• Childhood Immunizations Increased In 2007 Oklahoma's immunization coverage for children ages 19 months to 35 months improved from 44th in the nation in 2005 to 25th in 2006. This success means that 80% of Oklahoma's children in this age group are now fully immunized against 10 deadly and devastating diseases, including polio and hepatitis B.
• Decrease in Youth Tobacco Use According to the 2007 Oklahoma Youth
Tobacco Survey, the number of youth who are either experimenting with smoking or are established smokers has declined significantly since 2002. In total, there are an estimated 15,000
fewer Oklahoma middle school students and 12,000 fewer Oklahoma high school students who are either experimenting with smoking or are established smokers than in 2002.
Mission The mission of the Department of Health is to promote, protect and improve the health of all Oklahomans through strategies that focus on preventing disease and injuries. Local health service delivery is accomplished by approximately 2,340 employees located at 69 county health departments throughout the state. Poor health behaviors and lifestyle choices by Oklahomans pose a significant challenge for the Department when seeking ways to improve the public’s health outcomes.
FY-2007 Expenditures by Category Total $280.1 Million
Disease & Prevention
Services $54.2, 17%
Support Services $30.3, 9%
Family Health Services, $101.8,
32%
Community Health Services
$84.7, 26%
Protective Health Services $50.1,
16%
Funding The three sources of funding for public health programs are state appropriations, revolving funds and federal funds. The following pie chart shows FY-2008 funding by source.
FY-2008 Health Department Funding by Source Total = $356.7 million
Federal 210.6, 59%
Revolving $72.3 , 20%
Appropriated $73.8 , 21%

FY-2009 Executive Budget
HEALTH B-139
Health Status in Oklahoma The Board of Health State of the State’s Health Report has reached the conclusion for several years that the ‘State of the State’s Health’ is unacceptable and that remains the case. Oklahomans continue to die of heart disease, cancer, stroke, and chronic obstructive pulmonary disease at a greater rate than the rest of the United States. The following chart, compiled from Center for Disease Control (CDC) data, shows that the age adjusted death rate (total mortality rate) in Oklahoma became greater than the national average in the late nineteen eighties and has continued to climb while the national average has dropped. In 2005, the most recent year for which data are available, there were 952.7 deaths per 100,000 people in Oklahoma, but the average for the U.S. was 798.8 deaths per 100,000 people. Oklahoma ranks 48 on this outcome measure meaning that there are only three states with worse outcomes.
Oklahoma vs. US Age Adjusted Death Rates per 100,000 Population
750
800
850
900
950
1000
198719
8819
8919
9019
9119
9219
9319
9419
9519
9619
9719
9819
9920
0020
0120
0220
0320
0420
05
Source: Center for Disease Control
US
OK
In United Health Foundation’s State Health Rankings, 2007 edition, Oklahoma ranks 47th
in overall health status among all states. This is a drop from the last two years when Oklahoma was ranked 44th. Our highest rank in recent years was 40th in the 2004 report. In 1990, Oklahoma ranked 31st in overall health compared to other states, and in the intervening years Oklahoma has lost ground in terms of relative health status compared to other states. Challenges to Oklahoma’s public health include limited
access to primary care with 79.7 primary care physicians per 100,000 population, a high prevalence of smoking at 25.1% of the population, many poor mental and physical health days per month at 4.3 days and 4.5 days in the previous 30 days, respectively, and a high rate of deaths from cardiovascular disease at 412.1 deaths per 100,000 population. According the United Health Foundation, Oklahoma also has large health disparities. In Oklahoma, blacks experience 31% more premature death than whites. Residents in non-urban areas of the state experience 37% more premature death than those in the fringe counties of large metropolitan areas. Divisions of the State Department of Health Family Health Services Family Planning Services County health departments and non-profit clinics provide family planning services to low-income women at risk for unwanted and mistimed pregnancies. Services include physical exams, contraceptive supplies, education and counseling and voluntary sterilization. Child Abuse Prevention Home visitation programs for low-resource mothers improve health indicators and parenting skills in an effort to avert child abuse, unwanted repeat pregnancies and other adverse outcomes. Child Guidance Services Diagnostic and short term treatment services for developmental, psychological, speech, language and hearing problems for children are provided through county health departments. Women, Infants and Children (WIC) WIC is a federally funded program that provides nutritional education and coupons for selected items to pregnant women and children less than 5 years old.
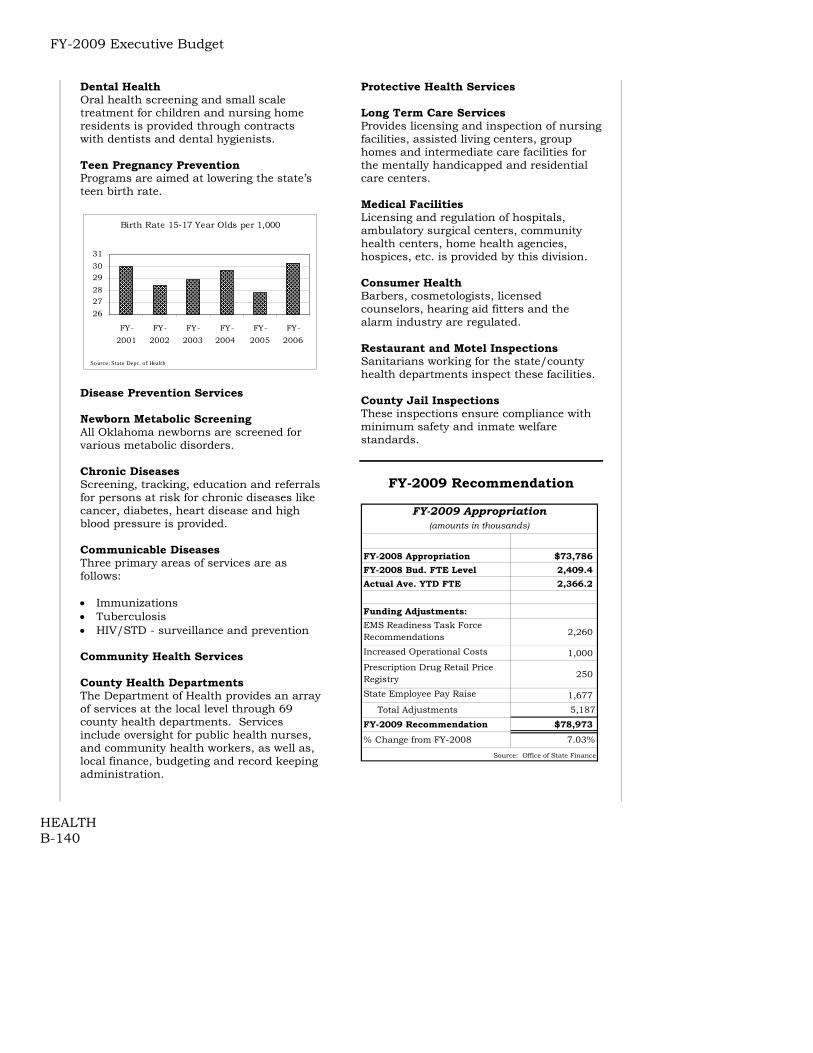
FY-2009 Executive Budget
HEALTH B-140
Dental Health Oral health screening and small scale treatment for children and nursing home residents is provided through contracts with dentists and dental hygienists. Teen Pregnancy Prevention Programs are aimed at lowering the state’s teen birth rate.
Birth Rate 15-17 Year Olds per 1,000
262728293031
FY-2001
FY-2002
FY-2003
FY-2004
FY-2005
FY-2006
Source: State Dep t . o f Health Disease Prevention Services Newborn Metabolic Screening All Oklahoma newborns are screened for various metabolic disorders. Chronic Diseases Screening, tracking, education and referrals for persons at risk for chronic diseases like cancer, diabetes, heart disease and high blood pressure is provided. Communicable Diseases Three primary areas of services are as follows: • Immunizations • Tuberculosis • HIV/STD - surveillance and prevention Community Health Services County Health Departments The Department of Health provides an array of services at the local level through 69 county health departments. Services include oversight for public health nurses, and community health workers, as well as, local finance, budgeting and record keeping administration.
Protective Health Services Long Term Care Services Provides licensing and inspection of nursing facilities, assisted living centers, group homes and intermediate care facilities for the mentally handicapped and residential care centers. Medical Facilities Licensing and regulation of hospitals, ambulatory surgical centers, community health centers, home health agencies, hospices, etc. is provided by this division. Consumer Health Barbers, cosmetologists, licensed counselors, hearing aid fitters and the alarm industry are regulated. Restaurant and Motel Inspections Sanitarians working for the state/county health departments inspect these facilities. County Jail Inspections These inspections ensure compliance with minimum safety and inmate welfare standards.
FY-2009 Recommendation
FY-2008 Appropriation $73,786FY-2008 Bud. FTE Level 2,409.4Actual Ave. YTD FTE 2,366.2
Funding Adjustments:EMS Readiness Task Force Recommendations 2,260
Increased Operational Costs 1,000Prescription Drug Retail Price Registry 250
State Employee Pay Raise 1,677 Total Adjustments 5,187
FY-2009 Recommendation $78,973% Change from FY-2008 7.03%
Source: Office of State Finance
FY-2009 Appropriation(amounts in thousands)

FY-2009 Executive Budget
HEALTH B-141
Increased Operational Costs The Governor's budget includes $1 Million for increased operational costs due to increases in employee benefits and the costs of administrating legislative pass throughs. EMS Readiness Task Force Recommendations The Governor’s budget includes $2,260,000 to implement the recommendations of the Governor’s EMS Readiness Task Force. These recommendations include:
Recommendation Cost Perform Crisis Interventions $100,000 Award crisis recovery grants to crumbling and at-risk EMS providers
$1,200,000
Create community/state sustainable partnerships
$800,000
Establish a fallen medics fund
$10,000 per incident
Increase the medical community’s investment
$150,000
Total Cost $2,260,000 Prescription Drug Retail Price Registry The Governor’s budget includes $250,000 for the development of a new website that allows the State Health Department to obtain pricing information from pharmacies, post the information on the Internet in a user-friendly format, and respond to consumer inquiries about the information. State Employee Pay Raise The Governor’s budget includes $1,677,103 for a 5% state employee pay increase for The Oklahoma Department of Health effective January 1, 2009. This funding is based on October 2007 salary information.

FY-2009 Executive Budget
HEALTH B-142
Department of Mental Health and Substance Abuse
Services Notable Achievements • Success in Drug & Mental Health
Courts The Drug & Mental Health Courts have shown continued success. The re-arrest rates for drug court graduates after four years are less than that of released inmates. Unemployment for drug court graduates has been reduced 86.9%. For drug court participants, the number of children living with their parents has increased by 39.6%. The number of subsequent jail days for mental health court participants has been reduced by 94%.
• Receipt of ATR grant in FY-08 Access to Recovery (ATR) – This $12 million grant, payable over three years, provides treatment for men and women leaving jail or prison who have a history of substance abuse, with a special emphasis on those with methamphetamine addictions. The grant allows ODMHSAS to seek new partnerships with faith-based organizations and encourages development of not only treatment services but also important supports (including peer support services) that facilitate sustained recovery.
• Success with PACT teams The Program for Assertive Community Treatment (PACT) serves over 970 Oklahomans. Participants in PACT have experienced a 73% reduction in inpatient hospital days and a 64% reduction in jail days.
• Systems of Care Originally awarded in fall of 2002 as a six-year, $9.4 million grant, Systems of Care established children’s behavioral health services “hubs” throughout Oklahoma. The program is designed to coordinate intensive services for children with serious emotional and behavioral problems and their families. Evaluation results which compare desirable and
undesirable outcomes show that after involvement with Systems of Care, children experience fewer out of home placements, school suspensions, arrests and self-harm attempts.
Mission The Mental Health Law of 1953 established the Oklahoma Department of Mental Health and Substance Abuse Services (ODMHSAS), although publicly supported services to Oklahomans with mental illness date back to early statehood. The agency’s mission is to promote healthy communities and provide the highest quality care to enhance the well being of all Oklahomans. Today, the two principal realms of ODMHSAS activity are mental health and substance abuse. State appropriations are the largest single source of revenue for ODMHSAS services. In FY-2008, expenditures from appropriated funds amounted to 73% of total expenditures equaling about $229 million.
FY-2008 Expenditures by Fund Type Total = $229.1 million
Federal 16%
Revolving 11%
Appropriated 73%
Source: Office of State Finance Comparison of Clients and Expenditures In FY-1999, 33.5% of the agency’s total expenditures were for state-operated inpatient psychiatric hospitals which served 3.9% of the clients. Since that time, the agency has focused on shifting to community based services. Illustrative of the shift in service delivery to community based services, the hospital portion of total
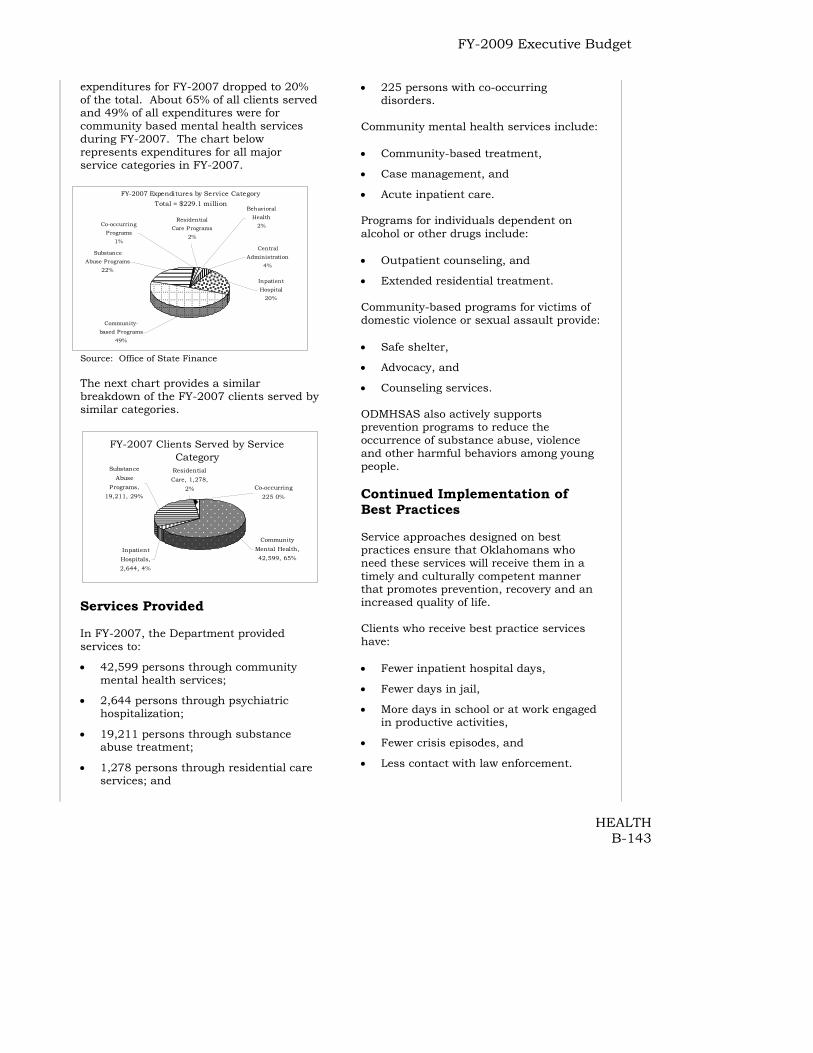
FY-2009 Executive Budget
HEALTH B-143
expenditures for FY-2007 dropped to 20% of the total. About 65% of all clients served and 49% of all expenditures were for community based mental health services during FY-2007. The chart below represents expenditures for all major service categories in FY-2007.
FY-2007 Expenditures by Service Category Total = $229.1 million
Residential Care Programs
2%
Behavioral Health
2%
Central Administration
4%
Substance Abuse Programs
22%
Co-occurring Programs
1%
Community-based Programs
49%
Inpatient Hospital
20%
Source: Office of State Finance The next chart provides a similar breakdown of the FY-2007 clients served by similar categories.
FY-2007 Clients Served by Service Category
Community Mental Health, 42,599, 65%
Inpatient Hospitals, 2,644, 4%
Substance Abuse
Programs, 19,211, 29%
Residential Care, 1,278,
2% Co-occurring 225 0%
Services Provided In FY-2007, the Department provided services to:
• 42,599 persons through community mental health services;
• 2,644 persons through psychiatric hospitalization;
• 19,211 persons through substance abuse treatment;
• 1,278 persons through residential care services; and
• 225 persons with co-occurring disorders.
Community mental health services include: • Community-based treatment,
• Case management, and
• Acute inpatient care.
Programs for individuals dependent on alcohol or other drugs include: • Outpatient counseling, and
• Extended residential treatment. Community-based programs for victims of domestic violence or sexual assault provide: • Safe shelter,
• Advocacy, and
• Counseling services.
ODMHSAS also actively supports prevention programs to reduce the occurrence of substance abuse, violence and other harmful behaviors among young people. Continued Implementation of Best Practices Service approaches designed on best practices ensure that Oklahomans who need these services will receive them in a timely and culturally competent manner that promotes prevention, recovery and an increased quality of life. Clients who receive best practice services have: • Fewer inpatient hospital days,
• Fewer days in jail,
• More days in school or at work engaged in productive activities,
• Fewer crisis episodes, and
• Less contact with law enforcement.

FY-2009 Executive Budget
HEALTH B-144
Key Performance Measure
Number of Inpatient Hospital Days
63,00063,38864,37571,773
56,578
86,64087,926
97,551
020,00040,00060,00080,000
100,000120,000
FY-2
000
FY-2
001
FY-2
002
FY-2
003
FY-2
004
FY-2
005
FY-2
006
FY-2
007 E
st.
Source: ODMHSAS Community-Based Mental Health Services Public policy now focuses on placing persons with mental illness in the most appropriate environment possible for ongoing care and treatment. Service providers, advocates and family members agree that placement in the "community" where persons with mental illness are closer to family and friends provides the best atmosphere for success. Today, due to the advent of psychotropic medications, improved therapeutic methods and an increase in non-hospital resources, this public policy is a reality. Program for Assertive Community Treatment (PACT) Oklahoma is a leader in the development and implementation of this service delivery model. It is outreach-oriented and designed for adults with severe and persistent mental illnesses. Using a 24-hour a day, 7 days a week approach, PACT teams deliver comprehensive community treatment, rehabilitation and support services to consumers in their homes, at work and in community settings. The result of this service delivery system is a dramatic drop in inpatient hospital days and jail days for these clients. The following chart shows the growth in the number of adults with severe and persistent mental illness which are served in this program.
PACT Clients Served
202397
559
641943
0 200 400 600 800 1000
FY-2003
FY-2005
FY-2007
Source: ODMHSAS
Drug Courts Drug court graduates are less likely to be rearrested than those on traditional probation or those who have gone to prison and are on parole. According to ODMHSAS:
• The re-arrest rate after four years for drug court graduates is 23.5%;
• The re-arrest rate for traditional probationers is 38.2%; and
• The re-arrest rate for prison parolees is 54.3%.
The cost of drug courts is also dramatically less expensive than incarceration at $5,000 per year per person vs. $17,454 per year per person in the prison system.
Number of Drug Court Clients Receiving DMHSAS Funded Services
1,6152,006
2,5634,551
5,806
5,776
0 1,000 2,000 3,000 4,000 5,000 6,000 7,000
FY-2003
FY-2004
FY-2005
FY-2006
FY-2007
FY-2008 Est.
So urce: ODMHSAS New Generation Medications Remarkably effective medications are now available for the treatment of mental illness. These newer generation medications are considered an essential treatment for mental illnesses such as schizophrenia, bi-polar and major depressive disorders. When a person with severe mental illness is successfully stabilized with appropriate medication and community supports, it

FY-2009 Executive Budget
HEALTH B-145
leads to a decrease in inpatient hospital days. The savings created by this decrease constitutes part of the funding the agency has shifted to the purchase of these medications. The Governor and the Legislature support ODMHSAS in its commitment to new generation medications by providing funding specifically earmarked for purchase of these drugs. For FY-2008, a total of $6.5 million was budgeted for this purpose. In addition to appropriated funding, pharmaceutical firms donate almost $25 million worth of new generation medications for use in treatment of mentally ill patients. Community Mental Health Centers Oklahoma has 20 mental health service areas covering the state. In each area, a publicly supported community mental health center (CMHC) serves as the primary access point for the non-Medicaid, publicly funded mental health services. Most CMHCs have satellite offices or other specialized programs within their service areas. These centers provide the following services to assist adult mental health clients in the community: • Emergency intervention • Assessment • Counseling • Psychosocial rehabilitation • Case management • Community support services CMHCs also provide therapeutic services for children who are demonstrating symptoms of emotional disturbance. Five CMHCs are state operated, while the others are private non-profit organizations contracting with ODMHSAS. The Department funds social and recreational services for individuals with mental illness who live in residential care facilities. Support for certain other community-based services, such as assistance for mentally ill individuals who are homeless is also provided. An important outcome for persons with mental illness who live in residential care facilities
is their ability to sustain themselves within a community based setting and avoid costly inpatient treatment. Key Performance Measure
Admissions/Readmissions to State Psychiatric Hospitals for Persons in Residental Care
2119
89
5
0
5
10
15
20
25
FY-2003 FY-2004 FY-2005 FY-2006 FY-2007
Source: ODMHSAS
FY-2009 Recommendation
FY-2008 Appropriation $207,529Griffin Memorial Shortfall and Forensics Center Equipment (100)
FY-2008 Base $207,429FY-2008 Bud. FTE Level 2,193.0Actual Ave. YTD FTE 2,092.2
Funding Adjustments:Smart on Crime Initiative 2,500
Increase due to 3% usage increase for services to persons not Medicaid eligible 4,290Loss of Medicaid revenue for PACT service - "unbundling" 1,750
Increase in Medicaid state match - FMAP decrease and 3% usage increase
1,000
Decreases in federal grants (block and SOC grant) 883State Employee Pay Raise 2,133 Total Adjustments 12,556
FY-2009 Recommendation $219,985$ Change from FY-2008 $12,456% Change from FY-2008 6.00%
(amounts in thousands)
Source: Office of State Finance
FY-2009 Appropriation
One-Time Adjustments The Governor’s budget removes $100,000 from the agency’s budget that was

FY-2009 Executive Budget
HEALTH B-146
appropriated to cover a budget shortfall for the Forensic Center and Griffin Memorial. Smart on Crime The Governor’s budget includes $2.5 million to fund the Smart of Crime Initiative. The purpose of this initiative is to create model programs to divert non-violent individuals with a mental illness and/or addiction, including methamphetamine addiction, from the criminal justice system. Interventions with these individuals must be available at various points in the criminal justice system, from pre-booking to re-entry, with the intent to intervene and divert at the earliest possible opportunity. The benefits to the citizens of Oklahoma include reduced crime and recidivism, cost savings, and healthier communities. Backing for this initiative includes the District Attorneys Council which voted to support the Smart on Crime Initiative at their annual meeting. The following is a break down of the programs that will be supported by this funding. Program Costs Jail Screening $350,000 Residential Substance Abuse Treatment
$700,000
Day Reporting Expansion $450,000 DIT Training $125,000 Probation and Parole Cross Training
$200,000
Mental Health Courts $675,000 Total $2,500,000
Non-Medicaid Eligible Utilization Increase The Governor’s Budget includes $4,289,733 for increased costs associated with a 3% usage increase for services to indigent persons who are not Medicaid eligible. The following graph shows the increase in the indigent (non-Medicaid) population for the last 4 years.
Number of Non-Medicad Indigent Persons Served
5.13%8.26%
9.02%
0
10000
20000
30000
40000
50000
60000
70000
2004 2005 2006 2007
The largest increases in costs for this population have been in the areas of assessments, physician and laboratory services and medications. Loss of Medicaid revenue for PACT The Governor’s budget includes $1.75 million for the loss of Medicaid revenues for the Program for Assertive Community Treatment (PACT) program due to “unbundling.” Until now PACT has received a bundled rate for the services provided. Now due to a change in CMS guidelines those services must be reimbursed individually. This has lead to a decrease in federal funds. FMAP deterioration and increased utilization of Medicaid Services FMAP stands for Federal Medical Assistance Percentage and represents the federal match which is provided to states for the Medicaid program. In recent years, as the federal matching percentage for Oklahoma has decreased, the amount of state dollars required to provide the same level of Medicaid services has increased. This budget proposes an adjustment of $1 million to provide increased state matching dollars for both the decrease in FMAP and an increase of Medicaid matchable services provided to ODMHSAS clients. Decreases in federal grants (block grants and SOC grant) The Governor’s budget includes $882,667 for a loss of federal funds for the block grants and to replace the funding for the Systems of Care grant which ends in FY-08. State Employee Pay Raise The Governor’s budget includes $2,133,245 for a 5% state employee pay increase for The Oklahoma Department of Mental

FY-2009 Executive Budget
HEALTH B-147
Health and Substance Abuse Services effective January 1, 2009. This funding is based on October 2007 salary information.
FY-2009 Executive Budget
HEALTH B-148
Oklahoma State Board of Examiners for Long Term
Care Administrators Brief History The Oklahoma State Board of Examiners for Nursing Home Administrators was originally established in 1968. The Board was recreated and restructured during the 2005 Legislative session by HB 1453 which instructed the Governor to appoint an entirely new Board effective July 1, 2005. Other significant provisions of HB 1453:
• Increases the amount of time a nursing home administrator must spend doing “on the job supervision of such facility”;
• Limits the members of the Board who can be nursing home owners to no more than five;
• Requires full investigation of all complaints filed against nursing home administrators;
• Directs the Board to develop a code of ethics for nursing home administrators; and
• Requires the Board to refer investigations to the proper law enforcement authorities.
In addition to the above requirements, new law was established which:
• Requires the Board to keep a registry of all complaints or other referrals complaining of acts or omissions of administrators;
• Requires any Board decision on a complaint to be voted on by a quorum of the Board in an open meeting; and
• Provides that no Board subcommittees or staff shall make recommendations to the Board regarding complaints.
FY-2009 Recommendation
The Governor’s budget recommends the $347,000 pass-through appropriation in the State Department of Health be continued in FY-2009 for this agency.

FY-2009 Executive Budget
HUMAN RESOURCES AND ADMINISTRATION B-149
Department of Central Services
Notable Achievement • Successfully installed new computer
systems for fleet management, allowing for the complete inventorying and monitoring of expenditures associated with vehicles in the state’s fleet.
• Implemented a new printing system to improve job costing and tracking of expenditures associated with the state’s printing operation.
• Completed several deferred maintenance and repair projects within the Capitol complex. Also began the process to identify and repair the significant water damage to the Transportation, Denver Davidson and Thorpe buildings.
Main Duties/Responsibilities The Department of Central Services provides a wide variety of support services to state agencies and other governmental entities. Fleet Management regulates the acquisition, lease, operation, maintenance, repair, and disposal of the vehicles required for state agencies. State Leasing administers the leasing and space management of property for all state agencies and institutions. Facilities Services operates and maintains seventeen buildings; the total space managed is approximately two million square feet. Multi-State Cooperative Purchasing Agreements Current Purchasing Agreements: Pharmaceutical purchases for the Department of Corrections, Health Dept., Department of Mental Health, as well as other state and county agencies, are through the Minnesota Multi-State Contracting Alliance for Pharmacy (MMCAP). The combined purchasing volume for the 44 member states, plus the cities of Chicago and Los Angles, for
contract year 2005/2006 is over one billion dollars with Oklahoma accounting for over $19 million on contract purchases. MMCAP distributes, based on percentage of total sales, $3 million in drug credits to participating state facilities. Oklahoma received $57,212 in credits for this reporting period. MMCAP is an excellent example of combining state spend to become a viable force in the marketplace. Other multi-state opportunities include contracts of MRO supplies, Satellite Phones, Personal Computers, Hazardous Equipment Response Equipment and Automated External Defibrillators (AED) for which Oklahoma is the lead state. Statewide contracts The continued expansion of statewide contracts has simplified the acquisition of supplies and services in more than 125 areas. Statewide contracts provide greater convenience, simplified procedures, and significantly reduced administrative costs to the State. The ease of use of these contracts also reduces the need to carry additional inventories, as products can be quickly and easily acquired. Competitively bid statewide service contracts eliminate the need for agencies to draft and solicit for services and items commonly purchased among state agencies. The recently added Office Products Portal provides a 61% discount to State users for disposable office products and has greatly increased our ability to assure State Use compliance while providing a one stop order process that has simplified the lives of our users. DCS has also entered into a statewide auto rental contract and will soon release a trip calculator.
Actual Savings FY-2000 $973,000 FY-2001 $1,167,600 FY-2002 $1,401,120 FY-2003 $1,751,400 FY-2004 $2,189,250 FY-2005 $2,736,562 FY-2006 $1,659,040
SOURCE: Dept. of Central Services

FY-2009 Executive Budget
HUMAN RESOURCES AND ADMINISTRATION B-150
Fleet Management Fleet Management provides vehicles, repair services, and fuel to state agencies at a cost lower than the private sector. Fleet Management continues to assess the State’s vehicular needs and requirements to identify savings to the State. CORE Oklahoma Project The Department of Central Services and the Office of State Finance signed a contract with PeopleSoft as the Enterprise Vendor for designing, developing and installing an integrated system to replace the Legacy system for Financials, Purchasing, Personnel and Human Resources. The Office of State Finance, Office of Personnel Management, DCS and employees from several other agencies staff the project, named CORE.
FY-2009 Recommendation
FY-2008 Appropriation $19,054
Deferred Maintenance Needs (2,296)
FY-2008 Base $16,758
FY-2008 Bud. FTE Level 243.0
Actual Ave. YTD FTE 237.3
Funding Adjustments:
State Employee Pay Raise 304
FY-2009 Recommendation $17,062$ Change from FY-2008 ($1,992)
% Change from FY-2008 -10.46%
FY-2009 Appropriation(amounts in thousands)
Source: Office of State Finance Removal of One-Time Funding The Governor’s budget removes $2,296,400 for deferred maintenance needs. State Employee Pay Raise The Governor’s budget includes $304,107 for a 5% state employee pay increase for the Department of Central Services effective January 1, 2009. This funding is based on October 2007 salary information.
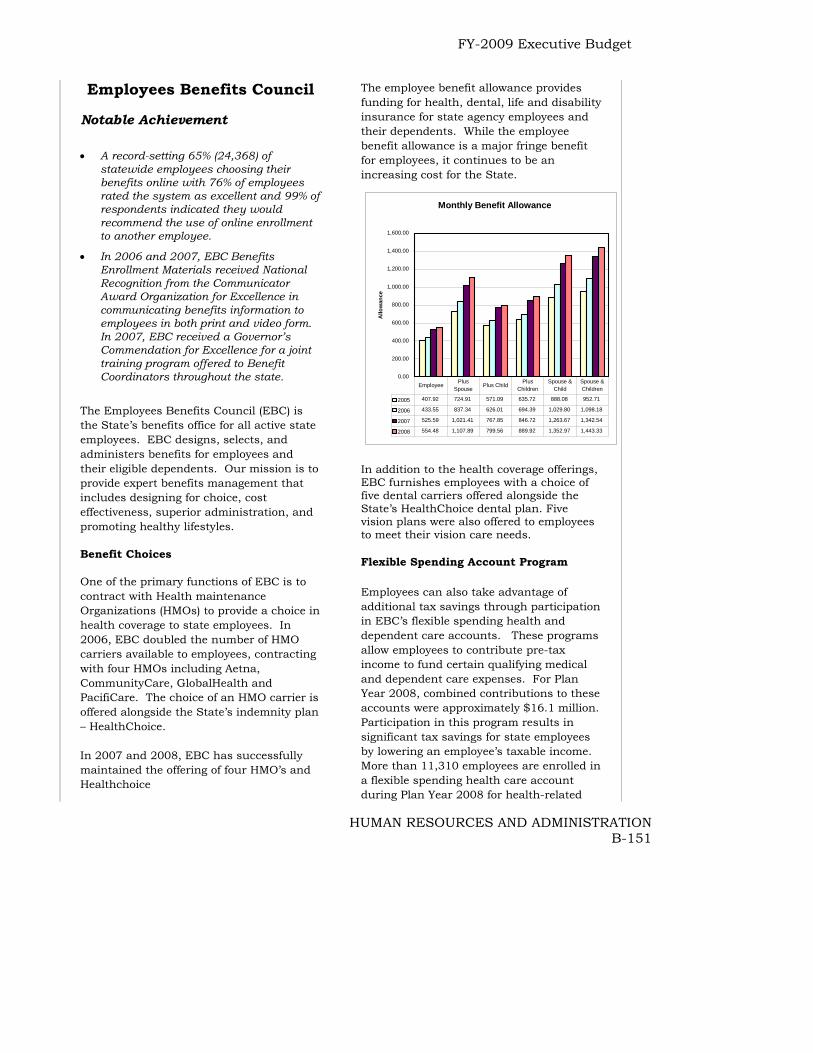
FY-2009 Executive Budget
HUMAN RESOURCES AND ADMINISTRATION B-151
Employees Benefits Council Notable Achievement
• A record-setting 65% (24,368) of statewide employees choosing their benefits online with 76% of employees rated the system as excellent and 99% of respondents indicated they would recommend the use of online enrollment to another employee.
• In 2006 and 2007, EBC Benefits Enrollment Materials received National Recognition from the Communicator Award Organization for Excellence in communicating benefits information to employees in both print and video form. In 2007, EBC received a Governor’s Commendation for Excellence for a joint training program offered to Benefit Coordinators throughout the state.
The Employees Benefits Council (EBC) is the State’s benefits office for all active state employees. EBC designs, selects, and administers benefits for employees and their eligible dependents. Our mission is to provide expert benefits management that includes designing for choice, cost effectiveness, superior administration, and promoting healthy lifestyles. Benefit Choices One of the primary functions of EBC is to contract with Health maintenance Organizations (HMOs) to provide a choice in health coverage to state employees. In 2006, EBC doubled the number of HMO carriers available to employees, contracting with four HMOs including Aetna, CommunityCare, GlobalHealth and PacifiCare. The choice of an HMO carrier is offered alongside the State’s indemnity plan – HealthChoice. In 2007 and 2008, EBC has successfully maintained the offering of four HMO’s and Healthchoice
The employee benefit allowance provides funding for health, dental, life and disability insurance for state agency employees and their dependents. While the employee benefit allowance is a major fringe benefit for employees, it continues to be an increasing cost for the State.
Monthly Benefit Allowance
0.00
200.00
400.00
600.00
800.00
1,000.00
1,200.00
1,400.00
1,600.00
Allo
wan
ce
2005 407.92 724.91 571.09 635.72 888.08 952.71
2006 433.55 837.34 626.01 694.39 1,029.80 1,098.18
2007 525.59 1,021.41 767.85 846.72 1,263.67 1,342.54
2008 554.48 1,107.89 799.56 889.92 1,352.97 1,443.33
EmployeePlus
SpousePlus Child
Plus Children
Spouse & Child
Spouse & Children
In addition to the health coverage offerings, EBC furnishes employees with a choice of five dental carriers offered alongside the State’s HealthChoice dental plan. Five vision plans were also offered to employees to meet their vision care needs. Flexible Spending Account Program Employees can also take advantage of additional tax savings through participation in EBC’s flexible spending health and dependent care accounts. These programs allow employees to contribute pre-tax income to fund certain qualifying medical and dependent care expenses. For Plan Year 2008, combined contributions to these accounts were approximately $16.1 million. Participation in this program results in significant tax savings for state employees by lowering an employee’s taxable income. More than 11,310 employees are enrolled in a flexible spending health care account during Plan Year 2008 for health-related

FY-2009 Executive Budget
HUMAN RESOURCES AND ADMINISTRATION B-152
expenses, and more than 732 state employees are using a dependent care account. EBC offers MyFlex Online, which allows state employees to review their flexible spending account activity via the Internet. Health and Wellness The OK Health program offers employees a unique and effective solution for better health by incorporating wellness, disease management, and health mentoring into a single, comprehensive wellness-mentoring program. Employees are required to complete a detailed health risk assessment, which stratifies participants into one of five risk tiers, based on potential health problems.
Each risk tier determines the frequency of mentoring as well as goals and action plans for the employee. With a dedicated staff of nine professional health mentors, employees participating in the program at twelve months have already been successful in lowering elevated systolic and diastolic blood pressure, LDL cholesterol, triglycerides, weight, blood glucose, and quitting cigarette smoking.
To encourage participation in the program, employees are eligible to receive three wellness incentives. The first incentive includes an initial visit to a primary care physician and lab work at no out-of-pocket cost to the participants. The second wellness incentive is a discount at a participating fitness center.
A third possible incentive offered by some agencies is the OK Health pay incentive. More than 55 state agencies have elected to offer pay incentives and are authorized to pay participants $100 (Bronze), $300 (Silver), or $500 (Gold) for successfully completing the program. The incentives consist of three separate payments payable to a participant upon completion of the (1) initial enrollment, (2) twelve-week follow up, and (3) achieving goals at the twelve-month
follow up. There are many other ancillary benefits from having healthy employees such as less absenteeism and increased productivity.
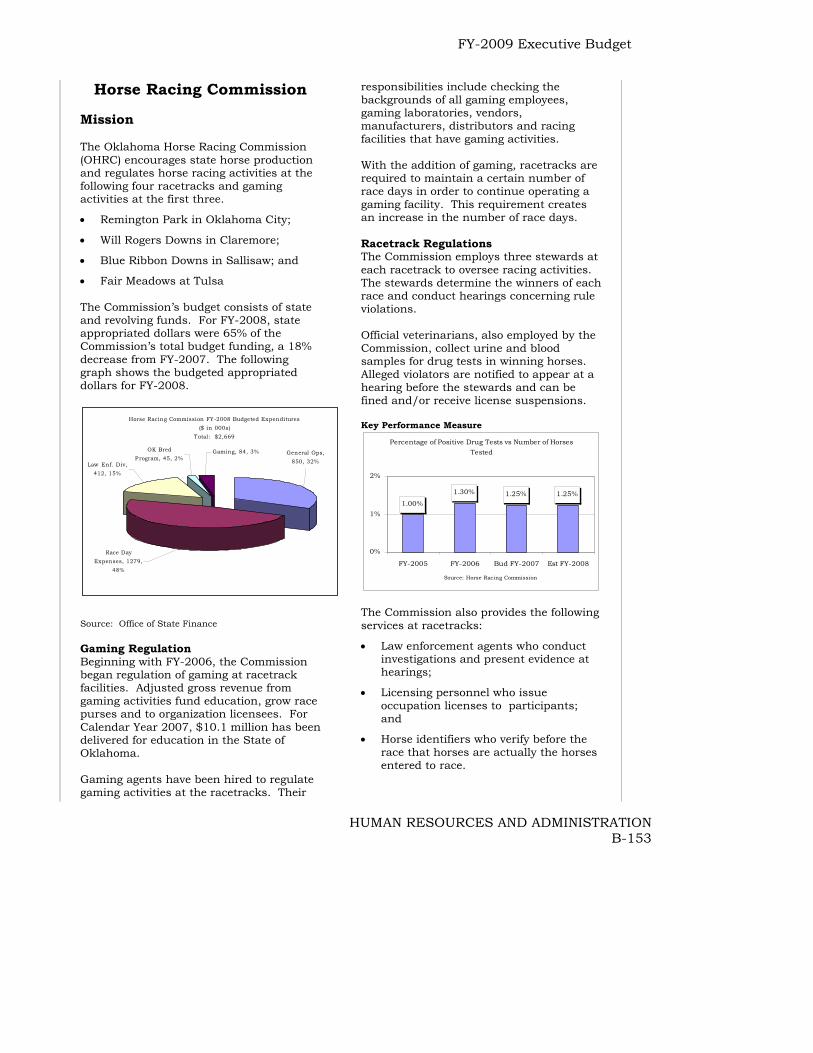
FY-2009 Executive Budget
HUMAN RESOURCES AND ADMINISTRATION B-153
Horse Racing Commission Mission The Oklahoma Horse Racing Commission (OHRC) encourages state horse production and regulates horse racing activities at the following four racetracks and gaming activities at the first three.
• Remington Park in Oklahoma City;
• Will Rogers Downs in Claremore;
• Blue Ribbon Downs in Sallisaw; and
• Fair Meadows at Tulsa The Commission’s budget consists of state and revolving funds. For FY-2008, state appropriated dollars were 65% of the Commission’s total budget funding, a 18% decrease from FY-2007. The following graph shows the budgeted appropriated dollars for FY-2008.
Horse Racing Commission FY-2008 Budgeted Expenditures ($ in 000s)
Total: $2,669
General Ops, 850, 32%
Race Day Expenses, 1279,
48%
Law Enf. Div, 412, 15%
OK Bred P rogram, 45, 2%
Gaming, 84, 3%
Source: Office of State Finance Gaming Regulation Beginning with FY-2006, the Commission began regulation of gaming at racetrack facilities. Adjusted gross revenue from gaming activities fund education, grow race purses and to organization licensees. For Calendar Year 2007, $10.1 million has been delivered for education in the State of Oklahoma. Gaming agents have been hired to regulate gaming activities at the racetracks. Their
responsibilities include checking the backgrounds of all gaming employees, gaming laboratories, vendors, manufacturers, distributors and racing facilities that have gaming activities. With the addition of gaming, racetracks are required to maintain a certain number of race days in order to continue operating a gaming facility. This requirement creates an increase in the number of race days. Racetrack Regulations The Commission employs three stewards at each racetrack to oversee racing activities. The stewards determine the winners of each race and conduct hearings concerning rule violations. Official veterinarians, also employed by the Commission, collect urine and blood samples for drug tests in winning horses. Alleged violators are notified to appear at a hearing before the stewards and can be fined and/or receive license suspensions. Key Performance Measure
Percentage of Positive Drug Tests vs Number of Horses Tested
1.00%
1.30% 1.25% 1.25%
0%
1%
2%
FY-2005 FY-2006 Bud FY-2007 Est FY-2008
Source: Horse Racing Commission
The Commission also provides the following services at racetracks:
• Law enforcement agents who conduct investigations and present evidence at hearings;
• Licensing personnel who issue occupation licenses to participants; and
• Horse identifiers who verify before the race that horses are actually the horses entered to race.
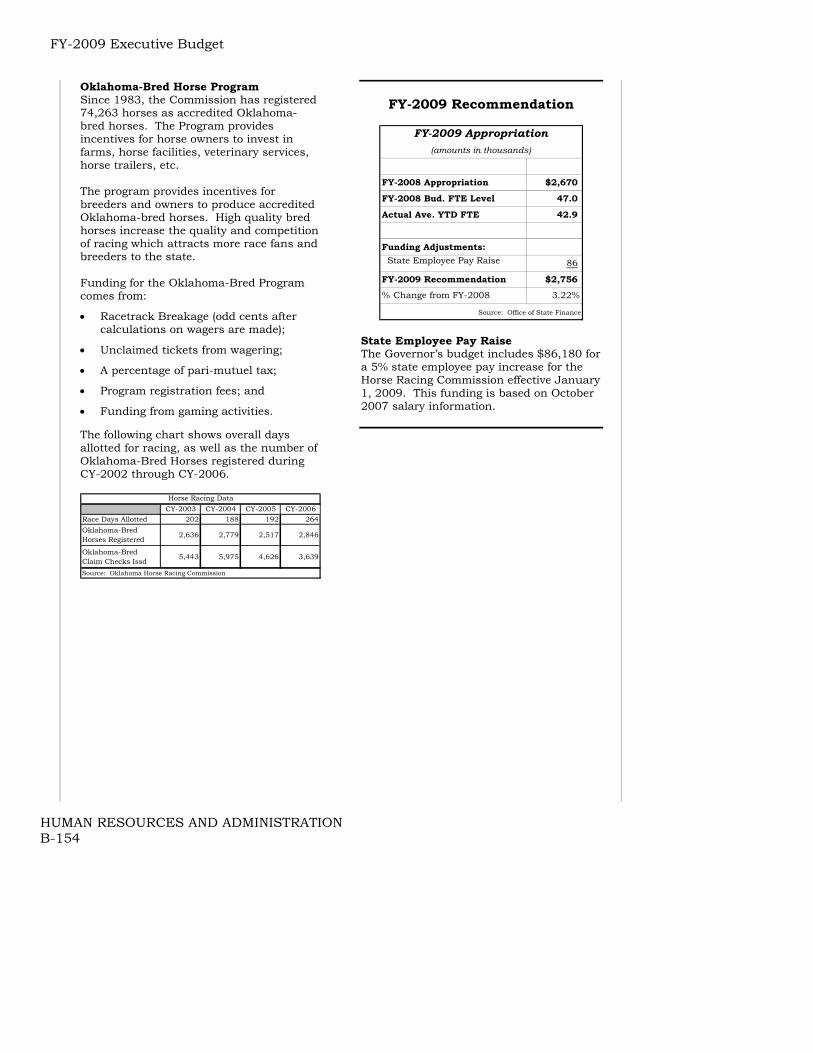
FY-2009 Executive Budget
HUMAN RESOURCES AND ADMINISTRATION B-154
Oklahoma-Bred Horse Program Since 1983, the Commission has registered 74,263 horses as accredited Oklahoma-bred horses. The Program provides incentives for horse owners to invest in farms, horse facilities, veterinary services, horse trailers, etc. The program provides incentives for breeders and owners to produce accredited Oklahoma-bred horses. High quality bred horses increase the quality and competition of racing which attracts more race fans and breeders to the state. Funding for the Oklahoma-Bred Program comes from:
• Racetrack Breakage (odd cents after calculations on wagers are made);
• Unclaimed tickets from wagering;
• A percentage of pari-mutuel tax;
• Program registration fees; and
• Funding from gaming activities. The following chart shows overall days allotted for racing, as well as the number of Oklahoma-Bred Horses registered during CY-2002 through CY-2006.
CY-2003 CY-2004 CY-2005 CY-2006Race Days Allotted 202 188 192 264Oklahoma-Bred Horses Registered
2,636 2,779 2,517 2,846
Oklahoma-Bred Claim Checks Issd
5,443 5,975 4,626 3,639
Source: Oklahoma Horse Racing Commission
Horse Racing Data
FY-2009 Recommendation
FY-2008 Appropriation $2,670
FY-2008 Bud. FTE Level 47.0
Actual Ave. YTD FTE 42.9
Funding Adjustments: State Employee Pay Raise 86
FY-2009 Recommendation $2,756% Change from FY-2008 3.22%
FY-2009 Appropriation(amounts in thousands)
Source: Office of State Finance State Employee Pay Raise The Governor’s budget includes $86,180 for a 5% state employee pay increase for the Horse Racing Commission effective January 1, 2009. This funding is based on October 2007 salary information.

FY-2009 Executive Budget
HUMAN RESOURCES AND ADMINISTRATION B-155
Human Rights Commission The Oklahoma Human Rights Commission works to eliminate discrimination and promote unity and understanding among Oklahomans. The Commission consists of a nine-person board. The Commission establishes policy, sets goals, approves programs and projects, and conducts public hearings on human rights complaints. The Commission consists of two distinct functional divisions - Enforcement and Compliance, and Community Relations. The Community Relations Division provides outreach and educational services. The Enforcement and Compliance Division receives, processes, and investigates complaints of discrimination in the areas of employment, housing, and public accommodation. To resolve complaints, the Commission contracts with the Equal Employment Opportunity Commission (EEOC) and Housing and Urban Development (HUD). Under these contracts, complaints of discrimination are resolved in compliance with the policies and procedures of EEOC and HUD. Through these contracts, the Human Rights Commission receives training on EEOC and HUD policies and procedures. During FY-2007, the Commission resolved 216 employment discrimination complaints and 69 housing discrimination complaints.
FY-2009 Recommendation
FY-2008 Appropriation $710
FY-2008 Bud. FTE Level 19.0
Actual Ave. YTD FTE 14.9
Funding Adjustments: State Employee Pay Raise 13
FY-2009 Recommendation $724% Change from FY-2008 1.90%
FY-2009 Appropriation(amounts in thousands)
Source: Office of State Finance State Employee Pay Raise The Governor’s budget includes $13,465 for a 5% state employee pay increase for the Human Rights Commission effective January 1, 2009. This funding is based on October 2007 salary information.

FY-2009 Executive Budget
HUMAN RESOURCES AND ADMINISTRATION B-156
Merit Protection Commission Notable Achievement • Installed audio-video display and
capture equipment to record administrative law hearings.
• Certified three new volunteer facilitators through the Supreme Court Mediation Program to serve in the Commission’s Alternative Dispute Resolution Program.
• Certified one investigator through the United States Equal Employment Opportunity Commission.
• Conducted 14 days of on-site training that included 270 state employee participants.
Mission
The Commission serves the State of Oklahoma Executive Branch by providing quasi-judicial programs in accordance with the Administrative Procedures Act and Oklahoma Personnel Act to protect employees’ constitutional due process rights and to shield the state from costly litigation in state and federal court. The agency’s mission is to design, implement, and enforce a dispute resolution system for state employees. This system is comprised of training, consultation, investigation, mediation, and adjudication to protect the integrity of the personnel system. In addition, the Commission provides Alternative Dispute Resolution programs and manages the state Grievance Program. These components focus on problem solving and dispute resolution to enhance the state workplace and indirectly improve productivity. These programs serve the people of Oklahoma by promoting effective human resources management and ensuring legal practices are followed in state government.
Appeals The chart below shows the total number of appeals filed with the Merit Protection Commission over the past five fiscal years.
Number of Appeals
295219
284225
163
0
100
200
300
400
2003 2004 2005 2006 2007
Fiscal Year
Source: Merit Protection Commission Alternative Dispute Resolution The Commission’s Alternative Dispute Resolution program exists in two primary forms: Negotiation Conferences and Mediations. The chart below displays the number of Alternative Dispute Resolution sessions and the resulting settlements.
116 109 93138
94
4682
6165
52
050
100150200250
2003 2004 2005 2006 2007
Fiscal Year
Case
s
Settled ADR Sessions
The gap between the sessions and the settlements has continued to close over the past fiscal years. This continued success hinges on proper recruitment and training of volunteer mediators. Grievance Management The Commission is committed to helping employees and agencies resolve conflict at the lowest level possible through the internal grievance management program. By rule appeals of most alleged violations must first go through the internal grievance
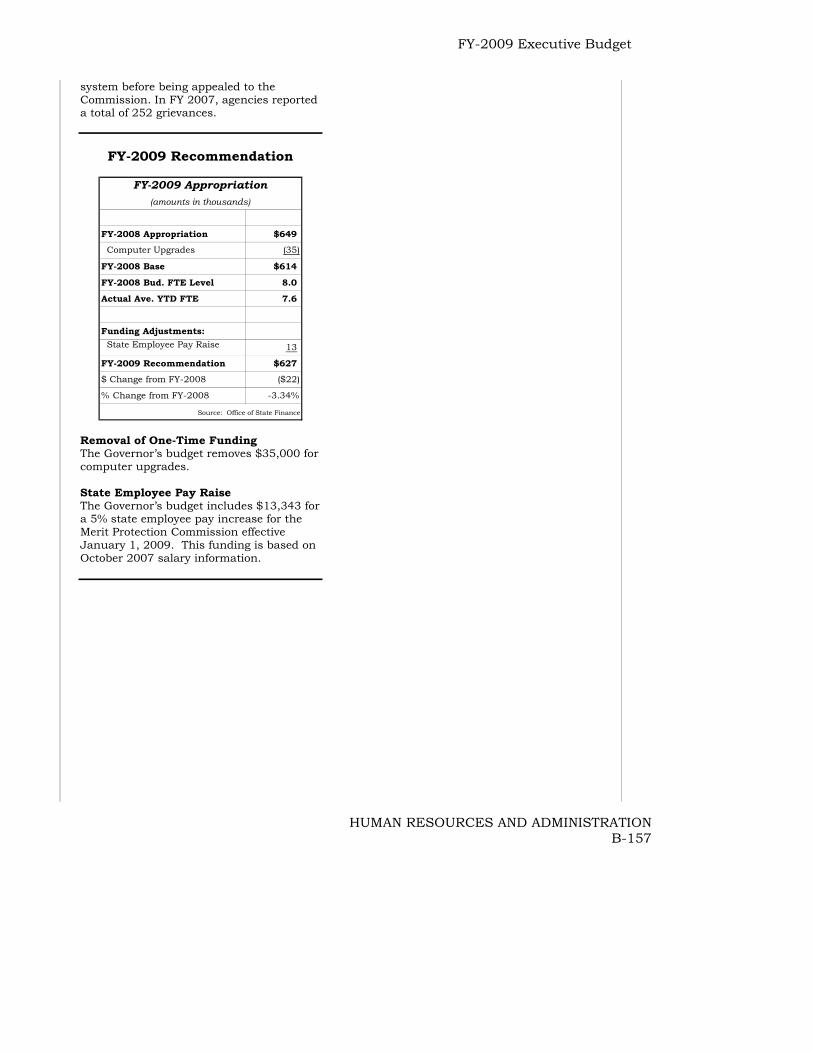
FY-2009 Executive Budget
HUMAN RESOURCES AND ADMINISTRATION B-157
system before being appealed to the Commission. In FY 2007, agencies reported a total of 252 grievances.
FY-2009 Recommendation
FY-2008 Appropriation $649 Computer Upgrades (35)
FY-2008 Base $614
FY-2008 Bud. FTE Level 8.0
Actual Ave. YTD FTE 7.6
Funding Adjustments: State Employee Pay Raise 13
FY-2009 Recommendation $627
$ Change from FY-2008 ($22)
% Change from FY-2008 -3.34%
FY-2009 Appropriation(amounts in thousands)
Source: Office of State Finance Removal of One-Time Funding The Governor’s budget removes $35,000 for computer upgrades. State Employee Pay Raise The Governor’s budget includes $13,343 for a 5% state employee pay increase for the Merit Protection Commission effective January 1, 2009. This funding is based on October 2007 salary information.
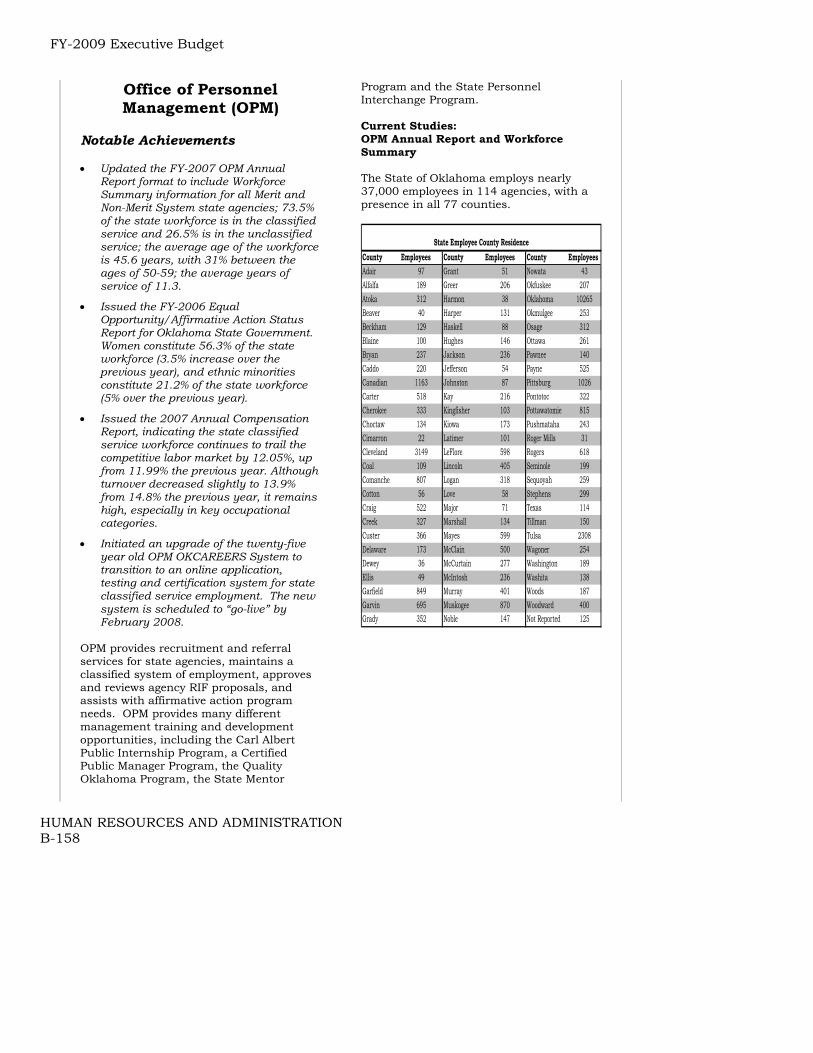
FY-2009 Executive Budget
HUMAN RESOURCES AND ADMINISTRATION B-158
Office of Personnel Management (OPM)
Notable Achievements • Updated the FY-2007 OPM Annual
Report format to include Workforce Summary information for all Merit and Non-Merit System state agencies; 73.5% of the state workforce is in the classified service and 26.5% is in the unclassified service; the average age of the workforce is 45.6 years, with 31% between the ages of 50-59; the average years of service of 11.3.
• Issued the FY-2006 Equal Opportunity/Affirmative Action Status Report for Oklahoma State Government. Women constitute 56.3% of the state workforce (3.5% increase over the previous year), and ethnic minorities constitute 21.2% of the state workforce (5% over the previous year).
• Issued the 2007 Annual Compensation Report, indicating the state classified service workforce continues to trail the competitive labor market by 12.05%, up from 11.99% the previous year. Although turnover decreased slightly to 13.9% from 14.8% the previous year, it remains high, especially in key occupational categories.
• Initiated an upgrade of the twenty-five year old OPM OKCAREERS System to transition to an online application, testing and certification system for state classified service employment. The new system is scheduled to “go-live” by February 2008.
OPM provides recruitment and referral services for state agencies, maintains a classified system of employment, approves and reviews agency RIF proposals, and assists with affirmative action program needs. OPM provides many different management training and development opportunities, including the Carl Albert Public Internship Program, a Certified Public Manager Program, the Quality Oklahoma Program, the State Mentor
Program and the State Personnel Interchange Program. Current Studies: OPM Annual Report and Workforce Summary The State of Oklahoma employs nearly 37,000 employees in 114 agencies, with a presence in all 77 counties.
County Employees County Employees County EmployeesAdair 97 Grant 51 Nowata 43Alfalfa 189 Greer 206 Okfuskee 207Atoka 312 Harmon 38 Oklahoma 10265Beaver 40 Harper 131 Okmulgee 253Beckham 129 Haskell 88 Osage 312Blaine 100 Hughes 146 Ottawa 261Bryan 237 Jackson 236 Pawnee 140Caddo 220 Jefferson 54 Payne 525Canadian 1163 Johnston 87 Pittsburg 1026Carter 518 Kay 216 Pontotoc 322Cherokee 333 Kingfisher 103 Pottawatomie 815Choctaw 134 Kiowa 173 Pushmataha 243Cimarron 22 Latimer 101 Roger Mills 31Cleveland 3149 LeFlore 598 Rogers 618Coal 109 Lincoln 405 Seminole 199Comanche 807 Logan 318 Sequoyah 259Cotton 56 Love 58 Stephens 299Craig 522 Major 71 Texas 114Creek 327 Marshall 134 Tillman 150Custer 366 Mayes 599 Tulsa 2308Delaware 173 McClain 500 Wagoner 254Dewey 36 McCurtain 277 Washington 189Ellis 49 McIntosh 236 Washita 138Garfield 849 Murray 401 Woods 187Garvin 695 Muskogee 870 Woodward 400Grady 352 Noble 147 Not Reported 125
State Employee County Residence

FY-2009 Executive Budget
HUMAN RESOURCES AND ADMINISTRATION B-159
Professionals 16,529 45%Administrative Support 5,640 15%Protective Service 3,940 11%Paraprofessionals 3,000 8%Technicians 2,899 8%Service Maintenance 2,034 6%Officials / Administrators 1,921 5%Skilled Craft 898 2%
Employees by Job Category and Percent of W
Source: Office of Personnel Management Equal Opportunity/Affirmative Action Status Report for Oklahoma State Government 114 state agencies prepared FY-2007 Affirmative Action Plans, which reflected the following state government workforce, ethnic minority, and female representation.
Race Male Female Total PercentWhite 12,484 15,243 27,727 78.8%Black 1,100 2,371 3,471 9.9%Asian/Pacific Islander 249 339 588 1.7%Amer. Indian/Ala. Native 1,212 1,364 2,576 7.3%Hispanic 312 493 805 2.3%Totals 15,537 19,810 35,167Percent of Totals 43.7% 56.3% 100.0%
State Government Work Force Represenation
EEO Category FY 2005
2005 Percent of Category FY 2006
2006 Percent of Category
CLF Comparison
Officials and Administrators 265 13.6% 279 14.0% 15.1Professionals 2,821 19.7% 3,031 20.2% 17.2Technicians 492 17.1% 499 17.4% 21.9Protective Services 762 19.0% 795 19.4% 21.6Paraprofessionals 1,025 30.4% 1,117 31.9% 21.9Administrative Support 1,080 22.2% 1,072 22.7% 21.2Skilled Craft 159 17.5% 157 16.7% 21.9Service Maintenance 482 23.8% 490 24.1% 31.1Totals 7086 20.6% 7440 21.2% 22.9
Minority Representation by EEO Category
EEO Category FY 2005
2005 Percent of Category FY 2006
2006 Percent of Category
CLF Comparison
Officials/Administrators 848 43.6% 876 43.9% 37.6Professionals 9,225 64.3% 9,752 65.0% 55.6Technicians 1,086 37.7% 1,097 38.3% 59.7Protective Services 607 15.1% 649 15.8% 16.7Paraprofessionals 2,472 73.4% 2,622 74.9% 59.7Administrative Support 4,204 86.4% 4,087 86.4% 70.1Skilled Craft 35 3.8% 35 3.7% 6.5Service Maintenance 670 33.0% 692 34.0% 41.5Totals 19,147 55.7% 19,810 56.3% 46.2
Female Representation by EEO Category
Annual Compensation Report The report concluded that by state employees not receiving a general increase this year and market pay increasing at nearly a 4 percent rate caused state employees to fall behind private sector pay. State pay has lagged the market by double digit figures for seven of the last nine years.
Year State Market Difference2007 34,714 38,897 -12.05%2006 32,428 36,315 -11.99%2005 31,518 34,102 -8.20%2004 29,969 33,393 -11.43%2003 29,969 33,361 -11.32%
State of Oklahoma vs. Market
SOURCE: Office of Personnel Management 244 of 399 (61%) classified service benchmark jobs trail the competitive labor market by 10% or more. The 399 benchmark jobs represent 20,072 employees or 73% of classified service employees. State classified service overall turnover rates decreased slightly from the previous year’s rate of 14.8% to 13.9%, and the voluntary rate decreased from 12.3% to 11.6%.

FY-2009 Executive Budget
HUMAN RESOURCES AND ADMINISTRATION B-160
JFD CODE JFD TITLE
PAY BAND INCS 2007 2006 2005
Y12C REGISTERED NURSE III M 355 -22.35% -13.77% -14.69%Y12B REGISTERED NURSE II K 313 -23.61% -23.71% -19.65%H20A SOCIAL SERVICES SPECIALIST I H 310 -18.73% -20.89% -23.07%T22B TRANSPORTATION SPECIALIST II J 151 -10.35% -13.68% -15.31%D12B AUDITOR II J 131 -31.27% -29.44% -14.35%F41C CONSTRUCTION/MAINTENANCE TECH III H 126 -43.64% -49.19% -36.61%R20C ENVIRONMENTAL PROGRAMS SPEC III K 110 -21.78% -31.50% -34.02%D12C AUDITOR III K 106 -24.56% -30.74% -40.43%T21C TRANSPORTATION TECH III H 89 -42.39% -32.14% -42.53%F41B CONSTRUCTION/MAINTENANCE TECH II G 82 -38.85% -34.51% -17.68%
Pay Movement Mechanism Usage Report State agencies, without additional funding and fromexisting budgets, continue to utilize statutorily authorized pay movement mechanisms to address critical recruitment and retention workforce challenges. CORE Oklahoma Project OPM is a member of the CORE PeopleSoft Project Team along with the Office of State Finance, The Department of Central Services, and the Department of Commerce. For analysis and management purposes, CORE enables OPM to integrate its information into a streamlined electronic system.
FY-2009 Recommendation
FY-2008 Appropriation $4,892
FY-2008 Bud. FTE Level 76.0
Actual Ave. YTD FTE 67.7
Funding Adjustments: State Employee Pay Raise 84 Workforce Study 725
Total Adjustments 809
FY-2009 Recommendation $5,701
% Change from FY-2008 16.54%
Source: Office of State Finance
FY-2009 Appropriation(amounts in thousands)
State Employee Pay Raise The Governor’s budget includes $83,929 for a 5% state employee pay increase for Personnel Management effective January 1, 2009. This funding is based on October 2007 salary information. Workforce Compensation Study The Governor’s budget includes $725,000 to contract with an independent consulting firm to conduct a comprehensive study of the entire Executive Branch work force.

FY-2009 Executive Budget
HUMAN RESOURCES AND ADMINISTRATION B-161
State & Education Employees Group Insurance
Board Notable Achievements • Successful implementation of Medicare
Part D for retiree members • Technology upgrades accomplished in
communication, training and information sharing
• Enhanced member security with unique
member identification numbers The Oklahoma State & Education Employees Group Insurance Board (OSEEGIB) provides self-funded insurance plans to state, education, and local government employees as well as their dependents and survivors. The plan is a self-insured health, dental, life and disability program, which is actuarially rated to provide premiums adequate to meet the payment of all claims, administrative expenses and any change in reserve estimates. OSEEGIB health insurance plans are open to state, education, and local governments. These plans are also available to retirees provided the retiree elects to participate prior to retirement.
OSEEGIB Member Enrollment as of 1/1/2007
Pre-Medicare, 14,231, 6%
Active, 185,848,
78%
Medicare, 37,009, 16%
Source: OSEEGIB
Each of these enrollment categories faces a different cost structure. For example, pre-Medicare retirees are generally in their mid-50s through 64 years of age and experience greater medical costs. Medicare retirees have greater total medical costs; however, Medicare covers a part of the cost.
The general opinion is that the members are state agency employees; however, the following graph shows that the primary beneficiaries are education employees and their dependents.
All Health Plan Membership by Employer Type as of 1/1/2007
Education, 130,142,
55%
Local Govt., 12,097, 5%
State, 94,849, 40%
Source: OSEEGIB
Members have a choice of health insurance plans. All members may enroll in HealthChoice, which is the state offered preferred provider option (PPO). In 2006 there were 127,440 enrolled in HealthChoice and 24,064 enrolled in health maintenance organizations (HMO) across the state.

FY-2009 Executive Budget
HUMAN RESOURCES AND ADMINISTRATION B-162

FY-2009 Executive Budget
HUMAN SERVICES B-163
Oklahoma Commission on Children & Youth
Notable Achievements • In FY- 2007, the Office of Juvenile
System Oversight increased the number of visits to private residential facilities by 26% over FY-2006. Complaints and requests for assistance increased to an all time reported high of 502 for FY-2007.
• In FY-2007, the Joint Oklahoma Information Network (JOIN) data base was increased by 14,997 records. Additionally, 771,086 hits were made to the website. This was a 240% increase from FY-2006.
Mission The mission of the Oklahoma Commission on Children and Youth (OCCY) is to improve services to children and their families by: Planning, coordinating and communicating with communities and between public and private agencies; independent monitoring of the children and youth service system; and testing models and demonstration programs for effective services. In pursuit of their mission OCCY administers the following programs: • Office of Juvenile System Oversight
• Joint Oklahoma Information Network (JOIN)
• Board of Child Abuse Examination
• Child Death Review Board
Child Death Review Board
345313 292
396 409
161193194
141141
0
100
200
300
400
500
FY-2002 FY-2003 FY-2004 FY-2005 FY-2006
Total Cases Reviewed Accidental Deaths
Source: Child Death Review Board Annual Reports
• Office of Planning and Coordination
• Interagency Coordinating Council
• Juvenile Personnel Training
• Oklahoma Areawide Services Information System (OASIS)
• Post Adjudication Review Boards Office of Juvenile System Oversight OCCY’s Office of Juvenile System Oversight Division (OJSO) monitors compliance of public and private, residential and non-residential facilities with their established responsibilities, which include state and federal laws, applicable accrediting and licensing standards, policies and procedures, and applicable court orders.
0
20
40
60
80
FY-2003 FY-2004 FY-2005 FY-2006 FY-2007
OJSO Facility Visits
State Private
Source: OCCY
452
467
450
490502
420
440
460
480
500
520
FY-2003 FY-2004 FY-2005 FY-2006 FY-2007
OJSO Investigations
Source: OCCY Joint Oklahoma Information Network (JOIN) In 1997, the Legislature passed HB 1391 - The Coordinated Database System for Children Act. HB 1391 directed OCCY to develop a system to allow sharing of case information and data collection used in planning, research, outcome evaluation and service coordination. The project is called

FY-2009 Executive Budget
HUMAN SERVICES B-164
JOIN – Joint Oklahoma Information Network. The JOIN resource directory and eligibility determination are now up and running. The database does three main things: • Gives citizens and service providers
easy access to services through a resource directory;
• Provides a better service delivery system to clients through agency collaboration; and
• Provides aggregate information from participating agencies
Oklahoma agencies who serve children and families, 13 in all, have signed an interagency agreement to participate in the project. The database can be accessed at http://www.join.ok.gov
FY-2009 Recommendation
FY-2008 Appropriation $2,334
FY-2008 Bud. FTE Level 27.5
Actual Ave. YTD FTE 26.8
Funding Adjustments:
Additional OJSO Duties 250
State Employee Pay Raise 32
Total Adjustments 282
FY-2009 Recommendation $2,616
% Change from FY-2008 12.08%
Source: Office of State Finance
(amounts in thousands)
FY-2009 Appropriation
State Employee Pay Raise The Governor’s budget includes $32,612 for a 5% state employee pay increase for the Oklahoma Commission on Children and Youth effective January 1, 2009. This funding is based on October 2007 salary information.
Additional Duties for the Office of Juvenile System Oversight (OJSO) Senate Bill 790 passed during the 2007 Session requires OJSO to prepare a public report in child death or near-death cases when criminal charges are filed against the person responsible for the child. The Governor’s budget includes $250,000 to fund additional FTE and start up costs associated with these additional responsibilities.

FY-2009 Executive Budget
HUMAN SERVICES B-165
Office of Disability Concerns Notable Achievement • In an effort to provide accessible
information on services and training available for persons with disabilities, the Office of Disability Concerns maintains a website at www.odc.ok.gov. This website was accessed more than 157,077 times during FY-2007. This was an increase of 37,000 website visits over the prior year. The site is organized into: Technical Assistance, Employment Development, Information Services and the Client Assistance Program with information pertinent to each area available for download by the visitor.
• House Bill 1084, passed during the 2007 legislative session, changed the name of the agency from the Office of Handicapped Concerns to the Office of Disability Concerns.
Mission The Office of Disability Concerns (ODC) helps develop policies and services to meet the needs of Oklahomans with disabilities. The Governor's Advisory Committee on Employment of the Handicapped and the Governor's Advisory Committee to the Office of Disability Concerns assist the ODC in meeting this role. ODC assists citizens with disabilities in seeking and becoming employed. The staff at ODC provide information, attend job fairs, provide entrepreneurial education and support the Business Leadership Network (BLN). BLN is a coalition of employers that promote employment for people with disabilities. During FY-2006, ODC began a training program for disabled high school students in how to most effectively present their skills and abilities as they enter post-secondary education or employment. The program is called High School Hi-Tech, Tech Now Training. ODC also administers the federally funded Client Assistance Program (CAP). CAP provides information, intervention, case
management and, in some cases, assistance in the appeals and/or fair hearing process to individuals who are eligible for or receiving services funded by the Rehabilitation Act.
FY-2009 Recommendation
FY-2008 Appropriation $413
FY-2008 Bud. FTE Level 8.0
Actual Ave. YTD FTE 8.0
Funding Adjustments:
State Employee Pay Raise 7
FY-2009 Recommendation $420% Change from FY-2008 1.70%
FY-2009 Appropriation(amounts in thousands)
Source: Office of State Finance State Employee Pay Raise The Governor’s budget includes $6,688 for a 5% state employee pay increase for the Office of Disability Concerns effective January 1, 2009. This funding is based on October 2007 salary information.
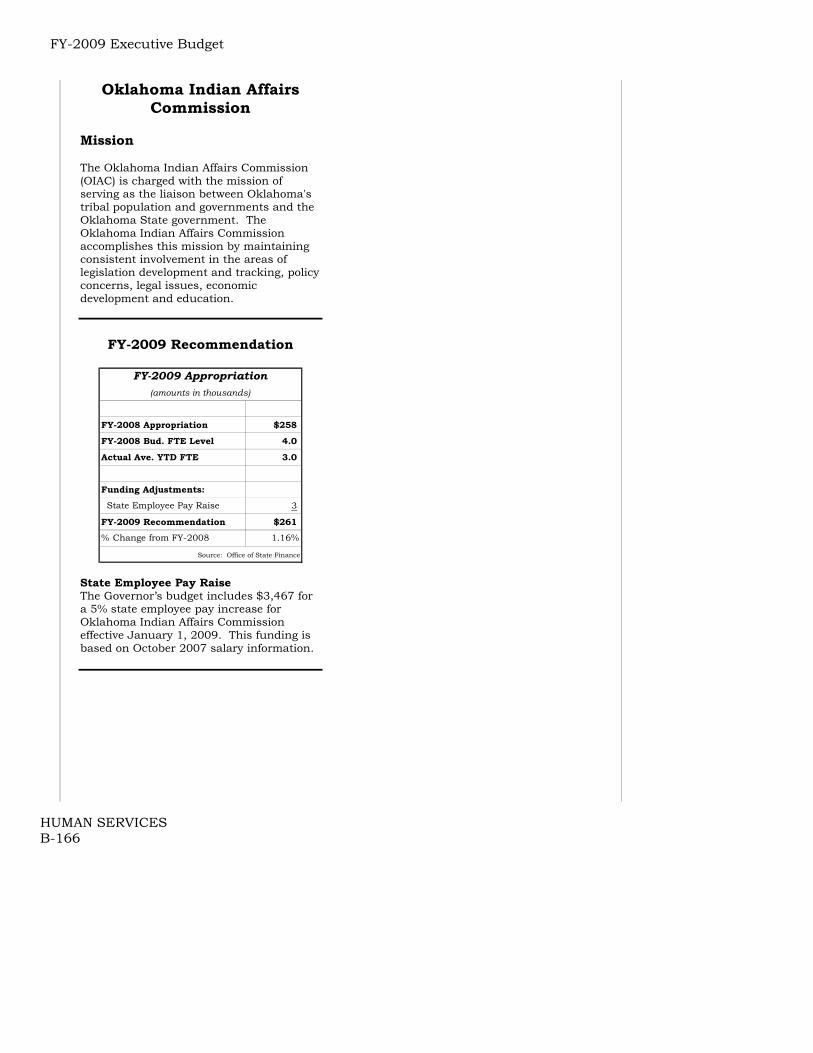
FY-2009 Executive Budget
HUMAN SERVICES B-166
Oklahoma Indian Affairs Commission
Mission The Oklahoma Indian Affairs Commission (OIAC) is charged with the mission of serving as the liaison between Oklahoma's tribal population and governments and the Oklahoma State government. The Oklahoma Indian Affairs Commission accomplishes this mission by maintaining consistent involvement in the areas of legislation development and tracking, policy concerns, legal issues, economic development and education.
FY-2009 Recommendation
FY-2008 Appropriation $258
FY-2008 Bud. FTE Level 4.0
Actual Ave. YTD FTE 3.0
Funding Adjustments:
State Employee Pay Raise 3
FY-2009 Recommendation $261% Change from FY-2008 1.16%
FY-2009 Appropriation(amounts in thousands)
Source: Office of State Finance State Employee Pay Raise The Governor’s budget includes $3,467 for a 5% state employee pay increase for Oklahoma Indian Affairs Commission effective January 1, 2009. This funding is based on October 2007 salary information.

FY-2009 Executive Budget
HUMAN SERVICES B-167
Department of Human Services
Notable Achievements • Increased Adoptions The Oklahoma
Department of Human Services (OKDHS) authorized 1,579 adoption placements in FY-2007 – a record nine years in a row for over 1,000 authorized adoption placements per year.
• Quality Child Care In 2007, 94% of children receiving a child care subsidy were served in facilities with a quality rating of one star plus or higher. This is a substantial increase from FY-1999, when only 9% were served in facilities with a quality rating above one star.
• Access to Medical Care OKDHS certified a record number of persons, mostly children, to receive healthcare during FY-2007. Over 751,000 members were enrolled in SoonerCare (Oklahoma’s Medicaid Program) during the year.
• Access to food and nutrition OKDHS continues to certify record numbers of Food Stamp recipients, about half of whom are children. This benefit contributes to a level of healthy nutrition to which these families would otherwise not have access. More than 635,000 persons received assistance through this program in FY-2007.
• Child Support Enforcement The Child Support Enforcement Division collected over $238 million in child support in FY-2007, an 8% increase from FY-2006.
• Paternities Established The Child Support Enforcement Division established 19,561 paternities in FY-2007, an 8% increase from FY-2006.
Mission The mission of the Department of Human Services (DHS) is to help individuals and families in need help themselves lead safer, healthier, more independent and productive lives.
In pursuit of their mission, DHS administers the following programs: • Family Support Services
o TANF
o Food Stamps
o Adult Protective Services
• Developmental Disabilities
o Institutional Facilities
o Home and Community Based Waiver Programs
• Children and Family Services
o Adoptive Services
o Foster Care
o Child Welfare
• Child Care
o Child Care Subsidy
o Child Care Facility Licensing
• Aging Services
o ADvantage Program
o Personal Care Program
• Child Support Enforcement In FY-2007, DHS ranks as the fourth largest state agency, representing 8.0% of the state appropriated budget. DHS’s FY-2008 operational budget, a total of $1.7 billion, includes the following revenue sources: Federal Grants: $976,818,654 State Funding: $584,106,135 Other Sources: $149,265, 265

FY-2009 Executive Budget
HUMAN SERVICES B-168
DHS Funding by Activity FY-2008 Budget
Total: $1,710,190,625
Children & Family Svcs
10%
Developmental Disabilities
16%
Family Support Svcs2%
Aging Services9%
Adm/Data Svcs/Finance
7%
Food Stamps27%
Child Care10%
OJA 0%
Field Operations
13%
TANF3%
Child Support Enforcement
3%
Source: FY-2008 Budget Work Program Family Support Services Temporary Assistance for Needy Families (TANF) As a result of state and federal reform initiatives, Oklahoma has reduced the number of children and families receiving public cash assistance by over 72% from 47,712 average monthly cases in FY-1993 to 10,002 average monthly cases in FY-2007. While the state initiated a number of different welfare reforms prior to 1995, the federal Personal Responsibility and Work Opportunity Reconciliation Act (PRWORA), passed in the fall of 1996, fundamentally changed the way public cash assistance programs were delivered to children and families across the nation. The Temporary Assistance to Needy Families (TANF) block grant created in PRWORA replaced the traditional cash assistance entitlement program, known as Aid to Families with Dependent Children. The four major goals of TANF are: • Provide cash assistance to needy
families so that children may be cared for in their own homes or in the homes of relatives;
• Promote job preparation, work and marriage to end the dependence of needy parents on government benefits;
• Prevent and reduce the incidence of out-of-wedlock pregnancies and establish annual numerical goals for preventing and reducing the incidence of these pregnancies; and
• Encourage the formation and maintenance of two-parent families.
TANF services fall into three main categories: • Cash Assistance
• Work Activities
• Family Formation/ Stabilization Services
TANF Cash Assistance and TANF Work Activities
($ in millions)
$0$20,000$40,000$60,000$80,000
$100,000$120,000
FY-1
997
FY-1
998
FY-1
999
FY-2
000
FY-2
001
FY-2
002
FY-2
003
FY-2
004
FY-2
005
FY-2
006
FY-2
007
TANF Cash Assistance TANF Work Activities
Source: OKDHS Annual Reports Key Performance Measure
Total Work Activities Entered vs. TANF Work Activities Expenditures
05,000
10,00015,00020,00025,00030,00035,00040,000
FY-2000
FY-2001
FY-2002
FY-2003
FY-2004
FY-2005
FY-2006
FY-2007
Total Work Activities Entered TANF Work Activities Expenditures
Source: OKDHS Annual Reports TANF Funding While the TANF block grant amount has remained relatively stable over past fiscal years, the amount spent on TANF services has decreased.

FY-2009 Executive Budget
HUMAN SERVICES B-169
TANF Funds Transferred to Day Care
$-
$20,000
$40,000
$60,000
$80,000
$100,000
$120,000
FY-2002 FY-2003 FY-2004 FY-2005 FY-2006 FY-2007
(000
's)
TANF Available Funding (after transfers, before MOE)TANF Funds Transferred to Day Care
Source: OKDHS Due to the importance of child care, more of the block grant is being transferred to child care. The amount transferred to child care increased from $48 million in FY-2001 to a peak of over $96 million in FY-2005. Due to escalating additional state subsidies appropriated beginning in FY-2005, the necessary transfer from TANF to Child Care was $56.4 million, or $40 million less in FY-2007 than FY-2005. Without child care services, many parents would not be able to leave TANF assistance for gainful employment. How TANF Cash Payments Work A family of three is eligible for $292 maximum cash benefits per month. The following example illustrates how the eligibility calculation works: A family of three has earned monthly income of $500. DHS adjusts earned income by subtracting $120 from that amount; leaving $380 adjusted earned income. Half of their adjusted earned income reduces the family’s cash payment amount. Therefore, the family is eligible to receive $102 per month ($292-$190).
Examples of Monthly Cash Payments for a Family of Three
Adjusted Monthly Earned Income
Max. Cash Assistance
$0 $292 $250 $167 $500 $42 $550 $17 Formula: $292 – [(Earned Income - $120)/2] Cash Benefits and Current Cases Expenditures for cash assistance benefits have decreased by over 73% from $129
million in FY-1996 to $25.9 million in FY-2007. Of the 21,943 average monthly persons receiving TANF benefits in FY-2007, 3,779 cases had an adult on work requirements. The remaining 18,164 monthly average cases are “child only” cases. In these cases, the cash benefit is for the child or children only. An example of this type of case is that in which the child’s parents are deceased and the child lives with a grandparent. Time-limited Benefits One of the provisions of the TANF program limits cash assistance payments to five years in a lifetime. In FY-2007, 44 families became ineligible for cash assistance benefits as a result of this provision. DHS policy allows caseworkers to arrange limited assistance to families facing specific hardships after exceeding TANF time limits. Low Income Home Energy Assistance Program (LIHEAP) Through a federal grant, DHS assists low income Oklahoma households with paying their energy bills. The majority of the grant is used for winter heating. The remainder is used for summer cooling bills and for weatherization services (through the Oklahoma Department of Commerce). DHS administers the program by taking applications and disbursing funds to the client’s energy provider. Eligible clients have incomes less than 110% of the federal poverty level, or $1,833 per month for a family of four, and must be responsible for paying their utility bill. During FFY-2007 (Federal Fiscal Year), OKDHS served 128,664 households or 62% of eligible households. Benefit payments are one-time; the average payment made on behalf of a beneficiary in FFY-2007 was $86 for heating assistance, $164 for cooling assistance and $252 for crisis assistance. Developmental Disabilities The Developmental Disabilities Services Division (DDSD) in DHS provides institutional and community based services to people with a primary diagnosis of mental retardation (IQ of 70 or below). Clients may also have other developmental

FY-2009 Executive Budget
HUMAN SERVICES B-170
disabilities in addition to mental retardation such as autism, cerebral palsy and Down Syndrome. DDSD’s primary goal is to enable children and adults to lead more independent and productive lives in the least restrictive environment. At the end of FY-2007, the number of persons ages 3 and up served in DDSD community based programs was 5,308. This is an increase of 5% over the prior year. Three public institutions were serving 365 persons at the end of FY-2007. There are at least four types of recipients receiving services for developmental disabilities: • Public ICF/MR: People who are in one
of three public institutions;
• Class Member: People who are members of the Homeward Bound Class and receive unlimited community based services;
• Home & Community Based Services or In-Home Supports Waiver: Non-class members who receive community based services through a Medicaid waiver; and
• People not on a Medicaid waiver receiving sheltered workshop or group home services.
Cost of Service by Type of Recipient As the following graph illustrates, institutional care is the most expensive service delivery model. It cost approximately $488 per day in FY-2007 to serve these residents. The next most expensive clients are the members of the Hissom class. In FY-2007, class members cost an average of approximately $320 per day.
$488
$328
$137
$31
$0
$100
$200
$300
$400
$500
PublicICF/MR
ClassMember
OtherHCBS
In HomeSupports
Average Cost per day by Client Type - FY-2007
Source: OKDHS While $320 per day is less than the cost of serving people in public institutions, it is more than twice what is spent on community services for non-class members. The main reason for the disparity is the court-ordered 100% state dollar services provided only to members of the Hissom class. Institutional Care The state operates three public institutions for people with developmental disabilities: Southern Oklahoma Resource Center (SORC) near Pauls Valley, Northern Oklahoma Resource Center in Enid (NORCE) and the Greer Center, located on the NORCE campus. The Greer Center is operated through a contract with Liberty Health Care Services of Oklahoma. For Medicaid purposes, these public institutions are technically classified as Intermediate Care Facilities for the Mentally Retarded (ICF/MR). While community based services are considered the most preferred and cost-effective treatment alternative for children and adults, a small number qualify for institutional level services. Clients in these facilities range in age from 14 to over 70 and suffer from multiple developmental and physical disabilities and require 24 hour medical attention. Homeward Bound Class Members of the Homeward Bound Class are former residents of the Hissom Center who filed a class action lawsuit in 1985 to compel the state to create community-based alternatives to institutional placements. The resulting court order required the closure of the Hissom

FY-2009 Executive Budget
HUMAN SERVICES B-171
Memorial Center in Sand Springs. The Court Order closing Hissom was issued in 1987 and the last resident was moved into the community in April of 1994. In FY-2004, a separate waiver was created for Hissom class members only. At the end of the year, 805 clients were being served through this waiver. Services for class members are mandated by the court while services are offered to other people as funds become available. Additional State Services Provided to Class Members Services mandated by the Federal Court for the Homeward Bound class members are: • room and board supplement payments
and single placement supplements;
• special needs and other supported living payments go mostly for medical services that Medicaid does not cover, such as dental services for adults; and
• cost settlement payments allow providers to recover all of their costs for services to class members.
Home and Community Based Medicaid Services The Department of Human Services administers three different home and community based waiver programs for children and adults. These are services provided to persons with developmental disabilities who are not in institutions. Over the past three decades, states have decreased institutional care services and increased home and community based services. This move has occurred for two main reasons. First, the quality of life for children and adults with developmental disabilities is better in community placements versus institutional placements. Second, in FY-2007 institutional care cost an average of $488 a day while community based care for non-class members costs an average of $137 a day for other Home and Community Based Waiver clients and $31 per day for In Home Supports Waiver clients.
These services are paid for with state and federal dollars. Some Sheltered Workshops slots and some group home placements are entirely state funded while others are funded through Medicaid with almost 70% federal dollars. Description of waiver programs: • The Home and Community Based
Services Waiver Program (HCBSW) – These services are for developmentally disabled people who are independent of a family and usually live in a residential facility. Recipients must be Medicaid eligible.
• The In Home Supports Waiver – DHS established this waiver in 2000 in an effort to serve individuals on the waiver waiting list. These services are for children or adults living at home with families. The amount received is capped at $19,225 for adults and $12,820 for children. Recipients must be eligible for Medicaid.
• All of the above-mentioned waivers provide recipients with habilitation training specialists, respite care, adaptive equipment, architectural modifications, medical supplies and services, various therapies, family training and counseling, transportation and employment services.
• Homeward Bound Class Waiver – This waiver was created in FY-2004 for Hissom Class members.
# Served Total Exp. # Served Total Exp. # Served Total Exp. # Served Total Exp.
HCBSW 2,282 $111,444 2,354 $109,017 2,592 $120,235 2,710 $135,862
Homeward Bound Waiver 822 $90,118 805 $89,109 805 $93,385 796 $95,375IHSW-Adult 775 $9,729 864 $9,908 1,216 $13,894 1,466 $18,592IHSW-Children 388 $2,936 405 $2,750 527 $3,359 635 $4,556
FY-2007FY-2006FY-2004 FY-2005
Source: OKDHS In FY-2007, approximately 4,811 people who were non-class members were served through some type of community-based waiver.

FY-2009 Executive Budget
HUMAN SERVICES B-172
Waiting List for Community Based Services At the end of FY-2007, there were 3,314 people with developmental disabilities on the waiting list to receive services from one of the waivers administered through DDSD. This is a 16% over FY-2006. Medicaid-eligible persons waiting for services are of all ages. Many of them and their families face financial hardships every day trying to provide costly services such as medical supplies, therapy and adaptive equipment on limited incomes with no access to health care. Children and Family Services The Children and Family Services division in the Department of Human Services is responsible for three main programs: • Investigating all allegations of child
abuse and neglect;
• Providing foster care and kinship placements and family preservation programs to children from abusive homes; and
• Providing permanent adoptive placements for children in need of adoption.
Child Protective Services Child abuse and neglect referrals increased by 2,318 from FY-2005 to FY-2007. This count is based on the number of children included in the referral and/or investigation.
56,562
36,259
8,093
57,383
35,943
7,500
59,329
34,253
7,102
61,613
34,944
7,607
63,128
35,316
7,739
63,931
34,794
7,397
0
20,000
40,000
60,000
80,000
FY-2002 FY-2003 FY-2004 FY-2005 FY-2006 FY-2007
Child Protective Services
Referrals Received Investigations Complete Investigations Confirmed
Source: OKDHS In FY-2004, OKDHS hit a record low number of confirmations. In FY-2007, the number of confirmations decreased slightly
both as a whole number and as a percentage of referrals.
FY-1999 18.60% FY-2000 15.75% FY-2001 15.03% FY-2002 14.31% FY-2003 13.07% FY-2004 11.97% FY-2005 12.35% FY-2006 12.26% FY-2007 11.57%
Neglect is historically the largest category of child mistreatment and in FY-2007 accounted for 85% of confirmations.
FY-2006 Confirmations by Type
Neglect85%
Abuse15%
Source: OKDHS Foster Care Children who must be removed from their homes for health and safety reasons are placed in foster care or kinship placements. Once children are in foster care, the primary goal is to place them in a safe, permanent environment, ideally with their parents. During FY-2007 there was a monthly average of 8,279 children in foster care or kinship placements, an increase of 4.8% from FY-2006. The average length of stay for a child placed in out-of-home care decreased from 23 months in FY-1999 to 21.6 months in FY-2007.

FY-2009 Executive Budget
HUMAN SERVICES B-173
How Children Leave Foster Care
63%17%
10%
7% 3%Reunificationwith Family
Adoption
Custody toRelative/GuardianshipReached Majority
Other
Source: OKDHS Growth in Adoptions In recent years, adoptive home authorizations, the preliminary step to permanent adoptions, have sharply increased. From FY-1998 to FY-2007, DHS has increased the number of placements by almost 195% from 536 placements in FY-1998 to 1,579 placements in FY-2007. Key Performance Measure
1,0511,210
1,003
1,2061,314 1,333
1,151
1,3361,579
0200400
600800
1,0001,200
1,4001,600
FY-99 FY-00 FY-01 FY-02 FY-03 FY-04 FY-05 FY-06 FY-07
Adoptive Home Placements
Source: OKDHS DHS put together the program Swift Adoption to increase permanent adoptive home placements. This program was in response to a federal adoption initiative to increase the number of permanent home placements. Administratively, DHS placed all staff under the state office and contracted out certain services. As a result, adoption placements have more than tripled since 1996. Currently, more than 9,000 children are supported by adoption assistance payments and services. DHS provides subsidies to people who adopt “special needs” children. Oklahoma includes the following in the definition of special needs:
• physically or mentally disabled;
• children over 8 years old;
• siblings;
• emotionally disturbed;
• ethnic/race; and
• high risk of mental disease. While the number will fluctuate during the year, approximately 1,200 children are awaiting adoption. Child Care Child Care Subsidies Child care activities in the Department can be divided into two main areas: the Child Care Subsidy Program and Child Care Licensing. Subsidized child care pays part or all of the child care costs for qualifying families while parents or caretakers work, attend school, or receive training. Subsidized child care was provided for approximately 75,000 children during FY-2007. The monthly average number of children for whom subsidy payments were made was 41,933 in FY-2007. Total payment increases are due to increased rates for the improved quality of child care facilities.
$130.7
$136.7 $138.0
$134.5
$139.0
45,246
41,933
48,552
46,870 47,294
$126.0
$128.0
$130.0
$132.0
$134.0
$136.0
$138.0
$140.0
FY-2003 FY-2004 FY-2005 FY-2006 FY-2007
38,000
40,000
42,000
44,000
46,000
48,000
50,000
Subsidy Payments Number of Children
Source: OKDHS Quality Child Care Initiative The Stars System pays different rates depending on the level of accreditation earned by the facility. These levels, referred to as Stars, are as follows: • One Star – Basic Licensing
Requirements;

FY-2009 Executive Budget
HUMAN SERVICES B-174
• One Star Plus – Transitioning to Higher Level;
• Two Star – Seven Quality Criteria including Master Teachers; and
• Three Star – Two Star Criteria and Nationally Accredited.
Child Care Licensing The Division of Child Care licenses and inspects almost 5,200 child care centers and family care homes in Oklahoma for children ages six weeks to 12 years. The division also licenses 136 residential and shelter facilities that provide care for children who are unable to live at home and 62 child placing agencies that place children in foster homes and adoptive homes.
4,1614,394 4,372
4,0483,716
3,397
0
1,000
2,000
3,000
4,000
5,000
FY-2002 FY-2003 FY-2004 FY-2005 FY-2006 FY-2007
Licensed Child Care Homes
Source: OKDHS
1,897
1,868 1,869
1,843
1,8171,807
1,750
1,775
1,800
1,825
1,850
1,875
1,900
FY-2002 FY-2003 FY-2004 FY-2005 FY-2006 FY-2007
Licensed Child Care Centers
Source: OKDHS While the number of centers and homes is decreasing, the overall capacity is actually increasing due to homes and centers increasing their individual capacities. Total capacity in FY-2006 and FY-2007 is almost 140,000 slots. The following chart shows total capacity in number of slots available for the DHS Child Care Subsidy program versus those that are not.
104,111
36,064
98,546
44,262
103,857
38,856
101,470
39,037
107,768
32,374
0
50,000
100,000
150,000
FY-2003 FY-2004 FY-2005 FY-2006 FY-2007
DHS Licensed Child Care Facilities Capacity
DHS Contract Non-Contract
Aging Services Aging Services is responsible for the following programs: • Congregate Meals
• Ombudsman Program
• Advocacy
• Volunteer Programs The Aging Services Division also administers the following two Medicaid programs. ADvantage Waiver Operated through contracts with the Long Term Care Authorities of Tulsa and Enid, this home health care program provides an alternative to nursing home care for some people. In order to qualify for ADvantage services, a person must meet Medicaid income guidelines and require nursing home-level care. These services divert people away from nursing homes by providing home health care services and/or some services in adult day centers. The ADvantage program provides a significant savings when compared to the cost of nursing home care.

FY-2009 Executive Budget
HUMAN SERVICES B-175
$7,614
$23,453
$0
$10,000
$20,000
$30,000
ADvantage Waiver Nursing Home
FY-2007 Average Annual Cost per Client
Source: OKDHS After several years of remaining stable, FY-2005 saw a sharp increase in the number of clients at the end of the year, 12,787 clients as compared to 10,677 clients in FY-2004. This is an increase of almost 20%. FY-2007 saw another significant increase with a year end count of 17,512, another increase of almost 15%.
10,911 10,950 10,67712,787
15,24017,512
0
5,000
10,000
15,000
20,000
FY-2002 FY-2003 FY-2004 FY-2005 FY-2006 FY-2007
ADvantage Waiver Recipients - End of Year
Source: OKDHS Personal Care The second Medicaid program administered by the Aging Services Division is Personal Care. This service is available to those who meet the medical eligibility criteria as determined by an Aging Services long-term care nurse. Personal care aides, who generally work for home care agencies, provide non-medical assistance to people in their homes. Child Support Enforcement This division is primarily responsible for locating non-custodial parents, establishing paternity and collecting and distributing support payments. In addition to restructuring the public welfare program, The Personal Responsibility and Work Opportunity Reconciliation Act of 1996
implemented a number of changes to Child Support Enforcement. Finding ways to encourage and require parents to be financially responsible for their children is central to the spirit and letter of the law. As the chart below illustrates, child support collections continue to increase each year. FY-2006 collections were up 17% over FY-2005 and FY-2007 collections rose almost 9% over FY-2006. Key Performance Measure
$143.0 $153.4$166.0
$187.5$219.3
$238.9
$0.0
$50.0
$100.0
$150.0
$200.0
$250.0
FY-2002 FY-2003 FY-2004 FY-2005 FY-2006 FY-2007
Child Support Collections (millions of dollars)
Source: OKDHS Emphasis on Fatherhood Child support is not just about finding non-custodial parents and making sure they send a check each month to their children. Financial support is important, but finding more and better ways to foster positive and nurturing relationships between fathers and children is also important. Key Performance Measure
13,480 12,704
15,15316,139
17,942
19,561
0
5,000
10,000
15,000
20,000
FY-2002 FY-2003 FY-2004 FY-2005 FY-2006 FY-2007
Paternities Established
Source: OKDHS

FY-2009 Executive Budget
HUMAN SERVICES B-176
FY-2009 Recommendation
FY-2008 Appropriation $557,107
FY-2008 Bud. FTE Level 8,014.0
Actual Ave. YTD FTE 7,864.4
Funding Adjustments:
FMAP Deterioration 8,000
Deficit Reducation Act 2,500
ADvantage Shortfall 5,000
State Employee Pay Raise 5,235
Total Adjustments 20,735
FY-2009 Recommendation $577,842
% Change from FY-2008 3.72%
Source: Office of State Finance
FY-2009 Appropriation(amounts in thousands)
Federal Medical Assistance Percentage (FMAP) Deterioration The Federal Medical Assistance Percentage (FMAP) represents the federal match provided to the state for the Medicaid program. The Governor’s budget includes $8.0 million for the FFY-2009 decrease in FMAP. Deficit Reduction Act (DRA) of 2005 The Governor’s budget proposes $2.5 million to replace the loss of federal funds as a result of DRA. ADvantage Waiver Shortfall The Governor’s budget recommends $5 million for the ADvantage waiver shortfall. This funding goes toward the increase in new clients and an increase in the demand for services with current clients. State Employee Pay Raise The Governor’s budget includes $5,234,732 for a 5% state employee pay increase for the Department of Human Services effective January 1, 2009. This funding is based on October 2007 salary information.

FY-2009 Executive Budget
HUMAN SERVICES B-177
J.D. McCarty Center for Children with Developmental
Disabilities Notable Achievements • More of Oklahoma’s children with
developmental disabilities have been served. There were approximately 46,000 patient encounters in FY-2007.
• Five, week long summer day camp programs served 65 children with special needs. Children with developmental disabilities from the metropolitan area attended the camps Monday through Friday. The focus was to provide a fun and loving environment so that each camper can learn new skills, make friends and gain independence while having a blast!
• Continued a successful campaign to raise awareness of the center’s services and garner private funds to build J.D. McCarty Center’s first summer camp facility, which will enable JDMC to expand its summer camp program. The facility will consist of an activity center, pool with a splash pad, a ropes course and outside activity field, a campfire circle, fishing dock for lake use and overnight cabins.
• The Conference Center on J.D. McCarty’s campus hosted 91 events during FY-2007 and generated over $96,000 in revenue.
Mission The mission of the J.D. McCarty Center (JDMC) for Children with Developmental Disabilities is to provide a comprehensive program of habilitative care to Oklahoma's citizens with disabilities. The J.D. McCarty Center habilitates, rehabilitates, evaluates, and treats Oklahoma's developmentally disabled children, enabling them to reach their maximum potential. The ultimate goal is to enable children to return to a family or community environment.
JDMC’s emphasis on telecommunications will enable the agency to reach a more general population, such as doctors’ offices, clinics, kiosks in frequently traveled locations and the rapidly expanding population of web surfers. In recent years, the JDMC has seen an increase in the number of children that come to the facility in the custody of the state. JDMC is also seeing an increase in children with behavioral problems and more severe diagnoses. This led to an increase in the average length of stay for children in the hospital, especially for state custody children through FY-2005. However, after moving into their new facility and no longer having to house children in wards, many of their challenging behaviors were successfully resolved and foster care placements increased. This has resulted in a dramatic drop in average length of stay for custody children from 732 days in FY-2005 to 366 days in FY-2007.
399
42
476
42
732
40
390
44
366
370
200
400
600
800
Day
s
FY-2003 FY-2004 FY-2005 FY-2006 FY-2007
Average Length of Stay for Children in State Custody vs. Non-Custody
State Custody Non-Custody
Source: JD McCarty Center
$866$831
$879 $899
$947
$989
$750
$800
$850
$900
$950
$1,000
FY-2002 FY-2003 FY-2004 FY-2005 FY-2006 FY-2007
Cost per Bed per Day (as per Medicaid Cost Report)
Source: JD McCarty Center

FY-2009 Executive Budget
HUMAN SERVICES B-178
FY-2009 Recommendation
FY-2008 Appropriation $4,453
FY-2008 Bud. FTE Level 224.1
Actual Ave. YTD FTE 204.6
Funding Adjustments: Registered Nursing Staff 950
State Employee Pay Raise 208
Total Adjustments 1,158
FY-2009 Recommendation $5,611
% Change from FY-2008 26.01%
Source: Office of State Finance
(amounts in thousands)
FY-2009 Appropriation
Registered Nursing Staff The Governor’s budget proposes $950,000 million to fund the hiring of 17additional registered nurses. Due to a mandate from the U.S. Department of Health, the J.D. McCarty Center must hire these nurses in order to remain a licensed Medicaid facility. State Employee Pay Raise The Governor’s budget includes $208,230 for a 5% state employee pay increase for the J.D. McCarty Center effective January 1, 2009. This funding is based on October 2007 salary information.

FY-2009 Executive Budget
HUMAN SERVICES B-179
Office of Juvenile Affairs Notable Achievements • Accountability / Community
Residential Programs: In conjunction with the Oklahoma Department of Human Services, OJA contracted for a 12-bed Level D staff secure group home near Wayne, OK. The group home is for delinquents with developmental disabilities. OJA received $800,000 in funding to expand the Community At-Risk Services (CARS) throughout the state.
• Institutional Program: Additional digital recording & cameras ($450,000) were added to the three OJA operated institutions. Funding came from the Juvenile Accountability Block Grant (JABG).
• Regional Secure Detention: OJA received $3.3 million in funding to construct a new 18-bed detention center in Craig County to replace the current 12-bed center. Completion of the project is expected in early FY-2009.
Mission The Oklahoma Juvenile Reform Act (HB 2640) created the Office of Juvenile Affairs (OJA) as the state juvenile justice agency effective July 1, 1995. Previously, the Department of Human Services (DHS) provided services for Oklahoma’s youth adjudicated delinquent or youth in-need-of-supervision. The mission of OJA is to promote public safety and reduce juvenile delinquency by providing professional prevention, education and treatment services, as well as secure facilities for juveniles. OJA manages these functions through five main programs: juvenile justice and delinquency prevention, residential, nonresidential, juvenile accountability incentive block grant and community based youth services.
The Office of Juvenile Affairs:
● serves as the state planning and coordinating agency for statewide juvenile justice and delinquency prevention services;
● preserves and strengthens family ties whenever possible;
● provides court intake, probation and parole for delinquent youth;
● removes a juvenile from the custody of parents if the safety of the juvenile or the protection of the public would otherwise be endangered;
● provides treatment, care, guidance and discipline to adjudicated juveniles removed from the custody of parents to assist the juvenile in becoming a responsible, productive member of society; and
● provides a system for the rehabilitation and reintegration of juvenile delinquents into society.
OJA is one of the 10 largest state agencies. The agency’s FY-2007 appropriation is 1.6% of the total state appropriated budget. The following chart shows OJA’s FY-2007 expenditures by program.
FY-2007 Expenditures by Program
Residential Svcs43%
Office of Juv Justice &
Delinquency Prevention
1%
Non Residential Svcs31%
Santa Claus Commission
0%
Community Based Youth
Services19%
Admin6%
Juvenile Accountability Inc Blk Grant
0%
Source: Office of Juvenile Affairs While OJA receives funding from federal grants and revolving funds, nearly 88% of operational funding in FY-2007 came from state appropriations. Approximately 10% of OJA’s funding came from federal funds, and 2% from revolving funds. Grants received include the Juvenile Accountability Incentive Block Grant, the Juvenile Justice and Delinquency Prevention Formula Grant, Title V and Challenge Grants.

FY-2009 Executive Budget
HUMAN SERVICES B-180
Terry D. v. Rader In January 1978, the class-action lawsuit Terry D. v. Rader was filed in Federal Court, alleging abusive practices, unconstitutional use of isolation and restraints, the absence of adequately trained staff, and the mixing of offenders with non-offenders. The suit was a successful challenge to the number of youth in State custody and resulted in DHS closing a number of public institutions and implementing a variety of community-based programs for children and youth. Subsequent to the creation of OJA, an Amended Court Plan of Implementation was filed with the court that detailed OJA’s responsibilities in the operation of the juvenile justice system. In 1996, OJA was able to meet Federal Court requirements for the dismissal of the lawsuit.
System Placement Placement Demand Two key factors contribute to the overall juvenile justice system placement demand: the total juvenile arrest rate and the number of out-of-home placement admissions. According to data from the Oklahoma State Bureau of Investigation (OSBI) 2006 Uniform Crime Report, total juvenile arrests increased slightly in 2006. The following chart shows a seven-year history of juvenile arrests.
25,869 24,885 23,970 24,684 23,880
21,435 21,541
0
5,000
10,000
15,000
20,000
25,000
30,000
2000 2001 2002 2003 2004 2005 2006
Total Juvenile Arrests
In this chart, the word “arrest” refers to the police handling of all juveniles who have been accused of committing a crime and are taken into custody when, under the same circumstances, the crime would warrant the arrest of an adult. Police “contacts” with juveniles do not count as
arrests when no offense has been committed. Instances where juveniles are taken into custody for their own protection and not because the juvenile has committed a crime, such as neglect cases, are not listed as arrests. The following chart provides a comparison of the out-of-home placement admissions and discharges since FY-2002.
1,292 1,318
1,038 988 1,0061,040858
930854 832
934
839
0
500
1,000
1,500
FY-2002 FY-2003 FY-2004 FY-2005 FY-2006 FY-2007
Out of Home Placement Admissions and Discharges
Admissions Discharges
Source: OJA To address the placement demand each year, OJA determines the security level each adjudicated juvenile requires and matches the juvenile with the next available bed placement option at that level. Placement Waiting List The following graph illustrates the change in the average number of juveniles awaiting placement over 11 years (FY-2005 is the most recent year for which data is available). Juveniles on the waiting list are typically held in lock-down county detention centers. These juveniles do not begin any treatment services at this point, however the detention centers have on-site teachers.
Average # of Juveniles on Waiting List
0
20
40
60
80
100
120
140
FY-97 FY-98 FY-99 FY-00 FY-01 FY-02 FY-03 FY-04 FY-05 FY-06 FY-07

FY-2009 Executive Budget
HUMAN SERVICES B-181
While the waiting list has dramatically decreased from FY-1995, the number of juveniles awaiting placement has been on the rise since FY-2002. Community Based Youth Services Forty-one designated Youth Service Agencies provide a statewide system of prevention, diversion, intervention and treatment programs to keep juveniles from entering or further penetrating into the juvenile justice system. Youth Service Agencies are not-for-profit and governed by local boards of directors made up of community volunteers. OJA contracts with Youth Service Agencies to provide First Offender programming, Community At-Risk Services (CARS), Emergency Shelter care and other services. The First Offender Program is a statewide program for juveniles who have committed a first-time misdemeanor or non-violent felony. The program provides juveniles and their parents 12 hours or more of skill development classes emphasizing communication, anger management, problem solving and decision-making. Over 3,300 juveniles received First Offender services in FY-2007. Youth Service Agencies also provide community-based treatment services such as Community At Risk Services (CARS). The purpose of CARS is to provide services to juveniles in custody or under OJA supervision to prevent out of home placement and to reintegrate juveniles returning from out of home placements. Services include mentoring, tutoring, counseling, diagnostic and evaluation services and supervision of youth in independent living.
9.2%9.7% 9.9%
9.4%8.4% 7.7% 8.4% 8.3% 7.6%
0.0%
2.0%
4.0%
6.0%
8.0%
10.0%
FY-98 FY-99 FY-00 FY-01 FY-02 FY-03 FY-04 FY-05 FY-06
First Offender Recidivism Rates
Source: Office of Juvenile Affairs Successful reintegration of juveniles back into the community is fundamental for both the juvenile and the community. Without effective reintegration programs, juveniles are more likely to re-offend and become incarcerated again. This is counter-productive for the youth and costly to the state. Key Performance Measure
CARS Completion Rates
63.2%71.3% 72.4% 74.0% 76.5% 83.7%
76.2% 75.9%
0.0%
20.0%
40.0%
60.0%
80.0%
100.0%
FY-00 FY-01 FY-02 FY-03 FY-04 FY-05 FY-06 FY-07
Emergency shelters provide short-term residential care to youth in need of temporary housing. Shelters are open 24 hours a day, seven days a week and serve both Department of Human Services and OJA youth. Some Youth Service Agencies also operate Community Intervention Centers (CICs), foster homes, therapeutic foster homes, group homes and detention centers. Nonresidential Services The Juvenile Services Unit (JSU) provides intake, probation and parole services to juveniles in all 77 counties, except those with Juvenile Bureaus. Juvenile Bureaus, located in Comanche, Oklahoma, and Tulsa counties, perform intake and probation

FY-2009 Executive Budget
HUMAN SERVICES B-182
functions. In those counties, JSU staff provides parole services. The most common intake of district attorneys is to file a petition for court involvement. The total number of intakes has declined by 348 since FY-2006, from 15,921 to 15,573 in FY-2007.
6,053
4,140
1,720
71
5,839
4,122
1,561
83
5,726
4,149
1,628
74
0
2,000
4,000
6,000
8,000
File Petition InformalProbation
Diverted
Intake Options
File Petition Informal Probation Diverted Motion to Certify
Source: Office of Juvenile Affairs ● In FY-2007, 3,996 or 34.5% of the total
intakes were dismissed.
Contracted service programs assist the local staff, or Juvenile Justice Specialists, in developing an individualized service plan for each juvenile and family. OJA provides a full continuum of services to encourage positive, law-abiding behavior and balances those services with public safety.
0
5,000
10,000
15,000
20,000
25,000
FY-2004 FY-2005 FY-2006 FY-2007
OJA Referrals
Total Referrals Total Juveniles Violent Crime Referrals
Source: Office of Juvenile Affairs ● In FY-2007, 9,247 referrals were first
time referrals, 41% of total referrals.
JSU staff also takes an active role in their communities to develop a system of graduated sanctions to address juvenile problems at an early stage. The Graduated Sanctions Program is a community-based initiative that provides accountability and facilitates services for non-compliant youth. The goal is to prevent further penetration of
lesser offending youth into the juvenile justice system. OJA permits flexibility in the decisions that local community residents make regarding youth within their community. Currently, 10 communities have a Graduated Sanctions Program. Residential Services OJA provides rehabilitative facilities for treatment to OJA custody youth in out-of-home community based and institutional placements. Since FY-1994, OJA has increased the number of beds in the juvenile system. These additional beds have allowed OJA to remove violent offenders from the street and reduce the number of juveniles awaiting placement. The number of beds peaked in FY-2000 and has since declined due to budget cuts. The following chart provides a breakdown of the available beds by type.
FY-2007 Bed Placement Options
37%
4% 0%11%
48%
Secure Community Based
SWOSU Group Homes* Bootcamp
Diagnostic/ Evaluation
Source: Office of Juvenile Affairs OJA strives to intervene in the delinquent life style of adjudicated youth in custody. Facilities provide applicable treatment for specific problems to enable normal adolescent maturation and to prepare the youth for reintegration into the home and the community. Two key performance measures for this area are completion rates and recidivism rates.

FY-2009 Executive Budget
HUMAN SERVICES B-183
Key Performance Measure
Completion Rates - Residential Services
61.9%
71.6%
59.8%
63.2%63.5%
70.1%
50.0%
55.0%
60.0%
65.0%
70.0%
75.0%
FY-2002 FY-2003 FY-2004 FY-2005 FY-2006 FY-2007
Source: Office of Juvenile Affairs Completion of services is defined as a regularly scheduled discharge from out-of-home placement. Non-completion represents a disruption of services and may occur for a variety or reasons, including AWOL, hospitalization, re-arrest and placement in detention or early court dismissal of a case. The completion rate for residential services has increased over the past five years, from 70.1% in FY-2002 to 71.6% in FY-2007. Key Performance Measure
Residential Services - Recidivism Rates
25.6%
24.7%
27.6%29.5%
32.3%31.2%
28.1%28.5%28.7%
0.0%
5.0%
10.0%
15.0%
20.0%
25.0%
30.0%
35.0%
FY-98 FY-99 FY-00 FY-01 FY-02 FY-03 FY-04 FY-05 FY-06
Source: Office of Juvenile Affairs Recidivism is defined as those juveniles who fail to remain crime-free within one year of discharge from a residential program. Secure Bed Costs The FY-2007 average per diem bed cost at the state-operated facilities was $244. During FY-2003, OJA made several reductions to reduce per diem costs at the state facilities. OJA canceled a contract for a medium secure facility in Union City and relocated 80 juveniles into OJA operated institutions. The table below provides the per diem bed cost at each facility.
Key Performance Measure
Facility FY-01 FY-02 FY-03 FY-04 FY-05 FY-06 FY-07
SOJC $188.65 $216.28 $218.52 $206.32 $218.44 $241.07 $248.86
COJC 225.08 240.97 199.72 181.79 187.36 214.72 208.07
LERC 196.81 216.60 184.36 186.46 207.88 232.13 273.69
UCJC (private) 128.04 134.74
Source: Office of Juvenile Affairs
*The contract for operation of the medium secure facility expired on December 2, 2002.
Per Diem Bed Costs
** Daily cost per bed is based on the number of beds utilized and does not reflect any indirect costs.
Contract Discontinued
Youthful Offender HB 2640 created the Youthful Offender Act to ensure public safety and hold adolescents ages 13 through 17 accountable for the commission of serious crimes. Implementation of this essential reform tool began on January 1, 1998. The Act allows courts the discretion to place youthful offenders in the custody or under the supervision of OJA if the court determines that rehabilitation is appropriate. Upon good conduct and successful completion of OJA’s program, the court can discharge the sentence and the youthful offender can avoid conviction for a crime This Act also establishes a bridge between OJA and the Department of Corrections (DOC) for youthful offenders. Previously, when a youth in OJA’s custody reached 18 years of age, the court would have to discharge the youth. Now, if a youth is sentenced as a youthful offender and placed in the custody or under the supervision of OJA, the court can discharge the youth or transfer custody to DOC when the youthful offender reaches 18 years of age. The court can also hold periodic review hearings, at its discretion, to determine the status of a youthful offender prior to the youth reaching 18 years of age. In FY-2007, 118 youthful offenders were remanded to OJA custody and 15 were remanded to OJA supervision. Of those remanded to OJA custody, 114 (96.6%) were placed in secure institutions.

FY-2009 Executive Budget
HUMAN SERVICES B-184
FY-2008 Supplemental
FY-2008 Appropriation $110,061 Supplemental 2,093
FY-2008 Adj. Appropriation $112,154% Change from FY-2007 7.61%
% Change from Original FY-2008 1.90%
FY-2008 Supplemental(amounts in thousands)
Source: Office of State Finance The Governor’s budget recommends supplemental funding of $2,092,950 to address maintenance and programmatic issues. The following items are funded through the supplemental:
• Start up costs associated with performing background checks through the National Crime Information Center;
• The Performance Based Standards
Program, a national program that provides outcome measures for juvenile facilities on safety and programming issues;
• Software, necessary equipment,
and installation of a monitoring device that allows OJA to track juveniles within the facility;
• Maintenance issues at the Lloyd E.
Rader Facility;
• 2.5 FTE to be hired as mental health specialists;
• HVAC and roof repair for OJA’s
Norman building;
• Additional level E beds; and
• HVAC repair at the Lloyd E. Rader facility.
FY-2009 Recommendation
FY-2008 Appropriation $110,061
FY-2008 Bud. FTE Level 1,035.0
Actual Ave. YTD FTE 994.2
Funding Adjustments: Annualize Supplemental 1,447 Employee Retention 1,733 Level E Beds 969 Gang Prevention 1,000
State Employee Pay Raise 934
Total Adjustments 6,083
FY-2009 Recommendation $116,144
% Change from FY-2008 5.53%
Source: Office of State Finance
(amounts in thousands)
FY-2009 Appropriation
Annualize Supplemental Funding The Governor’s budget recommends annualizing $1,446,750 of the FY-2008 supplemental. This amount excludes one-time funding for the maintenance issues and HVAC repair at Rader and the roof and HVAC repair for the Norman building. Employee Retention The Governor’s budget includes $1,733,320 to fund salary increases for employee retention. This amount also funds an increase in the shift differential for employees working the midnight shift at OJA facilities. Level E Beds The Governor’s budget recommends $969,382 to fund 24 new level E beds to segregate the younger population from the older juveniles. Gang Prevention The Governor’s budget includes $1.0 million for gang prevention and intervention. This funding will be used to expand current programs and to develop pilot projects in rural areas across the State.

FY-2009 Executive Budget
HUMAN SERVICES B-185
State Employee Pay Raise The Governor’s budget includes $933,565 for a 5% state employee pay increase for the Office of Juvenile Affairs effective January 1, 2009. This funding is based on October 2007 salary information. Enterprise Agency The Governor’s budget recommends OJA’s participation in the Enterprise Agency program. The Governor’s Budget also proposes any savings that OJA realizes from being an Enterprise Agency be used for operational funding and budgetary purposes. Capital Spending Proposal The Governor’s budget includes $24,892 million in a capital bond issue. Of the amount, $20 million is for construction of a new Youthful Offender Facility, and $4,892 million is for construction of 2 new detention centers each with 12 beds.

FY-2009 Executive Budget
HUMAN SERVICES B-186
Physician Manpower Training Commission (PMTC)
Notable Achievements • Physicians placed in rural Oklahoma in
FY-2008 will provide an economic impact of $23 million to rural Oklahoma.
• Twenty-nine scholarships were given to
physician assistant students in FY-2008. This program provides funding to physician assistant students who agree to establish their practice in rural Oklahoma communities with a population of 20,000 or less.
• In FY-2008, 380 nursing students
received scholarships through the Oklahoma Nursing Student Assistance Program; 171 of these nursing students are matched (50%) with health care facilities in Oklahoma.
Mission The Legislature created the Physician Manpower Training Commission (PMTC) in 1975 to enhance medical care in rural and underserved areas of the state through the following programs: • Oklahoma Intern/Resident Cost-
Sharing;
• Community Match Rural Scholarship Incentive Programs;
o Rural Medical Education Scholarship Loan
o Family Practice Resident Rural Scholarship
o Physician/Community Match Loan
• Physician Placement Program;
• Nursing Student Assistance Program; and
• Physician Assistant Scholarship Program.
There are no other programs like this in any other state. The PMTC programs provide approximately 30 physicians each
year to Oklahoma communities with an estimated economic impact of approximately $34.5 million annually. A 1998 study conducted by the Cooperative Extension Service at OSU indicated that a physician establishing practice in a rural Oklahoma community generates 50 jobs and approximately $1.15 million of income annually. Physicians are vital to the economic health of small Oklahoma communities. Oklahoma Intern/Resident Cost Sharing The PMTC administers a cost-sharing program to fund Family Practice residents’ salaries at the University of Oklahoma Health Sciences Center and the Oklahoma State University College of Osteopathic Medicine. The benchmark for the amount of funds per resident is based on the regional average for similar programs and is attained annually. The graph below depicts the amount of funds per resident for the past five fiscal years. Training for Family Practice residents takes place in Oklahoma City, Tulsa, Enid, Ramona, Lawton and Durant. Statistics show that primary care residents trained in Oklahoma will more likely establish a medical practice in Oklahoma.
Amount of funds per resident
$43,605
$46,843 $47,419$49,363
$51,580
$38,000$40,000$42,000$44,000$46,000$48,000$50,000$52,000$54,000
FY-2004 FY-2005 FY-2006 FY-2007 FY-2008
Community Match Rural Scholarship Incentive Programs Rural Medical Education Scholarship Loan PMTC also administers a loan program where medical or osteopathic students contract to practice in a rural community

FY-2009 Executive Budget
HUMAN SERVICES B-187
with a population of 7,500 or less when their training is completed. A student can receive up to $60,000 over a four-year period with a payback of practicing in a rural community one year for each year of financial assistance. Since 1975, 389 students have participated in the program. Family Practice Resident Rural Scholarship This scholarship program is for residents in accredited Oklahoma Family Practice Programs. Each participating resident receives $1,000 per month (up to 36 months) with a month for month practice obligation in an underserved community upon completion of residency training. Since 1992, 141 recipients have completed training and are fulfilling their obligations. Physician/Community Match Loan A rural Oklahoma community may provide loans matched by PMTC to any qualified primary care physician to assist in establishing a full-time medical practice. The physician repays the loan by practicing medicine in that community. Since 1989, 145 physicians have been placed.
The following graph shows the total number of physicians who began rural practices compared to the number of communities seeking a physician. Over the last five years, 47% of the communities requesting physicians actually received a physician.
Community Match Rural Scholarship Incentive Programs
2026
34 3020
54 5360 62 59
0
20
40
60
80
FY-2004 FY-2005 FY-2006 FY-2007 FY-2008
Communities receiving physicians Communities requesting physicians
Physician Assistant Program Created in FY-2006, this is a two and a half year scholarship/loan program for physician assistant students in accredited physician assistant programs. Participating students receive $1,000 per month, for up
to 30 months, with a month for month practice obligation in a rural community of 20,000 population or less. The first full class of program participants will be graduated this calendar year and begin repaying their obligations in rural Oklahoma. Nursing Student Assistance Program Established in 1982, this program provides financial assistance to Oklahoma nursing students pursuing Licensed Practical Nursing, Associate Degree in Nursing, Bachelor’s of Science in Nursing or Master’s of Science in Nursing degrees. The scholarship loan is repaid by working as a nurse in Oklahoma, with an emphasis on rural communities. There are two programs:
• Matching scholarship assistance provided by PMTC and matched by a community or institution which in return receives the services of the nurse upon graduation; and
• Non-matching scholarship assistance is provided solely by PMTC.
Since its inception, there have been 4,713 participants. The graph below shows the number of recent recipients by fiscal year.
Number of Nursing Scholarships Awarded
380
324290
247272
050
100150200250300350400
FY-2004 FY-2005 FY-2006 FY-2007 FY-2008

FY-2009 Executive Budget
HUMAN SERVICES B-188
FY-2009 Recommendation
FY-2008 Appropriation $5,524FY-2008 Bud. FTE Level 6.0Actual Ave. YTD FTE 6.0
Funding Adjustments:State Employee Pay Raise 9
FY-2009 Recommendation $5,533% Change from FY-2008 0.16%
(amounts in thousands)
Source: Office of State Finance
FY-2009 Appropriation
State Employee Pay Raise The Governor’s budget includes $9,480 for a 5% state employee pay increase for PMTC effective January 1, 2009. This funding is based on October 2007 salary information.

FY-2009 Executive Budget
HUMAN SERVICES B-189
Department of Rehabilitation Services
Notable Achievements ● The Department of Rehabilitation
Services (DRS) provided employment and educational services to more than 77,000 Oklahomans with disabilities and their families during FY-2006.
● DRS’s Vocational Rehabilitation and Visual Services divisions assisted 2,210 persons with disabilities to start new jobs during FY-2007. A range of vocational rehabilitation and employment services were provided to 18,221 persons who were preparing to go to work. Those who become employed reduce the need for disability benefits and social services while paying taxes on their earnings.
● This year, the Oklahoma School for the Deaf’s National Accessible Learning Center became the only educational video library of its kind in the U.S. It distributes approximately 70,000 educational videos specially formatted for students across the nation who are deaf, hard of hearing, blind or visually impaired.
● DRS’s Disability Determination Division is nationally recognized by SSA every year for outstanding production. In 2007, the division processed and cleared 53,825 cases, while the accuracy of claims decisions remained high at 96%. The Disability Determination Division was the only state program to rank in the top seven nationally in three categories: initial applications, application cases that are resubmitted for a second review by different staff, and cases that are periodically reviewed to determine any change in status of the disability that might affect eligibility.
Mission The mission of the Department of Rehabilitation Services (DRS) is to provide opportunities for individuals with disabilities to achieve productivity,
independence, and an enriched quality of life. The agency administers four main programs: • Vocational Rehabilitation and Visual
Services Division;
• Oklahoma School for the Blind;
• Oklahoma School for the Deaf; and
• Disability Determination Division
Vocational Rehabilitation and Visual Services Division The Vocational Rehabilitation and Visual Services (RVS) division of DRS administers the federal vocation rehabilitation program for Oklahomans with disabilities. DRS provides vocational rehabilitation, education, employment services and independent living programs. Once a client is determined eligible for RVS services, he or she is placed into one of four priority groups according to the severity of his or her disability and in accordance with guidelines in the federal Rehabilitation Act. DRS receives $4 from the federal government for every $1 of state funding for this program. Key Performance Measure
$4,088
$16,752
$3,751
$17,339
$4,100
$19,048
$5,387
$17,446
6,149
18,012
$0
$5,000
$10,000
$15,000
$20,000
FY-2003 FY-2004 FY-2005 FY-2006 FY-2007
Average Cost of Service vs Average Client Earnings (VRS)
Cost of Services Average Earnings
Source: OKDRS

FY-2009 Executive Budget
HUMAN SERVICES B-190
Key Performance Measure Vocational Rehabilitation Services Successful Placements
2,210
2,307
2,0292,0202,016
1,800
1,900
2,000
2,100
2,200
2,300
2,400
FY-2003 FY-2004 FY-2005 FY-2006 FY-2007
Source: OKDRS DRS counts a case as successful once the client has been involved in integrated employment for more than 90 days. At an average cost per client of $6,149, successfully placed clients received the benefit of earning an average paycheck of $18,012 per year in FY-2007. School for the Deaf and School for the Blind The Oklahoma School for the Deaf and Oklahoma School for the Blind provide residential and day education programs for children who have a primary disability of either blindness or deafness. A comprehensive curriculum of reading, language arts, mathematics, social studies, science, physical education and computer-science serves children through the 12th grade. The School for the Blind (OSB) in Muskogee provides special instruction in Braille, orientation and mobility, low vision aids and adaptive technology. The School for the Deaf (OSD) in Sulphur provides sign language classes and adaptive technology. During the 2006-2007 school year, OSD served a total of 225 students from all across the state. The Sulphur campus housed 83 students during the school week, while 58 students attended school during the day, and 31 preschoolers were served in the satellite preschools in Edmond and Broken Arrow.
A total of 131 students attended OSB campus in Muskogee, 56 residential students and 45 day students.
83
58
31
5645
31
OSD OSB
Number of Students 2006-2007 School Year
ResidentialStudents
DayStudents
Satellite /SummerStudents
Source: OKDRS Both schools are resource centers in the state for services to children who are blind, deaf, or hard of hearing. OSD and OSB offer outreach services to these students in public schools throughout the state. Both schools also provide specialized training and summer programs for parents and special education teachers. Nationwide, 47 states and the District of Columbia have schools for the deaf; 42 states and the District of Columbia have schools for the blind. Key Performance Measure
14%0%
86%
23%
38% 38%
18%23%
59%
0%
20%
40%
60%
80%
100%
FY-2005 FY-2006 FY-2007
Post-Graduation Statistics - OSB
Employed Unemployed Post-Secondary
Source: OKDRS

FY-2009 Executive Budget
HUMAN SERVICES B-191
Key Performance Measure
10% 5%
85%
18% 29%
53%
18%27%
55%
0%
20%
40%
60%
80%
100%
FY-2005 FY-2006 FY-2007
Post-Graduation Statistics - OSD
Unemployed Employed Post-Secondary
Source: OKDRS
Disability Determination Division The Disability Determination Division (DDD) makes medical eligibility determinations for Oklahomans applying for Supplemental Security Income disability or Social Security Disability benefits. This program is funded 100% with federal dollars.
FY-2009 Recommendation
FY-2008 Appropriation $29,475
FY-2008 Bud. FTE Level 907.0
Actual Ave. YTD FTE 888.3
Funding Adjustments:
Teacher Salary Base Inc 136 Annualization One-Time Funding 65
Teacher Salary Increase 162 Federal Basic Support Grant 351 State Employee Pay Increase 465
Total Adjustments 1,179
FY-2009 Recommendation $30,654
% Change from FY-2008 4.00%
Source: Office of State Finance
FY-2009 Appropriation(amounts in thousands)
Teacher Salary Base Increase The Governor’s budget provides $136,000 for teacher’s who are scheduled to receive a pay increase due to their number of years
as a teacher. Of this amount, OSB receives $56,000, and OSD receives $80,000. Annualization of One-Time Funding The Governor’s budget includes $64,695 to annualize the one-time funding that DRS received for the teacher salary increase that passed during the 2007 legislative session. Teacher Salary Increase The Governor’s budget $162,277 for teacher salaries to continue the State’s efforts to reach the regional average. As the most recent salary figures indicate the state is $1,140 below the regional average, the Governor’s new proposal provides an average increase of approximately $1,200 and rewards veteran teachers by weighting the increase based on years of service. Federal Basic Support Grant The Governor’s budget recommends $351,000 to be used towards the state match for the Federal Basic Support Grant. Currently, DRS does not have the full amount of state funding needed for the match. The federal money is used for programs in the Vocational Rehabilitation and Visual Services division. State Employee Pay Increase The Governor’s budget includes $465,473 for a 5% state employee pay increase for the Department of Rehabilitation Services effective January 1, 2009. This funding is based on October 2007 salary information.
FY-2009 Executive Budget
HUMAN SERVICES B-192
University Hospitals Authority and Trust
Notable Achievements • Pre-tax Earnings Distributions as per
the Joint Operating Agreement The terms of the Joint Operating
Agreement specify that each calendar year the University Hospitals Trust receives the first $9 million of pre-tax earnings of the hospitals encompassed in the agreement. Over the course of the Agreement approximately $109 million in pre-tax preference payments have been made to the University Hospitals Trust. The Trust uses these funds to fulfill its mission to support medical education and clinical research.
• Investment in Medical Technology, Equipment and Research and Medical Facilities
To date, the University Hospitals Authority and Trust and HCA Health Services of Oklahoma (dba OU Medical Center) have combined investments of $277 million on hospital equipment and facilities improvements. In addition the Trust provided $18.6 million for the construction of the Stanton L. Young Basic Research building Phase II where state of the art genomics and oncology research began in 2006. The Trust has also completed the Arrhythmia Research Institute located in the O.U. Medical Center where pioneering arrhythmia oblation procedures were innovated.
Brief History In early 1998, the University Hospitals Authority entered into a Joint Operating Agreement (JOA) with HCA Health Services of Oklahoma, Inc., a subsidiary of Columbia Corporation. The agreement completed the largest and most comprehensive privatization in Oklahoma, consisting of a long-term lease between the University Hospitals Trust and HCA Health Services of Oklahoma, Inc. to lease, manage and operate the University Hospitals.
This historic partnership combined University Hospital, Children’s Hospital of Oklahoma, O’Donoghue Rehabilitation Institute and Presbyterian Hospital to form what is now called OU Medical Center. This name represents the association of the hospitals with the University of Oklahoma Health Sciences Center medical schools. The OU Medical Center hospitals serve as teaching hospitals for the medical schools. Current Role of the Authority The Authority, in conjunction with the University Hospital Trust, is responsible for monitoring the JOA and making yearly financial reports to the Governor and the Legislature. The mission of the Authority is to be a catalyst for medical excellence, to support medical education, clinical research and to assure the best care available to all Oklahoma citizens regardless of means, while growing essential alliances and maximizing utilization of State and Federal resources. Indigent Care Expenditures The OU Medical Center Hospitals provide care to indigent persons equaling at least 120% of the state’s appropriation for indigent care. In the event that audited costs of indigent care go above 150% of the appropriation, the Governing Board of the JOA can seek an increase in the appropriations from the Legislature or reduce services to indigents. Indigent care means medical care provided to individuals who do not have insurance and cannot pay for the cost of the care they receive. During FY-2007, there were a total of 202,012 persons who received indigent care services at OU Medical Center. The categories of service are as follows:
• 16,342 Inpatients, and
• 185,667 Adult and Pediatric outpatient and ER visits.
Of the number of persons who received services, 604 of the inpatients, 3,309 of the outpatients and 187 of the emergency room patients were Department of Corrections’
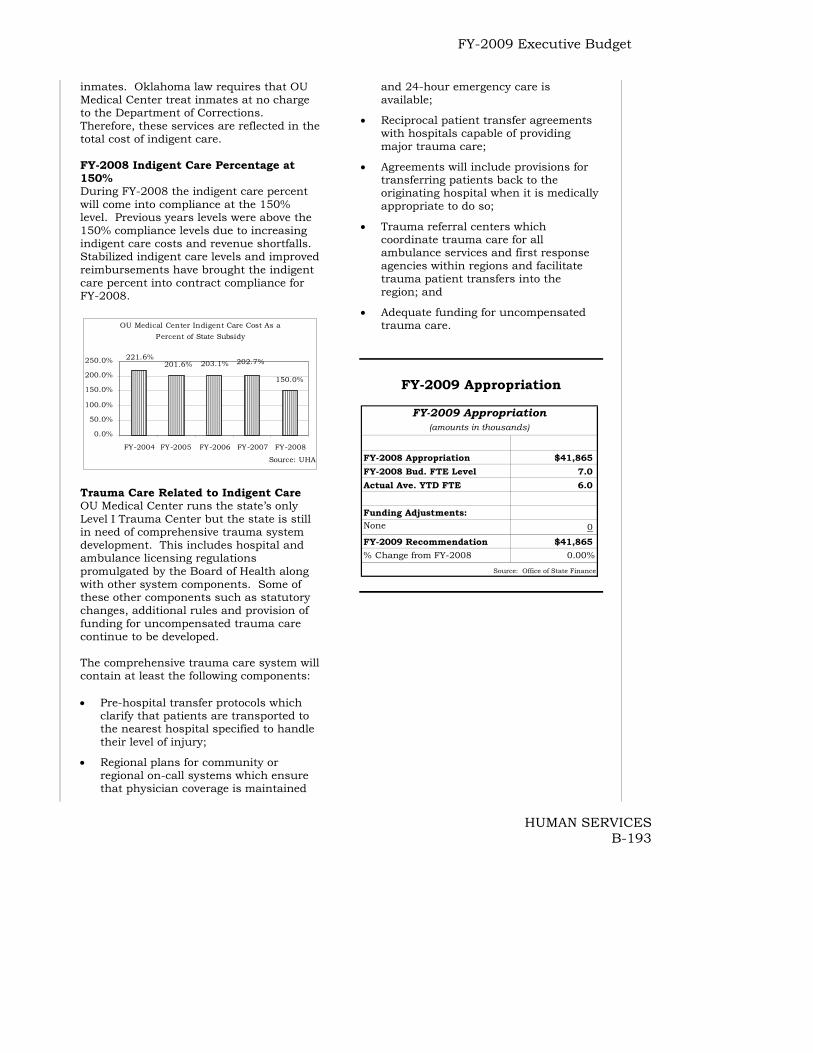
FY-2009 Executive Budget
HUMAN SERVICES B-193
inmates. Oklahoma law requires that OU Medical Center treat inmates at no charge to the Department of Corrections. Therefore, these services are reflected in the total cost of indigent care. FY-2008 Indigent Care Percentage at 150% During FY-2008 the indigent care percent will come into compliance at the 150% level. Previous years levels were above the 150% compliance levels due to increasing indigent care costs and revenue shortfalls. Stabilized indigent care levels and improved reimbursements have brought the indigent care percent into contract compliance for FY-2008.
OU Medical Center Indigent Care Cost As a Percent of State Subsidy
150.0%
202.7%203.1%201.6%221.6%
0.0%
50.0%
100.0%
150.0%
200.0%
250.0%
FY-2004 FY-2005 FY-2006 FY-2007 FY-2008
Source: UHA
Trauma Care Related to Indigent Care OU Medical Center runs the state’s only Level I Trauma Center but the state is still in need of comprehensive trauma system development. This includes hospital and ambulance licensing regulations promulgated by the Board of Health along with other system components. Some of these other components such as statutory changes, additional rules and provision of funding for uncompensated trauma care continue to be developed. The comprehensive trauma care system will contain at least the following components: • Pre-hospital transfer protocols which
clarify that patients are transported to the nearest hospital specified to handle their level of injury;
• Regional plans for community or regional on-call systems which ensure that physician coverage is maintained
and 24-hour emergency care is available;
• Reciprocal patient transfer agreements with hospitals capable of providing major trauma care;
• Agreements will include provisions for transferring patients back to the originating hospital when it is medically appropriate to do so;
• Trauma referral centers which coordinate trauma care for all ambulance services and first response agencies within regions and facilitate trauma patient transfers into the region; and
• Adequate funding for uncompensated trauma care.
FY-2009 Appropriation
FY-2008 Appropriation $41,865FY-2008 Bud. FTE Level 7.0Actual Ave. YTD FTE 6.0
Funding Adjustments:None 0
FY-2009 Recommendation $41,865% Change from FY-2008 0.00%
FY-2009 Appropriation(amounts in thousands)
Source: Office of State Finance

FY-2009 Executive Budget
HUMAN SERVICES B-194

FY-2009 Executive Budget
MILITARY B-195
Oklahoma Military Department
Mission The Oklahoma Military Department’s (OMD) mission is to preserve the state and the nation through the organization and training of the Oklahoma National Guard. To that end, OMD is committed to providing adequate training facilities for the Oklahoma National Guard. OMD also continues to serve Oklahoma’s at-risk youth with programs, which instill self-esteem and discipline in our young people. Youth Programs The Oklahoma Military Department fields five programs involving Oklahoma’s youth. On July 1, 2005, Oklahoma Military Department reconstituted the State Transition and Reintegration System (STARS), providing statewide tracking services for adjudicated youth through personal contacts and advanced Global Position Satellite (GPS) technologies. First Lady Kim Henry became the official spokesperson for Oklahoma’s National Guard Youth Challenge Program, and this program set a national mark by being the first program of its kind to publish their entry web page in both English and Spanish. Throughout 2006, the Youth Programs Division (YPD) continued to develop and refine the coordination between its residential programs resulting in significant progress in the areas of job training and job placement. Thunderbird Youth Academy In Pryor since 1993, the Thunderbird Youth Academy (TYA) holds two 22-week sessions per calendar year. This voluntary program utilizes military discipline to improve self-esteem and physical fitness of approximately 200 Oklahoma at-risk youths every year.
Education is a key component of the TYA. The curriculum focuses on specific criteria, GED completion and basic life skills. GED preparation is intensive and directed toward improving each cadet academically. Once cadets obtain their GED, they have the opportunity to complete college level studies before graduation. This voluntary program is the result of a cooperative effort between TYA and local colleges and universities. The credits are fully transferable and certified college instructors teach the classes. Since 1993 2,464 of Oklahoma’s high school dropouts have dramatically improved their education level and employability potential, with 227 graduating in 2006.
Placement Statistics of TYA Graduates (1993 - 2006)
Other16%
Military17%
Employed39%
Higher Education
28%Source: OK Military Department
Thunderbirds Regimented Training Program (TRTP) Having served 865 adjudicated cadets in Pryor, this residential program continues to be a unique asset to the Office of Juvenile Affairs. TRTP also maintains the highest standards of the American Correctional Association certification criteria. Thunderbird Trades Academy (TTA) Located in Pryor, this residential program launched its inaugural class January 12, 2004 in cooperation with OSU-Okmulgee. TTA has graduated 35 youth to date and has a 100% placement rate. TTA has developed new partnerships which are setting the stage for significant job training and placement enhancements and may result in establishing a new model for the nation.
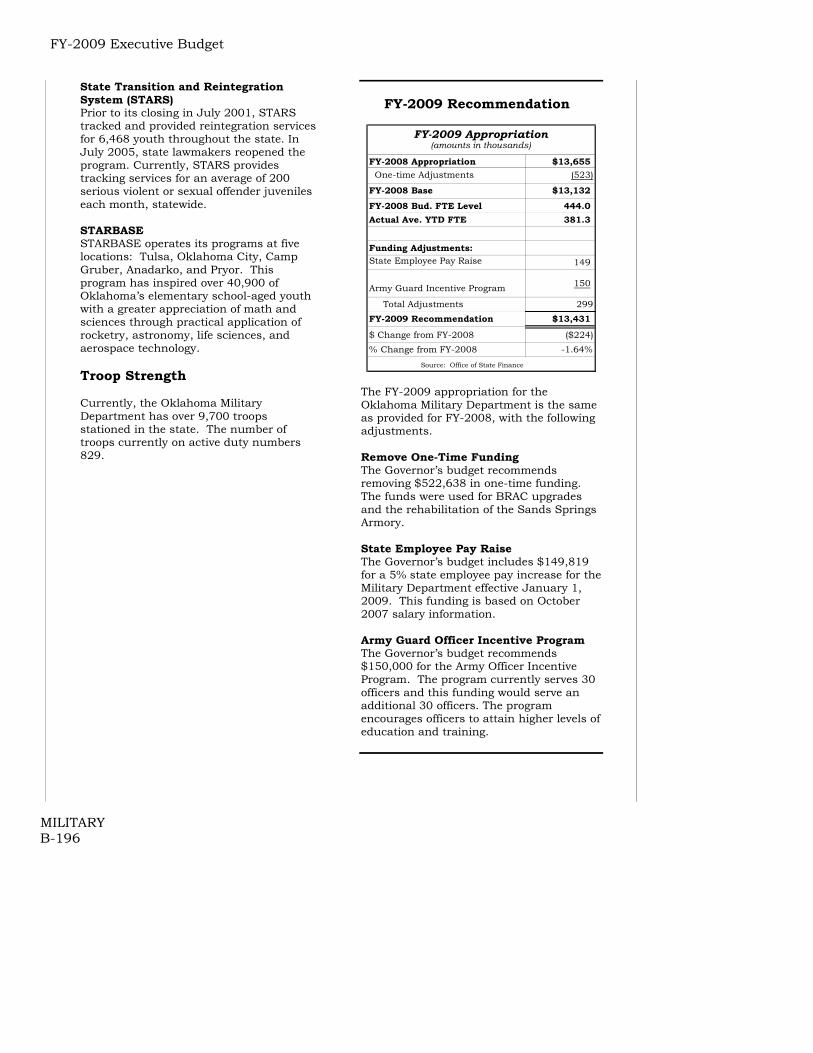
FY-2009 Executive Budget
MILITARY B-196
State Transition and Reintegration System (STARS) Prior to its closing in July 2001, STARS tracked and provided reintegration services for 6,468 youth throughout the state. In July 2005, state lawmakers reopened the program. Currently, STARS provides tracking services for an average of 200 serious violent or sexual offender juveniles each month, statewide. STARBASE STARBASE operates its programs at five locations: Tulsa, Oklahoma City, Camp Gruber, Anadarko, and Pryor. This program has inspired over 40,900 of Oklahoma’s elementary school-aged youth with a greater appreciation of math and sciences through practical application of rocketry, astronomy, life sciences, and aerospace technology. Troop Strength Currently, the Oklahoma Military Department has over 9,700 troops stationed in the state. The number of troops currently on active duty numbers 829.
FY-2009 Recommendation
FY-2008 Appropriation $13,655 One-time Adjustments (523)
FY-2008 Base $13,132FY-2008 Bud. FTE Level 444.0Actual Ave. YTD FTE 381.3
Funding Adjustments:State Employee Pay Raise 149
Army Guard Incentive Program 150
Total Adjustments 299
FY-2009 Recommendation $13,431
$ Change from FY-2008 ($224)% Change from FY-2008 -1.64%
Source: Office of State Finance
FY-2009 Appropriation(amounts in thousands)
The FY-2009 appropriation for the Oklahoma Military Department is the same as provided for FY-2008, with the following adjustments. Remove One-Time Funding The Governor’s budget recommends removing $522,638 in one-time funding. The funds were used for BRAC upgrades and the rehabilitation of the Sands Springs Armory. State Employee Pay Raise The Governor’s budget includes $149,819 for a 5% state employee pay increase for the Military Department effective January 1, 2009. This funding is based on October 2007 salary information. Army Guard Officer Incentive Program The Governor’s budget recommends $150,000 for the Army Officer Incentive Program. The program currently serves 30 officers and this funding would serve an additional 30 officers. The program encourages officers to attain higher levels of education and training.

FY-2009 Executive Budget
SAFETY AND SECURITY B-197
Alcohol Beverage Laws Enforcement Commission
Notable Achievements • The agency has performed all required
alcohol inspections throughout all 77 counties with only 26 field agents.
• Agency employees continue to serve the Regional Organized Crime Information Center and OKLEX board.
• Oklahoma’s compliance rate for rejecting the sale of tobacco to minors in FY 2007 continued to exceed national standards.
• ABLE maintains documentation on 48,465 licensees and issues over 14,000 licenses per year.
Mission The Alcohol Beverage Laws Enforcement Commission (ABLE) protects and enforces state laws pertaining to alcoholic beverages, youth access to tobacco, and charity games. Their priority enforcement is the minimization of alcohol and tobacco use by Oklahoma’s youth. Alcohol Education Education and creating awareness are a large part of ABLE’s strategy for reducing teenage alcohol use. Before attaining alcohol licenses, businesses must attend an orientation provided by ABLE through a contract with a private organization to train new employees of alcohol-serving entities. Also, ABLE trains business employees to spot fraudulent driver licenses, and intoxicated and underage persons. Source: ABLE FY-2004 FY-2005 FY-2006 FY-2007Alcohol Inspections (Businesses) 2,489 2,164 2,761 2,872Costs per Alcohol Inspection $102.38 $104.55 $110.10 $123.06
FY-2009 Recommendation
FY-2008 Appropriation $3,925FY-2008 Bud. FTE Level 51.0Actual Ave. YTD FTE 44.7
Funding Adjustments:State Employee Pay Raise 66
FY-2009 Recommendation $3,991
% Change from FY-2008 1.68%
Source: Office of State Finance
FY-2009 Appropriation(amounts in thousands)
State Employee Pay Raise The Governor’s budget includes $66,428 for a 5% state employee pay increase for the ABLE Commission effective January 1, 2009. This funding is based on October 2007 salary information.

FY-2009 Executive Budget
SAFETY AND SECURITY B-198
Attorney General
Mission The mission of the Office of Attorney General is to represent Oklahoma by serving and protecting citizens, government and the law. A few of the services it provides to accomplish its mission are: • Representing the state in criminal
appeals;
• Investigating criminal matters anywhere in the state through the Multi County Grand Jury;
• Providing advice and counsel to all State Officers, Boards and Commissions;
• Writing opinions upon all questions of law submitted to the Attorney General by persons or bodies with proper statutory authority; and
• Appearing, as required by statute, and prosecuting or defending, before any court, board or commission, any cause or proceeding in which the state is an interested party.
FY-2007 Special Funds
$0 $500 $1,000 $1,500 $2,000 $2,500 $3,000 $3,500
Revolving Fund
Insurance Fraud
Federal Funds
VINES Grant
VPO Grant
(in 000's)Source: Attorney General Contract Attorneys Under state law, various agencies contract with the Attorney General’s office for legal services. With these contracts, the agency is guaranteed that an assistant attorney general will spend a certain amount of his or her time working for the agency. Contracts with the Attorney General vary from 25% of an attorney’s time to 100%. As of January,
2006, the Attorney General’s Office has contracts with more than 48 state agencies. Key Performance Measure
Cost of Counsel ($ Per Hour)FY-2005 FY-2006 FY-2007
Assistant Attorney General $61 $61 $61Market Rate of Private Counsel $141 $151 $156
Domestic Violence Unit In 2005, the Legislature authorized the transfer of the powers and duties associated with the Domestic Violence and Sexual Assault Program to the Attorney General’s Office from the Department of Mental Health and Substance Abuse Services. Funds were reallocated to the budget of the Attorney General for the continuation of programs and services. Services include community-based programs for victims of domestic violence and sexual abuse that provide: • Safe shelter; • Advocacy; and • Counseling services.
FY-2009 Recommendation
FY-2008 Appropriation $13,944FY-2008 Bud. FTE Level 179.5Actual Ave. YTD FTE 173.9
Funding Adjustments:State Employee Pay Raise 186
Vine Maintenance/Protective Order 865
Domestic Violence Unit 500
Total Adjustments 1,551
FY-2009 Recommendation $15,495
% Change from FY-2008 11.12%
Source: Office of State Finance
FY-2009 Appropriation(amounts in thousands)
State Employee Pay Raise The Governor’s budget includes $186,000 for a 5% state employee pay increase for the Attorney General’s office effective January

FY-2009 Executive Budget
SAFETY AND SECURITY B-199
1, 2009. This funding is based on October 2007 salary information. VINE Maintenance and VINE Protective Order The Governor’s budget recommends $550,000 to maintain the VINE system and $315,000 for the VINE protective order. The VINE system notifies victims of crimes when there is a change in an inmate’s status. Domestic Violence Unit The Governor’s budget recommends $500,000 to maintain and improve services for victims of domestic violence. The domestic violence unit provides crisis intervention and shelter to victims of domestic abuse, sexual assault and stalking.

FY-2009 Executive Budget
SAFETY AND SECURITY B-200
Board of Tests for Alcohol and Drug Influence
Notable Achievements
• The Board made significant changes to the Board of Test Rules (Title 40) to make the testing procedure less contentious in the courtroom.
• In the past year, over 550 individuals were trained in the proper use of the CMI Intoxilyzer 5000D and the legal implications of the tests.
• The rules governing interlock installers and users were rewritten with the help of the interlock company’s association to better comply with current statutes.
• The Board approved the use of the CMI Intoxilyzer 8000 and began the process of developing software requirements to comply with Oklahoma law and to complement the LEADERS program and ultimately make work simpler for law enforcement personnel.
Mission The Board of Tests for Alcohol and Drug Influence promotes a safe driving environment through:
• Proper training of officers in the use of breath testing equipment;
• Inspection and training of ignition interlock installers;
• Performing certification, calibration and maintenance on breath testing equipment to factory and Board standards;
• Maintaining records associated with breath testing and ignition interlock to include rules of the Board, policies and procedures of the Board, and minutes of each meeting of the Board; and,
Background The Board of Tests for Alcohol and Drug Influence is comprised of the Dean of the University of Oklahoma College of Medicine, the Commissioner of Public Safety, the Director of the Oklahoma State Bureau of Investigation, the State Commissioner of Health, the Director of the Council of Law Enforcement Education and Training, one certified peace officer selected by the Oklahoma Sheriffs and Peace Officers Association, and one person selected by the Oklahoma Association of Chiefs of Police. By statute, the Legislature appropriates funds to the Department of Public Safety to be transferred for the support of the Board of Tests for Alcohol and Drug Influence.
FY-2009 Recommendation
FY-2008 Appropriation $300FY-2008 Bud. FTE Level 7.0Actual Ave. YTD FTE 6.0
Funding Adjustments:None 0
FY-2009 Recommendation $300
% Change from FY-2008 0.00%
Source: Office of State Finance
FY-2009 Appropriation(amounts in thousands)

FY-2009 Executive Budget
SAFETY AND SECURITY B-201
Department of Corrections (DOC)
Notable Achievements • In January 2007, the department
implemented a partnership with the Department of Mental Health and Substance Abuse Services to provide re-entry services to seriously mentally ill offenders. DMHSAS Integrated Services Discharge Managers were placed at the Oklahoma State Penitentiary, Joseph Harp Correctional Center and Mabel Bassett Correctional Center to assist offenders assigned to facility Mental Health Units preparing to return to the community. Additionally, four Re-entry Intensive Care Coordination Teams (2 in Tulsa and 2 in OKC) were established utilizing local community Mental Health Center staff contracted through DMHSAS to work on re-entry plans for mentally ill offenders being released to communities.
• DOC placed 773 offenders on Global Positioning Satellite (GPS) monitoring during FY-2006, double the number from FY-2005, with the success rate of offenders completing the program through parole or discharge remaining at 90%.
• 1,305 inmates received their GED’s in FY-2007. All DOC Education Programs are accredited by the Oklahoma State Department of Education and the North Central Educational Association.
• Since January 2007, six institutions, community corrections centers and probation and parole divisions have completed successful accreditation audits by the American Correctional Association.
• Oklahoma Correctional Industries generated $19.2 million in sales of manufactured products and services with $1.4 million in profit for FY-2007. Sales rose by 21% from FY-2006 to FY-2007.
• A total of 3,352 offenders participated in substance abuse treatment with 1,270
successfully completing it during FY-2007.
Mission The Department of Corrections’ (DOC) mission reflects the importance of public safety by seeking to protect the public, its employees and the offenders under its supervision. The agency’s responsibilities include: ● housing inmates safely and securely;
● providing opportunities for inmates to become rehabilitated;
● facilitating a successful transition for inmates back into society; and,
● monitoring inmate behavior upon release.
As one of the state’s largest agencies, DOC’s FY-2007 appropriation makes up 7% of the state appropriations. DOC’s appropriations have more than doubled from FY-1996 to FY-2007. The following charts show DOC’s appropriation history, supplemental appropriation history, and their FY-2007 expenditures by account.
Appropriation History
$0
$100,000
$200,000
$300,000
$400,000
$500,000
$600,000
FY-1
999
FY-2
000
FY-2
001
FY-2
002
FY-2
003
FY-2
004
FY-2
005
FY-2
006
FY-2
007
FY-2
008
(in
000'
s)
Source: Office of State Finance
Supplemental Appropriation History
$0$5,000
$10,000$15,000$20,000$25,000$30,000$35,000
FY-2
000
FY-2
001
FY-2
002
FY-2
003
FY-2
004
FY-2
005
FY-2
006
FY-2
007
(in 0
00's
)
Source: Office of State Finance

FY-2009 Executive Budget
SAFETY AND SECURITY B-202
FY-2006 FY-2007Prison Operations $171,996 $181,918Medical Services $53,566 $58,695General Operations* $49,530 $51,692Contract Facilities $80,109 $112,451Community Sentencing $11,503 $9,882Offender Programs $23,093 $20,009Prison Industries $24,741 $26,740Community Corrections $21,592 $26,234Probation and Parole Services $23,702 $30,150
$459,832 $517,771*General Operations includes Central Office Ops and Regional Office Ops
Source: Department of Corrections
Expenditures by Program (in 000's)
91% of operational funding in FY-2007 came from state appropriations, with revolving funds and federal funds making up the remaining 9%. DOC generates revolving funds from the sale of products and services to inmates (canteen sales) and from the sale of inmate-produced products and services to internal and external purchasers. DOC typically receives federal grant funds for specific programs or services such as sex offender management or substance abuse treatment. The Demand for Prison Beds As illustrated in the graphs, the number of violent crimes reported decreased by 14.9% and nonviolent crimes decreased 10.4%, both from 1994 to 2005.
Violent Crimes Reported
0
5,000
10,000
15,000
20,000
25,000
1994
1995
1996
1997
1998
1999
2000
2001
2002
2003
2004
2005
Source: Federal Bureau of Investigation Crime Report
Non-Violent Crimes Reported
120,000
130,000
140,000
150,000
160,000
170,000
1994
1995
1996
1997
1998
1999
2000
2001
2002
2003
2004
2005
Source: Federal Bureau of Investigation Crime Report Despite the overall decrease in violent and nonviolent crimes since 1994, the number of offenders incarcerated in Oklahoma has increased. Oklahoma imprisons 658 inmates for each 100,000 residents. This is 132% of the national average of 497 prisoners per 100,000 residents and Oklahoma’s incarceration rate is consistently higher than the national average.
Peer State Incarceration Rates
497
658
323
334
524
466
247
478
0 100 200 300 400 500 600 700 800
National Average
Oklahoma
Kansas
New Mexico
Missouri
Colorado
Nebraska
Arkansas
Inmates per 100,000
Source: Bureau of Justice Statictics The incarceration rate of women in Oklahoma is also higher than that of the U.S. In 2007, Oklahoma was ranked as the state with the highest incarceration of women. Oklahoma’s incarceration rate has grown at a quicker rate than the population of the state. Part of this increase can be traced back to the early 1990s when offenders began to serve more time for their offenses and special laws designed to release prisoners early were rarely invoked. As of December 11, 2007, the inmate population was 26,204, up from the FY-2006 year-end population of 25,912. The inmate population is expected to increase to 26,316 for FY-2008 and 27,035 for FY-2009.

FY-2009 Executive Budget
SAFETY AND SECURITY B-203
Year End Inmate Population
23,547
24,11424,524
25,114
25,91226,204
22,000
22,500
23,000
23,500
24,000
24,500
25,000
25,500
26,000
26,500
2002 2003 2004 2005 2006 2007
Fiscal Year
Num
ber
of I
nm
ates
The graph below breaks down the inmate population by the county of controlling offense. This is where the offense occurred. The numbers do not reflect inmates that were convicted outside the state.
Inmate Population by County
TOTAL ALL OTHER
COUNTIES, 13,11252.01%
TULSA 4,691
18.61%
OKLAHOMA 7,406
29.38%
Source: Department of Corrections One contributing factor to this increase is that since FY-2000, there has been an increasing trend in the number of drug and alcohol receptions. In 2002, drug and alcohol related receptions accounted for just over 42% of total receptions. The state has implemented a number of initiatives to deal with this issue, such as drug courts and community sentencing.
Comparison of Drug and Alcohol Related Receptions *Controlling Offense vs. Any Active Offense
(as a percent of total receptions)
55% 55% 55% 56% 55% 56%
40%40%41%42%42%42%
5.00%15.00%25.00%35.00%45.00%55.00%65.00%
2002 2003 2004 2005 2006 2007
Fiscal Year
Perc
enta
ge o
f Tot
al
Rec
epti
ons
Any Controlling
*Please note: Control ling offense is based on Association of State The number of receptions, releases and the average time served are three critical factors in the demand for more bed space. For FY-2007, DOC processed 8,914 new inmates, over 700 inmates more than were
released. The trend has been more receptions were more than releases, increasing the population.
Oklahoma Department of CorrectionsOffender Population, Receptions & Releases
End of Fiscal Year Comparison
21,500
22,000
22,500
23,000
23,500
24,000
24,500
25,000
25,500
26,000
26,500
FY 2002 FY 2003 FY 2004 FY 2005 FY 2006 FY 2007
Fiscal Year
Num
ber
of I
ncar
cera
ted
Off
ende
rs i
n Po
pula
tion
0
1,000
2,000
3,000
4,000
5,000
6,000
7,000
8,000
9,000
10,000
Num
ber
of I
nmat
e R
ecep
tion
sN
umbe
r of
Inm
ate
Rel
ease
s
Population Receptions Releases The average time served is another important component that influences the overall correctional system volume. Because the mandatory amount of time-served to be eligible for parole increased in the late 1990’s, DOC inmates are serving more time in custody. The Prison System DOC operates eight secure public facilities for maximum and medium-security inmates. State-operated minimum-security facilities and community centers provide additional capacity for a total state-operated capacity of 17,658 beds. In 1996, policy makers decided to use private prisons rather than build new facilities to accommodate the increased bed demand. Today, DOC is using 7,441 private prison beds. The state also contracts with county jails and halfway houses for additional beds. The following tables provide a breakdown of the total system capacity and the varying per diem rates. Effective October 1, 2006, rates for the halfway houses and private prisons were increased five percent. Effective January 1, 2007, the jail back-up rate increased to $27.00 per day. During FY-2007, the contract with Great Plains Correctional Facility was not renewed, creating an immediate need for 800 beds.

FY-2009 Executive Budget
SAFETY AND SECURITY B-204
State Facilities:
FY-2007 Actual Operating Cost
per Inmate Minimum Security $51.99 Medium Security 56.02 Maximum Security 69.23 Community Corrections 53.79 Work Centers 40.64
Contracted Services: Per Diem Private Prisons:
Davis $51.17 Lawton 47.70 Cimarron 51.41
Contract Jails 33.89 Halfway Houses 39.37 Jail Back-up 27.00
Source: Department of Corrections
Total System Capacity State Medium & Maximum 7,954 State Minimum & Community Centers 10,067 State-Operated Capacity 18,021 Private Prisons 4,559 County Jails 1,209 Halfway Houses 1,310 Contract Bed Capacity 7,078 Total Bed Capacity 25,099
Source: Department of Corrections – 1/14/08
Officer Staffing Levels Without an adequate number of correctional officers (COs), the ability to retain quality employees is diminished. In FY-2006 and FY-2007, there were improvements made to the pay plan for officers and the Department has seen some improvement in retention rates and vacancy level. However, the ratio of inmates to officers has not decreased because of the continued increase in the prison population.
Key Performance Measure
Inmate to Correctional Officer Ratio
7.6
8.58.8
9 9.0
6.5
7
7.5
8
8.5
9
9.5
FY-2003 FY-2004 FY-2005 FY-2006 FY-2007
Source: Department of Corrections Community Sentencing The Community Sentencing Act provides incarceration alternatives for certain nonviolent criminals. The Act marks an important shift in public policy by providing cost-effective alternatives to prison incarceration while still protecting the public. DOC’s FY-2007 budget for the program was $11.5 million. The local community sentencing system provides the court a continuum of sanctions to provide the offender opportunities to change his/her behavior. The array of options allows the court to match offenders with the most appropriate sanctions and establishes a gradation of actions to increase control for individuals who fail to conform to the rules and conditions of their sentence. While in the community, the offender is employed, receives treatment and pays restitution and court fees. Sanctions may include community service, special needs programs, and supervision or education programs. Each local sentencing system supervises its offenders with state probation and parole officers or with another qualified source. As of October 31, 2006, there were 3,252 offenders with a community sentence.
Community Sentencing Crime Categories
6% 6%6%11%
5%
21% 13%
54%
23%
55%
0%
10%
20%
30%
40%
50%
60%
Assault Property D.U.I. Drug Other
FY-2006 FY-2007

FY-2009 Executive Budget
SAFETY AND SECURITY B-205
Inmate Health Care The state has both a moral and legal obligation to provide adequate health care for those confined under state custody. However, providing health care in a prison setting is more costly and complicated than in other settings. The nature of the prison population makes injuries and wounds more common and inmates generally do not lead healthy lifestyles. Consequently, instances of hepatitis and other communicable diseases are much more prevalent. The cost of health care nationwide is continuing to escalate faster than the inflation rate. This cost growth is compounded by the special, and usually costly, precautions that must be taken to protect other citizens when an inmate needs treatment outside the prison facility. DOC’s health care is provided by two main entities, OU Medical Center and Lindsay Hospital. The following chart demonstrates the increasing health care costs for the Department of Corrections.
Inmate Medical Expenditures
-
5,000,000
10,000,000
15,000,000
20,000,000
25,000,000
30,000,000
35,000,000
40,000,000
FY2000
FY 2001
FY 2002
FY 2003
FY 2004
FY 2005
FY 2006
FY 2007
FY 2008
Inmate MedicalE di
Cost Savings Initiatives DOC actively seeks to control the upward-spiraling cost of health care for inmates. The agency also continues to take additional steps that will mitigate some of the growing pressure on budgetary resources. Some of these actions include: ● reducing the number of approved “drive
from home to work” state vehicles from
48, on December 1, 2005, to seven by March 1, 2006;
● upgrading the copier and negotiating a better lease rate;
● consolidating the duties of the training manager and director;
● eliminating two internal affairs positions;
● utilizing Parole Board video conferencing from host sites;
● combining three OCI garment operations into two, three OCI record conversion operations into two, and the OCI bindery operation into another existing operation;
● eliminating contracts for literacy labs at 16 facilities and providing these services in-house;
● using tele-psychiatry to reduce travel time/expenses for psychiatrists at five facilities and security transports at one facility;
● increasing the use of telemedicine and online consultations for specialty visits conducted with the University Physicians Medical Group;
● reducing hospital stays and costs by using medical case management services;
● physically aggregating prisoners with similar medical conditions and continuing to consider the medical needs of inmates when assigning them to facilities;
● establishing a physician referral review process prior to inmates being sent out for specialized and/or inpatient medical care;
● increasing the use of the Medicaid Reimbursement program;
● reducing temporary staff and payroll; and,
● increasing the use of certified nurses’ aides and certified medical aides to administer medicines.

FY-2009 Executive Budget
SAFETY AND SECURITY B-206
FY-2008 Supplemental
FY-2008 Appropriation $477,543 Supplemental 21000
FY-2008 Adj. Appropriation $498,543% Change from FY-2007 9.33%
% Change from Original FY-2008 4.40%
Source: Office of State Finance
FY-2008 Supplemental(amounts in thousands)
The Governor’s supplemental recommendation provides $21 million in funding to secure the necessary prison beds to protect public safety. With the agency’s facilities near capacity, DOC must lease additional private beds to meet the remaining need.
FY-2009 Recommendation
FY-2008 Appropriation $477,543FY-2008 Bud. FTE Level 4,833.5Actual Ave. YTD FTE 4,886.5
Funding Adjustments:Supplemetal Anuulaization and 2.7% Projected Growth 30,192
Increased Funding for Treatment and Rehabilitation Services
2,000
Annulaization of HB 1105 Funding 5,077
Teacher Salary Increase 240State Employee Pay Raise 5,177 Total Adjustments 42,686
FY-2009 Recommendation $520,229
% Change from FY-2008 8.94%
Source: Office of State Finance
FY-2009 Appropriation(amounts in thousands)
Annualize FY-2008 Supplemental and FY-2009 Growth The Governor's budget recommends a funding increase of $30.2 million to the Department of Corrections for annualization of the supplemental and a projected 2.7% growth in inmates in FY-2009 at a cost of $13,691,880. Increased Funding for Treatment and Rehabilitation Services The Governor’s budget recommends $2 million dollars for treatment and rehabilitation services. These services aid in reducing recidivism in inmates who have been released from DOC custody. Annualization of HB1105 Funding The Governor’s budget recommends $5.1 million to annualize HB1105 funding and to increase prison teacher pay. Teacher Salary Increase The Governor’s Budget proposes $240,170 for teacher salaries to continue the State’s efforts to reach the regional average. As the most recent salary figures indicate the state
FY-2009 Executive Budget
SAFETY AND SECURITY B-207
is $1,140 below the regional average, the Governor’s new proposal provides an average increase of approximately $1,200 and rewards veteran teachers by weighting the increase based on years of service. State Employee Pay Raise The Governor’s budget includes $5,176,505 for a 5% state employee pay increase for the Department of Corrections effective January 1, 2009. This funding is based on October 2007 salary information.

FY-2009 Executive Budget
SAFETY AND SECURITY B-208
District Attorneys’ Council (DAC)
Notable Achievements • Oklahoma currently has 38 drug court
programs operating in 54 counties.
• A staff member of the District Attorneys’ Council attends every Pardon and Parole Board meeting as a representative for Victim’s Services.
• In calendar year 2007, the DAC instituted a program to ensure that every prosecutor in the state receives trial advocacy training. This program is designed to enhance the trial skills of all prosecutors the citizens of Oklahoma receive the best possible representation in the courtroom.
Mission The mission of the District Attorney’s Council is to protect the citizens of the State of Oklahoma through the effective and efficient administration of justice. One of the District Attorneys’ Council’s (DAC) main duties is to develop a formula to distribute state appropriated funds to local District Attorney Offices. Other services provided include:
• Administrative support for local District Attorneys;
• Victims of Crime services;
• Education of state leaders on the District Attorneys’ positions on criminal justice issues; and
• Assistance to the state’s multi-jurisdictional drug task forces.
District Attorneys The 27 District Attorneys in the state are locally elected officials. They are responsible for prosecuting state criminal cases on behalf of the public. Total funding for FY-2007 was $87.5 million.
Funding Sources FY-2008 Budget
Misc. Revolving
Funds6%
JAG Trust Federal Funds
4%
Victims of Crime Funds
5%
Federal Funds
4%
DAC Revolving
Fund39%
General Revenue
42%
Source: District Attorneys' Council Multi-jurisdictional Task Forces DAC oversees and provides assistance to the state’s multi-jurisdictional task forces. The various task forces are a primary weapon in the state’s “war on drugs”. Seizure and forfeiture proceeds supplement federal grants to fund these task forces. Federal grants that fund these task forces are from the Department of Justice’s (DOJ) Byrne Grant program. The program’s general purpose is to improve the criminal justice process. With the number of methamphetamine labs seized decreasing, the drug task forces have focused their attention on drug trafficking organizations.

FY-2009 Executive Budget
SAFETY AND SECURITY B-209
FY-2009 Recommendation
FY-2008 Appropriation $39,920FY-2008 Bud. FTE Level 1,143.3Actual Ave. YTD FTE 1,140.6
Funding Adjustments:State Employee Pay Raise 1,515Zero Based Funding Formula 3,000 Total Adjustments 4,515
FY-2009 Recommendation $44,435% Change from FY-2008 11.31%
Source: Office of State Finance
FY-2009 Appropriation(amounts in thousands)
State Employee Pay Raise The Governor’s budget includes $1,515,151 for a 5% state employee pay increase for the District Attorneys’ Council effective January 1, 2009. This funding is based on October 2007 salary information. Zero-based Funding Formula The Governor's budget recommends $3 million in increased funding necessary for the continued usage of the zero-based funding formula which funds all the District Attorney offices.
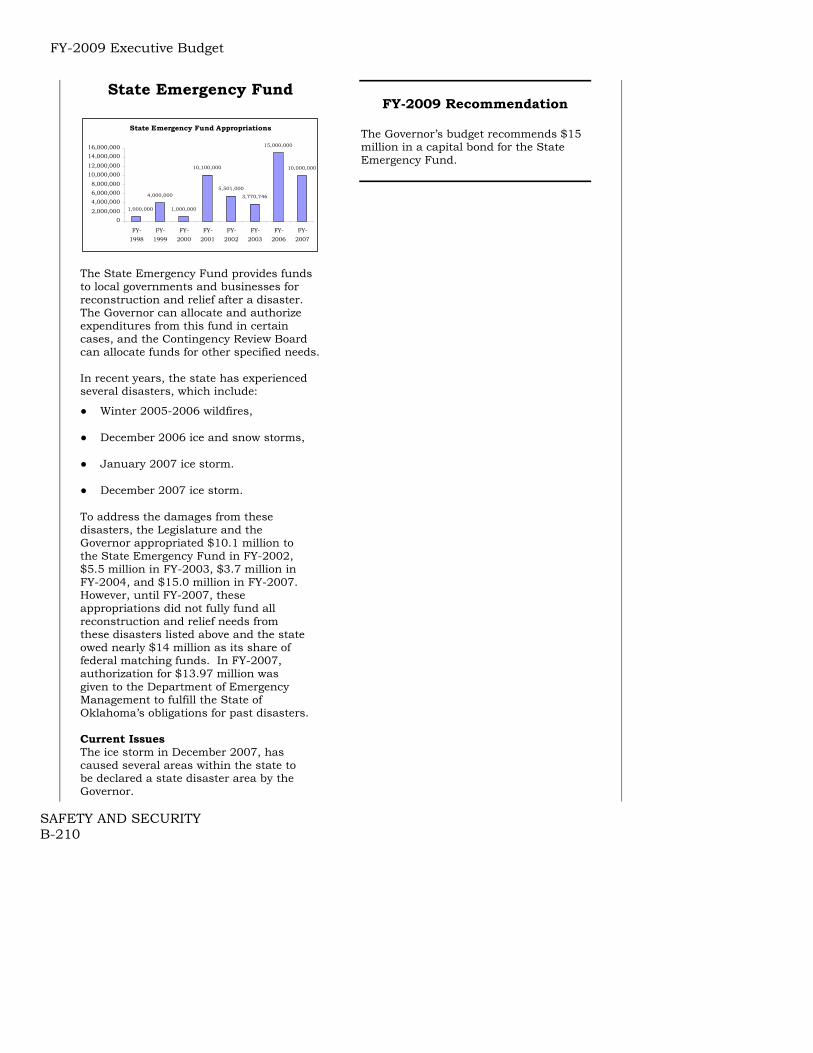
FY-2009 Executive Budget
SAFETY AND SECURITY B-210
State Emergency Fund
State Emergency Fund Appropriations
4,000,000
1,000,000
10,100,000
5,501,000
3,770,746
15,000,000
10,000,000
1,000,000
02,000,0004,000,0006,000,0008,000,000
10,000,00012,000,00014,000,00016,000,000
FY-1998
FY-1999
FY-2000
FY-2001
FY-2002
FY-2003
FY-2006
FY-2007
The State Emergency Fund provides funds to local governments and businesses for reconstruction and relief after a disaster. The Governor can allocate and authorize expenditures from this fund in certain cases, and the Contingency Review Board can allocate funds for other specified needs. In recent years, the state has experienced several disasters, which include:
● Winter 2005-2006 wildfires,
● December 2006 ice and snow storms,
● January 2007 ice storm.
● December 2007 ice storm.
To address the damages from these disasters, the Legislature and the Governor appropriated $10.1 million to the State Emergency Fund in FY-2002, $5.5 million in FY-2003, $3.7 million in FY-2004, and $15.0 million in FY-2007. However, until FY-2007, these appropriations did not fully fund all reconstruction and relief needs from these disasters listed above and the state owed nearly $14 million as its share of federal matching funds. In FY-2007, authorization for $13.97 million was given to the Department of Emergency Management to fulfill the State of Oklahoma’s obligations for past disasters. Current Issues The ice storm in December 2007, has caused several areas within the state to be declared a state disaster area by the Governor.
FY-2009 Recommendation
The Governor’s budget recommends $15 million in a capital bond for the State Emergency Fund.

FY-2009 Executive Budget
SAFETY AND SECURITY B-211
Oklahoma Department of Emergency Management
(ODEM)
Notable Achievements • The Oklahoma Department of
Emergency Management (ODEM) responded to and worked recovery for an unprecedented nine federally declared disasters in 2007. The year started and ended with ice storms. In between flooding, tornadoes and severe thunderstorms impacted the state.
• Through response efforts, ODEM worked to deliver generators where power was interrupted, hay bales where snowdrifts left livestock hungry, bottled water where water treatment plants were idle and cots, blankets and ready-to-eat meals to shelters where Oklahomans took refuge from Mother Nature’s furry. Through recovery efforts, ODEM delivered more than $32 million in disaster assistance to homeowners and business owners impacted when more than 400 homes were destroyed and another 1,100 were damaged during four months of flooding. Recovery work continues for the disasters that left nearly $225 million in damage to state and local infrastructure.
• ODEM assisted local preparedness efforts by distributing nearly $930,000 in grant funds to 60 city and county emergency management departments through the Emergency Management Performance Grant program.
• As part of the department’s mitigation work, ODEM managed grants totaling nearly $60 million. The funding delivered safe rooms in schools, reverse 911 notification systems, a severe weather notification system for the deaf and hard of hearing, hazard mitigation plans for cities and counties and the acquisition of properties that repetitively flood.
Mission The mission of the ODEM is to minimize the effects of natural and man-made disasters. The agency accomplishes this by preparing and implementing preparedness plans, assisting local government subdivisions with training for and mitigation of disasters and coordinating actual disaster response/recovery operations. The Department is divided into four main areas: Hazard Mitigation Assists communities with identifying and implementing long-term hazard mitigation measures. Community Preparedness Provides coordination with other state and federal agencies in developing their capability to respond to a catastrophic disaster. Emergency Response Coordinates state emergency operations. The staff also monitors events and evaluates whether they may qualify as a State-declared emergency and the need for federal emergency and disaster assistance. Disaster Recovery Departmental staff implements procedures to provide for the quick and efficient delivery of state and federal aid to persons who have been affected by an emergency or disaster.

FY-2009 Executive Budget
SAFETY AND SECURITY B-212
FY-2009 Recommendation
FY-2008 Appropriation $837 Civil Air Patrol (30)
FY-2008 Base $807FY-2008 Bud. FTE Level 25.0Actual Ave. YTD FTE 27.4
Funding Adjustments: State Employee Pay Raise 16 Secure HVAC 250 Additional FTE's 250 Total Adjustments 516
FY-2009 Recommendation $1,323$ Change from FY-2008 $486% Change from FY-2008 58.06%
FY-2009 Appropriation(amounts in thousands)
Source: Office of State Finance Removal of One-Time Funding The Governor’s budget recommends reducing payment to the Civil Air Patrol by $30,000. State Employee Pay Raise The Governor’s budget includes $15,761 for a 5% state employee pay increase for the Department of Emergency Management effective January 1, 2009. This funding is based on October 2007 salary information. Raise HVAC Intake The Governor’s budget recommends $250,000 to secure the HVAC intake grate for the Heat and Air system. In its current state the system is susceptible to a possible chemical or biological attack. Additional FTE The Governor’s budget recommends $250,000 for additional FTE’s for the Department of Emergency Management. Increased natural disasters over the past several years have led to the need for more full time employees.
FY-2009 Executive Budget
SAFETY AND SECURITY B-213
State Fire Marshal (SFM) Notable Achievements
• The SFM names fire service representatives to serve as grant evaluators at the U.S. Fire Administration in Washington D.C. These representatives then present their community leaders with critical information on successful grant-writing.
• The Smoke Alarm Readiness and Response Team (SMARRT), under coordination of the SFM, gave away free smoke alarms and guidelines on installation and maintenance of them this year.
• The SFM recently purchased a mobile communications trailer and two vehicles with Homeland Security grant funds. This one-of-a-kind unit is equipped to provide interoperable communications between emergency first responders, law enforcement, EMT, county and city officials during all-hazards incidents statewide.
Mission The mission of the agency is to promote safety and awareness and reduce the loss of lives and property through public education, investigations, inspections, reviewing building plans, enforcing code and collecting statistical data from the annual incident reports from more than 900 fire departments. Programs include:
• Investigating and documenting the cause or origins of fires;
• Enforcing Life Safety Codes and fire/crime prevention; and
• Developing fire safety campaigns.
The State Fire Marshal positions investigators around the state for fast response to all investigative needs. This increases the probability of detecting any possible attempt of arson. The SFM has the legal authority to arrest suspects if
probable cause exists in an arson investigation.
FY-2008 Supplemental
FY-2008 Appropriation $2,271 Supplemental 68
FY-2008 Adj. Appropriation $2,339% Change from FY-2007 13.96%
% Change from Original FY-2008 2.99%
Source: Office of State Finance
FY-2008 Supplemental(amounts in thousands)
The Governor’s supplemental recommendation provides $68,000 in funding to assist the agency with the funding shortage they face due to retiring employees.
FY-2009 Recommendation
FY-2008 Appropriation $2,271FY-2008 Bud. FTE Level 34.0Actual Ave. YTD FTE 31.1
Funding Adjustments:State Employee Pay Raise 41
FY-2009 Recommendation $2,312
% Change from FY-2008 1.81%
FY-2009 Appropriation(amounts in thousands)
Source: Office of State Finance State Employee Pay Raise The Governor’s budget includes $41,403 for a 5% state employee pay increase for the State Fire Marshall effective January 1, 2009. This funding is based on October 2007 salary information.

FY-2009 Executive Budget
SAFETY AND SECURITY B-214
Oklahoma Indigent Defense System (OIDS)
The Oklahoma Indigent Defense System (OIDS) provides representation for indigent Oklahomans charged with committing criminal acts.
OIDS provides services in three ways:
• OIDS enters into legal services contracts with local firms for non-capital trials. They receive payment in a lump sum each year to cover all cases in that particular year;
• OIDS staff attorneys handle capital trial cases and all cases that have reached the appellate level. They also represent indigents in non-capital trial cases in 16 counties where they are unable to contract with local firms at a reasonable rate; and
• OIDS appoints conflict counsel in cases when there is not a contract in the appropriate county and OIDS has a conflict of interest.
Case and Cost Statistics
Source: OIDS FY FY FY2005 2006 2007
# of Non-Capital cases (staff) 7,229 6,702 5,257Ave. Cost per Non-Capital case (staff) $293 $344 $463Capital Trial clients (staff) 76 67 65Ave. Cost per Capital case (staff) $32,158 $35,941 $28,708# of contract Non-Capital cases 30,955 31,715 30,179# of conflict Non-Capital cases 433 386 376
In FY-2007, OIDS represented a total of 38,556 court appointments. Of these total cases, over 32,000 were contract non-capital trial cases, 65 capital trial cases, and 696 general appeals cases.
FY-2009 Recommendation
FY-2008 Appropriation $16,304FY-2008 Bud. FTE Level 65.0Actual Ave. YTD FTE 65.0
Funding Adjustments:State Employee Pay Raise 218
FY-2009 Recommendation $16,522
% Change from FY-2008 1.34%
FY-2009 Appropriation(amounts in thousands)
Source: Office of State Finance State Employee Pay Raise The Governor’s budget includes $218,015 for a 5% state employee pay increase for the Oklahoma Indigent Defense System effective January 1, 2009. This funding is based on October 2007 salary information.

FY-2009 Executive Budget
SAFETY AND SECURITY B-215
Oklahoma State Bureau of Investigation
(OSBI)
Notable Achievements
• All appropriate OSBI personnel are now trained in incident management and fully NIMS (National Incident Management System) compliant, the only state level law enforcement agency to achieve compliance.
• All convicted offender DNA samples
are now processed in-house by the CODIS Unit (Combined DNA Index System). The Unit is current with processing and generated 114 “cold hits” this past year.
• New Y-STR DNA technology was
validated for casework. The technology looks specifically at male contributions to biological samples from crime scenes, especially sexual assaults.
• Average Forensic Laboratory case
turnaround time decreased 9.4% to a very acceptable 29 days.
• Increased the number of clients
using the Automated Criminal History System (ACHS) for name based criminal history searches. Currently, 18.9% of all searches are processed though ACHS.
• Homicide investigations totaled 75
for the year, an increase of 25% from 2006.
• The Investigative Division was
completely reorganized to provide better service to criminal justice agencies.
Mission The mission of the Oklahoma State Bureau of Investigation is to insure the safety and security of the citizens of Oklahoma.
OSBI clients include federal, tribal, state, district, county and municipal law enforcement and prosecutorial agencies, the general public and statutory requestors such as the Governor, Attorney General, and the Medical Examiner. OSBI provides a wide array of investigative and forensic laboratory services including technical crime scene investigations and investigations of criminal offenses such as homicide, rape, assault, theft, fraud, embezzlement, and corruption. Specialized services include computer forensics, criminal intelligence, information sharing systems, polygraphs, forensic interviewing of child victims, training, expert testimony, laboratory analysis, and Internet crimes against children investigations.
OSBI Funding Sources for FY-2007
Other1%
AFIS Fund10%
State Approps48%
Federal Funds
3%Forensic Science Fund
11%
OSBI Revolving
Fund27%
Source: Oklahoma State Bureau of Investigation
Child Abuse Response Team (CART) In 2006 SB 1800 created the CART and authorized two new FTE. Funding for this program was provided in the 2007 Legislative session. CART was created to conduct child abuse investigations. The OSBI now has a new Forensic Child Abuse Investigator and Forensic Child Abuse Investigator, who, along with seven other Special Agents with extensive training in child abuse investigations, train, support, and assist law enforcement agencies in cases where children have been assaulted, abused, or exploited. Since January 1, 2007, the OSBI has investigated 147 cases of child abuse involving 184 victims.

FY-2009 Executive Budget
SAFETY AND SECURITY B-216
Forensic Science Center The new $30 million 86,000 square foot forensic laboratory in Edmond is scheduled for substantial completion in March 2008. This facility replaces the existing outdated 19,000 square foot Central Laboratory building that was built in 1972. State Fusion Center The OSBI developed and implemented an intelligence Fusion Center. It is staffed with nine OSBI Analysts and three OSBI Agents, and supplemented by analysts from OCPD, Tulsa P.D., Military Department, and the FBI. We are a virtual Fusion Center until renovation of physical space in the OSBI Headquarters is completed in February 2008. Information Sharing Initiatives The federal grant funded OASIS (Oklahoma Automated Secure Information Sharing) and OKLeX (Oklahoma Law Enforcement Information Exchange) are secure searchable web based sources of valuable information for law enforcement agencies. OASIS is a data warehouse of information shared by the OSBI, DPS, OCPD, and TPD, while OKLeX is an Internet portal allowing all law enforcement agencies to search various data bases for information.
FY-2009 Recommendation
FY-2008 Appropriation $17,316FY-2008 Bud. FTE Level 317.0Actual Ave. YTD FTE 299.7
Funding Adjustments:State Employee Pay Raise 463
FY-2009 Recommendation $17,779
% Change from FY-2008 2.67%
FY-2009 Appropriation(amounts in thousands)
Source: Office of State Finance State Employee Pay Raise The Governor’s budget includes $462,900 for a 5% state employee pay increase for OSBI effective January 1, 2009. This funding is based on October 2007 salary information.

FY-2009 Executive Budget
SAFETY AND SECURITY B-217
Council on Law Enforcement Education and
Training (CLEET)
Notable Achievement • 417 recruits attended the Oklahoma
Basic Law Enforcement Academy in FY-2007, a decrease of 53 recruits over the FY-2006 total.
• 11,098 law enforcement officers completed CLEET provided continuing education training in FY-2007 compared to 9,388 in FY-2006.
• CLEET accredited 2,239 training programs from client agencies to conduct training in-house to address specific needs in their jurisdiction. The number of accredited programs increased 18% over FY-2006.
Mission The mission of CLEET is to:
• Protect citizens by developing well trained and highly skilled law enforcement and security professionals;
• Establish standards and provide
training for peace officer certification;
• Deliver high quality professional
training programs that focus on success for Oklahoma law enforcement officers through continuing and advanced education programs;
• Investigate matters that could result
in revocation of peace officer certification;
• Establish licensing and training
standards for private security officers, private investigators, security guard agencies and private investigative agencies;
• Regulate unlicensed activity and investigate complaints against licensees that may result in punitive action including filing of criminal charges.
88% of CLEET’s budget is provided through the CLEET certified fund. This fund is comprised of a $9 penalty assessment fee that is added on to any criminal fine. 34% of fees collected are dedicated to the Training Center Revolving Fund to pay the annual bond debt service that financed the construction of the center. Training CLEET began meeting with stakeholders in October, 2006 to gain input on proposed curriculum changes for the basic law enforcement academy. SB920 increased the number of hours for the basic law enforcement academy from 375 hours to 505 hours, an increase of 130 hours. Input on proposed curriculum changes was gained from law enforcement agencies, subject matter experts as well as law enforcement professional organizations. The increase in hours will move Oklahoma towards national parity for law enforcement basic academy training.
Total Number of Peace Officers Served
12,80013,00013,20013,40013,60013,80014,00014,20014,400
FY-2003 FY-2004 FY-2005 FY-2006 FY-2007
Source: C.L.E.E.T. Continuing Education CLEET conducted 187 specialized and advanced classroom courses at 60 locations across the state. Through the use of technology, CLEET has established a continuous learning environment through web-based training that allows law enforcement officers to access training 24 hours a day, 7 days a week.

FY-2009 Executive Budget
SAFETY AND SECURITY B-218
Administration In FY-2007, CLEET collected $ 6,346,723 from seven fee sources representing an increase of $ 33,294 over FY-2006 collections. The Penalty Assessment Fee is the primary funding source for CLEET's appropriated budget and funds the debt service for the new law enforcement training center in Ada. CLEET is the central depository for peace officer records in Oklahoma. Private Security Licensing The licensing activity for security guards, private investigators and agency licenses is driven by customer demand and regulatory efforts. There were 9,504 active licenses at the end of FY-2007, a 3% decrease from FY-2006.
FY-2009 Recommendation
FY-2008 Appropriation $4,410FY-2008 Bud. FTE Level 52.0Actual Ave. YTD FTE 42.8
Funding Adjustments:State Employee Pay Raise 52
FY-2009 Recommendation $4,462
% Change from FY-2008 1.18%
FY-2009 Appropriation(amounts in thousands)
Source: Office of State Finance State Employee Pay Raise The Governor’s budget includes $51,830 for a 5% state employee pay increase for CLEET effective January 1, 2009. This funding is based on October 2007 salary information.

FY-2009 Executive Budget
SAFETY AND SECURITY B-219
Board of Medicolegal Investigations
Notable Achievements
• The Board completed the implementation of a statewide death investigator program. The Board now has almost 30 agency-trained investigators serving all areas of the state.
• The Board continues to increase the number of forensic drug tests.
Mission The Board of Medicolegal Investigations, investigates deaths in Oklahoma that are sudden, violent or suspicious. The primary goal is to determine with medical and legal certainty the cause of death. The agency conducts scene investigations, autopsies and external examinations, histological examinations and toxicological analyses. Medicolegal has two laboratories within the state: the Central Laboratory, located in Oklahoma City, and the Eastern Laboratory, located in Tulsa.
FY-2009 Recommendation
FY-2008 Appropriation $4,826FY-2008 Bud. FTE Level 78.5Actual Ave. YTD FTE 70.8
Funding Adjustments:State Employee Pay Raise 72
Annualize FY-2008 Supplemental 981
Total Adjustments 1,053
FY-2009 Recommendation $5,879% Change from FY-2008 21.82%
Source: Office of State Finance
FY-2009 Appropriation(amounts in thousands)
State Employee Pay Raise The Governor’s budget includes $72,167 for a 5% state employee pay increase for the Board of Medicolegal Investigations effective January 1, 2009. This funding is based on October 2007 salary information. Annualize the FY-2008 Supplemental The Governor's budget recommends annualizing the $980,598 supplemental from FY-2008.
Source: Medicolegal FY FY FY 2005 2006 2007
Autopsies 1,525 1,851 1,884 Drug Screens 24339 26,170 28,334 # of Autopsies per Pathologist 214 370 343

FY-2009 Executive Budget
SAFETY AND SECURITY B-220
Oklahoma Bureau of Narcotics and Dangerous
Drugs (OBNDD) Mission Committed to honor, integrity, and excellence, the Oklahoma Bureau of Narcotics will serve the citizens of Oklahoma in the quest for a drug-free state. The Oklahoma Bureau of Narcotics & Dangerous Drugs Control (OBN) is responsible for drug enforcement in Oklahoma. The strength of OBN lies in the unique skills and abilities of dedicated agents and support staff. They conduct a wide variety of specialized programs to combat the local availability of various domestic and foreign produced drugs. Enforcement, intelligence, diversion, regulatory, wire intercept, legal, analytical, and educational activities are directed from OBN headquarters in Oklahoma City; five district offices located in Tulsa, McAlester, Ardmore, Lawton and Woodward; and nine regional offices in Ada, Altus, Clinton, Duncan, Enid, Guymon, Henryetta, Idabel, and Muskogee. Legislative Efforts and Agency Accomplishments The legislative formula for addressing Oklahoma’s drug problem with a small agency has proven effective. OBN, with the assistance of the Oklahoma legislature, has designed, enacted and enforced numerous laws and programs to combat and suppress domestic and foreign sources of drugs. Many of these measures became the blueprints for other states. These include an aggressive narcotics aerial eradication program in the late 1980’s aimed at domestic cannabis cultivation [in fact, from 1997 to 2004 domestic marijuana plant seizures dropped approximately ninety-five percent (95%)] and a unique electronic tracking program to halt prescription drug abuse in 1990. OBN led efforts to control chemicals in the early 1990’s to stop a two-decade old clandestine methamphetamine lab problem, and crafted a bold law in 2004
that virtually eliminated another meth lab epidemic overnight. This landmark measure would become a model for the White House and the rest of the country to follow.
Electronic Surveillance and Intelligence In 1996, OBN initiated a state-of-the-art electronic surveillance and wire intercept unit effecting arrests of members from some of the most powerful drug cartels operating on American soil. OBN’s ESI unit maintains one of the only full-time interception units in this part of the country with bilingual agents and support staff enabling OBN to monitor Spanish-speaking cartels in real time.
The ESI Division also oversees a Financial Asset and Seizure Team (FAST). Established in 2006, this unit identifies and seizes illegally gained assets of drug traffickers. Marijuana Eradication Aggressive enforcement actions by OBN and the Drug Enforcement Administration (DEA) proved to be quite effective. In 1997, there were over eighty-nine thousand

FY-2009 Executive Budget
SAFETY AND SECURITY B-221
(89,000.) cultivated marijuana plants seized in Oklahoma. However, by 2004, the number dropped to four thousand three hundred twelve (4,312) plants. Diversion Diversion is a highly technical area that requires a vast knowledge beyond that of street drugs. OBN employs a specific division specializing in this area of narcotics enforcement. This division oversees over 15,000 doctors, pharmacists, and hospitals licensed with OBN to possess, dispense, and prescribe controlled dangerous substances. Prescription Monitoring Program In 2004 OBN received legislative authority to expand OSTAR and rename the new system to the CONTROL Program or Comprehensive Oklahoma Narcotics Tracking and Reporting On-Line. This enabled the Oklahoma Bureau of Narcotics to track the prescribing of all scheduled drugs. This database automatically generates reports of individual drug seekers called “doctor shoppers” who illegally obtain prescriptions from multiple practitioners. It will also identify over-prescribing practitioners. Deconfliction The High Intensity Drug Trafficking Area (HIDTA) Oklahoma Intel Center (OIC) is part of the North Texas HIDTA. The OIC is currently configured as the central clearinghouse for Deconfliction Events and Subjects/Targets for Law Enforcement in the State of Oklahoma. The deconfliction system consists of two parts: (1) the Events side of the system is for safety to minimize the possibility of the sixty (60) or more agencies that participate in the project from conducting planned enforcement actions in the same location at the same time, and (2) the Subject side of the deconfliction system puts investigators together with other agencies who are conducting an investigation on the same group or individual.
OBN and Education A primary mission of the Oklahoma Bureau of Narcotics and Dangerous Drugs Control is to provide law enforcement and civilian drug education and training. OBN personnel conduct dozens of trainings and presentations not only in Oklahoma, but these individuals are nationally recognized as the premier experts in their field. Each year, OBN provides the training to tens of thousands of police officers, professionals, and citizens in Oklahoma and dozens of other states. OBN is currently recruiting and training twenty (20) AmeriCorps members to provide extensive drug awareness and drug abuse education opportunities to youth, parents, faculty, school administrators, and communities who are geographically located throughout the State of Oklahoma. The AmeriCorps members will be able to provide training to at least 350,000 students, which is approximately fifty percent (50%) of the student population throughout the State of Oklahoma. Online Training OBN has a statewide Internet based Online Methamphetamine Training application to develop methamphetamine related training for state and local law enforcement as well the general public. This will enable thousands of law enforcement persons and other professional to receive highly specialized and effective training with a negligible cost to the state of Oklahoma. Mobile Operations Team (MOT) MOT was developed in November of 2006 and consists of a specialized unit of highly trained and fast moving agents performing high-level, high-security narcotics investigations within the State of Oklahoma. MOT was created to assist local law enforcement entities requesting assistance dealing with isolated groups of drug dealers in their area. The team also works with District Attorneys and responds to law enforcement requests statewide. The MOT team infiltrates and develops criminal cases against cell groups of street to mid
FY-2009 Executive Budget
SAFETY AND SECURITY B-222
level drug dealers. This team also specializes in covert operations, surveillance camera missions, and the disruption and dismantling of narcotic activity. The Drug Enforcement Treatment Education and Resources (DETER) was organized in conjunction with the first MOT mission to coordinate resources of civic leaders, law enforcement, educators, intervention groups, faith-based groups and the general public to positively impact the illicit drug issues that plague our society. OBN & Chickasaw Nation On May 24th, 2007 the Oklahoma Bureau of Narcotics and the Chickasaw Nation signed a cross-deputization agreement for a cooperative drug enforcement partnership on and off tribal lands. As the number of domestic methamphetamine laboratories has gone down the availability of Mexican-produced methamphetamine is prevalent in Oklahoma. Currently law enforcement is seeing a trend of methamphetamine traffickers utilizing tribal lands to conduct their illicit business, including drug trafficking and clandestine money laundering. As of September 1st 2007, the Oklahoma Bureau of Narcotics obtained a federal grant to work in partnership with the Chickasaw Nation, pharmaceutical industry, and the community to develop and implement a systematic attack on the source of methamphetamine manufacture and distribution networks throughout the state of Oklahoma.
FY-2009 Recommendation
FY-2008 Appropriation $6,774FY-2008 Bud. FTE Level 109.0Actual Ave. YTD FTE 105.7
Funding Adjustments:State Employee Pay Raise 153
FY-2009 Recommendation $6,927
% Change from FY-2008 2.26%
FY-2009 Appropriation(amounts in thousands)
Source: Office of State Finance State Employee Pay Raise The Governor’s budget includes $152,894 for a 5% state employee pay increase for the OBNDD effective January 1, 2009. This funding is based on October 2007 salary information.

FY-2009 Executive Budget
SAFETY AND SECURITY B-223
Pardon and Parole Board Notable Achievements ● The Board began using video
conferencing in February, 2006 to interview inmates for parole consideration. This initiative has decreased travel costs for the Board and the Department of Corrections.
The Pardon and Parole Board provides recommendations for the supervised release of adult felons through a case-by-case investigative process. The Board strives to protect the public during this process and to maintain a low revocation and recidivism rate for the State of Oklahoma. With timely recommendations and appropriate community-level programs, the Board can contribute to the intelligent management and control of the State’s inmate population. Explanations of the Key Terms ● Parole is the release of a prisoner whose
sentence has not expired, on condition of future good behavior.
● Pardon is the exemption of a convicted person from the penalties of an offense or a crime.
● Clemency is the act of leniency or mercy on an individual for a crime committed.
The Board’s staff determines parole eligibility for persons in the Department of Corrections’ custody, prepares an extensive investigative report which includes a recommendation to the Board and notifies the victims and other related entities. The Board reviews this information and makes recommendations for clemency on the various parole programs, commutations and pardons, as prescribed by law. Upon recommendation by the Board, the Governor makes the final decision on the clemency, with the restrictions and stipulations recommended by the Board. The Board The Pardon and Parole Board is a constitutional, five-member, part-time body charged with making clemency
recommendations to the Governor concerning convicted adult felons. Members of the Board are appointed: Three by the Governor, one by the Chief Justice of the State Supreme Court, and one by the presiding Judge of the Court of Criminal Appeals. The members hold office coterminous with the Governor and meet several days each month at one of the State penal institutions.
FY-2009 Recommendation
FY-2008 Appropriation $2,578FY-2008 Bud. FTE Level 47.0Actual Ave. YTD FTE 42.1
Funding Adjustments:State Employee Pay Raise 49
FY-2009 Recommendation $2,627
% Change from FY-2008 1.90%
FY-2009 Appropriation(amounts in thousands)
Source: Office of State Finance State Employee Pay Raise The Governor’s budget includes $49,275 for a 5% state employee pay increase for the Pardon and Parole Board effective January 1, 2009. This funding is based on October 2007 salary information.

FY-2009 Executive Budget
SAFETY AND SECURITY B-224
Department of Public Safety (DPS)
Notable Achievements ● In early 2007, the Department
underwent a major conversion in the issuance of oversized and overweight permits. The process has transitioned into a full- scale call center providing a more efficient, customer-friendly operation. As a result of this transition, the agency anticipates a 15% to 25% increase in permit issuance volume.
● The court liaison positions established in FY-2006 continue to see benefits. Two personnel travel around the state to hold court-clerk instruction classes regarding operations and the documents required from the municipal and district courts. The largest benefit to this program is the reduction in errors on the forms and increased efficiency by the Department and the 423 Municipal court clerks.
● A website hosted by DPS continues to add court clerks from around the state. This website results in more accurate and timely conviction, suspension and withdrawal data received by DPS from court clerks and aids them in complying with federal mandates.
● The Amber Alert system, managed by the Department, proved its worthiness again in 2007. The most notable rescue was that of a 3-year-old girl who was located by Trooper Josh Blue shortly after the Amber Alert was issued.
● DPS also launched the Silver Alert program for missing senior citizens. The Silver Alert system works much like the Amber Alert system does. Through the use of the Oklahoma Law Enforcement Telecommunications System, alerts can be instant messaged to all law enforcement agencies statewide.
Mission The Department of Public Safety provides the following services to ensure a safe and secure environment for the citizens of this state:
• Law Enforcement Services; and
• Driver License Services;
In FY-2007, the Department of Public Safety received 1.4 % of the state’s appropriated budget. Approximately 40% of the Department’s budget is funded by appropriations. Law Enforcement Services • The Oklahoma Highway Patrol (OHP)
patrols over 96,000 miles of road, investigates collisions and enforces size and weight laws. OHP also assists local and federal agencies following a federal disaster.
• Commercial Vehicle Enforcement Troop enforces size and weight laws.
• Lake Patrol enforces laws on state lakes.
• Executive Security provides security and transportation for the Governor and Lt. Governor.
Trooper Strength In calendar year 2007, 39 troopers retired. The agency graduated two trooper academies during FY-2007, graduating 37 new troopers in September 2006, and 49 new troopers in July 2007. The Department was authorized to hold another academy, which will start February 2008.

FY-2009 Executive Budget
SAFETY AND SECURITY B-225
Driver License Services In an effort to streamline and improve agency services to the public, a newly named division, Driver Compliance, was implemented on November 1, 2007 by combining three current divisions that interact with each other into one. Driver Improvement (DI) and Financial Responsibility (FR) both take actions and hold hearings on drivers who do not comply with certain laws, which affect their driving status. Driver License Services (DLS) maintains the demographic files of all drivers, which DI and FR rely on to notify drivers of actions. DLS also issues handicap placards, the application for which is reviewed by the DI Medical Aspects Desk for potential medical compliance issues.
FY-2009 Recommendation
FY-2008 Appropriation $98,370 One-time Adjustments (1,200)
FY-2008 Base $97,170FY-2008 Bud. FTE Level 1,516.0Actual Ave. YTD FTE 1,508.7
Funding Adjustments:State Employee Pay Raise 1,664Increased Funding from OTA 3,200 Total Adjustments 4,864
FY-2009 Recommendation $102,034
$ Change from FY-2008 $3,664% Change from FY-2008 3.72%
Source: Office of State Finance
FY-2009 Appropriation(amounts in thousands)
Remove One-Time Funding The Governor’s budget recommends removing $1.2 million in one-time funds that were used to construct a new troop headquarter. State Employee Pay Raise The Governor’s budget includes $1,663,663 for a 5% state employee pay increase for the Department of Public Safety and the Board of Tests for Alcohol and Drug Influence
effective January 1, 2009. This funding is based on October 2007 salary information. Increased Funding from OTA The Governor’s budget recommends increasing payments from OTA to DPS by $3.2 million to cover indirect Trooper costs that have not been funded.

FY-2009 Executive Budget
SAFETY AND SECURITY B-226

FY-2009 Executive Budget
SCIENCE & TECHNOLOGY B-227
Oklahoma Center for the Advancement of Science and
Technology (OCAST) Notable Achievements • Since its creation in 1987, OCAST has
leveraged more than $17 of private and federal funding for every dollar invested in peer-reviewed R&D projects. That investment represents $2.6 billion cumulative leverage for all OCAST programs.
• According to the Oklahoma Department
of Commerce, OCAST investments have also resulted in the additional benefit of $109 million in state and local taxes in 2006.
• Advanced Chemical Technologies, an
Oklahoma chemical firm that specializes in a silane weatherproofing penetrant developed through OCAST- funded research, is making sales around the world. Their product, Sil-Act, is sprayed on concrete and masonry surfaces and creates a molecular bond that protects bridges, highways and monuments from the ravages of weather and salt. The product currently is in use on the Bird Creek Bridge in Tulsa, on the Centennial Expressway, Tinker Air Force Base runways, the Murrah Building Bombing Memorial in Oklahoma City, and on bridges and structures around the nation. The OCAST investment was made in 1994.
• The Oklahoma Manufacturing Alliance,
an OCAST strategic partner, in 2007 assisted 479 Oklahoman manufacturers, created or maintained 3,903 Oklahoma jobs, increased and retained sales of $152 million, and saved manufacturers $79 million in production costs.
Mission The Oklahoma Center for the Advancement of Science and Technology is tasked with improving the Oklahoma economy by
moving technology from concept to commercialization. Using internationally-accepted methods of applying public funds to research projects, OCAST helps Oklahomans develop knowledge-based businesses. These businesses, in turn, attract private and federal investment, world-class scientists and collaborative relationships that translate into quality jobs for Oklahoma. To achieve its vision, OCAST: • Increases cooperation among the private
sector, research foundations and universities through collaborations and networks that maximize productivity;
• Provides leadership, information,
services and financial assistance to enhance the ability of Oklahoma advanced technology firms and Oklahoma scientific researchers to compete in the marketplace;
• Uses nationally recognized experts as
peer reviewers to ensure performance that meets national standards of excellence and provides Oklahoma with national visibility; and
• Leverages federal and private resources
to optimize the effectiveness of limited state resources.
OCAST is Oklahoma’s only technology-based economic development agency – the only agency focusing solely on technology, its development, transfer, commercialization and impact on Oklahoma’s economy. Research and Development Programs OCAST strives to select businesses with solid futures for research and development funds. Many startup businesses fail in the first few years. The following graph shows the historical survivability of companies with awards from OCAST.
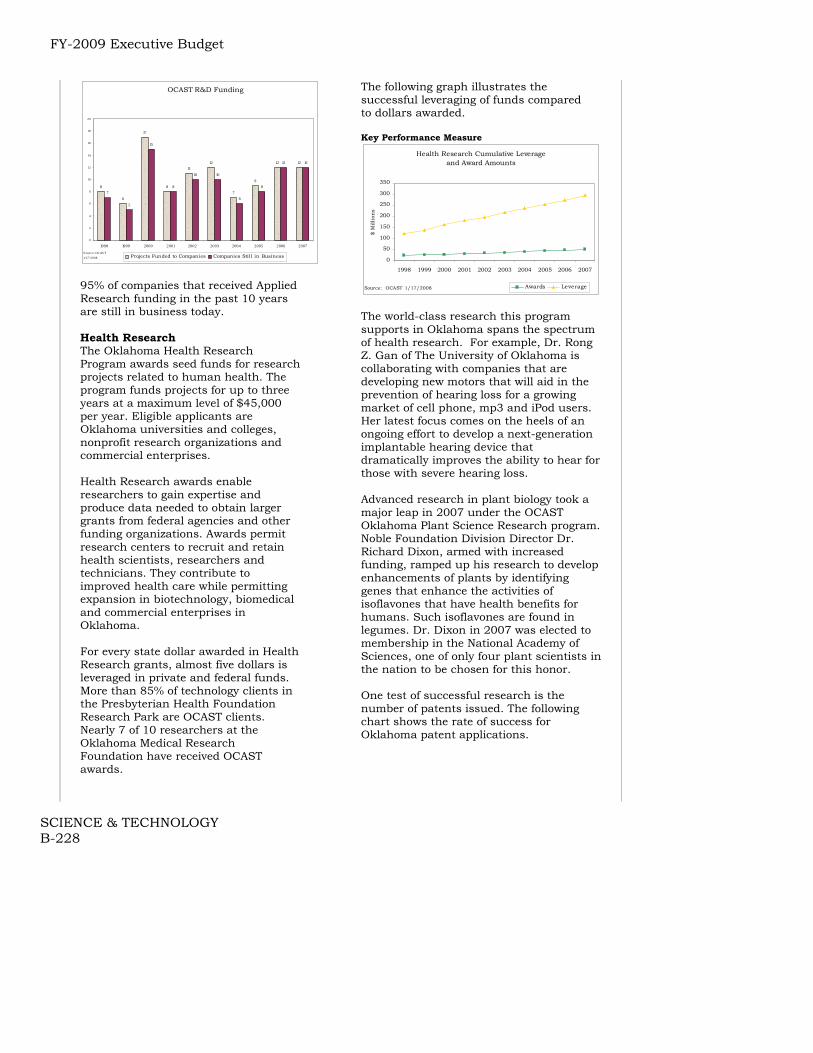
FY-2009 Executive Budget
SCIENCE & TECHNOLOGY B-228
OCAST R&D Funding
8
6
17
8
1112
7
9
12 12
7
5
15
8
10 10
6
8
12 12
0
2
4
6
8
10
12
14
16
18
20
1998 1999 2000 2001 2002 2003 2004 2005 2006 2007
Projects Funded to Companies Companies Still in BusinessS ourc e : OCAS T1/ 17/ 2008 95% of companies that received Applied Research funding in the past 10 years are still in business today. Health Research The Oklahoma Health Research Program awards seed funds for research projects related to human health. The program funds projects for up to three years at a maximum level of $45,000 per year. Eligible applicants are Oklahoma universities and colleges, nonprofit research organizations and commercial enterprises. Health Research awards enable researchers to gain expertise and produce data needed to obtain larger grants from federal agencies and other funding organizations. Awards permit research centers to recruit and retain health scientists, researchers and technicians. They contribute to improved health care while permitting expansion in biotechnology, biomedical and commercial enterprises in Oklahoma. For every state dollar awarded in Health Research grants, almost five dollars is leveraged in private and federal funds. More than 85% of technology clients in the Presbyterian Health Foundation Research Park are OCAST clients. Nearly 7 of 10 researchers at the Oklahoma Medical Research Foundation have received OCAST awards.
The following graph illustrates the successful leveraging of funds compared to dollars awarded. Key Performance Measure
Health Research Cumulative Leverageand Award Amounts
0
50
100
150
200
250
300
350
1998 1999 2000 2001 2002 2003 2004 2005 2006 2007
$ M
illi
ons
Awards LeverageSource: OCAST 1/17/2008 The world-class research this program supports in Oklahoma spans the spectrum of health research. For example, Dr. Rong Z. Gan of The University of Oklahoma is collaborating with companies that are developing new motors that will aid in the prevention of hearing loss for a growing market of cell phone, mp3 and iPod users. Her latest focus comes on the heels of an ongoing effort to develop a next-generation implantable hearing device that dramatically improves the ability to hear for those with severe hearing loss. Advanced research in plant biology took a major leap in 2007 under the OCAST Oklahoma Plant Science Research program. Noble Foundation Division Director Dr. Richard Dixon, armed with increased funding, ramped up his research to develop enhancements of plants by identifying genes that enhance the activities of isoflavones that have health benefits for humans. Such isoflavones are found in legumes. Dr. Dixon in 2007 was elected to membership in the National Academy of Sciences, one of only four plant scientists in the nation to be chosen for this honor. One test of successful research is the number of patents issued. The following chart shows the rate of success for Oklahoma patent applications.

FY-2009 Executive Budget
SCIENCE & TECHNOLOGY B-229
FY-2003 FY-2004 FY-2005 FY-2006 FY-2007Applications 26 12 11 18 24Awards 10 10 1 2 1
Source: OCAST 1/17/2008
Health Research Patents
Applied Research The Oklahoma Applied Research Support (OARS) program competitively awards funds for one- to three-year projects based upon technical merit, potential for market success and commitment of resources. The program requires a minimum of one dollar matching support for each state dollar awarded. Eligible applicants are Oklahoma businesses and universities, colleges or nonprofit research organizations with industrial partners. Pure Protein and its founder, Dr. William Hildebrand, last year made monumental advances to fight diseases, better match transplant patients, and make the blood supply safer. The firm also made progress in predicting susceptibility to and fight autoimmune diseases. Dr. Hildebrand and his team over time have received more than $850,000 in OCAST funding through various programs and have attracted $20 million of federal research funds. They employ 27 people and enjoy annual sales of $5-7 million.
Oklahoma Applied Research Support (OARS)Awards by Research Area
FY-2007Other, $1,766,945
[ 8% ]
Electronic / Communications
$3,323,889 ( 14% )Biotechnology
$9,502,660 ( 41% )
Manufacturing $1,766,945 ( 8% )
Advanced Materials, and Chemicals
$5,162,337 ( 22% )
Information Technology
$1,867,475 ( 8% )
Source: OCAST OARS produces commercially viable Research and Development. Federal and private funding attracted to OARS projects and the ratio of OARS support to private and federal support both demonstrate the program’s effectiveness at securing capital. For every state dollar awarded to Applied Research another $15 is leveraged in private and
federal funds and business financial impacts. In FY-2007, OARS produced $27 million in sales, resulted in 70 employees hired inside Oklahoma and 22 from out-of-state, created jobs with an average salary of $50,583 – 57% above the Oklahoma per capita income, and created $85.6 million annual leveraged federal funding and economic benefits to Oklahoma. Key Performance Measure
Applied Research Cumulative Leverageand Award Amounts
0
100
200
300
400
500
1998 1999 2000 2001 2002 2003 2004 2005 2006 2007
$ M
illio
ns
Awards LeverageSource: OCAST 1/17/2008
OARS R&D Faculty and Student Intern Partnerships The Intern Partnership program provides support for qualified research and development partnership projects that involve industry and institutions of higher education. The program increases the pool of scientists, engineers and business entrepreneurs available to Oklahoma industry, encourages students to be scientists and engineers and enhances faculty members’ teaching experience. The faculty and student interns come from rural and urban colleges and they intern throughout Oklahoma. Through this program the interns learn first-hand about the many outstanding high-tech employment opportunities in Oklahoma. This program helps Oklahoma companies and helps reduce the “brain-drain” from Oklahoma. Oklahoma Seed Capital Fund After having been in statute for a number of years, the Legislature provided funding for

FY-2009 Executive Budget
SCIENCE & TECHNOLOGY B-230
this program in FY-2007, enabling OCAST to implement the program through a competitive proposal process. The result was a new Oklahoma Seed Capital Fund, LLC, managed by i2E, Inc., a not-for-profit corporation, under contract to OCAST. After its first six months of full operation, this OCAST program has moved forward on four term sheets that involve investments totaling $2 million from the Fund and attracting approximately $7.8 million of additional co-investment from other funds and private investors. This means $9.8 million will go to Oklahoma technology companies in need of seed capital stage resources to continue growth and expansion. Altheus Therapeutics, based in Oklahoma City, was the first recipient of funds in September 2007, with a $600,000 investment from the Oklahoma Seed Capital Fund and co-investment of an additional $3 million (from primarily out-of state sources). The total round of $3.6 million in financing will carry the company into clinical trials to test a new therapy for inflammatory bowel disease. Technology Development Programs Through the following programs OCAST develops, implements, evaluates and modifies programs and services designed to encourage and enable small Oklahoma firms to develop, apply and commercialize technology. Small Business Research Assistance (SBRA) The federal Small Business Innovation Research (SBIR) program provides financial support for technology feasibility studies and prototype development that is lacking in the private investment community. The federal Small Business Technology Transfer (STTR) program accomplishes this purpose while forging research collaborations between small firms and universities or other nonprofit research institutions.
OCAST’s SBRA program provides assistance to improve the quality of proposals submitted to the federal programs, defrays a portion of a qualifying firm’s federal SBIR or STTR proposal preparation costs, bridges funding between federal SBIR grants and assists in locating research resources necessary to successfully compete in the SBIR and STTR programs. Every state taxpayer dollar expended in FY-2007 attracted $22 of private and federal funding. Oklahoma Alliance for Manufacturing Excellence (The Alliance) OCAST provides oversight and state matching funds to this affiliate of the National Institute of Standards and Technology (NIST) Manufacturing Extension Partnership program. The Alliance helps small and medium-sized manufacturers modernize in order to compete successfully. Under a partnership with Oklahoma State University, The Alliance also provides engineering services to small and rural manufacturers through its Application Engineers program. Every state taxpayer dollar expended in FY-2007 attracted $152 of private and federal funding. Oklahoma Technology Commercialization Center (Tech Center) OCAST contracts with a private, nonprofit organization to operate the Tech Center, which assists entrepreneurs, early-stage technology companies and companies seeking to commercialize new technologies. The Tech Center assesses needs, guides clients through the commercialization process and links them to a comprehensive network of technology sources (including Oklahoma universities) and commercialization assistance services. The Tech Center also provides specialized business development services, access to early-state risk financing, access to specialized incubator space and help in transferring technology.

FY-2009 Executive Budget
SCIENCE & TECHNOLOGY B-231
Every state taxpayer dollar expended in FY-2007 attracted $6 of private and federal funding. The chart below depicts funding obtained by OTCC clients from various sources over the last 7 years.
Tech Center Client Obtained Funding (1999 - 2007)
$78
$216
$140
$0
$50
$100
$150
$200
$250
Angel Capital Venture Capital Strategic Investor
Type of Funding
$ in Millions
OCAST Technology Business Finance Program (TBFP) This OCAST program provides limited pre-seed financing for start-up advanced technology firms. The program requires a match and includes payback provisions. Those paybacks have totaled more than $2 million since the program began in 1999. Every state taxpayer dollar expended in FY-2007 attracted $7 of private and federal funding. Inventors Assistance Service (IAS) OCAST contracts with Oklahoma State University to operate the IAS. Through workshops, web site and on-site consultations, the IAS provides Oklahoma inventors with information and training on developing their invention and on issues related to patenting/licensing, marketing and manufacturing. The IAS assists the independent inventor in navigating the process from idea to marketplace.
FY-2009 Recommendation
FY-2008 Appropriation $22,457FY-2008 Bud. FTE Level 25.0Actual Ave. YTD FTE 23.7
Funding Adjustments:State Employee Pay Increase 39Enhancement of Existing Programs 1,000Annualiziation of One-Time Funding 6,000Replace Seed Capital Funds 5,000 Total Adjustments 12,039
FY-2009 Recommendation $34,496% Change from FY-2008 53.61%
Source: Office of State Finance
(amounts in thousands)FY-2009 Appropriation
State Employee Pay Raise The Governor’s budget includes $39,706 for a 5% state employee pay increase for OCAST effective January 1, 2009. This funding is based on October 2007 salary information. Enhancement of Existing Programs The Governor’s budget provides an additional $1 million to enhance existing OCAST programs. Up to 50% of qualified projects are not funded currently due to lack of available funding. Annualization of One-Time Funding The Governor’s budget provides $6 million to continue funding a BioEnergy Center established in 2007, helping keep Oklahoma at the forefront of this transformative movement and to advance the development of a commercial biofuels industry in Oklahoma. Replace Seed Capital Funds The Governor’s budget proposes replacing seed capital funds that were diverted in 2007 for the establishment of the BioEnergy Center.

FY-2009 Executive Budget
SCIENCE & TECHNOLOGY B-232

FY-2009 Executive Budget
SECRETARY OF STATE B-233
-
500,000
1,000,000
1,500,000
2,000,000
2,500,000
FY-00 FY-02 FY-04 FY-06
OK Voter Turnout and Voter Registration for the General Election
Voter Registration Voter Turnout
Election Board
Notable Achievement The Election Board successfully implemented voting for disabled voters, including blind voters. The State Election Board coordinates all statewide elections for over 2,000 precincts in the State’s 77 counties. Unlike Florida and many other states whose election system problems became evident in the 2000 national elections, Oklahoma’s unified system serves as a model. In place for more than a decade, the uniform system provides:
• One voting system;
• One kind of ballot;
• One way of voting;
• One way of counting ballots; and
• One way of recounting ballots. The graph below shows the voter registration and voter turnout for each of the general elections. A general election is held on the first Tuesday in November in even number years. The next general election is scheduled for November 4, 2008.
Source: Election Board
The graph below shows the number of voter information requests received by the Election Board. Voter information requests were the highest in FY-04 due to the presidential election and state general election.
Source: Election Board
Help America Vote Act of 2002 (HAVA) This federal act was passed in light of the voting problems of the Presidential Election of 2000. The legislation calls for a wide variety of improvements and also establishes a set of national standards that states must meet. In FY-2006, the Election Board was appropriated an additional $1.5 million, which is set aside as federal matching money for HAVA. The largest expenditures necessary in Oklahoma are in the areas of polling place technology and disabled voter accessibility. Election Costs Every four years the State of Oklahoma has seven statewide elections: two primaries, two run-off primaries, two general elections, and one presidential preferential primary. The cost for each statewide election fluctuates based upon the number of ballots printed and the transit cost of ballots to counties. An estimate for the cost of a general election is $950,000, and special elections are around $900,000. In FY-2006, there were 3 statewide elections. The table below shows the number of local elections in FY-2006.
380400420440460480500520540
FY-02 FY-03 FY-04 FY-05 FY-06
Voter Information Requests

FY-2009 Executive Budget
SECRETARY OF STATE B-234
County 58School 352Municipal 364Other 5Total 779Source: Election Board
Total Elections in FY-2007
County, school, and municipal elections are usually held on the same day making the total number of local elections high.
FY-2009 Recommendation
FY-2008 Appropriation $7,786 Presidential Primary (980)
FY-2008 Base $6,806FY-2008 Bud. FTE Level 24.0Actual Ave. YTD FTE 21.3
Funding Adjustments: State Employee Pay Raise 137 Election Restocking 100 Total Adjustments 237
FY-2009 Recommendation $7,043$ Change from FY-2008 ($743)% Change from FY-2008 -9.54%
FY-2009 Appropriation(amounts in thousands)
Source: Office of State Finance Removal of One-Time Funding The Governor’s Budget removes $980,000 for costs associated with the Presidential Primary. State Employee Pay Raise The Governor’s budget includes $136,918 for a 5% state employee pay increase for the Election Board effective January 1, 2009. This funding is based on October 2007 salary information. Restocking after 2008 Statewide Elections The Governor’s budget includes $100,000 to cover supplies, forms and other materials used by county officials and precinct
officials as well as supplies and parts used for the voting equipment and the statewide database, will be depleted after the 2008 elections.
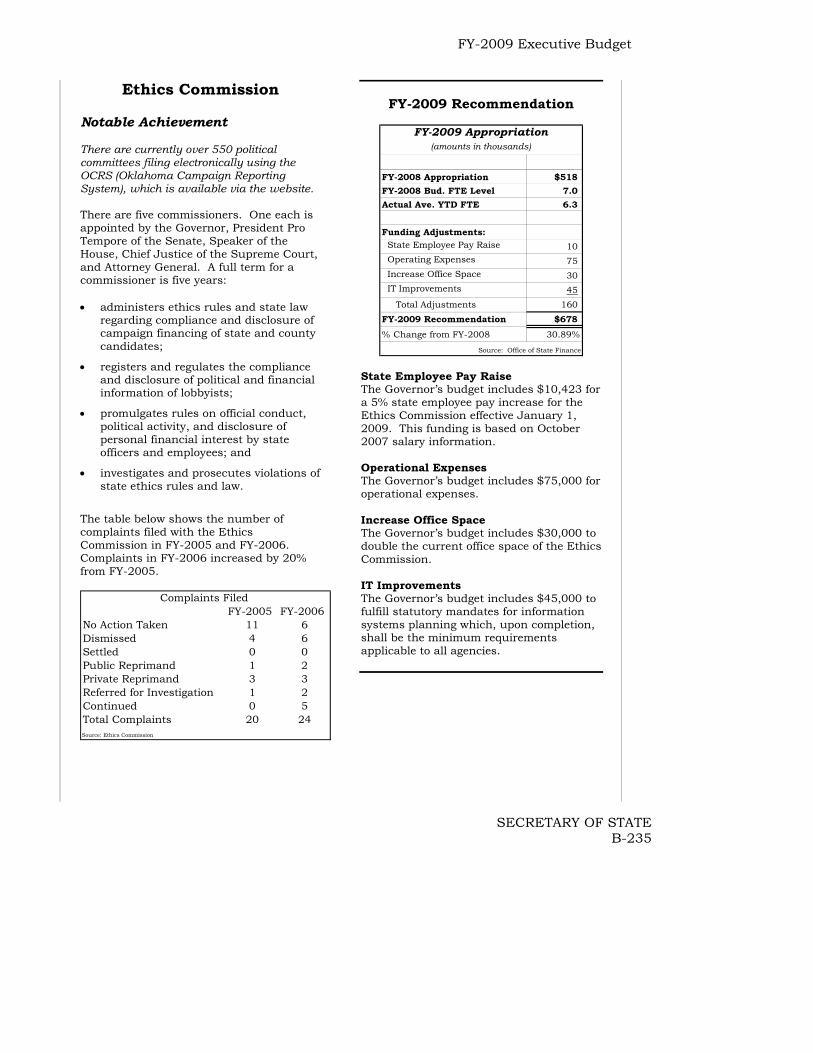
FY-2009 Executive Budget
SECRETARY OF STATE B-235
Ethics Commission Notable Achievement There are currently over 550 political committees filing electronically using the OCRS (Oklahoma Campaign Reporting System), which is available via the website. There are five commissioners. One each is appointed by the Governor, President Pro Tempore of the Senate, Speaker of the House, Chief Justice of the Supreme Court, and Attorney General. A full term for a commissioner is five years: • administers ethics rules and state law
regarding compliance and disclosure of campaign financing of state and county candidates;
• registers and regulates the compliance and disclosure of political and financial information of lobbyists;
• promulgates rules on official conduct, political activity, and disclosure of personal financial interest by state officers and employees; and
• investigates and prosecutes violations of state ethics rules and law.
The table below shows the number of complaints filed with the Ethics Commission in FY-2005 and FY-2006. Complaints in FY-2006 increased by 20% from FY-2005.
Complaints Filed FY-2005 FY-2006
No Action Taken 11 6Dismissed 4 6Settled 0 0Public Reprimand 1 2Private Reprimand 3 3Referred for Investigation 1 2Continued 0 5Total Complaints 20 24Source: Ethics Commission
FY-2009 Recommendation
FY-2008 Appropriation $518FY-2008 Bud. FTE Level 7.0Actual Ave. YTD FTE 6.3
Funding Adjustments: State Employee Pay Raise 10 Operating Expenses 75 Increase Office Space 30 IT Improvements 45 Total Adjustments 160
FY-2009 Recommendation $678% Change from FY-2008 30.89%
Source: Office of State Finance
FY-2009 Appropriation(amounts in thousands)
State Employee Pay Raise The Governor’s budget includes $10,423 for a 5% state employee pay increase for the Ethics Commission effective January 1, 2009. This funding is based on October 2007 salary information. Operational Expenses The Governor’s budget includes $75,000 for operational expenses. Increase Office Space The Governor’s budget includes $30,000 to double the current office space of the Ethics Commission. IT Improvements The Governor’s budget includes $45,000 to fulfill statutory mandates for information systems planning which, upon completion, shall be the minimum requirements applicable to all agencies.

FY-2009 Executive Budget
SECRETARY OF STATE B-236
Council on Judicial Complaints
Created in Title 20 of the Oklahoma Statutes, the Council on Judicial Complaints accepts and investigates allegations of judicial misconduct. The Council has jurisdiction over all persons subject to the Code of Judicial Conduct, including approximately 690 state, municipal and administrative judges. The Council determines whether complaints are dismissed, warrant a reprimand or admonition or go before the Court on the Judiciary. The Council consists of three members, each serving a five-year term, two of whom must be members of the Oklahoma Bar Association. The appointing authorities are the Speaker of the House of Representatives, the President Pro Tempore of the Senate, and the President of the Oklahoma Bar Association. Duties and responsibilities of the Council include holding hearings, administering oaths and receiving testimony and other evidence. The Council may also issue and serve subpoenas. Proceedings before the Council are confidential.
Complaints Filed and Dismissed
189 201171
224195
153171
230
183173159
173
0
50
100
150
200
250
300
FY-2002 FY-2003 FY-2004 FY-2005 FY-2006 FY-2007
FiledDismissed
FY-2009 Recommendation
FY-2008 Appropriation $284
FY-2008 Bud. FTE Level 2.0
Actual Ave. YTD FTE 2.0
Funding Adjustments: State Employee Pay Raise 4
FY-2009 Recommendation $288% Change from FY-2008 1.41%
FY-2009 Appropriation(amounts in thousands)
Source: Office of State Finance State Employee Pay Raise The Governor’s budget includes $3,600 for a 5% state employee pay increase for the Council on Judicial Complaints effective January 1, 2009. This funding is based on October 2007 salary information.
FY-2009 Executive Budget
SECRETARY OF STATE B-237
Secretary of State
Notable Achievements
• New technology allowed the Secretary of State to:
1. Improve employee efficiency
2. Increase on-line user activity
3. Distribute Legislation, Administrative Rules, and other SOS publications
4. Use targeted training to increase IT division effectiveness by 15%, thereby decreasing maintenance costs by $200,000.
The Secretary of State (SOS), created in Article VI of the Oklahoma Constitution, has a number of constitutional and statutorily established duties. These include:
• Serving as the official repository of executive orders and official acts of the Governor;
• Filing and distributing copies of all laws enacted by the Legislature;
• Maintaining information about all meetings held under the Open Meeting Act;
• Maintaining a central registry for filing business documents on corporations and partnerships of all types;
Funding Sources The Secretary of State is funded in majority by revenue derived from fees collected for such things as Business Entity, Notary and Trademark filings. The Oklahoma Administrative Code and the Oklahoma Register The Oklahoma Administrative Code is the official compilation of agency rules and executive orders for the State of Oklahoma. The Oklahoma Register is a semi-monthly publication documenting administrative code changes between publications of the annual supplements.
Address Confidentiality Program The Address Confidentiality Program (ACP) provides services to residents who are victims of domestic violence, sexual assault and stalking. First, the program provides victims with a substitute address for use in interacting with state and local agencies. Second, victims are provided with a cost-free mail forwarding service. The Secretary of State is the victim’s agent for service of process and receipt of mail. There are currently 118 active participants in this program. Business Registration Services on the Internet The Secretary of State is utilizing the Internet in an effort to cut costs and increase efficiency. In FY-2001, the agency contracted with NIC Conquest, Inc. to develop this business registration system, SoonerAccess. SoonerAccess allows customers to submit the majority of business entity documents, trademarks/renewals, and Notary Public applications/renewals on-line. One-Stop Customer Service Center The Secretary of State is working with the Tax Commission to determine if business services offered by the Secretary of State’s office can be co-located to the Tax Commission’s one-stop customer service center.
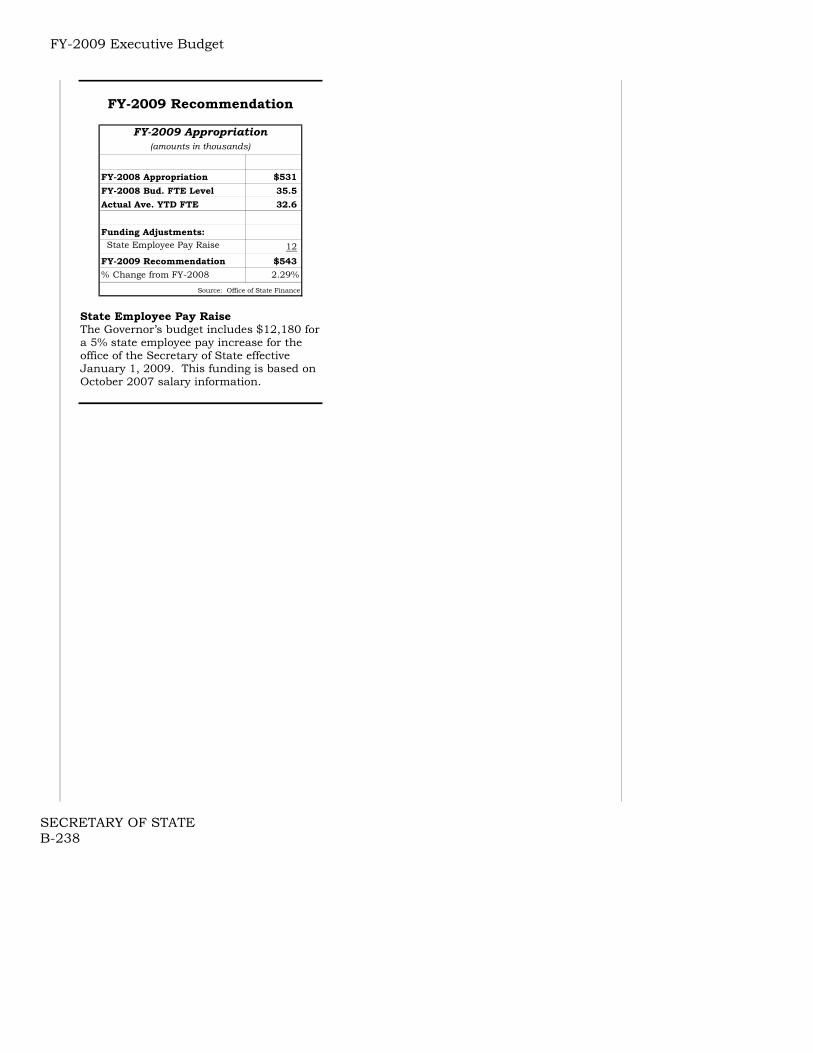
FY-2009 Executive Budget
SECRETARY OF STATE B-238
FY-2009 Recommendation
FY-2008 Appropriation $531FY-2008 Bud. FTE Level 35.5Actual Ave. YTD FTE 32.6
Funding Adjustments: State Employee Pay Raise 12
FY-2009 Recommendation $543% Change from FY-2008 2.29%
FY-2009 Appropriation(amounts in thousands)
Source: Office of State Finance State Employee Pay Raise The Governor’s budget includes $12,180 for a 5% state employee pay increase for the office of the Secretary of State effective January 1, 2009. This funding is based on October 2007 salary information.

FY-2009 Executive Budget
TRANPORTATION B-239
Oklahoma Aeronautics Commission (OAC)
Notable Achievements
• The Oklahoma Airport System Plan is used by the Federal Aviation Administration (FAA) as a model for other states and the FAA Southwest Region.
• Aeronautics Commission staff were recognized by the FAA with an External FAA award for its “Outstanding Contribution to the Enhancement of Aviation in Oklahoma,” stating that the Commission’s staff has “contributed significantly to assuring the future growth and efficiency of the National Air Transportation System.”
• Nominated for the national ‘Airports Ally Award’ as part of FAA’s Awards for Excellence Program.
• Provided seed funding to establish the Oklahoma Aerospace Alliance, the state’s first aerospace industry trade association.
Mission The mission of the (OAC) is to promote aviation, which includes fostering the growth of the aerospace industry and ensuring that the needs of commerce and communities across the state are met by the state’s 114 public airports that comprise the Oklahoma Airport System. Oklahoma has 114 public airports; 111 of those public airports are General Aviation (GA) airports and 49 of those 114 are also Regional Business airports (RBs, 46 of which are GA airports). Currently, 42 of the RBs have jet-capable (5,000 feet or longer) runways. Three of the RBs are scheduled airline airports – OKC Will Rogers, Tulsa International and Lawton-Ft. Sill Municipal. The OAC determines the airport projects that will be funded with state and federal funds through its capital planning and programming process and its Capital
Improvement Program. The vast majority of funding for airport projects comes from the federal government through the FAA Airport Improvement Program. During the last several years, the OAC has programmed an average of $10 million in federal funds for airport projects in Oklahoma. This does not include the more than $12 million a year in federal funds (through individual $150,000 grants) that is going directly to the 100 Oklahoma GA airports that are in the federal system. The OAC is funded with aviation-generated (aircraft excise tax, aircraft registration fees and aviation fuel tax), revenues. In FY-2007, OAC received $3,280,752 from these sources. The average from these sources over the past four fiscal years, including FY-2007, was $2,587,496. In FY-2007, the OAC expended $2,373,804 on airport projects, nearly $300,000 to promote the aerospace industry, and $1,495,053 on operations.
FY-2009 Executive Budget
TRANSPORTATION B-240
Oklahoma Space Industry Development Authority
(OSIDA)
Notable Achievements • Assisted in creating over 150 jobs in the
aerospace field. Rocketplane limited has hired 80 Oklahomans while TGV Rocket has hired 16. The average salary of these jobs is $85,000;
• Received $1,250,000.00 from NASA for Aerospace Education for K-12 as well as Oklahoma Colleges and Universities including;
o University of Oklahoma;
o Oklahoma State University;
o Southwestern Oklahoma State University; and
o Various school districts across the state.
• Named the World’s Newest Gateway to Space on June 12, 2006, receiving a Launch Site Operators License from the Federal Aviation Administration’s Office of Commercial Space Transportation;
• Signed a letter of agreement with the Federal Aviation Administration’s Regional Air Traffic Control Center authorizing sub-orbital space flight from the Oklahoma Spaceport in a custom designed space flight corridor designed by OSIDA.
Mission OSIDA aspires to aid economic development in Oklahoma by stimulating the creation of space commerce, education and space related industries. Clinton Sherman Airpark OSIDA acquired the Clinton Sherman Airpark at no cost in the summer of 2005. This acquisition is ideal for development of space industry because of the airpark’s advantages:
• Infrastructure in place that includes runways, hangars, and ramps to fuel the vehicles;
• Favorable weather conditions
• 50 Employees, funded through the South Western Oklahoma Development Authority, to maintain and operate the airpark; and
• Over 13,500 feet of runway and ramp space.
During FY-2005, OSIDA completed a flight safety study and an environmental impact survey for the Clinton Sherman Airpark. Completion of these studies allowed OSIDA to obtain a Spaceport license for the Airpark from the Federal Aviation Agency (FAA) in 2006. Having a licensed Spaceport makes Oklahoma more competitive in attracting aerospace companies to the state, and allows the agency to become self-sufficient in the near future. RocketPlane LTD. In January 2003, Rocketplane Limited Inc. announced they would begin development of a sub-orbital aircraft in Oklahoma. RocketPlane cited OSIDA, state leaders and the advantages of the Clinton-Sherman Airpark as their reasons for choosing Oklahoma for this huge project. Rocketplane LTD., as part of its $30 million investment has contracted with over 100 companies from around the state to help develop the needed technology.
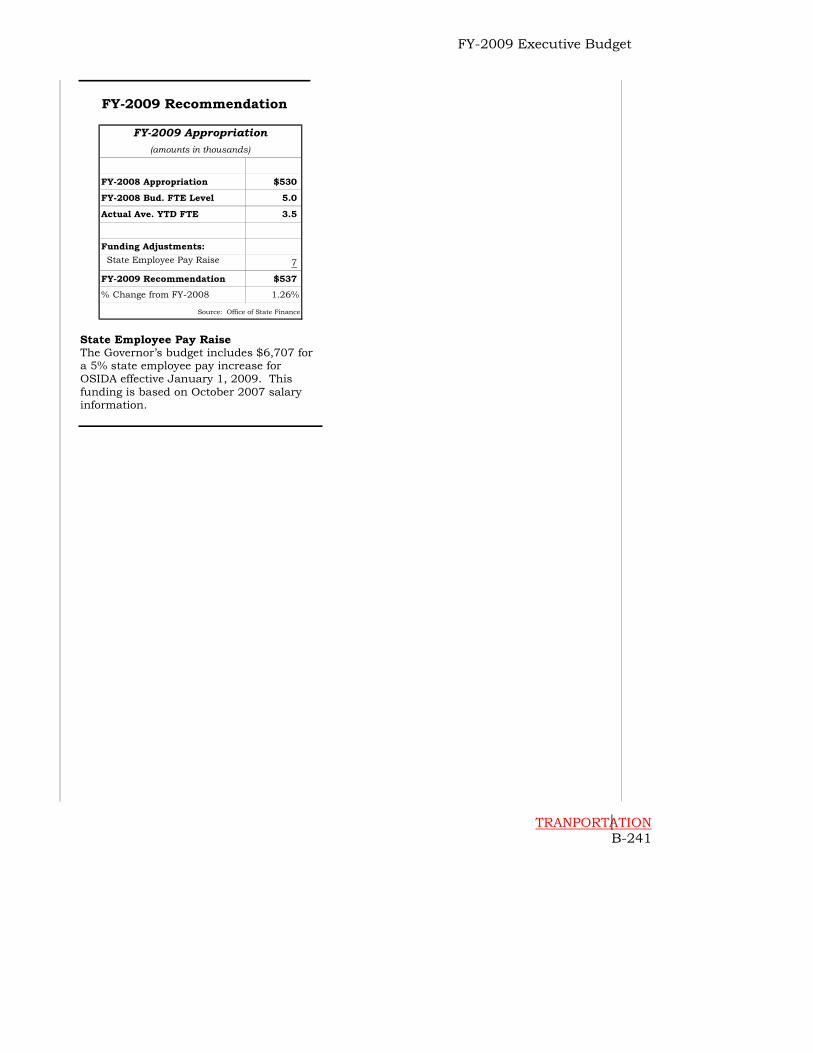
FY-2009 Executive Budget
TRANPORTATION B-241
FY-2009 Recommendation
FY-2008 Appropriation $530
FY-2008 Bud. FTE Level 5.0
Actual Ave. YTD FTE 3.5
Funding Adjustments: State Employee Pay Raise 7
FY-2009 Recommendation $537% Change from FY-2008 1.26%
FY-2009 Appropriation(amounts in thousands)
Source: Office of State Finance State Employee Pay Raise The Governor’s budget includes $6,707 for a 5% state employee pay increase for OSIDA effective January 1, 2009. This funding is based on October 2007 salary information.

FY-2009 Executive Budget
TRANSPORTATION B-242
Department of Transportation
(ODOT)
Notable Achievement • The Transportation Commission
awarded contracts for the rehabilitation or reconstruction of 68 bridges that were fully, or in part, funded by the $100 million appropriation made available through the provisions of SB1288.
• The Department significantly increased the number bridges included in the Eight Year Construction Work plan to 480 from the 167 that were contained in the initial Construction Work Plan in 2003.
• ODOT, in conjunction with County Commissioners, developed the five year County Improvement for Roads and Bridges (CIRB) Work Plan. This plan schedules projects that will be initiated for county roads and bridges that are made available from the provisions of HB1176 which will provide an additional $85 million annually. Included in this initial plan is the reconstruction or rehabilitation of 110 county bridges.
Mission
The Oklahoma State Department of Transportation (ODOT) is charged with the planning, construction, operation and maintenance of Oklahoma’s state and federal transportation infrastructure. This includes 671 miles of interstate and 11,613 miles of non-interstate roads and bridges to maintain. The Department of Transportation is a non-appropriated agency. The legislature authorizes the agency to spend its budget. The budget allocation in FY-2008 is $1,343,756,000.
FY-2008 Budget Allocation of $1,343,756,000
Admin, $27,222
Transit, $26,047
Rail, $33,244
Engineering, $71,476
Operations, $60,437
Maintenance, $176,515
Road Construction,
$948,815
Source: ODOT Of the $1.3 billion budget, ODOT’s budget is comprised of federal and revolving funds. The chart below shows the funding breakdown by source.
FY-2007 Budget by Funding Source
Federal51%
Revolving49%
Source: ODOT Motor Fuel Taxes Motor fuel taxes are the main source of revenue to the State Transportation Fund (STF), ODOT’s primary source of state funding. The motor fuel taxes that are deposited to the fund are gasoline excise tax, diesel fuel excise tax, special fuel use tax, and special fuel decals. The gasoline tax is assessed on the consumer when they purchase gas and is the largest source of revenue to STF. Currently, the tax rate is 16 cents per gallon. The map below shows the gasoline excise tax rates for Oklahoma and its border states.

FY-2009 Executive Budget
TRANPORTATION B-243
18.0%
20.0%
22.0%
24.0%
26.0%
28.0%
FY-01 FY-02 FY-03 FY-04 FY-05 FY-06 FY-07Est.
% of the State Highway System in Critical Condition
The gasoline tax revenue is apportioned to municipalities for local road repair. The following table shows the apportionment of gasoline tax revenue.
Transportation Fund 63.75%County Highways 30.13%Cities & Towns 1.88%
High Priority State Bridges Fd 1.63%
County Bridge & Road Imrpovement Fund 2.63%
Gasoline Tax Apportionment
Source: Oklahoma Tax Commission Diesel tax revenue is also apportioned to the County Highway and the County Bridge and Road Improvement Fund. These funds are the only source of revenue that counties have for highway and bridge maintenance and repair. GARVEE Bonds The Grant Anticipation Revenue Vehicles program, or "GARVEE," allows the state to address immediate highway needs by issuing bonds and using future federal highway funds to retire them. Governor Henry directed ODOT to pursue a first phase of GARVEE projects valued at $300 million. The Governor has identified 12 "economic development" corridors for the GARVEE program where roads will be improved to help enhance the state's business climate. More than $500 million will be spent on the first phase of the following corridor projects over the next four years. GARVEE Projects
• Oklahoma City: US-77 (Broadway Extension) bridges and roadway with interchange at I-44, from one-fourth mile north of NW 63rd Street to NW 36th Street. COST: $75 million.
• Oklahoma City: US-77 (Broadway Extension) I-44 to Memorial Road. COST: $28 million
• Tulsa: I-44 from Arkansas River bridge to Yale Ave. COST: $75 million
• Tulsa: US-169 from I-244 to 21st Street. COST: $18 million
• Idabel: US-70 from Idabel to Hugo. COST: $60.5 million
• Durant: US-70 from I-35 to Durant. COST: $66 million
• Ada: Highway 99 from I-40 to Ada. COST: $26 million
• Sequoyah County: US-59 from US-271 to I-40 near Sallisaw. COST: $38 million
• SW Oklahoma: US-183 from US-70 to I-40. COST: $33 million
• Woodward: SH-3 from SH-34 in Woodward to SH-33 in Watonga. COST: $46 million
• Rogers County: SH-88 from US-412 in Inola to I-44 and SH-20/88 beginning at Claremore and ending at south bypass. COST: $46.5 million
State Highway System Historically, roads and bridges have received poor condition ratings from the Federal Highway Administration. According to ODOT, Oklahoma has 3,000 miles of highways rated in inadequate or critical condition. Also, 1,600 bridges are structurally deficient and functionally obsolete. Key Performance Measure
Source: ODOT
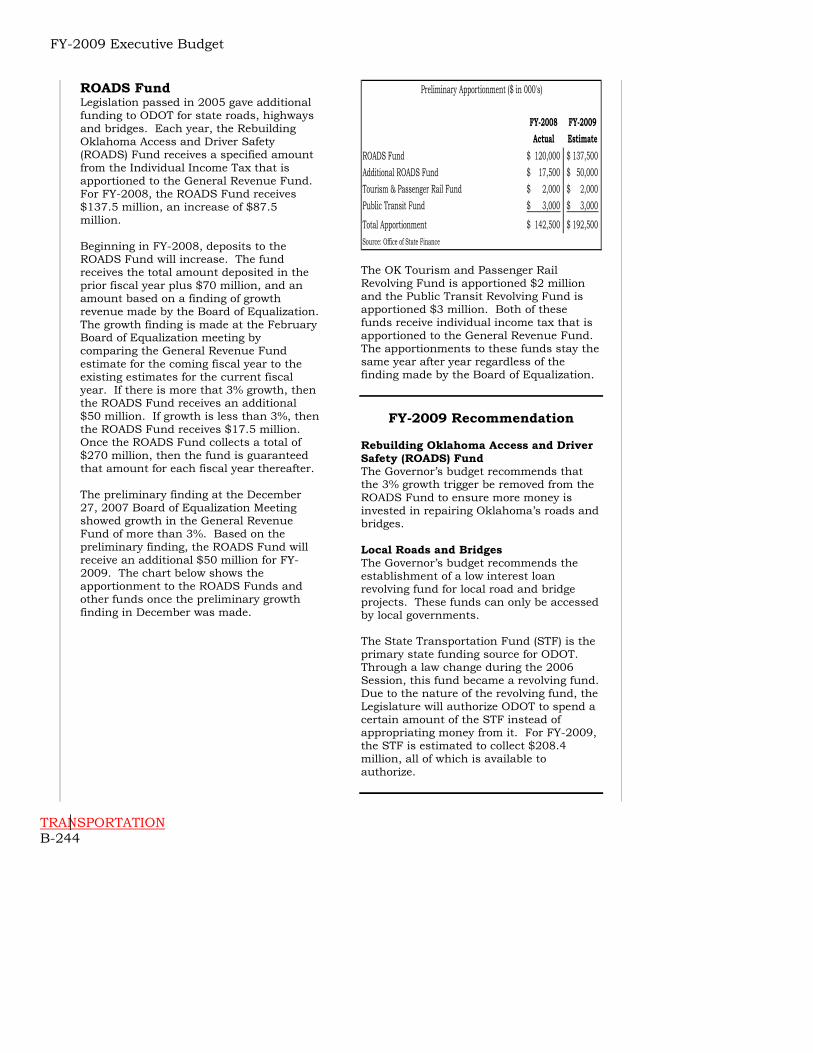
FY-2009 Executive Budget
TRANSPORTATION B-244
ROADS Fund Legislation passed in 2005 gave additional funding to ODOT for state roads, highways and bridges. Each year, the Rebuilding Oklahoma Access and Driver Safety (ROADS) Fund receives a specified amount from the Individual Income Tax that is apportioned to the General Revenue Fund. For FY-2008, the ROADS Fund receives $137.5 million, an increase of $87.5 million. Beginning in FY-2008, deposits to the ROADS Fund will increase. The fund receives the total amount deposited in the prior fiscal year plus $70 million, and an amount based on a finding of growth revenue made by the Board of Equalization. The growth finding is made at the February Board of Equalization meeting by comparing the General Revenue Fund estimate for the coming fiscal year to the existing estimates for the current fiscal year. If there is more that 3% growth, then the ROADS Fund receives an additional $50 million. If growth is less than 3%, then the ROADS Fund receives $17.5 million. Once the ROADS Fund collects a total of $270 million, then the fund is guaranteed that amount for each fiscal year thereafter. The preliminary finding at the December 27, 2007 Board of Equalization Meeting showed growth in the General Revenue Fund of more than 3%. Based on the preliminary finding, the ROADS Fund will receive an additional $50 million for FY-2009. The chart below shows the apportionment to the ROADS Funds and other funds once the preliminary growth finding in December was made.
FY-2008 FY-2009 Actual Estimate
ROADS Fund 120,000$ 137,500$ Additional ROADS Fund 17,500$ 50,000$ Tourism & Passenger Rail Fund 2,000$ 2,000$ Public Transit Fund 3,000$ 3,000$
Total Apportionment 142,500$ 192,500$ Source: Office of State Finance
Preliminary Apportionment ($ in 000's)
The OK Tourism and Passenger Rail Revolving Fund is apportioned $2 million and the Public Transit Revolving Fund is apportioned $3 million. Both of these funds receive individual income tax that is apportioned to the General Revenue Fund. The apportionments to these funds stay the same year after year regardless of the finding made by the Board of Equalization.
FY-2009 Recommendation Rebuilding Oklahoma Access and Driver Safety (ROADS) Fund The Governor’s budget recommends that the 3% growth trigger be removed from the ROADS Fund to ensure more money is invested in repairing Oklahoma’s roads and bridges. Local Roads and Bridges The Governor’s budget recommends the establishment of a low interest loan revolving fund for local road and bridge projects. These funds can only be accessed by local governments. The State Transportation Fund (STF) is the primary state funding source for ODOT. Through a law change during the 2006 Session, this fund became a revolving fund. Due to the nature of the revolving fund, the Legislature will authorize ODOT to spend a certain amount of the STF instead of appropriating money from it. For FY-2009, the STF is estimated to collect $208.4 million, all of which is available to authorize.

FY-2009 Executive Budget
VETERANS AFFAIRS B-245
Oklahoma Department of Veterans Affairs
Notable Achievements • New Human Resources System ODVA implemented a new Human
Resources system that will provide ODVA with better integrated and more accurate HR records. As part of the new HR system ODVA implemented a new Nurse Scheduling system that will allow better allocation of resources for the care of the veterans.
• Continued Compliance USDVA Standards All seven of ODVA’s centers have continued to be fully licensed by the USDVA. Maintaining licensing requires the ODVA to be up to the latest VA standards. In 2007, this required ODVA to meet new pharmacological regulations on the mixing of IV drugs.
• Continued assistance to Oklahoma’s’ Veterans ODVA’s claims and benefits department has continued to work to help veterans get their benefits and to provide aid when they need it. This year, in addition to the normal assistance, the agency helped 58 veteran-families in eastern Oklahoma who were impacted by a flood.
Mission The Oklahoma Department of Veterans Affairs provides medical and rehabilitative services for veterans and their families. The Department operates seven long term care centers located in Norman, Clinton, Ardmore, Sulphur, Claremore, Talihina and Lawton. The Centers provide intermediate to skilled nursing care and domiciliary care for war time veterans. In FY-2007, the average daily population in the Oklahoma Centers was approximately 1,381. The Department estimates that during FY-2007, over 187 honorably discharged veterans were on a waiting list for admission to one of the veterans centers.
Number of Veterans on Waiting List Ardmore 5 Claremore 35 Clinton 6 Norman 38 Sulphur 0 Talihina 0 Lawton 103 TOTAL 187 The Department’s funding comes from three primary sources. These sources are patient revenue, state appropriations and a federal per diem payment per veteran in each center. Each of the three funding sources makes up roughly one-third of the total. Nationally, federal funding for these centers makes up 31% of the total.
FY-2007 Expenditures by Fund Total Expenditures = $105.6 million
Source: Office of State Finance
Revolving32%
Federal31%
Appropriated 35%
Bed Occupancy and Cost
FY-2007 Patients per Center
Ard
mor
e
Cla
rem
ore
Clin
ton
Nor
man
Su
lph
ur
Talih
ina
Law
ton
Avg. # of Patients 168 290 145 286 124 168 200
Available Beds 175 302 148 301 132 175 200
Percent Filled 96% 96% 98% 95% 94% 96% 100%
Per Capita Cost
$202 $163 $207 $170 $230 $202 $207
The following chart shows the average daily per capita cost by facility in FY-2007.
Formatted: Font: 12 pt, Bold
Formatted: Font: 10 pt, Not Bold

FY-2009 Executive Budget
VETERANS AFFAIRS B-246
FY-2007 Average Cost Per Day Per Center
Source: ODVA
$0.00
$50.00
$100.00
$150.00
$200.00
$250.00
Ardmor
e
Clarem
ore
Clinton
Norman
Sulph
ur
Talih
ina
Lawton
Cost Comparison to Other States The national average cost per day in state operated Veterans Centers was $213.07 in 2007. The average cost per day during the same time period in Oklahoma centers was $197.25. Federal Funds The U.S. Department of Veterans Affairs (USDVA) pays for a portion of the care provided in our Veterans Centers. Payment is made for each day and each bed that is occupied. Federal per diem payments usually increase each year, but by varying amounts.
USDVA Per Diem Payments by Federal Fiscal Year
Source: USDVA & ODVA
$63.40$67.71
$57.78$56.24$59.36
$0.00
$20.00
$40.00
$60.00
$80.00
2003 2004 2005 2006 2007
FY-2009 Recommendation
FY-2008 Appropriation $40,283FY-2008 Bud. FTE Level 1,941.3Actual Ave. YTD FTE 1,857.8
Funding Adjustments:Increased Operating Costs 250State Employee Pay Raise 1,215 Total Adjustments 1,465FY-2009 Recommendation $41,748% Change from FY-2008 3.64%
Source: Office of State Finance
FY-2009 Appropriation(amounts in thousands)
Increased Operating Costs The Governor’s budget includes $250,000 to help the Department cover the increased cost of medical supplies, food and energy. State Employee Pay Raise The Governor’s budget includes $1,215,060 for a 5% state employee pay increase for the Oklahoma Department of Veteran’s Affairs effective January 1, 2009. This funding is based on October 2007 salary information.
Formatted: Border: Top: (Singlesolid line, Auto, 1.5 pt Line width)
Formatted: Font: 10 pt
FY-2009 Executive Budget
LEGISLATURE B-247
House of Representatives, Legislative Service Bureau
and State Senate The House of Representatives, Legislative Service Bureau (LSB) and the State Senate represent the legislative branch. The Oklahoma Legislature consists of 101 members in the House of Representatives and 48 members in the State Senate. They convene annually beginning on the first Monday in February, and adjourn on the last Friday in May. Normally, the Legislature is in session Monday through Thursday. Extra sessions may be called by the Governor or by the Legislature. State Senators serve four-year terms with half of the members elected every 2 years. Members of the House of Representatives serve two-year terms. Each house of the Legislature considers four different types of legislation: • Bills that will become law when passed by
both houses and signed by the Governor; • Joint Resolutions that have the effect of
law if passed by both houses and signed by the Governor but may not become part of the statutes;
• Concurrent resolutions which express the
will of both of the houses; and • Simple resolutions, which express the will
of the house of origin. In 1990, voters in Oklahoma decided to adopt term limits for legislators. Therefore, legislators have a 12-year limit on service in the House of Representatives, the Senate, or both.

FY-2009 Executive Budget
LEGISLATURE B-248
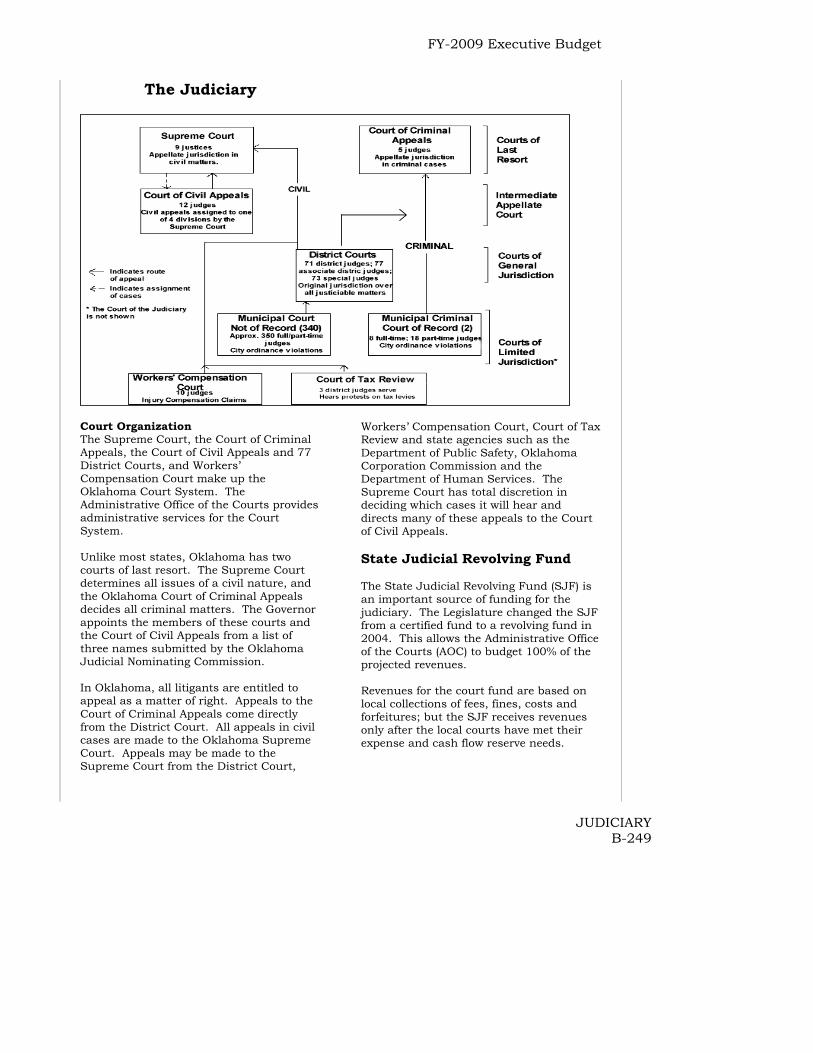
FY-2009 Executive Budget
JUDICIARY B-249
The Judiciary
Court Organization The Supreme Court, the Court of Criminal Appeals, the Court of Civil Appeals and 77 District Courts, and Workers’ Compensation Court make up the Oklahoma Court System. The Administrative Office of the Courts provides administrative services for the Court System. Unlike most states, Oklahoma has two courts of last resort. The Supreme Court determines all issues of a civil nature, and the Oklahoma Court of Criminal Appeals decides all criminal matters. The Governor appoints the members of these courts and the Court of Civil Appeals from a list of three names submitted by the Oklahoma Judicial Nominating Commission. In Oklahoma, all litigants are entitled to appeal as a matter of right. Appeals to the Court of Criminal Appeals come directly from the District Court. All appeals in civil cases are made to the Oklahoma Supreme Court. Appeals may be made to the Supreme Court from the District Court,
Workers’ Compensation Court, Court of Tax Review and state agencies such as the Department of Public Safety, Oklahoma Corporation Commission and the Department of Human Services. The Supreme Court has total discretion in deciding which cases it will hear and directs many of these appeals to the Court of Civil Appeals. State Judicial Revolving Fund The State Judicial Revolving Fund (SJF) is an important source of funding for the judiciary. The Legislature changed the SJF from a certified fund to a revolving fund in 2004. This allows the Administrative Office of the Courts (AOC) to budget 100% of the projected revenues. Revenues for the court fund are based on local collections of fees, fines, costs and forfeitures; but the SJF receives revenues only after the local courts have met their expense and cash flow reserve needs.

FY-2009 Executive Budget
JUDICIARY B-250
Actual Actual Actual Estimated$000's FY-2004 FY-2005 FY-2006 FY-2007
Total Collections $77,049 $78,969 $79,083 $78,969Local Court Expenditures $40,772 $42,301 $45,046 $42,301Law Library $1,766 $1,368 $1,321 $1,368St. Judicial Fund Deposits $31,236 $38,563 $36,018 $38,563
Title 20 of the Oklahoma Statutes, Section 1301 et seq. states: “All fees, fines, costs and forfeitures shall, when collected by the court clerk, be deposited in a fund in the county treasury designated ‘The Court Fund’, and shall be used, from year to year, in defraying the expenses of holding court in said county.” County court clerks deposit in the SJF the amount by which local court receipts exceed expenses for the reporting period. The statute also allows court clerks to retain 20% of their expenses for the reporting period from the excess amount. Title 20 of the Oklahoma Statutes, Section 1308 requires court fund transfers to be either quarterly or monthly, depending on county population. Over the past years, court fund collections have experienced solid growth. Local court expenditures, however, have grown at a slightly higher rate. Local court obligations fall into three basic categories: 1. Lump sum expenses: Jurors and
witnesses, guardianship evaluations, publications, supplies, telephones, etc.;
2. Restricted expenses: Renovation,
remodeling, maintenance, furniture and fixtures, part-time bailiffs, part-time court clerks (which are generally full-time employees), per diem court reporters, etc.; and
3. Mandated expenses: Law library
assessments and contributions to the SJF.
SOURCE: The Administrative Office of the Courts Lump sum expenditures are closely related to court caseloads and case complexities. These costs vary from year to year. Restricted expenditures relate to work force
and facility needs and tend to be predictable. Mandated expenditures are established by law. Over the last ten years, certain local court expenses have shifted from the local court budget to the state budget. Expenses now paid at the state level include the cost of providing indigent criminal defense for 75 counties and the elimination of the requirement to place or apportion 10% of court fund collections to the State Judicial Retirement Fund. This cost-shift has offset even greater growth in local court expenditures and allowed court fund collections continued growth.

FY-2009 Executive Budget
JUDICIARY B-251
Court of Criminal Appeals The Court of Criminal Appeals is the highest court in the State of Oklahoma with appellate jurisdiction in criminal cases. It is the state court of last resort in criminal matters, with appeals coming directly from the District Courts and Municipal Courts of Record. The Court also promulgates rules, procedures and uniform jury instructions in criminal cases. Judge Gary Lumpkin is presiding judge. In recent years, the Court of Criminal Appeals has eliminated a backlog of cases, guaranteeing that both the State and individual litigants now have a speedy resolution of appellate issues relating to crimes committed in Oklahoma. As of June 30, 2007, the Court had approximately 755 appeal cases pending – an decrease over the 880 cases pending on July 1, 2006. There were approximately 1,287 cases filed during fiscal year 2007.
Criminal Appeals Caseload
1200
1250
1300
1350
1400
2004 2005 2006
Source: Court of Criminal Appeals
FY-2009 Recommendation
FY-2008 Appropriation $3,490FY-2008 Bud. FTE Level 36.0Actual Ave. YTD FTE 32.1
Funding Adjustments:State Employee Pay Raise 38
FY-2009 Recommendation $3,528% Change from FY-2008 1.09%
Source: Office of State Finance
FY-2009 Appropriation(amounts in thousands)
State Employee Pay Raise The Governor’s budget includes $37,742 for a 5% state employee pay increase for the Court of Criminal Appeals effective January 1, 2009. This funding is based on October 2007 salary information.

FY-2009 Executive Budget
JUDICIARY B-252
District Courts In Oklahoma, the court of general jurisdiction is the District Court. Seventy-seven district courts hear both criminal and civil cases and form the backbone of the court system. Currently, there are nine judicial administrative districts managing 26 judicial districts in the State of Oklahoma. Presiding judges are elected by their peers to assist in the administration of Oklahoma’s trial courts. The elected positions of District Judge, Associate District Judge and Special Judge often serve as the first contact a person may have with the judicial system. Under the current system, the District Courts collect fines, fees and bond forfeitures. Local courts deposit a portion in the Law Library Fund, cover local operating expenditures and deposit the remaining amount in the State Judicial Fund. District Court Funding Resources:
$000's FY-2005 FY-2006 FY-2007 FY-2008General Revenue $6,072 $962 $16,220 $21,450State Judicial Fund 22 46,338 38,183 36,225Special Cash 0 0 0 0443 Fund 26278 0 0 0
TOTAL $32,372 $47,300 $54,403 $57,675Note: The State Judicial Fund was converted to a Revolving Fund in FY-2005. Deposits to the Revolving Fundare shown under the 443 Fund.
FY-2009 Recommendation
FY-2008 Appropriation $57,675FY-2008 Bud. FTE Level 645.0Actual Ave. YTD FTE 636.4
Funding Adjustments:State Employee Pay Raise 491
FY-2009 Recommendation $58,166% Change from FY-2008 0.85%
Source: Office of State Finance
FY-2009 Appropriation(amounts in thousands)
State Employee Pay Raise The Governor’s budget includes $490,959 for a 5% state employee pay increase for District Courts effective January 1, 2009. This funding is based on October 2007 salary information.

FY-2009 Executive Budget
JUDICIARY B-253
Supreme Court The Oklahoma Supreme Court is the highest court in Oklahoma for civil matters. The Court consists of nine Justices. Each Justice is selected from one of nine judicial districts. The Justices stand for retention on a six-year rotating schedule. The retention ballot appears on general election ballots and is a non-partisan, non-competitive election process. Chief Justice James R. Winchester is presiding judge and James E. Edmondson is Vice-Chief Justice. The Court has been successful in eliminating a backlog of cases from more than 3,300 in 1998. Besides deciding cases, this court is also responsible for administering the State’s entire judicial system.
Case-backlog Reduction
3,331
1,476
0
500
1,000
1,500
2,000
2,500
3,000
3,500
1998 2003
Source: Supreme Court The Court recently published its annual report, the first one in six years. There were two more counties added to the Oklahoma State Courts Network website and preparations began to add two more, for a total of 74 counties’ courts represented and searchable. Wiley Post Building Renovation The Supreme Court is currently in the process of renovating the Wiley Post Historical Building for use as a Judicial Center to house the Oklahoma State Supreme Court, the Court of Criminal Appeals, the Court of Civil Appeals, Administrative Offices of the Courts and the Court Clerk. The target date of completion is extended to mid-2009.
FY-2009 Recommendation
FY-2008 Appropriation $19,421FY-2008 Bud. FTE Level 215.0Actual Ave. YTD FTE 163.8
Funding Adjustments:State Employee Pay Raise 305
FY-2009 Recommendation $19,726% Change from FY-2008 1.57%
Source: Office of State Finance
FY-2009 Appropriation(amounts in thousands)
State Employee Pay Raise The Governor’s budget includes $305,031 for a 5% state employee pay increase for the Supreme Court effective January 1, 2009. This funding is based on October 2007 salary information.

FY-2009 Executive Budget
JUDICIARY B-254
Workers’ Compensation Court
The Workers’ Compensation Court is comprised of ten Judges who are appointed by the Governor. It is the mission of the Workers’ Compensation Court to apply the law as set out in the Oklahoma Workers’ Compensation Act. It is the responsibility of this limited tribunal to provide fair and timely resolution of disputes and identification of issues involving on-the-job injuries. Judges also participate in educational seminars and the Court sponsors a biennial conference. Judge Gene Prigmore is the current presiding judge. Following major reforms enacted in July 2005, the Workers’ Compensation Court adopted new rules which were approved by the Supreme Court and became effective on January 30, 2006. The Court amended its forms and processes and sponsored and participated in numerous educational seminars on these changes. The Court also implemented a Mediation System consistent with this reform legislation to provide employees and employers convenient access to informal procedures for resolution of a workers’ compensation dispute.
Court Orders Given
14,000
15,000
16,000
17,000
18,000
FY-2003 FY-2004 FY-2005 FY-2006 FY-2007
Total Number of Hearings
0
20,000
40,000
60,000
80,000
100,000
FY-2003 FY-2004 FY-2005 FY-2006 FY-2007
Source: Workers' Compensation Court
FY-2009 Recommendation
FY-2008 Appropriation $5,242FY-2008 Bud. FTE Level 86.3Actual Ave. YTD FTE 82.0
Funding Adjustments:State Employee Pay Raise 123
FY-2009 Recommendation $5,365% Change from FY-2008 2.35%
Source: Office of State Finance
FY-2009 Appropriation(amounts in thousands)
State Employee Pay Raise The Governor’s budget includes $123,448 for a 5% state employee pay increase for the Workers’ Compensation Court effective January 1, 2009. This funding is based on October 2007 salary information.
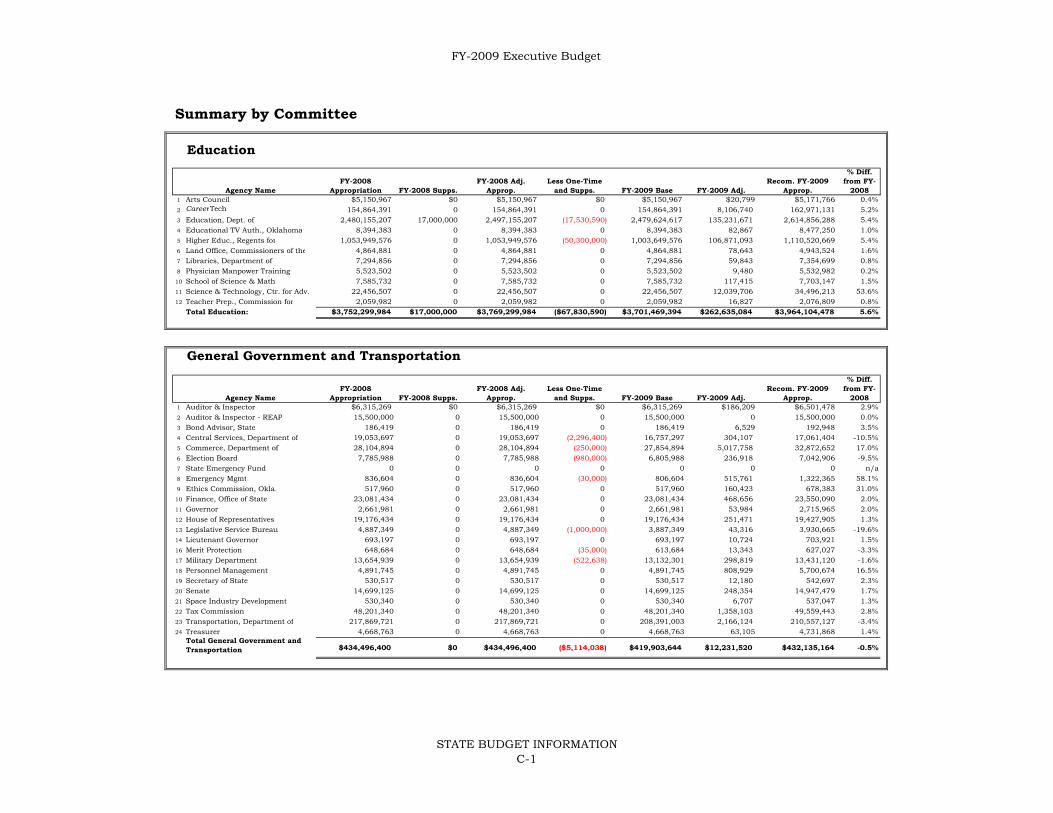
FY-2009 Executive Budget
Summary by Committee
Education
1 Arts Council $5,150,967 $0 $5,150,967 $0 $5,150,967 $20,799 $5,171,766 0.4%2 CareerTech 154,864,391 0 154,864,391 0 154,864,391 8,106,740 162,971,131 5.2%3 Education, Dept. of 2,480,155,207 17,000,000 2,497,155,207 (17,530,590) 2,479,624,617 135,231,671 2,614,856,288 5.4%4 Educational TV Auth., Oklahoma 8,394,383 0 8,394,383 0 8,394,383 82,867 8,477,250 1.0%5 Higher Educ., Regents for 1,053,949,576 0 1,053,949,576 (50,300,000) 1,003,649,576 106,871,093 1,110,520,669 5.4%6 Land Office, Commissioners of the 4,864,881 0 4,864,881 0 4,864,881 78,643 4,943,524 1.6%7 Libraries, Department of 7,294,856 0 7,294,856 0 7,294,856 59,843 7,354,699 0.8%8 Physician Manpower Training 5,523,502 0 5,523,502 0 5,523,502 9,480 5,532,982 0.2%10 School of Science & Math 7,585,732 0 7,585,732 0 7,585,732 117,415 7,703,147 1.5%11 Science & Technology, Ctr. for Adv. 22,456,507 0 22,456,507 0 22,456,507 12,039,706 34,496,213 53.6%12 Teacher Prep., Commission for 2,059,982 0 2,059,982 0 2,059,982 16,827 2,076,809 0.8%
Total Education: $3,752,299,984 $17,000,000 $3,769,299,984 ($67,830,590) $3,701,469,394 $262,635,084 $3,964,104,478 5.6%
General Government and Transportation
1 Auditor & Inspector $6,315,269 $0 $6,315,269 $0 $6,315,269 $186,209 $6,501,478 2.9%2 Auditor & Inspector - REAP 15,500,000 0 15,500,000 0 15,500,000 0 15,500,000 0.0%3 Bond Advisor, State 186,419 0 186,419 0 186,419 6,529 192,948 3.5%4 Central Services, Department of 19,053,697 0 19,053,697 (2,296,400) 16,757,297 304,107 17,061,404 -10.5%5 Commerce, Department of 28,104,894 0 28,104,894 (250,000) 27,854,894 5,017,758 32,872,652 17.0%6 Election Board 7,785,988 0 7,785,988 (980,000) 6,805,988 236,918 7,042,906 -9.5%7 State Emergency Fund 0 0 0 0 0 0 0 n/a8 Emergency Mgmt 836,604 0 836,604 (30,000) 806,604 515,761 1,322,365 58.1%9 Ethics Commission, Okla. 517,960 0 517,960 0 517,960 160,423 678,383 31.0%10 Finance, Office of State 23,081,434 0 23,081,434 0 23,081,434 468,656 23,550,090 2.0%11 Governor 2,661,981 0 2,661,981 0 2,661,981 53,984 2,715,965 2.0%12 House of Representatives 19,176,434 0 19,176,434 0 19,176,434 251,471 19,427,905 1.3%13 Legislative Service Bureau 4,887,349 0 4,887,349 (1,000,000) 3,887,349 43,316 3,930,665 -19.6%14 Lieutenant Governor 693,197 0 693,197 0 693,197 10,724 703,921 1.5%16 Merit Protection 648,684 0 648,684 (35,000) 613,684 13,343 627,027 -3.3%17 Military Department 13,654,939 0 13,654,939 (522,638) 13,132,301 298,819 13,431,120 -1.6%18 Personnel Management 4,891,745 0 4,891,745 0 4,891,745 808,929 5,700,674 16.5%19 Secretary of State 530,517 0 530,517 0 530,517 12,180 542,697 2.3%20 Senate 14,699,125 0 14,699,125 0 14,699,125 248,354 14,947,479 1.7%21 Space Industry Development 530,340 0 530,340 0 530,340 6,707 537,047 1.3%22 Tax Commission 48,201,340 0 48,201,340 0 48,201,340 1,358,103 49,559,443 2.8%23 Transportation, Department of 217,869,721 0 217,869,721 0 208,391,003 2,166,124 210,557,127 -3.4%24 Treasurer 4,668,763 0 4,668,763 0 4,668,763 63,105 4,731,868 1.4%
Total General Government and Transportation $434,496,400 $0 $434,496,400 ($5,114,038) $419,903,644 $12,231,520 $432,135,164 -0.5%
% Diff. from FY-
2008Less One-Time
and Supps. FY-2009 Base FY-2009 Adj.Recom. FY-2009
Approp.Agency NameFY-2008
Appropriation FY-2008 Supps.FY-2008 Adj.
Approp.
% Diff. from FY-
2008Less One-Time
and Supps. FY-2009 Base FY-2009 Adj.Recom. FY-2009
Approp.Agency NameFY-2008
Appropriation FY-2008 Supps.FY-2008 Adj.
Approp.
STATE BUDGET INFORMATIONC-1

FY-2009 Executive Budget
Health and Social Services
1 Health Care Authority $771,709,298 $0 $771,709,298 $0 $771,709,298 $82,934,888 854,644,186 10.7%2 Health Department 73,786,143 0 73,786,143 0 73,786,143 5,187,103 $78,973,246 7.0%3 J.D. McCarty Center 4,452,961 0 4,452,961 0 4,452,961 1,158,230 5,611,191 26.0%4 Mental Health Department 207,529,129 0 207,529,129 (100,000) 207,429,129 12,555,645 219,984,774 6.0%5 University Hospitals Authority 41,865,342 0 41,865,342 0 41,865,342 0 41,865,342 0.0%6 Veterans Affairs Department 40,282,600 0 40,282,600 0 40,282,600 1,465,060 41,747,660 3.6%
Total Health and Social Services: $1,139,625,473 $0 $1,139,625,473 ($100,000) $1,139,525,473 $103,300,926 $1,242,826,399 9.1%
Human Services
1 Children & Youth, Commission on $2,334,473 $0 $2,334,473 $0 $2,334,473 $282,612 $2,617,085 12.1%2 Handicapped Concerns, Office of 412,769 0 412,769 0 412,769 6,688 419,457 1.6%3 Human Rights Commission 710,226 0 710,226 0 710,226 13,465 723,691 1.9%4 Human Services, Department of 557,107,190 0 557,107,190 0 557,107,190 20,734,732 577,841,922 3.7%5 Indian Affairs Commission 258,466 0 258,466 0 258,466 3,467 261,933 1.3%6 Juvenile Affairs, Office of 110,060,812 2,092,950 112,153,762 (2,092,950) 110,060,812 6,083,017 116,143,829 3.6%7 Rehabilitation Services, Dept. of 29,474,679 0 29,474,679 0 29,474,679 1,196,601 30,671,280 4.1%
Total Human Services: $700,358,615 $2,092,950 $702,451,565 ($2,092,950) $700,358,615 $28,320,582 $728,679,197 3.7%
Public Safety and Judiciary
1 A.B.L.E. Commission $3,925,266 $0 $3,925,266 $0 $3,925,266 $66,428 $3,991,694 1.7%2 Attorney General 13,944,449 0 13,944,449 0 13,944,449 1,551,020 15,495,469 11.1%3 Corrections Department 477,543,364 21,000,000 498,543,364 (21,000,000) 477,543,364 42,685,189 520,228,553 8.9%4 Court of Criminal Appeals 3,489,631 0 3,489,631 0 3,489,631 37,742 3,527,373 1.1%5 District Attorneys Council 39,920,210 0 39,920,210 0 39,920,210 4,515,151 44,435,361 11.3%6 District Courts 57,674,778 0 57,674,778 0 57,674,778 490,959 58,165,737 0.9%7 Fire Marshal 2,270,855 68,000 2,338,855 (68,000) 2,270,855 41,403 2,312,258 1.8%8 Indigent Defense System 16,304,008 0 16,304,008 0 16,304,008 218,015 16,522,023 1.3%9 Investigation, Bureau of 17,316,450 0 17,316,450 0 17,316,450 462,900 17,779,350 2.7%10 Judicial Complaints, Council 283,729 0 283,729 0 283,729 3,600 287,329 1.3%11 Law Enf. Educ. & Training 4,410,370 0 4,410,370 0 4,410,370 51,830 4,462,200 1.2%12 Medicolegal Investigations Board 4,825,625 980,598 5,806,223 (980,598) 4,825,625 1,052,765 5,878,390 21.8%13 Narc. & Dang. Drugs Control 6,773,895 0 6,773,895 0 6,773,895 152,894 6,926,789 2.3%14 Pardon & Parole Board 2,577,581 0 2,577,581 0 2,577,581 49,275 2,626,856 1.9%15 Public Safety Department 98,370,391 0 98,370,391 (1,200,000) 97,170,391 4,863,663 102,034,054 3.7%16 Supreme Court 19,420,570 0 19,420,570 0 19,420,570 305,031 19,725,601 1.6%17 Workers' Compensation Court 5,242,033 0 5,242,033 0 5,242,033 123,448 5,365,481 2.4%
Total Public Safety and Judiciary $774,293,205 $22,048,598 $796,341,803 ($23,248,598) $773,093,205 $56,671,313 $829,764,518 7.2%
Notes:6
% Diff. from FY-
2008
The District Courts' appropriation includes income to the State Judicial Revolving Fund.
Less One-Time and Supps. FY-2009 Base FY-2009 Adj.
Recom. FY-2009 Approp.Agency Name
FY-2008 Appropriation FY-2008 Supps.
FY-2008 Adj. Approp.
% Diff. from FY-
2008
Agency NameFY-2008
Appropriation FY-2008 Supps.FY-2008 Adj.
Approp.Less One-Time
and Supps. FY-2009 Base FY-2009 Adj.Recom. FY-2009
Approp.
% Diff. from FY-
2008
Less One-Time and Supps. FY-2009 Base FY-2009 Adj.
Recom. FY-2009 Approp.Agency Name
FY-2008 Appropriation FY-2008 Supps.
FY-2008 Adj. Approp.
STATE BUDGET INFORMATIONC-2

FY-2009 Executive Budget
Natural Resources
1 Agriculture $33,678,049 $0 $33,678,049 ($492,864) $33,185,185 $494,503 $33,679,688 0.0%2 Centennial Commission 1,066,511 0 1,066,511 (1,066,511) 0 0 0 -100.0%3 Conservation Commission 9,187,084 0 9,187,084 0 9,187,084 72,648 9,259,732 0.8%4 Consumer Credit Commission 669,042 0 669,042 0 669,042 17,908 686,950 2.7%5 Corporation Commission 12,210,417 0 12,210,417 0 12,210,417 599,780 12,810,197 4.9%6 Environmental Quality 9,728,096 0 9,728,096 0 9,728,096 804,648 10,532,744 8.3%7 Historical Society, Oklahoma 14,687,451 0 14,687,451 (100,000) 14,587,451 158,078 14,745,529 0.4%8 Horse Racing Commission 2,669,568 0 2,669,568 0 2,669,568 86,180 2,755,748 3.2%9 Insurance Department 2,515,943 0 2,515,943 0 2,515,943 185,156 2,701,099 7.4%10 J.M. Davis Memorial Comm 535,403 0 535,403 (150,000) 385,403 9,516 394,919 -26.2%11 Labor Department 3,760,284 0 3,760,284 0 3,760,284 119,850 3,880,134 3.2%12 Mines, Department of 1,013,586 0 1,013,586 0 1,013,586 34,509 1,048,095 3.4%13 Scenic Rivers Commission 345,322 0 345,322 0 345,322 15,390 360,712 4.5%15 Tourism & Recreation 27,826,991 0 27,826,991 0 27,826,991 954,020 28,781,011 3.4%16 Water Resources Board 6,801,524 0 6,801,524 0 6,801,524 146,268 6,947,792 2.2%18 Will Rogers Memorial Comm. 1,083,702 0 1,083,702 (150,000) 933,702 18,590 952,292 -12.1%
Total Natural Resources: $127,778,973 $0 $127,778,973 ($1,959,375) $125,819,598 $3,717,044 $129,536,642 1.4%
State Total $6,928,852,650 $41,141,548 $6,969,994,198 ($100,345,551) $6,860,169,929 $466,876,469 $7,327,046,398
% Diff. from FY-
2008Agency NameFY-2008
Appropriation FY-2008 Supps.FY-2008 Adj.
Approp.Less One-Time
and Supps. FY-2009 Base FY-2009 Adj.Recom. FY-2009
Approp.
STATE BUDGET INFORMATIONC-3
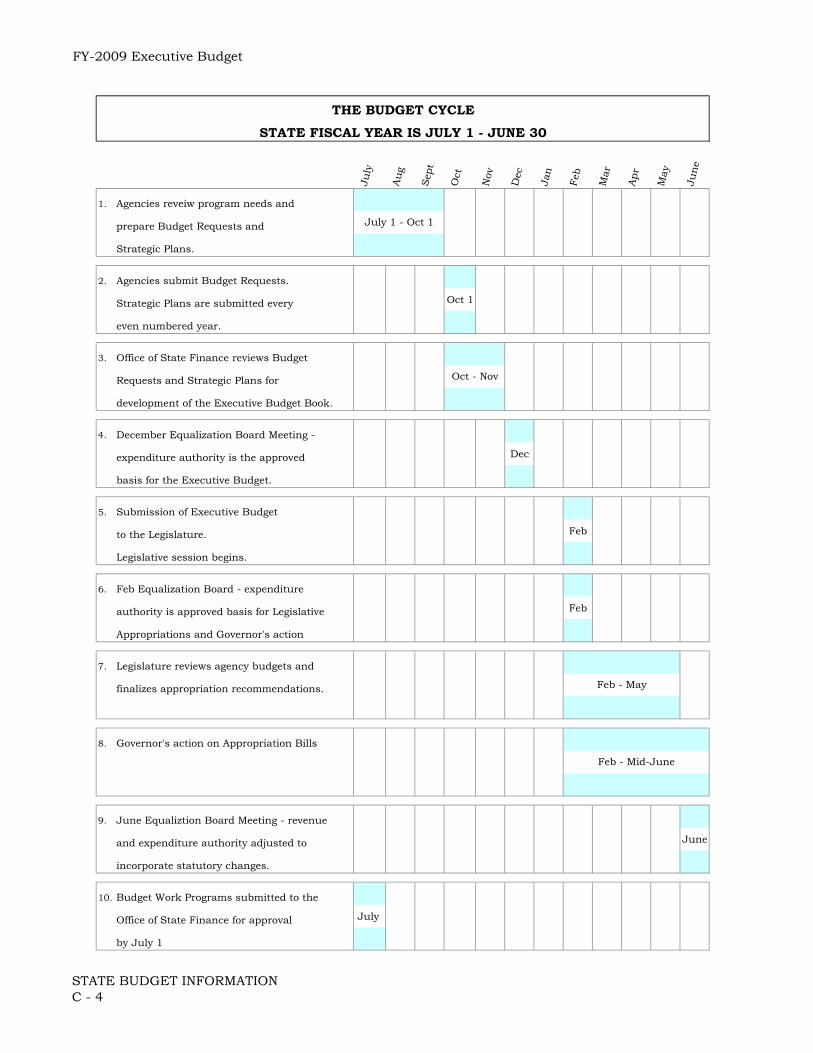
FY-2009 Executive Budget
THE BUDGET CYCLESTATE FISCAL YEAR IS JULY 1 - JUNE 30
July
Au
g
Sept
Oct
Nov
Dec
Jan
Feb
Mar
Apr
May
June
1. Agencies reveiw program needs and
prepare Budget Requests and
Strategic Plans.
2. Agencies submit Budget Requests.
Strategic Plans are submitted every Oct 1
even numbered year.
3. Office of State Finance reviews Budget
Requests and Strategic Plans for
development of the Executive Budget Book.
4. December Equalization Board Meeting -
expenditure authority is the approved Dec
basis for the Executive Budget.
5. Submission of Executive Budget
to the Legislature. Feb
Legislative session begins.
6. Feb Equalization Board - expenditure
authority is approved basis for Legislative Feb
Appropriations and Governor's action
7. Legislature reviews agency budgets and
finalizes appropriation recommendations.
8. Governor's action on Appropriation Bills
9. June Equaliztion Board Meeting - revenue
and expenditure authority adjusted to June
incorporate statutory changes.
10. Budget Work Programs submitted to the
Office of State Finance for approval July
by July 1
Feb - May
Feb - Mid-June
Oct - Nov
July 1 - Oct 1
STATE BUDGET INFORMATIONC - 4
FY-2009 Executive Budget
Oklahoma State Budget Process – State Fiscal Year is July 1 through June 30.
1. Agencies review program performance and financial needs for preparation of the Budget Request and Strategic Plan
2. The Budget Request is the legal document which contains all financial and program
information for each agency including a listing of all requests for additional state funds and changes in revolving or federal funds. Budget Requests must be submitted October 1 of every year under Section 41.29 of Title 62. Agency Strategic Plans include each agency’s mission, goals and performance measures within a five year time line. Section 45.3 of Title 62 requires strategic plans to be submitted October 1 of every even-numbered year.
3. The Office of State Finance Budget Division reviews agency budget requests and
holds agency budget request hearings for development of the Executive Budget. 4. December Equalization Board Meeting – The Equalization Board is the constitutional
body responsible for setting revenue and expenditure authority for the Governor and Legislature (Sec. 23 Art. 10 of Oklahoma Constitution). The limit approved at this meeting is the amount used for development of the Executive Budget Book.
5. Submission of Executive Budget – The Governor is required to submit an Executive
Budget to the Legislature on the first Monday of each regular legislative session. The budget must be balanced using the December Equalization Board amounts.
6. February Equalization Board Meeting – The Board is constitutionally required under
Section 23 of Article 10 to meet again and incorporate economic adjustments to the revenue and expenditure authority. The limit approved at this meeting constitutes the limit for Legislative appropriations action.
7. Legislative Appropriations Process – The appropriations subcommittees and
legislative staff of each house review agency budgets, budget requests and pass appropriation bills.
8. Governor acts, within constitutional time lines set forth in Sections 11 and 12 of
Article 6 of the Oklahoma Constitution, to sign, veto or pocket veto appropriation bills. 9. June Equalization Board Meeting – The board is authorized in Section 23 of Article 10
of the Oklahoma Constitution to meet and incorporate statutory changes that increase or decrease revenue and expenditure authority for the coming fiscal year.
10. Agency Budget Work Programs are required under Section 41.7c of Title 62 and serve
as the official plan of how the agency intends to utilize available funds to accomplish statutory duties and responsibilities. The document is due on or as close thereafter June 1 and is approved July 1.
STATE BUDGET INFORMATION C – 5

FY-2009 Executive Budget
STATE BUDGET INFORMATION C-6
Oklahoma State Budget Process State Equalization Board The Oklahoma Constitution provides for a number of checks and balances to ensure the Governor and Legislature maintain a balanced budget every year. One of the most important provisions is Section 23 of Article 10 which outlines the framework for how Oklahoma sustains a balanced budget. This section designates the State Board of Equalization as the body responsible for establishing expenditure limits for the Governor and the Legislature. The Board of Equalization is comprised of the Governor, Lieutenant Governor, Treasurer, Auditor and Inspector, Attorney General, Superintendent of Public Instruction and Secretary of Agriculture
Pursuant to Section 23, the Equalization Board must meet at least two times every fiscal year:
• “no more than 45 days but no less than 35 days before the start of the legislative session” (sometime in late December or early January); and
• “within five days after the monthly apportionment in February of each year”. The Board can only meet again and adjust revenue estimates if the Legislature and Governor enact laws during regular or special session that reduce or increase revenue certified by the board, transfer cash from one fund to another or establish a new certified appropriated fund. In practice, the Equalization Board meets in June to incorporate legislative changes enacted during the session and re-certify revenue available for the coming fiscal year. The benefit of this approach is that both the executive and legislative body are required to use the same revenue estimate and expenditure limit. State expenditures passed by the Legislature and enacted by the Governor cannot exceed the amount of funds certified and authorized by the Board. The Office of State Finance which staffs the Board, compiles revenue projections from various revenue collecting agencies throughout the state, analyzes the information and presents the information to the Board for its consideration and approval. Projections for the General Revenue Fund which makes up more than 80% of total state appropriated spending are estimated utilizing a state economic model developed by Oklahoma State University and modified to fit the state’s customized needs by Tax Commission staff. Revenue estimates presented to the Board are based on current and prior year collection trends, economic forecasts, federal tax law changes and other foreseeable factors. Revenue certified and authorized at the December Board meeting serves as the basis for the Governor’s Executive Budget. The Board considers possible revisions to the December estimate at the February meeting. Revisions to the December estimate are based on economic changes which have been noted since that time, which may increase or decrease anticipated revenue collections. The estimate approved at this meeting sets the limit on which legislative appropriations are based.

FY-2009 Executive Budget
STATE BUDGET INFORMATION C-7
State Revenues and Expenditures Spending Limits Oklahomans believe in responsible budgeting and limiting state expenditure growth to reasonable levels. This philosophy is cemented in paragraph 1 of Section 23 in Article 10 of the Constitution. Increases in Legislative appropriations in any year are limited to no more than 12% more than the preceding year’s level, adjusted for inflation. Oklahoma’s budget over the past ten years has increased at an average rate of 4.89% in nominal terms. This rate of growth is actually less than the 5.0% average increase in personal income over the past decade. Paragraph 1 of Section 23 provides an additional limit for Oklahoma’s state budget. This paragraph limits expenditures of certified funds to 95% of the Equalization Board estimate. This internal safeguard protects agency budgets from mild fluctuations in revenues in the event revenues do not meet the 100% estimate. Certain statutory revolving funds are also included in the executive and legislative expenditure authority considered by the Equalization Board. Estimates for revolving funds are included for informational purposes. The Equalization Board does not have to approve them since they are not certified funds. Unlike certified funds, the Governor and Legislature can spend 100% of the revolving fund estimate. There are six revolving fund estimates that are included in the executive and legislative expenditure authority. Revenues from four of the six funds are specifically dedicated to education purposes. Funds from the Tobacco Settlement Fund are directed for health services and the Judicial Fund is directed for district court operations. Cash Management Another internal budget control is provided in Section 10.1 of Title 62 of the Oklahoma Statutes which creates the Cash Flow Reserve Fund (CFRF). The CFRF is used for two purposes: (1) to make allocations to agencies in July since the General Revenue Fund (GRF) for that year has no collections until the end of July, and (2) to ensure that each monthly allocation of revenue to agencies is equal to one-twelfth of the money appropriated by the Legislature. This second purpose is intended to protect State agencies from variation in monthly revenue collection patterns and in practice the CFRF is used to make up the difference between actual collections in a month and the required allocations. Money is deposited into the Cash Flow Reserve Fund for the next fiscal year from current year General Revenue Fund collections that are in excess of the amount appropriated from the fund. The limit on deposits into the Cash Flow Reserve Fund is 10% of the amount certified by the Board of Equalization as available for appropriation from the General Revenue Fund for the next year. General Revenue Fund collections that are in excess of the certified estimate cannot be used to make deposits to the Cash Flow Reserve Fund as those monies are directed elsewhere according to the State Constitution. Any excess General Revenue Fund collections for the current year after the Cash Flow Reserve Fund for the next year has been funded are carried forward as cash that is available for appropriation by the Legislature. Budget Stabilization Revenue collected in excess of 100% of the certified GRF estimate is deposited in the Constitutional Reserve Fund (CRF), known as the Rainy Day Fund, at the end of the fiscal year. Deposits into the CRF are limited to 10% of the certified actual collections to the GRF for the preceding fiscal year. The CRF can be accessed for three different and distinct purposes: emergencies, future year budget stabilization, and current year budget stabilization. Up to

FY-2009 Executive Budget
STATE BUDGET INFORMATION C-8
25% of the fund may be appropriated upon a declaration of an emergency by the Governor or three-fourths of both the House and Senate. Up to three-eighths of the CRF may be appropriated to make up any decline in revenue certified as available for appropriation by the Board of Equalization from one year to the next. The amount can not exceed the decline in certified revenue. The final three-eighths of the CRF may be appropriated to address a current year revenue shortfall. To access this money, the BOE must determine that a revenue failure has occurred in the GRF and appropriations from the CRF for this purpose are limited to the amount of the shortfall. Revenue Shortfalls The Director of the Office of State Finance (OSF) is statutorily charged with making allotments to agencies to control expenditures. State law also requires the State’s budget to remain in balance every fiscal year. Oklahoma is barred from expending more money than it collects in a given year. To ensure that revenues are sufficient to meet the appropriations specified by the Legislature, OSF closely monitors collections throughout the year. The allocation of appropriated monies to agencies occurs on the Tuesday following the second Monday of every month during a fiscal year. As we saw in FY-2002 and FY-2003, during times of economic recession state revenue collections can fall below the level of appropriations. Thus, limiting appropriations to only 95% of estimated collections is an insufficient measure to ensure the state maintains a balanced budget during times of severe economic distress. Title 62, Section 41.9 of the Oklahoma Statutes reads, in part:
“At the end of any fiscal year, the entire amount appropriated to any spending agency must be allotted by the Budget Director, except where the estimated budget resources during any fiscal year are insufficient to pay all of the appropriations for such year in full. The Budget Director shall not allot to any spending agency during any fiscal year, an amount which will be in excess of the amount of revenue collected and allocated to appropriations made to such spending agency. In the event of a failure of revenue, the Budget Director shall control the allotment authorizations to prevent obligations being incurred in excess of the revenue to be collected. However, the Budget Director shall make all reductions within each state fund where a revenue failure occurs apply to each department, institution, board, commission or special appropriation made by the State Legislature, in the ratio that its total appropriation for that fiscal year bears to the total of all appropriations for that fiscal year, as provided in Section 23, Article 10, of the Constitution of Oklahoma.”
This directs the Office of State Finance to allocate all of the money appropriated to state agencies, unless revenue collections are less than the amount appropriated. When this occurs, OSF is required by this statute to reduce the allocations to agencies to no more than the amount of revenue collected. Further, the reduction in allocations is to be effected upon all agencies receiving money from the fund in which the failure occurs. Each agency receives a proportional share of the reduction based on their share of appropriations compared to the total appropriations from the fund.
FY-2009 Executive Budget
STATE BUDGET INFORMATION C-9
Executive and Legislative Appropriations Process Executive Budget The Governor sets the tone for state budget recommendations with the submission of the Executive Budget on the first Monday in February of each regular legislative session. Section 41.34 of Title 62 requires the Governor to submit a balanced budget with detailed revenue and expenditure proposals to the presiding officer of each house. The Director of State Finance is required to prepare the document after reviewing state agency budgets, requests and developing recommendations. The proposals outlined in the Governor’s Executive Budget Book serve as the Governor's fiscal and policy priorities for the year. Legislative Process The Legislature reviews the Executive Budget and works with the Governor throughout the session to enact a balanced budget. Establishing the state budget is the responsibility of the appropriations committees of the Senate and the House of Representatives. The committees of each house work through appropriation subcommittees which are categorized by specific budget areas such as general government, education, health and safety and security. Subcommittees review agency budgets, requests for additional funding and Governor's recommendations.
The General Appropriations (GA) Bill is a method to provide a base level of funding. This provision is a safeguard to ensure state government programs and services do not shut down in the event the Legislature and the Governor are unable to agree on a budget. Historically, general appropriation bills are passed in March or April of the regular legislative session.
A recent addition to state law, Section 9.11 of Title 62, passed during the 2003 session requires the Legislature to present an appropriation bill to fully fund common education to the Governor at least 25 days prior to April 10 (subsection E of Section 6-101 of Title 70) but not later than April 1. Adjustments to increase or decrease the amount may still be made by the Legislature.
Appropriation decisions for agencies are typically not finalized until April or May when the General Conference Committee on Appropriations, or GCCA is convened. The primary difference between an appropriation subcommittee of the House or Senate and GCCA is that GCCA is comprised of both House and Senate members. Before beginning the GCCA process, the House and Senate agree to allocate a certain amount of available funding to each GCCA subcommittee. Before a formal appropriations bill is presented to either legislative body, the two houses must work together in GCCA, negotiate spending priorities and produce a unified budget together.
Appropriations bills may be written for individual agencies or groups of agencies that are within the same subject area such as education. In addition to appropriating funds for the coming fiscal year, appropriation bills also include agency spending limits, total personnel hiring limits, and the maximum salaries of directors. If the bills are approved by a majority of both houses, the appropriation bill is sent to the Governor. All legislation, including appropriation bills become effective 90 days after the end of the legislative session or later if a later effective date is specified. Legislation may become effective earlier if passed with an emergency clause. For an emergency clause to be enacted, two-thirds of each body must approve the emergency clause through a separate vote on the bill.

FY-2009 Executive Budget
STATE BUDGET INFORMATION C-10
Governor’s Action
Section 11 of Article 6 provides the Governor five working days, excluding Sundays, to enact or veto all or part of an appropriations bill while the Legislature is in regular session. If the Governor does not sign or veto a bill within five days, a bill automatically becomes law. The Governor has 15 working days to sign or veto a bill after the regular session has adjourned. Any bill presented to the Governor within five days of the end of the regular legislative session must be acted upon with the 15 days also. In contrast to actions taken during session, if the Governor does not sign or veto a bill within the 15 working days after session, the bill fails to become law. This is also referred to as a pocket veto.
In addition to these powers, Section 12 of Article 6 of the Oklahoma Constitution gives the Governor the authority to disapprove an entire appropriations bill or any item or single appropriation within the bill. This line-item veto power is one manner the Governor exercises control of state budget appropriations.
Vetoes may be overridden by two-thirds majority of each house for bills with no emergency clause and by three-fourths majority of each house for bills with an emergency clause.
Funds Subject to Appropriation
The State Board of Equalization, in accordance with Section 23, Article X of the Oklahoma Constitution, annually certifies the following funds as available for appropriation. Each of these funds is identified in the accounting structure with a three-digit code. The first two digits uniquely identify the fund. The last digit represents the year the funds were collected (e.g. "190" would be the
General Revenue Fund collected in FY-2000).
General Revenue Fund (Fund 19X):
Income to this fund is from state taxes, fees, regulatory functions, and income on money and property. Approximately one-half of all state revenue is deposited to this fund. Funds are appropriated for the operation of state government and other purposes specified by the Legislature. (Article 10, Section 2)
Council on Law Enforcement Education and Training (CLEET) Fund (Fund 58X): Income is derived from a penalty assessment fee. Any person penalized for violating Oklahoma law pays a penalty assessment. Income is dedicated to peace officer training. (Title 20, Section 1313.2; effective November 1, 1988)
Commissioners of the Land Office Fund (Fund 51X): This fund was created to receive revenue collected from surface leasing of lands managed by the Commissioners of the Land Office and 6 percent of the revenue generated from the Common School Fund, the Education Institutions Fund, the University of Oklahoma Fund, the University Preparatory School Fund, the Oklahoma State University Fund, the Public Building Fund, and the Greer 33 Fund. Funds are used for administrative costs of the Commissioners of the Land Office. Funds not used for administrative costs of the Commissioners of the Land Office are allocated to public schools. (Title 64, Section 15; effective July 1, 1992)
Mineral Leasing Fund (Fund 55X): Income to this fund is from a share of lease sales and royalty payments on oil and gas production on federal lands within the state. Funds are used for the financial support of public schools. (Title 62, Section 41.8; effective 1920)

FY-2009 Executive Budget
STATE BUDGET INFORMATION C-11
Special Occupational Health and Safety Fund (Fund 54X): Each insurance carrier writing Workers' Compensation Insurance in this state, the State Insurance Fund, and each self-insured employer authorized to make workers compensation payments directly to employees pays a sum equal to three-fourths of 1 percent of the total workers compensation losses, excluding medical payments and temporary total disability compensation. Funds are used exclusively for the operation and administration of the Occupational Health and Safety Standards Act of 1970 and other necessary expenses of the Department of Labor. (Title 40, Section 417.1; effective July 1, 1986)
Public Building Fund (Fund 11X): Income to the fund is from portions of leases, sales, rentals and royalties of lands set aside for public building purposes by the state's Enabling Act (Section 33) and lands granted in lieu thereof, under the management of the Commissioners of the Land Office. Funds are appropriated for major maintenance and capital improvements of public facilities. (Title 64, Section 371; effective 1910)
Oklahoma Education Lottery Trust Fund (Fund 38X): In November of 2004, voters passed State Question 706 which established this fund as one available for appropriation by the Legislature for the purposes of common education, higher education, and career technology education. Revenue deposited in the fund comes from net proceeds generated by the Oklahoma Lottery. .
Agency Budgets The state’s budget cycle can be divided into three areas:
• Agency Budget Work Programs • Agency Strategic Plans • Agency Budget Request • Financial Tools
The state’s budget is prepared on a cash basis utilizing encumbrance accounting. Encumbrances represent executed but unperformed purchase orders. In the State’s Comprehensive Annual Financial Report (CAFR) encumbrances are recorded as: (1) expenditures for budgetary purposes if expected to be presented for payment by November 15, following the end of the fiscal year and, (2) reservations of fund balance for GAAP purposes. Budget Work Programs Oklahoma statutes provide the legal framework under which state agencies budget and expend funds in a responsible manner. Section 41.7c of Title 62 requires every agency to submit a balanced budget on the first day in June or soon thereafter. Funds must be budgeted by program category and must conform to program categories and expenditure limits placed in law. Appropriation bills set maximum limits on the amount of state appropriated funds, revolving funds and federal funds that each program may budget and spend for the fiscal year. Maximum limits for personnel or full-time-equivalent (FTE) personnel, lease-purchase expenditures and director salaries are also defined in statute. Budget work programs must work within these parameters to provide a plan on how the agency will utilize all state, revolving and federal funds for the fiscal year. Work programs are reviewed by the Budget Division of OSF and the approved work program serves as a basis for the subsequent allotment of funds. Certified funds such as the General

FY-2009 Executive Budget
STATE BUDGET INFORMATION C-12
Revenue Fund are allotted to agencies on a monthly basis and cash appropriations are appropriated in a lump sum. Budget Work Programs can be revised at any time during the fiscal year if justified. Revisions can be accomplished within various expenditure, full-time-equivalent employee and transfer limits. Agencies are allowed under law (Section 41.46 of Title 62) to transfer up to a maximum of 25% of funds between line-items. The Contingency Review Board can approve transfers between line-items up to 40%. All transfers are subject to review by the Joint Legislative Committee on Budget and Program Oversight to determine if the transfer meets legislative intent or subverts the intention and objectives of the Legislature. Executive and legislative staff review agency budgets and expenditures throughout the year to ensure each agency is meeting program goals and stated legal expenditure limits. Strategic Planning Across the nation, states are in the process of implementing measures to improve efficiency and accountability in state government. Oklahoma is no different. Over the past seven years, the Executive and Legislative branch have implemented measures designed to focus on meaningful performance data which can then be used to make better budgeting decisions. Passed in 1999, the Oklahoma Program Performance Budgeting and Accountability Act required agencies to submit strategic plans defining their mission, vision, goals and performance measures. At the same time, state agency budget request forms were modified to incorporate program information and performance measures for every program category within an agency. Section 45.3 of Title 62 requires every agency to submit five year strategic plans on October 1 of every even numbered year. Strategic planning helps focus agency leadership and staff on short-term and long-term goals and how to achieve those goals. Outcome measures required in strategic plans and agency budget requests focus agency leadership and staff on monitoring and improving performance. This information is a valuable tool for policymakers. This performance information is also used in routine and special performance evaluations and policy analysis conducted by agencies, the Office of State Finance, legislative staff, Auditor and Inspector and outside consultants. Evaluating government programs and services using meaningful data, allows elected officials to make better, more informed budgeting decisions. Budget Request Section 41.29 of Title 62 requires agencies to submit a “Budget Request” on October 1, of every year. The budget request serves as the financial plan to the agency’s strategic plan. This document outlines program funding and performance information and includes a detailed listing of additional state funding requested by each agency. The Budget Division has been working with select agencies over the past two years to refine and improve funding and performance measure information submitted in the Budget Request and Strategic Plan. There is particular emphasis on unit costs and program performance. Copies of each agency’s budget request and strategic plan is submitted to the Office of State Finance, House and Senate staff and members of the Legislative Oversight Committee on State Budget and Performance. This committee, established in Section 41.47 of Title 62, is required to review each agency’s programs, funding and performance once every four years. Members are directed to utilize zero-base budgeting and performance base budgeting techniques.

FY-2009 Executive Budget
STATE BUDGET INFORMATION C-13
Financial Tools Comprehensive Annual Financial Report (CAFR) The CAFR is the primary means of reporting the financial activities for all state agencies. Prepared by the Division of Central Accounting and Reporting and in conformance with Governmental Accounting Standards Board (GASB) statements 34 and 35, this model provides a better picture of the state’s financial status as a single, unified entity. Financial statements contained in the CAFR include a statement of net assets and liabilities, statement of activities outlining major state expenditures, statement of Revenues, Expenditures and Changes in Fund Balances. The CAFR is a valuable tool to use when reviewing and analyzing overall state budget revenue and expenditure trends. Single Audit The Single Audit is prepared by the Auditor & Inspector’s Office to meet the requirements of the Single Audit Act. The federal funds expended by all State agencies (excluding higher education and civil emergency management) are included within the scope of the Single Audit. This report provides information on the type of federal funds available for state agencies such as block grants, entitlement programs, matching grants and reports federal fund expenditures for each agency. This report, required by the federal government ensures state agencies are properly expending and accounting for federal funds. Performance Audits Since FY-2002, the Office of the State Auditor and Inspector has been conducting performance audits, authorized by 74 O.S. Supp 2001, 213.2. A performance audit includes economy, efficiency, and program audits. Economy and efficiency audits determine whether the entity is utilizing its resources economically and efficiently. Auditors also determine the causes of inefficiencies or uneconomical practices. A program audit determines if a program is achieving the desired results or benefits established by the Legislature, or other authorizing body. Program audits also ascertain the effectiveness of organizations, programs, activities or functions. In practice, performance audits determine if an agency is focusing resources on activities that maximize productivity or outcomes. In addition to identifying efficiencies, performance audits can also identify areas worthy of additional state investment. This is another important tool for policymakers to utilize when reviewing the efficiency and effectiveness of agency programs and expenditures. Financial System Daily, monthly and annual reports generated from the Office of State Finance financial systems provide quality agency budgeting and expenditure reports which allow policymakers to track funds by program and object code. Other essential financial reports include budget to actual reports, cash balance and receipts and disbursements for funds. The Budget Request and Strategic Plan documents give policymakers the opportunity to review an agency’s mission, goals and performance to ensure resources are allocated to specified statutory duties and responsibilities. Not only do these financial tools ensure agencies are spending money appropriately but wisely. All of the financial tools mentioned can provide policymakers the opportunity to make informed fiscal policy recommendations based on quality financial and performance information.

FY-2009 Executive Budget
STATE BUDGET INFORMATION C-14
Capital Budget
The Capital Budget Process The State of Oklahoma’s Capital Improvement Plan (CIP) and the Long-Range Capital Planning Commission were established in 1992. This provided the infrastructure for state and local governments to perform comprehensive capital plans. Capital projects are defined as one-time projects costing at least $25 thousand with a useful life of at least five years. The CIP development process begins early in the calendar year. July 1 is the official deadline for agencies, boards, commissions, trusts, colleges and universities to input their Capital Budget Requests into a web-based system hosted by the Office of State Finance. Once received, the Commission separates requests into two broad categories: self-funded and appropriation-funded. Generally, the Commission accepts an applicant’s ranking of self-funded projects without further review. Projects requiring an appropriation are evaluated according to a ranking process to permit the equitable allocation of limited state resources. The ranking system uses eight criteria:
• legal obligations;
• fiscal impact;
• urgency of maintenance needs;
• departmental priority;
• economic impact;
• impact on service to the public; and
• completion of prior phases.
For more information on the Capitol Budget process please contact Tim Martin with the State Bond Advisor, 602-3100.

FY-2009 Executive Budget
STATE BUDGET INFORMATION C-15
Oklahoma Revenues and Expenditures Major Tax Sources The single largest source of revenue collected by the state comes from taxes paid by Oklahoma citizens, businesses and others doing business in the state. Tax revenue accounted for 50% of total state revenue collections in FY-2007. Most of the state’s appropriated revenue is from general taxes. For FY-2007, tax revenue comprised 87% of total appropriated revenue. Taxes such as income tax are compulsory payments and cannot legally be avoided. This is in contrast to fees, like fishing licenses, which are discretionary and voluntary to the extent one decides to utilize a state service. The seven major tax categories for FY-2009, which provide 91% of total state tax revenue, are:
Seven Major Tax CategoriesFY-2009
Sales and Use Taxes
27%
Gross Production
Taxes13%
Other9%
Insurance Premium
Tax2%
Motor Vehicle Taxes
8%
Corporate Income Tax
6%
Individual Income Tax
35%
Income Taxes Oklahoma’s income tax laws date back to 1915 when an income tax was imposed on the net income of individuals residing in Oklahoma and upon the Oklahoma portion of nonresidents’ income. The income tax was extended to corporations and banks in 1931. The importance of the income tax to state revenues increased when voters approved the 1933 constitutional amendment prohibiting state taxation of property. While there have been numerous changes to the income tax law since its inception, today it is the single most important source of state revenue and represents almost 42% of all state tax revenue in the General Revenue Fund.

FY-2009 Executive Budget
STATE BUDGET INFORMATION C-16
Individual Income Tax: The Oklahoma individual income tax calculation uses two different methods. Method I employs rates from 0.5 percent to 5.50 percent and does not permit the deduction of federal income paid tax from net income. Method II utilizes rates from 0.5 percent to 10 percent and permits the deduction of federal income tax paid from net income. Taxpayers calculate their tax liability by both methods and pay the lesser amount. The majority of taxpayers owe less and pay tax based on the Method I calculation. During the 2005 session, Senate Bill 435 eliminated the second method of calculating income tax and modified the tax bracket for single and joint filers. In 2006, the Legislature passed and the Governor approved the largest tax cut package in history. House Bill 1172 lowers the individual income tax rate and increases the standard deduction over several years. Currently, the individual income tax rate is 5.50% but decreases to 5.25% at a point determined by the board of Equalization based on the amount of growth revenue for the coming fiscal year as required by statute. The increase in the standard deduction is a gradual increase. By the year 2010, the standard deduction will equal the federal standard deduction if the Board of Equalization determines there is sufficient growth revenue. The table below shows the individual income tax rates and corresponding standard deduction increase.
Tax Rate
Married Filing Jointly
Head of Household Single
2006 6.25% 3,000 3,000 2,000 2007 5.65% 5,500 4,125 2,750 2008 5.50% 6,500 4,875 3,250 2009 5.50% 8,500 6,375 4,250 2010* 5.25%
Standard Deduction
Match Federal Deduction *Based on the amount of growth revenue determined by the Board of Equalization.
In addition, the apportionment of individual income tax receipts was changed by the Legislature for the current fiscal year. The table below shows those changes.
FY-2007 FY-2008 FY-2009
General Revenue 86.16% 85.66% 85.66%
1017 Fund 8.34% 8.34% 8.34%
Teacher’s Retirement Fund
4.50% 5.00% 5.00%
Ad Valorem Reimburse. Fund
1.00% 1.00% 1.00%
Individual Income Tax ApportionmentsFY-2007 to FY-2009

FY-2009 Executive Budget
STATE BUDGET INFORMATION C-17
orporate Income Tax: Like current individual income tax rates, corporate income tax rates
he corporate income tax rate is applied to all taxable income. Manufacturers’ exemptions and
hile revenue from the corporate income tax is important to the overall revenue picture, it t,
nder those classifications, all income immediately goes to the partners or shareholders, and
vidual
nue.
Cwere progressive when implemented in 1931 and remained that way until 1935 when a flat, sixpercent rate was established. The rate was decreased to four percent in 1947. The rate has since been increased to its original and current level of six percent. Tsome targeted credits and incentive payments frequently are used as economic development tools which reduce a company’s income tax liability. The largest of these targeted incentive programs is the “Quality Jobs” program. Wprovides only 6% of total tax revenue. That is because corporations subject to the corporateincome tax have become, over time, a smaller part of the overall economy. This is due, in parto the fact that many businesses now organize as subchapter S corporations or limited liability organizations. Uas a result, the companies pay no corporate income tax. The partners or shareholders, however, are taxed on that income, as well as income from other sources, under the indiincome tax, rather than under the corporate income tax. Additionally, some businesses may be subject to some other form of taxation, such as the bank privilege tax or the insurance premium tax. Legislation in 2004 changed the apportionment of corporate income tax reveThe table below shows the change in apportionment.
FY-2007 FY-2008 FY-2009
General Revenue 78.00% 77.50% 77.50%
1017 Fund 16.50% 16.50% 16.50%
Teacher’s Retirement Fund
4.50% 5.00% 5.00%
Ad Valorem Reimburse. Fund
1.00% 1.00% 1.00%
Corporate Income Tax ApportionmentsFY-2007 to FY-2009
tate Sales and Use Taxes
he State sales and use tax has varied considerably in both rate and purpose since its initial
l
he revenue continued to be dedicated in this manner until the 1980s, when all collections
S Timposition in 1933 when a temporary one percent tax was dedicated to public schools. Two years later, the tax was renewed, but the revenue from the tax was apportioned to the GeneraRevenue Fund. In 1939, the rate was increased to two percent with 97 percent of the revenue apportioned to the State Assistance Fund or welfare programs administered by what is now the Department of Human Services. Twere apportioned to the General Revenue Fund. Since then, the General Revenue Fund hasbeen the primary source of state funds for the Department of Human Services.

FY-2009 Executive Budget
STATE BUDGET INFORMATION C-18
When Oklahoma faced a state funding crisis brought on by the decline of the petroleum industry in the 1980s, the state sales tax was increased incrementally to four percent. In 1990, the “Education Reform Act”, also known as House Bill 1017, was passed, increasing the sales and use taxes to the current 4.5 percent level. The sales and use taxes are imposed on sales of tangible personal property and on the furnishing of some services, such as transportation, meals and lodging, as well as telecommunication services. Most services, however, are not subject to the sales and use taxes. Exemptions are also allowed when the product or service is subject to another tax, such as the motor fuels tax. Other specific exemptions are made for governmental and nonprofit entities, agriculture and to certain areas targeted to encourage economic development. The value of some of the large exemptions from the sales and use tax include an exemption on sales to manufacturers equal to $1.4 billion in sales tax revenue and sales for resale which total $720 million in sales tax revenue. During the 2005 legislative session, the apportionment for sales and use tax revenue changed. Now, for each fiscal year the apportionment for use tax is the same as the apportionment for sales tax. The table below shows the change in apportionment.
FY-2007 FY-2008 FY-2009
General Revenue 85.04% 83.61% 83.61%
1017 Fund 10.46% 10.46% 10.46%
Teacher’s Retirement Fund 4.50% 5.00% 5.00%
Sales Tax and Use Tax Apportionment FY-2007 to FY-2009
Remaining 0.93% to: 36%-Ok Tourism Promotion Revolving Fund 64%-Ok Tourism Capital Revolving Fund
Motor Vehicle Taxes Motor vehicle taxes and fees have a long history in Oklahoma. Oklahoma City was the birthplace of the parking meter in 1913 and it was here that “horseless carriages” were tagged before it was required by the State. Oklahoma’s modern day motor vehicle taxes are comprised of a broad category of taxes and fees imposed on the purchase and use of motor vehicles, including an excise tax levied on the purchase of cars, trucks, buses, boats and motors, as well as annual registration fees. Motor vehicle registration fees, commonly called tag fees, are paid annually in lieu of ad valorem or personal property taxes. Voter’s passage of State Question 691 in 2000 tied the cost of registration fees to the age of the vehicle: Years 1 – 4: $91 annually Years 5 – 8: $81 annually Years 9 – 12: $61 annually

FY-2009 Executive Budget
STATE BUDGET INFORMATION C-19
Years 13 – 16: $41 annually Years 17 and beyond: $21 annually The question also changed the calculation of the motor vehicle excise tax, which is paid in lieu of state and local sales taxes. Previously, the tax was assessed at 3.25 percent of the factory delivered price and depreciated at a rate of 35 percent annually. The state question’s approval left the rate the same, but assessed it against the actual sales price of the vehicle, which is usually lower than the factory delivered price of a new vehicle. Motor vehicle taxes are collected by independent businesses operating as motor license agents or tag agents. The only exception to this is the taxes and fees imposed on trucks and trailers used in interstate commerce, which are collected by the Oklahoma Tax Commission. The chart below shows how motor vehicle taxes and fees are apportioned.
General Revenue Fund 39.84%State Transportation Fund 0.31%Counties for Highways 7.24%Cities and Towns 3.10%School Districts 36.20%
Motor Vehicle Tax Apportionment
Motor Fuel Taxes In 1910, local roadways were maintained by requiring able bodied males to provide four days of labor per year – less if they brought their own horse. By 1916, a two mill tax was levied in townships to supplement the work requirement but both were completely abolished by 1933. The first gasoline tax become effective in 1923 and was used for the construction and maintenance of roads and bridges. Prior to that time, local governments were responsible for roads and bridges which were supported through ad valorem taxes at the local level. Motor fuel taxes in Oklahoma are a form of selective sales tax and include the gasoline tax and diesel excise tax, the motor fuel importer use tax and the special fuel use tax. The taxes are levied on the quantity or volume of fuel sold, rather than the price. The state gasoline tax is 16 cents per gallon, plus a 1 cent per gallon special assessment. The state tax on diesel fuel is 13 cents per gallon, plus a 1 cent per gallon assessment. There are some major exemptions to the payment of motor fuel taxes. All government entities are exempt and the tax paid on diesel fuel used off-road and for agricultural purposes may be refunded upon application to the Oklahoma Tax Commission. Fuel used by all recognized Indian tribes for tribal governmental purposes may be exempt. Tribes may request a refund for taxes paid on motor fuel used for tribal purposes, or in the alternative, they may enter into a compact with the State to receive a portion of the motor fuels tax collections. If they compact with the State, the tribes must agree not to challenge the constitutionality of the motor fuel tax code. The law permitting the sharing of motor fuels revenue went into effect in 1996. Motor fuels tax revenue supports road and bridge building, plus maintenance, for both state and local governments. A 1 cent per gallon special assessment provides for environmental cleanup of leaking petroleum storage tanks. Almost one-third of the total motor fuel revenue is apportioned for local uses with the remainder used for state purposes. According to state statute, motor fuel taxes, like sales taxes, are assessed on the consumer when they purchase
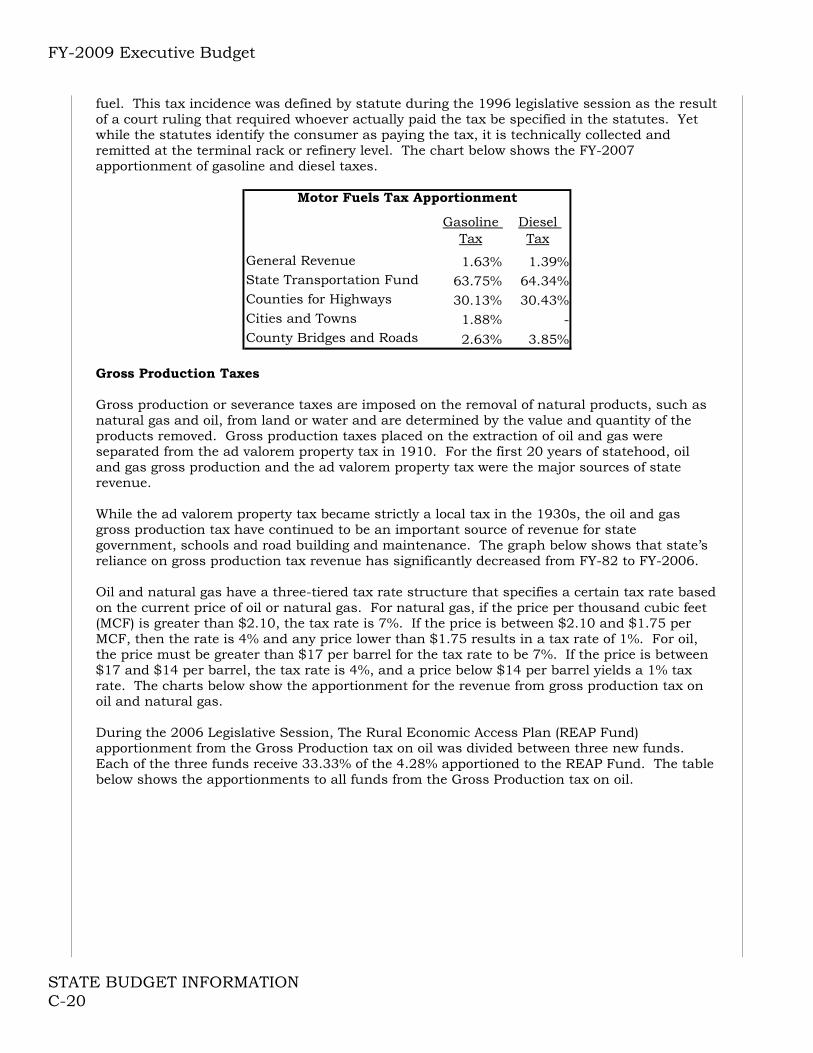
FY-2009 Executive Budget
STATE BUDGET INFORMATION C-20
fuel. This tax incidence was defined by statute during the 1996 legislative session as the result of a court ruling that required whoever actually paid the tax be specified in the statutes. Yet while the statutes identify the consumer as paying the tax, it is technically collected and remitted at the terminal rack or refinery level. The chart below shows the FY-2007 apportionment of gasoline and diesel taxes.
Gasoline Tax
Diesel Tax
General Revenue 1.63% 1.39%State Transportation Fund 63.75% 64.34%Counties for Highways 30.13% 30.43%Cities and Towns 1.88% -County Bridges and Roads 2.63% 3.85%
Motor Fuels Tax Apportionment
Gross Production Taxes Gross production or severance taxes are imposed on the removal of natural products, such as natural gas and oil, from land or water and are determined by the value and quantity of the products removed. Gross production taxes placed on the extraction of oil and gas were separated from the ad valorem property tax in 1910. For the first 20 years of statehood, oil and gas gross production and the ad valorem property tax were the major sources of state revenue. While the ad valorem property tax became strictly a local tax in the 1930s, the oil and gas gross production tax have continued to be an important source of revenue for state government, schools and road building and maintenance. The graph below shows that state’s reliance on gross production tax revenue has significantly decreased from FY-82 to FY-2006. Oil and natural gas have a three-tiered tax rate structure that specifies a certain tax rate based on the current price of oil or natural gas. For natural gas, if the price per thousand cubic feet (MCF) is greater than $2.10, the tax rate is 7%. If the price is between $2.10 and $1.75 per MCF, then the rate is 4% and any price lower than $1.75 results in a tax rate of 1%. For oil, the price must be greater than $17 per barrel for the tax rate to be 7%. If the price is between $17 and $14 per barrel, the tax rate is 4%, and a price below $14 per barrel yields a 1% tax rate. The charts below show the apportionment for the revenue from gross production tax on oil and natural gas. During the 2006 Legislative Session, The Rural Economic Access Plan (REAP Fund) apportionment from the Gross Production tax on oil was divided between three new funds. Each of the three funds receive 33.33% of the 4.28% apportioned to the REAP Fund. The table below shows the apportionments to all funds from the Gross Production tax on oil.

FY-2009 Executive Budget
STATE BUDGET INFORMATION C-21
Common Education Technology Fund 25.72%OK Student Aid Revolving Fund 25.72%Higher Education Capital Fund 25.72%County Highways 7.14%School Districts 7.14%County Roads and Bridges 4.28%REAP Fund 4.28%
Tourism Capital Expenditure Fund 33.33%Conservation Commission Fund 33.33%Community Water Revolving Fund 33.33%
Gross Production Tax – Oil Apportionment
General Revenue Fund 85.72%County Highways 7.14%School Districts 7.14%
Gross Production Tax – Natural Gas Apportionment

FY-2009 Executive Budget
STATE BUDGET INFORMATION C-22
Constitutional Reserve "Rainy Day" Fund (CRF) History Description FY-89 FY-90 FY-91 FY-92 FY-93 Beginning RDF Balance 77,994,351 152,804,609 151,734,223 196,861,899 135,008,898 Adjustments to the Balance 0 0 10,464 25,176 0 Appropriations (26,000,000) (75,000,000) (30,000,000) (61,878,177) (43,867,903)
-Budget Stabilization 1)Current Fiscal Year - - - - - 2)Next Fiscal Year - - - - -
-Emergency 38,997,176 76,402,305 75,867,112 98,430,950 67,504,449 End of FY Deposit 100,810,258 73,929,614 75,117,212 0 0 Ending Balance 152,804,609 151,734,223 196,861,899 135,008,898 91,140,995 Description FY-94 FY-95 FY-96 FY-97 FY-98 Beginning RDF Balance 91,140,995 45,574,052 45,574,052 114,300,821 308,906,533 Adjustments to the Balance 3,555 0 12,909 388,745 0 Appropriations (45,570,498) 0 (22,688,345) (52,825,496) (154,444,000)
-Budget Stabilization 1)Current Fiscal Year - - - - - 2)Next Fiscal Year - - - - -
-Emergency 45,570,498 22,787,026 22,787,026 57,150,411 154,453,266 End of FY Deposit 0 0 91,402,205 247,042,463 142,898,076 Ending Balance 45,574,052 45,574,052 114,300,821 308,906,533 297,360,609 Description FY-99 FY-00 FY-01 FY-02 FY-03 Beginning RDF Balance 297,360,609 149,858,523 157,542,574 340,685,730 72,398,995 Adjustments to the Balance 1,119,324 28,700 9,826 299,087 0 Appropriations (148,621,410) (74,929,261) (78,771,287) (268,585,822) (72,262,663)
-Budget Stabilization 1)Current Fiscal Year - - - 98,242,957 36,199,498 2)Next Fiscal Year - - - - -
-Emergency 148,680,304 74,929,262 78,771,287 170,342,865 36,199,498 End of FY Deposit 0 82,584,612 261,904,617 0 0 Ending Balance 149,858,523 157,542,574 340,685,730 72,398,995 136,333 Description FY-04 FY-05 FY-06 FY-07 FY-08 Beginning RDF Balance 136,333 217,501,299 461,316,574 495,690,168 571,598,627 Adjustments to the Balance 0 0 268,565 0 0 Appropriations 0 0 0 0 0
-Budget Stabilization 1)Current Fiscal Year 68,167 - - - - 2)Next Fiscal Year - - - - -
-Emergency 68,167 54,375,325 115,329,143 123,922,542 142,899,657 End of FY Deposit 217,364,966 243,815,275 34,105,029 75,908,459 N/A Ending Balance 217,501,299 461,316,574 495,690,168 571,598,627 N/A

FY-2009 EXECUTIVE BUDGET
1 2 3 4 5 6 7 8 9FY-2006 Percent Percent of FY-2007 Percent Percent of FY-2008 Percent Percent of
Agency / Cabinet Name Appropriation Change Total Appropriation Change Total Appropriation Change Total
SUMMARY BY CABINET Governor $2,578,710 2.22% 0.04% $2,641,163 2.42% 0.04% $2,661,981 0.79% 0.04% Lieutenant Governor 592,436 13.22% 0.01% 592,436 0.00% 0.009% 693,197 17.01% 0.010% Agriculture 36,999,997 16.17% 0.60% 37,268,701 0.73% 0.55% 42,865,133 15.02% 0.61% Commerce and Tourism 90,522,534 2.53% 1.46% 88,459,871 -2.28% 1.31% 92,910,558 5.03% 1.32% Education 3,208,748,707 8.52% 51.86% 3,454,998,597 7.67% 51.24% 3,719,455,094 7.65% 52.80% Energy 13,203,355 4.93% 0.21% 15,081,841 14.23% 0.22% 13,224,003 -12.32% 0.19% Environment 15,340,476 -4.88% 0.25% 17,282,166 12.66% 0.26% 16,529,620 -4.35% 0.23% Finance and Revenue 86,666,319 5.09% 1.40% 89,683,898 3.48% 1.33% 90,503,091 0.91% 1.28% Health 909,937,163 23.92% 14.71% 1,009,567,436 10.95% 14.97% 1,053,024,570 4.30% 14.95% Human Resouces & Administr 20,509,420 3.77% 0.33% 22,422,169 9.33% 0.33% 27,973,920 24.76% 0.40% Human Services 619,191,715 15.30% 10.01% 681,720,756 10.10% 10.11% 751,490,194 10.23% 10.67% Military Affairs 12,546,432 55.61% 0.20% 12,898,334 2.80% 0.19% 13,654,939 5.87% 0.19% Safety and Security 578,165,197 10.04% 9.34% 651,008,576 12.60% 9.65% 689,019,068 5.84% 9.78% Science and Technology 12,400,942 6.27% 0.28% 22,442,616 80.98% 0.51% 22,456,507 0.06% 0.32% Secretary of State 7,903,126 -4.56% 0.24% 9,021,927 14.16% 0.27% 9,118,194 1.07% 0.13% Transportation 275,671,401 36.88% 4.46% 285,940,419 3.73% 4.24% 218,400,061 -23.62% 3.10% Veterans 36,040,332 19.77% 0.58% 39,324,159 9.11% 0.58% 40,282,600 2.44% 0.57% OPERS - Deferred Comp. 0 0.00% 0.00% 0 0.00% 0.00% 0 0.00% 0.00%Total Executive Branch $5,927,018,262 12.53% 95.79% $6,440,355,065 8.66% 95.51% ############## 5.65% 96.58%
balances The Legislature $34,191,830 3.13% 0.55% $35,732,522 4.51% 0.53% $38,762,908 8.48% 0.55% The Judiciary 70,493,724 12.07% 1.14% 79,253,297 12.43% 1.18% 85,827,012 8.29% 1.22%Total Legis. & Judic. $104,685,554 8.98% 1.69% $114,985,819 9.84% 1.71% $124,589,920 8.35% 1.77%
Total Excl. Supps. / Ret. $6,031,703,816 12.47% 97.48% $6,555,340,884 8.68% 97.22% ############## 5.70% 98.35%balances
Supplementals & Emerg. Fund 155,841,940 ####### 2.52% 187,578,680 20.36% 2.78% 116,063,211 -38.13% 1.65%TOTAL APPROPRIATIONS $6,187,545,756 14.67% 100.00% $6,742,919,564 8.98% 100.00% ############## 4.48% 100.00%
balancesGOVERNOR, LT. GOVERNORGovernor $2,578,710 2.22% 0.04% $2,641,163 2.42% 0.04% $2,661,981 0.79% 0.04%Lieutenant Governor 592,436 13.22% 0.01% 592,436 0.00% 0.01% 693,197 17.01% 0.01%
STATE BUDGET INFORMATIONC-23

FY-2009 EXECUTIVE BUDGET
1 2 3 4 5 6 7 8 9FY-2006 Percent Percent of FY-2007 Percent Percent of FY-2008 Percent Percent of
Agency / Cabinet Name Appropriation Change Total Appropriation Change Total Appropriation Change TotalTOTAL GOV., LT. GOV. $3,171,146 4.11% 0.05% $3,233,599 1.97% 0.05% $3,355,178 3.76% 0.05%
AGRICULTUREAgriculture $27,196,069 12.24% 0.44% $28,314,906 4.11% 0.42% $33,678,049 18.94% 0.48%Conservation Commission 9,803,928 28.70% 0.16% 8,953,795 -8.67% 0.13% 9,187,084 2.61% 0.13%TOTAL AGRICULTURE $36,999,997 16.17% 0.60% $37,268,701 0.73% 0.55% $42,865,133 15.02% 0.61%
COMMERCE AND TOURISMCommerce, Department of $27,334,663 -18.01% 0.44% $25,082,836 -8.24% 0.37% $28,104,894 12.05% 0.40%Centennial Commission 3,899,630 ####### 0.06% 1,062,291 -72.76% 0.02% 1,066,511 0.40% 0.02%Historical Society 13,106,387 29.23% 0.21% 14,480,363 10.48% 0.21% 14,687,451 1.43% 0.21%J.M. Davis Memorial Comm. 347,454 4.98% 0.01% 382,166 9.99% 0.01% 535,403 40.10% 0.01%Labor Department 3,224,721 5.33% 0.05% 3,613,893 12.07% 0.05% 3,760,284 4.05% 0.05%Native American Cultural Cente 0 n/a 0.00% 0 n/a 0.00% 0 0.00% 0.00%REAP -local gov't thru Aud & In 15,500,000 0.00% 0.25% 15,500,000 0.00% 0.23% 15,500,000 0.00% 0.22%Scenic Rivers Commission 323,041 n/a 0.01% 339,752 5.17% 0.01% 345,322 1.64% 0.00%Tourism & Recreation Dept. 25,955,959 7.42% 0.42% 27,073,374 4.31% 0.40% 27,826,991 2.78% 0.39%Wildlife Conservation Comm. 0 n/a 0.00% 0 n/a 0.00% 0 0.00% 0.00%Will Rogers Memorial Comm. 830,679 -5.89% 0.01% 925,196 11.38% 0.01% 1,083,702 17.13% 0.02%TOTAL COMMERCE & TOURIS $90,522,534 2.53% 1.46% $88,459,871 -2.28% 1.31% $92,910,558 5.03% 1.32%
EDUCATIONArts Council $4,243,338 8.14% 0.07% $4,442,810 4.70% 0.07% $5,150,967 15.94% 0.07%Education, Department of 2,164,263,450 7.80% 34.98% 2,348,041,255 8.49% 34.82% 2,480,155,207 5.63% 35.20%Educational TV Authority 4,624,059 10.05% 0.07% 5,164,350 11.68% 0.08% 8,394,383 62.54% 0.12%Higher Educ., Regents for 889,433,880 10.88% 14.37% 933,933,880 5.00% 13.85% 1,053,949,576 12.85% 14.96%Department of Libraries 6,681,355 7.55% 0.11% 6,847,731 2.49% 0.10% 7,294,856 6.53% 0.10%Private Vo-Tech Schools Board 171,879 10.56% 0.00% 0 -100.00% 0.00% 0 0.00% 0.00%School of Science & Mathematic 7,020,513 6.82% 0.11% 7,230,508 2.99% 0.11% 7,585,732 4.91% 0.11%Teacher Preparation Commissio 2,022,875 1.24% 0.03% 2,050,705 1.38% 0.03% 2,059,982 0.45% 0.03%Career & Technology Education 130,287,358 5.17% 2.11% 147,287,358 13.05% 2.18% 154,864,391 5.14% 2.20%TOTAL EDUCATION $3,208,748,707 8.52% 51.86% $3,454,998,597 7.67% 51.24% $3,719,455,094 7.65% 52.80%
STATE BUDGET INFORMATIONC-24
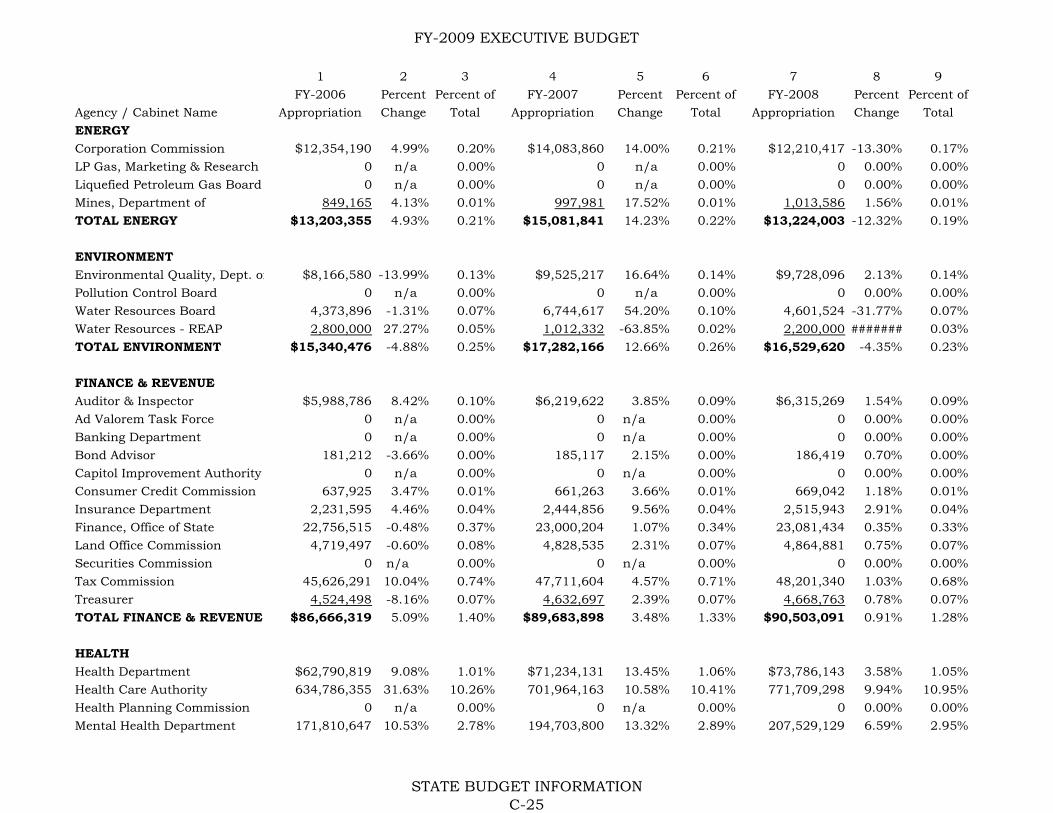
FY-2009 EXECUTIVE BUDGET
1 2 3 4 5 6 7 8 9FY-2006 Percent Percent of FY-2007 Percent Percent of FY-2008 Percent Percent of
Agency / Cabinet Name Appropriation Change Total Appropriation Change Total Appropriation Change TotalENERGYCorporation Commission $12,354,190 4.99% 0.20% $14,083,860 14.00% 0.21% $12,210,417 -13.30% 0.17%LP Gas, Marketing & Research 0 n/a 0.00% 0 n/a 0.00% 0 0.00% 0.00%Liquefied Petroleum Gas Board 0 n/a 0.00% 0 n/a 0.00% 0 0.00% 0.00%Mines, Department of 849,165 4.13% 0.01% 997,981 17.52% 0.01% 1,013,586 1.56% 0.01%TOTAL ENERGY $13,203,355 4.93% 0.21% $15,081,841 14.23% 0.22% $13,224,003 -12.32% 0.19%
ENVIRONMENTEnvironmental Quality, Dept. of $8,166,580 -13.99% 0.13% $9,525,217 16.64% 0.14% $9,728,096 2.13% 0.14%Pollution Control Board 0 n/a 0.00% 0 n/a 0.00% 0 0.00% 0.00%Water Resources Board 4,373,896 -1.31% 0.07% 6,744,617 54.20% 0.10% 4,601,524 -31.77% 0.07%Water Resources - REAP 2,800,000 27.27% 0.05% 1,012,332 -63.85% 0.02% 2,200,000 ####### 0.03%TOTAL ENVIRONMENT $15,340,476 -4.88% 0.25% $17,282,166 12.66% 0.26% $16,529,620 -4.35% 0.23%
FINANCE & REVENUEAuditor & Inspector $5,988,786 8.42% 0.10% $6,219,622 3.85% 0.09% $6,315,269 1.54% 0.09%Ad Valorem Task Force 0 n/a 0.00% 0 n/a 0.00% 0 0.00% 0.00%Banking Department 0 n/a 0.00% 0 n/a 0.00% 0 0.00% 0.00%Bond Advisor 181,212 -3.66% 0.00% 185,117 2.15% 0.00% 186,419 0.70% 0.00%Capitol Improvement Authority 0 n/a 0.00% 0 n/a 0.00% 0 0.00% 0.00%Consumer Credit Commission 637,925 3.47% 0.01% 661,263 3.66% 0.01% 669,042 1.18% 0.01%Insurance Department 2,231,595 4.46% 0.04% 2,444,856 9.56% 0.04% 2,515,943 2.91% 0.04%Finance, Office of State 22,756,515 -0.48% 0.37% 23,000,204 1.07% 0.34% 23,081,434 0.35% 0.33%Land Office Commission 4,719,497 -0.60% 0.08% 4,828,535 2.31% 0.07% 4,864,881 0.75% 0.07%Securities Commission 0 n/a 0.00% 0 n/a 0.00% 0 0.00% 0.00%Tax Commission 45,626,291 10.04% 0.74% 47,711,604 4.57% 0.71% 48,201,340 1.03% 0.68%Treasurer 4,524,498 -8.16% 0.07% 4,632,697 2.39% 0.07% 4,668,763 0.78% 0.07%TOTAL FINANCE & REVENUE $86,666,319 5.09% 1.40% $89,683,898 3.48% 1.33% $90,503,091 0.91% 1.28%
HEALTHHealth Department $62,790,819 9.08% 1.01% $71,234,131 13.45% 1.06% $73,786,143 3.58% 1.05%Health Care Authority 634,786,355 31.63% 10.26% 701,964,163 10.58% 10.41% 771,709,298 9.94% 10.95%Health Planning Commission 0 n/a 0.00% 0 n/a 0.00% 0 0.00% 0.00%Mental Health Department 171,810,647 10.53% 2.78% 194,703,800 13.32% 2.89% 207,529,129 6.59% 2.95%
STATE BUDGET INFORMATIONC-25
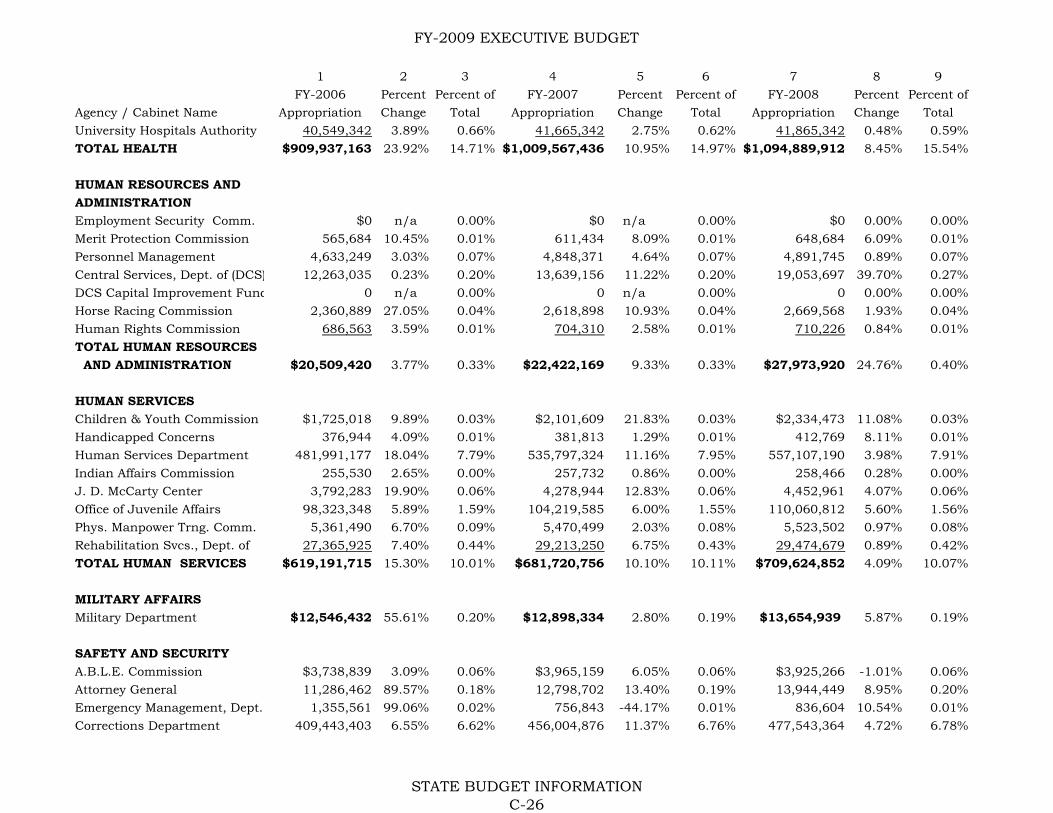
FY-2009 EXECUTIVE BUDGET
1 2 3 4 5 6 7 8 9FY-2006 Percent Percent of FY-2007 Percent Percent of FY-2008 Percent Percent of
Agency / Cabinet Name Appropriation Change Total Appropriation Change Total Appropriation Change TotalUniversity Hospitals Authority 40,549,342 3.89% 0.66% 41,665,342 2.75% 0.62% 41,865,342 0.48% 0.59%TOTAL HEALTH $909,937,163 23.92% 14.71% $1,009,567,436 10.95% 14.97% $1,094,889,912 8.45% 15.54%
HUMAN RESOURCES AND ADMINISTRATIONEmployment Security Comm. $0 n/a 0.00% $0 n/a 0.00% $0 0.00% 0.00%Merit Protection Commission 565,684 10.45% 0.01% 611,434 8.09% 0.01% 648,684 6.09% 0.01%Personnel Management 4,633,249 3.03% 0.07% 4,848,371 4.64% 0.07% 4,891,745 0.89% 0.07%Central Services, Dept. of (DCS) 12,263,035 0.23% 0.20% 13,639,156 11.22% 0.20% 19,053,697 39.70% 0.27%DCS Capital Improvement Fund 0 n/a 0.00% 0 n/a 0.00% 0 0.00% 0.00%Horse Racing Commission 2,360,889 27.05% 0.04% 2,618,898 10.93% 0.04% 2,669,568 1.93% 0.04%Human Rights Commission 686,563 3.59% 0.01% 704,310 2.58% 0.01% 710,226 0.84% 0.01%TOTAL HUMAN RESOURCES AND ADMINISTRATION $20,509,420 3.77% 0.33% $22,422,169 9.33% 0.33% $27,973,920 24.76% 0.40%
HUMAN SERVICESChildren & Youth Commission $1,725,018 9.89% 0.03% $2,101,609 21.83% 0.03% $2,334,473 11.08% 0.03%Handicapped Concerns 376,944 4.09% 0.01% 381,813 1.29% 0.01% 412,769 8.11% 0.01%Human Services Department 481,991,177 18.04% 7.79% 535,797,324 11.16% 7.95% 557,107,190 3.98% 7.91%Indian Affairs Commission 255,530 2.65% 0.00% 257,732 0.86% 0.00% 258,466 0.28% 0.00%J. D. McCarty Center 3,792,283 19.90% 0.06% 4,278,944 12.83% 0.06% 4,452,961 4.07% 0.06%Office of Juvenile Affairs 98,323,348 5.89% 1.59% 104,219,585 6.00% 1.55% 110,060,812 5.60% 1.56%Phys. Manpower Trng. Comm. 5,361,490 6.70% 0.09% 5,470,499 2.03% 0.08% 5,523,502 0.97% 0.08%Rehabilitation Svcs., Dept. of 27,365,925 7.40% 0.44% 29,213,250 6.75% 0.43% 29,474,679 0.89% 0.42%TOTAL HUMAN SERVICES $619,191,715 15.30% 10.01% $681,720,756 10.10% 10.11% $709,624,852 4.09% 10.07%
MILITARY AFFAIRSMilitary Department $12,546,432 55.61% 0.20% $12,898,334 2.80% 0.19% $13,654,939 5.87% 0.19%
SAFETY AND SECURITYA.B.L.E. Commission $3,738,839 3.09% 0.06% $3,965,159 6.05% 0.06% $3,925,266 -1.01% 0.06%Attorney General 11,286,462 89.57% 0.18% 12,798,702 13.40% 0.19% 13,944,449 8.95% 0.20%Emergency Management, Dept. 1,355,561 99.06% 0.02% 756,843 -44.17% 0.01% 836,604 10.54% 0.01%Corrections Department 409,443,403 6.55% 6.62% 456,004,876 11.37% 6.76% 477,543,364 4.72% 6.78%
STATE BUDGET INFORMATIONC-26

FY-2009 EXECUTIVE BUDGET
1 2 3 4 5 6 7 8 9FY-2006 Percent Percent of FY-2007 Percent Percent of FY-2008 Percent Percent of
Agency / Cabinet Name Appropriation Change Total Appropriation Change Total Appropriation Change TotalDistrict Attorneys Council 30,592,742 13.61% 0.49% 39,092,742 27.78% 0.58% 39,920,210 2.12% 0.57%Fire Marshal 1,685,180 9.64% 0.03% 2,052,561 21.80% 0.03% 2,270,855 10.64% 0.03%Indigent Defense System 15,633,001 8.35% 0.25% 16,206,256 3.67% 0.24% 16,304,008 0.60% 0.23%Investigation, Bureau of 11,154,628 15.21% 0.18% 13,351,567 19.70% 0.20% 17,316,450 29.70% 0.25%Law Enf. Educ. & Training 2,758,783 2.70% 0.04% 3,265,473 18.37% 0.05% 4,410,370 35.06% 0.06%Medicolegal Invest., Board of 3,922,904 14.46% 0.06% 4,587,380 16.94% 0.07% 4,825,625 5.19% 0.07%Narc. & Dang. Drugs Control 5,389,595 8.51% 0.09% 6,320,763 17.28% 0.09% 6,773,895 7.17% 0.10%Pardon and Parole Board 2,316,329 7.72% 0.04% 2,555,018 10.30% 0.04% 2,577,581 0.88% 0.04%Public Safety, Department of 78,887,770 21.25% 1.27% 90,051,236 14.15% 1.34% 98,370,391 9.24% 1.40%TOTAL SAFETY & SECURITY $578,165,197 10.04% 9.34% $651,008,576 12.60% 9.65% $689,019,068 5.84% 9.78%
SECRETARY OF STATECouncil on Judicial Complaints $278,826 2.83% 0.00% $282,503 1.32% 0.00% $283,729 0.43% 0.00%Election Board 6,621,839 -6.37% 0.11% 7,709,951 16.43% 0.11% 7,785,988 0.99% 0.11%Ethics Commission 492,277 2.40% 0.01% 504,039 2.39% 0.01% 517,960 2.76% 0.01%Secretary of State 510,184 11.66% 0.01% 525,434 2.99% 0.01% 530,517 0.97% 0.01%TOTAL SECRETARY OF STATE $7,903,126 -4.56% 0.13% $9,021,927 14.16% 0.13% $9,118,194 1.07% 0.13%
SCIENCE AND TECHNOLOGYOCAST $12,400,942 6.27% 0.20% $22,442,616 80.98% 0.33% $22,456,507 0.06% 0.32%
TRANSPORTATIONTransportation Department $275,148,137 36.97% 4.45% $285,411,848 3.73% 4.23% $217,869,721 -23.66% 3.09%Space Industry Develop. Author 523,264 0.95% 0.01% 528,571 1.01% 0.01% 530,340 0.33% 0.01%TOTAL TRANSPORTATION $275,671,401 36.88% 4.46% $285,940,419 3.73% 4.24% $218,400,061 -23.62% 3.10%
VETERANSVeterans Affairs Department $36,040,332 19.77% 0.58% $39,324,159 9.11% 0.58% $40,282,600 2.44% 0.57%
OPERS Deferred Comp. $0 0.00% 0.00% $0 0.00% $0 0.00% 0.00%TOTAL EXECUTIVE BRANCH $5,927,018,262 12.53% 95.79% $6,440,355,065 8.66% 95.51% ############## 5.65% 96.58%
LEGISLATUREHouse of Representatives $18,629,154 3.03% 0.30% $19,176,434 2.94% 0.28% $19,176,434 0.00% 0.27%
STATE BUDGET INFORMATIONC-27
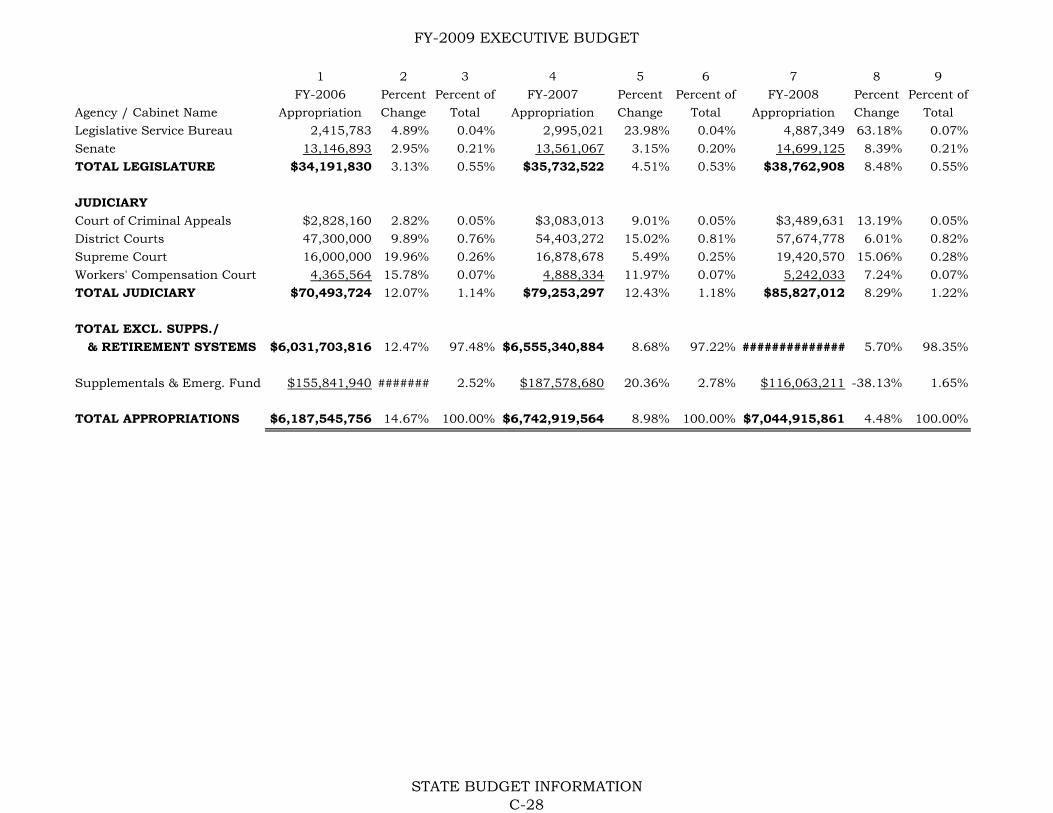
FY-2009 EXECUTIVE BUDGET
1 2 3 4 5 6 7 8 9FY-2006 Percent Percent of FY-2007 Percent Percent of FY-2008 Percent Percent of
Agency / Cabinet Name Appropriation Change Total Appropriation Change Total Appropriation Change TotalLegislative Service Bureau 2,415,783 4.89% 0.04% 2,995,021 23.98% 0.04% 4,887,349 63.18% 0.07%Senate 13,146,893 2.95% 0.21% 13,561,067 3.15% 0.20% 14,699,125 8.39% 0.21%TOTAL LEGISLATURE $34,191,830 3.13% 0.55% $35,732,522 4.51% 0.53% $38,762,908 8.48% 0.55%
JUDICIARYCourt of Criminal Appeals $2,828,160 2.82% 0.05% $3,083,013 9.01% 0.05% $3,489,631 13.19% 0.05%District Courts 47,300,000 9.89% 0.76% 54,403,272 15.02% 0.81% 57,674,778 6.01% 0.82%Supreme Court 16,000,000 19.96% 0.26% 16,878,678 5.49% 0.25% 19,420,570 15.06% 0.28%Workers' Compensation Court 4,365,564 15.78% 0.07% 4,888,334 11.97% 0.07% 5,242,033 7.24% 0.07%TOTAL JUDICIARY $70,493,724 12.07% 1.14% $79,253,297 12.43% 1.18% $85,827,012 8.29% 1.22%
TOTAL EXCL. SUPPS./ & RETIREMENT SYSTEMS $6,031,703,816 12.47% 97.48% $6,555,340,884 8.68% 97.22% ############## 5.70% 98.35%
Supplementals & Emerg. Fund $155,841,940 ####### 2.52% $187,578,680 20.36% 2.78% $116,063,211 -38.13% 1.65%
TOTAL APPROPRIATIONS $6,187,545,756 14.67% 100.00% $6,742,919,564 8.98% 100.00% $7,044,915,861 4.48% 100.00%
STATE BUDGET INFORMATIONC-28
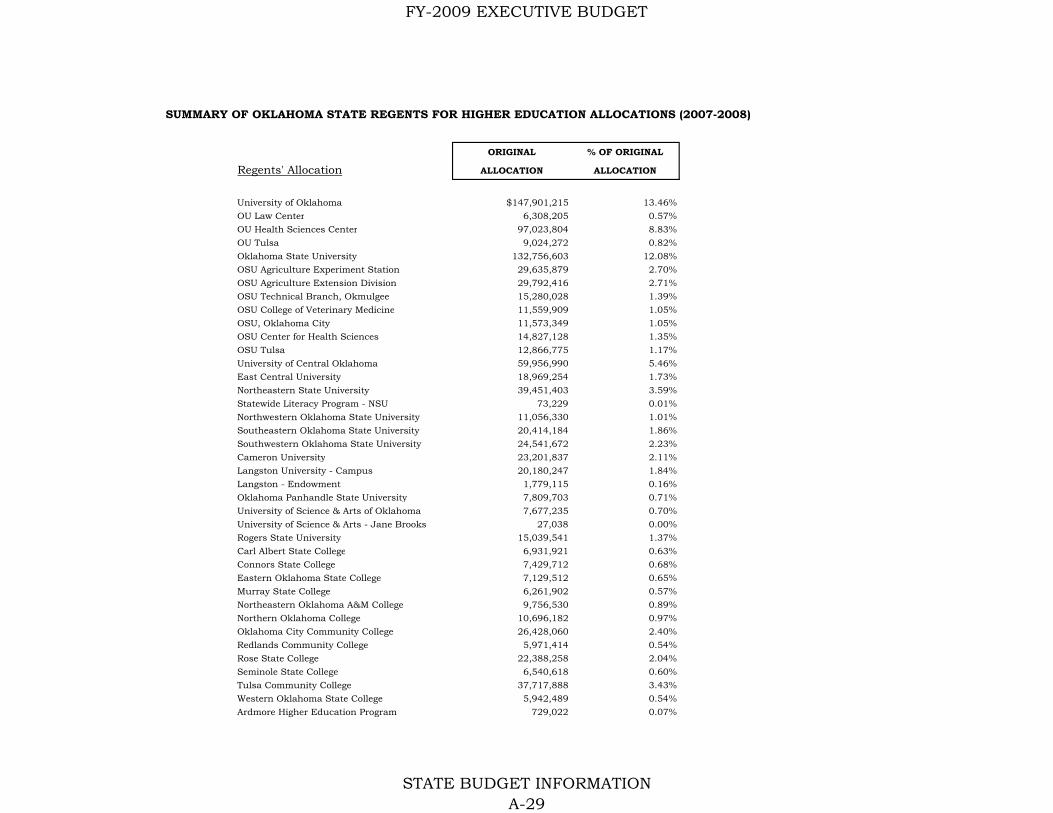
FY-2009 EXECUTIVE BUDGET
SUMMARY OF OKLAHOMA STATE REGENTS FOR HIGHER EDUCATION ALLOCATIONS (2007-2008)
ORIGINAL % OF ORIGINAL
Regents' Allocation ALLOCATION ALLOCATION
University of Oklahoma $147,901,215 13.46%OU Law Center 6,308,205 0.57%OU Health Sciences Center 97,023,804 8.83%OU Tulsa 9,024,272 0.82%Oklahoma State University 132,756,603 12.08%OSU Agriculture Experiment Station 29,635,879 2.70%OSU Agriculture Extension Division 29,792,416 2.71%OSU Technical Branch, Okmulgee 15,280,028 1.39%OSU College of Veterinary Medicine 11,559,909 1.05%OSU, Oklahoma City 11,573,349 1.05%OSU Center for Health Sciences 14,827,128 1.35%OSU Tulsa 12,866,775 1.17%University of Central Oklahoma 59,956,990 5.46%East Central University 18,969,254 1.73%Northeastern State University 39,451,403 3.59%Statewide Literacy Program - NSU 73,229 0.01%Northwestern Oklahoma State University 11,056,330 1.01%Southeastern Oklahoma State University 20,414,184 1.86%Southwestern Oklahoma State University 24,541,672 2.23%Cameron University 23,201,837 2.11%Langston University - Campus 20,180,247 1.84%Langston - Endowment 1,779,115 0.16%Oklahoma Panhandle State University 7,809,703 0.71%University of Science & Arts of Oklahoma 7,677,235 0.70%University of Science & Arts - Jane Brooks 27,038 0.00%Rogers State University 15,039,541 1.37%Carl Albert State College 6,931,921 0.63%Connors State College 7,429,712 0.68%Eastern Oklahoma State College 7,129,512 0.65%Murray State College 6,261,902 0.57%Northeastern Oklahoma A&M College 9,756,530 0.89%Northern Oklahoma College 10,696,182 0.97%Oklahoma City Community College 26,428,060 2.40%Redlands Community College 5,971,414 0.54%Rose State College 22,388,258 2.04%Seminole State College 6,540,618 0.60%Tulsa Community College 37,717,888 3.43%Western Oklahoma State College 5,942,489 0.54%Ardmore Higher Education Program 729,022 0.07%
STATE BUDGET INFORMATIONA-29

FY-2009 EXECUTIVE BUDGET
SUMMARY OF OKLAHOMA STATE REGENTS FOR HIGHER EDUCATION ALLOCATIONS (2007-2008)
ORIGINAL % OF ORIGINAL
Regents' Allocation cont. ALLOCATION ALLOCATION
Ponca City Learning Site 500,000 0.05%
OSF CORE Assessment Fees 149,565 0.01%Section 13 Offsets 10,036,945 0.91%Entry-Yr Tchr Prog Funds 1,877,309 0.17%State Regents' Budget 9,332,625 0.85%OneNet (includes Higher Ed User Fees) 4,364,387 0.40%Internet II / National Lamda Rail 1,529,250 0.14%Scholar-Leadership Enrichment Program 305,882 0.03%Economic Development Incentives 1,047,523 0.10%Regional University Scholarships 800,229 0.07%Prospective Teacher Scholarships 100,000 0.01%Chiropractic Scholarships 40,000 0.00%National Guard Waiver Program 2,045,612 0.19%Tulsa Reconciliation Scholarships 50,000 0.00%Concurrent Enrollment Waiver Program 2,500,000 0.23%Teacher Shortage Incentive Program 402,692 0.04%Brain Gain 2010 3,750,000 0.34%Student Preparation Program 1,174,710 0.11%Summer Academies Program 600,000 0.05%Oklahoma Tuition Aid Grants 18,927,327 1.72%Academic Scholars Program 8,604,500 0.78%Endowed Chairs Program 7,500,000 0.68%Academic Library Databases 410,000 0.04%Master Lease Program 75,000 0.01%OCIA Debt Service 41,284,949 3.76%EPSCoR 3,449,647 0.31%Quartz Mountain 1,268,448 0.12%OHLAP 48,100,000 4.38%George & Donna Nigh Scholarship 70,000 0.01%Oklahoma Tuition Equalization Program 3,828,751 0.35%Capital and One-Time Allocations 1,023,929 0.09%Office of Accountability 770,520 0.07%Adult Degree Completion Program 500,000 0.05%TOTAL ALLOCATIONS OF APPROPRIATIONS * $1,099,070,669 100.00%
* Includes $50,374,284 from the Higher Education Capital Revolving Fund, $50,374,284 from the Student Aid Revolving Fund, $35,366,875 from the Lottery Trust Fund, $10,750,238 from the OHLAP Trust Fund, and $91,877,261 from the Special Cash Fund.
STATE BUDGET INFORMATIONA-30

FY-2009 Executive Budget
FY-2008 Nonappropriated Agency Budgets and FTEFY-2008 FY-2008
Agency Number and Name Budget FTE1. 020 Accountancy Board $1,470,994 7.3 2. 039 Boll Weevil Eradication Organization 1,376,758 20.1 3. 044 Anatomical Board 12,000 - 4. 045 Architects Board 431,507 3.0 5. 060 Aeronautics Commission 9,707,842 10.7 6. 065 Banking Department 5,033,768 38.5 7. 092 Tobacco Board of Directors 15,298,821 4.8 8. 140 Podiatry Board 14,100 - 9. 145 Chiropractic Examiners Board 240,253 2.4 10. 170 Construction Industries Board 3,049,000 33.6 11. 190 Costemology Board 996,855 11.6 12. 215 Dental Board 504,640 4.0 13. 285 Funeral Board 348,661 3.4 14. 290 Employment Security Commission 100,874,160 707.3 15. 307 Interstate Oil Compact Commission 1,201,420 2.5 16. 315 Firefighters Pension and Retirement Board 10,815,356 8.9 17. 320 Department of Wildlife Conservation 46,453,567 341.7 18. 343 State Board of Examiners of Perfusionists 11,000 - 19. 359 Energy Resources Board 18,839,242 - 20. 370 Industrial Finance Authority 10,223,832 6.8 21. 390 CompSource Oklahoma 35,099,010 371.2 22. 416 Law Enforcement Retirement System 4,956,289 4.2 23. 435 Lottery Commission 137,308,356 41.5 24. 444 L P Gas Research, Mkting & Safety Comm 595,500 - 25. 445 Liquefied Petroleum Gas Board 608,239 10.6 26. 446 Comm on Marginally Producing Oil & Gas Wells 645,620 4.6 27. 448 Board of Alcohol and Drug Counselors 215,353 1.4 28. 450 Medical Licensure Board 3,211,390 22.9 29. 475 Motor Vehicle Commission 390,900 4.1 30. 509 Nursing Home Administrators Board 626,807 2.7 31. 510 Board of Nursing 2,938,019 24.3 32. 515 Public Employees Retirement System 7,791,602 51.4 33. 516 State & Ed. Employees Group Insur. Board 41,923,174 175.1 34. 520 Optometry Board 199,883 2.7 35. 525 Osteopathic Examiners Board 551,726 4.5 36. 535 Peanut Commission 178,702 1.0 37. 557 Police Pension & Retirement Board 4,099,260 10.3 38. 560 Pharmacy Board 1,259,144 8.5 39. 570 Engineers & Land Surveyors Board 1,093,768 8.5 40. 575 Psychologists Board 251,397 2.0 41. 588 Real Estate Commission 2,362,881 16.2 42. 615 Foresters Board 1,350 - 43. 622 Social Workers Board 196,242 1.0 44. 630 Securities Commission 19,733,924 26.1 45. 632 Speech-Language Pathology & Audiology Board 112,967 1.8 46. 715 Teachers' Retirement System 321,874,983 49.0 47. 755 Used Motor Vehicle & Parts Commission 876,003 9.2 48. 772 Board of Tests for Alcohol / Drug Influence 482,204 6.0 49. 790 Veterinary Medical Examiners 358,687 3.0 50. 815 Employees Benefits Council 6,153,912 32.4 51. 875 Wheat Commission 2,430,250 5.0
Total: $825,431,320 2,107.8
STATE BUDGET INFORMATIONC-31
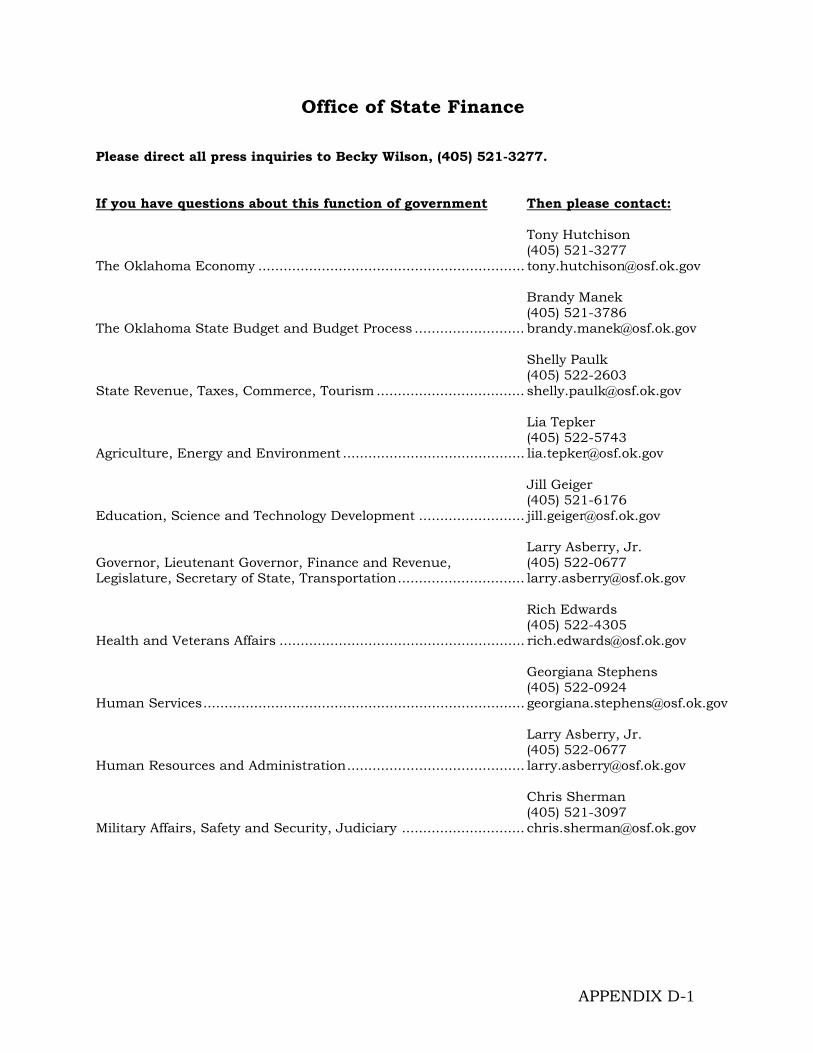
Office of State Finance Please direct all press inquiries to Becky Wilson, (405) 521-3277. If you have questions about this function of government Then please contact: Tony Hutchison
(405) 521-3277 The Oklahoma Economy ............................................................... [email protected] Brandy Manek
(405) 521-3786 The Oklahoma State Budget and Budget Process .......................... [email protected] Shelly Paulk (405) 522-2603 State Revenue, Taxes, Commerce, Tourism ................................... [email protected] Lia Tepker (405) 522-5743 Agriculture, Energy and Environment ........................................... [email protected] Jill Geiger (405) 521-6176 Education, Science and Technology Development ......................... [email protected] Larry Asberry, Jr. Governor, Lieutenant Governor, Finance and Revenue, (405) 522-0677 Legislature, Secretary of State, Transportation.............................. [email protected] Rich Edwards (405) 522-4305 Health and Veterans Affairs .......................................................... [email protected] Georgiana Stephens (405) 522-0924 Human Services............................................................................ [email protected] Larry Asberry, Jr. (405) 522-0677 Human Resources and Administration.......................................... [email protected] Chris Sherman (405) 521-3097 Military Affairs, Safety and Security, Judiciary ............................. [email protected]
APPENDIX D-1
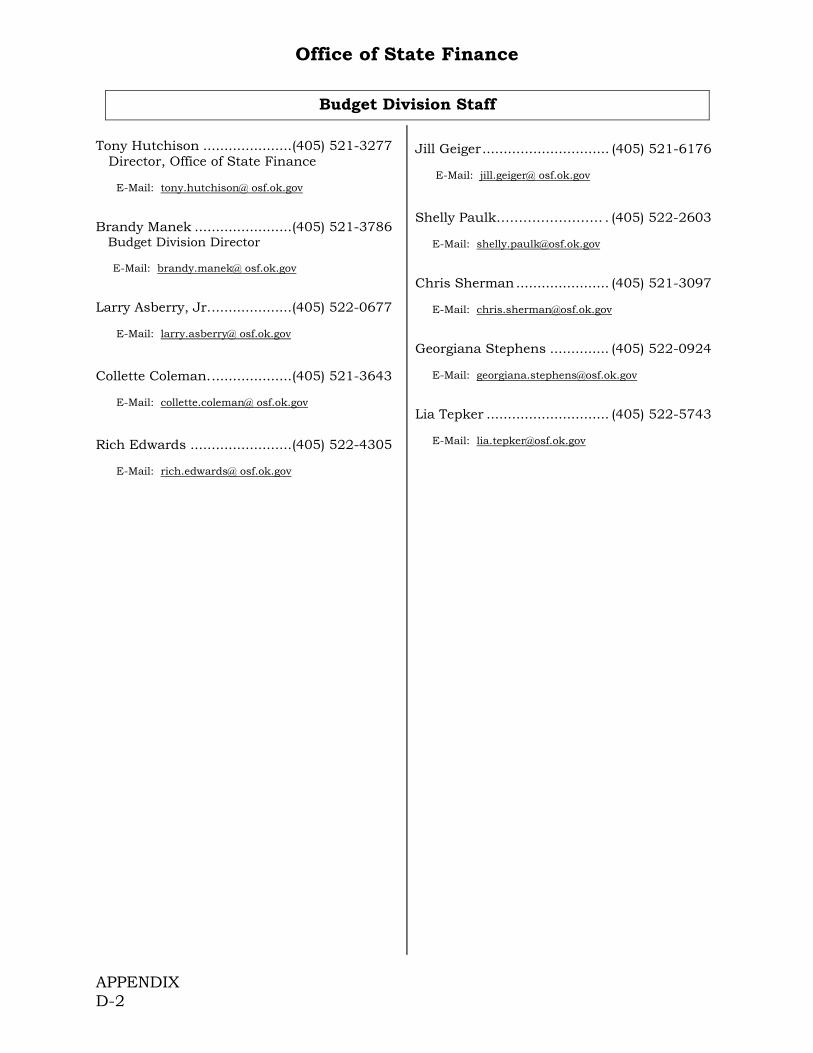
Office of State Finance
Budget Division Staff Tony Hutchison .....................(405) 521-3277 Director, Office of State Finance E-Mail: tony.hutchison@ osf.ok.gov Brandy Manek .......................(405) 521-3786 Budget Division Director E-Mail: brandy.manek@ osf.ok.gov Larry Asberry, Jr....................(405) 522-0677 E-Mail: larry.asberry@ osf.ok.gov Collette Coleman....................(405) 521-3643 E-Mail: collette.coleman@ osf.ok.gov Rich Edwards ........................(405) 522-4305 E-Mail: rich.edwards@ osf.ok.gov
Jill Geiger.............................. (405) 521-6176 E-Mail: jill.geiger@ osf.ok.gov Shelly Paulk……………………. (405) 522-2603 E-Mail: [email protected] Chris Sherman...................... (405) 521-3097 E-Mail: [email protected] Georgiana Stephens .............. (405) 522-0924 E-Mail: [email protected] Lia Tepker ............................. (405) 522-5743 E-Mail: [email protected]
APPENDIX D-2

FY-2009 Executive Budget
APPENDIX D-3
Agriculture
Commerce & Tourism
Education
Energy
Environment
Finance & Revenue
Health
Human Resources &
Administration
Human Services
Safety & Security
Secretary of
State
Science & Tech. Development
Transportation
Veterans Affairs
CITIZENS OF OKLAHOMA
STATE LEGISLATURE
JUDICIAL BRANCH
Executive Branch Of Government
GOVERNOR LIEUTENANT GOVERNOR
Cabinet Department Secretaries
Supreme Court/Court of Appeals Court of Criminal Appeals District Courts Workers Compensation Court
State Senate House of Representatives Legislative Service Bureau
The Cabinet Secretaries are appointed by the Governor with the approval of the Senate. Many of the secretaries are also heads of Executive Branch agencies. Most state agencies have a controlling board or commission which appoints a chief operating officer. Most board and commission members are appointed by the Governor, some requiring Senate approval. Some agencies do not have a controlling board, and most of those agency heads are appointed by the Governor with Senate approval. More information on the appointment process is included in the Executive-Historical document. State agencies are assigned to a cabinet department by the Governor. The specific agency assignments to each cabinet are shown on the next page.
Other State-wide Elected Officials: State Treasurer Attorney General Labor Commissioner State Auditor and Inspector State Insurance Commissioner 3 Corporation Commissioners Superintendent of Public Instruction
Military Affairs

FY-2009 Executive Budget
660 Southeastern Oklahoma State Univ. 525 Osteopathic Examiners Board 305 Office of the Governor 665 Southwestern Oklahoma State Univ. 343 Perfusionists, State Bd. of Examiners 440 Office of the Lieutenant Governor 618 Student Loan Authority 548 Personnel Management
Agriculture 750 Tulsa Community College 560 Pharmacy Board 120 University of Central Oklahoma 140 Podiatric Medical Examiners, Bd. of 40 Agriculture, Department of 760 University of Oklahoma 570 Prof. Engin. & Land Surveyors Bd. 39 Boll Weevil Eradication Org. 150 Univ. of Science and Arts of Okla. 575 Psychologists, Bd. of Examiners 645 Conservation Commission 41 Western Oklahoma State College 588 Real Estate Commission 615 Foresters, Board of Registered 622 Social Workers Board, Bd. of Lic. 535 Peanut Commission
Energy 632 Speech-Lang. Pathology & Aud. Bd. 875 Wheat Commission 516 State and Ed. Empl. Group Ins. Bd. 185 Corporation Commission * Commerce and Tourism 755 Used Motor Vehicle & Parts 359 Energy Resources Board
790 Veterinary Medical Examiners Board 980 Grand River Dam Authority 981 Capital Investment Board 307 Interstate Oil Comp. Com. 007 Centennial Commission
Human Services160 Commerce, Department of 900 Development Finance Authority
290 Employment Security Commission 350 Historical Society 922 Housing Finance Authority 370 Industrial Finance Authority 204 J.M. Davis Memorial Commission 405 Labor, Department of * 981 Municipal Power Authority 361 Native American Cultural/Ed. Auth 568 Scenic Rivers Comm. 566 Tourism & Recreation, Dept. of 880 Will Rogers Memorial Commission Education 44 Anatomical Board 55 Arts Council 800 Career & Technology Education 266 Educational TV Authority 265 Education, Department of * 430 Library Department 563 Private Vocational School, Board of 629 School of Science & Mathematics 269 Teacher Preparation, Comm. for Colleges and Universities 606 Ardmore Higher Education Center 100 Cameron University 108 Carl Albert State College 165 Connors State College 230 East Central University 240 Eastern Oklahoma State College 420 Langston University 470 Murray State College 480 Northeastern Okla. A & M College 485 Northeastern State University 490 Northern Oklahoma College 505 Northwestern Oklahoma State Univ. 530 Oklahoma Panhandle State Univ. 10 Oklahoma State University 761 Oklahoma University Law Center 633 Oklahoma City Community College 770 Okla. University Health Science Ctr. 773 OSU -College of Osteopathic Medicine 14 OSU -College of Veterinary Medicine 11 OSU -Experiment Station 12 OSU -Extension Division 13 OSU -School of Tech. Training 15 OSU -Technical Institute of OKC 16 OSU -Tulsa 771 OU Health Sci. Ctr. Prof. Prac. Plan 620 Qtz Mtn. Arts/Conf. Cntr/Nat. Pk. 241 Redlands Community College 600 Regents for A&M Colleges 605 Regents for Higher Education 610 Regional University System of OK 461 Rogers State University 531 Rose State College 623 Seminole State College
445 LPG Board 444 LPG Research, Marketing and Safety 127 Children & Youth, Commission 446 Marg. Prod. O&G Wells, Comm. on 326 Handicapped Concerns, Office of 125 Mines, Department of 830 Human Services, Department of 360 Indian Affairs Commission
Environment 670 J.D. McCarty Center 400 Juvenile Affairs, Office of 292 Dept. of Environmental Quality 619 Physicians Manpower Trng. Comm. 920 Environmental Finance Authority 805 Rehabilitative Services 835 Water Resources Board 825 University Hospitals Authority 320 Wildlife Conservation, Dept. of
Finance and Revenue Military Affairs300 Auditor & Inspector * 25 Military Department 65 Banking Department
Safety and Security582 Bond Advisor 91 Building Bonds Commission 30 ABLE Commission 105 Capitol Improvement Authority 49 Attorney General * 390 CompSource Oklahoma 772 Chem. Tests for Alc/Drug Infl., Bd. of 635 Consumer Credit, Comm. for 309 Civil Emergency Mgmt, Dept. of 90 Finance, Office of State 131 Corrections Department 315 Firefighters Pension & Retirement 220 District Attorney’s Council 385 Insurance Department * 310 Fire Marshal, State 410 Land Office, Commissioners of the 47 Indigent Defense System 416 Law Enforcement Retirement 308 Investigation, Bureau of 435 Lottery Commission 415 Law Enf. Educ. & Trng., Council on 557 Police Pension & Retirement System 342 Medicolegal Investigations, Bd. of 515 Public Employees’ Retirement System 477 Narcotics & Dang. Drugs, Bureau of 630 Securities Commission 306 Pardon and Parole Board 695 Tax Commission 585 Public Safety, Department of 715 Teachers’ Retirement System
Science and Technology Dev.092 Tobacco Settle. End. Trust Bd. of Dir. 740 Treasurer 628 Center f/t Adv. of Sci. & Technology
Health Secretary of State
448 Alcohol and Drug Coun., Bd. of Lic. 270 Election Board 783 Community Hospitals Authority 296 Ethics Commission 170 Construction Industries Bd. 678 Judicial Complaints, Council on 807 Health Care Authority 625 Secretary of State 340 Health, Department of
Transportation452 Mental Health and Sub. Abuse Svc. 509 Nursing Homes, Board of Exam. for 978 Okla. Transportation Authority
346 Space Industry Development Auth. Human Resources and Admin. 345 Transportation, Department of
060 Aeronautics Commission 22 Abstractor’s Board 20 Accountancy Board
Veterans Affairs 45 Architects, Board of Gov.of Licensed 650 Veterans Affairs, Department of 580 Central Services, Dept. of
145 Chiropractic Examiners Board 190 Cosmetology Board 215 Dentistry, Board of 815 Employees Benefits Council 285 Funeral Board
* Agency is headed by a statewide elected official or their controlling board is made up of elected officials. They are assigned to a cabinet department for purposes of coordinating services and programs only.
353 Horse Racing Commission 355 Human Rights Commission 450 Medical Licensure & Supv., Bd. of 298 Merit Protection Commission 475 Motor Vehicle Commission 510 Nursing Board 520 Optometry Board
APPENDIX D-4

FY-2009 Executive Budget
FY-2004 FY-2005 FY-2006 FY-2007 FY-2008Cabinet/Agency Actual Actual Actual Actual YTD
Governor 33.8 33.1 34.4 32.5 32.7Lieutenant Governor 6.8 8.6 8.0 6.5 6.5Agriculture 534.3 526.2 555.1 539.8 545.1Commerce and Tourism 2,071.5 2,123.4 2,180.8 2,175.0 2,175.0Education (excluding Higher Education) 958.2 967.8 1,004.8 1,026.4 1,011.1Energy 866.9 906.1 911.5 1,011.7 941.0Environment 971.6 986.2 984.9 997.7 1,008.9Finance and Revenue 1,989.1 1,965.3 2,025.6 2,042.7 2,030.2Health 4,239.7 4,446.6 4,698.7 4,840.3 5,251.3Human Resources and Administration 724.6 702.7 748.5 756.4 768.7Human Services 9,515.2 9,743.2 9,910.3 10,203.9 10,001.3Military 331.5 341.8 368.5 305.5 254.2Safety and Security 8,118.1 8,160.6 8,257.3 8,290.5 8,503.4Science & Technology 19.9 18.7 19.3 23.0 23.7Secretary of State 66.8 67.8 64.9 64.8 62.2Transportation 2,962.5 2,958.3 2,947.1 3,009.7 3,088.0Veterans Affairs 1,603.8 1,741.9 1,813.9 1,817.2 1,857.8
35,014.3 35,698.3 36,533.6 37,143.6 37,561.1
Regents 326.4 325.5 320.8 323.3 319.0Higher Education 28,875.0 29,335.2 30,070.9 31,074.6 31,761.5
29,201.4 29,660.7 30,391.7 31,397.9 32,080.5
Total Executive Branch 64,215.7 65,359.0 66,925.3 68,541.5 69,641.6
Legislature 513.5 507.3 494.6 468.1 469.4Judiciary 868.1 871.8 881.9 900.3 914.3
1,381.6 1,379.1 1,376.5 1,368.4 1,383.7
GRAND TOTAL 65,597.3 66,738.1 68,301.8 69,909.9 71,025.3
Total Excluding Higher Ed 36,722.3 37,402.9 38,230.9 38,835.3 39,263.8
305 Governor 33.8 33.1 34.4 32.5 32.7
440 Lieutenant Governor 6.8 8.6 8.0 6.5 6.5
Agriculture40 Agriculture, Department of 429.5 438.0 466.8 454.9 458.239 Boll Weevil Eradication 41.9 26.5 27.2 23.5 20.1
645 Conservation Commission 57.4 56.8 56.3 56.3 60.8535 Peanut Commission 0.0 1.0 1.0 0.0 0.0631 Sheep & Wool Commission 1.0 0.0 0.0 1.0 1.0875 Wheat Commission 4.5 3.9 3.8 4.1 5.0
Total 534.3 526.2 555.1 539.8 545.1
APPENDIXD-5

FY-2009 Executive BudgetFY-2004 FY-2005 FY-2006 FY-2007 FY-2008
Cabinet/Agency Actual Actual Actual Actual YTDCommerce and Tourism
7 Centennial Commission 7.0 7.6 6.9 7.1 7.0160 Commerce, Department of 118.9 133.4 148.2 152.4 151.4290 Employment Security Commission, OK 730.2 749.3 793.5 739.2 707.3350 Historical Society, Oklahoma 139.3 141.5 156.8 163.7 169.8922 Housing Finance Authority 112.3 112.8 110.9 111.5 111.8370 Industrial Finance Authority 7.7 6.8 6.6 6.8 6.8204 J.M. Davis Memorial Commission 7.2 6.5 6.4 5.9 6.5405 Labor Department 94.6 99.1 93.2 97.9 96.1981 Municipal Power Authority 45.7 46.9 48.0 49.1 51.2568 Scenic Rivers Commission 10.0 11.1 12.1 12.8 14.7566 Tourism & Recreation, Department of 787.7 797.0 787.2 817.4 840.4880 Will Rogers Memorial Commission 10.9 11.4 11.0 11.2 12.0
Total 2,071.5 2,123.4 2,180.8 2,175.0 2,175.0
Education (Excl. Higher Education)44 Anatomical Board 0.0 0.0 0.0 0.0 0.055 Arts Council, State 15.9 15.3 16.4 16.2 15.5
800 Career & Technology Education 333.6 345.2 359.3 359.6 342.2265 Education, State Department of 337.6 338.3 356.1 372.5 372.0266 Educational Television Authority 66.2 63.1 65.0 67.2 70.8430 Libraries, Department of 67.5 65.5 65.8 62.6 61.1563 Private Vocational Schools Board 2.6 2.8 2.8 2.6 2.8629 School of Science & Mathematics 67.8 69.1 70.9 73.1 70.5618 Student Loan Authority 58.3 59.3 59.3 63.4 66.2269 Teacher Preparation, OK Commission 8.7 9.2 9.2 9.2 10.0
Total 958.2 967.8 1,004.8 1,026.4 1,011.1
Energy185 Corporation Commission 366.5 402.5 459.1 473.4 478.1
Energy Resource Board 0.0 0.0980 Grand River Dam Authority (GRDA) 451.5 455.0 401.9 487.2 410.1307 Interstate Oil Compact Commission 0.0 0.4 1.5 2.0 2.5445 Liquefied Petroleum Gas Board 9.8 9.0 9.1 9.1 10.6446 Marginally Producing Oil & Gas Wells 3.5 3.5 4.2 4.6 4.6125 Mines, Department of 35.6 35.7 35.7 35.4 35.1
Total 866.9 906.1 911.5 1,011.7 941.0
Environment292 Dept. of Environmental Quality (DEQ) 538.5 546.9 548.3 565.1 568.3835 Water Resources Board 96.9 97.8 92.7 94.4 98.9320 Wildlife Conservation Commission 336.2 341.5 343.9 338.2 341.7
Total 971.6 986.2 984.9 997.7 1,008.9
Finance and Revenue300 Auditor & Inspector 147.1 152.1 151.2 149.2 138.165 Banking Department, State 39.1 39.1 40.3 39.3 38.5
390 CompSource 377.6 371.8 370.2 363.7 371.290 Finance, Office of State 114.4 135.5 139.2 148.5 156.5
APPENDIXD-6
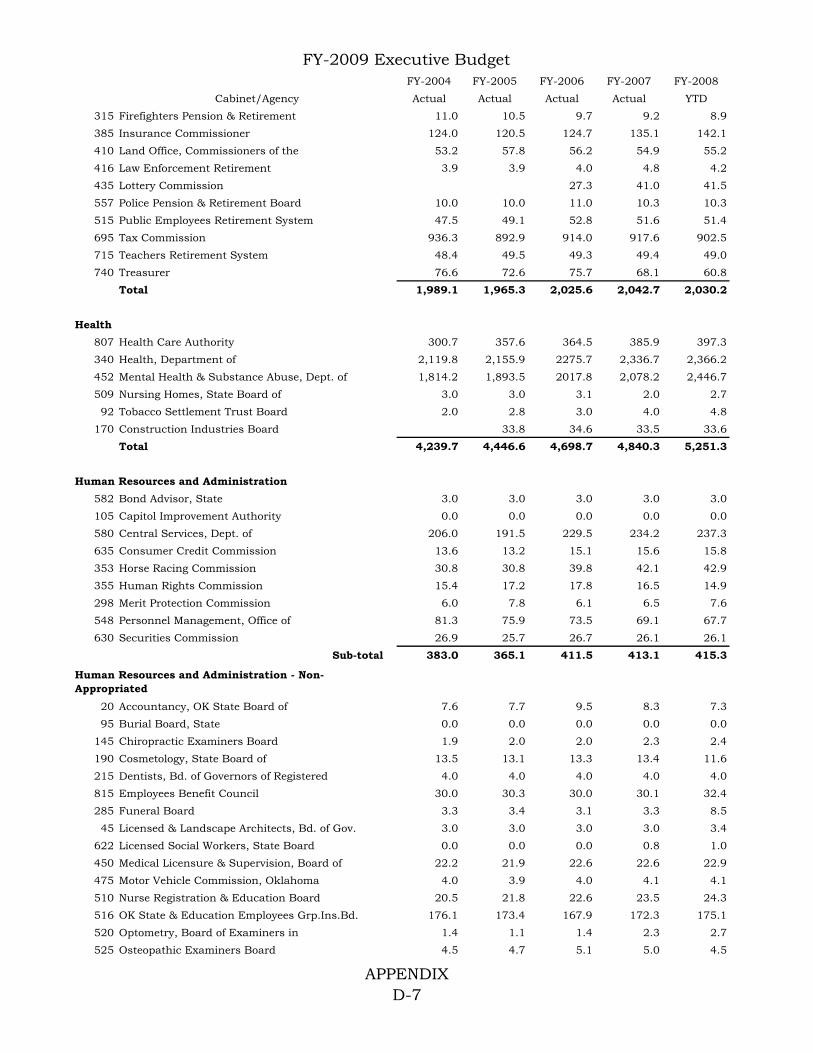
FY-2009 Executive BudgetFY-2004 FY-2005 FY-2006 FY-2007 FY-2008
Cabinet/Agency Actual Actual Actual Actual YTD315 Firefighters Pension & Retirement 11.0 10.5 9.7 9.2 8.9385 Insurance Commissioner 124.0 120.5 124.7 135.1 142.1410 Land Office, Commissioners of the 53.2 57.8 56.2 54.9 55.2416 Law Enforcement Retirement 3.9 3.9 4.0 4.8 4.2435 Lottery Commission 27.3 41.0 41.5557 Police Pension & Retirement Board 10.0 10.0 11.0 10.3 10.3515 Public Employees Retirement System 47.5 49.1 52.8 51.6 51.4695 Tax Commission 936.3 892.9 914.0 917.6 902.5715 Teachers Retirement System 48.4 49.5 49.3 49.4 49.0740 Treasurer 76.6 72.6 75.7 68.1 60.8
Total 1,989.1 1,965.3 2,025.6 2,042.7 2,030.2
Health807 Health Care Authority 300.7 357.6 364.5 385.9 397.3340 Health, Department of 2,119.8 2,155.9 2275.7 2,336.7 2,366.2452 Mental Health & Substance Abuse, Dept. of 1,814.2 1,893.5 2017.8 2,078.2 2,446.7509 Nursing Homes, State Board of 3.0 3.0 3.1 2.0 2.792 Tobacco Settlement Trust Board 2.0 2.8 3.0 4.0 4.8
170 Construction Industries Board 33.8 34.6 33.5 33.6Total 4,239.7 4,446.6 4,698.7 4,840.3 5,251.3
Human Resources and Administration 582 Bond Advisor, State 3.0 3.0 3.0 3.0 3.0105 Capitol Improvement Authority 0.0 0.0 0.0 0.0 0.0580 Central Services, Dept. of 206.0 191.5 229.5 234.2 237.3635 Consumer Credit Commission 13.6 13.2 15.1 15.6 15.8353 Horse Racing Commission 30.8 30.8 39.8 42.1 42.9355 Human Rights Commission 15.4 17.2 17.8 16.5 14.9298 Merit Protection Commission 6.0 7.8 6.1 6.5 7.6548 Personnel Management, Office of 81.3 75.9 73.5 69.1 67.7630 Securities Commission 26.9 25.7 26.7 26.1 26.1
Sub-total 383.0 365.1 411.5 413.1 415.3
20 Accountancy, OK State Board of 7.6 7.7 9.5 8.3 7.395 Burial Board, State 0.0 0.0 0.0 0.0 0.0
145 Chiropractic Examiners Board 1.9 2.0 2.0 2.3 2.4190 Cosmetology, State Board of 13.5 13.1 13.3 13.4 11.6215 Dentists, Bd. of Governors of Registered 4.0 4.0 4.0 4.0 4.0815 Employees Benefit Council 30.0 30.3 30.0 30.1 32.4285 Funeral Board 3.3 3.4 3.1 3.3 8.545 Licensed & Landscape Architects, Bd. of Gov. 3.0 3.0 3.0 3.0 3.4
622 Licensed Social Workers, State Board 0.0 0.0 0.0 0.8 1.0450 Medical Licensure & Supervision, Board of 22.2 21.9 22.6 22.6 22.9475 Motor Vehicle Commission, Oklahoma 4.0 3.9 4.0 4.1 4.1510 Nurse Registration & Education Board 20.5 21.8 22.6 23.5 24.3516 OK State & Education Employees Grp.Ins.Bd. 176.1 173.4 167.9 172.3 175.1520 Optometry, Board of Examiners in 1.4 1.1 1.4 2.3 2.7525 Osteopathic Examiners Board 4.5 4.7 5.1 5.0 4.5
Human Resources and Administration - Non-Appropriated
APPENDIXD-7

FY-2009 Executive BudgetFY-2004 FY-2005 FY-2006 FY-2007 FY-2008
Cabinet/Agency Actual Actual Actual Actual YTD560 Pharmacy, Board of 8.2 8.1 8.0 8.0 8.5
Podiatry Board, State Board of 0.0 0.0570 Professional Engineers & Land Surveyors 5.8 6.4 7.2 8.5 8.5575 Psychologist Examiners Board 2.0 1.6 2.1 2.0 2.0588 Real Estate Commission, Oklahoma 17.5 17.4 16.7 15.7 16.2632 Speech Pathology & Audiology Board 1.7 1.5 1.6 1.7 1.8755 Used Motor Vehicle & Parts Commission 10.4 9.1 9.9 9.4 9.2790 Veterinary Medical Examiners, Board of 4.0 3.2 3.0 3.0 3.0
Sub-total 341.6 337.6 337.0 343.3 353.4Total 724.6 702.7 748.5 756.4 768.7
Human Services 127 Children & Youth, Commission on 20.4 21.3 22.6 26.6 26.8326 Handicapped Concerns, Office of 7.6 8.0 7.7 7.8 8.0830 Human Services Department 7,505.3 7,621.9 7788.7 8,062.1 7,864.4360 Indian Affairs Commission 4.5 3.4 2.9 2.3 3.0670 J.D. McCarty Ctr. for Handicapped Concerns 137.8 183.8 197.6 202.0 204.6400 Juvenile Affairs, Office of 989.6 1,030.4 998.0 1,003.0 994.2619 Physician Manpower Training Commission 6.0 6.1 6.0 5.8 6.0805 Rehabilitative Services, OK Dept. of 840.0 864.3 882.7 889.3 888.3825 University Hospitals Authority 4.0 4.0 4.1 5.0 6.0
Total 9,515.2 9,743.2 9,910.3 10,203.9 10,001.3
Military25 Military Department 331.5 341.8 368.5 305.5 254.2
Safety and Security30 A.B.L.E. Commission 47.4 44.5 43.4 45.3 44.749 Attorney General 158.1 163.2 165.6 172.8 173.9
772 Chem. Tests for Alcohol & Drug Infl. 0.0 5.0 4.3 4,761.3 4,886.5131 Corrections Department 4,683.7 4,687.1 4722.9 33.0 42.8415 Council on Law Enforcement Educ.&Trng. 34.0 34.2 34.0 1,140.8 1,140.6220 District Attorney's Council 1,101.0 1,115.2 1162.4 26.6 27.4309 Emergency Mgt., Dept. of 26.8 25.3 25.1 122.9 122.047 Indigent Defense System 120.8 122.8 123.9 286.3 299.7
308 Investigation, Okla. State Bureau of (OSBI) 291.1 291.7 286.8 1.9 1.4448 Licensed Alcohol & Drug Counselors, Board of 1.1 69.3 70.8342 Medicolegal Invest. Bd. 63.4 60.1 63.3 94.3 105.7477 Narcotics & Dangerous Drugs Control 94.6 94.3 94.0 41.8 42.1306 Pardon and Parole Board 36.2 37.8 42.5 1,457.4 1,508.7585 Public Safety, Department of 1,432.1 1,451.1 1457.1 31.4 31.1310 State Fire Marshal, Office of 28.9 28.3 30.9 5.4 6.0
Total 8,118.1 8,160.6 8,257.3 8,290.5 8,503.4
Science and Technology 628 Cent.f/t Adv.of Science & Technology 19.9 18.7 19.3 23.0 23.7
Secretary of State 678 Council on Judicial Complaints 2.0 2.0 2.0 2.0 2.0
APPENDIXD-8
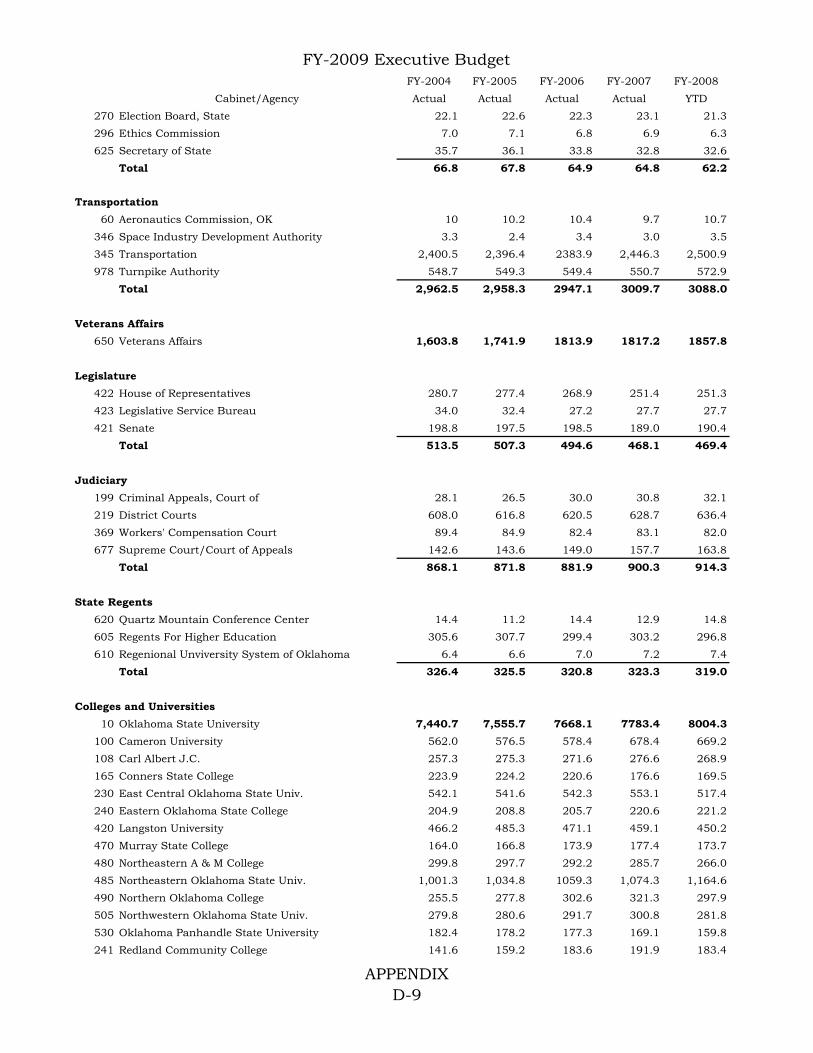
FY-2009 Executive BudgetFY-2004 FY-2005 FY-2006 FY-2007 FY-2008
Cabinet/Agency Actual Actual Actual Actual YTD270 Election Board, State 22.1 22.6 22.3 23.1 21.3296 Ethics Commission 7.0 7.1 6.8 6.9 6.3625 Secretary of State 35.7 36.1 33.8 32.8 32.6
Total 66.8 67.8 64.9 64.8 62.2
Transportation60 Aeronautics Commission, OK 10 10.2 10.4 9.7 10.7
346 Space Industry Development Authority 3.3 2.4 3.4 3.0 3.5345 Transportation 2,400.5 2,396.4 2383.9 2,446.3 2,500.9978 Turnpike Authority 548.7 549.3 549.4 550.7 572.9
Total 2,962.5 2,958.3 2947.1 3009.7 3088.0
Veterans Affairs650 Veterans Affairs 1,603.8 1,741.9 1813.9 1817.2 1857.8
Legislature422 House of Representatives 280.7 277.4 268.9 251.4 251.3423 Legislative Service Bureau 34.0 32.4 27.2 27.7 27.7421 Senate 198.8 197.5 198.5 189.0 190.4
Total 513.5 507.3 494.6 468.1 469.4
Judiciary199 Criminal Appeals, Court of 28.1 26.5 30.0 30.8 32.1219 District Courts 608.0 616.8 620.5 628.7 636.4369 Workers' Compensation Court 89.4 84.9 82.4 83.1 82.0677 Supreme Court/Court of Appeals 142.6 143.6 149.0 157.7 163.8
Total 868.1 871.8 881.9 900.3 914.3
State Regents620 Quartz Mountain Conference Center 14.4 11.2 14.4 12.9 14.8605 Regents For Higher Education 305.6 307.7 299.4 303.2 296.8610 Regenional Unviversity System of Oklahoma 6.4 6.6 7.0 7.2 7.4
Total 326.4 325.5 320.8 323.3 319.0
Colleges and Universities10 Oklahoma State University 7,440.7 7,555.7 7668.1 7783.4 8004.3
100 Cameron University 562.0 576.5 578.4 678.4 669.2108 Carl Albert J.C. 257.3 275.3 271.6 276.6 268.9165 Conners State College 223.9 224.2 220.6 176.6 169.5230 East Central Oklahoma State Univ. 542.1 541.6 542.3 553.1 517.4240 Eastern Oklahoma State College 204.9 208.8 205.7 220.6 221.2420 Langston University 466.2 485.3 471.1 459.1 450.2470 Murray State College 164.0 166.8 173.9 177.4 173.7480 Northeastern A & M College 299.8 297.7 292.2 285.7 266.0485 Northeastern Oklahoma State Univ. 1,001.3 1,034.8 1059.3 1,074.3 1,164.6490 Northern Oklahoma College 255.5 277.8 302.6 321.3 297.9505 Northwestern Oklahoma State Univ. 279.8 280.6 291.7 300.8 281.8530 Oklahoma Panhandle State University 182.4 178.2 177.3 169.1 159.8241 Redland Community College 141.6 159.2 183.6 191.9 183.4
APPENDIXD-9

FY-2009 Executive BudgetFY-2004 FY-2005 FY-2006 FY-2007 FY-2008
Cabinet/Agency Actual Actual Actual Actual YTD461 Rogers State Univ.(Claremore J.C.) 330.8 348.3 362.1 366.5 381.9531 Rose State College 534.8 614.4 569.7 574.8 569.5606 Ardmore Higher EducationCenter 12.4623 Seminole J.C. 157.5 158.5 159.4 167.7 166.3633 South Oklahoma City J.C. 458.9 481.5 511.2 580.6 608.1660 Southeastern Oklahoma State Univ. 540.6 538.5 559.3 568.4 527.6665 Southwestern Oklahoma State Univ. 676.7 684.3 710.8 731.1 722.4750 Tulsa J.C. 1,191.4 1,239.7 1256.7 1,253.6 1,248.7120 University of Central Oklahoma 1,203.3 1,218.2 1280.6 1,344.4 1,387.8150 Univ. of Science and Arts of Okla 166.0 169.6 166.7 175.8 174.241 Western Oklahoma State College 137.4 146.2 155.9 162.9 153.8
325 OU Geological Survey 0.0 0.0 0.0 0.0 0.0760 University of Oklahoma 6,464.3 6,410.2 6636.8 6,962.7 7,327.4761 Oklahoma University Law Center 0.0 0.0 0.0 0.0 0.0770 Okla. University Health Science Ctr. 4,674.3 4,739.2 4936.9 5,169.1 5,297.5771 OU Health Science Ctr.Prof.Prac.Plan 317.5 324.1 326.4 348.7 356.0845 Medical Research & Technology Auth. 0.0 0.0 0.0 0.0 0.0
28,875.0 29,335.2 30,070.9 31,074.6 31,761.5Total 65,597.3 66,738.1 68,301.8 69,909.9 71,025.3
APPENDIXD-10

FY-2009 Executive Budget
APPENDIX D-11
GLOSSARY Actuarial Accrued Liability (re: retirement): That portion, as determined by a particular cost method, of the actuarial present value of pension plan benefits and expenses which is not provided for by Normal Cost contributions. Actuarial Assumptions (re: retirement): Assumptions as to the occurrence of future events affecting pension costs, such as: mortality, withdrawal, disablement and retirement; changes in compensation and government provided benefits; rates of investment earnings and asset appreciation or depreciation; procedures used to determine the Actuarial Value of Assets; characteristics of future entrants and other relevant items.
Annualization: The computation of costs or revenues for a full year. Usually applied when calculating the full year impact/cost of a program that was funded for a partial year in a previous budget. Appropriation: Legal authorization granted by the Legislature to make expenditures or incur obligations that may be limited by fund, agency, department, program, object, character, time period or amount. Unexpended appropriations lapse back to the original fund after the lapse (expiration) date. Appropriations Base: An agency's previous year appropriation reduced by one-time appropriations. Basic Industry: An industry that sells most of its service or product to out-of-state buyers. Board of Equalization: A Constitutional body, the State Board of Equalization is made up of the Governor, Lieutenant Governor, State Treasurer, State Auditor and Inspector, Attorney General, Superintendent of Public Instruction, and President of the State Board of Agriculture. The Board annually certifies the amount of state funds available for appropriation. The Board also has duties regarding the equalization of ad valorem taxes among the counties. Budgeted Vacancy: A vacant employee position which is funded in an agency’s current budget (in most instances, the vacancy has remained unfilled for an extended period of time). Budget Request: A detailed outline of an agency's financial needs for the next fiscal year. Budget Work Program: An outline of detailed planned expenditures for the ensuing or current fiscal year, which takes into consideration funds appropriated by the Legislature and other funds available to the agency, and any expenditure limitations or directives expressed in legislation.
Capital Expenditure / Outlay: Expenditures made for securing capital assets. Capital assets are significant, tangible assets with a value greater than $25 thousand that have a life greater than one year and will be used in providing services.
Carryover: This term refers to unobligated monies an agency has available to fund its operations in succeeding fiscal years. Generally, carryover monies are considered non-recurring in nature.

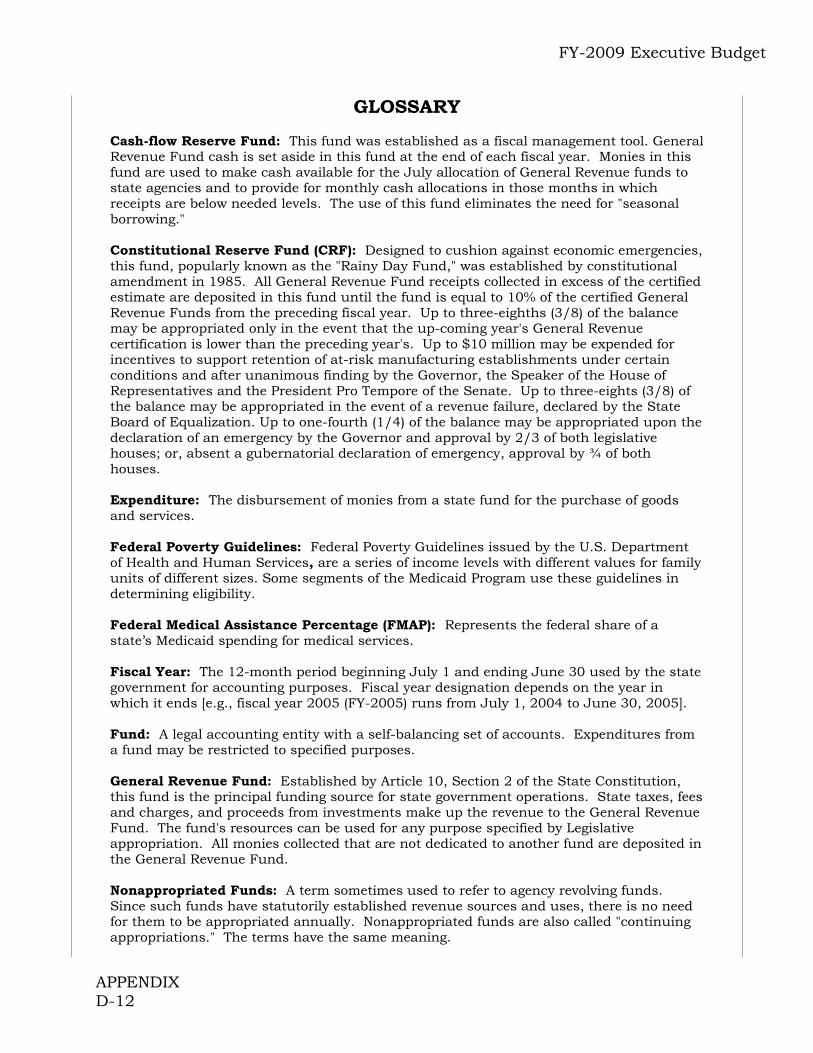
FY-2009 Executive Budget
APPENDIX D-12
GLOSSARY Cash-flow Reserve Fund: This fund was established as a fiscal management tool. General Revenue Fund cash is set aside in this fund at the end of each fiscal year. Monies in this fund are used to make cash available for the July allocation of General Revenue funds to state agencies and to provide for monthly cash allocations in those months in which receipts are below needed levels. The use of this fund eliminates the need for "seasonal borrowing." Constitutional Reserve Fund (CRF): Designed to cushion against economic emergencies, this fund, popularly known as the "Rainy Day Fund," was established by constitutional amendment in 1985. All General Revenue Fund receipts collected in excess of the certified estimate are deposited in this fund until the fund is equal to 10% of the certified General Revenue Funds from the preceding fiscal year. Up to three-eighths (3/8) of the balance may be appropriated only in the event that the up-coming year's General Revenue certification is lower than the preceding year's. Up to $10 million may be expended for incentives to support retention of at-risk manufacturing establishments under certain conditions and after unanimous finding by the Governor, the Speaker of the House of Representatives and the President Pro Tempore of the Senate. Up to three-eights (3/8) of the balance may be appropriated in the event of a revenue failure, declared by the State Board of Equalization. Up to one-fourth (1/4) of the balance may be appropriated upon the declaration of an emergency by the Governor and approval by 2/3 of both legislative houses; or, absent a gubernatorial declaration of emergency, approval by ¾ of both houses. Expenditure: The disbursement of monies from a state fund for the purchase of goods and services. Federal Poverty Guidelines: Federal Poverty Guidelines issued by the U.S. Department of Health and Human Services, are a series of income levels with different values for family units of different sizes. Some segments of the Medicaid Program use these guidelines in determining eligibility. Federal Medical Assistance Percentage (FMAP): Represents the federal share of a state’s Medicaid spending for medical services. Fiscal Year: The 12-month period beginning July 1 and ending June 30 used by the state government for accounting purposes. Fiscal year designation depends on the year in which it ends [e.g., fiscal year 2005 (FY-2005) runs from July 1, 2004 to June 30, 2005].
Fund: A legal accounting entity with a self-balancing set of accounts. Expenditures from a fund may be restricted to specified purposes. General Revenue Fund: Established by Article 10, Section 2 of the State Constitution, this fund is the principal funding source for state government operations. State taxes, fees and charges, and proceeds from investments make up the revenue to the General Revenue Fund. The fund's resources can be used for any purpose specified by Legislative appropriation. All monies collected that are not dedicated to another fund are deposited in the General Revenue Fund.
Nonappropriated Funds: A term sometimes used to refer to agency revolving funds. Since such funds have statutorily established revenue sources and uses, there is no need for them to be appropriated annually. Nonappropriated funds are also called "continuing appropriations." The terms have the same meaning.


FY-2009 Executive Budget
APPENDIX D-13
GLOSSARY OneNet: Oklahoma’s Telecommunications Network (OneNet is not an acronym) One-time: Budget items that receive funding for one fiscal year (for example, funding for a feasibility study, funding for the replacement of major equipment items, funding for the purchase of furniture for a new facility, etc.). Program Budgeting: A tool to organize budget data by program, rather than item of expenditure or organizational location (generally an agency or division). Program budgeting seeks to link the expenditure of resources with the original mission or purpose of the appropriation of tax dollars. Rainy Day Fund: See Constitutional Reserve Fund. Reception – Department of Corrections: An inmate that is received at the Lexington Assessment & Reception Center from a county sheriff after sentencing by a District court to a term of incarceration for a felony conviction. Revolving Fund: A fund created statutorily or by inference to finance and account for a particular department or division. Fees received, transfers of appropriations, or other fund transfers support expenditures paid from revolving funds. Revolving funds are continuing funds and are not subject to fiscal year limitations. Agencies generally may exercise greater control over the expenditure of revolving funds than they may over appropriated dollars. Supplemental Appropriation: This refers to a subsequent appropriation made to an agency in addition to the agency's initial annual appropriation. Supplemental appropriations are to deal with current year funding issues and may be made for a variety of reasons such as to offset a revenue shortfall or to offset insufficient funds to operate a program effectively. Some observers view supplemental appropriations as a sign of inept management or a means of subverting the State's balanced budget restrictions.
Temporary Assistance to Needy Families (TANF): The Federal program that replaced the Aid to Families with Dependent Children (AFDC) program pursuant to the Personal Responsibility and Work Opportunity Reconciliation Act of 1996, enacted August 22, 1996. This act makes significant changes to the United States Welfare System. Unfunded Liability (re: retirement): The excess of the Actuarial Accrued Liability (that portion, as determined by a particular Actuarial Cost Method, of the Actuarial Present Value of pension plan benefits and expenses which is not provided for by future Normal Costs) over the Actuarial Value of Assets (the value of cash, investments, and other property belonging to a pension plan, as used by the actuary for the purpose of an Actuarial Valuation).