FY-2010 Executive Budget, Oklahoma Gov. Brad Henry
307
FY-2010 Executive Budget Governor Brad Henry February 2, 2009
-
Upload
khangminh22 -
Category
Documents
-
view
0 -
download
0
Transcript of FY-2010 Executive Budget, Oklahoma Gov. Brad Henry

FY-2010
Executive Budget
Governor Brad Henry
February 2, 2009

Brad Henry Office of the Governor
State of Oklahoma
STATE CAPITOL BUILDING 2300 N. LINCOLN BOULEVARD, SUITE 212 OKLAHOMA CITY, OKLAHOMA 73105 (405) 521-2342 (405) 521-3353
February 2, 2009
To the citizens of the Great State of Oklahoma and the Oklahoma Legislature: I am pleased to submit for your consideration the FY-2010 executive budget. As required by state law, I have presented a balanced budget. The recommendations in this budget build on recent successes and will help ensure a strong and prosperous Oklahoma into the next century. Oklahoma is hardly immune to the global recession, but our state is still faring better many other states. Still, there is no denying that these difficult economic times demand both thrift and sacrifice. This budget reflects that reality. It is necessary to make precise, surgical cuts in many state agencies while protecting core functions of government such as education, healthcare, transportation and public safety. A tight budget year highlights the need for Oklahoma to plan ahead for growth once the recession ends. Economic development does not occur in a vacuum. It requires forward-thinking initiatives and bold vision. With the EDGE Research Endowment, Oklahoma already has a strong and innovative tool for nurturing high-tech businesses and jobs. Now is the time to ensure a permanent funding mechanism that can ultimately make it the $1 billion endowment it was meant to be. The challenges we face also bring opportunity. In this year’s budget, I have included programs aimed at improving government efficiency in such realms as purchasing and information technology. I ask the Legislature and the Citizens of Oklahoma to support this agenda for a strong and prosperous Oklahoma. I am confident that all Oklahomans can agree on these common goals to achieve excellence and carry our state forward.
Sincerely, Brad Henry Governor
February 2, 2009 Governor Henry: Please accept this, your executive budget for the FY-2010 budget year. The budget is balanced as required by law. The budgets of all state agencies, boards and commissions were thoroughly reviewed in the preparation of this budget. Staff of the Budget Division of OSF, the Secretary of Finance and Revenue and I met with directors of major state agencies to examine and analyze agency programs and expenditures. State agency administrators and their staff provided information necessary for this rigorous budget review. They also made suggestions to improve the efficiency and effectiveness of the delivery of services by their agencies. Our examination also included a review of management efficiencies and innovations, alternative funding methods, tax policies, expenditures and revenue enhancement ideas. Thank you for all of your time and attention in the development of the budget. To others involved in this process, I extend my appreciation for their input. I also want to thank analysts with the Budget Division for their diligence, hard work and dedication. Sincerely, Michael Clingman, Director Office of State Finance
OKLAHOMA OFFICE OF STATE FINANCE
February 2, 2009
Citizens of the State of Oklahoma
Members of the First Regular Session of the Fifty-Second Legislature
Governor Brad Henry’s FY-2010 budget consists of the following two documents. Both are available on the Internet. You can view them by accessing the Oklahoma Home Page, the Home Page of the Office of the Governor, or the Home Page of the Office of State Finance. The Oklahoma Home Page address is: http://www.ok.gov. Volume I is distributed to the State Legislature, the media and the State Publications Clearinghouse. Volume II is available online.
“FY-2010 EXECUTIVE BUDGET, Volume I” This document contains Governor Henry’s budget recommendations to the 2009 Legislature. It includes a discussion of state revenues, a summary of his proposed budget and explanations of budget recommendations for state agencies. “FY-2010 EXECUTIVE BUDGET, Volume II- HISTORICAL DATA”
This document is available online and includes detailed historical financial information about each agency of state government. The information is arranged by Cabinet Department and Branch of Government. The individual display for each agency/entity of government includes the following: Mission of the Agency Description of the Board/Commission that governs the agency Description of agency Duties/Responsibilities Constitutional and Statutory References related to the entity Information regarding agency workload or performance criteria Expenditure and personnel data for FY-2007, FY-2008 and FY-2009
2300 North Lincoln Boulevard, Room 122, Oklahoma City, OK 73105-4801 Telephone (405) 521-2141 FAX (405) 521-3902
FY-2010 Executive Budget
TABLE OF CONTENTS
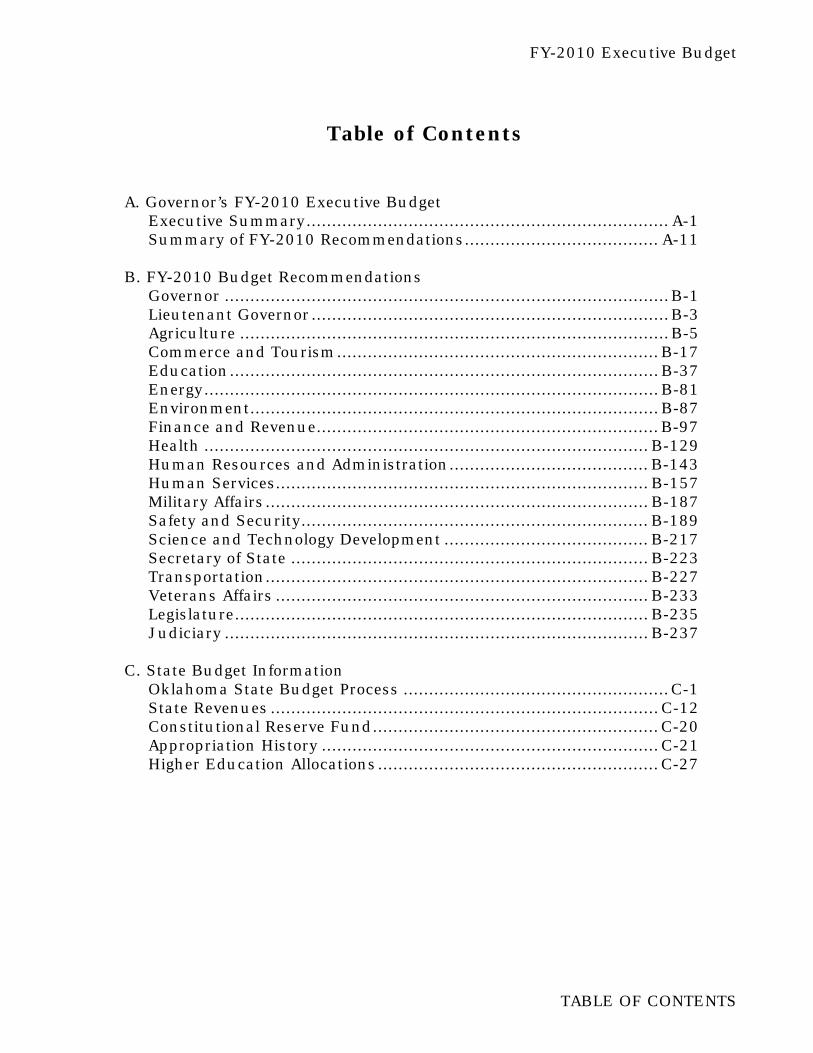
Table of Contents
A. Governor’s FY-2010 Executive Budget
Executive Summary....................................................................... A-1 Summary of FY-2010 Recommendations...................................... A-11
B. FY-2010 Budget Recommendations
Governor .......................................................................................B-1 Lieutenant Governor......................................................................B-3 Agriculture ....................................................................................B-5 Commerce and Tourism...............................................................B-17 Education....................................................................................B-37 Energy.........................................................................................B-81 Environment................................................................................B-87 Finance and Revenue...................................................................B-97 Health ....................................................................................... B-129 Human Resources and Administration....................................... B-143 Human Services......................................................................... B-157 Military Affairs........................................................................... B-187 Safety and Security.................................................................... B-189 Science and Technology Development ........................................ B-217 Secretary of State ...................................................................... B-223 Transportation........................................................................... B-227 Veterans Affairs ......................................................................... B-233 Legislature................................................................................. B-235 Judiciary ................................................................................... B-237
C. State Budget Information
Oklahoma State Budget Process ....................................................C-1 State Revenues ............................................................................C-12 Constitutional Reserve Fund........................................................C-20 Appropriation History ..................................................................C-21 Higher Education Allocations.......................................................C-27

FY-2008 Executive Budget
TABLE OF CONTENTS
D. Appendix Budget Staff...................................................................................D-1 State Organization Chart ...............................................................D-3 State Agencies Listed by Cabinet....................................................D-4 Summary of FTE Changes .............................................................D-5 Glossary ......................................................................................D-11
Index............................................................................................ Index 1

FY-2010 Executive Budget
EXECUTIVE SUMMARY A-1
Executive Summary While the global recession has not hit Oklahoma as hard as many states, economic uncertainty provides a host of challenges for the 2010 budget year. Governor Henry’s budget for 2010 reflects the thrift and sacrifice necessary during this period. It makes precise, targeted cuts while protecting core services of government such as education, healthcare, public safety and transportation. A tighter budget also offers opportunities to improve overall government efficiency. Governor Henry’s budget includes purchasing reforms, streamlining of information technologies and other cost-effectiveness measures. Nevertheless, the budget proposed by Governor Henry looks ahead with bold strategies for long-term economic growth. The 2010 executive budget calls for a permanent funding mechanism for the EDGE (Economic Development Generating Excellence) Research Endowment, one of the most innovative tools by which the State of Oklahoma can cultivate high-tech businesses and jobs. By dedicating future interest earnings from the state Rainy Day Fund to EDGE projects and earmarking 35 percent of annual state investment earnings for the endowment itself, Oklahoma can make tremendous strides toward creating a $1 billion endowment to spur cutting-edge research and development in such industries as biotech, aerospace and renewable energies. The budget also builds on the nationally recognized success of Insure Oklahoma, a public/private partnership that enables eligible small businesses to provide health insurance for employees. Under Governor Henry’s budget, Insure Oklahoma would boost participation by allowing additional low-cost choices, such as high-deductible and tailored-benefit plans. In recent years, the State of Oklahoma has made significant investments to strengthen common and higher education, improve transportation infrastructure, enhance public safety and ensure more accessible and affordable healthcare for Oklahomans. The 2010 budget seeks to protect the gains in these areas with an eye on future improvements when revenue conditions stabilize.
FY-2010 Executive Budget
EXECUTIVE SUMMARY A-2
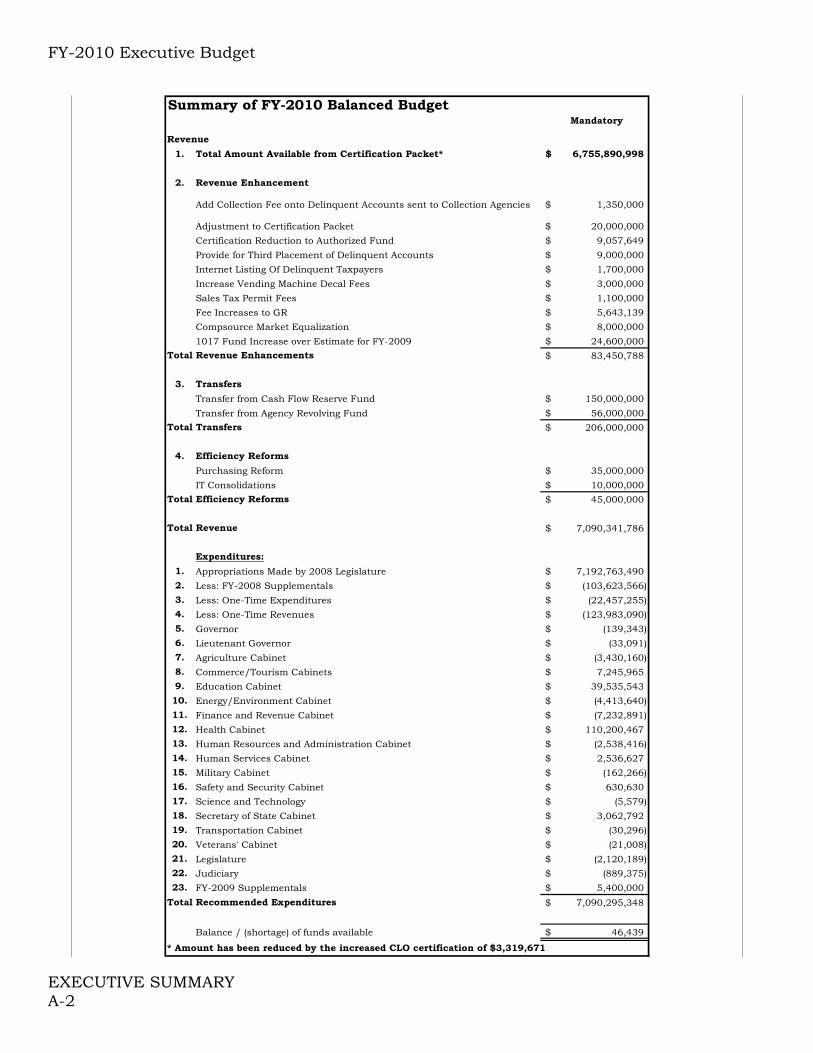
Summary of FY-2010 Balanced Budget Mandatory
Revenue
1. Total Amount Available from Certification Packet* 6,755,890,998$
2. Revenue Enhancement
Add Collection Fee onto Delinquent Accounts sent to Collection Agencies 1,350,000$
Adjustment to Certification Packet 20,000,000$
Certification Reduction to Authorized Fund 9,057,649$
Provide for Third Placement of Delinquent Accounts 9,000,000$
Internet Listing Of Delinquent Taxpayers 1,700,000$
Increase Vending Machine Decal Fees 3,000,000$
Sales Tax Permit Fees 1,100,000$
Fee Increases to GR 5,643,139$
Compsource Market Equalization 8,000,000$
1017 Fund Increase over Estimate for FY-2009 24,600,000$
Total Revenue Enhancements 83,450,788$
3. Transfers
Transfer from Cash Flow Reserve Fund 150,000,000$
Transfer from Agency Revolving Fund 56,000,000$
Total Transfers 206,000,000$
4. Efficiency Reforms
Purchasing Reform 35,000,000$
IT Consolidations 10,000,000$
Total Efficiency Reforms 45,000,000$
Total Revenue 7,090,341,786$
Expenditures:
1. Appropriations Made by 2008 Legislature 7,192,763,490$
2. Less: FY-2008 Supplementals (103,623,566)$
3. Less: One-Time Expenditures (22,457,255)$
4. Less: One-Time Revenues (123,983,090)$
5. Governor (139,343)$
6. Lieutenant Governor (33,091)$
7. Agriculture Cabinet (3,430,160)$
8. Commerce/Tourism Cabinets 7,245,965$
9. Education Cabinet 39,535,543$
10. Energy/Environment Cabinet (4,413,640)$
11. Finance and Revenue Cabinet (7,232,891)$
12. Health Cabinet 110,200,467$
13. Human Resources and Administration Cabinet (2,538,416)$
14. Human Services Cabinet 2,536,627$
15. Military Cabinet (162,266)$
16. Safety and Security Cabinet 630,630$
17. Science and Technology (5,579)$
18. Secretary of State Cabinet 3,062,792$
19. Transportation Cabinet (30,296)$
20. Veterans' Cabinet (21,008)$
21. Legislature (2,120,189)$
22. Judiciary (889,375)$
23. FY-2009 Supplementals 5,400,000$
Total Recommended Expenditures 7,090,295,348$
Balance / (shortage) of funds available 46,439$
* Amount has been reduced by the increased CLO certification of $3,319,671
FY-2010 Executive Budget
EXECUTIVE SUMMARY A-3
Potential Additional Revenues
Federal Stabilization The United States Congress is currently working on an economic stimulus package that would send federal dollars to states to stabilize their fiscal situations. The House passed the measure January 28. The Senate Finance Committee and Senate Appropriations Committee currently have the measure under consideration. In its current form the State Stabilization funding to Oklahoma is over $2 billion for the following purposes:
Hold the federal matching rates for Medicaid Harmless in FY-2009 and FY-2010 and increase the rates by 4.9%
Title I Education and Special Education Education Technology K-12 Construction Child Care Subsidies Community Services Block Grants Highways Energy and Environment (e.g. Clean Water, Weatherization)
Governor Henry’s budget includes funding from the State Stabilization package for increased utilization in the Medicaid program and holding the Medicaid matching rate harmless. Collection Fee on Delinquent Accounts Currently, the Oklahoma Tax Commission pays collection agencies $1.8 million to pursue delinquent tax payments. This proposal allows the Tax Commission to recover those costs by adding them to the delinquent amount owed by the taxpayer. The Governor’s budget assumes a 75% collection rate; this proposal results in an increase of $1.35 million in FY-2010. Third Placement of Delinquent Accounts The Oklahoma Tax Commission currently has authority to contract with debt collection agencies. Under the current two contracts, one agency is the first to receive the delinquent accounts (first placement); if the agency is unable to collect within the time provided under the contract, the account is referred to the second agency (second placement). The proposal would be to provide specifically for third placement and allow for an increased fee for the services. The statute currently caps the fees at 20% of the amount collected. The current contracts provide for a fee of 4.5% and 8% respectively. The Governor’s budget includes $9 million for an increase in the fee to the third placement agency and the ability to collect the fee from the taxpayer. Open Taxes Governor Henry’s budget proposes joining 15 other states that list delinquent taxpayers on the Internet as a collection tool. This program requires contact of delinquent taxpayer to give them opportunity to satisfy their tax debt or make payout arrangements within a set time period prior to listing on the Internet. The Governor’s budget includes $1.7 million in additional revenue from this program. Vending Machine Decal Fee In lieu of sales tax, owners of vending machines purchase decals for $50 a year. The fee has not changed since 1988. Raising the decal fee to $100 would result in an annual increase of $3 million.
FY-2010 Executive Budget
EXECUTIVE SUMMARY A-4
Sales Tax Permit Fee Vendors must obtain a sales tax permit fee from the Tax Commission. The fee is $20 and is valid for three years. The fee has not changed since 1986. Increasing the fee to $50 would result in an annual increase of $1.1 million. Fee Increases to General Revenue The Governor’s budget includes fee increases to licenses, permits and fees collected by the following agencies: Securities Commission, Horse Racing Commission, Department of Labor, Motor Vehicles Commission, Secretary of State, Consumer Credit Commission and the Oklahoma Water Resources Board. Many of these fees have not increased since the 1980’s and 1990’s while inflation has increased an average of 2.85% per year since 1985. The fee increases noted here are deposited into the General Revenue Fund and total $5.6 million. CompSource Market Equalization Currently, insurance carriers in the State of Oklahoma are required to remit an annual 2.25% premium tax to the Insurance Commissioner based on direct written premiums. CompSource Oklahoma is not assessed under present state law. CompSource, a state agency, currently has the largest share of the workers compensation market in Oklahoma. The Governor’s budget proposes a market equalization assessment on this agency of 2.25% to improve market place competition. This assessment would be charged to CompSource on its direct written premiums and would result in $8 million being collected to the General Revenue Fund of the State Of Oklahoma. As long as regulatory processes CompSource currently follows as a state agency are modified simultaneously, actuarial cost increases will not be passed on to policyholders due to this assessment. This proposal assumes that CompSource will receive legislative authorization to develop new financial, administrative and human resource policies in line with their mission as a state authorized enterprise which will provide cost savings in excess of the cost of the market equalization assessment. FY-2009 1017 Fund Increase over Authorization The Department of Education (DOE) receives funding through the Education Reform or 1017 revolving fund. The Board of Equalization certified and the Legislature authorized DOE to spend $616.8 million from this fund in FY-2009. The revenues to this fund are currently above that estimate by 5%. The Governor’s budget includes a 4% increase in revenues collected to the 1017 fund in FY-2009 of $24.6 million. Adjustment to Certification Packet The December Board of Equalization estimates omitted revenues for the sunsetting of tax credits in the amount of $20 million. Certification Reduction to Authorized Fund The December Board of Equalization certified the amount available to the State Transportation Fund in FY-2010 at $198.5 million. This is a decrease of $9 million from the authorized amount in FY-2009. Cash Flow Reserve Fund This budget proposes a transfer of $150 million from the FY-2009 Cash Flow Reserve Fund (CFRF) to the Special Cash fund for the FY-2010 budget. Currently, the balance in the CFRF is over $181.7 million. Through December, actual collections for FY-2009 exceed estimated collections by $202 million with a current balance in the FY-2009 General Revenue fund of over $242.6 million after allocations to agencies in January. Current projections by the Office of State Finance indicate that the balance in the General Revenue Fund exceeds the amount
FY-2010 Executive Budget
EXECUTIVE SUMMARY A-5
necessary for cash flow purposes for the remainder of FY-2009. A transfer of funds from the CFRF, as this budget proposes, is a prudent measure to help fund vital state services. Special Cash Fund Transfers One component of the FY-2010 budget involved identifying a variety of agency revolving funds that exceed the amount needed to balance FY-2009 expenditures. These funds can be re-directed to cover agency operating costs for FY-2010. This proposal transfers a total of $26 million to the special cash fund. This proposed transfer of funds is based on a careful analysis of budgeted versus actual receipts and disbursements. Efficiency Reform
The Governor proposes a savings of $45 million to state government through a gain in operating efficiencies in FY-2010. A number of states have realized significant cost savings by privatizing their procurement and technology services or dramatically restructuring them for better efficiency. Oklahoma’s government has taken significant steps in this direction and will continue to do so this year. The implementation of many of these efficiencies has been underway for several years and can be complete during FY-2010. In 2007, the Office of State Finance (OSF) engaged the services of the Hackett Group, a global leader in corporate consulting. (Hackett has consulted with more than 2,700 organizations worldwide; including 97% of companies listed on the Dow Jones, and currently has clients ranging from Wal-Mart to FedEx to Bank of America.) The involvement of Hackett provided OSF the ability to analyze a vast array of private and public sector benchmarks. The first phase of the Hackett study was completed on December 20th, 2007, and established Oklahoma’s savings benchmarks relative to peer states and world class organizations. Phase I included an analysis of cash disbursements, travel expenses, customer billing, interagency accounting, and fixed assets. The analysis established that there are a number of opportunities to achieve significant efficiencies and savings in cash management, transaction costs and technology leverage. The study highlighted more than $65 million in potential savings in 10 separate areas that can be realized by the state. Total process cost savings of $45.1 million and technology cost savings of $21 million comprised the largest cost savings categories. This program established a three year plan to implement the study’s recommendations. Approximately one-third of the total savings was recognized in FY-2009. Some of the projects begun last year include personnel and function streamlining between OSF and the Office of the Treasurer and numerous shared services contracts between OSF and smaller agencies. Information Technology The Governor’s budget anticipates a total cost savings of $10 million in the 2010 fiscal year through consolidation and modernization of IT infrastructure. By taking a coordinated approach to information technology OSF is achieving cost savings, increasing technological compatibility among state agencies and leveraging the State’s information technology to its best and most efficient use. More specifically, cost effective Voice over Internet Protocol (VOIP) availability for the State will become available this year. After completing a telecommunications rate study, OSF will lower costs to traditional telecom users in state government. The new rates of $13.25 for each line and $2 for voice mail are $3.75 and $2, respectively, less than the old rates. This will result in almost $1 million of savings to state agencies.

FY-2010 Executive Budget
EXECUTIVE SUMMARY A-6
The completion of OSF’s data center will also realize significant savings both in economy of scale and in reduction of duplication of plant, equipment, personnel and software licenses. OSF is evaluating migrating the state to a common e-mail platform and negotiating enterprise software license agreements. Procurement Reform An extensive analysis of the Oklahoma Central Purchasing Act and its current implementation was completed by IBM Business Consulting Services in 2006 and identified $2.1 billion of state costs that could be targeted for savings. Governor Henry’s budget includes savings of $35 million by the Department of Central Services program to make the State’s purchasing practices more efficient by continuing to implement the recommendations from the IBM Study. A second study has now been done by Treya Partners that reinforces the findings of the IBM Study, that $24 million to $71 million in savings could be achieved within a year to 18 months time. The Governor’s budget takes a conservative approach by estimating a gain of $35 million accruing from improvements to DCS’s purchasing processes. This includes both legislative changes made in the last session of the legislature and changes to DCS’s rules to implement recommendations from the earlier study. Hospital Provider Assessment Oklahoma’s rate of uninsured individuals ranks 8th in the nation. There are over 640,000 uninsured Oklahomans. This means 18.5% of the population does not have health insurance. This high rate of uninsured individuals places an intense strain on Oklahoma’s health care system. In order to reduce the number of uninsured, strengthen the state health care network and claim more federal matching funds for Oklahoma medical programs and professionals, the Governor is proposing implementing a Hospital Provider Assessment. The provider assessment would be assessed on hospitals as a percentage of their patient revenue. These funds would then be matched with federal dollars at the Federal Medical Assistance Percentage (FMAP) rate. The provider assessment revenues combined with the federal funds will provide health insurance for Oklahoma families and individuals, some of whom have never had health insurance, along with improving the quality of health care for all Oklahomans by establishing a stable funding source for programs purchasing health care services. A reduction in Oklahoma’s uninsured population will ease the burden on Oklahoma’s health care systems and will make great strides in improving our citizens’ overall health Expenditure Proposals The first step in developing this budget involved reviewing individual agency budgets. Office of State Finance staff utilized performance based budgeting techniques to evaluate programs and services. The Governor places a strong emphasis on performance and efficiency measures for agencies. Since the Governor’s budget revenues (as certified by the Board of Equalization) are almost $310 million less than the 2008 Legislature’s appropriations authority, agencies have been and will continue to be challenged to improve services and outcomes. Citizens must have confidence that tax dollars are being spent efficiently and effectively. A more detailed explanation of each of these items is in the appropriate pages for the agency listed. Note that a summary of these funding adjustments by Cabinet Department is located later in this section. The starting point for expenditure proposals is FY-2009 appropriations. Subtracting one time expenditures and FY-2008 supplementals from this amount produces a base level of expenditures. Adding proposed changes in expenditures yields the total Executive Budget.

FY-2010 Executive Budget
EXECUTIVE SUMMARY A-7
FY-2008 Supplementals The following table lists FY-2008 supplemental appropriations subtracted from the FY-2009 state expenditure base:
FY-2008 Supplementals
a. Education, Board of 74,523,566$
b. Corrections, Department of 24,000,000$
c. Corporation Commission 3,100,000$
d. Juvenile Affairs, Office of 2,000,000$
Total FY-2008 Supplementals: 103,623,566$ One-Time Expenditures Over $22 million was appropriated for one-time FY-2009 expenditure items: FY-2009 One-Times
a. DOE: Lawsuit (200,000)$
b. CareerTech: Restaurant Training Program (250,000)$
c. CareerTech: Public Safety Facility (150,000)$
d. Regents: Woodward Building (725,000)$
e. OETA: Digital Equipment (3,200,000)$
f. Attorney General: Lawsuit Settlement (57,255)$
g. Emergency Management: HVAC Intake Grate (350,000)$
h. Emergency Fund (15,000,000)$
i. DOT: State Highway Improvements (100,000)$
k. OTC: Compliance Initiative (500,000)$
l. OTC: Emergency Generator (500,000)$
m. OTC: Lawsuit (1,000,000)$
n. Corp Comm: IT Upgrades (205,000)$
o. Tourism: Festival (25,000)$
p. Tourism: Marine Improvements (20,000)$
q. Tourism: Aquarium (100,000)$
r. Tourism: Theater (75,000)$
Total One-Time Expenditures: (22,457,255)$ Subtracting these one-time expenditure items from the FY-2009 expenditure base yields the baseline budget for FY-2010.
FY-2009 Supplementals The following list includes supplemental appropriations proposed in the FY-2010 Executive Budget:
FY-2009 Supplementals
a. University Hospitals: OSU-Tulsa 5,000,000$
b. OSU-County Government Training Transfer from Auditor's Office 400,000$
Total FY-2009 Supplementals 5,400,000$
Please see individual agency sections for more detail.
FY-2010 Key Funding Issues
A significant obligation in FY-2010 is the income tax reduction. In 2006, the Legislature passed and the Governor approved the largest tax cut package in history. House Bill 1172
FY-2010 Executive Budget
EXECUTIVE SUMMARY A-8
ears.
g
e
deduction is a gradual increase. By the year 2010, the standard eduction will equal the federal standard deduction if the Board of Equalization determines
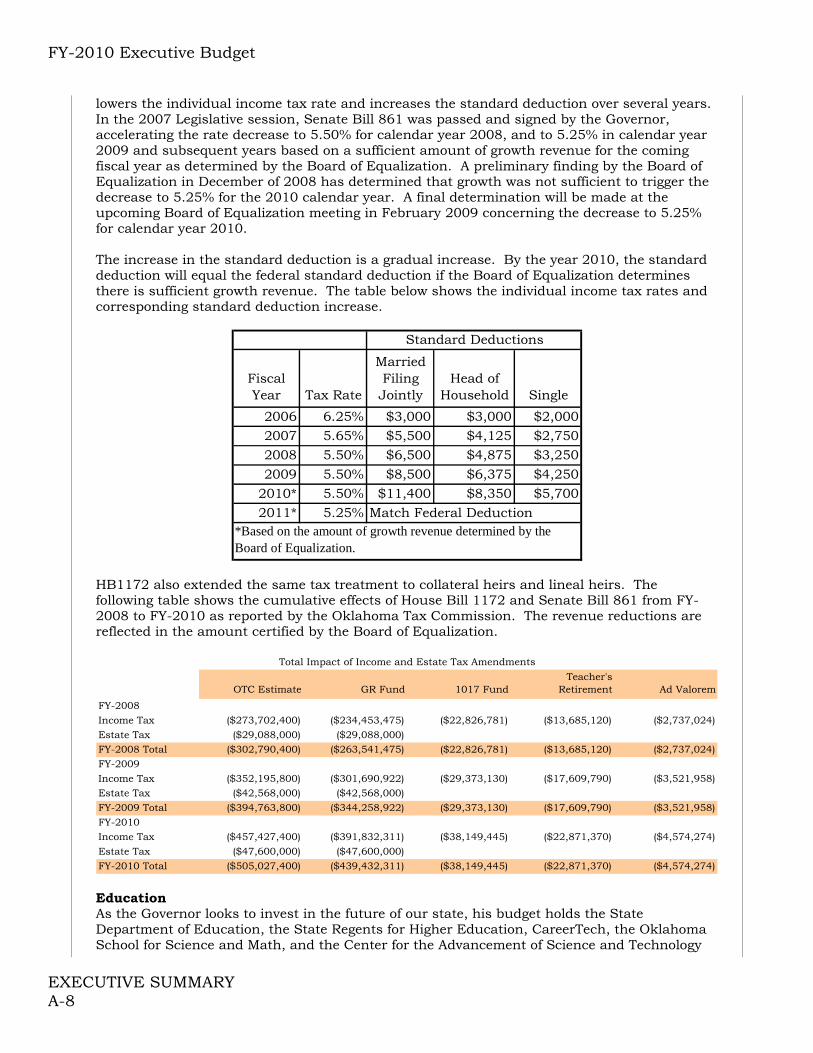
lowers the individual income tax rate and increases the standard deduction over several yIn the 2007 Legislative session, Senate Bill 861 was passed and signed by the Governor, accelerating the rate decrease to 5.50% for calendar year 2008, and to 5.25% in calendar year 2009 and subsequent years based on a sufficient amount of growth revenue for the cominfiscal year as determined by the Board of Equalization. A preliminary finding by the Board of Equalization in December of 2008 has determined that growth was not sufficient to trigger thdecrease to 5.25% for the 2010 calendar year. A final determination will be made at the upcoming Board of Equalization meeting in February 2009 concerning the decrease to 5.25% for calendar year 2010. The increase in the standard dthere is sufficient growth revenue. The table below shows the individual income tax rates and corresponding standard deduction increase.
Fiscal Year Tax Rate
Married Filing Jointly
Head of Household Single
2006 6.25% $3,000 $3,000 $2,0002007 5.65% $5,500 $4,125 $2,7502008 5.50% $6,500 $4,875 $3,2502009 5.50% $8,500 $6,375 $4,250
2010* 5.50% $11,400 $8,350 $5,7002011* 5.25% Match Federal Deduction
*Based on the amount of growth revenue determined by the Board of Equalization.
Standard Deductions
HB1172 also extended the same tax treatment to collateral heirs and lineal heirs. The
llowing table shows the cumulative effects of House Bill 1172 and Senate Bill 861 from FY-s are
fo2008 to FY-2010 as reported by the Oklahoma Tax Commission. The revenue reductionreflected in the amount certified by the Board of Equalization.
Total Impact of Income and Estate Tax Amend
OTC Estimate GR Fund 1017 FundTeacher's
Retirement Ad Valorem
FY-2008Income Tax ($273,702,400) ($234,453,475) ($22,826,781) ($13,685,120) ($2,737,024)Estate Tax ($29,088,000) ($29,088,000)FY-2008 Total ($302,790,400) ($263,541,475) ($22,826,781) ($13,685,120) ($2,737,024)FY-2009Income Tax ($352,195,800) ($301,690,922) ($29,373,130) ($17,609,790) ($3,521,958)Estate Tax ($42,568,000) ($42,568,000)FY-2009 Total ($394,763,800) ($344,258,922) ($29,373,130) ($17,609,790) ($3,521,958)FY-2010Income Tax ($457,427,400) ($391,832,311) ($38,149,445) ($22,871,370) ($4,574,274)Estate Tax ($47,600,000) ($47,600,000)FY-2010 Total ($505,027,400) ($439,432,311) ($38,149,445) ($22,871,370) ($4,574,274)
ments
Education
s the Governor looks to invest in the future of our state, his budget holds the State of Education, the State Regents for Higher Education, CareerTech, the Oklahoma
School for Science and Math, and the Center for the Advancement of Science and Technology
ADepartment
FY-2010 Executive Budget
EXECUTIVE SUMMARY A-9
ory costs
ther services to our state’s most ulnerable populations, the Governor’s budget funds the Oklahoma Health Care Authority, the
nd Substance Abuse Services, University Hospitals Authority,
g Y-2009 funding levels for the Department of Corrections, the Department of Public Safety, the
u of Investigation and Oklahoma Bureau of Narcotics and Dangerous
of the fact that the current appropriations authority, as certified by the Board of qualization, is $310 million less than the 2008 Legislature’s appropriations authority, the
to agencies that range from 0% to 10%, up to 10% e
a
harmless from general appropriation cuts. The Governor’s budget also funds mandatto continue the increase in employer contribution rates to the Teacher’s Retirement system andprovide health benefits to teachers and support personnel. Health and Human Services In order to provide a consistent level of health benefits and ovDepartment of Mental Health athe State Health Department, the Department of Human Services and the Office of Juvenile Affairs at their FY-2009 level of appropriation. The Governor’s budget includes replacement of one-time funding to the Oklahoma Health Care Authority with an ongoing revenue source. Safety and Security The Governor’s budget recognizes the need to protect the citizens of Oklahoma by continuinFOklahoma State BureaDrugs. Appropriation and Travel Reductions In light EGovernor’s budget includes surgical cutstravel cuts to and recommendations that certain agencies be allowed to increase fees to thextent that they cover the cost of services provided. Many agencies have fees that have not increased in over 20 years while inflation has risen an average of 2.85% annually since 1985,cumulative increase of over 96%.

FY-2010 Executive Budget
EXECUTIVE SUMMARY A-10

FY-2010 Executive Budget
EXECUTIVE SUMMARY A - 11
Agency/Cabinet NameFY-2009
Appropriation FY-2009 Supps.FY-2009 Adj.
Approp.Less One-Time
and Supps. FY-2010 Base FY-2010 Adj.Recom. FY-2010
Approp.
% Diff. from FY-
2009
1 Governor $2,661,981 $0 $2,661,981 $0 $2,661,981 (139,343) $2,522,638 -5.2%2 Lieutenant Governor 659,597 0 659,597 0 659,597 (33,091) 626,506 -5.0%3 Agriculture 44,833,147 0 44,833,147 0 44,833,147 (3,430,160) 41,402,987 -7.7%4 Commerce and Tourism 94,868,925 0 94,868,925 (11,986,000) 82,882,925 7,245,965 90,128,890 -5.0%5 Education 3,760,744,494 400,000 3,761,144,494 (4,925,000) 3,756,219,494 39,535,543 3,795,755,037 0.9%6 Energy 13,429,003 0 13,429,003 (205,000) 13,224,003 (1,284,463) 11,939,540 -11.1%7 Environment 16,529,620 0 16,529,620 0 16,529,620 (3,129,178) 13,400,442 -18.9%8 Finance and Revenue 92,503,091 0 92,503,091 (2,000,000) 90,503,091 (7,232,891) 83,270,200 -10.0%9 Health 1,126,729,503 0 1,126,729,503 (108,217,090) 1,018,512,413 110,200,467 1,128,712,880 0.2%10 Human Resources & Admin. 27,598,398 0 27,598,398 0 27,598,398 (2,538,416) 25,059,982 -9.2%11 Human Services 757,921,731 5,000,000 762,921,731 (5,000,000) 757,921,731 2,536,627 760,458,358 0.3%12 Military 13,132,301 0 13,132,301 0 13,132,301 (162,266) 12,970,035 -1.2%13 Safety and Security 732,966,959 0 732,966,959 (15,407,255) 717,559,704 630,630 718,190,334 -2.0%14 Science and Technology 22,456,507 0 22,456,507 0 22,456,507 (5,579) 22,450,928 0.0%15 Secretary of State 8,138,194 0 8,138,194 (4,000,000) 4,138,194 3,062,792 7,200,986 -11.5%16 Transportation 208,221,788 0 208,221,788 (100,000) 208,121,788 (30,296) 208,091,492 -0.1%17 Veterans Affairs 40,282,600 0 40,282,600 0 40,282,600 (21,008) 40,261,592 -0.1%
Total Executive Branch $6,963,677,839 $5,400,000 ($151,840,345) $6,817,237,494 $145,205,333 $6,962,442,827 0.0%
21 Legislature $39,412,908 $0 $39,412,908 $0 $39,412,908 ($2,120,189) $37,292,719 -5.4%22 Judiciary 86,049,176 0 86,049,176 0 86,049,176 ($889,375) 85,159,801 -1.0%
Total Legis. & Judic. $125,462,084 $0 $0 $125,462,084 -$3,009,564 $122,452,520 -2.4%
State Total $7,089,139,923 $5,400,000 $0 ($151,840,345) $6,942,699,578 $142,195,769 $7,084,895,347 -0.1%
Governor
Agency NameFY-2009
Appropriation FY-2009 Supps.FY-2009 Adj.
Approp.Less One-Time
and Supps. FY-2010 Base FY-2010 Adj.Recom. FY-2010
Approp.
% Diff. from FY-
2009
1 Governor $2,661,981 $0 $2,661,981 0 $2,661,981 ($139,343) $2,522,638 -5.2%Total Governor $2,661,981 $0 $2,661,981 $0 $2,661,981 ($139,343) $2,522,638 -5.2%
Lieutenant Governor
Agency NameFY-2009
Appropriation FY-2009 Supps.FY-2009 Adj.
Approp.Less One-Time
and Supps. FY-2010 Base FY-2010 Adj.Recom. FY-2010
Approp.
% Diff. from FY-
2009
1 Lieutenant Governor $659,597 $0 $659,597 0 $659,597 ($33,091) $626,506 -5.0%Total Lieutenant Gov. $659,597 $0 $659,597 $0 $659,597 ($33,091) $626,506 -5.0%
Agriculture
Agency NameFY-2009
Appropriation FY-2009 Supps.FY-2009 Adj.
Approp.Less One-Time
and Supps. FY-2010 Base FY-2010 Adj.Recom. FY-2010
Approp.
% Diff. from FY-
2009
1 Agriculture $34,540,185 $0 $34,540,185 0 $34,540,185 ($2,895,818) $31,644,367 -8.4%2 Conservation Comm $10,292,962 0 10,292,962 0 10,292,962 (534,342) 9,758,620 -5.2%
Total Agriculture $44,833,147 $0 $44,833,147 $0 $44,833,147 ($3,430,160) $41,402,987 -7.7%
Commerce and Tourism
Agency NameFY-2009
Appropriation FY-2009 Supps.FY-2009 Adj.
Approp.Less One-Time
and Supps. FY-2010 Base FY-2010 Adj.Recom. FY-2010
Approp.
% Diff. from FY-
2009
1 Commerce, Department of $30,934,772 0 30,934,772 -11,766,000 19,168,772 15,278,332 34,447,104 11.4%2 Commerce - REAP $15,500,000 0 15,500,000 0 15,500,000 (5,500,000) 10,000,000 -35.5%3 Historical Society, Oklahoma $14,967,451 0 14,967,451 0 14,967,451 (764,113) 14,203,338 -5.1%4 J.M. Davis Memorial Comm $385,403 0 385,403 0 385,403 (19,270) 366,133 -5.0%5 Labor Department $3,760,284 0 3,760,284 0 3,760,284 (292,724) 3,467,560 -7.8%6 Scenic Rivers Commission $345,322 0 345,322 0 345,322 (17,266) 328,056 -5.0%7 Tourism & Recreation $28,041,991 0 28,041,991 -220,000 27,821,991 (1,392,308) 26,429,683 -5.7%8 Will Rogers Memorial Comm $933,702 0 933,702 0 933,702 (46,685) 887,017 -5.0%
Total Commerce & Tourism $94,868,925 $0 $94,868,925 ($11,986,000) $82,882,925 $7,245,965 $90,128,890 -5.0%
Notes:1. NACEA's appropriation included

FY-2010 Executive Budget
EXECUTIVE SUMMARY A - 12
Education
Agency NameFY-2009
Appropriation FY-2009 Supps.FY-2009 Adj.
Approp.Less One-Time
and Supps. FY-2010 Base FY-2010 Adj.Recom. FY-2010
Approp.
% Diff. from FY-
2009
1 Arts Council $5,150,967 $0 $5,150,967 0 $5,150,967 ($158,729) $4,992,238 -3.1%2 Career Tech $158,269,736 0 158,269,736 -400,000 157,869,736 3,516,923 161,386,659 2.0%3 Educational TV Auth., Oklahoma $8,394,383 0 8,394,383 -3,200,000 5,194,383 (156,525) 5,037,858 -40.0%
4 Education, Dept. of $2,531,702,553 0 2,531,702,553 -200,000 2,531,502,553 36,752,780 2,568,255,333 1.4%
5 Higher Educ., Regents for $1,039,886,280 400,000 1,040,286,280 -1,125,000 1,039,161,280 23,301 1,039,184,581 -0.1%
6 Libraries, Dept. of $7,294,856 0 7,294,856 0 7,294,856 (371,820) 6,923,036 -5.1%7 School of Science & Math $7,985,737 0 7,985,737 0 7,985,737 (1,741) 7,983,996 0.0%8 Teacher Prep, Commission for $2,059,982 0 2,059,982 0 2,059,982 (68,647) 1,991,335 -3.3%
Total Education $3,760,744,494 $400,000 $3,761,144,494 ($4,925,000) $3,756,219,494 $39,535,543 $3,795,755,037 0.9%
4. Regents also receive $54 million for the Oklahoma Promise program through Individual Income Tax apportionment.
Energy
Agency NameFY-2009
Appropriation FY-2009 Supps.FY-2009 Adj.
Approp.Less One-Time
and Supps. FY-2010 Base FY-2010 Adj.Recom. FY-2010
Approp.
% Diff. from FY-
2009
1 Corporation Commission $12,415,417 $0 $12,415,417 -205,000 $12,210,417 ($1,250,605) $10,959,812 -11.7%2 Mines, Department of $1,013,586 0 1,013,586 0 1,013,586 (33,858) 979,728 -3.3%
Total Energy $13,429,003 $0 $13,429,003 ($205,000) $13,224,003 ($1,284,463) $11,939,540 -11.1%
Environment
Agency NameFY-2009
Appropriation FY-2009 Supps.FY-2009 Adj.
Approp.Less One-Time
and Supps. FY-2010 Base FY-2010 Adj.Recom. FY-2010
Approp.
% Diff. from FY-
2009
1 Environmental Quality, Dept. of $9,728,096 $0 $9,728,096 0 $9,728,096 ($1,966,810) $7,761,286 -20.2%2 Water Resources Board $4,601,524 0 4,601,524 0 4,601,524 (1,162,368) 3,439,156 -25.3%3 Water Resources - REAP $2,200,000 0 2,200,000 0 2,200,000 2,200,000 0.0%
Total Environment $16,529,620 $0 $16,529,620 $0 $16,529,620 ($3,129,178) $13,400,442 -18.9%
Finance and Revenue
Agency NameFY-2009
Appropriation FY-2009 Supps.FY-2009 Adj.
Approp.Less One-Time
and Supps. FY-2010 Base FY-2010 Adj.Recom. FY-2010
Approp.
% Diff. from FY-
2009
1 Auditor & Inspector $6,315,269 $0 $6,315,269 0 $6,315,269 ($762,028) $5,553,241 -12.1%2 Bond Advisor, State $186,419 0 186,419 0 186,419 (9,889) 176,530 -5.3%3 Consumer Credit Commission $669,042 0 669,042 0 669,042 (42,166) 626,876 -6.3%4 Finance, Office of State $23,081,434 0 23,081,434 0 23,081,434 (1,183,453) 21,897,981 -5.1%5 Insurance Department $2,515,943 0 2,515,943 0 2,515,943 (2,515,943) 0 -100.0%6 Land Office, Commissioners $4,864,881 0 4,864,881 0 4,864,881 4,864,881 0.0%7 Tax Commission $50,201,340 0 50,201,340 -2,000,000 48,201,340 (2,481,999) 45,719,341 -8.9%8 Treasurer $4,668,763 0 4,668,763 0 4,668,763 (237,413) 4,431,350 -5.1%
Total Finance and Revenue $92,503,091 $0 $92,503,091 ($2,000,000) $90,503,091 ($7,232,891) $83,270,200 -10.0%
Health
Agency NameFY-2009
Appropriation FY-2009 Supps.FY-2009 Adj.
Approp.Less One-Time
and Supps. FY-2010 Base FY-2010 Adj.Recom. FY-2010
Approp.
% Diff. from FY-
2009
1 Health Care Authority $842,122,261 $0 $842,122,261 -108,217,090 $733,905,171 $108,182,092 $842,087,263 0.0%2 Health Department $75,028,113 0 75,028,113 0 75,028,113 1,398,525 76,426,638 1.9%3 Mental Health Department $209,579,129 0 209,579,129 0 209,579,129 619,850 210,198,979 0.3%
Total Health $1,126,729,503 $0 $1,126,729,503 ($108,217,090) $1,018,512,413 $110,200,467 $1,128,712,880 0.2%
FY-2010 Executive Budget
EXECUTIVE SUMMARY A - 13
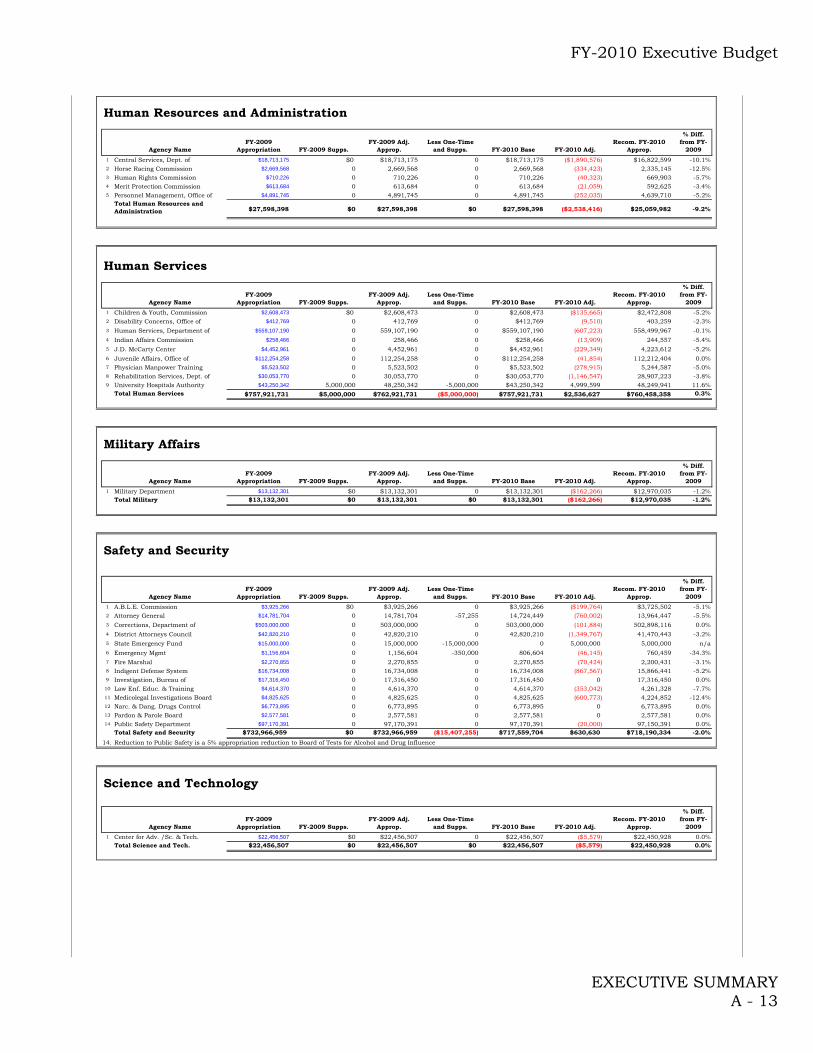
Human Resources and Administration
Agency NameFY-2009
Appropriation FY-2009 Supps.FY-2009 Adj.
Approp.Less One-Time
and Supps. FY-2010 Base FY-2010 Adj.Recom. FY-2010
Approp.
% Diff. from FY-
2009
1 Central Services, Dept. of $18,713,175 $0 $18,713,175 0 $18,713,175 ($1,890,576) $16,822,599 -10.1%2 Horse Racing Commission $2,669,568 0 2,669,568 0 2,669,568 (334,423) 2,335,145 -12.5%3 Human Rights Commission $710,226 0 710,226 0 710,226 (40,323) 669,903 -5.7%4 Merit Protection Commission $613,684 0 613,684 0 613,684 (21,059) 592,625 -3.4%5 Personnel Management, Office of $4,891,745 0 4,891,745 0 4,891,745 (252,035) 4,639,710 -5.2%
Total Human Resources and Administration $27,598,398 $0 $27,598,398 $0 $27,598,398 ($2,538,416) $25,059,982 -9.2%
Human Services
Agency NameFY-2009
Appropriation FY-2009 Supps.FY-2009 Adj.
Approp.Less One-Time
and Supps. FY-2010 Base FY-2010 Adj.Recom. FY-2010
Approp.
% Diff. from FY-
2009
1 Children & Youth, Commission $2,608,473 $0 $2,608,473 0 $2,608,473 ($135,665) $2,472,808 -5.2%2 Disability Concerns, Office of $412,769 0 412,769 0 $412,769 (9,510) 403,259 -2.3%3 Human Services, Department of $559,107,190 0 559,107,190 0 $559,107,190 (607,223) 558,499,967 -0.1%4 Indian Affairs Commission $258,466 0 258,466 0 $258,466 (13,909) 244,557 -5.4%5 J.D. McCarty Center $4,452,961 0 4,452,961 0 $4,452,961 (229,349) 4,223,612 -5.2%6 Juvenile Affairs, Office of $112,254,258 0 112,254,258 0 $112,254,258 (41,854) 112,212,404 0.0%7 Physician Manpower Training $5,523,502 0 5,523,502 0 $5,523,502 (278,915) 5,244,587 -5.0%8 Rehabilitation Services, Dept. of $30,053,770 0 30,053,770 0 $30,053,770 (1,146,547) 28,907,223 -3.8%9 University Hospitals Authority $43,250,342 5,000,000 48,250,342 -5,000,000 $43,250,342 4,999,599 48,249,941 11.6%
Total Human Services $757,921,731 $5,000,000 $762,921,731 ($5,000,000) $757,921,731 $2,536,627 $760,458,358 0.3%
Military Affairs
Agency NameFY-2009
Appropriation FY-2009 Supps.FY-2009 Adj.
Approp.Less One-Time
and Supps. FY-2010 Base FY-2010 Adj.Recom. FY-2010
Approp.
% Diff. from FY-
2009
1 Military Department $13,132,301 $0 $13,132,301 0 $13,132,301 ($162,266) $12,970,035 -1.2%Total Military $13,132,301 $0 $13,132,301 $0 $13,132,301 ($162,266) $12,970,035 -1.2%
Safety and Security
Agency NameFY-2009
Appropriation FY-2009 Supps.FY-2009 Adj.
Approp.Less One-Time
and Supps. FY-2010 Base FY-2010 Adj.Recom. FY-2010
Approp.
% Diff. from FY-
2009
1 A.B.L.E. Commission $3,925,266 $0 $3,925,266 0 $3,925,266 ($199,764) $3,725,502 -5.1%2 Attorney General $14,781,704 0 14,781,704 -57,255 14,724,449 (760,002) 13,964,447 -5.5%3 Corrections, Department of $503,000,000 0 503,000,000 0 503,000,000 (101,884) 502,898,116 0.0%4 District Attorneys Council $42,820,210 0 42,820,210 0 42,820,210 (1,349,767) 41,470,443 -3.2%5 State Emergency Fund $15,000,000 0 15,000,000 -15,000,000 0 5,000,000 5,000,000 n/a6 Emergency Mgmt $1,156,604 0 1,156,604 -350,000 806,604 (46,145) 760,459 -34.3%7 Fire Marshal $2,270,855 0 2,270,855 0 2,270,855 (70,424) 2,200,431 -3.1%8 Indigent Defense System $16,734,008 0 16,734,008 0 16,734,008 (867,567) 15,866,441 -5.2%9 Investigation, Bureau of $17,316,450 0 17,316,450 0 17,316,450 0 17,316,450 0.0%10 Law Enf. Educ. & Training $4,614,370 0 4,614,370 0 4,614,370 (353,042) 4,261,328 -7.7%11 Medicolegal Investigations Board $4,825,625 0 4,825,625 0 4,825,625 (600,773) 4,224,852 -12.4%12 Narc. & Dang. Drugs Control $6,773,895 0 6,773,895 0 6,773,895 0 6,773,895 0.0%13 Pardon & Parole Board $2,577,581 0 2,577,581 0 2,577,581 0 2,577,581 0.0%14 Public Safety Department $97,170,391 0 97,170,391 0 97,170,391 (20,000) 97,150,391 0.0%
Total Safety and Security $732,966,959 $0 $732,966,959 ($15,407,255) $717,559,704 $630,630 $718,190,334 -2.0%
14. Reduction to Public Safety is a 5% appropriation reduction to Board of Tests for Alcohol and Drug Influence
Science and Technology
Agency NameFY-2009
Appropriation FY-2009 Supps.FY-2009 Adj.
Approp.Less One-Time
and Supps. FY-2010 Base FY-2010 Adj.Recom. FY-2010
Approp.
% Diff. from FY-
2009
1 Center for Adv. /Sc. & Tech. $22,456,507 $0 $22,456,507 0 $22,456,507 ($5,579) $22,450,928 0.0%Total Science and Tech. $22,456,507 $0 $22,456,507 $0 $22,456,507 ($5,579) $22,450,928 0.0%
FY-2010 Executive Budget
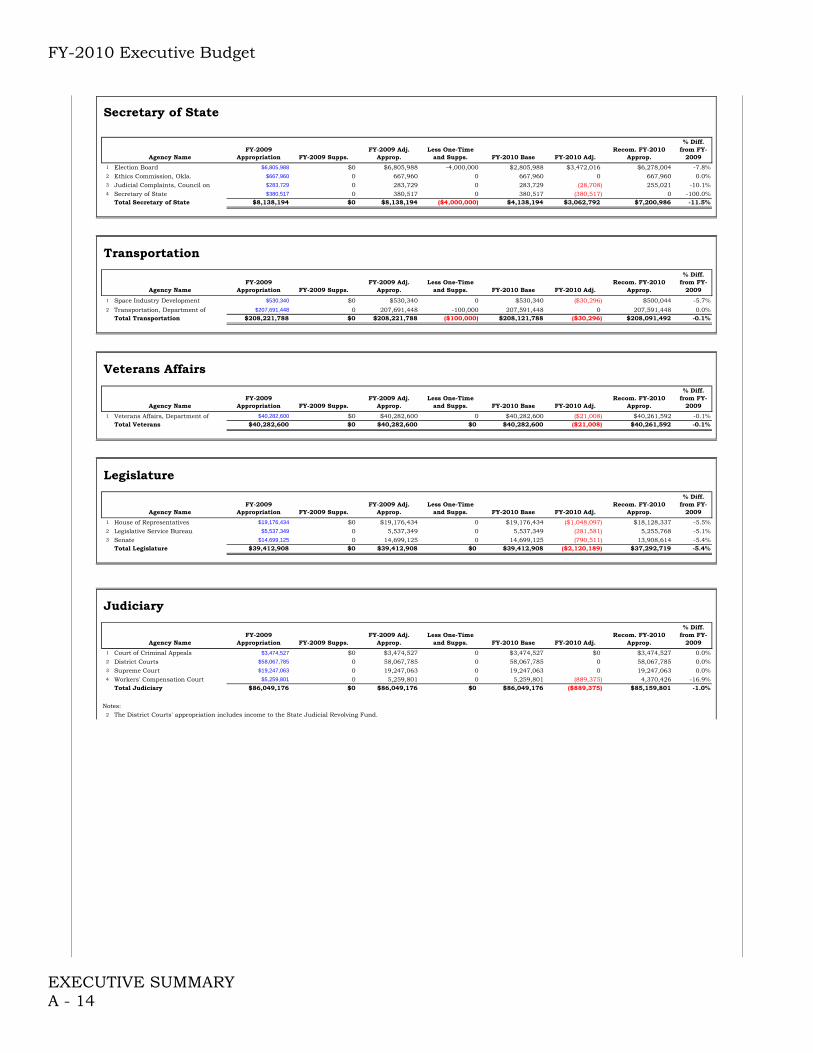
EXECUTIVE SUMMARY A - 14
Secretary of State
Agency NameFY-2009
Appropriation FY-2009 Supps.FY-2009 Adj.
Approp.Less One-Time
and Supps. FY-2010 Base FY-2010 Adj.Recom. FY-2010
Approp.
% Diff. from FY-
2009
1 Election Board $6,805,988 $0 $6,805,988 -4,000,000 $2,805,988 $3,472,016 $6,278,004 -7.8%2 Ethics Commission, Okla. $667,960 0 667,960 0 667,960 0 667,960 0.0%3 Judicial Complaints, Council on $283,729 0 283,729 0 283,729 (28,708) 255,021 -10.1%4 Secretary of State $380,517 0 380,517 0 380,517 (380,517) 0 -100.0%
Total Secretary of State $8,138,194 $0 $8,138,194 ($4,000,000) $4,138,194 $3,062,792 $7,200,986 -11.5%
Transportation
Agency NameFY-2009
Appropriation FY-2009 Supps.FY-2009 Adj.
Approp.Less One-Time
and Supps. FY-2010 Base FY-2010 Adj.Recom. FY-2010
Approp.
% Diff. from FY-
2009
1 Space Industry Development $530,340 $0 $530,340 0 $530,340 ($30,296) $500,044 -5.7%2 Transportation, Department of $207,691,448 0 207,691,448 -100,000 207,591,448 0 207,591,448 0.0%
Total Transportation $208,221,788 $0 $208,221,788 ($100,000) $208,121,788 ($30,296) $208,091,492 -0.1%
Veterans Affairs
Agency NameFY-2009
Appropriation FY-2009 Supps.FY-2009 Adj.
Approp.Less One-Time
and Supps. FY-2010 Base FY-2010 Adj.Recom. FY-2010
Approp.
% Diff. from FY-
2009
1 Veterans Affairs, Department of $40,282,600 $0 $40,282,600 0 $40,282,600 ($21,008) $40,261,592 -0.1%Total Veterans $40,282,600 $0 $40,282,600 $0 $40,282,600 ($21,008) $40,261,592 -0.1%
Legislature
Agency NameFY-2009
Appropriation FY-2009 Supps.FY-2009 Adj.
Approp.Less One-Time
and Supps. FY-2010 Base FY-2010 Adj.Recom. FY-2010
Approp.
% Diff. from FY-
2009
1 House of Representatives $19,176,434 $0 $19,176,434 0 $19,176,434 ($1,048,097) $18,128,337 -5.5%2 Legislative Service Bureau $5,537,349 0 5,537,349 0 5,537,349 (281,581) 5,255,768 -5.1%3 Senate $14,699,125 0 14,699,125 0 14,699,125 (790,511) 13,908,614 -5.4%
Total Legislature $39,412,908 $0 $39,412,908 $0 $39,412,908 ($2,120,189) $37,292,719 -5.4%
Judiciary
Agency NameFY-2009
Appropriation FY-2009 Supps.FY-2009 Adj.
Approp.Less One-Time
and Supps. FY-2010 Base FY-2010 Adj.Recom. FY-2010
Approp.
% Diff. from FY-
2009
1 Court of Criminal Appeals $3,474,527 $0 $3,474,527 0 $3,474,527 $0 $3,474,527 0.0%2 District Courts $58,067,785 0 58,067,785 0 58,067,785 0 58,067,785 0.0%3 Supreme Court $19,247,063 0 19,247,063 0 19,247,063 0 19,247,063 0.0%4 Workers' Compensation Court $5,259,801 0 5,259,801 0 5,259,801 (889,375) 4,370,426 -16.9%
Total Judiciary $86,049,176 $0 $86,049,176 $0 $86,049,176 ($889,375) $85,159,801 -1.0%
Notes:2 The District Courts' appropriation includes income to the State Judicial Revolving Fund.
FY-2010 Executive Budget
GOVERNOR B-1
Governor As Chief Magistrate of the State, the Governor is vested by the Oklahoma Constitution with “the Supreme Executive power.” At the beginning of each session of the Legislature, the Governor presents the budget recommendations for the various state agencies and reports on the condition of the State. Every bill passed by the Legislature during regular session and prior to adjournment, before it becomes a law, is presented to the Governor. The Governor approves the bill if he signs it, if not; he vetoes it and returns it with his objections to the Legislature, which can override his objections by a two-thirds vote. When any State office becomes vacant, the Governor, unless otherwise provided by law, appoints a person to fill such vacancy, in certain instances by and with advice and consent of the Senate. The Governor is Commander in Chief of the state militia. Additional duties of the Governor include:
Conduct the business of Oklahoma with other states;
Grant commutations, pardons and paroles;
Approve agency rules;
Negotiate tribal compacts; and
Conserve the peace throughout the state.
The Governor presides over or is a member of the following state boards and commissions:
State Board of Equalization (Article 10, Section 21)
Interstate Oil Compact (52 O.S. 201)
Oklahoma Historical Society (53 O.S. 1.6)
School Land Commission (64 O.S. 156)
Capital Improvement Authority (73 O.S. 98.2)
Oklahoma Capitol Complex Centennial Commission (73 O.S. 98.2)
Transportation Commission (69 O.S. 302)
Educational Commission (70 O.S. 506.1)
Commissioners of the Land Office (70 O.S. 611)
Southern Regional Educational Compact (70 O.S. 2127)
Oklahoma Transportation Authority (69 O.S. 1703)
Indian Affairs Commission (74 O.S. 1201)
Southern Growth Policy Board (74 O.S. 3501)
Contingency Review Board (74 O.S. 1201)
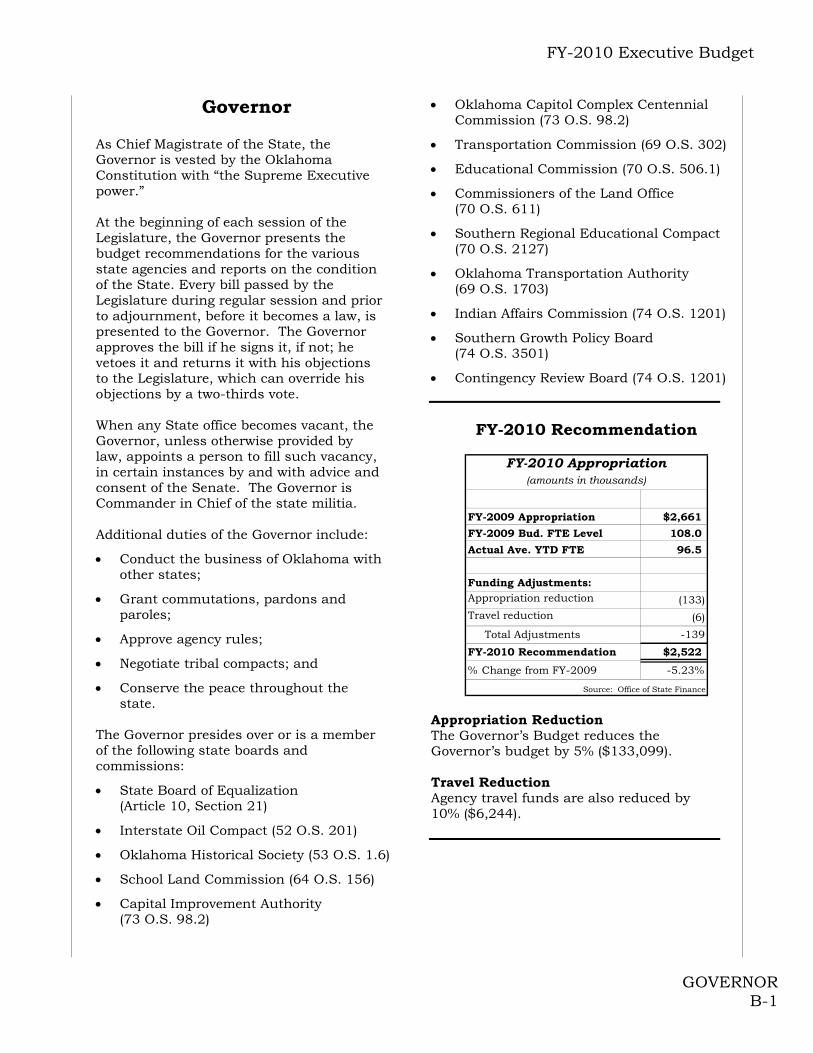
FY-2010 Recommendation
FY-2009 Appropriation $2,661
FY-2009 Bud. FTE Level 108.0
Actual Ave. YTD FTE 96.5
Funding Adjustments:Appropriation reduction (133)Travel reduction (6)
Total Adjustments -139
FY-2010 Recommendation $2,522
% Change from FY-2009 -5.23%
Source: Office of State Finance
FY-2010 Appropriation(amounts in thousands)
Appropriation Reduction The Governor’s Budget reduces the Governor’s budget by 5% ($133,099). Travel Reduction Agency travel funds are also reduced by 10% ($6,244).

FY-2010 Executive Budget
GOVERNOR B-2

FY-2010 Executive Budget
LIEUTENANT GOVERNOR B-3
Lieutenant Governor
Oklahoma’s Lieutenant Governor serves in place of the Governor when the Governor leaves the state. Also, the Lieutenant Governor serves as the President of the Oklahoma State Senate, casting a vote in the event of a tie and presiding over joint sessions of the State Legislature. In addition, the Lieutenant Governor presides over or is a member of the following 8 state boards and commissions:
State Insurance Fund (CompSource) 85 O.S. 131(A)(2)
Tourism and Recreation Commission 74 O.S. 1804)
State Board of Equalization 68 O.S. 2864 (A)
School Land Commission 64 O.S. 1
Oklahoma Linked Deposit Board 62 O.S. 88.3 (A)(2)
Capital Improvement Authority
Native American Cultural and Education Authority (ex-officio member) 74 O.S. 1226.2 (B)(2)
Film and Music Advisory Commission 74 O.S. 5026
Oklahoma Capitol Complex Centennial Commission 73 O.S. 98.2 (A)
FY-2010 Recommendation
FY-2009 Appropriation $660
FY-2009 Bud. FTE Level 6.5
Actual Ave. YTD FTE 7.6
Funding Adjustments:Appropriation reduction (33)
Total Adjustments -33
FY-2010 Recommendation $627
% Change from FY-2009 -5.00%
Source: Office of State Finance
FY-2010 Appropriation(amounts in thousands)
Appropriation Reduction The Governor’s budget reduces the Lieutenant Governor’s FY-2010 Appropriation by 5% ($32,980).

FY-2010 Executive Budget
LIEUTENANT GOVERNOR B-4

FY-2010 Executive Budget
AGRICULTURE B-5
Department of Agriculture, Food and Forestry (ODAFF)
Notable Achievements • Oklahoma has remained free of Brucellosis since April 2001. Mission The Department of Agriculture, Food, and Forestry is the lead agency in the state for improvement and regulation of the agricultural industry in Oklahoma. The Department of Agriculture’s budget consists of state, federal and revolving funds. In FY-2008, state appropriated dollars were 57% of the department’s total funding of $61,114,959. The chart below shows the actual expenditures for the department in FY-2008.
Department of Agriculture FY-2008 Actual Expenditures (In 000s)
Food
Safety/Ag lab,
$8,479,
16%
Admin,
$9,367,
17%
Agr'l Env'l
Mgmt Svcs,
$1,197,
3%
Pub
Info/Lgl/Stat/
Mkt Dev, $
5,704,
11%
Wildlife,
$2,212,
4%
Forestry,
$18,959,
35%
Consumer
Protection
Svcs/Anml
Ind Svcs,
$7,519,
14%
Source: Office of State Finance
Animal Industry Services (AIS) One of the agency’s most important functions is to ensure the quality and safety of the state’s agricultural products. This division is responsible for the detection, eradication and control of livestock, poultry and aquaculture diseases. The introduction of disease, foreign or domestic, can have a negative economic impact on Oklahoma producers. In addition, some animal diseases have the potential to infect humans. AIS works with State and Federal laboratories, the Oklahoma Office of the Federal Area Veterinarian in Charge and
Oklahoma Veterinary Practitioners in conducting surveillance to avert potential outbreaks. Specific responsibilities of the Animal Industry Services Division includes: • detecting, controlling and eradicating livestock diseases in farms, ranches, auction markets, slaughter plants, feedlots and other concentration points throughout the state; • monitoring the movement of animals and poultry into, through and out of Oklahoma to verify compliance with state and federal laws and regulations; • controlling the use of vaccines and biologics; • preventing the spread of diseases transmissible to man and domestic animals Forestry Services One of the department’s missions is to protect, conserve and enhance Oklahoma’s forest resources. These resources provide a multitude of benefits, including cleansing our air and water, providing habitat for wildlife, enhancing recreational opportunities and supporting a wood products industry with a value exceeding $2.3 billion annually. Wildfires Forestry Services is the primary state agency responsible for the control and prevention of wildland fire. It carries out this responsibility in two ways – (1) by suppressing wildfires with its own wildland fire resources, and (2) by providing assistance to the state’s 875 certified fire departments. Forestry Services provides direct initial attack on wildfires over all or parts of 18 counties in far eastern Oklahoma. Each year, highly trained and well equipped state firefighters suppress an average of 1,500 wildfires in this area. Without such fire protection, the owners of Oklahoma’s forestlands, 70% of which are Oklahoma families, could not afford the risk of investing in tree planting or other practices to improve their land’s productivity. As the division responsible for Oklahoma’s wildfire protection, Forestry Services plays a critical role in addressing emergency

FY-2010 Executive Budget
AGRICULTURE B-6
situations. Through its cooperative agreements with the federal wildland fire agencies, and through its membership in the South Central Interstate Forest Fire Protection Compact, OFS can bring resources from other states and from federal fire agencies. Rural Fire Defense Throughout the state, Forestry Services manages one of the largest and most successful rural community fire assistance programs in America, called the Rural Fire Defense Program (RFDP). The RFDP provides technical assistance to the state’s fire departments through 11 rural fire coordinators. Additionally, both state and federal grant funds are used to purchase equipment, provide wildland fire clothing, build and improve fire stations, and provide training facilities. Furthermore, each year the legislature provides an operational grant to every certified fire department in communities under 10,000 in population. Forestry Services operates an equipment revolving fund to provide low cost fire suppression and safety gear to Oklahoma Volunteer Fire Departments. Funds are expended for bulk purchases of personal protective clothing, hoses, nozzles, pumps and other items, which are in turn sold to fire departments at a low cost. For the past two years, Forestry Services has maintained an agreement with the USDA Forest Service, to acquire property through the Firefighter Property Program (FPP) and bring such property into the state for use by wildland fire agencies, including volunteer fire departments. Once placed in service, the title to such property is passed to the receiving agency. Since the early 1980’s, virtually every rural fire department in Oklahoma has received one or more trucks through the FPP or the former Federal Excess Property Program (FEPP). The following graph shows the four-year average for structures lost to fire in the protection area.
Structures Lost to Fire in the Protection Area
0
20
40
60
80
100
FY-2004 FY-2005 FY-2006 FY-2007 FY-2008
Source: ODAFF
Operational Grants The operational grants, first funded in FY-1990, provide funds for expenses of local fire-fighting associations. The grants help cities, towns, fire districts and rural fire departments pay for insurance, protective clothing and equipment. The grants are 100% state funded. Since FY-2001, at least $2 million has been provided each year to fund these grants, with 850-875 grants being awarded each year.
History of Operational Grants
Year No. Per Entity Funding
FY-2003 860 2,326 2,000,000
FY-2004 869 2,301 2,000,000
FY-2005 874 2,288 2,000,000
FY-2006 874 7,437 6,500,000
FY-2007 0 - -
FY-2008 877 5,100 4,500,000
FY-2009 877 5,100 4,500,000
Total 5,231 24,552 $21,500,000Source: ODAFF
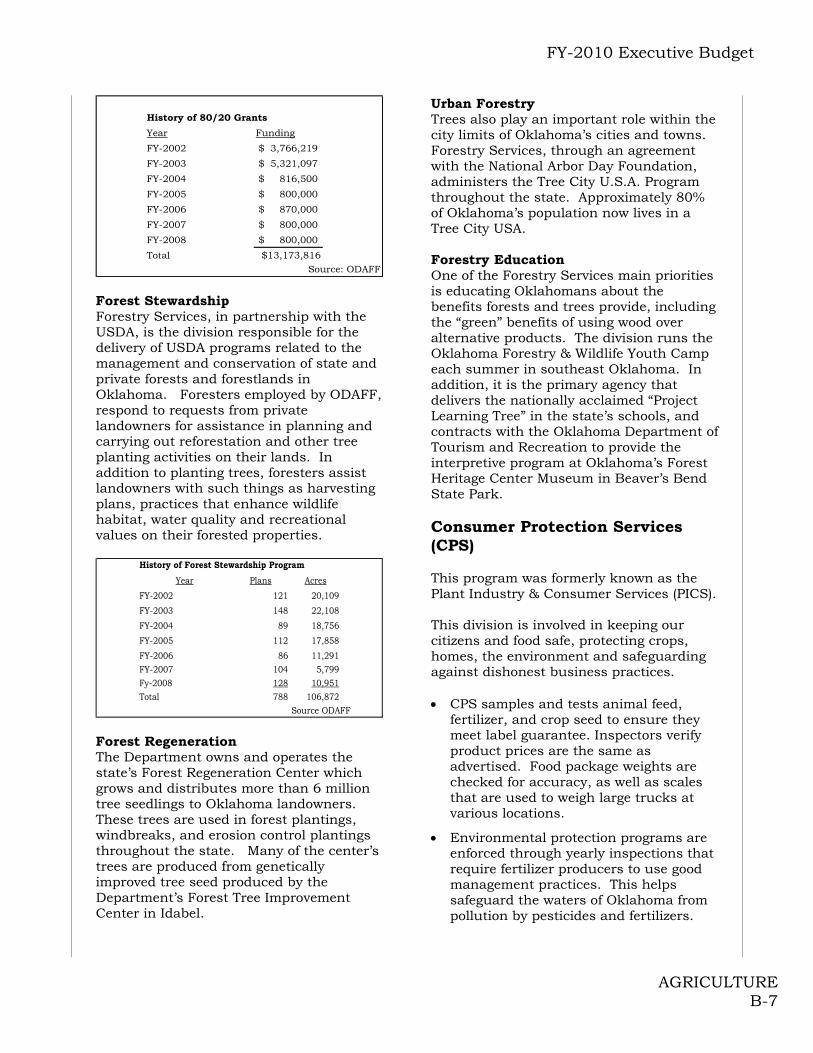
80/20 Grant Funding First funded in FY-1992, the 80/20 grants (state/local funding) provide equipment and building needs for rural fire departments. Approximately 129 fire departments received grants in FY-2008.
FY-2010 Executive Budget
AGRICULTURE B-7
History of 80/20 Grants
Year Funding
FY-2002 3,766,219$
FY-2003 5,321,097$
FY-2004 816,500$
FY-2005 800,000$
FY-2006 870,000$
FY-2007 800,000$
FY-2008 800,000$
Total $13,173,816Source: ODAFF
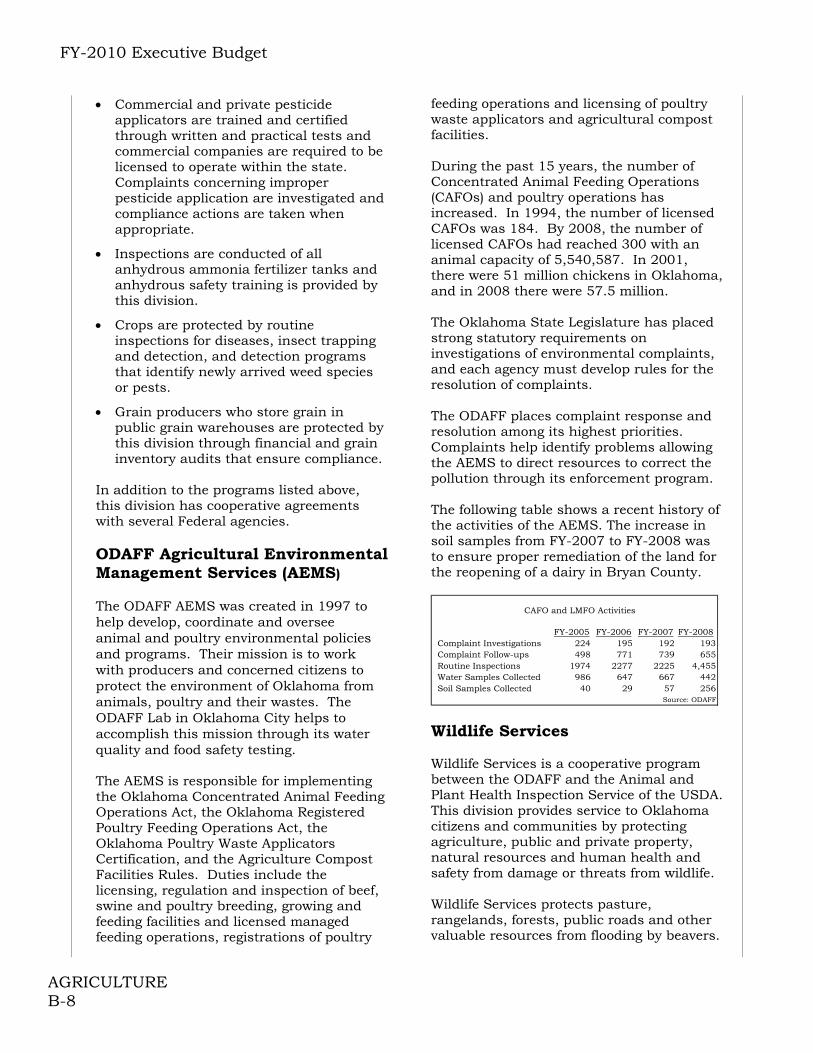
Forest Stewardship Forestry Services, in partnership with the USDA, is the division responsible for the delivery of USDA programs related to the management and conservation of state and private forests and forestlands in Oklahoma. Foresters employed by ODAFF, respond to requests from private landowners for assistance in planning and carrying out reforestation and other tree planting activities on their lands. In addition to planting trees, foresters assist landowners with such things as harvesting plans, practices that enhance wildlife habitat, water quality and recreational values on their forested properties.
History of Forest Stewardship Program
Year Plans Acres
FY-2002 121 20,109
FY-2003 148 22,108
FY-2004 89 18,756
FY-2005 112 17,858
FY-2006 86 11,291FY-2007 104 5,799Fy-2008 128 10,951Total 788 106,872
Source ODAFF Forest Regeneration The Department owns and operates the state’s Forest Regeneration Center which grows and distributes more than 6 million tree seedlings to Oklahoma landowners. These trees are used in forest plantings, windbreaks, and erosion control plantings throughout the state. Many of the center’s trees are produced from genetically improved tree seed produced by the Department’s Forest Tree Improvement Center in Idabel.
Urban Forestry Trees also play an important role within the city limits of Oklahoma’s cities and towns. Forestry Services, through an agreement with the National Arbor Day Foundation, administers the Tree City U.S.A. Program throughout the state. Approximately 80% of Oklahoma’s population now lives in a Tree City USA. Forestry Education One of the Forestry Services main priorities is educating Oklahomans about the benefits forests and trees provide, including the “green” benefits of using wood over alternative products. The division runs the Oklahoma Forestry & Wildlife Youth Camp each summer in southeast Oklahoma. In addition, it is the primary agency that delivers the nationally acclaimed “Project Learning Tree” in the state’s schools, and contracts with the Oklahoma Department of Tourism and Recreation to provide the interpretive program at Oklahoma’s Forest Heritage Center Museum in Beaver’s Bend State Park. Consumer Protection Services (CPS) This program was formerly known as the Plant Industry & Consumer Services (PICS). This division is involved in keeping our citizens and food safe, protecting crops, homes, the environment and safeguarding against dishonest business practices. CPS samples and tests animal feed,
fertilizer, and crop seed to ensure they meet label guarantee. Inspectors verify product prices are the same as advertised. Food package weights are checked for accuracy, as well as scales that are used to weigh large trucks at various locations.
Environmental protection programs are enforced through yearly inspections that require fertilizer producers to use good management practices. This helps safeguard the waters of Oklahoma from pollution by pesticides and fertilizers.
FY-2010 Executive Budget
AGRICULTURE B-8
Commercial and private pesticide applicators are trained and certified through written and practical tests and commercial companies are required to be licensed to operate within the state. Complaints concerning improper pesticide application are investigated and compliance actions are taken when appropriate.
Inspections are conducted of all anhydrous ammonia fertilizer tanks and anhydrous safety training is provided by this division.
Crops are protected by routine inspections for diseases, insect trapping and detection, and detection programs that identify newly arrived weed species or pests.
Grain producers who store grain in public grain warehouses are protected by this division through financial and grain inventory audits that ensure compliance.
In addition to the programs listed above, this division has cooperative agreements with several Federal agencies. ODAFF Agricultural Environmental Management Services (AEMS) The ODAFF AEMS was created in 1997 to help develop, coordinate and oversee animal and poultry environmental policies and programs. Their mission is to work with producers and concerned citizens to protect the environment of Oklahoma from animals, poultry and their wastes. The ODAFF Lab in Oklahoma City helps to accomplish this mission through its water quality and food safety testing. The AEMS is responsible for implementing the Oklahoma Concentrated Animal Feeding Operations Act, the Oklahoma Registered Poultry Feeding Operations Act, the Oklahoma Poultry Waste Applicators Certification, and the Agriculture Compost Facilities Rules. Duties include the licensing, regulation and inspection of beef, swine and poultry breeding, growing and feeding facilities and licensed managed feeding operations, registrations of poultry
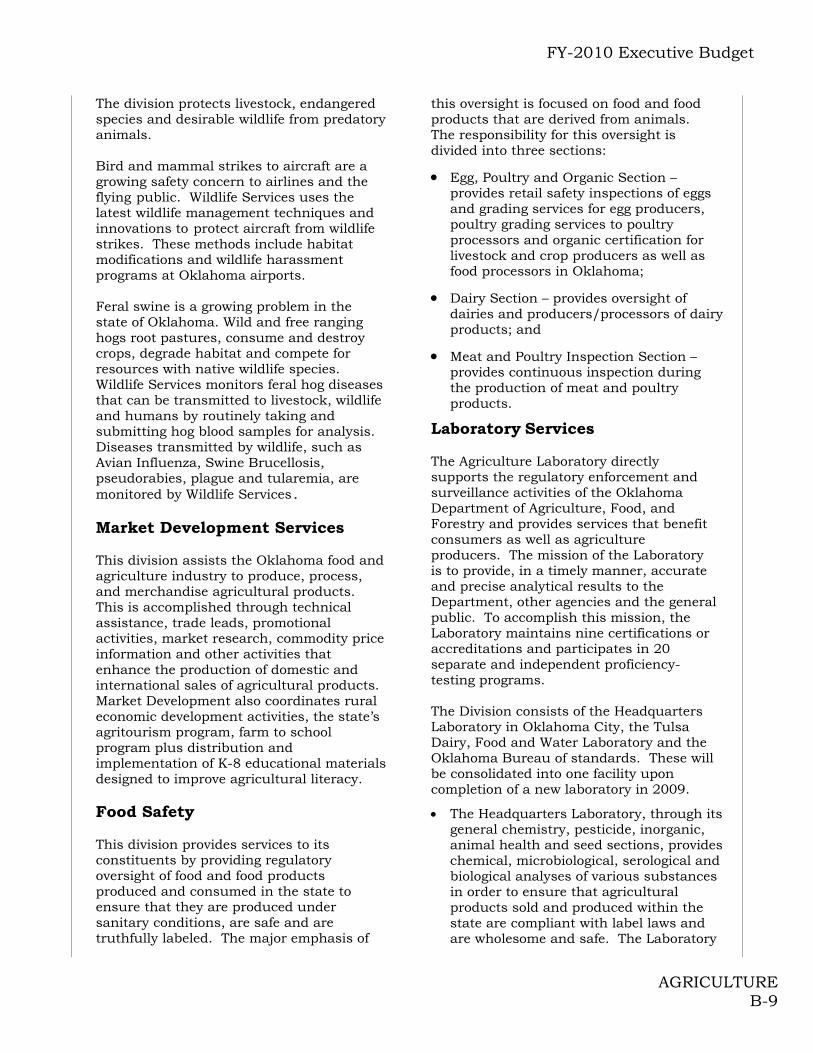
feeding operations and licensing of poultry waste applicators and agricultural compost facilities. During the past 15 years, the number of Concentrated Animal Feeding Operations (CAFOs) and poultry operations has increased. In 1994, the number of licensed CAFOs was 184. By 2008, the number of licensed CAFOs had reached 300 with an animal capacity of 5,540,587. In 2001, there were 51 million chickens in Oklahoma, and in 2008 there were 57.5 million. The Oklahoma State Legislature has placed strong statutory requirements on investigations of environmental complaints, and each agency must develop rules for the resolution of complaints. The ODAFF places complaint response and resolution among its highest priorities. Complaints help identify problems allowing the AEMS to direct resources to correct the pollution through its enforcement program. The following table shows a recent history of the activities of the AEMS. The increase in soil samples from FY-2007 to FY-2008 was to ensure proper remediation of the land for the reopening of a dairy in Bryan County.
FY-2005 FY-2006 FY-2007 FY-2008Complaint Investigations 224 195 192 193Complaint Follow-ups 498 771 739 655Routine Inspections 1974 2277 2225 4,455Water Samples Collected 986 647 667 442Soil Samples Collected 40 29 57 256
Source: ODAFF
CAFO and LMFO Activities
Wildlife Services Wildlife Services is a cooperative program between the ODAFF and the Animal and Plant Health Inspection Service of the USDA. This division provides service to Oklahoma citizens and communities by protecting agriculture, public and private property, natural resources and human health and safety from damage or threats from wildlife. Wildlife Services protects pasture, rangelands, forests, public roads and other valuable resources from flooding by beavers.
FY-2010 Executive Budget
AGRICULTURE B-9
The division protects livestock, endangered species and desirable wildlife from predatory animals. Bird and mammal strikes to aircraft are a growing safety concern to airlines and the flying public. Wildlife Services uses the latest wildlife management techniques and innovations to protect aircraft from wildlife strikes. These methods include habitat modifications and wildlife harassment programs at Oklahoma airports. Feral swine is a growing problem in the state of Oklahoma. Wild and free ranging hogs root pastures, consume and destroy crops, degrade habitat and compete for resources with native wildlife species. Wildlife Services monitors feral hog diseases that can be transmitted to livestock, wildlife and humans by routinely taking and submitting hog blood samples for analysis. Diseases transmitted by wildlife, such as Avian Influenza, Swine Brucellosis, pseudorabies, plague and tularemia, are monitored by Wildlife Services. Market Development Services This division assists the Oklahoma food and agriculture industry to produce, process, and merchandise agricultural products. This is accomplished through technical assistance, trade leads, promotional activities, market research, commodity price information and other activities that enhance the production of domestic and international sales of agricultural products. Market Development also coordinates rural economic development activities, the state’s agritourism program, farm to school program plus distribution and implementation of K-8 educational materials designed to improve agricultural literacy. Food Safety This division provides services to its constituents by providing regulatory oversight of food and food products produced and consumed in the state to ensure that they are produced under sanitary conditions, are safe and are truthfully labeled. The major emphasis of
this oversight is focused on food and food products that are derived from animals. The responsibility for this oversight is divided into three sections:
Egg, Poultry and Organic Section – provides retail safety inspections of eggs and grading services for egg producers, poultry grading services to poultry processors and organic certification for livestock and crop producers as well as food processors in Oklahoma;
Dairy Section – provides oversight of dairies and producers/processors of dairy products; and
Meat and Poultry Inspection Section – provides continuous inspection during the production of meat and poultry products.
Laboratory Services The Agriculture Laboratory directly supports the regulatory enforcement and surveillance activities of the Oklahoma Department of Agriculture, Food, and Forestry and provides services that benefit consumers as well as agriculture producers. The mission of the Laboratory is to provide, in a timely manner, accurate and precise analytical results to the Department, other agencies and the general public. To accomplish this mission, the Laboratory maintains nine certifications or accreditations and participates in 20 separate and independent proficiency-testing programs. The Division consists of the Headquarters Laboratory in Oklahoma City, the Tulsa Dairy, Food and Water Laboratory and the Oklahoma Bureau of standards. These will be consolidated into one facility upon completion of a new laboratory in 2009.
The Headquarters Laboratory, through its general chemistry, pesticide, inorganic, animal health and seed sections, provides chemical, microbiological, serological and biological analyses of various substances in order to ensure that agricultural products sold and produced within the state are compliant with label laws and are wholesome and safe. The Laboratory

FY-2010 Executive Budget
AGRICULTURE B-10
is the only entity in the state that checks label compliance on livestock and pet feeds, fertilizers, pesticides, meat and meat products. The Agricultural Laboratory is the lead entity in the state for testing related to the Federal Insecticide, Fungicide and Rodenticide Act (FIFRA). Through a cooperative agreement with U. S. EPA, the pesticide section performs all pesticide testing in the state related to FIFRA activities. Chemical and microbiological testing of ground and surface water is performed in order to determine the presence of pollution related to agricultural activities. The Laboratory performs food safety testing on meat and meat products. It provides serological testing for various livestock diseases. Biological examinations of crop, forage, and vegetable seeds are conducted in order to ensure proper purity and germination rates and to check for noxious weeds.
The Tulsa Dairy Lab provides analyses of milk and milk products to determine wholesomeness and safety for human consumption in support of the Federal Pasteurized Milk Ordinance (PMO). It is an FDA certified food laboratory and assists the main laboratory in providing bacteriological analyses of meat and meat products.
The Oklahoma Bureau of Standards is the highest authority in the state relating to the calibration of length, volume, and weight measurements. The Bureau maintains and calibrates all of the standards relating to measurements and maintains traceability of these standards to the National Institute of Standards and Technology (NIST). The Bureau performs testing and calibration for private industry, service companies and other state agencies. The Bureau is accredited through the National Voluntary Laboratory Accreditation Program.
Agricultural Statistics Division The Agricultural Statistics Divisions is a cooperative program between the ODAFF and the National Agricultural Statistics
Service (NASS) of the USDA. This division conducts agricultural surveys every year and prepares reports covering virtually every aspect of U.S. and Oklahoma agriculture. Production and supplies of food and fiber, prices paid and received by farmers, farm labor and wages, farm finances, chemical use, and changes in the demographics of producers are only a few examples.
NASS is committed to providing timely, accurate, and useful statistics in service to U.S. agriculture. To uphold our continuing commitment, NASS will:
Provide objective and unbiased statistics on a preannounced schedule that is fair and impartial to all market participants.
Conduct the Census of Agriculture every five years, providing the only source of consistent, comparable, and detailed agricultural data for every county in America.
Serve the needs of our data users and customers at a local level by compiling and publishing the annual Agriculture Statistics bulletin as well as conduct reimbursable surveys for our cooperative relationship with Oklahoma State University.
Safeguard the privacy of farmers, ranchers, and other data providers, with a guarantee that confidentiality and data security continue to be our top priorities.

FY-2010 Executive Budget
AGRICULTURE B-11
FY-2010 Recommendation
FY-2009 Appropriation $34,540
FY-2009 Bud. FTE Level 478.0
Actual Ave. YTD FTE 448.6
Funding Adjustments:Appropriation Reduction (1,332)Travel Reduction (64)Agency Fee Increase (1,500)
Total Adjustments -2,896
FY-2010 Recommendation $31,644
% Change from FY-2009 -8.38%
Source: Office of State Finance
FY-2010 Appropriation(amounts in thousands)
Appropriation Reduction The Governor’s Budget reduces the FY-2010 appropriation for ODAFF by 5% ($1,332,109). Travel Reduction Agency travel funds are also reduced by 10% ($63,709). Agency Fee Increase The Governor's budget recommends fee increases in the amount of $1,500,000. The agency's appropriation is reduced accordingly.
FY-2010 Executive Budget
AGRICULTURE B-12
Boll Weevil Eradication Organization
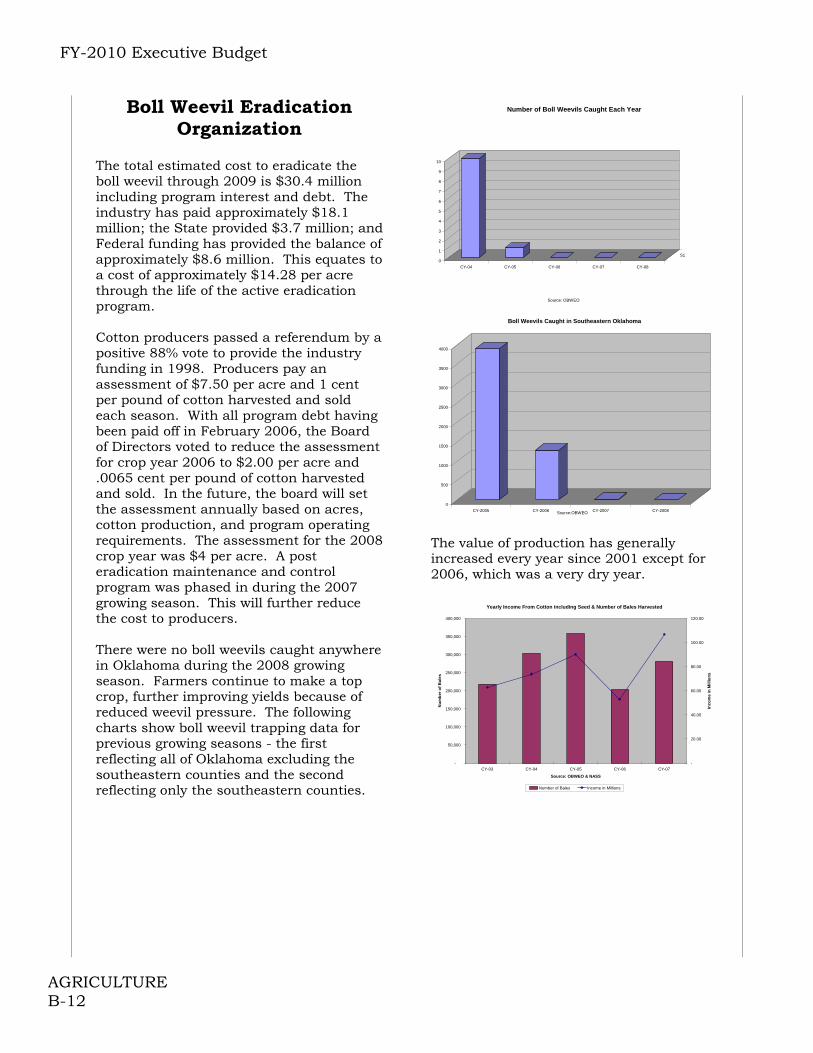
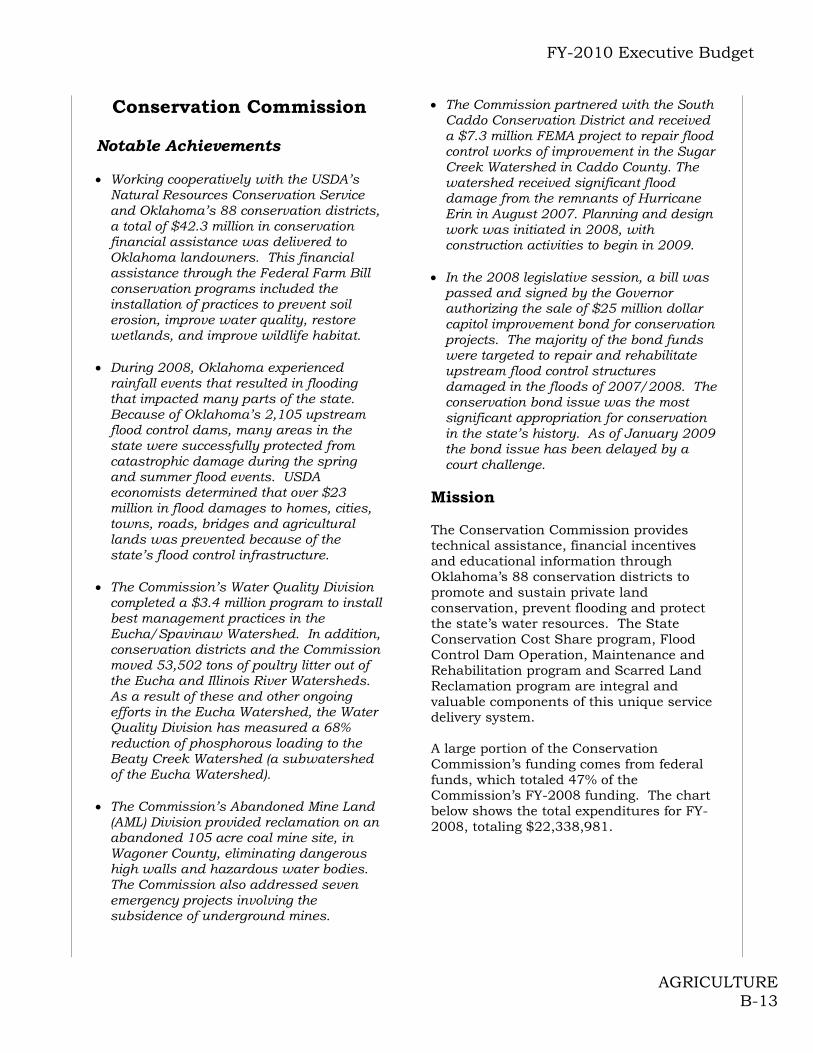
The total estimated cost to eradicate the boll weevil through 2009 is $30.4 million including program interest and debt. The industry has paid approximately $18.1 million; the State provided $3.7 million; and Federal funding has provided the balance of approximately $8.6 million. This equates to a cost of approximately $14.28 per acre through the life of the active eradication program. Cotton producers passed a referendum by a positive 88% vote to provide the industry funding in 1998. Producers pay an assessment of $7.50 per acre and 1 cent per pound of cotton harvested and sold each season. With all program debt having been paid off in February 2006, the Board of Directors voted to reduce the assessment for crop year 2006 to $2.00 per acre and .0065 cent per pound of cotton harvested and sold. In the future, the board will set the assessment annually based on acres, cotton production, and program operating requirements. The assessment for the 2008 crop year was $4 per acre. A post eradication maintenance and control program was phased in during the 2007 growing season. This will further reduce the cost to producers. There were no boll weevils caught anywhere in Oklahoma during the 2008 growing season. Farmers continue to make a top crop, further improving yields because of reduced weevil pressure. The following charts show boll weevil trapping data for previous growing seasons - the first reflecting all of Oklahoma excluding the southeastern counties and the second reflecting only the southeastern counties.
0
1
2
3
4
5
6
7
8
9
10
CY-04 CY-05 CY-06 CY-07 CY-08
S1
Number of Boll Weevils Caught Each Year
Source: OBWEO
0
500
1000
1500
2000
2500
3000
3500
4000
CY-2005 CY-2006 CY-2007 CY-2008
Boll Weevils Caught in Southeastern Oklahoma
Source:OBWEO The value of production has generally increased every year since 2001 except for 2006, which was a very dry year.
Yearly Income From Cotton including Seed & Number of Bales Harvested
-
50,000
100,000
150,000
200,000
250,000
300,000
350,000
400,000
CY-03 CY-04 CY-05 CY-06 CY-07
Source: OBWEO & NASS
Nu
mb
er o
f B
ales
-
20.00
40.00
60.00
80.00
100.00
120.00
Inco
me
in M
illio
ns
Number of Bales Income in Millions
FY-2010 Executive Budget
AGRICULTURE B-13
Conservation Commission Notable Achievements Working cooperatively with the USDA’s
Natural Resources Conservation Service and Oklahoma’s 88 conservation districts, a total of $42.3 million in conservation financial assistance was delivered to Oklahoma landowners. This financial assistance through the Federal Farm Bill conservation programs included the installation of practices to prevent soil erosion, improve water quality, restore wetlands, and improve wildlife habitat.
During 2008, Oklahoma experienced
rainfall events that resulted in flooding that impacted many parts of the state. Because of Oklahoma’s 2,105 upstream flood control dams, many areas in the state were successfully protected from catastrophic damage during the spring and summer flood events. USDA economists determined that over $23 million in flood damages to homes, cities, towns, roads, bridges and agricultural lands was prevented because of the state’s flood control infrastructure.
The Commission’s Water Quality Division
completed a $3.4 million program to install best management practices in the Eucha/Spavinaw Watershed. In addition, conservation districts and the Commission moved 53,502 tons of poultry litter out of the Eucha and Illinois River Watersheds. As a result of these and other ongoing efforts in the Eucha Watershed, the Water Quality Division has measured a 68% reduction of phosphorous loading to the Beaty Creek Watershed (a subwatershed of the Eucha Watershed).
The Commission’s Abandoned Mine Land
(AML) Division provided reclamation on an abandoned 105 acre coal mine site, in Wagoner County, eliminating dangerous high walls and hazardous water bodies. The Commission also addressed seven emergency projects involving the subsidence of underground mines.
The Commission partnered with the South Caddo Conservation District and received a $7.3 million FEMA project to repair flood control works of improvement in the Sugar Creek Watershed in Caddo County. The watershed received significant flood damage from the remnants of Hurricane Erin in August 2007. Planning and design work was initiated in 2008, with construction activities to begin in 2009.
In the 2008 legislative session, a bill was
passed and signed by the Governor authorizing the sale of $25 million dollar capitol improvement bond for conservation projects. The majority of the bond funds were targeted to repair and rehabilitate upstream flood control structures damaged in the floods of 2007/2008. The conservation bond issue was the most significant appropriation for conservation in the state’s history. As of January 2009 the bond issue has been delayed by a court challenge.
Mission The Conservation Commission provides technical assistance, financial incentives and educational information through Oklahoma’s 88 conservation districts to promote and sustain private land conservation, prevent flooding and protect the state’s water resources. The State Conservation Cost Share program, Flood Control Dam Operation, Maintenance and Rehabilitation program and Scarred Land Reclamation program are integral and valuable components of this unique service delivery system. A large portion of the Conservation Commission’s funding comes from federal funds, which totaled 47% of the Commission’s FY-2008 funding. The chart below shows the total expenditures for FY-2008, totaling $22,338,981.
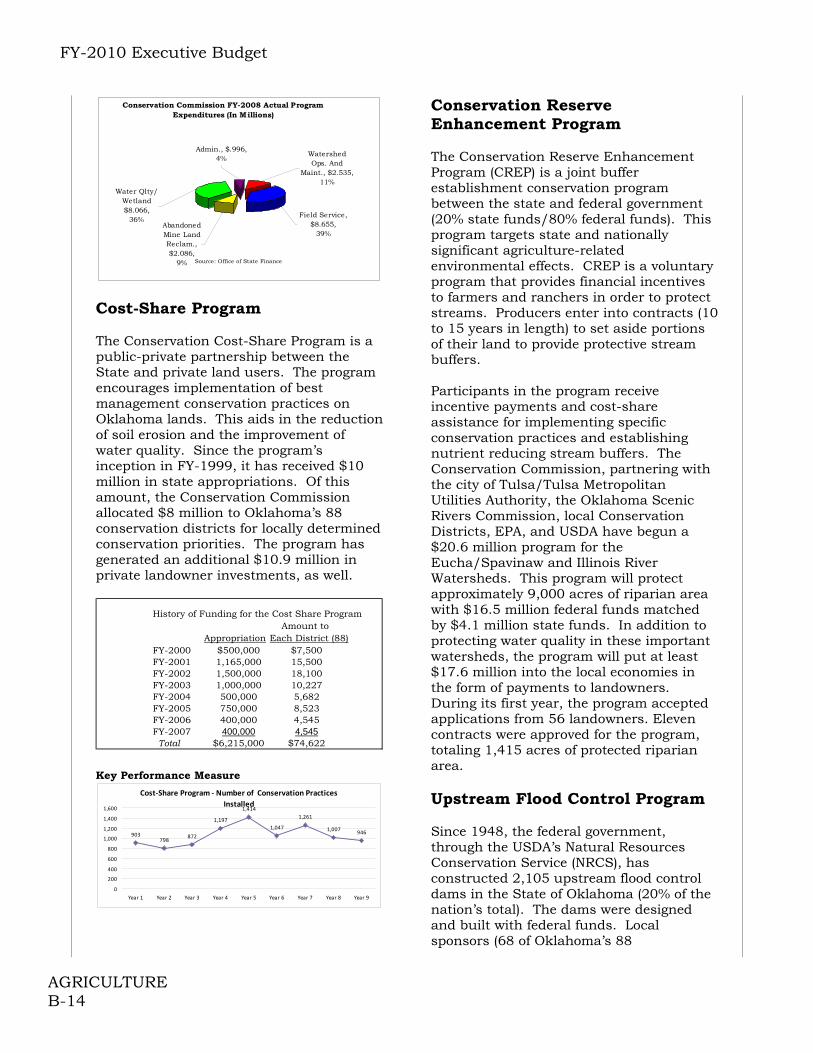
FY-2010 Executive Budget
AGRICULTURE B-14
Conservation Commission FY-2008 Actual Program Expenditures (In Millions)
Water Qlty/ Wetland $8.066,
36%Abandoned Mine Land Reclam., $2.086,
9%
Field Service, $8.655,
39%
Watershed Ops. And
Maint., $2.535,11%
Admin., $.996, 4%
Source: Office of State Finance
Cost-Share Program The Conservation Cost-Share Program is a public-private partnership between the State and private land users. The program encourages implementation of best management conservation practices on Oklahoma lands. This aids in the reduction of soil erosion and the improvement of water quality. Since the program’s inception in FY-1999, it has received $10 million in state appropriations. Of this amount, the Conservation Commission allocated $8 million to Oklahoma’s 88 conservation districts for locally determined conservation priorities. The program has generated an additional $10.9 million in private landowner investments, as well.
History of Funding for the Cost Share ProgramAmount to
Appropriation Each District (88)FY-2000 $500,000 $7,500FY-2001 1,165,000 15,500FY-2002 1,500,000 18,100FY-2003 1,000,000 10,227FY-2004 500,000 5,682FY-2005 750,000 8,523FY-2006 400,000 4,545FY-2007 400,000 4,545 Total $6,215,000 $74,622
Key Performance Measure
Cost‐Share Program ‐ Number of Conservation Practices
Installed
903798
872
1,197
1,414
1,047
1,261
1,007946
0
200
400
600
800
1,000
1,200
1,400
1,600
Year 1 Year 2 Year 3 Year 4 Year 5 Year 6 Year 7 Year 8 Year 9
Conservation Reserve Enhancement Program The Conservation Reserve Enhancement Program (CREP) is a joint buffer establishment conservation program between the state and federal government (20% state funds/80% federal funds). This program targets state and nationally significant agriculture-related environmental effects. CREP is a voluntary program that provides financial incentives to farmers and ranchers in order to protect streams. Producers enter into contracts (10 to 15 years in length) to set aside portions of their land to provide protective stream buffers. Participants in the program receive incentive payments and cost-share assistance for implementing specific conservation practices and establishing nutrient reducing stream buffers. The Conservation Commission, partnering with the city of Tulsa/Tulsa Metropolitan Utilities Authority, the Oklahoma Scenic Rivers Commission, local Conservation Districts, EPA, and USDA have begun a $20.6 million program for the Eucha/Spavinaw and Illinois River Watersheds. This program will protect approximately 9,000 acres of riparian area with $16.5 million federal funds matched by $4.1 million state funds. In addition to protecting water quality in these important watersheds, the program will put at least $17.6 million into the local economies in the form of payments to landowners. During its first year, the program accepted applications from 56 landowners. Eleven contracts were approved for the program, totaling 1,415 acres of protected riparian area. Upstream Flood Control Program Since 1948, the federal government, through the USDA’s Natural Resources Conservation Service (NRCS), has constructed 2,105 upstream flood control dams in the State of Oklahoma (20% of the nation’s total). The dams were designed and built with federal funds. Local sponsors (68 of Oklahoma’s 88

FY-2010 Executive Budget
AGRICULTURE B-15
conservation districts) are responsible for obtaining the necessary land rights and have continuing responsibility for the operation and maintenance of these dams. The federal government’s estimated public investment in these dams is $2.1 billion in present value. The annual benefit realized from the dams is over $75 million. The primary purpose of the dams is to impound water to reduce flooding of prime farmland, highways, communities and residences. The dams also provide water resources for drinking water, recreation, industry, fire protection and significant wildlife habitat. There is a growing concern and increased interest that many of the early upstream flood control dams that were built under the USDA assisted small watershed program are at or near the end of their 50-year planned design life and may pose a public safety concern. Many of the older small dams have significant rehabilitation needs. Some pose a threat to public safety to people and towns downstream from the dams. Throughout the state, there are 229 dams that have been reclassified as high hazard due to residential and business development downstream. The cost to modify the dams to meet mandated dam safety criteria is over $200 million, due to upstream and downstream development. Federal legislation in 2000 authorized cost share assistance through the NRCS to rehabilitate the nation’s upstream flood control dams. To be eligible for rehabilitation, the state and/or local sponsors must provide a 35% match to federal dollars. The Conservation Commission, local district sponsors, and NRCS have completed 15 rehabilitation projects and have 23 in planning or design pending the funding for construction. Federal 319 Grant for Non-Point Source Pollution FY-2008 federal funding from the Clean Water Act Section 319 for Oklahoma’s Non-
point Source management program has increased compared to FY-2007 funding after one-time monies were allocated. The funds are used to implement targeted programs to abate water quality impacts from non-point source pollution. Key Performance Measure
Tons of Pollutant Removed
32.76
55.72
35 35
7.24
14.14
8 8
0
10
20
30
40
50
60
FY‐2006 FY‐2007 FY‐2008 FY‐2009
Nitrogen
Phosphorus
Federal funds must be matched with 40% state and local funds, much of which comes from the Commission’s Conservation Cost-Share Program. Since 1999, the Conservation Commission received approximately $4.9 million in appropriations, as a state match for federal “EPA 319 Funds”, to reduce nutrient impacts in the Beaty Creek, Illinois River, Lake Wister, Ft. Cobb, Honey Creek (Grand Lake), North Canadian River, Stillwater Creek and Spavinaw Creek priority watersheds. The programs target non-point source pollution including nutrients, agriculture, silviculture, rural unpaved roads, rural waste systems, non-regulated construction activities and stream bank destabilization. Ongoing and completed Priority Watershed Non-point Source Projects and the totals for best management practice implementation include:
Beaty Creek Watershed ($2.1 million) within the Lake Eucha Watershed completed in FY-2005;
Illinois River Watershed ($2.0
million) completed in FY-2005;
Lake Wister Watershed ($1.9 million) to be completed;
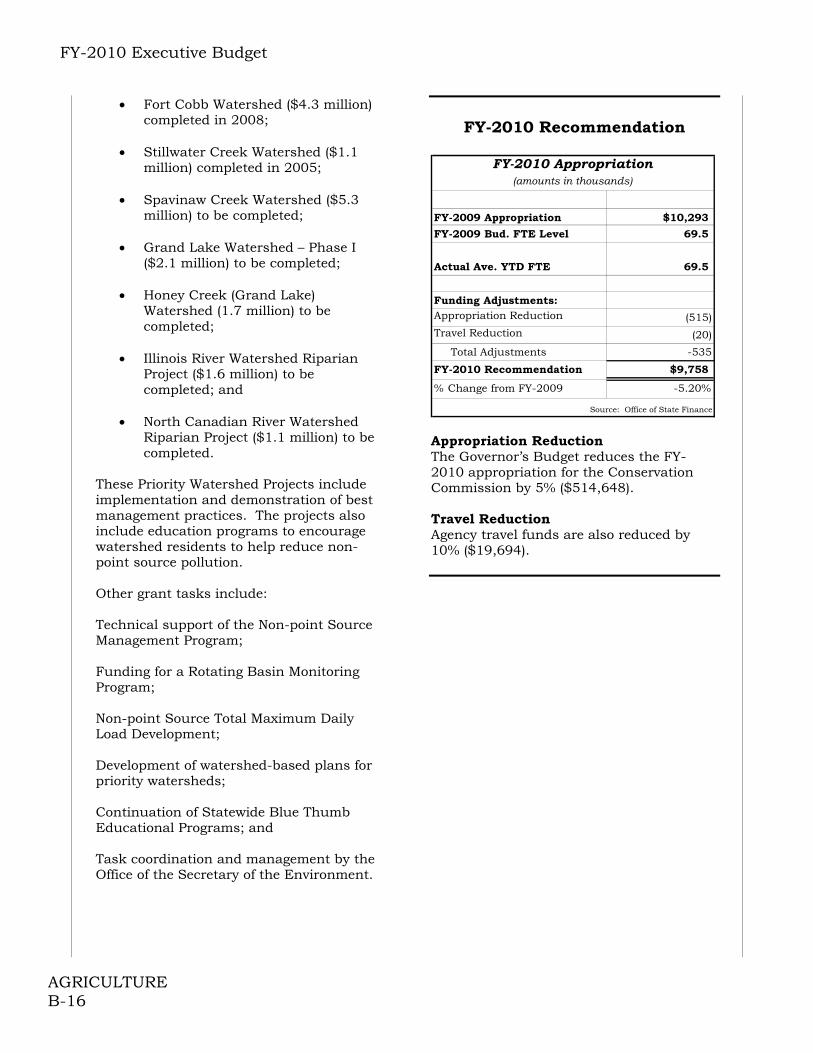
FY-2010 Executive Budget
AGRICULTURE B-16
Fort Cobb Watershed ($4.3 million) completed in 2008;
Stillwater Creek Watershed ($1.1
million) completed in 2005;
Spavinaw Creek Watershed ($5.3 million) to be completed;
Grand Lake Watershed – Phase I
($2.1 million) to be completed;
Honey Creek (Grand Lake) Watershed (1.7 million) to be completed;
Illinois River Watershed Riparian
Project ($1.6 million) to be completed; and
North Canadian River Watershed
Riparian Project ($1.1 million) to be completed.
These Priority Watershed Projects include implementation and demonstration of best management practices. The projects also include education programs to encourage watershed residents to help reduce non-point source pollution. Other grant tasks include: Technical support of the Non-point Source Management Program; Funding for a Rotating Basin Monitoring Program; Non-point Source Total Maximum Daily Load Development; Development of watershed-based plans for priority watersheds; Continuation of Statewide Blue Thumb Educational Programs; and Task coordination and management by the Office of the Secretary of the Environment.
FY-2010 Recommendation
FY-2009 Appropriation $10,293
FY-2009 Bud. FTE Level 69.5
Actual Ave. YTD FTE 69.5
Funding Adjustments:Appropriation Reduction (515)Travel Reduction (20)
Total Adjustments -535
FY-2010 Recommendation $9,758
% Change from FY-2009 -5.20%
Source: Office of State Finance
FY-2010 Appropriation(amounts in thousands)
Appropriation Reduction The Governor’s Budget reduces the FY-2010 appropriation for the Conservation Commission by 5% ($514,648). Travel Reduction Agency travel funds are also reduced by 10% ($19,694).

FY-2010 Executive Budget
COMMERCE AND TOURISM B-17
Department of Commerce
Notable Achievements
The Oklahoma Department of Commerce assisted 38 companies with relocation to the state, 58% selecting sites in rural areas. These relocation projects are expected to create over 8,000 new jobs, 30% in rural areas. The agency also supported 37 existing Oklahoma companies with business start-up and expansion projects, resulting in the planned creation of 6,754 new jobs, 26% in rural areas. The total of new jobs projected is 15,072 with $1.9 billion in planned investment.
Fifty business and government leaders
serve on the Governor’s Council for Workforce and Economic Development. The Council leads state efforts to enhance the workforce delivery system and increase the skills and availability of Oklahoma’s workforce. Workforce has successfully incubated the Career Readiness Certificate (CRC) program by awarding over 20,000 certificates to Oklahomans. In addition, three Oklahoma communities received designation as Work Ready Communities based on high graduation rates, CRC’s, and other business related criteria. Oklahoma is the first in the nation to receive such designation.
Agency knowledge-based initiatives are
designed to increase the number of new economy jobs in Oklahoma. While workforce programming seeks to attract highly skilled “elsewhere Oklahomans” back to the state through Project Boomerang, entrepreneurial programs support the diverse needs of start-up companies in rural and urban areas. In addition, the agency actively supports the state Bioscience Association to strategically advance the targeted industry sector.
More than 128,000 Oklahomans in all 77
counties were served by Community Services Block Grants leveraging 1.6 million hours of Oklahoma volunteer time. Over 200 Community Development Block
Grants were awarded, supporting the infrastructural needs of rural Oklahoma.
The Main Street Program has 41
participating communities responsible for the locally realized net gain of 217 new businesses and 598 new jobs. Over 93,000 volunteer hours were contributed in support of local main street programs and projects across the state.
Mission The Oklahoma Department of Commerce is responsible for increasing the quantity and quality of jobs available in Oklahoma by attracting new business, promoting the development and availability of a skilled workforce, supporting communities, and supporting the growth of existing businesses and entrepreneurs. The graph below shows actual program expenditures for FY-2008 in the total amount of $103.1 million.
Department of Commerce FY-2008 Actual Program Expenditures (in 000s)
Global Business, $3,339,
3%
Contracts for Comm and Econ
Dev., $63,672,
58%
Oper'l Support, $8,124,
7%
Comm. Dev.,
$35,591,32%
Source: OSF
Programs Rural Action Partnership The Rural Action Partnership Program connects economic development resources with the needs of rural Oklahoma. Rural development specialists serve communities and regions to encourage alliances and support economic development programs. The program assists rural communities in the effort to grow and recruit businesses and identify ways for communities to
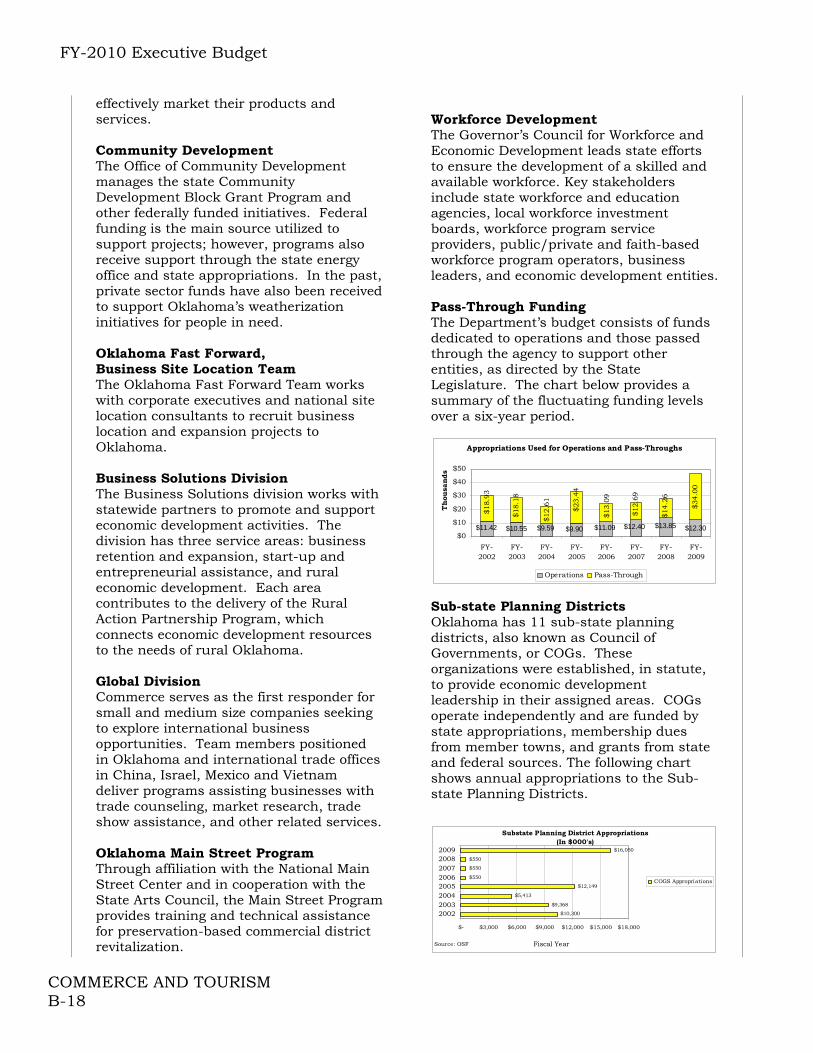
FY-2010 Executive Budget
COMMERCE AND TOURISM B-18
effectively market their products and services. Community Development The Office of Community Development manages the state Community Development Block Grant Program and other federally funded initiatives. Federal funding is the main source utilized to support projects; however, programs also receive support through the state energy office and state appropriations. In the past, private sector funds have also been received to support Oklahoma’s weatherization initiatives for people in need. Oklahoma Fast Forward, Business Site Location Team The Oklahoma Fast Forward Team works with corporate executives and national site location consultants to recruit business location and expansion projects to Oklahoma. Business Solutions Division The Business Solutions division works with statewide partners to promote and support economic development activities. The division has three service areas: business retention and expansion, start-up and entrepreneurial assistance, and rural economic development. Each area contributes to the delivery of the Rural Action Partnership Program, which connects economic development resources to the needs of rural Oklahoma. Global Division Commerce serves as the first responder for small and medium size companies seeking to explore international business opportunities. Team members positioned in Oklahoma and international trade offices in China, Israel, Mexico and Vietnam deliver programs assisting businesses with trade counseling, market research, trade show assistance, and other related services. Oklahoma Main Street Program Through affiliation with the National Main Street Center and in cooperation with the State Arts Council, the Main Street Program provides training and technical assistance for preservation-based commercial district revitalization.
Workforce Development The Governor’s Council for Workforce and Economic Development leads state efforts to ensure the development of a skilled and available workforce. Key stakeholders include state workforce and education agencies, local workforce investment boards, workforce program service providers, public/private and faith-based workforce program operators, business leaders, and economic development entities. Pass-Through Funding The Department’s budget consists of funds dedicated to operations and those passed through the agency to support other entities, as directed by the State Legislature. The chart below provides a summary of the fluctuating funding levels over a six-year period.
Appropriations Used for Operations and Pass-Throughs
$12.30
$34.0
0
$13.85$12.40$11.09$9.90$9.59$10.55$11.42
$14.2
6
$12.6
9
$13.0
9
$23.4
4
$12.6
1
$18.1
8
$18.9
3
$0
$10
$20
$30
$40
$50
FY-2002
FY-2003
FY-2004
FY-2005
FY-2006
FY-2007
FY-2008
FY-2009
Thousa
nds
Operations Pass-Through Sub-state Planning Districts Oklahoma has 11 sub-state planning districts, also known as Council of Governments, or COGs. These organizations were established, in statute, to provide economic development leadership in their assigned areas. COGs operate independently and are funded by state appropriations, membership dues from member towns, and grants from state and federal sources. The following chart shows annual appropriations to the Sub-state Planning Districts.
Substate Planning District Appropriations(In $000's)
$10,300
$9,368
$5,413
$12,149
$550
$550
$550
$16,050
$- $3,000 $6,000 $9,000 $12,000 $15,000 $18,000
20022003200420052006200720082009
COGS Appropriations
Source: OSF Fiscal Year

FY-2010 Executive Budget
COMMERCE AND TOURISM B-19
FY-2010 Recommendation
FY-2009 Appropriation $30,935
Remove One-time Funding (11,766)
FY-2009 Base $19,169
FY-2009 Bud. FTE Level 155.0
Actual Ave. YTD FTE 154.1
Funding Adjustments:Appropriation Reduction (1,029)Travel Reduction (65)Replace One-time Funding 11,766
Annualize One-Time Funding3,500
Annualize Bond Debt Service - NACEA 1,106
Total Adjustments 15,278
FY-2010 Recommendation $34,447
$ Change from FY-2009 $3,512
% Change from FY-2009 11.35%
FY-2010 Appropriation(amounts in thousands)
Source: Office of State Finance Replace One-time Funding The Governor’s Budget recommends replacing one-time funding in the amount of $11,766,000, which will be ongoing funds for the department. BioEnergy Center The Governor’s budget provides $3.5 million to continue funding a BioEnergy Center established in 2007, helping keep Oklahoma at the forefront of this transformative movement and to advance the development of a commercial biofuels industry in Oklahoma. Annualize Bond Debt Service The Governor’s budget includes an annualization for bond debt service payment in the amount of $1,106,000. Appropriation Reduction The Governor’s Budget reduces the FY-2010 appropriation for the Department of Commerce by 5% ($1,029,039).
Travel Reduction Agency travel funds are also reduced by 10% ($64,507).
FY-2010 Executive Budget
COMMERCE AND TOURISM B-20
Native American Cultural & Educational Authority (NACEA) The NACEA was created on September 1, 1994. It is authorized to construct and operate the American Indian Cultural Center and Museum; generating awareness and understanding of the history of tribes and their relationship to Oklahoma today. The American Indian Cultural Center will feature modern-day expressions of the tribal nations and provide visitors a rare opportunity to be immersed in traditional celebrations, contemporary events, and activities both inside the Cultural Center and across the 300-acre Cultural Park. Located at the junction of Interstate 35 and Interstate 40, the Cultural Center will be a satellite institution that will connect cultural institutions throughout the entire state. The American Indian Cultural Center project is ultimately envisioned as having four components: American Indian Cultural Center &
Museum – a 125,000-square-foot institution telling Oklahoma’s story in relation to the presence of our Oklahoma tribes, past and present.
A 300-acre park that is landscaped/programmed to extend the experience of Native cultures to all visitors.
Privately-funded and commercially-operated business enterprises that complement the Mission of the Cultural Center, attract large numbers of visitors to the site, and will contribute revenue to the project.
A 4,000-square-foot visitor welcome center connecting destinations across Oklahoma.
Construction on the project is underway and total project funding to date is $77.5 million. The NACEA has completed $50 million in construction and $27.5 million is currently under construction. The NACEA has received $7 million in federal funding for the Cultural Center. In addition, the State of Oklahoma has provided $62.5
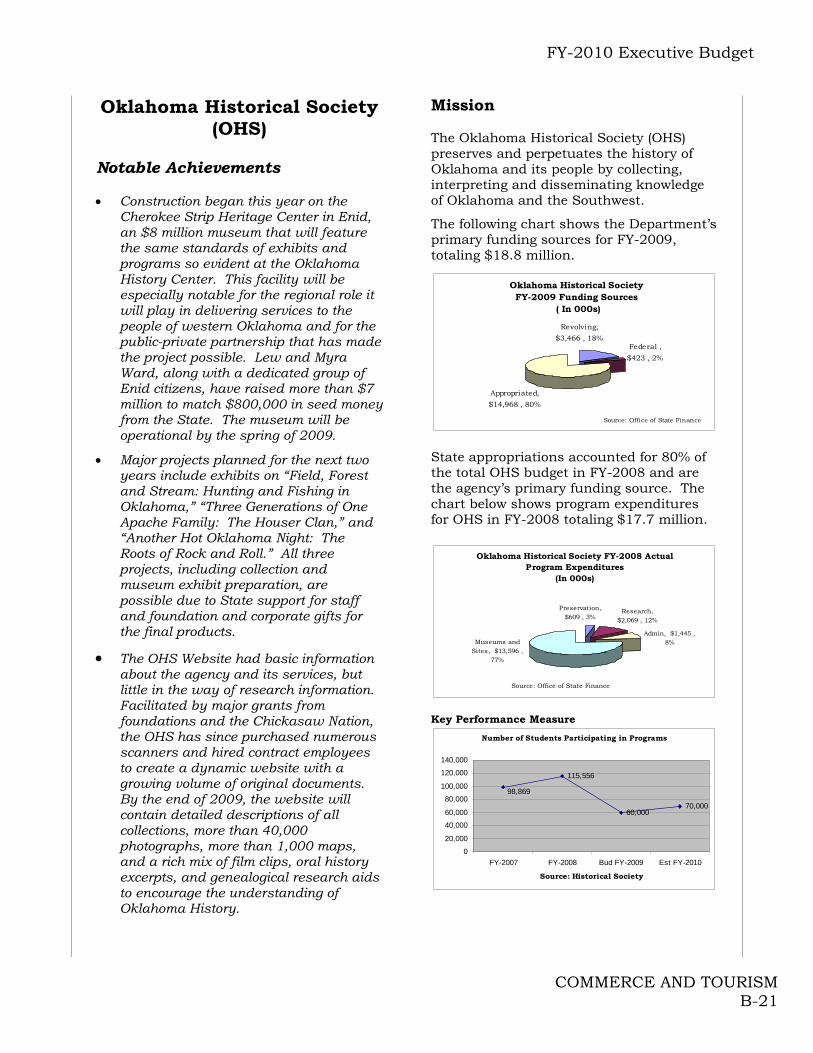
FY-2010 Executive Budget
COMMERCE AND TOURISM B-21
Oklahoma Historical Society (OHS)
Notable Achievements Construction began this year on the
Cherokee Strip Heritage Center in Enid, an $8 million museum that will feature the same standards of exhibits and programs so evident at the Oklahoma History Center. This facility will be especially notable for the regional role it will play in delivering services to the people of western Oklahoma and for the public-private partnership that has made the project possible. Lew and Myra Ward, along with a dedicated group of Enid citizens, have raised more than $7 million to match $800,000 in seed money from the State. The museum will be operational by the spring of 2009.
Major projects planned for the next two years include exhibits on “Field, Forest and Stream: Hunting and Fishing in Oklahoma,” “Three Generations of One Apache Family: The Houser Clan,” and “Another Hot Oklahoma Night: The Roots of Rock and Roll.” All three projects, including collection and museum exhibit preparation, are possible due to State support for staff and foundation and corporate gifts for the final products.
The OHS Website had basic information about the agency and its services, but little in the way of research information. Facilitated by major grants from foundations and the Chickasaw Nation, the OHS has since purchased numerous scanners and hired contract employees to create a dynamic website with a growing volume of original documents. By the end of 2009, the website will contain detailed descriptions of all collections, more than 40,000 photographs, more than 1,000 maps, and a rich mix of film clips, oral history excerpts, and genealogical research aids to encourage the understanding of Oklahoma History.
Mission The Oklahoma Historical Society (OHS) preserves and perpetuates the history of Oklahoma and its people by collecting, interpreting and disseminating knowledge of Oklahoma and the Southwest.
The following chart shows the Department’s primary funding sources for FY-2009, totaling $18.8 million.
Oklahoma Historical Society FY-2009 Funding Sources
( In 000s)
Federal ,
$423 , 2%
Appropriated,
$14,968 , 80%
Revolving,
$3,466 , 18%
Source: Office of State Finance
State appropriations accounted for 80% of the total OHS budget in FY-2008 and are the agency’s primary funding source. The chart below shows program expenditures for OHS in FY-2008 totaling $17.7 million.
Oklahoma Historical Society FY-2008 Actual Program Expenditures
(In 000s)
Research, $2,069 , 12%
Admin, $1,445 , 8%
Preservation, $609 , 3%
Museums and Sites, $13,596 ,
77%
Source: Office of State Finance
Key Performance Measure
Number of Students Participating in Programs
115,556
60,00070,000
98,869
0
20,000
40,000
60,000
80,000
100,000
120,000
140,000
FY-2007 FY-2008 Bud FY-2009 Est FY-2010
Source: Historical Society
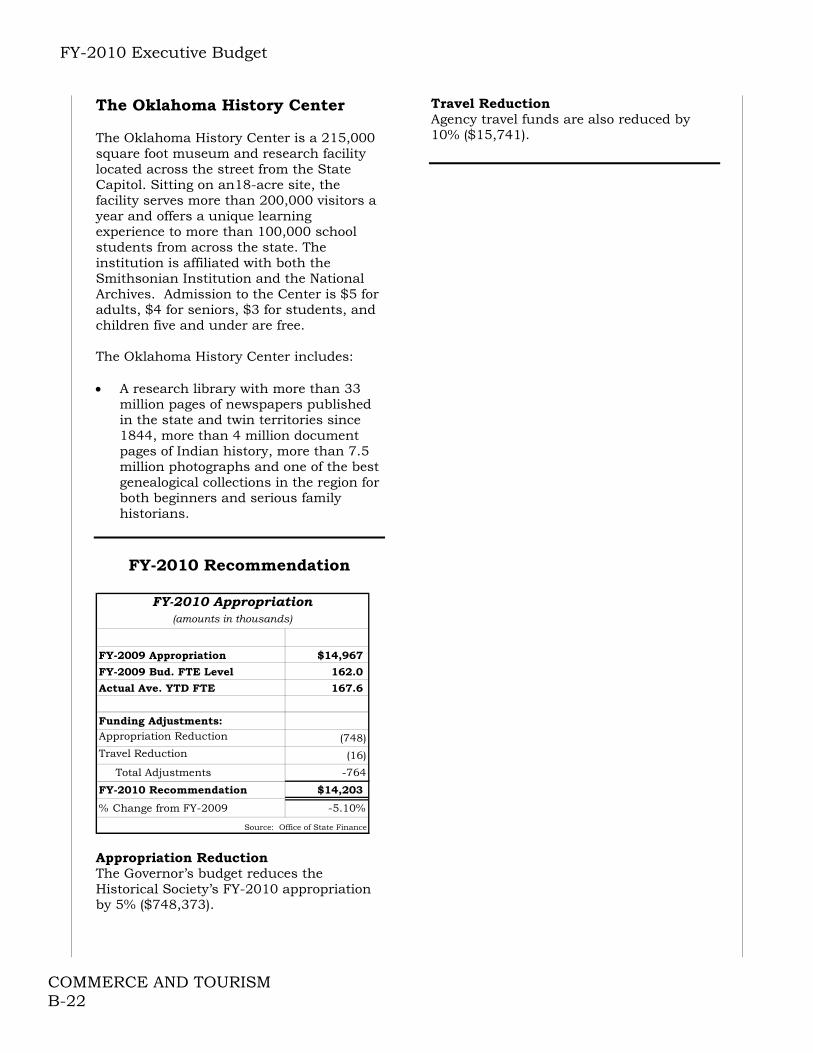
FY-2010 Executive Budget
COMMERCE AND TOURISM B-22
The Oklahoma History Center The Oklahoma History Center is a 215,000 square foot museum and research facility located across the street from the State Capitol. Sitting on an18-acre site, the facility serves more than 200,000 visitors a year and offers a unique learning experience to more than 100,000 school students from across the state. The institution is affiliated with both the Smithsonian Institution and the National Archives. Admission to the Center is $5 for adults, $4 for seniors, $3 for students, and children five and under are free. The Oklahoma History Center includes: A research library with more than 33
million pages of newspapers published in the state and twin territories since 1844, more than 4 million document pages of Indian history, more than 7.5 million photographs and one of the best genealogical collections in the region for both beginners and serious family historians.
FY-2010 Recommendation
FY-2009 Appropriation $14,967
FY-2009 Bud. FTE Level 162.0
Actual Ave. YTD FTE 167.6
Funding Adjustments:Appropriation Reduction (748)Travel Reduction (16)
Total Adjustments -764
FY-2010 Recommendation $14,203
% Change from FY-2009 -5.10%
Source: Office of State Finance
FY-2010 Appropriation(amounts in thousands)
Appropriation Reduction The Governor’s budget reduces the Historical Society’s FY-2010 appropriation by 5% ($748,373).
Travel Reduction Agency travel funds are also reduced by 10% ($15,741).
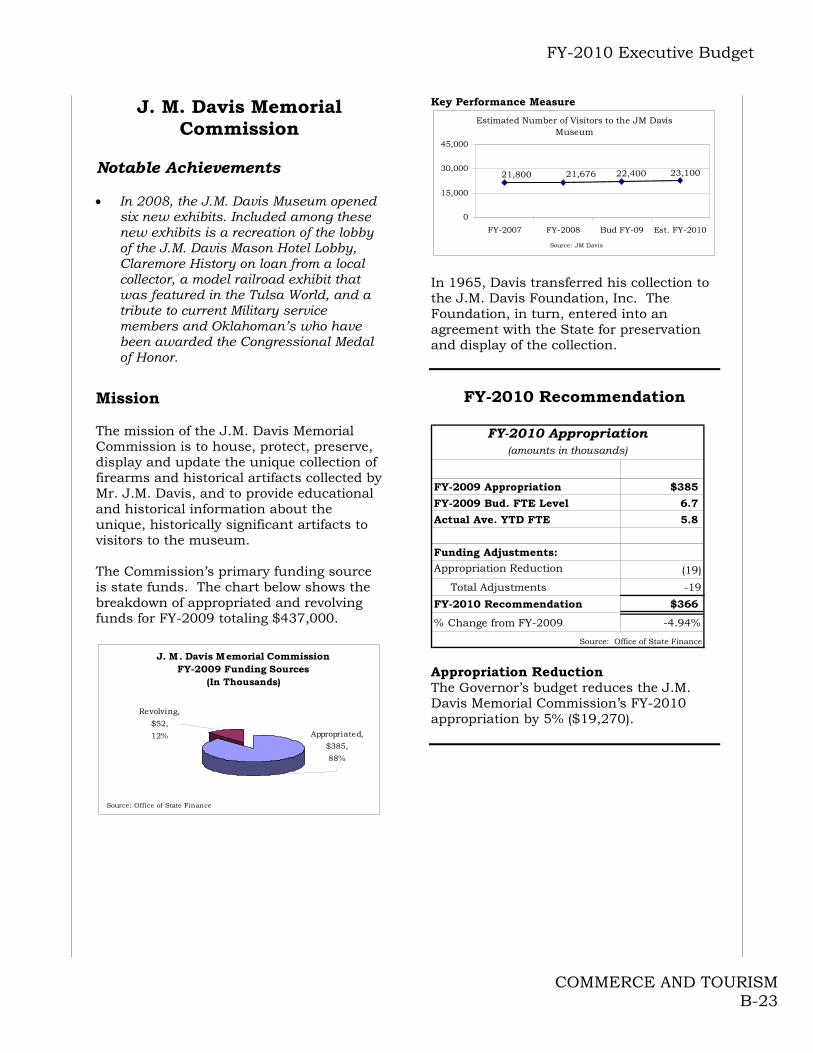
FY-2010 Executive Budget
COMMERCE AND TOURISM B-23
J. M. Davis Memorial Commission
Notable Achievements In 2008, the J.M. Davis Museum opened
six new exhibits. Included among these new exhibits is a recreation of the lobby of the J.M. Davis Mason Hotel Lobby, Claremore History on loan from a local collector, a model railroad exhibit that was featured in the Tulsa World, and a tribute to current Military service members and Oklahoman’s who have been awarded the Congressional Medal of Honor.
Mission The mission of the J.M. Davis Memorial Commission is to house, protect, preserve, display and update the unique collection of firearms and historical artifacts collected by Mr. J.M. Davis, and to provide educational and historical information about the unique, historically significant artifacts to visitors to the museum. The Commission’s primary funding source is state funds. The chart below shows the breakdown of appropriated and revolving funds for FY-2009 totaling $437,000.
J. M. Davis Memorial CommissionFY-2009 Funding Sources
(In Thousands)
Appropriated,
$385,
88%
Revolving,
$52,
12%
Source: Office of State Finance
Key Performance Measure
Estimated Number of Visitors to the JM Davis Museum
23,10022,40021,67621,800
0
15,000
30,000
45,000
FY-2007 FY-2008 Bud FY-09 Est. FY-2010
Source: JM Davis
In 1965, Davis transferred his collection to the J.M. Davis Foundation, Inc. The Foundation, in turn, entered into an agreement with the State for preservation and display of the collection.
FY-2010 Recommendation
FY-2009 Appropriation $385
FY-2009 Bud. FTE Level 6.7
Actual Ave. YTD FTE 5.8
Funding Adjustments:
Appropriation Reduction (19)
Total Adjustments -19
FY-2010 Recommendation $366
% Change from FY-2009 -4.94%
Source: Office of State Finance
FY-2010 Appropriation(amounts in thousands)
Appropriation Reduction The Governor’s budget reduces the J.M. Davis Memorial Commission’s FY-2010 appropriation by 5% ($19,270).
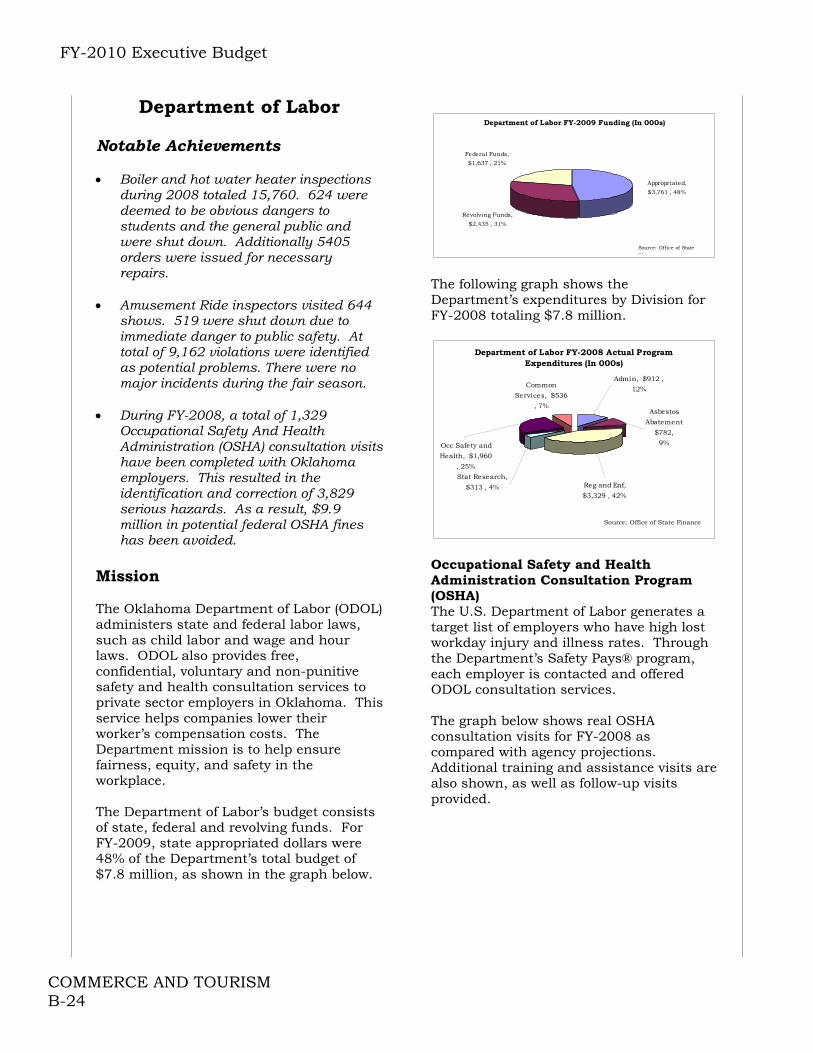
FY-2010 Executive Budget
COMMERCE AND TOURISM B-24
Department of Labor Notable Achievements Boiler and hot water heater inspections
during 2008 totaled 15,760. 624 were deemed to be obvious dangers to students and the general public and were shut down. Additionally 5405 orders were issued for necessary repairs.
Amusement Ride inspectors visited 644
shows. 519 were shut down due to immediate danger to public safety. At total of 9,162 violations were identified as potential problems. There were no major incidents during the fair season.
During FY-2008, a total of 1,329
Occupational Safety And Health Administration (OSHA) consultation visits have been completed with Oklahoma employers. This resulted in the identification and correction of 3,829 serious hazards. As a result, $9.9 million in potential federal OSHA fines has been avoided.
Mission The Oklahoma Department of Labor (ODOL) administers state and federal labor laws, such as child labor and wage and hour laws. ODOL also provides free, confidential, voluntary and non-punitive safety and health consultation services to private sector employers in Oklahoma. This service helps companies lower their worker’s compensation costs. The Department mission is to help ensure fairness, equity, and safety in the workplace. The Department of Labor’s budget consists of state, federal and revolving funds. For FY-2009, state appropriated dollars were 48% of the Department’s total budget of $7.8 million, as shown in the graph below.
Department of Labor FY-2009 Funding (In 000s)
Appropriated,
$3,761 , 48%
Revolving Funds,
$2,435 , 31%
Federal Funds,
$1,637 , 21%
Source: Office of State
Fi The following graph shows the Department’s expenditures by Division for FY-2008 totaling $7.8 million.
Department of Labor FY-2008 Actual Program Expenditures (In 000s)
Common
Services, $536
, 7%
Reg and Enf,
$3,329 , 42%
Stat Research,
$313 , 4%
Asbestos
Abatement
$782,
9%
Admin, $912 ,
12%
Occ Safety and
Health, $1,960
, 25%
Source: Office of State Finance
Occupational Safety and Health Administration Consultation Program (OSHA) The U.S. Department of Labor generates a target list of employers who have high lost workday injury and illness rates. Through the Department’s Safety Pays® program, each employer is contacted and offered ODOL consultation services. The graph below shows real OSHA consultation visits for FY-2008 as compared with agency projections. Additional training and assistance visits are also shown, as well as follow-up visits provided.
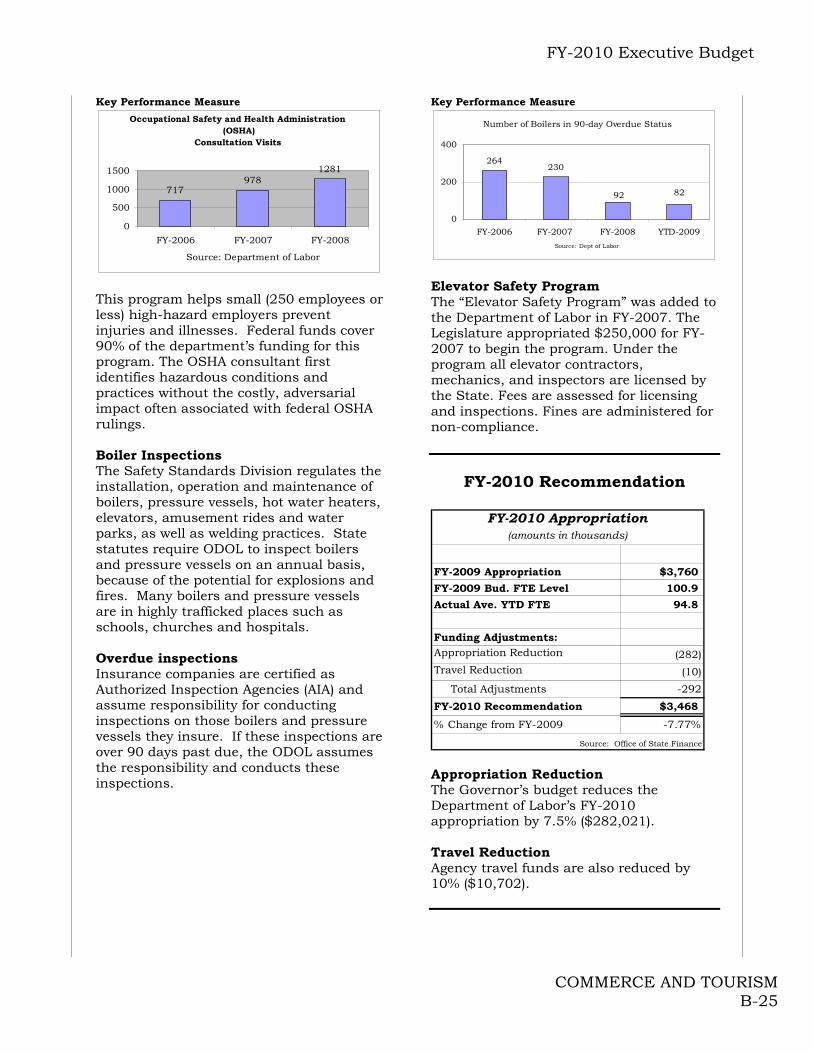
FY-2010 Executive Budget
COMMERCE AND TOURISM B-25
Key Performance Measure
Occupational Safety and Health Administration (OSHA)
Consultation Visits
717978
1281
0
500
1000
1500
FY-2006 FY-2007 FY-2008
Source: Department of Labor
This program helps small (250 employees or less) high-hazard employers prevent injuries and illnesses. Federal funds cover 90% of the department’s funding for this program. The OSHA consultant first identifies hazardous conditions and practices without the costly, adversarial impact often associated with federal OSHA rulings. Boiler Inspections
The Safety Standards Division regulates the installation, operation and maintenance of boilers, pressure vessels, hot water heaters, elevators, amusement rides and water parks, as well as welding practices. State statutes require ODOL to inspect boilers and pressure vessels on an annual basis, because of the potential for explosions and fires. Many boilers and pressure vessels are in highly trafficked places such as schools, churches and hospitals. Overdue inspections Insurance companies are certified as Authorized Inspection Agencies (AIA) and assume responsibility for conducting inspections on those boilers and pressure vessels they insure. If these inspections are over 90 days past due, the ODOL assumes the responsibility and conducts these inspections.
Key Performance Measure
Number of Boilers in 90-day Overdue Status
264230
92 82
0
200
400
FY-2006 FY-2007 FY-2008 YTD-2009
Source: Dept of Labor
Elevator Safety Program The “Elevator Safety Program” was added to the Department of Labor in FY-2007. The Legislature appropriated $250,000 for FY-2007 to begin the program. Under the program all elevator contractors, mechanics, and inspectors are licensed by the State. Fees are assessed for licensing and inspections. Fines are administered for non-compliance.
FY-2010 Recommendation
FY-2009 Appropriation $3,760
FY-2009 Bud. FTE Level 100.9
Actual Ave. YTD FTE 94.8
Funding Adjustments:Appropriation Reduction (282)Travel Reduction (10)
Total Adjustments -292
FY-2010 Recommendation $3,468
% Change from FY-2009 -7.77%
Source: Office of State Finance
(amounts in thousands)
FY-2010 Appropriation
Appropriation Reduction The Governor’s budget reduces the Department of Labor’s FY-2010 appropriation by 7.5% ($282,021). Travel Reduction Agency travel funds are also reduced by 10% ($10,702).

FY-2010 Executive Budget
COMMERCE AND TOURISM B-26
Rural Economic Action Plan
Mission The Rural Economic Action Plan (REAP) is a grant program. REAP provides grants to build and repair infrastructure in communities with a population of less than 7,000. According to statute these grants can be used for things such as sewer and water line construction or repair, water treatment, water acquisition, distribution and related projects.
FY-2010 Recommendation
FY-2009 Appropriation for REAP $15,500
Funding Adjustments:
Pass-through Reduction (5,500)
Total Adjustments -5,500
FY-2010 Recommendation $10,000
% Change from FY-2009 -35.48%
Source: Office of State Finance
FY-2010 Appropriation(amounts in thousands)
Pass-through Reduction The Governor’s Budget recommends a reduction in pass-through funds in the amount of $5,500,000.

FY-2010 Executive Budget
COMMERCE AND TOURISM B-27
Oklahoma Employment Security Commission
Notable Achievements
OESC believes in the power of technology to improve the quality of services we deliver to Oklahomans. Our experience is that use of technology is central to program design. The use of technology enhances the efficiency of our programs.
Oklahoma’s Unemployment Insurance Benefits division was awarded a national award by the US Department of Labor at the Unemployment Insurance Director’s Conference in Tempe, Arizona in November of 2008. Oklahoma was recognized as the top medium-sized state in the US in paying UI benefits in a timely and quality manner
The Oklahoma Employment Security Commission (OESC) strives to provide employment security and promote the economic well-being of the state of Oklahoma. The OESC operates under the guidelines of federal-state grant agreements. OESC serves Oklahoma by providing labor market information, employment services, unemployment insurance and veterans’ service. Improving Customer Service The OESC transitioned many of its services to online, web-based applications. This allows OESC to serve more customers while improving the quality of service. Oklahoma Job Link and Oklahoma Wage Network are direct results of these improvements. Oklahoma Job Link is a powerful, online job matching Web site matches employers of all sizes and industries with qualified job candidates. During Program Year 2007, 23,945 job orders were listed in OJL which represented 60,565 job openings.
The Oklahoma Wage Network provides dynamic access to wage and employment estimates for the State, Metropolitan Areas, Workforce Investments Areas, and Local Labor Market Areas. OWN is an interactive web service that allows the user to view a wide range of data, including employment estimates (where available). A data user can view more detailed information about an occupation by clicking on the occupation. Streamlining Internal Operations OESC has also worked diligently to improve efficiencies within its operations. While man improvements are not listed here, the services below delineate OESC’s goals. As much as OklahomaJobLink.com proves to be an invaluable resource to employers and job seekers in Oklahoma, the online job matching tool has increased the efficiency and effectiveness of staff by providing a tremendous resource. The large pool of qualified applicants makes it easier to assist employers as they hire new workers. With thousands of positions available for job seekers, the Oklahoma workforce system provides improved services to Oklahoma workers. Oklahoma Service Link (OSL) OSL is the staff component of Oklahoma Job Link. It allows staff to enter services, track customer progress, generate reports, and other activities to aid in their delivery of service to employers, training seekers, and job seekers. In Oklahoma’s integrated service delivery model, OSL is a valuable tool that makes integration more streamlined and successful. OESC has also redesigned its user interface on its computer network. It has Implementes a Tab-Based Enhancement (TAB-E) that will allow call center staff to transition to screens faster and allow more efficient error-correction. This will reduce call center customer transaction and wait times.
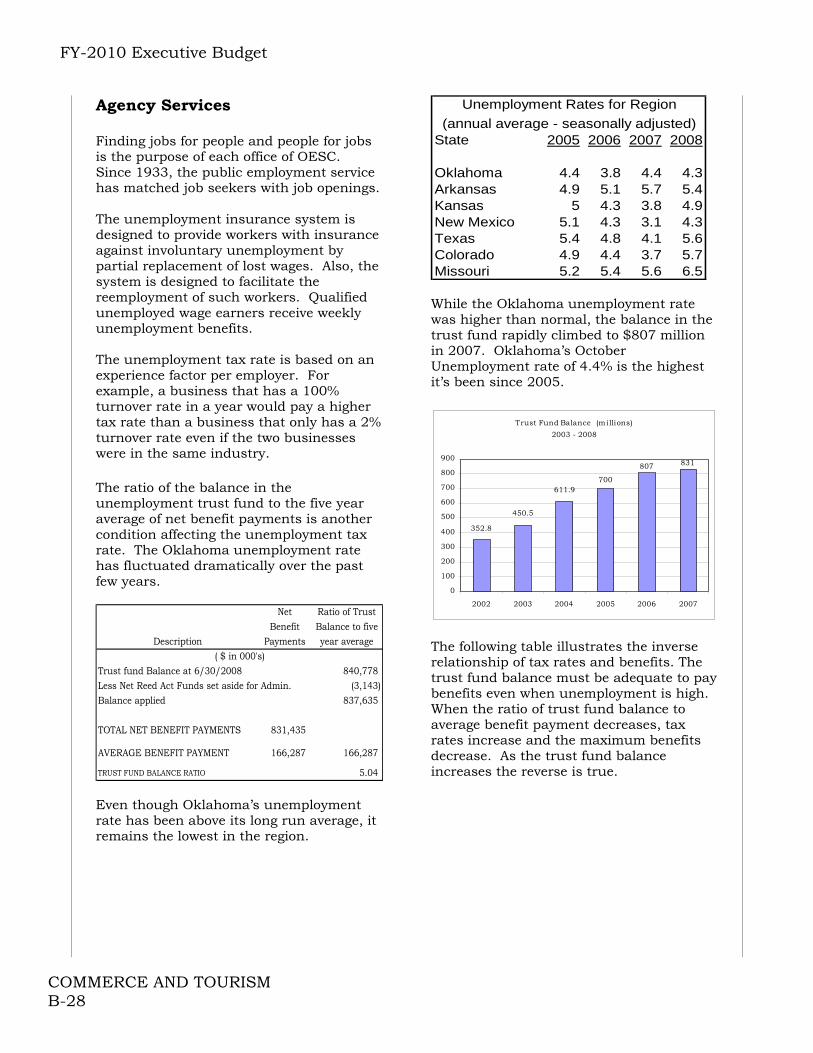
FY-2010 Executive Budget
COMMERCE AND TOURISM B-28
Agency Services Finding jobs for people and people for jobs is the purpose of each office of OESC. Since 1933, the public employment service has matched job seekers with job openings. The unemployment insurance system is designed to provide workers with insurance against involuntary unemployment by partial replacement of lost wages. Also, the system is designed to facilitate the reemployment of such workers. Qualified unemployed wage earners receive weekly unemployment benefits. The unemployment tax rate is based on an experience factor per employer. For example, a business that has a 100% turnover rate in a year would pay a higher tax rate than a business that only has a 2% turnover rate even if the two businesses were in the same industry. The ratio of the balance in the unemployment trust fund to the five year average of net benefit payments is another condition affecting the unemployment tax rate. The Oklahoma unemployment rate has fluctuated dramatically over the past few years.
Net Ratio of TrustBenefit Balance to five
Description Payments year average
Trust fund Balance at 6/30/2008 840,778 Less Net Reed Act Funds set aside for Admin. (3,143) Balance applied 837,635
TOTAL NET BENEFIT PAYMENTS 831,435
AVERAGE BENEFIT PAYMENT 166,287 166,287
TRUST FUND BALANCE RATIO 5.04
( $ in 000's)
Even though Oklahoma’s unemployment rate has been above its long run average, it remains the lowest in the region.
State 2005 2006 2007 2008
Oklahoma 4.4 3.8 4.4 4.3Arkansas 4.9 5.1 5.7 5.4Kansas 5 4.3 3.8 4.9New Mexico 5.1 4.3 3.1 4.3Texas 5.4 4.8 4.1 5.6Colorado 4.9 4.4 3.7 5.7Missouri 5.2 5.4 5.6 6.5
Unemployment Rates for Region
(annual average - seasonally adjusted)
While the Oklahoma unemployment rate was higher than normal, the balance in the trust fund rapidly climbed to $807 million in 2007. Oklahoma’s October Unemployment rate of 4.4% is the highest it’s been since 2005.
Trust Fund Balance (millions)
2003 - 2008
352.8
831807
700611.9
450.5
0
100
200
300
400
500
600
700
800
900
2002 2003 2004 2005 2006 2007
The following table illustrates the inverse relationship of tax rates and benefits. The trust fund balance must be adequate to pay benefits even when unemployment is high. When the ratio of trust fund balance to average benefit payment decreases, tax rates increase and the maximum benefits decrease. As the trust fund balance increases the reverse is true.

FY-2010 Executive Budget
COMMERCE AND TOURISM B-29
EFFECT OF TRUST FUND CONDITION ON CONTRIBUTIONS AND BENEFITS PER EMPLOYEE
Ratio of Fund Balance to Over 3.00 2.50 2.00 Less thanaverage benefit payments 3.50% 3.49 2.99 2.49 2.00
Condition NONE A B C DMinimum Rate 0.1% 0.2% 0.2% 0.2% 0.3%Maximum Rate 5.5% 5.8% 7.3% 8.3% 9.2%
Taxable Wage Base $13,600 $14,500 $15,300 $16,200 $17,000
Minimum UI Contribution Per Employ $14 $29 $31 $32 $51
Average UI Contribution Per Employe $140 $189 $230 $275 $374
Maximum UI Contribution Per Emplo $748 $841 $1,117 $1,345 $1,564
Maximum Weekly Benefit Per Claiman $392 $376 $359 $343 $326
Maximum Total Benefit Per Claimant $8,500 $8,100 $7,700 $7,200 $6,800
Source: OESC Overview 2008 Other Programs The veterans’ services division addresses the specific employment and training needs of veterans through special programs. Through its various programs, veterans are assisted in their efforts to find employment opportunities. These programs are all inclusive for veterans of any of the U.S. military services and not just for those who are disabled Economic Research and Analysis regarding employment and employees is core to OESC. Labor market information is gathered and reported on the state and national level. The goal of this program is to provide quality information that will improve the functioning of labor markets by serving the needs of workers, employers, economic developers, planners, and policy makers. OESC, in conjunction with the Department of Commerce, provides administrative support to the Governor’s Council. The Governor’s Council is a council of statewide decision-makers who work collaboratively toward a common workforce development system to ensure that workforce development is supporting economic development and growth of the Oklahoma economy.
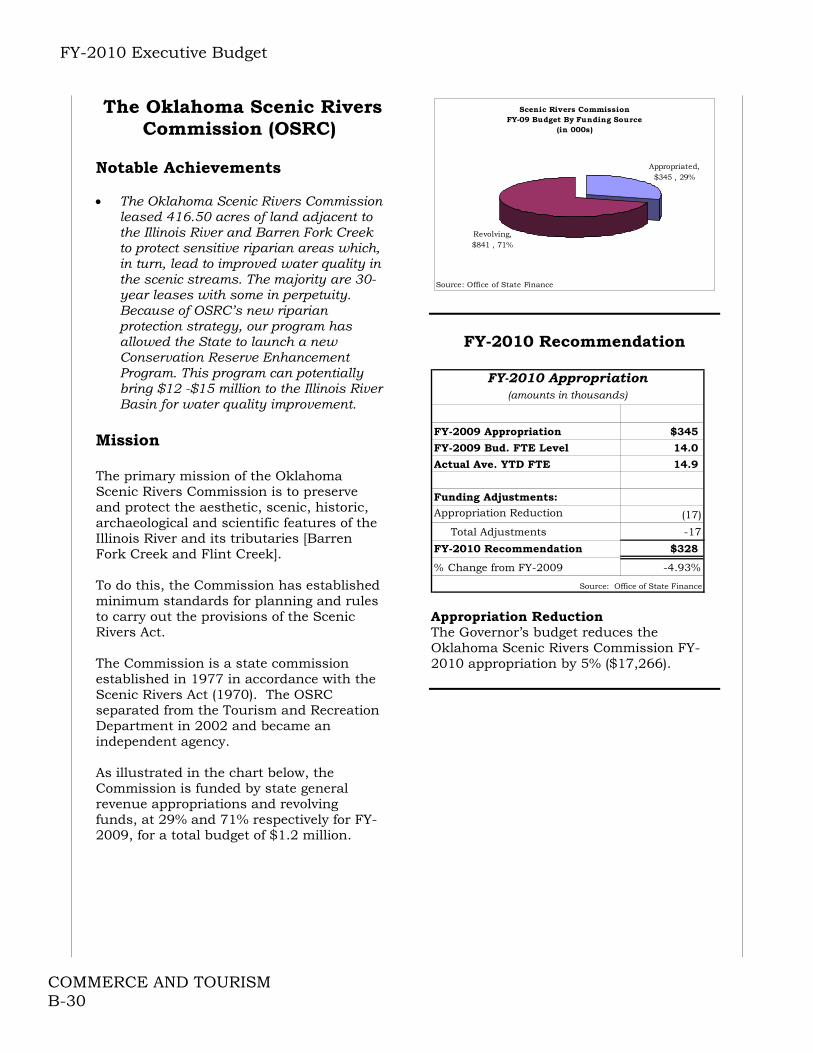
FY-2010 Executive Budget
COMMERCE AND TOURISM B-30
The Oklahoma Scenic Rivers Commission (OSRC)
Notable Achievements The Oklahoma Scenic Rivers Commission
leased 416.50 acres of land adjacent to the Illinois River and Barren Fork Creek to protect sensitive riparian areas which, in turn, lead to improved water quality in the scenic streams. The majority are 30-year leases with some in perpetuity. Because of OSRC’s new riparian protection strategy, our program has allowed the State to launch a new Conservation Reserve Enhancement Program. This program can potentially bring $12 -$15 million to the Illinois River Basin for water quality improvement.
Mission The primary mission of the Oklahoma Scenic Rivers Commission is to preserve and protect the aesthetic, scenic, historic, archaeological and scientific features of the Illinois River and its tributaries [Barren Fork Creek and Flint Creek]. To do this, the Commission has established minimum standards for planning and rules to carry out the provisions of the Scenic Rivers Act. The Commission is a state commission established in 1977 in accordance with the Scenic Rivers Act (1970). The OSRC separated from the Tourism and Recreation Department in 2002 and became an independent agency. As illustrated in the chart below, the Commission is funded by state general revenue appropriations and revolving funds, at 29% and 71% respectively for FY-2009, for a total budget of $1.2 million.
Scenic Rivers CommissionFY-09 Budget By Funding Source
(in 000s)
Appropriated, $345 , 29%
Revolving, $841 , 71%
Source: Office of State Finance
FY-2010 Recommendation
FY-2009 Appropriation $345
FY-2009 Bud. FTE Level 14.0
Actual Ave. YTD FTE 14.9
Funding Adjustments:
Appropriation Reduction (17)
Total Adjustments -17
FY-2010 Recommendation $328
% Change from FY-2009 -4.93%
Source: Office of State Finance
FY-2010 Appropriation(amounts in thousands)
Appropriation Reduction The Governor’s budget reduces the Oklahoma Scenic Rivers Commission FY-2010 appropriation by 5% ($17,266).

FY-2010 Executive Budget
COMMERCE AND TOURISM B-31
Oklahoma Tourism and Recreation Department
Notable Achievements
Tourism is the third largest industry in Oklahoma. The “Travel Industry Association of America” reported that tourism provides an estimated economic impact of about $5.3 billion per year in travel and tourism-related spending.* Travel spending supports about 72,000 jobs throughout the state. Domestic travel spending brought in over $842 million in local, state and federal tax revenue. *TIA report is released every two years. Next report will be released in January 2010.
With more than 1.7 million unique
visitors, TravelOK.com remains a powerful marketing tool – experiencing a 40 percent increase in unique visitors from 2007 to 2008. An online campaign resulted in more than 4 million impressions and 73,000 click-throughs to the Agritourism web site.
More than 1.3 million travelers were
served through our Tourism Information Centers around the state.
Return on our advertising dollars has
grown, with every $1 spent generating $32.54 in travel spending in Oklahoma.
The OKLA Strong travel development
partnership program, which has more than 35 active tourism industry partners, is helping to boost Oklahoma’s impact at consumer trade shows.
A new Oklahoma Route 66 guide, which
received an Award of Merit by the Oklahoma City chapter of the Public Relations Society of America, was produced.
FY-2009 is a year of progress for
Oklahoma State Parks. A resource management planning program was initiated which creates individual park plans for conservation and development. A new park sign program was developed and is being implemented throughout the
system. Grants and donations were received from the Kirkpatrick Foundation for geography class curriculum that relates to state parks, the Telecom Pioneers donated an accessible cabin for Roman Nose State Park and the Cherokee Nation provided funds for law enforcement support at state parks.
A statewide essay and drawing contest
resulted in adopting a theme of “Making Memories” for the State Park advertising program. Radio and print advertisements were developed for parks, lodges and golf courses. The theme was carried through to our trade show exhibits and other literature for a comprehensive program.
Oklahoma State Parks is committed to
becoming a cleaner and greener system through major energy and resource conservation efforts, renovation of facilities with sustainable materials and efficient systems and transitioning into less toxic—more environmentally friendly cleaning products. This effort supports our conservation and visitor education goals.
Oklahoma Today, the official magazine of
Oklahoma since 1956, had another stellar year. Advertising sales were up, subscriptions held steady, and the publication was the recipient of many more regional, national and international awards.
Mission The Tourism and Recreation Department is the steward of the state’s park system. The Department also advances economic development through the promotion of travel and tourism in Oklahoma. The agency mission is to advance the exceptional quality of life in Oklahoma by preserving, maintaining, and promoting our natural assets and cultural richness. The Department is primarily funded by state general revenue appropriations and revolving funds, 31% and 42% respectively in FY-2009, totaling $60.7 million.
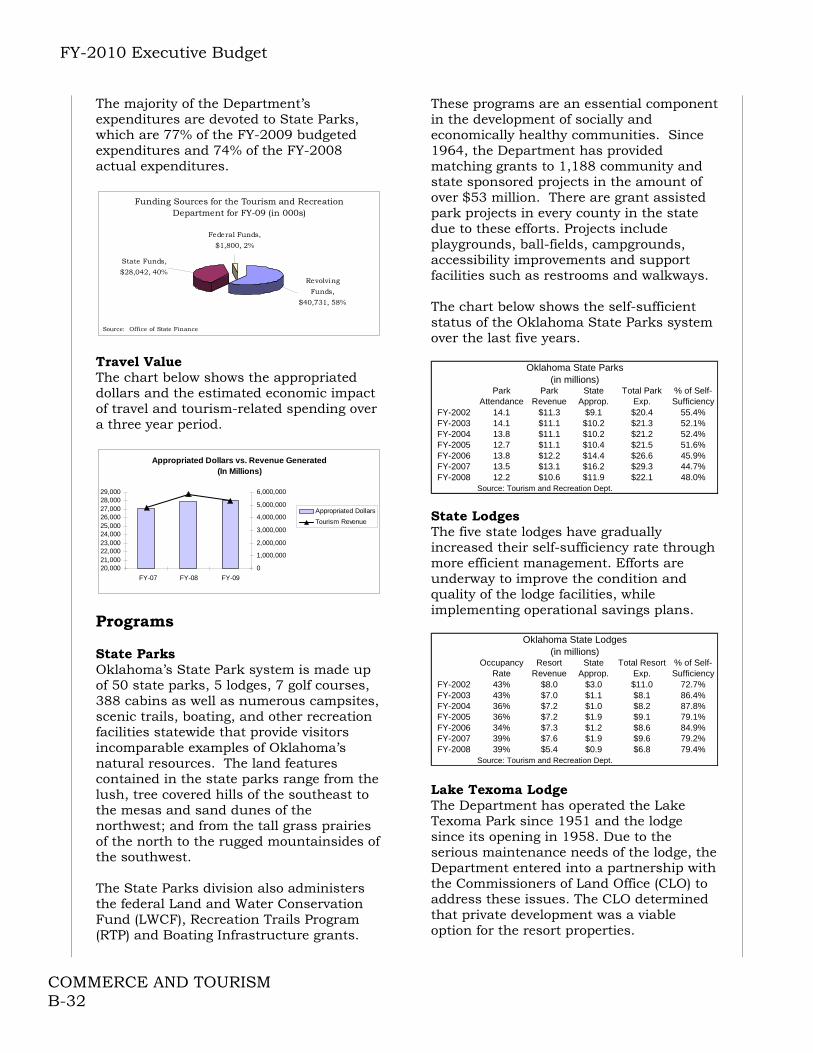
FY-2010 Executive Budget
COMMERCE AND TOURISM B-32
The majority of the Department’s expenditures are devoted to State Parks, which are 77% of the FY-2009 budgeted expenditures and 74% of the FY-2008 actual expenditures.
Funding Sources for the Tourism and Recreation Department for FY-09 (in 000s)
Revolving
Funds,
$40,731, 58%
Federal Funds,
$1,800, 2%
State Funds,
$28,042, 40%
Source: Office of State Finance Travel Value The chart below shows the appropriated dollars and the estimated economic impact of travel and tourism-related spending over a three year period.
Appropriated Dollars vs. Revenue Generated (In Millions)
20,00021,00022,00023,00024,00025,00026,00027,00028,00029,000
FY-07 FY-08 FY-09
0
1,000,000
2,000,000
3,000,000
4,000,000
5,000,000
6,000,000
Appropriated Dollars
Tourism Revenue
Programs State Parks Oklahoma’s State Park system is made up of 50 state parks, 5 lodges, 7 golf courses, 388 cabins as well as numerous campsites, scenic trails, boating, and other recreation facilities statewide that provide visitors incomparable examples of Oklahoma’s natural resources. The land features contained in the state parks range from the lush, tree covered hills of the southeast to the mesas and sand dunes of the northwest; and from the tall grass prairies of the north to the rugged mountainsides of the southwest. The State Parks division also administers the federal Land and Water Conservation Fund (LWCF), Recreation Trails Program (RTP) and Boating Infrastructure grants.
These programs are an essential component in the development of socially and economically healthy communities. Since 1964, the Department has provided matching grants to 1,188 community and state sponsored projects in the amount of over $53 million. There are grant assisted park projects in every county in the state due to these efforts. Projects include playgrounds, ball-fields, campgrounds, accessibility improvements and support facilities such as restrooms and walkways. The chart below shows the self-sufficient status of the Oklahoma State Parks system over the last five years.
Park Attendance
Park Revenue
State Approp.
Total Park Exp.
% of Self-Sufficiency
FY-2002 14.1 $11.3 $9.1 $20.4 55.4%FY-2003 14.1 $11.1 $10.2 $21.3 52.1%FY-2004 13.8 $11.1 $10.2 $21.2 52.4%FY-2005 12.7 $11.1 $10.4 $21.5 51.6%FY-2006 13.8 $12.2 $14.4 $26.6 45.9%FY-2007 13.5 $13.1 $16.2 $29.3 44.7%FY-2008 12.2 $10.6 $11.9 $22.1 48.0%
Source: Tourism and Recreation Dept.
Oklahoma State Parks(in millions)
State Lodges The five state lodges have gradually increased their self-sufficiency rate through more efficient management. Efforts are underway to improve the condition and quality of the lodge facilities, while implementing operational savings plans.
Occupancy Rate
Resort Revenue
State Approp.
Total Resort Exp.
% of Self-Sufficiency
FY-2002 43% $8.0 $3.0 $11.0 72.7%FY-2003 43% $7.0 $1.1 $8.1 86.4%FY-2004 36% $7.2 $1.0 $8.2 87.8%FY-2005 36% $7.2 $1.9 $9.1 79.1%FY-2006 34% $7.3 $1.2 $8.6 84.9%FY-2007 39% $7.6 $1.9 $9.6 79.2%FY-2008 39% $5.4 $0.9 $6.8 79.4%
Source: Tourism and Recreation Dept.
Oklahoma State Lodges(in millions)
Lake Texoma Lodge The Department has operated the Lake Texoma Park since 1951 and the lodge since its opening in 1958. Due to the serious maintenance needs of the lodge, the Department entered into a partnership with the Commissioners of Land Office (CLO) to address these issues. The CLO determined that private development was a viable option for the resort properties.

FY-2010 Executive Budget
COMMERCE AND TOURISM B-33
In 2005, the Department transferred its ownership interest in the lodge and two golf courses to the CLO. This process resulted in the submission of private development proposals and the transfer of property to the private developer’s control. The Department no longer operates the lodge or the golf courses at Lake Texoma. Golf Courses Use of state golf courses has decreased compared to prior years, primarily due to the loss of Chickasaw Pointe, Lake Texoma and Fountainhead Golf Courses.
Golf Rounds
(thousands)Golf
RevenueState
Approp.Total Golf
Exp.% of Self-Sufficiency
FY-2002 182.7 $4.9 $0.1 $5.0 98.0%FY-2003 161.6 $4.5 $1.3 $5.8 77.6%FY-2004 158.0 $4.3 $0.7 $5.0 86.0%FY-2005 158.1 $4.4 $1.0 $5.5 80.0%FY-2006 158.0 $4.3 $0.9 $5.2 82.7%FY-2007 138.0 $4.7 $0.8 $5.6 83.9%FY-2008 114.0 $2.5 $0.03 $3.0 83.3%
Source: Tourism and Recreation Dept.
Oklahoma State Golf Courses($ in millions)
When most of the state golf courses were constructed there was little competition. Originally, state courses were well attended and generally were self-supporting. This was a result of the state courses’ ability to charge a much lower rate than private, city and county golf courses. As competitors drastically reduced rates, the state golf courses began to lose their competitive edge. Many state golf courses sell 30% to 38% fewer rounds than competitors. Capital Maintenance Funding Beginning in FY-2009, the Legislature is providing the Department with an estimated $10-12 million in capital maintenance funding from an apportionment of sales and use taxes. The Department currently has in excess of $70 million in identified needs. The following categories and allocations are noted below: Building Refurbishments $3,390,000 Comfort Stations $3,100,000 Campgrounds $2,000,000 Maint. Facilities, Equip. $1,595,000 A&E Emergency Fund $665,000 Playgrounds $650,000 Docks/Shelters $500,000
Master Plan/Acquisitions $500,000 Total $12,400,000 This year’s program will go towards improving our most popular and most significant revenue-generating assets, our cabins and campgrounds. It also will go towards necessary improvements for shelters, walkways, docks and restrooms so park visitors have facilities that are accessible, clean and safe. For FY-2009, the Legislature has provided the Department with a portion of the REAP Water Projects Funds to fund infrastructure and environmental improvements estimated to be $2.9 million. The Department currently has in excess of $15 million in identified environmental needs. Types of projects funded include potable water, wastewater and erosion control work. The Department is using the list of environmental needs that was developed cooperatively with the Department of Environmental Quality. The certainty of dedicated funds will allow the Department to realistically plan for park preservation and the systematic elimination of long standing facility needs. Travel and Tourism This division develops information, marketing plans and programs designed to attract tourists to the state and to encourage Oklahomans to vacation in-state. It disseminates information related to the state's public and private attractions, facilities and events to support increased economic development and awareness of Oklahoma as a travel destination. The division operates 11 tourism information centers located at various points of entry into the state and at the State Capitol. These centers are designed to provide travel information to visitors traveling through and to our state and, ultimately, to encourage travelers to extend their stay in Oklahoma.
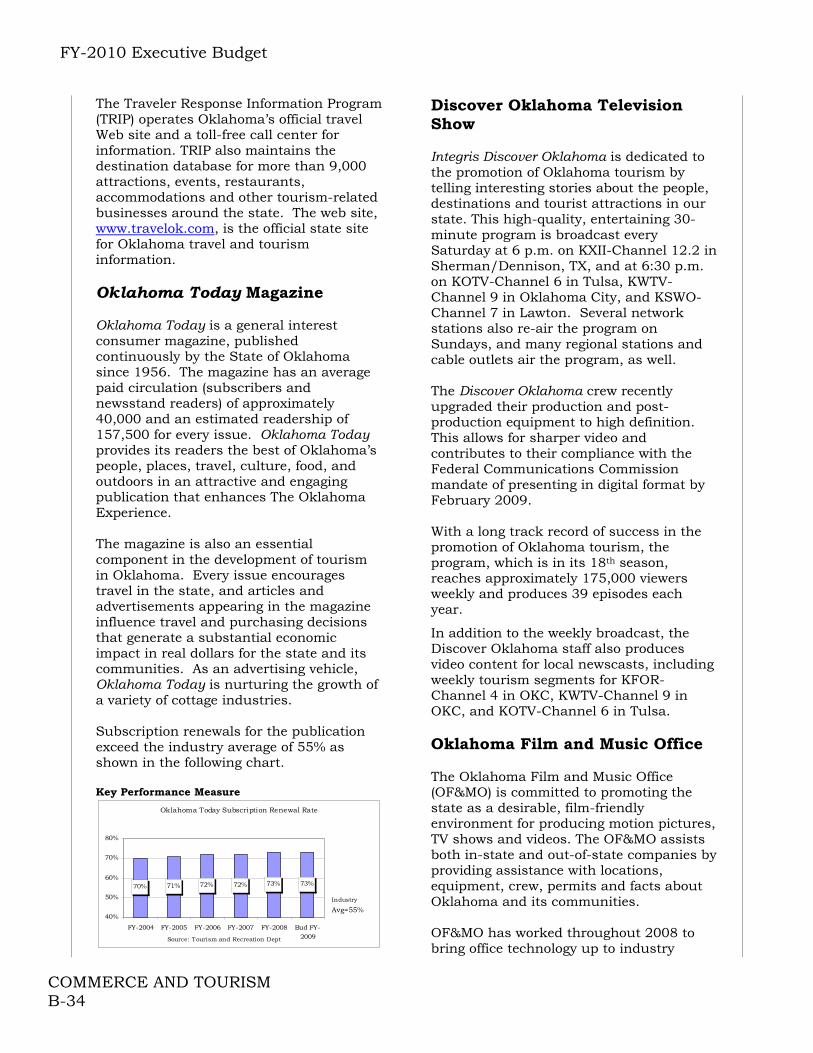
FY-2010 Executive Budget
COMMERCE AND TOURISM B-34
The Traveler Response Information Program (TRIP) operates Oklahoma’s official travel Web site and a toll-free call center for information. TRIP also maintains the destination database for more than 9,000 attractions, events, restaurants, accommodations and other tourism-related businesses around the state. The web site, www.travelok.com, is the official state site for Oklahoma travel and tourism information. Oklahoma Today Magazine Oklahoma Today is a general interest consumer magazine, published continuously by the State of Oklahoma since 1956. The magazine has an average paid circulation (subscribers and newsstand readers) of approximately 40,000 and an estimated readership of 157,500 for every issue. Oklahoma Today provides its readers the best of Oklahoma’s people, places, travel, culture, food, and outdoors in an attractive and engaging publication that enhances The Oklahoma Experience. The magazine is also an essential component in the development of tourism in Oklahoma. Every issue encourages travel in the state, and articles and advertisements appearing in the magazine influence travel and purchasing decisions that generate a substantial economic impact in real dollars for the state and its communities. As an advertising vehicle, Oklahoma Today is nurturing the growth of a variety of cottage industries. Subscription renewals for the publication exceed the industry average of 55% as shown in the following chart. Key Performance Measure
Oklahoma Today Subscription Renewal Rate
70% 71% 72% 72% 73% 73%
40%
50%
60%
70%
80%
FY-2004 FY-2005 FY-2006 FY-2007 FY-2008 Bud FY-2009Source: Tourism and Recreation Dept
Industry
Avg=55%
Discover Oklahoma Television Show Integris Discover Oklahoma is dedicated to the promotion of Oklahoma tourism by telling interesting stories about the people, destinations and tourist attractions in our state. This high-quality, entertaining 30-minute program is broadcast every Saturday at 6 p.m. on KXII-Channel 12.2 in Sherman/Dennison, TX, and at 6:30 p.m. on KOTV-Channel 6 in Tulsa, KWTV-Channel 9 in Oklahoma City, and KSWO-Channel 7 in Lawton. Several network stations also re-air the program on Sundays, and many regional stations and cable outlets air the program, as well. The Discover Oklahoma crew recently upgraded their production and post-production equipment to high definition. This allows for sharper video and contributes to their compliance with the Federal Communications Commission mandate of presenting in digital format by February 2009. With a long track record of success in the promotion of Oklahoma tourism, the program, which is in its 18th season, reaches approximately 175,000 viewers weekly and produces 39 episodes each year.
In addition to the weekly broadcast, the Discover Oklahoma staff also produces video content for local newscasts, including weekly tourism segments for KFOR-Channel 4 in OKC, KWTV-Channel 9 in OKC, and KOTV-Channel 6 in Tulsa. Oklahoma Film and Music Office The Oklahoma Film and Music Office (OF&MO) is committed to promoting the state as a desirable, film-friendly environment for producing motion pictures, TV shows and videos. The OF&MO assists both in-state and out-of-state companies by providing assistance with locations, equipment, crew, permits and facts about Oklahoma and its communities. OF&MO has worked throughout 2008 to bring office technology up to industry

FY-2010 Executive Budget
COMMERCE AND TOURISM B-35
standards. Reel-Scout, a leader in the development and implementation of software solutions for film commissions, was selected to revolutionize the way location photos are stored, maintained and categorized. With this new technology, which will be implemented in early 2009, OF&MO will be able to showcase locations across the state to producers, directors, location scouts and other film industry professionals in real time with just a few clicks of the mouse. Additionally, OF&MO is working with representatives from Miles Media to revamp the state’s film and music website, www.oklahomafilm.org. The first round of updates includes enhancements to Oklahoma’s official online production guide, a resource maintained by OF&MO which helps producers find skilled crew members in the state. Also included in the first round of improvements to the website is a first for Oklahoma- a comprehensive music database that will include information about the state’s musicians, venues, and music-related businesses and services. OF&MO is also working with House leadership and statewide arts leaders on a task force to study the viability of a statewide creative artists guild to provide incubation, networking, and educational opportunities for Oklahoma artists of all disciplines. Legislation which created this task force was passed in 2008. Other legislation passed in 2008 affecting the film and music industries includes a measure to increase the state rebate for filming in Oklahoma from 15% to 17% when music written or recorded in Oklahoma is used in the film. The Tourism Development Act was revised, making it more accessible for those wishing to create film and music production facilities in Oklahoma. The long-term goal of the office is to increase film, television and music production in Oklahoma as a means of economic development and diversification. With advances in technology and continued support for state and local financial incentives, OF&MO looks forward to a banner year of film and music in the great state of Oklahoma.
FY-2010 Recommendation
FY-2009 Appropriation $28,042
Remove One-time Funding (220)
FY-2009 Base $27,822
FY-2009 Bud. FTE Level 841.8
Actual Ave. YTD FTE 775.7
Funding Adjustments:Appropriation Reduction (1,358)Travel Reduction (34)
Total Adjustments -1,392
FY-2010 Recommendation $26,430
$ Change from FY-2009 ($1,612)
% Change from FY-2009 -5.75%
FY-2010 Appropriation(amounts in thousands)
Source: Office of State Finance Remove One-time Funding The Governor’s Budget recommends removing one-time funding in the amount of $220,000. Appropriation Reduction The Governor’s Budget reduces the FY-2010 appropriation for the Tourism Department by 5% ($1,358,050). Travel Reduction Agency travel funds are also reduced by 10% ($34,259).

FY-2010 Executive Budget
COMMERCE AND TOURISM B-36
Will Rogers Memorial Commission
Notable Achievements
A new exhibit, “Wilson on Will: A Retrospective of the Art of Charles Banks Wilson,” opened at the Memorial Museum in November 2008. Will Rogers has been a favorite subject of the renowned Oklahoma artist since Wilson’s youth.
A monument to Clem V. Rogers, the
father of Will, Indian Territory rancher, and Cherokee political leader, was dedicated at the Birthplace Ranch in August 2008. The project was funded through the Oklahoma Centennial Commission.
Mission The Will Rogers Memorial Commission was established in 1938 to honor the life and works of Will Rogers through the creation of the Will Rogers Memorial Museum in Claremore. The museum and Will Rogers birthplace Ranch host 154,000 visitors annually. Admission is free, and both facilities are open year round.
Number of Visitors to Will Rogers Museum and Birthplace Ranch
154,000
146,000
139,000
132,000
120,000125,000130,000135,000140,000145,000150,000155,000160,000
FY-2006 FY-2007 FY-2008 Bud FY-2009
Source:Will Rogers Memorial
Over 96% of the Commission’s budget is comprised of state appropriated funds. The remaining funding is derived from donations and foundation grants. The Commission spends one-third of its budget for educational outreach. The following graph shows the correlation between the funding that the State provides and the estimated number of visitors.
Cost Per Visitor to the State
$6.61$6.24
$7.36
$6.23
$4.00
$5.00
$6.00
$7.00
$8.00
FY-2006 FY-2007 FY-2008 Bud FY-2009
Source: Office of State Finance
FY-2010 Recommendation
FY-2009 Appropriation $934
FY-2009 Bud. FTE Level 10.3
Actual Ave. YTD FTE 10.0
Funding Adjustments:
Appropriation Reduction (46)
Total Adjustments -46
FY-2010 Recommendation $888
% Change from FY-2009 -4.93%
Source: Office of State Finance
FY-2010 Appropriation(amounts in thousands)
Appropriation Reduction The Governor’s budget reduces the Will Roger’s Memorial Commission’s FY-2010 appropriation by 5% ($46,685).
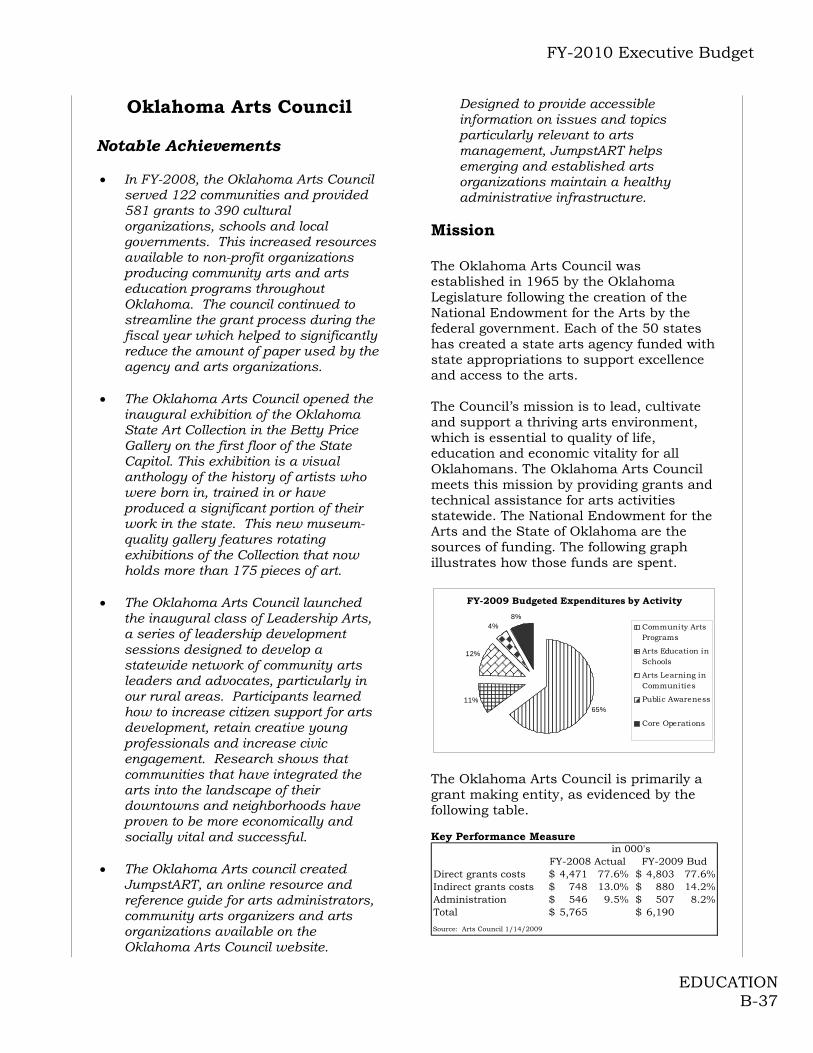
FY-2010 Executive Budget
EDUCATION B-37
Oklahoma Arts Council Notable Achievements In FY-2008, the Oklahoma Arts Council
served 122 communities and provided 581 grants to 390 cultural organizations, schools and local governments. This increased resources available to non-profit organizations producing community arts and arts education programs throughout Oklahoma. The council continued to streamline the grant process during the fiscal year which helped to significantly reduce the amount of paper used by the agency and arts organizations.
The Oklahoma Arts Council opened the
inaugural exhibition of the Oklahoma State Art Collection in the Betty Price Gallery on the first floor of the State Capitol. This exhibition is a visual anthology of the history of artists who were born in, trained in or have produced a significant portion of their work in the state. This new museum- quality gallery features rotating exhibitions of the Collection that now holds more than 175 pieces of art.
The Oklahoma Arts Council launched
the inaugural class of Leadership Arts, a series of leadership development sessions designed to develop a statewide network of community arts leaders and advocates, particularly in our rural areas. Participants learned how to increase citizen support for arts development, retain creative young professionals and increase civic engagement. Research shows that communities that have integrated the arts into the landscape of their downtowns and neighborhoods have proven to be more economically and socially vital and successful.
The Oklahoma Arts council created
JumpstART, an online resource and reference guide for arts administrators, community arts organizers and arts organizations available on the Oklahoma Arts Council website.
Designed to provide accessible information on issues and topics particularly relevant to arts management, JumpstART helps emerging and established arts organizations maintain a healthy administrative infrastructure.
Mission The Oklahoma Arts Council was established in 1965 by the Oklahoma Legislature following the creation of the National Endowment for the Arts by the federal government. Each of the 50 states has created a state arts agency funded with state appropriations to support excellence and access to the arts. The Council’s mission is to lead, cultivate and support a thriving arts environment, which is essential to quality of life, education and economic vitality for all Oklahomans. The Oklahoma Arts Council meets this mission by providing grants and technical assistance for arts activities statewide. The National Endowment for the Arts and the State of Oklahoma are the sources of funding. The following graph illustrates how those funds are spent.
FY-2009 Budgeted Expenditures by Activity
65%11%
12%
4%8%
Community ArtsPrograms
Arts Education inSchools
Arts Learning inCommunities
Public Awareness
Core Operations
The Oklahoma Arts Council is primarily a grant making entity, as evidenced by the following table. Key Performance Measure
Direct grants costs 4,471$ 77.6% 4,803$ 77.6%Indirect grants costs 748$ 13.0% 880$ 14.2%Administration 546$ 9.5% 507$ 8.2%Total 5,765$ 6,190$
Source: Arts Council 1/14/2009
in 000'sFY-2008 Actual FY-2009 Bud
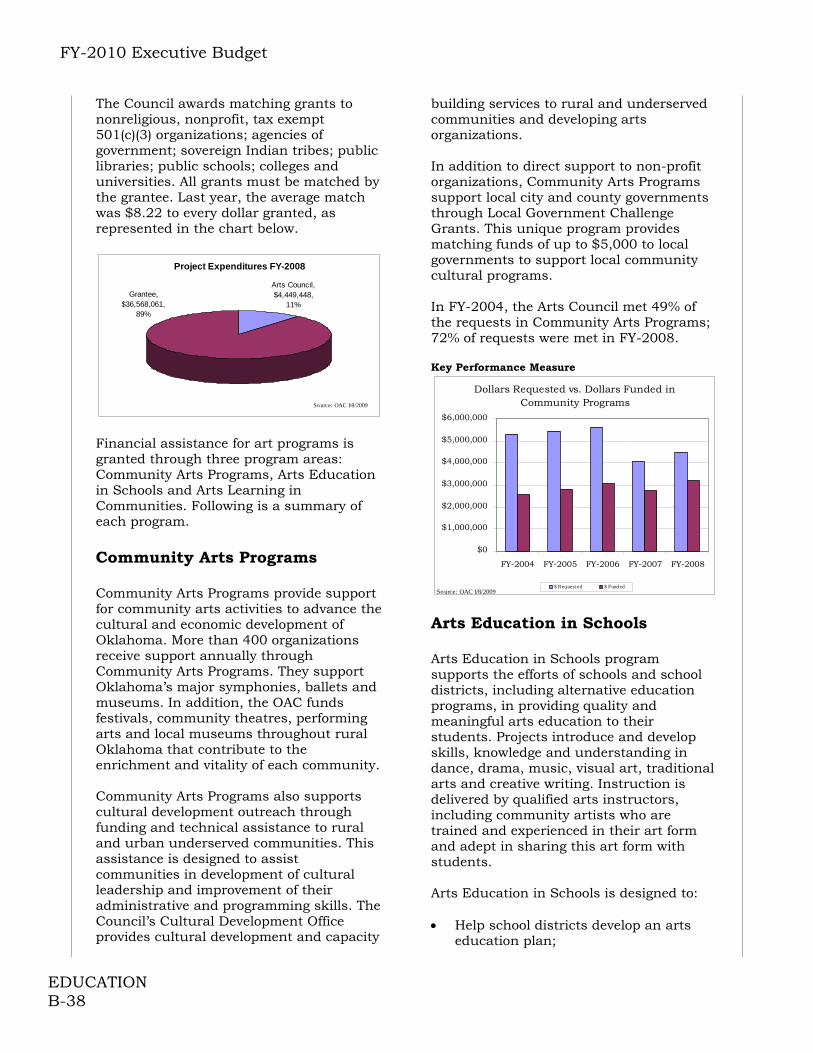
FY-2010 Executive Budget
EDUCATION B-38
The Council awards matching grants to nonreligious, nonprofit, tax exempt 501(c)(3) organizations; agencies of government; sovereign Indian tribes; public libraries; public schools; colleges and universities. All grants must be matched by the grantee. Last year, the average match was $8.22 to every dollar granted, as represented in the chart below.
Project Expenditures FY-2008
Grantee, $36,568,061,
89%
Arts Council, $4,449,448,
11%
Source: OAC 1/8/2009
Financial assistance for art programs is granted through three program areas: Community Arts Programs, Arts Education in Schools and Arts Learning in Communities. Following is a summary of each program. Community Arts Programs Community Arts Programs provide support for community arts activities to advance the cultural and economic development of Oklahoma. More than 400 organizations receive support annually through Community Arts Programs. They support Oklahoma’s major symphonies, ballets and museums. In addition, the OAC funds festivals, community theatres, performing arts and local museums throughout rural Oklahoma that contribute to the enrichment and vitality of each community. Community Arts Programs also supports cultural development outreach through funding and technical assistance to rural and urban underserved communities. This assistance is designed to assist communities in development of cultural leadership and improvement of their administrative and programming skills. The Council’s Cultural Development Office provides cultural development and capacity
building services to rural and underserved communities and developing arts organizations. In addition to direct support to non-profit organizations, Community Arts Programs support local city and county governments through Local Government Challenge Grants. This unique program provides matching funds of up to $5,000 to local governments to support local community cultural programs. In FY-2004, the Arts Council met 49% of the requests in Community Arts Programs; 72% of requests were met in FY-2008. Key Performance Measure
Dollars Requested vs. Dollars Funded in Community Programs
$0
$1,000,000
$2,000,000
$3,000,000
$4,000,000
$5,000,000
$6,000,000
FY-2004 FY-2005 FY-2006 FY-2007 FY-2008
$ Reques ted $ Fund edSource: OAC 1/8/2009
Arts Education in Schools Arts Education in Schools program supports the efforts of schools and school districts, including alternative education programs, in providing quality and meaningful arts education to their students. Projects introduce and develop skills, knowledge and understanding in dance, drama, music, visual art, traditional arts and creative writing. Instruction is delivered by qualified arts instructors, including community artists who are trained and experienced in their art form and adept in sharing this art form with students. Arts Education in Schools is designed to: Help school districts develop an arts
education plan;
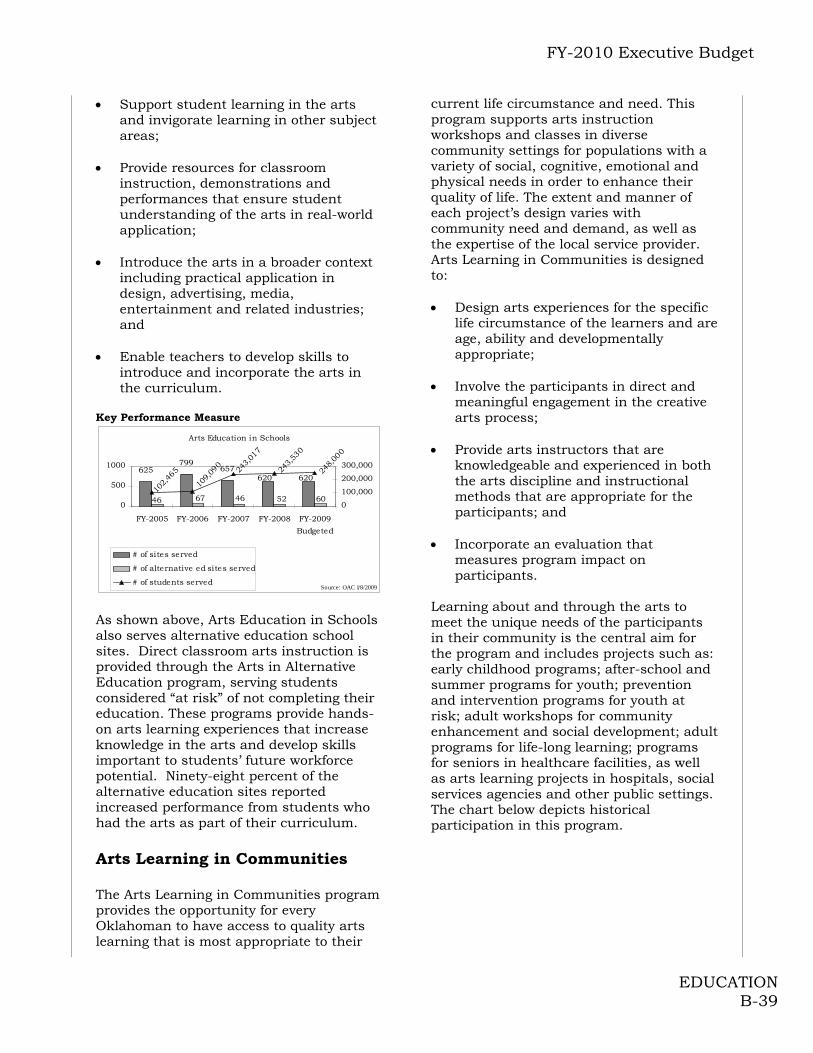
FY-2010 Executive Budget
EDUCATION B-39
Support student learning in the arts and invigorate learning in other subject areas;
Provide resources for classroom
instruction, demonstrations and performances that ensure student understanding of the arts in real-world application;
Introduce the arts in a broader context
including practical application in design, advertising, media, entertainment and related industries; and
Enable teachers to develop skills to
introduce and incorporate the arts in the curriculum.
Key Performance Measure
Arts Education in Schools
625799
657620620
46 67 46 52 6010
2,46
5
109,
090
243,
017
243,
530
248,
000
0
500
1000
FY-2005 FY-2006 FY-2007 FY-2008 FY-2009
Budgeted
0
100,000
200,000
300,000
# of sites served
# of alternative ed sites served
# of students servedSource: OAC 1/8/2009
As shown above, Arts Education in Schools also serves alternative education school sites. Direct classroom arts instruction is provided through the Arts in Alternative Education program, serving students considered “at risk” of not completing their education. These programs provide hands-on arts learning experiences that increase knowledge in the arts and develop skills important to students’ future workforce potential. Ninety-eight percent of the alternative education sites reported increased performance from students who had the arts as part of their curriculum. Arts Learning in Communities The Arts Learning in Communities program provides the opportunity for every Oklahoman to have access to quality arts learning that is most appropriate to their
current life circumstance and need. This program supports arts instruction workshops and classes in diverse community settings for populations with a variety of social, cognitive, emotional and physical needs in order to enhance their quality of life. The extent and manner of each project’s design varies with community need and demand, as well as the expertise of the local service provider. Arts Learning in Communities is designed to: Design arts experiences for the specific
life circumstance of the learners and are age, ability and developmentally appropriate;
Involve the participants in direct and
meaningful engagement in the creative arts process;
Provide arts instructors that are
knowledgeable and experienced in both the arts discipline and instructional methods that are appropriate for the participants; and
Incorporate an evaluation that
measures program impact on participants.
Learning about and through the arts to meet the unique needs of the participants in their community is the central aim for the program and includes projects such as: early childhood programs; after-school and summer programs for youth; prevention and intervention programs for youth at risk; adult workshops for community enhancement and social development; adult programs for life-long learning; programs for seniors in healthcare facilities, as well as arts learning projects in hospitals, social services agencies and other public settings. The chart below depicts historical participation in this program.

FY-2010 Executive Budget
EDUCATION B-40
Key Performance Measure
Arts Learning in Communities
335319
189
86 92
2,181 2,359
23,158
43,335 43,335
0
100
200
300
400
FY-2005 FY-2006 FY-2007 FY-2008 FY-2009
Budgeted
0
10,000
20,000
30,000
40,000
50,000
# of sites served # of participantsSource: OAC 1/8/2009
FY-2010 Recommendation
FY-2009 Appropriation $5,151
FY-2009 Bud. FTE Level 16.0
Actual Ave. YTD FTE 15.1
Funding Adjustments:
3% Appropriation Reduction (155)
10% Travel Reduction (4) Total Adjustments: (159)
FY-2010 Recommendation $4,992
% Change from FY-2009 -3.09%
Source: Office of State Finance
FY-2010 Appropriation(amounts in thousands)
Appropriation Reduction The Governor’s Budget reduces the Oklahoma Arts Council’s FY-2010 appropriation by 3% ($154,529). Travel Reduction Agency travel funds are also reduced by 10% ($4,200).
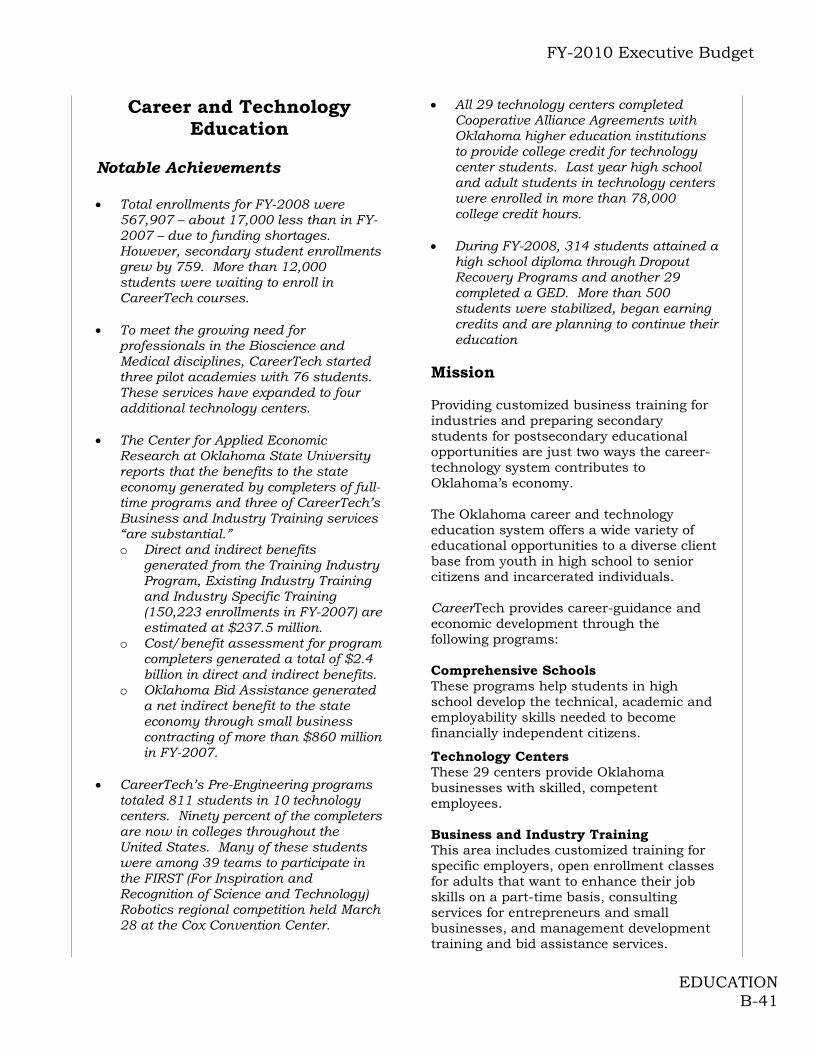
FY-2010 Executive Budget
EDUCATION B-41
Career and Technology Education
Notable Achievements Total enrollments for FY-2008 were
567,907 – about 17,000 less than in FY-2007 – due to funding shortages. However, secondary student enrollments grew by 759. More than 12,000 students were waiting to enroll in CareerTech courses.
To meet the growing need for
professionals in the Bioscience and Medical disciplines, CareerTech started three pilot academies with 76 students. These services have expanded to four additional technology centers.
The Center for Applied Economic
Research at Oklahoma State University reports that the benefits to the state economy generated by completers of full-time programs and three of CareerTech’s Business and Industry Training services “are substantial.” o Direct and indirect benefits
generated from the Training Industry Program, Existing Industry Training and Industry Specific Training (150,223 enrollments in FY-2007) are estimated at $237.5 million.
o Cost/benefit assessment for program completers generated a total of $2.4 billion in direct and indirect benefits.
o Oklahoma Bid Assistance generated a net indirect benefit to the state economy through small business contracting of more than $860 million in FY-2007.
CareerTech’s Pre-Engineering programs
totaled 811 students in 10 technology centers. Ninety percent of the completers are now in colleges throughout the United States. Many of these students were among 39 teams to participate in the FIRST (For Inspiration and Recognition of Science and Technology) Robotics regional competition held March 28 at the Cox Convention Center.
All 29 technology centers completed Cooperative Alliance Agreements with Oklahoma higher education institutions to provide college credit for technology center students. Last year high school and adult students in technology centers were enrolled in more than 78,000 college credit hours.
During FY-2008, 314 students attained a
high school diploma through Dropout Recovery Programs and another 29 completed a GED. More than 500 students were stabilized, began earning credits and are planning to continue their education
Mission Providing customized business training for industries and preparing secondary students for postsecondary educational opportunities are just two ways the career-technology system contributes to Oklahoma’s economy. The Oklahoma career and technology education system offers a wide variety of educational opportunities to a diverse client base from youth in high school to senior citizens and incarcerated individuals. CareerTech provides career-guidance and economic development through the following programs: Comprehensive Schools These programs help students in high school develop the technical, academic and employability skills needed to become financially independent citizens.
Technology Centers These 29 centers provide Oklahoma businesses with skilled, competent employees. Business and Industry Training This area includes customized training for specific employers, open enrollment classes for adults that want to enhance their job skills on a part-time basis, consulting services for entrepreneurs and small businesses, and management development training and bid assistance services.
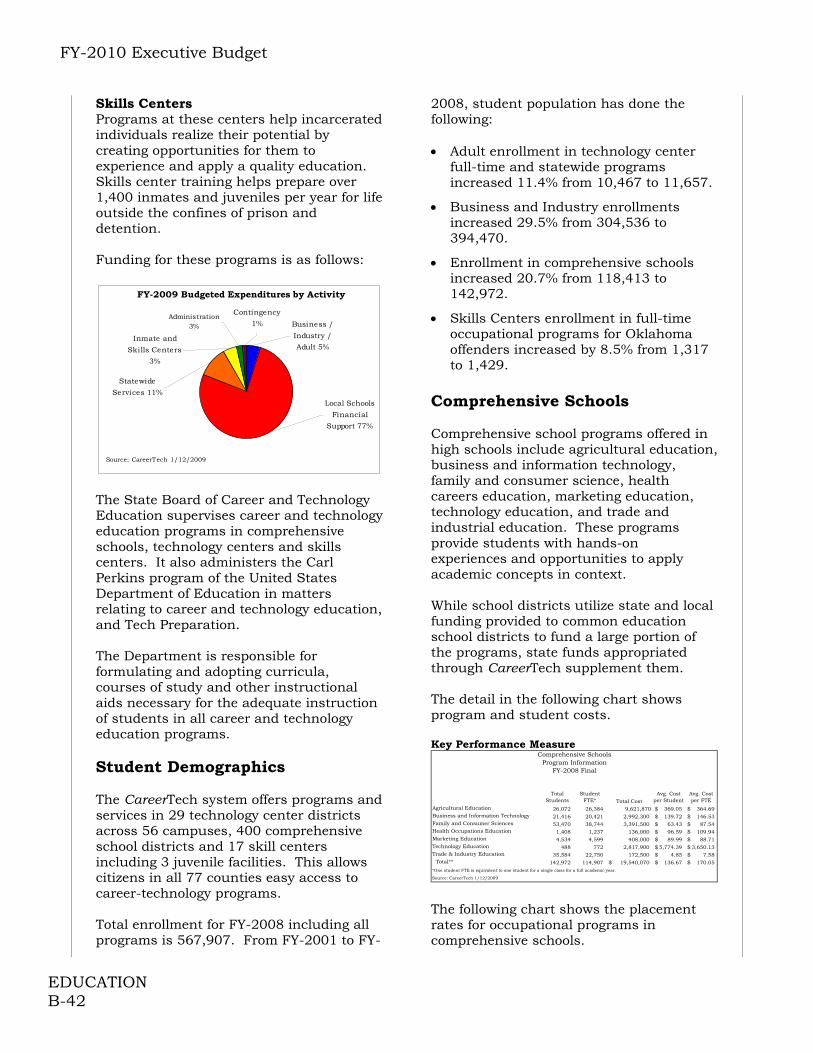
FY-2010 Executive Budget
EDUCATION B-42
Skills Centers Programs at these centers help incarcerated individuals realize their potential by creating opportunities for them to experience and apply a quality education. Skills center training helps prepare over 1,400 inmates and juveniles per year for life outside the confines of prison and detention. Funding for these programs is as follows:
FY-2009 Budgeted Expenditures by Activity
Local Schools
Financial
Support 77%
Administration 3%
Inmate and
Skills Centers
3%
Contingency
1% Business /
Industry /
Adult 5%
Statewide
Services 11%
Source: CareerTech 1/12/2009
The State Board of Career and Technology Education supervises career and technology education programs in comprehensive schools, technology centers and skills centers. It also administers the Carl Perkins program of the United States Department of Education in matters relating to career and technology education, and Tech Preparation. The Department is responsible for formulating and adopting curricula, courses of study and other instructional aids necessary for the adequate instruction of students in all career and technology education programs. Student Demographics The CareerTech system offers programs and services in 29 technology center districts across 56 campuses, 400 comprehensive school districts and 17 skill centers including 3 juvenile facilities. This allows citizens in all 77 counties easy access to career-technology programs. Total enrollment for FY-2008 including all programs is 567,907. From FY-2001 to FY-
2008, student population has done the following: Adult enrollment in technology center
full-time and statewide programs increased 11.4% from 10,467 to 11,657.
Business and Industry enrollments increased 29.5% from 304,536 to 394,470.
Enrollment in comprehensive schools increased 20.7% from 118,413 to 142,972.
Skills Centers enrollment in full-time occupational programs for Oklahoma offenders increased by 8.5% from 1,317 to 1,429.
Comprehensive Schools Comprehensive school programs offered in high schools include agricultural education, business and information technology, family and consumer science, health careers education, marketing education, technology education, and trade and industrial education. These programs provide students with hands-on experiences and opportunities to apply academic concepts in context. While school districts utilize state and local funding provided to common education school districts to fund a large portion of the programs, state funds appropriated through CareerTech supplement them. The detail in the following chart shows program and student costs. Key Performance Measure
Comprehensive SchoolsProgram Information
FY-2008 Final
Total Students
Student FTE* Total Cost
Avg. Cost per Student
Avg. Cost per FTE
Agricultural Education 26,072 26,384 9,621,870 369.05$ 364.69$ Business and Information Technology 21,416 20,421 2,992,300 139.72$ 146.53$ Family and Consumer Sciences 53,470 38,744 3,391,500 63.43$ 87.54$ Health Occupations Education 1,408 1,237 136,000 96.59$ 109.94$ Marketing Education 4,534 4,599 408,000 89.99$ 88.71$ Technology Education 488 772 2,817,900 5,774.39$ 3,650.13$ Trade & Industry Education 35,584 22,750 172,500 4.85$ 7.58$ Total** 142,972 114,907 19,540,070$ 136.67$ 170.05$ *One student FTE is equivalent to one student for a single class for a full academic year.
Source: CareerTech 1/12/2009 The following chart shows the placement rates for occupational programs in comprehensive schools.

FY-2010 Executive Budget
EDUCATION B-43
Comprehensive SchoolsFollow Up Occupational Programs
4% 3% 3% 3%
15% 14% 14% 13% 13%4% 4% 4%
75% 75% 76%
4% 4% 4% 4% 4%3%
5%4%
72% 75%
0%
20%
40%
60%
80%
FY-2003 FY-2004 FY-2005 FY-2006 FY-2007
Military Employed Related to Training
Employed Not Related to Training Continuing Education
Unemployed or Not in Labor ForceSource: CareerTech 1/12/2009 The chart below shows the completion and retention rates for occupational programs in comprehensive schools. Key Performance Measure
Comprehensive SchoolsCompletion and Retention Rates
23%22%23%22%22%
40%42%41%43%44%
37%37%36%35%
22%
0%
10%
20%
30%
40%
50%
FY-2003 FY-2004 FY-2005 FY-2006 FY-2007
Retention Completers Transfers/LeaversSource: CareerTech 1/12/2009 Technology Centers The technology centers provide training for both high school students and adults. Technology centers serve 72 counties throughout the state, reaching virtually all citizens. Technology centers receive state and federal appropriations and local ad valorem funds, as do other public schools. They may charge fees for training adult students. Ad valorem revenues make up the majority of local funds; tuition and fee revenue accounts for about 10% of local funding. Funding Sources Funding for the technology centers comes from three sources: State Appropriated Revenue (30.2%);
Local Taxes, Tuition and Other (65.0%); and
Federal Funds (4.8%). Funding Formula (State Funds) HB 1239 approved in 1991 mandated the development of a new funding formula for technology centers. It equalized variances
in local funding sources, encouraged maximum local support, provided for allowable general fund balances and rewarded having ad valorem ratios above the required minimum. The formula initially considers a target quality program cost and then subtracts available local general fund income to come up with the state’s contribution to each technology center. Quality Program costs include: Direct Cost
o Instruction and Classroom Activity
Indirect Cost
o Instructional Support
o General Administration
o General Support
o Guidance and Counseling
o Operation of Plant
Student Transportation Services
Local General Fund Income: Maximum General Fund Valuation
Millage
Excessive Unencumbered General Fund Balance
Tuition
o Adults in Full-time programs
o Business and Industry Training Programs
o Client-based programs
Business and Industry Training Business and industry specific training attracts new industry and helps existing businesses expand and prosper. Training programs designed for specific employers are delivered at the area technology centers or at worksites. The most popular training offerings for clients of the Training for Industry Program (TIP) and Existing Industry Training programs are: quality-related training such as Lean Manufacturing, ISO, Six Sigma,

FY-2010 Executive Budget
EDUCATION B-44
process improvement and kanban; team skills training, including effective communications, problem-solving, and time management; management and supervisory training; customer service skills; and industrial maintenance skills. Training offerings such as software and computer skills, quality-related training, management and supervisory skills, and team skills are very popular for Industry Specific Training clients. Safety training runs the gamut from Forklift Driver Certifications and Blood Bourne Pathogens to Lock Out/Tag Out, Confined Space Entry and HAZMAT. Popular Adult and Career Development programs include software or computer classes and continuing education for industries such as real estate and accounting. Training for Industry Program (TIP) In existence since 1968, TIP is an economic development incentive available to qualifying companies that create new jobs in Oklahoma. TIP provides customized start-up training for "wealth generating" companies, i.e. companies that are generally exporters of goods and services out of the state and, therefore, importers of new dollars into the state. Eligible businesses are ones that are exporters of goods and services and are creating new full-time jobs in: Manufacturing; Processing; Business services; and Warehouse and distribution.
Key Performance Measure
Number of TIP Enrollments(in thousands)
47.7
41
23.4
28
21.1
0
10
20
30
40
50
60
FY-2004 FY-2005 FY-2006 FY-2007 FY-2008Source: CareerTech 1/12/2009
This program has been a successful tool for recruiting business. Demand for training by businesses is cyclical. CareerTech has experienced strong growth in the past three years and expects to have another busy year in FY-2009. Key Performance Measure
Average Wage for TIP Businesses per hour
$13.45$13.56$13.72
$13.38$13.34
12.82
12.42$12.20
$11.96
$11.00
$11.50
$12.00
$12.50
$13.00
$13.50
$14.00
FY-2004 FY-2005 FY-2006 FY-2007 FY-2008
TIP All OK (median wage)Source: CareerTech 1/12/2009 Below is the funding history for TIP.
TIP Appropriation and Expenditure History (in 000's)
$3.8
$4.3
$5.1
$5.1$5
.1
$3.1
$5.4
$4.7
$5.5
$5.4
$0.0
$1.0
$2.0
$3.0
$4.0
$5.0
$6.0
FY-2004 FY-2005 FY-2006 FY-2007 FY-2008
Appropriations ExpendituresSource: CareerTech Existing Industry Training Oklahoma companies can make sure existing employees are up-to-date with the latest skills and knowledge by taking advantage of the Existing Industry Training Program. This program is intended to serve businesses that need to retrain incumbent workers in order to retool existing processes or expand a product line. CareerTech and existing industries frequently partner when specific training is required. The participating business pays no tuition but frequently provides classroom space or unique materials. Oklahoma Bid Assistance Network The Oklahoma Bid Assistance Network (OBAN) is part of a nationwide effort of Procurement Technical Assistant Centers (PTACs). OBAN was established in 1986 through the Oklahoma Department of Career and Technology Education.
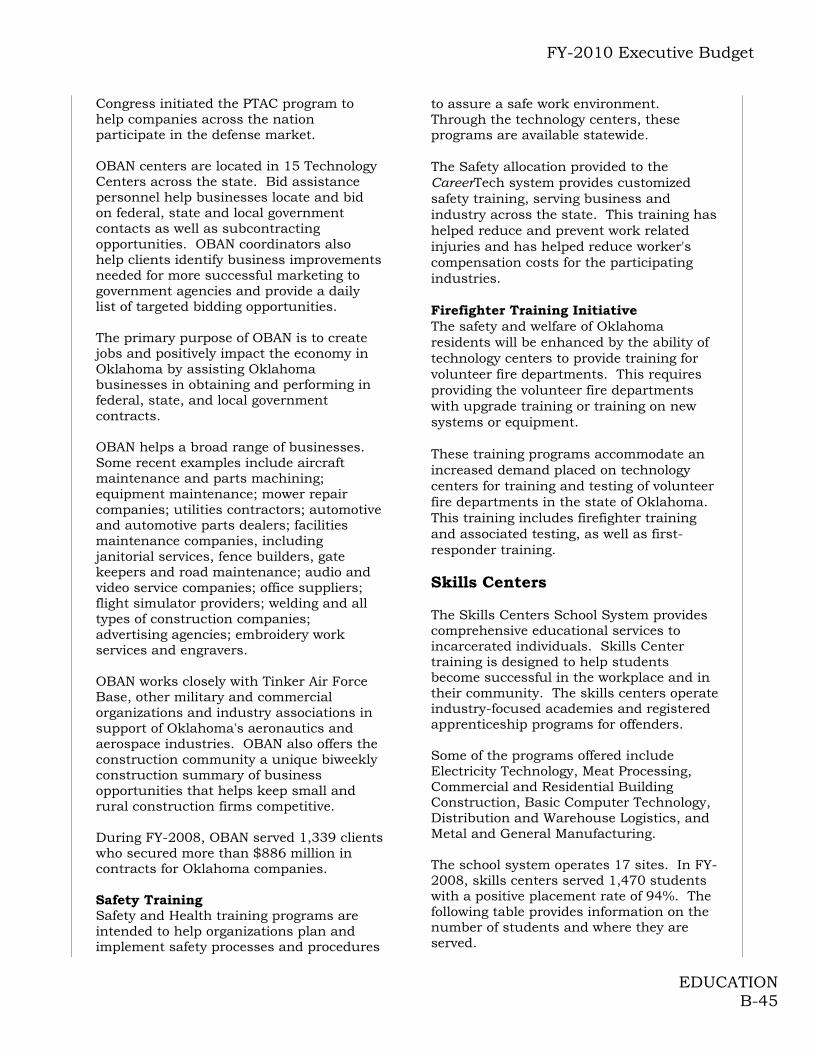
FY-2010 Executive Budget
EDUCATION B-45
Congress initiated the PTAC program to help companies across the nation participate in the defense market. OBAN centers are located in 15 Technology Centers across the state. Bid assistance personnel help businesses locate and bid on federal, state and local government contacts as well as subcontracting opportunities. OBAN coordinators also help clients identify business improvements needed for more successful marketing to government agencies and provide a daily list of targeted bidding opportunities. The primary purpose of OBAN is to create jobs and positively impact the economy in Oklahoma by assisting Oklahoma businesses in obtaining and performing in federal, state, and local government contracts. OBAN helps a broad range of businesses. Some recent examples include aircraft maintenance and parts machining; equipment maintenance; mower repair companies; utilities contractors; automotive and automotive parts dealers; facilities maintenance companies, including janitorial services, fence builders, gate keepers and road maintenance; audio and video service companies; office suppliers; flight simulator providers; welding and all types of construction companies; advertising agencies; embroidery work services and engravers. OBAN works closely with Tinker Air Force Base, other military and commercial organizations and industry associations in support of Oklahoma's aeronautics and aerospace industries. OBAN also offers the construction community a unique biweekly construction summary of business opportunities that helps keep small and rural construction firms competitive. During FY-2008, OBAN served 1,339 clients who secured more than $886 million in contracts for Oklahoma companies. Safety Training Safety and Health training programs are intended to help organizations plan and implement safety processes and procedures
to assure a safe work environment. Through the technology centers, these programs are available statewide. The Safety allocation provided to the CareerTech system provides customized safety training, serving business and industry across the state. This training has helped reduce and prevent work related injuries and has helped reduce worker's compensation costs for the participating industries. Firefighter Training Initiative The safety and welfare of Oklahoma residents will be enhanced by the ability of technology centers to provide training for volunteer fire departments. This requires providing the volunteer fire departments with upgrade training or training on new systems or equipment. These training programs accommodate an increased demand placed on technology centers for training and testing of volunteer fire departments in the state of Oklahoma. This training includes firefighter training and associated testing, as well as first- responder training. Skills Centers The Skills Centers School System provides comprehensive educational services to incarcerated individuals. Skills Center training is designed to help students become successful in the workplace and in their community. The skills centers operate industry-focused academies and registered apprenticeship programs for offenders. Some of the programs offered include Electricity Technology, Meat Processing, Commercial and Residential Building Construction, Basic Computer Technology, Distribution and Warehouse Logistics, and Metal and General Manufacturing. The school system operates 17 sites. In FY-2008, skills centers served 1,470 students with a positive placement rate of 94%. The following table provides information on the number of students and where they are served.

FY-2010 Executive Budget
EDUCATION B-46
FY-2007 FY-2008State prisons 1,246 1,266Private prisons 282 0Juvenile centers 110 106Community corrections 151 98 Total 1,789 1,470Source: Career Tech January 2009
CareerTech Skills Centers
Inmates who are trained in CareerTech Skills Centers are 11% less likely to reoffend. If they are placed in a job related to their training, they are 17% less likely to be reincarcerated.
A Young Offender Initiative implemented in FY-2006 has served over 339 young at-risk individuals, many of whom are probationers. These programs are operated through special arrangements with technology centers. Of the students trained, over 90% have been placed in high-growth, high-wage occupations with local companies.
Key Performance Measure
Skills Centers Employment Related to Training
55%59% 59%
65%
75%
0%
10%
20%
30%
40%
50%
60%
70%
80%
FY-2003 FY-2004 FY-2005 FY-2006 FY-2007
Source: Career Tech, January 2 00 9 Dropout Recovery Since 1995, the Oklahoma Career and Technology Education system has operated Dropout Recovery Programs at various technology centers. These programs are intended to serve out-of-school youth who have not completed the requirements for a high school credential. Currently, nine Technology Centers provide dropout recovery services. In FY-2008, 939 students enrolled in these programs statewide. Of these, 343 completed the requirements for a high school credential
and over 500 are scheduled to return during FY-2009 to continue their education. Over 40 students were stabilized and returned to their home high school to continue their education. These hardest to serve youth are given the opportunity to develop life and employability skills while completing their academic requirements and gaining occupational skills. Many of these students were 15 to 16 years of age at the time they dropped out.
FY-2010 Recommendations
FY-2009 Appropriation $158,270
One-time Adjustments (400)
FY-2009 Base $157,870
FY-2009 Bud. FTE Level 341.1
Actual Ave. YTD FTE 329.6
Funding Adjustments:
Health Care Increases for Tech Centers 2,619
Teachers' Retirement 99310% Travel Cut (95)
Total Adjustments 3,517
FY-2010 Recommendation $161,387
$ Change from FY-2009 $3,117
% Change from FY-2009 1.97%
Source: Office of State Finance
FY-2010 Appropriation(amounts in thousands)
One-Time Adjustments The Governor’s budget removes $400,000 of one-time funding from CareerTech’s budget. Health Care Increase for Technical Centers The Governor’s budget includes $2,618,927 for required increases to Health Care programs at technical centers. Teachers’ Retirement Increase The Governor’s Budget includes $992,777 for agency Teachers’ Retirement Increases.
FY-2010 Executive Budget
EDUCATION B-47
Travel Reduction Agency travel funds are also reduced by 10% ($94,781).

FY-2010 Executive Budget
EDUCATION B-48
Oklahoma Educational Television Authority (OETA)
Notable Achievements OETA serves more Oklahomans than
any other television operation. Full-power stations are strategically located in Eufaula, Tulsa, Oklahoma City and Cheyenne with 15 low-power translator stations helping get the OETA signal out to virtually every Oklahoman.
State-of-the-art digital, high definition OETA television programming is now available to more than 75% of the state’s citizens with the remaining 25% to receive the service by the end of 2009.
OETA now distributes two separate channels of programming through its four main transmitters in Eufaula, Tulsa, Oklahoma City and Cheyenne. This 24-hour service provides one channel of High Definition programming and one channel devoted specifically to Oklahoma-oriented programming.
A total of four channels of cable programming have now been added, quadrupling the service of top-quality television for viewers in Tulsa and Oklahoma City. This expands OETA’s service from 8,760 hours per year to more than 30,000 hours per year.
Partnerships with OETA viewers and private funders have continued to increase over the past five years and now accounts for more than half of the network’s income.
OETA is the only television operation (either commercial or non-commercial) serving the entire state of Oklahoma and the only broadcast television signal for many rural Oklahomans.
Nationally, OETA consistently ranks among the top seven public television operations in terms of cumulative audience rankings. OETA is in the top three most-viewed prime time public television markets in the U.S.
More than 1.8 million Oklahomans tune in weekly to OETA with 30,000 of them supporting the station by becoming and remaining members.
OETA has taken a lead role in promoting Oklahoma as “The State of Creativity” with more than 60 one-minute productions spotlighting the state’s residents who have made their mark on the arts, business, education, research, agriculture, etc., through creative problem-solving.
Mission OETA is a federally licensed and regulated agency that operates non-commercial educational television channels assigned by the Federal Communications Commission (FCC). Branded as “The Oklahoma Network”, OETA was the first such state network - formed in 1953. Oklahoma state government consistently spends less per capita than 13 other states that operate such networks. OETA has been able to offset the declining state portion of its operating budget through on-air membership drives, corporate, grant and foundation solicitations. However, as OETA’s infrastructure is being replaced with more costly digital equipment, operating costs are rising more dramatically.
Funding by Source
$-$2,000,000$4,000,000$6,000,000$8,000,000
$10,000,000$12,000,000$14,000,000$16,000,000$18,000,000
FY-2005 FY-2006 FY-2007 FY-2008 FY-2009
Budgeted
Foundation and privateState appropriationsSo urce: OETA
OETA has two main activities within the agency, broadcasting/technical and programming/production. FY-2008 Expenditures by activity are illustrated in the following graph:
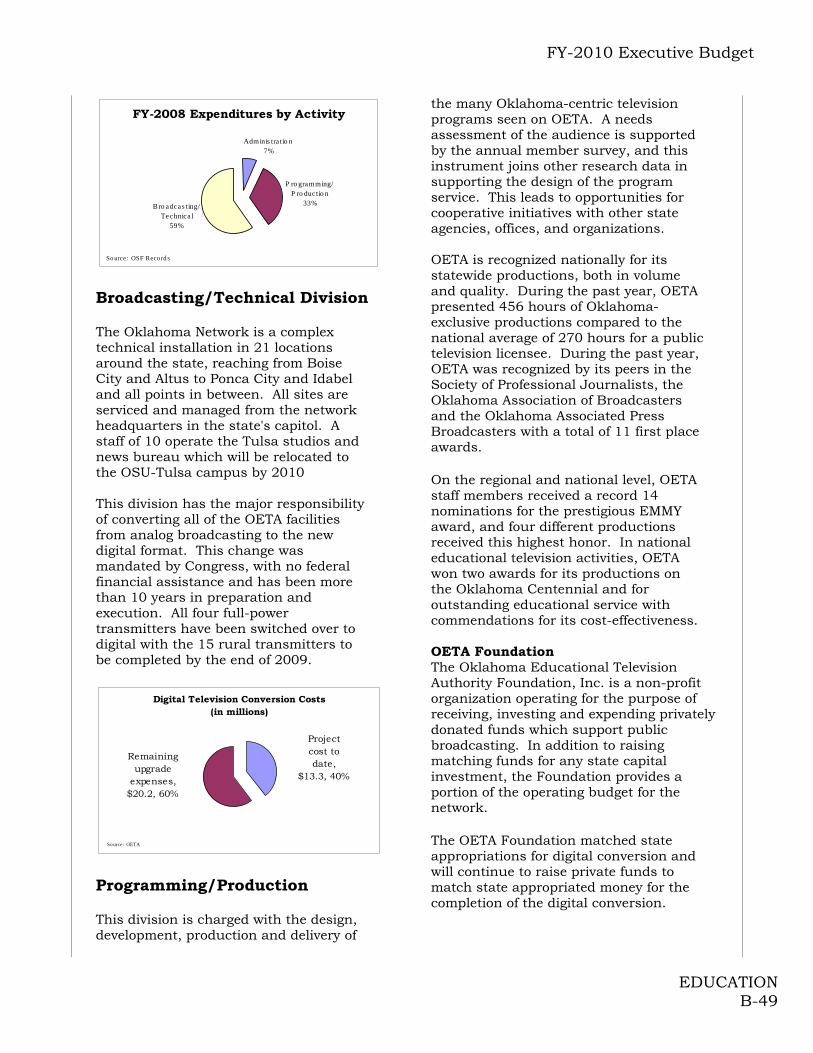
FY-2010 Executive Budget
EDUCATION B-49
FY-2008 Expenditures by Activity
Adminis tra tio n7%
P ro gramming/P ro ductio n
33%Bro adcas ting/ Technica l
59%
So urce: OSF Record s
Broadcasting/Technical Division The Oklahoma Network is a complex technical installation in 21 locations around the state, reaching from Boise City and Altus to Ponca City and Idabel and all points in between. All sites are serviced and managed from the network headquarters in the state's capitol. A staff of 10 operate the Tulsa studios and news bureau which will be relocated to the OSU-Tulsa campus by 2010 This division has the major responsibility of converting all of the OETA facilities from analog broadcasting to the new digital format. This change was mandated by Congress, with no federal financial assistance and has been more than 10 years in preparation and execution. All four full-power transmitters have been switched over to digital with the 15 rural transmitters to be completed by the end of 2009.
Digital Television Conversion Costs(in millions)
Project cost to date,
$13.3, 40%
Remaining upgrade
expenses, $20.2, 60%
Source: OETA
Programming/Production This division is charged with the design, development, production and delivery of
the many Oklahoma-centric television programs seen on OETA. A needs assessment of the audience is supported by the annual member survey, and this instrument joins other research data in supporting the design of the program service. This leads to opportunities for cooperative initiatives with other state agencies, offices, and organizations. OETA is recognized nationally for its statewide productions, both in volume and quality. During the past year, OETA presented 456 hours of Oklahoma-exclusive productions compared to the national average of 270 hours for a public television licensee. During the past year, OETA was recognized by its peers in the Society of Professional Journalists, the Oklahoma Association of Broadcasters and the Oklahoma Associated Press Broadcasters with a total of 11 first place awards.
On the regional and national level, OETA staff members received a record 14 nominations for the prestigious EMMY award, and four different productions received this highest honor. In national educational television activities, OETA won two awards for its productions on the Oklahoma Centennial and for outstanding educational service with commendations for its cost-effectiveness. OETA Foundation The Oklahoma Educational Television Authority Foundation, Inc. is a non-profit organization operating for the purpose of receiving, investing and expending privately donated funds which support public broadcasting. In addition to raising matching funds for any state capital investment, the Foundation provides a portion of the operating budget for the network. The OETA Foundation matched state appropriations for digital conversion and will continue to raise private funds to match state appropriated money for the completion of the digital conversion.
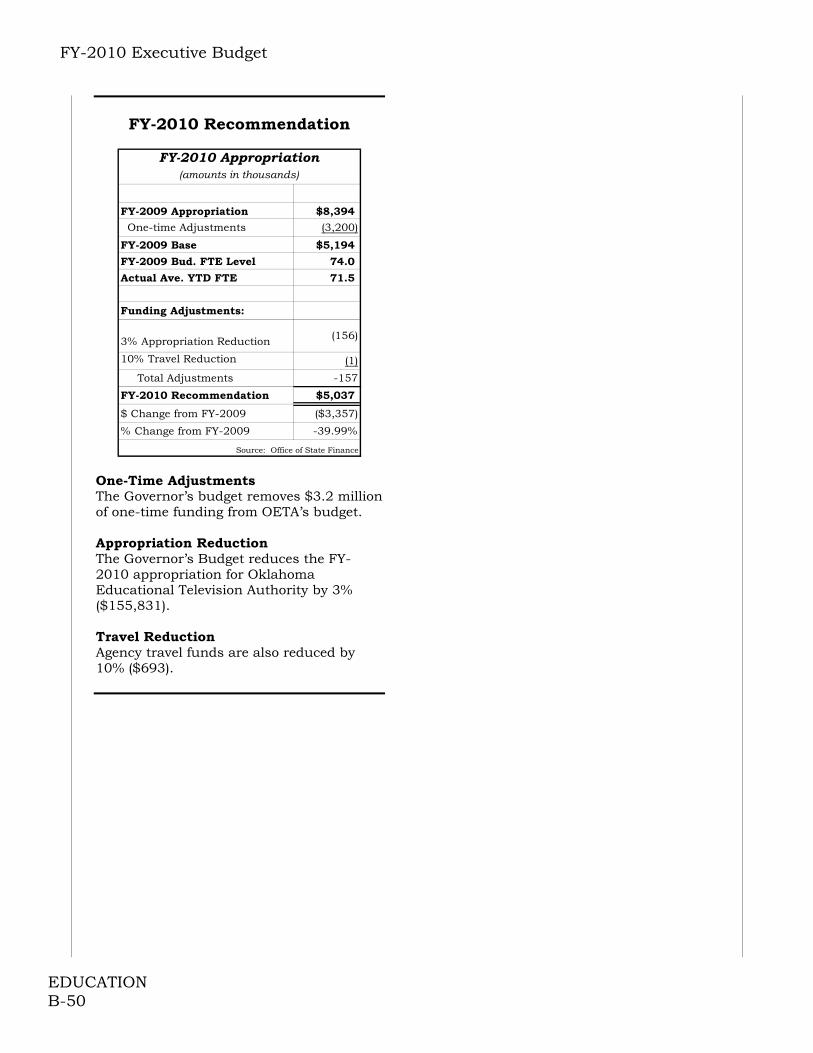
FY-2010 Executive Budget
EDUCATION B-50
FY-2010 Recommendation
FY-2009 Appropriation $8,394
One-time Adjustments (3,200)
FY-2009 Base $5,194
FY-2009 Bud. FTE Level 74.0
Actual Ave. YTD FTE 71.5
Funding Adjustments:
3% Appropriation Reduction (156)
10% Travel Reduction (1)
Total Adjustments -157
FY-2010 Recommendation $5,037
$ Change from FY-2009 ($3,357)
% Change from FY-2009 -39.99%
(amounts in thousands)
Source: Office of State Finance
FY-2010 Appropriation
One-Time Adjustments The Governor’s budget removes $3.2 million of one-time funding from OETA’s budget. Appropriation Reduction The Governor’s Budget reduces the FY-2010 appropriation for Oklahoma Educational Television Authority by 3% ($155,831). Travel Reduction Agency travel funds are also reduced by 10% ($693).

FY-2010 Executive Budget
EDUCATION B-51
Elementary and Secondary Education
Notable Achievements Oklahoma’s early childhood education
program for four-year-old children has been named number one in access by the National Institute for Early Education Research for the past five years. In FY-2009, nearly 72% of Oklahoma four-year-olds are attending Pre-Kindergarten programs in public schools, an historic high of 35,688 students.
The National Board for Professional
Teaching Standards reported in December 2008 that Oklahoma again had the 10th highest number of National Board Certified teachers in the U.S. Oklahoma ranks 5th in the nation in the percentage of its teaching force that is nationally certified. Nationally certified teachers comprise nearly 6% of all Oklahoma teachers, nearly three times the national average rate. The state has 2,307 National Board Certified Teachers while Missouri has 490, Arkansas has 1,116, Colorado has 398, Kansas has 297, Texas has 472 and New Mexico has 387.
Per ACE, Oklahoma Mathematics
Laboratories were provided to 10 middle schools with low student achievement in math. The median scores of 8th grade students tested at the 10 original grant schools participating in the Oklahoma Mathematics Laboratories program in 2006 went up 20.4% the first year; the new schools added in 2007 posted a 19.1% increase and a 5.5% increase in 2008. Eighteen new math labs were added in the 2008-2009 school year; there are currently 54 math labs in Oklahoma public schools.
According to the first eleven years of
Education Week's "Quality Counts" report cards, Oklahoma has always been in the top half of states in “Standards and Accountability” (13th in 2008) and in the top 10 states in
“Improving Teacher Quality” (10th in 2008). The 13th annual report “Quality Counts 2009” ranked Oklahoma 25th overall on 150 measures of policy and performance.
The number of high schools with
Advanced Placement programs has climbed from 81 in 1997 to 337 in 2008. The number of AP exams taken in 2008 (20,380 taken by 12,307 public school students) was over six times greater than the number of exams taken in 1996-97 when the AP Incentives Program began.
Oklahoma was one of only 14 states in
the U.S. to improve mathematics scores at both Grade 4 and 8 in 2007 on the National Assessment of Educational Progress (NAEP), also called “The Nation’s Report Card,” compared to the previous test in 2005. NAEP scores also improved for Grade 4 reading, and held steady in Grade 8 reading. Oklahoma’s reading scores are statistically the same as the national average.
Governor Henry has been working to strengthen Oklahoma’s school system since elected to office. For the past few years, the Governor’s initiatives have included working for fair compensation for teachers and support personnel. This included a pay increase plan for teachers to reach the regional average over four years. The state appropriated funds to pay 100% of teacher and support personnel health insurance, and has accelerated the Governor’s initial plan to meet the regional average on teacher salaries. The Governor also created a new funding source for education – the Education Lottery and Gaming Regulation Act. The past three years, the Governor has also worked to improve educational quality to ensure that every child has the strong academic skills necessary for success. This was accomplished through the Achieving Classroom Excellence (ACE) Act of 2005, and was more finely honed in the 2006 legislative session.
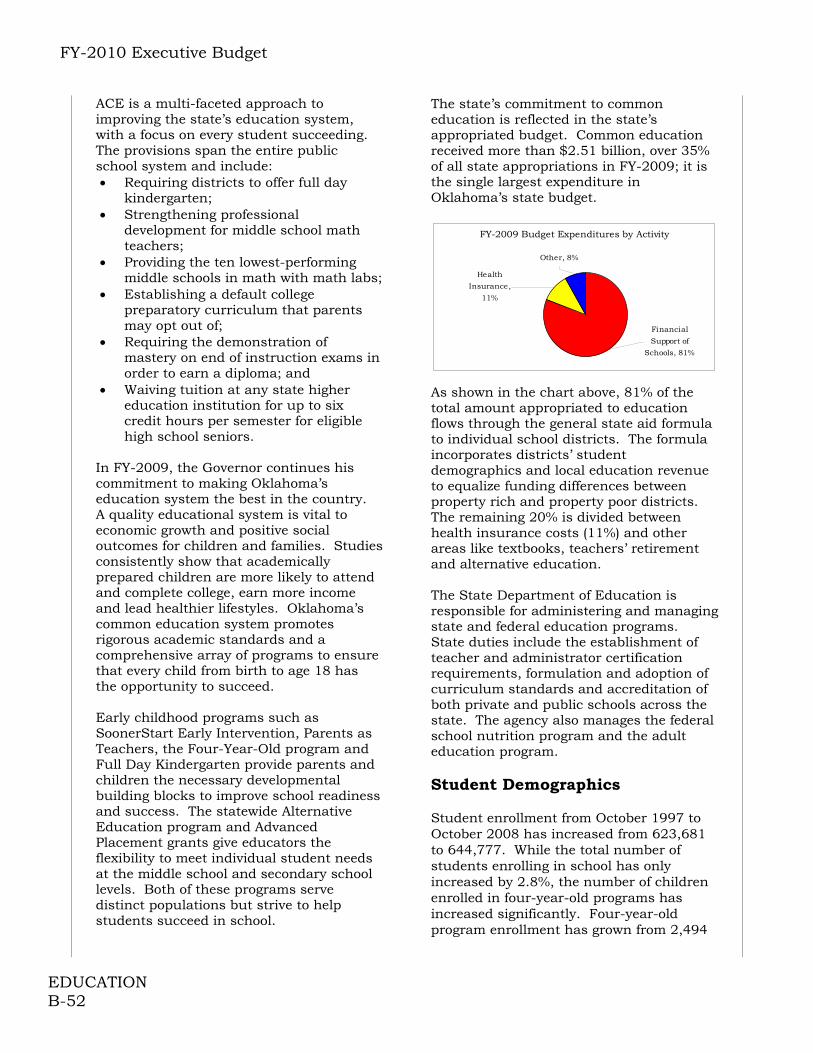
FY-2010 Executive Budget
EDUCATION B-52
ACE is a multi-faceted approach to improving the state’s education system, with a focus on every student succeeding. The provisions span the entire public school system and include: Requiring districts to offer full day
kindergarten; Strengthening professional
development for middle school math teachers;
Providing the ten lowest-performing middle schools in math with math labs;
Establishing a default college preparatory curriculum that parents may opt out of;
Requiring the demonstration of mastery on end of instruction exams in order to earn a diploma; and
Waiving tuition at any state higher education institution for up to six credit hours per semester for eligible high school seniors.
In FY-2009, the Governor continues his commitment to making Oklahoma’s education system the best in the country. A quality educational system is vital to economic growth and positive social outcomes for children and families. Studies consistently show that academically prepared children are more likely to attend and complete college, earn more income and lead healthier lifestyles. Oklahoma’s common education system promotes rigorous academic standards and a comprehensive array of programs to ensure that every child from birth to age 18 has the opportunity to succeed. Early childhood programs such as SoonerStart Early Intervention, Parents as Teachers, the Four-Year-Old program and Full Day Kindergarten provide parents and children the necessary developmental building blocks to improve school readiness and success. The statewide Alternative Education program and Advanced Placement grants give educators the flexibility to meet individual student needs at the middle school and secondary school levels. Both of these programs serve distinct populations but strive to help students succeed in school.
The state’s commitment to common education is reflected in the state’s appropriated budget. Common education received more than $2.51 billion, over 35% of all state appropriations in FY-2009; it is the single largest expenditure in Oklahoma’s state budget.
FY-2009 Budget Expenditures by Activity
Other, 8%
Health
Insurance,
11%
Financial
Support of
Schools, 81%
As shown in the chart above, 81% of the total amount appropriated to education flows through the general state aid formula to individual school districts. The formula incorporates districts’ student demographics and local education revenue to equalize funding differences between property rich and property poor districts. The remaining 20% is divided between health insurance costs (11%) and other areas like textbooks, teachers’ retirement and alternative education. The State Department of Education is responsible for administering and managing state and federal education programs. State duties include the establishment of teacher and administrator certification requirements, formulation and adoption of curriculum standards and accreditation of both private and public schools across the state. The agency also manages the federal school nutrition program and the adult education program.
Student Demographics
Student enrollment from October 1997 to October 2008 has increased from 623,681 to 644,777. While the total number of students enrolling in school has only increased by 2.8%, the number of children enrolled in four-year-old programs has increased significantly. Four-year-old program enrollment has grown from 2,494
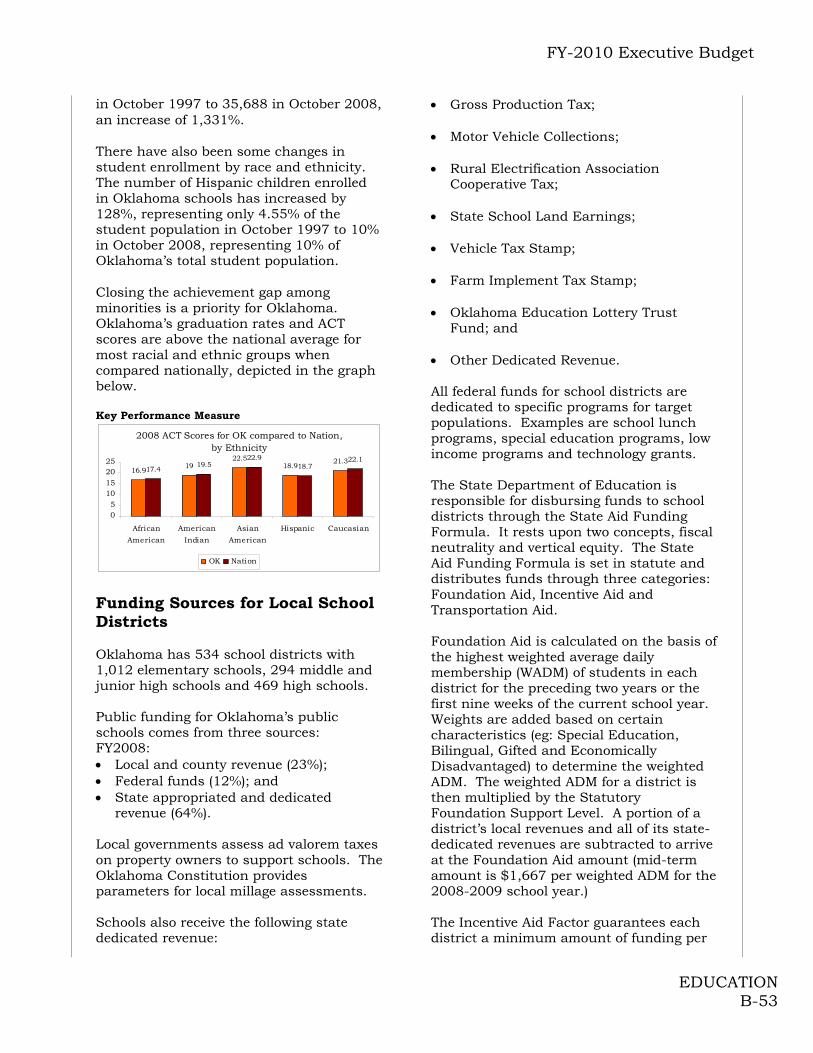
FY-2010 Executive Budget
EDUCATION B-53
in October 1997 to 35,688 in October 2008, an increase of 1,331%. There have also been some changes in student enrollment by race and ethnicity. The number of Hispanic children enrolled in Oklahoma schools has increased by 128%, representing only 4.55% of the student population in October 1997 to 10% in October 2008, representing 10% of Oklahoma’s total student population. Closing the achievement gap among minorities is a priority for Oklahoma. Oklahoma’s graduation rates and ACT scores are above the national average for most racial and ethnic groups when compared nationally, depicted in the graph below. Key Performance Measure
2008 ACT Scores for OK compared to Nation, by Ethnicity
16.919
22.518.9
21.317.4
19.522.9
18.722.1
05
10152025
African
American
American
Indian
Asian
American
Hispanic Caucasian
OK Nation
Funding Sources for Local School Districts Oklahoma has 534 school districts with 1,012 elementary schools, 294 middle and junior high schools and 469 high schools. Public funding for Oklahoma’s public schools comes from three sources: FY2008: Local and county revenue (23%); Federal funds (12%); and State appropriated and dedicated
revenue (64%). Local governments assess ad valorem taxes on property owners to support schools. The Oklahoma Constitution provides parameters for local millage assessments. Schools also receive the following state dedicated revenue:
Gross Production Tax; Motor Vehicle Collections; Rural Electrification Association
Cooperative Tax; State School Land Earnings; Vehicle Tax Stamp; Farm Implement Tax Stamp; Oklahoma Education Lottery Trust
Fund; and Other Dedicated Revenue. All federal funds for school districts are dedicated to specific programs for target populations. Examples are school lunch programs, special education programs, low income programs and technology grants. The State Department of Education is responsible for disbursing funds to school districts through the State Aid Funding Formula. It rests upon two concepts, fiscal neutrality and vertical equity. The State Aid Funding Formula is set in statute and distributes funds through three categories: Foundation Aid, Incentive Aid and Transportation Aid. Foundation Aid is calculated on the basis of the highest weighted average daily membership (WADM) of students in each district for the preceding two years or the first nine weeks of the current school year. Weights are added based on certain characteristics (eg: Special Education, Bilingual, Gifted and Economically Disadvantaged) to determine the weighted ADM. The weighted ADM for a district is then multiplied by the Statutory Foundation Support Level. A portion of a district’s local revenues and all of its state-dedicated revenues are subtracted to arrive at the Foundation Aid amount (mid-term amount is $1,667 per weighted ADM for the 2008-2009 school year.) The Incentive Aid Factor guarantees each district a minimum amount of funding per
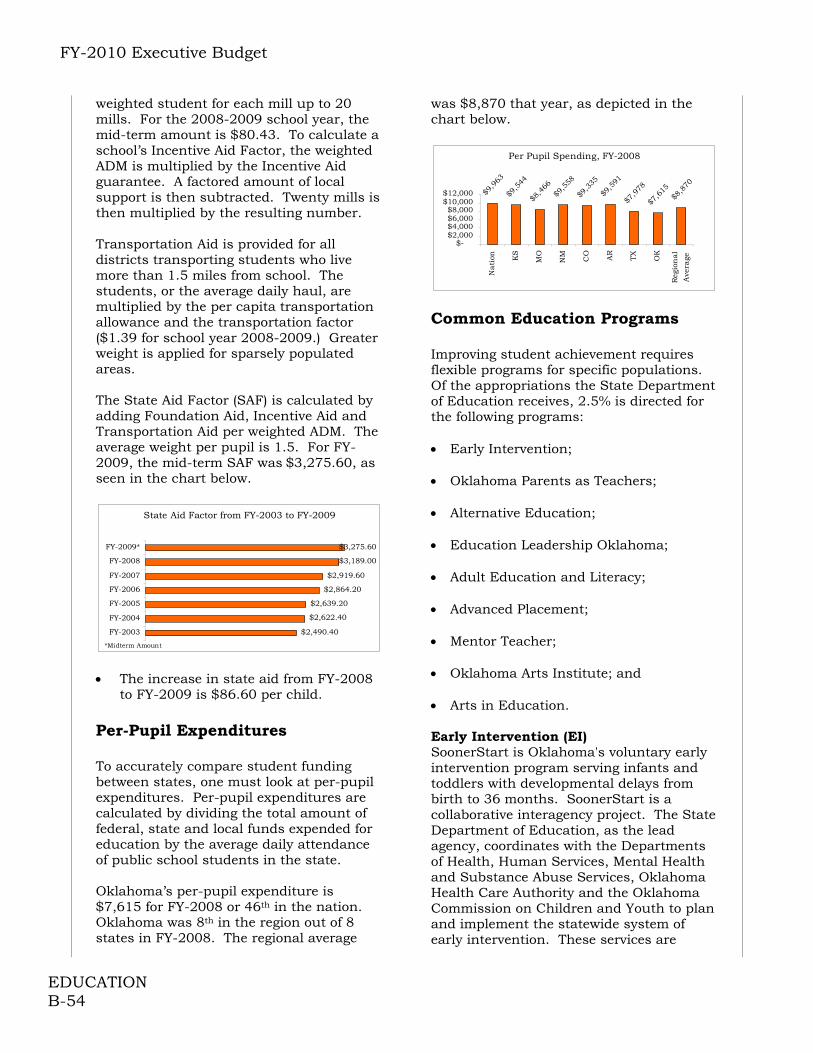
FY-2010 Executive Budget
EDUCATION B-54
weighted student for each mill up to 20 mills. For the 2008-2009 school year, the mid-term amount is $80.43. To calculate a school’s Incentive Aid Factor, the weighted ADM is multiplied by the Incentive Aid guarantee. A factored amount of local support is then subtracted. Twenty mills is then multiplied by the resulting number. Transportation Aid is provided for all districts transporting students who live more than 1.5 miles from school. The students, or the average daily haul, are multiplied by the per capita transportation allowance and the transportation factor ($1.39 for school year 2008-2009.) Greater weight is applied for sparsely populated areas. The State Aid Factor (SAF) is calculated by adding Foundation Aid, Incentive Aid and Transportation Aid per weighted ADM. The average weight per pupil is 1.5. For FY-2009, the mid-term SAF was $3,275.60, as seen in the chart below.
State Aid Factor from FY-2003 to FY-2009
$2,490.40
$2,622.40
$2,639.20
$2,864.20
$2,919.60
$3,189.00
$3,275.60
FY-2003
FY-2004
FY-2005
FY-2006
FY-2007
FY-2008
FY-2009*
*Midterm Amount The increase in state aid from FY-2008
to FY-2009 is $86.60 per child. Per-Pupil Expenditures To accurately compare student funding between states, one must look at per-pupil expenditures. Per-pupil expenditures are calculated by dividing the total amount of federal, state and local funds expended for education by the average daily attendance of public school students in the state. Oklahoma’s per-pupil expenditure is $7,615 for FY-2008 or 46th in the nation. Oklahoma was 8th in the region out of 8 states in FY-2008. The regional average
was $8,870 that year, as depicted in the chart below.
Per Pupil Spending, FY-2008
$9,
963
$9,
544
$8,
466
$9,
558
$9,
335
$9,
591
$7,
978
$7,
615
$8,
870
$-$2,000$4,000$6,000$8,000
$10,000$12,000
Nati
on KS
MO
NM
CO
AR
TX
OK
Reg
ion
al
Ave
rage
Common Education Programs Improving student achievement requires flexible programs for specific populations. Of the appropriations the State Department of Education receives, 2.5% is directed for the following programs: Early Intervention; Oklahoma Parents as Teachers; Alternative Education; Education Leadership Oklahoma; Adult Education and Literacy; Advanced Placement; Mentor Teacher; Oklahoma Arts Institute; and Arts in Education. Early Intervention (EI) SoonerStart is Oklahoma's voluntary early intervention program serving infants and toddlers with developmental delays from birth to 36 months. SoonerStart is a collaborative interagency project. The State Department of Education, as the lead agency, coordinates with the Departments of Health, Human Services, Mental Health and Substance Abuse Services, Oklahoma Health Care Authority and the Oklahoma Commission on Children and Youth to plan and implement the statewide system of early intervention. These services are

FY-2010 Executive Budget
EDUCATION B-55
designed to complement the medical care a child may receive from a physician. The program staff provides caregivers the skills and support they need to help them work with their childen to attain essential developmental skills and accomplish the goals developed on an Individualized Family Service Plan (IFSP). An IFSP is designed for each child. Depending on a child's and family's individual needs, SoonerStart offers one or a combination of services, some of which include, counseling, nutrition and physical therapy to name a few. The four most common diagnoses of infants and toddlers served by SoonerStart are Down Syndrome, Failure to Thrive, Hydrocephalus and Cerebral Palsy. The SoonerStart program will work with approximately 13,540 children in FY-2009. Oklahoma Parents as Teachers Parents are children’s most important and effective teachers. Children’s academic success is in most instances dependent on parents’ active involvement in their child’s early years. Recognizing the importance of this relationship, Parents as Teachers (OPAT) is a free and voluntary program which provides parents of children ages zero to three the skills to maximize their child’s potential. Services are based on early childhood development research. School districts apply for grants to fund OPAT programs. Qualifications to receive an OPAT program grant are based on enrollment history (if applicable), district Average Daily Membership (ADM) and new or expanded programs. As with other service programs, multiple districts can join to create an OPAT program. For FY-2008, 5,619 children in 99 districts were served.
Year Appropriation
# of Districts
# of families served
1991-92 650,000 13 377
2003-04 1,295,709 55 2,835
2004-05 1,295,000 68 4,235
2005-06 2,045,709 162 4,762
2006-07 2,045,709 97 4,784
2007-08 2,045,709 99 5,619
Source: SDE Four-Year Old Program Oklahoma is one of only three states that require teachers of four-year-olds to have a degree in early childhood education. Georgia and New York are the only other states requiring this quality indicator. Requiring this certification improves the quality of teaching and learning in the classroom and increases the probability children will be prepared for school in later years. Nearly 72% of the four-year-old population in Oklahoma participates in this voluntary program. The basis for Oklahoma’s high participation rate lies in the unique partnerships schools are creating with private child care providers. The State Department of Education encourages schools to provide certified teachers to private child care facilities to expand access. Lawton, Norman and Putnam City School districts are just a few of the districts involved in this initiative. Alternative Education The purpose of this program is to provide alternative education choices to prevent dropouts and increase the number of high school graduates. The Juvenile Justice Reform Act of 1994 established the Statewide Academy System that began with eight pilot programs in three counties. State law now requires all districts reporting dropouts and juvenile justice referrals to offer alternative education in Grades 6-12. More than 11,195 students from 467school districts were served in 249 Statewide Alternative Education Academies in 2007-2008.
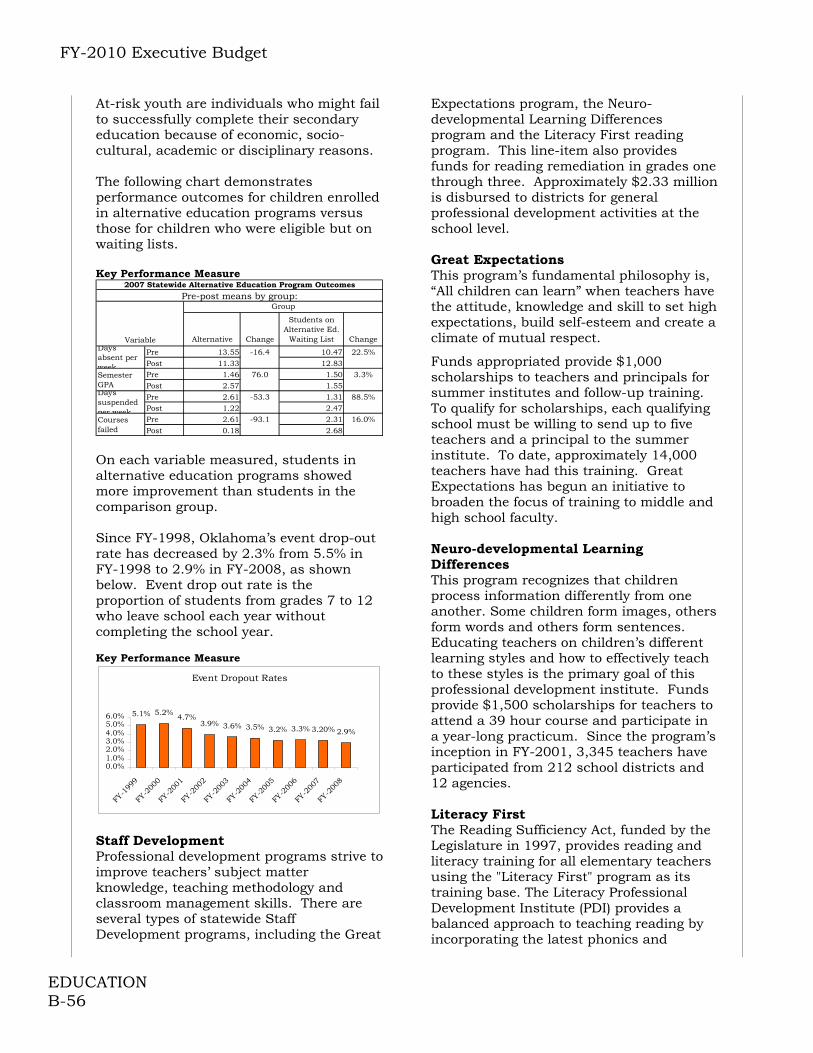
FY-2010 Executive Budget
EDUCATION B-56
At-risk youth are individuals who might fail to successfully complete their secondary education because of economic, socio-cultural, academic or disciplinary reasons. The following chart demonstrates performance outcomes for children enrolled in alternative education programs versus those for children who were eligible but on waiting lists. Key Performance Measure
Alternative Change
Students on Alternative Ed.
Waiting List Change
Pre 13.55 -16.4 10.47 22.5%
Post 11.33 12.83Pre 1.46 76.0 1.50 3.3%Post 2.57 1.55
Pre 2.61 -53.3 1.31 88.5%Post 1.22 2.47Pre 2.61 -93.1 2.31 16.0%
Post 0.18 2.68
2007 Statewide Alternative Education Program Outcomes
Pre-post means by group:
Variable
Group
Days absent per weekSemester GPADays suspended per weekCourses failed On each variable measured, students in alternative education programs showed more improvement than students in the comparison group. Since FY-1998, Oklahoma’s event drop-out rate has decreased by 2.3% from 5.5% in FY-1998 to 2.9% in FY-2008, as shown below. Event drop out rate is the proportion of students from grades 7 to 12 who leave school each year without completing the school year. Key Performance Measure
Event Dropout Rates
5.1% 5.2%4.7%
3.9% 3.6% 3.5% 3.2% 3.3% 3.20% 2.9%
0.0%1.0%2.0%3.0%4.0%5.0%6.0%
FY-1
999
FY-2
000
FY-2
001
FY-2
002
FY-2
003
FY-2
004
FY-2
005
FY-2
006
FY-2
007
FY-2
008
Staff Development Professional development programs strive to improve teachers’ subject matter knowledge, teaching methodology and classroom management skills. There are several types of statewide Staff Development programs, including the Great
Expectations program, the Neuro-developmental Learning Differences program and the Literacy First reading program. This line-item also provides funds for reading remediation in grades one through three. Approximately $2.33 million is disbursed to districts for general professional development activities at the school level. Great Expectations This program’s fundamental philosophy is, “All children can learn” when teachers have the attitude, knowledge and skill to set high expectations, build self-esteem and create a climate of mutual respect.
Funds appropriated provide $1,000 scholarships to teachers and principals for summer institutes and follow-up training. To qualify for scholarships, each qualifying school must be willing to send up to five teachers and a principal to the summer institute. To date, approximately 14,000 teachers have had this training. Great Expectations has begun an initiative to broaden the focus of training to middle and high school faculty. Neuro-developmental Learning Differences This program recognizes that children process information differently from one another. Some children form images, others form words and others form sentences. Educating teachers on children’s different learning styles and how to effectively teach to these styles is the primary goal of this professional development institute. Funds provide $1,500 scholarships for teachers to attend a 39 hour course and participate in a year-long practicum. Since the program’s inception in FY-2001, 3,345 teachers have participated from 212 school districts and 12 agencies. Literacy First The Reading Sufficiency Act, funded by the Legislature in 1997, provides reading and literacy training for all elementary teachers using the "Literacy First" program as its training base. The Literacy Professional Development Institute (PDI) provides a balanced approach to teaching reading by incorporating the latest phonics and
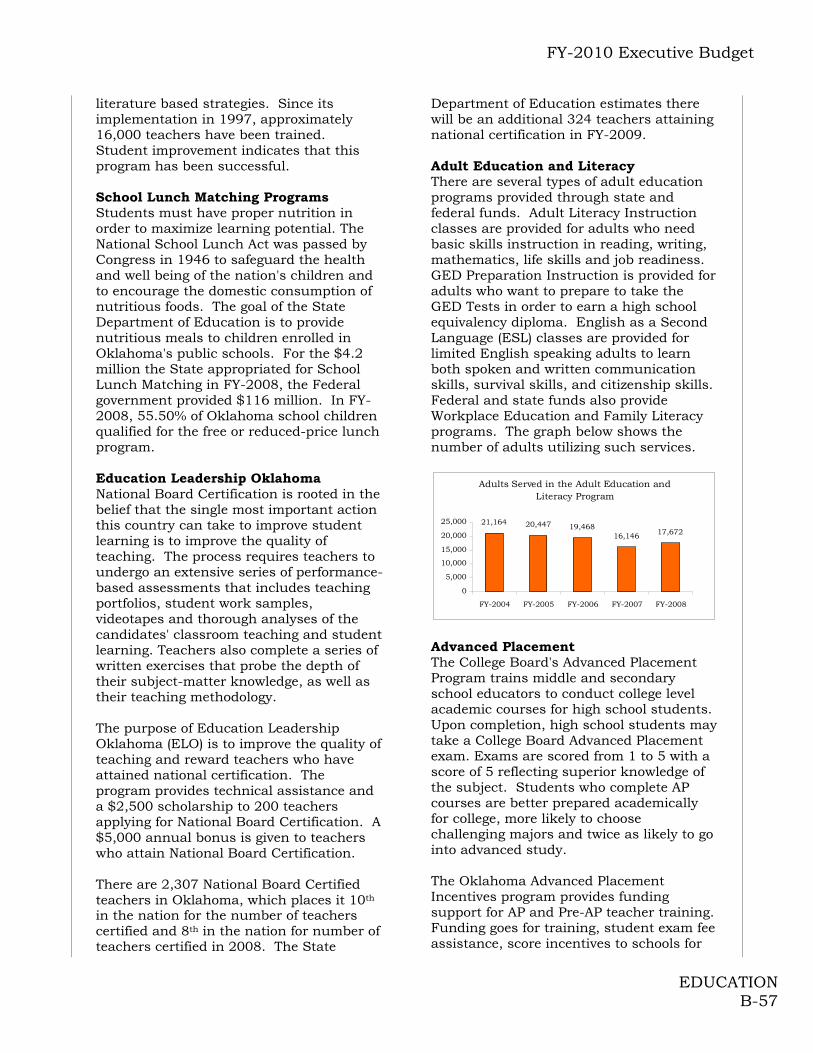
FY-2010 Executive Budget
EDUCATION B-57
literature based strategies. Since its implementation in 1997, approximately 16,000 teachers have been trained. Student improvement indicates that this program has been successful. School Lunch Matching Programs Students must have proper nutrition in order to maximize learning potential. The National School Lunch Act was passed by Congress in 1946 to safeguard the health and well being of the nation's children and to encourage the domestic consumption of nutritious foods. The goal of the State Department of Education is to provide nutritious meals to children enrolled in Oklahoma's public schools. For the $4.2 million the State appropriated for School Lunch Matching in FY-2008, the Federal government provided $116 million. In FY-2008, 55.50% of Oklahoma school children qualified for the free or reduced-price lunch program. Education Leadership Oklahoma National Board Certification is rooted in the belief that the single most important action this country can take to improve student learning is to improve the quality of teaching. The process requires teachers to undergo an extensive series of performance-based assessments that includes teaching portfolios, student work samples, videotapes and thorough analyses of the candidates' classroom teaching and student learning. Teachers also complete a series of written exercises that probe the depth of their subject-matter knowledge, as well as their teaching methodology. The purpose of Education Leadership Oklahoma (ELO) is to improve the quality of teaching and reward teachers who have attained national certification. The program provides technical assistance and a $2,500 scholarship to 200 teachers applying for National Board Certification. A $5,000 annual bonus is given to teachers who attain National Board Certification. There are 2,307 National Board Certified teachers in Oklahoma, which places it 10th in the nation for the number of teachers certified and 8th in the nation for number of teachers certified in 2008. The State
Department of Education estimates there will be an additional 324 teachers attaining national certification in FY-2009. Adult Education and Literacy There are several types of adult education programs provided through state and federal funds. Adult Literacy Instruction classes are provided for adults who need basic skills instruction in reading, writing, mathematics, life skills and job readiness. GED Preparation Instruction is provided for adults who want to prepare to take the GED Tests in order to earn a high school equivalency diploma. English as a Second Language (ESL) classes are provided for limited English speaking adults to learn both spoken and written communication skills, survival skills, and citizenship skills. Federal and state funds also provide Workplace Education and Family Literacy programs. The graph below shows the number of adults utilizing such services.
Adults Served in the Adult Education and Literacy Program
21,164 20,447 19,46816,146 17,672
0
5,000
10,000
15,000
20,000
25,000
FY-2004 FY-2005 FY-2006 FY-2007 FY-2008
Advanced Placement The College Board's Advanced Placement Program trains middle and secondary school educators to conduct college level academic courses for high school students. Upon completion, high school students may take a College Board Advanced Placement exam. Exams are scored from 1 to 5 with a score of 5 reflecting superior knowledge of the subject. Students who complete AP courses are better prepared academically for college, more likely to choose challenging majors and twice as likely to go into advanced study. The Oklahoma Advanced Placement Incentives program provides funding support for AP and Pre-AP teacher training. Funding goes for training, student exam fee assistance, score incentives to schools for

FY-2010 Executive Budget
EDUCATION B-58
AP program development and AP course grants. Data from the College Board’s AP program shows 12,307 Oklahoma public school students took 20,380 exams last school year. The number of exams taken is more than four times the number of exams taken in 1996-97, the year Oklahoma’s AP Incentives program began. Students score a grade of 3, 4 or 5 on almost half of the exams taken, or 8,876, as seen below. Key Performance Measure
AP Scores of 3 and Above
50%49%
45% 45%
45%
0
5,000
10,000
15,000
20,000
25,000
2003 2004 2005 2006 2007
30%
35%
40%
45%
50%
55%
3 and Abo ve Exams Taken % o f To tal with sco ring 3 and Ab o ve
Source: SDE
Mentor Teacher Teachers who have quality mentors during their first years of teaching are more likely to be better teachers and remain in the profession. Since 1981, Oklahoma has required all first year teachers to participate in a residency program. Every first-year teacher is assigned to a committee comprised of a mentor teacher, a higher education professor and the principal. At the end of the school year, the committee recommends whether the first year teacher should receive state certification. The mentor teacher plays the most active role in a teacher’s residency year, providing 72 hours of consultation. State law provides that teacher consultants may receive an annual stipend of not more than $500. The FY-2009 budget included funding for the program in the amount of $700,000.
Statewide Assessments and Outcomes The National Assessment of Educational Progress (NAEP) is the only measure of student achievement in the United States that compares the performance of students in one state with the performance of students across other states. NAEP, sponsored by the U.S. Department of Education, has been conducted for over 30 years. The test is not administered to every student in the country. Instead, a sample size of students representing different socioeconomic, racial and ethnic backgrounds is tested in each state. Results are then extrapolated for aggregate state scores. Reading and writing tests in grades 4 and 8 are administered every other year, with the next administration scheduled for 2009. The following charts are from the National Assessment of Education Progress Report for 2007.
NAEP Grade 4 Reading % Proficient
63 69 66 67 6451
60 646370 72 67 65
58 64 65
0
20
40
60
80
AR CO KS MO Nation NM OK TX
2005 2007
In the 4th grade reading category, Oklahoma finished 5th in the region and 1% below the national average.
NAEP Grade 8 Reading % Proficient
69 75 78 76 7362
72 696978 80 76 72
6372 73
020406080
100
AR CO KS MO Nation NM OK TX
2005 2007
In the 8th grade reading category, Oklahoma finished 5th in the region and equal to the national average.
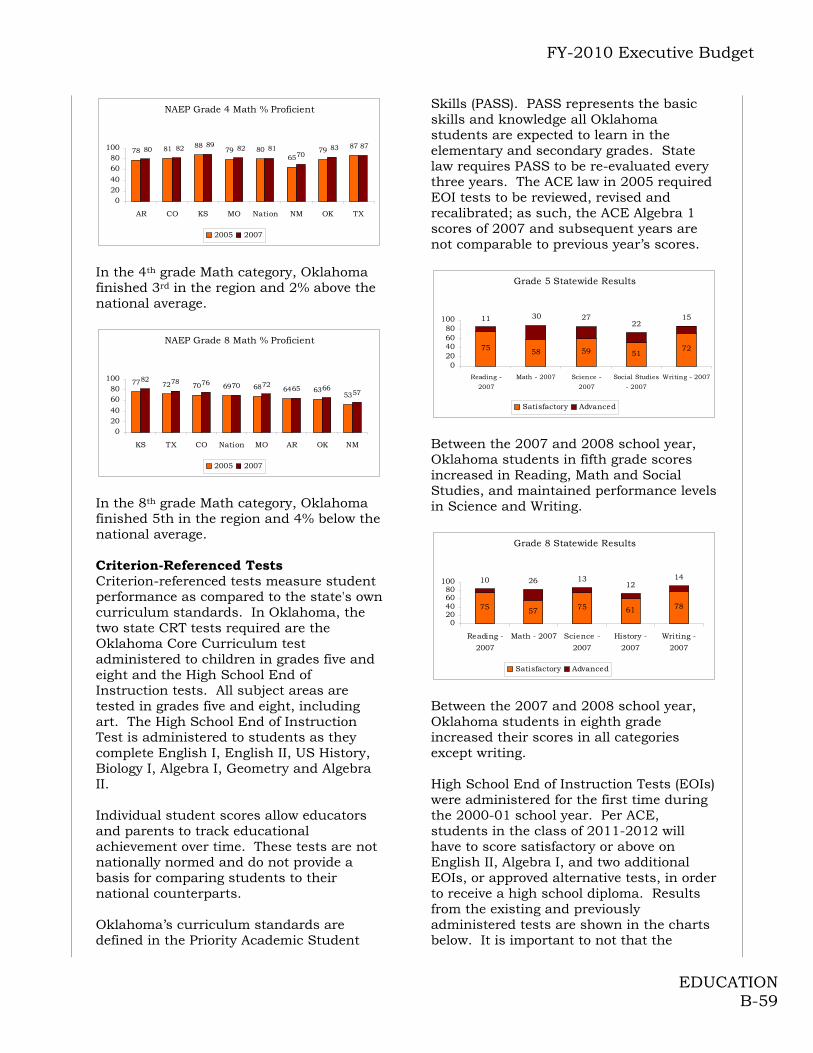
FY-2010 Executive Budget
EDUCATION B-59
NAEP Grade 4 Math % Proficient
78 81 8879 80
6579 87
7087838182898280
020406080
100
AR CO KS MO Nation NM OK TX
2005 2007
In the 4th grade Math category, Oklahoma finished 3rd in the region and 2% above the national average.
NAEP Grade 8 Math % Proficient
77 72 70 69 68 64 6353
82 78 76 70 72 65 6657
020406080
100
KS TX CO Nation MO AR OK NM
2005 2007
In the 8th grade Math category, Oklahoma finished 5th in the region and 4% below the national average. Criterion-Referenced Tests Criterion-referenced tests measure student performance as compared to the state's own curriculum standards. In Oklahoma, the two state CRT tests required are the Oklahoma Core Curriculum test administered to children in grades five and eight and the High School End of Instruction tests. All subject areas are tested in grades five and eight, including art. The High School End of Instruction Test is administered to students as they complete English I, English II, US History, Biology I, Algebra I, Geometry and Algebra II. Individual student scores allow educators and parents to track educational achievement over time. These tests are not nationally normed and do not provide a basis for comparing students to their national counterparts. Oklahoma’s curriculum standards are defined in the Priority Academic Student
Skills (PASS). PASS represents the basic skills and knowledge all Oklahoma students are expected to learn in the elementary and secondary grades. State law requires PASS to be re-evaluated every three years. The ACE law in 2005 required EOI tests to be reviewed, revised and recalibrated; as such, the ACE Algebra 1 scores of 2007 and subsequent years are not comparable to previous year’s scores.
Grade 5 Statewide Results
75 58 59 5172
1522
273011
020406080
100
Reading -
2007
Math - 2007 Science -
2007
Social Studies
- 2007
Writing - 2007
Satisfactory Advanced
Between the 2007 and 2008 school year, Oklahoma students in fifth grade scores increased in Reading, Math and Social Studies, and maintained performance levels in Science and Writing.
Grade 8 Statewide Results
75 57 75 61 78
1412
132610
020406080
100
Reading -
2007
Math - 2007 Science -
2007
History -
2007
Writing -
2007
Satisfactory Advanced
Between the 2007 and 2008 school year, Oklahoma students in eighth grade increased their scores in all categories except writing. High School End of Instruction Tests (EOIs) were administered for the first time during the 2000-01 school year. Per ACE, students in the class of 2011-2012 will have to score satisfactory or above on English II, Algebra I, and two additional EOIs, or approved alternative tests, in order to receive a high school diploma. Results from the existing and previously administered tests are shown in the charts below. It is important to not that the
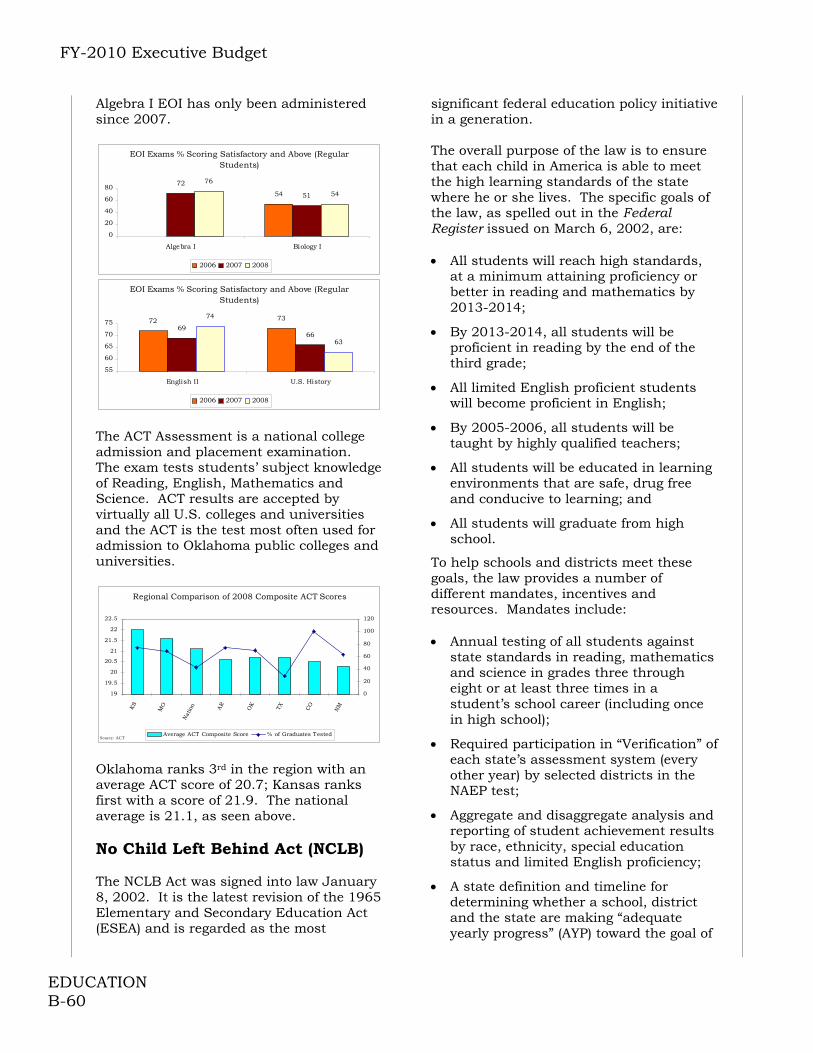
FY-2010 Executive Budget
EDUCATION B-60
Algebra I EOI has only been administered since 2007.
EOI Exams % Scoring Satisfactory and Above (Regular Students)
54
72
51
76
54
0
20
40
60
80
Algebra I Biology I
2006 2007 2008
EOI Exams % Scoring Satisfactory and Above (Regular
Students)
72 73
6966
74
63
55
60
65
70
75
English II U.S. History
2006 2007 2008
The ACT Assessment is a national college admission and placement examination. The exam tests students’ subject knowledge of Reading, English, Mathematics and Science. ACT results are accepted by virtually all U.S. colleges and universities and the ACT is the test most often used for admission to Oklahoma public colleges and universities.
Regional Comparison of 2008 Composite ACT Scores
19
19.5
20
20.5
21
21.5
22
22.5
KS
MO
Nat
ion AR
OK
TX CO
NM
0
20
40
60
80
100
120
Average ACT Composite Score % of Graduates TestedSource: ACT Oklahoma ranks 3rd in the region with an average ACT score of 20.7; Kansas ranks first with a score of 21.9. The national average is 21.1, as seen above. No Child Left Behind Act (NCLB) The NCLB Act was signed into law January 8, 2002. It is the latest revision of the 1965 Elementary and Secondary Education Act (ESEA) and is regarded as the most
significant federal education policy initiative in a generation. The overall purpose of the law is to ensure that each child in America is able to meet the high learning standards of the state where he or she lives. The specific goals of the law, as spelled out in the Federal Register issued on March 6, 2002, are: All students will reach high standards,
at a minimum attaining proficiency or better in reading and mathematics by 2013-2014;
By 2013-2014, all students will be proficient in reading by the end of the third grade;
All limited English proficient students will become proficient in English;
By 2005-2006, all students will be taught by highly qualified teachers;
All students will be educated in learning environments that are safe, drug free and conducive to learning; and
All students will graduate from high school.
To help schools and districts meet these goals, the law provides a number of different mandates, incentives and resources. Mandates include: Annual testing of all students against
state standards in reading, mathematics and science in grades three through eight or at least three times in a student’s school career (including once in high school);
Required participation in “Verification” of each state’s assessment system (every other year) by selected districts in the NAEP test;
Aggregate and disaggregate analysis and reporting of student achievement results by race, ethnicity, special education status and limited English proficiency;
A state definition and timeline for determining whether a school, district and the state are making “adequate yearly progress” (AYP) toward the goal of
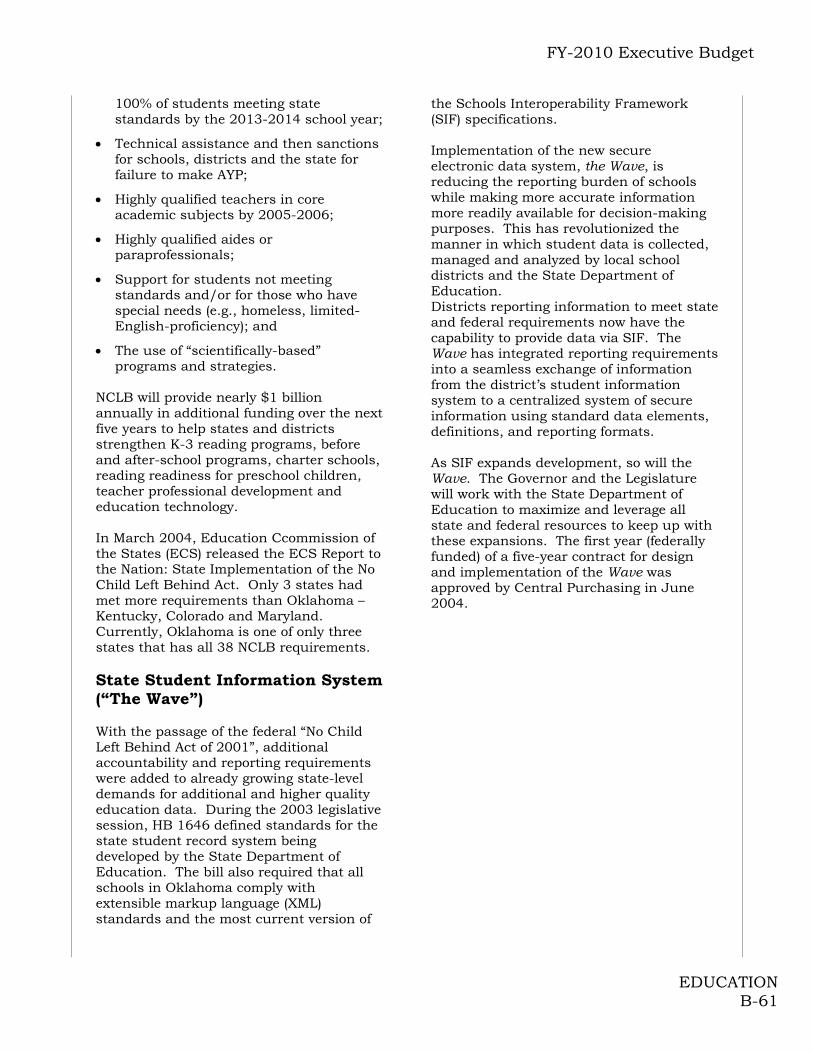
FY-2010 Executive Budget
EDUCATION B-61
100% of students meeting state standards by the 2013-2014 school year;
Technical assistance and then sanctions for schools, districts and the state for failure to make AYP;
Highly qualified teachers in core academic subjects by 2005-2006;
Highly qualified aides or paraprofessionals;
Support for students not meeting standards and/or for those who have special needs (e.g., homeless, limited-English-proficiency); and
The use of “scientifically-based” programs and strategies.
NCLB will provide nearly $1 billion annually in additional funding over the next five years to help states and districts strengthen K-3 reading programs, before and after-school programs, charter schools, reading readiness for preschool children, teacher professional development and education technology. In March 2004, Education Ccommission of the States (ECS) released the ECS Report to the Nation: State Implementation of the No Child Left Behind Act. Only 3 states had met more requirements than Oklahoma – Kentucky, Colorado and Maryland. Currently, Oklahoma is one of only three states that has all 38 NCLB requirements. State Student Information System (“The Wave”) With the passage of the federal “No Child Left Behind Act of 2001”, additional accountability and reporting requirements were added to already growing state-level demands for additional and higher quality education data. During the 2003 legislative session, HB 1646 defined standards for the state student record system being developed by the State Department of Education. The bill also required that all schools in Oklahoma comply with extensible markup language (XML) standards and the most current version of
the Schools Interoperability Framework (SIF) specifications. Implementation of the new secure electronic data system, the Wave, is reducing the reporting burden of schools while making more accurate information more readily available for decision-making purposes. This has revolutionized the manner in which student data is collected, managed and analyzed by local school districts and the State Department of Education. Districts reporting information to meet state and federal requirements now have the capability to provide data via SIF. The Wave has integrated reporting requirements into a seamless exchange of information from the district’s student information system to a centralized system of secure information using standard data elements, definitions, and reporting formats. As SIF expands development, so will the Wave. The Governor and the Legislature will work with the State Department of Education to maximize and leverage all state and federal resources to keep up with these expansions. The first year (federally funded) of a five-year contract for design and implementation of the Wave was approved by Central Purchasing in June 2004.

FY-2010 Executive Budget
EDUCATION B-62
FY-2010 Recommendation
FY-2009 Appropriation $2,531,703
FY-2009 Bud. FTE Level 407.0
Actual Ave. YTD FTE 365.5
Funding Adjustments:Teachers' Retirement 13,201
Flex Benefit Allowance 22,663
ACE Remediation 1,500
ACE Alternative Test Reimbursement 210School Lunch Match 17710% Travel Reduction (147)SoonerStart 1,300Teacher Working Condition Survey 100Proposed Fee Increase (2,251)
Total Adjustments 36,753
FY-2010 Recommendation $2,568,456
% Change from FY-2009 1.45%
Source: Office of State Finance
FY-2010 Appropriation(amounts in thousands)
Teachers’ Retirement Increase The Governor’s Budget includes $13,201,465 million for agency Teachers’ Retirement Increases. Flexible Benefit Allowance The Governor’s budget includes $22,662,808 for required increases to Health Care programs. ACE Remediation The Governor’s budget proposes $1.5 million to fund remediation costs associated with implementing the ACE Act of 2005. ACE Alternative Test Reimbursement The Governor’s budget proposes $210,000 to fund alternative testing costs associated with implementing the ACE Act of 2005. School Lunch Match The Governor’s budget includes $176,972 to meet the continuing rise in total lunch participation and the rise in federal reimbursement rates.
Travel Reduction Agency travel funds are reduced by 10% ($147,215). SoonerStart The Governor’s budget includes $1.3 million to fund costs associated with the SoonerStart program. Teacher Working Condition Survey The Governor’s budget recommends $100,000 to fund a teacher working condition survey. Proposed Fee Increases The Governor's budget recommends fee increases at the State Department of Education in the amount of $2,251,250. The agency's appropriation is reduced accordingly.
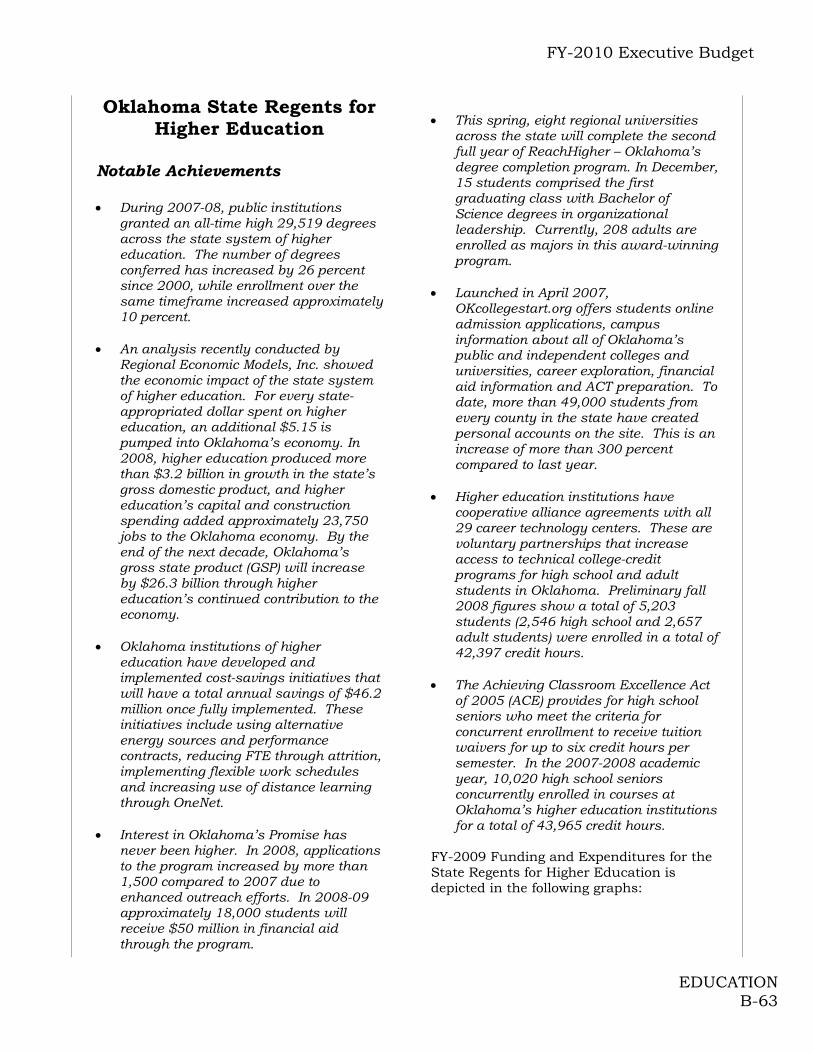
FY-2010 Executive Budget
EDUCATION B-63
Oklahoma State Regents for Higher Education
Notable Achievements During 2007-08, public institutions
granted an all-time high 29,519 degrees across the state system of higher education. The number of degrees conferred has increased by 26 percent since 2000, while enrollment over the same timeframe increased approximately 10 percent.
An analysis recently conducted by Regional Economic Models, Inc. showed the economic impact of the state system of higher education. For every state-appropriated dollar spent on higher education, an additional $5.15 is pumped into Oklahoma’s economy. In 2008, higher education produced more than $3.2 billion in growth in the state’s gross domestic product, and higher education’s capital and construction spending added approximately 23,750 jobs to the Oklahoma economy. By the end of the next decade, Oklahoma’s gross state product (GSP) will increase by $26.3 billion through higher education’s continued contribution to the economy.
Oklahoma institutions of higher education have developed and implemented cost-savings initiatives that will have a total annual savings of $46.2 million once fully implemented. These initiatives include using alternative energy sources and performance contracts, reducing FTE through attrition, implementing flexible work schedules and increasing use of distance learning through OneNet.
Interest in Oklahoma’s Promise has
never been higher. In 2008, applications to the program increased by more than 1,500 compared to 2007 due to enhanced outreach efforts. In 2008-09 approximately 18,000 students will receive $50 million in financial aid through the program.
This spring, eight regional universities
across the state will complete the second full year of ReachHigher – Oklahoma’s degree completion program. In December, 15 students comprised the first graduating class with Bachelor of Science degrees in organizational leadership. Currently, 208 adults are enrolled as majors in this award-winning program.
Launched in April 2007,
OKcollegestart.org offers students online admission applications, campus information about all of Oklahoma’s public and independent colleges and universities, career exploration, financial aid information and ACT preparation. To date, more than 49,000 students from every county in the state have created personal accounts on the site. This is an increase of more than 300 percent compared to last year.
Higher education institutions have cooperative alliance agreements with all 29 career technology centers. These are voluntary partnerships that increase access to technical college-credit programs for high school and adult students in Oklahoma. Preliminary fall 2008 figures show a total of 5,203 students (2,546 high school and 2,657 adult students) were enrolled in a total of 42,397 credit hours.
The Achieving Classroom Excellence Act
of 2005 (ACE) provides for high school seniors who meet the criteria for concurrent enrollment to receive tuition waivers for up to six credit hours per semester. In the 2007-2008 academic year, 10,020 high school seniors concurrently enrolled in courses at Oklahoma’s higher education institutions for a total of 43,965 credit hours.
FY-2009 Funding and Expenditures for the State Regents for Higher Education is depicted in the following graphs:
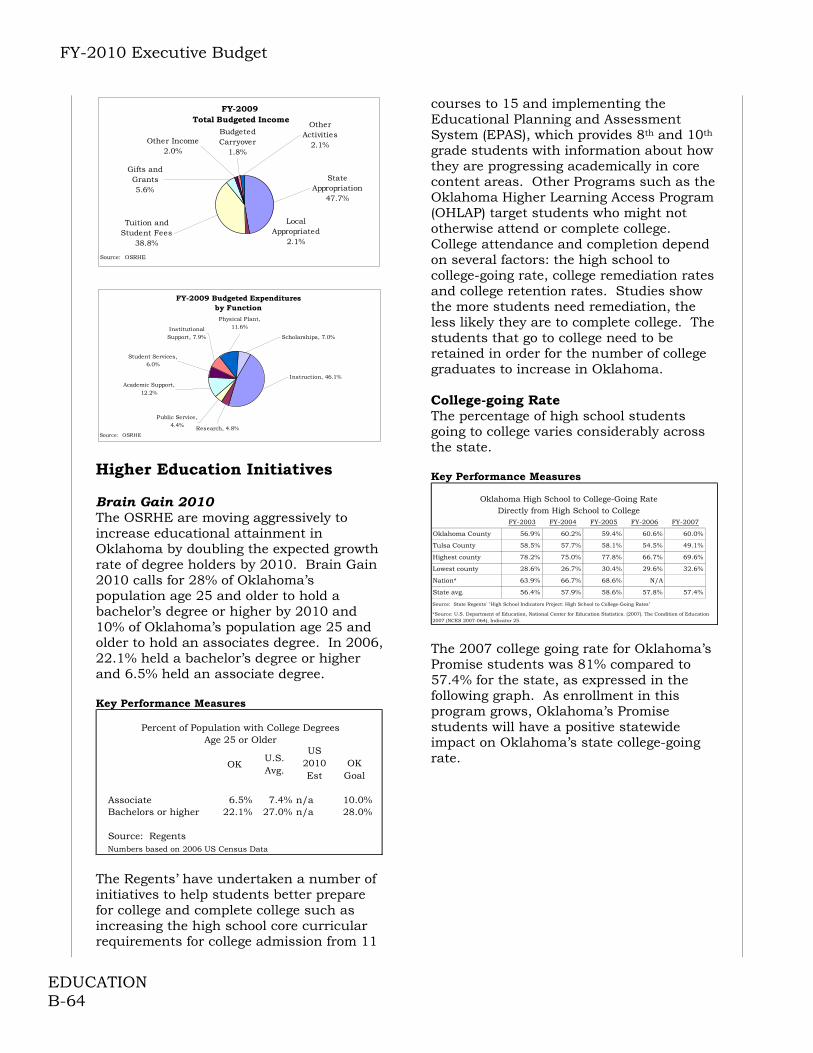
FY-2010 Executive Budget
EDUCATION B-64
FY-2009 Total Budgeted Income
Budgeted Carryover
1.8%
Other Income2.0%
Gifts and Grants5.6%
Local Appropriated
2.1%
Tuition and Student Fees
38.8%
State Appropriation
47.7%
Other Activities
2.1%
Source: OSRHE
FY-2009 Budgeted Expenditures by Function
Scholarships, 7.0%
Physical Plant, 11.6%Institutional
Support, 7.9%
Student Services, 6.0%
Academic Support, 12.2%
Research, 4.8%
Public Service, 4.4%
Instruction, 46.1%
Source: OSRHE Higher Education Initiatives Brain Gain 2010 The OSRHE are moving aggressively to increase educational attainment in Oklahoma by doubling the expected growth rate of degree holders by 2010. Brain Gain 2010 calls for 28% of Oklahoma’s population age 25 and older to hold a bachelor’s degree or higher by 2010 and 10% of Oklahoma’s population age 25 and older to hold an associates degree. In 2006, 22.1% held a bachelor’s degree or higher and 6.5% held an associate degree. Key Performance Measures
Percent of Population with College DegreesAge 25 or Older
OKU.S. Avg.
US 2010 Est
OK Goal
Associate 6.5% 7.4% n/a 10.0%Bachelors or higher 22.1% 27.0% n/a 28.0%
Source: RegentsNumbers based on 2006 US Census Data
The Regents’ have undertaken a number of initiatives to help students better prepare for college and complete college such as increasing the high school core curricular requirements for college admission from 11
courses to 15 and implementing the Educational Planning and Assessment System (EPAS), which provides 8th and 10th grade students with information about how they are progressing academically in core content areas. Other Programs such as the Oklahoma Higher Learning Access Program (OHLAP) target students who might not otherwise attend or complete college. College attendance and completion depend on several factors: the high school to college-going rate, college remediation rates and college retention rates. Studies show the more students need remediation, the less likely they are to complete college. The students that go to college need to be retained in order for the number of college graduates to increase in Oklahoma. College-going Rate The percentage of high school students going to college varies considerably across the state. Key Performance Measures
Oklahoma High School to College-Going RateDirectly from High School to College
FY-2003 FY-2004 FY-2005 FY-2006 FY-2007
Oklahoma County 56.9% 60.2% 59.4% 60.6% 60.0%
Tulsa County 58.5% 57.7% 58.1% 54.5% 49.1%
Highest county 78.2% 75.0% 77.8% 66.7% 69.6%
Lowest county 28.6% 26.7% 30.4% 29.6% 32.6%
Nation* 63.9% 66.7% 68.6% N/A
State avg. 56.4% 57.9% 58.6% 57.8% 57.4%
Source: State Regents' "High School Indicators Project: High School to College-Going Rates"
*Source: U.S. Department of Education, National Center for Education Statistics. (2007). The Condition of Education 2007 (NCES 2007-064), Indicator 25. The 2007 college going rate for Oklahoma’s Promise students was 81% compared to 57.4% for the state, as expressed in the following graph. As enrollment in this program grows, Oklahoma’s Promise students will have a positive statewide impact on Oklahoma’s state college-going rate.
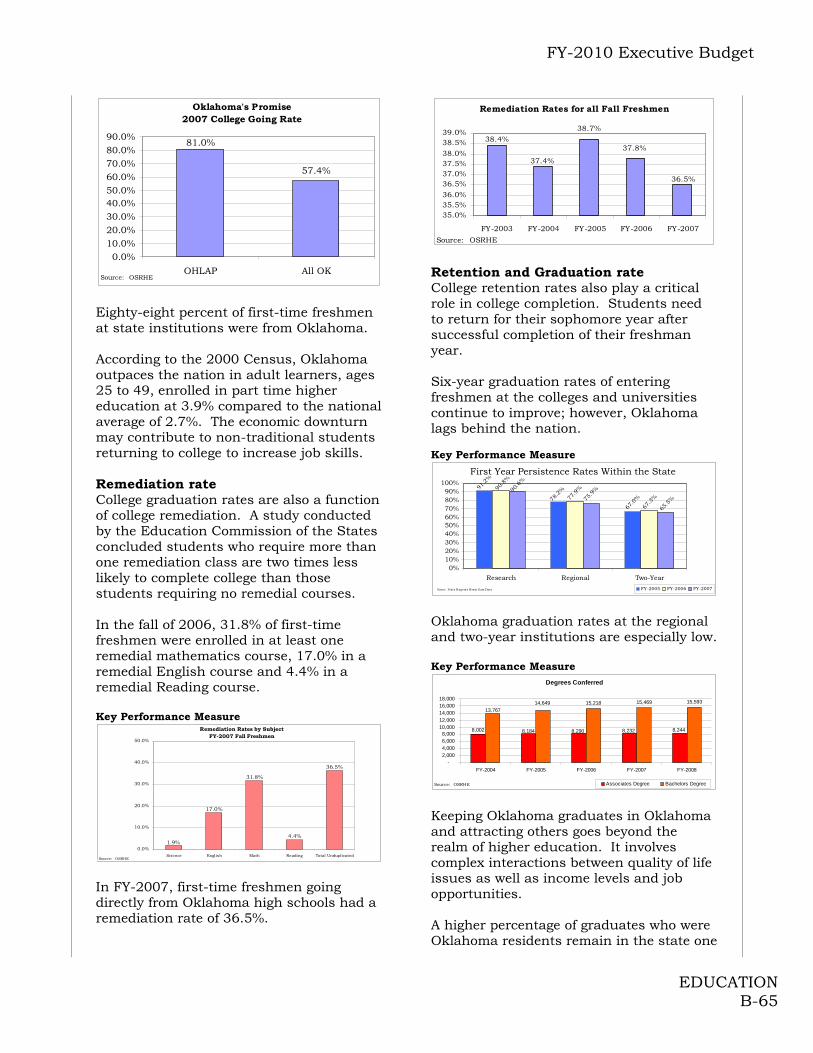
FY-2010 Executive Budget
EDUCATION B-65
Oklahoma's Promise2007 College Going Rate
57.4%
81.0%
0.0%10.0%20.0%30.0%40.0%50.0%60.0%70.0%80.0%90.0%
OHLAP All OKSource: OSRHE
Eighty-eight percent of first-time freshmen at state institutions were from Oklahoma. According to the 2000 Census, Oklahoma outpaces the nation in adult learners, ages 25 to 49, enrolled in part time higher education at 3.9% compared to the national average of 2.7%. The economic downturn may contribute to non-traditional students returning to college to increase job skills. Remediation rate College graduation rates are also a function of college remediation. A study conducted by the Education Commission of the States concluded students who require more than one remediation class are two times less likely to complete college than those students requiring no remedial courses. In the fall of 2006, 31.8% of first-time freshmen were enrolled in at least one remedial mathematics course, 17.0% in a remedial English course and 4.4% in a remedial Reading course. Key Performance Measure
Remediation Rates by Subject FY-2007 Fall Freshmen
36.5%
4.4%
31.8%
17.0%
1.9%0.0%
10.0%
20.0%
30.0%
40.0%
50.0%
Science English Math Reading Total Unduplicated
S R t "R di ti R t " Source: OSRHE In FY-2007, first-time freshmen going directly from Oklahoma high schools had a remediation rate of 36.5%.
Remediation Rates for all Fall Freshmen
38.7%
36.5%
37.8%
37.4%
38.4%
35.0%35.5%36.0%36.5%37.0%37.5%38.0%38.5%39.0%
FY-2003 FY-2004 FY-2005 FY-2006 FY-2007
Source: OSRHE Retention and Graduation rate College retention rates also play a critical role in college completion. Students need to return for their sophomore year after successful completion of their freshman year. Six-year graduation rates of entering freshmen at the colleges and universities continue to improve; however, Oklahoma lags behind the nation. Key Performance Measure
First Year Persistence Rates Within the State
67.0
%78.2
%91.2
%
77.9
%90.8
%
67.3
%
65.5
%75.9
%90.6
%
0%10%20%30%40%50%60%70%80%90%
100%
Research Regional Two-Year
FY-2005 FY-2006 FY-2007Surce: State Reg ents Brain Gain Data
Oklahoma graduation rates at the regional and two-year institutions are especially low. Key Performance Measure
Degrees Conferred
15,218 15,469 15,593
8,2448,2328,2908,1848,002
14,649
13,767
-2,0004,000
6,0008,000
10,00012,000
14,00016,00018,000
FY-2004 FY-2005 FY-2006 FY-2007 FY-2008
Associates Degree Bachelors DegreeSource: OSRHE Keeping Oklahoma graduates in Oklahoma and attracting others goes beyond the realm of higher education. It involves complex interactions between quality of life issues as well as income levels and job opportunities. A higher percentage of graduates who were Oklahoma residents remain in the state one
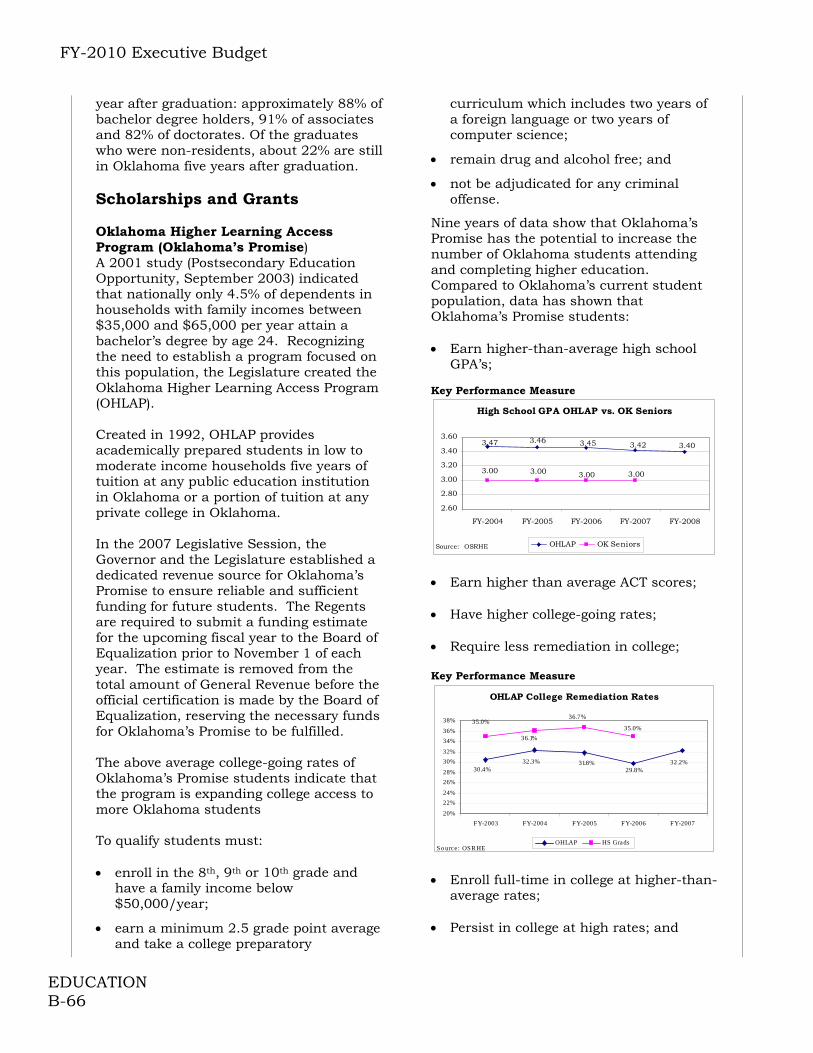
FY-2010 Executive Budget
EDUCATION B-66
year after graduation: approximately 88% of bachelor degree holders, 91% of associates and 82% of doctorates. Of the graduates who were non-residents, about 22% are still in Oklahoma five years after graduation. Scholarships and Grants Oklahoma Higher Learning Access Program (Oklahoma’s Promise) A 2001 study (Postsecondary Education Opportunity, September 2003) indicated that nationally only 4.5% of dependents in households with family incomes between $35,000 and $65,000 per year attain a bachelor’s degree by age 24. Recognizing the need to establish a program focused on this population, the Legislature created the Oklahoma Higher Learning Access Program (OHLAP). Created in 1992, OHLAP provides academically prepared students in low to moderate income households five years of tuition at any public education institution in Oklahoma or a portion of tuition at any private college in Oklahoma. In the 2007 Legislative Session, the Governor and the Legislature established a dedicated revenue source for Oklahoma’s Promise to ensure reliable and sufficient funding for future students. The Regents are required to submit a funding estimate for the upcoming fiscal year to the Board of Equalization prior to November 1 of each year. The estimate is removed from the total amount of General Revenue before the official certification is made by the Board of Equalization, reserving the necessary funds for Oklahoma’s Promise to be fulfilled. The above average college-going rates of Oklahoma’s Promise students indicate that the program is expanding college access to more Oklahoma students To qualify students must: enroll in the 8th, 9th or 10th grade and
have a family income below $50,000/year;
earn a minimum 2.5 grade point average and take a college preparatory
curriculum which includes two years of a foreign language or two years of computer science;
remain drug and alcohol free; and
not be adjudicated for any criminal offense.
Nine years of data show that Oklahoma’s Promise has the potential to increase the number of Oklahoma students attending and completing higher education. Compared to Oklahoma’s current student population, data has shown that Oklahoma’s Promise students: Earn higher-than-average high school
GPA’s; Key Performance Measure
High School GPA OHLAP vs. OK Seniors
3.47 3.46 3.45 3.42 3.40
3.003.003.003.00
2.60
2.80
3.00
3.20
3.40
3.60
FY-2004 FY-2005 FY-2006 FY-2007 FY-2008
OHLAP OK SeniorsSource: OSRHE
Earn higher than average ACT scores; Have higher college-going rates; Require less remediation in college; Key Performance Measure
OHLAP College Remediation Rates
32.2%29.8%
31.8%32.3%30.4%
35.0%
36.7%
36.1%
35.0%
20%
22%
24%
26%
28%
30%
32%
34%
36%
38%
FY-2003 FY-2004 FY-2005 FY-2006 FY-2007
OHLAP HS GradsSo urce: OSRHE
Enroll full-time in college at higher-than-
average rates; Persist in college at high rates; and
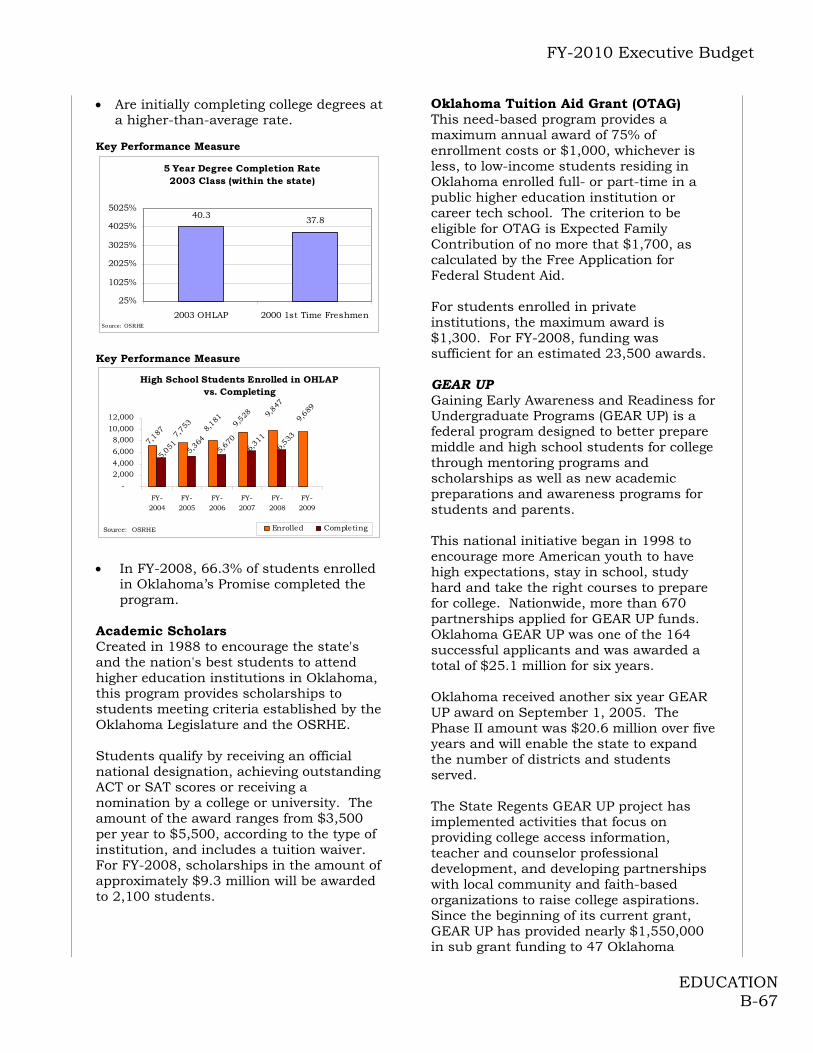
FY-2010 Executive Budget
EDUCATION B-67
Are initially completing college degrees at a higher-than-average rate.
Key Performance Measure
5 Year Degree Completion Rate2003 Class (within the state)
40.3 37.8
25%
1025%
2025%
3025%
4025%
5025%
2003 OHLAP 2000 1st Time FreshmenSo urce: OSRHE
Key Performance Measure
High School Students Enrolled in OHLAPvs. Completing
9,5
28
7,7
53
7,1
87
9,8
47
8,1
81
9,6
89
6,5
33
6,3
11
5,6
70
5,3
64
5,0
51
-
2,0004,000
6,000
8,00010,000
12,000
FY-2004
FY-2005
FY-2006
FY-2007
FY-2008
FY-2009
Enrolled CompletingSource: OSRHE In FY-2008, 66.3% of students enrolled
in Oklahoma’s Promise completed the program.
Academic Scholars Created in 1988 to encourage the state's and the nation's best students to attend higher education institutions in Oklahoma, this program provides scholarships to students meeting criteria established by the Oklahoma Legislature and the OSRHE. Students qualify by receiving an official national designation, achieving outstanding ACT or SAT scores or receiving a nomination by a college or university. The amount of the award ranges from $3,500 per year to $5,500, according to the type of institution, and includes a tuition waiver. For FY-2008, scholarships in the amount of approximately $9.3 million will be awarded to 2,100 students.
Oklahoma Tuition Aid Grant (OTAG) This need-based program provides a maximum annual award of 75% of enrollment costs or $1,000, whichever is less, to low-income students residing in Oklahoma enrolled full- or part-time in a public higher education institution or career tech school. The criterion to be eligible for OTAG is Expected Family Contribution of no more that $1,700, as calculated by the Free Application for Federal Student Aid. For students enrolled in private institutions, the maximum award is $1,300. For FY-2008, funding was sufficient for an estimated 23,500 awards. GEAR UP Gaining Early Awareness and Readiness for Undergraduate Programs (GEAR UP) is a federal program designed to better prepare middle and high school students for college through mentoring programs and scholarships as well as new academic preparations and awareness programs for students and parents. This national initiative began in 1998 to encourage more American youth to have high expectations, stay in school, study hard and take the right courses to prepare for college. Nationwide, more than 670 partnerships applied for GEAR UP funds. Oklahoma GEAR UP was one of the 164 successful applicants and was awarded a total of $25.1 million for six years. Oklahoma received another six year GEAR UP award on September 1, 2005. The Phase II amount was $20.6 million over five years and will enable the state to expand the number of districts and students served. The State Regents GEAR UP project has implemented activities that focus on providing college access information, teacher and counselor professional development, and developing partnerships with local community and faith-based organizations to raise college aspirations. Since the beginning of its current grant, GEAR UP has provided nearly $1,550,000 in sub grant funding to 47 Oklahoma
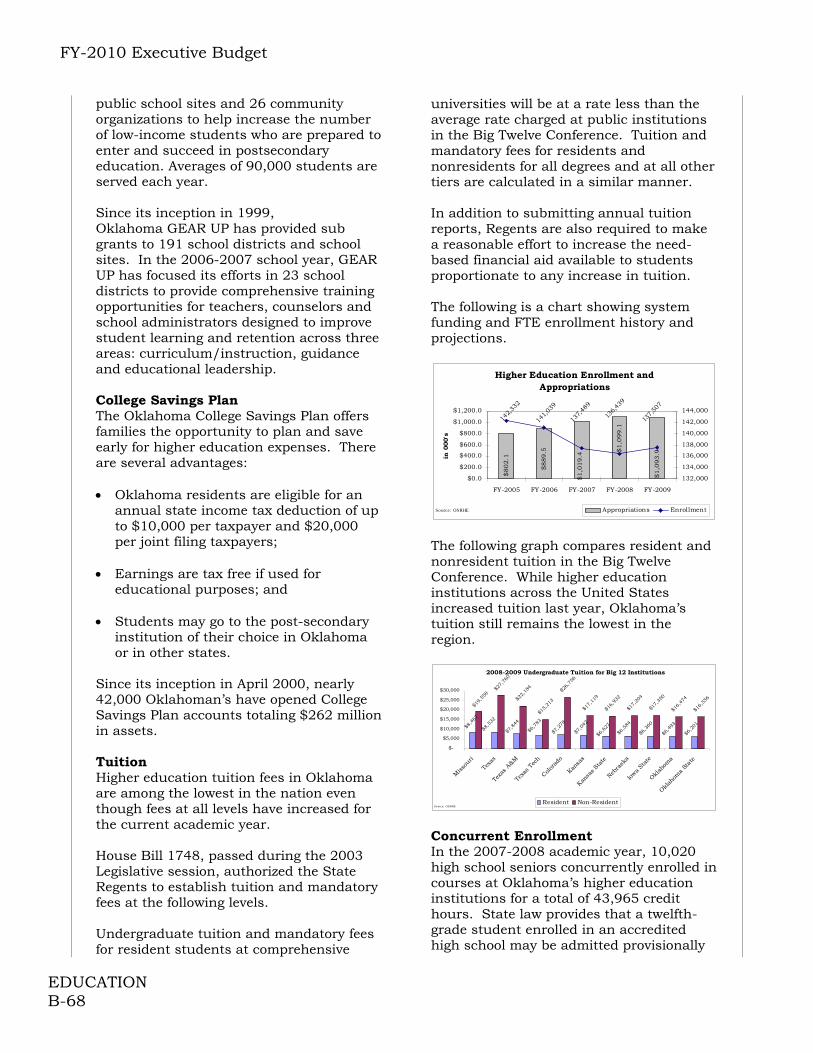
FY-2010 Executive Budget
EDUCATION B-68
public school sites and 26 community organizations to help increase the number of low-income students who are prepared to enter and succeed in postsecondary education. Averages of 90,000 students are served each year. Since its inception in 1999, Oklahoma GEAR UP has provided sub grants to 191 school districts and school sites. In the 2006-2007 school year, GEAR UP has focused its efforts in 23 school districts to provide comprehensive training opportunities for teachers, counselors and school administrators designed to improve student learning and retention across three areas: curriculum/instruction, guidance and educational leadership. College Savings Plan The Oklahoma College Savings Plan offers families the opportunity to plan and save early for higher education expenses. There are several advantages: Oklahoma residents are eligible for an
annual state income tax deduction of up to $10,000 per taxpayer and $20,000 per joint filing taxpayers;
Earnings are tax free if used for
educational purposes; and Students may go to the post-secondary
institution of their choice in Oklahoma or in other states.
Since its inception in April 2000, nearly 42,000 Oklahoman’s have opened College Savings Plan accounts totaling $262 million in assets. Tuition Higher education tuition fees in Oklahoma are among the lowest in the nation even though fees at all levels have increased for the current academic year. House Bill 1748, passed during the 2003 Legislative session, authorized the State Regents to establish tuition and mandatory fees at the following levels. Undergraduate tuition and mandatory fees for resident students at comprehensive
universities will be at a rate less than the average rate charged at public institutions in the Big Twelve Conference. Tuition and mandatory fees for residents and nonresidents for all degrees and at all other tiers are calculated in a similar manner. In addition to submitting annual tuition reports, Regents are also required to make a reasonable effort to increase the need-based financial aid available to students proportionate to any increase in tuition. The following is a chart showing system funding and FTE enrollment history and projections.
Higher Education Enrollment and Appropriations
$802.1
$889.5
$1,0
19.4
$1
,093
.9$1,0
99.1
136
,439
137,
489
141,
039
142,
332
137
,507
$0.0
$200.0
$400.0
$600.0
$800.0
$1,000.0
$1,200.0
FY-2005 FY-2006 FY-2007 FY-2008 FY-2009
in 0
00's
132,000
134,000
136,000
138,000
140,000
142,000
144,000
Appropriations EnrollmentSo urce: OSRHE
The following graph compares resident and nonresident tuition in the Big Twelve Conference. While higher education institutions across the United States increased tuition last year, Oklahoma’s tuition still remains the lowest in the region.
2008-2009 Undergraduate Tuition for Big 12 Institutions
$22
,184
$15
,213
$
26,7
56
$17
,119
$16
,932
$17
,204
$17
,350
$16
,474
$16
,556
$6,
201
$6,
493
$6,
360
$6,
584
$6,
627
$7,
042
$7,
278
$6,
783
$7,
844
$8,
532
$8,
467
$19
,558
$27
,760
$-
$5,000
$10,000
$15,000
$20,000
$25,000
$30,000
Miss
ouri
Texa
s
Texa
s A&
M
Texa
s Te
ch
Color
ado
Kansa
s
Kansa
s Sta
te
Nebra
ska
Iowa
State
Oklah
oma
Oklah
oma
Stat
e
Resident Non-ResidentSo urce: OSRHE Concurrent Enrollment In the 2007-2008 academic year, 10,020 high school seniors concurrently enrolled in courses at Oklahoma’s higher education institutions for a total of 43,965 credit hours. State law provides that a twelfth-grade student enrolled in an accredited high school may be admitted provisionally
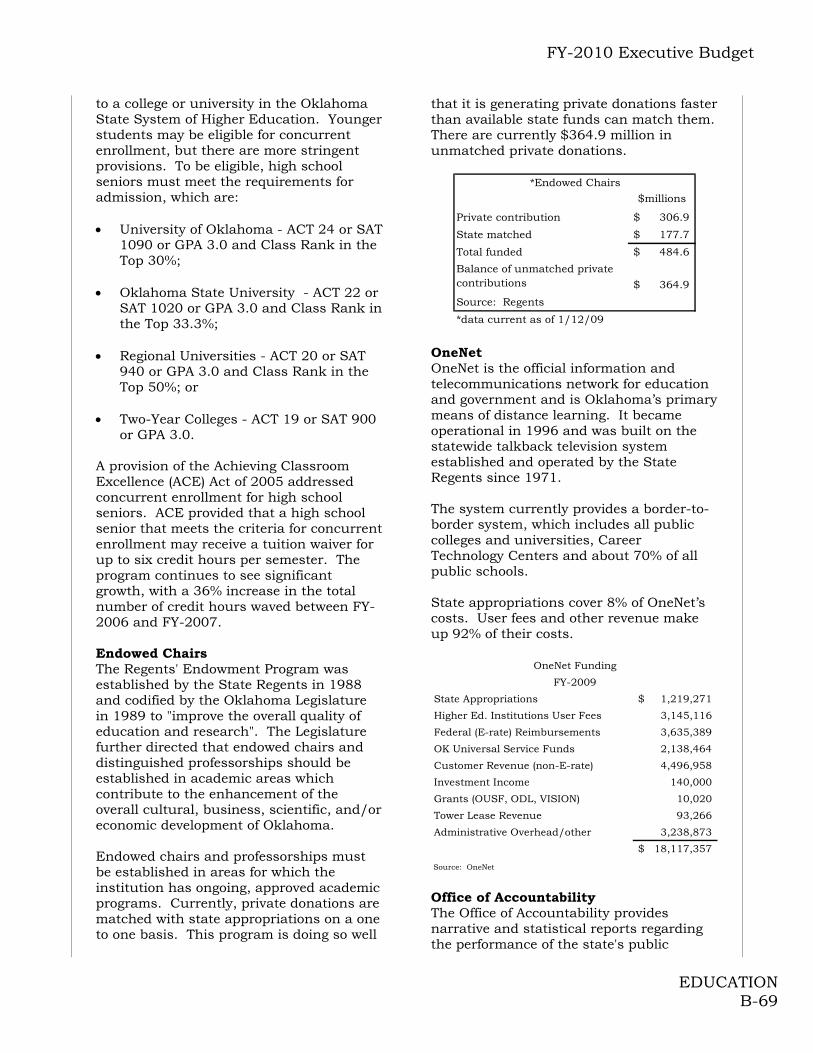
FY-2010 Executive Budget
EDUCATION B-69
to a college or university in the Oklahoma State System of Higher Education. Younger students may be eligible for concurrent enrollment, but there are more stringent provisions. To be eligible, high school seniors must meet the requirements for admission, which are: University of Oklahoma - ACT 24 or SAT
1090 or GPA 3.0 and Class Rank in the Top 30%;
Oklahoma State University - ACT 22 or
SAT 1020 or GPA 3.0 and Class Rank in the Top 33.3%;
Regional Universities - ACT 20 or SAT
940 or GPA 3.0 and Class Rank in the Top 50%; or
Two-Year Colleges - ACT 19 or SAT 900
or GPA 3.0. A provision of the Achieving Classroom Excellence (ACE) Act of 2005 addressed concurrent enrollment for high school seniors. ACE provided that a high school senior that meets the criteria for concurrent enrollment may receive a tuition waiver for up to six credit hours per semester. The program continues to see significant growth, with a 36% increase in the total number of credit hours waved between FY-2006 and FY-2007. Endowed Chairs The Regents' Endowment Program was established by the State Regents in 1988 and codified by the Oklahoma Legislature in 1989 to "improve the overall quality of education and research". The Legislature further directed that endowed chairs and distinguished professorships should be established in academic areas which contribute to the enhancement of the overall cultural, business, scientific, and/or economic development of Oklahoma. Endowed chairs and professorships must be established in areas for which the institution has ongoing, approved academic programs. Currently, private donations are matched with state appropriations on a one to one basis. This program is doing so well
that it is generating private donations faster than available state funds can match them. There are currently $364.9 million in unmatched private donations.
$millions
Private contribution 306.9$
State matched 177.7$
Total funded 484.6$
Balance of unmatched private contributions 364.9$
Source: Regents
*data current as of 1/12/09
*Endowed Chairs
OneNet OneNet is the official information and telecommunications network for education and government and is Oklahoma’s primary means of distance learning. It became operational in 1996 and was built on the statewide talkback television system established and operated by the State Regents since 1971. The system currently provides a border-to-border system, which includes all public colleges and universities, Career Technology Centers and about 70% of all public schools. State appropriations cover 8% of OneNet’s costs. User fees and other revenue make up 92% of their costs.
State Appropriations 1,219,271$
Higher Ed. Institutions User Fees 3,145,116
Federal (E-rate) Reimbursements 3,635,389
OK Universal Service Funds 2,138,464
Customer Revenue (non-E-rate) 4,496,958
Investment Income 140,000
Grants (OUSF, ODL, VISION) 10,020
Tower Lease Revenue 93,266
Administrative Overhead/other 3,238,873
18,117,357$
Source: OneNet
OneNet Funding
FY-2009
Office of Accountability The Office of Accountability provides narrative and statistical reports regarding the performance of the state's public
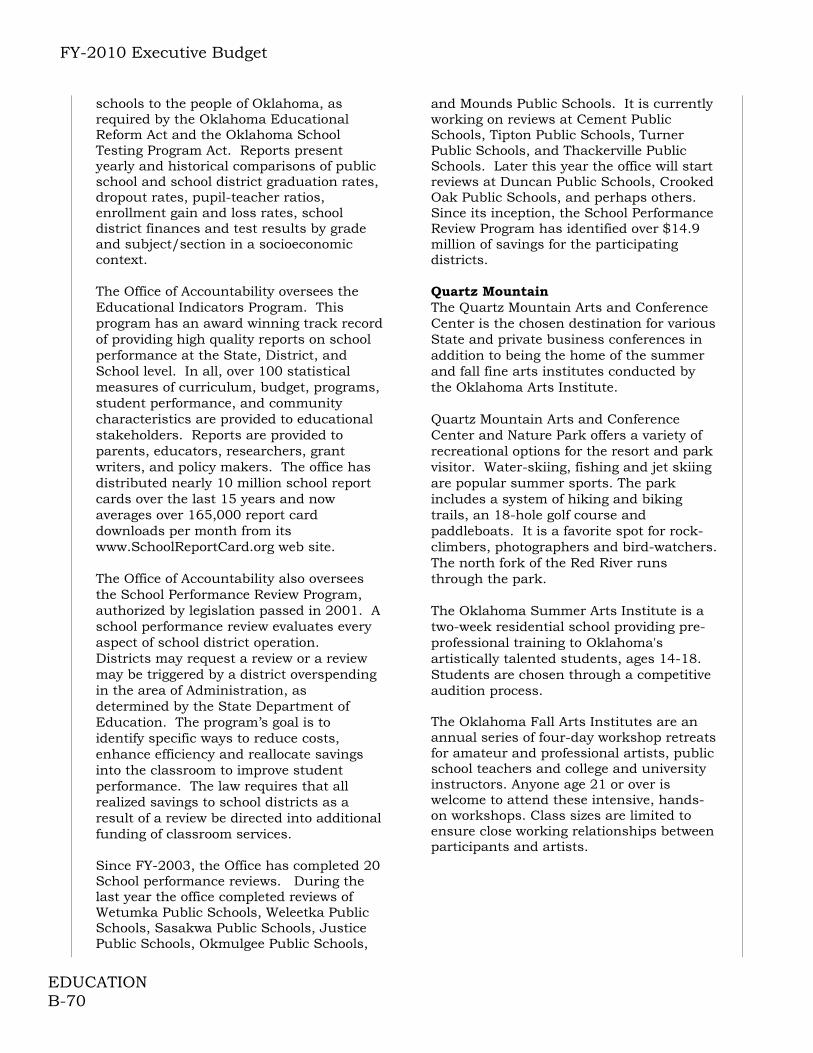
FY-2010 Executive Budget
EDUCATION B-70
schools to the people of Oklahoma, as required by the Oklahoma Educational Reform Act and the Oklahoma School Testing Program Act. Reports present yearly and historical comparisons of public school and school district graduation rates, dropout rates, pupil-teacher ratios, enrollment gain and loss rates, school district finances and test results by grade and subject/section in a socioeconomic context. The Office of Accountability oversees the Educational Indicators Program. This program has an award winning track record of providing high quality reports on school performance at the State, District, and School level. In all, over 100 statistical measures of curriculum, budget, programs, student performance, and community characteristics are provided to educational stakeholders. Reports are provided to parents, educators, researchers, grant writers, and policy makers. The office has distributed nearly 10 million school report cards over the last 15 years and now averages over 165,000 report card downloads per month from its www.SchoolReportCard.org web site. The Office of Accountability also oversees the School Performance Review Program, authorized by legislation passed in 2001. A school performance review evaluates every aspect of school district operation. Districts may request a review or a review may be triggered by a district overspending in the area of Administration, as determined by the State Department of Education. The program’s goal is to identify specific ways to reduce costs, enhance efficiency and reallocate savings into the classroom to improve student performance. The law requires that all realized savings to school districts as a result of a review be directed into additional funding of classroom services. Since FY-2003, the Office has completed 20 School performance reviews. During the last year the office completed reviews of Wetumka Public Schools, Weleetka Public Schools, Sasakwa Public Schools, Justice Public Schools, Okmulgee Public Schools,
and Mounds Public Schools. It is currently working on reviews at Cement Public Schools, Tipton Public Schools, Turner Public Schools, and Thackerville Public Schools. Later this year the office will start reviews at Duncan Public Schools, Crooked Oak Public Schools, and perhaps others. Since its inception, the School Performance Review Program has identified over $14.9 million of savings for the participating districts. Quartz Mountain The Quartz Mountain Arts and Conference Center is the chosen destination for various State and private business conferences in addition to being the home of the summer and fall fine arts institutes conducted by the Oklahoma Arts Institute. Quartz Mountain Arts and Conference Center and Nature Park offers a variety of recreational options for the resort and park visitor. Water-skiing, fishing and jet skiing are popular summer sports. The park includes a system of hiking and biking trails, an 18-hole golf course and paddleboats. It is a favorite spot for rock-climbers, photographers and bird-watchers. The north fork of the Red River runs through the park. The Oklahoma Summer Arts Institute is a two-week residential school providing pre-professional training to Oklahoma's artistically talented students, ages 14-18. Students are chosen through a competitive audition process. The Oklahoma Fall Arts Institutes are an annual series of four-day workshop retreats for amateur and professional artists, public school teachers and college and university instructors. Anyone age 21 or over is welcome to attend these intensive, hands-on workshops. Class sizes are limited to ensure close working relationships between participants and artists.
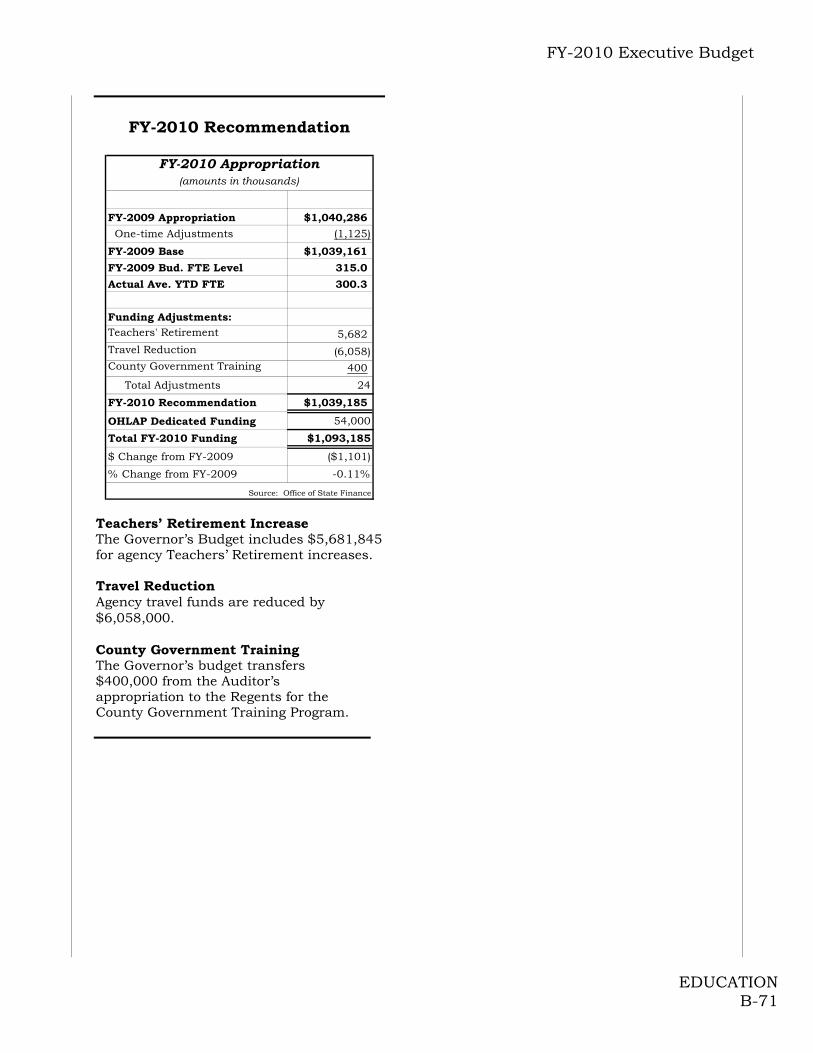
FY-2010 Executive Budget
EDUCATION B-71
FY-2010 Recommendation
FY-2009 Appropriation $1,040,286
One-time Adjustments (1,125)
FY-2009 Base $1,039,161
FY-2009 Bud. FTE Level 315.0
Actual Ave. YTD FTE 300.3
Funding Adjustments:Teachers' Retirement 5,682Travel Reduction (6,058)County Government Training 400
Total Adjustments 24
FY-2010 Recommendation $1,039,185
OHLAP Dedicated Funding 54,000
Total FY-2010 Funding $1,093,185
$ Change from FY-2009 ($1,101)
% Change from FY-2009 -0.11%
(amounts in thousands)
Source: Office of State Finance
FY-2010 Appropriation
Teachers’ Retirement Increase The Governor’s Budget includes $5,681,845 for agency Teachers’ Retirement increases. Travel Reduction Agency travel funds are reduced by $6,058,000. County Government Training The Governor’s budget transfers $400,000 from the Auditor’s appropriation to the Regents for the County Government Training Program.
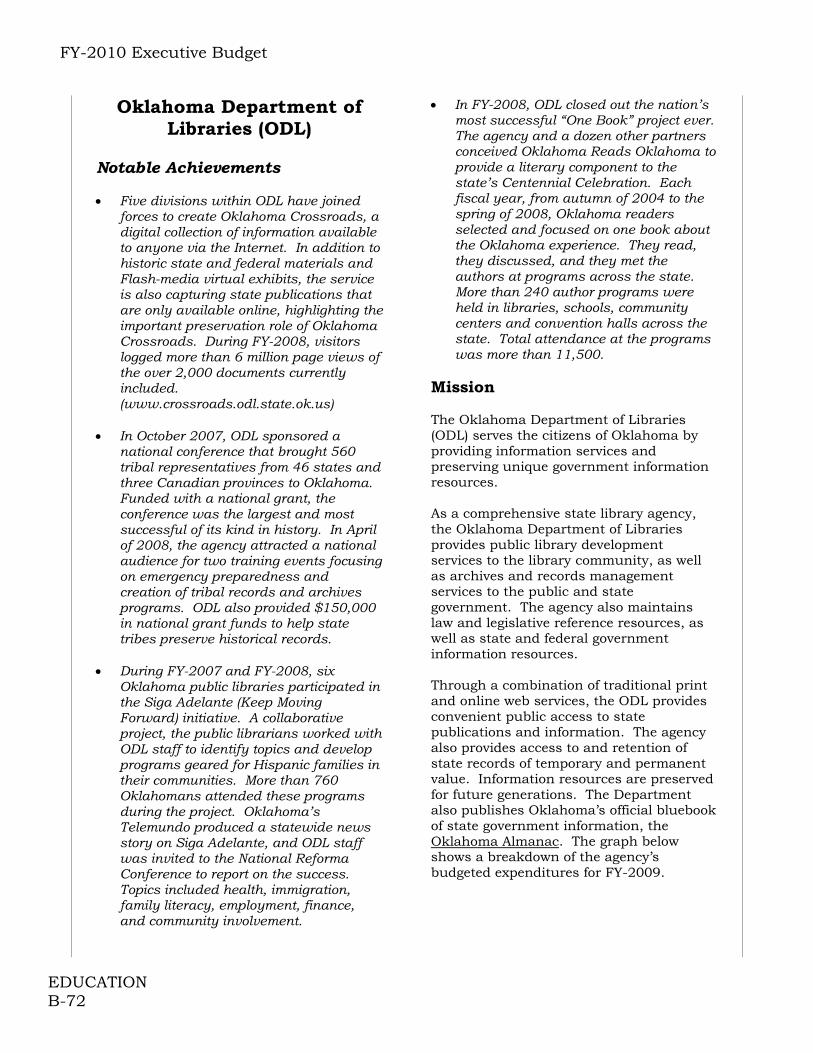
FY-2010 Executive Budget
EDUCATION B-72
Oklahoma Department of Libraries (ODL)
Notable Achievements Five divisions within ODL have joined
forces to create Oklahoma Crossroads, a digital collection of information available to anyone via the Internet. In addition to historic state and federal materials and Flash-media virtual exhibits, the service is also capturing state publications that are only available online, highlighting the important preservation role of Oklahoma Crossroads. During FY-2008, visitors logged more than 6 million page views of the over 2,000 documents currently included. (www.crossroads.odl.state.ok.us)
In October 2007, ODL sponsored a
national conference that brought 560 tribal representatives from 46 states and three Canadian provinces to Oklahoma. Funded with a national grant, the conference was the largest and most successful of its kind in history. In April of 2008, the agency attracted a national audience for two training events focusing on emergency preparedness and creation of tribal records and archives programs. ODL also provided $150,000 in national grant funds to help state tribes preserve historical records.
During FY-2007 and FY-2008, six
Oklahoma public libraries participated in the Siga Adelante (Keep Moving Forward) initiative. A collaborative project, the public librarians worked with ODL staff to identify topics and develop programs geared for Hispanic families in their communities. More than 760 Oklahomans attended these programs during the project. Oklahoma’s Telemundo produced a statewide news story on Siga Adelante, and ODL staff was invited to the National Reforma Conference to report on the success. Topics included health, immigration, family literacy, employment, finance, and community involvement.
In FY-2008, ODL closed out the nation’s most successful “One Book” project ever. The agency and a dozen other partners conceived Oklahoma Reads Oklahoma to provide a literary component to the state’s Centennial Celebration. Each fiscal year, from autumn of 2004 to the spring of 2008, Oklahoma readers selected and focused on one book about the Oklahoma experience. They read, they discussed, and they met the authors at programs across the state. More than 240 author programs were held in libraries, schools, community centers and convention halls across the state. Total attendance at the programs was more than 11,500.
Mission The Oklahoma Department of Libraries (ODL) serves the citizens of Oklahoma by providing information services and preserving unique government information resources. As a comprehensive state library agency, the Oklahoma Department of Libraries provides public library development services to the library community, as well as archives and records management services to the public and state government. The agency also maintains law and legislative reference resources, as well as state and federal government information resources. Through a combination of traditional print and online web services, the ODL provides convenient public access to state publications and information. The agency also provides access to and retention of state records of temporary and permanent value. Information resources are preserved for future generations. The Department also publishes Oklahoma’s official bluebook of state government information, the Oklahoma Almanac. The graph below shows a breakdown of the agency’s budgeted expenditures for FY-2009.
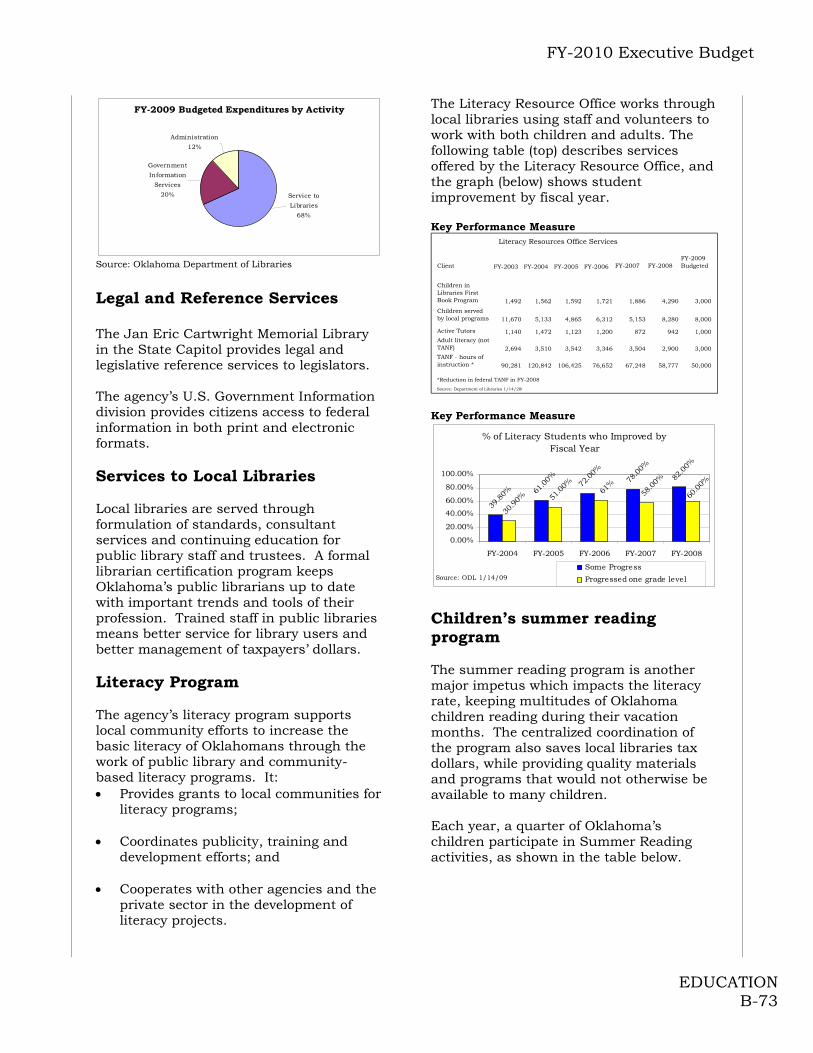
FY-2010 Executive Budget
EDUCATION B-73
FY-2009 Budgeted Expenditures by Activity
Administration
12%
Service to
Libraries
68%
Government
Information
Services
20%
Source: Oklahoma Department of Libraries
Legal and Reference Services The Jan Eric Cartwright Memorial Library in the State Capitol provides legal and legislative reference services to legislators. The agency’s U.S. Government Information division provides citizens access to federal information in both print and electronic formats. Services to Local Libraries Local libraries are served through formulation of standards, consultant services and continuing education for public library staff and trustees. A formal librarian certification program keeps Oklahoma’s public librarians up to date with important trends and tools of their profession. Trained staff in public libraries means better service for library users and better management of taxpayers’ dollars. Literacy Program The agency’s literacy program supports local community efforts to increase the basic literacy of Oklahomans through the work of public library and community-based literacy programs. It: Provides grants to local communities for
literacy programs; Coordinates publicity, training and
development efforts; and Cooperates with other agencies and the
private sector in the development of literacy projects.
The Literacy Resource Office works through local libraries using staff and volunteers to work with both children and adults. The following table (top) describes services offered by the Literacy Resource Office, and the graph (below) shows student improvement by fiscal year. Key Performance Measure
Client FY-2003 FY-2004 FY-2005 FY-2006 FY-2007 FY-2008FY-2009 Budgeted
Children in Libraries First Book Program 1,492 1,562 1,592 1,721 1,886 4,290 3,000
Children served by local programs 11,670 5,133 4,865 6,312 5,153 8,280 8,000
Active Tutors 1,140 1,472 1,123 1,200 872 942 1,000Adult literacy (not TANF) 2,694 3,510 3,542 3,346 3,504 2,900 3,000TANF - hours of instruction * 90,281 120,842 106,425 76,652 67,248 58,777 50,000
Literacy Resources Office Services
Source: Department of Libraries 1/14/200
*Reduction in federal TANF in FY-2008
Key Performance Measure
% of Literacy Students who Improved by Fiscal Year
61.0
0%72
.00%
78.0
0%
82.0
0%
39.8
0% 60.0
0%
58.0
0%
61%
51.0
0%
30.9
0%
0.00%
20.00%
40.00%
60.00%
80.00%
100.00%
FY-2004 FY-2005 FY-2006 FY-2007 FY-2008
Some Progress
Progressed one grade levelSource: ODL 1/14/09
Children’s summer reading program The summer reading program is another major impetus which impacts the literacy rate, keeping multitudes of Oklahoma children reading during their vacation months. The centralized coordination of the program also saves local libraries tax dollars, while providing quality materials and programs that would not otherwise be available to many children. Each year, a quarter of Oklahoma’s children participate in Summer Reading activities, as shown in the table below.

FY-2010 Executive Budget
EDUCATION B-74
Key Performance Measure
# of children enrolled
% of eligible children enrolled
FY-2003 86,868 25%FY-2004 97,820 28%FY-2005 84,250 26%FY-2006 86,331 27%FY-2007 87,331 25%FY-2008 85,810 25%FY-2009 Bud. 87,526 26%
Summer Reading Program
Source: Department of Libraries 1/14/2009
FY-2010 Recommendation
FY-2009 Appropriation $7,295
FY-2009 Bud. FTE Level 63.1
Actual Ave. YTD FTE 56.6
Funding Adjustments:
5% Appropriation Reduction (365)
10% Travel Reduction (7)
Total Adjustments (372)
FY-2010 Recommendation $6,923
% Change from FY-2009 -5.10%
(amounts in thousands)
Source: Office of State Finance
FY-2010 Appropriation
Appropriation Reduction The Governor’s Budget reduces the Oklahoma Department of Libraries’ FY-2010 appropriation by 5% ($364,743). Travel Reduction Agency travel funds are also reduced by 10% ($7,077).

FY-2010 Executive Budget
EDUCATION B-75
Oklahoma School of Science and Mathematics (OSSM)
Notable Achievements The First 1,000: OSSM has graduated more than 1,000 students since 1992. More than one-half of these graduates are still involved in completing their educational and professional training. The following achievements are descriptive of those students who have been out of OSSM long enough to complete at least one degree: More than half who have completed a
degree and have entered the workforce are working in Oklahoma;
Ten have started their own businesses in Oklahoma;
Three who were working out-of-state have returned and are now faculty at OSSM;
Two have found jobs in Oklahoma through the Department of Commerce Project Boomerang;
300 are practicing engineers;
60 have earned an M.D.;
5 have earned a D.O.;
40 have earned a Ph.D.;
2 have earned a D.V.M.;
2 have earned a D.D.S.;
25 have earned a J.D.;
85% have stayed in a technical field for their chosen profession;
Alumni with Ph.D.s or M.D.s are teaching at MIT, Stanford, Michigan, United States Air Force Academy, Air Force Institute of Technology, Johns Hopkins College of Medicine, Wake Forest College of Medicine, Southern Utah University, The Citadel, University of California – Berkeley, and University of California – Merced;
3 are serving in the ministry;
40 are serving in the armed forces of the United States; and
More than half stayed in Oklahoma for undergraduate education.
Mission The mission of the Oklahoma School of Science and Mathematics is twofold: To foster the educational development
of Oklahoma high school students who are academically talented in science and math; and
To assist in the improvement of science and mathematics education for the state.
The OSSM has two main activities: a residential school, to which 70% of FY-2009 budget expenditures will go, and regional outreach, comprising the remaining 30%. Residential High School OSSM maintains a tuition-free residential high school for 144 students. Residential students represent the entire state with over half of the enrollment from smaller communities. Students focus on biology, chemistry, physics, computer science, mathematics and the humanities. They excel as measured by college admissions, scholarships and awards each year. All graduating seniors are college bound. The amount of total annual scholarships received by OSSM students is significant, as seen in the graph below.
OSSM Residential Student Scholarships
$4.3
$6.9$8.3
$7.4$7.3
$5.5
$0.0
$2.0
$4.0
$6.0
$8.0
$10.0
2003 2004 2005 2006 2007 2008
$ m
illion
s
Source: OSSM 1/14/2009 The scholarship awards per graduate are also impressive, as the following graph indicates.
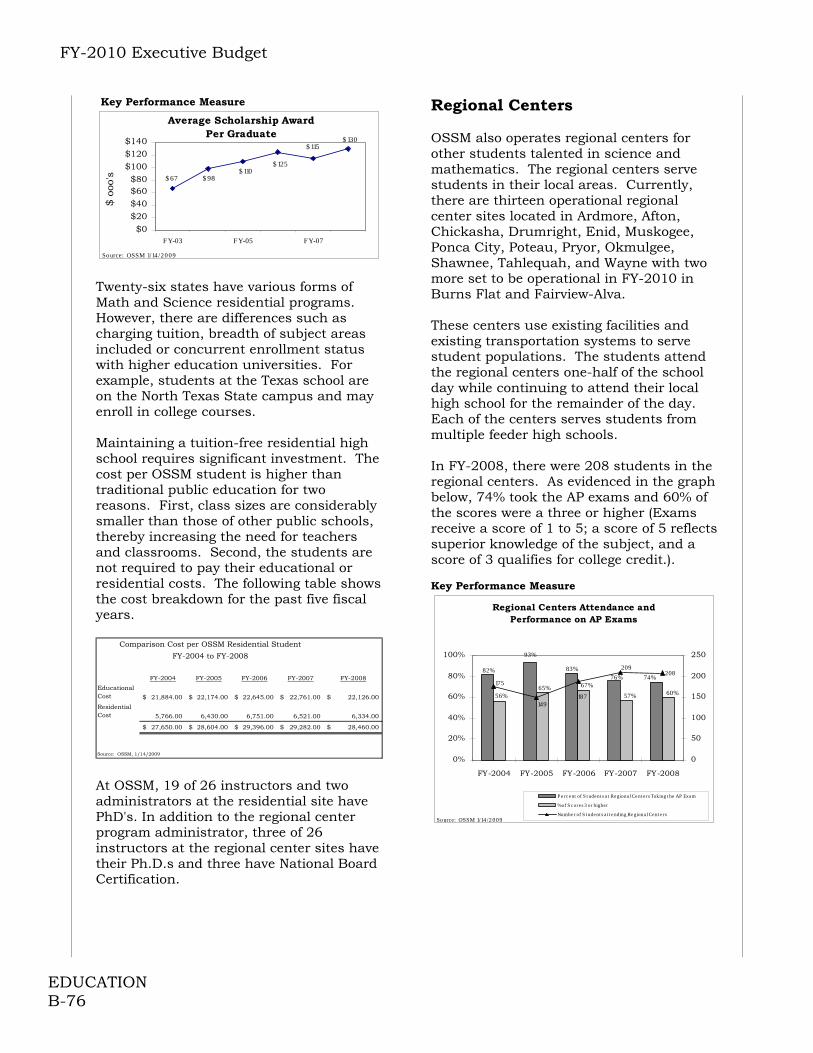
FY-2010 Executive Budget
EDUCATION B-76
Key Performance Measure
Average Scholarship AwardPer Graduate
$ 67 $ 98$ 110
$ 125
$ 115$ 130
$0$20$40$60$80
$100$120$140
FY-03 FY-05 FY-07
$ o
oo's
Source: OSSM 1/14 /20 09 Twenty-six states have various forms of Math and Science residential programs. However, there are differences such as charging tuition, breadth of subject areas included or concurrent enrollment status with higher education universities. For example, students at the Texas school are on the North Texas State campus and may enroll in college courses. Maintaining a tuition-free residential high school requires significant investment. The cost per OSSM student is higher than traditional public education for two reasons. First, class sizes are considerably smaller than those of other public schools, thereby increasing the need for teachers and classrooms. Second, the students are not required to pay their educational or residential costs. The following table shows the cost breakdown for the past five fiscal years.
FY-2004 FY-2005 FY-2006 FY-2007 FY-2008
Educational Cost 21,884.00$ 22,174.00$ 22,645.00$ 22,761.00$ 22,126.00$
Residential Cost 5,766.00 6,430.00 6,751.00 6,521.00 6,334.00
27,650.00$ 28,604.00$ 29,396.00$ 29,282.00$ 28,460.00$
Source: OSSM, 1/14/2009
Comparison Cost per OSSM Residential Student
FY-2004 to FY-2008
At OSSM, 19 of 26 instructors and two administrators at the residential site have PhD's. In addition to the regional center program administrator, three of 26 instructors at the regional center sites have their Ph.D.s and three have National Board Certification.
Regional Centers OSSM also operates regional centers for other students talented in science and mathematics. The regional centers serve students in their local areas. Currently, there are thirteen operational regional center sites located in Ardmore, Afton, Chickasha, Drumright, Enid, Muskogee, Ponca City, Poteau, Pryor, Okmulgee, Shawnee, Tahlequah, and Wayne with two more set to be operational in FY-2010 in Burns Flat and Fairview-Alva. These centers use existing facilities and existing transportation systems to serve student populations. The students attend the regional centers one-half of the school day while continuing to attend their local high school for the remainder of the day. Each of the centers serves students from multiple feeder high schools. In FY-2008, there were 208 students in the regional centers. As evidenced in the graph below, 74% took the AP exams and 60% of the scores were a three or higher (Exams receive a score of 1 to 5; a score of 5 reflects superior knowledge of the subject, and a score of 3 qualifies for college credit.). Key Performance Measure
Regional Centers Attendance and Performance on AP Exams
93%
83%82%76% 74%
56%65% 67%
57% 60%
175
149187
209208
0%
20%
40%
60%
80%
100%
FY-2004 FY-2005 FY-2006 FY-2007 FY-2008
0
50
100
150
200
250
P e rc ent of S t udent s a t Regiona l Ce nt e rs Taking t he AP Exam
% of S c ores 3 or highe r
Numbe r of S t udent s a t t e nding Re giona l Cent e rsSource: OSSM 1/14 /2 009

FY-2010 Executive Budget
EDUCATION B-77
FY-2010 Recommendation
FY-2009 Appropriation $7,986
FY-2009 Bud. FTE Level 81.0
Actual Ave. YTD FTE 73.8
Funding Adjustments:10% Travel Reduction (2)
FY-2010 Recommendation $7,984
% Change from FY-2009 -0.03%
Source: Office of State Finance
FY-2010 Appropriation(amounts in thousands)
Travel Reduction Agency travel funds are also reduced by 10% ($1,741).
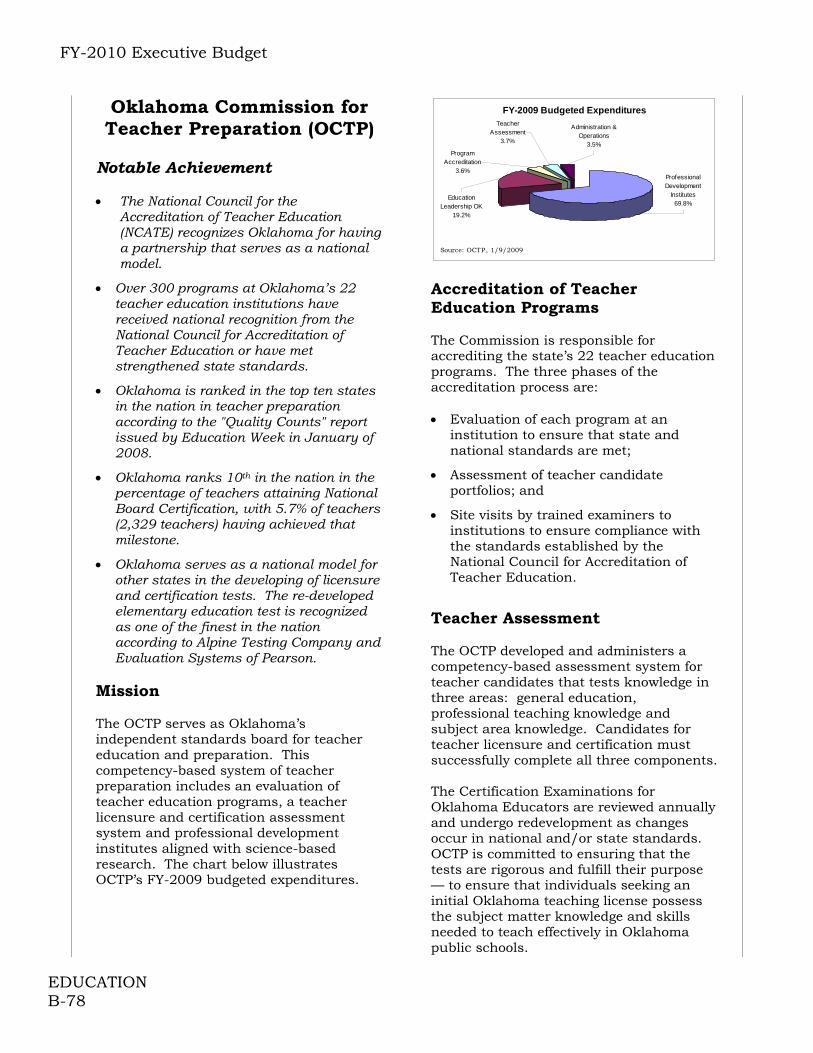
FY-2010 Executive Budget
EDUCATION B-78
Oklahoma Commission for Teacher Preparation (OCTP)
Notable Achievement The National Council for the
Accreditation of Teacher Education (NCATE) recognizes Oklahoma for having a partnership that serves as a national model.
Over 300 programs at Oklahoma’s 22 teacher education institutions have received national recognition from the National Council for Accreditation of Teacher Education or have met strengthened state standards.
Oklahoma is ranked in the top ten states in the nation in teacher preparation according to the "Quality Counts" report issued by Education Week in January of 2008.
Oklahoma ranks 10th in the nation in the percentage of teachers attaining National Board Certification, with 5.7% of teachers (2,329 teachers) having achieved that milestone.
Oklahoma serves as a national model for other states in the developing of licensure and certification tests. The re-developed elementary education test is recognized as one of the finest in the nation according to Alpine Testing Company and Evaluation Systems of Pearson.
Mission The OCTP serves as Oklahoma’s independent standards board for teacher education and preparation. This competency-based system of teacher preparation includes an evaluation of teacher education programs, a teacher licensure and certification assessment system and professional development institutes aligned with science-based research. The chart below illustrates OCTP’s FY-2009 budgeted expenditures.
FY-2009 Budgeted Expenditures
Administration &Operations
3.5%Program
Accreditation3.6%
Teacher Assessment
3.7%
Education Leadership OK
19.2%
ProfessionalDevelopment
Institutes69.8%
Source: OCTP, 1/9/2009
Accreditation of Teacher Education Programs The Commission is responsible for accrediting the state’s 22 teacher education programs. The three phases of the accreditation process are: Evaluation of each program at an
institution to ensure that state and national standards are met;
Assessment of teacher candidate portfolios; and
Site visits by trained examiners to institutions to ensure compliance with the standards established by the National Council for Accreditation of Teacher Education.
Teacher Assessment The OCTP developed and administers a competency-based assessment system for teacher candidates that tests knowledge in three areas: general education, professional teaching knowledge and subject area knowledge. Candidates for teacher licensure and certification must successfully complete all three components. The Certification Examinations for Oklahoma Educators are reviewed annually and undergo redevelopment as changes occur in national and/or state standards. OCTP is committed to ensuring that the tests are rigorous and fulfill their purpose — to ensure that individuals seeking an initial Oklahoma teaching license possess the subject matter knowledge and skills needed to teach effectively in Oklahoma public schools.
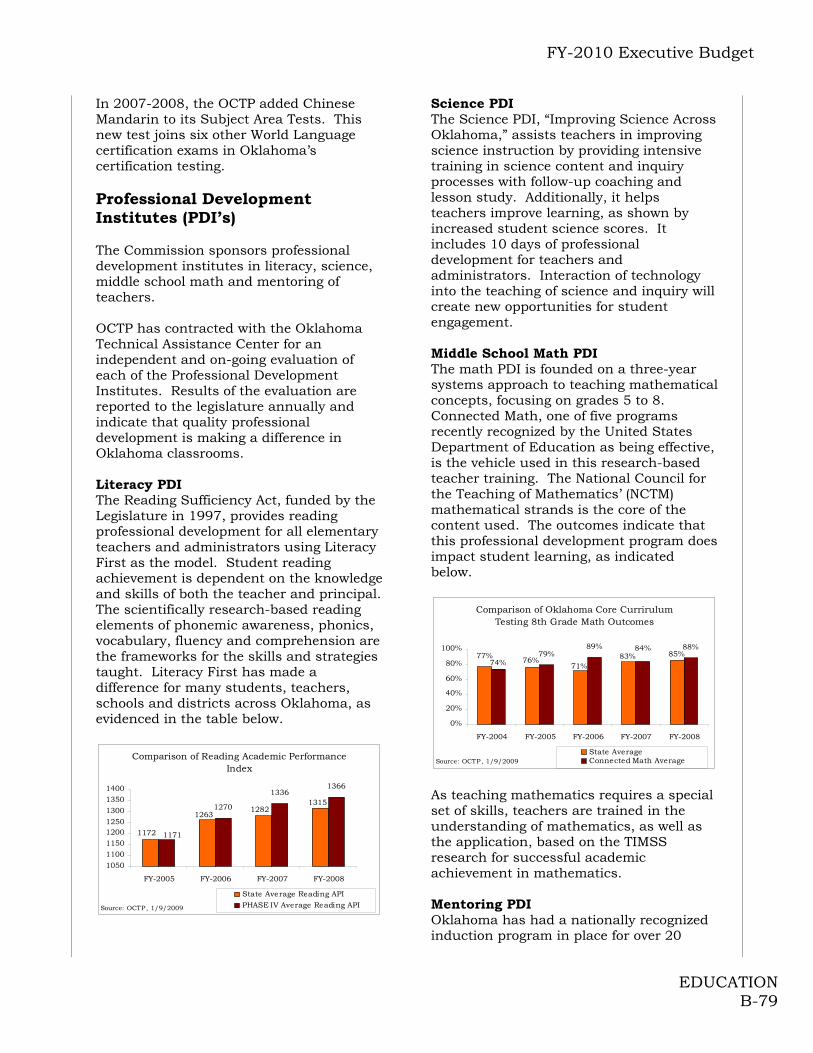
FY-2010 Executive Budget
EDUCATION B-79
In 2007-2008, the OCTP added Chinese Mandarin to its Subject Area Tests. This new test joins six other World Language certification exams in Oklahoma’s certification testing. Professional Development Institutes (PDI’s) The Commission sponsors professional development institutes in literacy, science, middle school math and mentoring of teachers. OCTP has contracted with the Oklahoma Technical Assistance Center for an independent and on-going evaluation of each of the Professional Development Institutes. Results of the evaluation are reported to the legislature annually and indicate that quality professional development is making a difference in Oklahoma classrooms. Literacy PDI The Reading Sufficiency Act, funded by the Legislature in 1997, provides reading professional development for all elementary teachers and administrators using Literacy First as the model. Student reading achievement is dependent on the knowledge and skills of both the teacher and principal. The scientifically research-based reading elements of phonemic awareness, phonics, vocabulary, fluency and comprehension are the frameworks for the skills and strategies taught. Literacy First has made a difference for many students, teachers, schools and districts across Oklahoma, as evidenced in the table below.
Comparison of Reading Academic Performance Index
1270
13361366
13151282
1263
1172 1171
10501100115012001250130013501400
FY-2005 FY-2006 FY-2007 FY-2008
State Average Reading APIPHASE IV Average Reading APISource: OCTP, 1/9/2009
Science PDI The Science PDI, “Improving Science Across Oklahoma,” assists teachers in improving science instruction by providing intensive training in science content and inquiry processes with follow-up coaching and lesson study. Additionally, it helps teachers improve learning, as shown by increased student science scores. It includes 10 days of professional development for teachers and administrators. Interaction of technology into the teaching of science and inquiry will create new opportunities for student engagement. Middle School Math PDI The math PDI is founded on a three-year systems approach to teaching mathematical concepts, focusing on grades 5 to 8. Connected Math, one of five programs recently recognized by the United States Department of Education as being effective, is the vehicle used in this research-based teacher training. The National Council for the Teaching of Mathematics’ (NCTM) mathematical strands is the core of the content used. The outcomes indicate that this professional development program does impact student learning, as indicated below.
Comparison of Oklahoma Core Currirulum Testing 8th Grade Math Outcomes
77% 79%89% 88%
76%71%
83% 85%74%
84%
0%
20%
40%
60%
80%
100%
FY-2004 FY-2005 FY-2006 FY-2007 FY-2008
State Average Connected Math AverageSource: OCTP, 1/9/2009
As teaching mathematics requires a special set of skills, teachers are trained in the understanding of mathematics, as well as the application, based on the TIMSS research for successful academic achievement in mathematics. Mentoring PDI Oklahoma has had a nationally recognized induction program in place for over 20

FY-2010 Executive Budget
EDUCATION B-80
years. Realizing that Oklahoma loses 40 to 50% of the State’s teachers during the first five years of the profession, OCTP has developed the Oklahoma Mentoring Network (OMN). The OMN is expanding on Oklahoma’s residency program by developing and piloting a high quality, two-year mentoring program that is consistent, replicable, and sustainable throughout the state. Innovations of this model include a partnership of universities, a state agency, and a teacher organization. The 2007-2008 school year was the first year of the two-year model. Education Leadership Oklahoma Education Leadership Oklahoma provides scholarships and training for teachers going through the National Board for Professional Teachers certification process. OCTP provides technical assistance, training and a scholarship of $2,500 for candidates to pay for the application process, assessment and preparation costs. Upon successful completion, classroom teachers receive $5,000 annually for the life of the certificate. Teachers that earn certification, but do not receive the scholarship, qualify for reimbursement equivalent to the amount of the scholarship.
Top 10 States with Total National Board Certified Teachers: 2008-2009
6,498
12,670
2,329
2,5032,717
2,8972,932
3,1914,240
14,211
0
2,000
4,000
6,000
8,000
10,000
12,000
14,000
16,000
NC FL SC CA IL OH MS WA GA OKSo urce: NBPTS
As indicated above, in FY-2008 there were 2,329 National Board Certified Teachers in Oklahoma, making Oklahoma 10th in the nation in the number of teachers achieving this high honor. Further, NBCTs make up 5.7% of the state’s teaching force and 58.4% of the state’s NBCTs teach in Title I schools. A recent study by the National Research Council affirmed that National Board Certification has had a positive impact on student achievement, teacher retention, and professional development.
FY-2010 Recommendation
FY-2009 Appropriation $2,060
FY-2009 Bud. FTE Level 11.0
Actual Ave. YTD FTE 10.4
Funding Adjustments:
3% Appropriation Reduction (62)10% Travel Reduction (7) Total Adjustments: (69)
FY-2010 Recommendation $1,991
% Change from FY-2009 -3.35%
(amounts in thousands)
Source: Office of State Finance
FY-2010 Appropriation
Appropriation Reduction The Governor’s Budget reduces the FY-2010 appropriation for the Oklahoma Commission for Teacher Preparation by 3% ($61,799). Travel Reduction Agency travel funds are also reduced by 10% ($6,847).

FY-2010 Executive Budget
ENERGY B-81
Oklahoma Corporation Commission (OCC)
Notable Achievements
The Information Technology (IT) Division upgraded the core power supply enhancing the agency's ability to deal with, and recover from, loss of power. Multiple web-based surveys were developed to gauge satisfaction with agency services. The IT Division worked with the Petroleum Storage Tank Division to provide a field inspection system that makes field work easier to complete and subsequently transmit data to the main office for processing. The Risk Based Data Management System project kicked off in late summer. This project has multiple phases, the first two of which are underway. It is a partnership between the agency and the Ground Water Protection Council. Another significant project is the IRP/IFTA (International Registration Plan and the International Fuel Tax Agreement) project for the Transportation Division. This project is in full development and incremental testing has begun.
In FY-2008, OCC field inspectors located
and turned in to the Oklahoma Energy Resources Board 523 abandoned oil and gas sites for remediation.
The Consumer Services Division’s two Mineral Owners Escrow Account (MOEA) staff collected and deposited a record $8,016,734 in FY-2008, with the total being held in escrow totaling $16,403,264. The MOEA keeps records on money owed to unknown or unlocated mineral owners. The funds are held in interest-bearing escrow with the State Treasurer until the mineral owners are found or a maximum of five (5) years. After five years, unclaimed funds are transferred to the Unclaimed Property Section of the State Treasurer's office.
Mission The Oklahoma Corporation Commission regulates and enforces laws and activities
associated with the exploration and production of oil and gas, public utilities, the safety aspects of motor carrier, rail and pipeline transportation and the storage and dispensing of petroleum-based fuels. The Commission oversees the conservation of natural resources to avoid waste and protect the environment. The Commission has 3 elected Commissioners. The Corporation Commission is primarily funded with revolving funds. Of the Commission’s FY-2009 budgeted revenue sources, revolving funds are 57% of budgeted revenue. The following is a chart displaying the actual program expenditures of the Commission for FY-2008.
OCC Actual FY-2008 Program Expenditures (in thousands)
Adm Proc.,$2371,6% Publ
Util's,$2362,6%
Petro. Stor. Tank Div, $4695,12%
Admin., $2987,8%Data Proc &
Undergrd Inj.,$2987,8%
Trans, $10631,27%
Gen Cnsl/Con. Svcs., $2997,8%
O&G Conserv Div, $10621,27%
Consumer Services Division The Consumer Services Division of the OCC is made up of five departments, which serve both regulated industry and Oklahoma consumers. Public Utility Complaints answers questions and investigates complaints involving regulated utilities and their customers; Technical Services conducts field tests for quality of utility service and industry compliance with OCC rules; Oil and Gas assists mineral and royalty owners, surface owners and consumers with their questions about drilling, operating procedures and how to locate well information; Mineral Owners Escrow Account (MOEA) keeps records on money owed to unknown or unlocated mineral owners; Consumer Education maintains a statewide outreach and community involvement to help inform consumers and industry about the
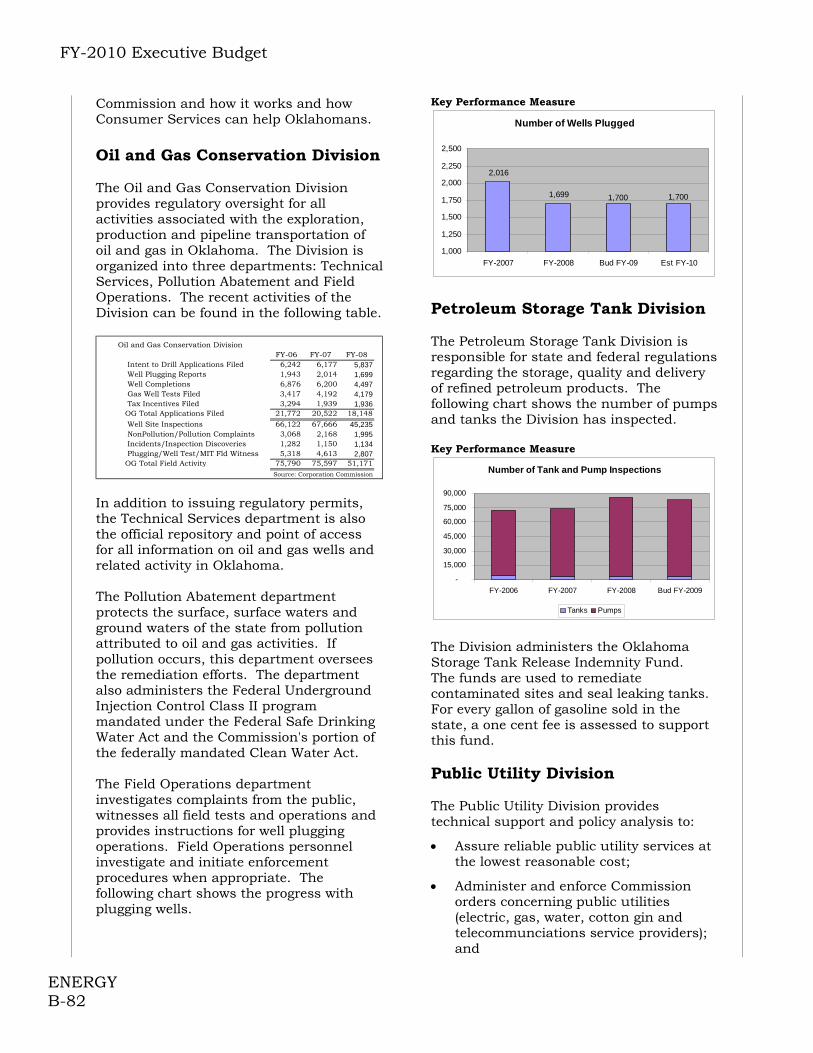
FY-2010 Executive Budget
ENERGY B-82
Commission and how it works and how Consumer Services can help Oklahomans. Oil and Gas Conservation Division The Oil and Gas Conservation Division provides regulatory oversight for all activities associated with the exploration, production and pipeline transportation of oil and gas in Oklahoma. The Division is organized into three departments: Technical Services, Pollution Abatement and Field Operations. The recent activities of the Division can be found in the following table.
Oil and Gas Conservation DivisionFY-06 FY-07 FY-08
Intent to Drill Applications Filed 6,242 6,177 5,837 Well Plugging Reports 1,943 2,014 1,699 Well Completions 6,876 6,200 4,497 Gas Well Tests Filed 3,417 4,192 4,179 Tax Incentives Filed 3,294 1,939 1,936 OG Total Applications Filed 21,772 20,522 18,148
Well Site Inspections 66,122 67,666 45,235 NonPollution/Pollution Complaints 3,068 2,168 1,995 Incidents/Inspection Discoveries 1,282 1,150 1,134 Plugging/Well Test/MIT Fld Witness 5,318 4,613 2,807 OG Total Field Activity 75,790 75,597 51,171
Source: Corporation Commission In addition to issuing regulatory permits, the Technical Services department is also the official repository and point of access for all information on oil and gas wells and related activity in Oklahoma. The Pollution Abatement department protects the surface, surface waters and ground waters of the state from pollution attributed to oil and gas activities. If pollution occurs, this department oversees the remediation efforts. The department also administers the Federal Underground Injection Control Class II program mandated under the Federal Safe Drinking Water Act and the Commission's portion of the federally mandated Clean Water Act. The Field Operations department investigates complaints from the public, witnesses all field tests and operations and provides instructions for well plugging operations. Field Operations personnel investigate and initiate enforcement procedures when appropriate. The following chart shows the progress with plugging wells.
Key Performance Measure
Number of Wells Plugged
1,7001,7001,699
2,016
1,000
1,250
1,500
1,750
2,000
2,250
2,500
FY-2007 FY-2008 Bud FY-09 Est FY-10
Petroleum Storage Tank Division The Petroleum Storage Tank Division is responsible for state and federal regulations regarding the storage, quality and delivery of refined petroleum products. The following chart shows the number of pumps and tanks the Division has inspected. Key Performance Measure
Number of Tank and Pump Inspections
-
15,000
30,000
45,000
60,000
75,000
90,000
FY-2006 FY-2007 FY-2008 Bud FY-2009
Tanks Pumps
The Division administers the Oklahoma Storage Tank Release Indemnity Fund. The funds are used to remediate contaminated sites and seal leaking tanks. For every gallon of gasoline sold in the state, a one cent fee is assessed to support this fund. Public Utility Division The Public Utility Division provides technical support and policy analysis to:
Assure reliable public utility services at the lowest reasonable cost;
Administer and enforce Commission orders concerning public utilities (electric, gas, water, cotton gin and telecommunciations service providers); and

FY-2010 Executive Budget
ENERGY B-83
Fulfill constitutional and statutory obligations.
Staff is responsible for developing and presenting objective, independently researched, fact-based findings and recommendations to the Commission. In FY-2008, the Division was responsible for regulating 548 public utilities. Transportation Division The Transportation Division administers licensing and certification of private and for-hire trucks that operate within and through Oklahoma. The Division also enforces motor carrier licensing requirements, federal motor carrier safety standards, some federal and state railroad regulations and pipeline safety regulations. Oklahoma has more than 6,330 for-hire and private motor carriers licensed to operate in intrastate commerce, 24 railroads that operate in Oklahoma and almost 40,000 miles of natural gas and hazardous liquid pipeline within the state. The table that follows documents the recent fiscal year activities and progress made by the Division and the graph shows the percentage of pipeline operators inspected. Key Performance Measure TransportationPerformance Measures
FY06 FY07 FY08Motor Carrier Licenses/Permits Issued 4,794 5,134 952 Interstate Registration Certificates Issued 153 107 - Single State Registrations Issued 3,234 622 - Unified Carrier Registration applications processed 5,811 Insurance Filings Approved 13,629 14,870 12,064 Identification Devices Issued 96,339 62,432 1,215 Letters of notification to Motor Carriers 12,185 12,049 8,697 DOT Numbers Issued 431 361 310 Hazardous Waste Credentials Issued 51 50 48 Deleterious Substance Transport Permits Issued 259 323 422 IRP applications processed 13,749 12,185 13,067 IFTA applications processed 2,685 3,752 3,906 Vehicles Registered 171,591 156,895 131,444 IRP and IFTA audits conducted 266 405 305 Total Applications Activity 319,107 269,185 178,241
Vehicle Checks 101,198 190,088 193,912 Citations Issued 26,743 20,937 17,656 Warnings Issued 2,666 2,764 1,817 Vehicle Inspections 506 386 486 Educational Contacts 986 1,129 1,054 Railroad Complaints/Queries Investigated 124 214 276 Pipeline Gas/Liquid Units Inspected 280 368 280 Pipeline Gas/Liquid Operators Inspected 222 143 143 Total Field Activity 132,725 216,029 215,624 Vehicle checks increase is a result of implementation of new recordkeeping system.
Percentage of Pipeline Operators Inspected
55%55%
93%
55%
40%
50%
60%
70%
80%
90%
100%
FY-2007 FY-2008 Budgeted FY-09 Estimated FY-10
Office of Administrative Proceedings The Office of Administrative Proceedings is the court division of the Corporation Commission. It includes administrative law judges, legal secretaries, court reporters and the Court Clerk's Office. Filings are made and hearings are conducted in the Western Regional Office in Oklahoma City and in the Eastern Regional Office in Tulsa. Testimony and evidence may be presented by phone instead of appearing in person before an administrative law judge. In FY-2008, ten full time administrative law judges, two part time Administrative law judges and one appellate referee conducted 32,273 hearings. Key Performance Measure
Administrative Proceedings Hearings Conducted
39,021
33,523 32,273
0
10,000
20,000
30,000
40,000
50,000
FY-06 FY-07 FY-08

FY-2010 Executive Budget
ENERGY B-84
FY-2010 Recommendation
FY-2009 Appropriation $12,415
Remove One-time Funding (205)
FY-2009 Base $12,210
FY-2009 Bud. FTE Level 492.0
Actual Ave. YTD FTE 476.9
Funding Adjustments:Appropriation Reduction (1,221)Travel Reduction (30)
Total Adjustments -1,251
FY-2010 Recommendation $10,959
$ Change from FY-2009 ($1,456)
% Change from FY-2009 -11.73%
FY-2010 Appropriation(amounts in thousands)
Source: Office of State Finance Remove One-time Funding The Governor’s Budget recommends removing one-time funding in the amount of $205,000. Appropriation Reduction The Governor’s Budget reduces the FY-2010 appropriation for the Corporation Commission by 10% ($1,221,042). Travel Reduction Agency travel funds are also reduced by 10% ($29,563).
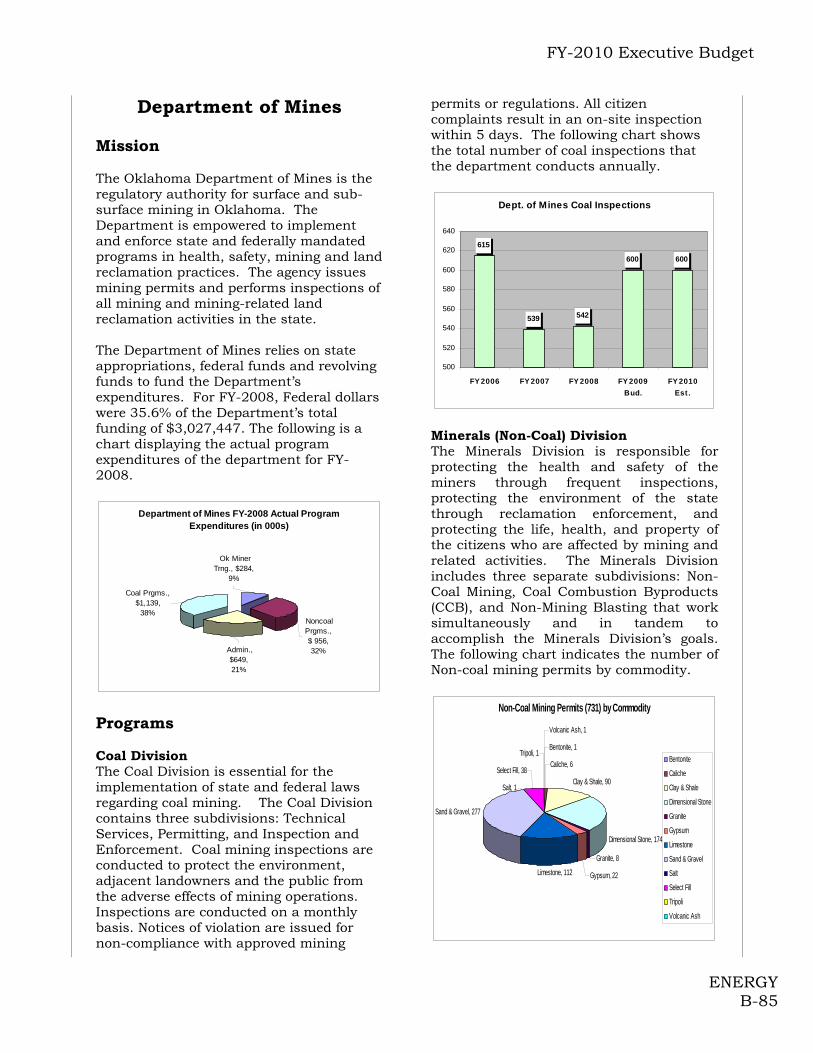
FY-2010 Executive Budget
ENERGY B-85
Department of Mines Mission The Oklahoma Department of Mines is the regulatory authority for surface and sub-surface mining in Oklahoma. The Department is empowered to implement and enforce state and federally mandated programs in health, safety, mining and land reclamation practices. The agency issues mining permits and performs inspections of all mining and mining-related land reclamation activities in the state. The Department of Mines relies on state appropriations, federal funds and revolving funds to fund the Department’s expenditures. For FY-2008, Federal dollars were 35.6% of the Department’s total funding of $3,027,447. The following is a chart displaying the actual program expenditures of the department for FY-2008.
Department of Mines FY-2008 Actual Program Expenditures (in 000s)
Noncoal Prgms.,$ 956, 32% Admin.,
$649, 21%
Ok Miner Trng., $284,
9%
Coal Prgms., $1,139,
38%
Programs Coal Division The Coal Division is essential for the implementation of state and federal laws regarding coal mining. The Coal Division contains three subdivisions: Technical Services, Permitting, and Inspection and Enforcement. Coal mining inspections are conducted to protect the environment, adjacent landowners and the public from the adverse effects of mining operations. Inspections are conducted on a monthly basis. Notices of violation are issued for non-compliance with approved mining
permits or regulations. All citizen complaints result in an on-site inspection within 5 days. The following chart shows the total number of coal inspections that the department conducts annually.
Dept. of Mines Coal Inspections
615
539 542
600 600
500
520
540
560
580
600
620
640
FY2006 FY2007 FY2008 FY2009Bud.
FY2010Est.
Minerals (Non-Coal) Division The Minerals Division is responsible for protecting the health and safety of the miners through frequent inspections, protecting the environment of the state through reclamation enforcement, and protecting the life, health, and property of the citizens who are affected by mining and related activities. The Minerals Division includes three separate subdivisions: Non-Coal Mining, Coal Combustion Byproducts (CCB), and Non-Mining Blasting that work simultaneously and in tandem to accomplish the Minerals Division’s goals. The following chart indicates the number of Non-coal mining permits by commodity. Non-Coal Mining Permits (731) by Commodity
Bentonite, 1
Caliche, 6
Clay & Shale, 90
Dimensional Stone, 174
Granite, 8
Gypsum, 22Limestone, 112
Sand & Gravel, 277
Salt, 1
Select Fill, 38
Tripoli, 1
Volcanic Ash, 1
Bentonite
Caliche
Clay & Shale
Dimensional Stone
Granite
Gypsum
Limestone
Sand & Gravel
Salt
Select Fill
Tripoli
Volcanic Ash
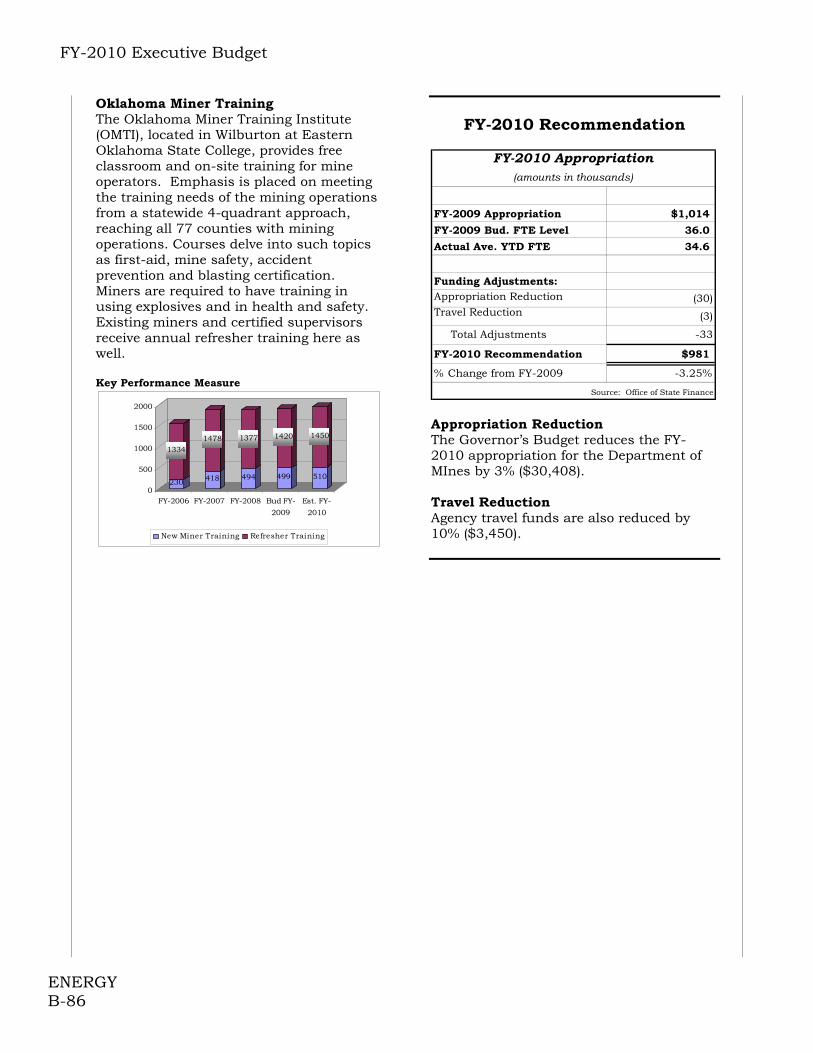
FY-2010 Executive Budget
ENERGY B-86
Oklahoma Miner Training The Oklahoma Miner Training Institute (OMTI), located in Wilburton at Eastern Oklahoma State College, provides free classroom and on-site training for mine operators. Emphasis is placed on meeting the training needs of the mining operations from a statewide 4-quadrant approach, reaching all 77 counties with mining operations. Courses delve into such topics as first-aid, mine safety, accident prevention and blasting certification. Miners are required to have training in using explosives and in health and safety. Existing miners and certified supervisors receive annual refresher training here as well. Key Performance Measure
230
1334
418
1478
494
1377
499
1420
510
1450
0
500
1000
1500
2000
FY-2006 FY-2007 FY-2008 Bud FY-
2009
Est. FY-
2010
New Miner Training Refresher Training
FY-2010 Recommendation
FY-2009 Appropriation $1,014
FY-2009 Bud. FTE Level 36.0
Actual Ave. YTD FTE 34.6
Funding Adjustments:Appropriation Reduction (30)Travel Reduction (3)
Total Adjustments -33
FY-2010 Recommendation $981
% Change from FY-2009 -3.25%
Source: Office of State Finance
FY-2010 Appropriation(amounts in thousands)
Appropriation Reduction The Governor’s Budget reduces the FY-2010 appropriation for the Department of MInes by 3% ($30,408). Travel Reduction Agency travel funds are also reduced by 10% ($3,450).
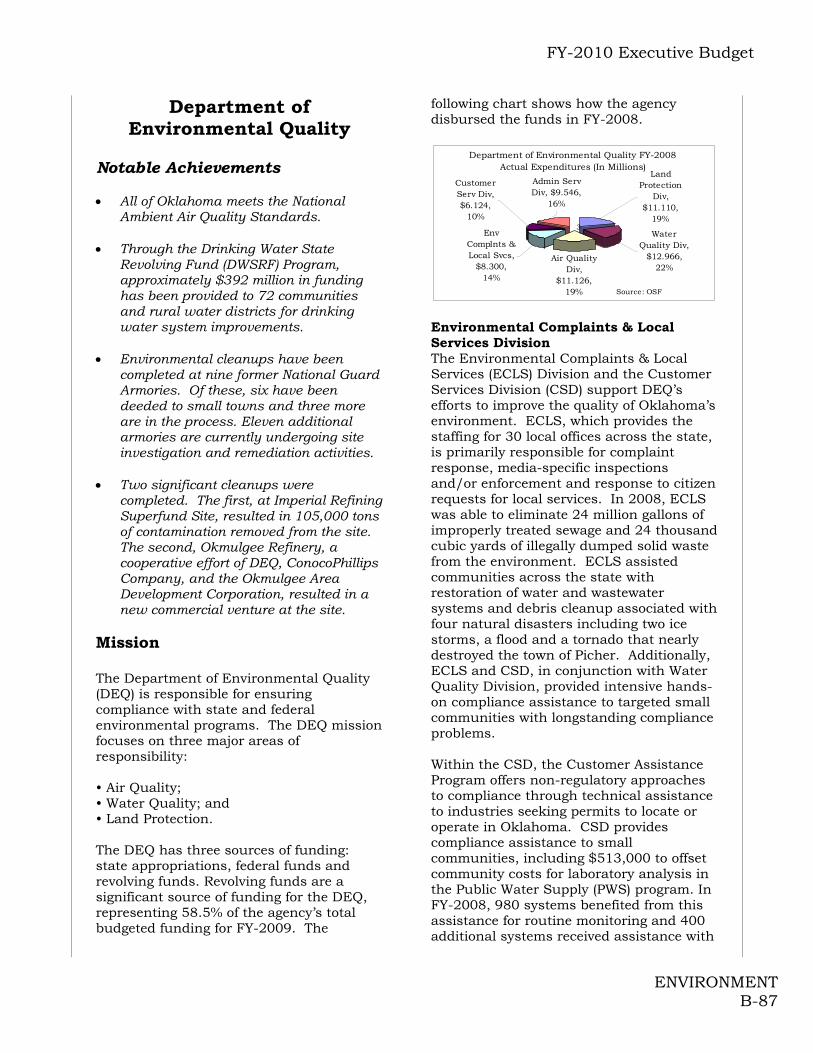
FY-2010 Executive Budget
ENVIRONMENT B-87
Department of Environmental Quality
Notable Achievements All of Oklahoma meets the National
Ambient Air Quality Standards. Through the Drinking Water State
Revolving Fund (DWSRF) Program, approximately $392 million in funding has been provided to 72 communities and rural water districts for drinking water system improvements.
Environmental cleanups have been
completed at nine former National Guard Armories. Of these, six have been deeded to small towns and three more are in the process. Eleven additional armories are currently undergoing site investigation and remediation activities.
Two significant cleanups were
completed. The first, at Imperial Refining Superfund Site, resulted in 105,000 tons of contamination removed from the site. The second, Okmulgee Refinery, a cooperative effort of DEQ, ConocoPhillips Company, and the Okmulgee Area Development Corporation, resulted in a new commercial venture at the site.
Mission The Department of Environmental Quality (DEQ) is responsible for ensuring compliance with state and federal environmental programs. The DEQ mission focuses on three major areas of responsibility: • Air Quality; • Water Quality; and • Land Protection. The DEQ has three sources of funding: state appropriations, federal funds and revolving funds. Revolving funds are a significant source of funding for the DEQ, representing 58.5% of the agency’s total budgeted funding for FY-2009. The
following chart shows how the agency disbursed the funds in FY-2008.
Department of Environmental Quality FY-2008 Actual Expenditures (In Millions)
Customer Serv Div, $6.124,
10%
Admin Serv Div, $9.546,
16%
Env Complnts & Local Svcs,
$8.300,14%
Air Quality Div,
$11.126,19%
Water Quality Div,
$12.966,22%
Land Protection
Div, $11.110,
19%
Source: OSF
3
Environmental Complaints & Local Services Division The Environmental Complaints & Local Services (ECLS) Division and the Customer Services Division (CSD) support DEQ’s efforts to improve the quality of Oklahoma’s environment. ECLS, which provides the staffing for 30 local offices across the state, is primarily responsible for complaint response, media-specific inspections and/or enforcement and response to citizen requests for local services. In 2008, ECLS was able to eliminate 24 million gallons of improperly treated sewage and 24 thousand cubic yards of illegally dumped solid waste from the environment. ECLS assisted communities across the state with restoration of water and wastewater systems and debris cleanup associated with four natural disasters including two ice storms, a flood and a tornado that nearly destroyed the town of Picher. Additionally, ECLS and CSD, in conjunction with Water Quality Division, provided intensive hands-on compliance assistance to targeted small communities with longstanding compliance problems. Within the CSD, the Customer Assistance Program offers non-regulatory approaches to compliance through technical assistance to industries seeking permits to locate or operate in Oklahoma. CSD provides compliance assistance to small communities, including $513,000 to offset community costs for laboratory analysis in the Public Water Supply (PWS) program. In FY-2008, 980 systems benefited from this assistance for routine monitoring and 400 additional systems received assistance with
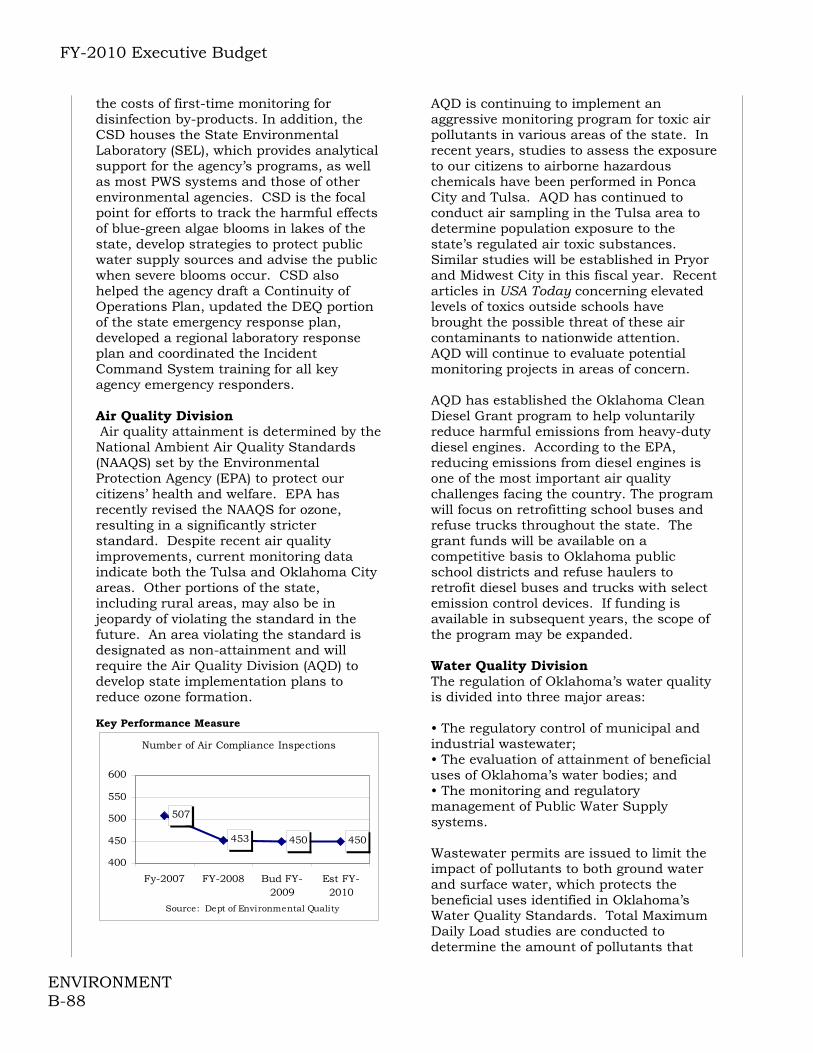
FY-2010 Executive Budget
ENVIRONMENT B-88
the costs of first-time monitoring for disinfection by-products. In addition, the CSD houses the State Environmental Laboratory (SEL), which provides analytical support for the agency’s programs, as well as most PWS systems and those of other environmental agencies. CSD is the focal point for efforts to track the harmful effects of blue-green algae blooms in lakes of the state, develop strategies to protect public water supply sources and advise the public when severe blooms occur. CSD also helped the agency draft a Continuity of Operations Plan, updated the DEQ portion of the state emergency response plan, developed a regional laboratory response plan and coordinated the Incident Command System training for all key agency emergency responders. Air Quality Division Air quality attainment is determined by the National Ambient Air Quality Standards (NAAQS) set by the Environmental Protection Agency (EPA) to protect our citizens’ health and welfare. EPA has recently revised the NAAQS for ozone, resulting in a significantly stricter standard. Despite recent air quality improvements, current monitoring data indicate both the Tulsa and Oklahoma City areas. Other portions of the state, including rural areas, may also be in jeopardy of violating the standard in the future. An area violating the standard is designated as non-attainment and will require the Air Quality Division (AQD) to develop state implementation plans to reduce ozone formation. Key Performance Measure
Number of Air Compliance Inspections
507
453 450 450
400
450
500
550
600
Fy-2007 FY-2008 Bud FY-2009
Est FY-2010
Source: Dept of Environmental Quality
AQD is continuing to implement an aggressive monitoring program for toxic air pollutants in various areas of the state. In recent years, studies to assess the exposure to our citizens to airborne hazardous chemicals have been performed in Ponca City and Tulsa. AQD has continued to conduct air sampling in the Tulsa area to determine population exposure to the state’s regulated air toxic substances. Similar studies will be established in Pryor and Midwest City in this fiscal year. Recent articles in USA Today concerning elevated levels of toxics outside schools have brought the possible threat of these air contaminants to nationwide attention. AQD will continue to evaluate potential monitoring projects in areas of concern. AQD has established the Oklahoma Clean Diesel Grant program to help voluntarily reduce harmful emissions from heavy-duty diesel engines. According to the EPA, reducing emissions from diesel engines is one of the most important air quality challenges facing the country. The program will focus on retrofitting school buses and refuse trucks throughout the state. The grant funds will be available on a competitive basis to Oklahoma public school districts and refuse haulers to retrofit diesel buses and trucks with select emission control devices. If funding is available in subsequent years, the scope of the program may be expanded. Water Quality Division The regulation of Oklahoma’s water quality is divided into three major areas: • The regulatory control of municipal and industrial wastewater; • The evaluation of attainment of beneficial uses of Oklahoma’s water bodies; and • The monitoring and regulatory management of Public Water Supply systems. Wastewater permits are issued to limit the impact of pollutants to both ground water and surface water, which protects the beneficial uses identified in Oklahoma’s Water Quality Standards. Total Maximum Daily Load studies are conducted to determine the amount of pollutants that
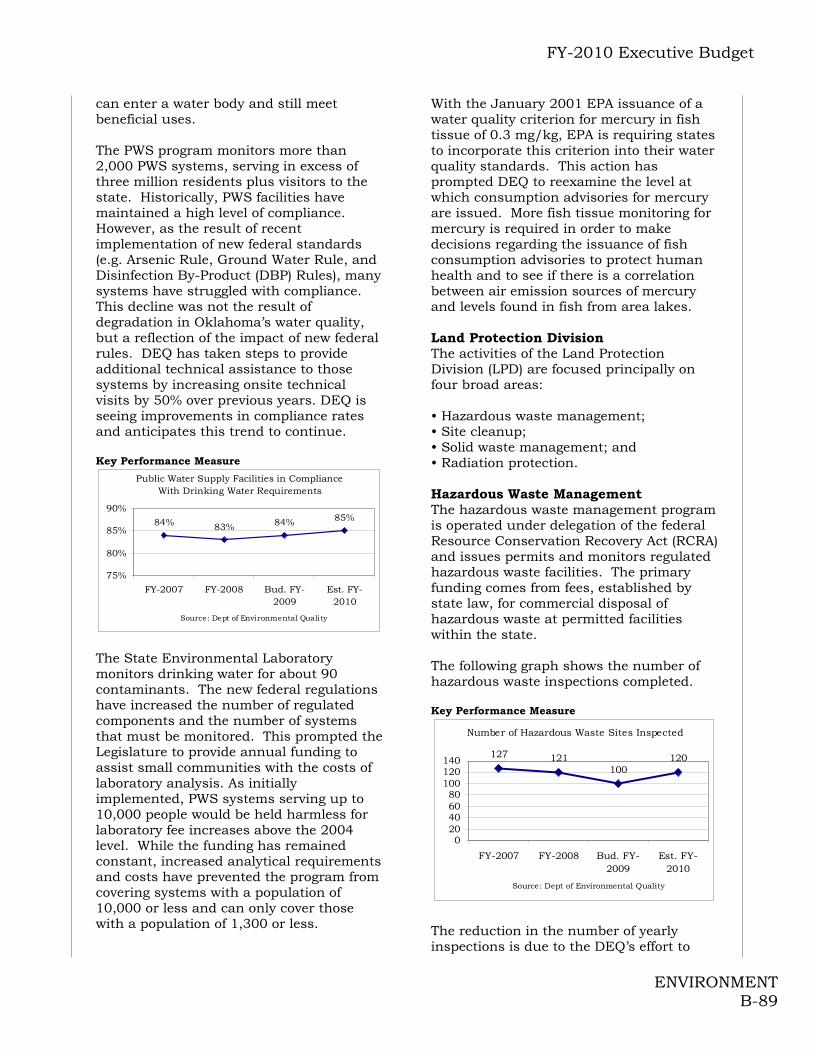
FY-2010 Executive Budget
ENVIRONMENT B-89
can enter a water body and still meet beneficial uses. The PWS program monitors more than 2,000 PWS systems, serving in excess of three million residents plus visitors to the state. Historically, PWS facilities have maintained a high level of compliance. However, as the result of recent implementation of new federal standards (e.g. Arsenic Rule, Ground Water Rule, and Disinfection By-Product (DBP) Rules), many systems have struggled with compliance. This decline was not the result of degradation in Oklahoma’s water quality, but a reflection of the impact of new federal rules. DEQ has taken steps to provide additional technical assistance to those systems by increasing onsite technical visits by 50% over previous years. DEQ is seeing improvements in compliance rates and anticipates this trend to continue. Key Performance Measure
Public Water Supply Facilities in Compliance With Drinking Water Requirements
84% 83% 84% 85%
75%
80%
85%
90%
FY-2007 FY-2008 Bud. FY-2009
Est. FY-2010
Source: Dept of Environmental Quality
The State Environmental Laboratory monitors drinking water for about 90 contaminants. The new federal regulations have increased the number of regulated components and the number of systems that must be monitored. This prompted the Legislature to provide annual funding to assist small communities with the costs of laboratory analysis. As initially implemented, PWS systems serving up to 10,000 people would be held harmless for laboratory fee increases above the 2004 level. While the funding has remained constant, increased analytical requirements and costs have prevented the program from covering systems with a population of 10,000 or less and can only cover those with a population of 1,300 or less.
With the January 2001 EPA issuance of a water quality criterion for mercury in fish tissue of 0.3 mg/kg, EPA is requiring states to incorporate this criterion into their water quality standards. This action has prompted DEQ to reexamine the level at which consumption advisories for mercury are issued. More fish tissue monitoring for mercury is required in order to make decisions regarding the issuance of fish consumption advisories to protect human health and to see if there is a correlation between air emission sources of mercury and levels found in fish from area lakes. Land Protection Division The activities of the Land Protection Division (LPD) are focused principally on four broad areas: • Hazardous waste management; • Site cleanup; • Solid waste management; and • Radiation protection. Hazardous Waste Management The hazardous waste management program is operated under delegation of the federal Resource Conservation Recovery Act (RCRA) and issues permits and monitors regulated hazardous waste facilities. The primary funding comes from fees, established by state law, for commercial disposal of hazardous waste at permitted facilities within the state. The following graph shows the number of hazardous waste inspections completed. Key Performance Measure
Number of Hazardous Waste Sites Inspected
127 121100
120
020406080
100120140
FY-2007 FY-2008 Bud. FY-2009
Est. FY-2010
Source: Dept of Environmental Quality
The reduction in the number of yearly inspections is due to the DEQ’s effort to

FY-2010 Executive Budget
ENVIRONMENT B-90
concentrate on larger waste generators. These generators represent the greatest potential hazard to the environment and require more time to inspect. Site Clean-up The Site Cleanup Assistance Program was established in 2006 with funding provided by SB 1366. This program is working to clean up 57 armories that are scheduled to be returned to local communities under the federal Base Realignment and Closure Program. Currently, nine armories have been completed and eleven are in evaluation or remediation phases. Environmental hazards that have been remediated include: lead, dust and sand from indoor firing ranges, lead-based paint, and asbestos. In addition, three abandoned hazardous waste sites that do not qualify for other programs are under investigation or remediation. These funds will also provide a long-term revenue source for the required match of Superfund cleanup costs. Superfund Match costs are expected to escalate substantially over the next five years as National Priorities List (NPL) sites move into the construction phases of remediation. In the Superfund program, Oklahoma is able to leverage 90% federal funding by providing a 10% match for NPL site actions. Solid Waste Management DEQ’s solid waste program regulates the generation and disposal of solid waste. It also works in partnership with county and local governments to improve local solid waste infrastructure. Local needs include cleaning of illegal dumps, the development of convenience centers for bulky waste, obtaining equipment for managing disaster debris and increasing recycling. Where enhancements have been implemented, it has allowed local jurisdictions to take a more holistic approach to the management of wastes. Local governmental assistance includes cleaning trash dumps, recycling (including storm debris management) and land restoration projects.
Key Performance Measure
Number of Solid Waste Inspections
596
400450
400
0100200300400500600700
FY-2007 FY-2008 Bud. FY-2009
Est. FY-2010
Source: Dept of Environmental Quality
The LPD also oversees the implementation of the Waste Tire Recycling Act, which involves collection and recycling of roughly 3,000,000 tires annually. The program also includes requirements for commercial tire processors and provisions for cleaning up abandoned tire dumps throughout the state. Since the inception of the Waste Tire Recycling Act, the DEQ has successfully managed Oklahoma’s waste tire stream. By working closely with waste tire processors, the number of waste tires in illegal dumps across the state has dropped from millions to an estimated 350,000. From FY-2004 through FY-2008, nearly 11.9 million waste tires were removed from the waste stream. Approximately 569,000 waste tires were collected from illegal tire dumps and community-wide collection events. Radiation Protection The LPD is responsible for regulating the safe use of most sources of radiation in the state. DEQ handles about 300 radioactive materials licenses and about 150 industrial, therapeutic and analytical X-ray systems facilities. Since receiving authorization in 2001, DEQ has assumed most of the duties of the Nuclear Regulatory Commission in Oklahoma including education and testing. Although Oklahoma is not generally thought of as a "nuclear state", Tulsa is one of the world's major centers of industrial radiography (the use of very powerful radioactive sources to look for hidden flaws in materials such as pipelines, boilers and aircraft parts). There are also numerous types of radioactive materials used in the
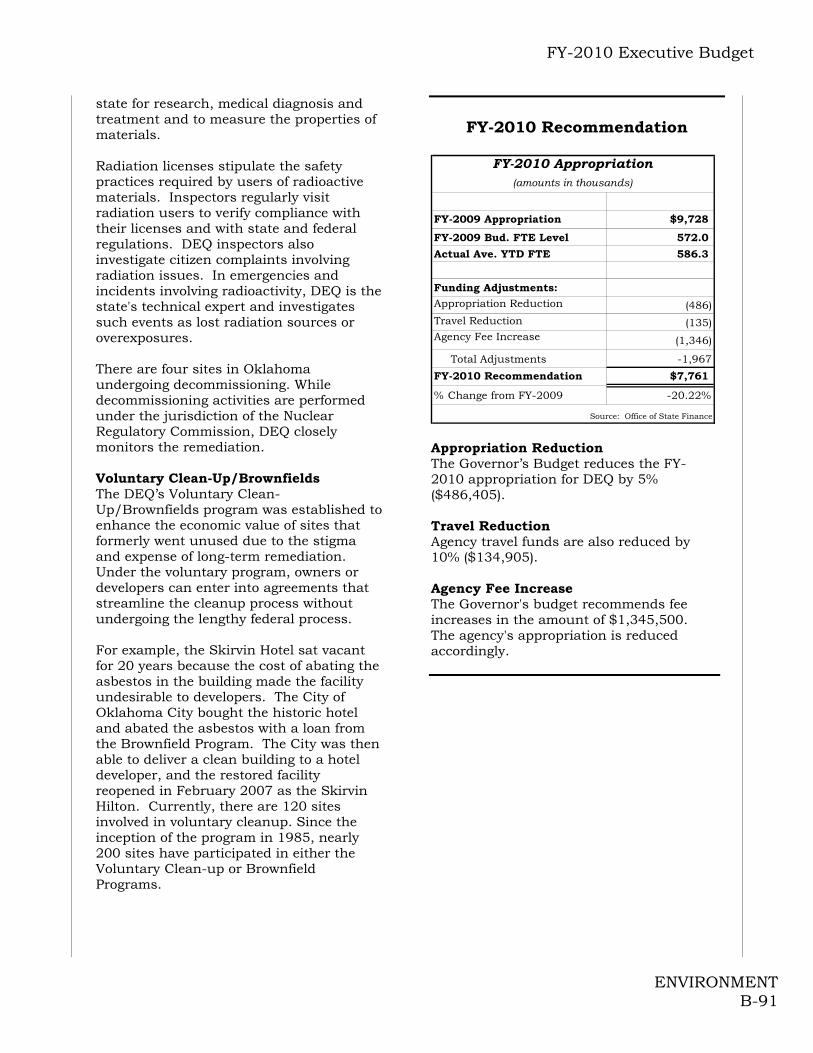
FY-2010 Executive Budget
ENVIRONMENT B-91
state for research, medical diagnosis and treatment and to measure the properties of materials. Radiation licenses stipulate the safety practices required by users of radioactive materials. Inspectors regularly visit radiation users to verify compliance with their licenses and with state and federal regulations. DEQ inspectors also investigate citizen complaints involving radiation issues. In emergencies and incidents involving radioactivity, DEQ is the state's technical expert and investigates such events as lost radiation sources or overexposures. There are four sites in Oklahoma undergoing decommissioning. While decommissioning activities are performed under the jurisdiction of the Nuclear Regulatory Commission, DEQ closely monitors the remediation. Voluntary Clean-Up/Brownfields The DEQ’s Voluntary Clean-Up/Brownfields program was established to enhance the economic value of sites that formerly went unused due to the stigma and expense of long-term remediation. Under the voluntary program, owners or developers can enter into agreements that streamline the cleanup process without undergoing the lengthy federal process. For example, the Skirvin Hotel sat vacant for 20 years because the cost of abating the asbestos in the building made the facility undesirable to developers. The City of Oklahoma City bought the historic hotel and abated the asbestos with a loan from the Brownfield Program. The City was then able to deliver a clean building to a hotel developer, and the restored facility reopened in February 2007 as the Skirvin Hilton. Currently, there are 120 sites involved in voluntary cleanup. Since the inception of the program in 1985, nearly 200 sites have participated in either the Voluntary Clean-up or Brownfield Programs.
FY-2010 Recommendation
FY-2009 Appropriation $9,728
FY-2009 Bud. FTE Level 572.0
Actual Ave. YTD FTE 586.3
Funding Adjustments:
Appropriation Reduction (486)Travel Reduction (135)Agency Fee Increase (1,346)
Total Adjustments -1,967
FY-2010 Recommendation $7,761
% Change from FY-2009 -20.22%
Source: Office of State Finance
FY-2010 Appropriation(amounts in thousands)
Appropriation Reduction The Governor’s Budget reduces the FY-2010 appropriation for DEQ by 5% ($486,405). Travel Reduction Agency travel funds are also reduced by 10% ($134,905). Agency Fee Increase The Governor's budget recommends fee increases in the amount of $1,345,500. The agency's appropriation is reduced accordingly.

FY-2010 Executive Budget
ENVIRONMENT B-92
Oklahoma Water Resources Board (OWRB)
Notable Achievements 42 Local Input Meetings were held across
the state. Additionally, preparations were made for 11 Regional Input Meetings that will be held in early FY-2009. Technical studies to help evaluate and ensure a reliable water supply for all Oklahomans commenced in 2008, which included approximately $1.3 million worth of work through the US Army Corps of Engineers to project water use demands and evaluate available supplies over the next 50 years. The OWRB secured over $1 million in federal matching money to assist in this effort.
The OWRB’s loan programs continued to provide financing at up to 40% below the market interest rate with up to a 30-year repayment term even during very difficult market conditions. Over $83 million in water and wastewater loans and grants were approved for 50 cities and rural water districts throughout Oklahoma.
The Arbuckle Simpson Groundwater Study was completed by the Planning and Management Division in FY-2008. The completion of this study is a milestone in meeting the requirements of SB288.
The OWRB was showcased in 2008 on Go Green Oklahoma!, a Web site that shows how state agencies are providing green savings in the way of reducing the amount of paper in use. The OWRB launched the Online Well Log Filing Program in 2003, and in 2008 received approximately 6,000 well log reports, with 5,000 of the reports currently entered online.
The OWRB’s Floodplain Management program currently assists a record number of 381 communities participating in the National Flood Insurance Program (NFIP).
Mission
The mission of the OWRB is to manage and protect the water resources of the state and plan for Oklahoma's long-range water needs in a responsive, innovative, and professional manner to ensure that all Oklahomans have adequate quantities of good water.
Water Resources Management Appropriation of stream and ground waters in Oklahoma, overseen by the OWRB's Permitting Section, is the foundation of the State’s water management activities to ensure long-term availability of this invaluable public. Water rights administration consists of legal and technical activities, including application processing and permit issuance, stream water forfeiture analysis, compliance investigation, annual water use reporting, record management and geospatial mapping.
To establish the quantity of water available for appropriation within the State’s stream and groundwater basins, the OWRB’s Technical Section cooperates with numerous State and Federal technical agencies and universities in large-scale water supply studies. The Technical Section began work on the Garber-Wellington Groundwater Study that will result in the maximum annual yield for the basin, in four years. The stream system hydrologic investigations, which provide information on the stream systems and evaluate how much stream water is available for appropriation, are in the process of being updated to reflect ten years of additional data. Also, the Technical Section has contracted to have a stream water allocation model developed for the Blue River and Muddy Boggy Creek stream systems. These models will provide detailed information on how change in stream flows, particularly during dry years, affects existing permits and potentially interferes with the evaluation of new applications for existing water rights.

FY-2010 Executive Budget
ENVIRONMENT B-93
In addition, the OWRB collects critical information on existing surface and groundwater supplies with a multi-faceted monitoring network that provides real-time data to enhance and complement Oklahoma's existing flood forecasting and warning capabilities, guides operation of state lakes and reservoirs, contributes vital information to the state's drought monitoring and response efforts, and facilitates agreement in interstate stream compacts.
To help ensure that future water supplies are available and used wisely, all OWRB activities are centered on the Oklahoma Comprehensive Water Plan, a dynamic document published and continually updated by the OWRB, that establishes guidelines for the present and future use of the state's water resources and outlines policy recommendations for water resources management. The document is currently being updated through a five-year undertaking initiated through 2006 legislation.
Water Quality Programs
The OWRB develops and maintains Oklahoma's Water Quality Standards and routinely collects physical, chemical and biological data to support the document.
Beneficial Use Monitoring Program (BUMP) This program is designed to monitor ambient water quality of surface and groundwater. BUMP collects monthly samples at 100 stream and river sites and samples each of our 127 publicly owned reservoirs every two to three years. This baseline data is critical to making informed and prudent water quality management decisions. The OWRB directs Oklahoma's Beneficial Use Monitoring Program (BUMP) to document beneficial use impairments, identify impairment sources, detect water quality trends, provide needed information for the Water Quality Standards and facilitate the prioritization of pollution control activities. Other water quality monitoring activities provide background
data for Total Maximum Daily Loading (TMDL) studies, including both stream gauge and water quality data, much of which is related to confirming 303(d) listings and determining allocations. The 303(d) list is a federally mandated list of waters that have threatened or impaired beneficial uses. Stream water is also monitored by the OWRB for the Federal Energy Regulatory Commission (FERC) permitting process for hydroelectric power generation activities. The OWRB samples approximately 850 groundwater wells to track movement of pollutants from Confined Animal Feeding Operations (CAFO) in support regulation by the Oklahoma Department of Agriculture, Food and Forestry. As part of its Clean Lakes Program, the OWRB conducts water quality assessments to determine the relative health of state lakes and the problems impairing them. OWRB also coordinates a successful volunteer water quality monitoring program and implements diagnostic and feasibility studies, which seek to ensure the recreational benefits of public lakes throughout the state. The OWRB also participates with municipal governments and federal agencies to assess and control various water quality problems impacting Oklahoma waters.
Financial Assistance Program
OWRB’s Financial Assistance Program (FAP) consists of the following loan programs: State Revolving Fund Clean Water (Wastewater) Loan Program, State Revolving Fund Drinking Water Loan Program, and the Bond Issue Loan Program. The OWRB also administers two grant programs, the Emergency Grant Program and the Rural Economic Action Plan (REAP) Grant Program, for water and wastewater infrastructure.
From the original $25 million seed money allocated to the OWRB in 1982 and additional direct appropriations totaling almost $16 million, the FAP has currently provided over $1.7 billion in water and wastewater projects in Oklahoma, including construction and improvement of water supplies, storage facilities, pump stations,
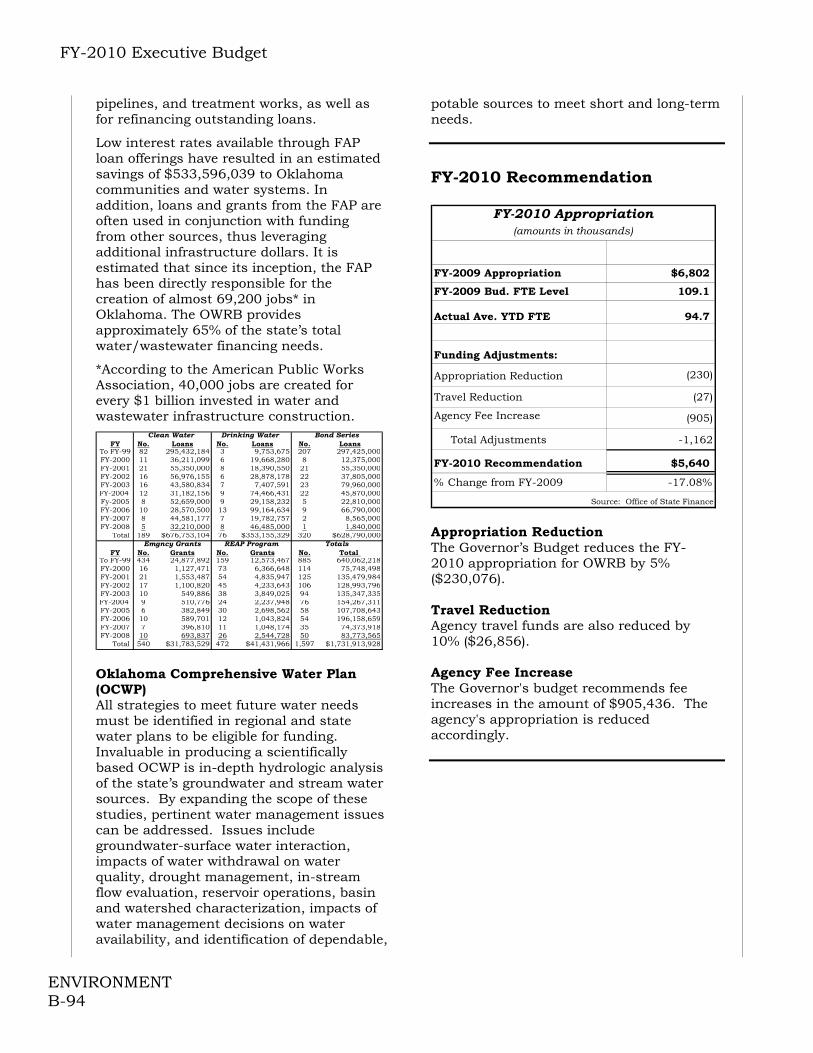
FY-2010 Executive Budget
ENVIRONMENT B-94
pipelines, and treatment works, as well as for refinancing outstanding loans.
Low interest rates available through FAP loan offerings have resulted in an estimated savings of $533,596,039 to Oklahoma communities and water systems. In addition, loans and grants from the FAP are often used in conjunction with funding from other sources, thus leveraging additional infrastructure dollars. It is estimated that since its inception, the FAP has been directly responsible for the creation of almost 69,200 jobs* in Oklahoma. The OWRB provides approximately 65% of the state’s total water/wastewater financing needs.
*According to the American Public Works Association, 40,000 jobs are created for every $1 billion invested in water and wastewater infrastructure construction.
Clean Water Drinking Water Bond SeriesFY No. Loans No. Loans No. Loans
To FY-99 82 295,432,184 3 9,753,675 207 297,425,000FY-2000 11 36,211,099 6 19,668,280 8 12,375,000FY-2001 21 55,350,000 8 18,390,550 21 55,350,000FY-2002 16 56,976,155 6 28,878,178 22 37,805,000FY-2003 16 43,580,834 7 7,407,591 23 79,960,000FY-2004 12 31,182,156 9 74,466,431 22 45,870,000Fy-2005 8 52,659,000 9 29,158,232 5 22,810,000FY-2006 10 28,570,500 13 99,164,634 9 66,790,000FY-2007 8 44,581,177 7 19,782,757 2 8,565,000FY-2008 5 32,210,000 8 46,485,000 1 1,840,000
Total 189 $676,753,104 76 $353,155,329 320 $628,790,000Emgncy Grants REAP Program Totals
FY No. Grants No. Grants No. Total To FY-99 434 24,877,892 159 12,573,467 885 640,062,218FY-2000 16 1,127,471 73 6,366,648 114 75,748,498FY-2001 21 1,553,487 54 4,835,947 125 135,479,984FY-2002 17 1,100,820 45 4,233,643 106 128,993,796FY-2003 10 549,886 38 3,849,025 94 135,347,335FY-2004 9 510,776 24 2,237,948 76 154,267,311FY-2005 6 382,849 30 2,698,562 58 107,708,643FY-2006 10 589,701 12 1,043,824 54 196,158,659FY-2007 7 396,810 11 1,048,174 35 74,373,918FY-2008 10 693,837 26 2,544,728 50 83,773,565
Total 540 $31,783,529 472 $41,431,966 1,597 $1,731,913,928 Oklahoma Comprehensive Water Plan (OCWP) All strategies to meet future water needs must be identified in regional and state water plans to be eligible for funding. Invaluable in producing a scientifically based OCWP is in-depth hydrologic analysis of the state’s groundwater and stream water sources. By expanding the scope of these studies, pertinent water management issues can be addressed. Issues include groundwater-surface water interaction, impacts of water withdrawal on water quality, drought management, in-stream flow evaluation, reservoir operations, basin and watershed characterization, impacts of water management decisions on water availability, and identification of dependable,
potable sources to meet short and long-term needs.
FY-2010 Recommendation
FY-2009 Appropriation $6,802
FY-2009 Bud. FTE Level 109.1
Actual Ave. YTD FTE 94.7
Funding Adjustments:
Appropriation Reduction (230)
Travel Reduction (27)
Agency Fee Increase (905)
Total Adjustments -1,162
FY-2010 Recommendation $5,640
% Change from FY-2009 -17.08%
Source: Office of State Finance
(amounts in thousands)
FY-2010 Appropriation
Appropriation Reduction The Governor’s Budget reduces the FY-2010 appropriation for OWRB by 5% ($230,076). Travel Reduction Agency travel funds are also reduced by 10% ($26,856). Agency Fee Increase The Governor's budget recommends fee increases in the amount of $905,436. The agency's appropriation is reduced accordingly.
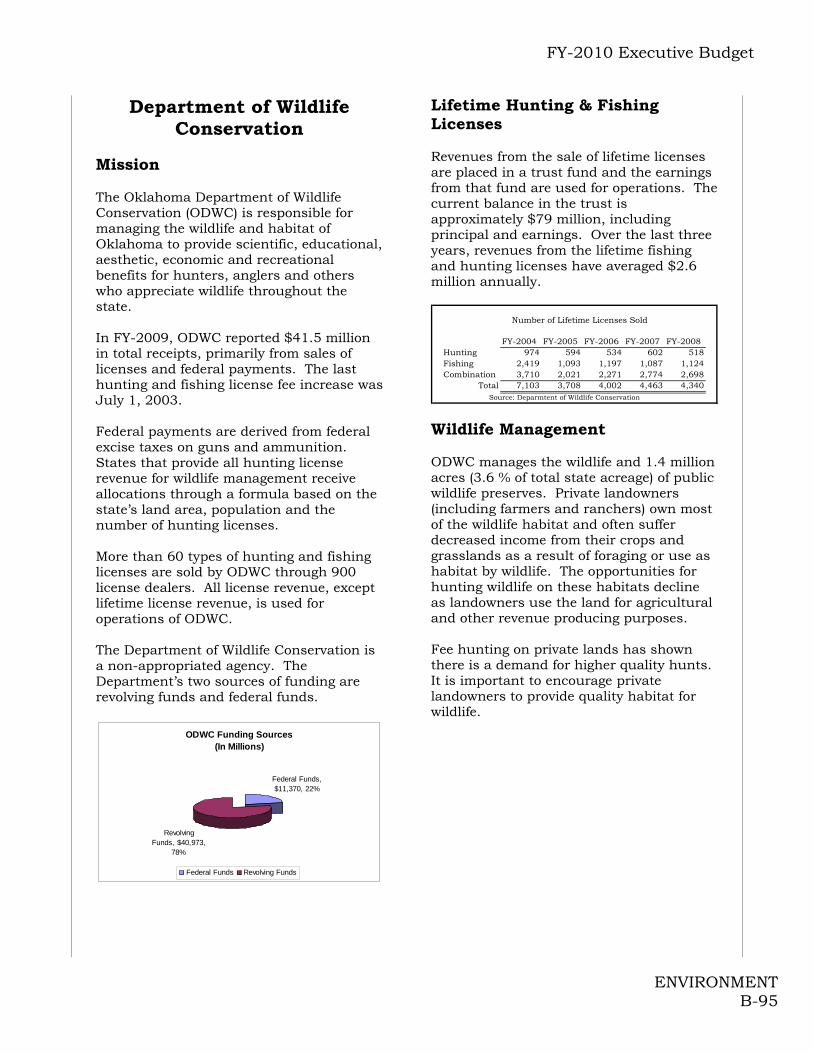
FY-2010 Executive Budget
ENVIRONMENT B-95
Department of Wildlife Conservation
Mission The Oklahoma Department of Wildlife Conservation (ODWC) is responsible for managing the wildlife and habitat of Oklahoma to provide scientific, educational, aesthetic, economic and recreational benefits for hunters, anglers and others who appreciate wildlife throughout the state. In FY-2009, ODWC reported $41.5 million in total receipts, primarily from sales of licenses and federal payments. The last hunting and fishing license fee increase was July 1, 2003. Federal payments are derived from federal excise taxes on guns and ammunition. States that provide all hunting license revenue for wildlife management receive allocations through a formula based on the state’s land area, population and the number of hunting licenses. More than 60 types of hunting and fishing licenses are sold by ODWC through 900 license dealers. All license revenue, except lifetime license revenue, is used for operations of ODWC. The Department of Wildlife Conservation is a non-appropriated agency. The Department’s two sources of funding are revolving funds and federal funds.
ODWC Funding Sources(In Millions)
Revolving Funds, $40,973,
78%
Federal Funds, $11,370, 22%
Federal Funds Revolving Funds
Lifetime Hunting & Fishing Licenses Revenues from the sale of lifetime licenses are placed in a trust fund and the earnings from that fund are used for operations. The current balance in the trust is approximately $79 million, including principal and earnings. Over the last three years, revenues from the lifetime fishing and hunting licenses have averaged $2.6 million annually.
FY-2004 FY-2005 FY-2006 FY-2007 FY-2008Hunting 974 594 534 602 518Fishing 2,419 1,093 1,197 1,087 1,124Combination 3,710 2,021 2,271 2,774 2,698
Total 7,103 3,708 4,002 4,463 4,340Source: Deparmtent of Wildlife Conservation
Number of Lifetime Licenses Sold
Wildlife Management ODWC manages the wildlife and 1.4 million acres (3.6 % of total state acreage) of public wildlife preserves. Private landowners (including farmers and ranchers) own most of the wildlife habitat and often suffer decreased income from their crops and grasslands as a result of foraging or use as habitat by wildlife. The opportunities for hunting wildlife on these habitats decline as landowners use the land for agricultural and other revenue producing purposes. Fee hunting on private lands has shown there is a demand for higher quality hunts. It is important to encourage private landowners to provide quality habitat for wildlife.

FY-2010 Executive Budget
ENVIRONMENT B-96
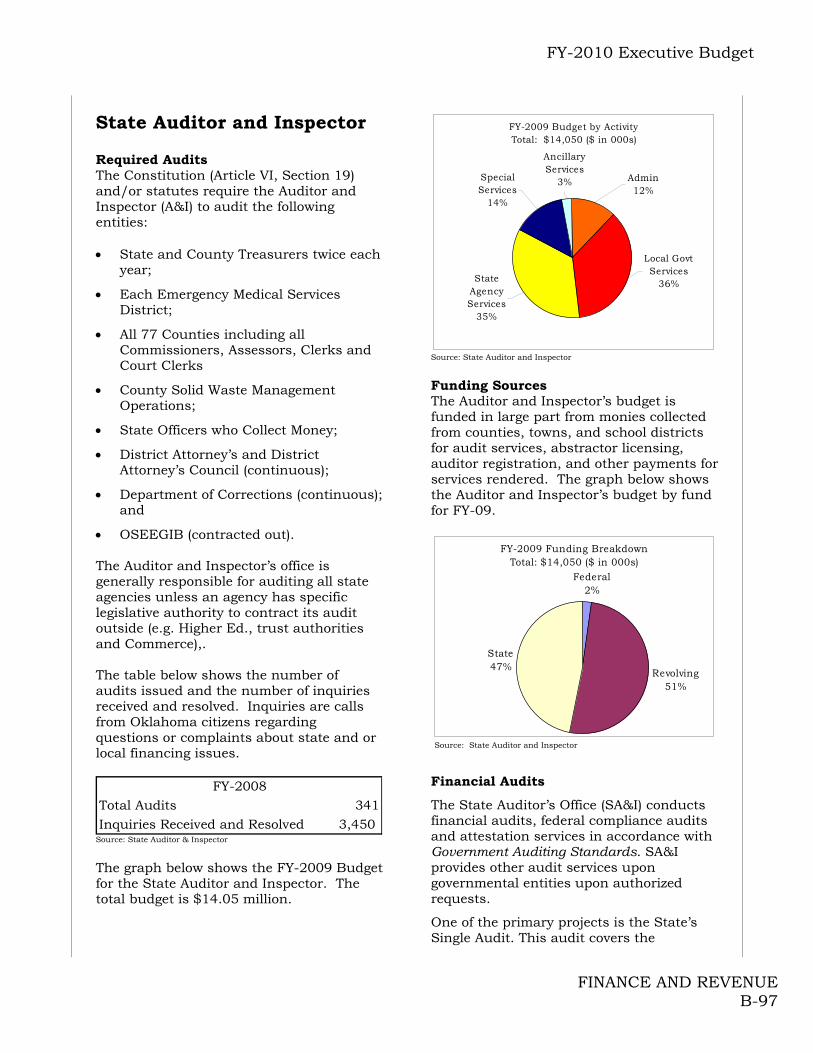
FY-2010 Executive Budget
FINANCE AND REVENUE B-97
State Auditor and Inspector
Required Audits The Constitution (Article VI, Section 19) and/or statutes require the Auditor and Inspector (A&I) to audit the following entities: State and County Treasurers twice each
year;
Each Emergency Medical Services District;
All 77 Counties including all Commissioners, Assessors, Clerks and Court Clerks
County Solid Waste Management Operations;
State Officers who Collect Money;
District Attorney’s and District Attorney’s Council (continuous);
Department of Corrections (continuous); and
OSEEGIB (contracted out).
The Auditor and Inspector’s office is generally responsible for auditing all state agencies unless an agency has specific legislative authority to contract its audit outside (e.g. Higher Ed., trust authorities and Commerce),. The table below shows the number of audits issued and the number of inquiries received and resolved. Inquiries are calls from Oklahoma citizens regarding questions or complaints about state and or local financing issues.
Total Audits 341Inquiries Received and Resolved 3,450
FY-2008
Source: State Auditor & Inspector The graph below shows the FY-2009 Budget for the State Auditor and Inspector. The total budget is $14.05 million.
FY-2009 Budget by ActivityTotal: $14,050 ($ in 000s)
State Agency Services
35%
Special Services
14%
Ancillary Services
3% Admin12%
Local Govt Services
36%
Source: State Auditor and Inspector
Funding Sources The Auditor and Inspector’s budget is funded in large part from monies collected from counties, towns, and school districts for audit services, abstractor licensing, auditor registration, and other payments for services rendered. The graph below shows the Auditor and Inspector’s budget by fund for FY-09.
FY-2009 Funding BreakdownTotal: $14,050 ($ in 000s)
Federal2%
Revolving51%
State47%
Source: State Auditor and Inspector
Financial Audits
The State Auditor’s Office (SA&I) conducts financial audits, federal compliance audits and attestation services in accordance with Government Auditing Standards. SA&I provides other audit services upon governmental entities upon authorized requests.
One of the primary projects is the State’s Single Audit. This audit covers the

FY-2010 Executive Budget
FINANCE AND REVENUE B-98
operations of all state agencies, boards and commissions and is conducted in accordance with Office of Management and Budget A-133, Audits of States, Local Governments and Non-Profit Organizations. The Single Audit is a combination of two separate, yet interrelated audits with one being the audit of the State’s Comprehensive Annual Financial Report (CAFR). The second portion of the Single Audit covers federal funds expended by state agencies and their compliance with applicable laws and regulations.
Performance Audits
Performance audits provide information to improve operations and aid those responsible for initiating corrective action. 74 O.S. § 213.2 authorizes the State Auditor and Inspector to conduct a performance audit on any public officer, institution or other governmental entity upon the written request of the Governor, the chief executive officer of a governmental entity or pursuant to a concurrent resolution of the Legislature.
The most common types of performance audits performed by the Division include economy and efficiency audits (determine whether an entity is acquiring, protecting and using its resources in the most productive manner), program effectiveness audits (address and measure the extent to which a program is achieving its goals and objectives), and compliance audits (relates to compliance criteria established by laws, regulations, and contract provisions).
Specialized Audits
Specialized Audits conducted by the State Auditor and Inspector consist of the following: Minerals Management Audits of oil and gas royalty paid on federal land located in the State; Horse Racing Audits of the pari-mutuel betting systems at the race tracks; Gaming Audits of the slot accounting systems of the racinos in the State; Oklahoma State Education and Employees Group Insurance Board Audits which are audits of compliance with agency rules for eligibility and claims, and Investigative Audits.
FY-2010 Recommendation
FY-2009 Appropriation $6,315
FY-2009 Bud. FTE Level 138.0
Actual Ave. YTD FTE 124.6
Funding Adjustments:Appropriation Reduction (316)Travel Reduction (46)
County Gov't Personnel Training (400)
Total Adjustments -762
FY-2010 Recommendation $5,553
% Change from FY-2009 -12.07%
Source: Office of State Finance
FY-2010 Appropriation(amounts in thousands)
Appropriation Reduction The Governor’s Budget reduces the State Auditor and Inspector’s FY-2010 Appropriation by 5% ($315,763). The County Government Personnel Training program was transferred to Oklahoma State University. The Governor’s budget reduces the State Auditor and Inspector’s FY-2010 Appropriation by $400,000. Travel Reduction Agency travel funds are reduced by 10% ($46,264).

FY-2010 Executive Budget
FINANCE AND REVENUE B-99
Banking Department Mission The State Banking Department preserves and promotes sound, constructive competition among financial institutions and ensures the security of deposits. It regulates State-chartered/licensed: • Banks, • Savings and loan associations, • Credit unions, • Trust companies, • Perpetual care cemeteries, • Money Order Companies, and • Money Transmitter Companies. The Conference of State Bank Supervisors (CSBS) accredits the Department. The CSBS evaluates the Department in the areas of administration and finance, personnel, training, examination, supervision and legislation. The Banking Department has two activities, administration and examinations. The primary expenditures are devoted to bank examinations. During FY-2008, examinations were 77% of the Department’s total expenditures.
Banking Department Actual FY-2008 Program Expenditures (In Millions)
Admin,
$1.078,
23%
Exams,
$3.513
77%
Source: Banking Department
State chartered banks There are approximately 178 state chartered banks in Oklahoma. The Banking Department views the growth of the state chartered banking system as a plus for Oklahoma because state charters better fit the economic needs of smaller banking institutions. For example, a state
chartered bank can lend 30% of its capital assets, whereas a national chartered bank can only lend 15%. State chartered banks are also able to deal with in-state banking officials who are familiar with their local circumstances.
End of Calendar Year Number of
Banks
2003 1842004 1852005 1852006 1852007 1772008 178
Oklahoma State Chartered Banks
Source: Banking Department Revenue from Banks and other Regulated Entities Banks pay assessments based on a percentage rate of the bank’s total assets. The Department deposits 10% of Bank and Credit Union assessments into the General Revenue Fund and the remainder directly into agency revolving funds. The Department deposited $555,473 into the General Revenue Fund for FY-2008 and estimates they will deposit $550,000 in FY-2009.
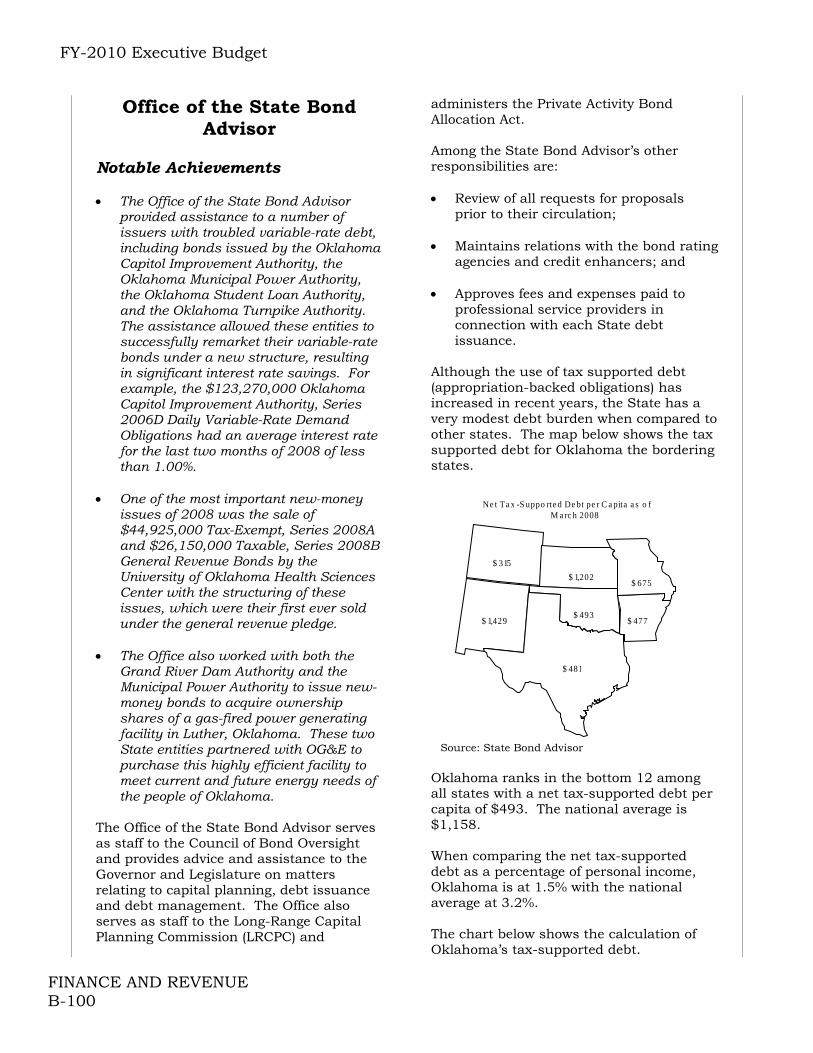
FY-2010 Executive Budget
FINANCE AND REVENUE B-100
Office of the State Bond Advisor
Notable Achievements The Office of the State Bond Advisor
provided assistance to a number of issuers with troubled variable-rate debt, including bonds issued by the Oklahoma Capitol Improvement Authority, the Oklahoma Municipal Power Authority, the Oklahoma Student Loan Authority, and the Oklahoma Turnpike Authority. The assistance allowed these entities to successfully remarket their variable-rate bonds under a new structure, resulting in significant interest rate savings. For example, the $123,270,000 Oklahoma Capitol Improvement Authority, Series 2006D Daily Variable-Rate Demand Obligations had an average interest rate for the last two months of 2008 of less than 1.00%.
One of the most important new-money
issues of 2008 was the sale of $44,925,000 Tax-Exempt, Series 2008A and $26,150,000 Taxable, Series 2008B General Revenue Bonds by the University of Oklahoma Health Sciences Center with the structuring of these issues, which were their first ever sold under the general revenue pledge.
The Office also worked with both the
Grand River Dam Authority and the Municipal Power Authority to issue new-money bonds to acquire ownership shares of a gas-fired power generating facility in Luther, Oklahoma. These two State entities partnered with OG&E to purchase this highly efficient facility to meet current and future energy needs of the people of Oklahoma.
The Office of the State Bond Advisor serves as staff to the Council of Bond Oversight and provides advice and assistance to the Governor and Legislature on matters relating to capital planning, debt issuance and debt management. The Office also serves as staff to the Long-Range Capital Planning Commission (LRCPC) and
administers the Private Activity Bond Allocation Act. Among the State Bond Advisor’s other responsibilities are: Review of all requests for proposals
prior to their circulation; Maintains relations with the bond rating
agencies and credit enhancers; and Approves fees and expenses paid to
professional service providers in connection with each State debt issuance.
Although the use of tax supported debt (appropriation-backed obligations) has increased in recent years, the State has a very modest debt burden when compared to other states. The map below shows the tax supported debt for Oklahoma the bordering states. Oklahoma ranks in the bottom 12 among all states with a net tax-supported debt per capita of $493. The national average is $1,158. When comparing the net tax-supported debt as a percentage of personal income, Oklahoma is at 1.5% with the national average at 3.2%. The chart below shows the calculation of Oklahoma’s tax-supported debt.
Source: State Bond Advisor
$ 1,429
$ 481
$ 493
$ 1,202$ 675
$ 477
Ne t Ta x -S uppo rte d De bt pe r C a pita a s o f M a rc h 2008
$ 315
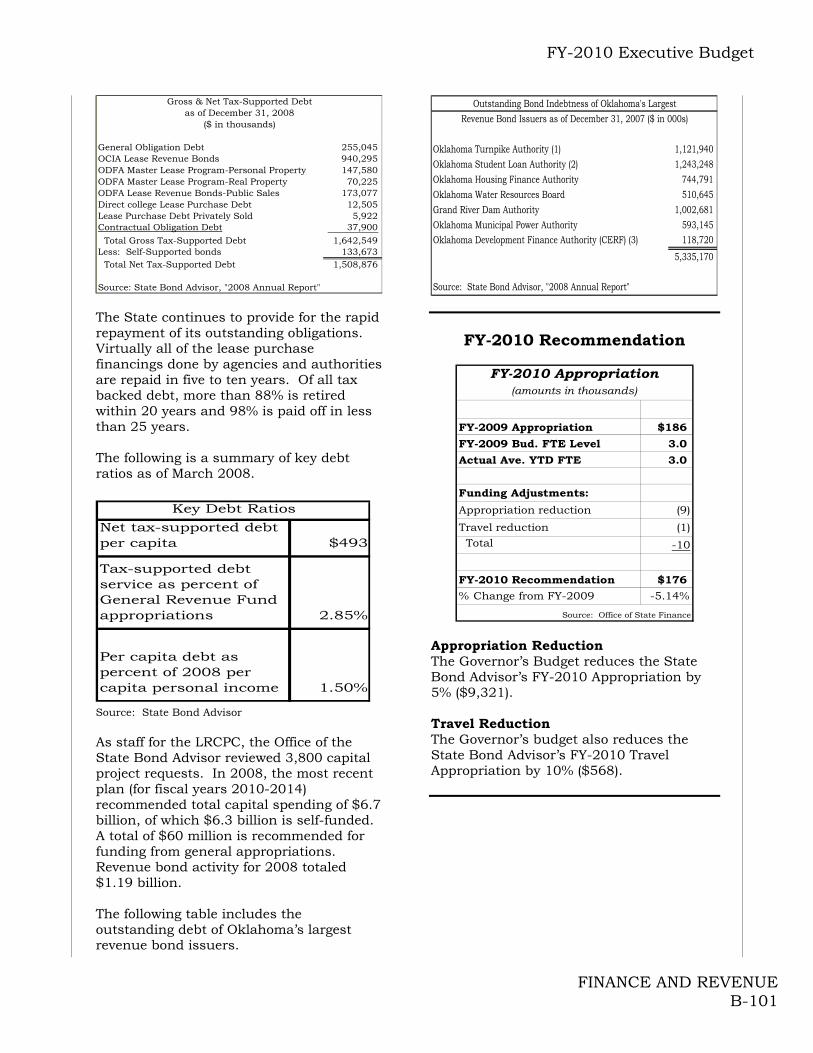
FY-2010 Executive Budget
FINANCE AND REVENUE B-101
General Obligation Debt 255,045 OCIA Lease Revenue Bonds 940,295 ODFA Master Lease Program-Personal Property 147,580 ODFA Master Lease Program-Real Property 70,225 ODFA Lease Revenue Bonds-Public Sales 173,077 Direct college Lease Purchase Debt 12,505 Lease Purchase Debt Privately Sold 5,922 Contractual Obligation Debt 37,900
Total Gross Tax-Supported Debt 1,642,549 Less: Self-Supported bonds 133,673
Total Net Tax-Supported Debt 1,508,876
Source: State Bond Advisor, "2008 Annual Report"
as of December 31, 2008($ in thousands)
Gross & Net Tax-Supported Debt
The State continues to provide for the rapid repayment of its outstanding obligations. Virtually all of the lease purchase financings done by agencies and authorities are repaid in five to ten years. Of all tax backed debt, more than 88% is retired within 20 years and 98% is paid off in less than 25 years. The following is a summary of key debt ratios as of March 2008.
Net tax-supported debt per capita $493
Tax-supported debt service as percent of General Revenue Fund appropriations 2.85%
Per capita debt as percent of 2008 per capita personal income 1.50%
Key Debt Ratios
Source: State Bond Advisor As staff for the LRCPC, the Office of the State Bond Advisor reviewed 3,800 capital project requests. In 2008, the most recent plan (for fiscal years 2010-2014) recommended total capital spending of $6.7 billion, of which $6.3 billion is self-funded. A total of $60 million is recommended for funding from general appropriations. Revenue bond activity for 2008 totaled $1.19 billion. The following table includes the outstanding debt of Oklahoma’s largest revenue bond issuers.
Oklahoma Turnpike Authority (1) 1,121,940 Oklahoma Student Loan Authority (2) 1,243,248 Oklahoma Housing Finance Authority 744,791 Oklahoma Water Resources Board 510,645 Grand River Dam Authority 1,002,681 Oklahoma Municipal Power Authority 593,145 Oklahoma Development Finance Authority (CERF) (3) 118,720
5,335,170
Source: State Bond Advisor, "2008 Annual Report"
Outstanding Bond Indebtness of Oklahoma's LargestRevenue Bond Issuers as of December 31, 2007 ($ in 000s)
FY-2010 Recommendation
FY-2009 Appropriation $186
FY-2009 Bud. FTE Level 3.0
Actual Ave. YTD FTE 3.0
Funding Adjustments:
Appropriation reduction (9)
Travel reduction (1)
Total -10
FY-2010 Recommendation $176
% Change from FY-2009 -5.14%
Source: Office of State Finance
FY-2010 Appropriation(amounts in thousands)
Appropriation Reduction The Governor’s Budget reduces the State Bond Advisor’s FY-2010 Appropriation by 5% ($9,321). Travel Reduction The Governor’s budget also reduces the State Bond Advisor’s FY-2010 Travel Appropriation by 10% ($568).

FY-2010 Executive Budget
FINANCE AND REVENUE B-102
Capitol Improvement Authority
The Oklahoma Capitol Improvement Authority (OCIA) is primarily responsible for acquiring and maintaining buildings for other state agencies. OCIA also issues bonds to obtain buildings when authorized by the Legislature. Participating agencies make lease payments from their appropriations to the OCIA. The OCIA then makes debt service payments through a Trustee/Paying Agent to the bondholders. Outstanding Issues As of December 31, 2007, the OCIA had 29 series of obligations outstanding. The total outstanding principal amount of these obligations was $1.1 billion. The following table lists OCIA obligations authorized and issued in FY-2006.
General Obligation Bonds There are two types of general obligation bonds issued by the State. The first are government-purpose issues to fund legislatively identified capital projects. All of these bonds are secured by cigarette tax revenue initially and, ultimately, by the full faith and credit of the State. The general obligation bonds are set to retire in 2018. In 2005, the state paid the remaining debt on the General Obligation Bond Series 2003B of $7.1 million. The table below shows the principal amount and balance of
the General Obligation Bond Series 2003A in FY-2006 and FY-2007.
The second type of general obligation bonds are issued by the Oklahoma Industrial Finance Authority (OIFA) to fund industrial loans, and are secured initially by loan repayments from the private-sector industrial borrowers and then by OIFA reserves. As of December 31, 2006, there were 11 series of these bonds, with a total principal amount outstanding at that date of $60,400,000.
Obligations Issued Amount
FY-2008 Annual Debt
Service($ in 000's)
Attorney General 3,000 226Higher Education 333,610 18,096Higher Education 6,040 6,329Higher Education 50,000 7,500Dept. of Agriculture 24,410 1,811Dept. of Mental Health 18,900 1,398Supreme Court 22,040 1,677Higher Education 125,700 6,285OSBI 6,430 487Total $590,130 $43,809Source: OCIA
7/15/2005 7/15/2006Principal 6,635 13,990Balance 247,500 233,510Source: State Bond Advisor
General Obligation Bond PaymentsSeries 2003A ($ in 000's)
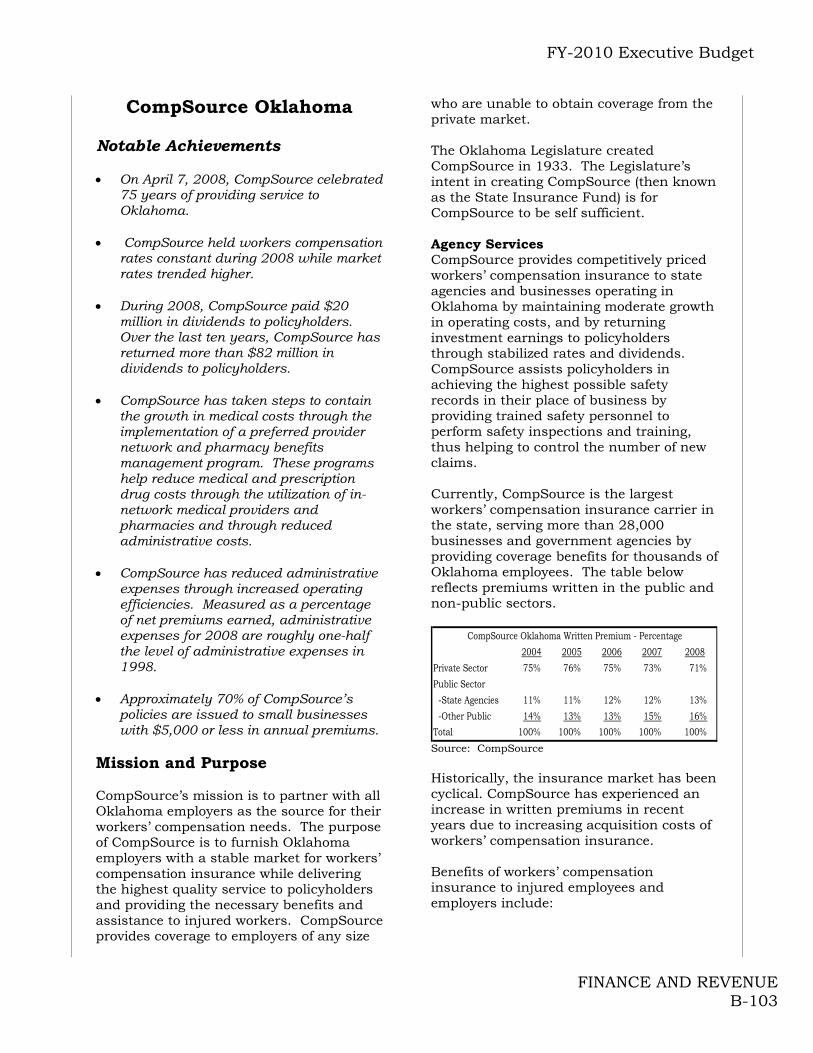
FY-2010 Executive Budget
FINANCE AND REVENUE B-103
CompSource Oklahoma Notable Achievements On April 7, 2008, CompSource celebrated
75 years of providing service to Oklahoma.
CompSource held workers compensation
rates constant during 2008 while market rates trended higher.
During 2008, CompSource paid $20
million in dividends to policyholders. Over the last ten years, CompSource has returned more than $82 million in dividends to policyholders.
CompSource has taken steps to contain
the growth in medical costs through the implementation of a preferred provider network and pharmacy benefits management program. These programs help reduce medical and prescription drug costs through the utilization of in-network medical providers and pharmacies and through reduced administrative costs.
CompSource has reduced administrative
expenses through increased operating efficiencies. Measured as a percentage of net premiums earned, administrative expenses for 2008 are roughly one-half the level of administrative expenses in 1998.
Approximately 70% of CompSource’s
policies are issued to small businesses with $5,000 or less in annual premiums.
Mission and Purpose CompSource’s mission is to partner with all Oklahoma employers as the source for their workers’ compensation needs. The purpose of CompSource is to furnish Oklahoma employers with a stable market for workers’ compensation insurance while delivering the highest quality service to policyholders and providing the necessary benefits and assistance to injured workers. CompSource provides coverage to employers of any size
who are unable to obtain coverage from the private market. The Oklahoma Legislature created CompSource in 1933. The Legislature’s intent in creating CompSource (then known as the State Insurance Fund) is for CompSource to be self sufficient. Agency Services CompSource provides competitively priced workers’ compensation insurance to state agencies and businesses operating in Oklahoma by maintaining moderate growth in operating costs, and by returning investment earnings to policyholders through stabilized rates and dividends. CompSource assists policyholders in achieving the highest possible safety records in their place of business by providing trained safety personnel to perform safety inspections and training, thus helping to control the number of new claims. Currently, CompSource is the largest workers’ compensation insurance carrier in the state, serving more than 28,000 businesses and government agencies by providing coverage benefits for thousands of Oklahoma employees. The table below reflects premiums written in the public and non-public sectors.
2004 2005 2006 2007 2008
Private Sector 75% 76% 75% 73% 71%
Public Sector
-State Agencies 11% 11% 12% 12% 13%
-Other Public 14% 13% 13% 15% 16%
Total 100% 100% 100% 100% 100%
CompSource Oklahoma Written Premium - Percentage
Source: CompSource Historically, the insurance market has been cyclical. CompSource has experienced an increase in written premiums in recent years due to increasing acquisition costs of workers’ compensation insurance. Benefits of workers’ compensation insurance to injured employees and employers include:

FY-2010 Executive Budget
FINANCE AND REVENUE B-104
Injured employees receive compensation when unable to work;
Medical bills from job related injuries are paid with no deductible;
Employers potentially avoid general tort liability for workplace injuries; and
Programs encouraging injured workers to return to work as soon as possible.
CompSource provides stability to the state’s economy because it provides a source of workers’ compensation insurance coverage to businesses that may not otherwise be able to obtain coverage through the private market.
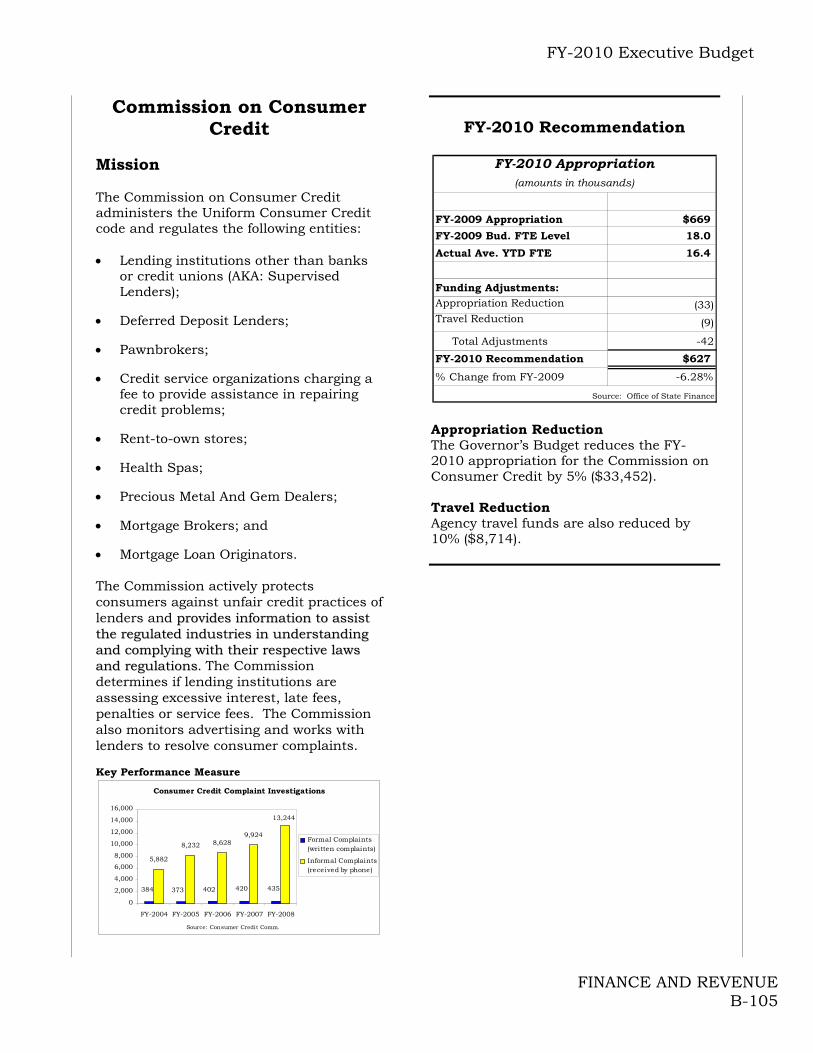
FY-2010 Executive Budget
FINANCE AND REVENUE B-105
Commission on Consumer Credit
Mission The Commission on Consumer Credit administers the Uniform Consumer Credit code and regulates the following entities: Lending institutions other than banks
or credit unions (AKA: Supervised Lenders);
Deferred Deposit Lenders;
Pawnbrokers;
Credit service organizations charging a fee to provide assistance in repairing credit problems;
Rent-to-own stores;
Health Spas;
Precious Metal And Gem Dealers;
Mortgage Brokers; and
Mortgage Loan Originators. The Commission actively protects consumers against unfair credit practices of lenders and pprroovviiddeess iinnffoorrmmaattiioonn ttoo aassssiisstt tthhee rreegguullaatteedd iinndduussttrriieess iinn uunnddeerrssttaannddiinngg aanndd ccoommppllyyiinngg wwiitthh tthheeiirr rreessppeeccttiivvee llaawwss aanndd rreegguullaattiioonnss.. The Commission determines if lending institutions are assessing excessive interest, late fees, penalties or service fees. The Commission also monitors advertising and works with lenders to resolve consumer complaints. Key Performance Measure
Consumer Credit Complaint Investigations
5,882
8,6289,924
435420402373384
13,244
8,232
0
2,000
4,000
6,000
8,000
10,000
12,000
14,000
16,000
FY-2004 FY-2005 FY-2006 FY-2007 FY-2008
Source: Consumer Credit Comm.
Formal Complaints(written complaints)
Informal Complaints(received by phone)
FY-2010 Recommendation
FY-2009 Appropriation $669
FY-2009 Bud. FTE Level 18.0
Actual Ave. YTD FTE 16.4
Funding Adjustments:Appropriation Reduction (33)Travel Reduction (9)
Total Adjustments -42
FY-2010 Recommendation $627
% Change from FY-2009 -6.28%
Source: Office of State Finance
FY-2010 Appropriation(amounts in thousands)
Appropriation Reduction The Governor’s Budget reduces the FY-2010 appropriation for the Commission on Consumer Credit by 5% ($33,452). Travel Reduction Agency travel funds are also reduced by 10% ($8,714).
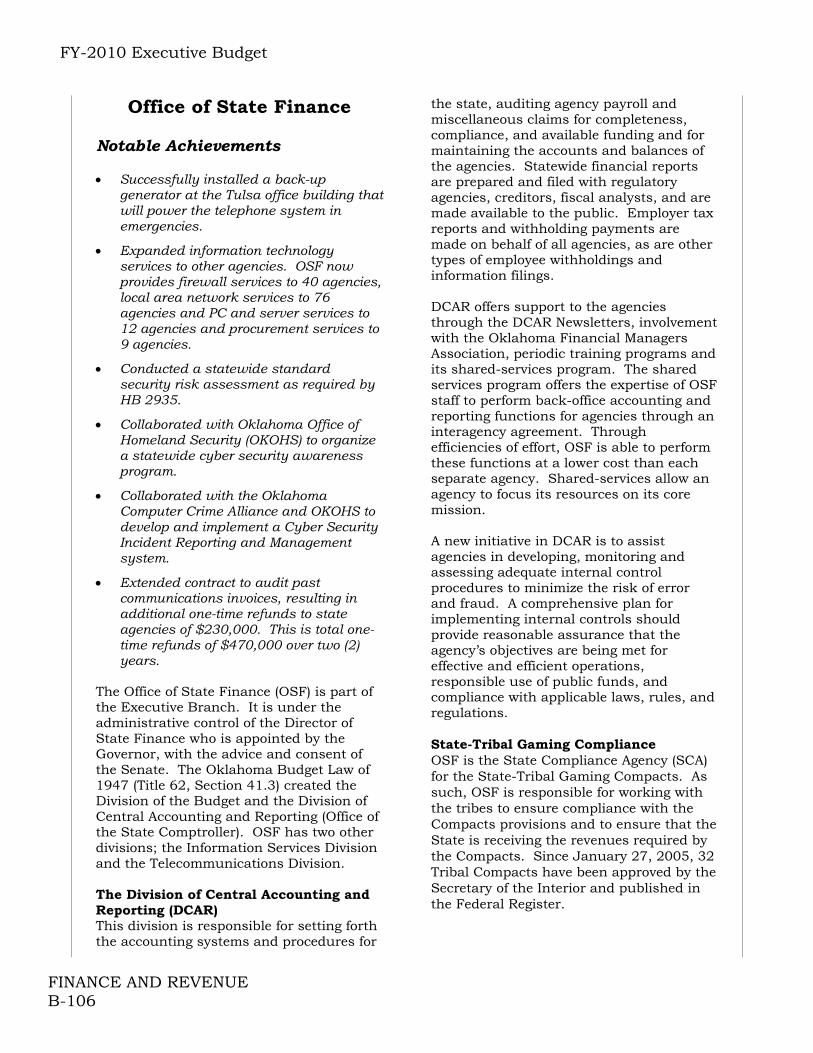
FY-2010 Executive Budget
FINANCE AND REVENUE B-106
Office of State Finance
Notable Achievements Successfully installed a back-up
generator at the Tulsa office building that will power the telephone system in emergencies.
Expanded information technology services to other agencies. OSF now provides firewall services to 40 agencies, local area network services to 76 agencies and PC and server services to 12 agencies and procurement services to 9 agencies.
Conducted a statewide standard security risk assessment as required by HB 2935.
Collaborated with Oklahoma Office of Homeland Security (OKOHS) to organize a statewide cyber security awareness program.
Collaborated with the Oklahoma Computer Crime Alliance and OKOHS to develop and implement a Cyber Security Incident Reporting and Management system.
Extended contract to audit past communications invoices, resulting in additional one-time refunds to state agencies of $230,000. This is total one-time refunds of $470,000 over two (2) years.
The Office of State Finance (OSF) is part of the Executive Branch. It is under the administrative control of the Director of State Finance who is appointed by the Governor, with the advice and consent of the Senate. The Oklahoma Budget Law of 1947 (Title 62, Section 41.3) created the Division of the Budget and the Division of Central Accounting and Reporting (Office of the State Comptroller). OSF has two other divisions; the Information Services Division and the Telecommunications Division. The Division of Central Accounting and Reporting (DCAR) This division is responsible for setting forth the accounting systems and procedures for
the state, auditing agency payroll and miscellaneous claims for completeness, compliance, and available funding and for maintaining the accounts and balances of the agencies. Statewide financial reports are prepared and filed with regulatory agencies, creditors, fiscal analysts, and are made available to the public. Employer tax reports and withholding payments are made on behalf of all agencies, as are other types of employee withholdings and information filings. DCAR offers support to the agencies through the DCAR Newsletters, involvement with the Oklahoma Financial Managers Association, periodic training programs and its shared-services program. The shared services program offers the expertise of OSF staff to perform back-office accounting and reporting functions for agencies through an interagency agreement. Through efficiencies of effort, OSF is able to perform these functions at a lower cost than each separate agency. Shared-services allow an agency to focus its resources on its core mission. A new initiative in DCAR is to assist agencies in developing, monitoring and assessing adequate internal control procedures to minimize the risk of error and fraud. A comprehensive plan for implementing internal controls should provide reasonable assurance that the agency’s objectives are being met for effective and efficient operations, responsible use of public funds, and compliance with applicable laws, rules, and regulations. State-Tribal Gaming Compliance OSF is the State Compliance Agency (SCA) for the State-Tribal Gaming Compacts. As such, OSF is responsible for working with the tribes to ensure compliance with the Compacts provisions and to ensure that the State is receiving the revenues required by the Compacts. Since January 27, 2005, 32 Tribal Compacts have been approved by the Secretary of the Interior and published in the Federal Register.
FY-2010 Executive Budget
FINANCE AND REVENUE B-107
Budget Division The Budget Division prepares the Governor's budget and assists in drafting supporting legislation for the Governor's proposals. Budget Division staff manages the state's budget system and make appropriate allotments and transfers as authorized by law. The division conducts fiscal policy research and analysis to improve the cost-efficiency of current financial practices. Developing and monitoring performance measures are another integral function of this division. Budget Division personnel also prepare analyses of appropriation and substantive legislation and make recommendations based on their research to the Governor. In addition, the Budget Division prepares revenue certification information for the Board of Equalization, which sets the appropriations limit for the Legislature. To ensure the State is able to make 100% allocations based on legislative appropriations, division personnel monitor collections to the General Revenue Fund and other funds authorized for expenditure. Information Services Division (ISD) The mission of ISD is to provide Oklahoma State agencies with quality, cost effective and secure information technology and telecommunications products and services. ISD manages the state’s data processing and telecommunications infrastructures. ISD sets standards for these areas to ensure compatibility of voice and data communications. ISD manages the local area networks for OSF, the Governor and several other state agencies. The communications infrastructure includes a state backbone of fiber-optic cable connecting the most populous areas of the state to high-speed internet capabilities. ISD also manages the State telephone system by negotiating long-distance and local services for the majority of state agencies. Improving security for the network as well as implementing a disaster recovery plan is a priority for this division. ISD sets security guidelines and procedures for all agencies. OSF works with Homeland
Security, the Federal Bureau of Investigation, and OSBI to continually evaluate the system and propose changes to improve IT security. Communications Operations Reporting Enterprise (CORE) The Office of State Finance, the Office of Personnel Management and the Department of Central Services serve as the lead agencies in the CORE project. The CORE project, an enterprise resource planning system, is a 7 year project that began in 2002. The purchasing and financial components of CORE/PeopleSoft went “live” November 3, 2003. These components of CORE/PeopleSoft, replaced antiquated systems with an integrated computer system that will permit user agencies to more easily access vital data. The project is multi-phased with various modules being made available during the different phases. Phase I included the implementation of the financial and procurement module, the human resources and payrolls system, and the budget module. Phase II of the project will roll out new applications to eliminate the need for the stand-alone and duplicative systems in the agencies. The modules include federal grant tracking, project accounting, billing, accounts receivable, inventories and asset management. These modules are in the initial design stages now and OSF is seeking the input of all agencies to ensure a suitable system is designed. Phase II enhanced many aspects of Phase I modules and implemented new functionality within the purchasing system. A new vendor portal will open the way for on-line bidding of state purchases and allow a vendor to view its purchase orders, deliveries and payments with the state in one centralized location.

FY-2010 Executive Budget
FINANCE AND REVENUE B-108
FY-2010 Recommendation
FY-2009 Appropriation $23,081
FY-2009 Bud. FTE Level
Actual Ave. YTD FTE 155.3
Funding Adjustments:Appropriation Reduction (1,154)Travel Reduction (29)
Total Adjustments -1,183
FY-2010 Recommendation $21,898
% Change from FY-2009 -5.13%
Source: Office of State Finance
FY-2010 Appropriation(amounts in thousands)
Appropriation Reduction The Governor’s budget reduces the Office of State Finance’s FY-2010 Appropriation by 5% ($1,154,072). Travel Reduction Agency travel funds are reduced by 10% ($29,382).
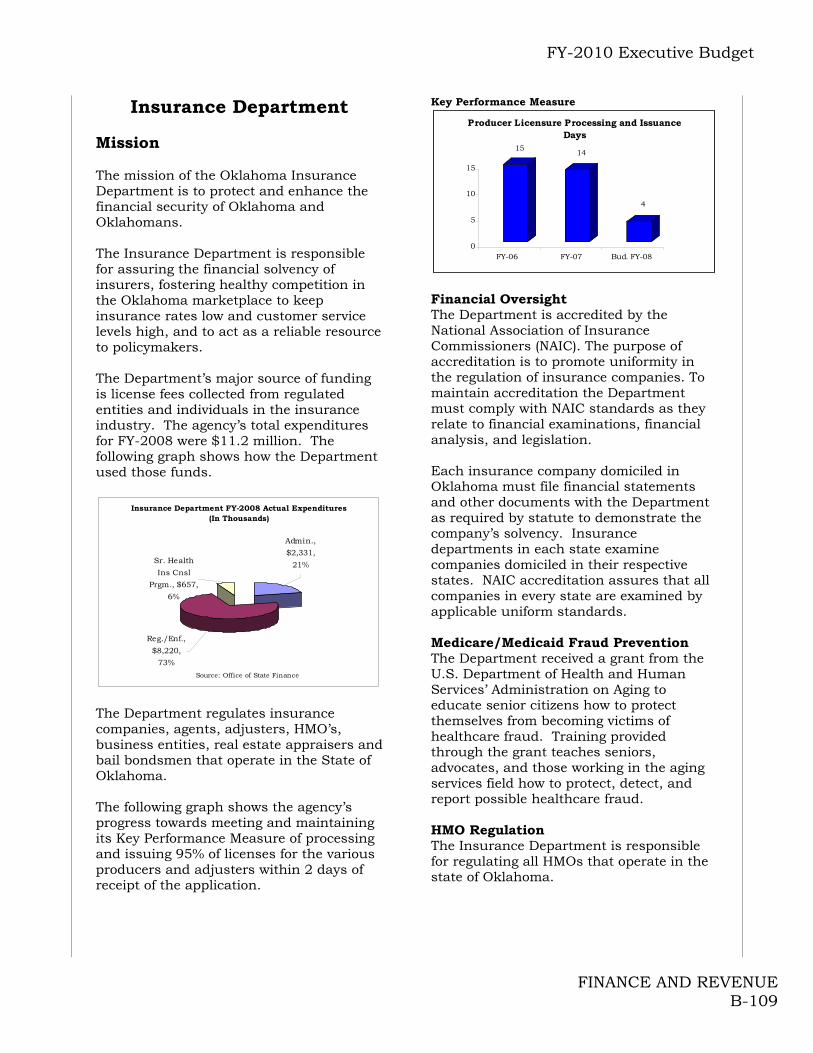
FY-2010 Executive Budget
FINANCE AND REVENUE B-109
Insurance Department Mission The mission of the Oklahoma Insurance Department is to protect and enhance the financial security of Oklahoma and Oklahomans. The Insurance Department is responsible for assuring the financial solvency of insurers, fostering healthy competition in the Oklahoma marketplace to keep insurance rates low and customer service levels high, and to act as a reliable resource to policymakers. The Department’s major source of funding is license fees collected from regulated entities and individuals in the insurance industry. The agency’s total expenditures for FY-2008 were $11.2 million. The following graph shows how the Department used those funds.
Insurance Department FY-2008 Actual Expenditures (In Thousands)
Sr. Health
Ins Cnsl
Prgm., $657,
6%
Admin.,
$2,331,
21%
Reg./Enf.,
$8,220,
73%
Source: Office of State Finance
The Department regulates insurance companies, agents, adjusters, HMO’s, business entities, real estate appraisers and bail bondsmen that operate in the State of Oklahoma. The following graph shows the agency’s progress towards meeting and maintaining its Key Performance Measure of processing and issuing 95% of licenses for the various producers and adjusters within 2 days of receipt of the application.
Key Performance Measure
1514
4
0
5
10
15
FY-06 FY-07 Bud. FY-08
Producer Licensure Processing and Issuance Days
Financial Oversight The Department is accredited by the National Association of Insurance Commissioners (NAIC). The purpose of accreditation is to promote uniformity in the regulation of insurance companies. To maintain accreditation the Department must comply with NAIC standards as they relate to financial examinations, financial analysis, and legislation. Each insurance company domiciled in Oklahoma must file financial statements and other documents with the Department as required by statute to demonstrate the company’s solvency. Insurance departments in each state examine companies domiciled in their respective states. NAIC accreditation assures that all companies in every state are examined by applicable uniform standards. Medicare/Medicaid Fraud Prevention The Department received a grant from the U.S. Department of Health and Human Services’ Administration on Aging to educate senior citizens how to protect themselves from becoming victims of healthcare fraud. Training provided through the grant teaches seniors, advocates, and those working in the aging services field how to protect, detect, and report possible healthcare fraud. HMO Regulation The Insurance Department is responsible for regulating all HMOs that operate in the state of Oklahoma.

FY-2010 Executive Budget
FINANCE AND REVENUE B-110
FY-2010 Recommendation
FY-2009 Appropriation $2,516
FY-2009 Bud. FTE Level 129.0
Actual Ave. YTD FTE 121.9
Funding Adjustments:
Make Agency Non-Appropriated(2,516)
Total Adjustments -2,516
FY-2010 Recommendation $0
% Change from FY-2009 -100.00%
Source: Office of State Finance
(amounts in thousands)
FY-2010 Appropriation
Make Agency Non-Appropriated The Governor's budget makes the Insurance Department a non-appropriated agency and recommends that the Insurance Department be given the flexibility to raise fees to support their operations. The Insurance Department has not increased a majority of their fees since the 1980's and 1990's while inflation has increased an average of 2.85% per year since 1985. The Governor's budget also transfers $5 million from the Insurance Department's revolving funds to Special Cash.
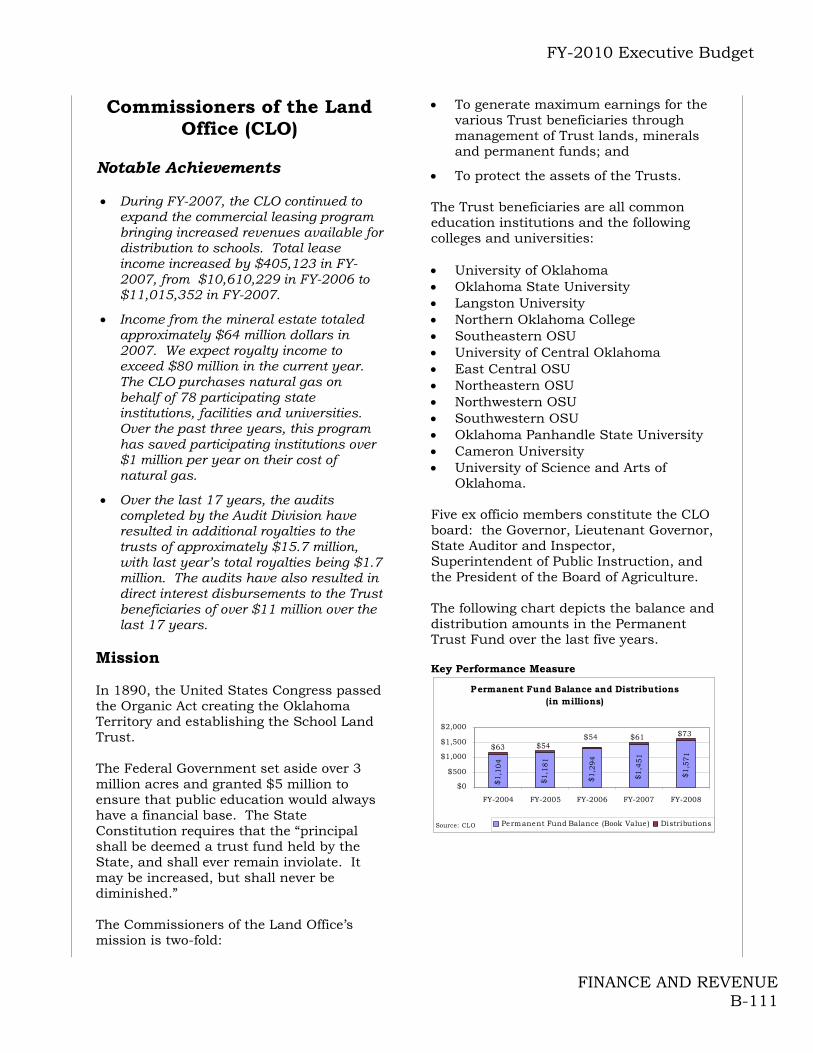
FY-2010 Executive Budget
FINANCE AND REVENUE B-111
Commissioners of the Land Office (CLO)
Notable Achievements During FY-2007, the CLO continued to
expand the commercial leasing program bringing increased revenues available for distribution to schools. Total lease income increased by $405,123 in FY-2007, from $10,610,229 in FY-2006 to $11,015,352 in FY-2007.
Income from the mineral estate totaled approximately $64 million dollars in 2007. We expect royalty income to exceed $80 million in the current year. The CLO purchases natural gas on behalf of 78 participating state institutions, facilities and universities. Over the past three years, this program has saved participating institutions over $1 million per year on their cost of natural gas.
Over the last 17 years, the audits completed by the Audit Division have resulted in additional royalties to the trusts of approximately $15.7 million, with last year’s total royalties being $1.7 million. The audits have also resulted in direct interest disbursements to the Trust beneficiaries of over $11 million over the last 17 years.
Mission In 1890, the United States Congress passed the Organic Act creating the Oklahoma Territory and establishing the School Land Trust. The Federal Government set aside over 3 million acres and granted $5 million to ensure that public education would always have a financial base. The State Constitution requires that the “principal shall be deemed a trust fund held by the State, and shall ever remain inviolate. It may be increased, but shall never be diminished.” The Commissioners of the Land Office’s mission is two-fold:
To generate maximum earnings for the various Trust beneficiaries through management of Trust lands, minerals and permanent funds; and
To protect the assets of the Trusts. The Trust beneficiaries are all common education institutions and the following colleges and universities: University of Oklahoma Oklahoma State University Langston University Northern Oklahoma College Southeastern OSU University of Central Oklahoma East Central OSU Northeastern OSU Northwestern OSU Southwestern OSU Oklahoma Panhandle State University Cameron University University of Science and Arts of
Oklahoma. Five ex officio members constitute the CLO board: the Governor, Lieutenant Governor, State Auditor and Inspector, Superintendent of Public Instruction, and the President of the Board of Agriculture. The following chart depicts the balance and distribution amounts in the Permanent Trust Fund over the last five years. Key Performance Measure
Permanent Fund Balance and Distributions (in millions)
$1
,10
4
$1
,18
1
$1
,29
4
$1
,45
1
$1
,57
1
$73$61$54$54$63
$0
$500
$1,000
$1,500
$2,000
FY-2004 FY-2005 FY-2006 FY-2007 FY-2008
Permanent Fund Balance (Book Value ) DistributionsSource: CLO
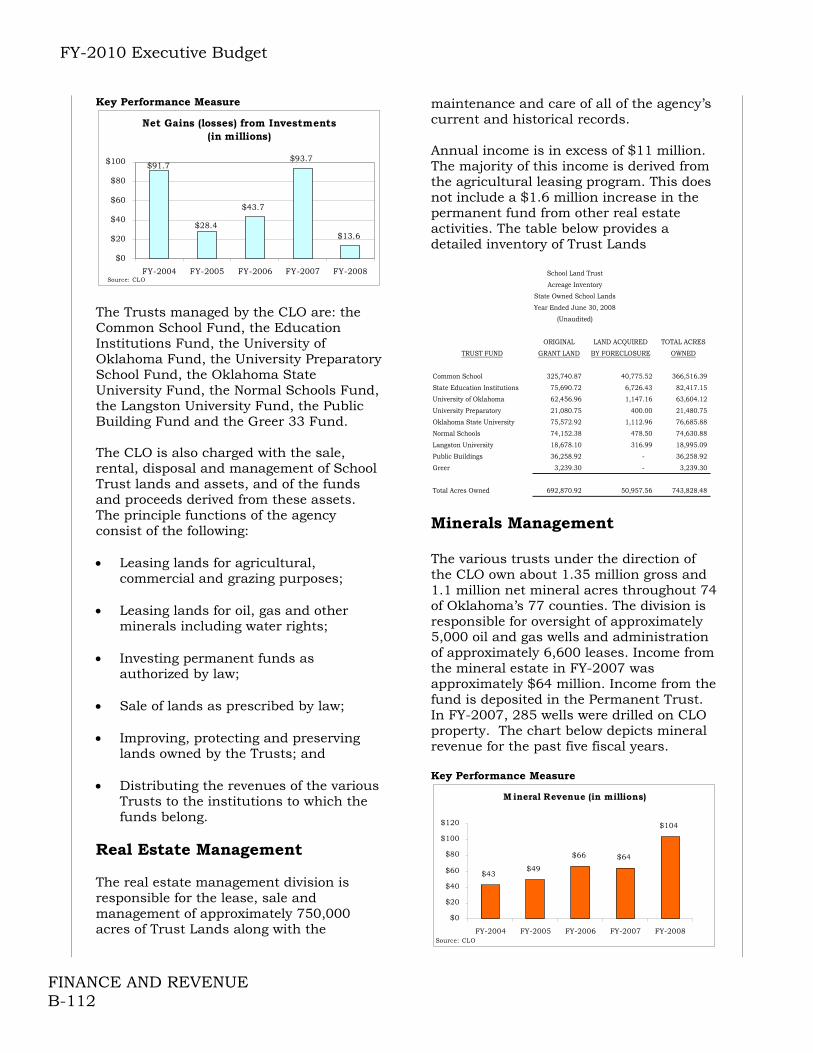
FY-2010 Executive Budget
FINANCE AND REVENUE B-112
Key Performance Measure
Net Gains (losses) from Investments (in millions)
$43.7
$93.7
$13.6
$91.7
$28.4
$0
$20
$40
$60
$80
$100
FY-2004 FY-2005 FY-2006 FY-2007 FY-2008Source: CLO
The Trusts managed by the CLO are: the Common School Fund, the Education Institutions Fund, the University of Oklahoma Fund, the University Preparatory School Fund, the Oklahoma State University Fund, the Normal Schools Fund, the Langston University Fund, the Public Building Fund and the Greer 33 Fund. The CLO is also charged with the sale, rental, disposal and management of School Trust lands and assets, and of the funds and proceeds derived from these assets. The principle functions of the agency consist of the following: Leasing lands for agricultural,
commercial and grazing purposes; Leasing lands for oil, gas and other
minerals including water rights; Investing permanent funds as
authorized by law; Sale of lands as prescribed by law; Improving, protecting and preserving
lands owned by the Trusts; and Distributing the revenues of the various
Trusts to the institutions to which the funds belong.
Real Estate Management The real estate management division is responsible for the lease, sale and management of approximately 750,000 acres of Trust Lands along with the
maintenance and care of all of the agency’s current and historical records. Annual income is in excess of $11 million. The majority of this income is derived from the agricultural leasing program. This does not include a $1.6 million increase in the permanent fund from other real estate activities. The table below provides a detailed inventory of Trust Lands
ORIGINAL LAND ACQUIRED TOTAL ACRES
TRUST FUND GRANT LAND BY FORECLOSURE OWNED
Common School 325,740.87 40,775.52 366,516.39
State Education Institutions 75,690.72 6,726.43 82,417.15
University of Oklahoma 62,456.96 1,147.16 63,604.12
University Preparatory 21,080.75 400.00 21,480.75
Oklahoma State University 75,572.92 1,112.96 76,685.88
Normal Schools 74,152.38 478.50 74,630.88
Langston University 18,678.10 316.99 18,995.09
Public Buildings 36,258.92 - 36,258.92
Greer 3,239.30 - 3,239.30
Total Acres Owned 692,870.92 50,957.56 743,828.48
(Unaudited)
School Land Trust
Acreage Inventory
State Owned School Lands
Year Ended June 30, 2008
Minerals Management The various trusts under the direction of the CLO own about 1.35 million gross and 1.1 million net mineral acres throughout 74 of Oklahoma’s 77 counties. The division is responsible for oversight of approximately 5,000 oil and gas wells and administration of approximately 6,600 leases. Income from the mineral estate in FY-2007 was approximately $64 million. Income from the fund is deposited in the Permanent Trust. In FY-2007, 285 wells were drilled on CLO property. The chart below depicts mineral revenue for the past five fiscal years. Key Performance Measure
M ineral Revenue (in millions)
$43$49
$66 $64
$104
$0
$20
$40
$60
$80
$100
$120
FY-2004 FY-2005 FY-2006 FY-2007 FY-2008Source: CLO
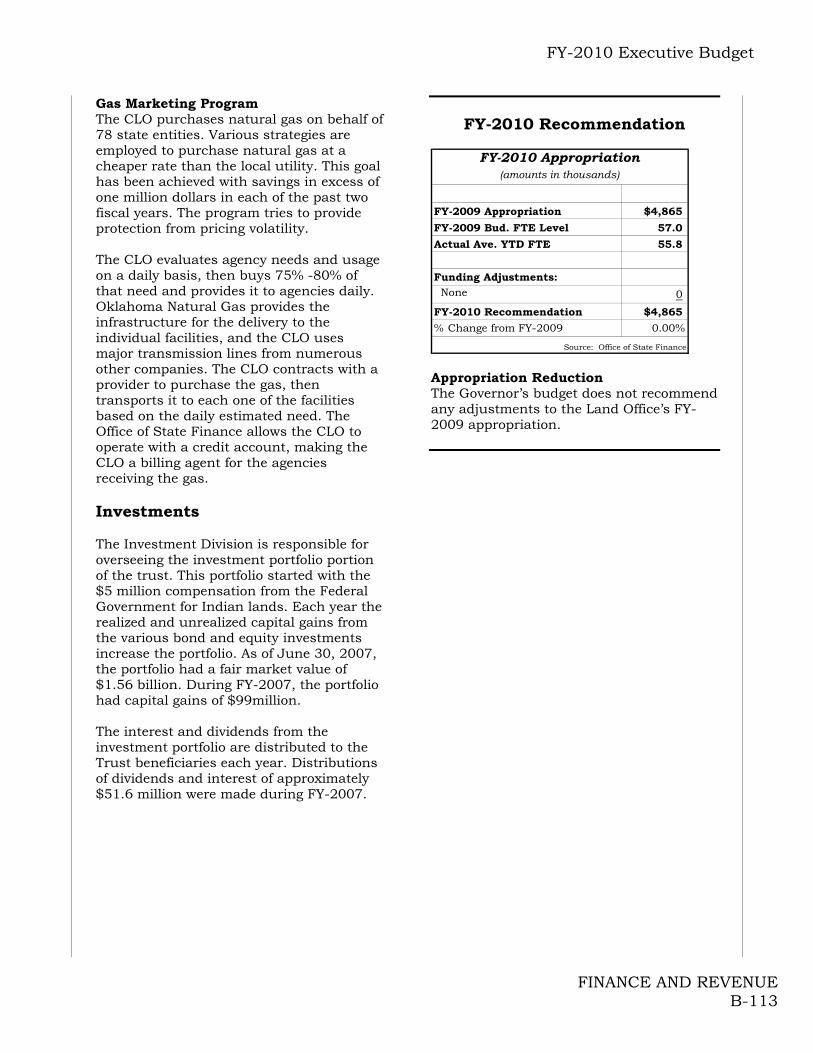
FY-2010 Executive Budget
FINANCE AND REVENUE B-113
Gas Marketing Program The CLO purchases natural gas on behalf of 78 state entities. Various strategies are employed to purchase natural gas at a cheaper rate than the local utility. This goal has been achieved with savings in excess of one million dollars in each of the past two fiscal years. The program tries to provide protection from pricing volatility. The CLO evaluates agency needs and usage on a daily basis, then buys 75% -80% of that need and provides it to agencies daily. Oklahoma Natural Gas provides the infrastructure for the delivery to the individual facilities, and the CLO uses major transmission lines from numerous other companies. The CLO contracts with a provider to purchase the gas, then transports it to each one of the facilities based on the daily estimated need. The Office of State Finance allows the CLO to operate with a credit account, making the CLO a billing agent for the agencies receiving the gas. Investments The Investment Division is responsible for overseeing the investment portfolio portion of the trust. This portfolio started with the $5 million compensation from the Federal Government for Indian lands. Each year the realized and unrealized capital gains from the various bond and equity investments increase the portfolio. As of June 30, 2007, the portfolio had a fair market value of $1.56 billion. During FY-2007, the portfolio had capital gains of $99million. The interest and dividends from the investment portfolio are distributed to the Trust beneficiaries each year. Distributions of dividends and interest of approximately $51.6 million were made during FY-2007.
FY-2010 Recommendation
FY-2009 Appropriation $4,865
FY-2009 Bud. FTE Level 57.0
Actual Ave. YTD FTE 55.8
Funding Adjustments: None 0
FY-2010 Recommendation $4,865
% Change from FY-2009 0.00%
Source: Office of State Finance
(amounts in thousands)
FY-2010 Appropriation
Appropriation Reduction The Governor’s budget does not recommend any adjustments to the Land Office’s FY-2009 appropriation.
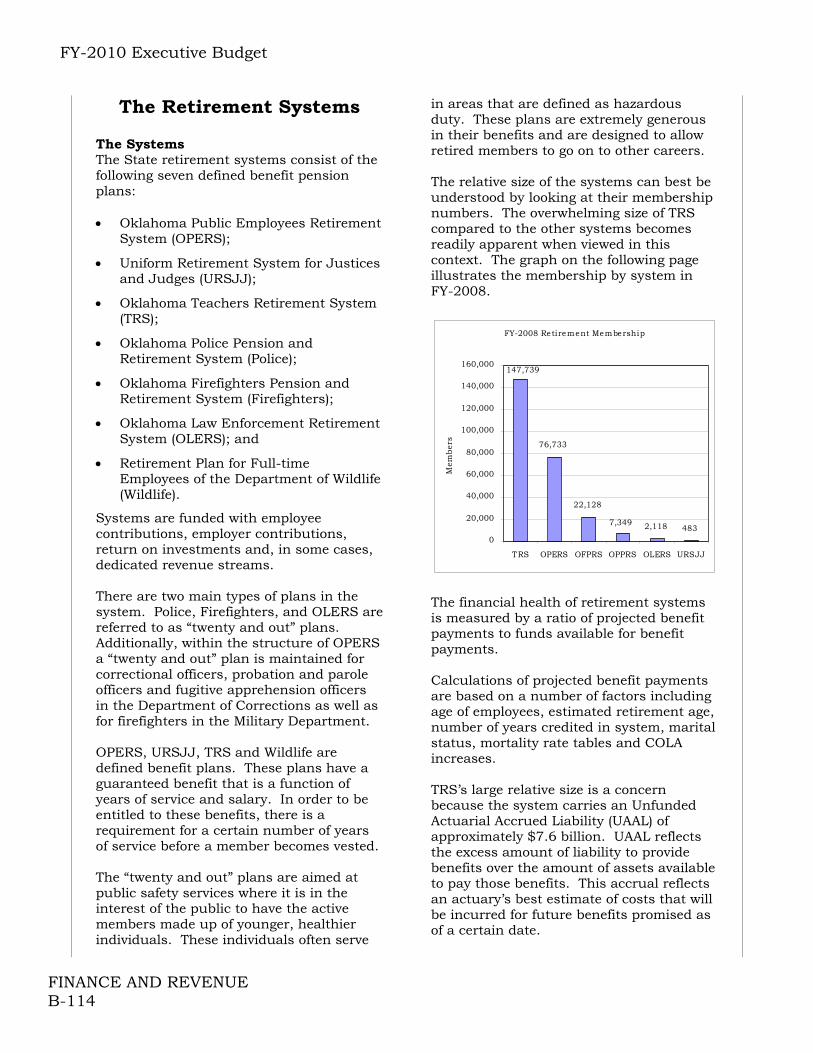
FY-2010 Executive Budget
FINANCE AND REVENUE B-114
The Retirement Systems The Systems The State retirement systems consist of the following seven defined benefit pension plans: Oklahoma Public Employees Retirement
System (OPERS);
Uniform Retirement System for Justices and Judges (URSJJ);
Oklahoma Teachers Retirement System (TRS);
Oklahoma Police Pension and Retirement System (Police);
Oklahoma Firefighters Pension and Retirement System (Firefighters);
Oklahoma Law Enforcement Retirement System (OLERS); and
Retirement Plan for Full-time Employees of the Department of Wildlife (Wildlife).
Systems are funded with employee contributions, employer contributions, return on investments and, in some cases, dedicated revenue streams. There are two main types of plans in the system. Police, Firefighters, and OLERS are referred to as “twenty and out” plans. Additionally, within the structure of OPERS a “twenty and out” plan is maintained for correctional officers, probation and parole officers and fugitive apprehension officers in the Department of Corrections as well as for firefighters in the Military Department. OPERS, URSJJ, TRS and Wildlife are defined benefit plans. These plans have a guaranteed benefit that is a function of years of service and salary. In order to be entitled to these benefits, there is a requirement for a certain number of years of service before a member becomes vested. The “twenty and out” plans are aimed at public safety services where it is in the interest of the public to have the active members made up of younger, healthier individuals. These individuals often serve
in areas that are defined as hazardous duty. These plans are extremely generous in their benefits and are designed to allow retired members to go on to other careers. The relative size of the systems can best be understood by looking at their membership numbers. The overwhelming size of TRS compared to the other systems becomes readily apparent when viewed in this context. The graph on the following page illustrates the membership by system in FY-2008.
FY-2008 Retirement Membership
76,733
22,128
2,118 483
147,739
7,349
0
20,000
40,000
60,000
80,000
100,000
120,000
140,000
160,000
TRS OPERS OFPRS OPPRS OLERS URSJJ
Mem
ber
s
The financial health of retirement systems is measured by a ratio of projected benefit payments to funds available for benefit payments. Calculations of projected benefit payments are based on a number of factors including age of employees, estimated retirement age, number of years credited in system, marital status, mortality rate tables and COLA increases. TRS’s large relative size is a concern because the system carries an Unfunded Actuarial Accrued Liability (UAAL) of approximately $7.6 billion. UAAL reflects the excess amount of liability to provide benefits over the amount of assets available to pay those benefits. This accrual reflects an actuary’s best estimate of costs that will be incurred for future benefits promised as of a certain date.

FY-2010 Executive Budget
FINANCE AND REVENUE B-115
The simplest way to understand the health of any retirement system is to view its funded ratio, which is a ratio of debt to assets. The term fully-funded applies to a retirement system in which contributions are sufficient to pay for the benefits of existing and new employees. The table to the right lists funded ratios for each agency over the past four fiscal years.
2005 2006 2007 2008Teachers 49.5% 49.3% 52.6% 50.5%OPERS 72.0% 71.4% 72.6% 73.1%Firefighters 63.7% 58.5% 62.6% 61.8%Police 78.6% 78.0% 0.0% 82.2%OLERS 84.0% 84.4% 83.0% 82.9%Judges 108.7% 102.5% 98.9% 96.4%
Funded Ratios by System
Source: FY-2008 Annual Reports The funding ratio of TRS is one of the lowest in the nation. This gap in funding of TRS liabilities is an absolute obligation of the State according the Attorney General’s. Ultimately, therefore, the responsibility for this debt falls on the shoulders of all Oklahomans. In 2007, the legislature passed and Governor Henry signed Senate Bill 357 into law. This legislation increases the employer contribution rates into the Teachers Retirement System. Current estimates show this legislation will bring the system to an 80% funded ratio over the next 20 years. A sensible combination of asset classes is another determinant of soundness of retirement funds. The allocation by asset class of the Oklahoma retirement funds are within prudent guidelines. The only unusual allocation is in the alternative assets of Police with investment in venture capital; however, the investment in alternative assets is within prudent guidelines. Police is the only state retirement fund that invests in venture capital. Dedicated Revenues The State systems differ from many other defined benefit retirement plans since several of the systems receive contributions other than employer and employee
contributions. TRS, Firefighters, OLERS, and Police are all recipients of dedicated revenue streams. The insurance premium tax provides all the dedicated revenue for Firefighters and Police and approximately half of the dedicated revenue to OLERS. These state revenues flow to Police and Firefighters although the members are employed primarily by cities and counties rather than the state.
% $ millions % $ millions % $ millions % $ millionsOFPRS 41.70% $60.47 41.70% $62.55 41.70% $58.38 34.00% $47.60OPPRS 17.00% $24.65 17.00% $25.50 17.00% $23.80 14.00% $19.60OLERS 6.10% $8.85 6.10% $9.15 6.10% $8.54 5.00% $7.00GRF 35.20% $51.04 35.20% $52.80 35.20% $49.28 47.00% $65.80HB1017 0.00% $0.00 0.00% $0.00 0.00% $0.00
Total $145.00 $150.00 $140.00 $140.00
Insurance Premium Tax ApportionmentFY-2010 and laterFY-2006 FY-2007 FY-2008 - FY-2009
The amount dedicated to the retirement plans through FY-2009 will increase above previous levels. The General Revenue Fund will decrease to provide for the increase to the retirement funds. The retirement systems exist for the benefit of employees and their beneficiaries. All of the systems provide a benefit for their members with varying provisions for their beneficiaries in the event of the death of the member. Spouse beneficiaries generally receive a lifetime benefit which varies from being the same amount as the employee to half. Minor children beneficiaries receive a benefit as long as they are minors or, in some cases, while enrolled in higher education. The table below shows the average regular benefit of retirees only. This table does not include any amounts that may be received from Deferred Retirement Option Plans (DROP) programs, disability programs or payments to beneficiaries.

FY-2010 Executive Budget
FINANCE AND REVENUE B-116
System Avg. Benefit*
OTRS 17,244OPERS 15,378OFPRS
Paid 8,090Volunteer 14,038
OPPRS 29,537OLERS 33,858DRW 26,511URSJJ 60,887
*Avg. benefit includes service retirees only.
Retiree Annual Benefits
Oklahoma Public Employees Retirement System (OPERS)
Notable Achievements Government Finance Officers Association
(GFOA) has recognized OPERS for outstanding achievement in financial reporting for eleven years in a row.
All member documents for OPERS and SoonerSave are being imaged rather than microfilmed.
An online member enrollment process was implemented and 90% are done online.
An agency Intranet was developed for office policies, procedures and forms
Mission The mission of OPERS is to provide and promote accountable and financially sound retirement plans for its members. OPERS administers a defined benefit retirement plan for public employees as well as for judges and justices (URSJJ). OPERS’ clients are composed of:
State and county employees, except for Oklahoma and Tulsa counties, and
Local governments that choose to participate.
Contribution Rates
2005 2006 2007 2008State Agencies 121 123 124 125County Govts 75 75 75 75Local Towns/Cities 28 28 28 28Other Local Govts 42 45 46 47Total 266 271 273 275
OPERS Participating Empoyers
Source: OPERS Financial statements, June 30, 2008 Effective July 1, 2008, the state, county and local agency employer contribution rates increase as follows: State agency employer contribution rates increased by 1.0% from 13.5% to 14.5% for FY 2009 and will increase 1.0% each year thereafter until it reaches 16.5% in FY 2011. Employee contributions for most state
employees are now a level 3.5% of salary; and
The combined employee and employer
contribution rate for county and local agencies increased by 1.0% to 18% in FY 2009 and will increase 1.0% each year thereafter until it reaches 20% in FY 2011.
OPERS’ Funded Status The funded ratio of OPERS was in a steady decline since 1998, but posted an increase at the end of 2007 and 2008. OPERS had a funded ratio of 91% in 1998 and was 73.0% at the end of FY 2008. The total “required contribution rate” is now 22.98% of salaries while the System is only projected to take in 18% of salaries in employer and employee contributions in the coming fiscal year. The employer contribution rate is 14.5% of salary for FY 2009 and increases to only 15.5% in FY 2010. Deferred Compensation OPERS also administers SoonerSave which consists of two defined contribution plans- A deferred compensation plan and a deferred savings incentive plan. SoonerSave is available to state employees, as well as any elected officials receiving a salary from the state. The deferred compensation plan is an Internal Revenue Service 457 Plan. Contributions and
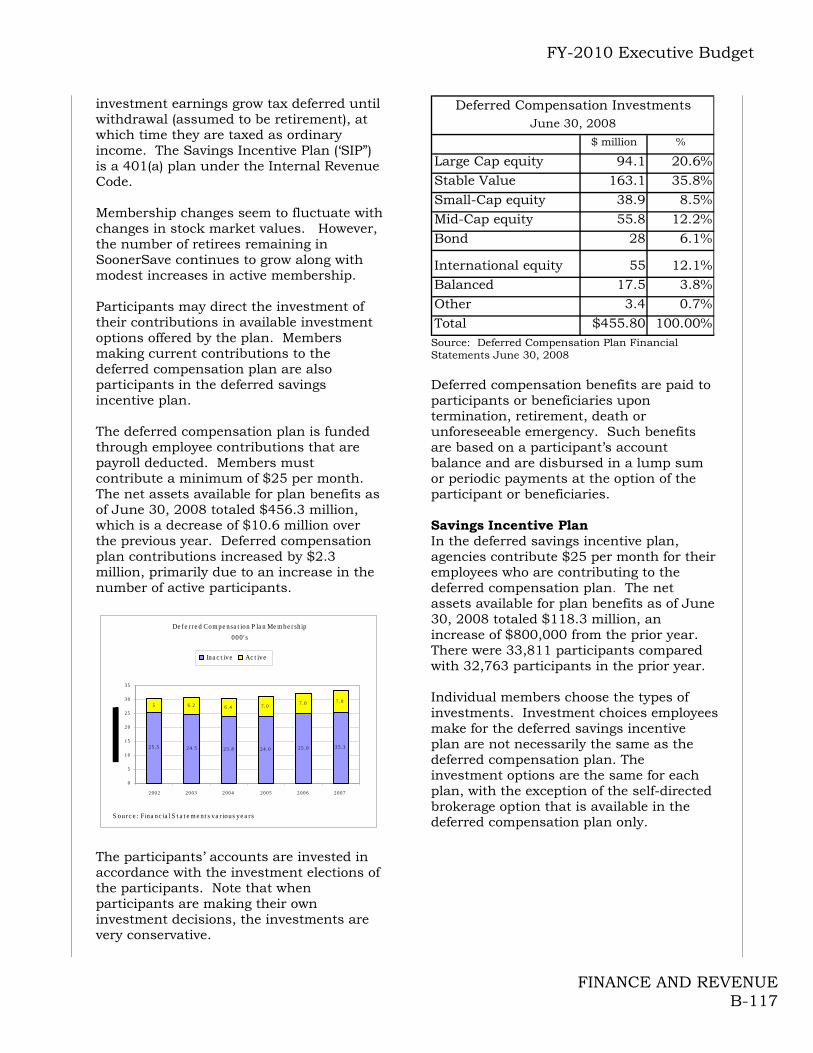
FY-2010 Executive Budget
FINANCE AND REVENUE B-117
investment earnings grow tax deferred until withdrawal (assumed to be retirement), at which time they are taxed as ordinary income. The Savings Incentive Plan (‘SIP”) is a 401(a) plan under the Internal Revenue Code. Membership changes seem to fluctuate with changes in stock market values. However, the number of retirees remaining in SoonerSave continues to grow along with modest increases in active membership. Participants may direct the investment of their contributions in available investment options offered by the plan. Members making current contributions to the deferred compensation plan are also participants in the deferred savings incentive plan. The deferred compensation plan is funded through employee contributions that are payroll deducted. Members must contribute a minimum of $25 per month. The net assets available for plan benefits as of June 30, 2008 totaled $456.3 million, which is a decrease of $10.6 million over the previous year. Deferred compensation plan contributions increased by $2.3 million, primarily due to an increase in the number of active participants.
De fe r re d Com pe nsa t ion P la n Me m be r sh ip
000' s
2 5 . 5 2 4 . 5 2 3 . 8 2 4 . 0 2 5 . 0 2 5 . 3
5 6 . 2 6 . 4 7 . 07 . 0 7 . 8
0
5
1 0
1 5
2 0
2 5
3 0
3 5
2 0 0 2 2 0 0 3 2 0 0 4 2 0 0 5 2 0 0 6 2 0 0 7
Ina c t ive Ac t ive
S ourc e : Fina nc ia l S t a t e m e nt s va r ious ye a r s
The participants’ accounts are invested in accordance with the investment elections of the participants. Note that when participants are making their own investment decisions, the investments are very conservative.
$ million %
Large Cap equity 94.1 20.6%Stable Value 163.1 35.8%Small-Cap equity 38.9 8.5%Mid-Cap equity 55.8 12.2%Bond 28 6.1%
International equity 55 12.1%Balanced 17.5 3.8%Other 3.4 0.7%Total $455.80 100.00%
Deferred Compensation InvestmentsJune 30, 2008
Source: Deferred Compensation Plan Financial Statements June 30, 2008 Deferred compensation benefits are paid to participants or beneficiaries upon termination, retirement, death or unforeseeable emergency. Such benefits are based on a participant’s account balance and are disbursed in a lump sum or periodic payments at the option of the participant or beneficiaries. Savings Incentive Plan In the deferred savings incentive plan, agencies contribute $25 per month for their employees who are contributing to the deferred compensation plan. The net assets available for plan benefits as of June 30, 2008 totaled $118.3 million, an increase of $800,000 from the prior year. There were 33,811 participants compared with 32,763 participants in the prior year. Individual members choose the types of investments. Investment choices employees make for the deferred savings incentive plan are not necessarily the same as the deferred compensation plan. The investment options are the same for each plan, with the exception of the self-directed brokerage option that is available in the deferred compensation plan only.

FY-2010 Executive Budget
FINANCE AND REVENUE B-118
Uniform Retirement System for Justices and Judges (URSJJ)
The Uniform Retirement System for Justices and Judges is a defined benefit pension plan covering all justices and judges of the Oklahoma Supreme Court, Courts of Criminal Appeal, Workers’ Compensation Court, Court of Appeals and District Courts. The membership of URSJJ at June 30 is as follows:
2006 2007 2008Retirees and beneficiaries 180 194 195Terminated vested 10 11 11Active participants 272 278 277 Total 462 483 483
URSJJ Membership data
Source: FY-2008 Annual Report URSJJ Contribution Rates The current employee contribution rate is 8%. The current statutory employer contribution rate for FY 2009 is 7.0%. This rate is scheduled to go up to 8.5% in FY 2010 and increase 1.5% a year to top out at 22% in FY 2019. The OPERS Board has specific statutory authority to raise contribution rates to keep this System 100% funded, if recommended by an actuary. The OPERS Board set employer rates at 54.34% effective September 1, 2008. However, none of the judicial entities was appropriated sufficient funds to pay the higher rate. URSJJ Funded Status The URSJJ funded status has been steadily declining from a high at June 30, 2002 of 148.2% to the current funded ratio at June 30, 2008 of 96.4%. This decline is due to an insufficient contribution rate structure. The total actuarial required contribution rate is now 33.22% while the System is projected to take in only 16.5% of salaries in employer and employee contributions for the coming fiscal year. Even with the increasing schedule of employer contributions in future years, the funded ratio is expected to continue its decline.
Teachers Retirement System (TRS)
Notable Achievements Received Government Finance Officers
Association’s (GFOA) certificate for twelfth straight year.
Internal cash management earned the System over $11.9 million (in excess of $265,000 over exclusively using the custodian). The system’s securities lending and commission recapture programs netted $10.5 million and $790,000.
The Teachers Retirement Systems (TRS) was established in 1943 for the purpose of providing retirement allowances and other specified benefits for qualified persons employed by state-supported educational institutions. The category of education employees includes local school district employees and higher education employees, as well as a few others engaged in education.
TRS is the largest state retirement system with 147,739 members and net assets of $8.9 billion as of June 30, 2008. As of June 30, 2008, only 50.5% of OTRS actuarial liabilities were covered by the actuarial value of its assets. The funding period increased from 21.6 years to 54.4 years. The increase in the dedicated revenue and an improved economy are expected to improve the funded position of the system in the future. TRS receives dedicated revenue from a portion of the state’s sales, use, individual income tax and corporate tax receipts. The system will also receive 5% of the net proceeds of the education lottery. The actuarial assumption is that these receipts will increase at 3.5% annually. Additionally, the percentage of these sources is scheduled to increase. The dedicated tax revenue has increased $23.3 million each year for the past two years to $266.8 million.
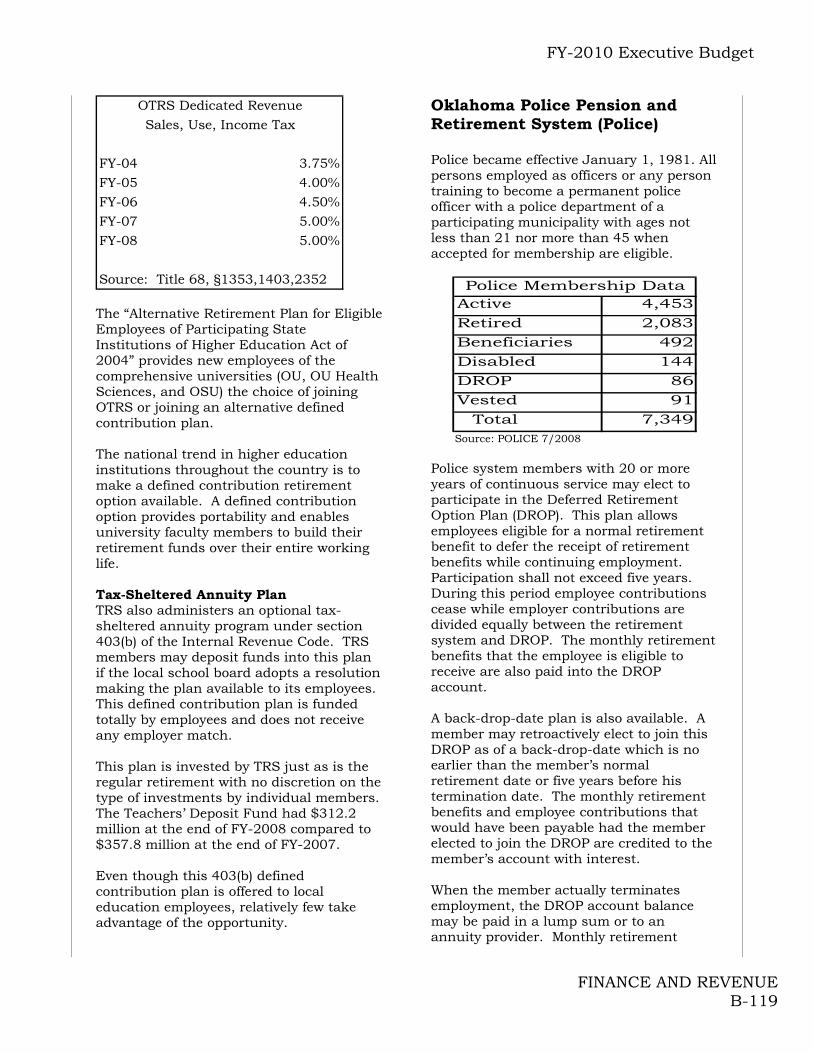
FY-2010 Executive Budget
FINANCE AND REVENUE B-119
FY-04 3.75%FY-05 4.00%FY-06 4.50%FY-07 5.00%FY-08 5.00%
Source: Title 68, §1353,1403,2352
OTRS Dedicated RevenueSales, Use, Income Tax
The “Alternative Retirement Plan for Eligible Employees of Participating State Institutions of Higher Education Act of 2004” provides new employees of the comprehensive universities (OU, OU Health Sciences, and OSU) the choice of joining OTRS or joining an alternative defined contribution plan. The national trend in higher education institutions throughout the country is to make a defined contribution retirement option available. A defined contribution option provides portability and enables university faculty members to build their retirement funds over their entire working life. Tax-Sheltered Annuity Plan TRS also administers an optional tax-sheltered annuity program under section 403(b) of the Internal Revenue Code. TRS members may deposit funds into this plan if the local school board adopts a resolution making the plan available to its employees. This defined contribution plan is funded totally by employees and does not receive any employer match. This plan is invested by TRS just as is the regular retirement with no discretion on the type of investments by individual members. The Teachers’ Deposit Fund had $312.2 million at the end of FY-2008 compared to $357.8 million at the end of FY-2007. Even though this 403(b) defined contribution plan is offered to local education employees, relatively few take advantage of the opportunity.
Oklahoma Police Pension and Retirement System (Police) Police became effective January 1, 1981. All persons employed as officers or any person training to become a permanent police officer with a police department of a participating municipality with ages not less than 21 nor more than 45 when accepted for membership are eligible.
Active 4,453Retired 2,083Beneficiaries 492Disabled 144DROP 86Vested 91
Total 7,349
Police Membership Data
Source: POLICE 7/2008 Police system members with 20 or more years of continuous service may elect to participate in the Deferred Retirement Option Plan (DROP). This plan allows employees eligible for a normal retirement benefit to defer the receipt of retirement benefits while continuing employment. Participation shall not exceed five years. During this period employee contributions cease while employer contributions are divided equally between the retirement system and DROP. The monthly retirement benefits that the employee is eligible to receive are also paid into the DROP account. A back-drop-date plan is also available. A member may retroactively elect to join this DROP as of a back-drop-date which is no earlier than the member’s normal retirement date or five years before his termination date. The monthly retirement benefits and employee contributions that would have been payable had the member elected to join the DROP are credited to the member’s account with interest. When the member actually terminates employment, the DROP account balance may be paid in a lump sum or to an annuity provider. Monthly retirement

FY-2010 Executive Budget
FINANCE AND REVENUE B-120
benefits are then paid directly to the retired member. Oklahoma Law Enforcement Retirement System (OLERS) The plan was established July 1, 1947. Qualified law enforcement officers of various state agencies and departments are members. The normal retirement date for retirement benefits eligibility is 20 years of service or age 62 with 10 years of service.
Agency Active RetiredABLE 24 30OSBI 146 83OSBN 64 37Board of Pharmacy 1 3Tourism 55 51DPS 956 992Quartz Mt. 2 1OU 43 1OSU 31 0Grand River Dam 4 0
Total Members 1,326 1,198
OLERS Membership Data
Source: OLERS 01/08
Department of Wildlife Retirement Plan (Wildlife)
The DWR is a single-employer defined benefit plan. All permanent, full-time employees of the Department of Wildlife are eligible to participate on the date of their employment. This retirement system is unique since a single agency manages the retirement system for its own employees. The retirement system has 315 active participants and 163 retired and inactive participants. It has a funded ratio of 80.4%.The revenue source for the retirement fund is the Department's contribution and the employee's contributions. The funds are held and invested through a trust account. The employer contribution is based on the annual valuation report and is currently set on a 15 year amortization schedule to fund the liability. The Department has increased the annual contribution to 2.8 million
based on the actuarial valuation report. Employees contribute 3% of salary. The vesting period is 10 years.
OPERS URSJJ OTRS OPPRS OFPRS OLERSActive members 45,472 272 88,133 4,247 11,409 1,170Retired Members* 24,372 180 43,506 2,035 5,223 775Vested Members 52,254 10 6,637 84 1,070 26Deferred Option Plan (DROP) - - - 121 1,667 105Employee Contribution %:
State-not elected 3.0% to 6.4% 8.00% 7.00% 8% 8% 8&State-elected 4.5% to 10% - 4.50% - - -Hazardous Duty 8 - - - - -County & Local 3.5% to 11.41% 5.00% 7.6% 12.70% 12.9%** 10.50%
Employee Contribution $: $55,989 $1,717 $258,409 $17,671 $16,337 $4,569Actuarial Value of Assets $5,654,276 $210,376 $8,421,867 $1,627,476 $1,546,486 $651,671Actuarial Accrued Liability $7,914,658 $205,305 $16,024,394 $2,035,653 $2,666,306 $772,269* Includes regular retirees and disabled retirees as well as beneficiaries and spouses** Volunteers receive 0%
Source: Annual Financial Reports, Actuarial Reports as of July 1, 2007
Plan Year Ending 6/30/2007 ($ in 000's)Retirement Systems - Number of Members and Employee Contribution Amounts
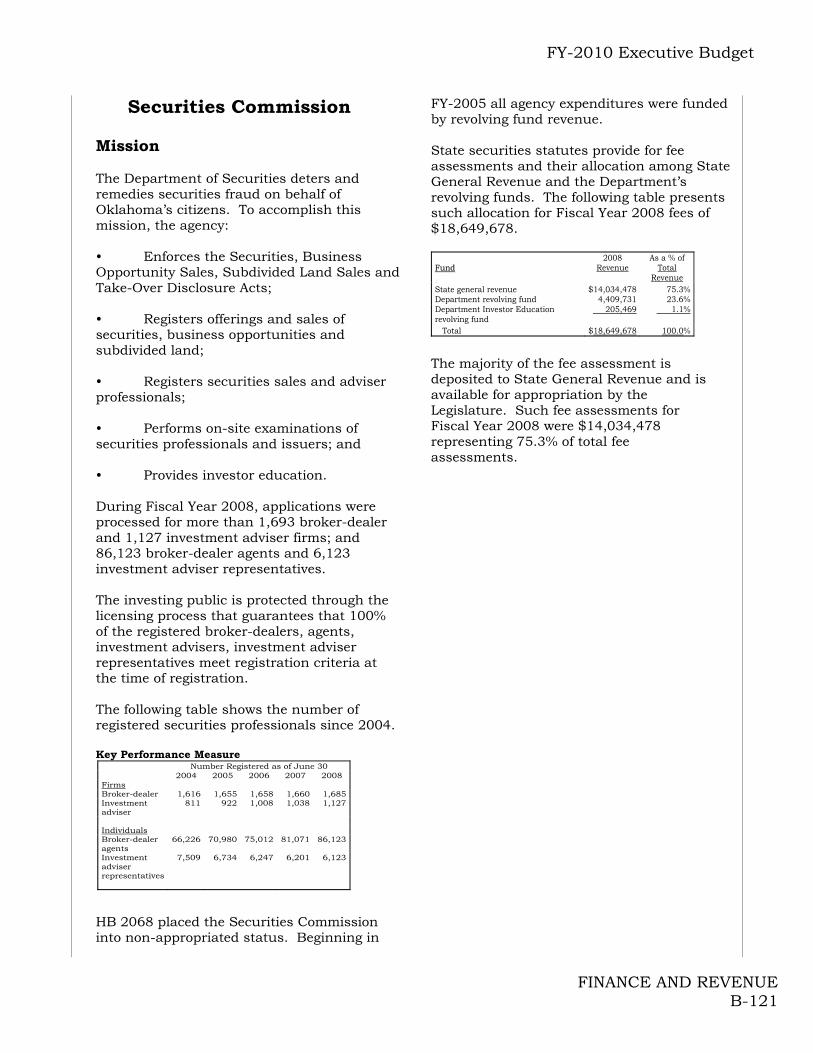
FY-2010 Executive Budget
FINANCE AND REVENUE B-121
Securities Commission Mission The Department of Securities deters and remedies securities fraud on behalf of Oklahoma’s citizens. To accomplish this mission, the agency: • Enforces the Securities, Business Opportunity Sales, Subdivided Land Sales and Take-Over Disclosure Acts; • Registers offerings and sales of securities, business opportunities and subdivided land; • Registers securities sales and adviser professionals; • Performs on-site examinations of securities professionals and issuers; and • Provides investor education. During Fiscal Year 2008, applications were processed for more than 1,693 broker-dealer and 1,127 investment adviser firms; and 86,123 broker-dealer agents and 6,123 investment adviser representatives. The investing public is protected through the licensing process that guarantees that 100% of the registered broker-dealers, agents, investment advisers, investment adviser representatives meet registration criteria at the time of registration. The following table shows the number of registered securities professionals since 2004. Key Performance Measure
Number Registered as of June 30 2004 2005 2006 2007 2008 Firms Broker-dealer 1,616 1,655 1,658 1,660 1,685 Investment adviser
811 922 1,008 1,038 1,127
Individuals Broker-dealer agents
66,226 70,980 75,012 81,071 86,123
Investment adviser representatives
7,509 6,734 6,247 6,201 6,123
HB 2068 placed the Securities Commission into non-appropriated status. Beginning in
FY-2005 all agency expenditures were funded by revolving fund revenue. State securities statutes provide for fee assessments and their allocation among State General Revenue and the Department’s revolving funds. The following table presents such allocation for Fiscal Year 2008 fees of $18,649,678. FFuunndd ..
2008 Revenue
As a % of Total
Revenue State general revenue $14,034,478 75.3% Department revolving fund 4,409,731 23.6% Department Investor Education revolving fund
205,469 1.1%
Total $18,649,678 100.0%
The majority of the fee assessment is deposited to State General Revenue and is available for appropriation by the Legislature. Such fee assessments for Fiscal Year 2008 were $14,034,478 representing 75.3% of total fee assessments.

FY-2010 Executive Budget
FINANCE AND REVENUE B-122
Oklahoma Tax Commission (OTC)
Notable Achievements Implemented use of an outsourcing firm
to collect income and business tax, which provided for a 77.4% increase ($19 million to $33.7 million) in collections from FY-1999 to FY-2008.
Introduced an on-line business tax filing
system that has grown from 81,324 annual filings in FY-2003 to 566,818 annual filings in FY-2008. Each of these on-line filings decreases the agency's costs and increases the efficiency of our existing staff. Results of a recent customer satisfaction survey of this system show that a significant majority of users feels the system is easy to use and quicker than paper filing.
The Commission has seen a 323%
increase (226,000 to 955,934) in on-line income tax return filers from FY-2000 to FY-2008. This system increases the agency's efficiency by eliminating in-house data entry and the time and errors
inherent in the manual data entry process.
The agency has been an active
participant in the Streamlined Sales Tax Agreement since its inception. Through FY-2008, the agency has collected $21 million as a result of its participation.
The Professional License Compliance
program has significantly increased compliance. Since inception in FY-2000 through FY-2008, the OTC has collected $88 million from delinquent license holders.
The agency’s compliance and
enforcement efforts of Oklahoma’s cigarette and tobacco tax laws was significantly augmented by the addition of staff in both office and field audit. Over the past year, cigarette tax collections increased $19.8 million while, according to statistics, overall smoking has decreased.
In early 2009, gross production tax filers
will be able to register on-line. Within the next twelve months, they will also be able to report and pay these taxes. This effort will provide 24/7 accessibility and help reduce the OTC’s processing costs. Additionally, collecting this information electronically will significantly help the OTC’s compliance efforts in this area.
The Digital License Plate System went
into production during Fall 2008. The system uses modern technology to produce on-demand license plates at a faster rate and lower operating costs. The weight of the finished product allows for lower postage costs when mailing. The initial implementation will include general issue license plates and then move to special order plates. As of January 1, 2009 all Oklahoma car owners will begin receiving the new tags as they register their vehicle. By the end of the calendar year, all cars in Oklahoma will have been issued the new tag.

FY-2010 Executive Budget
FINANCE AND REVENUE B-123
The primary responsibilities of the Tax Commission include the collection and distribution of approximately 75 different taxes, fees and licenses. The Commission allocates revenues to state funds and local government units, and collects and distributes local sales taxes levied by cities and towns in Oklahoma. The Oklahoma Tax Commission consists of three distinct departments: Taxpayer Services, Revenue Administration and Support Services. Income Tax Return Processing Since 2003, the Tax Commission has greatly reduced the amount of time required to process income tax refunds. The Commission utilizes temporary seasonal employees from February through June to process returns. Key Performance Measure
Average Time to Process an Income Tax Return
76
121110
14
12
0
2
4
6
8
10
12
14
16
FY-02 FY-03 FY-04 FY-05 FY-06 FY-07 FY-08
Day
s
Source: Oklahoma Tax Commission Professional License Compliance Effective July 1, 2000, legislation required OTC to review professional license applicants for income tax compliance. This tax review is conducted before a state license is issued. OTC reviews the following professions through this program:
Doctors Nurses Attorneys Insurance agents Teachers Architects
Accountants All medical related licenses Engineers Abstractors Cosmetologists Process servers All Health Department licenses such
as plumbers, electricians, etc. Abstractors Funeral directors Securities brokers
The graph below shows the collections from the Professional License Compliance Program through FY-2008. Key Performance Measure
$9,000
$14,000
$12,500
$10,000 $10,000
$5,000 $5,000
$-
$2,000
$4,000
$6,000
$8,000
$10,000
$12,000
$14,000
FY-02 FY-03 FY-04 FY-05 FY-06 FY-07 FY-08
Pofress ional License Com pliance Program Collections($ in 000s)
Source: Oklahoma Tax Commission Tobacco Enforcement The Tax Commission has undertaken a variety of compliance and enforcement efforts in order to insure that all cigarette and tobacco taxes are being accurately reported and paid. These efforts include, but are not limited to: Assessed over $431,00 on taxes owed
but not paid from purchases of cigarette products over the internet since the project began in October 2005;
Increased compliance and enforcement efforts of Oklahoma’s cigarette and tobacco tax laws with additional staff. Over the past year, cigarette tax collections increased $19.8 million while, according to statistics, overall smoking has decreased.
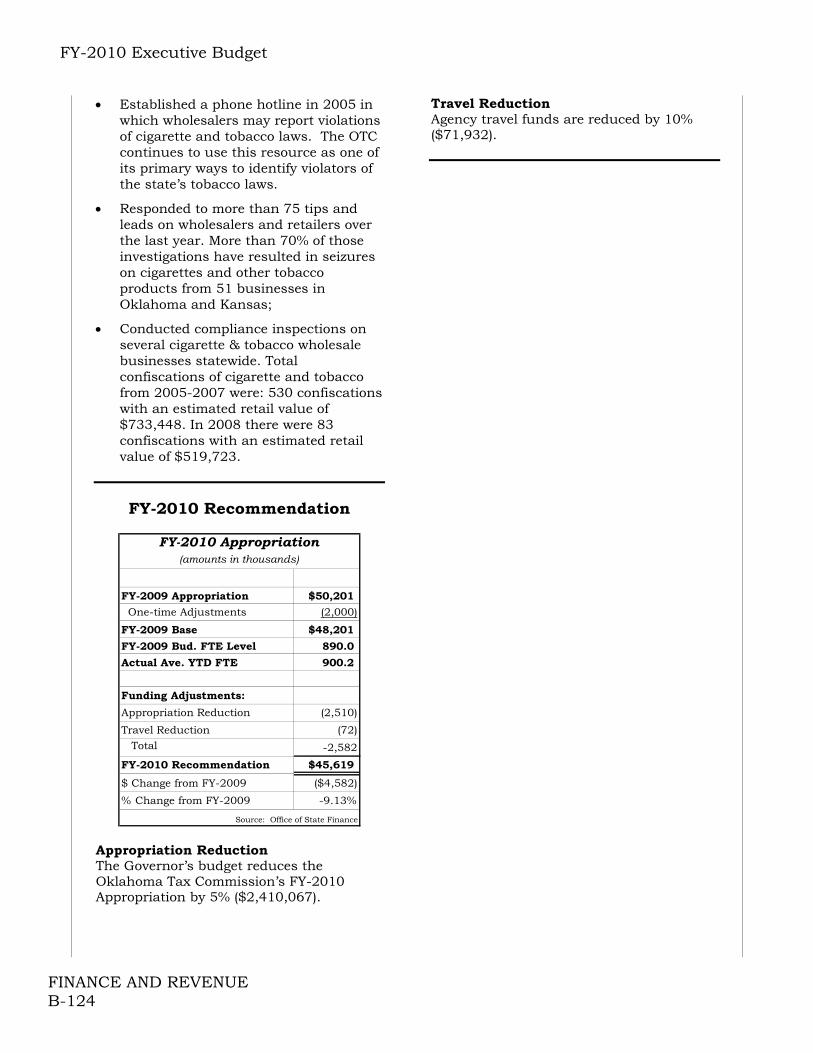
FY-2010 Executive Budget
FINANCE AND REVENUE B-124
Established a phone hotline in 2005 in which wholesalers may report violations of cigarette and tobacco laws. The OTC continues to use this resource as one of its primary ways to identify violators of the state’s tobacco laws.
Responded to more than 75 tips and leads on wholesalers and retailers over the last year. More than 70% of those investigations have resulted in seizures on cigarettes and other tobacco products from 51 businesses in Oklahoma and Kansas;
Conducted compliance inspections on several cigarette & tobacco wholesale businesses statewide. Total confiscations of cigarette and tobacco from 2005-2007 were: 530 confiscations with an estimated retail value of $733,448. In 2008 there were 83 confiscations with an estimated retail value of $519,723.
FY-2010 Recommendation
FY-2009 Appropriation $50,201
One-time Adjustments (2,000)
FY-2009 Base $48,201
FY-2009 Bud. FTE Level 890.0
Actual Ave. YTD FTE 900.2
Funding Adjustments:
Appropriation Reduction (2,510)
Travel Reduction (72) Total -2,582
FY-2010 Recommendation $45,619
$ Change from FY-2009 ($4,582)
% Change from FY-2009 -9.13%
FY-2010 Appropriation(amounts in thousands)
Source: Office of State Finance Appropriation Reduction The Governor’s budget reduces the Oklahoma Tax Commission’s FY-2010 Appropriation by 5% ($2,410,067).
Travel Reduction Agency travel funds are reduced by 10% ($71,932).

FY-2010 Executive Budget
FINANCE AND REVENUE B-125
State Treasurer Notable Achievements During the first two years of the current
administration, investment earnings for the General Revenue Fund were tripled – generating almost $100 million during FY 2006 and almost $150 million during FY 2007. For FY 2008, earnings are projected to be $160 million;
New investments in US Agency senior securities, which yield more than comparable US Treasury securities, enhanced earnings in FY 2007 by $18.2 million. During FY 2008, US Agency investments were further diversified to include mortgage-backed securities. The increase attributable to this new strategy is projected to be $22.8 million for FY 2008;
Investment in highest-quality commercial paper for short-term liquidity will generate more than $540,000 in additional income during FY 2008;
Online trading was implemented during FY 2007 and expanded to include Agency issues in FY 2008. During FY 2007, online trading saved $82,000. Savings will total $440,000 during FY 2008;
Two contracts renegotiated by Treasurer Meacham for banking services reduced the cost of banking services to the state by one-third or $250,000 per year;
By implementing several initiatives, including a “fast track” claims process, the amount of unclaimed property returned to its rightful owners has been greatly enhanced. In the past two years, the number of claims paid has jumped 52 percent and the amount of money returned has increased by 26 percent.
The SEED for Oklahoma Kids initiative was launched in January 2008. The multi-year study, funded by the Ford Foundation, will measure the effectiveness of matching grants, totaling up to $2 million, in encouraging low to moderate income households to save for
a child's education with the Oklahoma College Savings Plan:
A restructuring of the investments of the Oklahoma Tobacco Settlement Endowment Trust Fund and negotiated reductions in investment fees will help the state realize a total added benefit of more than $17.9 million over the next five years.
Staffing within the treasurer’s office has been reduced by 13.5 FTE in the past two years to save more than $400,000 per year.
Mission The mission of the State Treasurer's Office is to serve the people of Oklahoma and state agencies by providing sound financial services, reuniting citizens with their unclaimed property, and promoting economic development opportunities in a fiscally responsible and efficient manner while adhering to the highest professional and ethical standards. Finding ways to save money and generate more income for the state is part of the culture in the State Treasurer’s Office. Due to these efforts, taxpayers are realizing a benefit of more than $116 million each year. Investment Portfolio The Treasurer directs the investment of approximately $5 billion for the state’s General Revenue Fund and for state agencies. Due to several initiatives designed to increase earnings while maintaining safety and liquidity, the treasurer has been able to maintain income levels from the portfolio during the falling interest rate cycle the economy as been experiencing. Direct Deposit/PayCard Contract Legislation requested by the Treasurer’s Office, effective July 1, 2007, requires all state employee pay be done with direct deposit. Employees that are unable to have a banking relationship can use a pay card. Annual savings, once fully implemented, will be approximately $250,000 for state government.
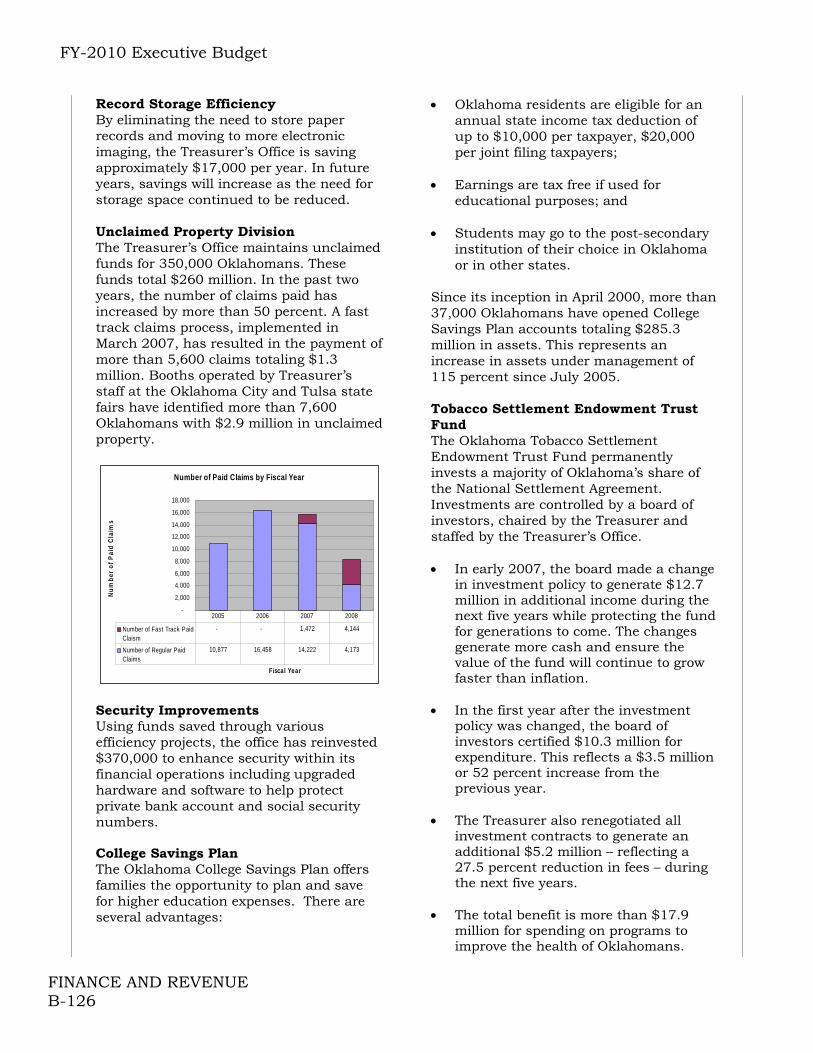
FY-2010 Executive Budget
FINANCE AND REVENUE B-126
Record Storage Efficiency By eliminating the need to store paper records and moving to more electronic imaging, the Treasurer’s Office is saving approximately $17,000 per year. In future years, savings will increase as the need for storage space continued to be reduced. Unclaimed Property Division The Treasurer’s Office maintains unclaimed funds for 350,000 Oklahomans. These funds total $260 million. In the past two years, the number of claims paid has increased by more than 50 percent. A fast track claims process, implemented in March 2007, has resulted in the payment of more than 5,600 claims totaling $1.3 million. Booths operated by Treasurer’s staff at the Oklahoma City and Tulsa state fairs have identified more than 7,600 Oklahomans with $2.9 million in unclaimed property.
Number of Paid Claims by Fiscal Year
-
2,000
4,000
6,000
8,000
10,000
12,000
14,000
16,000
18,000
Fiscal Year
Nu
mb
er o
f P
aid
Cla
ims
Number of Fast Track PaidClaism
- - 1,472 4,144
Number of Regular PaidClaims
10,877 16,458 14,222 4,173
2005 2006 2007 2008
Security Improvements Using funds saved through various efficiency projects, the office has reinvested $370,000 to enhance security within its financial operations including upgraded hardware and software to help protect private bank account and social security numbers. College Savings Plan The Oklahoma College Savings Plan offers families the opportunity to plan and save for higher education expenses. There are several advantages:
Oklahoma residents are eligible for an annual state income tax deduction of up to $10,000 per taxpayer, $20,000 per joint filing taxpayers;
Earnings are tax free if used for
educational purposes; and Students may go to the post-secondary
institution of their choice in Oklahoma or in other states.
Since its inception in April 2000, more than 37,000 Oklahomans have opened College Savings Plan accounts totaling $285.3 million in assets. This represents an increase in assets under management of 115 percent since July 2005. Tobacco Settlement Endowment Trust Fund The Oklahoma Tobacco Settlement Endowment Trust Fund permanently invests a majority of Oklahoma’s share of the National Settlement Agreement. Investments are controlled by a board of investors, chaired by the Treasurer and staffed by the Treasurer’s Office. In early 2007, the board made a change
in investment policy to generate $12.7 million in additional income during the next five years while protecting the fund for generations to come. The changes generate more cash and ensure the value of the fund will continue to grow faster than inflation.
In the first year after the investment policy was changed, the board of investors certified $10.3 million for expenditure. This reflects a $3.5 million or 52 percent increase from the previous year.
The Treasurer also renegotiated all investment contracts to generate an additional $5.2 million – reflecting a 27.5 percent reduction in fees – during the next five years.
The total benefit is more than $17.9 million for spending on programs to improve the health of Oklahomans.

FY-2010 Executive Budget
FINANCE AND REVENUE B-127
The trust fund currently contains $382 million.
FY-2010 Recommendation
FY-2009 Appropriation $4,469
FY-2009 Bud. FTE Level 62.5
Actual Ave. YTD FTE 70.1
Funding Adjustments:
Appropriation reduction (233)
Travel reduction (4)
Total Adjustments -237
FY-2010 Recommendation $4,232
% Change from FY-2009 -5.30%
Source: Office of State Finance
(amounts in thousands)
FY-2010 Appropriation
Appropriation Reduction The Governor’s budget reduces the State Treasurer’s FY-2010 Appropriation by 5% ($233,438. Travel Reduction Agency travel funds are reduced by 10% ($3,975).

FY-2010 Executive Budget
FINANCE AND REVENUE B-128
Oklahoma Lottery Commission
The Oklahoma Lottery Commission is governed by a seven member Board of Trustees appointed by the Governor with the advice and consent of the Senate. Proceeds from the lottery are used to pay prizes to the players, commissions to the lottery retailers, costs of creating and maintaining a gaming system and to fund the Commission’s operating costs. The State appropriated one-time funding of $500,000 to cover costs associated with starting the lottery in FY-05 and FY-06. These funds were repaid to the State in FY-07, and through December of 2007, the Lottery has provided more than $160 million to the State to benefit education in Oklahoma. Oklahomans who enjoy playing the lottery can choose from several fun and entertaining games: Scratcher / Instant tickets where the players scratch a ticket to see if they are a winner, and several online games where the player chooses numbers, or has the gaming system choose numbers for them, and waits until the next drawing to see if they are a winner. The online games offered by the Lottery are Pick 3 (sales started November 10, 2005), Powerball (sales started January 12, 2006); Cash 5 (sales started September 1, 2006) and Hot Lotto (sales started January 3, 2008). All net proceeds from the Oklahoma Lottery Commission benefit Oklahoma education.
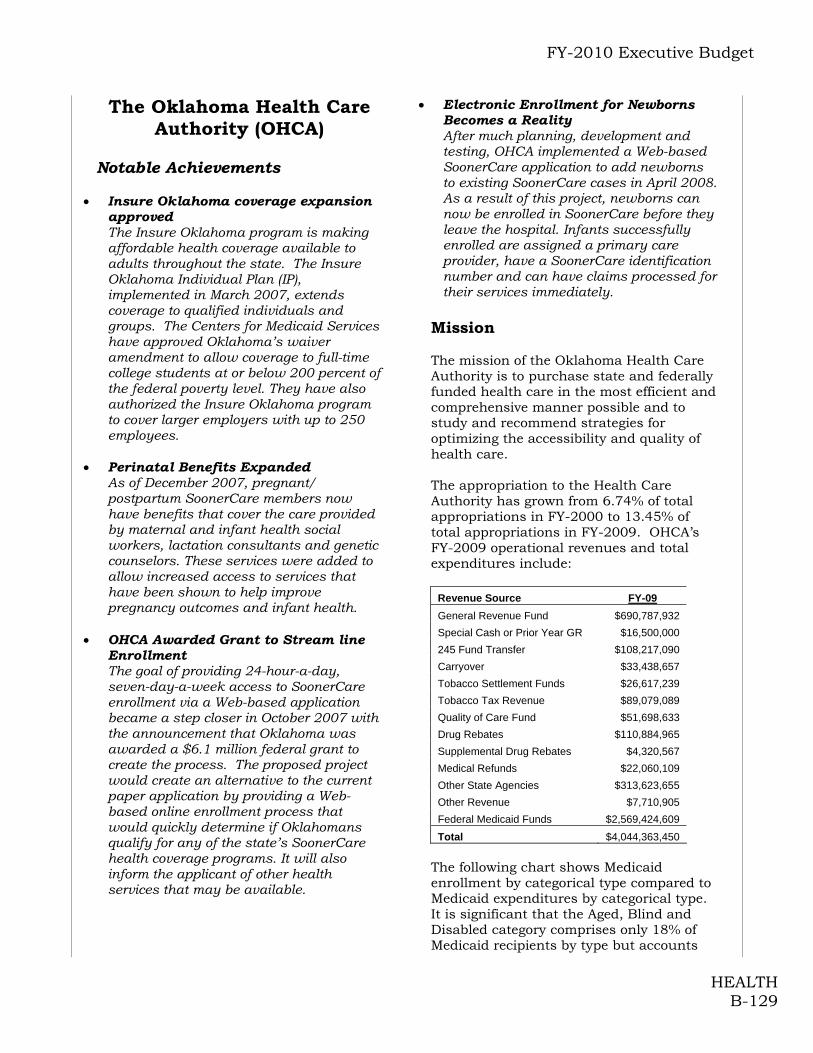
FY-2010 Executive Budget
HEALTH B-129
The Oklahoma Health Care Authority (OHCA)
Notable Achievements
Insure Oklahoma coverage expansion approved The Insure Oklahoma program is making affordable health coverage available to adults throughout the state. The Insure Oklahoma Individual Plan (IP), implemented in March 2007, extends coverage to qualified individuals and groups. The Centers for Medicaid Services have approved Oklahoma’s waiver amendment to allow coverage to full-time college students at or below 200 percent of the federal poverty level. They have also authorized the Insure Oklahoma program to cover larger employers with up to 250 employees.
Perinatal Benefits Expanded As of December 2007, pregnant/
postpartum SoonerCare members now have benefits that cover the care provided by maternal and infant health social workers, lactation consultants and genetic counselors. These services were added to allow increased access to services that have been shown to help improve pregnancy outcomes and infant health.
OHCA Awarded Grant to Stream line
Enrollment The goal of providing 24-hour-a-day, seven-day-a-week access to SoonerCare enrollment via a Web-based application became a step closer in October 2007 with the announcement that Oklahoma was awarded a $6.1 million federal grant to create the process. The proposed project would create an alternative to the current paper application by providing a Web-based online enrollment process that would quickly determine if Oklahomans qualify for any of the state’s SoonerCare health coverage programs. It will also inform the applicant of other health services that may be available.
Electronic Enrollment for Newborns Becomes a Reality After much planning, development and testing, OHCA implemented a Web-based SoonerCare application to add newborns to existing SoonerCare cases in April 2008. As a result of this project, newborns can now be enrolled in SoonerCare before they leave the hospital. Infants successfully enrolled are assigned a primary care provider, have a SoonerCare identification number and can have claims processed for their services immediately.
Mission The mission of the Oklahoma Health Care Authority is to purchase state and federally funded health care in the most efficient and comprehensive manner possible and to study and recommend strategies for optimizing the accessibility and quality of health care. The appropriation to the Health Care Authority has grown from 6.74% of total appropriations in FY-2000 to 13.45% of total appropriations in FY-2009. OHCA’s FY-2009 operational revenues and total expenditures include:
Revenue Source FY-09
General Revenue Fund $690,787,932
Special Cash or Prior Year GR $16,500,000
245 Fund Transfer $108,217,090
Carryover $33,438,657
Tobacco Settlement Funds $26,617,239
Tobacco Tax Revenue $89,079,089
Quality of Care Fund $51,698,633
Drug Rebates $110,884,965
Supplemental Drug Rebates $4,320,567
Medical Refunds $22,060,109
Other State Agencies $313,623,655
Other Revenue $7,710,905
Federal Medicaid Funds $2,569,424,609
Total $4,044,363,450
The following chart shows Medicaid enrollment by categorical type compared to Medicaid expenditures by categorical type. It is significant that the Aged, Blind and Disabled category comprises only 18% of Medicaid recipients by type but accounts
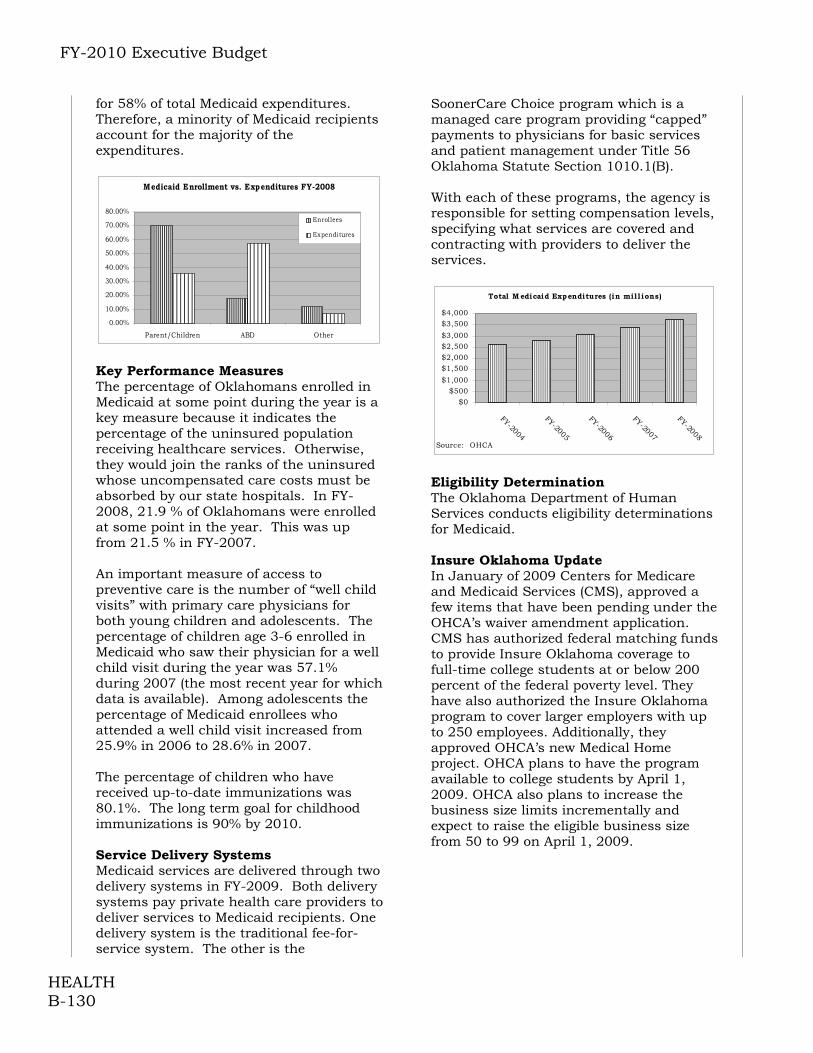
FY-2010 Executive Budget
HEALTH B-130
for 58% of total Medicaid expenditures. Therefore, a minority of Medicaid recipients account for the majority of the expenditures.
Medicaid Enrollment vs. Expenditures FY-2008
0.00%
10.00%
20.00%
30.00%
40.00%
50.00%
60.00%
70.00%
80.00%
Parent/Children ABD Other
Enrollees
Expenditures
Key Performance Measures The percentage of Oklahomans enrolled in Medicaid at some point during the year is a key measure because it indicates the percentage of the uninsured population receiving healthcare services. Otherwise, they would join the ranks of the uninsured whose uncompensated care costs must be absorbed by our state hospitals. In FY-2008, 21.9 % of Oklahomans were enrolled at some point in the year. This was up from 21.5 % in FY-2007. An important measure of access to preventive care is the number of “well child visits” with primary care physicians for both young children and adolescents. The percentage of children age 3-6 enrolled in Medicaid who saw their physician for a well child visit during the year was 57.1% during 2007 (the most recent year for which data is available). Among adolescents the percentage of Medicaid enrollees who attended a well child visit increased from 25.9% in 2006 to 28.6% in 2007. The percentage of children who have received up-to-date immunizations was 80.1%. The long term goal for childhood immunizations is 90% by 2010. Service Delivery Systems Medicaid services are delivered through two delivery systems in FY-2009. Both delivery systems pay private health care providers to deliver services to Medicaid recipients. One delivery system is the traditional fee-for-service system. The other is the
SoonerCare Choice program which is a managed care program providing “capped” payments to physicians for basic services and patient management under Title 56 Oklahoma Statute Section 1010.1(B). With each of these programs, the agency is responsible for setting compensation levels, specifying what services are covered and contracting with providers to deliver the services.
Total M edicaid Expenditures (in mil l ions)
$0$500
$1,000
$1,500$2,000$2,500$3,000
$3,500$4,000
FY-2004
FY-2005
FY-2006
FY-2007
FY-2008Source: OHCA
Eligibility Determination The Oklahoma Department of Human Services conducts eligibility determinations for Medicaid. Insure Oklahoma Update In January of 2009 Centers for Medicare and Medicaid Services (CMS), approved a few items that have been pending under the OHCA’s waiver amendment application. CMS has authorized federal matching funds to provide Insure Oklahoma coverage to full-time college students at or below 200 percent of the federal poverty level. They have also authorized the Insure Oklahoma program to cover larger employers with up to 250 employees. Additionally, they approved OHCA’s new Medical Home project. OHCA plans to have the program available to college students by April 1, 2009. OHCA also plans to increase the business size limits incrementally and expect to raise the eligible business size from 50 to 99 on April 1, 2009.

FY-2010 Executive Budget
HEALTH B-131
Economic Impact and Cost Drivers Direct and Indirect Impact of Medicaid Spending Health care services are a substantial economic presence in Oklahoma. The health care sector affects the economy in much the same way a manufacturing plant does by bringing in money, while providing jobs and wages to residents. Based on the Federal Fiscal Year 2009 matching rate, Medicaid imported federal dollars into Oklahoma at a rate of 1.93:1. Health care businesses, in turn, have an additional impact through the purchases of technology and services. The $3.7 billion in Medicaid expenditures for FY-2008 is estimated to have supported 130,000 direct and indirect jobs within the health care industry and $3.6 billion in income. Increased business activity and increased tax collections are also a significant part of the economic impact of Medicaid spending. Expenditures per Recipient While health care costs across the board continue to increase, Oklahoma is one of the most effective states in the region in controlling per recipient costs according to the Southern Legislative Conference’s (SLC) most recent data. Only Georgia, Arkansas, Texas and Louisiana had lower average per recipient payments in Federal Fiscal Year 2005 than Oklahoma.
Average Payment Per Medicaid Recipient FFY-2005 Southern Legislative Conference
$3,3
46$3
,623
$3,8
28$3
,974
$4,0
27
$4,5
52$4
,721
$4,7
82$4
,847
$4,8
83$4
,953
$5,2
17
$5,7
14
$4,1
55 $5,4
33 $6,4
12
$0
$1,000
$2,000
$3,000$4,000
$5,000
$6,000
$7,000
Geo
rgia
Arka
nsas
Texa
s
Loui
sian
a
Okl
ahom
a
Flor
ida
Misso
uri
Kentu
cky
Tenn
esse
e
Mississ
ippi
Sout
h Car
olin
a
Alab
ama
Virg
inia
North
Car
olin
a
Wes
t Virg
inia
Mar
yland
Enrollment, Utilization and Covered Services Other cost drivers for health care are the enrollment volume, utilization and covered services. As the total volume of enrollment increases and more people have access to medical care, expenditures go up. In
addition, an increase in the average number of services or prescriptions per recipient also drives costs. The total array of covered services is the third cost driver of Medicaid costs. When making funding decisions for the state Medicaid budget, all these factors must be taken into account.
FY-2010 Recommendation
FY-2009 Appropriation $842,122
One-time Adjustments (108,217)
FY-2009 Base $733,905
FY-2009 Bud. FTE Level 444.5
Actual Ave. YTD FTE 434.5
Funding Adjustments:
Replace One Time Funding 108,217Travel Cut (35)
Total Adjustments 108,182
FY-2010 Recommendation $842,087
$ Change from FY-2009 ($35)
% Change from FY-2009 0.00%
(amounts in thousands)
FY-2010 Appropriation
Source: Office of State Finance Replace One-Time Funding The Governor’s Budget Includes $108,217,090 to replace the one-time funding provided by the Insure Oklahoma fund. Travel Cut Agency travel funds are reduced by 10% ($34,998). Provider Fee and Federal Funds The Governor’s Budget includes anticipated federal funds and Hospital Provider Fee revenue to support: decreases in the FMAP rate, growth and utilization increases, Medicare A&B premium increases, Medicare prescription drug phase down increases, and provider rate increases. The Hospital Provider Fee will also support an expansion of coverage for the uninsured.

FY-2010 Executive Budget
HEALTH B-132
The Department of Health Notable Achievements Oklahoma’s Health Ranking
Improves Oklahoma’s Health Ranking improved from 47th in the nation to 43rd according to 2008 report. Notable improvements included an 8 percent drop in the percentage of Oklahoma children who live in poverty, an increase in immunizations among young children and a reduction in the number of infectious disease case.
Continued Improvement for
Childhood Immunizations Recent adoption of the new national standard for vaccination that includes varicella as part of the primary series shows Oklahoma ranked 15th nationally with a 78.6% completion rate among 19-35 month children in 2007. Additionally, Oklahoma continued to rank 25th nationally among 19-35 month old children for the previous national standard that excluded varicella. In 2005, Oklahoma ranked 44th nationally.
Emergency Preparedness and
Response In 2008, the Centers for Disease Control and Prevention (CDC) upgraded Oklahoma’s Strategic National Stockpile (SNS) program readiness score from 91% to 97%. The state’s SNS program is designed to rapidly acquire and distribute medical countermeasures in response to a terrorist attack, natural disaster, or other public health emergency.
In 2008, the agency was engaged in two major emergency response efforts. In August, the agency mounted a major response to the largest E. coli 0111 outbreak recorded to date in the United States. During this response effort, the agency was also engaged in the response to Hurricane Gustav as several hundred citizens of Louisiana were evacuated to Oklahoma in advance of the storm. The OSDH staff assisted with coordination of the transfer of hospital patients through the National Disaster
Management System (NDMS), coordination of deployment of EMS services, establishment of shelter medical operations, and coordination of care for those with special needs.
Child Guidance Service In 2008, in partnership with other key child serving agencies, took the lead to improve the system of early childhood mental heath services through providing child care mental health consultation and consultation with primary care physicians to implement developmental/behavioral screening. As a result, young children statewide with behavioral health concerns now benefit from earlier recognition and intervention and are bettered prepared to be successful in school.
Expanded Newborn Screenings
The Newborn Screening Program expanded its screening in 2008 of all newborns to now include 53 conditions, including amino acid, fatty acid oxidation and organic acid disorders. This expansion is consistent with the recommendations of the American College of Medical Genetics, March of Dimes and the Oklahoma Genetics Advisory Council. Consequently, Oklahoma newborns now benefit from early recognition of certain rare disorders and medical intervention to prevent serious problems like mental retardation.
Mission The mission of the Department of Health is to promote, protect and improve the health of all Oklahomans through strategies that focus on preventing disease and injuries. Local health service delivery is accomplished by approximately 2,250 employees located at 69 county health departments throughout the state. Poor health behaviors and lifestyle choices by Oklahomans pose a significant challenge for the Department when seeking ways to improve the public’s health outcomes.
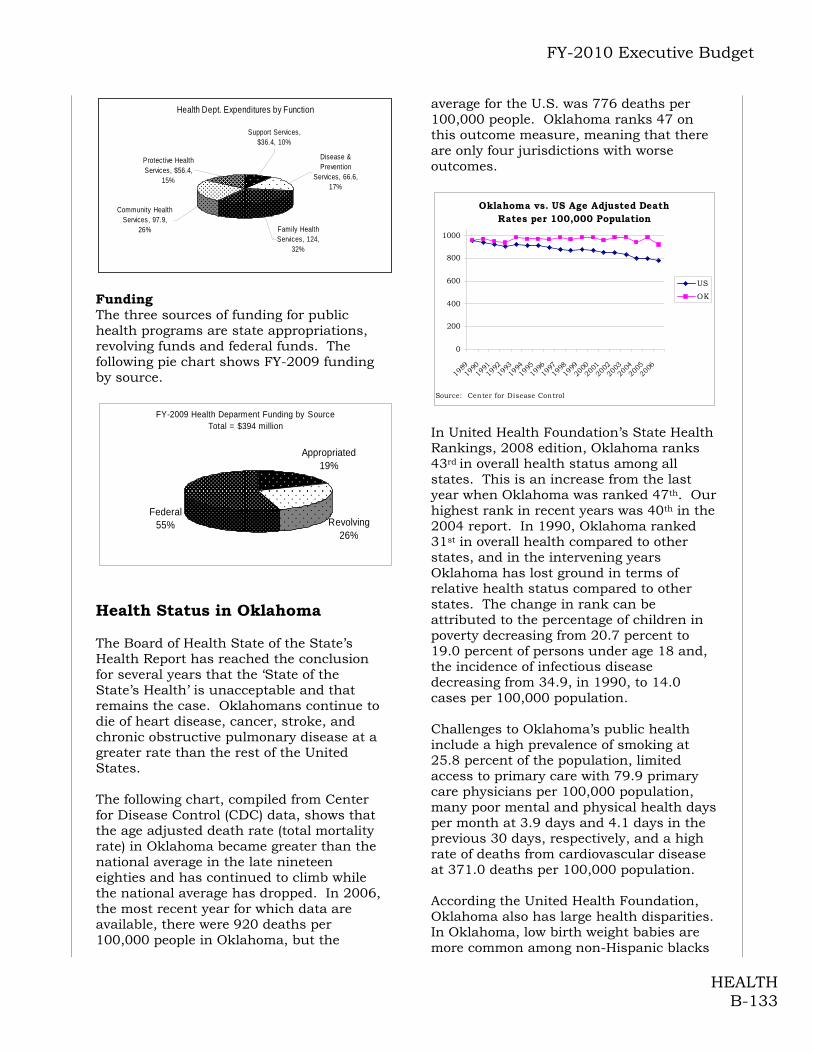
FY-2010 Executive Budget
HEALTH B-133
Health Dept. Expenditures by Function
Disease & Prevention
Services, 66.6, 17%
Support Services, $36.4, 10%
Protective Health Services, $56.4,
15%
Community Health Services, 97.9,
26% Family Health Services, 124,
32%
Funding The three sources of funding for public health programs are state appropriations, revolving funds and federal funds. The following pie chart shows FY-2009 funding by source.
FY-2009 Health Deparment Funding by SourceTotal = $394 million
Appropriated19%
Revolving26%
Federal55%
Health Status in Oklahoma The Board of Health State of the State’s Health Report has reached the conclusion for several years that the ‘State of the State’s Health’ is unacceptable and that remains the case. Oklahomans continue to die of heart disease, cancer, stroke, and chronic obstructive pulmonary disease at a greater rate than the rest of the United States. The following chart, compiled from Center for Disease Control (CDC) data, shows that the age adjusted death rate (total mortality rate) in Oklahoma became greater than the national average in the late nineteen eighties and has continued to climb while the national average has dropped. In 2006, the most recent year for which data are available, there were 920 deaths per 100,000 people in Oklahoma, but the
average for the U.S. was 776 deaths per 100,000 people. Oklahoma ranks 47 on this outcome measure, meaning that there are only four jurisdictions with worse outcomes.
Oklahoma vs. US Age Adjusted Death Rates per 100,000 Population
0
200
400
600
800
1000
19891990
19911992
19931994
1995
1996
199719
9819
9920
002001
20022003
20042005
2006
Source: Center for Disease Control
US
OK
In United Health Foundation’s State Health Rankings, 2008 edition, Oklahoma ranks 43rd in overall health status among all states. This is an increase from the last year when Oklahoma was ranked 47th. Our highest rank in recent years was 40th in the 2004 report. In 1990, Oklahoma ranked 31st in overall health compared to other states, and in the intervening years Oklahoma has lost ground in terms of relative health status compared to other states. The change in rank can be attributed to the percentage of children in poverty decreasing from 20.7 percent to 19.0 percent of persons under age 18 and, the incidence of infectious disease decreasing from 34.9, in 1990, to 14.0 cases per 100,000 population. Challenges to Oklahoma’s public health include a high prevalence of smoking at 25.8 percent of the population, limited access to primary care with 79.9 primary care physicians per 100,000 population, many poor mental and physical health days per month at 3.9 days and 4.1 days in the previous 30 days, respectively, and a high rate of deaths from cardiovascular disease at 371.0 deaths per 100,000 population. According the United Health Foundation, Oklahoma also has large health disparities. In Oklahoma, low birth weight babies are more common among non-Hispanic blacks

FY-2010 Executive Budget
HEALTH B-134
at 13.6 percent than Hispanics at 6.5 percent. Access to health care varies significantly by race and ethnicity in the state; 56.1 percent of Hispanics lack health insurance compared to 20.8 percent of non-Hispanic whites. Divisions of the State Department of Health Family Health Services Family Planning Services County health departments and non-profit clinics provide family planning services to low-income women at risk for unwanted and mistimed pregnancies. Services include physical exams, contraceptive supplies, education and counseling and voluntary sterilization. Child Abuse Prevention Home visitation programs for low-resource mothers improve health indicators and parenting skills in an effort to avert child abuse, unwanted repeat pregnancies and other adverse outcomes. Child Guidance Services Diagnostic and short term treatment services for developmental, psychological, speech, language and hearing problems for children are provided through county health departments. Women, Infants and Children (WIC) WIC is a federally funded program that provides nutritional education and coupons for selected items to pregnant women and children less than 5 years old. Dental Health Oral health screening and small scale treatment for children and nursing home residents is provided through contracts with dentists and dental hygienists. Teen Pregnancy Prevention Programs are aimed at lowering the number of teen pregnancies. Disease Prevention Services
Newborn Metabolic Screening All Oklahoma newborns are screened for various metabolic disorders. Chronic Diseases Screening, tracking, education and referrals for persons at risk for chronic diseases like cancer, diabetes, heart disease and high blood pressure are provided. Communicable Diseases Three primary areas of services are as follows: Immunizations Tuberculosis HIV/STD - surveillance and prevention Community Health Services County Health Departments The Department of Health provides an array of services at the local level through 69 county health departments. Services include oversight for public health nurses, and community health workers, as well as local finance, budgeting and record keeping administration. Protective Health Services Long Term Care Services Provides licensing and inspection of nursing facilities, assisted living centers, group homes and intermediate care facilities for the mentally handicapped and residential care centers. Medical Facilities Licensing and regulation of hospitals, ambulatory surgical centers, community health centers, home health agencies, hospices, etc. is provided by this division. Consumer Health Barbers, cosmetologists, licensed counselors, hearing aid fitters and the alarm industry are regulated. Restaurant and Motel Inspections Sanitarians working for the state/county health departments inspect these facilities.

FY-2010 Executive Budget
HEALTH B-135
County Jail Inspections These inspections ensure compliance with minimum safety and inmate welfare standards.
FY-2010 Recommendation
FY-2009 Appropriation $75,028
FY-2009 Bud. FTE Level 2,253.9
Actual Ave. YTD FTE 2,244.9
Funding Adjustments:
FQHC Expansion 2,00010% Travel Cut (601)
Total Adjustments 1,399
FY-2010 Recommendation $76,427
% Change from FY-2009 1.86%
Source: Office of State Finance
FY-2010 Appropriation(amounts in thousands)
FQHC Expansion The Governor’s Budget includes $2 Million for an expansion of Federally Qualified Health Center’s indigent care services. Travel Budget Cut The Health Departments travel funds are also reduced by 10% ($601,475).

FY-2010 Executive Budget
HEALTH B-136
Department of Mental Health and Substance Abuse Services (ODMHSAS)
Notable Achievements 42% Drug Courts The re-arrest rates for
drug court graduates after four years is 24% compared to 54% for inmates released at the end of their sentence. Unemployment for drug court graduates has been reduced 86.2%. For drug court participants, the number of children living with their parents has increased by 48.7%
Mental Health Courts The number of
jail days for mental health court participants has been reduced by 92%. The unemployment for mental health court graduates has been reduced by 94%.
Jail Diversion and Day Reporting
Programs Tulsa’s COPES program successfully diverted 97% of non-violent criminal offenders from incarceration. Oklahoma County’s Day Reporting program decreased jail days by 95.7% and reduced inpatient days by 78.8% for individuals with mental illness arrested for non-violent crimes
Progress in telemedicine Through
legislative authorization in 2008 and close work with the Oklahoma Medical Licensure Board, ODMHSAS has expanded use of telemedicine throughout the state of Oklahoma. Telemedicine provides greater access to psychiatrists, greater efficiencies, and easier access to services for rural Oklahomans
Private-Public Partnership to Broadcast Crystal Darkness Oklahoma Following the leadership of First Lady Kim Henry, the ODMHSAS & OBNDD served as lead agencies in the production, broadcast, and community mobilization of Crystal Darkness, a 30 minute documentary on the tragedy of methamphetamine use and the hope of recovery from this dangerous drug. The
documentary was broadcast over virtually every broadcast network at 6:30 p.m. on January 13th with a viewership estimated of over 1 million Watch parties, attended by a conservatively estimated 25,000 Oklahomans, were facilitated in all areas of the state by ODMHSAS’s Area Prevention Resource Centers and other community partners and over 750 calls were generated into the state’s 2-1-1 system
ODMHSAS Leadership Academy Wins Quality Crown Award for Excellence Building upon the concept of the Governor’s executive leadership development program, ODMHSAS started its own executive leadership academy to facilitate core leadership skills related to the provision of mental health and substance abuse services for the agency’s emerging leaders. This program was recognized as the state’s top quality initiative among Oklahoma state agencies at the 2008 Quality Team Day
Efficiency for Oklahoma Taxpayers
The ODMHSAS continues to dedicate a majority of state and federal dollars to the direct provision of services. The agency spends 96% of its resources on direct services, representing one of the lowest administrative rates among peer mental health and substance abuse authorities from other states and also one of the best rates among state agencies in Oklahoma
Mission The Mental Health Law of 1953 established the Oklahoma Department of Mental Health and Substance Abuse Services (ODMHSAS), although publicly supported services to Oklahomans with mental illness date back to early statehood. The agency’s mission is to promote healthy communities and provide the highest quality care to enhance the well being of all Oklahomans. Today, the two principal
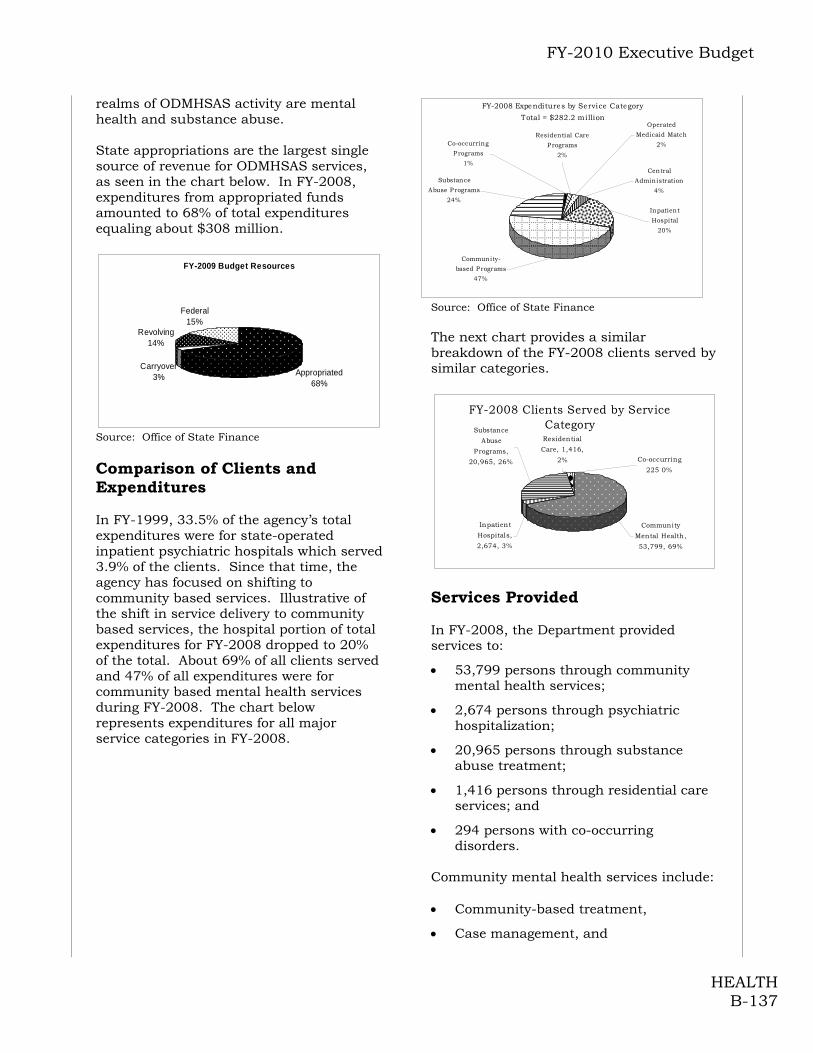
FY-2010 Executive Budget
HEALTH B-137
realms of ODMHSAS activity are mental health and substance abuse. State appropriations are the largest single source of revenue for ODMHSAS services, as seen in the chart below. In FY-2008, expenditures from appropriated funds amounted to 68% of total expenditures equaling about $308 million.
FY-2009 Budget Resources
Appropriated68%
Carryover3%
Revolving14%
Federal15%
Source: Office of State Finance Comparison of Clients and Expenditures In FY-1999, 33.5% of the agency’s total expenditures were for state-operated inpatient psychiatric hospitals which served 3.9% of the clients. Since that time, the agency has focused on shifting to community based services. Illustrative of the shift in service delivery to community based services, the hospital portion of total expenditures for FY-2008 dropped to 20% of the total. About 69% of all clients served and 47% of all expenditures were for community based mental health services during FY-2008. The chart below represents expenditures for all major service categories in FY-2008.
FY-2008 Expenditures by Service Category
Total = $282.2 million
Residential Care
P rograms
2%
Operated
Medicaid Match
2%
Central
Administration
4%
Substance
Abuse P rograms
24%
Co-occurring
P rograms
1%
Community-
based P rograms
47%
Inpatient
Hospital
20%
Source: Office of State Finance The next chart provides a similar breakdown of the FY-2008 clients served by similar categories.
FY-2008 Clients Served by Service Category
Community
Mental Health,
53,799, 69%
Inpatient
Hospitals,
2,674, 3%
Substance
Abuse
P rograms,
20,965, 26%
Residential
Care, 1,416,
2% Co-occurring
225 0%
Services Provided In FY-2008, the Department provided services to:
53,799 persons through community mental health services;
2,674 persons through psychiatric hospitalization;
20,965 persons through substance abuse treatment;
1,416 persons through residential care services; and
294 persons with co-occurring disorders.
Community mental health services include: Community-based treatment,
Case management, and
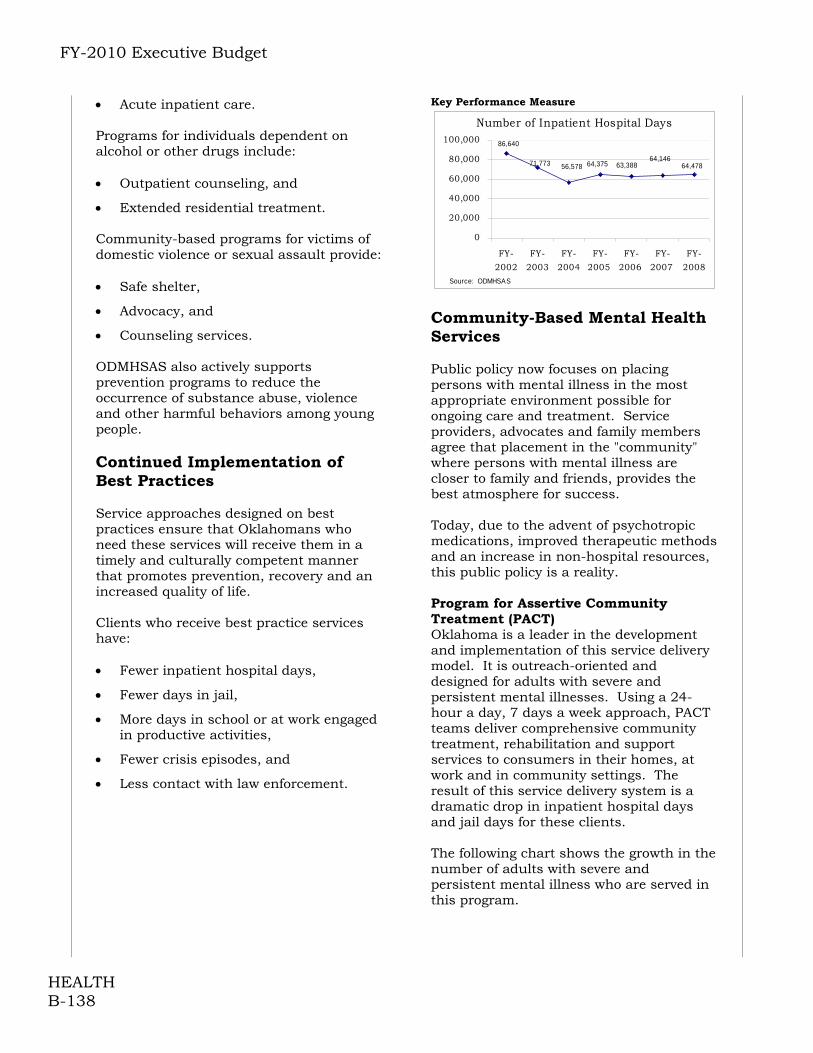
FY-2010 Executive Budget
HEALTH B-138
Acute inpatient care.
Programs for individuals dependent on alcohol or other drugs include: Outpatient counseling, and
Extended residential treatment. Community-based programs for victims of domestic violence or sexual assault provide: Safe shelter,
Advocacy, and
Counseling services.
ODMHSAS also actively supports prevention programs to reduce the occurrence of substance abuse, violence and other harmful behaviors among young people. Continued Implementation of Best Practices Service approaches designed on best practices ensure that Oklahomans who need these services will receive them in a timely and culturally competent manner that promotes prevention, recovery and an increased quality of life. Clients who receive best practice services have: Fewer inpatient hospital days,
Fewer days in jail,
More days in school or at work engaged in productive activities,
Fewer crisis episodes, and
Less contact with law enforcement.
Key Performance Measure
Number of Inpatient Hospital Days
64,47864,146
64,375 63,38856,57871,773
86,640
0
20,000
40,000
60,000
80,000
100,000
FY-
2002
FY-
2003
FY-
2004
FY-
2005
FY-
2006
FY-
2007
FY-
2008Source: ODMHSAS
Community-Based Mental Health Services Public policy now focuses on placing persons with mental illness in the most appropriate environment possible for ongoing care and treatment. Service providers, advocates and family members agree that placement in the "community" where persons with mental illness are closer to family and friends, provides the best atmosphere for success. Today, due to the advent of psychotropic medications, improved therapeutic methods and an increase in non-hospital resources, this public policy is a reality. Program for Assertive Community Treatment (PACT) Oklahoma is a leader in the development and implementation of this service delivery model. It is outreach-oriented and designed for adults with severe and persistent mental illnesses. Using a 24-hour a day, 7 days a week approach, PACT teams deliver comprehensive community treatment, rehabilitation and support services to consumers in their homes, at work and in community settings. The result of this service delivery system is a dramatic drop in inpatient hospital days and jail days for these clients. The following chart shows the growth in the number of adults with severe and persistent mental illness who are served in this program.
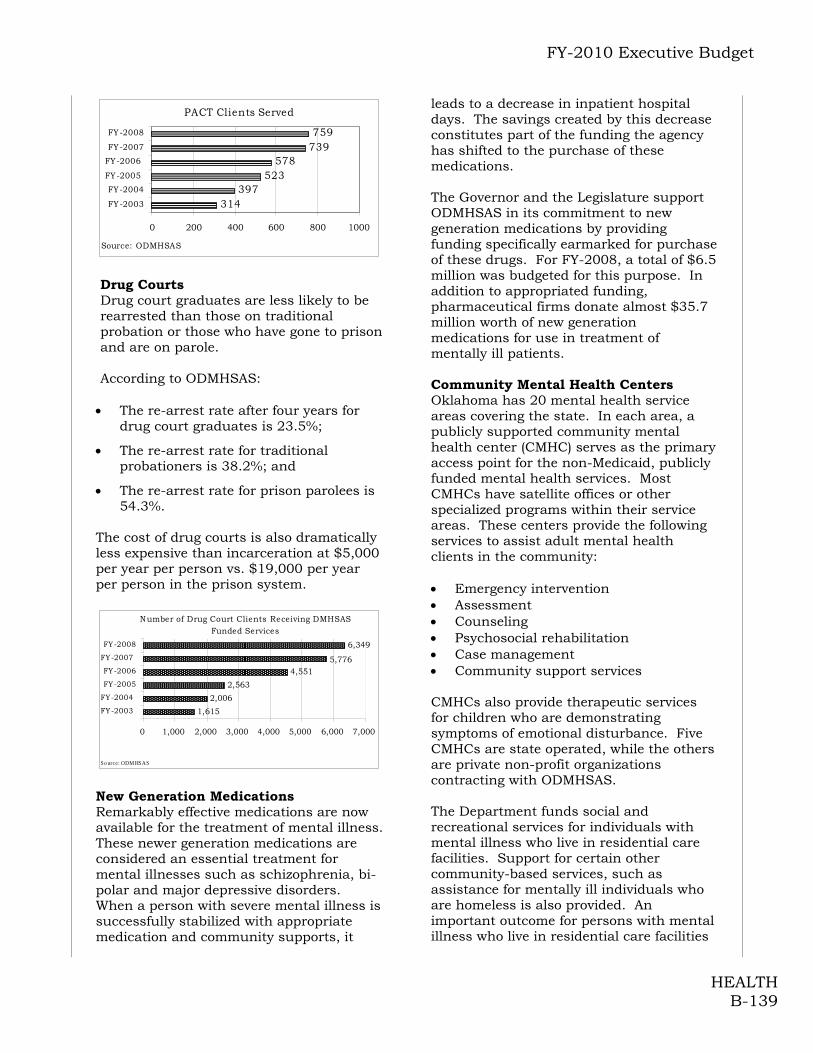
FY-2010 Executive Budget
HEALTH B-139
PACT Clients Served
314397
523578
739759
0 200 400 600 800 1000
FY-2003
FY-2004
FY-2005
FY-2006
FY-2007
FY-2008
Source: ODMHSAS
Drug Courts Drug court graduates are less likely to be rearrested than those on traditional probation or those who have gone to prison and are on parole. According to ODMHSAS: The re-arrest rate after four years for
drug court graduates is 23.5%;
The re-arrest rate for traditional probationers is 38.2%; and
The re-arrest rate for prison parolees is 54.3%.
The cost of drug courts is also dramatically less expensive than incarceration at $5,000 per year per person vs. $19,000 per year per person in the prison system.
Number of Drug Court Clients Receiving DMHSAS Funded Services
1,615
2,006
2,563
4,551
6,349
5,776
0 1,000 2,000 3,000 4,000 5,000 6,000 7,000
FY-2003
FY-2004
FY-2005
FY-2006
FY-2007
FY-2008
So urce: ODM HSAS New Generation Medications Remarkably effective medications are now available for the treatment of mental illness. These newer generation medications are considered an essential treatment for mental illnesses such as schizophrenia, bi-polar and major depressive disorders. When a person with severe mental illness is successfully stabilized with appropriate medication and community supports, it
leads to a decrease in inpatient hospital days. The savings created by this decrease constitutes part of the funding the agency has shifted to the purchase of these medications. The Governor and the Legislature support ODMHSAS in its commitment to new generation medications by providing funding specifically earmarked for purchase of these drugs. For FY-2008, a total of $6.5 million was budgeted for this purpose. In addition to appropriated funding, pharmaceutical firms donate almost $35.7 million worth of new generation medications for use in treatment of mentally ill patients. Community Mental Health Centers Oklahoma has 20 mental health service areas covering the state. In each area, a publicly supported community mental health center (CMHC) serves as the primary access point for the non-Medicaid, publicly funded mental health services. Most CMHCs have satellite offices or other specialized programs within their service areas. These centers provide the following services to assist adult mental health clients in the community: Emergency intervention Assessment Counseling Psychosocial rehabilitation Case management Community support services CMHCs also provide therapeutic services for children who are demonstrating symptoms of emotional disturbance. Five CMHCs are state operated, while the others are private non-profit organizations contracting with ODMHSAS. The Department funds social and recreational services for individuals with mental illness who live in residential care facilities. Support for certain other community-based services, such as assistance for mentally ill individuals who are homeless is also provided. An important outcome for persons with mental illness who live in residential care facilities

FY-2010 Executive Budget
HEALTH B-140
is their ability to sustain themselves within a community based setting and avoid costly inpatient treatment. Key Performance Measure
Admissions/Readmissions to State Psychiatric Hospitals for Persons in Residental Care
182119
89
0
5
10
15
20
25
FY-2004 FY-2005 FY-2006 FY-2007 FY-2008
So urce: ODM HSAS
FY-2010 Recommendation
FY-2009 Appropriation $209,579
FY-2009 Bud. FTE Level 2,098.1
Actual Ave. YTD FTE 2,092.4
Funding Adjustments:
Crystal Darkness Campaign 500
System of Care Grant Match 25010% Travel Cut (130)
Total Adjustments 620
FY-2010 Recommendation $210,199
% Change from FY-2009 0.30%
(amounts in thousands)
Source: Office of State Finance
FY-2010 Appropriation
Crystal Darkness Campaign The Governor’s Budget includes $500,000 for a statewide initiative that will include an education and treatment campaign to combat methamphetamine usage. System of Care Grant Match The Governor’s budget includes $250,000 for the System of Care Grant. Federal Stimulus The Governor’s budget also includes anticipated federal funds to support decreases in the FMAP rate and growth and utilization increases in the Medicaid program.
Travel Budget Cut The Department of Mental Health and Substance Abuse travel funds are reduced by 10% ($130,150).
FY-2010 Executive Budget
HEALTH B-141
Oklahoma State Board of Examiners for Long Term
Care Administrators Brief History The Oklahoma State Board of Examiners for Nursing Home Administrators was originally established in 1968. The Board was recreated and restructured during the 2005 Legislative session by HB 1453, which instructed the Governor to appoint an entirely new Board effective July 1, 2005. Other significant provisions of HB 1453:
Increase the amount of time a nursing home administrator must spend doing “on the job supervision of such facility”;
Limit the members of the Board who can be nursing home owners to no more than five;
Require full investigation of all complaints filed against nursing home administrators;
Direct the Board to develop a code of ethics for nursing home administrators; and
Require the Board to refer investigations to the proper law enforcement authorities.
In addition to the above requirements, new law was established which:
Requires the Board to keep a registry of all complaints or other referrals complaining of acts or omissions of administrators;
Requires any Board decision on a complaint to be voted on by a quorum of the Board in an open meeting; and
Provides that no Board subcommittees or staff shall make recommendations to the Board regarding complaints.
FY-2010 Recommendation The Governor’s budget recommends the $347,000 pass-through appropriation in the State Department of Health be continued in FY-2010 for this agency.

FY-2010 Executive Budget
HEALTH B-142
FY-2010 Executive Budget
HUMAN RESOURCES AND ADMINISTRATION B-143
Department of Central Services
Notable Achievement Successfully installed new computer
systems for fleet management, allowing for the complete inventorying and monitoring of expenditures associated with vehicles in the state’s fleet.
Implemented a new printing system to improve job costing and tracking of expenditures associated with the state’s printing operation.
Completed several deferred maintenance and repair projects within the Capitol complex. Also began the process to identify and repair the significant water damage to the Transportation, Denver Davidson and Thorpe buildings.
Main Duties/Responsibilities The Department of Central Services provides a wide variety of support services to state agencies and other governmental entities. Fleet Management regulates the acquisition, lease, operation, maintenance, repair, and disposal of the vehicles required for state agencies. State Leasing administers the leasing and space management of property for all state agencies and institutions. Facilities Services operates and maintains seventeen buildings; the total space managed is approximately two million square feet. Multi-State Cooperative Purchasing Agreements Current Purchasing Agreements: Pharmaceutical purchases for the Department of Corrections, Health Department, Department of Mental Health, as well as other state and county agencies, are through the Minnesota Multi-State Contracting Alliance for Pharmacy (MMCAP). The combined purchasing volume for the 44 member states, plus the cities of Chicago and Los Angeles, for
contract year 2005/2006 is over one billion dollars with Oklahoma accounting for over $19 million on contract purchases. MMCAP distributes, based on percentage of total sales, $3 million in drug credits to participating state facilities. Oklahoma received $57,212 in credits for this reporting period. MMCAP is an excellent example of combining state spend to become a viable force in the marketplace. Other multi-state opportunities include contracts of MRO supplies, Satellite Phones, Personal Computers, Hazardous Equipment Response Equipment and Automated External Defibrillators (AED) for which Oklahoma is the lead state. Statewide contracts The continued expansion of statewide contracts has simplified the acquisition of supplies and services in more than 125 areas. Statewide contracts provide greater convenience, simplified procedures, and significantly reduced administrative costs to the State. The ease of use of these contracts also reduces the need to carry additional inventories, as products can be quickly and easily acquired. Competitively bid statewide service contracts eliminate the need for agencies to draft and solicit for services and items commonly purchased among state agencies. The recently added Office Products Portal provides a 61% discount to State users for disposable office products and has greatly increased our ability to assure State Use compliance while providing a one stop order process that has simplified the lives of our users. DCS has also entered into a statewide auto rental contract and will soon release a trip calculator. Fleet Management Fleet Management provides vehicles, repair services, and fuel to state agencies at a cost lower than the private sector. Fleet Management continues to assess the State’s vehicular needs and requirements to identify savings to the State.

FY-2010 Executive Budget
HUMAN RESOURCES AND ADMINISTRATION B-144
FY-2010 Recommendation
FY-2009 Appropriation $18,713
FY-2009 Bud. FTE Level 248.4
Actual Ave. YTD FTE 246.8
Funding Adjustments:
Appropriation reduction (1,871)
Travel reduction (19) Total -1,891
FY-2010 Recommendation $16,823
% Change from FY-2009 -10.10%
Source: Office of State Finance
FY-2010 Appropriation(amounts in thousands)
Appropriation Reduction The Governor’s budget reduces the Department of Central Service’s FY-2010 Appropriation by 10% ($1,871,318). Travel Reduction Agency travel funds are reduced by 10% ($19,259).
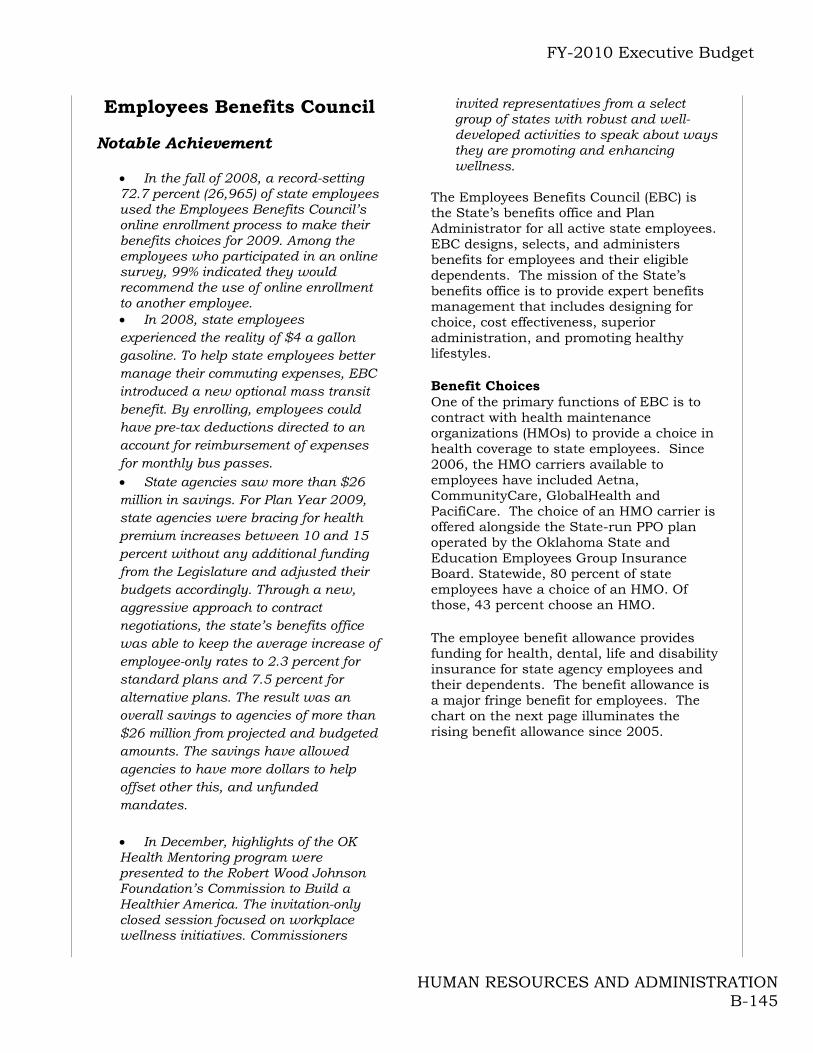
FY-2010 Executive Budget
HUMAN RESOURCES AND ADMINISTRATION B-145
Employees Benefits Council Notable Achievement
In the fall of 2008, a record-setting 72.7 percent (26,965) of state employees used the Employees Benefits Council’s online enrollment process to make their benefits choices for 2009. Among the employees who participated in an online survey, 99% indicated they would recommend the use of online enrollment to another employee. In 2008, state employees experienced the reality of $4 a gallon gasoline. To help state employees better manage their commuting expenses, EBC introduced a new optional mass transit benefit. By enrolling, employees could have pre-tax deductions directed to an account for reimbursement of expenses for monthly bus passes. State agencies saw more than $26 million in savings. For Plan Year 2009, state agencies were bracing for health premium increases between 10 and 15 percent without any additional funding from the Legislature and adjusted their budgets accordingly. Through a new, aggressive approach to contract negotiations, the state’s benefits office was able to keep the average increase of employee-only rates to 2.3 percent for standard plans and 7.5 percent for alternative plans. The result was an overall savings to agencies of more than $26 million from projected and budgeted amounts. The savings have allowed agencies to have more dollars to help offset other this, and unfunded mandates. In December, highlights of the OK Health Mentoring program were presented to the Robert Wood Johnson Foundation’s Commission to Build a Healthier America. The invitation-only closed session focused on workplace wellness initiatives. Commissioners
invited representatives from a select group of states with robust and well-developed activities to speak about ways they are promoting and enhancing wellness.
The Employees Benefits Council (EBC) is the State’s benefits office and Plan Administrator for all active state employees. EBC designs, selects, and administers benefits for employees and their eligible dependents. The mission of the State’s benefits office is to provide expert benefits management that includes designing for choice, cost effectiveness, superior administration, and promoting healthy lifestyles. Benefit Choices One of the primary functions of EBC is to contract with health maintenance organizations (HMOs) to provide a choice in health coverage to state employees. Since 2006, the HMO carriers available to employees have included Aetna, CommunityCare, GlobalHealth and PacifiCare. The choice of an HMO carrier is offered alongside the State-run PPO plan operated by the Oklahoma State and Education Employees Group Insurance Board. Statewide, 80 percent of state employees have a choice of an HMO. Of those, 43 percent choose an HMO. The employee benefit allowance provides funding for health, dental, life and disability insurance for state agency employees and their dependents. The benefit allowance is a major fringe benefit for employees. The chart on the next page illuminates the rising benefit allowance since 2005.
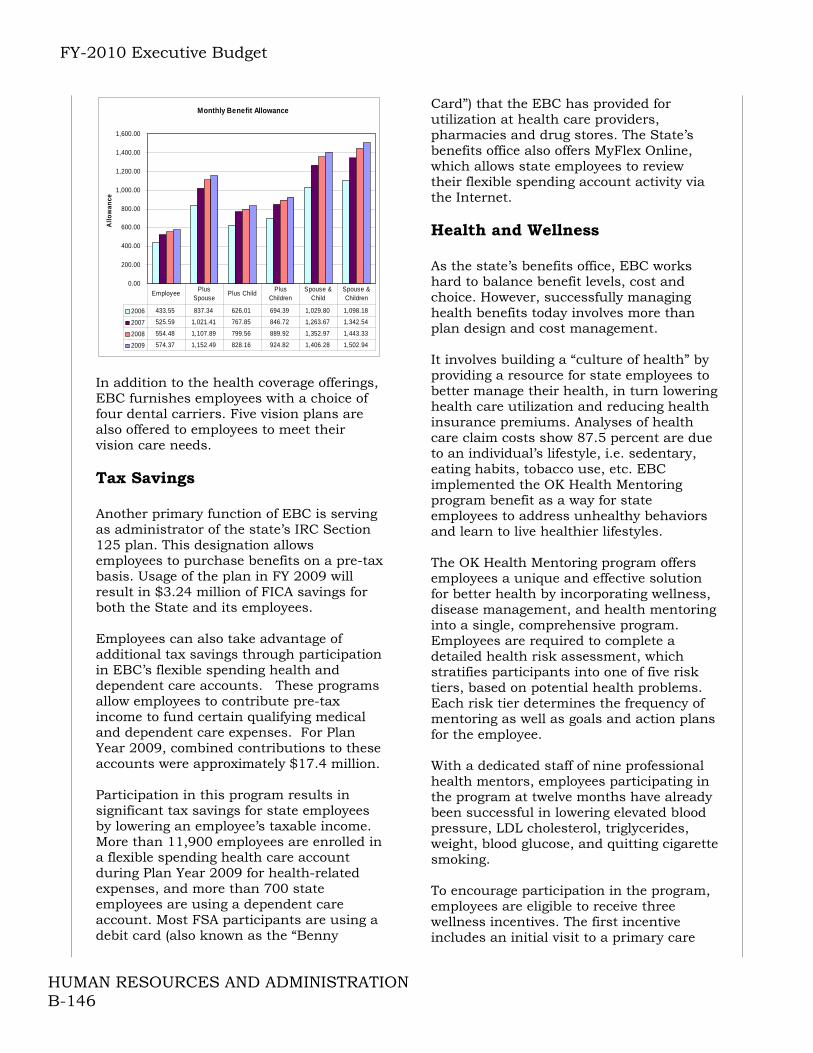
FY-2010 Executive Budget
HUMAN RESOURCES AND ADMINISTRATION B-146
Monthly Benefit Allowance
0.00
200.00
400.00
600.00
800.00
1,000.00
1,200.00
1,400.00
1,600.00
All
ow
ance
2006 433.55 837.34 626.01 694.39 1,029.80 1,098.18
2007 525.59 1,021.41 767.85 846.72 1,263.67 1,342.54
2008 554.48 1,107.89 799.56 889.92 1,352.97 1,443.33
2009 574.37 1,152.49 828.16 924.82 1,406.28 1,502.94
EmployeePlus
SpousePlus Child
Plus Children
Spouse & Child
Spouse & Children
In addition to the health coverage offerings, EBC furnishes employees with a choice of four dental carriers. Five vision plans are also offered to employees to meet their vision care needs. Tax Savings Another primary function of EBC is serving as administrator of the state’s IRC Section 125 plan. This designation allows employees to purchase benefits on a pre-tax basis. Usage of the plan in FY 2009 will result in $3.24 million of FICA savings for both the State and its employees. Employees can also take advantage of additional tax savings through participation in EBC’s flexible spending health and dependent care accounts. These programs allow employees to contribute pre-tax income to fund certain qualifying medical and dependent care expenses. For Plan Year 2009, combined contributions to these accounts were approximately $17.4 million. Participation in this program results in significant tax savings for state employees by lowering an employee’s taxable income. More than 11,900 employees are enrolled in a flexible spending health care account during Plan Year 2009 for health-related expenses, and more than 700 state employees are using a dependent care account. Most FSA participants are using a debit card (also known as the “Benny
Card”) that the EBC has provided for utilization at health care providers, pharmacies and drug stores. The State’s benefits office also offers MyFlex Online, which allows state employees to review their flexible spending account activity via the Internet. Health and Wellness As the state’s benefits office, EBC works hard to balance benefit levels, cost and choice. However, successfully managing health benefits today involves more than plan design and cost management. It involves building a “culture of health” by providing a resource for state employees to better manage their health, in turn lowering health care utilization and reducing health insurance premiums. Analyses of health care claim costs show 87.5 percent are due to an individual’s lifestyle, i.e. sedentary, eating habits, tobacco use, etc. EBC implemented the OK Health Mentoring program benefit as a way for state employees to address unhealthy behaviors and learn to live healthier lifestyles. The OK Health Mentoring program offers employees a unique and effective solution for better health by incorporating wellness, disease management, and health mentoring into a single, comprehensive program. Employees are required to complete a detailed health risk assessment, which stratifies participants into one of five risk tiers, based on potential health problems. Each risk tier determines the frequency of mentoring as well as goals and action plans for the employee. With a dedicated staff of nine professional health mentors, employees participating in the program at twelve months have already been successful in lowering elevated blood pressure, LDL cholesterol, triglycerides, weight, blood glucose, and quitting cigarette smoking. To encourage participation in the program, employees are eligible to receive three wellness incentives. The first incentive includes an initial visit to a primary care

FY-2010 Executive Budget
HUMAN RESOURCES AND ADMINISTRATION B-147
physician and lab work at no out-of-pocket cost to the participants. The second wellness incentive is a discount at a participating fitness center. A third possible incentive offered by some agencies is the OK Health pay incentive. As of Jan. 1, 2009, 64 state agencies -- which include more than 69 percent (24,773) of active state employees -- have elected to offer pay incentives and are authorized to pay participants $100 (Bronze), $300 (Silver), or $500 (Gold) for successfully completing the program. The incentives consist of three separate payments payable to a participant upon completion of the (1) initial enrollment, (2) twelve-week follow up, and (3) achieving goals at the twelve-month follow up. There are many other ancillary benefits from having healthy employees such as less absenteeism and increased productivity.
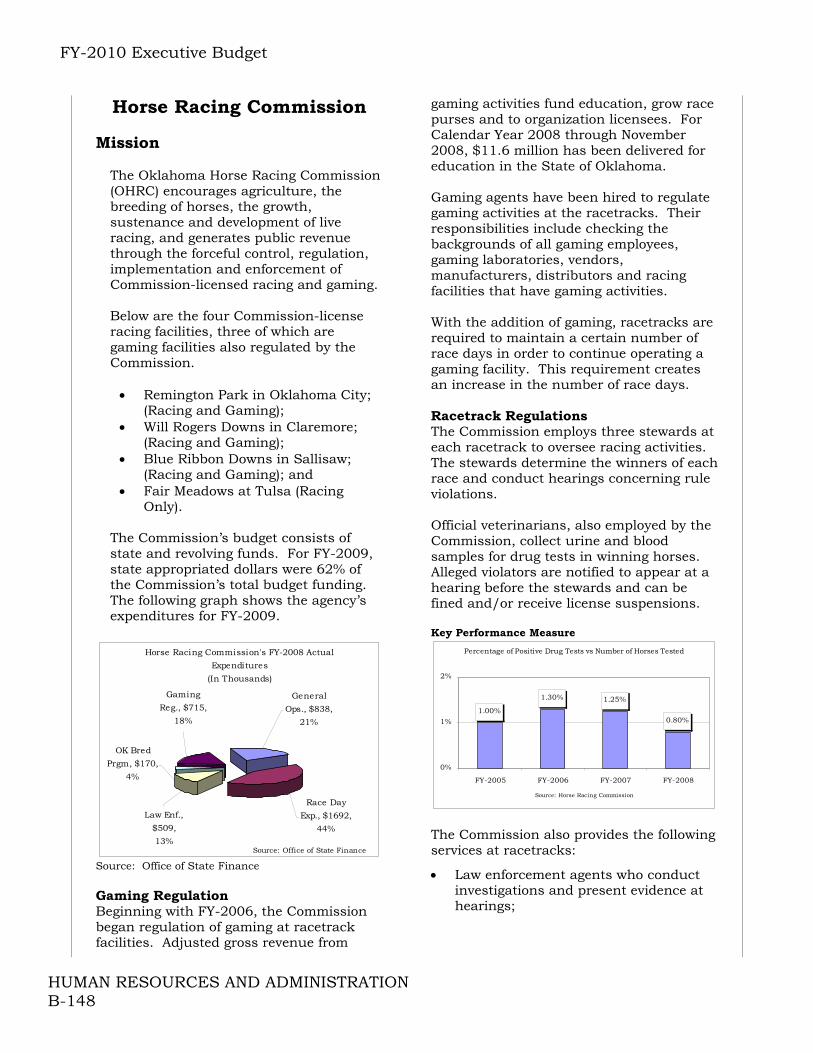
FY-2010 Executive Budget
HUMAN RESOURCES AND ADMINISTRATION B-148
Horse Racing Commission Mission
The Oklahoma Horse Racing Commission (OHRC) encourages agriculture, the breeding of horses, the growth, sustenance and development of live racing, and generates public revenue through the forceful control, regulation, implementation and enforcement of Commission-licensed racing and gaming. Below are the four Commission-license racing facilities, three of which are gaming facilities also regulated by the Commission.
Remington Park in Oklahoma City;
(Racing and Gaming); Will Rogers Downs in Claremore;
(Racing and Gaming); Blue Ribbon Downs in Sallisaw;
(Racing and Gaming); and Fair Meadows at Tulsa (Racing
Only).
The Commission’s budget consists of state and revolving funds. For FY-2009, state appropriated dollars were 62% of the Commission’s total budget funding. The following graph shows the agency’s expenditures for FY-2009.
Horse Racing Commission's FY-2008 Actual
Expenditures
(In Thousands)
Gaming
Reg., $715,
18%
Law Enf.,
$509,
13%
General
Ops., $838,
21%
Race Day
Exp., $1692,
44%
OK Bred
Prgm, $170,
4%
Source: Office of State Finance Source: Office of State Finance Gaming Regulation Beginning with FY-2006, the Commission began regulation of gaming at racetrack facilities. Adjusted gross revenue from
gaming activities fund education, grow race purses and to organization licensees. For Calendar Year 2008 through November 2008, $11.6 million has been delivered for education in the State of Oklahoma. Gaming agents have been hired to regulate gaming activities at the racetracks. Their responsibilities include checking the backgrounds of all gaming employees, gaming laboratories, vendors, manufacturers, distributors and racing facilities that have gaming activities. With the addition of gaming, racetracks are required to maintain a certain number of race days in order to continue operating a gaming facility. This requirement creates an increase in the number of race days. Racetrack Regulations The Commission employs three stewards at each racetrack to oversee racing activities. The stewards determine the winners of each race and conduct hearings concerning rule violations. Official veterinarians, also employed by the Commission, collect urine and blood samples for drug tests in winning horses. Alleged violators are notified to appear at a hearing before the stewards and can be fined and/or receive license suspensions. Key Performance Measure
Percentage of Positive Drug Tests vs Number of Horses Tested
1.00%
1.30% 1.25%
0.80%
0%
1%
2%
FY-2005 FY-2006 FY-2007 FY-2008
Source: Horse Racing Commission
The Commission also provides the following services at racetracks:
Law enforcement agents who conduct investigations and present evidence at hearings;
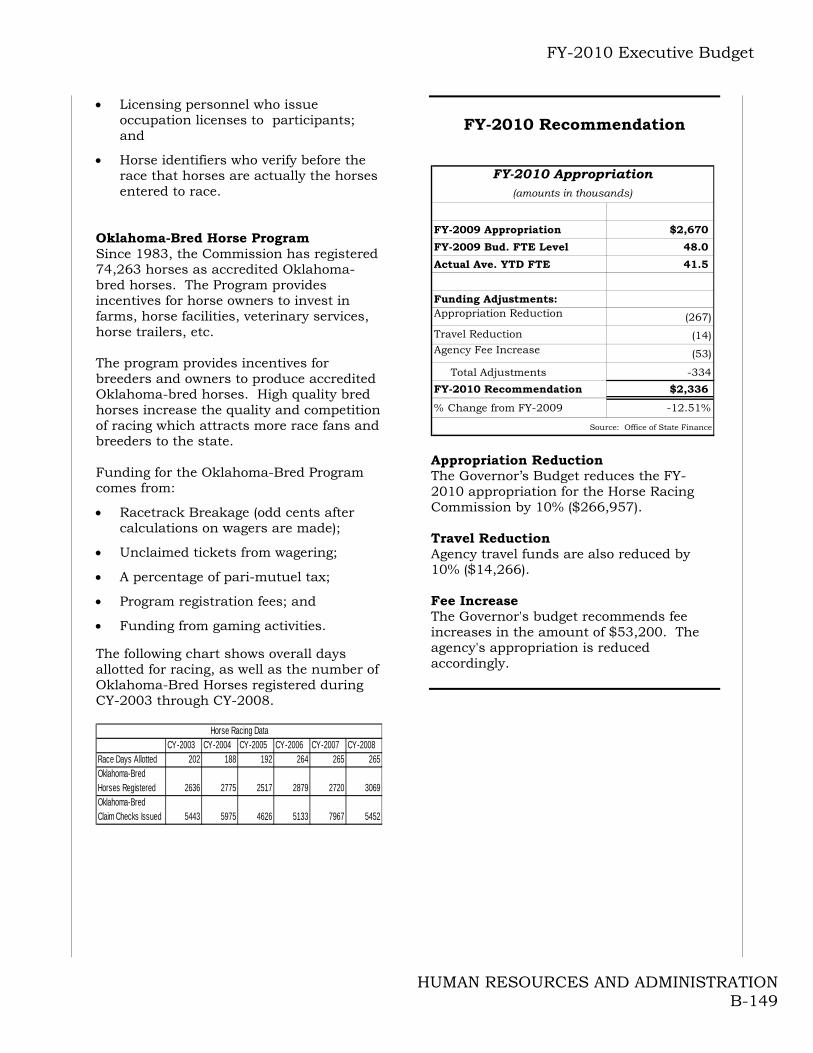
FY-2010 Executive Budget
HUMAN RESOURCES AND ADMINISTRATION B-149
Licensing personnel who issue occupation licenses to participants; and
Horse identifiers who verify before the race that horses are actually the horses entered to race.
Oklahoma-Bred Horse Program Since 1983, the Commission has registered 74,263 horses as accredited Oklahoma-bred horses. The Program provides incentives for horse owners to invest in farms, horse facilities, veterinary services, horse trailers, etc. The program provides incentives for breeders and owners to produce accredited Oklahoma-bred horses. High quality bred horses increase the quality and competition of racing which attracts more race fans and breeders to the state. Funding for the Oklahoma-Bred Program comes from:
Racetrack Breakage (odd cents after calculations on wagers are made);
Unclaimed tickets from wagering;
A percentage of pari-mutuel tax;
Program registration fees; and
Funding from gaming activities. The following chart shows overall days allotted for racing, as well as the number of Oklahoma-Bred Horses registered during CY-2003 through CY-2008.
CY-2003 CY-2004 CY-2005 CY-2006 CY-2007 CY-2008Race Days Allotted 202 188 192 264 265 265Oklahoma-Bred Horses Registered 2636 2775 2517 2879 2720 3069Oklahoma-Bred Claim Checks Issued 5443 5975 4626 5133 7967 5452
Horse Racing Data
FY-2010 Recommendation
FY-2009 Appropriation $2,670
FY-2009 Bud. FTE Level 48.0
Actual Ave. YTD FTE 41.5
Funding Adjustments:Appropriation Reduction (267)
Travel Reduction (14)Agency Fee Increase (53)
Total Adjustments -334
FY-2010 Recommendation $2,336
% Change from FY-2009 -12.51%
Source: Office of State Finance
FY-2010 Appropriation(amounts in thousands)
Appropriation Reduction The Governor’s Budget reduces the FY-2010 appropriation for the Horse Racing Commission by 10% ($266,957). Travel Reduction Agency travel funds are also reduced by 10% ($14,266). Fee Increase The Governor's budget recommends fee increases in the amount of $53,200. The agency's appropriation is reduced accordingly.

FY-2010 Executive Budget
HUMAN RESOURCES AND ADMINISTRATION B-150
Human Rights Commission The Oklahoma Human Rights Commission works to eliminate discrimination and promote unity and understanding among Oklahomans. The Commission consists of a nine-person board. The Commission establishes policy, sets goals, approves programs and projects, and conducts public hearings on human rights complaints. The Commission consists of two distinct functional divisions - Enforcement and Compliance, and Community Relations. The Community Relations Division provides outreach and educational services. The Enforcement and Compliance Division receives, processes, and investigates complaints of discrimination in the areas of employment, housing, and public accommodation. To resolve complaints, the Commission contracts with the Equal Employment Opportunity Commission (EEOC) and Housing and Urban Development (HUD). Under these contracts, complaints of discrimination are resolved in compliance with the policies and procedures of EEOC and HUD. Through these contracts, the Human Rights Commission receives training on EEOC and HUD policies and procedures. During FY-2008, the Commission resolved 202 employment discrimination complaints and 60 housing discrimination complaints.
FY-2010 Recommendation
FY-2009 Appropriation $710
FY-2009 Bud. FTE Level 17.0
Actual Ave. YTD FTE 14.0
Funding Adjustments:Appropriation Reduction (36)Travel Reduction (5)
Total Adjustments -41
FY-2010 Recommendation $669
% Change from FY-2009 -5.74%
Source: Office of State Finance
FY-2010 Appropriation(amounts in thousands)
Appropriation Reduction The Governor’s budget reduces the Department of Central Service’s FY-2010 Appropriation by 3% ($35,511). Travel Reduction Agency travel funds are reduced by 10% ($4,811).
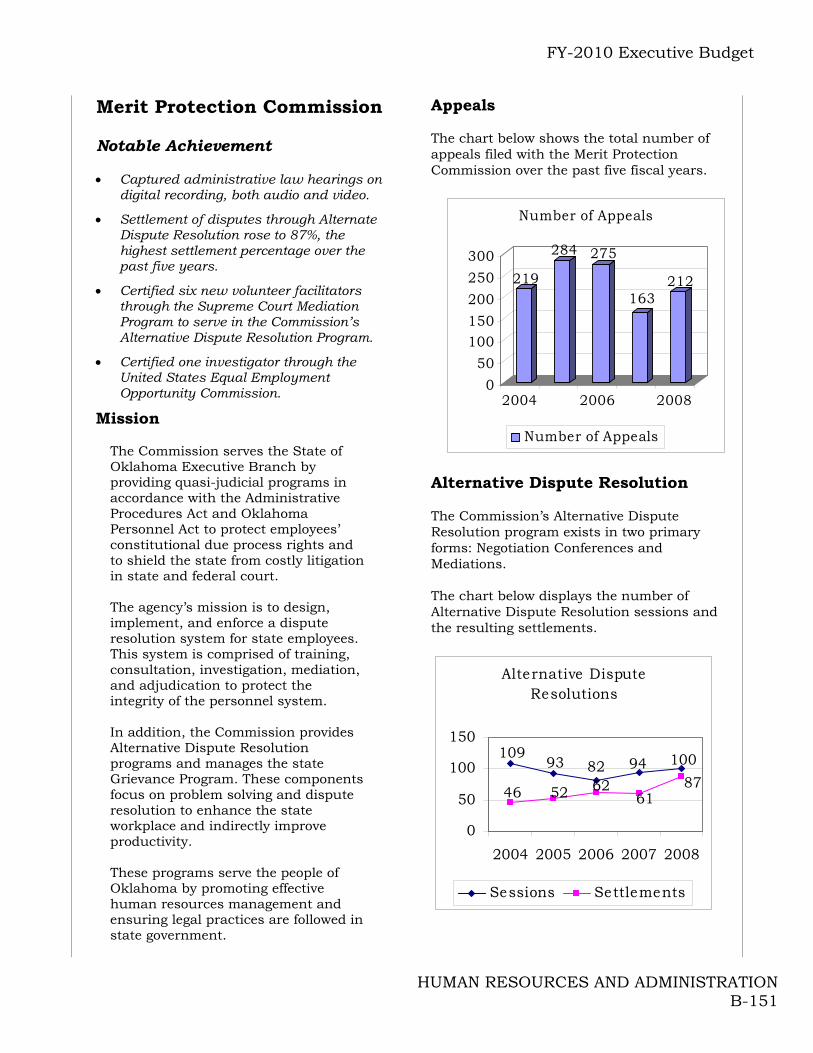
FY-2010 Executive Budget
HUMAN RESOURCES AND ADMINISTRATION B-151
Merit Protection Commission Notable Achievement Captured administrative law hearings on
digital recording, both audio and video.
Settlement of disputes through Alternate Dispute Resolution rose to 87%, the highest settlement percentage over the past five years.
Certified six new volunteer facilitators through the Supreme Court Mediation Program to serve in the Commission’s Alternative Dispute Resolution Program.
Certified one investigator through the United States Equal Employment Opportunity Commission.
Mission
The Commission serves the State of Oklahoma Executive Branch by providing quasi-judicial programs in accordance with the Administrative Procedures Act and Oklahoma Personnel Act to protect employees’ constitutional due process rights and to shield the state from costly litigation in state and federal court. The agency’s mission is to design, implement, and enforce a dispute resolution system for state employees. This system is comprised of training, consultation, investigation, mediation, and adjudication to protect the integrity of the personnel system. In addition, the Commission provides Alternative Dispute Resolution programs and manages the state Grievance Program. These components focus on problem solving and dispute resolution to enhance the state workplace and indirectly improve productivity. These programs serve the people of Oklahoma by promoting effective human resources management and ensuring legal practices are followed in state government.
Appeals The chart below shows the total number of appeals filed with the Merit Protection Commission over the past five fiscal years.
219
284 275
163212
0
50
100150
200
250
300
2004 2006 2008
Number of Appeals
Number of Appeals
Alternative Dispute Resolution The Commission’s Alternative Dispute Resolution program exists in two primary forms: Negotiation Conferences and Mediations. The chart below displays the number of Alternative Dispute Resolution sessions and the resulting settlements.
Alternative Dispute Resolutions
82 94 10010993
8761
625246
0
50
100
150
2004 2005 2006 2007 2008
Sessions Settlements

FY-2010 Executive Budget
HUMAN RESOURCES AND ADMINISTRATION B-152
The gap between the sessions and the settlements has continued to close over the past fiscal years. This continued success hinges on proper recruitment and training of volunteer mediators. Grievance Management The Commission is committed to helping employees and agencies resolve conflict at the lowest level possible through the internal grievance management program. By rule appeals of most alleged violations must first go through the internal grievance system before being appealed to the Commission. In FY 2008, agencies reported a total of 238 grievances.
FY-2010 Recommendation
FY-2009 Appropriation $614
FY-2009 Bud. FTE Level 8.0
Actual Ave. YTD FTE 7.2
Funding Adjustments:Appropriation Reduction (18)Travel Reduction (3)
Total Adjustments -21
FY-2010 Recommendation $592
% Change from FY-2009 -3.49%
Source: Office of State Finance
(amounts in thousands)
Appropriation Reduction The Governor’s Budget reduces the Merit Protection Commission’s budget by 3% ($18,411). Travel Reduction Agency travel funds are reduced by 10% ($775).
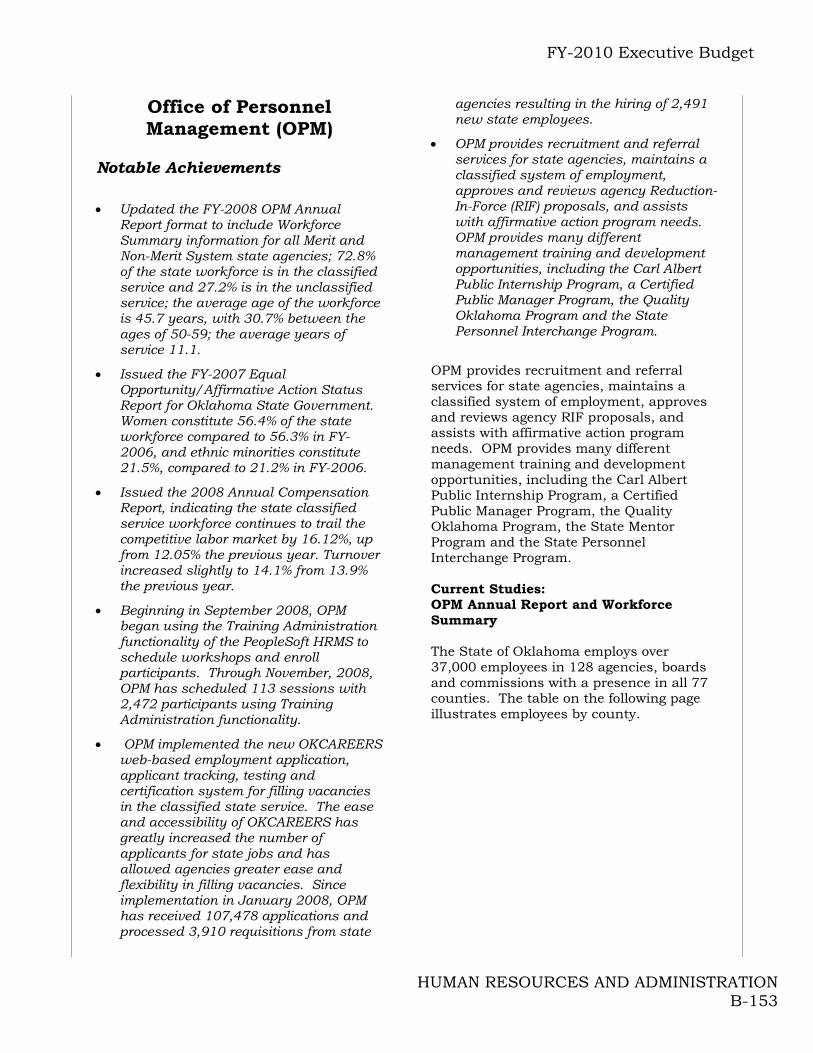
FY-2010 Executive Budget
HUMAN RESOURCES AND ADMINISTRATION B-153
Office of Personnel Management (OPM)
Notable Achievements
Updated the FY-2008 OPM Annual Report format to include Workforce Summary information for all Merit and Non-Merit System state agencies; 72.8% of the state workforce is in the classified service and 27.2% is in the unclassified service; the average age of the workforce is 45.7 years, with 30.7% between the ages of 50-59; the average years of service 11.1.
Issued the FY-2007 Equal Opportunity/Affirmative Action Status Report for Oklahoma State Government. Women constitute 56.4% of the state workforce compared to 56.3% in FY-2006, and ethnic minorities constitute 21.5%, compared to 21.2% in FY-2006.
Issued the 2008 Annual Compensation Report, indicating the state classified service workforce continues to trail the competitive labor market by 16.12%, up from 12.05% the previous year. Turnover increased slightly to 14.1% from 13.9% the previous year.
Beginning in September 2008, OPM began using the Training Administration functionality of the PeopleSoft HRMS to schedule workshops and enroll participants. Through November, 2008, OPM has scheduled 113 sessions with 2,472 participants using Training Administration functionality.
OPM implemented the new OKCAREERS web-based employment application, applicant tracking, testing and certification system for filling vacancies in the classified state service. The ease and accessibility of OKCAREERS has greatly increased the number of applicants for state jobs and has allowed agencies greater ease and flexibility in filling vacancies. Since implementation in January 2008, OPM has received 107,478 applications and processed 3,910 requisitions from state
agencies resulting in the hiring of 2,491 new state employees.
OPM provides recruitment and referral services for state agencies, maintains a classified system of employment, approves and reviews agency Reduction-In-Force (RIF) proposals, and assists with affirmative action program needs. OPM provides many different management training and development opportunities, including the Carl Albert Public Internship Program, a Certified Public Manager Program, the Quality Oklahoma Program and the State Personnel Interchange Program.
OPM provides recruitment and referral services for state agencies, maintains a classified system of employment, approves and reviews agency RIF proposals, and assists with affirmative action program needs. OPM provides many different management training and development opportunities, including the Carl Albert Public Internship Program, a Certified Public Manager Program, the Quality Oklahoma Program, the State Mentor Program and the State Personnel Interchange Program. Current Studies: OPM Annual Report and Workforce Summary The State of Oklahoma employs over 37,000 employees in 128 agencies, boards and commissions with a presence in all 77 counties. The table on the following page illustrates employees by county.

FY-2010 Executive Budget
HUMAN RESOURCES AND ADMINISTRATION B-154
County Employees County Employees County EmployeesAdair 98 Grant 53 Nowata 40
Alfalfa 183 Greer 196 Okfuskee 220
Atoka 321 Harmon 39 Oklahoma 9,694
Beaver 37 Harper 138 Okmulgee 234
Beckham 122 Haskell 84 Osage 264
Blaine 99 Hughes 155 Ottawa 311
Bryan 230 Jackson 249 Out of State 75
Caddo 207 Jefferson 61 Pawnee 143
Canadian 1,207 Johnston 89 Payne 500
Carter 515 Kay 212 Pittsburg 966
Cherokee 328 Kingfisher 132 Pontotoc 335
Choctaw 133 Kiowa 168 Pottawatomie 815
Cimarron 21 Latimer 242 Pushmataha 250
Cleveland 3,913 Le Flore 469 Roger Mills 31
Coal 107 Lincoln 404 Rogers 638
Comanche 807 Logan 332 Seminole 193
Cotton 53 Love 59 Sequoyah 264
Craig 539 Major 71 Stephens 305
Creek 349 Marshall 117 Texas 122
Custer 366 Mayes 639 Tillman 155
Delaware 178 McClain 510 Tulsa 2,311
Dewey 37 McCurtain 292 Wagoner 360
Ellis 53 McIntosh 237 Washington 199
Garfield 820 Murray 395 Washita 141
Garvin 674 Muskogee 864 Woods 189
Grady 374 Noble 142 Woodward 399
Total 37,274
State Employee County Residence
OPM FY-2008 Annual Report Equal Opportunity/Affirmative Action Status Report for Oklahoma State Government 117 state agencies prepared FY-2008 Affirmative Action Plans, which reflected the following 2007 state government workforce, ethnic minority, and female representation.
Race Male Female Total PercentWhite 12,454 15,209 27,663 78.50%
Black 1094 2,430 3,524 10.00%
Asian / Pacific Islander 259 364 623 1.80%
Amer. Indian/Alas. Native 1,214 1,379 2,593 7.30%
Hispanic 330 507 837 2.40%
Totals 15,351 19,889 35,240
Percent of Totals 43.60% 56.40% 100.00%
State Government Work Force Representation
OPM 2007 EEO/Affirmative Action Status Report Annual Compensation Report The 2008 Annual Compensation Report concluded that state classified employee pay fell behind pay the market by 16.1% as of the end of FY-2008. As shown in the table below, the current market deficit is the most sever of the past five years. During that time, average classified pay
lagged the market by double-digit figures in each year, excluding FY-2005. The latter year was an exception due to the two general pay increases totaling $2,800 authorized by the legislature in FY-2005.
YearState of
Oklahoma Market%
Difference2008 $34,868 $40,490 -16.12%2007 $34,714 $38,897 -12.05%
2006 $32,427 $36,315 -11.99%
2005 $31,518 $34,102 -8.20%
2004 $29,968 $33,393 -11.40%
SOURCE: Office of Personnel Management
The report also concluded that overall turnover rate for the state’s classified work force increased slightly from the previous year, moving from 13.9%-14.1%. The voluntary rate increased slightly from 11.6% to 11.7%.
Professionals 16,838 45%
Administrative Support 5,730 15%
Protective Service 3,961 11%
Paraprofessionals 3,029 8%
Technicians 2,729 8%
Service Maintenance 2,025 6%
Officials and Administrators 1,905 5%
Skilled Craft 874 2%
Totals 37,091 100%
Employees by Job Category and Percent
Source: Office of Personnel Management Pay Movement Mechanism Usage Report State agencies, without additional funding and from existing budgets, continue to utilize statutorily authorized pay movement mechanisms to address critical recruitment and retention workforce challenges. However, as the table below illustrates, the overall usage of these mechanisms declined significantly from 2006 to 2007.
FY-2010 Executive Budget
HUMAN RESOURCES AND ADMINISTRATION B-155
PMM TITLE 2006 2006 Amount 2007 2007 Amount % DiffLATERAL TRANSFER 110 $105,349.16 67 $16,555.54 -84.29%
CAREER PROGRESSION 2,290 $3,100,907.34 2318 $924,304.21 -70.19%PERFORMANCE-BASED ADJUSTMENT 619 $841,769.88 595 $492,040.48 -41.55%
COMPLETION OF PROB/TRIAL PERIOD 684 $473,331.17 553 $124,313.29 -73.74%EQUITY ADJUSTMENT 777 $811,140.03 1164 $294,130.96 -63.74%SKILL-BASED PAY ADJUSTMENT 152 $69,944.54 166 $220,838.26 215.73%MARKET ADJUSTMENT 2,239 $3,560,350.93 1449 $1,074,568.49 -69.82%
Total 6,871 $8,962,793.06 6312 $3,146,751.23 -64.89%
% of State Payroll 0.59% 0.20%
FY-2010 Recommendation
FY-2009 Appropriation $4,892
FY-2009 Bud. FTE Level 70.6
Actual Ave. YTD FTE 65.1
Funding Adjustments:
Appropriation reduction (245)
Travel reduction (7) Total -252
FY-2010 Recommendation $4,640
% Change from FY-2009 -5.15%
Source: Office of State Finance
FY-2010 Appropriation(amounts in thousands)
Appropriation Reduction The Governor’s budget reduces the Office of Personnel Management’s FY-2010 Appropriation by 5% ($244,587). Travel Reduction Agency travel funds are reduced by 10% (7,448).

FY-2010 Executive Budget
HUMAN RESOURCES AND ADMINISTRATION B-156
State & Education Employees Group Insurance
Board Notable Achievements Successful implementation of Medicare
Part D for retiree members Technology upgrades accomplished in
communication, training and information sharing
Enhanced member security with unique member identification numbers
The Oklahoma State & Education Employees Group Insurance Board (OSEEGIB) provides self-funded insurance plans to state, education, and local government employees as well as their dependents and survivors. The plan is a self-insured health, dental, life and disability program, which is actuarially rated to provide premiums adequate to meet the payment of all claims, administrative expenses and any change in reserve estimates. OSEEGIB health insurance plans are open to state, education, and local governments. These plans are also available to retirees provided the retiree elects to participate prior to retirement.
OSEEGIB Member Enrollment P rimaries and Dependents
as of 1/1/2009
Pre-Medicare,
11,596, 6%
Active,
134,755,
75%
Medicare,
34,865, 19%
Source: OSEEGIB
Each of these enrollment categories faces a different cost structure. For example, pre-Medicare retirees are generally in their mid-50s through 64 years of age and experience greater medical costs. Medicare retirees have greater total medical costs; however, Medicare covers a part of the cost.
The general opinion is that the members are state agency employees; however, the following graph shows that the primary beneficiaries are education employees and their dependents.
Health Plan Membership by Employer Type as of 1/1/2009
Total = 230,509
Education, 120,554,
52%
Local Govt., 12,795, 5%
State, 100,933,
43%
Source: OSEEGIB
Members have a choice of health insurance plans. All members may enroll in HealthChoice, which is the state offered preferred provider option (PPO). In 2006 there were 127,440 enrolled in HealthChoice and 24,064 enrolled in health maintenance organizations (HMO) across the state.
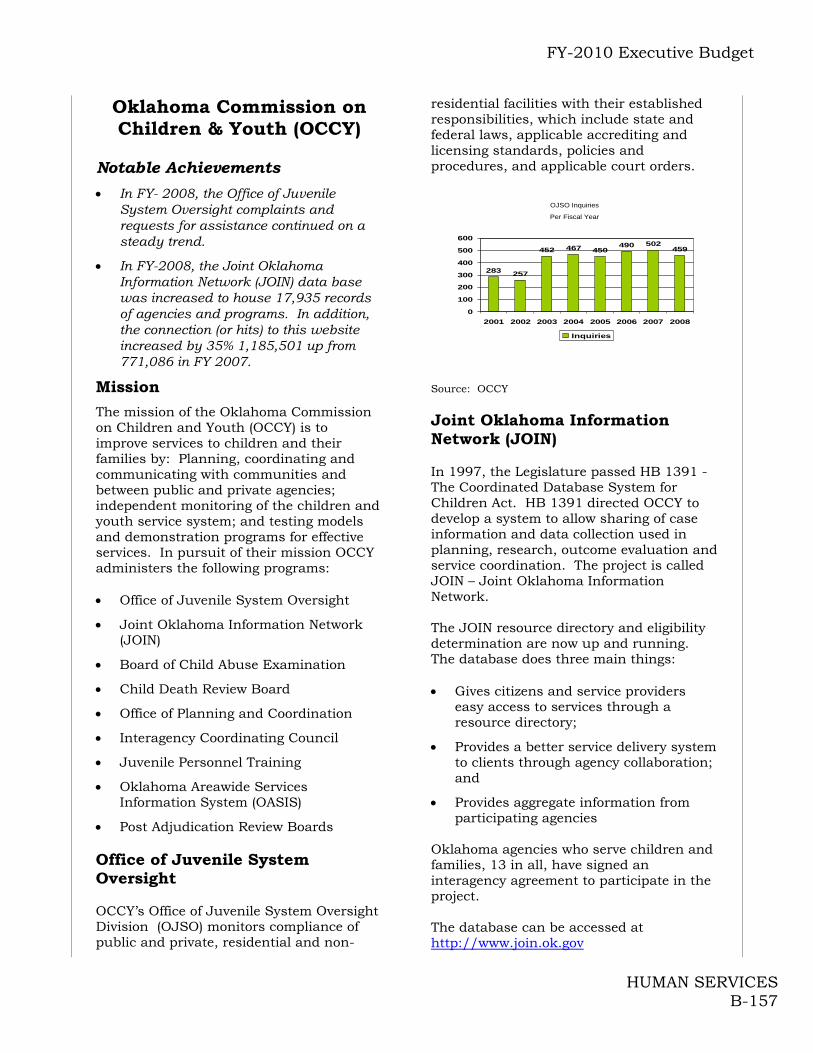
FY-2010 Executive Budget
HUMAN SERVICES B-157
Oklahoma Commission on Children & Youth (OCCY)
Notable Achievements
In FY- 2008, the Office of Juvenile System Oversight complaints and requests for assistance continued on a steady trend.
In FY-2008, the Joint Oklahoma Information Network (JOIN) data base was increased to house 17,935 records of agencies and programs. In addition, the connection (or hits) to this website increased by 35% 1,185,501 up from 771,086 in FY 2007.
Mission
The mission of the Oklahoma Commission on Children and Youth (OCCY) is to improve services to children and their families by: Planning, coordinating and communicating with communities and between public and private agencies; independent monitoring of the children and youth service system; and testing models and demonstration programs for effective services. In pursuit of their mission OCCY administers the following programs: Office of Juvenile System Oversight
Joint Oklahoma Information Network (JOIN)
Board of Child Abuse Examination
Child Death Review Board
Office of Planning and Coordination
Interagency Coordinating Council
Juvenile Personnel Training
Oklahoma Areawide Services Information System (OASIS)
Post Adjudication Review Boards Office of Juvenile System Oversight OCCY’s Office of Juvenile System Oversight Division (OJSO) monitors compliance of public and private, residential and non-
residential facilities with their established responsibilities, which include state and federal laws, applicable accrediting and licensing standards, policies and procedures, and applicable court orders.
283 257
452 467 450490 502
459
0
100
200
300
400
500
600
2001 2002 2003 2004 2005 2006 2007 2008
Inquiries
OJSO Inquiries
Per Fiscal Year
Source: OCCY Joint Oklahoma Information Network (JOIN) In 1997, the Legislature passed HB 1391 - The Coordinated Database System for Children Act. HB 1391 directed OCCY to develop a system to allow sharing of case information and data collection used in planning, research, outcome evaluation and service coordination. The project is called JOIN – Joint Oklahoma Information Network. The JOIN resource directory and eligibility determination are now up and running. The database does three main things: Gives citizens and service providers
easy access to services through a resource directory;
Provides a better service delivery system to clients through agency collaboration; and
Provides aggregate information from participating agencies
Oklahoma agencies who serve children and families, 13 in all, have signed an interagency agreement to participate in the project. The database can be accessed at http://www.join.ok.gov
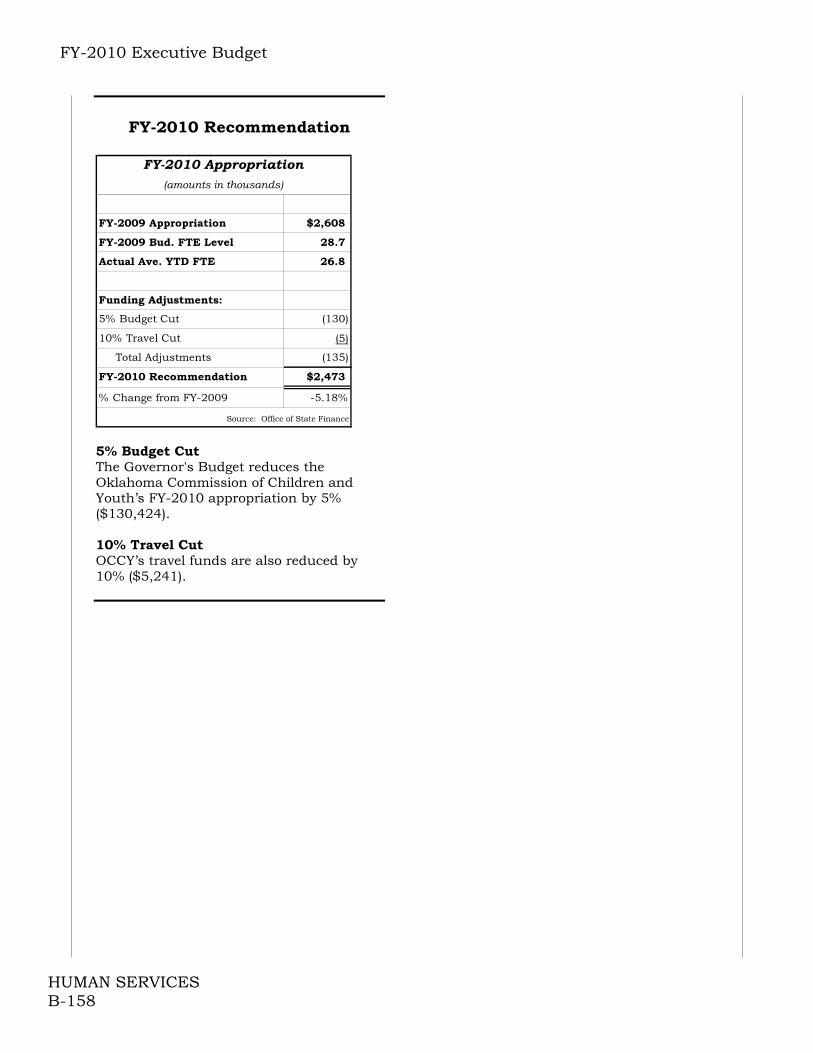
FY-2010 Executive Budget
HUMAN SERVICES B-158
FY-2010 Recommendation
FY-2009 Appropriation $2,608
FY-2009 Bud. FTE Level 28.7
Actual Ave. YTD FTE 26.8
Funding Adjustments:
5% Budget Cut (130)
10% Travel Cut (5)
Total Adjustments (135)
FY-2010 Recommendation $2,473
% Change from FY-2009 -5.18%
Source: Office of State Finance
(amounts in thousands)
FY-2010 Appropriation
5% Budget Cut The Governor's Budget reduces the Oklahoma Commission of Children and Youth’s FY-2010 appropriation by 5% ($130,424). 10% Travel Cut OCCY’s travel funds are also reduced by 10% ($5,241).
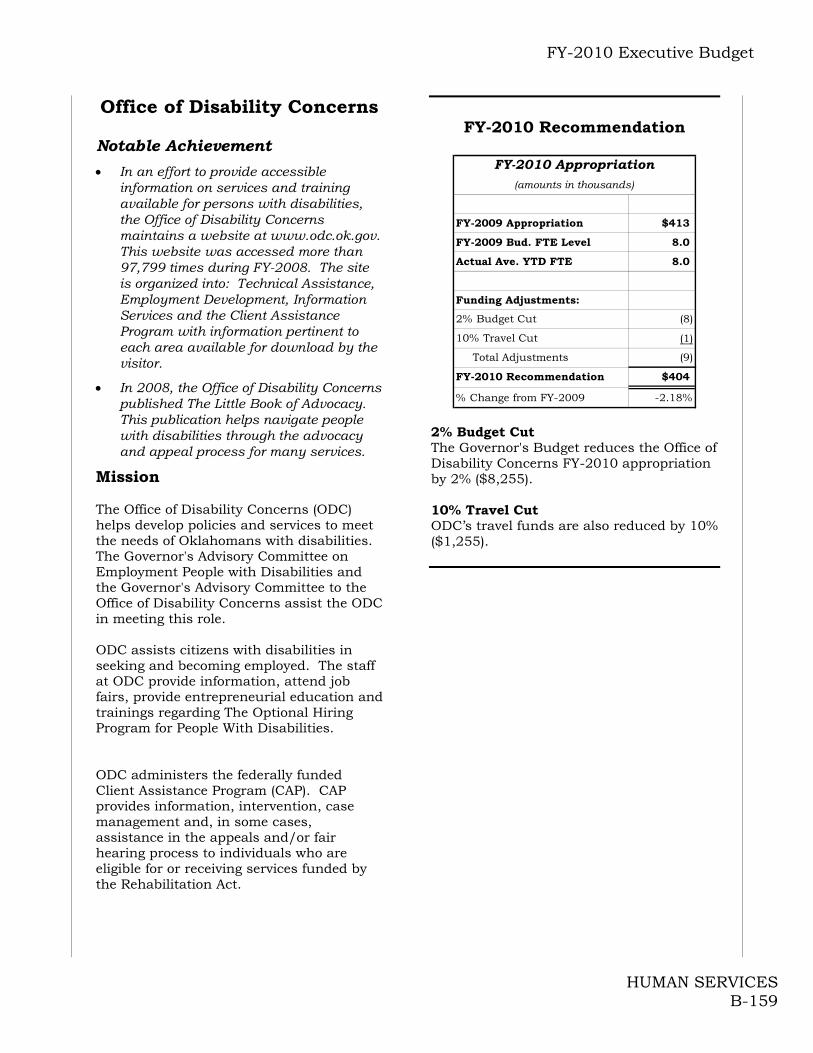
FY-2010 Executive Budget
HUMAN SERVICES B-159
Office of Disability Concerns Notable Achievement
In an effort to provide accessible information on services and training available for persons with disabilities, the Office of Disability Concerns maintains a website at www.odc.ok.gov. This website was accessed more than 97,799 times during FY-2008. The site is organized into: Technical Assistance, Employment Development, Information Services and the Client Assistance Program with information pertinent to each area available for download by the visitor.
In 2008, the Office of Disability Concerns published The Little Book of Advocacy. This publication helps navigate people with disabilities through the advocacy and appeal process for many services.
Mission The Office of Disability Concerns (ODC) helps develop policies and services to meet the needs of Oklahomans with disabilities. The Governor's Advisory Committee on Employment People with Disabilities and the Governor's Advisory Committee to the Office of Disability Concerns assist the ODC in meeting this role. ODC assists citizens with disabilities in seeking and becoming employed. The staff at ODC provide information, attend job fairs, provide entrepreneurial education and trainings regarding The Optional Hiring Program for People With Disabilities. ODC administers the federally funded Client Assistance Program (CAP). CAP provides information, intervention, case management and, in some cases, assistance in the appeals and/or fair hearing process to individuals who are eligible for or receiving services funded by the Rehabilitation Act.
FY-2010 Recommendation
FY-2009 Appropriation $413
FY-2009 Bud. FTE Level 8.0
Actual Ave. YTD FTE 8.0
Funding Adjustments:
2% Budget Cut (8)
10% Travel Cut (1)
Total Adjustments (9)
FY-2010 Recommendation $404
% Change from FY-2009 -2.18%
FY-2010 Appropriation(amounts in thousands)
2% Budget Cut The Governor's Budget reduces the Office of Disability Concerns FY-2010 appropriation by 2% ($8,255). 10% Travel Cut ODC’s travel funds are also reduced by 10% ($1,255).
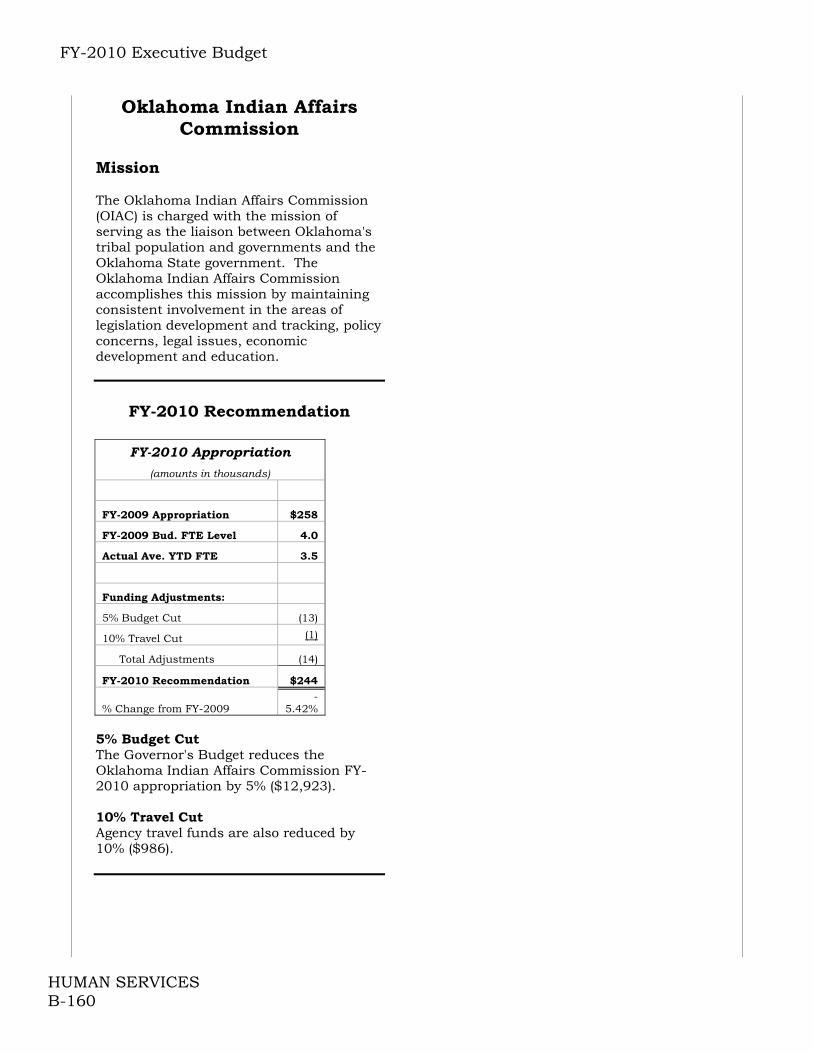
FY-2010 Executive Budget
HUMAN SERVICES B-160
Oklahoma Indian Affairs Commission
Mission The Oklahoma Indian Affairs Commission (OIAC) is charged with the mission of serving as the liaison between Oklahoma's tribal population and governments and the Oklahoma State government. The Oklahoma Indian Affairs Commission accomplishes this mission by maintaining consistent involvement in the areas of legislation development and tracking, policy concerns, legal issues, economic development and education.
FY-2010 Recommendation
FY-2010 Appropriation
(amounts in thousands)
FY-2009 Appropriation $258
FY-2009 Bud. FTE Level 4.0
Actual Ave. YTD FTE 3.5
Funding Adjustments:
5% Budget Cut (13)
10% Travel Cut (1)
Total Adjustments (14)
FY-2010 Recommendation $244
% Change from FY-2009 -
5.42%
5% Budget Cut The Governor's Budget reduces the Oklahoma Indian Affairs Commission FY-2010 appropriation by 5% ($12,923). 10% Travel Cut Agency travel funds are also reduced by 10% ($986).
FY-2010 Executive Budget
HUMAN SERVICES B-161
Oklahoma Department of Human Services (OKDHS)
Notable Achievements Referrals for Child Abuse Neglect
received by OKDHS were a record 114,492 alleging a child to be the victim of child abuse or neglect, 11,714, children were confirmed victims; the fewest number of confirmations in the past ten years.
Quality Child Care In FY-2008, 96% of children receiving a child care subsidy were served in facilities with a quality rating of one star plus or higher. This is a substantial increase from FY-1999, when only 9% were served in facilities with a quality rating above one star.
Vulnerable adult referrals to OKDHS in FY-2008 were 17,133 for alleged abuse or neglect; 10,315 cases of abuse or neglect of vulnerable adults was confirmed.
Access to food and nutrition OKDHS continues to certify record numbers of Supplemental Nutrition Assistance (Food Stamp) benefits for Oklahomans, about half of whom are children. This benefit contributes to a level of healthy nutrition to which these families would otherwise not have access. More than 633,000 Oklahomans received assistance through this program in FY-2008. More than 16,000 different seniors received more than 2.1 million congregate meals through 275 nutrition sites statewide.
Increased Adoptions OKDHS authorized 1,676 adoption placements in FY-2008 – a record ten years in a row for over 1,000 authorized adoption placements per year. In FY-2008 1,409 children in foster care had finalized adoptions into families, the largest number ever and a 22% increase over FY-07.
Access to Medical Care OKDHS certified a record number of persons, mostly children, to receive healthcare during FY-2008. Over 791,000 members
were enrolled in SoonerCare (Oklahoma’s Medicaid Program) for at least one month during the year.
Paternities Established Child Support Services established 20,404 paternities in FY-2008; a 4% increase from FY-2007. Establishment of paternity is the first step in adding children to the health insurance plans of their parents.
Medically fragile elderly and disabled Oklahomans who were financially eligible for nursing home placement received care in their own homes and communities through the ADvantage Waiver program in FY-2008 serving 23,585 Oklahomans.
Comprehensive community-based developmental disabilities services were provided to 5,300 individuals in FY-2008.
Child Support enrollment reaches all time high of 208,208 Oklahoma children in FY-2008, the largest number ever of children enrolled and approximately a 30% increase from four years ago. The Child Support Services Division collected over $268 million in child support in FY-2008, an 11% increase from FY-2007.
Subsidized child care was received by 71,868 children in FY-2008 which facilitated parents or caregivers participating in employment or education opportunities.
Employment of Temporary Assistance to Needy Families (TANF) recipients totaled 1,781 parents who were then able to discontinue receipt of the TANF benefit. Three months after leaving the TANF program, at least 86% of the TANF parents were still employed.
Mission The mission of the Oklahoma Department of Human Services (OKDHS) is to help individuals and families in need help themselves lead safer, healthier, more independent and productive lives.

FY-2010 Executive Budget
HUMAN SERVICES B-162
In pursuit of their mission, OKDHS administers the following programs: Family Support Services
o TANF
o Supplemental Nutrition Assistance (Food Stamps)
o Adult Protective Services
Developmental Disabilities
o Institutional Facilities
o Home and Community Based Waiver Programs
Children and Family Services
o Adoptive Services
o Foster Care
o Child Welfare
Child Care
o Child Care Subsidy
o Child Care Facility Licensing
Aging Services
o ADvantage Program
o Personal Care Program
Child Support Services In FY-2009, OKDHS ranks as the fourth largest state agency, representing 8.9% of the state appropriated budget. OKDHS’s FY-2009 operational budget, a total of $1.8 billion, includes the following revenue sources: Federal Grants: $1,059,235,115 State Funding: $611,226,799 Other Sources: $149,011,439
OKDHS Funding by Activitiy, FY-2009 Budget Total $1,819,473,353
Child Care Services9%
SNAP (Food Stamps)27%
TANF4%
Family Support Services6%
Children & Family Svcs10%
Field Operations13%
Admin7%
Developmental Disabilities Services
15%
Child Support Services3%
Aging Services6%
Family Support Services Temporary Assistance for Needy Families (TANF) As a result of state and federal reform initiatives, Oklahoma has reduced the number of children and families receiving public cash assistance by over 81% from 47,712 average monthly cases in FY-1993 to 9,020 average monthly cases in FY-2008. While the state initiated a number of different welfare reforms prior to 1995, the federal Personal Responsibility and Work Opportunity Reconciliation Act (PRWORA), passed in the fall of 1996, fundamentally changed the way public cash assistance programs were delivered to children and families across the nation. The TANF block grant created in PRWORA replaced the traditional cash assistance entitlement program, known as Aid to Families with Dependent Children (AFDC). The four major goals of TANF are: Provide cash assistance to needy
families so that children may be cared for in their own homes or in the homes of relatives;
Promote job preparation, work and marriage to end the dependence of needy parents on government benefits;
Prevent and reduce the incidence of out-of-wedlock pregnancies and establish annual numerical goals for preventing and reducing the incidence of these pregnancies; and
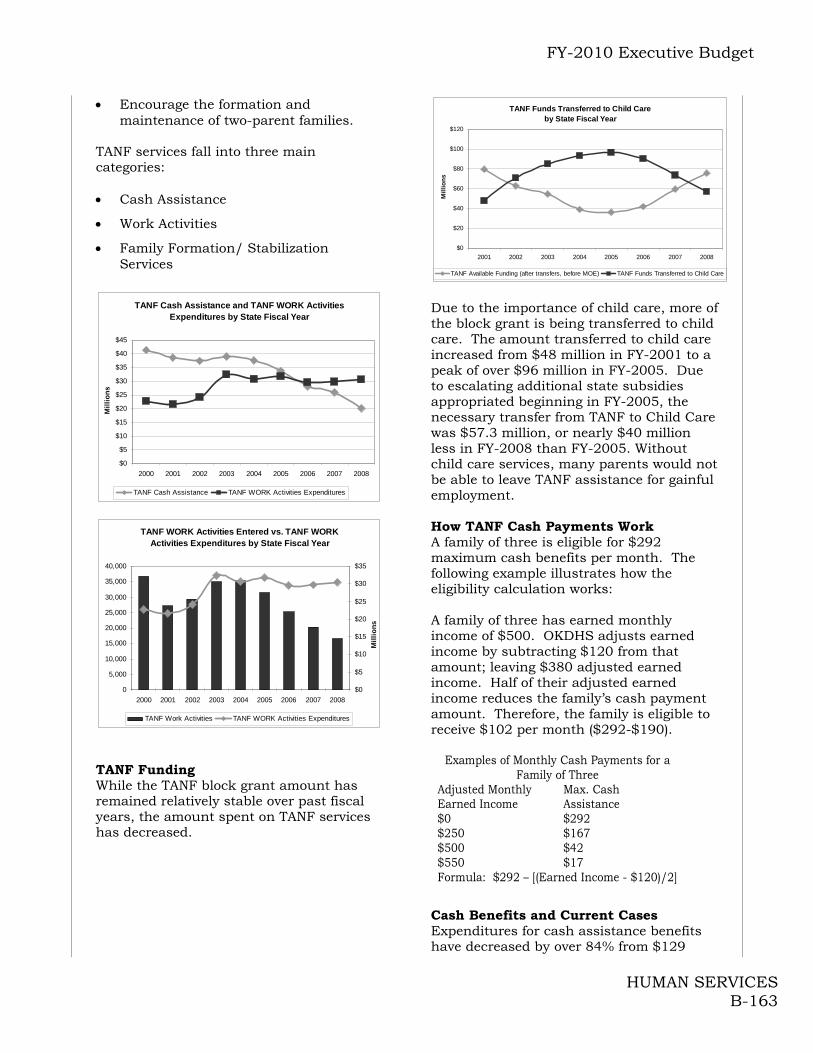
FY-2010 Executive Budget
HUMAN SERVICES B-163
Encourage the formation and maintenance of two-parent families.
TANF services fall into three main categories: Cash Assistance
Work Activities
Family Formation/ Stabilization Services
TANF Cash Assistance and TANF WORK Activities
Expenditures by State Fiscal Year
$0
$5
$10
$15
$20
$25
$30
$35
$40
$45
2000 2001 2002 2003 2004 2005 2006 2007 2008
Mil
lio
ns
TANF Cash Assistance TANF WORK Activities Expenditures
TANF WORK Activities Entered vs. TANF WORK Activities Expenditures by State Fiscal Year
0
5,000
10,000
15,000
20,000
25,000
30,000
35,000
40,000
2000 2001 2002 2003 2004 2005 2006 2007 2008
$0
$5
$10
$15
$20
$25
$30
$35
Mil
lio
ns
TANF Work Activities TANF WORK Activities Expenditures
TANF Funding While the TANF block grant amount has remained relatively stable over past fiscal years, the amount spent on TANF services has decreased.
TANF Funds Transferred to Child Careby State Fiscal Year
$0
$20
$40
$60
$80
$100
$120
2001 2002 2003 2004 2005 2006 2007 2008
Mil
lio
ns
TANF Available Funding (after transfers, before MOE) TANF Funds Transferred to Child Care
Due to the importance of child care, more of the block grant is being transferred to child care. The amount transferred to child care increased from $48 million in FY-2001 to a peak of over $96 million in FY-2005. Due to escalating additional state subsidies appropriated beginning in FY-2005, the necessary transfer from TANF to Child Care was $57.3 million, or nearly $40 million less in FY-2008 than FY-2005. Without child care services, many parents would not be able to leave TANF assistance for gainful employment. How TANF Cash Payments Work A family of three is eligible for $292 maximum cash benefits per month. The following example illustrates how the eligibility calculation works: A family of three has earned monthly income of $500. OKDHS adjusts earned income by subtracting $120 from that amount; leaving $380 adjusted earned income. Half of their adjusted earned income reduces the family’s cash payment amount. Therefore, the family is eligible to receive $102 per month ($292-$190).
Examples of Monthly Cash Payments for a Family of Three
Adjusted Monthly Earned Income
Max. Cash Assistance
$0 $292 $250 $167 $500 $42 $550 $17 Formula: $292 – [(Earned Income - $120)/2]
Cash Benefits and Current Cases Expenditures for cash assistance benefits have decreased by over 84% from $129
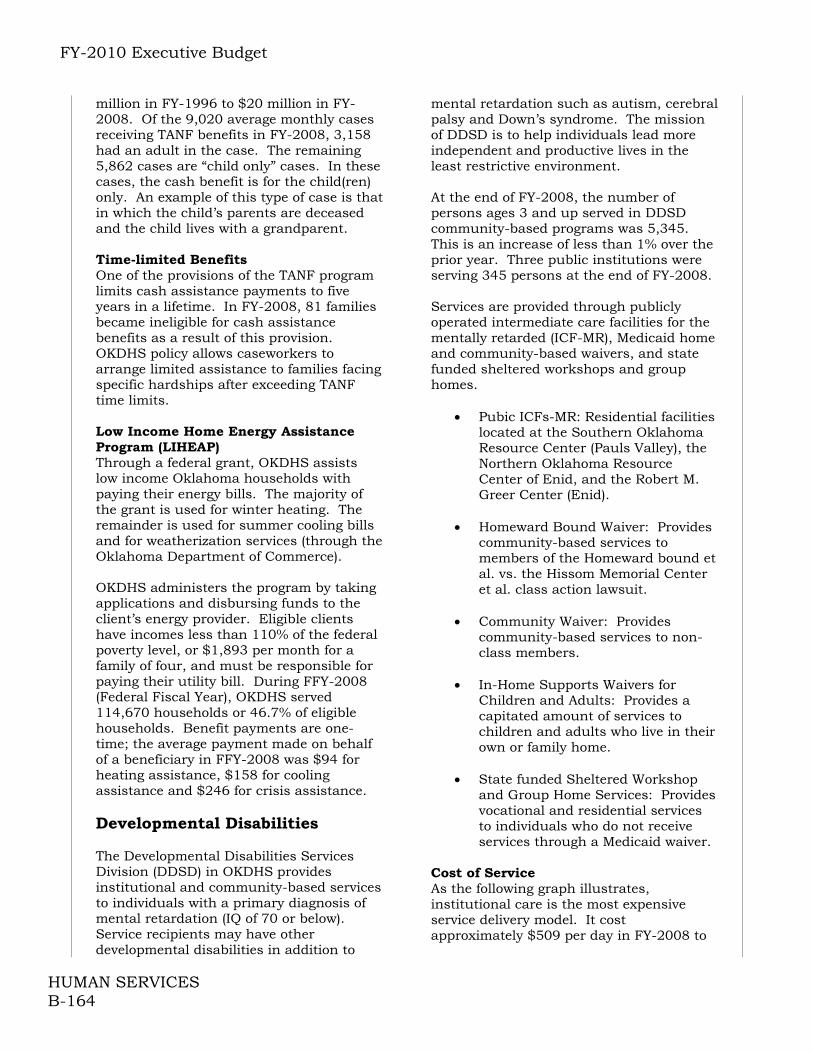
FY-2010 Executive Budget
HUMAN SERVICES B-164
million in FY-1996 to $20 million in FY-2008. Of the 9,020 average monthly cases receiving TANF benefits in FY-2008, 3,158 had an adult in the case. The remaining 5,862 cases are “child only” cases. In these cases, the cash benefit is for the child(ren) only. An example of this type of case is that in which the child’s parents are deceased and the child lives with a grandparent. Time-limited Benefits One of the provisions of the TANF program limits cash assistance payments to five years in a lifetime. In FY-2008, 81 families became ineligible for cash assistance benefits as a result of this provision. OKDHS policy allows caseworkers to arrange limited assistance to families facing specific hardships after exceeding TANF time limits. Low Income Home Energy Assistance Program (LIHEAP) Through a federal grant, OKDHS assists low income Oklahoma households with paying their energy bills. The majority of the grant is used for winter heating. The remainder is used for summer cooling bills and for weatherization services (through the Oklahoma Department of Commerce). OKDHS administers the program by taking applications and disbursing funds to the client’s energy provider. Eligible clients have incomes less than 110% of the federal poverty level, or $1,893 per month for a family of four, and must be responsible for paying their utility bill. During FFY-2008 (Federal Fiscal Year), OKDHS served 114,670 households or 46.7% of eligible households. Benefit payments are one-time; the average payment made on behalf of a beneficiary in FFY-2008 was $94 for heating assistance, $158 for cooling assistance and $246 for crisis assistance. Developmental Disabilities The Developmental Disabilities Services Division (DDSD) in OKDHS provides institutional and community-based services to individuals with a primary diagnosis of mental retardation (IQ of 70 or below). Service recipients may have other developmental disabilities in addition to
mental retardation such as autism, cerebral palsy and Down’s syndrome. The mission of DDSD is to help individuals lead more independent and productive lives in the least restrictive environment. At the end of FY-2008, the number of persons ages 3 and up served in DDSD community-based programs was 5,345. This is an increase of less than 1% over the prior year. Three public institutions were serving 345 persons at the end of FY-2008. Services are provided through publicly operated intermediate care facilities for the mentally retarded (ICF-MR), Medicaid home and community-based waivers, and state funded sheltered workshops and group homes.
Pubic ICFs-MR: Residential facilities located at the Southern Oklahoma Resource Center (Pauls Valley), the Northern Oklahoma Resource Center of Enid, and the Robert M. Greer Center (Enid).
Homeward Bound Waiver: Provides
community-based services to members of the Homeward bound et al. vs. the Hissom Memorial Center et al. class action lawsuit.
Community Waiver: Provides
community-based services to non-class members.
In-Home Supports Waivers for
Children and Adults: Provides a capitated amount of services to children and adults who live in their own or family home.
State funded Sheltered Workshop
and Group Home Services: Provides vocational and residential services to individuals who do not receive services through a Medicaid waiver.
Cost of Service As the following graph illustrates, institutional care is the most expensive service delivery model. It cost approximately $509 per day in FY-2008 to

FY-2010 Executive Budget
HUMAN SERVICES B-165
serve these residents. Next are the members of the Hissom class. In FY-2008, class members cost an average of approximately $332 per day.
Cost of Services
$509
$332
$147
$32
$0
$100
$200
$300
$400
$500
$600
Public ICF/MR Class Member Other HCBS In-Home Supports
The main reason for the difference between the cost of class member services and the cost of non-class member services is the court-ordered 100% state dollar services provided only to members of the Hissom class. Institutional Care The state operates three public institutions for people with developmental disabilities: Southern Oklahoma Resource Center (SORC) near Pauls Valley, Northern Oklahoma Resource Center in Enid (NORCE) and the Greer Center, located on the NORCE campus. The Greer Center is operated through a contract with Liberty Health Care Services of Oklahoma. These public institutions are licensed as Intermediate Care Facilities for the Mentally Retarded (ICF/MR). Residents of these facilities have multiple developmental and physical disabilities and require 24 hour care. Homeward Bound Class Members of the Homeward Bound Class are former residents of the Hissom Memorial Center who filed a class action lawsuit in 1985 to compel the state to create community-based alternatives to institutional placements. The resulting court order required the closure of the Hissom Memorial Center in Sand Springs. The court order closing Hissom was issued in 1987 and the last resident was moved into the community in April of 1994.
In FY-2004, a separate waiver was created for Hissom class members only. At the end of FY-2008, 747 clients were being served through the Homeward Bound waiver. Services for class members are mandated by the court while services are offered to other people as funds become available. Additional State Services Provided to Class Members State payments mandated by the Federal Court for the Homeward Bound class members are: daily room and board payments;
residential size supplement;
medical supplement;
transportation supplement; and
property replacement supplement. Home and Community-Based Medicaid Services OKDHS administers three additional home and community-based waiver programs for children and adults. These programs permit the state to provide an array of services that assist individuals to live in the community as an alternative to institutional placement. Over the past three decades, states have decreased institutional care services and increased home and community-based services. Services are paid for with state and federal dollars. Some Sheltered Workshops slots and some group home placements are entirely state funded while others are funded through Medicaid with almost 67% federal dollars. Description of waiver programs
Community Waiver Funded through the Centers for Medicare and Medicaid, the Community waiver allows services to be provided in the community to eligible individuals as an alternative to institutional placement. The Community waiver provides a comprehensive array of services including a variety of residential,

FY-2010 Executive Budget
HUMAN SERVICES B-166
employment, and habilitative services.
In-Home Supports Waiver for
Children Funded through the Centers for Medicare and Medicaid, the In-Home Supports waiver provides services for children age 3 through 17 years who are living at home with their families. The annual cost of the services each child may receive is capitated.
In-Home Supports Waiver for
Adults Funded through the Centers for Medicare and Medicaid, the In-Home Supports waiver provides services for adults who live with their families or in their own home. The annual cost of the services each adult may receive is capitated.
Homeward Bound Waiver Funded
through the Centers for Medicare and Medicaid, the Homeward Bound waiver allows services to be provided in the community for members of the Hissom class action lawsuit, Homeward Bound et al v. the Hissom Memorial Center at al. The Homeward Bound waiver provides a comprehensive array of services including residential, employment, and habilitative services.
FY-2005 FY-2006 FY-2007 FY-2008
# Served
Total Exp. (in millions)
# Served
Total Exp. (in millions)
# Served
Total Exp. (in millions)
# Served
Total Exp. (in millions)
HCBSW 2,354 109.0 2,592 120.2 2,710 135.9 2,770 148.3Class Member 805 89.1 805 93.4 796 95.4 781 94.6IHSW-Adult 864 9.9 1,216 13.9 1,466 18.6 1,534 20.5IHSW-Children 405 2.8 527 3.4 635 4.6 611 4.5Total 4,428 210.8 5,140 230.9 5,607 254.5 5,696 267.9
In FY-2008, approximately 4,915 people who were non-class members were served through some type of community-based waiver. Waiver Request List for Community-Based Services At the end of FY-2008, there were 4,060 individuals on the waiver request list to receive services through one of the waivers administered by DDSD. This is a 22% increase over FY-2007. However, three-
fourths of the individuals on the list receive other services such as Medicaid, food benefits, family support subsidy, sheltered workshop, assisted living and adult day care. Children and Family Services The Children and Family Services division in OKDHS is responsible for three main programs: Investigating all allegations of child
abuse and neglect;
Providing foster care and kinship placements and family preservation programs to children from abusive homes; and
Providing permanent adoptive placements for children in need of adoption.
Child Protective Services Child abuse and neglect referrals increased by 2,616 from FY-2007 to FY-2008. This count is based on the number of children included in the referral and/or investigation.
Child Protective Services (Family Based)
53,584 53,51856,589 57,587
59,40361,753 63,128 63,931 65,493
53,346
0
10,000
20,000
30,000
40,000
50,000
60,000
70,000
1999 2000 2001 2002 2003 2004 2005 2006 2007 2008
Referrals Received Investigations Confirmed Investigations Completed In FY-2008, the number of children who were confirmed to be a victim of child abuse or neglect was at the lowest level in the last ten years.
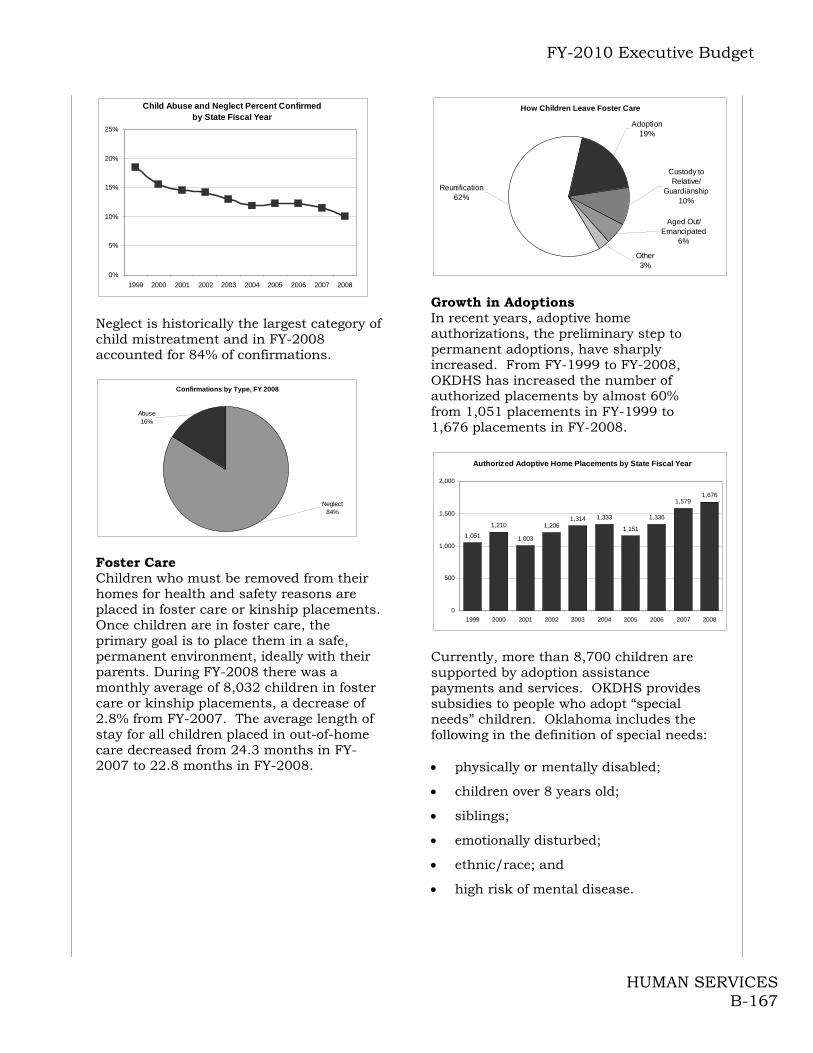
FY-2010 Executive Budget
HUMAN SERVICES B-167
Child Abuse and Neglect Percent Confirmedby State Fiscal Year
0%
5%
10%
15%
20%
25%
1999 2000 2001 2002 2003 2004 2005 2006 2007 2008
Neglect is historically the largest category of child mistreatment and in FY-2008 accounted for 84% of confirmations.
Confirmations by Type, FY 2008
Neglect84%
Abuse16%
Foster Care Children who must be removed from their homes for health and safety reasons are placed in foster care or kinship placements. Once children are in foster care, the primary goal is to place them in a safe, permanent environment, ideally with their parents. During FY-2008 there was a monthly average of 8,032 children in foster care or kinship placements, a decrease of 2.8% from FY-2007. The average length of stay for all children placed in out-of-home care decreased from 24.3 months in FY-2007 to 22.8 months in FY-2008.
How Children Leave Foster Care
Other3%
Aged Out/ Emancipated
6%
Reunification62%
Custody to Relative/
Guardianship10%
Adoption19%
Growth in Adoptions In recent years, adoptive home authorizations, the preliminary step to permanent adoptions, have sharply increased. From FY-1999 to FY-2008, OKDHS has increased the number of authorized placements by almost 60% from 1,051 placements in FY-1999 to 1,676 placements in FY-2008.
Authorized Adoptive Home Placements by State Fiscal Year
1,051
1,210
1,003
1,2061,314 1,333
1,151
1,336
1,5791,676
0
500
1,000
1,500
2,000
1999 2000 2001 2002 2003 2004 2005 2006 2007 2008
Currently, more than 8,700 children are supported by adoption assistance payments and services. OKDHS provides subsidies to people who adopt “special needs” children. Oklahoma includes the following in the definition of special needs: physically or mentally disabled;
children over 8 years old;
siblings;
emotionally disturbed;
ethnic/race; and
high risk of mental disease.

FY-2010 Executive Budget
HUMAN SERVICES B-168
Child Care Services OKDHS Child care activities can be divided into two main areas: the Child Care Subsidy Program and Child Care Licensing. Child Care Subsidies Subsidized child care pays part or all of the child care costs for qualifying families while parents or caretakers work, attend school, or receive training. Subsidized child care was provided for almost 72,000 different children during FY-2008. The monthly average number of children for whom subsidy payments were made was 40,250 in FY-2008.
Child Care Subsidies
$126
$128
$130
$132
$134
$136
$138
$140
$142
2003 2004 2005 2006 2007 2008
Mil
lio
ns
0
10,000
20,000
30,000
40,000
50,000
60,000
Subsidy Payments Average Number of Children
Quality Child Care Initiative The Reaching for the Stars Program pays licensed child care facilities different rates depending on the level of accreditation earned by the facility. These levels, referred to as Stars, are as follows: One Star – Basic Licensing
Requirements;
One Star Plus – Transitioning to Higher Level;
Two Star – Seven Quality Criteria including Master Teachers; and
Three Star – Two Star Criteria and Nationally Accredited.
Child Care Licensing Child Care Services licenses and inspects almost 4,800 child care homes and centers in Oklahoma for children ages six weeks to 12 years. The division also licenses 136
residential and shelter facilities that provide care for children who are unable to live at home and 62 child placing agencies that place children in foster homes and adoptive homes.
Licensed Child Care Homes and Centersby State Fiscal Year
4,161 4,400 4,372 4,048 3,716 3,397 2,974
1,897 1,867 1,8691,843
1,8171,807
1,788
0
1,000
2,000
3,000
4,000
5,000
6,000
7,000
2002 2003 2004 2005 2006 2007 2008
Licensed Child Care Homes Licensed Child Care Centers Total authorized licensed capacity in FY-2008 is almost 138,000. The following chart shows total licensed capacity available for the Child Care Subsidy program versus those that are not subsidized.
Licensed Child Care Facilities Capacity by State Fiscal Year
36,0
64
44,2
62
38,8
56
39,0
37
32,3
74
33,2
12
104,
111
98,5
46
103,
857
101,
470
107,
768
104,
531
0
20,000
40,000
60,000
80,000
100,000
120,000
140,000
160,000
2003 2004 2005 2006 2007 2008
DHS Contract No DHS Contract Aging Services Aging Services is responsible for the following programs: Congregate Meals
Ombudsman Program
Advocacy
Volunteer Programs The Aging Services Division also administers the following two Medicaid programs.
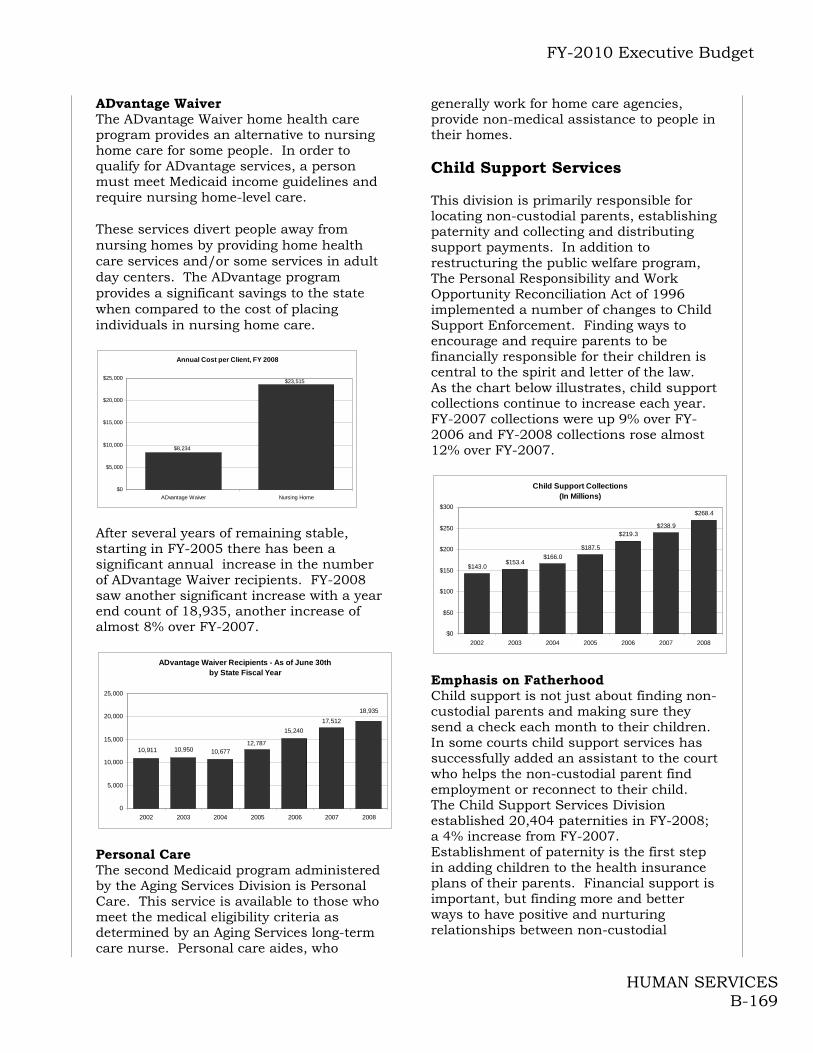
FY-2010 Executive Budget
HUMAN SERVICES B-169
ADvantage Waiver The ADvantage Waiver home health care program provides an alternative to nursing home care for some people. In order to qualify for ADvantage services, a person must meet Medicaid income guidelines and require nursing home-level care. These services divert people away from nursing homes by providing home health care services and/or some services in adult day centers. The ADvantage program provides a significant savings to the state when compared to the cost of placing individuals in nursing home care.
Annual Cost per Client, FY 2008
$23,515
$8,234
$0
$5,000
$10,000
$15,000
$20,000
$25,000
ADvantage Waiver Nursing Home
After several years of remaining stable, starting in FY-2005 there has been a significant annual increase in the number of ADvantage Waiver recipients. FY-2008 saw another significant increase with a year end count of 18,935, another increase of almost 8% over FY-2007.
ADvantage Waiver Recipients - As of June 30thby State Fiscal Year
17,512
18,935
15,240
12,78710,67710,95010,911
0
5,000
10,000
15,000
20,000
25,000
2002 2003 2004 2005 2006 2007 2008
Personal Care The second Medicaid program administered by the Aging Services Division is Personal Care. This service is available to those who meet the medical eligibility criteria as determined by an Aging Services long-term care nurse. Personal care aides, who
generally work for home care agencies, provide non-medical assistance to people in their homes. Child Support Services This division is primarily responsible for locating non-custodial parents, establishing paternity and collecting and distributing support payments. In addition to restructuring the public welfare program, The Personal Responsibility and Work Opportunity Reconciliation Act of 1996 implemented a number of changes to Child Support Enforcement. Finding ways to encourage and require parents to be financially responsible for their children is central to the spirit and letter of the law. As the chart below illustrates, child support collections continue to increase each year. FY-2007 collections were up 9% over FY-2006 and FY-2008 collections rose almost 12% over FY-2007.
Child Support Collections(In Millions)
$143.0$153.4
$166.0
$187.5
$219.3$238.9
$268.4
$0
$50
$100
$150
$200
$250
$300
2002 2003 2004 2005 2006 2007 2008
Emphasis on Fatherhood Child support is not just about finding non-custodial parents and making sure they send a check each month to their children. In some courts child support services has successfully added an assistant to the court who helps the non-custodial parent find employment or reconnect to their child. The Child Support Services Division established 20,404 paternities in FY-2008; a 4% increase from FY-2007. Establishment of paternity is the first step in adding children to the health insurance plans of their parents. Financial support is important, but finding more and better ways to have positive and nurturing relationships between non-custodial

FY-2010 Executive Budget
HUMAN SERVICES B-170
parents and their children is also important.
FY-2010 Recommendation
FY-2009 Appropriation $559,107
FY-2009 Bud. FTE Level 8,083.6
Actual Ave. YTD FTE 8,082.5
Funding Adjustments:
6% Travel Cut (607)
FY-2010 Recommendation $558,500
% Change from FY-2009 -0.11%
Source: Office of State Finance
FY-2010 Appropriation(amounts in thousands)
6% Travel Cut Agency travel funds are also reduced by 6% ($607,223). The Governor’s budget also includes anticipated federal funds to support decreases in the Federal Medical Assistance Percentage (FMAP) rate. Federal Stimulus The Governor’s budget also includes anticipated federal funds to support decreases in the FMAP rate and growth and utilization increases in the Medicaid program.

FY-2010 Executive Budget
HUMAN SERVICES B-171
J.D. McCarty Center for Children with Developmental
Disabilities Notable Achievements
More of Oklahoma’s children with developmental disabilities have been served. There were approximately 44,000 patient encounters in FY-2008.
Five, week long summer day camp programs served 65 children with special needs. Children with developmental disabilities from the metropolitan area attended the camps Monday through Friday. The focus was to provide a fun and loving environment so that each camper can learn new skills, make friends and gain independence while having a blast!
In 2008 J.D. McCarty broke ground on Camp Claphans. Camp Claphans will be the Center’s first summer camp facility, which will enable JDMC to expand its summer camp program. The facility will consist of an activity center, pool with a splash pad, a ropes course and outside activity field, a campfire circle, fishing dock for lake use and overnight cabins.
The Conference Center on J.D. McCarty’s campus hosted 69 events days during FY-2008 and generated over $87,716 in revenue.
Mission The mission of the J.D. McCarty Center (JDMC) for Children with Developmental Disabilities is to provide a comprehensive program of habilitative care to Oklahoma's citizens with disabilities. The J.D. McCarty Center habilitates, rehabilitates, evaluates, and treats Oklahoma's developmentally disabled children, enabling them to reach their maximum potential. The ultimate goal is to enable children to return to a family or community environment.
JDMC’s emphasis on telecommunications will enable the agency to reach a more general population, such as doctors’ offices, clinics, kiosks in frequently traveled locations and the rapidly expanding population of web surfers. In recent years, the JDMC has seen an increase in the number of children that come to the facility in the custody of the state. JDMC is also seeing an increase in children with behavioral problems and more severe diagnoses. This led to an increase in the average length of stay for children in the hospital, especially for state custody children through FY-2005. However, after moving into their new facility and no longer having to house children in wards, many of their challenging behaviors were successfully resolved and foster care placements increased. This has resulted in a dramatic drop in average length of stay for custody children from 732 days in FY-2005 to 444 days in FY-2008.
476
42
732
40
390
44
366
37
444
33.270
200
400
600
800
Da
ys
FY-2004 FY-2005 FY-2006 FY-2007 FY-2008
Average Length of Stay for Chi ldren in State Custody vs.
Non-Custody
State Custody Non-Custody
Source: JD McCarty Center
$831$879
$899 $947 $989$1,088
$0
$200
$400
$600
$800
$1,000
$1,200
FY-2003 FY-2004 FY-2005 FY-2006 FY-2007 Fy-2008
Cost per Bed per Day (as per Medicaid Cost Report)
Source: JD McCarty Center
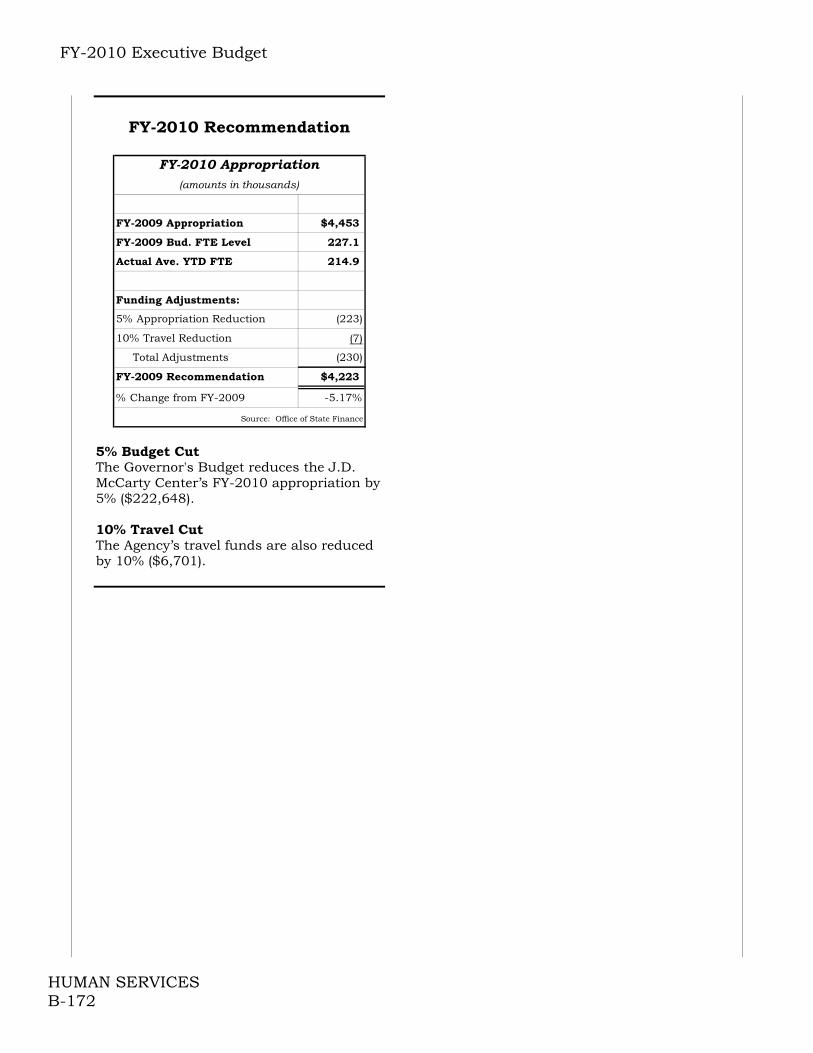
FY-2010 Executive Budget
HUMAN SERVICES B-172
FY-2010 Recommendation
FY-2009 Appropriation $4,453
FY-2009 Bud. FTE Level 227.1
Actual Ave. YTD FTE 214.9
Funding Adjustments:
5% Appropriation Reduction (223)
10% Travel Reduction (7)
Total Adjustments (230)
FY-2009 Recommendation $4,223
% Change from FY-2009 -5.17%
Source: Office of State Finance
(amounts in thousands)
FY-2010 Appropriation
5% Budget Cut The Governor's Budget reduces the J.D. McCarty Center’s FY-2010 appropriation by 5% ($222,648). 10% Travel Cut The Agency’s travel funds are also reduced by 10% ($6,701).
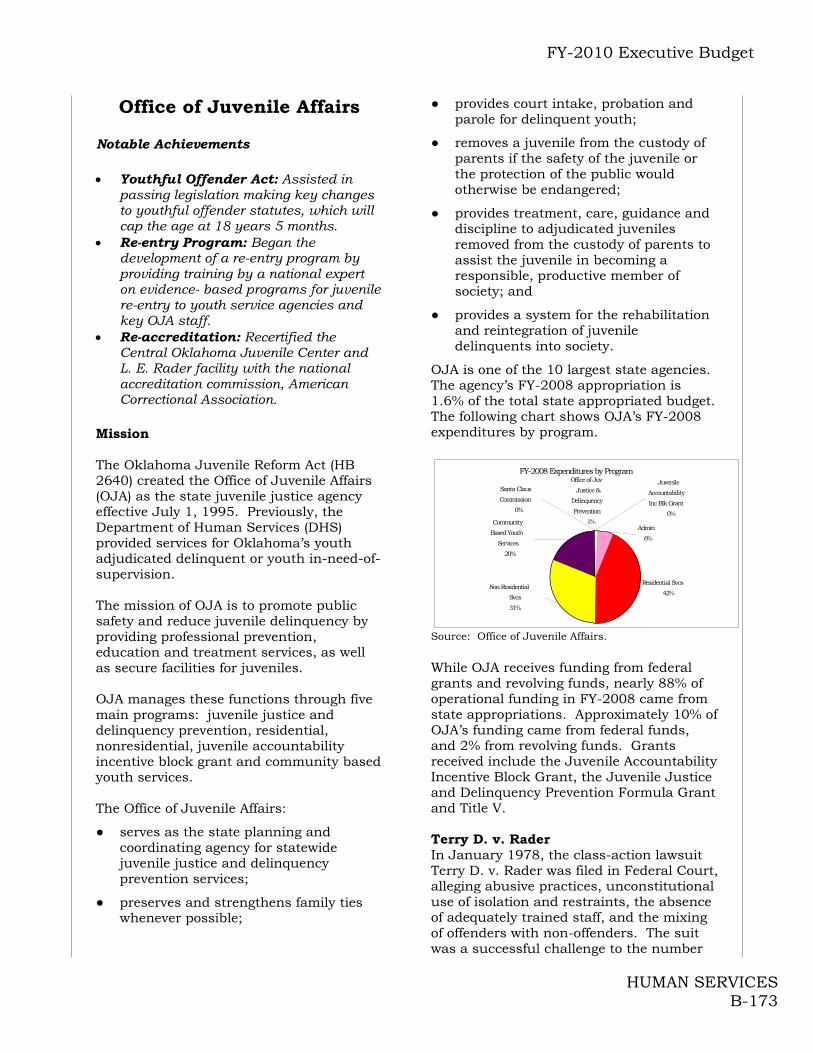
FY-2010 Executive Budget
HUMAN SERVICES B-173
Office of Juvenile Affairs Notable Achievements
Youthful Offender Act: Assisted in passing legislation making key changes to youthful offender statutes, which will cap the age at 18 years 5 months.
Re-entry Program: Began the development of a re-entry program by providing training by a national expert on evidence- based programs for juvenile re-entry to youth service agencies and key OJA staff.
Re-accreditation: Recertified the Central Oklahoma Juvenile Center and L. E. Rader facility with the national accreditation commission, American Correctional Association.
Mission The Oklahoma Juvenile Reform Act (HB 2640) created the Office of Juvenile Affairs (OJA) as the state juvenile justice agency effective July 1, 1995. Previously, the Department of Human Services (DHS) provided services for Oklahoma’s youth adjudicated delinquent or youth in-need-of-supervision. The mission of OJA is to promote public safety and reduce juvenile delinquency by providing professional prevention, education and treatment services, as well as secure facilities for juveniles. OJA manages these functions through five main programs: juvenile justice and delinquency prevention, residential, nonresidential, juvenile accountability incentive block grant and community based youth services. The Office of Juvenile Affairs:
● serves as the state planning and coordinating agency for statewide juvenile justice and delinquency prevention services;
● preserves and strengthens family ties whenever possible;
● provides court intake, probation and parole for delinquent youth;
● removes a juvenile from the custody of parents if the safety of the juvenile or the protection of the public would otherwise be endangered;
● provides treatment, care, guidance and discipline to adjudicated juveniles removed from the custody of parents to assist the juvenile in becoming a responsible, productive member of society; and
● provides a system for the rehabilitation and reintegration of juvenile delinquents into society.
OJA is one of the 10 largest state agencies. The agency’s FY-2008 appropriation is 1.6% of the total state appropriated budget. The following chart shows OJA’s FY-2008 expenditures by program.
FY-2008 Expenditures by Program
Residential Svcs
42%
Office of Juv Justice &
Delinquency Prevention
1%
Non Residential
Svcs
31%
Santa Claus
Commission
0%
Community
Based Youth
Services
20%
Admin
6%
Juvenile
Accountability
Inc Blk Grant
0%
Source: Office of Juvenile Affairs. While OJA receives funding from federal grants and revolving funds, nearly 88% of operational funding in FY-2008 came from state appropriations. Approximately 10% of OJA’s funding came from federal funds, and 2% from revolving funds. Grants received include the Juvenile Accountability Incentive Block Grant, the Juvenile Justice and Delinquency Prevention Formula Grant and Title V. Terry D. v. Rader In January 1978, the class-action lawsuit Terry D. v. Rader was filed in Federal Court, alleging abusive practices, unconstitutional use of isolation and restraints, the absence of adequately trained staff, and the mixing of offenders with non-offenders. The suit was a successful challenge to the number

FY-2010 Executive Budget
HUMAN SERVICES B-174
of youth in State custody and resulted in DHS closing a number of public institutions and implementing a variety of community-based programs for children and youth. Subsequent to the creation of OJA, an Amended Court Plan of Implementation was filed with the court that detailed OJA’s responsibilities in the operation of the juvenile justice system. In 1996, OJA was able to meet Federal Court requirements for the dismissal of the lawsuit. Nonresidential Services The Juvenile Services Unit (JSU) provides intake, probation and parole services to youth in all 77 counties, except those with Juvenile Bureaus. Juvenile Bureaus, located in Canadian, Comanche, Oklahoma, and Tulsa counties, perform intake and probation functions. In those counties, JSU staff provides parole services. Three key factors contribute to the overall juvenile justice system demand for non-residential services: The total juvenile arrest rate contributing to the total juvenile referrals to OJA and the bureaus; and intake decisions made by district attorneys that require diversion, informal probation, and court-involved treatment services. Not all arrested juveniles are referred to OJA or the bureaus for intake processing. The establishment of interlocutory agreements with some municipal courts has resulted in the processing of juveniles arrested for certain classes of less serious crimes such as misdemeanors by those courts.
25,869 24,885 23,970 24,684 23,880
21,435 21,541 21,463
0
5,000
10,000
15,000
20,000
25,000
30,000
2000 2001 2002 2003 2004 2005 2006 2007
Total Juvenile Arrests
Source: Oklahoma State Bureau of Investigation (OSBI) 2007 Uniform Crime Report. The introduction and funding by OJA of Community Intervention Centers (CIC) in eight municipalities for the temporary holding of juveniles arrested for less serious
offenses in order to free up law enforcement resources, has also encouraged the diversion of some juveniles for processing by municipal courts. During FY-2008, 6,552 CIC admissions took place with more than 70% of admitted juveniles released to their parents or custodians within four hours.
25,274
17,157
1,570
24,172
16,734
1,394
24,592
16,488
1,411
25,077
16,599
1,497
23,630
15,714
1,307
23,285
15,323
1,388
23,124
15,124
1,329
22,610
15,041
1,402
22,399
14,757
1,561
0
5,000
10,000
15,000
20,000
25,000
30,000
FY-2000 FY-2001 FY-2002 FY-2003 FY-2004 FY-2005 FY-2006 FY-2007 FY-2008
Juvenile Justice Referrals
Source: Office of Juvenile Affairs.
Every referral received by OJA and the juvenile bureaus must be processed through an intake process. In FY-2008, 9,076 (61.5%) of the total of 14,757 juveniles referred were referred for the first time to the juvenile justice system. The most common intake decision by district attorneys is to file a petition for court involvement. The total number of intakes has declined by 246 since FY-2006, from 15,921 to 15,675 in FY-2008. In FY-2008, 4,031 or 25.7% of the total intakes were dismissed. The chart below depicts the intake decisions resulting in services.
5,839
4,122
1,561
83
5,726
4,149
1,628
74
5,608
4,375
1,597
64
0
1,000
2,000
3,000
4,000
5,000
6,000
FY-2006 FY-2007 FY-2008
Intake Decisions Resulting in Services
File Petition Informal Probation Diverted Motion to Certify Source: Office of Juvenile Affairs. Contracted service programs assist the OJA’s Juvenile Justice Specialists in developing an individualized service plan for each juvenile and family. OJA provides a full range of services to encourage positive, law-abiding behavior and balances
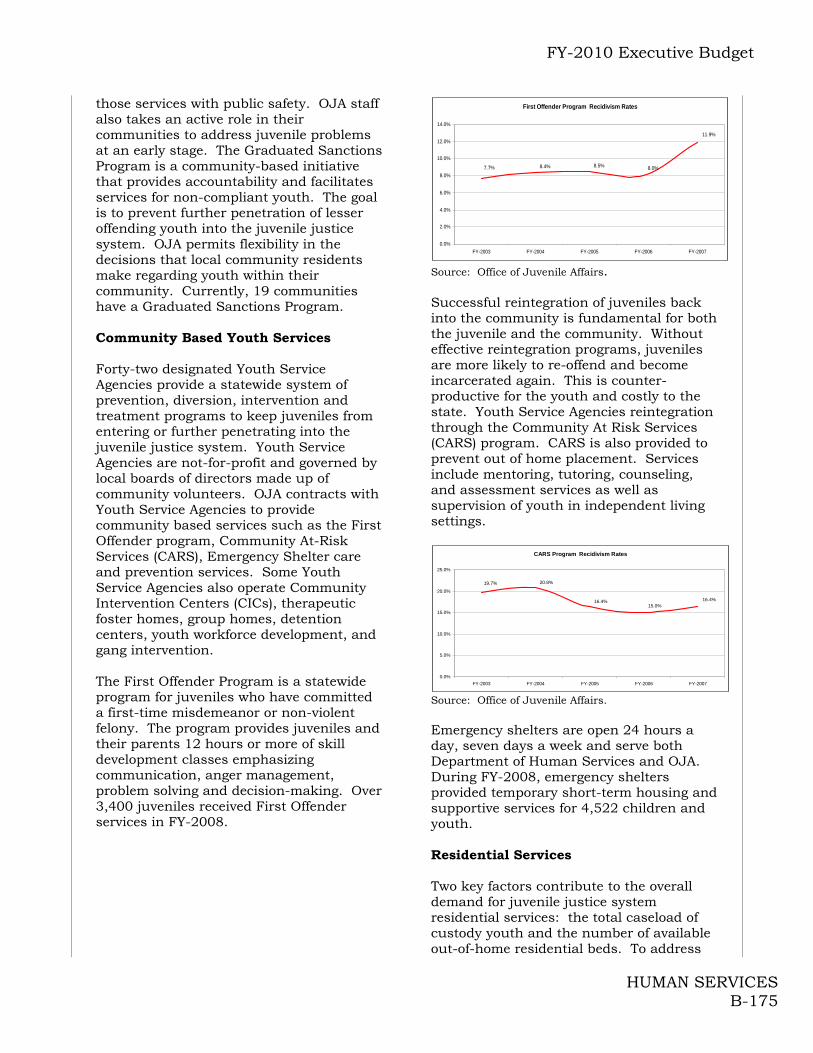
FY-2010 Executive Budget
HUMAN SERVICES B-175
those services with public safety. OJA staff also takes an active role in their communities to address juvenile problems at an early stage. The Graduated Sanctions Program is a community-based initiative that provides accountability and facilitates services for non-compliant youth. The goal is to prevent further penetration of lesser offending youth into the juvenile justice system. OJA permits flexibility in the decisions that local community residents make regarding youth within their community. Currently, 19 communities have a Graduated Sanctions Program. Community Based Youth Services Forty-two designated Youth Service Agencies provide a statewide system of prevention, diversion, intervention and treatment programs to keep juveniles from entering or further penetrating into the juvenile justice system. Youth Service Agencies are not-for-profit and governed by local boards of directors made up of community volunteers. OJA contracts with Youth Service Agencies to provide community based services such as the First Offender program, Community At-Risk Services (CARS), Emergency Shelter care and prevention services. Some Youth Service Agencies also operate Community Intervention Centers (CICs), therapeutic foster homes, group homes, detention centers, youth workforce development, and gang intervention. The First Offender Program is a statewide program for juveniles who have committed a first-time misdemeanor or non-violent felony. The program provides juveniles and their parents 12 hours or more of skill development classes emphasizing communication, anger management, problem solving and decision-making. Over 3,400 juveniles received First Offender services in FY-2008.
First Offender Program Recidivism Rates
11.9%
8.0%8.5%8.4%7.7%
0.0%
2.0%
4.0%
6.0%
8.0%
10.0%
12.0%
14.0%
FY-2003 FY-2004 FY-2005 FY-2006 FY-2007
Source: Office of Juvenile Affairs. Successful reintegration of juveniles back into the community is fundamental for both the juvenile and the community. Without effective reintegration programs, juveniles are more likely to re-offend and become incarcerated again. This is counter-productive for the youth and costly to the state. Youth Service Agencies reintegration through the Community At Risk Services (CARS) program. CARS is also provided to prevent out of home placement. Services include mentoring, tutoring, counseling, and assessment services as well as supervision of youth in independent living settings.
CARS Program Recidivism Rates
19.7% 20.8%
16.4%15.0%
16.4%
0.0%
5.0%
10.0%
15.0%
20.0%
25.0%
FY-2003 FY-2004 FY-2005 FY-2006 FY-2007
Source: Office of Juvenile Affairs. Emergency shelters are open 24 hours a day, seven days a week and serve both Department of Human Services and OJA. During FY-2008, emergency shelters provided temporary short-term housing and supportive services for 4,522 children and youth. Residential Services Two key factors contribute to the overall demand for juvenile justice system residential services: the total caseload of custody youth and the number of available out-of-home residential beds. To address

FY-2010 Executive Budget
HUMAN SERVICES B-176
placement demand each year, OJA determines the security risk and treatment need each custody juvenile presents and matches the juvenile with the available and appropriate placement options. The chart provides a comparison of the custody caseload and the number of available out-of-home residential beds since FY-2003. The number of available residential beds has declined since a peak of 1,020 in FY-2000.
2,230
750
2,064
728
1,923
683
1,841
679
1,871
644
1,812
640
0
500
1,000
1,500
2,000
2,500
FY-2003 FY-2004 FY-2005 FY-2006 FY-2007 FY-2008
Custody Population & Residential Beds
Custody Population Residential Beds Source: Office of Juvenile Affairs.
FY-2008 Residential Bed Options
54%41%
5%
Secure Community Based Regimented Treatment Source: Office of Juvenile Affairs. The waiting list represents the gap between the placement demand for custody juveniles presenting community risks and the number of available out-of-home residential beds. The following graph illustrates the change in the average number of juveniles awaiting placement over the past twelve fiscal years. Juveniles on the waiting list are typically held in secure county detention centers. For FY-2008, the average number of juveniles waiting for placement was 78.
Source: Office of Juvenile Affairs. Because of the limited number of available beds, out-of-home residential facilities are reserved for custody youth who present moderate and serious risks to communities. Residential treatment services represent the most intensive intervention to interdict a pattern of behavior that will otherwise result in an adult career in crime. Facilities provide applicable treatment for specific problems to enable normal youth maturation and to prepare the youth for reintegration into the home and the community.
Residential Services - Completion Rates
74.9%
63.5% 63.2%59.8%
61.9%
71.6%
0.0%
10.0%
20.0%
30.0%
40.0%
50.0%
60.0%
70.0%
80.0%
FY-2003 FY-2004 FY-2005 FY-2006 FY-2007 FY-2008
Source: Office of Juvenile Affairs. The performance measures for residential services include completion and recidivism rates. Completion of services is defined as a regularly scheduled discharge from out-of-home placement. Non-completion may occur for a variety or reasons, including AWOL, hospitalization, re-arrest and placement in detention or early court dismissal of a case. Recidivism is defined as those juveniles who fail to remain crime-free within one year of discharge from a residential program.
Average Waiting List Count
0
20
40
60
80
100
120
140
FY-97 FY-98 FY-99 FY-00 FY-01 FY-02 FY-03 FY-04 FY-05 FY-06 FY-07 FY-08
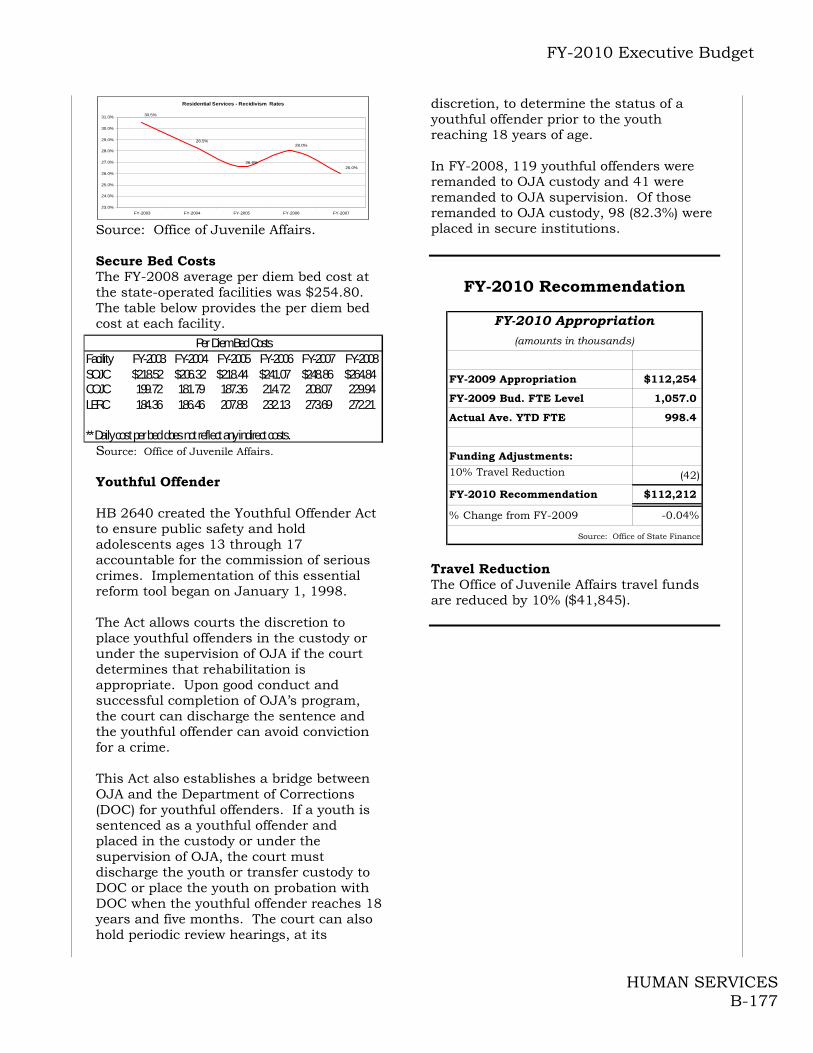
FY-2010 Executive Budget
HUMAN SERVICES B-177
Residential Services - Recidivism Rates
26.0%
28.0%
26.6%
28.5%
30.5%
23.0%
24.0%
25.0%
26.0%
27.0%
28.0%
29.0%
30.0%
31.0%
FY-2003 FY-2004 FY-2005 FY-2006 FY-2007 Source: Office of Juvenile Affairs. Secure Bed Costs The FY-2008 average per diem bed cost at the state-operated facilities was $254.80. The table below provides the per diem bed cost at each facility.
Source: Office of Juvenile Affairs. Youthful Offender HB 2640 created the Youthful Offender Act to ensure public safety and hold adolescents ages 13 through 17 accountable for the commission of serious crimes. Implementation of this essential reform tool began on January 1, 1998. The Act allows courts the discretion to place youthful offenders in the custody or under the supervision of OJA if the court determines that rehabilitation is appropriate. Upon good conduct and successful completion of OJA’s program, the court can discharge the sentence and the youthful offender can avoid conviction for a crime. This Act also establishes a bridge between OJA and the Department of Corrections (DOC) for youthful offenders. If a youth is sentenced as a youthful offender and placed in the custody or under the supervision of OJA, the court must discharge the youth or transfer custody to DOC or place the youth on probation with DOC when the youthful offender reaches 18 years and five months. The court can also hold periodic review hearings, at its
discretion, to determine the status of a youthful offender prior to the youth reaching 18 years of age. In FY-2008, 119 youthful offenders were remanded to OJA custody and 41 were remanded to OJA supervision. Of those remanded to OJA custody, 98 (82.3%) were placed in secure institutions.
FY-2010 Recommendation
FY-2009 Appropriation $112,254
FY-2009 Bud. FTE Level 1,057.0
Actual Ave. YTD FTE 998.4
Funding Adjustments:
10% Travel Reduction (42)
FY-2010 Recommendation $112,212
% Change from FY-2009 -0.04%
Source: Office of State Finance
(amounts in thousands)
FY-2010 Appropriation
Travel Reduction The Office of Juvenile Affairs travel funds are reduced by 10% ($41,845).
Facility FY-2003 FY-2004 FY-2005 FY-2006 FY-2007 FY-2008SOJC $218.52 $206.32 $218.44 $241.07 $248.86 $264.84COJC 199.72 181.79 187.36 214.72 208.07 229.94LERC 184.36 186.46 207.88 232.13 273.69 272.21
** Daily cost per bed does not reflect any indirect costs.
Per Diem Bed Costs
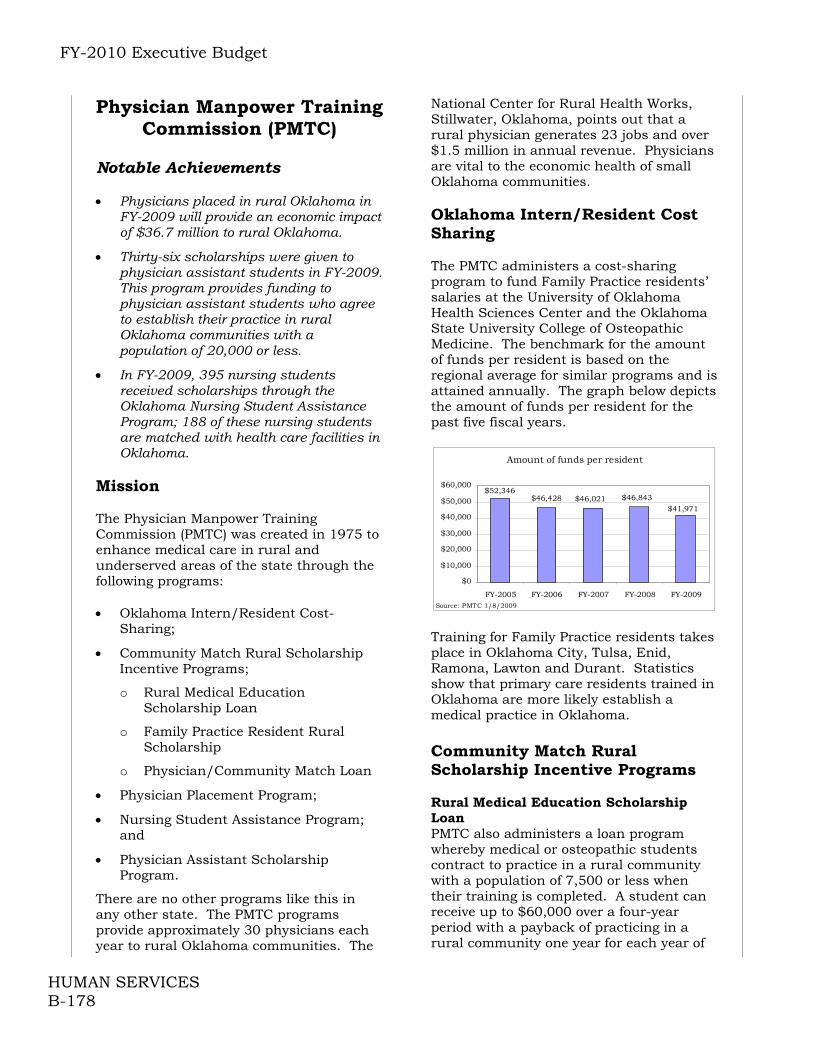
FY-2010 Executive Budget
HUMAN SERVICES B-178
Physician Manpower Training Commission (PMTC)
Notable Achievements Physicians placed in rural Oklahoma in
FY-2009 will provide an economic impact of $36.7 million to rural Oklahoma.
Thirty-six scholarships were given to physician assistant students in FY-2009. This program provides funding to physician assistant students who agree to establish their practice in rural Oklahoma communities with a population of 20,000 or less.
In FY-2009, 395 nursing students received scholarships through the Oklahoma Nursing Student Assistance Program; 188 of these nursing students are matched with health care facilities in Oklahoma.
Mission The Physician Manpower Training Commission (PMTC) was created in 1975 to enhance medical care in rural and underserved areas of the state through the following programs: Oklahoma Intern/Resident Cost-
Sharing;
Community Match Rural Scholarship Incentive Programs;
o Rural Medical Education Scholarship Loan
o Family Practice Resident Rural Scholarship
o Physician/Community Match Loan
Physician Placement Program;
Nursing Student Assistance Program; and
Physician Assistant Scholarship Program.
There are no other programs like this in any other state. The PMTC programs provide approximately 30 physicians each year to rural Oklahoma communities. The
National Center for Rural Health Works, Stillwater, Oklahoma, points out that a rural physician generates 23 jobs and over $1.5 million in annual revenue. Physicians are vital to the economic health of small Oklahoma communities. Oklahoma Intern/Resident Cost Sharing The PMTC administers a cost-sharing program to fund Family Practice residents’ salaries at the University of Oklahoma Health Sciences Center and the Oklahoma State University College of Osteopathic Medicine. The benchmark for the amount of funds per resident is based on the regional average for similar programs and is attained annually. The graph below depicts the amount of funds per resident for the past five fiscal years.
Amount of funds per resident
$41,971$46,843$46,021$46,428
$52,346
$0
$10,000
$20,000
$30,000
$40,000
$50,000
$60,000
FY-2005 FY-2006 FY-2007 FY-2008 FY-2009Source: PMTC 1/8/2009
Training for Family Practice residents takes place in Oklahoma City, Tulsa, Enid, Ramona, Lawton and Durant. Statistics show that primary care residents trained in Oklahoma are more likely establish a medical practice in Oklahoma. Community Match Rural Scholarship Incentive Programs Rural Medical Education Scholarship Loan PMTC also administers a loan program whereby medical or osteopathic students contract to practice in a rural community with a population of 7,500 or less when their training is completed. A student can receive up to $60,000 over a four-year period with a payback of practicing in a rural community one year for each year of

FY-2010 Executive Budget
HUMAN SERVICES B-179
financial assistance. Since 1975, 407 students have participated in the program. Family Practice Resident Rural Scholarship This scholarship program is for residents in accredited Oklahoma Family Practice Programs. Each participating resident receives $1,000 per month (up to 36 months) with a month-for-month practice obligation in an underserved community upon completion of residency training. Since 1992, 177 recipients have completed training and are fulfilling their obligations. Physician/Community Match Loan A rural Oklahoma community may provide loans matched by PMTC to any qualified primary care physician to assist in establishing a full-time medical practice. The physician repays the loan by practicing medicine in that community. Since 1989, 163 physicians have been placed The following graph shows the total number of physicians who began rural practices compared to the number of communities seeking a physician. Over the last five years, 44% of the communities requesting physicians actually received a physician.
Community Match Rural Scholarship Incentive Programs
2634 30
20 24
5360 62 59
74
0
20
40
60
80
FY-2005 FY-2006 FY-2007 FY-2008 FY-2009
Communities receiving physiciansCommunities requesting physiciansSource: PMTC 1/8/2009
Physician Assistant Program Created in FY-2006, this is a two and a half year scholarship/loan program for physician assistant students in accredited physician assistant programs. Participating students receive $1,000 per month for up to 30 months, with a month-for-month practice obligation in a rural community of 20,000 population or less. The first full class of program participants will be graduated this calendar year and begin
repaying their obligations in rural Oklahoma. Since its inception, there have been 50 physician assistance participants. Nursing Student Assistance Program Established in 1982, this program provides financial assistance to Oklahoma nursing students pursuing Licensed Practical Nursing, Associate Degree in Nursing, Bachelor’s of Science in Nursing or Master’s of Science in Nursing degrees. The scholarship loan is repaid by working as a nurse in Oklahoma, with an emphasis on rural communities. There are two programs:
Matching scholarship assistance provided by PMTC and matched by a community or institution which in return receives the services of the nurse upon graduation; and
Non-matching scholarship assistance is provided solely by PMTC.
Since its inception, there have been 4,998 participants. The graph below shows the number of recent recipients by fiscal year.
Number of Nursing Scholarships Awarded
395
380324
290247
0
100
200
300
400
500
FY-2005 FY-2006 FY-2007 FY-2008 FY-2009Source: PMTC 1/8/2009
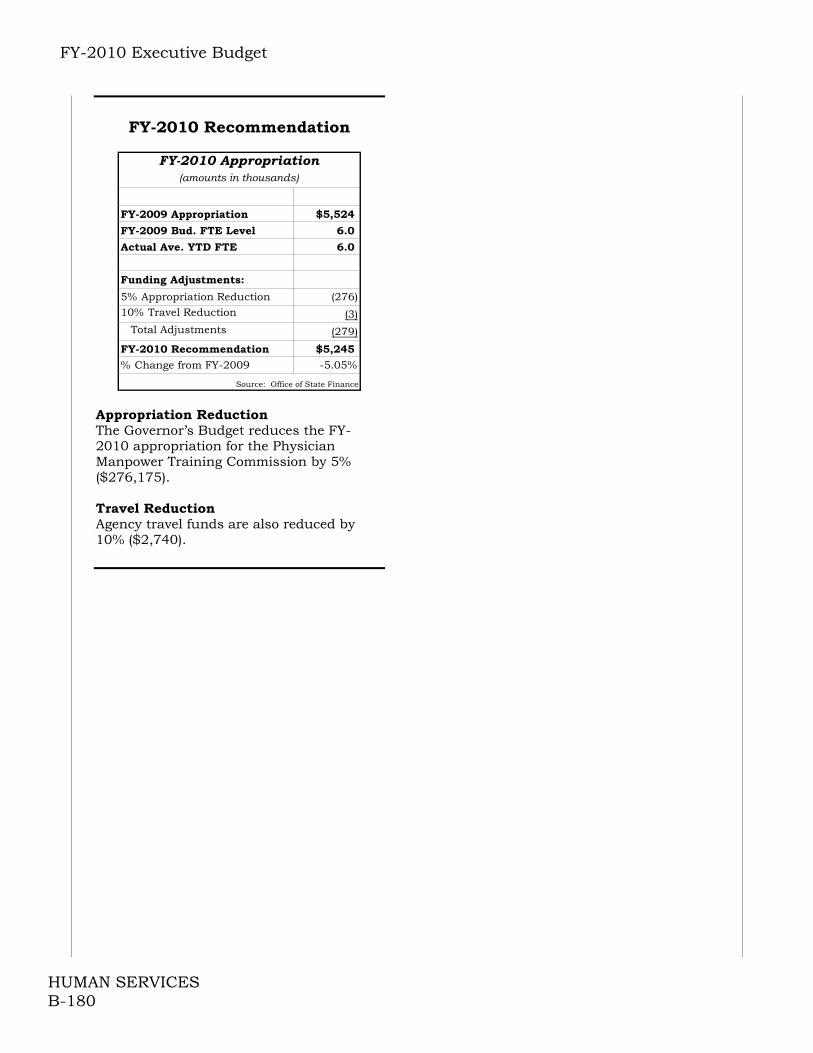
FY-2010 Executive Budget
HUMAN SERVICES B-180
FY-2010 Recommendation
FY-2009 Appropriation $5,524
FY-2009 Bud. FTE Level 6.0
Actual Ave. YTD FTE 6.0
Funding Adjustments:
5% Appropriation Reduction (276)10% Travel Reduction (3) Total Adjustments (279)
FY-2010 Recommendation $5,245
% Change from FY-2009 -5.05%
(amounts in thousands)
Source: Office of State Finance
FY-2010 Appropriation
Appropriation Reduction The Governor’s Budget reduces the FY-2010 appropriation for the Physician Manpower Training Commission by 5% ($276,175). Travel Reduction Agency travel funds are also reduced by 10% ($2,740).

FY-2010 Executive Budget
HUMAN SERVICES B-181
Department of Rehabilitation Services
Notable Achievements
● The Department of Rehabilitation Services (DRS) assisted more than 68,000 Oklahomans with disabilities and their families during FY-2008.
● DRS’s Vocational Rehabilitation and Visual Services divisions assisted 2,246 persons with disabilities to start new jobs during 2008. A range of vocational rehabilitation and employment services were provided to 12,500 persons who were preparing to go to work. Those who become employed reduce the need for disability benefits and social services while paying taxes on their earnings.
● This year, the Oklahoma School for the Deaf partnered with the University of Science and Arts of Oklahoma and the Jane Brooks Foundation in order to expand OSD early childhood services at a satellite in Chickasha.
● Oklahoma School for the Blind hosted a national outreach forum for school for the blind staff from 26 states. Forum participants shared ideas and learned about new and exciting issues related to blindness and visual impairment.
● DRS’s Disability Determination Division is nationally recognized by SSA every year for outstanding production. In 2008, the division ranked fourth in the nation in initial claims accuracy at 96.5%. In support of the Commissioner of Social Security’s goal of reducing backlogs in the Office of Disabilities Adjudication Review, the Disability Determination Division voluntarily reviewed 1,451 remands resulting in 446 fully favorable reversals.
Mission
The mission of the Department of Rehabilitation Services (DRS) is to provide opportunities for individuals with disabilities to achieve productivity, independence, and an enriched quality of life.
The agency administers four main programs: Vocational Rehabilitation and Visual
Services Division;
Oklahoma School for the Blind;
Oklahoma School for the Deaf; and
Disability Determination Division
Vocational Rehabilitation and Visual Services Division The Vocational Rehabilitation and Visual Services (DVR/DVS) divisions of DRS administers the federal vocation rehabilitation program for Oklahomans with disabilities. DRS provides vocational rehabilitation, education, employment services and independent living programs. Once a client is determined eligible for vocational rehabilitation services, he or she is placed into one of three priority groups according to the severity of his or her disability and in accordance with guidelines in the federal Rehabilitation Act. DRS receives $4 from the federal government for every $1 of state funding for this program. Key Performance Measure
$3,751
$17,339
$4,100
$19,048
$5,387
$17,446
$6,149
$18,012
$9,306
$20,250
$0
$5,000
$10,000
$15,000
$20,000
$25,000
FY-2004 FY-2005 FY-2006 FY-2007 FY-2008
Average Cost of Service vs Average Client Earnings (VRS)
Co s t o f Services Average Earnings
Source: OKDRS
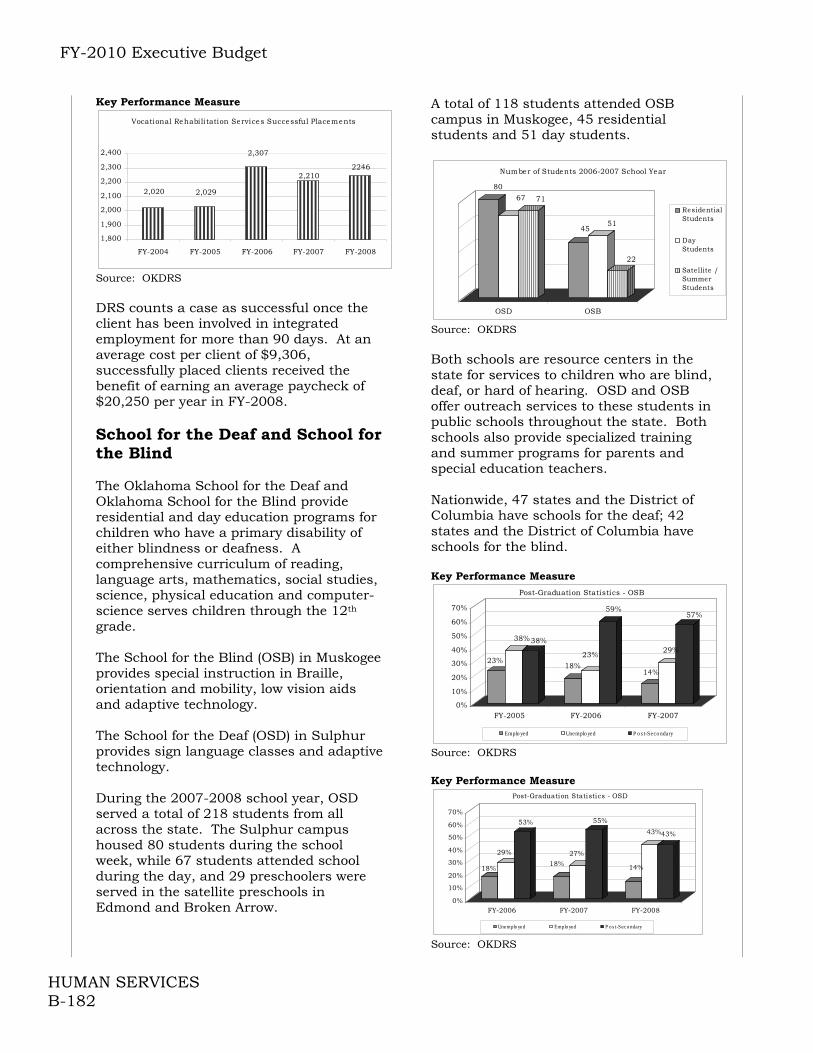
FY-2010 Executive Budget
HUMAN SERVICES B-182
Key Performance Measure
Vocational Rehabi li tation Services Successful Placements
2,020 2,029
2,307
2,2102246
1,800
1,900
2,000
2,100
2,200
2,300
2,400
FY-2004 FY-2005 FY-2006 FY-2007 FY-2008
Source: OKDRS DRS counts a case as successful once the client has been involved in integrated employment for more than 90 days. At an average cost per client of $9,306, successfully placed clients received the benefit of earning an average paycheck of $20,250 per year in FY-2008. School for the Deaf and School for the Blind The Oklahoma School for the Deaf and Oklahoma School for the Blind provide residential and day education programs for children who have a primary disability of either blindness or deafness. A comprehensive curriculum of reading, language arts, mathematics, social studies, science, physical education and computer-science serves children through the 12th grade. The School for the Blind (OSB) in Muskogee provides special instruction in Braille, orientation and mobility, low vision aids and adaptive technology. The School for the Deaf (OSD) in Sulphur provides sign language classes and adaptive technology. During the 2007-2008 school year, OSD served a total of 218 students from all across the state. The Sulphur campus housed 80 students during the school week, while 67 students attended school during the day, and 29 preschoolers were served in the satellite preschools in Edmond and Broken Arrow.
A total of 118 students attended OSB campus in Muskogee, 45 residential students and 51 day students.
8067 71
4551
22
OSD OSB
Number of Students 2006-2007 School Year
ResidentialStudents
DayStudents
Satellite /SummerStudents
Source: OKDRS Both schools are resource centers in the state for services to children who are blind, deaf, or hard of hearing. OSD and OSB offer outreach services to these students in public schools throughout the state. Both schools also provide specialized training and summer programs for parents and special education teachers. Nationwide, 47 states and the District of Columbia have schools for the deaf; 42 states and the District of Columbia have schools for the blind. Key Performance Measure
23%
38% 38%
18%23%
59%
14%
29%
57%
0%
10%
20%
30%
40%
50%
60%
70%
FY-2005 FY-2006 FY-2007
Post-Graduation Statistics - OSB
Emplo yed Unemplo yed P o s t-Seco ndary
Source: OKDRS Key Performance Measure
18%
29%
53%
18%27%
55%
14%
43%43%
0%
10%
20%
30%
40%
50%
60%
70%
FY-2006 FY-2007 FY-2008
Post-Graduation Statistics - OSD
Unemplo yed Emplo yed P o s t-Seco ndary Source: OKDRS
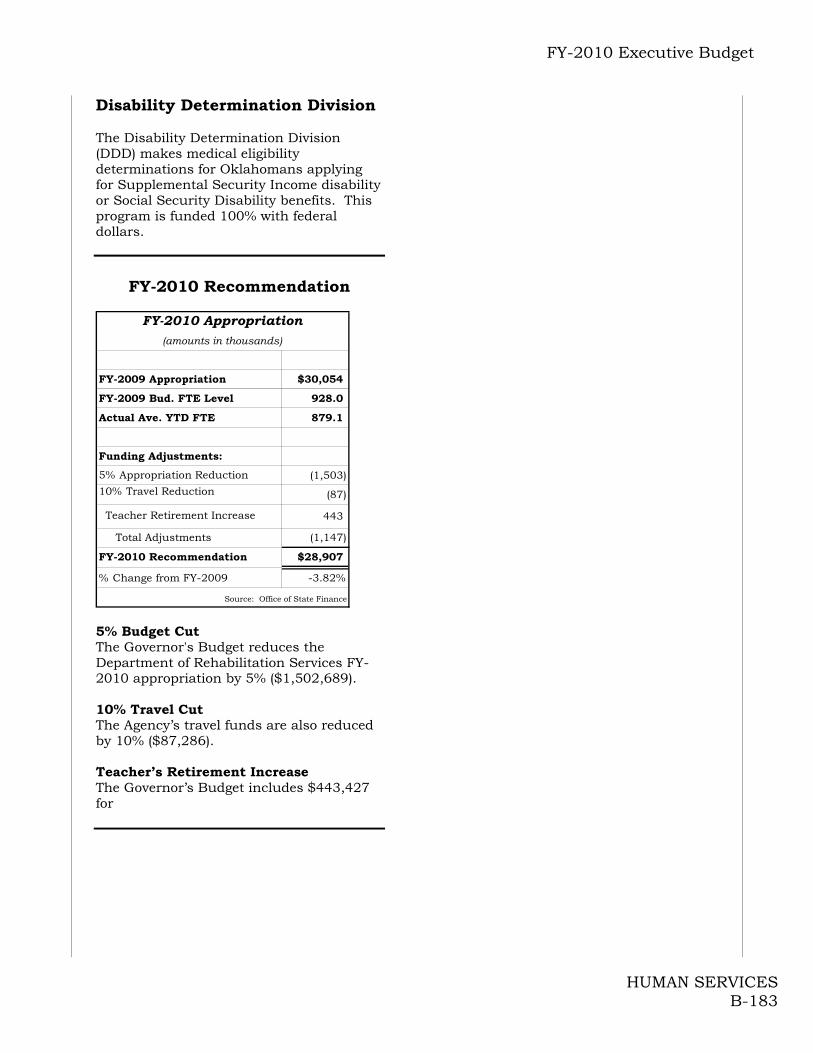
FY-2010 Executive Budget
HUMAN SERVICES B-183
Disability Determination Division The Disability Determination Division (DDD) makes medical eligibility determinations for Oklahomans applying for Supplemental Security Income disability or Social Security Disability benefits. This program is funded 100% with federal dollars.
FY-2010 Recommendation
FY-2009 Appropriation $30,054
FY-2009 Bud. FTE Level 928.0
Actual Ave. YTD FTE 879.1
Funding Adjustments:
5% Appropriation Reduction (1,503)
10% Travel Reduction (87)
Teacher Retirement Increase 443
Total Adjustments (1,147)
FY-2010 Recommendation $28,907
% Change from FY-2009 -3.82%
Source: Office of State Finance
FY-2010 Appropriation(amounts in thousands)
5% Budget Cut The Governor's Budget reduces the Department of Rehabilitation Services FY-2010 appropriation by 5% ($1,502,689). 10% Travel Cut The Agency’s travel funds are also reduced by 10% ($87,286). Teacher’s Retirement Increase The Governor’s Budget includes $443,427 for
FY-2010 Executive Budget
HUMAN SERVICES B-184
University Hospitals Authority and Trust
Notable Achievements Pre-tax Earnings Distributions as per
the Joint Operating Agreement The terms of the Joint Operating
Agreement specify that each calendar year the University Hospitals Trust receives the first $9 million of pre-tax earnings of the hospitals encompassed in the agreement. Over the course of the Agreement approximately $109 million in pre-tax preference payments have been made to the University Hospitals Trust. The Trust uses these funds to fulfill its mission to support medical education and clinical research.
Investment in Medical Technology, Equipment and Research and Medical Facilities
To date, the University Hospitals Authority and Trust and HCA Health Services of Oklahoma (dba OU Medical Center) have combined investments of $297 million on hospital equipment and facilities improvements. In addition the Trust provided $18.6 million for the construction of the Stanton L. Young Basic Research building Phase II where state of the art genomics and oncology research began in 2006. The Trust has also completed the Arrhythmia Research Institute located in the O.U. Medical Center where pioneering arrhythmia oblation procedures were innovated. In 2007 the Trust began construction of the 330,000 square foot O.U. Children’s Physicians medical office building where centralized state of the art pediatric care will be provided to Oklahoma’s children.
Brief History In early 1998, the University Hospitals Authority entered into a Joint Operating Agreement (JOA) with HCA Health Services of Oklahoma, Inc., a subsidiary of Columbia Corporation. The agreement completed the largest and most comprehensive privatization in Oklahoma, consisting of a long-term lease between the
University Hospitals Trust and HCA Health Services of Oklahoma, Inc. to lease, manage and operate the University Hospitals. This historic partnership combined University Hospital, Children’s Hospital of Oklahoma, O’Donoghue Rehabilitation Institute and Presbyterian Hospital to form what is now called OU Medical Center. This name represents the association of the hospitals with the University of Oklahoma Health Sciences Center medical schools. The OU Medical Center hospitals serve as teaching hospitals for the medical schools. Current Role of the Authority The Authority, in conjunction with the University Hospital Trust, is responsible for monitoring the JOA and making yearly financial reports to the Governor and the Legislature. The mission of the Authority is to be a catalyst for medical excellence, to support medical education, clinical research and to assure the best care available to all Oklahoma citizens regardless of means, while growing essential alliances and maximizing utilization of State and Federal resources. Indigent Care Expenditures The OU Medical Center Hospitals provide care to indigent persons equaling at least 120% of the state’s appropriation for indigent care. In the event that audited costs of indigent care go above 150% of the appropriation, the Governing Board of the JOA can seek an increase in the appropriations from the Legislature or reduce services to indigents. Indigent care means medical care provided to individuals who do not have insurance and cannot pay for the cost of the care they receive. During FY-2008, there were a total of 225,608 admissions, clinic and emergency room visits providing care to the medically indigent at OU Medical Center. The categories of service are as follows:
15,431 Admissions
210,177 Adult and Pediatric outpatient and ER visits.
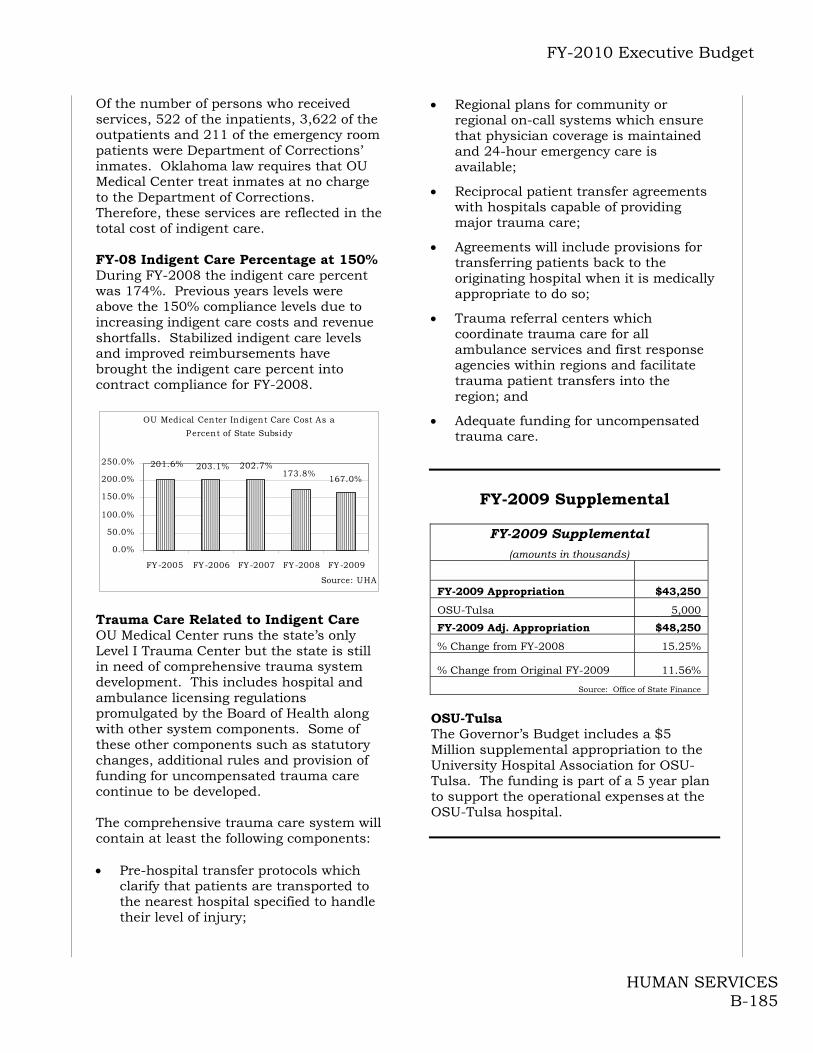
FY-2010 Executive Budget
HUMAN SERVICES B-185
Of the number of persons who received services, 522 of the inpatients, 3,622 of the outpatients and 211 of the emergency room patients were Department of Corrections’ inmates. Oklahoma law requires that OU Medical Center treat inmates at no charge to the Department of Corrections. Therefore, these services are reflected in the total cost of indigent care. FY-08 Indigent Care Percentage at 150% During FY-2008 the indigent care percent was 174%. Previous years levels were above the 150% compliance levels due to increasing indigent care costs and revenue shortfalls. Stabilized indigent care levels and improved reimbursements have brought the indigent care percent into contract compliance for FY-2008.
OU Medical Center Indigent Care Cost As a
Percent of State Subsidy
167.0%173.8%
202.7%203.1%201.6%
0.0%
50.0%
100.0%
150.0%
200.0%
250.0%
FY-2005 FY-2006 FY-2007 FY-2008 FY-2009
Source: UHA
Trauma Care Related to Indigent Care OU Medical Center runs the state’s only Level I Trauma Center but the state is still in need of comprehensive trauma system development. This includes hospital and ambulance licensing regulations promulgated by the Board of Health along with other system components. Some of these other components such as statutory changes, additional rules and provision of funding for uncompensated trauma care continue to be developed. The comprehensive trauma care system will contain at least the following components: Pre-hospital transfer protocols which
clarify that patients are transported to the nearest hospital specified to handle their level of injury;
Regional plans for community or regional on-call systems which ensure that physician coverage is maintained and 24-hour emergency care is available;
Reciprocal patient transfer agreements with hospitals capable of providing major trauma care;
Agreements will include provisions for transferring patients back to the originating hospital when it is medically appropriate to do so;
Trauma referral centers which coordinate trauma care for all ambulance services and first response agencies within regions and facilitate trauma patient transfers into the region; and
Adequate funding for uncompensated trauma care.
FY-2009 Supplemental
FY-2009 Supplemental
(amounts in thousands)
FY-2009 Appropriation $43,250
OSU-Tulsa 5,000
FY-2009 Adj. Appropriation $48,250
% Change from FY-2008 15.25%
% Change from Original FY-2009 11.56%
Source: Office of State Finance
OSU-Tulsa The Governor’s Budget includes a $5 Million supplemental appropriation to the University Hospital Association for OSU-Tulsa. The funding is part of a 5 year plan to support the operational expenses at the OSU-Tulsa hospital.

FY-2010 Executive Budget
HUMAN SERVICES B-186
FY-2010 Appropriation
FY-2010 Appropriation
(amounts in thousands)
FY-2009 Appropriation $43,250
FY-2009 Bud. FTE Level 7.0
Actual Ave. YTD FTE 7.0
Funding Adjustments:
Annualize Supplemental 5,000
10% Travel Cut 1
Total Adjustments 5,001
FY-2009 Recommendation $48,251
% Change from FY-2009 11.56%
Source: Office of State Finance
Annualize Supplemental The Governor’s Budget includes $5 million to annualize the supplemental appropriation for OSU-Tulsa. 10% Travel Cut Agency travel funds are reduced by 10% ($401)

FY-2010 Executive Budget
MILITARY B-187
Oklahoma Military Department
Mission The Oklahoma Military Department’s (OMD) mission is to preserve the state and the nation through the organization and training of the Oklahoma National Guard. To that end, OMD is committed to providing adequate training facilities for the Oklahoma National Guard. OMD also continues to serve Oklahoma’s at-risk youth with programs, which instill self-esteem and discipline in our young people. Youth Programs The Oklahoma Military Department fields five programs involving Oklahoma’s youth. On July 1, 2005, Oklahoma Military Department reconstituted the State Transition and Reintegration System (STARS), providing statewide tracking services for adjudicated youth through personal contacts and advanced Global Position Satellite (GPS) technologies. First Lady Kim Henry became the official spokesperson for Oklahoma’s National Guard Youth Challenge Program, and this program set a national mark by being the first program of its kind to publish their entry web page in both English and Spanish. Throughout 2006, the Youth Programs Division (YPD) continued to develop and refine the coordination between its residential programs resulting in significant progress in the areas of job training and job placement. Thunderbird Youth Academy In Pryor since 1993, the Thunderbird Youth Academy (TYA) holds two 22-week sessions per calendar year. This voluntary program utilizes military discipline to improve self-esteem and physical fitness of approximately 200 Oklahoma at-risk youths every year.
Education is a key component of the TYA. The curriculum focuses on specific criteria, GED completion and basic life skills. GED preparation is intensive and directed toward improving each cadet academically. Once cadets obtain their GED, they have the opportunity to complete college level studies before graduation. This voluntary program is the result of a cooperative effort between TYA and local colleges and universities. The credits are fully transferable and certified college instructors teach the classes. Since 1993 2,464 of Oklahoma’s high school dropouts have dramatically improved their education level and employability potential, with 227 graduating in 2006.
Placement Statistics of TYA Graduates (1993 - 2006)
Other16%
Military17%
Employed39%
Higher Education
28%Source: OK Military Department
Thunderbirds Regimented Training Program (TRTP) Having served 865 adjudicated cadets in Pryor, this residential program continues to be a unique asset to the Office of Juvenile Affairs. TRTP also maintains the highest standards of the American Correctional Association certification criteria. Thunderbird Trades Academy (TTA) Located in Pryor, this residential program launched its inaugural class January 12, 2004, in cooperation with OSU-Okmulgee. TTA has graduated 35 youth to date and has a 100% placement rate. TTA has developed new partnerships which are setting the stage for significant job training and placement enhancements and may result in establishing a new model for the nation.

FY-2010 Executive Budget
MILITARY B-188
State Transition and Reintegration System (STARS) Prior to its closing in July 2001, STARS tracked and provided reintegration services for 6,468 youth throughout the state. In July 2005, state lawmakers reopened the program. Currently, STARS provides tracking services for an average of 200 serious violent or sexual offender juveniles each month, statewide. STARBASE STARBASE operates its programs at five locations: Tulsa, Oklahoma City, Camp Gruber, Anadarko, and Pryor. This program has inspired over 40,900 of Oklahoma’s elementary school-aged youth with a greater appreciation of math and sciences through practical application of rocketry, astronomy, life sciences, and aerospace technology. Troop Strength Currently, the Oklahoma Military Department has over 9,700 troops stationed in the state. The number of troops currently on active duty is 1190.
FY-2010 Recommendation
FY-2009 Appropriation $13,132
FY-2009 Bud. FTE Level 441.0
Actual Ave. YTD FTE 368.7
Funding Adjustments:Appropriation Reduction (394)10% Travel Reduction (30)
Total Adjustments -424
FY-2010 Recommendation $12,708
% Change from FY-2009 -3.23%
Source: Office of State Finance
FY-2010 Appropriation(amounts in thousands)
Appropriation Reduction The Governor’s budget reduces the Military Department’s FY-2010 appropriation by 3% ($393,969). Travel Reduction Agency travel funds are also reduced by 10% ($30,943). The agency’s appropriations are reduced accordingly.

FY-2010 Executive Budget
SAFETY AND SECURITY B-189
Alcohol Beverage Laws Enforcement Commission
(ABLE) Notable Achievements The agency has performed all required
alcohol inspections throughout all 77 counties with only 26 field agents.
Agency employees continue to serve the Regional Organized Crime Information Center and OKLEX board.
Oklahoma’s compliance rate for rejecting the sale of tobacco to minors in FY-2007 continued to exceed national standards.
ABLE maintains documentation on 48,465 licensees and issues over 14,000 licenses per year.
Mission The Alcohol Beverage Laws Enforcement Commission protects and enforces state laws pertaining to alcoholic beverages, youth access to tobacco, and charity games. Their priority enforcement is the minimization of alcohol and tobacco use by Oklahoma’s youth. Alcohol Education Education and creating awareness are a large part of ABLE’s strategy for reducing teenage alcohol use. Before attaining alcohol licenses, businesses must attend an orientation provided by ABLE through a contract with a private organization to train new employees of alcohol-serving entities. Also, ABLE trains business employees to spot fraudulent driver licenses, and intoxicated and underage persons. Source: ABLE FY-2004 FY-2005 FY-2006 FY-2007Alcohol Inspections (Businesses) 2,489 2,164 2,761 2,872Costs per Alcohol Inspection $102.38 $104.55 $110.10 $123.06
FY-2010 Recommendation
FY-2009 Appropriation $3,925
FY-2009 Bud. FTE Level 48.0
Actual Ave. YTD FTE 42.3
Funding Adjustments:Appropriation Reduction (196)10% Travel Reduction (4)
Total Adjustments -200
FY-2010 Recommendation $3,725
% Change from FY-2009 -5.10%
Source: Office of State Finance
FY-2010 Appropriation(amounts in thousands)
Appropriation Reduction The Governor’s budget reduces Alcohol Beverage Laws Enforcement Commission FY-2010 appropriation by 5% (196,263). Travel Reduction Agency travel funds are also reduced by 10% ($3,501). The agency’s appropriations are reduced accordingly.

FY-2010 Executive Budget
SAFETY AND SECURITY B-190
Attorney General
Mission The mission of the Office of Attorney General is to represent Oklahoma by serving and protecting citizens, government and the law. A few of the services it provides to accomplish its mission are: Representing the state in criminal
appeals;
Investigating criminal matters anywhere in the state through the Multi County Grand Jury;
Providing advice and counsel to all State Officers, Boards and Commissions;
Writing opinions upon all questions of law submitted to the Attorney General by persons or bodies with proper statutory authority;
Appearing, as required by statute, and prosecuting or defending, before any court, board or commission, any cause or proceeding in which the state is an interested party;
Overseeing funding and certification for domestic violence and sexual assault programs as well as batters' intervention programs across the state;
Providing statewide and regional training for law enforcement officers, prosecutors, victim advocates, healthcare professionals, and various other allied professionals;
Developing and maintaining a hotline that provides crisis intervention and resources to victims of domestic violence, sexual assault and stalking;
Implementing OK VINE, Oklahoma's criminal tracking and automated victim notification service and VINE Protective Order, a service that provides status change notification to victims filing protective orders; and
Administering the Address Confidentiality Program which allows agencies to accept a substitute address for participants and enables them to respond to requests without disclosing the location of victims of domestic violence, sexual assault and stalking to their perpetrators.
FY-2008 Special Funds
$0 $500 $1,000 $1,500 $2,000 $2,500 $3,000 $3,500
Revolving Fund
Workers' Comp Fraud
CASA
Federal Funds
Medicaid Fraud Unit Fund
Special Cash
(in 000's)Source: Attorney General Contract Attorneys Under state law, various agencies contract with the Attorney General’s office for legal services. With these contracts, the agency is guaranteed that an assistant attorney general will spend a certain amount of his or her time working for the agency. Contracts with the Attorney General vary from 25% of an attorney’s time to 100%. As of January, 2009, the Attorney General’s Office has contracts with more than 48 state agencies. Key Performance Measure
Cost of Counsel ($ Per Hour)FY-2006 FY-2007 FY-2008
Assistant Attorney General $61 $61 $65Market Rate of Private Counsel $151 $156 $190
Domestic Violence Unit In 2005, the Legislature authorized the transfer of the powers and duties associated with the Domestic Violence and Sexual Assault Program to the Attorney General’s Office from the Department of Mental Health and Substance Abuse Services. Funds were reallocated to the budget of the Attorney General for the continuation of programs and services. Services include community-based programs for victims of
FY-2010 Executive Budget
SAFETY AND SECURITY B-191
domestic violence and sexual abuse that provide:
Safe shelter; Advocacy; and Counseling services.
FY-2010 Recommendation
FY-2009 Appropriation $14,782
One-time Adjustments (57)
FY-2009 Base $14,725
FY-2009 Bud. FTE Level 180.5
Actual Ave. YTD FTE 174.3
Funding Adjustments:Appropriation Reduction (736)10% Travel Reduction (24)
Total Adjustments -760
FY-2010 Recommendation $13,965
$ Change from FY-2009 ($817)
% Change from FY-2009 -5.53%
Source: Office of State Finance
FY-2010 Appropriation(amounts in thousands)
One-Time Adjustment The Governor’s budget reduces the Attorney General’s budget by $57,522. This was one-time funding to assist with the Attorney General’s lawsuit. Appropriation Reduction The Governor’s budget reduces the Attorney Generals FY-2010 appropriation by 5% (736,222). Travel Reduction Agency travel funds are also reduced by 10% ($23,780). The agency’s appropriations are reduced accordingly.
FY-2010 Executive Budget
SAFETY AND SECURITY B-192
Board of Tests for Alcohol and Drug Influence
Notable Achievements
The Board made significant changes to the Board of Test Rules (Title 40) to make the testing procedure less contentious in the courtroom.
The rules governing interlock installers and users were rewritten with the help of the interlock company’s association to better comply with current statutes.
The Board approved the use of the CMI Intoxilyzer 8000 and is in the process of developing software requirements to comply with Oklahoma law and to complement the LEADERS program and ultimately make work simpler for law enforcement personnel.
Mission The Board of Tests for Alcohol and Drug Influence promotes a safe driving environment through:
Proper training of officers in the use of breath testing equipment;
Inspection and training of ignition interlock installers;
Performing certification, calibration and maintenance on breath testing equipment to factory and Board standards; and
Maintaining records associated with breath testing and ignition interlock to include rules of the Board, policies and procedures of the Board, and minutes of each meeting of the Board; and,
Background The Board of Tests for Alcohol and Drug Influence is comprised of the Dean of the University of Oklahoma College of Medicine, the Commissioner of Public Safety, the Director of the Oklahoma State Bureau of Investigation, the State Commissioner of Health, the Director of the Council of Law Enforcement Education and Training, one certified peace officer selected by the Oklahoma Sheriffs and Peace Officers Association, and one person selected by the Oklahoma Association of Chiefs of Police. By statute, the Legislature appropriates funds to the Department of Public Safety to be transferred for the support of the Board of Tests for Alcohol and Drug Influence.
FY-2010 Recommendation
FY-2009 Appropriation $400
FY-2009 Bud. FTE Level 7.0
Actual Ave. YTD FTE 7.0
Funding Adjustments:Administrative Reduction (20)
FY-2010 Recommendation $380
FY-2010 Appropriation(amounts in thousands)
Source: Office of State Finance Appropriation Reduction The Governor’s budget reduces the Board of Tests FY-2010 appropriation by 5% ($20,000).

FY-2010 Executive Budget
SAFETY AND SECURITY B-193
Department of Corrections (DOC)
Notable Achievements
Offenders on work release at state operated community corrections centers, community work centers and at contract facilities contribute to their cost of incarceration. During FY-2009 a total of $5,316,044.33 in program support was generated through use of these work release beds.
During FY-2008 DOC placed 852
offenders on Global Positioning Satellite (GPS Monitoring), with the success rate of offenders completing the program through parole or discharge at 93%. This program saved the state 154,760 bed days at an average cost of $43.65 per day.
The Volunteer Services Unit trained
an additional 1,377 volunteers in FY-2008. Volunteers contributed approximately 165,089 hours of service in FY-2008, with an estimated monetary value of $2,588,594.44.
The first year of the DOC/DMHSAS
interagency reentry program for offenders with serious mental illness served over 150 mentally ill offenders with significant improvement in successful community adjustment.
The Faith and Character Community
Programs at Mabel Bassett Correctional Center and Oklahoma State Reformatory graduated their first classes. This program has since been expanded to Dick Conner Correctional Center.
Long term outcomes for successfully
released Community Sentencing offenders continue to be outstanding. Ninety percent of offenders who completed the program prior to July
1, 2004, remained in the community as of June 30, 2007.
DOC entered into a partnership with
the Oklahoma Highway Patrol – Troop Z to improve communications between staff of both agencies. As a result the amount of man hours spent in the recapture of escapees has significantly decreased from an average time for recapture of 36 days in FY-2006 to an average of 2.2 days in FY-2008.
Oklahoma Correctional Industries
generated $19,079,311 in sales of manufactured products and services. Sales were slightly below FY-2007 numbers, but despite lower sales and significant increases in raw materials and other expenses, OCI held prices steady throughout the fiscal year, thus resulting in additional savings for customers.
The Department of Corrections’ Agri-
Services Unit began a new venture into goat production with assistance from both Oklahoma State University and Langston University. Additionally, the Agri-Services Unit’s Meat Cutting School, the only U.S. Department of Labor approved such school in the United States in a correctional setting, graduated 25 apprentice meat cutters during the fiscal year.
A total of 2,670 offenders
participated in substance abuse treatment with 923 successful completions during FY-2008.
Two thousand five hundred forty-four
offenders participated in GED classes during FY-2008 and 1,047 offenders completed the course. Nine hundred ninety offenders passed the test and received GED completion certificates.
The new Offender Banking System
(OBS) will consolidate the 50+ agency special accounts that
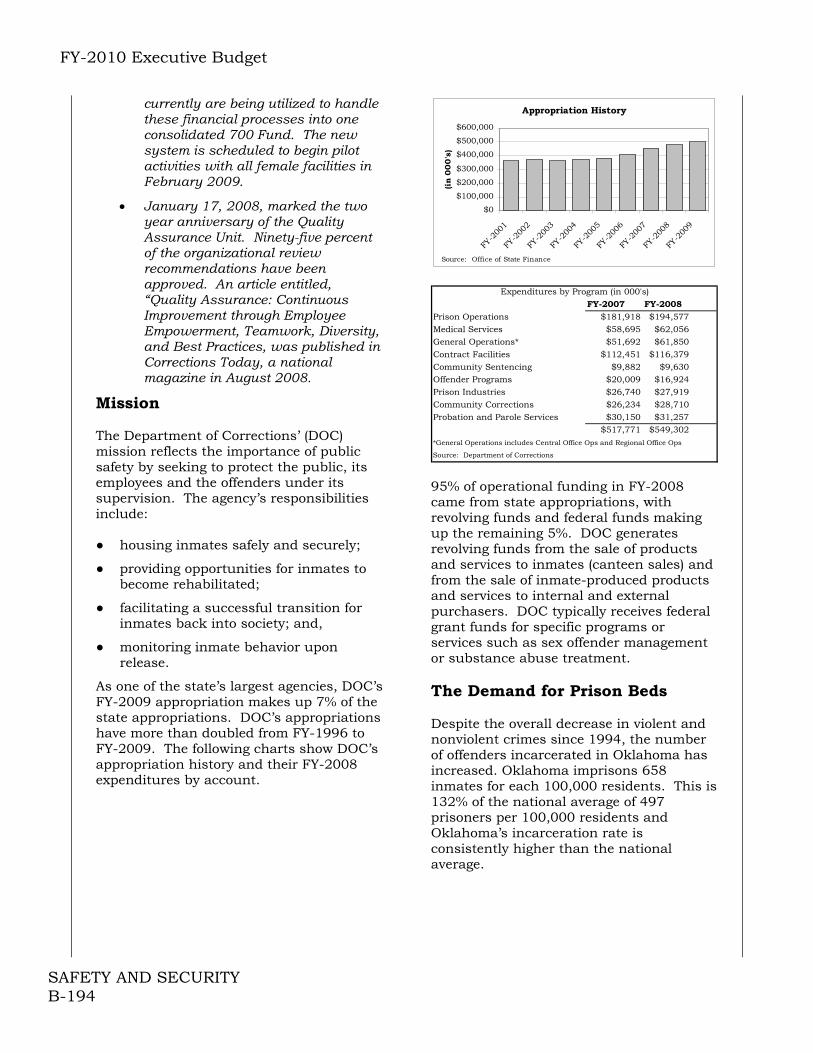
FY-2010 Executive Budget
SAFETY AND SECURITY B-194
currently are being utilized to handle these financial processes into one consolidated 700 Fund. The new system is scheduled to begin pilot activities with all female facilities in February 2009.
January 17, 2008, marked the two year anniversary of the Quality Assurance Unit. Ninety-five percent of the organizational review recommendations have been approved. An article entitled, “Quality Assurance: Continuous Improvement through Employee Empowerment, Teamwork, Diversity, and Best Practices, was published in Corrections Today, a national magazine in August 2008.
Mission The Department of Corrections’ (DOC) mission reflects the importance of public safety by seeking to protect the public, its employees and the offenders under its supervision. The agency’s responsibilities include: ● housing inmates safely and securely;
● providing opportunities for inmates to become rehabilitated;
● facilitating a successful transition for inmates back into society; and,
● monitoring inmate behavior upon release.
As one of the state’s largest agencies, DOC’s FY-2009 appropriation makes up 7% of the state appropriations. DOC’s appropriations have more than doubled from FY-1996 to FY-2009. The following charts show DOC’s appropriation history and their FY-2008 expenditures by account.
Appropriation History
$0
$100,000
$200,000
$300,000
$400,000
$500,000
$600,000
FY-2
001
FY-2
002
FY-2
003
FY-2
004
FY-2
005
FY-2
006
FY-2
007
FY-2
008
FY-2
009
(in
00
0's
)
Source: Office of State Finance
FY-2007 FY-2008Prison Operations $181,918 $194,577Medical Services $58,695 $62,056General Operations* $51,692 $61,850Contract Facilities $112,451 $116,379Community Sentencing $9,882 $9,630Offender Programs $20,009 $16,924Prison Industries $26,740 $27,919Community Corrections $26,234 $28,710Probation and Parole Services $30,150 $31,257
$517,771 $549,302*General Operations includes Central Office Ops and Regional Office Ops
Source: Department of Corrections
Expenditures by Program (in 000's)
95% of operational funding in FY-2008 came from state appropriations, with revolving funds and federal funds making up the remaining 5%. DOC generates revolving funds from the sale of products and services to inmates (canteen sales) and from the sale of inmate-produced products and services to internal and external purchasers. DOC typically receives federal grant funds for specific programs or services such as sex offender management or substance abuse treatment. The Demand for Prison Beds Despite the overall decrease in violent and nonviolent crimes since 1994, the number of offenders incarcerated in Oklahoma has increased. Oklahoma imprisons 658 inmates for each 100,000 residents. This is 132% of the national average of 497 prisoners per 100,000 residents and Oklahoma’s incarceration rate is consistently higher than the national average.
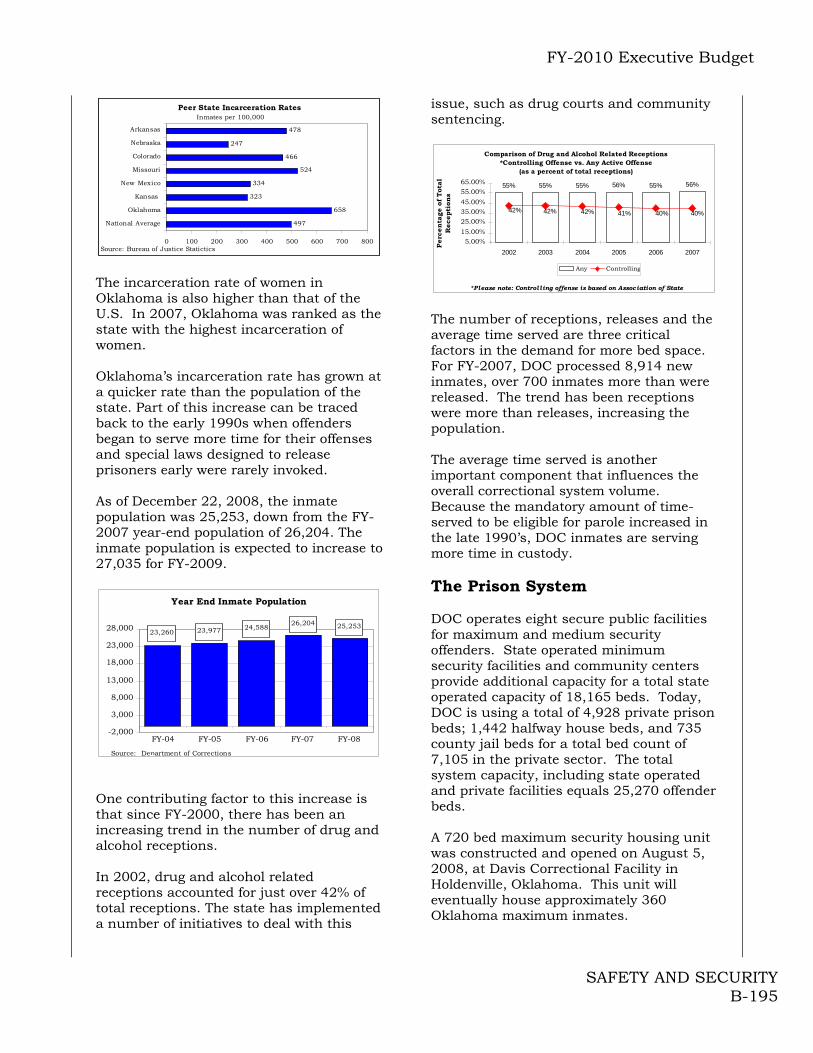
FY-2010 Executive Budget
SAFETY AND SECURITY B-195
Peer State Incarceration Rates
497
658
323
334
524
466
247
478
0 100 200 300 400 500 600 700 800
National Average
Oklahoma
Kansas
New Mexico
Missouri
Colorado
Nebraska
Arkansas
Inmates per 100,000
Source: Bureau of Justice Statictics The incarceration rate of women in Oklahoma is also higher than that of the U.S. In 2007, Oklahoma was ranked as the state with the highest incarceration of women. Oklahoma’s incarceration rate has grown at a quicker rate than the population of the state. Part of this increase can be traced back to the early 1990s when offenders began to serve more time for their offenses and special laws designed to release prisoners early were rarely invoked. As of December 22, 2008, the inmate population was 25,253, down from the FY-2007 year-end population of 26,204. The inmate population is expected to increase to 27,035 for FY-2009.
Year End Inmate Population
25,25326,20424,58823,97723,260
-2,000
3,000
8,000
13,000
18,000
23,000
28,000
FY-04 FY-05 FY-06 FY-07 FY-08
Source: Department of Corrections One contributing factor to this increase is that since FY-2000, there has been an increasing trend in the number of drug and alcohol receptions. In 2002, drug and alcohol related receptions accounted for just over 42% of total receptions. The state has implemented a number of initiatives to deal with this
issue, such as drug courts and community sentencing.
Comparison of Drug and Alcohol Related Receptions *Controlling Offense vs. Any Active Offense
(as a percent of total receptions)
55% 55% 55% 56% 55% 56%
40%40%41%42%42%42%
5.00%15.00%
25.00%
35.00%45.00%
55.00%
65.00%
2002 2003 2004 2005 2006 2007
Fiscal Year
Perc
en
tage o
f T
ota
l R
ecepti
on
s
Any Controlling
*Please note: Controll ing offense is based on Association of State The number of receptions, releases and the average time served are three critical factors in the demand for more bed space. For FY-2007, DOC processed 8,914 new inmates, over 700 inmates more than were released. The trend has been receptions were more than releases, increasing the population. The average time served is another important component that influences the overall correctional system volume. Because the mandatory amount of time-served to be eligible for parole increased in the late 1990’s, DOC inmates are serving more time in custody. The Prison System DOC operates eight secure public facilities for maximum and medium security offenders. State operated minimum security facilities and community centers provide additional capacity for a total state operated capacity of 18,165 beds. Today, DOC is using a total of 4,928 private prison beds; 1,442 halfway house beds, and 735 county jail beds for a total bed count of 7,105 in the private sector. The total system capacity, including state operated and private facilities equals 25,270 offender beds. A 720 bed maximum security housing unit was constructed and opened on August 5, 2008, at Davis Correctional Facility in Holdenville, Oklahoma. This unit will eventually house approximately 360 Oklahoma maximum inmates.
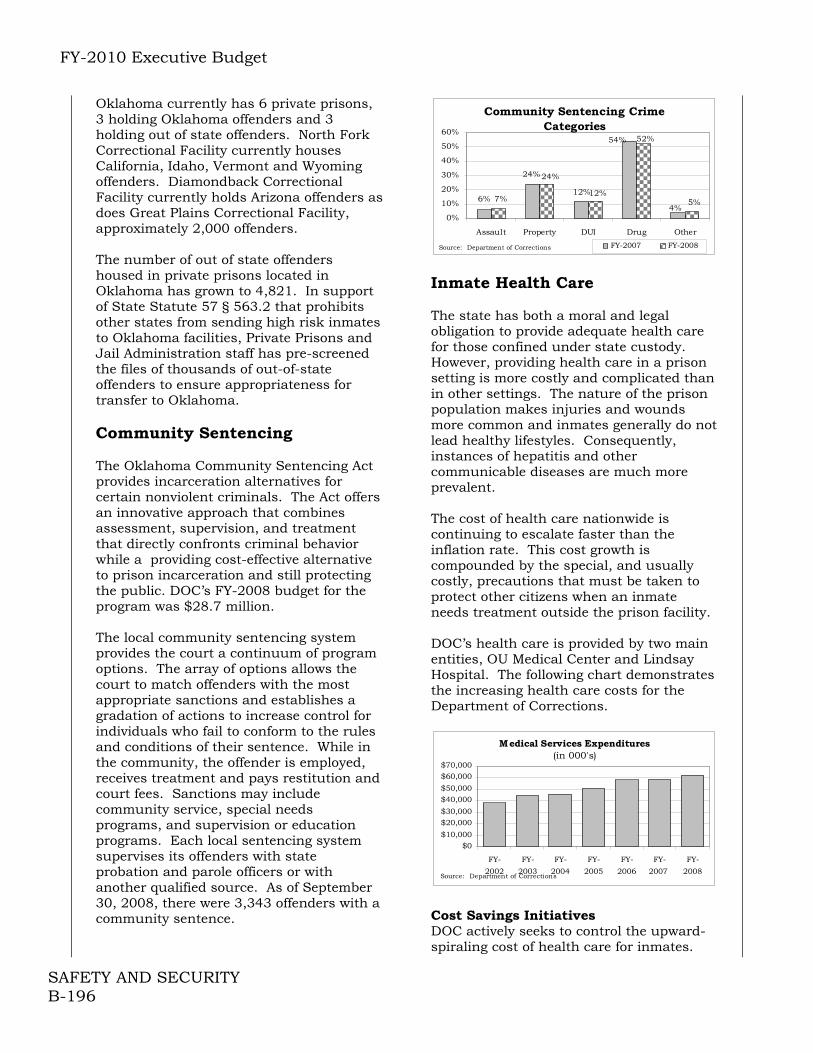
FY-2010 Executive Budget
SAFETY AND SECURITY B-196
Oklahoma currently has 6 private prisons, 3 holding Oklahoma offenders and 3 holding out of state offenders. North Fork Correctional Facility currently houses California, Idaho, Vermont and Wyoming offenders. Diamondback Correctional Facility currently holds Arizona offenders as does Great Plains Correctional Facility, approximately 2,000 offenders. The number of out of state offenders housed in private prisons located in Oklahoma has grown to 4,821. In support of State Statute 57 § 563.2 that prohibits other states from sending high risk inmates to Oklahoma facilities, Private Prisons and Jail Administration staff has pre-screened the files of thousands of out-of-state offenders to ensure appropriateness for transfer to Oklahoma. Community Sentencing The Oklahoma Community Sentencing Act provides incarceration alternatives for certain nonviolent criminals. The Act offers an innovative approach that combines assessment, supervision, and treatment that directly confronts criminal behavior while a providing cost-effective alternative to prison incarceration and still protecting the public. DOC’s FY-2008 budget for the program was $28.7 million. The local community sentencing system provides the court a continuum of program options. The array of options allows the court to match offenders with the most appropriate sanctions and establishes a gradation of actions to increase control for individuals who fail to conform to the rules and conditions of their sentence. While in the community, the offender is employed, receives treatment and pays restitution and court fees. Sanctions may include community service, special needs programs, and supervision or education programs. Each local sentencing system supervises its offenders with state probation and parole officers or with another qualified source. As of September 30, 2008, there were 3,343 offenders with a community sentence.
Community Sentencing Crime Categories
6%4%
24%
12%
54%
5%7%
24%
12%
52%
0%
10%
20%
30%
40%
50%
60%
Assault Property DUI Drug Other
FY-2007 FY-2008Source: Department of Corrections Inmate Health Care The state has both a moral and legal obligation to provide adequate health care for those confined under state custody. However, providing health care in a prison setting is more costly and complicated than in other settings. The nature of the prison population makes injuries and wounds more common and inmates generally do not lead healthy lifestyles. Consequently, instances of hepatitis and other communicable diseases are much more prevalent. The cost of health care nationwide is continuing to escalate faster than the inflation rate. This cost growth is compounded by the special, and usually costly, precautions that must be taken to protect other citizens when an inmate needs treatment outside the prison facility. DOC’s health care is provided by two main entities, OU Medical Center and Lindsay Hospital. The following chart demonstrates the increasing health care costs for the Department of Corrections.
Medical Services Expenditures(in 000's)
$0$10,000
$20,000$30,000
$40,000$50,000
$60,000$70,000
FY-
2002
FY-
2003
FY-
2004
FY-
2005
FY-
2006
FY-
2007
FY-
2008Source: Department of Corrections
Cost Savings Initiatives DOC actively seeks to control the upward-spiraling cost of health care for inmates.

FY-2010 Executive Budget
SAFETY AND SECURITY B-197
The agency also continues to take additional steps that will mitigate some of the growing pressure on budgetary resources. Some of these actions include: ● upgrading the copier and negotiating a
better lease rate;
● consolidating the duties of the training manager and director;
● eliminating two internal affairs positions;
● utilizing Parole Board video conferencing from host sites;
● combining three OCI garment operations into two, three OCI record conversion operations into two, and the OCI bindery operation into another existing operation;
● eliminating contracts for literacy labs at 16 facilities and providing these services in-house;
● using tele-psychiatry to reduce travel time/expenses for psychiatrists at five facilities and security transports at one facility;
● increasing the use of telemedicine and online consultations for specialty visits conducted with the University Physicians Medical Group;
● reducing hospital stays and costs by using medical case management services;
● physically aggregating prisoners with similar medical conditions and continuing to consider the medical needs of inmates when assigning them to facilities;
● establishing a physician referral review process prior to inmates being sent out for specialized and/or inpatient medical care;
● increasing the use of the Medicaid Reimbursement program;
● reducing temporary staff and payroll; and,
● increasing the use of certified nurses’ aides and certified medical aides to administer medicines.
FY-2010 Recommendation
FY-2010 Appropriation
(amounts in thousands)
FY-2009 Appropriation $503,000
FY-2009 Bud. FTE Level 4,989.0
Actual Ave. YTD FTE 5,032.3
Funding Adjustments:
10% Travel Reduction (102)
FY-2010 Recommendation $502,898
% Change from FY-2009 -0.02%
Source: Office of State Finance
Travel Reduction Agency travel funds are also reduced by 10% ($101,884)
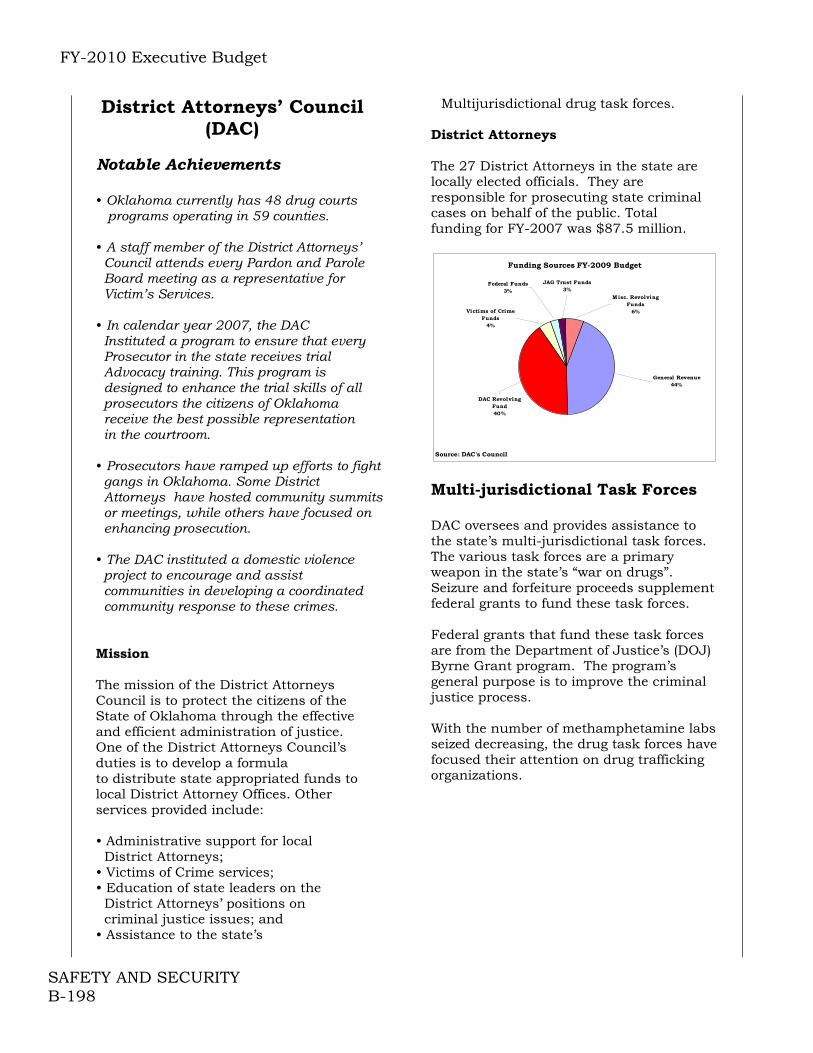
FY-2010 Executive Budget
SAFETY AND SECURITY B-198
District Attorneys’ Council (DAC)
Notable Achievements • Oklahoma currently has 48 drug courts programs operating in 59 counties. • A staff member of the District Attorneys’ Council attends every Pardon and Parole Board meeting as a representative for Victim’s Services. • In calendar year 2007, the DAC Instituted a program to ensure that every Prosecutor in the state receives trial Advocacy training. This program is designed to enhance the trial skills of all prosecutors the citizens of Oklahoma receive the best possible representation in the courtroom. • Prosecutors have ramped up efforts to fight gangs in Oklahoma. Some District Attorneys have hosted community summits or meetings, while others have focused on enhancing prosecution. • The DAC instituted a domestic violence project to encourage and assist communities in developing a coordinated community response to these crimes.
Mission The mission of the District Attorneys Council is to protect the citizens of the State of Oklahoma through the effective and efficient administration of justice. One of the District Attorneys Council’s duties is to develop a formula to distribute state appropriated funds to local District Attorney Offices. Other services provided include: • Administrative support for local District Attorneys; • Victims of Crime services; • Education of state leaders on the District Attorneys’ positions on criminal justice issues; and • Assistance to the state’s
Multijurisdictional drug task forces. District Attorneys The 27 District Attorneys in the state are locally elected officials. They are responsible for prosecuting state criminal cases on behalf of the public. Total funding for FY-2007 was $87.5 million.
Funding Sources FY-2009 Budget
General Revenue44%
DAC Revolving Fund40%
Victims of Crime Funds
4%
Federal Funds3%
Misc. Revolving Funds
6%
JAG Trust Funds3%
Source: DAC's Council Multi-jurisdictional Task Forces DAC oversees and provides assistance to the state’s multi-jurisdictional task forces. The various task forces are a primary weapon in the state’s “war on drugs”. Seizure and forfeiture proceeds supplement federal grants to fund these task forces. Federal grants that fund these task forces are from the Department of Justice’s (DOJ) Byrne Grant program. The program’s general purpose is to improve the criminal justice process. With the number of methamphetamine labs seized decreasing, the drug task forces have focused their attention on drug trafficking organizations.
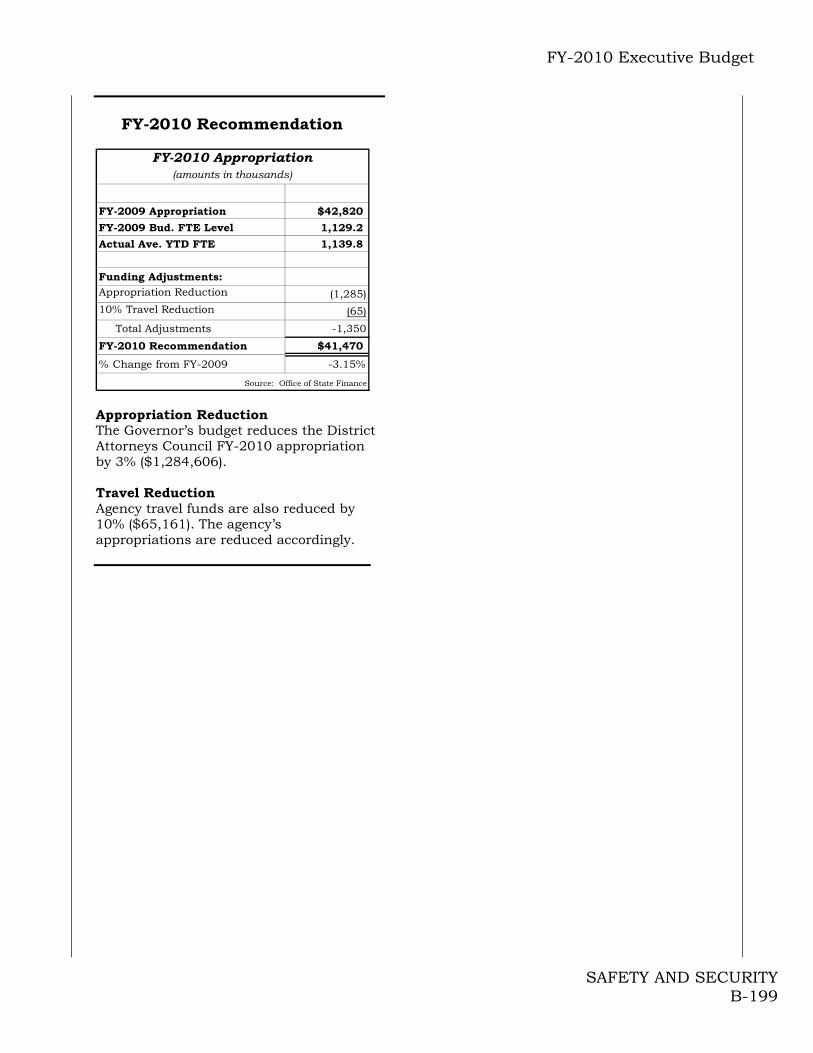
FY-2010 Executive Budget
SAFETY AND SECURITY B-199
FY-2010 Recommendation
FY-2009 Appropriation $42,820
FY-2009 Bud. FTE Level 1,129.2
Actual Ave. YTD FTE 1,139.8
Funding Adjustments:Appropriation Reduction (1,285)10% Travel Reduction (65)
Total Adjustments -1,350
FY-2010 Recommendation $41,470
% Change from FY-2009 -3.15%
Source: Office of State Finance
FY-2010 Appropriation(amounts in thousands)
Appropriation Reduction The Governor’s budget reduces the District Attorneys Council FY-2010 appropriation by 3% ($1,284,606). Travel Reduction Agency travel funds are also reduced by 10% ($65,161). The agency’s appropriations are reduced accordingly.

FY-2010 Executive Budget
SAFETY AND SECURITY B-200
State Emergency Fund
State Emergency Fund Appropriations
4,000,000
1,000,000
10,100,000
5,501,000
3,770,746
15,000,000
10,000,000
1,000,000
0
2,000,000
4,000,000
6,000,000
8,000,000
10,000,000
12,000,000
14,000,000
16,000,000
FY-
1998
FY-
1999
FY-
2000
FY-
2001
FY-
2002
FY-
2003
FY-
2006
FY-
2007
The State Emergency Fund provides funds to local governments and businesses for reconstruction and relief after a disaster. The Governor can allocate and authorize expenditures from this fund in certain cases, and the Contingency Review Board can allocate funds for other specified needs. In recent years, the state has experienced several disasters, which include:
● Winter 2005-2006 wildfires,
● December 2006 ice and snow storms,
● January 2007 ice storm.
● December 2007 ice storm.
To address the damages from these disasters, the Legislature and the Governor appropriated $10.1 million to the State Emergency Fund in FY-2002, $5.5 million in FY-2003, $3.7 million in FY-2004, and $15.0 million in FY-2006. However, until FY-2007, these appropriations did not fully fund all reconstruction and relief needs from these disasters listed above and the state owed nearly $14 million as its share of federal matching funds. In FY-2007, authorization for $10 million was given to the Department of Emergency Management to fulfill the State of Oklahoma’s obligations for past disasters. Current Issues The tornados in May 2008 caused several areas within the state to be declared a state disaster area by the Governor.
FY-2010 Recommendation
The Governor’s budget recommends $5 million for the State Emergency Fund.
FY-2010 Executive Budget
SAFETY AND SECURITY B-201
Oklahoma Department of Emergency Management
(ODEM)
Notable Achievements The Oklahoma Department of
Emergency Management led the state’s recovery efforts for five presidentially declared disasters as well as Oklahoma’s response in support of neighboring states impacted by hurricanes Gustav and Ike.
OEM’s efforts benefitted local
governments that sustained more than $45 million in infrastructure damage and response costs due to flooding, tornadoes and other severe weather. In addition to working with Oklahoma City officials to shelter 1,800 Hurricane Gustav evacuees at the former Lucent Plant, OEM officials sent Oklahoma Highway Patrol troopers, Oklahoma County Sheriffs deputies and Oklahoma National Guard personnel and equipment to assist with hurricane response efforts in Louisiana and Texas under the Emergency Management Assistance Compact. Additionally, OEM delivered more than $2.5 million in aid to residents of the Town of Picher after hundreds of homes and businesses were damaged by an EF-4 tornado on May 10.
In addition to the 2008 disasters,
state emergency management officials continued to manage recovery efforts for last year’s record-setting nine disaster declarations that left more than $225 million in infrastructure damage to cities, towns and counties.
Renovation of the State Emergency
Operations Center was completed and in April.
OEM assisted local preparedness
efforts by distributing more than $1
million in grant funds to 70 city and county emergency management departments through the Emergency Management Performance Grant program.
As part of the department’s
mitigation efforts, OEM helped cities, towns, counties and schools to secure funding needed to prepare hazard mitigation plans. Local governments are required to have a hazard mitigation plan in order to qualify for other mitigation grants. Additionally, OEM mitigation work delivered safe rooms in schools and storm warning systems in cities and towns across the state.
Mission The mission of the OEM is to minimize the effects of natural and man-made disasters. The agency accomplishes this by preparing and implementing preparedness plans, assisting local government subdivisions with training for and mitigation of disasters and coordinating actual disaster response/recovery operations. The Department is divided into four main areas: Hazard Mitigation Assists communities with identifying and implementing long-term hazard mitigation measures. Community Preparedness Provides coordination with other state and federal agencies in developing their capability to respond to a catastrophic disaster. Emergency Response Coordinates state emergency operations. The staff also monitors events and evaluates whether they may qualify as a State-declared emergency and the need for federal emergency and disaster assistance. Disaster Recovery Departmental staff implements procedures to provide for the quick and efficient

FY-2010 Executive Budget
SAFETY AND SECURITY B-202
delivery of state and federal aid to persons who have been affected by an emergency or disaster.
FY-2010 Recommendation
FY-2009 Appropriation $1,157
One-time Adjustments (350)
FY-2009 Base $807
FY-2009 Bud. FTE Level 25.0
Actual Ave. YTD FTE 27.5
Funding Adjustments:Appropriation Reduction (24)10% Travel Reduction (22)
Total Adjustments -46
FY-2010 Recommendation $761
$ Change from FY-2009 ($396)
% Change from FY-2009 -34.23%
Source: Office of State Finance
FY-2010 Appropriation(amounts in thousands)
One-Time Adjustment The Governor’s budget reduces the the Department of Emergency Managements budget by $350,000. This was one-time funding provided to fix the agency’s HVAC system. Appropriation Reduction The Governor’s budget reduces the Oklahoma Department of Emergency Management’s FY-2010 appropriation by 3% ($24,198). Travel Reduction Agency travel funds are also reduced by 10% ($21,947). The agency’s appropriations are reduced accordingly.

FY-2010 Executive Budget
SAFETY AND SECURITY B-203
State Fire Marshal (SFM) Notable Achievements
The SFM names fire service representatives to serve as grant evaluators at the U.S. Fire Administration in Washington D.C. These representatives then present their community leaders with critical information on successful grant-writing.
With passage of the Fire Safe Compliant Cigarette Act, the SFM began enforcement activities on January 1, 2009. The SFM will also compare statistics 10 years prior and 10 years after passage to determine the success of the Act and anticipates reduced fires caused by smoking materials.
The SFM purchased a mobile communications trailer and tow vehicle with Homeland Security grant funds. This one-of-a-kind unit is equipped to provide interoperable communications between emergency first responders, law enforcement, EMT, county and city officials during all-hazards incidents statewide.
Mission The mission of the agency is to promote safety and awareness and reduce the loss of lives and property through public education, investigations, inspections, reviewing building plans, enforcing code and collecting statistical data from the annual incident reports from more than 900 fire departments. Duties include:
Investigating and documenting the cause or origins of fires;
Assisting with and enforcing adopted Life Safety Codes and fire/crime prevention; and
Developing fire safety campaigns.
The State Fire Marshal positions investigators around the state for fast response to all investigative needs. This increases the probability of detecting any
possible attempt of arson. The SFM has the legal authority to arrest suspects if probable cause exists in an arson investigation.
FY-2010 Recommendation
FY-2009 Appropriation $2,271
FY-2009 Bud. FTE Level 31.0
Actual Ave. YTD FTE 30.1
Funding Adjustments:Appropriation Reduction (68)10% Travel Reduction (2)
Total Adjustments -70
FY-2010 Recommendation $2,201
% Change from FY-2009 -3.08%
Source: Office of State Finance
FY-2010 Appropriation(amounts in thousands)
Appropriation Reduction The Governor’s budget reduces the State Fire Marshal’s FY-2010 appropriation by 3% ($68,126). Travel Reduction Agency travel funds are also reduced by 10% ($2,299). The agency’s appropriations are reduced accordingly.
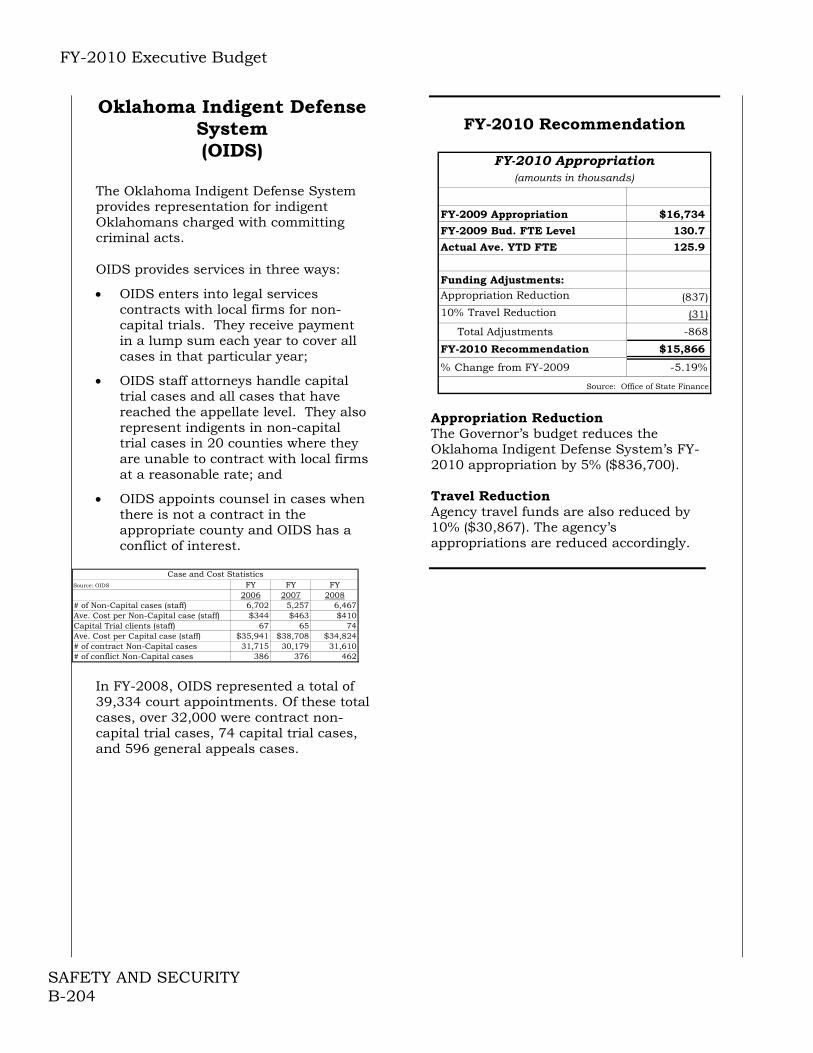
FY-2010 Executive Budget
SAFETY AND SECURITY B-204
Oklahoma Indigent Defense System (OIDS)
The Oklahoma Indigent Defense System provides representation for indigent Oklahomans charged with committing criminal acts.
OIDS provides services in three ways:
OIDS enters into legal services contracts with local firms for non-capital trials. They receive payment in a lump sum each year to cover all cases in that particular year;
OIDS staff attorneys handle capital trial cases and all cases that have reached the appellate level. They also represent indigents in non-capital trial cases in 20 counties where they are unable to contract with local firms at a reasonable rate; and
OIDS appoints counsel in cases when there is not a contract in the appropriate county and OIDS has a conflict of interest.
Case and Cost Statistics
Source: OIDS FY FY FY2006 2007 2008
# of Non-Capital cases (staff) 6,702 5,257 6,467Ave. Cost per Non-Capital case (staff) $344 $463 $410Capital Trial clients (staff) 67 65 74Ave. Cost per Capital case (staff) $35,941 $38,708 $34,824# of contract Non-Capital cases 31,715 30,179 31,610# of conflict Non-Capital cases 386 376 462
In FY-2008, OIDS represented a total of 39,334 court appointments. Of these total cases, over 32,000 were contract non-capital trial cases, 74 capital trial cases, and 596 general appeals cases.
FY-2010 Recommendation
FY-2009 Appropriation $16,734
FY-2009 Bud. FTE Level 130.7
Actual Ave. YTD FTE 125.9
Funding Adjustments:Appropriation Reduction (837)10% Travel Reduction (31)
Total Adjustments -868
FY-2010 Recommendation $15,866
% Change from FY-2009 -5.19%
Source: Office of State Finance
FY-2010 Appropriation(amounts in thousands)
Appropriation Reduction The Governor’s budget reduces the Oklahoma Indigent Defense System’s FY-2010 appropriation by 5% ($836,700). Travel Reduction Agency travel funds are also reduced by 10% ($30,867). The agency’s appropriations are reduced accordingly.

FY-2010 Executive Budget
SAFETY AND SECURITY B-205
Oklahoma State Bureau of Investigation
(OSBI)
Notable Achievements
All appropriate OSBI personnel are now trained in incident management and fully NIMS (National Incident Management System) compliant, the only state level law enforcement agency to achieve compliance.
All convicted offender DNA samples
are now processed in-house by the CODIS Unit (Combined DNA Index System). The Unit is current with processing and generated 114 “cold hits” this past year.
New Y-STR DNA technology was
validated for casework. The technology looks specifically at male contributions to biological samples from crime scenes, especially sexual assaults.
Average Forensic Laboratory case
turnaround time decreased 9.4% to a very acceptable 29 days.
Increased the number of clients using
the Automated Criminal History System (ACHS) for name based criminal history searches. Currently, 18.9% of all searches are processed though ACHS.
Homicide investigations totaled 75
for the year, an increase of 25% from 2006.
The Investigative Division was
completely reorganized to provide better service to criminal justice agencies.
Mission The mission of the Oklahoma State Bureau of Investigation is to ensure the safety and security of the citizens of Oklahoma.
OSBI clients include federal, tribal, state, district, county and municipal law enforcement and prosecutorial agencies, the general public and statutory requestors such as the Governor, Attorney General, and the Medical Examiner.
OSBI provides a wide array of investigative and forensic laboratory services including technical crime scene investigations and investigations of criminal offenses such as homicide, rape, assault, theft, fraud, embezzlement, and corruption. Specialized services include computer forensics, criminal intelligence, information sharing systems, polygraphs, forensic interviewing of child victims, training, expert testimony, laboratory analysis, and Internet crimes against children investigations.
OSBI Funding Sources for FY-2008
Other
1%
AFIS Fund
9%
State Approps
55%
Federal
Funds
2%
Forensic
Science Fund
9%
OSBI
Revolving
Fund
24%
Source: Oklahoma State Bureau of
Investigation
Child Abuse Response Team (CART) In 2006 SB 1800 created the CART and authorized two new FTE. Funding for this program was provided in the 2007 Legislative session. CART was created to conduct child abuse investigations. The OSBI now has a new Forensic Child Abuse Investigator, who, along with seven other Special Agents with extensive training in child abuse investigations, train, support, and assist law enforcement agencies in cases where children have been assaulted, abused, or exploited. Since January 1, 2007, the OSBI has investigated 147 cases of child abuse involving 184 victims.

FY-2010 Executive Budget
SAFETY AND SECURITY B-206
Forensic Science Center The new $30 million 86,000 square foot forensic laboratory in Edmond is scheduled for substantial completion in March 2008. This facility replaces the existing outdated 19,000 square foot Central Laboratory building that was built in 1972. State Fusion Center The OSBI developed and implemented an intelligence Fusion Center. It is staffed with nine OSBI Analysts and three OSBI Agents, and supplemented by analysts from OCPD, Tulsa P.D., Military Department, and the FBI. Information Sharing Initiatives The federal grant-funded OASIS (Oklahoma Automated Secure Information Sharing) and OKLeX (Oklahoma Law Enforcement Information Exchange) are secure, searchable web based sources of valuable information for law enforcement agencies. OASIS is a data warehouse of information shared by the OSBI, DPS, OCPD, and TPD, while OKLeX is an Internet portal allowing all law enforcement agencies to search various data bases for information.
FY-2010 Recommendation
FY-2009 Appropriation $17,316
FY-2009 Bud. FTE Level 318.1
Actual Ave. YTD FTE 314.7
Funding Adjustments: None 0
FY-2010 Recommendation $17,316
% Change from FY-2009 0.00%
Source: Office of State Finance
FY-2010 Appropriation(amounts in thousands)
The Governor’s budget does not recommend any adjustments to the OSBI’s FY-2009 appropriation.
FY-2010 Executive Budget
SAFETY AND SECURITY B-207
Council on Law Enforcement Education and
Training (CLEET)
Notable Achievement
406 recruits from municipal, town, county, state and tribal law enforcement agencies attended the Oklahoma Basic Law Enforcement Academy in FY-2008. Another 113 officers began an academy in June, 2008.
12,615 individuals completed CLEET
provided continuing education training in FY-2008 compared to 11,098 in FY-2007.
CLEET accredited 2,033 training
programs from client agencies to conduct training in-house to address specific needs in their jurisdiction.
A formal Curriculum Review Committee comprised of subject matter experts was established to review and revise the basic academy curriculum.
Operation Cooperation Program was established in Oklahoma. The Operation Cooperation concept is based on researched examples across the nation, of how shared resources of training, intelligence, hard assets, and extra eyes and ears on the street have been a force amplifier for private and public agencies to increase security and protection for communities.
Mission The mission of CLEET is to:
Protect citizens by developing well trained and highly skilled law enforcement and security professionals;
Establish standards and provide training for peace officer certification;
Deliver high quality professional
training programs that focus on success for Oklahoma law enforcement officers through continuing and advanced education programs;
Investigate matters that could result in revocation of peace officer certification;
Establish licensing and training
standards for private security officers, private investigators, security guard agencies and private investigative agencies; and
Regulate unlicensed activity and investigate complaints against licensees that may result in punitive action including filing of criminal charges.
Training On July 1, 2008, basic academy hours of training were increased from 505 to 576 hours. Input on proposed curriculum changes was gained from law enforcement agencies, subject matter experts as well as law enforcement professional organizations. More time has been dedicated for practical exercises to allow the students to participate in mock vehicle accident investigations, crime scene investigations, responding to domestic violence calls, etc. Training is focused on academic excellence and student achievement to ensure entry-level police officers are prepared for essential tasks. Continuing Education
Through the use of technology, CLEET has established a continuous learning environment through web-based training that allows law enforcement officers to access training 24 hours a day, 7 days a week.
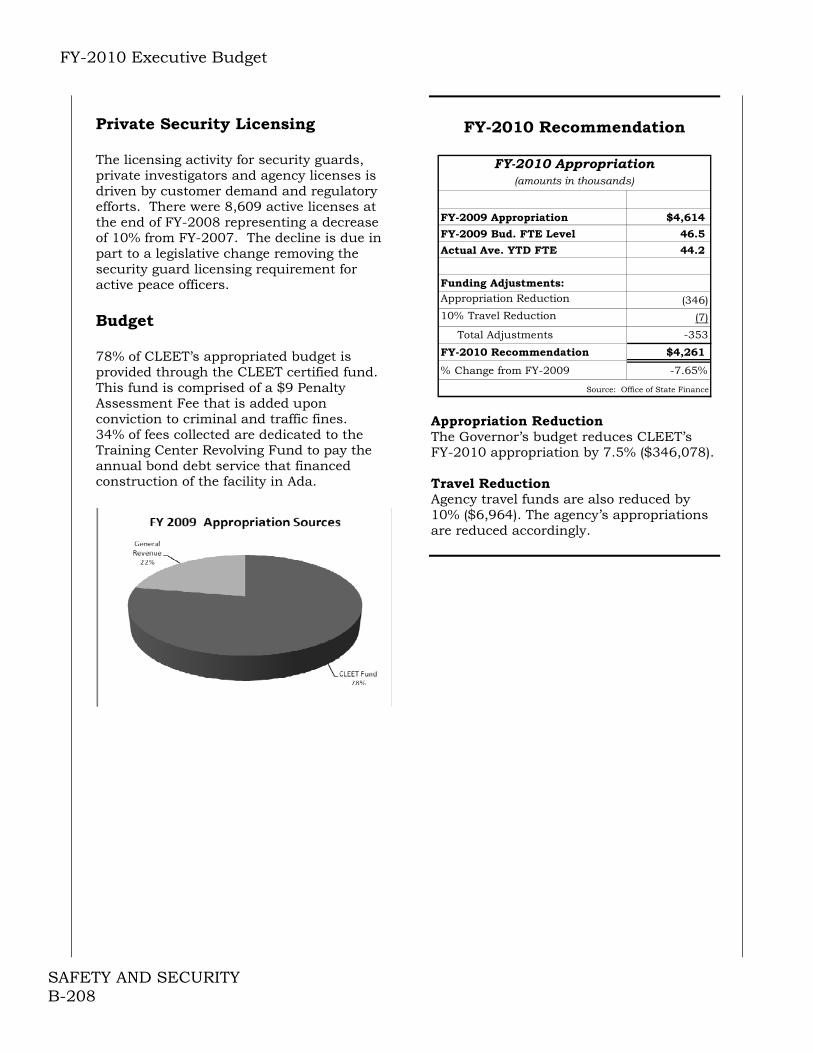
FY-2010 Executive Budget
SAFETY AND SECURITY B-208
Private Security Licensing The licensing activity for security guards, private investigators and agency licenses is driven by customer demand and regulatory efforts. There were 8,609 active licenses at the end of FY-2008 representing a decrease of 10% from FY-2007. The decline is due in part to a legislative change removing the security guard licensing requirement for active peace officers. Budget 78% of CLEET’s appropriated budget is provided through the CLEET certified fund. This fund is comprised of a $9 Penalty Assessment Fee that is added upon conviction to criminal and traffic fines. 34% of fees collected are dedicated to the Training Center Revolving Fund to pay the annual bond debt service that financed construction of the facility in Ada.
FY-2010 Recommendation
FY-2009 Appropriation $4,614
FY-2009 Bud. FTE Level 46.5
Actual Ave. YTD FTE 44.2
Funding Adjustments:Appropriation Reduction (346)10% Travel Reduction (7)
Total Adjustments -353
FY-2010 Recommendation $4,261
% Change from FY-2009 -7.65%
Source: Office of State Finance
FY-2010 Appropriation(amounts in thousands)
Appropriation Reduction The Governor’s budget reduces CLEET’s FY-2010 appropriation by 7.5% ($346,078). Travel Reduction Agency travel funds are also reduced by 10% ($6,964). The agency’s appropriations are reduced accordingly.
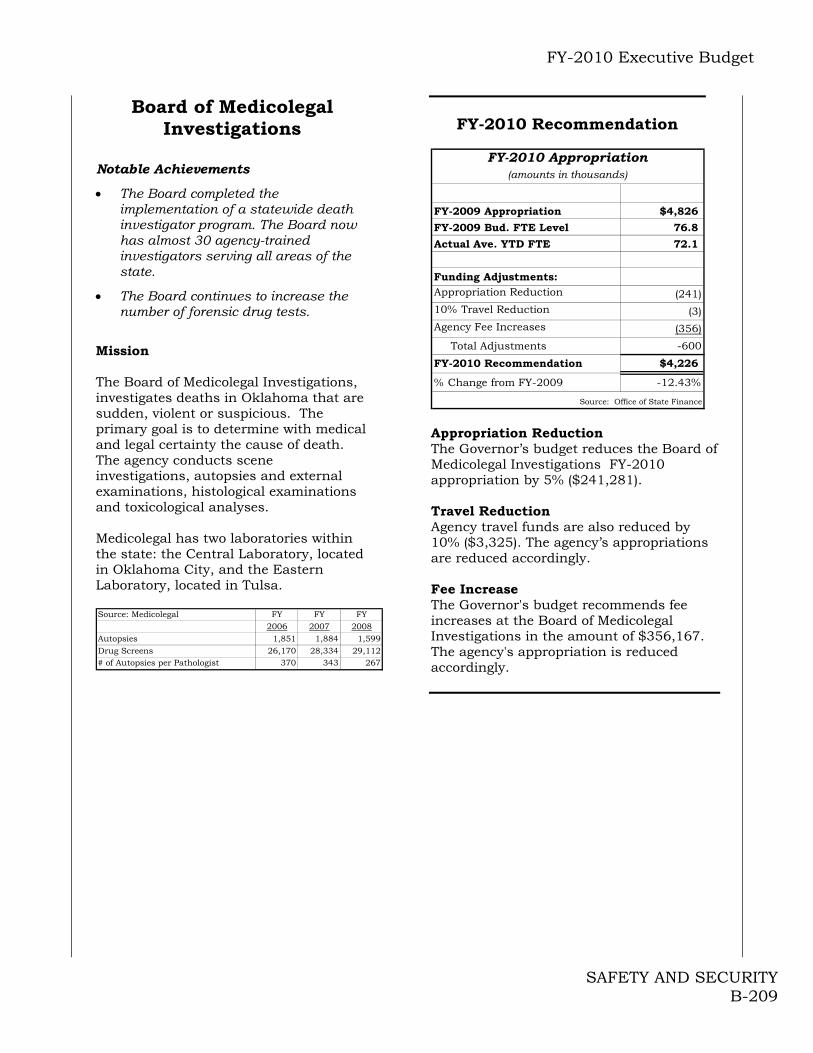
FY-2010 Executive Budget
SAFETY AND SECURITY B-209
Board of Medicolegal Investigations
Notable Achievements
The Board completed the implementation of a statewide death investigator program. The Board now has almost 30 agency-trained investigators serving all areas of the state.
The Board continues to increase the number of forensic drug tests.
Mission The Board of Medicolegal Investigations, investigates deaths in Oklahoma that are sudden, violent or suspicious. The primary goal is to determine with medical and legal certainty the cause of death. The agency conducts scene investigations, autopsies and external examinations, histological examinations and toxicological analyses. Medicolegal has two laboratories within the state: the Central Laboratory, located in Oklahoma City, and the Eastern Laboratory, located in Tulsa. Source: Medicolegal FY FY FY
2006 2007 2008Autopsies 1,851 1,884 1,599Drug Screens 26,170 28,334 29,112# of Autopsies per Pathologist 370 343 267
FY-2010 Recommendation
FY-2009 Appropriation $4,826
FY-2009 Bud. FTE Level 76.8
Actual Ave. YTD FTE 72.1
Funding Adjustments:Appropriation Reduction (241)10% Travel Reduction (3)Agency Fee Increases (356)
Total Adjustments -600
FY-2010 Recommendation $4,226
% Change from FY-2009 -12.43%
Source: Office of State Finance
FY-2010 Appropriation(amounts in thousands)
Appropriation Reduction The Governor’s budget reduces the Board of Medicolegal Investigations FY-2010 appropriation by 5% ($241,281). Travel Reduction Agency travel funds are also reduced by 10% ($3,325). The agency’s appropriations are reduced accordingly. Fee Increase The Governor's budget recommends fee increases at the Board of Medicolegal Investigations in the amount of $356,167. The agency's appropriation is reduced accordingly.

FY-2010 Executive Budget
SAFETY AND SECURITY B-210
Oklahoma Bureau of Narcotics and Dangerous
Drugs (OBNDD) Mission Committed to honor, integrity, and excellence, the Oklahoma Bureau of Narcotics will serve the citizens of Oklahoma in the quest for a drug-free state. History The regulatory functions of the Office of the Commissioner of Narcotics & Dangerous Drugs Control (under the Oklahoma Attorney General) merged with the Oklahoma State Bureau of Investigation’s Drug Enforcement/Narcotics Unit in 1975 to create the Oklahoma Bureau of Narcotics & Dangerous Drugs Control. The Oklahoma Bureau of Narcotics & Dangerous Drugs Control (OBN) is responsible for drug enforcement in Oklahoma. OBN conducts a wide variety of specialized programs to combat the local availability of various domestic and foreign produced drugs. These programs are directed from OBN headquarters in Oklahoma City; five district offices located in Tulsa, McAlester, Ardmore, Lawton and Woodward; and nine regional offices in Ada, Altus, Clinton, Duncan, Enid, Guymon, Henryetta, Idabel, and Muskogee. Legislative Efforts and Agency Accomplishments OBN, with the assistance of the Oklahoma Legislature, has designed, enacted and enforced numerous laws and programs to combat and suppress domestic and foreign sources of drugs. Many of these measures became the blueprints for other states. These include an aggressive narcotics aerial eradication program in the late 1980’s aimed at domestic cannabis cultivation [in fact, from 1997 to 2004 domestic marijuana plant seizures dropped approximately ninety-five percent (95%)] and a unique electronic tracking program to halt prescription drug abuse in 1990. OBN
led efforts to control chemicals in the early 1990’s to stop a two-decade old clandestine methamphetamine lab problem, and crafted a bold law in 2004 that virtually eliminated another meth lab epidemic overnight. This landmark measure would become a model for the White House and the rest of the country to follow.
Methamphetamine Labs Seized
0
200
400
600
800
1000
1200
2000 2001 2002 2003 2004 2005 2006 2007
Number of Labs After HB 2176Source: Bureau of Narcotics
Electronic Surveillance and Intelligence (ESI) In 1996, OBN initiated a state-of-the-art electronic surveillance and wire intercept unit effecting arrests of members from some of the most powerful drug cartels operating on American soil. OBN’s ESI unit maintains one of the only full-time interception units in this part of the country with bilingual agents and support staff enabling OBN to monitor Spanish-speaking cartels in real time. The ESI Division also oversees a Financial Asset and Seizure Team (FAST). Established in 2006, this unit identifies and seizes illegally gained assets of drug traffickers. Marijuana Eradication Aggressive enforcement actions by OBN and the Drug Enforcement Administration (DEA) proved to be quite effective. In 1997, there were over eighty-nine thousand (89,000.) cultivated marijuana plants seized in Oklahoma. However, since 2004, the number has dropped to below ten thousand (10,000) plants.

FY-2010 Executive Budget
SAFETY AND SECURITY B-211
Number of Cultivated Plants Seized
010,00020,00030,00040,00050,00060,00070,00080,00090,000
100,000
1997
1998
1999
2000
2001
2002
2003
2004
2005
2006
2007
2008
Source: Bureau of Narcotics Diversion OBN employs a division specializing in diversion cases. This division oversees over 15,000 doctors, pharmacists, and hospitals licensed with OBN to possess, dispense, and prescribe controlled dangerous substances. Prescription Monitoring Program In 2004 OBN received legislative authority to expand OSTAR and rename the new system to the CONTROL Program or Comprehensive Oklahoma Narcotics Tracking and Reporting On-Line. This enabled the Oklahoma Bureau of Narcotics to track the prescribing of all scheduled drugs. This database automatically generates reports of individual drug seekers called “doctor shoppers” who illegally obtain prescriptions from multiple practitioners. It also identifies over-prescribing practitioners.
Drug Overdose Deaths in Oklahoma
Pharmaceutical
Drugs
458 Deaths
81%
Street Drugs
107 Deaths
19%
Source:OBNDD Deconfliction The High Intensity Drug Trafficking Area (HIDTA) Oklahoma Intel Center (OIC) is part of the North Texas HIDTA. The OIC is currently configured as the central clearinghouse for Deconfliction Events and Subjects/Targets for Law Enforcement in
the State of Oklahoma. The deconfliction system consists of two parts: (1) the Events side of the system is for safety to minimize the possibility of the sixty (60) or more agencies that participate in the project from conducting planned enforcement actions in the same location at the same time, and (2) the Subject side of the deconfliction system puts investigators together with other agencies who are conducting an investigation on the same group or individual. OBN and Education A primary mission of the Oklahoma Bureau of Narcotics and Dangerous Drugs Control is to provide law enforcement and civilian drug education and training. OBN personnel conduct dozens of trainings and presentations not only in Oklahoma. These individuals are nationally recognized as the premier experts in their field. Each year, OBN provides the training to tens of thousands of police officers, professionals, and citizens in Oklahoma and dozens of other states. OBN currently has nine (9) trained AmeriCorps members and in the process of recruiting and training eleven (11) more AmeriCorps members to expand drug awareness and drug abuse education opportunities to youth, parents, faculty, school administrators, and communities of Oklahoma. The AmeriCorps members will be able to provide training to at least 350,000 students, which is approximately fifty percent (50%) of the student population throughout the State of Oklahoma. Mobile Operations Team (MOT) MOT was developed in November of 2006 and consists of a specialized unit of highly trained and fast moving agents performing high-level, high-security narcotics investigations within the State of Oklahoma. MOT was created to assist local law enforcement entities requesting assistance dealing with isolated groups of drug dealers in their area. The team also works with District Attorneys and responds to law enforcement requests statewide. The MOT team infiltrates and develops criminal

FY-2010 Executive Budget
SAFETY AND SECURITY B-212
cases against cell groups of street to mid level drug dealers. This team also specializes in covert operations, surveillance missions, and the disruption and dismantling of narcotic activity. The Drug Enforcement Treatment Education and Resources (DETER) was organized in conjunction with the first MOT mission to coordinate resources of civic leaders, law enforcement, educators, intervention groups, faith-based groups and the general public to positively impact the illicit drug issues that plague our society. OBN & Chickasaw Nation On May 24th, 2007, the Oklahoma Bureau of Narcotics and the Chickasaw Nation signed a cross-deputization agreement for a cooperative drug enforcement partnership on and off tribal lands. As the number of domestic methamphetamine laboratories has gone down, the availability of Mexican-produced methamphetamine has increased in Oklahoma. Currently, law enforcement is seeing a trend of methamphetamine traffickers utilizing tribal lands to conduct their illicit business, including drug trafficking and clandestine money laundering. As of September 1st, 2007, the Oklahoma Bureau of Narcotics obtained a federal grant to work in partnership with the Chickasaw Nation, pharmaceutical industry, and the community to develop and implement a systematic attack on the source of methamphetamine manufacture and distribution networks throughout the state of Oklahoma, with the focus on or near Chickasaw tribal lands. This grant money is used to upgrade the current pseudoephedrine electronic tracking system, providing information to local and tribal law enforcement on the diversion of pseudoephedrine and the funds used to educate pharmacies, as well as the public about drug abuse related to methamphetamine. Crystal Darkness Oklahoma The Oklahoma Bureau of Narcotics and Dangerous Drugs Control are taking a leadership position in an historic methamphetamine awareness project.
Crystal Darkness Oklahoma, co-chaired by Oklahoma First Lady Kim Henry, is a campaign modeled after similar programs in Nevada, California, Oregon, and Arizona. The project is aimed at increasing meth awareness, as well as providing prevention, treatment and law enforcement assistance to communities across Oklahoma. Crystal Darkness Oklahoma began with the historic airing of a half-hour documentary on all Oklahoma television stations, as well as radio and internet media. The documentary featured testimonials graphically articulating the devastating impact meth has had on families and communities across the state. The documentary aired January 13, 2009. OBN is helping organize the law enforcement effort, as well as developing and managing the Crystal Darkness Oklahoma web site, and assisting with the campaign’s education, training and promotion of the televised event. In addition, OBN will be comprehensively involved in Phase II, which involves meth awareness education and training for schools, parents and community groups, as well as ensuring law enforcement entities continue working together to suppress and eliminate meth production, trafficking, distribution and use. OBNDDC is consistently viewed as a national model for drug enforcement as a result of its proactive investigative and enforcement techniques, cutting-edge regulatory oversight programs, and aggressive legislative initiatives that have shaped national drug policy.
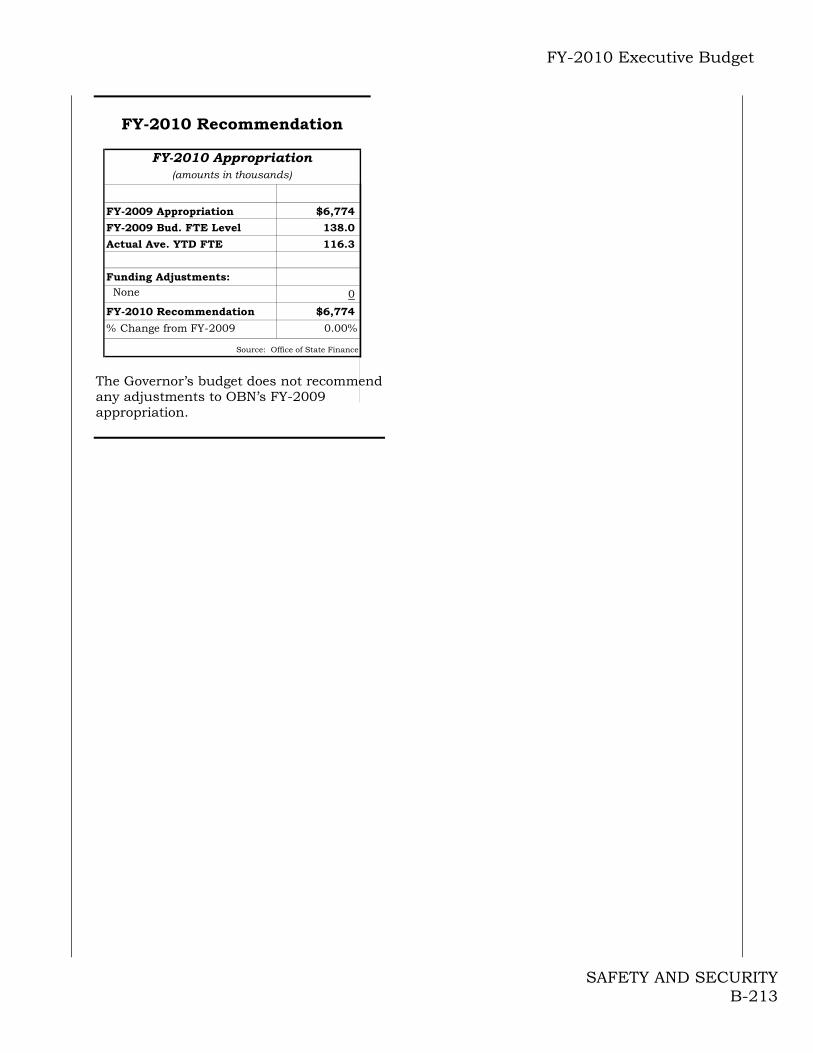
FY-2010 Executive Budget
SAFETY AND SECURITY B-213
FY-2010 Recommendation
FY-2009 Appropriation $6,774
FY-2009 Bud. FTE Level 138.0
Actual Ave. YTD FTE 116.3
Funding Adjustments: None 0
FY-2010 Recommendation $6,774
% Change from FY-2009 0.00%
Source: Office of State Finance
FY-2010 Appropriation(amounts in thousands)
The Governor’s budget does not recommend any adjustments to OBN’s FY-2009 appropriation.

FY-2010 Executive Budget
SAFETY AND SECURITY B-214
Pardon and Parole Board Notable Achievements ● The Board began using video
conferencing in February, 2006 to interview inmates for parole consideration. This initiative has decreased travel costs for the Board and the Department of Corrections.
The Pardon and Parole Board provides recommendations for the supervised release of adult felons through a case-by-case investigative process. The Board strives to protect the public during this process and to maintain a low revocation and recidivism rate for the State of Oklahoma. With timely recommendations and appropriate community-level programs, the Board can contribute to the intelligent management and control of the State’s inmate population. Explanations of the Key Terms ● Parole is the release of a prisoner whose
sentence has not expired, on condition of future good behavior.
● Pardon is the exemption of a convicted person from the penalties of an offense or a crime.
● Clemency is the act of leniency or mercy on an individual for a crime committed.
The Board’s staff determines parole eligibility for persons in the Department of Corrections’ custody, prepares an extensive investigative report which includes a recommendation to the Board and notifies the victims and other related entities. The Board reviews this information and makes recommendations for clemency on the various parole programs, commutations and pardons, as prescribed by law. Upon recommendation by the Board, the Governor makes the final decision on the clemency, with the restrictions and stipulations recommended by the Board. The Board The Pardon and Parole Board is a constitutional, five-member, part-time body charged with making clemency
recommendations to the Governor concerning convicted adult felons. Members of the Board are appointed: Three by the Governor, one by the Chief Justice of the State Supreme Court, and one by the presiding Judge of the Court of Criminal Appeals. The members hold office coterminous with the Governor and meet several days each month at one of the State penal institutions.
FY-2010 Recommendation
FY-2009 Appropriation $2,578
FY-2009 Bud. FTE Level 39.0
Actual Ave. YTD FTE 41.6
Funding Adjustments: None 0
FY-2010 Recommendation $2,578
% Change from FY-2009 0.00%
Source: Office of State Finance
FY-2010 Appropriation(amounts in thousands)
The Governor’s budget does not recommend any adjustments to Pardon and Parole Board’s FY-2009 appropriation.
FY-2010 Executive Budget
SAFETY AND SECURITY B-215
Department of Public Safety (DPS)
Notable Achievements
In early 2007, the Department underwent a major conversion in the issuance of oversized and overweight permits. The process has transitioned into a full- scale call center providing a more efficient, customer-friendly operation. As a result of this transition, the agency anticipates a 15% to 25% increase in permit issuance volume.
The court liaison positions established in FY-2006 continue to see benefits. Two personnel travel around the state to hold court-clerk instruction classes regarding operations and the documents required from the municipal and district courts. The largest benefit to this program is the reduction in errors on the forms and increased efficiency by the Department and the 423 Municipal court clerks.
A website hosted by DPS continues to
add court clerks from around the state. This website results in more accurate and timely conviction, suspension and withdrawal data received by DPS from court clerks and aids them in complying with federal mandates.
The Amber Alert system, managed by
the Department, proved its worthiness again in 2007. The most notable rescue was that of a 3-year-old girl who was located by Trooper Josh Blue shortly after the Amber Alert was issued.
DPS also launched the Silver Alert
program for missing senior citizens. The Silver Alert system works much like the Amber Alert system does. Through the use of the Oklahoma Law Enforcement Telecommunications System, alerts can be instant
messaged to all law enforcement agencies statewide.
Mission The Department of Public Safety provides the following services to ensure a safe and secure environment for the citizens of this state:
Law Enforcement Services; and
Driver License Services;
In FY-2007, the Department of Public Safety received 1.4 % of the state’s appropriated budget. Approximately 40% of the Department’s budget is funded by appropriations. Law Enforcement Services
The Oklahoma Highway Patrol (OHP) patrols over 96,000 miles of road, investigates collisions and enforces size and weight laws. OHP also assists local and federal agencies following a federal disaster.
Commercial Vehicle Enforcement Troop enforces size and weight laws.
Lake Patrol enforces laws on state lakes.
Executive Security provides security and transportation for the Governor and Lt. Governor.
Trooper Strength In calendar year 2007, 39 troopers retired. The agency graduated two trooper academies during FY-2007, graduating 37 new troopers in September 2006, and 49 new troopers in July 2007. The Department was authorized to hold another academy, which will start February 2008.
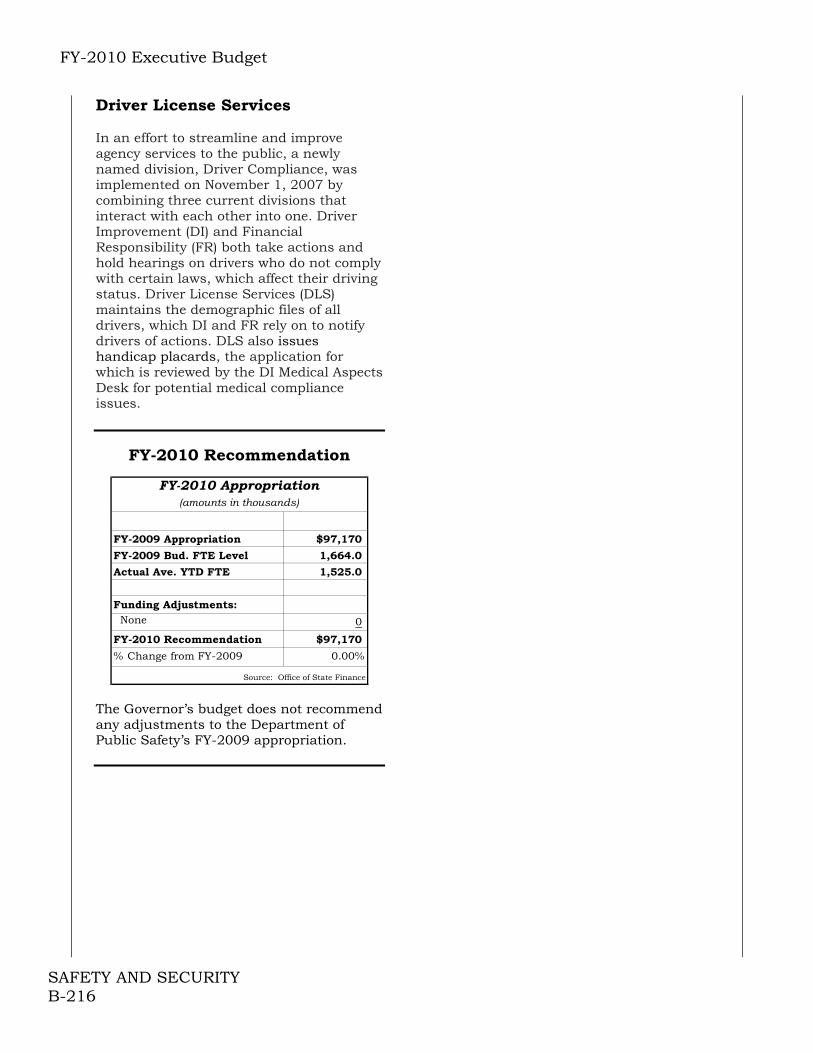
FY-2010 Executive Budget
SAFETY AND SECURITY B-216
Driver License Services In an effort to streamline and improve agency services to the public, a newly named division, Driver Compliance, was implemented on November 1, 2007 by combining three current divisions that interact with each other into one. Driver Improvement (DI) and Financial Responsibility (FR) both take actions and hold hearings on drivers who do not comply with certain laws, which affect their driving status. Driver License Services (DLS) maintains the demographic files of all drivers, which DI and FR rely on to notify drivers of actions. DLS also issues handicap placards, the application for which is reviewed by the DI Medical Aspects Desk for potential medical compliance issues.
FY-2010 Recommendation
FY-2009 Appropriation $97,170
FY-2009 Bud. FTE Level 1,664.0
Actual Ave. YTD FTE 1,525.0
Funding Adjustments: None 0
FY-2010 Recommendation $97,170
% Change from FY-2009 0.00%
Source: Office of State Finance
FY-2010 Appropriation(amounts in thousands)
The Governor’s budget does not recommend any adjustments to the Department of Public Safety’s FY-2009 appropriation.
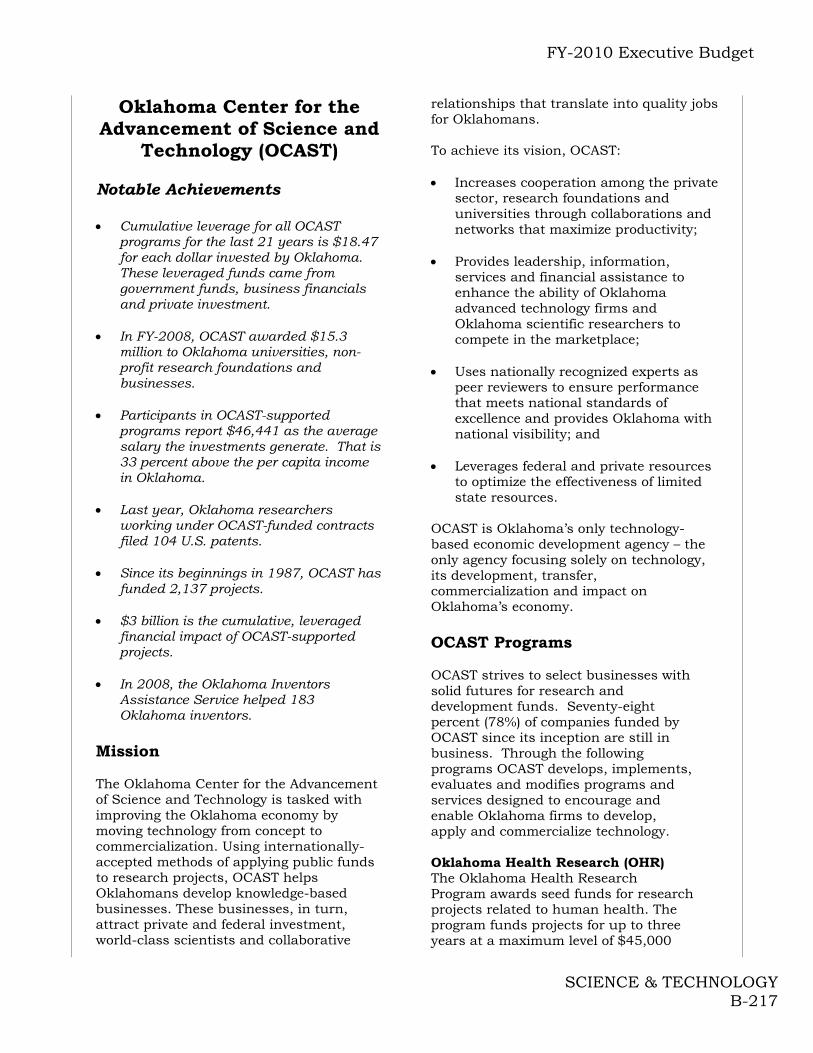
FY-2010 Executive Budget
SCIENCE & TECHNOLOGY B-217
Oklahoma Center for the Advancement of Science and
Technology (OCAST) Notable Achievements Cumulative leverage for all OCAST
programs for the last 21 years is $18.47 for each dollar invested by Oklahoma. These leveraged funds came from government funds, business financials and private investment.
In FY-2008, OCAST awarded $15.3
million to Oklahoma universities, non-profit research foundations and businesses.
Participants in OCAST-supported
programs report $46,441 as the average salary the investments generate. That is 33 percent above the per capita income in Oklahoma.
Last year, Oklahoma researchers
working under OCAST-funded contracts filed 104 U.S. patents.
Since its beginnings in 1987, OCAST has
funded 2,137 projects. $3 billion is the cumulative, leveraged
financial impact of OCAST-supported projects.
In 2008, the Oklahoma Inventors
Assistance Service helped 183 Oklahoma inventors.
Mission The Oklahoma Center for the Advancement of Science and Technology is tasked with improving the Oklahoma economy by moving technology from concept to commercialization. Using internationally-accepted methods of applying public funds to research projects, OCAST helps Oklahomans develop knowledge-based businesses. These businesses, in turn, attract private and federal investment, world-class scientists and collaborative
relationships that translate into quality jobs for Oklahomans. To achieve its vision, OCAST: Increases cooperation among the private
sector, research foundations and universities through collaborations and networks that maximize productivity;
Provides leadership, information,
services and financial assistance to enhance the ability of Oklahoma advanced technology firms and Oklahoma scientific researchers to compete in the marketplace;
Uses nationally recognized experts as
peer reviewers to ensure performance that meets national standards of excellence and provides Oklahoma with national visibility; and
Leverages federal and private resources
to optimize the effectiveness of limited state resources.
OCAST is Oklahoma’s only technology-based economic development agency – the only agency focusing solely on technology, its development, transfer, commercialization and impact on Oklahoma’s economy. OCAST Programs OCAST strives to select businesses with solid futures for research and development funds. Seventy-eight percent (78%) of companies funded by OCAST since its inception are still in business. Through the following programs OCAST develops, implements, evaluates and modifies programs and services designed to encourage and enable Oklahoma firms to develop, apply and commercialize technology. Oklahoma Health Research (OHR) The Oklahoma Health Research Program awards seed funds for research projects related to human health. The program funds projects for up to three years at a maximum level of $45,000

FY-2010 Executive Budget
SCIENCE & TECHNOLOGY B-218
per year. Eligible applicants are Oklahoma universities and colleges, nonprofit research organizations and commercial enterprises. In FY-2008, for every state dollar awarded in health research funding, eight dollars was leveraged in private and federal funds. Health Research awards enable researchers to gain expertise and produce data needed to obtain larger grants from federal agencies and other funding organizations. Awards permit research centers to recruit and retain health scientists, researchers and technicians. They contribute to improved health care while permitting expansion in biotechnology, biomedical and commercial enterprises in Oklahoma. The following graph illustrates the successful leveraging of funds compared to dollars awarded. Key Performance Measure
Health Research Cumulative Leverageand Award Amounts
0
50
100
150
200
250
300
350
1999 2000 2001 2002 2003 2004 2005 2006 2007 2008
$ M
illio
ns
Awards LeverageSource: OCAST 01/06/09 One test of successful research is the number of patents issued. The following chart shows the rate of success for Oklahoma patent applications.
FY-2004 FY-2005 FY-2006 FY-2007 FY-2008
Applications 12 11 18 24 22
Awards 10 1 2 1 4
Source: OCAST
Health Research Patents
Success Story An estimated 1.75 million Americans over age 50 have developed loss of vision or blindness due to age-related macular degeneration. And of the more than 200,000 Oklahomans living with
diabetes, 90 percent will develop an eye disease. With OCAST support, Oklahoma City-based Charlesson LLC is developing innovative treatments for weakening and blinding eye diseases. Charlesson is developing nanoparticles that can be used in eye drops, tablets and long-term release injections. Charlesson has leveraged OCAST funding to attract grants from the National Institutes of Health. With more than $6 million in research grants, the company also has annual revenues of more than $500,000 through pharmaceutical contracts. The company has expanded from two to 19 employees in two years and plans to hire three scientists in 2009. Oklahoma Plant Science Research (OPSR) Plant science research funds are awarded through external, peer-reviewed funding competitions with preference given to plant research projects which have potential commercial application and the development of new products and services that shall form the basis of new, high-technology plant science/agriculture industry for the state. Collaborative research, which brings together personnel from multiple organizations, from multiple disciplines and with varied experiences and perspective frequently enhances the prospects successful research. Collaborative projects among institutions of higher education, non-profit research organizations and private enterprises are encouraged, and proposals involving co-principal investigators from more than one organization are strongly encouraged. Success Story Advanced research in plant biology made steady progress in 2008 under the OCAST Oklahoma Plant Science Research program. At Oklahoma State University, Ramanjulu Sunkar, assistant professor in the department of biochemistry and molecular biology, is examining micro ribonucleic acids (miRNAs) in wheat, rice, switchgrass,

FY-2010 Executive Budget
SCIENCE & TECHNOLOGY B-219
legumes and other plant species. In plants, miRNAs have been shown to regulate growth, development and a variety of biotic and abiotic stress responses. This plant molecular biology research can help unravel complex plant regulatory networks that control development, nutrition and stress responses. The end goal is to breed better plants that can be drought or disease resistant. R&D Faculty and Student Intern Partnerships (RDIP) The R&D Intern Partnership program provides support for qualified research and development partnership projects that involve industry and institutions of higher education. The program increases the pool of scientists, engineers and business entrepreneurs available to Oklahoma industry, encourages students to be scientists and engineers and enhances faculty members’ teaching experience. The faculty and student interns come from rural and urban colleges and they intern throughout Oklahoma. Through this program the interns learn first-hand about the many outstanding high-tech employment opportunities in Oklahoma. This program helps Oklahoma companies and helps reduce the “brain-drain” from Oklahoma. Success Story Students at Cameron University’s department of multimedia design are playing an integral role in your safety. Through the OCAST R&D Intern Partnership program, students built a virtual campus for the Federal Law Enforcement Training Center. This campus provides training, information and collaborative capabilities to public safety and enforcement personnel. The interns also created training and development tools for DNA evidence gathering and testing. Since inception, OCAST has funded 524 student interns. It is an important step in keeping Oklahoma’s best and brightest in the state and connecting them to high-paying, technically-challenging jobs.
Oklahoma Applied Research The Oklahoma Applied Research Support (OARS) program competitively awards funds for one- to three-year projects based upon technical merit, potential for market success and commitment of resources. The program requires a minimum of one dollar matching support for each state dollar awarded. Eligible applicants are Oklahoma businesses and universities, colleges or nonprofit research organizations with industrial partners.
Oklahoma Applied Research Support (OARS)Cumulative Awards by Research Area
( FY2001 - FY2008 )Electronics/
Communications
$5,903,753
(16%)
Other
$2,838,361
(8%)
Biotechnology
$14,267,073
(37%)
Manufacturing
$3,167,917 (9%)
Advanced
Materials, and
Chemicals
$8,059,769 (22%)
Information
Technology
$2,897,490
(8%)
Source: OCAST 01/06/09 OARS produces commercially viable Research and Development. Federal and private funding attracted to OARS projects and the ratio of OARS support to private and federal support both demonstrate the program’s effectiveness at securing capital. In FY-2008, for every state dollar awarded to Applied Research another $20 was leveraged in private and federal funds and business financial impacts. In FY-2008, OARS produced $41 million in sales, resulted in 308 employees being added and/or retained in Oklahoma organizations, with an average salary of $48,482 – 39% above the Oklahoma per capita income, and created $100.7 million annual leveraged federal funding and economic benefits to Oklahoma.
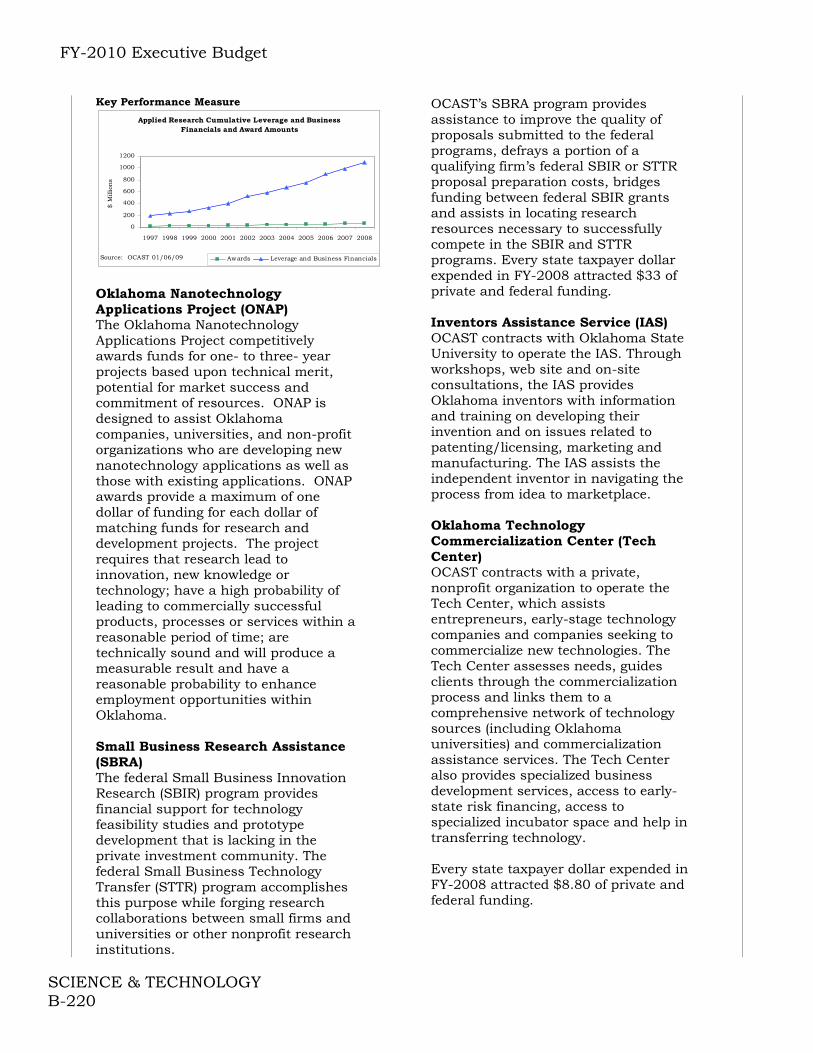
FY-2010 Executive Budget
SCIENCE & TECHNOLOGY B-220
Key Performance Measure
Applied Research Cumulative Leverage and Business Financials and Award Amounts
0
200
400
600
800
1000
1200
1997 1998 1999 2000 2001 2002 2003 2004 2005 2006 2007 2008
$ M
illio
ns
Awards Leverage and Business FinancialsSource: OCAST 01/06/09
Oklahoma Nanotechnology Applications Project (ONAP) The Oklahoma Nanotechnology Applications Project competitively awards funds for one- to three- year projects based upon technical merit, potential for market success and commitment of resources. ONAP is designed to assist Oklahoma companies, universities, and non-profit organizations who are developing new nanotechnology applications as well as those with existing applications. ONAP awards provide a maximum of one dollar of funding for each dollar of matching funds for research and development projects. The project requires that research lead to innovation, new knowledge or technology; have a high probability of leading to commercially successful products, processes or services within a reasonable period of time; are technically sound and will produce a measurable result and have a reasonable probability to enhance employment opportunities within Oklahoma. Small Business Research Assistance (SBRA) The federal Small Business Innovation Research (SBIR) program provides financial support for technology feasibility studies and prototype development that is lacking in the private investment community. The federal Small Business Technology Transfer (STTR) program accomplishes this purpose while forging research collaborations between small firms and universities or other nonprofit research institutions.
OCAST’s SBRA program provides assistance to improve the quality of proposals submitted to the federal programs, defrays a portion of a qualifying firm’s federal SBIR or STTR proposal preparation costs, bridges funding between federal SBIR grants and assists in locating research resources necessary to successfully compete in the SBIR and STTR programs. Every state taxpayer dollar expended in FY-2008 attracted $33 of private and federal funding. Inventors Assistance Service (IAS) OCAST contracts with Oklahoma State University to operate the IAS. Through workshops, web site and on-site consultations, the IAS provides Oklahoma inventors with information and training on developing their invention and on issues related to patenting/licensing, marketing and manufacturing. The IAS assists the independent inventor in navigating the process from idea to marketplace. Oklahoma Technology Commercialization Center (Tech Center) OCAST contracts with a private, nonprofit organization to operate the Tech Center, which assists entrepreneurs, early-stage technology companies and companies seeking to commercialize new technologies. The Tech Center assesses needs, guides clients through the commercialization process and links them to a comprehensive network of technology sources (including Oklahoma universities) and commercialization assistance services. The Tech Center also provides specialized business development services, access to early-state risk financing, access to specialized incubator space and help in transferring technology. Every state taxpayer dollar expended in FY-2008 attracted $8.80 of private and federal funding.

FY-2010 Executive Budget
SCIENCE & TECHNOLOGY B-221
OCAST Technology Business Finance Program (TBFP) This OCAST program provides limited pre-seed financing for start-up advanced technology firms. The program requires a match and includes payback provisions. Those paybacks have totaled more than $3.1 million since the program began in 1999. Every state taxpayer dollar expended in FY-2008 attracted $12.70 of private and federal funding. Success Story As the quest for energy independence continues and environmental concerns increase, new Oklahoma developed technologies are becoming a vital piece to solving this global problem. There are nearly 300,000 marginal gas wells in the U.S. These wells, often located in rural areas, don’t produce enough natural gas to justify building pipelines or multimillion dollar conversion facilities. Without this access, thousands of marginal well sites are being abandoned. With assistance from OCAST funding, Northeast Oklahoma Technologies, Inc. (NEOTech) is creating a small, skid-mounted device that can be transported on a flatbed truck. The portable equipment will process natural gas at well sites instead of at large off-site facilities. This technology will have a significant impact for the local economy and will provide new business opportunities for small oil and gas producers, while bringing us one step closer to energy independence. Oklahoma Seed Capital Fund After having been in statute for a number of years, the Legislature provided funding for this program in FY-2007, enabling OCAST to implement the program through a competitive proposal process. The result was a new Oklahoma Seed Capital Fund LLC managed by i2E, Inc., a not-for-profit corporation, under contract to OCAST. After receiving two years of full funding, the Oklahoma Seed Capital Revolving Fund has made approximately $3.4 million of immediate investment in seven companies, with more than $5 million reserved for follow-on rounds for these companies. Co-investment commitment by other private
sector funds and individuals has exceeded another $8 million to date. This means that more than $11 million will go to Oklahoma technology companies in need of seed capital stage resources to continue growth and expansion, and an additional $10 million – including $5 million of state funds plus a similar minimum of $5 million in anticipated private sector funds – are ready for investment in these companies in the near future. Success Story InnovAlarm, now doing business as Lifetone Technology, is an Oklahoma City developer of an innovative, patented technology designed to improve fire safety for those who are most at risk – including senior citizens, people with hearing loss and young children and adolescents. Their product wirelessly connects to existing alarms, “listens” for standard smoke and carbon monoxide tones and emits an alarm sound that is in the lower frequency range to which individuals in these at-risk categories will respond. In FY-2008 the Oklahoma Seed Capital Revolving fund invested approximately $430,000 in the company; eight other funds and individuals also invested for a total of $4.2 million. Full production of Lifetone products is scheduled for March 2009 with sales to begin in April. Currently follow-on funding is being set up to launch and build inventory. Oklahoma Manufacturing Alliance (Manufacturing Alliance) OCAST provides oversight and state matching funds to this affiliate of the National Institute of Standards and Technology (NIST) Manufacturing Extension Partnership program. The Alliance helps small and medium-sized manufacturers modernize in order to compete successfully. Under a partnership with Oklahoma State University, the Manufacturing Alliance also provides engineering services to small and rural manufacturers through its Application Engineers program. Every state taxpayer dollar expended in FY-2008 attracted $173 of private and federal funding.
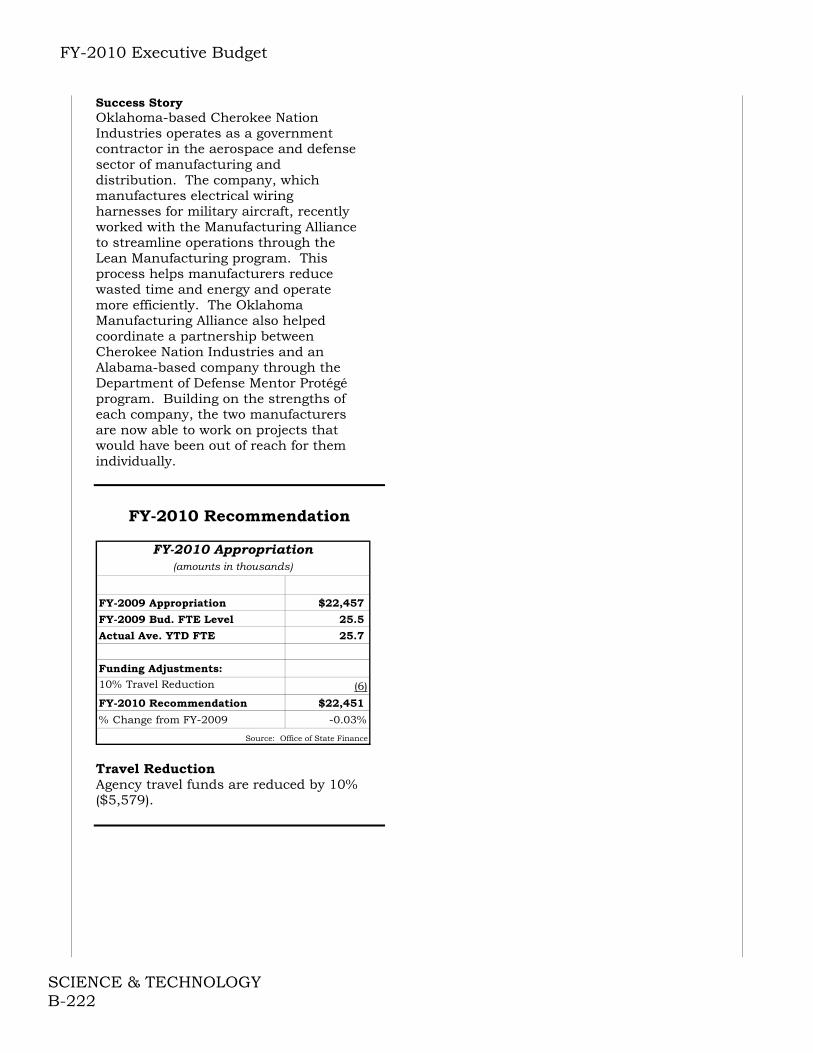
FY-2010 Executive Budget
SCIENCE & TECHNOLOGY B-222
Success Story Oklahoma-based Cherokee Nation Industries operates as a government contractor in the aerospace and defense sector of manufacturing and distribution. The company, which manufactures electrical wiring harnesses for military aircraft, recently worked with the Manufacturing Alliance to streamline operations through the Lean Manufacturing program. This process helps manufacturers reduce wasted time and energy and operate more efficiently. The Oklahoma Manufacturing Alliance also helped coordinate a partnership between Cherokee Nation Industries and an Alabama-based company through the Department of Defense Mentor Protégé program. Building on the strengths of each company, the two manufacturers are now able to work on projects that would have been out of reach for them individually.
FY-2010 Recommendation
FY-2009 Appropriation $22,457
FY-2009 Bud. FTE Level 25.5
Actual Ave. YTD FTE 25.7
Funding Adjustments:
10% Travel Reduction (6)
FY-2010 Recommendation $22,451
% Change from FY-2009 -0.03%
Source: Office of State Finance
FY-2010 Appropriation(amounts in thousands)
Travel Reduction Agency travel funds are reduced by 10% ($5,579).
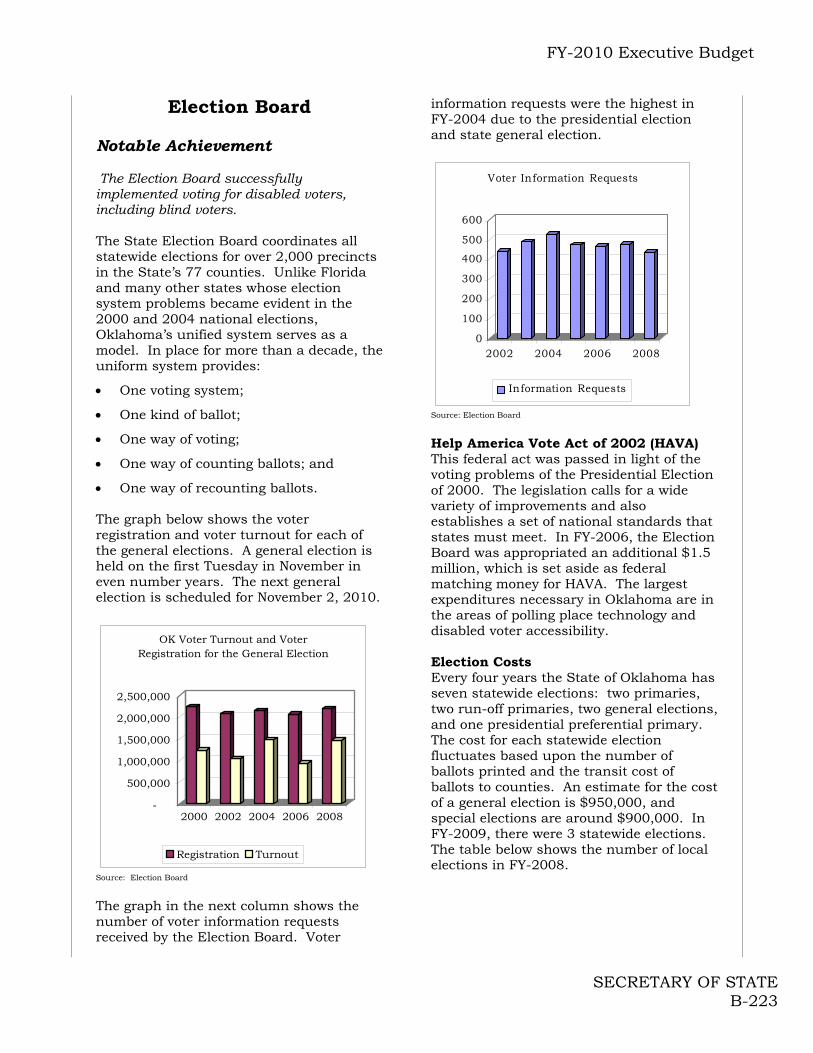
FY-2010 Executive Budget
SECRETARY OF STATE B-223
Election Board Notable Achievement The Election Board successfully implemented voting for disabled voters, including blind voters. The State Election Board coordinates all statewide elections for over 2,000 precincts in the State’s 77 counties. Unlike Florida and many other states whose election system problems became evident in the 2000 and 2004 national elections, Oklahoma’s unified system serves as a model. In place for more than a decade, the uniform system provides:
One voting system;
One kind of ballot;
One way of voting;
One way of counting ballots; and
One way of recounting ballots. The graph below shows the voter registration and voter turnout for each of the general elections. A general election is held on the first Tuesday in November in even number years. The next general election is scheduled for November 2, 2010.
-
500,000
1,000,000
1,500,000
2,000,000
2,500,000
2000 2002 2004 2006 2008
OK Voter Turnout and Voter Registration for the General Election
Registration Turnout
Source: Election Board
The graph in the next column shows the number of voter information requests received by the Election Board. Voter
information requests were the highest in FY-2004 due to the presidential election and state general election.
0
100
200
300
400
500
600
2002 2004 2006 2008
Voter Information Requests
Information Requests
Source: Election Board
Help America Vote Act of 2002 (HAVA) This federal act was passed in light of the voting problems of the Presidential Election of 2000. The legislation calls for a wide variety of improvements and also establishes a set of national standards that states must meet. In FY-2006, the Election Board was appropriated an additional $1.5 million, which is set aside as federal matching money for HAVA. The largest expenditures necessary in Oklahoma are in the areas of polling place technology and disabled voter accessibility. Election Costs Every four years the State of Oklahoma has seven statewide elections: two primaries, two run-off primaries, two general elections, and one presidential preferential primary. The cost for each statewide election fluctuates based upon the number of ballots printed and the transit cost of ballots to counties. An estimate for the cost of a general election is $950,000, and special elections are around $900,000. In FY-2009, there were 3 statewide elections. The table below shows the number of local elections in FY-2008.
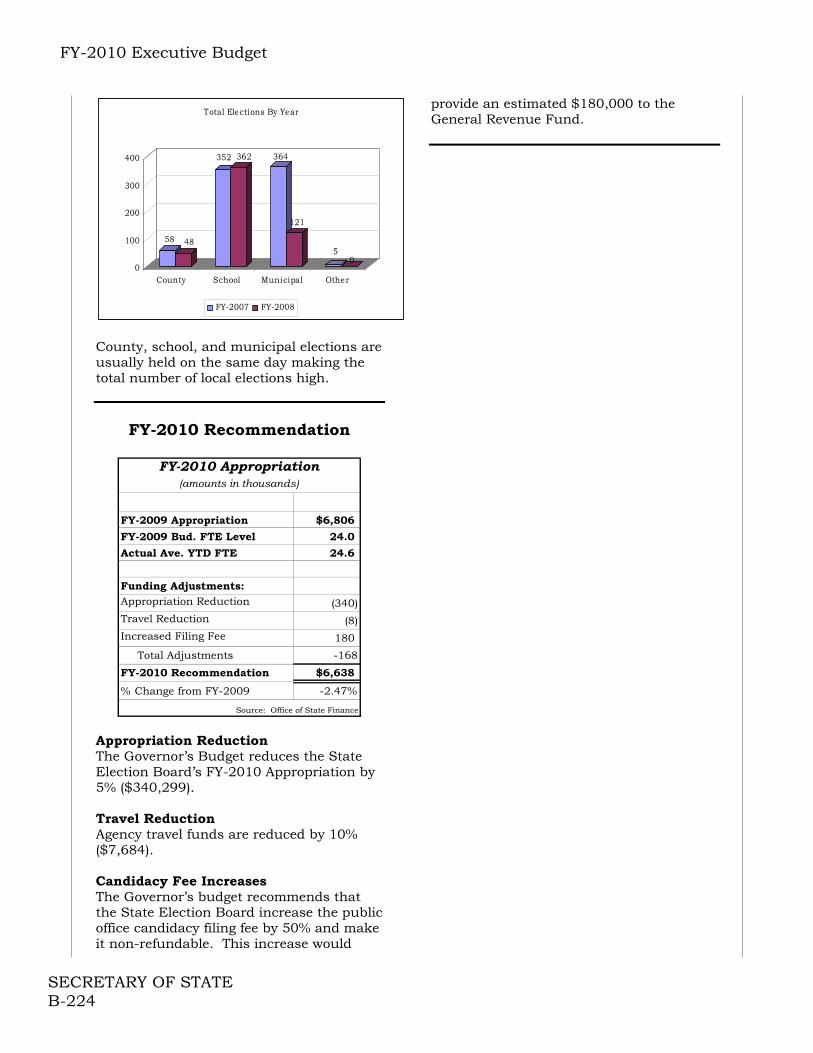
FY-2010 Executive Budget
SECRETARY OF STATE B-224
58 48
352 362 364
121
50
0
100
200
300
400
County School Municipal Other
Total Elections By Year
FY-2007 FY-2008
County, school, and municipal elections are usually held on the same day making the total number of local elections high.
FY-2010 Recommendation
FY-2009 Appropriation $6,806
FY-2009 Bud. FTE Level 24.0
Actual Ave. YTD FTE 24.6
Funding Adjustments:Appropriation Reduction (340)Travel Reduction (8)Increased Filing Fee 180
Total Adjustments -168
FY-2010 Recommendation $6,638
% Change from FY-2009 -2.47%
Source: Office of State Finance
FY-2010 Appropriation(amounts in thousands)
Appropriation Reduction The Governor’s Budget reduces the State Election Board’s FY-2010 Appropriation by 5% ($340,299). Travel Reduction Agency travel funds are reduced by 10% ($7,684). Candidacy Fee Increases The Governor’s budget recommends that the State Election Board increase the public office candidacy filing fee by 50% and make it non-refundable. This increase would
provide an estimated $180,000 to the General Revenue Fund.
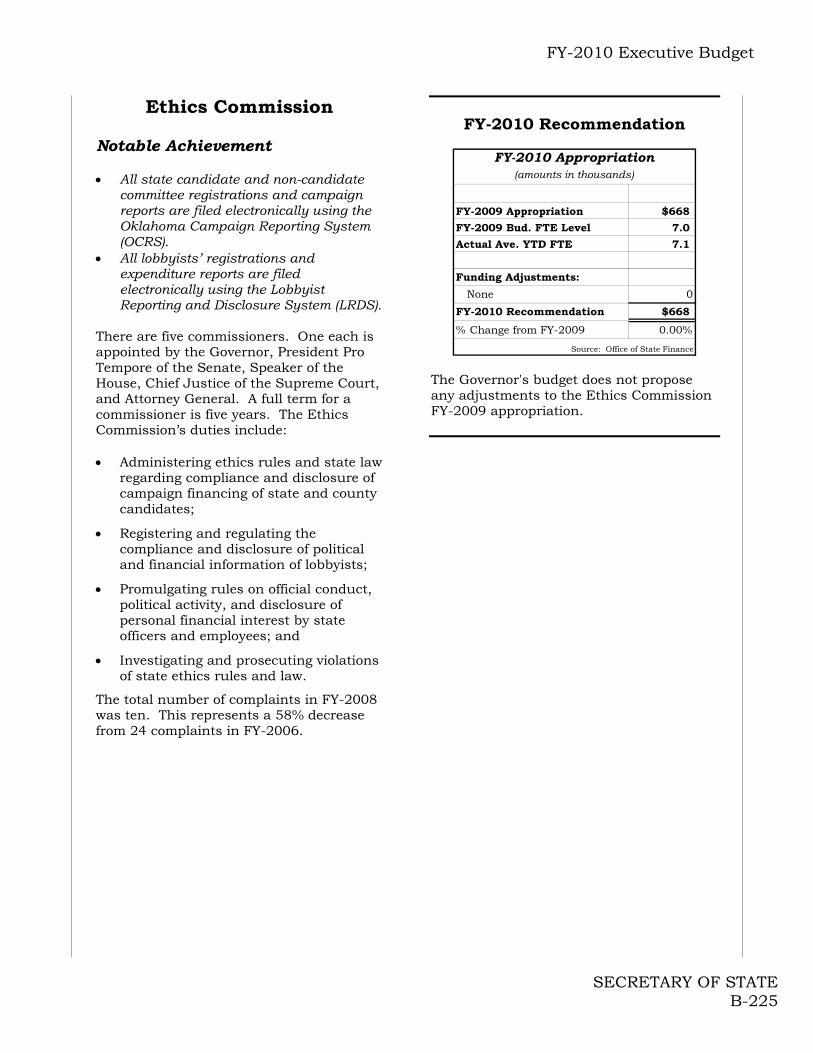
FY-2010 Executive Budget
SECRETARY OF STATE B-225
Ethics Commission Notable Achievement All state candidate and non-candidate
committee registrations and campaign reports are filed electronically using the Oklahoma Campaign Reporting System (OCRS).
All lobbyists’ registrations and expenditure reports are filed electronically using the Lobbyist Reporting and Disclosure System (LRDS).
There are five commissioners. One each is appointed by the Governor, President Pro Tempore of the Senate, Speaker of the House, Chief Justice of the Supreme Court, and Attorney General. A full term for a commissioner is five years. The Ethics Commission’s duties include: Administering ethics rules and state law
regarding compliance and disclosure of campaign financing of state and county candidates;
Registering and regulating the compliance and disclosure of political and financial information of lobbyists;
Promulgating rules on official conduct, political activity, and disclosure of personal financial interest by state officers and employees; and
Investigating and prosecuting violations of state ethics rules and law.
The total number of complaints in FY-2008 was ten. This represents a 58% decrease from 24 complaints in FY-2006.
FY-2010 Recommendation
FY-2009 Appropriation $668
FY-2009 Bud. FTE Level 7.0
Actual Ave. YTD FTE 7.1
Funding Adjustments:
None 0
FY-2010 Recommendation $668
% Change from FY-2009 0.00%
Source: Office of State Finance
FY-2010 Appropriation(amounts in thousands)
The Governor's budget does not propose any adjustments to the Ethics Commission FY-2009 appropriation.

FY-2010 Executive Budget
SECRETARY OF STATE B-226
Secretary of State
Notable Achievements
New technology allowed the Secretary of State to:
1. Improve employee efficiency
2. Increase on-line user activity
3. Distribute Legislation, Administrative Rules, and other SOS publications
4. Use targeted training to increase IT division effectiveness by 15%, thereby decreasing maintenance costs by $200,000.
The Secretary of State, created in Article VI of the Oklahoma Constitution, has a number of constitutional and statutorily established duties. These include:
Serving as the official repository of executive orders and official acts of the Governor;
Filing and distributing copies of all laws enacted by the Legislature;
Maintaining information regarding meetings held under the Open Meeting Act;
Maintaining a central registry for filing business documents on corporations and partnerships of all types;
Funding Sources The Secretary of State is funded in majority by revenue derived from fees collected for such things as Business Entity, Notary and Trademark filings. The Oklahoma Administrative Code and the Oklahoma Register The Oklahoma Administrative Code is the official compilation of agency rules and executive orders for the State of Oklahoma. The Oklahoma Register is a semi-monthly publication documenting administrative code changes between publications of the annual supplements.
Address Confidentiality Program The Address Confidentiality Program (ACP) provides services to residents who are victims of domestic violence, sexual assault and stalking. First, the program provides victims with a substitute address for use in interacting with state and local agencies. Second, victims are provided with a cost-free mail forwarding service. The Secretary of State is the victim’s agent for service of process and receipt of mail. There are currently 118 active participants in this program. Business Registration Services on the Internet The Secretary of State is utilizing the Internet in an effort to cut costs and increase efficiency. In FY-2001, the agency contracted with NIC Conquest, Inc. to develop this business registration system, SoonerAccess. SoonerAccess allows customers to submit the majority of business entity documents, trademarks/renewals, and Notary Public applications/renewals on-line. One-Stop Customer Service Center The Secretary of State is working with the Tax Commission to determine if business services offered by the Secretary of State’s office can be co-located to the Tax Commission’s one-stop customer service center. Governor’s Recommendation The Governor’s budget makes the Secretary of State a non-appropriated agency and recommends that the Secretary of State be given the flexibility to raise fees to support its operations.

FY-2010 Executive Budget
TRANSPORTATION B-227
Oklahoma Aeronautics Commission (OAC)
Notable Achievements
Led passage of HB 3239, HB 3098 and HB 2501. House Bill 3239, the Aerospace Industry Engineer Workforce Bil offers a tax credit of $5,000 for up to five years to engineers hired after January 1, 2009, by an Oklahoma aerospace company. Companies who hire those engineers will receive a tax credit (10% for an in-state graduate and 5% for an out-of-state graduate) for the compensation paid to an engineer during the first five years of his or her employment.
Led passage of HB 3098, the Aerospace Development Act of 2008. House Bill 3098 transferred the administration of two key aerospace programs, the Center for Aerospace Supplier Quality (CASQ) and the Oklahoma Aerospace Institute (OAI), to OAC in November 2009, allowing OAI to focus on creating a partnership of service providers to serve the aerospace industry.
Led passage of HB 2501, amending what is commonly known as the Aircraft Dealers’ Protection Act. This bill removed barriers to aviation manufacturers entering into dealership and service center agreements with Oklahoma aviation businesses.
Awarded capital improvement grants totaling $2,108,168 in FY-2008 to General Aviation airports throughout the state in order to make sure that our airports are being utilized in bringing business to Oklahoma.
Awarded aviation education grants/contracts totaling $120,360 in FY-2008 to promote aviation and the aerospace industry to elementary through high school students throughout the state.
The Oklahoma Airport System Plan is used by the Federal Aviation Administration (FAA) as a model for
other states and the FAA Southwest Region.
Mission The mission of the (OAC) is to promote aviation, which includes fostering the viability and growth of the aerospace industry and ensuring that the needs of commerce and communities across the state are met by the state’s 114 public airports that comprise the Oklahoma Airport System. Oklahoma has 114 publicly-owned airports. 111 of these are General Aviation airports, while the other 3 are Air Carrier airports – OKC Will Rogers, Tulsa International and Lawton-Ft. Sill Municipal. Out of the 111 General Aviation airports, 46 are classified as Regional Business airports (RBs). Currently, 41 of the RBs have jet-capable (5,000 feet or longer) runways. The OAC determines the airport projects that will be funded with state and federal funds through its capital planning and programming process and its Capital Improvement Program. The vast majority of funding for airport projects comes from the federal government through the Federal Aviation Administration Airport Improvement Program. During the last several years, the OAC has programmed over $10 million annually in federal funds for airport projects in Oklahoma. This does not include the more than $12 million a year in federal funds (through individual $150,000 grants) that is going directly to the 100 Oklahoma GA airports that are in the federal system. The OAC is funded with aviation-generated (aircraft excise tax, aircraft registration fees and aviation fuel tax), revenues. In FY-2008, OAC received $5,164,746 from these sources. The average from these sources over the past four fiscal years, including FY-2007, was $4,504,562. In FY-2008, the OAC expended $1,786,268 on airport projects, nearly $90,503 to promote the aerospace industry, and $1,459,834 on operations.
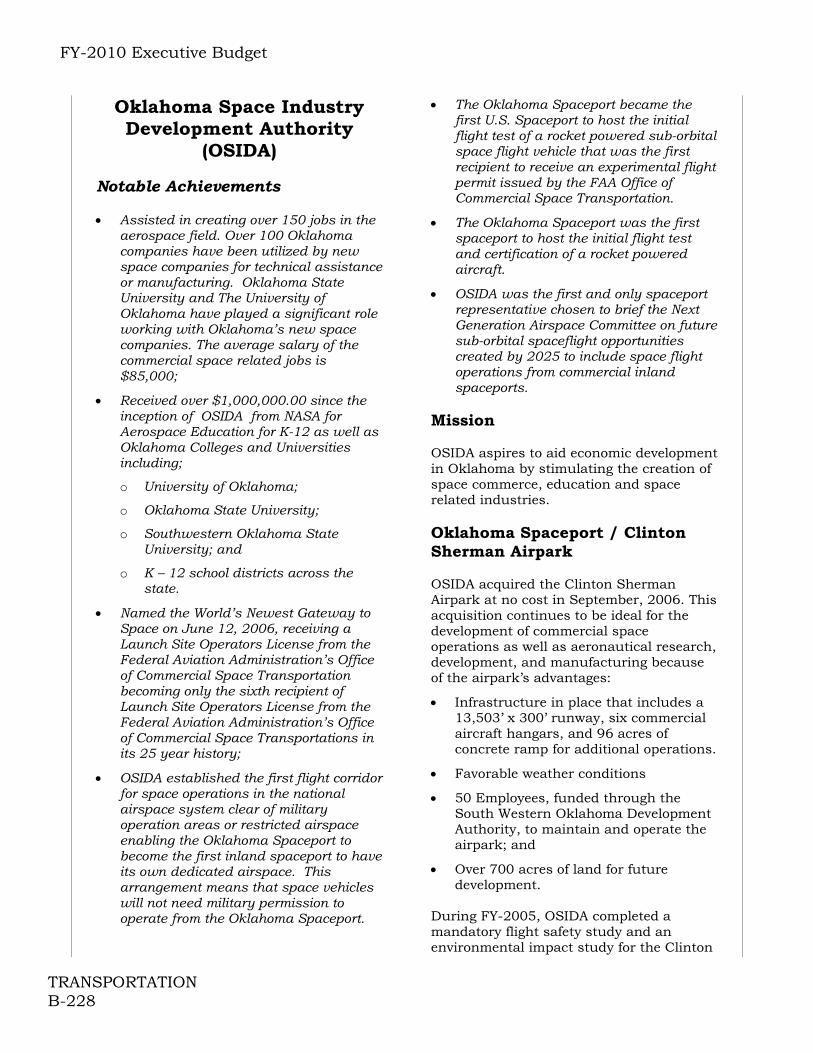
FY-2010 Executive Budget
TRANSPORTATION B-228
Oklahoma Space Industry Development Authority
(OSIDA)
Notable Achievements Assisted in creating over 150 jobs in the
aerospace field. Over 100 Oklahoma companies have been utilized by new space companies for technical assistance or manufacturing. Oklahoma State University and The University of Oklahoma have played a significant role working with Oklahoma’s new space companies. The average salary of the commercial space related jobs is $85,000;
Received over $1,000,000.00 since the inception of OSIDA from NASA for Aerospace Education for K-12 as well as Oklahoma Colleges and Universities including;
o University of Oklahoma;
o Oklahoma State University;
o Southwestern Oklahoma State University; and
o K – 12 school districts across the state.
Named the World’s Newest Gateway to Space on June 12, 2006, receiving a Launch Site Operators License from the Federal Aviation Administration’s Office of Commercial Space Transportation becoming only the sixth recipient of Launch Site Operators License from the Federal Aviation Administration’s Office of Commercial Space Transportations in its 25 year history;
OSIDA established the first flight corridor for space operations in the national airspace system clear of military operation areas or restricted airspace enabling the Oklahoma Spaceport to become the first inland spaceport to have its own dedicated airspace. This arrangement means that space vehicles will not need military permission to operate from the Oklahoma Spaceport.
The Oklahoma Spaceport became the first U.S. Spaceport to host the initial flight test of a rocket powered sub-orbital space flight vehicle that was the first recipient to receive an experimental flight permit issued by the FAA Office of Commercial Space Transportation.
The Oklahoma Spaceport was the first spaceport to host the initial flight test and certification of a rocket powered aircraft.
OSIDA was the first and only spaceport representative chosen to brief the Next Generation Airspace Committee on future sub-orbital spaceflight opportunities created by 2025 to include space flight operations from commercial inland spaceports.
Mission OSIDA aspires to aid economic development in Oklahoma by stimulating the creation of space commerce, education and space related industries. Oklahoma Spaceport / Clinton Sherman Airpark OSIDA acquired the Clinton Sherman Airpark at no cost in September, 2006. This acquisition continues to be ideal for the development of commercial space operations as well as aeronautical research, development, and manufacturing because of the airpark’s advantages:
Infrastructure in place that includes a 13,503’ x 300’ runway, six commercial aircraft hangars, and 96 acres of concrete ramp for additional operations.
Favorable weather conditions
50 Employees, funded through the South Western Oklahoma Development Authority, to maintain and operate the airpark; and
Over 700 acres of land for future development.
During FY-2005, OSIDA completed a mandatory flight safety study and an environmental impact study for the Clinton
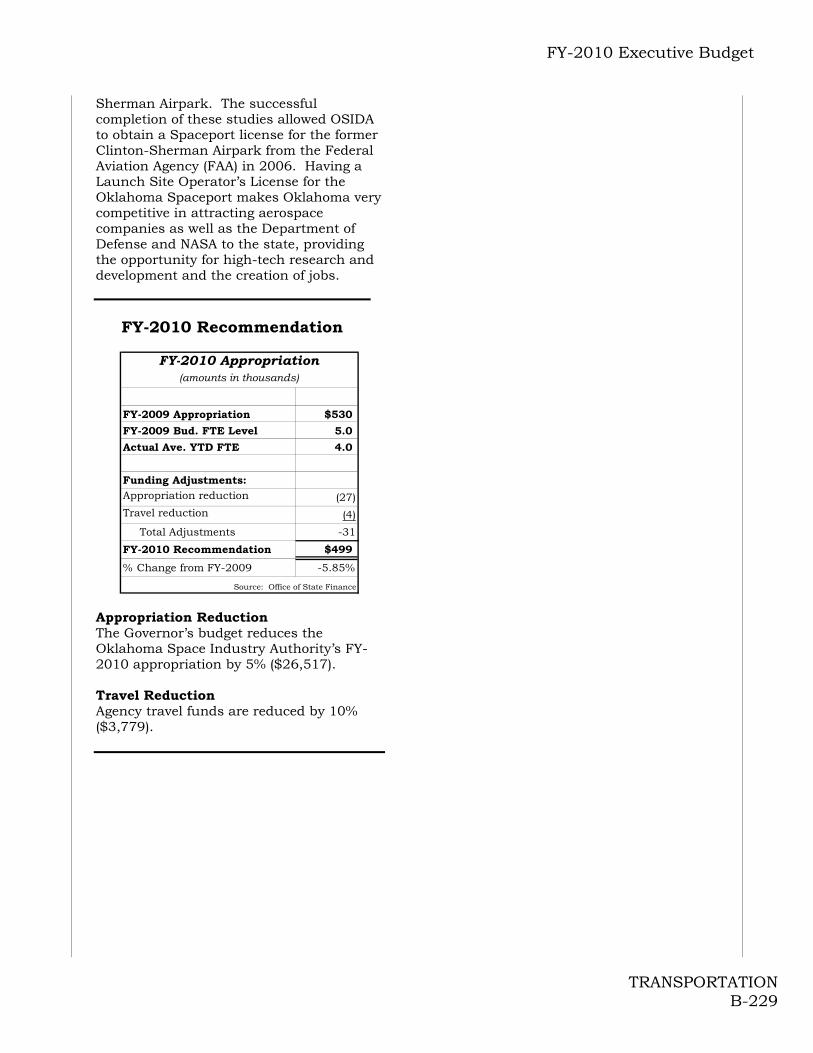
FY-2010 Executive Budget
TRANSPORTATION B-229
Sherman Airpark. The successful completion of these studies allowed OSIDA to obtain a Spaceport license for the former Clinton-Sherman Airpark from the Federal Aviation Agency (FAA) in 2006. Having a Launch Site Operator’s License for the Oklahoma Spaceport makes Oklahoma very competitive in attracting aerospace companies as well as the Department of Defense and NASA to the state, providing the opportunity for high-tech research and development and the creation of jobs.
FY-2010 Recommendation
FY-2009 Appropriation $530
FY-2009 Bud. FTE Level 5.0
Actual Ave. YTD FTE 4.0
Funding Adjustments:Appropriation reduction (27)Travel reduction (4)
Total Adjustments -31
FY-2010 Recommendation $499
% Change from FY-2009 -5.85%
Source: Office of State Finance
FY-2010 Appropriation(amounts in thousands)
Appropriation Reduction The Governor’s budget reduces the Oklahoma Space Industry Authority’s FY-2010 appropriation by 5% ($26,517). Travel Reduction Agency travel funds are reduced by 10% ($3,779).
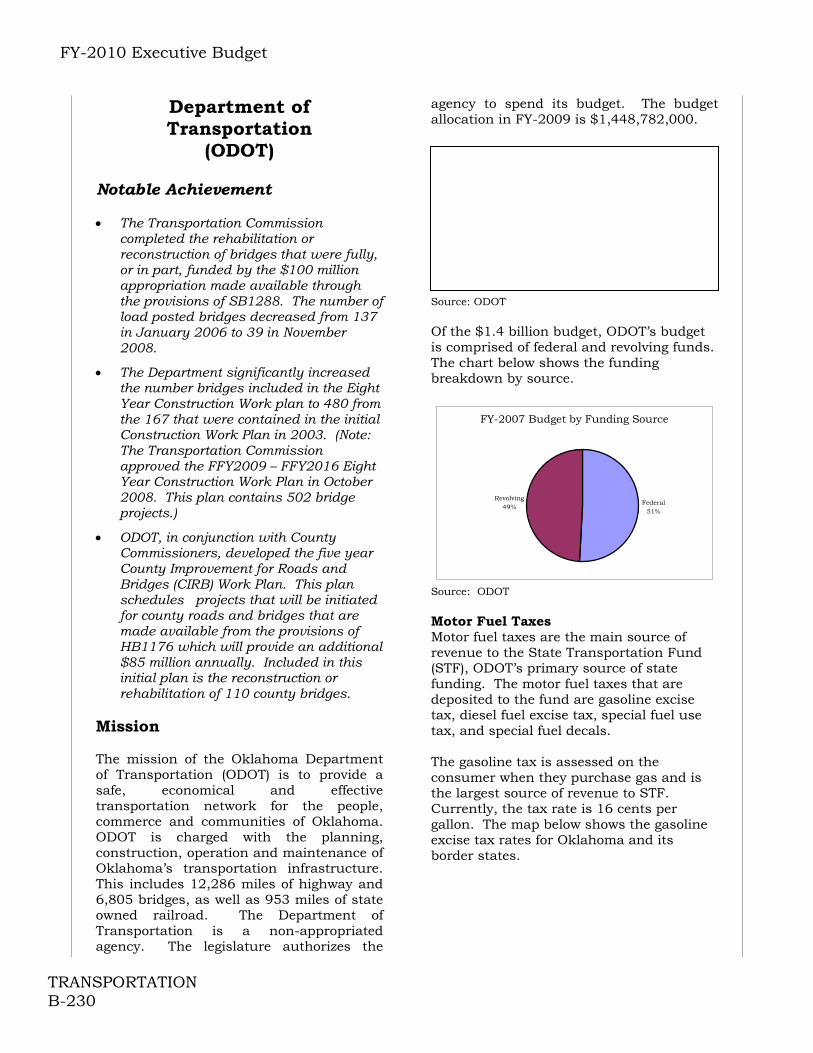
FY-2010 Executive Budget
TRANSPORTATION B-230
Department of Transportation
(ODOT)
Notable Achievement The Transportation Commission
completed the rehabilitation or reconstruction of bridges that were fully, or in part, funded by the $100 million appropriation made available through the provisions of SB1288. The number of load posted bridges decreased from 137 in January 2006 to 39 in November 2008.
The Department significantly increased the number bridges included in the Eight Year Construction Work plan to 480 from the 167 that were contained in the initial Construction Work Plan in 2003. (Note: The Transportation Commission approved the FFY2009 – FFY2016 Eight Year Construction Work Plan in October 2008. This plan contains 502 bridge projects.)
ODOT, in conjunction with County Commissioners, developed the five year County Improvement for Roads and Bridges (CIRB) Work Plan. This plan schedules projects that will be initiated for county roads and bridges that are made available from the provisions of HB1176 which will provide an additional $85 million annually. Included in this initial plan is the reconstruction or rehabilitation of 110 county bridges.
Mission
The mission of the Oklahoma Department of Transportation (ODOT) is to provide a safe, economical and effective transportation network for the people, commerce and communities of Oklahoma. ODOT is charged with the planning, construction, operation and maintenance of Oklahoma’s transportation infrastructure. This includes 12,286 miles of highway and 6,805 bridges, as well as 953 miles of state owned railroad. The Department of Transportation is a non-appropriated agency. The legislature authorizes the
agency to spend its budget. The budget allocation in FY-2009 is $1,448,782,000. Source: ODOT Of the $1.4 billion budget, ODOT’s budget is comprised of federal and revolving funds. The chart below shows the funding breakdown by source.
FY-2007 Budget by Funding Source
Federal51%
Revolving49%
Source: ODOT Motor Fuel Taxes Motor fuel taxes are the main source of revenue to the State Transportation Fund (STF), ODOT’s primary source of state funding. The motor fuel taxes that are deposited to the fund are gasoline excise tax, diesel fuel excise tax, special fuel use tax, and special fuel decals. The gasoline tax is assessed on the consumer when they purchase gas and is the largest source of revenue to STF. Currently, the tax rate is 16 cents per gallon. The map below shows the gasoline excise tax rates for Oklahoma and its border states.
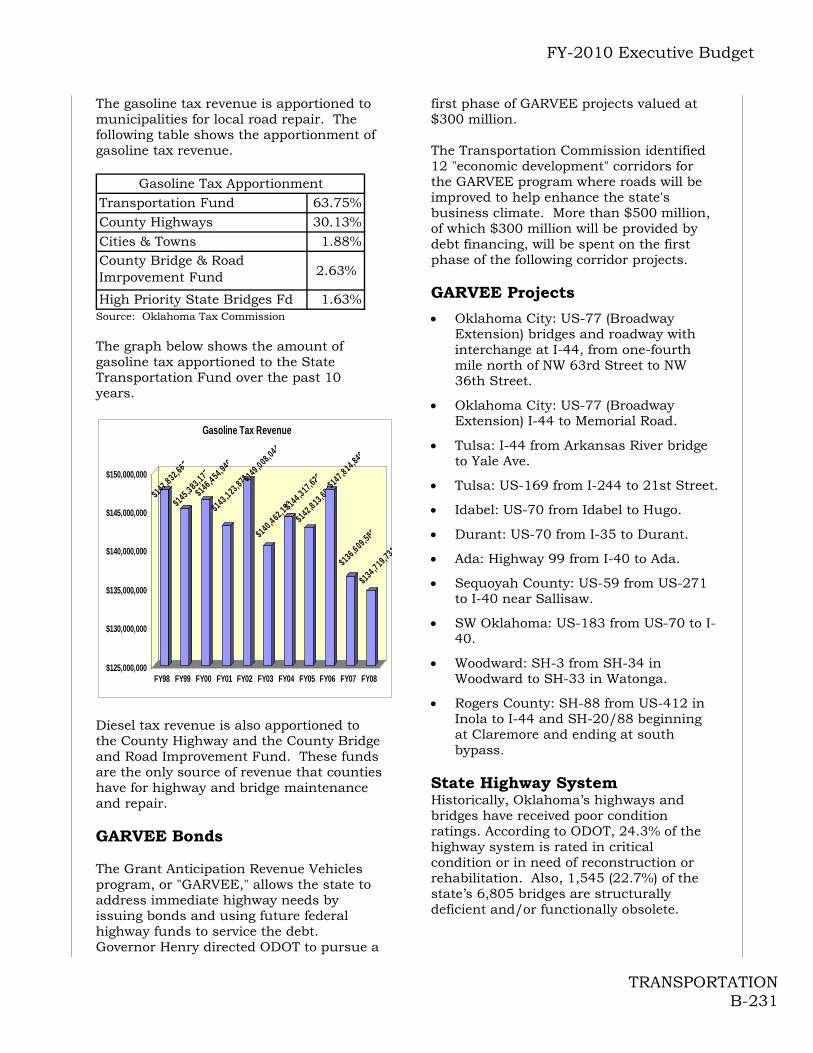
FY-2010 Executive Budget
TRANSPORTATION B-231
The gasoline tax revenue is apportioned to municipalities for local road repair. The following table shows the apportionment of gasoline tax revenue.
Transportation Fund 63.75%County Highways 30.13%Cities & Towns 1.88%
High Priority State Bridges Fd 1.63%
County Bridge & Road Imrpovement Fund 2.63%
Gasoline Tax Apportionment
Source: Oklahoma Tax Commission The graph below shows the amount of gasoline tax apportioned to the State Transportation Fund over the past 10 years.
$147 ,832,663
$145 ,383,177
$146 ,4 54,946
$143 ,123,873 $149 ,008,044
$140 ,4 62,153 $144 ,3 17,628
$142 ,8 13,604 $147 ,8 14,846
$136 ,609,588
$134 ,7 19,731
$125,000,000
$130,000,000
$135,000,000
$140,000,000
$145,000,000
$150,000,000
FY98 FY99 FY00 FY01 FY02 FY03 FY04 FY05 FY06 FY07 FY08
Gasoline Tax Revenue
Diesel tax revenue is also apportioned to the County Highway and the County Bridge and Road Improvement Fund. These funds are the only source of revenue that counties have for highway and bridge maintenance and repair. GARVEE Bonds The Grant Anticipation Revenue Vehicles program, or "GARVEE," allows the state to address immediate highway needs by issuing bonds and using future federal highway funds to service the debt. Governor Henry directed ODOT to pursue a
first phase of GARVEE projects valued at $300 million. The Transportation Commission identified 12 "economic development" corridors for the GARVEE program where roads will be improved to help enhance the state's business climate. More than $500 million, of which $300 million will be provided by debt financing, will be spent on the first phase of the following corridor projects. GARVEE Projects
Oklahoma City: US-77 (Broadway Extension) bridges and roadway with interchange at I-44, from one-fourth mile north of NW 63rd Street to NW 36th Street.
Oklahoma City: US-77 (Broadway Extension) I-44 to Memorial Road.
Tulsa: I-44 from Arkansas River bridge to Yale Ave.
Tulsa: US-169 from I-244 to 21st Street.
Idabel: US-70 from Idabel to Hugo.
Durant: US-70 from I-35 to Durant.
Ada: Highway 99 from I-40 to Ada.
Sequoyah County: US-59 from US-271 to I-40 near Sallisaw.
SW Oklahoma: US-183 from US-70 to I-40.
Woodward: SH-3 from SH-34 in Woodward to SH-33 in Watonga.
Rogers County: SH-88 from US-412 in Inola to I-44 and SH-20/88 beginning at Claremore and ending at south bypass.
State Highway System Historically, Oklahoma’s highways and bridges have received poor condition ratings. According to ODOT, 24.3% of the highway system is rated in critical condition or in need of reconstruction or rehabilitation. Also, 1,545 (22.7%) of the state’s 6,805 bridges are structurally deficient and/or functionally obsolete.

FY-2010 Executive Budget
TRANSPORTATION B-232
18.0%
20.0%
22.0%
24.0%
26.0%
28.0%
FY-01 FY-02 FY-03 FY-04 FY-05 FY-06 FY-07
Est.
% of the State Highway System in Critical Condition
Key Performance Measure Source: ODOT
ROADS Fund The 2006 Oklahoma legislative session, through H.B. 1176, provided an excellent foundation of opportunity to address the long-term needs of our transportation system. The legislative intent for H.B. 1176 was to provide an additional $50 million annually. Because of the statutory trigger mechanism requiring a 3% growth in estimated revenues apportioned to the General Revenue Fund, ODOT did not receive the intended amount for fiscal years 2008 and 2009. Continued inability of the State to meet the 3% threshold would have had a negative impact on ODOT’s Eight Year Construction Work Plan. The 2008 legislative session provided an improved opportunity to address the long-term needs of our transportation system through H.B. 2272, which removed the 3% trigger based on the growth of state revenues that was contained in HB 1176. The new bill provides for an annual increase beginning with fiscal year 2010 of $30 million until the funding level reaches $370 million each year. In addition to the funding for highways and bridges, the Oklahoma Tourism and Passenger Rail Revolving Fund is apportioned $2 million and the Public Transit Revolving Fund is apportioned $3 million.
FY-2010 Recommendation
FY-2009 Appropriation $207,691
One-time Adjustments (100)
FY-2009 Base $207,591
Actual Ave. YTD FTE 2,472.4
Funding Adjustments:
Decreased Certification (9,058)
FY-2010 Recommendation $198,533
$ Change from FY-2009 ($9,158)
% Change from FY-2009 -4.41%
(amounts in thousands)
Source: Office of State Finance
FY-2010 Appropriation
Decreased Certification The Board of Equalization certified revenues of $198,533,799 to the State Transportation Fund for FY-2010.
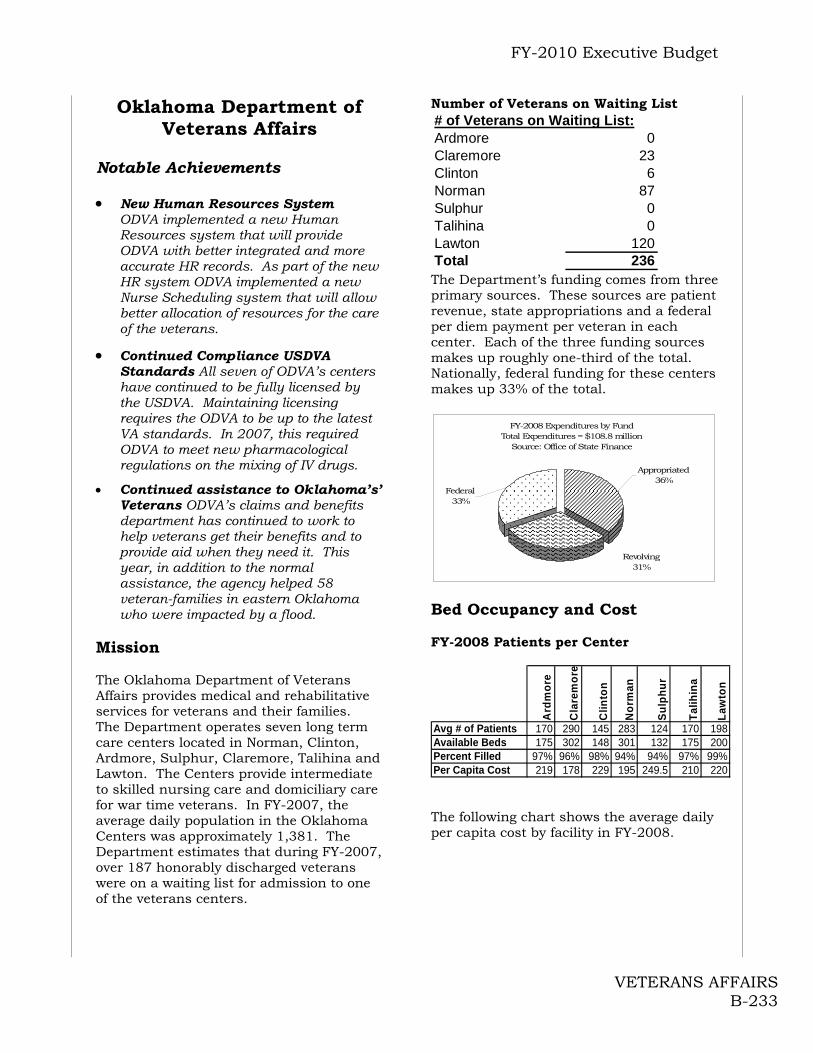
FY-2010 Executive Budget
VETERANS AFFAIRS B-233
Oklahoma Department of Veterans Affairs
Notable Achievements New Human Resources System ODVA implemented a new Human
Resources system that will provide ODVA with better integrated and more accurate HR records. As part of the new HR system ODVA implemented a new Nurse Scheduling system that will allow better allocation of resources for the care of the veterans.
Continued Compliance USDVA Standards All seven of ODVA’s centers have continued to be fully licensed by the USDVA. Maintaining licensing requires the ODVA to be up to the latest VA standards. In 2007, this required ODVA to meet new pharmacological regulations on the mixing of IV drugs.
Continued assistance to Oklahoma’s’ Veterans ODVA’s claims and benefits department has continued to work to help veterans get their benefits and to provide aid when they need it. This year, in addition to the normal assistance, the agency helped 58 veteran-families in eastern Oklahoma who were impacted by a flood.
Mission The Oklahoma Department of Veterans Affairs provides medical and rehabilitative services for veterans and their families. The Department operates seven long term care centers located in Norman, Clinton, Ardmore, Sulphur, Claremore, Talihina and Lawton. The Centers provide intermediate to skilled nursing care and domiciliary care for war time veterans. In FY-2007, the average daily population in the Oklahoma Centers was approximately 1,381. The Department estimates that during FY-2007, over 187 honorably discharged veterans were on a waiting list for admission to one of the veterans centers.
Number of Veterans on Waiting List # of Veterans on Waiting List:Ardmore 0Claremore 23Clinton 6Norman 87Sulphur 0Talihina 0Lawton 120Total 236 The Department’s funding comes from three primary sources. These sources are patient revenue, state appropriations and a federal per diem payment per veteran in each center. Each of the three funding sources makes up roughly one-third of the total. Nationally, federal funding for these centers makes up 33% of the total.
FY-2008 Expenditures by Fund Total Expenditures = $108.8 million
Source: Office of State Finance
Revolving31%
Federal33%
Appropriated36%
Bed Occupancy and Cost FY-2008 Patients per Center
Ard
mo
re
Cla
rem
ore
Clin
ton
No
rman
Su
lph
ur
Tal
ihin
a
Law
ton
Avg # of Patients 170 290 145 283 124 170 198Available Beds 175 302 148 301 132 175 200Percent Filled 97% 96% 98% 94% 94% 97% 99%Per Capita Cost 219 178 229 195 249.5 210 220 The following chart shows the average daily per capita cost by facility in FY-2008.
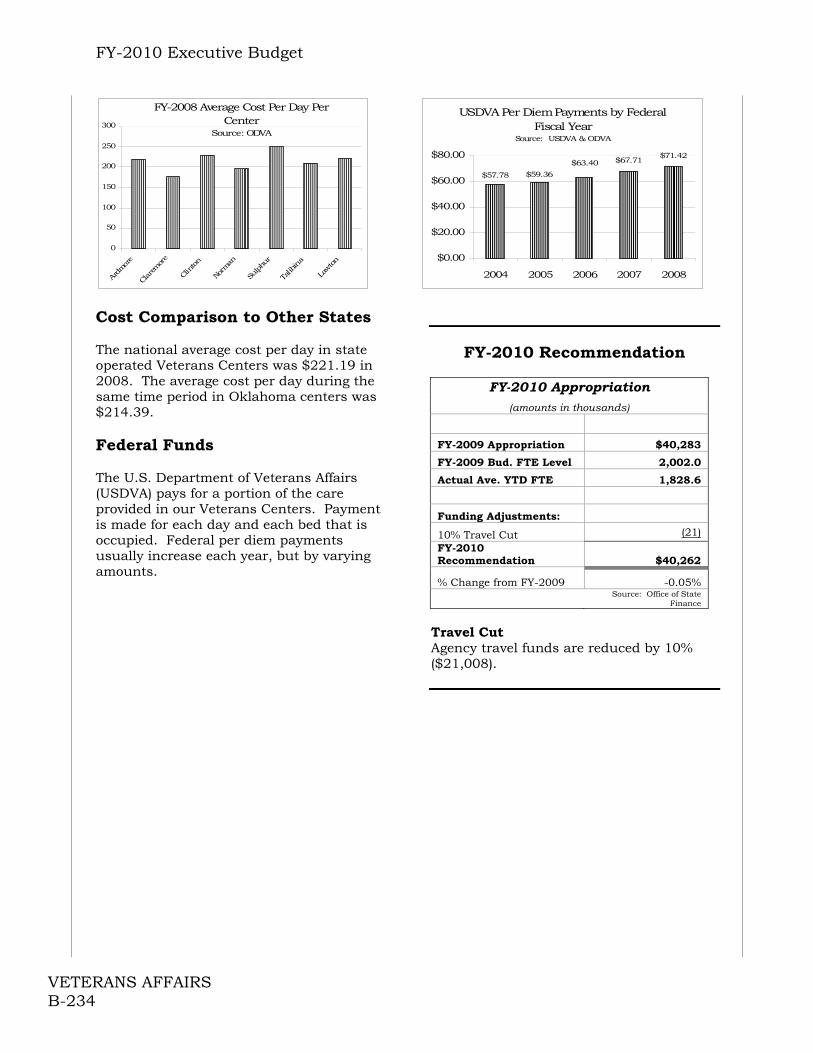
FY-2010 Executive Budget
VETERANS AFFAIRS B-234
FY-2008 Average Cost Per Day Per Center
Source: ODVA
0
50
100
150
200
250
300
Ardm
ore
Clar
emore
Clinton
Norm
an
Sulphu
r
Talih
ina
Lawt
on
Cost Comparison to Other States The national average cost per day in state operated Veterans Centers was $221.19 in 2008. The average cost per day during the same time period in Oklahoma centers was $214.39. Federal Funds The U.S. Department of Veterans Affairs (USDVA) pays for a portion of the care provided in our Veterans Centers. Payment is made for each day and each bed that is occupied. Federal per diem payments usually increase each year, but by varying amounts.
USDVA Per Diem Payments by Federal Fiscal Year
Source: USDVA & ODVA
$67.71$71.42
$59.36$57.78
$63.40
$0.00
$20.00
$40.00
$60.00
$80.00
2004 2005 2006 2007 2008
FY-2010 Recommendation
FY-2010 Appropriation
(amounts in thousands)
FY-2009 Appropriation $40,283
FY-2009 Bud. FTE Level 2,002.0
Actual Ave. YTD FTE 1,828.6
Funding Adjustments:
10% Travel Cut (21)
FY-2010 Recommendation $40,262
% Change from FY-2009 -0.05%
Source: Office of State
Finance
Travel Cut Agency travel funds are reduced by 10% ($21,008).
FY-2010 Executive Budget
LEGISLATURE B-235
House of Representatives, Legislative Service Bureau and State Senate The House of Representatives, Legislative Service Bureau (LSB) and the State Senate represent the legislative branch. The Oklahoma Legislature consists of 101 members in the House of Representatives and 48 members in the State Senate. They convene annually beginning on the first Monday in February, and adjourn on the last Friday in May. Normally, the Legislature is in session Monday through Thursday. Extra sessions may be called by the Governor or by the Legislature. State Senators serve four-year terms with half of the members elected every 2 years. Members of the House of Representatives serve two-year terms. Each house of the Legislature considers four different types of legislation: Bills that will become law when passed by
both houses and signed by the Governor; Joint Resolutions that have the effect of
law if passed by both houses and signed by the Governor but may not become part of the statutes;
Concurrent resolutions which express the
will of both of the houses; and Simple resolutions, which express the will
of the house of origin. In 1990, voters in Oklahoma decided to adopt term limits for legislators. Therefore, legislators have a 12-year limit on service in the House of Representatives, the Senate, or both. Appropriation Reduction The Governor’s budget recommends a 5% appropriations reduction and a 10% travel reduction for all agencies within the Legislative cabinet.

FY-2010 Executive Budget
LEGISLATURE B-236
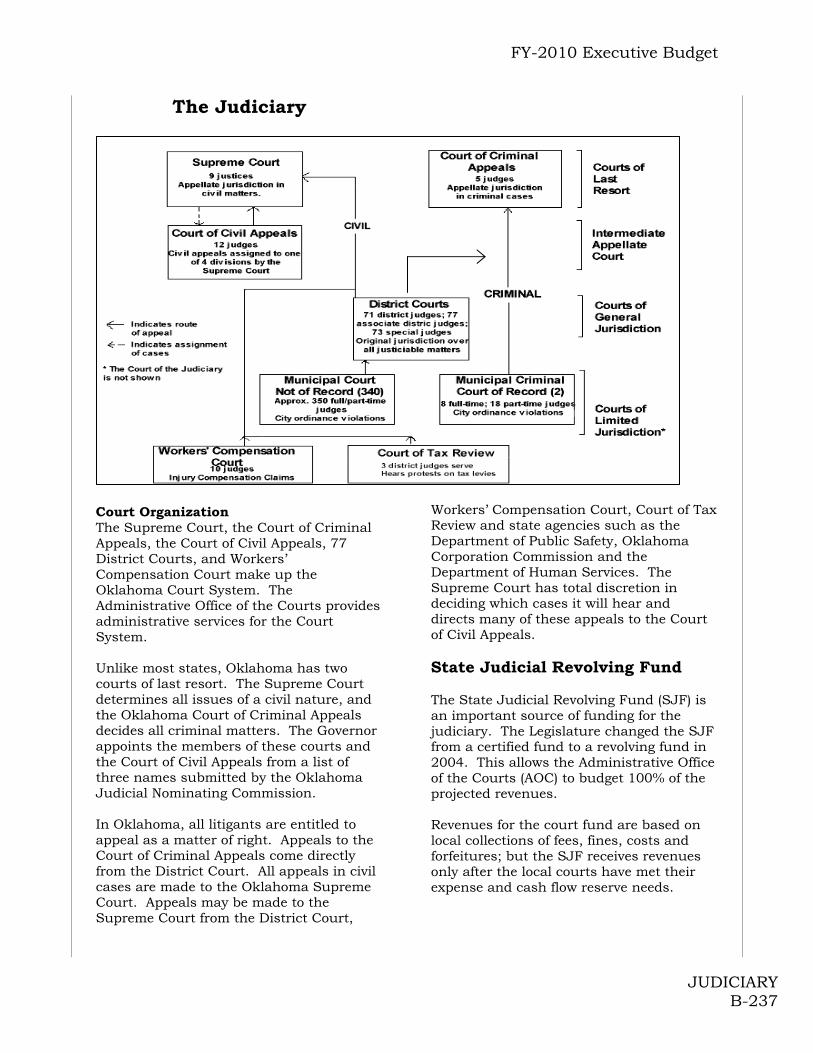
FY-2010 Executive Budget
JUDICIARY B-237
The Judiciary
Court Organization The Supreme Court, the Court of Criminal Appeals, the Court of Civil Appeals, 77 District Courts, and Workers’ Compensation Court make up the Oklahoma Court System. The Administrative Office of the Courts provides administrative services for the Court System. Unlike most states, Oklahoma has two courts of last resort. The Supreme Court determines all issues of a civil nature, and the Oklahoma Court of Criminal Appeals decides all criminal matters. The Governor appoints the members of these courts and the Court of Civil Appeals from a list of three names submitted by the Oklahoma Judicial Nominating Commission. In Oklahoma, all litigants are entitled to appeal as a matter of right. Appeals to the Court of Criminal Appeals come directly from the District Court. All appeals in civil cases are made to the Oklahoma Supreme Court. Appeals may be made to the Supreme Court from the District Court,
Workers’ Compensation Court, Court of Tax Review and state agencies such as the Department of Public Safety, Oklahoma Corporation Commission and the Department of Human Services. The Supreme Court has total discretion in deciding which cases it will hear and directs many of these appeals to the Court of Civil Appeals. State Judicial Revolving Fund The State Judicial Revolving Fund (SJF) is an important source of funding for the judiciary. The Legislature changed the SJF from a certified fund to a revolving fund in 2004. This allows the Administrative Office of the Courts (AOC) to budget 100% of the projected revenues. Revenues for the court fund are based on local collections of fees, fines, costs and forfeitures; but the SJF receives revenues only after the local courts have met their expense and cash flow reserve needs.
FY-2010 Executive Budget
JUDICIARY B-238
County court clerks deposit in the SJF the amount by which local court receipts exceed expenses for the reporting period. The statute also allows court clerks to retain 20% of their expenses for the reporting period from the excess amount. Court fund transfers are made either quarterly or monthly, depending on county population. Over the past years, court fund collections have experienced solid growth. Local court expenditures, however, have grown at a slightly higher rate. Local court obligations fall into three basic categories: 1. Lump sum expenses: Jurors and
witnesses, guardianship evaluations, publications, supplies, telephones, etc.;
2. Restricted expenses: Renovation,
remodeling, maintenance, furniture and fixtures, part-time bailiffs, part-time court clerks (which are generally full-time employees), per diem court reporters, etc.; and
3. Mandated expenses: Law library
assessments and contributions to the SJF.
Lump sum expenditures are closely related to court caseloads and case complexities. These costs vary from year to year. Restricted expenditures relate to work force and facility needs and tend to be predictable. Mandated expenditures are established by law. Over the last ten years, certain local court expenses have shifted from the local court budget to the state budget. Expenses now paid at the state level include the cost of providing indigent criminal defense for 75 counties and the elimination of the requirement to place or apportion 10% of court fund collections to the State Judicial Retirement Fund. This cost-shift has offset even greater growth in local court expenditures and allowed court fund collections continued growth.
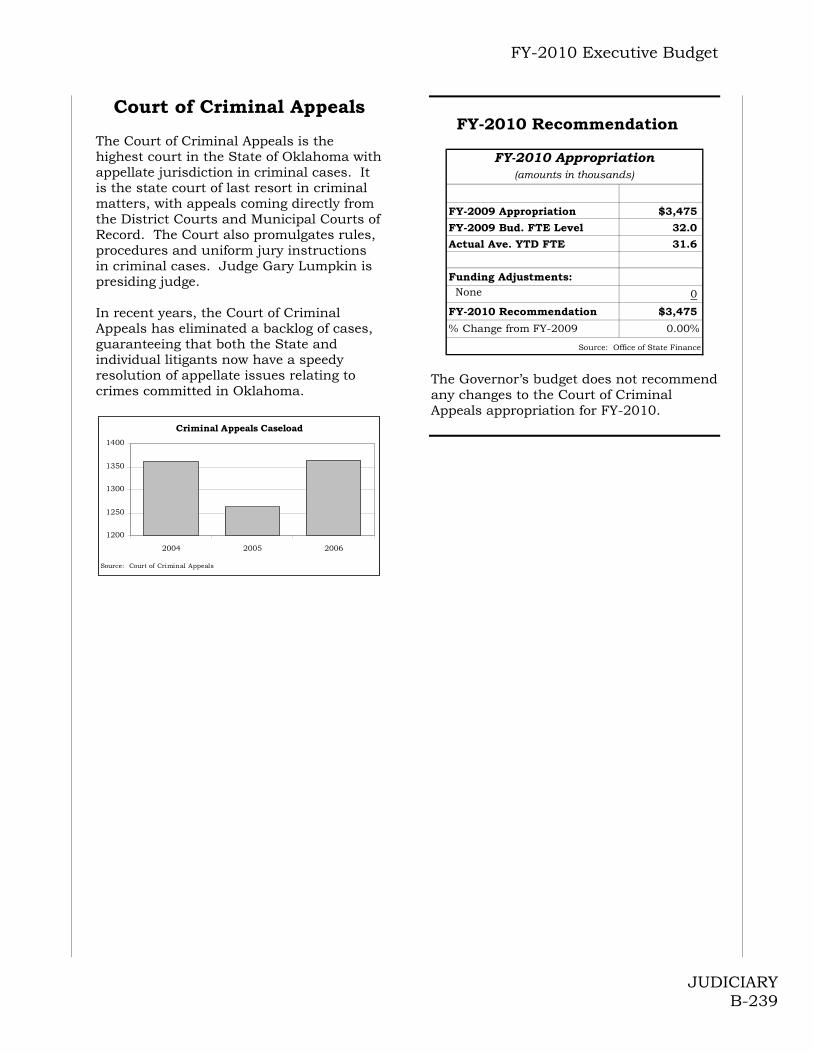
FY-2010 Executive Budget
JUDICIARY B-239
Court of Criminal Appeals The Court of Criminal Appeals is the highest court in the State of Oklahoma with appellate jurisdiction in criminal cases. It is the state court of last resort in criminal matters, with appeals coming directly from the District Courts and Municipal Courts of Record. The Court also promulgates rules, procedures and uniform jury instructions in criminal cases. Judge Gary Lumpkin is presiding judge. In recent years, the Court of Criminal Appeals has eliminated a backlog of cases, guaranteeing that both the State and individual litigants now have a speedy resolution of appellate issues relating to crimes committed in Oklahoma.
Criminal Appeals Caseload
1200
1250
1300
1350
1400
2004 2005 2006
Source: Court of Criminal Appeals
FY-2010 Recommendation
FY-2009 Appropriation $3,475
FY-2009 Bud. FTE Level 32.0
Actual Ave. YTD FTE 31.6
Funding Adjustments: None 0
FY-2010 Recommendation $3,475
% Change from FY-2009 0.00%
Source: Office of State Finance
FY-2010 Appropriation(amounts in thousands)
The Governor’s budget does not recommend any changes to the Court of Criminal Appeals appropriation for FY-2010.
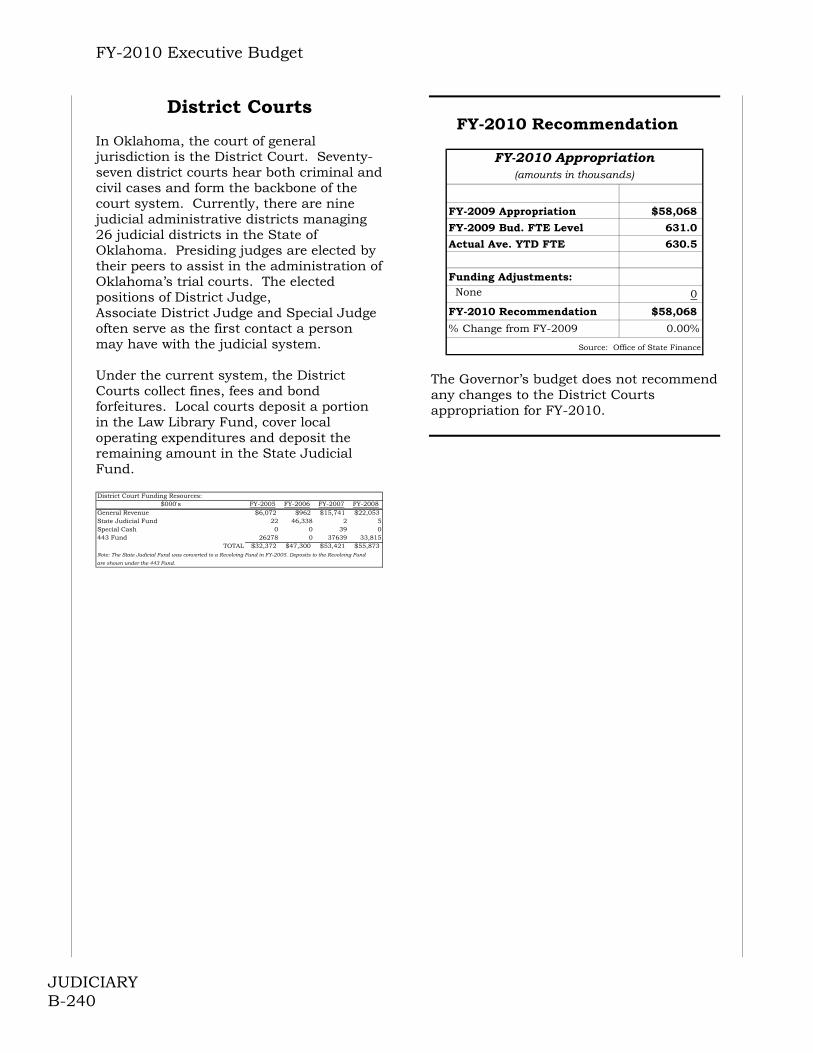
FY-2010 Executive Budget
JUDICIARY B-240
District Courts In Oklahoma, the court of general jurisdiction is the District Court. Seventy-seven district courts hear both criminal and civil cases and form the backbone of the court system. Currently, there are nine judicial administrative districts managing 26 judicial districts in the State of Oklahoma. Presiding judges are elected by their peers to assist in the administration of Oklahoma’s trial courts. The elected positions of District Judge, Associate District Judge and Special Judge often serve as the first contact a person may have with the judicial system. Under the current system, the District Courts collect fines, fees and bond forfeitures. Local courts deposit a portion in the Law Library Fund, cover local operating expenditures and deposit the remaining amount in the State Judicial Fund. District Court Funding Resources:
$000's FY-2005 FY-2006 FY-2007 FY-2008General Revenue $6,072 $962 $15,741 $22,053State Judicial Fund 22 46,338 2 5Special Cash 0 0 39 0443 Fund 26278 0 37639 33,815
TOTAL $32,372 $47,300 $53,421 $55,873Note: The State Judicial Fund was converted to a Revolving Fund in FY-2005. Deposits to the Revolving Fund
are shown under the 443 Fund.
FY-2010 Recommendation
FY-2009 Appropriation $58,068
FY-2009 Bud. FTE Level 631.0
Actual Ave. YTD FTE 630.5
Funding Adjustments: None 0
FY-2010 Recommendation $58,068
% Change from FY-2009 0.00%
Source: Office of State Finance
FY-2010 Appropriation(amounts in thousands)
The Governor’s budget does not recommend any changes to the District Courts appropriation for FY-2010.
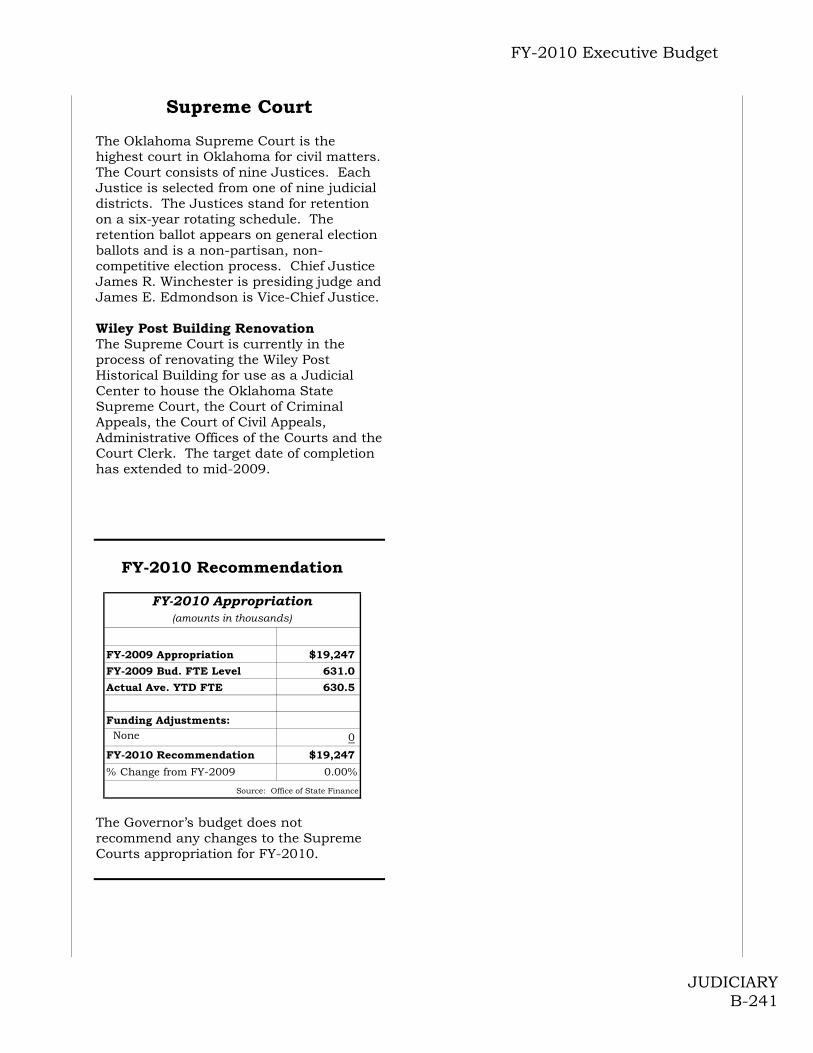
FY-2010 Executive Budget
JUDICIARY B-241
Supreme Court The Oklahoma Supreme Court is the highest court in Oklahoma for civil matters. The Court consists of nine Justices. Each Justice is selected from one of nine judicial districts. The Justices stand for retention on a six-year rotating schedule. The retention ballot appears on general election ballots and is a non-partisan, non-competitive election process. Chief Justice James R. Winchester is presiding judge and James E. Edmondson is Vice-Chief Justice. Wiley Post Building Renovation The Supreme Court is currently in the process of renovating the Wiley Post Historical Building for use as a Judicial Center to house the Oklahoma State Supreme Court, the Court of Criminal Appeals, the Court of Civil Appeals, Administrative Offices of the Courts and the Court Clerk. The target date of completion has extended to mid-2009.
FY-2010 Recommendation
FY-2009 Appropriation $19,247
FY-2009 Bud. FTE Level 631.0
Actual Ave. YTD FTE 630.5
Funding Adjustments: None 0
FY-2010 Recommendation $19,247
% Change from FY-2009 0.00%
Source: Office of State Finance
FY-2010 Appropriation(amounts in thousands)
The Governor’s budget does not recommend any changes to the Supreme Courts appropriation for FY-2010.

FY-2010 Executive Budget
JUDICIARY B-242
Workers’ Compensation Court
The Workers' Compensation Court is composed of ten judges appointed by the Governor. Its mission is to provide fair and timely procedures for the resolution of disputes and identification of issues involving work-related injuries. The Court is vested with jurisdiction to administer the Workers' Compensation Act, including determining claims for compensation, the liability of employers and insurers, and any rights asserted under the Act. It also regulates self-insured employers, maintains employer insurance coverage records, establishes a workers' compensation medical fee schedule, provides information about workers' compensation through its Counselor Department and participation in educational programs, and maintains a Mediation System for disposition of claims without the necessity of trial. Judge Mary A. Black is the current Presiding Judge.
Court Orders Given
15,23815,261
16,872
17,225
15,975
16,727
14,000
15,000
16,000
17,000
18,000
FY-2003 FY-2004 FY-2005 FY-2006 FY-2007 FY-2008Source: Workers Comp Court
Total Number of Hearings
0
20,000
40,000
60,000
80,000
100,000
FY-2003 FY-2004 FY-2005 FY-2006 FY-2007 FY-2008
Source: Workers' Compensation Court
FY-2010 Recommendation
FY-2009 Appropriation $5,260
FY-2009 Bud. FTE Level 85.0
Actual Ave. YTD FTE 81.6
Funding Adjustments: Increased Fees (899)
FY-2010 Recommendation $4,361
% Change from FY-2009 -17.09%
Source: Office of State Finance
FY-2010 Appropriation(amounts in thousands)
Fee Increase The Governor’s budget recommends that the Workers’ Compensation Court raise the Background Check Fee and the Final Award and Re-open Fee. The result will be a $899,375 increase in income to the agency. The agency’s appropriation has been reduced accordingly.

FY-2009 Executive Budget
THE BUDGET CYCLE
STATE FISCAL YEAR IS JULY 1 - JUNE 30
July
Au
g
Sep
t
Oct
Nov
Dec
Jan
Feb
Mar
Apr
May
Jun
e
1. Agencies reveiw program needs and
prepare Budget Requests and
Strategic Plans.
2. Agencies submit Budget Requests.
Strategic Plans are submitted every Oct 1
even numbered year.
3. Office of State Finance reviews Budget
Requests and Strategic Plans for
development of the Executive Budget Book.
4. December Equalization Board Meeting -
expenditure authority is the approved Dec
basis for the Executive Budget.
5. Submission of Executive Budget
to the Legislature. Feb
Legislative session begins.
6. Feb Equalization Board - expenditure
authority is approved basis for Legislative Feb
Appropriations and Governor's action
7. Legislature reviews agency budgets and
finalizes appropriation recommendations.
8. Governor's action on Appropriation Bills
9. June Equaliztion Board Meeting - revenue
and expenditure authority adjusted to June
incorporate statutory changes.
10. Budget Work Programs submitted to the
Office of State Finance for approval July
by July 1
Feb - May
Feb - Mid-June
Oct - Nov
July 1 - Oct 1
STATE BUDGET INFORMATIONC - 4
FY-2010 Executive Budget
Oklahoma State Budget Process – State Fiscal Year is July 1 through June 30.
1. Agencies review program performance and financial needs for preparation of the Budget Request and Strategic Plan
2. The Budget Request is the legal document which contains all financial and program
information for each agency including a listing of all requests for additional state funds and changes in revolving or federal funds. Budget Requests must be submitted October 1 of every year under Section 41.29 of Title 62. Agency Strategic Plans include each agency’s mission, goals and performance measures within a five year time line. Section 45.3 of Title 62 requires strategic plans to be submitted October 1 of every even-numbered year.
3. The Office of State Finance Budget Division reviews agency budget requests and
holds agency budget request hearings for development of the Executive Budget. 4. December Equalization Board Meeting – The Equalization Board is the constitutional
body responsible for setting revenue and expenditure authority for the Governor and Legislature (Sec. 23 Art. 10 of Oklahoma Constitution). The limit approved at this meeting is the amount used for development of the Executive Budget Book.
5. Submission of Executive Budget – The Governor is required to submit an Executive
Budget to the Legislature on the first Monday of each regular legislative session. The budget must be balanced using the December Equalization Board amounts.
6. February Equalization Board Meeting – The Board is constitutionally required under
Section 23 of Article 10 to meet again and incorporate economic adjustments to the revenue and expenditure authority. The limit approved at this meeting constitutes the limit for Legislative appropriations action.
7. Legislative Appropriations Process – The appropriations subcommittees and
legislative staff of each house review agency budgets, budget requests and pass appropriation bills.
8. Governor acts, within constitutional time lines set forth in Sections 11 and 12 of
Article 6 of the Oklahoma Constitution, to sign, veto or pocket veto appropriation bills. 9. June Equalization Board Meeting – The board is authorized in Section 23 of Article 10
of the Oklahoma Constitution to meet and incorporate statutory changes that increase or decrease revenue and expenditure authority for the coming fiscal year.
10. Agency Budget Work Programs are required under Section 41.7c of Title 62 and serve
as the official plan of how the agency intends to utilize available funds to accomplish statutory duties and responsibilities. The document is due on or as close thereafter June 1 and is approved July 1.
STATE BUDGET INFORMATION C – 5
FY-2010 Executive Budget
STATE BUDGET INFORMATION C-6
Oklahoma State Budget Process State Equalization Board The Oklahoma Constitution provides for a number of checks and balances to ensure the Governor and Legislature maintain a balanced budget every year. One of the most important provisions is Section 23 of Article 10 which outlines the framework for how Oklahoma sustains a balanced budget. This section designates the State Board of Equalization as the body responsible for establishing expenditure limits for the Governor and the Legislature. The Board of Equalization is comprised of the Governor, Lieutenant Governor, Treasurer, Auditor and Inspector, Attorney General, Superintendent of Public Instruction and Secretary of Agriculture.
Pursuant to Section 23, the Equalization Board must meet at least two times every fiscal year:
“no more than 45 days but no less than 35 days before the start of the legislative session” (sometime in late December or early January); and
“within five days after the monthly apportionment in February of each year”. The Board can only meet again and adjust revenue estimates if the Legislature and Governor enact laws during regular or special session that reduce or increase revenue certified by the board, transfer cash from one fund to another or establish a new certified appropriated fund. In practice, the Equalization Board meets in June to incorporate legislative changes enacted during the session and to re-certify revenue available for the coming fiscal year. The benefit of this approach is that both the executive and legislative body are required to use the same revenue estimate and expenditure limit. State expenditures passed by the Legislature and enacted by the Governor cannot exceed the amount of funds certified and authorized by the Board. The Office of State Finance which staffs the Board, compiles revenue projections from various revenue collecting agencies throughout the state, analyzes the information and presents the information to the Board for its consideration and approval. Projections for the General Revenue Fund which makes up more than 80% of total state appropriated spending are estimated utilizing a state economic model developed by Oklahoma State University and modified to fit the state’s customized needs by Tax Commission staff. Revenue estimates presented to the Board are based on current and prior year collection trends, economic forecasts, federal tax law changes and other foreseeable factors. Revenue certified and authorized at the December Board meeting serves as the basis for the Governor’s Executive Budget. The Board considers possible revisions to the December estimate at the February meeting. Revisions to the December estimate are based on economic changes which have been noted since that time, which may increase or decrease anticipated revenue collections. The estimate approved at this meeting sets the limit on which legislative appropriations are based.

FY-2010 Executive Budget
STATE BUDGET INFORMATION C-7
State Revenues and Expenditures Spending Limits Oklahomans believe in responsible budgeting and limiting state expenditure growth to reasonable levels. This philosophy is cemented in paragraph 1 of Section 23 in Article 10 of the Constitution. Increases in Legislative appropriations in any year are limited to no more than 12% more than the preceding year’s level, adjusted for inflation. Paragraph 1 of Section 23 provides an additional limit for Oklahoma’s state budget. This paragraph limits expenditures of certified funds to 95% of the Equalization Board estimate. This internal safeguard protects agency budgets from mild fluctuations in revenues in the event revenues do not meet the 100% estimate. Certain statutory revolving funds are also included in the executive and legislative expenditure authority considered by the Equalization Board. Estimates for revolving funds are included for informational purposes. The Equalization Board does not have to approve them since they are not certified funds. Unlike certified funds, the Governor and Legislature can spend 100% of the revolving fund estimate. There are six revolving fund estimates that are included in the executive and legislative expenditure authority. Revenues from four of the six funds are specifically dedicated to education purposes. Funds from the Tobacco Settlement Fund are directed for health services and the Judicial Fund is directed for district court operations. Cash Management Another internal budget control is provided in Section 10.1 of Title 62 of the Oklahoma Statutes which creates the Cash Flow Reserve Fund (CFRF). The CFRF is used for two purposes: (1) to make allocations to agencies in July since the General Revenue Fund (GRF) for that year has no collections until the end of July, and (2) to ensure that each monthly allocation of revenue to agencies is equal to one-twelfth of the money appropriated by the Legislature. This second purpose is intended to protect State agencies from variation in monthly revenue collection patterns and in practice the CFRF is used to make up the difference between actual collections in a month and the required allocations for that month. Money is deposited into the Cash Flow Reserve Fund for the next fiscal year from current year General Revenue Fund collections that are in excess of the amount appropriated from the fund. The limit on deposits into the Cash Flow Reserve Fund is 10% of the amount certified by the Board of Equalization as available for appropriation from the General Revenue Fund for the next year. General Revenue Fund collections that are in excess of the certified estimate cannot be used to make deposits to the Cash Flow Reserve Fund as those monies are directed elsewhere according to the State Constitution. Any excess General Revenue Fund collections for the current year after the Cash Flow Reserve Fund for the next year has been funded are carried forward as cash that is available for appropriation by the Legislature. Budget Stabilization A portion of the revenue collected in excess of 100% of the certified GRF estimate is deposited in the Constitutional Reserve Fund (CRF), known as the Rainy Day Fund, at the end of the fiscal year. Deposits into the CRF are limited to 10% of the certified actual collections to the GRF for the preceding fiscal year. The CRF can be accessed for three different and distinct purposes: emergencies, future year budget stabilization, and current year budget stabilization. Up to 25% of the fund may be appropriated upon a declaration of an emergency by the Governor with two-thirds legislative concurrence or three-fourths of both the House and Senate. Up to three-eighths of the CRF may be appropriated to make up any decline in
FY-2010 Executive Budget
STATE BUDGET INFORMATION C-8
revenue certified as available for appropriation by the Board of Equalization from one year to the next. The amount can not exceed the decline in certified revenue. The final three-eighths of the CRF may be appropriated to address a current year revenue shortfall. To access this money, the BOE must determine that a revenue failure has occurred in the GRF and appropriations from the CRF for this purpose are limited to the amount of the shortfall. Revenue Shortfalls The Director of the Office of State Finance (OSF) is statutorily charged with making allotments to agencies to control expenditures. State law also requires the State’s budget to remain in balance every fiscal year. Oklahoma is barred from expending more money than it collects in a given year. To ensure that revenues are sufficient to meet the appropriations specified by the Legislature, OSF closely monitors collections throughout the year. The allocation of appropriated monies to agencies occurs on the Tuesday following the second Monday of every month during a fiscal year. As we saw in FY-2002 and FY-2003, during times of economic recession state revenue collections can fall below the level of appropriations. Thus, limiting appropriations to only 95% of estimated collections is an insufficient measure to ensure the state maintains a balanced budget during times of severe economic distress. Title 62, Section 41.9 of the Oklahoma Statutes reads, in part:
“At the end of any fiscal year, the entire amount appropriated to any spending agency must be allotted by the Budget Director, except where the estimated budget resources during any fiscal year are insufficient to pay all of the appropriations for such year in full. The Budget Director shall not allot to any spending agency during any fiscal year, an amount which will be in excess of the amount of revenue collected and allocated to appropriations made to such spending agency. In the event of a failure of revenue, the Budget Director shall control the allotment authorizations to prevent obligations being incurred in excess of the revenue to be collected. However, the Budget Director shall make all reductions within each state fund where a revenue failure occurs apply to each department, institution, board, commission or special appropriation made by the State Legislature, in the ratio that its total appropriation for that fiscal year bears to the total of all appropriations for that fiscal year, as provided in Section 23, Article 10, of the Constitution of Oklahoma.”
This directs the Office of State Finance to allocate all of the money appropriated to state agencies, unless revenue collections are less than the amount appropriated. When this occurs, OSF is required by this statute to reduce the allocations to agencies to no more than the amount of revenue collected. Further, the reduction in allocations is to be effected upon all agencies receiving money from the fund in which the failure occurs. Each agency receives a proportional share of the reduction based on their share of appropriations compared to the total appropriations from the fund.

FY-2010 Executive Budget
STATE BUDGET INFORMATION C-9
Executive and Legislative Appropriations Process Executive Budget The Governor sets the tone for state budget recommendations with the submission of the Executive Budget on the first Monday in February of each regular legislative session. Section 41.34 of Title 62 requires the Governor to submit a balanced budget with detailed revenue and expenditure proposals to the presiding officer of each house. The Director of State Finance is required to prepare the document after reviewing state agency budgets, requests and developing recommendations. The proposals outlined in the Governor’s Executive Budget Book serve as the Governor's fiscal and policy priorities for the year. Legislative Process The Legislature reviews the Executive Budget and works with the Governor throughout the session to enact a balanced budget. Establishing the state budget is the responsibility of the appropriations committees of the Senate and the House of Representatives. The committees of each house work through appropriation subcommittees which are categorized by specific budget areas such as general government, education, health, and safety and security. Subcommittees review agency budgets, requests for additional funding and Governor's recommendations.
The General Appropriations (GA) Bill is a method to provide a base level of funding. This provision is a safeguard to ensure state government programs and services do not shut down in the event the Legislature and the Governor are unable to agree on a budget. Historically, general appropriation bills are passed in March or April of the regular legislative session.
A recent addition to state law, Section 9.11 of Title 62, passed during the 2003 session requires the Legislature to present an appropriation bill to fully fund common education to the Governor at least 25 days prior to April 10 (subsection E of Section 6-101 of Title 70) but not later than April 1. Adjustments to increase or decrease the amount may still be made by the Legislature.
Appropriation decisions for agencies are typically not finalized until April or May when the General Conference Committee on Appropriations, or GCCA is convened. The primary difference between an appropriation subcommittee of the House or Senate and GCCA is that GCCA is comprised of both House and Senate members. Before beginning the GCCA process, the House and Senate agree to allocate a certain amount of available funding to each GCCA subcommittee. Before a formal appropriations bill is presented to either legislative body, the two houses must work together in GCCA, negotiate spending priorities and produce a unified budget together.
Appropriations bills may be written for individual agencies or groups of agencies that are within the same subject area such as education. In addition to appropriating funds for the coming fiscal year, appropriation bills also include agency spending limits, total personnel hiring limits, and the maximum salaries of directors. If the bills are approved by a majority of both houses, the appropriation bill is sent to the Governor. All legislation, including appropriation bills become effective 90 days after the end of the legislative session or later if a later effective date is specified. Legislation may become effective earlier if passed with an emergency clause. For an emergency clause to be enacted, two-thirds of each body must approve the emergency clause through a separate vote on the bill.

FY-2010 Executive Budget
STATE BUDGET INFORMATION C-10
Governor’s Action
Section 11 of Article 6 provides the Governor five working days, excluding Sundays, to enact or veto all or part of an appropriations bill while the Legislature is in regular session. If the Governor does not sign or veto a bill within five days, a bill automatically becomes law. The Governor has 15 working days to sign or veto a bill after the regular session has adjourned. Any bill presented to the Governor within five days of the end of the regular legislative session must be acted upon with the 15 days also. In contrast to actions taken during session, if the Governor does not sign or veto a bill within the 15 working days after session, the bill fails to become law. This is also referred to as a pocket veto.
In addition to these powers, Section 12 of Article 6 of the Oklahoma Constitution gives the Governor the authority to disapprove an entire appropriations bill or any item or single appropriation within the bill. This line-item veto power is one manner by which the Governor exercises control of state budget appropriations.
Vetoes may be overridden by two-thirds majority of each house for bills with no emergency clause and by three-fourths majority of each house for bills with an emergency clause.
Funds Subject to Appropriation
The State Board of Equalization, in accordance with Section 23, Article X of the Oklahoma Constitution, annually certifies the following funds as available for appropriation. Each of these funds is identified in the accounting structure with a three-digit code. The first two digits uniquely identify the fund. The last digit represents the year the funds were collected (e.g. "190" would be the General Revenue Fund collected in FY-2000).
General Revenue Fund (Fund 19X):
Income to this fund is from state taxes, fees, regulatory functions, and income on money and property. Approximately one-half of all state revenue is deposited to this fund. Funds are appropriated for the operation of state government and other purposes specified by the Legislature. (Article 10, Section 2)
Council on Law Enforcement Education and Training (CLEET) Fund (Fund 58X): Income is derived from a penalty assessment fee. Any person penalized for violating Oklahoma law pays a penalty assessment. Income is dedicated to peace officer training. (Title 20, Section 1313.2; effective November 1, 1988)
Commissioners of the Land Office Fund (Fund 51X): This fund was created to receive revenue collected from surface leasing of lands managed by the Commissioners of the Land Office and 6 percent of the revenue generated from the Common School Fund, the Education Institutions Fund, the University of Oklahoma Fund, the University Preparatory School Fund, the Oklahoma State University Fund, the Public Building Fund, and the Greer 33 Fund. Funds are used for administrative costs of the Commissioners of the Land Office. Funds not used for administrative costs of the Commissioners of the Land Office are allocated to public schools. (Title 64, Section 15; effective July 1, 1992)
Mineral Leasing Fund (Fund 55X): Income to this fund is from a share of lease sales and royalty payments on oil and gas production on federal lands within the state. Funds are used for the financial support of public schools. (Title 62, Section 41.8; effective 1920)
Special Occupational Health and Safety Fund (Fund 54X): Each insurance carrier writing Workers' Compensation Insurance in this state, the State Insurance Fund, and each self-insured employer authorized to make workers compensation payments directly to employees
FY-2010 Executive Budget
STATE BUDGET INFORMATION C-11
pays a sum equal to three-fourths of 1 percent of the total workers compensation losses, excluding medical payments and temporary total disability compensation. Funds are used exclusively for the operation and administration of the Occupational Health and Safety Standards Act of 1970 and other necessary expenses of the Department of Labor. (Title 40, Section 417.1; effective July 1, 1986)
Public Building Fund (Fund 11X): Income to the fund is from portions of leases, sales, rentals and royalties of lands set aside for public building purposes by the state's Enabling Act (Section 33) and lands granted in lieu thereof, under the management of the Commissioners of the Land Office. Funds are appropriated for major maintenance and capital improvements of public facilities. (Title 64, Section 371; effective 1910)
Oklahoma Education Lottery Trust Fund (Fund 38X): In November of 2004, voters passed State Question 706 which established this fund as one available for appropriation by the Legislature for the purposes of common education, higher education, and career technology education. Revenue deposited in the fund comes from net proceeds generated by the Oklahoma Lottery. .
Agency Budgets The state’s budget cycle can be divided into three areas:
Agency Budget Work Programs Agency Strategic Plans Agency Budget Request Financial Tools
The state’s budget is prepared on a cash basis utilizing encumbrance accounting. Encumbrances represent executed but unperformed purchase orders. In the State’s Comprehensive Annual Financial Report (CAFR) encumbrances are recorded as: (1) expenditures for budgetary purposes if expected to be presented for payment by November 15, following the end of the fiscal year and, (2) reservations of fund balance for GAAP purposes. Budget Work Programs Oklahoma statutes provide the legal framework under which state agencies budget and expend funds in a responsible manner. Section 41.7c of Title 62 requires every agency to submit a balanced budget on the first day in June or soon thereafter. Funds must be budgeted by program category and must conform to program categories and expenditure limits placed in law. Appropriation bills set maximum limits on the amount of state appropriated funds, revolving funds and federal funds that each program may budget and spend for the fiscal year. Maximum limits for personnel or full-time-equivalent (FTE) personnel, lease-purchase expenditures and director salaries are also defined in statute. Budget work programs must work within these parameters to provide a plan on how the agency will utilize all state, revolving and federal funds for the fiscal year. Work programs are reviewed by the Budget Division of OSF and the approved work program serves as a basis for the subsequent allotment of funds. Certified funds such as the General Revenue Fund are allotted to agencies on a monthly basis and cash appropriations are appropriated in a lump sum. Budget Work Programs can be revised at any time during the
FY-2010 Executive Budget
STATE BUDGET INFORMATION C-12
fiscal year if justified. Revisions can be accomplished within various expenditure, full-time-equivalent employee and transfer limits. Agencies are allowed under law (Section 41.46 of Title 62) to transfer up to a maximum of 25% of funds between line-items. The Contingency Review Board can approve transfers between line-items up to 40%. All transfers are subject to review by the Joint Legislative Committee on Budget and Program Oversight to determine if the transfer meets legislative intent or subverts the intention and objectives of the Legislature. Executive and legislative staff review agency budgets and expenditures throughout the year to ensure each agency is meeting program goals and stated legal expenditure limits. Strategic Planning Across the nation, states are in the process of implementing measures to improve efficiency and accountability in state government. Oklahoma is no different. Over the past seven years, the Executive and Legislative branch have implemented measures designed to focus on meaningful performance data which can then be used to make better budgeting decisions. Passed in 1999, the Oklahoma Program Performance Budgeting and Accountability Act required agencies to submit strategic plans defining their mission, vision, goals and performance measures. At the same time, state agency budget request forms were modified to incorporate program information and performance measures for every program category within an agency. Section 45.3 of Title 62 requires every agency to submit five year strategic plans on October 1 of every even numbered year. Strategic planning helps focus agency leadership and staff on short-term and long-term goals and how to achieve those goals. Outcome measures required in strategic plans and agency budget requests focus agency leadership and staff on monitoring and improving performance. This information is a valuable tool for policymakers. This performance information is also used in routine and special performance evaluations and policy analysis conducted by agencies, the Office of State Finance, legislative staff, Auditor and Inspector and outside consultants. Evaluating government programs and services using meaningful data, allows elected officials to make better, more informed budgeting decisions. Budget Request Section 41.29 of Title 62 requires agencies to submit a “Budget Request” on October 1, of every year. The budget request serves as the financial plan to the agency’s strategic plan. This document outlines program funding and performance information and includes a detailed listing of additional state funding requested by each agency. The Budget Division has been working with select agencies over the past two years to refine and improve funding and performance measure information submitted in the Budget Request and Strategic Plan. There is particular emphasis on unit costs and program performance. Copies of each agency’s budget request and strategic plan is submitted to the Office of State Finance, House and Senate staff and members of the Legislative Oversight Committee on State Budget and Performance. This committee, established in Section 41.47 of Title 62, is required to review each agency’s programs, funding and performance once every four years. Members are directed to utilize zero-base budgeting and performance base budgeting techniques. Financial Tools
FY-2010 Executive Budget
STATE BUDGET INFORMATION C-13
Comprehensive Annual Financial Report (CAFR) The CAFR is the primary means of reporting the financial activities for all state agencies. Prepared by the Division of Central Accounting and Reporting and in conformance with Governmental Accounting Standards Board (GASB) statements 34 and 35, this model provides a better picture of the state’s financial status as a single, unified entity. Financial statements contained in the CAFR include a statement of net assets and liabilities, statement of activities outlining major state expenditures, statement of Revenues, Expenditures and Changes in Fund Balances. The CAFR is a valuable tool to use when reviewing and analyzing overall state budget revenue and expenditure trends. Single Audit The Single Audit is prepared by the Auditor & Inspector’s Office to meet the requirements of the Single Audit Act. The federal funds expended by all State agencies (excluding higher education and civil emergency management) are included within the scope of the Single Audit. This report provides information on the type of federal funds available for state agencies such as block grants, entitlement programs, matching grants and reports federal fund expenditures for each agency. This report, required by the federal government ensures state agencies are properly expending and accounting for federal funds. Performance Audits Since FY-2002, the Office of the State Auditor and Inspector has been conducting performance audits, authorized by 74 O.S. Supp 2001, 213.2. A performance audit includes economy, efficiency, and program audits. Economy and efficiency audits determine whether the entity is utilizing its resources economically and efficiently. Auditors also determine the causes of inefficiencies or uneconomical practices. A program audit determines if a program is achieving the desired results or benefits established by the Legislature, or other authorizing body. Program audits also ascertain the effectiveness of organizations, programs, activities or functions. In practice, performance audits determine if an agency is focusing resources on activities that maximize productivity or outcomes. In addition to identifying efficiencies, performance audits can also identify areas worthy of additional state investment. This is another important tool for policymakers to utilize when reviewing the efficiency and effectiveness of agency programs and expenditures. Financial System Daily, monthly and annual reports generated from the Office of State Finance financial systems provide quality agency budgeting and expenditure reports which allow policymakers to track funds by program and object code. Other essential financial reports include budget to actual reports, cash balance and receipts and disbursements for funds. The Budget Request and Strategic Plan documents give policymakers the opportunity to review an agency’s mission, goals and performance to ensure resources are allocated to specified statutory duties and responsibilities. Not only do these financial tools ensure agencies are spending money appropriately but wisely. All of the financial tools mentioned can provide policymakers the opportunity to make informed fiscal policy recommendations based on quality financial and performance information.

FY-2010 Executive Budget
STATE BUDGET INFORMATION C-14
Capital Budget The Capital Budget Process The State of Oklahoma’s Capital Improvement Plan (CIP) and the Long-Range Capital Planning Commission were established in 1992. This provided the infrastructure for state and local governments to perform comprehensive capital plans. Capital projects are defined as one-time projects costing at least $25 thousand with a useful life of at least five years. The CIP development process begins early in the calendar year. July 1 is the official deadline for agencies, boards, commissions, trusts, colleges and universities to input their Capital Budget Requests into a web-based system hosted by the Office of State Finance. Once received, the Commission separates requests into two broad categories: self-funded and appropriation-funded. Generally, the Commission accepts an applicant’s ranking of self-funded projects without further review. Projects requiring an appropriation are evaluated according to a ranking process to permit the equitable allocation of limited state resources. The ranking system uses the following criteria:
legal obligations;
fiscal impact;
urgency of maintenance needs;
departmental priority;
economic impact;
impact on service to the public; and
completion of prior phases.
For more information on the Capitol Budget process please contact Tim Martin with the State Bond Advisor, 602-3100.

FY-2010 Executive Budget
STATE BUDGET INFORMATION C-15
Oklahoma Revenues and Expenditures Major Tax Sources The single largest source of revenue collected by the state comes from taxes paid by Oklahoma citizens, businesses and others doing business in the state. Tax revenue accounted for approximately 50% of total state revenue collections in FY-2008. Most of the state’s appropriated revenue is from general taxes. For FY-2008, tax revenue comprised 85% of total appropriated revenue. Taxes such as income tax are compulsory payments and cannot legally be avoided. This is in contrast to fees, like fishing licenses, which are discretionary and voluntary to the extent one decides to utilize a state service. The seven major tax categories for FY-2010 which provide approximately 91% of total state tax revenue are:
The Seven Major Tax CategoriesFY-2010
Other9%Insurance
Premium Tax2%
GrossProduction
Taxes10%
MotorVehicleTaxes
8%
Sales and UseTaxes30%
CorporateIncome Tax
6%
IndividualIncome Tax
35%
Income Taxes Oklahoma’s income tax laws date back to 1915 when an income tax was imposed on the net income of individuals residing in Oklahoma and upon the Oklahoma portion of nonresidents’ income. The income tax was extended to corporations and banks in 1931. The importance of the income tax to state revenues increased when voters approved the 1933 constitutional amendment prohibiting state taxation of property. While there have been numerous changes to the income tax law since its inception, today it is the single most

FY-2010 Executive Budget
STATE BUDGET INFORMATION C-16
important source of state revenue and represents nearly 44% of all state tax revenue in the General Revenue Fund. Individual Income Tax: The Oklahoma individual income tax calculation uses two different methods. Method I employs rates from 0.5 percent to 5.50 percent and does not permit the deduction of federal income paid tax from net income. Method II utilizes rates from 0.5 percent to 10 percent and permits the deduction of federal income tax paid from net income. Taxpayers calculate their tax liability by both methods and pay the lesser amount. The majority of taxpayers owe less and pay tax based on the Method I calculation. During the 2005 session, Senate Bill 435 eliminated the second method of calculating income tax and modified the tax bracket for single and joint filers. In 2006, the Legislature passed and the Governor approved the largest tax cut package in history. House Bill 1172 lowers the individual income tax rate and increases the standard deduction over several years. Currently, the individual income tax rate is 5.50% but decreases to 5.25% at a point determined by the board of Equalization based on the amount of growth revenue for the coming fiscal year as required by statute. The increase in the standard deduction is a gradual increase. By the year 2011, the standard deduction will equal the federal standard deduction if the Board of Equalization determines there is sufficient growth revenue. The table below shows the individual income tax rates and corresponding standard deduction increase.
Tax Rate
Married Filing Jointly
Head of Household Single
2007 5.65% 5,500 4,125 2,750 2008 5.50% 6,500 4,875 3,250 2009 5.50% 8,500 6,375 4,250 2010 5.50% 11,400 8,350 5,700 2011* 5.25%
Standard Deduction
Match Federal Deduction *Based on the amount of growth revenue determined by the Board of Equalization.
In addition, the apportionment of individual income tax receipts was changed by the 2006 Legislature. The table below shows those changes.
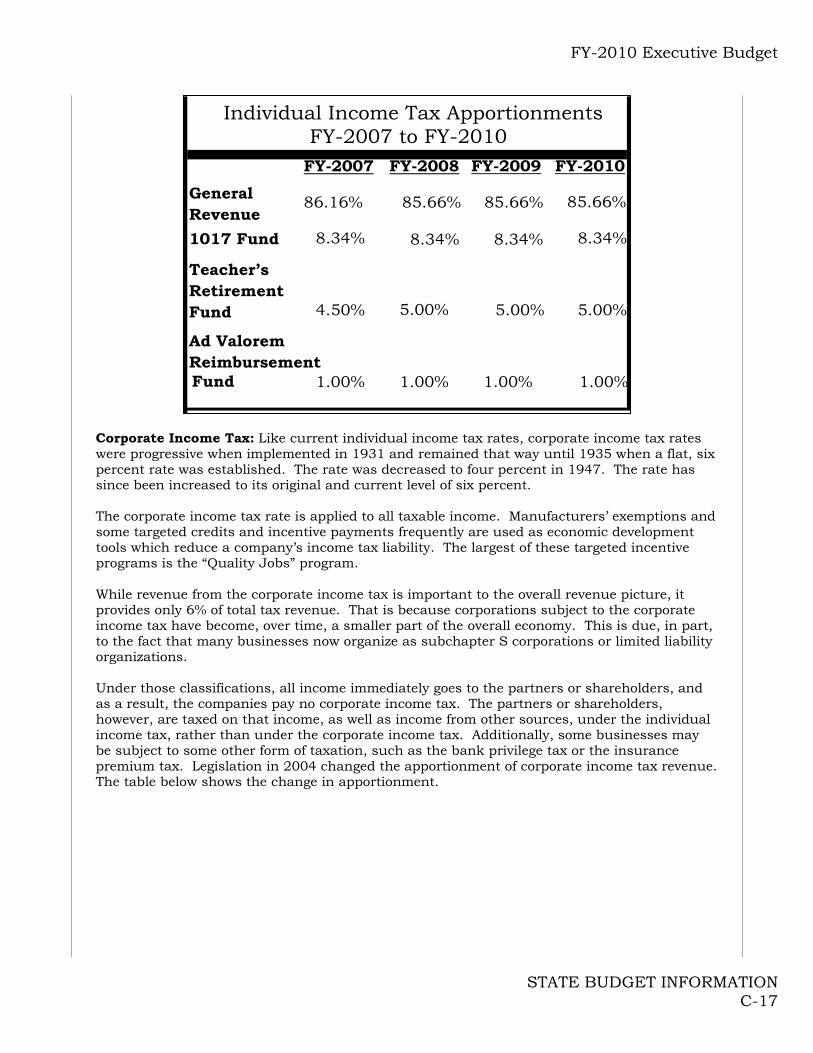
FY-2010 Executive Budget
STATE BUDGET INFORMATION C-17
FY-2007 FY-2008 FY-2009
General Revenue
86.16% 85.66% 85.66%
1017 Fund 8.34% 8.34% 8.34%
Teacher’s Retirement Fund 4.50% 5.00% 5.00%
Ad Valorem Reimbursement Fund 1.00% 1.00% 1.00%
FY-2007 to FY-2010 Individual Income Tax Apportionments
1.00%
5.00%
8.34%
85.66%
FY-2010
Corporate Income Tax: Like current individual income tax rates, corporate income tax rates were progressive when implemented in 1931 and remained that way until 1935 when a flat, six percent rate was established. The rate was decreased to four percent in 1947. The rate has since been increased to its original and current level of six percent. The corporate income tax rate is applied to all taxable income. Manufacturers’ exemptions and some targeted credits and incentive payments frequently are used as economic development tools which reduce a company’s income tax liability. The largest of these targeted incentive programs is the “Quality Jobs” program. While revenue from the corporate income tax is important to the overall revenue picture, it provides only 6% of total tax revenue. That is because corporations subject to the corporate income tax have become, over time, a smaller part of the overall economy. This is due, in part, to the fact that many businesses now organize as subchapter S corporations or limited liability organizations. Under those classifications, all income immediately goes to the partners or shareholders, and as a result, the companies pay no corporate income tax. The partners or shareholders, however, are taxed on that income, as well as income from other sources, under the individual income tax, rather than under the corporate income tax. Additionally, some businesses may be subject to some other form of taxation, such as the bank privilege tax or the insurance premium tax. Legislation in 2004 changed the apportionment of corporate income tax revenue. The table below shows the change in apportionment.
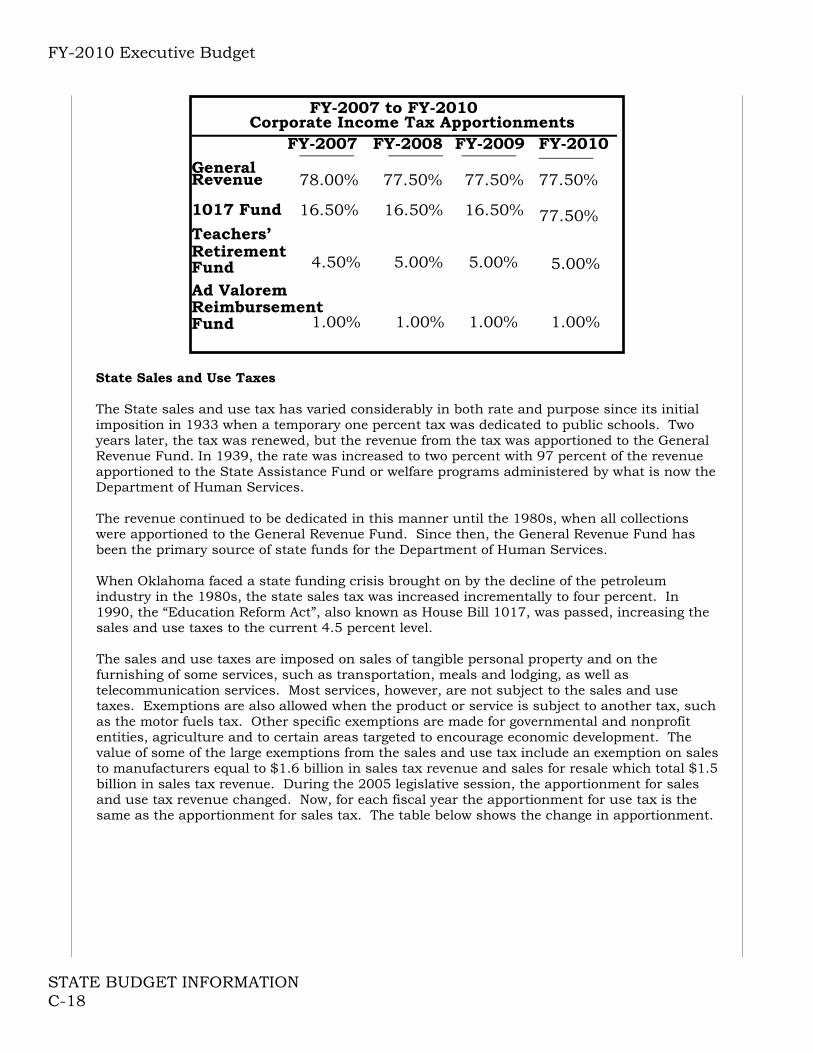
FY-2010 Executive Budget
STATE BUDGET INFORMATION C-18
77.50%
77.50%
5.00%
1.00% 1.00% 1.00%
Ad Valorem Reimbursement
1.00% Fund
5.00% 5.00% 4.50%
Teachers’ RetirementFund
16.50% 16.50% 16.50% 1017 Fund
77.50% 77.50% 78.00% General Revenue
FY-2007 FY-2008 FY-2009 Corporate Income Tax Apportionments
FY-2007 to FY-2010
FY-2010
State Sales and Use Taxes The State sales and use tax has varied considerably in both rate and purpose since its initial imposition in 1933 when a temporary one percent tax was dedicated to public schools. Two years later, the tax was renewed, but the revenue from the tax was apportioned to the General Revenue Fund. In 1939, the rate was increased to two percent with 97 percent of the revenue apportioned to the State Assistance Fund or welfare programs administered by what is now the Department of Human Services. The revenue continued to be dedicated in this manner until the 1980s, when all collections were apportioned to the General Revenue Fund. Since then, the General Revenue Fund has been the primary source of state funds for the Department of Human Services. When Oklahoma faced a state funding crisis brought on by the decline of the petroleum industry in the 1980s, the state sales tax was increased incrementally to four percent. In 1990, the “Education Reform Act”, also known as House Bill 1017, was passed, increasing the sales and use taxes to the current 4.5 percent level. The sales and use taxes are imposed on sales of tangible personal property and on the furnishing of some services, such as transportation, meals and lodging, as well as telecommunication services. Most services, however, are not subject to the sales and use taxes. Exemptions are also allowed when the product or service is subject to another tax, such as the motor fuels tax. Other specific exemptions are made for governmental and nonprofit entities, agriculture and to certain areas targeted to encourage economic development. The value of some of the large exemptions from the sales and use tax include an exemption on sales to manufacturers equal to $1.6 billion in sales tax revenue and sales for resale which total $1.5 billion in sales tax revenue. During the 2005 legislative session, the apportionment for sales and use tax revenue changed. Now, for each fiscal year the apportionment for use tax is the same as the apportionment for sales tax. The table below shows the change in apportionment.

FY-2010 Executive Budget
STATE BUDGET INFORMATION C-19
5.00%
Remaining 0.93% to: 36%-Ok Tourism Promotion Revolving Fund 64%-Ok Tourism Capital Revolving Fund
5.00% 5.00% 4.50% Retirement Fund Teachers’
10.46% 10.46% 1017 Fund
FY-2010 FY-2007 FY-2008 FY-2009 General
Sales Tax and Use Tax Apportionment FY-2007 to FY-2009
83.61%
83.61% 10.46% 10.46%
83.61% 85.04% Revenue
Motor Vehicle Taxes Motor vehicle taxes and fees have a long history in Oklahoma. Oklahoma City was the birthplace of the parking meter in 1913 and it was here that “horseless carriages” were tagged before it was required by the State. Oklahoma’s modern day motor vehicle taxes are comprised of a broad category of taxes and fees imposed on the purchase and use of motor vehicles, including an excise tax levied on the purchase of cars, trucks, buses, boats and motors, as well as annual registration fees. Motor vehicle registration fees, commonly called tag fees, are paid annually in lieu of ad valorem or personal property taxes. Voter’s passage of State Question 691 in 2000 tied the cost of registration fees to the age of the vehicle: Years 1 – 4: $91 annually Years 5 – 8: $81 annually Years 9 – 12: $61 annually Years 13 – 16: $41 annually Years 17 and beyond: $21 annually The question also changed the calculation of the motor vehicle excise tax, which is paid in lieu of state and local sales taxes. Previously, the tax was assessed at 3.25 percent of the factory delivered price and depreciated at a rate of 35 percent annually. The state question’s approval left the rate the same, but assessed it against the actual sales price of the vehicle, which is usually lower than the factory delivered price of a new vehicle. Motor vehicle taxes are collected by independent businesses operating as motor license agents or tag agents. The only exception to this is the taxes and fees imposed on trucks and trailers used in interstate commerce, which are collected by the Oklahoma Tax Commission. The chart below shows how motor vehicle taxes and fees are apportioned for 2010.
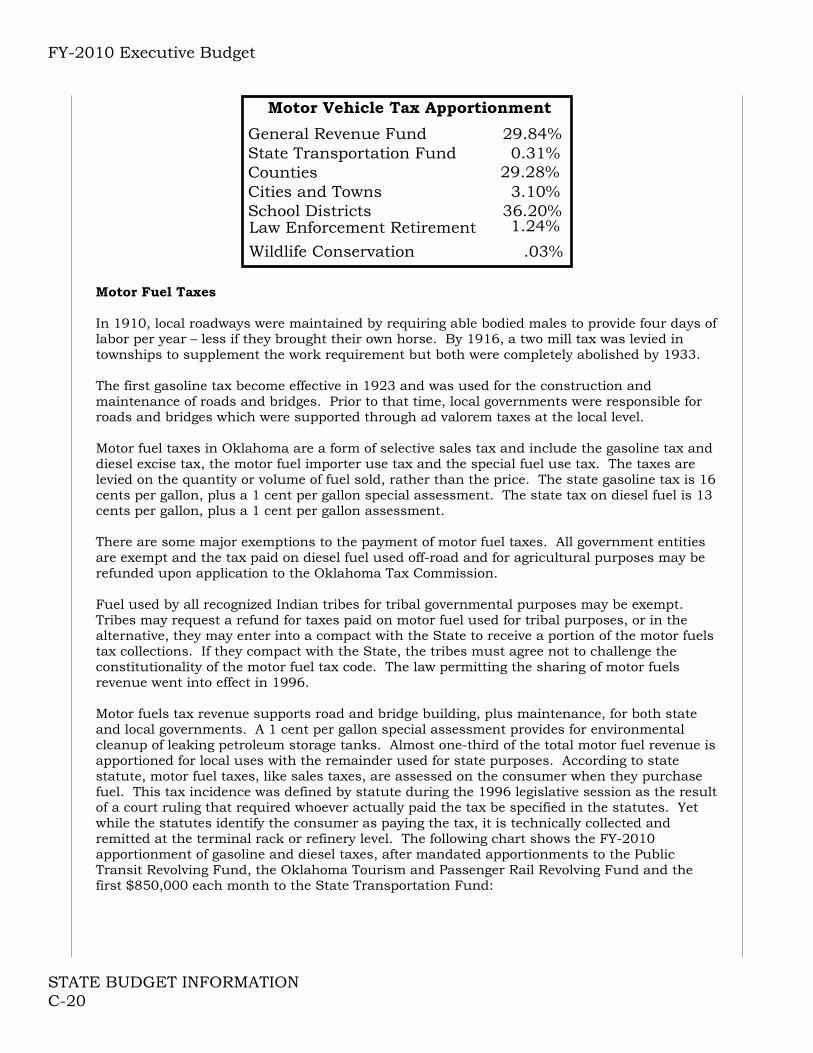
FY-2010 Executive Budget
STATE BUDGET INFORMATION C-20
.03% Wildlife Conservation
Motor Vehicle Tax Apportionment
29.84% 0.31%
29.28% 3.10%
36.20% 1.24%
General Revenue Fund State Transportation Fund Counties Cities and Towns School Districts Law Enforcement Retirement
Motor Fuel Taxes In 1910, local roadways were maintained by requiring able bodied males to provide four days of labor per year – less if they brought their own horse. By 1916, a two mill tax was levied in townships to supplement the work requirement but both were completely abolished by 1933. The first gasoline tax become effective in 1923 and was used for the construction and maintenance of roads and bridges. Prior to that time, local governments were responsible for roads and bridges which were supported through ad valorem taxes at the local level. Motor fuel taxes in Oklahoma are a form of selective sales tax and include the gasoline tax and diesel excise tax, the motor fuel importer use tax and the special fuel use tax. The taxes are levied on the quantity or volume of fuel sold, rather than the price. The state gasoline tax is 16 cents per gallon, plus a 1 cent per gallon special assessment. The state tax on diesel fuel is 13 cents per gallon, plus a 1 cent per gallon assessment. There are some major exemptions to the payment of motor fuel taxes. All government entities are exempt and the tax paid on diesel fuel used off-road and for agricultural purposes may be refunded upon application to the Oklahoma Tax Commission. Fuel used by all recognized Indian tribes for tribal governmental purposes may be exempt. Tribes may request a refund for taxes paid on motor fuel used for tribal purposes, or in the alternative, they may enter into a compact with the State to receive a portion of the motor fuels tax collections. If they compact with the State, the tribes must agree not to challenge the constitutionality of the motor fuel tax code. The law permitting the sharing of motor fuels revenue went into effect in 1996. Motor fuels tax revenue supports road and bridge building, plus maintenance, for both state and local governments. A 1 cent per gallon special assessment provides for environmental cleanup of leaking petroleum storage tanks. Almost one-third of the total motor fuel revenue is apportioned for local uses with the remainder used for state purposes. According to state statute, motor fuel taxes, like sales taxes, are assessed on the consumer when they purchase fuel. This tax incidence was defined by statute during the 1996 legislative session as the result of a court ruling that required whoever actually paid the tax be specified in the statutes. Yet while the statutes identify the consumer as paying the tax, it is technically collected and remitted at the terminal rack or refinery level. The following chart shows the FY-2010 apportionment of gasoline and diesel taxes, after mandated apportionments to the Public Transit Revolving Fund, the Oklahoma Tourism and Passenger Rail Revolving Fund and the first $850,000 each month to the State Transportation Fund:

FY-2010 Executive Budget
STATE BUDGET INFORMATION C-21
Gross Production Taxes Gross production or severance taxes are imposed on the removal of natural products, such as natural gas and oil, from land or water and are determined by the value and quantity of the products removed. Gross production taxes placed on the extraction of oil and gas were separated from the ad valorem property tax in 1910. For the first 20 years of statehood, oil and gas gross production and the ad valorem property tax were the major sources of state revenue. While the ad valorem property tax became strictly a local tax in the 1930s, the oil and gas gross production tax have continued to be an important source of revenue for state government, schools and road building and maintenance. Oil and natural gas have a three-tiered tax rate structure that specifies a certain tax rate based on the current price of oil or natural gas. For natural gas, if the price per thousand cubic feet (MCF) is greater than $2.10, the tax rate is 7%. If the price is between $2.10 and $1.75 per MCF, then the rate is 4% and any price lower than $1.75 results in a tax rate of 1%. For oil, the price must be greater than $17 per barrel for the tax rate to be 7%. If the price is between $17 and $14 per barrel, the tax rate is 4%, and a price below $14 per barrel yields a 1% tax rate. The charts below show the apportionment for the revenue from gross production tax on oil and natural gas. During the 2006 Legislative Session, The Rural Economic Access Plan (REAP Fund) apportionment from the Gross Production tax on oil was divided between three new funds. Each of the three funds receive 33.33% of the 4.28% apportioned to the REAP Fund. The table below shows the apportionments to all funds from the Gross Production tax on oil.
Gasoline Diesel Motor Fuels Tax Apportionment
Tax Tax
High Priority State Bridge Fund 1.63% 1.39%
State Transportation Fund 63.75% 64.34%
30.43% Counties for Highways 30.13%
-Cities and Towns 1.88% County Bridges and Roads 2.63% 3.85%
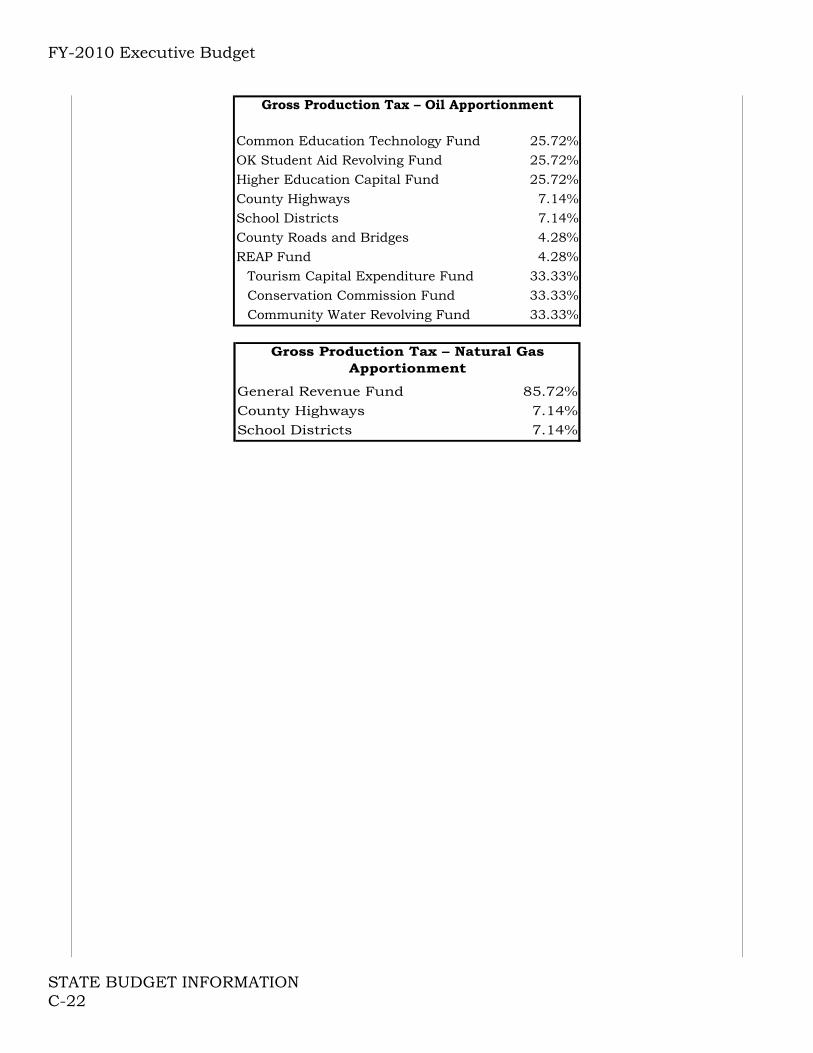
FY-2010 Executive Budget
STATE BUDGET INFORMATION C-22
Common Education Technology Fund 25.72%OK Student Aid Revolving Fund 25.72%Higher Education Capital Fund 25.72%County Highways 7.14%School Districts 7.14%County Roads and Bridges 4.28%REAP Fund 4.28%
Tourism Capital Expenditure Fund 33.33%Conservation Commission Fund 33.33%Community Water Revolving Fund 33.33%
Gross Production Tax – Oil Apportionment
General Revenue Fund 85.72%County Highways 7.14%School Districts 7.14%
Gross Production Tax – Natural Gas Apportionment

FY-2010 Executive Budget
Constitutional Reserve "Rainy Day" Fund (CRF) History Description FY-90 FY-91 FY-92 FY-93 FY-94 Beginning RDF Balance 152,804,609 151,734,223 196,861,899 135,008,898 91,140,995 Adjustments to the Balance 0 10,464 25,176 0 3,555 Appropriations (75,000,000) (30,000,000) (61,878,177) (43,867,903) (45,570,498)
-Budget Stabilization 1)Current Fiscal Year - - - - - 2)Next Fiscal Year - - - - -
-Emergency 76,402,305 75,867,112 98,430,950 67,504,449 45,570,498 End of FY Deposit 73,929,614 75,117,212 0 0 0 Ending Balance 151,734,223 196,861,899 135,008,898 91,140,995 45,574,052 Description FY-95 FY-96 FY-97 FY-98 FY-99 Beginning RDF Balance 45,574,052 45,574,052 114,300,821 308,906,533 297,360,609 Adjustments to the Balance 0 12,909 388,745 0 1,119,324 Appropriations 0 (22,688,345) (52,825,496) (154,444,000) (148,621,410)
-Budget Stabilization 1)Current Fiscal Year - - - - - 2)Next Fiscal Year - - - - -
-Emergency 22,787,026 22,787,026 57,150,411 154,453,266 148,680,304 End of FY Deposit 0 91,402,205 247,042,463 142,898,076 0 Ending Balance 45,574,052 114,300,821 308,906,533 297,360,609 149,858,523 Description FY-00 FY-01 FY-02 FY-03 FY-04 Beginning RDF Balance 149,858,523 157,542,574 340,685,730 72,398,995 136,333 Adjustments to the Balance 28,700 9,826 299,087 0 0 Appropriations (74,929,261) (78,771,287) (268,585,822) (72,262,663) 0
-Budget Stabilization 1)Current Fiscal Year - - 98,242,957 36,199,498 68,167 2)Next Fiscal Year - - - - -
-Emergency 74,929,262 78,771,287 170,342,865 36,199,498 68,167 End of FY Deposit 82,584,612 261,904,617 0 0 217,364,966 Ending Balance 157,542,574 340,685,730 72,398,995 136,333 217,501,299 Description FY-05 FY-06 FY-07 FY-08 FY-09 Beginning RDF Balance 217,501,299 461,316,574 495,690,168 571,598,627 596,573,270 Adjustments to the Balance 0 268,565 0 0 0 Appropriations 0 0 0 0 0
-Budget Stabilization 1)Current Fiscal Year - - - - - 2)Next Fiscal Year - - - - -
-Emergency 54,375,325 115,329,143 123,922,542 142,899,657 149,143,317 End of FY Deposit 243,815,275 34,105,029 75,908,459 24,974,643 N/A Ending Balance 461,316,574 495,690,168 571,598,627 596,573,270 N/A
STATE BUDGET INFORMATION C-22
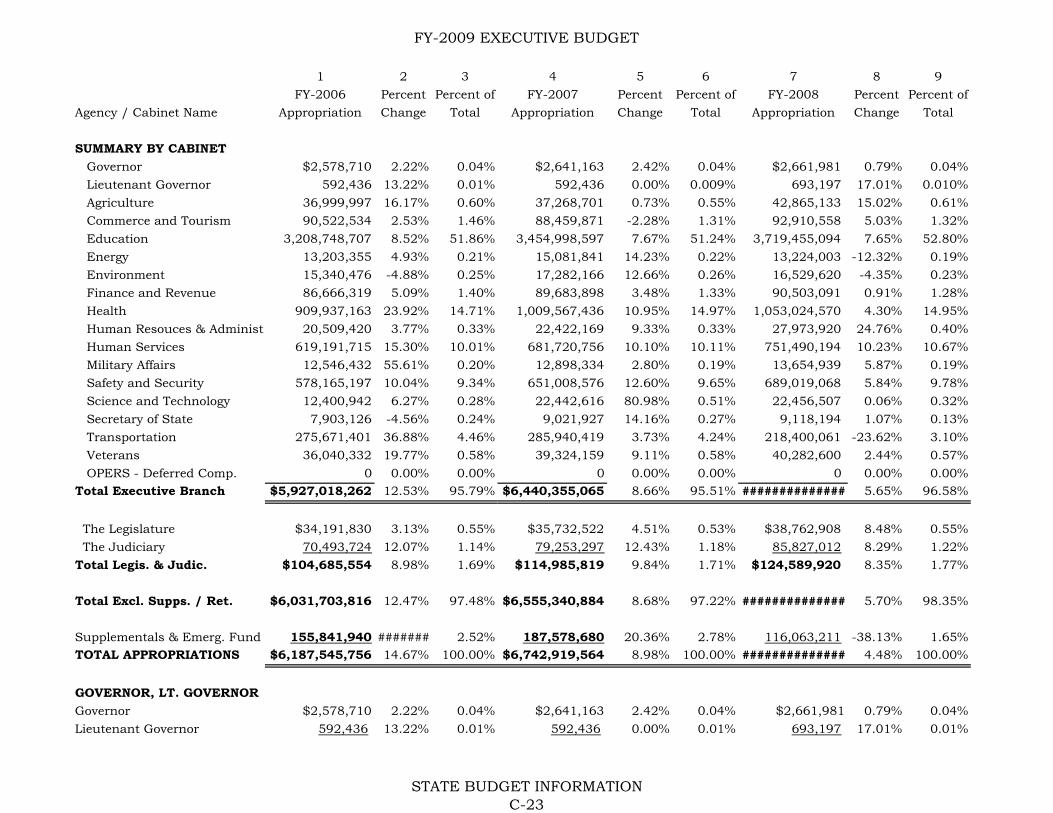
FY-2009 EXECUTIVE BUDGET
1 2 3 4 5 6 7 8 9
FY-2006 Percent Percent of FY-2007 Percent Percent of FY-2008 Percent Percent of
Agency / Cabinet Name Appropriation Change Total Appropriation Change Total Appropriation Change Total
SUMMARY BY CABINET
Governor $2,578,710 2.22% 0.04% $2,641,163 2.42% 0.04% $2,661,981 0.79% 0.04%
Lieutenant Governor 592,436 13.22% 0.01% 592,436 0.00% 0.009% 693,197 17.01% 0.010%
Agriculture 36,999,997 16.17% 0.60% 37,268,701 0.73% 0.55% 42,865,133 15.02% 0.61%
Commerce and Tourism 90,522,534 2.53% 1.46% 88,459,871 -2.28% 1.31% 92,910,558 5.03% 1.32%
Education 3,208,748,707 8.52% 51.86% 3,454,998,597 7.67% 51.24% 3,719,455,094 7.65% 52.80%
Energy 13,203,355 4.93% 0.21% 15,081,841 14.23% 0.22% 13,224,003 -12.32% 0.19%
Environment 15,340,476 -4.88% 0.25% 17,282,166 12.66% 0.26% 16,529,620 -4.35% 0.23%
Finance and Revenue 86,666,319 5.09% 1.40% 89,683,898 3.48% 1.33% 90,503,091 0.91% 1.28%
Health 909,937,163 23.92% 14.71% 1,009,567,436 10.95% 14.97% 1,053,024,570 4.30% 14.95%
Human Resouces & Administr 20,509,420 3.77% 0.33% 22,422,169 9.33% 0.33% 27,973,920 24.76% 0.40%
Human Services 619,191,715 15.30% 10.01% 681,720,756 10.10% 10.11% 751,490,194 10.23% 10.67%
Military Affairs 12,546,432 55.61% 0.20% 12,898,334 2.80% 0.19% 13,654,939 5.87% 0.19%
Safety and Security 578,165,197 10.04% 9.34% 651,008,576 12.60% 9.65% 689,019,068 5.84% 9.78%
Science and Technology 12,400,942 6.27% 0.28% 22,442,616 80.98% 0.51% 22,456,507 0.06% 0.32%
Secretary of State 7,903,126 -4.56% 0.24% 9,021,927 14.16% 0.27% 9,118,194 1.07% 0.13%
Transportation 275,671,401 36.88% 4.46% 285,940,419 3.73% 4.24% 218,400,061 -23.62% 3.10%
Veterans 36,040,332 19.77% 0.58% 39,324,159 9.11% 0.58% 40,282,600 2.44% 0.57%
OPERS - Deferred Comp. 0 0.00% 0.00% 0 0.00% 0.00% 0 0.00% 0.00%Total Executive Branch $5,927,018,262 12.53% 95.79% $6,440,355,065 8.66% 95.51% ############## 5.65% 96.58%
balances
The Legislature $34,191,830 3.13% 0.55% $35,732,522 4.51% 0.53% $38,762,908 8.48% 0.55%
The Judiciary 70,493,724 12.07% 1.14% 79,253,297 12.43% 1.18% 85,827,012 8.29% 1.22%
Total Legis. & Judic. $104,685,554 8.98% 1.69% $114,985,819 9.84% 1.71% $124,589,920 8.35% 1.77%
Total Excl. Supps. / Ret. $6,031,703,816 12.47% 97.48% $6,555,340,884 8.68% 97.22% ############## 5.70% 98.35%
balances
Supplementals & Emerg. Fund 155,841,940 ####### 2.52% 187,578,680 20.36% 2.78% 116,063,211 -38.13% 1.65%TOTAL APPROPRIATIONS $6,187,545,756 14.67% 100.00% $6,742,919,564 8.98% 100.00% ############## 4.48% 100.00%
balances
GOVERNOR, LT. GOVERNOR
Governor $2,578,710 2.22% 0.04% $2,641,163 2.42% 0.04% $2,661,981 0.79% 0.04%
Lieutenant Governor 592,436 13.22% 0.01% 592,436 0.00% 0.01% 693,197 17.01% 0.01%
STATE BUDGET INFORMATIONC-23
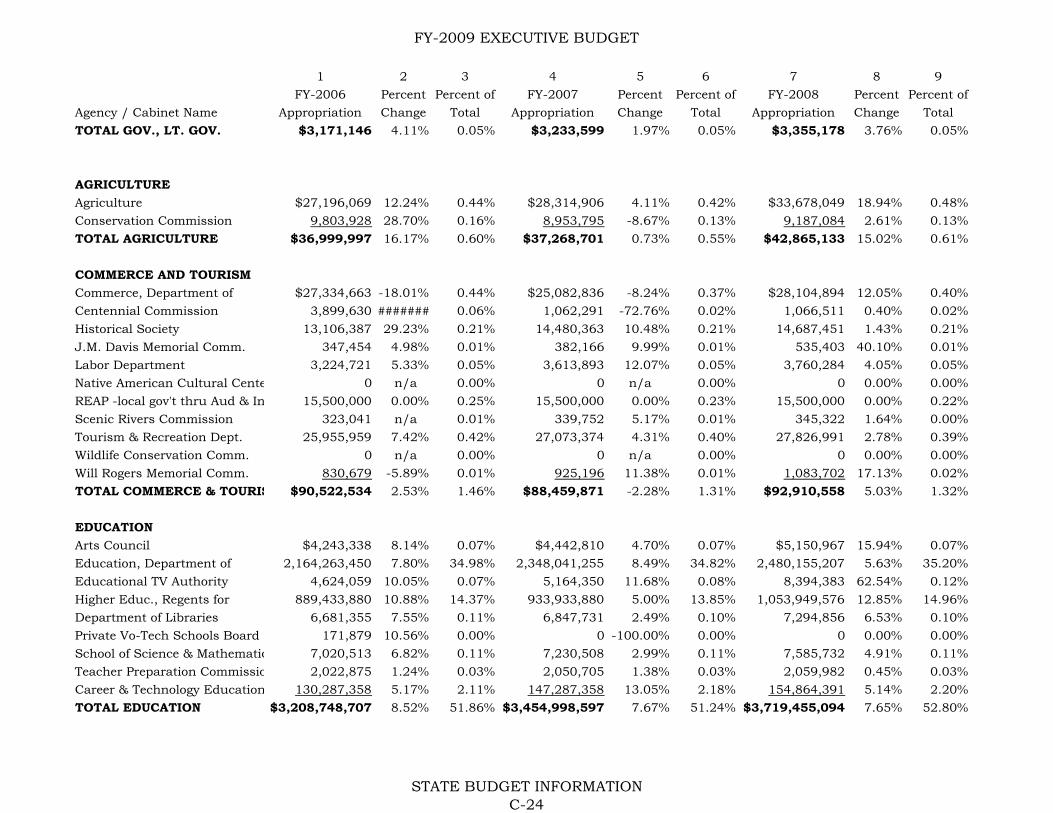
FY-2009 EXECUTIVE BUDGET
1 2 3 4 5 6 7 8 9
FY-2006 Percent Percent of FY-2007 Percent Percent of FY-2008 Percent Percent of
Agency / Cabinet Name Appropriation Change Total Appropriation Change Total Appropriation Change Total
TOTAL GOV., LT. GOV. $3,171,146 4.11% 0.05% $3,233,599 1.97% 0.05% $3,355,178 3.76% 0.05%
AGRICULTURE
Agriculture $27,196,069 12.24% 0.44% $28,314,906 4.11% 0.42% $33,678,049 18.94% 0.48%
Conservation Commission 9,803,928 28.70% 0.16% 8,953,795 -8.67% 0.13% 9,187,084 2.61% 0.13%
TOTAL AGRICULTURE $36,999,997 16.17% 0.60% $37,268,701 0.73% 0.55% $42,865,133 15.02% 0.61%
COMMERCE AND TOURISM
Commerce, Department of $27,334,663 -18.01% 0.44% $25,082,836 -8.24% 0.37% $28,104,894 12.05% 0.40%
Centennial Commission 3,899,630 ####### 0.06% 1,062,291 -72.76% 0.02% 1,066,511 0.40% 0.02%
Historical Society 13,106,387 29.23% 0.21% 14,480,363 10.48% 0.21% 14,687,451 1.43% 0.21%
J.M. Davis Memorial Comm. 347,454 4.98% 0.01% 382,166 9.99% 0.01% 535,403 40.10% 0.01%
Labor Department 3,224,721 5.33% 0.05% 3,613,893 12.07% 0.05% 3,760,284 4.05% 0.05%
Native American Cultural Cente 0 n/a 0.00% 0 n/a 0.00% 0 0.00% 0.00%
REAP -local gov't thru Aud & In 15,500,000 0.00% 0.25% 15,500,000 0.00% 0.23% 15,500,000 0.00% 0.22%
Scenic Rivers Commission 323,041 n/a 0.01% 339,752 5.17% 0.01% 345,322 1.64% 0.00%
Tourism & Recreation Dept. 25,955,959 7.42% 0.42% 27,073,374 4.31% 0.40% 27,826,991 2.78% 0.39%
Wildlife Conservation Comm. 0 n/a 0.00% 0 n/a 0.00% 0 0.00% 0.00%
Will Rogers Memorial Comm. 830,679 -5.89% 0.01% 925,196 11.38% 0.01% 1,083,702 17.13% 0.02%
TOTAL COMMERCE & TOURIS $90,522,534 2.53% 1.46% $88,459,871 -2.28% 1.31% $92,910,558 5.03% 1.32%
EDUCATION
Arts Council $4,243,338 8.14% 0.07% $4,442,810 4.70% 0.07% $5,150,967 15.94% 0.07%
Education, Department of 2,164,263,450 7.80% 34.98% 2,348,041,255 8.49% 34.82% 2,480,155,207 5.63% 35.20%
Educational TV Authority 4,624,059 10.05% 0.07% 5,164,350 11.68% 0.08% 8,394,383 62.54% 0.12%
Higher Educ., Regents for 889,433,880 10.88% 14.37% 933,933,880 5.00% 13.85% 1,053,949,576 12.85% 14.96%
Department of Libraries 6,681,355 7.55% 0.11% 6,847,731 2.49% 0.10% 7,294,856 6.53% 0.10%
Private Vo-Tech Schools Board 171,879 10.56% 0.00% 0 -100.00% 0.00% 0 0.00% 0.00%
School of Science & Mathematic 7,020,513 6.82% 0.11% 7,230,508 2.99% 0.11% 7,585,732 4.91% 0.11%
Teacher Preparation Commissio 2,022,875 1.24% 0.03% 2,050,705 1.38% 0.03% 2,059,982 0.45% 0.03%
Career & Technology Education 130,287,358 5.17% 2.11% 147,287,358 13.05% 2.18% 154,864,391 5.14% 2.20%
TOTAL EDUCATION $3,208,748,707 8.52% 51.86% $3,454,998,597 7.67% 51.24% $3,719,455,094 7.65% 52.80%
STATE BUDGET INFORMATIONC-24
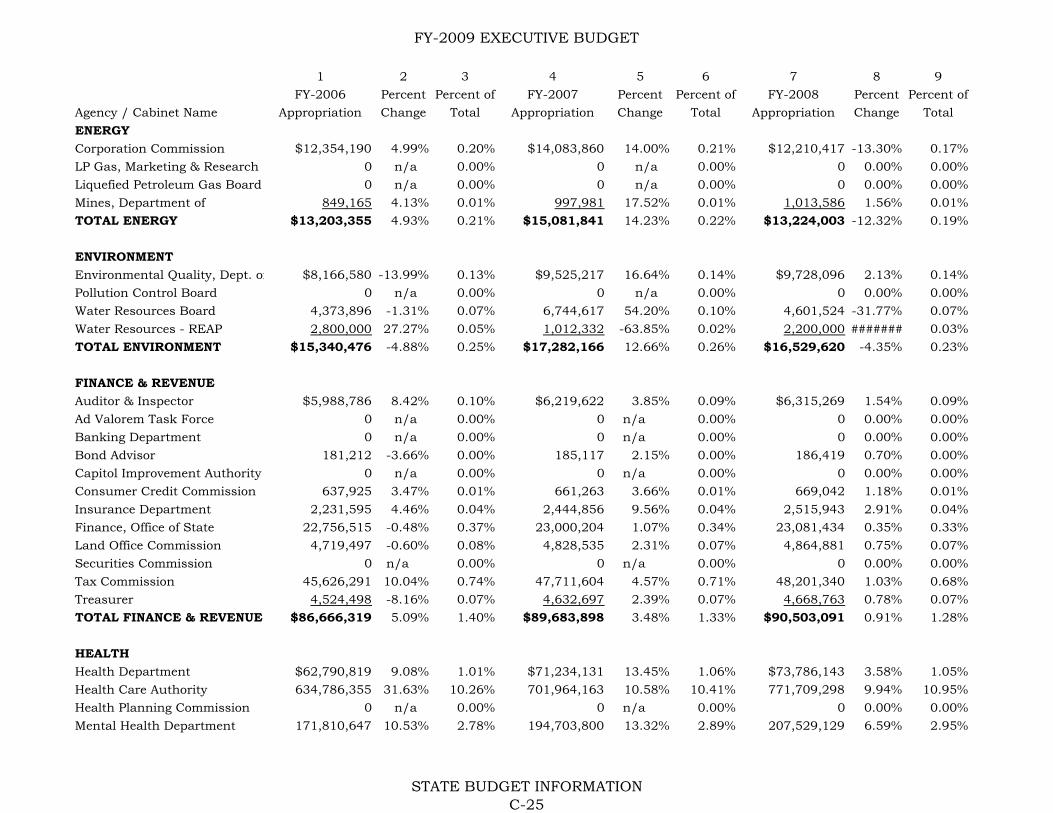
FY-2009 EXECUTIVE BUDGET
1 2 3 4 5 6 7 8 9
FY-2006 Percent Percent of FY-2007 Percent Percent of FY-2008 Percent Percent of
Agency / Cabinet Name Appropriation Change Total Appropriation Change Total Appropriation Change Total
ENERGY
Corporation Commission $12,354,190 4.99% 0.20% $14,083,860 14.00% 0.21% $12,210,417 -13.30% 0.17%
LP Gas, Marketing & Research 0 n/a 0.00% 0 n/a 0.00% 0 0.00% 0.00%
Liquefied Petroleum Gas Board 0 n/a 0.00% 0 n/a 0.00% 0 0.00% 0.00%
Mines, Department of 849,165 4.13% 0.01% 997,981 17.52% 0.01% 1,013,586 1.56% 0.01%
TOTAL ENERGY $13,203,355 4.93% 0.21% $15,081,841 14.23% 0.22% $13,224,003 -12.32% 0.19%
ENVIRONMENT
Environmental Quality, Dept. of $8,166,580 -13.99% 0.13% $9,525,217 16.64% 0.14% $9,728,096 2.13% 0.14%
Pollution Control Board 0 n/a 0.00% 0 n/a 0.00% 0 0.00% 0.00%
Water Resources Board 4,373,896 -1.31% 0.07% 6,744,617 54.20% 0.10% 4,601,524 -31.77% 0.07%
Water Resources - REAP 2,800,000 27.27% 0.05% 1,012,332 -63.85% 0.02% 2,200,000 ####### 0.03%
TOTAL ENVIRONMENT $15,340,476 -4.88% 0.25% $17,282,166 12.66% 0.26% $16,529,620 -4.35% 0.23%
FINANCE & REVENUE
Auditor & Inspector $5,988,786 8.42% 0.10% $6,219,622 3.85% 0.09% $6,315,269 1.54% 0.09%
Ad Valorem Task Force 0 n/a 0.00% 0 n/a 0.00% 0 0.00% 0.00%
Banking Department 0 n/a 0.00% 0 n/a 0.00% 0 0.00% 0.00%
Bond Advisor 181,212 -3.66% 0.00% 185,117 2.15% 0.00% 186,419 0.70% 0.00%
Capitol Improvement Authority 0 n/a 0.00% 0 n/a 0.00% 0 0.00% 0.00%
Consumer Credit Commission 637,925 3.47% 0.01% 661,263 3.66% 0.01% 669,042 1.18% 0.01%
Insurance Department 2,231,595 4.46% 0.04% 2,444,856 9.56% 0.04% 2,515,943 2.91% 0.04%
Finance, Office of State 22,756,515 -0.48% 0.37% 23,000,204 1.07% 0.34% 23,081,434 0.35% 0.33%
Land Office Commission 4,719,497 -0.60% 0.08% 4,828,535 2.31% 0.07% 4,864,881 0.75% 0.07%
Securities Commission 0 n/a 0.00% 0 n/a 0.00% 0 0.00% 0.00%
Tax Commission 45,626,291 10.04% 0.74% 47,711,604 4.57% 0.71% 48,201,340 1.03% 0.68%
Treasurer 4,524,498 -8.16% 0.07% 4,632,697 2.39% 0.07% 4,668,763 0.78% 0.07%
TOTAL FINANCE & REVENUE $86,666,319 5.09% 1.40% $89,683,898 3.48% 1.33% $90,503,091 0.91% 1.28%
HEALTH
Health Department $62,790,819 9.08% 1.01% $71,234,131 13.45% 1.06% $73,786,143 3.58% 1.05%
Health Care Authority 634,786,355 31.63% 10.26% 701,964,163 10.58% 10.41% 771,709,298 9.94% 10.95%
Health Planning Commission 0 n/a 0.00% 0 n/a 0.00% 0 0.00% 0.00%
Mental Health Department 171,810,647 10.53% 2.78% 194,703,800 13.32% 2.89% 207,529,129 6.59% 2.95%
STATE BUDGET INFORMATIONC-25

FY-2009 EXECUTIVE BUDGET
1 2 3 4 5 6 7 8 9
FY-2006 Percent Percent of FY-2007 Percent Percent of FY-2008 Percent Percent of
Agency / Cabinet Name Appropriation Change Total Appropriation Change Total Appropriation Change Total
University Hospitals Authority 40,549,342 3.89% 0.66% 41,665,342 2.75% 0.62% 41,865,342 0.48% 0.59%
TOTAL HEALTH $909,937,163 23.92% 14.71% $1,009,567,436 10.95% 14.97% $1,094,889,912 8.45% 15.54%
HUMAN RESOURCES AND
ADMINISTRATION
Employment Security Comm. $0 n/a 0.00% $0 n/a 0.00% $0 0.00% 0.00%
Merit Protection Commission 565,684 10.45% 0.01% 611,434 8.09% 0.01% 648,684 6.09% 0.01%
Personnel Management 4,633,249 3.03% 0.07% 4,848,371 4.64% 0.07% 4,891,745 0.89% 0.07%
Central Services, Dept. of (DCS) 12,263,035 0.23% 0.20% 13,639,156 11.22% 0.20% 19,053,697 39.70% 0.27%
DCS Capital Improvement Fund 0 n/a 0.00% 0 n/a 0.00% 0 0.00% 0.00%
Horse Racing Commission 2,360,889 27.05% 0.04% 2,618,898 10.93% 0.04% 2,669,568 1.93% 0.04%
Human Rights Commission 686,563 3.59% 0.01% 704,310 2.58% 0.01% 710,226 0.84% 0.01%
TOTAL HUMAN RESOURCES
AND ADMINISTRATION $20,509,420 3.77% 0.33% $22,422,169 9.33% 0.33% $27,973,920 24.76% 0.40%
HUMAN SERVICES
Children & Youth Commission $1,725,018 9.89% 0.03% $2,101,609 21.83% 0.03% $2,334,473 11.08% 0.03%
Handicapped Concerns 376,944 4.09% 0.01% 381,813 1.29% 0.01% 412,769 8.11% 0.01%
Human Services Department 481,991,177 18.04% 7.79% 535,797,324 11.16% 7.95% 557,107,190 3.98% 7.91%
Indian Affairs Commission 255,530 2.65% 0.00% 257,732 0.86% 0.00% 258,466 0.28% 0.00%
J. D. McCarty Center 3,792,283 19.90% 0.06% 4,278,944 12.83% 0.06% 4,452,961 4.07% 0.06%
Office of Juvenile Affairs 98,323,348 5.89% 1.59% 104,219,585 6.00% 1.55% 110,060,812 5.60% 1.56%
Phys. Manpower Trng. Comm. 5,361,490 6.70% 0.09% 5,470,499 2.03% 0.08% 5,523,502 0.97% 0.08%
Rehabilitation Svcs., Dept. of 27,365,925 7.40% 0.44% 29,213,250 6.75% 0.43% 29,474,679 0.89% 0.42%
TOTAL HUMAN SERVICES $619,191,715 15.30% 10.01% $681,720,756 10.10% 10.11% $709,624,852 4.09% 10.07%
MILITARY AFFAIRS
Military Department $12,546,432 55.61% 0.20% $12,898,334 2.80% 0.19% $13,654,939 5.87% 0.19%
SAFETY AND SECURITY
A.B.L.E. Commission $3,738,839 3.09% 0.06% $3,965,159 6.05% 0.06% $3,925,266 -1.01% 0.06%
Attorney General 11,286,462 89.57% 0.18% 12,798,702 13.40% 0.19% 13,944,449 8.95% 0.20%
Emergency Management, Dept. 1,355,561 99.06% 0.02% 756,843 -44.17% 0.01% 836,604 10.54% 0.01%
Corrections Department 409,443,403 6.55% 6.62% 456,004,876 11.37% 6.76% 477,543,364 4.72% 6.78%
STATE BUDGET INFORMATIONC-26
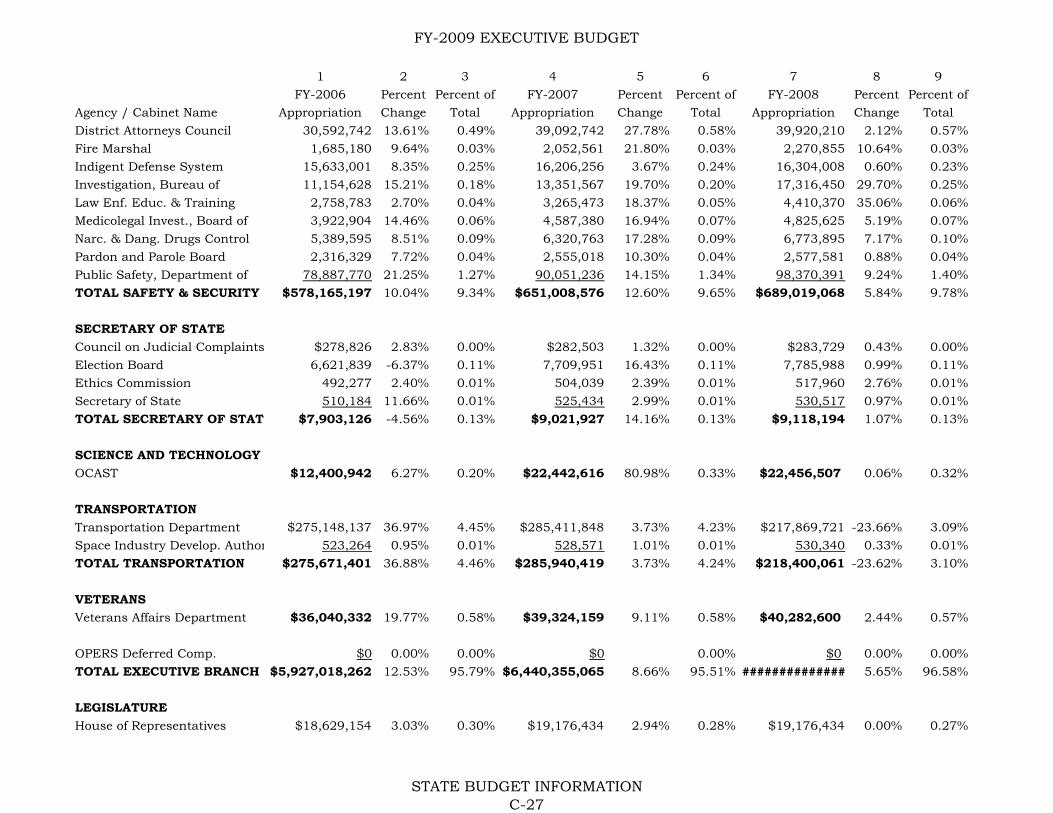
FY-2009 EXECUTIVE BUDGET
1 2 3 4 5 6 7 8 9
FY-2006 Percent Percent of FY-2007 Percent Percent of FY-2008 Percent Percent of
Agency / Cabinet Name Appropriation Change Total Appropriation Change Total Appropriation Change Total
District Attorneys Council 30,592,742 13.61% 0.49% 39,092,742 27.78% 0.58% 39,920,210 2.12% 0.57%
Fire Marshal 1,685,180 9.64% 0.03% 2,052,561 21.80% 0.03% 2,270,855 10.64% 0.03%
Indigent Defense System 15,633,001 8.35% 0.25% 16,206,256 3.67% 0.24% 16,304,008 0.60% 0.23%
Investigation, Bureau of 11,154,628 15.21% 0.18% 13,351,567 19.70% 0.20% 17,316,450 29.70% 0.25%
Law Enf. Educ. & Training 2,758,783 2.70% 0.04% 3,265,473 18.37% 0.05% 4,410,370 35.06% 0.06%
Medicolegal Invest., Board of 3,922,904 14.46% 0.06% 4,587,380 16.94% 0.07% 4,825,625 5.19% 0.07%
Narc. & Dang. Drugs Control 5,389,595 8.51% 0.09% 6,320,763 17.28% 0.09% 6,773,895 7.17% 0.10%
Pardon and Parole Board 2,316,329 7.72% 0.04% 2,555,018 10.30% 0.04% 2,577,581 0.88% 0.04%
Public Safety, Department of 78,887,770 21.25% 1.27% 90,051,236 14.15% 1.34% 98,370,391 9.24% 1.40%
TOTAL SAFETY & SECURITY $578,165,197 10.04% 9.34% $651,008,576 12.60% 9.65% $689,019,068 5.84% 9.78%
SECRETARY OF STATE
Council on Judicial Complaints $278,826 2.83% 0.00% $282,503 1.32% 0.00% $283,729 0.43% 0.00%
Election Board 6,621,839 -6.37% 0.11% 7,709,951 16.43% 0.11% 7,785,988 0.99% 0.11%
Ethics Commission 492,277 2.40% 0.01% 504,039 2.39% 0.01% 517,960 2.76% 0.01%
Secretary of State 510,184 11.66% 0.01% 525,434 2.99% 0.01% 530,517 0.97% 0.01%
TOTAL SECRETARY OF STATE $7,903,126 -4.56% 0.13% $9,021,927 14.16% 0.13% $9,118,194 1.07% 0.13%
SCIENCE AND TECHNOLOGY
OCAST $12,400,942 6.27% 0.20% $22,442,616 80.98% 0.33% $22,456,507 0.06% 0.32%
TRANSPORTATION
Transportation Department $275,148,137 36.97% 4.45% $285,411,848 3.73% 4.23% $217,869,721 -23.66% 3.09%
Space Industry Develop. Author 523,264 0.95% 0.01% 528,571 1.01% 0.01% 530,340 0.33% 0.01%
TOTAL TRANSPORTATION $275,671,401 36.88% 4.46% $285,940,419 3.73% 4.24% $218,400,061 -23.62% 3.10%
VETERANS
Veterans Affairs Department $36,040,332 19.77% 0.58% $39,324,159 9.11% 0.58% $40,282,600 2.44% 0.57%
OPERS Deferred Comp. $0 0.00% 0.00% $0 0.00% $0 0.00% 0.00%
TOTAL EXECUTIVE BRANCH $5,927,018,262 12.53% 95.79% $6,440,355,065 8.66% 95.51% ############## 5.65% 96.58%
LEGISLATURE
House of Representatives $18,629,154 3.03% 0.30% $19,176,434 2.94% 0.28% $19,176,434 0.00% 0.27%
STATE BUDGET INFORMATIONC-27
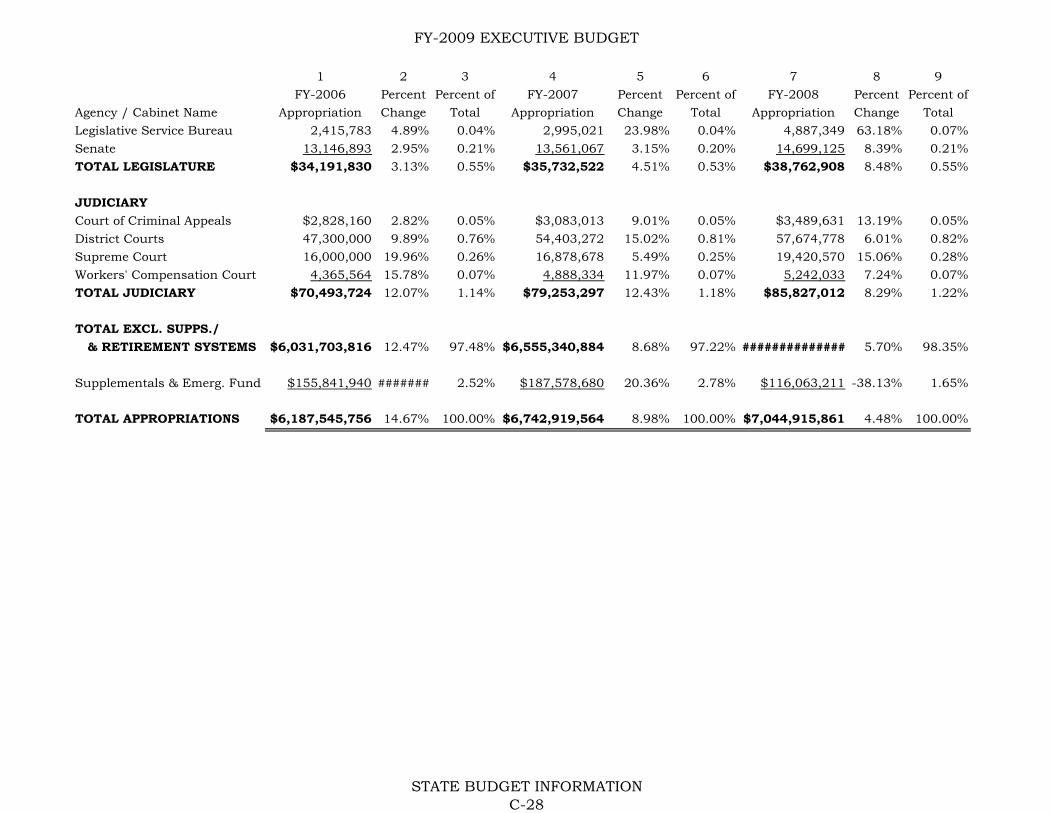
FY-2009 EXECUTIVE BUDGET
1 2 3 4 5 6 7 8 9
FY-2006 Percent Percent of FY-2007 Percent Percent of FY-2008 Percent Percent of
Agency / Cabinet Name Appropriation Change Total Appropriation Change Total Appropriation Change Total
Legislative Service Bureau 2,415,783 4.89% 0.04% 2,995,021 23.98% 0.04% 4,887,349 63.18% 0.07%
Senate 13,146,893 2.95% 0.21% 13,561,067 3.15% 0.20% 14,699,125 8.39% 0.21%
TOTAL LEGISLATURE $34,191,830 3.13% 0.55% $35,732,522 4.51% 0.53% $38,762,908 8.48% 0.55%
JUDICIARY
Court of Criminal Appeals $2,828,160 2.82% 0.05% $3,083,013 9.01% 0.05% $3,489,631 13.19% 0.05%
District Courts 47,300,000 9.89% 0.76% 54,403,272 15.02% 0.81% 57,674,778 6.01% 0.82%
Supreme Court 16,000,000 19.96% 0.26% 16,878,678 5.49% 0.25% 19,420,570 15.06% 0.28%
Workers' Compensation Court 4,365,564 15.78% 0.07% 4,888,334 11.97% 0.07% 5,242,033 7.24% 0.07%
TOTAL JUDICIARY $70,493,724 12.07% 1.14% $79,253,297 12.43% 1.18% $85,827,012 8.29% 1.22%
TOTAL EXCL. SUPPS./
& RETIREMENT SYSTEMS $6,031,703,816 12.47% 97.48% $6,555,340,884 8.68% 97.22% ############## 5.70% 98.35%
Supplementals & Emerg. Fund $155,841,940 ####### 2.52% $187,578,680 20.36% 2.78% $116,063,211 -38.13% 1.65%
TOTAL APPROPRIATIONS $6,187,545,756 14.67% 100.00% $6,742,919,564 8.98% 100.00% $7,044,915,861 4.48% 100.00%
STATE BUDGET INFORMATIONC-28

FY-2009 EXECUTIVE BUDGET
SUMMARY OF OKLAHOMA STATE REGENTS FOR HIGHER EDUCATION ALLOCATIONS (2007-2008)
ORIGINAL % OF ORIGINAL
Regents' Allocation ALLOCATION ALLOCATION
University of Oklahoma $147,901,215 13.46%
OU Law Center 6,308,205 0.57%
OU Health Sciences Center 97,023,804 8.83%
OU Tulsa 9,024,272 0.82%
Oklahoma State University 132,756,603 12.08%
OSU Agriculture Experiment Station 29,635,879 2.70%
OSU Agriculture Extension Division 29,792,416 2.71%
OSU Technical Branch, Okmulgee 15,280,028 1.39%
OSU College of Veterinary Medicine 11,559,909 1.05%
OSU, Oklahoma City 11,573,349 1.05%
OSU Center for Health Sciences 14,827,128 1.35%
OSU Tulsa 12,866,775 1.17%
University of Central Oklahoma 59,956,990 5.46%
East Central University 18,969,254 1.73%
Northeastern State University 39,451,403 3.59%
Statewide Literacy Program - NSU 73,229 0.01%
Northwestern Oklahoma State University 11,056,330 1.01%
Southeastern Oklahoma State University 20,414,184 1.86%
Southwestern Oklahoma State University 24,541,672 2.23%
Cameron University 23,201,837 2.11%
Langston University - Campus 20,180,247 1.84%
Langston - Endowment 1,779,115 0.16%
Oklahoma Panhandle State University 7,809,703 0.71%
University of Science & Arts of Oklahoma 7,677,235 0.70%
University of Science & Arts - Jane Brooks 27,038 0.00%
Rogers State University 15,039,541 1.37%
Carl Albert State College 6,931,921 0.63%
Connors State College 7,429,712 0.68%
Eastern Oklahoma State College 7,129,512 0.65%
Murray State College 6,261,902 0.57%
Northeastern Oklahoma A&M College 9,756,530 0.89%
Northern Oklahoma College 10,696,182 0.97%
Oklahoma City Community College 26,428,060 2.40%
Redlands Community College 5,971,414 0.54%
Rose State College 22,388,258 2.04%
Seminole State College 6,540,618 0.60%
Tulsa Community College 37,717,888 3.43%
Western Oklahoma State College 5,942,489 0.54%
Ardmore Higher Education Program 729,022 0.07%
STATE BUDGET INFORMATIONA-29
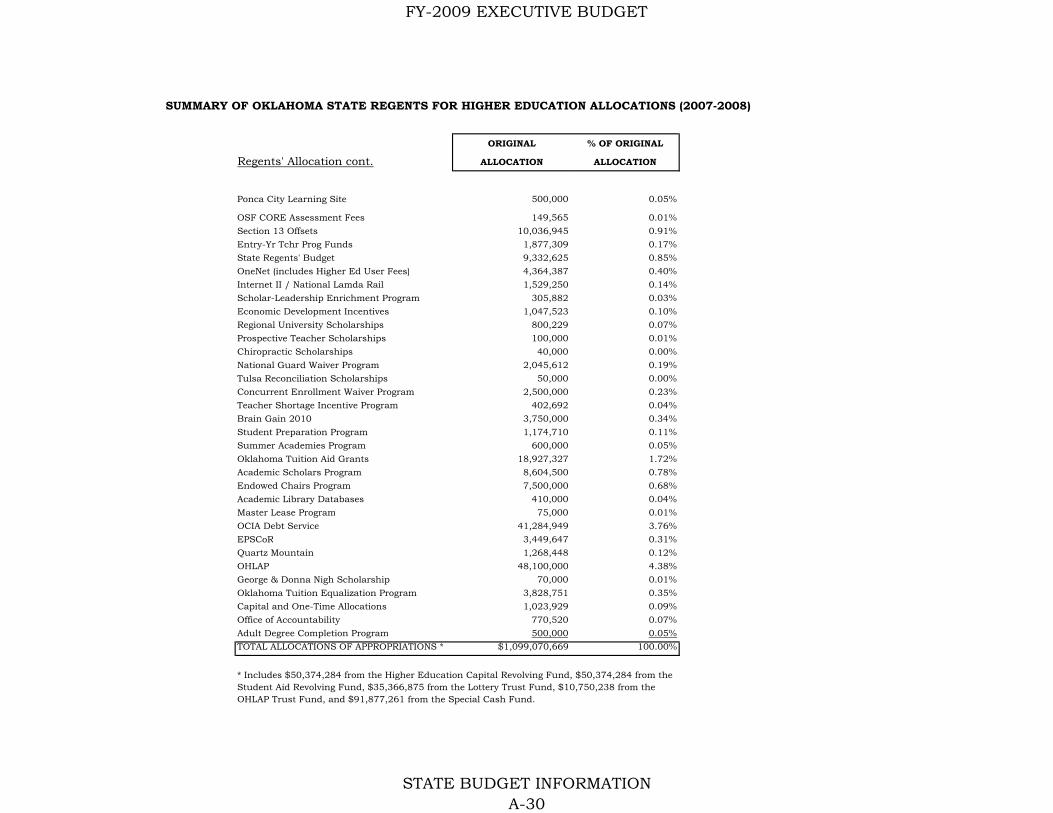
FY-2009 EXECUTIVE BUDGET
SUMMARY OF OKLAHOMA STATE REGENTS FOR HIGHER EDUCATION ALLOCATIONS (2007-2008)
ORIGINAL % OF ORIGINAL
Regents' Allocation cont. ALLOCATION ALLOCATION
Ponca City Learning Site 500,000 0.05%
OSF CORE Assessment Fees 149,565 0.01%
Section 13 Offsets 10,036,945 0.91%
Entry-Yr Tchr Prog Funds 1,877,309 0.17%
State Regents' Budget 9,332,625 0.85%
OneNet (includes Higher Ed User Fees) 4,364,387 0.40%
Internet II / National Lamda Rail 1,529,250 0.14%
Scholar-Leadership Enrichment Program 305,882 0.03%
Economic Development Incentives 1,047,523 0.10%
Regional University Scholarships 800,229 0.07%
Prospective Teacher Scholarships 100,000 0.01%
Chiropractic Scholarships 40,000 0.00%
National Guard Waiver Program 2,045,612 0.19%
Tulsa Reconciliation Scholarships 50,000 0.00%
Concurrent Enrollment Waiver Program 2,500,000 0.23%
Teacher Shortage Incentive Program 402,692 0.04%
Brain Gain 2010 3,750,000 0.34%
Student Preparation Program 1,174,710 0.11%
Summer Academies Program 600,000 0.05%
Oklahoma Tuition Aid Grants 18,927,327 1.72%
Academic Scholars Program 8,604,500 0.78%
Endowed Chairs Program 7,500,000 0.68%
Academic Library Databases 410,000 0.04%
Master Lease Program 75,000 0.01%
OCIA Debt Service 41,284,949 3.76%
EPSCoR 3,449,647 0.31%
Quartz Mountain 1,268,448 0.12%
OHLAP 48,100,000 4.38%
George & Donna Nigh Scholarship 70,000 0.01%
Oklahoma Tuition Equalization Program 3,828,751 0.35%
Capital and One-Time Allocations 1,023,929 0.09%
Office of Accountability 770,520 0.07%
Adult Degree Completion Program 500,000 0.05%
TOTAL ALLOCATIONS OF APPROPRIATIONS * $1,099,070,669 100.00%
* Includes $50,374,284 from the Higher Education Capital Revolving Fund, $50,374,284 from the Student Aid Revolving Fund, $35,366,875 from the Lottery Trust Fund, $10,750,238 from the OHLAP Trust Fund, and $91,877,261 from the Special Cash Fund.
STATE BUDGET INFORMATIONA-30
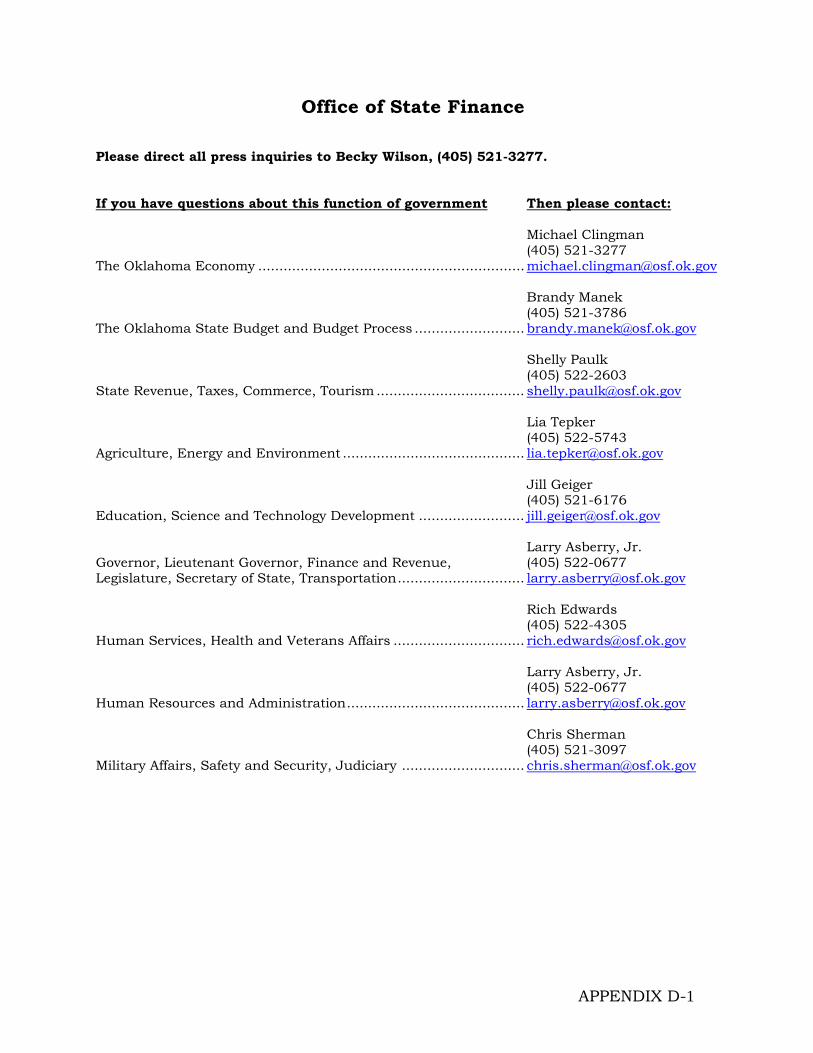
Office of State Finance Please direct all press inquiries to Becky Wilson, (405) 521-3277. If you have questions about this function of government Then please contact: Michael Clingman
(405) 521-3277 The Oklahoma Economy ...............................................................michael.clingman@osf.ok.gov Brandy Manek
(405) 521-3786 The Oklahoma State Budget and Budget Process .......................... [email protected] Shelly Paulk (405) 522-2603 State Revenue, Taxes, Commerce, Tourism ................................... [email protected] Lia Tepker (405) 522-5743 Agriculture, Energy and Environment ........................................... [email protected] Jill Geiger (405) 521-6176 Education, Science and Technology Development ......................... [email protected] Larry Asberry, Jr. Governor, Lieutenant Governor, Finance and Revenue, (405) 522-0677 Legislature, Secretary of State, Transportation.............................. [email protected] Rich Edwards (405) 522-4305 Human Services, Health and Veterans Affairs ............................... [email protected] Larry Asberry, Jr. (405) 522-0677 Human Resources and Administration.......................................... [email protected] Chris Sherman (405) 521-3097 Military Affairs, Safety and Security, Judiciary ............................. [email protected]
APPENDIX D-1
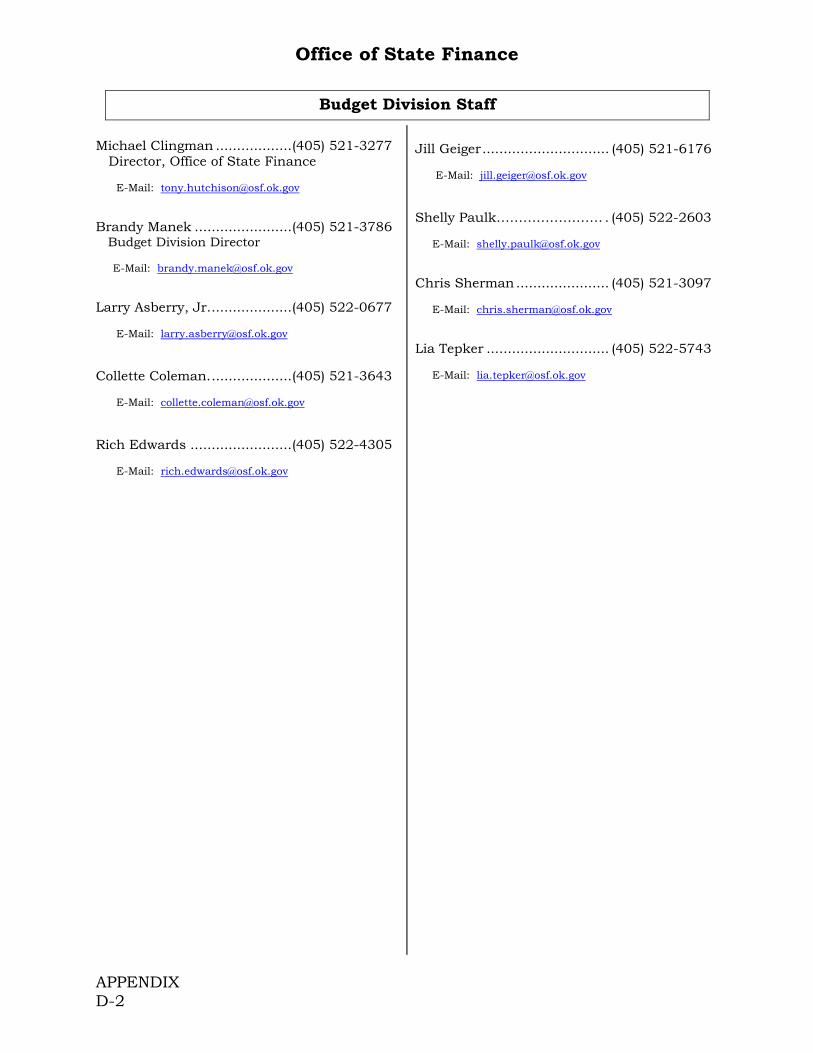
Office of State Finance
Budget Division Staff
Michael Clingman ..................(405) 521-3277 Director, Office of State Finance E-Mail: [email protected] Brandy Manek .......................(405) 521-3786 Budget Division Director E-Mail: [email protected] Larry Asberry, Jr....................(405) 522-0677 E-Mail: [email protected] Collette Coleman....................(405) 521-3643 E-Mail: [email protected] Rich Edwards ........................(405) 522-4305 E-Mail: [email protected]
Jill Geiger.............................. (405) 521-6176 E-Mail: [email protected] Shelly Paulk……………………. (405) 522-2603 E-Mail: [email protected] Chris Sherman...................... (405) 521-3097 E-Mail: [email protected] Lia Tepker ............................. (405) 522-5743 E-Mail: [email protected]
APPENDIX D-2
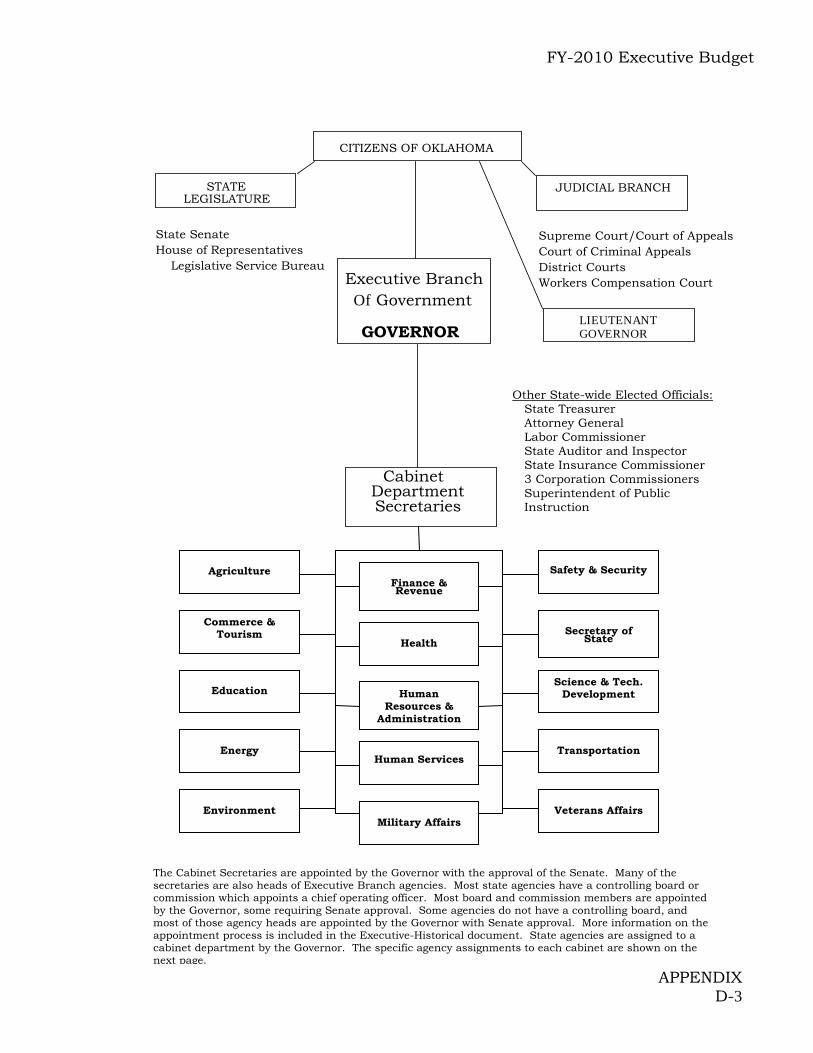
FY-2010 Executive Budget
APPENDIX D-3
Agriculture
Commerce & Tourism
Education
Energy
Environment
Finance & Revenue
Health
Human Resources &
Administration
Human Services
Safety & Security
Secretary of
State
Science & Tech. Development
Transportation
CITIZENS OF OKLAHOMA
Veterans Affairs
STATE LEGISLATURE
JUDICIAL BRANCH
Executive Branch Of Government
GOVERNOR LIEUTENANT GOVERNOR
Cabinet Department Secretaries
Supreme Court/Court of Appeals State SenateHouse of Representatives Court of Criminal Appeals
District Courts Legislative Service Bureau Workers Compensation Court
Military Affairs
Other State-wide Elected Officials: State Treasurer Attorney General Labor Commissioner State Auditor and Inspector State Insurance Commissioner 3 Corporation Commissioners Superintendent of Public Instruction
The Cabinet Secretaries are appointed by the Governor with the approval of the Senate. Many of the secretaries are also heads of Executive Branch agencies. Most state agencies have a controlling board or commission which appoints a chief operating officer. Most board and commission members are appointed by the Governor, some requiring Senate approval. Some agencies do not have a controlling board, and most of those agency heads are appointed by the Governor with Senate approval. More information on the appointment process is included in the Executive-Historical document. State agencies are assigned to a cabinet department by the Governor. The specific agency assignments to each cabinet are shown on the next page.

FY-2010 Executive Budget
305 Office of the Governor 440 Office of the Lieutenant Governor Agriculture 40 Agriculture, Department of 39 Boll Weevil Eradication Org. 645 Conservation Commission 615 Foresters, Board of Registered 535 Peanut Commission 875 Wheat Commission Commerce and Tourism 981 Capital Investment Board 160 Commerce, Department of 900 Development Finance Authority
290 Employment Security Commission 350 Historical Society 922 Housing Finance Authority 370 Industrial Finance Authority 204 J.M. Davis Memorial Commission 405 Labor, Department of * 981 Municipal Power Authority 361 Native American Cultural/Ed. Auth 568 Scenic Rivers Comm. 566 Tourism & Recreation, Dept. of 880 Will Rogers Memorial Commission Education 44 Anatomical Board 55 Arts Council 800 Career & Technology Education 266 Educational TV Authority 265 Education, Department of * 430 Library Department 563 Private Vocational School, Board of 629 School of Science & Mathematics 269 Teacher Preparation, Comm. for Colleges and Universities 606 Ardmore Higher Education Center 100 Cameron University 108 Carl Albert State College 165 Connors State College 230 East Central University 240 Eastern Oklahoma State College 420 Langston University 470 Murray State College 480 Northeastern Okla. A & M College 485 Northeastern State University 490 Northern Oklahoma College 505 Northwestern Oklahoma State Univ. 530 Oklahoma Panhandle State Univ. 10 Oklahoma State University 761 Oklahoma University Law Center 633 Oklahoma City Community College 770 Okla. University Health Science Ctr. 773 OSU -College of Osteopathic Medicine 14 OSU -College of Veterinary Medicine 11 OSU -Experiment Station 12 OSU -Extension Division 13 OSU -School of Tech. Training 15 OSU -Technical Institute of OKC 16 OSU -Tulsa 771 OU Health Sci. Ctr. Prof. Prac. Plan 620 Qtz Mtn. Arts/Conf. Cntr/Nat. Pk. 241 Redlands Community College 600 Regents for A&M Colleges 605 Regents for Higher Education 610 Regional University System of OK 461 Rogers State University 531 Rose State College 623 Seminole State College
660 Southeastern Oklahoma State Univ.
665 Southwestern Oklahoma State Univ. 618 Student Loan Authority 750 Tulsa Community College 120 University of Central Oklahoma 760 University of Oklahoma 150 Univ. of Science and Arts of Okla. 41 Western Oklahoma State College Energy 185 Corporation Commission * 359 Energy Resources Board 980 Grand River Dam Authority 307 Interstate Oil Comp. Com. 445 LPG Board 444 LPG Research, Marketing and Safety 446 Marg. Prod. O&G Wells, Comm. on 125 Mines, Department of Environment 292 Dept. of Environmental Quality 920 Environmental Finance Authority 835 Water Resources Board 320 Wildlife Conservation, Dept. of Finance and Revenue 300 Auditor & Inspector * 22 Abstractors 65 Banking Department 582 Bond Advisor 91 Building Bonds Commission 105 Capitol Improvement Authority 390 CompSource Oklahoma 635 Consumer Credit, Comm. for 90 Finance, Office of State 315 Firefighters Pension & Retirement 385 Insurance Department * 410 Land Office, Commissioners of the 416 Law Enforcement Retirement 435 Lottery Commission 557 Police Pension & Retirement System 515 Public Employees’ Retirement System 630 Securities Commission 695 Tax Commission 715 Teachers’ Retirement System 092 Tobacco Settle. End. Trust Bd. of Dir. 740 Treasurer Health 448 Alcohol and Drug Coun., Bd. of Lic. 783 Community Hospitals Authority 170 Construction Industries Bd. 807 Health Care Authority 340 Health, Department of 452 Mental Health and Sub. Abuse Svc. 509 Nursing Homes, Board of Exam. for Human Resources and Admin. 22 Abstractor’s Board 20 Accountancy Board 45 Architects, Board of Gov.of Licensed 580 Central Services, Dept. of 145 Chiropractic Examiners Board 190 Cosmetology Board 215 Dentistry, Board of 815 Employees Benefits Council 285 Funeral Board 353 Horse Racing Commission 355 Human Rights Commission 450 Medical Licensure & Supv., Bd. of 298 Merit Protection Commission 475 Motor Vehicle Commission 510 Nursing Board 520 Optometry Board
525 Osteopathic Examiners Board 343 Perfusionists, State Bd. of Examiners 548 Personnel Management 560 Pharmacy Board 140 Podiatric Medical Examiners, Bd. of 570 Prof. Engin. & Land Surveyors Bd. 575 Psychologists, Bd. of Examiners 588 Real Estate Commission 622 Social Workers Board, Bd. of Lic. 632 Speech-Lang. Pathology & Aud. Bd. 516 State and Ed. Empl. Group Ins. Bd. 755 Used Motor Vehicle & Parts 790 Veterinary Medical Examiners Board
Human Services 127 Children & Youth, Commission 326 Handicapped Concerns, Office of 830 Human Services, Department of 360 Indian Affairs Commission 670 J.D. McCarty Center 400 Juvenile Affairs, Office of 619 Physicians Manpower Trng. Comm. 805 Rehabilitative Services 825 University Hospitals Authority
Military Affairs 25 Military Department Safety and Security 30 ABLE Commission 49 Attorney General * 772 Chem. Tests for Alc/Drug Infl., Bd. of 309 Civil Emergency Mgmt, Dept. of 131 Corrections Department 220 District Attorney’s Council 310 Fire Marshal, State 47 Indigent Defense System 308 Investigation, Bureau of 415 Law Enf. Educ. & Trng., Council on 342 Medicolegal Investigations, Bd. of 477 Narcotics & Dang. Drugs, Bureau of 306 Pardon and Parole Board 585 Public Safety, Department of Science and Technology Dev. 628 Center f/t Adv. of Sci. & Technology Secretary of State 270 Election Board 296 Ethics Commission 678 Judicial Complaints, Council on 625 Secretary of State Transportation 978 Okla. Transportation Authority 346 Space Industry Development Auth. 345 Transportation, Department of 060 Aeronautics Commission Veterans Affairs 650 Veterans Affairs, Department of
* Agency is headed by a statewide elected official or their controlling board is made up of elected officials. They are assigned to a cabinet department for purposes of coordinating services and programs only.
APPENDIX D-4
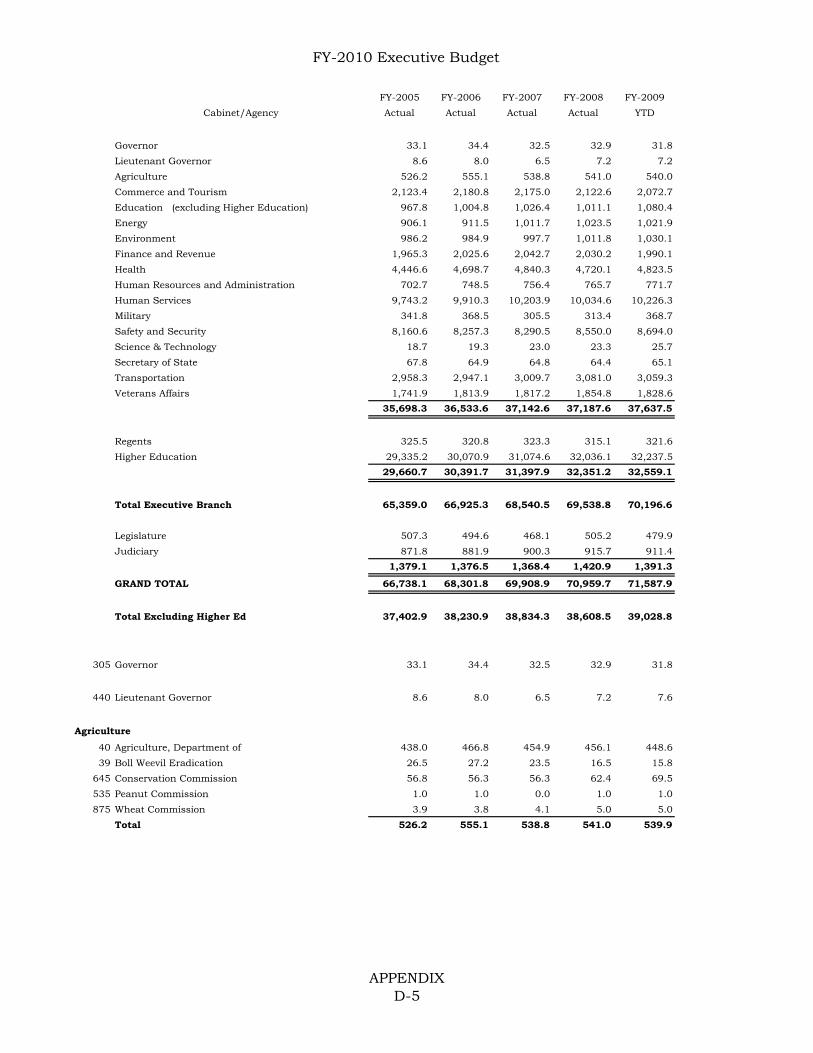
FY-2010 Executive Budget
FY-2005 FY-2006 FY-2007 FY-2008 FY-2009
Cabinet/Agency Actual Actual Actual Actual YTD
Governor 33.1 34.4 32.5 32.9 31.8
Lieutenant Governor 8.6 8.0 6.5 7.2 7.2
Agriculture 526.2 555.1 538.8 541.0 540.0
Commerce and Tourism 2,123.4 2,180.8 2,175.0 2,122.6 2,072.7
Education (excluding Higher Education) 967.8 1,004.8 1,026.4 1,011.1 1,080.4
Energy 906.1 911.5 1,011.7 1,023.5 1,021.9
Environment 986.2 984.9 997.7 1,011.8 1,030.1
Finance and Revenue 1,965.3 2,025.6 2,042.7 2,030.2 1,990.1
Health 4,446.6 4,698.7 4,840.3 4,720.1 4,823.5
Human Resources and Administration 702.7 748.5 756.4 765.7 771.7
Human Services 9,743.2 9,910.3 10,203.9 10,034.6 10,226.3
Military 341.8 368.5 305.5 313.4 368.7
Safety and Security 8,160.6 8,257.3 8,290.5 8,550.0 8,694.0
Science & Technology 18.7 19.3 23.0 23.3 25.7
Secretary of State 67.8 64.9 64.8 64.4 65.1
Transportation 2,958.3 2,947.1 3,009.7 3,081.0 3,059.3
Veterans Affairs 1,741.9 1,813.9 1,817.2 1,854.8 1,828.6
35,698.3 36,533.6 37,142.6 37,187.6 37,637.5
Regents 325.5 320.8 323.3 315.1 321.6
Higher Education 29,335.2 30,070.9 31,074.6 32,036.1 32,237.5
29,660.7 30,391.7 31,397.9 32,351.2 32,559.1
Total Executive Branch 65,359.0 66,925.3 68,540.5 69,538.8 70,196.6
Legislature 507.3 494.6 468.1 505.2 479.9
Judiciary 871.8 881.9 900.3 915.7 911.4
1,379.1 1,376.5 1,368.4 1,420.9 1,391.3
GRAND TOTAL 66,738.1 68,301.8 69,908.9 70,959.7 71,587.9
Total Excluding Higher Ed 37,402.9 38,230.9 38,834.3 38,608.5 39,028.8
305 Governor 33.1 34.4 32.5 32.9 31.8
440 Lieutenant Governor 8.6 8.0 6.5 7.2 7.6
Agriculture
40 Agriculture, Department of 438.0 466.8 454.9 456.1 448.6
39 Boll Weevil Eradication 26.5 27.2 23.5 16.5 15.8
645 Conservation Commission 56.8 56.3 56.3 62.4 69.5
535 Peanut Commission 1.0 1.0 0.0 1.0 1.0
875 Wheat Commission 3.9 3.8 4.1 5.0 5.0
Total 526.2 555.1 538.8 541.0 539.9
APPENDIXD-5
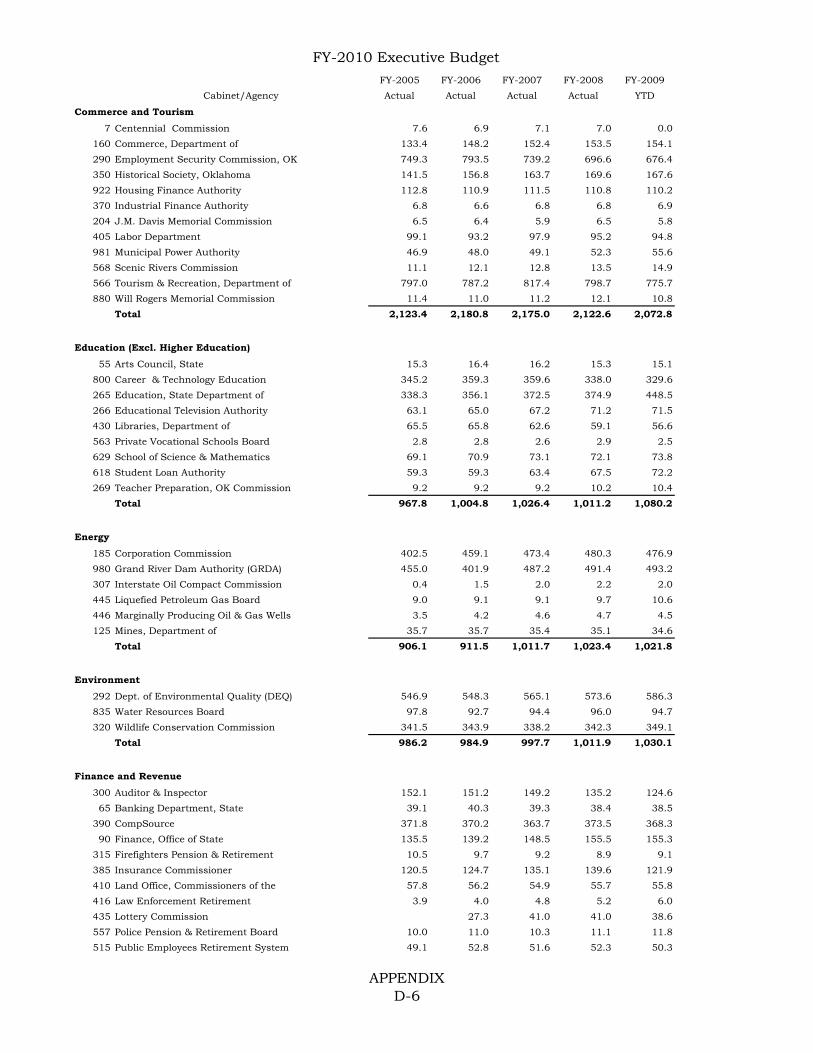
FY-2010 Executive Budget
FY-2005 FY-2006 FY-2007 FY-2008 FY-2009
Cabinet/Agency Actual Actual Actual Actual YTD
Commerce and Tourism
7 Centennial Commission 7.6 6.9 7.1 7.0 0.0
160 Commerce, Department of 133.4 148.2 152.4 153.5 154.1
290 Employment Security Commission, OK 749.3 793.5 739.2 696.6 676.4
350 Historical Society, Oklahoma 141.5 156.8 163.7 169.6 167.6
922 Housing Finance Authority 112.8 110.9 111.5 110.8 110.2
370 Industrial Finance Authority 6.8 6.6 6.8 6.8 6.9
204 J.M. Davis Memorial Commission 6.5 6.4 5.9 6.5 5.8
405 Labor Department 99.1 93.2 97.9 95.2 94.8
981 Municipal Power Authority 46.9 48.0 49.1 52.3 55.6
568 Scenic Rivers Commission 11.1 12.1 12.8 13.5 14.9
566 Tourism & Recreation, Department of 797.0 787.2 817.4 798.7 775.7
880 Will Rogers Memorial Commission 11.4 11.0 11.2 12.1 10.8
Total 2,123.4 2,180.8 2,175.0 2,122.6 2,072.8
Education (Excl. Higher Education)
55 Arts Council, State 15.3 16.4 16.2 15.3 15.1
800 Career & Technology Education 345.2 359.3 359.6 338.0 329.6
265 Education, State Department of 338.3 356.1 372.5 374.9 448.5
266 Educational Television Authority 63.1 65.0 67.2 71.2 71.5
430 Libraries, Department of 65.5 65.8 62.6 59.1 56.6
563 Private Vocational Schools Board 2.8 2.8 2.6 2.9 2.5
629 School of Science & Mathematics 69.1 70.9 73.1 72.1 73.8
618 Student Loan Authority 59.3 59.3 63.4 67.5 72.2
269 Teacher Preparation, OK Commission 9.2 9.2 9.2 10.2 10.4
Total 967.8 1,004.8 1,026.4 1,011.2 1,080.2
Energy
185 Corporation Commission 402.5 459.1 473.4 480.3 476.9
980 Grand River Dam Authority (GRDA) 455.0 401.9 487.2 491.4 493.2
307 Interstate Oil Compact Commission 0.4 1.5 2.0 2.2 2.0
445 Liquefied Petroleum Gas Board 9.0 9.1 9.1 9.7 10.6
446 Marginally Producing Oil & Gas Wells 3.5 4.2 4.6 4.7 4.5
125 Mines, Department of 35.7 35.7 35.4 35.1 34.6
Total 906.1 911.5 1,011.7 1,023.4 1,021.8
Environment
292 Dept. of Environmental Quality (DEQ) 546.9 548.3 565.1 573.6 586.3
835 Water Resources Board 97.8 92.7 94.4 96.0 94.7
320 Wildlife Conservation Commission 341.5 343.9 338.2 342.3 349.1
Total 986.2 984.9 997.7 1,011.9 1,030.1
Finance and Revenue
300 Auditor & Inspector 152.1 151.2 149.2 135.2 124.6
65 Banking Department, State 39.1 40.3 39.3 38.4 38.5
390 CompSource 371.8 370.2 363.7 373.5 368.3
90 Finance, Office of State 135.5 139.2 148.5 155.5 155.3
315 Firefighters Pension & Retirement 10.5 9.7 9.2 8.9 9.1
385 Insurance Commissioner 120.5 124.7 135.1 139.6 121.9
410 Land Office, Commissioners of the 57.8 56.2 54.9 55.7 55.8
416 Law Enforcement Retirement 3.9 4.0 4.8 5.2 6.0
435 Lottery Commission 27.3 41.0 41.0 38.6
557 Police Pension & Retirement Board 10.0 11.0 10.3 11.1 11.8
515 Public Employees Retirement System 49.1 52.8 51.6 52.3 50.3
APPENDIXD-6
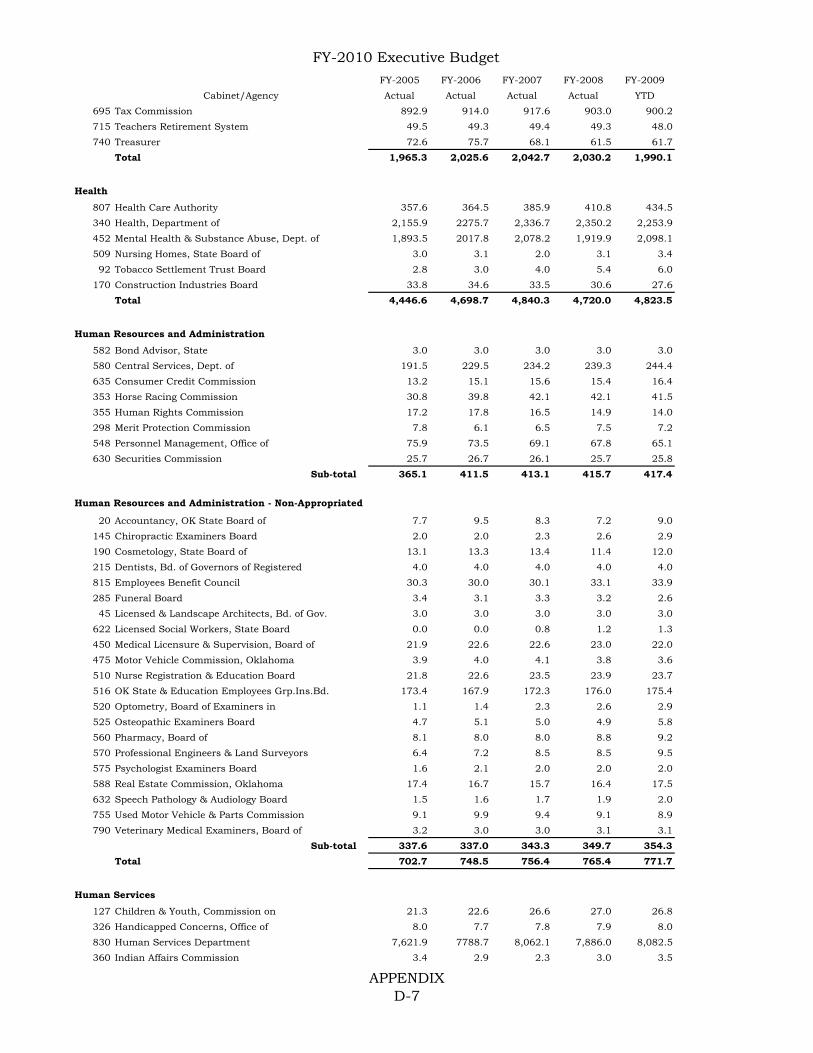
FY-2010 Executive Budget
FY-2005 FY-2006 FY-2007 FY-2008 FY-2009
Cabinet/Agency Actual Actual Actual Actual YTD
695 Tax Commission 892.9 914.0 917.6 903.0 900.2
715 Teachers Retirement System 49.5 49.3 49.4 49.3 48.0
740 Treasurer 72.6 75.7 68.1 61.5 61.7
Total 1,965.3 2,025.6 2,042.7 2,030.2 1,990.1
Health
807 Health Care Authority 357.6 364.5 385.9 410.8 434.5
340 Health, Department of 2,155.9 2275.7 2,336.7 2,350.2 2,253.9
452 Mental Health & Substance Abuse, Dept. of 1,893.5 2017.8 2,078.2 1,919.9 2,098.1
509 Nursing Homes, State Board of 3.0 3.1 2.0 3.1 3.4
92 Tobacco Settlement Trust Board 2.8 3.0 4.0 5.4 6.0
170 Construction Industries Board 33.8 34.6 33.5 30.6 27.6
Total 4,446.6 4,698.7 4,840.3 4,720.0 4,823.5
Human Resources and Administration
582 Bond Advisor, State 3.0 3.0 3.0 3.0 3.0
580 Central Services, Dept. of 191.5 229.5 234.2 239.3 244.4
635 Consumer Credit Commission 13.2 15.1 15.6 15.4 16.4
353 Horse Racing Commission 30.8 39.8 42.1 42.1 41.5
355 Human Rights Commission 17.2 17.8 16.5 14.9 14.0
298 Merit Protection Commission 7.8 6.1 6.5 7.5 7.2
548 Personnel Management, Office of 75.9 73.5 69.1 67.8 65.1
630 Securities Commission 25.7 26.7 26.1 25.7 25.8
Sub-total 365.1 411.5 413.1 415.7 417.4
20 Accountancy, OK State Board of 7.7 9.5 8.3 7.2 9.0
145 Chiropractic Examiners Board 2.0 2.0 2.3 2.6 2.9
190 Cosmetology, State Board of 13.1 13.3 13.4 11.4 12.0
215 Dentists, Bd. of Governors of Registered 4.0 4.0 4.0 4.0 4.0
815 Employees Benefit Council 30.3 30.0 30.1 33.1 33.9
285 Funeral Board 3.4 3.1 3.3 3.2 2.6
45 Licensed & Landscape Architects, Bd. of Gov. 3.0 3.0 3.0 3.0 3.0
622 Licensed Social Workers, State Board 0.0 0.0 0.8 1.2 1.3
450 Medical Licensure & Supervision, Board of 21.9 22.6 22.6 23.0 22.0
475 Motor Vehicle Commission, Oklahoma 3.9 4.0 4.1 3.8 3.6
510 Nurse Registration & Education Board 21.8 22.6 23.5 23.9 23.7
516 OK State & Education Employees Grp.Ins.Bd. 173.4 167.9 172.3 176.0 175.4
520 Optometry, Board of Examiners in 1.1 1.4 2.3 2.6 2.9
525 Osteopathic Examiners Board 4.7 5.1 5.0 4.9 5.8
560 Pharmacy, Board of 8.1 8.0 8.0 8.8 9.2
570 Professional Engineers & Land Surveyors 6.4 7.2 8.5 8.5 9.5
575 Psychologist Examiners Board 1.6 2.1 2.0 2.0 2.0
588 Real Estate Commission, Oklahoma 17.4 16.7 15.7 16.4 17.5
632 Speech Pathology & Audiology Board 1.5 1.6 1.7 1.9 2.0
755 Used Motor Vehicle & Parts Commission 9.1 9.9 9.4 9.1 8.9
790 Veterinary Medical Examiners, Board of 3.2 3.0 3.0 3.1 3.1
Sub-total 337.6 337.0 343.3 349.7 354.3
Total 702.7 748.5 756.4 765.4 771.7
Human Services
127 Children & Youth, Commission on 21.3 22.6 26.6 27.0 26.8
326 Handicapped Concerns, Office of 8.0 7.7 7.8 7.9 8.0
830 Human Services Department 7,621.9 7788.7 8,062.1 7,886.0 8,082.5
360 Indian Affairs Commission 3.4 2.9 2.3 3.0 3.5
Human Resources and Administration - Non-Appropriated
APPENDIXD-7
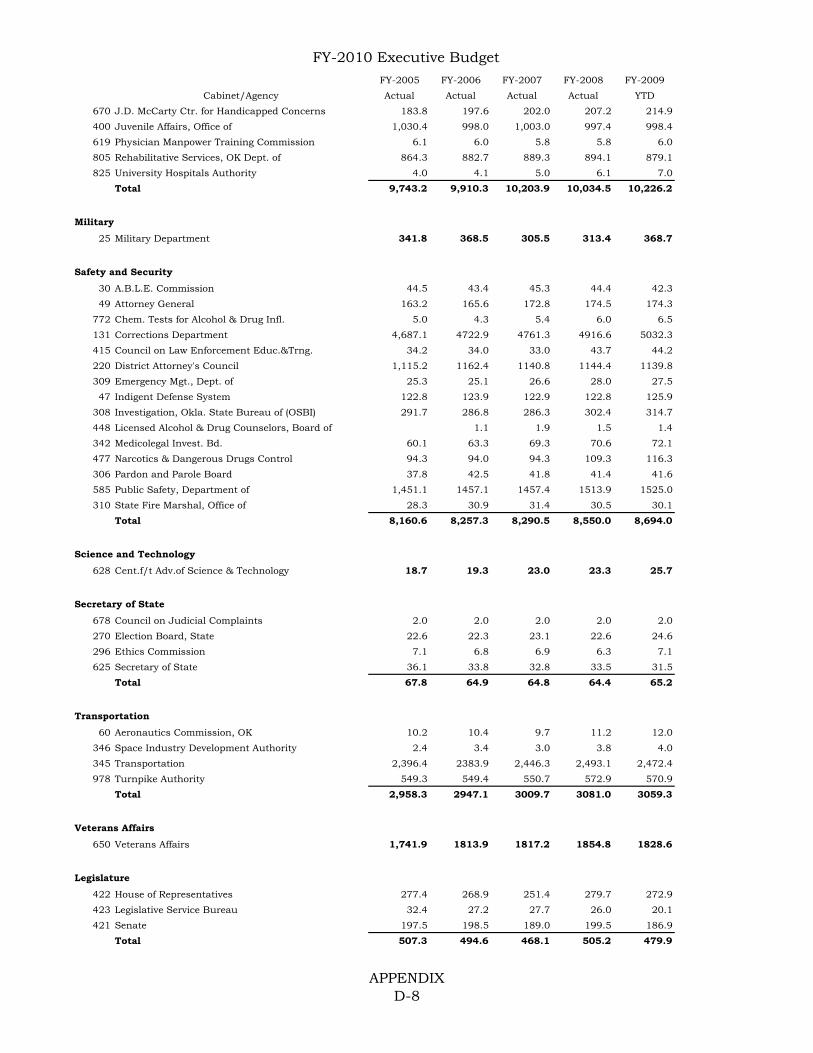
FY-2010 Executive Budget
FY-2005 FY-2006 FY-2007 FY-2008 FY-2009
Cabinet/Agency Actual Actual Actual Actual YTD
670 J.D. McCarty Ctr. for Handicapped Concerns 183.8 197.6 202.0 207.2 214.9
400 Juvenile Affairs, Office of 1,030.4 998.0 1,003.0 997.4 998.4
619 Physician Manpower Training Commission 6.1 6.0 5.8 5.8 6.0
805 Rehabilitative Services, OK Dept. of 864.3 882.7 889.3 894.1 879.1
825 University Hospitals Authority 4.0 4.1 5.0 6.1 7.0
Total 9,743.2 9,910.3 10,203.9 10,034.5 10,226.2
Military
25 Military Department 341.8 368.5 305.5 313.4 368.7
Safety and Security
30 A.B.L.E. Commission 44.5 43.4 45.3 44.4 42.3
49 Attorney General 163.2 165.6 172.8 174.5 174.3
772 Chem. Tests for Alcohol & Drug Infl. 5.0 4.3 5.4 6.0 6.5
131 Corrections Department 4,687.1 4722.9 4761.3 4916.6 5032.3
415 Council on Law Enforcement Educ.&Trng. 34.2 34.0 33.0 43.7 44.2
220 District Attorney's Council 1,115.2 1162.4 1140.8 1144.4 1139.8
309 Emergency Mgt., Dept. of 25.3 25.1 26.6 28.0 27.5
47 Indigent Defense System 122.8 123.9 122.9 122.8 125.9
308 Investigation, Okla. State Bureau of (OSBI) 291.7 286.8 286.3 302.4 314.7
448 Licensed Alcohol & Drug Counselors, Board of 1.1 1.9 1.5 1.4
342 Medicolegal Invest. Bd. 60.1 63.3 69.3 70.6 72.1
477 Narcotics & Dangerous Drugs Control 94.3 94.0 94.3 109.3 116.3
306 Pardon and Parole Board 37.8 42.5 41.8 41.4 41.6
585 Public Safety, Department of 1,451.1 1457.1 1457.4 1513.9 1525.0
310 State Fire Marshal, Office of 28.3 30.9 31.4 30.5 30.1
Total 8,160.6 8,257.3 8,290.5 8,550.0 8,694.0
Science and Technology
628 Cent.f/t Adv.of Science & Technology 18.7 19.3 23.0 23.3 25.7
Secretary of State
678 Council on Judicial Complaints 2.0 2.0 2.0 2.0 2.0
270 Election Board, State 22.6 22.3 23.1 22.6 24.6
296 Ethics Commission 7.1 6.8 6.9 6.3 7.1
625 Secretary of State 36.1 33.8 32.8 33.5 31.5
Total 67.8 64.9 64.8 64.4 65.2
Transportation
60 Aeronautics Commission, OK 10.2 10.4 9.7 11.2 12.0
346 Space Industry Development Authority 2.4 3.4 3.0 3.8 4.0
345 Transportation 2,396.4 2383.9 2,446.3 2,493.1 2,472.4
978 Turnpike Authority 549.3 549.4 550.7 572.9 570.9
Total 2,958.3 2947.1 3009.7 3081.0 3059.3
Veterans Affairs
650 Veterans Affairs 1,741.9 1813.9 1817.2 1854.8 1828.6
Legislature
422 House of Representatives 277.4 268.9 251.4 279.7 272.9
423 Legislative Service Bureau 32.4 27.2 27.7 26.0 20.1
421 Senate 197.5 198.5 189.0 199.5 186.9
Total 507.3 494.6 468.1 505.2 479.9
APPENDIXD-8
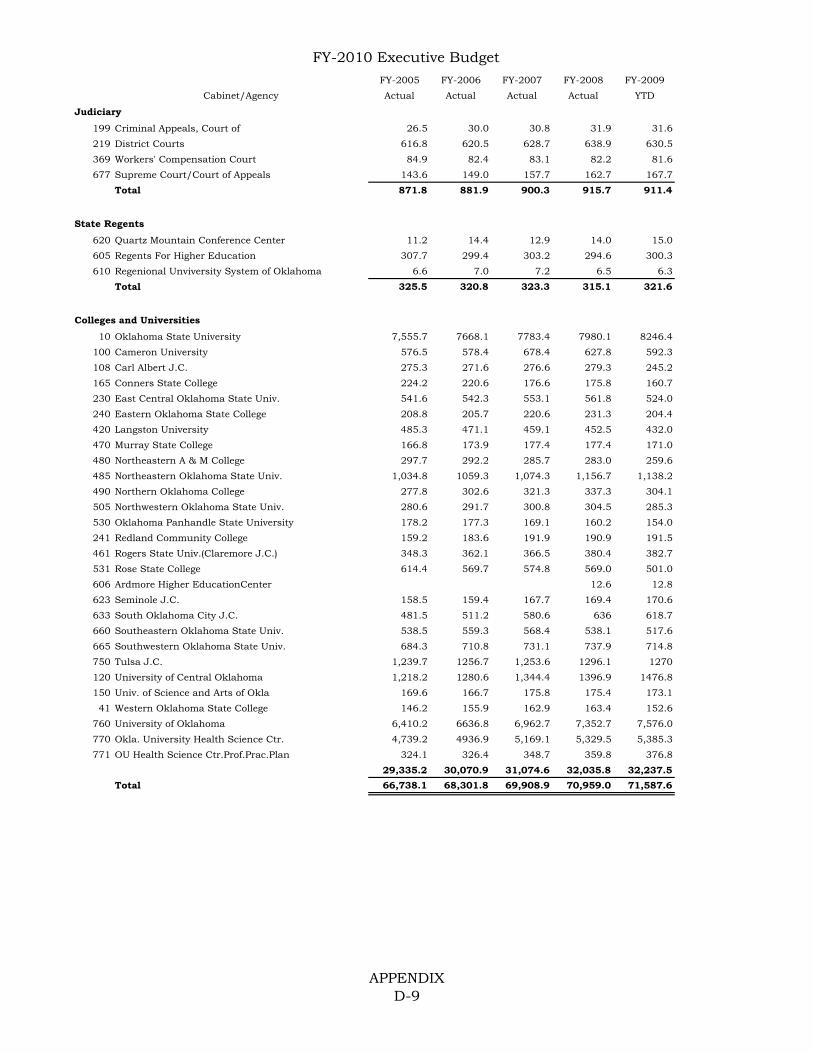
FY-2010 Executive Budget
FY-2005 FY-2006 FY-2007 FY-2008 FY-2009
Cabinet/Agency Actual Actual Actual Actual YTD
Judiciary
199 Criminal Appeals, Court of 26.5 30.0 30.8 31.9 31.6
219 District Courts 616.8 620.5 628.7 638.9 630.5
369 Workers' Compensation Court 84.9 82.4 83.1 82.2 81.6
677 Supreme Court/Court of Appeals 143.6 149.0 157.7 162.7 167.7
Total 871.8 881.9 900.3 915.7 911.4
State Regents
620 Quartz Mountain Conference Center 11.2 14.4 12.9 14.0 15.0
605 Regents For Higher Education 307.7 299.4 303.2 294.6 300.3
610 Regenional Unviversity System of Oklahoma 6.6 7.0 7.2 6.5 6.3
Total 325.5 320.8 323.3 315.1 321.6
Colleges and Universities
10 Oklahoma State University 7,555.7 7668.1 7783.4 7980.1 8246.4
100 Cameron University 576.5 578.4 678.4 627.8 592.3
108 Carl Albert J.C. 275.3 271.6 276.6 279.3 245.2
165 Conners State College 224.2 220.6 176.6 175.8 160.7
230 East Central Oklahoma State Univ. 541.6 542.3 553.1 561.8 524.0
240 Eastern Oklahoma State College 208.8 205.7 220.6 231.3 204.4
420 Langston University 485.3 471.1 459.1 452.5 432.0
470 Murray State College 166.8 173.9 177.4 177.4 171.0
480 Northeastern A & M College 297.7 292.2 285.7 283.0 259.6
485 Northeastern Oklahoma State Univ. 1,034.8 1059.3 1,074.3 1,156.7 1,138.2
490 Northern Oklahoma College 277.8 302.6 321.3 337.3 304.1
505 Northwestern Oklahoma State Univ. 280.6 291.7 300.8 304.5 285.3
530 Oklahoma Panhandle State University 178.2 177.3 169.1 160.2 154.0
241 Redland Community College 159.2 183.6 191.9 190.9 191.5
461 Rogers State Univ.(Claremore J.C.) 348.3 362.1 366.5 380.4 382.7
531 Rose State College 614.4 569.7 574.8 569.0 501.0
606 Ardmore Higher EducationCenter 12.6 12.8
623 Seminole J.C. 158.5 159.4 167.7 169.4 170.6
633 South Oklahoma City J.C. 481.5 511.2 580.6 636 618.7
660 Southeastern Oklahoma State Univ. 538.5 559.3 568.4 538.1 517.6
665 Southwestern Oklahoma State Univ. 684.3 710.8 731.1 737.9 714.8
750 Tulsa J.C. 1,239.7 1256.7 1,253.6 1296.1 1270
120 University of Central Oklahoma 1,218.2 1280.6 1,344.4 1396.9 1476.8
150 Univ. of Science and Arts of Okla 169.6 166.7 175.8 175.4 173.1
41 Western Oklahoma State College 146.2 155.9 162.9 163.4 152.6
760 University of Oklahoma 6,410.2 6636.8 6,962.7 7,352.7 7,576.0
770 Okla. University Health Science Ctr. 4,739.2 4936.9 5,169.1 5,329.5 5,385.3
771 OU Health Science Ctr.Prof.Prac.Plan 324.1 326.4 348.7 359.8 376.8
29,335.2 30,070.9 31,074.6 32,035.8 32,237.5
Total 66,738.1 68,301.8 69,908.9 70,959.0 71,587.6
APPENDIXD-9

FY-2010 Executive Budget
APPENDIX D-10
GLOSSARY Actuarial Accrued Liability (re: retirement): That portion, as determined by a particular cost method, of the actuarial present value of pension plan benefits and expenses which is not provided for by Normal Cost contributions. Actuarial Assumptions (re: retirement): Assumptions as to the occurrence of future events affecting pension costs, such as: mortality, withdrawal, disablement and retirement; changes in compensation and government provided benefits; rates of investment earnings and asset appreciation or depreciation; procedures used to determine the Actuarial Value of Assets; characteristics of future entrants and other relevant items.
Annualization: The computation of costs or revenues for a full year. Usually applied when calculating the full year impact/cost of a program that was funded for a partial year in a previous budget. Appropriation: Legal authorization granted by the Legislature to make expenditures or incur obligations that may be limited by fund, agency, department, program, object, character, time period or amount. Unexpended appropriations lapse back to the original fund after the lapse (expiration) date. Appropriations Base: An agency's previous year appropriation reduced by one-time appropriations. Basic Industry: An industry that sells most of its service or product to out-of-state buyers. Board of Equalization: A Constitutional body, the State Board of Equalization is made up of the Governor, Lieutenant Governor, State Treasurer, State Auditor and Inspector, Attorney General, Superintendent of Public Instruction, and President of the State Board of Agriculture. The Board annually certifies the amount of state funds available for appropriation. The Board also has duties regarding the equalization of ad valorem taxes among the counties. Budgeted Vacancy: A vacant employee position which is funded in an agency’s current budget (in most instances, the vacancy has remained unfilled for an extended period of time). Budget Request: A detailed outline of an agency's financial needs for the next fiscal year. Budget Work Program: An outline of detailed planned expenditures for the ensuing or current fiscal year, which takes into consideration funds appropriated by the Legislature and other funds available to the agency, and any expenditure limitations or directives expressed in legislation.
Capital Expenditure / Outlay: Expenditures made for securing capital assets. Capital assets are significant, tangible assets with a value greater than $25 thousand that have a life greater than one year and will be used in providing services.
Carryover: This term refers to unobligated monies an agency has available to fund its operations in succeeding fiscal years. Generally, carryover monies are considered non-recurring in nature.


FY-2010 Executive Budget
APPENDIX D-11
GLOSSARY Cash-flow Reserve Fund: This fund was established as a fiscal management tool. General Revenue Fund cash is set aside in this fund at the end of each fiscal year. Monies in this fund are used to make cash available for the July allocation of General Revenue funds to state agencies and to provide for monthly cash allocations in those months in which receipts are below needed levels. The use of this fund eliminates the need for "seasonal borrowing." Constitutional Reserve Fund (CRF): Designed to cushion against economic emergencies, this fund, popularly known as the "Rainy Day Fund," was established by constitutional amendment in 1985. All General Revenue Fund receipts collected in excess of the certified estimate are deposited in this fund until the fund is equal to 10% of the certified General Revenue Funds from the preceding fiscal year. Up to three-eighths (3/8) of the balance may be appropriated only in the event that the up-coming year's General Revenue certification is lower than the preceding year's. Up to $10 million may be expended for incentives to support retention of at-risk manufacturing establishments under certain conditions and after unanimous finding by the Governor, the Speaker of the House of Representatives and the President Pro Tempore of the Senate. Up to three-eights (3/8) of the balance may be appropriated in the event of a revenue failure, declared by the State Board of Equalization. Up to one-fourth (1/4) of the balance may be appropriated upon the declaration of an emergency by the Governor and approval by 2/3 of both legislative houses; or, absent a gubernatorial declaration of emergency, approval by ¾ of both houses. Expenditure: The disbursement of monies from a state fund for the purchase of goods and services. Federal Poverty Guidelines: Federal Poverty Guidelines issued by the U.S. Department of Health and Human Services, are a series of income levels with different values for family units of different sizes. Some segments of the Medicaid Program use these guidelines in determining eligibility. Federal Medical Assistance Percentage (FMAP): Represents the federal share of a state’s Medicaid spending for medical services. Fiscal Year: The 12-month period beginning July 1 and ending June 30 used by the state government for accounting purposes. Fiscal year designation depends on the year in which it ends [e.g., fiscal year 2005 (FY-2005) runs from July 1, 2004 to June 30, 2005].
Fund: A legal accounting entity with a self-balancing set of accounts. Expenditures from a fund may be restricted to specified purposes. General Revenue Fund: Established by Article 10, Section 2 of the State Constitution, this fund is the principal funding source for state government operations. State taxes, fees and charges, and proceeds from investments make up the revenue to the General Revenue Fund. The fund's resources can be used for any purpose specified by Legislative appropriation. All monies collected that are not dedicated to another fund are deposited in the General Revenue Fund.
Nonappropriated Funds: A term sometimes used to refer to agency revolving funds. Since such funds have statutorily established revenue sources and uses, there is no need for them to be appropriated annually. Nonappropriated funds are also called "continuing appropriations." The terms have the same meaning.


FY-2010 Executive Budget
APPENDIX D-12
GLOSSARY OneNet: Oklahoma’s Telecommunications Network (OneNet is not an acronym) One-time: Budget items that receive funding for one fiscal year (for example, funding for a feasibility study, funding for the replacement of major equipment items, funding for the purchase of furniture for a new facility, etc.). Program Budgeting: A tool to organize budget data by program, rather than item of expenditure or organizational location (generally an agency or division). Program budgeting seeks to link the expenditure of resources with the original mission or purpose of the appropriation of tax dollars. Rainy Day Fund: See Constitutional Reserve Fund. Reception – Department of Corrections: An inmate that is received at the Lexington Assessment & Reception Center from a county sheriff after sentencing by a District court to a term of incarceration for a felony conviction. Revolving Fund: A fund created statutorily or by inference to finance and account for a particular department or division. Fees received, transfers of appropriations, or other fund transfers support expenditures paid from revolving funds. Revolving funds are continuing funds and are not subject to fiscal year limitations. Agencies generally may exercise greater control over the expenditure of revolving funds than they may over appropriated dollars. Supplemental Appropriation: This refers to a subsequent appropriation made to an agency in addition to the agency's initial annual appropriation. Supplemental appropriations are to deal with current year funding issues and may be made for a variety of reasons such as to offset a revenue shortfall or to offset insufficient funds to operate a program effectively. Some observers view supplemental appropriations as a sign of inept management or a means of subverting the State's balanced budget restrictions.
Temporary Assistance to Needy Families (TANF): The Federal program that replaced the Aid to Families with Dependent Children (AFDC) program pursuant to the Personal Responsibility and Work Opportunity Reconciliation Act of 1996, enacted August 22, 1996. This act makes significant changes to the United States Welfare System. Unfunded Liability (re: retirement): The excess of the Actuarial Accrued Liability (that portion, as determined by a particular Actuarial Cost Method, of the Actuarial Present Value of pension plan benefits and expenses which is not provided for by future Normal Costs) over the Actuarial Value of Assets (the value of cash, investments, and other property belonging to a pension plan, as used by the actuary for the purpose of an Actuarial Valuation).
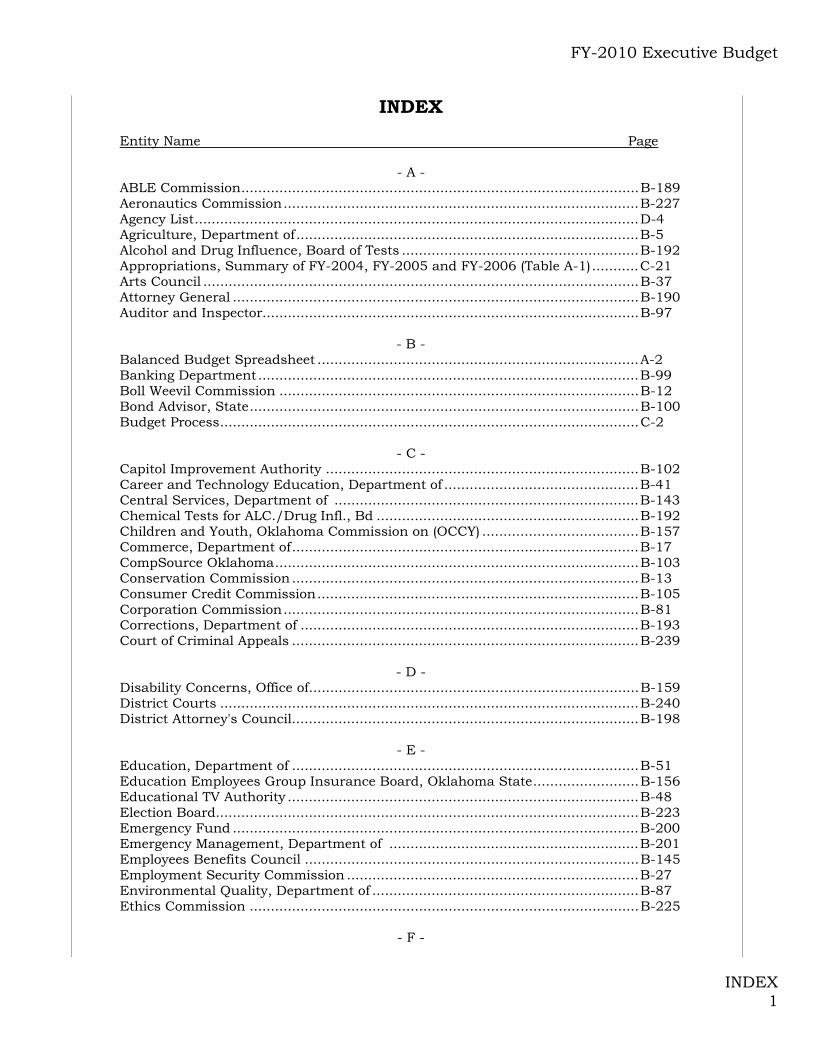
FY-2010 Executive Budget
INDEX 1
INDEX
Entity Name Page
- A - ABLE Commission..............................................................................................B-189 Aeronautics Commission....................................................................................B-227 Agency List.........................................................................................................D-4 Agriculture, Department of.................................................................................B-5 Alcohol and Drug Influence, Board of Tests ........................................................B-192 Appropriations, Summary of FY-2004, FY-2005 and FY-2006 (Table A-1)...........C-21 Arts Council .......................................................................................................B-37 Attorney General ................................................................................................B-190 Auditor and Inspector.........................................................................................B-97
- B - Balanced Budget Spreadsheet ............................................................................A-2 Banking Department ..........................................................................................B-99 Boll Weevil Commission .....................................................................................B-12 Bond Advisor, State............................................................................................B-100 Budget Process...................................................................................................C-2
- C -
Capitol Improvement Authority ..........................................................................B-102 Career and Technology Education, Department of ..............................................B-41 Central Services, Department of ........................................................................B-143 Chemical Tests for ALC./Drug Infl., Bd ..............................................................B-192 Children and Youth, Oklahoma Commission on (OCCY) .....................................B-157 Commerce, Department of..................................................................................B-17 CompSource Oklahoma......................................................................................B-103 Conservation Commission ..................................................................................B-13 Consumer Credit Commission............................................................................B-105 Corporation Commission....................................................................................B-81 Corrections, Department of ................................................................................B-193 Court of Criminal Appeals ..................................................................................B-239
- D - Disability Concerns, Office of..............................................................................B-159 District Courts ...................................................................................................B-240 District Attorney's Council..................................................................................B-198
- E - Education, Department of ..................................................................................B-51 Education Employees Group Insurance Board, Oklahoma State.........................B-156 Educational TV Authority ...................................................................................B-48 Election Board....................................................................................................B-223 Emergency Fund ................................................................................................B-200 Emergency Management, Department of ...........................................................B-201 Employees Benefits Council ...............................................................................B-145 Employment Security Commission .....................................................................B-27 Environmental Quality, Department of ...............................................................B-87 Ethics Commission ............................................................................................B-225
- F -
FY-2008 Executive Budget
INDEX 2
Finance, Office of State.......................................................................................B-106 Fire Marshal, State.............................................................................................B-203 FTE Summary ....................................................................................................D-5 Funds Subject to Appropriation..........................................................................C-7
- G - Glossary.............................................................................................................D-10 Governor ............................................................................................................B-1
- H -
Health Care Authority ........................................................................................B-129 Health, Department of........................................................................................B-132 Higher Education, Regents for............................................................................B-63 Higher Education, Summary of Regents' Allocations to Colleges and Universities..C-27 Historical Society ...............................................................................................B-21 Horse Racing Commission..................................................................................B-148 House of Representatives ...................................................................................B-235 Human Rights Commission................................................................................B-150 Human Services, Department of .........................................................................B-161
- I - Indian Affairs Commission .................................................................................B-160 Indigent Defense System ....................................................................................B-204 Insurance, Department of...................................................................................B-109 Investigation, Oklahoma State Bureau of............................................................B-205
- J - J. D. McCarty Center..........................................................................................B-171 J. M. Davis Memorial Commission......................................................................B-23 Judiciary............................................................................................................B-237 Juvenile Affairs, Office of....................................................................................B-173
- L - Labor, Department of .........................................................................................B-24 Land Office, Commission of the .........................................................................B-111 Law Enforcement Education and Training, Council on (CLEET)..........................B-207 Legislative Service Bureau..................................................................................B-235 Libraries, Department of ....................................................................................B-72 Lieutenant Governor ..........................................................................................B-3 Lottery Commission, Oklahoma..........................................................................B-128
- M - Medicolegal Investigations, Board of ...................................................................B-209 Mental Health and Substance Abuse Services, Department of ............................B-136 Merit Protection Commission..............................................................................B-151 Military Department ...........................................................................................B-187 Mines, Department of .........................................................................................B-85
- N -
Narcotics and Dangerous Drugs Control, Bureau of ...........................................B-210 Native American Cultural and Educational Authority .........................................B-20 Nursing Home Administrators, Board of Examiners for ......................................B-141
FY-2010 Executive Budget
INDEX 3
- O -
OCAST (Center for the Advancement of Science and Technology)........................B-217 Oklahoma State Bureau of Investigation (OSBI)..................................................B-205 Organization Chart.............................................................................................D-3
- P -
Pardon and Parole Board....................................................................................B-214 Personnel Management, Office of .......................................................................B-153 Physician Manpower Training Commission.........................................................B-178 Public Safety, Department of ..............................................................................B-215
- R - Rainy Day Fund Balance....................................................................................C-20 Recommendations by Cabinet ............................................................................A-11 Regents for Higher Education.............................................................................B-63 Rehabilitation Services, Department of ...............................................................B-181 Retirement Systems ...........................................................................................B-114 Revenue Process.................................................................................................C-4
- S - School Land Commission ...................................................................................B-111 School of Science & Mathematics .......................................................................B-75 Scenic Rivers Commission..................................................................................B-30 Science and Technology, OK Center for the Advancement of...............................B-217 Secretary of State ...............................................................................................B-226 Securities Commission .......................................................................................B-121 Senate................................................................................................................B-235 Space Industry Development Authority ..............................................................B-228 Staff Directory ....................................................................................................D-1 State Fire Marshal..............................................................................................B-203 Supreme Court...................................................................................................B-241
- T - Tax Commission.................................................................................................B-122 Teacher Preparation, Commission for .................................................................B-78 Tourism and Recreation, Department of .............................................................B-31 Transportation, Department of ...........................................................................B-230 Treasurer ...........................................................................................................B-125
- U -
University Hospitals Authority............................................................................B-184
- V - Veterans Affairs, Department of..........................................................................B-233
- W -
Water Resources Board ......................................................................................B-92 Wildlife Conservation, Department of .................................................................B-95 Will Rogers Memorial Commission......................................................................B-36 Workers' Compensation Court............................................................................B-242