City of Dana Point California ADOPTED BUDGET
291
CITY OF DANA POINT OPERATING BUDGET & CAPITAL IMPROVEMENT PROGRAM FISCAL YEARS 2015-2016 & 2016-2017
-
Upload
khangminh22 -
Category
Documents
-
view
0 -
download
0
Transcript of City of Dana Point California ADOPTED BUDGET

CITY OF DANA POINT
OPERATING BUDGET & CAPITAL IMPROVEMENT PROGRAM
FISCAL YEARS 2015-2016 & 2016-2017

City of Dana Point California
ADOPTED BUDGET 2015-2016 & 2016-2017
Carlos N. Olvera Mayor John Tomlinson Mayor Pro Tem Joseph Muller Council Member
J. Scott Schoeffel Council Member Richard A. Viczorek Council Member
Douglas C. Chotkevys City Manager
Prepared by: Department of Administrative Services
Cover photo courtesy of D. Ramey Logan – City of Dana Point aerial view

1. INTRODUCTION
Transmittal Letter 1 Mission Statement 17 City of Dana Point Directory 18 City of Dana Point Organizational Chart 19 Budget Philosophy and Operating Guidelines 20 Accounting Principles 21 Budget Calendar 22 Facts about Dana Point 23 5 Year Master Financial Plan 24 Highlights of FY 14 & 15 Accomplishments 55 Appropriations Limit 73
2. BUDGET SUMMARIES
Overview 74 General Fund: Revenue Comparison by Source 75 Expenditure Comparison by Department 76 General Fund Total Sources/Allocations 77 Authorized Positions by Department 78 Personnel Classifications 79
3. CHANGES IN FUND BALANCE
Description of Fund Balances 80 FY 16 Combined Changes in Fund Bal. – All Funds 82 FY 17 Combined Changes in Fund Bal. – All Funds 83 General Fund 84 Gasoline Tax Fund 85 Measure M Fund 86 AB2766 Fund 87 Coastal Transit Fund 88 Tourism Business Improvement District Fund 89 Headlands Habitat Fund (ESHA) 90 Capital Improvements Fund 91 Facilities Improvements Fund 92 Park Development Fund 93 Supp. Law Enforcement Services Fund 94 CFD 2006-1 Facilities Maintenance Fund 95
4. GENERAL FUND
Overview 96 Revenue and Expenditure Summary 97 Revenues and Sources: Description of Revenue Sources 98 Revenue Summary 99 Revenue Detail 100 FY 16 Expenditure Summary by Dept. & Type 103 FY 17 Expenditure Summary by Dept. & Type 104 Expenditure and Uses: City Council 105 City Manager 108 Administrative Services 112 Public Information Services 118 City Clerk 121 CD – Planning 126 CD – Building 131 CD – Code Enforcement 136
GENERAL FUND CONT. CD – Economic Development 141
PW – Administration 146 PW – Street Maintenance 151 PW – Traffic Engineering 157 PW – Solid Waste 161 PW – Engineering 166 PW – Water Quality 171 PS – Police Services 178 PS – VIPS 182 PS - Emergency & Support Services 185 City Attorney 190 Community Services 193 Parks 199 Facilities 204 Risk Management 209 Non-Departmental 212
5. SPECIAL REVENUE FUNDS
Gasoline Tax Fund 216 Measure M Fund 218 AB2766 Fund 220 Coastal Transit Fund 222 Tourism Business Improvement District Fund 224 Headlands Habitat Fund (ESHA) 226 Supp. Law Enforcement Services Fund 228 CFD 2006-1 Facilities Maintenance Fund 230
6. CAPITAL PROJECTS
Facilities Improvement Fund 232 Park Development Fund 234 Capital Improvement Projects Fund 236
7. DEBT MANAGEMENT
Computation of Legal Debt Margin 239
8. BUDGET REFERENCE MATERIAL
Budget Glossary 240 Description of Fund Types and Uses 244
9. CAPITAL IMPROVEMENT PROGRAM(Page C-1 through C-23)

THIS PAGE INTENTIONALLY LEFT BLANK

INTRODUCTION


Capistrano Beach they have focused staff efforts to energize the neighborhood watch program and code enforcement to abate nuisances. I am also proud of the outstanding work being done by our School Resource deputy and our contract intervention specialist working with parents and students to keep our kids safe and helping them to be productive members of our community – the work they are doing is innovative and showing great results.
Our planning, building and engineering staff have been inundated by an onslaught of development projects the past two years, particularly new and remodel residential projects, but also a good amount of commercial work; the pace of projects being submitted to the City does not appear to be slowing. For the first nine months of FY15, we issued residential building permits for projects valued at over $68 million and covering over 450,000 square feet, in addition to about $12 million of commercial projects covering 250,000 square feet.
Several other accomplishments are worth noting, including successful implementation of a Quiet Zone (no train horns) at the Capistrano Beach railroad crossing; beginning design of the Capistrano Beach Coast Highway bike path extension; continued our annual citywide residential and arterial street improvements program; new grant-funded medians on Pacific Coast Highway from Crown Valley to Blue Lantern; obtained grant funds for the City’s first trolley that will run from Capistrano Beach, through the harbor and up to our Monarch Beach resorts; and, continued making significant progress as a leader in regional efforts to keep our ocean clean.
Other focus areas included in the last budget included beginning replacement of emergency radio equipment, which the City has funded and ordered more than half of the equipment necessary; implemented new accounting software; and, supported a large number of successful community events.
Two years ago, immediately following the recession, we committed to achieve more than just maintain the status quo, and I believe we have excelled in many critical areas of municipal services, and the ability to do so remains in large part because of the fiscally responsible practices that have been consistently observed by the Dana Point City Council. I have continuously, even relentlessly encouraged our staff to provide service in a manner that our community rightfully deserves, and that is at a 5-Star level of customer service. Nothing short of that is acceptable to me or your staff.
With the continued improvement in the economy, the completion of the major Lantern District projects, and while maintaining efficient and effective day-to-day functions, staff will be focusing new efforts toward more efficient deployment of our police resources, economic development and long-range planning. As of this writing we are recruiting a new Economic Development Manager, and will be tasking this individual with crafting and implementing new economic development and marketing plans. Our Doheny Village Plan, though in draft form and being presented this Spring to the Planning Commission and City Council, had stalled because of staff commitments to address development activity the past two years – this Plan must be brought to completion and staff is committed to do so. The proposed budget also invests in the City’s General
2

Plan which has not had a comprehensive update since it was adopted in 1991, with many sections sorely in need of modernization to match our evolving community’s vision and goals.
A new section is included in this budget, that being a Master Financial Plan. The 2013-2014 Orange County Grand Jury published a report entitled “Orange County City Pension Liability – Budget Transparency Critically Needed”, that focused on pension reporting, but went further and made recommendations to all cities in the County to expand the amount of financial data and information included in annual budgets. In response to that report, staff has prepared the Master Financial Plan section of this budget that details historical and projected amounts, and information for the City’s major revenues and expenditures.
This budget outlines how we will continue to make informed, strategic fiscal decisions to maintain and improve our level of service to the community. Dana Point, being on what some refer to as the California Riviera, is without question an extraordinary place to live, conduct business and visit.
Situation in Sacramento In the Governor’s proposed Fiscal Year 2015-16 budget, the administration raises its revenue estimates, which results in a multibillion-dollar influx of new funds for schools and community colleges under the Proposition 98 minimum funding guarantee. The California Legislative Analyst Office (LAO) indicates that the Governor's plan identifies cost pressures and budget risks in health and human services programs, and new program commitments outside of Proposition 98 are limited. The Governor's proposal to pay off the State's retiree health liabilities over the next few decades would, if funded, address a major piece of the State’s large, unaddressed liabilities. The LAO’s November 2014 fiscal outlook report suggests that major economic indicators such as the increase in housing prices, rising stock prices and lower unemployment rate all point to the U.S. economy remaining stable and growing. In general, the outlook states that the economy reflects a continued recovery from the recession and that State revenues are looking better than previous projections. The California Department of Finance’s November Finance Bulletin also pointed out steady improvement in State revenues. The LAO says the State is likely to collect one to two billion dollars more of tax revenue in fiscal 2014-2015 than was originally projected. This additional revenue will go largely to schools and community colleges. Whether tax revenues grow further, stagnate, or decline in 2015-16 will depend in large part on trends in volatile capital gains and business income. There are several persistent risks that exist throughout California and will affect the overall state of the economy. From a statewide perspective, general city revenues have returned to pre-recession levels, but the recovery has been uneven, with coastal cities often doing better than those inland.
3

A significant issue remains regarding funding of public pension liabilities, with recent reports predicting that the California Public Employees Retirement System (“CalPERS”) will further adjust its pension funding methodology, and in a manner that will significantly increase costs over time to agencies that contract with CalPERS for their employees’ pensions. While Sales Tax has long been a source of revenue growth in most cities, changes in the economy and an expanding e-commerce market are posing challenges with the future stability of Sales Tax. California’s composite Sales Tax rate is among the highest in the nation, and its base among the narrowest. Services and intangible goods are not taxed – yet that is where the largest growth in the economy is occurring. Calendar 2014 was the third driest year in the 119 years of official California water monitoring records. The ongoing drought crisis will cost billions in lost farm revenue and thousands of jobs. Total economic impact to the State’s economy is yet to be fully estimated. In response to the crisis, the State and local agencies are beginning to take a number of mitigating steps, including mandatory conservation, implementing efficiency programs, investing in new infrastructure to safely recycle used water, and increasing storage capacity. The fundamental problem, according to the State, is that California's water has been overcommitted while the State's population continues to rise and the economy continues to grow. The State has not hesitated in the past, during budget crisis, to reach into local government revenues and take or borrow money, or off-load its service responsibilities. In recent years a few State Constitution amendments passed by voters now prevent the State from excessive interference with local governments’ finances. We will remain diligent in monitoring State actions and be ready to address any challenges that might appear in the future.
City’s Proposed FY16 & FY17 Budgets
Following is a summary of the proposed budget, focusing first on the revenue side of the equation, then on expenditures. Please refer to the Master Financial Plan section of this budget for a more extensive discussion of major revenues and expenditures .
General Fund Estimated Revenues Total projected General Fund revenue and transfers in for FY16 and FY17 are $33.5 million and $34.4 million, respectively. Over the past couple of years we have seen consistent improvement in the City’s revenue performance in almost every line item. The City’s largest revenue sources (transient occupancy tax, property tax, in-lieu property tax and sales tax) combined comprise over 81% of General Fund revenues, and all did well in the past fiscal year. Home improvement and other building activity has been incredibly busy the past two plus years, as evidenced by the increases in planning, building and engineering permit revenue and related charges for services. Dana Point has seen
4

unprecedented levels of private, high value, residential building activity which has lifted building permit revenue through FY15. A 10% hotel bed tax, known as Transient Occupancy Tax (“TOT”), remains easily the City’s largest revenue source, projected at $11.6 million for FY16, or about 35% of General Fund revenue. TOT, after dropping 40% during the recession, will surpass the pre-recession high of FY08. Through the first nine months of FY15, TOT was up 11% compared to FY14. The increase is largely attributed to solid group bookings, including a good number of room nights consumed this winter as groups and individuals ventured west to escape the record cold weather experienced from Chicago through the Northeast U.S. Staff does not recommend forecasting this to repeat. In general, as we observed over the years, TOT performance directly correlates to the overall state of the economy. Considering the City’s high dependency on TOT, we remain conservative in our projections for the next two fiscal years, using a flat to declining projection for FY16 and a 1.75% increase for FY17. The next largest revenue is Property Tax, projected at $6.8 million for FY16, or 21% of General Fund revenue. This FY16 projection is a 3.25% increase over FY15. For every dollar of property tax collected by the County each year from Dana Point property owners, the City receives only 7.6 cents. As a coastal community, Dana Point was not as negatively impacted by the weak housing market as many other cities, particularly those further from the coast. In the near-term, the increased value from infill development is likely going to come from luxury home construction and remodels in Monarch Beach and Strands at Headlands, a condominium development on PCH across from Doheny State Beach, and finally with new development in the Lantern District. In-Lieu Property Tax, which as of FY15 was the third largest General Fund revenue source, is the result of two State actions, one involving Vehicle License Fees (“VLF”) and the other Sales Tax. They took almost all of the City’s VLF and replaced it with some of the State’s portion of Property Tax revenue. They also took one-fourth of the City’s Sales Tax revenue and replaced it with Property Tax. The Sales Tax taking (known as the Triple Flip) is being reversed in FY16, so the In-Lieu Property Tax will be decreasing by about $1.4 million, and Sales Tax will increase by a like amount. With this change, In-Lieu Property Tax will become the fourth largest revenue source, at $3.2 million in FY16, which is a 2% increase over FY15’s VLF portion of the In Lieu Property Tax. Currently the fourth largest revenue category, Sales Tax will become the third largest revenue in FY16, and at $5.6 million will represent about 17% of General Fund operating revenue. In FY15, Sales Tax reached a decade high level last seen in FY04. Based on the State Board of Equalization projections and the City’s Sales Tax consultant, Staff projects revenue to increase 3.2% in FY16 followed by 2.5% growth in FY17. Once the Triple Flip is eliminated in FY16, Sales Tax will become the third largest revenue source for the City. The return of the 25% of Sales Tax is expected to be about $1.4 million in FY16.
5

Next in line are the fourth and fifth largest revenue sources, namely Licenses & Permits at $1.3 million projected for FY16, and Charges for Services also at $1.3 million, both just under 4% of General Fund revenues. These permits and charges are mainly associated with development activity that uses planning, building and engineering services, plus recreation related fees. As mentioned earlier, the City continues to process an elevated level of development plans and permits. Staff is prepared, with contract help, to continue managing the heightened level of development activity, but for conservative revenue forecasting purposes is not projecting that this level of activity will be sustained.
Interest Income Earned on City Funds Held on Deposit Each year the City updates the City’s Statement of Safekeeping and Investment of Public Funds, and presents it to the City Council for adoption. This document governs the manner in which City funds are invested. The City’s portfolio currently consists of investment in the State of California Local Agency Investment Fund (“LAIF”), and in a laddered portfolio of two-year U.S. Treasury Notes (“T-Notes”). These investments have a target allocation of half in LAIF and half in T-Notes. After peaking in the third calendar quarter of 2007, interest rates achieved on the portfolio began a steady decline along with Federal Reserve Board actions in response to the recession. The LAIF yield stood at 5.25% in August 2007, fell and has remained low for several years, and was at 0.28% on March 31, 2015. The City’s T-Note portfolio yield also fell from a peak of 4.73% to the current 0.38%. On March 18, 2015 the Federal Reserve announced that it would consider raising interest rates in mid-2015, but the decision might still be delayed until later in the year. As of March 31, 2015, the City’s investment portfolio totaled $34.0 million. The City’s Local Agency Investment Fund (LAIF) account ended the month with a balance of $19.8 million, and the T-Note portfolio stood at $14.2 million. The T-Notes range in amount from $1.8 million to $2.8 million. As the next several T-Notes mature, the amounts reinvested in T-Notes are being reduced and the funds transferred to LAIF to accommodate cash flow needs associated with the Lantern District project payments.
General Fund Proposed Expenditures
The proposed General Fund expenditure budget, excluding transfers to other funds, is $33.6 million and $33.9 million for FY16 and FY17, respectively. The primary objective when developing the budget is to allocate resources in a manner that continues to support high-quality public services, maintains assets, addresses emerging issues, takes advantage of opportunities, and to do so without an operating deficit.
Considering the improved state of the economy, the City is positioned to continue moving in a positive direction the next two years, and beyond. Completion of the Lantern District project is right around the corner, and though it was a challenging project, we are excited with the results, looking forward to the project’s completion, and
6

looking beyond to development and activation of this town’s dream of having a real town center.
As mentioned earlier, major goals for the upcoming year are to improve the efficiency of our police deployment by building our own police substation and finish this community’s work on the Doheny Village Plan; we also plan to update the City’s Historic Resource Inventory, reduce reliance on potable water and keep a focus on improving water quality, and a host of other initiatives. We are committed to continuing our 5-Star level of customer service, and will be renewing that commitment through additional staff training. The City Council’s continued policy direction focusing on responsible financial practices makes it possible for our employees to maintain the value added approach to serving the public. As I have said before, an essential ingredient that separates Dana Point from other cities is our City Council’s desire to work openly and collaboratively with residents, business and other stakeholders to make Dana Point a special community.
Law Enforcement in Dana Point The City contracts with the Orange County Sheriff’s Department (“OCSD”) for dedicated law enforcement services. OCSD is responsible for providing the full spectrum of professional, responsive law enforcement services to our residents, businesses and visitors. OCSD, operating as the City’s Police Services Department, is a community partner and has established their Community Oriented Policing philosophy by being an integral part of City operations, along with their presence in our neighborhoods, schools, at community events and City functions.
Dana Point has one of the lowest crime rates among coastal cities in Orange County, and this is a direct result from the City Council’s investment in Sheriff resources and its commitment to public safety. The latest statistics available show our crime rate, at 19 crimes per thousand people per year, is well below other coastal cities that show crime rates 21% to 47% higher. Our Community Oriented Policing philosophy, including our specialized Community Service Unit (“CSU”) of our Police Services Department, is an integral part of the City’s ability to maintain its identity as a safe community. Our CSU specializes in bringing all interested parties together to work toward resolution of neighborhood issues and/or crime occurring within the community.
In the past year we assigned an existing CSU deputy to be the City’s first Homeless Liaison Officer. Since July 2014, he has helped about 30 homeless individuals get into the OC Rescue Mission, assisted a dozen individuals to get medical detox treatment, distributed dozens of sanitation kits, and helped over 40 individuals to get medical and mental health referrals. This effort is having a very positive impact on individuals, and on our public safety.
The public safety picture is not always rosy, as we are expecting and preparing for a projected uptick in property crimes due to the effects of the recently passed State Proposition 47 (“Prop 47”). This new law reduces the penalty for possession of dangerous drugs from felonies to misdemeanors. That means that individuals in
7

possession of methamphetamine, heroin, cocaine and date-rape drugs now can only be given a ticket instead of being arrested. Many of these individuals commit property crimes to support their drug habits, and typically include residential and vehicle burglary, petty theft and vehicle theft, among others. Where an individual’s criminal activity use to get interrupted by the occasional drug-related arrest, now only being served with a ticket their criminal activity continues less abated. In addition, many individuals that were already incarcerated for possession when Prop 47 took effect had their sentences reduced retroactively and were set free. Our OCSD partners are committed to working both creatively and diligently to quash this anticipated increase in crime.
For the same level of resources as contracted for in FY15, the projected OCSD contract for FY16 is $10.8 million, an increase of 6.9%. This increase is due to several factors, including but not limited to:
• increased total compensation for Sheriff’s Deputies per a recently approved laboragreement that provided raises and benefit increases, offset to some extent byadditional contributions by deputies toward retirement premiums;
• the creation of an OCSD Field Training Bureau intended to improve deputyreadiness using a centralized program prior to sending deputies out to work witha patrol training officer as has been standard practice;
• a new substation was leased in South Orange County and moved roughly half ofthe contract city’s deputies to it (note: all patrol deputies report to a substationeach shift to dress, attend briefings, etc…), and this new substation requiresadditional staff; and,
• County and Department Overhead cost increases.
Our FY17 proposed budget is based on a 5% increase, above the 10-year average increase of 4.1%. To better partner with contract cities, the Sheriff has committed her command staff to meet with a working group of City Managers to discuss the future of public safety and how best to evolve policing strategies in a cost-effective manner.
I am proposing to make a $560,000 investment in FY16 to solve what we have viewed for years to be the most significant inefficiency in our current police deployment model. Our deputies currently report to the Aliso Viejo substation at the beginning and end of every shift, and must commute in their patrol cars to their beats in Dana Point. The commute consumes over one hour, per deputy, per shift and is time we are paying for that is frankly not productive. As we were discussing the increased overhead cost associated with the new substation mentioned above, we began thinking that this may be the time to address this long-standing inefficiency by outfitting our own substation here at City Hall. If approved it will include a locker room, briefing room and an armory, and will be completed in the next year. This move will result in an increase in productive patrol hours for every shift, and will reduce our OCSD contract overhead costs associated with the Aliso Viejo substation.
Finally, our Intervention Specialist Program (ISP) at Dana Hills High School (DHHS), in conjunction with our assigned OCSD School Resource Officer, continues to prove itself as a valued resource for our community. The program was initiated in FY09, and
8

continues with the goal of focusing on educating and guiding high school students, their parents, and faculty to work together towards achieving a drug- and alcohol-free environment at DHHS, and to further the reduction of risky behavior of youth in the community. The program is a crucial tool in preventing and addressing drug-and alcohol issues among our community’s youth, and efforts are being made to take the program to our feeder middle schools.
City Personnel Costs It is important to point out that the City’s hybrid service delivery model of using in-house Staff along with a significant amount of contract services provides a great deal of flexibility. Adjusting budgets to achieve necessary savings is more manageable when the vast majority of the operating budget is not made up of labor related costs. The City invests about one-fourth of its General Fund operating budget in personnel. It is not uncommon for other cities to have well over 50% of their budget invested in labor. With this said, it is still important to ensure that the City is equipped with adequate regular staff to manage day-to-day operations. One of the City’s greatest resources is its staff. It is critical to maintain adequate and quality staffing to deliver high quality, exceptional, timely services and programs.
During the recession we de-funded several positions to save money, and we are again proposing to leave some authorized positions vacant, such as a secretary in Engineering and a senior civil engineer. We have found that over time, contract staffing is more expensive than in-house staffing, particular with the more technical/professional types of work. At the same time, when managed appropriately contract staffing is an economic way to deal with temporary, increased workloads. The City manages the blend of our personnel and contract labor to make sure we operate in the most effective and economical manner in providing our services and programs. As we look toward the next couple of years, particularly at the extent of long-range planning including the Doheny Village Plan and General Plan Update in conjunction with the crush of development projects we are processing, I am proposing augmenting our Planning Division with a Planning Manager. I am confident this dedicated position will allow us to better deliver these critical planning projects while maintaining our high-level of customer care. In addition, I am proposing that we move the Management Analyst position from the Economic Development Department over to the Administrative Services Department, and then downgrade the vacated Management Analyst position within the Economic Development Department to an Assistant Administrative Analyst. This will provide us with some much needed additional resources in Administrative Services, to not only better monitor the large number of private special events put on by non-profit organizations, and by private entities such as our resorts, but also to provide better staff coverage of our risk management and human resource functions.
The Dana Point City Employees Association (DPEA) represents less than half of the City’s workforce. As of this writing, the City is in the second year of a three-year agreement that expires December 31, 2016. We are fortunate to have employees committed to providing the highest level of service that our community deserves and
9

demands. When the recession hit, staff responded to the difficult economic times by stepping up to the plate and assumed more responsibility in the face of having less resources to draw upon. Staff was also not given raises for five years. The current labor agreement provided 2.9% pay increases in FY15 and FY16, net of employees picking up the Employee Portion of retirement benefits. The third year of the DPEA agreement returns the City to a merit-based compensation approach where the City provides a 3% salary pool that may be distributed based on individual success, but only if the City’s financial condition warrants.
The following highlights some of the more significant issues and services in the FY16 and FY17 budgets:
Water Quality and Natural Resources The City will continue its leadership position on efforts to improve water quality both in Dana Point and upstream. We look forward to improving a large storm drain culvert on the east side of San Juan Creek, possibly with an infiltration project that reduces dry weather flow pollutants. We will also continue working closely with the host of agencies that have a vested interest in water quality in the creek and at Doheny State Beach, finding solutions to issues identified. We will also continue to be an active participant in the South Orange County Watershed Management Area Group, helping develop regional solutions to water issues. Our continued operation of the prototype ozone treatment system at North Creek, the Salt Creek Ozone Treatment System and nuisance water diversions, and the filter systems and diversions at the Headlands are all making a positive difference in our water quality. Along with the County, we will continue efforts to maintain and improve water quality at Baby Beach, and we will continue to build on the Docent programs for the Ocean Institute tide pool area and the Headlands nature parks.
Additional initiatives and programs included in the proposed budget include:
1. Trolley Services (Coastal Transit Fund FY16 $42,000 and FY17 $141,000):Beginning in summer 2015, residents and visitors will be able to board the DanaPoint PCH trolley at numerous stops along our coast. The initial year of service willbe on weekends (Fri/Sat/Sun) beginning June 26, 2015, and runs throughSeptember 7, 2015 (Labor Day). The plan is that a successful 2015 will translate toseven day per week trolley service in summer 2016. There are plans for 15 PCHTrolley stops on the route, from Capistrano Beach at Palisades Drive on the southterminus, to Salt Creek at the north terminus. Planned stops along the route includeDoheny Village, Doheny State Beach, Dana Point Harbor, Lantern District andStrands Beach. Four trolleys will be in service this summer, with stops made in 15minute intervals. For ease of use, trolley riders will be able to access real-timetrolley locations and wait times using their smartphones.
The trolley will be funded in part by a grant from the Orange County Transportation Authority’s Project V, and in part by our Coastal Transit Fund. OCTA will fund up to 80% of operating costs in FY16, and 71.3% from FY17 through FY21. Our Coastal
10

Transit Fund was established and funded in 2002 by specific developer impact fees. No General Fund monies are proposed to fund the trolley. Continued funding of the trolley is contingent on achieving an average minimum number of riders.
2. Doheny Village Plan Update (FY16 $50,000): In 2011, the City hired ROMA Design to help initiate a comprehensive planning effort for a Doheny Village Plan. The City held public workshops in 2011 and 2012. A draft plan was prepared by ROMA in 2013 for internal staff review but, due to other demands on Planning staff, since that time the effort was not sustained. The City will reinitiate this effort in FY16.
3. General Plan Update (FY16 net $175,000 and FY17 $200,000): A city’s General Plan needs to be regularly updated to reflect the vision and goals of the Community. California guidelines for general plans suggest that communities adopt a comprehensive general plan update every eight to ten years. While several General Plan amendments have been adopted since the City’s original plan was adopted in 1991, a comprehensive update to the elements of the General Plan has never occurred. The City did initiate an overall update in 2004-05 but, due to other priorities, the update was not completed.
In order to continue the effort in the upcoming two fiscal years, along with augmenting Planning staff, it is proposed to retain the assistance of an outside planning consultant to assist in the update. The update process will include an extensive review and outreach program focused on obtaining input from the public, Planning Commission and City Council. After a draft is prepared, it will be presented at a public workshop with the Planning Commission. Following consideration of input received at the workshop, a public hearing will be conducted with the Planning Commission. The Planning Commission’s recommendations will then be forwarded to the City Council for their review and decision. After formal adoption, the updated General Plan will be forwarded to the Coastal Commission for review and approval.
4. California Environmental Quality Act Work (FY16 $100,000 and FY17 $150,000):
This proposal is to combine work for the CEQA environmental reviews and documentation necessary to complete the Doheny Village Plan and the General Plan Update proposed above.
5. Historic Resources Inventory (FY15 $64,500): This project was funded by Council action in April 2015, and though it does not impact the proposed budget, is worthy to note as the work will be taking place during this budget period. This project updates the City’s current inventory of historic resources and is critical as the last inventory dates back to 1997. This update would include a resurvey of previously surveyed and/or designated properties, as well as a look at other properties citywide that could be considered historic given the passage of time, and therefore eligible for inclusion. This effort will begin in FY15 and will be complete in FY16.
6. Economic Development Strategy (FY16 $25,000): This proposal is to develop a city-wide economic development strategy that will serve as a basis for updating the
11

Economic Development Element of the General Plan. The economic development strategy will enable the City to be strategic as it deploys resources, and will serve to inform the land use planning process relative to economic development. This effort will begin in FY16 and be complete in FY17.
7. Irrigation control systems upgrade ($55,000): In efforts to reduce use of water, both potable and reclaimed, the past few years staff has been upgrading park’s and median irrigation control systems, and is proposing to continue the upgrades in FY16. These systems control irrigation based on moisture content, and will shut off the system if there is a break in a water line. Additional improvements and upgrades are discussed in the Capital Projects section.
8. Teleworks Interactive Voice Response (IVR) System (FY16 $50,000): In support of the IT Master Plan and the City’s policy of providing 5-star customer service, the addition of the IVR system will enhance the publics’ ability to interact with the City by providing the link for planning and building applicants to access our systems and allow them to schedule and track timing of inspections, check the status of plan reviews/projects, and other related activities regarding their project. This access can require little or no interaction with staff, and is available around the clock.
9. Q-Matic Customer Service Queuing System (FY17 $50,000): Another system that will enhance customer service is Q-Matic queuing system. Once implemented, it will assist customers in navigating the permit application process by keeping track of customers and directing them to the appropriate stations for service. This system will cut down the wait time at the Permit Center and includes the ability to generate accountability reports to see where our processes need improvement.
10. Upgrade of the City’s Website (FY15 $44,050): The City’s current website was launched in 2007 and with the recession had not been upgraded for several years. The City Council funded this project late FY15, but I believe it important enough to mention because the work will be completed during this budget cycle and will provide much improved user functionality, with public access to City records being expanded. Great customer service is no longer measured only by professionalism and courtesy, to the public it also includes easy, online access to information in a transparent manner.
11. Community Events/Services: The proposed budget continues to support the City’s wide variety of community events: the 2015 Festival of Whales was once again a great success, bringing tens of thousands of visitors to town; the Dana Point Grand Prix celebrated its 9th successful year and is America’s largest single-day criterium bike race; the Dana Point State BBQ Championship is the largest one on the west coast, and brings world-class barbeque chefs and thousands of fans to celebrate America’s love for BBQ and family outdoor fun; Movies in the Park are a hit with the kids, while adults enjoy our Concerts in the Park; and, the 4th of July Fireworks Spectacular is second to none on the coast. We propose continued funding for all of our cherished events.
12

We will also continue to collaborate with all of our community partners, including the Dana Point Chamber of Commerce, Dana Point Harbor Association, Dana Point Symphony, Doheny State Beach Interpretive Association, Ocean Institute, Age Well Senior Services, Dana Point Historical Society, Veterans of Foreign Wars, 5th Marine Support Group, Rotary Club, American Cancer Society Relay for Life, and all the other local businesses and non-profits that help bring world-class programs and events to our community. We look forward to continuing to support all of our events while also providing opportunities and exposure for our local business community.
12. Facility Refurbishments (FY16 $77,000 and FY17 $250,000): The Dana Point Community Center on Del Obispo Street is the City facility that houses our Community Services Department (Parks & Recreation), and hosts more activities than any other City facility. It also provides space to AgeWell Senior Services and the Beach Cities Senior Club, and hosts the Saddleback College Emeritus Program for free senior based classes. The facility has administration offices, a gym, and meeting space with a full kitchen that is primarily utilized for senior events and dinners. The building was constructed in 1987, with the Senior Center addition in 2000. The building shows visible signs of wear and is in need of maintenance. The proposed budget includes replacing bleachers and flooring/carpeting, painting, and miscellaneous interior improvements.
When I started working for the City, our City Hall complex was essentially commercial office spaces rented to private companies, with some City offices upstairs. Over the past eight years we have been renovating the complex to create a true City Hall, an office at a time. The first area renovated was police services, so that we now have our own police station with a public counter. Second up was creating our own Emergency Operations Center. This was followed by Community Development and their public-counter area, followed by our Public Works & Engineering offices. We then renovated space so the Dana Point Historical Society and our Veterans of Foreign Wars could have their first, permanent space to conduct business. The final piece, proposed for FY17, is the Administrative Services area, which houses the City Clerk, Administrative Services, City Attorney and City Manager. This office space renovation will include painting, replacing flooring/carpet, and various interior improvements.
Staff will continue to monitor revenues and expenditures throughout the fiscal year and will make recommendations on modifications as necessary to ensure the City is able to provide quality services while maintaining a balanced budget.
General Fund Balance Projection
In August 2006, the City Council adopted a General Fund Reserve Policy. The policy established a Cash Flow Reserve (set at 10% of General Fund revenue), Emergency Reserve (set at 20%), and a Capital Projects Sinking Fund Reserve (balance of not less
13

than $2.5 million). In addition, the City has a reserve for funds collected from developers and dedicated to creating public art (“Art in Public Places Reserve”). The City has traditionally had fully funded reserves, within its City Council approved policy, since the policy was adopted in calendar 2006. The General Fund’s ending fund balance at June 30, 2014 was $21.7 million, including fully funded reserves per Policy and a Council directed Potential State Budget Impacts Reserve. In June 2014, $7.7 million of that fund balance was committed to the Del Prado portion of the Lantern District (Town Center) project currently under construction. The $7.7 million was comprised of the entirety of both the Capital Projects Sinking Fund Reserve ($2.5 million) and the State Budget Impacts Reserves ($1.475 million), along with $3,625,000 million from the sale of surplus property and $100,000 of Unassigned Fund Balance. After funding the $7.7 million Lantern District project, the City’s available reserves are budgeted to end FY15 at $15.3 million, or 45.2% of FY15 budgeted revenue. Included in that amount was $1.25 million returned to the Capital Projects Reserve from the FY15 operating surplus. The Government Finance Officers Association generally considers a 16.7% fund balance, or two months of revenues, as being the minimum acceptable level of reserves. As we look forward to FY16, the Capital Projects Sinking Fund Reserve is slated to return to the $2.5 million balance that it had prior to funding the Lantern District project. Staff is also recommending, given recent State Constitution protections approved by voters where the State is prohibited from taking City revenues, that the State Budget Impacts Reserve not be funded. Finally, note that the actual General Fund operating surplus that will occur in FY15, per City Council Policy, will be transferred to the Capital Projects Fund after the FY15 books are closed. The following are the projected General Fund balances at the end of each fiscal year: Estimated Projected Projected General Fund Reserves 6/30/2015 6/30/2016 6/30/2017 Cash Flow $ 3,348,000 $ 3,287,000 $ 3,377,000 Emergency 6,696,000 6,574,000 6,754,000 Capital Projects Sinking Fund 1,250,000 2,500,000 2,500,000 Art in Public Places 117,954 117,954 117,954 Potential State Budget Impacts - - - - - - Total Reserved Fund Balance 11,411,954 12,478,954 12,748,954 Undesignated Fund Balance 3,848,627 3,206,220 3,301,857 Total Reserved and Undesignated Fund Balance $ 15,260,581 $ 15,685,174 $ 16,050,811
14

Capital Infrastructure Funding Policy
In August 2006, in addition to the General Fund Reserve Policy mentioned above, the City Council approved the Capital Infrastructure Funding Policy. The General Fund Reserve Policy requires that a minimum balance of $2.5 million be maintained in the General Fund Capital Project Sinking Fund Reserve. In June 2014, the City Council directed use of this reserve as part of the funding for the Del Prado Phase of the Lantern District improvement project. During FY15, one-half of the minimum reserve amount was replenished from current year operating surplus. In FY16, it is anticipated that the other half will be replenished. Also a list of unfunded Priority 1 and Priority 2 projects has been identified and included in the CIP budget, and should the City’s financial position improve, Staff intends to engage the City Council in discussions to prioritize and allocate funds for those projects. Lastly, the policy directs that each year any General Fund surplus be transferred to the Capital Projects Fund.
Capital Improvement Projects
The following new projects for mandates, repair and replacement of existing infrastructure are included in the proposed FY16 and FY17 budgets, combined:
• Storm Drain Repairs ($200,000/year)
• Water Quality Diversion/ Treatment Plant Repairs ($50,000/year)
• Slurry Seal ($100,000/year)
• Arterial Roadway Rehabilitation Design and Repairs ($100,000 /year)
• Sidewalk and Concrete Repairs ($100,000/year)
• Sidewalk ADA Improvements ($100,000/year)
• Traffic Safety Repairs and Improvements ($150,000/year)
• Annual Residential Roadway Resurfacing FY16/17 ($3,466,782)
• Arterial Roadway Resurfacing - Del Obispo ($1,020,360)
• Smart Irrigation System Drought Alterations ($155,000)
• Crown Valley Parkway Median Drought Conversion ($450,000)
• La Plaza Park & Lantern Bay Park Drought Conversion ($375,000)
• Crystal Cove Park Barrier Railing Replacement ($150,000)
15

16

CITY OF DANA POINT
MISSION STATEMENT
The City of Dana Point encourages community involvement and is committed to:
• Develop and ensure the highest possible quality of life for our residents, businesses and visitors.
• Provide a safe and healthy environment within a soundeconomic atmosphere.
• Provide an effective and efficient government which is open and responsive to the needs of the community and works for the benefit of all.
17

CITY OF DANA POINT DIRECTORY
Administrative Staff
Douglas Chotkevys City Manager
Mike Killebrew Assistant City Manager
Kathy Ward City Clerk
Ursula Luna-Reynosa Director of Community Development
Brad Fowler Director of Public Works & Engineering
Mike Rose Director of Disaster Preparedness & Facilities
Kevin Evans Director of Community Services & Parks
Lt. Russell Chilton Chief of Police Services
Patrick Muñoz City Attorney
Department of Administrative Services (Finance & Administration Division)
Mike Killebrew Assistant City Manager
Beverly Brion Accounting Supervisor
Shelley Velez Senior Personnel Analyst
Kate Lasso Management Analyst
DyAnne Weamire Administrative Secretary
Tina Pacific Accounting Technician
Robin Harnish Accountant
Shelby Savage Account Clerk
18

CITY OF DANA POINT ORGANIZATIONAL CHART
Electorate
City Council
City Manager
Administrative Services
City Clerk
Community Development
Public Works & Engineering
Services
Disaster Preparedness &
Facilities
Community Services &
Parks
Police Services (OC Sheriff)
City Attorney
19

BUDGET PHILOSOPHY AND OPERATING GUIDELINES
1. The City of Dana Point's budget is designed to serve four major purposes:
• Definition of policy in compliance with legal requirements for General Lawcities in the State of California, Governmental Accounting Standards Board(GASB) financial reporting requirements and audit standards, and fiscaldirections of the City Council.
• Utilization as an operations guide for administrative staff in themanagement and control of fiscal resources.
• Presentation of the City's financial plan for the ensuing fiscal year,itemizing projected revenues and estimated expenditures.
• Illustration as a communications document for citizens who wish tounderstand the operations and costs of City services.
2. The budget is constructed by program and a budget detail supporting documenthas been prepared for control purposes.
3. Departmental budgets are originated within each department.
4. Where applicable, the department head will assign priorities to projects andactivities in preparing program budgets for the department.
5. Department Heads are responsible for operating within their budget amount asapproved by the City Manager and authorized by the City Council.
6. The City Council has the legal authority to amend the budget at any time duringthe fiscal year. The City Manager has the authority to make administrativeadjustments to the budget as long as those changes will neither have a significantpolicy impact nor affect budgeted year-end fund balances.
7. Current year requirements of the Capital Improvement Program (CIP) will beincorporated into the annual operational budget and defined as the capitalbudget.
8. Fund balances will be maintained at levels which will protect the City fromfuture uncertainties.
20

CITY OF DANA POINT SUMMARY OF ACCOUNTING PRINCIPLES
Fund Accounting
The accounts of the City are organized on the basis of funds and account groups, each of which is considered a separate accounting entity. The operations of each fund are accounted for with a separate set of self-balancing accounts that comprise its assets, liabilities, fund equity, revenues and expenditures. Government resources are allocated to and accounted for in individual funds based upon the purposes for which they are to be spent and the means by which spending activities are controlled. The various funds are grouped into generic fund types and broad fund categories as follows:
Governmental Funds: General Fund Special Revenue Fund Capital Projects Fund
Fiduciary Fund: Agency Fund
Accounting Basis
All governmental funds and the agency fund are accounted for using the modified accrual basis of accounting. Their revenues are recognized when they become measurable and available as net current assets. The primary revenue sources susceptible to accrual are property and sales taxes, investment income, federal entitlements, transient occupancy taxes, franchise fees, motor vehicle fees and gas tax subventions.
Expenditures are generally recognized under the modified accrual basis of accounting when the related fund liability is incurred. An exception to this general rule is principal and interest due on general long-term debt which is recognized when due.
Encumbrance accounting, under which purchase orders, contracts, and other commitments for the expenditure of funds are recorded in order to reserve that portion of the applicable appropriation, is employed in the governmental funds. Open encumbrances are recorded as reservation of fund balance since the commitments will be paid by subsequent years budget appropriations. Encumbrances do not constitute expenditures or liabilities.
21

BUDGET CALENDAR January 19 Distribute budget materials to departments.
February 20 Completed budget materials due to ASD for General Fund departments, CFD Fund, Coastal Transit.
February 27 Budget Narratives & Major Accomplishments due to ASD.
March 2-13 ASD consolidates budget information. ASD to provide CM with preliminary estimate of General Fund operating balance on March 11.
March 16-27 Meetings w/ CM, ASD and Dept Heads to review budget submittals, identify initial revisions; discuss IT projects. Meetings order: ASD, CC, ES, Parks & Rec., CD, PW.
March 30- April 1 CM meets individually with City Council to solicit input on operating and CIP budget priorities.
April 3 CM to provide direction to PW, ES, Parks & Rec re: CIP budget priorities, based upon City Council input and funding availability. PW to continue development of CIP budget.
Complete budget materials to ASD for Gas Tax, Measure M, Facilities Improvement, Parks Development funds.
April 1–17 ASD prepares preliminary budget incorporating initial revisions identified during CM review. Preliminary budget will consist of revenues, department budgets, narratives and CIP budget.
April 17 Draft 7-year CIP budget due from PW to CM and ASD.
April 17 CM meeting w/ ASD & PW to finalize proposed CIP budget.
April 17 Final proposed CIP budget spreadsheets due to ASD for inclusion in Proposed Budget package.
April 17-30 ASD assembles Draft Proposed Budget.
May 1 Draft Proposed Budget distributed.
May 4-15 Individual budget briefings by CM with City Council.
May 18 Public Hearing Notice for June 2nd meeting due to City Clerk Dept.
ASD prepares Council Agenda Report for Budget and Gann Limit adoption in June
June 2 City Council Budget Workshop and Public Hearing on Proposed Budget. City Council to provide consensus changes to Proposed Budget. ASD prepares Council Agenda Report for Budget and Gann Limit adoption in June.
June 16 Continued Budget Hearing, if necessary.
June 2 Public Hearing on Proposed Budget. City Council to provide consensus changes to Proposed Budget. ASD prepares Council Agenda Report for Budget and Gann Limit adoption in June.
June 2-19 ASD incorporates City Council budget revisions from Hearings into final Proposed Budget.
22

FACTS ABOUT DANA POINT
Date of Incorporation: January 1, 1989 Form of Government: Council-Manager City Area/Population: 6.7 Square Miles/33,625* Assessed Valuation: $9,787,131,567.00
Fire Protection: Number of Stations 2 Number of Career Fire Fighters & Officers 24 Number of Reserve Fire Fighters 17
Police Protection: Number of Sworn Officers 34 Number of Non-Sworn Staff 7
Education: Number of Public Schools 3 Number of Teachers 140 Number of Students 2599
Recreation & Culture: Parks 28 Libraries 1
Hotels/Motels Number of Operating Hotel/Motels 13 Total Number of Rooms 1,843
Number of Registered Voters 20,500
* The Nielsen Company
23

THIS PAGE INTENTIONALLY LEFT BLANK

The City of Dana Point Master Financial Plan
Fiscal Years 2016-2020
24

Table of Contents
Community Vision, Mission and Core Values ......................................................................................27
Overview of Revenues, Expenditures and Fund Balance .................................................................28
Orange County Economic Forecast ......................................................................................................32
General Fund Revenue Summary ......................................................................................................... 34
Transient Occupancy Tax Revenue ...................................................................................................... 35
Property Taxes ......................................................................................................................................... 37
Property Transfer Tax .............................................................................................................................. 39
Sales Tax ................................................................................................................................................... 40
In-lieu Property Taxes: MVIL & Sales Tax .......................................................................................... 42
Licenses & Permits: Planning, Building & Engineering Permits ....................................................... 43
Charges for Services ............................................................................................................................... 43
General Fund Expenditures Summary.................................................................................................. 44
Public Safety ............................................................................................................................................. 46
Personnel Costs ....................................................................................................................................... 47
Street Systems Maintenance & Operations ......................................................................................... 51
Park Maintenance & Related Utilities .................................................................................................... 52
All Other Professional Services.............................................................................................................. 53
Capital Asset Investments ...................................................................................................................... 53
A Discussion on Reserves ...................................................................................................................... 53
Closing Observations ............................................................................................................................... 54
25

Table of Figures
Figure 1: General Fund Operating Revenues & Expenditures, FY06 to FY20 ...............................30 Figure 2: Operating Revenues ............................................................................................................... 34 Figure 3: General Fund Operating Revenue, FY06 to FY20 ............................................................. 35 Figure 4: Transient Occupancy Tax Revenue Trend, FY01 to FY20 ............................................... 37 Figure 5: Secured & Unsecured Property Taxes Revenue Trend, FY01 to FY20 ......................... 38 Figure 6: Sales Tax by Industry Group ................................................................................................. 40 Figure 7: Sales Tax Revenue Trend, FY01 to FY20........................................................................... 41 Figure 8: In-Lieu Property Tax Revenue Trend, FY05 to FY20 ........................................................ 42 Figure 9: General Fund Operating Expenditure, FY06 to FY20 ....................................................... 45 Figure 10: Operating Expenditure by Type .......................................................................................... 46 Figure 11: OCSD Contract Cost Trend, FY06 to FY20 ...................................................................... 47 Figure 12: Personnel Cost Trend, FY06 to FY20 ................................................................................ 48
Table of Tables
Table 1: General Fund - Summary of Designated Fund Balances....................................................31 Table 2: Operating Revenue & Expenditure Summary, FY15-FY20 ............................................... 33 Table 3: Dana Point Revenue Sources, FY16 Proposed Budget ..................................................... 34 Table 4: Transient Occupancy Tax Revenue History ......................................................................... 37 Table 5: OCFA Property Tax Growth Projections ............................................................................... 38 Table 6: Secured & Unsecured Property Tax History......................................................................... 39 Table 7: Property Transfer Tax History ................................................................................................. 39 Table 8: FY14 Top 10 Sales Tax Producers........................................................................................ 41 Table 9: Sales Tax History ...................................................................................................................... 41 Table 10: In-Lieu Property Tax History ................................................................................................. 42 Table 11: Licenses & Permits Revenue History .................................................................................. 43 Table 12: Development Charges for Services ..................................................................................... 43 Table 13: FY15 General Fund Expenditures Budget, Cumulative Table ........................................45 Table 14: Sheriff's Contract Cost History .............................................................................................47 Table 15: Personnel Cost History .......................................................................................................... 48 Table 16: CalPERS Earnings History.................................................................................................... 50 Table 17: CalPERS Employer Share Rate History ............................................................................. 50 Table 18: CalPERS Employer Share Paid By the City ....................................................................... 51 Table 19: Salaries, Retirement Cost & Benefits, detail ...................................................................... 51
26

Community Vision, Mission and Core Values
Community Vision Statement - that the City of Dana Point is the most beautiful, desirable andsafest coastal community in which to live, work, visit, play or conduct business.
Community Mission Statement:
The City of Dana Point encourages community involvement and is committed to:
Develop and ensure the highest possible quality of life for our residents, businesses andvisitors;
Provide a safe and healthy environment within a sound economic atmosphere; Provide an efficient and effective government which is open and responsive to the needs
of the community and works for the benefit of all; and, Support and abide by the Community Core Values.
Community Core Values:
To act with integrity and honesty; To strive for excellence, innovation and creativity; To promote openness in the discussion of community issues, including periodic surveys
and website enhancements; To be responsive to listening, understanding, and respecting individual and differing
views; To accept responsibility, take action, address problems, be accountable and achieve
results; To be direct and disciplined, but flexible; To encourage citizen involvement in City activities; and, To preserve the heritage and historical value of the community.
The City of Dana Point encourages community involvement and is dedicated to deliveringexemplary municipal services responsive to our entire community, and consistent with ourhistory, culture and our unique character. We are committed to developing and ensuring thehighest possible quality of life for our residents, businesses, and visitors through providing asafe and healthy environment within a sound economic atmosphere, and running effectivegovernment which is open and responsive to the needs of the entire community and works forthe benefits of all.
27

Purpose:
The purpose of this Master Financial Plan (“MFP”) is to provide a forward-looking perspective on the City’s financial condition, and to help ensure it meets its long-term financial and development goals. It is a planning tool intended to aid ongoing budget discussions and in decision-making by providing insight into the long-term implications of today’s policy choices and budgetary decisions.
Overview of Revenues, Expenditures and Fund Balance
This MFP was prepared as part of the development of the upcoming two-year proposed budget, covering fiscal year’s 2015-2016 and 2016-2017 (“FY16” and “FY17”), and focuses on major General Fund revenues and expenditures, plus an additional three years of projections, out through FY20. This five-year forecast is sensitive to changes in assumptions for future revenue and expenditure growth. It is important to keep in mind when reviewing the forecast that the assumptions used for this forecast tend to be conservative, meaning that revenues are projected modestly, while expenditure growth is projected more aggressively.
The proposed budget document prepared for City Council consideration focuses on the upcoming two-year fiscal period. It contains comprehensive information for all City departments and all City funds on a program and detailed, line-item level. The proposed bi-annual budget contains historical data for both revenues and expenditures, along with estimated amounts for the current year and proposed amounts for the upcoming two years. The MFP goes further and takes a longer look, both retrospectively and prospectively. It provides a greater historical context and demonstrates how staff substantiates the estimates and projections going forward.
Revenues
The five-year revenue forecast included in the MFP indicates that revenues are finally back to the FY08 pre-recession levels, and are projected to continue on a positive path for the coming years. Revenue reached $33.4 million in FY08, the highest amount in the City’s history. The City lost over 21% of its revenues during the recession, and it has taken several years of a slowly recovering economy to finally regain pre-recession levels.
Dana Point’s Transient Occupancy Tax (“TOT”), Property Tax, Sales Tax and In-Lieu Property Tax combined represent over 81% of General Fund revenue. The City has seen a combined increase of nearly 20% in tax receipts for the past three years beginning FY12, following a rapid decline during FY09 through FY11. The steady increase in these tax receipts is obviously a good sign of economic improvement and growth. In addition, most economic models project modest revenue growth going forward, especially for property tax and sales tax. TOT revenue has demonstrated the strongest increases in the past three years compared to other revenues, due obviously to the improved economy, but likely augmented by efforts of the individual hotels, their brands, along with efforts of the Dana Point Tourism Business Improvement District (TBID) and the City in promoting Dana Point as a destination for family, group and business travelers. The outlook suggests that TOT revenue will continue increasing on a positive path. Overall, the forecast is positive with a very conservative, average overall projected growth rate of 1.75% over the proposed two-year budget, and the subsequent three-year forecasting period through FY20 as well.
28

Expenditures
The City’s expenditures are projected each year of the MFP to stay within available resources. In reviewing historic City expenditure data, the FY09, FY10 and FY11 budgets utilized some discretionary fund balance each year; including designated reserves deemed no longer necessary (e.g. library expansion and high school pool refurbishment). (See Figure 1 below). The use of fund balance was for specific one-time expenditures and transfers from the General Fund to other funds for capital projects, and is not an indication of an issue where ongoing operating expenditures exceed ongoing revenues. Even during the recent recession, the City managed to maintain services even with the unprecedented decline in revenues.
As a part of this MFP, Staff also developed an expenditure projection beyond the two-year proposed budget that provides an important tool to help prioritize budget decisions out through FY20. Again, a conservative approach was utilized for this forecast, resulting in an overall 2.0% average annual growth in expenditures. Major cost categories covered in detail below include:
• The Sheriff’s contract for police services, the largest single expenditure at $10.8 million in FY16, and staff conservatively projects this to grow at 5% each year;
• City personnel expenditures, which support all City programs and services, andrepresents the second largest cost category, and shows growth in FY16 due to fillingpositions kept vacant during the recession and adding staff for advanced planning, areduction in FY17 due to a temporary reduction in pension rates, and is projected to seean average annual growth of 3.2% per year through FY20; this includes a conservativeassumption that pension costs increase 8% each year from FY18 to FY20, in caserecent changes to CalPERS actuarial assumptions have a negative impact on rates;
• Street Systems Maintenance & Operations, our third largest category, includes acontract with the County of Orange for much of the day-to-day work; along with concreteand asphalt repairs; signal maintenance, repair and power; storm drain, curb, gutter andsidewalk maintenance and repairs; contract traffic engineering; street sweeping; and,citywide light-pole banner program. Recent history for this category shows expendituresto be very consistent year to year, and we project it to grow about 2.0% per year beyondthe two-year budget.
• Park Maintenance & Related Utilities includes park landscaping, citywide tree trimming, sports field and playground repairs, potable and reclaimed water irrigation, electricity, signage and a host of other items, makes up the fourth largest expenditure category. Staff is proposing to continue programs and investments to reduce reliance on potable water, including surveying continuously for leaks, installing smart-sensor equipment to only water when needed, expand the use of reclaimed water, and to utilize drought-tolerant landscaping.
• Professional Service Contracts is the fifth largest major category of expense, and covers a wide variety of contracted out core-level services, in addition to services for peek-level work that exceeds the base-level workload that staff covers. These contracts include items such as auditing, plan checking, engineering studies, environmental impact reports, contract recreation class instructors, senior services, website hosting, information technology management, printing, banking, Coastal Animal Services Authority, custodial, etc… These costs are projected beyond FY17 to increase at 2% per year.
29

• All Other Program Areas covers services, supplies, insurance, legal and equipmentcosts for the operations of the General Government of the City that are not included inthe categories above. These costs are also projected beyond FY17 to increase at 2%per year.
Figure 1: General Fund Operating Revenues & Expenditures, FY06 to FY20
* Revenues exclude one-time Transfers-In to the General Fund from other funds, and Sale of Surplus property.** Expenditures exclude Transfers-Out to other Funds for Capital Projects.
$20.0
$22.0
$24.0
$26.0
$28.0
$30.0
$32.0
$34.0
$36.0
$38.0
$40.0
06 07 08 09 10 11 12 13 14 15 16 17 18 19 20
Mill
ions
, $$
Fiscal Year
Revenues*
Expenditures**
FY06-FY14 Actuals
FY15 Budget
FY16-FY17 Proposed
FY18-FY20 Projected
30

Fund Balance
The City has traditionally had fully funded reserves, within its City Council approved policy, since the policy was adopted in calendar 2006. The General Fund’s ending fund balance at June 30, 2014 was $21.7 million, including fully funded reserves in accordance with City Council Policy for Emergencies, Cash Flow and Capital Projects Sinking Fund, and in addition had funded a Potential State Budget Impacts Reserve. City Council policy dictates that in addition to any Unassigned Fund Balance, the City should fund a Cash Flow Reserve (10%) and an Emergency Reserve (20%), combined totaling 30% of annual budgeted General Fund revenue.
Table 1: General Fund - Summary of Designated Fund Balances
Fund Balance Category: Actual
June 30, 2014 Original
FY15 Budget Amended
FY15 Budget Emergencies $ 5,946,000 $ 5,909,000 $ 6,696,000 Cash Flow 2,973,000 2,955,000 3,348,000 Potential State Budget Impacts 1,475,000 1,475,000 - - Capital Projects 2,500,000 2,500,000 1,250,000 Prepaid Expenditures 154,796 - - - - Art in Public Places 117,954 127,048 117,954 Total Designated Fund Balance 13,166,750 12,966,048 11,411,954 Unassigned Fund Balance 8,536,094 127,723 3,848,627 Projected Fund Balance, 6/30/15 $ 21,702,844 $ 13,093,771 $ 15,260,581
As of June 30, 2014, the City had set-aside the minimum $2,500,000 in its Capital Projects Reserve and $1,475,000 in its Potential State Budget Impacts Reserve; those are in addition to the Cash Flow and Emergency Reserves. Excluding reserves for Art in Public Places and Prepaid Expenditures, the total available liquid reserves stood at $21.4 million, or 68.6% of General Fund annual revenue on June 30, 2014.
It is important to note that in June 2014, $7.7 million of that fund balance was committed to the Del Prado portion of the Lantern District (Town Center) project in FY15. The $7.7 million was comprised of both the Capital Projects and State Budget Impacts Reserves, along with $3,625,000 million from the sale of surplus property and $100,000 of Unassigned Fund Balance.
As of this writing, and after paying the $7.7 million commitment, the City’s General Fund available reserves still stood at a very healthy 45.2% of FY15 budgeted revenue. Included in that amount was $1.25 million returned to the Capital Projects Reserve from current year operating surplus. Note that the Government Finance Officers Association generally considers a 16.7% fund balance, or two months of revenues, as being the minimum acceptable level of reserves.
31

Orange County Economic Forecast
Dana Point’s financial forecasting methodology is based on the City’s recent financial performance, along with assessments made by economists covering the local, regional and national economies. The City looks closely at economic updates from Chapman University, Cal State Fullerton’s College of Business and Economics, and the State Legislative Analyst’s Office. In addition, hotel industry specific information from sources such as PKF Consulting, retail sales tax projections from HdL Companies, and a variety of information available regarding property valuations are also referenced.
Assessment of Current Economic Conditions:
The State’s Legislative Analyst’s (LAO) November 2014 fiscal outlook report suggests that major economic indicators such as the increase in housing prices, rising stock prices and lower unemployment rate all point to the U.S. economy remaining stable and growing. In general, the outlook states that the economy reflects a continued recovery from the recession and that State revenues are looking better than previous projections. The California Department of Finance’s November Finance Bulletin also pointed out steady improvement in State revenues.
Regardless of this optimistic prognosis made by the State, economists are not united in their view of the future. A forecast by Cal State Fullerton suggests that the economy should perform well over the next three years, growing above its long-term average growth rate, with improvement in virtually every sector. They do caution against excessive longer-term optimism though.
Locally, the Orange County economic growth can be described as “growing” but “slowly”. According to Cal State Fullerton’s Center for Economic Analysis and Forecasting, “Mediocre growth seems to be the new norm”. Their forecast predicts the county’s unemployment rate will drop from the current 5.1% to 4.8% this year, and to 4.5% in 2016. But even as the labor force is recovering, participation is declining. Some of the unemployment reductions could be attributed to more discouraged workers leaving the labor force. The county’s labor force participation rate was 52.2% in 2012, and is on track to drop to an estimated 51.3% this year.
The OC Business Council prepared an economic update for the Southern California Association of Governments, and analyzed data provided by Chapman University, Cal State Fullerton and UCLA. According to this report, Orange County’s outlook to achieve pre-recession employment levels appears on track to occur in 2015. Consumers and business executives alike are generally united in reporting a positive outlook for the county’s economic growth and job creation. The challenge for Orange County will be to maintain the positive changes through the next several years by improving the job pipeline, from education to employment, and accommodating high-wage and emerging occupations will also be critical in maintaining this momentum.
The City of Dana Point is experiencing its fourth year over year increase in General Fund revenues, with fiscal year to date March 31, 2015 running approximately $2.8 million, or 14% ahead of last fiscal year (one-time income received last year from the sale of surplus property is excluded from this analysis). Consistent improvement in the City’s revenue performance is seen through almost every line item. Recurring tax revenue sources showing strong increases include Transient Occupancy Tax (up $880k or 11%), Property Tax (up $320k or 8%), Sales Tax (up $226k or 10%); in addition, the Short Term Rental TOT which began last year has added about $360k per year to City revenues.
32

Home improvement and other building activity has been incredibly busy the past two plus years, as evidenced by the sizeable increases in Planning, Building and Engineering Permits revenue and related Charges for Services. Dana Point has seen unprecedented levels of private, high-value, residential building activity which has lifted Building Permit revenue tremendously in FY15, up $653k, or 105%, compared to the first 9 months of last fiscal year. Several high value projects are driving building revenues up, and it is expected to continue for the next couple of years as infill projects, particularly in the Monarch Beach and Strands areas, work to completion. In addition, there is a 168 unit condominium development near Doheny State Beach that may be breaking ground in FY16, two of the four largest resorts are doing extensive tenant improvements this year, several other infill projects on the drawing board for the Town Center area, and another large resort is working through the entitlement process that is intended to result in extensive tenant improvements as well.
The City continues to be proactive in managing its budget and resources by reviewing revenue trends on a regular basis and adjusting revenue and expenditure budgets to maintain a healthy and strong financial position.
Table 2: Operating Revenue & Expenditure Summary, FY15-FY20 CITY OF DANA POINTMaster Financial PlanRevenue and Expenditure Projections
FY15 Amended Budget FY16 Proposed FY17 Proposed FY18 Projected FY19 Projected FY20 Projected
Revenues: Transient Occupancy Tax 11,600,000$ 11,600,000$ 11,800,000$ 12,000,000$ 12,200,000$ 12,400,000$ Property Tax 6,600,000 6,815,000 7,035,000 7,230,000 7,430,000 7,630,000 Sales Tax 4,100,000 5,640,000 5,700,000 5,850,000 5,975,000 6,100,000 In-Lieu Property Tax 4,500,000 3,200,000 3,280,000 3,350,000 3,400,000 3,450,000 Charges for Services 1,445,000 1,229,000 1,209,000 1,200,000 1,200,000 1,200,000 Licenses & Permits 1,553,000 1,273,000 1,360,000 1,200,000 1,100,000 1,000,000 All Other Revenues* 3,679,673 3,742,000 4,019,000 4,139,570 4,263,757 4,391,670 Total Revenues 33,477,673 33,499,000 34,403,000 34,969,570 35,568,757 36,171,670
Expenditures: Sheriff 's Contract 10,126,000 10,821,000 11,360,000 11,900,000 12,495,000 13,100,000 Personnel Services 7,579,000 8,091,000 8,166,000 8,370,150 8,580,000 8,800,000 Street Systems Maintenance & Operations 4,203,000 4,374,000 4,391,000 4,478,820 4,568,396 4,659,764 Park Maintenance & Related Utilities 2,408,000 2,460,000 2,610,000 2,662,200 2,715,444 2,769,753 All Other Professional Services* 2,380,000 2,254,000 2,224,000 2,268,480 2,313,850 2,360,127 All Other Program Areas** 4,968,936 4,408,000 5,006,000 4,234,020 4,318,700 4,405,074 Total Expenditures 31,664,936 32,408,000 33,757,000 33,913,670 34,991,390 36,094,718
Operating Surplus/(Deficit) of Revenues Over/(Under) Expenditures 1,812,737$ 1,091,000$ 646,000$ 1,055,900$ 577,367$ 76,952$
Transfers Out to Other Funds 8,255,166$ 667,074$ 280,000$ -$ -$ -$
* Professional Services excludes Professional Services contracts included in the expenditure categories above.** All Other Program Areas excludes Operating Transfers Out for all years as they are one-time outlays; the FY18 projection is based on the FY17 Proposed Budget, less one-time FY17 expenditures totalling $855k.
33

General Fund Revenue Summary
The General Fund is used to account for most of our municipal functions. Departments in the General Fund include: City Council, City Manager, Administrative Services; City Clerk; City Attorney; Emergency Preparedness & Facilities, Community Development, Community Services & Parks, Police Services and Public Works & Engineering. The General Fund accounts for resources traditionally associated with local government including property tax, sales tax, transient occupancy tax (TOT), and planning/building/engineering licenses and permits.
The six largest revenues make up 90% of all General Fund Revenue. TOT, Property Tax, In Lieu Property Tax and Sales Tax, which combined account for 80% of all General Fund revenue. Table 3: Dana Point Revenue Sources, FY16 Proposed Budget
Revenue Amount % of TOTAL Cumulative 1. Transient Occupancy Tax $ 11,600,000 34.6% 34.6% 2. Property Tax 6,815,000 20.3% 54.9% 3. Sales Tax 5,640,000 16.8% 71.7% 4. In-Lieu Property Tax 3,200,000 9.6% 81.3% 5. Licenses & Permits 1,273,000 3.8% 85.1% 6. Charges for Services 1,229,000 3.7% 88.8% 7. All Other Revenues 3,742,000 11.2% 100%
TOTAL $ 33,499,000
Figure 2: Operating Revenues
The City has had a strong yet somewhat concentrated revenue base since incorporation, that concentration being on tourism. Hotel TOT is vital to the City’s fiscal health, as was demonstrated through the recession years. For FY09, as the recession set in, General Fund revenues decreased $5 million, or 15%. Further declines were seen in FY10 and FY11, before beginning to rebound (see the graph below). Most of that decline was in TOT, and since the resorts are also large generators of Sales Tax revenue, we also saw a decline in it.
Transient Occupancy Tax
35%
Property Tax 20%
Sales Tax 17%
In-Lieu Property Tax 9%
Licenses & Permits 4%
Charges for Service 4%
All Other Revenue
11%
FY16 Proposed General Fund Budget: $33.5 million
34

Figure 3: General Fund Operating Revenue, FY06 to FY20
The FY16 proposed budget projects revenues to be relatively flat, and the FY17 budget shows growth of 2.7%. There are several reasons for the use of conservative estimates, which are explained below in the detailed discussions for each of the revenues, particularly with TOT and building related fees and charges. For the out years of the MFP forecast (FY18 to FY20), annual revenue growth is projected to be approximately 1.7%.
General Fund revenue returned to pre-recession levels in FY15, and did so at a rather fast pace over the preceding three fiscal years. The pace of the increase is not assumed in the MFP to continue at the same rate, simply because the only other time that pace was seen was prior to the recession, and the City deems it best to be conservative. However, the same underlying conditions that drove up the economy pre-recession do not appear to exist at this time, particularly as it relates to the home mortgage industry and lax lending practices by the banking industry. There is some concern, however, in regards to the volatility in the oil markets, particularly as negative trends may impact tourism.
As noted earlier, the six most significant individual revenue sources to watch during the next five years are TOT, Property Tax, Sales Tax, In-lieu Property Tax, Charges for Services, and Licenses and Permits. These revenue streams will be discussed in greater detail in the following pages.
Transient Occupancy Tax Revenue
In FY15, Transient Occupancy Tax (TOT) is currently budgeted at $11,600,000, or 34.7% of total General Fund budgeted revenue, and represents the City’s largest single revenue source. Needless to say, the City is highly reliant upon tourism industry. Dana Point serves a significant number of visitors each year, and is home to four resorts with two being five-star and one four-star, nine other hotels and motels, and a 29-unit bed and breakfast inn, for a total of 1,843 rooms.
$28.5
$31.8 $33.4
$28.3
$24.7 $26.5
$27.8
$30.6 $32.0
$33.5 $33.5 $34.4 $34.9 $35.6 $36.2
$20.0
$25.0
$30.0
$35.0
$40.0
$45.0
06 07 08 09 10 11 12 13 14 15 16 17 18 19 20
In M
illio
ns
Fiscal Year
35

The Transient Occupancy Tax rate, at 10%, is levied on hotel guests. Our four largest resorts are also the City’s largest individual property tax payers, some of its largest employers, and its biggest sales tax generators. Hotel guests dine in our restaurants, shop in our retail establishments, and enjoy our recreation opportunities. Cumulatively, the tourism industry (directly and indirectly) drives over half of the City’s revenues.
The City took a significant hit when TOT revenue dropped during the recession. After reaching a peak of $11.3 million in FY08, TOT declined $2.7 million in FY09, and an additional $1.4 million in FY10 to an annual low of $7.2 million. This was a cumulative decline of 36% from the peak. There has since been four consecutive years of increased TOT, and soon to be a fifth with the close of FY15. A rapid 14.7% increase was seen in FY11, with another 13.3% increase in FY12, a more moderate 7.5% increase in FY13, and a 9.1% increase in FY14, reaching $11 million (See Diagram 2). FY15 is shaping up to be a record year, and new projections as of the end of April 2015 are putting TOT projected at $11.75 million, a 5.6% increase compared to FY14.
According to the resorts, FY15 was marked by solid group bookings, including a good number of room nights consumed by groups that ventured west to escape the record cold weather experienced from Chicago through the Northeast U.S. We are using a flat projection for FY16, and very moderate increases through FY20. There is the potential for a new 90-plus room hotel at the Headlands in the next few years, and for a currently closed hotel off of Harbor Drive to be reopened or rebuilt; however, staff has not factored these into the TOT projection. As we observed in earlier years, TOT performance directly correlates to the overall state of the economy, and with that we remain cognizant of the negative impact declines in TOT can have on our financial condition.
Tourism, group and event-related business continues to improve, particularly with the individual hotel brand efforts as well as the City’s Tourism Business Improvement District’s (“DPTBID”) meeting/conference planner incentive program, which is proving to be effective at attracting new groups to our resorts. Other TBID-driven programs, such as brand marketing and special events, have also increased public awareness of Dana Point as a destination.
PKF Tourism and Hospitality projects up to 400 new luxury hotel rooms in Southern California coastal areas within the next four years, with another 466 rooms expected in Anaheim by 2017. Over 4,000 non-luxury rooms could be built in Orange County in the next five years, and another 5,000 non-luxury rooms in San Diego. The presence of this competition, especially in the luxury sector, reinforces the importance of our efforts to continuously market Dana Point.
Based on the information regarding the Dana Point resorts bookings confirmed in the 2nd Quarter of FY15, we project that TOT revenue for the current fiscal year is on target to reach $11,775,000, eclipsing the original $11,125,000 budget by $625,000. For FY16 through FY20, given the pressure of the possible increase in additional rooms added in other cities, the historic cold weather back east and warm weather in Dana Point that bumped up this year’s revenue, and more particularly because of the City’s dependence on TOT, the City is projecting very limited growth in this revenue.
36

Figure 4: Transient Occupancy Tax Revenue Trend, FY01 to FY20
Table 4: Transient Occupancy Tax Revenue History
Fiscal Year Amount % Change Fiscal Year Amount % Change FY01 $ 6,294,000 5.8% FY11 $ 8,338,000 15.5%FY02
St. Regis opens 7,142,000 13.5% FY12 9,382,000 12.5% FY03 8,157,000 14.2% FY13 10,086,000 7.5%FY04 8,438,000 3.4% FY14 11,122,000 9.1%FY05
Ritz remodel 7,722,000 (8.5%) FY15
Projected 11,750,000 5.6% FY06 9,392,000 21.6% FY16 Est. 11,600,000 (1.4%)FY07 10,888,000 15.9% FY17 Est. 11,800,000 1.75%FY08 11,299,000 3.8% FY 18 Est. 12,000,000 1.75%FY09 8,630,000 (19.5%) FY 19 Est. 12,200,000 1.75%FY10
Marriott remodel 7,221,000 (20.6%) FY 20 Est. 12,400,000 1.75%
The City also began collecting Short Term Rental TOT revenue in of Spring 2014. For FY15, it is expected to finish at $360,000. Given that this is not only a new source of revenue for the City, but also because the advent of this industry is relatively new, the City at this point is projecting Short Term Rental TOT to remain at the same level through FY20.
Property Taxes
The General Fund’s second largest revenue is property tax, making up approximately 20% of revenue. Property taxes are imposed by the County at a rate of 1% of assessed property value, with the base level established at the sales price when a property sells. Thereafter, the assessed value is increased each year as properties increase in value, but no more than 2% per year. During economic downturns, and as property values decrease, the County Assessor can and does reduce assessed values on the tax role; this, in turn, decreases the amount of property tax due. As the economy and property values rebound back to and above pre-recession levels, the
4,000
5,000
6,000
7,000
8,000
9,000
10,000
11,000
12,000
13,000
01 02 03 04 05 06 07 08 09 10 11 12 13 14 15 16 17 18 19 20
Mill
ion,
$$
Fiscal Year
37

County Assessor can and does increase assessed values back to where they would have been had the recession not occurred, with that base value increased up to the maximum 2% per year.
The total assessed value of property in Dana Point grew 3.2% in FY14, and is expected to achieve a larger increase in FY15. The City receives roughly 7.6% for every $1 of property tax paid. The other 92.4% goes to other agencies and special districts, with the largest beneficiaries being the Capistrano Unified School District at 39%, State at 16.6%, Orange County Fire Authority (“OCFA”) at 12.2%, and Saddleback Community College District at 9.6%.
The Orange County Fire Authority (“OCFA”) is highly dependent on property taxes and contracts with a consultant to perform extensive analysis and projections of property taxes, and they project the following annual increases for Dana Point:
Table 5: OCFA Property Tax Growth Projections
As the City is nearly built-out, property tax revenue increases are driven mainly by reassessments occurring from property sales and growth in current assessments under Prop 13. That is not to say that there will not be growth due to infill development, as there will be, but rather the assessed value of infill development in any given year equates to a fraction of the assessed value on the existing tax roll. In the near-term, the increased value from infill development is likely going to come from luxury home construction and remodels in Monarch Beach and Strands at Headlands, a condominium development on PCH across from Doheny State Beach, and finally with new development in the Lantern District.
Property taxes are projected to increase about 5.4% in FY15. Increases of roughly 3.25% are estimated for FY16 and FY17, and then 2.75% for FY18 through FY20. As new construction continues in the Monarch Beach and Strands areas, increased values for those properties will be added to the tax roll, and will bolster increases from home re-sales along with the existing base that is expected to achieve the maximum 2% annual increase.
Figure 5: Secured & Unsecured Property Taxes Revenue Trend, FY01 to FY20
1,500
2,500
3,500
4,500
5,500
6,500
7,500
8,500
01 02 03 04 05 06 07 08 09 10 11 12 13 14 15 16 17 18 19 20
Mill
ion,
$$
Fiscal Year
OCFA Property Tax Growth Projections
Fiscal Year IncreaseFY16 4.9%
FY17 3.6%
FY18 3.5% FY19 3.2%
FY20 3.2%
38

Table 6: Secured & Unsecured Property Tax History
Fiscal Year Amount % Change Fiscal Year Amount % Change FY01 $ 3,241,000 FY12 $ 5,888,000 (0.8%) FY02 3,556,000 9.6% FY13 * 6,108,000 3.7% FY03 3,861,000 8.5% FY14 6,263,000 2.5%
FY04 4,154,000 7.6% FY15
Budgeted 6,250,000
FY05 4,471,000 7.6% FY15
Projected 6,600,000 5.4%
FY06 4,957,000 10.9% FY16 Est. 6,815,000 3.25% FY07 5,322,000 7.4% FY17 Est. 7,035,000 3.25% FY08 6,001,000 12.8% FY 18 Est. 7,230,000 2.75% FY09 6,176,000 2.9% FY 19 Est. 7,430,000 2.75% FY10* 6,110,000 (1.1%) FY 20 Est. 7,630,000 2.75% FY11 5,935,000 (2.9%)
* In the table above, for comparative purposes we excluded a one-time borrowing by the State of $882k in FY10, andalso excluded the repayment of it in FY13.
Property Transfer Tax
Property Transfer Tax is a relatively small portion of the City’s revenue, but it is an indicator that reflects on the overall state of the economy, particularly with activity in property sales. Property Transfer Tax is assessed on the sale of property, with the City and the County each receiving 55 cents for every $1,000 of sales value. Other than large numbers of residential properties selling such as occurred the few years prior to the recession, the variance from year to year is most impacted by high dollar sales, such as hotels and parcels in Monarch Beach and Strands.
With the housing market stabilizing after the recession, and increases in overall sales prices and increased activity in luxury homes, we initially projected only minor increases in the amount of property transfer tax to be received in FY14 and FY15; however, one of the resorts was sold and inflated the FY14 amount by almost $200,000, as was the case in FY13 as well, in addition to an increase in activity at the Strands and in Monarch Beach. Property transfer taxes are projected to stabilize at $350,000 per year.
Table 7: Property Transfer Tax History
Fiscal Year Amount % Change Fiscal Year Amount % Change FY01 $ 287,000 FY12 $ 230,000 15.2% FY02 282,000 (1.5%) FY13 459,000 99% FY03 319,000 13% FY14 570,000 24.3% FY04 498,000 56% FY15 Budgeted 300,000 (47.4%) FY05 525,000 5.4% FY15 Projected 350,000 (35.6%) FY06 441,000 (16%) FY16 Est. 350,000 - - FY07 395,000 (10%) FY17 Est. 350,000 - - FY08 374,000 (5.3%) FY 18 Est. 350,000 - - FY09 224,000 (40%) FY 19 Est. 350,000 - - FY10 229,000 2.4% FY 20 Est. 350,000 - - FY11 200,000 (12.8%)
39

Sales Tax
Currently the fourth largest revenue, in FY15 Sales Tax is projected to be about 12.5% of General Fund operating revenue. It will become the third largest revenue source in FY16 when the State unwinds what is referred to as the Triple Flip, which started in FY05 when the State took 25% of cities Sales Tax and replaced it with In-Lieu Property Tax. The return of the 25% of Sales Tax is expected to be about $1.4 million in FY16, with a corresponding decrease to In-Lieu Property Tax.
Our Sales Tax revenue estimates are based largely on information from the State Board of Equalization and HdL Companies, the City’s Sales Tax consultant. Due to high property values and the limited availability of space, there is limited commercial and industrial development opportunity within the city. Since some of the largest Sales Tax generating businesses are tourism based, this revenue tends to move along a similar trend line as TOT.
Sales Tax revenue decreased a cumulative 22.7% from FY08 to FY10. For FY11 and FY12, it rebounded by almost the same amount, but FY12 included a large one-time allocation for a misreported prior-year payment. That one-time allocation in FY12 made it appear that taxable sales had gone down 4% in FY13, while absent it FY13 actually increased 1%. By FY14, it had returned to its pre-recession level of $3.8 million. For FY15, it is projected to finish at $4.1 million, reaching the high mark achieved in FY04.
Sales Tax revenue in Dana Point tends to experience lower increases than in other Orange County cities. Dana Point does not have large retailers, malls, new-car dealerships or commercial construction. The profile of Dana Point Sales Tax is dominated by restaurants and hotel retail sales (about 48% of total), followed by fuel and service stations (18%), general consumer goods (12%) and other categories (see diagram below).
Figure 6: Sales Tax by Industry Group
Restaurants & Hotels 48%
Fuel & Service Stations
18%
General Consumer
Goods 12%
Food & Drugs 7%
Building & Construction
6%
Autos & Transportation
5%
Business & Industry
4%
40

Table 8: FY14 Top 10 Sales Tax Producers = 41% of Sales Tax (alphabetically)
Firm Name Circle K 76 (Niguel Rd) Mariott Laguna Cliffs Circle K (3 locations) Ritz Carlton Chevron (2 locations) St Regis Monarch Beach Ganahl Lumber Sun County Marine Monach Bay Chevron (2 locations) Western Emulsions
After unwinding the Triple Flip mentioned above, the City’s Sales Tax consultant projects just over $5.6 million for FY16, a 4% increase over their FY15 estimate. Though the consultant projects another 3.9% increase in FY17, given the construction that may take place with the harbor rebuild, dependence on the hotels and the volatility of gasoline prices, staff is using a growth factor of 2.5% for FY17 and 2.0% thereafter.
Table 9: Sales Tax History
Fiscal Year Amount % Change
Fiscal Year Amount % Change
FY01 $ 3,374,000 FY12 $ 3,570,000 16.1% FY02 3,605,000 6.8% FY13 3,425,000 (4.1%) FY03 3,795,000 5.3% FY14 3,794,000 10.8%
FY04 4,015,000 5.8% FY15
Budgeted 4,000,000 5.4%
FY05* 3,117,000 (22.4%) FY15
Projected 4,100,000 8.1%
FY06 3,447,000 10.6% FY16 Est.* 5,640,000* n/a FY07 3,762,000 9.1% $4,230,000 $1,410,000 3.2% NEW FY08 3,867,000 2.8% FY17 Est. 5,700,000 2.5% FY09 2,998,000 (22.5%) FY18 Est. 5,850,000 2.0% FY10 2,909,000 (3.0%) FY19 Est. 5,975,000 2.0% FY11 3,075,000 5.7% FY20 Est. 6,100,000 2.0%
*In FY16, the State unwinds the “Triple Flip” (described above). The return of the 25% is estimated to be $1,410,000of additional Sales Tax in FY16. For FY16 in the table above, the $5,640,000 is the full amount of Sales Tax expected, the $4,230,000 is shown for comparison purposes to FY15, and the $1,410,000 is the return of the Triple Flip amount. There is a $1,410,000 corresponding decrease to the In-Lieu revenue detailed later in this report.
Figure 7: Sales Tax Revenue Trend, FY01 to FY20
1,5002,0002,5003,0003,5004,0004,5005,0005,5006,0006,500
01 02 03 04 05 06 07 08 09 10 11 12 13 14 15 16 17 18 19 20
Mill
ion,
$$
Fiscal Year
41

In-lieu Property Taxes: MVIL & Sales Tax
In-lieu Property Tax is currently the City’s third largest General Fund revenue source at 13%. This tax is the result of the State’s Vehicle License Fee (VLF) swap, along with the Triple Flip described earlier in this report.
The VLF swap represents approximately 92% of the pre-swap amount of motor vehicle in-lieu (MVIL) revenues received by the City, and is a permanent swap for a like amount Property Tax. The projection for this revenue is directly tied to growth (or decline) in assessed property values. Using the Property Tax projected growth rate, the MVIL portion of the In-Lieu Property Tax is estimated to be $3.1 million in FY15, $3.2 million in FY16 and $3.280 million in FY17.
The Triple Flip is eliminated in FY16 and was discussed above in the Sales Tax section.
Table 10: In-Lieu Property Tax History
Fiscal Year Total In-Lieu % Change MVIL portion Sales Tax Triple Flip FY05 $ 2,665,000 $ 1,701,000 $ 964,000 FY06 3,119,000 17.0% 2,231,000 888,000 FY07 3,867,000 24.0% 2,653,000 1,244,000 FY08 4,276,000 10.6% 2,859,000 1,417,000 FY09 4,154,000 (2.9%) 2,975,000 1,179,000 FY10 3,719,000 (10.5%) 2,936,000 783,000 FY11 3,944,000 6.1% 2,911,000 1,033,000 FY12 3,947,000 0.07% 2,932,000 1,015,000 FY13 4,319,000 8.3% 2,963,000 1,356,000 FY14 4,271,000 (1.9%) 3,058,000 1,213,000 FY15 Budgeted 4,300,000 2.5% 3,116,000 1,184,000 FY15 Projected 4,500,000 5.4% 3,100,000 1,400,000 FY16 Est. 3,200,000 2% 3,200,000 n/a FY17 Est. 3,280,000 2% 3,280,000 n/a FY 18 Est. 3,350,000 2% 3,350,000 n/a FY 19 Est. 3,400,000 2% 3,400,000 n/a FY 20 Est. 3,450,000 2% 3,450,000 n/a
Figure 8: In-Lieu Property Tax Revenue Trend, FY05 to FY20
2,000
2,500
3,000
3,500
4,000
4,500
5,000
05 06 07 08 09 10 11 12 13 14 15 16 17 18 19 20
Mill
ion,
$$
Fiscal Year
42

Licenses & Permits: Planning, Building & Engineering Permits
These revenues also relate to development activity, and include engineering related items such as encroachment permits, transportation permits and grading plan checks; planning related items such as permits for site development, coastal development and conditional uses; and, permits for building, plumbing, sewer, electrical and mechanical. As mentioned above, development activity has increased substantially post-recession, and there is no indication that major changes to the pace of development will occur in the next couple of years given all of the projects being submitted, but staff wants to be conservative in the out years given the uncertainty of development activity, and thus is showing a trend back toward more traditional levels beyond this two-year budget cycle.
Table 11: Licenses & Permits Revenue History
Fiscal Year Amount % Change Fiscal Year Amount % Change FY07 $ 686,000 FY14 $ 1,112,000 59.1% FY08 772,000 12.5% FY15 Budgeted 1,553,000 39.7% FY09 639,000 (17.3%) FY16 Est. 1,273,000 (18.0%) FY10 679,000 6.3% FY17 Est. 1,360,000 6.8% FY11 679,000 0% FY18 Est. 1,200,000 (11.8%) FY12 667,000 (1.7%) FY19 Est. 1,100,000 (8.3%) FY13 699,000 3.3% FY20 Est. 1,000,000 (9.1%)
Charges for Services
Charges for Services account for approximately 3.7% of General Fund revenue and includes planning, building and engineering fees, reimbursed expenses mainly associated with contract assistance for development project submittals, fees for recreation classes and activities, and development impact fees.
Table 12: Development Charges for Services
The City has seen a significant increase in development activity in the past couple of years, which has resulted in an increase in building, engineering and planning fees collected. Services provided include building plan checks, tentative tract and parcel map processing, map checks, variances, environmental impact reports, lot line adjustments, grading inspections, and a variety of other related activity. For FY15, building revenue is expected to be fairly flat, but that is compared to FY14 that hit $1,469,000, up $490,000 compared to FY13, or 50%.
For the coming few years development activity is expected to stay at a heightened level. In addition, reimbursements to the City from developers for contracted out planning and engineering services are recorded in this category.
Revenue % Change FY07 $ 1,201,000 FY08 1,271,000 5.8% FY09 874,000 (31.2%) FY10 1,360,000 155.6% FY11 1,081,000 (20.5%) FY12 907,000 (16.1%) FY13 979,000 7.8% FY14 1,469,000 50.1%
FY15 Budgeted 1,445,000 (0%) FY16 Est. 1,229,000 (14.9%) FY17 Est. 1,209,000 (1.6%) FY18 Est. 1,200,000 (0.7%) FY19 Est. 1,200,000 0% FY20 Est. 1,200,000 0%
43

The City is conducting a fee study that was commissioned in 2014, but was delayed as the Community Development Department worked to address the crush of planning and development activity they were processing. The study will provide a current assessment of the extent of subsidies provided for use of City planning, building and engineering services. The current fee schedule has remained almost entirely unchanged since 1998.
Recreation classes and activities fees are also included in the Charges For Services category, and are generated mainly for activities held at the Del Obispo Community Center. The City offers a wide variety of contract instructor-led classes in areas such as arts, fitness and sports. These revenues increased substantially between FY10 and FY13, as the recession took hold and individuals sought out more cost effective recreation and special interest learning opportunities. In FY14, as the economy improved, there was a decrease in revenue but not back to the pre-recession amounts. We project a slow increase in this revenue over the next several years with average annual receipts in the $250,000 to $300,000 range.
General Fund Expenditures Summary
For budget planning and this MFP, certain expenditures are classified as “non-discretionary”, or ongoing. That is, in order to maintain the levels of service our residents expect, as well as meet the City’s contractual, State and Federal obligations, a certain amount of expenditures need to be incurred every fiscal year.
The City provides a wide variety of services. With recessionary effects first being felt during FY09, operating expenditures were reduced to offset to a large extent the decline in General Fund revenue, and to keep the operating budget balanced without a significant drawdown of discretionary reserves. The City, since incorporation, has staffed for a base level of workload and contract oversight, contracted for peak workloads, and relied heavily on contract services for certain municipal functions.
During the economic downturn, this approach served the City well as it was able to scale back on contracts where appropriate and cost effective, left staff positions unfilled as employees left through normal attrition, did not provide wage increases to employees for five years, and leaned extensively on remaining staff to cover the base workload plus gaps in service for critical programs. In the last two fiscal years, the City has been experiencing a major spike in development activity and municipal construction projects that created a need for additional resources. The City again reached out to the private sector to absorb much of the increased workload.
The following graph shows a trend that projects an increase in expenditures around 2.0% annually. General Fund expenditures for FY15, excluding transfers of $8.3 million for capital projects, are estimated at $31.7 million. Excluding transfers of $637,000 for capital projects, the proposed FY16 budget is $32.4 million; additionally, the FY17 proposed budget is $33.8 million, and includes roughly $855,000 of one-time expenditures including the final funding for the General Plan Update ($200k), Plan Check overflow contracts ($125k), Doheny Village Specific Plan ($150k), traffic-control network enhancements ($50k), Administrative Services Office refurbishment ($250k), among others.
44

Figure 9: General Fund Operating Expenditure, FY06 to FY20
The City’s largest expenditures are categorized in the MFP as follows, and represents 86.5% of proposed General Fund expenditures: Sheriff’s Contract for police services, Personnel Services covering City staff, Street Systems Maintenance & Operations, Park Maintenance and Related Utilities, and Professional Services Contracts.
Table 13: FY15 General Fund Expenditures Budget, Cumulative Table
Expenditure Category
FY16 Proposed Budget
% of TOTAL
Cumulative %
1. Sheriff’s Contract $ 10,821,000 33.4% 2. Personnel Services 8,091,000 25.0% 58.4% 3. Streets Systems Maintenance
& Operations 4,400,000 13.6% 72.0% 4. Park Maintenance & Related
Utilities 2,460,000 7.5% 79.5% 5. Professional Services
Contracts 2,253,000 7.0% 86.5% 6. All Other Program Areas* 4,383,000 13.5% 100.0%
TOTAL** $ 32,408,000 * All Other Program Areas includes non-personnel costs for all departments excepting contracts for Traffic,Engineering and Parks Departments which are included in numbers 3. and 4. Above, and excluding Personnel Services costs. ** Excludes Operating Transfers Out of $667,000.
26.26
29.73 29.61 29.61
27.55 28.04
27.34 27.89
28.17
31.66 32.41
33.76 33.91 34.99
36.09
25.00
27.00
29.00
31.00
33.00
35.00
37.00
06 07 08 09 10 11 12 13 14 15 16 17 18 19 20
Mill
ion,
$$
Fiscal Year
45

Figure 10: Operating Expenditure by Type
Public Safety
The City contracts with the Orange County Sheriff’s Department (“OCSD”) for dedicated law enforcement services. OCSD is responsible for providing the full spectrum of professional, responsive law enforcement services to our residents, businesses and visitors. OCSD, operating as the City’s Police Services Department, is a community partner and has established their Community Oriented Policing philosophy by being an integral part of City operations, along with their presence at community events and City functions.
The OCSD contract, projected at $10.8 million for FY16, is the largest expenditure item and accounts for about a third of the operating budget. The contract includes 41 OCSD staff dedicated to Dana Point, including 34 full-time sworn positions, 6 non-sworn community service officers, and an office assistant. In addition, the contract includes costs shared with other OCSD contract cities for a cadre of sworn and non-sworn support positions assigned to serve South Orange County. The annual contract cost also includes allocated costs covering County, OCSD Department Overhead, and OCSD Field Training Bureau and South Division Command. In FY15, the contract cost increased 5.2%, due mainly to an increase in County retirement and worker’s compensation costs, South Division Command Overhead, training and the addition of a part-time, extra help deputy. The increase in retirement costs was due to the Orange County Employees Retirement System (OCERS) Pension Actuarial Valuation which included a change in actuarial assumptions for investment earnings (reduced from 7.75% to 7.25%).
On average, the cost of police services for Dana Point has been increasing by 4.1% annually for the last 10 years.
Sheriff's Contract
33%
Personnel Services
25%
Street Systems M&O 14%
Park Maintenance &
Utilities 8%
All Other Programs
20%
FY 16 Proposed General Fund Operating Budget: $32.6 Million
46
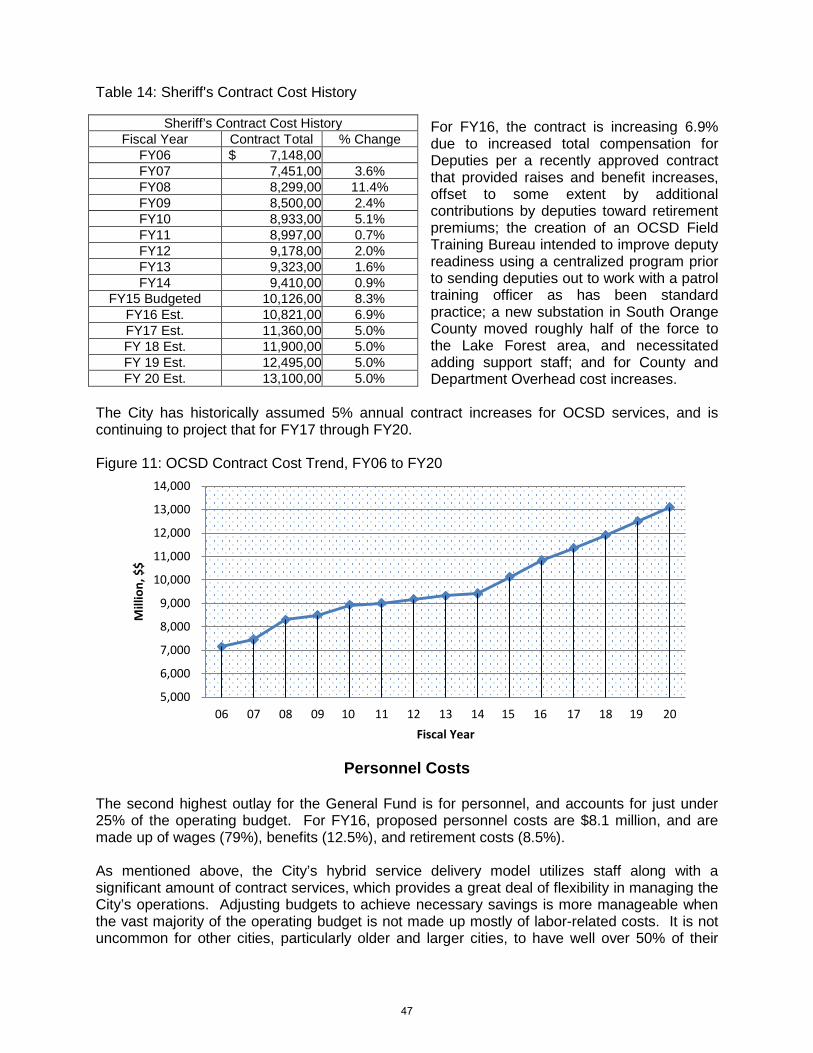
Table 14: Sheriff's Contract Cost History
For FY16, the contract is increasing 6.9% due to increased total compensation for Deputies per a recently approved contract that provided raises and benefit increases, offset to some extent by additional contributions by deputies toward retirement premiums; the creation of an OCSD Field Training Bureau intended to improve deputy readiness using a centralized program prior to sending deputies out to work with a patrol training officer as has been standard practice; a new substation in South Orange County moved roughly half of the force to the Lake Forest area, and necessitated adding support staff; and for County and Department Overhead cost increases.
The City has historically assumed 5% annual contract increases for OCSD services, and is continuing to project that for FY17 through FY20.
Figure 11: OCSD Contract Cost Trend, FY06 to FY20
Personnel Costs
The second highest outlay for the General Fund is for personnel, and accounts for just under 25% of the operating budget. For FY16, proposed personnel costs are $8.1 million, and are made up of wages (79%), benefits (12.5%), and retirement costs (8.5%).
As mentioned above, the City’s hybrid service delivery model utilizes staff along with a significant amount of contract services, which provides a great deal of flexibility in managing the City’s operations. Adjusting budgets to achieve necessary savings is more manageable when the vast majority of the operating budget is not made up mostly of labor-related costs. It is not uncommon for other cities, particularly older and larger cities, to have well over 50% of their
5,000
6,000
7,000
8,000
9,000
10,000
11,000
12,000
13,000
14,000
06 07 08 09 10 11 12 13 14 15 16 17 18 19 20
Mill
ion,
$$
Fiscal Year
Sheriff’s Contract Cost History Fiscal Year Contract Total % Change
FY06 $ 7,148,00FY07 7,451,00 3.6% FY08 8,299,00 11.4% FY09 8,500,00 2.4% FY10 8,933,00 5.1% FY11 8,997,00 0.7% FY12 9,178,00 2.0% FY13 9,323,00 1.6% FY14 9,410,00 0.9%
FY15 Budgeted 10,126,00 8.3% FY16 Est. 10,821,00 6.9% FY17 Est. 11,360,00 5.0% FY 18 Est. 11,900,00 5.0% FY 19 Est. 12,495,00 5.0% FY 20 Est. 13,100,00 5.0%
47

budgets dedicated to personnel costs. With that said, it is important to ensure that the City is equipped with adequate staff to manage day-to-day operations and projects, and to deliver high quality services in a timely manner.
Figure 12: Personnel Cost Trend, FY06 to FY20
Table 15: Personnel Cost History
Fiscal Year Total % Change
FY06 $ 4,067,000 FY07 4,815,000 18.4% FY08* 6,116,000 27.0% FY09* 6,958,000 13.8% FY10** 6,676,000 (4.1%) FY11 6,933,000 3.8% FY12 7,040,000 1.5% FY13 7,180,000 2.0% FY14 7,177,000 0.0%
FY15 Budgeted 7,579,000 5.6% FY16 Est. 8,091,000 6.8% FY17 Est. 8,166,000 0.9% FY 18 Est. 8,370,000 2.5% FY 19 Est. 8,580,000 2.5% FY 20 Est. 8,800,000 2.5%
* From FY07 to FY09, the City transitioned Planning, Building and Engineering from contracts to less expensive staffpositions. From FY08 to FY13, the City froze positions as they became vacant, and did not provide wage increases for staff. In FY14, some vacant positions were filled, particularly in the Community Development Department. ** For comparison purposes, the FY10 amount excludes an $860,000 payoff of an unfunded pension obligation established when CalPERS moved the City into a small agency pension pool in 2004.
Salaries
Less than half of the City’s workforce is represented by the Dana Point Employees Association (“DPEA”), which negotiates with the City for labor related issues. Starting when the recession hit in 2008, City employees went five years without a wage increase. The City entered into a 3-year agreement with the DPEA in January, 2014. The agreement includes pay increases effective October 1, 2014 and again October 1, 2015, and net to 2.9% each after factoring in additional contributions from employees toward their retirement benefits. The third year of the
2,000
3,000
4,000
5,000
6,000
7,000
8,000
9,000
10,000
06 07 08 09 10 11 12 13 14 15 16 17 18 19 20
Mill
ion,
$$
Fiscal Year
48

agreement returns pay decisions to a merit-based compensation approach where the City provides a pool that may be distributed based on an individual’s success, but only at an amount set and approved by the City Council after considering the City’s financial condition, among other factors. Beginning in FY14 and completing in FY15, the City provided its’ non-represented employees with a similar 2.9% net raises.
Assuming the economy remains steady, there are no substantive changes in staffing, and health and retirement costs are in line with projections, it is projected that cost increases from FY18 through FY20 will average 2.5% per year.
Benefits:
The City offers a "cafeteria style" flexible benefits plan, with a fixed monthly allowance provided to full-time employees, in varying amounts as discussed below. Employees may apply the allowance toward premiums for the health, dental, life and disability insurance plans that fit their needs and budget; and, where the cost is greater than the City’s monthly contribution the employee pays the difference.
The Dana Point Employees Association (DPEA) labor agreement requires an annual review of the monthly benefit allowance, as well as a $25 benefit allowance increase for each $25 increase in the average cost of medical insurance plans surveyed. Non-represented employees, including department heads, have traditionally received the same adjustment. Recent history for the change in monthly allowances have been FY08 ($25), FY09 ($0), FY10 ($50), FY11 ($50), FY12 ($50), FY13 ($75), FY14 ($0) and FY15 ($50). The monthly benefit allowance increased an average of 5% over that time period.
For FY15, the monthly contributions available to employees are $1,050 for represented employees, $1,175 for non-represented, $1,375 for department directors, and $1,425 for the City Manager. Staff is projecting a $25/month increase in FY16, and a $50/month increase in FY17. Predicting what health care costs are going to be from year to year with all the changes taking place in health care coverage and industry costs is anybody’s guess. The average increase for City employees has been $50/month each year over the past several years, and that is what is included in the projections for FY18 through FY20.
Retirement:
The City contracts with the California Public Employee's Retirement System (“CalPERS”), a cost-sharing, multiple-employer public employee defined benefit pension plan. CalPERS provides retirement benefits, annual cost-of-living adjustments, and death benefits to plan members and beneficiaries of contract agencies. CalPERS acts as a common investment and administrative agent for participating public entities within the State of California.
The City paid both the Employer Share and Employee Share (the latter set by the State Statute at 7% of pay) of pension contributions until October 1, 2013. The current DPEA Agreement allowed the City to implement a key component of the State enacted Public Employee Pension Reform Act (PEPRA), where the new standard is for employees to pay the Employee Share of pension costs. Beginning October 1, 2013, the City’s non-represented employees started paying 4 of the 7% Employee Share, and then on October 1, 2014 the non-represented employees picked up the remaining 3 of the 7% Employee Share. The same two year phase in of full pick up of the Employee Share is in process for the represented employees, with the second stage taking effect October 1, 2015. The Employer’s Share is an actuarially determined
49

rate established by CalPERS each year, with the City benefitting from, or bearing the responsibility for, changes in pension costs.
Until FY12, CalPERS used a 7.75% actuarial expected return on its investment portfolio. As can be seen in the table below, CalPERS actual earnings over the past eight years have fluctuated dramatically.
Table 16: CalPERS Earnings History
In FY12, the CalPERS Board lowered the actuarial earnings assumption down from 7.75% to 7.5%; in addition, they began making more conservative assumptions in regards to pensioner mortality, and took a less aggressive approach to allocating gains and losses. The latter is intended to moderate fluctuations year to year in rates charged to contract agencies.
The funded status stood at 81.3% on June 30, 2013 (the most recent valuation available). Due to the recession’s impact on the stock market and real
estate values in 2008-2009, CalPERS lost a significant amount on its investment portfolio. CalPERS is working to improve the funded status of the pension plan by increasing rates. An updated valuation covering CalPERS FY14 will not be available until later this year, but CalPERS did report an 18.4% time-weighted rate of return on its investments in FY14, significantly above the 7.5% earnings assumption.
Unlike the Employee Share that is set at 7%, the Employer Share fluctuates from year to year in conjunction with the success of CalPERS investment earnings, but in a manner that the actual gains and losses on investments are smoothed or amortized in a rolling manner into the Employer Rate each year. The change from year to year can be seen in the following table:
Table 17: CalPERS Employer Share Rate History
Fiscal Year Employer
Share % Change Fiscal Year Employer
Share % Change
FY09 11.954% FY15
Budgeted 11.522% 6.8% FY10 11.736% (1.8%) FY16 Est. 10.828% (6.0%) FY11 8.984% (23.5%) FY17 Est. 11.216% 3.6% FY12 10.059% 12.0% FY18 Est. 12.100% 8% FY13 10.238% 1.8% FY19 Est. 13.070% 8% FY14 10.781% 5.3% FY20 Est. 14.000% 8%
The City’s required annual contribution to CalPERS for full-time employees over the past several years, along with the percentage actually paid by the City, are as follows:
CalPERS Earnings History
Fiscal Year
Actual Earnings
Actuarial Earnings
Assumption FY07 19.1% 7.75% FY08 (5.1%) “ FY09 (24.8%) “ FY10 13.3% “ FY11 21.7% “ FY12 0.1% 7.5% FY13 13.2% “ FY14 18.4% “
50

Table 18: CalPERS Employer Share Paid By the City
Fiscal Year Annual Pension Cost
Percentage Contributed
FY06 $ 388,000 100% FY07 457,000 100% FY08 537,000 100% FY09 585,000 100% FY10 1,166,000 100% FY11 445,000 100% FY12 491,000 100% FY13 482,000 100% FY14 530,000 100%
For the table below, the Salaries column includes full- and part-time wages, commissioner stipends and overtime. The retirement column includes both full-time and part-time staff; and, the Benefits column includes cafeteria allowances and Medicare taxes.
Table 19: Salaries, Retirement Cost & Benefits, detail
Fiscal Year Salaries % Change Retirement** %
Change Benefits % Change
FY08 $ 4,633,000 $ 811,000 $ 671,000 FY09 5,297,000 14.3% 909,000 12.1% 753,000 12.2% FY10* 5,315,000 0.3% 670,000 (26.3%) 790,000 4.9% FY11 5,285,000 (0.6%) 805,000 20.1% 843,000 6.7% FY12 5,328,000 0.8% 847,000 5.3% 866,000 2.7% FY13 5,441,000 2.1% 850,000 0.4% 889,000 2.7% FY14 5,453,000 0.2% 784,000 (7.8%) 940,000 5.7% FY15 Budgeted 5,396,000 (1.0%) 965,000 23.1% 1,040,000 10.6% FY15 Projected 5,915,000 8.5% 704,000 (10.2%) 960,000 2.1% FY16 Est. 6,380,000 7.9% 691,000 (1.8%) 1,020,000 6.4% FY17 Est. 6,409,000 0.5% 707,000 2.3% 1,051,000 2.9% FY 18 Est. 6,085,841 3.0% 849,104 8.0% 926,997 5.0% FY 19 Est. 6,234,148 3.0% 895,104 8.0% 926,997 5.0% FY 20 Est. 6,356,000 3.0% 963,309 8.0% 926,997 5.0%
* For comparison purposes, excluded from the FY10 Retirement Cost amount shown here is a one-time $860,000pay-off of an unfunded liability created when PERS moved the City into the small agency pension plan pool in FY04. ** The Retirement Column includes both CalPERS pension for full-time employees, and ICMA deferred compensation for part-time employees.
Total personnel costs are expected to increase annually by 3.8% on average the next five years. The main contributing factors are the addition of a Planning Manager (long-term planning) and Assistant Administrative Analyst (Economic Development) in FY16, conservative projections for Pension rate increases of 8%, and cafeteria allowance increases.
Street Systems Maintenance & Operations This category is for contracts only, and excludes personnel costs that were forecast in the Personnel Services section above, and minor ancillary costs such as office and operating supplies, memberships & dues and training, among others. These contract services are projected to account for $4.4 million in FY16. The largest component, at $1.4 million is Street Maintenance, and includes: a contract for a variety of work performed by the County of Orange; striping/stenciling; Underground Service Alerts; concrete and asphalt repair and crack fill;
51

sidewalk grinding; I-5 PCH off ramp litter removal, graffiti removal, emergency repairs and a variety of other services. These Street Maintenance Costs have increased consistently at under 2% per year, and are projected to continue at this rate.
Landscape Median Maintenance ($755,000) is also included in this category. These costs have increased over the past several years, from $502,000 in FY10 and projected to reach $795,000 by FY17. The increase is mostly associated with new medians on PCH from the City’s north border on down through the Lantern District. For FY18 through FY20, and absent the addition of any new medians not already accounted for, these costs are assumed to stabilize with a 2% per year increase. Most medians are watered with reclaimed water, and Staff is working on plans to convert to reclaimed water the few remaining medians that use potable water; where this is not feasible, staff has been planting drought tolerant landscaping.
Also included are: Storm Drain Maintenance ($465,000), which covers regular inspections, inlet filter cleaning and repairs, and trash diversion system maintenance and repair; Water Quality program components ($530,000) such as the National Pollution Discharge Elimination System (NPDES) related costs, Stormwater Diversion systems operations & monitoring, and the Grease Interceptor Rebate Program; finally, it includes Street Sweeping ($278,000).
This category also includes Utilities for traffic signals and street lights ($313,000), Traffic Engineering professional services ($159,000), and traffic signal maintenance and repair ($199,000). Finally, the City’s street event banner program ($260,000) is included in this category, which has an elevated budget by roughly $100,000 in FY16 as the City expands the program, particularly into the Capistrano Beach and Doheny Village areas.
Overall, the Street Systems Maintenance & Operations category is assumed to see a 2% cost increase from FY18 through FY20.
Park Maintenance & Related Utilities This is the fourth largest category of expense, and is proposed at $2.46 million for FY16. It covers Park Maintenance ($1.15 million), Park Utilities ($685,000), Tree Maintenance ($550,000), and Professional Services contracts for certified playground inspections, vandalism repairs and graffiti abatement ($75,000).
Park Maintenance includes landscaping, sports field and playground repairs, lights, signage and irrigation systems, among other items. Of all expenses in this category, relatively significant increases have only been seen recently in utilities, with reclaimed and potable water making up roughly 75% of the $685,000 projected in utility costs for FY16, and in tree trimming. For the latter, contract costs have been increasing quicker than the consumer price index as contractors are seeing higher labor costs associated with wages and health benefits.
Over the past several years, the City has added a number of amenities that require water and some electricity, namely Sea Terrace Park and the PCH medians. The City currently has reclaimed water available for the most of the Golden Lantern and PCH medians north of the Lantern District, as well as at Sea Terrace Park. To address the drought conditions and manage costs, the City is working with the South Coast Water District to bring reclaimed to Lantern Bay Park, La Plaza Park, the remaining Golden Lantern median (south of Del Prado)
52

not using reclaimed water, and a new median being constructed on Del Prado north of Golden Lantern. Assuming the City reduces use of potable water as is being planned, and absent the addition of any new park amenities coming online during that time For FY18 through FY20, costs are expected to increase 2% per year during that period.
All Other Professional Services All Other Professional Services is the fifth largest category of expenditure. For FY16, this line item is proposed at $2.25 million of General Fund expenditures. There is a base level of recurring contracts that do not vary much from year to year, and include functions such as the City’s funding for the Coastal Animal Services Authority; bank fees; annual financial audit; information technology services; custodial, website hosting; waste franchise audits; crossing guards; arborist consulting; recreation class contract instructors; contract labor for planning, building and engineering; and the list goes on. Projections for these base level contracted services are conservatively projected at 2.0%, which is much higher than the current Consumer Price Index for the region, usually a good indicator for growth in these costs, and which is currently at 0.5%.
The largest individual area of Professional Services expenditures relate to development projects, and include items such as environmental impact reports, geotechnical studies, traffic studies, etc. Costs incurred by the City to process development project submittals are borne by developers, thus there is no impact to the City’s bottom line.
Capital Asset Investments The City’s infrastructure includes buildings, streets, curbs, gutters, sidewalks, signals, medians, storm drains, water treatment facilities, playgrounds, etc. Using a combination of City monies, development impact fees, grants, and other sources, the City has consistently maintained a robust capital improvement projects program over the years. The book value of the City’s investment in Capital Assets, net of depreciation, has doubled over the past 10 years, from $83 million to $166 million, or about $8.3 million per year.
Over the past 15 years, the City’s General Fund has committed over $67 million to Capital Projects, along with over $41.5 million from other sources. The City remains committed to maintaining and improving its infrastructure.
A Discussion on Reserves The City Council adopted a General Fund reserve policy in 2005. The policy established a Cash Flow Reserve, Emergency Reserve and Capital Projects Sinking Fund Reserve. The Cash Flow Reserve is set at 10% of General Fund revenue and provides liquidity for normal fluctuations in monthly revenue inflows and expenditure outflows, such that a sufficient amount of monies are always on-hand to meet the City’s fiscal obligations. The Emergency Reserve is set at 20% of General Fund revenue and provides a source of fiscal resources that can be used for a variety of unanticipated contingencies that could result from major uninsured claims against the City, natural disasters, major economic downturns and other situations of this nature. The Capital Projects Sinking Fund Reserve is set at a minimum $2.5 million, and is used to accumulate funds for major repairs and/or replacement of capital assets.
53

When adopting the two-year FY07 and FY08 budget, the Council did not amend the reserve policy, but they did take action to set aside funds to address impacts that might be caused by the State of California borrowing or taking City revenues, and it was set at $2.33 million. In FY10, the State borrowed $880,000 of the City’s property tax revenue, and repaid it with interest in FY13. Over the past several years, voters amended the State Constitution in a manner that precludes the State from borrowing or taking any known City revenues. At this time, the State Budget Impacts Reserve has a zero balance.
In June 2014, the City Council amended the City’s FY15 budget and in doing so directed the use of the $2.5 million Capital Projects Reserve to fund a portion of the Town Center Lantern District Project Phase II. In April 2015, utilizing current year operating surplus, $1.25 million was returned to the reserve. The proposed budget anticipates replenishing this reserve back to $2.5 million.
As of this writing both the Cash Flow and Emergency Reserve remain fully funded per policy at $3,031,000 and $6,062,000, respectively.
Closing Observations
A forecast is simply a prediction of future conditions, and is intended to be a planning tool and not deemed a perfect picture of what is to come. This Master Financial Plan is the first of its kind for the City, and with that is a work in progress. As we progress through the next two years leading up to the next budget cycle, this plan will be revisited and refined to reflect current operating conditions along with longer-term needs of the City.
54

THIS PAGE INTENTIONALLY LEFT BLANK

HIGHLIGHTS OF FISCAL YEAR 2014 & 2015 ACCOMPLISHMENTS
The following is a synopsis of the Major Accomplishments of the City of Dana Point during the 2014 & 2015 Fiscal Year.
ADMINISTRATIVE SERVICES DEPARTMENT
1. Awarded the National Award for Excellence in Financial Reporting for the Fiscal Year 2012and 2013 Comprehensive Annual Financial Reports (CAFR).
2. Completed the Fiscal Year 2012-2013 and the 2013-2014 annual City audits with no negativeaudit findings.
3. Successfully implemented a new accounting software system (Incode V.X. Financials by TylerTechnologies) with modern functionality that affords real time access to accountingtransactions. Five years of data were converted into the new system. It has multiple capabilitiesincluding scanning of invoices, cash receipts, and deposits directly into the system whichoptimizes access to financial records.
4. Administered and implemented the City’s ninth, two-year budget process for Fiscal Years 2015-2016 and 2016-2017.
5. In 2013, refinanced the 2008 Headlands CFD bonds and added an additional tranche ofbonds. The refinance provided an approximate $540,000 in interest savings. The additionalbonds provided funds to reimburse the developer for completed public infrastructure.
6. In 2014, worked with the bond and legal teams to issue the final Headlands CFD bondtranche. Funding provided for the final and complete reimbursement to the developer.
7. Automated capital assets records through the integrated fixed asset module in the newaccounting software system.
8. Automated the processing of water utility bills through a procurement card program to pay Bankof America electronically and receive quarterly rebates to the City.
9. Executed training of non-administrative City staff on the new accounting system. Trained Citypersonnel to access and process reports and requests.
10. Evaluated and implemented processes, procedures, and tracking systems as needed to ensureAffordable Care Act (ACA) compliance.
11. Continued positive labor relations with Dana Point Employees Association (DPEA) andnegotiated a successor MOU through December 31, 2016.
12. Administered and coordinated citywide in-house and off-site employee training opportunities,including training required by California laws and regulations.
13. Conducted annual Health Benefits Open Enrollment and annual Performance Evaluation/MeritReview process for all eligible City staff.
55

14. Coordinated implementation of Public Employees’ Pension Reform Act (PEPRA) provisions.
15. Developed processes and procedures to implement the Healthy Workplace Healthy Family Actof 2014 (AB 1522).
16. Conducted annual salary range survey for all City positions and presented to the City Council.
17. Received successful results of bi-annual Risk Management audit and recognition for timelyWorkers’ Compensation management.
18. Successfully implemented an in-house employee Health and Wellness program with over 70%staff participation and created a monthly Health and Wellness Newsletter for City employees topromote the benefit of a healthy life style.
19. Coordinated the City’s Community Newsletter with the Community Services & Parks andCommunity Development departments.
20. In conjunction with Police Services, continued to manage the high school’s on-campus drug andalcohol early intervention program staffed by a contract intervention specialist.
21. Worked with the Community Alliance Network of the Council on Alcohol and DrugDependence – Orange County (NCADD-OC) to further educate our youth on alcohol and drugdependence.
22. Initiated a fee study with a goal to update the City’s 15-year old existing fee schedule forplanning, building and engineering functions.
23. Identified and submitted claims to the State of California for costs incurred by the City totalingover $100,000 in regards to State mandates.
24. Participated in a SONGS Emergency drill under the City’s Emergency Plan.
EMERGENCY SERVICES DEPARTMENT
1. The Emergency Services Coordinator served as the Chair of the Interjurisdictional PlanningCommittee (IPC) for the San Onofre Nuclear Generating Station, and headed the offsiteemergency planning transition in the early stages of the decommissioning process.
2. The City of Dana Point Community Emergency Response Team (CERT) program continues toprovide valuable disaster preparedness training to interested residents. This program continuesto be applauded by those who have completed the course.
3. Division Staff maintains our public safety wireless mesh network capable of supporting camerasused for public asset protection, public safety, crime prevention, disaster response, and trafficengineering. Staff expanded the network to include several digital communications devices fortraffic management and coordination capabilities.
4. The Dana Point Emergency Operations Center continues to evolve in our ongoing effort to setthe bar for local disaster preparedness and planning. We continue to impress representatives of
56

other agencies at all levels of government, with the size, design, use of technology, and level of readiness that we demonstrate with this facility.
5. Staff has partnered with the Orange County Fire Authority with a local distribution program ofsmoke detectors and carbon monoxide alarms.
6. Participated in monthly, quarterly, and annual tests of emergency communications systems,such as the Yellow Phone System (YPS), the conference call bridge line, the Community AlertSiren System, OA-1 EOC-EOC Radio, CUSD Emergency Radio, Tri-Cities RACES, and theAlertOC mass notification system.
7. Maintained the City's inventory of radiological monitoring equipment.
8. Emergency Services Staff maintained our certification as a NOAA/NWS Storm Ready andTsunami Ready City.
CITY CLERK DEPARTMENT
1. Successfully administered the November 4, 2014 election.
2. Updated the City’s Records Retention Policy which conforms with the City’s RecordsRetention Schedule.
3. Continued on-going implementation of a Records Management and Document Imaging System(SIRE). The system enhances customer service to the citizens and businesses of Dana Point by providing information and public services on-line in an effective, accessible manner. In addition, it helps the City realize operational efficiencies and increased productivity of City staff.
4. Installed a specialized desktop scanner to convert 22+ years of the City’s microfiche into digitalform to be accessible by the public and staff.
5. Worked in conjunction with the Public Works Department to digitize over 500 Final Tract fileswhich will make the records easily accessible to the public and staff.
6. Coordinated and maintained the Records Management Program with all City departments whichinclude archive, inactive, microfilmed and digital records, and conducted an annual destructionof records per the City’s Retention Schedule.
7. Prepared agendas, packets and minutes for approximately 25 regular and special City Councilmeetings per year.
8. Responded to approximately 750 annual requests for copies of records from the public pursuantto the Public Records Act and deposition subpoenas; responded to daily requests for records fromCity staff.
9. Processed over 100 Statements of Economic Interest Statements and numerous semi-annual andannual election campaign disclosure statements annually as required by the Political Reform Act.
57

10 Published notices and processed applications for the Planning Commission, Traffic Improvement Subcommittee, Arts and Culture Commission, Youth Board and all other City Subcommittees and Task Forces; also, scheduled interviews and administered oaths of office.
11. Compiled and posted updated information required by the Maddy Act, including the addition ofvarious subcommittees and task forces established by the City Council.
12. Managed the maintenance of the City’s website.
13. Coordinated the codification and distribution of supplements of the Municipal and Zoning Code.
14. Completed filing the City’s Ticket Policy (Form 802) monthly to the FPPC and filing the PublicOfficials Appointments (Form 806) annually for posting on the City’s website.
15. Received and processed approximately 90 annual City contracts including required bonds andinsurance.
16. Received and processed summons and lawsuits against the City.
17. Published, posted and processed 5 ordinances and approximately 50 resolutions annually.
18. Published, posted and processed approximately 70 legal notices.
19. Recorded approximately 30 legal documents through the County’s Recorders Office.
20. Participated in a SONGS Emergency drill under the City’s Emergency Plan.
COMMUNITY DEVELOPMENT DEPARTMENT
PLANNING
1. The Planning counter has seen a steady increase in counter visits with close to 4,000 countervisits per year in FY15, a 44% increase over the last 5 years. During this period, 71discretionary permits (CUP/CDP/SDP’s) and over 100 special event permits were processedthrough Planning.
2. Processed applications for residential development including a new, 11 unit subdivision inCapistrano Beach and many new custom homes on vacant lots, demolishing existing homes andbuilding new, custom homes, as well as additions and remodels to existing homes. MonarchBeach, the Headlands, Beach Road and Capo Beach bluff lots are areas of high concentrationfor this activity.
3. On the commercial side, a number of significant, new development applications have beenreceived. Noteworthy projects that have received entitlements include: the Harbor Revitalization
58

project, 168 residential units on a former mobile home park site, and a substantial renovation and expansion of Gloria Dei church. In the Lantern District, two mixed-use projects, a new single story commercial building and substantial renovation of two existing commercial buildings have been entitled for a cumulative total of 127 residential units and approximately 53,595 square feet of new or newly renovated commercial space.
4. Way Finding Sign Program – In conjunction with Public Works, began working on acomprehensive way finding signage program. This program will assist visitors navigate theirway through town by helping direct people to primary and secondary destinations, as well as topublic parking opportunities.
5. Lantern District - Staff has initiated a process to address parking concerns with the TownCenter Plan area and presented a Parking Management Report to the Planning Commission andCity Council in early 2014. The City Council directed staff to move forward with therecommendations in the Parking Management Report, along with policy direction regarding theexisting code regarding parking in lieu fees.
6. Short Term Rentals Zone Text Amendment - An ordinance was approved legalizing short-term rentals and allowing for the establishment of rules to limit negative impacts. Anamendment to the City’s Zoning Code both the Planning Commission and the City Councilapproved and it has been submitted to the California Coastal Commission (CCC).
7. Doheny Village Plan –A draft plan is currently under review, with a joint study session of theCity Council and Planning Commission expected Spring 2015.
8. Allowance of Poultry in Residential Districts Zone Text Amendment – Was presented anddenied by the City Council.
9. General Plan Update – Staff applied for and received a $125,000 grant to assist in completinga General Plan Update.
10. Participated in a SONGS Emergency drill under the City’s Emergency Plan.
BUILDING AND CODE ENFORCEMENT
1. As of the first 9 months of 2014-15 fiscal year, there were active residential building permitsthat totaled $68M of investment and active commercial building permits that totaled $12M ofinvestment. The first nine months of this fiscal year, the Building Division procured $477,640in building plan check fees. Once a project completes plan check, they pull building permits tostart construction so it is a good indicator of future investment. The same period last year and
59

the year before took in $384,921 and $218,395, respectively, in building plan check fees with a 24% and 76% increase from the year prior, respectively.
2. Permits issued in in the first nine months of FY 15 were 1,519 compared to last fiscal for thissame period of 1,434. This equates to the following:
• Residential – Total valuation of $68M representing approximately 456,856 square feet• Commercial – Total valuation of $12M representing approximately 250,002 square feet
3. Successfully implemented the tri-annual update with the adoption of the 2013 CaliforniaBuilding Codes. This project includes amendments to the City’s Municipal Code, along withupdating of forms and pamphlets, and extensive staff training.
4. Streamlined the permit process, including over the counter permit hours being implemented foruncomplicated projects enabling an applicant to submit plans for a plan check to have themreviewed, and receive their permit in the same visit. A combination building fee was establishedto allow for faster calculation of building fees to reduce the waiting time at the counter,directional signage at the Permit Center counter, and a revised Building Permit Applicationcorresponding with the work flow process to ensure a complete application is submitted.
5. Code Enforcement continues to be a high priority for the City. In addition to the propertymanagement and nuisance abatement issues, the enforcement of Short Term Rentals was anadded responsibility in 2014.
ECONOMIC DEVELOPMENT
1. The Economic Development Division has been active this past fiscal year with a number of newprograms and initiatives being implemented. Data correlated to efforts of economicdevelopment include:
• 21 New Business Openings (estimated since we don’t have a Business License to trackthis data; ribbon cuttings and new Certificates of Occupancy were utilized for thisestimate)
• 9% Increase in TOT from FY 14 to FY 15 to over $11 million• 4% Increase in Sales Tax based on the last four quarters of data to $5.6 million
2. Business Retention and Expansion (BRE) Program - A BRE Program has been establishedwhich is an umbrella for a number of efforts to support the existing business community and to help them grow their business here in Dana Point. These efforts include:
• Scheduled business visits to gain an understanding of the various barriers to growth thatbusinesses are facing and connect them to existing resources.
60

• Business workshops hosted by the City, the Chamber of Commerce and SCORE.SCORE is a non-profit consisting of retired business executives that offer free adviceand mentoring services to small businesses. The workshops began in late summer 2014and have been well received. To date, four workshops have been held on the topics ofSocial Media, Computer Maintenance for the Small Business, Email Marketing withConstant Contact and the Affordable Care Act. Six workshops within a calendar yearwill be scheduled.
• City procured ESRI Business Analyst which combines demographic and business data,detailed maps, and advanced spatial analytics to assist businesses with their locationdecision making process. This information is helpful for efforts related to both businessexpansion as well as business attraction.
• In 2014, the City started providing a commercial property search tool to allow existingand prospective businesses and investors to search for available commercial property forsale or lease in Dana Point. This information is updated monthly through a third party.On the back end, Staff has access to sales and lease comps that are helpful for real estateanalysis.
3. Tourist Business Improvement District (TBID) – The TBID was established in 2009 andstarted generating assessment revenue in 2010. A number of programs have been funded with this money to influence the brand message of Dana Point as a luxury destination and to increase the number of hotel stays, particularly during the non-peak season. The Elephant Parade exposed Dana Point to international media coverage. This public/private partnership was acknowledged by the Orange County Business Council at their annual Red Tape to Red Carpet awards.
4. IlluminOcean – 40 Nights of Holiday Lights was sponsored by the TBID to generate additionalexposure and increase visits to Dana Point. The goal is to grow the event to eventually make it an event of national exposure.
5. Statewide Community Infrastructure Program (SCIP) – The City joined SCIP in 2014. SCIPis a financing program that enables developers to finance public improvements and fees.
6. Housing Element Certification – The City successfully received certification of its HousingElement from California’s Housing and Community Development (HCD) Agency in 2014. Because HCD certified the previous Housing Element in 2009 and the City provided annual reports to HCD and received certification in 2014, Dana Point has qualified for a streamlined certification process which means our next Housing Element is not required until 2022.
7. Del Prado Business Assistance – The City is working with the Del Prado businesses during theconstruction of the Phase 2 Town Center Lantern District improvements. The program includes temporary signage, business spotlights, a raffle program and other marketing efforts to help drive business to Del Prado. Businesses citywide have generously donated prizes for the contest and consumers have responded to the added incentive to shop on Del Prado.
61

8. Retail Recruitment Program – The City kicked off a retail recruitment program with theirattendance at the May International Council of Shopping Centers (ICSC) RECon event in Las Vegas. RECon is a global convention for the shopping center industry and provides networking and educational opportunities for retail real estate professionals from around the world with over 34,000 attendees and 1,000 exhibitors. The City compiled demographic and sales data information formatted specifically for targeted retailers and desired uses. A new retail webpage has been added to the Economic Development section of the City’s website that showcases available retail opportunities in the City. A section of this page showcases new retailers that come to town. Through these efforts, the City has facilitated dialogue with various retailers and Dana Point property owners.
PUBLIC WORKS DEPARTMENT
CAPITAL IMPROVEMENT PROJECTS
1. Finished both phases of the design for the PCH/Del Prado Streetscape Improvement Project.Construction of Phase 1 of the City’s Project was completed in November 2014, and Phase 2should be complete by September 2015. The Phase 1 work effort included returning the one waycouplet in downtown on PCH back to two way traffic, safely, on time & under budget.
2. Designed, Bid and Constructed the PCH Rehabilitation Project which resurfaced Pacific CoastHighway between Niguel Road and Crown Valley.
3. Designed, Bid and Constructed the Annual Roadway Resurfacing Project FY13 which resultedin rehabilitation of Via Canon in the Capistrano Beach neighborhood.
4. Designed, Bid and Constructed the Annual Roadway Resurfacing Project FY14 Phase 1 whichresulted in rehabilitation of Violet Lantern and El Camino Capistrano.
5. Designed, Bid and Constructed the Town Center South Gateway Project.
6. Worked with the South Coast Water District to construct downtown improvements inconjunction with the PCH/Del Prado Streetscape Improvement Project.
7. Designed, Bid and Constructed the PCH Medians Phase III Project. This Project was grantfunded in part and resulted in the extension of landscaped medians from Selva Road to BlueLantern on PCH, as well as the entry median and sign just west of Crown Valley on PCH.
8. Assisted OCTA and Metrolink in managing the Railroad Crossing Safety Enhancement Programwhich resulted in significant improvements at the Beach Road Railroad Crossing. Theimprovements were completed and the City successfully attained Quiet Zone Status (no trainhorns) as a result of the modifications.
62

9. Assisted the County of Orange in obtaining grant funds for the San Juan Creek Bike TrailImprovement Project which improved the bike trail to avoid flooding from San Juan Creek, withconstruction completed this year.
10. Continued to utilize in-house construction management and inspection staff which has improvedcustomer service, and costs the City about one-half the expense if outside consultants were used.Completed several in-house design efforts for roadway repair projects, saving considerable costsover contract design services.
11. Made numerous storm drain repairs throughout the City based on recent storm drain inspections.
12. Obtained $500,000 grant funds for Del Obispo Street asphalt repair work.
13. Worked on the design of the Coast Highway Shared Use Path Extension adjacent to DohenyState Beach, and between Palisades and the County owned pedestrian bridge over CoastHighway.
14. Developed a design and implemented the Doheny Village Public Parking Lot at the corner ofDomingo and Doheny Park Road.
ENGINEERING
1. Continued to utilize in-house staff for most Development Plan Check and Inspection Services,including Geotechnical review, saving the City and our applicants’ time and money. With thedoubling of the development workload this period, however, we had to augment our staffinglevel with consultants to meet delivery deadlines. Applicants are paying those costs as part oftheir development processing fees.
2. Continued to assist the Planning and Building Divisions with the review and processing of theirincreased level of development work.
3. Processed Annual Permits with all Utility Companies to streamline permit processing andresultant inspections.
4. Processed Special Event applications/requests in conjunction with the Planning Division andprovided support for those events where public street use was involved.
5. Major private development project submittals included the Dana Point Hotel, Monarch SouthMobile Home Estates property, South Shores Church, Sea Terrace Park Maintenance Facility,Majestic Development, Dana Marina Inn, Advent Building, St. Regis East, a large number ofcustom Headlands homes, and other Town Center Projects.
6. Worked together with the Planning Department on the Connectivity Study for Doheny Village,the Dana Point Harbor and the Lantern District, the Draft Doheny Village Plan, and the ParkingManagement Initial Draft Plan.
7. Working extensively with OCTA on the PCH Complete Street Plan, the South Orange CountyBicycle Master Plan and the proposed Dana Point Trolley & Harbor Shuttle Project. Developed
63

a PCH “Complete Street” concept plan for adding Class III pedestrian/bike paths to compliment the vehicular trail on Hwy 1 in concert with other beach cities.
8. Obtained $2.4 million in competitive grant funds for the seven-year Dana Point Trolley, HarborShuttle and Event Program.
9. Successfully assisted with managing the Annual Grand Prix Professional Criterium BicycleEvent and other bicycle and running permits through the City.
10. Completed the updated Storm Drain GPS Master Plan for Citywide facilities.
11. Prepared the Draft City Heat Safety Program and Confined Space Entry Program for RiskManagement.
12. Began an updated review of City Facilities as part of the City’s ADA Transition Plan and SelfEvaluation.
13. Established the Base Flood Elevation for the San Juan Creek Mobile Home Estates Project.
14. Facilitated and approved the City’s first “Green Roof” at the Monarch St. Regis MaintenanceFacility in 2014.
15. Worked with Dana Point Harbor to secure entitlements for the Dana Point Harbor Project andreviewed plans in that regard.
16. Continued to assist our customers in numerous records requests and general inquiries related toall facets of engineering and development.
WATER QUALITY AND NATURAL RESOURCES PROTECTION
1. Retained funding through OCTA Measure M2 Tier 2 for a future water quality project at a largestorm drain culvert at LO1S02 in San Juan Creek. Currently evaluating feasibility and options,and working with stakeholders and regulatory agencies to evaluate complimentary infiltrationproject to reduce dry weather flow pollutants into San Juan Creek. Staff solicited partnersupport, including the City of San Juan Capistrano, County of Orange, CalTrans and theMunicipal Water District of Orange County. The Co-permittees of south Orange Countyprepared and submitted a comprehensive Report of Waste Discharge (ROWD) on 5/20/14which contains a comprehensive assessment of the state of water quality in Orange County andexplores trends for four primary water quality issues on which the Permittees intend to focusduring the Fifth Term and should be considered part of this annual report assessment.
2. We continue the comprehensive two-prong bacteria investigation and sanitary survey at SanJuan Creek’s LO1SO2 Storm Drain/Doheny State Beach with multiple stakeholders; including:the State Water Resources Control Board & San Diego Regional Water Quality Control Board,Dana Point & San Juan Capistrano, Caltrans & State Parks, Orange County Watersheds, HealthCare Agency & Flood Control, South Coast Water District & San Juan Capistrano UtilitiesDept., South Orange County Wastewater Authority, and Southern California Coastal WaterResearch Project. Dana Point facilitated three stakeholder meetings in FY14 and three dye tests
64

of private sanitary sewer infrastructure (Harbor and State Parks) to ensure that repairs were effective in preventing infiltration into beach water.
LO1SO2 Storm Drain specific actions include:
a. Continued monitoring and incorporation of new testing parameters as suggested in theSCCWRP Guidance Manual. More data is needed and we will continue to monitor.
b. Various focused investigations and abatement, as necessary, of infrastructure by both SanJuan Capistrano and Caltrans.
c. Developed four possible BMP alternative solutions should source control solutions fail.
3. Staff continues to be an active participant in the South Orange County Watershed ManagementArea Group, helping develop regional solutions to water issues.
4. Staff were selected to present technical papers at the National StormCon Conference inPortland, OR, in August, 2014 and the American Planners Association Statewide Conference inAnaheim in September, 2014.
5. Staff is an active participant in the California Beach Stakeholder Group, administered by theState Water Resources Control Board. The City and our fellow San Juan Creek Watershedpartners developed a strategy and drafted the San Juan Creek Comprehensive Load ReductionPlan per the Beaches and Creeks Total Maximum Daily Load (TMDL).
6. Continued to work cooperatively with South Coast Water District on joint Water Use EfficiencyPrograms which are highly focused on runoff reduction and prevention. A notable achievementare the highly acclaimed “H20 for HOAs” Workshops which have become a model program forimplementation throughout our Region. The San Diego Regional Water Quality Control Boardhas recognized these workshops as valuable to our water quality program.
7. Continued to administer the Grease Interceptor Rebate program to prevent sewer block andspills caused by grease on behalf of the City and South Coast Water District. A total of 10interceptors, totaling $77,000 in rebate funds, have been provided to date under this program.
8. Continued applying innovative solutions to water quality issues, such as operating the prototypeozone treatment system at North Creek, the Salt Creek Ozone Treatment System and nuisancewater diversions, and the filter systems and diversions at the Headlands.
9. The City, together with County of Orange’s Watersheds, Parks and Dana Point HarborDepartments, continued to maintain and improve water quality at Baby Beach and achieved thefirst milestone of the Baby Beach Total Maximum Daily Load (TMDL) regulations.
10. The City applied for and received approval of a Nature Education Facilities Grant fromCalifornia State Parks in the amount of $98,595 for the creation of 5 new exhibits, interpretivepanels and maps at the Nature Interpretive Center.
65

11. Continued to build up the Docent programs for the Ocean Institute tidepool area and theHeadlands nature parks (now with over 60 active volunteers), nature walks and children’sprograms.
12. Participated in the State’s Marine Life Protection Program and Orange County Marine ProtectedAreas Council as it relates to Dana Point waters.
13. Conducted regular Ocean Water Quality Subcommittee meetings on relevant issues.
SOLID WASTE AND RECYCLING
1. The City’s franchise hauler, CR&R, Inc. is offering a voluntary food waste composting serviceto commercial businesses as an additional diversion program to remove waste from the landfills.There are currently three businesses participating in food scrap composting program:Albertsons, Ritz-Carlton Resort and Salt Creek Grille. In 2013, 229.34 tons of food waste washauled from these businesses and processed and composted.
2. Manage the SHARPS mail-back program for City residents who need a safe, convenient, andno-cost way to dispose of medical SHARPS syringes.
3. In conjunction with Dana Point Police Services’ Safe Medication Drop-Off program, staffeducates Dana Point residents about the convenient drop off bin located within the PoliceServices lobby for unwanted, unused and expired prescription and over-the-counter medicationdisposal options.
4. Successfully expanded household battery and CFL bulb recycling program at City Hall.
5. Effective February 2014, a residential Household Hazardous Waste (HHW) curbside collectionprogram commenced allowing Dana Point residents a convenient option for disposing of HHW.Outreach efforts to promote the new residential program have been published in the City’s localnewspapers and included on the City’s website. Additionally, refrigerator magnets with HHWprogram information are available to Dana Point residents at City Hall and at each of the City’sBulky Item Clean Up Day, free of charge.
6. A residential outreach program was implemented in 2014 to remind residents of the option tohave their trash/recycle/green waste carts exchanged for clean carts free of charge. Programinformation is included as a CR&R billing insert for residents.
7. Achieved a 56% solid waste diversion rate, exceeding the State’s 50% mandate in the mostrecent 2014 Annual Report.
8. Implemented a Multi-Family Residence Recycling Signage Program as a public outreach effortto educate residents about diverting recyclables from the landfill.
9. Yard and food waste composting workshops (4 annually) held for residents.
10. The Tri-Annual Bulky Item Clean Up Day events diverted over 120 tons of recyclable materialfrom the landfill.
66

11. The tiered Plastic Bag Ban ordinance, approved by City Council in February 2012, went intoeffect for businesses on April 1, 2013 for the 1st tier and October 1, 2013 for the 2nd tier basedon gross annual taxable sales.
12. Developed a zero waste education and outreach program entitled “Show Your Love Dana Point”directed at bringing attention to the numerous ways in which the community can help improveour ocean, our beaches and our community through smart and sustainable practices.
13. Participated in a SONGS Emergency drill under the City’s Emergency Plan.
STREET MAINTENANCE
1. Continued to complete disabled access ramps with City projects andwhere requested byresidents.
2. Inspect every public walkway annually and make necessary repairs to eliminate potentialtripping hazards.
3. Work with Caltrans to improve the appearance and cleanliness of landscaped areas and otherareas along the State Route 1/Interstate 5 Freeway corridor.
4. Continued to support public events such as the Grand Prix Bike Race, Festival of Whales, 4th ofJuly, Concours d’Elegance, Turkey Trot, Championship BBQ Event, Battle of the Paddle, theMS Bike Ride, Concerts in the Parks, Doheny Village Farmer’s Market, and many more eventsthroughout the year. Continued to utilize a lower cost street maintenance service to pick up trashalong all major arterial streets weekly, saving the City money and improving the appearance ofthe City.
5. Continued various street maintenance activities including street sweeping, sidewalk inspections,pavement condition assessment and repair on City roadways, weekly trash collection,emergency response, storm drain maintenance, maintenance of water quality diversions andtrash collection units, and storm drain filter maintenance.
6. Assisted in the review and repair of root related tree damage to sidewalks in Town Center.
7. Continued the City’s Public Property Graffiti Removal Program with same-day service.
8. Staged emergency equipment in 3 locations to allow for faster response times duringemergencies.
9. Instituted a work order management program to track requests, aid in schedule work and trackresponse times.
10. Provided oversight of construction work throughout the city, assuring safety guidelines andquality standards are being followed.
67

11. Continued to assist Code Enforcement in mitigating public right of way obstructions andhazards caused by private property owners.
12. Managed the City’s maintenance and procurement program for 35 vehicles.
13. Participated in a SONGS Emergency drill under the City’s Emergency Plan.
PUBLIC WORKS ADMINISTRATION
1. Expanded the City-wide Special Events Banner Program to highlight and advertise upcomingevents taking place within the City including more in Capistrano Beach and the OC Harbor.
2. Obtained and Administered Grant Funding for three key projects:
a. Construction of a new water proof, concrete bike trail along San Juan Creek underPCH to avoid flooded conditions;
b. New drought tolerant landscaped medians on PCH between Selva Road and NiguelShores Drive;
c. New drought tolerant landscaped medians on PCH between Blue Lantern and SelvaRoad; and,
d. Construction of a new segment of the Coast Highway Shared Use Path betweenPalisades and the County owned pedestrian bridge.
3. Continued to implement effective ways to do more with in-house staff, hence reducing highercontract costs. Examples include assuming all emergency response duties for traffic signal andstreet maintenance related emergencies, performing street light inspections, and setting trafficcontrol for events and emergencies.
4. Participated in a SONGS Emergency drill under the City’s Emergency Plan.
TRAFFIC
1. Continued to address daily inquiries regarding traffic safety issues and parking citywide.
2. Successfully converted the one-way section of PCH in downtown to two way traffic.
3. Installed and managed signal coordination timing on PCH, Golden Lantern, Del Obispo, CrownValley and Stonehill Drive. This included automating several controllers so that timing changescould be made remotely, saving staff time and providing more efficient operations.
4. Continued to review and process the City Council adopted Signal Synchronization Plan.
5. Secured a grant for a new City Trolley for PCH and for special events.
6. Conducted regular Traffic Improvement Subcommittee meetings on various issues of interest.
68

7. Addressed numerous inquiries on parking and traffic safety issues with creative low costsolutions meeting State regulations.
POLICE SERVICES DEPARTMENT
POLICE SERVICES
1. Our Community Services Unit (CSU) has performed in an outstanding manner during thisreporting period. They have utilized the Community Oriented Policing and Problem Solving(COPPS) model of policing to reduce crime and build stronger relationships between LawEnforcement and the community.
2. To improve service and responsiveness to the public, we set up a phone number that is availablefor the community to use to contact us directly on non-emergency matters (questions, commentsand community concerns). Those who contact us receive a response in a timely manner andreceive a follow up call (if desired) to report on the outcome of our efforts and/or response tothe matter. The contact info is: (949) 248-3531.
3. Police Services is working with the City Attorney’s office and the Orange County DistrictAttorney to create pro-active measures to ensure that those individuals on Parole or Probationare restricted from being out in the community during certain hours of the night.
4. The crime prevention program “Hide it, Lock it or Lose it” (HILIOLI) was implemented in2009. The results of the award winning program are still being seen with an overall reduction inproperty crimes.
5. Police Services and the City recognize the importance of protecting our students at Dana HillsHigh School. Our School Resource Officer Program continues with the funding provided by agrant from Citizen Options for Public Safety (C.O.P.S.). Each deputy is required to spend atleast one hour per month on campus to remain familiar with the high school environment andphysical layout of the campus. All personnel are trained in Rapid Response Tactics and areprepared to respond quickly and effectively to violence on the school grounds.
6. In addition to these safeguards, the City and Police Services implemented an Early InterventionProgram to help prevent student involvement in the abuse of alcohol and drugs. The program isstaffed by an Early Intervention Specialist who provides guidance and resources to students,their parents and school staff. This program is helping reduce risky behaviors by students, helpsparents learn how to better address issues, and has prevented many instances where otherwisewe could have seen students causing serious harm to themselves or others.
7. We continued our agreement with the County of Orange Harbors, Beaches and ParksDepartment to have a deputy patrol the beach areas.
8. Police services continued the assignment of one deputy to work full time with the SouthOperations Directed Enforcement Team (DET). This team targets career criminals and assistsSouth Investigations with additional manpower for more labor intensive investigations.
69

9. Police Services has actively sought out grant funding to offset operational and program costs.During this period we obtained funding to offset our HILIOLI program development, our SROposition and assist with funding our COPPS project in the city.
10. With the growing concern over the homeless population Police Services implemented aHomeless Liaison Officer program. An assigned deputy works closely with homeless advocacygroups and with the District Attorney’s Office. He attempts to connect the homeless populationwith much needed resources, and at the same time works with the District Attorney’s Office inprosecution of repeat offenders.
VIPS
1. Volunteers performed over 10,000 hours of community service during the 2012-through 2014time period. Since the inception of the program, VIPS have accumulated 134,337 hours ofservice, saving the City approximately $2.9 million (Based on a nationwide volunteer standardof $21.36 an hour).
Additional deliverables included:
• Issued 1,917 parking citations.
• Performed 589 vacation home checks.
• Removed over 3,000 illegal signs and/or stickers on City property.
• Provided assistance to code enforcement on 611 occasions.
• Conducted 4,331 park inspections.
• Had 3,712 contacts with the public at the Police Services front counter.
• Provided over 3000 citizen assists.
• Conducted high visibility bicycle patrols to both residents and businesses.
2. Continued to provide valuable traffic control assistance to police services at several specialevents including the Festival of Whales parade, Fourth of July, Doheny music festival, BicycleGrand Prix, and Turkey Trot, and host of other events.
3. Patrolled business and residential areas of the city to deter criminal activity.
4. Conducted T-3 patrols in the Dana Point Harbor and at special events.
70

COMMUNITY SERVICES & PARKS DEPARTMENT
COMMUNITY SERVICES
1. Collaborated with local non-profits to help produce the following events:
a. Grand Prix of Cycling/Kid’s Race
b. Dana Point Harbor Boat Parade
c. Dana Point Relay for Life
d. VFW Memorial Day Event
e. VFW Veteran’s Day Event
f. Senior Valentine Dinner Dance
g. Senior New Year’s Eve Dinner Dance
h. St. Patrick’s Day Luncheon
2. Produced and conducted twenty-two successful major city-wide events:
a. Festival of Whales Parade
b. Festival of Whales Movie in the Park
c. Festival of Whales Concert & BBQ
d. Egg Hunts (2 locations, Pines Park & Sea Canyon Park, averaging 1,000 in
attendance at each location)
e. Movies in the Park (4 movies, averaging 1,000 in attendance for each movie)
f. 4th of July Fireworks Display
g. Summer Concert Series (9 concerts, averaging 3,500 per concert, highlighting
Lantern Bay, Sea Terrace and Heritage Parks)
h. Dana Point State BBQ Championship (Largest competition on the west coast)
i. Halloween Spooktacular & Moonlight Movie
j. Winter Festival & Tree Lighting
71

3. Continued to collaborate with the Dana Point Chamber of Commerce, Dana Point HarborAssociation, AgeWell Senior Services, Dana Point Historical Society, American Cancer Relayfor Life, local businesses and non-profits to help produce programs and events for theCommunity.
4. Participated in a SONGS Emergency drill under the City’s Emergency Plan.
PARKS
1. Installed three bocce ball courts at Lantern Bay Park.
2. Removed and replaced the park sign at Crystal Cove Park.
3. Removed sand play surface in playground at Sea Canyon and replaced it with safer poured inplace rubber surface.
4. Landscaped the Golden Lantern parkway from Jeremiah to Priscilla with drought tolerant plantsand added a new subsurface irrigation system to eliminate water runoff.
5. Removed and replaced the park sign at Louise Leyden Park.
6. Added new railing around picnic area at Sea Canyon Park and replaced concrete to meet ADAstandards.
7. Resurfaced basketball court, racquet ball court and 2 tennis courts at Del Obispo Park.
8. Landscaped Shipwreck Park.
9. Added concrete benches to Creekside Park.
10. Installed new removable bollards at Lantern Bay Park and at the entrance to Creekside Park offof Admiral Way.
11. Resurfaced basketball court at Dana Crest Park.
12. Installed erosion control measures at Pines Park.
13. Landscaped two sections of Sea Terrace Park to address drainage issues.
14. Upgraded the light poles in the old section of Sea Terrace Park to match the ones in the newsection.
15. Installed smart-timer irrigation controllers at various locations to help reduce water usage andcontrol runoff.
72

City of Dana Point Appropriations Subject to Limit
The Appropriations Limitation imposed by Propositions 4 and 11 creates a restriction on the amount of revenue which can be appropriated in any fiscal year. Not all revenues are restricted by the Limit, only those which are referred to as "proceeds of taxes". The purpose of the law is to limit governmental spending by putting a cap on the total proceeds of taxes that may be appropriated each year. This limit is increased each year through a formula that takes into consideration changes in population, the Consumer Price Index and State per-capita income. The City of Dana Point's appropriations limit for fiscal year 2016 is $83,057,148 and was calculated as follows:
The City of Dana Point's Appropriations Limitation (FY 2015): $79,587,148
FY 2016 Adjustment Factors:
1. Population % .52 2. Per Capita Personal Income % 3.82 3. Population converted to a ratio 1.0052 4. Inflation converted to a ratio 1.0382
Total Adjustment Factor (=3 x 4) 1.0436
FY 2016 Appropriations Limit ($79,587,148 x 1.0436) $83,057,148
73

THIS PAGE IS INTENTIONALLY LEFT BLANK

BUDGET SUMMARIES

Budget Summaries Overview
The Budget Summaries section includes a breakdown of revenues and expenditures by funds including General Fund specifics and City totals. The overviews include comparative information for Fiscal Years 2013 through 2017
The summaries presented include the following:
General Fund Revenue Comparison – By Source General Fund Expenditure Comparison – By Department General Fund Total Sources & Allocation Comparison Authorized full-time Positions – By Department Personnel Classifications
74

CITY OF DANA POINTGENERAL FUND REVENUE COMPARISON - BY SOURCE
Fiscal Years 2013 Through 2017
FY2013 FY2014 FY2015 FY2016 FY2017Actual Actual Budget Budget Budget
TAXES & FRANCHISESProperty Taxes $ 6,990,531 $ 6,263,169 $ 6,600,000 $ 6,815,000 $ 7,035,000Property Transfer Taxes 458,752 570,407 350,000 350,000 350,000Franchise Fees 1,328,760 1,314,649 1,223,000 1,235,000 1,247,000Homeowner Property Tax Relief 47,728 23,061 51,511 50,000 50,000Transient Occupancy Taxes 10,086,366 11,007,316 11,600,000 11,600,000 11,800,000Short Term Rental TOT 0 115,065 360,000 360,000 360,000Sales & Use Taxes 3,425,323 3,794,435 4,100,000 5,640,000 5,750,000In-lieu Property Taxes 4,318,786 4,270,627 4,500,000 3,200,000 3,280,000
LICENSES & PERMITSShort Term Rental Permits 0 20,850 20,000 20,000 20,000Engineering Permits 72,054 257,738 326,542 243,000 245,000Planning Permits 49,947 93,548 105,000 95,000 95,000Building Permits 577,424 739,978 1,071,000 915,000 1,000,000
FINES & FORFEITURESFines & Forfeitures 198,768 198,521 200,000 250,000 250,000Penalties, Interest & Restitution 36,995 63,904 100,000 50,000 50,000
USE OF MONEY & PROPERTYRental of Property 79,845 77,730 60,000 60,000 60,000City Plaza Rent 75,227 75,708 74,000 75,000 75,000Investment Interest 124,124 86,289 72,000 87,800 87,800
INTERGOVERNMENTALWaste Disposal Allocation 0 0 0 0 53,278State/Local Grants 154,539 134,461 120,250 0 0Intergovernmental Cost Reimbursements 534,266 118,145 54,000 100,000 100,000Nuclear Power Program 145,930 149,600 160,000 140,000 140,000
CHARGES FOR SERVICESEngineering Fees 24,510 52,386 60,000 49,000 49,000Art in Public Places Fee 3,984 0 0 0 0Planning Fees 78,541 96,667 84,000 95,000 100,000Building Fees 347,218 688,198 621,000 550,000 600,000Recreation Classes & Activities 344,448 266,278 278,000 280,000 283,000Solid Waste Exemption Fee 0 2,220 2,000 2,000 2,000Development Impact Fees 9,207 2,858 0 0 0Reimbursed Expenses 508,040 604,165 350,000 235,000 160,000Reimbursed Developer Expenses Revenue 0 0 330,000 300,000 300,000Photocopies 0 1,403 0 1,000 1,000Other P/B/E (planning, bld., engineering) 0 27,136 0 0 0
OTHEROther Financing Sources 0 3,625,000 0 0 151,600Planning Appeals 6,650 2,000 1,000 1,000 1,000Solid Waste Administration Fee 49,301 51,388 50,000 50,000 50,000Abandoned Vehicle Abatement Program 3,695 0 0 0 0Beverage Container Recycling 9,302 9,148 0 0 0Litigation Settlements 0 0 0 0 0Miscellaneous Revenue 52,576 20,576 5,000 25,000 25,000
GENERAL FUND TOTAL $30,142,837 $34,824,621 $32,928,303 $32,873,800 $33,770,678
75

FY2013 FY2014 FY2015 FY2016 FY2017 FY2013 FY2014 FY2015 FY2016 FY2017Actual Actual Budget Budget Budget Actual Actual Budget Budget Budget
CITY COUNCIL PUBLIC SAFETYPersonnel 48,864$ 48,740$ 48,370$ 46,959$ 46,959$ Personnel 207,896$ 207,342$ 226,462$ 225,976$ 227,597$ Materials & Services 57,947 66,793 81,500 84,500 84,500 Materials & Services 9,651,158 9,733,820 10,570,670 10,911,352 11,810,650 Capital Outlay - - - - - Capital Outlay 13,500 - 200,000 - 150,000 Total 106,811$ 115,533$ 129,870$ 131,459$ 131,459$ Total 9,872,554$ 9,941,162$ 10,997,132$ 11,137,328$ 12,188,247$
CITY MANAGER CITY ATTORNEYPersonnel 392,863$ 387,230$ 407,594$ 399,180$ 401,342$ Personnel -$ -$ -$ -$ -$ Materials & Services 54,801 36,242 131,285 132,510 133,310 Materials & Services 853,386 899,070 904,721 703,500 707,500 Capital Outlay - - 35,000 - - Capital Outlay - - - - - Total 447,664$ 423,472$ 573,879$ 531,690$ 534,652$ Total 853,386$ 899,070$ 904,721$ 703,500$ 707,500$
ADMINISTRATIVE SERVICES RECREATION & PARKSPersonnel 748,211$ 785,951$ 804,729$ 982,255$ 995,132$ Personnel 893,956$ 950,391$ 1,006,666$ 1,024,413$ 1,034,573$ Materials & Services 140,450 148,228 168,743 152,643 154,543 Materials & Services 3,912,710 4,038,500 4,380,390 4,577,005 4,768,205 Capital Outlay - - - - - Debt Service - - - - - Total 888,661$ 934,179$ 973,472$ 1,134,898$ 1,149,675$ Capital Outlay 24,539 33,300 - - -
Total 4,831,205$ 5,022,191$ 5,387,056$ 5,601,418$ 5,802,778$ PUBLIC INFORMATION SERVICES
Materials & Services 64,282$ 55,239$ 142,100$ 128,195$ 127,530$ RISK MANAGEMENTTotal 64,282$ 55,239$ 142,100$ 128,195$ 127,530$ Personnel -$ -$ -$ -$ -$
Materials & Services - - 1,300 1,300 1,300 CITY CLERK Risk Management 745,748 466,510 536,800 623,000 623,000
Personnel 376,637$ 370,656$ 387,911$ 405,066$ 408,970$ Total 745,748$ 466,510$ 538,100$ 624,300$ 624,300$ Materials & Services 93,755 50,680 134,460 72,640 96,970 Capital Outlay - - 12,000 - - FACILITIESTotal 470,392$ 421,336$ 534,371$ 477,706$ 505,940$ Personnel 153,858$ 136,983$ 115,273$ 190,613$ 192,377$
Materials & Services 459,527 504,171 585,647 539,310 541,310 COMMUNITY DEVELOPMENT Capital Outlay - 95,664 - - -
Personnel 2,328,854$ 2,379,743$ 2,568,029$ 2,769,323$ 2,795,178$ Total 613,385$ 736,818$ 700,920$ 729,923$ 733,687$ Materials & Services 540,679 658,401 758,694 992,255 849,005 Capital Outlay - 20,879 - 2,200 2,000 NON-DEPARTMENTALTotal 2,869,533$ 3,059,023$ 3,326,723$ 3,763,778$ 3,646,183$ Personnel -$ 4,420$ 4,500$ 9,000$ 9,000$
Materials & Services 689,968 783,840 1,061,195 903,900 924,330 PUBLIC WORKS Capital Outlay 99,549 102,575 3,380 98,000 195,000
Personnel 2,029,087$ 1,905,371$ 2,009,553$ 2,038,432$ 2,055,577$ Transfers Out 30,000 7,748,859 8,255,166 667,074 280,000 Materials & Services 3,274,157 3,138,703 4,317,798 4,394,158 4,421,183 Total 819,517$ 8,639,694$ 9,324,241$ 1,677,974$ 1,408,330$ Capital Outlay - - 60,000 - - Total 5,303,244$ 5,044,074$ 6,387,351$ 6,432,590$ 6,476,760$ TOTAL 27,886,382$ 35,758,301$ 39,919,936$ 33,074,758$ 34,037,041$
CITY OF DANA POINTGENERAL FUND EXPENDITURE COMPARISON BY DEPARTMENT
Fiscal Years 2013 Through 2017
76

FY2013 FY2014 FY2015 FY2016 FY2017REVENUES & SOURCES Actual Actual Budget Budget Budget
General Fund - Revenue $30,142,838 $34,824,624 $32,928,303 $32,873,800 $33,770,678
Transfer In - from Facilities Improvement Fund 0 0 0 0 0
Transfer In - from Measure M Fund 72,426 66,200 0 0 0
Transfer In - from Gas Tax Fund 369,145 703,170 549,370 625,551 632,000
TOTAL REVENUES & SOURCES $30,584,409 $35,593,994 $33,477,673 $33,499,351 $34,402,678
EXPENDITURES & USES
General Fund - Operating Expenditures $27,856,381 $28,112,678 $31,664,770 $32,407,684 $33,757,041
Transfer Out - to Capital Improvements Fund 0 7,718,859 7,925,166 0 0
Transfer Out - to CFD2006-1 Maintenance Fund 30,000 30,000 330,000 30,000 30,000
Transfer Out - to Facilities Improvement Fund 0 0 0 637,074 250,000
TOTAL EXPENDITURES & USES $27,886,381 $35,861,537 $39,919,936 $33,074,758 $34,037,041
REVENUES & OTHER SOURCES OVER (UNDER)EXPENDITURES & OTHER USES $2,698,028 -$267,543 -$6,442,263 $424,593 $365,637
CITY OF DANA POINTGENERAL FUND TOTAL SOURCES & ALLOCATION COMPARISON
Fiscal Years 2013 Through 2017
77

FY2014 FY2015 FY2016 FY2017 FY2014 FY2015 FY2016 FY2017
City Manager Public Works - Street/Drainage MaintenanceCity Manager 1 1 1 1 Senior Management Analyst 0.33 0.33 0.33 0.33Executive Secretary 1 1 1 1 Streets & Fleet Manager 1 1 1 1
City Clerk Public Works - Traffic EngineeringCity Clerk 1 1 1 1 Senior Civil Engineer 1 1 1 1Deputy City Clerk 1 1 1 1City Clerk Specialist 1 1 1 1 Public Works - Solid WasteSecretary 1 1 1 1 Senior Management Analyst 0.34 0.34 0.34 0.34
Administrative Services Public Works - EngineeringAccounting Supervisor 1 1 1 1 Engineering Technician III 3 3 3 3Accounting Technician 1 1 1 1 City Engineer 1 1 1 1Accountant 1 1 1 1 Senior Construction Inspector 1 1 1 1Administrative Secretary 1 1 1 1 Principal Civil Engineer 1 1 1 1Dir. of Administrative Services 1 1 1 1 Secretary 2 2 2 2Management Analyst 1 1 2 2 Senior Civil Engineer 4 4 4 4Senior Personnel Analyst 1 1 1 1
Public Works - Water QualityCommunity Development - Planning Senior Civil Engineer 1 1 1 1Dir. of Community Development 1 1 1 1 Natural Resources Protection Officer 1 1 1 1Administrative Secretary 1 1 1 1City Architect/Planning Manager 1 1 1 1 FacilitiesPlanning Manager 0 0 1 1 Bldg. & Facil. Maint. Worker III 1 1 1 1Associate Planner 2 2 2 2 Director of Facilities & Disaster Svcs 0.5 0.5 0.5 0.5Senior Planner 3 3 3 3
Public Safety - Emergency ServicesCommunity Development - Building Emergency Services Coordinator 1 1 1 1Secretary 0.5 0.5 0.5 0.5 Director of Facilities & Disaster Svcs 0.5 0.5 0.5 0.5Permit Technician 1 1 1 1Building Official 1 1 1 1 Community Services - ParksSenior Structural Engineer 1 1 1 1 Parks Manager 1 1 1 1Chief Building Inspector 1 1 1 1 Parks Supervisor 1 1 1 1Senior Building Inspector 2 2 2 2 Parks Maintenance Worker III 1 1 1 1Senior Permit Technician 1 1 1 1
Community ServicesCommunity Development - Code Enforcement Administrative Aide 1 1 1 1Code Enforcement Officer 4 4 4 4 Administrative Secretary 1 1 1 1Secretary 0.5 0.5 0.5 0.5 Dir. Community Svcs & Parks 1 1 1 1
Recreation Manager 1 1 1 1Community Development - Economic Development Recreation Coordinator 2 2 2 2Economic Development Manager 1 1 1 1Management Analyst 1 1 0 0 Total Personnel 66.00 66.00 68.00 68.00Assistant Administrative Analyst 0 0 1 1
Public Works - AdministrationDir. of Pub. Works & Engr. Svcs. 1 1 1 1Administrative Secretary 1 1 1 1Senior Management Analyst 0.33 0.33 0.33 0.33
CITY OF DANA POINTAUTHORIZED FULL-TIME POSITIONS - BY DEPARTMENT
Fiscal Years 2014 Through 2017
78

AUTHORIZED FULL-AUTHORIZED FULL-AUTHORIZED FULL-AUTHORIZED FULL-FULL TIME PERSONNEL TIME POSITIONS TIME POSITIONS TIME POSITIONS TIME POSITIONSTITLE FY2014 FY2015 FY2016 FY 2017Accountant 1 1 1 1Accounting Technician 1 1 1 1Accounting Supervisor 1 1 1 1Administrative Aide 1 1 1 1Administrative Secretary 4 4 4 4Assistant Admin Analyst 0 0 1 1Assistant City Manager/Director of Administrative Services 1 1 1 1Associate Engineer 0 0 0 0Associate Planner 2 2 2 2Building Official 1 1 1 1Building/Facilities Maintenance Worker III 1 1 1 1Chief Building Inspector 1 1 1 1City Architect/Planning Manager 1 1 1 1Planning Manager 0 0 1 1City Clerk 1 1 1 1City Clerk Specialist 1 1 1 1City Engineer 1 1 1 1City Manager 1 1 1 1Code Enforcement Officer 4 4 4 4Deputy City Clerk 1 1 1 1Director of Community Development 1 1 1 1Director of Community Services & Parks 1 1 1 1Director of Facilities & Disaster Preparedness 1 1 1 1Director of Public Works & Engineering Services 1 1 1 1Economic Development Manager 1 1 1 1Emergency Services Coordinator 1 1 1 1Engineering Technician III 3 3 3 3Executive Secretary 1 1 1 1Management Analyst 2 2 2 2Natural Resource Protection Officer 1 1 1 1Parks Maintenance Worker III 1 1 1 1Parks Manager 1 1 1 1Parks Supervisor 1 1 1 1Permit Technician 1 1 1 1Personnel Analyst 0 0 0 0Principal Civil Engineer 1 1 1 1Recreation Coordinator 2 2 2 2Recreation Manager 1 1 1 1Recreation Supervisor II 0 0 0 0Secretary 4 4 4 4Senior Building Inspector 2 2 2 2Senior Civil Engineer 6 6 6 6Senior Construction Inspector 1 1 1 1Senior Management Analyst 1 1 1 1Senior Permit Technician 1 1 1 1Senior Personnel Analyst 1 1 1 1Senior Planner 3 3 3 3Senior Structural Engineer 1 1 1 1Streets & Fleet Manager 1 1 1 1
TOTAL FULL TIME 66 66 68 68
PART-TIME PERSONNEL (Hours vary from 0 to a max of 30 hrs per week depending on position)Account Clerk 1 1 1 1Administrative Intern/Admin Services 0 0 1 1Administrative Intern/City Clerk 0 0 1 1Public Works Intern 2 2 2 2Records Assistant (not funded) 1 1 1 1Recreation Leader 4 4 4 4Secretary 2 2 2 2Secretary - On Call 1 1 1 1Staff Aide - Recreation 1 1 1 1Staff Aide - Visitor's Center (Seasonal) 4 4 4 4Maintenance Aide/Buidling & Facilities 0 0 1 1
CITY OF DANA POINTPERSONNEL CLASSIFICATIONS
79

CHANGES IN FUND BALANCE

DESCRIPTION OF FUND BALANCES
GENERAL FUND: General Fund balances are comprised of two components: Unreserved balances and Reserved balances. Reserved balances constitute that portion of the General Fund which is restricted for cash flow, interest earning and financing purposes. Unreserved balances are a resource against which expenditures or appropriations are made and are the result of either: (1) expenditure savings from the prior fiscal years; or (2) revenue surplus from the prior fiscal years.
The General Fund reserve items components correspond to the following purposes: - Encumbrance reserves are monies carried over from the previous budget year to pay for
previous year obligations. - Reserve for State budget impacts corresponds to funds set aside to deal with potential City
budget impacts that could result from actions taken by the State of California to balance its budget.
- Reserve 20% of General Fund revenues in an emergency reserve that can only be utilized by a 4/5 majority City Council vote.
- Reserve $105,796 collected from developers for the creation and display of artwork in public locations in the City of Dana Point.
- Investment mark to market represents unrealized gains on the market value of City investments.
- Cash Flow Reserve, established at 10% of General Fund revenues, is the fund balance amount which may be required for expenditures early in the fiscal year, when the revenues necessary for such expenditures may not be received until later in the fiscal year.
- Capital Projects Sinking Fund corresponds to funds set aside for future replacement of City infrastructure.
Because the Reserved balances may not be available for current year General Fund expenditures, the Unreserved balances more accurately reflect the financial situation of the General Fund.
GAS TAX FUND: The Gas Tax revenues received representing the replacement of the Traffic Congestion Relief funds (Prop 42) are transferred to the Capital Improvement Projects Fund. The balance of the Gas Tax revenues are transferred to the General Fund and will be used to pay for ongoing road maintenance costs.
MEASURE M FUND: All Measure M revenues are transferred to the Capital Improvement Fund and are used to pay for qualifying Capital Improvement Projects.
AB2766 FUND: This fund accounts for all unexpended funds received by the City pursuant to Assembly Bill 2766, and are restricted for use in implementing elements of the California's Clean Air Act.
80

COASTAL TRANSIT FUND: This fund accounts for funds received by the City to mitigate impacts to coastal access that were anticipated to result from the projected residential development in Orange County. The funds are restricted for use to provide coastal recreational transit services. The City of Dana Point and the California Coastal Commission amended the Memorandum of Understanding on March 17, 2015. This amendment contemplates the City utilizing a portion of these funds to support both event shuttles and fixed route trolley service along Pacific Coast Highway and shuttle service from the Dana Hills High School parking lot to the OC County Harbor. Fixed route PCH service is scheduled to begin the summer of 2015.
TOURISM BUSINESS IMPROVEMENT DISTRICT (TBID) FUND: This fund was establish to account for assessment funds received by the City, collected by the Tourism Business Improvement District (St. Regis Monarch Beach, Ritz Carlton Laguna Niguel, Laguna Cliffs Marriott and DoubleTree Doheny Beach), used to promote Dana Point as an overnight destination and includes activities such as advertising, public relations, and marketing to attract and extend overnight stays in Dana Point hotels.
HEADLANDS HABITAT FUND (ESHA): This fund was established to account for the revenues and expenditures related to maintaining the natural habitat at the Headlands Reserve.
CAPITAL IMPROVEMENT PROJECTS FUND: This fund was established to account for major improvements to the City’s infrastructure, including streets, medians, sidewalks, storm drains, parks and other facilities. Funds reserved include accumulations for future open space acquisition, transportation improvements and undergrounding of utilities.
FACILITIES IMPROVEMENT FUND This fund was established to account for major one-time expenditures to improve city-owned facilities including City Plaza and the Del Obispo Recreation Center.
PARK DEVELOPMENT FUND: This fund accounts for monies received by the City through the County, State and Federal Governments, as well as contributions from developers, which are restricted for use in park site acquisition, development and improvement.
SUPPLEMENTAL LAW ENFORCEMENT SERVICES FUND: This fund accounts for the proceeds of Assembly Bill 3229, passed by the California State legislature in 1996. These funds are allocated to the City by the State, and are restricted for use in enhancing front line law enforcement activities.
CFD 2006-1 FACILITIES MAINTENANCE FUND: This fund was established to account for expenditures relating to the ongoing maintenance of landscaping, revetment, storm water quality and funicular associated with CFD 2006-1.
81

01 02 04 05 06 07 09 11 12 21 25 27
General Gas Tax Measure M AB2766 Clean Air Act
Coastal Transit
Tourism Business
Improvement
Headlands Habitat ESHA CIP Facilities
Improvements Park
Development
Supplemental Law
Enforcement
CFD Headlands
Maintenance Total
Estimated Fund Balance 6/30/2015 15,260,581$ -$ 133,094$ 300,562$ 1,231,426$ 747,259$ 213,994$ 608,055$ 172,926$ 583,500$ 203$ 72,299$ 19,323,899$
Revenues & Transfers In:REVENUES:
Taxes & Franchises 29,250,000 794,622 595,581 950,000 31,590,203 Licenses & Permits 1,273,000 1,273,000 Fines & Forfeitures 300,000 300,000 Use of Money & Property 222,800 900 800 6,300 3,000 30,450 - 600 1,400 266,250 Intergovernmental 240,000 - 40,000 280,000 Charges for Services 1,512,000 324,000 1,836,000 Other 76,000 - - 76,000
Sub-total Revenues 32,873,800 794,622 596,481 40,800 6,300 953,000 30,450 - - - 600 325,400 35,621,453
TRANSFERS-INfrom Gas Tax Fund 625,551 - 625,551 from Park Development Fund 75,000 75,000 from CIP Fund - - estimated FY15 reprogrammed CIP 1,250,000 estimated FY15 General Fund Surplus 2,500,000 from General Fund - 637,074 30,000 667,074 from AB2766 Fund - - from Measure M Fund 595,581 595,581
Sub-total Transfers-in 625,551 - - - - - 4,420,581 637,074 - - 30,000 5,713,206
Total Revenues & Transfers In 33,499,351$ 794,622$ 596,481$ 40,800$ 6,300$ 953,000$ 30,450$ 4,420,581$ 637,074$ -$ 600$ 355,400$ 41,334,659$
Expenditures & Transfers OutEXPENDITURES
Personnel 8,091,216 8,091,216 Materials & Services 23,593,268 42,000 1,200,000 22,700 1,920,681 208,300 26,986,949 Risk Management 623,000 623,000 Capital Outlay 100,200 810,000 910,200
Sub-total Operating Expenditures 32,407,684 - - - 42,000 1,200,000 22,700 1,920,681 810,000 - - 208,300 36,611,365
TRANSFERS-OUTto CIP Fund 637,074 - 595,581 75,000 1,307,655 to Headlands CFD Maint. Fund 30,000 - 30,000 to Facility Improvement Fund - - - to General Fund 625,551 - - 625,551
Sub-total Operating Transfers-out 667,074 625,551 595,581 - - - - - - 75,000 - - 1,963,206
Total Expenditures & Transfers Out 33,074,758 625,551 595,581 - 42,000 1,200,000 22,700 1,920,681 810,000 75,000 - 208,300 38,574,571
Change in Fund Balance FY16 424,593 169,071 900 40,800 (35,700) (247,000) 7,750 2,499,900 (172,926) (75,000) 600 147,100 2,760,088
Estimated Ending Fund Balance 6/30/2016 15,685,174$ 169,071$ 133,994$ 341,362$ 1,195,726$ 500,259$ 221,744$ 3,107,955$ -$ 508,500$ 803$ 219,399$ 22,083,987$
YEAR-END FUND BALANCE DETAILS
Cash Flow 3,287,000$ 3,287,000$ Capital Projects Sinking Fund 2,500,000 2,500,000 Emergencies 6,575,000 6,575,000 Priority 1 Projects - - Investment mark to market - - Art in Public Places 117,954 117,954 Potential State Budget Impacts - - Future Years' Expenditures 3,205,220 169,071 133,994 341,362 1,195,726 500,259 221,744 3,107,955 - 508,500 803 219,399 9,604,033
Estimated Total Fund Balance 6/30/2016 15,685,174$ 169,071$ 133,994$ 341,362$ 1,195,726$ 500,259$ 221,744$ 3,107,955$ -$ 508,500$ 803$ 219,399$ 22,083,987$
CITY OF DANA POINTFISCAL YEAR 2016 BUDGET
CHANGES IN FUND BALANCE - ALL FUNDS
82

01 02 04 05 06 07 09 11 12 21 25 27
General Gas Tax Measure M AB2766 Clean Air
Coastal Transit
Tourism Business
Improvement
Headlands Habitat ESHA CIP Facilities
Improvements Park
Development
Supplemental Law
Enforcement
CFD Headlands
Maintenance Total
Estimated Fund Balance 6/30/2016 15,685,174$ 169,071$ 133,994$ 341,362$ 1,195,726$ 500,259$ 221,744$ 3,107,955$ -$ 508,500$ 803$ 219,399$ 22,083,987$
Revenues & Transfers InREVENUES:
Taxes & Franchises 29,872,000 802,000 627,364 950,000 32,251,364 Licenses & Permits 1,360,000 1,360,000 Fines & Forfeitures 300,000 300,000 Use of Money & Property 222,800 900 800 6,300 3,000 30,450 - 600 1,400 266,250 Intergovernmental 293,278 - 40,000 1,107,187 1,440,465 Charges for Services 1,495,000 324,000 1,819,000 Other 227,600 - 227,600
Sub-total Revenues 33,770,678 802,000 628,264 40,800 6,300 953,000 30,450 1,107,187 - - 600 325,400 37,664,679
TRANSFERS-INfrom Gas Tax Fund 632,000 339,071 971,071 from Park Development Fund 455,000 455,000 from CIP Fund - - reprogrammed from FY15 CIP 750,722 estimated FY16 General Fund surplus - from General Fund - 250,000 30,000 280,000 from AB2766 Fund 307,636 307,636 from Measure M Fund 627,364 627,364
Sub-total Transfers-in 632,000 - - - - - - 2,479,793 250,000 - - 30,000 3,391,793
Total Revenues & Transfers In 34,402,678 802,000 628,264 40,800 6,300 953,000 30,450 3,586,980 250,000 - 600 355,400 41,056,472
Expenditures & Transfers OutEXPENDITURES
Personnel 8,166,705 8,166,705 Materials & Services 24,620,336 141,000 1,000,000 22,700 6,211,284 359,900 32,355,220 Risk Management 623,000 623,000 Capital Outlay 347,000 250,000 597,000
Sub-total Operating Expenditures 33,757,041 - - - 141,000 1,000,000 22,700 6,211,284 250,000 - - 359,900 41,741,925
TRANSFERS-OUTto CIP Fund 339,071 627,364 307,636 455,000 1,729,071 to Headlands CFD Maint. Fund 30,000 30,000 to Facility Improvement Fund 250,000 250,000 to General Fund 632,000 - 632,000
Sub-total Operating Transfers-out 280,000 971,071 627,364 307,636 - - - - - 455,000 - - 2,641,071
Total Expenditures & Transfers Out 34,037,041 971,071 627,364 307,636 141,000 1,000,000 22,700 6,211,284 250,000 455,000 - 359,900 44,382,996
Change in Fund Balance FY17 365,637 (169,071) 900 (266,836) (134,700) (47,000) 7,750 (2,624,304) - (455,000) 600 (4,500) (3,326,524)
Estimated Ending Fund Balance 6/30/2017 16,050,811$ -$ 134,894$ 74,526$ 1,061,026$ 453,259$ 229,494$ 483,651$ -$ 53,500$ 1,403$ 214,899$ 18,757,463$
YEAR-END FUND BALANCE DETAILS
Unreserved - DesignatedCash Flow 3,377,000$ 3,377,000$ Capital Projects Sinking Fund 2,500,000 2,500,000 Emergencies 6,754,000 6,754,000 Art in Public Places 117,954 117,954 Potential State Budget Impacts - - Future Years' Expenditures 3,301,857 - 134,894 74,526 1,061,026 453,259 229,494 483,651 - 53,500 1,403 214,899 6,008,509
Estimated Ending Fund Balance 6/30/2017 16,050,811$ -$ 134,894$ 74,526$ 1,061,026$ 453,259$ 229,494$ 483,651$ -$ 53,500$ 1,403$ 214,899$ 18,757,463$
CITY OF DANA POINTFISCAL YEAR 2017 BUDGET
CHANGES IN FUND BALANCE - ALL FUNDS
83

CHANGES IN FUND BALANCE
FY2014 FY2015 FY2016 FY2017
GENERAL FUND Actual Estimated Budget Budget
Revenues 31,199,625$ 32,928,303$ 32,873,800$ 33,770,678$
Expenditures 28,112,685 31,664,770 32,407,684 33,757,041
Other Sources (Uses)Operating Transfers In 769,370 549,370 625,551 632,000 Operating Transfers Out (7,748,859) (8,255,166) (667,074) (280,000) Sale of Surplus Property 3,625,000 - - -
Total Other Sources (Uses) (3,354,489) (7,705,796) (41,523) 352,000
Revenues & Other Sources Over (Under)Expenditures & Other Uses (267,549) (6,442,263) 424,593 365,637
Fund Balance, Beginning of Year 21,970,393 21,702,844 15,260,581 15,685,174
Fund Balance, End of Year $21,702,844 $15,260,581 $15,685,174 $16,050,811
Reserved:Nonspendable 154,796$ -$ -$ -$ Restricted 117,954 117,954 117,954 117,954 Assigned 2,500,000 1,250,000 2,500,000 2,500,000 Unassigned 18,930,094 13,892,627 13,067,220 13,432,857
Total Fund Balance 21,702,844$ 15,260,581$ 15,685,174$ 16,050,811$
84

CHANGES IN FUND BALANCE
FY2014 FY2015 FY2016 FY2017
GASOLINE TAX FUND Actual Budget Budget Budget
Revenues 1,132,864$ 1,065,577$ 794,622$ 802,000$
Other Sources (Uses)
Operating Transfers Out (1,206,484) (1,142,757) (625,551) (971,071)
Revenues & Other Sources Over (Under)
Expenditures & Other Uses (73,620) (77,180) 169,071 (169,071)
Fund Balance, Beginning of Year 150,800 77,180 - 169,071
Fund Balance, End of Year 77,180$ -$ 169,071$ -$
Restricted 77,180$ -$ 169,071$ -$
Total Fund Balance 77,180$ -$ 169,071$ -$
85

CHANGES IN FUND BALANCE
FY2014 FY2015 FY2016 FY2017
MEASURE M FUND Actual Budget Budget Budget
Revenues 617,549$ 553,790$ 596,481$ 628,264$
Other Sources (Uses)
Operating Transfers Out (588,037) (529,505) (595,581) (627,364)
Revenues & Other Sources Over (Under)
Expenditures & Other Uses 29,512 24,285 900 900
Fund Balance, Beginning of Year 79,297 108,809 133,094 133,994
Fund Balance, End of Year $108,809 $133,094 $133,994 $134,894
Restricted 108,809$ 133,094$ 133,994$ 134,894$
Total Fund Balance 108,809$ 133,094$ 133,994$ 134,894$
86

CHANGES IN FUND BALANCE
FY2014 FY2015 FY2016 FY2017
AB2766 FUND Actual Budget Budget Budget
Revenues 31,664$ 40,800$ 40,800$ 40,800$
Expenditures 15,258 - - -
Other Sources (Uses)
Operating Transfers Out - - - (307,636)
Revenues & Other Sources Over (Under)
Expenditures & Other Uses 16,406 40,800 40,800 (266,836)
Fund Balance, Beginning of Year 243,356 259,762 300,562 341,362
Fund Balance, End of Year 259,762$ 300,562$ 341,362$ 74,526$
Restricted 259,762$ 300,562$ 341,362$ 74,526$
Total Fund Balance 259,762$ 300,562$ 341,362$ 74,526$
87

CHANGES IN FUND BALANCE
FY2014 FY2015 FY2016 FY2017
COASTAL TRANSIT FUND Actual Budget Budget Budget
Revenues 3,498$ 6,300$ 6,300$ 6,300$
Expenditures 120,000 42,000 141,000
Revenues & Other Sources Over (Under)
Expenditures & Other Uses 3,498 (113,700) (35,700) (134,700)
Fund Balance, Beginning of Year 1,341,628 1,345,126 1,231,426 1,195,726
Fund Balance, End of Year 1,345,126$ 1,231,426$ 1,195,726$ 1,061,026$
Restricted 1,345,126$ 1,231,426$ 1,195,726$ 1,061,026$
Assigned
Total Fund Balance 1,345,126$ 1,231,426$ 1,195,726$ 1,061,026$
88

CHANGES IN FUND BALANCE
FY2014 FY2015 FY2016 FY2017
TBID FUND Actual Budget Budget Budget
Revenues 1,082,257$ 950,000$ 953,000$ 953,000$
Expenditures 1,254,369 1,950,269 1,200,000 1,000,000
Revenues & Other Sources Over (Under)
Expenditures & Other Uses (172,112) (1,000,269) (247,000) (47,000)
Fund Balance, Beginning of Year 1,919,640 1,747,528 747,259 500,259
Fund Balance, End of Year 1,747,528$ 747,259$ 500,259$ 453,259$
Restricted 1,747,528 747,259 500,259 453,259
Assigned
Total Fund Balance $1,747,528 $747,259 $500,259 $453,259
89

CHANGES IN FUND BALANCE
FY2014 FY2015 FY2016 FY2017
HEADLANDS HABITAT FUND (ESHA) Actual Budget Budget Budget
Revenues $30,558 $30,450 30,450 30,450
Expenditures 4,314 22,700 22,700 22,700
Revenues & Other Sources Over (Under)
Expenditures & Other Uses 26,244 7,750 7,750 7,750
Fund Balance, Beginning of Year 180,000 206,244 213,994 221,744
Fund Balance, End of Year $206,244 $213,994 $221,744 $229,494
Restricted 206,244$ 213,994$ 221,744$ 229,494$
Assigned
Total Fund Balance $206,244 $213,994 $221,744 $229,494
90

CHANGES IN FUND BALANCE
FY2014 FY2015 FY2016 FY2017
CAPITAL IMPROVEMENTS FUND Actual Budget Budget Budget
Revenues 324,063$ -$ -$ 1,107,187$
Expenditures 6,600,515 17,168,697 1,920,681 6,211,284
Other Sources (Uses)
Operating Transfers In 8,744,010 8,922,741 4,420,581 2,479,793
Operating Transfers Out - - - -
Revenues & Other Sources Over (Under)
Expenditures & Other Uses 2,467,558 (8,245,956) 2,499,900 (2,624,304)
Fund Balance, Beginning of Year 6,386,453 8,854,011 608,055 3,107,955
Fund Balance, End of Year 8,854,011$ 608,055$ 3,107,955$ 483,651$
Nonspendable
Restricted
Assigned 8,854,011 608,055 3,107,955 483,651
Unassigned
Total Fund Balance $8,854,011 $608,055 $3,107,955 $483,651
91

CHANGES IN FUND BALANCE
FY2014 FY2015 FY2016 FY2017
FACILITIES IMPROVEMENT FUND Actual Budget Budget Budget
Revenues -$ -$ -$ -$
Expenditures 307,602 - 810,000 250,000
Other Sources (Uses)
Operating Transfers In - - 637,074 250,000
Operating Transfers Out - -
Revenues & Other Sources Over (Under)
Expenditures & Other Uses (307,602) - (172,926) -
Fund Balance, Beginning of Year 480,528 172,926 172,926 -
Fund Balance, End of Year 172,926$ 172,926$ -$ -$
Restricted
Assigned 172,926$ 172,926$ -$ -$
Total Fund Balance 172,926$ 172,926$ -$ -$
92

CHANGES IN FUND BALANCE
FY2014 FY2015 FY2016 FY2017
PARK DEVELOPMENT FUND Actual Budget Budget Budget
Revenues 6,800$ -$ -$ -$
Expenditures - 99,850 - -
Other Sources (Uses)
Operating Transfers Out - - 75,000 455,000
Revenues & Other Sources Over (Under)
Expenditures & Other Uses 6,800 (99,850) (75,000) (455,000)
Fund Balance, Beginning of Year 676,550 683,350 583,500 508,500
Fund Balance, End of Year 683,350$ 583,500$ 508,500$ 53,500$
Restricted 683,350$ 583,500$ 508,500$ 53,500$
Assigned
Total Fund Balance 683,350$ 583,500$ 508,500$ 53,500$
93

CHANGES IN FUND BALANCE
FY2014 FY2015 FY2016 FY2017
SUPP. LAW ENFORCE. SERVICES FUND Actual Budget Budget Budget
Revenues 103,304$ 100,305$ 600$ 600$
Expenditures 88,570 164,571 - -
Other Sources (Uses)
Operating Transfers Out - - - -
Revenues & Other Sources Over (Under)
Expenditures & Other Uses 14,734 (64,266) 600 600
Fund Balance, Beginning of Year 49,735 64,469 203 803
Fund Balance, End of Year 64,469$ 203$ 803$ 1,403$
Restricted 64,469$ 203$ 803$ 1,403$
Total Fund Balance 64,469$ 203$ 803$ 1,403$
94

CHANGES IN FUND BALANCE
FY2014 FY2015 FY2016 FY2017
CFD 2006-1 MAINTENANCE FUND Actual Budget Budget Budget
Revenues 116,873$ 534,115$ 325,400$ 325,400$
Expenditures 151,425 928,300 208,300 359,900
Other Sources (Uses)
Operating Transfers In 30,000 330,000 30,000 30,000
Revenues & Other Sources Over (Under)
Expenditures & Other Uses (4,552) (64,185) 147,100 (4,500)
Fund Balance, Beginning of Year 141,036 136,484 72,299 219,399
Fund Balance, End of Year $136,484 $72,299 $219,399 $214,899
Restricted 136,484$ 72,299$ 219,399$ 214,899$
Assigned
Total Fund Balance $136,484 $72,299 $219,399 $214,899
95

GENERAL FUND

General Fund Operating Budget Overview
The following section is divided into three parts:
1. A General Fund revenue and expenditure budget summary.
2. A revenue summary and detail section, which includes a description of revenue sources followed by schedules of total General Fund revenues by major category and individual account, with a description of major changes from the preceding year.
3. The City's General Fund expenditures have been categorized by department.
Each departmental budget consists of a budget narrative, a program summary, and the detail of expenditures by individual general ledger account. The departments are presented as follows:
Department # Page
City Council (01) 105 City Manager (11) 108 Administrative Services (21) 112 Public Information Services (22) 118 City Clerk (31) 121 Community Development Planning (41) 126 Building (42) 131 Code Enforcement (43) 136 Economic Development (44) 141 Public Works Administration (51) 146 Street Maintenance (52) 151 Traffic Engineering (53) 157 Solid Waste (54) 161 Engineering (56) 166 Water Quality (57) 171 Public Safety Police Services (61) 178 VIPS (62) 182 Emergency & Support Services (12) 185 City Attorney (71) 190 Community Services (81) 193 Parks (55) 199 Facilities (95) 204 Risk Management (97) 209 Non-Departmental (99) 212
96

Proposed % Proposed %REVENUES & TRANSFERS-IN:
Taxes & Franchises 29,250,000$ 87.32% 29,872,000$ 86.83%Licenses & Permits 1,273,000 3.80% 1,360,000 3.95%Fines & Forfeitures 300,000 0.90% 300,000 0.87%Use of Money & Property 222,800 0.67% 222,800 0.65%Intergovernmental 240,000 0.72% 293,278 0.85%Charges for Services 1,512,000 4.51% 1,495,000 4.35%Other 76,000 0.23% 227,600 0.66%Operating Transfers In (from other funds) 625,551 1.87% 632,000 1.84%
33,499,351 100% 34,402,678 100%
EXPENDITURES:City Council 131,459 0.40% 131,459 0.39%City Manager 531,690 1.61% 534,652 1.57%Administrative Services 1,134,898 3.43% 1,149,675 3.38%Public Information Services 128,195 0.39% 127,530 0.37%City Clerk 477,706 1.44% 505,940 1.49%Community Development:
Planning 1,800,839 5.44% 1,701,178 5.00%Building 1,122,788 3.39% 1,120,010 3.29%Code Enforcement 434,208 1.31% 440,358 1.29%Economic Development 405,944 1.23% 384,637 1.13%
sub-total 3,763,778 11.38% 3,646,183 10.71%Public Works:
Administration 365,754 1.11% 368,974 1.08%Street Maintenance 2,632,976 7.96% 2,565,109 7.54%Traffic Engineering 671,850 2.03% 713,850 2.10%Solid Waste 81,824 0.25% 132,084 0.39%Engineering 1,815,637 5.49% 1,827,222 5.37%Water Quality & Nat. Res. 864,549 2.61% 869,521 2.55%
sub-total 6,432,590 19.45% 6,476,760 19.03%Public Safety:
Police Services 10,766,852 32.55% 11,816,150 34.72%VIPS 19,300 0.06% 19,300 0.06%Emergency Services 351,176 1.06% 352,797 1.04%
sub-total 11,137,328 33.67% 12,188,247 35.81%
City Attorney 703,500 2.13% 707,500 2.08%Community Services 1,944,889 5.88% 1,952,499 5.74%Parks 3,656,528 11.06% 3,850,280 11.31%Facilities 729,923 2.21% 733,687 2.16%Risk Management 624,300 1.89% 624,300 1.83%Non-Departmental 1,010,900 3.06% 1,128,330 3.32%Operating Transfers Out (to other Funds) 667,074 2.02% 280,000 0.82%
Total General Fund Expenditures & Transfers-Out 33,074,758 100.00% 34,037,041 100.00%
Change in Fund Balance (includes one-time expenditures) 424,593$ 365,637$
FY2016 FY2017
CITY OF DANA POINTGENERAL FUND REVENUE & EXPENDITURE BUDGET SUMMARY
97

DESCRIPTION OF MAJOR GENERAL FUND REVENUE SOURCES
Property Tax - Property tax is collected by the County Tax Collector and is based on the full value of a property as determined by the County Assessor’s Office.
Sales Tax – Sales tax is levied on all tangible retail goods sold within the Dana Point city limits. An 8.0% tax is levied at the site where the sale is made, and one percent is remitted back to the City of Dana Point by the State of California. Additionally, Measure M, the Revised Traffic Improvement and Growth Management Ordinance, provides for the collection of one-half (½) percent retail transaction and use tax for use in funding the Transportation Improvement Program (included in the 8.0% rate).
Real Property Transfer Tax – Real property transfer tax is collected by the County Tax Collector and is based on the value of property transferred.
Franchise Fees – A franchise fee is charged for the privilege of using public right-of-way and property within the City for public or private purposes.
Transient Occupancy Tax – Transient occupancy tax is collected by the operators of hotels and motels located within the City limits of Dana Point. Ten percent of the total rent collected by a motel or hotel is remitted to the City.
Intergovernmental – Revenue from other governmental agencies include monies generated in Dana Point but which are paid to the State of California. The State returns the appropriate amounts of certain fees to the City according to formulas established by law.
Service Charges/Licenses and Permits – These charges are directly charged to individuals for specific services rendered by the City. They include charges to process or issue building permits and the costs to conduct engineering and planning reviews of any building project undertaken by a licensed contractor or private property owner.
Use of Money and Property – The use of money and property are monies received as a result of investment interest and rental of City owned properties.
Fines and Forfeitures – Fines and forfeitures are remitted to the City from the Orange County Court system for legal violations (traffic tickets and other violations) which occur in Dana Point.
In-lieu Property Taxes – Pursuant to the 2004 Budget Act, the State swapped substantial portions of motor vehicle in-lieu fees and sales taxes that were previously allocated to cities for property taxes that are allocated by Counties. The City’s motor vehicle in-lieu fees have been eliminated and sales taxes have been reduced by 25%. The In-lieu property tax revenue represents the substitution of property taxes for these revenues. The sales tax portion of this swap is temporary and the sales tax revenues will revert back to the City in FY 2016.
98

Actual Amended Budget Proposed ProposedFY2014 FY2015 FY2016 FY2017
Property Taxes 6,263,169$ 6,600,000$ 6,815,000$ 7,035,000$ Franchise Fees 1,314,648 1,223,000 1,235,000 1,247,000 Property Transfer Taxes 570,407 350,000 350,000 350,000 Transient Occupancy Tax 11,007,316 11,600,000 11,600,000 11,800,000 Short Term Rental TOT 115,065 360,000 360,000 360,000 Sales & Use Tax 3,794,435 4,100,000 5,640,000 5,750,000 In-lieu Property Taxes 4,270,627 4,500,000 3,200,000 3,280,000 Homeowner's Property Tax Relief 23,061 51,511 50,000 50,000
TAXES & FRANCHISES TOTAL 27,358,728 28,784,511 29,250,000 29,872,000
Planning Permits 93,548 105,000 95,000 95,000 Building Permits 739,979 1,071,000 915,000 1,000,000 Engineering Permits 257,738 326,542 243,000 245,000 Short Term Rental Permits 20,850 20,000 20,000 20,000
LICENSES & PERMITS TOTAL 1,112,115 1,522,542 1,273,000 1,360,000
Fines & Forfeitures 198,521 200,000 250,000 250,000 Penalties, Interest & Restitution 63,904 100,000 50,000 50,000
FINES & FORFEITURES TOTAL 262,425 300,000 300,000 300,000
Rental of Property 77,730 60,000 60,000 60,000 Office Space Rent 75,708 74,000 75,000 75,000 Investment Interest 86,289 72,000 87,800 87,800
USE OF MONEY & PROPERTY TOTAL 239,727 206,000 222,800 222,800
Waste Disposal Allocation - - - 53,278 Nuclear Power Program 149,600 160,000 140,000 140,000 Intergov't Cost Reimbursements 118,145 54,000 100,000 100,000 State Grants 134,461 120,250 - -
INTERGOVERNMENTAL TOTAL 402,206 334,250 240,000 293,278
Planning Fees 96,667 84,000 95,000 100,000 Building Fees 688,198 621,000 550,000 600,000 Engineering Fees 52,386 60,000 49,000 49,000 Impact Fees 2,858 - - - Reimbursed Expenses 604,165 350,000 235,000 160,000 Recreation Classes, Activities & Trips 266,278 278,000 280,000 283,000 Reimbursed Developer Exp. Revenue - 330,000 300,000 300,000 Other 30,759 2,000 3,000 3,000
CHARGES FOR SERVICES TOTAL 1,741,311 1,725,000 1,512,000 1,495,000
Miscellaneous 20,576 5,000 25,000 25,000 Planning Appeal Fee 2,000 1,000 1,000 1,000 User Fee Income Solid Waste 51,388 50,000 50,000 50,000 Beverage Container Recycling 9,148 - - - Abandoned Vehicle Abatement - - - - Other Financing Sources 3,625,000 - - 151,600
OTHER REVENUES TOTAL 3,708,112 56,000 76,000 227,600
TOTAL GENERAL FUND REVENUES 34,824,624 32,928,303 32,873,800 33,770,678
Operating Tranfer-In from Gasoline Tax Fund 703,170 549,370 625,551 632,000 Operating Tranfer-In from Measure M Fund 66,200 - - -
TOTAL OPERATING TRANSFERS-IN 769,370 549,370 625,551 632,000
TOTAL GENERAL FUND REV/TSF. IN 35,593,994$ 33,477,673$ 33,499,351$ 34,402,678$
CITY OF DANA POINTBUDGET SUMMARY - GENERAL FUND REVENUES
99

Fiscal Year Fiscal Year Fiscal Year Fiscal Year2014 2015 2016 2017
Acct # Description Actual Amended Proposed Proposed
GENERAL FUNDTAXES (Type 10)01-10-6101 SEC & UNSEC PROPERTY TAX 6,263,169$ 6,600,000$ 6,815,000$ 7,035,000$ 01-10-6103 PROPERTY TRANSFER TAX 570,407 350,000 350,000 350,000 01-10-6105 FRANCHISE FEES 1,314,649 1,223,000 1,235,000 1,247,000
CR&R - Commercial 122,085 125,000 126,020 127,260 Cox Communications 753,718 702,000 709,020 716,110 San Diego Gas & Electric 328,552 286,000 288,860 291,630 So. California Gas Co. 110,294 110,000 111,100 112,000
01-10-6107 HOMEOWNERS PROPERTY TAX RELIEF 23,061 51,511 50,000 50,000 01-10-6109 TRANSIENT OCCUPANCY TAX 11,007,316 11,600,000 11,600,000 11,800,000 01-10-6110 SHORT TERM RENTAL TOT 115,065 360,000 360,000 360,000 01-10-6111 SALES & USE TAX 3,794,435 4,100,000 5,640,000 5,750,000 01-10-6113 IN-LIEU PROPERTY TAXES 4,270,627 4,500,000 3,200,000 3,280,000
Motor-vehicle license fees (swap) 3,057,950 3,100,000 3,200,000 3,280,000 Sales taxes (triple flip) 1,212,677 1,400,000 - -
TOTAL TAXES (Type 10) 27,358,729 28,784,511 29,250,000 29,872,000
LICENSES & PERMITS (Type 20)01-20-6201 SITE DEVELOPMENT PERMITS 38,078 25,000 25,000 25,000 01-20-6203 COASTAL DEVELOPMENT PERMITS 28,791 40,000 30,000 30,000 01-20-6205 CONDITIONAL USE PERMITS 9,809 15,000 15,000 15,000 01-20-6207 OTHER PLANNING PERMITS 16,870 25,000 25,000 25,000 01-20-6209 BUILDING PERMITS 557,037 960,000 820,000 895,000 01-20-6211 PLUMBING PERMITS 58,703 35,000 30,000 33,000 01-20-6213 SEWER PERMITS 180 - - - 01-20-6215 ELECTRICAL PERMITS 90,147 60,000 51,000 56,000 01-20-6217 MECHANICAL PERMITS 33,658 15,000 13,000 15,000 01-20-6219 OTHER BUILDING PERMITS 253 1,000 1,000 1,000 01-20-6218 SHORT TERM RENTAL PERMITS 20,850 20,000 20,000 20,000 01-20-6221 TRANSPORTATION PERMITS 747 1,000 1,000 1,000 01-20-6223 ENCROACHMENT PERMITS 11,780 20,000 15,000 17,000 01-20-6225 GRADING PERMIT FEES (Incl. Geo. Reimb.) 238,386 295,542 220,000 220,000 01-20-6227 OTHER ENGINEERING PERMITS 6,825 10,000 7,000 7,000 TOTAL LICENSES & PERMITS (Type 20) 1,112,114 1,522,542 1,273,000 1,360,000
FINES & FORFEITURES (Type 30)01-30-6301 FINES & FORFEITURES 198,521 200,000 250,000 250,000
Vehicle Code Fines 110,000 110,000 Parking fines (DMV) 30,000 30,000 Veh. Code, Health & Welfare, other (County) 110,000 110,000
01-30-6303 PENALTIES, INTEREST & RESTITUTION 63,904 100,000 50,000 50,000 TOT late filing penalties & interest 5,000 5,000 Const. & Demo. Non-Compliance Penalties 35,000 35,000
City of Dana PointGeneral Fund Revenue Budget Detail
100

Fiscal Year Fiscal Year Fiscal Year Fiscal Year2014 2015 2016 2017
Acct # Description Actual Amended Proposed Proposed
City of Dana PointGeneral Fund Revenue Budget Detail
Other (municipal code violations) 10,000 10,000 TOTAL FINES & FORFEITURES (Type 30) 262,425 300,000 300,000 300,000
USE OF MONEY & PROPERTY (Type 40)01-40-6401 RENTAL OF PROPERTY 77,730 60,000 60,000 60,000
Community Center and ballfields 30,000 30,000 30,000 City Council chamber (SCWD) 10,000 10,000 10,000 Parks 20,000 20,000 20,000
01-40-6403 INVESTMENT INTEREST 86,289 72,000 87,800 87,800 Treasury Note & LAIF portfolio 100,800 100,800 Measure M Fund (900) (900) CFD Maintenance (1,400) (1,400) TBID (3,000) (3,000) Park Development Fund interest allocation - - SLESF interest allocation (600) (600) Coastal Transit Fund interest allocation (6,300) (6,300) AB2766 Fund interest allocation (800) (800)
01-40-6405 CITY PLAZA OFFICE SPACE RENT 75,708 74,000 75,000 75,000 TOTAL USE OF MONEY & PROPERTY (Type 40) 239,727 206,000 222,800 222,800
INTERGOVERNMENTAL (Type 50)01-50-6514 WASTE DISPOSAL ALLOCATION - - - 53,278 01-50-6515 NUCLEAR POWER PROGRAM 149,600 160,000 140,000 140,000
San Onofre Emergency Preparedness01-50-6521 INTERGOV'T COST REIMBURSEMENTS 118,145 54,000 100,000 100,000 01-50-6523 STATE GRANTS 134,461 120,250 - - TOTAL INTERGOVERNMENTAL (Type 50) 402,206 334,250 240,000 293,278
CHARGES FOR SERVICES (Type 60)01-60-6609 VARIANCE MINOR AMENDMENT FEES 2,412 3,000 4,000 4,000 01-60-6611 TENTATIVE TRACT MAP FEE 6,802 - - - 01-60-6613 TENTATIVE PARCEL MAP FEE 3,520 - - - 01-60-6623 PLANNING PLAN CHECK FEE 82,385 80,000 90,000 95,000 01-60-6627 OTHER PLANNING FEES 1,548 1,000 1,000 1,000 01-60-6631 BUILDING PLAN CHECK FEES 634,146 580,000 515,000 560,000 01-60-6633 PERMIT ISSUANCE FEE 53,700 40,000 34,000 39,000 01-60-6635 OTHER BUILDING FEES 352 1,000 1,000 1,000 01-60-6639 ADDRESSING FEE 5,949 - - - 01-60-6641 GRADING INSPECTION FEE 8,544 20,000 17,000 17,000 01-60-6655 OTHER ENGINEERING FEES 37,893 40,000 32,000 32,000 01-60-6659 SOLID WASTE EXEMPTION FEES 2,220 2,000 2,000 2,000 01-60-6681 GENERAL GOV'T IMPACT FEES 2,858 - - - 01-60-6683 ART IN PUBLIC PLACES FEES - - - -
101

Fiscal Year Fiscal Year Fiscal Year Fiscal Year2014 2015 2016 2017
Acct # Description Actual Amended Proposed Proposed
City of Dana PointGeneral Fund Revenue Budget Detail
01-60-6685 REIMBURSED EXPENSES 604,165 350,000 235,000 160,000 City expenses directly reimbursable by developers, homeowners, attorneys, etc: Headlands CFD Staff time allocation 12,000 12,000 12,000
Doheny Blues Fest. Police Svs (61-233) 15,000 15,000 15,000 CR&R contract administration 80,402 75,000 80,500 80,500 CR&R fran. agrmnt. compliance audit (54-223) 50,000 - 50,000 Headlands ESHA Maintenance (57-211) 22,500 - - HOA incentive program (57-251) - 2,500 2,500 Litigation (97-409) - - - Litigation support (97-413) - - - Midyear Budget Adjustments 175,500 - - General Plan update (41-223)(SCAG) - 125,000 -
01-60-6691 RECREATION CLASSES 223,660 223,000 225,000 228,000 01-60-6692 REIMB. DEVELOPER EXP. - PLANNING - 330,000 300,000 300,000 01-60-6693 ACTIVITIES & TRIPS 42,618 55,000 55,000 55,000 01-60-6697 PHOTOCOPIES 1,403 - 1,000 1,000 01-60-6699 OTHER P/B/E (planning, bld., engineering) 27,136 - - - TOTAL CHARGES FOR SERVICES (Type 60) 1,741,311 1,725,000 1,512,000 1,495,000
OTHER REVENUE (Type 70)01-70-6701 PLANNING APPEAL FEE 2,000 1,000 1,000 1,000 01-70-6703 MISCELLANEOUS REVENUES 20,576 5,000 25,000 25,000 01-70-6705 BEVERAGE CONTAINER RECYCLING 9,148 - - - 01-70-6707 USER FEE AB939 SOLID WASTE 51,388 50,000 50,000 50,000 01-70-6709 LITIGATION SETTLEMENTS - - - - 01-70-6713 ABANDONED VEH. ABATEMENT PROG. - - - - 01-70-6715 OTHER FINANCING SOURCES 3,625,000 - - 151,600
Sale of parcel on Via Canon FY14 and Repayment of Funicular Loan FY18
TOTAL OTHER REVENUE (Type 70) 3,708,112 56,000 76,000 227,600
TOTAL GENERAL OPERATING FUND REVENUES 34,824,624$ 32,928,303$ 32,873,800$ 33,770,678$
TRANSFERS IN (Type 90)01-90-6903 TRANSFERS IN - FROM GAS TAX FUND 703,170$ 549,370$ 625,551$ 632,000$
See Gas Tax Fund for computation
01-90-6904 TRANSFERS IN - MEASURE M FUND 66,200 - - -
01-90-6905 TRANSFERS IN - FROM SLESF FUND - - - - See SLES Fund for computation
TOTAL GEN FUND REVENUES & TRANSFERS-IN $ 35,593,994 $ 33,477,673 $ 33,499,351 $ 34,402,678
102

Materials & Risk Capital Transfers Personnel Services Management Outlay Out Total
GENERAL FUND OPERATING EXPENDITURES & TRANSFERS
City Council 46,959 84,500 - - - 131,459 City Manager 399,180 132,510 - - 531,690 Administrative Services 982,255 152,643 - - 1,134,898 Public Information Services - 128,195 - - 128,195 City Clerk 405,066 72,640 - - 477,706 Community Development:
Planning 1,287,484 513,355 - - 1,800,839 Building 817,733 302,855 2,200 - 1,122,788 Code Enforcement 404,823 29,385 - - 434,208 Economic Development 259,284 146,660 - - 405,944
sub-total 2,769,323 992,255 2,200 - 3,763,778 Public Works:
Administration 344,529 21,225 - - 365,754 Street Maintenance 179,768 2,453,208 - - 2,632,976 Traffic Engineering - 671,850 - - 671,850 Solid Waste 38,074 43,750 - - 81,824 Engineering 1,230,662 584,975 - - 1,815,637 Water Quality & Nat. Res. 245,399 619,150 - - 864,549
sub-total 2,038,432 4,394,158 - - 6,432,590 Public Safety:
Police Services - 10,766,852 - - 10,766,852 VIPS - 19,300 - - 19,300 Emergency Services 225,976 125,200 - - 351,176
sub-total 225,976 10,911,352 - - 11,137,328 City Attorney - 703,500 - - 703,500 Community Services 709,864 1,235,025 - - 1,944,889 Parks 314,548 3,341,980 - - 3,656,528 Facilities 190,613 539,310 - - 729,923 Risk Management - 1,300 623,000 - - 624,300 Non-Departmental 9,000 903,900 98,000 667,074 1,677,974
Total Oper Exp & Transfers 8,091,216 23,593,268 623,000 100,200 667,074 33,074,758
Change in Fund Balance (includes one-time expenditures) 424,593$
CITY OF DANA POINTGENERAL FUND OPERATING BUDGET SUMMARY
BY DEPARTMENT AND EXPEDITURE TYPEFISCAL YEAR 2016
103

Materials & Risk Capital Transfers Personnel Services Management Outlay Out Total
GENERAL FUND OPERATING EXPENDITURES & TRANSFERS
City Council 46,959 84,500 - - 131,459 City Manager 401,342 133,310 - - 534,652 Administrative Services 995,132 154,543 - - 1,149,675 Public Information Services - 127,530 - - 127,530 City Clerk 408,970 96,970 - - 505,940 Community Development:
Planning 1,297,223 403,955 - - 1,701,178 Building 825,405 292,605 2,000 - 1,120,010 Code Enforcement 410,973 29,385 - - 440,358 Economic Development 261,577 123,060 - - 384,637
sub-total 2,795,178 849,005 2,000 - 3,646,183 Public Works:
Administration 347,124 21,850 - - 368,974 Street Maintenance 180,901 2,384,208 - - 2,565,109 Traffic Engineering - 713,850 - - 713,850 Solid Waste 38,334 93,750 - - 132,084 Engineering 1,242,247 584,975 - - 1,827,222 Water Quality & Nat. Res. 246,971 622,550 - - 869,521
sub-total 2,055,577 4,421,183 - - 6,476,760 Public Safety:
Police Services - 11,666,150 150,000 - 11,816,150 VIPS - 19,300 - - 19,300 Emergency Services 227,597 125,200 - - 352,797
sub-total 227,597 11,810,650 150,000 - 12,188,247 City Attorney - 707,500 - - 707,500 Community Services 716,474 1,236,025 - - 1,952,499 Parks 318,100 3,532,180 - - 3,850,280 Facilities 192,377 541,310 - - 733,687 Risk Management - 1,300 623,000 - - 624,300 Non-Departmental 9,000 924,330 195,000 280,000 1,408,330
Total Oper Exp & Transfers 8,166,705 24,620,336 623,000 347,000 280,000 34,037,041
Change in Fund Balance (includes one-time expenditures) 365,637$
CITY OF DANA POINTGENERAL FUND OPERATING BUDGET SUMMARY
BY DEPARTMENT AND EXPEDITURE TYPEFISCAL YEAR 2017
104

City of Dana Point Budget Narrative
Department: CITY COUNCIL Program: CITY COUNCIL (01)
DEPARTMENT: CITY COUNCIL
PROGRAM: CITY COUNCIL
DESCRIPTION:
The City Council is the legislative body of the community and establishes all City government policy. The City Council consists of five members elected to four year overlapping terms. Annually, the Council selects one of its members to serve as Mayor for a one year term of office.
All policies of the City are reviewed and established by the City Council. The City Council is responsible for the appointment of the City Manager, City Attorney, and the City Treasurer as well as members of all advisory committees, the Planning Commission and the Arts and Culture Commission.
OBJECTIVES:
DANA POINT MISSION STATEMENT
The City of Dana Point encourages community involvement and is committed to:
Develop and ensure the highest possible quality of life for our residents, businesses and visitors.
Provide a safe and healthy environment within a sound economic atmosphere.
Provide an efficient and effective government which is open and responsive to the needs of the community and works for the benefit of all.
105

Fiscal Year Fiscal Year Fiscal Year Fiscal Year
2014 2015 2016 2017
Actual Amended Proposed Proposed
EXPENDITURE SUMMARY
Personnel 48,740$ 48,370$ 46,959$ 46,959$
Materials & Services 66,793 81,500 84,500 84,500
Capital Outlay - - - -
Total Expenditures 115,533$ 129,870$ 131,459$ 131,459$
REVENUE SUMMARY
NONE
AUTHORIZED PERSONNEL
City of Dana Point
Program Summary
Department: CITY COUNCIL
Program: CITY COUNCIL (01)
106

Fiscal Year Fiscal Year Fiscal Year Fiscal Year2014 2015 2016 2017
Actual Amended Proposed Proposed
PERSONNEL1010 SALARIES 43,102$ 45,102$ 43,102$ 43,102$
1100 BENEFITS 120 - - -
1120 RETIREMENT BENEFITS 4,874 2,643 3,233 3,233
1140 MEDI-TAX 1.45% 644 625 625 625
TOTAL PERSONNEL 48,740 48,370 46,959 46,959
MATERIALS & SERVICES2010 COMMUNICATIONS - - - -
2070 OFFICE SUPPLIESGeneral office supplies 1,500 1,500 1,500
59 1,500 1,500 1,500
2090 MEMBERSHIPS & DUES - - - -
2110 OPERATING SUPPLIESYouth Board 3,000 3,000 3,000 General operating supplies 10,000 12,000 12,000
11,730 13,000 15,000 15,000
2130 BOOKS & SUBSCRIPTIONSMiscellaneous 500 500 500
5 500 500 500
2230 PROFESSIONAL SERVICESMiscellaneous 5,000 5,000 5,000
- 5,000 5,000 5,000
2270 TRAVEL, CONF. & MEETINGSTravel, conferences & meetings 15,000 16,000 16,000
13,644 15,000 16,000 16,000
2290 MILEAGE REIMBURSEMENTAuto allowance 16,500 16,500 16,500
16,500 16,500 16,500 16,500
2410 COMMUNITY ACTIVITIESSponsorships 30,000 30,000 30,000
24,855 30,000 30,000 30,000
TOTAL MAT'LS & SERV. 66,793 81,500 84,500 84,500
CAPITAL OUTLAY3010 FURNITURE & EQUIPMENT - - - -
TOTAL CAPITAL OUTLAY - - - -
GRAND TOTAL EXPENDITURES 115,533$ 129,870$ 131,459$ 131,459$
City of Dana PointExpenditure Plan Detail ReportDepartment: CITY COUNCIL
Program: CITY COUNCIL (01)
107

City of Dana Point Budget Narrative
Department: CITY MANAGER Program: CITY MANAGER (11)
DEPARTMENT: CITY MANAGER
PROGRAM: CITY MANAGER
DESCRIPTION:
The City Manager is appointed by the City Council to serve as the “Chief Administrative Officer” of the City. The City Manager’s Office coordinates the implementation of the City Council policy decisions and initiation of all intergovernmental operations of the City organization.
The program areas overseen by the City Manager’s Office include the administration and guidance of the City departments in the implementation of the mandates of the City Council; represents the City with outside government agencies; presents a biennial budget to the City Council; and coordinates a variety of public information resources for both internal and public distribution. The City Manager is responsible for the long range planning for the organization and the development of recommendations to the City Council on a variety of public policy issues. The City Manager is also the appointed City Treasurer.
OBJECTIVES:
Assist the City Council in initiating and implementing policies and programs that are responsive to community needs, and facilitate communication and efficient operations between departments.
Work cooperatively with outside agencies ensuring City representation in regards to local issues.
Provide for the long range planning of the organization to ensure the efficient operation of the City government in providing the necessary services to enhance the quality of life for the residents, businesses, and visitors to the community.
Coordinate intra-departmental activities to ensure the efficient and effective implementation of City Council policies.
Administer and direct the implementation of City services.
Work closely with business and community representatives to ensure coordination and communication.
108

Fiscal Year Fiscal Year Fiscal Year Fiscal Year
2014 2015 2016 2017
Actual Amended Proposed Proposed
EXPENDITURE SUMMARY
Personnel 387,230$ 407,594$ 399,180$ 401,342$
Materials & Services 36,242 131,285 132,510 133,310
Capital Outlay - 35,000 - -
Total Expenditures 423,472$ 573,879$ 531,690$ 534,652$
REVENUE SUMMARY
NONE
AUTHORIZED PERSONNELCity Manager 1 1 1 1
Executive Secretary 1 1 1 1
Total 2 2 2 2
City of Dana Point
Program Summary
Department: CITY MANAGER
Program: CITY MANAGER'S OFFICE (11)
109

Fiscal Year Fiscal Year Fiscal Year Fiscal Year
2014 2015 2016 2017
Actual Amended Proposed Proposed
PERSONNEL
1010 SALARIES 290,502$ 315,465$ 307,308$ 307,308$
1030 HOURLY
Part-time clerical assistance 7,000 7,296 7,407
6,101 7,000 7,296 7,407
1050 OVERTIME - - - -
1100 BENEFITS 46,906 45,876 31,500 32,400
1120 RETIREMENT BENEFITS 39,443 35,273 48,514 49,664
1140 MEDI-TAX 1.45% 4,278 3,980 4,562 4,563
1200 OUTSIDE ASSISTANCE - - - -
TOTAL PERSONNEL 387,230 407,594 399,180 401,342
MATERIALS & SERVICES
2010 COMMUNICATIONS
Cell phone 2,000 2,700 2,700
1,830 2,000 2,700 2,700
2030 EQUIPMENT MAINTENANCE - - - -
2050 VEHICLE MAINTENANCE
Fuel 5,250 5,500 5,700
Repairs & maintenance 550 800 1,400
Vehicle cleaning 560 560 560
8,002 6,360 6,860 7,660
2070 OFFICE SUPPLIES
Routine office supplies 1,750 - -
Laser printer toner 250 - -
Miscellaneous 3,000 - -
551 5,000 - -
2090 MEMBERSHIPS & DUES
Orange County City Manager's Association 325 325 325
California City Management Foundation 400 425 425
360 725 750 750
City of Dana Point
Expenditure Plan Detail Report
Department: CITY MANAGER
Program: CITY MANAGER'S OFFICE (11)
110

Fiscal Year Fiscal Year Fiscal Year Fiscal Year
2014 2015 2016 2017
Actual Amended Proposed Proposed
2110 OPERATING SUPPLIES
Miscellaneous 8,000 8,000 8,000
4,074 8,000 8,000 8,000
2130 BOOKS & SUBSCRIPTIONS
Newspapers 250 250 250
Miscellaneous 600 600 600
928 850 850 850
2150 TRAINING
Department staff 600 600 600
- 600 600 600
2230 PROFESSIONAL SERVICES
Sacramento legislative advocate 25,000 25,000 25,000
Coastal Commission legislative advocate 50,000 50,000 50,000
Special projects 25,000 25,000 25,000
14,712 100,000 100,000 100,000
2270 TRAVEL, CONF. & MEETINGS
Travel, conferences & meetings 7,500 12,500 12,500
5,711 7,500 12,500 12,500
2290 MILEAGE REIMBURSEMENT
Staff mileage reimbursements 250 250 250
74 250 250 250
TOTAL MAT'LS & SERV. 36,242 131,285 132,510 133,310
CAPITAL OUTLAY
3010 FURNITURE & EQUIPMENT - 35,000 - -
TOTAL CAPITAL OUTLAY - 35,000 - -
GRAND TOTAL EXPENDITURES 423,472$ 573,879$ 531,690$ 534,652$
111

City of Dana Point Budget Narrative
Department: ADMINISTRATIVE SERVICES Program: FINANCE & ADMINISTRATION (21)
DEPARTMENT: ADMINISTRATIVE SERVICES
PROGRAM: FINANCE & ADMINISTRATION
DESCRIPTION:
The Finance element of this program is responsible for cash management, investment of funds, revenue forecasting and general accounting (including financial reporting, internal audit, payroll, accounts payable, accounts receivable, financial oversight and administration of all City funds and accounts). In addition, the program is responsible for ensuring legal compliance with all grant programs, Community Facilities District administration requirements, the City’s budget, and purchasing functions. Primary responsibilities include budget preparation and control, financial analysis, purchasing authorization, and responsibility to maintain the risk management function. Additionally, this program is responsible for maintaining the City’s investment policy and preparation of the monthly City Treasurer’s report in accordance with Federal and State mandates.
The Administration element of this program is responsible for the implementation and administration of programs and projects in support of the City government. These include the administration of the City’s personnel function, management of various contracts, and the coordination of special programs and projects as assigned by the City Manager. Primary responsibilities include administrative support for financial studies, recruitments, labor relations, administration of worker’s compensation, benefits, personnel policies, compliance with Federal and State mandates including FLSA, ADA, FMLA, and personnel training programs.
OBJECTIVES:
Develop and maintain effective and efficient financial planning, reporting and accounting systems so as to ensure the safeguarding of City assets and to support the operating departments in achieving their program objectives.
Manage the City’s investment portfolio within the Council-authorized Investment Policy. The safety of principal is the primary objective and liquidity is the secondary objective, with an overall goal of maximizing the City’s return on its investment.
Conduct annual review of City’s investment policy for any necessary revisions.
Monitor the budget, analyze and review budget proposals, ongoing analysis of existing and potential revenues and expenditures, and long range fiscal projections.
112

Provide risk management functions which involve the identification and evaluation of actual and potential risks, and the elimination, transfer of control or insurance protection of such risks.
Continue activities geared toward reduction of the City’s risk exposure in general, property and other liability programs.
Provide timely and accurate monthly financial reports.
Provide support to the City Council, City Manager, and employees through efficient administration of the City’s personnel, labor relations and benefits program.
Continue positive relations with the Dana Point Employees Association.
PROGRAM INDICATORS:
Process approximately 375 checks per month
Generate 12 monthly financial reports per year
Process 26 payrolls per year
Process approximately 350 purchase requisitions per year
Process approximately 1,000 Insurance Certificates per year
Track approximately 25 risk management claims per year
Conduct employee recruitments as needed
Invest City portfolio of approximately $34 million
113

Fiscal Year Fiscal Year Fiscal Year Fiscal Year
2014 2015 2016 2017
Actual Amended Proposed Proposed
EXPENDITURE SUMMARY
Personnel 785,951$ 804,729$ 982,255$ 995,132$
Materials & Services 148,228 168,743 152,643 154,543
Capital Outlay - - - -
Total Expenditures 934,179$ 973,472$ 1,134,898$ 1,149,675$
REVENUE SUMMARY
NONE
AUTHORIZED PERSONNELDirector of Administrative Services 1 1 1 1
Accounting Supervisor 1 1 1 1
Accounting Technician* 1 1 1 1
Account Clerk (filled in Jan. 2016)** 0 0 0.5 1
Accountant 1 1 1 1
Administrative Secretary 1 1 1 1
Management Analyst*** 1 1 2 2
Senior Personnel Analyst 1 1 1 1
Sub-total 7 7 9 9
Regular Part-time
Account Clerk (eliminated in Nov. 2016)*** 0.5 0.5 0.5 0
Admin Intern (if needed for projects) 0.5 0.5 0.0 0.0
Total 8.0 8.0 9.00 9.0
*Accounting Tech. filled w/hourly job-share @ 25 hours per week
** Convert Accounting Clerk Part-Time to Admin Aide Full-Time Mid-FY16.
***Moved from Economic Development (ED) in FY16. Replace in ED with Asst. Admin. Analyst.
City of Dana Point
Program Summary
Department: ADMINISTRATIVE SERVICES
Program: FINANCE & ADMINISTRATION (21)
114
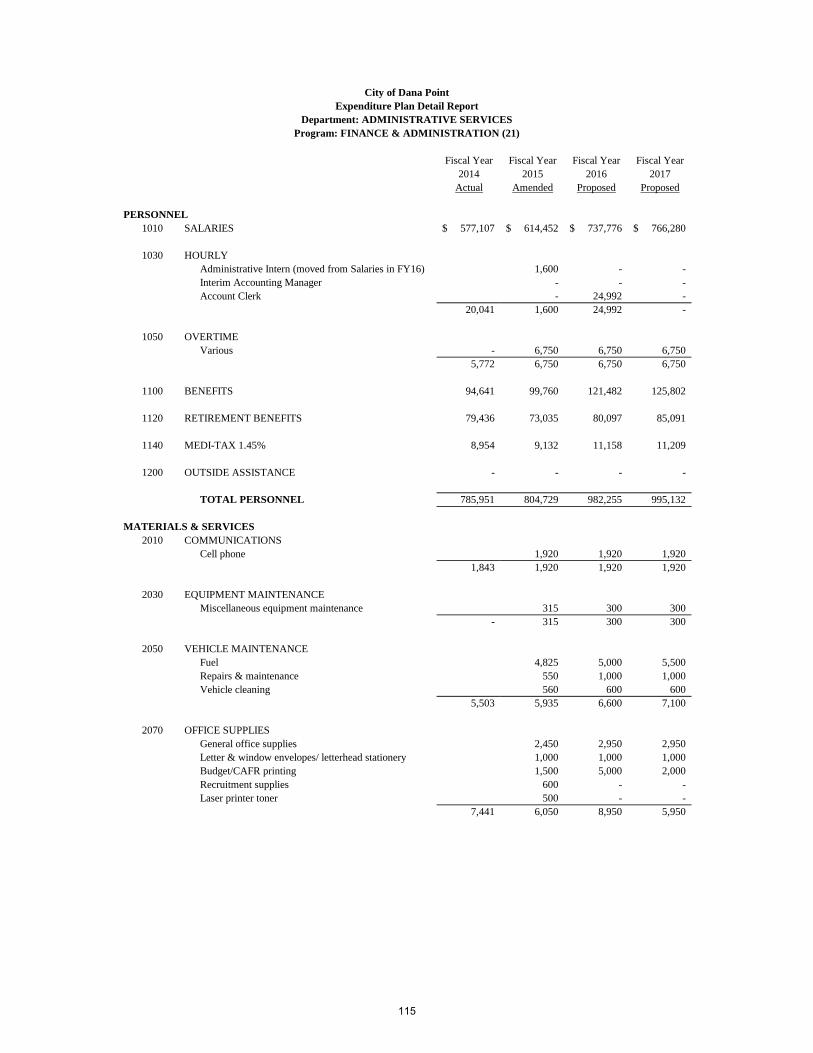
Fiscal Year Fiscal Year Fiscal Year Fiscal Year
2014 2015 2016 2017
Actual Amended Proposed Proposed
PERSONNEL
1010 SALARIES 577,107$ 614,452$ 737,776$ 766,280$
1030 HOURLY
Administrative Intern (moved from Salaries in FY16) 1,600 - -
Interim Accounting Manager - - -
Account Clerk - 24,992 -
20,041 1,600 24,992 -
1050 OVERTIME
Various - 6,750 6,750 6,750
5,772 6,750 6,750 6,750
1100 BENEFITS 94,641 99,760 121,482 125,802
1120 RETIREMENT BENEFITS 79,436 73,035 80,097 85,091
1140 MEDI-TAX 1.45% 8,954 9,132 11,158 11,209
1200 OUTSIDE ASSISTANCE - - - -
TOTAL PERSONNEL 785,951 804,729 982,255 995,132
MATERIALS & SERVICES
2010 COMMUNICATIONS
Cell phone 1,920 1,920 1,920
1,843 1,920 1,920 1,920
2030 EQUIPMENT MAINTENANCE
Miscellaneous equipment maintenance 315 300 300
- 315 300 300
2050 VEHICLE MAINTENANCE
Fuel 4,825 5,000 5,500
Repairs & maintenance 550 1,000 1,000
Vehicle cleaning 560 600 600
5,503 5,935 6,600 7,100
2070 OFFICE SUPPLIES
General office supplies 2,450 2,950 2,950
Letter & window envelopes/ letterhead stationery 1,000 1,000 1,000
Budget/CAFR printing 1,500 5,000 2,000
Recruitment supplies 600 - -
Laser printer toner 500 - -
7,441 6,050 8,950 5,950
City of Dana Point
Expenditure Plan Detail Report
Department: ADMINISTRATIVE SERVICES
Program: FINANCE & ADMINISTRATION (21)
115

Fiscal Year Fiscal Year Fiscal Year Fiscal Year
2014 2015 2016 2017
Actual Amended Proposed Proposed
2090 MEMBERSHIPS & DUES
California Society of Municipal Finance Officers 350 400 400
Orange County City Manager's Association 325 325 325
National Public Employer Labor Relations Assn. - 175 175
Government Finance Officers Association 250 300 300
O.C. League - OCHRC 375 275 275
CALPACS 325 300 300
Community organizations (Rotary) 1,200 880 880
California Public Employee Labor Relations Assn. 700 700 700
3,082 3,525 3,355 3,355
2110 OPERATING SUPPLIES
Oral board expenses 500 1,000 1,000
Small equipment replacement 400 - -
Check printing/tax forms 500 500 500
Miscellaneous 500 500 500
2,652 1,900 2,000 2,000
2130 BOOKS & SUBSCRIPTIONS
Personnel journals 200 300 300
Governmental acct'g rules annual subscription 225 250 250
Orange County Register - online - 300 300
Survey Monkey - 300 300
GoToMeeting - 468 468
Miscellaneous 200 - -
679 625 1,618 1,618
2150 TRAINING
Citywide training (moved to Dept 99) 2,700 - -
Citywide training (employee health) 1,200 1,200 1,200
Citywide sup'v training (O.C. Empl Relation Consort.) 3,000 - -
Departmental staff training 2,250 2,250 2,250
Diehl Evans tax workshops 550 550 550
California Society of Municipal Finance Officers 300 300 300
7,385 10,000 4,300 4,300
2230 PROFESSIONAL SERVICES
Employee physicals/drug screens/fingerprinting 6,850 6,850 6,850
Flexible spending account administration 1,700 1,600 1,600
Fund Accounting software maintenance 1,600 1,600 1,600
State Controller's Report Preparation 2,000 2,500 2,500
Annual city audit 23,220 25,000 28,000
Annual review of City investment policy 1,780 - -
CAFR data & review:
HdL CAFR reporting package 1,000 1,000 1,000
Demographic data 300 300 300
GFOA review fee 650 650 650
116

Fiscal Year Fiscal Year Fiscal Year Fiscal Year
2014 2015 2016 2017
Actual Amended Proposed Proposed
Employee wellness services 1,000 1,000 1,000
Bank of America - banking services 6,000 8,400 8,800
Armored car service 3,000 3,000 3,000
Human resources software service 11,500 11,500 11,500
Investment security safekeeping services 2,500 3,000 3,000
Bank of America merchant services (credit cards) 12,000 18,000 19,000
ADP payroll services 13,000 15,000 15,000
Sales tax analysis 5,800 5,800 5,800
Sales tax audit recovery fee 6,000 3,000 3,000
Fee Study 26,873 - -
Miscellaneous 3,000 3,000 3,000
CalPERS GASB Valuation Fee - 1,700 1,700
114,049 129,773 112,900 117,300
2250 ADVERTISING
Personnel recruitments 2,500 3,500 3,500
2,470 2,500 3,500 3,500
2270 TRAVEL, CONF. & MEETINGS
CJPIA, CALPELRA, MMASC, LCW, CSMFO, LCC - 5,000 6,000 6,000
2,063 5,000 6,000 6,000
2290 MILEAGE REIMBURSEMENT
Staff mileage reimbursements 1,200 1,200 1,200
1,061 1,200 1,200 1,200
TOTAL MAT'LS & SERV. 148,228 168,743 152,643 154,543
CAPITAL OUTLAY
3010 FURNITURE & EQUIPMENT - - - -
TOTAL CAPITAL OUTLAY - - - -
GRAND TOTAL EXPENDITURES 934,179$ 973,472$ 1,134,898$ 1,149,675$
117

City of Dana Point Budget Narrative
Department: ADMINISTRATIVE SERVICES Program: PUBLIC INFORMATION SERVICES (22)
DEPARTMENT: ADMINISTRATIVE SERVICES
PROGRAM: PUBLIC INFORMATION SERVICES
DESCRIPTION:
Working with the City Clerk and other departments, Public Information Services implements programs to enhance communications between City government and all members of the community, including residents, businesses, visitors and other governmental agencies. These programs promote public outreach, public education and public participation in accordance with the following Community Core Values:
Promote openness in the discussion of community issues
Be responsive by listening, understanding, and respecting individual and differing views
Encourage citizen involvement in City activities
Public Information Services facilitates outreach and public education programs, maintains quality cable broadcast of public meetings, assists with website development, promotes special events, and augments on-going efforts to promote the City's Mission Statement and Strategic Planning Initiatives of the Strategic Plan.
OBJECTIVES:
Promote the City's Vision Statement and Mission Statement to encourage community involvement, promote public education, and to continually enhance the community image and sense of place.
Ensure the community has easy access to information and services via the media of their choice - print, video, Internet, telephone, or television.
Build community pride and positive identification among citizens with their City.
Provide consumer protection through the successful implementation and enforcement of the cable franchise agreement and customer service ordinance.
Develop and coordinate Public, Educational and Governmental programming for cable television, including public meeting broadcast, Community Bulletin Board and quality educational programming on cable television.
118

Fiscal Year Fiscal Year Fiscal Year Fiscal Year
2014 2015 2016 2017
Actual Amended Proposed Proposed
EXPENDITURE SUMMARY
Personnel -$ -$ -$ -$
Materials & Services 55,239 142,100 128,195 127,530
Capital Outlay - - - -
Total Expenditures 55,239$ 142,100$ 128,195$ 127,530$
REVENUE SUMMARY
NONE
AUTHORIZED PERSONNEL
Program: PUBLIC INFORMATION SERVICES (22)
City of Dana Point
Program Summary
Department: ADMINISTRATIVE SERVICES
119

Fiscal Year Fiscal Year Fiscal Year Fiscal Year
2014 2015 2016 2017
Actual Amended Proposed Proposed
MATERIALS & SERVICES
2030 EQUIPMENT MAINTENANCE
Video broadcasting equipment maintenance -$ 15,000$ 15,000$ 15,000$
Council chamber system maintenance - 3,000 5,000 5,000
- 18,000 20,000 20,000
2070 OFFICE SUPPLIES
Cable broadcasting materials & supplies - 1,500 - -
General office supplies - - - -
- 1,500 - -
2090 MEMBERSHIPS & DUES - - - -
- - - -
2130 BOOKS & SUBSCRIPTIONS
Broadcasting & cable magazine - - -
- - - -
2230 PROFESSIONAL SERVICES
Internet live streaming 16,000 19,000 19,000
Council mtg cable TV prod. / PEG programming 55,000 55,000 55,000
Planning commission mtgs (24/yr - 8hrs @ $30/hr) 6,000 6,000 6,000
Disaster & emergency response (4@$1500) 6,000 6,000 6,000
24/7 community bulletin board (10hrs/mo) 3,600 3,600 3,600
Special Programming (4th July, FOW, etc.) 10,000 10,000 10,000
VeriSign Symantec ($995 gets three years of services) - 995 -
Web-site management 1,000 1,000
Web-site annual maintenance 6,600 6,930
Mid-Year Budget Adjustments 26,000 - -
55,239 122,600 108,195 107,530
TOTAL MAT'LS & SERV. 55,239 142,100 128,195 127,530
GRAND TOTAL EXPENDITURES 55,239$ 142,100$ 128,195$ 127,530$
City of Dana Point
Expenditure Plan Detail Report
Department: ADMINISTRATIVE SERVICES
Program: PUBLIC INFORMATION SERVICES (22)
120

City of Dana Point Budget Narrative
Department: CITY CLERK Program: CITY CLERK (31)
DEPARTMENT: CITY CLERK
PROGRAM: CITY CLERK
DESCRIPTION:
The City Clerk is appointed by and provides support services to the City Manager. As a manager of public information, the City Clerk oversees the legislative history created by the City Council, maintains and preserves all official records and documents of the City, researches and disseminates information for staff and the public, and administers a City-wide Records Management Program. In addition, the City Clerk reviews and updates the City’s Records Retention Schedule as required. The City Clerk ensures the legislative process is “open and public” by publishing and posting notices and ordinances as required by law, coordinates the video streaming of City Council meetings, prepares City Council agendas and meeting minutes, and follows up on all decisions made by the City Council, including arranging for signatures on all official documents, certifying the adoption of ordinances and resolutions, and attesting to Council action. The City Clerk also facilitates municipal elections, administers the Political Reform Act requirements as required by State law, responds to Public Records Act requests, maintains the City’s website, acts as the City's Notary Public and handles miscellaneous administrative matters assigned by the City Manager.
OBJECTIVES:
Provide support for City Council legislative operations, including attendance at public meetings, public noticing, agenda production and distribution, minute preparation and other legislative follow-up services.
Administer the local election process, oversee all Political Reform Act requirements as required by State law including Campaign Statement filings and Conflict of Interest filings.
Receive subpoenas served on the City.
Administer City-wide Records Management Program and Document Imaging System in accordance with the approved Records Retention Schedule; utilize approved procedures for destruction of inactive records and the imaging of permanent records.
Oversee Municipal Code/Zoning Code updates utilizing services provided by Quality Code Publishing Company.
121

Notice all vacancies for Planning Commission, Arts & Culture Commission, Traffic Improvement Subcommittee and Committees, Task Forces and Youth Board, schedule interviews, and administer oaths of office.
Oversee the front counter/reception lobby area, maintaining a high level of customer service.
Attend and conduct bid openings for Capital Improvement Projects.
Maintain the City’s website and video streaming software.
Coordinate Ethics Training (AB 1234) for City Council, Commissions and appropriate staff.
Attend and participate in emergency drills conducted by the City’s Emergency Services Coordinator as required.
Administer the City’s Ticket Policy (Form 802) monthly and Public Officials Appointments (Form 806) annually.
Provide Notary Public services.
PROGRAM INDICATORS:
Prepare agendas, packets and minutes for approximately 25 Regular and Special Council meetings annually.
Process over 100 annual Statements of Economic Interest throughout the year and numerous campaign disclosure statements.
Receive and process approximately 750 public records requests annually for copies of City records and process numerous requests for records from staff.
Publish, post and process approximately 70 legal notices.
Publish, post and process approximately 5 ordinances and 50 resolutions annually.
Oversee Records Management Program, which contains all of the City’s official records. Continue digital imaging of City vital records. Continue to conduct annual destruction of records according to the City’s Retention Schedule.
Coordinate biannual codification and supplements to the Municipal Code (including the Zoning Code).
Receive and process approximately 87 City contracts per year including required bonds and insurance.
Record approximately 30 legal documents through the County Recorder’s office.
Oversee the maintenance of the City’s website.
Maintain the highest level of customer service.
122

Fiscal Year Fiscal Year Fiscal Year Fiscal Year
2014 2015 2016 2017
Actual Amended Proposed Proposed
EXPENDITURE SUMMARY
Personnel 370,656$ 387,911$ 405,066$ 408,970$
Materials & Services 50,680 134,460 72,640 96,970
Capital Outlay - 12,000 - -
Total Expenditures 421,336$ 534,371$ 477,706$ 505,940$
REVENUE SUMMARY
NONE
AUTHORIZED PERSONNEL
City Clerk 1 1 1 1
Deputy City Clerk 1 1 1 1
City Clerk Specialist 1 1 1 1
Secretary 1 1 1 1
Sub-total 4 4 4 4
Regular Part-Time:
Admin Intern 0 0 0.5 0.5
Records Assistant* 0.65 0.65 0.65 0.65
Sub-total 0.65 0.65 1.15 1.15
*Part-time Records Assistant vacant, not funded in FY16 & FY17
Total 4.65 4.65 5.15 5.15
City of Dana Point
Program Summary
Department: CITY CLERK
Program: CITY CLERK (31)
123

Fiscal Year Fiscal Year Fiscal Year Fiscal Year
2014 2015 2016 2017
Actual Amended Proposed Proposed
PERSONNEL
1010 SALARIES 267,785$ 285,946$ 293,061$ 294,660$
1030 HOURLY
Records intern (19 hrs/wk) - - 14,000 14,000
1050 OVERTIME
Staff support for City Council 1,276 1,500 1,500 1,500
1100 BENEFITS 56,597 57,126 56,400 58,200
1120 RETIREMENT BENEFITS 40,809 36,606 35,631 36,113
1140 MEDI-TAX 1.45% 4,189 3,733 4,474 4,497
1200 OUTSIDE ASSISTANCE
Clerical support 3,000 - -
TOTAL PERSONNEL 370,656 387,911 405,066 408,970
MATERIALS & SERVICES
2010 COMMUNICATIONS
Cell phones 1,200 1,200 1,200
1,200 1,200 1,200 1,200
2030 EQUIPMENT MAINTENANCE
Typewriter & scanner maintenance 500 500 500
- 500 500 500
2070 OFFICE SUPPLIES
Agenda materials 1,000 1,000 1,000
Official minute/reso/ord books & paper 1,500 1,500 1,500
Laser printer toner 1,000 1,000 1,000
Stationery - - -
Materials for November 2016 Regular election - 1,000 -
City seal tile plaques 1,500 1,500 1,500
Routine office supplies 1,400 1,400 1,400
4,650 6,400 7,400 6,400
2090 MEMBERSHIPS & DUES
National Notary Association (City Clerk) 300 300 300
Assoc. Rec. Mgrs. & Admin 225 225 225
Int'l Institute of Municipal Clerks (City Clerk) 450 450 450
Clerks Association of California (City Clerk) 320 350 350
1,238 1,295 1,325 1,325
2110 OPERATING SUPPLIES
Records mgmt. supplies (folders, labels, shredding) 3,000 3,000 3,000
Sire maintenance/support 5,500 5,500 5,500
Vision Annual Maintenance (City Website) - 6,600 6,930
Miscellaneous 1,500 2,000 2,000
9,427 10,000 17,100 17,430
City of Dana Point
Expenditure Plan Detail Report
Department: CITY CLERK
Program: CITY CLERK (31)
124

Fiscal Year Fiscal Year Fiscal Year Fiscal Year
2014 2015 2016 2017
Actual Amended Proposed Proposed
2130 BOOKS & SUBSCRIPTIONS
OC Business Journal 100 100 100
Directory of Cities/Clerks 50 50 50
Election code updates 65 65 65
Guidestar 1,200 300 300
Miscellaneous 150 150 150
859 1,565 665 665
2150 TRAINING
Notary training (next due FY2019) 1,000 - -
Department Staff training 1,200 1,200 1,200
110 2,200 1,200 1,200
2230 PROFESSIONAL SERVICES
Quality Code (Municode supplements) 6,000 6,000 6,000
Datalok (offsite microfilm storage) 1,250 1,250 1,250
County of Orange (Nov 2016 regular election) 25,000 - 25,000
Outside Temp Assistance - 3,000 3,000
Midyear Budget Adjustment 46,050 - -
10,852 78,300 10,250 35,250
2250 ADVERTISING
Citywide legal advertising 22,000 22,000 22,000
13,444 22,000 22,000 22,000
2270 TRAVEL, CONF. & MEETINGS
Travel, conferences & meetings 5,000 5,000 5,000
3,537 5,000 5,000 5,000
2290 MILEAGE REIMBURSEMENT
Auto allowance 4,800 4,800 4,800
Staff mileage reimbursements 1,200 1,200 1,200
5,363 6,000 6,000 6,000
TOTAL MAT'LS & SERV. 50,680 134,460 72,640 96,970
CAPITAL OUTLAY
3010 FURNITURE & EQUIPMENT - 12,000 - -
TOTAL CAPITAL OUTLAY - 12,000 - -
GRAND TOTAL EXPENDITURES 421,336$ 534,371$ 477,706$ 505,940$
125

City of Dana Point Budget Narrative
Department: COMMUNITY DEVELOPMENT Program: PLANNING (41)
DEPARTMENT: COMMUNITY DEVELOPMENT
PROGRAM: PLANNING
DESCRIPTION:
The Community Development Planning Division provides the community of Dana Point with a variety of current and advanced planning services. Responsibilities include review of development projects for conformance with established policy and regulations; updating and maintaining the City’s Zoning Code; administering approved specific plans, including the Town Center Plan and Harbor Revitalization Plan, and development and approval of new specific plans such as the Doheny Village Plan. The department maintains and administers the City’s General Plan, assuring that the plan reflects community values and State statutes. The Planning Division also carries out the requirements of the California Environmental Quality Act, the California Coastal Act, and the Subdivision Map Act. The Planning Program is directly responsible for providing staff support to the City’s Planning Commission.
OBJECTIVES: Process amendments to the Town Center/Lantern District Plan and implement the Plan. Including; coordination with Public Works/Engineering Department for Town Center public improvements, implement the recommendations of the Parking Management Program and process development applications to influence the best design in accordance with the goals and policies of the Plan.
Complete preparation and approval of the Doheny Village Plan.
Prepare a General Plan update for approval.
Continue to update the Zoning Ordinance to remove inconsistencies and to establish revised development standards as necessary.
Continue to process current development projects.
PROGRAM INDICATORS: Process approximately 200 Coastal Development Permits, Conditional Use Permits, Site Development Permits, and Special Event Permits per year.
Provide professional and technical assistance to approximately 4,000 customers per year at the public counter, plus telephone inquiries and site visits.
126

Fiscal Year Fiscal Year Fiscal Year Fiscal Year
2014 2015 2016 2017
Actual Amended Proposed Proposed
EXPENDITURE SUMMARY
Personnel 975,186$ 1,071,406$ 1,287,484$ 1,297,223$
Materials & Services 458,097 437,534 513,355 403,955
Capital Outlay - - - -
Total Expenditures 1,433,283$ 1,508,940$ 1,800,839$ 1,701,178$
REVENUE SUMMARY
Planning Permits 93,548$ 105,000$ 95,000$ 95,000$
Planning Fees 96,667 84,000 95,000 100,000
Reimbursed Developer Expense - Planning - 330,000 300,000 300,000
Planning Appeal Fees 2,000 1,000 1,000 1,000
Total Revenues 192,215$ 520,000$ 491,000$ 496,000$
AUTHORIZED PERSONNEL
Director of Community Development 1 1 1 1
City Architect/Planning Manager 1 1 1 1
Planning Manager (New FY16) 0 0 1 1
Senior Planner 3 3 3 3
Associate Planner 2 2 2 2
Assistant Planner* 1 1 1 1
Administrative Secretary 1 1 1 1
Total 9 9 10 10
*Added February 2014
City of Dana Point
Program Summary
Department: COMMUNITY DEVELOPMENT
Program: PLANNING (41)
127

Fiscal Year Fiscal Year Fiscal Year Fiscal Year
2014 2015 2016 2017
Actual Amended Proposed Proposed
PERSONNEL
1010 SALARIES 699,715$ 821,099$ 998,005$ 1,000,581$
1030 HOURLY - - - -
1050 OVERTIME
Planning Commission support and other 3,277 5,000 7,000 7,000
1070 STIPENDS 9,000 9,000 9,000 9,000
1100 BENEFITS 129,603 126,713 151,350 155,400
1120 RETIREMENT BENEFITS 106,113 98,645 107,426 110,502
1140 MEDI-TAX 1.45% 10,139 10,949 14,703 14,740
1200 OUTSIDE ASSISTANCE 17,339 - - -
TOTAL PERSONNEL 975,186 1,071,406 1,287,484 1,297,223
MATERIALS & SERVICES
2010 COMMUNICATIONS
Cell phones 1,320 1,680 1,680
1,680 1,320 1,680 1,680
2030 EQUIPMENT MAINTENANCE
FAX machine 220 220 220
Transcriber 255 255 255
Typewriter maintenance 35 35 35
- 510 510 510
2070 OFFICE SUPPLIES
General office supplies 2,500 2,500 2,500
General Plan update printing 1,000 - 1,000
Town Center Plan printing - 1,000 -
Stationery/envelopes 500 500 500
Laser printer toner cartridges 700 700 700
Misc. computer supplies 150 150 150
Facsimile copier toner 800 800 800
Printing - documents 500 500 500
Printing - maps 500 500 500
Printing - handouts 500 500 500
Historical plaques 2,000 2,000 2,000
Harbor Plan printing 250 - -
Doheny Village Plan printing 250 250 1,000
Planning Commission Chair Recogintion 150 150 150
Miscellaneous 350 350 350
7,347 10,150 9,900 10,650
City of Dana Point
Expenditure Plan Detail Report
Department: COMMUNITY DEVELOPMENT
Program: PLANNING (41)
128

Fiscal Year Fiscal Year Fiscal Year Fiscal Year
2014 2015 2016 2017
Actual Amended Proposed Proposed
2090 MEMBERSHIPS & DUES
Amer. Planning Assoc. Memberships (4) 1,800 2,700 2,700
Amer. Institute of Cert. Planners (3) 525 875 875
Amer. Institute of Architects (1) 1,175 1,175 1,175
Urban Land Institute 190 190 190
Orange County Planning Directors 150 150 150
I.C.M.A. Membership - 875 875
Assoc. of Environmental Planners 100 - -
Nat. Trust of Historic Preservation 50 50 50
Califorina Preservation Foundation 150 150 150
Midyr Budget Adjustments (1,000) 150 150
3,043 3,140 6,315 6,315
2110 OPERATING SUPPLIES
Film 50 50 50
Drafting supplies 260 200 200
Graphic supplies 150 - -
Customer Service supplies - 3,500 3,500
460 460 3,750 3,750
2130 BOOKS & SUBSCRIPTIONS
Planning publications 500 1,000 1,000
889 500 1,000 1,000
2150 TRAINING
Technical training (Planning Staff) 1,540 1,500 1,500
Department Staff training 2,000 600 600
American Planners Assoc. "Nuts & Bolts" training 350 350 350
I.C.M.A. Emerging Professionals Leadership Institute - 500 500
Miscellaneous 1,000 1,000 1,000
1,110 4,890 3,950 3,950
2230 PROFESSIONAL SERVICES
General Plan update (w/$125k SCAG grant FY16) 300,000 200,000
Historic resource inventory 100,000 - -
Doheny Village Plan/ GP Update EIR - 100,000 150,000
Doheny Village Plan completion - 50,000 -
Special projects, appeals, etc. - - -
Contract Planning Services (Mid-Yr Adjustment) 293,949 - -
427,971 393,949 450,000 350,000
2250 ADVERTISING
Request for Proposals (2) 500 1,000 1,000
CEQA Notices (Partial Fee Offset) 1,500 3,000 3,000
3,555 2,000 4,000 4,000
2270 TRAVEL, CONF. & MEETINGS
Coastal Commission Meetings 2,000 2,000 2,000
Chamber of Commerce State of the City 150 150 150
CA APA Conference (Anaheim) - 5 2,000 2,500 2,500
National APA Conference 2,000 - -
OC APA Lunch Training 150 150 150
UCLA Land Use Conf. (1 Day) - 5 1,500 2,500 2,500
AIA Conference 2,000 2,000 2,000
California Preservation Foundation 500 500 500
League of CA Cities Annual Conf. - 1 - 1,200 1,200
League of CA Cities - PC Academy - 7 - 10,150 -
ICMA Regional Summit - 1,200 1,200
Miscellaneous 1,915 1,500 1,500
4,081 12,215 23,850 13,700
129

Fiscal Year Fiscal Year Fiscal Year Fiscal Year
2014 2015 2016 2017
Actual Amended Proposed Proposed
2290 MILEAGE REIMBURSEMENT
Planning Commissioner auto allowance 3,000 3,000 3,000
Auto allowance 4,800 4,800 4,800
Staff mileage reimbursement 600 600 600
7,961 8,400 8,400 8,400
TOTAL MAT'LS & SERV. 458,097 437,534 513,355 403,955
CAPITAL OUTLAY
3010 FURNITURE & EQUIPMENT - - - -
TOTAL CAPITAL OUTLAY - - - -
GRAND TOTAL EXPENDITURES 1,433,283$ 1,508,940$ 1,800,839$ 1,701,178$
130

City of Dana Point Budget Narrative
Department: COMMUNITY DEVELOPMENT Program: BUILDING (42)
DEPARTMENT: COMMUNITY DEVELOPMENT
PROGRAM: BUILDING
DESCRIPTION:
The Building and Safety Division of the Department of Community Development is responsible for administrating and enforcing the California Building and Safety Codes. This includes performing plan reviews on construction documents as well as assuring all project proposals meet the current California building codes and municipal ordinances of the City. The program also distributes plans for review by other agencies or City departments, issues building permits and conducts inspections and issues Certificates of Occupancy. The program also performs special inspections as requested. The Building Division updates the California Building and Fire Codes every three years as required by the State.
OBJECTIVES: Maintain an effective building, electrical, plumbing, and mechanical inspection program.
Introduce and adopt updated building codes and related provisions as required.
Continue to provide updated materials/applications to the general public on the Codes and city development processes.
Continue to implement improvements to our new Development Services Center (DSC) counter operations as recommended by the City consultant’s report for enhancing our DSC counter operations and customer service.
Provide “Over-The-Counter” plan review for minor projects/revisions and rechecks of large projects.
Continue to Implement the new Trakit.Net development permitting and companion CityGIS mapping system and Update the eTrakit.Net Module and companion Community View to provide Public Access from the Web for development information. Implement iTrakit to allow Code Officers and Inspectors direct access to permitting and property information.
Continue to train Building and Safety and City staff on the changes in the new Building Codes and development processes.
131

PROGRAM INDICATORS: Perform approximately 7,500 building inspections per year.
Issue approximately 1,800 permits per year.
Process approximately 1,100 plan checks per year.
132

Fiscal Year Fiscal Year Fiscal Year Fiscal Year
2014 2015 2016 2017
Actual Amended Proposed Proposed
EXPENDITURE SUMMARY
Personnel 826,686$ 836,236$ 817,733$ 825,405$
Materials & Services 119,210 182,368 302,855 292,605
Capital Outlay - - 2,200 2,000
Total Expenditures 945,896$ 1,018,604$ 1,122,788$ 1,120,010$
REVENUE SUMMARY
Building Permits 739,978$ 1,071,000$ 915,000$ 1,000,000$
Building Fees 688,198 621,000 550,000 600,000
Total Revenues 1,428,176$ 1,692,000$ 1,465,000$ 1,600,000$
$482,280 $673,396 $342,212 $479,990
AUTHORIZED PERSONNEL
Permit Technician 1 1 1 1
Building Official 1 1 1 1
Senior Structural Engineer 1 1 1 1
Chief Building Inspector 1 1 1 1
Senior Building Inspector 2 2 2 2
Senior Permit Technician 1 1 1 1
Secretary 0.5 0.5 0.5 0.5
Total 7.5 7.5 7.5 7.5
Program Summary
Department: COMMUNITY DEVELOPMENT
Program: BUILDING (42)
City of Dana Point
133

Fiscal Year Fiscal Year Fiscal Year Fiscal Year
2014 2015 2016 2017
Actual Amended Proposed Proposed
PERSONNEL
1010 SALARIES 651,833$ 674,640$ 657,384$ 661,140$
1030 HOURLY - - - -
1050 OVERTIME
Emergency services 16,053 2,500 20,000 20,000
16,053 2,500 20,000 20,000
1100 BENEFITS 82,996 98,318 93,750 96,900
1120 RETIREMENT BENEFITS 99,677 85,169 67,760 69,009
1140 MEDI-TAX 1.45% 10,007 9,488 9,822 9,877
1200 OUTSIDE ASSISTANCE - - - -
1990 PERSONNEL ALLOCATION
One-half secretary to CD-Code Enforcement. (43) (33,880) (33,879) (30,984) (31,521)
TOTAL PERSONNEL 826,686 836,236 817,733 825,405
MATERIALS & SERVICES
2010 COMMUNICATIONS
Cell phones 2,300 2,500 2,500
Verizon express network service for laptop 1,200 1,200 1,200
3,799 3,500 3,700 3,700
2030 EQUIPMENT MAINTENANCE
Cash register 210 300 300
Date/time stamp machine 115 120 120
Microfiche reader/printer 500 600 600
Midyr Budget Adjustment 150 - -
43 975 1,020 1,020
2050 VEHICLE MAINTENANCE
Fuel 3,792 2,875 2,875
Repairs & maintenance 1,600 3,200 3,200
Vehicle cleaning 2,120 2,120 2,120
Midyr Budget Adjustment 650 - -
4,922 8,162 8,195 8,195
2070 OFFICE SUPPLIES
Permit system forms 2,000 2,500 2,500
Building permit printing 4,000 6,000 6,000
Stationery/envelopes 200 500 500
Miscellaneous supplies 1,050 2,000 2,000
8,050 7,250 11,000 11,000
2090 MEMBERSHIPS & DUES
California Building Officials (CalBO) 300 325 325
So Cal Association of Code Officials (SCACO) 250 250 250
Int'l Code Council 300 400 400
Orange Empire Chapter ICC 300 300 300
International Assoc. of Electrical Inspectors 300 300 300
Int'l Assoc of Plumbing & Mechanical Officials 490 450 450
1,922 1,940 2,025 2,025
City of Dana Point
Expenditure Plan Detail Report
Department: COMMUNITY DEVELOPMENT
Program: BUILDING (42)
134

Fiscal Year Fiscal Year Fiscal Year Fiscal Year
2014 2015 2016 2017
Actual Amended Proposed Proposed
2110 OPERATING SUPPLIES
Building permits toner & printer 2,000 4,000 4,000
Digital camera 500 500 500
Miscellaneous 500 500 500
Trakit (permit software) license & maintenance 14,000 18,000 18,500
Digital Map Products - Annual Licensing Fee - 40,290 43,490
(items A thru E are now covered under Annual Fee)
A. GIS Thomas Bros. license agreement 2,000 - -
B. GIS - Community View 8,000 - -
C. Digital Map Products - CityGIS II upgrade 13,500 - -
D. GIS database maintenance 5,500 - -
E.GIS property attribute records (DMP) 3,000 - -
Teleworks - IVR System - 50,000 2,000
ESRI annual licensing fee 2,000 2,500 2,500
Q-Matic - DSC Queing System - - 50,000
48,304 51,000 115,790 121,490
2130 BOOKS & SUBSCRIPTIONS
Interpretive Manuals 2,500 2,500 2,500
Code Books (2016 CA Building Codes) 1,000 15,000 -
Reference Books (2016) - 2,500 -
4,313 3,500 20,000 2,500
2150 TRAINING
Trakit training (all CDD Staff) 1,500 1,500 1,500
Building code training 3,500 3,500 3,500
3,152 5,000 5,000 5,000
2230 PROFESSIONAL SERVICES
Plan check services (overflow) 25,000 125,000 125,000
Midyr Budget Adjustment 63,691 - -
34,890 88,691 125,000 125,000
2240 BLDG. PLAN CHECK/INSP SVC - - - -
2250 ADVERTISING - - - -
2270 TRAVEL, CONF. & MEETINGS
ICC & Calbo ABM 7,150 5,925 7,475
5,015 7,150 5,925 7,475
2290 MILEAGE REIMBURSEMENT
Auto allowance 4,800 4,800 4,800
Staff mileage reimbursements 400 400 400
4,800 5,200 5,200 5,200
TOTAL MAT'LS & SERV. 119,210 182,368 302,855 292,605
CAPITAL OUTLAY
3010 FURNITURE & EQUIPMENT
Kiosk PC and Software 2,200 -
Mobile Printers to support field units - 2,000
TOTAL CAPITAL OUTLAY - - 2,200 2,000
GRAND TOTAL EXPENDITURES 945,896$ 1,018,604$ 1,122,788$ 1,120,010$
135

City of Dana Point Budget Narrative
Department: COMMUNITY DEVELOPMENT Program: CODE ENFORCEMENT (43)
DEPARTMENT: COMMUNITY DEVELOPMENT
PROGRAM: CODE ENFORCEMENT
DESCRIPTION:
The Code Enforcement Division of the Department of Community Development receives and investigates potential Zoning, Property Maintenance and Building Code violations of the Dana Point Municipal Code. Code Enforcement officers use a systematic approach to eliminate blight, gain compliance and eliminate the code violations. Code Enforcement also maintains an active program not only for code compliance, but property maintenance, education and property enhancement and is an active partner with the Orange County Sheriffs’ Department identifying, documenting and eliminating graffiti in our community through the new Tracking Automated and Graffiti Reporting System (TAGRS).
OBJECTIVES:
Maintain an annual weed abatement program of sending letters to property owners requiring weed abatement and clearing parcels as needed.
Continue to use citations as a tool to gain compliance for nuisance cases. Also use Administrative Citations as a cost effective methods to gain compliance.
Continue to employ methods to ensure high compliance rates at the most effective cost, in coordination with the City Attorney’s Office.
Continue to focus code enforcement in the Lantern Village and Capistrano Beach residential areas as well as in the commercial areas of the community.
PROGRAM INDICATORS:
Initiate and resolve approximately 1,300 Code Enforcement cases per year.
Initiate and resolve approximately 250 Weed Abatement cases per year.
Review approximately 300 Massage License applications per year.
Maintain a pro-active, community-based Code Enforcement program throughout the community.
Continue to be an active partner with the Orange County Sheriffs’ Department identifying, documenting and eliminating graffiti within our community through the new
136

Tracking Automated and Graffiti Reporting System (TAGRS) program (approximately 100 cases per year).
Work on special neighborhood programs to improve property maintenance.
Process, inspect and monitor approximately 160 Short Term Rental properties under the new regulations.
137

Fiscal Year Fiscal Year Fiscal Year Fiscal Year
2014 2015 2016 2017
Actual Amended Proposed Proposed
EXPENDITURE SUMMARY
Personnel 331,275$ 400,208$ 404,823$ 410,973$
Materials & Services 21,533 24,532 29,385 29,385
Capital Outlay 20,879 - - -
Total Expenditures 373,687$ 424,740$ 434,208$ 440,358$
REVENUE SUMMARY
Contract Hearing Officer -$ -$ -$ -$
Total Revenues -$ -$ -$ -$
AUTHORIZED PERSONNEL
Secretary 0.5 0.5 0.5 0.5
Code Enforcement Officer 4 4 4 4
Total 4.5 4.5 4.5 4.5
Department: COMMUNITY DEVELOPMENT
Program: CODE ENFORCEMENT (43)
City of Dana Point
Program Summary
138

Fiscal Year Fiscal Year Fiscal Year Fiscal Year
2014 2015 2016 2017
Actual Amended Proposed Proposed
PERSONNEL
1010 SALARIES 212,214$ 265,235$ 283,535$ 287,322$
1030 HOURLY - - - -
1050 OVERTIME
Code Enforce. Officers (incl. Sat & Sun coverage) 4,632 7,200 7,200 7,200
1100 BENEFITS 45,723 55,400 51,000 52,800
1120 RETIREMENT BENEFITS 31,481 34,288 27,888 27,859
1140 MEDI-TAX 1.45% 3,345 3,715 4,216 4,271
1200 OUTSIDE ASSISTANCE - - - -
1990 PERSONNEL ALLOCATION
One-half secretary from CD-Building (42) 33,880 34,370 30,984 31,521
TOTAL PERSONNEL 331,275 400,208 404,823 410,973
MATERIALS & SERVICES
2010 COMMUNICATIONS
Cell phones 3,400 4,500 4,500
3,131 3,400 4,500 4,500
2030 EQUIPMENT MAINTENANCE
2050 VEHICLE MAINTENANCE
Fuel 3,552 3,470 3,470
Repairs & maintenance 1,200 2,425 2,425
Vehicle cleaning 1,680 2,240 2,240
Midyr Budget Adjustment - - -
6,004 6,432 8,135 8,135
2070 OFFICE SUPPLIES
General office supplies 2,000 2,000 2,000
CR&R trash tags 700 700 700
Color laser printer supplies 1,000 1,500 1,500
Stationery/envelopes 400 500 500
4,100 4,100 4,700 4,700
2090 MEMBERSHIPS & DUES
So. Ca. Assoc. of Code Enforcement Officers 300 300 300
238 300 300 300
City of Dana Point
Expenditure Plan Detail Report
Department: COMMUNITY DEVELOPMENT
Program: CODE ENFORCEMENT (43)
139

Fiscal Year Fiscal Year Fiscal Year Fiscal Year
2014 2015 2016 2017
Actual Amended Proposed Proposed
2110 OPERATING SUPPLIES
Tax information (from County of Orange) 150 150 150
Digital camera 500 500 500
205 650 650 650
2130 BOOKS & SUBSCRIPTIONS
Miscellaneous 50 100 100
- 50 100 100
2150 TRAINING
Department Staff training 1,500 2,000 2,000
402 1,500 2,000 2,000
2230 PROFESSIONAL SERVICES
Weed abatement contract 7,100 8,000 8,000
7,345 7,100 8,000 8,000
2250 ADVERTISING
Weed abatement 200 200 200
- 200 200 200
2270 TRAVEL, CONF. & MEETINGS
Code enforcement annual conf (2) 300 300 300
28 300 300 300
2290 MILEAGE REIMBURSEMENT
Staff mileage reimbursements 500 500 500
80 500 500 500
TOTAL MAT'LS & SERV. 21,533 24,532 29,385 29,385
CAPITAL OUTLAY
3010 FURNITURE & EQUIPMENT
Truck for New Code Enforcement Officer 20,879 - - -
TOTAL CAPITAL OUTLAY 20,879 - - -
GRAND TOTAL EXPENDITURES 373,687$ 424,740$ 434,208$ 440,358$
140

City of Dana Point Budget Narrative
Department: COMMUNITY DEVELOPMENT Program: ECONOMIC DEVELOPMENT (44)
DEPARTMENT: COMMUNITY DEVELOPMENT
PROGRAM: ECONOMIC DEVELOPMENT
DESCRIPTION: The Economic Development Division of Community Development Department promotes and maintains a healthy local economy through business attraction, retention and expansion. The Economic Development Program assists with business development and outreach, Tourism Business Improvement District administration, grants research, grant-writing and grant administration, Youth Board administration, Special Event permit administration, Business Registration, social media outreach, City newsletter and other public outreach programs, and special projects. The goals of Economic Development are to seek opportunities to enhance revenues for local businesses and the City and to enhance Dana Point quality of life.
OBJECTIVES: Prepare an Economic Development Strategy.
Implement goals of the Town Center Plan; foster business relations during construction, identify and secure private parking lots to be converted to public parking lots, proactively recruit target retailers.
Implement the Business Retention and Expansion (BRE) Program to support and build local business opportunities by serving as a resource for business needs and partnering with the Chamber of Commerce and Harbor Merchants Association.
Coordinate marketing and public information efforts, including quarterly City Newsletter.
Work with hotel general managers to administer the Dana Point Tourism Business Improvement District (TBID).
Address visitor needs through the Visitor Center kiosk, website information and collateral materials.
Execute an aggressive Retail Recruitment Program.
PROGRAM INDICATORS:
Proactively meet with 50 businesses as part of the BRE Program to help businesses grow.
Attend 40-50 annual Harbor Association, Chamber of Commerce meetings and ribbon cuttings to show support to the business community.
141

Administration of Tourism Business Improvement District, including 12 monthly meetings, 4 quarterly City Council status updates, annual renewals and TBID project support.
Provide 6 SCORE business workshops.
Meet with 25 retailers as part of the Retail Recruitment Program.
142

Fiscal Year Fiscal Year Fiscal Year Fiscal Year
2014 2015 2016 2017
Actual Amended Proposed Proposed
EXPENDITURE SUMMARY
Personnel $246,596 $260,179 $259,284 $261,577
Materials & Services 59,561 114,260 146,660 123,060
Capital Outlay - - - -
Total Expenditures $306,157 $374,439 $405,944 $384,637
REVENUE SUMMARY
NONE
AUTHORIZED PERSONNEL
Economic Development Manager 1 1 1 1
Management Analyst* 1 1 0 0
Assistant Admin Analyst 0 0 1 1
Total 2 2 2 2
*Moved to Administrative Services in FY16; replaced with Assistant Admin Analyst.
Program: ECONOMIC DEVELOPMENT (44)
City of Dana Point
Department: COMMUNITY DEVELOPMENT
Program Summary
143

Fiscal Year Fiscal Year Fiscal Year Fiscal Year
2014 2015 2016 2017
Actual Amended Proposed Proposed
PERSONNEL
1010 SALARIES 181,376$ 197,784$ 197,550$ 198,588$
1030 HOURLY
Visitor Center Ambassadors 9,500 10,000 10,000
8,246 9,500 10,000 10,000
1050 OVERTIME - - - -
1100 BENEFITS 26,797 26,800 27,000 27,900
1120 RETIREMENT BENEFITS 27,356 23,408 21,725 22,064
1140 MEDI-TAX 1.45% 2,821 2,687 3,009 3,025
TOTAL PERSONNEL 246,596 260,179 259,284 261,577
MATERIALS & SERVICES
2010 COMMUNICATIONS
Cell phones 1,100 1,680 1,680
1,062 1,100 1,680 1,680
2070 OFFICE SUPPLIES
General office supplies 700 700 700
Brochures, printing 5,000 5,000 5,000
2,359 5,700 5,700 5,700
2090 MEMBERSHIPS & DUES
Urban Land Institute - 215 215
Calif Assoc Local Economic Development 545 625 625
Int'l Council of Shopping Centers 100 100 100
Anaheim/OC CVB 650 650 650
California Downtown Assn. 300 300 300
American Planning Association 410 - -
American Institute of Certified Planners 170 - -
Orange County Visitor's Association 5,000 5,000 5,000
Orange County Business Council 5,000 5,000 5,000
California Travel Association 650 650 650
Midyr Budget Adjustments (6,000) - -
12,095 6,825 12,540 12,540
2130 BOOKS & SUBSCRIPTIONS
Downtown Promotion Reporter - 290 290
Miscellaneous 200 200 200
200 200 490 490
City of Dana Point
Expenditure Plan Detail Report
Department: COMMUNITY DEVELOPMENT
Program: ECONOMIC DEVELOPMENT (44)
144

Fiscal Year Fiscal Year Fiscal Year Fiscal Year
2014 2015 2016 2017
Actual Amended Proposed Proposed
2150 TRAINING
CALED training 1,000 1,000 1,000
OC Tourism Conference 200 350 350
Housing Training 200 200 200
1,268 1,400 1,550 1,550
2230 PROFESSIONAL SERVICES
GIS Maps - 1,000 1,000
Econ Dev Strategy/ Econ Dev Gen Plan Element - 25,000 -
Economic Development Consultants - 20,000 20,000
Midyr Budget Adjustments 25,000 - -
- 25,000 46,000 21,000
2250 ADVERTISING
Broadcast City Events on PBS SoCal - 10,000 10,000
Dana Point Map - - 1,400
California Visitor's Guide 8,000 - -
Public outreach, banners, trade shows 2,000 2,000 2,000
Midyr Budget Adjustments (6,955) - -
- 3,045 12,000 13,400
2270 TRAVEL, CONF. & MEETINGS
ICSC - 7,000 7,000
DP Chamber of Commerce 300 450 450
American Planning Association 700 - -
Annual CALED, CALTRAVEL conference 1,250 1,250 1,250
Midyr Budget Adjustments 1,000 - -
2,583 3,250 8,700 8,700
2290 MILEAGE REIMBURSEMENT
Staff mileage reimbursements 500 500 500
621 500 500 500
2600 MARKETING
Business sign program 15,000 - -
Public outreach (brochures & mailings) 15,000 1,000 1,000
Broadcast City events on PBS SoCa; 13,000 - -
Marketing Plan Implementation 40,000 50,000 50,000
Visitor's Center Kiosk 2,000 2,000 2,000
Bus. Retension/Expansion (BRE) workshops - 3,000 3,000
ESRI - 500 500
Commerial Property Listing 3,500 1,000 1,000
Midyr Budget Adjustments (21,260) - -
39,373 67,240 57,500 57,500
TOTAL MAT'LS & SERV. 59,561 114,260 146,660 123,060
CAPITAL OUTLAY
3010 FURNITURE & EQUIPMENT - - - -
TOTAL CAPITAL OUTLAY - - - -
GRAND TOTAL EXPENDITURES 306,157$ 374,439$ 405,944$ 384,637$
145

City of Dana Point Budget Narrative
Department: PUBLIC WORKS Program: ADMINISTRATION (51)
DEPARTMENT: PUBLIC WORKS
PROGRAM: ADMINISTRATION
DESCRIPTION:
The Public Works Administration Division is responsible for the operations and activities performed by the Public Works and Engineering Services Department. This Division provides the overall direction and administrative support for the Engineering, Traffic Engineering, Solid Waste, Street Maintenance, and Water Quality and Natural Resources Divisions, as well as the Capital Improvement Program. This Division directs the development and implementation of the Department’s goals, objectives, policies, and priorities.
The mission of Public Works Administration Division is to lead the Department in providing quality public services that are cost effective, timely, proactive, innovative, safe, environmentally conscious, and legally compliant. One of the of the Division’s most important responsibilities is to manage, monitor, and adjust the operating and capital project’s budgets based on the Department needs for projects, staffing, equipment, materials and services. The Division is also tasked with preparing and presenting public works related staff reports to the City Council, government agencies and other important stakeholders within the community.
OBJECTIVES:
Direct employees to provide five-star customer service to the general public, other departments, other public agencies and private entities who conduct business in the City of Dana Point.
Ensure positive progress on major projects including the Pacific Coast Highway and Del Prado improvements, the Connectivity Study, Doheny Village Plan and the Harbor Revitalization.
Initiate public relations activities and respond to public inquiries and complaints.
Manage the Department operating and capital improvement budgets by forecasting the need for additional funds, monitoring and approving expenditures and preparing budget adjustments as necessary.
Negotiate contracts and agreements; coordinate with legal counsel and other departments to determine City needs.
146

Monitor and evaluate the efficiency and effectiveness of service delivery methods and procedures.
Improve employee safety awareness and reduce exposure to liability in the public right of way.
Provide good stewardship of our environment through the Solid Waste and Recycling, Water Quality and Natural Resources Divisions.
Direct the training, selection, motivation and evaluation of department personnel.
Provide employees with the appropriate equipment, software, and office supplies to effectively meet customer demands.
Facilitate resolution of issues with other City departments and with other Public Works related agencies to the benefit of the City.
Ensure the Department is effectively maintaining the public infrastructure.
Ensure the Department is trained and prepared to respond to emergencies.
147

Fiscal Year Fiscal Year Fiscal Year Fiscal Year
2014 2015 2016 2017
Actual Amended Proposed Proposed
EXPENDITURE SUMMARY
Personnel $323,788 $348,755 $344,529 $347,124
Materials & Services 18,836 22,860 21,225 21,850
Capital Outlay - 60,000 - -
Total Expenditures $342,624 $431,615 $365,754 $368,974
REVENUE SUMMARY
NONE
AUTHORIZED PERSONNELDirector of Public Works & Engr Svcs. 1 1 1 1
Senior Management Analyst 0.33 0.33 0.33 0.33
Administrative Secretary 1 1 1 1
Total 2.33 2.33 2.33 2.33
Program: ADMINISTRATION (51)
Department: PUBLIC WORKS
Program Summary
City of Dana Point
148

Fiscal Year Fiscal Year Fiscal Year Fiscal Year
2014 2015 2016 2017
Actual Amended Proposed Proposed
PERSONNEL
1010 SALARIES 308,299$ 329,707$ 331,798$ 332,638$
1030 HOURLY - - - -
1050 OVERTIME
Secretary - 250 250 250
1100 BENEFITS 46,886 46,989 43,650 45,000
1120 RETIREMENT BENEFITS 44,699 39,514 40,164 41,078
1140 MEDI-TAX 1.45% 4,958 4,175 4,815 4,827
1200 OUTSIDE ASSISTANCE - - - -
1990 PERSONNEL ALLOCATION
One-third Sr. Mgmt Analyst to PW-Street Maint. (52) (35,940) (38,124) (38,334)
One-third Sr. Mgmt Analyst to PW-Solid Waste (54) (35,940) (38,124) (38,334)
(81,054) (71,880) (76,148) (76,668)
TOTAL PERSONNEL 323,788 348,755 344,529 347,124
MATERIALS & SERVICES
2010 COMMUNICATIONS
Cell phones 1,380 1,380 1,380
1,380 1,380 1,380 1,380
2030 EQUIPMENT MAINTENANCE - - - -
2050 VEHICLE MAINTENANCE
Fuel 5,800 6,200 6,500
Repairs & maintenance 300 300 500
Vehicle cleaning 530 530 530
8,648 6,630 7,030 7,530
2070 OFFICE SUPPLIES
General office supplies 1,050 1,050 1,050
Laser printer toner 760 760 760
Letterhead and envelopes 1,000 1,000 1,000
Reprographic/photocopy services 2,000 2,000 2,000
Color printer ink cartridges 2,750 1,040 1,040
Microfiche supplies 200 200 200
Printing - forms/notices/surveys 1,500 1,500 1,500
7,531 9,260 7,550 7,550
City of Dana Point
Expenditure Plan Detail Report
Department: PUBLIC WORKS
Program: ADMINISTRATION (51)
149

Fiscal Year Fiscal Year Fiscal Year Fiscal Year
2014 2015 2016 2017
Actual Amended Proposed Proposed
2090 MEMBERSHIPS & DUES
American Public Works Association 185 185 185
American Society of Civil Engineers 280 280 280
Professional engineer license renewal 125 - 125
498 590 465 590
2110 OPERATING SUPPLIES - - - -
2130 BOOKS & SUBSCRIPTIONS
Technical journals, specification updates - - - -
- - - -
2150 TRAINING
Department Staff training 900 900 900
- 900 900 900
2230 PROFESSIONAL SERVICES - - - -
2250 ADVERTISING - - - -
2270 TRAVEL, CONF. & MEETINGS
Travel, conferences & meetings 3,500 3,500 3,500
470 3,500 3,500 3,500
2290 MILEAGE REIMBURSEMENT
Staff mileage reimbursement 600 400 400
309 600 400 400
TOTAL MAT'LS & SERV. 18,836 22,860 21,225 21,850
CAPITAL OUTLAY
3010 FURNITURE & EQUIPMENT
Two fleet vehicles replaced 60,000 - -
TOTAL CAPITAL OUTLAY - 60,000 - -
GRAND TOTAL EXPENDITURES 342,624$ 431,615$ 365,754$ 368,974$
150

City of Dana Point Budget Narrative
Department: PUBLIC WORKS Program: STREET MAINTENANCE (52)
DEPARTMENT: PUBLIC WORKS
PROGRAMS: STREET MAINTENANCE
DESCRIPTION:
The Street Maintenance Division is responsible for coordinating, supervising, and inspecting the maintenance and minor repair of the City’s streets, striping, sidewalks, storm drains, inlet filters, storm water diversions, storm drain trash removal units, pump stations and public/private utilities. The Street Maintenance Division oversees numerous long term service contracts for street and storm drain maintenance, street sweeping, concrete and asphalt repairs, inlet filter cleaning and replacement and trash removal unit maintenance. This Division also issues encroachment permits to utility companies and other entities for construction and repairs in the public right of way.
The Street Maintenance Division is heavily involved in implementing traffic control plans and preparing public streets for major events such as the Grand Prix Bike Race, Festival of Whales Parade, 4th of July Fireworks, BBQ Championships, Oktoberfest and other events. Street Maintenance is also tasked with managing the light pole banner installation and holiday decoration program. This program includes the installation and change out of more than 500 light pole banners on a seasonal basis. New banners and other necessary equipment are purchased out of the Street Maintenance budget. Finally, the Street Maintenance division manages the City’s fleet of vehicles by managing acquisition and contracting out for cleaning, maintenance, and repairs.
OBJECTIVES:
Provide five-star customer service to all with whom the Division interacts.
Maximize the useful life of the City owned streets, storm drains, and other public infrastructure by using a proactive maintenance program.
Effectively manage the City’s long term agreement with the County of Orange to maintain 19 miles of arterial streets, 56 miles of non-arterial streets, and 18 miles of storm drains.
Monitor and ensure the safety of the public right of way in concert with the Traffic Division.
Provide high quality street sweeping services to all public arterial and residential streets (approximately 150 curb miles not including medians) on a weekly basis.
151

Maintain the City’s storm drain system and be prepared to respond to natural disasters.
Prevent urban runoff from polluting our City’s beaches by conducting quarterly inspections and necessary cleanings of 762 storm drain inlet filters, eight storm drain trash removal units, and 17 storm water diversions.
Utilize the Orange County Juvenile Probation Work Program and other contractors for weed abatement, debris collection, and other minor maintenance.
Award cost effective contracts and manage qualified firms providing asphalt and concrete repair projects in the right of way.
Continue to improve ADA accessibility in the public right of way in conjunction with the City’s Capital Improvement Program.
Manage and oversee technical and non-technical aspects of the City’s vehicle fleet to ensure the proper acquisition and maintenance of 56 vehicles, including trailers and equipment
Implement cost effective pedestrian and vehicular traffic control plans for major City events such as the Grand Prix Bike Race, Festival of Whales Parade, 4th of July Celebration, Turkey Trot, Dana Hills High School graduation event, Dana Hills High School Cross Country, Concerts in the Park, Battle of the Paddle, the International BBQ event and numerous private/public events throughout the year.
Create a sense of place and identity for Dana Point residents, businesses and visitors through the special events and seasonal banner and holiday decoration program.
Ensure that utility companies and other entities adhere to the City’s municipal codes and other ordinances by issuing encroachment permits and conducting inspections in the public right of way.
Avoid lawsuits by performing annual inspections and necessary repairs to City sidewalks and hardscape citywide using established inspection/safety criteria and disabled access guidelines.
PROGRAM INDICATORS:
Process 90 to 100 work orders per month, including all contracts and special projects.
Respond to 80 calls per month for assistance with street sweeping, traffic concerns, drainage issues, sidewalks and street related issues.
Review 100 USA/Dig Alert notifications per month to identify locations impacting the City’s Right-of –way.
152

Respond to pothole repair needs within one working day.
Respond to graffiti calls in City Right-of-way within one working day.
Perform, at minimum, quarterly inspections and servicing of all storm drain inlet filters.
Perform, at minimum, inspections and servicing of the City’s storm drain trash removal units every 6 weeks.
Test the materials captured in the catch basin filters annually and perform visual inspections quarterly.
Perform a walking inspection of all the City sidewalks annually, and direct maintenance work as needed.
Respond to accident scenes to assist with clean up, traffic control, safety and cost recovery.
Provide support for all major City sanctioned events including coordination, traffic control and providing assistance to other Departments including Police Services & Community Services.
Provide support for all special events in the City including assistance in the planning process as well as as-needed oversight, traffic control and traffic signal modifications
153

Fiscal Year Fiscal Year Fiscal Year Fiscal Year
2014 2015 2016 2017
Actual Amended Proposed Proposed
EXPENDITURE SUMMARY
Personnel $176,655 $174,430 $179,768 $180,901
Materials & Services 2,033,056 2,393,817 2,453,208 2,384,208
Capital Outlay - - - -
Total Expenditures $2,209,711 $2,568,247 $2,632,976 $2,565,109
REVENUE SUMMARY
NONE
AUTHORIZED PERSONNEL
Senior Management Analyst 0.33 0.33 0.33 0.33
Streets & Fleet Manager 1 1 1 1
Total 1.33 1.33 1.33 1.33
Program: STREET MAINTENANCE (52)
Department: PUBLIC WORKS
Program Summary
City of Dana Point
154

Fiscal Year Fiscal Year Fiscal Year Fiscal Year
2014 2015 2016 2017
Actual Amended Proposed Proposed
PERSONNEL
1010 SALARIES 101,164$ 110,201$ 113,981$ 113,981$
1100 BENEFITS 13,500 13,400 14,250 14,700
1120 RETIREMENT BENEFITS 15,003 13,451 11,810 12,234
1140 MEDI-TAX 1.45% 1,461 1,438 1,653 1,653
1990 PERSONNEL ALLOCATION
One-third Sr. Mgmt Analyst from PW-Admin (51) 45,527 35,940 38,074 38,334
TOTAL PERSONNEL 176,655 174,430 179,768 180,901
MATERIALS & SERVICES
2010 COMMUNICATIONS
Cell phone 1,080 1,080 1,080
1,080 1,080 1,080 1,080
2050 VEHICLE MAINTENANCE
Fuel 3,150 1,743 1,743
Repairs & maintenance 400 500 500
Vehicle cleaning 560 560 560
4,827 4,110 2,803 2,803
2070 OFFICE SUPPLIES
Routine office supplies 350 350 350
349 350 350 350
2090 MEMBERSHIPS & DUES
ISA (International Society of Arboriculture) 170 170 170
170 170 170 170
2110 OPERATING SUPPLIES
Employee uniforms (shirts, hats, jackets) 300 300 300
Equipment, small tools, materials 12,000 13,000 13,000
Light pole banner repair & replacement 1,300 1,300 1,300
Benches, trash cans, etc. 2,000 16,000 16,000
13,445 15,600 30,600 30,600
2150 TRAINING
Departmental Staff training 300 300 300
60 300 300 300
2210 UTILITIES - - - -
City of Dana Point
Expenditure Plan Detail Report
Department: PUBLIC WORKS
Program: STREET MAINTENANCE (52)
155

Fiscal Year Fiscal Year Fiscal Year Fiscal Year
2014 2015 2016 2017
Actual Amended Proposed Proposed
2230 PROFESSIONAL SERVICES
Banner/holiday decorations (installation/takedown) 64,000 190,000 100,000
Special event-related traffic control 55,000 45,000 45,000
Banners - 25,000 25,000
Midyr Budget Adjust. (banners, prof.services, holiday décor.) 152,094 - -
104,913 271,094 260,000 170,000
2250 ADVERTISING - - - -
2270 TRAVEL, CONF. & MEETINGS
Conference 500 500 500
- 500 500 500
2350 STREET MAINTENANCE
County contract - streets 830,179 736,000 738,000
County contract - striping/stenciling 228,123 231,000 235,000
County work program 25,000 25,000 25,000
Underground Service Alert (USA) 2,500 2,500 2,500
Concrete remove and replace 100,000 125,000 125,000
Asphalt remove and replace 100,000 100,000 100,000
Rubberized asphalt crack fill 25,000 25,000 25,000
Sidewalk grinding 25,000 25,000 25,000
Caltrans ROW & Citywide litter removal 65,000 75,000 75,000
Graffiti removal 15,000 15,000 15,000
Emergency repairs 10,000 10,000 10,000
Addt'l traffic control/misc maintenance - 15,000 15,000
Sidewalk Steam-Cleaning/Maintenance Svcs - 10,000 25,000
Citywide weed abatement - 20,000 20,000
Midyear Budget Adjustments (holiday décor) 15,551 - -
1,317,312 1,441,353 1,414,500 1,435,500
2490 STREET SWEEPING
Monthly service 271,425 271,425 271,425
Special event sweeping 6,500 6,500 6,500
Street sweeping online database 480 480 480
Midyear Budget Adjustments (transfer to 52-2230) (31,645) - -
243,338 246,760 278,405 278,405
2510 STORM DRAINS
County contract - storm drain maintenance 61,000 80,000 80,000
Inlet filter cleaning services 146,000 146,000 146,000
Storm drain trash removal unit cleaning svcs 142,000 142,000 142,000
Inlet filter purchases/repairs 2,500 2,500 2,500
Strom Drain Cleaning Services 34,000 52,000 52,000
Trash removal unit/diversion repairs 22,000 22,000 22,000
Emergency repairs 5,000 5,000 5,000
Additional video inspection services - 15,000 15,000
347,562 412,500 464,500 464,500
2530 SAFETY LIGHTING - - - -
TOTAL MAT'LS & SERV. 2,033,056 2,393,817 2,453,208 2,384,208
GRAND TOTAL EXPENDITURES 2,209,711$ 2,568,247$ 2,632,976$ 2,565,109$
156

City of Dana Point Budget Narrative
Department: PUBLIC WORKS Program: TRAFFIC ENGINEERING (53)
DEPARTMENT: PUBLIC WORKS
PROGRAM: TRAFFIC ENGINEERING
DESCRIPTION:
The Traffic Engineering Division is responsible for safe and efficient daily traffic and parking operations within the City limits. The Division performs professional traffic engineering analyses in developing or reviewing plans for facilitating traffic movement, accident prevention and placing work area and special event traffic control. The Division oversees the preparation of plans, specifications, cost estimates and contract documents for traffic related street repairs, traffic control plans, and signing and striping plans.
The City’s traffic signal system is an integral part of the Division’s daily activities. The traffic signals located on most arterial streets have been coordinated so that motorists enjoy the convenience of more green lights where possible in the City. Maintaining effective signal coordination is a constant task for the Division.
Maintaining the City’s bikeway system and Class III pedestrian/bicycle paths is also the responsibility of the Traffic Engineering Division. Bicyclists depend on the City to properly maintain bike lanes and provide safe detours when normal routes are affected by construction in the street. Further, this Division is always seeking opportunities to improve the bikeway system with the addition of bike lanes and other improvements.
Finally, the Division is expected to be in constant communication with local, regional, and State transportation agencies such as OCTA and Caltrans to keep current on safety and liability related issues. This includes review and implementation of State and Federal Traffic guidelines and standards that are constantly changing.
OBJECTIVES:
Provide five-star customer service to all with whom the Division interacts.
Support the City Council and the Traffic Improvement Subcommittee by providing technical analyses, studies, reports, and presentations as necessary.
Respond to community complaints and concerns related to traffic safety in a prompt, professional, helpful, and courteous manner.
Provide adequate parking for residents, businesses, and visitors within the City limits, as appropriate.
157

Review subdivision tract and parcel maps for calculations related to traffic trip generation and overall traffic safety to ensure the proper inclusion of necessary public works coincident with private development.
Write and process work orders for traffic related work including new signs, modifications to existing signage and striping, traffic calming, congestion relief, curb marking modifications and other related work citywide.
Ensure safe and efficient travel along City streets by managing, improving and maintaining the City’s traffic signal system.
Encourage residents and visitors to use the City’s bikeways by providing safe, smooth, well maintained bike lanes and pedestrian paths that can be enjoyed by all.
Reduce the City’s exposure to liability by identifying and eliminating potentially hazardous pedestrian, bicycle and vehicular traffic conditions in the public right of way.
Avoid lawsuits by installing/implementing industry approved traffic safety devices on public streets and pathways, using State guidelines and standards.
Review signing and striping on all arterial and collector streets annually for compliance with local, state and federal regulations.
PROGRAM INDICATORS:
Prepare approximately 15 City Council meeting agenda reports each fiscal year.
Provide staff support for Traffic Improvement Subcommittee meetings.
Complete approximately 500 traffic investigations per year as requested.
Prepare 450 work orders per year to improve signing and striping issues citywide.
Perform annual review of signing and striping on all arterial and collector streets with licensed traffic/civil engineering staff, and update as-built plans as needed to comply with local, state and federal regulations.
158

Fiscal Year Fiscal Year Fiscal Year Fiscal Year
2014 2015 2016 2017
Actual Amended Proposed Proposed
EXPENDITURE SUMMARY
Personnel -$ -$ -$ -$
Materials & Services 506,021 657,500 671,850 713,850
Capital Outlay - - - -
Total Expenditures 506,021$ 657,500$ 671,850$ 713,850$
REVENUE SUMMARY
NONE
AUTHORIZED PERSONNEL
Senior Civil Engineer (traffic)* 1 1 1 1Total 1 1 1 1
* As of April 2015, the Senior Civil Engineer (traffic) position was not funded; additional funds
budgeted in Professional Services for contract to deliver these services.
Program: TRAFFIC ENGINEERING (53)
Department: PUBLIC WORKS
Program Summary
City of Dana Point
159

Fiscal Year Fiscal Year Fiscal Year Fiscal Year
2014 2015 2016 2017
Actual Amended Proposed Proposed
MATERIALS & SERVICES
2010 COMMUNICATIONS -$ -$ -$ -$
2070 OFFICE SUPPLIES
General office supplies 349 350 350 350
2110 OPERATING SUPPLIES - - - -
2150 TRAINING
Department Staff training 100 300 300
100 100 300 300
2210 UTILITIES
Traffic signals 35,000 37,000 39,000
City of SJC shared signal costs 1,050 1,200 1,200
Street lights 263,000 275,000 295,000
296,164 299,050 313,200 335,200
2230 PROFESSIONAL SERVICES
Traffic engineering consultant 140,000 140,000 140,000
Traffic signal timing consultant 5,000 5,000 5,000
Traffic studies/counts/speed verification 6,000 6,000 6,000
Emerg. vehicle pre-emption inspection/maintenance 17,000 - 20,000
Traffic Signal Communications Consulting - 8,000 8,000
113,432 168,000 159,000 179,000
2250 ADVERTISING - - - -
2270 TRAVEL, CONF. & MEETINGS - - - -
2290 MILEAGE REIMBURSEMENT - - - -
2530 SAFETY LIGHTING / TRAFFIC SIGNALS
Monthly traffic signal maintenance 40,000 40,000 40,000
Extraordinary signal maintenance 75,000 40,000 40,000
Traffic safety projects/emergencies 25,000 25,000 25,000
Traffic Signal Equipment Painting 25,000 25,000 25,000
Traffic Signal/Mesh Network Comm. Equip. Upgrades - 30,000 30,000
LED Illuminated street name signs - 35,000 35,000
Battery Purchases for signal backup units - 4,000 4,000
Midyear Budget Adjustment (Traffic Signal Equipment Painting) 25,000 - -
95,976 190,000 199,000 199,000
TOTAL MAT'LS & SERV. 506,021 657,500 671,850 713,850
CAPITAL OUTLAY
3010 FURNITURE & EQUIPMENT - - - -
TOTAL CAPITAL OUTLAY - - - -
GRAND TOTAL EXPENDITURES 506,021$ 657,500$ 671,850$ 713,850$
City of Dana Point
Expenditure Plan Detail Report
Department: PUBLIC WORKS
Program: TRAFFIC ENGINEERING (53)
160

City of Dana Point Budget Narrative
Department: PUBLIC WORKS Program: SOLID WASTE AND RECYCLING (54)
DEPARTMENT: PUBLIC WORKS
PROGRAM: SOLID WASTE AND RECYCLING
DESCRIPTION:
The primary responsibility of the Solid Waste and Recycling Division is to manage the exclusive franchise agreement for solid waste and recycling services, currently between CR&R, Inc. and the City of Dana Point. Managing the contract includes conducting service performance audits, calculating annual rate adjustments, and amending the agreement as necessary. The Solid Waste and Recycling Division communicates with CR&R on a daily basis to ensure customer satisfaction.
CR&R, Inc. provides exclusive solid waste and recycling services to all residential, commercial, and temporary service customers in the City of Dana Point. CR&R is responsible for weekly curbside collection of residential refuse, recyclables, and green waste. Commercial, multi-family, and temporary solid waste is scheduled for collection multiple days per week. No other hauler besides CR&R is permitted to haul waste from the City of Dana Point.
CR&R is responsible for administering most of the recycling and related public education programs in the City of Dana Point and achieving a diversion rate that complies with SB 1016. The City takes responsibility for the SHARPS mail back program, the Plastic Bag Ban and Styrofoam Ban programs, the CFL and Battery Collection Recycling Program, the Construction and Demolition Ordinance program, the tri-annual Bulky Item Drop off events, four (4) Community Vermicomposting Workshops held during the Spring and Fall months and annual reporting to the South Coast Air Quality Management District (AQMD) and the State of California Department of Resources, Recycling and Recovery (CalRecycle).
CR&R also responds to daily requests for bulky item pick up service Citywide. Further, CR&R also provides bins to City staff and contractors for various projects.
OBJECTIVES:
Provide five-star customer service to all with whom the Division interacts.
Actively manage the exclusive franchise agreement between the City of Dana Point and CR&R, Inc. for solid waste and recycling services.
Achieve an annual diversion rate that complies with Senate Bill 1016.
161

Continue to divert more than 75% of the construction and demolition waste generated.
Evaluate the Construction and Demolition ordinance program and look for ways to increase the efficiency of the program while increasing the percentage of C&D materials diverted.
Provide recycling and sustainable practice opportunities to Dana Point residents, business owners and visitors. Develop the “Zero Waste” program in concert with our youth, businesses and hotels.
In conjunction with CR&R, sponsor at least three Bulky Item Clean Up Day events per calendar year where residents can dispose of unwanted furniture, home appliances, televisions, computers, florescent light bulbs, green waste and other bulky items free of charge. This event includes on-site document shredding and donations to Goodwill Industries.
Continue to work with businesses in Dana Point to seek improvements in managing their waste stream programs in order to maintain compliance with Assembly Bill 341 (Mandatory Commercial Recycling, effective July 1, 2012).
Continue to quickly respond to the City’s requests for bulky item pick up service for items dumped in the roadways and the City right-of-way.
PROGRAM INDICATORS:
CR&R provides curbside collection services to approximately 11,450 residential units without complaint.
CR&R collects approximately 8,994 tons of recyclable materials and 10,287 tons of solid waste from single and multi-family residential units per year, effectively.
CR&R collects approximately 5,980 tons of recyclable materials and 6,088 tons of solid waste from commercial accounts per year, effectively.
CR&R collected approximately 2.4 tons of Household Hazardous Waste (HHW) in the first year of the City’s new Residential HHW Collection Program (program commenced Feb. 2014).
CR&R collected approximately 247 tons of commercial organic waste through the Food Scrap Recycling Program per year, effectively.
CR&R must exceed the annual diversion rate that complies with Senate Bill 1016. CR&R is responsible for this mandate through the franchise agreement.
162

City staff processes approximately 125 new Construction and Demolition Plans and approximately 98 C&D deposit refunds per year.
City staff administers approximately 240 Waste Exemption Permits per year.
163

Fiscal Year Fiscal Year Fiscal Year Fiscal Year
2014 2015 2016 2017
Actual Amended Proposed Proposed
EXPENDITURE SUMMARY
Personnel 35,527$ 35,940$ 38,074$ 38,334$
Materials & Services 42,420 124,032 43,750 93,750
Capital Outlay - - - -
Total Expenditures 77,947$ 159,972$ 81,824$ 132,084$
REVENUE SUMMARY
Solid Waste Franchise Fee 122,085$ 125,000$ 126,020$ 127,260$
AB939 Administration Fee 51,388 50,000 50,000 50,000
Solid waste franchise audit - 50,000 - 50,000
Reimb. Exp - CR&R Contract Admin 80,402 75,000 80,500 80,500
Total Revenues 253,875$ 300,000$ 256,520$ 307,760$
AUTHORIZED PERSONNEL
Senior Management Analyst 0.34 0.34 0.34 0.34
Total 0.34 0.34 0.34 0.34
Program: SOLID WASTE (54)
Department: PUBLIC WORKS
Program Summary
City of Dana Point
164

Fiscal Year Fiscal Year Fiscal Year Fiscal Year
2014 2015 2016 2017
Actual Amended Proposed Proposed
PERSONNEL
1990 PERSONNEL ALLOCATION
One-third Sr. Mgmt. Analyst from PW-Admin (51) 35,527$ 35,940$ 38,074$ 38,334$
TOTAL PERSONNEL 35,527 35,940 38,074 38,334
MATERIALS & SERVICES
2070 OFFICE SUPPLIES
Education outreach materials 1,500 1,500 1,500
Recycling containers 500 500 500
Office supplies 350 350 350
2,024 2,350 2,350 2,350
2230 PROFESSIONAL SERVICES
SHARPS program 3,500 3,600 3,600
Mercury disposal recycling service 1,400 1,500 1,500
Dept. of Conservation grant programs 5,000 5,000 5,000
Residential tagging program 13,900 13,900 13,900
Advertising for community recycling events 6,300 7,400 7,400
Zero Waste Campaign/Outreach 10,000 10,000 10,000
Franchise agreement compliance audit (reimbursed) 50,000 - 50,000
Midyear Budget Adjustments (FY14 carryover) 31,582 - -
40,396 121,682 41,400 91,400
TOTAL MAT'LS & SERV. 42,420 124,032 43,750 93,750
GRAND TOTAL EXPENDITURES 77,947$ 159,972$ 81,824$ 132,084$
City of Dana Point
Expenditure Plan Detail Report
Department: PUBLIC WORKS
Program: SOLID WASTE (54)
165

City of Dana Point Budget Narrative
Department: PUBLIC WORKS Program: ENGINEERING (56)
DEPARTMENT: PUBLIC WORKS
PROGRAM: ENGINEERING
DESCRIPTION:
The Engineering Division is organized in three sections: Development Engineering, Capital Improvement Program (CIP) Design, and Construction.
Development Engineering staff are responsible for oversight (accuracy/safety) of engineering design related to private and public development within the City. This Division reviews all types of engineering plans to ensure compliance with applicable codes and ordinances. The Development Engineering Division conducts field inspections for resident/property owner constructed improvements on both private and public property. They are responsible for issuing encroachment, grading, improvement and transportation permits to public and private applicants. They are also responsible for plan checking services, third party geotechnical grading reviews, assisting the Planning Division with the discretionary development review process, as well as assisting the Building Division on plan checking for a variety of permit types.
The CIP Design and Construction Sections are tasked with managing the design and construction of capital projects funded by the City’s CIP program. The in-house construction design engineers are tasked with drawing up construction plans, administering complex grant programs related to funding capital projects, responding to public records requests, managing outside engineering consultants, preparing engineering exhibits for events and general engineering purposes, and assisting on a variety of resident/property owner inquiries. The Construction Section project manager and inspector are responsible for managing construction contracts for capital projects. The construction team is crucial for the timely, safe and cost effective construction of City parks, street and right-of-way repair and rehabilitation, storm drains and other major infrastructure improvements, and landscaped medians. Further, the construction team assists with emergency response related to accidents and storms.
OBJECTIVES:
Deliver the PCH/Del Prado Streetscape Improvement Project phased construction on time, under budget, safely and attaining top quality results, as budgeted.
Provide five-star customer service to the contractors, developers, home owners, businesses, and other applicants who visit the public counter for engineering services.
166

Develop procedures that are considerate of customer needs and allow for a streamlined, straightforward, and professional engineering review process.
Perform plan checking services, facilitate third party geotechnical and grading reviews through an engineering consultant, and assist the Planning and Building Division with plan checking reviews.
Effectively issue encroachment, grading, and transportation permits to applicants and inspect the permitted work in a professional and timely manner.
Process final parcel and tract maps, bonds and deeds for required projects, and prepare technical maps and legal descriptions.
Prepare accurate and timely easement deeds, permits, agreements, deed restrictions, studies and other engineering documents in support of public and private projects.
Ensure compliance with the City Municipal Code as it relates to engineering services.
Pursue implementation of the City’s seven year Capital Improvement Program to continue to enhance the quality, safety and beauty of the City’s infrastructure and publicly owned property.
Manage construction contracts for capital projects in a professional manner to assure projects are delivered safely, on time, obtaining top quality results and within the City Council approved budget.
Continue to improve the filing and retrieval system of engineering documents such as plans, reports, permits and other property related information.
Identify and investigate new grant funding opportunities that can be used to construct capital projects and continue to administer current grant programs.
Be prepared to respond to natural disasters and other emergencies in our city.
PROGRAM INDICATORS:
Issue 355 engineering permits per fiscal year.
Perform 1,269 plan checks per fiscal year.
Conduct approximately 160 inspections per month
Provide same day or next day initial response to all inquiries.
167

Fiscal Year Fiscal Year Fiscal Year Fiscal Year
2014 2015 2016 2017
Actual Amended Proposed Proposed
EXPENDITURE SUMMARY
Personnel 1,139,295$ 1,205,899$ 1,230,662$ 1,242,247$
Materials & Services 184,777 456,483 584,975 584,975
Capital Outlay 56,447 - - -
Total Expenditures 1,380,519$ 1,662,382$ 1,815,637$ 1,827,222$
REVENUE SUMMARY
Engineering Permits 257,738$ 326,542$ 243,000$ 245,000$
Engineering Fees 52,386 60,000 49,000 49,000
Total Revenues 310,124$ 386,542$ 292,000$ 294,000$
AUTHORIZED PERSONNEL
Senior Civil Engineer* 4 4 4 4
City Engineer 1 1 1 1
Senior Construction Inspector 1 1 1 1
Principal Civil Engineer 1 1 1 1
Secretary** 2 2 2 2
Engineering Technician III 3 3 3 3Sub-total 12 12 12 12
* One Senior Civil Engineer position vacant, not funded in FY16 & FY17
**One Secretary position vacant, not funded in FY16 & FY17
Regular Part-time
Engineering Intern 0.5 0.5 0.5 0.5
Program: ENGINEERING (56)
Department: PUBLIC WORKS
Program Summary
City of Dana Point
168

Fiscal Year Fiscal Year Fiscal Year Fiscal Year
2014 2015 2016 2017
Actual Amended Proposed Proposed
PERSONNEL
1010 SALARIES 862,041$ 937,590$ 962,087$ 967,617$
1030 HOURLY
Intern (20 hours/week) 13,520 13,500 13,500
9,042 13,520 13,500 13,500
1050 OVERTIME
Senior construction inspector 2,500 2,500 2,500
2,389 2,500 2,500 2,500
1100 BENEFITS 123,873 123,900 135,000 139,500
1120 RETIREMENT BENEFITS 129,365 115,852 103,392 104,867
1140 MEDI-TAX 1.45% 12,585 12,537 14,182 14,262
1990 PERSONNEL ALLOCATION - - - -
TOTAL PERSONNEL 1,139,295 1,205,899 1,230,662 1,242,247
MATERIALS & SERVICES
2010 COMMUNICATIONS
Cell phone 5,460 6,000 6,000
6,407 5,460 6,000 6,000
2050 VEHICLE MAINTENANCE
Fuel 6,326 4,525 4,525
Repairs & maintenance 3,640 2,320 2,320
Vehicle cleaning 2,210 2,210 2,210
13,244 12,176 9,055 9,055
2070 OFFICE SUPPLIES
General office supplies 2,700 4,200 4,200
2,635 2,700 4,200 4,200
2090 MEMBERSHIPS & DUES
American Public Works Association (9) 740 800 800
Construction Management Assn of Amer. (1) 75 100 100
Construction Manager Certification Inst. (1) 120 120 120
Professional Enginner license renewal 500 750 750
American Society of Civil Engineers (6) 1,120 1,400 1,400
1,153 2,555 3,170 3,170
2110 OPERATING SUPPLIES
AUTOCAD software licenses 4,500 6,500 6,500
Miscellaneous software 4,000 6,000 6,000
Computer supplies 1,500 1,500 1,500
Tools for field inspectors 300 500 500
Employee uniforms 1,400 1,400 1,400
Field Equipment replacement 400 400 400
Wide format plotter: Maintenance service 2,100 2,500 2,500
Wide format plotter: Supplies 1,000 1,500 1,500
Miscellaneous supplies 1,700 1,700 1,700
15,691 16,900 22,000 22,000
City of Dana Point
Expenditure Plan Detail Report
Department: PUBLIC WORKS
Program: ENGINEERING (56)
169

Fiscal Year Fiscal Year Fiscal Year Fiscal Year
2014 2015 2016 2017
Actual Amended Proposed Proposed
2130 BOOKS & SUBSCRIPTIONS
Technical journals, specification updates 1,000 1,000 1,000
571 1,000 1,000 1,000
2150 TRAINING
Department Staff training 5,000 5,000 5,000
1,036 5,000 5,000 5,000
2230 PROFESSIONAL SERVICES
Aerial images 8,650 8,650 8,650
Special project management & support 13,000 13,000 13,000
Geological consultation (emergencies) 17,000 17,000 17,000
CIP contract services 250,000 250,000 250,000
Planning application review cost - 20,000 20,000
Midyr Budget Adjustments (3rd party geotech) 115,542 - -
137,985 404,192 308,650 308,650
2240 GEOTECH THIRD PARTY REVIEWS (reimbursed)
Contract Geotech Services (new account detail) - - 220,000 220,000
- - 220,000 220,000
2250 ADVERTISING
- - - -
2270 TRAVEL, CONF. & MEETINGS
- - - -
2290 MILEAGE REIMBURSEMENT
Staff mileage reimbursement 6,500 5,900 5,900
6,055 6,500 5,900 5,900
TOTAL MAT'LS & SERV. 184,777 456,483 584,975 584,975
CAPITAL OUTLAY
3010 FURNITURE & EQUIPMENT 56,447 - - -
TOTAL CAPITAL OUTLAY 56,447 - - -
GRAND TOTAL EXPENDITURES 1,380,519$ 1,662,382$ 1,815,637$ 1,827,222$
170

City of Dana Point Budget Narrative
Department: PUBLIC WORKS Program: WATER QUALITY & NATURAL RESOURCES (57)
DEPARTMENT: PUBLIC WORKS
PROGRAM: WATER QUALITY & NATURAL RESOURCES
DESCRIPTION:
The Natural Resources Protection Section of the Division is responsible for planning, coordinating and implementing natural resource protection activities at the Headlands Conservation Area and the Dana Poin t Sta te Marine Conservation Area. The Natural Resources Protection Program directs the ecological functioning, restoration and protection of habitat, preservation of rare or threatened species, protection of the biodiversity in the conservation areas, and education of the public.
The Natural Resources Protection program includes planning, developing and presenting interpretive programs at the Headlands Nature Interpretive Center and conducting tours of the open space and shoreline areas. The Natural Resources Protection Officer is responsible for the daily operation of the Nature Interpretive Center, which includes recruiting, training, and scheduling volunteers and docent staff to participate in and deliver interpretive programs.
The Water Quality Section of the Division is responsible for implementing the City’s Ocean Water Quality Program and maintaining compliance with environmental regulations such as the City’s MS4 Storm Water Permit and Total Maximum Daily Load (TMDL) requirements.
The Division is tasked with public education and outreach related to the impacts of surface runoff pollution, how to keep pollutants out of storm drains, water conservation and other sustainable living topics to a wide variety of target audiences. Outreach also includes City staff training, inspection and enforcement of construction sites, commercial businesses and Homeowners Associations for effective Best Management Practices (BMPs), and conducts outreach at City events.
The Section is responsible for administration, monitoring, operation, and maintenance of the City’s structural Best Management Practices (BMPs). The City’s inventory of structural BMPs include the Salt Creek Ozone Treatment Facility, the North Creek Ozone Treatment Project, seventeen nuisance water diversion facilities and eight s torm drain trash removal units. These treatment controls protect and improve creek and beach water quality and reduce public health risks.
The Section also reviews public and private development project plans, completing and submitting numerous required reporting documents, and obtaining grant funds
171

for water quality projects and studies. Coordinates with the Ocean Water Quality Subcommittee, South Coast Water District, Municipal Water District of Orange County, South Orange County Wastewater Authority, South Orange County Watershed Management Agency and other agencies to implement water quality conservation and sanitary sewer programs.
OBJECTIVES:
Plan, develop, and implement the Natural Resource Protection Program at the Headlands Conservation Area and State Marine Conservation Area.
Recruit, train, and supervise volunteer docents to present interpretive programs at the Headlands Nature Interpretive Center and conduct nature and history tours of the conservation area and State Marine Conservation Area.
Monitor use of the State Marine Conservation Area through patrols, volunteer Tidepool Interpretive Program docents, and monitoring the bus reservation program for school groups.
Encourage public cooperation with park regulations through patrolling, docent tours, repair of fences, and implementation of effective signage.
Continue evolution of the Nature Interpretive Center exhibit space that reflects the biological, geological, historical, and cultural importance of the Headlands.
Ensure fuel modification/weed abatement and biological monitoring activities are accomplished in accordance with guidelines outlined in the HMMP (URS 2005) for the terrestrial Conservation Parks.
Work with State of California Department of Fish and Wildlife, Ocean Institute, and Orange County Marine Protected Area Council to manage the local Marine Protected Areas (MPA) and implement changes to existing MPA’s as developed through the Marine Life Protection Act.
Initiate a species inventory for the conservation areas, including mapping of all rare plant locations, monitoring of predator use, and biodiversity sampling to assist in the management of the area, and create a GIS database.
Provide five-star customer service to all with whom the Division comes in contact.
Maintain a commitment to City’s Mission Statement and #1 Strategic Goal by demonstrating an ongoing commitment, continued leadership and implementation of an effective water quality program. Continue to build partnerships with regulatory agencies, other agencies, and stakeholders to develop and execute innovative solutions to address water quality issues.
172

Modify and enhance existing program elements to meet progressive Water Quality National Pollutant Discharge Elimination System (NPDES) Municipal Separate Storm Sewer System (MS4) permit and Total Maximum Daily Load (TMDL) requirements.
Maintain compliance with environmental regulations.
Facilitate the City’s Ocean Water Quality Subcommittee meetings, efforts and directives.
Provide an effective public outreach program to inform and educate a variety of target audiences on the importance of controlling runoff and associated pollutants, conserving water and reducing spills from the sanitary sewer system.
Organize successful community outreach at strategic events, such as Coastal Cleanup Day, Ocean Awareness Day, and Emergency Preparedness Expo.
Encourage innovative and sustainable design for new development, redevelopment and revitalization projects, such as Lantern District (Town Center) and Dana Point Harbor with appropriate water quality control measures.
Reduce beach posting in Dana Point.
PROGRAM INDICATORS:
Continue to protect (through docent interpretive enforcement and Natural Resources Protection Officer patrol activities) and improve the natural resources including the Headlands Conservation Parks, trails system, Nature Interpretive Center (NIC), and tidepools and beaches within the Dana Point State Marine Conservation Area, and avoid loss of endangered species and rare plants.
Maintain and continually educate a quality group of docents dedicated to assisting in the preservation of the Headlands Conservat ion Area and Dana Point State Marine Conservation Area, and to fill all operating hours of the NIC and the Tidepool Interpretive Program (TIP) with well-trained volunteer docents.
Continue to further develop displays, dioramas, exhibits and models within and adjacent to the Nature Interpretive Center as well as create maps and interpretive panels to be placed along the Headlands trails systems to better educate the public by completing the currently awarded grant requirements.
Produce monthly docent led Nature, Whale, and History tours that are free to the public. The tours have been a great success with an average of 10 or more people attending each tour. Add a new tour twice during this budget period (e.g. Summer Sunset Walk).
173

Design, develop, and implement organized children’s programs, at the California Department of Education Content Standard level, that create an interest in nature and history.
Continue to work closely with the Center for Natural Lands Management (CNLM) to conduct biological monitoring, maintenance activities, and to ensure the conservation values of the 29.4 acre CNLM Dana Point Preserve.
Maintain compliance with the National Pollution Discharge Elimination System (NPDES) MS4 Stormwater Permit without enforcement actions and/or fines.
Submit required reporting to regulating agencies, such as San Diego Regional Water Quality Control Board and South Orange County Wastewater Authority on time.
Continue comprehensive investigation and develop solutions on any identified health risk at Doheny State Beach, specifically a Capital Improvement Project for storm drain L01S02.
Continue partnerships with lead scientists (SCCWRP and OCHCA) to improve testing protocols for beach water quality, specifically identifying a better beach warning protocol.
Continue to efficiently operate and maintain City Best Management Practices, such as the Salt Creek Ozone Facility, trash separation units and nuisance water diversions in accordance with applicable regulations, permits and agreements.
Continue community outreach programs such as education activities during Coastal Clean Up Day and Ocean Awareness Day and newspaper articles.
Modify and enhance existing program elements to meet new Clean Beach National Pollutant Discharge Elimination Plan (NPDES) permit and Total Maximum Daily Load (TMDL) requirements
Facilitate the City’s Ocean Water Quality Subcommittee meetings and efforts. Continue to inspire public participation and ideas for new projects.
Review, approve and implement system-wide Best Management Practices (BMPs) for private and public projects; investigating and utilizing new technology as it becomes available for improved water quality measures.
Continue to enhance and implement an effective public outreach program to inform and educate the public on the importance of controlling urban runoff and associated pollutants, conserve water and reduce spills from the sanitary sewer system.
174

Fiscal Year Fiscal Year Fiscal Year Fiscal Year
2014 2015 2016 2017
Actual Amended Proposed Proposed
EXPENDITURE SUMMARY
Personnel $230,106 $244,529 $245,399 $246,971
Materials & Services 400,385 663,106 619,150 622,550
Capital Outlay - - - -
Total Expenditures $630,491 $907,635 $864,549 $869,521
REVENUE SUMMARY
Headlands Interpretive Center -$ 22,500$ -$ -$
HOA incentive program 2,500 - 2,500 2,500
Total Revenues 2,500$ 22,500$ 2,500$ 2,500$
AUTHORIZED PERSONNEL
Senior Civil Engineer 1 1 1 1
Natural Resources Protection Officer 1 1 1 1
Sub-total 2 2 2 2
Part-time
Intern 0.5 0.5 0.5 0.5
Total 2.5 2.5 2.5 2.5
Program: WATER QUALITY & NATURAL RESOURCES (57)
Department: PUBLIC WORKS
Program Summary
City of Dana Point
175

Fiscal Year Fiscal Year Fiscal Year Fiscal Year
2014 2015 2016 2017
Actual Amended Proposed Proposed
PERSONNEL
1010 SALARIES 164,167$ 180,384$ 180,832$ 180,832$
1030 HOURLY
Intern 14,040 13,500 13,500
11,572 14,040 13,500 13,500
1100 BENEFITS 27,000 26,800 28,500 29,400
1120 RETIREMENT BENEFITS 24,667 21,023 19,750 20,421
1140 MEDI-TAX 1.45% 2,700 2,282 2,818 2,818
1990 PERSONNEL ALLOCATION - - - -
TOTAL PERSONNEL 230,106 244,529 245,399 246,971
MATERIALS & SERVICES
2010 COMMUNICATIONS
Cell phone 1,680 1,680 1,680
1,680 1,680 1,680 1,680
2070 OFFICE SUPPLIES
General office supplies 875 875 875
566 875 875 875
2090 MEMBERSHIPS & DUES
Association of State Flood Plain Managers 110 130 130
Certified Flood Plain Manager - 300 -
Certified Inspector of Sediment & Erosion Control 200 200 200
Marine education & research organizations 300 300 300
Certified Professional in Storm Water Quality 200 250 250
Keep California Beautiful 200 - -
Conservation Biology 125 125 125
Nat'l Marine Educators Assn 40 40 40
California Coastal Coalition 1,000 1,000 1,000
1,733 2,175 2,345 2,045
2110 OPERATING SUPPLIES
Printing/public education materials 3,000 3,000 3,000
Water quality booth setup/takedown 1,000 - -
Water quality education outreach materials 5,000 6,000 6,000
Meetings and workshops 500 500 500
Tools and field equipment 500 500 500
Park brochures/educational pamplets 4,000 4,000 4,000
ESHA Maintenance (moved to new Fund 27) 22,400 - -
Midyear Budget Adjustment 4,246 - -
84,348 40,646 14,000 14,000
2130 BOOKS & SUBSCRIPTIONS
Miscellaneous 600 600 600
- 600 600 600
2150 TRAINING
Citywide NPDES training 3,000 2,000 2,000
Docent training 300 300 300
City of Dana Point
Expenditure Plan Detail Report
Department: PUBLIC WORKS
Program: WATER QUALITY & NATURAL RESOURCES (57)
176

Advanced docent training 400 400 400
Department Staff training 750 750 750
175 4,450 3,450 3,450
2230 PROFESSIONAL SERVICES
Salt Creek technical support 5,000 5,000 5,000
Federal lobbyist 24,000 24,000 24,000
NPDES Commercial Inspections 12,000 12,000 12,000
Special investigations - Illegal discharge/connection, NAL,
spill clean-up 20,000 20,000 20,000
33,099 61,000 61,000 61,000
2270 TRAVEL, CONF. & MEETINGS
Conferences 4,000 4,000 4,000
2,777 4,000 4,000 4,000
2290 MILEAGE REIMBURSEMENT
Staff mileage reimbursements 1,500 1,200 1,200
912 1,500 1,200 1,200
2510 STORM DRAINS
NPDES (co-permitee share) 70,000 75,000 78,000
SOCWMA cost share 5,750 6,500 6,700
Baby Beach TMDL + cost share 25,000 25,000 30,000
SWRCB/NPDES permit fee 10,500 16,500 18,000
San Juan Creek TMDL Cost Share 11,000 13,000
Diversion flow treatment 45,000 45,000 45,000
Monitoring (SOCWA, etc) 21,000 18,000 18,000
Salt Creek:
Operation and maintenance (SCWD) 165,000 125,000 130,000
Operation and maintenance (SDG&E) 57,000 50,000 52,000
Planned Equipment Replacement - 65,000 50,000
Extraordinary repairs 30,000 20,000 20,000
Grease interceptor rebate program 25,000 15,000 15,000
North Creek ozone treatment 60,000 50,000 50,000
Headlands diversion flow treatment & monitoring 11,000 8,000 8,000
Midyear Budget Adjustment (FY14 carryover) 20,930
275,095 546,180 530,000 533,700
TOTAL MAT'LS & SERV. 400,385 663,106 619,150 622,550
GRAND TOTAL EXPENDITURES 630,491$ 907,635$ 864,549$ 869,521$
177

City of Dana Point Budget Narrative
Department: PUBLIC SAFETY Program: POLICE SERVICES (61)
DEPARTMENT: PUBLIC SAFETY
PROGRAM: POLICE SERVICES
DESCRIPTION:
The City contracts for law enforcement with the Orange County Sheriff’s Department. The Sheriff’s Department is responsible for providing for the safety, well-being and physical protection of local residents, business, visitors and property rights.
OBJECTIVES:
Provide responsive, professional and caring law enforcement services to the City of Dana Point.
Respond to calls for services promptly.
Provide patrol service, bicycle patrol program, parking and traffic safety, investigative services, police protection and enforcement of municipal ordinances. To provide the citizens of Dana Point with a Community Based Policing concept that provides them with a positive, interactive form of policing.
Provide assistance for special units such as Narcotics Detail, Hazardous Devices Squad, Crime Prevention Detail, Equestrian Units, Air Support Bureau, Reserve Bureau, and the Coroner Division when needed.
Staff and monitor public counter in Police Services to provide Dana Point Citizens a direct access point to Community Based Policing Deputies.
Initiate and maintain crime prevention programs.
Maintain a high level of professional law enforcement services to the community.
PROGRAM INDICATORS:
Maintain prompt response time in answering over 16,000 estimated calls for service and to remain within a 40-60% preventative patrol time range.
Respond to and initiate reporting of an average of 27 traffic collisions a month and issue moving, parking, and other citations as warranted to promote a policy of traffic safety education through the City of Dana Point.
178

Fiscal Year Fiscal Year Fiscal Year Fiscal Year
2014 2015 2016 2017
Actual Amended Proposed Proposed
EXPENDITURE SUMMARY
Personnel -$ -$ -$ -$
Materials & Services 9,638,670 10,456,300 10,766,852 11,666,150
Capital Outlay - 200,000 - 150,000
Total Expenditures $9,638,670 $10,656,300 $10,766,852 $11,816,150
REVENUE SUMMARY
Fines & Forfeitures $198,521 $200,000 $250,000 $250,000
Abandoned Vehicle Abatement - - - -
Total Revenues $198,521 $200,000 $250,000 $250,000
AUTHORIZED PERSONNEL
Contract (Orange County Sheriff)
Lieutenant 1 1 1 1
Sergeant 6 6 6 6
Investigator 2 2 2 2
Deputy 25 25 25 25
Community Services Officer 6 6 6 6
Investigative Assistant 1 1 1 1
Office Specialist 0 0 0 0
Total 41 41 41 41
Also pay for portions of Regional-Shared personnel related to Traffic, Auto Theft, Directed Enforcement,
Subpoena and Courts.
Program: POLICE SERVICES (61)
Department: PUBLIC SAFETY
Program Summary
City of Dana Point
179

Fiscal Year Fiscal Year Fiscal Year Fiscal Year
2014 2015 2016 2017
Actual Amended Proposed Proposed
MATERIALS & SERVICES
2010 COMMUNICATIONS
Cell phones & satellite phones (4) -$ 8,500$ 8,500$ 8,500$
7,250 8,500 8,500 8,500
2030 EQUIPMENT MAINTENANCE
Bicycle maintenance 3,000 3,000 3,000
800 MHz backbone maintenance 13,000 13,450 13,550
Laptop computers, external defibrilators 2,000 2,300 2,400
Canon 5000 copier (Police) 4,000 4,000 4,000
Hand held radar/radar trailer maintenance 1,200 1,500 1,500
23,476 23,200 24,250 24,450
2050 VEHICLE MAINTENANCE
Motorcycle maintenance 8,000 8,000 8,000
Fleet maintenance 19,000 19,000 19,500
Fuel 38,000 38,000 39,000
51,607 65,000 65,000 66,500
2070 OFFICE SUPPLIES
Routine office supplies 9,500 9,500 9,500
4,699 9,500 9,500 9,500
2110 OPERATING SUPPLIES
Special events 22,500 23,500 24,000
Bicycle patrol supplies (helmets, uniforms, tires, etc.) 1,250 1,250 1,250
Employee business cards, City letterhead 1,500 1,200 1,200
Awards & commendations 2,500 2,500 2,500
Name tags for deputies 500 500 500
Micelleanous 5,500 5,500 5,500
30,895 33,750 34,450 34,950
2150 TRAINING
Employee development 5,000 4,000 4,000
1,477 5,000 4,000 4,000
2230 PROFESSIONAL SERVICES
Trauma intervention program 5,000 5,250 5,250
Intervention specialist 55,000 60,000 65,000
Crossing guards 55,000 57,000 57,000
102,860 115,000 122,250 127,250
City of Dana Point
Expenditure Plan Detail Report
Department: PUBLIC SAFETY
Program: POLICE SERVICES (61)
180

Fiscal Year Fiscal Year Fiscal Year Fiscal Year
2014 2015 2016 2017
Actual Amended Proposed Proposed
2270 TRAVEL, CONF. & MEETINGS
Miscellaneous 5,000 6,000 6,000
5,912 5,000 6,000 6,000
2330 POLICE SERVICES
Contract services (+8.52% FY16 / est +5.00% FY17) 10,171,350 10,821,210 11,360,000
-Admin Sergeant (278,308) -
-FY15 Overtime rate adjustment credit (75,000) -
-Special assignments (overtime billed separate from Contract) 25,000 25,000 25,000
Midyear Budget Adjustments (5,000) - -
9,410,494 10,191,350 10,492,902 11,385,000
TOTAL MAT'LS & SERV. 9,638,670 10,456,300 10,766,852 11,666,150
CAPITAL OUTLAY
3010 FURNITURE & EQUIPMENT
P25 Compliant Radios (13/year x 4 years) 150,000 - 150,000
Vehicle Replacements (2) 50,000 - -
- 200,000 - 150,000
TOTAL CAPITAL OUTLAY - 200,000 - 150,000
GRAND TOTAL EXPENDITURES 9,638,670$ 10,656,300$ 10,766,852$ 11,816,150$
181

City of Dana Point Budget Narrative
Department: PUBLIC SAFETY Program: VIPS (62)
DEPARTMENT: PUBLIC SAFETY
PROGRAM: VOLUNTEERS IN POLICE SERVICES
DESCRIPTION:
Dana Point Police Services developed a City based volunteer program for the community entitled the Volunteers in Police Services (VIPS). The program is administered by the Community Based Policing Sergeant.
OBJECTIVES:
Provide assistance to City personnel, clerical, code enforcement, traffic and Police Services.
Provide parking enforcement, traffic control and assistance at special events.
Initiate and maintain crime prevention programs.
Maintain a high level of visibility in the community.
Provide community service programs.
Maintain a high level of participation in Neighborhood Watch Block Captains program.
Provide Neighborhood Watch Programs.
Assist Police Services and City personnel with special events.
PROGRAM INDICATORS:
Provide 35 home checks per month.
Donate a minimum of 24 hours per month per volunteer to the program.
182

Fiscal Year Fiscal Year Fiscal Year Fiscal Year
2014 2015 2016 2017
Actual Amended Proposed Proposed
EXPENDITURE SUMMARY
Personnel -$ -$ -$ -$
Materials & Services 12,648 24,850 19,300 19,300
Capital Outlay - - - -
Total Expenditures 12,648$ 24,850$ 19,300$ 19,300$
REVENUE SUMMARYNONE
AUTHORIZED PERSONNEL
Program: VIPS (62)
Department: PUBLIC SAFETY
Program Summary
City of Dana Point
183

Fiscal Year Fiscal Year Fiscal Year Fiscal Year
2014 2015 2016 2017
Actual Amended Proposed Proposed
MATERIALS & SERVICES
2010 COMMUNICATIONS
Cell phone service -$ 500$ -$ -$
- 500 - -
2030 EQUIPMENT MAINTENANCE
Bicycle maintenance 750 500 500
Midyear Budget Adjustments 5,000 - -
25 5,750 500 500
2050 VEHICLE MAINTENANCE
Van patrol (gas, maintenance & repairs) 4,700 5,000 5,000
Midyear Budget Adjustments 800 - -
7,106 5,500 5,000 5,000
2070 OFFICE SUPPLIES
Neighborhood watch/ business watch materials 7,000 7,000 7,000
Routine supplies for 1 staff/25 volunteers 1,500 1,500 1,500
Midyear Budget Adjustments (6,000) - -
2,183 2,500 8,500 8,500
2110 OPERATING SUPPLIES
Volunteer uniform replacement 2,500 2,500 2,500
Routine supplies 1,100 1,100 1,100
Midyear Budget Adjustments 6,000 - -
3,223 9,600 3,600 3,600
2150 TRAINING
Volunteer development courses 600 800 800
Midyear Budget Adjustment (250) - -
- 350 800 800
2230 PROFESSIONAL SERVICES - - - -
2270 TRAVEL, CONF. & MEETINGS
Crime prevention meetings 250 250 250
Volunteer development conferences 350 350 350
111 600 600 600
2290 MILEAGE REIMBURSEMENT
Staff mileage reimbursement 350 300 300
Midyear Budget Adjustment (300) - -
- 50 300 300
TOTAL MAT'LS & SERV. 12,648 24,850 19,300 19,300
GRAND TOTAL EXPENDITURES 12,648$ 24,850$ 19,300$ 19,300$
City of Dana Point
Expenditure Plan Detail Report
Department: PUBLIC SAFETY
Program: VIPS (62)
184

City of Dana Point Budget Narrative
Department: DISASTER PREPAREDNESS AND FACILITIES Program: EMERGENCY SERVICES (12)
DEPARTMENT: DISASTER PREPAREDNESS AND FACILITIES
PROGRAM: EMERGENCY SERVICES
DESCRIPTION:
The Emergency Services Division coordinates disaster preparedness, response, and recovery programs as set forth in State and Federal regulations. Funding for the Emergency Services Division is provided for in the general fund budget and offset by revenue received through the State of California for actual activities related to nuclear power preparedness. The Emergency Services Division also coordinates the Community Emergency Response Team (CERT) program. This program offers emergency preparedness training to the community and provides a core group of trained volunteers capable of supporting the City following a major disaster.
OBJECTIVES:
Maintain the City’s Emergency Operations Center (EOC) in a state of operational readiness to support disaster response efforts
Provide disaster preparedness information and training to the community via multiple public outreach programs and public education materials
Maintain City Emergency Plan in compliance with federal regulation 44 CFR 30 and the California Emergency Services Act
Conduct training and coordinate exercises for City staff that may be called upon to serve in time of disaster, as a member of the City’s Emergency Organization
Support the City’s Emergency Organization to respond to and recover from actual emergencies and disasters
Manage and administer the City’s Community Emergency Response Team (CERT) training and volunteer program
Maintain the City’s certification with the National Oceanic and Atmospheric Administration (NOAA/NWS) StormReady and TsunamiReady programs
Maintain the City’s Public Safety wireless mesh network to support law enforcement operations, disaster response, and traffic management capabilities throughout the city.
185

Participate in the Interjurisdictional Planning Committee (IPC) charged with developing and maintaining emergency plans for the San Onofre Nuclear Generating Station (SONGS)
Prepare and submit general fund budget, Nuclear Power Preparedness (NPP) budget, and semi-annual reimbursement claims for actual time spent on NPP projects
Participate with other affected jurisdictions to plan for federally evaluated exercises required by federal document NUREG-0654
Participate with other affected jurisdictions in planning meetings and workshops sponsored by OES, FEMA, NRC, or other agency directly related to nuclear power preparedness
Use NPP funds to maintain dosimetry equipment and to advance emergency operations center response capabilities.
Attend emergency management and NPP-related training courses, conferences, symposiums and meetings to maintain and enhance technical proficiency.
Participate in monthly radio communications system tests, monthly Yellow Telephone System (YPS) tests, and annual Community Alert Siren System test.
Participate with other affected jurisdictions in periodic drills, dress rehearsals and exercises that are established to meet the requirements of NUREG 0654 and the objectives of FEMA REP 14.
186

Fiscal Year Fiscal Year Fiscal Year Fiscal Year
2014 2015 2016 2017
Actual Amended Proposed Proposed
EXPENDITURE SUMMARY
Personnel 207,342$ 226,462$ 225,976$ 227,597$
Materials & Services 82,502 89,520 125,200 125,200
Capital Outlay - - - -
Total Expenditures 289,844$ 315,982$ 351,176$ 352,797$
REVENUE SUMMARY
Nuclear Power Program 149,600$ 160,000$ 140,000$ 140,000$
AUTHORIZED PERSONNEL
Emergency Services Coordinator 1 1 1 1
Director of Disaster Prep. & Facilities 0.5 0.5 0.5 0.5
Sub-total 1.5 1.5 1.5 1.5
Part-time secretary 0.5 0.5 0.5 0.5
Total 2 2 2 2
Program: EMERGENCY AND SUPPORT SERVICES (12)
Department: PUBLIC SAFETY
Program Summary
City of Dana Point
187

Fiscal Year Fiscal Year Fiscal Year Fiscal Year
2014 2015 2016 2017
Actual Amended Proposed Proposed
PERSONNEL
1010 SALARIES - partially reimbursed 219,913$ 227,908$ 231,905$ 231,905$
1030 HOURLY
Administrative support 20,000 21,344 21,669
17,219 20,000 21,344 21,669
1050 OVERTIME - - - -
1100 BENEFITS 32,933 29,876 30,900 31,800
1120 RETIREMENT BENEFITS 31,864 29,311 29,802 30,687
1140 MEDI-TAX 1.45% 3,404 3,160 3,672 3,677
1200 OUTSIDE ASSISTANCE
Administrative/secretarial support - - - -
1990 PERSONNEL ALLOCATION
One-half Emerg. Svcs. Mgr. to Facilities (95) (83,793) (91,647) (92,141)
(97,991) (83,793) (91,647) (92,141)
TOTAL PERSONNEL 207,342 226,462 225,976 227,597
MATERIALS & SERVICES
2010 COMMUNICATIONS
Satellite phone usage 1,000 1,000 1,000
Radio equipment 1,000 1,000 1,000
Orange County 800MHz system 1,200 1,000 1,000
Wireless data units 3,000 4,000 4,000
Cell phones 2,100 2,500 2,500
6,184 8,300 9,500 9,500
2030 EQUIPMENT MAINTENANCE
Communications maintenance - 50% reimbursed 1,000 1,000 1,000
EOC software maintenance - 50% reimbursed 800 6,800 6,800
EOC Equipment Maint - 50% reimbursed 6,000 - -
Radiological equipment calibration - reimbursed 1,500 1,500 1,500
Emergency generator - 50% reimbursed 6,000 7,000 7,000
11,966 15,300 16,300 16,300
2050 VEHICLE MAINTENANCE
Fuel 8,085 6,500 6,500
Repairs & maintenance 2,470 1,500 1,500
Vehicle cleaning 1,120 1,200 1,200
13,917 11,675 9,200 9,200
2070 OFFICE SUPPLIES
Routine office supplies 1,000 1,000 1,000
Outside printing (brochures, etc.) 2,000 2,000 2,000
1,852 3,000 3,000 3,000
City of Dana Point
Expenditure Plan Detail Report
Department: PUBLIC SAFETY
Program: EMERGENCY AND SUPPORT SERVICES (12)
188

Fiscal Year Fiscal Year Fiscal Year Fiscal Year
2014 2015 2016 2017
Actual Amended Proposed Proposed
2090 MEMBERSHIPS & DUES
CESA 75
International Assoc. of Emergency Managers 170 200 200
75 245 200 200
2110 OPERATING SUPPLIES
Community Emergency Response Team program 7,000 7,000 7,000
NOAA storm-ready tsunami certification program 2,000 2,000 2,000
EOC maintenance 5,000 5,000 5,000
Public Safety Mesh 15,000 15,000 15,000
Community Preparedness Expo 10,000 10,000 10,000
Disaster supplies rotation 2,000 5,000 5,000
Emergency response supplies 5,000 5,000 5,000
43,838 46,000 49,000 49,000
2130 BOOKS & SUBSCRIPTIONS - - - -
- - - -
2150 TRAINING
NPP-related training - reimbursed 1,500 - -
Department staff - 2,500 2,500
1,495 1,500 2,500 2,500
2230 PROFESSIONAL SERVICES
Wireless Mesh Prev Maint Contract - 30,000 30,000
- - 30,000 30,000
2270 TRAVEL, CONF. & MEETINGS
Travel, conference & meetings 3,000 5,000 5,000
2,983 3,000 5,000 5,000
2290 MILEAGE REIMBURSEMENT
Staff mileage reimbursements 500 500 500
192 500 500 500
2570 STORM DAMAGE - - -
- - - -
TOTAL MAT'LS & SERV. 82,502 89,520 125,200 125,200
CAPITAL OUTLAY
3010 FURNITURE & EQUIPMENT - - - -
TOTAL CAPITAL OUTLAY - - - -
GRAND TOTAL EXPENDITURES 289,844$ 315,982$ 351,176$ 352,797$
189

City of Dana Point Budget Narrative
Department: CITY ATTORNEY Program: CITY ATTORNEY (71)
DEPARTMENT: CITY ATTORNEY
PROGRAM: CITY ATTORNEY
DESCRIPTION:
The City Attorney acts as legal advisor to the City Council, City Manager, the various City Departments, commissions, committees and boards. The City Attorney prepares or approves as to legal form all proposed City ordinances, resolutions, contracts and other legal documents. The City Attorney also represents the City in certain litigation cases in which the City is involved and prosecutes violations of City laws. The City Attorney gives assistance and advice for City-related litigation handled by California Joint Powers Insurance Authority (CJPIA).
OBJECTIVES:
Provide oral and written advice and opinions as requested.
Review and prepare ordinances, resolutions, contracts, written opinions and agreements.
Attend meetings of the City Council and Planning Commission to advise upon the legality of all activity.
Enforce the City Code and prosecute violators.
Review and process claims against the City not covered by CJPIA, including legal defense in selected situations.
Initiate legal action when deemed necessary or proper by the City Council.
Provide timely legal advice to City Council, City staff, Planning Commission, Traffic Commission and advisory bodies.
Provide all-purpose litigation capability on behalf of the City.
PROGRAM INDICATORS:
Attend all City Council meetings.
Attend all Planning Commission meetings.
190

Fiscal Year Fiscal Year Fiscal Year Fiscal Year
2014 2015 2016 2017
Actual Amended Proposed Proposed
EXPENDITURE SUMMARY
Materials & Services 899,070$ 904,721$ 703,500$ 707,500$
Capital Outlay - - - -
Total Expenditures 899,070$ 904,721$ 703,500$ 707,500$
REVENUE SUMMARYNONE
AUTHORIZED PERSONNEL
Program: CITY ATTORNEY (71)
Department: CITY ATTORNEY
Program Summary
City of Dana Point
191

Fiscal Year Fiscal Year Fiscal Year Fiscal Year
2014 2015 2016 2017
Actual Amended Proposed Proposed
MATERIALS & SERVICES
2130 BOOKS & SUBSCRIPTIONS
Legal code updates -$ 7,000$ 7,500$ 7,500$
4,860 7,000 7,500 7,500
2310 CITY ATTORNEY SERVICES
Retainer account 121,000 116,000 120,000
O.C. Muni code violation custody fees 14,000 5,000 5,000
Muni code violations/prosecution 343,000 325,000 325,000
General legal services (non-litigation) 265,000 250,000 250,000
Adjustment for Headlands legal costs (Reimb.) 154,721 - -
894,210 897,721 696,000 700,000
TOTAL MAT'LS & SERV. 899,070 904,721 703,500 707,500
GRAND TOTAL EXPENDITURES 899,070$ 904,721$ 703,500$ 707,500$
City of Dana Point
Expenditure Plan Detail Report
Department: CITY ATTORNEY
Program: CITY ATTORNEY (71)
192

City of Dana Point Budget Narrative
Department: COMMUNITY SERVICES & PARKS Program: COMMUNITY SERVICES (81)
DEPARTMENT: COMMUNITY SERVICES & PARKS
PROGRAM: COMMUNITY SERVICES
DESCRIPTION:
The Community Services Division creates community through people, parks and programs by providing recreational and cultural arts programs for all ages. Some of the ongoing programs and services offered include: contract recreation classes, sports camps, youth and adult sports leagues, and major city-wide events, such as concerts in the park, movies in the park, holiday events and also collaborative non-profit community events.
The Community Services Division oversees the permitting process to reserve any one of 28 parks in the City’s park inventory, as well as facility rentals in the Community Center. The parks are widely used for a variety of special occasions such as weddings, anniversaries, birthdays, public meetings, and memorial ceremonies. The division manages the operation of the Del Obispo Community Park that includes a Community/Senior Center, three lighted ball fields, two tennis courts, batting cages, and outdoor handball, and supervises the operation of a multi-purpose field and a dedicated softball field at Dana Hills High School.
The Community Services Division works closely with local groups and City departments in a collaborative effort to offer a wide variety of community events such as: 4th of July fireworks, Grand Prix of Cycling, Dana Point Harbor Boat Parade, Car Shows, Dana Point Relay for Life, VFW Memorial Day Service, VFW Veteran’s Day Service and Festival of Whales celebration events.
OBJECTIVES:
• Strengthen community image and sense of place• Support economic development• Strengthen safety and security• Promote health and wellness• Foster human development• Increase cultural unity• Provide recreational experiences
193

PROGRAM INDICATORS
Provide support for Age Well Senior Services to implement a variety of programs and services designed to meet the needs of the senior population in Dana Point. Many of the services include a congregate meal program, home delivered meals, outreach program, educational classes, wellness programs, and themed events.
• Monthly food commodity program serving 2,328• Congregate meal program, serving 7,036 annually• Home delivered meals providing 4,749 meals annually• Case management services, serving 40 cases annually• Various senior support services, such as health, legal, taxes, etc., serving 690
annually• Saddleback Emeritus Institute contractual classes• Through OCTA, provides 2,000 rides for seniors to meals program annually• Monthly special events, serving 1,320 annually. Twilight dinners and Holiday
dances, Thanksgiving lunch, New Year’s Eve Dinner Dance, Valentine DinnerDance and St. Patrick’s Day Luncheon.
Produce and conduct (21) major city events – Festival of Whales Parade, Movie in the Park and, Concert; (2) Egg Hunts; (4) June Movies in the Park; 4th of July Fireworks Display; (8) Summer Concert Series; Dana Point State BBQ Championship; Halloween Spooktacular & Moonlight Movie; and the Winter Festival & Tree Lighting.
In addition to the City coordinated events, the division worked with local non-profit groups in a collaborative effort to produce a variety of community events such as: Grand Prix of Cycling/Kid’s Race, Dana Point Harbor Boat Parade, Car Shows, Dana Point Relay For Life, Pet Project Foundation Whales & Tails Wag-A-thon, VFW Memorial Day and Veteran’s Day Event and Festival of Whales celebration events.
The contractual class program serves over 3,800 people annually.
Conduct youth (basketball) and adult (softball and kickball) seasonal sports programs.
Coordinate facility and park rentals for private, non-profit or commercial groups.
Enhancement of City’s marketing program through quarterly publication, annual calendar and updating of City’s website.
194

Fiscal Year Fiscal Year Fiscal Year Fiscal Year
2014 2015 2016 2017
Actual Amended Proposed Proposed
EXPENDITURE SUMMARY
Personnel 656,117$ 694,202$ 709,864$ 716,474$
Materials & Services 1,144,342 1,214,720 1,235,025 1,236,025
Capital Outlay 16,800 - - -
Total Expenditures 1,817,259$ 1,908,922$ 1,944,889$ 1,952,499$
REVENUE SUMMARY
Park programs & activities 266,278$ 278,000$ 280,000$ 283,000$
Total Revenues 266,278$ 278,000$ 280,000$ 283,000$
AUTHORIZED PERSONNELFull-time
Administrative Aide 1 1 1 1
Recreation Coordinator 2 2 2 2
Director - Community Svs & Parks 1 1 1 1
Administrative Secretary 1 1 1 1
Recreation Manager 1 1 1 1
Sub-total 6 6 6 6
Regular Part-time
Staff Aide 0.4 0.4 0.4 0.4
Total 6.40 6.40 6.40 6.40
Program: COMMUNITY SERVICES (81)
Department: COMMUNITY SERVICES & PARKS
Program Summary
City of Dana Point
195

Fiscal Year Fiscal Year Fiscal Year Fiscal Year
2014 2015 2016 2017
Actual Amended Proposed Proposed
PERSONNEL
1010 SALARIES 419,752$ 449,153$ 469,570$ 472,979$
1030 HOURLY
Recreation Leaders 56,850
Part-time secretary (32 hrs. per week) -
Senior program coordinator (20 hrs/wk) 13,650
Part-time Staff - 70,500 70,500
48,323 70,500 70,500 70,500
1050 OVERTIME
Hourly staff - special events, meetings & leagues 12,209 20,000 20,000 20,000
1100 BENEFITS 83,591 85,318 81,900 84,600
1120 RETIREMENT BENEFITS 69,806 62,088 59,774 60,224
1140 MEDI-TAX 1.45% 7,436 7,143 8,121 8,170
1200 OUTSIDE ASSISTANCE - - - -
1990 PERSONNEL ALLOCATION 15,000 - - -
TOTAL PERSONNEL 656,117 694,202 709,864 716,474
MATERIALS & SERVICES
2010 COMMUNICATIONS
Cell phone 1,320 1,320 1,320
1,320 1,320 1,320 1,320
2030 EQUIPMENT MAINTENANCE
Copier 3,500 3,500 3,500
Fax 150 150 150
Recreation software maintenance 4,000 4,000 4,000
3,877 7,650 7,650 7,650
2050 VEHICLE MAINTENANCE
Fuel 1,635 1,635 1,635
Repairs & maintenance 300 300 300
Vehicle cleaning 600 600 600
Midyear Budget Adjustments 3,515
1,325 6,050 2,535 2,535
2070 OFFICE SUPPLIES
Routine office supplies 2,350 2,350 2,350
Copier supplies (paper) 1,750 1,750 1,750
Fax machine toner cartridges 200 200 200
Laminating machine supplies 100 100 100
3,968 4,400 4,400 4,400
2090 MEMBERSHIPS & DUES
So. California Municipal Athletic Federation (4) 210 280 280
California Park & Recreation Society (4) 480 640 640
690 690 920 920
2110 OPERATING SUPPLIES
City of Dana Point
Expenditure Plan Detail Report
Department: COMMUNITY SERVICES & PARKS
Program: COMMUNITY SERVICES (81)
196

Fiscal Year Fiscal Year Fiscal Year Fiscal Year
2014 2015 2016 2017
Actual Amended Proposed Proposed
Medical/first aid 300 300 300
Replacement of chairs & tables 7,500 7,500 7,500
Plant maintenance contract 500 500 500
Staff uniforms 1,000 1,000 1,000
7,836 9,300 9,300 9,300
2150 TRAINING
Department Staff training 1,500 1,500 1,500
160 1,500 1,500 1,500
2170 POSTAGE
Quarterly recreation brochures 14,000 14,000 14,000
Office postage 525 600 600
14,189 14,525 14,600 14,600
2230 PROFESSIONAL SERVICES
Contract classes (Split Instructor/City) 180,000 180,000 180,000
Marketing/promotion contract 34,000 34,000 34,000
Quarterly recreation brochure 40,000 40,000 40,000
City calendar 10,000 10,000 10,000
Scholarship classes 500 1,000 1,000
Age Well Senior Services 47,500 47,500 47,500
Midyr. Budget Adjustments (16,015)
280,491 295,985 312,500 312,500
2250 ADVERTISING
Events (egg hunt, concerts, craft faire) 8,000 10,000 10,000
4th of July fireworks promotions 3,000 3,000 3,000
10,970 11,000 13,000 13,000
2270 TRAVEL, CONF. & MEETINGS
- - -
- - - -
2290 MILEAGE REIMBURSEMENT
Auto allowance 4,800 4,800 4,800
Staff mileage reimbursements 1,500 1,500 1,500
5,490 6,300 6,300 6,300
2410 COMMUNITY ACTIVITIES
4th of July Fireworks Show 135,000 140,000 140,000
4th of July trolley service 10,000 10,000 10,000
Grad Nite contribution 5,000 5,000 5,000
Ceremonies 2,500 2,500 2,500
Relay For Life 7,000 7,000 7,000
Coastal Cleanup Day 2,500 2,500 2,500
Summer Concerts 130,000 135,000 135,000
Art Festival 12,000 12,000 12,000
Community Events 15,000 15,000 15,000
Youth Services:
Ocean Institute youth programs 25,000 25,000 25,000
Capo Valley Boys & Girls Club sponsorship 25,000 25,000 25,000
Holiday program 15,000 15,000 15,000
Holiday decorations 10,000 20,000 20,000
Holiday Shuttles - 15,000 15,000
Dana Point Grand Prix Bike Race Sponsorship 20,000 20,000 20,000
Dana Point Grand Prix Bike Race Operation 10,000 10,000 10,000
Doheny Blues Festival Sponsorship 15,000 15,000 15,000
Halloween Spooktacular & Movie 5,000 6,000 7,000
Dana Point BBQ Championship 65,000 90,000 90,000
Friday Movies in the Park 20,000 30,000 30,000
Turkey Trot sponsorship 20,000 20,000 20,000
197

Fiscal Year Fiscal Year Fiscal Year Fiscal Year
2014 2015 2016 2017
Actual Amended Proposed Proposed
Dana Point Symphony Sponsorship 20,000 20,000 20,000
Festival of Whales:
Sponsorship 25,000 30,000 30,000
Marketing 10,000 10,000 10,000
Movie night 3,500 5,000 5,000
Concert 10,000 15,000 15,000
Community parade 30,000 30,000 30,000
Midyear Budget Adjustments 117,500 - -
719,002 765,000 730,000 731,000
2430 RECREATION PROGRAMS
Youth sports 20,000 20,000 20,000
Adult sports 9,000 9,000 9,000
Transportation for senior services 8,000 8,000 8,000
Egg Hunt 9,000 14,000 14,000
Holiday Craft Faire 20,000 25,000 25,000
Senior Programs (Add'l Monthly Events FY16/17) 30,000 55,000 55,000
Midyr Budget Adjustments (5,000) - -
95,024 91,000 131,000 131,000
TOTAL MAT'LS & SERV. 1,144,342 1,214,720 1,235,025 1,236,025
CAPITAL OUTLAY
3010 FURNITURE & EQUIPMENT
Event Electric Cart 16,800 - - -
TOTAL CAPITAL OUTLAY 16,800 - - -
GRAND TOTAL EXPENDITURES 1,817,259$ 1,908,922$ 1,944,889$ 1,952,499$
198

City of Dana Point Budget Narrative
Department: COMMUNITY SERVICES & PARKS Program: PARKS (55)
DEPARTMENT: COMMUNITY SERVICES & PARKS
PROGRAM: PARKS
DESCRIPTION:
The Parks and Median Program is responsible for 28 beautiful parks, including a community garden, that provide safe, clean and attractive facilities for our citizens of Dana Point. There are over 100 acres of developed park land with approximately 3,000 trees, 8 outdoor restroom buildings, 10 playgrounds, 5 dog fun zones and 21 parks with security lighting. The City’s landscape medians and parkways contain over 5,000 trees. The cornerstone of the City’s parks is Del Obispo Park. It features a 15,000 sq. ft. Community Center that includes a full size gym, a Senior Center, a restroom/concession stand, 3 lighted ball fields, 1 handball court, 2 tennis courts, 1 outdoor and 2 indoor basketball courts. The City maintains 5.4 acres of the Dana Hills High School Sports Park, a joint venture between the City and Capistrano Unified School District to improve the recreation resources available to the youth in our community. The sports park has 2 lighted regulation softball fields, a soccer field and a restroom and concession facility. In addition, this Division is responsible for maintaining the 30.5 acres of publicly owned landscaped medians and right-of-way trees. A total of 8,000 City trees are trimmed according to International Society of Arboriculture standards for both beauty and to reduce risk.
OBJECTIVES:
Provide the finest parks, medians and street trees possible.
Provide professional contract administration for park and median landscape and tree maintenance, vandalism repair, graffiti removal, security lighting maintenance and amenity repairs to provide the community with accessible, safe, clean and well maintained parks, medians and recreational facilities.
Provide timely planning, design, repair and construction of facilities consistent with public recreation needs and economic feasibility.
Provide timely information and knowledgeable responses to address public inquiries and community concerns.
Pursue implementation of the City’s Park Capital Improvement Program, Parks & Recreation Master Plan, Bikeways & Pedestrian Trails Master Plan, Tree Master Plan and Landscape Beautification Program to further enhance the City’s open space.
199

Reduce use of potable water.
Efficiently install and modify City parks irrigation control systems in a cost effective manner.
Provide cost effective and responsive services for maintenance and repair.
PROGRAM INDICATORS:
Perform weekly landscape and median inspections, receive input from and provide feedback to the community.
Perform weekly inspections of parkways and medians to ensure the health of landscaping and compliance with National Pollution Discharge Elimination System (NPDES).
Perform weekly inspections of tree trimming contractor to ensure compliance with City and ISA standards. Annually trim the following:
●4,000 street and park trees (2-year program for 8,000 trees)●300 Canary Island Date Palms
Perform monthly certified playground inspections to ensure community safety.
200

Fiscal Year Fiscal Year Fiscal Year Fiscal Year
2014 2015 2016 2017
Actual Amended Proposed Proposed
EXPENDITURE SUMMARY
Personnel 294,274$ 312,464$ 314,548$ 318,100$
Materials & Services 2,894,158 3,165,670 3,341,980 3,532,180
Capital Outlay 16,500 - - -
Total Expenditures 3,204,932$ 3,478,134$ 3,656,528$ 3,850,280$
REVENUE SUMMARY
Park & Community Center Rentals 67,730$ 50,000$ 50,000$ 50,000$
AUTHORIZED PERSONNEL
Parks Maintenance Worker III 1 1 1 1
Parks Supervisor 1 1 1 1
Parks Manager 1 1 1 1
Total 3 3 3 3
Program: PARKS (55)
Department: COMMUNITY SERVICES & PARKS
Program Summary
City of Dana Point
201

Fiscal Year Fiscal Year Fiscal Year Fiscal Year
2014 2015 2016 2017
Actual Amended Proposed Proposed
PERSONNEL
1010 SALARIES 228,510$ 233,965$ 240,336$ 242,396$
1050 OVERTIME
After hours emergency response 5,000 5,000 5,000
5,072 5,000 5,000 5,000
1100 BENEFITS 37,500 39,200 39,750 41,100
1120 RETIREMENT BENEFITS 34,950 31,240 25,905 26,016
1140 MEDI-TAX 1.45% 3,242 3,059 3,557 3,587
1990 PERSONNEL ALLOCATION (15,000) - - -
TOTAL PERSONNEL 294,274 312,464 314,548 318,100
MATERIALS & SERVICES
2010 COMMUNICATIONS
Cell phones 1,800 1,800 1,800
1,800 1,800 1,800 1,800
2030 EQUIP & FACIL. MAINT. - -
2050 VEHICLE MAINTENANCE
Fuel 9,000 9,300 9,500
Repairs & maintenance 3,500 2,680 2,680
Vehicle cleaning 1,000 1,680 1,680
Midyear Budget Adjustments 2,500 - -
13,498 16,000 13,660 13,860
2070 OFFICE SUPPLIES
General office supplies 1,050 1,200 1,200
1,035 1,050 1,200 1,200
2090 MEMBERSHIPS & DUES
California Park & Recreation Society (2) 420 420 420
International Society of Arboriculture (1) - - -
25 420 420 420
2110 OPERATING SUPPLIES
Repair & installation - mutt mitt dispensers 4,000 1,000 1,000
Employee uniforms 3,000 3,000 3,000
Mutt mitts 21,000 24,000 24,000
Small tools/hardware 75,000 75,000 75,000
111,734 103,000 103,000 103,000
2150 TRAINING
Department Staff training 900 900 900
- 900 900 900
2190 FACIL & EQUIP LEASE/RENTAL
Portable toilets (Thunderbird Park & Sea Terrace Park) 6,100 6,000 6,000
5,005 6,100 6,000 6,000
2210 UTILITIES
City of Dana Point
Expenditure Plan Detail Report
Department: COMMUNITY SERVICES & PARKS
Program: PARKS (55)
202

Fiscal Year Fiscal Year Fiscal Year Fiscal Year
2014 2015 2016 2017
Actual Amended Proposed Proposed
Water/sewer 550,000 575,000 600,000
Sportspark lights - Del Obispo and DHHS 60,000 60,000 60,000
Security lighting & irrigation controllers 50,000 50,000 50,000
640,836 660,000 685,000 710,000
2230 PROFESSIONAL SERVICES
Playground Inspections 35,000 35,000 35,000
ADA compliance inspections 500 500 500
Bee extermination 4,000 4,000 4,000
Vandalism repair/Grafitti abatement 25,000 35,000 35,000
56,620 64,500 74,500 74,500
2270 TRAVEL, CONF. & MEETINGS
- - -
- - - -
2290 MILEAGE REIMBURSEMENT
Staff mileage reimbursement 500 500 500
57 500 500 500
2450 LANDSCAPE (MEDIANS)
Annual maintenance 615,000 615,000 650,000
Extraordinary 60,000 60,000 65,000
Median & parkway landscape repair/replacement 80,000 80,000 80,000
Midyr Budget Adjustments (126,600) - -
683,051 628,400 755,000 795,000
2470 TREE MAINTENANCE
Trimming 450,000 550,000 600,000
445,429 450,000 550,000 600,000
2550 PARK MAINTENANCE
Landscape:
Annual maintenance 525,000 550,000 600,000
Extraordinary maintenance 52,500 55,000 60,000
Ballfields - maintenance/infield renovation 145,000 200,000 200,000
Hardscape:
Light standards (repl. rusted/rotten) 20,000 25,000 25,000
Hardscape repair/replacement 50,000 60,000 80,000
Playground maintenance/repair 35,000 35,000 35,000
Park sign replacement 25,000 20,000 20,000
Irrigation/Drainage/Water Distribution:
Irrigation control systems upgrade 25,000 100,000 100,000
Backflow preventers (preventative maint/testing) 3,000 5,000 5,000
Park equipment repair, maintenance & replacement 90,000 100,000 100,000
Midyear Budget Adjustments 262,500 - -
935,068 1,233,000 1,150,000 1,225,000
TOTAL MAT'LS & SERV. 2,894,158 3,165,670 3,341,980 3,532,180
CAPITAL OUTLAY
3010 FURNITURE & EQUIPMENT
- - -
16,500 - - -
3050 PARK STRUCT. & IMPVMNTS. - - - -
TOTAL CAPITAL OUTLAY 16,500 - - -
GRAND TOTAL EXPENDITURES 3,204,932$ 3,478,134$ 3,656,528$ 3,850,280$
203

City of Dana Point Budget Narrative
Department: DISASTER PREPAREDNESS AND FACILITIES Program: FACILITIES (95)
DEPARTMENT: DISASTER PREPAREDNESS AND FACILITIES
PROGRAM: FACILITIES
DESCRIPTION:
The Facilities Maintenance Division provides for equipment, operating supplies, resources, and labor to manage all aspects of City owned buildings, including preventative maintenance, repairs, custodial services, tenant space improvements, contract and project management, and facility enhancement. The current inventory of City facilities includes:
City Plaza / City Hall
Del Obispo Community Center
Del Obispo Sports Park (Restrooms and Concession facility)
Dana Hills High School Sports Field (Restrooms and Concession Facility)
Creekside, Sea Canyon, Lantern Bay, and Sunset Parks (Restroomfacilities)
PCH Pedestrian Bridge
Funicular inclined elevator
Nature Interpretive Center
South Strands Restroom
Strands Parking Lot restroom and North Strands Stairs restroom (County-owned but maintained by Dana Point Facilities Division)
OBJECTIVES:
Provide property management and coordination of maintenance activities by a variety of contractors and/or City staff to achieve and maintain a high standard of quality in a cost-effective manner.
204

Continue to maintain a proactive maintenance program to maximize the useful life of City-owned building infrastructure.
Oversee performance measures established as a part of the various maintenance service contracts.
Provide contract administration for custodial services, system repairs, and general building maintenance.
Monitor and adjust for appropriate levels of service for various maintenance activities and identify alternatives for delivery of those services, such as private contractors or City staff.
Seek to minimize as-needed contractual work through a regular building inspection schedule and an effective preventive maintenance program.
Respond quickly to evaluate and address maintenance or facilities related safety concerns identified by staff and/or the public.
205

Fiscal Year Fiscal Year Fiscal Year Fiscal Year
2014 2015 2016 2017
Actual Amended Proposed Proposed
EXPENDITURE SUMMARY
Personnel $136,983 $115,273 $190,613 $192,377
Materials & Services 504,171 585,647 539,310 541,310
Capital Outlay 95,664 - - -
Total Expenditures $736,818 $700,920 $729,923 $733,687
REVENUE SUMMARY
City Plaza rental revenues $75,708 $74,000 $75,000 $75,000
Total Revenues $75,708 $74,000 $75,000 $75,000
AUTHORIZED PERSONNEL
Bldg. & Facilities Mntce. Worker I/II/III 1 1 1 1
Director of Disaster Prep. & Facilities 0.5 0.5 0.5 0.5Total 1.5 1.5 1.5 1.5
Program: FACILITIES (95)
Department: EMERGENCY & SUPPORT SERVICES
Program Summary
City of Dana Point
206

Fiscal Year Fiscal Year Fiscal Year Fiscal Year
2014 2015 2016 2017
Actual Amended Proposed Proposed
PERSONNEL
1010 SALARIES 26,897$ 24,939$ 61,246$ 62,179$
1030 HOURLY
Maintenance Worker - - 14,000 14,000
1050 OVERTIME
After hours emergency response 520 2,000 2,000 2,000
1100 BENEFITS 6,629 900 12,750 13,200
1120 RETIREMENT BENEFITS 4,471 2,917 7,850 7,724
1140 MEDI-TAX 1.45% 475 724 1,120 1,134
1200 OUTSIDE ASSISTANCE
Administrative/secretarial support - - - -
- - - -
1990 PERSONNEL ALLOCATION
One-half Emerg. Svcs. Mgr. from ES (12) 97,991 83,793 91,647 92,141
TOTAL PERSONNEL 136,983 115,273 190,613 192,377
MATERIALS & SERVICES
2010 COMMUNICATIONS
Cell phone 960 1,260 1,260
676 960 1,260 1,260
2030 EQUIPMENT & FACILITY MAINTENANCE
Custodial contract 118,000 120,000 120,000
Building pest control 9,200 10,000 10,000
Elevator maintenance contract 9,500 10,000 10,000
Sewer pump station maint (Comm Ctr. & Strand Bch) 8,500 10,000 10,000
HVAC maintenance 10,000 10,000 10,000
HVAC Replacement 15,000 15,000 15,000
Fire extinguisher and sprinkler inspection 2,000 2,000 2,000
Floor mats / carpet cleaning 4,000 4,000 4,000
Facility security systems (alarm, surveilance) 20,000 20,000 20,000
Signage 2,000 2,000 2,000
Strand shower maintenance 8,000 9,000 9,000
Electrical 4,000 4,000 4,000
Painting 4,000 4,000 4,000
Plumbing 8,000 8,000 8,000
EFC Equipment Replacement - 10,000 12,000
Building Renovations / Improvements 50,000 50,000 50,000
Extraordinary maintenance 15,000 15,000 15,000
Midyear Budget Adjustments 66,520 - -
331,390 353,720 303,000 305,000
2050 VEHICLE MAINTENANCE
Fuel 1,607 1,000 1,000
Repairs & maintenance 1,000 1,250 1,250
Vehicle cleaning 560 700 700
1,113 3,167 2,950 2,950
City of Dana Point
Expenditure Plan Detail Report
Department: EMERGENCY & SUPPORT SERVICES
Program: FACILITIES (95)
207

Fiscal Year Fiscal Year Fiscal Year Fiscal Year
2014 2015 2016 2017
Actual Amended Proposed Proposed
2070 OFFICE SUPPLIES - - - -
2090 MEMBERSHIPS & DUES - - - -
2110 OPERATING SUPPLIES
Electrical/Plumbing supplies 12,000 6,000 6,000
Paint and supplies 2,000 2,000 2,000
General Hardware/Maintenance Supplies 10,000 24,000 24,000
Custodial Supplies 11,000 13,500 13,500
30,410 35,000 45,500 45,500
2150 TRAINING
Staff training 500 - -
- 500 - -
2190 FACILITIES & EQUIPMENT LEASE/RENT - - - -
2210 UTILITIES
Community Center:
Water 4,400 5,500 5,500
Gas 1,600 1,600 1,600
Electricity - building 22,000 25,000 25,000
Nature Interpretive Center:
Water 2,700 4,000 4,000
Electricity 500 500 500
Strands Restroom:
Water 3,600 4,500 4,500
Electricity 500 500 500
City Plaza:
Electricity 92,000 95,000 95,000
Water/sewer 6,500 6,500 6,500
Data service (SCWD/Mesh) 3,500 3,500 3,500
Other:
Property taxes 5,000 5,000 5,000
140,582 142,300 151,600 151,600
2230 PROFESSIONAL SERVICES
Contract Maintenance During Peak Periods 50,000 35,000 35,000
- 50,000 35,000 35,000
2270 TRAVEL, CONF. & MEETINGS - - - -
2290 MILEAGE REIMBURSEMENT
Staff mileage reimbursement - - -
- - - -
TOTAL MAT'LS & SERV. 504,171 585,647 539,310 541,310
CAPITAL OUTLAY
3010 FURNITURE & EQUIPMENT 95,664 - - -
95,664 - - -
3030 FACILITY IMPROVEMENTS - - - -
TOTAL CAPITAL OUTLAY 95,664 - - -
GRAND TOTAL EXPENDITURES 736,818$ 700,920$ 729,923$ 733,687$
208

City of Dana Point Budget Narrative
Department: ADMINISTRATIVE SERVICES Program: RISK MANAGEMENT (97)
DEPARTMENT: ADMINISTRATIVE SERVICES
PROGRAM: RISK MANAGEMENT
DESCRIPTION:
The Risk Management Program provides for insurance coverage relating to general liability, property and employee bonds for all City administered activities. This program also manages special events insurance certificates for non-City local events and activities. Additionally, it covers payment of liability and unemployment claims as well as funding for administrative expenses, consulting, related legal expenses, and claims adjusting services, and all loss costs for which there is no coverage under the California Joint Powers Insurance Authority (CJPIA) protection plan. It also processes and approves nearly 1,000 Insurance Certificates each year from outside agencies, which do work for the City.
Staff also coordinate an annual inspection of City facilities by the CJPIA and performs the ongoing task of ensuring that our public facilities meet OSHA requirements and are safe for both employees and the public. Staff coordinates risk management-related employee training programs (such as Driver Training classes) and monitors related Federal, State and Local case law. The administration of Risk Management activities is provided by Staff from within the Administrative Services Department (Finance and Administration). The Director of Administrative Services serves as the City’s Risk Manager.
OBJECTIVE:
Conduct CJPIA risk management evaluation of City risk management procedures related to safety practices, City facilities, and standard contracts.
Coordinate implementation of insurance certificate and professional services contract tracking database in conjunction with City Clerk Department.
Ensure that all recreation instructors and special events hosted by the City are properly insured.
209

Fiscal Year Fiscal Year Fiscal Year Fiscal Year
2014 2015 2016 2017
Actual Amended Proposed Proposed
EXPENDITURE SUMMARY
Personnel -$ -$ -$ -$
Materials & Services - 1,300 1,300 1,300
Risk Management 466,510 536,800 623,000 623,000
Capital Outlay - - - -
Total Expenditures 466,510$ 538,100$ 624,300$ 624,300$
AUTHORIZED PERSONNELNONE
Program: RISK MANAGEMENT (97)
Department: ADMINISTRATIVE SERVICES
Program Summary
City of Dana Point
210

Fiscal Year Fiscal Year Fiscal Year Fiscal Year
2014 2015 2016 2017
Actual Amended Proposed Proposed
MATERIALS & SERVICES
2130 BOOKS & SUBSCRIPTIONS
OSHA standards & miscellaneous -$ 300$ 300$ 300$
2150 TRAINING
CJPIA training/workshops - 1,000 1,000 1,000
TOTAL MAT'LS & SERV. - 1,300 1,300 1,300
INSURANCE
4010 LIABILITY INSURANCE PREMIUMS
General liability premium (estimate) - 326,500 375,000 375,000
Quite Zone Premium - - 16,000 16,000
236,961 326,500 391,000 391,000
4030 PROPERTY INSURANCE PREMIUMS
Annual Premium - Property, Earthquake, Auto,
Pollution, Boiler/Machinery 66,372 79,200 89,300 89,300
4050 EMPLOYEE BOND PREMIUMS
Employee bonds 979 1,500 1,200 1,200
4090 GENERAL LIABILITY/PROPERTY CLAIMS
Litigation expenses - reimbursed 53,138 - - -
4110 WORKERS' COMPENSATION
Annual premium 108,674 112,100 140,000 140,000
4130 CONSULTING/WITNESS FEES
Litigation support 351 10,000 - -
4210 UNEMPLOYMENT BENEFITS
Contingency 35 7,500 1,500 1,500
TOTAL INSURANCE 466,510 536,800 623,000 623,000
GRAND TOTAL EXPENDITURES 466,510$ 538,100$ 624,300$ 624,300$
City of Dana Point
Expenditure Plan Detail Report
Department: ADMINISTRATIVE SERVICES
Program: RISK MANAGEMENT (97)
211

City of Dana Point Budget Narrative
Department: ADMINISTRATIVE SERVICES Program: NON-DEPARTMENTAL (99)
DEPARTMENT: ADMINISTRATIVE SERVICES
PROGRAM: NON-DEPARTMENTAL
DESCRIPTION:
The Non-Departmental Program provides for citywide expenditures such as computers, printers and related peripheral equipment, communications/telephones, Internet access, central office supplies, copiers, postage, miscellaneous programs such as Animal Control, and miscellaneous City memberships.
This program is administered by the Administrative Services Department.
212

Fiscal Year Fiscal Year Fiscal Year Fiscal Year
2014 2015 2016 2017
Actual Amended Proposed Proposed
EXPENDITURE SUMMARY
Personnel 4,420$ 4,500$ 9,000$ 9,000$
Materials & Services 783,840 1,061,195 903,900 924,330
Capital Outlay 102,575 3,380 98,000 195,000
Total Operating Expenditures 890,835$ 1,069,075$ 1,010,900$ 1,128,330$
Operating Transers-out 7,748,859 8,255,166 667,074 280,000
Total Oper. Expend. & Tsfs. Out 8,639,694$ 9,324,241$ 1,677,974$ 1,408,330$
REVENUE SUMMARY
NONE
AUTHORIZED PERSONNELNONE
Program: NON-DEPARTMENTAL (99)
Department: ADMINISTRATIVE SERVICES
Program Summary
City of Dana Point
213

Fiscal Year Fiscal Year Fiscal Year Fiscal Year2014 2015 2016 2017
Actual Amended Proposed ProposedPERSONNEL
1100 BENEFITS Mandated CalPERS Retiree Health Premium 4,420$ 4,500$ 9,000$ 9,000$ (3 retirees in FY15 @ $125/mo.; est. 6 in FY16)TOTAL PERSONNEL 4,420 4,500 9,000 9,000
MATERIALS & SERVICES2010 COMMUNICATIONS
Telephone - City Hall & Community Center 23,000 26,000 26,000 Digital data lines/Internet service 36,000 36,000 36,000 Telephone software updates/programming changes 3,000 3,000 3,000 Web-site hosting and maintenance annual fee - 6,600 6,930 Repair & maintenance of switching equip/phones 2,500 2,500 2,500
40,613 64,500 74,100 74,430
2030 EQUIP/FACIL MAINT/REPAIROffice equipment repair: postage, date stamp machine 1,000 1,000 1,000 Interior potted plants rental/maintenance 3,200 3,300 3,400 Konica Minola C650 (Records Room) 2,200 3,000 3,000 Konica Minola C754E copier (Admin) 8,000 7,000 7,000 Konica Minola C754E copier (Public Works) 5,750 5,000 5,000 Konica Minola C754E copier (Community Development) 5,750 6,500 6,500
9,657 25,900 25,800 25,900
2070 OFFICE SUPPLIESCentral supplies (white copier paper) 10,000 10,000 10,000 Miscellaneous office supplies 2,500 5,000 5,000
8,445 12,500 15,000 15,000
2090 MEMBERSHIPS & DUESAssociation of Calif. Cities - Orange County 12,000 - - League of California Cities - State dues 13,500 13,500 13,500 Orange County Human Relations (supervisory training) 3,150 3,200 3,200 So. Calif. Association of Governments (SCAG) 3,950 3,500 3,500 Orange County Council of Gov'ts (OCCOG) 5,700 5,500 5,500 Allocation of LAFCO costs - 3,700 3,700 Miscellaneous 1,650 1,000 1,000
38,360 39,950 30,400 30,400
2110 OPERATING SUPPLIESMiscellaneous operating supplies 23,500 24,000 25,000 Postage machine supplies 500 500 500 Central copier supplies (toner, staples, etc.) 1,000 1,000 1,000
24,736 25,000 25,500 26,500
2150 TRAINING City-wide training (moved from Dept. 21) 21,500 21,500 Tuition Reimbursements (moved from 99-2270) - 12,000 12,000
- - 33,500 33,500
2170 POSTAGEU.S. Mail (general & bulk rate postage) 16,000 11,000 11,000 Business reply annual permit 745 - - Overnight delivery service (FedX, UPS, etc.) 5,000 5,000 5,000
12,530 21,745 16,000 16,000
2190 FACIL & EQUIP LEASE/RENTPostage meter lease 4,000 2,500 2,500 Miscellaneous 500 - -
2,161 4,500 2,500 2,500
2220 REIMBURSED DEV REV EXPReimb. Development Expenditures 250,000 - -
- 250,000 - -
City of Dana PointExpenditure Plan Detail Report
Department: ADMINISTRATIVE SERVICESProgram: NON-DEPARTMENTAL (99)
214

Fiscal Year Fiscal Year Fiscal Year Fiscal Year2014 2015 2016 2017
Actual Amended Proposed Proposed
2230 PROFESSIONAL SERVICESCASA - animal control services 324,000 327,000 340,000 Dana Point Library - Sunday hours 50,000 50,000 50,000 Miscellaneous 1,000 - - Midyear Budget Adjustments 7,300 - -
459,886 382,300 377,000 390,000
2270 TRAVEL, CONF. & MEETINGSTuition Reimb. (FY16, moved to Acct. 99-2150) 4,000 - - Employee/Volunteer Recognition Events 20,000 23,000 23,000
23,967 24,000 23,000 23,000
2590 DATA TECHNOLOGYNon-warranty printer repairs & maintenance (15) 2,500 2,500 2,500 Data/phone line cable repairs & installation 1,000 1,000 1,000 LAN hubs, switches, repair & replacement 3,000 10,000 10,000 Extended warranty contracts - routers/firewall 1,600 1,600 1,600 LAN technical support & consulting (hourly) 70,000 80,000 80,000 Misc computer & network parts & supplies 1,500 1,500 1,500 Maintenance - anti-virus software 3,000 3,000 3,000 Maintenance - network backup software 10,000 10,000 10,000 Maintenance - spam filtering software (bi-annual) 1,200 1,500 1,500 Maintenance - other network software - 1,500 1,500 Misc minor software purchases - 2,000 2,000 Cyclical technology hardware replacement: Network Back-up systems 17,000 - - Servers 10,000 9,000 15,000 Employee computers (desktop & laptop) 25,000 25,000 25,000 Printers 5,000 5,000 5,000 Uninterruptable Power Supplies 2,500 2,500 2,500
163,485 153,300 156,100 162,100
2610 MARKETING - - - -
2990 RESERVE FOR SERVICE ENHANCEMENTSReserve for Service Enhancements - 57,500 125,000 125,000
- 57,500 125,000 125,000
TOTAL MAT'LS & SERV. 783,840 1,061,195 903,900 924,330
CAPITAL OUTLAY3010 FURNITURE & EQUIPMENT
Future Capital Outlay 102,575 3,380 98,000 195,000
TOTAL CAPITAL OUTLAY 102,575 3,380 98,000 195,000
TOTAL OPERATING EXPENDITURES 890,835 1,069,075 1,010,900 1,128,330
OPERATING TRANSFERS OUT9010 TO FACILITIES IMPROVEMENT FUND (12)
Facility improvements - Community Center (General Fund Contribution) - - 77,074 Police Substation Buildout - - 560,000 Administrative Services Office Refurbishment - - - 250,000
- - 637,074 250,000
9031 TO CFD MAINTENANCE FUND (27)City share funicular maintenance ($300k loan in FY15) - 330,000 30,000 30,000
30,000 330,000 30,000 30,000
9050 TO CAPITAL IMPROVEMENTS FUNDTown Center, mandates, repairs & repl. of infrastructure 7,700,000 - - Priority 1 CIP Reserve (10% of Priority 1 Projects) 20,000 - - Midyr Budget Adjustments 205,166
7,718,859 7,925,166 - -
TOTAL OPERATING TRANSFERS OUT 7,748,859 8,255,166 667,074 280,000
GRAND TOTAL OPERATING EXP. & TSFS. OUT 8,639,694$ 9,324,241$ 1,677,974$ 1,408,330$
215

SPECIAL REVENUE FUNDS

GASOLINE TAX FUND
FY2016 FY2017Proposed Proposed
Beginning Fund Balance -$ 169,071$
Revenues and Sources
169,071 170,000 213,252 215,000 114,744 116,000
Gasoline Taxes - Section 2103 Gasoline Taxes - Section 2105 Gasoline Taxes - Section 2106
291,555 295,000 Gasoline Taxes - Section 2107 Gasoline Taxes - Section 2107.5 6,000 6,000
Total Revenues and Sources 794,622 802,000
Expenditures and Uses
Transfer Out to General Fund 625,551 632,000 Transfer Out to CIP Fund - 339,071
Total Expenditures and Uses 625,551 971,071
Ending Fund Balance 169,071$ -$
State gasoline tax is statutorily created under Article 19 of the State Constitution. The gas tax revenue is allocated to each county based on the gasoline sales in the county. The funds are further distributed to each entity on a population basis. The funds are for street construction and maintenance purposes allocated to local entities
The City of Dana Point receives gas tax revenue from five sources: Section 2103; Section2105; Section 2106; Section 2107 and Section 2107.5. Expenditures of money under thesesections may be used for any street or road purpose.
Sections 2105, 2106, 2107 and 2107.5 revenues are transferred to the General Fund. Thesefunds are used to pay for ongoing contracted road maintenance provided by the County ofOrange and other vendors. Section 2103 revenues are transferred to the Capital ImprovementProjects fund for use in roadway improvements.
216

City of Dana PointRevenue & Expenditures Detail Listing
GASOLINE TAX FUND (02)
Fiscal Year Fiscal Year Fiscal Year Fiscal Year2014 2015 2016 2017
Actual Amended Proposed Proposed
REVENUES & TRANSFERS-IN:
02-10-6121 HWY USERS TAX - SEC 2106* 126,337$ 144,393$ 114,744$ 116,000$
02-10-6123 HWY USERS TAX - SEC 2107* 261,066 219,608 291,555 295,000
02-10-6125 HWY USERS TAX - SEC 2107.5* 6,000 6,000 6,000 6,000
02-10-6127 HWY USERS TAX - SEC 2105* 245,355 179,369 213,252 215,000
02-10-6129 HWY USERS TAX - SEC 2103** 494,107 390,314 169,071 170,000
02-10-6199 HWY USERS TAX - deferral - - - -
*These revenue are typically transferred to General Fund**This revenue is typically transferred to CIP Fund
Total Revenues & Transfers-in 1,132,865$ 939,684$ 794,622$ 802,000$
EXPENDITURES & TRANSFERS OUT:
02-99-90-0000-9030 TRANSFERS OUT - TO GENERAL FUND $ 703,170 $ 549,370 $ 625,551 $ 632,000
02-99-90-0000-9050 TRANSFERS OUT - TO CIP FUND 503,314 390,314 - 339,071
Total Expenditures & Transfers-out 1,206,484$ 939,684$ 625,551$ 971,071$
217

MEASURE M FUND
FY2016 FY2017Proposed Proposed
Beginning Fund Balance 133,094$ 133,994$
Revenues and Sources
Measure M Taxes 595,581 627,364 Investment Income 900 900
Total Revenues and Sources 596,481 628,264
Expenditures and Uses
Transfer Out to Capital Improvement Projects Fund 595,581 627,364
Total Expenditures and Uses 595,581 627,364
Ending Fund Balance 133,994$ 134,894$
Measure M is the half cent sales tax for transportation improvements first approved by OrangeCounty voters in 1990, and renewed by voters for a 30-year extension in 2006. The combinedmeasures raise the sales tax in Orange County by one-half cent through 2041 for use in fundingthe Transportaiton Improvement Program. All Measure M revenues are transferred to theCapital Improvement Fund. The funds are used to pay for qualifying Capital ImprovementProjects.
218

City of Dana PointRevenue & Expenditures Detail Listing
MEASURE M FUND (04)
Fiscal Year Fiscal Year Fiscal Year Fiscal Year2014 2015 2016 2017
Actual Amended Proposed Proposed
REVENUES & TRANSFERS-IN:
04-10-6141 MEASURE M REVENUES 506,824$ 529,505$ 595,581$ 627,364$ Estimates provide by Orange CountyTransportation Authority
04-40-6403 INVESTMENT INCOME 695 - 900 900
04-50-6521 INTERGOVERNMENTAL COST REIMB 110,031 Total Revenues & Transfers-in 617,550$ 529,505$ 596,481$ 628,264$
EXPENDITURES & TRANSFERS OUT:
TRANSFERS OUT - TO GENERAL FUND 66,200$ -$ -$ -$ 04-99-90-0000-9030
04-99-90-0000-9050 TRANSFERS OUT - TO CIP FUND* 521,837 529,505 595,581 627,364
Total Expenditures & Transfers-out 588,037$ 529,505$ 595,581$ 627,364$
219

AB2766 FUND
FY2016 FY2017Proposed Proposed
Beginning Fund Balance $300,562 $341,362
Revenues and Sources40,000 40,000Intergovernmental Cost Reimbursement
Investment Income 800 800
Total Revenues and Sources 40,800 40,800
Expenditures and UsesTo be determined - - Transfers to CIP fund - 307,636
Total Expenditures and Uses - 307,636
Ending Fund Balance $341,362 $74,526
In 1991 the California State legislature enacted Assembly Bill 2766 ("AB2766") to authorizeair pollution control districts to impose fees on motor vehicles. The fees are restricted for usein reducing air pollution from motor vehicles. The fee is collected by the CaliforniaDepartment of Motor Vehicles on each vehicle in the benefit area, and distributed to qualifiedlocal jurisdictions by the South Coast Air Quality Management District.
The City is currently evaluating a variety of potential uses for these funds. In the past, thesefunds were used to pave dirt alleys, to lease electric powered vehicles used by the City's CodeEnforcement Officers, install traffic signals and run seasonal trolleys.
220

City of Dana PointRevenue & Expenditures Detail ListingAB2766 - CLEAN AIR ACT FUND (05)
Fiscal Year Fiscal Year Fiscal Year Fiscal Year2014 2015 2016 2017
Actual Amended Proposed Proposed
REVENUES & TRANSFERS-IN:
05-40-6403 INVESTMENT INCOME 646$ 800$ 800$ 800$ Interest allocation from General Fund.
05-50-6521 INTERGOVERNMENTAL COST REIMB 31,017 40,000 40,000 40,000
Total Revenues & Transfers-in 31,663$ 40,800$ 40,800$ 40,800$
EXPENDITURES & TRANSFERS OUT:
05-99-20-0000-2190 FACILITY & EQUIP LEASE/RENT -$ -$ -$ -$
05-99-20-0000-2230 PROFESSIONAL SERVICES - - - -
05-99-30-0000-3010 FURNITURE & EQUIPMENT Parks Electric Utility Vehicle 15,258 - - -
15,258 - - -
05-99-90-0000-9050 TRANSFERS OUT - TO CIP FUND - - - 307,636
Total Expenditures & Transfers-out 15,258$ -$ -$ 307,636$
221

COASTAL TRANSIT FUND
FY2016 FY2017Proposed Proposed
Beginning Fund Balance $1,231,426 $1,195,726
Revenues and Sources- - Coastal Transit Fees
Investment Income 6,300 6,300
Total Revenues and Sources 6,300 6,300
Expenditures and Uses
Implementation of coastal transit program 42,000 141,000
Total Expenditures and Uses 42,000 141,000
Ending Fund Balance $1,195,726 $1,061,026
In the early 80's, the California Coastal Commission (Coastal Commission) imposed a coastalaccess fee on new development in what is now the Salt Creek corridor (Monarch BeachSpecific Plan) and portions of Laguna Niguel and Laguna Beach. The funds were intended tomitigate impacts to coastal access that were anticipated to result from the projected residentialdevelopment in Orange County. Specifically, the permit language limits the use of the fundsfor the "provision of coastal recreational transit services". Approximately $1.2 million has beenaccumulated since the program was implemented.
In 2001, the City, in partnership with the City of Laguna Niguel and County of Orange,developed a feasibility study which assessed utilizing the funds for a shuttle program. Theintent was to develop a transit program which would improve summer access to and from thebeach and harbor areas, but not compete with existing transit systems (i.e., OCTA and LagunaBeach Transit). The Study was approved by the Dana Point City Council in November 2001.
In 2002, the City entered into a Memorandum of Understanding (MOU) with the CoastalCommission which released the fund balance to the City of Dana Point for implementing theprogram detailed in the Feasibility Study. The City of Laguna Niguel opted not to participate.
The City of Dana Point and the California Coastal Commission amended the Memorandum ofUnderstanding on March 17, 2015. This amendment contemplates the City utilizing a portionof these funds to support both event shuttles and fixed route trolley service along Pacific CoastHighway and shuttle service from the Dana Hills High School parking lot to the O C CountyHarbor. Fixed route PCH service is scheduled to begin the summer of 2015.
222

City of Dana PointRevenue & Expenditures Detail Listing
COASTAL TRANSIT FUND (06)
Fiscal Year Fiscal Year Fiscal Year Fiscal Year2014 2015 2016 2017
Actual Amended Proposed Proposed
REVENUES & TRANSFERS-IN:
06-40-6403 INVESTMENT INCOME 3,498$ 6,300$ 6,300$ 6,300$ Interest allocation from General Fund.
Total Revenues & Transfers-in 3,498$ 6,300$ 6,300$ 6,300$
EXPENDITURES & TRANSFERS OUT:
06-99-20-0000-2230 Ten-year program life - expend. est @ 10%/yr. -$ 120,000$ 42,000$ 141,000$ Program to be brought to Council for approval
Total Expenditures & Transfers-out -$ 120,000$ 42,000$ 141,000$
223
PROFESSIONAL SERVICES

TOURISM BUSINESS IMPROVEMENT DISTRICT
TBID
In FY14 the separate TBID fund was created.
FY2016 FY2017Proposed Proposed
Beginning Fund Balance $747,259 $500,259
Revenues and SourcesTBID Tax Revenue 950,000 950,000 Interest Income 3,000 3,000
Total Revenues and Sources 953,000 953,000
Expenditures and UsesTBID Expenditures 1,200,000 1,000,000
Total Expenditures and Uses 1,200,000 1,000,000
Ending Fund Balance $500,259 $453,259
The Tourism Business Improvement District was established in 2009 to account for assessment funds received by the City, collected by the Tourism Business Improvement District (St. Regis Monarch Beach, Ritz Carlton Laguna Niguel, Laguna Cliffs Marriott and DoubleTree Doheny Beach), used to promote Dana Point as an overnight destination and includes activities such as advertising, public relations, and marketing to attract and extend overnight stays in Dana Point hotels.
Previous to FY14, the TBID funds were accounted for within the trust/agency
224

City of Dana PointRevenue & Expenditures Detail Listing
TOURISM BUSINESS IMPROVEMENT DISTRICT (07)
Fiscal Year Fiscal Year Fiscal Year Fiscal Year2014 2015 2016 2017
Actual Amended Proposed Proposed
REVENUES & TRANSFERS-IN:07-10-6115 TBID TAXES 1,017,360$ 950,000$ 950,000$ 950,000$
07-40-6403 INVESTMENT INCOME 4,897 - 3,000 3,000
07-70-6703 MISCELLANEOUS 60,000 - - -
Total Revenues & Transfers-in 1,082,257$ 950,000$ 953,000$ 953,000$
EXPENDITURES & TRANSFERS OUT:
07-99-20-0000-2573 TBID EXPENDITURES 1,254,369$ 1,600,000$ 1,200,000$ 1,000,000$
Total Expenditures & Transfers-out 1,254,369$ 1,600,000$ 1,200,000$ 1,000,000$
225

HEADLANDS HABITAT FUND (ESHA)
FY2016 FY2017Proposed Proposed
Beginning Fund Balance $213,994 $221,744
Revenues and Sources30,450 30,450 Investment Income
(Annuity=$30,000/year thru 2062)
Total Revenues and Sources 30,450 30,450
Expenditures and UsesHabitat Maintenance 22,700 22,700 Furniture and equipment - -
Total Expenditures and Uses 22,700 22,700
Ending Fund Balance $221,744 $229,494
The Headlands Habitat Fund was established in 2013 to account for funds provided by theDeveloper of the Strand at the Headlands in accordance with Dana Point Local Coastal Plan 1-03 (“LCP”) dated May 27, 2004, and the Headlands Habitat Management and Monitoring Plan(“HMMP”) dated April 18, 2005. The Developer was required to provide the City with anendowment to fund ongoing maintenance and monitoring of Environmentally Sensitive HabitatAreas (“ESHA”) located generally within the “Strand at the Headlands” development. Theendowment is intended to be “sufficient to maintain the biological values of the retainedESHA/habitat area within the City owned Harbor Point Park, Hilltop Park and around theSouth Strand switchback path. The endowment was funded in April 2013 with a $180,000cash payment to the City, and the purchase of an annuity contract that will pay the City $30,000per year for 50 years. Interest earned on monies in this fund must accrue to the fund. Specificmaintenance functions include required biological monitoring (e.g. gnatcatcher, sensitive andexotic species); feral and domestic animal control, weed/exotic species control and monitoring;and, reporting.
226

City of Dana PointRevenue & Expenditures Detail Listing
HEADLAND HABITAT FUND (09)
Fiscal Year Fiscal Year Fiscal Year Fiscal Year2014 2015 2016 2017
Actual Amended Proposed Proposed
REVENUES & TRANSFERS-IN:
09-90-6990 CONTRIBUTED CAPITAL* -$ -$ -$ -$
09-40-6403 INVESTMENT INCOME 30,558 30,450 30,450 30,450
Total Revenues & Transfers-in 30,558$ 30,450$ 30,450$ 30,450$
EXPENDITURES & TRANSFERS OUT:
09-99-20-0000-2550 HABITAT MAINTENANCE 4,314$ 22,700$ 22,700$ 22,700$
Total Expenditures & Transfers-out 4,314$ 22,700$ 22,700$ 22,700$
* Annuity purchased by the Developer generates $30,450 per year, for 50 years, through year 2063.
227

SUPPLEMENTAL LAW ENFORCEMENT SERVICES FUND
FY2016 FY2017Proposed Proposed
Beginning Fund Balance $203 $803
Revenues and SourcesInvestment Income 600 600
Total Revenues and Sources 600 600
Expenditures and Uses
To be determined - -
Total Expenditures and Uses - -
Ending Fund Balance $803 $1,403
In 1996 the California State legislature enacted Assembly Bill 3229, commonly known as theCitizens' Option for Public Safety, or COPS, program. The State provided $100 million offunding for this program. The funds are allocated to local governments based on population.The funds are required to be used to enhance front line local law enforcement activities, and arefurther restricted in use to supplement rather than supplant existing funding levels.
The COPS program is funded annually, at the discretion of the State legislature. As a result,there is not assurance that this program will receive funding every year. Accordingly, the Citydoes not budget this fund during the regular budget process. Rather, once the State legislaturefunds the program for a particular year (ususally in September), the City modifies the adoptedbudget.
228

City of Dana PointRevenue & Expenditures Detail Listing
SUPPLEMENTAL LAW ENFORCEMENT SERVICES FUND (25)
Fiscal Year Fiscal Year Fiscal Year Fiscal Year2014 2015 2016 2017
Actual Amended Proposed Proposed
REVENUES & TRANSFERS-IN:
25-40-6403 INVESTMENT INCOME 147$ 600$ 600$ 600$
25-50-6501 SLESF REVENUES 103,157 55,582 - - This State program does not have guaranteed funding every year. If the State funds the program in FY16 and/or FY17, budgetadjustments will be made to reflect it.
Total Revenues & Transfers-in 103,304$ 56,182$ 600$ 600$
88,571 120,448$ -$ -$
- - - -
EXPENDITURES & TRANSFERS OUT:
25-99-20-0000-2572 SLESF Program Operating Expenditures
25-99-30-0000-3010 SLESF Program Capital Expenditures
25-99-90-0000-9030 TRANSFERS OUT - TO GENERAL FUND - - - -
Total Expenditures & Transfers-out 88,571$ 120,448$ -$ -$
229

CFD 2006-1 FACILITIES MAINTENANCE FUND
FY2016 FY2017Proposed Proposed
Beginning Fund Balance $72,299 $218,399
Revenues and SourcesInvestment interest 1,400 1,400 Charges for services 324,000 324,000 Transfer in from General Fund 30,000 30,000
Total Revenues and Sources 355,400 355,400
Expenditures and UsesMaterials and services - 359,900 Furniture and equipment 208,300 -
Total Expenditures and Uses 208,300 359,900
Ending Fund Balance $218,399 $214,899
On June 14, 2006, pursuant to the Mello-Roos Community Facilities Act of 1982, theCommunity Facilities District No. 2006-1 of the City of Dana Point (the "District") was formedin order to finance the acquisition and/or construction of certain public improvements in thearea of the City commonly referred to as "The Headlands".
In conjunction with the formation of the District, a special maintenance tax was levied on theproperties located within the District to fund the ongoing maintenance of landscaping,revetment, storm water quality and funicular. The CFD2006-1 Facilities Maintenance Fund wasestablished to account for these maintenance activities.
230

City of Dana PointRevenue & Expenditures Detail Listing
HEADLANDS CFD MAINTENANCE FUND (27)
Fiscal Year Fiscal Year Fiscal Year Fiscal Year2014 2015 2016 2017
Actual Amended Proposed Proposed
REVENUES & TRANSFERS-IN:
27-40-6403 INVESTMENT INTEREST 906$ 1,400$ 1,400$ 1,400$
27-60-6685 CHARGES FOR SERVICES 115,967 324,000 324,000 324,000 Special taxes - CFD properties
27-90-6901 TRANSFER IN - FROM GENERAL FUND 30,000 330,000 30,000 30,000 Funicular operations contribution $30k, if needed; FY15 $300,000, 3-year Loan From General Fund for Funicular Car Replacement
Total Revenues & Transfers-in 146,873$ 655,400$ 355,400$ 355,400$
EXPENDITURES
27-99-20-0000-2030 FACILITY/EQUIPMENT MAINTENANCEFunicular maintenance 45,000$ 45,000$ 45,000$ Funicular operating cost 50,000 50,000 50,000 Revetment walkway maintenance 2,800
71,245 97,800 95,000 95,000
27-99-20-0000-2110 OPERATING SUPPLIES - - - -
27-99-20-0000-2210 UTILITIES 59,558 65,000 75,000 75,000
27-99-20-0000-2230 PROFESSIONAL SERVICESAllocated City Staff costs for maintenance 8,901 7,000 7,000 7,000
27-99-20-0000-2450 LANDSCAPE MAINTENANCELot Q & portion of Lot BB maintenance - - 15,000 15,000
- - 15,000 15,000
27-99-20-0000-2470 TREE TRIMMING - - - -
27-99-20-0000-2550 PARK MAINTENANCE - - - -
27-99-20-0000-2630 INFRASTRUCTURE & HARDSCAPE - - - -
27-99-20-0000-2650 COUNTY / WATER DISTRICT FACILITIESSelva BMPs - storm screen/media filter repl. 7,400 7,500 7,500 Selva BMPs - storm screen/media filter maint. 8,600 8,800 8,800
11,721 16,000 16,300 16,300
27-99-40-0000-4030 PROPERTY INSURANCE PREMIUMSCJPIA premium - funicular 500
- 500 - -
27-99-30-0000-3010 FURNITURE & EQUIPMENTReplacement Cabin Contract - 742,000 - -
- 742,000 - - 27-99-30-0000-3030 FACILITY IMPROVEMENTS
27-99-70-0000-7050 GENERAL FUND LOAN REPAYMENT w/ INTEREST - - - 151,600
Total Expenditures & Transfers-out 151,425$ 928,300$ 208,300$ 359,900$
231

CAPITAL PROJECT FUNDS

FACILITIES IMPROVEMENT FUND
FY2016 FY2017Proposed Proposed
Beginning Fund Balance $172,926 $0
Revenues and Sources637,074 250,000 Operating Transfer from General Fund
Operating Transfer from Capital Improvments Fund - -
Total Revenues and Sources 637,074 250,000
Expenditures and UsesFacility Improvements 810,000 250,000
Total Expenditures and Uses 810,000 250,000
Ending Fund Balance $0 $0
In fiscal 2006 the City established the Facilities Improvment Fund to account for expendituresmade for major improvements or rehabilitation of the City Hall and Del Obispo CommunityCenter facilities. The principal funding source of these improvements are transfers from theCity's General Fund.
232

City of Dana PointRevenue & Expenditures Detail Listing
FACILITIES IMPROVEMENT FUND (12)
Fiscal Year Fiscal Year Fiscal Year Fiscal Year2014 2015 2016 2017
Actual Amended Proposed Proposed
REVENUES & TRANSFERS-IN:
12-90-6901 TRANSFER-IN FROM GENERAL FUND -$ -$ 637,074$ 250,000$
12-90-6911 TRANSFER-IN FROM CIP FUNDNone - - - -
Total Revenues & Transfers-in -$ -$ 637,074$ 250,000$
EXPENDITURES & TRANSFERS OUT:
12-99-30-0000-3030 FACILITY IMPROVEMENTSCommunity Center:
Bleachers -$ -$ 45,000$ -$ Flooring/Carpet 100,000 Paint 40,000 Cabinets 20,000 Lighting / Misc Interior Improvements 20,000 Infrastructure 25,000
City Plaza:Police Services Project 500,000 Roof Mechanical Well Coating replacement 60,000
Administrative Services Renovation 250,000 - - 810,000 250,000
12-99-90-0000-9030 TRANSFERS OUT - TO GENERAL FUND - - - -
Total Expenditures & Transfers-out -$ -$ 810,000$ 250,000$
233

FY2016 FY2017Proposed Proposed
Beginning Fund Balance $583,500 $508,500
Revenues and Sources
- - Developer Deposits Investment Income - -
Total Revenues and Sources - -
Expenditures and Uses
Transfer Out to Capital Improvement Projects Fund 75,000 455,000
Total Expenditures and Uses 75,000 455,000
Ending Fund Balance $508,500 $53,500
PARK DEVELOPMENT FUND
The Park Development Fund was established in December 1993 as a result of the consolidationof the City with the former Capistrano Bay Park & Recreation District. This fund is used toaccount for monies received from the County, State and Federal governments, as well asmonies received from developers, which are restricted for use in the acquisition, developmentand improvement of parks within the City.
234

City of Dana PointRevenue & Expenditures Detail ListingPARK DEVELOPMENT FUND (21)
Fiscal Year Fiscal Year Fiscal Year Fiscal Year2014 2015 2016 2017
Actual Amended Proposed Proposed
REVENUES & TRANSFERS-IN:
21-40-6403 INVESTMENT INCOME -$ -$ -$ -$ Interest allocation from General Fund.
21-70-6702 PARK FEES 6,800 100,000 - - Fee eliminated in FY14 by Council Action
Total Revenues & Transfers-in 6,800$ 100,000$ -$ -$
- -$ -$ -$
- - - -
EXPENDITURES & TRANSFERS OUT:
21-99-20-0000-2230 PROFESSIONAL SERVICES
21-99-90-0000-9030 TRANSFERS OUT - TO GENERAL FUND
21-99-90-0000-9050 TRANSFERS OUT - TO CIP FUND 99,850 75,000 455,000
Total Expenditures & Transfers-out -$ 99,850$ 75,000$ 455,000$
235

FY2016 FY2017Proposed Proposed
Beginning Fund Balance $608,055 $3,107,955
Revenues and Sources:
Operating Transfers-In:from General Fund - - from Measure M Fund 595,581 627,364 from Park Development Fund 75,000 455,000 from Gasoline Tax Fund - 339,071 from AB2766 Fund - 307,636
Estimated FY15 Reprogrammed CIP 1,250,000 750,722 Estimated FY15 General Fund Surplus 2,500,000 Measure M - GMA11 - - California Dept. of Parks & Recreation - - Intersection Improvement Program - - Orange County Transportation Authority - 1,107,187 Developer Contributions - - TEA - -
Total Revenues and Sources 4,420,581 3,586,980
Expenditures and Uses
Capital Improvement Projects 1,920,681 6,211,284
Total Expenditures and Uses 1,920,681 6,211,284
Ending Fund Balance $3,107,955 $483,651
Reserves/Designations of Fund Balances:Capital Projects Sinking Fund 50,000 220,000Pacific Coast Highway Remediation - - Priority 1 Project - - Undesignated 3,057,955 263,651
Total Reserves/Designations 3,107,955$ 483,651$
CAPITAL IMPROVEMENT PROJECTS FUND
The projects selected and funded for the FY2016 and FY2017 Capital Improvement Program are inthe Capital Improvement Fund section of the two-year budget. The Capital Improvement Fundincorporates all sources and expenditures for capital projects.
The purpose of the Capital Improvement Program is to provide the City of Dana Point with a long-range program for major municipal capital construction projects based on the systemic developmentof an advanced financial plan. The Capital Improvment Program is a separate seven year planningdocument used by the City to identify Capital Improvement needs and to coordinate financing andtiming of those needs in a manner that maximizes the return to the public. As each annual budget isprepared, additional projects and priority needs are developed and added to the program to maintaina total seven year plan.
Major funding for the Capital Improvement Program is via transfers from the General, Gas Tax,Measure M, Park Development and AB2766 Funds. Other funding sources include the County, Stateand Federal governments, developer contributions and interest earnings.
236

THIS PAGE INTENTIONALLY LEFT BLANK

CIP BUDGET SUMMARY FY16 AND FY17
Project No. Description Comments
Estimated Unspent Funds 6-
30-15Reprogrammed
Funds Carryover FundsFY16 GF/CIP
UndesignatedFY16 CIP
Designated FY16Other
Funds
FY16 Reprogrammed
FundsFY17 GF/CIP
UndesignatedFY17CIP
Designated FY17 Other
FundsFY17 Reprogrammed
Funds Total Appropriation Total Unfunded Total Project Cost
1. PREVIOUSLY BUDGETED 2012-2013 and 2013-2014 PROJECTS (CIP FUND)1223 PCH/Del Prado Improvements- Phase I Design FY16: Close out. Reprogram $58,502 to CIP#1. 58,052 (58,052) - - - - - - - - - - - 1239 General Park Rehabilitation (Parks Division) FY16: Close out. Reprogram $90,344 to CIP#1. 90,344 (90,344) - - - - - - - - - - -
1242 Town Center Streetscape Construction
FY15: Carryover unspent project balance at 6/30/15. Anticipated project savings will fund FY16: Crown Valley Parkway Median Improvements in the amount of $450,000 (Priority1, #11) 4,939,305 (450,000) 4,489,305 - 4,489,305 - 4,489,305
1260 Minor DrainageFY16: Reprogram $51,604 to CIP#1; Reprogram #2,594 to CIP#2. FY17: Reprogram $200,000 to CIP#1. 254,198 (254,198) - - - - - - - - - - -
1261 Slurry Seal FY16: Funds to be transferred to CIP#1268 (FY15 Annual Residential Phase 1) 200,000 200,000 - 200,000 200,000
1262 Arterial Roadway Rehabilitation and RepairsFY16: Reprogram $47,406 to CIP#2 Reprogram $100,000 to CIP#3; Reprogram $2,594 to CIP#4. FY17: Reprogram $50,000 to CIP#2; Reprogram $100,000 to CIP#3. 300,000 (300,000) - - - - - - - - - - -
1263 Sidewalk and Concrete Repairs FY16: Funds to be transferred to CIP#1268 (FY15 Annual Residential Phase 1) 200,000 200,000 - - - - - - - - 200,000 - 200,000 1264 Sidewalk ADA Improvements FY16: Reprogram $97,406 to CIP#4. FY17: Reprogram $97,389 to CIP#4. 194,795 (194,795) - - - - - - - - - - -
1265 Traffic Safety Repairs and ImprovementsFY16: Reprogram $2,611 to CIP#4. Reprogram $100,000 to CIP#5. Reprogram $68,898 to CIP#5. 171,509 (171,509) - - - - - - - - - - -
1267Annual Residential Resurfacing, FY 13/14, Phase II ( Calle Portola, Juanita, Via Sacramento)
FY16: $586,807 to be transferred to CIP#1268 (FY15 Annual Residential Phase 1). Reprogram $100,000 to CIP#6; Reprogram $80,779 to CIP#7. FY17: Reprogram $31,102 to CIP#5; Reprogram $100,000 to CIP#6. 898,688 (311,881) 586,807 - - - - - - - - 586,807 - 586,807
1268 Annual Residential Roadway Resurfacing, FY14/15 Phase IFY16: Carryover project funding balance. Transfer in project balances from CIP#1261, CIP#1263, CIP#1267 and CIP#1269 for a total project balance of $2,752,995. 1,036,881 1,036,881 - - - - - - - - 1,036,881 - 1,036,881
1269 Annual Residential ResurfacingFY14/15, Phase II FY16: Funds to be transferred to CIP#1268 (FY15 Annual Residential Phase 1) 729,307 729,307 - - - - - - - - 729,307 - 729,307 1270 San Juan Creek Drain Project (L01S02) FY15: Carryover to FY16 200,000 200,000 - - - - - - - - 200,000 - 200,000 1271 Storm Drain Repairs FY16: Reprogram $44,943 to CIP#7 44,943 (44,943) - - - - - - - - - - - -
1272 BCIP Coast Highway Class 1 Bikeway/Pedestrian Way
FY16: Reprogram $24,278 to CIP#7. FY17: Reprogram $100,722 to CIP#7. Project in the amount of $914,823 will be funded entirely through OCTA grant funds (607,187) and AQMD Clean Air AB2766 funds ($307,636). 125,000 (125,000) - - - - - - - 914,823 - 914,823 - 914,823
- - - - -
SUBTOTAL 9,443,022 (2,000,722) 7,442,300 - - - - - - 914,823 - 8,357,123 - 8,357,123 2. MANDATES, REPAIR, AND REPLACEMENT TO EXISTING INFRASTRUCTURE
1274 Storm Drain RepairsFY16: Reprogram $58,052 from CIP#1223; Reprogram $90,344 from CIP#1239; Reprogram $51,604 from CIP#1260. FY17: Reprogram $200,000 from CIP#1260. - - - - - - 200,000 - - - 200,000 400,000 - 400,000
1275 Water Quality Diversion/Treatment Plant RepairsFY16: Reprogram $2,594 from CIP#1260. Reprogram $47,406 from CIP#1262. FY17: Reprogram $50,000 from CIP#1262. - - - - - - 50,000 - - - 50,000 100,000 - 100,000
1276 Slurry Seal Program FY16: Reprogram $100,000 from CIP#1262. FY17: Reprogram $100,000 from CIP#1262. - - - - - - 100,000 - - - 100,000 200,000 - 200,000
1277 Arterial Roadway Rehabilitation and RepairsFY16: Reprogram $2,594 from CIP#1262. Reprogram $97,406 from CIP#1264. FY17: Reprogram $97,389 from CIP#1264; Reprogram $2,611 from CIP#1265. - - - - - - 100,000 - - - 100,000 200,000 - 200,000
1278 Sidewalk and Concrete RepairsFY16: Reprogram $100,000 from CIP#1265. FY17: Reprogram $68,898 from CIP#1265. Reprogram $31,102 from CIP#1267. - - - - - - 100,000 - - - 100,000 200,000 - 200,000
1279 Sidewalk ADA Improvements FY16: Reprogram $100,000 from CIP#1267. FY17: Reprogram $100,000 from CIP#1267. - - - - - - 100,000 - - - 100,000 200,000 - 200,000
1280 Traffic Safety Repairs and Improvements
FY16: Reprogram $80,779 from CIP#1267. Reprogram $44,943 from CIP#1271. Reprogram $24,278 from CIP#1272. FY17: Reprogram $100,722 from CIP#1272. Transfer in $49,278 from Undesignated CIP Fund Balance Transfers-In. - - - - - - 150,000 49,278 - - 100,722 300,000 - 300,000
1281 Annual Residential Roadway Resurfacing, FY17 FY16: M2 Funding $595,581. FY17: M2 Funding $627,364. Portion of Gas Tax $20,350. Transfer in $2,223,487 from Undesignated CIP Fund Balance - - - - 595,581 - 2,223,487 - 647,714 - 3,466,782 - 3,466,782
1282 Arterial Roadway Resurfacing: Del Obispo from Stonehill to PCH : APM
FY17:OCTA grant award of $500,000. City share in the amount of $520,360 to be funded from anticipated Gas Tax revenue for FY16 ($169,071) and FY17 ($169,071) . Transfer in $182,218 from Undesignated CIP Fund Balance Transfers-In. - - - - - - - 182,218 - 838,142 - 1,020,360 - 1,020,360
1283 Smart Irrigation System Drought AlterationsFY16: Transfer funding from Park Development Fund Balance in the amount of $75,000 FY17: Transfer funding from Park Development Fund Balance in the amount of $80,000. - - - - 75,000 - - - 80,000 - - 155,000 - 155,000
1284 Crown Valley Parkway Median Drought ConversionFY16:Transfer project savings in the amount of $450,000 from CIP#1242 upon project conclusion - - - - - - 450,000 - - - - 450,000 - 450,000
1285 La Plaza Park/Lantern Bay Park Drought Conversion FY17: Transfer funding from Park Development Fund Balance in the amount of $375,000 - - - - - - - - 375,000 - - 375,000 - 375,0001286 Crystal Cove Barrier Railing Replacement FY17: Transfer $150,000 from Undesignated CIP Fund Balance - - - - - - - 150,000 - - - 150,000 - 150,000
- - - - 75,000 595,581 1,250,000 2,604,983 455,000 1,485,856 750,722 7,217,142 - 7,217,142 3. PRIORITY 1 NEW PROJECTS (CIP FUND)
1287 Underground Electrical-SDG&E FY17: SDG&E grant funded project - - - - - - - - - 2,200,000 - 2,200,000 - 2,200,0001288 City Wayfinding Signage Program, Phase I FY16: Transfer $500,000 from Undesignated CIP Fund Balance Transfers-In - - - 500,000 - - - - - - - 500,000 - 500,000
SUBTOTAL - - - 500,000 - - - - - 2,200,000 - 2,700,000 - 2,700,000 TOTAL 9,443,022 (2,000,722) 7,442,300 500,000 75,000 595,581 1,250,000 2,604,983 455,000 4,600,679 750,722 18,274,265 - 18,274,265
CIP Fund Balance Beginning Balance Additions 2016
Transfers In/Out from GF/CIP
Undesignated
Transfers In/Out GF/CIP
Designated
Transfers In/Out /M2/Gas Tax
FundsEnding Balance
2016
Transfers In/Out from GF/CIP
UndesignatedTransfers In/Out
GF/CIP Designated
Transfers In/Out Gas Tax & Measure M Additions 2017
Ending Balance 2017
Fund Balance
FY16:Transfer $500,000 to Priority#1, #2. Transfer out $50,000 to Priroity 1 New Projects. FY17: Transfer $49,278 to CIP#7; Transfer $2,223,487 to CIP#8;Transfer $182,218 to CIP#9; Transfer $150,000 to CIP#13. 3,154,983 - (550,000) - - - (2,604,983) - - - 0
Designated for Priority 1 Projects (10% of new Priority 1 Projects) FY16: Transfer in $50,000 for required 10% of new Priority 1 CIP projects from Undesignated CIP Fund Balance Transfers-In. (Priority 1, #2) 0 - 50,000 - - - - - - - 50,000
CIP Sinking Fund 1,250,000 1,250,000 Total CIP Fund Balance 4,404,983 0 (500,000) 0 0 0 (2,604,983) 0 0 0 1,300,000
General Fund Undesignated Balance
4. PRIORITY 2 POTENTIAL PROJECTS (UNFUNDED) (NOT PRIORITIZED)1B Coast Highway Class 1 Bike Trail Phase 2 - - - - - - - - - - - - 1,000,000 1,000,000 2B Coast Highway Landscaped Medians - - - - - - - - - - - - 1,500,000 1,500,000 3B Harbor Point Park Bluff Stabalization - - - - - - - - - - - - 2,000,000 2,000,000 4B City Wayfinding Signage Program, Phase 2 - - - - - - - - - - - - 500,000 500,000 5B Capo Beach Medians - - - - - - - - - - - - 300,000 300,000 6B Del Obispo Parking Lot - - - - - - - - - - - - 150,000 150,000 7B Sea Terrace Park Phase II (Road and parking lot) - - - - - - - - - - - - 1,500,000 1,500,000 8B Sea Terrace Park Phase II (Restroom and recreational improvements) - - - - - - - - - - - - 1,500,000 1,500,000 9B Pines Park Restroom Construction - - - - - - - - - - - - 650,000 650,000
237

Project No. Description Comments
Estimated Unspent Funds 6-
30-15Reprogrammed
Funds Carryover FundsFY16 GF/CIP
UndesignatedFY16 CIP
Designated FY16Other
Funds
FY16 Reprogrammed
FundsFY17 GF/CIP
UndesignatedFY17CIP
Designated FY17 Other
FundsFY17 Reprogrammed
Funds Total Appropriation Total Unfunded Total Project Cost
10B Storm Drain Master Plan Improvements, Phase 5 - - - - - - - - - - - - 3,000,000 3,000,000 11B PCH Medians, Final Phase - - - - - - - - - - - - 500,000 500,000 12B Automation of Diversions - - - - - - - - - - - 1,080,000 1,080,000 13B Salt Creek Recycling Plant City Contribution - - - - - - - - - - - 1,000,000 1,000,000 14B Monarch Bay Assoc: PCH Beautification Project, Phase 2 - - - - - - - - - - - 75,000 75,000 15B PCH/Coast Highway: Complete Street Protected Bikeway/Pedestrian Way - - - - - - - - - - - - 3,000,000 3,000,000
16B-1 Salt Creek Recycling Distribution System-City Contribution - - - - - - - - - - - - 1,000,000 1,000,000 16B-2 Salt Creek Runoff RO System (SCWD Project) - - - - - - - - - - - - 6,000,000 6,000,000 16B-3 Sea Terrace Park Recycled Water Reservoir (SCWD Project) - - - - - - - - - - - - 2,500,000 2,500,000 17B Restroom Replacement at Sea Canyon/Sunset Park - - - - - - - - - - - - 1,300,000 1,300,000 18B Bicycle Trails Master Plan, Phase II - - - - - - - - - - - - 1,000,000 1,000,000 19B Blue Lantern Median - - - - - - - - - - - - 400,000 400,000 20B RH Dana Joint Use Fields - - - - - - - - - - - - 850,000 850,000 21B Capo Beach Connectivity Study - - - - - - - - - - - - 500,000 500,000 22B San Juan Creek Levee Improvements - - - - - - - - - - - - 43,000,000 43,000,000 23B Dana Point Skatepark - - - - - - - - - - - - 750,000 750,000
TOTAL - - - - - - - - - - - - 75,055,000 75,055,000
238

DEBT MANAGEMENT

CITY OF DANA POINT Computation of Legal Debt Margin
June 30, 2015
Assessed Valuation (1) $9,787,131,567
Legal Debt Limit - 3.75% of Total Assessed Valuation $367,017,434
Amount of Debt Applicable to Limit: None 0
Legal Debt Margin $367,017,434
Note (1):
The general laws of the State of California For municipalities provide for a legal debt limit of 15% of gross assessed valuation. However, this provision was enacted when assessed valuation was established based on 25% of market value. Effective with FY1981-82, taxable property is assessed at 100% of market value. Although the debt limit provision has not been amended by the State since this change, the percentage has been proportionately modified to 3.75% for the purposes of this calculation for consistency with the original intent of the State’s debt limit
239

THIS PAGE INTENTIONALLY LEFT BLANK

BUDGET REFERENCE MATERIALS

GLOSSARY
Allocate - To divide a lump-sum appropriation which is designated for expenditure by specific organization units and/or for specific purposes, activities, or objects.
Annual Budget - A budget applicable to a single fiscal year.
Appropriation - An authorization made by the Council which permits the City to incur obligations and to make expenditures of resources.
Audit - Prepared by an independent Certified Public Accountant (CPA), the primary objective of an audit is to determine if the City's Financial Statements present fairly the City's financial position and results of operations in conformity with generally accepted accounting principles. In conjunction with their performance of an audit, it is customary for an independent auditor to issue a Management Letter stating the adequacy of the City's internal controls as well as recommending improvements to the City's financial management practices.
Budget - A financial plan for a specified period of time that matches planned revenues and expenditures to municipal services.
Budget Detail - A support document to the published budget detailing the line item expenditures.
Budget Message - Included in the opening section of the budget, the Budget Message provides the Council and the public with a general summary of the most important aspects of the budget, changes from the previous fiscal years, and the views and recommendations of the City Manager.
Capital Improvement Program (CIP) - A program to provide for the maintenance or replacement of existing public facilities and assets and for the construction or acquisition of new ones.
Charges for Services - Charges paid to the City by users of a service to help support the costs of providing that service.
CJPIA - California Joint Powers Insurance Authority.
Coastal Area Road Improvements and Traffic Signals (CARITS) - A program to finance the construction of roadway gaps, intersection improvements and traffic signals within the coastal area circulation system of the County.
Community Facilities District (“CFD”) – A legal construct used to provide an alternate method of financing the acquisition, construction, and maintenance of certain public facilities, and/or services.
240

Contingency - An appropriation of funds to cover unforeseen events that occur during the fiscal year, such as flood emergencies, Federal mandates, shortfalls in revenue, and similar eventualities.
Contractual Services - Services rendered to City activities by private firms, individuals or other governmental agencies. Examples of these services include traffic engineering, law enforcement, and city attorney services.
Department - A major organizational unit of the City which has been assigned overall management responsibility for an operation or a group of related operations within a functional area.
Designated Fund Balance - Portion of unreserved fund balance designated by City policy for a specific future use.
Encumbrance - The legal commitment of appropriated funds to purchase an item or service. To encumber funds means to set aside or commit funds for a future expenditure.
ESHA – Environmentally Sensitive Habitat Areas.
Expenditure - The outflow of funds paid or to be paid for an asset obtained or goods and services obtained regardless of when the expense is actually paid. This term applies to all funds. An encumbrance is not an expenditure; an encumbrance reserves funds to be expended.
Fiscal Year - The beginning and ending period for recording financial transactions. The City has specified July 1 to June 30 as its fiscal year.
Fixed Assets - Assets of long-term nature such as land, buildings, machinery, furniture, and other equipment. The City has defined such assets as those with an expected life in excess of three years and an acquisition cost in excess of $5,000.
Franchise Fee - A franchise fee is charged for the privilege of using public rights-of-way and property within the City for public or private purposes. The City currently assesses franchise fees on cable television, utilities, and trash collection contractors.
Fund - An accounting entity that records all financial transactions for specific activities or government functions. The generic fund types used by the City are: General, Special Revenue, Capital Project, and Internal Service Funds.
Fund Balance - The excess of current assets over current liabilities, and represents the cumulative effect of revenues and other financing sources over expenditures and other financing uses.
General Fund - The primary operating fund of the City. All revenues that are not allocated by law or contractual agreement to a specific fund are accounted for in the General Fund. With the exception of subvention or grant revenues restricted for specific uses, General Fund
241

resources can be utilized for any legitimate governmental purpose. Goal - A statement of broad direction, purpose, or intent. Infrastructure - The physical assets of the City, i.e., streets, water and sewer lines, public buildings, and parks, and the support structures within a development. Infrastructure is capitalized if it has cost in excess of $50,000 and an expected useful life of over 5 years. Investment Revenue - Revenue received as interest from the investment of funds not immediately required to meet cash disbursement obligations. Line-Item Budget - A budget that lists detailed expenditure categories (salary, materials, telephone service, travel, etc.) separately, along with the amount budgeted for each specified category. The City uses a program rather than line-item budget, although detail line-item accounts are maintained and recorded for financial reporting and control purposes. Municipal - In its broadest sense, an adjective which denotes the state and all subordinate units of government. In a more restricted sense, an adjective which denotes a city or village as opposed to other local governments. Key Objective - A statement of specific direction, purpose, or intent based on the needs of the community and the goals established for a specific program. Operating Budget - The portion of the budget that pertains to daily operations providing basic governmental services. The program budgets in the financial plan form the operating budget. Policy - A direction that must be followed to advance toward a goal. The direction can be a course of action or a guiding principle. Property Tax - A statutory limited tax levy which may be imposed for any purpose. Program - A grouping of activities organized to accomplish basic goals and objectives. Program Budget - A budget that focuses upon the goals and objectives of an agency or jurisdiction rather than upon its organizational budget units or object classes of expenditure. Program Indicator - A measurement of program activities. Reserve - An account used to indicate that a portion of a fund's balance is legally restricted for a specific purpose and is, therefore, not available for general appropriation. Revenue - Funds that the government receives as income. It includes such items as tax payments, fees from specific services, receipts from other governments, fines, forfeitures, grants, shared revenue, and interest income.
242

Risk Management - An organized attempt to protect an organization's assets against accidental loss in the most cost-effective manner. Sales Tax - A tax on the purchase of goods and services. Special Assessment - A compulsory levy made against certain properties to defray part or all of the cost of a specific improvement or service deemed to primarily benefit those parties. Special Revenue Funds - Funds used to account for the proceeds from specific revenue sources (other than trusts or major capital projects) that are legally restricted to expenditures for specific purposes. Subventions - Revenues collected by the State (or other level of government) which are allocated to the City on a formula basis. The major subventions received by the City from the State of California include motor vehicle in-lieu, and gasoline taxes. Trust and Agency Funds - Also known as Fiduciary Fund Types, these funds are used to account for assets held by the City in a trustee capacity or as an agent for private individuals, organizations, or other governmental agencies. User Fees - The payment of a fee for direct receipt of a service by the party benefiting from the service. Working Capital - Difference between current assets and current liabilities.
243

DESCRIPTION OF FUND TYPES AND USES
GENERAL FUND
General Fund - To account for all financial resources that are not restricted as to their use. A broad range of municipal activities are provided through this fund including City Manager, City Attorney, Financial Management, Community Development, Public Works, Community Programs, Recreation and Public Safety.
SPECIAL REVENUE FUNDS Gasoline Tax Fund - To account for gasoline tax allocations by the State of California. These revenues are restricted to expenditure by the State for street related purposes only. Measure M Fund - To account for Measure M allocations by the State of California. Measure M provides for the collection of the one-half (1/2) percent retail transaction and use tax for use in funding the Transportation Improvement Program. AB2766 Fund - To account for revenues received pursuant to Assembly Bill 2766, which provides for a portion of a $1 fee collected from vehicle registrations to be allocated to cities for use in developing programs to reduce air pollution from motor vehicles. Supplemental Law Enforcement Services Fund - To account for revenues received pursuant to Assembly Bill 3229, which provides funds to local agencies for use in enhancing front line law enforcement activities. Coastal Transit Fund - To account for funds received by the City to mitigate impacts to coastal access due to residential development. The funds are restricted for use in providing coastal recreational transit services. CFD 2006-1 Facilities Maintenance Fund – To account for revenues and expenditures associated with the ongoing maintenance of certain facilities located within the boundaries of Community Facilities District 2006-1 of the City of Dana Point, including landscaping, revetment, storm water quality and funicular. Headlands Habitat Fund - To account for the endowment revenues and expenditures related to maintaining the natural habitat at the Headlands Reserve. Tourism Business Improvement District (TBID) Fund - To account for assessment funds received by the City, collected by the Tourism Business Improvement District (St. Regis Monarch Beach, Ritz Carlton Laguna Niguel, Laguna Cliffs Marriott and Double Tree Doheny Beach), used to promote Dana Point as an overnight destination and includes activities such as advertising, public relations, and marketing to attract and extend overnight stays in Dana Point hotels.
244

CAPITAL PROJECT FUNDS Facilities Improvement Fund - This fund was established to account for major one-time expenditures to improve city-owned facilities including City Plaza and the Del Obispo Recreation Center. Capital Improvements Project Fund - To account for financial resources used in the construction or acquisition of major capital facilities. Park Development Fund - To account for fees collected from the County, State and Federal Governments and developers, which are restricted for use in parkland acquisition, improvement or development. CFD 2006-1 Acquisition Fund – CLOSED in FY15 - To account for the acquisition of certain public improvements located within the boundaries of the Community Facilities District 2006-1 of the City of Dana Point (commonly referred to as “the Headlands”).
FIDUCIARY FUNDS Trust/Agency Fund - To account for assets held by the City as an agent on behalf of other agencies, developers and deferred compensation plans. These funds are custodial in nature (assets equal liabilities) and do not involve the measurement of results of operations.
245

SEV
EN Y
EAR
CA
PITA
L IM
PRO
VEM
ENT
PRO
GR
AM
Fisc
al Y
ears
201
6 –
2022
City
of D
ana
Poin
t, C
alifo
rnia

City
of D
ana
Poin
t SE
VE
N Y
EA
R C
API
TA
L IM
PRO
VE
ME
NT
PR
OG
RA
M
FISC
AL
YE
AR
S 20
16 –
202
2
PRO
GR
AM
PU
RPO
SE A
ND
DES
CR
IPTI
ON
Cap
ital I
mpr
ovem
ent P
rogr
am
The
purp
ose
of t
he C
apita
l Im
prov
emen
t Pr
ogra
m (
CIP
) is
a s
even
-yea
r pl
anni
ng i
nstru
men
t us
ed b
y th
e C
ity t
o id
entif
y ca
pita
l im
prov
emen
t nee
ds a
nd to
coo
rdin
ate
finan
cing
and
tim
ing
of th
ose
need
s in
a m
anne
r tha
t max
imiz
es th
e re
turn
to th
e pu
blic
. Th
e va
st m
ajor
ity o
f the
Cap
ital I
mpr
ovem
ent P
rogr
am is
act
ually
dev
oted
to re
pair
or re
plac
emen
t of e
xist
ing
infr
astru
ctur
e. A
s ea
ch tw
o ye
ar b
udge
t is
prep
ared
, add
ition
al p
roje
cts
and
prio
rity
need
s ar
e de
velo
ped
and
adde
d to
the
prog
ram
to m
aint
ain
a to
tal s
even
-yea
r pl
an.
Cap
ital B
udge
t
The
first
tw
o ye
ars
of t
he C
IP i
s ca
lled
the
capi
tal
budg
et.
The
capi
tal
budg
et i
s in
corp
orat
ed i
nto
the
two
year
City
“op
erat
ing”
bu
dget
, whi
ch a
ppro
pria
tes
fund
s fo
r sp
ecifi
c fa
cilit
ies,
equi
pmen
t an
d im
prov
emen
ts.
Proj
ects
sla
ted
for
subs
eque
nt y
ears
in
the
prog
ram
are
ack
now
ledg
ed o
n a
plan
ning
bas
is b
ut d
o no
t rec
eive
ulti
mat
e ex
pend
iture
aut
horit
y un
til th
ey a
re e
vent
ually
inco
rpor
ated
in
to th
e ca
pita
l bud
get.
As
such
, ten
tativ
e C
ounc
il en
dors
emen
t of t
he o
vera
ll se
ven-
year
pro
gram
is d
esira
ble
for e
ffec
tive
plan
ning
an
d ev
entu
al im
plem
enta
tion
of o
vera
ll C
ity g
oals
and
obj
ectiv
es.
Cap
ital I
mpr
ovem
ents
Cap
ital i
mpr
ovem
ents
are
maj
or p
roje
cts (
$100
,000
+) u
nder
take
n by
the
City
that
are
gen
eral
ly n
on-r
ecur
ring
min
or e
xpen
ditu
res o
n an
ann
ual
basi
s. I
n th
is s
ense
the
y ar
e di
ffer
entia
ted
from
ope
ratin
g an
d m
aint
enan
ce (
O&
M)
expe
nditu
res
for
norm
al C
ity
oper
atio
n. T
hey
gene
rally
inc
lude
lan
d an
d rig
ht-o
f-w
ay a
cqui
sitio
n, c
onst
ruct
ion
or m
odifi
catio
n an
d re
pairs
of
build
ings
or
faci
litie
s, pu
blic
inf
rast
ruct
ure
repa
ir/re
plac
emen
t, co
nstru
ctio
n or
mod
ifica
tion,
pur
chas
e of
maj
or e
quip
men
t w
ith l
ong
life
expe
ctan
cy, a
nd p
roje
cts
requ
iring
deb
t obl
igat
ion
or b
orro
win
g. C
-1

City
of D
ana
Poin
t SE
VE
N Y
EA
R C
API
TA
L IM
PRO
VE
ME
NT
PR
OG
RA
M
FISC
AL
YE
AR
S 20
16 –
202
2
Prim
ary
Prog
ram
Rev
enue
Sou
rces
Stat
e H
ighw
ay U
ser’
s (G
asol
ine)
Tax
es- U
nder
Sec
tion
2103
, 210
5, 2
106,
210
7, a
nd 2
107.
5 of
the
Cal
iforn
ia S
treet
s an
d H
ighw
ays
Cod
e, C
ities
are
allo
cate
d a
shar
e of
the
reve
nues
der
ived
from
the
stat
e ta
xes o
n ga
solin
e. T
hese
reve
nues
are
rest
ricte
d in
thei
r use
to
the
cons
truct
ion,
impr
ovem
ent a
nd m
aint
enan
ce o
f pub
lic st
reet
s. C
oast
al A
rea
Roa
d Im
prov
emen
ts a
nd T
raff
ic S
igna
ls (
CA
RIT
S) F
ees
– Th
e C
AR
ITS
Cou
nty
Fee
Prog
ram
will
fin
ance
the
co
nstru
ctio
n of
regi
onal
road
way
gap
s, in
ters
ectio
n im
prov
emen
ts a
nd tr
affic
sig
nals
with
in th
e co
asta
l are
a ci
rcul
atio
n sy
stem
of t
he
Cou
nty.
The
road
impr
ovem
ents
to b
e fu
nded
by
this
pro
gram
are
iden
tifie
d in
the
Sout
h C
ount
y R
oad
Impr
ovem
ent A
ctio
n Pl
an.
Mea
sure
M F
und-
Ren
ewed
Mea
sure
M (M
2), t
he R
evis
ed T
raff
ic Im
prov
emen
t and
Gro
wth
Man
agem
ent O
rdin
ance
, pro
vide
s for
the
colle
ctio
n of
one
-hal
f (1/
2) p
erce
nt re
tail
trans
actio
n an
d us
e ta
x to
fund
the
Tran
spor
tatio
n Im
prov
emen
t Pro
gram
, typ
ical
ly u
sed
for
road
repa
irs.
Traf
fic S
igna
l Fee
s - F
ees
requ
ired
of a
dev
elop
er/b
uild
er fo
r pur
pose
of d
efra
ying
the
actu
al o
r est
imat
ed c
osts
of c
onst
ruct
ing
futu
re
traff
ic s
igna
lizat
ion
impr
ovem
ents
in th
e vi
cini
ty o
f the
dev
elop
men
t/bui
ldin
g. T
hese
fund
s m
ay b
e us
ed o
nly
for t
he c
onst
ruct
ion
or
reim
burs
emen
t for
con
stru
ctio
n of
traf
fic s
igna
ls w
ithin
the
area
from
whi
ch th
e fe
es c
ompr
omis
ing
the
fund
wer
e co
llect
ed. I
nter
est
accr
uing
from
thes
e fu
nds c
an b
e us
ed a
nyw
here
with
in th
e C
ity.
Arte
rial
Hig
hway
Reh
abili
tatio
n Pr
ogra
m (
AH
RP)
- T
he M
easu
re M
Arte
rial
Hig
hway
Reh
abili
tatio
n Pr
ogra
m (
AH
RP)
is
to h
elp
impr
ove
pave
men
t con
ditio
n in
Ora
nge
Cou
nty.
Spe
cific
ally
, the
AH
RP
is d
esig
ned
to fu
nd p
avem
ent r
ehab
ilita
tion
proj
ects
on
maj
or
Mas
ter P
lan
of A
rteria
l Hig
hway
s (M
PAH
) arte
rial r
oadw
ays t
hrou
ghou
t Ora
nge
Cou
nty.
In
ters
ectio
n Im
prov
emen
t Pr
ogra
m (
IIP)
– M
easu
re M
Int
erse
ctio
n Im
prov
emen
t Pr
ogra
m p
rovi
des
fund
s fo
r m
any
of O
rang
e C
ount
y’s
mos
t co
nges
ted
inte
rsec
tions
. Fu
ndin
g is
mad
e av
aila
ble
for
gene
ral
inte
rsec
tion
impr
ovem
ents
, su
ch a
s w
iden
ing,
lan
e st
ripin
g, a
nd a
esth
etic
impr
ovem
ents
.
C-2

Gen
eral
Fun
d- T
he c
apita
l bud
get i
s of
ten
supp
orte
d by
the
trans
fer
of u
nenc
umbe
red
mon
ies
from
the
City
’s G
ener
al F
und
whi
ch
resu
lts fr
om a
nnua
l Ope
ratin
g re
venu
e ex
ceed
ing
annu
al O
pera
ting
cost
s. A
ccur
ate
Gen
eral
Fun
d co
ntrib
utio
n fo
reca
stin
g is
diff
icul
t an
d de
pend
ent
on t
he C
ity’s
fut
ure
year
abi
lity
to m
atch
cos
ts w
ith r
even
ues.
Gen
eral
pur
pose
fun
ds m
ay b
e us
ed t
o fin
ance
any
ca
pita
l pro
ject
. D
evel
opm
ent I
mpa
ct F
ee-
The
City
Cou
ncil
appr
oved
Lan
tern
Dis
tric
t Dev
elop
men
t Im
pact
Fee
was
ena
cted
to h
elp
reim
burs
e th
e G
ener
al F
und
for
expe
nditu
res
used
to p
rovi
de n
eces
sary
pub
lic im
prov
emen
ts/a
men
ities
to s
uppo
rt in
crea
sed
deve
lopm
ent f
or th
at
spec
ific
area
. Th
ese
fund
s may
be
used
to su
ppor
t any
City
wid
e C
apita
l Im
prov
emen
t Pro
ject
. Pa
rk D
evel
opm
ent F
ees-
Fee
req
uire
d of
a d
evel
oper
/bui
lder
for
pur
pose
s of
def
rayi
ng th
e ac
tual
or
estim
ated
cos
ts o
f co
nstru
ctin
g fu
ture
par
k an
d re
crea
tion
impr
ovem
ents
. A
B27
66 F
und-
Aut
horiz
ed b
y th
e St
ate,
fee
s ar
e im
pose
d on
mot
or v
ehic
les
by t
he a
ir po
llutio
n co
ntro
l di
stric
ts.
The
fees
are
co
llect
ed b
y th
e C
alifo
rnia
Dep
artm
ent
of M
otor
Veh
icle
s an
d di
strib
uted
to
loca
l ag
enci
es b
y th
e So
uth
Coa
st A
ir Q
ualit
y M
anag
emen
t Dis
trict
to b
e us
ed fo
r pro
ject
s whi
ch im
prov
e ai
r qua
lity.
G
MA
11
– Th
ese
are
Mea
sure
M fu
nds
set a
side
for r
egio
nal p
roje
cts
with
in a
City
’s G
row
th M
anag
emen
t Are
a (G
MA
). Th
e C
ount
y of
Ora
nge
is d
ivid
ed in
to e
leve
n G
MA
’s a
nd th
e C
ity o
f Dan
a Po
int i
s mem
ber o
f GM
A #
11 a
long
with
the
citie
s of S
an C
lem
ente
and
Sa
n Ju
an C
apis
trano
. Per
iodi
cally
, if
fund
ing
is a
ccum
ulat
ed, t
hese
thre
e ci
ties
may
app
rove
a li
st o
f pr
ojec
ts to
be
fund
ed b
y th
e al
loca
tion
of G
MA
fund
s est
ablis
hed
by O
CTA
. O
ther
Gra
nt F
unds
- O
ther
Fed
eral
, Sta
te a
nd C
ount
y ag
enci
es m
ay p
rovi
de g
rant
fun
ding
for
spe
cific
pro
gram
s th
at t
he C
ity m
ay
obta
in fo
r spe
cific
pro
ject
s suc
h as
wat
er q
ualit
y, b
icyc
le fa
cilit
ies i
mpr
ovem
ents
or n
atur
al re
sour
ces p
rogr
ams.
C-3

TH
IS P
AG
E IN
TEN
TIO
NA
LL
Y L
EFT
BL
AN
K
C-4

PR
EV
IOU
SLY
BU
DG
ET
ED
FIS
CA
L Y
EA
RS
2014
& 2
015
CA
RR
YO
VE
R P
RO
JEC
TS

C-5
Dep
artm
ent:
Pro
ject
Nam
e:
Publ
ic W
orks
CLA
SSIF
ICAT
ION
:H
ealth
and
Saf
ety
Proj
ect
X
Reh
abili
tatio
n P
roje
ctX
Wat
er Q
ualit
y P
roje
ct
Bea
utifi
catio
n P
roje
ctX
X
Item
Car
ryov
er
Fund
ing
FY16
FY17
FY20
FY21
FY22
Tota
l
Estim
ated
Con
stru
ctio
n C
osts
:P
re-D
esig
nD
esig
nC
onst
ruct
ion
$4,4
89,3
05$4
,489
,305
Unf
unde
d C
onst
ruct
ion
Cos
tsTo
tal E
stim
ated
Pro
ject
Cos
t$4
,489
,305
$0$0
$0$0
$0$4
,489
,305
Ope
ratio
n &
Mai
nten
ance
:
Cos
tsTo
tal O
& M
Cos
tsFu
ndin
g So
urce
:C
ontin
uing
App
ropr
iatio
ns$4
,489
,305
$4,4
89,3
05C
IP F
und
Tota
l Fun
ding
$4,4
89,3
05$0
$0$0
$0$0
$4,4
89,3
05
SPEC
IAL
CO
NSI
DER
ATIO
NS:
PRO
JEC
T D
ESC
RIP
TIO
N:
$0
$0$0
$0
Des
irabl
e
D
efer
rabl
e FY18
Con
stru
ctio
n of
the
Tow
n C
ente
r Pla
n w
as p
relim
inar
ily e
stim
ated
to c
ost $
19 m
illio
n. P
roje
ct
carry
over
fund
ing
to F
Y16
wou
ld a
llow
com
plet
ion
of th
e P
CH
and
upc
oast
ent
ry p
ortio
n of
the
proj
ect.
The
Tow
n C
ente
r (La
nter
n D
istri
ct) S
treet
scap
e im
prov
emen
ts
incl
udes
sig
nfic
ant b
eaut
ifica
tion
impr
ovem
ents
and
road
way
ci
rcul
atio
n ch
ange
s on
bot
h P
acifi
c C
oast
Hig
hway
(PC
H) a
nd
Del
Pra
do b
etw
een
Blu
e La
nter
n an
d C
oppe
r Lan
tern
. Th
e P
roje
ct is
bei
ng c
onst
ruct
ed in
two
City
pha
ses.
Reh
abili
tatio
n w
ork
on P
CH
(Pha
se 1
A) w
as c
ompl
eted
in F
ebru
ary
2015
, and
re
sulte
d in
PC
H c
hang
ing
to tw
o-w
ay tr
affic
. P
hase
2A
, whi
ch
enco
mpa
sses
stre
etsc
ape
impr
ovem
ents
on
Del
Pra
do, w
ill
trans
form
the
stre
et to
a m
ore
pede
stria
n fri
endl
y, b
usin
ess
dist
rict.
Pro
ject
com
plet
ion
is e
xpec
ted
in S
epte
mbe
r 201
5.
PRIO
RIT
Y:
Pro
ject
No.
: 1242
Tow
n C
ente
r St
reet
scap
e C
onst
ruct
ion
(PC
H/D
el P
rado
)
FY19PR
OJE
CT
LOC
ATIO
N:
Par
k P
roje
ct
Man
date
d P
roje
ct
Ess
entia
l
N
eces
sary

C-6
Dep
artm
ent:
Proj
ect N
ame:
Publ
ic W
orks
CLA
SSIF
ICAT
ION
:H
ealth
and
Saf
ety
Proj
ect
____
____
Reh
abilit
atio
n Pr
ojec
t
X
Wat
er Q
ualit
y Pr
ojec
t__
____
__Be
autif
icat
ion
Proj
ect
____
X
Item
Car
ryov
er
Fund
ing
FY16
FY17
FY20
FY21
FY22
Tota
l
Estim
ated
Con
stru
ctio
n C
osts
:D
esig
n
C
onst
ruct
ion
$2,7
52,9
95
$2,7
52,9
95O
ther To
tal E
stim
ated
Pro
ject
Cos
t$2
,752
,995
$2
,752
,995
Ope
ratio
n &
Mai
nten
ance
:
Cos
tsTo
tal O
& M
Cos
tsFu
ndin
g So
urce
:C
ontin
uing
App
ropr
iatio
ns$1
,036
,881
$1
,036
,881
Rep
rogr
amm
ed F
unds
$1,7
16,1
14
$1,7
16,1
14M
easu
re M
2 Fu
nds
Gas
/Exc
ise
HU
TA T
ax F
unds
Tota
l Fun
ding
$2,7
52,9
95
$2,7
52,9
95
SPEC
IAL
CO
NSI
DER
ATIO
NS:
PRO
JEC
T D
ESC
RIP
TIO
N:
Nec
essa
ry
FY18
This
pro
gram
is in
tend
ed to
pro
vide
fund
ing
to re
habi
litat
e no
n-ar
teria
l stre
ets
incl
udin
g re
side
ntia
l, re
side
ntia
l col
lect
or,
and
colle
ctor
stre
ets.
Stre
ets
are
sele
cted
for r
ehab
ilitat
ion
usin
g th
e C
ity's
Pav
emen
t Man
agem
ent P
lan
whi
ch ra
tes
stre
ets
city
wid
e an
d re
com
men
ds im
prov
emen
ts in
prio
rity
orde
r by
stre
et c
ondi
tion.
Fun
ding
for t
his
Proj
ect i
s cu
rren
tly
antic
ipat
ed to
be
used
to p
ave
a po
rtion
of C
alle
Por
tola
, C
alle
Jua
nita
, and
Cal
le N
aran
ja.
Fund
ing
from
CIP
#'s
1261
, 12
63, 1
267
and
1269
will
be re
prog
ram
med
into
this
CIP
pr
ojec
t.
PRIO
RIT
Y:
Park
Pro
ject
Man
date
d Pr
ojec
t
Esse
ntia
l
Proj
ect N
o.:
1268
Annu
al R
esid
entia
l Res
urfa
cing
FY
14, P
hase
II
FY19PR
OJE
CT
LOC
ATIO
N:
Des
irabl
e
D
efer
rabl
e
Vario
us L
ocat
ions

C-7
Dep
artm
ent:
Proj
ect N
ame:
Publ
ic W
orks
CLA
SSIF
ICAT
ION
:H
ealth
and
Saf
ety
Proj
ect
X__
__R
ehab
ilitat
ion
Proj
ect
Wat
er Q
ualit
y Pr
ojec
tX
____
Beau
tific
atio
n Pr
ojec
t__
__
Item
Car
ryov
er
Fund
ing
FY16
FY17
FY20
FY21
FY22
Tota
l
Estim
ated
Con
stru
ctio
n C
osts
:D
esig
n
C
onst
ruct
ion
$200
,000
$470
,236
$6
70,2
36O
ther To
tal E
stim
ated
Pro
ject
Cos
t$2
00,0
00$4
70,2
36
$6
70,2
36O
pera
tion
& M
aint
enan
ce:
Cos
tsTo
tal O
& M
Cos
tsFu
ndin
g So
urce
:C
ontin
uing
App
ropr
iatio
ns$2
00,0
00
$200
,000
Rep
rogr
amm
ed F
unds
C
IP D
esig
nate
d Fu
nds
Mea
sure
M2
Fund
s$4
70,2
36$4
70,2
36G
as/E
xcis
e H
UTA
Tax
Fun
dsTo
tal F
undi
ng$2
00,0
00$4
70,2
36
$670
,236
Proj
ect N
o.:
1270
San
Juan
Cre
ek S
torm
Dra
in W
ater
Qua
lity
Proj
ect (
L01S
02)
FY19PR
OJE
CT
LOC
ATIO
N:
Des
irabl
e
D
efer
rabl
e FY18
Nee
d m
ap fr
om R
eg
The
City
is w
orki
ng w
ith th
e C
ity o
f San
Jua
n C
apis
trano
, Cal
Tran
s, S
CW
D a
nd th
e C
ount
y of
O
rang
e to
dev
elop
the
proj
ect s
cope
and
obt
ain
gran
t fun
ding
to p
ay fo
r the
maj
ority
of t
his
proj
ect.
This
pro
pose
d pr
ojec
t is
inte
nded
to h
elp
fund
infil
tratio
n an
d di
vers
ion
of d
ry w
eath
er fl
ow fr
om s
torm
dra
in L
01S0
2. T
his
stor
m d
rain
em
ptie
s to
San
Jua
n C
reek
nea
r PC
H.
The
requ
irem
ent i
s to
impr
ove
wat
er q
ualit
y fro
m th
is s
ourc
e.
OC
TA g
rant
ed th
e C
ity a
24
mon
th e
xten
sion
to F
Y15/
16 o
f th
is g
rant
fund
ed p
rogr
am d
ue to
ong
oing
mul
ti-ag
ency
in
vest
igat
ions
into
dry
wea
ther
flow
vol
ume
into
the
L01S
02
stor
m d
rain
.PR
IOR
ITY:
Park
Pro
ject
Man
date
d Pr
ojec
t
Esse
ntia
l
N
eces
sary
SPEC
IAL
CO
NSI
DER
ATIO
NS:
PRO
JEC
T D
ESC
RIP
TIO
N:

C-8
Dep
artm
ent:
Proj
ect N
ame:
Publ
ic W
orks
CLA
SSIF
ICAT
ION
:H
ealth
and
Saf
ety
Proj
ect
X__
__R
ehab
ilitat
ion
Proj
ect
Wat
er Q
ualit
y Pr
ojec
t__
____
__Be
autif
icat
ion
Proj
ect
____
Item
Car
ryov
er
Fund
ing
FY16
FY17
FY20
FY21
FY22
Tota
l
Estim
ated
Con
stru
ctio
n C
osts
:D
esig
n
C
onst
ruct
ion
$914
,823
$9
14,8
23O
ther To
tal E
stim
ated
Pro
ject
Cos
t$9
14,8
23
$914
,823
Ope
ratio
n &
Mai
nten
ance
:
Cos
tsTo
tal O
& M
Cos
tsFu
ndin
g So
urce
:R
epro
gram
med
Fun
ds
CIP
Des
igna
ted
Fund
sM
easu
re M
2 Fu
nds
(BC
IP G
rant
)$6
07,1
87$6
07,1
87G
as/E
xcis
e H
UTA
Tax
Fun
dsA
B27
66 A
ir Q
ualit
y Fu
ndin
g (A
QM
D)
$307
,636
$307
,636
Tota
l Fun
ding
$914
,823
$9
14,8
23
SPEC
IAL
CO
NSI
DER
ATIO
NS:
PRO
JEC
T D
ESC
RIP
TIO
N:
Man
date
d Pr
ojec
t
Nec
essa
ry
Nee
d m
ap fr
om R
eg
This
pro
ject
will
enco
mpa
ss th
e ex
tens
ion
of th
e tw
o w
ay
bike
way
/ped
estri
an w
ay a
long
Coa
st H
ighw
ay fr
om th
e C
apis
trano
Sur
fsid
e In
n Pe
dest
rian
Ove
rcro
ssin
g to
Pa
lisad
es D
rive.
The
impr
ovem
ents
will
enha
nce
the
bicy
cle
and
pede
stria
n lin
kage
s ci
tyw
ide,
max
imiz
e m
obilit
y an
d ac
cess
ibilit
y an
d en
hanc
e tra
vel s
afet
y fo
r ped
estri
ans
and
bicy
clis
ts.
PRIO
RIT
Y:
Park
Pro
ject
Esse
ntia
l
Des
irabl
e
D
efer
rabl
e FY18
Proj
ect N
o.:
1272
BC
IP C
oast
Hig
hway
Cla
ss 1
Bik
eway
/Ped
estr
ian
Way
FY19PR
OJE
CT
LOC
ATIO
N:

M
AN
DA
TE
S, R
EPA
IRS,
AN
D R
EPL
AC
EM
EN
T T
O E
XIS
TIN
G IN
FRA
STR
UC
TU
RE

C-9
Dep
artm
ent:
Proj
ect N
ame:
Publ
ic W
orks
CLA
SSIF
ICAT
ION
:H
ealth
and
Saf
ety
Proj
ect
____
____
Reh
abilit
atio
n Pr
ojec
tX
Wat
er Q
ualit
y Pr
ojec
t__
____
__Be
autif
icat
ion
Proj
ect
____
X
Item
Car
ryov
er
Fund
ing
FY16
FY17
FY20
FY21
FY22
Tota
l
Estim
ated
Con
stru
ctio
n C
osts
:D
esig
n
C
onst
ruct
ion
$200
,000
$200
,000
$200
,000
$200
,000
$200
,000
$1,4
00,0
00O
ther To
tal E
stim
ated
Pro
ject
Cos
t$2
00,0
00$2
00,0
00$2
00,0
00$2
00,0
00$2
00,0
00$1
,400
,000
Ope
ratio
n &
Mai
nten
ance
:
Cos
tsTo
tal O
& M
Cos
tsFu
ndin
g So
urce
:R
epro
gram
med
Fun
ds$2
00,0
00$2
00,0
00$4
00,0
00C
IP U
ndes
igna
ted
Fund
s$2
00,0
00$2
00,0
00$2
00,0
00$1
,000
,000
Mea
sure
M2
Fund
sG
as/E
xcis
e H
UTA
Tax
Fun
dsA
B27
66 A
ir Q
ualit
y Fu
ndin
g (A
QM
D)
Tota
l Fun
ding
$200
,000
$200
,000
$200
,000
$200
,000
$200
,000
$1,4
00,0
00$2
00,0
00
SPEC
IAL
CO
NSI
DER
ATIO
NS:
PRO
JEC
T D
ESC
RIP
TIO
N:
$200
,000
$2
00,0
00
$200
,000
$200
,000
Vario
us L
ocat
ions
This
ann
ual p
roje
ct w
as e
stab
lishe
d to
fund
sto
rm d
rain
re
pairs
iden
tifie
d in
the
City
's in
spec
tions
of s
torm
dra
ins
city
wid
e. W
ork
item
s in
clud
e re
mov
ing
debr
is fr
om s
torm
dr
ains
, rep
airin
g st
orm
dra
in p
ipe,
rem
ovin
g ob
stru
ctio
ns
from
sto
rm d
rain
s, li
ning
sto
rm d
rain
s, e
tc.
PRIO
RIT
Y:
Park
Pro
ject
Man
date
d Pr
ojec
t
Esse
ntia
l
N
eces
sary FY
18
$200
,000
Proj
ect N
o.:
1274
Stor
m D
rain
Rep
airs
FY19PR
OJE
CT
LOC
ATIO
N:
$200
,000
$200
,000
Des
irabl
e
D
efer
rabl
e

C-1
0
Dep
artm
ent:
Proj
ect N
ame:
Publ
ic W
orks
CLA
SSIF
ICAT
ION
:H
ealth
and
Saf
ety
Proj
ect
____
____
Reh
abilit
atio
n Pr
ojec
tX
Wat
er Q
ualit
y Pr
ojec
tX
____
Beau
tific
atio
n Pr
ojec
t__
__
X
Item
Car
ryov
er
Fund
ing
FY16
FY17
FY20
FY21
FY22
Tota
l
Estim
ated
Con
stru
ctio
n C
osts
:D
esig
n
C
onst
ruct
ion
$50,
000
$50,
000
$50,
000
$50,
000
$50,
000
$350
,000
Oth
er Tota
l Est
imat
ed P
roje
ct C
ost
$50,
000
$50,
000
$50,
000
$50,
000
$50,
000
$350
,000
Ope
ratio
n &
Mai
nten
ance
:
Cos
tsTo
tal O
& M
Cos
tsFu
ndin
g So
urce
:R
epro
gram
med
Fun
ds$5
0,00
0$5
0,00
0$1
00,0
00C
IP U
ndes
igna
ted
Fund
s$5
0,00
0$5
0,00
0$5
0,00
0$2
50,0
00M
easu
re M
2 Fu
nds
Gas
/Exc
ise
HU
TA T
ax F
unds
AB
2766
Air
Qua
lity
Fund
ing
(AQ
MD
)To
tal F
undi
ng$5
0,00
0$5
0,00
0$5
0,00
0$5
0,00
0$5
0,00
0$3
50,0
00
Proj
ect N
o.:
1275
Wat
er Q
ualit
y D
iver
sion
/Tre
atm
ent P
lant
Rep
airs
FY19PR
OJE
CT
LOC
ATIO
N:
$50,
000
$50,
000
$5
0,00
0
Esse
ntia
l
Des
irabl
e
D
efer
rabl
e FY18
$50,
000
Vario
us L
ocat
ions
This
ann
ual p
roje
ct w
as e
stab
lishe
d to
fund
mai
nten
ance
and
re
pairs
to C
ityw
ide
stor
m d
rain
CD
S W
ater
Qua
lity
units
(tr
ash
rem
oval
and
filtr
atio
n sy
stem
s).
Fund
ing
will
also
be
utiliz
ed fo
r req
uire
d eq
uipm
ent r
epai
rs/re
plac
emen
t at t
he
Salt
Cre
ek O
zone
Tre
atm
ent P
lant
.
PRIO
RIT
Y:
Park
Pro
ject
$50,
000
Man
date
d Pr
ojec
t
Nec
essa
ry
$5
0,00
0
$50,
000
SPEC
IAL
CO
NSI
DER
ATIO
NS:
PRO
JEC
T D
ESC
RIP
TIO
N:
$50,
000

C-1
1
Dep
artm
ent:
Proj
ect N
ame:
Publ
ic W
orks
CLA
SSIF
ICAT
ION
:H
ealth
and
Saf
ety
Proj
ect
____
____
Reh
abilit
atio
n Pr
ojec
tX
Wat
er Q
ualit
y Pr
ojec
t__
____
__Be
autif
icat
ion
Proj
ect
____
X
Item
Car
ryov
er
Fund
ing
FY16
FY17
FY20
FY21
FY22
Tota
l
Estim
ated
Con
stru
ctio
n C
osts
:D
esig
n
C
onst
ruct
ion
$100
,000
$100
,000
$100
,000
$100
,000
$100
,000
$700
,000
Oth
er Tota
l Est
imat
ed P
roje
ct C
ost
$100
,000
$100
,000
$100
,000
$100
,000
$100
,000
$700
,000
Ope
ratio
n &
Mai
nten
ance
:
Cos
tsTo
tal O
& M
Cos
tsFu
ndin
g So
urce
:R
epro
gram
med
Fun
ds$1
00,0
00$1
00,0
00$2
00,0
00C
IP U
ndes
igna
ted
Fund
s$1
00,0
00$1
00,0
00$1
00,0
00$5
00,0
00M
easu
re M
2 Fu
nds
Gas
/Exc
ise
HU
TA T
ax F
unds
AB
2766
Air
Qua
lity
Fund
ing
(AQ
MD
)To
tal F
undi
ng$1
00,0
00$1
00,0
00$1
00,0
00$1
00,0
00$1
00,0
00$7
00,0
00$1
00,0
00
SPEC
IAL
CO
NSI
DER
ATIO
NS:
PRO
JEC
T D
ESC
RIP
TIO
N:
$100
,000
Man
date
d Pr
ojec
t
Nec
essa
ry
$1
00,0
00
$100
,000
Vario
us L
ocat
ions
Slur
ry s
eal r
esid
entia
l and
arte
rial s
treet
s to
ext
end
surfa
ce
life.
PRIO
RIT
Y:
Park
Pro
ject
$100
,000
$100
,000
Esse
ntia
l
Des
irabl
e
D
efer
rabl
e FY18
Proj
ect N
o.:
1276
Slur
ry S
eal P
rogr
am
FY19PR
OJE
CT
LOC
ATIO
N:
$100
,000
$100
,000

C-1
2
Dep
artm
ent:
Proj
ect N
ame:
Publ
ic W
orks
CLA
SSIF
ICAT
ION
:H
ealth
and
Saf
ety
Proj
ect
____
____
Reh
abilit
atio
n Pr
ojec
tX
Wat
er Q
ualit
y Pr
ojec
t__
____
__Be
autif
icat
ion
Proj
ect
____
X
Item
Car
ryov
er
Fund
ing
FY16
FY17
FY20
FY21
FY22
Tota
l
Estim
ated
Con
stru
ctio
n C
osts
:D
esig
n$1
00,0
00$1
00,0
00$1
00,0
00$1
00,0
00$1
00,0
00$7
00,0
00C
onst
ruct
ion
Oth
er Tota
l Est
imat
ed P
roje
ct C
ost
$100
,000
$100
,000
$100
,000
$100
,000
$100
,000
$700
,000
Ope
ratio
n &
Mai
nten
ance
:
Cos
tsTo
tal O
& M
Cos
tsFu
ndin
g So
urce
:R
epro
gram
med
Fun
ds$1
00,0
00$1
00,0
00$2
00,0
00C
IP U
ndes
igna
ted
Fund
s$1
00,0
00$1
00,0
00$1
00,0
00$5
00,0
00M
easu
re M
2 Fu
nds
Gas
/Exc
ise
HU
TA T
ax F
unds
AB
2766
Air
Qua
lity
Fund
ing
(AQ
MD
)To
tal F
undi
ng$1
00,0
00$1
00,0
00$1
00,0
00$1
00,0
00$1
00,0
00$7
00,0
00$1
00,0
00
SPEC
IAL
CO
NSI
DER
ATIO
NS:
PRO
JEC
T D
ESC
RIP
TIO
N:
$100
,000
Man
date
d Pr
ojec
t
Nec
essa
ry $100
,000
$100
,000
Vario
us L
ocat
ions
This
pro
ject
is a
con
tinua
tion
of a
n on
-goi
ng p
rogr
am to
re
habi
litat
e/m
aint
ain
our s
treet
sys
tem
. W
ith o
ver 7
5 m
iles
of
publ
ic s
treet
s, th
is a
sset
repr
esen
ts o
ur la
rges
t cap
ital
inve
stm
ent a
nd it
is n
eces
sary
to p
erio
dica
lly re
habi
litat
e th
ese
stre
ets
to p
rolo
ng th
eir u
sefu
l ser
vice
life
and
to
prov
ide
a sa
fe a
nd e
ffici
ent t
rans
porta
tion
netw
ork.
Thi
s fu
ndin
g le
vel s
uppo
rts th
e an
nual
adv
ance
des
ign
effo
rt, n
ot
cons
truct
ion,
to o
btai
n m
atch
ing
fund
ing
for p
ossi
ble
gran
t op
portu
nitie
s.
PRIO
RIT
Y:
Park
Pro
ject
$100
,000
Esse
ntia
l
Des
irabl
e
D
efer
rabl
e FY18
Proj
ect N
o.:
1277
Arte
rial R
oadw
ay R
ehab
ilita
tion
and
Rep
airs
FY19PR
OJE
CT
LOC
ATIO
N:
$100
,000
$100
,000
$100
,000

C-1
3
Dep
artm
ent:
Proj
ect N
ame:
Publ
ic W
orks
CLA
SSIF
ICAT
ION
:H
ealth
and
Saf
ety
Proj
ect
X__
__R
ehab
ilitat
ion
Proj
ect
____
Wat
er Q
ualit
y Pr
ojec
t__
____
__Be
autif
icat
ion
Proj
ect
____
X
Item
Car
ryov
er
Fund
ing
FY16
FY17
FY20
FY21
FY22
Tota
l
Estim
ated
Con
stru
ctio
n C
osts
:D
esig
n
C
onst
ruct
ion
$100
,000
$100
,000
$100
,000
$100
,000
$100
,000
$700
,000
Oth
er Tota
l Est
imat
ed P
roje
ct C
ost
$100
,000
$100
,000
$100
,000
$100
,000
$100
,000
$700
,000
Ope
ratio
n &
Mai
nten
ance
:
Cos
tsTo
tal O
& M
Cos
tsFu
ndin
g So
urce
:R
epro
gram
med
Fun
ds$1
00,0
00$1
00,0
00$2
00,0
00C
IP U
ndes
igna
ted
Fund
s$1
00,0
00$1
00,0
00$1
00,0
00$5
00,0
00M
easu
re M
2 Fu
nds
Gas
/Exc
ise
HU
TA T
ax F
unds
AB
2766
Air
Qua
lity
Fund
ing
(AQ
MD
)To
tal F
undi
ng$1
00,0
00$1
00,0
00$1
00,0
00$1
00,0
00$1
00,0
00$7
00,0
00$1
00,0
00
SPEC
IAL
CO
NSI
DER
ATIO
NS:
PRO
JEC
T D
ESC
RIP
TIO
N:
$100
,000
Man
date
d Pr
ojec
t
Nec
essa
ry
$1
00,0
00
$100
,000
Vario
us L
ocat
ions
The
inte
nt o
f thi
s an
nual
pro
gram
is to
impl
emen
t im
prov
emen
ts a
long
City
sid
ewal
ks to
pro
vide
repa
ir an
d re
plac
emen
t whe
re n
eede
d ba
sed
on C
ity in
spec
tions
. St
aff
cont
inua
lly id
entif
ies
need
ed im
prov
emen
ts a
nd o
nce
iden
tifie
d, th
e im
prov
emen
ts w
ill be
prio
ritiz
ed a
nd
impl
emen
ted.
PRIO
RIT
Y:
Park
Pro
ject
$100
,000
$100
,000
Esse
ntia
l
Des
irabl
e
D
efer
rabl
e FY18
Proj
ect N
o.:
1278
Side
wal
k an
d C
oncr
ete
Rep
airs
FY19PR
OJE
CT
LOC
ATIO
N:
$100
,000
$100
,000

C-1
4
Dep
artm
ent:
Proj
ect N
ame:
Publ
ic W
orks
CLA
SSIF
ICAT
ION
:H
ealth
and
Saf
ety
Proj
ect
X__
X__
Reh
abilit
atio
n Pr
ojec
t__
__W
ater
Qua
lity
Proj
ect
____
____
Beau
tific
atio
n Pr
ojec
t__
__
X
Item
Car
ryov
er
Fund
ing
FY16
FY17
FY20
FY21
FY22
Tota
l
Estim
ated
Con
stru
ctio
n C
osts
:D
esig
n
C
onst
ruct
ion
$100
,000
$100
,000
$100
,000
$100
,000
$100
,000
$700
,000
Oth
er Tota
l Est
imat
ed P
roje
ct C
ost
$100
,000
$100
,000
$100
,000
$100
,000
$100
,000
$700
,000
Ope
ratio
n &
Mai
nten
ance
:
Cos
tsTo
tal O
& M
Cos
tsFu
ndin
g So
urce
:R
epro
gram
med
Fun
ds$1
00,0
00$1
00,0
00$2
00,0
00C
IP U
ndes
igna
ted
Fund
s$1
00,0
00$1
00,0
00$1
00,0
00$5
00,0
00M
easu
re M
2 Fu
nds
Gas
/Exc
ise
HU
TA T
ax F
unds
AB
2766
Air
Qua
lity
Fund
ing
(AQ
MD
)To
tal F
undi
ng$1
00,0
00$1
00,0
00$1
00,0
00$1
00,0
00$1
00,0
00$7
00,0
00$1
00,0
00
SPEC
IAL
CO
NSI
DER
ATIO
NS:
PRO
JEC
T D
ESC
RIP
TIO
N:
$100
,000
Man
date
d Pr
ojec
t
Nec
essa
ry
$1
00,0
00
$100
,000
Vario
us L
ocat
ions
The
inte
nt o
f thi
s an
nual
pro
gram
is to
impl
emen
t im
prov
emen
ts a
long
City
sid
ewal
ks a
nd p
arks
to p
rovi
de
bette
r acc
ess
and
rem
ove
barr
iers
for t
he d
isab
led
whe
re
need
ed.
Staf
f con
tinue
s to
iden
tify
need
ed im
prov
emen
ts
and
once
iden
tifie
d, th
e im
prov
emen
ts w
ill be
prio
ritiz
ed a
nd
impl
emen
ted.
Fur
ther
, thi
s fu
ndin
g so
urce
pro
vide
s a
mea
ns
for C
ity s
taff
to b
e re
spon
sive
to is
sues
as
they
are
iden
tifie
d.PR
IOR
ITY:
Park
Pro
ject
$100
,000
$100
,000
Esse
ntia
l
Des
irabl
e
D
efer
rabl
e FY18
Proj
ect N
o.:
1279
Side
wal
k AD
A Im
prov
emen
ts
FY19PR
OJE
CT
LOC
ATIO
N:
$100
,000
$100
,000

C-1
5
Dep
artm
ent:
Proj
ect N
ame:
Publ
ic W
orks
CLA
SSIF
ICAT
ION
:H
ealth
and
Saf
ety
Proj
ect
X__
__R
ehab
ilitat
ion
Proj
ect
____
Wat
er Q
ualit
y Pr
ojec
t__
____
__Be
autif
icat
ion
Proj
ect
____
X
Item
Car
ryov
er
Fund
ing
FY16
FY17
FY20
FY21
FY22
Tota
l
Estim
ated
Con
stru
ctio
n C
osts
:D
esig
n
C
onst
ruct
ion
$150
,000
$150
,000
$150
,000
$150
,000
$150
,000
$1,0
50,0
00O
ther To
tal E
stim
ated
Pro
ject
Cos
t$1
50,0
00$1
50,0
00$1
50,0
00$1
50,0
00$1
50,0
00$1
,050
,000
Ope
ratio
n &
Mai
nten
ance
:
Cos
tsTo
tal O
& M
Cos
tsFu
ndin
g So
urce
:R
epro
gram
med
Fun
ds$1
50,0
00$1
00,7
22$2
50,7
22C
IP U
ndes
igna
ted
Fund
s$4
9,27
8$1
50,0
00$1
50,0
00$1
50,0
00$7
99,2
78M
easu
re M
Fun
dsG
as/E
xcis
e H
UTA
Tax
Fun
dsA
B27
66 A
ir Q
ualit
y Fu
ndin
g (A
QM
D)
Tota
l Fun
ding
$150
,000
$150
,000
$150
,000
$150
,000
$150
,000
$1,0
50,0
00
Proj
ect N
o.:
1280
Traf
fic S
afet
y R
epai
rs a
nd Im
prov
emen
ts
FY19PR
OJE
CT
LOC
ATIO
N:
$150
,000
$150
,000
$1
50,0
00
Des
irabl
e
D
efer
rabl
e FY18
$150
,000
$150
,000
Vario
us L
ocat
ions
The
inte
nt o
f thi
s an
nual
pro
gram
is to
impl
emen
t im
prov
emen
ts, w
hich
wou
ld e
nhan
ce tr
affic
saf
ety
and
redu
ce a
ccid
ents
thro
ugho
ut th
e C
ity.
Impr
ovem
ents
whi
ch
may
be
reco
mm
ende
d va
ry, a
nd m
ay in
clud
e: s
igni
ng,
strip
ing,
add
ition
al ri
ght o
r lef
t tur
n la
nes,
sig
nal
mod
ifica
tions
, med
ian
mod
ifica
tions
, ins
talla
tion
of m
edia
ns,
stre
et li
ghtin
g, in
stal
latio
n of
rada
r spe
ed s
igns
and
oth
er
impr
ovem
ents
.PR
IOR
ITY:
Park
Pro
ject
Man
date
d Pr
ojec
t
Esse
ntia
l
N
eces
sary
$1
50,0
00
$150
,000
SPEC
IAL
CO
NSI
DER
ATIO
NS:
PRO
JEC
T D
ESC
RIP
TIO
N:
$150
,000

C-1
6
Dep
artm
ent:
Proj
ect N
ame:
Publ
ic W
orks
CLA
SSIF
ICAT
ION
:H
ealth
and
Saf
ety
Proj
ect
X__
__R
ehab
ilitat
ion
Proj
ect
____
Wat
er Q
ualit
y Pr
ojec
t__
____
__Be
autif
icat
ion
Proj
ect
____
X
Item
Car
ryov
er
Fund
ing
FY16
FY17
FY20
FY21
FY22
Tota
l
Estim
ated
Con
stru
ctio
n C
osts
:D
esig
n
C
onst
ruct
ion
$3,4
66,7
82$3
,466
,782
Oth
er Tota
l Est
imat
ed P
roje
ct C
ost
$3,4
66,7
82
$3,4
66,7
82O
pera
tion
& M
aint
enan
ce:
Cos
tsTo
tal O
& M
Cos
tsFu
ndin
g So
urce
:R
epro
gram
med
Fun
dsC
IP U
ndes
igna
ted
Fund
s$2
,223
,487
$2,2
23,4
87M
easu
re M
2 Fu
nds
$595
,581
$627
,364
$1,2
22,9
45G
as/E
xcis
e H
UTA
Tax
Fun
ds$2
0,35
0$2
0,35
0A
B27
66 A
ir Q
ualit
y Fu
ndin
g (A
QM
D)
Tota
l Fun
ding
$595
,581
$2,8
71,2
01$3
,466
,782
Proj
ect N
o.:
1281
Annu
al R
esid
entia
l Roa
dway
Res
urfa
cing
, FY1
7
FY19PR
OJE
CT
LOC
ATIO
N:
Des
irabl
e
D
efer
rabl
e FY18
Vario
us L
ocat
ions
This
pro
gram
is in
tend
ed to
pro
vide
fund
ing
to re
habi
litat
e no
n-ar
teria
l stre
ets
incl
udin
g re
side
ntia
l, re
sidn
etia
l col
lect
or
and
colle
ctor
stre
ets.
Stre
ets
are
sele
cted
for r
ehab
ilitai
on
usin
g th
e C
ity's
Pav
emen
t Man
agem
ent P
lan
whi
ch ra
tes
stre
ets
City
wid
e an
d re
com
men
ds im
prov
emen
ts in
prio
rity
orde
r by
stre
et c
ondi
tion.
Fun
ding
for t
his
proj
ect i
s cu
rren
tly
antic
ipat
ed to
be
used
to p
ave
stre
ets
in th
e St
ratfo
rd a
t the
Pa
cific
Dev
elop
men
t and
Cam
ino
Cap
istra
no in
Cap
istra
no
Beac
h. T
he s
treet
s th
at a
ctua
lly a
re p
aved
may
cha
nge,
ho
wev
er, b
ased
on
the
upda
ted
reco
mm
enda
tions
out
lined
in
the
Pave
men
t Man
agem
ent P
lan.
PRIO
RIT
Y:
Park
Pro
ject
Man
date
d Pr
ojec
t
Esse
ntia
l
N
eces
sary
SPEC
IAL
CO
NSI
DER
ATIO
NS:
PRO
JEC
T D
ESC
RIP
TIO
N:

C-1
7
Dep
artm
ent:
Proj
ect N
ame:
Publ
ic W
orks
CLA
SSIF
ICAT
ION
:H
ealth
and
Saf
ety
Proj
ect
____
____
Reh
abilit
atio
n Pr
ojec
tX
Wat
er Q
ualit
y Pr
ojec
t__
____
__Be
autif
icat
ion
Proj
ect
____
X
Item
Car
ryov
er
Fund
ing
FY16
FY17
FY20
FY21
FY22
Tota
l
Estim
ated
Con
stru
ctio
n C
osts
:D
esig
n
C
onst
ruct
ion
$1,0
20,3
60$1
,020
,360
Oth
er Tota
l Est
imat
ed P
roje
ct C
ost
$1,0
20,3
60
$1,0
20,3
60O
pera
tion
& M
aint
enan
ce:
Cos
tsTo
tal O
& M
Cos
tsFu
ndin
g So
urce
:R
epro
gram
med
Fun
dsC
IP U
ndes
igna
ted
Fund
s$1
82,2
18$1
82,2
18M
easu
re M
2 Fu
nds
(APM
Gra
nt)
$500
,000
$500
,000
Gas
/Exc
ise
HU
TA T
ax F
unds
$169
,071
$169
,071
$338
,142
AB
2766
Air
Qua
lity
Fund
ing
(AQ
MD
)To
tal F
undi
ng$1
69,0
71$8
51,2
89$1
,020
,360
SPEC
IAL
CO
NSI
DER
ATIO
NS:
PRO
JEC
T D
ESC
RIP
TIO
N:
This
pro
gram
is in
tend
ed to
pro
vide
fund
ing
to re
habi
litat
e D
el O
bisp
o (S
tone
hill
to P
CH
) for
arte
rial s
treet
repa
irs.
Parti
al p
roje
ct fu
ndin
g ha
s be
en a
war
ded
to th
e C
ity th
roug
h O
CTA
's A
rteria
l Pav
emen
t Man
agem
ent (
APM
) Com
petit
ive
Gra
nt P
rogr
am.
PRIO
RIT
Y:
Park
Pro
ject
Man
date
d Pr
ojec
t
Esse
ntia
l
N
eces
sary
Des
irabl
e
D
efer
rabl
e FY18
Proj
ect N
o.:
1282
Arte
rial R
oadw
ay R
esur
faci
ng- D
el O
bisp
o (S
tone
hill
to P
CH
)
FY19PR
OJE
CT
LOC
ATIO
N:

C-1
8
Dep
artm
ent:
Proj
ect N
ame:
Publ
ic W
orks
CLA
SSIF
ICAT
ION
:H
ealth
and
Saf
ety
Proj
ect
____
_X_
Reh
abilit
atio
n Pr
ojec
tX
Wat
er Q
ualit
y Pr
ojec
t__
X__
__X
__Be
autif
icat
ion
Proj
ect
____
X
Item
Car
ryov
er
Fund
ing
FY16
FY17
FY20
FY21
FY22
Tota
l
Estim
ated
Con
stru
ctio
n C
osts
:D
esig
n
C
onst
ruct
ion
$75,
000
$80,
000
$155
,000
Oth
er Tota
l Est
imat
ed P
roje
ct C
ost
$75,
000
$80,
000
$1
55,0
00O
pera
tion
& M
aint
enan
ce:
Cos
tsTo
tal O
& M
Cos
tsFu
ndin
g So
urce
:Pa
rk D
evel
opm
ent F
und
$75,
000
$80,
000
$155
,000
CIP
Und
esig
nate
d Fu
nds
Mea
sure
M2
Fund
sG
as/E
xcis
e H
UTA
Tax
Fun
dsA
B27
66 A
ir Q
ualit
y Fu
ndin
g (A
QM
D)
Tota
l Fun
ding
$75,
000
$80,
000
$155
,000
Proj
ect N
o.:
1283
Smar
t Irr
igat
ion
Syst
em D
roug
ht A
ltera
tion
FY19PR
OJE
CT
LOC
ATIO
N:
Des
irabl
e
D
efer
rabl
e FY18
Vario
us L
ocat
ions
This
pro
gram
is in
tend
ed to
pro
vide
fund
ing
to u
pgra
de
irrig
atio
n co
ntro
l equ
ipm
ent i
n C
ity p
arks
and
faci
litie
s ci
tyw
ide
to h
elp
redu
ce w
ater
use
to a
ddre
ss th
e dr
ough
t.
PRIO
RIT
Y:
Park
Pro
ject
Man
date
d Pr
ojec
t
Esse
ntia
l
N
eces
sary
SPEC
IAL
CO
NSI
DER
ATIO
NS:
PRO
JEC
T D
ESC
RIP
TIO
N:

C-1
9
Dep
artm
ent:
Proj
ect N
ame:
Publ
ic W
orks
CLA
SSIF
ICAT
ION
:H
ealth
and
Saf
ety
Proj
ect
____
____
Reh
abilit
atio
n Pr
ojec
tX
Wat
er Q
ualit
y Pr
ojec
t__
X__
__X
__Be
autif
icat
ion
Proj
ect
____
X
Item
Car
ryov
er
Fund
ing
FY16
FY17
FY20
FY21
FY22
Tota
l
Estim
ated
Con
stru
ctio
n C
osts
:D
esig
n
C
onst
ruct
ion
$450
,000
$450
,000
Oth
er Tota
l Est
imat
ed P
roje
ct C
ost
$450
,000
$4
50,0
00O
pera
tion
& M
aint
enan
ce:
Cos
tsTo
tal O
& M
Cos
tsFu
ndin
g So
urce
:R
epro
gram
med
Fun
ding
$450
,000
$450
,000
CIP
Und
esig
nate
d Fu
nds
Mea
sure
M2
Fund
s G
as/E
xcis
e H
UTA
Tax
Fun
dsA
B27
66 A
ir Q
ualit
y Fu
ndin
g (A
QM
D)
Tota
l Fun
ding
$450
,000
$450
,000
Proj
ect N
o.:
1284
Cro
wn
Valle
y M
edia
n D
roug
ht C
onve
rsio
n
FY19PR
OJE
CT
LOC
ATIO
N:
Des
irabl
e
D
efer
rabl
e FY18
This
pro
gram
is in
tend
ed to
pro
vide
fund
ing
to u
pgra
de th
e C
row
n Va
lley
med
ians
to ir
rigat
e w
ith re
clai
med
wat
er.
This
is
dep
ende
nt o
n SC
WD
pro
vidi
ng a
recl
aim
ed w
ater
mai
n lin
e. A
ltern
ativ
es a
re b
eing
con
side
red
that
cou
ld in
clud
e tu
rf re
plac
emen
t with
dro
ught
tole
rant
pla
nts,
con
vers
ion
of th
e irr
igat
ion
syst
em to
use
recy
cled
wat
er, a
nd o
ther
alte
rnat
ives
th
at m
ay b
e m
ore
cost
ly.
PRIO
RIT
Y:
Park
Pro
ject
Man
date
d Pr
ojec
t
Esse
ntia
l
N
eces
sary
SPEC
IAL
CO
NSI
DER
ATIO
NS:
PRO
JEC
T D
ESC
RIP
TIO
N:

C-2
0
Dep
artm
ent:
Proj
ect N
ame:
Publ
ic W
orks
CLA
SSIF
ICAT
ION
:H
ealth
and
Saf
ety
Proj
ect
____
_X_
Reh
abilit
atio
n Pr
ojec
tX
Wat
er Q
ualit
y Pr
ojec
t__
X__
__X
__Be
autif
icat
ion
Proj
ect
____
X
Item
Car
ryov
er
Fund
ing
FY16
FY17
FY20
FY21
FY22
Tota
l
Estim
ated
Con
stru
ctio
n C
osts
:D
esig
n$2
5,00
0
$25,
000
Con
stru
ctio
n$3
50,0
00$3
50,0
00O
ther To
tal E
stim
ated
Pro
ject
Cos
t$3
75,0
00
$375
,000
Ope
ratio
n &
Mai
nten
ance
:
Cos
tsTo
tal O
& M
Cos
tsFu
ndin
g So
urce
:Pa
rk D
evel
opm
ent F
und
$375
,000
$375
,000
CIP
Und
esig
nate
d Fu
nds
Mea
sure
M2
Fund
sG
as/E
xcis
e H
UTA
Tax
Fun
dsA
B27
66 A
ir Q
ualit
y Fu
ndin
g (A
QM
D)
Tota
l Fun
ding
$375
,000
$375
,000
Proj
ect N
o.:
1285
La P
laza
Par
k/La
nter
n B
ay P
ark
Dro
ught
Con
vers
ion
FY19PR
OJE
CT
LOC
ATIO
N:
Des
irabl
e
D
efer
rabl
e FY18
Lant
ern
Bay
Par
k an
d La
Pl
aza
Park
This
pro
gram
is in
tend
ed to
pro
vide
fund
ing
to c
onve
rt th
e ex
istin
g irr
igat
ion
syst
em a
t Lan
tern
Bay
Par
k an
d La
Pla
za
Park
to u
se re
cycl
ed w
ater
. So
uth
Coa
st W
ater
Dis
trict
is
cons
truct
ing
new
infra
stru
ctur
e th
at w
ill m
ake
recy
cled
wat
er
avai
labl
e to
the
City
. Fu
ndin
g w
ill be
use
d fo
r des
ign
and
cons
truct
ion
cost
s to
allo
w th
e co
nver
sion
to o
ccur
at b
oth
park
s.PR
IOR
ITY:
Park
Pro
ject
Man
date
d Pr
ojec
t
Esse
ntia
l
N
eces
sary
SPEC
IAL
CO
NSI
DER
ATIO
NS:
PRO
JEC
T D
ESC
RIP
TIO
N:

C-2
1
Dep
artm
ent:
Proj
ect N
ame:
Publ
ic W
orks
CLA
SSIF
ICAT
ION
:H
ealth
and
Saf
ety
Proj
ect
_X_
____
Reh
abilit
atio
n Pr
ojec
t__
__W
ater
Qua
lity
Proj
ect
____
___
X__
Beau
tific
atio
n Pr
ojec
t__
__
X
Item
Car
ryov
er
Fund
ing
FY16
FY17
FY20
FY21
FY22
Tota
l
Estim
ated
Con
stru
ctio
n C
osts
:D
esig
n
C
onst
ruct
ion
$150
,000
$150
,000
Oth
er Tota
l Est
imat
ed P
roje
ct C
ost
$150
,000
$1
50,0
00O
pera
tion
& M
aint
enan
ce:
Cos
tsTo
tal O
& M
Cos
tsFu
ndin
g So
urce
:Pa
rk D
evel
opm
ent F
und
CIP
Und
esig
nate
d Fu
nds
$150
,000
$150
,000
Mea
sure
M2
Fund
s (A
PM G
rant
)G
as/E
xcis
e H
UTA
Tax
Fun
dsA
B27
66 A
ir Q
ualit
y Fu
ndin
g (A
QM
D)
Tota
l Fun
ding
$150
,000
$150
,000
SPEC
IAL
CO
NSI
DER
ATIO
NS:
PRO
JEC
T D
ESC
RIP
TIO
N:
Cry
stal
Cov
e Pa
rk
This
pro
gram
is in
tend
ed to
pro
vide
fund
ing
to re
plac
e ex
istin
g ba
rrie
r fen
cing
at C
ryst
al C
ove
Park
, a p
ark
that
ov
erlo
oks
PCH
alo
ng V
ia E
leva
do.
PRIO
RIT
Y:
Park
Pro
ject
Man
date
d Pr
ojec
t
Esse
ntia
l
N
eces
sary
Des
irabl
e
D
efer
rabl
e FY18
Proj
ect N
o.:
1286
Cry
stal
Cov
e Pa
rk B
arrie
r Rai
ling
Rep
lace
men
t
FY19PR
OJE
CT
LOC
ATIO
N:

THIS PAGE INTENTIONALLY LEFT BLANK

PR
IOR
ITY
1 N
EW
PR
OJE
CT
S

C-2
2
Dep
artm
ent:
Proj
ect N
ame:
Publ
ic W
orks
CLA
SSIF
ICAT
ION
:H
ealth
and
Saf
ety
Proj
ect
____
____
Reh
abilit
atio
n Pr
ojec
t__
__W
ater
Qua
lity
Proj
ect
____
___
__Be
autif
icat
ion
Proj
ect
__X
__
X X
Item
Car
ryov
er
Fund
ing
FY16
FY17
FY20
FY21
FY22
Tota
l
Estim
ated
Con
stru
ctio
n C
osts
:D
esig
nC
onst
ruct
ion
$2,2
00,0
00$2
,200
,000
Oth
er Tota
l Est
imat
ed P
roje
ct C
ost
$2,2
00,0
00$2
,200
,000
Ope
ratio
n &
Mai
nten
ance
:
Cos
tsTo
tal O
& M
Cos
tsFu
ndin
g So
urce
:G
rant
Fun
ding
- SD
G&E
20A
$2,2
00,0
00$2
,200
,000
CIP
Und
esig
nate
d Fu
nds
Mea
sure
M2
Fund
sG
as/E
xcis
e H
UTA
Tax
Fun
dsA
B27
66 A
ir Q
ualit
y Fu
ndin
g (A
QM
D)
Tota
l Fun
ding
$2,2
00,0
00$2
,200
,000
Proj
ect N
o.:
1287
Und
ergr
ound
Ele
ctric
al -S
DG
&E
FY19PR
OJE
CT
LOC
ATIO
N:
Des
irabl
e
D
efer
rabl
e FY18
To B
e D
eter
min
ed a
s pr
ojec
t pr
ogre
sses
This
pro
gram
is in
tend
ed to
use
SD
G&E
pro
vide
d 20
A fu
nds
to u
nder
grou
nd o
verh
ead
utilit
ies.
Loc
atio
ns o
f whe
re th
e w
ork
wou
ld o
ccur
wou
ld b
e ba
sed
on S
DG
&E c
riter
ia, a
nd
wou
ld b
e se
lect
ed b
y th
e C
ity if
the
Proj
ect m
oves
forw
ard.
Th
e ex
act l
ocat
ion
of w
here
this
wor
k w
ould
occ
ur is
not
kn
own
at th
is ti
me.
PRIO
RIT
Y:
Park
Pro
ject
Man
date
d Pr
ojec
t
Esse
ntia
l
N
eces
sary
SPEC
IAL
CO
NSI
DER
ATIO
NS:
PRO
JEC
T D
ESC
RIP
TIO
N:

C-2
3
Dep
artm
ent:
Proj
ect N
ame:
Publ
ic W
orks
CLA
SSIF
ICAT
ION
:H
ealth
and
Saf
ety
Proj
ect
____
____
Reh
abilit
atio
n Pr
ojec
t__
__W
ater
Qua
lity
Proj
ect
____
___
__Be
autif
icat
ion
Proj
ect
_ X
__
X
Item
Car
ryov
er
Fund
ing
FY16
FY17
FY20
FY21
FY22
Tota
l
Estim
ated
Con
stru
ctio
n C
osts
:D
esig
n
C
onst
ruct
ion
$500
,000
$500
,000
Oth
er Tota
l Est
imat
ed P
roje
ct C
ost
$500
,000
$5
00,0
00O
pera
tion
& M
aint
enan
ce:
Cos
tsTo
tal O
& M
Cos
tsFu
ndin
g So
urce
:G
rant
Fun
ding
- SD
G&E
CIP
Und
esig
nate
d Fu
nds
$500
,000
$500
,000
Mea
sure
M2
Fund
s G
as/E
xcis
e H
UTA
Tax
Fun
dsA
B27
66 A
ir Q
ualit
y Fu
ndin
g (A
QM
D)
Tota
l Fun
ding
$500
,000
$500
,000
Proj
ect N
o.:
1288
City
Way
findi
ng S
igna
ge P
rogr
am, P
hase
I
FY19PR
OJE
CT
LOC
ATIO
N:
Des
irabl
e
D
efer
rabl
e FY18
City
wid
e lo
catio
ns
This
pro
gram
is in
tend
ed to
pro
vide
fund
ing
to
impl
emen
t/con
stru
ct th
e C
ity C
ounc
il ap
prov
ed w
ayfin
ding
si
gnag
e ci
tyw
ide.
Way
findi
ng s
igna
ge is
bei
ng d
esig
ned
curr
ently
by
a co
nsul
tant
reta
ined
by
the
City
. Th
e si
gns
will
be in
tend
ed to
gui
de v
isito
rs a
nd g
uest
s to
des
tinat
ions
with
in
the
City
in a
wel
l-des
igne
d an
d at
tract
ive
way
. It
also
in
clud
es s
igna
ge p
lans
for p
arki
ng a
nd h
isto
rical
poi
nts
of
inte
rest
as
wel
l.PR
IOR
ITY:
Park
Pro
ject
Man
date
d Pr
ojec
t
Esse
ntia
l
N
eces
sary
SPEC
IAL
CO
NSI
DER
ATIO
NS:
PRO
JEC
T D
ESC
RIP
TIO
N:

T
HIS
PA
GE
INT
ENT
ION
AL
LY
LE
FT B
LA
NK