CITY OF ST. JOSEPH MISSOURI ADOPTED BUDGET ...
380
CITY OF ST. JOSEPH MISSOURI ADOPTED BUDGET FISCAL YEAR 2015 – 2016
-
Upload
khangminh22 -
Category
Documents
-
view
1 -
download
0
Transcript of CITY OF ST. JOSEPH MISSOURI ADOPTED BUDGET ...
CITY OF ST. JOSEPH MISSOURI
ADOPTED BUDGET FISCAL YEAR 2015 – 2016
FY2015-2016
ANNUAL OPERATING BUDGET
AND
PROGRAM OF SERVICES
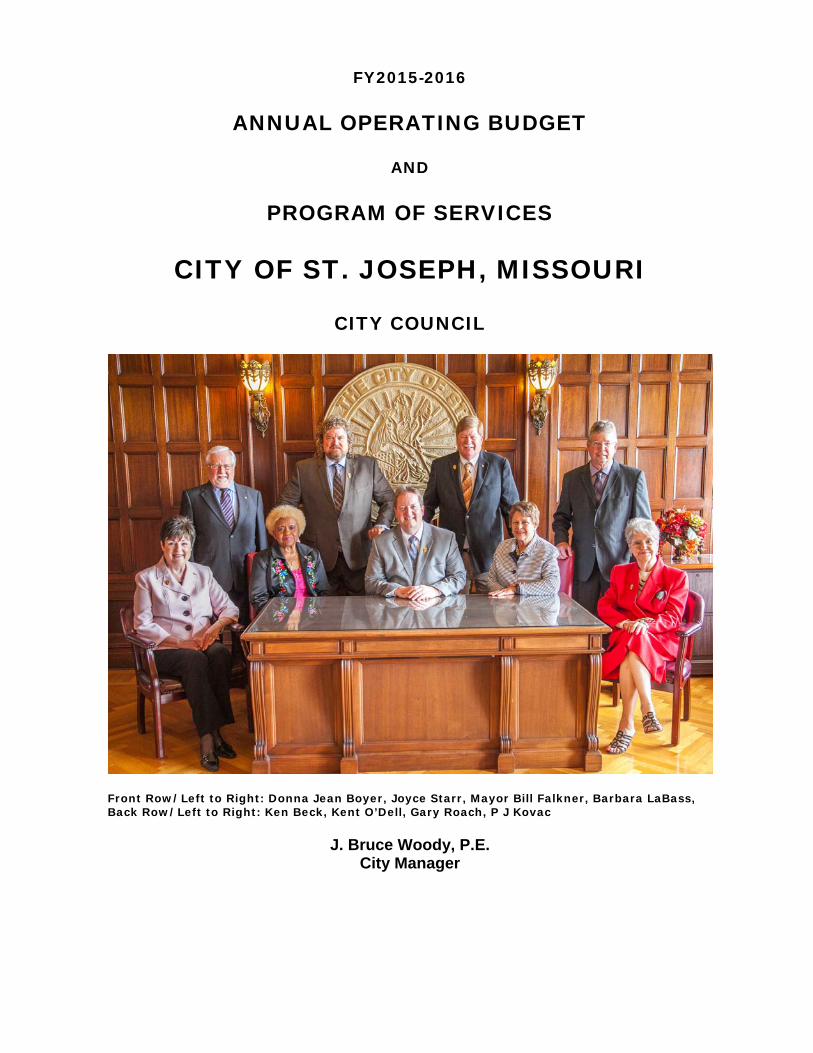
CITY OF ST. JOSEPH, MISSOURI
CITY COUNCIL
Front Row/Left to Right: Donna Jean Boyer, Joyce Starr, Mayor Bill Falkner, Barbara LaBass, Back Row/Left to Right: Ken Beck, Kent O’Dell, Gary Roach, P J Kovac
J. Bruce Woody, P.E. City Manager
TABLE OF CONTENTSPage
INTRODUCTIONPREFACE
Table of Contents iIntroduction to the City of St. Joseph iiiSt. Joseph Yesterday & Today ivManagement Team and Advisory Bodies viOrganization Chart viiHow to Use This Document viiiBudget Adoption Ordinance [upon adoption]
BUDGET TRANSMITTALCity Manager's Budget Transmittal 1 - 1Revenue Discussion 1 - 12
CITY MISSION AND POLICIESCity Council Vision & Mission Statements 1 - 20How Our Policy Documents Relate 1 - 23Key Fiscal Policies 1 - 24
BUDGET SUMMARYBudget Process 2 - 1Budget Calendar 2 - 2Budget Overview, Charts & Graphs 2 - 3
OPERATING DEPARTMENTSGENERAL GOVERNMENT 3 - 1
Mayor & City Council 3 - 4
City Clerk 3 - 7
City Manager's Office 3 - 10
Legal Services 3 - 15
ADMINISTRATIVE SERVICES 4 - 1
Administration, Budget & Finance, Municipal Court, Building Maintenance Divisions 4 - 5
Human Resources Divisions 4 - 18
Technology Services Divisions 4 - 23
PLANNING & COMMUNITY DEVELOPMENT 5 - 1
Administration & Planning Divisions 5 - 4
Community Development Divisions 5 - 7
Inspections & Code Enforcement Divisions 5 - 21
PUBLIC SAFETY 6 - 1
Police Department 6 - 4
Fire Department 6 - 22
Health Department 6 - 37
PARKS & RECREATION 7 - 1
Administration & Parks Maintenance Divisions 7 - 4
Recreation Divisions 7 - 11
Parks Civic Facilities Divisions 7 - 23
RESERVED 8 - -
PUBLIC WORKS 9 - 1Administration, MPO, Street Enhancement Use Tax, Engineering, Transit & Street Divisions 9 - 4Public Parking 9 - 28
Airport Operations & CIP 9 - 31
Landfill Operations & CIP 9 - 35
Water Protection & CIP 9 - 40
i
OTHER DEPARTMENTS/PROGRAMS 10 - 1
Non-Departmental & Cell Phone 10 - 3
Gaming Initiatives and Museum Tax Initiatives 10 - 5
TIF & EDC Programs 10 - 9
FUND SUMMARIES 11 - 1Fund Budgeting Overview 11 - 2
General Fund 11 - 6
Special Revenue FundsStreets Maintenance Fund 11 - 16Parks Maintenance Fund 11 - 21CDBG Fund 11 - 25Gaming Initiatives Fund 11 - 29Special Allocation Fund 11 - 33Museum Fund 11 - 37Public Safety Sales Tax Fund 11 - 41
Enterprise FundsParking Operations Fund 11 - 45Water Protection Fund 11 - 49Golf Fund 11 - 54Transit Fund 11 - 58Landfill Fund 11 - 62Aviation Fund 11 - 66
Capital Projects Fund 11 - 70
SUPPLEMENTAL INFORMATIONDebt Discussion & Schedules 12 - 1
12 - 13
FIVE YEAR CIP PLANCIP Plan Adoption Resolution (after adoption)City Manager's Letter of Transmittal CIP - 1Capital Projects & Planning Process Discussion CIP - 3Capital Expenditures Five -Year History CIP - 6FY2016 Total Capital Budget - Sources & Uses CIP - 8On-Going Project Description Sheets CIP - 16Capital Project Summary by Major Funding Source CIP - 27Capital Projects by Purpose & Year CIP - 28
ii
Fund Summary, Fund Balance, Line Item Revenue & Expenditure Summaries in the folllowing order:
Glossary
iii
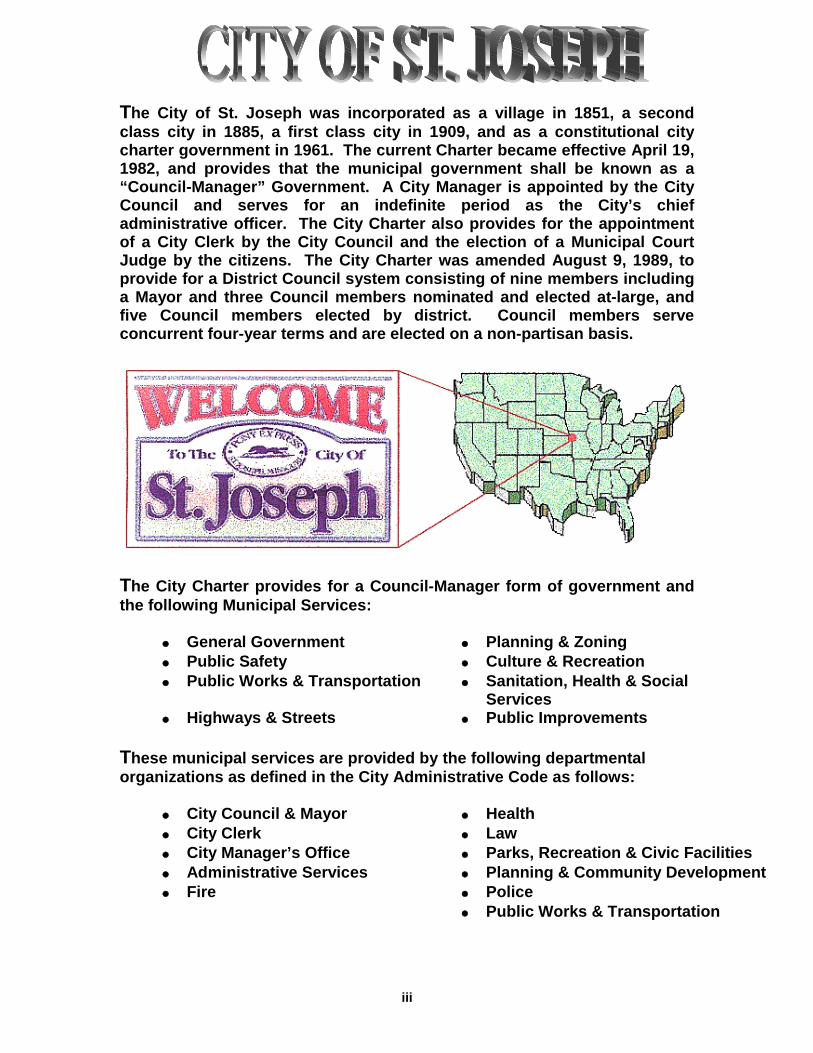
The City of St. Joseph was incorporated as a village in 1851, a second class city in 1885, a first class city in 1909, and as a constitutional city charter government in 1961. The current Charter became effective April 19, 1982, and provides that the municipal government shall be known as a “Council-Manager” Government. A City Manager is appointed by the City Council and serves for an indefinite period as the City’s chief administrative officer. The City Charter also provides for the appointment of a City Clerk by the City Council and the election of a Municipal Court Judge by the citizens. The City Charter was amended August 9, 1989, to provide for a District Council system consisting of nine members including a Mayor and three Council members nominated and elected at-large, and five Council members elected by district. Council members serve concurrent four-year terms and are elected on a non-partisan basis.
The City Charter provides for a Council-Manager form of government and the following Municipal Services:
• General Government • Planning & Zoning • Public Safety • Culture & Recreation • Public Works & Transportation • Sanitation, Health & Social
Services • Highways & Streets • Public Improvements
These municipal services are provided by the following departmental organizations as defined in the City Administrative Code as follows:
• City Council & Mayor • Health • City Clerk • Law • City Manager’s Office • Parks, Recreation & Civic Facilities • Administrative Services • Planning & Community Development • Fire • Police • Public Works & Transportation
iv
ST. JOSEPH
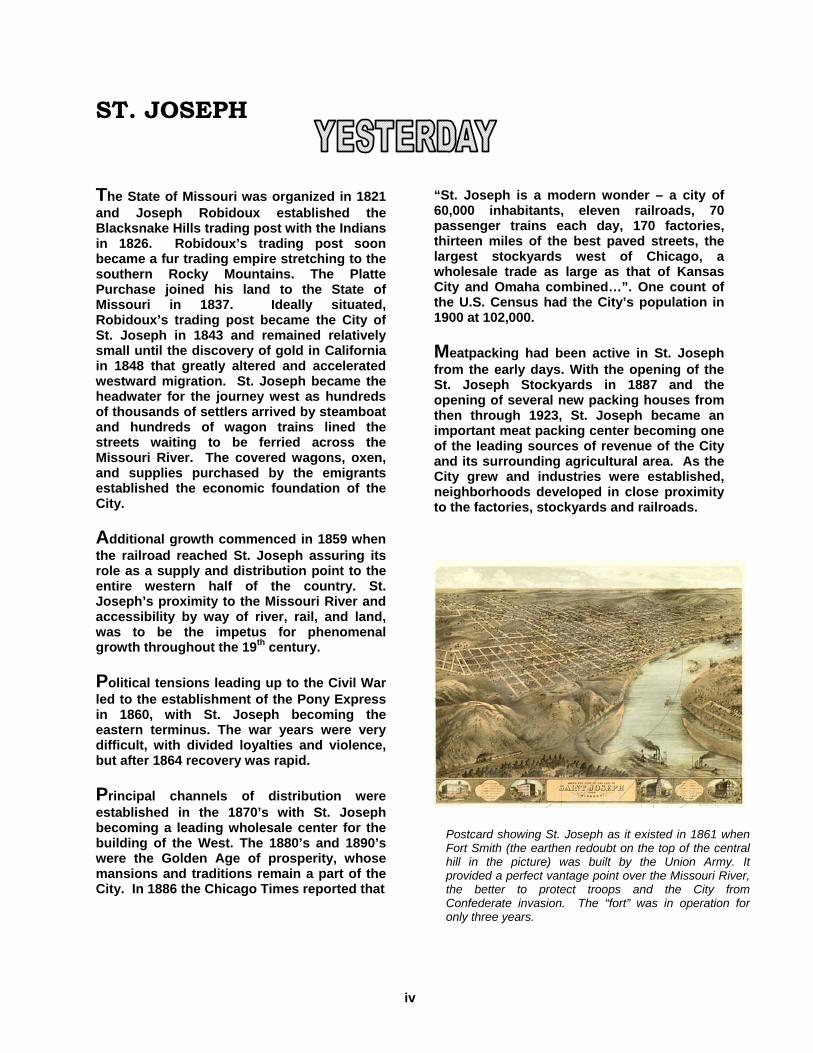
The State of Missouri was organized in 1821 and Joseph Robidoux established the Blacksnake Hills trading post with the Indians in 1826. Robidoux’s trading post soon became a fur trading empire stretching to the southern Rocky Mountains. The Platte Purchase joined his land to the State of Missouri in 1837. Ideally situated, Robidoux’s trading post became the City of St. Joseph in 1843 and remained relatively small until the discovery of gold in California in 1848 that greatly altered and accelerated westward migration. St. Joseph became the headwater for the journey west as hundreds of thousands of settlers arrived by steamboat and hundreds of wagon trains lined the streets waiting to be ferried across the Missouri River. The covered wagons, oxen, and supplies purchased by the emigrants established the economic foundation of the City. Additional growth commenced in 1859 when the railroad reached St. Joseph assuring its role as a supply and distribution point to the entire western half of the country. St. Joseph’s proximity to the Missouri River and accessibility by way of river, rail, and land, was to be the impetus for phenomenal growth throughout the 19th century. Political tensions leading up to the Civil War led to the establishment of the Pony Express in 1860, with St. Joseph becoming the eastern terminus. The war years were very difficult, with divided loyalties and violence, but after 1864 recovery was rapid. Principal channels of distribution were established in the 1870’s with St. Joseph becoming a leading wholesale center for the building of the West. The 1880’s and 1890’s were the Golden Age of prosperity, whose mansions and traditions remain a part of the City. In 1886 the Chicago Times reported that
“St. Joseph is a modern wonder – a city of 60,000 inhabitants, eleven railroads, 70 passenger trains each day, 170 factories, thirteen miles of the best paved streets, the largest stockyards west of Chicago, a wholesale trade as large as that of Kansas City and Omaha combined…”. One count of the U.S. Census had the City’s population in 1900 at 102,000.
Meatpacking had been active in St. Joseph from the early days. With the opening of the St. Joseph Stockyards in 1887 and the opening of several new packing houses from then through 1923, St. Joseph became an important meat packing center becoming one of the leading sources of revenue of the City and its surrounding agricultural area. As the City grew and industries were established, neighborhoods developed in close proximity to the factories, stockyards and railroads.
Postcard showing St. Joseph as it existed in 1861 when Fort Smith (the earthen redoubt on the top of the central hill in the picture) was built by the Union Army. It provided a perfect vantage point over the Missouri River, the better to protect troops and the City from Confederate invasion. The “fort” was in operation for only three years.
v
ST. JOSEPH
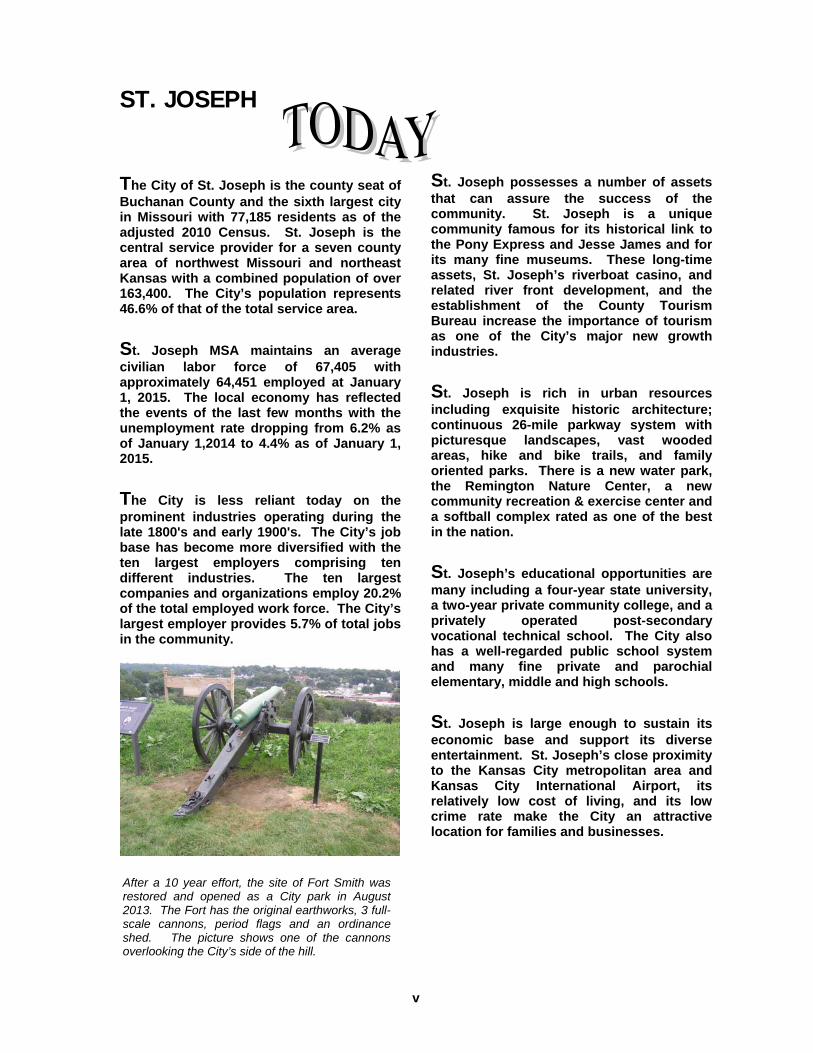
The City of St. Joseph is the county seat of Buchanan County and the sixth largest city in Missouri with 77,185 residents as of the adjusted 2010 Census. St. Joseph is the central service provider for a seven county area of northwest Missouri and northeast Kansas with a combined population of over 163,400. The City’s population represents 46.6% of that of the total service area. St. Joseph MSA maintains an average civilian labor force of 67,405 with approximately 64,451 employed at January 1, 2015. The local economy has reflected the events of the last few months with the unemployment rate dropping from 6.2% as of January 1,2014 to 4.4% as of January 1, 2015. The City is less reliant today on the prominent industries operating during the late 1800's and early 1900's. The City’s job base has become more diversified with the ten largest employers comprising ten different industries. The ten largest companies and organizations employ 20.2% of the total employed work force. The City’s largest employer provides 5.7% of total jobs in the community.
St. Joseph possesses a number of assets that can assure the success of the community. St. Joseph is a unique community famous for its historical link to the Pony Express and Jesse James and for its many fine museums. These long-time assets, St. Joseph’s riverboat casino, and related river front development, and the establishment of the County Tourism Bureau increase the importance of tourism as one of the City’s major new growth industries. St. Joseph is rich in urban resources including exquisite historic architecture; continuous 26-mile parkway system with picturesque landscapes, vast wooded areas, hike and bike trails, and family oriented parks. There is a new water park, the Remington Nature Center, a new community recreation & exercise center and a softball complex rated as one of the best in the nation. St. Joseph’s educational opportunities are many including a four-year state university, a two-year private community college, and a privately operated post-secondary vocational technical school. The City also has a well-regarded public school system and many fine private and parochial elementary, middle and high schools. St. Joseph is large enough to sustain its economic base and support its diverse entertainment. St. Joseph’s close proximity to the Kansas City metropolitan area and Kansas City International Airport, its relatively low cost of living, and its low crime rate make the City an attractive location for families and businesses.
After a 10 year effort, the site of Fort Smith was restored and opened as a City park in August 2013. The Fort has the original earthworks, 3 full-scale cannons, period flags and an ordinance shed. The picture shows one of the cannons overlooking the City’s side of the hill.
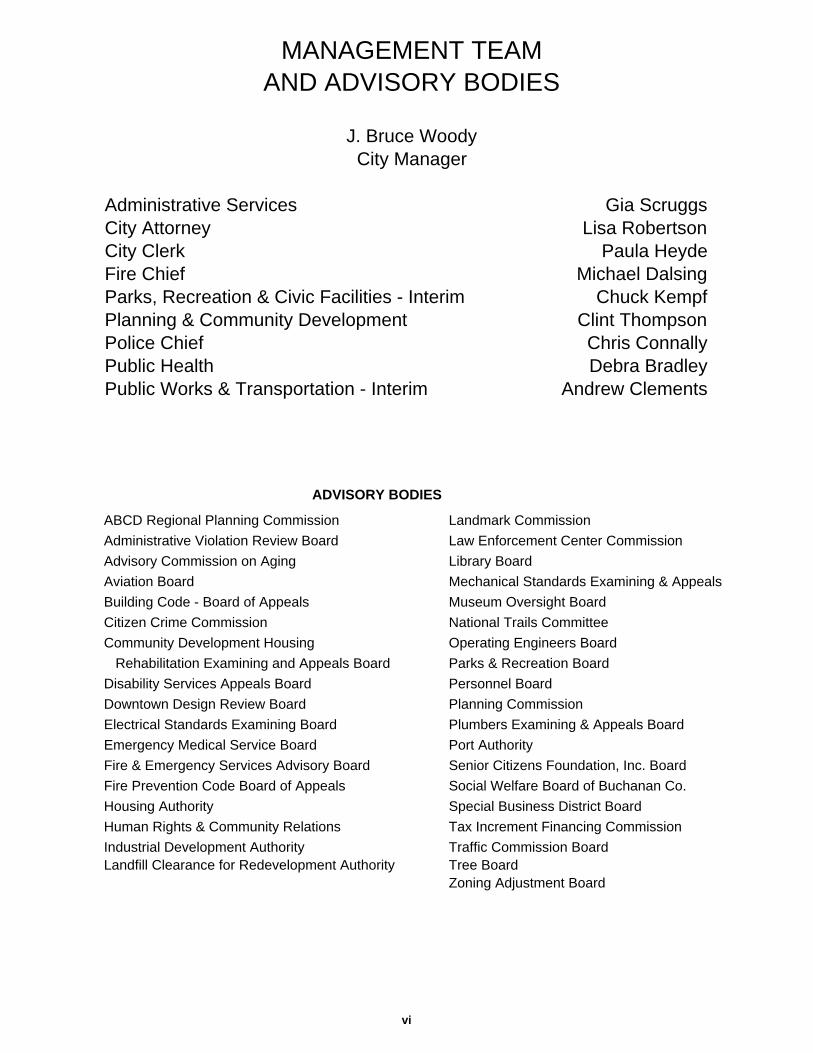
MANAGEMENT TEAMAND ADVISORY BODIES
J. Bruce WoodyCity Manager
Administrative Services Gia ScruggsCity Attorney Lisa RobertsonCity Clerk Paula HeydeFire Chief Michael DalsingParks, Recreation & Civic Facilities - Interim Chuck KempfPlanning & Community Development Clint ThompsonPolice Chief Chris ConnallyPublic Health Debra BradleyPublic Works & Transportation - Interim Andrew Clements
ADVISORY BODIES
ABCD Regional Planning Commission Landmark Commission
Administrative Violation Review Board Law Enforcement Center Commission
Advisory Commission on Aging Library Board
Aviation Board Mechanical Standards Examining & Appeals
Building Code - Board of Appeals Museum Oversight Board
Citizen Crime Commission National Trails Committee
Community Development Housing Operating Engineers Board
Rehabilitation Examining and Appeals Board Parks & Recreation Board
Disability Services Appeals Board Personnel Board
Downtown Design Review Board Planning Commission
Electrical Standards Examining Board Plumbers Examining & Appeals Board
Emergency Medical Service Board Port Authority
Fire & Emergency Services Advisory Board Senior Citizens Foundation, Inc. Board
Fire Prevention Code Board of Appeals Social Welfare Board of Buchanan Co.
Housing Authority Special Business District Board
Human Rights & Community Relations Tax Increment Financing Commission
Industrial Development Authority Traffic Commission BoardLandfill Clearance for Redevelopment Authority Tree Board
Zoning Adjustment Board
vi
vii
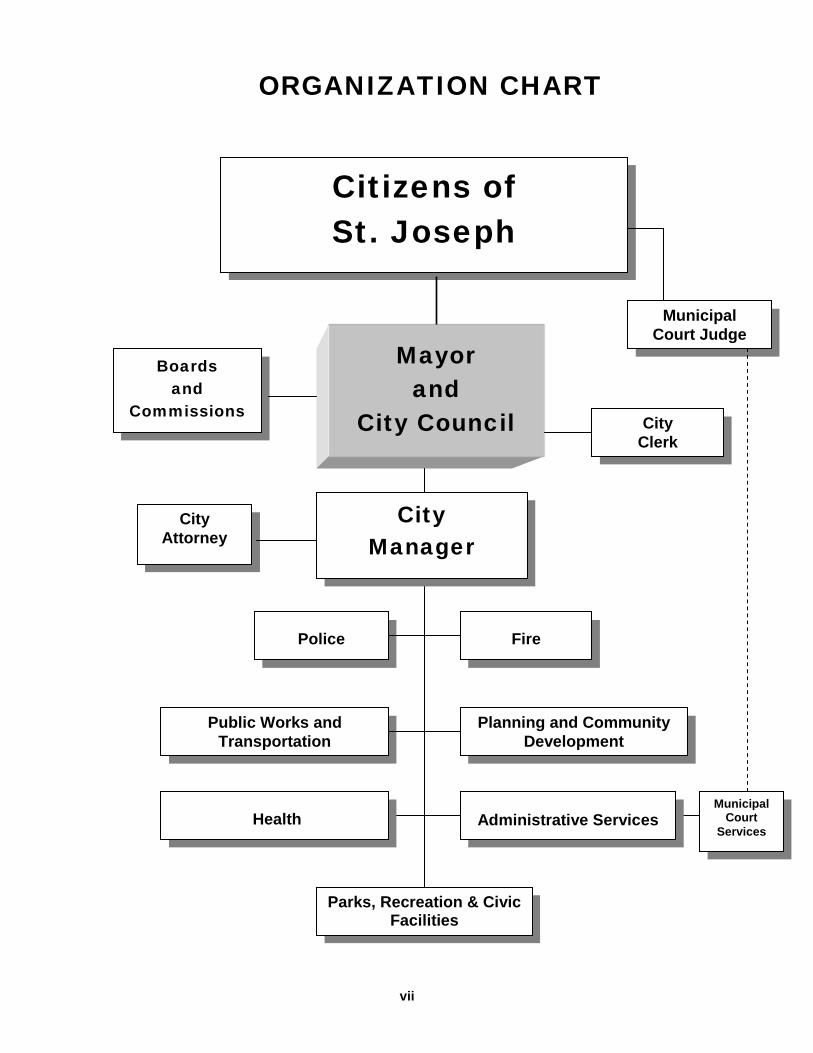
ORGANIZATION CHART
Citizens of St. Joseph
Mayor and
City Council
Municipal Court Judge
City Clerk
Boards and
Commissions
City Manager
Police
Fire
Public Works and Transportation
Planning and Community Development
Parks, Recreation & Civic Facilities
Administrative Services
Health
City Attorney
Municipal Court
Services
viii
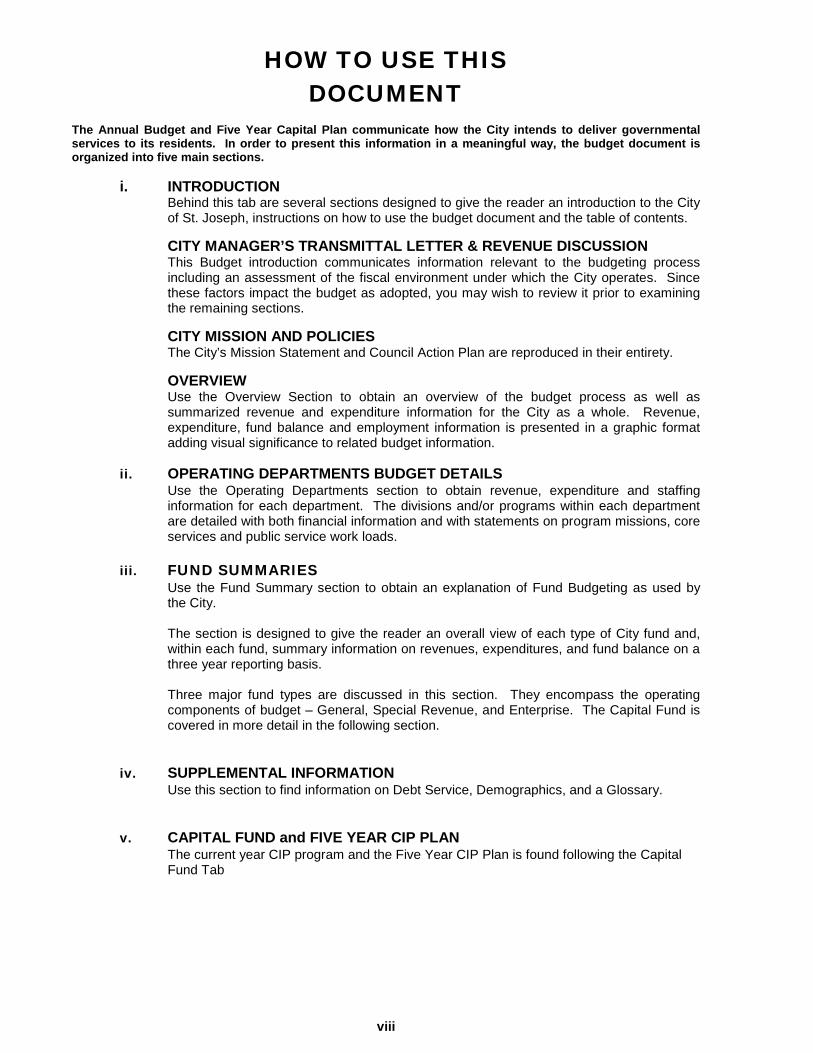
HOW TO USE THIS DOCUMENT
The Annual Budget and Five Year Capital Plan communicate how the City intends to deliver governmental services to its residents. In order to present this information in a meaningful way, the budget document is organized into five main sections. i. INTRODUCTION Behind this tab are several sections designed to give the reader an introduction to the City of St. Joseph, instructions on how to use the budget document and the table of contents.
CITY MANAGER’S TRANSMITTAL LETTER & REVENUE DISCUSSION This Budget introduction communicates information relevant to the budgeting process including an assessment of the fiscal environment under which the City operates. Since these factors impact the budget as adopted, you may wish to review it prior to examining the remaining sections.
CITY MISSION AND POLICIES The City’s Mission Statement and Council Action Plan are reproduced in their entirety.
OVERVIEW
Use the Overview Section to obtain an overview of the budget process as well as summarized revenue and expenditure information for the City as a whole. Revenue, expenditure, fund balance and employment information is presented in a graphic format adding visual significance to related budget information.
ii. OPERATING DEPARTMENTS BUDGET DETAILS Use the Operating Departments section to obtain revenue, expenditure and staffing information for each department. The divisions and/or programs within each department are detailed with both financial information and with statements on program missions, core services and public service work loads.
iii. FUND SUMMARIES Use the Fund Summary section to obtain an explanation of Fund Budgeting as used by the City. The section is designed to give the reader an overall view of each type of City fund and, within each fund, summary information on revenues, expenditures, and fund balance on a three year reporting basis. Three major fund types are discussed in this section. They encompass the operating components of budget – General, Special Revenue, and Enterprise. The Capital Fund is covered in more detail in the following section.
iv. SUPPLEMENTAL INFORMATION Use this section to find information on Debt Service, Demographics, and a Glossary.
v. CAPITAL FUND and FIVE YEAR CIP PLAN The current year CIP program and the Five Year CIP Plan is found following the Capital Fund Tab

CITY MANAGER’S BUDGET TRANSMITTAL
1 - 1
April 30, 2015 Mayor Bill Falkner and Members of the City Council City of St. Joseph 1100 Frederick Avenue St. Joseph, Missouri 64501 Dear Mayor Falkner and City Council: I am pleased to present to you the fiscal year 2016 (FY16) Proposed Annual Budget. The theme of this year’s budget is “Back to Basics”. The emphasis is on basic services, maintenance of existing infrastructure, and supporting the fiscal health of the organization. There are fewer capital improvement projects this year and more maintenance related projects to improve and maintain the infrastructure and services that we already provide. The City Council’s annual budget is the single most important document in communicating the policy priorities of the governing body. And this year’s budget continues to reflect the City Council’s responsiveness to priorities identified in the 2014 St. Joseph Community Survey. Specifically, it includes appropriations that increase our level of street maintenance and increases the size of our police force by another six officers and a sergeant. Both were needs identified as priorities in the community survey. In response, the City Council proposed plans to increase services and this budget reflects actions they are able to undertake thanks to voter approval of additional revenue to contract for more street repair and to increase our police presence. The Public Safety Tax, approved by voters in 2012, allows for the next phase of increased staffing in the police department in FY16. A Use Tax approved by voters in April 2015 is dedicated by the City Council exclusively for street maintenance after a minor amount is retained to preserve the General Fund from loss of revenue to out-of-state vehicle & equipment purchases. But, the concurrent challenge is to do this work while also addressing the responsibility to provide efficient and fiscally responsible public services. An annual budget must achieve a fine balance between the vast numbers of tasks to be accomplished and the limited amount of resources necessary to accomplish those tasks. Then once adopted, a budget also provides accountability for the use of those limited public resources. This proposed budget and accompanying budget message is presented to you in accordance with Article VI, Section 6.3, of the City Charter. It is complete, except for any changes made by the City Council during the May budget work sessions and corrections, if any, to proposed revenues and expenditures that may be necessary through the date of budget adoption on June 8, 2015. OPERATING BUDGET OVERVIEW – FY2016 Fiscal years 2014 and 2015 had unusually high capital budgets, primarily in response to regulatory and environmental compliance mandates by the federal (EPA) and state (MDNR) governments on our wastewater utility. While those issues constituted a significant portion of the capital budgets for the last

CITY MANAGER’S BUDGET TRANSMITTAL
1 - 2
two years, they are significantly reduced this year. Operating expenses for the wastewater utility, however, continue to rise as a response to those mandates. Fiscal year 2016 will see the addition of six more personnel at the water protection plant in order to meet the need for staffing related to the regulatory support required for the municipal separate storm sewer system permit activities and for the proper management and oversight of the new treatment processes at the facility. City-wide operating expenses have also risen, in response to passage of the Public Safety Tax on August 6, 2013, which allowed for the additional of six police officers to the force in FY2015 and for seven more officers in the upcoming year. The combined effect for the overall budget is an 11.6% reduction from last year. The proposed budget for FY2016 totals $139,910,000 and compares to the adopted annual budget for FY2015, as follows: Expenditure Component
Proposed Expenditure
FY2016
Adopted Expenditure
FY2015
Dollar Increase
(Decrease)
Percent Increase
(Decrease) Operating Expenditures $114,366,000 $106,004,000 $7,518,000 7.9%Capital Improvements 25,574,000 52,318,000 ($26,744,000) (51.1%)
Total $139,910,000 $158,322,000 ($48,176,000) (11.6%) Operating Revenues The operating revenue component of the City’s FY2016 Proposed Annual Budget, net of Capital Project receipts, transfers, bonds, Special Allocation Fund revenues and capital grants, are projected to increase by 3.3%, or $324,000. This does not, as yet, include the revenues from rate increases in the Water Protection Fund. When the current rate study is complete, the proposed revenue increase will be made part of the budget. Sales tax revenues continue to improve, leading to an increase in current year projections and a four percent (4%) increase in FY2016 receipts. The largest contribution to the increase is the influx of revenues from the second full year of the Public Safety Sales Tax, projected to generate $6.31 million next year. Passage of the Use Tax initiative will begin to generate revenues starting July 1, 2015. However, with no experience in this unpredictable revenue source, a conservative projection of $290,000 has been included to go towards Street Enhancement projects. If/when additional revenues are received the budget will be amended to reflect them. Property tax revenues are expected to remain basically flat compared to the current year’s receipts, as are franchise taxes and most other major sources of revenue. Operating Expenditures The net operating expenditure component of the City’s FY2016 Proposed Annual Budget (excluding Special Allocation Funds, CIP programs, cell phone expenditures) increased by 8.5% or $8.046 million above that adopted by the City Council for FY2015. Some of the changes resulted from operational mandates or elements beyond City control. One of these was the advent of a 27th payroll in the upcoming fiscal year, estimated to cost $1,764,000. This occurs every eleven to twelve years. However, the City has been designating a portion of revenue from each fund every year since FY2005, building a reserve in order to absorb this cost without major impacts to
CITY MANAGER’S BUDGET TRANSMITTAL
1 - 3
operating fund balances. Beginning in FY17 we will again begin setting aside reserves for the next occurrence of a 27th payroll in FY2028. Another increase affecting departments city-wide is my recommendation for a proposed 1.5% cost of living increase for all employees. In 2012 a compensation and classification study was conducted and a revised wage scale was enacted. We eliminated the step matrix plan that contained 4-5% steps in favor of an open plan that allowed for yearly Cost of Living Adjustments (COLAs) based on the Consumer Price Index (CPI) to keep current with the market. The total impact to wages and benefits in FY16 is projected at $650,000. A final proposal which would affect departments city-wide (but not yet built into the Proposed Budget as submitted) is my recommendation to re-institute a $15 per pay period City matching program for contributions of $15 or more made by an employee into their own 457 retirement plans. At $15 per pay period it is a relatively low-cost way of encouraging employees to save for retirement beyond the City-provided retirement plans. (Currently only 50% of employees contribute toward a 457 retirement plan.) Taking into account the current participation rate and that next year contains 27 payrolls instead of the normal 26, the total cost will come to $128,385. The major changes to the operating budget as presented are more easily discussed by department and are detailed in the table starting on the following page.
CITY MANAGER’S BUDGET TRANSMITTAL
1 - 4
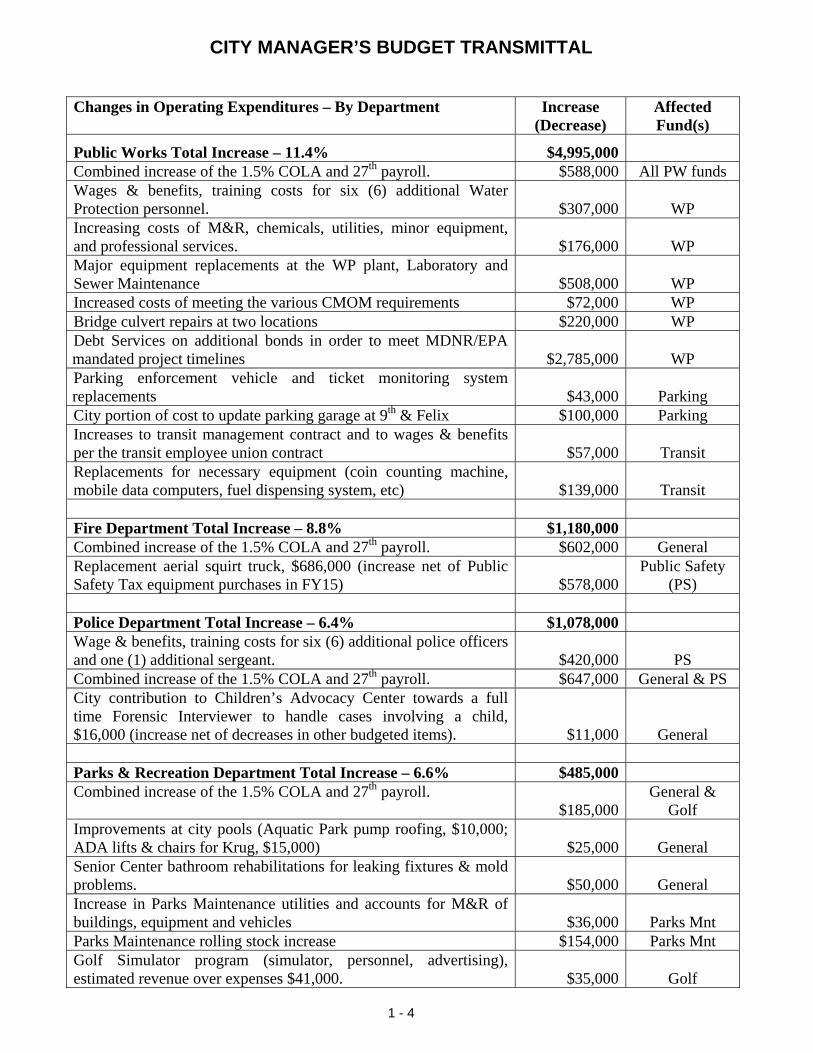
Changes in Operating Expenditures – By Department Increase
(Decrease) Affected Fund(s)
Public Works Total Increase – 11.4% $4,995,000 Combined increase of the 1.5% COLA and 27th payroll. $588,000 All PW funds Wages & benefits, training costs for six (6) additional Water Protection personnel. $307,000 WP Increasing costs of M&R, chemicals, utilities, minor equipment, and professional services. $176,000 WP Major equipment replacements at the WP plant, Laboratory and Sewer Maintenance $508,000 WP Increased costs of meeting the various CMOM requirements $72,000 WP Bridge culvert repairs at two locations $220,000 WP Debt Services on additional bonds in order to meet MDNR/EPA mandated project timelines $2,785,000 WP Parking enforcement vehicle and ticket monitoring system replacements $43,000 Parking City portion of cost to update parking garage at 9th & Felix $100,000 Parking Increases to transit management contract and to wages & benefits per the transit employee union contract $57,000 Transit Replacements for necessary equipment (coin counting machine, mobile data computers, fuel dispensing system, etc) $139,000 Transit Fire Department Total Increase – 8.8% $1,180,000 Combined increase of the 1.5% COLA and 27th payroll. $602,000 General Replacement aerial squirt truck, $686,000 (increase net of Public Safety Tax equipment purchases in FY15) $578,000
Public Safety (PS)
Police Department Total Increase – 6.4% $1,078,000 Wage & benefits, training costs for six (6) additional police officers and one (1) additional sergeant. $420,000 PS Combined increase of the 1.5% COLA and 27th payroll. $647,000 General & PS City contribution to Children’s Advocacy Center towards a full time Forensic Interviewer to handle cases involving a child, $16,000 (increase net of decreases in other budgeted items). $11,000 General Parks & Recreation Department Total Increase – 6.6% $485,000 Combined increase of the 1.5% COLA and 27th payroll.
$185,000 General &
Golf Improvements at city pools (Aquatic Park pump roofing, $10,000; ADA lifts & chairs for Krug, $15,000) $25,000 General Senior Center bathroom rehabilitations for leaking fixtures & mold problems. $50,000 General Increase in Parks Maintenance utilities and accounts for M&R of buildings, equipment and vehicles $36,000 Parks Mnt Parks Maintenance rolling stock increase $154,000 Parks Mnt Golf Simulator program (simulator, personnel, advertising), estimated revenue over expenses $41,000. $35,000 Golf
CITY MANAGER’S BUDGET TRANSMITTAL
1 - 5
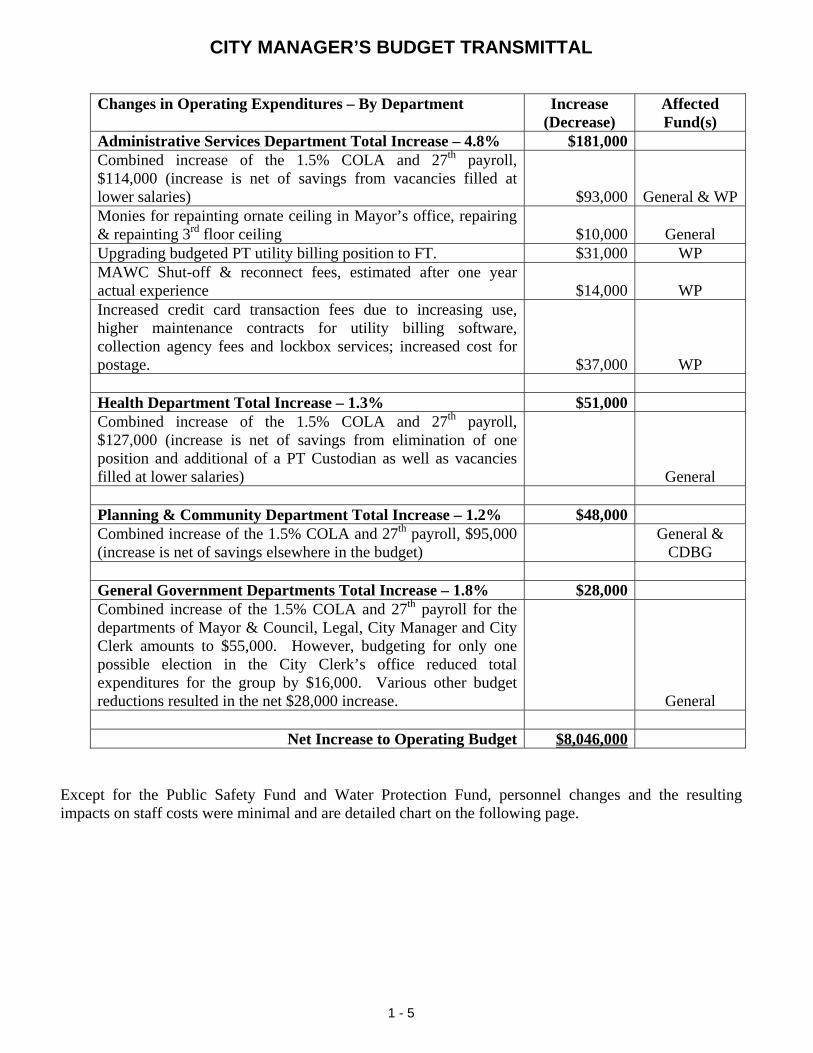
Changes in Operating Expenditures – By Department Increase (Decrease)
Affected Fund(s)
Administrative Services Department Total Increase – 4.8% $181,000 Combined increase of the 1.5% COLA and 27th payroll, $114,000 (increase is net of savings from vacancies filled at lower salaries) $93,000 General & WPMonies for repainting ornate ceiling in Mayor’s office, repairing & repainting 3rd floor ceiling $10,000 General Upgrading budgeted PT utility billing position to FT. $31,000 WP MAWC Shut-off & reconnect fees, estimated after one year actual experience $14,000 WP Increased credit card transaction fees due to increasing use, higher maintenance contracts for utility billing software, collection agency fees and lockbox services; increased cost for postage. $37,000 WP Health Department Total Increase – 1.3% $51,000 Combined increase of the 1.5% COLA and 27th payroll, $127,000 (increase is net of savings from elimination of one position and additional of a PT Custodian as well as vacancies filled at lower salaries) General Planning & Community Department Total Increase – 1.2% $48,000 Combined increase of the 1.5% COLA and 27th payroll, $95,000 (increase is net of savings elsewhere in the budget)
General & CDBG
General Government Departments Total Increase – 1.8% $28,000 Combined increase of the 1.5% COLA and 27th payroll for the departments of Mayor & Council, Legal, City Manager and City Clerk amounts to $55,000. However, budgeting for only one possible election in the City Clerk’s office reduced total expenditures for the group by $16,000. Various other budget reductions resulted in the net $28,000 increase. General
Net Increase to Operating Budget $8,046,000 Except for the Public Safety Fund and Water Protection Fund, personnel changes and the resulting impacts on staff costs were minimal and are detailed chart on the following page.
CITY MANAGER’S BUDGET TRANSMITTAL
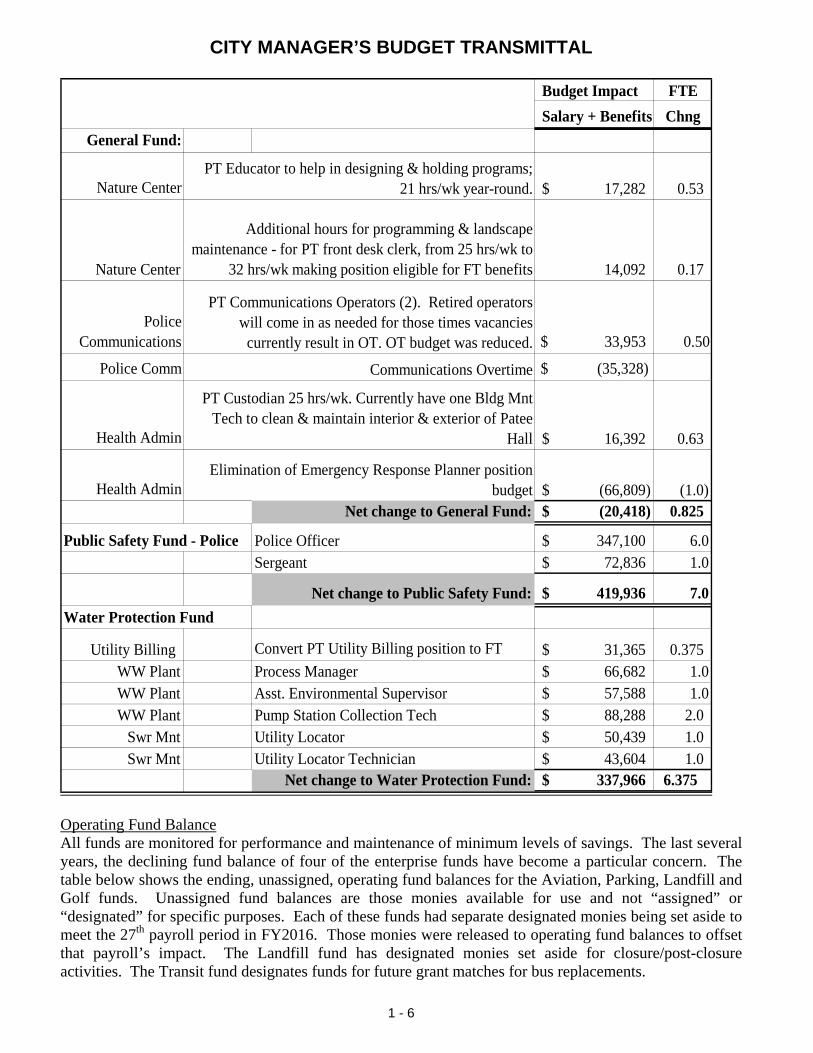
1 - 6
Budget Impact FTESalary + Benefits Chng
General Fund:
Nature Center 17,282$ 0.53
Nature Center 14,092 0.17
Police Communications $ 33,953 0.50
Police Comm $ (35,328)
Health Admin 16,392$ 0.63
Health Admin (66,809)$ (1.0)Net change to General Fund: (20,418)$ 0.825
Police Officer 347,100$ 6.0Sergeant 72,836$ 1.0
Net change to Public Safety Fund: 419,936$ 7.0
Utility Billing Convert PT Utility Billing position to FT 31,365$ 0.375WW Plant Process Manager 66,682$ 1.0WW Plant Asst. Environmental Supervisor 57,588$ 1.0WW Plant Pump Station Collection Tech 88,288$ 2.0
Swr Mnt Utility Locator 50,439$ 1.0Swr Mnt Utility Locator Technician 43,604$ 1.0
Net change to Water Protection Fund: 337,966$ 6.375
Water Protection Fund
Public Safety Fund - Police
PT Educator to help in designing & holding programs; 21 hrs/wk year-round.
PT Communications Operators (2). Retired operators will come in as needed for those times vacancies
currently result in OT. OT budget was reduced.
Communications Overtime
Additional hours for programming & landscape maintenance - for PT front desk clerk, from 25 hrs/wk to
32 hrs/wk making position eligible for FT benefits
PT Custodian 25 hrs/wk. Currently have one Bldg Mnt Tech to clean & maintain interior & exterior of Patee
Hall
Elimination of Emergency Response Planner position budget
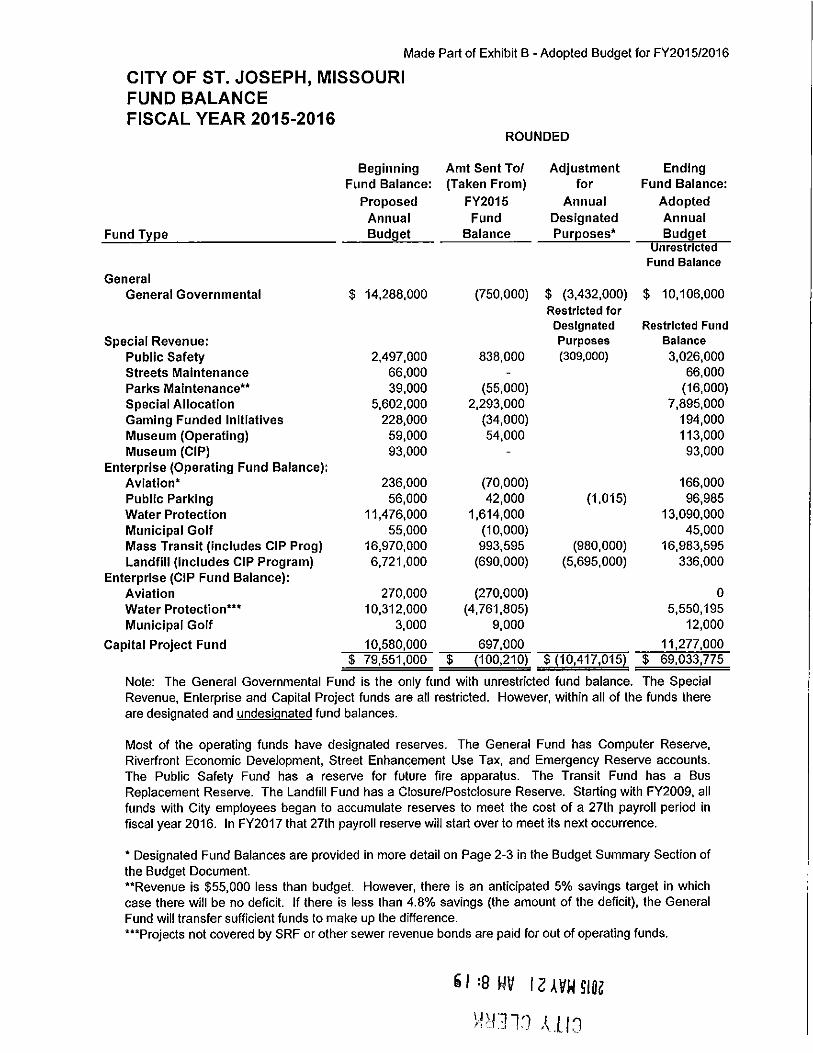
Operating Fund Balance All funds are monitored for performance and maintenance of minimum levels of savings. The last several years, the declining fund balance of four of the enterprise funds have become a particular concern. The table below shows the ending, unassigned, operating fund balances for the Aviation, Parking, Landfill and Golf funds. Unassigned fund balances are those monies available for use and not “assigned” or “designated” for specific purposes. Each of these funds had separate designated monies being set aside to meet the 27th payroll period in FY2016. Those monies were released to operating fund balances to offset that payroll’s impact. The Landfill fund has designated monies set aside for closure/post-closure activities. The Transit fund designates funds for future grant matches for bus replacements.
CITY MANAGER’S BUDGET TRANSMITTAL
1 - 7
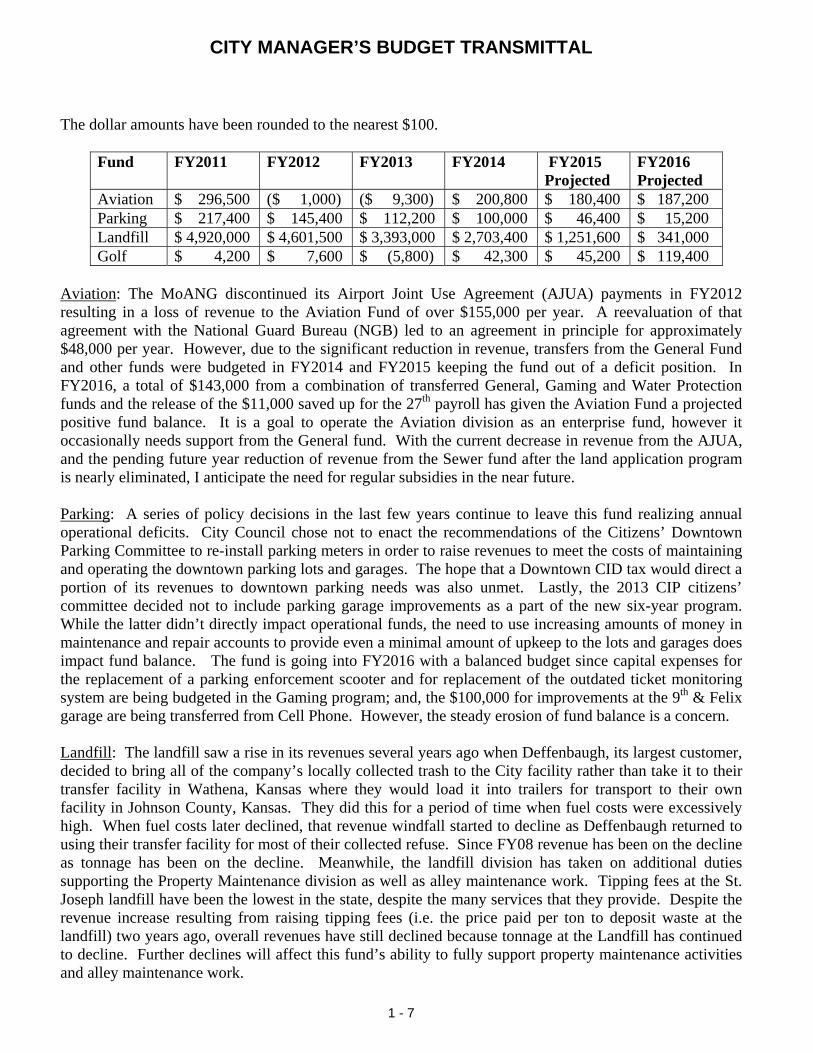
The dollar amounts have been rounded to the nearest $100.
Fund FY2011 FY2012 FY2013 FY2014 FY2015 Projected
FY2016 Projected
Aviation $ 296,500 ($ 1,000) ($ 9,300) $ 200,800 $ 180,400 $ 187,200 Parking $ 217,400 $ 145,400 $ 112,200 $ 100,000 $ 46,400 $ 15,200 Landfill $ 4,920,000 $ 4,601,500 $ 3,393,000 $ 2,703,400 $ 1,251,600 $ 341,000 Golf $ 4,200 $ 7,600 $ (5,800) $ 42,300 $ 45,200 $ 119,400
Aviation: The MoANG discontinued its Airport Joint Use Agreement (AJUA) payments in FY2012 resulting in a loss of revenue to the Aviation Fund of over $155,000 per year. A reevaluation of that agreement with the National Guard Bureau (NGB) led to an agreement in principle for approximately $48,000 per year. However, due to the significant reduction in revenue, transfers from the General Fund and other funds were budgeted in FY2014 and FY2015 keeping the fund out of a deficit position. In FY2016, a total of $143,000 from a combination of transferred General, Gaming and Water Protection funds and the release of the $11,000 saved up for the 27th payroll has given the Aviation Fund a projected positive fund balance. It is a goal to operate the Aviation division as an enterprise fund, however it occasionally needs support from the General fund. With the current decrease in revenue from the AJUA, and the pending future year reduction of revenue from the Sewer fund after the land application program is nearly eliminated, I anticipate the need for regular subsidies in the near future. Parking: A series of policy decisions in the last few years continue to leave this fund realizing annual operational deficits. City Council chose not to enact the recommendations of the Citizens’ Downtown Parking Committee to re-install parking meters in order to raise revenues to meet the costs of maintaining and operating the downtown parking lots and garages. The hope that a Downtown CID tax would direct a portion of its revenues to downtown parking needs was also unmet. Lastly, the 2013 CIP citizens’ committee decided not to include parking garage improvements as a part of the new six-year program. While the latter didn’t directly impact operational funds, the need to use increasing amounts of money in maintenance and repair accounts to provide even a minimal amount of upkeep to the lots and garages does impact fund balance. The fund is going into FY2016 with a balanced budget since capital expenses for the replacement of a parking enforcement scooter and for replacement of the outdated ticket monitoring system are being budgeted in the Gaming program; and, the $100,000 for improvements at the 9th & Felix garage are being transferred from Cell Phone. However, the steady erosion of fund balance is a concern. Landfill: The landfill saw a rise in its revenues several years ago when Deffenbaugh, its largest customer, decided to bring all of the company’s locally collected trash to the City facility rather than take it to their transfer facility in Wathena, Kansas where they would load it into trailers for transport to their own facility in Johnson County, Kansas. They did this for a period of time when fuel costs were excessively high. When fuel costs later declined, that revenue windfall started to decline as Deffenbaugh returned to using their transfer facility for most of their collected refuse. Since FY08 revenue has been on the decline as tonnage has been on the decline. Meanwhile, the landfill division has taken on additional duties supporting the Property Maintenance division as well as alley maintenance work. Tipping fees at the St. Joseph landfill have been the lowest in the state, despite the many services that they provide. Despite the revenue increase resulting from raising tipping fees (i.e. the price paid per ton to deposit waste at the landfill) two years ago, overall revenues have still declined because tonnage at the Landfill has continued to decline. Further declines will affect this fund’s ability to fully support property maintenance activities and alley maintenance work.
CITY MANAGER’S BUDGET TRANSMITTAL
1 - 8
Municipal Golf Course: Over the last few years, the golf course has transitioned from hiring a golf pro, who provided lessons and owned and operated the pro-shop, to contracting with a part time person to provide lessons and operating the pro-shop using city staff. While those budgeted expenses and revenues have balanced, unpredictable weather plays a part in the overall actual performance of the fund. Golf course personnel continue to look for ways to maintain and improve revenue streams. One of the initiatives for next year is to install a Golf Simulator. This will allow for play during the fall, winter and early spring days when weather precludes outdoor course play. Plans are to provide for winter leagues, open course play, and open range times. Groups can also rent simulator time in the banquet room for special events and parties. Taking into account this new revenue, as well as the monies set aside for the 27th payroll, the Golf fund is anticipating improving fund balances.
Capital Budget Overview – FY2016 Capital improvement expenditures are anticipated to decrease from the FY2014 and FY2015 highs of $107,937,000 and $52,318,000 respectively to $25,573,000, a decrease of over 50%. The capital programs in the Aviation, Transit and Golf funds all have budgeted increases. Landfill and the Capital Projects funds have decreases. The decrease with the biggest impact comes from the timing of MDNR and EPA-mandated water quality projects in the Water Protection fund. FY2016 projects, budgeted at $4,762,000, are not at the level of those undertaken last year which totaled over $33,141,000. City staff has been strategically scheduling the projects to coordinate with the annual State Revolving Fund program to maximize interest rate savings using the $105 million sewer bond authority granted by voters in April 2011 and the new $190 million in authority approved by voters in August 2014. The subsidized interest rate of SRF bonds are 2-3% lower than conventional bonds, which saves the rate payers millions of dollars in interest expense for construction of federal and state mandated projects for the wastewater utility. The Capital Projects fund reflects the third year of the approved projects with a decrease of $9,755,000 from the FY2015 mid-year amended total of $16,291,000 to $6,536,500 in FY2016. (Funding for several streets projects originally scheduled for FY2016 was moved ahead to FY2015.) Details of the City’s projected capital projects’ spending for FY2016 can be found in the City Capital Projects section of the budget document. Discretionary Expenditures Being a service organization, a significant fraction of overall costs are salary and benefits. Additionally, much of our revenue is restricted or allocated to specific uses, leaving little discretionary funding. Most of the City’ discretionary expenditures are those made from the Gaming Fund and the Cell Phone receipts (cell phone franchise revenue) which total only 2.4% of the overall FY16 budget. The remaining source of discretionary funding is the General fund. Appropriating those funds for alternative uses requires careful policy discussions about what existing services would have to be reduced or eliminated to offset the cost of any new priority. For many departments, reductions in capital expenses have been the means by which budgets are balanced as the cost of utilities, fuel, payroll, and other expenses rise. The City has continued to look to the discretionary funds of Gaming or Cell Phone for many of those purchases.

CITY MANAGER’S BUDGET TRANSMITTAL
1 - 9
This year, I am recommending $110,000 in Cell Phone funds for major purchases of replacement equipment for the Parks Maintenance division as well as $20,000 for improvements at the Pioneer Woman and Pony Express statues. Similarly, I am recommending $311,900 in Cell Phone funds for the purchase of capital equipment for the Street Maintenance division and $220,000 for various building repairs/renovations and for major culvert repairs at the SW Parkway Bridge and at 3600 Pickett. Combined, they total $661,900 which is an increase from the $355,000 that was appropriated for these purposes in FY15.
Proposed Cell Phone Uses:
For use by City Council: $200,000 $150,000 in Economic Development Match Funds $50,000 2nd year of 3 year contribution to MSWU/Chief’s camp improvements.
For the Health Department $131,600 Replacement vehicles (2) and roof replacement and repair for Patee Hall.
For Administrative Services $20,000 Renovations to 1st floor Customer Service area to open a second door for customer convenience & upgraded security measures to both the office and to City Hall.
Transfer to Parking Fund $100,000 City portion of cost of renovating the garage at 9th & Felix.
Transfer to Golf Fund $100,000 Golf CIP program for cart path repairs Transfer to Streets Maintenance Fund $531,900 Streets Rolling Stock & capital improvements Transfer to Parks Maintenance Fund $130,000 Parks Maintenance Rolling Stock & statue
improvements Transfer to Capital Projects Fund $350,000 City contribution to remaining projects
at the NE Community Park TOTAL: $1,563,500
Gaming revenues have begun a slight increase from the downturn that occurred three years ago when flooding closed the casino for three months of the fiscal year. Given the uncertain nature of this revenue source, the wisdom of past Councils’ decisions to not use this revenue source for on-going personnel costs have been reinforced. The City has relied, however, on this source for several recurring contractual agreements with outside agencies and for a few one-time, minor capital acquisitions for various City departments. Details of the proposed budget for Gaming start on the following page.
CITY MANAGER’S BUDGET TRANSMITTAL
1 - 10
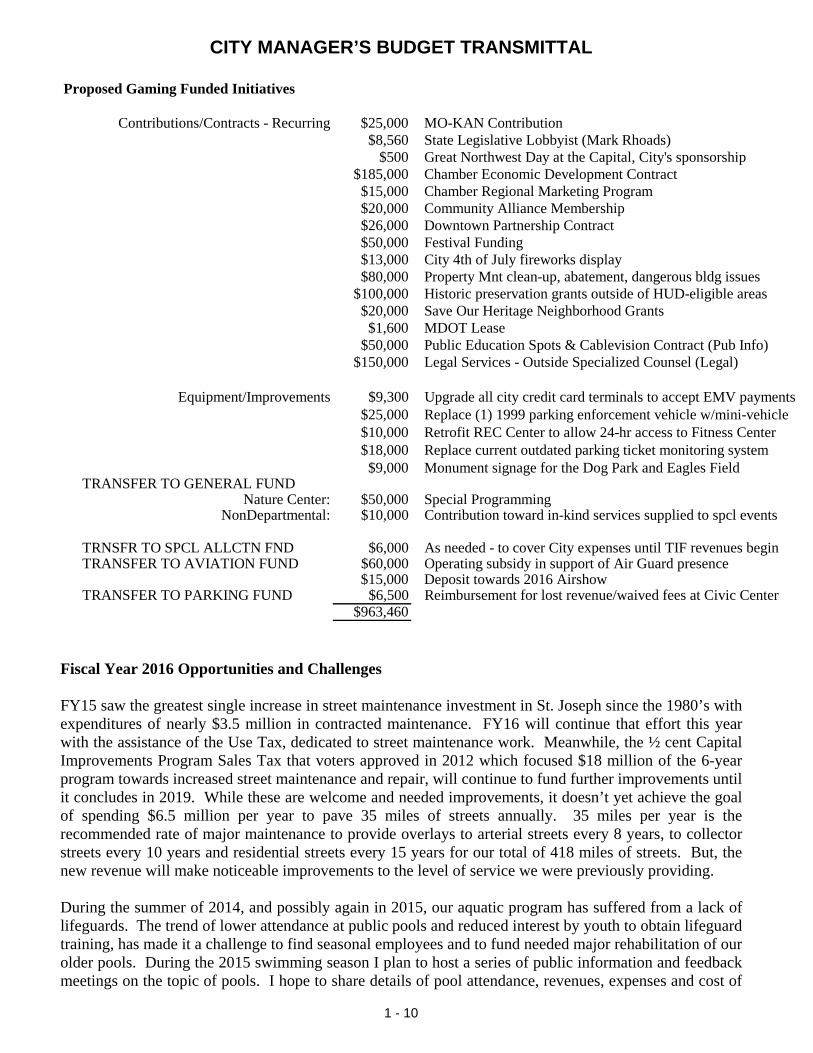
Proposed Gaming Funded Initiatives
Contributions/Contracts - Recurring $25,000 MO-KAN Contribution$8,560 State Legislative Lobbyist (Mark Rhoads)
$500 Great Northwest Day at the Capital, City's sponsorship$185,000 Chamber Economic Development Contract$15,000 Chamber Regional Marketing Program$20,000 Community Alliance Membership$26,000 Downtown Partnership Contract$50,000 Festival Funding$13,000 City 4th of July fireworks display$80,000 Property Mnt clean-up, abatement, dangerous bldg issues
$100,000 Historic preservation grants outside of HUD-eligible areas$20,000 Save Our Heritage Neighborhood Grants$1,600 MDOT Lease
$50,000 Public Education Spots & Cablevision Contract (Pub Info)$150,000 Legal Services - Outside Specialized Counsel (Legal)
Equipment/Improvements $9,300 Upgrade all city credit card terminals to accept EMV payments$25,000 Replace (1) 1999 parking enforcement vehicle w/mini-vehicle$10,000 Retrofit REC Center to allow 24-hr access to Fitness Center$18,000 Replace current outdated parking ticket monitoring system$9,000 Monument signage for the Dog Park and Eagles Field
TRANSFER TO GENERAL FUNDNature Center: $50,000 Special Programming
NonDepartmental: $10,000 Contribution toward in-kind services supplied to spcl events
TRNSFR TO SPCL ALLCTN FND $6,000 As needed - to cover City expenses until TIF revenues beginTRANSFER TO AVIATION FUND $60,000 Operating subsidy in support of Air Guard presence
$15,000 Deposit towards 2016 AirshowTRANSFER TO PARKING FUND $6,500 Reimbursement for lost revenue/waived fees at Civic Center
$963,460
Fiscal Year 2016 Opportunities and Challenges FY15 saw the greatest single increase in street maintenance investment in St. Joseph since the 1980’s with expenditures of nearly $3.5 million in contracted maintenance. FY16 will continue that effort this year with the assistance of the Use Tax, dedicated to street maintenance work. Meanwhile, the ½ cent Capital Improvements Program Sales Tax that voters approved in 2012 which focused $18 million of the 6-year program towards increased street maintenance and repair, will continue to fund further improvements until it concludes in 2019. While these are welcome and needed improvements, it doesn’t yet achieve the goal of spending $6.5 million per year to pave 35 miles of streets annually. 35 miles per year is the recommended rate of major maintenance to provide overlays to arterial streets every 8 years, to collector streets every 10 years and residential streets every 15 years for our total of 418 miles of streets. But, the new revenue will make noticeable improvements to the level of service we were previously providing. During the summer of 2014, and possibly again in 2015, our aquatic program has suffered from a lack of lifeguards. The trend of lower attendance at public pools and reduced interest by youth to obtain lifeguard training, has made it a challenge to find seasonal employees and to fund needed major rehabilitation of our older pools. During the 2015 swimming season I plan to host a series of public information and feedback meetings on the topic of pools. I hope to share details of pool attendance, revenues, expenses and cost of
REVENUE DISCUSSION
1 - 12
The City of St. Joseph, Missouri derives revenue from various sources including taxes, user fees, government grants and subventions, licenses and permits, fines and forfeitures, bond proceeds, investment earnings, and other less significant types of revenue including sales of fixed assets, insurance recoveries, special assessments, and donations. Due to the varying types of revenue, many different methods must be employed to project revenues. The projection methods selected depend on the nature and materiality of the revenue item and the period of time over which the revenue is projected. The specific revenue projection technique employed for any given revenue item is identified in the city’s Revenue Manual, updated and published annually. Revenue Projection Techniques
Historical Data - This method predicts future revenue based on historical movements over time and assumes that historical trends will continue in the future. Budget staff compiles a revenue history for the previous five years, determines average rate of change, and applies this rate of change to the previous year’s annual revenue amount. Current Data - This method predicts future revenue based on actual or annualized current year revenues and is often used when historical data and trends are not available or, if used, would result in an inaccurate revenue projection. Facts & Circumstances - This method predicts future revenue on facts and circumstances uniquely affecting the revenue item including actions promulgated by or undertaken with third parties. This method is often supported by certain documentation in the form of lease/rental agreements, grant agreements, service contracts, legislative records, judicial findings, property appraisals, consultant’s reports, rate making authority rulings, government statistical reports etc… And, finally, Financial Services staff may adjust its projections to reflect the probable impact on revenues of anticipated changes in the economy, legislation, inflation, and demographics. Judgmental Estimates - this method relies on a person knowledgeable in the field, often a department director, who prepares a revenue projection based on awareness of past and present conditions including fee changes, development plans, marketing campaigns, usage activity, frequency, volume, weight, and similar determinations. Examples include landfill and sewer revenue where anticipated usage, weight, and volume are major revenue determining factors.
Who Prepares Revenue Projections?
Revenue projections are prepared by department directors and budget staff and are approved by the City Manager as part of the annual budgeting process. Prior to submitting revenue projections to the City Manager, budget staff compares and reconciles revenue projections with those prepared by department directors. Large bond issues anticipated in the Water Protection Fund, tend to distort the percentages other revenue sources provide to the operations of the City. Therefore the following discussions exclude that amount for purposes of establishing major revenue sources and providing the percentage of support provided whenever such issues are anticipated. Revenue Sources
Property Tax – Property taxes represent 11.0% of the City’s budgeted resources. Property taxes include real, personal, public safety, railroad & utility, merchants & manufacturers’, financial institutions’, and payments in lieu of tax. Such taxes are assessed at the prescribed tax rate per $100 of assessed value determined at 12%, 19%, and 32% of fair market value for agricultural, residential, and commercial property, respectively.

REVENUE DISCUSSION
1 - 13
Revenue Assumptions - Annual growth in property taxes for the past five years had fluctuated between less than 1% up to 2% in re-assessment years. Due to the Hancock Amendment, property tax growth is confined to the lower of 5% or the Consumer Price Index ceiling. New construction valuations and prior year tax collections are not restricted by the Hancock Amendment. The fairly recent economic slow-down and increased foreclosure rate through the region has resulted in low activity over the past several years. The biggest impact on the City was a change in the State Statutes requiring the City to permanently lower its general purpose tax rate by six (6) cents per $100 valuation. The Statute also made that the City’s new cap. Legislative action to reverse the unintended consequence on the City of St. Joseph, and on other taxing jurisdictions, of the senate bill was passed but vetoed by the Governor. Therefore, real and personal property tax revenues have been essentially flat. There was an uptick in revenues in FY2012 as the result of the 2011 reassessment year and from the resolution of several high-dollar protested tax cases. The estimate for FY2014 is higher than the original budget. FY13 was a reassessment year, however the County has not increased assessments appreciably. For FY2016 revenues are projected to increase less than 1% over the FY15 adopted budget.
Property Tax Five Year Trend
$16,150$15,681
$15,978 $16,145 $16,076
$15,000
$16,000
$17,000
$18,000
$19,000
$20,000
FY2012 FY2013 FY2014 FY2015 FY2016In T
hous
ands
of D
olla
rs
Sales Tax – Sales taxes represent 33% of the City’s total revenue, up 1% from last year. Sales taxes include the local 1.5% sales tax (General Fund), ½% CIP sales tax (Capital Projects Fund), ½% Public Safety Tax (Public Safety Fund), .375% mass transit sales tax (Transit Fund), 5% cigarette tax (General Fund), 3% hotel/motel tax (General Fund), 3% hotel/motel economic development tax (General Fund) and state fuel tax distributions (Streets Mnt Fund). Going into effect July 1, 2015 is the City’s ability to collect the Use Tax (equal to the City’s current sales tax rate at any given time) on goods and materials bought outside of the state (General Fund with a little more than 90% designated towards Street Maintenance & Enhancement).
Revenue Assumptions – Beginning around FY2000 the annual growth in sales taxes slowed to an average of 1% to 1.5%. Staff remained cautiously optimistic that the local economy would continue to hold its own against the nation-wide economic slow-down in the recent past. Several major economic boosts – the development of a second shopping center in the northeast section of the City, redevelopment and expansion at the local mall continues, several smaller retail/commercial developments, and the development of a major food processing plant just south of the downtown area – have allowed the area to at least maintain a stable sales tax base. At three-quarters of the way through this fiscal year, retail sales tax revenues are running almost 8% over the same period last year. This is the highest growth in sales taxes the
REVENUE DISCUSSION
1 - 14
City has seen in over a decade. As a result, FY2015 projections have been cautiously raised and FY2016 budgets set at with a 4.5% increase above current year projections. This is the first time since FY2001 a more than 2% increase in sales tax revenues has been budgeted and the revenue source needs to be closely monitored in case the forecast is overly optimistic.
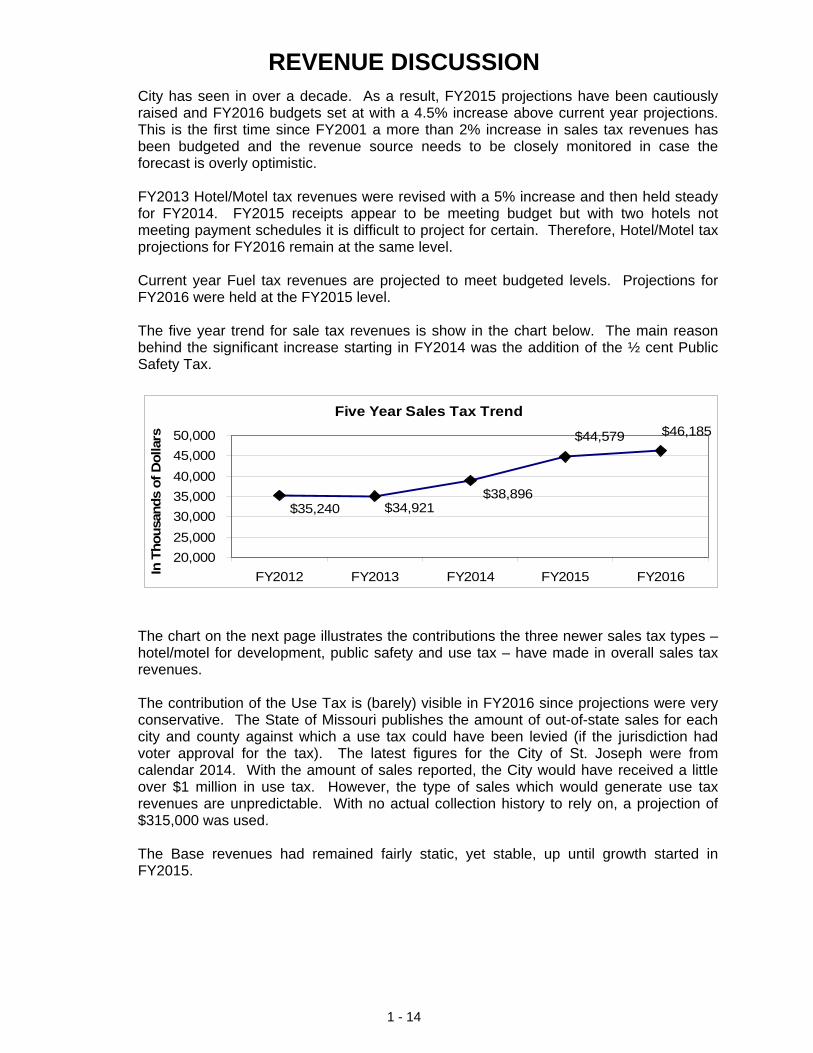
FY2013 Hotel/Motel tax revenues were revised with a 5% increase and then held steady for FY2014. FY2015 receipts appear to be meeting budget but with two hotels not meeting payment schedules it is difficult to project for certain. Therefore, Hotel/Motel tax projections for FY2016 remain at the same level. Current year Fuel tax revenues are projected to meet budgeted levels. Projections for FY2016 were held at the FY2015 level. The five year trend for sale tax revenues is show in the chart below. The main reason behind the significant increase starting in FY2014 was the addition of the ½ cent Public Safety Tax.
Five Year Sales Tax Trend
$35,240 $34,921$38,896
$44,579 $46,185
20,000
25,000
30,000
35,000
40,000
45,000
50,000
FY2012 FY2013 FY2014 FY2015 FY2016In T
hous
ands
of D
olla
rs
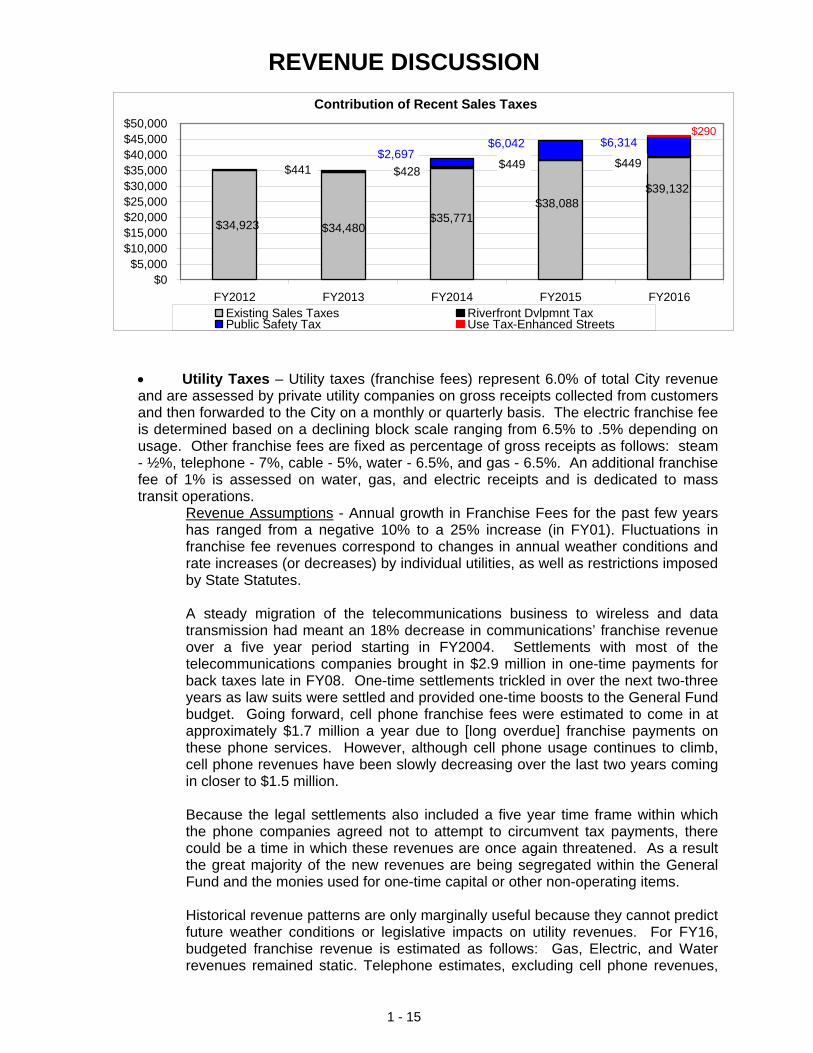
The chart on the next page illustrates the contributions the three newer sales tax types – hotel/motel for development, public safety and use tax – have made in overall sales tax revenues. The contribution of the Use Tax is (barely) visible in FY2016 since projections were very conservative. The State of Missouri publishes the amount of out-of-state sales for each city and county against which a use tax could have been levied (if the jurisdiction had voter approval for the tax). The latest figures for the City of St. Joseph were from calendar 2014. With the amount of sales reported, the City would have received a little over $1 million in use tax. However, the type of sales which would generate use tax revenues are unpredictable. With no actual collection history to rely on, a projection of $315,000 was used. The Base revenues had remained fairly static, yet stable, up until growth started in FY2015.
REVENUE DISCUSSION
1 - 15
Contribution of Recent Sales Taxes
$34,923 $34,480$35,771
$38,088$39,132
$441 $428$449 $449
$2,697$6,042 $6,314
$290
$0$5,000
$10,000$15,000$20,000$25,000$30,000$35,000$40,000$45,000$50,000
FY2012 FY2013 FY2014 FY2015 FY2016Existing Sales Taxes Riverfront Dvlpmnt TaxPublic Safety Tax Use Tax-Enhanced Streets
Utility Taxes – Utility taxes (franchise fees) represent 6.0% of total City revenue and are assessed by private utility companies on gross receipts collected from customers and then forwarded to the City on a monthly or quarterly basis. The electric franchise fee is determined based on a declining block scale ranging from 6.5% to .5% depending on usage. Other franchise fees are fixed as percentage of gross receipts as follows: steam - ½%, telephone - 7%, cable - 5%, water - 6.5%, and gas - 6.5%. An additional franchise fee of 1% is assessed on water, gas, and electric receipts and is dedicated to mass transit operations.
Revenue Assumptions - Annual growth in Franchise Fees for the past few years has ranged from a negative 10% to a 25% increase (in FY01). Fluctuations in franchise fee revenues correspond to changes in annual weather conditions and rate increases (or decreases) by individual utilities, as well as restrictions imposed by State Statutes. A steady migration of the telecommunications business to wireless and data transmission had meant an 18% decrease in communications’ franchise revenue over a five year period starting in FY2004. Settlements with most of the telecommunications companies brought in $2.9 million in one-time payments for back taxes late in FY08. One-time settlements trickled in over the next two-three years as law suits were settled and provided one-time boosts to the General Fund budget. Going forward, cell phone franchise fees were estimated to come in at approximately $1.7 million a year due to [long overdue] franchise payments on these phone services. However, although cell phone usage continues to climb, cell phone revenues have been slowly decreasing over the last two years coming in closer to $1.5 million. Because the legal settlements also included a five year time frame within which the phone companies agreed not to attempt to circumvent tax payments, there could be a time in which these revenues are once again threatened. As a result the great majority of the new revenues are being segregated within the General Fund and the monies used for one-time capital or other non-operating items. Historical revenue patterns are only marginally useful because they cannot predict future weather conditions or legislative impacts on utility revenues. For FY16, budgeted franchise revenue is estimated as follows: Gas, Electric, and Water revenues remained static. Telephone estimates, excluding cell phone revenues,
REVENUE DISCUSSION
1 - 16
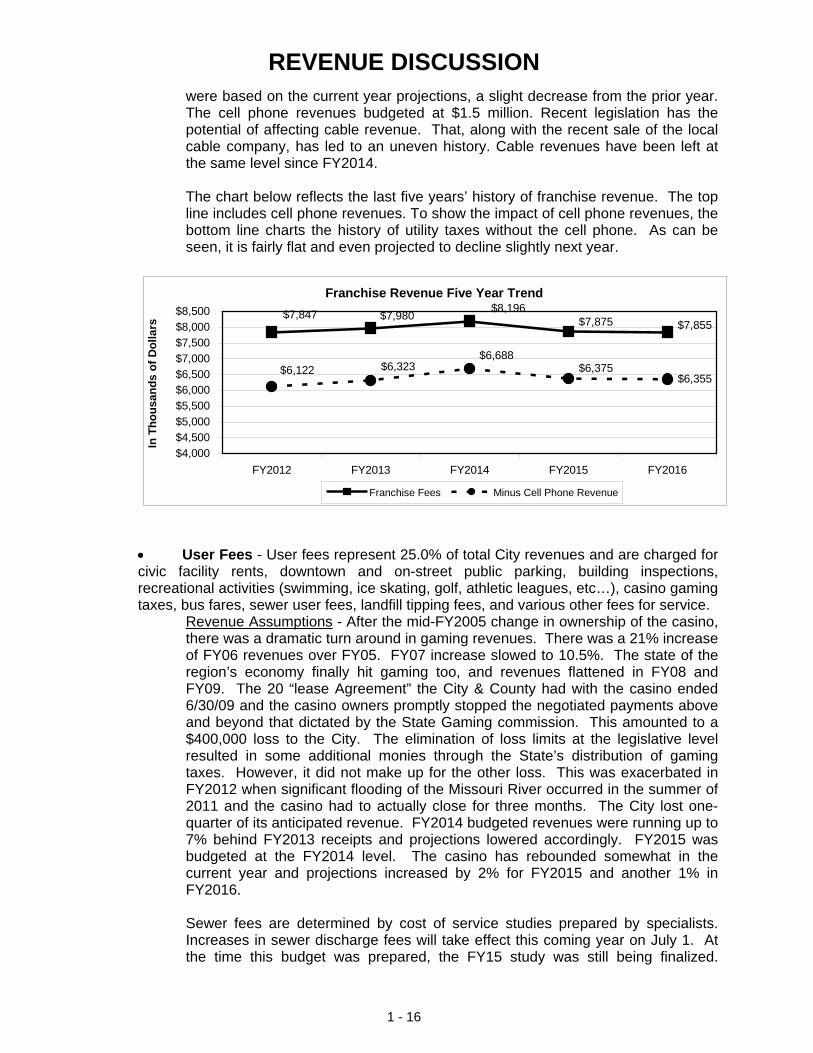
were based on the current year projections, a slight decrease from the prior year. The cell phone revenues budgeted at $1.5 million. Recent legislation has the potential of affecting cable revenue. That, along with the recent sale of the local cable company, has led to an uneven history. Cable revenues have been left at the same level since FY2014. The chart below reflects the last five years’ history of franchise revenue. The top line includes cell phone revenues. To show the impact of cell phone revenues, the bottom line charts the history of utility taxes without the cell phone. As can be seen, it is fairly flat and even projected to decline slightly next year.
Franchise Revenue Five Year Trend
$6,355
$7,855$7,875$8,196
$7,980$7,847
$6,375$6,688
$6,323$6,122
$4,000$4,500$5,000
$5,500$6,000$6,500$7,000$7,500$8,000$8,500
FY2012 FY2013 FY2014 FY2015 FY2016
In T
hous
ands
of D
olla
rs
Franchise Fees Minus Cell Phone Revenue
User Fees - User fees represent 25.0% of total City revenues and are charged for civic facility rents, downtown and on-street public parking, building inspections, recreational activities (swimming, ice skating, golf, athletic leagues, etc…), casino gaming taxes, bus fares, sewer user fees, landfill tipping fees, and various other fees for service.
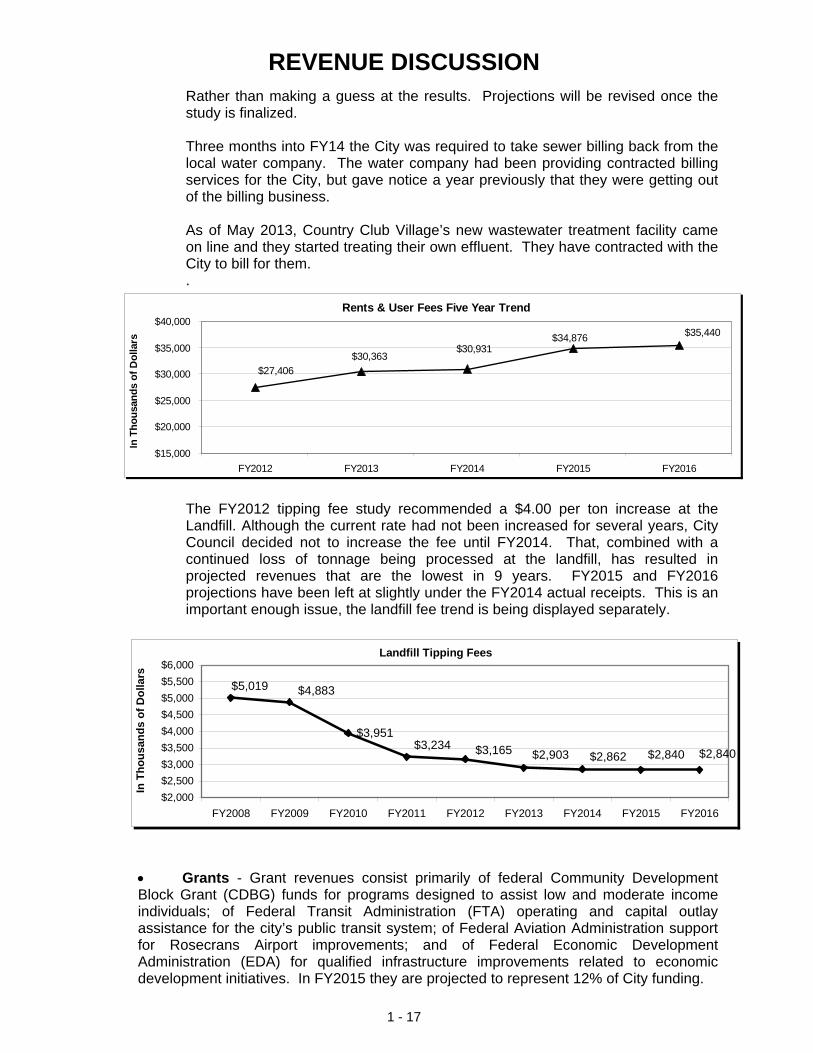
Revenue Assumptions - After the mid-FY2005 change in ownership of the casino, there was a dramatic turn around in gaming revenues. There was a 21% increase of FY06 revenues over FY05. FY07 increase slowed to 10.5%. The state of the region’s economy finally hit gaming too, and revenues flattened in FY08 and FY09. The 20 “lease Agreement” the City & County had with the casino ended 6/30/09 and the casino owners promptly stopped the negotiated payments above and beyond that dictated by the State Gaming commission. This amounted to a $400,000 loss to the City. The elimination of loss limits at the legislative level resulted in some additional monies through the State’s distribution of gaming taxes. However, it did not make up for the other loss. This was exacerbated in FY2012 when significant flooding of the Missouri River occurred in the summer of 2011 and the casino had to actually close for three months. The City lost one-quarter of its anticipated revenue. FY2014 budgeted revenues were running up to 7% behind FY2013 receipts and projections lowered accordingly. FY2015 was budgeted at the FY2014 level. The casino has rebounded somewhat in the current year and projections increased by 2% for FY2015 and another 1% in FY2016. Sewer fees are determined by cost of service studies prepared by specialists. Increases in sewer discharge fees will take effect this coming year on July 1. At the time this budget was prepared, the FY15 study was still being finalized.
REVENUE DISCUSSION
1 - 17
Rather than making a guess at the results. Projections will be revised once the study is finalized. Three months into FY14 the City was required to take sewer billing back from the local water company. The water company had been providing contracted billing services for the City, but gave notice a year previously that they were getting out of the billing business. As of May 2013, Country Club Village’s new wastewater treatment facility came on line and they started treating their own effluent. They have contracted with the City to bill for them. .
Rents & User Fees Five Year Trend
$27,406
$30,363$30,931
$34,876 $35,440
$15,000
$20,000
$25,000
$30,000
$35,000
$40,000
FY2012 FY2013 FY2014 FY2015 FY2016
In T
hous
ands
of D
olla
rs
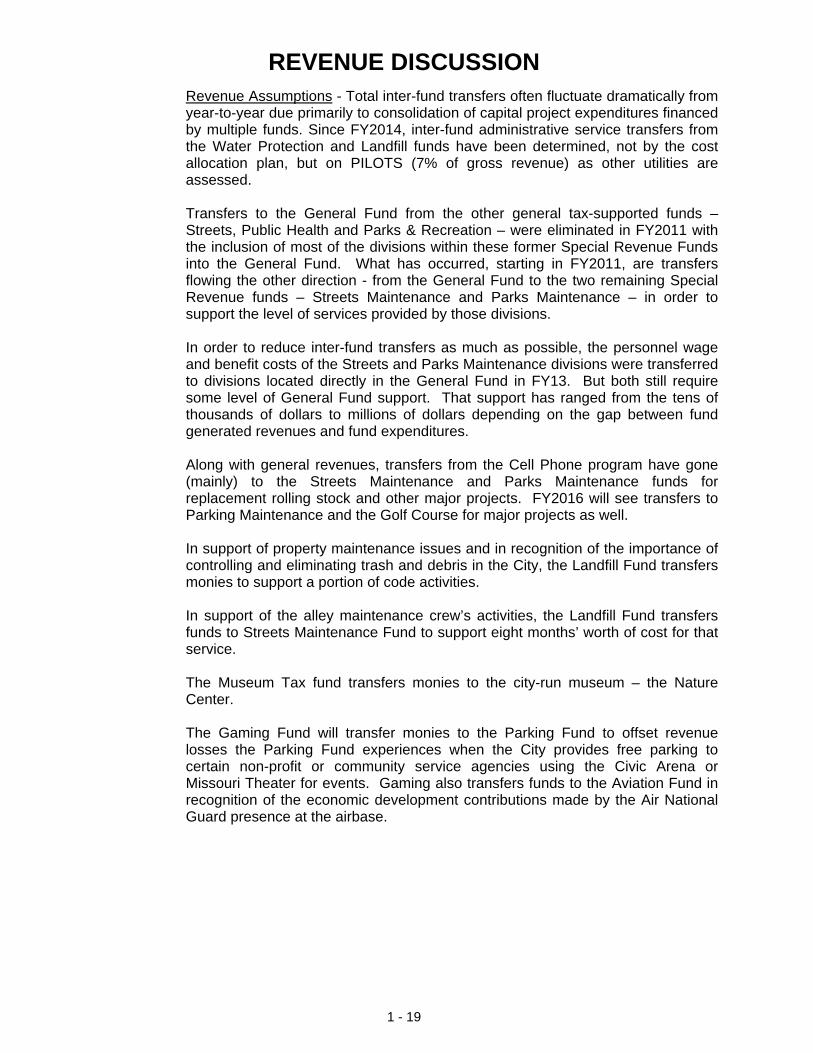
The FY2012 tipping fee study recommended a $4.00 per ton increase at the Landfill. Although the current rate had not been increased for several years, City Council decided not to increase the fee until FY2014. That, combined with a continued loss of tonnage being processed at the landfill, has resulted in projected revenues that are the lowest in 9 years. FY2015 and FY2016 projections have been left at slightly under the FY2014 actual receipts. This is an important enough issue, the landfill fee trend is being displayed separately.
Landfill Tipping Fees
$3,951
$2,840$2,840$2,862$2,903$3,165
$4,883$5,019
$3,234
$2,000
$2,500
$3,000
$3,500
$4,000
$4,500
$5,000
$5,500
$6,000
FY2008 FY2009 FY2010 FY2011 FY2012 FY2013 FY2014 FY2015 FY2016
In T
hous
ands
of D
olla
rs
Grants - Grant revenues consist primarily of federal Community Development Block Grant (CDBG) funds for programs designed to assist low and moderate income individuals; of Federal Transit Administration (FTA) operating and capital outlay assistance for the city’s public transit system; of Federal Aviation Administration support for Rosecrans Airport improvements; and of Federal Economic Development Administration (EDA) for qualified infrastructure improvements related to economic development initiatives. In FY2015 they are projected to represent 12% of City funding.

REVENUE DISCUSSION
1 - 18
Revenue Assumptions - Historical revenue patterns and trends are only marginally useful when projecting future grant revenues. Federal funding for the CDBG programs dropped for five straight years, with a loss of $732,000 between FY2012 and FY2013 and another $301,000 between FY2013 and FY2014. FY2015 entitlement amounts temporarily stabilized with a small, $10,000 increase. FY2016 will see another slight increase of $16,000. Other grant funding is based on funding applications pending and/or approved for specific projects and program activities. Increases and decreases in total grant revenue often correspond with increases and decreases in capital projects funded by grants. FY2010 through FY2012 grant revenue was impacted a great deal by federal stimulus funds the City received. FY2016 proposed grant amounts are based on known or anticipated amounts. Unbudgeted grants received during the year, result in an amended budget to recognize the revenue and intended expenditures tied to them.
Licenses/Permits/Fines - Licenses and permits are charged to specific individuals based on the value of service provided. Licenses are issued for occupational licenses, liquor licenses, dog licenses, trade licenses/examination fees, and garage sale licenses. Permits are issued for trash hauling, septic tanks, food establishments, street cuts, and alarm monitoring. Fine revenue is generated as a byproduct of the city’s effort to reduce violations of its code of ordinances. Overall, these sources generate 1% of the City’s revenues.
Revenue Assumptions – Overall fine revenues have a projected 2.5% increase over the original FY2015 budget. Most of the increase is the result of the Administrative Code Penalties introduced mid-FY14. All other license and permit revenues have remained fairly constant over the past few years. Revenue estimates are based largely on the experience and projections of the responsible departments. Given the slight rally in the economy, revenues for inspection fees and plan review have been held steady.
Sale of Bonds - Bond sales occur intermittently in response to the funding requirements of capital projects and capital outlay initiatives.
Revenue Assumptions - Bonds sales most often occur in response to individual capital project and capital outlay funding initiatives with little or no relationship to prior year bond sales. At the time the budget was prepared, the Public Works department reported no plans for additional bond issues in FY2016.
Interest/Other - Interest revenues consist primarily of interest earned on operating and capital project cash reserves. Lesser amounts of interest are derived from special assessments and accounts receivable. Other revenues are generated from special assessment principal collections, sale of fixed assets, insurance recoveries, and reimbursements of prior year expenditures.
Revenue Assumptions - Interest earnings relate most specifically to the amount of expected cash reserves, fund balances, and interest rates rather than to historical interest income totals. Much of what is ultimately contingent in nature. Due to the contingent nature of insurance recoveries, refunds of prior year expenditures, and sale of fixed assets, such revenues are usually not included in the Annual Budget
Transfers In – The majority of inter-fund transfers occur to reimburse the General Fund for administrative services. Other transfers serve as operating subsidies for those funds unable to sustain operations and to consolidate capital project expenditures when funding is provided by multiple funds and funding sources.
REVENUE DISCUSSION
1 - 19
Revenue Assumptions - Total inter-fund transfers often fluctuate dramatically from year-to-year due primarily to consolidation of capital project expenditures financed by multiple funds. Since FY2014, inter-fund administrative service transfers from the Water Protection and Landfill funds have been determined, not by the cost allocation plan, but on PILOTS (7% of gross revenue) as other utilities are assessed. Transfers to the General Fund from the other general tax-supported funds – Streets, Public Health and Parks & Recreation – were eliminated in FY2011 with the inclusion of most of the divisions within these former Special Revenue Funds into the General Fund. What has occurred, starting in FY2011, are transfers flowing the other direction - from the General Fund to the two remaining Special Revenue funds – Streets Maintenance and Parks Maintenance – in order to support the level of services provided by those divisions. In order to reduce inter-fund transfers as much as possible, the personnel wage and benefit costs of the Streets and Parks Maintenance divisions were transferred to divisions located directly in the General Fund in FY13. But both still require some level of General Fund support. That support has ranged from the tens of thousands of dollars to millions of dollars depending on the gap between fund generated revenues and fund expenditures. Along with general revenues, transfers from the Cell Phone program have gone (mainly) to the Streets Maintenance and Parks Maintenance funds for replacement rolling stock and other major projects. FY2016 will see transfers to Parking Maintenance and the Golf Course for major projects as well. In support of property maintenance issues and in recognition of the importance of controlling and eliminating trash and debris in the City, the Landfill Fund transfers monies to support a portion of code activities. In support of the alley maintenance crew’s activities, the Landfill Fund transfers funds to Streets Maintenance Fund to support eight months’ worth of cost for that service. The Museum Tax fund transfers monies to the city-run museum – the Nature Center. The Gaming Fund will transfer monies to the Parking Fund to offset revenue losses the Parking Fund experiences when the City provides free parking to certain non-profit or community service agencies using the Civic Arena or Missouri Theater for events. Gaming also transfers funds to the Aviation Fund in recognition of the economic development contributions made by the Air National Guard presence at the airbase.
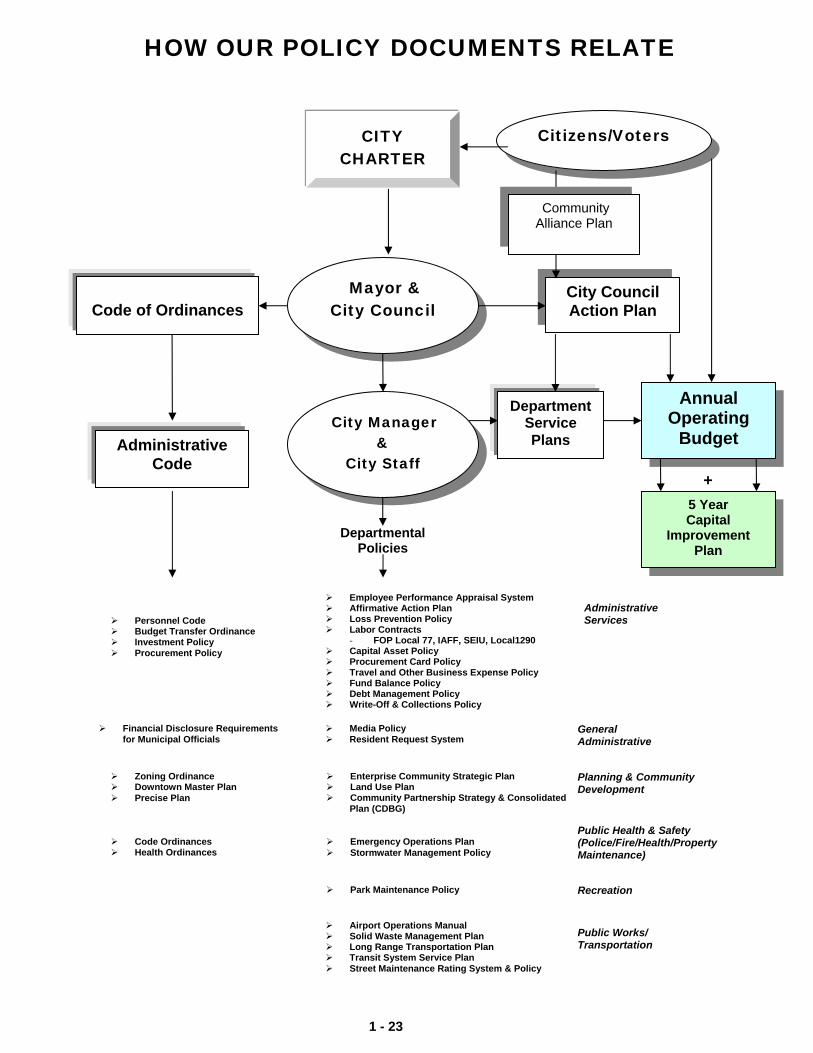
City Mission and Policies
A section designed to give the reader relevant information regarding the City’s overall vision, mission, immediate goals, and key fiscal policies.
City of St. Joseph Vision, Mission Statement, Core Strategies
City Council Action Plan (as yet not updated by the
newly elected council) Key Fiscal Policies
1 - 20
VISION STATEMENT Historic St. Joseph, on the banks of the Missouri River, is a city with a rural feel in an urban setting, connected by a world-class parkway and dedicated to a safe, family-friendly environment.
Revised August 2010
MISSION STATEMENT
The City of St. Joseph is dedicated to providing quality services by working to enhance the quality of life and to create a healthy, progressive community in which to live, work and visit.
CITY COUNCIL CORE STRATEGIES
The goal of the City is to enhance the quality of life through the
following Core Strategies:
1) Financial Viability & Economic Development Continue to enhance the high level of service quality and financial stability within the City by encouraging redevelopment through new and expanding businesses with quality job growth, by exploring and diversifying tax and revenue sources, and by ensuring the long-term viability of financial strategies within City government.
2) A Safe, Family-Friendly, Healthy Community Provide support to neighborhood groups, individual homeowners and business owners in maintaining and improving property values, aesthetics and safety throughout the City. Promote healthy lifestyles. Maintain the excellent quality of life aspects of the community. Provide the best level of public safety possible within the City’s financial ability to do so.
3) Customer-Involved & Customer-Informed Government
Promote effective communication among employees, City Council and the community. Actively seek insights into the needs of the city and elicit cooperation and support from all elements of the community. Exhibit respect
1 - 21
and dignity for our customers. Provide information to help promote transparency at all levels of governmental activities.
4) Qualified and Dedicated Internal Workforce. Select, train, motivate and retain highly qualified, dedicated municipal
employees. Create an atmosphere of enthusiastic, innovative, pro-active approaches to problem-solving and tolerance for mistakes. Recognize failure as the price paid for improvement. Listen to employees’ requirements and expectations and ideas for cutting red tape by simplifying processes, procedures and systems. Recognize change is a given, not government as usual, by remaining open-minded and flexible to new ideas and concepts. Recognize employee value to the extent possible within the City’s financial ability to do so.
5) Sound and Expanding Infrastructure Base Strive to improve the City’s basic infrastructure (streets, sewers, curbs & gutters,
sidewalks, public facilities) in order to support economic development and to provide safe environment in which our citizens live, work, and play. Promote best practices and effective technology to improve safe travel and encourage convenient and accessible modes of transportation. Meet local, state and national mandates as to public health and safety.
Revised November 2011 ACTION PLAN (2012-2014)
The Action Plan represents specific items within the Core Strategies that City
Council identified during their November 2011 annual retreat. The City Manager and department directors are tasked with exploring these items and to report on the viability of implementation. Specific items/topics are not all-inclusive of a Core Strategy and not all strategies had issues staff
were asked to address. Those items in italics remain on the Action Plan but were not specifically addressed in the recent retreat.
1) Financial Viability & Economic Development
Downtown / Riverfront Revitalization Continue present emphasis on downtown development plan. Develop architecturally consistent plan for attractive corridors to downtown. Explore possibilities for a safe harbor marina.
Exploring new or expanded businesses. Enhance participation and funding sources for economic development with
the Chamber of Commerce. Examine policies and practices that may impede development. Explore options for strategic annexation to enhance economic capacity of the
city. Create a plan to facilitate both commercial & residential infill development.
Community Appearance Create financial incentives to help people renovate property Revise and update existing building codes to facilitate rehabilitation of older
properties.
1 - 22
2) A Safe, Family-Friendly, Healthy Community Public Safety Concerns Plan for adequate staffing and retention of public safety personnel. Follow through on fire services plan for relocations of fire stations and best
and highest deployment of personnel. Tourism, recreation and cultural amenities Coordinate with the organizations associated with tourism. Review uses of the museum tax. Continue to utilize facilities to attract prominent tournaments.
3) Customer-Involved Government
Communications and Public Relations Continue to enhance external relations (business partnerships, other public
entities, Community Alliance) Expand the Public Information/Communications Division Make sure customer service remains a high priority Look into methods of Branding / Marketing the City
4) Qualified and Dedicated Internal Workforce
Monitor internal relations with the various working groups (Local 77, IAFF, SEIU, general employees)
5) Sound and Expanding Infrastructure Base
Enhance funding for sidewalks, curbs, gutters, streets. Develop funding source for major corridor enhancement. Keep Council apprised as to the progress made in meeting CSO and other
environmental mandates for the City’s sewer system. Maintain funding for parks’ and ball fields’ maintenance.
1 - 23
HOW OUR POLICY DOCUMENTS RELATE
Zoning Ordinance Downtown Master Plan Precise Plan
+
City Council Action Plan
Code of Ordinances
Annual Operating
Budget Administrative Code
Departmental Policies
Personnel Code Budget Transfer Ordinance Investment Policy Procurement Policy
Employee Performance Appraisal System Affirmative Action Plan Loss Prevention Policy Labor Contracts
- FOP Local 77, IAFF, SEIU, Local1290 Capital Asset Policy Procurement Card Policy Travel and Other Business Expense Policy Fund Balance Policy Debt Management Policy Write-Off & Collections Policy
General Administrative
Emergency Operations Plan Stormwater Management Policy
Enterprise Community Strategic Plan Land Use Plan Community Partnership Strategy & Consolidated Plan (CDBG)
Citizens/Voters
Mayor & City Council
CITY CHARTER
City Manager &
City Staff
Department Service Plans
5 Year Capital
Improvement Plan
Administrative Services
Planning & Community Development
Public Health & Safety (Police/Fire/Health/Property Maintenance)
Recreation Park Maintenance Policy
Public Works/ Transportation
Airport Operations Manual Solid Waste Management Plan Long Range Transportation Plan Transit System Service Plan Street Maintenance Rating System & Policy
Financial Disclosure Requirements for Municipal Officials
Media Policy Resident Request System
Community Alliance Plan
Code Ordinances Health Ordinances

KEY FISCAL POLICIES
1 - 24
FUND BALANCE This fund balance policy applies to all city’s fund balance and reserves. The objective of establishing and maintaining a fund balance policy is for the city to be in a strong fiscal position that will (1) provide sufficient cash flow for daily financial needs, (2) secure and maintain investment grade bond ratings, (3) offset significant economic downturns or revenue shortfalls, and (4) provide funds for unforeseen expenditures related to emergencies. In February, 2009, Governmental Accounting Standards Board (GASB) issued GASB Statement No. 54, Fund Balance Reporting and Governmental Fund Type Definitions effective for fiscal periods beginning after June 15, 2010. This standard created new classifications for fund balance based upon constraints placed on the use of current fund balance and redefines governmental fund type definitions effective for the City of St. Joseph for fiscal year ending June 30, 2011. Minimum Fund Balance General Fund – The General Fund is used to account for resources traditionally associated with government which are not required legally or by sound financial management to be accounted for and reported in another fund. The City shall strive to maintain a fund balance level in the General Fund equal to 10% of annual expenditures. The purpose for maintaining this balance will be for meeting emergencies arising from (1) the loss or substantial reduction in actual revenue collections over anticipated amounts (2) unexpected expenditures due to natural disasters or casualty losses (3) non-budgeted expenditures for the satisfaction of court judgments and litigation costs and (4) conditions that threaten the loss of life, health or property within the community. The availability of resources in other funds and the potential drain on the General fund resources from other funds could affect the necessary level of minimum unrestricted fund balance. The availability of resources in other funds may reduce the amount of unrestricted fund balance needed in the General fund, just as deficits in other funds may require that a higher level of unrestricted fund balance be maintained in the General fund. All other funds, including Special Revenue Funds, Debt Service Funds, and Capital Project Funds do not have a fund balance requirement. Fund balances in these funds are dictated by revenue sources and are equal to a schedule of expenditures and capital projects. Special Revenue Funds – Special revenue funds are created to account for the proceeds of specific revenue sources that are legally restricted to expenditure for specific purposes. The amount of any reservation of fund balance shall be governed by the legal authority underlying the creation of the individual funds. Debt Service Fund – Debt service fund is created for very specific reserve amounts
KEY FISCAL POLICIES
1 - 25
as part of the ordinance or resolution which authorizes the issuance of the bonds. Reserve requirement for any outstanding bond issue will be consistent with the ordinance or resolution authorizing the issuance of the bonds. Capital Projects Fund – Capital projects fund is created to account for resources designated to construct or acquire capital assets and major improvements. These projects may extend beyond a single fiscal year. However, at a minimum, the fiscal year end reserved fund balance, and estimated revenues for the ensuing fiscal year must be sufficient to meet all outstanding fund encumbrances. The City will periodically review of the sufficiency of the minimum fund balance levels in all funds. Order Of Resource Use The City will classify its fund balances based on the nature of the particular net resources reported in a governmental fund and on the constraints placed on their use. It is the policy of the City to utilize the restricted fund balance for a specific purpose prior to unrestricted fund balance when more than one fund balance resource is required. Unrestricted fund balance will be maintained for necessary and unexpected expenditures. With this policy, the City will consent to committed amounts first followed by assigned funds before allocating unassigned net resources when more than one unrestricted resource is required. This policy shall recognize the financial importance of a stable and sufficient level of fund balance. In the event that the fund balance is so calculated to be less than the policy anticipates for minimum required balances, the City will strive to adjust budget resources in the subsequent fiscal years to restore the balance. Whenever an operating fund balance falls below the level established above, the City will restore through revenue allocations or expenditure reductions back to the allowable level. The City will strive to develop and maintain a diversified and reliable revenue stream so as to avoid becoming overly dependent on any single source of revenue. Efforts will be directed to optimize existing revenue sources while periodically reviewing potential new revenue sources. Any amounts in an operating fund balance that exceed the appropriate level of that fund may be utilized in the following year’s operating budget for one-time or limited purposes. The City Manager is directed to make recommendations to the City Council with the proposed budget a plan to restore the minimum requirements. (See specifics under the Revenue and Expenditure policy sections below.) Stabilization Arrangements Appropriation from fund balance shall require the approval of the City Council. If fund balance is nearing its minimum threshold, such appropriations shall be only for one time expenditures and not for ongoing and routine operating expenditures. It should
KEY FISCAL POLICIES
1 - 26
be used to insure adequate reserves, respond to unforeseen emergencies, protect from revenue shortages, other contingencies, and overall financial stability. Authority To Commit Fund Balance The City Council is the highest level of authority and any committed amounts will be imposed by Ordinance. Authority To Assign Fund Balance The authority to assign fund balance for specific uses will be delegated to the City Manager and/or the Director of Financial Services. Unlike committed fund balance, the action taken to assign fund balance may be made after year end. The City will classify fund balance at year end for financial reporting purposes. Thus only current, and not future, net resources are classified. Typically the subsequent year’s budgeted expenditures are expected to be paid from the subsequent year’s revenues and not the current reporting year’s ending fund balance. On occasion, the City will “deficit” budget, or in other words, budget more expenditures than anticipated revenues and drawdown beginning fund balance for the subsequent year. An appropriation of existing fund balance to eliminate a projected budgetary deficit in the subsequent year’s budget in an amount no greater than the projected excess of expected expenditures over expected revenues satisfies the criteria to be classified as an assignment of fund balance. (6/4/2007, rev. 6/13/2011) BUDGET POLICIES Operating Budget Policies 1. Balanced Budget – Current revenues will be sufficient to support current operating expenditures. 2. Operating Deficits - Annual fund net operating deficits, a condition in which annual operating deficits exceed annual operating revenues, shall not be allowed for any purpose other than one that is temporary, minor and would not cause operating fund balance to be reduced below 5% of annual budgeted operating expenditures. 3. The City will avoid budgetary and accounting procedures that balance the current budget at the expense of future budgets. (6/4/2007) Expenditure Policies 1. In order to meet the operating budget policies above, the following protocols shall be followed when developing annual operating budgets: a. Annual increases to employee health insurance at the fund level shall not exceed 15%.
KEY FISCAL POLICIES
1 - 27
b. Annual increases to other employee benefit categories at the fund level shall not exceed 2% c. Annual increases to other operating expenditures at the fund level shall not exceed 2%. d. Annual service expansions shall not be allowed if those expansions rely upon revenue sources that are temporary in nature or provide for less than 100% of the full amount needed to operate that program or activity. e. The addition of new employee positions will only be requested after service needs have been thoroughly examined and it is substantiated that the additional staffing will result in increased revenue, enhanced operating efficiencies, or the achievement of specific objectives approved by the Council. In no event shall an increase in staffing levels be allowed to bring fund balance below the established target for any operating fund. 2. In the event that item 1 protocols are not sufficient to achieve the aforementioned fund balance and operating budget objectives, the City Council shall consider the following actions: a. Additional fees and revenues (see Revenue Policies), b. Adjust municipal programs and activities; explore alternate means of service delivery, procurement options, etc. These may or may not require a reduction in budgeted positions, active or vacant. To the extent feasible, personnel cost reductions will be achieved through attrition and reassignment. 3. Employee Compensation - The City will strive to provide for an annual increase to employee compensation in accordance with the City of St. Joseph Employee Compensation Plan. In the event the protocols and actions described above are not effective, only then shall the City Council forego employee compensation adjustments in accordance with the Employee Compensation Plan. (6/4/2007) Revenue Policies 1. One-Time Revenues – One time revenues shall be used only for one-time expenditures (including capital expenditures). The City will avoid using temporary revenues to fund on-going programs and activities. 2. Grants – The City shall actively pursue federal, state and other grant opportunities when deemed appropriate. Before accepting any grant the City shall thoroughly consider all implications related to costs associated with complying with the terms of the grant agreement and the ongoing obligations that will be required in connection with the acceptance of the grant. Programs financed with grant monies will be monitored and the service program will be adjusted to reflect the level of available funding. In the event of reduced grant funding, City resources may be substituted only after all program priorities and alternatives are considered during the budget process.
KEY FISCAL POLICIES
1 - 28
3. Revenue Diversification – The City will strive to develop and maintain a diversified and reliable revenue stream (in all funds as far as possible) so as to avoid becoming overly dependent on any single source of revenue. Efforts will be directed to optimize existing revenue sources while periodically reviewing potential new revenue sources. 4. Estimation of Annual Budgeted Revenues – The Administrative Services Department will provide an annual estimate of anticipated revenues using an objective and analytical process. When faced with assumption uncertainties, conservative projections will be utilized. 5. User Fees and Charges – A. General and Special Revenue Funds - Fees and charges shall be periodically evaluated and, if necessary, adjusted annually to assure that they cover all direct and indirect costs unless it is determined by City Council that full cost recovery would not be in the best interest of the public. B. Enterprise Funds – Fees and user charges for each enterprise fund shall be set at a level that fully supports the total direct and indirect cost of the activity. Indirect costs include the cost of annual depreciation of capital assets and overhead charges. 6. Administrative and Program Support Services – The City shall set fund transfers for each fund at a rate that fully covers direct and/or indirect costs of providing support services to other funds. The Indirect Cost Plan will be developed in accordance with prevailing federal indirect cost guidelines. (6/4/2007) INVESTMENT POLICY It is the policy of the City of St. Joseph, Missouri, to invest public funds in a manner which will provide the highest investment return with the maximum security while meeting the daily cash flow demands of the City and while conforming to all Missouri state statutes, the City Charter, the City Administrative Code, and the City's Code of Ordinances governing the investment of public funds. The City Investment Policy, a separate document, is available on request. (7/19/1994; rev. 10/18/2010) CAPITAL ASSET POLICY The Capital Asset Policy provides comprehensive guidelines for the classification, recording and control of capital assets. The policy applies to the recording of capital assets in the General Capital Asset Account Group and in the Proprietary Funds as necessary in order to 1) provide for physical and financial control, 2) avoid duplication and inefficient use of assets and 3) account for general government capital expenditures in compliance with Federal guidelines and State statutes and regulations concerning municipal accounting, auditing and reporting requirements. The Capital Asset Policy, a separate document, is available on request. (4/7/1997, rev. 12/13/1999; rev. 2/24/10)

KEY FISCAL POLICIES
1 - 29
PROCUREMENT POLICY The City’s Procurement Policy provides a process for the fair and equitable treatment of all persons involved in public procurement with the city, to maximize the procurement value of public funds in procurement and to provide safeguards for maintaining a procurement system of quality and integrity. The policy applies to all contracts or commitments for the expenditure of any public funds under the city’s control. It shall apply to every expenditure of public funds by the city irrespective of their source. When the procurement involves the expenditure of federal assistance or contract funds, the procurement shall be conducted in accordance with any applicable federal laws and/or regulations, which have not been set out in the policy. The City Procurement Policy, made part of the city’s code of ordinances, is available on request. (4/19/1982; rev. 3/22/1999; rev. 5/23/2005; rev. 12/18/2006; rev 2/25/2008) TRAVEL & OTHER BUSINESS EXPENSE POLICY The Travel and Other Business Expense Policy (Policy) has been established for use by City employees and officials who travel and incur business expenses on behalf of the City both outside and inside the City. The Policy establishes General Conditions which are those requirements that must be satisfied in order to qualify for advance travel authorization from the City Manager and/or department directors. The Policy identifies Specific Conditions which are those individual requirements necessary for proper approval, payment, documentation, and reconciliation of actual travel and related business expenses. The Policy lists Allowable Expenses that are generally considered by the City and the Internal Revenue Service to be ordinary and necessary in the exercise of business when traveling for the City. The Policy identifies Unallowable Expenses considered by the City to be unordinary and unnecessary in the exercise of business when traveling for the City. The Policy includes Travel Position Statements that address, expand, and/or clarify the City’s treatment of complex and/or specific travel and related business expense issues. Definitions explain terms commonly used when discussing travel and travel related issues. The Travel and Other Business Expense Policy, a separate document, is available on request. (4/30/1990; rev. 12/27/1999; rev. 6/13/2011) TAX AND SECURITIES LAWS COMPLIANCE POLICY The Internal Revenue Service and the Securities and Exchange Commission have increased requirements for compliance with federal tax and securities laws and expanded enforcement of such laws, shifting the burden of proof for compliance with such laws to the issuers of governmental obligations. The Tax and Securities Law Compliance Policy is intended to ensure compliance with Federal tax and securities laws following issuance of such bonds and obligations. The policy is available upon request. (10/29/2012)
KEY FISCAL POLICIES
1 - 30
WRITE OFF AND COLLECTIONS POLICY The City adopted a Write-Off and Collections Policy to establish a consistent and effective method of handling various types of accounts receivables and improving collection efforts. The focus of collection efforts will be concentrated on billed amounts that remain uncollected past their due dates for more than 90 days (“Current Receivables”). The policy was drafted in order to pull together and formalize various departmental collection practices that had developed over the years. The policy is available upon request. (March 17, 2014) DEBT MANAGEMENT POLICY The Debt Management Policy was established to accomplish several objectives: Minimize the cost of borrowing Provide timely funding of capital projects and other financial needs Optimize the City’s credit ratings Establish a framework for appropriate security to investors of City obligations Ensure compliance with all statutory and regulatory obligations Communicate to the City and the municipal bond market the manner in which
the City will participate in financing its debt obligations The policy lays out the guidelines for the use of debt. It explains the types of debt the City is authorized to issue. Method of bonds sale are explained. Debt capacity guidelines are established for each type of debt obligation. Guidance is provided on debt structuring and terms of sale. The actual components of debt management are discussed including the need for feasibility analyses and studies, debt service cash flow monitoring, covenant compliance, prepayment and defeasance of debt, and refunding of existing debt. Selection of related professional services – financial advisor, bond counsel, investment bankers/underwriters – is covered. Finally, investment of bond proceeds, debt reporting and the City’s regulatory compliance and disclosure obligations are detailed. The policy is available on request. (4/14/2014)
Budget Summary
An overview of the Annual Budget presented in a series of tables, charts and graphs designed to give the reader an overall general understanding of the budget and the budget process.
Budget Process
Budget Calendar
Budget Overview / Fund Balance Financial Summaries:
Where the Money Comes From
Where the Money Goes - by Expenditure Type
Where the Money Goes - by Program & Fund Type
Where the Money Goes - Operations & CIP Summary
Department / Fund Crosswalk
Department / Function Flowchart
All Funds Combined – Sources & Uses
Personnel Summaries: Staffing - by Service/Program
Staffing - by Fund
Personnel Expenditures – Five Year History
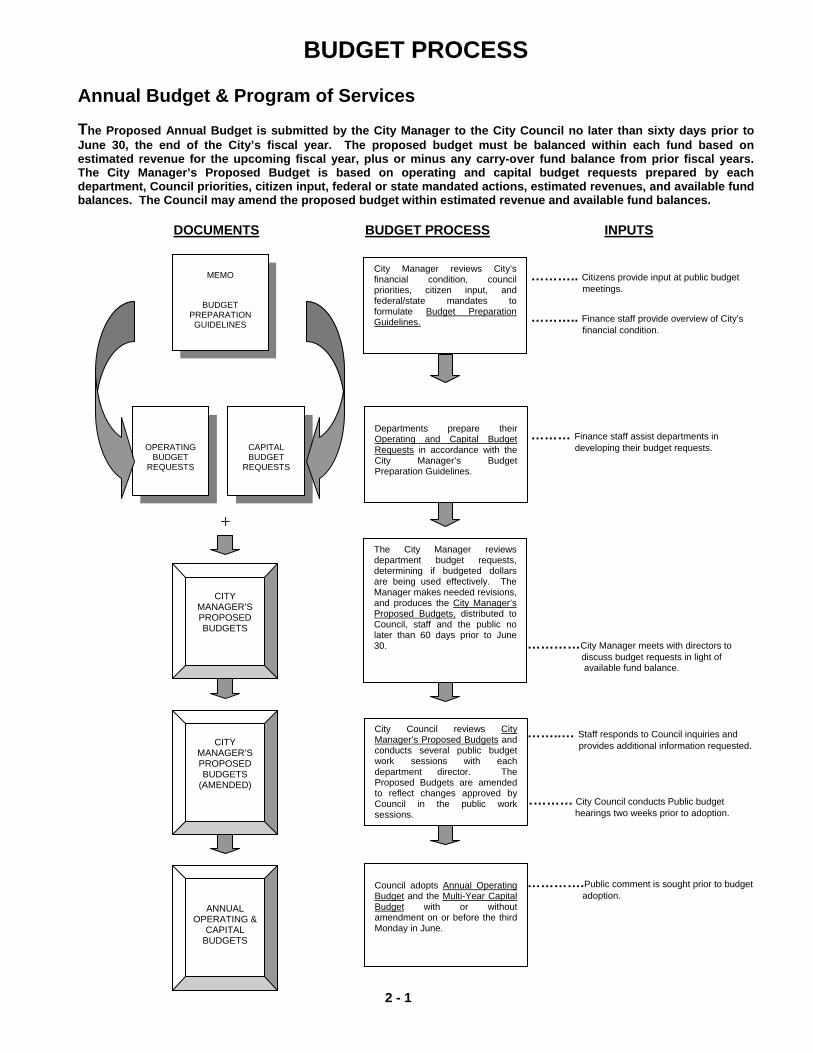
2 - 1
BUDGET PROCESS Annual Budget & Program of Services The Proposed Annual Budget is submitted by the City Manager to the City Council no later than sixty days prior to June 30, the end of the City’s fiscal year. The proposed budget must be balanced within each fund based on estimated revenue for the upcoming fiscal year, plus or minus any carry-over fund balance from prior fiscal years. The City Manager’s Proposed Budget is based on operating and capital budget requests prepared by each department, Council priorities, citizen input, federal or state mandated actions, estimated revenues, and available fund balances. The Council may amend the proposed budget within estimated revenue and available fund balances.
DOCUMENTS BUDGET PROCESS INPUTS ……….. Citizens provide input at public budget meetings.
……….. Finance staff provide overview of City’s financial condition.
……… Finance staff assist departments in developing their budget requests.
…………City Manager meets with directors to discuss budget requests in light of
available fund balance. ……..… Staff responds to Council inquiries and provides additional information requested.
` ………… City Council conducts Public budget hearings two weeks prior to adoption. ………….Public comment is sought prior to budget adoption.
MEMO
BUDGET PREPARATION GUIDELINES
OPERATING BUDGET
REQUESTS
CAPITAL BUDGET
REQUESTS
CITY
MANAGER’S PROPOSED BUDGETS
CITY
MANAGER’S PROPOSED BUDGETS
(AMENDED)
ANNUAL OPERATING &
CAPITAL BUDGETS
City Manager reviews City’s financial condition, council priorities, citizen input, and federal/state mandates to formulate Budget Preparation Guidelines.
Departments prepare their Operating and Capital Budget Requests in accordance with the City Manager’s Budget Preparation Guidelines.
The City Manager reviews department budget requests, determining if budgeted dollars are being used effectively. The Manager makes needed revisions, and produces the City Manager’s Proposed Budgets, distributed to Council, staff and the public no later than 60 days prior to June 30.
City Council reviews City Manager’s Proposed Budgets and conducts several public budget work sessions with each department director. The Proposed Budgets are amended to reflect changes approved by Council in the public work sessions.
Council adopts Annual Operating Budget and the Multi-Year Capital Budget with or without amendment on or before the third Monday in June.
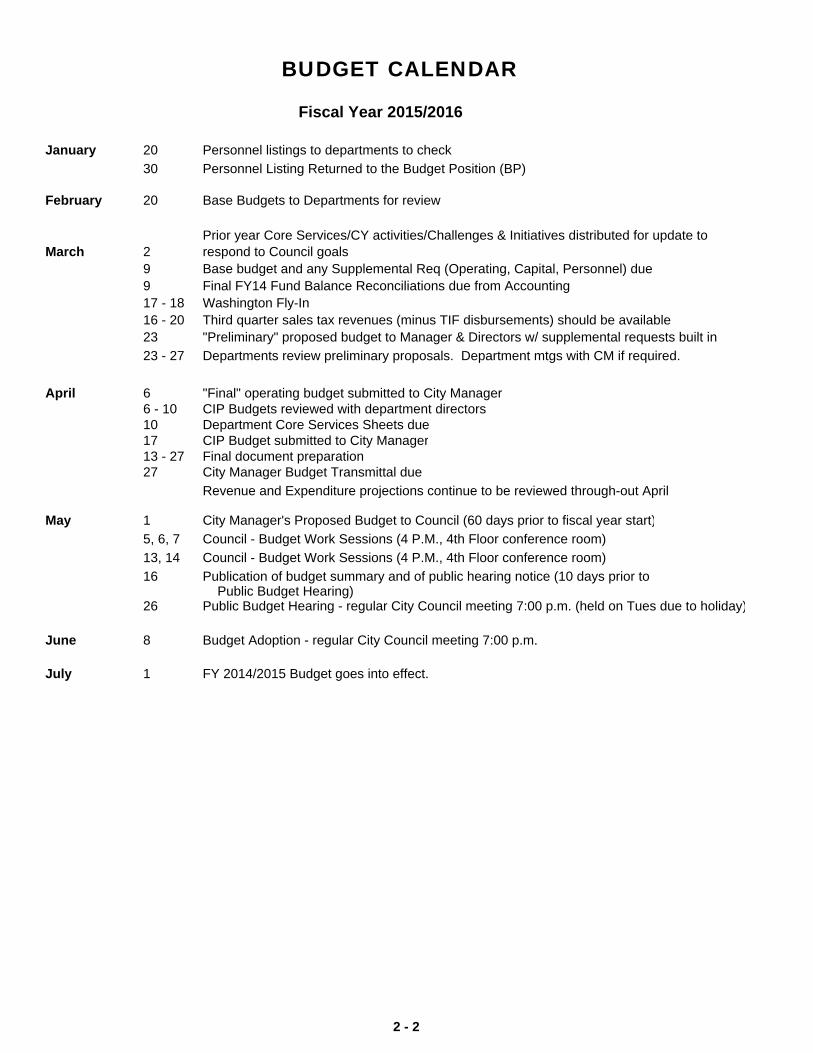
Fiscal Year 2015/2016
January 20 Personnel listings to departments to check
30 Personnel Listing Returned to the Budget Position (BP)
February 20 Base Budgets to Departments for review
March 29 Base budget and any Supplemental Req (Operating, Capital, Personnel) due9 Final FY14 Fund Balance Reconciliations due from Accounting17 - 18 Washington Fly-In16 - 20 Third quarter sales tax revenues (minus TIF disbursements) should be available23 "Preliminary" proposed budget to Manager & Directors w/ supplemental requests built in
23 - 27 Departments review preliminary proposals. Department mtgs with CM if required.
April 6 "Final" operating budget submitted to City Manager6 - 10 CIP Budgets reviewed with department directors10 Department Core Services Sheets due 17 CIP Budget submitted to City Manager13 - 27 Final document preparation27 City Manager Budget Transmittal due
Revenue and Expenditure projections continue to be reviewed through-out April
May 1 City Manager's Proposed Budget to Council (60 days prior to fiscal year start)
5, 6, 7 Council - Budget Work Sessions (4 P.M., 4th Floor conference room)
13, 14 Council - Budget Work Sessions (4 P.M., 4th Floor conference room)
16 Publication of budget summary and of public hearing notice (10 days prior to Public Budget Hearing)
26 Public Budget Hearing - regular City Council meeting 7:00 p.m. (held on Tues due to holiday)
June 8 Budget Adoption - regular City Council meeting 7:00 p.m.
July 1 FY 2014/2015 Budget goes into effect.
BUDGET CALENDAR
Prior year Core Services/CY activities/Challenges & Initiatives distributed for update to respond to Council goals
2 - 2
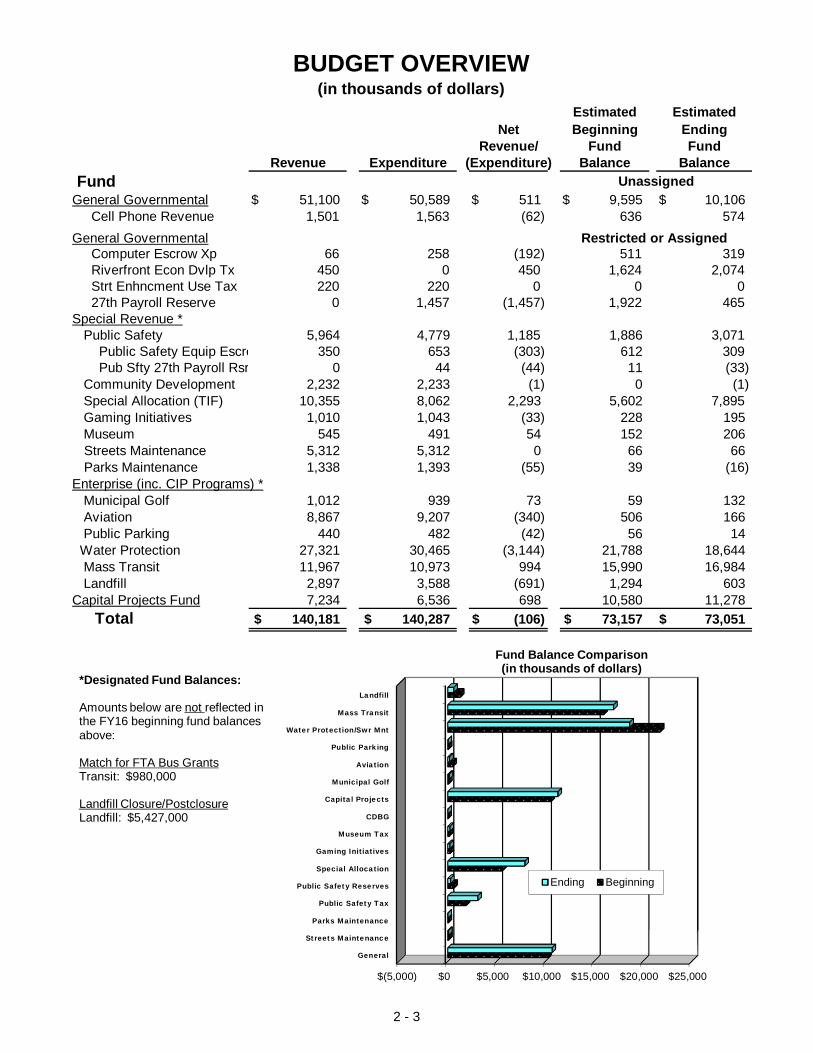
BUDGET OVERVIEW(in thousands of dollars)
Estimated EstimatedNet Beginning Ending
Revenue/ Fund FundRevenue Expenditure (Expenditure) Balance Balance
Fund Unassigned General Governmental 51,100 $ 50,589 $ 511 $ 9,595 $ 10,106 $ Cell Phone Revenue 1,501 1,563 (62) 636 574
General Governmental Restricted or Assigned Computer Escrow Xp 66 258 (192) 511 319 Riverfront Econ Dvlp Tx 450 0 450 1,624 2,074 Strt Enhncment Use Tax 220 220 0 0 0 27th Payroll Reserve 0 1,457 (1,457) 1,922 465Special Revenue * Public Safety 5,964 4,779 1,185 1,886 3,071 Public Safety Equip Escro 350 653 (303) 612 309 Pub Sfty 27th Payroll Rsr 0 44 (44) 11 (33) Community Development 2,232 2,233 (1) 0 (1) Special Allocation (TIF) 10,355 8,062 2,293 5,602 7,895 Gaming Initiatives 1,010 1,043 (33) 228 195 Museum 545 491 54 152 206
Streets Maintenance 5,312 5,312 0 66 66 Parks Maintenance 1,338 1,393 (55) 39 (16)Enterprise (inc. CIP Programs) * Municipal Golf 1,012 939 73 59 132 Aviation 8,867 9,207 (340) 506 166 Public Parking 440 482 (42) 56 14 Water Protection 27,321 30,465 (3,144) 21,788 18,644 Mass Transit 11,967 10,973 994 15,990 16,984 Landfill 2,897 3,588 (691) 1,294 603 Capital Projects Fund 7,234 6,536 698 10,580 11,278
Total 140,181 $ 140,287 $ (106)$ 73,157 $ 73,051 $
$(5,000) $0 $5,000 $10,000 $15,000 $20,000 $25,000
General
Streets Maintenance
Parks Maintenance
Public Safety Tax
Public Safety Reserves
Special Allocation
Gaming Initiatives
Museum Tax
CDBG
Capital Projects
Municipal Golf
Aviation
Public Parking
Water Protection/Swr Mnt
Mass Transit
Landfill
Fund Balance Comparison(in thousands of dollars)
Ending Beginning
*Designated Fund Balances:
Amounts below are not reflected in the FY16 beginning fund balances above:
Match for FTA Bus GrantsTransit: $980,000
Landfill Closure/PostclosureLandfill: $5,427,000
2 - 3

WHERE THE MONEY COMES FROM(in thousands of dollars)
% ofchange
FY2015 FY2016 fromFY2014 Adopted Estimated % of FY2015Actual Budget Actual Budget total Adopted
Revenue Property Tax $15,978 $16,024 $16,145 $16,076 11% 0.32 % Sales Tax 38,896 41,467 44,579 46,185 33% 11.38 % Utility Tax 8,195 7,935 7,875 7,855 6% (1.01)% User Fees & Gaming 30,931 35,364 34,876 36,542 26% 3.33 % Grants 5,690 15,744 8,523 18,487 13% 17.42 %
99,690 116,534 111,998 125,145 89% 7.39 %
Other Revenue Licenses & Permits 1,590 1,596 1,595 1,596 1% 0.00 % Fines 1,425 1,316 1,294 1,350 1% 2.58 % Interest 374 348 271 239 0% (31.32)% Bond Proceeds 16,737 28,757 44,108 0 0% 0.00 % Other 2,321 2,427 3,264 2,434 2% 0.29 %
22,447 34,444 50,532 5,619 4% (83.69)%Operating Revenue 122,137 150,978 162,530 130,764 93% (13.39)%
Interfund Transfers-In 8,494 8,875 10,760 9,416 7% 6.10 %
From (to) Fund Balance 42,017 (1,531) (18,094) 107 0% (106.99)%
Total Revenue 172,648 $ 158,322 $ 155,196 $ 140,287 $ 100% (11.39)%
Property Tax11%
Sales Tax33%
Utility Franchise Fees4%
User Fees26%
Grants13%
All Other Revenue4%
Transfers-In7%
2 - 4
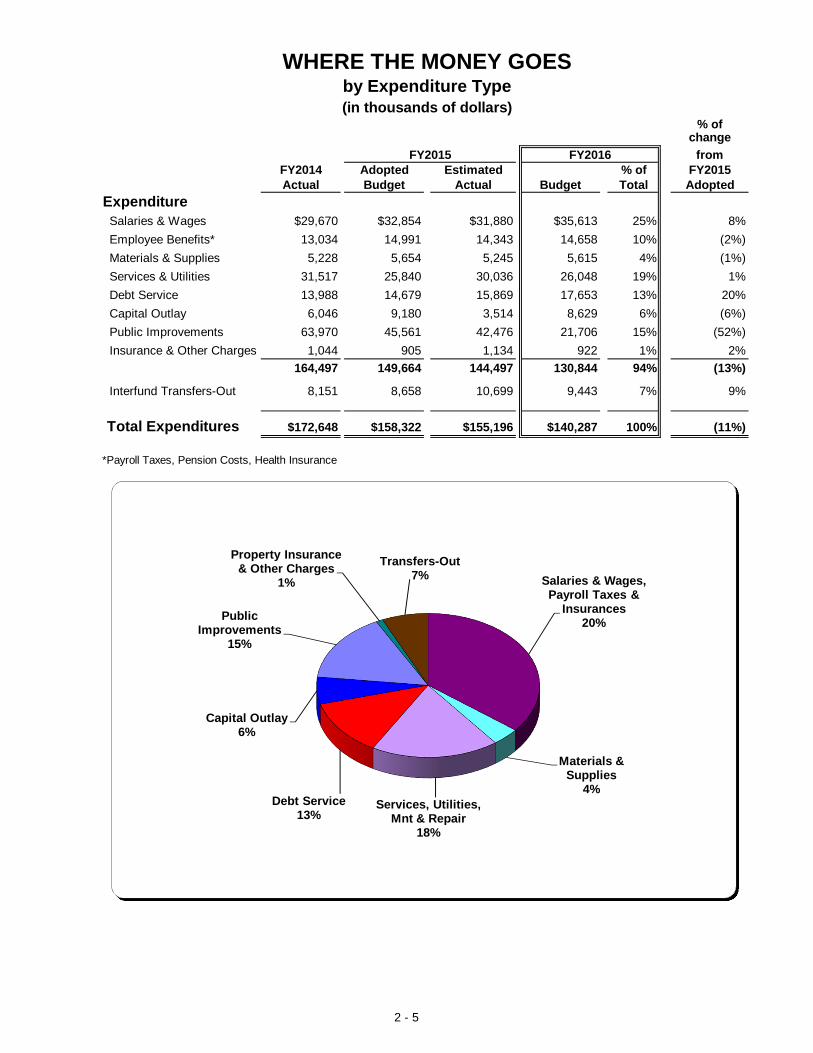
WHERE THE MONEY GOESby Expenditure Type(in thousands of dollars)
% ofchange
FY2015 FY2016 fromFY2014 Adopted Estimated % of FY2015Actual Budget Actual Budget Total Adopted
Expenditure Salaries & Wages $29,670 $32,854 $31,880 $35,613 25% 8%
Employee Benefits* 13,034 14,991 14,343 14,658 10% (2%)
Materials & Supplies 5,228 5,654 5,245 5,615 4% (1%)
Services & Utilities 31,517 25,840 30,036 26,048 19% 1%
Debt Service 13,988 14,679 15,869 17,653 13% 20%
Capital Outlay 6,046 9,180 3,514 8,629 6% (6%)
Public Improvements 63,970 45,561 42,476 21,706 15% (52%)
Insurance & Other Charges 1,044 905 1,134 922 1% 2%
164,497 149,664 144,497 130,844 94% (13%)
Interfund Transfers-Out 8,151 8,658 10,699 9,443 7% 9%
Total Expenditures $172,648 $158,322 $155,196 $140,287 100% (11%)
*Payroll Taxes, Pension Costs, Health Insurance
Salaries & Wages, Payroll Taxes &
Insurances20%
Materials & Supplies
4%Services, Utilities,
Mnt & Repair18%
Debt Service13%
Capital Outlay6%
Public Improvements
15%
Property Insurance & Other Charges
1%
Transfers-Out7%
2 - 5

WHERE THE MONEY GOES
by Program and Fund Type(in thousands of dollars)
%FY2015 FY2016 change
% of fromFund FY2014 Adopted Estimated Operating FY2015Type Department Actual Budget Actual Budget Total Budget
G City Council & Mayor $196 $228 $210 $228 0.20 % 0.00 %G City Clerk 247 222 222 211 0.18 % (4.95)%G City Manager 424 505 429 523 0.46 % 3.56 %G Legal 528 557 557 579 0.50 % 3.95 %
Planning & CD Department 3,862 3,940 4,140 3,993 3.48 % 1.35 %G Admin, Bldg Dvlpmnt, Prop Mnt 1,662 1,730 1,704 1,760 1.53 % 1.73 %
SR CDBG Programs 2,200 2,210 2,436 2,233 1.95 % 1.04 % Administrative Services 3,330 3,742 3,779 3,930 3.43 % 5.02 %G Fin, HR, Tech, Mun Crt, Cust Srvc 2,860 3,130 3,135 3,240 2.82 % 3.51 %E Utility Billing 470 612 644 690 0.60 % 12.75 % Police 14,524 16,974 16,641 18,046 15.73 % 6.32 %G Police 13,339 14,289 14,064 14,798 12.90 % 3.56 %
SR Public Safety Police 1,185 2,685 2,577 3,248 2.83 % 20.97 % Fire 12,096 13,423 13,144 14,646 12.77 % 9.11 %G Fire 11,199 12,147 11,868 12,605 10.99 % 3.77 %
SR Public Safety Fire 897 1,276 1,276 2,041 1.78 % 59.95 % Health Department 3,430 3,819 3,919 3,877 3.38 % 1.52 %G Health 3,357 3,596 3,696 3,691 3.22 % 2.64 %
SR Public Safety Health 73 223 223 186 0.16 % (16.59)%Public Works Department 106,492 82,896 81,138 67,660 115.00 % (18.38)%
G PW Admin, Eng, & Strts Mnt 7,093 7,565 8,600 8,323 7.26 % 10.02 %SR Streets Maintenance (non-prsnl) 5,367 5,140 6,538 5,312 4.63 % 3.35 %E Municipal Airport 619 605 548 618 0.54 % 2.15 %cp Airport CIP 515 4,905 357 8,589 33.58 % 100.00 %E Parking Maintenance 403 385 391 482 0.42 % 25.19 %E Water Protection/Sewer Mnt 19,673 20,915 21,474 25,012 21.80 % 19.59 %cp WP CIP 63,865 28,671 33,796 4,763 18.62 % (83.39)%E Transit Operations 5,098 5,794 5,250 5,798 5.05 % 0.07 %cp Transit CIP 5 4,595 0 5,175 20.24 % 12.62 %E Landfill/Recycling Operations 3,179 3,305 3,245 3,268 2.85 % (1.12)%cp Landfill CIP 675 1,016 939 320 1.25 % 100.00 %
Parks, Recreation Department 7,078 7,377 7,582 8,095 6.96 % 9.73 %G Parks, Recreation & Civic Fac. 4,792 5,308 5,475 5,763 5.02 % 8.57 %
SR Parks Maintenance 1,423 1,244 1,293 1,393 1.21 % 11.98 %E Municipal Golf Course 840 810 794 824 0.72 % 1.73 %cp Golf CIP 23 15 20 115 0.45 % 666.67 %
CAP Capital Proj (Non-Enterprise) 8,530 13,041 11,154 6,537 5.70 % (49.87)%
Other ProgramsSR Special Allocation 7,058 8,195 8,284 8,062 7.03 % (1.62)%SR Municipal Museum Tax 422 442 448 416 0.36 % (5.88)%cp Museum CIP 358 75 75 75 0.07 % -G Non Department Specific Exp 2,881 1,865 2,448 2,366 2.06 % 26.86 %
SR Gaming Financed Initiatives 1,192 1,021 1,026 1,043 0.91 % 2.15 %
Total Operating 98,677 106,004 108,855 114,713 82% 8.22 %
Total Capital Projects 73,971 52,318 46,341 25,574 18% (51.12)%
Total Expenditures $172,648 $158,322 $155,196 $140,287 100% (11.39)%
G = General Government E = EnterpriseSR = Special Revenue CAP = Capital Projects
2 - 6
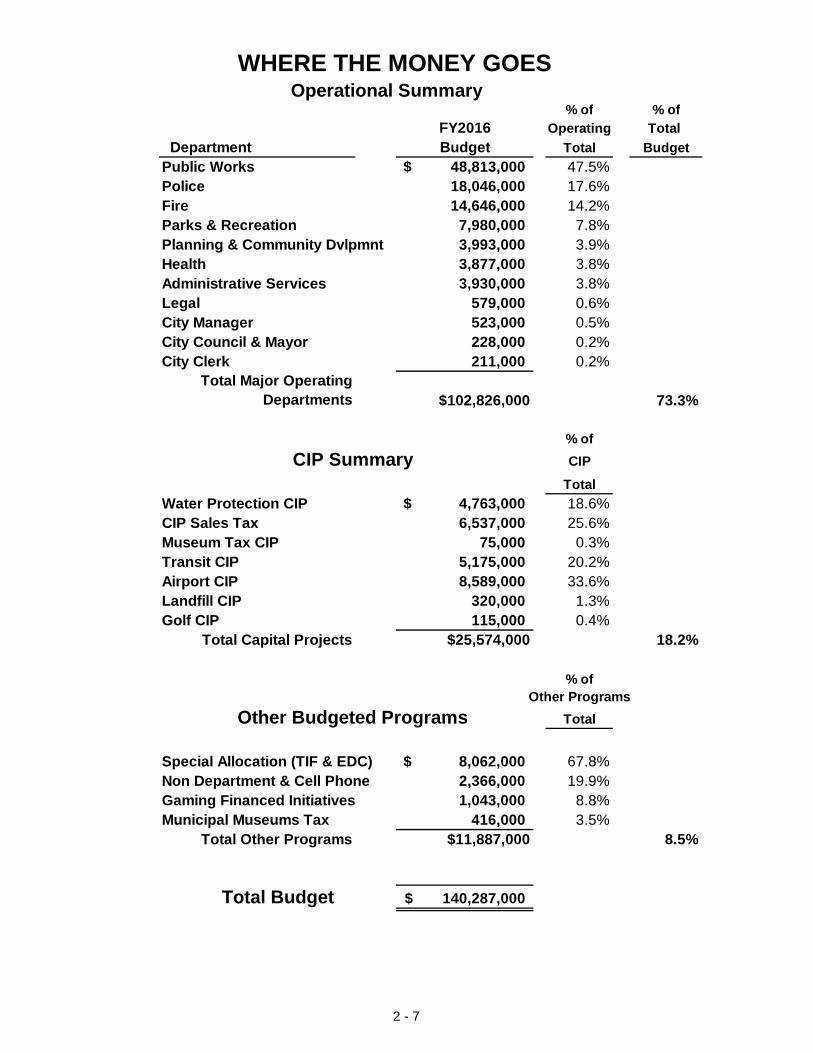
WHERE THE MONEY GOESOperational Summary
% of % ofFY2016 Operating Total
Department Budget Total BudgetPublic Works 48,813,000$ 47.5%Police 18,046,000 17.6%Fire 14,646,000 14.2%Parks & Recreation 7,980,000 7.8%Planning & Community Dvlpmnt 3,993,000 3.9%Health 3,877,000 3.8%Administrative Services 3,930,000 3.8%Legal 579,000 0.6%City Manager 523,000 0.5%City Council & Mayor 228,000 0.2%City Clerk 211,000 0.2%
Total Major Operating Departments $102,826,000 73.3%
% ofCIP Summary CIP
TotalWater Protection CIP 4,763,000$ 18.6%CIP Sales Tax 6,537,000 25.6%Museum Tax CIP 75,000 0.3%Transit CIP 5,175,000 20.2%Airport CIP 8,589,000 33.6%Landfill CIP 320,000 1.3%Golf CIP 115,000 0.4%
Total Capital Projects $25,574,000 18.2%
% ofOther Programs
Other Budgeted Programs Total
Special Allocation (TIF & EDC) 8,062,000$ 67.8%Non Department & Cell Phone 2,366,000 19.9%Gaming Financed Initiatives 1,043,000 8.8%Municipal Museums Tax 416,000 3.5%
Total Other Programs $11,887,000 8.5%
Total Budget 140,287,000$
2 - 7
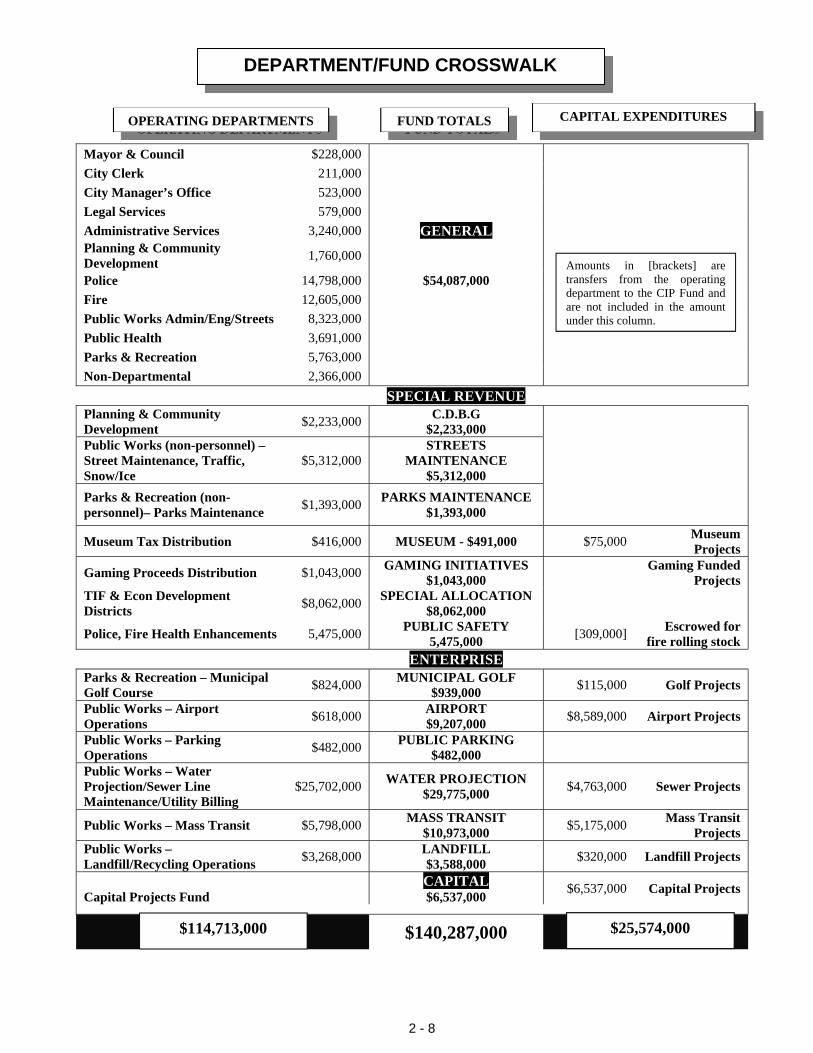
2 - 8
Mayor & Council $228,000
City Clerk 211,000
City Manager’s Office 523,000
Legal Services 579,000
Administrative Services 3,240,000 GENERAL Planning & Community Development 1,760,000
Police 14,798,000 $54,087,000
Fire 12,605,000
Public Works Admin/Eng/Streets 8,323,000
Public Health 3,691,000
Parks & Recreation 5,763,000
Non-Departmental 2,366,000 SPECIAL REVENUE Planning & Community Development $2,233,000
C.D.B.G $2,233,000
Public Works (non-personnel) – Street Maintenance, Traffic, Snow/Ice
$5,312,000 STREETS
MAINTENANCE $5,312,000
Parks & Recreation (non-personnel)– Parks Maintenance $1,393,000
PARKS MAINTENANCE $1,393,000
Museum Tax Distribution $416,000 MUSEUM - $491,000 $75,000 Museum Projects
Gaming Proceeds Distribution $1,043,000 GAMING INITIATIVES
$1,043,000 Gaming Funded
Projects TIF & Econ Development Districts $8,062,000
SPECIAL ALLOCATION $8,062,000
Police, Fire Health Enhancements 5,475,000 PUBLIC SAFETY
5,475,000 [309,000] Escrowed for
fire rolling stock ENTERPRISE Parks & Recreation – Municipal Golf Course $824,000
MUNICIPAL GOLF $939,000 $115,000 Golf Projects
Public Works – Airport Operations $618,000
AIRPORT $9,207,000 $8,589,000 Airport Projects
Public Works – Parking Operations $482,000
PUBLIC PARKING $482,000
Public Works – Water Projection/Sewer Line Maintenance/Utility Billing
$25,702,000 WATER PROJECTION
$29,775,000 $4,763,000 Sewer Projects
Public Works – Mass Transit $5,798,000 MASS TRANSIT
$10,973,000 $5,175,000 Mass Transit
Projects Public Works – Landfill/Recycling Operations $3,268,000
LANDFILL $3,588,000 $320,000 Landfill Projects
Capital Projects Fund CAPITAL $6,537,000 $6,537,000 Capital Projects
$140,287,000
DEPARTMENT/FUND CROSSWALK
OPERATING DEPARTMENTS FUND TOTALS CAPITAL EXPENDITURES
Amounts in [brackets] are transfers from the operating department to the CIP Fund and are not included in the amount under this column.
$114,713,000 $25,574,000
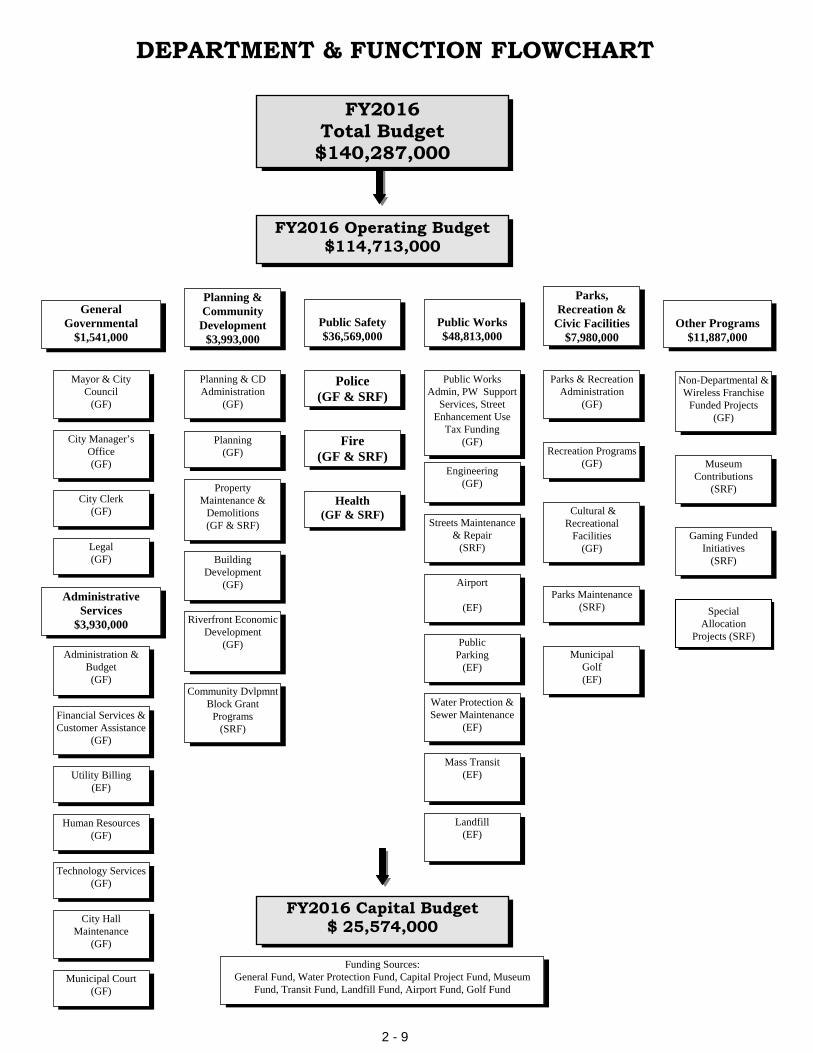
2 - 9
DEPARTMENT & FUNCTION FLOWCHART
FY2016 Total Budget $140,287,000
FY2016 Operating Budget $114,713,000
General Governmental
$1,541,000
Planning & Community
Development $3,993,000
Public Works Admin, PW Support
Services, Street Enhancement Use
Tax Funding (GF) Fire
(GF & SRF)
Parks, Recreation &
Civic Facilities $7,980,000
Streets Maintenance & Repair
(SRF)
Parks Maintenance (SRF)
Municipal Court (GF)
City Manager’s Office (GF)
Gaming Funded Initiatives
(SRF)
Airport
(EF)
Public Parking
(EF)
Water Protection & Sewer Maintenance
(EF)
Municipal Golf (EF)
Mass Transit (EF)
Landfill (EF)
Special Allocation
Projects (SRF)
Public Works $48,813,000
Museum Contributions
(SRF)
Non-Departmental & Wireless Franchise
Funded Projects (GF)
Public Safety $36,569,000
Health (GF & SRF)
Engineering (GF)
Police (GF & SRF)
Administration & Budget (GF)
City Clerk (GF)
Legal (GF)
Parks & Recreation Administration
(GF)
Recreation Programs (GF)
Cultural & Recreational
Facilities (GF)
Mayor & City Council
(GF)
Property Maintenance &
Demolitions (GF & SRF)
Utility Billing (EF)
Riverfront Economic Development
(GF)
Planning & CD Administration
(GF)
Technology Services (GF)
Other Programs
$11,887,000
Building Development
(GF)
FY2016 Capital Budget $ 25,574,000
Funding Sources: General Fund, Water Protection Fund, Capital Project Fund, Museum
Fund, Transit Fund, Landfill Fund, Airport Fund, Golf Fund
Human Resources (GF)
Planning (GF)
Administrative Services
$3,930,000
Financial Services & Customer Assistance
(GF)
City Hall Maintenance
(GF)
Community Dvlpmnt Block Grant
Programs (SRF)
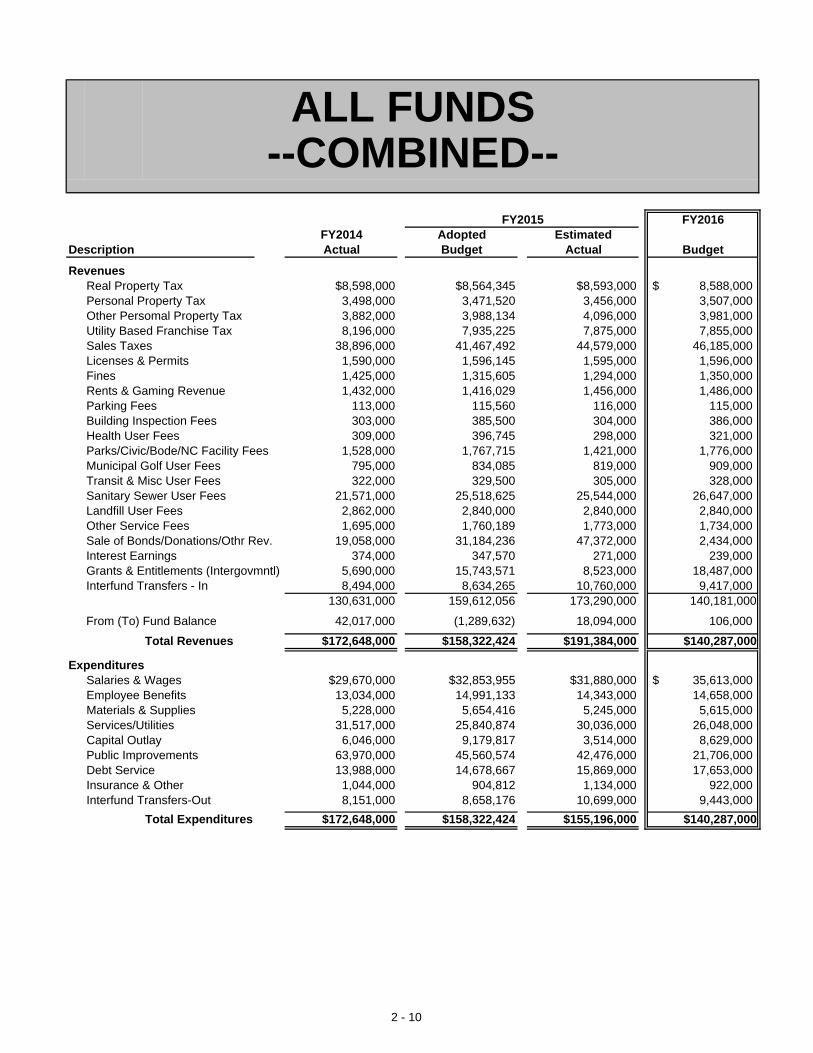
ALL FUNDS--COMBINED--
FY2015 FY2016FY2014 Adopted Estimated
Description Actual Budget Actual Budget
RevenuesReal Property Tax $8,598,000 $8,564,345 $8,593,000 8,588,000$ Personal Property Tax 3,498,000 3,471,520 3,456,000 3,507,000 Other Persomal Property Tax 3,882,000 3,988,134 4,096,000 3,981,000 Utility Based Franchise Tax 8,196,000 7,935,225 7,875,000 7,855,000 Sales Taxes 38,896,000 41,467,492 44,579,000 46,185,000 Licenses & Permits 1,590,000 1,596,145 1,595,000 1,596,000 Fines 1,425,000 1,315,605 1,294,000 1,350,000 Rents & Gaming Revenue 1,432,000 1,416,029 1,456,000 1,486,000 Parking Fees 113,000 115,560 116,000 115,000 Building Inspection Fees 303,000 385,500 304,000 386,000 Health User Fees 309,000 396,745 298,000 321,000 Parks/Civic/Bode/NC Facility Fees 1,528,000 1,767,715 1,421,000 1,776,000 Municipal Golf User Fees 795,000 834,085 819,000 909,000 Transit & Misc User Fees 322,000 329,500 305,000 328,000 Sanitary Sewer User Fees 21,571,000 25,518,625 25,544,000 26,647,000 Landfill User Fees 2,862,000 2,840,000 2,840,000 2,840,000 Other Service Fees 1,695,000 1,760,189 1,773,000 1,734,000 Sale of Bonds/Donations/Othr Rev. 19,058,000 31,184,236 47,372,000 2,434,000 Interest Earnings 374,000 347,570 271,000 239,000 Grants & Entitlements (Intergovmntl) 5,690,000 15,743,571 8,523,000 18,487,000 Interfund Transfers - In 8,494,000 8,634,265 10,760,000 9,417,000
130,631,000 159,612,056 173,290,000 140,181,000
From (To) Fund Balance 42,017,000 (1,289,632) 18,094,000 106,000 Total Revenues $172,648,000 $158,322,424 $191,384,000 $140,287,000
ExpendituresSalaries & Wages $29,670,000 $32,853,955 $31,880,000 35,613,000$ Employee Benefits 13,034,000 14,991,133 14,343,000 14,658,000 Materials & Supplies 5,228,000 5,654,416 5,245,000 5,615,000 Services/Utilities 31,517,000 25,840,874 30,036,000 26,048,000 Capital Outlay 6,046,000 9,179,817 3,514,000 8,629,000 Public Improvements 63,970,000 45,560,574 42,476,000 21,706,000 Debt Service 13,988,000 14,678,667 15,869,000 17,653,000 Insurance & Other 1,044,000 904,812 1,134,000 922,000 Interfund Transfers-Out 8,151,000 8,658,176 10,699,000 9,443,000
Total Expenditures $172,648,000 $158,322,424 $155,196,000 $140,287,000
2 - 10
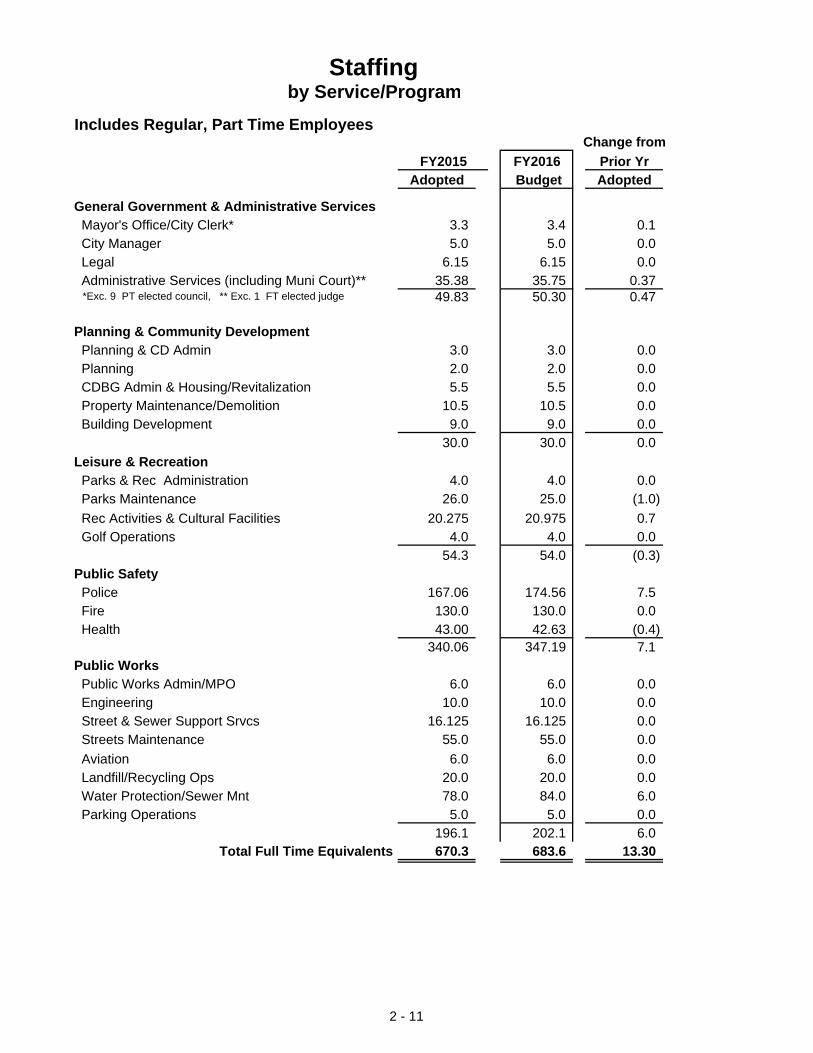
Staffingby Service/Program
Includes Regular, Part Time EmployeesChange from
FY2015 FY2016 Prior YrAdopted Budget Adopted
General Government & Administrative Services Mayor's Office/City Clerk* 3.3 3.4 0.1 City Manager 5.0 5.0 0.0 Legal 6.15 6.15 0.0 Administrative Services (including Muni Court)** 35.38 35.75 0.37 *Exc. 9 PT elected council, ** Exc. 1 FT elected judge 49.83 50.30 0.47
Planning & Community Development Planning & CD Admin 3.0 3.0 0.0 Planning 2.0 2.0 0.0 CDBG Admin & Housing/Revitalization 5.5 5.5 0.0 Property Maintenance/Demolition 10.5 10.5 0.0 Building Development 9.0 9.0 0.0
30.0 30.0 0.0
Leisure & Recreation Parks & Rec Administration 4.0 4.0 0.0 Parks Maintenance 26.0 25.0 (1.0)
Rec Activities & Cultural Facilities 20.275 20.975 0.7 Golf Operations 4.0 4.0 0.0
54.3 54.0 (0.3)Public Safety Police 167.06 174.56 7.5 Fire 130.0 130.0 0.0 Health 43.00 42.63 (0.4)
340.06 347.19 7.1Public Works Public Works Admin/MPO 6.0 6.0 0.0 Engineering 10.0 10.0 0.0 Street & Sewer Support Srvcs 16.125 16.125 0.0 Streets Maintenance 55.0 55.0 0.0
Aviation 6.0 6.0 0.0 Landfill/Recycling Ops 20.0 20.0 0.0 Water Protection/Sewer Mnt 78.0 84.0 6.0 Parking Operations 5.0 5.0 0.0
196.1 202.1 6.0 Total Full Time Equivalents 670.3 683.6 13.30
2 - 11
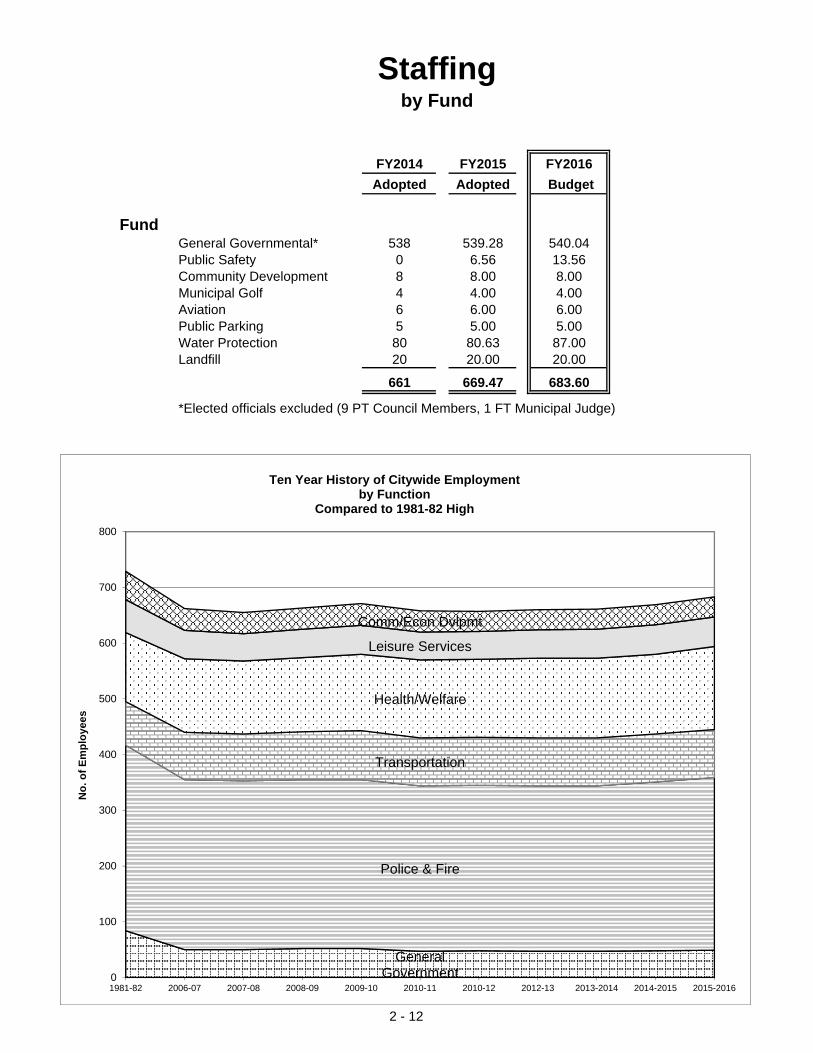
Staffingby Fund
FY2014 FY2015 FY2016Adopted Adopted Budget
FundGeneral Governmental* 538 539.28 540.04Public Safety 0 6.56 13.56Community Development 8 8.00 8.00Municipal Golf 4 4.00 4.00Aviation 6 6.00 6.00Public Parking 5 5.00 5.00Water Protection 80 80.63 87.00Landfill 20 20.00 20.00
661 669.47 683.60
*Elected officials excluded (9 PT Council Members, 1 FT Municipal Judge)
General Government
Police & Fire
Transportation
Health/Welfare
Leisure Services
Comm/Econ Dvlpmt
0
100
200
300
400
500
600
700
800
1981-82 2006-07 2007-08 2008-09 2009-10 2010-11 2010-12 2012-13 2013-2014 2014-2015 2015-2016
No.
of E
mpl
oyee
s
Ten Year History of Citywide Employmentby Function
Compared to 1981-82 High
2 - 12

PERSONNEL EXPENDITURESEstimated Budget*
2011-12 2012-13 2013-14 2014-15 2015-16Salary & Wages 26,210,146 25,831,196 26,889,746 28,965,230 32,503,236
Overtime 1,206,364 1,196,802 1,318,463 1,336,615 1,418,075
FLSA OT (Firefighters) 161,840 171,174 188,591 171,000 180,000
Temporary/Part-Time Wages 895,449 990,596 984,596 1,109,285 1,194,290
Out-of-Title 135,965 122,111 119,934 127,200 144,800
Sick Buy-Back 16,890 19,157 16,101 16,103 17,900
Retired Firefighter Consultants 162,176 156,908 152,884 152,000 154,400
Total Salaries 28,788,830 28,487,944 29,670,315 31,877,433 35,612,701
Police Pension 1,729,509 1,760,366 1,752,618 1,702,068 1,754,692
Lagers Pension 3,060,986 3,295,742 3,501,285 3,774,226 3,233,363
FICA 1,039,587 1,057,209 1,091,644 1,152,246 1,214,187
Medicare 374,823 383,285 401,515 462,952 482,275
ICMA Deferred Compensation 37,410 41,551 47,339 42,148 219,693
Health 3,967,132 4,187,997 4,123,739 4,706,512 5,150,394
Dental 160,526 179,411 181,871 182,354 209,708
Federal Hlth Insurance Tax 0 0 0 3,640 1,855
Life 92,180 92,582 96,296 125,846 124,179
Unemployment 22,717 16,898 12,645 7,685 700
Long Term Disability 57,674 57,902 59,813 81,768 81,466
Workers Compensation 872,313 861,392 1,036,109 1,306,191 1,328,480
Uniform Allowance 319,837 351,750 355,063 366,775 385,500
Fire EMT Allowance 19,937 21,917 22,479 22,750 23,750
Car/Mileage Allowance 58,900 59,918 61,963 68,260 70,610
Conference/Training 279,434 315,032 283,068 333,896 377,304
Total Benefits 12,092,965 12,682,952 13,027,447 14,339,317 14,658,156
*FY16 Proposed Amounts exclude the impact of the 27th Payroll - approx. $1,918,400 of wages & benefits city-wide.
$5,000,000
$10,000,000
$15,000,000
$20,000,000
$25,000,000
$30,000,000
$35,000,000
$40,000,000
$45,000,000
$50,000,000
2011-12 2012-13 2013-14 2014-15 2015-16
Personnel Expenditures
Pensions Insurances Payroll Taxes Other Series6
2 - 13
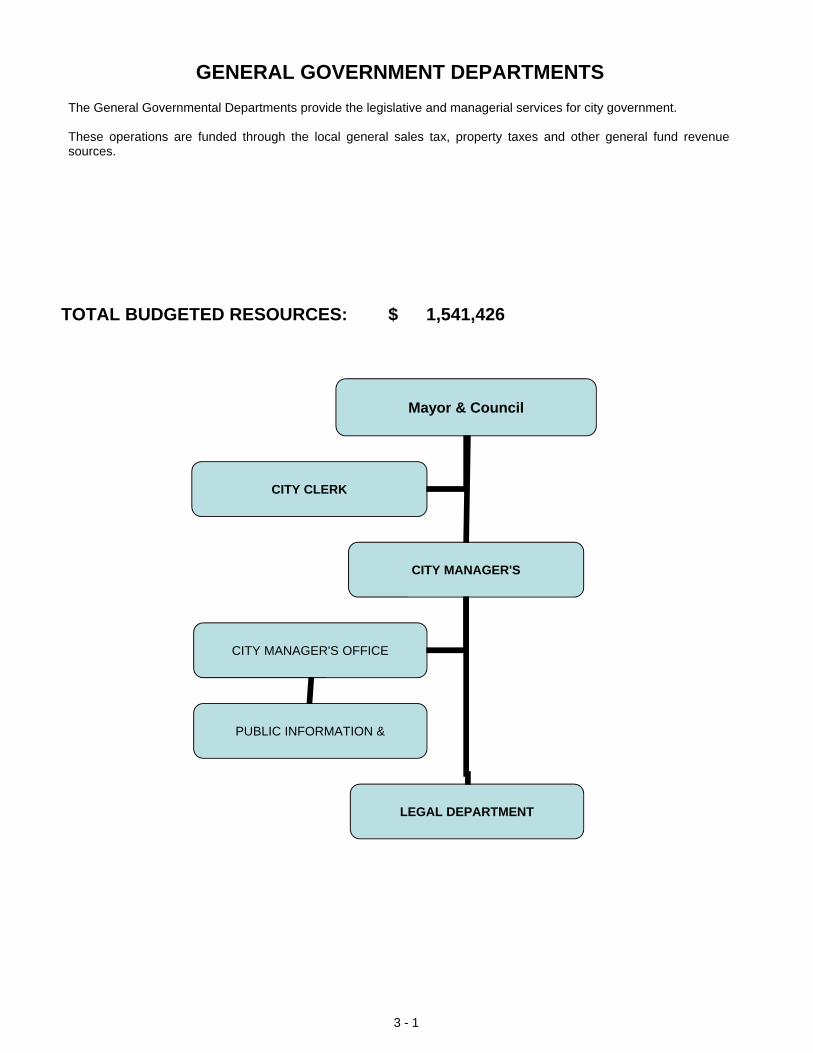
GENERAL GOVERNMENT DEPARTMENTS
TOTAL BUDGETED RESOURCES: 1,541,426$
The General Governmental Departments provide the legislative and managerial services for city government.
These operations are funded through the local general sales tax, property taxes and other general fund revenuesources.
Mayor & Council
CITY MANAGER'S
CITY CLERK
CITY MANAGER'S OFFICE
PUBLIC INFORMATION &
LEGAL DEPARTMENT
3 - 1
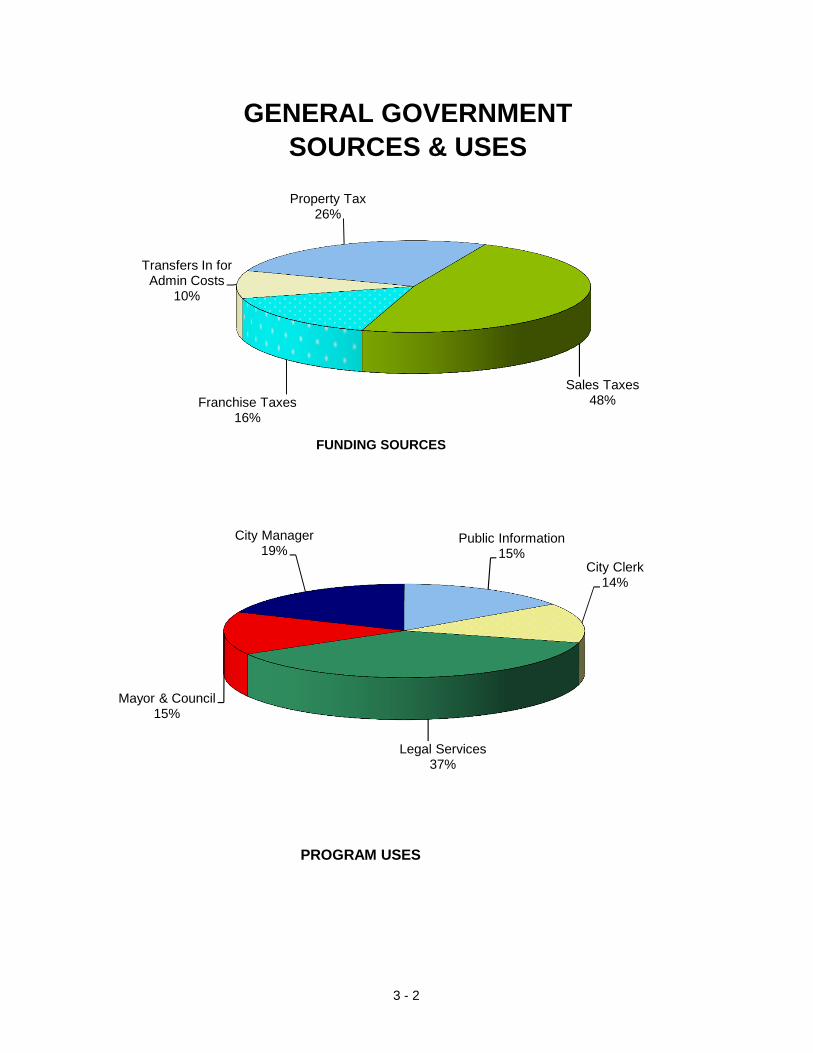
GENERAL GOVERNMENTSOURCES & USES
Property Tax26%
Sales Taxes48%Franchise Taxes
16%
Transfers In for Admin Costs
10%
Mayor & Council15%
City Manager19%
Public Information15%
City Clerk14%
Legal Services37%
PROGRAM USES
FUNDING SOURCES
3 - 2
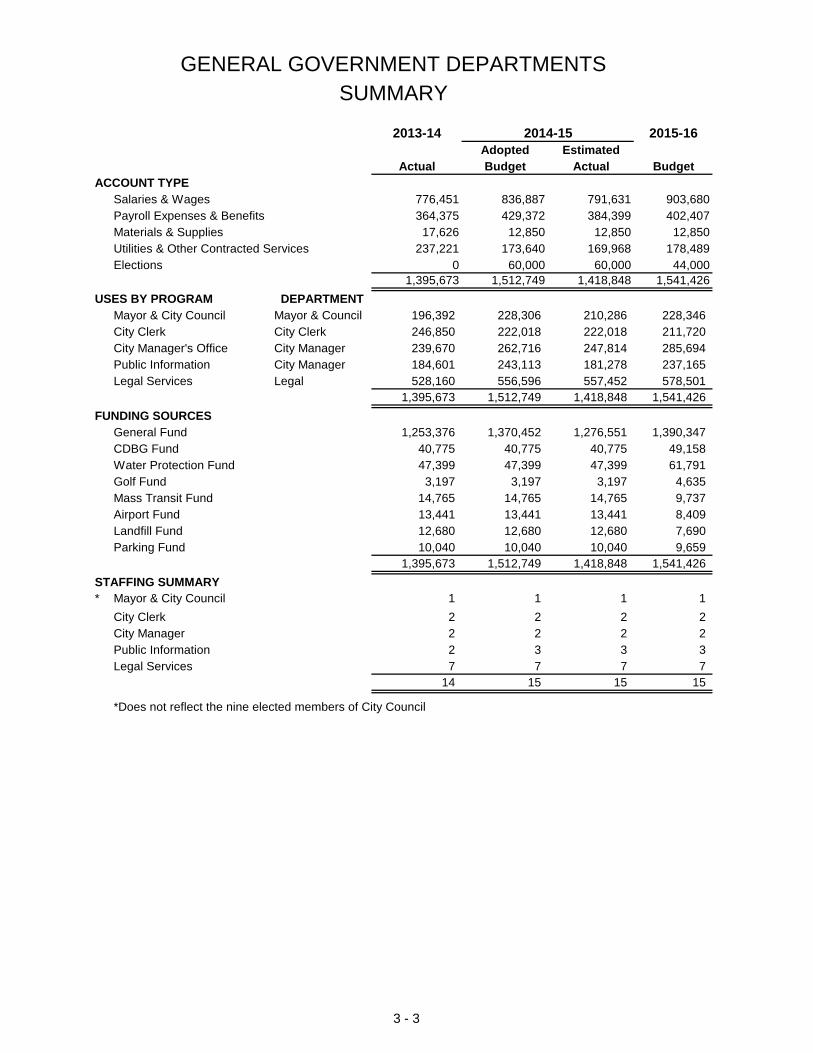
GENERAL GOVERNMENT DEPARTMENTSSUMMARY
2013-14 2014-15 2015-16Adopted Estimated
Actual Budget Actual BudgetACCOUNT TYPE
Salaries & Wages 776,451 836,887 791,631 903,680Payroll Expenses & Benefits 364,375 429,372 384,399 402,407Materials & Supplies 17,626 12,850 12,850 12,850Utilities & Other Contracted Services 237,221 173,640 169,968 178,489Elections 0 60,000 60,000 44,000
1,395,673 1,512,749 1,418,848 1,541,426
USES BY PROGRAMMayor & City Council 196,392 228,306 210,286 228,346City Clerk 246,850 222,018 222,018 211,720City Manager's Office 239,670 262,716 247,814 285,694Public Information 184,601 243,113 181,278 237,165Legal Services 528,160 556,596 557,452 578,501
1,395,673 1,512,749 1,418,848 1,541,426
FUNDING SOURCESGeneral Fund 1,253,376 1,370,452 1,276,551 1,390,347CDBG Fund 40,775 40,775 40,775 49,158Water Protection Fund 47,399 47,399 47,399 61,791Golf Fund 3,197 3,197 3,197 4,635Mass Transit Fund 14,765 14,765 14,765 9,737Airport Fund 13,441 13,441 13,441 8,409Landfill Fund 12,680 12,680 12,680 7,690Parking Fund 10,040 10,040 10,040 9,659
1,395,673 1,512,749 1,418,848 1,541,426
STAFFING SUMMARY* Mayor & City Council 1 1 1 1
City Clerk 2 2 2 2City Manager 2 2 2 2Public Information 2 3 3 3Legal Services 7 7 7 7
14 15 15 15
*Does not reflect the nine elected members of City Council
City ManagerLegal
DEPARTMENTMayor & CouncilCity ClerkCity Manager
3 - 3
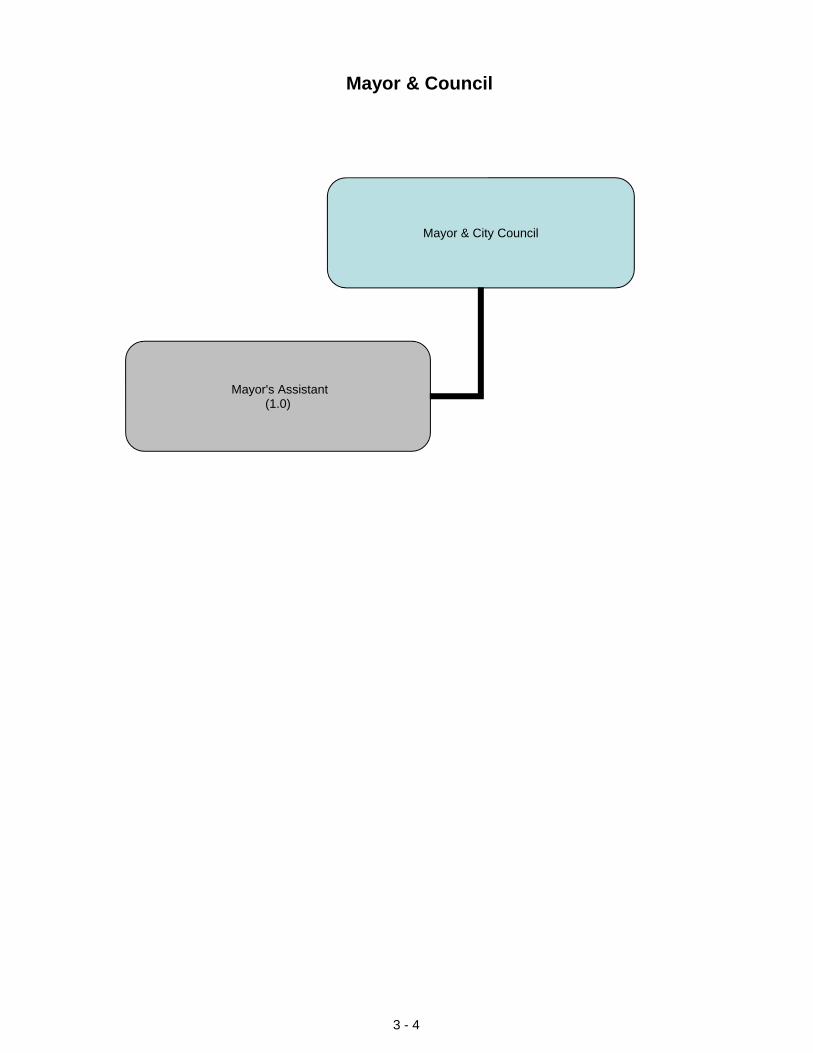
Mayor & Council
Mayor & City Council
Mayor's Assistant(1.0)
3 - 4
Mayor & City Council
Mission
Core Services
Current Year Activity/Achievements
Budget Challenges/Planned Initiatives
To provide the City Manager clear policy direction toward providing quality services in order to enhance thequality of life and to create a healthy, progressive community in which to live, work and visit.
• Provide policy direction for City operations;• Promote public participation in government through regular and special Council meetings, public hearings andworkshops, and City Talk programs; and• Encourage partnerships with other public, private and nonprofit sectors to resolve local issues.
• Held approximately 74 public Council meetings and work sessions to discuss pending issues.• Conducted four (4) City Talk meetings throughout the city limits.• CIP Tax passed.
• Attracting new businesses.• Continuing Downtown and Riverfront development.• Moving St. Jo Frontier Casino to Downtown Riverfront.• Improve streets and infrastructure.• Public Safety Tax initiative.
3 - 5
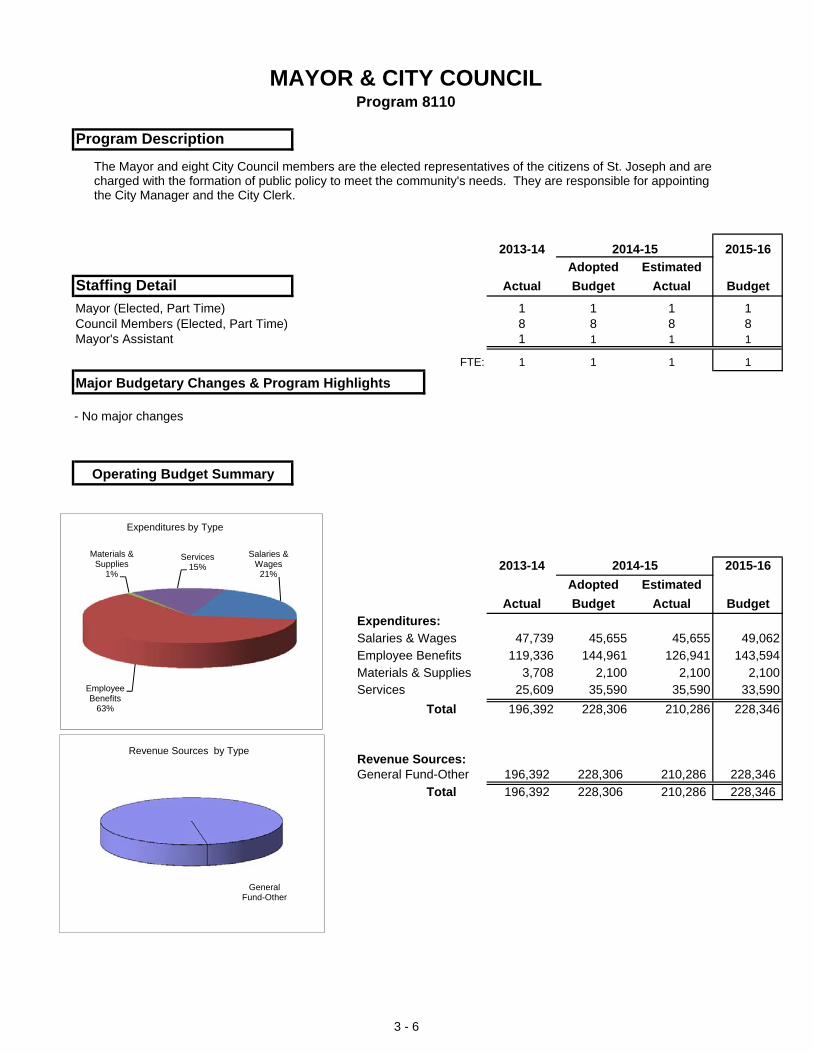
MAYOR & CITY COUNCILProgram 8110
Program Description
2013-14 2014-15 2015-16Adopted Estimated
Staffing Detail Actual Budget Actual Budget
Mayor (Elected, Part Time) 1 1 1 1Council Members (Elected, Part Time) 8 8 8 8Mayor's Assistant 1 1 1 1
FTE: 1 1 1 1
Major Budgetary Changes & Program Highlights
Operating Budget Summary
2013-14 2014-15 2015-16Adopted Estimated
Actual Budget Actual BudgetExpenditures:Salaries & Wages 47,739 45,655 45,655 49,062Employee Benefits 119,336 144,961 126,941 143,594Materials & Supplies 3,708 2,100 2,100 2,100Services 25,609 35,590 35,590 33,590
Total 196,392 228,306 210,286 228,346
Revenue Sources:General Fund-Other 196,392 228,306 210,286 228,346
Total 196,392 228,306 210,286 228,346
Salaries & Wages
21%
Employee Benefits
63%
Materials & Supplies
1%
Services15%
Expenditures by Type
General Fund-Other
Revenue Sources by Type
- No major changes
The Mayor and eight City Council members are the elected representatives of the citizens of St. Joseph and are charged with the formation of public policy to meet the community's needs. They are responsible for appointing the City Manager and the City Clerk.
3 - 6
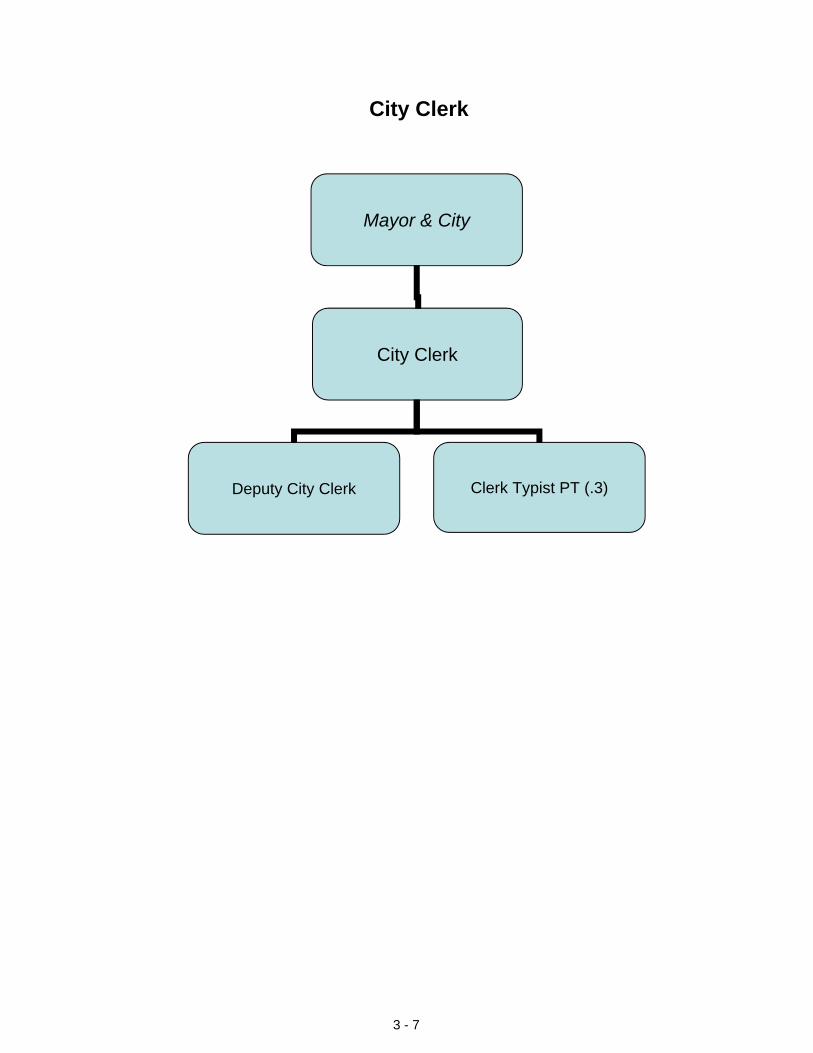
City Clerk
Mayor & City
City Clerk
Deputy City Clerk Clerk Typist PT (.3)
3 - 7
City Clerk
Mission
Core Services
Current Year Activity/Achievements
Budget Challenges/Planned Initiatives
To provide City Council, other city departments and citizens with accurate and timely information.
- Preserve the integrity of the City's official records.- Provide for records disposal to the fullest extent permissible by Missouri law.- Provide for the cost effective, legal maintenance of permanent records for all City departments.- Inform citizenry of public hearings pursuant to Missouri law.- Administer the City Council paperless agenda process.- Oversee City Council agenda process which includes creation of bimonthly agendas,
coordination of ordinances and resolutions, duplication and distribution of agendamaterials to interested parties
- Prepare Council meeting and work session minutes in a timely manner.- Prepare appointment letters and certificates of appointments for individuals nominated to serve
on boards and commissions; maintain list of boards and commissions.- Post meeting notices/agendas pursuant to Missouri law.- Process requests for copies of public documents in a timely manner.- Conduct city elections as required by the City Charter- Send correspondence to the City Council on a daily basis using the Council's electronic tablets.
• Performance Statistics: FY13 FY14 % Inc (Dec)Responses to customer requests for information 764 961 23%Number of ordinances and resolutions processed 358 350 ( 2%)Number of Council meetings and work sessions held 74 66 (11%)Supplements to the code processed and distributed 4 4 --Bills of Sale processed 120 64 (47%)
3 - 8
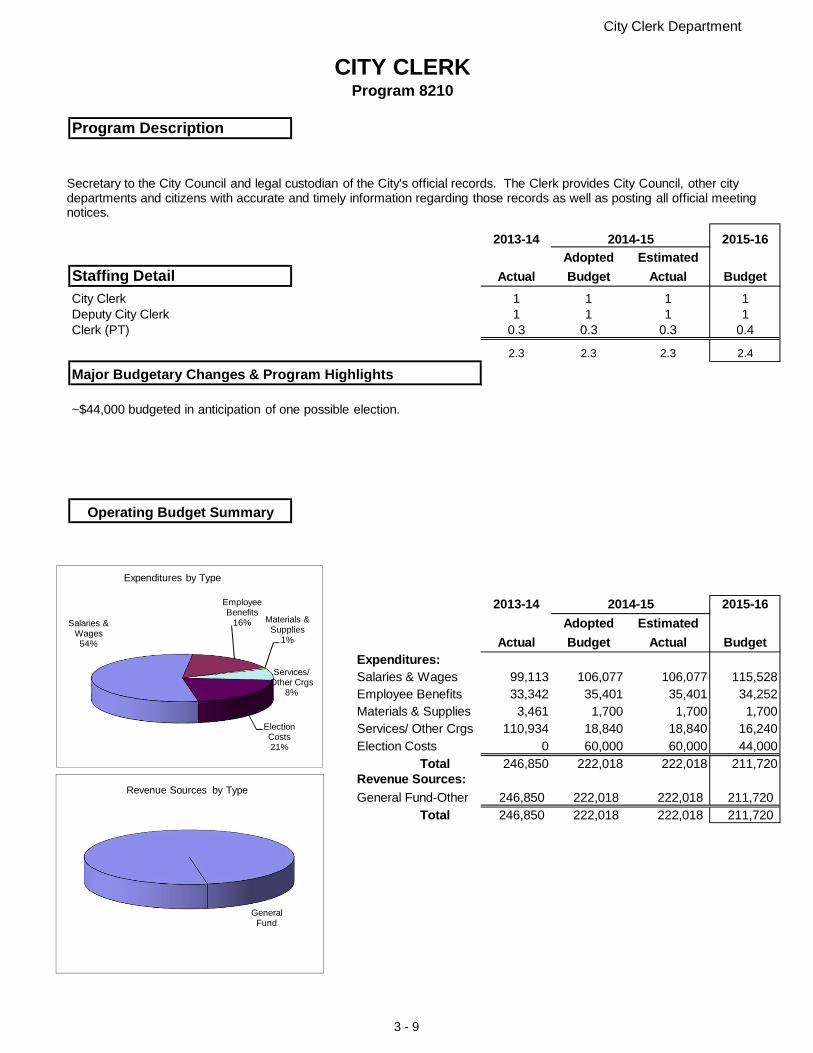
City Clerk Department
CITY CLERKProgram 8210
Program Description
2013-14 2014-15 2015-16Adopted Estimated
Staffing Detail Actual Budget Actual BudgetCity Clerk 1 1 1 1Deputy City Clerk 1 1 1 1Clerk (PT) 0.3 0.3 0.3 0.4
2.3 2.3 2.3 2.4
Major Budgetary Changes & Program Highlights
Operating Budget Summary
2013-14 2014-15 2015-16Adopted Estimated
Actual Budget Actual BudgetExpenditures:Salaries & Wages 99,113 106,077 106,077 115,528Employee Benefits 33,342 35,401 35,401 34,252Materials & Supplies 3,461 1,700 1,700 1,700Services/ Other Crgs 110,934 18,840 18,840 16,240Election Costs 0 60,000 60,000 44,000
Total 246,850 222,018 222,018 211,720Revenue Sources:General Fund-Other 246,850 222,018 222,018 211,720
Total 246,850 222,018 222,018 211,720
Salaries & Wages54%
Employee Benefits
16% Materials & Supplies
1%
Services/ Other Crgs
8%
Election Costs21%
Expenditures by Type
General Fund
Revenue Sources by Type
Secretary to the City Council and legal custodian of the City's official records. The Clerk provides City Council, other city departments and citizens with accurate and timely information regarding those records as well as posting all official meetingnotices.
~$44,000 budgeted in anticipation of one possible election.
3 - 9
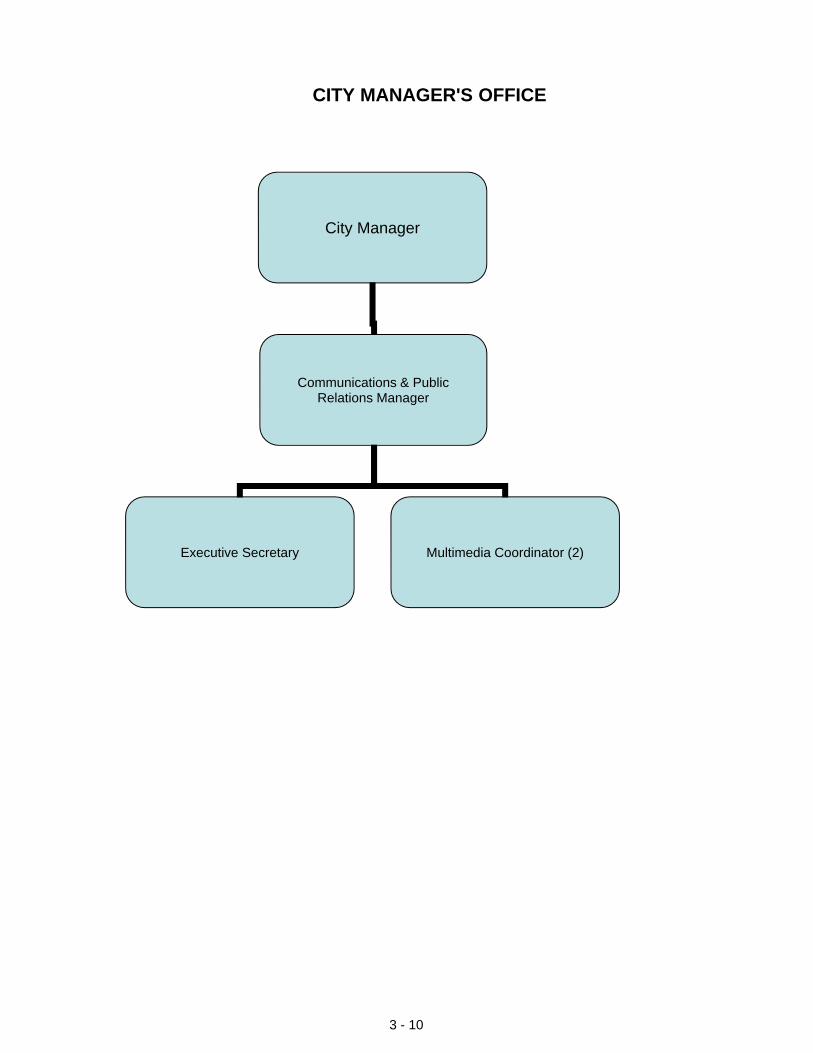
CITY MANAGER'S OFFICE
City Manager
Communications & Public Relations Manager
Multimedia Coordinator (2)Executive Secretary
3 - 10

City Manager
Mission
Core Services
Current Year Activity/Achievements
Budget Challenges/Planned Initiatives
To implement the policies established by City Council through the overall management and administration of day-to-day City operations and to deliver efficient and affordable city services.
- Implements Council policies and goals by assigning initiatives to department directors.- Provides professional leadership and support on organizational issues to all city departments.-Acts as the communication link between staff and Council, as well as creating and maintaining relationshipsbetween the City and other public and community entities.- Utilizes the Communications Manager, Directors, and other City staff to provide timely follow-up to Councilinquiries.- Oversees the financial health of the organization. Works to maintain and improve the city's bond ratings.
• Worked on public information and outreach programs related to the Public Safety Tax and the Clean Air (non-smoking) initiative.• Implemented the Classification / Compensation Study.• Initiated the first year of the new 2013 1/2 cent CIP sales tax Capital Improvements Program.• Continued a public dialog about the importance of investing in a proper level of maintenance of our existingpublic infrastructure.
• Explore revenue sources to maintain City services, including possible Use Tax and/or General ObligationBonds.• Initiate discussion of proposed fire station location recommendations.• Promote Downtown Master Plan and explore Event Center concept in anticipation of a possible relocation of thecasino.• Work with the City Council to choose goals for their up-coming four year term.• Development and implementation of a City brand.
3 - 11
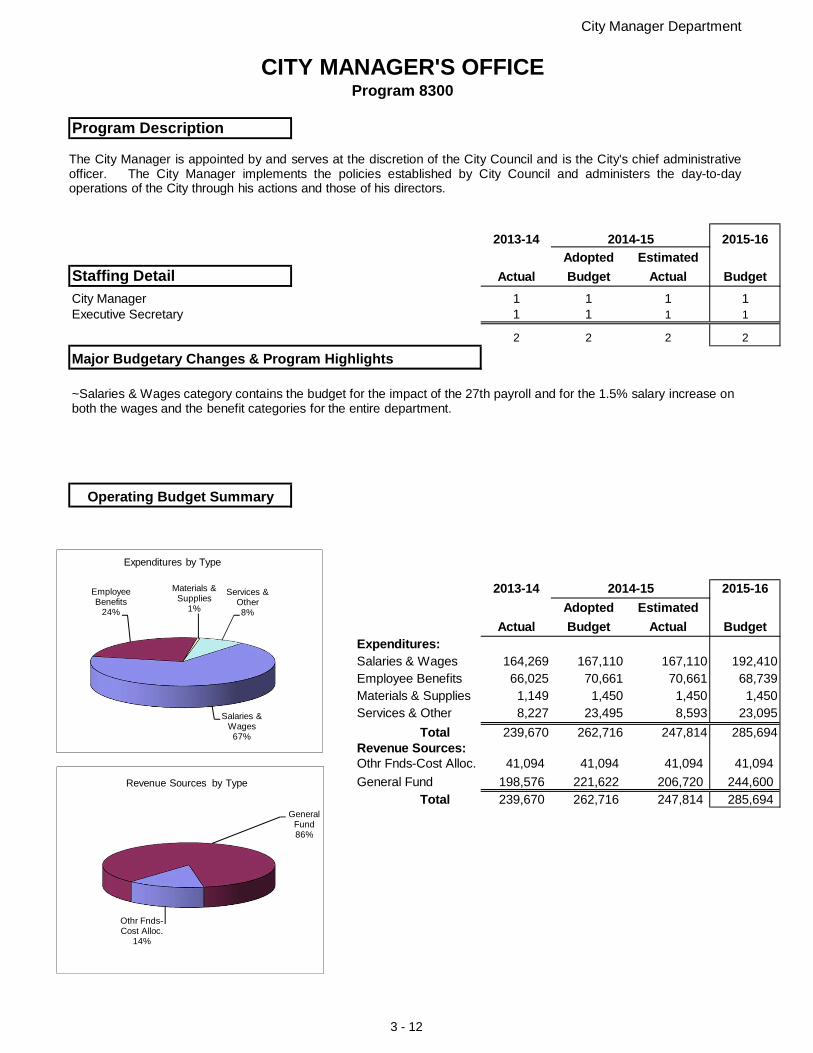
City Manager Department
CITY MANAGER'S OFFICEProgram 8300
Program Description
2013-14 2014-15 2015-16Adopted Estimated
Staffing Detail Actual Budget Actual BudgetCity Manager 1 1 1 1Executive Secretary 1 1 1 1
2 2 2 2
Major Budgetary Changes & Program Highlights
Operating Budget Summary
2013-14 2014-15 2015-16Adopted Estimated
Actual Budget Actual BudgetExpenditures:Salaries & Wages 164,269 167,110 167,110 192,410Employee Benefits 66,025 70,661 70,661 68,739Materials & Supplies 1,149 1,450 1,450 1,450Services & Other 8,227 23,495 8,593 23,095
Total 239,670 262,716 247,814 285,694Revenue Sources:Othr Fnds-Cost Alloc. 41,094 41,094 41,094 41,094
General Fund 198,576 221,622 206,720 244,600Total 239,670 262,716 247,814 285,694
Salaries & Wages67%
Employee Benefits
24%
Materials & Supplies
1%
Services & Other8%
Expenditures by Type
Othr Fnds-Cost Alloc.
14%
General Fund86%
Revenue Sources by Type
The City Manager is appointed by and serves at the discretion of the City Council and is the City's chief administrativeofficer. The City Manager implements the policies established by City Council and administers the day-to-dayoperations of the City through his actions and those of his directors.
~Salaries & Wages category contains the budget for the impact of the 27th payroll and for the 1.5% salary increase onboth the wages and the benefit categories for the entire department.
3 - 12
Public Information Office
Mission
Core Services
Current Year Activity/Achievements
Performance Statistics FY2013 FY2014Number of City Weekly publications produced 50 50Subscriber network for City Weekly 1,500 1,300Number of city meetings televised 24 36Produced document copies/prints for other departments:
Color 68,254 95,583Black & White 20,668 26,552
Number of press releases issued 47 55
Budget Challenges/Planned Initiatives
To provide effective communications and positive public relations between city government and the community.To provide effective communications to city employees to ensure quality, responsive customer service.
~Communicates public information in an effective, creative manner.~Markets, advertises, and promotes City services locally and regionally.~Represents the City on a variety of committees including Council appointed citizens committees andcommunity-wide projects and events.~Produces and disseminates a variety of newsletters, publications, press releases, and public information forthe City.~Provides writing, design, photography, and other graphic services for print, digital, and video communicationformats.~Produces programming and manages the City’s Government Access Channel 19.~Televises City Council and Planning Commission meetings.~Assists with content management for the City’s website.~Serves as the Public Information Officer during declared emergencies and for other general city contacts withthe media.
~Provided staff support to a number of citizen committees including the public safety tax.~Coordinated City Talk meetings.~Further expanded the utilization of social media as a method of communications.~Developed original programming for the city's government access channel, cable 19.~Completed the redesign of the city's website in cooperation with Technology Services.~In addition to televised City Council and Planning Commission meetings, numerous administrativehearings and public meetings, as well as a series of seven public meetings for the clean air initiative wereproduced.~Developed marketing campaigns and multimedia production for several special events.~Produced marketing pieces for three utility billing inserts, reaching 27,000 customers each insert.
~Create a brand for the City of St. Joseph.~Maintaining effective communications and developing original programming with limited staffing.
3 - 13

City Manager Department
PUBLIC INFORMATION & COMMUNICATIONSProgram 8320
Program Description
2013-14 2014-15 2015-16Adopted Estimated
Staffing Detail Actual Budget Actual BudgetCommunications & Public Relations Manager 1 1 1 1Multi-Media Coordinator 1 1 1 2
2 2 2 3
Major Budgetary Changes & Program Highlights
Operating Budget Summary
2013-14 2014-15 2015-16Adopted Estimated
Actual Budget Actual BudgetExpenditures:Salaries & Wages 98,634 139,313 93,971 140,246Employee Benefits 35,567 53,639 35,399 43,374Materials & Supplies 4,549 3,100 3,100 3,100Services & Other 45,851 47,061 48,808 50,445
Total 184,601 243,113 181,278 237,165Revenue Sources:Othr Fnds-Cost Alloc. 8,752 8,752 8,752 8,752
General Fund 175,849 234,361 172,526 228,413Total 184,601 243,113 181,278 237,165
Salaries & Wages59%
Employee Benefits
18% Materials & Supplies
2%
Services & Other21%
Expenditures by Type
Othr Fnds-Cost Alloc.
4%
General Fund96%
Revenue Sources by Type
This division assists the City Manager and other city departments with the effective use of technology to communicate with customers, both internal and external, by assisting with the preparation of material for the City’s website, programming of the City’s Government Access Channel and assisting with the preparation and distribution of other types of communications.
~No major changes.
3 - 14
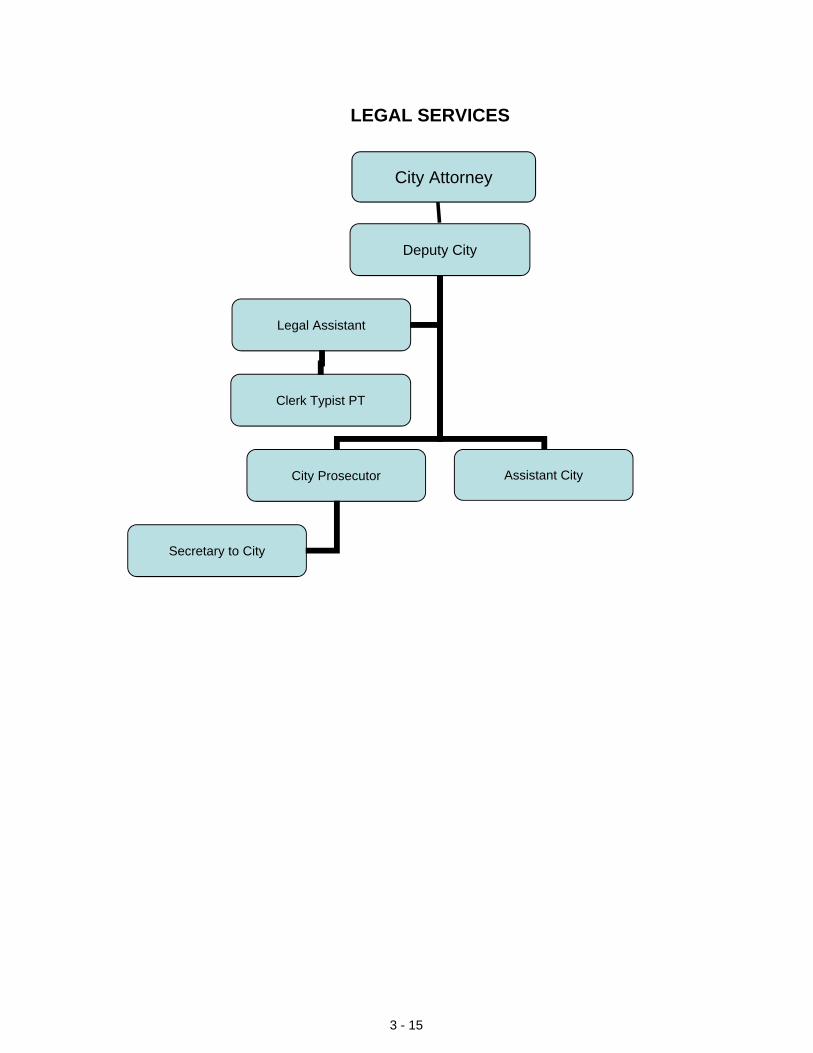
LEGAL SERVICES
City Attorney
Deputy City
Legal Assistant
City Prosecutor
Secretary to City
Assistant City
Clerk Typist PT
3 - 15
Legal Services
Mission
Core Services
Current Year Activity/Achievements
To provide effective and timely legal representation and advice to the City Council and City Administration. The officerepresents the City in legal controversies and is committed to minimizing negative legal exposure and potential liability.
- Represent the City Council, City Administration, operating departments and specified boards and commissions(Planning Commission, Board of Zoning Adjustment, Landmark Commission, Development and Plan Review) in allmatters of law pertaining to their official duties.- Assist departments in preparation of ordinances, resolutions, contracts, leases and other documents.- Assist departments in ensuring compliance with terms and conditions set forth in legal documents.- Represent the City in litigation; and/or monitor the activities of outside counsel retained to assist with litigation.- Prosecute Municipal Court violations through the City Prosecutor, who files charges and makes recommendations,as necessary and appropriate under the applicable facts and circumstances.- Attend regular City Council meetings, special meetings and/or work sessions as required.- Maintain up-to-date information on legal issues facing municipalities and ensure that the City is in compliance withnewly enacted legislation, both State and Federal, if applicable.- Assist with development of the City's official position on certain proposed legislation at the State and Federal level.- Monitor legislation being proposed during the legislative session for purposes of keeping apprised of any legislationthat might have an affect -- either positively or negatively -- on the City; advise department directors accordingly.- Assist with the annual review and update of the City's Personnel Manual.- Act as a member of the City's Labor Negotiation Team.
• Participated in contract discussions with representatives of various labor unions; considered compensation requestsfrom existing labor unions in conjunction with budget preparations.• Attended Development Review Committee meetings for purposes of providing input and keeping developmentprojects on track.• Provided quarterly litigation reports to the City Council and Administration.• Engaged in lengthy real estate negotiations and condemnation proceedings related to the Eastside Sewer Project,enabling the City to proceed on schedule and to maintain eligibility for SRF funding.• Reviewed multiple real estate contracts for NSP projects related to the City's sale and purchase of property.• Assisted with various code revisions, including revisions to the Zoning Code.• Reviewed Health Department documents for purposes of gaining reimbursement under the Affordable Care Act.• Assisted with the Administrative Hearing process related to the City's liquor code.• Continued negotiations related to the City's sewer system operations with state and federal regulatory agencies.• Continued negotiations and development of a contract with South St. Joseph Industrial Sewer District for secondarytreatment of the District’s wastewater.• Updated numerous contracts for less-expensive services purchased by the City, to clarify responsibilities, betterdefine the services or products to be provided and add language designed to limit the City’s liability exposure.• Advocated for the Board of Zoning Adjustment's position in two lawsuits filed regarding solar panel placements.• Assisted in the development of the City’s Write-off and Collection Policy• With CDBG staff, conducted regular meetings to monitor those with loans offered through that division.
Performance Statistics:Monitor over 50 contracts, leases and other legal documents.Average 40-50 requests for legal assistance weekly; respond, typically, within a week of the request with the goal ofresponding to all requests within a two-week period of time
Budget Challenges/Planned InitiativesLoss of one full-time Legal Assistant four years ago continues to cause strain on the department.
3 - 16
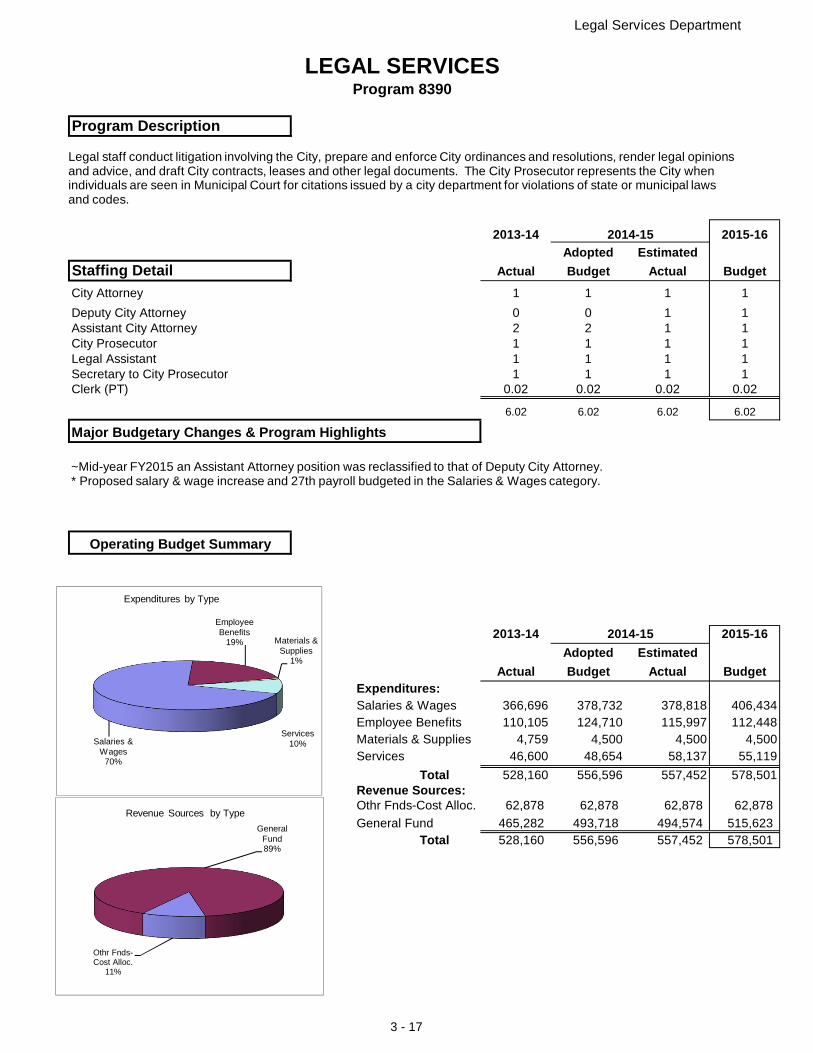
Legal Services Department
LEGAL SERVICESProgram 8390
Program Description
2013-14 2014-15 2015-16Adopted Estimated
Staffing Detail Actual Budget Actual Budget
City Attorney 1 1 1 1
Deputy City Attorney 0 0 1 1Assistant City Attorney 2 2 1 1City Prosecutor 1 1 1 1Legal Assistant 1 1 1 1Secretary to City Prosecutor 1 1 1 1Clerk (PT) 0.02 0.02 0.02 0.02
6.02 6.02 6.02 6.02
Major Budgetary Changes & Program Highlights
Operating Budget Summary
2013-14 2014-15 2015-16Adopted Estimated
Actual Budget Actual BudgetExpenditures:Salaries & Wages 366,696 378,732 378,818 406,434Employee Benefits 110,105 124,710 115,997 112,448Materials & Supplies 4,759 4,500 4,500 4,500Services 46,600 48,654 58,137 55,119
Total 528,160 556,596 557,452 578,501Revenue Sources:Othr Fnds-Cost Alloc. 62,878 62,878 62,878 62,878
General Fund 465,282 493,718 494,574 515,623Total 528,160 556,596 557,452 578,501
Salaries & Wages
70%
Employee Benefits
19% Materials & Supplies
1%
Services10%
Expenditures by Type
Othr Fnds-Cost Alloc.
11%
General Fund89%
Revenue Sources by Type
Legal staff conduct litigation involving the City, prepare and enforce City ordinances and resolutions, render legal opinionsand advice, and draft City contracts, leases and other legal documents. The City Prosecutor represents the City when individuals are seen in Municipal Court for citations issued by a city department for violations of state or municipal laws and codes.
~Mid-year FY2015 an Assistant Attorney position was reclassified to that of Deputy City Attorney.* Proposed salary & wage increase and 27th payroll budgeted in the Salaries & Wages category.
3 - 17
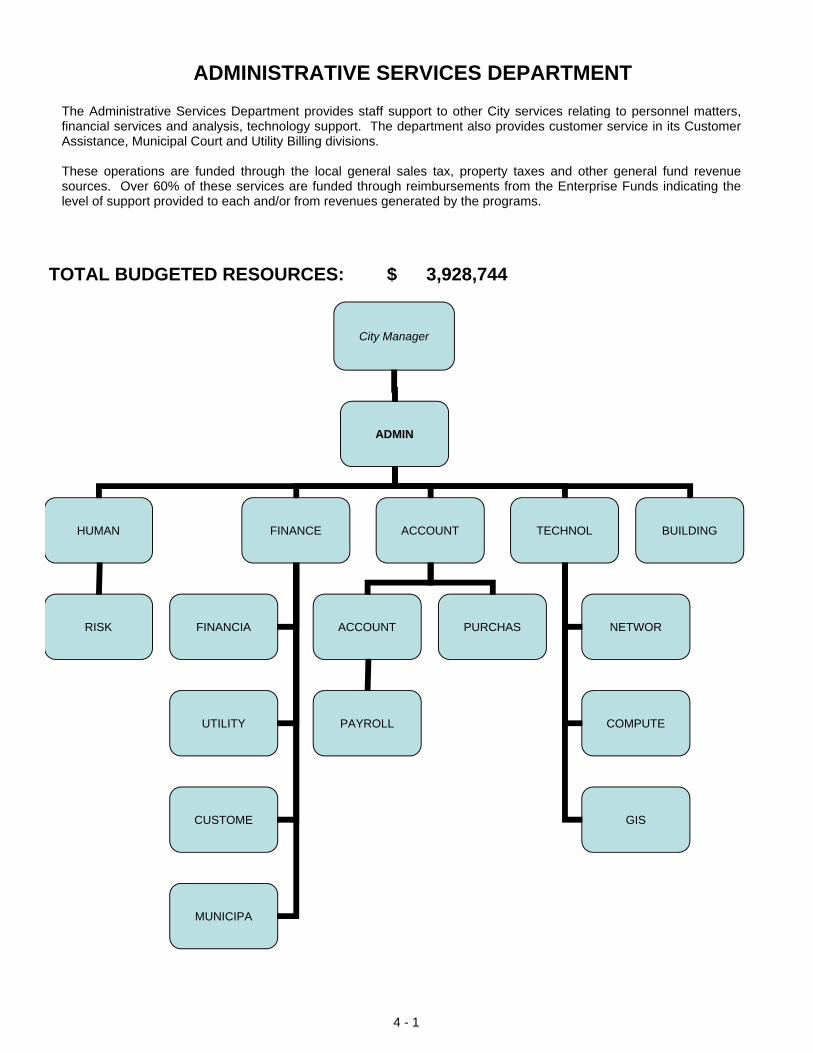
ADMINISTRATIVE SERVICES DEPARTMENT
TOTAL BUDGETED RESOURCES: 3,928,744$
City Manager
ADMIN
HUMAN FINANCE ACCOUNT TECHNOL
RISK
BUILDING
FINANCIA
UTILITY
CUSTOME
MUNICIPA
ACCOUNT PURCHAS
PAYROLL
NETWOR
COMPUTE
GIS
The Administrative Services Department provides staff support to other City services relating to personnel matters,financial services and analysis, technology support. The department also provides customer service in its CustomerAssistance, Municipal Court and Utility Billing divisions.
These operations are funded through the local general sales tax, property taxes and other general fund revenuesources. Over 60% of these services are funded through reimbursements from the Enterprise Funds indicating thelevel of support provided to each and/or from revenues generated by the programs.
4 - 1
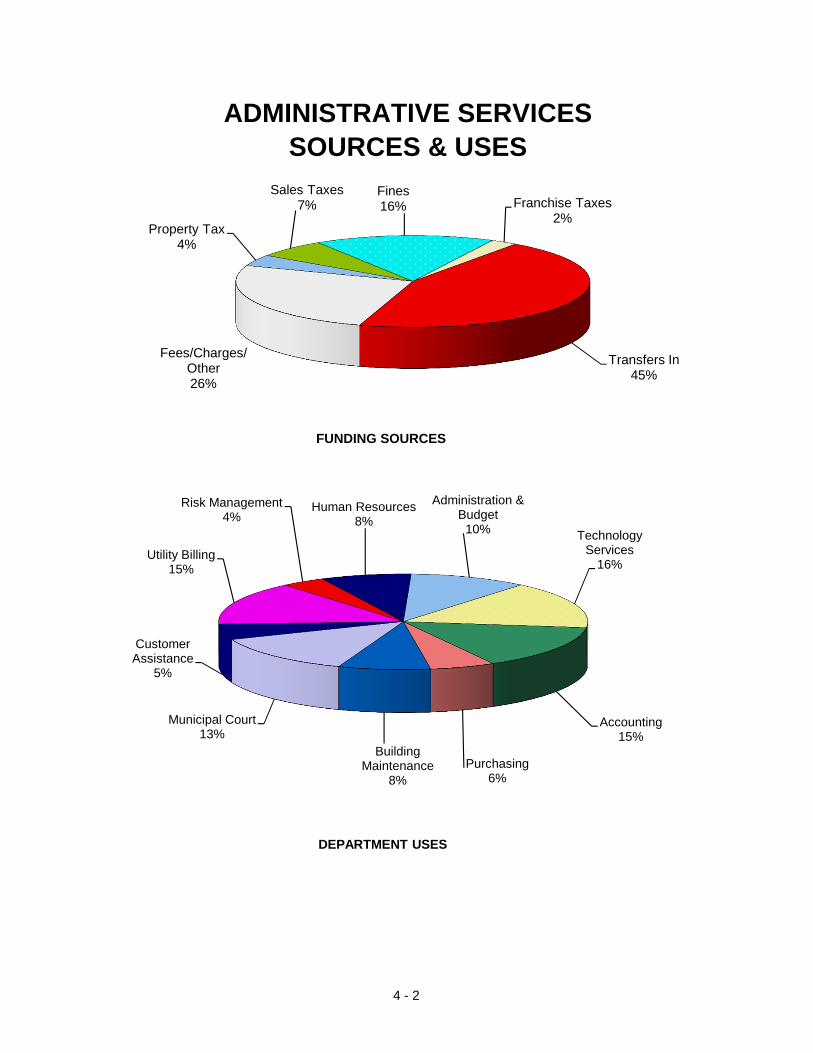
ADMINISTRATIVE SERVICESSOURCES & USES
Property Tax4%
Sales Taxes7%
Fines16% Franchise Taxes
2%
Transfers In45%
Fees/Charges/ Other26%
Risk Management4%
Human Resources8%
Administration & Budget
10% Technology Services
16%
Accounting15%
Purchasing6%
Building Maintenance
8%
Municipal Court13%
Customer Assistance
5%
Utility Billing15%
DEPARTMENT USES
FUNDING SOURCES
4 - 2
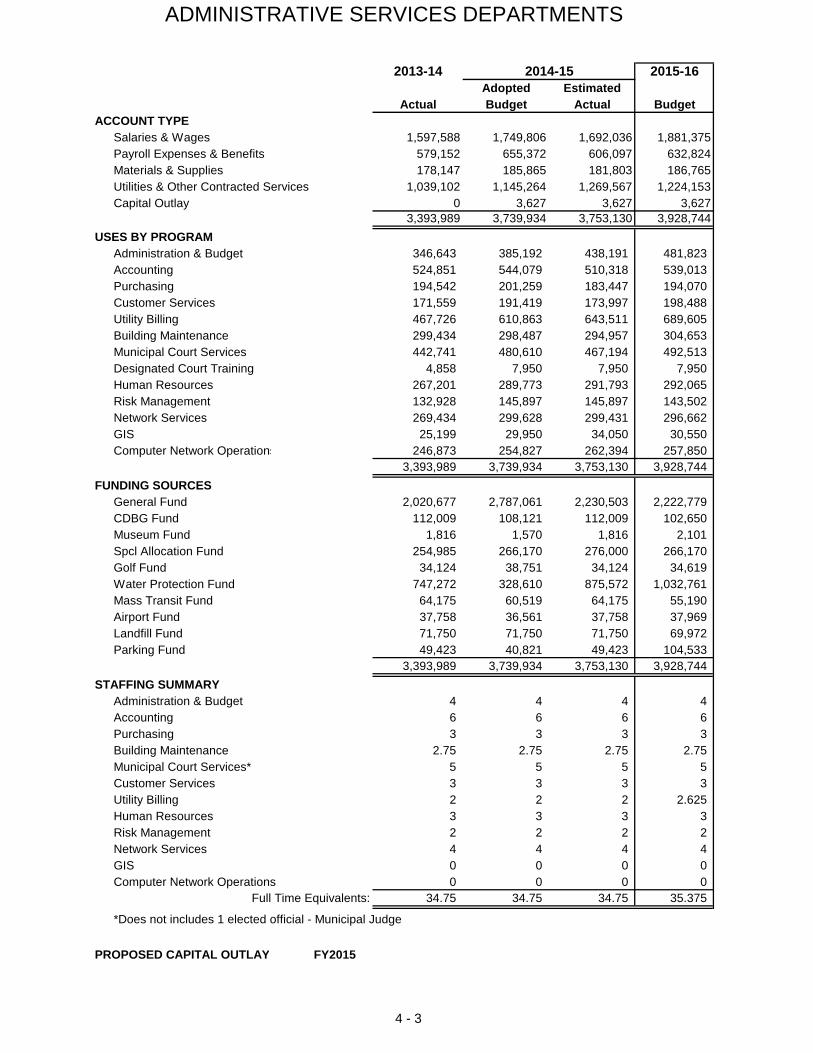
ADMINISTRATIVE SERVICES DEPARTMENTS
2013-14 2014-15 2015-16Adopted Estimated
Actual Budget Actual BudgetACCOUNT TYPE
Salaries & Wages 1,597,588 1,749,806 1,692,036 1,881,375Payroll Expenses & Benefits 579,152 655,372 606,097 632,824Materials & Supplies 178,147 185,865 181,803 186,765Utilities & Other Contracted Services 1,039,102 1,145,264 1,269,567 1,224,153Capital Outlay 0 3,627 3,627 3,627
3,393,989 3,739,934 3,753,130 3,928,744
USES BY PROGRAMAdministration & Budget 346,643 385,192 438,191 481,823Accounting 524,851 544,079 510,318 539,013Purchasing 194,542 201,259 183,447 194,070Customer Services 171,559 191,419 173,997 198,488Utility Billing 467,726 610,863 643,511 689,605Building Maintenance 299,434 298,487 294,957 304,653Municipal Court Services 442,741 480,610 467,194 492,513Designated Court Training 4,858 7,950 7,950 7,950Human Resources 267,201 289,773 291,793 292,065Risk Management 132,928 145,897 145,897 143,502Network Services 269,434 299,628 299,431 296,662GIS 25,199 29,950 34,050 30,550Computer Network Operations 246,873 254,827 262,394 257,850
3,393,989 3,739,934 3,753,130 3,928,744
FUNDING SOURCES General Fund 2,020,677 2,787,061 2,230,503 2,222,779CDBG Fund 112,009 108,121 112,009 102,650Museum Fund 1,816 1,570 1,816 2,101Spcl Allocation Fund 254,985 266,170 276,000 266,170Golf Fund 34,124 38,751 34,124 34,619Water Protection Fund 747,272 328,610 875,572 1,032,761Mass Transit Fund 64,175 60,519 64,175 55,190Airport Fund 37,758 36,561 37,758 37,969Landfill Fund 71,750 71,750 71,750 69,972Parking Fund 49,423 40,821 49,423 104,533
3,393,989 3,739,934 3,753,130 3,928,744
STAFFING SUMMARYAdministration & Budget 4 4 4 4Accounting 6 6 6 6Purchasing 3 3 3 3Building Maintenance 2.75 2.75 2.75 2.75Municipal Court Services* 5 5 5 5Customer Services 3 3 3 3Utility Billing 2 2 2 2.625Human Resources 3 3 3 3Risk Management 2 2 2 2Network Services 4 4 4 4GIS 0 0 0 0Computer Network Operations 0 0 0 0
Full Time Equivalents: 34.75 34.75 34.75 35.375
*Does not includes 1 elected official - Municipal Judge
PROPOSED CAPITAL OUTLAY FY2015
4 - 3
Administration & Budget
Mission
Core Services
Current Year Activity/Achievements
Budget Challenges/Planned Initiatives
To preserve the City's strong financial condition by creating a responsible financial strategy, effectively managingthe City's resources. To assist city management in the allocation of public resources to meet the service, programand facilities' needs and expectations of the community, as determined by the Mayor and Council, in accordancewith federal/state/local statutes and generally accepted accounting principles. Provide oversight and direction to theAdministrative Services Department personnel.
• Provide financial policy, cash management, debt management for the City.• Monitor City's financial condition and provide financial strategies to ensure fiscal solvency.• Prepare quarterly and annual financial reports that provide City Council, City staff and the public with thefinancial information necessary to make informed choices and decisions.• Provide consistent, cohesive budget planning, implementation, and administration. Oversee preparation of theannual Operating and CIP budgets as well as the Five Year CIP plan.• Act as part of the City's Labor Relations Negotiating Team.• Management and control of City revenues and accounts receivable, including the financial requirements relatedto the City’s Special Allocation Fund (TIF, TDD, CID, and EDC programs).• Work with the Buchanan County Assessor’s office to ensure compliance with Enterprise Zone, Chapter 100,Chapter 353 tax abatements• Track and review Buchanan County annual tax billing and monthly collection reports and disbursements.• Develop sewer reports and documenting processes. Work with Customer Assistance to provide customer convenient methods for payment of billings and questions regarding the accounts. • Reporting and monitoring past due accounts and Collection Agency reporting.• Maintain the data base for the parking ticket program and manage the collection process, including issuance ofsummons to Municipal Court.• Reconcile accounts receivable, Sewer (Springbrook), Municipal Court (INCODE), and parking citationsubsystems to general ledger.• Track, review and monitor TIF reimbursable expenses to Developers per Redevelopment Agreements andprepare and file TIF Reports with the Missouri Department of Economic Development.• Review and certify reimbursement requests for CIP and Sewer bond projects.• Conduct Cash Handling training for city employees and supervisors to ensure safekeeping of city assets andemployee safety.• Monitor daily revenue deposits of departments outside of City Hall. Enter revenues into the general ledger.• Perform quarterly monitoring of employee delinquencies for City services/fees as required by Personnel Code.
• Provided financial information for use tax proposed initiatives.• Prepared annual indirect cost plan.• Prepared Annual Budget document to reflect the new Public Safety Tax Fund requirements.• Implemented collection procedures for Special Assessments, Administrative Penalties and Sewer Receivablesincluding monthly listings provided to City's Collection Agency.- Implemented Springbrook Cash Receipts and Accounts Receivable modules to record all cash receipts withinsame software systems.
• Careful monitoring of city revenues & expenditures; preparing for the challenges facing the City.• Oversee integration of Springbrook cash receipts processing with financial software system - ONEsolution.• Continue development of utility billing system. • Continue auditing utility billing system by adding accounts to City's GIS to track those areas that appear unserved by City sewer system. Work with Sewer Maintenance to perform dye tests on areas where accounts seem to be on sewer.
4 - 4
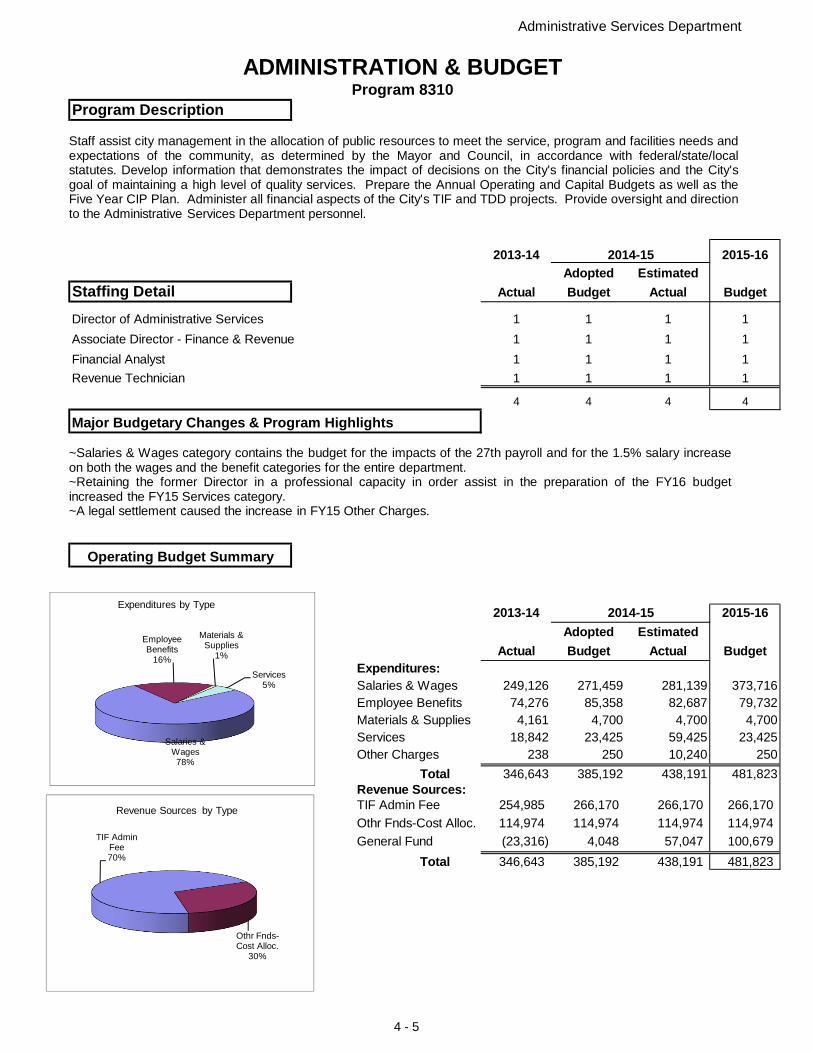
Administrative Services Department
ADMINISTRATION & BUDGETProgram 8310
Program Description
2013-14 2014-15 2015-16Adopted Estimated
Staffing Detail Actual Budget Actual Budget
Director of Administrative Services 1 1 1 1
Associate Director - Finance & Revenue 1 1 1 1
Financial Analyst 1 1 1 1
Revenue Technician 1 1 1 1
4 4 4 4
Major Budgetary Changes & Program Highlights
Operating Budget Summary
2013-14 2014-15 2015-16Adopted Estimated
Actual Budget Actual BudgetExpenditures:Salaries & Wages 249,126 271,459 281,139 373,716Employee Benefits 74,276 85,358 82,687 79,732Materials & Supplies 4,161 4,700 4,700 4,700Services 18,842 23,425 59,425 23,425Other Charges 238 250 10,240 250
Total 346,643 385,192 438,191 481,823Revenue Sources:TIF Admin Fee 254,985 266,170 266,170 266,170
Othr Fnds-Cost Alloc. 114,974 114,974 114,974 114,974
General Fund (23,316) 4,048 57,047 100,679
Total 346,643 385,192 438,191 481,823
Salaries & Wages78%
Employee Benefits
16%
Materials & Supplies
1%
Services5%
Expenditures by Type
TIF Admin Fee70%
Othr Fnds-Cost Alloc.
30%
Revenue Sources by Type
Staff assist city management in the allocation of public resources to meet the service, program and facilities needs andexpectations of the community, as determined by the Mayor and Council, in accordance with federal/state/localstatutes. Develop information that demonstrates the impact of decisions on the City's financial policies and the City'sgoal of maintaining a high level of quality services. Prepare the Annual Operating and Capital Budgets as well as theFive Year CIP Plan. Administer all financial aspects of the City's TIF and TDD projects. Provide oversight and directionto the Administrative Services Department personnel.
~Salaries & Wages category contains the budget for the impacts of the 27th payroll and for the 1.5% salary increaseon both the wages and the benefit categories for the entire department.~Retaining the former Director in a professional capacity in order assist in the preparation of the FY16 budgetincreased the FY15 Services category.~A legal settlement caused the increase in FY15 Other Charges.
4 - 5
Customer Assistance
Mission
Core Services
Current Year Activities/Achievements
Performance Statistics FY2013 FY2014 FY2015
8,100 8,360 8,573Number of new business licenses issued 645 709 501Amount generated for business licenses $867,000 $860,321 $882,068
Budget Challenges/Planned Initiatives
Number of business, health, liquor licenses; fire & alarm permits issued (Prior year)
Provide excellent customer service in the issuance of business licenses and payments for sewer use,parking tickets, bus passes, and all other services provided by customer assistance clerks for other citydepartments. Provide a positive attitude to both external and internal customers.
- Provide prompt, accurate and courteous customer service.- Help customers in understanding, completing and processing of applications for licenses, tickets and otherbillings.- Maintain proper cash handling protocols in order to comply with auditing practices.- Maintain Real Estate ownership records provided by the County.- Support other city departments by collecting sewer utility payments, fees and providing proper informationregarding their programs and policies.
- Continued yearly auditing of business licensing, checking for correct type of licenses- Cleaning up of notices and unnecessary information in permits plus, in preparation of new software
- WORK MANAGEMENT SOFTWARE: Implementation of a new, integrated work management program- May transition to a paperless, on-line customer service center.- May allow customers to apply and pay for permits, garage sale permits, etc. on-line.- Project approvals and scheduling status may be available on-line.- Email notifications may be sent out to customers when a status changes or a request is approved.- Activities and/or concerns throughout the city may be available to all city departments and customers.
- UTILITY BILLING: With the City's re-acquisition of the sewer billing function, the division has seenincreased walk-in traffic from individuals who prefer paying in person and customers paying bills by phone.Temporary staff have been added during business license billing cycle.
- BUSINESS LICENSING UPDATE: Our business licensing ordinance remains severely outdated. Many ofthe work classifications are no longer appropriate and many new ones do not fit very well in the old scheme.Serious consideration must be given to revising the fee schedules as business practices have changed. Forexample: Drive throughs were not common when last updated and are now essential to our fast foodindustry. Considerable effort and a possible vote of the people may be required to update this ordinance.
4 - 6
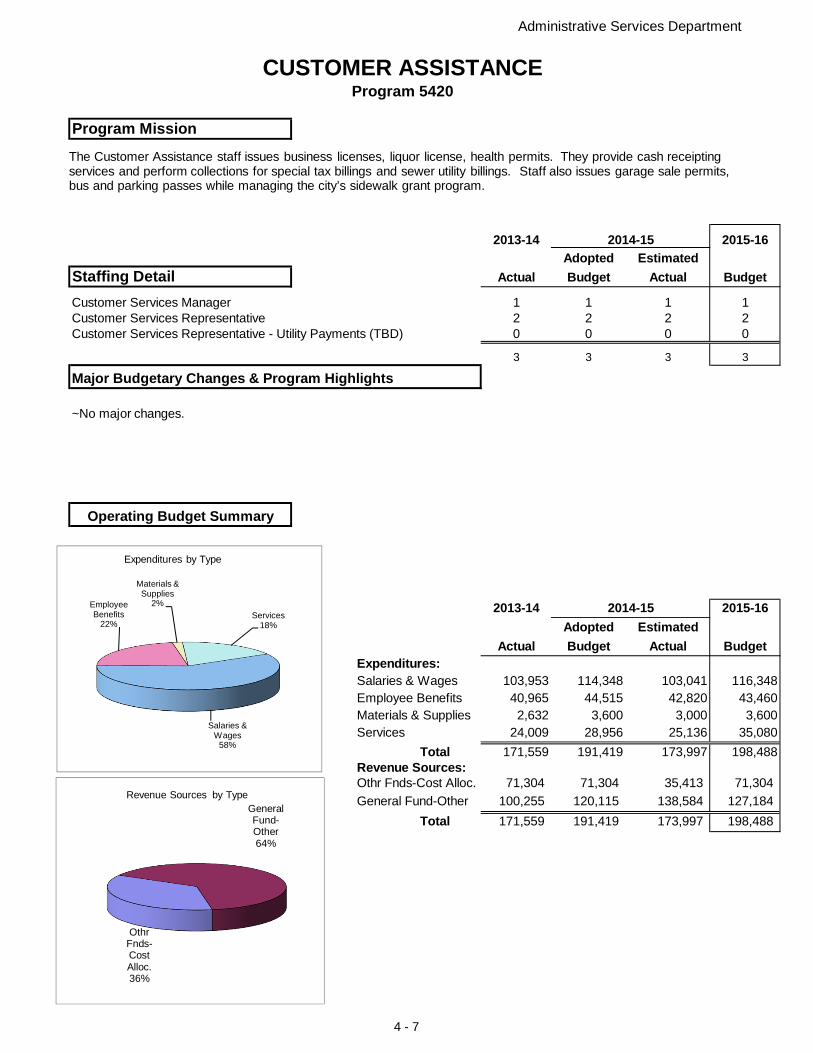
Administrative Services Department
CUSTOMER ASSISTANCEProgram 5420
Program Mission
2013-14 2014-15 2015-16Adopted Estimated
Staffing Detail Actual Budget Actual Budget
Customer Services Manager 1 1 1 1Customer Services Representative 2 2 2 2Customer Services Representative - Utility Payments (TBD) 0 0 0 0
3 3 3 3
Major Budgetary Changes & Program Highlights
Operating Budget Summary
2013-14 2014-15 2015-16Adopted Estimated
Actual Budget Actual BudgetExpenditures:Salaries & Wages 103,953 114,348 103,041 116,348Employee Benefits 40,965 44,515 42,820 43,460Materials & Supplies 2,632 3,600 3,000 3,600Services 24,009 28,956 25,136 35,080
Total 171,559 191,419 173,997 198,488Revenue Sources:Othr Fnds-Cost Alloc. 71,304 71,304 35,413 71,304
General Fund-Other 100,255 120,115 138,584 127,184
Total 171,559 191,419 173,997 198,488
Salaries & Wages
58%
Employee Benefits
22%
Materials & Supplies
2%
Services18%
Expenditures by Type
Othr Fnds-Cost Alloc.36%
General Fund-Other64%
Revenue Sources by Type
The Customer Assistance staff issues business licenses, liquor license, health permits. They provide cash receipting services and perform collections for special tax billings and sewer utility billings. Staff also issues garage sale permits,bus and parking passes while managing the city’s sidewalk grant program.
~No major changes.
4 - 7
Utility Billing
Mission
Core Services
Current Year Activities/Achievements
Performance Statistics FY2013* FY2014 FY2015Average Number of bills generated monthly 25,700 25,700 26,343
Average Number of monthly payments, by type:
Lockbox 12,000 12,835 10,510
Web 2,500-2,700 2,246 2,770
IVR (interactive voice response by phone) n/a 611 880
FirsTech (contracted vendor in grocery stores) 1,000 965 931
City Hall walk-ins, drop box, direct mail 500 418 475
Paperless Bills /Web Billing 450 450 450
Web Payment Types
Credit cards 64.5% 58.1% 55.3%
e-Check 35.5% 41.9% 44.7%
*Amounts estimated in FY13 since little actual experience had been realized.
Budget Challenges/Planned Initiatives
Provide accurate and timely utility billing statements. Research requests to correct billing errors. Verification ofsewer billing accuracy. Offer prompt and courteous customer service when contacted for information whether byphone, e-mail or in person.
• This division generates the monthly utility billing statements for the users of the City's sewer system.• Citizens' contact for issues with sewer billings. Research possible account adjustments.• Audit daily receipt batch postings for accuracy.• Reconciles the Sewer billing system with General Ledger and prepares journal entries to account for monthly adjustments to billings.• Prepare Aging reports on utility accounts receivable and follow collection procedures per City ordinance and State Statutes. • Provide back-up and assistance to the other customer representatives and permit clerks as necessary.
- Utility billing system implemented in FY13. Collection policy approved by Council in fiscal year 2014. Collectionletters being sent out quarterly.- Upgraded Customer Service telephone line to direct citizens directly to IVR (automated payment system),Customer Service for direct payments, and to Utility Billing staff to respond to any questions they have.
~Prepare procedure manual regarding billings, adjustments, collections etc. regarding sewer billing/collectionprocess.~Further communicate the enhanced Customer Service options for sewer payments via citizen interactive voiceresponse (IVR) system, online payments and contracted outside locations, as well as City staff's availability toanswer any questions citizens may have.~Continue training customer service representatives on acceptance of utility payments and on answering basicutility billing questions.~Evaluate the ability of the current customer service staff to undertake the additional tasks related to receivingutility payments at the counter.
4 - 8
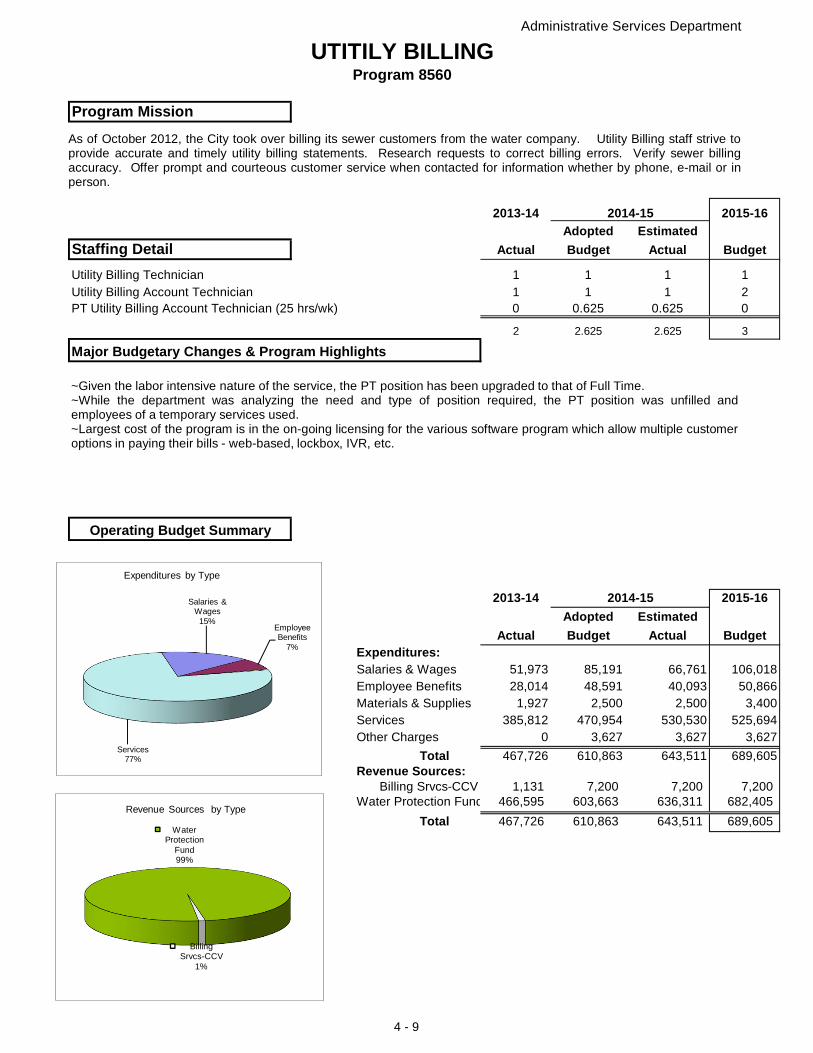
Administrative Services Department
UTITILY BILLINGProgram 8560
Program Mission
2013-14 2014-15 2015-16Adopted Estimated
Staffing Detail Actual Budget Actual Budget
Utility Billing Technician 1 1 1 1Utility Billing Account Technician 1 1 1 2PT Utility Billing Account Technician (25 hrs/wk) 0 0.625 0.625 0
2 2.625 2.625 3
Major Budgetary Changes & Program Highlights
Operating Budget Summary
2013-14 2014-15 2015-16Adopted Estimated
Actual Budget Actual BudgetExpenditures:Salaries & Wages 51,973 85,191 66,761 106,018Employee Benefits 28,014 48,591 40,093 50,866Materials & Supplies 1,927 2,500 2,500 3,400Services 385,812 470,954 530,530 525,694Other Charges 0 3,627 3,627 3,627
Total 467,726 610,863 643,511 689,605Revenue Sources:
Billing Srvcs-CCV 1,131 7,200 7,200 7,200Water Protection Fund 466,595 603,663 636,311 682,405
Total 467,726 610,863 643,511 689,605
Salaries & Wages
15%Employee Benefits
7%
Services77%
Expenditures by Type
Billing Srvcs-CCV
1%
Water Protection
Fund99%
Revenue Sources by Type
As of October 2012, the City took over billing its sewer customers from the water company. Utility Billing staff strive toprovide accurate and timely utility billing statements. Research requests to correct billing errors. Verify sewer billingaccuracy. Offer prompt and courteous customer service when contacted for information whether by phone, e-mail or inperson.
~Given the labor intensive nature of the service, the PT position has been upgraded to that of Full Time.~While the department was analyzing the need and type of position required, the PT position was unfilled andemployees of a temporary services used.~Largest cost of the program is in the on-going licensing for the various software program which allow multiple customeroptions in paying their bills - web-based, lockbox, IVR, etc.
4 - 9
Municipal Court Services
Mission
Core Services
Current Year Activity/Achievements
Budget Challenges/Planned Initiatives
Provide for the efficient running of Municipal Court in a manner that complies with City codes and the Office ofState Courts Administrator (OSCA).
• Management, collection and control of Municipal Court revenues and accounts receivables - general financialoversight of Municipal Court.• Prepare warrants, failure-to-appear notices and subpoenas.• Initiate suspension letters to defendants for failure to appear on traffic violations in court. Initiating suspension ofdriver's license with Missouri Department of Revenue if defendant fails to comply within 30 days.• Transmit monthly reports to the City Clerk, Buchanan County Circuit Court and Missouri Department of Revenue.• Enforce administrative policies and procedures as directed by Municipal Court Judge with regard to the judiciaryfunctions of the Municipal Court.• Comply with judicial orders and/or judicial directives given by the Municipal Court Judge.• Oversee all internal financial controls and audit functions associated with Municipal Court.• Coordinate case filings, updates, and dispositions with the City Prosecutor.• Coordinate warrant issuance and update warrant status with the SJPD.• Provide Court docket for arraignments and trials; schedule specific weekly arraignments and trials for specializedhearings, i.e. Code Compliance, Animal Control, and Spanish-speaking (or other individuals needing a translator).• Provide Municipal Court Judge and substitute judges with training necessary for Certification.• Provide staff training necessary for obtaining and continuing education required for certification from MissouriAssociation for Court Administration (MACA).• Coordinate scheduling of substitute judges in the Municipal Court Judge's absence.
• Research and implement solution for storage of citation data as required by State Statute.• Develop procedures for monitoring outside collections.• Explore the possibility of online citation inquiry access to attorneys and defendants for court dates and times toreduce the number of telephone calls coming in to Court staff.• Continue migrattion to "paperless court" process with the hardware & software provided for in the FY13 budget.
• Continue to testing of interface with the St. Joseph Police Department and Municipal Court to download citations and work with new City Prosecutor and Police Department to finalize this implementation.• Migration toward a paperless environment by scanning web payments, driver licenses, Photo ID's, and Attorney entries with regard to Municipal Court information.• Continue to send unpaid pay orders to contracted outside collection agency.
4 - 10
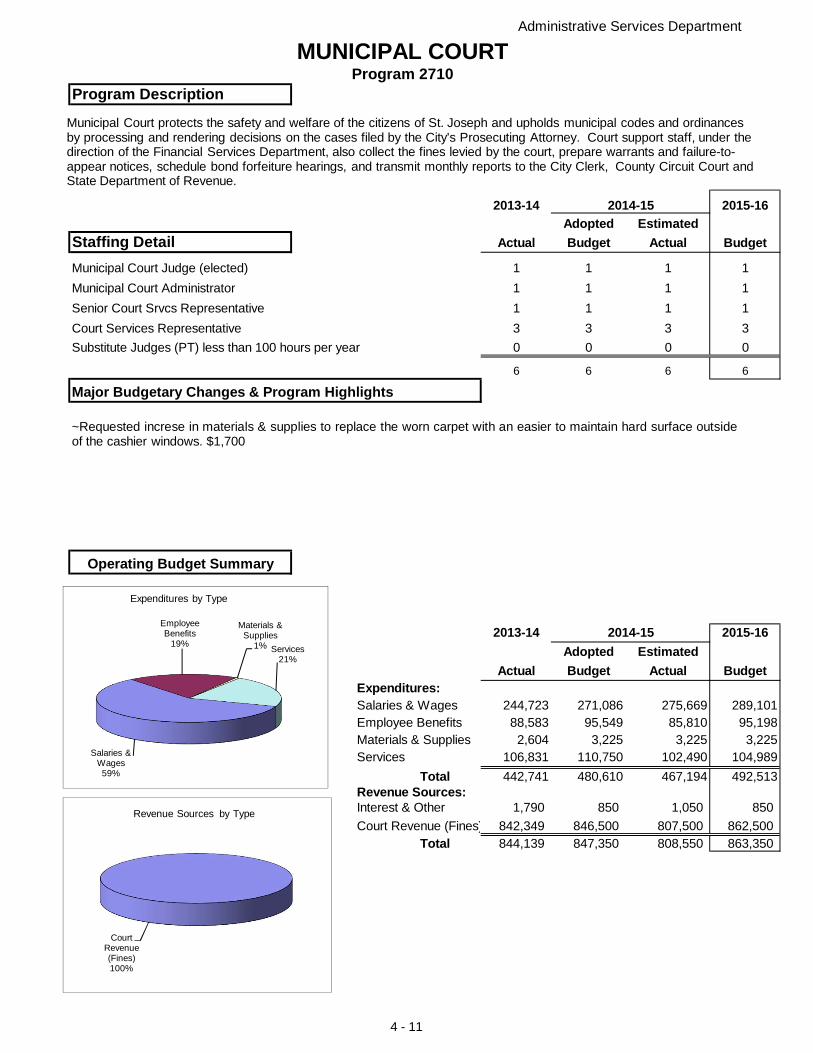
Administrative Services Department
MUNICIPAL COURTProgram 2710
Program Description
2013-14 2014-15 2015-16Adopted Estimated
Staffing Detail Actual Budget Actual Budget
Municipal Court Judge (elected) 1 1 1 1
Municipal Court Administrator 1 1 1 1
Senior Court Srvcs Representative 1 1 1 1
Court Services Representative 3 3 3 3
Substitute Judges (PT) less than 100 hours per year 0 0 0 0
6 6 6 6
Major Budgetary Changes & Program Highlights
Operating Budget Summary
2013-14 2014-15 2015-16Adopted Estimated
Actual Budget Actual BudgetExpenditures:Salaries & Wages 244,723 271,086 275,669 289,101Employee Benefits 88,583 95,549 85,810 95,198Materials & Supplies 2,604 3,225 3,225 3,225Services 106,831 110,750 102,490 104,989
Total 442,741 480,610 467,194 492,513Revenue Sources:Interest & Other 1,790 850 1,050 850
Court Revenue (Fines) 842,349 846,500 807,500 862,500Total 844,139 847,350 808,550 863,350
Salaries & Wages59%
Employee Benefits
19%
Materials & Supplies
1% Services21%
Expenditures by Type
Court Revenue (Fines)100%
Revenue Sources by Type
Municipal Court protects the safety and welfare of the citizens of St. Joseph and upholds municipal codes and ordinances by processing and rendering decisions on the cases filed by the City's Prosecuting Attorney. Court support staff, under the direction of the Financial Services Department, also collect the fines levied by the court, prepare warrants and failure-to-appear notices, schedule bond forfeiture hearings, and transmit monthly reports to the City Clerk, County Circuit Court and State Department of Revenue.
~Requested increse in materials & supplies to replace the worn carpet with an easier to maintain hard surface outsideof the cashier windows. $1,700
4 - 11
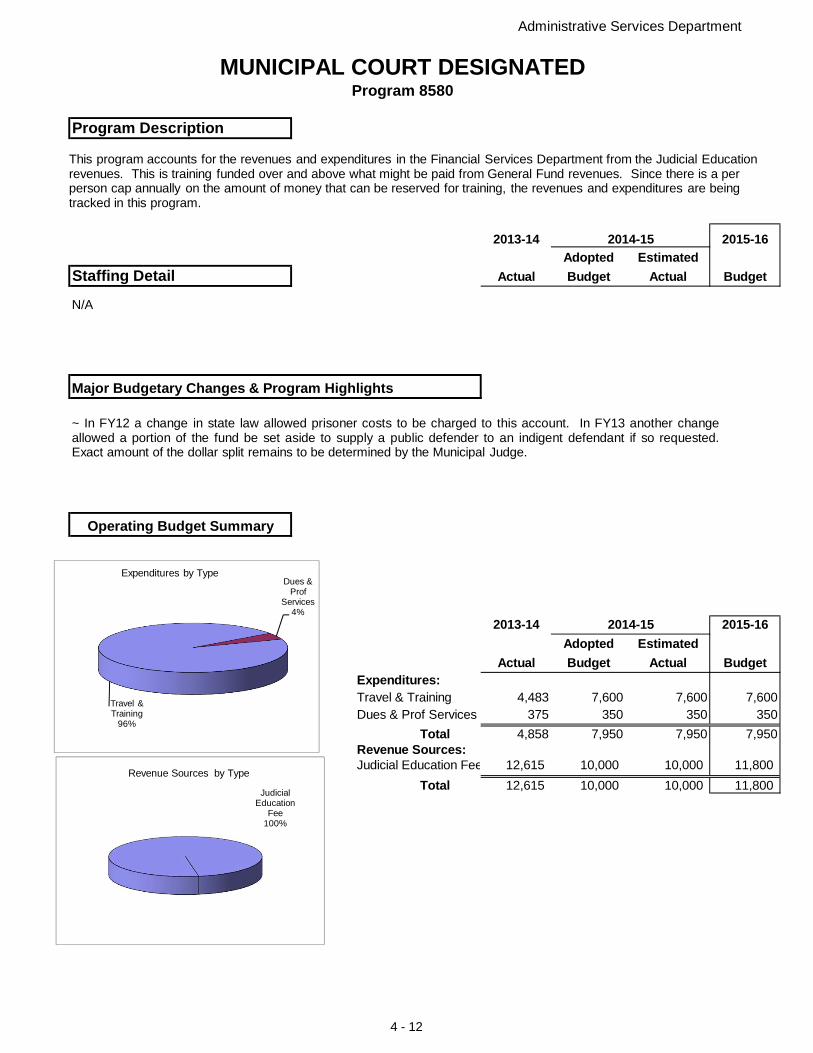
Administrative Services Department
MUNICIPAL COURT DESIGNATEDProgram 8580
Program Description
2013-14 2014-15 2015-16Adopted Estimated
Staffing Detail Actual Budget Actual Budget
N/A
Major Budgetary Changes & Program Highlights
Operating Budget Summary
2013-14 2014-15 2015-16Adopted Estimated
Actual Budget Actual BudgetExpenditures:Travel & Training 4,483 7,600 7,600 7,600Dues & Prof Services 375 350 350 350
Total 4,858 7,950 7,950 7,950Revenue Sources:Judicial Education Fee 12,615 10,000 10,000 11,800
Total 12,615 10,000 10,000 11,800
Travel & Training
96%
Dues & Prof
Services4%
Expenditures by Type
Judicial Education
Fee100%
Revenue Sources by Type
This program accounts for the revenues and expenditures in the Financial Services Department from the Judicial Education revenues. This is training funded over and above what might be paid from General Fund revenues. Since there is a per person cap annually on the amount of money that can be reserved for training, the revenues and expenditures are being tracked in this program.
~ In FY12 a change in state law allowed prisoner costs to be charged to this account. In FY13 another changeallowed a portion of the fund be set aside to supply a public defender to an indigent defendant if so requested.Exact amount of the dollar split remains to be determined by the Municipal Judge.
4 - 12

Accounting
Mission
Core Services
Current Year Activity/Achievements
Performance Statistics FY2013 FY2014 FY2015Police pension investment portfolio monitored 28,461,827$ 31,782,713$ 37,845,496$ Federal grants reconciled: # of grants 53 44 44
$ of grants 14,130,514$ 12,042,467$ 18,498,897$ City's investment portfolio diversified 45,000,000$ 50,000,000$ 71,000,000$ Number of capital assets inventoried 2,007 2,059 2,113 Maintained debt compliance for total debt service of: 144,890,788$ 169,522,678$ 265,895,626$ Number of procurement cards controlled 230 250 250 Number of community development loans processed 77 76 59 Payroll processed for: Full Time employees 649 637 643
Permanent, Part Time employees 37 35 45
Budget Challenges/Planned Initiatives
Promote confidence in the City's financial operations by providing management with timely,accurate and meaningful financial information and by continuing to achieve an unqualified (clean)audit opinion on the City's Annual Financial Report (CAFR).
- Provide investment and cash management, accounting, and payroll services.- Safeguard and manage city's assets.- Monitor internal controls, debt compliance, and grant reconciliation.- Conform, comply and implement the City's financial reporting to GAAP standards andstatements.- Provide departments with accurate and timely monthly financial reports/updates.- Review policies and procedures and update (or develop) as necessary.
Planned Initiatives:- Stay current with OneSolution Accounting Software upgrade and fixes.- Upcoming CAFR will require compliance with GASB issued Statement No. 72 (Fair Value Measurement andApplication)
• Received an unqualified (clean) audit opinion on the City's CAFR and received the GFOA distinguished CAFR Reporting award for the 25th consecutive year.• Reconciled 23 funds including the General fund, nine (9) special revenue funds, 1 capital project fund, six (6) enterprise funds, 1 internal service fund, six (6) trust and agency funds.•Successfully migrated from IFAS to OneSolution Accounting Software.•Recorded another two (2) State Revolving Fund Direct Loan offered by Department of Natural Resources as well as final offering of the original $105,000,000 bond authority.
4 - 13

Administrative Services Department
ACCOUNTINGProgram 8540
Program Description
2013-14 2014-15 2015-16Adopted Estimated
Staffing Detail Actual Budget Actual Budget
Accounting Manager 1 0 0 0
0 1 1 1
Accounting Supervisor 1 1 0 0
Accountant 2 2 3 3
Account Technician 1 1 1 1
Payroll Technician 1 1 1 1
6 6 6 6
Major Budgetary Changes & Program Highlights
Operating Budget Summary
2013-14 2014-15 2015-16Adopted Estimated
Actual Budget Actual BudgetExpenditures:Salaries & Wages 299,311 308,052 287,673 303,700Employee Benefits 98,709 103,986 94,985 98,622Materials & Supplies 3,677 5,000 4,693 5,000Services 123,154 127,041 122,967 131,691
Total 524,851 544,079 510,318 539,013Revenue Sources:Plce Pension Fnd (trf) 7,800 8,000 7,800 8,000
Othr Fnds-Cost Alloc. 116,384 116,384 116,384 116,384
General Fund 400,667 419,695 386,134 414,629
Total 524,851 544,079 510,318 539,013
Associate Director - Accounting & Procurement
Salaries & Wages
56%
Employee Benefits
18%
Materials & Supplies
1%Services
25%
Expenditures by Type
Plce Pension Fnd (trf)
1%
Othr Fnds-Cost Alloc.
22%
General Fund77%
Revenue Sources by Type
The Accounting staff provides management with timely, accurate and meaningful financial information. They continue to achieve an unqualified (clean) audit opinion on the City's Annual Financial Report (CAFR).
~Other than the impact of the Compensation Study implementation, no major changes.~The Police Pension Fund will reimburse the General Fund approximately $8,000 for the costs of its annual audit.
4 - 14
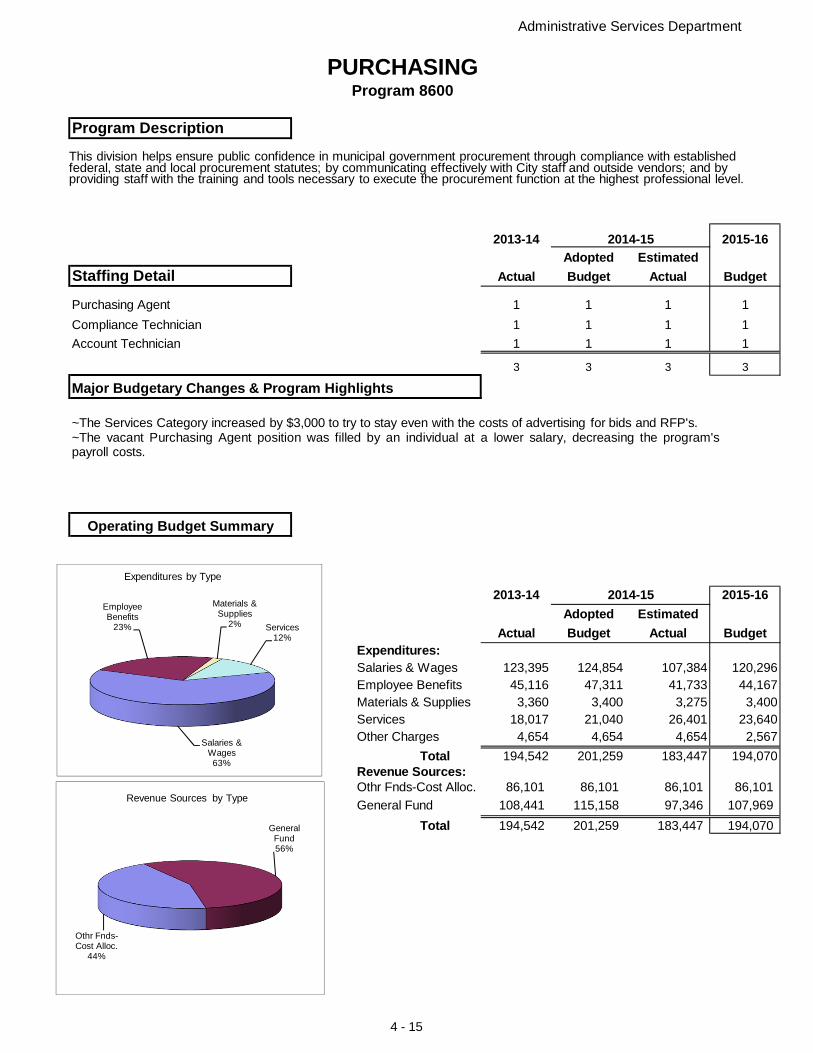
Administrative Services Department
PURCHASINGProgram 8600
Program Description
2013-14 2014-15 2015-16Adopted Estimated
Staffing Detail Actual Budget Actual Budget
Purchasing Agent 1 1 1 1
Compliance Technician 1 1 1 1
Account Technician 1 1 1 1
3 3 3 3
Major Budgetary Changes & Program Highlights
Operating Budget Summary
2013-14 2014-15 2015-16Adopted Estimated
Actual Budget Actual BudgetExpenditures:Salaries & Wages 123,395 124,854 107,384 120,296Employee Benefits 45,116 47,311 41,733 44,167Materials & Supplies 3,360 3,400 3,275 3,400Services 18,017 21,040 26,401 23,640Other Charges 4,654 4,654 4,654 2,567
Total 194,542 201,259 183,447 194,070Revenue Sources:Othr Fnds-Cost Alloc. 86,101 86,101 86,101 86,101
General Fund 108,441 115,158 97,346 107,969
Total 194,542 201,259 183,447 194,070
Salaries & Wages63%
Employee Benefits
23%
Materials & Supplies
2% Services12%
Expenditures by Type
Othr Fnds-Cost Alloc.
44%
General Fund56%
Revenue Sources by Type
This division helps ensure public confidence in municipal government procurement through compliance with established federal, state and local procurement statutes; by communicating effectively with City staff and outside vendors; and by providing staff with the training and tools necessary to execute the procurement function at the highest professional level.
~The Services Category increased by $3,000 to try to stay even with the costs of advertising for bids and RFP's.~The vacant Purchasing Agent position was filled by an individual at a lower salary, decreasing the program'spayroll costs.
4 - 15
Building Maintenance
Mission
Core Services
Current Year Activity/Achievements
Performance Statistics: FY2013 FY2014 FY2015Number of work orders completed 175 286 302Percent of work orders completed within 5 working days 98% 98% 98%
Budget Challenges/Planned Initiatives
Maintain a clean, orderly, safe, comfortable and aesthetically pleasing work environment at City Hall.
- Maintain a clean orderly, safe, comfortable and aesthetically pleasing work environment at City Hall.- Review existing custodial acitivities and recommend improvements if appropriate- Work with the Risk Manager and Fire Marshal in doing annual safety checks of the building.- Complete capital improvement upgrades to City Hall as scheduled in the CIP or operating budgets.- Monitor the building’s heating and cooling systems for maximum efficiency.- Maintain efficient use of storage space in the basement.- Develop a landscaping design for City Hall, purchase and plant annually.
• Annual inspections for boiler, air conditioning system, and elevator system passed.• One accident report filed, no workers compensation claims upheld for City Hall building related injuries.• Fourth floor conference room was re-painted. Replacement furniture was installed to provide more seatingarea for meeting attendees.• First floor conference room was remodeled per the request of the City Manager's Office with paint, verticalblinds and tables and chairs re-purposed from the fourth floor conference room.
A new dumpster enclosure will be completed by fall of 2015Several areas within City Hall will be repainted.
Line item accounts for M&R of Buildings, Minor Equipment and Other Supplies have been increased as theresult of unexpected purchases (flags, blinds, remodeling) in several areas.
4 - 16
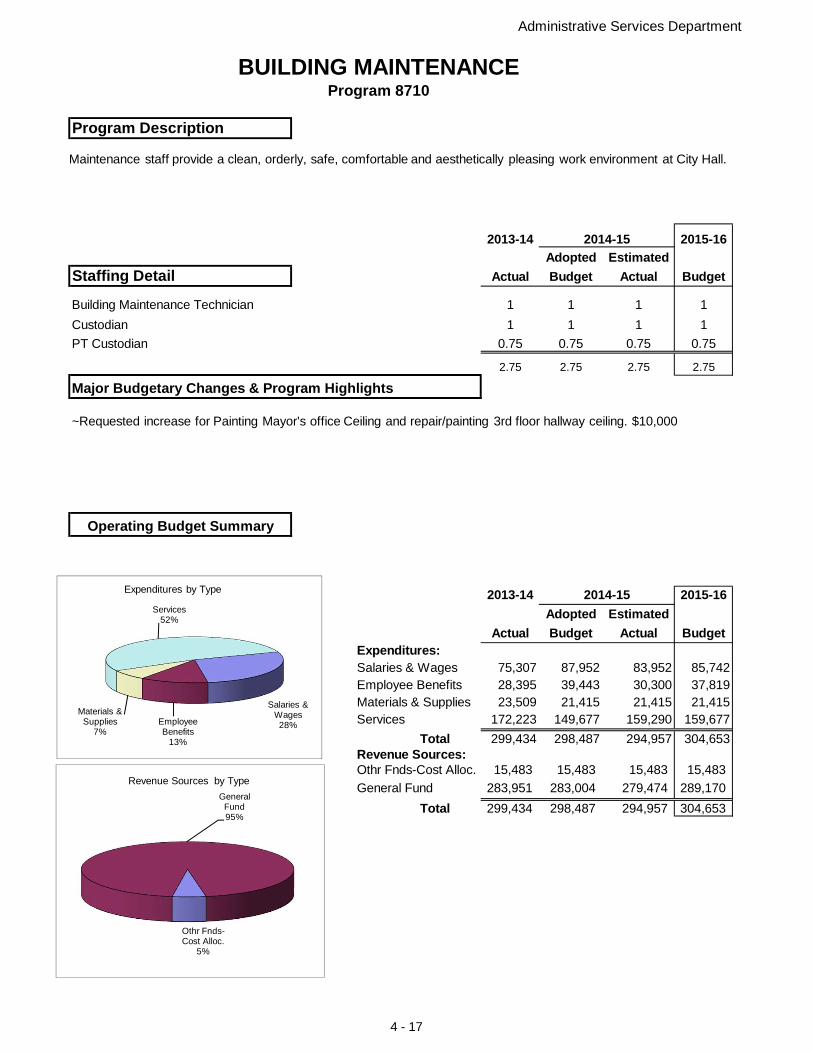
Administrative Services Department
BUILDING MAINTENANCEProgram 8710
Program Description
2013-14 2014-15 2015-16Adopted Estimated
Staffing Detail Actual Budget Actual Budget
Building Maintenance Technician 1 1 1 1
Custodian 1 1 1 1
PT Custodian 0.75 0.75 0.75 0.75
2.75 2.75 2.75 2.75
Major Budgetary Changes & Program Highlights
Operating Budget Summary
2013-14 2014-15 2015-16Adopted Estimated
Actual Budget Actual BudgetExpenditures:Salaries & Wages 75,307 87,952 83,952 85,742Employee Benefits 28,395 39,443 30,300 37,819Materials & Supplies 23,509 21,415 21,415 21,415Services 172,223 149,677 159,290 159,677
Total 299,434 298,487 294,957 304,653Revenue Sources:Othr Fnds-Cost Alloc. 15,483 15,483 15,483 15,483
General Fund 283,951 283,004 279,474 289,170
Total 299,434 298,487 294,957 304,653
Salaries & Wages28%Employee
Benefits13%
Materials & Supplies
7%
Services52%
Expenditures by Type
Othr Fnds-Cost Alloc.
5%
General Fund95%
Revenue Sources by Type
Maintenance staff provide a clean, orderly, safe, comfortable and aesthetically pleasing work environment at City Hall.
~Requested increase for Painting Mayor's office Ceiling and repair/painting 3rd floor hallway ceiling. $10,000
4 - 17
Human Resources
Mission
Core Services
Current Year Activity/Achievements
To support City management in securing and maintaining a qualified workforce to complement the City inmeeting its goal of maintaining a high level of quality services.
- Conduct all position recruitments including advertising, screening, and testing.- Maintain Human Resources Information System and other database systems for employees and retirees.- Administer an employee benefit package including bids, renewals and open enrollment periods.- Provide New Employee Orientation by educating the employees on benefits and policies.- Maintain city-wide classification system as well as assisting with the preparation and maintenance of jobdescriptions.- Oversee policy administration, maintenance of HR records, employment and labor laws, and all other HRfunctions.- Annually review and update the Personnel Manual to ensure the Manual reflects the needs of the City whilemaintaining legal aspects in dealing with personnel policies.- Coordinate mandated training.- Maintain labor relations and participate on the City's Labor Relations Negotiating Teams.- Provide direction and assistance to departments on policies, procedures, disciplinary matters, hiringprocedures, etc.- Coordinate employee benefit events (e.g. Benefits Fair, 457 presentations, MOST presentations)- Encourage wellness through events such as Health Sceenings, Health Risk Assessment, Flu Shot Clinics,Webinars, My Rewards, National Walk at Lunch, etc.- Coordinate employee leaves including but not limited to Family & Medical Leave Act absences.- Generate monthy performance evaluation list and track completion.- Process all personnel actions and the various tasks associated with each.
• Finalized implementation of new compensation plan.• Contributed as part of the Labor Negotiating Teams.• Conducted police entry level written and physical agility tests and fire entry level written test.• Conducted police and fire promotional level testing.• Performed annual Personnel Manual review and revisions, adopted by Council in October 2014.• Reviewed and distribute Compensation Guide.• Worked with CBIZ to renew health insurance with Blue Cross Blue Shield for coverage effective 7/1/14.• Continued to offer wellness incentive program through My Rewards provided by Blue Cross Blue Shield.• Provided annual wellness events to employees including Health/Benefit Fair and flu shot clinics.• Arranged presentations and employee meetings with benefit vendors (457 and MOST plans).• Complete JCPER and GASB 45 reports.• Administered employee benefit plans: health, dental, life, LTD, supplemental life, Colonial Cancer, universallife, dependent life, three pension plans, FLEX, DECAF, EAP, etc. and reconciled monthly statements.• Staff participated throughout the year in educational forums to keep abreast of employment law changes.• Advised employees and supervisors on policies, procedures, & benefit inquiries.• Advised retirees on benefit options.• Advised and assisted supervisors with disciplinary and other employment related issues.
4 - 18
Performance Statistics: FY2013 FY2014 FY2015Entry level and promotional tests administered 8 10 9Applications processed 3,100 5,000 4354Jobs posted 110 145 119New hires in-processed: Full time 80 100 83
Part time 155 147 124Performance appraisals reviewed 667 657 677Retirement applications facilitated 36 21 18FMLA Requests processed 152 120 121Personnel actions processed 507 588 513
Budget Challenges/Planned InitiativesBudget Challenges:• Accomplish increased work requirements with decreased staffing.• Sustain new compensation plan.
Planned Initiatives:• Contribute insights to the employee compensation plan.• Meet the increased regulatory compliance in light of heightened government enforcement.• Continue to work with OneSolution and gain training on the system's functions and reporting capabilities.• Prepare and ensure compliance with the ACA reporting requirements.• Research testing options for entry level and promotional tests.
4 - 19
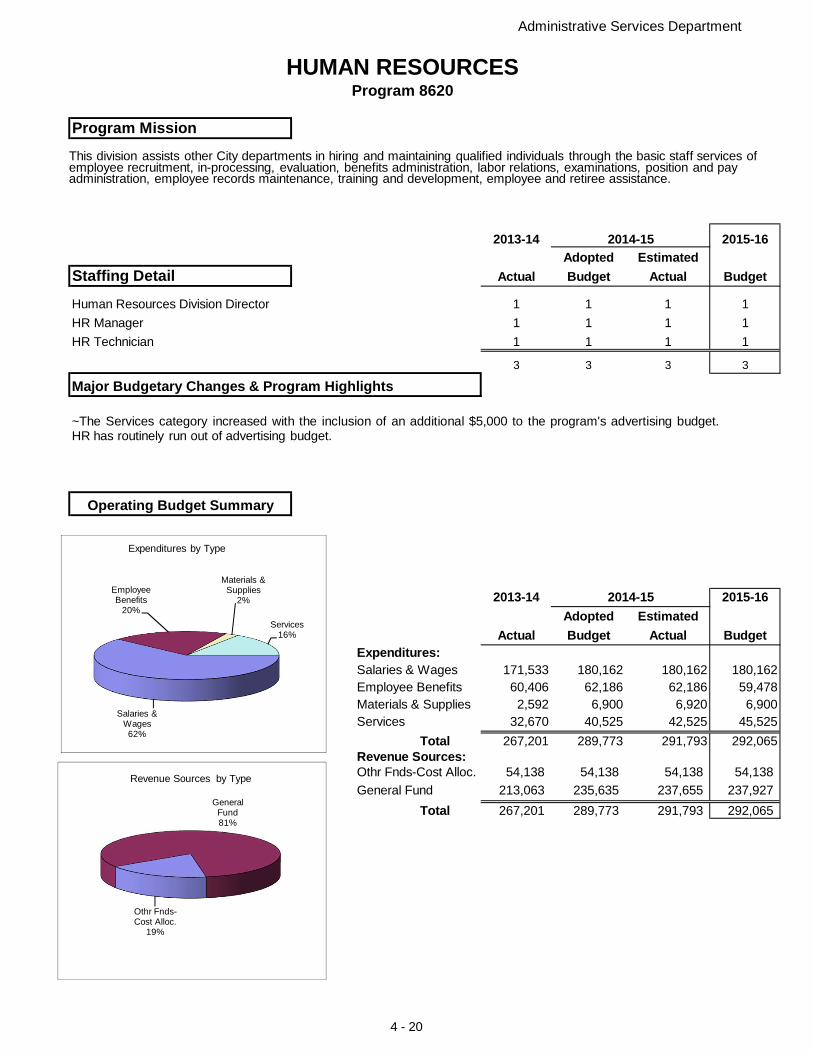
Administrative Services Department
HUMAN RESOURCESProgram 8620
Program Mission
2013-14 2014-15 2015-16Adopted Estimated
Staffing Detail Actual Budget Actual Budget
Human Resources Division Director 1 1 1 1
HR Manager 1 1 1 1
HR Technician 1 1 1 1
3 3 3 3
Major Budgetary Changes & Program Highlights
Operating Budget Summary
2013-14 2014-15 2015-16Adopted Estimated
Actual Budget Actual BudgetExpenditures:Salaries & Wages 171,533 180,162 180,162 180,162Employee Benefits 60,406 62,186 62,186 59,478Materials & Supplies 2,592 6,900 6,920 6,900Services 32,670 40,525 42,525 45,525
Total 267,201 289,773 291,793 292,065Revenue Sources:Othr Fnds-Cost Alloc. 54,138 54,138 54,138 54,138
General Fund 213,063 235,635 237,655 237,927
Total 267,201 289,773 291,793 292,065
Salaries & Wages62%
Employee Benefits
20%
Materials & Supplies
2%
Services16%
Expenditures by Type
Othr Fnds-Cost Alloc.
19%
General Fund81%
Revenue Sources by Type
This division assists other City departments in hiring and maintaining qualified individuals through the basic staff services ofemployee recruitment, in-processing, evaluation, benefits administration, labor relations, examinations, position and pay administration, employee records maintenance, training and development, employee and retiree assistance.
~The Services category increased with the inclusion of an additional $5,000 to the program's advertising budget.HR has routinely run out of advertising budget.
4 - 20
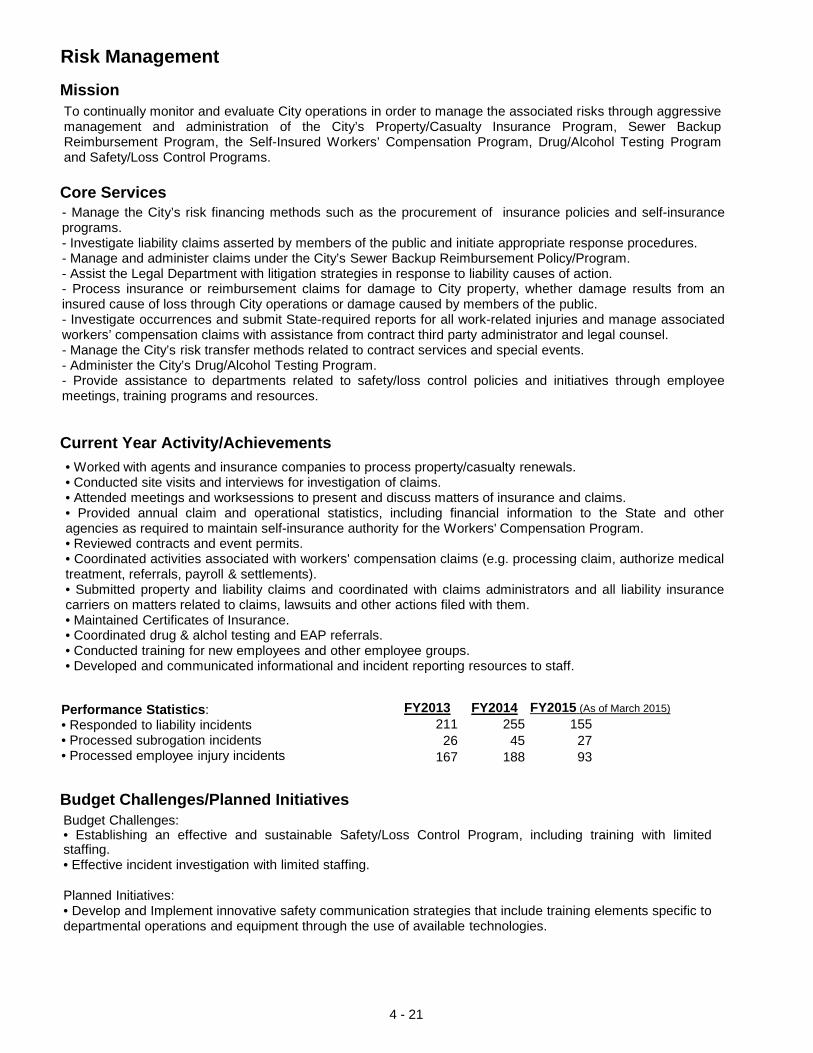
Risk Management
Mission
Core Services
Current Year Activity/Achievements
FY2013 FY2014 FY2015 (As of March 2015)
211 255 15526 45 27
167 188 93
Budget Challenges/Planned Initiatives
To continually monitor and evaluate City operations in order to manage the associated risks through aggressivemanagement and administration of the City’s Property/Casualty Insurance Program, Sewer BackupReimbursement Program, the Self-Insured Workers’ Compensation Program, Drug/Alcohol Testing Programand Safety/Loss Control Programs.
- Manage the City’s risk financing methods such as the procurement of insurance policies and self-insuranceprograms.- Investigate liability claims asserted by members of the public and initiate appropriate response procedures.- Manage and administer claims under the City’s Sewer Backup Reimbursement Policy/Program.- Assist the Legal Department with litigation strategies in response to liability causes of action.- Process insurance or reimbursement claims for damage to City property, whether damage results from aninsured cause of loss through City operations or damage caused by members of the public.- Investigate occurrences and submit State-required reports for all work-related injuries and manage associatedworkers’ compensation claims with assistance from contract third party administrator and legal counsel.- Manage the City’s risk transfer methods related to contract services and special events.- Administer the City’s Drug/Alcohol Testing Program.- Provide assistance to departments related to safety/loss control policies and initiatives through employeemeetings, training programs and resources.
Budget Challenges:• Establishing an effective and sustainable Safety/Loss Control Program, including training with limitedstaffing.• Effective incident investigation with limited staffing.
Planned Initiatives:• Develop and Implement innovative safety communication strategies that include training elements specific todepartmental operations and equipment through the use of available technologies.
• Worked with agents and insurance companies to process property/casualty renewals.• Conducted site visits and interviews for investigation of claims.• Attended meetings and worksessions to present and discuss matters of insurance and claims.• Provided annual claim and operational statistics, including financial information to the State and otheragencies as required to maintain self-insurance authority for the Workers' Compensation Program.• Reviewed contracts and event permits.• Coordinated activities associated with workers' compensation claims (e.g. processing claim, authorize medicaltreatment, referrals, payroll & settlements).• Submitted property and liability claims and coordinated with claims administrators and all liability insurancecarriers on matters related to claims, lawsuits and other actions filed with them.• Maintained Certificates of Insurance.• Coordinated drug & alchol testing and EAP referrals.• Conducted training for new employees and other employee groups.• Developed and communicated informational and incident reporting resources to staff.
Performance Statistics:• Responded to liability incidents• Processed subrogation incidents• Processed employee injury incidents
4 - 21
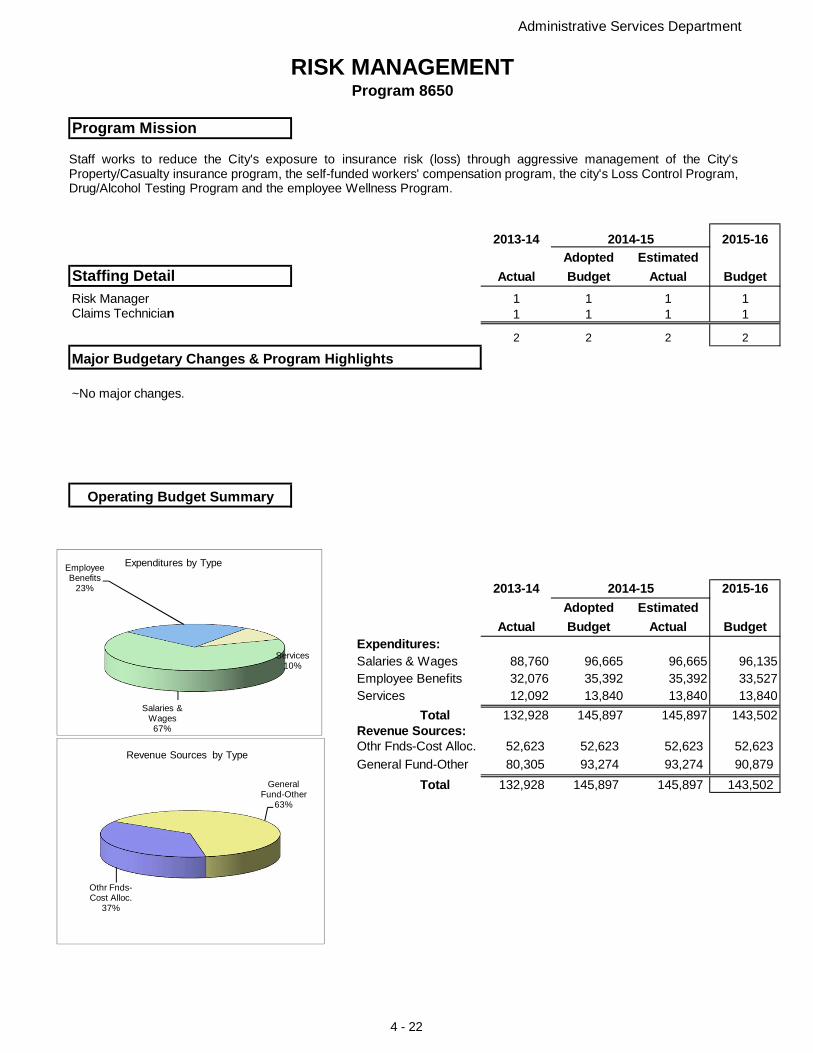
Administrative Services Department
RISK MANAGEMENTProgram 8650
Program Mission
2013-14 2014-15 2015-16Adopted Estimated
Staffing Detail Actual Budget Actual BudgetRisk Manager 1 1 1 1Claims Technician 1 1 1 1
2 2 2 2
Major Budgetary Changes & Program Highlights
Operating Budget Summary
2013-14 2014-15 2015-16Adopted Estimated
Actual Budget Actual BudgetExpenditures:Salaries & Wages 88,760 96,665 96,665 96,135Employee Benefits 32,076 35,392 35,392 33,527Services 12,092 13,840 13,840 13,840
Total 132,928 145,897 145,897 143,502Revenue Sources:Othr Fnds-Cost Alloc. 52,623 52,623 52,623 52,623
General Fund-Other 80,305 93,274 93,274 90,879
Total 132,928 145,897 145,897 143,502
Salaries & Wages67%
Employee Benefits
23%
Services10%
Expenditures by Type
Othr Fnds-Cost Alloc.
37%
General Fund-Other
63%
Revenue Sources by Type
Staff works to reduce the City's exposure to insurance risk (loss) through aggressive management of the City'sProperty/Casualty insurance program, the self-funded workers' compensation program, the city's Loss Control Program,Drug/Alcohol Testing Program and the employee Wellness Program.
~No major changes.
4 - 22
TECHNOLOGY SERVICES
Mission
Core Services
Current Year Activity/Achievements
Budget Challenges/Planned Initiatives
Promote ready access to municipal government information through appropriate day-to-day maintenance of theCity's PC-based computer network, by assisting other city departments with the development, implementationand use of various computer software systems at a minimum cost.
Network Services- Provide data/voice/video services to over 600 staff at 30 locations.- Maintain the data/phone network, establishing and maintaining minimum standards for desktop hardware anda standardized software environment.- Elements of the data network consist of computing platforms, local area networks (LAN) and Internet access.- Maintain the City's website (hosted by CivicPlus), as well as host/maintain sites for the nature center, CIP,Parks, Transit, Police and GIS.- Plan, manage, and maintain the production environment to maintain and enhance security, reliability,availability and performance.- Provide "on demand" service and support for system and security administration; problem resolution orcoordination; research into possible software/hardware acquisitions; and information requests regarding thesame.- Provide timely assistance and/or information in response to requests.Network Operations- Meet the requirements of replacing/upgrading PCs, printers, services and other equipment as needed througha funding mechanism based on a per PC charge.GIS Development- Maintain GIS data for access by City employees.
• Upgrading to OneSolution complete.• Upgrading Permits Plus to Accela Automation continues.• Implementation of a new VOIP phone system.• Server consolidation and virtualization.• Implemented major network changes.• Installation of several more wireless access points at City facilities.• Installation of DELL Appassure backup and disaster recovery software.• Continue to replace Windows XP workstations with Windows 7.• Launch OpenGov site for public viewing.
• Performance Statistics:Maintain a data network consisting of more than 450 desktop and laptop computers accessing a full suite ofgeneral purpose software tools, as well as over 15 business applications and services.More than 600 users are spread out over 30 locations.Over 100 mobile smartphone and tablet users plus personal devices.Approximately 4TB of data to manage.Maintain over 400 Avaya phones on the network.
- Continue to utilize automated management tools to stretch limited resources.- Complete implementation of: Microsoft Office 2010 throughout the network; Accela Automation; Windows 7/8upgrades.- Continue virtualization/consolidation of servers.- Maintaining the new Avaya phone system.- Continue to upgrade PCs and replace Windows XP machines.- Develop and implement a BYOD policy.- Upgrading the network.
4 - 23
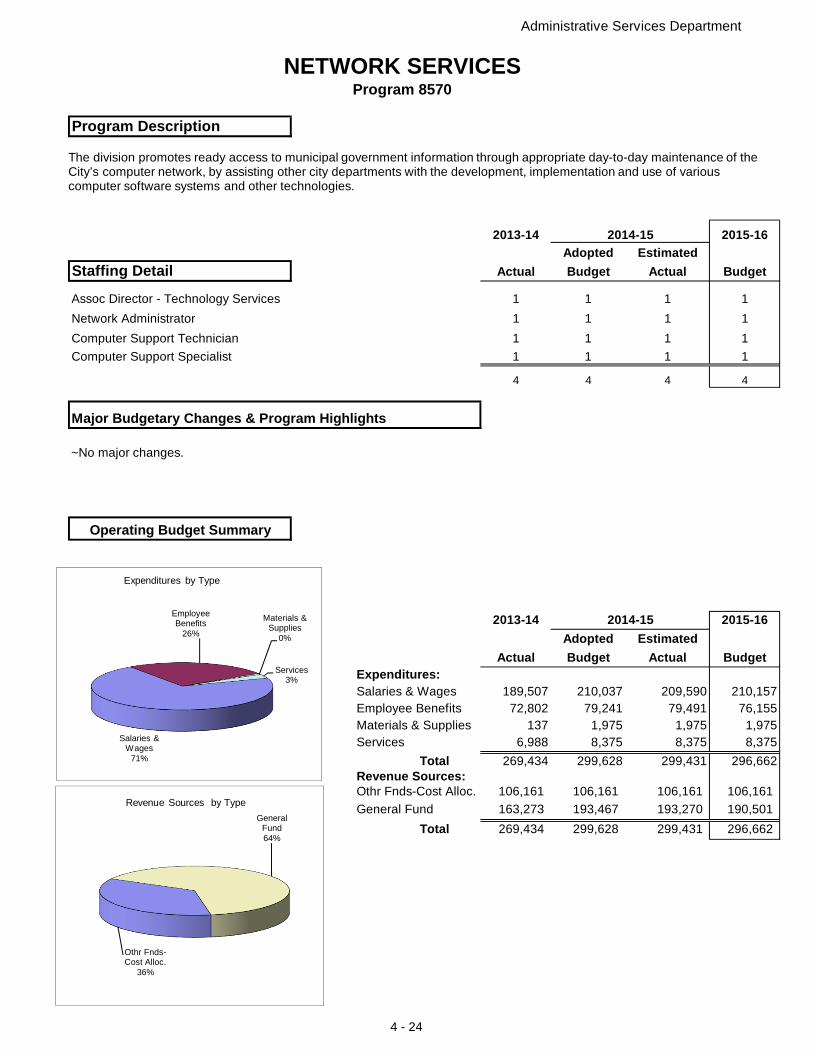
Administrative Services Department
NETWORK SERVICESProgram 8570
Program Description
2013-14 2014-15 2015-16Adopted Estimated
Staffing Detail Actual Budget Actual Budget
Assoc Director - Technology Services 1 1 1 1
Network Administrator 1 1 1 1
Computer Support Technician 1 1 1 1
Computer Support Specialist 1 1 1 1
4 4 4 4
Major Budgetary Changes & Program Highlights
Operating Budget Summary
2013-14 2014-15 2015-16Adopted Estimated
Actual Budget Actual BudgetExpenditures:Salaries & Wages 189,507 210,037 209,590 210,157Employee Benefits 72,802 79,241 79,491 76,155Materials & Supplies 137 1,975 1,975 1,975Services 6,988 8,375 8,375 8,375
Total 269,434 299,628 299,431 296,662Revenue Sources:Othr Fnds-Cost Alloc. 106,161 106,161 106,161 106,161
General Fund 163,273 193,467 193,270 190,501
Total 269,434 299,628 299,431 296,662
Salaries & Wages
71%
Employee Benefits
26%
Materials & Supplies
0%
Services3%
Expenditures by Type
Othr Fnds-Cost Alloc.
36%
General Fund64%
Revenue Sources by Type
The division promotes ready access to municipal government information through appropriate day-to-day maintenance of the City’s computer network, by assisting other city departments with the development, implementation and use of various computer software systems and other technologies.
~No major changes.
4 - 24
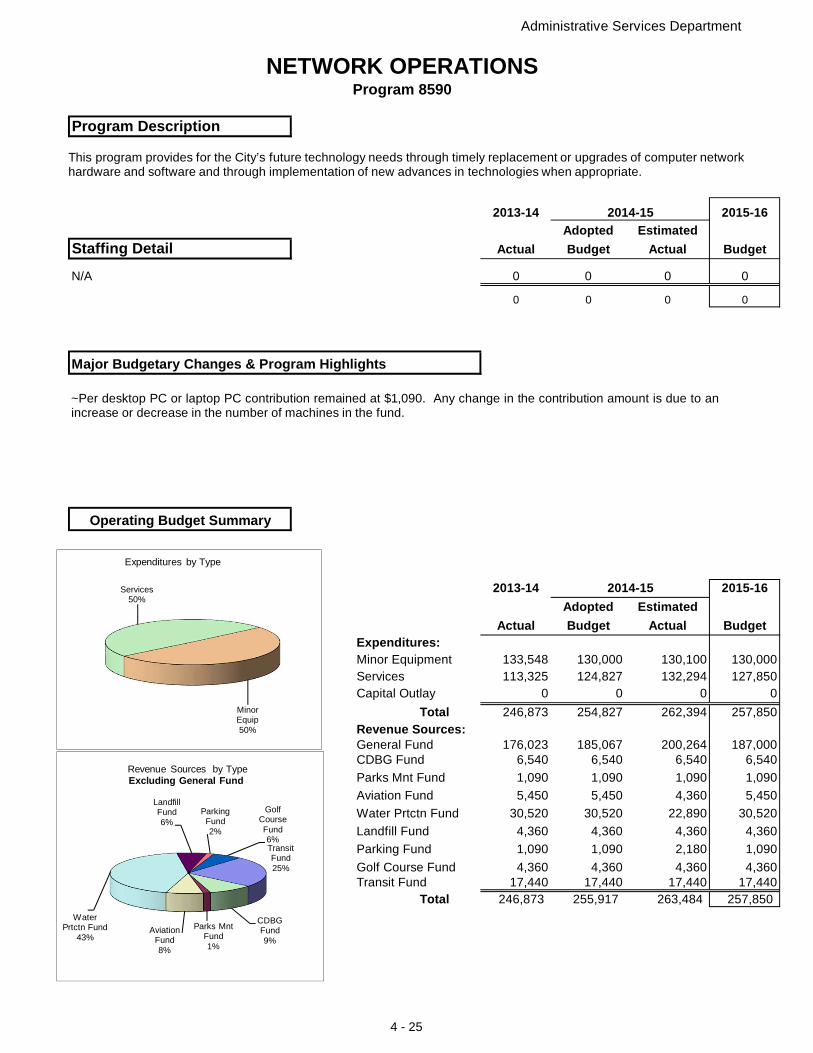
Administrative Services Department
NETWORK OPERATIONSProgram 8590
Program Description
2013-14 2014-15 2015-16Adopted Estimated
Staffing Detail Actual Budget Actual Budget
N/A 0 0 0 0
0 0 0 0
Major Budgetary Changes & Program Highlights
Operating Budget Summary
2013-14 2014-15 2015-16Adopted Estimated
Actual Budget Actual BudgetExpenditures:Minor Equipment 133,548 130,000 130,100 130,000Services 113,325 124,827 132,294 127,850Capital Outlay 0 0 0 0
Total 246,873 254,827 262,394 257,850Revenue Sources:General Fund 176,023 185,067 200,264 187,000CDBG Fund 6,540 6,540 6,540 6,540
Parks Mnt Fund 1,090 1,090 1,090 1,090
Aviation Fund 5,450 5,450 4,360 5,450
Water Prtctn Fund 30,520 30,520 22,890 30,520
Landfill Fund 4,360 4,360 4,360 4,360
Parking Fund 1,090 1,090 2,180 1,090
Golf Course Fund 4,360 4,360 4,360 4,360Transit Fund 17,440 17,440 17,440 17,440
Total 246,873 255,917 263,484 257,850
Minor Equip50%
Services50%
Expenditures by Type
CDBG Fund9%
Parks Mnt Fund1%
Aviation Fund8%
Water Prtctn Fund
43%
Landfill Fund6%
Parking Fund2%
Golf Course Fund6%Transit Fund25%
Revenue Sources by TypeExcluding General Fund
This program provides for the City’s future technology needs through timely replacement or upgrades of computer network hardware and software and through implementation of new advances in technologies when appropriate.
~Per desktop PC or laptop PC contribution remained at $1,090. Any change in the contribution amount is due to anincrease or decrease in the number of machines in the fund.
4 - 25
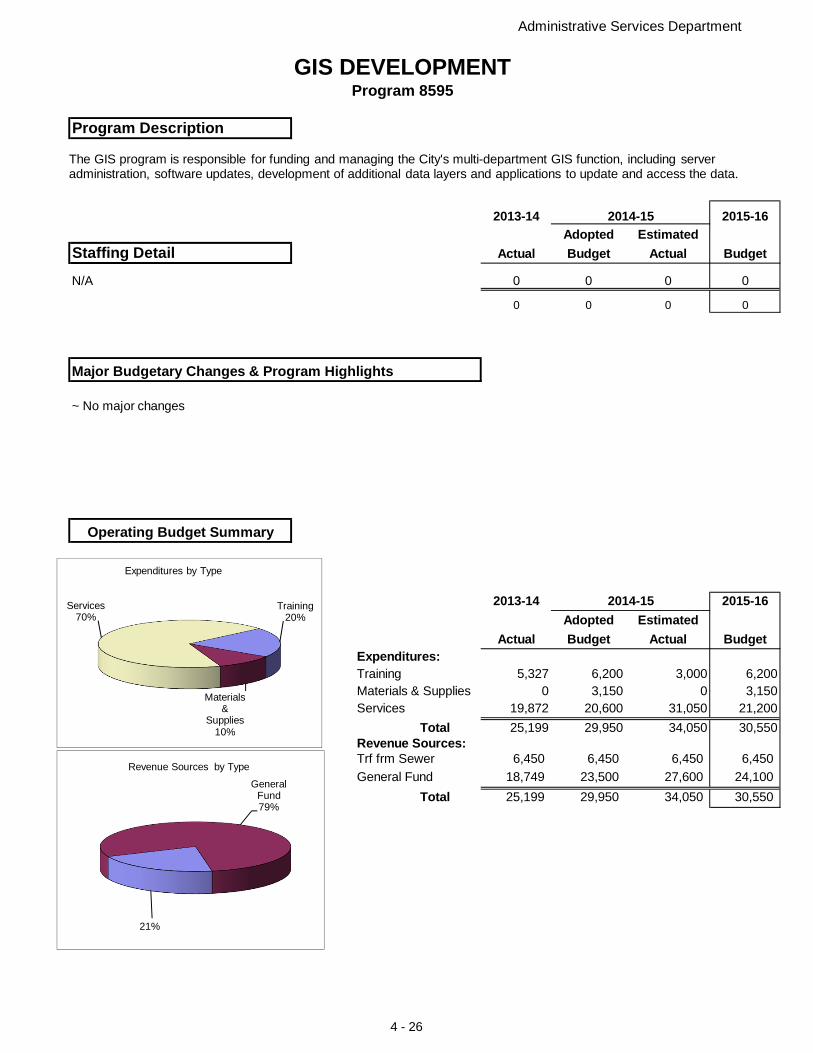
Administrative Services Department
GIS DEVELOPMENTProgram 8595
Program Description
2013-14 2014-15 2015-16Adopted Estimated
Staffing Detail Actual Budget Actual Budget
N/A 0 0 0 0
0 0 0 0
Major Budgetary Changes & Program Highlights
Operating Budget Summary
2013-14 2014-15 2015-16Adopted Estimated
Actual Budget Actual BudgetExpenditures:Training 5,327 6,200 3,000 6,200Materials & Supplies 0 3,150 0 3,150Services 19,872 20,600 31,050 21,200
Total 25,199 29,950 34,050 30,550Revenue Sources:Trf frm Sewer 6,450 6,450 6,450 6,450
General Fund 18,749 23,500 27,600 24,100
Total 25,199 29,950 34,050 30,550
Training20%
Materials &
Supplies10%
Services70%
Expenditures by Type
21%
General Fund79%
Revenue Sources by Type
The GIS program is responsible for funding and managing the City's multi-department GIS function, including server administration, software updates, development of additional data layers and applications to update and access the data.
~ No major changes
4 - 26

PLANNING & COMMUNITY DEVELOPMENT DEPARTMENT
TOTAL BUDGETED RESOURCES: 3,993,166$
The City of St. Joseph's planning and community development department provides economic planning andpublic/private sector cooperation in order to diversify the economic base of the community. Planning ensures thatdevelopment within the city follows adopted city plans and policies through review and consultation with privatedevelopers. And, the Community Development divisions address housing and non-housing-related communitydevelopment needs.
The Inspections and Code Compliance programs provide review and approval of code compliant construction anddevelopment.
These operations are funded through the local general sales tax, property taxes, special use permit fees, buildinginspections and permit fees and federal community development block grant sources.
P&CD ADMINISTRATION
COMMUNITY
C.D.
PLANNING INSPECTIONS &
CODE
BUILDING
DANGEROUS
HOUSING &
HOME
VARIOUS PASS-
Riverfront
5 - 1
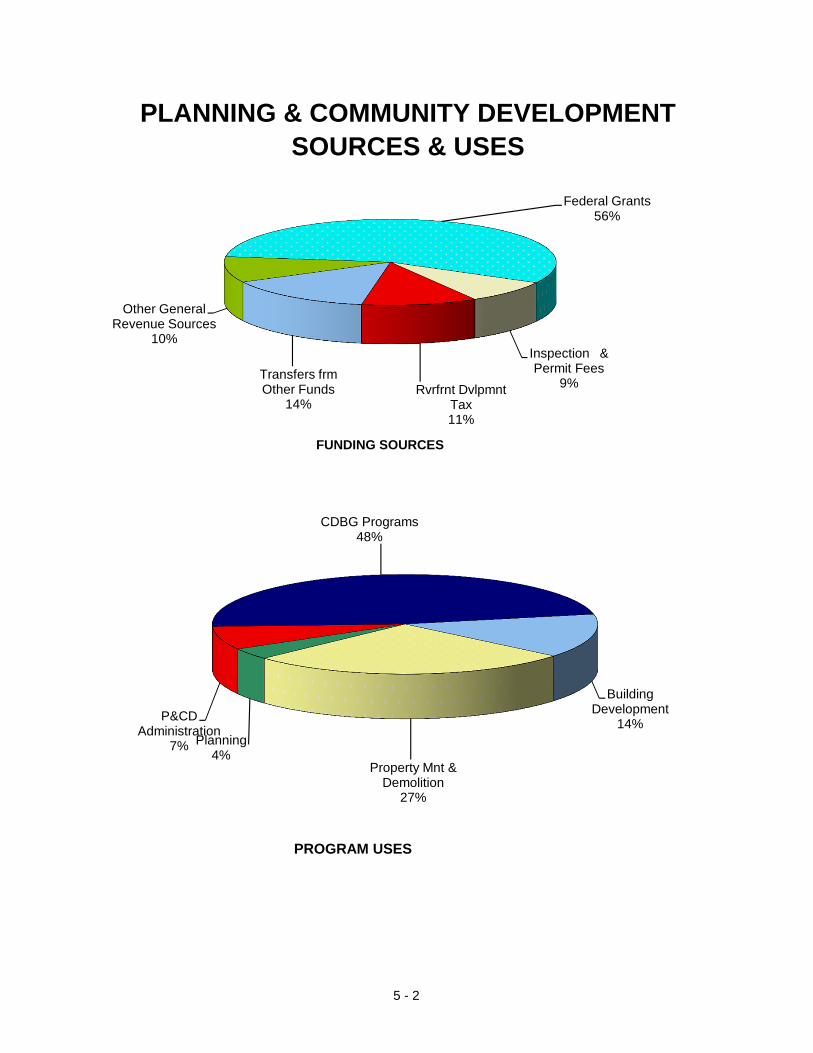
PLANNING & COMMUNITY DEVELOPMENTSOURCES & USES
Transfers frm Other Funds
14%
Other General Revenue Sources
10%
Federal Grants56%
Inspection & Permit Fees
9%Rvrfrnt Dvlpmnt Tax11%
P&CD Administration
7%
CDBG Programs48%
Building Development
14%
Property Mnt & Demolition
27%
Planning4%
PROGRAM USES
FUNDING SOURCES
5 - 2
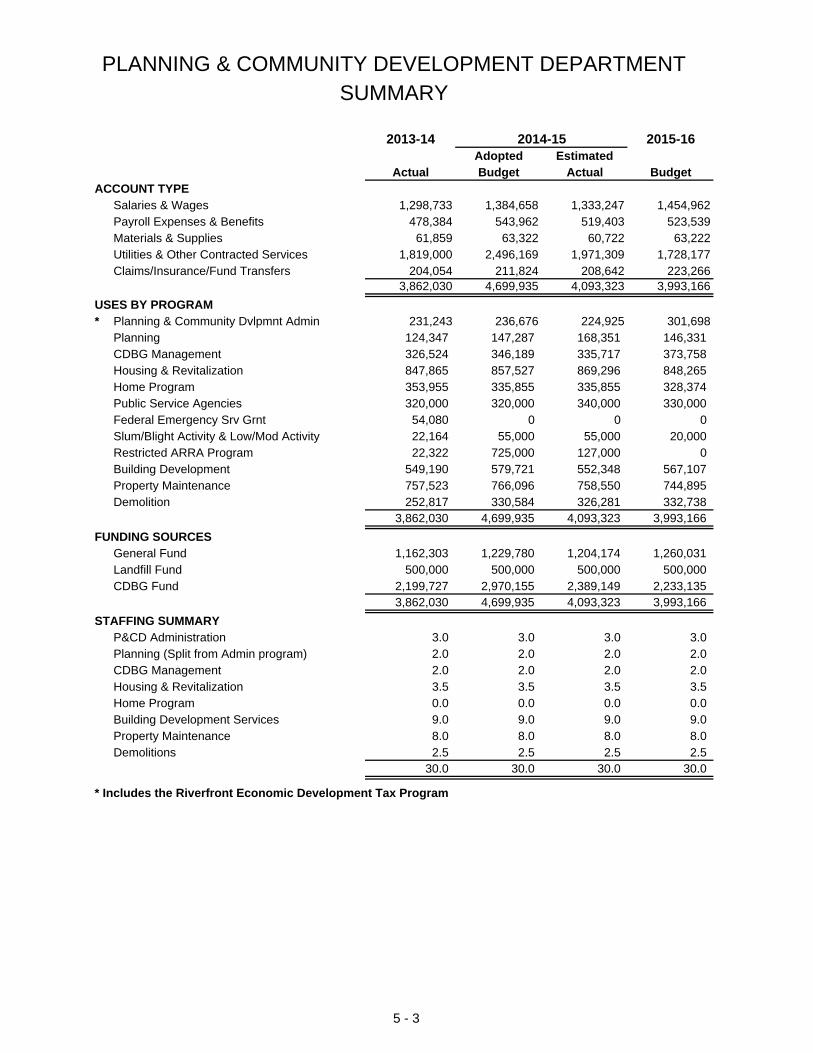
PLANNING & COMMUNITY DEVELOPMENT DEPARTMENTSUMMARY
2013-14 2014-15 2015-16Adopted Estimated
Actual Budget Actual BudgetACCOUNT TYPE
Salaries & Wages 1,298,733 1,384,658 1,333,247 1,454,962Payroll Expenses & Benefits 478,384 543,962 519,403 523,539Materials & Supplies 61,859 63,322 60,722 63,222Utilities & Other Contracted Services 1,819,000 2,496,169 1,971,309 1,728,177Claims/Insurance/Fund Transfers 204,054 211,824 208,642 223,266
3,862,030 4,699,935 4,093,323 3,993,166
USES BY PROGRAM* Planning & Community Dvlpmnt Admin 231,243 236,676 224,925 301,698
Planning 124,347 147,287 168,351 146,331CDBG Management 326,524 346,189 335,717 373,758Housing & Revitalization 847,865 857,527 869,296 848,265Home Program 353,955 335,855 335,855 328,374Public Service Agencies 320,000 320,000 340,000 330,000Federal Emergency Srv Grnt 54,080 0 0 0Slum/Blight Activity & Low/Mod Activity 22,164 55,000 55,000 20,000Restricted ARRA Program 22,322 725,000 127,000 0Building Development 549,190 579,721 552,348 567,107Property Maintenance 757,523 766,096 758,550 744,895Demolition 252,817 330,584 326,281 332,738
3,862,030 4,699,935 4,093,323 3,993,166
FUNDING SOURCESGeneral Fund 1,162,303 1,229,780 1,204,174 1,260,031Landfill Fund 500,000 500,000 500,000 500,000CDBG Fund 2,199,727 2,970,155 2,389,149 2,233,135
3,862,030 4,699,935 4,093,323 3,993,166
STAFFING SUMMARYP&CD Administration 3.0 3.0 3.0 3.0Planning (Split from Admin program) 2.0 2.0 2.0 2.0CDBG Management 2.0 2.0 2.0 2.0Housing & Revitalization 3.5 3.5 3.5 3.5Home Program 0.0 0.0 0.0 0.0Building Development Services 9.0 9.0 9.0 9.0Property Maintenance 8.0 8.0 8.0 8.0Demolitions 2.5 2.5 2.5 2.5
30.0 30.0 30.0 30.0
* Includes the Riverfront Economic Development Tax Program
5 - 3
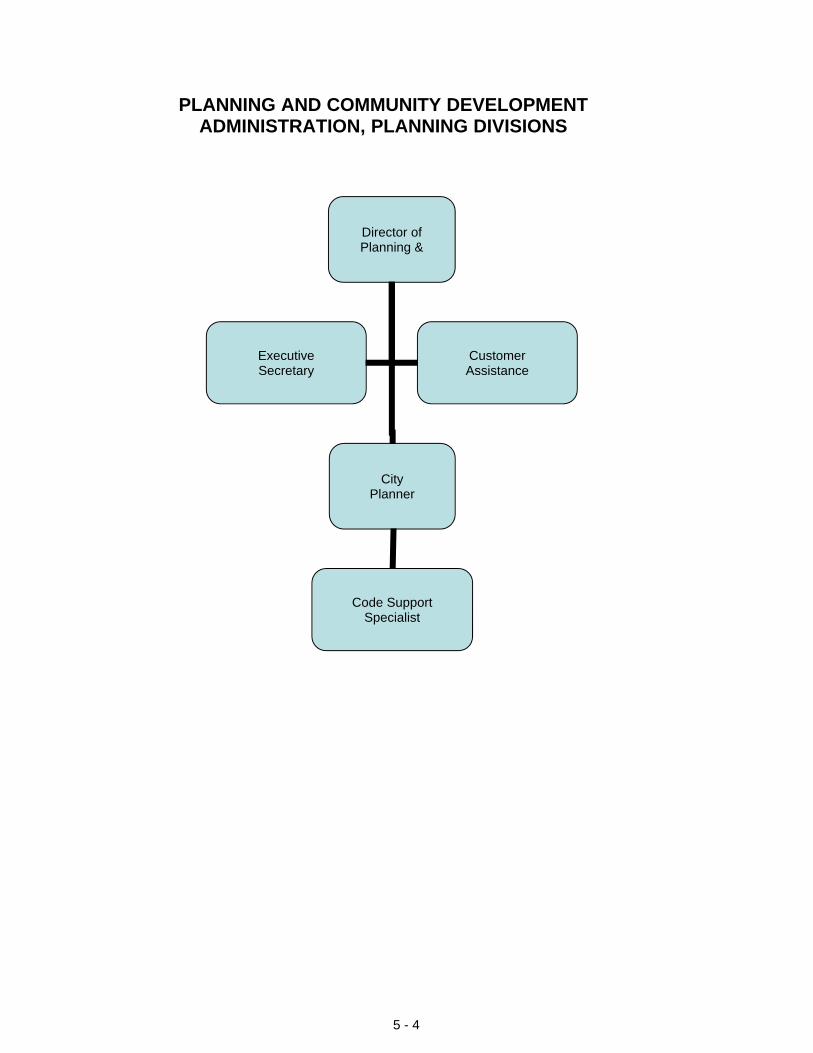
Director of Planning &
City Planner
Code Support Specialist
Executive Secretary
Customer Assistance
PLANNING AND COMMUNITY DEVELOPMENTADMINISTRATION, PLANNING DIVISIONS
5 - 4
Planning & Community Development Administration
Mission
Core Services
Current Year Activities/Achievements
Performance Statistics FY2013 FY2014 FY2015Number of special events processed & coordinated 124 116 132Number of walk through inspections for new businesses 265 285 312
Budget Challenges/Planned Initiatives
Support and enhance our community's economic development while ensuring public health and safety andcompliance with city ordinances and adopted codes.
--Managerial oversight of planning & zoning, neighborhood services and federally funded project administrationincluding the historic preservation functions of the City.--Implementation of the Downtown Master Plan and DREAM Initiative goals.--Facilitate in-house meetings of the Economic Development Team to ensure continuity and projectcoordination.--Work with Private Development to promote job creation.--Downtown Redevelopment--The integrated review, approval and inspection of buildings and developments.--The enforcement of assigned city ordinances and adopted codes.--The coordination, approval and permitting of special events such as parades and festivals which aresponsored by a variety of individuals or groups in the community.--The review and evaluation of various city ordinances planning and building codes to ensure compliance withchanging national, state and local laws, statutes and regulations.--Economic Development - Representatives from Administrative Services, Public Works, Legal, and Planning,as well as involvement of the Chamber of Commerce, work in collaboration to achieve a comprehensiveapproach to economic development efforts. A number of economic programs are available for businesseswanted to locate or expand in St. Joseph: Chapter 100 Bonds, Chapter 353 Tax Abatement, NeighborhoodImprovement Districts & Community Improvement Districts, Enhanced Enterprise Zone, Sales TaxImprovement Agreements, Tax Increment Financing
• Updated Downtown Redevelopment Study• Updated the Development Review Process• Administered economic development incentives to 15 companies.
- WORK MANAGEMENT SOFTWARE: The continued upgrading of our work management and informationsystem is our biggest challenge for this next year. This upgrade will not only allow us to more effectively supportour customer's needs but communicate more effectively between city departments. It will allow us to extendmany of our services to our customers wherever they may be with on-line access and provide them with muchof the same geographic information we will have.
5 - 5
Mission
Core Services
Current Year Activity/Achievements
Performance statistics FY2013 FY2014 FY2015Number of nuisances abated by the City 1,230 1,485 1153Number of violation notices sent 6,312 9,348 8265Current dangerous building cases 296 264 235Number of structures demolished 63 69 52
Budget Challenges/Planned Initiatives
Property MaintenanceProperty Maintenance, Demolitions
To work with citizens in an effort to reduce conditions that may pose health and safety hazards to the publicand to reduce blight in the community.
- Work with citizens in an effort to eliminate the amount of trash, debris and overgrown weeds, hazardoustrees and junk vehicles on private property.- Investigate complaints of violations of minimum housing standards and interior housing conditions.- Remove nuisance conditions on private and public property.- Enforcement of code compliance ordinances in order to curtail further blight.- Provide programs to educate property owners on their responsibility to responsively maintain theirproperties through public meetings and presentations.- Track complaints, inspections, notices, re-inspections, abatements, summons, incorporated photos witheach complaint and provide a variety of reports through the Permits Plus program.- When necessary, secure or demolish dilapidated, abandoned, or dangerous structures.- When possible, assist in the stabilization and marketing of vacant, abandoned, or deteriorating buildingsas an alternative to demolition.
1.Completed adoption and implementation of the new property maintenance codes as recommended by theCitizen's Review Committee and adopted by Council.
2. Complete implementation of Asset Management, Development Review and Planning work managementsoftware and continue working toward implementation of Building Development, Property Maintenance andBusiness License work management software.
1. Continue to fund the Historic Neighborhood grant program and work closely with midtown neighborhoodassociations to address concerns.2. Allocate a portion of Gaming funds budgeted for abatements and demolitions to fund public informationefforts in the form of informational workshops on the part of the Landmark Commission as well as for adiscovery trip to historic cities to learn how they have revitalized historic areas of their communities.
5 - 6

Planning & CD Department
PLANNING & COMMUNITY DEVELOPMENT ADMINISTRATIONProgram 8380
Program Description
2013-14 2014-15 2015-16Adopted Estimated
Staffing Detail Actual Budget Actual Budget
Director of Planning & Comm Develop 1 1 1 1Executive Secretary 1 1 1 1Customer Assistance Specialist 1 1 1 1
3 3 3 3
Major Budgetary Changes & Program Highlights
Operating Budget Summary
2013-14 2014-15 2015-16Adopted Estimated
Actual Budget Actual BudgetExpenditures:Salaries & Wages 165,862 172,460 163,510 240,192Employee Benefits 62,942 61,626 58,825 58,916Materials & Supplies 1,095 1,500 1,500 1,500Services 1,344 1,090 1,090 1,090
Total 231,243 236,676 224,925 301,698Revenue Sources:Indirect Cost-CDBG 58,199 64,571 58,199 80,623General Fund 173,044 172,105 166,726 221,075
Total 231,243 236,676 224,925 301,698
Salaries & Wages
80%
Employee Benefits
20%
Materials & Supplies
0%
Expenditures by Type
Cost Plan Allocation
21%
General Fund79%
Revenue Sources by Type
The administrative office provides managerial oversight of planning and zoning, building inspections, propertymaintenance issues, economic development coordination and federally funded project administration including thehistoric preservation functions of the City. Staff oversees permitting, licensing, building inspection, code complianceand development review and coordination. The Special Events Coordinator, makes sure that parades, festivals, andother special events sponsored by a variety of individuals or groups in the community are properly permitted and havemet all street and safety concerns. The position also serves City’s primary point of contact for all liquor licensing issues.
~Salaries & Wages category contains the budget for the impacts of the 27th payroll and for the 1.5% salary increase onboth the wages and the benefit categories for the department programs within the general fund.
5 - 7
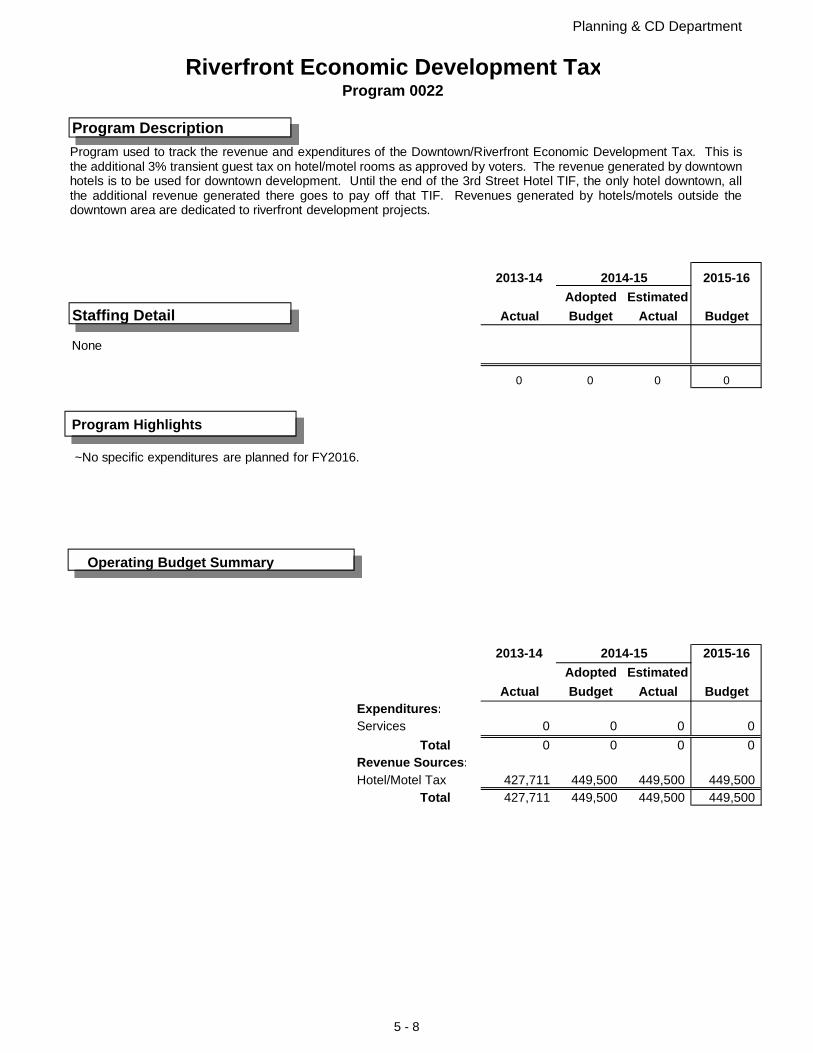
Planning & CD Department
Riverfront Economic Development TaxProgram 0022
Program Description
2013-14 2014-15 2015-16Adopted Estimated
Staffing Detail Actual Budget Actual Budget
0 0 0 0
Program Highlights
Operating Budget Summary
2013-14 2014-15 2015-16Adopted Estimated
Actual Budget Actual BudgetExpenditures:Services 0 0 0 0
Total 0 0 0 0Revenue Sources:Hotel/Motel Tax 427,711 449,500 449,500 449,500
Total 427,711 449,500 449,500 449,500
~No specific expenditures are planned for FY2016.
Program used to track the revenue and expenditures of the Downtown/Riverfront Economic Development Tax. This isthe additional 3% transient guest tax on hotel/motel rooms as approved by voters. The revenue generated by downtownhotels is to be used for downtown development. Until the end of the 3rd Street Hotel TIF, the only hotel downtown, allthe additional revenue generated there goes to pay off that TIF. Revenues generated by hotels/motels outside thedowntown area are dedicated to riverfront development projects.
None
5 - 8
Planning
Mission
Core Services
Current Year Activity/Achievements
Budget Challenges/Planned Initiatives
Planning ensures that development within the city follows adopted city plans and policies through review andconsultation with private developers.
- Reviews all residential and commercial development plans, all zoning and subdivision platting, annexationproposals in order to:
~ Ensure compliance with the City's Comprehensive Land Use Plan (CLUP) in order to manage the City'sgrowth & development
~ Ensure compliance with the City's Boulevard System master Plan in order to manage the expansion of theBoulevard/Parkway system to encompass the entire City.
~ Ensure compliance with the City's zoning code for proper spacing, location and design in order to makesure quality of life standards are met.- Provide staff support to the Downtown Review Board, Planning Commission and Zoning Board of Adjustment.- Provide technical planning assistance to the Downtown Partnership Board of Directors, St. Joseph MetroChamber of Commerce Government Relations Committee, and the St. Joseph MPO.- Prepare and review all US Census Bureau data for the city to be utilized in long range planning and goalsetting.
• Downtown Redevelopment• Job Creation/Retention
- Work to meet customers needs in planning services.- Promote economic development initiatives through various incentive programs.- Continued downtown redevelopment efforts.- Historic Property Inventory Plan
5 - 9

Planning & CD Department
PLANNINGProgram 5110
Program Description
2013-14 2014-15 2015-16Adopted Estimated
Staffing Detail Actual Budget Actual Budget
City Planner 1 1 1 1Code Support Specialist 1 1 1 1
2 2 2 2
Major Budgetary Changes & Program Highlights
Operating Budget Summary
2013-14 2014-15 2015-16Adopted Estimated
Actual Budget Actual BudgetExpenditures:Salaries & Wages 81,612 90,390 83,990 87,181Employee Benefits 25,733 36,047 34,473 35,680Materials & Supplies 1,504 1,750 1,750 1,750Outside Services 15,498 19,100 48,138 21,720
Total 124,347 147,287 168,351 146,331
Revenue Sources:Permits 35,574 35,000 35,000 35,000
General Fund-Other 88,773 112,287 133,351 111,331Total 124,347 147,287 168,351 146,331
Salaries & Wages60%
Employee Benefits
24%
Materials & Supplies
1%
Outside Services
15%
Expenditures by Type
Permits24%
Other General
Fund76%
Revenue Sources by Type
Planning ensures that development within the city follows adopted city planning and zoning plans and policies through review and consultation with private developers.
~No major changes.
5 - 10
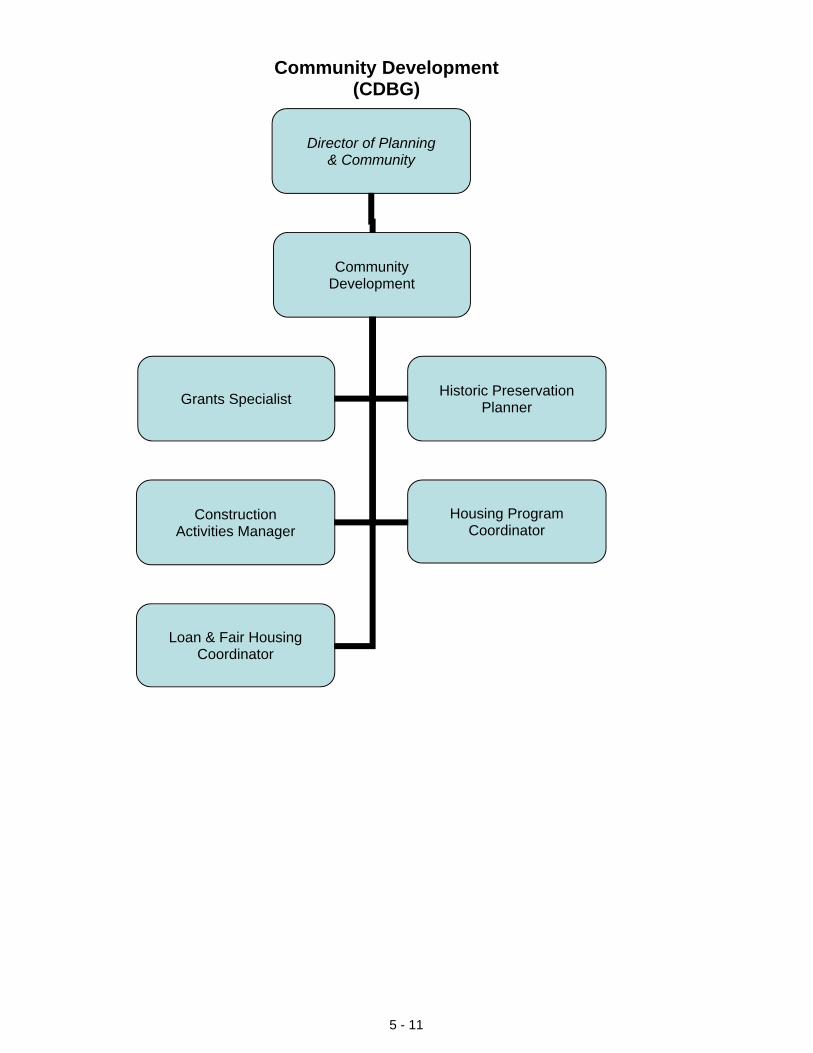
Director of Planning & Community
Community Development
Grants SpecialistHistoric Preservation
Planner
Construction Activities Manager
Housing Program Coordinator
Loan & Fair Housing Coordinator
Community Development (CDBG)
5 - 11
Community Development Block Grant Program
Mission
Core Services
Current Year Activity/Achievements
Performance Statistics FY2013 FY2014 FY2015Number of home improvement loans provided 24 26 32Number of slum/blight construction undertaken* 0 0 0
$300,000 $300,000 $300,000Number of sub-grantee programs approved & monitored 11 11 12
*No federal funding for the activity
Budget Challenges/Planned Initiatives
Amount available for support to programs addressing child care, public health, drug & alcohol, domestic violence, and treatment for children with disabilities
To address housing and non-housing-related community development needs as identified by citizens andcommunity groups; to provide decent housing by assisting the homeless and those at risk of homelessness; toprovide a suitable living environment by improving safety and livability of neighborhoods, restoring andpreserving properties of special value for historic, architectural or esthetic reasons; and, to expand economicopportunities to low-income persons.
Community Development Administration- Administer, monitor, and supervise all Community Development programs, public service projects, andspecial projects funded through HUD, CDBG, Home and Neighborhood Stabilization Program programs- Allocate and monitor use of federal funds to organizations and individuals able to undertake eligible activitiestoward the national Strategies of the CDBG program.
Housing and Revitalization & HOME Programs- Prevent further decline of the city's housing stock by focusing efforts on revitalization of core inner-cityneighborhoods.- Promote revitalization downtown through residential development.- Provide decent safe and sanitary housing for low to moderate-income families through implementation offederal loan programs.
Historic Preservation- Assist in the stabilization and marketing of vacant, abandoned, or deteriorating buildings as an alternative todemolitions when possible.
Demolition- Enhance public health and safegy, as well as the communitys appearance by securing or demolishingdilapidated, abandoned, or dangerous structures. (See Property Maintenance Department for Achievements& Activity statistics.)
• Underwent audits by HUD staff from the Region VII office, State Neighborhood Stabilization Programauditors and city auditor and received clean opinions.
The City's CDBG entitlement will receive a 2% increase in 2015. The City's HOME program will see a 10%reduction starting in July 2015. The City's entitlement for CDBG is projected to be $1,357,756 in 2015; theHOME Program is projected to be $258,374.
5 - 12
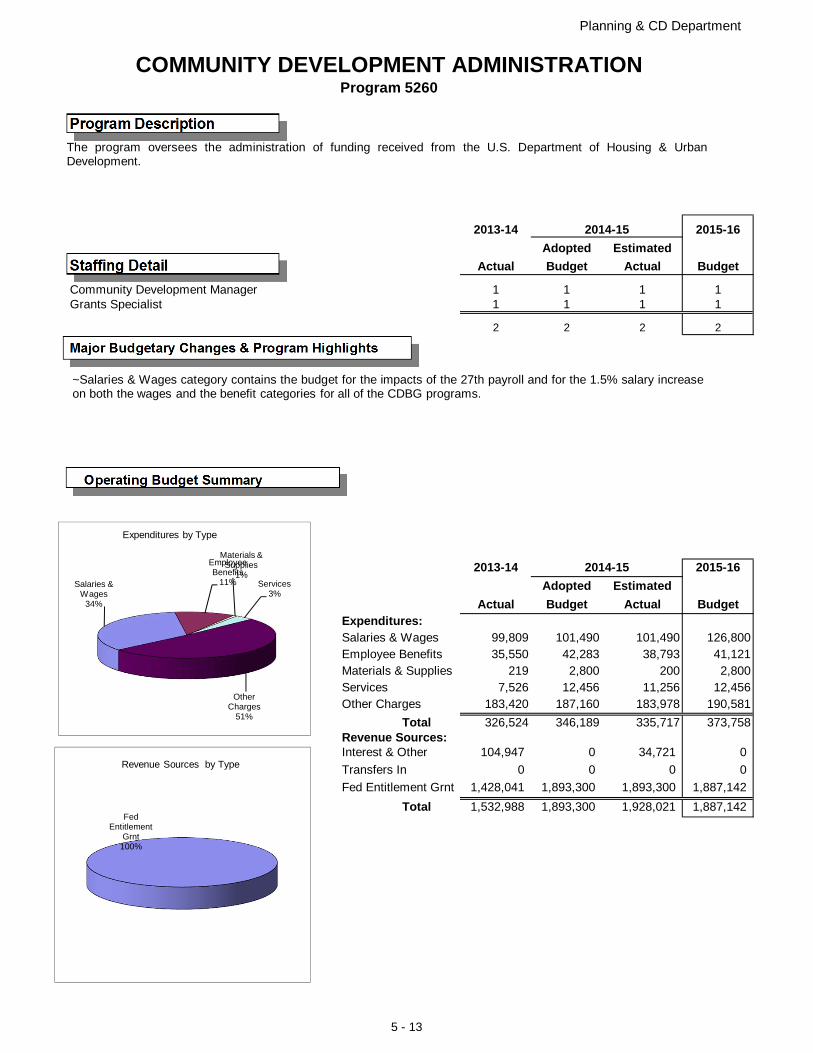
Planning & CD Department
COMMUNITY DEVELOPMENT ADMINISTRATIONProgram 5260
Program Description
2013-14 2014-15 2015-16Adopted Estimated
Staffing Detail Actual Budget Actual Budget
Community Development Manager 1 1 1 1Grants Specialist 1 1 1 1
2 2 2 2
Major Budgetary Changes & Program Highlights
Operating Budget Summary
2013-14 2014-15 2015-16Adopted Estimated
Actual Budget Actual BudgetExpenditures:Salaries & Wages 99,809 101,490 101,490 126,800Employee Benefits 35,550 42,283 38,793 41,121Materials & Supplies 219 2,800 200 2,800Services 7,526 12,456 11,256 12,456Other Charges 183,420 187,160 183,978 190,581
Total 326,524 346,189 335,717 373,758Revenue Sources:Interest & Other 104,947 0 34,721 0
Transfers In 0 0 0 0
Fed Entitlement Grnt 1,428,041 1,893,300 1,893,300 1,887,142
Total 1,532,988 1,893,300 1,928,021 1,887,142
Salaries & Wages
34%
Employee Benefits
11%
Materials & Supplies
1%Services
3%
Other Charges
51%
Expenditures by Type
Fed Entitlement
Grnt100%
Revenue Sources by Type
The program oversees the administration of funding received from the U.S. Department of Housing & UrbanDevelopment.
~Salaries & Wages category contains the budget for the impacts of the 27th payroll and for the 1.5% salary increaseon both the wages and the benefit categories for all of the CDBG programs.
5 - 13
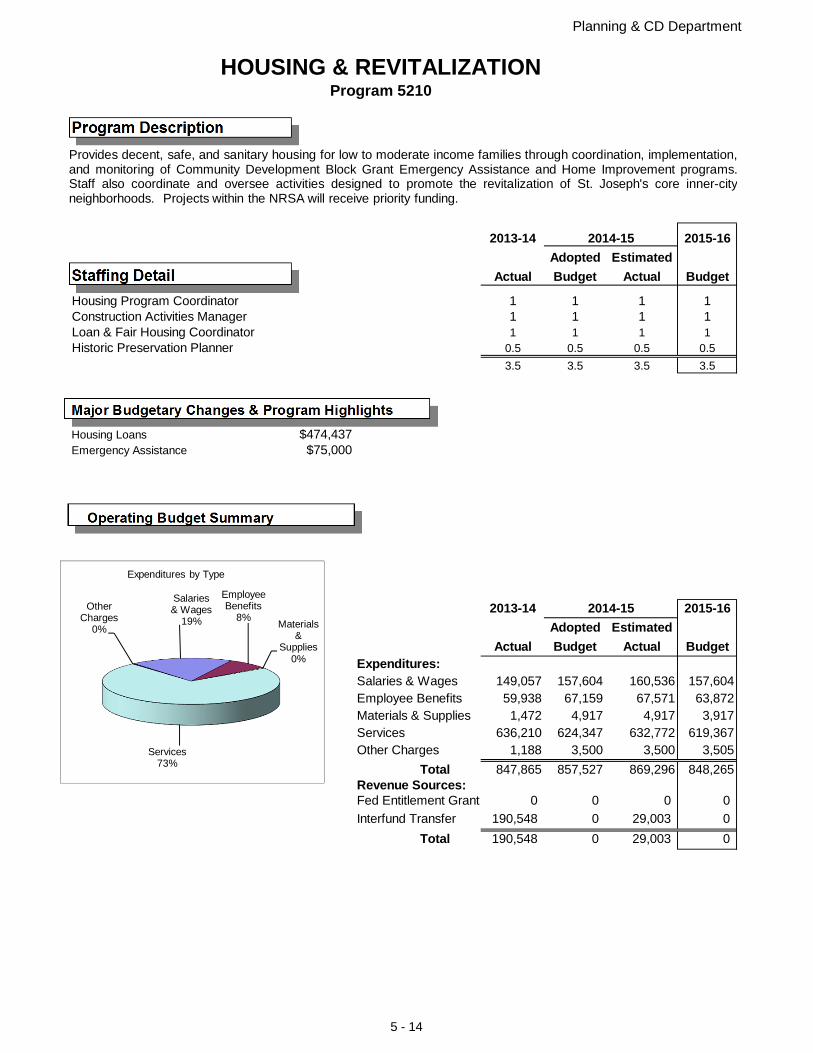
Planning & CD Department
HOUSING & REVITALIZATIONProgram 5210
Program Description
2013-14 2014-15 2015-16Adopted Estimated
Staffing Detail Actual Budget Actual Budget
Housing Program Coordinator 1 1 1 1Construction Activities Manager 1 1 1 1Loan & Fair Housing Coordinator 1 1 1 1Historic Preservation Planner 0.5 0.5 0.5 0.5
3.5 3.5 3.5 3.5
Major Budgetary Changes & Program HighlightsHousing Loans $474,437Emergency Assistance $75,000
Operating Budget Summary
2013-14 2014-15 2015-16Adopted Estimated
Actual Budget Actual BudgetExpenditures:Salaries & Wages 149,057 157,604 160,536 157,604Employee Benefits 59,938 67,159 67,571 63,872Materials & Supplies 1,472 4,917 4,917 3,917Services 636,210 624,347 632,772 619,367Other Charges 1,188 3,500 3,500 3,505
Total 847,865 857,527 869,296 848,265Revenue Sources:Fed Entitlement Grant 0 0 0 0
Interfund Transfer 190,548 0 29,003 0
Total 190,548 0 29,003 0
Salaries & Wages
19%
Employee Benefits
8%Materials
& Supplies
0%
Services73%
Other Charges
0%
Expenditures by Type
Provides decent, safe, and sanitary housing for low to moderate income families through coordination, implementation,and monitoring of Community Development Block Grant Emergency Assistance and Home Improvement programs.Staff also coordinate and oversee activities designed to promote the revitalization of St. Joseph's core inner-cityneighborhoods. Projects within the NRSA will receive priority funding.
5 - 14
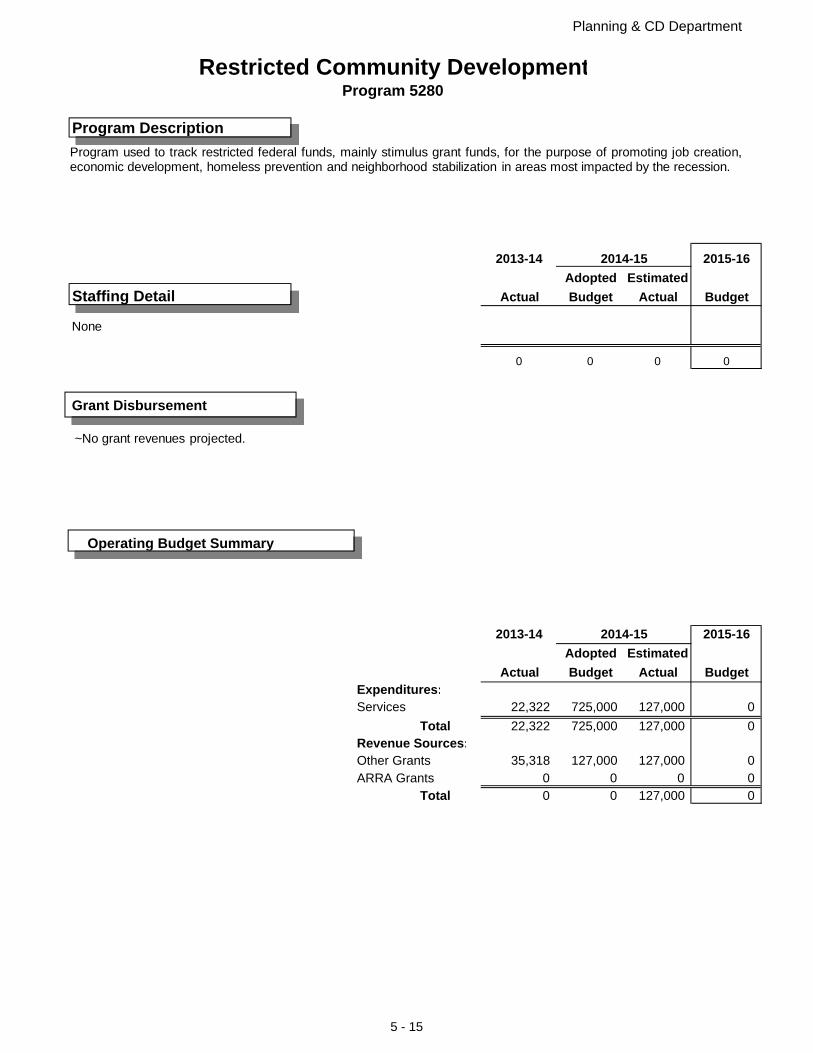
Planning & CD Department
Restricted Community DevelopmentProgram 5280
Program Description
2013-14 2014-15 2015-16Adopted Estimated
Staffing Detail Actual Budget Actual Budget
0 0 0 0
Grant Disbursement
Operating Budget Summary
2013-14 2014-15 2015-16Adopted Estimated
Actual Budget Actual BudgetExpenditures:Services 22,322 725,000 127,000 0
Total 22,322 725,000 127,000 0Revenue Sources:Other Grants 35,318 127,000 127,000 0ARRA Grants 0 0 0 0
Total 0 0 127,000 0
~No grant revenues projected.
Program used to track restricted federal funds, mainly stimulus grant funds, for the purpose of promoting job creation,economic development, homeless prevention and neighborhood stabilization in areas most impacted by the recession.
None
5 - 15
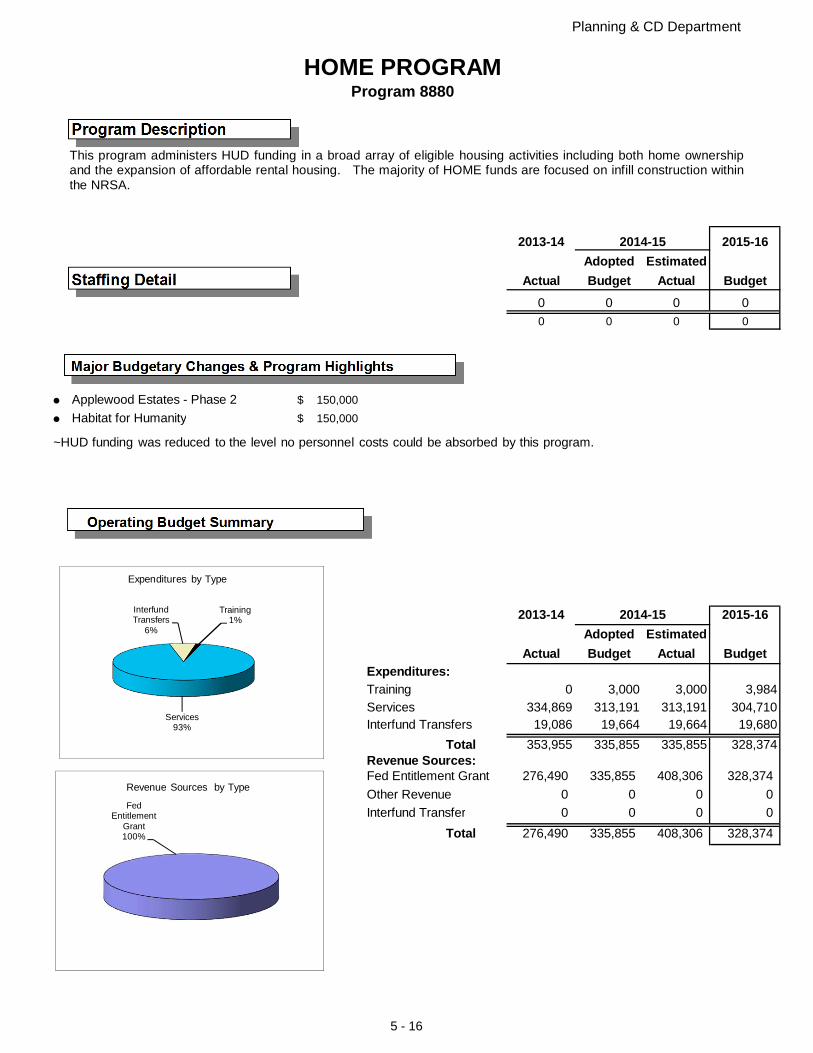
Planning & CD Department
HOME PROGRAMProgram 8880
Program Description
2013-14 2014-15 2015-16Adopted Estimated
Staffing Detail Actual Budget Actual Budget0 0 0 0
0 0 0 0
Major Budgetary Changes & Program Highlights
Applewood Estates - Phase 2 150,000$
Habitat for Humanity 150,000$
Operating Budget Summary
2013-14 2014-15 2015-16Adopted Estimated
Actual Budget Actual BudgetExpenditures:Training 0 3,000 3,000 3,984
Services 334,869 313,191 313,191 304,710Interfund Transfers 19,086 19,664 19,664 19,680
Total 353,955 335,855 335,855 328,374Revenue Sources:Fed Entitlement Grant 276,490 335,855 408,306 328,374
Other Revenue 0 0 0 0
Interfund Transfer 0 0 0 0
Total 276,490 335,855 408,306 328,374
Training1%
Services93%
Interfund Transfers
6%
Expenditures by Type
Fed Entitlement
Grant100%
Revenue Sources by Type
This program administers HUD funding in a broad array of eligible housing activities including both home ownershipand the expansion of affordable rental housing. The majority of HOME funds are focused on infill construction withinthe NRSA.
~HUD funding was reduced to the level no personnel costs could be absorbed by this program.
5 - 16
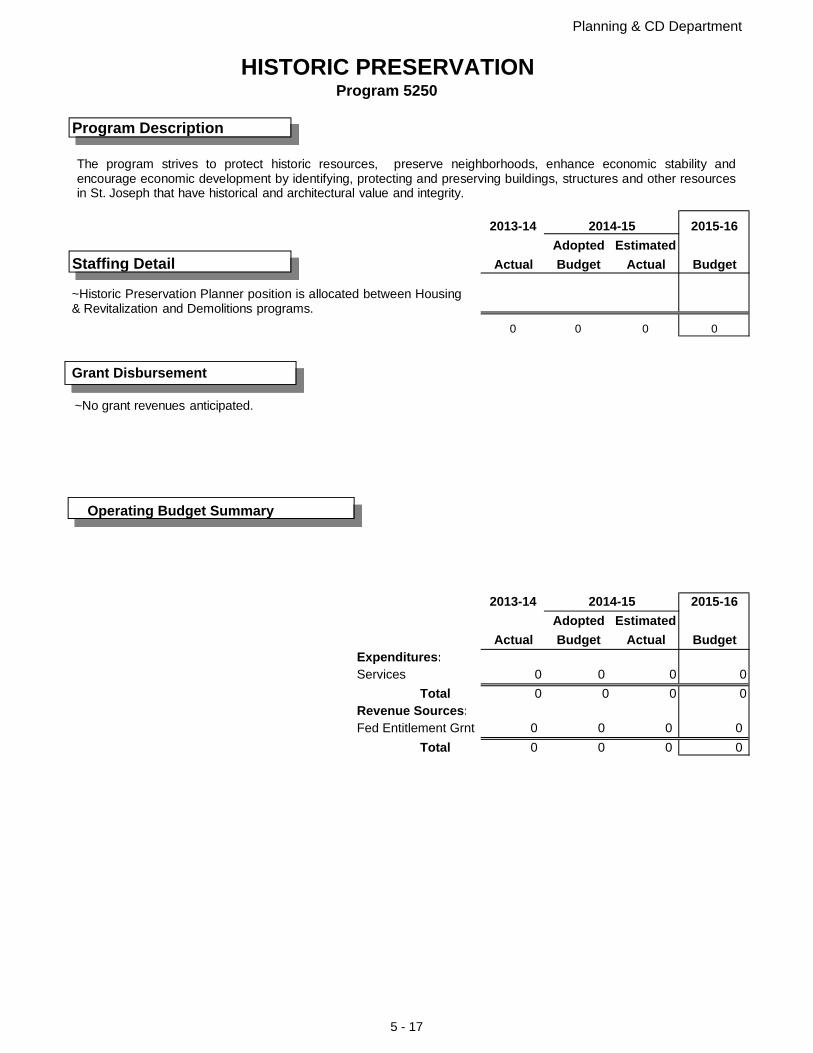
Planning & CD Department
HISTORIC PRESERVATIONProgram 5250
Program Description
2013-14 2014-15 2015-16Adopted Estimated
Staffing Detail Actual Budget Actual Budget
0 0 0 0
Grant Disbursement
Operating Budget Summary
2013-14 2014-15 2015-16Adopted Estimated
Actual Budget Actual BudgetExpenditures:Services 0 0 0 0
Total 0 0 0 0Revenue Sources:Fed Entitlement Grnt 0 0 0 0
Total 0 0 0 0
~No grant revenues anticipated.
The program strives to protect historic resources, preserve neighborhoods, enhance economic stability andencourage economic development by identifying, protecting and preserving buildings, structures and other resourcesin St. Joseph that have historical and architectural value and integrity.
~Historic Preservation Planner position is allocated between Housing& Revitalization and Demolitions programs.
5 - 17
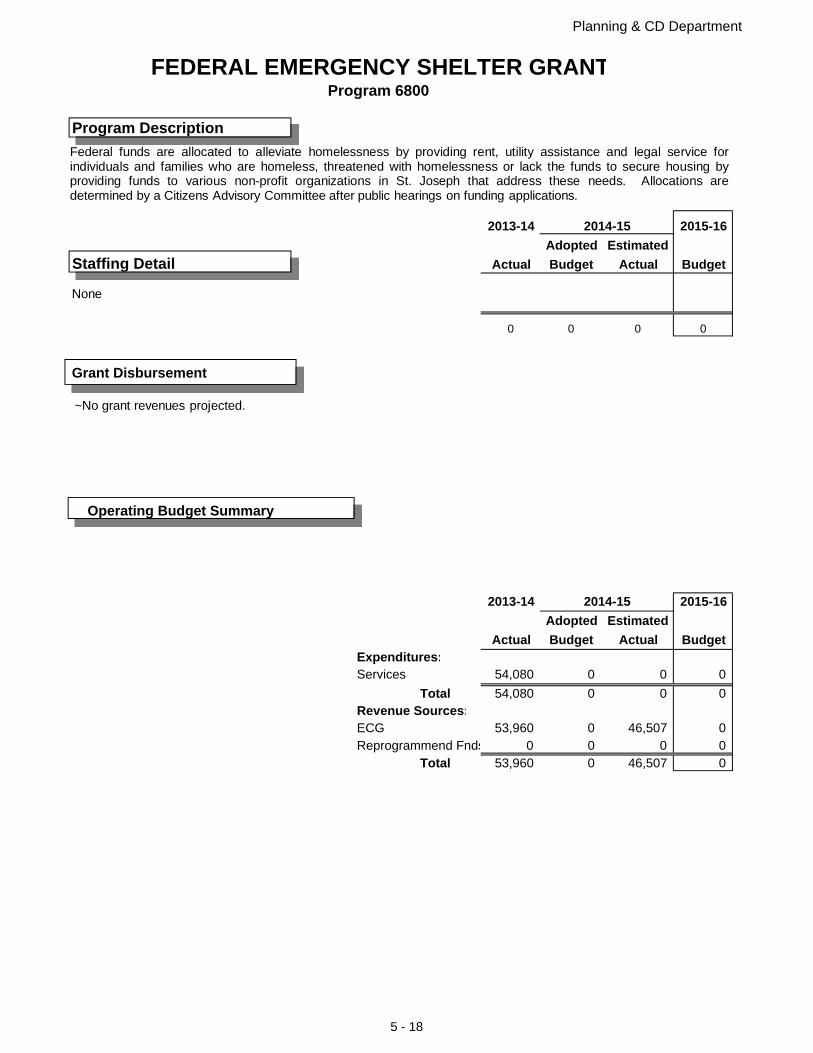
Planning & CD Department
FEDERAL EMERGENCY SHELTER GRANTProgram 6800
Program Description
2013-14 2014-15 2015-16Adopted Estimated
Staffing Detail Actual Budget Actual Budget
0 0 0 0
Grant Disbursement
Operating Budget Summary
2013-14 2014-15 2015-16Adopted Estimated
Actual Budget Actual BudgetExpenditures:Services 54,080 0 0 0
Total 54,080 0 0 0Revenue Sources:ECG 53,960 0 46,507 0Reprogrammend Fnds 0 0 0 0
Total 53,960 0 46,507 0
~No grant revenues projected.
Federal funds are allocated to alleviate homelessness by providing rent, utility assistance and legal service forindividuals and families who are homeless, threatened with homelessness or lack the funds to secure housing byproviding funds to various non-profit organizations in St. Joseph that address these needs. Allocations aredetermined by a Citizens Advisory Committee after public hearings on funding applications.
None
5 - 18
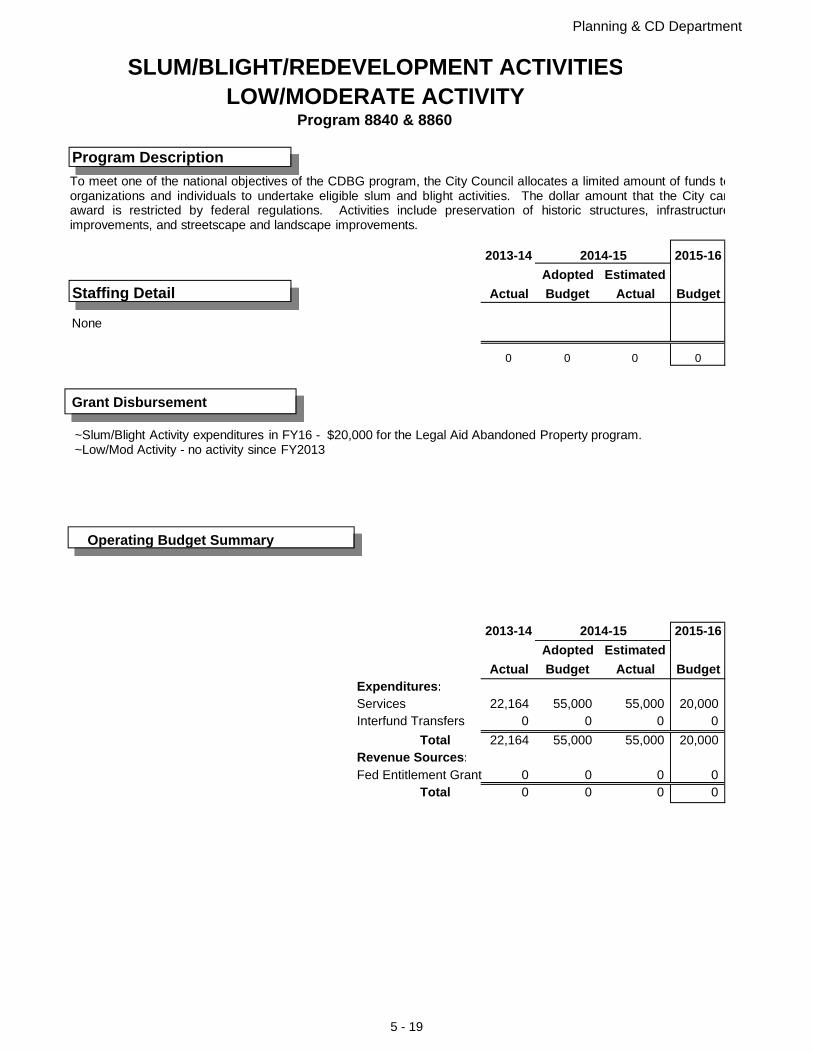
Planning & CD Department
SLUM/BLIGHT/REDEVELOPMENT ACTIVITIESLOW/MODERATE ACTIVITY
Program 8840 & 8860
Program Description
2013-14 2014-15 2015-16Adopted Estimated
Staffing Detail Actual Budget Actual Budget
0 0 0 0
Grant Disbursement
Operating Budget Summary
2013-14 2014-15 2015-16Adopted Estimated
Actual Budget Actual BudgetExpenditures:Services 22,164 55,000 55,000 20,000Interfund Transfers 0 0 0 0
Total 22,164 55,000 55,000 20,000Revenue Sources:Fed Entitlement Grant 0 0 0 0
Total 0 0 0 0
~Slum/Blight Activity expenditures in FY16 - $20,000 for the Legal Aid Abandoned Property program.~Low/Mod Activity - no activity since FY2013
To meet one of the national objectives of the CDBG program, the City Council allocates a limited amount of funds toorganizations and individuals to undertake eligible slum and blight activities. The dollar amount that the City canaward is restricted by federal regulations. Activities include preservation of historic structures, infrastructureimprovements, and streetscape and landscape improvements.
None
5 - 19
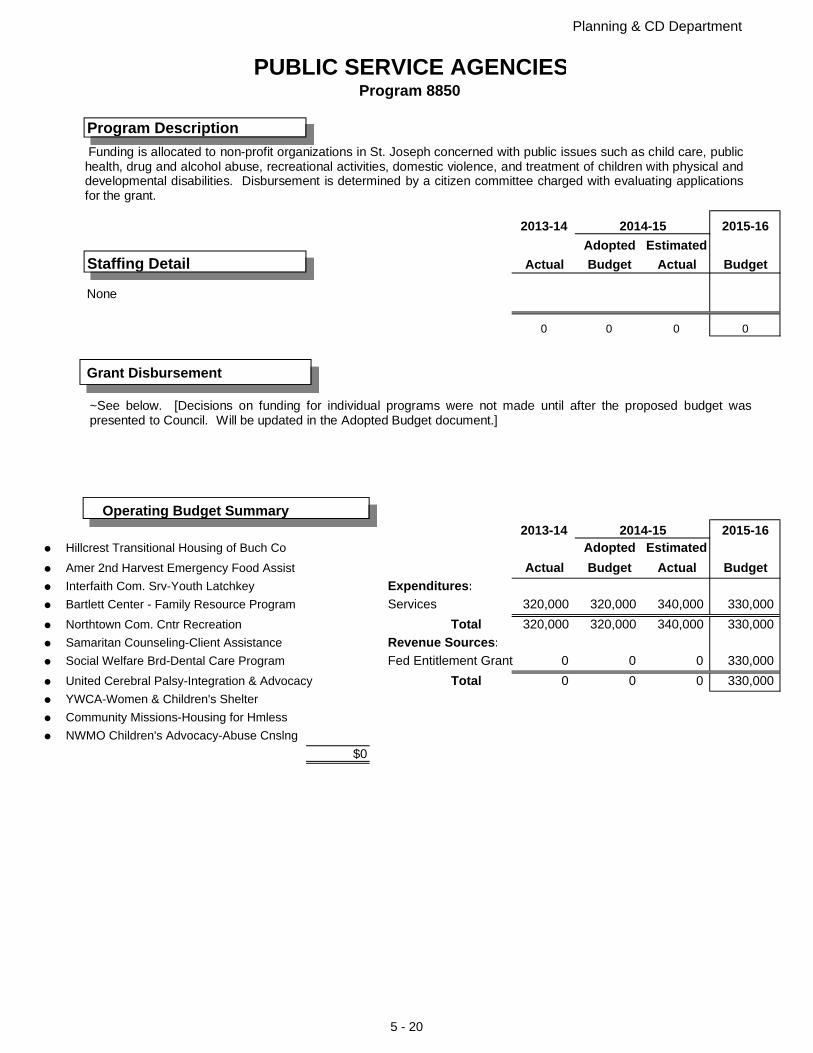
Planning & CD Department
PUBLIC SERVICE AGENCIESProgram 8850
Program Description
2013-14 2014-15 2015-16Adopted Estimated
Staffing Detail Actual Budget Actual Budget
0 0 0 0
Grant Disbursement
Operating Budget Summary2013-14 2014-15 2015-16
Hillcrest Transitional Housing of Buch Co Adopted Estimated Amer 2nd Harvest Emergency Food Assist Actual Budget Actual Budget Interfaith Com. Srv-Youth Latchkey Expenditures: Bartlett Center - Family Resource Program Services 320,000 320,000 340,000 330,000
Northtown Com. Cntr Recreation Total 320,000 320,000 340,000 330,000
Samaritan Counseling-Client Assistance Revenue Sources: Social Welfare Brd-Dental Care Program Fed Entitlement Grant 0 0 0 330,000
United Cerebral Palsy-Integration & Advocacy Total 0 0 0 330,000
YWCA-Women & Children's Shelter
Community Missions-Housing for Hmless
NWMO Children's Advocacy-Abuse Cnslng
$0
~See below. [Decisions on funding for individual programs were not made until after the proposed budget waspresented to Council. Will be updated in the Adopted Budget document.]
Funding is allocated to non-profit organizations in St. Joseph concerned with public issues such as child care, publichealth, drug and alcohol abuse, recreational activities, domestic violence, and treatment of children with physical anddevelopmental disabilities. Disbursement is determined by a citizen committee charged with evaluating applicationsfor the grant.
None
5 - 20
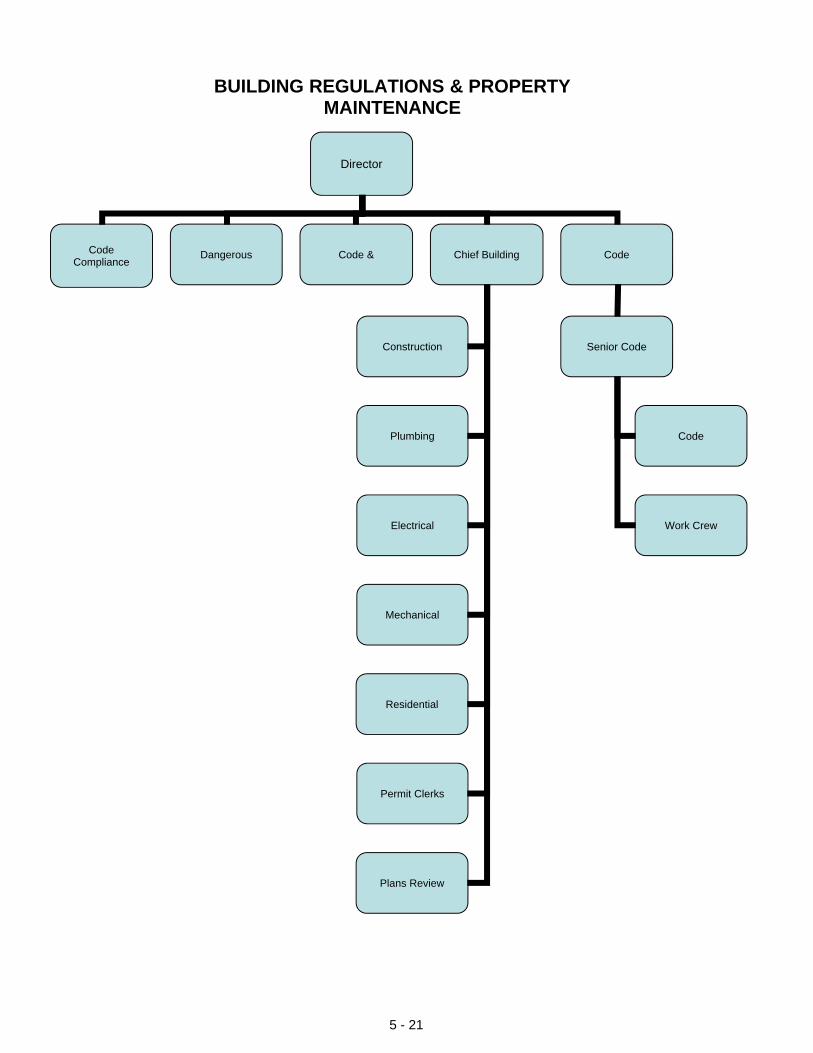
Director
Code Compliance
Dangerous Code & Chief Building
Construction
Plumbing
Electrical
Mechanical
Residential
Permit Clerks
Plans Review
Code
Senior Code
Code
Work Crew
BUILDING REGULATIONS & PROPERTY MAINTENANCE
5 - 21
Building Development Services
Mission
Core Services
Current Year Activities/Achievements
Performance Statistics FY2013 FY2014 FY2015Building permits issued 1,150 826 1205Mechanical inspections completed 555 661 619Electrical inspections 713 1,134 1250Plumbing inspections 615 919 958
100% 100% 100%
Budget Challenges/Planned Initiatives
Percent of plans reviewed within 10 working days of submission:
Ensure public health and safety through review and approval of code compliant construction and developmentwhile establishing creative policies and procedures designed to enhance community development andreinvestment.
- Integrated development and building review and approval process.- Building, mechanical, electrical & plumbing inspection and approval process.- Mechanical, electrical & plumbing trade licensing review and approval process.‐ Conceptual and preliminary customer consultation and review services. - Existing building inspection and reutilization services.- Building code enforcement policies and processes.- Internal and external building code compliance training.
• Implementation of new requirements for residential re-roof permits. The new requirements greatly increaseroofing contractor accountability to their customer as well as to the building department.
• Implementation of new requirements for demolition permits. Demolition permits now require additional inspections tohold contractors accountable for when they wrongfully damage property improvements.
• Set new tone and expectation regarding customer service. As a department, we are to help customers navigate code todiscover solutions that allow their projects to comply with adopted building regulations.
- WORK MANAGEMENT SOFTWARE: Significant staff time will be required to effectively train employees,inform the public and establish procedures for using the new software. Continued work to make onlinepermitting available to customers and providing mobile inspection capabilities available for inspectors.
- TRAINING: Staff members are updating their certifications during the next year. Other staff continue to attendprofessional training opportunities to maintain current certifications. An adequate level of training funds isimportant to allow the City to maintain its current ISO rating.
5 - 22
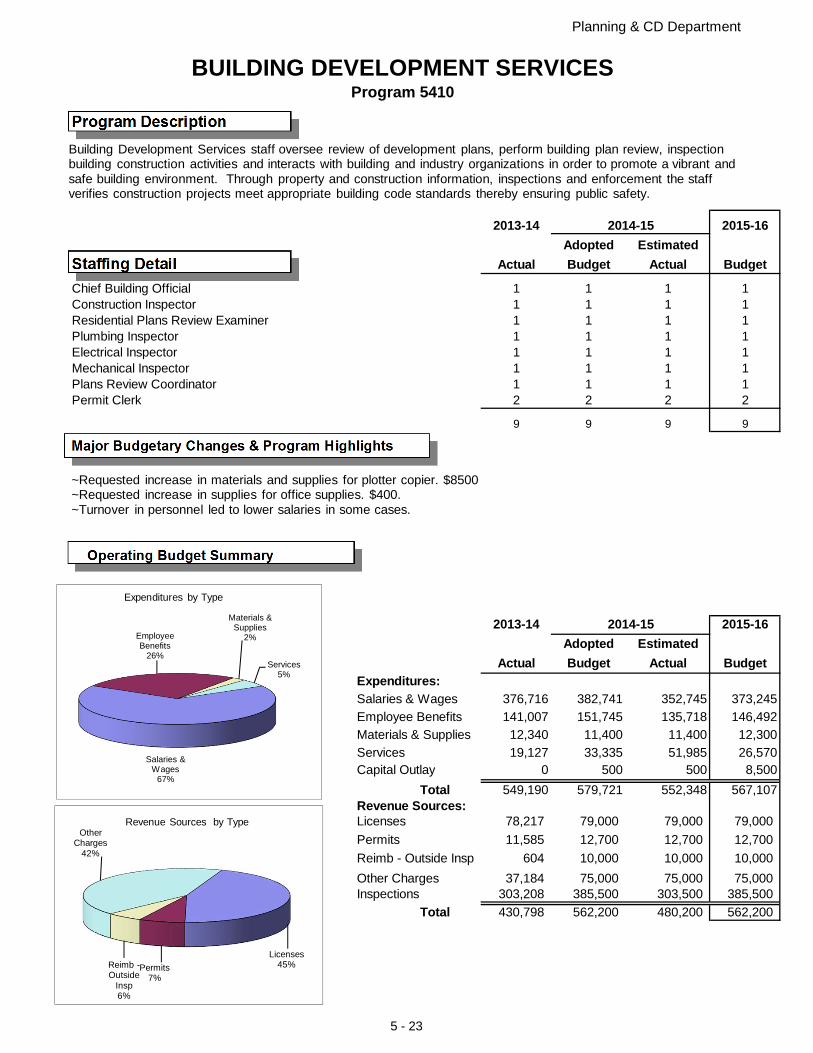
Planning & CD Department
BUILDING DEVELOPMENT SERVICESProgram 5410
Program Description
2013-14 2015-16Adopted Estimated
Staffing Detail Actual Budget Actual Budget
Chief Building Official 1 1 1 1Construction Inspector 1 1 1 1Residential Plans Review Examiner 1 1 1 1Plumbing Inspector 1 1 1 1Electrical Inspector 1 1 1 1Mechanical Inspector 1 1 1 1Plans Review Coordinator 1 1 1 1Permit Clerk 2 2 2 2
9 9 9 9
Major Budgetary Changes & Program Highlights
Operating Budget Summary
2013-14 2014-15 2015-16Adopted Estimated
Actual Budget Actual BudgetExpenditures:Salaries & Wages 376,716 382,741 352,745 373,245
Employee Benefits 141,007 151,745 135,718 146,492
Materials & Supplies 12,340 11,400 11,400 12,300
Services 19,127 33,335 51,985 26,570Capital Outlay 0 500 500 8,500
Total 549,190 579,721 552,348 567,107Revenue Sources:Licenses 78,217 79,000 79,000 79,000
Permits 11,585 12,700 12,700 12,700
Reimb - Outside Insp 604 10,000 10,000 10,000
Other Charges 37,184 75,000 75,000 75,000Inspections 303,208 385,500 303,500 385,500
Total 430,798 562,200 480,200 562,200
2014-15
Salaries & Wages
67%
Employee Benefits
26%
Materials & Supplies
2%
Services5%
Expenditures by Type
Licenses45%Permits
7%
Reimb -Outside
Insp6%
Other Charges
42%
Revenue Sources by Type
Building Development Services staff oversee review of development plans, perform building plan review, inspection building construction activities and interacts with building and industry organizations in order to promote a vibrant and safe building environment. Through property and construction information, inspections and enforcement the staff verifies construction projects meet appropriate building code standards thereby ensuring public safety.
~Requested increase in materials and supplies for plotter copier. $8500~Requested increase in supplies for office supplies. $400.~Turnover in personnel led to lower salaries in some cases.
5 - 23
Mission
Core Services
Current Year Activity/Achievements
Performance statistics FY2013 FY2014 % Inc (Dec)Number of nuisances abated by the City 1,230 1,485 17%Number of violation notices sent 6,312 9,348 48%Current dangerous building cases 296 264 (11%)Number of structures demolished 63 69 10%
Budget Challenges/Planned Initiatives
Property MaintenanceProperty Maintenance, Demolitions
To work with citizens in an effort to reduce conditions that may pose health and safety hazards to the public and toreduce blight in the community.
- Work with citizens in an effort to eliminate the amount of trash, debris and overgrown weeds, hazardous treesand junk vehicles on private property.- Investigate complaints of violations of minimum housing standards and interior housing conditions.- Remove nuisance conditions on private and public property.- Enforcement of code compliance ordinances in order to curtail further blight.- Provide programs to educate property owners on their responsibility to responsively maintain their propertiesthrough public meetings and presentations.- Track complaints, inspections, notices, re-inspections, abatements, summons, incorporated photos with eachcomplaint and provide a variety of reports through the Permits Plus program.- When necessary, secure or demolish dilapidated, abandoned, or dangerous structures.- When possible, assist in the stabilization and marketing of vacant, abandoned, or deteriorating buildings as analternative to demolition.
1.Completed adoption and implementation of the new property maintenance codes as recommended by theCitizen's Review Committee and adopted by Council.2. Complete implementation of Asset Management, Development Review and Planning work managementsoftware and continue working toward implementation of Building Development, Property Maintenance andBusiness License work management software.
1. Continue to fund the Historic Neighborhood grant program and work closely with midtown neighborhoodassociations to address concerns.2. Allocate a portion of Gaming funds budgeted for abatements and demolitions to fund public information efforts inthe form of inromational workshops on the part of the Landmark Commission as well as for a discovery trip tohistoric cities to learn how they have revitalized historic areas of their communities.
5 - 24
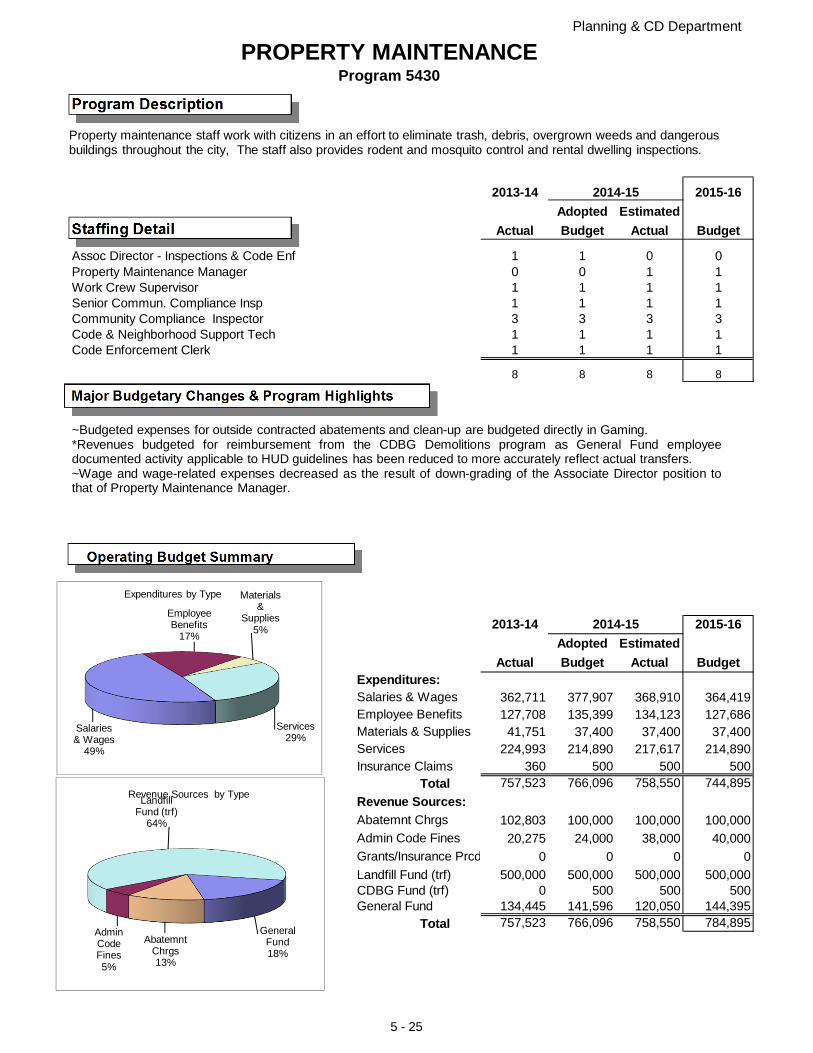
Planning & CD Department
PROPERTY MAINTENANCEProgram 5430
Program Description
2013-14 2014-15 2015-16Adopted Estimated
Staffing Detail Actual Budget Actual Budget
Assoc Director - Inspections & Code Enf 1 1 0 0Property Maintenance Manager 0 0 1 1Work Crew Supervisor 1 1 1 1Senior Commun. Compliance Insp 1 1 1 1Community Compliance Inspector 3 3 3 3Code & Neighborhood Support Tech 1 1 1 1Code Enforcement Clerk 1 1 1 1
8 8 8 8
Major Budgetary Changes & Program Highlights
Operating Budget Summary
2013-14 2014-15 2015-16Adopted Estimated
Actual Budget Actual BudgetExpenditures:Salaries & Wages 362,711 377,907 368,910 364,419 Employee Benefits 127,708 135,399 134,123 127,686 Materials & Supplies 41,751 37,400 37,400 37,400 Services 224,993 214,890 217,617 214,890 Insurance Claims 360 500 500 500
Total 757,523 766,096 758,550 744,895
Revenue Sources:Abatemnt Chrgs 102,803 100,000 100,000 100,000
Admin Code Fines 20,275 24,000 38,000 40,000
Grants/Insurance Prcd 0 0 0 0
Landfill Fund (trf) 500,000 500,000 500,000 500,000 CDBG Fund (trf) 0 500 500 500 General Fund 134,445 141,596 120,050 144,395
Total 757,523 766,096 758,550 784,895
Salaries & Wages
49%
Employee Benefits
17%
Materials &
Supplies5%
Services 29%
Expenditures by Type
Abatemnt Chrgs13%
Admin Code Fines5%
Landfill Fund (trf)
64%
General Fund18%
Revenue Sources by Type
Property maintenance staff work with citizens in an effort to eliminate trash, debris, overgrown weeds and dangerous buildings throughout the city, The staff also provides rodent and mosquito control and rental dwelling inspections.
~Budgeted expenses for outside contracted abatements and clean-up are budgeted directly in Gaming.*Revenues budgeted for reimbursement from the CDBG Demolitions program as General Fund employeedocumented activity applicable to HUD guidelines has been reduced to more accurately reflect actual transfers.~Wage and wage-related expenses decreased as the result of down-grading of the Associate Director position tothat of Property Maintenance Manager.
5 - 25
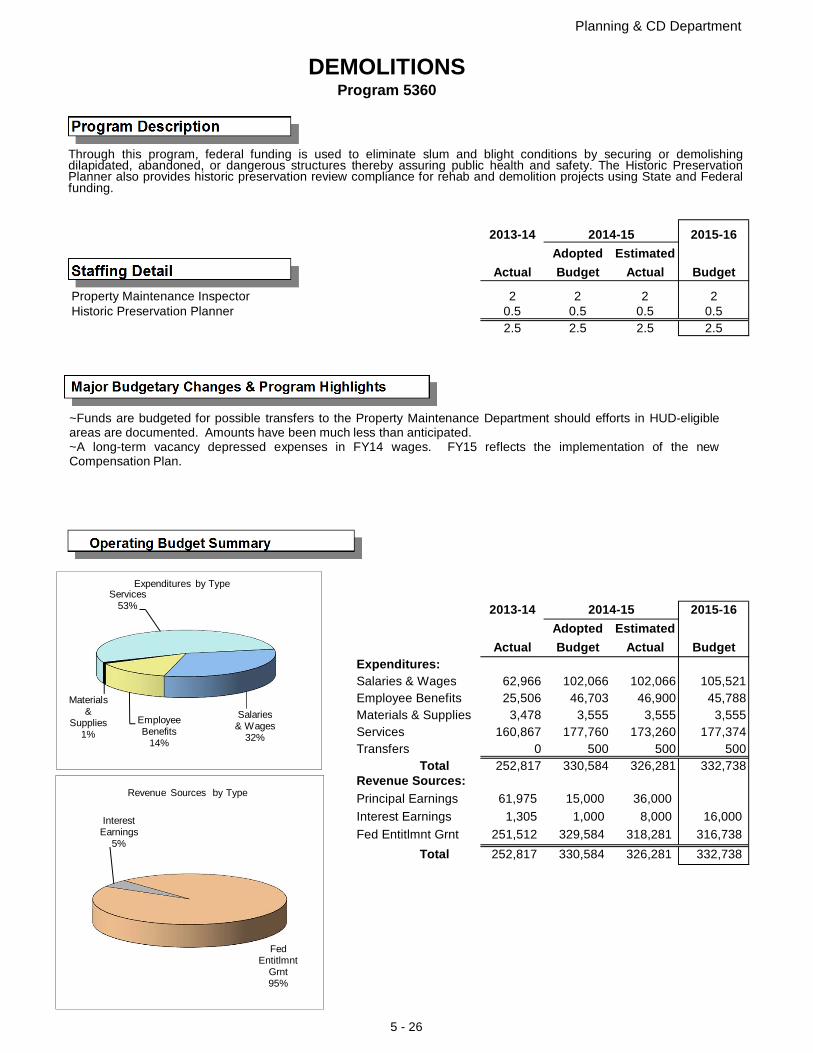
Planning & CD Department
DEMOLITIONSProgram 5360
Program Description
2013-14 2014-15 2015-16Adopted Estimated
Staffing Detail Actual Budget Actual Budget
Property Maintenance Inspector 2 2 2 2Historic Preservation Planner 0.5 0.5 0.5 0.5
2.5 2.5 2.5 2.5
Major Budgetary Changes & Program Highlights
Operating Budget Summary
2013-14 2014-15 2015-16Adopted Estimated
Actual Budget Actual BudgetExpenditures:Salaries & Wages 62,966 102,066 102,066 105,521Employee Benefits 25,506 46,703 46,900 45,788Materials & Supplies 3,478 3,555 3,555 3,555Services 160,867 177,760 173,260 177,374Transfers 0 500 500 500
Total 252,817 330,584 326,281 332,738Revenue Sources:Principal Earnings 61,975 15,000 36,000
Interest Earnings 1,305 1,000 8,000 16,000
Fed Entitlmnt Grnt 251,512 329,584 318,281 316,738
Total 252,817 330,584 326,281 332,738
Salaries & Wages
32%
Employee Benefits
14%
Materials &
Supplies1%
Services53%
Expenditures by Type
Interest Earnings
5%
Fed Entitlmnt
Grnt95%
Revenue Sources by Type
Through this program, federal funding is used to eliminate slum and blight conditions by securing or demolishingdilapidated, abandoned, or dangerous structures thereby assuring public health and safety. The Historic PreservationPlanner also provides historic preservation review compliance for rehab and demolition projects using State and Federalfunding.
~Funds are budgeted for possible transfers to the Property Maintenance Department should efforts in HUD-eligibleareas are documented. Amounts have been much less than anticipated.~A long-term vacancy depressed expenses in FY14 wages. FY15 reflects the implementation of the newCompensation Plan.
5 - 26
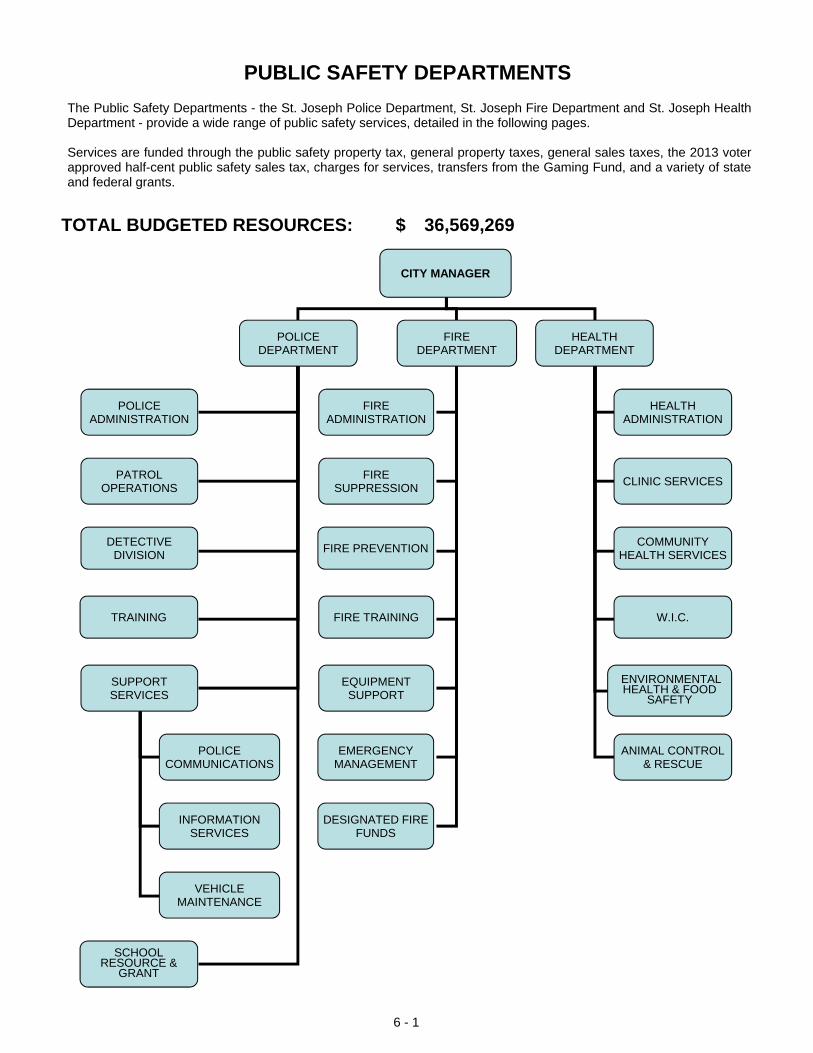
PUBLIC SAFETY DEPARTMENTS
TOTAL BUDGETED RESOURCES: 36,569,269$
CITY MANAGER
POLICE DEPARTMENT
FIRE DEPARTMENT
POLICE ADMINISTRATION
PATROL OPERATIONS
DETECTIVE DIVISION
TRAINING
SUPPORT SERVICES
FIRE ADMINISTRATION
FIRE SUPPRESSION
FIRE PREVENTION
FIRE TRAINING
EQUIPMENT SUPPORT
EMERGENCY MANAGEMENT
SCHOOL RESOURCE &
GRANT
POLICE COMMUNICATIONS
INFORMATION SERVICES
VEHICLE MAINTENANCE
DESIGNATED FIRE FUNDS
HEALTH DEPARTMENT
HEALTH ADMINISTRATION
CLINIC SERVICES
COMMUNITY HEALTH SERVICES
W.I.C.
ENVIRONMENTAL HEALTH & FOOD
SAFETY
ANIMAL CONTROL & RESCUE
The Public Safety Departments - the St. Joseph Police Department, St. Joseph Fire Department and St. Joseph HealthDepartment - provide a wide range of public safety services, detailed in the following pages.
Services are funded through the public safety property tax, general property taxes, general sales taxes, the 2013 voterapproved half-cent public safety sales tax, charges for services, transfers from the Gaming Fund, and a variety of stateand federal grants.
6 - 1
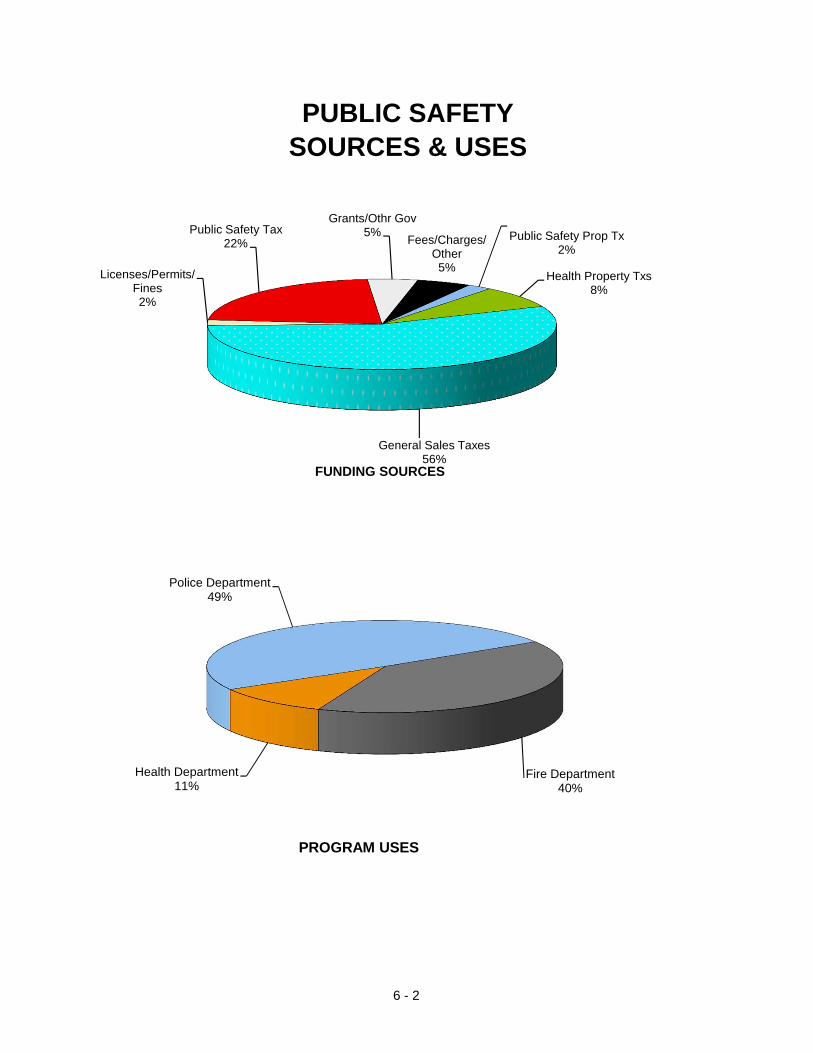
PUBLIC SAFETYSOURCES & USES
Public Safety Prop Tx2%
Health Property Txs8%
General Sales Taxes56%
Licenses/Permits/ Fines2%
Public Safety Tax22%
Grants/Othr Gov5%
Fees/Charges/ Other5%
Police Department49%
Fire Department40%
Health Department11%
PROGRAM USES
FUNDING SOURCES
6 - 2
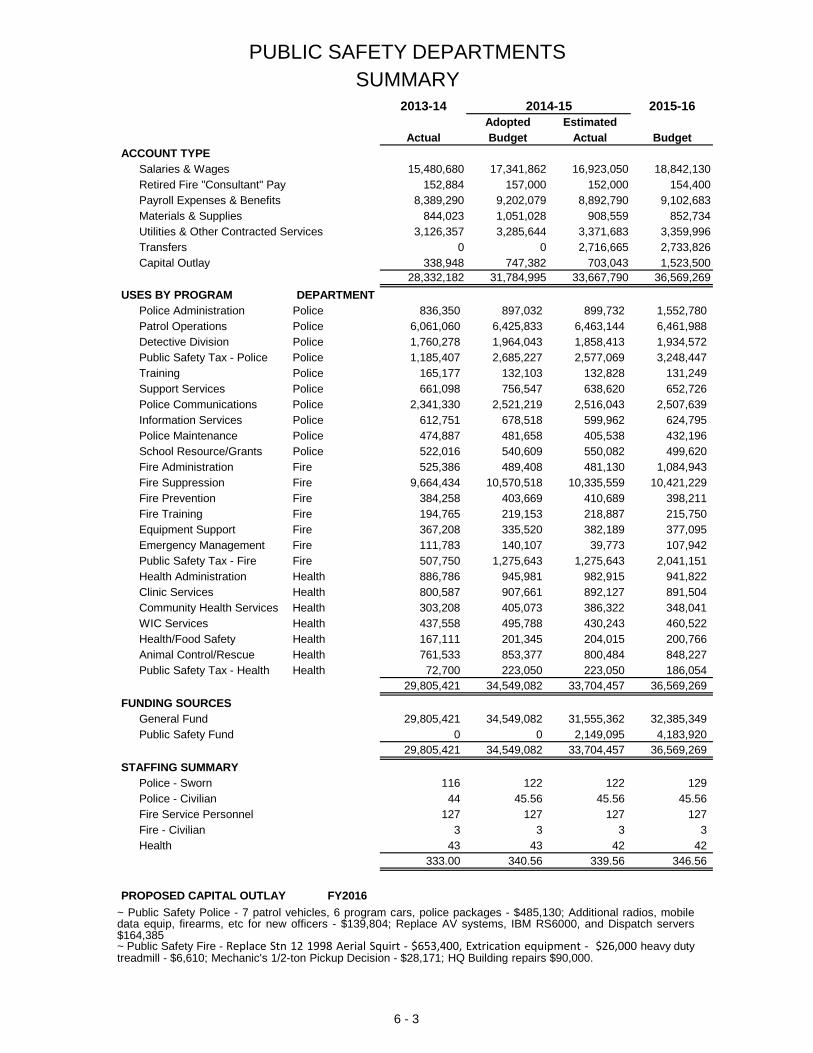
PUBLIC SAFETY DEPARTMENTSSUMMARY
2013-14 2014-15 2015-16Adopted Estimated
Actual Budget Actual BudgetACCOUNT TYPE
Salaries & Wages 15,480,680 17,341,862 16,923,050 18,842,130Retired Fire "Consultant" Pay 152,884 157,000 152,000 154,400Payroll Expenses & Benefits 8,389,290 9,202,079 8,892,790 9,102,683Materials & Supplies 844,023 1,051,028 908,559 852,734Utilities & Other Contracted Services 3,126,357 3,285,644 3,371,683 3,359,996Transfers 0 0 2,716,665 2,733,826Capital Outlay 338,948 747,382 703,043 1,523,500
28,332,182 31,784,995 33,667,790 36,569,269
USES BY PROGRAMPolice Administration 836,350 897,032 899,732 1,552,780Patrol Operations 6,061,060 6,425,833 6,463,144 6,461,988Detective Division 1,760,278 1,964,043 1,858,413 1,934,572Public Safety Tax - Police Police 1,185,407 2,685,227 2,577,069 3,248,447Training 165,177 132,103 132,828 131,249Support Services Police 661,098 756,547 638,620 652,726Police Communications Police 2,341,330 2,521,219 2,516,043 2,507,639Information Services 612,751 678,518 599,962 624,795Police Maintenance 474,887 481,658 405,538 432,196School Resource/Grants 522,016 540,609 550,082 499,620Fire Administration Fire 525,386 489,408 481,130 1,084,943Fire Suppression Fire 9,664,434 10,570,518 10,335,559 10,421,229Fire Prevention Fire 384,258 403,669 410,689 398,211Fire Training Fire 194,765 219,153 218,887 215,750Equipment Support Fire 367,208 335,520 382,189 377,095Emergency Management Fire 111,783 140,107 39,773 107,942Public Safety Tax - Fire Fire 507,750 1,275,643 1,275,643 2,041,151Health Administration Health 886,786 945,981 982,915 941,822Clinic Services Health 800,587 907,661 892,127 891,504Community Health Services Health 303,208 405,073 386,322 348,041WIC Services Health 437,558 495,788 430,243 460,522Health/Food Safety Health 167,111 201,345 204,015 200,766Animal Control/Rescue Health 761,533 853,377 800,484 848,227Public Safety Tax - Health Health 72,700 223,050 223,050 186,054
29,805,421 34,549,082 33,704,457 36,569,269
FUNDING SOURCESGeneral Fund 29,805,421 34,549,082 31,555,362 32,385,349Public Safety Fund 0 0 2,149,095 4,183,920
29,805,421 34,549,082 33,704,457 36,569,269
STAFFING SUMMARYPolice - Sworn 116 122 122 129Police - Civilian 44 45.56 45.56 45.56Fire Service Personnel 127 127 127 127Fire - Civilian 3 3 3 3Health 43 43 42 42
333.00 340.56 339.56 346.56
PROPOSED CAPITAL OUTLAY FY2016
Police
Police
DEPARTMENTPolicePolicePolice
PolicePolice
~ Public Safety Police - 7 patrol vehicles, 6 program cars, police packages - $485,130; Additional radios, mobiledata equip, firearms, etc for new officers - $139,804; Replace AV systems, IBM RS6000, and Dispatch servers$164,385~ Public Safety Fire - Replace Stn 12 1998 Aerial Squirt ‐ $653,400, Extrication equipment ‐ $26,000 heavy dutytreadmill - $6,610; Mechanic's 1/2-ton Pickup Decision - $28,171; HQ Building repairs $90,000.
6 - 3
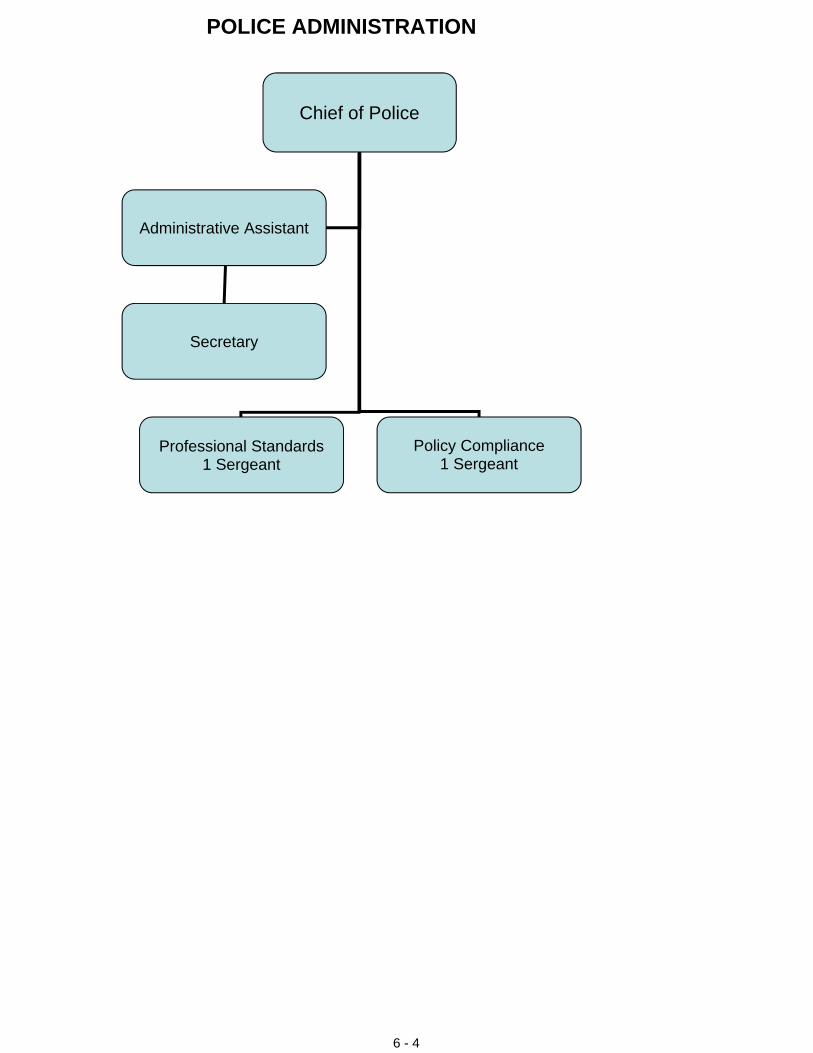
Chief of Police
Administrative Assistant
Secretary
Professional Standards1 Sergeant
Policy Compliance1 Sergeant
POLICE ADMINISTRATION
6 - 4
Police Administration
Mission
Core Services
Current Year Activity/Achievements
Performance Statistics (represent prior year totals) FY2013 FY2014 FY2015Number of "use of force" incidents reviewed 364 300 365Number of pursuits reviewed 4 2 15Number of documented complaints investigated 38 48 41Total crimes reported 10,752 10,729 10,517
Percent change in violent crimes 11% 4%Percent change in property crime -7% -3%
Total vehicle accidents 2,276 2,127 2,280
Budget Challenges/Planned Initiatives
To ensure professional police service through the establishment of department goals and objectives and theassurance that they are being accomplished; the creation and adherence to department written directives; andthe insistence on excellent communications with those outside the department.
- Administer the financial, operational and capital budgets of the department.- Manage the overall working of the department to provide a safe and secure community environment- Create a more involved, responsible community by building stronger community partnerships and improving
customer service.- Provide organizational leadership and support.- Ensure effective communications between Administration and line officers.- Educate the public as to general police procedures and give them information they can use to effectively work
with the Police Department through the Citizen Police Academy.-Coordinate strategies to reduce crime , the fear of crime, and improve quality of life for the citizens ofSt.Joseph.
-Coordinate the achievement of goals and objectives in the multiyear strategic plan.-Work with Division Commanders in setting annual goals, and monitor achievement.
-Continued implimentation of crime reduction strategy Informed Response through Intelligence an Statistics.-Maintain State Certification standards for performance and administration of the police department, audits completed, conducted staff inspection to include policy update.-Overcame staff reductions related to Military deployments, retirements, and officer injuries while hiring and training new personnel and continuing to meet or exceed the level of services provided in the past.-Added 6 commissioned personnel and 2 part time non-commissioned personnel-Completed and maintained system for providing and customer service feedback.-Planning and budgeting for additional personnel.-Attended weekly public meetings and provided presentations to citizen groups including Neighborhood Watch, Community Police Advisory Committee, etc.
-Conducted background investigations for new hires.
‐Increase staffing by 6 officers initially, 1 sergeant,additional training to increase staffing will stress resources. ‐Manage overtime to ensure adequate services are provided for the most serious crimes, while continuing toaddress other crime and quality of life issues in the community.‐Coordinate the achievement of goals and objectives established in the multiyear strategic plan.‐Revise multi year strategic plan to for the next 5 year period.‐Monitor monthly activity reports and progress on long term and short term goals and objectives.‐Enhance relationships with citizens and partner agencies.‐Ensure consistent compliance with department policies, procedures, as well as state and federal laws.‐Continue to investigate allegations of misconduct.‐Identify areas we can improve services‐Respond to every complaint filed by a citizen.
6 - 5

Police Department
POLICE ADMINISTRATIONProgram 8340
Program Description
2013-14 2014-15 2015-16Adopted Estimated
Staffing Detail Actual Budget Actual Budget
Police Chief 1 1 1 1Police Sergeant 2 2 2 2Administrative Asst to the Chief 1 1 1 1Secretary 1 1 1 1
5 5 5 5
Major Budgetary Changes & Program Highlights
Operating Budget Summary
2013-14 2014-15 2015-16Adopted Estimated
Actual Budget Actual BudgetExpenditures:Salaries & Wages 291,463 305,912 308,112 907,516Employee Benefits 125,052 121,341 120,341 132,088Materials & Supplies 4,118 4,600 4,600 4,600Services & LEC Contrb 415,717 465,179 466,679 508,576
Total 836,350 897,032 899,732 1,552,780Revenue Sources:Public Safety Tax 23,250 23,250 23,250 23,250
General Fund 813,100 873,782 876,482 1,529,530Total 836,350 897,032 899,732 1,552,780
Salaries & Wages58%
Employee Benefits
9%
Materials & Supplies
0%
Services & LEC
Contrb33%
Expenditures by Type
Public Safety Tax
1%
General Fund99%
Revenue Sources by Type
The Police Chief and staff ensure professional police service through the establishment of department goals andobjectives and the assurance that they are being accomplished; the creation and adherence to department writtendirectives; and the insistence on excellent communications with those outside the department. The Buchanan CountyLaw Enforcement Center serves as the operational headquarters of the St. Joseph Police Department. The City pays40% of the total L.E.C. operating budget.That expenditure is also budgeted in this program.
~Services category has increased due to (1) City's portion of LEC expenses are projected to increase $4,400 to$444,141; (2) $16,000 included as the City's contribution for the Communication Center's HVAC system repairs;$23,000 budgeted to add to previously approved $38,000 for replacement of (2) LEC elevators.~Transfer revenue from the Public Safety Tax Fund is to cover the incremental increase in wages and other payrollcosts as a result of the compensation plan implementation and negotiations with the police union.~Salaries & Wages category contains the budget for the impacts of the 27th payroll and for the 1.5% salary increaseon both the wages and the benefit categories for the police programs in the General Fund.
6 - 6
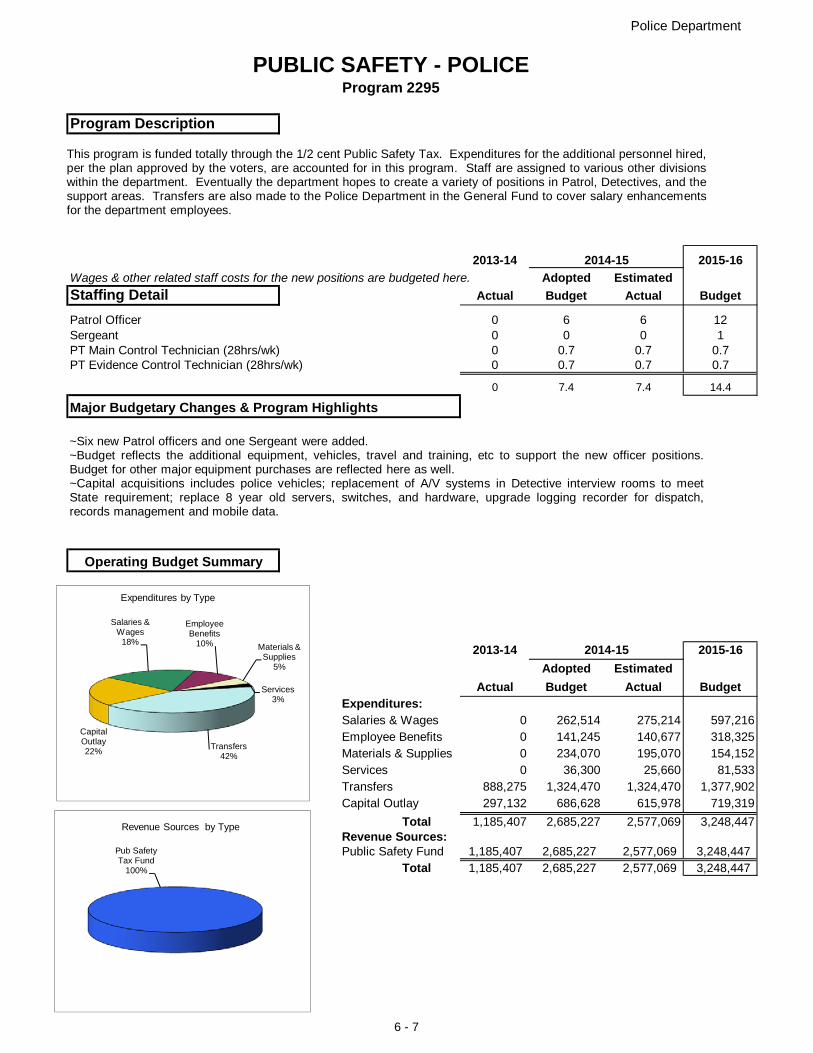
Police Department
PUBLIC SAFETY - POLICEProgram 2295
Program Description
2013-14 2014-15 2015-16Wages & other related staff costs for the new positions are budgeted here. Adopted Estimated Staffing Detail Actual Budget Actual Budget
Patrol Officer 0 6 6 12Sergeant 0 0 0 1PT Main Control Technician (28hrs/wk) 0 0.7 0.7 0.7PT Evidence Control Technician (28hrs/wk) 0 0.7 0.7 0.7
0 7.4 7.4 14.4
Major Budgetary Changes & Program Highlights
Operating Budget Summary
2013-14 2014-15 2015-16Adopted Estimated
Actual Budget Actual BudgetExpenditures:Salaries & Wages 0 262,514 275,214 597,216Employee Benefits 0 141,245 140,677 318,325Materials & Supplies 0 234,070 195,070 154,152Services 0 36,300 25,660 81,533Transfers 888,275 1,324,470 1,324,470 1,377,902Capital Outlay 297,132 686,628 615,978 719,319
Total 1,185,407 2,685,227 2,577,069 3,248,447Revenue Sources:Public Safety Fund 1,185,407 2,685,227 2,577,069 3,248,447
Total 1,185,407 2,685,227 2,577,069 3,248,447
Salaries & Wages
18%
Employee Benefits
10% Materials & Supplies
5%
Services3%
Transfers42%
Capital Outlay22%
Expenditures by Type
Pub Safety Tax Fund
100%
Revenue Sources by Type
This program is funded totally through the 1/2 cent Public Safety Tax. Expenditures for the additional personnel hired,per the plan approved by the voters, are accounted for in this program. Staff are assigned to various other divisionswithin the department. Eventually the department hopes to create a variety of positions in Patrol, Detectives, and thesupport areas. Transfers are also made to the Police Department in the General Fund to cover salary enhancementsfor the department employees.
~Six new Patrol officers and one Sergeant were added.~Budget reflects the additional equipment, vehicles, travel and training, etc to support the new officer positions.Budget for other major equipment purchases are reflected here as well.~Capital acquisitions includes police vehicles; replacement of A/V systems in Detective interview rooms to meetState requirement; replace 8 year old servers, switches, and hardware, upgrade logging recorder for dispatch,records management and mobile data.
6 - 7
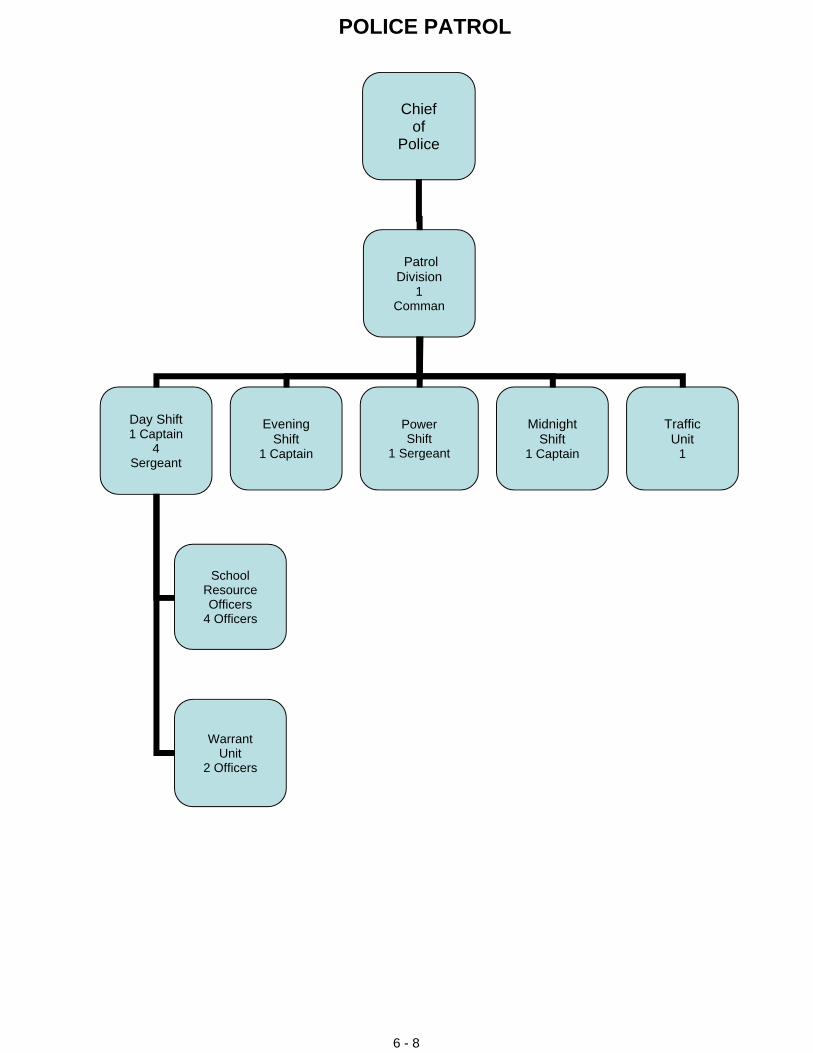
Chief of
Police
Patrol Division
1 Comman
Day Shift1 Captain
4 Sergeant
School Resource Officers
4 Officers
Warrant Unit
2 Officers
Evening Shift
1 Captain
Midnight Shift
1 Captain
Traffic Unit
1
Power Shift
1 Sergeant
POLICE PATROL
6 - 8
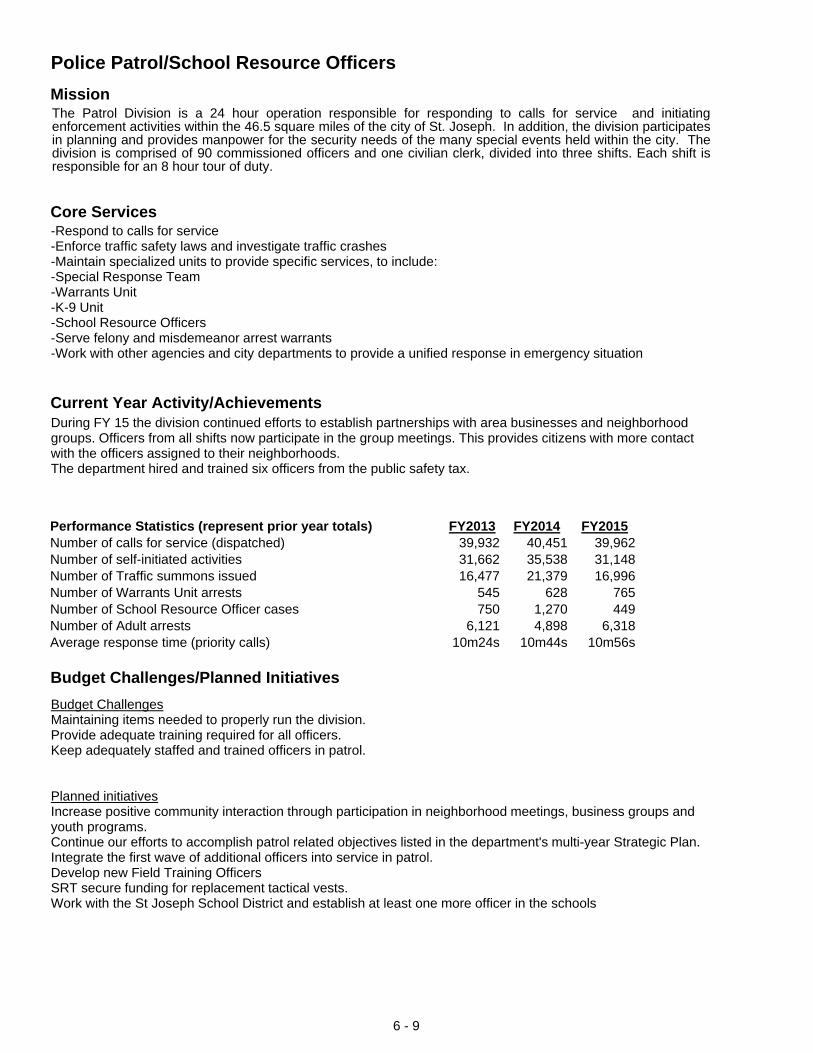
Police Patrol/School Resource OfficersMission
Core Services
Current Year Activity/Achievements
Performance Statistics (represent prior year totals) FY2013 FY2014 FY2015Number of calls for service (dispatched) 39,932 40,451 39,962Number of self-initiated activities 31,662 35,538 31,148Number of Traffic summons issued 16,477 21,379 16,996Number of Warrants Unit arrests 545 628 765Number of School Resource Officer cases 750 1,270 449Number of Adult arrests 6,121 4,898 6,318Average response time (priority calls) 10m24s 10m44s 10m56s
Budget Challenges/Planned Initiatives
The Patrol Division is a 24 hour operation responsible for responding to calls for service and initiatingenforcement activities within the 46.5 square miles of the city of St. Joseph. In addition, the division participatesin planning and provides manpower for the security needs of the many special events held within the city. Thedivision is comprised of 90 commissioned officers and one civilian clerk, divided into three shifts. Each shift isresponsible for an 8 hour tour of duty.
-Respond to calls for service-Enforce traffic safety laws and investigate traffic crashes-Maintain specialized units to provide specific services, to include:-Special Response Team-Warrants Unit-K-9 Unit-School Resource Officers-Serve felony and misdemeanor arrest warrants-Work with other agencies and city departments to provide a unified response in emergency situation
During FY 15 the division continued efforts to establish partnerships with area businesses and neighborhood groups. Officers from all shifts now participate in the group meetings. This provides citizens with more contact with the officers assigned to their neighborhoods.The department hired and trained six officers from the public safety tax.
Budget ChallengesMaintaining items needed to properly run the division.Provide adequate training required for all officers.Keep adequately staffed and trained officers in patrol.
Planned initiativesIncrease positive community interaction through participation in neighborhood meetings, business groups and youth programs.Continue our efforts to accomplish patrol related objectives listed in the department's multi-year Strategic Plan.Integrate the first wave of additional officers into service in patrol.Develop new Field Training OfficersSRT secure funding for replacement tactical vests.Work with the St Joseph School District and establish at least one more officer in the schools
6 - 9
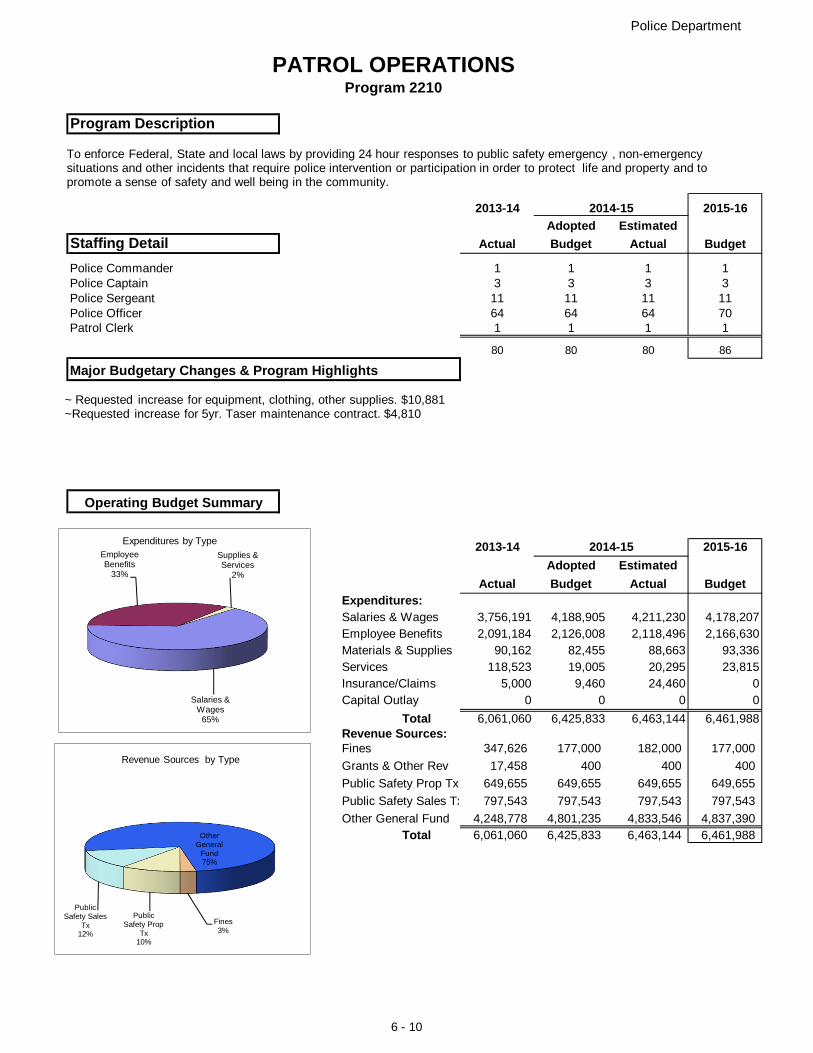
Police Department
PATROL OPERATIONSProgram 2210
Program Description
2013-14 2014-15 2015-16Adopted Estimated
Staffing Detail Actual Budget Actual Budget
Police Commander 1 1 1 1Police Captain 3 3 3 3Police Sergeant 11 11 11 11Police Officer 64 64 64 70Patrol Clerk 1 1 1 1
80 80 80 86
Major Budgetary Changes & Program Highlights
Operating Budget Summary
2013-14 2014-15 2015-16Adopted Estimated
Actual Budget Actual BudgetExpenditures:Salaries & Wages 3,756,191 4,188,905 4,211,230 4,178,207Employee Benefits 2,091,184 2,126,008 2,118,496 2,166,630Materials & Supplies 90,162 82,455 88,663 93,336Services 118,523 19,005 20,295 23,815Insurance/Claims 5,000 9,460 24,460 0Capital Outlay 0 0 0 0
Total 6,061,060 6,425,833 6,463,144 6,461,988Revenue Sources:Fines 347,626 177,000 182,000 177,000
Grants & Other Rev 17,458 400 400 400
Public Safety Prop Tx 649,655 649,655 649,655 649,655
Public Safety Sales Tx 797,543 797,543 797,543 797,543
Other General Fund 4,248,778 4,801,235 4,833,546 4,837,390Total 6,061,060 6,425,833 6,463,144 6,461,988
Salaries & Wages
65%
Employee Benefits
33%
Supplies & Services
2%
Expenditures by Type
Fines3%
Public Safety Prop
Tx10%
Public Safety Sales
Tx12%
Other General
Fund75%
Revenue Sources by Type
To enforce Federal, State and local laws by providing 24 hour responses to public safety emergency , non-emergency situations and other incidents that require police intervention or participation in order to protect life and property and to promote a sense of safety and well being in the community.
~ Requested increase for equipment, clothing, other supplies. $10,881~Requested increase for 5yr. Taser maintenance contract. $4,810
6 - 10

Police Department
SCHOOL RESOURCE & GRANT FUNDED PROGRAMS2280
Program Description
2013-14 2014-15 2015-16Adopted Estimated
Staffing Detail Actual Budget Actual Budget
School Resource Officers (Patrol Officers) 4 4 4 4
Major Budgetary Changes & Program Highlights
Operating Budget Summary
2013-14 2014-15 2015-16Adopted Estimated
Actual Budget Actual BudgetExpenditures:Salaries & Wages 249,669 284,384 277,304 290,420 Employee Benefits 136,401 135,443 127,933 145,240 Materials & Supplies 45,421 35,620 37,353 12,500 Services 49,524 84,462 83,592 51,460 Capital 41,001 700 23,900 0
Total 522,016 540,609 550,082 499,620
Revenue Sources:Charges for Services 25,404 26,000 26,000 26,000 Grants 163,083 217,365 215,449 151,053
SJSD Cntrbtn 137,807 152,587 152,587 152,587
Public Safety Sales Tx 0 41,310 0 41,310
Interest & Other 5,802 20 20 20 Other General Fund 189,920 144,637 156,026 169,960
Total 522,016 581,919 550,082 540,930
Salaries & Wages58%
Employee Benefits
29%
Materials & Supplies
3%Services
10%
Expenditures by Type
Charges for
Services5%
Grants28%
SJSD Cntrbtn
28%
Public Safety
Sales Tx8%Other
General Fund31%
Revenue Sources by Type
This program was developed to account for the revenues and expenditures by the Police Department from grant or otherspecial revenue sources such as the Gaming Fund. The largest program within this division is the School Resourceprogram with the mission of providing a police presence in the City's high schools both for security and for positiveinteractions with the students..
~No major changes
6 - 11
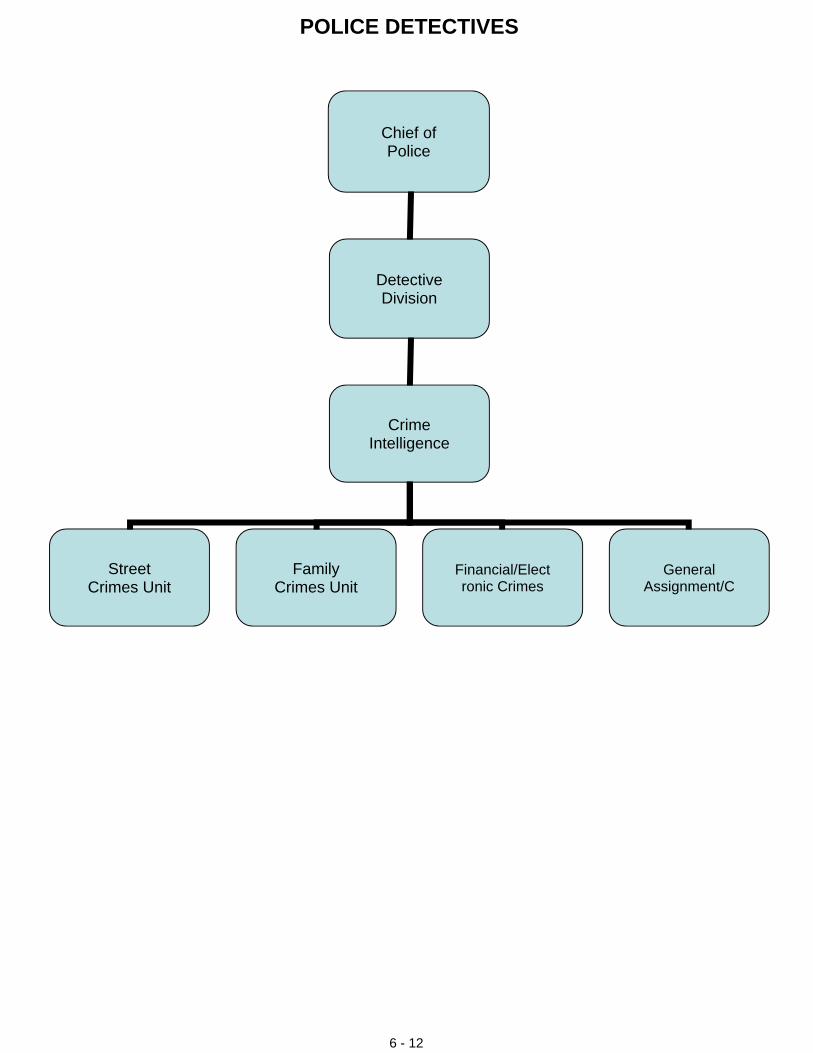
Chief of Police
Detective Division
Crime Intelligence
Street Crimes Unit
Family Crimes Unit
Financial/Electronic Crimes
General Assignment/C
POLICE DETECTIVES
6 - 12

Detectives
Mission
Core Services
Current Year Activity/Achievements
Case status and Disposition (prior year totals) FY2013 FY2014 FY2015Total Crimes reported 11,937 10,938 10,572
Open Cases 3,961 3,383 3,699Closed by Arrest 3,630 3,921 3,631Unfounded 67 67 51Referred to Juvenile Unit 5 233 233Cleared by Exception 1,010 573 364Referred to State Prosecutor 416 727 814Referred to City Prosecutor 558 439 266Referred to Other 7 137 155Unassigned 2,283 4,876 1,359
To apprehend suspected offenders, assist in the prosecution of those individuals, and recover stolen propertythrough the investigation of criminal acts that occur within the boundaries of the City in order to reduce crime andthe fear of crime
-Investigate all crimes assigned; question witnesses, victims, and suspects to determine factual material and provide evidence of leads.-Direct activities at the crime scene to assist victims; obtain clues, gather and preserve evidence.-Ensure photographs and fingerprints of all persons who are charged with violations are included in records.- Record progress of investigations and maintain informational files on crimes and suspects.-Review Department reports and other data pertaining to criminal cases such as auto theft, armed robbery, homicide, fraud, burglary, assault, arson, possession of controlled substance, and other related crimes-Aid patrol officers in the apprehension of suspects or offenders, act as a liaison between the department and other law enforcement agencies.-File applications for and review all search warrants obtained by any officer or unit of the department.-Assist in the preparation of cases for court. Prepare assigned cases for court and charges or responses to charges and procedures. -Assist in planning, conducting, and training citizens, students, and businesses in crime prevention programs. -Assist in training officers, volunteers and members of other city departments and outside agencies in criminal investigations and related issues.
-An established goal of the division during the year has been to research and take advantage of non-traditional training opportunities such as group webinars and other methods beyond the standard offerings that involve travel expenses that often exceed the cost of the training. This effort has proven very successful. Throughout the year members of the division received quality training at a reduced cost by adopting this method. Although it will never replace traditional training approaches entirely, it is a method we intend to continue whenever available.-The division has an obligation to provide 24 hour investigative/crime scene services for major incidents occurring within the city. Notification procedures and callout schedules were examined and adjusted during the year and have proven to provide a more efficient response than the previous method.-Since the Electronic Crimes Unit was established it has been a goal for the investigators assigned to the unit to obtain EnCase Certified Status. Through a difficult and lengthy process one of the detectives completed the testing and met the requirements to become the first certified examiner in the unit's history. The process now begins to certify a second examiner.
Budget Challenges/Planned Initiatives --Members of the division will continue to work toward accomplishing the objectives in the current Department Strategic Plan that relate to our function.-The planned addition of personnel to the division will require preparation in terms of additional equipment and organizing office space to accommodate the incoming detectives. This budget/logistics challenge remains a good problem to have. -A major challenge in terms of the program budget is the need to replace the aging and unreliable video/audio recording system in our interview rooms. By statute interviews/interrogations in most Part I crimes are required to be recorded. The current state of our equipment is becomming difficult to maintain. Previous attempts to sustain the system through replacing individual components to keep costs down have brought us to the point where full replacement of the system, with the exception of peripherals (cameras, microphones) is the only solution.
6 - 13
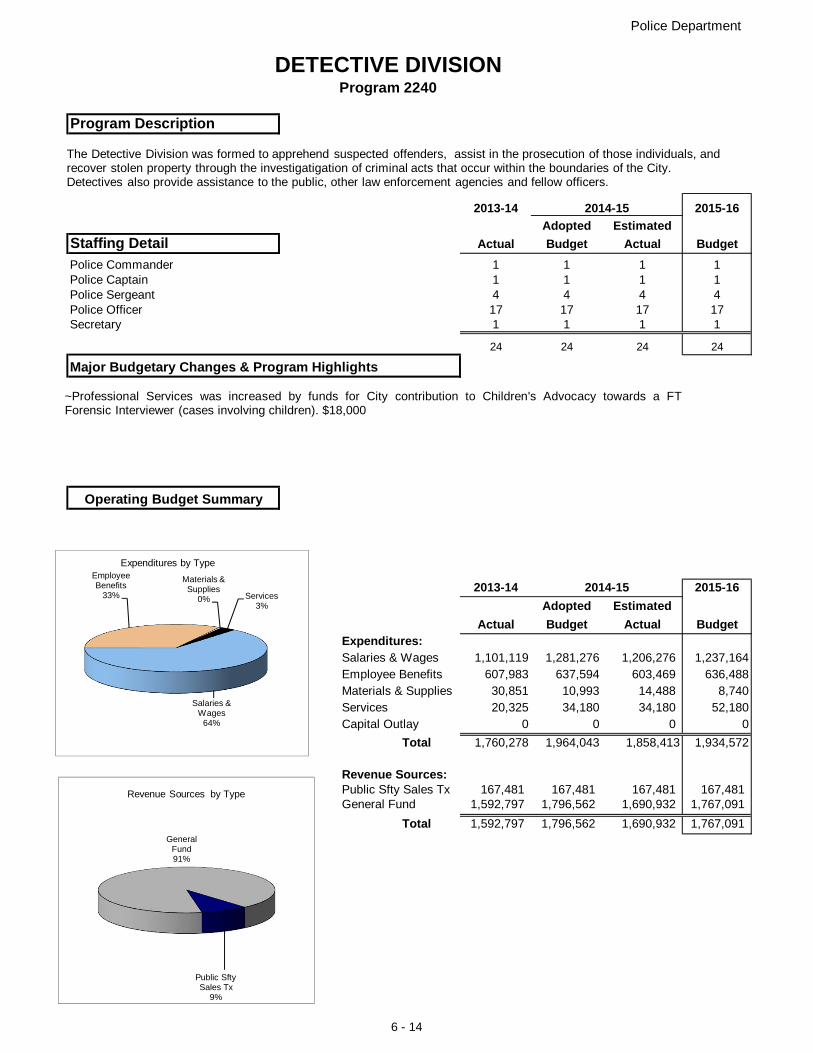
Police Department
DETECTIVE DIVISIONProgram 2240
Program Description
2013-14 2014-15 2015-16Adopted Estimated
Staffing Detail Actual Budget Actual BudgetPolice Commander 1 1 1 1Police Captain 1 1 1 1Police Sergeant 4 4 4 4Police Officer 17 17 17 17Secretary 1 1 1 1
24 24 24 24
Major Budgetary Changes & Program Highlights
Operating Budget Summary
2013-14 2014-15 2015-16Adopted Estimated
Actual Budget Actual BudgetExpenditures:Salaries & Wages 1,101,119 1,281,276 1,206,276 1,237,164Employee Benefits 607,983 637,594 603,469 636,488Materials & Supplies 30,851 10,993 14,488 8,740Services 20,325 34,180 34,180 52,180Capital Outlay 0 0 0 0
Total 1,760,278 1,964,043 1,858,413 1,934,572
Revenue Sources:Public Sfty Sales Tx 167,481 167,481 167,481 167,481General Fund 1,592,797 1,796,562 1,690,932 1,767,091
Total 1,592,797 1,796,562 1,690,932 1,767,091
Salaries & Wages
64%
Employee Benefits
33%
Materials & Supplies
0% Services3%
Expenditures by Type
General Fund91%
Public Sfty Sales Tx
9%
Revenue Sources by Type
The Detective Division was formed to apprehend suspected offenders, assist in the prosecution of those individuals, and recover stolen property through the investigatigation of criminal acts that occur within the boundaries of the City. Detectives also provide assistance to the public, other law enforcement agencies and fellow officers.
~Professional Services was increased by funds for City contribution to Children's Advocacy towards a FTForensic Interviewer (cases involving children). $18,000
6 - 14
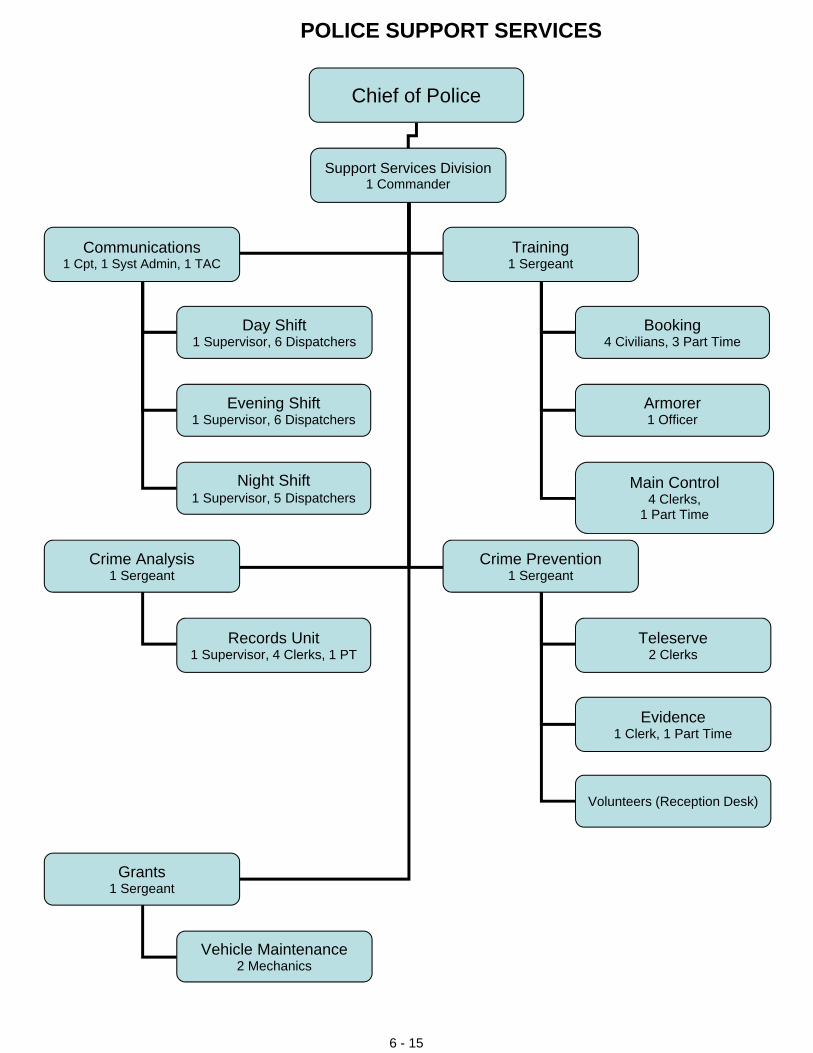
Chief of Police
Support Services Division1 Commander
Communications1 Cpt, 1 Syst Admin, 1 TAC
Training1 Sergeant
Crime Analysis1 Sergeant
Crime Prevention1 Sergeant
Grants1 Sergeant
Day Shift1 Supervisor, 6 Dispatchers
Evening Shift1 Supervisor, 6 Dispatchers
Night Shift1 Supervisor, 5 Dispatchers
Booking4 Civilians, 3 Part Time
Armorer1 Officer
Records Unit1 Supervisor, 4 Clerks, 1 PT
Teleserve2 Clerks
Evidence1 Clerk, 1 Part Time
Volunteers (Reception Desk)
Vehicle Maintenance2 Mechanics
Main Control4 Clerks,
1 Part Time
POLICE SUPPORT SERVICES
6 - 15
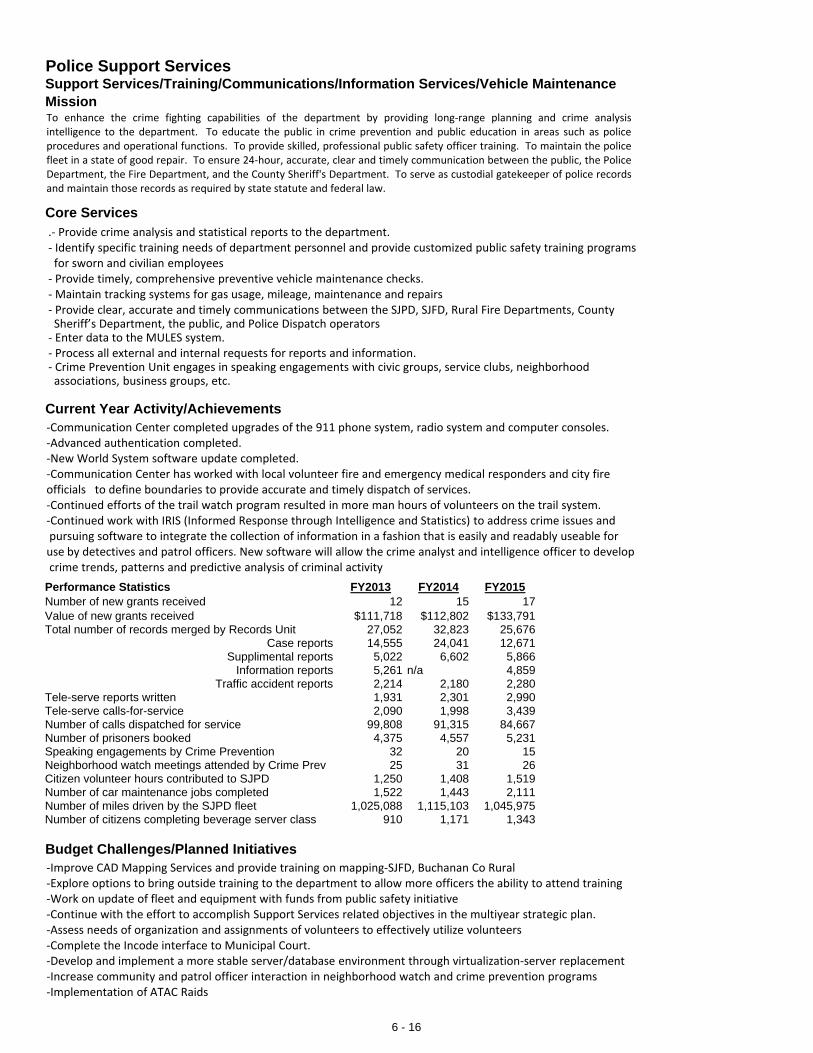
Mission
Core Services
Current Year Activity/Achievements
Performance Statistics FY2013 FY2014 FY2015Number of new grants received 12 15 17Value of new grants received $111,718 $112,802 $133,791Total number of records merged by Records Unit 27,052 32,823 25,676
Case reports 14,555 24,041 12,671Supplimental reports 5,022 6,602 5,866
Information reports 5,261 n/a 4,859Traffic accident reports 2,214 2,180 2,280
Tele-serve reports written 1,931 2,301 2,990Tele-serve calls-for-service 2,090 1,998 3,439Number of calls dispatched for service 99,808 91,315 84,667Number of prisoners booked 4,375 4,557 5,231Speaking engagements by Crime Prevention 32 20 15Neighborhood watch meetings attended by Crime Prev 25 31 26Citizen volunteer hours contributed to SJPD 1,250 1,408 1,519Number of car maintenance jobs completed 1,522 1,443 2,111Number of miles driven by the SJPD fleet 1,025,088 1,115,103 1,045,975Number of citizens completing beverage server class 910 1,171 1,343
Budget Challenges/Planned Initiatives
Police Support ServicesSupport Services/Training/Communications/Information Services/Vehicle Maintenance
To enhance the crime fighting capabilities of the department by providing long‐range planning and crime analysisintelligence to the department. To educate the public in crime prevention and public education in areas such as policeprocedures and operational functions. To provide skilled, professional public safety officer training. To maintain the policefleet in a state of good repair. To ensure 24‐hour, accurate, clear and timely communication between the public, the PoliceDepartment, the Fire Department, and the County Sheriff's Department. To serve as custodial gatekeeper of police recordsand maintain those records as required by state statute and federal law.
.‐ Provide crime analysis and statistical reports to the department.‐ Identify specific training needs of department personnel and provide customized public safety training programsfor sworn and civilian employees‐ Provide timely, comprehensive preventive vehicle maintenance checks.‐Maintain tracking systems for gas usage, mileage, maintenance and repairs‐ Provide clear, accurate and timely communications between the SJPD, SJFD, Rural Fire Departments, CountySheriff’s Department, the public, and Police Dispatch operators‐ Enter data to the MULES system. ‐ Process all external and internal requests for reports and information.‐ Crime Prevention Unit engages in speaking engagements with civic groups, service clubs, neighborhoodassociations, business groups, etc.
-Communication Center completed upgrades of the 911 phone system, radio system and computer consoles. ‐Advanced authentication completed.‐New World System software update completed.‐Communication Center has worked with local volunteer fire and emergency medical responders and city fire officials to define boundaries to provide accurate and timely dispatch of services. ‐Continued efforts of the trail watch program resulted in more man hours of volunteers on the trail system.‐Continued work with IRIS (Informed Response through Intelligence and Statistics) to address crime issues and pursuing software to integrate the collection of information in a fashion that is easily and readably useable for use by detectives and patrol officers. New software will allow the crime analyst and intelligence officer to develop crime trends, patterns and predictive analysis of criminal activity
‐Improve CAD Mapping Services and provide training on mapping‐SJFD, Buchanan Co Rural‐Explore options to bring outside training to the department to allow more officers the ability to attend training ‐Work on update of fleet and equipment with funds from public safety initiative‐Continue with the effort to accomplish Support Services related objectives in the multiyear strategic plan.‐Assess needs of organization and assignments of volunteers to effectively utilize volunteers‐Complete the Incode interface to Municipal Court.‐Develop and implement a more stable server/database environment through virtualization‐server replacement ‐Increase community and patrol officer interaction in neighborhood watch and crime prevention programs‐Implementation of ATAC Raids
6 - 16
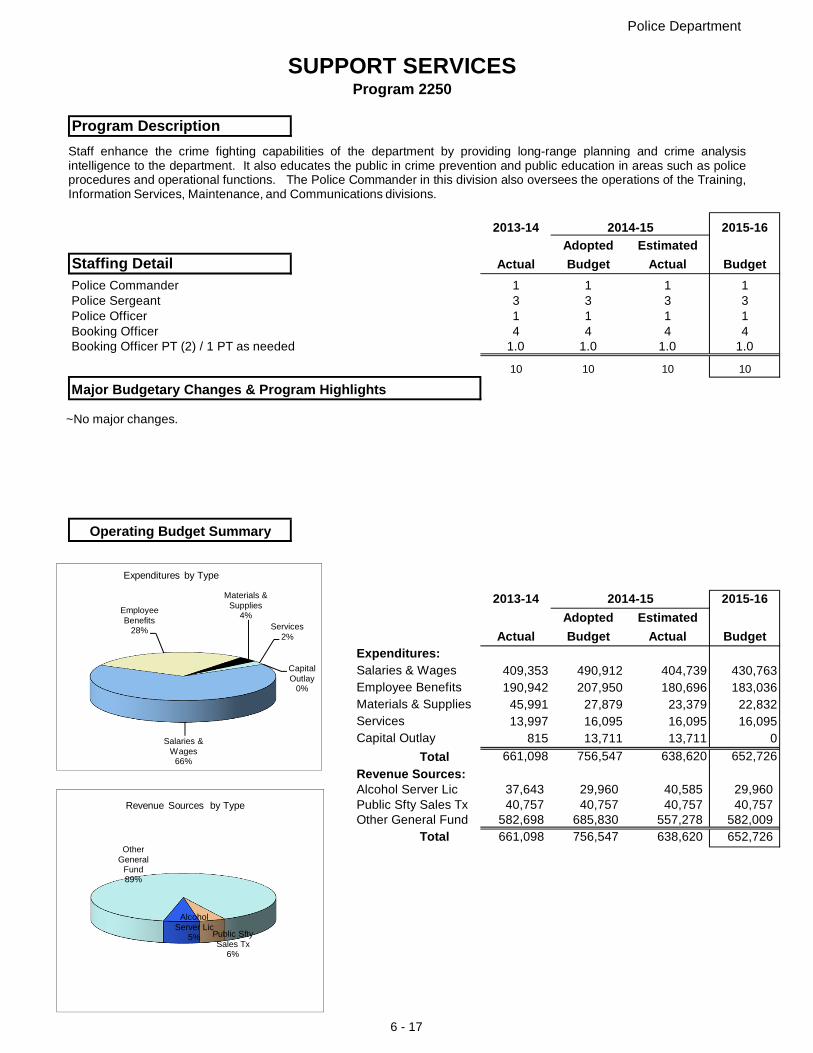
Police Department
SUPPORT SERVICESProgram 2250
Program Description
2013-14 2014-15 2015-16Adopted Estimated
Staffing Detail Actual Budget Actual BudgetPolice Commander 1 1 1 1Police Sergeant 3 3 3 3Police Officer 1 1 1 1Booking Officer 4 4 4 4Booking Officer PT (2) / 1 PT as needed 1.0 1.0 1.0 1.0
10 10 10 10
Major Budgetary Changes & Program Highlights
Operating Budget Summary
2013-14 2014-15 2015-16Adopted Estimated
Actual Budget Actual BudgetExpenditures:Salaries & Wages 409,353 490,912 404,739 430,763 Employee Benefits 190,942 207,950 180,696 183,036 Materials & Supplies 45,991 27,879 23,379 22,832 Services 13,997 16,095 16,095 16,095 Capital Outlay 815 13,711 13,711 0
Total 661,098 756,547 638,620 652,726
Revenue Sources:Alcohol Server Lic 37,643 29,960 40,585 29,960Public Sfty Sales Tx 40,757 40,757 40,757 40,757Other General Fund 582,698 685,830 557,278 582,009
Total 661,098 756,547 638,620 652,726
Salaries & Wages
66%
Employee Benefits
28%
Materials & Supplies
4%Services
2%
Capital Outlay
0%
Expenditures by Type
Public Sfty Sales Tx
6%
Other General
Fund89%
Alcohol Server Lic
5%
Revenue Sources by Type
Staff enhance the crime fighting capabilities of the department by providing long-range planning and crime analysisintelligence to the department. It also educates the public in crime prevention and public education in areas such as policeprocedures and operational functions. The Police Commander in this division also oversees the operations of the Training,Information Services, Maintenance, and Communications divisions.
~No major changes.
6 - 17
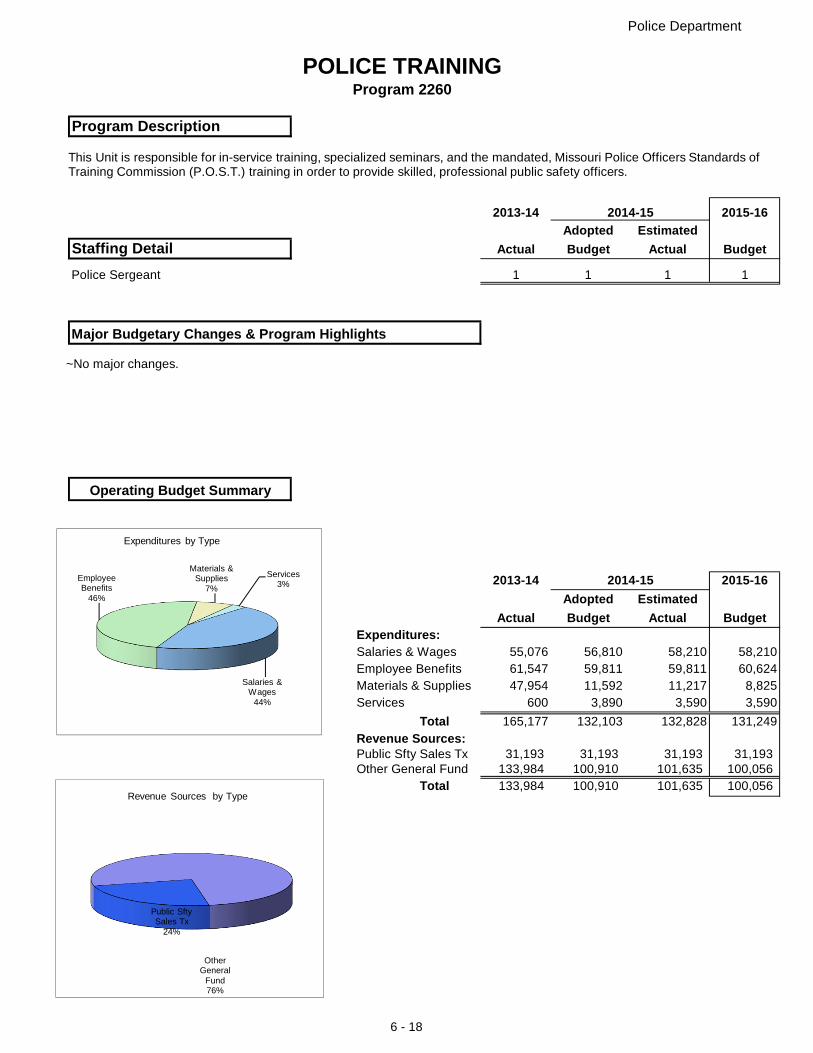
Police Department
POLICE TRAININGProgram 2260
Program Description
2013-14 2014-15 2015-16Adopted Estimated
Staffing Detail Actual Budget Actual Budget
Police Sergeant 1 1 1 1
Major Budgetary Changes & Program Highlights
Operating Budget Summary
2013-14 2014-15 2015-16Adopted Estimated
Actual Budget Actual BudgetExpenditures:Salaries & Wages 55,076 56,810 58,210 58,210Employee Benefits 61,547 59,811 59,811 60,624Materials & Supplies 47,954 11,592 11,217 8,825Services 600 3,890 3,590 3,590
Total 165,177 132,103 132,828 131,249Revenue Sources:Public Sfty Sales Tx 31,193 31,193 31,193 31,193Other General Fund 133,984 100,910 101,635 100,056
Total 133,984 100,910 101,635 100,056
Salaries & Wages
44%
Employee Benefits
46%
Materials & Supplies
7%
Services3%
Expenditures by Type
Public Sfty Sales Tx
24%
Other General
Fund76%
Revenue Sources by Type
This Unit is responsible for in-service training, specialized seminars, and the mandated, Missouri Police Officers Standards of Training Commission (P.O.S.T.) training in order to provide skilled, professional public safety officers.
~No major changes.
6 - 18
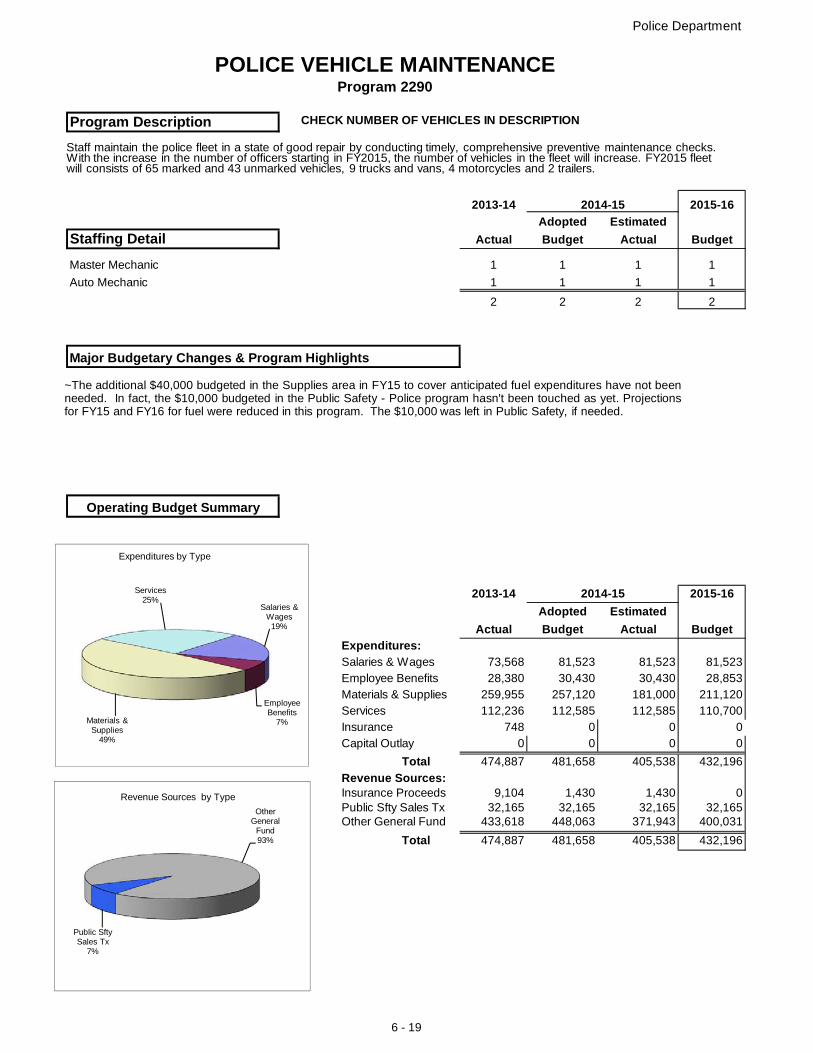
Police Department
POLICE VEHICLE MAINTENANCEProgram 2290
Program Description
2013-14 2014-15 2015-16Adopted Estimated
Staffing Detail Actual Budget Actual Budget
Master Mechanic 1 1 1 1
Auto Mechanic 1 1 1 1
2 2 2 2
Major Budgetary Changes & Program Highlights
Operating Budget Summary
2013-14 2014-15 2015-16Adopted Estimated
Actual Budget Actual BudgetExpenditures:Salaries & Wages 73,568 81,523 81,523 81,523Employee Benefits 28,380 30,430 30,430 28,853Materials & Supplies 259,955 257,120 181,000 211,120Services 112,236 112,585 112,585 110,700Insurance 748 0 0 0Capital Outlay 0 0 0 0
Total 474,887 481,658 405,538 432,196
Revenue Sources:Insurance Proceeds 9,104 1,430 1,430 0Public Sfty Sales Tx 32,165 32,165 32,165 32,165Other General Fund 433,618 448,063 371,943 400,031
Total 474,887 481,658 405,538 432,196
Salaries & Wages
19%
Employee Benefits
7%Materials & Supplies
49%
Services25%
Expenditures by Type
Public Sfty Sales Tx
7%
Other General
Fund93%
Revenue Sources by Type
Staff maintain the police fleet in a state of good repair by conducting timely, comprehensive preventive maintenance checks. With the increase in the number of officers starting in FY2015, the number of vehicles in the fleet will increase. FY2015 fleet will consists of 65 marked and 43 unmarked vehicles, 9 trucks and vans, 4 motorcycles and 2 trailers.
~The additional $40,000 budgeted in the Supplies area in FY15 to cover anticipated fuel expenditures have not beenneeded. In fact, the $10,000 budgeted in the Public Safety - Police program hasn't been touched as yet. Projectionsfor FY15 and FY16 for fuel were reduced in this program. The $10,000 was left in Public Safety, if needed.
CHECK NUMBER OF VEHICLES IN DESCRIPTION
6 - 19
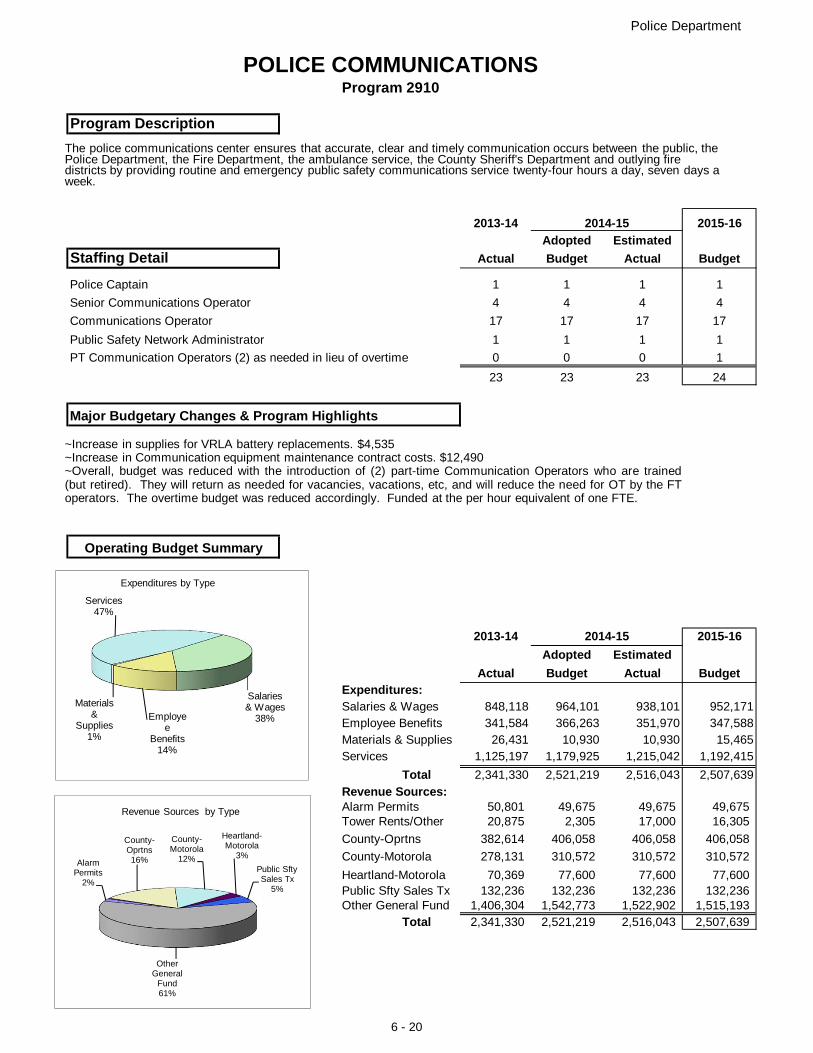
Police Department
POLICE COMMUNICATIONSProgram 2910
Program Description
2013-14 2014-15 2015-16Adopted Estimated
Staffing Detail Actual Budget Actual Budget
Police Captain 1 1 1 1
Senior Communications Operator 4 4 4 4
Communications Operator 17 17 17 17
Public Safety Network Administrator 1 1 1 1
PT Communication Operators (2) as needed in lieu of overtime 0 0 0 1
23 23 23 24
Major Budgetary Changes & Program Highlights
Operating Budget Summary
2013-14 2014-15 2015-16Adopted Estimated
Actual Budget Actual BudgetExpenditures:Salaries & Wages 848,118 964,101 938,101 952,171Employee Benefits 341,584 366,263 351,970 347,588Materials & Supplies 26,431 10,930 10,930 15,465Services 1,125,197 1,179,925 1,215,042 1,192,415
Total 2,341,330 2,521,219 2,516,043 2,507,639Revenue Sources:Alarm Permits 50,801 49,675 49,675 49,675Tower Rents/Other 20,875 2,305 17,000 16,305
County-Oprtns 382,614 406,058 406,058 406,058
County-Motorola 278,131 310,572 310,572 310,572
Heartland-Motorola 70,369 77,600 77,600 77,600Public Sfty Sales Tx 132,236 132,236 132,236 132,236Other General Fund 1,406,304 1,542,773 1,522,902 1,515,193
Total 2,341,330 2,521,219 2,516,043 2,507,639
Salaries & Wages
38%Employee
Benefits14%
Materials &
Supplies1%
Services47%
Expenditures by Type
Alarm Permits
2%
County-Oprtns16%
County-Motorola
12%
Heartland-Motorola
3%
Public Sfty Sales Tx
5%
Other General
Fund61%
Revenue Sources by Type
The police communications center ensures that accurate, clear and timely communication occurs between the public, the Police Department, the Fire Department, the ambulance service, the County Sheriff's Department and outlying fire districts by providing routine and emergency public safety communications service twenty-four hours a day, seven days a week.
~Increase in supplies for VRLA battery replacements. $4,535~Increase in Communication equipment maintenance contract costs. $12,490~Overall, budget was reduced with the introduction of (2) part-time Communication Operators who are trained(but retired). They will return as needed for vacancies, vacations, etc, and will reduce the need for OT by the FToperators. The overtime budget was reduced accordingly. Funded at the per hour equivalent of one FTE.
6 - 20
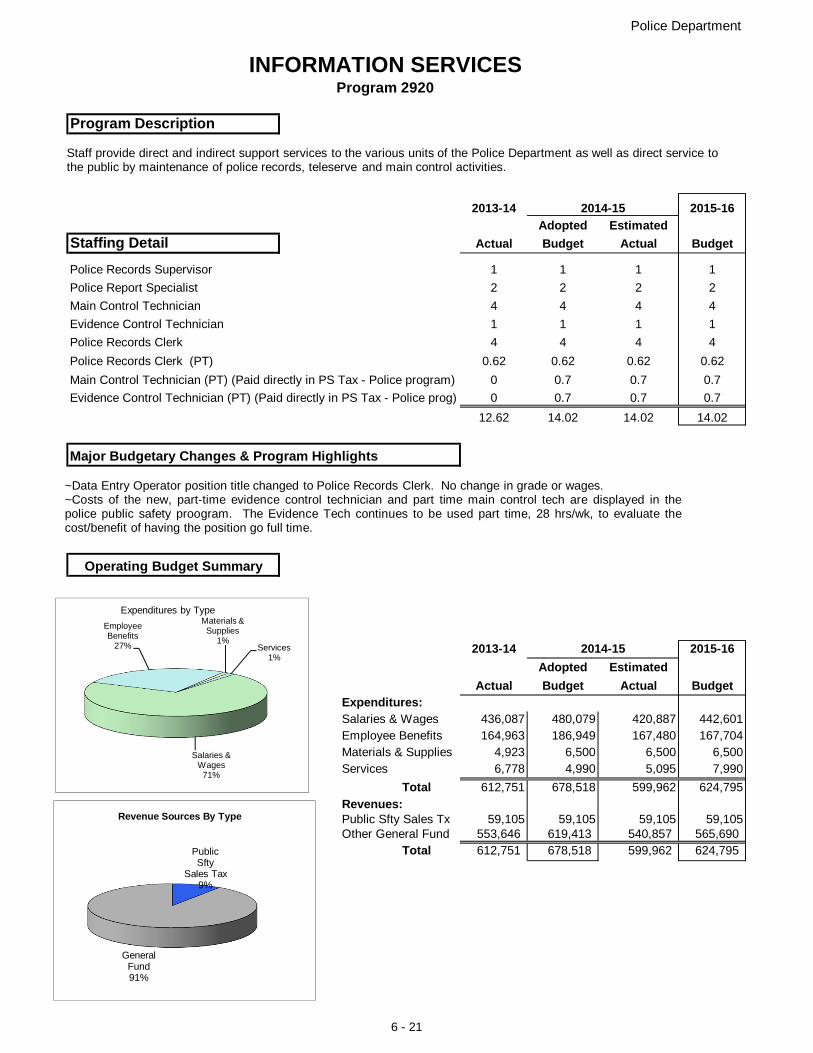
Police Department
INFORMATION SERVICESProgram 2920
Program Description
2013-14 2014-15 2015-16Adopted Estimated
Staffing Detail Actual Budget Actual Budget
Police Records Supervisor 1 1 1 1
Police Report Specialist 2 2 2 2
Main Control Technician 4 4 4 4
Evidence Control Technician 1 1 1 1
Police Records Clerk 4 4 4 4
Police Records Clerk (PT) 0.62 0.62 0.62 0.62
Main Control Technician (PT) (Paid directly in PS Tax - Police program) 0 0.7 0.7 0.7
Evidence Control Technician (PT) (Paid directly in PS Tax - Police prog) 0 0.7 0.7 0.7
12.62 14.02 14.02 14.02
Major Budgetary Changes & Program Highlights
Operating Budget Summary
2013-14 2014-15 2015-16Adopted Estimated
Actual Budget Actual BudgetExpenditures:Salaries & Wages 436,087 480,079 420,887 442,601Employee Benefits 164,963 186,949 167,480 167,704Materials & Supplies 4,923 6,500 6,500 6,500Services 6,778 4,990 5,095 7,990
Total 612,751 678,518 599,962 624,795Revenues:Public Sfty Sales Tx 59,105 59,105 59,105 59,105Other General Fund 553,646 619,413 540,857 565,690
Total 612,751 678,518 599,962 624,795
Salaries & Wages
71%
Employee Benefits
27%
Materials & Supplies
1%Services
1%
Expenditures by Type
Staff provide direct and indirect support services to the various units of the Police Department as well as direct service tothe public by maintenance of police records, teleserve and main control activities.
~Data Entry Operator position title changed to Police Records Clerk. No change in grade or wages.~Costs of the new, part-time evidence control technician and part time main control tech are displayed in thepolice public safety proogram. The Evidence Tech continues to be used part time, 28 hrs/wk, to evaluate thecost/benefit of having the position go full time.
Public Sfty
Sales Tax9%
General Fund91%
Revenue Sources By Type
6 - 21
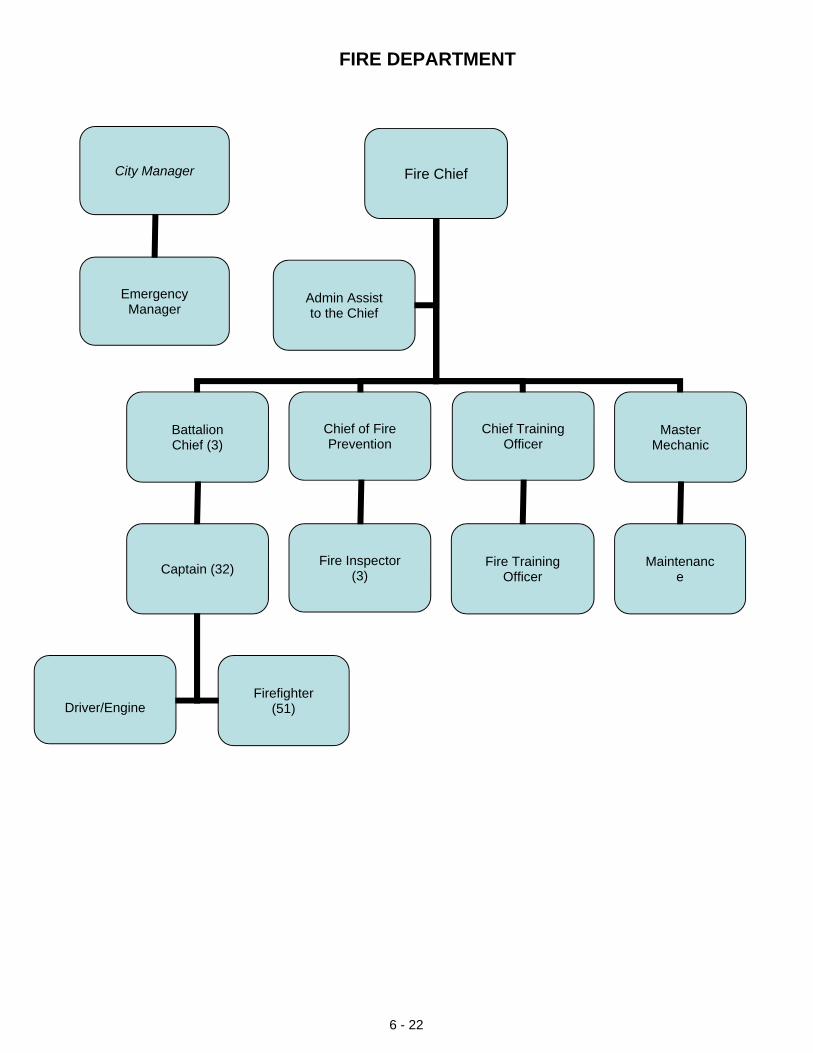
Fire Chief
Admin Assist to the Chief
Battalion Chief (3)
Captain (32)
Chief of Fire Prevention
Fire Inspector (3)
Chief Training Officer
Driver/Engine
Fire Training Officer
Firefighter (51)
Master Mechanic
Maintenance
FIRE DEPARTMENT
City Manager
Emergency Manager
6 - 22
Fire Administration
Mission
Core Services
Current Year Activity/Achievements
Budget Challenges/Planned Initiatives
To provide creative and innovative leadership in fire emergency and non-emergency services through themanagement and supervision of all aspects of fire protection.
- Oversee the daily operations pertaining to Fire Suppression, Fire Training, Fire Prevention and FireMaintenance.- Interact with and ensure that the non-emergent needs of the business community and the general public aremet.- Ensure the completion of all Capital Improvement Program projects relevant to the Fire Department.- Provide budgeting and oversight services to ensure fiscal control.- Acts as a member of the Labor Negotiating Committee for the contract with the IAFF.
- Work continues on the inside of station 4. The sprinkler system has been installed in the living quarters andindividual rooms have been built in the bedroom. Painting of the interior is complete and new bathroom fixturesare to be installed. The floor tile will be removed and an epoxy floor installed.-work also continues on station 5 with the interior painting also complete and floor tile removal and installationof an epoxy floor expected to start soon.- We recieved two new pumper trucks and placed them in service..-recieved and put into service two new first responder trucks to reduce the wear and tear on the larger trucks- Completed our second Citizen's Fire Academy.- Following our fire station relocation study, we are actively pursuing land at three different sites.- Established a voluntary physical fitness program for all firefighters, but primarily directed to older members ofthe Department. Requires set number of workout hours, maintaining or losing weight, and getting an annualphysical. A total of 13 older firefighters completed the requirements and are listed on a plaque at theheadquarters station.- Currently working as a member of the REMSA board to move the ambulance from a hospital based to acounty based service. attended ambulance board training on ethics, finances and issues related to serving ona board overseeing the ambulance- attended state and regional conferences.
Budget Challenges:- Finances continue to be a problem. Costs for fuel, repairs and upkeep continue to rise. However, thepurchase of two new trucks and the coming availability of public safety tax funds should help.Planned Initiatives:- Work to get more older firefighters to participate in physical fitness program.- Continue to apply for grants.- Pursue land acquistion for new stations and chose an architect.- Continue to work toward having all firefighters trained to FF2 level.-stay abreast of new changes and opportunities wtih the Affordable Care Act.-currently working on new dispatching levels. the type or level of calls will drop from 24 to 7 with the newsystem. Dispatchers will not have to look up different type of emergencies just chose one of the 7 levels. Thesystem will default the the next available unit and make it easier for the Fire Officer and the dispatchers
6 - 23
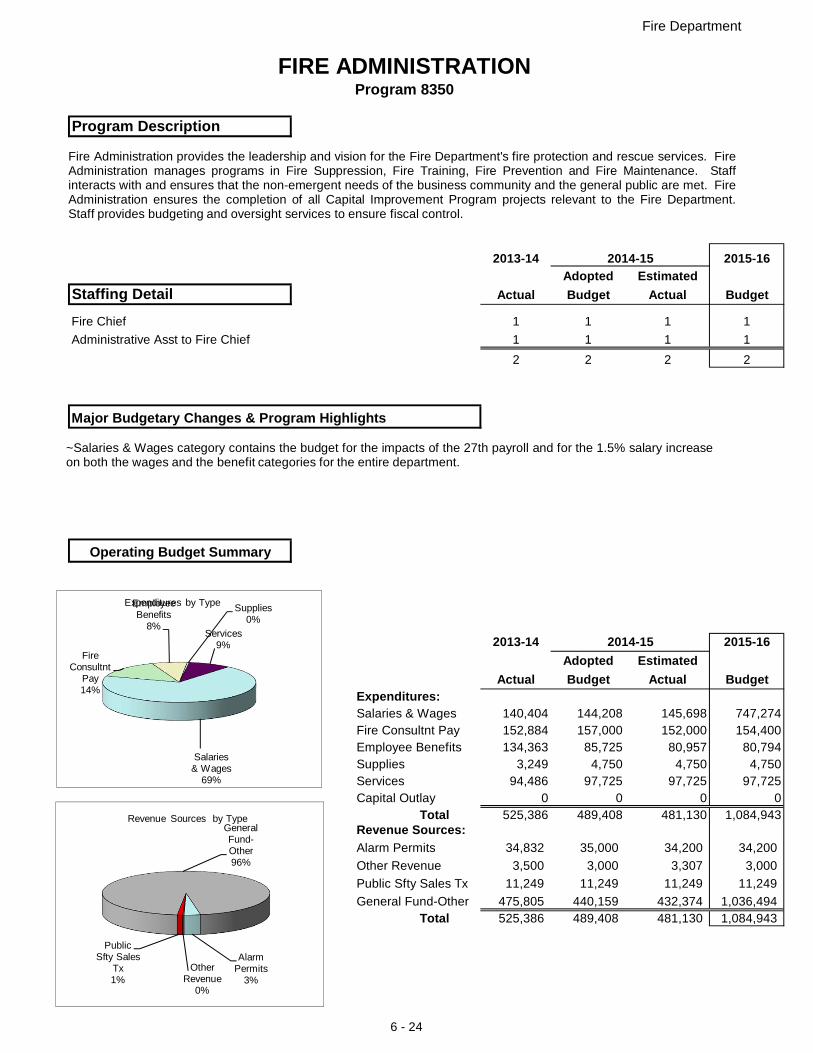
Fire Department
FIRE ADMINISTRATIONProgram 8350
Program Description
2013-14 2014-15 2015-16Adopted Estimated
Staffing Detail Actual Budget Actual Budget
Fire Chief 1 1 1 1
Administrative Asst to Fire Chief 1 1 1 1
2 2 2 2
Major Budgetary Changes & Program Highlights
Operating Budget Summary
2013-14 2014-15 2015-16Adopted Estimated
Actual Budget Actual BudgetExpenditures:Salaries & Wages 140,404 144,208 145,698 747,274Fire Consultnt Pay 152,884 157,000 152,000 154,400Employee Benefits 134,363 85,725 80,957 80,794Supplies 3,249 4,750 4,750 4,750Services 94,486 97,725 97,725 97,725Capital Outlay 0 0 0 0
Total 525,386 489,408 481,130 1,084,943Revenue Sources:Alarm Permits 34,832 35,000 34,200 34,200
Other Revenue 3,500 3,000 3,307 3,000
Public Sfty Sales Tx 11,249 11,249 11,249 11,249
General Fund-Other 475,805 440,159 432,374 1,036,494Total 525,386 489,408 481,130 1,084,943
Salaries & Wages
69%
Fire Consultnt
Pay14%
Employee Benefits
8%
Supplies0%
Services9%
Expenditures by Type
Alarm Permits
3%Other
Revenue0%
Public Sfty Sales
Tx1%
General Fund-Other96%
Revenue Sources by Type
Fire Administration provides the leadership and vision for the Fire Department's fire protection and rescue services. FireAdministration manages programs in Fire Suppression, Fire Training, Fire Prevention and Fire Maintenance. Staffinteracts with and ensures that the non-emergent needs of the business community and the general public are met. FireAdministration ensures the completion of all Capital Improvement Program projects relevant to the Fire Department.Staff provides budgeting and oversight services to ensure fiscal control.
~Salaries & Wages category contains the budget for the impacts of the 27th payroll and for the 1.5% salary increaseon both the wages and the benefit categories for the entire department.
6 - 24
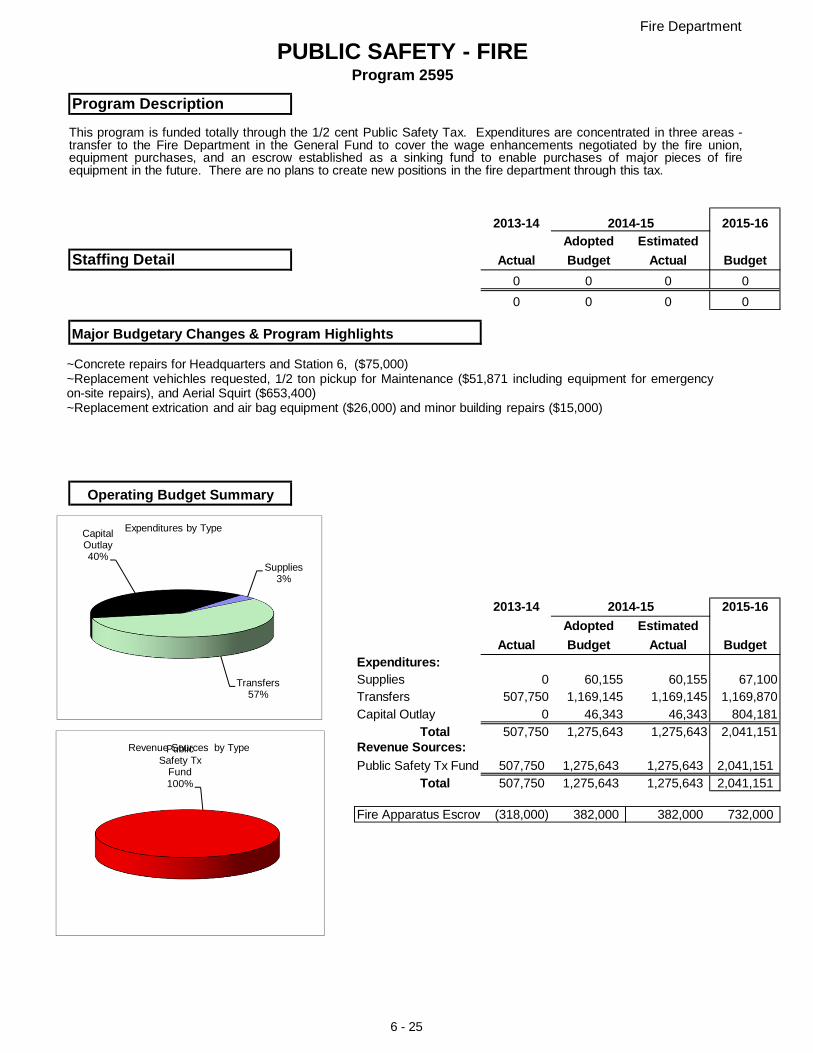
Fire Department
PUBLIC SAFETY - FIREProgram 2595
Program Description
2013-14 2014-15 2015-16Adopted Estimated
Staffing Detail Actual Budget Actual Budget0 0 0 0
0 0 0 0
Major Budgetary Changes & Program Highlights
Operating Budget Summary
2013-14 2014-15 2015-16Adopted Estimated
Actual Budget Actual BudgetExpenditures:Supplies 0 60,155 60,155 67,100Transfers 507,750 1,169,145 1,169,145 1,169,870Capital Outlay 0 46,343 46,343 804,181
Total 507,750 1,275,643 1,275,643 2,041,151Revenue Sources:Public Safety Tx Fund 507,750 1,275,643 1,275,643 2,041,151
Total 507,750 1,275,643 1,275,643 2,041,151
Fire Apparatus Escrow (318,000) 382,000 382,000 732,000
Supplies3%
Transfers57%
Capital Outlay40%
Expenditures by Type
Public Safety Tx
Fund100%
Revenue Sources by Type
This program is funded totally through the 1/2 cent Public Safety Tax. Expenditures are concentrated in three areas -transfer to the Fire Department in the General Fund to cover the wage enhancements negotiated by the fire union,equipment purchases, and an escrow established as a sinking fund to enable purchases of major pieces of fireequipment in the future. There are no plans to create new positions in the fire department through this tax.
~Concrete repairs for Headquarters and Station 6, ($75,000)~Replacement vehichles requested, 1/2 ton pickup for Maintenance ($51,871 including equipment for emergencyon-site repairs), and Aerial Squirt ($653,400)~Replacement extrication and air bag equipment ($26,000) and minor building repairs ($15,000)
6 - 25
Fire Suppression
Mission
Core Services
Current Year Activity/Achievements
Performance Statistics FY2013 FY2014 FY2015
Total number of calls 9,000 8,955% of those calls being medical 65% 59%Number of inspections completed by fire crews 300 361
Budget Challenges/Planned Initiatives
To protect the life, health and property of the public through provision of fire protection, emergency rescue andemergency medical First Responder Services.
- Respond to all types of fire-related emergencies within the City.- Implement specialized emergency rescue operations in: Confined Space Rescue, Light Rescue, Water/IceRescue, Swift Water & River Rescue, and Hazardous Materials Response.- Provide assistance and provide First Responder medical care to victims of sudden illness or injury.- Conduct fire inspections of residential apartments (multi-family), commercial, and industrial occupancies.- Maintain mutual aid agreements with surrounding communities.
- Worked with Local 77 to review current General Orders and SOG's.- All EMTs completed King Airway insertion refresher class.- Fire crews are participating in assigned training to meet ISO requirements.- New voluntary fitness program started - "Fit as a Rookie".-assist with community activities such as Citizen's fire academy and local festivals /events
- Continue to work toward having all firefighters trained to the level of Firefighter II.- Continue to work with Local 77 to establish a fitness program that includes a yearly physical for eachfirefighter.- Train on new boat for use in local lakes and ponds. Refresher training on ice rescue- Continue to support employees willing to enhance their medical skills through refresher and additional outsidedepartment classes, such as Trauma Trends, state fire schools, Hillyards, and EMS conferences- Maintain our current ISO rating of 3 while looking at cost effective opportunities to improve.
6 - 26
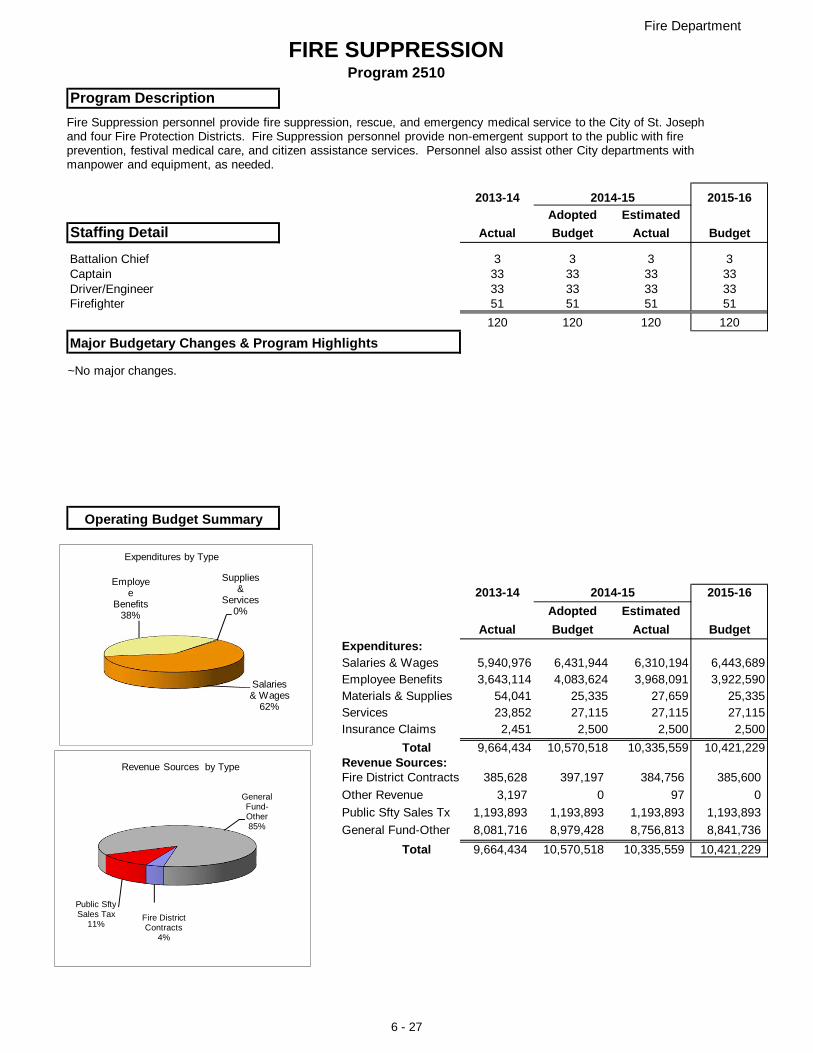
Fire Department
FIRE SUPPRESSIONProgram 2510
Program Description
2013-14 2014-15 2015-16Adopted Estimated
Staffing Detail Actual Budget Actual Budget
Battalion Chief 3 3 3 3Captain 33 33 33 33Driver/Engineer 33 33 33 33Firefighter 51 51 51 51
120 120 120 120
Major Budgetary Changes & Program Highlights
Operating Budget Summary
2013-14 2014-15 2015-16Adopted Estimated
Actual Budget Actual BudgetExpenditures:Salaries & Wages 5,940,976 6,431,944 6,310,194 6,443,689Employee Benefits 3,643,114 4,083,624 3,968,091 3,922,590Materials & Supplies 54,041 25,335 27,659 25,335Services 23,852 27,115 27,115 27,115Insurance Claims 2,451 2,500 2,500 2,500
Total 9,664,434 10,570,518 10,335,559 10,421,229Revenue Sources:Fire District Contracts 385,628 397,197 384,756 385,600
Other Revenue 3,197 0 97 0
Public Sfty Sales Tx 1,193,893 1,193,893 1,193,893 1,193,893
General Fund-Other 8,081,716 8,979,428 8,756,813 8,841,736
Total 9,664,434 10,570,518 10,335,559 10,421,229
Salaries & Wages
62%
Employee
Benefits38%
Supplies &
Services0%
Expenditures by Type
Fire District Contracts
4%
Public Sfty Sales Tax
11%
General Fund-Other85%
Revenue Sources by Type
Fire Suppression personnel provide fire suppression, rescue, and emergency medical service to the City of St. Joseph and four Fire Protection Districts. Fire Suppression personnel provide non-emergent support to the public with fire prevention, festival medical care, and citizen assistance services. Personnel also assist other City departments with manpower and equipment, as needed.
~No major changes.
6 - 27
Fire Prevention
Mission
Core Services
Current Year Activity/Achievements
Budget Challenges/Planned Initiatives
To provide the citizens of St Joseph with a safe community to work and conduct business in by buildingrelationships with all business owners in our city with a common goal of making their business a safe place.We will be proactive in our approach to seek out hazards and correct them before they can cause harm to lifeor property.
- Provide assistance with plans review to potential customers wanting to build or expand a business.- Provide inspections starting with the site review and following the project through to completion and theissuing of a certificate for occupancy.- Provide an inspection program for existing business completed by Fire Department captains and crews. Thiswill allow all businesses to be inspected within a three year time frame.- Provide investigations for all fires of significant loss to determine cause.- Provide public education to schools and service groups on fire safety.- Provide inspections for target hazards by Fire Prevention Inspectors with assistance from fire crews.
- Following direction of the fire chief, we have developed a new inspection program for company officers. Thisprogram allows Fire Crews to become familiar with the businesses in their district and also helps keep thosebusinesses safe for the public or whoever may enter them.- Following the completion of each inspection a survey card is left with the business. This survey is sent to CityHall, providing feedback on how we have done.- Inspections by FireCompanies have allowed fire inspectors to focus on high hazard businesses.- All inspectors have maintained their certifications.-working with development review and the new CBO, we have developed a checklist that will help us makesure that new homes, businesses and construction projects have a fire protection footprint and meet currentcodes- performed 303 inspections, 50 public presentations, 2 Juvenile fire starter counselings, 31 consultations, 25
Budget Challenges:- Meeting the demands of our community partners and working within our budget.- Keeping overtime costs within budget is difficult. It can be affected by the number and magnitude of fires weare called to investigate.-improve scheduling of fire prevention activities like the safety trailer to help offset overtime costs.
Planned Initiatives:- Of the three fire inspectors, one works mainly on IT projects/problems for the entire fire department. In thevery near future we are going to train more of our suppression people and one of our training officers to domore of this type of work.- We will be working on time management and an alternating schedule to inspect all businesses on a 3 yearrotation.
6 - 28
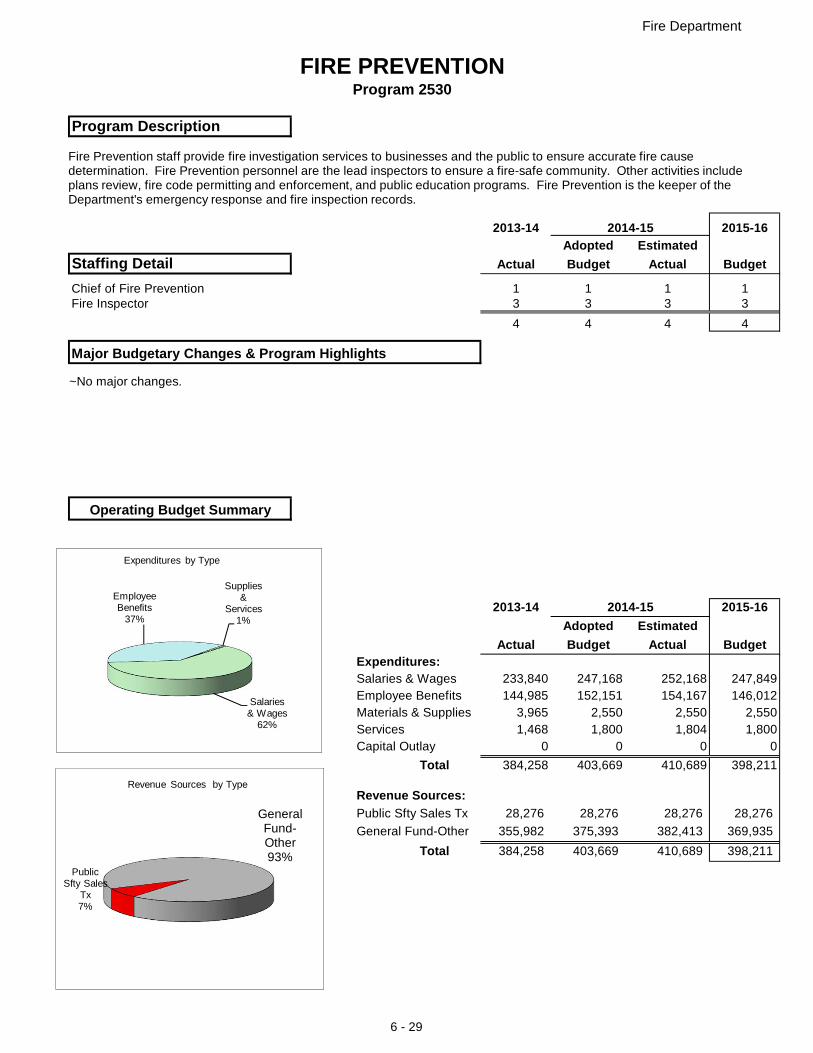
Fire Department
FIRE PREVENTIONProgram 2530
Program Description
2013-14 2014-15 2015-16Adopted Estimated
Staffing Detail Actual Budget Actual Budget
Chief of Fire Prevention 1 1 1 1Fire Inspector 3 3 3 3
4 4 4 4
Major Budgetary Changes & Program Highlights
Operating Budget Summary
2013-14 2014-15 2015-16Adopted Estimated
Actual Budget Actual BudgetExpenditures:Salaries & Wages 233,840 247,168 252,168 247,849Employee Benefits 144,985 152,151 154,167 146,012Materials & Supplies 3,965 2,550 2,550 2,550Services 1,468 1,800 1,804 1,800Capital Outlay 0 0 0 0
Total 384,258 403,669 410,689 398,211
Revenue Sources:Public Sfty Sales Tx 28,276 28,276 28,276 28,276
General Fund-Other 355,982 375,393 382,413 369,935
Total 384,258 403,669 410,689 398,211
Salaries & Wages
62%
Employee Benefits
37%
Supplies &
Services1%
Expenditures by Type
Public Sfty Sales
Tx7%
General Fund-Other93%
Revenue Sources by Type
Fire Prevention staff provide fire investigation services to businesses and the public to ensure accurate fire cause determination. Fire Prevention personnel are the lead inspectors to ensure a fire-safe community. Other activities include plans review, fire code permitting and enforcement, and public education programs. Fire Prevention is the keeper of the Department's emergency response and fire inspection records.
~No major changes.
6 - 29
Emergency Management
Mission
Core Services
Current Year Activity/Achievements
Budget Challenges/Planned Initiatives
The Emergency Management Coordinator's main objectives are: Life Safety, Incident Stabilization, and Protecting the Environment. This is accomplished through the Four Pillars of: Mitigation, Planning, Response and Recovery.
- Plan, organize, and direct the operations of the City’s Emergency Management Program with localgovernment, civic and business official and other interested groups.- Coordinate the emergency management program with other programs of city government. Supervise allsubordinate personnel assigned to the program and direct a program to recruit and train volunteer personnel.- Speak before various groups to promote interest and cooperation in the emergency management program.- Advise and assist business firms in establishing industrial emergency management programs.- Meet with state and federal emergency management officials to coordinate the City's emergency program.- Prepare various forms, official documents and reports for the state and federal officials.- Prepare the budget for emergency management programs.- Actively participate in all phases of major program areas- Mitigation, Preparedness, Response andRecovery. Responsibilities include planning for emergency communications support for major programsareas and those systems which have common application for other than emergency-caused disasters.
This position is currently being filled on a temporary basis. The job has been posted and we hope that it willbe filled in the near future
6 - 30
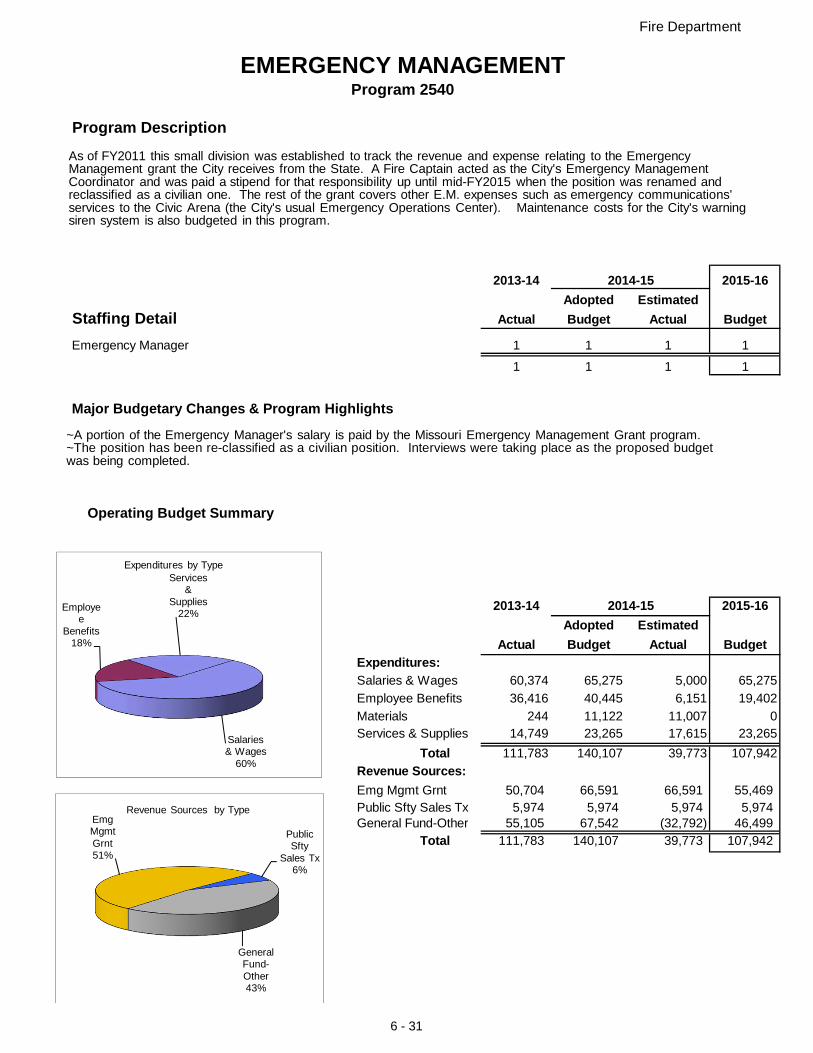
Fire Department
EMERGENCY MANAGEMENTProgram 2540
Program Description
2013-14 2014-15 2015-16Adopted Estimated
Staffing Detail Actual Budget Actual Budget
Emergency Manager 1 1 1 1
1 1 1 1
Major Budgetary Changes & Program Highlights
Operating Budget Summary
2013-14 2014-15 2015-16Adopted Estimated
Actual Budget Actual BudgetExpenditures:Salaries & Wages 60,374 65,275 5,000 65,275
Employee Benefits 36,416 40,445 6,151 19,402
Materials 244 11,122 11,007 0Services & Supplies 14,749 23,265 17,615 23,265
Total 111,783 140,107 39,773 107,942
Revenue Sources:50,704 66,591 66,591 55,4695,974 5,974 5,974 5,974
General Fund-Other 55,105 67,542 (32,792) 46,499Total 111,783 140,107 39,773 107,942
Public Sfty Sales TxEmg Mgmt Grnt
Salaries & Wages
60%
Employee
Benefits18%
Services &
Supplies22%
Expenditures by Type
Emg Mgmt Grnt51%
Public Sfty
Sales Tx6%
General Fund-Other43%
Revenue Sources by Type
As of FY2011 this small division was established to track the revenue and expense relating to the Emergency Management grant the City receives from the State. A Fire Captain acted as the City's Emergency Management Coordinator and was paid a stipend for that responsibility up until mid-FY2015 when the position was renamed and reclassified as a civilian one. The rest of the grant covers other E.M. expenses such as emergency communications' services to the Civic Arena (the City's usual Emergency Operations Center). Maintenance costs for the City's warning siren system is also budgeted in this program.
~A portion of the Emergency Manager's salary is paid by the Missouri Emergency Management Grant program.~The position has been re-classified as a civilian position. Interviews were taking place as the proposed budgetwas being completed.
6 - 31
Fire Maintenance
Mission
Core Services
Current Year Activity/Achievements
Budget Challenges/Planned Initiatives
To provide timely preventive maintenance, supply procurement, supply distribution and repairs for all Fire Departmentvehicles, buildings and equipment.
- Reduce downtime for all first-line fire equipment by:Immediate repair of first-line fire apparatus failures;Monthly preventive maintenance checks;Manufacturer’s recommended oil changes; Conduct engine oil analysis
- Provide a maintenance tracking and prioritization system.- Complete building maintenance/repairs, as needed.- Schedule and complete third-party testing of aerial units, ground ladders and pumps.Snow removal from all Fire Department Facilities. – Respond to any overtime call in emergency service repairs asdirected by on duty Battalion Chiefs.
• Maintained a fleet of 11 front line Fire trucks including 2 ladder trucks, 2 telesqurts, 2 heavy duty rescuetrucks and 5 pumpers. Reserve fleet consists of 2 reserve pumpers and 1 telesqurt.- Maintained fleet of 16 light duty trucks, 1 car, 3 rescue boats, and 5 specialized trailers.- Maintained 9 fire stations.- Maintained, organized, and inventoried shop area at Station 5.- Provided frequent updates on truck repairs to Battalion Chiefs and suppression personnel.- Assisted with the signage, training and putting in service two new apparatus, two new first responder trucksand the new shop truck.-painted station 5 interior and ceiling, and station 6 exterior.-constructed a wall separating the bedroom area from the locker room. built individual cubicles for eachbedroom, painted interior and ceiling, replaced old lighting with new LED fixtures and installed new bathroom
- Age and condition of the fleet continues to be a problem. With the purchase of the new pumpers and beingable to refurbish Ladder 5 will take some of the pressure off of the truck maintenance budget this year. Newfirst responder trucks should save wear and tear on larger aerial trucks.- Get both maintenance personnel certified on maintenance of emergency vehicles.- Add spare equipment and parts to limit down-time on front line and reserve trucks.Add spare suppressionequipment, parts inventory, and shop tools/equipment to limit down time of front line and reserve apparatus.- Establish a process to periodically steam clean and seal undercarriages of trucks to preserve frames andundercarriages.‐Replace living area floors at stations 4, 5, and 6, Apparatus floors at Head Quarters, and start construction of new stations to replace aging buildings.‐Replace traditional lighting with more energy efficient lighting.‐Study, review, and complete new daily/weekly driver inspection procedures of equipment by all fire personnel to eliminate costly future repairs.
6 - 32
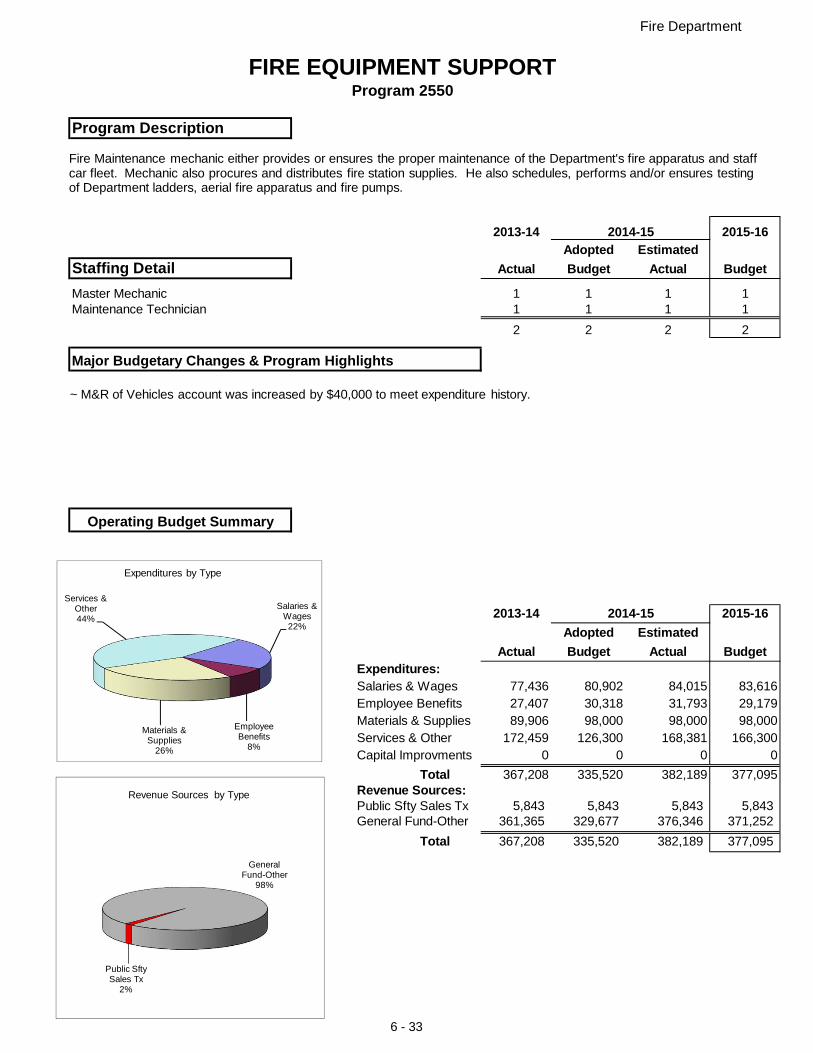
Fire Department
FIRE EQUIPMENT SUPPORTProgram 2550
Program Description
2013-14 2014-15 2015-16Adopted Estimated
Staffing Detail Actual Budget Actual Budget
Master Mechanic 1 1 1 1Maintenance Technician 1 1 1 1
2 2 2 2
Major Budgetary Changes & Program Highlights
Operating Budget Summary
2013-14 2014-15 2015-16Adopted Estimated
Actual Budget Actual BudgetExpenditures:Salaries & Wages 77,436 80,902 84,015 83,616Employee Benefits 27,407 30,318 31,793 29,179Materials & Supplies 89,906 98,000 98,000 98,000Services & Other 172,459 126,300 168,381 166,300Capital Improvments 0 0 0 0
Total 367,208 335,520 382,189 377,095Revenue Sources:Public Sfty Sales Tx 5,843 5,843 5,843 5,843General Fund-Other 361,365 329,677 376,346 371,252
Total 367,208 335,520 382,189 377,095
Salaries & Wages22%
Employee Benefits
8%
Materials & Supplies
26%
Services & Other44%
Expenditures by Type
Public Sfty Sales Tx
2%
General Fund-Other
98%
Revenue Sources by Type
Fire Maintenance mechanic either provides or ensures the proper maintenance of the Department's fire apparatus and staff car fleet. Mechanic also procures and distributes fire station supplies. He also schedules, performs and/or ensures testingof Department ladders, aerial fire apparatus and fire pumps.
~ M&R of Vehicles account was increased by $40,000 to meet expenditure history.
6 - 33
Budget Challenges/Planned Initiatives
Fire Training
Mission
Core Services
Current Year Activity/Achievements
To preserve and protect life and property of the citizens of St. Joseph and of the firefighting personnel themselves bydeveloping skilled, professional fire personnel through fire protection education and training.
- Increase the efficiency and effectiveness of the Fire Department through the integration of new strategies and oldpractices, better equipment and an increased awareness of new dangers as they evolve.- Improve firefighter safety.- Provide training and orientation for new firefighters.- Maintain current certifications for both fire and EMS.-set up testing for promotional exams-evaluate and purchase new tools and firefighting gear
- .- All captains and drivers have completed 40 hour Fire Inspector course.- Assisted with the Citizen Fire Academy.- Set up monthly training classes to meet ISO requirements.-sent firefighters to classes at both the missouri and iowa fire schools-all firefighters were recertified in CPR-all EMT's were refreshed on Airway insertion-All shifts were given Ice Rescue training
- Attempt to increase hands-on training by use of props and more realistic training evolutions.- Make better use of new technology, such as new phone system, that will allow us to teleconference classes.- Educate all firefighters on bloodborne pathogens and how to protect themselves on medical calls.- Continue to try to improve participation in the "Fit as a Rookie" physical fitness program, which is open to allfirefighters but is geared toward keeping older members in better shape to reduce injuries and heart attacks.- Attempt to increase certification of staff officers and captains for ISO and personal development.
6 - 34
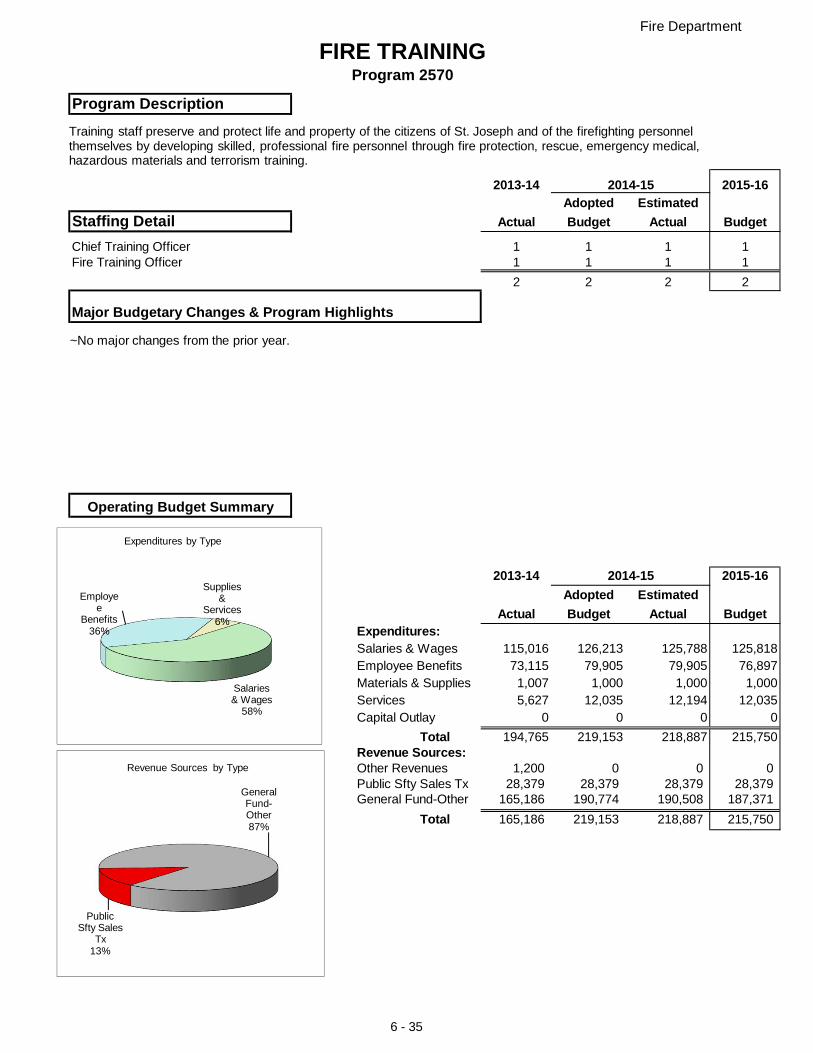
Fire Department
FIRE TRAININGProgram 2570
Program Description
2013-14 2014-15 2015-16Adopted Estimated
Staffing Detail Actual Budget Actual Budget
Chief Training Officer 1 1 1 1Fire Training Officer 1 1 1 1
2 2 2 2
Major Budgetary Changes & Program Highlights
Operating Budget Summary
2013-14 2014-15 2015-16Adopted Estimated
Actual Budget Actual BudgetExpenditures:Salaries & Wages 115,016 126,213 125,788 125,818Employee Benefits 73,115 79,905 79,905 76,897Materials & Supplies 1,007 1,000 1,000 1,000Services 5,627 12,035 12,194 12,035Capital Outlay 0 0 0 0
Total 194,765 219,153 218,887 215,750Revenue Sources:Other Revenues 1,200 0 0 0Public Sfty Sales Tx 28,379 28,379 28,379 28,379General Fund-Other 165,186 190,774 190,508 187,371
Total 165,186 219,153 218,887 215,750
Salaries & Wages
58%
Employee
Benefits36%
Supplies &
Services6%
Expenditures by Type
Public Sfty Sales
Tx13%
General Fund-Other87%
Revenue Sources by Type
Training staff preserve and protect life and property of the citizens of St. Joseph and of the firefighting personnel themselves by developing skilled, professional fire personnel through fire protection, rescue, emergency medical, hazardous materials and terrorism training.
~No major changes from the prior year.
6 - 35
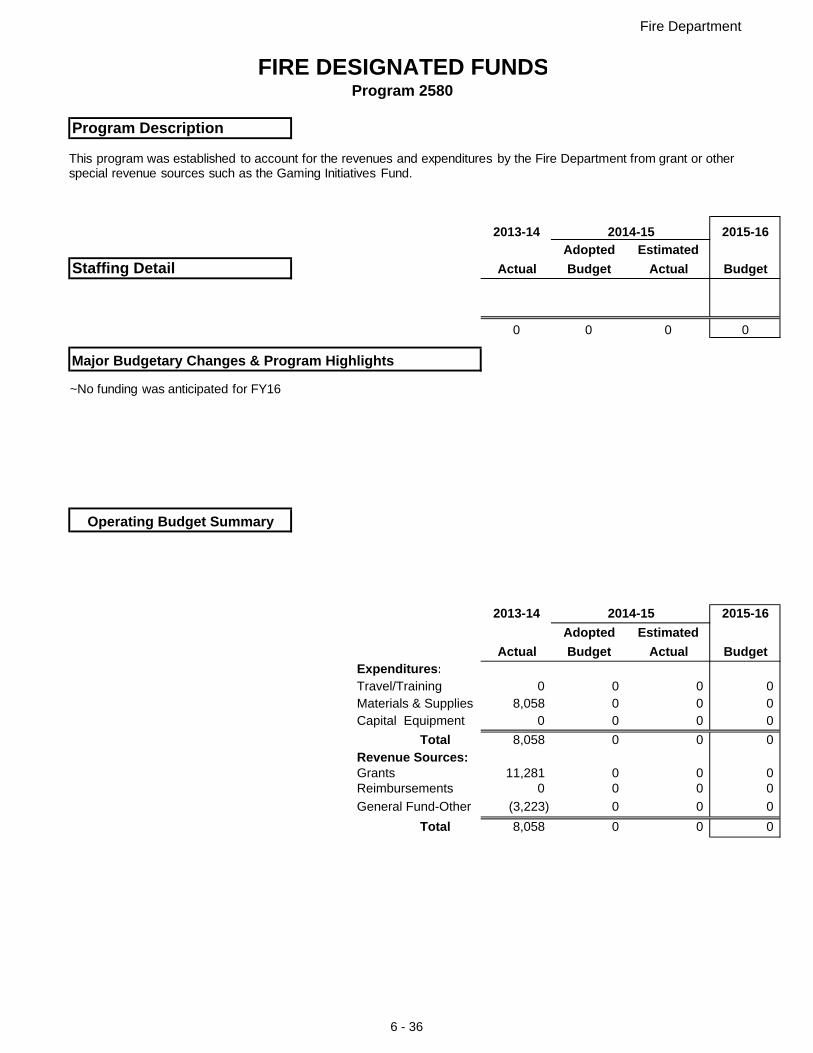
Fire Department
FIRE DESIGNATED FUNDSProgram 2580
Program Description
2013-14 2014-15 2015-16Adopted Estimated
Staffing Detail Actual Budget Actual Budget
0 0 0 0
Major Budgetary Changes & Program Highlights
Operating Budget Summary
2013-14 2014-15 2015-16Adopted Estimated
Actual Budget Actual BudgetExpenditures:Travel/Training 0 0 0 0Materials & Supplies 8,058 0 0 0Capital Equipment 0 0 0 0
Total 8,058 0 0 0Revenue Sources:Grants 11,281 0 0 0Reimbursements 0 0 0 0
General Fund-Other (3,223) 0 0 0
Total 8,058 0 0 0
This program was established to account for the revenues and expenditures by the Fire Department from grant or other special revenue sources such as the Gaming Initiatives Fund.
~No funding was anticipated for FY16
6 - 36
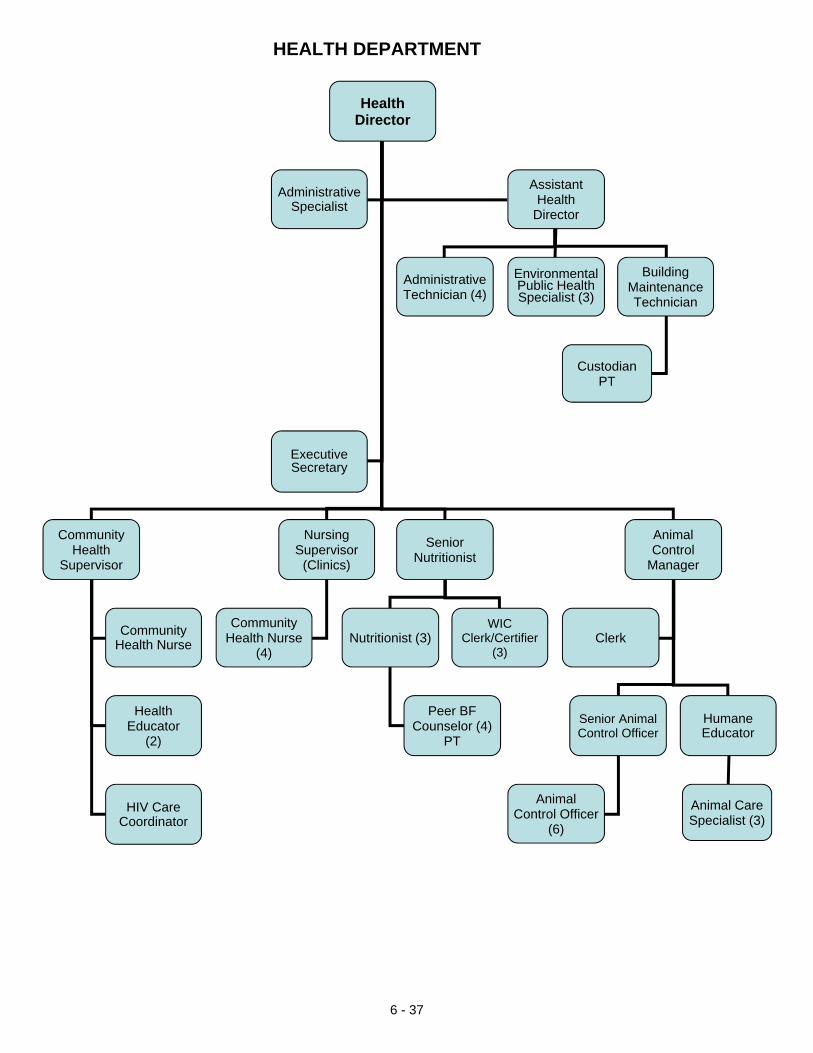
HEALTH DEPARTMENT
Health Director
Community Health
Supervisor
Nursing Supervisor
(Clinics)
Senior Nutritionist
Animal Control
Manager
Community Health Nurse
(4)Nutritionist (3)
Executive Secretary
Community Health Nurse
WIC Clerk/Certifier
(3)Clerk
Senior Animal Control Officer
Animal Control Officer
(6)
Administrative Specialist
Assistant Health
Director
Administrative Technician (4)
Environmental Public Health Specialist (3)
Building Maintenance Technician
Humane Educator
Peer BF Counselor (4)
PT
Health Educator
(2)
HIV Care Coordinator
Animal Care Specialist (3)
Custodian PT
6 - 37
Health Administration
Mission
Core Services
Current Year Activities/Achievements
Performance Statistics FY2013 FY2014Number of death certificates filed 750 262Certified copies of death certificates issued 6,803 6,833Certified copies of birth certificates issued 4,852 5,788Amount of DHSS grant funding (state & federal pass-through) $917,986 $917,986
To provide administrative services and management support to all health programs. To supply assessment andeducation to citizens, organizations and governments. To provide program and policy development which addressesemerging needs in our community. Ensure public health and safety during times of local, state or national crises.
- Provide planning, evaluation, budgeting, coordination, and administrative support for all divisions within the department.- Monitor compliance with State grants and contracts to ensure all contract requirements and deliverables are met.- Secure revenue from various resources such as contracts and grants, Medicaid & Medicare through monthly billing.- Collaborate and partner with various community organizations to address priority health issues through theimplementation of programs to improve the quality of life for community residents.- Identify gaps in public health service and create needed programs. Identify existing and new funding opportunities toimplement new programs, and identify opportunities for strengthening existing services.- Develop social media campaigns, participate in community outreach events and other opportunities to promote publichealth and to educate citizens.- Provide public information to the media.- Serve as a referral center for citizens needing to be connected to local resources/agencies for assistance.- Serve as Vital Statistics Registrar for Buchanan County, which entails filing Buchanan county death certificates with theState, and issuing Missouri birth and death certificates to the public.- Undertake facilities maintenance for Patee Market Health Center, a 100 year old building which houses two agencieswith ever growing and changing needs.- Provide Public Health Emergency Response and Planning to Buchanan County, and Regional Epidemiology servicesto Buchanan and surrounding counties.
- The Health Department has been a key partner in the establishment of "Live Well St. Joseph", a collaboration ofrepresentatives from area agencies and private companies working toward building a healthier community.- The Health Department served as team lead for the tobacco use prevention segment of the MFH grant, whichoversees the development of cessation classes, youth prevention and advocacy, policy development, and publiceducation.- Collaborative partnerships include Live Well St. Joe, Success by 6 Initiative through United Way, Northwest MissouriTobacco Use Prevention Coalition and Clean Air St. Joe, Youth Alliance, Heartland Foundation, St. Joseph Safety &Health Council, St. Joseph Public Works, St. Joseph Parks and Recreation, Second Harvest, and Pioneering HealthyCommunities (YMCA) and several divisions within the State of Missouri Department of Health and Senior Services.- The Health Department has been collaborating with service providers to identify way to better meet the needs ofpeople living in poverty. The group calls itself HEALTH (Helping Everyone Achieve Long-term Health).- The Northwest Missouri Medical Reserve Corp (NWMO MRC) received its national certification a few years ago andhas been accepting and training volunteers- NWMO MRC is an affiliate member of Missouri Disaster Response System providing acute care and functional needssupport to communities in MO at times of disaster.- NWMO MRC in collaboration with Show Me Response supports resiliency efforts of emergency management byproviding trained and credentialed volunteers in times of disaster.- NWMO MRC received the annual capacity building award as well as a $20,000 challenge award from the NationalAssociation of County and City Health Officials (NACCHO) for the purpose of training instructors and providing MentalHealth First Aid courses throughout Buchanan County and Northwest Missouri.
6 - 38
Budget Challenges/Planned Initiatives- The health department was graciously awarded CIP funding in both the 2008-2012 round, as well as the 2013-2018period, allowing us to combine the available funding in 2013 to begin plan development for a full building remodelingproject at Patee Market Health Center. Plans were finalized and construction began in March 2014. Patee Market willreceive new paint, flooring, millwork, base trim and chair rail. New stairwell treads were added to the three major stairareas of the building in 2012. Damaged soffits and dormers will be repaired and the flat portion of the roof will bereplaced as well. A new wall, pass-thru window system and coded doorway will be added to enclose and effectivelysecure an Administrative area where most financial transactions take place in the building, that was previously part of anopen floor plan.
- In the fall of 2013 the previously non-functional security surveillance system was upgraded with additional cameraviews added.
- In order to maintain Americans with Disabilities Act compliance, the mechanical and interior cab components of thebuilding elevator were also replaced in the fall of 2013. The elevator which was nearing the end of its mechanical lifeexpectancy was frequently malfunctioning, trapping patrons and staff inside the cab. Due to the age of the unit, partswere difficult to find when necessary for maintenance and repair, and often had to be fabricated at a great cost. Finally itwas determined that replacement was necessary. The "new" elevator now has an automatic lowering device that willlower to the 1st floor of the building and open the cab doors when a fire alarm sensor is activated, a feature not availableon the previous elevator.
- Completed an annual report for 2013. Plan to provide an annual report from here on out.
- Complete the Community Needs Assessment in conjunction with Community Health Services division and write anaction plan to address the needs.
- Challenge is to financially support the HEALTH group to address the social determinants of health, poverty, and overallhealth. The health department will continue to meet with the committee and offer assistance where we can.
6 - 39
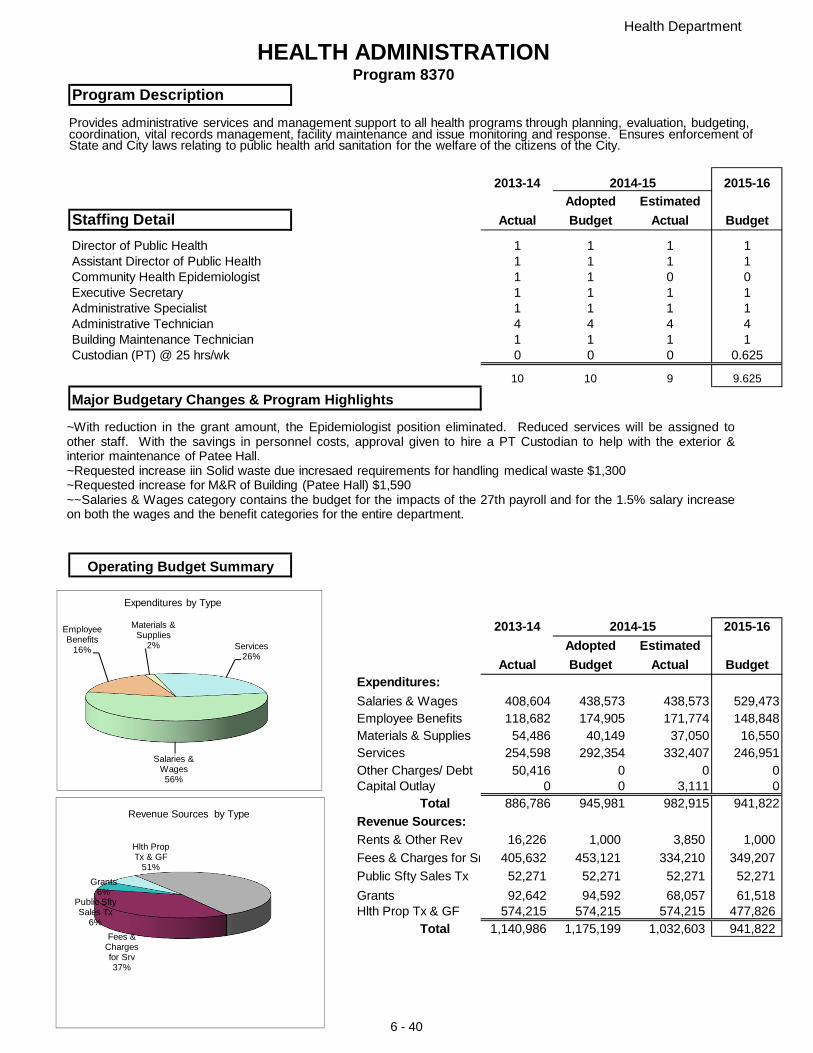
Health Department
HEALTH ADMINISTRATIONProgram 8370
Program Description
2013-14 2014-15 2015-16Adopted Estimated
Staffing Detail Actual Budget Actual Budget
Director of Public Health 1 1 1 1Assistant Director of Public Health 1 1 1 1Community Health Epidemiologist 1 1 0 0Executive Secretary 1 1 1 1Administrative Specialist 1 1 1 1Administrative Technician 4 4 4 4Building Maintenance Technician 1 1 1 1Custodian (PT) @ 25 hrs/wk 0 0 0 0.625
10 10 9 9.625
Major Budgetary Changes & Program Highlights
Operating Budget Summary
2013-14 2014-15 2015-16Adopted Estimated
Actual Budget Actual BudgetExpenditures:Salaries & Wages 408,604 438,573 438,573 529,473Employee Benefits 118,682 174,905 171,774 148,848Materials & Supplies 54,486 40,149 37,050 16,550Services 254,598 292,354 332,407 246,951Other Charges/ Debt 50,416 0 0 0Capital Outlay 0 0 3,111 0
Total 886,786 945,981 982,915 941,822
Revenue Sources:Rents & Other Rev 16,226 1,000 3,850 1,000
Fees & Charges for Sr 405,632 453,121 334,210 349,207
Public Sfty Sales Tx 52,271 52,271 52,271 52,271
Grants 92,642 94,592 68,057 61,518Hlth Prop Tx & GF 574,215 574,215 574,215 477,826
Total 1,140,986 1,175,199 1,032,603 941,822
Salaries & Wages56%
Employee Benefits
16%
Materials & Supplies
2% Services26%
Expenditures by Type
Fees & Charges for Srv37%
Public Sfty Sales Tx
6%
Grants6%
Hlth Prop Tx & GF
51%
Revenue Sources by Type
Provides administrative services and management support to all health programs through planning, evaluation, budgeting, coordination, vital records management, facility maintenance and issue monitoring and response. Ensures enforcement of State and City laws relating to public health and sanitation for the welfare of the citizens of the City.
~With reduction in the grant amount, the Epidemiologist position eliminated. Reduced services will be assigned toother staff. With the savings in personnel costs, approval given to hire a PT Custodian to help with the exterior &interior maintenance of Patee Hall.~Requested increase iin Solid waste due incresaed requirements for handling medical waste $1,300~Requested increase for M&R of Building (Patee Hall) $1,590~~Salaries & Wages category contains the budget for the impacts of the 27th payroll and for the 1.5% salary increaseon both the wages and the benefit categories for the entire department.
6 - 40
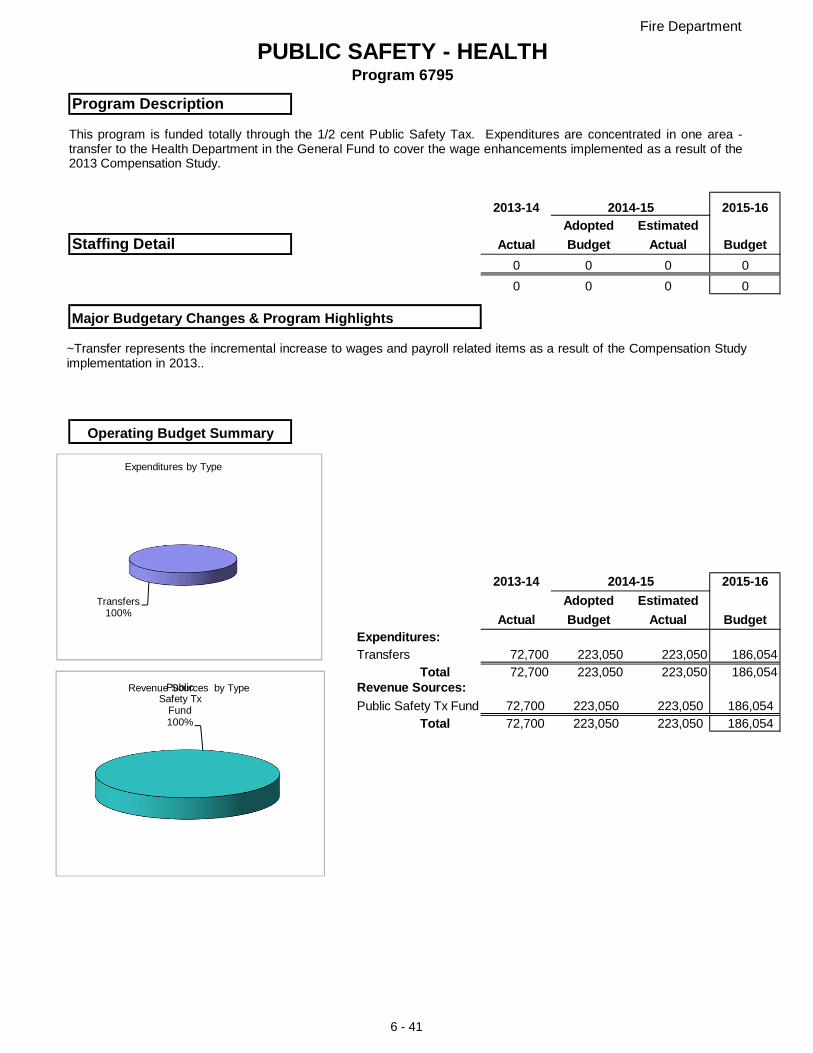
Fire Department
PUBLIC SAFETY - HEALTHProgram 6795
Program Description
2013-14 2014-15 2015-16Adopted Estimated
Staffing Detail Actual Budget Actual Budget0 0 0 0
0 0 0 0
Major Budgetary Changes & Program Highlights
Operating Budget Summary
2013-14 2014-15 2015-16Adopted Estimated
Actual Budget Actual BudgetExpenditures:Transfers 72,700 223,050 223,050 186,054
Total 72,700 223,050 223,050 186,054Revenue Sources:Public Safety Tx Fund 72,700 223,050 223,050 186,054
Total 72,700 223,050 223,050 186,054
Transfers100%
Expenditures by Type
Public Safety Tx
Fund100%
Revenue Sources by Type
This program is funded totally through the 1/2 cent Public Safety Tax. Expenditures are concentrated in one area -transfer to the Health Department in the General Fund to cover the wage enhancements implemented as a result of the2013 Compensation Study.
~Transfer represents the incremental increase to wages and payroll related items as a result of the Compensation Studyimplementation in 2013..
6 - 41
Health Clinics
Mission
Core Services
Current Year Activities/Achievements
Performance Statistics FY2013 FY2014 FY2015Immunization Attendance 1,915 1,726Immunizations given 3,932 3,302Tuberculin Skin Test screenings 770 519Individual contacts for TB medication dispensing 216 114Pregnancy tests 651 559Prenatal case management contacts 1,421 1,750
Temporary Medicade assistance forms issued 897 631Childhood lead screenings 20 34Head lice checks & consultations 11 18Blood pressure monitoring 6 21Communicable Disease investigation & follow-up 195 157
The City of St. Joseph Health Department is committed in providing its' citizens with health care programs thatpromote healthy lifestyles, education, disease prevention and assessment and are committed to thedevelopment and maintenance of a healthy environment.
- Community-wide immunizations for infants, children and adults through clinic services per DHSS guidelines.- Annual public influenza clinics.- Tuberculin skin testing, referral and assessment of LTBI clients and follow-up monitoring of treatment. Intensemonitoring of clients with tuberculosis disease; providing Directly Observed Therapy for medication with up todaily visits either in the clinic or the community.- Pregnancy testing for minimal fee, free prenatal case management offered to females to provide supportiveservices as well as information regarding the pregnancy and post delivery period. Provide resource and referralguidance for benefit of the individual.- Child Care Health Consultation program provides nursing on-site visits to child care providers to assesshealth and safety practices as well as educational programs, per contract guidelines, for the children and care-givers that is interactive and entertaining.- Lead screenings and venipunctures are done free by request for children up to 6 years of age as well as clinicbased nurse case management assessments. Provide the community education about lead dangers and teachprevention activities to reduce the risk of elevated blood lead levels.- Collaboration with other agencies to establish a local area health care network for various service areas.- Encourage the community to live healthy lifestyles by focusing on behavior related health habits.- Blood pressure monitoring is provided on a walk-in basis with results reported to respective physicians asrequested or required.- Free head lice checks performed on a walk-in basis for children and adults with education consultationprovided.- Communicable disease follow-up on all communicable and contagious diseases that are reportable in thestate of Missouri. Prevention activities promoted through individual and community education programs. Healthdepartment staff serve as resource and referral sources for the prevention, containment and control ofcommunicable diseases for health care professionals and the community at large. Active and passivesurveillance is conducted at designated sites.- Participation in health fairs and other outreach activities that are scheduled to provide health and safetypromotional activities throughout the year at various locations by health department staff.
The health department supplied the Social Welfare Board with $441,432.00 along with space, utilities, fluvaccine and some supplies.
6 - 42
Budget Challenges/Planned InitiativesChallenge: Increase in the cost of vaccine and supplies for purchased vaccine clinicsSolution: Working toward a contract with VaxCare. This private company partnership will allow for us to accessthe vaccines at no cost to us along with medical supplies that will also be made available. We will save onneedles, syringes, alcohol prep pads and private insurance vaccine by having them supplied through VaxCare.This will also be cost saving by eliminating multiple staff to price, purchase and monitor vaccines forexpirations. We are able to return vaccine that will expire with no penalty to us which will also be a cost savingbenefit. We do have to provide insurance information to VaxCare so they may directly bill the insurancecompanies.
Challenge: Due to reduction in federal funds, CDC guidelines direct states to now prohibit the use of 317funded vaccines to be used by local public health agencies, for any person; infant, child or adult, that are fullyinsured by a health plan that covers immunizations. Vaccine costs are expensive and not typically covered inthe government contracts.Solution: Working toward a contract with VaxCare. As stated above, this private company partnership will allowus to offer vaccinations to both child and adult that are fully insured by a health plan that covers immunizations.VaxCare already has multiple insurance company contracts established and will be the one to bill and collecton the insurance payments. This will be a cost saving measure for the Health Department as it eliminates theneed for staff to try to procure the insurance contracts along with being responsible for following up on thebilling responsibilities which can be time consuming.
Challenge: Increased restriction on state funded vaccine with increase demand and community need.Solution: Explore ways to expand coverage to increase immunization rates while keeping costs down. Again,VaxCare could prove beneficial for this purpose. We will get a set fee for every insured person's vaccine thatwe provide. As we will not need to purchase the vaccine or some supplies, this could prove to be a source ofrevenue. It will also supply a demand that we have not been able to meet with restrictions on our VFC/317vaccine. VaxCare is also willing to purchase the private vaccine that we have already purchased, but have notlegally been able to distribute. This will blunt a cost expenditure to the Health Department.
Challenge: Increased number of clients requesting prenatal services & pregnancy testing are repeat clients,many with the same risk factors.Solution: Initiate educational modules/classes to address these risk factors by using evidence-based programguidelines to enhance client outcomes to reduce and eliminate risks.
Challenge: Decrease in revenue from prenatal pregnancy tests and case management follow upSolution: We currently charge all pregnancy tests five dollars across the board. We have billed Medicaid in thepast for those clients who did turn out to have a positive pregnancy test and were Medicaid eligible. TheMedicaid reimbursement could be greater than the five dollars charged. Evaluate the specific requirementsaround Medicaid billing and/or individuals paying for testing fee.
6 - 43
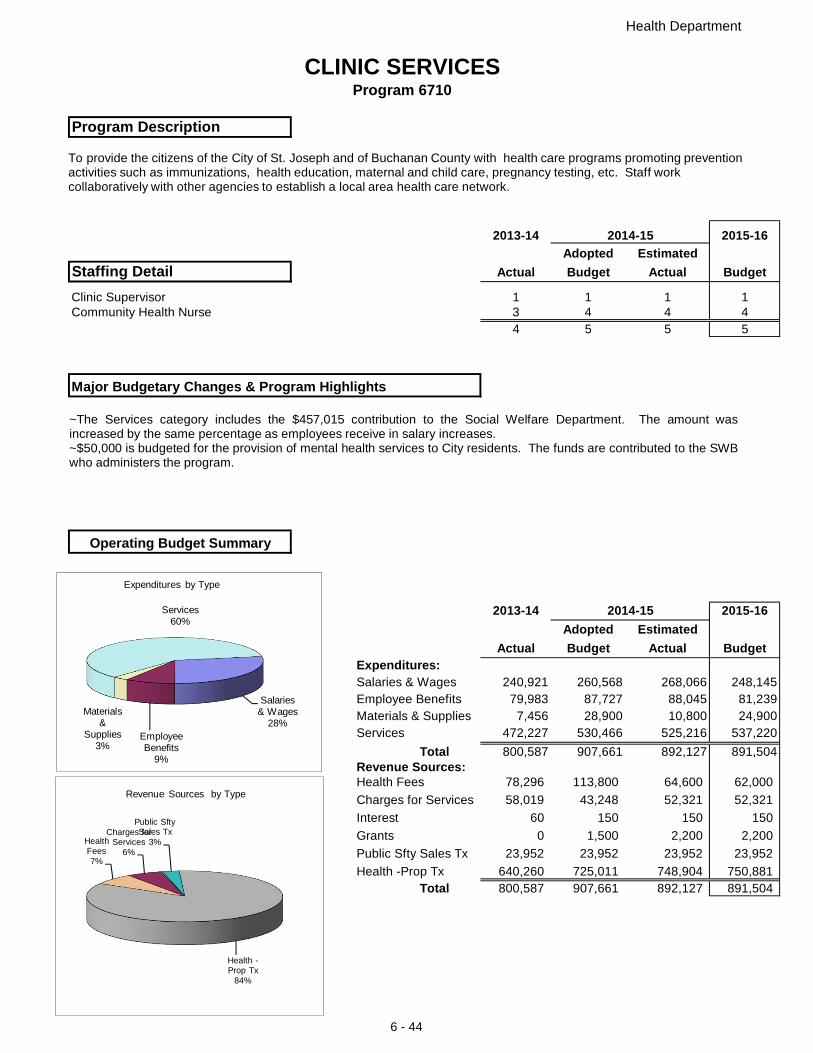
Health Department
CLINIC SERVICESProgram 6710
Program Description
2013-14 2014-15 2015-16Adopted Estimated
Staffing Detail Actual Budget Actual Budget
Clinic Supervisor 1 1 1 1Community Health Nurse 3 4 4 4
4 5 5 5
Major Budgetary Changes & Program Highlights
Operating Budget Summary
2013-14 2014-15 2015-16Adopted Estimated
Actual Budget Actual BudgetExpenditures:Salaries & Wages 240,921 260,568 268,066 248,145Employee Benefits 79,983 87,727 88,045 81,239Materials & Supplies 7,456 28,900 10,800 24,900Services 472,227 530,466 525,216 537,220
Total 800,587 907,661 892,127 891,504Revenue Sources:Health Fees 78,296 113,800 64,600 62,000
Charges for Services 58,019 43,248 52,321 52,321
Interest 60 150 150 150
Grants 0 1,500 2,200 2,200
Public Sfty Sales Tx 23,952 23,952 23,952 23,952
Health -Prop Tx 640,260 725,011 748,904 750,881Total 800,587 907,661 892,127 891,504
Salaries & Wages
28%Employee Benefits
9%
Materials &
Supplies3%
Services60%
Expenditures by Type
Health Fees7%
Charges for Services
6%
Public Sfty Sales Tx
3%
Health -Prop Tx
84%
Revenue Sources by Type
To provide the citizens of the City of St. Joseph and of Buchanan County with health care programs promoting prevention activities such as immunizations, health education, maternal and child care, pregnancy testing, etc. Staff work collaboratively with other agencies to establish a local area health care network.
~The Services category includes the $457,015 contribution to the Social Welfare Department. The amount wasincreased by the same percentage as employees receive in salary increases.~$50,000 is budgeted for the provision of mental health services to City residents. The funds are contributed to the SWBwho administers the program.
6 - 44
Community Health Services
Mission
Core Services
Current Year Activities/Achievements
Performance Statistics FY2013 FY2014HIV positive persons enrolled in case management 69 53HIV positive persons in case mgmt engaged in care 67 51Number of clients serviced in prevention for positives 15 -Number of educational community outreach events 27 11Number of individuals service in risk reduction sessions 68 144Number of HIV/STD clinic visits 1286 520Transit sessions 257 55
Budget Challenges/Planned Initiatives
Community Health Services assesses the health behavior outcomes of the community, develops strategies for healthpromotion, addresses barriers to health and linkage to care improving the quality of life for it's citizens.
- Provide access to HIV, STD, and Hepatitis C prevention and care to person in NW Missouri:HIV Care Services, HIV testing, HIV risk/harm reduction, HIV education, HIV case management & linkage to care- Gonorrhea, Chlamydia, and Syphilis Testing, STD risk/harm reduction, STD education, STD Treatment- Health Education for smoking cessation, healthy lifestyle habits (food choices, exercise and stress management), andchronic disease management.- Hepatitis C services including high risk vaccination, education, and testing and reporting
In 2013 we completed a community health needs assessment, educated our community on the effects of smoking &health and will add a variety of new health education classes to build resilient communities by improving the health ofit's individuals.
- Continue to monitor reductions in federal and state grant dollars due to greater access to care provided by the PatientProtection and Affordable Care Act (ACA).- To keep up with the demand for increased education associated with Department of Health and Human Servicesrecommendations and national trends within current budget and staffing limitations.- Limited dollars for staff development and training makes it challenging to keep up with current trends in the health caresetting.-Limited dollars to support community outreach and education classes.
6 - 45
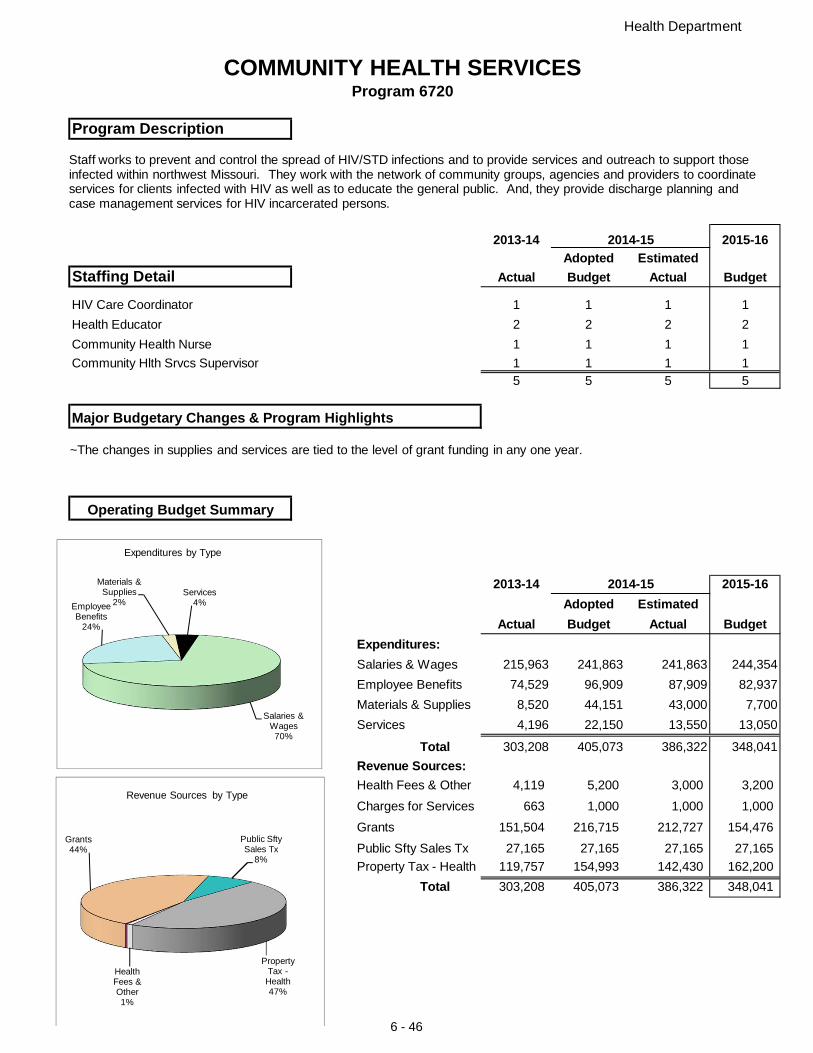
Health Department
COMMUNITY HEALTH SERVICESProgram 6720
Program Description
2013-14 2014-15 2015-16Adopted Estimated
Staffing Detail Actual Budget Actual Budget
HIV Care Coordinator 1 1 1 1
Health Educator 2 2 2 2
Community Health Nurse 1 1 1 1
Community Hlth Srvcs Supervisor 1 1 1 15 5 5 5
Major Budgetary Changes & Program Highlights
Operating Budget Summary
2013-14 2014-15 2015-16Adopted Estimated
Actual Budget Actual BudgetExpenditures:Salaries & Wages 215,963 241,863 241,863 244,354
Employee Benefits 74,529 96,909 87,909 82,937
Materials & Supplies 8,520 44,151 43,000 7,700
Services 4,196 22,150 13,550 13,050
Total 303,208 405,073 386,322 348,041
Revenue Sources:Health Fees & Other 4,119 5,200 3,000 3,200
Charges for Services 663 1,000 1,000 1,000
Grants 151,504 216,715 212,727 154,476
Public Sfty Sales Tx 27,165 27,165 27,165 27,165
Property Tax - Health 119,757 154,993 142,430 162,200
Total 303,208 405,073 386,322 348,041
Salaries & Wages70%
Employee Benefits
24%
Materials & Supplies
2%Services
4%
Expenditures by Type
Health Fees & Other1%
Grants44%
Public Sfty Sales Tx
8%
Property Tax -
Health47%
Revenue Sources by Type
Staff works to prevent and control the spread of HIV/STD infections and to provide services and outreach to support those infected within northwest Missouri. They work with the network of community groups, agencies and providers to coordinate services for clients infected with HIV as well as to educate the general public. And, they provide discharge planning and case management services for HIV incarcerated persons.
~The changes in supplies and services are tied to the level of grant funding in any one year.
6 - 46
WIC
Mission
Core Services
Current Year Activities/Achievements
Performance Statistics FY2013 FY2014Dollar amount of checks issued $2,041,658 $2,701,661Number of program participants 29,176 28,141Number of Spanish clients 3,788 2,447
The Special Supplemental Nutrition Program for Women, Infants, and Children (WIC) was established to providesupplemental foods, nutrition education, and referrals at no cost to eligible persons. The program serves as an adjunct togood health care during critical times of growth and development, in order to prevent the occurrence of health problemsand to improve the health status of the participants.
- Provide a link to WIC Services as one of the 111 contracted agencies, which provides certification and nutrition services operating in 242 clinics throughout the state of Missouri.- Check benefits can be cashed at any of the 680 vendors across Missouri.- Provide evaluation tools to identify the nutritional program risks and income eligibility of potential eligible clients.- Provides the community with a nutrition intervention program that helps educate on healthy eating, obesity and related diseases that effect nutritional status.- Provides nutritional foods and special medical dietary supplements during critical times of growth and development for pregnant, breastfeeding, non-breastfeeding women up to when the infant becomes six (6) months of age, newborns to one (1) year and children from one (1) year up to five (5) years of age.- Provides nutrition and breastfeeding education in an effort to educate families about good health and nutrition practices.- Provide Anthropometric measurements, Hematological Data and Specific Dental Criteria for the WIC participant to help improve their quality of life.- Provide Dietary Assessment, Nutrition and Breastfeeding Education and goal setting. In setting the goal, the SMART program is used: S=Specific, M=Measureable, A=Attainable/Achievable, R=Realistic, T=Time Bound.- Provides a link to community referrals.- Provides a policy for the WIC program to appropriately respond to community emergencies.
- Provided billboards and media coverages to promote the WIC Program.- Expanding nutrition education through use of the State WIC Website.- Strengthening Northwest WIC agency relationships by teleconferencing each quarter.- Increasing our support for our breastfeeding and non-breastfeeding participants by participating in the BreastfeedingTask Force, Breastfeeding peer counselor hospital visitations and area Breastfeeding Support group.- Providing additional educational resources, such as, posters and educational videos in the waiting room, added WICpamphlets and Breastfeeding pamphlet in packets given out at the local OB clinic and provided a Breastfeeding video tothe OB clinic.- The WIC Coordinator is a representative on the Health Advisory Council, partnering with other community leaders todevelop strategies to provide cohesive services for the community.- Operating a satellite clinic at the Heartland Hospital Obstetrics Unit to expand services for our community and provideWIC certification services for any qualified postpartum woman and infant, who may or may not be participating in any ofthe Northwest Missouri WIC unit.- Focusing on decreasing the percent of children qualifying for being at-risk of becoming over weight and decreasing thenumber of clients on high risk program factors.- Nutritionists attended various webinars and conference to further their nutrition knowledge.- Planned and implemented World Breastfeeding Week Activities.- Participated in a panel to support new mothers in the community through Success by 6.- Developed Breastfeeding Calendar for prenatal and breastfeeding women.- Offering weekly Breastfeeding classes for all prenatal participants.- Presented breastfeeding classes to the JUMP program and Hillyard Technical Center nursing class.- Promoted Breastfeeding Friendly Worksite Program and mini-grant applications.- Partnering with Northwest Health and Dental Services.
6 - 47
Budget Challenges/Planned Initiatives- Maintaining the current caseload of 2,434 per month.- Send Breastfeeding Coordinator to the 45 hour breastfeeding course for state compliance.- Continue to use billboards to promote WIC.- Increase the number of breastfeeding women in the program and their breastfeeding duration.- Decrease the trend of overweight children in our program, by decreasing the number that qualify for Risk Factor 114, (atrisk for becoming overweight).- Nutritionists attend at 1-2 nutrition conferences required yearly by WIC policy. Nutritionists will obtain some of theadditional trainings needed each year through the new WIC web-based programs.- Finding funds for incentives for the program.- Start monthly cooking classes in the coming fiscal year.- To be able to financially cover all the hours of the WIC Breastfeeding Peer Counselors' operations due to the grantconstraints.
6 - 48
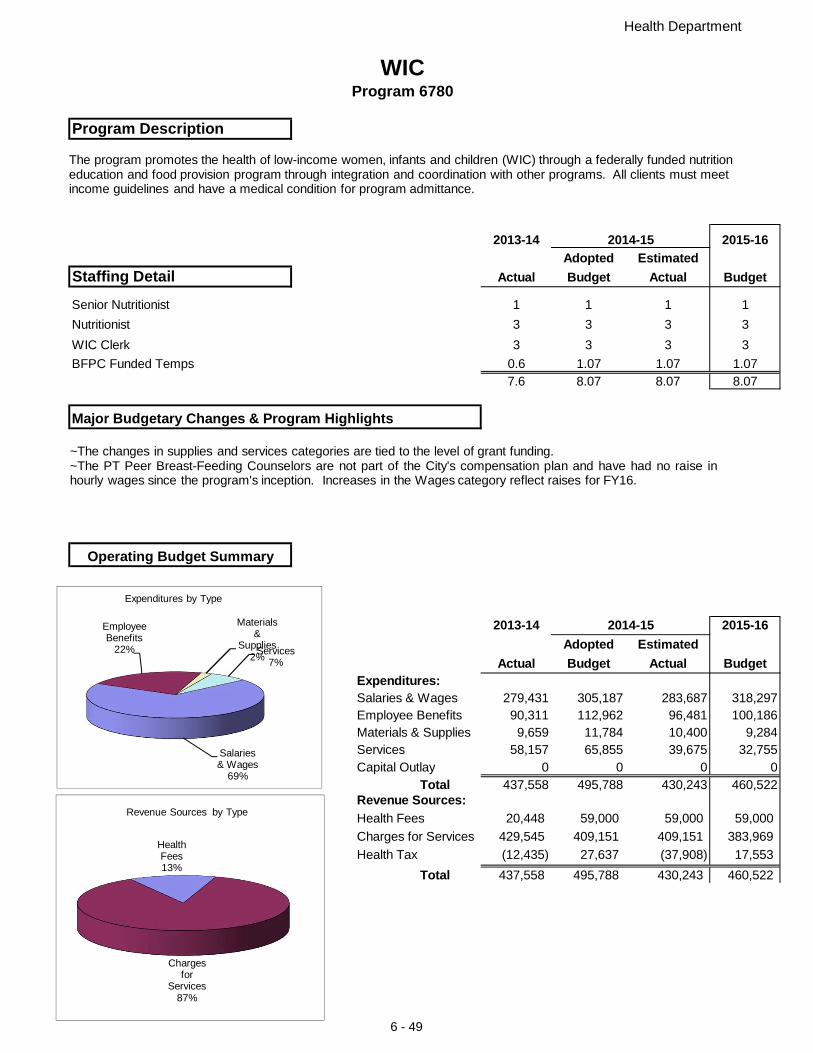
Health Department
WICProgram 6780
Program Description
2013-14 2014-15 2015-16Adopted Estimated
Staffing Detail Actual Budget Actual Budget
Senior Nutritionist 1 1 1 1
Nutritionist 3 3 3 3
WIC Clerk 3 3 3 3
BFPC Funded Temps 0.6 1.07 1.07 1.077.6 8.07 8.07 8.07
Major Budgetary Changes & Program Highlights
Operating Budget Summary
2013-14 2014-15 2015-16Adopted Estimated
Actual Budget Actual BudgetExpenditures:Salaries & Wages 279,431 305,187 283,687 318,297Employee Benefits 90,311 112,962 96,481 100,186Materials & Supplies 9,659 11,784 10,400 9,284Services 58,157 65,855 39,675 32,755Capital Outlay 0 0 0 0
Total 437,558 495,788 430,243 460,522Revenue Sources:Health Fees 20,448 59,000 59,000 59,000
Charges for Services 429,545 409,151 409,151 383,969
Health Tax (12,435) 27,637 (37,908) 17,553
Total 437,558 495,788 430,243 460,522
Salaries & Wages
69%
Employee Benefits
22%
Materials &
Supplies2%
Services7%
Expenditures by Type
Health Fees13%
Charges for
Services87%
Revenue Sources by Type
The program promotes the health of low-income women, infants and children (WIC) through a federally funded nutrition education and food provision program through integration and coordination with other programs. All clients must meet income guidelines and have a medical condition for program admittance.
~The changes in supplies and services categories are tied to the level of grant funding.~The PT Peer Breast-Feeding Counselors are not part of the City's compensation plan and have had no raise inhourly wages since the program's inception. Increases in the Wages category reflect raises for FY16.
6 - 49
Environmental Health & Food SafetyMission
Core Services
Current Year Activities/Achievements
Performance Statistics: FY2013 FY2014Number of food/drink establishments inspected by type of inspctn
Routine 1,513 1,211Follow-up 404 161Complaint 86 97
After hours response to truck wrecks 0 3Food establishment fires 5 5
510 200
Number of public & semi-private pools & spas inspectedRoutine 40 26
Follow-up 14 8Complaint 7 5
Fatal accident investigation 0 0
Number/percent of lodging facilities inspectedRoutine 12 14
Follow-up 14 92nd follow-up 3 43rd follow-up 2 3
Complaint investigation/inspections 20 10
Other inspections & contacts (pre-opening walk-thru, plan review final inspections, educational visits, training by staff)
To safeguard the public’s health and safety by ensuring that the appropriate services and establishments meeenvironmental and food safety codes, laws, and regulations
- Provide routine, follow-up, complaint, pre-opening walk-thru, seasonal, temporary event, and/or final inspections of allfood, lodging, and tattooing establishments and swimming pools and spas to ensure that they meet environmental andpublic health safety codes, laws, and regulations.- Provide public education on many topics such as, but not limited to food safety, mold control, precautions against WestNile virus, childhood lead poisoning prevention, preventing indoor asthma triggers, onsite wastewater treatment systemcomponents, operation, and installation, swimming pool and spa operation and maintenance.- Collect and verify documentation necessary to obtain a tattooing artist card.- Coordinate and investigate environmental health issues such as, but not limited to: Reports of suspected food bornecontamination, surfacing sewage complaint resolution and condemnation process (coordinated with Property Maintenanceand Public Works), air quality concerns, odor complaints (coordinated with Missouri Department of Natural Resources orMO-DNR), mercury collection and disposal, new and existing City-wide development plans, educate and enforce theprovisions of the Smoke Free Air in Certain Areas of Public Places Ordinance.- Review applications submitted, permit new system construction and existing system repairs or replacements, evaluatelocations for the availability of sanitary sewers, conduct site, construction, and final inspections for Onsite WastewaterTreatment Systems (OWTS), commonly called septic systems.- Provide Environmental contract services for the Holt County Health Department, including food, lodging and childcareestablishment inspections, as well as onsite wastewater treatment system permitting and approval.- 24/7 response to truck wrecks, fires, floods and other catastrophic events involving environmental health and food safety.
Food establishment inspections are made on the basis of risk to the consumer. The greater the risk the more frequent inspections are performed to safeguard the general public to maintain minimum sanitation standards as well as proper enforcement of these standards.
- Two full-time Environmental Public Health Specialists (EPHS) are dedicated solely to food safety. Using the latest statistics, monthly averages for each EPHS are as follows: 51 routine inspections, 7 follow-up inspections, 4 complaint investigation inspections, and 8 other inspections and contacts, or 70 total in-person contacts per month averaging 3.5 establishment visits per working day, not accounting for holidays, vacation/medical/comp time leave, time away for training, or other duties as assigned. Each EPHS receives on average 24 calls per month relative to their program. Calls may act as an opportunity for public education, or require situational response depending on the report.
6 - 50
Number of OWTS (septic systems) permitted: FY2013 FY2014Within the St. Joseph city limits 4 7
(via contract) Within the Village of Agency 0 2Number of site visits completed during construction/installations 16 20
Complaint investigations (surfacing sewage/illegal installation) 10 8
Other environmental servicesAir quality and/or odor complaints investigated 9 10
Radon, mold, or other environmental factors were addressed as phone calls or e-mails are received.
Holt County Environmental Services (via a Memo of Agreement)Food establishments inspected 45 45
Lodging establishments inspected 4 4Childcare establishments inspected 3 2
OWTS inspections (as notified)To minimally complete these services, 76 routine inspections are necessary, excluding OWTS inspections.
Budget Challenges/Planned InitiativesElectronic inspection software and hardware was fully integrated for conducting environmental health servicesinspections. This new process has received a lot of positive feedback from businesses receiving health inspections. Theincreased efficiency created through the electronic inspection process reduces inspection time, space required for recordretention, decreases reporting issues, allows staff to communicate more clearly and concisely, thus effectively, withestablishment owners, or others reviewing report results, and provide continually compiled health and food safetystatistics regarding the inspections and their frequency. Electronic inspections may be completed for food, lodging, ortattooing establishments, swimming pools and spas, 24-hour disaster response, emergency response planning, OnsiteWastewater Treatment Systems, or complaints received on any of the afore mentioned programs.
Environmental Health & Food Safety staff have developed a food handler's training to educate the food establishmentworkforce of standard health and safety practices while encouraging training and accountability. Pending the completionof construction at Patee Market Health Center, those classes will be offered to the public.
6 - 51
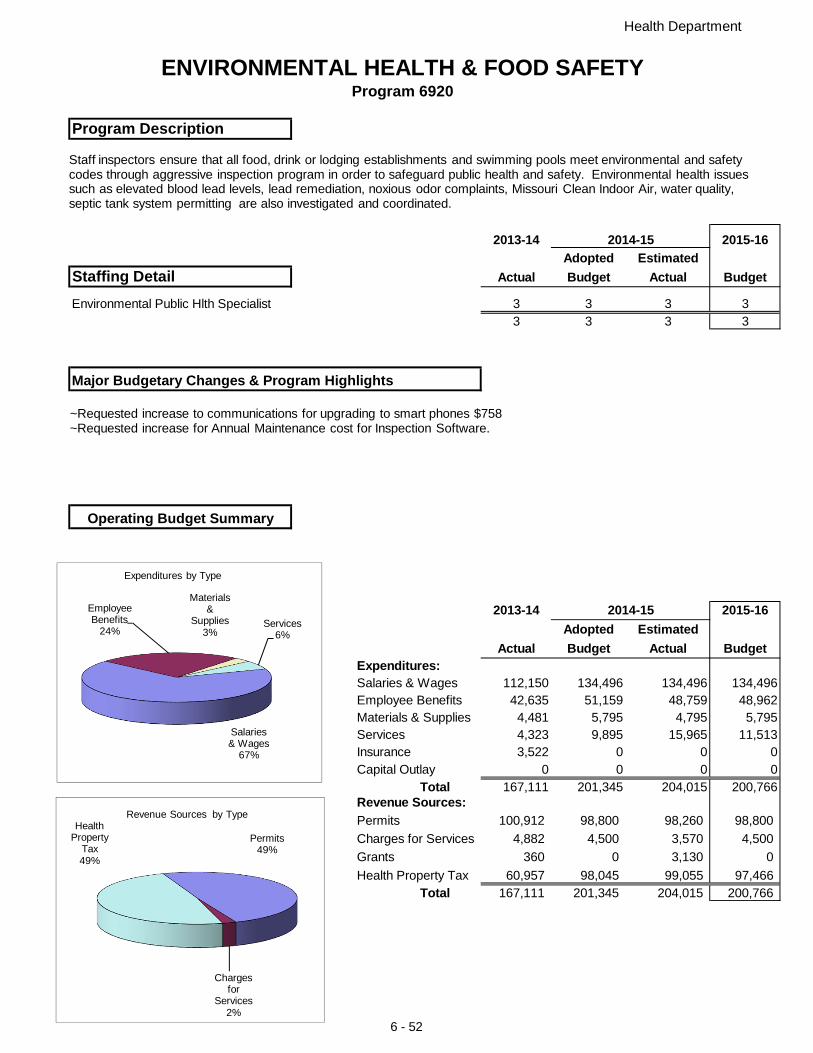
Health Department
ENVIRONMENTAL HEALTH & FOOD SAFETYProgram 6920
Program Description
2013-14 2014-15 2015-16Adopted Estimated
Staffing Detail Actual Budget Actual Budget
Environmental Public Hlth Specialist 3 3 3 33 3 3 3
Major Budgetary Changes & Program Highlights
Operating Budget Summary
2013-14 2014-15 2015-16Adopted Estimated
Actual Budget Actual BudgetExpenditures:Salaries & Wages 112,150 134,496 134,496 134,496Employee Benefits 42,635 51,159 48,759 48,962Materials & Supplies 4,481 5,795 4,795 5,795Services 4,323 9,895 15,965 11,513Insurance 3,522 0 0 0Capital Outlay 0 0 0 0
Total 167,111 201,345 204,015 200,766Revenue Sources:Permits 100,912 98,800 98,260 98,800
Charges for Services 4,882 4,500 3,570 4,500
Grants 360 0 3,130 0
Health Property Tax 60,957 98,045 99,055 97,466Total 167,111 201,345 204,015 200,766
Salaries & Wages
67%
Employee Benefits
24%
Materials &
Supplies3%
Services6%
Expenditures by Type
Permits49%
Charges for
Services2%
Health Property
Tax49%
Revenue Sources by Type
Staff inspectors ensure that all food, drink or lodging establishments and swimming pools meet environmental and safety codes through aggressive inspection program in order to safeguard public health and safety. Environmental health issues such as elevated blood lead levels, lead remediation, noxious odor complaints, Missouri Clean Indoor Air, water quality, septic tank system permitting are also investigated and coordinated.
~Requested increase to communications for upgrading to smart phones $758~Requested increase for Annual Maintenance cost for Inspection Software.
6 - 52
Animal Control and Rescue
Mission
Core Services
Current Year Activities/Achievements
Performance Statistics FY2013 FY2014Dogs:
Total number live dogs received 1,606 1,446Percent adopted/redeemed/placed 73 81
Number available for adoption 769 787Percent of available dogs adopted 87 93Number of strays impounded 953 865Number of unwanted pets relinquished to Shelter 458 506Number in the Prison Dog Program adopted 76 78
Cats:Number of live cats received 1,186 1,216Percent adopted/redeemed/placed 28 34Number available for adoption 456 520Percent of available cats adopted 68 75Number of strays impounded 854 743Number of unwanted pets relinquished to Shelter 514 517
Number of complaints investigated 8,727 7,804Number of citations issued 1,702 1,222Number of in the IMPACT program for repeat offenders 14 * *Not reported for this periodNumber of public education programs provided 108 *Number of pet therapy sessions provided 36 28Number of rabies vaccination clinics participants 848 864Number of rabies specimens submitted to lab 89 69Number of rabies cases confirmed 0 0
The mission of the Animal Control and Rescue program is to ensure the humane treatment of all animals and to protect thepublic from diseased and vicious animals through education, surveillance and enforcement of city codes.
- Animal Control Officers work 24-hours a day, 7-days a week in order to ensure public safety and a quick response to diresituations.- Operate the City's Animal Control Shelter pursuant to the Missouri Department of Agriculture Standards.- Offer public education programs on animal husbandry and safety issues.- Promote animals for adoption through local media outlets and the Shelter's webpage.- Investigate all citizen complaints regarding animal abuse and neglect.- Protect the public from zoonotic diseases by surveillance and impoundment of diseased wildlife and suspected rabidanimals.- Protect the public from feral animals by investigating citizen complaints of vicious or dangerous animals.- Vaccinate all impounded animals against common disease upon arrival.- Conduct annual city-wide rabies vaccination and pet registration clinics in partnership with local veterinarians.- Offer pet micro-chipping.- Offer low-cost spay/neuter financial assistance program to pet owners.- Offer cremation services for pets.
- Volunteers from the Friends of the Shelter conducted Saturday previews once a month to promote shelter animals.- The shelter is open various hours throughout the week including one late evening and on Saturday to accommodate thepublic and to increase adoptions.- Held five (5) city-wide rabies vaccination and pet registration clinics.- Continued the partnership with the Missouri Department of Corrections for the Puppies for Parolees program.- Partnered with PetSmart to offer satellite cat adoptions at their North Belt location- Continued IMPACT Program for repeat offenders.- Offered pet therapy to local residential care facilities- Partnered with the Girl Scouts of America to offer educational outreach- Received a targeted spay/neuter grant from PetSmart Charities for $63,000.00 to spay/neuter 1,000 animals from zip code64501
6 - 53
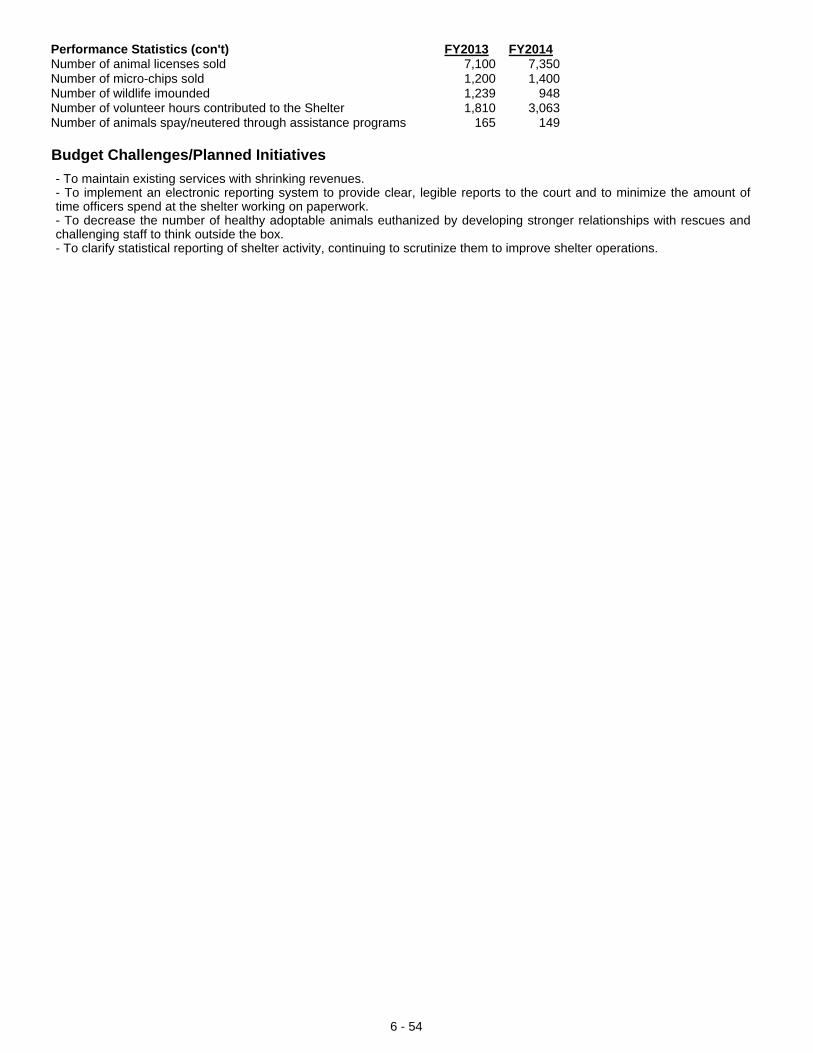
Performance Statistics (con't) FY2013 FY2014Number of animal licenses sold 7,100 7,350Number of micro-chips sold 1,200 1,400Number of wildlife imounded 1,239 948Number of volunteer hours contributed to the Shelter 1,810 3,063Number of animals spay/neutered through assistance programs 165 149
Budget Challenges/Planned Initiatives- To maintain existing services with shrinking revenues.- To implement an electronic reporting system to provide clear, legible reports to the court and to minimize the amount oftime officers spend at the shelter working on paperwork.- To decrease the number of healthy adoptable animals euthanized by developing stronger relationships with rescues andchallenging staff to think outside the box.- To clarify statistical reporting of shelter activity, continuing to scrutinize them to improve shelter operations.
6 - 54

Health Department
ANIMAL CONTROL & RESCUEProgram 6930
Program Description
2013-14 2014-15 2015-16Adopted Estimated
Staffing Detail Actual Budget Actual Budget
Animal Control Manager 1 1 1 1
Senior Animal Control Officer 1 1 1 1
Animal Control Officer 6 6 6 6
Humane Educator 1 1 1 1
Animal Care Specialist 3 3 3 3
Clerk 1 1 1 113 13 13 13
Major Budgetary Changes & Program Highlights
Operating Budget Summary
2013-14 2014-15 2015-16Adopted Estimated
Actual Budget Actual BudgetExpenditures:Salary & Wages 434,921 469,049 451,906 478,053Employee Benefits 175,714 193,215 177,455 179,061Materials & Supplies 51,447 46,700 35,200 51,700Services 99,451 139,413 134,923 134,413Insurance & Other 5,000 1,000 5,000Capital Outlay 0 0 0 0
Total 761,533 853,377 800,484 848,227
Revenue Sources:Licenses/Permits 51,013 52,200 53,500 53,900
Fines 31,911 31,000 31,000 31,000
Fees 55,704 61,500 51,100 61,500Grants 22,407 39,863 39,863 0Charges & Othr Rev 25,898 32,200 27,454 29,200Other General Fnd Rv 574,600 636,614 597,567 672,627
Total 761,533 853,377 800,484 848,227
Salary & Wages57%
Employee Benefits
21%
Materials &
Supplies6%
Services16%
Expenditures by Type
Licenses/Permits
6%
Fines4%
Fees7%
Charges & Othr
Rev4%
Other General Fnd Rv
79%
Revenue Sources by Type
Animal Control officers provide protection for all animals against inhumane treatment and protect the public from diseased and vicious animals through education and complaint investigation. Staff operate the city's animal shelter.
~ No major changes.
6 - 55
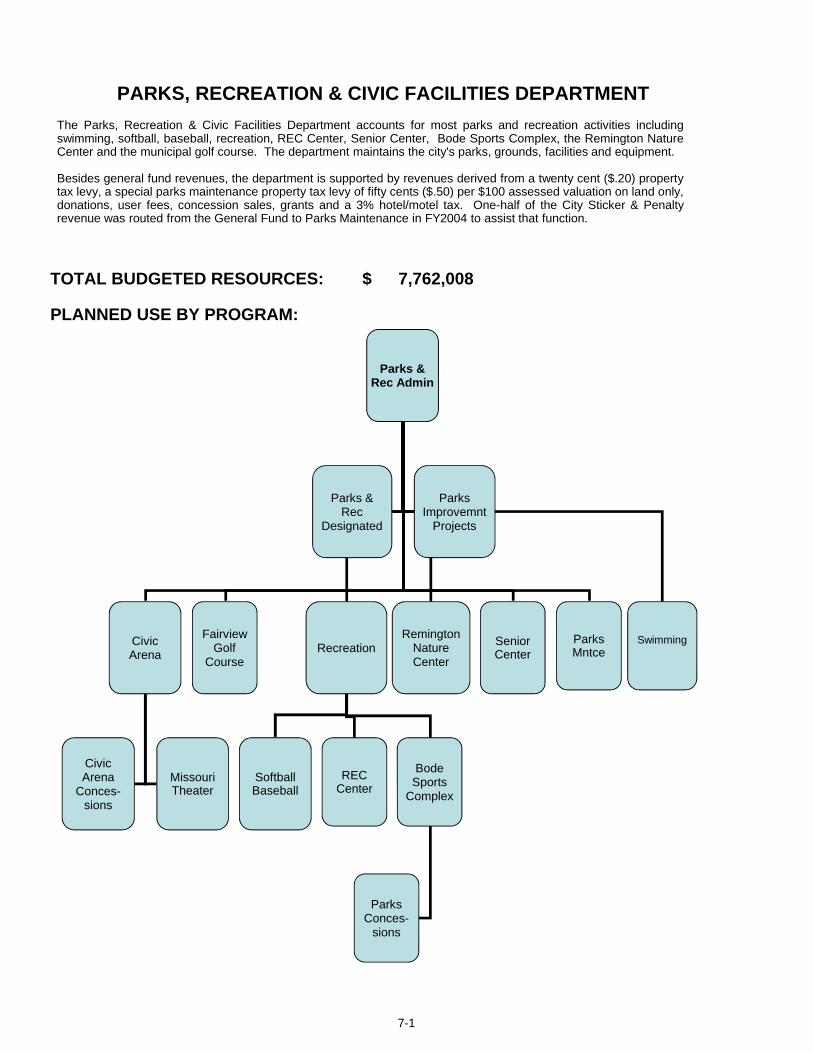
PARKS, RECREATION & CIVIC FACILITIES DEPARTMENT
TOTAL BUDGETED RESOURCES: 7,762,008$
PLANNED USE BY PROGRAM:
Parks & Rec Admin
Civic Arena
RecreationRemington
Nature Center
Parks & Rec
Designated
Civic Arena
Conces-sions
Missouri Theater
Softball Baseball
Parks Improvemnt
Projects
Fairview Golf
Course
Senior Center
REC Center
Bode Sports
Complex
Parks Conces-
sions
Parks Mntce
Swimming
The Parks, Recreation & Civic Facilities Department accounts for most parks and recreation activities includingswimming, softball, baseball, recreation, REC Center, Senior Center, Bode Sports Complex, the Remington NatureCenter and the municipal golf course. The department maintains the city's parks, grounds, facilities and equipment.
Besides general fund revenues, the department is supported by revenues derived from a twenty cent ($.20) propertytax levy, a special parks maintenance property tax levy of fifty cents ($.50) per $100 assessed valuation on land only,donations, user fees, concession sales, grants and a 3% hotel/motel tax. One-half of the City Sticker & Penaltyrevenue was routed from the General Fund to Parks Maintenance in FY2004 to assist that function.
7-1
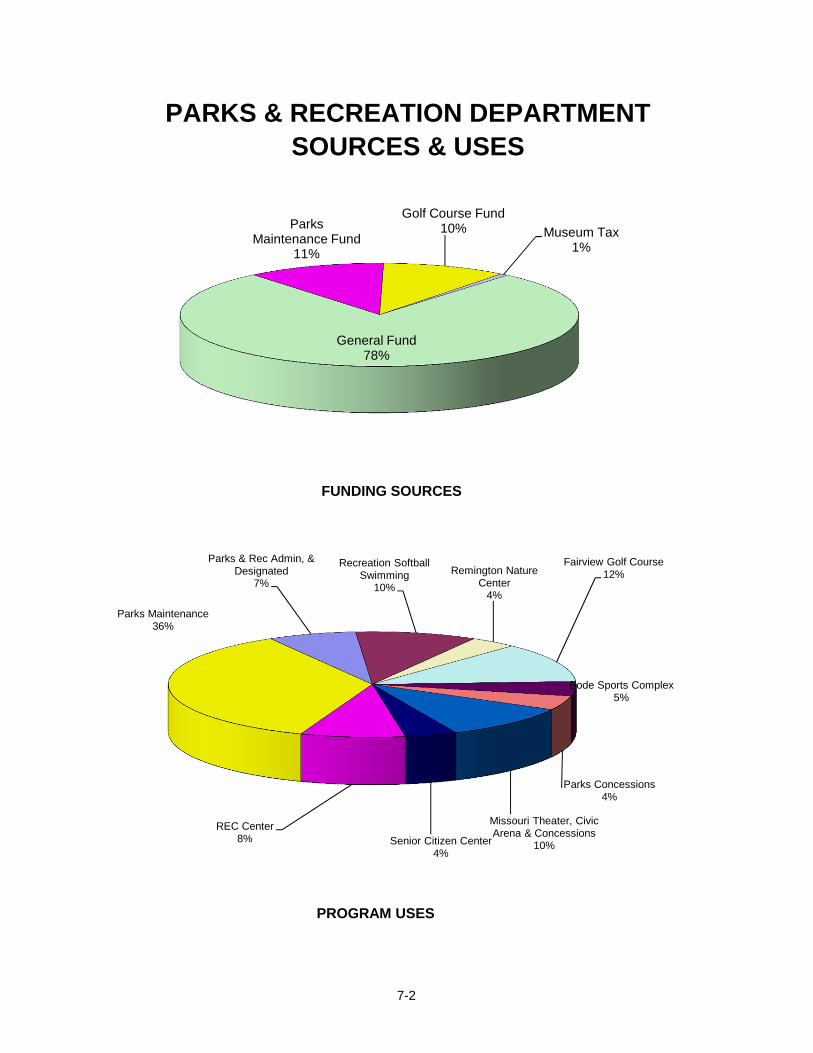
PARKS & RECREATION DEPARTMENTSOURCES & USES
General Fund78%
Parks Maintenance Fund
11%
Golf Course Fund10% Museum Tax
1%
FUNDING SOURCES
Parks & Rec Admin, & Designated
7%
Recreation Softball Swimming
10%
Remington Nature Center
4%
Fairview Golf Course12%
Bode Sports Complex5%
Parks Concessions4%
Missouri Theater, Civic Arena & Concessions
10%Senior Citizen Center4%
REC Center8%
Parks Maintenance36%
PROGRAM USES
7-2
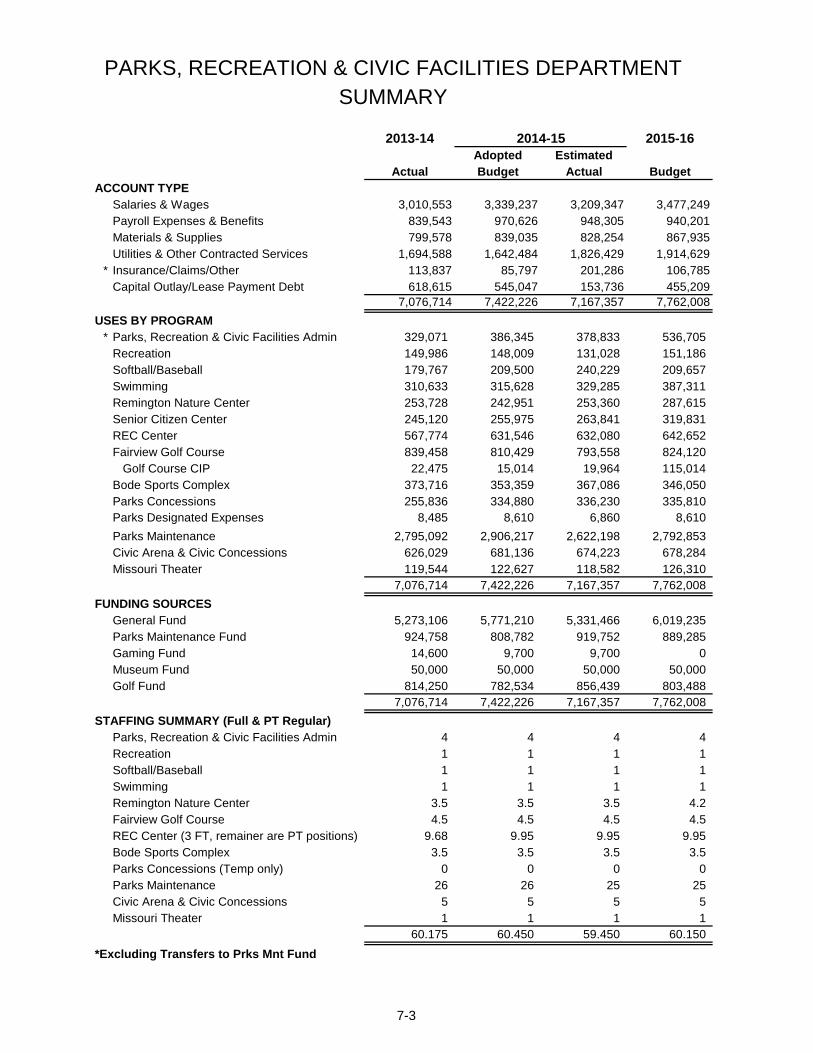
PARKS, RECREATION & CIVIC FACILITIES DEPARTMENTSUMMARY
2013-14 2014-15 2015-16Adopted Estimated
Actual Budget Actual BudgetACCOUNT TYPE
Salaries & Wages 3,010,553 3,339,237 3,209,347 3,477,249Payroll Expenses & Benefits 839,543 970,626 948,305 940,201Materials & Supplies 799,578 839,035 828,254 867,935Utilities & Other Contracted Services 1,694,588 1,642,484 1,826,429 1,914,629
* Insurance/Claims/Other 113,837 85,797 201,286 106,785Capital Outlay/Lease Payment Debt 618,615 545,047 153,736 455,209
7,076,714 7,422,226 7,167,357 7,762,008
USES BY PROGRAM* Parks, Recreation & Civic Facilities Admin 329,071 386,345 378,833 536,705
Recreation 149,986 148,009 131,028 151,186Softball/Baseball 179,767 209,500 240,229 209,657Swimming 310,633 315,628 329,285 387,311Remington Nature Center 253,728 242,951 253,360 287,615Senior Citizen Center 245,120 255,975 263,841 319,831REC Center 567,774 631,546 632,080 642,652Fairview Golf Course 839,458 810,429 793,558 824,120 Golf Course CIP 22,475 15,014 19,964 115,014Bode Sports Complex 373,716 353,359 367,086 346,050Parks Concessions 255,836 334,880 336,230 335,810Parks Designated Expenses 8,485 8,610 6,860 8,610
Parks Maintenance 2,795,092 2,906,217 2,622,198 2,792,853Civic Arena & Civic Concessions 626,029 681,136 674,223 678,284Missouri Theater 119,544 122,627 118,582 126,310
7,076,714 7,422,226 7,167,357 7,762,008
FUNDING SOURCESGeneral Fund 5,273,106 5,771,210 5,331,466 6,019,235Parks Maintenance Fund 924,758 808,782 919,752 889,285Gaming Fund 14,600 9,700 9,700 0Museum Fund 50,000 50,000 50,000 50,000Golf Fund 814,250 782,534 856,439 803,488
7,076,714 7,422,226 7,167,357 7,762,008
STAFFING SUMMARY (Full & PT Regular)Parks, Recreation & Civic Facilities Admin 4 4 4 4Recreation 1 1 1 1Softball/Baseball 1 1 1 1Swimming 1 1 1 1Remington Nature Center 3.5 3.5 3.5 4.2Fairview Golf Course 4.5 4.5 4.5 4.5REC Center (3 FT, remainer are PT positions) 9.68 9.95 9.95 9.95Bode Sports Complex 3.5 3.5 3.5 3.5Parks Concessions (Temp only) 0 0 0 0Parks Maintenance 26 26 25 25Civic Arena & Civic Concessions 5 5 5 5Missouri Theater 1 1 1 1
60.175 60.450 59.450 60.150
*Excluding Transfers to Prks Mnt Fund
7-3
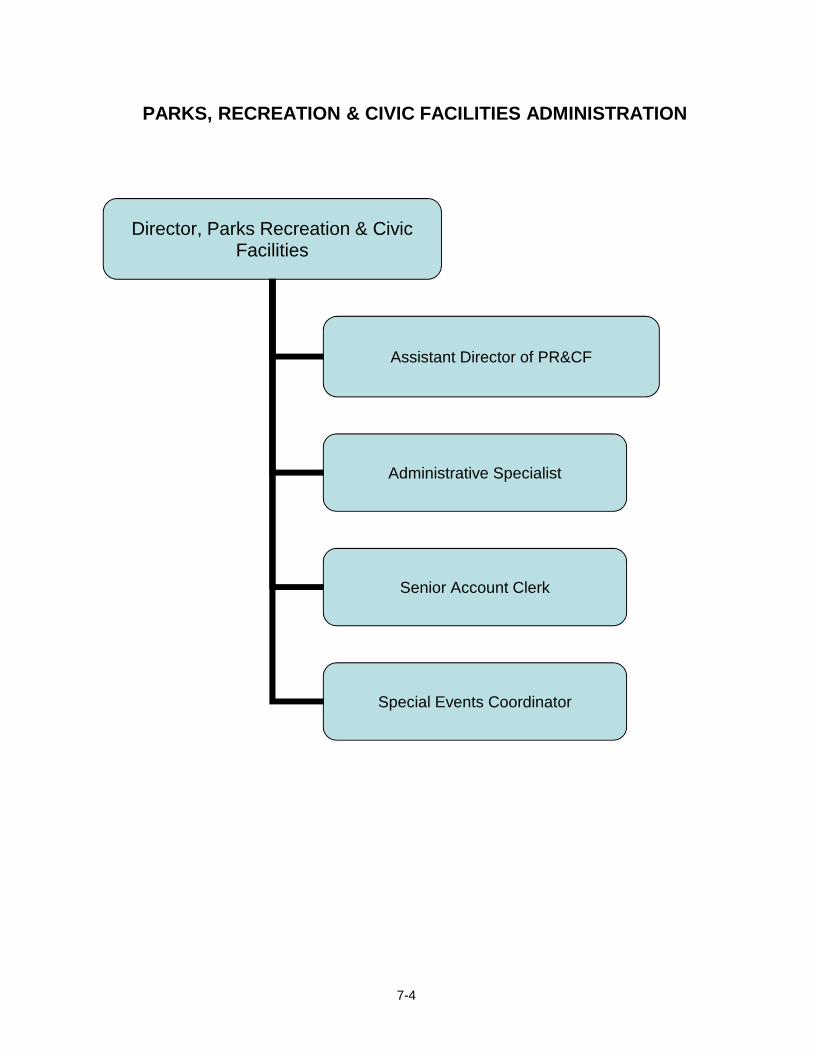
PARKS, RECREATION & CIVIC FACILITIES ADMINISTRATION
Director, Parks Recreation & Civic Facilities
Assistant Director of PR&CF
Administrative Specialist
Senior Account Clerk
Special Events Coordinator
7-4

Parks & Recreation Administration
Mission
Core Services
Current Year Activity/Achievements
Budget Challenges/Planned Initiatives
To provide quality-of-life experiences for the residents of St. Joseph and to add to the aesthetic appeal ofthe city. To provide for the recreational and special needs of all ages and abilities of the citizenry byadministering a well-rounded, interesting and complete experience. To enhance our City’s attractionsand assets for enjoyment by all citizens and for the encouragement of tourism.
- Administer the financial, operational & capital budgets of the department- Provide professional leadership & guidance to all divisions of the department- Encourage professional growth of staff, by providing opportunities for training- Explore funding opportunities through researching, drafting and submitting grants, as well as variousother revenue sources- Work to augment revenue and reduce expenditures- Collaborate with other departments, outside organizations and programs to provide quality programsand experiences- Enhance the options for recreation and entertainment for all interests, abilities and ages- Continue implementation of the Riverfront Development plan by exploring funding sources and optionsfor expansion- Further develop Parks and Recreation Board, expand involvement and gain feedback from theirexpertise
- Installed playground surfacing at 3 locations- Developed, applied, and secured grants, foundation funding, and donations for various programs,facilities, and improvements- Initiatives to help our residents be active and combat obesity- Constructed and opened an accessible treehouse and reviewed plans to install a universal playgroundat Bartlett Park- Assisted individuals and groups to honor & memorialize through donations to reforesting and benchadditions- Began work on Krug Lagoon renovations and Hyde Park Ball Field renovations- Worked on fee adjustments to augment revenue
- Continue evaluating properties as to practicality of maintaining and actual usage- Expansion of Hike & Bike Trails/Maintenance- Ever increasing use of parks, parkways and facilities for events and organizations increasing need ofassistance- Evaluate and revise some fees to help augment revenue- Meet public expectation of renovations (CIP & other)- Research best methods and revenue sources of renovating aging facilities and amenities- Realizing sufficient funding for universal playground and surfacing- Scheduling around renovations at Krug & Hyde to meet public needs and wants
7-5
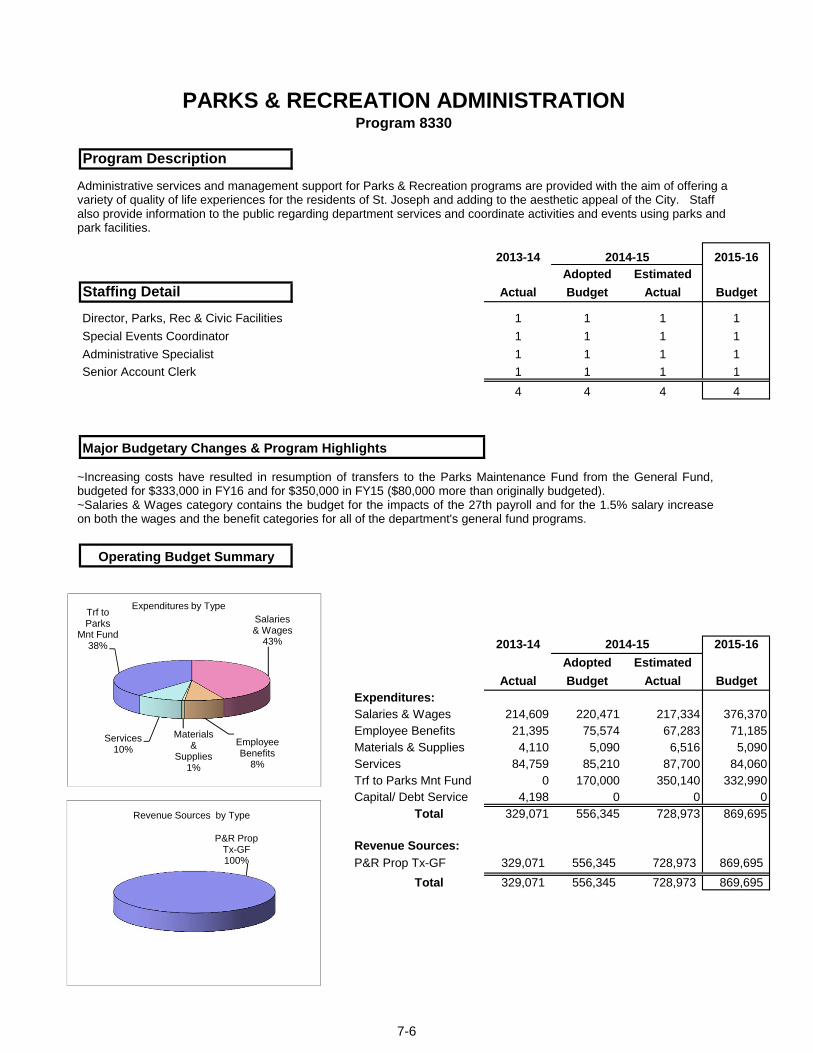
PARKS & RECREATION ADMINISTRATIONProgram 8330
Program Description
2013-14 2014-15 2015-16Adopted Estimated
Staffing Detail Actual Budget Actual Budget
Director, Parks, Rec & Civic Facilities 1 1 1 1
Special Events Coordinator 1 1 1 1
Administrative Specialist 1 1 1 1
Senior Account Clerk 1 1 1 1
4 4 4 4
Major Budgetary Changes & Program Highlights
Operating Budget Summary
2013-14 2014-15 2015-16Adopted Estimated
Actual Budget Actual BudgetExpenditures:Salaries & Wages 214,609 220,471 217,334 376,370Employee Benefits 21,395 75,574 67,283 71,185Materials & Supplies 4,110 5,090 6,516 5,090Services 84,759 85,210 87,700 84,060Trf to Parks Mnt Fund 0 170,000 350,140 332,990Capital/ Debt Service 4,198 0 0 0
Total 329,071 556,345 728,973 869,695
Revenue Sources:P&R Prop Tx-GF 329,071 556,345 728,973 869,695
Total 329,071 556,345 728,973 869,695
Salaries & Wages
43%
Employee Benefits
8%
Materials &
Supplies1%
Services10%
Trf to Parks
Mnt Fund38%
Expenditures by Type
P&R Prop Tx-GF100%
Revenue Sources by Type
Administrative services and management support for Parks & Recreation programs are provided with the aim of offering a variety of quality of life experiences for the residents of St. Joseph and adding to the aesthetic appeal of the City. Staff also provide information to the public regarding department services and coordinate activities and events using parks and park facilities.
~Increasing costs have resulted in resumption of transfers to the Parks Maintenance Fund from the General Fund,budgeted for $333,000 in FY16 and for $350,000 in FY15 ($80,000 more than originally budgeted).~Salaries & Wages category contains the budget for the impacts of the 27th payroll and for the 1.5% salary increaseon both the wages and the benefit categories for all of the department's general fund programs.
7-6
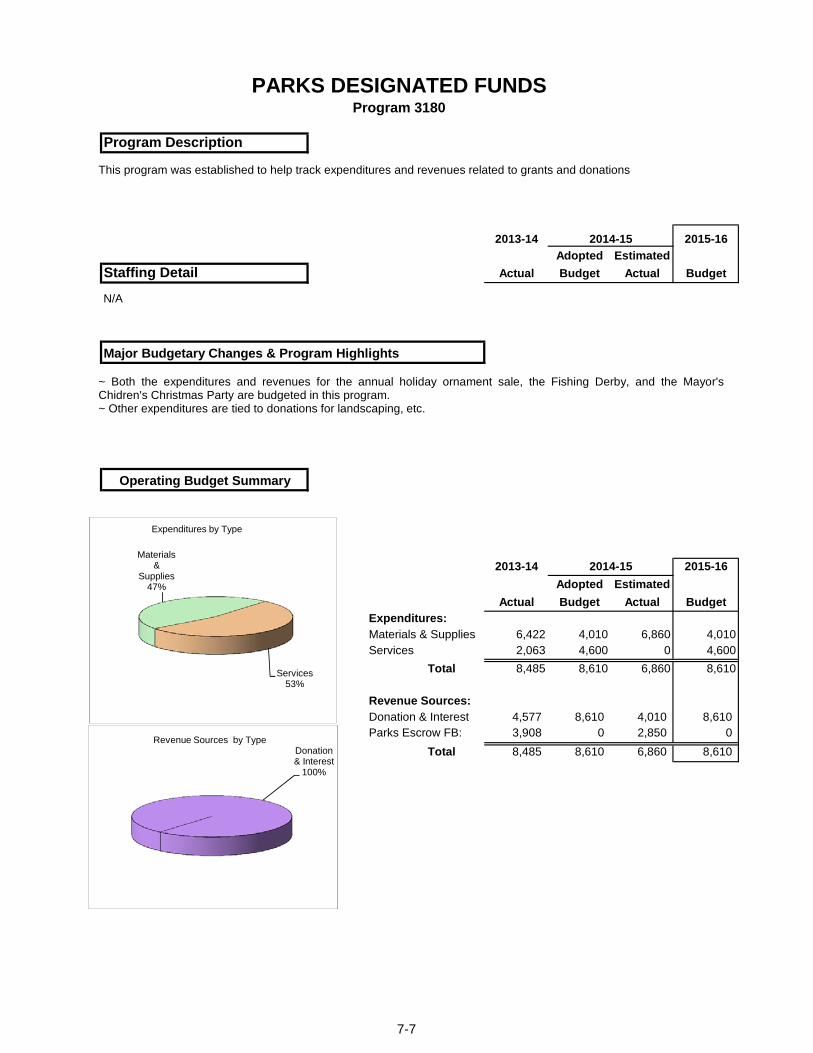
PARKS DESIGNATED FUNDSProgram 3180
Program Description
2013-14 2014-15 2015-16Adopted Estimated
Staffing Detail Actual Budget Actual Budget
N/A
Major Budgetary Changes & Program Highlights
Operating Budget Summary
2013-14 2014-15 2015-16Adopted Estimated
Actual Budget Actual BudgetExpenditures:Materials & Supplies 6,422 4,010 6,860 4,010Services 2,063 4,600 0 4,600
Total 8,485 8,610 6,860 8,610
Revenue Sources:Donation & Interest 4,577 8,610 4,010 8,610Parks Escrow FB: 3,908 0 2,850 0
Total 8,485 8,610 6,860 8,610
Services53%
Materials &
Supplies47%
Expenditures by Type
Donation & Interest
100%
Revenue Sources by Type
This program was established to help track expenditures and revenues related to grants and donations
~ Both the expenditures and revenues for the annual holiday ornament sale, the Fishing Derby, and the Mayor'sChidren's Christmas Party are budgeted in this program.~ Other expenditures are tied to donations for landscaping, etc.
7-7
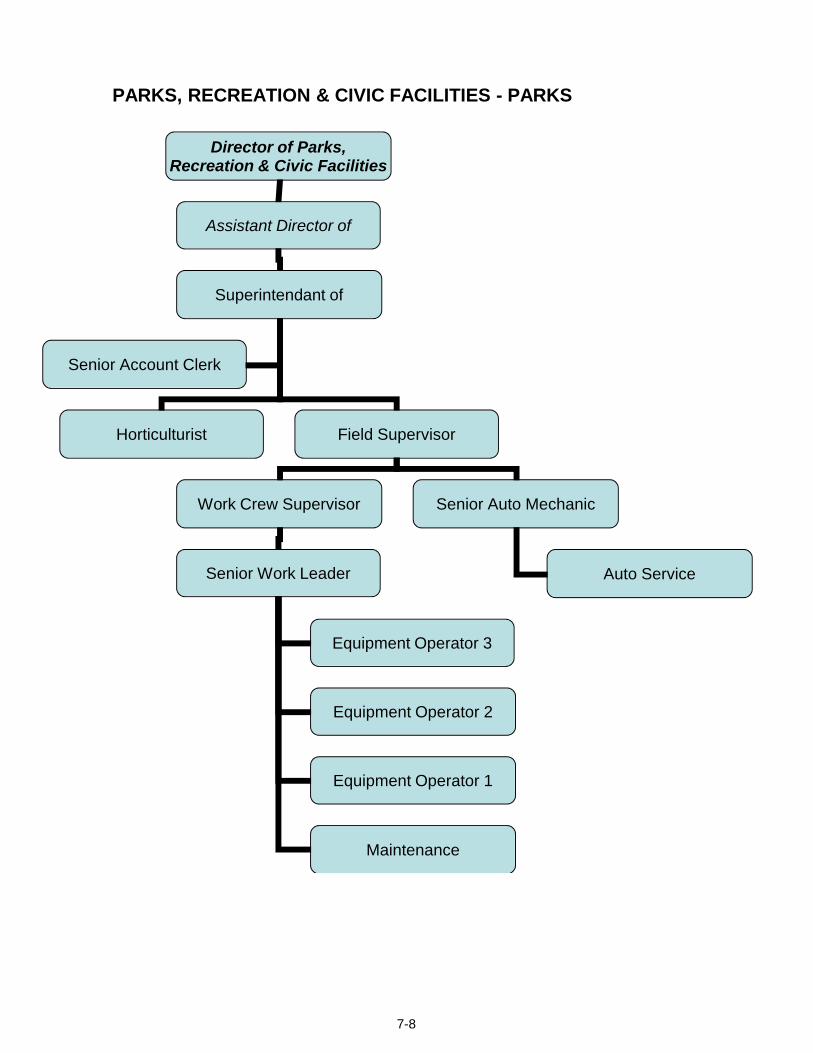
PARKS, RECREATION & CIVIC FACILITIES - PARKS
Director of Parks, Recreation & Civic Facilities
Assistant Director of
Superintendant of
Senior Account Clerk
Horticulturist Field Supervisor
Work Crew Supervisor Senior Auto Mechanic
Auto Service Senior Work Leader
Equipment Operator 3
Equipment Operator 2
Equipment Operator 1
Maintenance
7-8
Parks Maintenance
Mission
Core Services
Current Year Activity/Achievements
Budget Challenges/Planned Initiatives
Enhance both the beauty of the park system and user enjoyment of the City's park facilities by maintaining Cityparks, park buildings and equipment.
* Work with Garden Clubs and Volunteers to adopt certain landscape areas. Work with organizations to sponsor community improvement projects.* Partner with the Downtown Partnership in the Downtown Cleanup Program.* Maintain the scheduled maintenance program including mowing the 26 miles of City owned parks and parkways.* Clean and Maintain 23 Park system restrooms. Provide summertime trash pickup including emptying 320 trash barrels daily. And the weekly inspection of 16 playgrounds.* Raise tree limbs and eliminate hazardous limbs and trees along well traveled areas of the parkway and parks.* Pre-emerge, Seed, Aerate and Fertilize high use areas of parks.* Continue Capital Improvements such as the Krug Park Renovation, Living History Development and Playground Improvements.* Enhance floral plantings throughout the system.* Work to increase security and reduce vandalism in our parks and facilities.* Work to improve the overall experience and enjoyment of our parks, facilities and boulevard system.
* MAINTAINED 8 day mowing cycle of Boulevard system and parks.* OPENING of Fort Smith.* RESTORATION of “Dolphin Fountain” at Civic Center Park.* Provided SUPPORT to 50+ festivals, walks, runs and special events requiring an estimated 1250 man hours.* 34th year of HOLIDAY LIGHTING DISPLAYS. Welcoming 80,000 visitors to Holiday Park and an estimated 220,000 visitors viewing The South Pole!* Seasonal REMOVAL and REPLACEMENT of the French Bottoms floating boat dock.* REPAIRED roof of the Park Maintenance Garage.* CONSTRUCTION of “Tree House for Everyone” at Bartlett Park. Including 60’ of ADA accessible sidewalk.
* RESTORATION and RENOVATION of Krug Park Lagoon and Waterfall.* RENOVATION of Hyde Park Baseball Fields and Complex.* IMPROVEMENTS to the N. 25th St. Cul-de-Sac.* MAINTAIN 8 day mowing cycle of the boulevard and park system.* MAINTENANCE and UPKEEP of the newly added Corby Dog Park.* INSTALLATION of new unitary safety surfacing to the Hochman Park Playground.* RELOCATE Living History Display from Krug Park to the Remington Nature Center.* MAINTENANCE and UPKEEP of aging rolling stock.* PURCHASE and INSTALLATION of new universally accessible playground equipment and safety surfacing at Bartlett Park.* REPAIR roof of the Carpenter Shop located at our maintenance facility.* MAINTAIN our aging rolling stock and equipment.
7-9

PARKS MAINTENANCEProgram 3090
Program Description
2013-14 2014-15 2015-16Adopted Estimated
Staffing Detail Actual Budget Actual Budget
Superintendent of Parks 1 1 1 1Layout & Design Technician 1 1 0 0Horticulturist 1 1 1 1Field Supervisor 1 1 1 1Work Crew Supervisor 1 1 1 1Senior Work Leader 2 2 2 2Equipment Operator I 4 4 4 4Equipment Operator II 3 3 3 3Equipment Operator III 2 2 2 2Maintenance Technician 7 7 7 7Senior Auto Mechanic 1 1 1 1Auto Service Technician 1 1 1 1Senior Account Clerk 1 1 1 1
26 26 25 25
Major Budgetary Changes & Program Highlights
2013-14 2014-15 2015-16Operating Budget Summary Adopted Estimated
Actual Budget Actual BudgetExpenditures:Salaries & Wages 994,072 1,162,347 1,013,566 1,025,678Employee Benefits 379,103 393,320 379,826 374,285Materials & Supplies 193,625 194,650 177,343 206,650Services 661,690 692,810 872,634 913,810Insurance & Other 56,055 3,090 112,829 32,430Capital Outlay 510,547 460,000 66,000 240,000
Total 2,795,092 2,906,217 2,622,198 2,792,853Revenue Sources:Parks Mnt Spcl Tax 685,344 683,900 683,900 683,900City Sticker Tax 95,086 96,000 96,000 96,000
Rents & Other 46,435 25,000 26,060 25,000
Grants Donations 58,158 70,000 77,131 70,000
General Fund 1,373,175 1,725,667 1,743,532 1,732,953GF/Cell Phone Trf 460,000 60,000 60,000 130,000Prk Mnt FB from(to) 76,894 245,650 (64,425) 55,000
Total 2,795,092 2,906,217 2,622,198 2,792,853
Salaries & Wages
37%
Employee Benefits
13%
Materials & Supplies
7%
Services33%
Insurance & Other
1%
Capital Outlay
9%
Expenditures by Type
Grants Donations
3%Parks Mnt Spcl Tax
25%Rents & Other1%
City Sticker Tax3%
General Fund63%
GF/Cell Phone Trf
5%
Revenue Sources by Type
To enhance both the beauty of the park system and user enjoyment of the City's park facilities, staff maintains City parks, park buildings and equipment.
~Requests for replacement of 3/4 ton 4WD pickup, 1/2 tom 2wd pickup,parkway mowing tractor, 3/4 ton 4WD , 1/2 ton2WD pickup, $220,000 (Transfer from Cell Phone, $110,000)~Funds to clean statues and provide sidewalks, $20,000 (Transfer from Cell phone).~increase in cost for Holiday park and displays, $5,000~Increase in cost to maintain aging equipment and vehicles, $29,000~There is $9,000 budgeted in the Gaming Fund for monument signage at the Dog Park and Eagles Field.~With the retirement of the Layout & Design Technician, the position was eliminated.
7-10
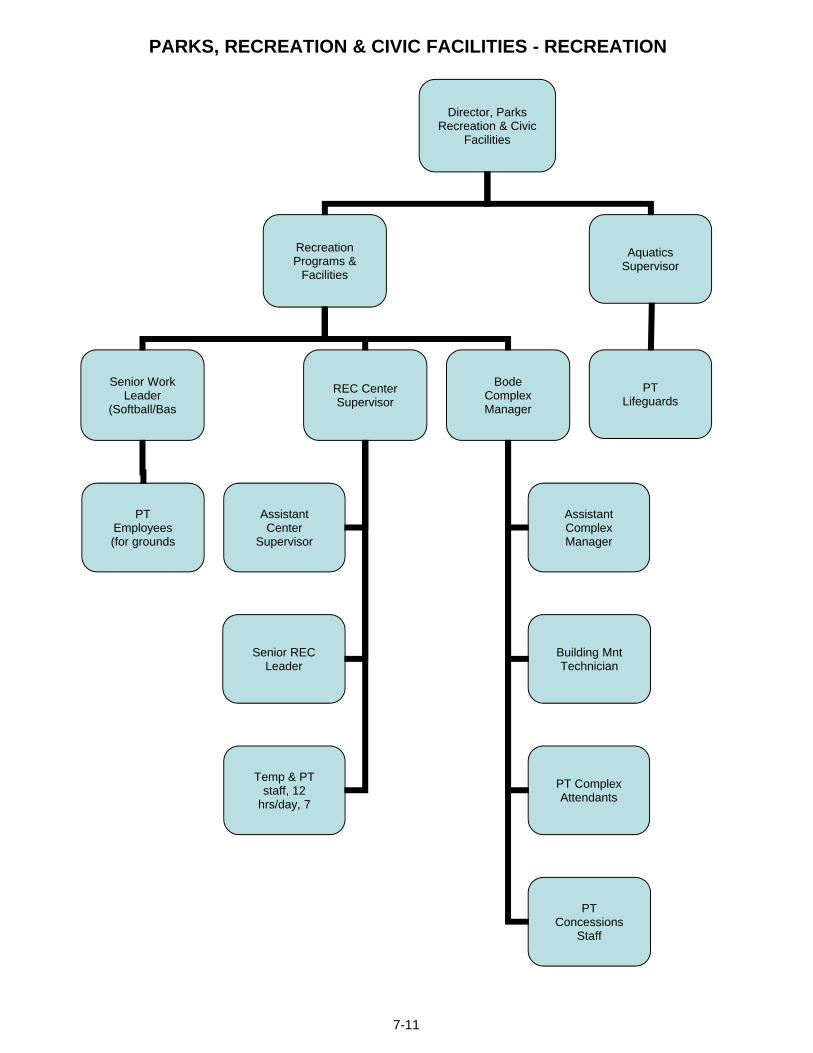
PARKS, RECREATION & CIVIC FACILITIES - RECREATION
Director, Parks Recreation & Civic
Facilities
Recreation Programs &
Facilities
Senior Work Leader
(Softball/Bas
REC Center Supervisor
Bode Complex Manager
PT Employees (for grounds
Assistant Center
Supervisor
Senior REC Leader
Assistant Complex Manager
Building Mnt Technician
PT Complex Attendants
PT Concessions
Staff
Aquatics Supervisor
PT Lifeguards
Temp & PT staff, 12
hrs/day, 7
7-11
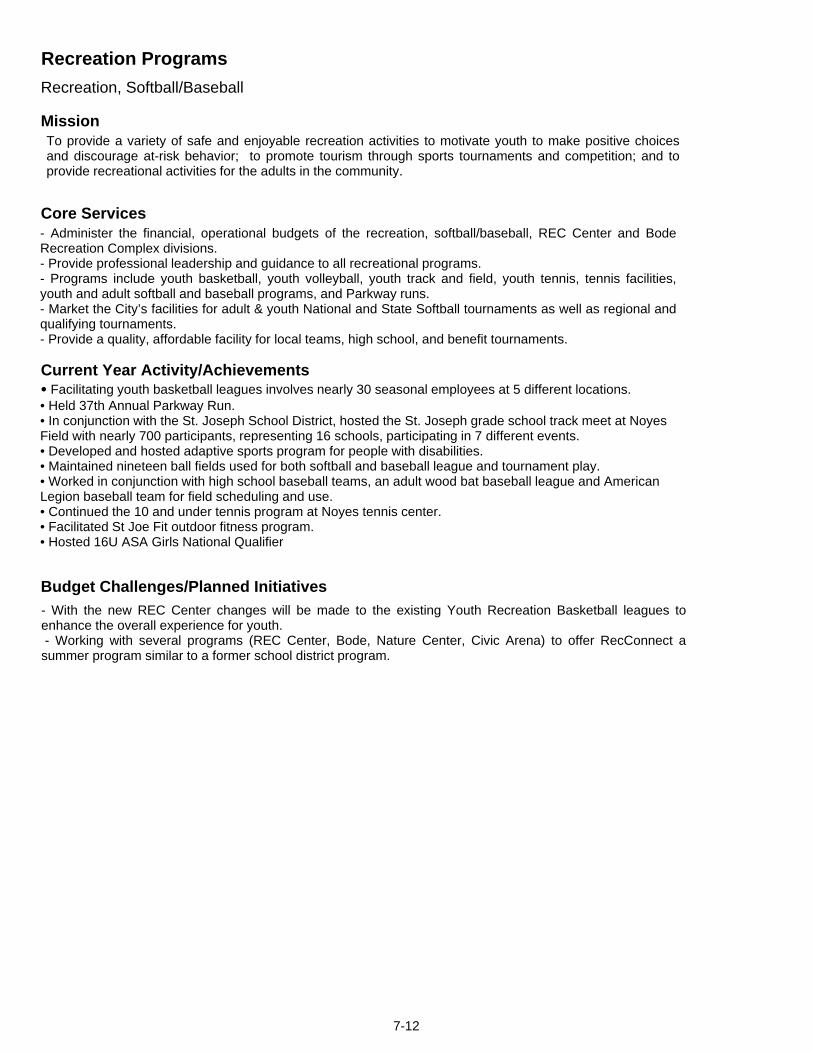
Recreation ProgramsRecreation, Softball/Baseball
Mission
Core Services
Current Year Activity/Achievements
Budget Challenges/Planned Initiatives
To provide a variety of safe and enjoyable recreation activities to motivate youth to make positive choicesand discourage at-risk behavior; to promote tourism through sports tournaments and competition; and toprovide recreational activities for the adults in the community.
- Administer the financial, operational budgets of the recreation, softball/baseball, REC Center and BodeRecreation Complex divisions.- Provide professional leadership and guidance to all recreational programs.- Programs include youth basketball, youth volleyball, youth track and field, youth tennis, tennis facilities,youth and adult softball and baseball programs, and Parkway runs.- Market the City’s facilities for adult & youth National and State Softball tournaments as well as regional andqualifying tournaments.- Provide a quality, affordable facility for local teams, high school, and benefit tournaments.
• Facilitating youth basketball leagues involves nearly 30 seasonal employees at 5 different locations.• Held 37th Annual Parkway Run.• In conjunction with the St. Joseph School District, hosted the St. Joseph grade school track meet at Noyes Field with nearly 700 participants, representing 16 schools, participating in 7 different events.• Developed and hosted adaptive sports program for people with disabilities.• Maintained nineteen ball fields used for both softball and baseball league and tournament play.• Worked in conjunction with high school baseball teams, an adult wood bat baseball league and American Legion baseball team for field scheduling and use.• Continued the 10 and under tennis program at Noyes tennis center.• Facilitated St Joe Fit outdoor fitness program.• Hosted 16U ASA Girls National Qualifier
- With the new REC Center changes will be made to the existing Youth Recreation Basketball leagues toenhance the overall experience for youth.- Working with several programs (REC Center, Bode, Nature Center, Civic Arena) to offer RecConnect a
summer program similar to a former school district program.
7-12
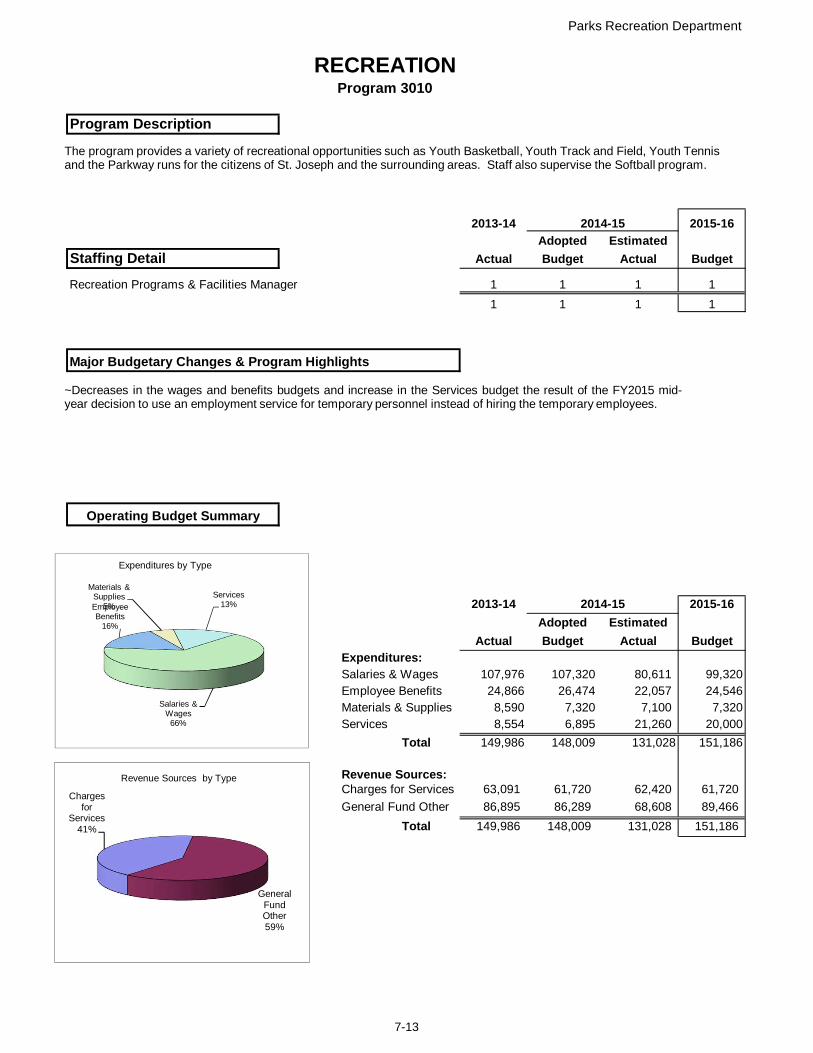
Parks Recreation Department
RECREATIONProgram 3010
Program Description
2013-14 2014-15 2015-16Adopted Estimated
Staffing Detail Actual Budget Actual Budget
Recreation Programs & Facilities Manager 1 1 1 1
1 1 1 1
Major Budgetary Changes & Program Highlights
Operating Budget Summary
2013-14 2014-15 2015-16Adopted Estimated
Actual Budget Actual BudgetExpenditures:Salaries & Wages 107,976 107,320 80,611 99,320Employee Benefits 24,866 26,474 22,057 24,546Materials & Supplies 8,590 7,320 7,100 7,320Services 8,554 6,895 21,260 20,000
Total 149,986 148,009 131,028 151,186
Revenue Sources:Charges for Services 63,091 61,720 62,420 61,720
General Fund Other 86,895 86,289 68,608 89,466
Total 149,986 148,009 131,028 151,186
Salaries & Wages
66%
Employee Benefits
16%
Materials & Supplies
5%Services
13%
Expenditures by Type
Charges for
Services41%
General Fund Other59%
Revenue Sources by Type
The program provides a variety of recreational opportunities such as Youth Basketball, Youth Track and Field, Youth Tennis and the Parkway runs for the citizens of St. Joseph and the surrounding areas. Staff also supervise the Softball program.
~Decreases in the wages and benefits budgets and increase in the Services budget the result of the FY2015 mid-year decision to use an employment service for temporary personnel instead of hiring the temporary employees.
7-13
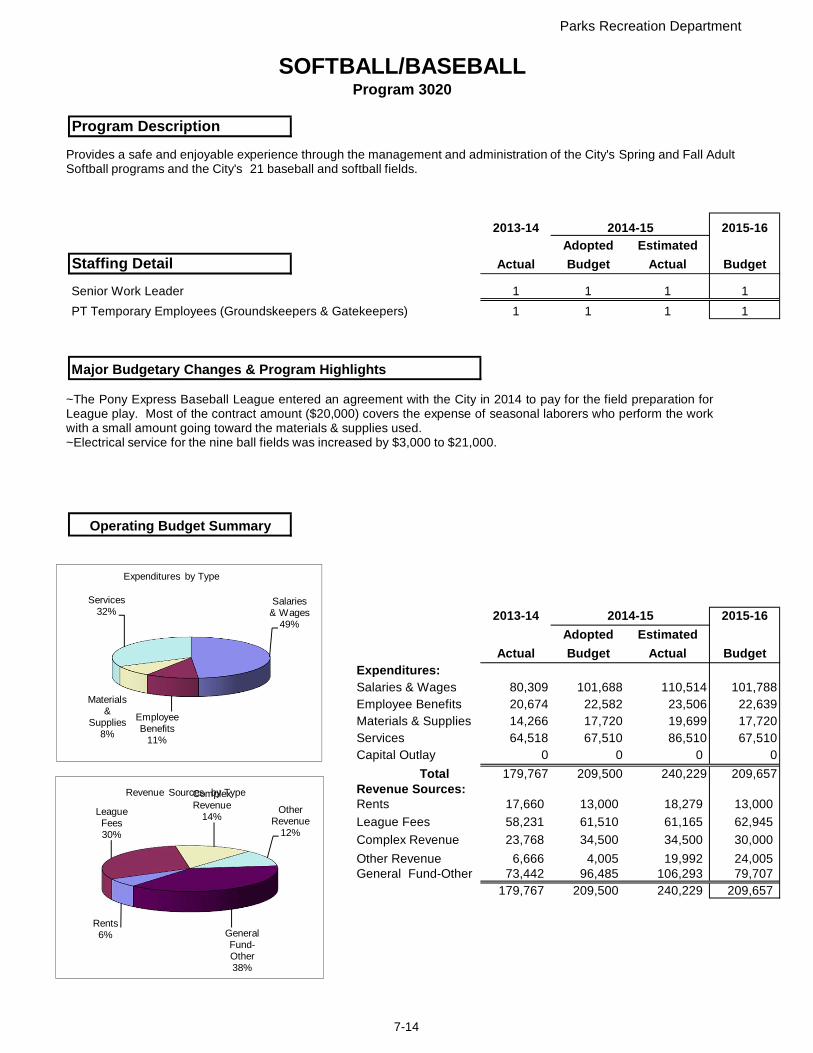
Parks Recreation Department
SOFTBALL/BASEBALLProgram 3020
Program Description
2013-14 2014-15 2015-16Adopted Estimated
Staffing Detail Actual Budget Actual Budget
Senior Work Leader 1 1 1 1
PT Temporary Employees (Groundskeepers & Gatekeepers) 1 1 1 1
Major Budgetary Changes & Program Highlights
Operating Budget Summary
2013-14 2014-15 2015-16Adopted Estimated
Actual Budget Actual BudgetExpenditures:Salaries & Wages 80,309 101,688 110,514 101,788Employee Benefits 20,674 22,582 23,506 22,639Materials & Supplies 14,266 17,720 19,699 17,720Services 64,518 67,510 86,510 67,510Capital Outlay 0 0 0 0
Total 179,767 209,500 240,229 209,657Revenue Sources:Rents 17,660 13,000 18,279 13,000
League Fees 58,231 61,510 61,165 62,945
Complex Revenue 23,768 34,500 34,500 30,000
Other Revenue 6,666 4,005 19,992 24,005General Fund-Other 73,442 96,485 106,293 79,707
179,767 209,500 240,229 209,657
Salaries & Wages
49%
Employee Benefits
11%
Materials &
Supplies8%
Services32%
Expenditures by Type
Rents6%
League Fees30%
Complex Revenue
14%Other
Revenue12%
General Fund-Other38%
Revenue Sources by Type
Provides a safe and enjoyable experience through the management and administration of the City's Spring and Fall Adult Softball programs and the City's 21 baseball and softball fields.
~The Pony Express Baseball League entered an agreement with the City in 2014 to pay for the field preparation forLeague play. Most of the contract amount ($20,000) covers the expense of seasonal laborers who perform the workwith a small amount going toward the materials & supplies used.~Electrical service for the nine ball fields was increased by $3,000 to $21,000.
7-14
St. Joseph REC Center
Mission
Core Services
Current Year Activity/Achievements
Budget Challenges/Planned Initiatives
To provide safe, supervised recreation and fitness opportunities through both adult and youth programsfor the entire community.
For Children:- Skill development for indoor and outdoor sports through the Lifetime Sports camps, leagues and fitnessprograms.- Continue co-sponsoring with Young Champions youth karate programs.- Open gym time for non-members- Birthday Parties- Sports leagues
For Adults:- Adult sports leagues- Zumba classes- Adult fitness/cardio classes- Judo/Jitisu class- Fitness room memberships- Adult open gym for non-members- Personal Training
-Added new fitness classes and programs to stay current with the fitness trends.-Little Ballers program was offered for three sessions again and each session’s participant numbers increased.- Expanding the Youth Volleyball program to offer a summer league.-Continued the partnership with Mosaic to hold the Pound Plunge weigh-ins and free classes at the center.-Partnered with more than 30 corporations to offer their employees a corporate rate membership for the facility.-Promoted the REC Center by attending may health fairs and events.
-Finding available space and time to meet the demand of some of the programs, activities, and classes continues to be a challenge. There is a great need for additional rooms and a gym.-Due to the high volume of traffic the center sees during the winter months, many walls need repair and repainted.-Looking at the possibility of offering 24-hour access to the fitness room which can increase the amount of memberships. Not having the 24-hour access now has detoured many people from signing up for a membership and they went to other facilities that do offer it. The REC Center is currently the only fitness facility in St. Joseph that doesn’t offer 24-hour access to their fitness room.-Offering additional summer adult and youth volleyball leagues.
7-15

Parks Recreation Department
REC CENTER(St. Joseph Recreation, Exercise & Community Center)
Program 3060
Program Description
2013-14 2014-15 2015-16Adopted Estimated
Staffing Detail Actual Budget Actual Budget
Recreation Center Manager 1 1 1 1Assistant REC Center Manager 1 1 1 1Senior REC Leader 0 0 0 1Custodian (3) @ 29 hrs/wk 2.175 2.175 2.175 2.175Receptionists (5) @ 29 hrs/wk 3.625 3.625 3.625 2.9Fitness Attendants (3) @ 25 hrs/wk 1.875 1.875 1.875 1.875Center has other Temp Fitness Instructors, Activity Room Attendants 9.675 9.675 9.675 9.95
Major Budgetary Changes & Program Highlights
Operating Budget Summary
2013-14 2014-15 2015-16Adopted Estimated
Actual Budget Actual BudgetExpenditures:Salaries & Wages 308,918 360,148 360,248 403,604Employee Benefits 46,538 73,980 74,030 68,378Materials & Supplies 76,710 68,200 67,200 66,200Services/ Claims 80,778 79,635 80,280 104,470Lease Payments 54,830 49,583 50,322 0
Total 567,774 631,546 632,080 642,652Revenue Sources:Charges for Services 414,718 445,300 311,979 450,300General Fund - Other 153,056 186,246 320,101 192,352
Total 567,774 631,546 632,080 642,652
Salaries & Wages
63%
Employee
Benefits11%
Materials &
Supplies10% Services/
Claims16%
Expenditures by Type
Charges for
Services70%
General Fund -Other30%
Revenue Sources by Type
The staff at the Center provide safe, supervised recreation opportunities through both adult and children's activityprograms for the whole community. The REC Center hosts a fitness room, three basketball/volleyball courts, acommunity room, an indoor running track and rooms for various recreation & fitness programs. The Center alsoinitiates summer playground and Life Skills programs.
~ Beginning toward the end of FY2015 the REC Center began the Summer Youth ReConnect program. The followingbudget increases are for support of that program. Entry fees ($79,000) are projected to cover the costs:
- Rec Supplies $6,000- Professional Services for Instructors & Buses for field trips, $23,840- Personnel costs for Temp/PT staff, $47,160
~Funds for the retro-fit of the Fitness Center to allow for 24-hour access to that amenity are budgeted in the GamingFund. Revenues are estimated to increase by at least $18,000 when 2nd & 3rd shift employees can attend duringhours not now available.
7-16
Bode Sports Complex
Mission
Core Services
Current Year Activity/Achievements
Budget Challenges/Planned Initiatives
Provide a variety of enjoyable, supervised, recreational activities for the community in a family friendlyenvironment.
- Recreational ice skating for individuals, school groups and private parties- Ice time for figure skating, host of the SJFSC - Hockey leagues youth, host of the GSJYHA- Classes for USFS Basic Skills program levels Snow Plow –Basic 8- 2 synchronized ice skating teams - Beyond Basic program - Outdoor, inline skate rink- 6 lighted outdoor basketball courts including the annual Summer Jam Program- On-site concessions- Outdoor skate park, including ramps, rails and half pipe
- Number of facility attendees – 100,000 people annually.- Available sessions of recreational ice skating 6 – 10 public sessions weekly depending on schedule of events.- Numbers of hours of league play Mon – Thur, 6pm – 10pm / Four to six hours on Saturday and four hours on Sunday for hockey games.- The Griffon Gliders Synchronized skating team and the New Generation Singers combined their individual talents into two spectacular Christmas shows.- Bode is on target to host more than four hundred parties this season August-May.- SJFSC will present their spring ice show “Wizard of Oz” May 8th and 9th, 2015- Pony Express Figure Skating Championship in September had over 215 competitors in the three day event.- Bode hosted the 3rd annual synchronized skating competition in November. Over four hundred competitors competed in the one day event. The Midwest Skating Council hosted the event.- St. Joseph Curling Club continues to grow.- Added an additional Learn to Skate program for the home school community of St. Joseph.- Implemented an additional Synchronized skating team of younger skaters. - Doubled the enrollment of Learn to Skate.- Started a Learn to Hockey Skate program that has generated additional revenue.
- Implement a Jr. Figure Skating Club through Bode Ice Arena as a feeder club to the St. Joseph Figure -Skating Club.- Form a recreational hockey league through Bode for Spring Hockey.- Continue to market the Learn to Skate Programs offered through the arena to different user groups.
7-17
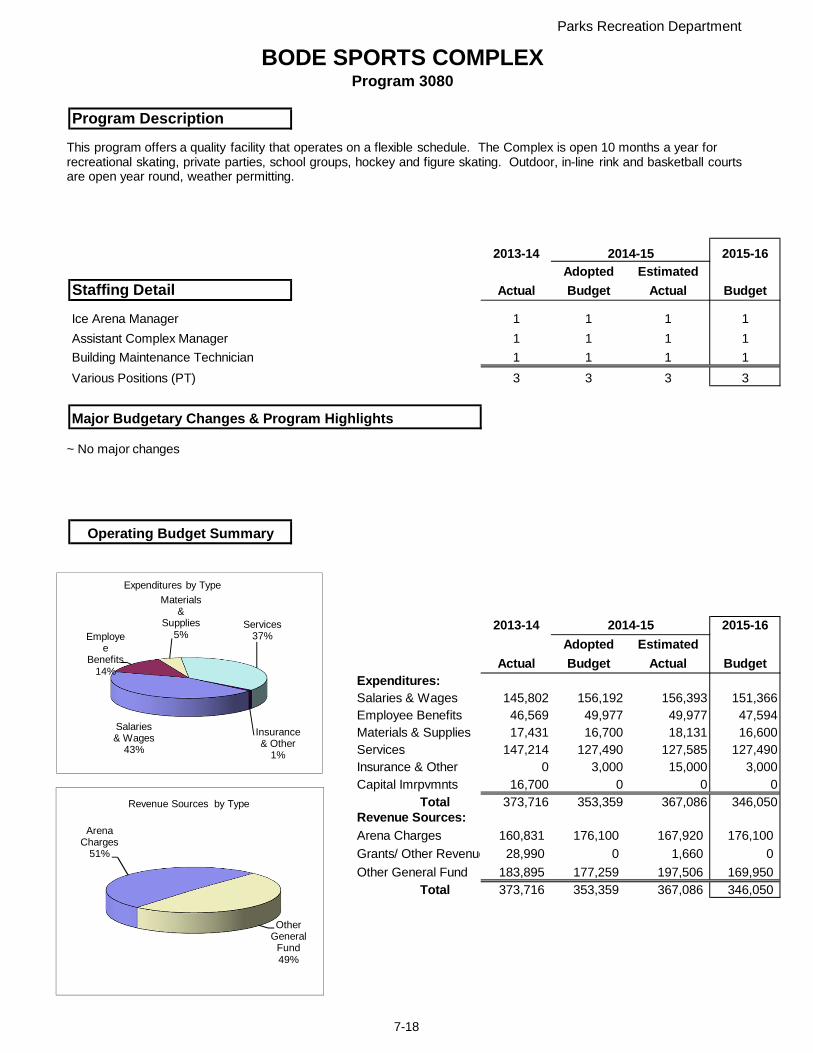
Parks Recreation Department
BODE SPORTS COMPLEXProgram 3080
Program Description
2013-14 2014-15 2015-16Adopted Estimated
Staffing Detail Actual Budget Actual Budget
Ice Arena Manager 1 1 1 1
Assistant Complex Manager 1 1 1 1
Building Maintenance Technician 1 1 1 1
Various Positions (PT) 3 3 3 3
Major Budgetary Changes & Program Highlights
Operating Budget Summary
2013-14 2014-15 2015-16Adopted Estimated
Actual Budget Actual BudgetExpenditures:Salaries & Wages 145,802 156,192 156,393 151,366Employee Benefits 46,569 49,977 49,977 47,594Materials & Supplies 17,431 16,700 18,131 16,600Services 147,214 127,490 127,585 127,490Insurance & Other 0 3,000 15,000 3,000Capital Imrpvmnts 16,700 0 0 0
Total 373,716 353,359 367,086 346,050Revenue Sources:Arena Charges 160,831 176,100 167,920 176,100
Grants/ Other Revenue 28,990 0 1,660 0
Other General Fund 183,895 177,259 197,506 169,950Total 373,716 353,359 367,086 346,050
Salaries & Wages
43%
Employee
Benefits14%
Materials &
Supplies5%
Services37%
Insurance & Other
1%
Expenditures by Type
Arena Charges
51%
Other General
Fund49%
Revenue Sources by Type
This program offers a quality facility that operates on a flexible schedule. The Complex is open 10 months a year for recreational skating, private parties, school groups, hockey and figure skating. Outdoor, in-line rink and basketball courts are open year round, weather permitting.
~ No major changes
7-18
Parks Concessions
Mission
Core Services
Current Year Activity/Achievements
Budget Challenges/Planned Initiatives
To provide outstanding customer service and a variety of menu options to users of the Parks Concessionsthroughout the city.
- Provide a clean and sanitary eating area and menu to users of Heritage Park, Bartlett Baseball fields, Hyde Complex, Hyde Pool, Remington Nature Center, Aquatic Park, Bode Ice Arena, Bode Sports Complex, Drake Complex, Noyes Tennis Courts, Keatley Center.- Keep facilities and grounds clean and well maintained within the Health Department Code.- Offer outstanding customer service to all users.- Employ over seventy seasonal part-time positions to the community.- Offer fair and responsible menu pricing.
‐ Continue to staff according to need and safety of employees.‐ All deliveries were made during the daylight hours to assure safety of staff.‐ Changed all cash registers to itemize products for better inventory control.‐ Operated a mobile concession site at the Keatley Center that offered service to the Parks, Recreation and Civic Facilities basketball program.‐ Opened a concession at Noyes Tennis Courts for a full season with great success.
- Continue to work with multiple vendors to achieve the maximum profit.- Working with the Health Department to establish a healthy eating initiative “Eat Smart in the Parks”. - Continue to strengthen the relationship with the CVB and Rec Supervisor in developing tournaments to utilize city facilities versus privately owned complexes.
7-19
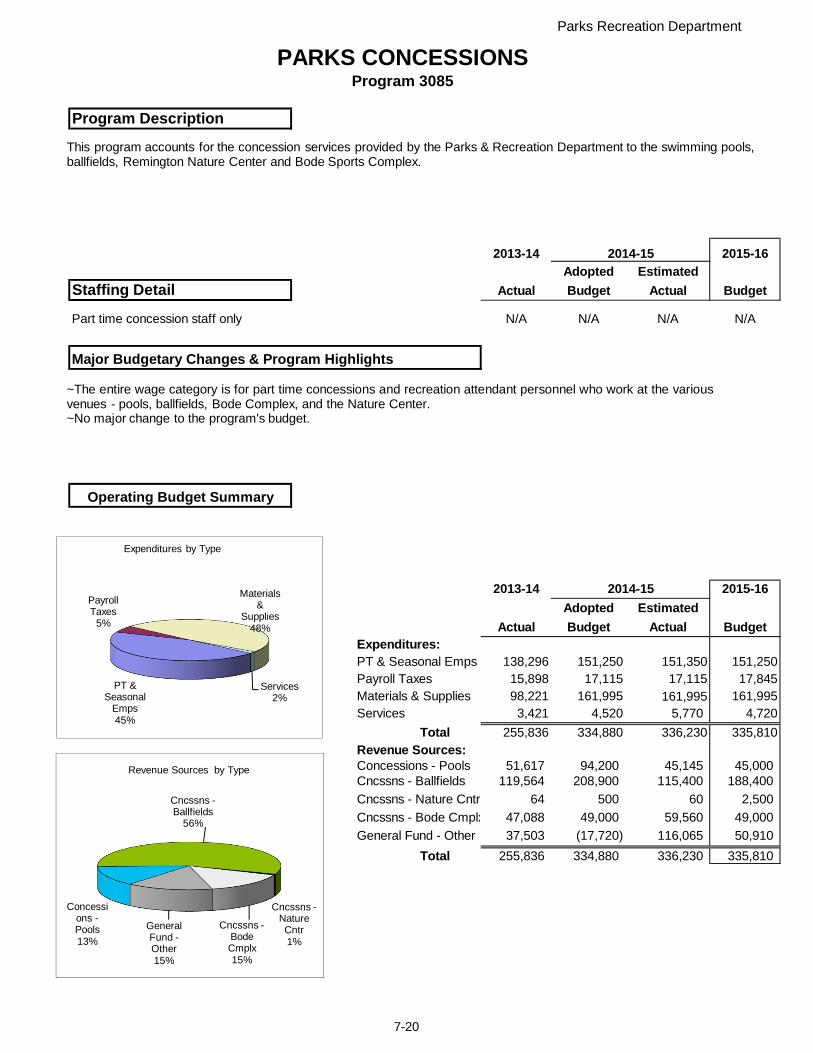
Parks Recreation Department
PARKS CONCESSIONSProgram 3085
Program Description
2013-14 2014-15 2015-16Adopted Estimated
Staffing Detail Actual Budget Actual Budget
Part time concession staff only N/A N/A N/A N/A
Major Budgetary Changes & Program Highlights
Operating Budget Summary
2013-14 2014-15 2015-16Adopted Estimated
Actual Budget Actual BudgetExpenditures:PT & Seasonal Emps 138,296 151,250 151,350 151,250Payroll Taxes 15,898 17,115 17,115 17,845Materials & Supplies 98,221 161,995 161,995 161,995Services 3,421 4,520 5,770 4,720
Total 255,836 334,880 336,230 335,810Revenue Sources:Concessions - Pools 51,617 94,200 45,145 45,000Cncssns - Ballfields 119,564 208,900 115,400 188,400
Cncssns - Nature Cntr 64 500 60 2,500
Cncssns - Bode Cmplx 47,088 49,000 59,560 49,000
General Fund - Other 37,503 (17,720) 116,065 50,910
Total 255,836 334,880 336,230 335,810
PT & Seasonal
Emps45%
Payroll Taxes
5%
Materials &
Supplies48%
Services2%
Expenditures by Type
Concessions -Pools13%
Cncssns -Ballfields
56%
Cncssns -Nature Cntr1%
Cncssns -Bode Cmplx15%
General Fund -Other15%
Revenue Sources by Type
This program accounts for the concession services provided by the Parks & Recreation Department to the swimming pools, ballfields, Remington Nature Center and Bode Sports Complex.
~The entire wage category is for part time concessions and recreation attendant personnel who work at the variousvenues - pools, ballfields, Bode Complex, and the Nature Center.~No major change to the program's budget.
7-20

Swimming
Mission
Core Services
Current Year Activity/Achievements
Performance Statistics: FY2013 FY2014Number of private pool rentals n/a 26Number of enrollees in swim lessons n/a 195Number of trained & certified life guards 80 60Number of Aquatic Park passes sold n/a 219
Budget Challenges/Planned Initiatives
To enable children and adults the enjoyment of recreational water activities, to provide a safe recreationalenvironment and to learn water safety skills that will last a lifetime.
- Supervise recreational swimming at the Aquatic Park and two neighborhood swimming pools.- Provide a family friendly swimming environment during the summer months- Swim lesson programming for ages 3 and up- Private rental and birthday party options available- Junior lifeguard, lifeguard training classes, and shallow water lifeguard
• Maintain three pools for approximately 65,000 participants and visitors a year.
- Increase hourly staff pay to retain experienced, quality employees, recruit new desired employees andhelp them offset the high cost of becoming certified and uniform expenses along with matching pay withjob duties- Budget for aging equipment replacement such as loungers, lifeguard stands, and mechanical equipment- Make repairs to well used facilities that have not had any major repairs in over 10 years and bring themup to current ADA standards- To begin discussions regarding the feasibility of the addition of an indoor aquatic center which will benecessary to ensure the sustainability of aquatics and aquatic programs for the City of St Joseph
7-21
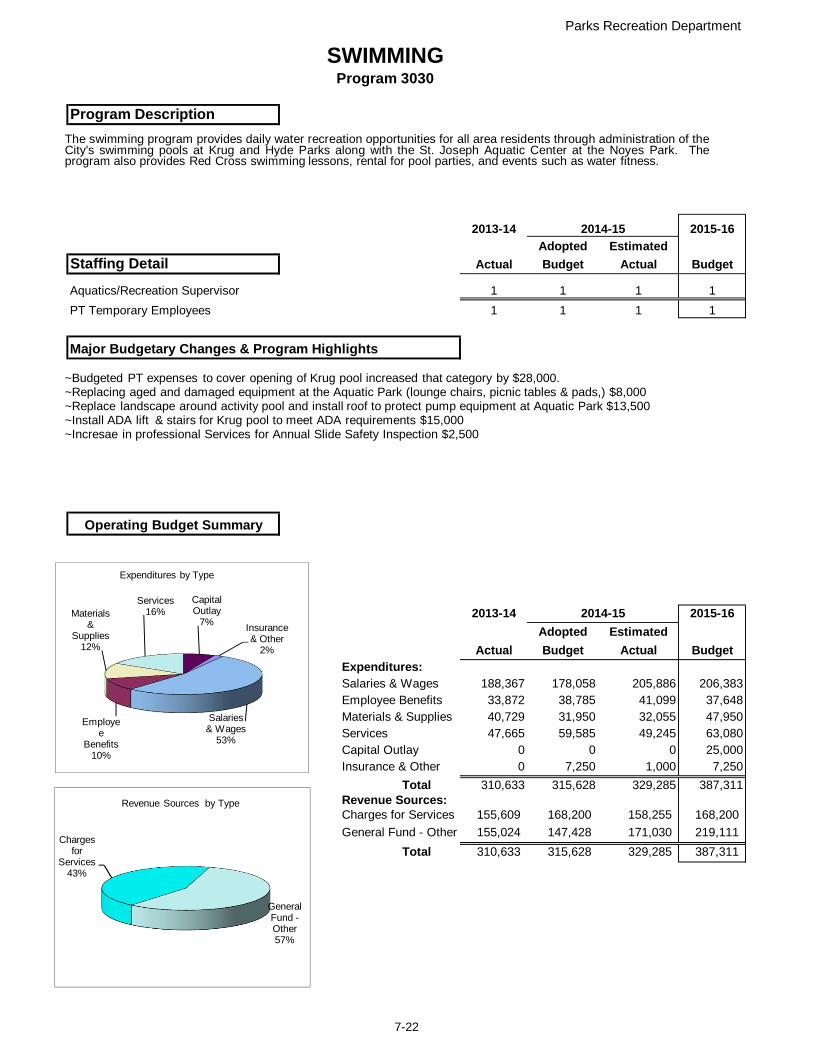
Parks Recreation Department
SWIMMINGProgram 3030
Program Description
2013-14 2014-15 2015-16Adopted Estimated
Staffing Detail Actual Budget Actual Budget
Aquatics/Recreation Supervisor 1 1 1 1
PT Temporary Employees 1 1 1 1
Major Budgetary Changes & Program Highlights
Operating Budget Summary
2013-14 2014-15 2015-16Adopted Estimated
Actual Budget Actual BudgetExpenditures:Salaries & Wages 188,367 178,058 205,886 206,383Employee Benefits 33,872 38,785 41,099 37,648Materials & Supplies 40,729 31,950 32,055 47,950Services 47,665 59,585 49,245 63,080Capital Outlay 0 0 0 25,000Insurance & Other 0 7,250 1,000 7,250
Total 310,633 315,628 329,285 387,311Revenue Sources:Charges for Services 155,609 168,200 158,255 168,200
General Fund - Other 155,024 147,428 171,030 219,111
Total 310,633 315,628 329,285 387,311
Salaries & Wages
53%
Employee
Benefits10%
Materials &
Supplies12%
Services16%
Capital Outlay
7%Insurance & Other
2%
Expenditures by Type
Charges for
Services43%
General Fund -Other57%
Revenue Sources by Type
The swimming program provides daily water recreation opportunities for all area residents through administration of theCity's swimming pools at Krug and Hyde Parks along with the St. Joseph Aquatic Center at the Noyes Park. Theprogram also provides Red Cross swimming lessons, rental for pool parties, and events such as water fitness.
~Budgeted PT expenses to cover opening of Krug pool increased that category by $28,000.~Replacing aged and damaged equipment at the Aquatic Park (lounge chairs, picnic tables & pads,) $8,000~Replace landscape around activity pool and install roof to protect pump equipment at Aquatic Park $13,500~Install ADA lift & stairs for Krug pool to meet ADA requirements $15,000~Incresae in professional Services for Annual Slide Safety Inspection $2,500
7-22
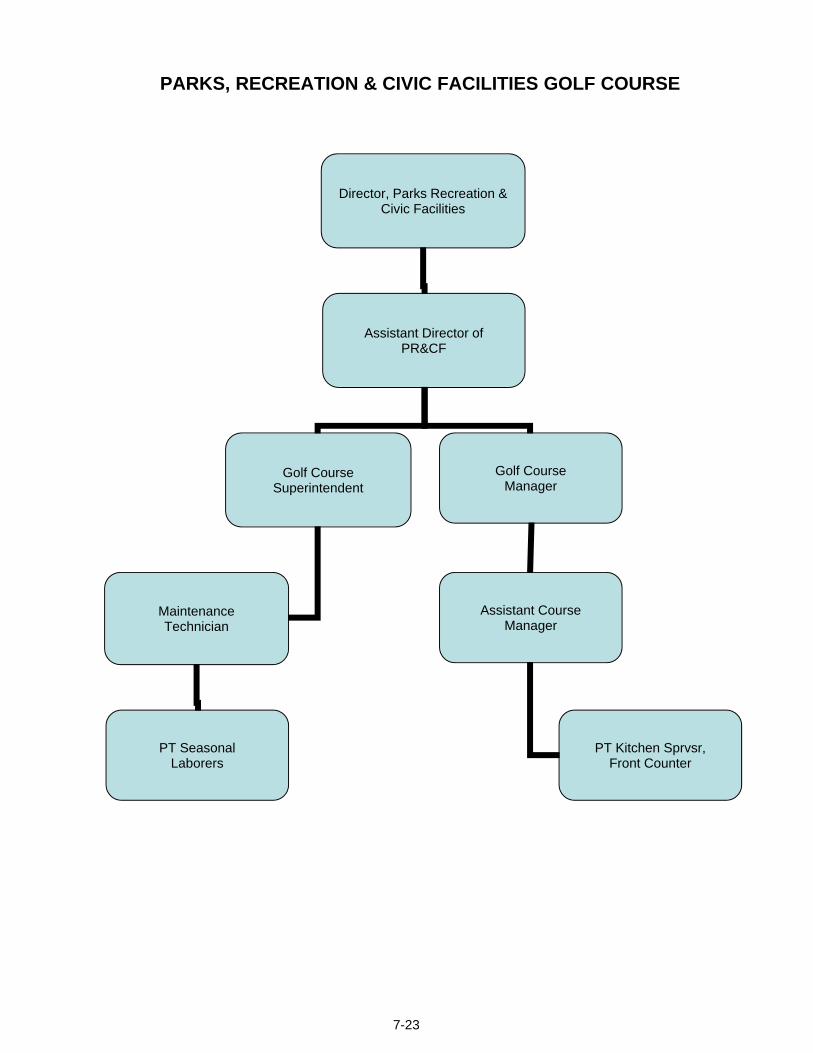
PARKS, RECREATION & CIVIC FACILITIES GOLF COURSE
Director, Parks Recreation & Civic Facilities
Assistant Director of PR&CF
Golf Course Superintendent
Maintenance Technician
Golf Course Manager
Assistant Course Manager
PT Kitchen Sprvsr, Front Counter
PT Seasonal Laborers
7-23
Fairview Municipal Golf Course
Mission
Core Services
Current Year Activity/Achievements
Budget Challenges/Planned Initiatives
To offer a competitive and enjoyable 18-hole golf environment and practice facility for St Joseph citizens as well as visitors through a manicured golf course, full service meeting/banquet room/concessions areas, and a fully stocked Merchandise Shop.
* The City’s only public 18 hole golf course* Club offers league and regular play for men, women, juniors, seniors, and couples as well as event play for corporate outings and fundraiser tournaments* Club offers a fully stocked Merchandise Shop for regular and gift certificate purchases* Meeting room and banquet space available as well as 3 outdoor patios* On-site concessions and catering services* Properly manicured golf course made consistent by adhering to daily, weekly, and other scheduled routines.* Maintain optimum turf performance through proper fertilization to greens, tees, and fairways; control and prevention of disease; aeration and seeding practices* Provide a clean and attractive clubhouse area with knowledgeable, courteous staff and concessions and catering for a full service experience* Provide quality food service with a clean and up-to-date facility and kitchen with properly trained staff
* In its third season the Wednesday Men’s League has increased to 104 participants each week for 15 weeks. Annual impact is estimated at $29,000 through golf/cart fees, concessions, and shop.* Another company has joined the Corporate Memberships Tier—Altec has 30 initial new members. Highland Community College has dropped out this year—all other companies have retained. This brings our annual membership in this category to 133 members.* Junior Program enrollment dropped from 50 participants in 2013 to 29 in 2014. This program is no longer in effect for 2015 due to less funding for Instructor through SJSD.* Banquet room has been a busy place this year hosting 59 events in eight months.* Maintenance Department has taken out several deteriorating trees this past winter. Areas will be reseeded and golf committee will analyze later in season if replacement trees need planted.* Wetter season has allowed for several thousand dollars being saved in water utility expense.* A new cart path from west cart shed entrance to area in front of clubhouse has been completed. This allows a much safer route to journey carts back and forth and also less wear and tear on them.
* Raising annual memberships did not happen this year after evaluating current rates elsewhere. To stay competitive we kept rates the same.* Finding new revenue sources especially in the off season months of golf becomes even more important to justify remaining fully open during winter months. We hope to purchase a golf simulator next season to bring in revenue through these slower times that will host leagues, open range, and open course play in a virtual atmosphere which will also increase concessions. * Finding a way to interest young golfers has been introduced through mini camps provided by MWSU and their golf instructors. They will now just pay a fee to use the different areas of golf course/facility per camper. This will benefit each camper with Professional instruction through the college’s PGA Professional.* Equipment is currently up to date for maintenance. * Several areas of cart path are currently in poor shape. We plan to reshape some areas back into grass areas to eliminate paths all together and make playable area. We also plan to budget for select areas to be taken out and sections of new concrete path installed.
7-24

Parks Recreation Department
FAIRVIEW MUNICIPAL GOLF COURSEProgram 3070
Program Description
2013-14 2014-15 2015-16Adopted Estimated
Staffing Detail Actual Budget Actual Budget
Golf Course Superintendent 1 1 1 1
Golf Course Manager 1 1 1 1
Golf Course Assistant Manager 1 1 1 1
Maintenance Technician 1 1 1 1
Part-time 3.25 3.25 3.25 3.25
7.25 7.25 7.25 7.25
Major Budgetary Changes & Program Highlights
Operating Budget Summary
2013-14 2014-15 2015-16Adopted Estimated
Actual Budget Actual BudgetExpenditures:Salaries & Wages 303,388 324,480 326,433 341,669Employee Benefits 74,923 83,192 82,353 78,801Materials & Supplies 218,910 186,900 194,000 186,900Services 184,455 131,400 103,315 135,900Other Charges 57,782 72,457 72,457 64,105Capital Outlay 0 12,000 15,000 16,745
Total 839,458 810,429 793,558 824,120Revenue Sources:Chrg for Golf Services 779,212 819,585 797,889 888,895
Trf from General Fund 60,245 0 0 0
(To)/From Golf FB 1 (9,156) (4,331) (64,775)Total 839,458 810,429 793,558 824,120
Salaries & Wages
41%
Employee Benefits
10%
Materials &
Supplies23%
Services16%
Other Charges
8%Capital Outlay
2%
Expenditures by Type
Fairview Golf Course, the City's only public course, offers a competitive and enjoyable golf environment and practice facility for St. Joseph citizens as well as visitors through leagues, clubs and other programs for men, women, seniors and juniors.
~Major changes for the Golf Course program comes from the addition of the Golf Simulator amenity which will provideopportunities for indoor golf activity during the offseason and for special occasions. Revenues (over $75,000) areprojected to more than offset the initial cost:
- Golf Simulator equipment, $16,745- Staff hours to help monitor the winter leagues, open play and open range time on the simulator, $12,000- Advertising golf simulator amenity, $4,500
~Salary & Wages category also reflects the impact of the 27th payroll and a 1.5% COLA.
Chrg for Golf
Services100%
Revenues By Type
7-25
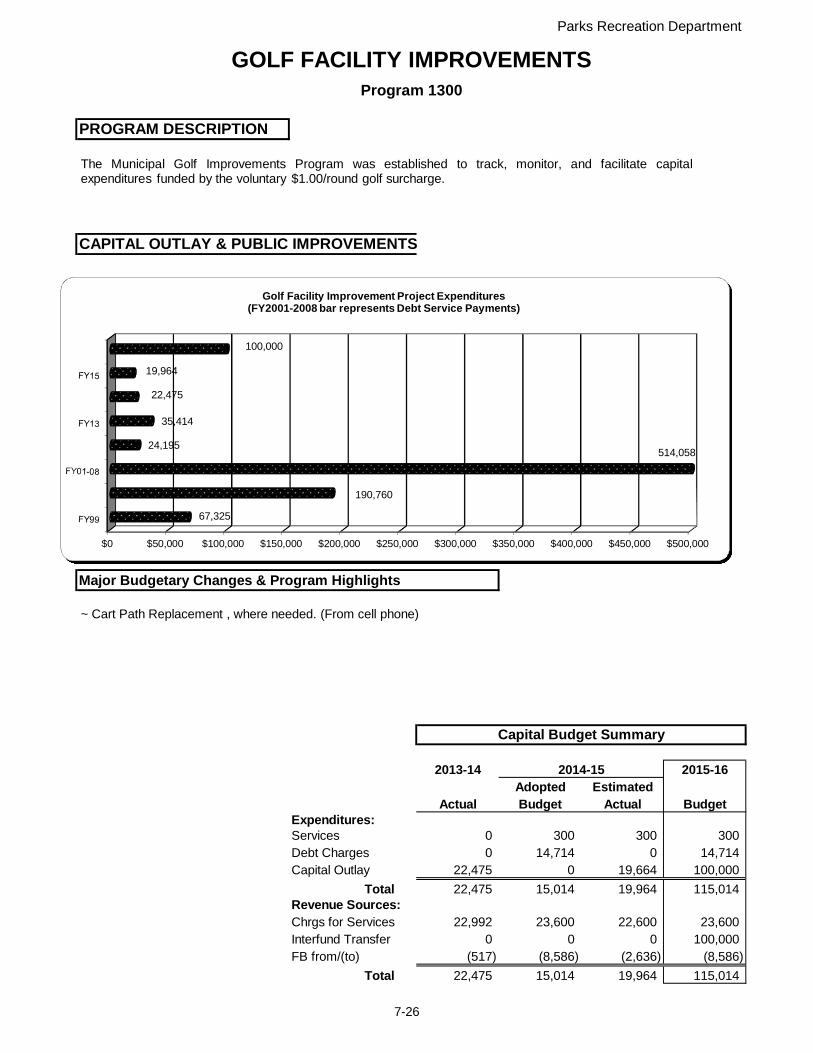
Parks Recreation Department
GOLF FACILITY IMPROVEMENTSProgram 1300
PROGRAM DESCRIPTION
CAPITAL OUTLAY & PUBLIC IMPROVEMENTS
Major Budgetary Changes & Program Highlights
Capital Budget Summary
2013-14 2014-15 2015-16Adopted Estimated
Actual Budget Actual BudgetExpenditures:Services 0 300 300 300Debt Charges 0 14,714 0 14,714Capital Outlay 22,475 0 19,664 100,000
Total 22,475 15,014 19,964 115,014Revenue Sources:Chrgs for Services 22,992 23,600 22,600 23,600Interfund Transfer 0 0 0 100,000FB from/(to) (517) (8,586) (2,636) (8,586)
Total 22,475 15,014 19,964 115,014
$0 $50,000 $100,000 $150,000 $200,000 $250,000 $300,000 $350,000 $400,000 $450,000 $500,000
67,325
190,760
514,05824,195
35,414
22,475
19,964
100,000
Golf Facility Improvement Project Expenditures(FY2001-2008 bar represents Debt Service Payments)
The Municipal Golf Improvements Program was established to track, monitor, and facilitate capitalexpenditures funded by the voluntary $1.00/round golf surcharge.
~ Cart Path Replacement , where needed. (From cell phone)
7-26

PARKS & RECREATION - CIVIC FACILITIES
Director, Parks Recreation & Civic
Facilities
Assistant Director of
Senior Center
CAFC Manager
Nature Center
AdminTechnician
Building Maint.
Clerk PT
Senior Account
Building Maint.
Cook, Cooks
Arena Operations
Arena Coordinato
Maintenance
Concession Staff PT
7-27

Remington Nature CenterMission
Core Services
Current Year Activity/Achievements
To inspire visitors to learn more about human impacts on the Earth, and instill a desire to be a positive steward for ourworld through programming and hands-on experiences concerning nature and the cultural heritage of the St. Josepharea for our citizens and for tourists.
* 13,000 square foot facility, located on the Missouri River* Open 356 days per year, including several holidays such as Memorial Day, Independence Day, and Labor Day* Showcase a variety of exhibits focusing on nature, and its relationship to our changing civilizations:
Aviary with eight unique varieties of birds7,000-gallon aquarium of native fish, including Lake and Shovelnose sturgeonReplica woolly mammoth and calfThousands of authentic Native American and Civil War artifactsBarbed wire display, with over 250 unique examples of patented wireRock and fossil displaysTaxidermy animals such as opossum, beaver, puma, black bear and bobcat
* Programming available for all ages in three categories: nature crafts, recreation education, and cultural history* Conference room space for meetings and special events* Memberships available, with a quarterly newsletter for members* Monthly email blasts to members, and approximately 395 email contacts * Four different types of birthday packages available * Indoor and outdoor dining areas* Special events and activities year-round including crafts and programming* Gift shop with hundreds of unique items
* Partnered with Bode Ice Arena to create a “Recreation Education” program package for schools and groups. * Gained additional followers to the Remington Nature Center Facebook page, and strengthened our presence on social media. We currently have over 1,200 friends on Facebook, as of print date. * Partnered with Creatures by Theresa to offer two additional birthday party packages. * We are now able to “theme” our birthday packages so participants can have a customized party. * The Parks Department managers are now meeting once a month to discuss challenges and successes within our divisions, as well as keeping each other up-to-date about events and activities. These meetings have proven to be beneficial and insightful. The Remington Nature Center will continue to attend these meetings. * Replaced heavy conference room chairs with lighter, fold-up chairs that are much easier to move and store. This has drastically cut down on maintenance overtime hours when we clean and set the room for rentals and groups. * Enhanced grounds by adding trees, mulch, planters, bird feeders, etc. Implemented most of these features with donated materials and volunteer assistance.* Hosted an average of 52 separate schools during April-June. The following is a sampling: Gallatin Kindergarten, Kearney 3rd Grade, West Platte 2nd Grade, Truman Middle School, North Kansas City Elementary Schools, and Atchison Kindergarten.* Participated in a variety of outreach opportunities off-property. The following is a sampling: Earth Day at the State Capital(April 2015), Amelia Earhart Festival in Atchison, Kansas, Tails West Children’s Craft Tent (2015) Children's Fair booth at the Civic Arena, Eagle Days at Squaw Creek National Wildlife Refuge, North Side Head Start programs, Downtown Rotary Club program, Carriage Square Health Care Center (with Remi the Woolly Mammoth), Living Community program, and programs for Kansas City’s Mid-Continent Library branches. * The Remington Nature Center is a member of the Museums Association of St. Joseph. Nature Center Manager Andrea McCoy is president of the Museums Association. * Website kept up-to-date and current with events and information. * Changed all lighting in the town area to LED, in an effort to conserve energy.* Updated many of our displays with the addition of numerous taxidermy animals on long-term loan from the Andrew County Museum, Savannah, MO. * The Remington Nature Center will receive complimentary press in the April 2015 edition of “Missouri Life” magazine.* Rotated window displays with several new exhibits throughout the year with displays from Chase Candy Company, Stetson, and Hillyard, among others. These displays highlight the history and longevity of local businesses in St. Joseph. * Obtained new taxidermy mounts including a Great Blue Heron, full deer mount, Barred Owl and Kingfisher, among others. Many of these mounts were donated, or heavily discounted, for the Remington Nature Center. * Updated reference room into a more useable space, “Kid’s Corner.” We painted the walls, moved the reference books into the back office area and added features such as children’s books, educational puzzles and games for the kids to do in this new space. The room is being used much more frequently by our guests. Adult educational books and resources are still able to be viewed and checked out.
7 -28
Budget Challenges/Planned Initiatives* Increase conference room fees to supplement budget. Fees will change 7/1/15 and will also include touring the nature center, which will make rentals less confusing for both our staff and guests. The fees have not been raised since opening in2008, and are in need of increase immediately. * We would like to forgo the donation line in our budget (Line item 5060). People are hesitant to donate to us, as we are a City Facility, and they know that any donations made will go into the General Fund, and will not benefit the nature center directly. * We would also like to reduce what is expected from memberships. Our admission fee is very low, ($3 for adults, $2 for
seniors, and $1 for kids, and free for children 3 and under). We offer many things for them to see and do while they are here, and the admission prices have not changed since we opened in 2008. If we are not going to increase our admission prices, it seems fruitless to push and promote memberships. We would like to keep memberships as an option, but not do a yearly membership drive, and lower our budget projections for memberships. * We need to hire an educator to work 21 hours a week, specifically and solely to handle the requests for programs and
outreach. We need this position to meet growing requests for formal educational programs, as well as general outside promotion of the Remington Nature Center. * Give additional hours/benefit package to Front Desk Clerk Beth Downey to bring her up to 29/30 hours a week, as we as
are becoming increasingly busier year-round. Beth also maintains our grounds and gardens, as well as maintenance of exhibits, and front desk duties. * Repair leaking water display and compensate in some fashion for the lack of hologram theatre system, with the
assistance of Parks Department employees. * Get additional feedback and insight from department director regarding the Remington Nature Center. We would
appreciate more of a consistent presence from our Director as we move forward. * Continue to explore, and find a solution for the lack of parking lot lighting. We currently have no parking lot lights and this
makes us unable to rent after hours during much of the year, as the parking area is dark and unsafe for our guests. We would like to gain perimeter lighting, solar lighting, or another option so we can host more events, book rentals, and make the overall area safer after business hours. * Continue to enhance the grounds with the addition of perennial trees, shrubs, and plantings; we will utilize volunteer
manpower as much as possible. * The building is over seven years old; we are actively working to hold off signs of typical wear-and-tear with continuous
cleaning, painting, and updating. We will continue to work with Parks Department staff to make improvements and changes at the lowest costs possible, which will enhance our building from fixtures and displays, to exhibits. * Continue to cross-train employees so they feel comfortable doing a variety of different tasks, from programming to exhibit
maintenance. * Continue, build upon, and expand our extremely successful programming, monthly special events for children, and
birthday party packages. * Continue our relationships and partnerships with Missouri Department of Conservation, Missouri Department of Natural
Resources, and the National Park Service through collective outreach and collaborations during public events. * Create a new brochure in 2015/2016, when copies of our current brochure are gone.
Where They Come From and What They Say…Visitors come from all 50 states, as well as countries such as Canada, Germany, Korea, South Africa, Wales, France and
Norway, just to mention a few. “We love our trips to the Nature Center! One of our favorite places! Thank you!”“This place is really cool!!!”“We love this place, can’t wait to return again.” – Tim C., Jessica G. & Carson
7 -29
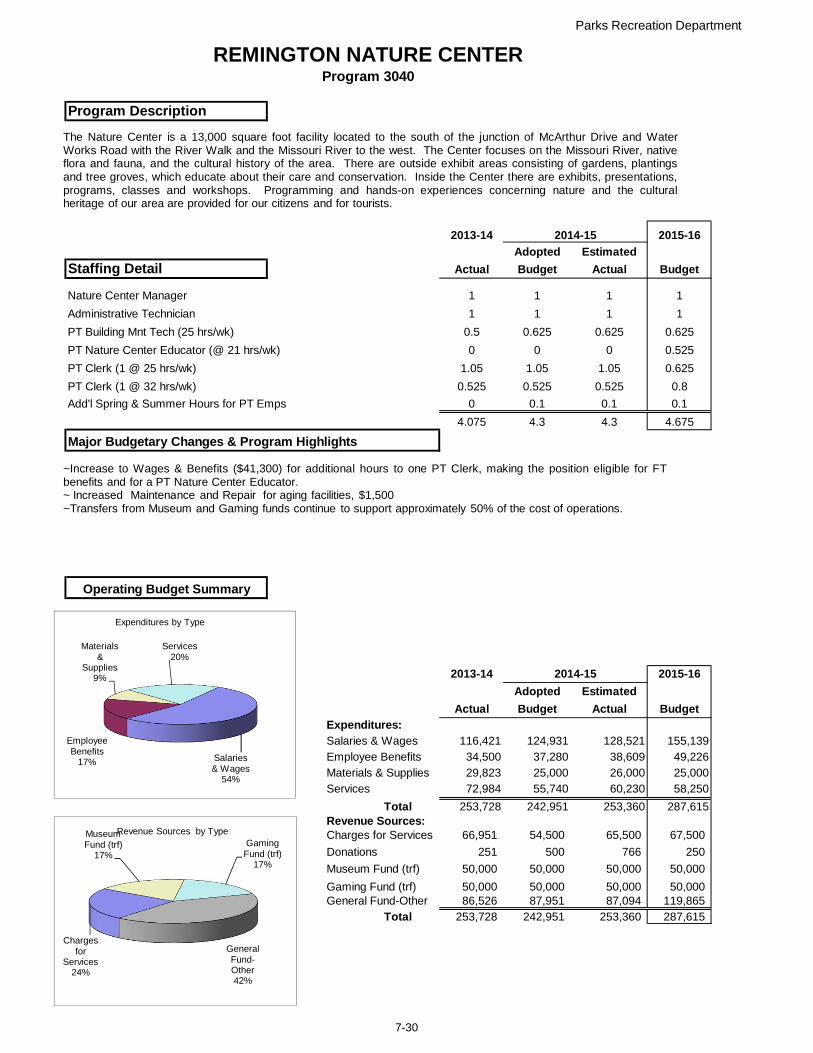
Parks Recreation Department
REMINGTON NATURE CENTERProgram 3040
Program Description
2013-14 2014-15 2015-16Adopted Estimated
Staffing Detail Actual Budget Actual Budget
Nature Center Manager 1 1 1 1
Administrative Technician 1 1 1 1
PT Building Mnt Tech (25 hrs/wk) 0.5 0.625 0.625 0.625
PT Nature Center Educator (@ 21 hrs/wk) 0 0 0 0.525
PT Clerk (1 @ 25 hrs/wk) 1.05 1.05 1.05 0.625
PT Clerk (1 @ 32 hrs/wk) 0.525 0.525 0.525 0.8
Add'l Spring & Summer Hours for PT Emps 0 0.1 0.1 0.1
4.075 4.3 4.3 4.675
Major Budgetary Changes & Program Highlights
Operating Budget Summary
2013-14 2014-15 2015-16Adopted Estimated
Actual Budget Actual BudgetExpenditures:Salaries & Wages 116,421 124,931 128,521 155,139Employee Benefits 34,500 37,280 38,609 49,226Materials & Supplies 29,823 25,000 26,000 25,000Services 72,984 55,740 60,230 58,250
Total 253,728 242,951 253,360 287,615Revenue Sources:Charges for Services 66,951 54,500 65,500 67,500
Donations 251 500 766 250
Museum Fund (trf) 50,000 50,000 50,000 50,000
Gaming Fund (trf) 50,000 50,000 50,000 50,000General Fund-Other 86,526 87,951 87,094 119,865
Total 253,728 242,951 253,360 287,615
Salaries & Wages
54%
Employee Benefits
17%
Materials &
Supplies9%
Services20%
Expenditures by Type
Charges for
Services24%
Museum Fund (trf)
17%Gaming Fund (trf)
17%
General Fund-Other42%
Revenue Sources by Type
The Nature Center is a 13,000 square foot facility located to the south of the junction of McArthur Drive and WaterWorks Road with the River Walk and the Missouri River to the west. The Center focuses on the Missouri River, nativeflora and fauna, and the cultural history of the area. There are outside exhibit areas consisting of gardens, plantingsand tree groves, which educate about their care and conservation. Inside the Center there are exhibits, presentations,programs, classes and workshops. Programming and hands-on experiences concerning nature and the culturalheritage of our area are provided for our citizens and for tourists.
~Increase to Wages & Benefits ($41,300) for additional hours to one PT Clerk, making the position eligible for FTbenefits and for a PT Nature Center Educator.~ Increased Maintenance and Repair for aging facilities, $1,500~Transfers from Museum and Gaming funds continue to support approximately 50% of the cost of operations.
7-30

Joyce Raye Patterson Senior Center
Mission
Core Services
Current Year Activity/AchievementsPerformance Statistics: FY2013 FY2014 FY2015
n/a 4,236 4,222Dance sessions attendance n/a 8,330 7,423Fitness Center memberships n/a 790 800Total attendance at the Center 66,626 65,879 60,936
Ages of Senior Center participants range from 50 years to 95 years
Budget Challenges/Planned Initiatives
Attendance at computer users group, blood pressure monitoring & other special groups
Provide a variety of services to persons age 50 and over, and to the disabled in a well maintained, clean, cheerfuland healthy environment in order to increase the overall health status of persons 50+ and to enhance the quality oflife for our citizens.
- Administer the financial, operational budgets of the Center.- Services include card groups, craft activities, dances, special events, meeting space, retirement associationmeetings, a computer lab.- Provide a fitness center geared towards persons 50+ emphasizing strength, safety, and cardiovascular training,with training provided through an instructor from the Shape Shoppe.- Provide a cafeteria (Tuesday-Friday), offering lunches open to the public with lunches offered at a reasonableprice.
- A major challenge is the need to rehabilitate the restrooms at the Senior Center. Pipes are breaking and leaking.The last time the restrooms were rehabilitated was in 1997-98. Paid for by the Senior Citizens Foundation, Inc. Atthat time, the pipes were not replaced. An architect, hired in FY2014, estimated the work would cost approximately$126,000 for all 5 restrooms. The Senior Citizens Foundation, Inc. does not feel that the restrooms are theirresponsibility at this time. This will be a challenge to find funding for this much needed project.- Solar panels need to be added to the center to reduce energy consumption. Specifications have been requestedby Engineering.- Bulbs and ballasts need to be replaced. One fixture was replaced through engineering.- Ice machine need to be replaced after about 27 years. It was owned not rented. The ice machine is now rentedcosting $100 per month. Many of our user groups use ice from our machine. Also, our cafeteria depends on icefrom this machine.
7-31
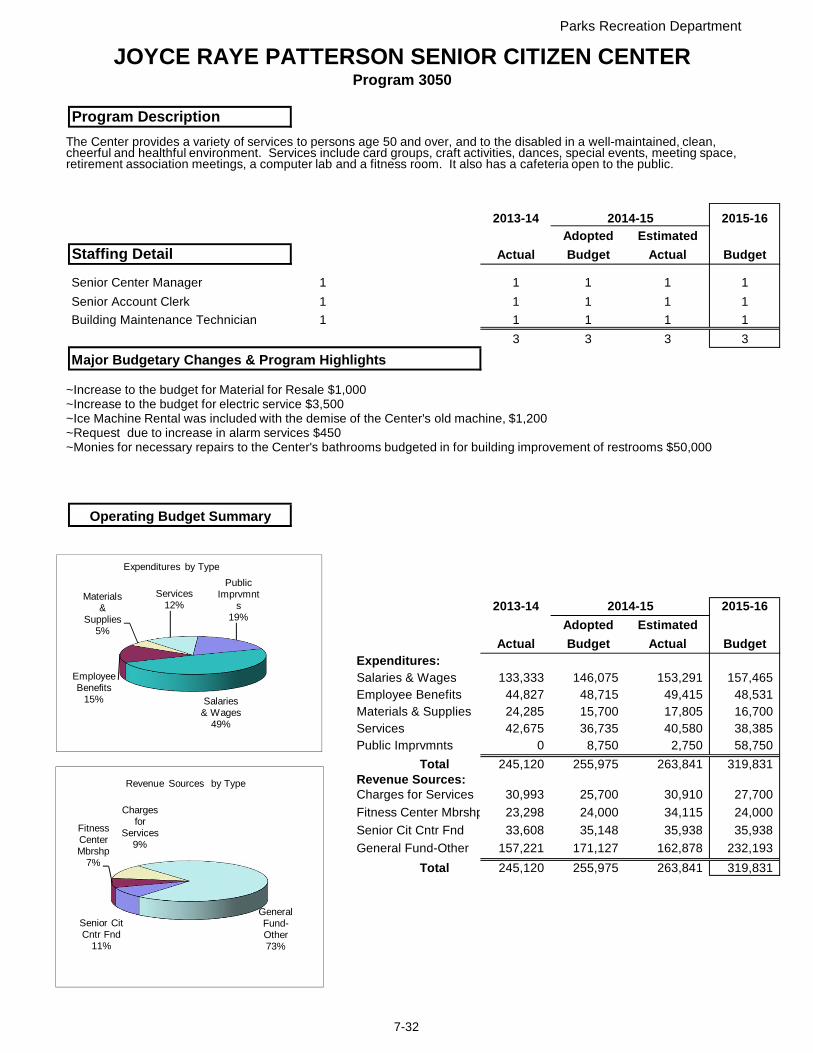
Parks Recreation Department
JOYCE RAYE PATTERSON SENIOR CITIZEN CENTERProgram 3050
Program Description
2013-14 2014-15 2015-16Adopted Estimated
Staffing Detail Actual Budget Actual Budget
Senior Center Manager 1 1 1 1 1
Senior Account Clerk 1 1 1 1 1
Building Maintenance Technician 1 1 1 1 1
3 3 3 3
Major Budgetary Changes & Program Highlights
Operating Budget Summary
2013-14 2014-15 2015-16Adopted Estimated
Actual Budget Actual BudgetExpenditures:Salaries & Wages 133,333 146,075 153,291 157,465Employee Benefits 44,827 48,715 49,415 48,531Materials & Supplies 24,285 15,700 17,805 16,700Services 42,675 36,735 40,580 38,385Public Imprvmnts 0 8,750 2,750 58,750
Total 245,120 255,975 263,841 319,831Revenue Sources:Charges for Services 30,993 25,700 30,910 27,700
Fitness Center Mbrshp 23,298 24,000 34,115 24,000
Senior Cit Cntr Fnd 33,608 35,148 35,938 35,938
General Fund-Other 157,221 171,127 162,878 232,193
Total 245,120 255,975 263,841 319,831
Salaries & Wages
49%
Employee Benefits
15%
Materials &
Supplies5%
Services12%
Public Imprvmnt
s19%
Expenditures by Type
Charges for
Services9%
Fitness Center Mbrshp
7%
Senior Cit Cntr Fnd
11%
General Fund-Other73%
Revenue Sources by Type
The Center provides a variety of services to persons age 50 and over, and to the disabled in a well-maintained, clean, cheerful and healthful environment. Services include card groups, craft activities, dances, special events, meeting space, retirement association meetings, a computer lab and a fitness room. It also has a cafeteria open to the public.
~Increase to the budget for Material for Resale $1,000~Increase to the budget for electric service $3,500~Ice Machine Rental was included with the demise of the Center's old machine, $1,200~Request due to increase in alarm services $450~Monies for necessary repairs to the Center's bathrooms budgeted in for building improvement of restrooms $50,000
7-32
Civic Center Arena and Concessions
Mission
Core Services
Current Year Activity/Achievements
Budget Challenges/Planned Initiatives
To enhance the local economy and contribute to the overall appeal of St. Joseph as a destination for bothlocal and outside business and tourist trade and entertainment by providing a downtown facility that hostsconcerts, banquets, trade shows, sporting events, conventions, graduations, family shows, dance recitalsand other special events.
• 40,000 square feet of unobstructed exhibition space for trade shows.• Provides venue for sporting events that include wrestling, basketball, roller derby, bullriding, mixed martial arts and zumba.• Provides facility for receptions, banquets, conventions, training and parties.• Concessions for event vendors and patrons.• Family entertainment facility for events such as dog shows, chili challenge and circus.
- Work to continue increase in NEW promoters/corporate usage of facility- Liberty National's Youth Wrestling Tournament came to St. Joseph from Municipal Auditorium for the second year and has booked for the third year.- Fourth Season for BlackSnake Roller Derby Girls - featuring four local teams- Dance Recital with Darcee’s School of Dance- St. Joseph Distributing Trade Show- SJSD Convocation & SJSD Basketball Jamboree- Bacon Fest First Annual event was a success and have booked for the 2nd Annual- Ludacris in concert and Christian concert- Three (3) Youth Wrestling Tournaments- Various Trade Shows which included Sports/Guns/Antique/Farm/Holiday Mart/Josephine Expo/Career Fair/Children’s Fair/Hiawatha Implement/Home Show- Numerous training dates- Hillcrest Transitional Housing hosted the Fall Ball and have been chosen to book their 2nd Annual Fall Ball as did Special Olympics Piccadilly Ladies Night Out- Pony Express Gymnastics returned after several years off- Boehringer Ingelheim Animal employee meeting- Another new event included Healthy Home Summit
- Continue to add more diverse events that will fit well with our facility.- Compile package deals to assist promoters, companies to bring their event to the Civic Arena.- Continue to develop deeper relationships with promoters showing them their event can be successful inSt. Joseph and specifically at the Civic Arena.
7-33
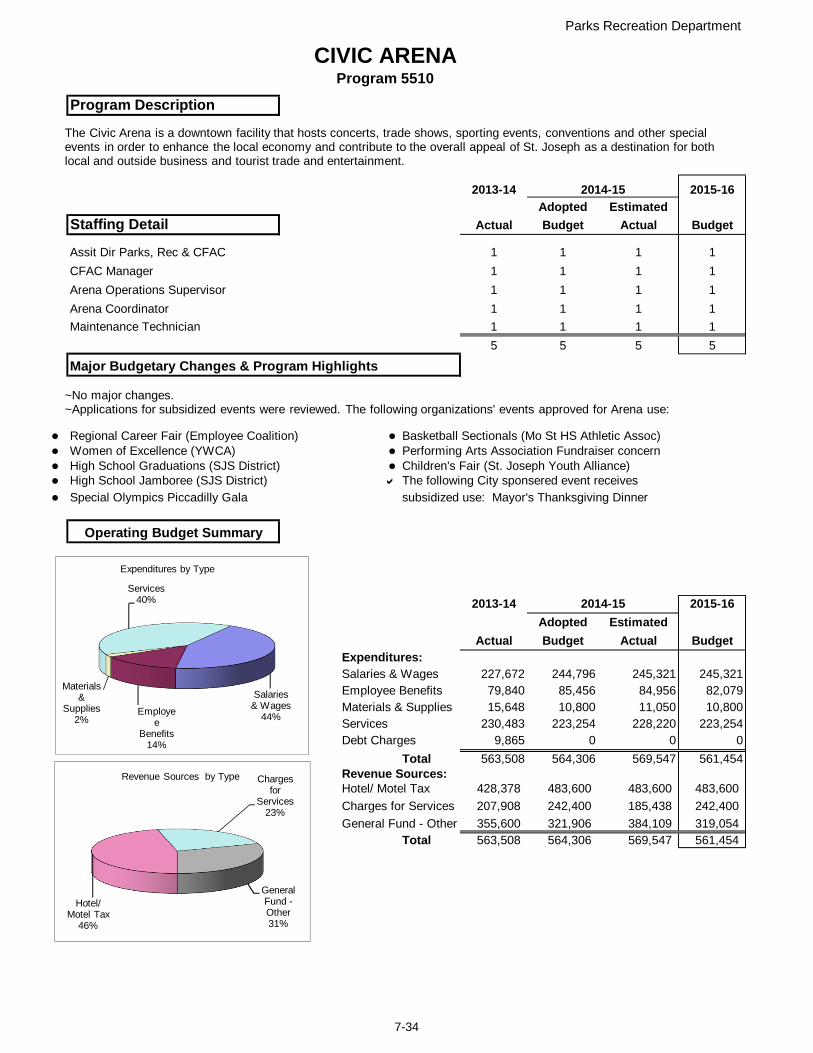
Parks Recreation Department
CIVIC ARENAProgram 5510
Program Description
2013-14 2014-15 2015-16Adopted Estimated
Staffing Detail Actual Budget Actual Budget
Assit Dir Parks, Rec & CFAC 1 1 1 1
CFAC Manager 1 1 1 1
Arena Operations Supervisor 1 1 1 1
Arena Coordinator 1 1 1 1
Maintenance Technician 1 1 1 1
5 5 5 5
Major Budgetary Changes & Program Highlights
Regional Career Fair (Employee Coalition) Basketball Sectionals (Mo St HS Athletic Assoc) Women of Excellence (YWCA) Performing Arts Association Fundraiser concern High School Graduations (SJS District) Children's Fair (St. Joseph Youth Alliance) High School Jamboree (SJS District) The following City sponsered event receives Special Olympics Piccadilly Gala subsidized use: Mayor's Thanksgiving Dinner
Operating Budget Summary
2013-14 2014-15 2015-16Adopted Estimated
Actual Budget Actual BudgetExpenditures:Salaries & Wages 227,672 244,796 245,321 245,321Employee Benefits 79,840 85,456 84,956 82,079Materials & Supplies 15,648 10,800 11,050 10,800Services 230,483 223,254 228,220 223,254Debt Charges 9,865 0 0 0
Total 563,508 564,306 569,547 561,454Revenue Sources:Hotel/ Motel Tax 428,378 483,600 483,600 483,600
Charges for Services 207,908 242,400 185,438 242,400
General Fund - Other 355,600 321,906 384,109 319,054Total 563,508 564,306 569,547 561,454
Salaries & Wages
44%Employee
Benefits14%
Materials &
Supplies2%
Services40%
Expenditures by Type
Hotel/ Motel Tax
46%
Charges for
Services23%
General Fund -Other31%
Revenue Sources by Type
The Civic Arena is a downtown facility that hosts concerts, trade shows, sporting events, conventions and other special events in order to enhance the local economy and contribute to the overall appeal of St. Joseph as a destination for both local and outside business and tourist trade and entertainment.
~No major changes.~Applications for subsidized events were reviewed. The following organizations' events approved for Arena use:
7-34
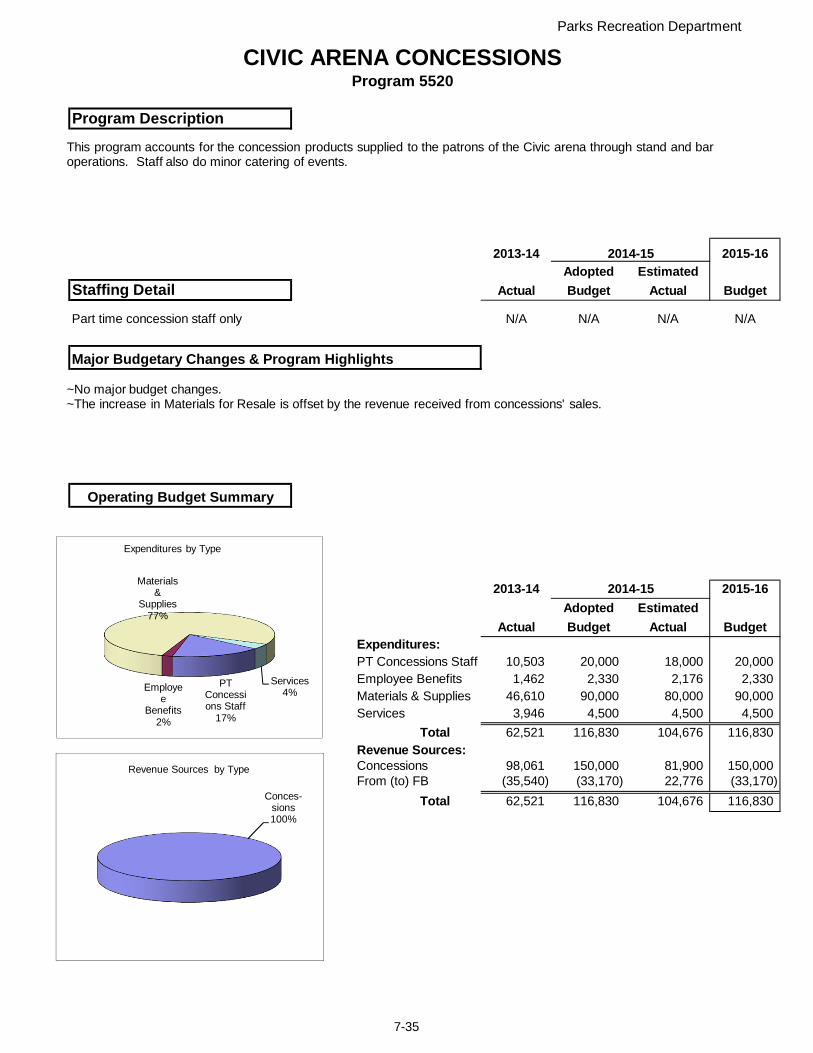
Parks Recreation Department
CIVIC ARENA CONCESSIONSProgram 5520
Program Description
2013-14 2014-15 2015-16Adopted Estimated
Staffing Detail Actual Budget Actual Budget
Part time concession staff only N/A N/A N/A N/A
Major Budgetary Changes & Program Highlights
Operating Budget Summary
2013-14 2014-15 2015-16Adopted Estimated
Actual Budget Actual BudgetExpenditures:PT Concessions Staff 10,503 20,000 18,000 20,000Employee Benefits 1,462 2,330 2,176 2,330Materials & Supplies 46,610 90,000 80,000 90,000Services 3,946 4,500 4,500 4,500
Total 62,521 116,830 104,676 116,830Revenue Sources:Concessions 98,061 150,000 81,900 150,000From (to) FB (35,540) (33,170) 22,776 (33,170)
Total 62,521 116,830 104,676 116,830
PT Concessions Staff
17%
Employee
Benefits2%
Materials &
Supplies77%
Services4%
Expenditures by Type
Conces-sions100%
Revenue Sources by Type
This program accounts for the concession products supplied to the patrons of the Civic arena through stand and bar operations. Staff also do minor catering of events.
~No major budget changes.~The increase in Materials for Resale is offset by the revenue received from concessions' sales.
7-35
Missouri Theater
Mission
Core Services
Current Year Activity/Achievements
Budget Challenges/Planned Initiatives
To provide a home to many of the City's arts associations and to serve as a venue for a wide variety ofcultural events.
- The Missouri Theater is a renovated 1926 vaudeville style entertainment venue in the heart of downtown St. Joseph.- The Missouri Theater has 1,200 seats and the inside is gorgeously designed unlike any other facility.- Rental facility for local arts organizations as well as other local and non-local promoters to produce theatrical productions, touring groups, concerts, dance recitals and group event rentals.- Provide office/retail space in the office complex for numerous arts organizations, downtown partnership and two local small businesses, including Pony Expresso and A to Z FreshAir Fare.- Missouri Theater is on the National Registry of Historic Buildings
- Local Company Productions of Hairspray, Spamalot, White Christmas, Tarzan, Street Car Named Desire.- Touring Companies that included Rich Litte, Country Gold Tour, Texas Gypies, One Hundred Years of Broadway, TSO, Cantus, Ailey II, In the Mood.- Four Local Dance Companies presenting their dance recitals.- Various graduations and art performances including St Joseph Symphony concert series, New Generation Singers, and Creative Arts Productions.-Major CIP renovations to the stage area.- We do have all office locations filled and open for business.
- Continue to expand marketing of the Missouri Theater through a Missouri Theater website based out the Allied Arts Council office, the City’s website and access channel and bi-weekly publications, the Civic Facilities Calendar of Events, and work diligently with the Convention and Visitors Bureau.- The Missouri Theater is a 1926 facility and with that comes a multitude of maintenance and upkeep challenges that we deal with continuously.
7-36
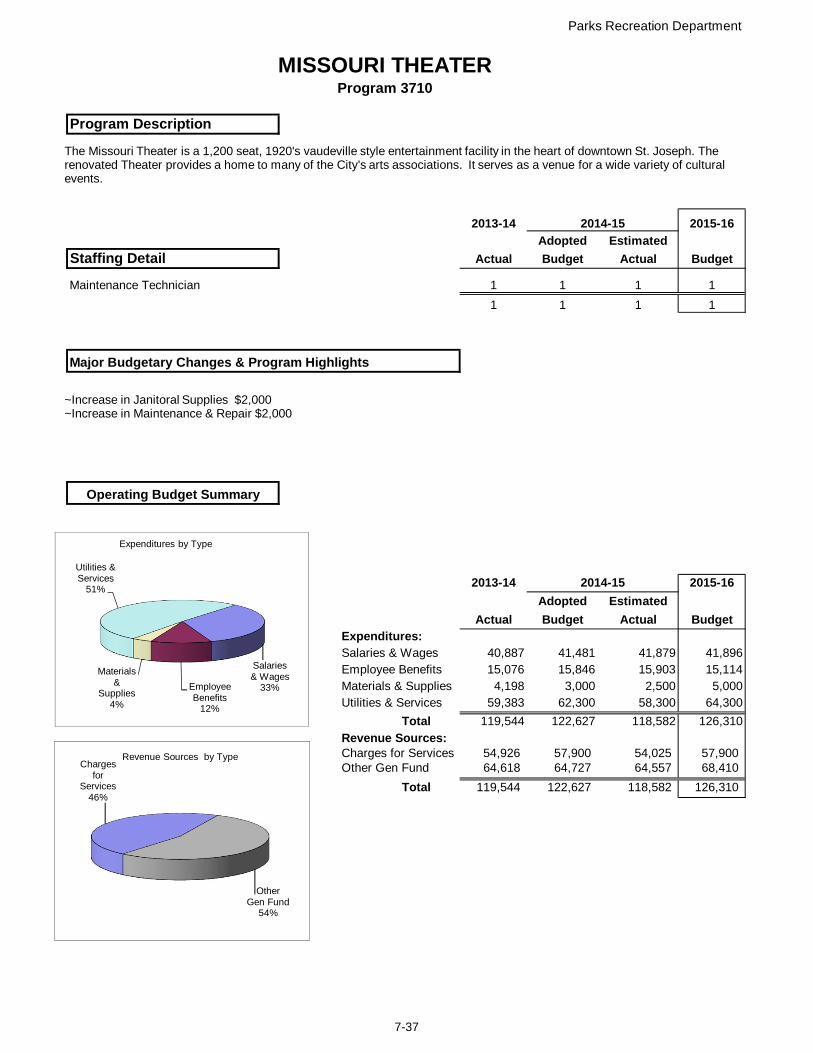
Parks Recreation Department
MISSOURI THEATERProgram 3710
Program Description
2013-14 2014-15 2015-16Adopted Estimated
Staffing Detail Actual Budget Actual Budget
Maintenance Technician 1 1 1 1
1 1 1 1
Major Budgetary Changes & Program Highlights
Operating Budget Summary
2013-14 2014-15 2015-16Adopted Estimated
Actual Budget Actual BudgetExpenditures:Salaries & Wages 40,887 41,481 41,879 41,896Employee Benefits 15,076 15,846 15,903 15,114Materials & Supplies 4,198 3,000 2,500 5,000Utilities & Services 59,383 62,300 58,300 64,300
Total 119,544 122,627 118,582 126,310
Revenue Sources:Charges for Services 54,926 57,900 54,025 57,900Other Gen Fund 64,618 64,727 64,557 68,410
Total 119,544 122,627 118,582 126,310
Salaries & Wages
33%Employee Benefits
12%
Materials &
Supplies4%
Utilities & Services
51%
Expenditures by Type
Charges for
Services46%
Other Gen Fund
54%
Revenue Sources by Type
The Missouri Theater is a 1,200 seat, 1920's vaudeville style entertainment facility in the heart of downtown St. Joseph. Therenovated Theater provides a home to many of the City's arts associations. It serves as a venue for a wide variety of cultural events.
~Increase in Janitoral Supplies $2,000~Increase in Maintenance & Repair $2,000
7-37
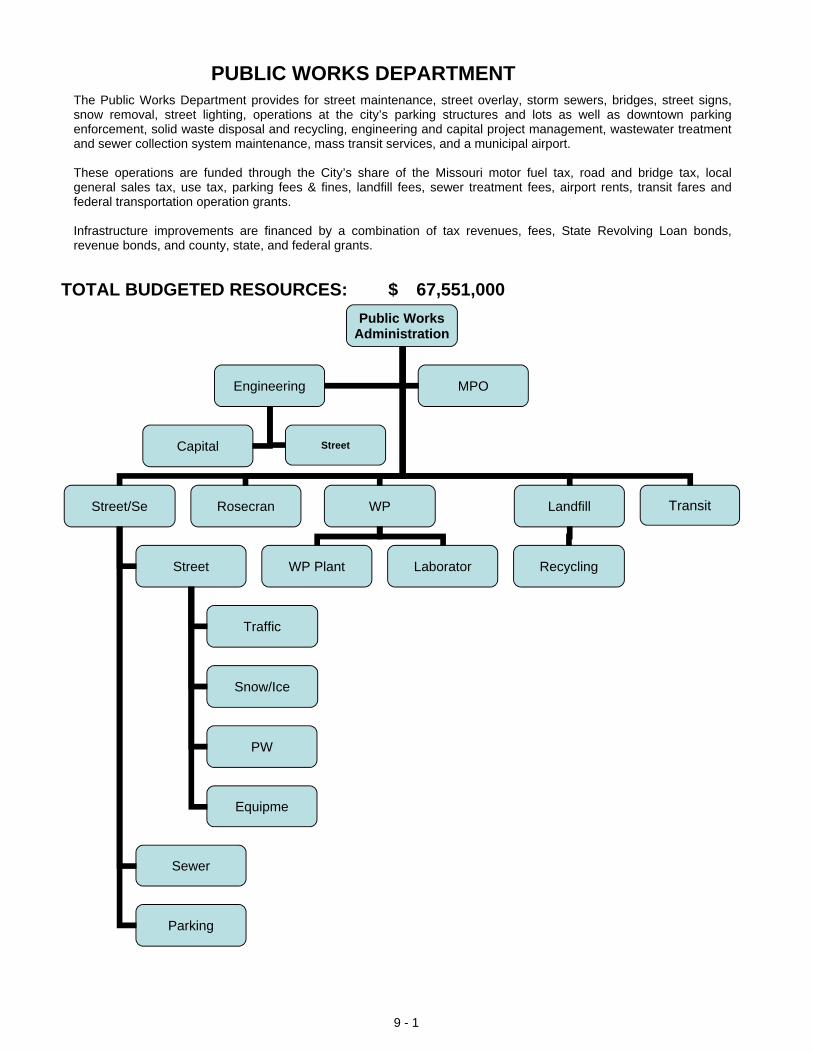
TOTAL BUDGETED RESOURCES: 67,551,000$
PUBLIC WORKS DEPARTMENTThe Public Works Department provides for street maintenance, street overlay, storm sewers, bridges, street signs,snow removal, street lighting, operations at the city’s parking structures and lots as well as downtown parkingenforcement, solid waste disposal and recycling, engineering and capital project management, wastewater treatmentand sewer collection system maintenance, mass transit services, and a municipal airport.
These operations are funded through the City’s share of the Missouri motor fuel tax, road and bridge tax, localgeneral sales tax, use tax, parking fees & fines, landfill fees, sewer treatment fees, airport rents, transit fares andfederal transportation operation grants.
Infrastructure improvements are financed by a combination of tax revenues, fees, State Revolving Loan bonds,revenue bonds, and county, state, and federal grants.
Public Works Administration
Street/Se WP
Engineering
Landfill
MPO
Rosecran
Street
Parking
Traffic
Snow/Ice
Sewer
PW
Equipme
WP Plant Laborator Recycling
Capital
Transit
Street
9 - 1

PUBLIC WORKS DEPARTMENTSOURCES & USES
General Fund22%
Aviation Fund1%
Landfill Fund7%
Water Protection Fund51%
Transit Fund12%
Parking Fund1%
Streets Maintenance Fund
6%
Gaming Fund0.4%
FUNDING SOURCES - OPERATING
Public Works Administration
5%
Engineering2%
MPO0%
Streets & Sewer Administration and
Support4%
Strts Mnt & Enhanced St Use
Tax17%
Parking Ops1%
Sewer Collection Syst Mtce
10%
WP Plant Administration and
Operations42%
Mass Transit12%
St. Joseph Rosecrans Airport
1%
Landfill & Recycling7%
PROGRAM USES - OPERATING
9-2
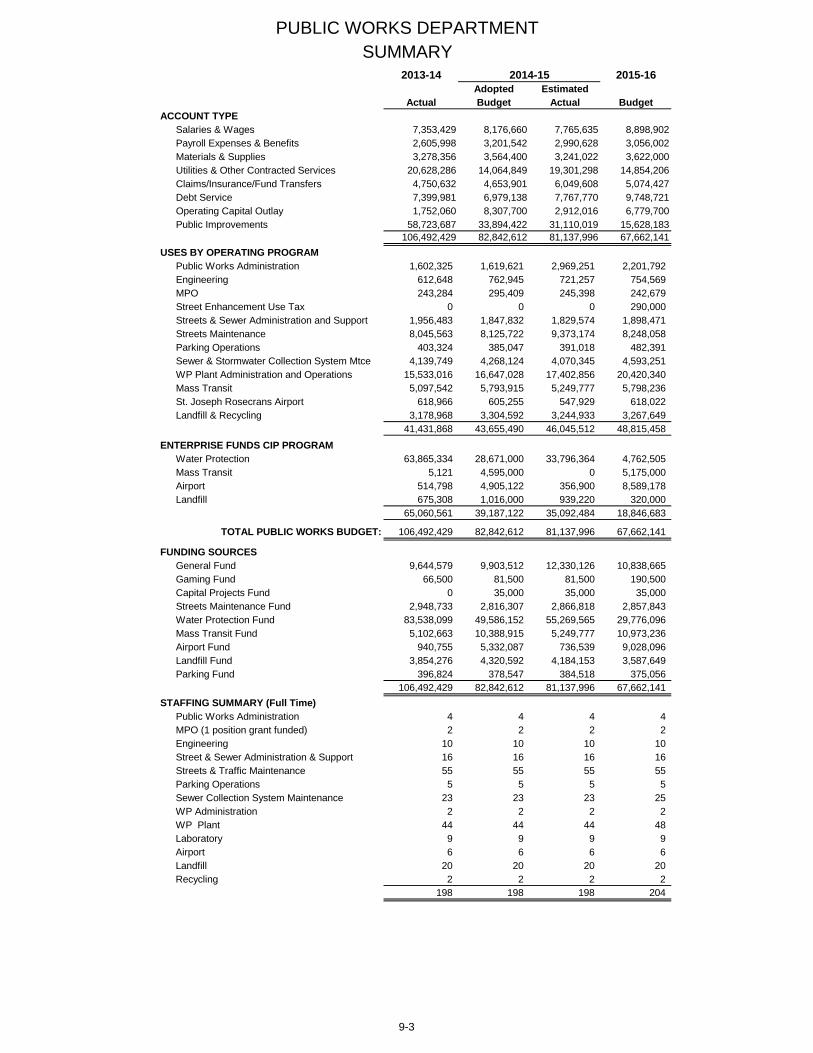
PUBLIC WORKS DEPARTMENTSUMMARY
2013-14 2014-15 2015-16Adopted Estimated
Actual Budget Actual BudgetACCOUNT TYPE
Salaries & Wages 7,353,429 8,176,660 7,765,635 8,898,902Payroll Expenses & Benefits 2,605,998 3,201,542 2,990,628 3,056,002Materials & Supplies 3,278,356 3,564,400 3,241,022 3,622,000Utilities & Other Contracted Services 20,628,286 14,064,849 19,301,298 14,854,206Claims/Insurance/Fund Transfers 4,750,632 4,653,901 6,049,608 5,074,427Debt Service 7,399,981 6,979,138 7,767,770 9,748,721Operating Capital Outlay 1,752,060 8,307,700 2,912,016 6,779,700Public Improvements 58,723,687 33,894,422 31,110,019 15,628,183
106,492,429 82,842,612 81,137,996 67,662,141
USES BY OPERATING PROGRAMPublic Works Administration 1,602,325 1,619,621 2,969,251 2,201,792Engineering 612,648 762,945 721,257 754,569MPO 243,284 295,409 245,398 242,679Street Enhancement Use Tax 0 0 0 290,000Streets & Sewer Administration and Support 1,956,483 1,847,832 1,829,574 1,898,471Streets Maintenance 8,045,563 8,125,722 9,373,174 8,248,058Parking Operations 403,324 385,047 391,018 482,391Sewer & Stormwater Collection System Mtce 4,139,749 4,268,124 4,070,345 4,593,251WP Plant Administration and Operations 15,533,016 16,647,028 17,402,856 20,420,340Mass Transit 5,097,542 5,793,915 5,249,777 5,798,236St. Joseph Rosecrans Airport 618,966 605,255 547,929 618,022Landfill & Recycling 3,178,968 3,304,592 3,244,933 3,267,649
41,431,868 43,655,490 46,045,512 48,815,458
ENTERPRISE FUNDS CIP PROGRAMWater Protection 63,865,334 28,671,000 33,796,364 4,762,505Mass Transit 5,121 4,595,000 0 5,175,000Airport 514,798 4,905,122 356,900 8,589,178Landfill 675,308 1,016,000 939,220 320,000
65,060,561 39,187,122 35,092,484 18,846,683
TOTAL PUBLIC WORKS BUDGET: 106,492,429 82,842,612 81,137,996 67,662,141
FUNDING SOURCESGeneral Fund 9,644,579 9,903,512 12,330,126 10,838,665Gaming Fund 66,500 81,500 81,500 190,500Capital Projects Fund 0 35,000 35,000 35,000Streets Maintenance Fund 2,948,733 2,816,307 2,866,818 2,857,843Water Protection Fund 83,538,099 49,586,152 55,269,565 29,776,096Mass Transit Fund 5,102,663 10,388,915 5,249,777 10,973,236Airport Fund 940,755 5,332,087 736,539 9,028,096Landfill Fund 3,854,276 4,320,592 4,184,153 3,587,649Parking Fund 396,824 378,547 384,518 375,056
106,492,429 82,842,612 81,137,996 67,662,141
STAFFING SUMMARY (Full Time)Public Works Administration 4 4 4 4MPO (1 position grant funded) 2 2 2 2Engineering 10 10 10 10Street & Sewer Administration & Support 16 16 16 16Streets & Traffic Maintenance 55 55 55 55Parking Operations 5 5 5 5Sewer Collection System Maintenance 23 23 23 25WP Administration 2 2 2 2WP Plant 44 44 44 48Laboratory 9 9 9 9Airport 6 6 6 6Landfill 20 20 20 20Recycling 2 2 2 2
198 198 198 204
9-3
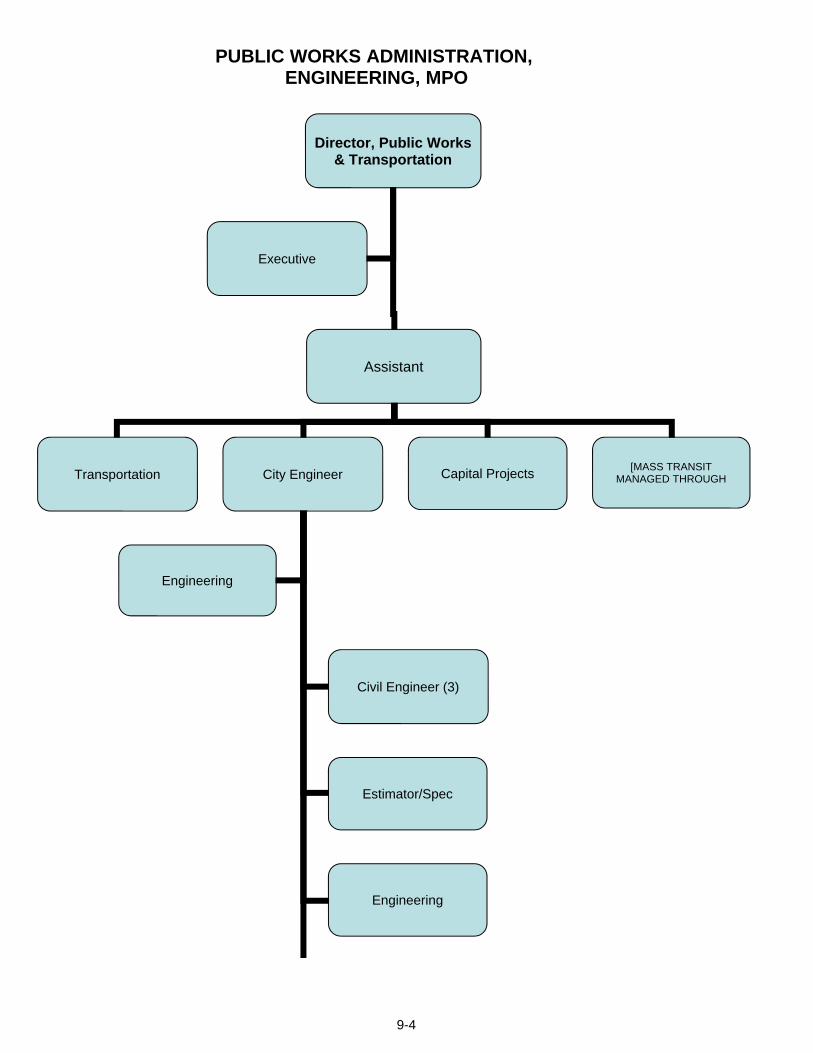
PUBLIC WORKS ADMINISTRATION,ENGINEERING, MPO
Director, Public Works & Transportation
Assistant
Transportation
Executive
City Engineer
Civil Engineer (3)
Estimator/Spec
Engineering
Capital Projects [MASS TRANSIT
MANAGED THROUGH
Engineering
9-4
Public Works Administration
Mission
Core Services
Current Year Activity/Achievements
Budget Challenges/Planned Initiatives
To improve the City’s basic infrastructure and services (streets, traffic control, bridges, curbs & gutters,sidewalks, wastewater utilities, mass transit, aviation and other public facilities) in order to support economicvitality and to provide a safe environment within which our citizens live, work, and play.
- Oversee department activities related to meeting City Council goals and City Manager priorities.-Promote best practices and effective technology to improve safe travel and encourage convenient andaccessible modes of transportation.- Provide administrative services and management oversight for Public Works and Transportation divisions andprograms.- Work with external regulatory bodies in developing thorough plans in order to meet local, state and nationalmandates as to public health and safety in all areas under the responsibility of the department.- Pursue and monitor grants for both operations and capital projects.- Coordinate capital projects monitoring and reporting
• Negotiate approval for the City's long-range CSO plan with the MDNR and the EPA• Manage debt financing for wastewater projects, including state revolving fund and revenue bonds• Apply budgeting constraints to prioritize core services
Performance Statistics:•Dollar amount of operating grants received: $3,372,085.28•Dollar amount of capital project grants procured: $1,606,795.28•Number of on-going capital projects monitored: 66 projects•Number of new capital projects that will start in FY14: 16
Budget Challenges:• Fixed revenues and growing expenses continue to reduce the level of street maintenance provided.
Planned Initiatives:• Focus on improving the public opinion of street maintenance through public education, communication, anddiscussion on public policy and funding priorities for street, curb and sidewalk maintenance.• Support sewer revenue bond activities to obtain additional bond authority from the voters as necessary tocomply with the Combined Sewer Long Term Control Plan's requirements under the Clean Water Act.
9-5
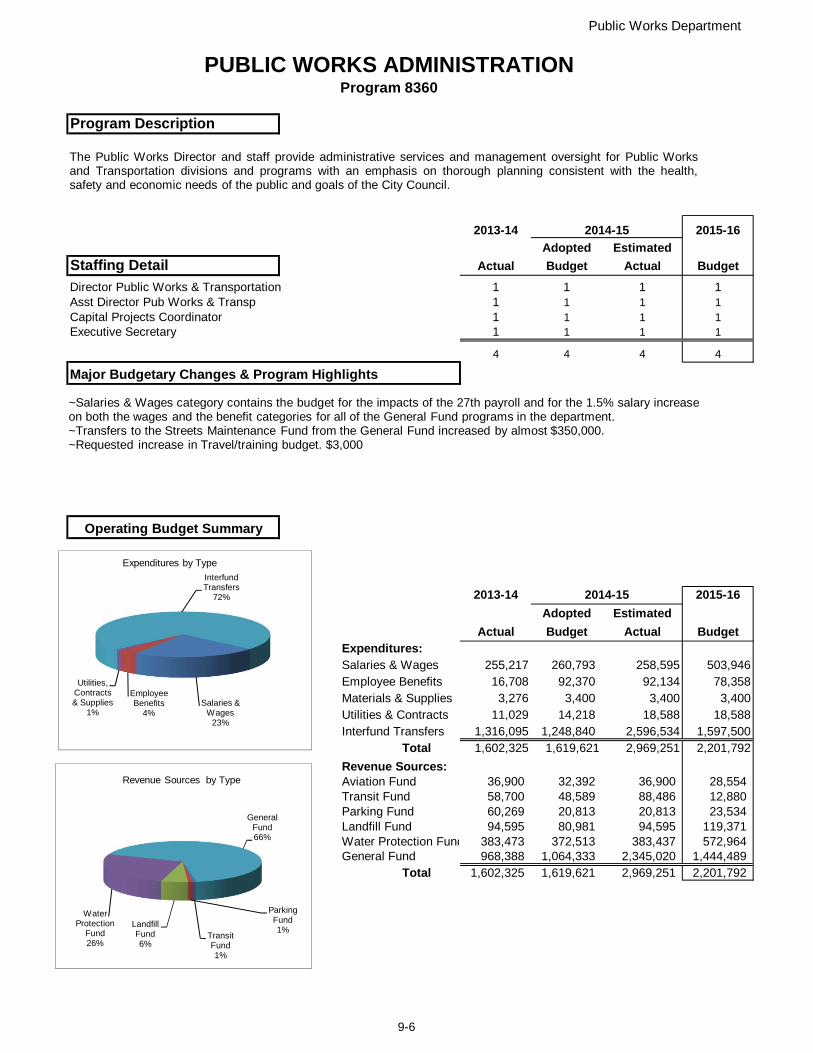
Public Works Department
PUBLIC WORKS ADMINISTRATIONProgram 8360
Program Description
2013-14 2014-15 2015-16Adopted Estimated
Staffing Detail Actual Budget Actual BudgetDirector Public Works & Transportation 1 1 1 1Asst Director Pub Works & Transp 1 1 1 1Capital Projects Coordinator 1 1 1 1Executive Secretary 1 1 1 1
4 4 4 4
Major Budgetary Changes & Program Highlights
Operating Budget Summary
2013-14 2014-15 2015-16Adopted Estimated
Actual Budget Actual BudgetExpenditures:Salaries & Wages 255,217 260,793 258,595 503,946Employee Benefits 16,708 92,370 92,134 78,358Materials & Supplies 3,276 3,400 3,400 3,400Utilities & Contracts 11,029 14,218 18,588 18,588Interfund Transfers 1,316,095 1,248,840 2,596,534 1,597,500
Total 1,602,325 1,619,621 2,969,251 2,201,792
Revenue Sources:Aviation Fund 36,900 32,392 36,900 28,554Transit Fund 58,700 48,589 88,486 12,880Parking Fund 60,269 20,813 20,813 23,534Landfill Fund 94,595 80,981 94,595 119,371Water Protection Fund 383,473 372,513 383,437 572,964General Fund 968,388 1,064,333 2,345,020 1,444,489
Total 1,602,325 1,619,621 2,969,251 2,201,792
Salaries & Wages
23%
Employee Benefits
4%
Utilities, Contracts & Supplies
1%
Interfund Transfers
72%
Expenditures by Type
Transit Fund1%
Parking Fund1%
Landfill Fund6%
Water Protection
Fund 26%
General Fund66%
Revenue Sources by Type
The Public Works Director and staff provide administrative services and management oversight for Public Worksand Transportation divisions and programs with an emphasis on thorough planning consistent with the health,safety and economic needs of the public and goals of the City Council.
~Salaries & Wages category contains the budget for the impacts of the 27th payroll and for the 1.5% salary increaseon both the wages and the benefit categories for all of the General Fund programs in the department.~Transfers to the Streets Maintenance Fund from the General Fund increased by almost $350,000.~Requested increase in Travel/training budget. $3,000
9-6
Metropolitan Planning Organization (MPO)
Mission
Core Services
Current Year Activity/Achievements
Budget Challenges/Planned Initiatives
To address multi-modal transportion planning needs throughout the urbanized area of St. Joseph, Missouri andElwood, Kansas (Counties of Buchanan, Andrew & Doniphan, Cities of Elwood, Wathena, St. Joseph, Village ofCountry Club & Savannah).
- Coordinate the development of the Unified Planning Work Program to define the major administrative,planning
and technical work elements for the upcoming year.- Address multi modal transportation developments related to funding and program requirements.- Monitor the Long Range Transportation Plan and the Transportation Improvement Program- Revise the LRTP every five years- Maintain a five-year TIP plan- Address work elements such as revising/updating the transportation micro-model; performing
demographic analysis, performing special transportation-related studies.- Updating required planning documents such as the Public Participation Plan, By-Laws (as needed) and theTitle
VI/Environmental Justice/Limited English Proficiency Program.
- Developing Safe Routes to School Plan for each member government- Conduct bicycle & pedestrian counts for the National Bicycle and Pedestrian Documentation Project- Sponsoring the 4th Annual Bike to Work Day- Produce a new 2012-2015 Transportation Improvement Program- Produce an updated Non-Motorized Geodatabase for the Non-Motorized Plan- Continue update of Long Range Transportation Plan (LRTP) - 3 year effort
Performance Statistics:• Number of Technical & Policy Board Meetings conducted - 12• Amount of FHWA & FTA funding received - approximately $131,000 for this year
- Integrating new initiatives including Active and Healthly Living into the planning process will be an area offocus.- Working with new stakeholders include health professionals, as well providing a mechanism to include newstakeholders in the decision making process.-Considerable effort will be made obtaining public input on short, medium and long term transportation issues.
9-7
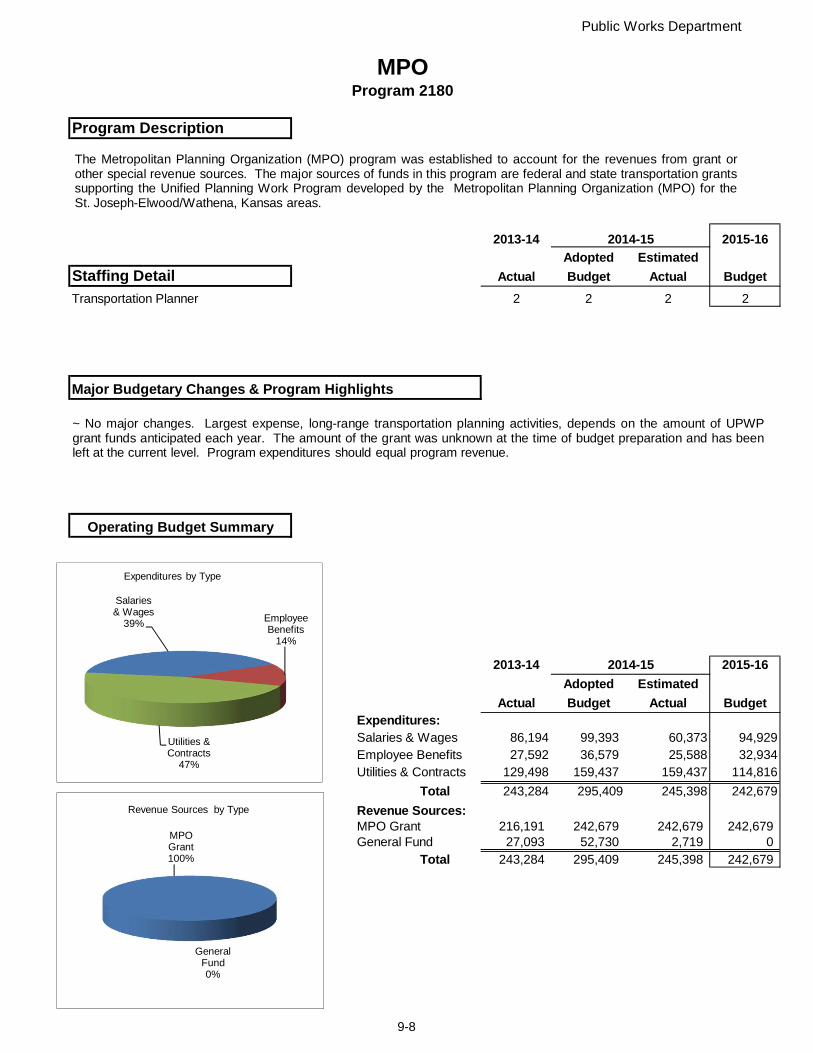
Public Works Department
MPOProgram 2180
Program Description
2013-14 2014-15 2015-16Adopted Estimated
Staffing Detail Actual Budget Actual BudgetTransportation Planner 2 2 2 2
Major Budgetary Changes & Program Highlights
Operating Budget Summary
2013-14 2014-15 2015-16Adopted Estimated
Actual Budget Actual BudgetExpenditures:Salaries & Wages 86,194 99,393 60,373 94,929Employee Benefits 27,592 36,579 25,588 32,934Utilities & Contracts 129,498 159,437 159,437 114,816
Total 243,284 295,409 245,398 242,679
Revenue Sources:MPO Grant 216,191 242,679 242,679 242,679General Fund 27,093 52,730 2,719 0
Total 243,284 295,409 245,398 242,679
Salaries & Wages
39% Employee Benefits
14%
Utilities & Contracts
47%
Expenditures by Type
MPO Grant100%
General Fund0%
Revenue Sources by Type
The Metropolitan Planning Organization (MPO) program was established to account for the revenues from grant orother special revenue sources. The major sources of funds in this program are federal and state transportation grantssupporting the Unified Planning Work Program developed by the Metropolitan Planning Organization (MPO) for theSt. Joseph-Elwood/Wathena, Kansas areas.
~ No major changes. Largest expense, long-range transportation planning activities, depends on the amount of UPWPgrant funds anticipated each year. The amount of the grant was unknown at the time of budget preparation and has beenleft at the current level. Program expenditures should equal program revenue.
9-8

STREET ENHANCEMENT USE TAXProgram 2185
Program Description
2013-14 2014-15 2015-16Adopted Estimated
Staffing Detail Actual Budget Actual Budget
N/A
Major Budgetary Changes & Program Highlights
Operating Budget Summary
2013-14 2014-15 2015-16Adopted Estimated
Actual Budget Actual BudgetExpenditures:Capital Improvements 0 0 0 290,000
Total 0 0 0 290,000
Revenue Sources:City Use Tax 0 0 0 290,000
Total 0 0 0 290,000
Capital Improveme
nts100%
Expenditures by Type
City Use Tax
100%
Revenue Sources by Type
~Tax revenues will not start until July 1 and won't be received by the City until August. With no history on this unpredictablerevenue source, budgets have been set conservatively.
In April 2015 voters approved a local use tax on out-of-state purchases for a period of 10 years. The rate of the tax isequal to the local sales tax at any given time, currently 2.875%. Proceeds are being used to preserve the existing generalfund revenues and, in this program, to provide revenues for streets maintenance activities and projects.
9-9

Engineering
Mission
Core Services
Current Year Activity/Achievements
Budget Challenges/Planned Initiatives
Ensure public safety by making sure City improvement projects adhere to national design, construction andmaintenance standards and ensure the cost effective use of resources in the design, construction andmaintenance of City improvement projects.
- Engineering inspection on capital projects, right-of-way, and developer-provided infrastructure.- In-house design of many smaller improvement projects such as extensions of Hike/Bike trails.- Provide timely project management for all significant city capital improvement projects at the level requestedby the sponsoring department.- Review CIP and operating budget projects at the start of the fiscal year to establish schedules and coordinateavailable manpower.- Review progress of projects with departments regularly through the Project Status Report.
• Completed in-house designs for 2012 Hike and Bike Trail from Gene Field to Northwest Parkway, County Lineand York Pump station, 2 sewer NIDs, and multiple small projects.• Projects in progress - South St. Joseph Industrial Sewer District wet well and Rosecrans Lagoon disinfection,Wastewater Treatment Plant Disinfection and outfall pump station, Whitehead stormwater bypass pipe, Multi-purpose Athletic Facility, Garfield Bridge Replacement, and Annual Asphalt Overlay.
Performance Statistics:• Number of formal construction contracts developed - 14• Number of Developer Plans reviewed - 240
- Controlling CIP project designs to remain within funding limits.- Managing several multi-million dollar wastewater projects with existing staff levels.- Replacement of one or more retirees during the Wastewater Treatment Plant projects.
9-10
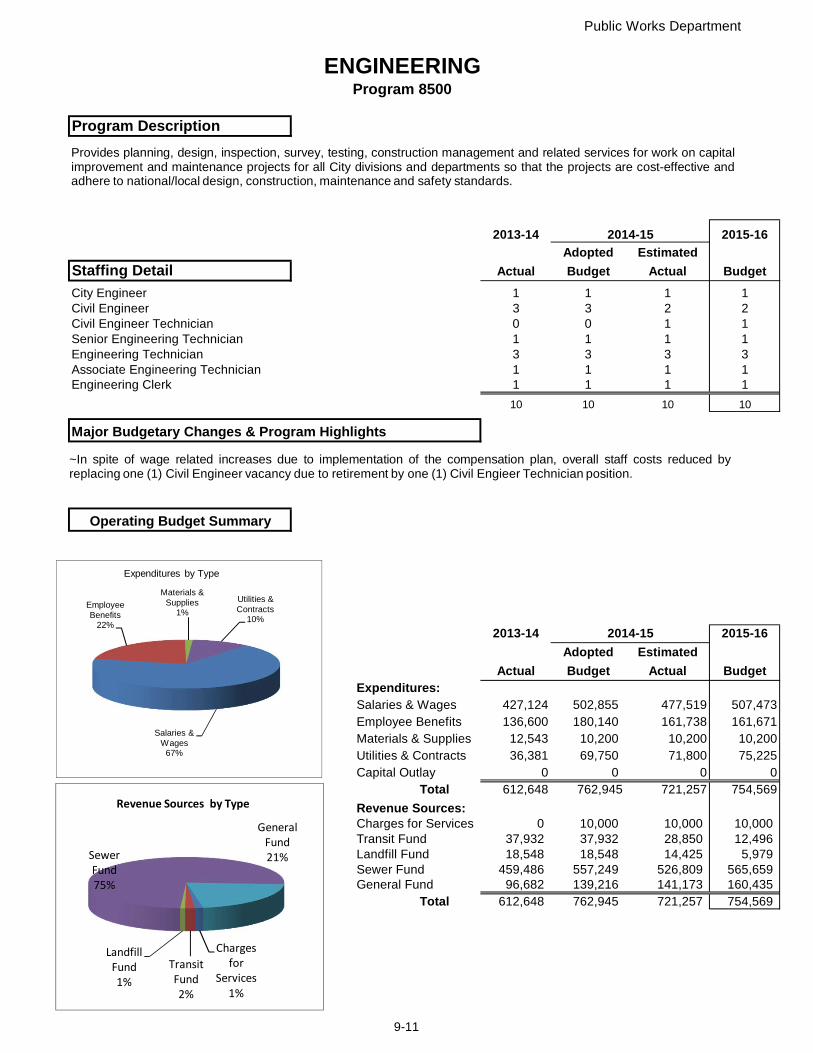
Public Works Department
ENGINEERINGProgram 8500
Program Description
2013-14 2014-15 2015-16Adopted Estimated
Staffing Detail Actual Budget Actual Budget
City Engineer 1 1 1 1Civil Engineer 3 3 2 2Civil Engineer Technician 0 0 1 1Senior Engineering Technician 1 1 1 1Engineering Technician 3 3 3 3Associate Engineering Technician 1 1 1 1Engineering Clerk 1 1 1 1
10 10 10 10
Major Budgetary Changes & Program Highlights
Operating Budget Summary
2013-14 2014-15 2015-16Adopted Estimated
Actual Budget Actual BudgetExpenditures:Salaries & Wages 427,124 502,855 477,519 507,473Employee Benefits 136,600 180,140 161,738 161,671Materials & Supplies 12,543 10,200 10,200 10,200Utilities & Contracts 36,381 69,750 71,800 75,225Capital Outlay 0 0 0 0
Total 612,648 762,945 721,257 754,569
Revenue Sources:Charges for Services 0 10,000 10,000 10,000Transit Fund 37,932 37,932 28,850 12,496Landfill Fund 18,548 18,548 14,425 5,979Sewer Fund 459,486 557,249 526,809 565,659General Fund 96,682 139,216 141,173 160,435
Total 612,648 762,945 721,257 754,569
Salaries & Wages
67%
Employee Benefits
22%
Materials & Supplies
1%
Utilities & Contracts
10%
Expenditures by Type
Charges for
Services1%
Transit Fund2%
Landfill Fund1%
Sewer Fund 75%
General Fund21%
Revenue Sources by Type
Provides planning, design, inspection, survey, testing, construction management and related services for work on capitalimprovement and maintenance projects for all City divisions and departments so that the projects are cost-effective andadhere to national/local design, construction, maintenance and safety standards.
~In spite of wage related increases due to implementation of the compensation plan, overall staff costs reduced byreplacing one (1) Civil Engineer vacancy due to retirement by one (1) Civil Engieer Technician position.
9-11
Mass TransitMission
Core Services
Current Year Activity/Achievements
Budget Challenges
Planned Initiatives
To provide safe, convenient and affordable public transportation to both the ambulatory and mobility challengedpopulations with a fixed route system that allows route deviation for curb-to-curb service.
- Accessible bus service on 8 fixed routes, 5 days a week.- Reduced service on 8 routes on weekends- Curb-to-Curb pickups with scheduled appointment at least 30 minutes prior to departure- Bus service to Elwood, 7 times daily on weekdays- Intelligent Transportation System and Scheduling software which allows faster reaction in the event of an emergency;provides better routing information to the passengers; increases passenger confidentiality; improves communicationsbetween the Drivers and Dispatchers; automates visual and voice announcements of major intersections and stops forsight and hearing challenged passengers; enables accurate passenger counting.- “Half-fare” passes and fares available to person with disabilities and over the age of 60.- "Youth fares" available to those age 18 and younger.
• Recognized by FTA as the fastest growing ridership in Missouri.
Performance Statistics: FY2013 FY2014 FY2015 (projected)• On-time performance 97% 98.7% 98.2%• Number of fare paying passengers (w/o transfers) 348,443 350,629 343,918
Number of trips (including transfers) 421,945 423,645 413,696Percent of operating budget funded by paying riders 5.8% 5.6% 5.6%
• Percent of “half-fare” passengers 26% 19% 20%• Cost per trip per passenger $11.87 $12.06 $11.46• Number of deviations 43,912 46,493 52,800
*trip = passenger ride from one bus or one point to another
- While fuel costs were lower this year, the market is still volatile, making it difficult to anticipate. The $3.75 a gallon forFY16 is a very conservative estimate.- The current CBA (contract) with the ATU (union) expires June 30, 2015, creating uncertainty about wages and benefitsgoing forward in 2016 and beyond.
- In July of 2012, Transit started a four-year cycle of replacing the rolling stock (buses) with the purchase of two Gillig 30'low-floor buses, similar to the current fleet specs. Funding needs to be secured for an additional 5 buses in FY16, 7buses in FY17, and 6 buses in FY18 .- Work toward implementation of recommended route reconfiguration (from comprehensive operational analysis study)
9-12
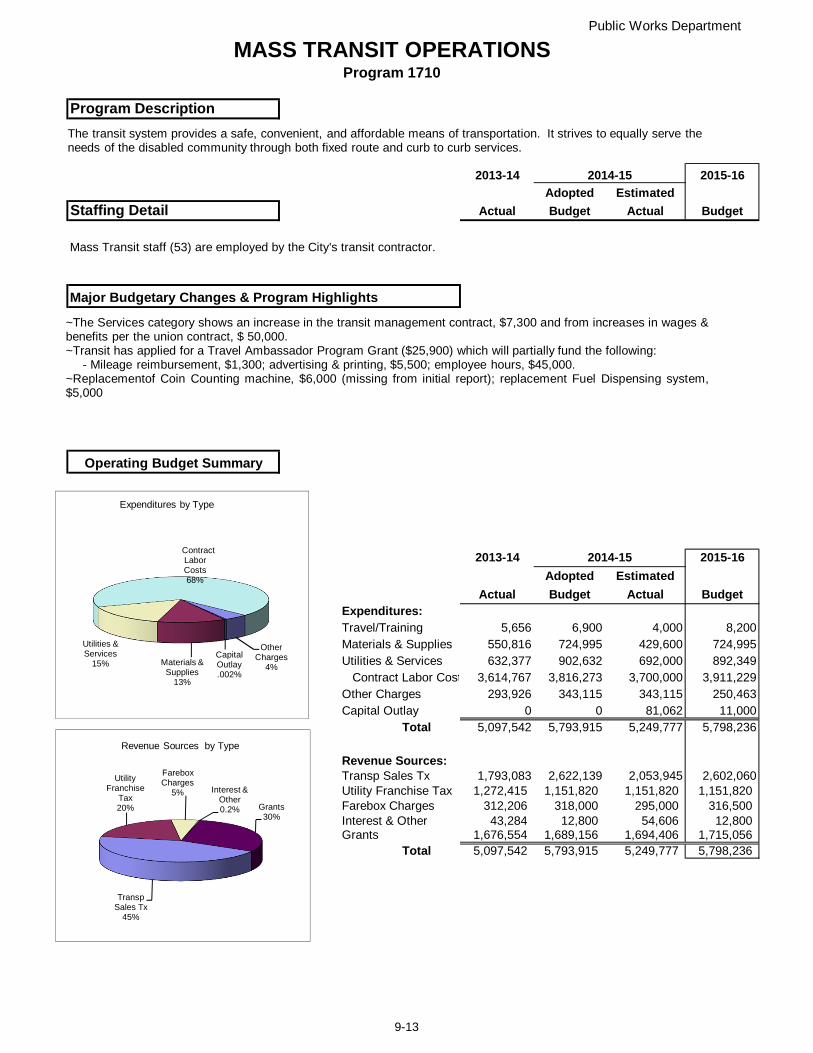
Public Works Department
MASS TRANSIT OPERATIONSProgram 1710
Program Description
2013-14 2014-15 2015-16Adopted Estimated
Staffing Detail Actual Budget Actual Budget
Mass Transit staff (53) are employed by the City's transit contractor.
Major Budgetary Changes & Program Highlights
Operating Budget Summary
2013-14 2014-15 2015-16Adopted Estimated
Actual Budget Actual BudgetExpenditures:Travel/Training 5,656 6,900 4,000 8,200Materials & Supplies 550,816 724,995 429,600 724,995Utilities & Services 632,377 902,632 692,000 892,349 Contract Labor Cost 3,614,767 3,816,273 3,700,000 3,911,229
Other Charges 293,926 343,115 343,115 250,463Capital Outlay 0 0 81,062 11,000
Total 5,097,542 5,793,915 5,249,777 5,798,236
Revenue Sources:Transp Sales Tx 1,793,083 2,622,139 2,053,945 2,602,060Utility Franchise Tax 1,272,415 1,151,820 1,151,820 1,151,820Farebox Charges 312,206 318,000 295,000 316,500Interest & Other 43,284 12,800 54,606 12,800Grants 1,676,554 1,689,156 1,694,406 1,715,056
Total 5,097,542 5,793,915 5,249,777 5,798,236
Materials & Supplies
13%
Utilities & Services
15%
Contract Labor Costs68%
Other Charges
4%
Capital Outlay.002%
Expenditures by Type
Transp Sales Tx
45%
Utility Franchise
Tax20%
Farebox Charges
5% Interest & Other0.2% Grants
30%
Revenue Sources by Type
The transit system provides a safe, convenient, and affordable means of transportation. It strives to equally serve the needs of the disabled community through both fixed route and curb to curb services.
~The Services category shows an increase in the transit management contract, $7,300 and from increases in wages &benefits per the union contract, $ 50,000.~Transit has applied for a Travel Ambassador Program Grant ($25,900) which will partially fund the following:
- Mileage reimbursement, $1,300; advertising & printing, $5,500; employee hours, $45,000.~Replacementof Coin Counting machine, $6,000 (missing from initial report); replacement Fuel Dispensing system,$5,000
9-13
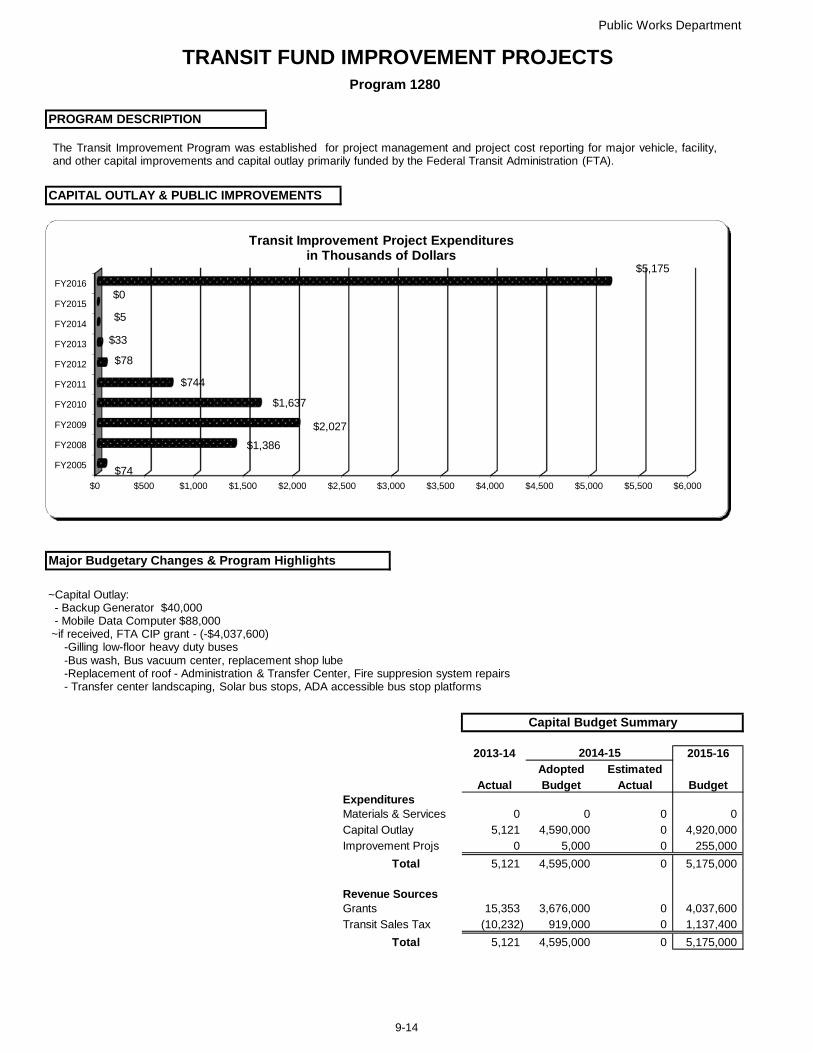
Public Works Department
TRANSIT FUND IMPROVEMENT PROJECTSProgram 1280
PROGRAM DESCRIPTION
CAPITAL OUTLAY & PUBLIC IMPROVEMENTS
Major Budgetary Changes & Program Highlights
Capital Budget Summary
2013-14 2015-16Adopted Estimated
Actual Budget Actual BudgetExpendituresMaterials & Services 0 0 0 0Capital Outlay 5,121 4,590,000 0 4,920,000Improvement Projs 0 5,000 0 255,000
Total 5,121 4,595,000 0 5,175,000
Revenue SourcesGrants 15,353 3,676,000 0 4,037,600Transit Sales Tax (10,232) 919,000 0 1,137,400
Total 5,121 4,595,000 0 5,175,000
2014-15
$0 $500 $1,000 $1,500 $2,000 $2,500 $3,000 $3,500 $4,000 $4,500 $5,000 $5,500 $6,000
FY2005
FY2008
FY2009
FY2010
FY2011
FY2012
FY2013
FY2014
FY2015
FY2016
$74
$1,386
$2,027
$1,637
$744
$78
$33
$5
$0
$5,175
Transit Improvement Project Expendituresin Thousands of Dollars
The Transit Improvement Program was established for project management and project cost reporting for major vehicle, facility,and other capital improvements and capital outlay primarily funded by the Federal Transit Administration (FTA).
~Capital Outlay:- Backup Generator $40,000- Mobile Data Computer $88,000~if received, FTA CIP grant - (-$4,037,600)
-Gilling low-floor heavy duty buses -Bus wash, Bus vacuum center, replacement shop lube-Replacement of roof - Administration & Transfer Center, Fire suppresion system repairs- Transfer center landscaping, Solar bus stops, ADA accessible bus stop platforms
9-14
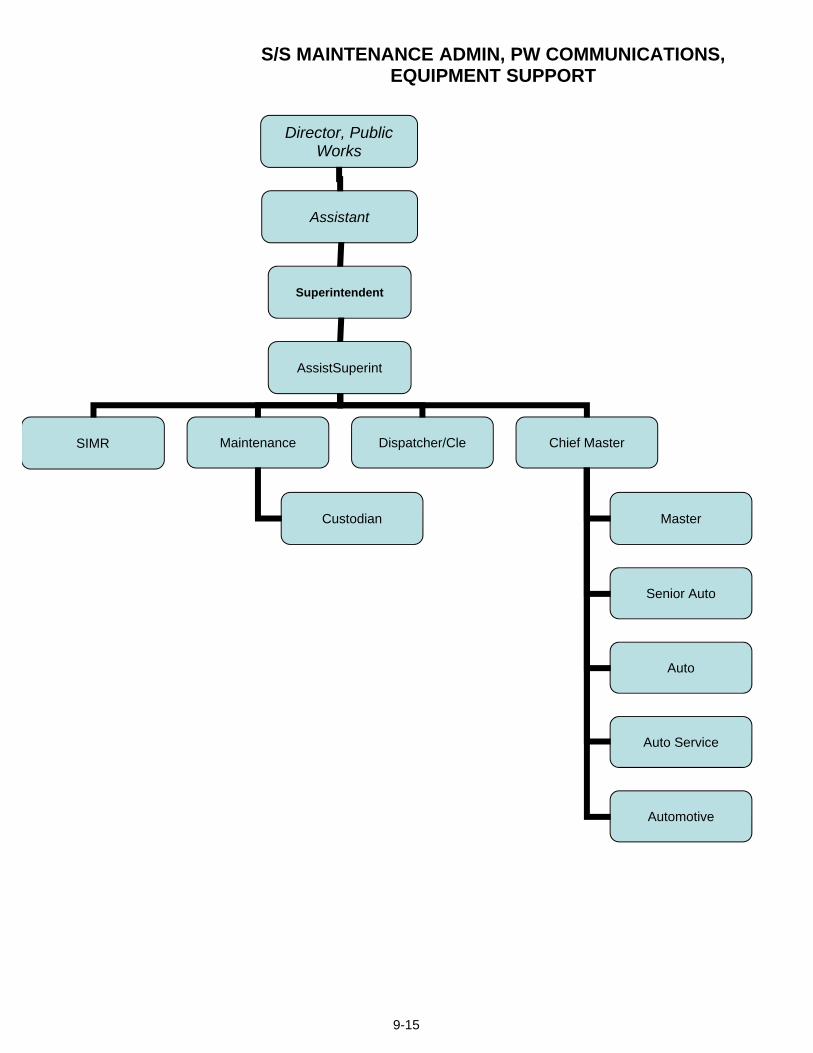
S/S MAINTENANCE ADMIN, PW COMMUNICATIONS, EQUIPMENT SUPPORT
Director, Public Works
Assistant
Superintendent
AssistSuperint
SIMR Maintenance
Custodian
Dispatcher/Cle Chief Master
Master
Senior Auto
Auto
Auto Service
Automotive
9-15
Mission
Core Services
Current Year Activity/Achievements
- Some equipment is sent out for repair due to various reasons such as:Painting & Body work
Glass repairSandblasting
Electrical diagnosticsRebuild Hydraulic Cylinders
Warranty WorkOff road tire repair
UpholsteryDiesel fuel injector pump repair
A/C Repair
Budget Challenges/Planned Initiatives
STREETS/SEWER ADMINISTRATION, COMMUNICATIONS, EQUIPMENT SUPPORTStreets/Sewer Maintenance Support
To provide administrative and management support for the efficient operation of all street maintenance, public parking,traffic and sewer maintenance programs.
- 24 hour, 7 day per week answering and dispatching service for street and sewer maintenance, emergencies,complaints and inquiries.- Clerical, data entry, security monitoring and fuel dispensing services to Public Works' Divisions.- Routine maintenance and emergency repairs for all street, sewer, engineering, traffic, public parking vehicles andequipment following a prioritized preventive maintenance and repair program for the delivery of services- Dispenses fuel to several City Departments.- Maintain the Street Rating Management System.- Supervise and coordinate activities of the above divisions.- Thorough inspection of all equipment brought in for repair.- Three-tiered preventative maintenance program- MO ONE CALL Locates
• Implementing the response strategy for the CMOM (Capacity, Management, Operation and Maintenance)requirements of the Clean Water Act.• Preparing for implementation of new Asset Management system.
Performance Statistics:• Four (4) ASE certified mechanics, with three (3) new hires currently working towards certification.• Dispensed 98,217 Gallons of Unleaded fuel & 78,028 Gallons Diesel fuel at a cost of $428,461.43 since July 1,2014.• Dispatch calls for Street & Sewer Mtce during normal working hours, also after normal working hours, weekends &holidays handle phone calls & dispatch for the Water Protection Plant.
- As equipment ages, the maintenance costs rise to the point where there's more expense to maintain a piece ofequipment then there is to purchase a replacement.- We currently have a list of equipment that will not be repaired due to the lack of adequate funding.
9-16
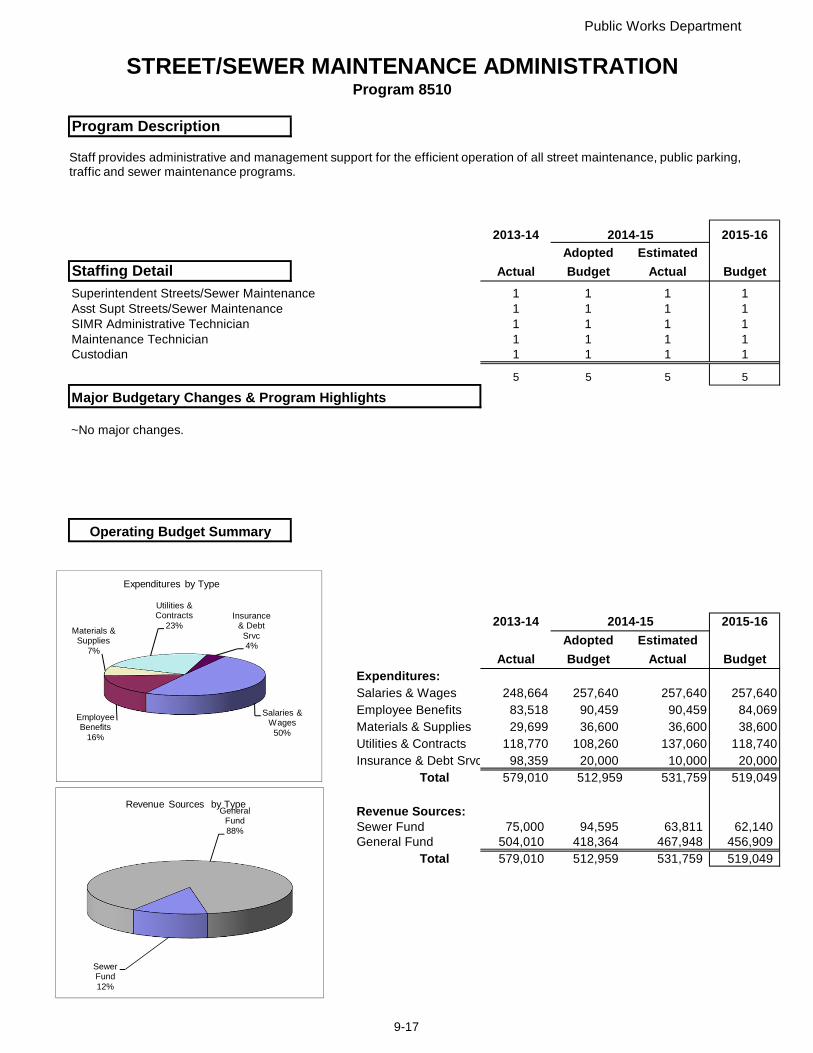
Public Works Department
STREET/SEWER MAINTENANCE ADMINISTRATIONProgram 8510
Program Description
2013-14 2014-15 2015-16Adopted Estimated
Staffing Detail Actual Budget Actual Budget
Superintendent Streets/Sewer Maintenance 1 1 1 1Asst Supt Streets/Sewer Maintenance 1 1 1 1SIMR Administrative Technician 1 1 1 1Maintenance Technician 1 1 1 1Custodian 1 1 1 1
5 5 5 5
Major Budgetary Changes & Program Highlights
Operating Budget Summary
2013-14 2014-15 2015-16Adopted Estimated
Actual Budget Actual BudgetExpenditures:Salaries & Wages 248,664 257,640 257,640 257,640Employee Benefits 83,518 90,459 90,459 84,069Materials & Supplies 29,699 36,600 36,600 38,600Utilities & Contracts 118,770 108,260 137,060 118,740Insurance & Debt Srvc 98,359 20,000 10,000 20,000
Total 579,010 512,959 531,759 519,049
Revenue Sources:Sewer Fund 75,000 94,595 63,811 62,140General Fund 504,010 418,364 467,948 456,909
Total 579,010 512,959 531,759 519,049
Salaries & Wages
50%
Employee Benefits
16%
Materials & Supplies
7%
Utilities & Contracts
23%Insurance
& Debt Srvc4%
Expenditures by Type
Sewer Fund 12%
General Fund88%
Revenue Sources by Type
Staff provides administrative and management support for the efficient operation of all street maintenance, public parking, traffic and sewer maintenance programs.
~No major changes.
9-17
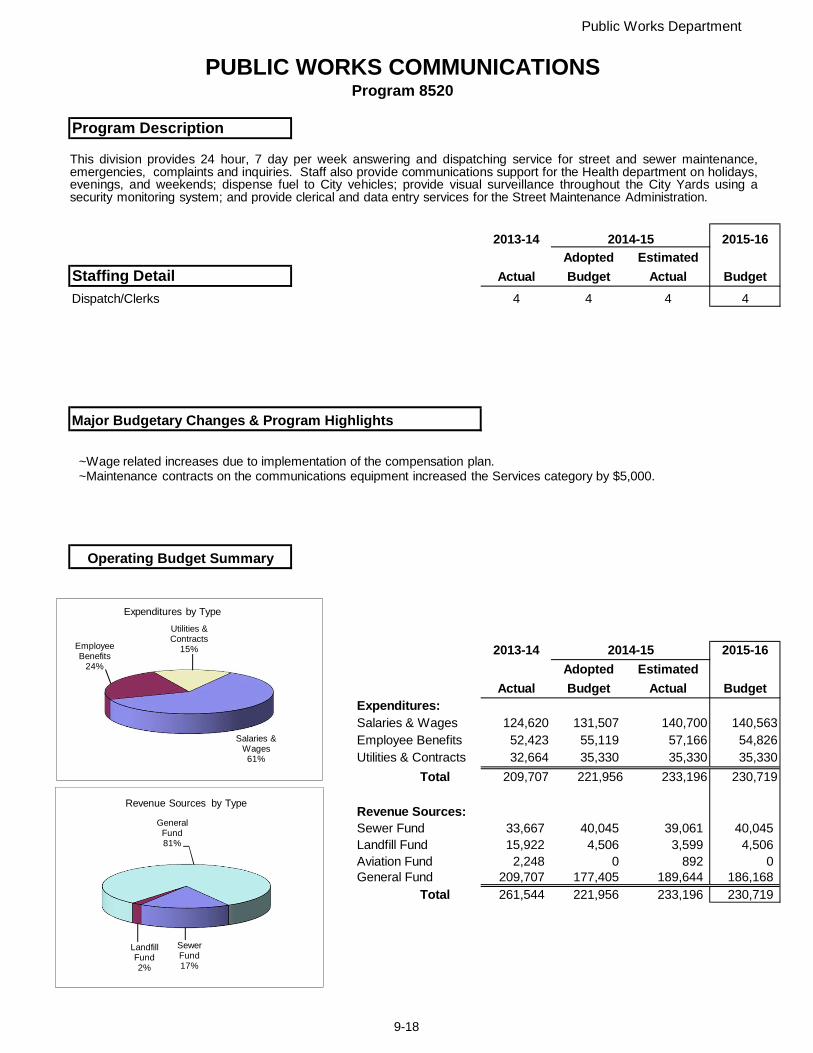
Public Works Department
PUBLIC WORKS COMMUNICATIONSProgram 8520
Program Description
2013-14 2014-15 2015-16Adopted Estimated
Staffing Detail Actual Budget Actual BudgetDispatch/Clerks 4 4 4 4
Major Budgetary Changes & Program Highlights
Operating Budget Summary
2013-14 2014-15 2015-16Adopted Estimated
Actual Budget Actual BudgetExpenditures:Salaries & Wages 124,620 131,507 140,700 140,563Employee Benefits 52,423 55,119 57,166 54,826Utilities & Contracts 32,664 35,330 35,330 35,330
Total 209,707 221,956 233,196 230,719
Revenue Sources:Sewer Fund 33,667 40,045 39,061 40,045Landfill Fund 15,922 4,506 3,599 4,506Aviation Fund 2,248 0 892 0General Fund 209,707 177,405 189,644 186,168
Total 261,544 221,956 233,196 230,719
Salaries & Wages61%
Employee Benefits
24%
Utilities & Contracts
15%
Expenditures by Type
Sewer Fund17%
Landfill Fund2%
General Fund81%
Revenue Sources by Type
This division provides 24 hour, 7 day per week answering and dispatching service for street and sewer maintenance,emergencies, complaints and inquiries. Staff also provide communications support for the Health department on holidays,evenings, and weekends; dispense fuel to City vehicles; provide visual surveillance throughout the City Yards using asecurity monitoring system; and provide clerical and data entry services for the Street Maintenance Administration.
~Wage related increases due to implementation of the compensation plan.~Maintenance contracts on the communications equipment increased the Services category by $5,000.
9-18
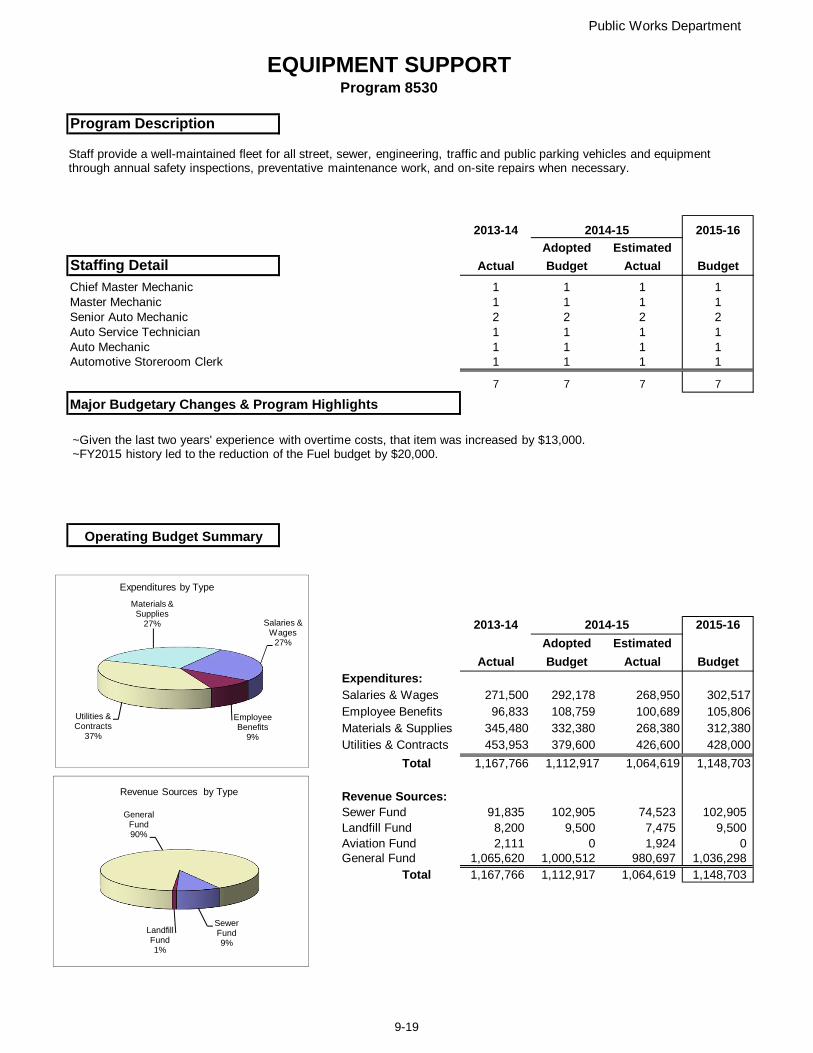
Public Works Department
EQUIPMENT SUPPORTProgram 8530
Program Description
2013-14 2014-15 2015-16Adopted Estimated
Staffing Detail Actual Budget Actual BudgetChief Master Mechanic 1 1 1 1Master Mechanic 1 1 1 1Senior Auto Mechanic 2 2 2 2Auto Service Technician 1 1 1 1Auto Mechanic 1 1 1 1Automotive Storeroom Clerk 1 1 1 1
7 7 7 7
Major Budgetary Changes & Program Highlights
Operating Budget Summary
2013-14 2014-15 2015-16Adopted Estimated
Actual Budget Actual BudgetExpenditures:Salaries & Wages 271,500 292,178 268,950 302,517Employee Benefits 96,833 108,759 100,689 105,806Materials & Supplies 345,480 332,380 268,380 312,380Utilities & Contracts 453,953 379,600 426,600 428,000
Total 1,167,766 1,112,917 1,064,619 1,148,703
Revenue Sources:Sewer Fund 91,835 102,905 74,523 102,905Landfill Fund 8,200 9,500 7,475 9,500Aviation Fund 2,111 0 1,924 0General Fund 1,065,620 1,000,512 980,697 1,036,298
Total 1,167,766 1,112,917 1,064,619 1,148,703
Salaries & Wages
27%
Employee Benefits
9%
Utilities & Contracts
37%
Materials & Supplies
27%
Expenditures by Type
Sewer Fund9%
Landfill Fund1%
General Fund90%
Revenue Sources by Type
Staff provide a well-maintained fleet for all street, sewer, engineering, traffic and public parking vehicles and equipment through annual safety inspections, preventative maintenance work, and on-site repairs when necessary.
~Given the last two years' experience with overtime costs, that item was increased by $13,000.~FY2015 history led to the reduction of the Fuel budget by $20,000.
9-19
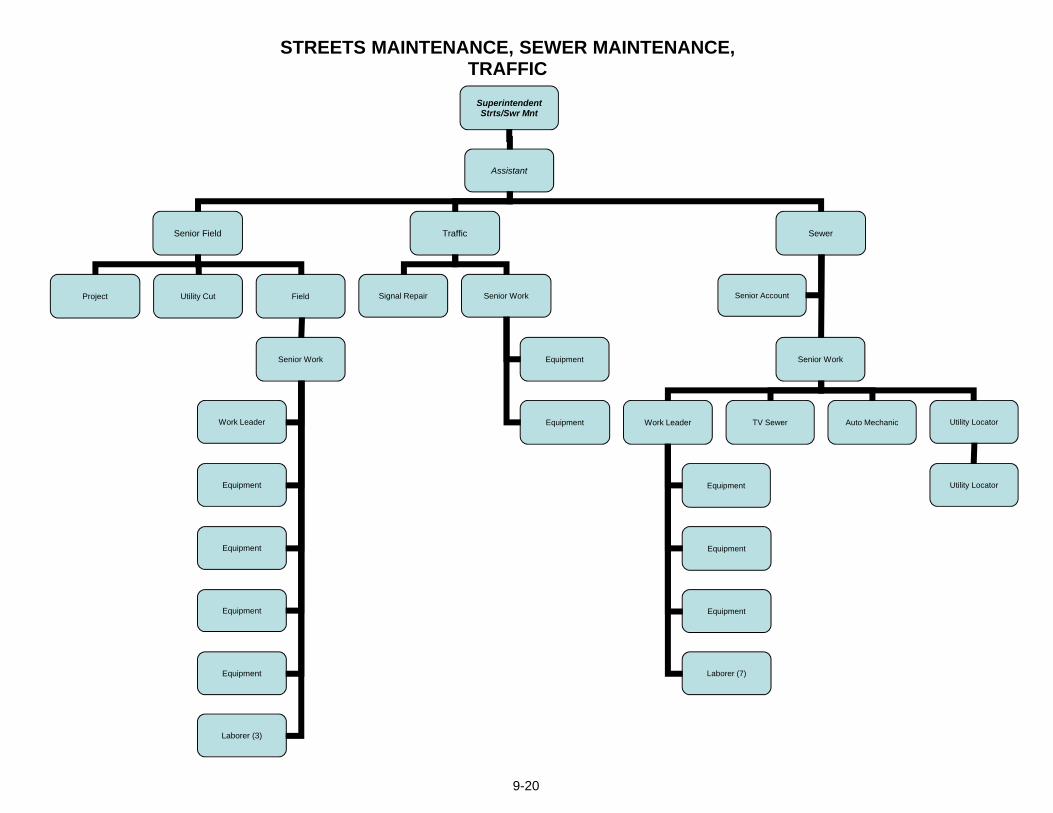
STREETS MAINTENANCE, SEWER MAINTENANCE, TRAFFIC
Superintendent Strts/Swr Mnt
Assistant
Senior Field Traffic
Project Utility Cut Field
Senior Work
Work Leader
Equipment
Equipment
Equipment
Equipment
Laborer (3)
Signal Repair Senior Work
Equipment
Equipment
Sewer
Senior Work
Work Leader TV Sewer Auto Mechanic
Equipment
Equipment
Equipment
Laborer (7)
Senior Account
Utility Locator
Utility Locator
9-20
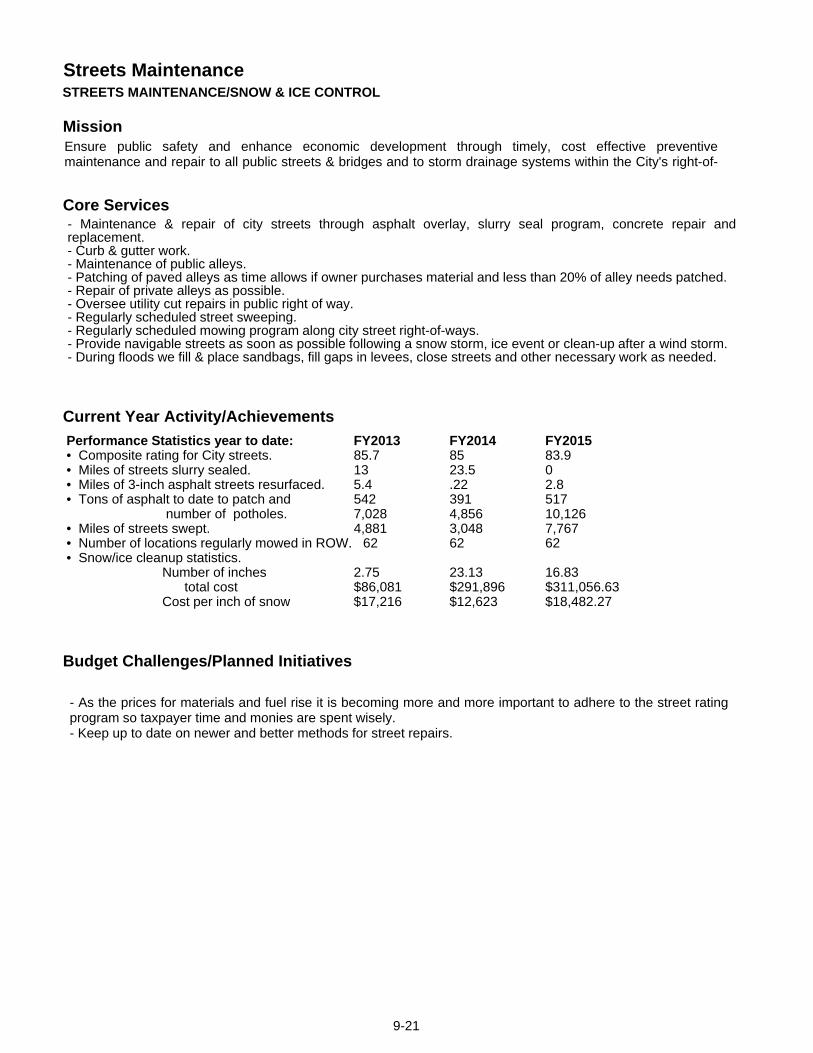
Mission
Core Services
Current Year Activity/Achievements
Budget Challenges/Planned Initiatives
Streets MaintenanceSTREETS MAINTENANCE/SNOW & ICE CONTROL
Ensure public safety and enhance economic development through timely, cost effective preventivemaintenance and repair to all public streets & bridges and to storm drainage systems within the City's right-of-
- Maintenance & repair of city streets through asphalt overlay, slurry seal program, concrete repair andreplacement.- Curb & gutter work.- Maintenance of public alleys.- Patching of paved alleys as time allows if owner purchases material and less than 20% of alley needs patched.- Repair of private alleys as possible.- Oversee utility cut repairs in public right of way.- Regularly scheduled street sweeping.- Regularly scheduled mowing program along city street right-of-ways.- Provide navigable streets as soon as possible following a snow storm, ice event or clean-up after a wind storm.- During floods we fill & place sandbags, fill gaps in levees, close streets and other necessary work as needed.
Performance Statistics year to date: FY2013 FY2014 FY2015• Composite rating for City streets. 85.7 85 83.9• Miles of streets slurry sealed. 13 23.5 0• Miles of 3-inch asphalt streets resurfaced. 5.4 .22 2.8• Tons of asphalt to date to patch and 542 391 517
number of potholes. 7,028 4,856 10,126• Miles of streets swept. 4,881 3,048 7,767• Number of locations regularly mowed in ROW. 62 62 62• Snow/ice cleanup statistics.
Number of inches 2.75 23.13 16.83total cost $86,081 $291,896 $311,056.63
Cost per inch of snow $17,216 $12,623 $18,482.27
- As the prices for materials and fuel rise it is becoming more and more important to adhere to the street ratingprogram so taxpayer time and monies are spent wisely.- Keep up to date on newer and better methods for street repairs.
9-21
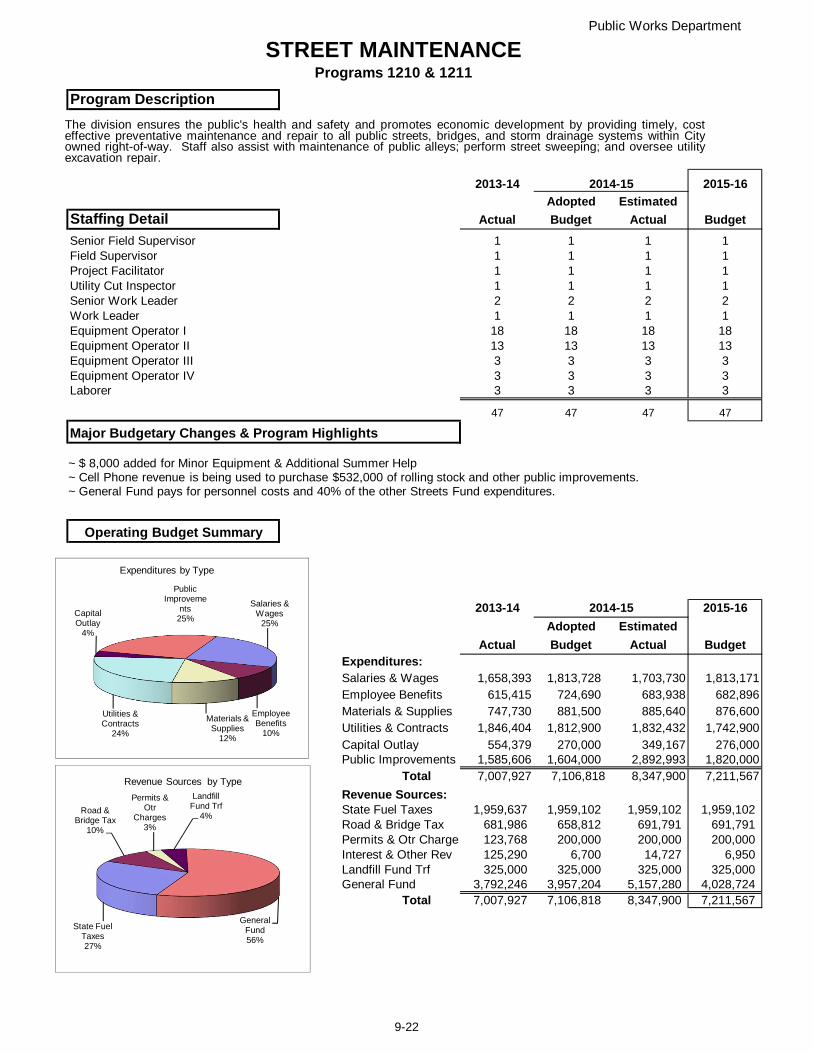
Public Works Department
STREET MAINTENANCEPrograms 1210 & 1211
Program Description
2013-14 2014-15 2015-16Adopted Estimated
Staffing Detail Actual Budget Actual BudgetSenior Field Supervisor 1 1 1 1Field Supervisor 1 1 1 1Project Facilitator 1 1 1 1Utility Cut Inspector 1 1 1 1Senior Work Leader 2 2 2 2Work Leader 1 1 1 1Equipment Operator I 18 18 18 18Equipment Operator II 13 13 13 13Equipment Operator III 3 3 3 3Equipment Operator IV 3 3 3 3Laborer 3 3 3 3
47 47 47 47
Major Budgetary Changes & Program Highlights
Operating Budget Summary
2013-14 2014-15 2015-16Adopted Estimated
Actual Budget Actual BudgetExpenditures:Salaries & Wages 1,658,393 1,813,728 1,703,730 1,813,171Employee Benefits 615,415 724,690 683,938 682,896Materials & Supplies 747,730 881,500 885,640 876,600Utilities & Contracts 1,846,404 1,812,900 1,832,432 1,742,900Capital Outlay 554,379 270,000 349,167 276,000Public Improvements 1,585,606 1,604,000 2,892,993 1,820,000
Total 7,007,927 7,106,818 8,347,900 7,211,567
Revenue Sources:State Fuel Taxes 1,959,637 1,959,102 1,959,102 1,959,102Road & Bridge Tax 681,986 658,812 691,791 691,791Permits & Otr Charges 123,768 200,000 200,000 200,000Interest & Other Rev 125,290 6,700 14,727 6,950Landfill Fund Trf 325,000 325,000 325,000 325,000General Fund 3,792,246 3,957,204 5,157,280 4,028,724
Total 7,007,927 7,106,818 8,347,900 7,211,567
Salaries & Wages
25%
Employee Benefits
10%
Materials & Supplies
12%
Utilities & Contracts
24%
Capital Outlay
4%
Public Improveme
nts25%
Expenditures by Type
State Fuel Taxes27%
Road & Bridge Tax
10%
Permits & Otr
Charges3%
Landfill Fund Trf
4%
General Fund56%
Revenue Sources by Type
The division ensures the public's health and safety and promotes economic development by providing timely, costeffective preventative maintenance and repair to all public streets, bridges, and storm drainage systems within Cityowned right-of-way. Staff also assist with maintenance of public alleys; perform street sweeping; and oversee utilityexcavation repair.
~ $ 8,000 added for Minor Equipment & Additional Summer Help~ Cell Phone revenue is being used to purchase $532,000 of rolling stock and other public improvements.~ General Fund pays for personnel costs and 40% of the other Streets Fund expenditures.
9-22
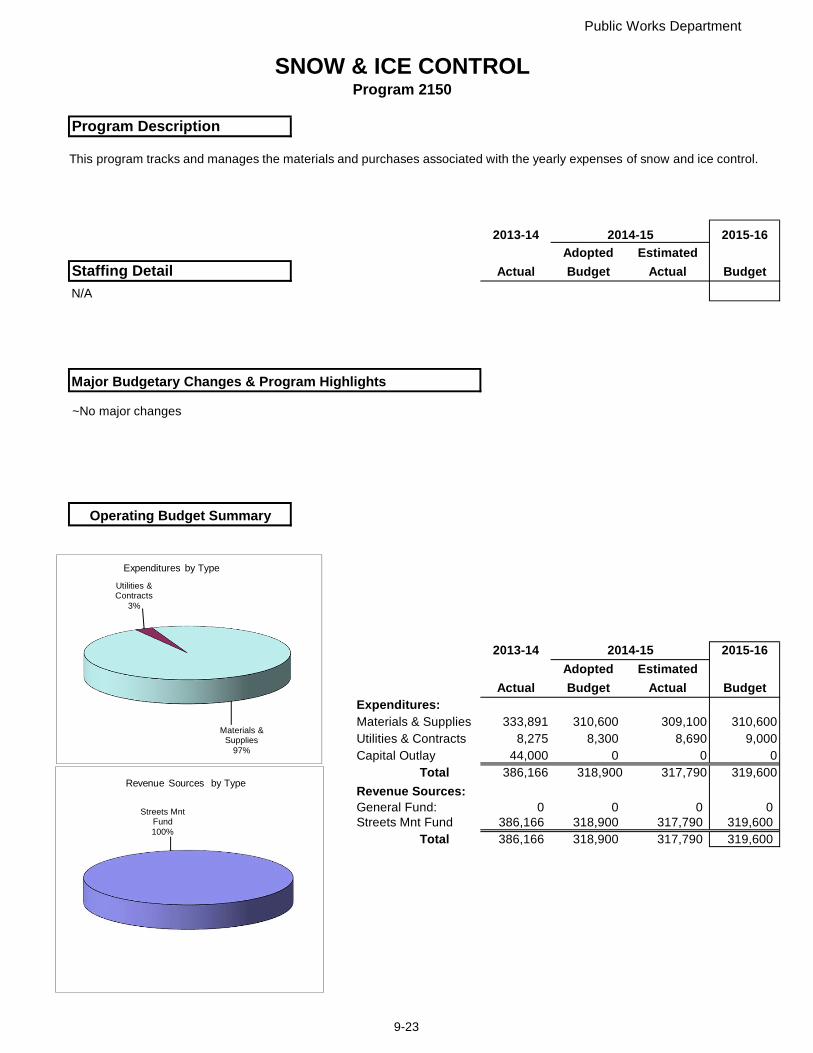
Public Works Department
SNOW & ICE CONTROLProgram 2150
Program Description
2013-14 2014-15 2015-16Adopted Estimated
Staffing Detail Actual Budget Actual Budget
N/A
Major Budgetary Changes & Program Highlights
Operating Budget Summary
2013-14 2014-15 2015-16Adopted Estimated
Actual Budget Actual BudgetExpenditures:Materials & Supplies 333,891 310,600 309,100 310,600Utilities & Contracts 8,275 8,300 8,690 9,000Capital Outlay 44,000 0 0 0
Total 386,166 318,900 317,790 319,600
Revenue Sources:General Fund: 0 0 0 0Streets Mnt Fund 386,166 318,900 317,790 319,600
Total 386,166 318,900 317,790 319,600
Materials & Supplies
97%
Utilities & Contracts
3%
Expenditures by Type
Streets Mnt Fund100%
Revenue Sources by Type
This program tracks and manages the materials and purchases associated with the yearly expenses of snow and ice control.
~No major changes
9-23
Mission
Core Services
Current Year Activity/Achievements
Budget Challenges/Planned Initiatives
Traffic
To protect the safety of vehicular and pedestrian traffic in accordance with the MUTCD.
- Maintain, repair and install the traffic control devices throughout the City, including traffic, fire, pedestrian andschool signals, weather stations, traffic signs and on and off-street pavement markings.- Provide annual traffic signal preventive maintenance programs.- Serve as a emergency response crew for snow/thunder/wind storms, floods, fires and other emergencies.- Serve as an "on call " service repairman.- Perform traffic counts and data collection as required.- Do visual checks and measurements for handicaps & dumpsters.- Research traffic needs.- Provide field safety inspections.- Coordinate road closures.- Maintain traffic accident to-date history computer files and determine high accident locations.
• Continuing major sign replacement program in order to comply with new sign reflectivity standards.• Replaced the overhead span wire with mast-arm type signal at St. Joseph Ave. & 5th Ave.• Tested Conflict Monitors in 64 intersections.• Installed 588 High Intensity Stop Signs to date "2014".
Installed a flashing school zones for a new school locations.
• Performance Statistics:Number of pavement markings lane miles; 408 lane miles.All Pedestrian crossings and stop bars painted.Sign maintenance (replacement).Signal/crosswalks installed - 5 this past year.Cabinet & Controller up grades- 4 this past year.Data collection in several different areas.Preventive Maintenance on traffic signal devices (at least once at each location).
- Upgrading sign making material (Plotter) to keep up with the MUTCD on high intensity reflectivity materials.- Keep replacing signs that do not comply with the MUTCD "as the budget will allow".- Paint 408 lane miles of pavement markings plus all pedestrian and stop bars.- Help the airport and park departments with their pavement markings.- Inventory of all signs throughout the city.- Events such as the Sound of Speed Airshow severely strain our budget resources.
9-24
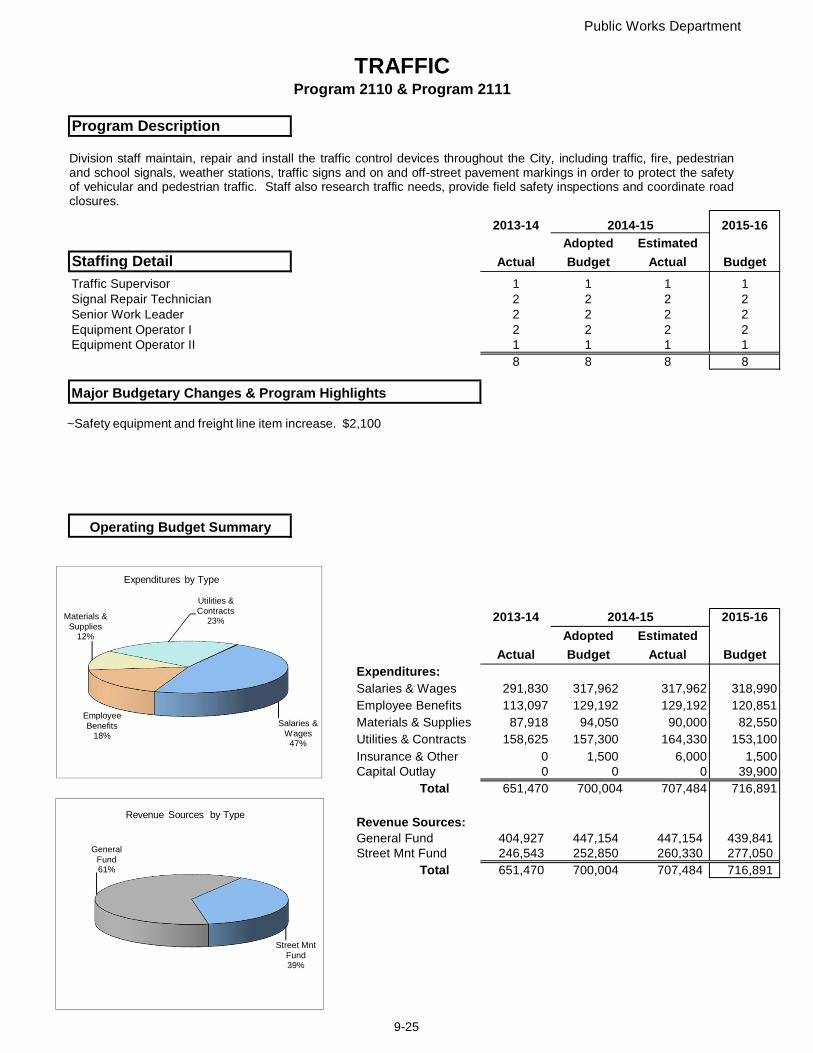
Public Works Department
TRAFFICProgram 2110 & Program 2111
Program Description
2013-14 2014-15 2015-16Adopted Estimated
Staffing Detail Actual Budget Actual Budget
Traffic Supervisor 1 1 1 1Signal Repair Technician 2 2 2 2Senior Work Leader 2 2 2 2Equipment Operator I 2 2 2 2Equipment Operator II 1 1 1 1
8 8 8 8
Major Budgetary Changes & Program Highlights
Operating Budget Summary
2013-14 2014-15 2015-16Adopted Estimated
Actual Budget Actual BudgetExpenditures:Salaries & Wages 291,830 317,962 317,962 318,990Employee Benefits 113,097 129,192 129,192 120,851Materials & Supplies 87,918 94,050 90,000 82,550Utilities & Contracts 158,625 157,300 164,330 153,100Insurance & Other 0 1,500 6,000 1,500Capital Outlay 0 0 0 39,900
Total 651,470 700,004 707,484 716,891
Revenue Sources:General Fund 404,927 447,154 447,154 439,841Street Mnt Fund 246,543 252,850 260,330 277,050
Total 651,470 700,004 707,484 716,891
Salaries & Wages
47%
Employee Benefits
18%
Materials & Supplies
12%
Utilities & Contracts
23%
Expenditures by Type
General Fund61%
Street Mnt Fund39%
Revenue Sources by Type
Division staff maintain, repair and install the traffic control devices throughout the City, including traffic, fire, pedestrianand school signals, weather stations, traffic signs and on and off-street pavement markings in order to protect the safetyof vehicular and pedestrian traffic. Staff also research traffic needs, provide field safety inspections and coordinate roadclosures.
~Safety equipment and freight line item increase. $2,100
9-25
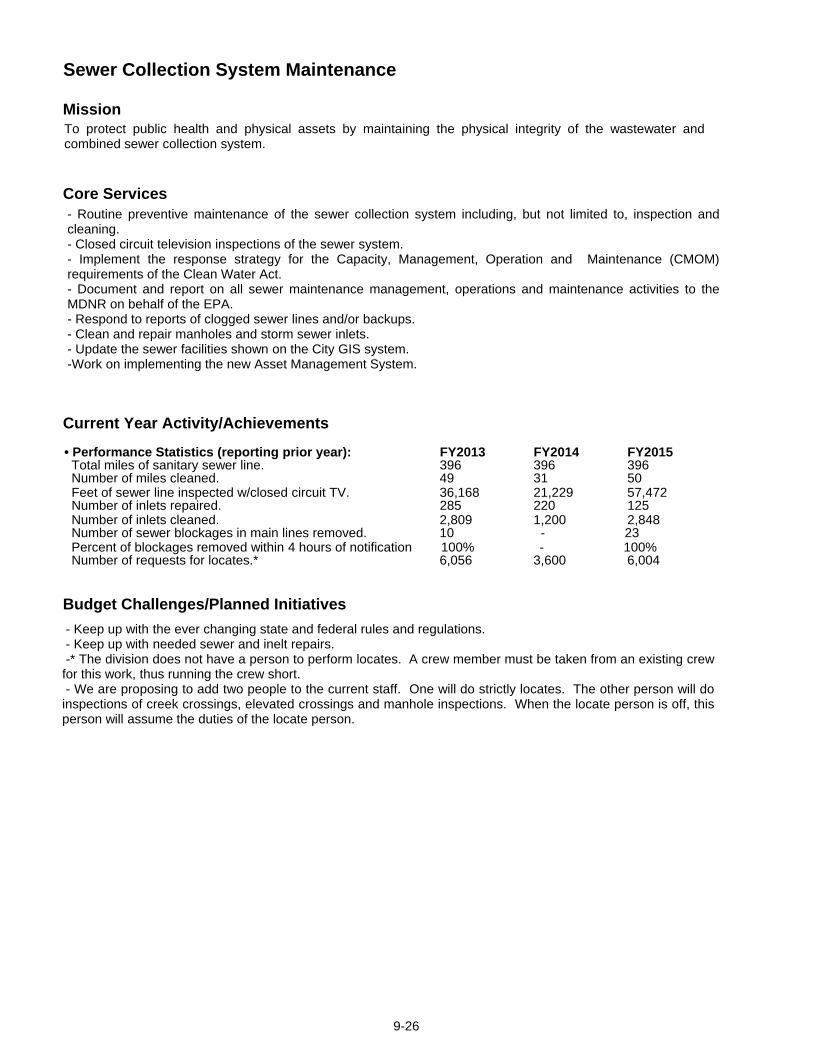
Mission
Core Services
Current Year Activity/Achievements
Budget Challenges/Planned Initiatives
Sewer Collection System Maintenance
To protect public health and physical assets by maintaining the physical integrity of the wastewater andcombined sewer collection system.
- Routine preventive maintenance of the sewer collection system including, but not limited to, inspection andcleaning.- Closed circuit television inspections of the sewer system.- Implement the response strategy for the Capacity, Management, Operation and Maintenance (CMOM)requirements of the Clean Water Act.- Document and report on all sewer maintenance management, operations and maintenance activities to theMDNR on behalf of the EPA.- Respond to reports of clogged sewer lines and/or backups.- Clean and repair manholes and storm sewer inlets.- Update the sewer facilities shown on the City GIS system.-Work on implementing the new Asset Management System.
• Performance Statistics (reporting prior year): FY2013 FY2014 FY2015Total miles of sanitary sewer line. 396 396 396Number of miles cleaned. 49 31 50Feet of sewer line inspected w/closed circuit TV. 36,168 21,229 57,472Number of inlets repaired. 285 220 125Number of inlets cleaned. 2,809 1,200 2,848Number of sewer blockages in main lines removed. 10 - 23Percent of blockages removed within 4 hours of notification 100% - 100%Number of requests for locates.* 6,056 3,600 6,004
- Keep up with the ever changing state and federal rules and regulations.- Keep up with needed sewer and inelt repairs.-* The division does not have a person to perform locates. A crew member must be taken from an existing crewfor this work, thus running the crew short.- We are proposing to add two people to the current staff. One will do strictly locates. The other person will doinspections of creek crossings, elevated crossings and manhole inspections. When the locate person is off, thisperson will assume the duties of the locate person.
9-26
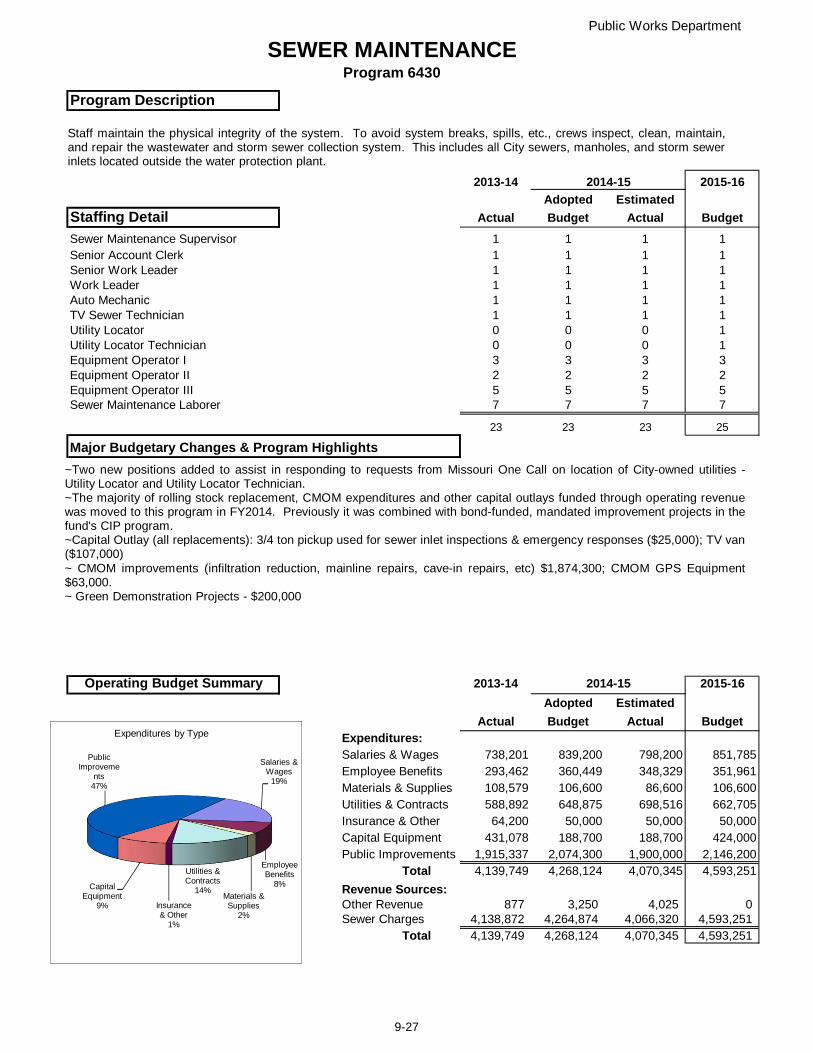
Public Works Department
SEWER MAINTENANCEProgram 6430
Program Description
2013-14 2014-15 2015-16Adopted Estimated
Staffing Detail Actual Budget Actual BudgetSewer Maintenance Supervisor 1 1 1 1Senior Account Clerk 1 1 1 1Senior Work Leader 1 1 1 1Work Leader 1 1 1 1Auto Mechanic 1 1 1 1TV Sewer Technician 1 1 1 1Utility Locator 0 0 0 1Utility Locator Technician 0 0 0 1Equipment Operator I 3 3 3 3Equipment Operator II 2 2 2 2Equipment Operator III 5 5 5 5Sewer Maintenance Laborer 7 7 7 7
23 23 23 25
Major Budgetary Changes & Program Highlights
Operating Budget Summary 2013-14 2014-15 2015-16Adopted Estimated
Actual Budget Actual BudgetExpenditures:Salaries & Wages 738,201 839,200 798,200 851,785Employee Benefits 293,462 360,449 348,329 351,961Materials & Supplies 108,579 106,600 86,600 106,600Utilities & Contracts 588,892 648,875 698,516 662,705Insurance & Other 64,200 50,000 50,000 50,000Capital Equipment 431,078 188,700 188,700 424,000Public Improvements 1,915,337 2,074,300 1,900,000 2,146,200
Total 4,139,749 4,268,124 4,070,345 4,593,251
Revenue Sources:Other Revenue 877 3,250 4,025 0Sewer Charges 4,138,872 4,264,874 4,066,320 4,593,251
Total 4,139,749 4,268,124 4,070,345 4,593,251
Salaries & Wages
19%
Employee Benefits
8%
Materials & Supplies
2%
Utilities & Contracts
14%
Insurance & Other
1%
Capital Equipment
9%
Public Improveme
nts47%
Expenditures by Type
Staff maintain the physical integrity of the system. To avoid system breaks, spills, etc., crews inspect, clean, maintain,and repair the wastewater and storm sewer collection system. This includes all City sewers, manholes, and storm sewerinlets located outside the water protection plant.
~Two new positions added to assist in responding to requests from Missouri One Call on location of City-owned utilities -Utility Locator and Utility Locator Technician.~The majority of rolling stock replacement, CMOM expenditures and other capital outlays funded through operating revenuewas moved to this program in FY2014. Previously it was combined with bond-funded, mandated improvement projects in thefund's CIP program.~Capital Outlay (all replacements): 3/4 ton pickup used for sewer inlet inspections & emergency responses ($25,000); TV van($107,000)~ CMOM improvements (infiltration reduction, mainline repairs, cave-in repairs, etc) $1,874,300; CMOM GPS Equipment$63,000.~ Green Demonstration Projects - $200,000
9-27
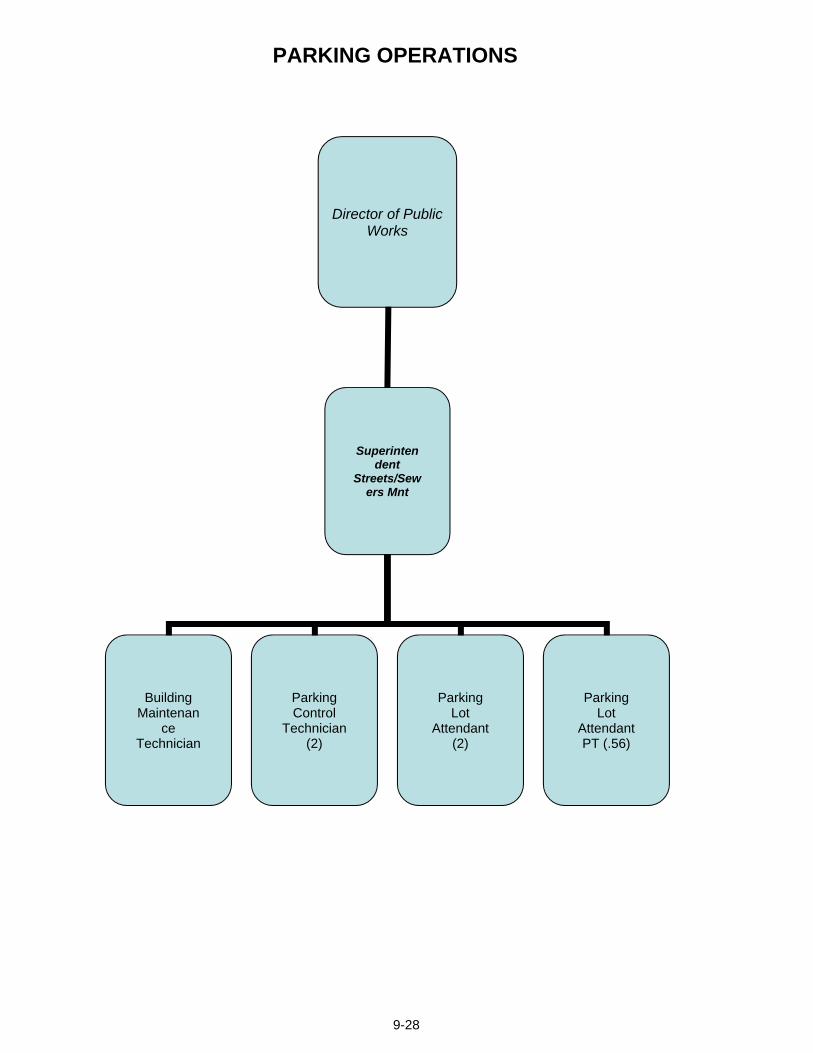
PARKING OPERATIONS
Director of Public Works
Superintendent
Streets/Sewers Mnt
Building Maintenan
ce Technician
Parking Control
Technician (2)
Parking Lot
Attendant (2)
Parking Lot
Attendant PT (.56)
9-28
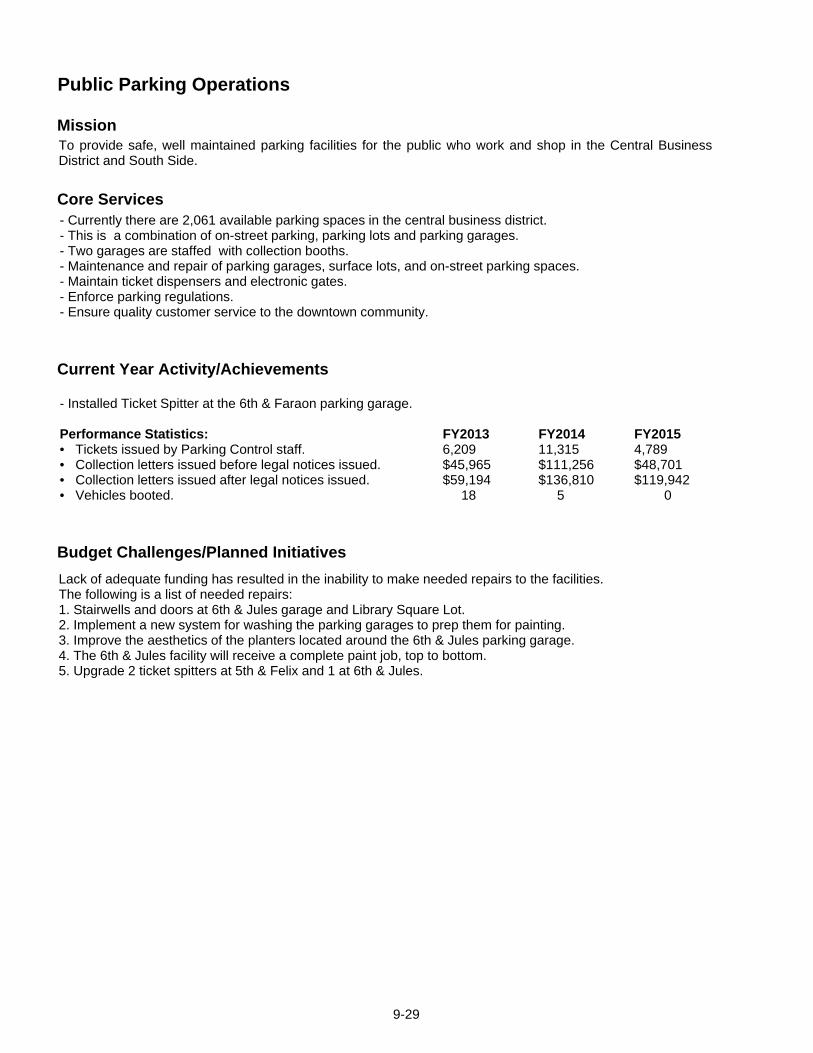
Mission
Core Services
Current Year Activity/Achievements
Budget Challenges/Planned Initiatives
Public Parking Operations
To provide safe, well maintained parking facilities for the public who work and shop in the Central BusinessDistrict and South Side.
- Currently there are 2,061 available parking spaces in the central business district.- This is a combination of on-street parking, parking lots and parking garages.- Two garages are staffed with collection booths.- Maintenance and repair of parking garages, surface lots, and on-street parking spaces.- Maintain ticket dispensers and electronic gates.- Enforce parking regulations.- Ensure quality customer service to the downtown community.
- Installed Ticket Spitter at the 6th & Faraon parking garage.
Performance Statistics: FY2013 FY2014 FY2015• Tickets issued by Parking Control staff. 6,209 11,315 4,789• Collection letters issued before legal notices issued. $45,965 $111,256 $48,701• Collection letters issued after legal notices issued. $59,194 $136,810 $119,942• Vehicles booted. 18 5 0
Lack of adequate funding has resulted in the inability to make needed repairs to the facilities.The following is a list of needed repairs:1. Stairwells and doors at 6th & Jules garage and Library Square Lot.2. Implement a new system for washing the parking garages to prep them for painting.3. Improve the aesthetics of the planters located around the 6th & Jules parking garage.4. The 6th & Jules facility will receive a complete paint job, top to bottom.5. Upgrade 2 ticket spitters at 5th & Felix and 1 at 6th & Jules.
9-29
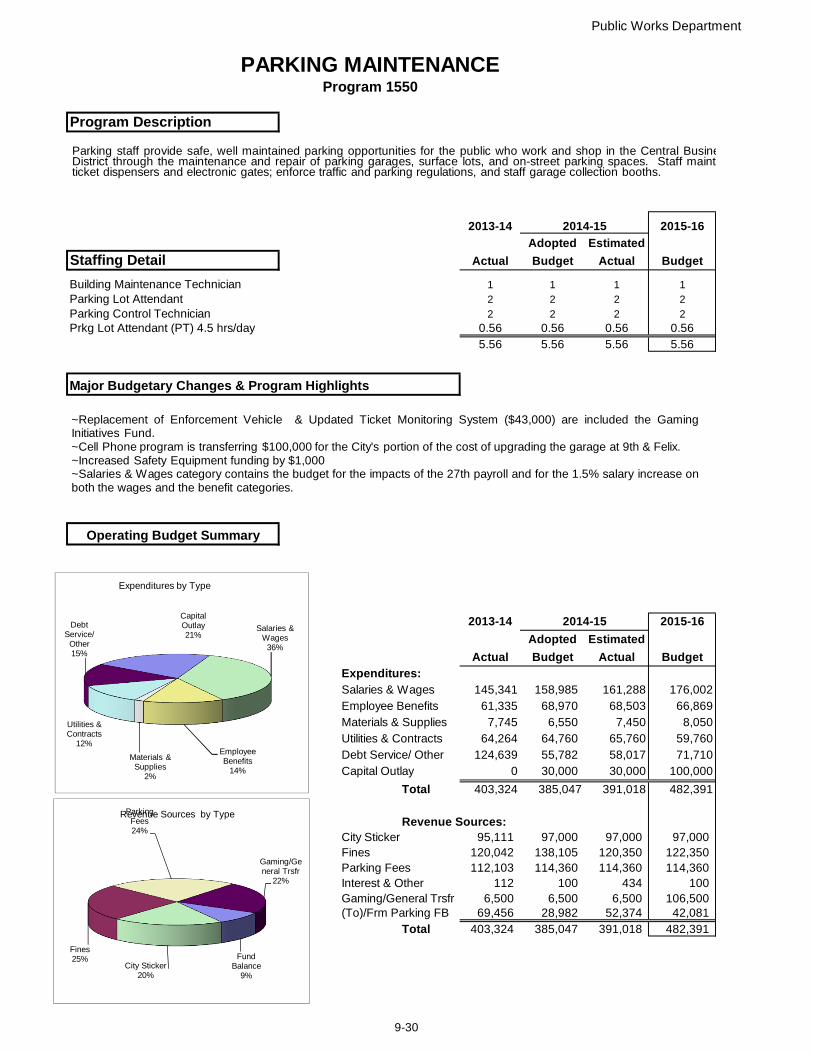
Public Works Department
PARKING MAINTENANCEProgram 1550
Program Description
2013-14 2014-15 2015-16Adopted Estimated
Staffing Detail Actual Budget Actual Budget
Building Maintenance Technician 1 1 1 1Parking Lot Attendant 2 2 2 2Parking Control Technician 2 2 2 2Prkg Lot Attendant (PT) 4.5 hrs/day 0.56 0.56 0.56 0.56
5.56 5.56 5.56 5.56
Major Budgetary Changes & Program Highlights
Operating Budget Summary
2013-14 2014-15 2015-16Adopted Estimated
Actual Budget Actual BudgetExpenditures:Salaries & Wages 145,341 158,985 161,288 176,002Employee Benefits 61,335 68,970 68,503 66,869Materials & Supplies 7,745 6,550 7,450 8,050Utilities & Contracts 64,264 64,760 65,760 59,760Debt Service/ Other 124,639 55,782 58,017 71,710Capital Outlay 0 30,000 30,000 100,000
Total 403,324 385,047 391,018 482,391
Revenue Sources:City Sticker 95,111 97,000 97,000 97,000Fines 120,042 138,105 120,350 122,350Parking Fees 112,103 114,360 114,360 114,360Interest & Other 112 100 434 100Gaming/General Trsfr 6,500 6,500 6,500 106,500(To)/Frm Parking FB 69,456 28,982 52,374 42,081
Total 403,324 385,047 391,018 482,391
Salaries & Wages
36%
Employee Benefits
14%
Materials & Supplies
2%
Utilities & Contracts
12%
Debt Service/
Other15%
Capital Outlay21%
Expenditures by Type
City Sticker20%
Fines25%
Parking Fees24%
Gaming/General Trsfr
22%
Fund Balance
9%
Revenue Sources by Type
Parking staff provide safe, well maintained parking opportunities for the public who work and shop in the Central BusineDistrict through the maintenance and repair of parking garages, surface lots, and on-street parking spaces. Staff maintticket dispensers and electronic gates; enforce traffic and parking regulations, and staff garage collection booths.
~Replacement of Enforcement Vehicle & Updated Ticket Monitoring System ($43,000) are included the GamingInitiatives Fund.~Cell Phone program is transferring $100,000 for the City's portion of the cost of upgrading the garage at 9th & Felix.~Increased Safety Equipment funding by $1,000~Salaries & Wages category contains the budget for the impacts of the 27th payroll and for the 1.5% salary increase onboth the wages and the benefit categories.
9-30
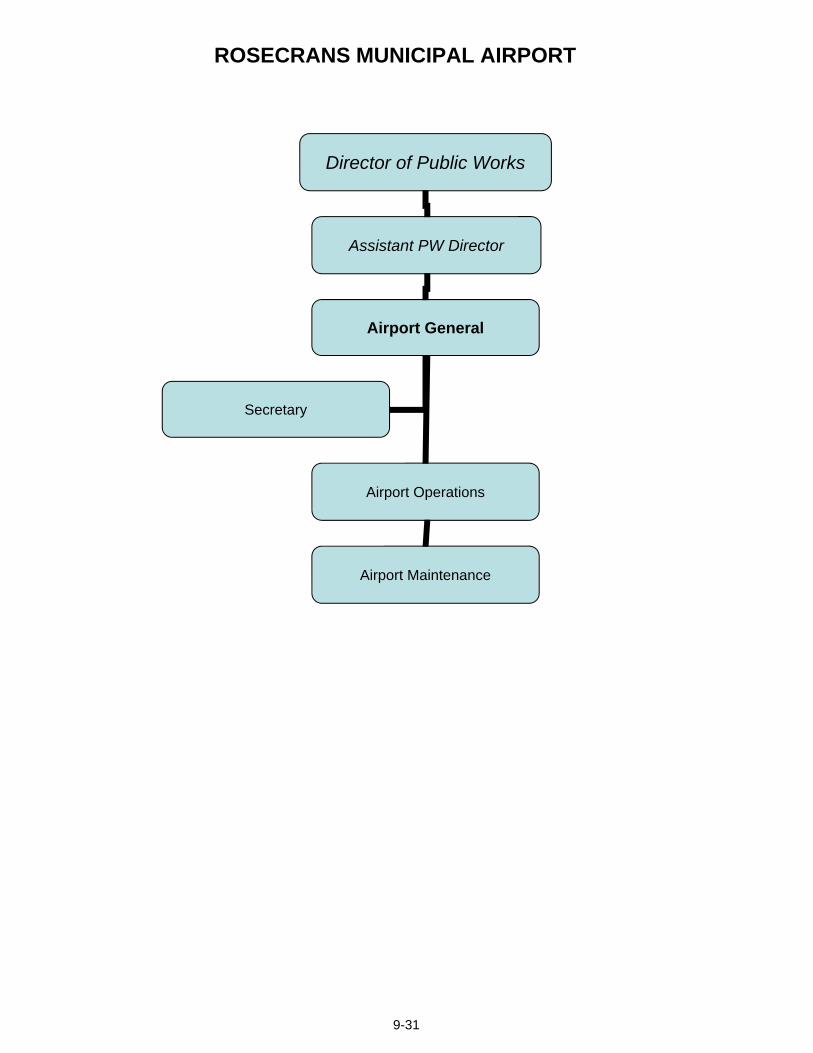
ROSECRANS MUNICIPAL AIRPORT
Director of Public Works
Assistant PW Director
Airport General
Airport Operations
Airport Maintenance
Secretary
9-31
Rosecrans Municipal Airport
Mission
Core Services
Current Year Activity/Achievements
Budget Challenges/Planned Initiatives
Dedicated to providing safe aeronautical facilities and quality services to all general, corporate, commercialand military aviation operations expected of a progressive community.
-Maintain all airport pavement and safety area surfaces, lighting and markings in accordance with FAAdirectives.- Provide required FAA airport maintenance and operations such as grass mowing, snow removal, wildlifecontrol.- Implement Safety Management Systems (SMS) to mitigate risks to aircraft, passengers, tenants, and visitors.- Meet or exceed compliance requirements evaluated during annual FAA Part 139 Airfield Safety Inspections.- Maintain a current airfield preventative maintenance program and forecast future airfield pavementrehabilitations.- Implement airport security measures as necessary to ensure airport safety and satisfy FAA obligations.
- Provide affordable aircraft hangar rental space for private and commercial aircraft at a fair market value.
- Inspect suppliers fueling equipment and vehicles for FAA compliance and ensure availabilty of aviation fuels.
- Maintain identifed operational joint use areas as contracted in the Airport Joint Use Agreement with ANG.Bureau
- Manage various land and property leases with tenants to resolve any deficiencies and monitor for compliance
• Recently completed a major taxiway rehab project, including LED lighting, airfield signs, and runway distanceremaining signs.
• 2012 Airshow successful. Next airshow date yet to be determined.
• Teamed with Engineering to execute Military Coooperative Construction Agreement for ANG projects.
• Spent considerable effort as part of the team to protect levees during the 2011 flood fight.
• Performance Statistics :
Based aircraft - 90 total;10 military and 80 general aviation includes corporate, agricultural medical andpersonal.
Number of aircraft operations (takeoffs & landings) - 22,783.
Total volume of aircraft fuel sales - 199,282.3 gallons (based on 2012 calendar year).
Percent occupancy of 34 existing T-hangars - 100% with a waiting list and 3 currently vacant.
- Ever increasing FAA requirements to maintain certification, such as wildlife control, crop restrictions, SMS, etc.- Air Shows are great for community but an added expense for several city departments- Aging buildings, equipment and surfaces maintainence continue to increase frequency of repair time and costs- Replacement of several aging equipment and appliances are needed.- Serious unexpected shortfall in operational funding due to the termination of any AJUA payment by ANGB.
9-32
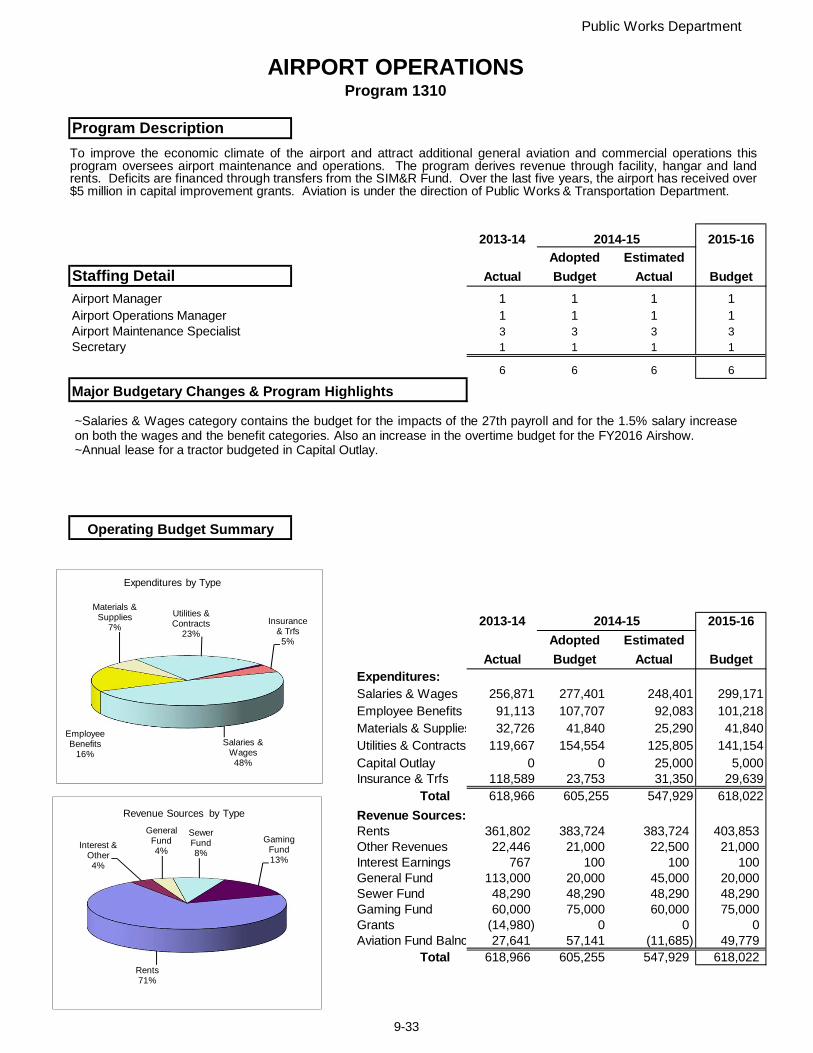
Public Works Department
AIRPORT OPERATIONSProgram 1310
Program Description
2013-14 2014-15 2015-16Adopted Estimated
Staffing Detail Actual Budget Actual BudgetAirport Manager 1 1 1 1Airport Operations Manager 1 1 1 1Airport Maintenance Specialist 3 3 3 3Secretary 1 1 1 1
6 6 6 6
Major Budgetary Changes & Program Highlights
Operating Budget Summary
2013-14 2014-15 2015-16Adopted Estimated
Actual Budget Actual BudgetExpenditures:Salaries & Wages 256,871 277,401 248,401 299,171Employee Benefits 91,113 107,707 92,083 101,218Materials & Supplies 32,726 41,840 25,290 41,840Utilities & Contracts 119,667 154,554 125,805 141,154Capital Outlay 0 0 25,000 5,000Insurance & Trfs 118,589 23,753 31,350 29,639
Total 618,966 605,255 547,929 618,022
Revenue Sources:Rents 361,802 383,724 383,724 403,853Other Revenues 22,446 21,000 22,500 21,000Interest Earnings 767 100 100 100General Fund 113,000 20,000 45,000 20,000Sewer Fund 48,290 48,290 48,290 48,290Gaming Fund 60,000 75,000 60,000 75,000Grants (14,980) 0 0 0Aviation Fund Balnc 27,641 57,141 (11,685) 49,779
Total 618,966 605,255 547,929 618,022
To improve the economic climate of the airport and attract additional general aviation and commercial operations thisprogram oversees airport maintenance and operations. The program derives revenue through facility, hangar and landrents. Deficits are financed through transfers from the SIM&R Fund. Over the last five years, the airport has received over$5 million in capital improvement grants. Aviation is under the direction of Public Works & Transportation Department.
~Salaries & Wages category contains the budget for the impacts of the 27th payroll and for the 1.5% salary increaseon both the wages and the benefit categories. Also an increase in the overtime budget for the FY2016 Airshow.~Annual lease for a tractor budgeted in Capital Outlay.
Salaries & Wages48%
Employee Benefits
16%
Materials & Supplies
7%
Utilities & Contracts
23%
Insurance & Trfs5%
Expenditures by Type
Rents71%
Interest & Other4%
General Fund4%
Sewer Fund 8%
Gaming Fund 13%
Revenue Sources by Type
9-33
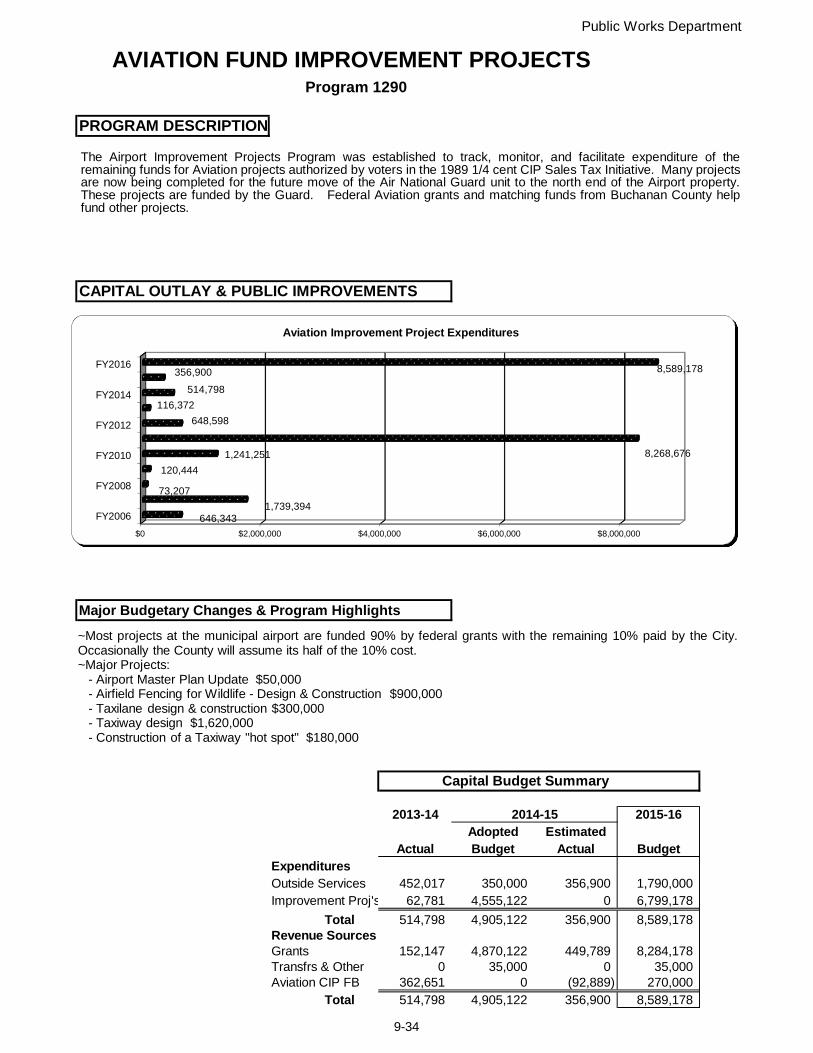
Public Works Department
AVIATION FUND IMPROVEMENT PROJECTS Program 1290
PROGRAM DESCRIPTION
CAPITAL OUTLAY & PUBLIC IMPROVEMENTS
Major Budgetary Changes & Program Highlights
Capital Budget Summary
2013-14 2014-15 2015-16Adopted Estimated
Actual Budget Actual BudgetExpendituresOutside Services 452,017 350,000 356,900 1,790,000Improvement Proj's 62,781 4,555,122 0 6,799,178
Total 514,798 4,905,122 356,900 8,589,178Revenue SourcesGrants 152,147 4,870,122 449,789 8,284,178Transfrs & Other 0 35,000 0 35,000Aviation CIP FB 362,651 0 (92,889) 270,000
Total 514,798 4,905,122 356,900 8,589,178
$0 $2,000,000 $4,000,000 $6,000,000 $8,000,000
FY2006
FY2008
FY2010
FY2012
FY2014
FY2016
646,3431,739,394
73,207
120,444
1,241,251 8,268,676
648,598
116,372
514,798
356,900 8,589,178
Aviation Improvement Project Expenditures
The Airport Improvement Projects Program was established to track, monitor, and facilitate expenditure of theremaining funds for Aviation projects authorized by voters in the 1989 1/4 cent CIP Sales Tax Initiative. Many projectsare now being completed for the future move of the Air National Guard unit to the north end of the Airport property.These projects are funded by the Guard. Federal Aviation grants and matching funds from Buchanan County helpfund other projects.
~Most projects at the municipal airport are funded 90% by federal grants with the remaining 10% paid by the City.Occasionally the County will assume its half of the 10% cost.~Major Projects:
- Airport Master Plan Update $50,000- Airfield Fencing for Wildlife - Design & Construction $900,000- Taxilane design & construction $300,000- Taxiway design $1,620,000- Construction of a Taxiway "hot spot" $180,000
9-34
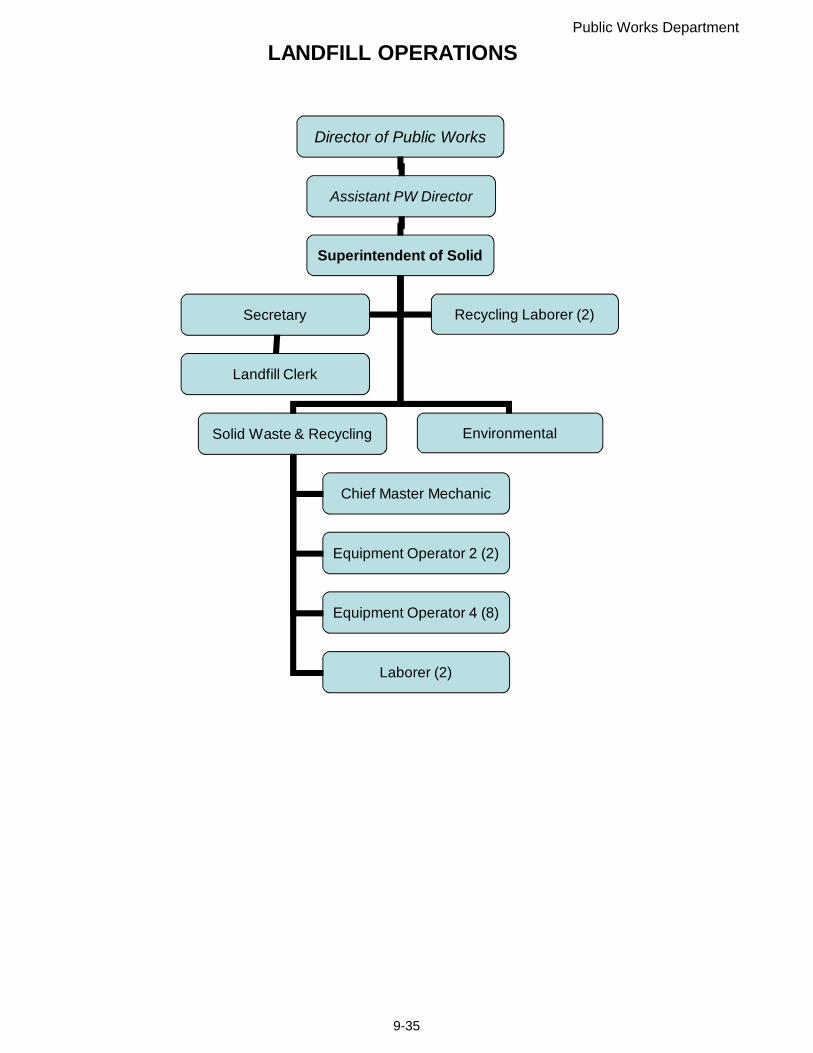
Public Works Department
LANDFILL OPERATIONS
Director of Public Works
Assistant PW Director
Superintendent of Solid
Secretary
Landfill Clerk
Solid Waste & Recycling
Chief Master Mechanic
Equipment Operator 2 (2)
Equipment Operator 4 (8)
Recycling Laborer (2)
Laborer (2)
Environmental
9-35
Public Works Department
Landfill & Recycling Operations
Mission
Core Services
Current Year Activity/Achievements
Budget Challenges/Planned Initiatives
Provide a comprehensive Solid Waste Management program that ensures the optimum protection of publichealth and of the environment.
- Manage daily operations at the existing landfill.- Provide a drop-off recycling center to reduce the volume of waste sent to the landfill.- Maintain the three closed landfills.- Develop new disposal areas for the future.- Meet all Federal and State laws governing solid waste disposal.- New gas to energy project completed that is generating electricity from the methane gas produced within theLandfill.- Offer a Household Hazardous Waste (HHW) program twice a year for items such as oil, antifreeze, latex paint.- Semi annual Clean-Sweep events during which materials can be brought to the Landfill at no charge for St.Joseph residential property owners.
.
• Gas to energy project in full operation with 98% run time• Completed City's commitment to the YMCA projectExcavating Area III Stage 6B for installation of clay liner and synthetics
Performance Statistics:• Number of pounds of trash received during “Clean Sweep” 1,001,900• Number of pounds of material dropped at the Recycling Center 1,043,004• Percent of pounds of recycling material compared to tons of landfill material .0052%• Number of tons received at the Landfill annually 96,235.80Number of pounds of materials collected at Household Hazardous Waste events 122,278
- Complete construction of Area III Stage 6B using City staff and equipment with the exception of synthetics- Support the alley maintenance program due to damage from trash trucks which are larger and heavier thanour alleys were originally meant to service.
.
9-36
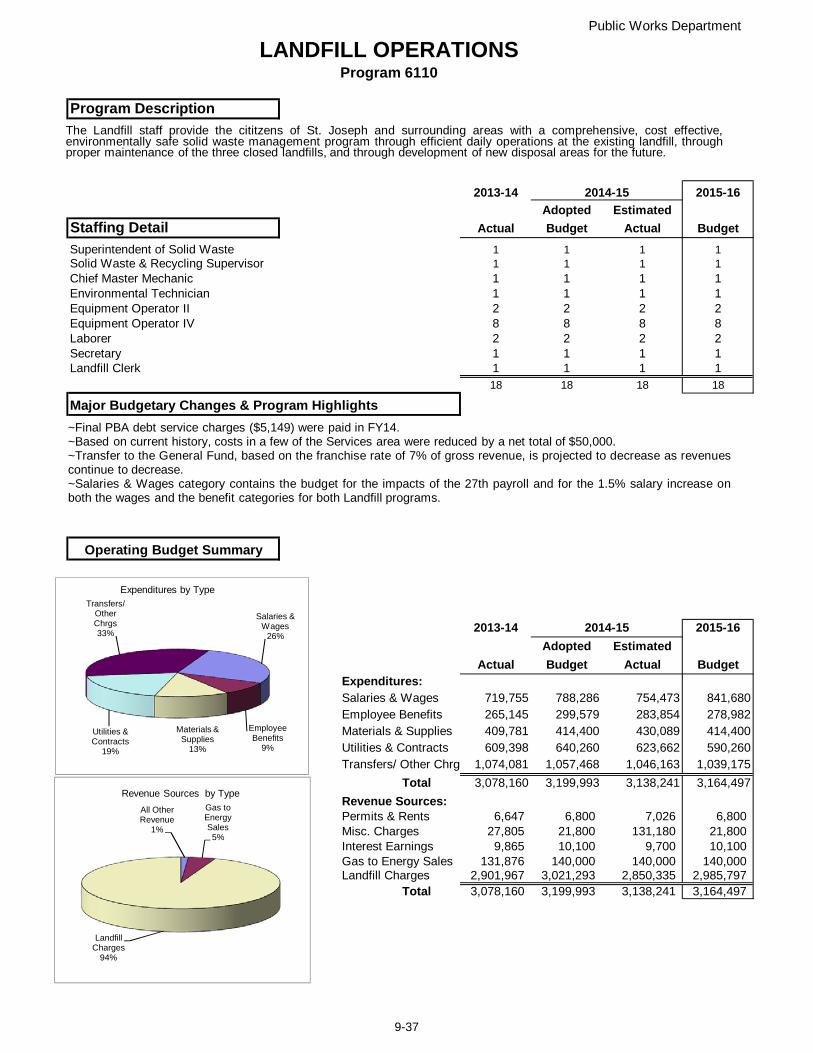
Public Works Department
LANDFILL OPERATIONSProgram 6110
Program Description
2013-14 2014-15 2015-16Adopted Estimated
Staffing Detail Actual Budget Actual BudgetSuperintendent of Solid Waste 1 1 1 1Solid Waste & Recycling Supervisor 1 1 1 1Chief Master Mechanic 1 1 1 1Environmental Technician 1 1 1 1Equipment Operator II 2 2 2 2Equipment Operator IV 8 8 8 8Laborer 2 2 2 2Secretary 1 1 1 1Landfill Clerk 1 1 1 1
18 18 18 18
Major Budgetary Changes & Program Highlights
Operating Budget Summary
2013-14 2014-15 2015-16Adopted Estimated
Actual Budget Actual BudgetExpenditures:Salaries & Wages 719,755 788,286 754,473 841,680Employee Benefits 265,145 299,579 283,854 278,982Materials & Supplies 409,781 414,400 430,089 414,400Utilities & Contracts 609,398 640,260 623,662 590,260Transfers/ Other Chrg 1,074,081 1,057,468 1,046,163 1,039,175
Total 3,078,160 3,199,993 3,138,241 3,164,497
Revenue Sources:Permits & Rents 6,647 6,800 7,026 6,800Misc. Charges 27,805 21,800 131,180 21,800Interest Earnings 9,865 10,100 9,700 10,100Gas to Energy Sales 131,876 140,000 140,000 140,000Landfill Charges 2,901,967 3,021,293 2,850,335 2,985,797
Total 3,078,160 3,199,993 3,138,241 3,164,497
Salaries & Wages
26%
Employee Benefits
9%
Materials & Supplies
13%
Utilities & Contracts
19%
Transfers/ Other Chrgs33%
Expenditures by Type
All Other Revenue
1%
Gas to Energy Sales5%
Landfill Charges
94%
Revenue Sources by Type
The Landfill staff provide the cititzens of St. Joseph and surrounding areas with a comprehensive, cost effective,environmentally safe solid waste management program through efficient daily operations at the existing landfill, throughproper maintenance of the three closed landfills, and through development of new disposal areas for the future.
~Final PBA debt service charges ($5,149) were paid in FY14.~Based on current history, costs in a few of the Services area were reduced by a net total of $50,000.~Transfer to the General Fund, based on the franchise rate of 7% of gross revenue, is projected to decrease as revenuescontinue to decrease.~Salaries & Wages category contains the budget for the impacts of the 27th payroll and for the 1.5% salary increase onboth the wages and the benefit categories for both Landfill programs.
9-37

Public Works Department
RECYCLING OPERATIONSProgram 6150
Program Description
2013-14 2014-15 2015-16Adopted Estimated
Staffing Detail Actual Budget Actual BudgetLaborer 2 2 2 2
Major Budgetary Changes & Program Highlights
Operating Budget Summary
2013-14 2014-15 2015-16Adopted Estimated
Actual Budget Actual BudgetExpenditures:Salaries & Wages 61,189 65,610 65,925 65,609Employee Benefits 25,932 27,809 27,809 26,363Materials & Supplies 1,942 1,250 1,508 1,250Utilities & Contracts 8,495 6,680 8,200 6,680Interfund Transfer 3,250 3,250 3,250 3,250Capital Outlay 0 0 0 0
Total 100,808 104,599 106,692 103,152
Revenue Sources:Recycling Revenues 17,050 18,500 18,500 18,500Landfill Revenues 83,758 86,099 88,192 84,652
Total 100,808 104,599 106,692 103,152
Salaries & Wages64%
Employee Benefits
26%
Materials & Supplies
1%
Utilities & Contracts
6%Interfund Transfer
3%
Expenditures by Type
Recycling Revenues
18%
Subsidy from
Tipping Fees82%
Revenue Sources by Type
The recycling center was opened in 1995 to reduce the volume of waste that otherwise would be sent to a landfill byproviding a drop-off site which collects eight types of products.
~No major changes
9-38
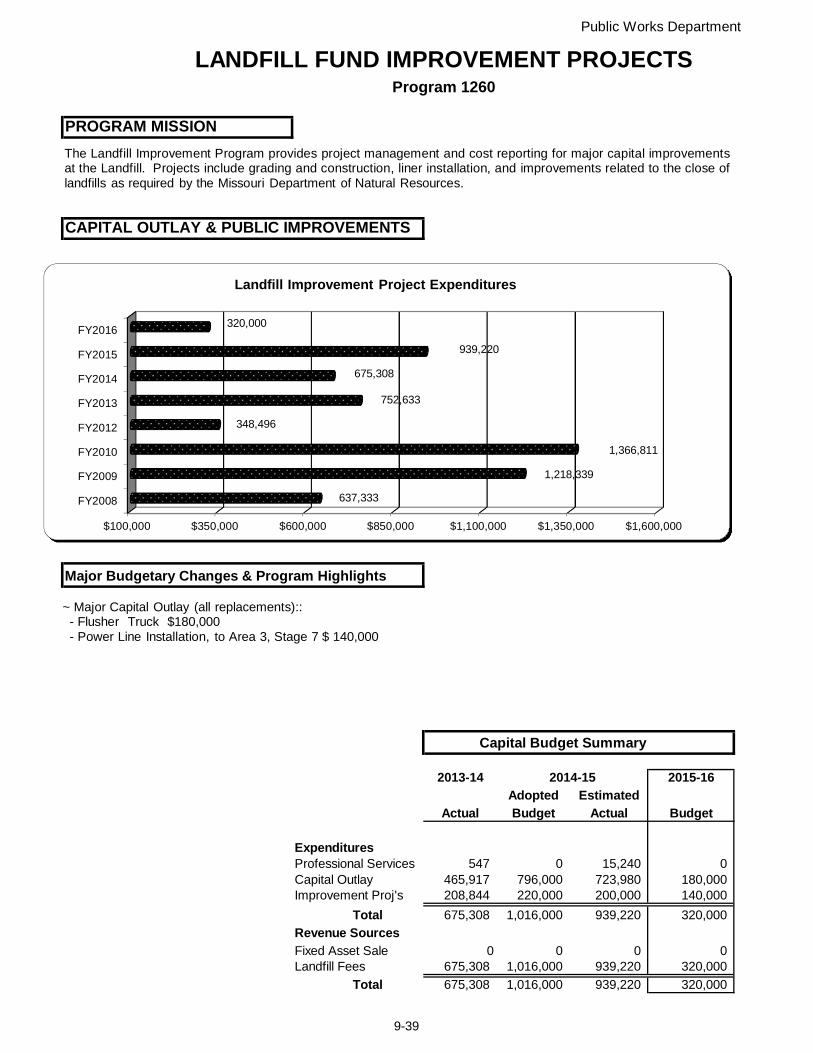
Public Works Department
LANDFILL FUND IMPROVEMENT PROJECTSProgram 1260
PROGRAM MISSION
CAPITAL OUTLAY & PUBLIC IMPROVEMENTS
Major Budgetary Changes & Program Highlights
Capital Budget Summary
2013-14 2014-15 2015-16Adopted Estimated
Actual Budget Actual Budget
ExpendituresProfessional Services 547 0 15,240 0Capital Outlay 465,917 796,000 723,980 180,000Improvement Proj's 208,844 220,000 200,000 140,000
Total 675,308 1,016,000 939,220 320,000
Revenue SourcesFixed Asset Sale 0 0 0 0Landfill Fees 675,308 1,016,000 939,220 320,000
Total 675,308 1,016,000 939,220 320,000
$100,000 $350,000 $600,000 $850,000 $1,100,000 $1,350,000 $1,600,000
FY2008
FY2009
FY2010
FY2012
FY2013
FY2014
FY2015
FY2016
637,333
1,218,339
1,366,811
348,496
752,633
675,308
939,220
320,000
Landfill Improvement Project Expenditures
The Landfill Improvement Program provides project management and cost reporting for major capital improvementsat the Landfill. Projects include grading and construction, liner installation, and improvements related to the close oflandfills as required by the Missouri Department of Natural Resources.
~ Major Capital Outlay (all replacements)::- Flusher Truck $180,000- Power Line Installation, to Area 3, Stage 7 $ 140,000
9-39

WATER PROTECTION
Director of Public Works
Assistant PW
Superintendent of
Operations
Secretary
Plant Mntnce
Senior Account Clerk
Laboratory Manager
Asst Plant Mntnce
Environmental
Senior Auto Plant Maintenance
Master Maintenance Maintenance
Industrial Painter (1) Laboror (4)
Master Plant Lead Plant Operator
Equipment Operator
Inventory Control Electronics
Plant Operator (6)
Process Manager
Assistant Lab
Lab Analysts (4)
Pump Station
Assist. Envrn Srvcs
Envrnmntl Srvcs
Pretreatment Lab
9-40
Public Works Department
WATER PROTECTION ADMINISTRATION, WATER PROTECTION SERVICES, LABORATORY
Mission
Core Services
Current Year Activity/Achievements
Budget Challenges/Planned Initiatives
To ensure that the public health is protected, the environment is not harmed, and this essential utility service isavailable to encourage growth and economic vitality in our community.
- Provide comprehensive wastewater treatment services.- Comply with all guidelines set forth by the Environmental Protection Agency (EPA) and the MissouriDepartment of Natural Resources (MDNR).- Comply with all discharge regulations set forth by the EPA, the MDNR and the National Pollutant DischargeElimination System (NPDES).- Monitor compliance by Significant Industrial Users (SIU's) with regulatory agency effluent guidelines as well aswith the City's Pre-Treatment Ordinance.- Monitor discharge from the City's system daily to ensure regulatory compliance.- Perform proactive major maintenance of significant process systems.- Monitor F.O.G.(Fats, Oils, Grease) Compliance from restaurants and other contributors- Administer MS4 Stormwater Program
- Implementing Phase 1 of the Long Term Control Plan for reducing combined sewer overflows. Phase 1 isestimated to cost $150,000,000.00 over the next 20 years.- Annual Cost of Service Rate Study completed.
Performance Statistics:• Average number of gallons at the plant daily is 17 million gallons per day.• Total capacity is 27 million gallons per day.• Number of pumping stations is 19.• Number of Notice of Violations issued against the City is zero.
- Operate a new disinfection treatment process and effluent pumping station.- Complete the construction of a new stormwater separation conduit for the Whitehead Creek.Complete the design of a new stormwater separation conduit for the Blacksnake Creek
- Finish the pilot study for ammonia removal options to complete the design of a new ammonia removalprocess.- Continue with design of ammonia removal process
9-41
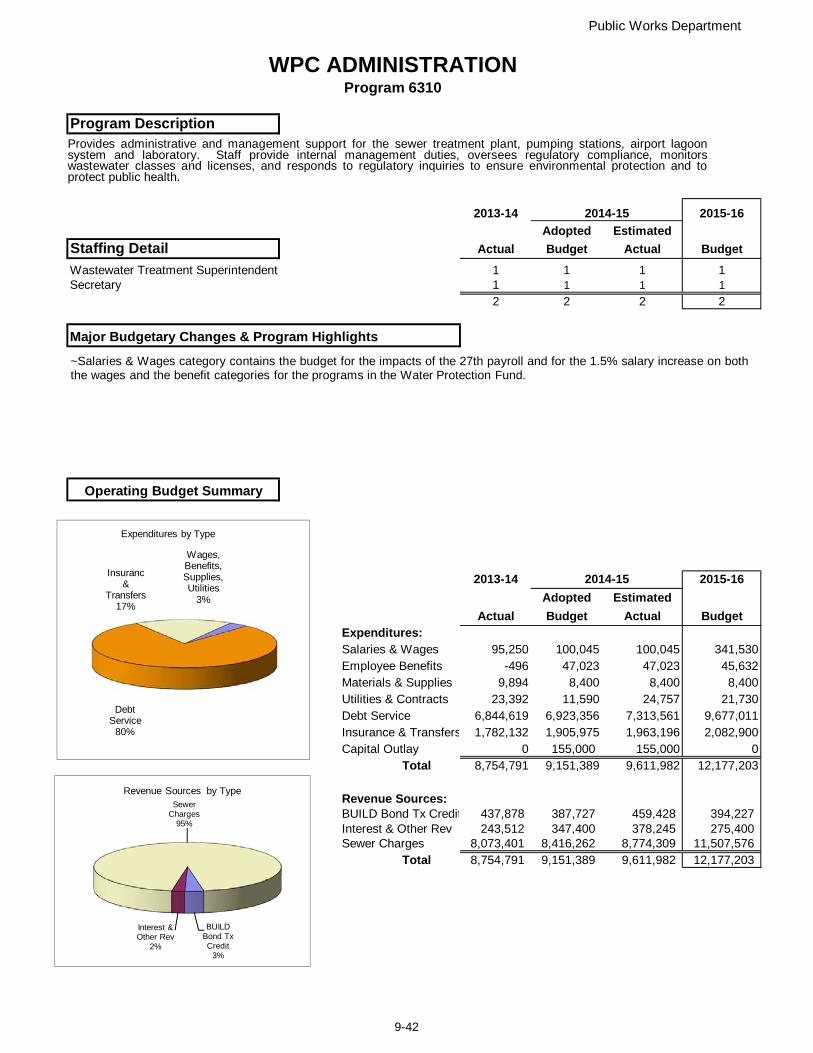
Public Works Department
WPC ADMINISTRATIONProgram 6310
Program Description
2013-14 2014-15 2015-16Adopted Estimated
Staffing Detail Actual Budget Actual BudgetWastewater Treatment Superintendent 1 1 1 1Secretary 1 1 1 1
2 2 2 2
Major Budgetary Changes & Program Highlights
Operating Budget Summary
2013-14 2014-15 2015-16Adopted Estimated
Actual Budget Actual BudgetExpenditures:Salaries & Wages 95,250 100,045 100,045 341,530Employee Benefits -496 47,023 47,023 45,632Materials & Supplies 9,894 8,400 8,400 8,400Utilities & Contracts 23,392 11,590 24,757 21,730Debt Service 6,844,619 6,923,356 7,313,561 9,677,011Insurance & Transfers 1,782,132 1,905,975 1,963,196 2,082,900Capital Outlay 0 155,000 155,000 0
Total 8,754,791 9,151,389 9,611,982 12,177,203
Revenue Sources:BUILD Bond Tx Credit 437,878 387,727 459,428 394,227Interest & Other Rev 243,512 347,400 378,245 275,400Sewer Charges 8,073,401 8,416,262 8,774,309 11,507,576
Total 8,754,791 9,151,389 9,611,982 12,177,203
Wages, Benefits, Supplies, Utilities
3%
Debt Service
80%
Insuranc &
Transfers17%
Expenditures by Type
BUILD Bond Tx Credit
3%
Interest & Other Rev
2%
Sewer Charges
95%
Revenue Sources by Type
Provides administrative and management support for the sewer treatment plant, pumping stations, airport lagoonsystem and laboratory. Staff provide internal management duties, oversees regulatory compliance, monitorswastewater classes and licenses, and responds to regulatory inquiries to ensure environmental protection and toprotect public health.
~Salaries & Wages category contains the budget for the impacts of the 27th payroll and for the 1.5% salary increase on boththe wages and the benefit categories for the programs in the Water Protection Fund.
9-42
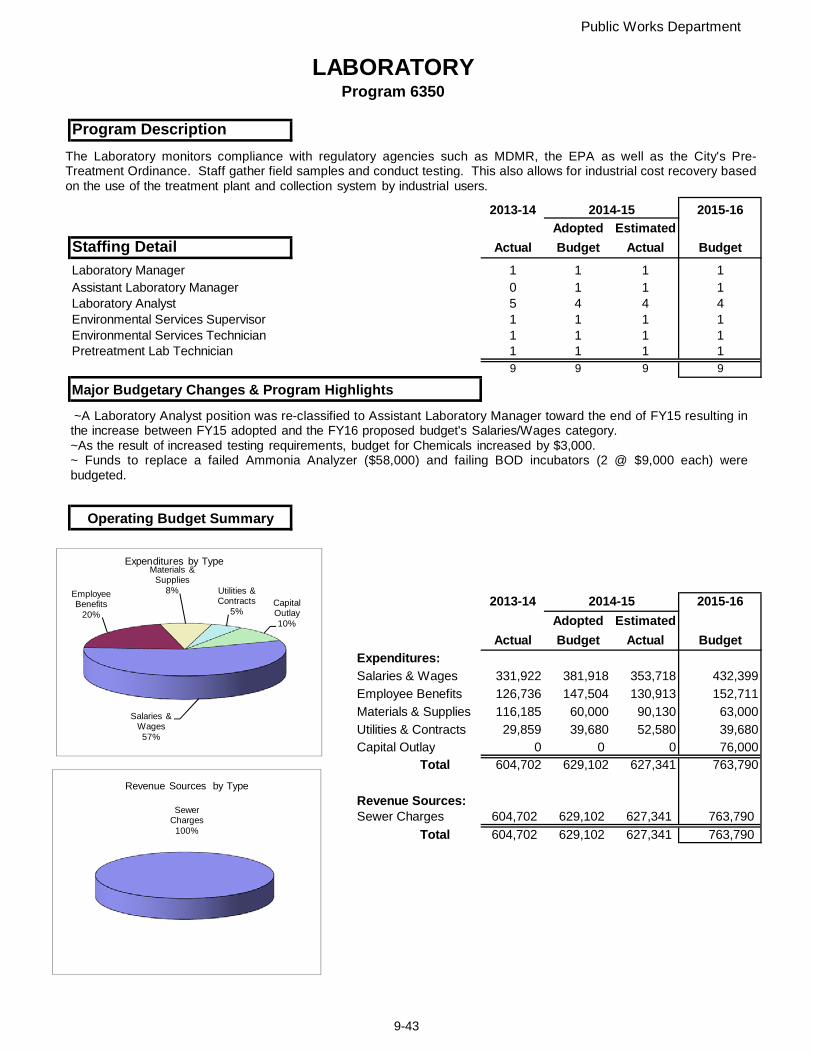
Public Works Department
LABORATORYProgram 6350
Program Description
2013-14 2014-15 2015-16Adopted Estimated
Staffing Detail Actual Budget Actual Budget
Laboratory Manager 1 1 1 1Assistant Laboratory Manager 0 1 1 1Laboratory Analyst 5 4 4 4Environmental Services Supervisor 1 1 1 1Environmental Services Technician 1 1 1 1Pretreatment Lab Technician 1 1 1 1
9 9 9 9
Major Budgetary Changes & Program Highlights
Operating Budget Summary
2013-14 2014-15 2015-16Adopted Estimated
Actual Budget Actual BudgetExpenditures:Salaries & Wages 331,922 381,918 353,718 432,399
Employee Benefits 126,736 147,504 130,913 152,711
Materials & Supplies 116,185 60,000 90,130 63,000
Utilities & Contracts 29,859 39,680 52,580 39,680Capital Outlay 0 0 0 76,000
Total 604,702 629,102 627,341 763,790
Revenue Sources:Sewer Charges 604,702 629,102 627,341 763,790
Total 604,702 629,102 627,341 763,790
Salaries & Wages57%
Employee Benefits
20%
Materials & Supplies
8% Utilities & Contracts
5%Capital Outlay10%
Expenditures by Type
Sewer Charges
100%
Revenue Sources by Type
The Laboratory monitors compliance with regulatory agencies such as MDMR, the EPA as well as the City's Pre-Treatment Ordinance. Staff gather field samples and conduct testing. This also allows for industrial cost recovery basedon the use of the treatment plant and collection system by industrial users.
~A Laboratory Analyst position was re-classified to Assistant Laboratory Manager toward the end of FY15 resulting inthe increase between FY15 adopted and the FY16 proposed budget's Salaries/Wages category.~As the result of increased testing requirements, budget for Chemicals increased by $3,000.~ Funds to replace a failed Ammonia Analyzer ($58,000) and failing BOD incubators (2 @ $9,000 each) werebudgeted.
9-43

Public Works Department
Water Protection PlantProgram 6330
Program Description
2013-14 2014-15 2015-16Adopted Estimated
Staffing Detail Actual Budget Actual BudgetOperations Manager 1 1 1 1
Plant Maintenance Supervisor 1 1 1 1Asst Plant Maintenance Supervisor 1 1 1 1Plant Maintenance Mechanic 12 12 12 12Master Plant Operator 1 1 1 1Lead Plant Operator 5 5 5 5Plant Operator 6 6 6 6Master Maintenance Electrician 2 2 2 2Electronics Technician 1 1 1 1Inventory Control Technician 1 1 1 1Senior Auto Mechanic 1 1 1 1Maintenance Technician 2 2 2 2Industrial Painter 1 1 1 1Equipment Operator III 4 4 4 4Asst Environmental Supervisor 0 0 0 1Pump Station Collection Technician 0 0 0 2Process Manager 0 0 0 1Laborer 4 4 4 4Senior Account Clerk 1 1 1 1Engineering Clerk PT (25 hrs/wk) 0.625 0.625 0.625 0.625
44.625 44.625 44.625 48.625
Major Budgetary Changes & Program Highlights
Operating Budget Summary 2013-14 2014-15 2015-16Adopted Estimated
Actual Budget Actual BudgetExpenditures:Salaries & Wages 1,641,358 1,889,159 1,798,116 1,951,497Employee Benefits 594,929 718,293 647,210 702,655Materials & Supplies 480,151 531,635 558,635 619,135Utilities & Contracts 3,408,937 3,679,450 3,805,995 3,906,060Capital Outlay 48,148 48,000 353,577 300,000
Total 6,173,523 6,866,537 7,163,533 7,479,347
Revenue Sources:Grants & Other 8,444 0 178,788 0Sewer Charges 6,165,079 6,866,537 6,984,745 7,479,347
Total 6,173,523 6,866,537 7,163,533 7,479,347
Salaries & Wages
26%
Employee Benefits
10%
Materials & Supplies
8%
Utilities & Contracts
52%
Capital Outlay
4%
Expenditures by Type
Staff operate and maintain all treatment plant facilities and equipment and monitor compliance with effluent guidelinesestablished by the Environmental Protection Agency (EPA) and Missouri Department of Natural Resources (MDNR) in orderto protect public health and the environment.
~Four positions added - Asst Environmental Supervisor, Process Manager, Pump Station Collection Technician (2)~Increased cost of wastewater treatment chemicals, safety equipment/clothing, and minor equipment boosted the Suppliescategory by $87,500.~Anticipating increased need for professional services in meeting state & federal mandates, the line item was increased$100,000.~ M&R of Buildings & Facilitites and of Equipment increased a combined $121,300.~ Major Capital (replacements): Highloader w/load cells ($135,000) and a roll-off dump truck ($165,000)
9-44
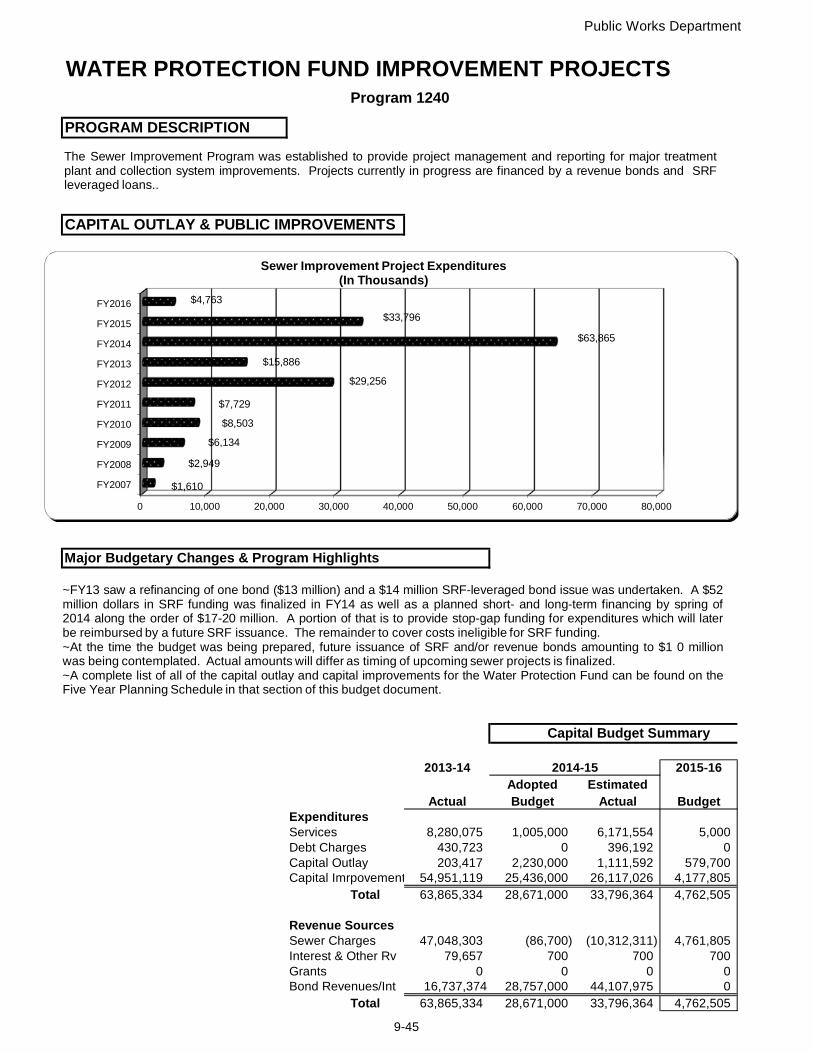
Public Works Department
Program 1240
PROGRAM DESCRIPTION
CAPITAL OUTLAY & PUBLIC IMPROVEMENTS
0 0
Major Budgetary Changes & Program Highlights
Capital Budget Summary
2013-14 2015-16Adopted Estimated
Actual Budget Actual BudgetExpendituresServices 8,280,075 1,005,000 6,171,554 5,000Debt Charges 430,723 0 396,192 0Capital Outlay 203,417 2,230,000 1,111,592 579,700Capital Imrpovement 54,951,119 25,436,000 26,117,026 4,177,805
Total 63,865,334 28,671,000 33,796,364 4,762,505
Revenue SourcesSewer Charges 47,048,303 (86,700) (10,312,311) 4,761,805Interest & Other Rv 79,657 700 700 700Grants 0 0 0 0Bond Revenues/Int 16,737,374 28,757,000 44,107,975 0
Total 63,865,334 28,671,000 33,796,364 4,762,505
WATER PROTECTION FUND IMPROVEMENT PROJECTS
2014-15
0 10,000 20,000 30,000 40,000 50,000 60,000 70,000 80,000
FY2007
FY2008
FY2009
FY2010
FY2011
FY2012
FY2013
FY2014
FY2015
FY2016
$1,610
$2,949
$6,134
$8,503
$7,729
$29,256
$15,886
$63,865
$33,796
$4,763
Sewer Improvement Project Expenditures(In Thousands)
The Sewer Improvement Program was established to provide project management and reporting for major treatmentplant and collection system improvements. Projects currently in progress are financed by a revenue bonds and SRFleveraged loans..
~FY13 saw a refinancing of one bond ($13 million) and a $14 million SRF-leveraged bond issue was undertaken. A $52million dollars in SRF funding was finalized in FY14 as well as a planned short- and long-term financing by spring of2014 along the order of $17-20 million. A portion of that is to provide stop-gap funding for expenditures which will laterbe reimbursed by a future SRF issuance. The remainder to cover costs ineligible for SRF funding.~At the time the budget was being prepared, future issuance of SRF and/or revenue bonds amounting to $1 0 millionwas being contemplated. Actual amounts will differ as timing of upcoming sewer projects is finalized.~A complete list of all of the capital outlay and capital improvements for the Water Protection Fund can be found on theFive Year Planning Schedule in that section of this budget document.
9-45
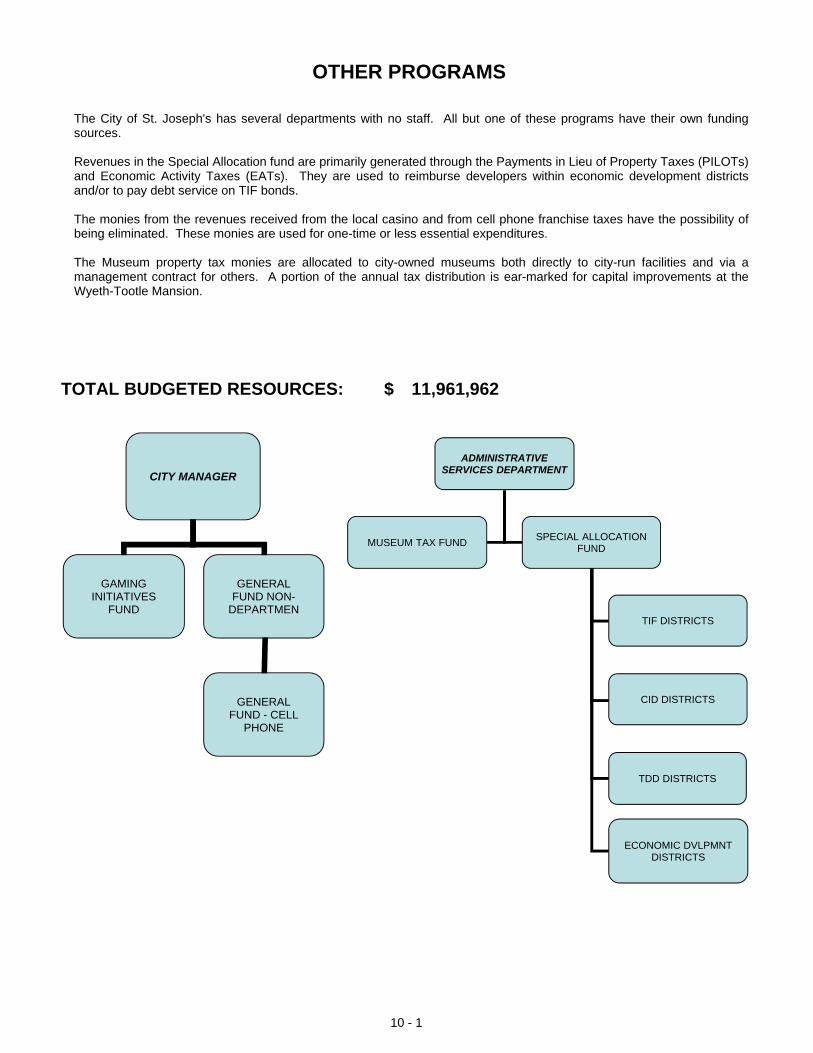
OTHER PROGRAMS
TOTAL BUDGETED RESOURCES: 11,961,962$
The City of St. Joseph's has several departments with no staff. All but one of these programs have their own fundingsources.
Revenues in the Special Allocation fund are primarily generated through the Payments in Lieu of Property Taxes (PILOTs)and Economic Activity Taxes (EATs). They are used to reimburse developers within economic development districtsand/or to pay debt service on TIF bonds.
The monies from the revenues received from the local casino and from cell phone franchise taxes have the possibility ofbeing eliminated. These monies are used for one-time or less essential expenditures.
The Museum property tax monies are allocated to city-owned museums both directly to city-run facilities and via amanagement contract for others. A portion of the annual tax distribution is ear-marked for capital improvements at theWyeth-Tootle Mansion.
ADMINISTRATIVE SERVICES DEPARTMENT
MUSEUM TAX FUNDSPECIAL ALLOCATION
FUND
TIF DISTRICTS
CID DISTRICTS
TDD DISTRICTS
ECONOMIC DVLPMNT DISTRICTS
CITY MANAGER
GAMING INITIATIVES
FUND
GENERAL FUND NON-
DEPARTMEN
GENERAL FUND - CELL
PHONE
10 - 1
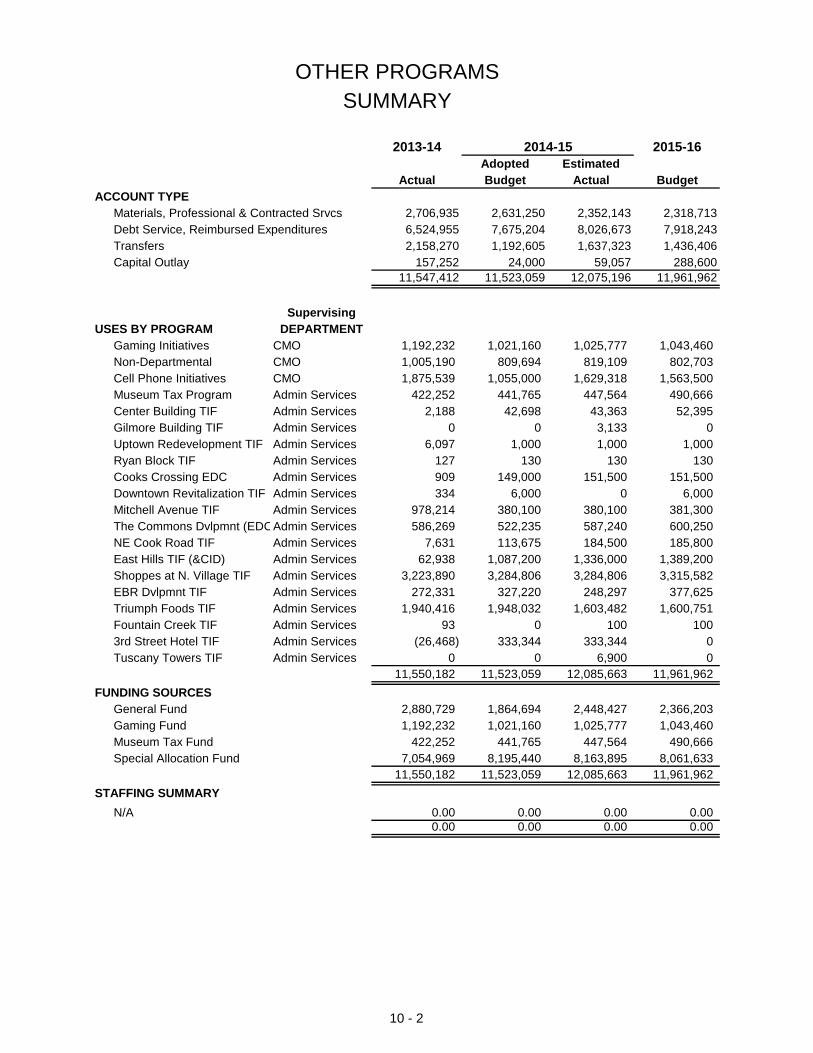
OTHER PROGRAMSSUMMARY
2013-14 2014-15 2015-16Adopted Estimated
Actual Budget Actual BudgetACCOUNT TYPE
Materials, Professional & Contracted Srvcs 2,706,935 2,631,250 2,352,143 2,318,713Debt Service, Reimbursed Expenditures 6,524,955 7,675,204 8,026,673 7,918,243Transfers 2,158,270 1,192,605 1,637,323 1,436,406Capital Outlay 157,252 24,000 59,057 288,600
11,547,412 11,523,059 12,075,196 11,961,962
SupervisingUSES BY PROGRAM
Gaming Initiatives 1,192,232 1,021,160 1,025,777 1,043,460Non-Departmental CMO 1,005,190 809,694 819,109 802,703Cell Phone Initiatives CMO 1,875,539 1,055,000 1,629,318 1,563,500Museum Tax Program Admin Services 422,252 441,765 447,564 490,666Center Building TIF Admin Services 2,188 42,698 43,363 52,395Gilmore Building TIF Admin Services 0 0 3,133 0Uptown Redevelopment TIF Admin Services 6,097 1,000 1,000 1,000Ryan Block TIF Admin Services 127 130 130 130Cooks Crossing EDC Admin Services 909 149,000 151,500 151,500Downtown Revitalization TIF Admin Services 334 6,000 0 6,000Mitchell Avenue TIF Admin Services 978,214 380,100 380,100 381,300The Commons Dvlpmnt (EDCAdmin Services 586,269 522,235 587,240 600,250NE Cook Road TIF Admin Services 7,631 113,675 184,500 185,800East Hills TIF (&CID) Admin Services 62,938 1,087,200 1,336,000 1,389,200Shoppes at N. Village TIF Admin Services 3,223,890 3,284,806 3,284,806 3,315,582EBR Dvlpmnt TIF Admin Services 272,331 327,220 248,297 377,625Triumph Foods TIF Admin Services 1,940,416 1,948,032 1,603,482 1,600,751Fountain Creek TIF Admin Services 93 0 100 1003rd Street Hotel TIF Admin Services (26,468) 333,344 333,344 0Tuscany Towers TIF Admin Services 0 0 6,900 0
11,550,182 11,523,059 12,085,663 11,961,962
FUNDING SOURCESGeneral Fund 2,880,729 1,864,694 2,448,427 2,366,203Gaming Fund 1,192,232 1,021,160 1,025,777 1,043,460Museum Tax Fund 422,252 441,765 447,564 490,666Special Allocation Fund 7,054,969 8,195,440 8,163,895 8,061,633
11,550,182 11,523,059 12,085,663 11,961,962
STAFFING SUMMARYN/A 0.00 0.00 0.00 0.00
0.00 0.00 0.00 0.00
DEPARTMENTCMO
10 - 2
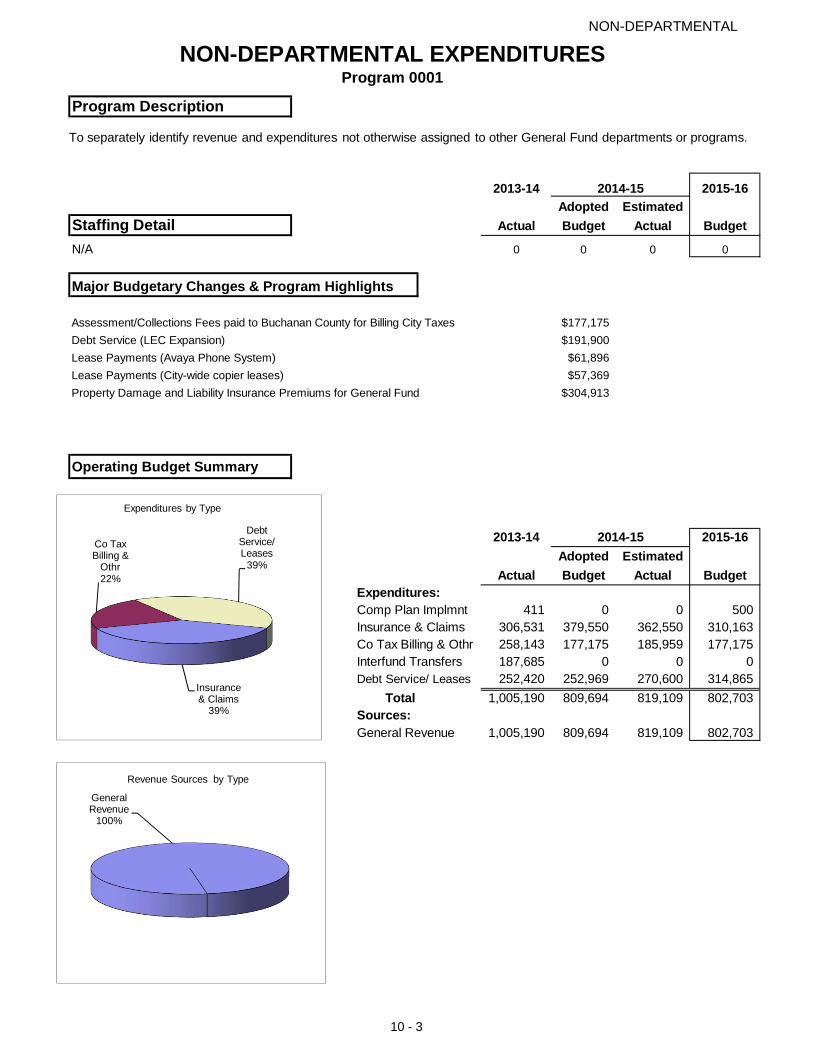
NON-DEPARTMENTAL
NON-DEPARTMENTAL EXPENDITURESProgram 0001
Program Description
2013-14 2014-15 2015-16Adopted Estimated
Staffing Detail Actual Budget Actual Budget
N/A 0 0 0 0
Major Budgetary Changes & Program Highlights
Assessment/Collections Fees paid to Buchanan County for Billing City Taxes $177,175
Debt Service (LEC Expansion) $191,900
Lease Payments (Avaya Phone System) $61,896
Lease Payments (City-wide copier leases) $57,369
Property Damage and Liability Insurance Premiums for General Fund $304,913
Operating Budget Summary
2013-14 2014-15 2015-16Adopted Estimated
Actual Budget Actual BudgetExpenditures:Comp Plan Implmnt 411 0 0 500Insurance & Claims 306,531 379,550 362,550 310,163Co Tax Billing & Othr 258,143 177,175 185,959 177,175Interfund Transfers 187,685 0 0 0Debt Service/ Leases 252,420 252,969 270,600 314,865
Total 1,005,190 809,694 819,109 802,703Sources:General Revenue 1,005,190 809,694 819,109 802,703
Insurance & Claims
39%
Co Tax Billing &
Othr22%
Debt Service/ Leases
39%
Expenditures by Type
General Revenue
100%
Revenue Sources by Type
To separately identify revenue and expenditures not otherwise assigned to other General Fund departments or programs.
10 - 3
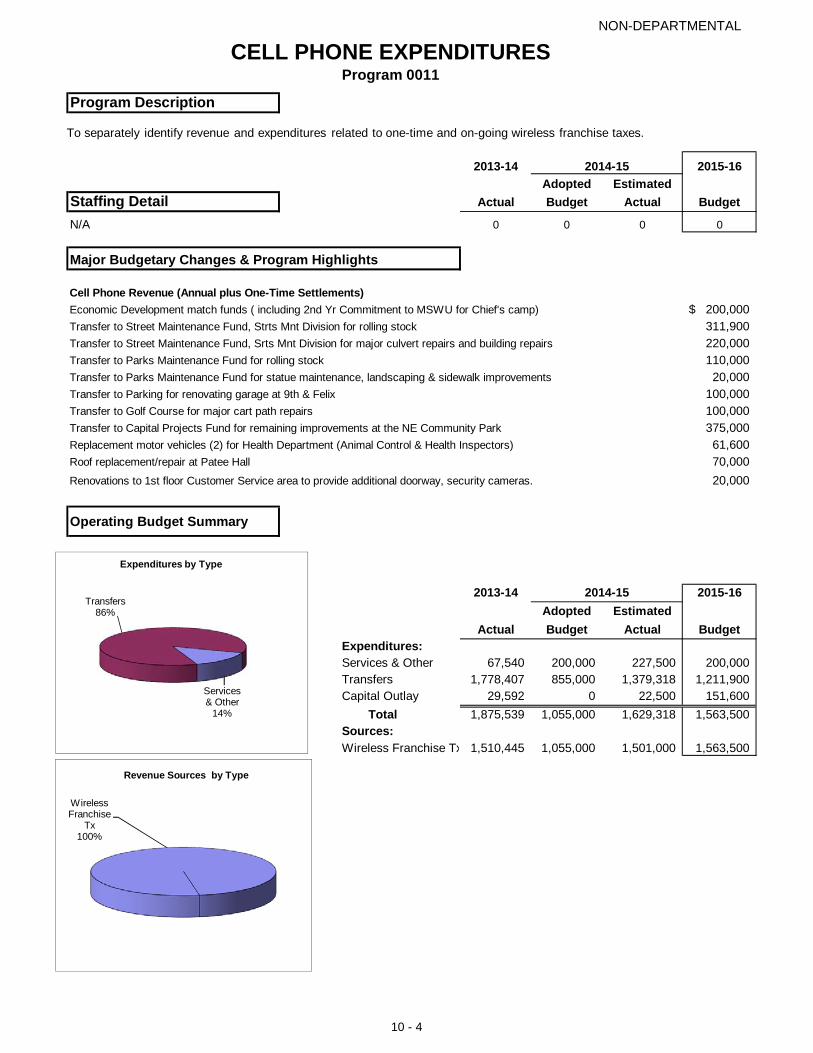
NON-DEPARTMENTAL
CELL PHONE EXPENDITURESProgram 0011
Program Description
2013-14 2014-15 2015-16Adopted Estimated
Staffing Detail Actual Budget Actual Budget
N/A 0 0 0 0
Major Budgetary Changes & Program Highlights
Cell Phone Revenue (Annual plus One-Time Settlements)Economic Development match funds ( including 2nd Yr Commitment to MSWU for Chief's camp) 200,000$ Transfer to Street Maintenance Fund, Strts Mnt Division for rolling stock 311,900 Transfer to Street Maintenance Fund, Srts Mnt Division for major culvert repairs and building repairs 220,000 Transfer to Parks Maintenance Fund for rolling stock 110,000 Transfer to Parks Maintenance Fund for statue maintenance, landscaping & sidewalk improvements 20,000 Transfer to Parking for renovating garage at 9th & Felix 100,000 Transfer to Golf Course for major cart path repairs 100,000 Transfer to Capital Projects Fund for remaining improvements at the NE Community Park 375,000 Replacement motor vehicles (2) for Health Department (Animal Control & Health Inspectors) 61,600 Roof replacement/repair at Patee Hall 70,000
Renovations to 1st floor Customer Service area to provide additional doorway, security cameras. 20,000
Operating Budget Summary
2013-14 2014-15 2015-16Adopted Estimated
Actual Budget Actual BudgetExpenditures:Services & Other 67,540 200,000 227,500 200,000Transfers 1,778,407 855,000 1,379,318 1,211,900Capital Outlay 29,592 0 22,500 151,600
Total 1,875,539 1,055,000 1,629,318 1,563,500Sources:Wireless Franchise Tx 1,510,445 1,055,000 1,501,000 1,563,500
Services & Other
14%
Transfers86%
Expenditures by Type
Wireless Franchise
Tx100%
Revenue Sources by Type
To separately identify revenue and expenditures related to one-time and on-going wireless franchise taxes.
10 - 4
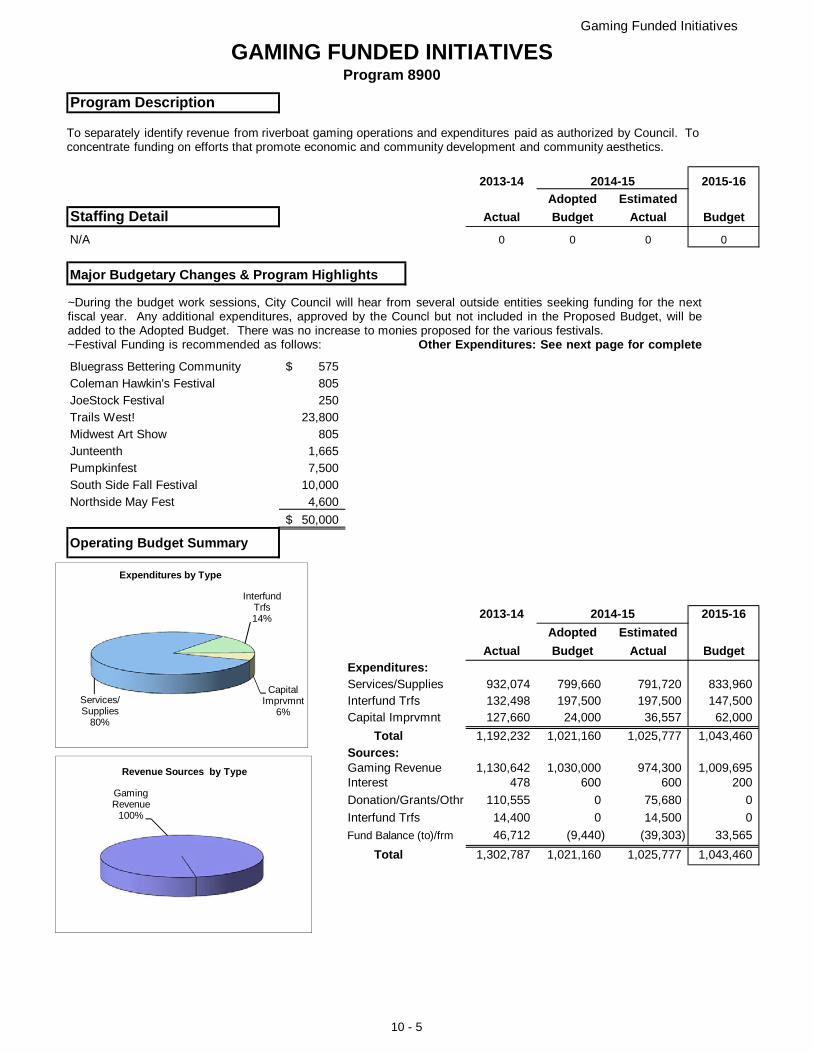
Gaming Funded Initiatives
GAMING FUNDED INITIATIVESProgram 8900
Program Description
2013-14 2014-15 2015-16Adopted Estimated
Staffing Detail Actual Budget Actual Budget
N/A 0 0 0 0
Major Budgetary Changes & Program Highlights
Bluegrass Bettering Community 575$ Coleman Hawkin's Festival 805JoeStock Festival 250Trails West! 23,800Midwest Art Show 805Junteenth 1,665Pumpkinfest 7,500South Side Fall Festival 10,000Northside May Fest 4,600
50,000$
Operating Budget Summary
2013-14 2014-15 2015-16Adopted Estimated
Actual Budget Actual BudgetExpenditures:Services/Supplies 932,074 799,660 791,720 833,960Interfund Trfs 132,498 197,500 197,500 147,500Capital Imprvmnt 127,660 24,000 36,557 62,000
Total 1,192,232 1,021,160 1,025,777 1,043,460Sources:Gaming Revenue 1,130,642 1,030,000 974,300 1,009,695Interest 478 600 600 200
Donation/Grants/Othr 110,555 0 75,680 0
Interfund Trfs 14,400 0 14,500 0
Fund Balance (to)/frm 46,712 (9,440) (39,303) 33,565
Total 1,302,787 1,021,160 1,025,777 1,043,460
Services/Supplies
80%
Interfund Trfs14%
Capital Imprvmnt
6%
Expenditures by Type
Gaming Revenue
100%
Revenue Sources by Type
To separately identify revenue from riverboat gaming operations and expenditures paid as authorized by Council. To concentrate funding on efforts that promote economic and community development and community aesthetics.
~During the budget work sessions, City Council will hear from several outside entities seeking funding for the nextfiscal year. Any additional expenditures, approved by the Councl but not included in the Proposed Budget, will beadded to the Adopted Budget. There was no increase to monies proposed for the various festivals.~Festival Funding is recommended as follows: Other Expenditures: See next page for complete
10 - 5

GAMING INITIATIVES
Proposed Gaming Funded Initiatives
Contributions/Contracts - Recurring $25,000 MO-KAN Contribution$8,560 State Legislative Lobbyist (Mark Rhoads)
$185,000 Chamber Economic Development Contract$500 Great Northwest Day at the Capital (City sponsorship share)
$20,000 Community Alliance Membership$26,000 Downtown Partnership Contract$50,000 Festival Funding$13,000 City 4th of July fireworks display$80,000 Property Mnt clean-up, abatement, dangerous bldg issues$20,000 Save Our Heritage Neighborhood Grants
$100,000 Historic preservation grants outside of HUD-eligible areas$1,600 MDOT Lease
$50,000 Public Education Spots & Cablevision Contract (Pub Info)$150,000 Legal Services - Outside Specialized Counsel (Legal)
Contributions/Contracts - Once or Limited $15,000 Chamber Marketing Program
Capital Equipment/Improvements $25,000 Replace Parking Enforcement Vehicle$18,000 Replace Ticket Monitoring System
$10,000 Retro-fit REC Center$9,000 Dog Park & Eagles Field Signage
$9,300 Upgraded Credit Card Processing Machines-city wideTRANSFER TO GENERAL FUND:
Nature Center: $50,000 Special ProgrammingNonDepartmental: $10,000 Reimbursment for in-kind services provided to spcl events
TRANSFER TO SPECIAL ALLOCATION FUND:City Sponsored TIFs: $6,000 As Needed - To cover City expenses until TIF revenues begin
TRANSFER TO AVIATION FUND:Airport Operations: $60,000 Operating Subsidy in support of Air Guard presence
$15,000 Deposit towards 2016 AirshowTRANSFER TO PARKING FUND:
Parking Operations: $6,500 Reimbursement for lost revenue/waived fees at Civic Center
$963,460
10 - 6
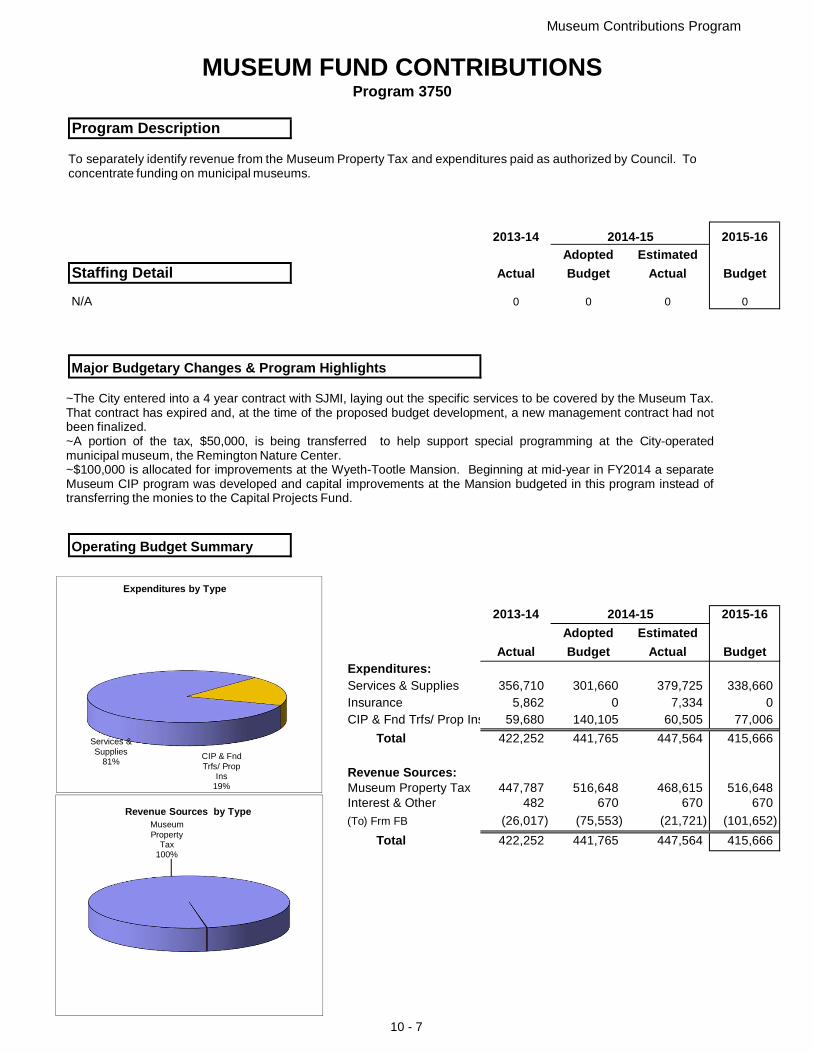
Museum Contributions Program
MUSEUM FUND CONTRIBUTIONSProgram 3750
Program Description
2013-14 2014-15 2015-16Adopted Estimated
Staffing Detail Actual Budget Actual Budget
N/A 0 0 0 0
Major Budgetary Changes & Program Highlights
Operating Budget Summary
2013-14 2014-15 2015-16Adopted Estimated
Actual Budget Actual BudgetExpenditures:Services & Supplies 356,710 301,660 379,725 338,660Insurance 5,862 0 7,334 0CIP & Fnd Trfs/ Prop Ins 59,680 140,105 60,505 77,006
Total 422,252 441,765 447,564 415,666
Revenue Sources:Museum Property Tax 447,787 516,648 468,615 516,648Interest & Other 482 670 670 670
(To) Frm FB (26,017) (75,553) (21,721) (101,652)
Total 422,252 441,765 447,564 415,666
Services & Supplies
81%CIP & Fnd Trfs/ Prop
Ins19%
Expenditures by Type
Museum Property
Tax100%
Revenue Sources by Type
To separately identify revenue from the Museum Property Tax and expenditures paid as authorized by Council. To concentrate funding on municipal museums.
~The City entered into a 4 year contract with SJMI, laying out the specific services to be covered by the Museum Tax.That contract has expired and, at the time of the proposed budget development, a new management contract had notbeen finalized.~A portion of the tax, $50,000, is being transferred to help support special programming at the City-operatedmunicipal museum, the Remington Nature Center.~$100,000 is allocated for improvements at the Wyeth-Tootle Mansion. Beginning at mid-year in FY2014 a separateMuseum CIP program was developed and capital improvements at the Mansion budgeted in this program instead oftransferring the monies to the Capital Projects Fund.
10 - 7
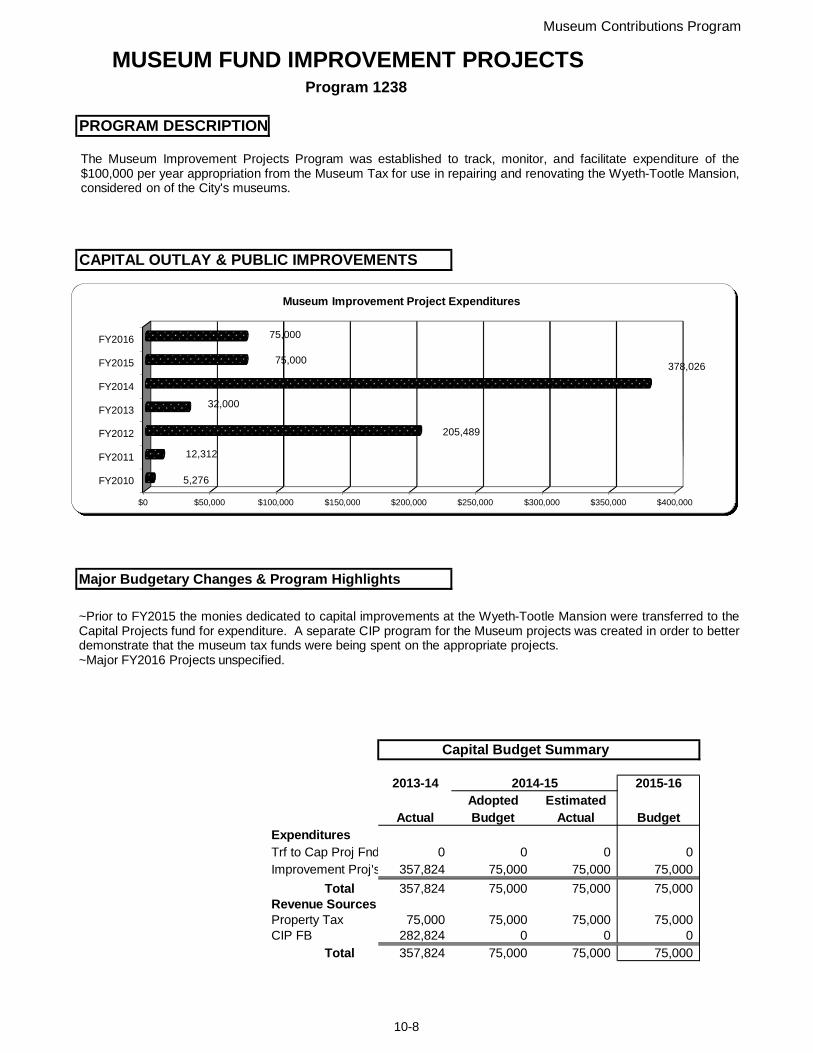
Museum Contributions Program
MUSEUM FUND IMPROVEMENT PROJECTS Program 1238
PROGRAM DESCRIPTION
CAPITAL OUTLAY & PUBLIC IMPROVEMENTS
Major Budgetary Changes & Program Highlights
Capital Budget Summary
2013-14 2014-15 2015-16Adopted Estimated
Actual Budget Actual BudgetExpendituresTrf to Cap Proj Fnd 0 0 0 0Improvement Proj's 357,824 75,000 75,000 75,000
Total 357,824 75,000 75,000 75,000Revenue SourcesProperty Tax 75,000 75,000 75,000 75,000CIP FB 282,824 0 0 0
Total 357,824 75,000 75,000 75,000
$0 $50,000 $100,000 $150,000 $200,000 $250,000 $300,000 $350,000 $400,000
FY2010
FY2011
FY2012
FY2013
FY2014
FY2015
FY2016
5,276
12,312
205,489
32,000
378,02675,000
75,000
Museum Improvement Project Expenditures
The Museum Improvement Projects Program was established to track, monitor, and facilitate expenditure of the$100,000 per year appropriation from the Museum Tax for use in repairing and renovating the Wyeth-Tootle Mansion,considered on of the City's museums.
~Prior to FY2015 the monies dedicated to capital improvements at the Wyeth-Tootle Mansion were transferred to theCapital Projects fund for expenditure. A separate CIP program for the Museum projects was created in order to betterdemonstrate that the museum tax funds were being spent on the appropriate projects.~Major FY2016 Projects unspecified.
10-8

Special Allocation Fund
CENTER BUILDING TIFProgram 5140
Program Description
2013-14 2014-15 2015-16Adopted Estimated
Staffing Detail Actual Budget Actual Budget
N/A 0 0 0 0
Major Budgetary Changes & Program Highlights
Operating Budget Summary
2013-14 2014-15 2015-16Adopted Estimated
Actual Budget Actual BudgetExpenditures:Prof Srvcs 2,188 2,135 2,800 2,800Reimbrsd Exp 0 40,563 40,563 49,595
Total 2,188 42,698 43,363 52,395Sources:PILOTS 12,090 12,158 12,158 12,158EATS 32,624 30,540 30,540 30,540Reimbursment 0 0 0 0
Interfund Trf (Gaming) 0 0 0 0
From(To) Fund Bal. (42,526) 0 665 9,697
Total 2,188 42,698 43,363 52,395
Prof Srvcs5%
Reimbrsd Exp95%
Expenditures by Type
PILOTS28%
EATS72%
Revenue Sources by Type
This program tracks the revenues and expenditures for the Center Building TIF. This is the first redevelopment project within the Dowtown Revitalization TIF district. The project is a building rehab program located at 6th and Edmond. In addition to updates of the building, the project also includes: streetscapes, sidewalks, and improvents to the city-owned public parkiing lot located west of the building. Reimbursable costs include public infrastructure, construction, architecture, and engineering.
~This is a pay-as-you-go TIF. A few small businesses are open within the building. The center-piece - the GroundRound Restaurant - replaced the Brazilian Restaurant in 2012.
10 - 9
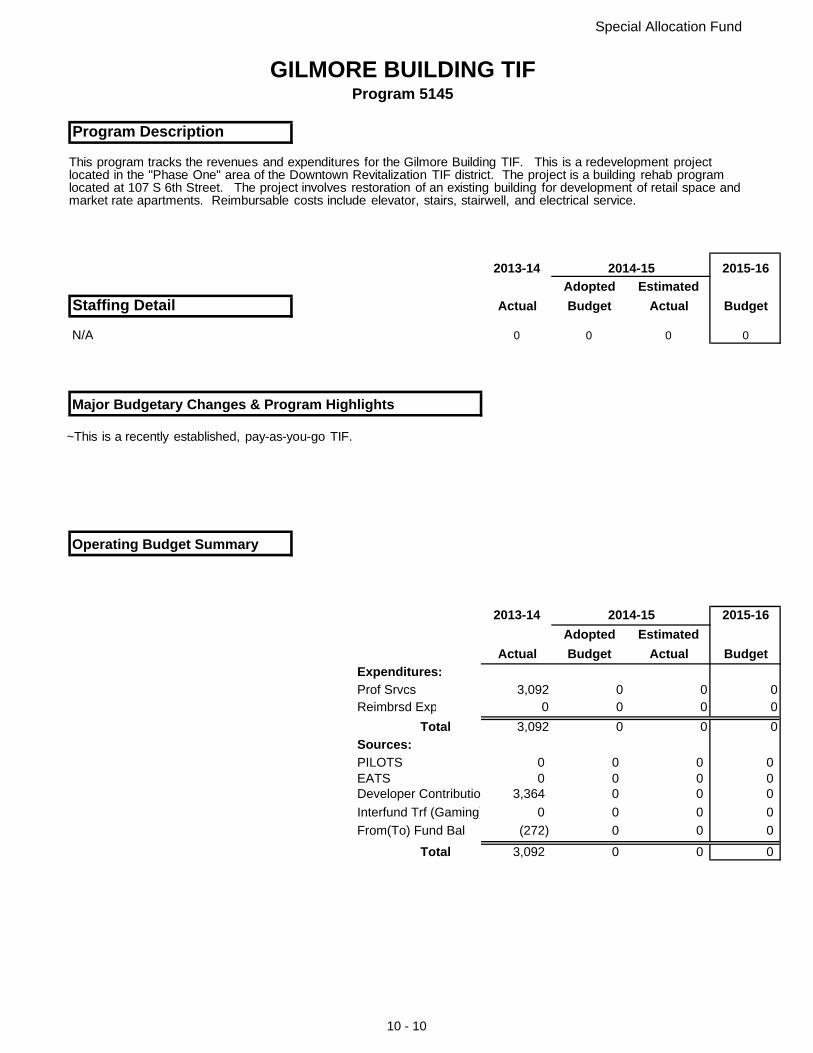
Special Allocation Fund
GILMORE BUILDING TIFProgram 5145
Program Description
2013-14 2014-15 2015-16Adopted Estimated
Staffing Detail Actual Budget Actual Budget
N/A 0 0 0 0
Major Budgetary Changes & Program Highlights
Operating Budget Summary
2013-14 2014-15 2015-16Adopted Estimated
Actual Budget Actual BudgetExpenditures:Prof Srvcs 3,092 0 0 0Reimbrsd Exp 0 0 0 0
Total 3,092 0 0 0
Sources:PILOTS 0 0 0 0EATS 0 0 0 0Developer Contributio 3,364 0 0 0
Interfund Trf (Gaming) 0 0 0 0
From(To) Fund Bal. (272) 0 0 0
Total 3,092 0 0 0
This program tracks the revenues and expenditures for the Gilmore Building TIF. This is a redevelopment project located in the "Phase One" area of the Downtown Revitalization TIF district. The project is a building rehab program located at 107 S 6th Street. The project involves restoration of an existing building for development of retail space and market rate apartments. Reimbursable costs include elevator, stairs, stairwell, and electrical service.
~This is a recently established, pay-as-you-go TIF.
10 - 10
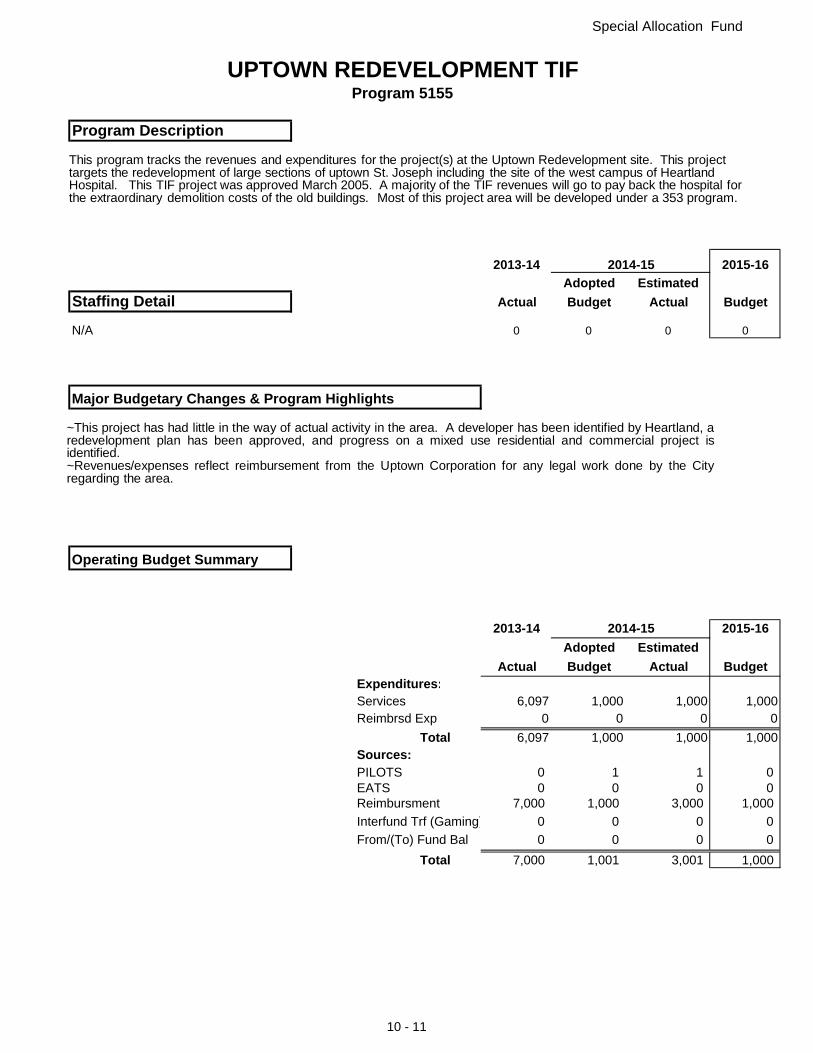
Special Allocation Fund
UPTOWN REDEVELOPMENT TIFProgram 5155
Program Description
2013-14 2014-15 2015-16Adopted Estimated
Staffing Detail Actual Budget Actual Budget
N/A 0 0 0 0
Major Budgetary Changes & Program Highlights
Operating Budget Summary
2013-14 2014-15 2015-16Adopted Estimated
Actual Budget Actual BudgetExpenditures:Services 6,097 1,000 1,000 1,000Reimbrsd Exp 0 0 0 0
Total 6,097 1,000 1,000 1,000Sources:PILOTS 0 1 1 0EATS 0 0 0 0Reimbursment 7,000 1,000 3,000 1,000
Interfund Trf (Gaming) 0 0 0 0
From/(To) Fund Bal 0 0 0 0
Total 7,000 1,001 3,001 1,000
This program tracks the revenues and expenditures for the project(s) at the Uptown Redevelopment site. This project targets the redevelopment of large sections of uptown St. Joseph including the site of the west campus of Heartland Hospital. This TIF project was approved March 2005. A majority of the TIF revenues will go to pay back the hospital for the extraordinary demolition costs of the old buildings. Most of this project area will be developed under a 353 program.
~This project has had little in the way of actual activity in the area. A developer has been identified by Heartland, aredevelopment plan has been approved, and progress on a mixed use residential and commercial project isidentified.~Revenues/expenses reflect reimbursement from the Uptown Corporation for any legal work done by the Cityregarding the area.
10 - 11
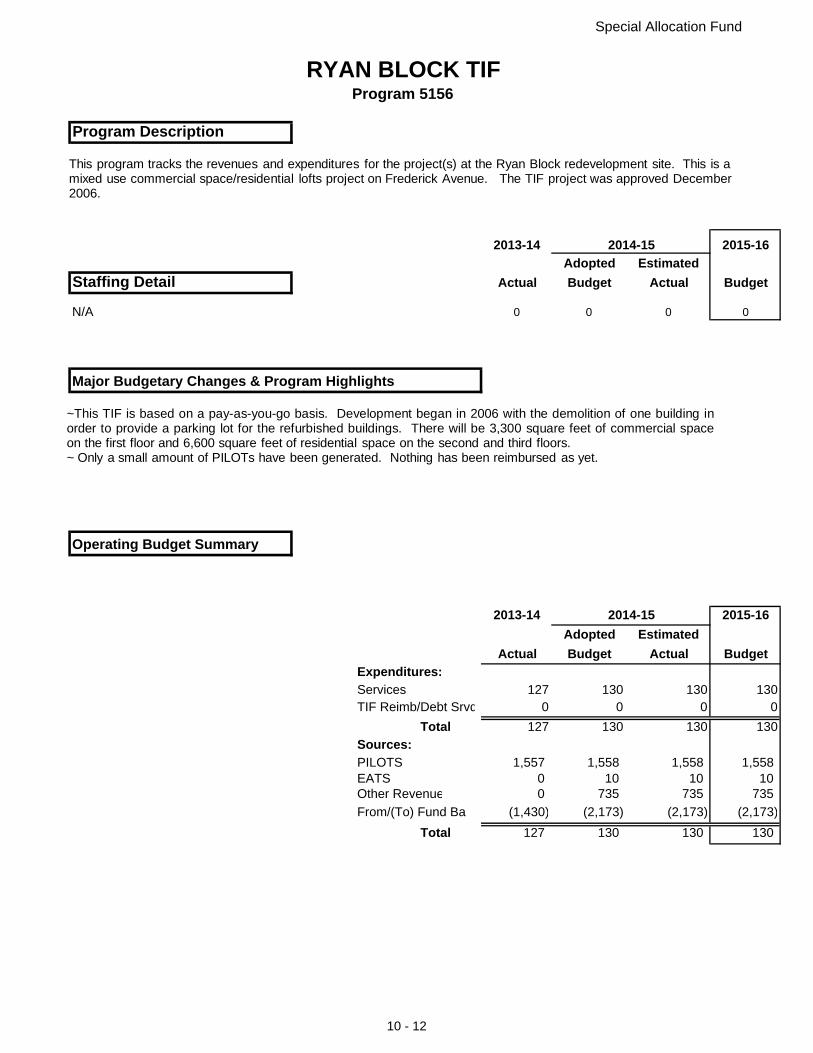
Special Allocation Fund
RYAN BLOCK TIFProgram 5156
Program Description
2013-14 2014-15 2015-16Adopted Estimated
Staffing Detail Actual Budget Actual Budget
N/A 0 0 0 0
Major Budgetary Changes & Program Highlights
Operating Budget Summary
2013-14 2014-15 2015-16Adopted Estimated
Actual Budget Actual BudgetExpenditures:Services 127 130 130 130TIF Reimb/Debt Srvd 0 0 0 0
Total 127 130 130 130
Sources:PILOTS 1,557 1,558 1,558 1,558EATS 0 10 10 10Other Revenue 0 735 735 735
From/(To) Fund Bal (1,430) (2,173) (2,173) (2,173)
Total 127 130 130 130
This program tracks the revenues and expenditures for the project(s) at the Ryan Block redevelopment site. This is a mixed use commercial space/residential lofts project on Frederick Avenue. The TIF project was approved December 2006.
~This TIF is based on a pay-as-you-go basis. Development began in 2006 with the demolition of one building inorder to provide a parking lot for the refurbished buildings. There will be 3,300 square feet of commercial spaceon the first floor and 6,600 square feet of residential space on the second and third floors.~ Only a small amount of PILOTs have been generated. Nothing has been reimbursed as yet.
10 - 12

Special Allocation Fund
COOKS CROSSING REDEVELOPMENTProgram 5157
Program Description
2013-14 2014-15 2015-16Adopted Estimated
Staffing Detail Actual Budget Actual Budget
N/A 0 0 0 0
Major Budgetary Changes & Program Highlights
Operating Budget Summary
2013-14 2014-15 2015-16Adopted Estimated
Actual Budget Actual BudgetExpenditures:Services 909 4,000 3,520 3,520TIF Reimbursable 0 145,000 147,980 147,980
Total 909 149,000 151,500 151,500Sources:PILOTS 0 77,000 77,000 77,000EATS 90,865 75,562 75,562 75,562Other Revenue 0 0 0 0
From/(To) Fund Bal (89,956) (3,562) (1,062) (1,062)
Total 909 149,000 151,500 151,500
This program tracks the revenues and expenditures for the project(s) at the Creeks Crossing redevelopment site. This is a commercial space project which redeveloped the site of an abandoned Payless Cashways building on the Belt Highway. Pay-as-you-go reimbursements are made through a Tax Redevelopment Agreement with the City.
~This Economic Development project is based on a pay-as-you-go basis. A property vacated by the formerbusiness years ago has been completely redeveloped. Tenants include Dicks' Sporting Goods, a re-located Aldi'sgrocery, a Starbucks, a Pet Smart and several other small businesses. The project was approved by City Councilin the spring of 2011.~Incentives include tax abatements through a 353 Redevelopment Agreement and sales tax reimbursementsthrough an Economic Development Agreement with the City. By FY15 revenue from City PILOTs will be available.The amount is currently unknown although an estimate has been projected.
Services2%
TIF Reimburs
able98%
Expenditures by Type
PILOTS50%
EATS50%
Revenues by Type
10 - 13
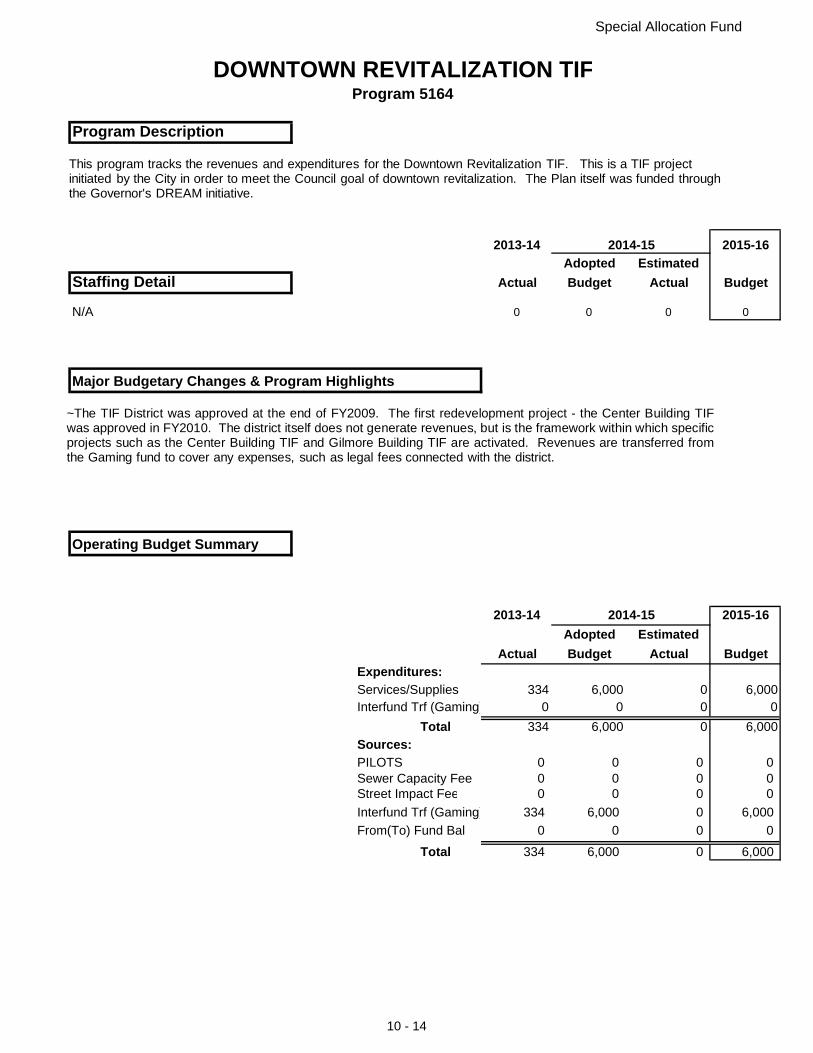
Special Allocation Fund
DOWNTOWN REVITALIZATION TIFProgram 5164
Program Description
2013-14 2014-15 2015-16Adopted Estimated
Staffing Detail Actual Budget Actual Budget
N/A 0 0 0 0
Major Budgetary Changes & Program Highlights
Operating Budget Summary
2013-14 2014-15 2015-16Adopted Estimated
Actual Budget Actual BudgetExpenditures:Services/Supplies 334 6,000 0 6,000Interfund Trf (Gaming) 0 0 0 0
Total 334 6,000 0 6,000
Sources:PILOTS 0 0 0 0Sewer Capacity Fee 0 0 0 0Street Impact Fee 0 0 0 0
Interfund Trf (Gaming) 334 6,000 0 6,000
From(To) Fund Bal. 0 0 0 0
Total 334 6,000 0 6,000
This program tracks the revenues and expenditures for the Downtown Revitalization TIF. This is a TIF project initiated by the City in order to meet the Council goal of downtown revitalization. The Plan itself was funded through the Governor's DREAM initiative.
~The TIF District was approved at the end of FY2009. The first redevelopment project - the Center Building TIFwas approved in FY2010. The district itself does not generate revenues, but is the framework within which specificprojects such as the Center Building TIF and Gilmore Building TIF are activated. Revenues are transferred fromthe Gaming fund to cover any expenses, such as legal fees connected with the district.
10 - 14
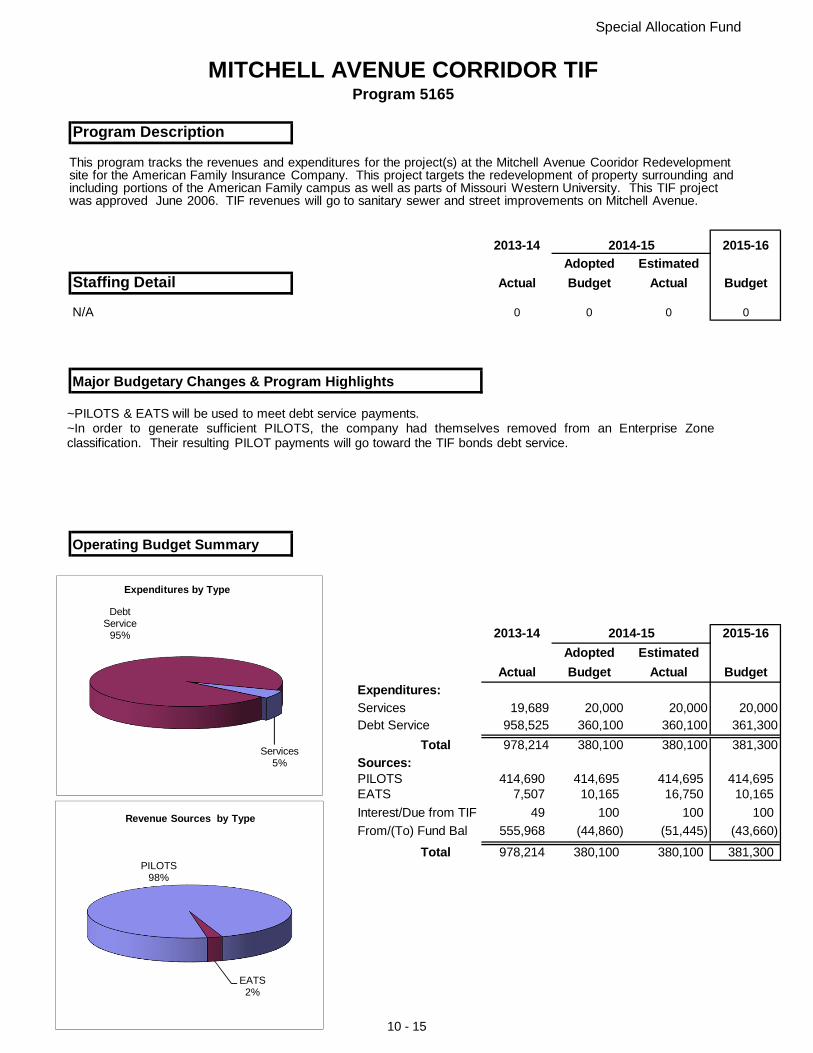
Special Allocation Fund
MITCHELL AVENUE CORRIDOR TIFProgram 5165
Program Description
2013-14 2014-15 2015-16Adopted Estimated
Staffing Detail Actual Budget Actual Budget
N/A 0 0 0 0
Major Budgetary Changes & Program Highlights
Operating Budget Summary
2013-14 2014-15 2015-16Adopted Estimated
Actual Budget Actual BudgetExpenditures:Services 19,689 20,000 20,000 20,000Debt Service 958,525 360,100 360,100 361,300
Total 978,214 380,100 380,100 381,300
Sources:PILOTS 414,690 414,695 414,695 414,695EATS 7,507 10,165 16,750 10,165
Interest/Due from TIF 49 100 100 100
From/(To) Fund Bal 555,968 (44,860) (51,445) (43,660)
Total 978,214 380,100 380,100 381,300
Services5%
Debt Service
95%
Expenditures by Type
PILOTS98%
EATS2%
Revenue Sources by Type
This program tracks the revenues and expenditures for the project(s) at the Mitchell Avenue Cooridor Redevelopment site for the American Family Insurance Company. This project targets the redevelopment of property surrounding and including portions of the American Family campus as well as parts of Missouri Western University. This TIF project was approved June 2006. TIF revenues will go to sanitary sewer and street improvements on Mitchell Avenue.
~PILOTS & EATS will be used to meet debt service payments.~In order to generate sufficient PILOTS, the company had themselves removed from an Enterprise Zoneclassification. Their resulting PILOT payments will go toward the TIF bonds debt service.
10 - 15
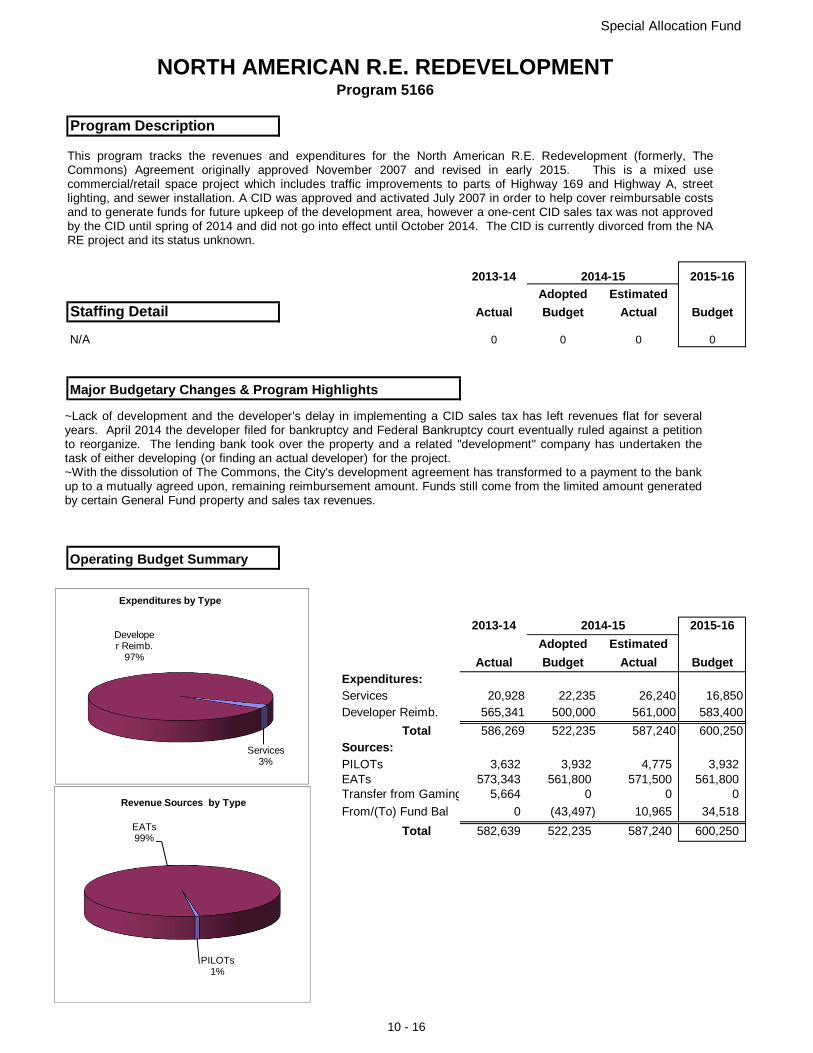
Special Allocation Fund
NORTH AMERICAN R.E. REDEVELOPMENTProgram 5166
Program Description
2013-14 2014-15 2015-16Adopted Estimated
Staffing Detail Actual Budget Actual Budget
N/A 0 0 0 0
Major Budgetary Changes & Program Highlights
Operating Budget Summary
2013-14 2014-15 2015-16Adopted Estimated
Actual Budget Actual BudgetExpenditures:Services 20,928 22,235 26,240 16,850Developer Reimb. 565,341 500,000 561,000 583,400
Total 586,269 522,235 587,240 600,250Sources:PILOTs 3,632 3,932 4,775 3,932EATs 573,343 561,800 571,500 561,800Transfer from Gaming 5,664 0 0 0
From/(To) Fund Bal 0 (43,497) 10,965 34,518
Total 582,639 522,235 587,240 600,250
Services3%
Developer Reimb.
97%
Expenditures by Type
PILOTs1%
EATs99%
Revenue Sources by Type
This program tracks the revenues and expenditures for the North American R.E. Redevelopment (formerly, TheCommons) Agreement originally approved November 2007 and revised in early 2015. This is a mixed usecommercial/retail space project which includes traffic improvements to parts of Highway 169 and Highway A, streetlighting, and sewer installation. A CID was approved and activated July 2007 in order to help cover reimbursable costsand to generate funds for future upkeep of the development area, however a one-cent CID sales tax was not approvedby the CID until spring of 2014 and did not go into effect until October 2014. The CID is currently divorced from the NARE project and its status unknown.
~Lack of development and the developer's delay in implementing a CID sales tax has left revenues flat for severalyears. April 2014 the developer filed for bankruptcy and Federal Bankruptcy court eventually ruled against a petitionto reorganize. The lending bank took over the property and a related "development" company has undertaken thetask of either developing (or finding an actual developer) for the project.~With the dissolution of The Commons, the City's development agreement has transformed to a payment to the bankup to a mutually agreed upon, remaining reimbursement amount. Funds still come from the limited amount generatedby certain General Fund property and sales tax revenues.
10 - 16
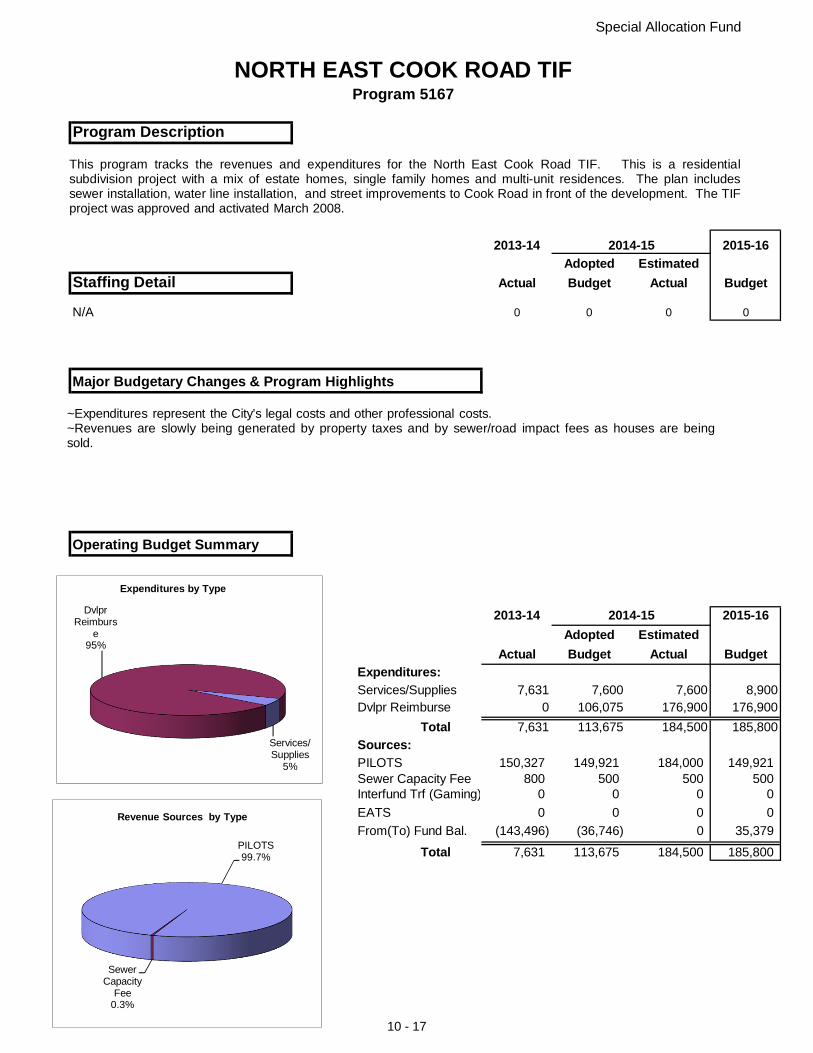
Special Allocation Fund
NORTH EAST COOK ROAD TIFProgram 5167
Program Description
2013-14 2014-15 2015-16Adopted Estimated
Staffing Detail Actual Budget Actual Budget
N/A 0 0 0 0
Major Budgetary Changes & Program Highlights
Operating Budget Summary
2013-14 2014-15 2015-16Adopted Estimated
Actual Budget Actual BudgetExpenditures:Services/Supplies 7,631 7,600 7,600 8,900Dvlpr Reimburse 0 106,075 176,900 176,900
Total 7,631 113,675 184,500 185,800
Sources:PILOTS 150,327 149,921 184,000 149,921Sewer Capacity Fee 800 500 500 500Interfund Trf (Gaming) 0 0 0 0
EATS 0 0 0 0
From(To) Fund Bal. (143,496) (36,746) 0 35,379
Total 7,631 113,675 184,500 185,800
Services/Supplies
5%
Dvlpr Reimburs
e95%
Expenditures by Type
PILOTS99.7%
Sewer Capacity
Fee0.3%
Revenue Sources by Type
This program tracks the revenues and expenditures for the North East Cook Road TIF. This is a residentialsubdivision project with a mix of estate homes, single family homes and multi-unit residences. The plan includessewer installation, water line installation, and street improvements to Cook Road in front of the development. The TIFproject was approved and activated March 2008.
~Expenditures represent the City's legal costs and other professional costs.~Revenues are slowly being generated by property taxes and by sewer/road impact fees as houses are beingsold.
10 - 17
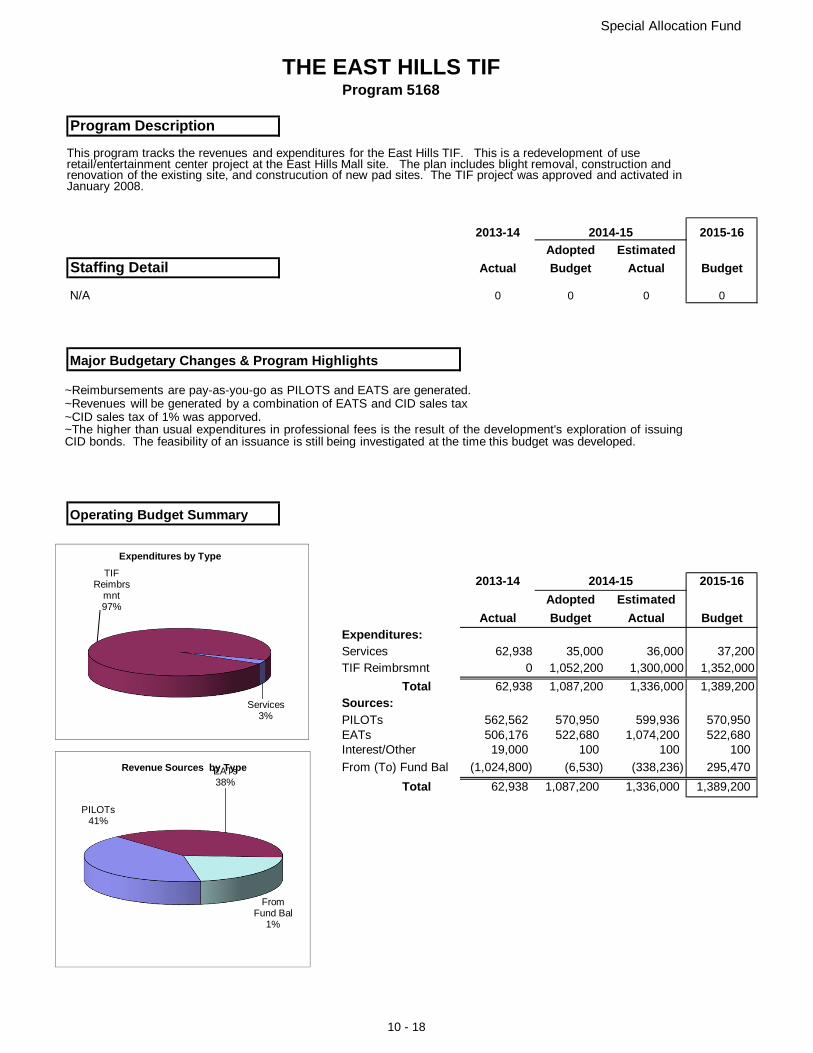
Special Allocation Fund
THE EAST HILLS TIFProgram 5168
Program Description
2013-14 2014-15 2015-16Adopted Estimated
Staffing Detail Actual Budget Actual Budget
N/A 0 0 0 0
Major Budgetary Changes & Program Highlights
Operating Budget Summary
2013-14 2014-15 2015-16Adopted Estimated
Actual Budget Actual BudgetExpenditures:Services 62,938 35,000 36,000 37,200TIF Reimbrsmnt 0 1,052,200 1,300,000 1,352,000
Total 62,938 1,087,200 1,336,000 1,389,200Sources:PILOTs 562,562 570,950 599,936 570,950EATs 506,176 522,680 1,074,200 522,680Interest/Other 19,000 100 100 100
From (To) Fund Bal (1,024,800) (6,530) (338,236) 295,470
Total 62,938 1,087,200 1,336,000 1,389,200
Services3%
TIF Reimbrs
mnt97%
Expenditures by Type
PILOTs41%
EATs38%
From Fund Bal
1%
Revenue Sources by Type
This program tracks the revenues and expenditures for the East Hills TIF. This is a redevelopment of use retail/entertainment center project at the East Hills Mall site. The plan includes blight removal, construction and renovation of the existing site, and construcution of new pad sites. The TIF project was approved and activated in January 2008.
~Reimbursements are pay-as-you-go as PILOTS and EATS are generated.~Revenues will be generated by a combination of EATS and CID sales tax~CID sales tax of 1% was apporved.~The higher than usual expenditures in professional fees is the result of the development's exploration of issuingCID bonds. The feasibility of an issuance is still being investigated at the time this budget was developed.
10 - 18
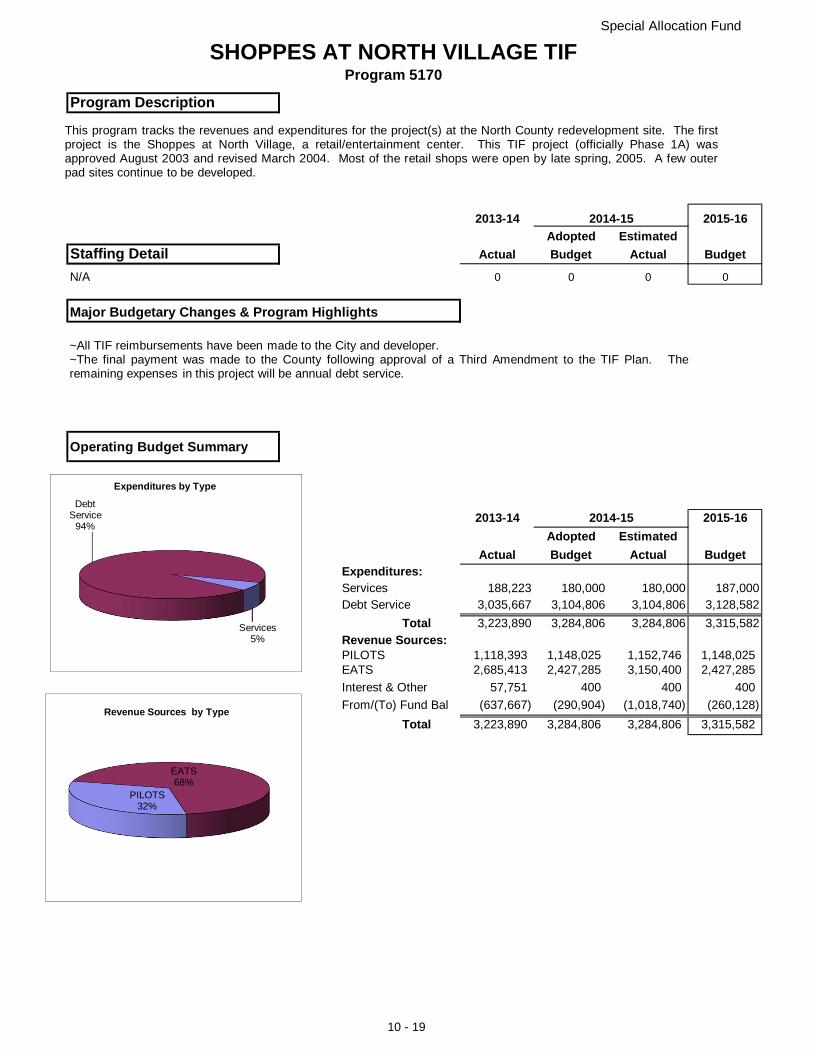
Special Allocation Fund
SHOPPES AT NORTH VILLAGE TIFProgram 5170
Program Description
2013-14 2014-15 2015-16Adopted Estimated
Staffing Detail Actual Budget Actual Budget
N/A 0 0 0 0
Major Budgetary Changes & Program Highlights
Operating Budget Summary
2013-14 2014-15 2015-16Adopted Estimated
Actual Budget Actual BudgetExpenditures:Services 188,223 180,000 180,000 187,000Debt Service 3,035,667 3,104,806 3,104,806 3,128,582
Total 3,223,890 3,284,806 3,284,806 3,315,582Revenue Sources:PILOTS 1,118,393 1,148,025 1,152,746 1,148,025EATS 2,685,413 2,427,285 3,150,400 2,427,285
Interest & Other 57,751 400 400 400
From/(To) Fund Bal (637,667) (290,904) (1,018,740) (260,128)
Total 3,223,890 3,284,806 3,284,806 3,315,582
Services5%
Debt Service
94%
Expenditures by Type
PILOTS32%
EATS68%
Revenue Sources by Type
This program tracks the revenues and expenditures for the project(s) at the North County redevelopment site. The firstproject is the Shoppes at North Village, a retail/entertainment center. This TIF project (officially Phase 1A) wasapproved August 2003 and revised March 2004. Most of the retail shops were open by late spring, 2005. A few outerpad sites continue to be developed.
~All TIF reimbursements have been made to the City and developer.~The final payment was made to the County following approval of a Third Amendment to the TIF Plan. Theremaining expenses in this project will be annual debt service.
10 - 19
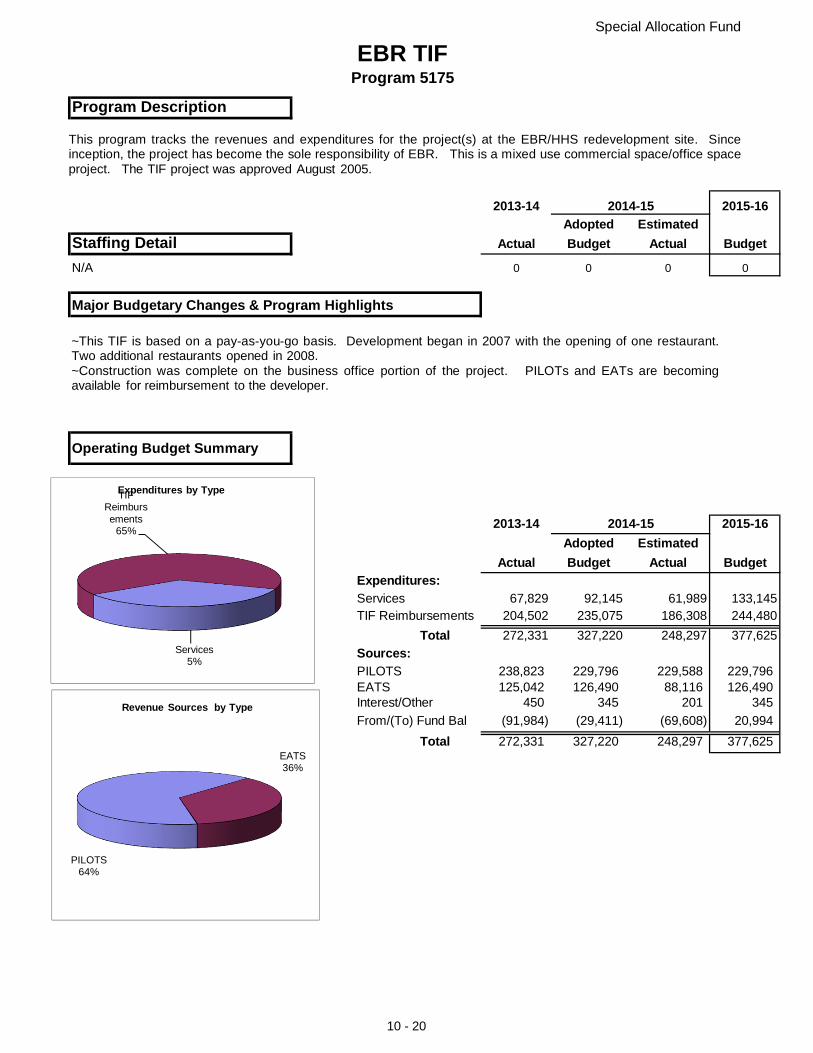
Special Allocation Fund
EBR TIFProgram 5175
Program Description
2013-14 2014-15 2015-16Adopted Estimated
Staffing Detail Actual Budget Actual Budget
N/A 0 0 0 0
Major Budgetary Changes & Program Highlights
Operating Budget Summary
2013-14 2014-15 2015-16Adopted Estimated
Actual Budget Actual BudgetExpenditures:Services 67,829 92,145 61,989 133,145TIF Reimbursements 204,502 235,075 186,308 244,480
Total 272,331 327,220 248,297 377,625
Sources:PILOTS 238,823 229,796 229,588 229,796EATS 125,042 126,490 88,116 126,490Interest/Other 450 345 201 345
From/(To) Fund Bal (91,984) (29,411) (69,608) 20,994
Total 272,331 327,220 248,297 377,625
Services5%
TIF Reimbursements
65%
Expenditures by Type
PILOTS64%
EATS36%
Revenue Sources by Type
This program tracks the revenues and expenditures for the project(s) at the EBR/HHS redevelopment site. Sinceinception, the project has become the sole responsibility of EBR. This is a mixed use commercial space/office spaceproject. The TIF project was approved August 2005.
~This TIF is based on a pay-as-you-go basis. Development began in 2007 with the opening of one restaurant.Two additional restaurants opened in 2008.~Construction was complete on the business office portion of the project. PILOTs and EATs are becomingavailable for reimbursement to the developer.
10 - 20
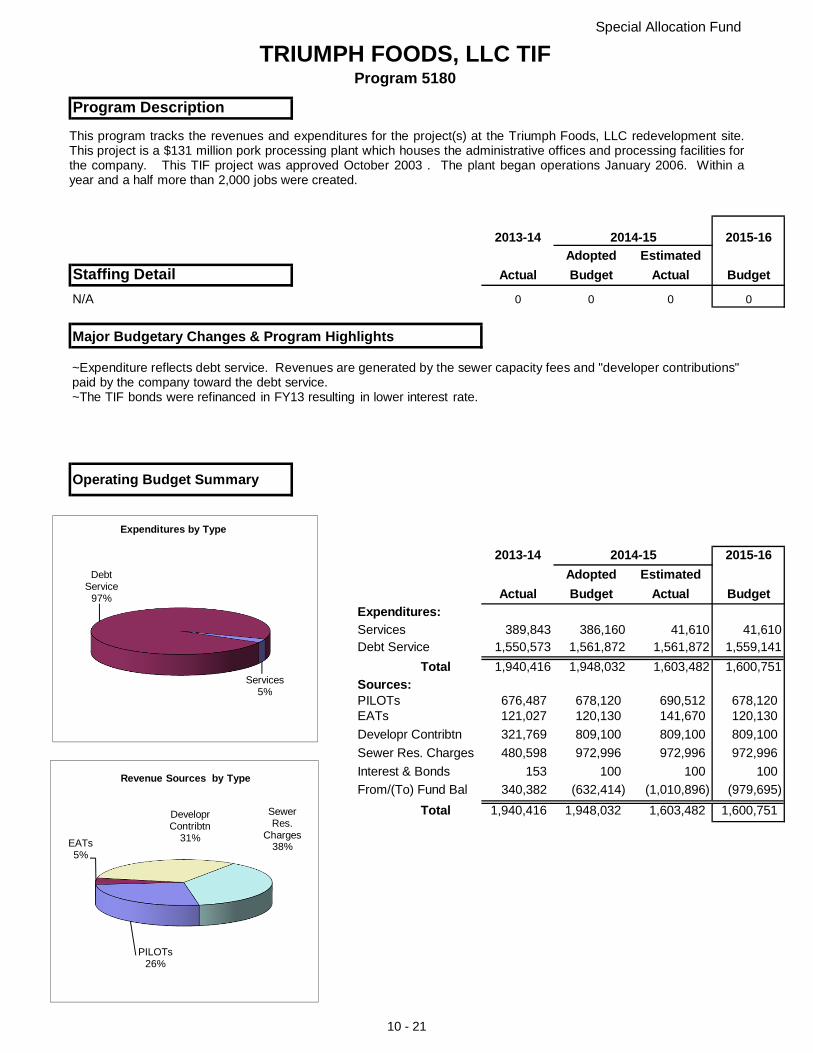
Special Allocation Fund
TRIUMPH FOODS, LLC TIFProgram 5180
Program Description
2013-14 2014-15 2015-16Adopted Estimated
Staffing Detail Actual Budget Actual Budget
N/A 0 0 0 0
Major Budgetary Changes & Program Highlights
Operating Budget Summary
2013-14 2014-15 2015-16Adopted Estimated
Actual Budget Actual BudgetExpenditures:Services 389,843 386,160 41,610 41,610Debt Service 1,550,573 1,561,872 1,561,872 1,559,141
Total 1,940,416 1,948,032 1,603,482 1,600,751
Sources:PILOTs 676,487 678,120 690,512 678,120EATs 121,027 120,130 141,670 120,130
Developr Contribtn 321,769 809,100 809,100 809,100
Sewer Res. Charges 480,598 972,996 972,996 972,996
Interest & Bonds 153 100 100 100
From/(To) Fund Bal 340,382 (632,414) (1,010,896) (979,695)
Total 1,940,416 1,948,032 1,603,482 1,600,751
Services5%
Debt Service
97%
Expenditures by Type
PILOTs26%
EATs5%
Developr Contribtn
31%
Sewer Res.
Charges38%
Revenue Sources by Type
This program tracks the revenues and expenditures for the project(s) at the Triumph Foods, LLC redevelopment site.This project is a $131 million pork processing plant which houses the administrative offices and processing facilities forthe company. This TIF project was approved October 2003 . The plant began operations January 2006. Within ayear and a half more than 2,000 jobs were created.
~Expenditure reflects debt service. Revenues are generated by the sewer capacity fees and "developer contributions"paid by the company toward the debt service.~The TIF bonds were refinanced in FY13 resulting in lower interest rate.
10 - 21
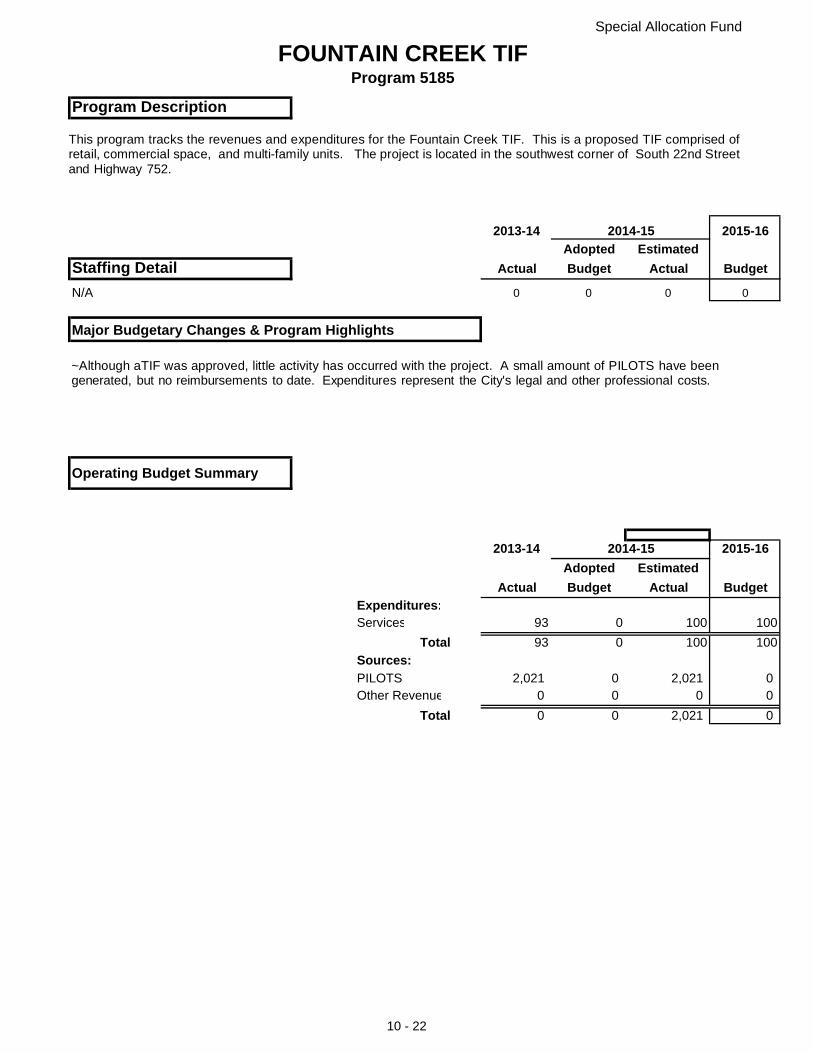
Special Allocation Fund
FOUNTAIN CREEK TIFProgram 5185
Program Description
2013-14 2014-15 2015-16Adopted Estimated
Staffing Detail Actual Budget Actual Budget
N/A 0 0 0 0
Major Budgetary Changes & Program Highlights
Operating Budget Summary
2013-14 2014-15 2015-16Adopted Estimated
Actual Budget Actual BudgetExpenditures:Services 93 0 100 100
Total 93 0 100 100
Sources:PILOTS 2,021 0 2,021 0Other Revenue 0 0 0 0
Total 0 0 2,021 0
This program tracks the revenues and expenditures for the Fountain Creek TIF. This is a proposed TIF comprised ofretail, commercial space, and multi-family units. The project is located in the southwest corner of South 22nd Streetand Highway 752.
~Although aTIF was approved, little activity has occurred with the project. A small amount of PILOTS have beengenerated, but no reimbursements to date. Expenditures represent the City's legal and other professional costs.
10 - 22

Special Allocation Fund
3RD STREET HOTEL TIFProgram 5190
Program Description
2013-14 2014-15 2015-16Adopted Estimated
Staffing Detail Actual Budget Actual Budget
N/A 0 0 0 0
Major Budgetary Changes & Program Highlights
Operating Budget Summary
2013-14 2014-15 2015-16Adopted Estimated
Actual Budget Actual BudgetExpenditures:Services 15,605 16,800 16,800 0TIF Reimbursements -42,073 316,544 316,544 0
Total -26,468 333,344 333,344 0
Sources:PILOTS 114,297 114,944 114,944 0EATS & TDD 215,039 255,425 255,425 0Other Revenue 0 0 0 0
From/(To) Fund Bal (355,804) (37,025) (37,025) 0
Total (26,468) 333,344 333,344 0
This program tracks the revenues and expenditures for the project(s) at the 3rd Street Hotel redevelopment site. Thisproject targets the redevelopment of a downtown hotel. This TIF project was approved January 2004 . Thedevelopers restored the hotel's Holiday Inn franchise. The facility now also houses a local, relocated restaurant.
~This TIF project has pay-as-you-go reimbursement. Revenues are generated from EATS, PILOTs and avoluntary 1% increase in all sales taxes relating to the hotel and restaurant through the TrasportationDevelopment District (TDD).~Total reimbursable amount certified is $2.5 million. If the company pays what it owes in hotel/motel taxes andproperty taxes in FY2015, the reimbursables will be completed and the TIF dissolved. In light of this, no revenueor expenditure amounts have been budgeted.
10 - 23
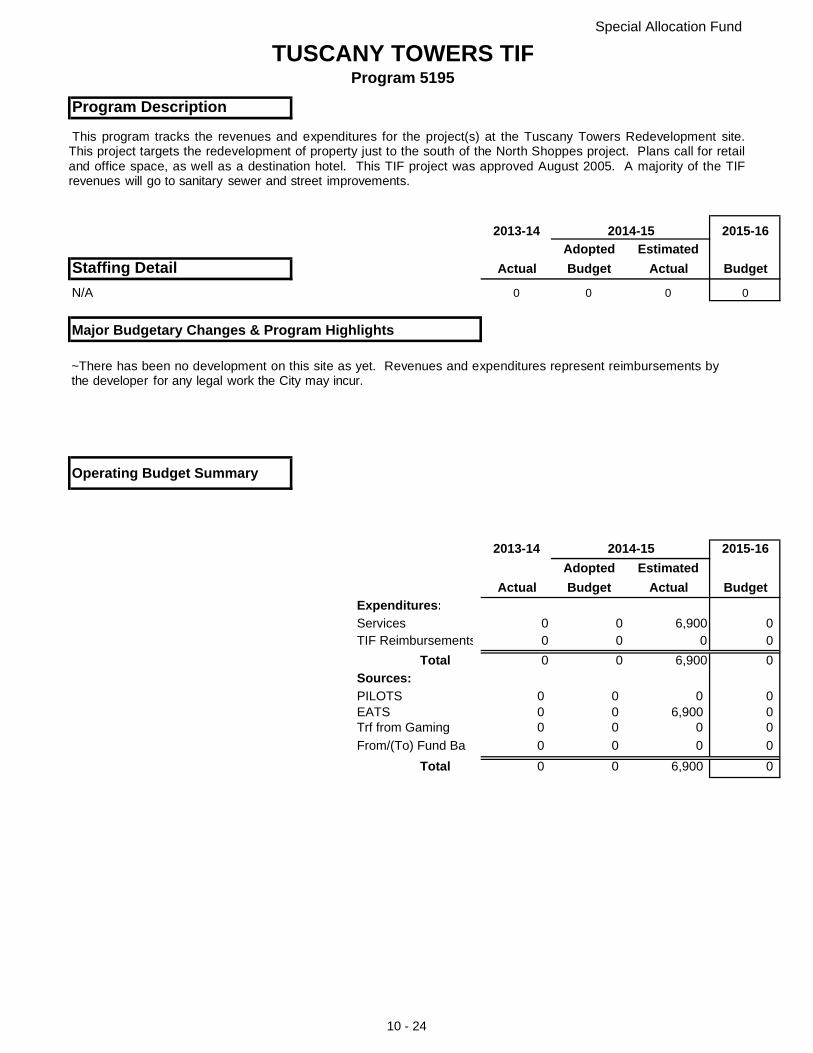
Special Allocation Fund
TUSCANY TOWERS TIFProgram 5195
Program Description
2013-14 2014-15 2015-16Adopted Estimated
Staffing Detail Actual Budget Actual Budget
N/A 0 0 0 0
Major Budgetary Changes & Program Highlights
Operating Budget Summary
2013-14 2014-15 2015-16Adopted Estimated
Actual Budget Actual BudgetExpenditures:Services 0 0 6,900 0TIF Reimbursements 0 0 0 0
Total 0 0 6,900 0
Sources:PILOTS 0 0 0 0EATS 0 0 6,900 0Trf from Gaming 0 0 0 0
From/(To) Fund Bal 0 0 0 0
Total 0 0 6,900 0
This program tracks the revenues and expenditures for the project(s) at the Tuscany Towers Redevelopment site.This project targets the redevelopment of property just to the south of the North Shoppes project. Plans call for retailand office space, as well as a destination hotel. This TIF project was approved August 2005. A majority of the TIFrevenues will go to sanitary sewer and street improvements.
~There has been no development on this site as yet. Revenues and expenditures represent reimbursements bythe developer for any legal work the City may incur.
10 - 24
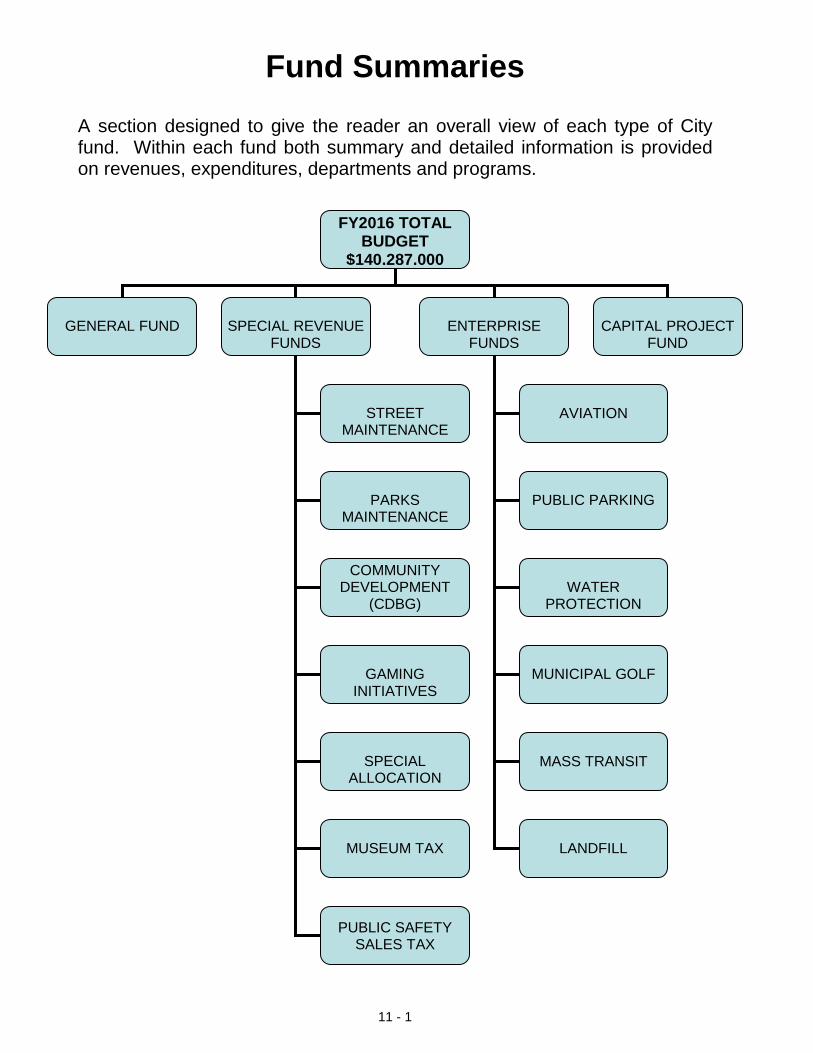
11 - 1
Fund Summaries
A section designed to give the reader an overall view of each type of City fund. Within each fund both summary and detailed information is provided on revenues, expenditures, departments and programs.
FY2016 TOTAL BUDGET
$140,287,000
GENERAL FUND
SPECIAL REVENUE
FUNDS
ENTERPRISE
FUNDS
CAPITAL PROJECT
FUND
STREET
MAINTENANCE
PARKS MAINTENANCE
COMMUNITY DEVELOPMENT
(CDBG)
GAMING
INITIATIVES
SPECIAL
ALLOCATION
MUSEUM TAX
AVIATION
PUBLIC PARKING
WATER
PROTECTION
MUNICIPAL GOLF
MASS TRANSIT
LANDFILL
PUBLIC SAFETY SALES TAX
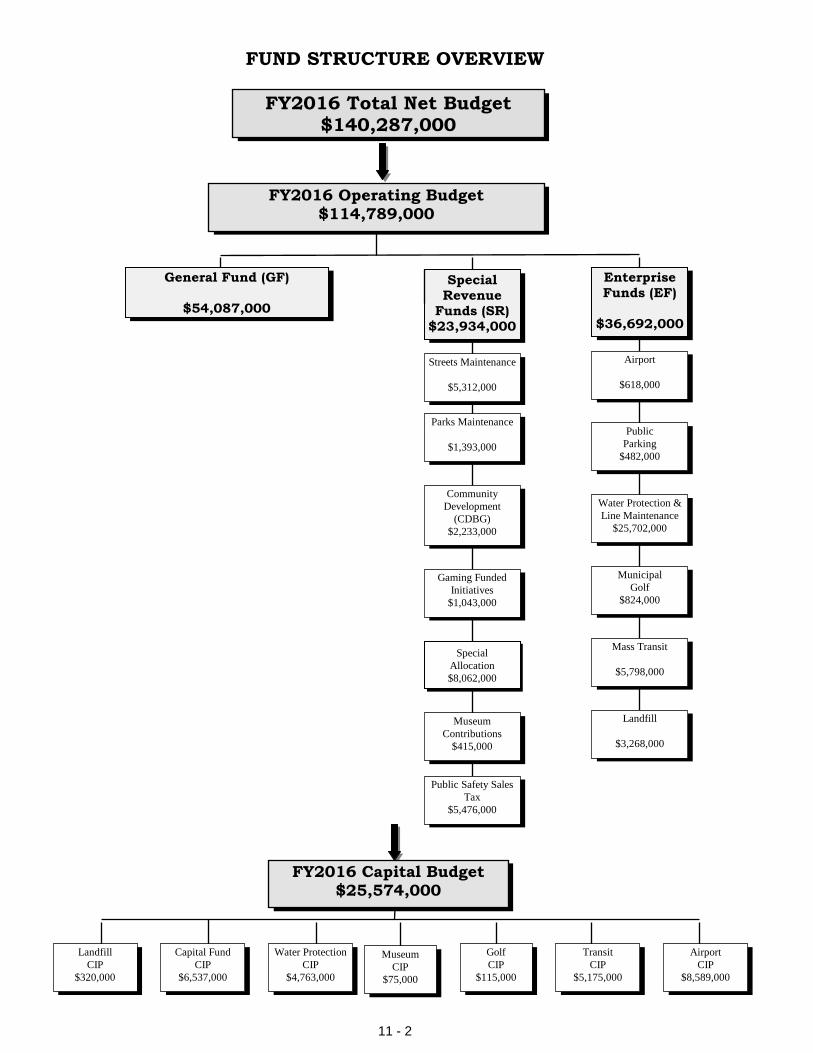
11 - 2
FUND STRUCTURE OVERVIEW
+
FY2016 Total Net Budget $140,287,000
FY2016 Operating Budget $114,789,000
General Fund (GF)
$54,087,000
Special Revenue
Funds (SR) $23,934,000
Enterprise Funds (EF)
$36,692,000
Streets Maintenance
$5,312,000
Parks Maintenance
$1,393,000
Community Development
(CDBG) $2,233,000
Gaming Funded Initiatives
$1,043,000
Airport
$618,000
Public Parking
$482,000
Water Protection & Line Maintenance
$25,702,000
Municipal Golf
$824,000
Mass Transit
$5,798,000
Landfill
$3,268,000
Special Allocation $8,062,000
Museum Contributions
$415,000
FY2016 Capital Budget $25,574,000
Capital Fund CIP
$6,537,000
Water Protection CIP
$4,763,000
Transit CIP
$5,175,000
Golf CIP
$115,000
Landfill CIP
$320,000
Airport CIP
$8,589,000
Public Safety Sales Tax
$5,476,000
Museum CIP
$75,000
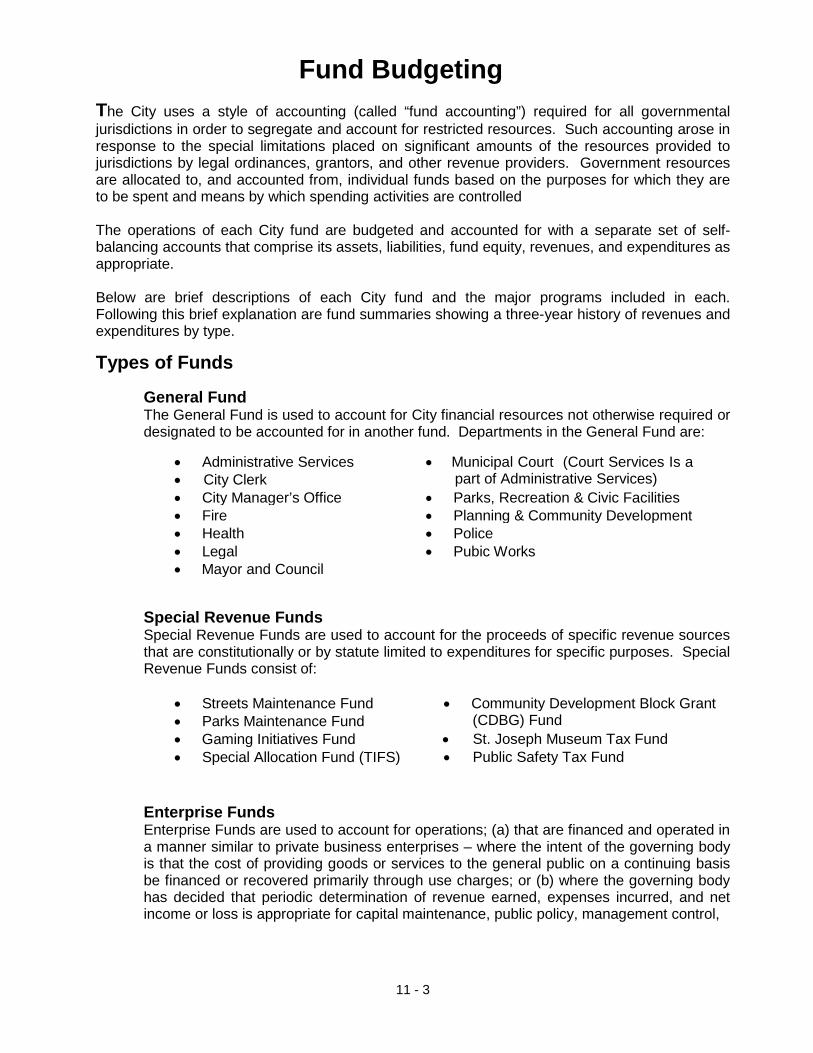
Fund Budgeting
The City uses a style of accounting (called “fund accounting”) required for all governmental jurisdictions in order to segregate and account for restricted resources. Such accounting arose in response to the special limitations placed on significant amounts of the resources provided to jurisdictions by legal ordinances, grantors, and other revenue providers. Government resources are allocated to, and accounted from, individual funds based on the purposes for which they are to be spent and means by which spending activities are controlled The operations of each City fund are budgeted and accounted for with a separate set of self-balancing accounts that comprise its assets, liabilities, fund equity, revenues, and expenditures as appropriate. Below are brief descriptions of each City fund and the major programs included in each. Following this brief explanation are fund summaries showing a three-year history of revenues and expenditures by type.
Types of Funds General Fund
The General Fund is used to account for City financial resources not otherwise required or designated to be accounted for in another fund. Departments in the General Fund are:
• Administrative Services • City Clerk
• Municipal Court (Court Services Is a part of Administrative Services)
• City Manager’s Office • Parks, Recreation & Civic Facilities • Fire • Planning & Community Development • Health • Police • Legal • Pubic Works • Mayor and Council
Special Revenue Funds Special Revenue Funds are used to account for the proceeds of specific revenue sources that are constitutionally or by statute limited to expenditures for specific purposes. Special Revenue Funds consist of:
• Streets Maintenance Fund • Community Development Block Grant • Parks Maintenance Fund (CDBG) Fund • Gaming Initiatives Fund • St. Joseph Museum Tax Fund • Special Allocation Fund (TIFS) • Public Safety Tax Fund
Enterprise Funds
Enterprise Funds are used to account for operations; (a) that are financed and operated in a manner similar to private business enterprises – where the intent of the governing body is that the cost of providing goods or services to the general public on a continuing basis be financed or recovered primarily through use charges; or (b) where the governing body has decided that periodic determination of revenue earned, expenses incurred, and net income or loss is appropriate for capital maintenance, public policy, management control,
11 - 3
Types of Funds (continued) accountability or other purposes. The City has six Enterprise Funds which are:
• Aviation Fund • Public Parking Fund • Water Protection Fund • Municipal Golf Fund • Mass Transit Fund • Landfill Fund
Capital Project Fund
Capital Project Fund is used to account for financial resources and expenditures associated with the acquisition and/or construction of major capital facilities for governmental funds. Capital project resources and expenditures associated with non-governmental funds, i.e., Enterprise Funds, are recorded in those funds. The City’s capitalized project program tracks the active projects from the 1993, 1998, 2003 and 2008 CIP Sales Tax Initiatives. Projects authorized in each voter approved initiative are tracked with identifying project numbers. Debt Service Fund The Debt Service Fund is used to account for the accumulation of resources for the payment of General Obligation (G.O.) debt. The City has one Debt Service Fund. The City currently has no outstanding G.O. debt.
Basis of Budgeting
Basis of budgeting refers to when revenues and expenditures are recognized in the accounts and reported in the financial records of the City, regardless of the measurement focus applied. Modified Accrual
All governmental funds are budgeted using the modified accrual basis of accounting. Revenues are recognized when they become measurable. A revenue is “Measurable” when the amount of the transaction can be reasonably determined. Sales taxes, property taxes, motor fuel taxes, utility franchise fees, and reimbursement type grants are major revenue sources that meet these criteria. Expenditures are generally recognized when the related fund liability is incurred. Accrual Enterprise funds are budgeted using the accrual basis of accounting. Revenues are recognized when they are earned, and expenses are recognized when they are incurred.
Encumbrances
Encumbrance accounts, under which purchase orders, contracts, and other commitments for the expenditure of monies are recorded, are extensions of formal budgetary control. Unencumbered appropriations lapse at year-end. Interfund Transactions
Transactions between funds are reflected as operating transfers in the accompanying budget document. Transfers to and from the various funds sometimes don’t agree in the Annual Budget document because offsetting transfers are in funds for which no budgets are prepared including the CDBG re-programmable funds and General Fund Emergency Reserves.
11 - 4

(this page intentionally left blank)
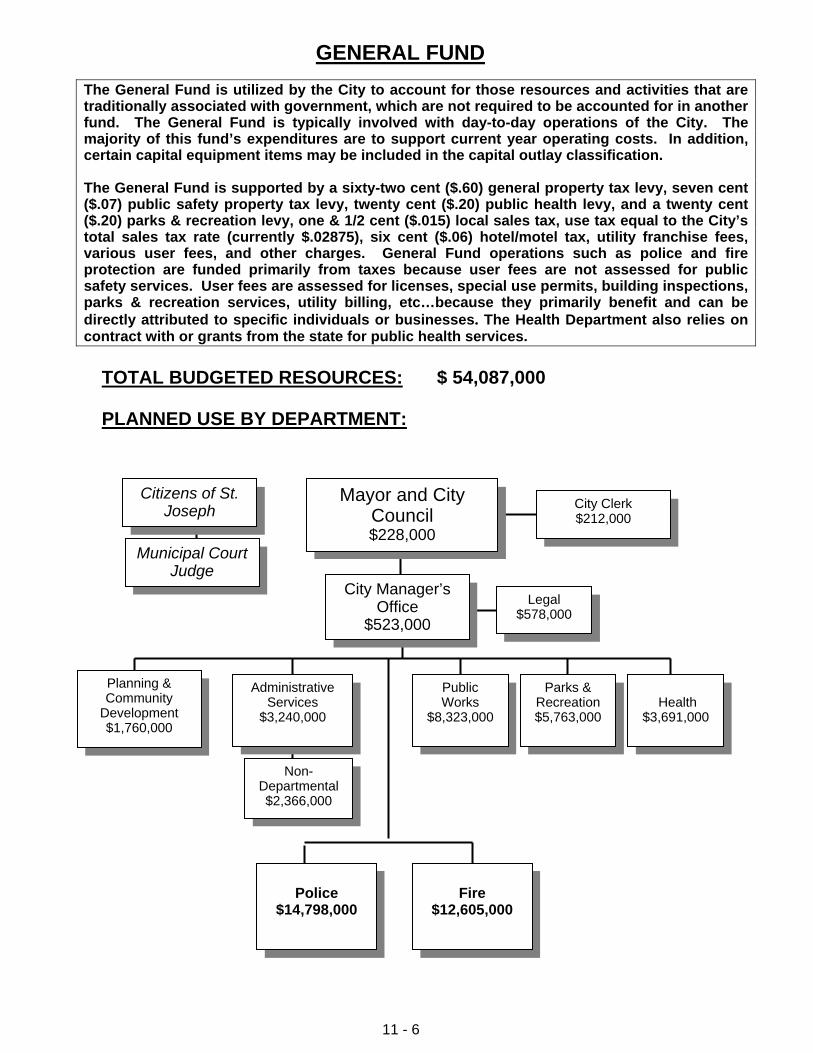
11 - 6
The General Fund is utilized by the City to account for those resources and activities that are traditionally associated with government, which are not required to be accounted for in another fund. The General Fund is typically involved with day-to-day operations of the City. The majority of this fund’s expenditures are to support current year operating costs. In addition, certain capital equipment items may be included in the capital outlay classification. The General Fund is supported by a sixty-two cent ($.60) general property tax levy, seven cent ($.07) public safety property tax levy, twenty cent ($.20) public health levy, and a twenty cent ($.20) parks & recreation levy, one & 1/2 cent ($.015) local sales tax, use tax equal to the City’s total sales tax rate (currently $.02875), six cent ($.06) hotel/motel tax, utility franchise fees, various user fees, and other charges. General Fund operations such as police and fire protection are funded primarily from taxes because user fees are not assessed for public safety services. User fees are assessed for licenses, special use permits, building inspections, parks & recreation services, utility billing, etc…because they primarily benefit and can be directly attributed to specific individuals or businesses. The Health Department also relies on contract with or grants from the state for public health services.
TOTAL BUDGETED RESOURCES: $ 54,087,000 PLANNED USE BY DEPARTMENT:
GENERAL FUND
City Clerk $212,000
Planning & Community
Development $1,760,000
Legal$578,000
Police
$14,798,000 Fire
$12,605,000
Mayor and City Council $228,000
City Manager’s Office
$523,000
AdministrativeServices
$3,240,000
Non- Departmental $2,366,000
Municipal Court Judge
Citizens of St. Joseph
Public Works
$8,323,000
Parks & Recreation $5,763,000
Health $3,691,000
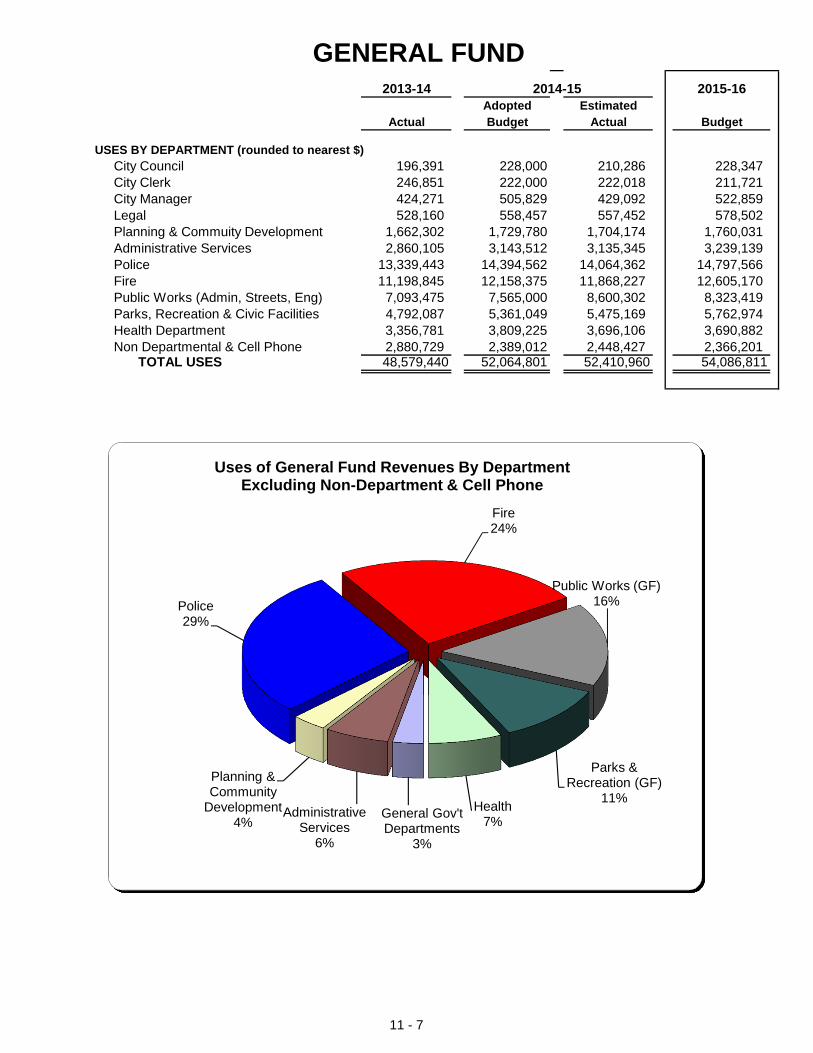
GENERAL FUND 2013-14 2014-15 2015-16
Adopted Estimated Actual Budget Actual Budget
USES BY DEPARTMENT (rounded to nearest $)City Council 196,391 228,000 210,286 228,347City Clerk 246,851 222,000 222,018 211,721City Manager 424,271 505,829 429,092 522,859Legal 528,160 558,457 557,452 578,502Planning & Commuity Development 1,662,302 1,729,780 1,704,174 1,760,031Administrative Services 2,860,105 3,143,512 3,135,345 3,239,139Police 13,339,443 14,394,562 14,064,362 14,797,566Fire 11,198,845 12,158,375 11,868,227 12,605,170Public Works (Admin, Streets, Eng) 7,093,475 7,565,000 8,600,302 8,323,419Parks, Recreation & Civic Facilities 4,792,087 5,361,049 5,475,169 5,762,974Health Department 3,356,781 3,809,225 3,696,106 3,690,882Non Departmental & Cell Phone 2,880,729 2,389,012 2,448,427 2,366,201
TOTAL USES 48,579,440 52,064,801 52,410,960 54,086,811
General Gov't Departments
3%
Administrative Services
6%
Planning & Community
Development4%
Police29%
Fire24%
Public Works (GF)16%
Parks & Recreation (GF)
11%Health
7%
Uses of General Fund Revenues By DepartmentExcluding Non-Department & Cell Phone
11 - 7
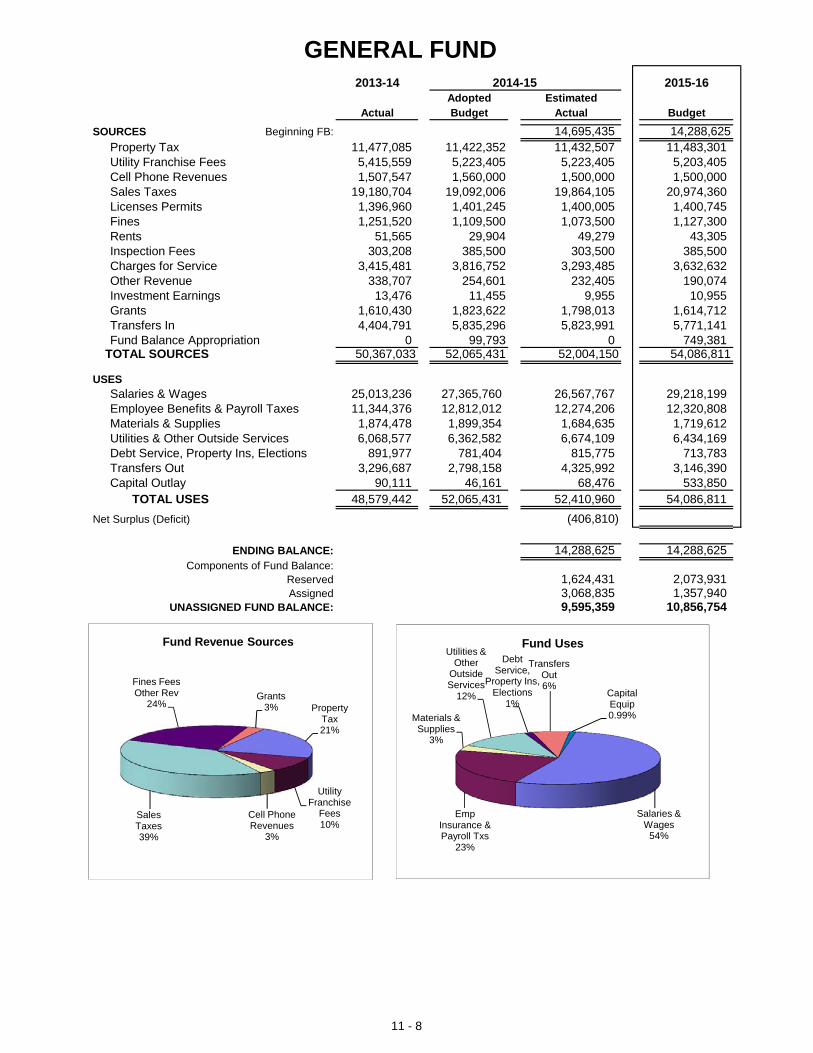
GENERAL FUND 2013-14 2014-15 2015-16
Adopted Estimated Actual Budget Actual Budget
SOURCES Beginning FB: 14,695,435 14,288,625Property Tax 11,477,085 11,422,352 11,432,507 11,483,301Utility Franchise Fees 5,415,559 5,223,405 5,223,405 5,203,405Cell Phone Revenues 1,507,547 1,560,000 1,500,000 1,500,000Sales Taxes 19,180,704 19,092,006 19,864,105 20,974,360Licenses Permits 1,396,960 1,401,245 1,400,005 1,400,745Fines 1,251,520 1,109,500 1,073,500 1,127,300Rents 51,565 29,904 49,279 43,305Inspection Fees 303,208 385,500 303,500 385,500Charges for Service 3,415,481 3,816,752 3,293,485 3,632,632Other Revenue 338,707 254,601 232,405 190,074Investment Earnings 13,476 11,455 9,955 10,955Grants 1,610,430 1,823,622 1,798,013 1,614,712Transfers In 4,404,791 5,835,296 5,823,991 5,771,141Fund Balance Appropriation 0 99,793 0 749,381
TOTAL SOURCES 50,367,033 52,065,431 52,004,150 54,086,811
USES Salaries & Wages 25,013,236 27,365,760 26,567,767 29,218,199Employee Benefits & Payroll Taxes 11,344,376 12,812,012 12,274,206 12,320,808Materials & Supplies 1,874,478 1,899,354 1,684,635 1,719,612Utilities & Other Outside Services 6,068,577 6,362,582 6,674,109 6,434,169Debt Service, Property Ins, Elections 891,977 781,404 815,775 713,783Transfers Out 3,296,687 2,798,158 4,325,992 3,146,390Capital Outlay 90,111 46,161 68,476 533,850
TOTAL USES 48,579,442 52,065,431 52,410,960 54,086,811
Net Surplus (Deficit) (406,810)
ENDING BALANCE: 14,288,625 14,288,625Components of Fund Balance:
Reserved 1,624,431 2,073,931Assigned 3,068,835 1,357,940
UNASSIGNED FUND BALANCE: 9,595,359 10,856,754
Property Tax21%
Utility Franchise
Fees10%
Cell Phone Revenues
3%
Sales Taxes39%
Fines Fees Other Rev
24%Grants
3%
Fund Revenue Sources
Salaries & Wages
54%
Emp Insurance & Payroll Txs
23%
Materials & Supplies
3%
Utilities & Other
Outside Services
12%
Debt Service,
Property Ins, Elections
1%
Transfers Out6%
Capital Equip0.99%
Fund Uses
11 - 8
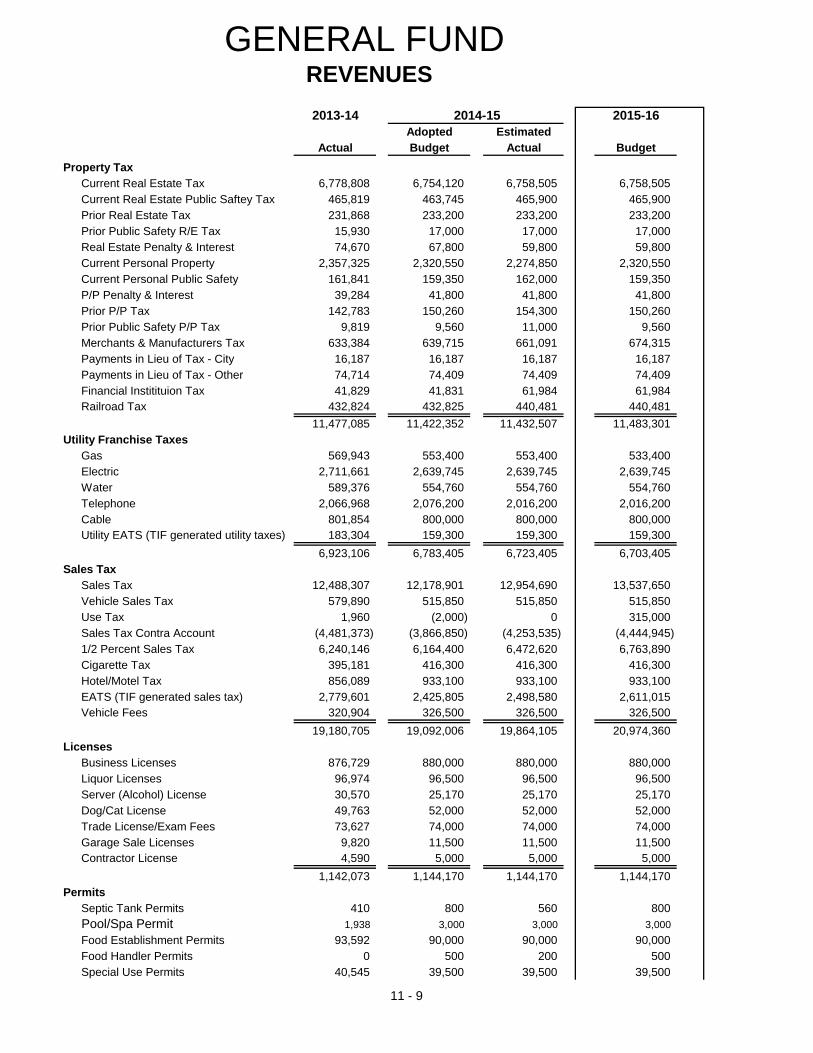
GENERAL FUND REVENUES2013-14 2014-15 2015-16
Adopted Estimated Actual Budget Actual Budget
Property Tax Current Real Estate Tax 6,778,808 6,754,120 6,758,505 6,758,505Current Real Estate Public Saftey Tax 465,819 463,745 465,900 465,900Prior Real Estate Tax 231,868 233,200 233,200 233,200Prior Public Safety R/E Tax 15,930 17,000 17,000 17,000Real Estate Penalty & Interest 74,670 67,800 59,800 59,800Current Personal Property 2,357,325 2,320,550 2,274,850 2,320,550Current Personal Public Safety 161,841 159,350 162,000 159,350P/P Penalty & Interest 39,284 41,800 41,800 41,800Prior P/P Tax 142,783 150,260 154,300 150,260Prior Public Safety P/P Tax 9,819 9,560 11,000 9,560Merchants & Manufacturers Tax 633,384 639,715 661,091 674,315Payments in Lieu of Tax - City 16,187 16,187 16,187 16,187Payments in Lieu of Tax - Other 74,714 74,409 74,409 74,409Financial Institituion Tax 41,829 41,831 61,984 61,984Railroad Tax 432,824 432,825 440,481 440,481
11,477,085 11,422,352 11,432,507 11,483,301Utility Franchise Taxes
Gas 569,943 553,400 553,400 533,400Electric 2,711,661 2,639,745 2,639,745 2,639,745Water 589,376 554,760 554,760 554,760Telephone 2,066,968 2,076,200 2,016,200 2,016,200Cable 801,854 800,000 800,000 800,000Utility EATS (TIF generated utility taxes) 183,304 159,300 159,300 159,300
6,923,106 6,783,405 6,723,405 6,703,405Sales Tax
Sales Tax 12,488,307 12,178,901 12,954,690 13,537,650Vehicle Sales Tax 579,890 515,850 515,850 515,850Use Tax 1,960 (2,000) 0 315,000Sales Tax Contra Account (4,481,373) (3,866,850) (4,253,535) (4,444,945)1/2 Percent Sales Tax 6,240,146 6,164,400 6,472,620 6,763,890Cigarette Tax 395,181 416,300 416,300 416,300Hotel/Motel Tax 856,089 933,100 933,100 933,100EATS (TIF generated sales tax) 2,779,601 2,425,805 2,498,580 2,611,015Vehicle Fees 320,904 326,500 326,500 326,500
19,180,705 19,092,006 19,864,105 20,974,360Licenses
Business Licenses 876,729 880,000 880,000 880,000Liquor Licenses 96,974 96,500 96,500 96,500Server (Alcohol) License 30,570 25,170 25,170 25,170Dog/Cat License 49,763 52,000 52,000 52,000Trade License/Exam Fees 73,627 74,000 74,000 74,000Garage Sale Licenses 9,820 11,500 11,500 11,500Contractor License 4,590 5,000 5,000 5,000
1,142,073 1,144,170 1,144,170 1,144,170Permits
Septic Tank Permits 410 800 560 800Pool/Spa Permit 1,938 3,000 3,000 3,000
Food Establishment Permits 93,592 90,000 90,000 90,000Food Handler Permits 0 500 200 500Special Use Permits 40,545 39,500 39,500 39,500
11 - 9
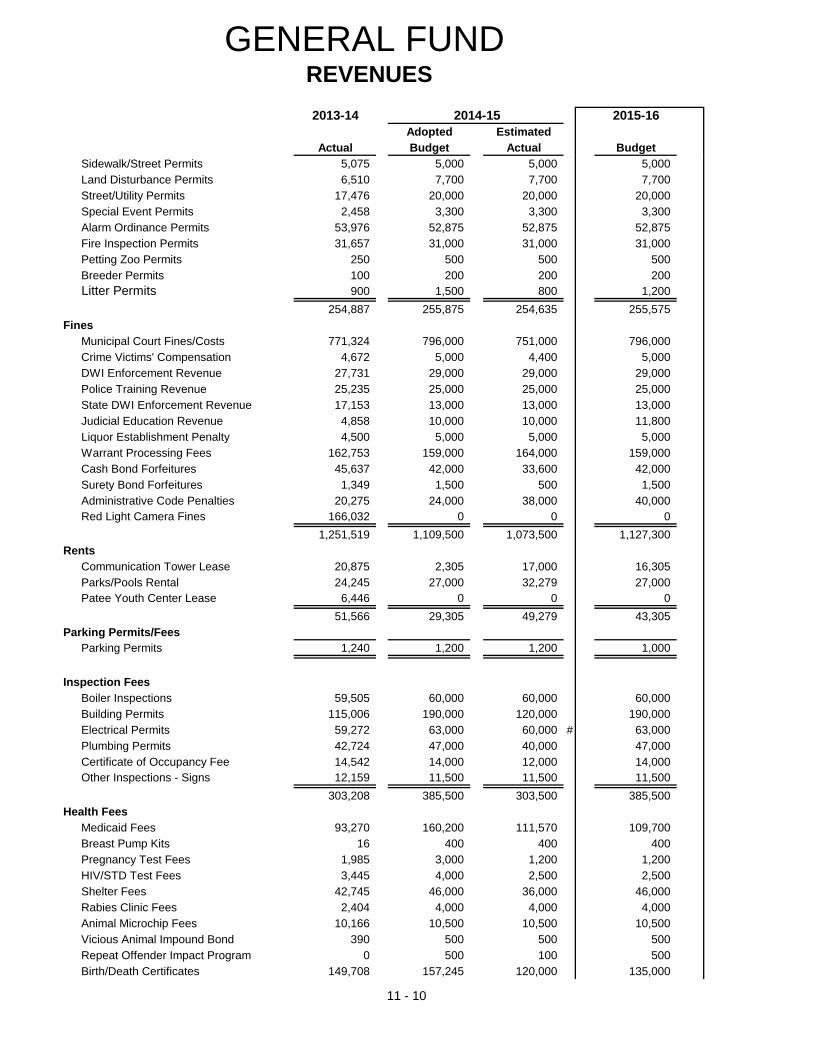
GENERAL FUND REVENUES2013-14 2014-15 2015-16
Adopted Estimated Actual Budget Actual Budget
Sidewalk/Street Permits 5,075 5,000 5,000 5,000Land Disturbance Permits 6,510 7,700 7,700 7,700Street/Utility Permits 17,476 20,000 20,000 20,000Special Event Permits 2,458 3,300 3,300 3,300Alarm Ordinance Permits 53,976 52,875 52,875 52,875Fire Inspection Permits 31,657 31,000 31,000 31,000Petting Zoo Permits 250 500 500 500Breeder Permits 100 200 200 200Litter Permits 900 1,500 800 1,200
254,887 255,875 254,635 255,575Fines
Municipal Court Fines/Costs 771,324 796,000 751,000 796,000Crime Victims' Compensation 4,672 5,000 4,400 5,000DWI Enforcement Revenue 27,731 29,000 29,000 29,000Police Training Revenue 25,235 25,000 25,000 25,000State DWI Enforcement Revenue 17,153 13,000 13,000 13,000Judicial Education Revenue 4,858 10,000 10,000 11,800Liquor Establishment Penalty 4,500 5,000 5,000 5,000Warrant Processing Fees 162,753 159,000 164,000 159,000Cash Bond Forfeitures 45,637 42,000 33,600 42,000Surety Bond Forfeitures 1,349 1,500 500 1,500Administrative Code Penalties 20,275 24,000 38,000 40,000Red Light Camera Fines 166,032 0 0 0
1,251,519 1,109,500 1,073,500 1,127,300Rents
Communication Tower Lease 20,875 2,305 17,000 16,305Parks/Pools Rental 24,245 27,000 32,279 27,000Patee Youth Center Lease 6,446 0 0 0
51,566 29,305 49,279 43,305Parking Permits/Fees
Parking Permits 1,240 1,200 1,200 1,000
Inspection Fees
Boiler Inspections 59,505 60,000 60,000 60,000Building Permits 115,006 190,000 120,000 190,000Electrical Permits 59,272 63,000 60,000 # 63,000Plumbing Permits 42,724 47,000 40,000 47,000Certificate of Occupancy Fee 14,542 14,000 12,000 14,000Other Inspections - Signs 12,159 11,500 11,500 11,500
303,208 385,500 303,500 385,500Health Fees
Medicaid Fees 93,270 160,200 111,570 109,700Breast Pump Kits 16 400 400 400Pregnancy Test Fees 1,985 3,000 1,200 1,200HIV/STD Test Fees 3,445 4,000 2,500 2,500Shelter Fees 42,745 46,000 36,000 46,000Rabies Clinic Fees 2,404 4,000 4,000 4,000Animal Microchip Fees 10,166 10,500 10,500 10,500Vicious Animal Impound Bond 390 500 500 500Repeat Offender Impact Program 0 500 100 500Birth/Death Certificates 149,708 157,245 120,000 135,000
11 - 10
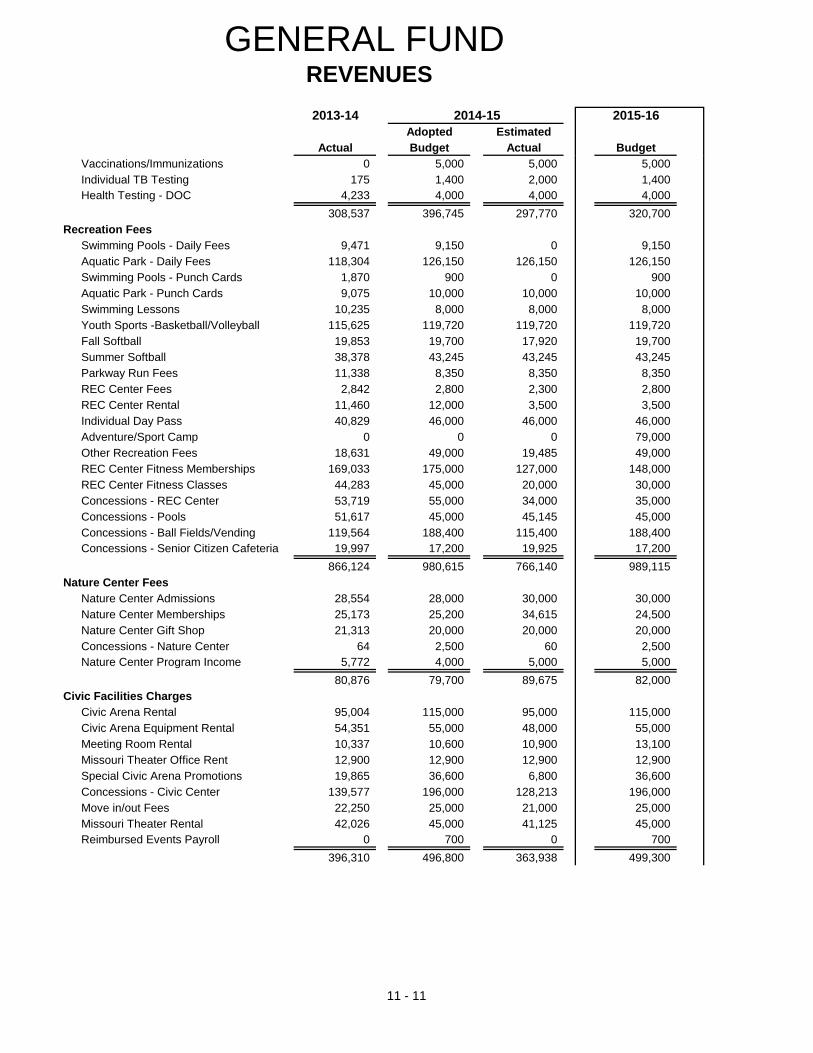
GENERAL FUND REVENUES2013-14 2014-15 2015-16
Adopted Estimated Actual Budget Actual Budget
Vaccinations/Immunizations 0 5,000 5,000 5,000Individual TB Testing 175 1,400 2,000 1,400Health Testing - DOC 4,233 4,000 4,000 4,000
308,537 396,745 297,770 320,700Recreation Fees
Swimming Pools - Daily Fees 9,471 9,150 0 9,150Aquatic Park - Daily Fees 118,304 126,150 126,150 126,150Swimming Pools - Punch Cards 1,870 900 0 900Aquatic Park - Punch Cards 9,075 10,000 10,000 10,000Swimming Lessons 10,235 8,000 8,000 8,000Youth Sports -Basketball/Volleyball 115,625 119,720 119,720 119,720Fall Softball 19,853 19,700 17,920 19,700Summer Softball 38,378 43,245 43,245 43,245Parkway Run Fees 11,338 8,350 8,350 8,350REC Center Fees 2,842 2,800 2,300 2,800REC Center Rental 11,460 12,000 3,500 3,500Individual Day Pass 40,829 46,000 46,000 46,000Adventure/Sport Camp 0 0 0 79,000Other Recreation Fees 18,631 49,000 19,485 49,000REC Center Fitness Memberships 169,033 175,000 127,000 148,000REC Center Fitness Classes 44,283 45,000 20,000 30,000Concessions - REC Center 53,719 55,000 34,000 35,000Concessions - Pools 51,617 45,000 45,145 45,000Concessions - Ball Fields/Vending 119,564 188,400 115,400 188,400Concessions - Senior Citizen Cafeteria 19,997 17,200 19,925 17,200
866,124 980,615 766,140 989,115Nature Center Fees
Nature Center Admissions 28,554 28,000 30,000 30,000Nature Center Memberships 25,173 25,200 34,615 24,500Nature Center Gift Shop 21,313 20,000 20,000 20,000Concessions - Nature Center 64 2,500 60 2,500Nature Center Program Income 5,772 4,000 5,000 5,000
80,876 79,700 89,675 82,000Civic Facilities Charges
Civic Arena Rental 95,004 115,000 95,000 115,000Civic Arena Equipment Rental 54,351 55,000 48,000 55,000Meeting Room Rental 10,337 10,600 10,900 13,100Missouri Theater Office Rent 12,900 12,900 12,900 12,900Special Civic Arena Promotions 19,865 36,600 6,800 36,600Concessions - Civic Center 139,577 196,000 128,213 196,000Move in/out Fees 22,250 25,000 21,000 25,000Missouri Theater Rental 42,026 45,000 41,125 45,000Reimbursed Events Payroll 0 700 0 700
396,310 496,800 363,938 499,300
11 - 11

GENERAL FUND REVENUES2013-14 2014-15 2015-16
Adopted Estimated Actual Budget Actual Budget
Bode Complex ChargesBode Complex Revenue 26,200 37,500 37,500 33,000Skating Lessons 22,814 21,000 25,565 21,000Ice Rental - Hocky 27,083 35,000 19,000 35,000Ice Rink Admissions 49,394 50,000 52,755 50,000Ice Rental - Figure Skating 13,633 14,000 14,500 14,000Ice Rental - General 45,474 53,100 53,100 53,100Advertising 8,675 9,000 8,400 9,000
193,273 219,600 210,820 215,100
Charges for ServicesCopies of Public Documents 9,966 12,800 9,854 12,800GIS Fees 0 0 0 0Plan Review/Archiving Fees 37,184 75,000 75,000 75,000Finance Administration Fees 254,985 266,170 276,000 266,170Trash/Weed Abatement 102,803 100,000 100,000 100,000Identification Cards 532 400 400 400Animal Cremation Services 9,132 10,000 10,000 10,000County Health Contract 62,621 70,263 64,479 64,476Fire District Contracts 385,628 397,197 384,756 385,600Non Criminal Fingerprint Fee 25,404 26,000 26,000 26,000State Health Contract 207,700 141,960 157,181 149,681State MCH Health Contract 38,182 37,748 47,009 47,009Childrens Lead Prevention 0 0 0 0Outreach Service Contract 5,439 5,500 5,312 5,312State WIC Contract 429,545 409,151 409,151 383,969
1,569,121 1,552,189 1,565,142 1,526,417Other Revenue
Sale of Fixed Assets 2,700 0 11,356 0Insurance Proceeds 2,908 0 0 0Girft Certificate Revenue 612 0 579 0Concessions - Vending Machines 4,655 5,150 4,150 4,150Donations 54,033 54,238 54,113 54,238Taser Reimbursement 240 400 400 400Recycling Revenue 3,855 2,300 2,300 2,300Nonrefundable Bid Deposits 8,790 8,000 8,000 8,000Recovery/Reimbursements 113,342 55,400 78,848 63,596Refunds of Prior Year Expenses (1,213) 0 5,951 0Other Revenues Over/Short 148,785 57,390 66,708 57,390
338,707 182,878 232,405 190,074Investment Earnings
Investment Interest Income 7,831 6,030 4,530 5,530MDFB Bonds Interest Income 12 25 25 25Interest on Special Assessments 5,633 5,400 5,400 5,400Interst on Accts/Notes Receivable 0 0 0 0
13,476 11,455 9,955 10,955
11 - 12
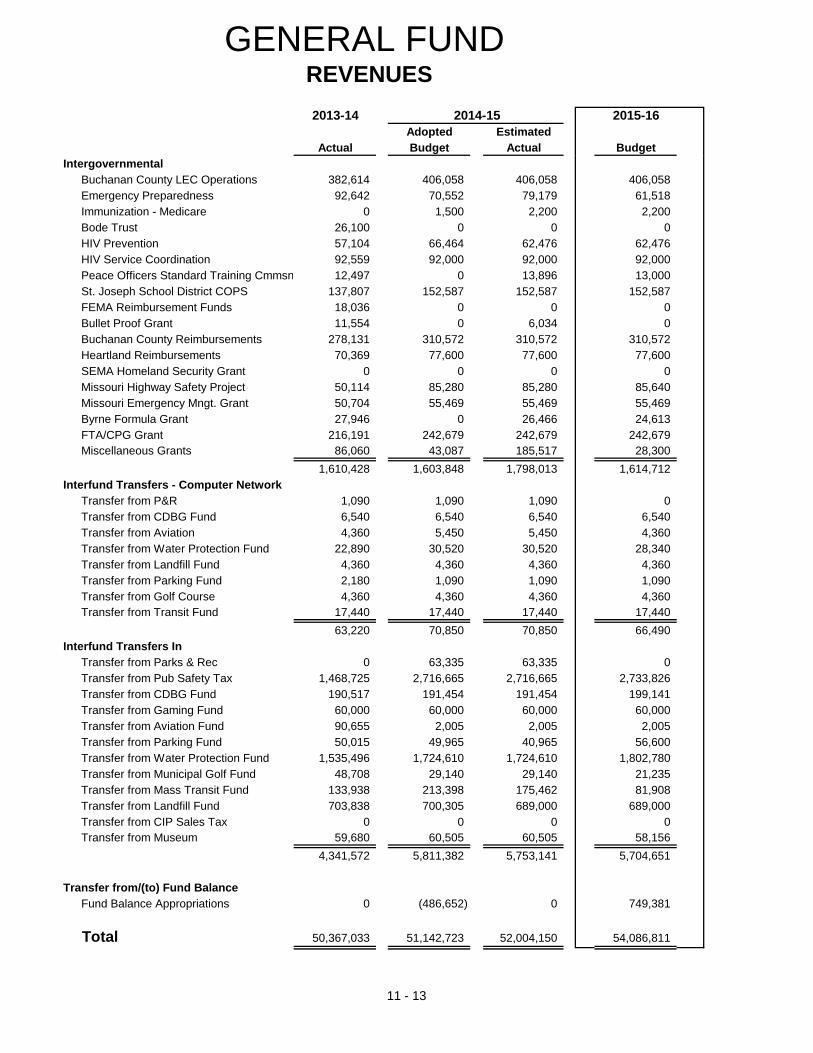
GENERAL FUND REVENUES2013-14 2014-15 2015-16
Adopted Estimated Actual Budget Actual Budget
Intergovernmental Buchanan County LEC Operations 382,614 406,058 406,058 406,058Emergency Preparedness 92,642 70,552 79,179 61,518Immunization - Medicare 0 1,500 2,200 2,200Bode Trust 26,100 0 0 0HIV Prevention 57,104 66,464 62,476 62,476HIV Service Coordination 92,559 92,000 92,000 92,000Peace Officers Standard Training Cmmsn 12,497 0 13,896 13,000St. Joseph School District COPS 137,807 152,587 152,587 152,587FEMA Reimbursement Funds 18,036 0 0 0Bullet Proof Grant 11,554 0 6,034 0Buchanan County Reimbursements 278,131 310,572 310,572 310,572Heartland Reimbursements 70,369 77,600 77,600 77,600SEMA Homeland Security Grant 0 0 0 0Missouri Highway Safety Project 50,114 85,280 85,280 85,640Missouri Emergency Mngt. Grant 50,704 55,469 55,469 55,469Byrne Formula Grant 27,946 0 26,466 24,613FTA/CPG Grant 216,191 242,679 242,679 242,679Miscellaneous Grants 86,060 43,087 185,517 28,300
1,610,428 1,603,848 1,798,013 1,614,712Interfund Transfers - Computer Network
Transfer from P&R 1,090 1,090 1,090 0Transfer from CDBG Fund 6,540 6,540 6,540 6,540Transfer from Aviation 4,360 5,450 5,450 4,360Transfer from Water Protection Fund 22,890 30,520 30,520 28,340Transfer from Landfill Fund 4,360 4,360 4,360 4,360Transfer from Parking Fund 2,180 1,090 1,090 1,090Transfer from Golf Course 4,360 4,360 4,360 4,360Transfer from Transit Fund 17,440 17,440 17,440 17,440
63,220 70,850 70,850 66,490Interfund Transfers In
Transfer from Parks & Rec 0 63,335 63,335 0Transfer from Pub Safety Tax 1,468,725 2,716,665 2,716,665 2,733,826Transfer from CDBG Fund 190,517 191,454 191,454 199,141Transfer from Gaming Fund 60,000 60,000 60,000 60,000Transfer from Aviation Fund 90,655 2,005 2,005 2,005Transfer from Parking Fund 50,015 49,965 40,965 56,600Transfer from Water Protection Fund 1,535,496 1,724,610 1,724,610 1,802,780Transfer from Municipal Golf Fund 48,708 29,140 29,140 21,235Transfer from Mass Transit Fund 133,938 213,398 175,462 81,908Transfer from Landfill Fund 703,838 700,305 689,000 689,000Transfer from CIP Sales Tax 0 0 0 0Transfer from Museum 59,680 60,505 60,505 58,156
4,341,572 5,811,382 5,753,141 5,704,651
Transfer from/(to) Fund BalanceFund Balance Appropriations 0 (486,652) 0 749,381
Total 50,367,033 51,142,723 52,004,150 54,086,811
11 - 13
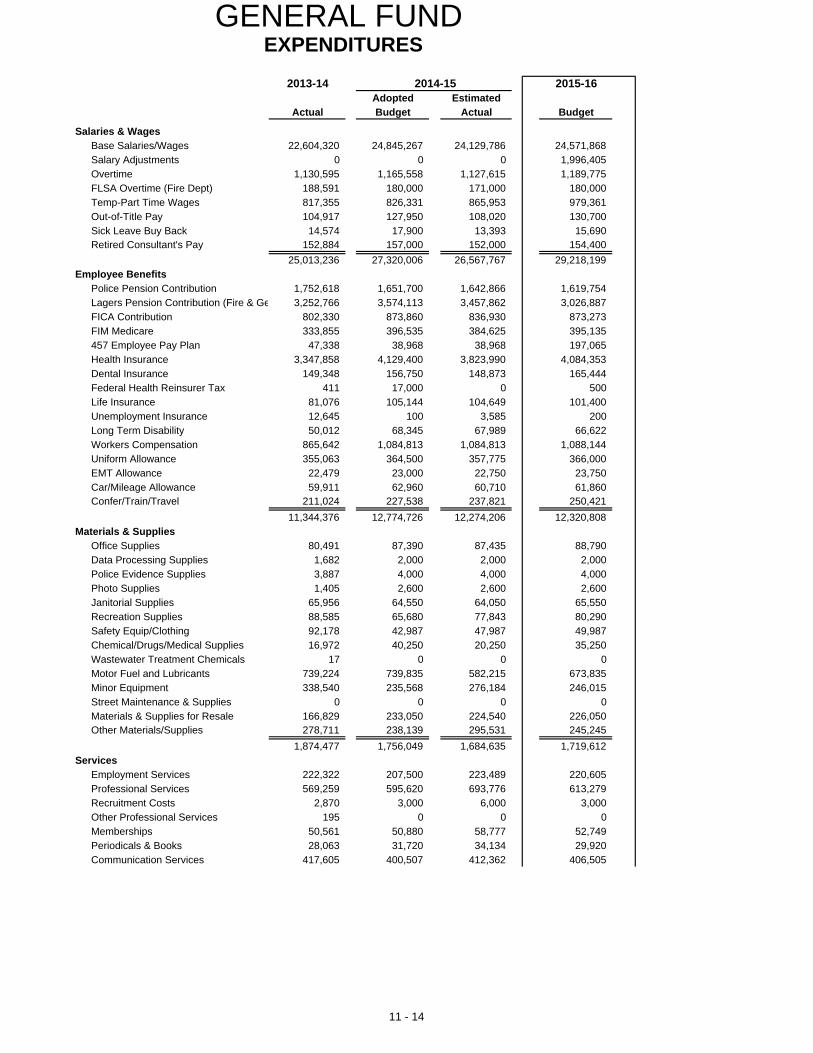
GENERAL FUND EXPENDITURES
2013-14 2014-15 2015-16Adopted Estimated
Actual Budget Actual Budget
Salaries & Wages Base Salaries/Wages 22,604,320 24,845,267 24,129,786 24,571,868Salary Adjustments 0 0 0 1,996,405Overtime 1,130,595 1,165,558 1,127,615 1,189,775FLSA Overtime (Fire Dept) 188,591 180,000 171,000 180,000Temp-Part Time Wages 817,355 826,331 865,953 979,361Out-of-Title Pay 104,917 127,950 108,020 130,700Sick Leave Buy Back 14,574 17,900 13,393 15,690Retired Consultant's Pay 152,884 157,000 152,000 154,400
25,013,236 27,320,006 26,567,767 29,218,199Employee Benefits
Police Pension Contribution 1,752,618 1,651,700 1,642,866 1,619,754Lagers Pension Contribution (Fire & Ge 3,252,766 3,574,113 3,457,862 3,026,887FICA Contribution 802,330 873,860 836,930 873,273FIM Medicare 333,855 396,535 384,625 395,135457 Employee Pay Plan 47,338 38,968 38,968 197,065Health Insurance 3,347,858 4,129,400 3,823,990 4,084,353Dental Insurance 149,348 156,750 148,873 165,444Federal Health Reinsurer Tax 411 17,000 0 500Life Insurance 81,076 105,144 104,649 101,400Unemployment Insurance 12,645 100 3,585 200Long Term Disability 50,012 68,345 67,989 66,622Workers Compensation 865,642 1,084,813 1,084,813 1,088,144Uniform Allowance 355,063 364,500 357,775 366,000EMT Allowance 22,479 23,000 22,750 23,750Car/Mileage Allowance 59,911 62,960 60,710 61,860Confer/Train/Travel 211,024 227,538 237,821 250,421
11,344,376 12,774,726 12,274,206 12,320,808Materials & Supplies
Office Supplies 80,491 87,390 87,435 88,790Data Processing Supplies 1,682 2,000 2,000 2,000Police Evidence Supplies 3,887 4,000 4,000 4,000Photo Supplies 1,405 2,600 2,600 2,600Janitorial Supplies 65,956 64,550 64,050 65,550Recreation Supplies 88,585 65,680 77,843 80,290Safety Equip/Clothing 92,178 42,987 47,987 49,987Chemical/Drugs/Medical Supplies 16,972 40,250 20,250 35,250Wastewater Treatment Chemicals 17 0 0 0Motor Fuel and Lubricants 739,224 739,835 582,215 673,835Minor Equipment 338,540 235,568 276,184 246,015Street Maintenance & Supplies 0 0 0 0Materials & Supplies for Resale 166,829 233,050 224,540 226,050Other Materials/Supplies 278,711 238,139 295,531 245,245
1,874,477 1,756,049 1,684,635 1,719,612Services
Employment Services 222,322 207,500 223,489 220,605Professional Services 569,259 595,620 693,776 613,279Recruitment Costs 2,870 3,000 6,000 3,000Other Professional Services 195 0 0 0Memberships 50,561 50,880 58,777 52,749Periodicals & Books 28,063 31,720 34,134 29,920Communication Services 417,605 400,507 412,362 406,505
11 - 14
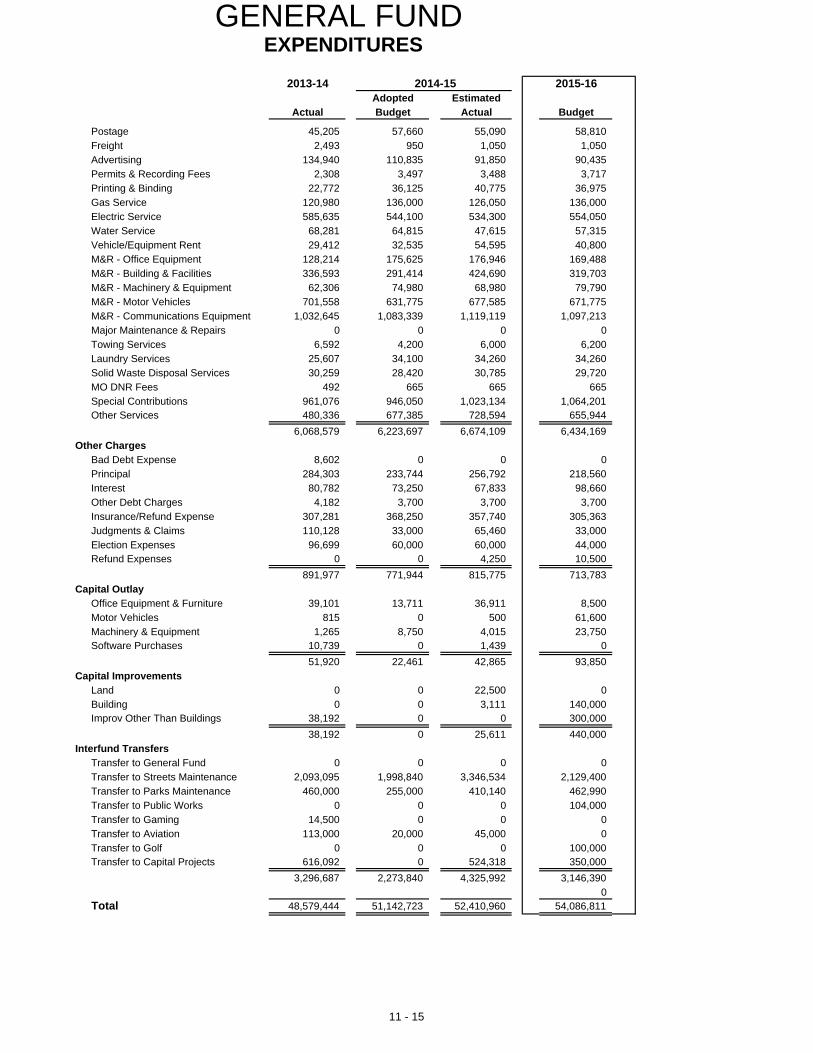
GENERAL FUND EXPENDITURES
2013-14 2014-15 2015-16Adopted Estimated
Actual Budget Actual Budget
Postage 45,205 57,660 55,090 58,810Freight 2,493 950 1,050 1,050Advertising 134,940 110,835 91,850 90,435Permits & Recording Fees 2,308 3,497 3,488 3,717Printing & Binding 22,772 36,125 40,775 36,975Gas Service 120,980 136,000 126,050 136,000Electric Service 585,635 544,100 534,300 554,050Water Service 68,281 64,815 47,615 57,315Vehicle/Equipment Rent 29,412 32,535 54,595 40,800M&R - Office Equipment 128,214 175,625 176,946 169,488M&R - Building & Facilities 336,593 291,414 424,690 319,703M&R - Machinery & Equipment 62,306 74,980 68,980 79,790M&R - Motor Vehicles 701,558 631,775 677,585 671,775M&R - Communications Equipment 1,032,645 1,083,339 1,119,119 1,097,213Major Maintenance & Repairs 0 0 0 0Towing Services 6,592 4,200 6,000 6,200Laundry Services 25,607 34,100 34,260 34,260Solid Waste Disposal Services 30,259 28,420 30,785 29,720MO DNR Fees 492 665 665 665Special Contributions 961,076 946,050 1,023,134 1,064,201Other Services 480,336 677,385 728,594 655,944
6,068,579 6,223,697 6,674,109 6,434,169Other Charges
Bad Debt Expense 8,602 0 0 0Principal 284,303 233,744 256,792 218,560Interest 80,782 73,250 67,833 98,660Other Debt Charges 4,182 3,700 3,700 3,700Insurance/Refund Expense 307,281 368,250 357,740 305,363Judgments & Claims 110,128 33,000 65,460 33,000Election Expenses 96,699 60,000 60,000 44,000Refund Expenses 0 0 4,250 10,500
891,977 771,944 815,775 713,783Capital Outlay
Office Equipment & Furniture 39,101 13,711 36,911 8,500Motor Vehicles 815 0 500 61,600Machinery & Equipment 1,265 8,750 4,015 23,750Software Purchases 10,739 0 1,439 0
51,920 22,461 42,865 93,850Capital Improvements
Land 0 0 22,500 0Building 0 0 3,111 140,000Improv Other Than Buildings 38,192 0 0 300,000
38,192 0 25,611 440,000Interfund Transfers
Transfer to General Fund 0 0 0 0Transfer to Streets Maintenance 2,093,095 1,998,840 3,346,534 2,129,400Transfer to Parks Maintenance 460,000 255,000 410,140 462,990Transfer to Public Works 0 0 0 104,000Transfer to Gaming 14,500 0 0 0Transfer to Aviation 113,000 20,000 45,000 0Transfer to Golf 0 0 0 100,000Transfer to Capital Projects 616,092 0 524,318 350,000
3,296,687 2,273,840 4,325,992 3,146,3900
Total 48,579,444 51,142,723 52,410,960 54,086,811
11 - 15
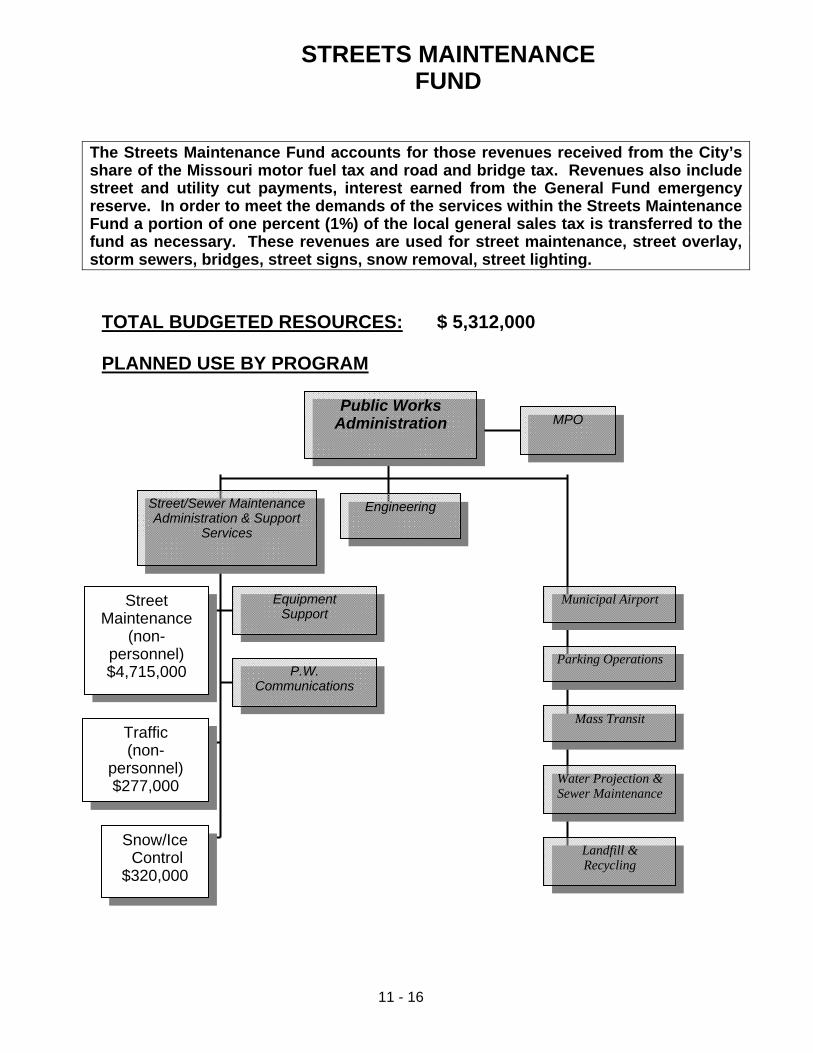
11 - 16
The Streets Maintenance Fund accounts for those revenues received from the City’s share of the Missouri motor fuel tax and road and bridge tax. Revenues also include street and utility cut payments, interest earned from the General Fund emergency reserve. In order to meet the demands of the services within the Streets Maintenance Fund a portion of one percent (1%) of the local general sales tax is transferred to the fund as necessary. These revenues are used for street maintenance, street overlay, storm sewers, bridges, street signs, snow removal, street lighting.
TOTAL BUDGETED RESOURCES: $ 5,312,000
PLANNED USE BY PROGRAM
STREETS MAINTENANCE FUND
Public WorksAdministration
Street/Sewer Maintenance Administration & Support
Services
Engineering
Equipment Support
MPO
P.W. Communications
Municipal Airport
Parking Operations
Mass Transit
Water Projection & Sewer Maintenance
Landfill & Recycling
Street Maintenance
(non-personnel) $4,715,000
Traffic (non-
personnel) $277,000
Snow/Ice Control
$320,000
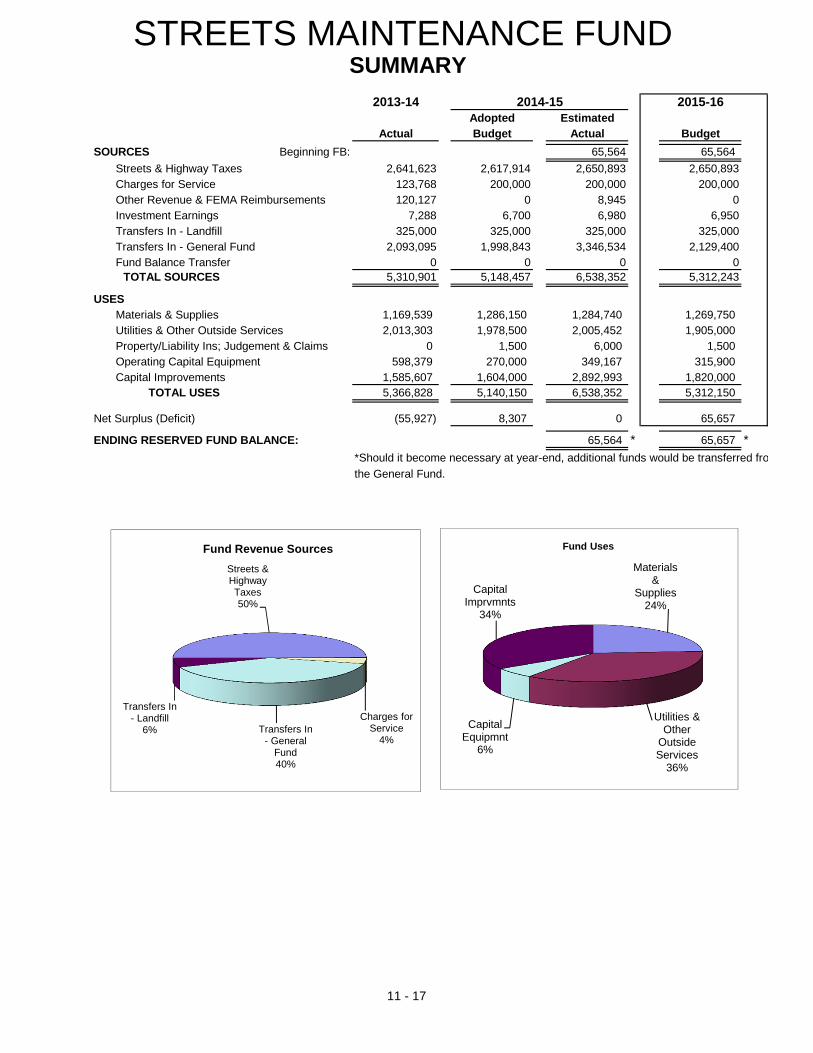
STREETS MAINTENANCE FUND SUMMARY
2013-14 2014-15 2015-16Adopted Estimated
Actual Budget Actual BudgetSOURCES Beginning FB: 65,564 65,564
Streets & Highway Taxes 2,641,623 2,617,914 2,650,893 2,650,893Charges for Service 123,768 200,000 200,000 200,000Other Revenue & FEMA Reimbursements 120,127 0 8,945 0Investment Earnings 7,288 6,700 6,980 6,950Transfers In - Landfill 325,000 325,000 325,000 325,000Transfers In - General Fund 2,093,095 1,998,843 3,346,534 2,129,400Fund Balance Transfer 0 0 0 0
TOTAL SOURCES 5,310,901 5,148,457 6,538,352 5,312,243
USES Materials & Supplies 1,169,539 1,286,150 1,284,740 1,269,750Utilities & Other Outside Services 2,013,303 1,978,500 2,005,452 1,905,000Property/Liability Ins; Judgement & Claims 0 1,500 6,000 1,500Operating Capital Equipment 598,379 270,000 349,167 315,900Capital Improvements 1,585,607 1,604,000 2,892,993 1,820,000
TOTAL USES 5,366,828 5,140,150 6,538,352 5,312,150
Net Surplus (Deficit) (55,927) 8,307 0 65,657
ENDING RESERVED FUND BALANCE: 65,564 * 65,657 **Should it become necessary at year-end, additional funds would be transferred fro
the General Fund.
Streets & Highway Taxes50%
Charges for Service
4%Transfers In
- General Fund40%
Transfers In - Landfill
6%
Fund Revenue SourcesMaterials
& Supplies
24%
Utilities & Other
Outside Services
36%
Capital Equipmnt
6%
Capital Imprvmnts
34%
Fund Uses
11 - 17
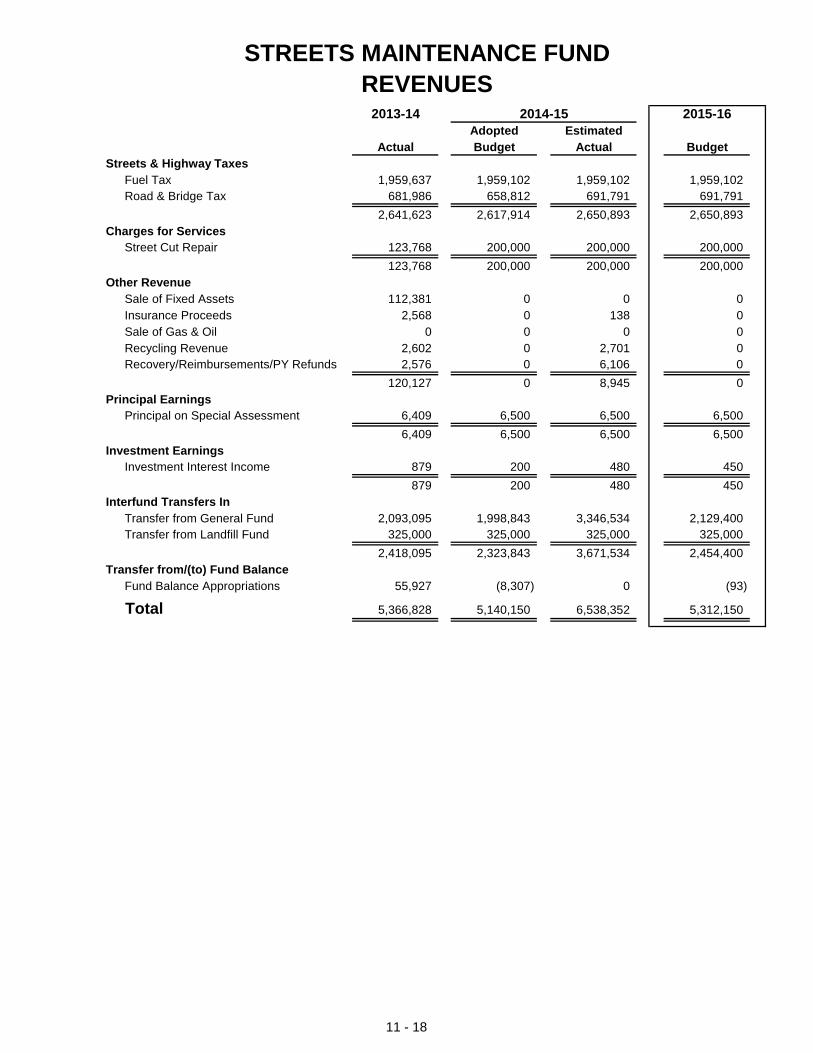
STREETS MAINTENANCE FUNDREVENUES
2013-14 2014-15 2015-16Adopted Estimated
Actual Budget Actual BudgetStreets & Highway Taxes
Fuel Tax 1,959,637 1,959,102 1,959,102 1,959,102Road & Bridge Tax 681,986 658,812 691,791 691,791
2,641,623 2,617,914 2,650,893 2,650,893Charges for Services
Street Cut Repair 123,768 200,000 200,000 200,000
123,768 200,000 200,000 200,000Other Revenue
Sale of Fixed Assets 112,381 0 0 0Insurance Proceeds 2,568 0 138 0Sale of Gas & Oil 0 0 0 0Recycling Revenue 2,602 0 2,701 0Recovery/Reimbursements/PY Refunds 2,576 0 6,106 0
120,127 0 8,945 0Principal Earnings
Principal on Special Assessment 6,409 6,500 6,500 6,500
6,409 6,500 6,500 6,500Investment Earnings
Investment Interest Income 879 200 480 450
879 200 480 450Interfund Transfers In
Transfer from General Fund 2,093,095 1,998,843 3,346,534 2,129,400Transfer from Landfill Fund 325,000 325,000 325,000 325,000
2,418,095 2,323,843 3,671,534 2,454,400Transfer from/(to) Fund Balance
Fund Balance Appropriations 55,927 (8,307) 0 (93)
Total 5,366,828 5,140,150 6,538,352 5,312,150
11 - 18
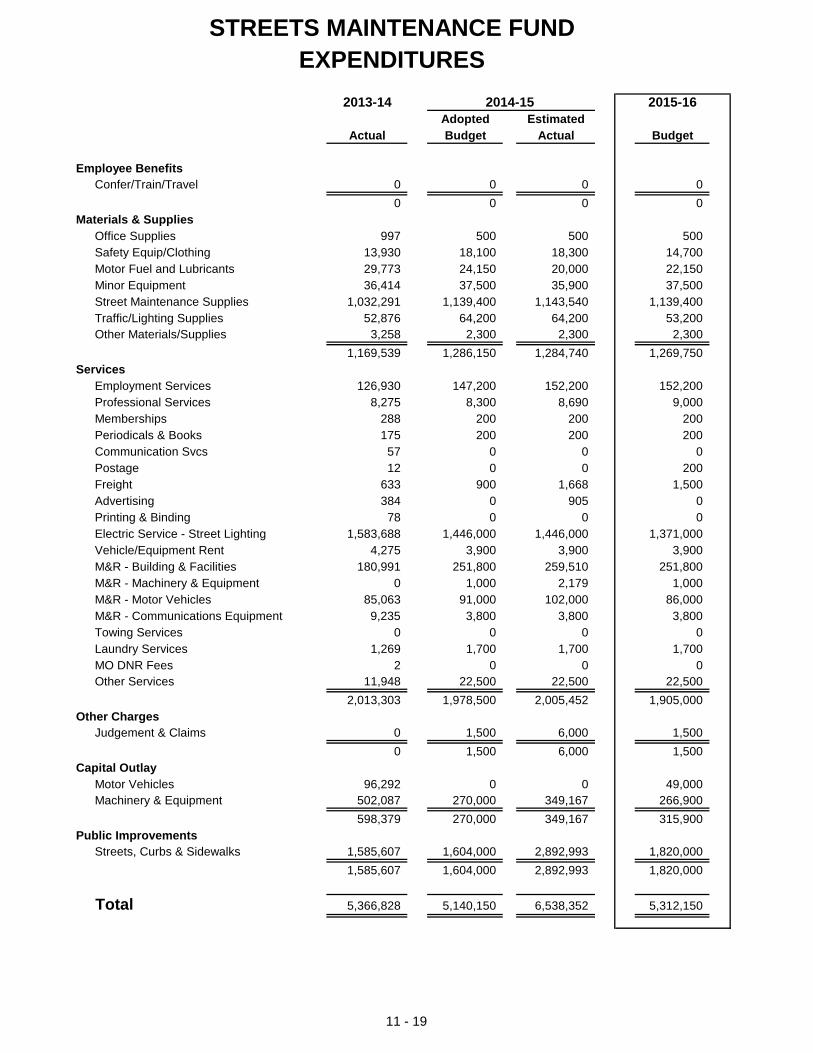
STREETS MAINTENANCE FUNDEXPENDITURES
2013-14 2014-15 2015-16Adopted Estimated
Actual Budget Actual Budget
Employee BenefitsConfer/Train/Travel 0 0 0 0
0 0 0 0Materials & Supplies
Office Supplies 997 500 500 500Safety Equip/Clothing 13,930 18,100 18,300 14,700Motor Fuel and Lubricants 29,773 24,150 20,000 22,150Minor Equipment 36,414 37,500 35,900 37,500Street Maintenance Supplies 1,032,291 1,139,400 1,143,540 1,139,400Traffic/Lighting Supplies 52,876 64,200 64,200 53,200Other Materials/Supplies 3,258 2,300 2,300 2,300
1,169,539 1,286,150 1,284,740 1,269,750Services
Employment Services 126,930 147,200 152,200 152,200Professional Services 8,275 8,300 8,690 9,000Memberships 288 200 200 200Periodicals & Books 175 200 200 200Communication Svcs 57 0 0 0Postage 12 0 0 200Freight 633 900 1,668 1,500Advertising 384 0 905 0Printing & Binding 78 0 0 0Electric Service - Street Lighting 1,583,688 1,446,000 1,446,000 1,371,000Vehicle/Equipment Rent 4,275 3,900 3,900 3,900M&R - Building & Facilities 180,991 251,800 259,510 251,800M&R - Machinery & Equipment 0 1,000 2,179 1,000M&R - Motor Vehicles 85,063 91,000 102,000 86,000M&R - Communications Equipment 9,235 3,800 3,800 3,800Towing Services 0 0 0 0Laundry Services 1,269 1,700 1,700 1,700MO DNR Fees 2 0 0 0Other Services 11,948 22,500 22,500 22,500
2,013,303 1,978,500 2,005,452 1,905,000Other Charges
Judgement & Claims 0 1,500 6,000 1,500
0 1,500 6,000 1,500Capital Outlay
Motor Vehicles 96,292 0 0 49,000Machinery & Equipment 502,087 270,000 349,167 266,900
598,379 270,000 349,167 315,900Public Improvements
Streets, Curbs & Sidewalks 1,585,607 1,604,000 2,892,993 1,820,000
1,585,607 1,604,000 2,892,993 1,820,000
Total 5,366,828 5,140,150 6,538,352 5,312,150
11 - 19

(this page intentionally left blank)
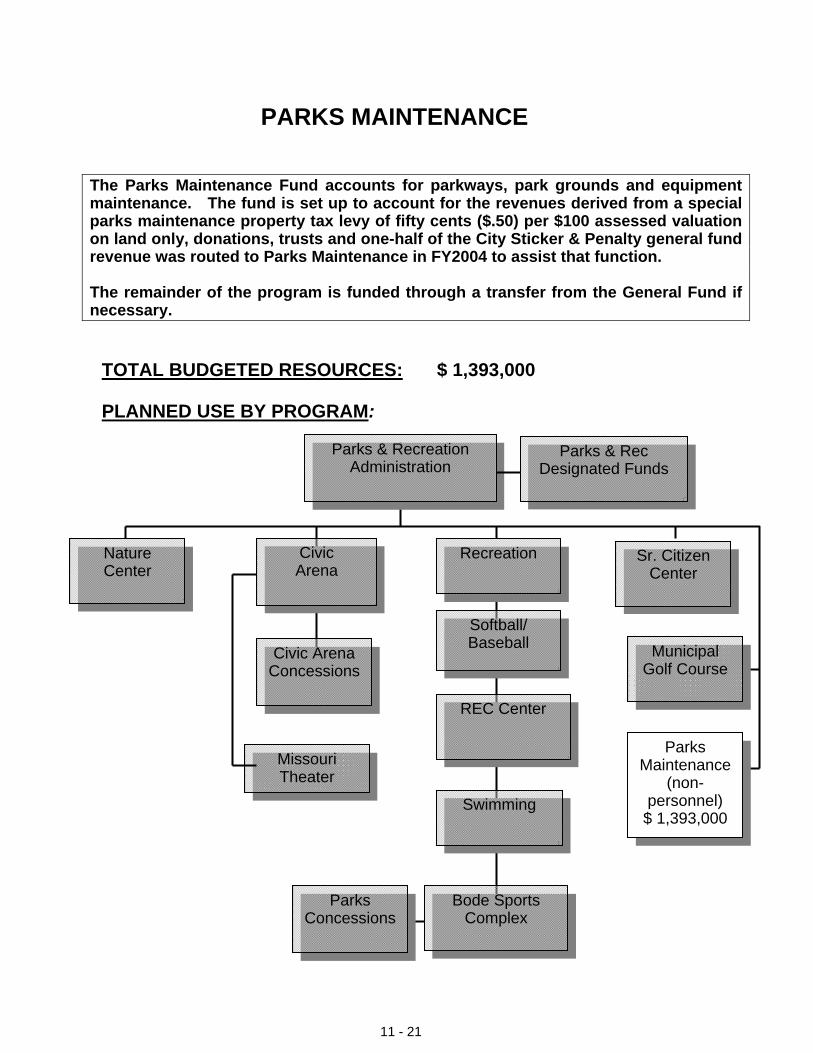
11 - 21
The Parks Maintenance Fund accounts for parkways, park grounds and equipment maintenance. The fund is set up to account for the revenues derived from a special parks maintenance property tax levy of fifty cents ($.50) per $100 assessed valuation on land only, donations, trusts and one-half of the City Sticker & Penalty general fund revenue was routed to Parks Maintenance in FY2004 to assist that function. The remainder of the program is funded through a transfer from the General Fund if necessary.
TOTAL BUDGETED RESOURCES: $ 1,393,000
PLANNED USE BY PROGRAM:
PARKS MAINTENANCE
Parks & Recreation Administration
Recreation
Swimming
REC Center
Missouri Theater
Softball/ Baseball
Sr. Citizen Center
Bode Sports Complex
Parks Maintenance
(non-personnel) $ 1,393,000
Civic Arena
Civic Arena Concessions
Parks & Rec Designated Funds
Parks Concessions
Nature Center
Municipal Golf Course
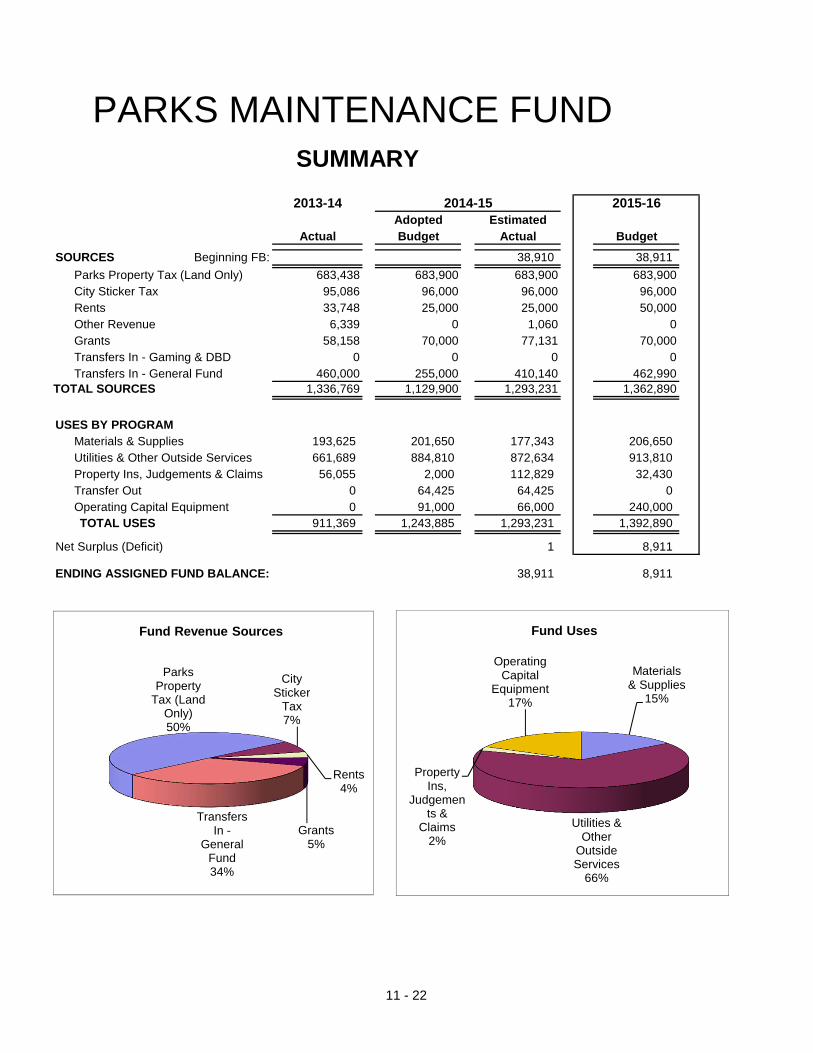
PARKS MAINTENANCE FUND SUMMARY2013-14 2014-15 2015-16
Adopted Estimated Actual Budget Actual Budget
SOURCES Beginning FB: 38,910 38,911
Parks Property Tax (Land Only) 683,438 683,900 683,900 683,900City Sticker Tax 95,086 96,000 96,000 96,000Rents 33,748 25,000 25,000 50,000Other Revenue 6,339 0 1,060 0Grants 58,158 70,000 77,131 70,000Transfers In - Gaming & DBD 0 0 0 0Transfers In - General Fund 460,000 255,000 410,140 462,990
TOTAL SOURCES 1,336,769 1,129,900 1,293,231 1,362,890
USES BY PROGRAMMaterials & Supplies 193,625 201,650 177,343 206,650Utilities & Other Outside Services 661,689 884,810 872,634 913,810Property Ins, Judgements & Claims 56,055 2,000 112,829 32,430Transfer Out 0 64,425 64,425 0Operating Capital Equipment 0 91,000 66,000 240,000TOTAL USES 911,369 1,243,885 1,293,231 1,392,890
Net Surplus (Deficit) 1 8,911
ENDING ASSIGNED FUND BALANCE: 38,911 8,911
Parks Property
Tax (Land Only)50%
City Sticker
Tax7%
Rents4%
Grants 5%
Transfers In -
General Fund34%
Fund Revenue Sources
Materials & Supplies
15%
Utilities & Other
Outside Services
66%
Property Ins,
Judgements &
Claims2%
Operating Capital
Equipment17%
Fund Uses
11 - 22
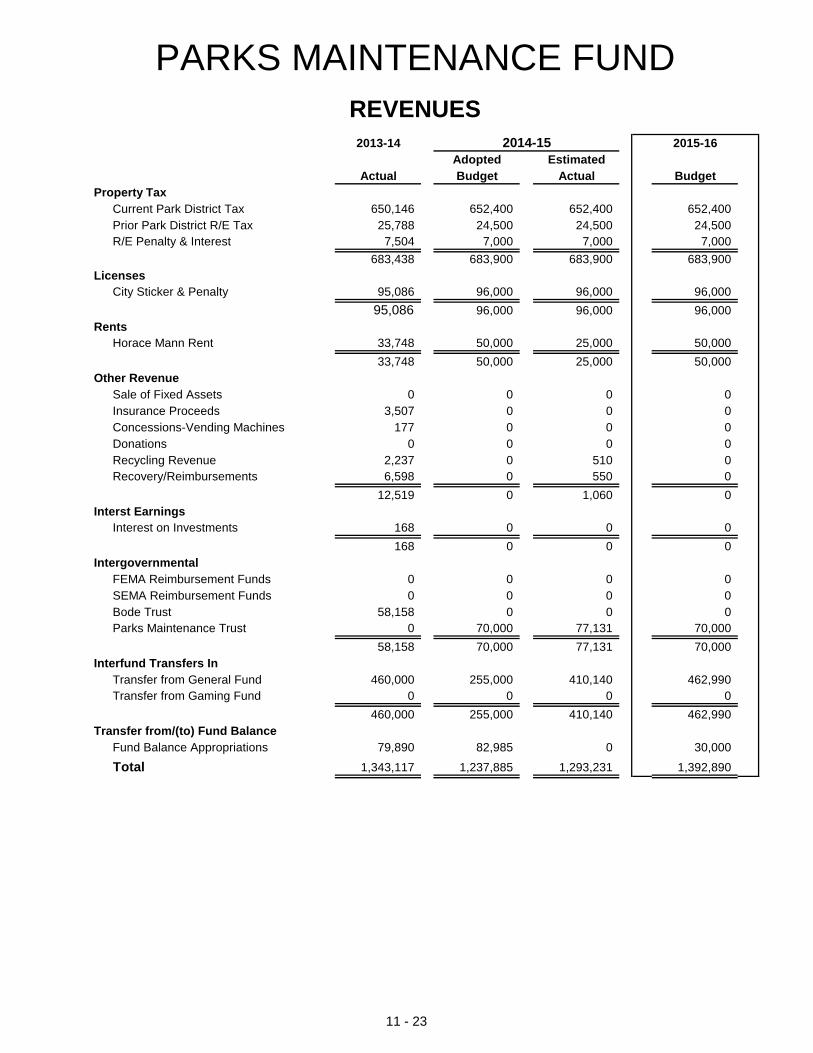
PARKS MAINTENANCE FUNDREVENUES
2013-14 2014-15 2015-16Adopted Estimated
Actual Budget Actual BudgetProperty Tax
Current Park District Tax 650,146 652,400 652,400 652,400Prior Park District R/E Tax 25,788 24,500 24,500 24,500R/E Penalty & Interest 7,504 7,000 7,000 7,000
683,438 683,900 683,900 683,900Licenses
City Sticker & Penalty 95,086 96,000 96,000 96,000
95,086 96,000 96,000 96,000Rents
Horace Mann Rent 33,748 50,000 25,000 50,000
33,748 50,000 25,000 50,000Other Revenue
Sale of Fixed Assets 0 0 0 0Insurance Proceeds 3,507 0 0 0Concessions-Vending Machines 177 0 0 0Donations 0 0 0 0Recycling Revenue 2,237 0 510 0Recovery/Reimbursements 6,598 0 550 0
12,519 0 1,060 0Interst Earnings
Interest on Investments 168 0 0 0
168 0 0 0Intergovernmental
FEMA Reimbursement Funds 0 0 0 0SEMA Reimbursement Funds 0 0 0 0Bode Trust 58,158 0 0 0Parks Maintenance Trust 0 70,000 77,131 70,000
58,158 70,000 77,131 70,000Interfund Transfers In
Transfer from General Fund 460,000 255,000 410,140 462,990Transfer from Gaming Fund 0 0 0 0
460,000 255,000 410,140 462,990Transfer from/(to) Fund Balance
Fund Balance Appropriations 79,890 82,985 0 30,000
Total 1,343,117 1,237,885 1,293,231 1,392,890
11 - 23

PARKS MAINTENANCE FUNDEXPENDITURES
2013-14 2014-15 2015-16Adopted Estimated
Actual Budget Actual BudgetMaterials & Supplies
Janitorial Supplies 6,207 5,000 5,000 5,000Recreation Supplies 20,869 21,000 21,000 21,000Safety Equip/Clothing 6,651 3,500 3,501 3,500Chemical/Drugs/Medical Supplies 0 150 242 150Motor Fuel and Lubricants 119,140 125,000 100,000 125,000Minor Equipment 20,809 27,000 27,000 27,000Traffic & Lighting Supplies 19,949 20,000 20,600 25,000
193,625 201,650 177,343 206,650Services
Employment Services 179,447 180,000 180,000 180,000Memberships 32 20 20 20Telephone Service 6,135 5,090 5,090 5,090Gas Service 11,347 45,000 30,000 45,000Electric Service 141,217 349,500 349,500 349,500Water Service 27,996 50,000 40,000 50,000Vehicle/Equipment Rent 2,568 2,700 2,700 2,700M&R - Building & Facilities 121,505 97,000 103,629 112,000M&R - Machinery & Equipment 11,806 12,000 12,000 16,000M&R - Motor Vehicles 101,738 90,000 90,000 100,000M&R - Communications Equipment 4,039 5,000 5,000 5,000Major Repairs & Replacement 6,678 0 5,170 0Laundry Services 982 500 1,035 500MO DNR Fees 559 1,000 1,000 1,000Other Services 45,640 47,000 47,490 47,000
661,689 884,810 872,634 913,810Interfund Transfers
Transfer to Computer Network 0 1,090 1,090 0Transfer to General Fund 1,090 63,335 63,335 0
1,090 64,425 64,425 0Other Charges
Judgement & Claims/Insurance 56,055 2,000 112,829 32,430
56,055 2,000 112,829 32,430Capital Outlay
Motor Vehicles 187,380 35,000 35,000 140,000Machinery & Equipment 323,168 50,000 25,000 80,000
510,548 85,000 60,000 220,000Capital Improvements
Iimprov Other Than Buildings 0 0 6,000 20,000
0 0 6,000 20,000
Total 1,423,007 1,237,885 1,293,231 1,392,890
11 - 24
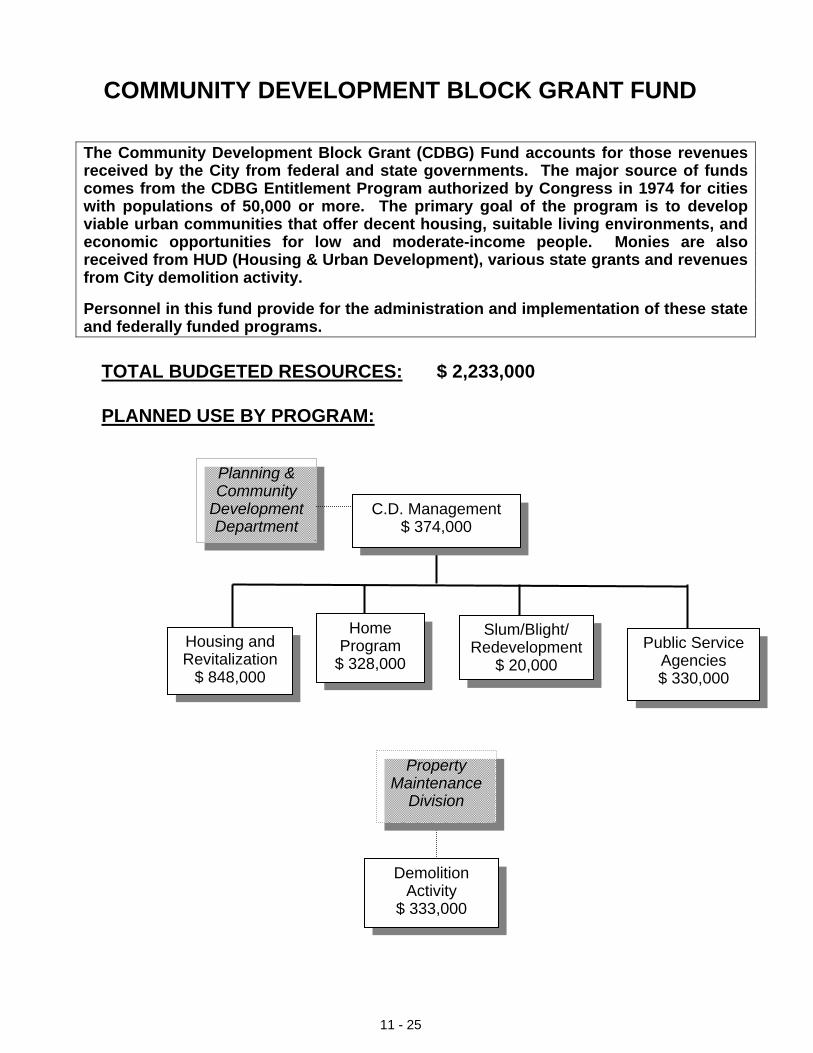
11 - 25
The Community Development Block Grant (CDBG) Fund accounts for those revenues received by the City from federal and state governments. The major source of funds comes from the CDBG Entitlement Program authorized by Congress in 1974 for cities with populations of 50,000 or more. The primary goal of the program is to develop viable urban communities that offer decent housing, suitable living environments, and economic opportunities for low and moderate-income people. Monies are also received from HUD (Housing & Urban Development), various state grants and revenues from City demolition activity. Personnel in this fund provide for the administration and implementation of these state and federally funded programs.
TOTAL BUDGETED RESOURCES: $ 2,233,000
PLANNED USE BY PROGRAM:
COMMUNITY DEVELOPMENT BLOCK GRANT FUND
C.D. Management $ 374,000
Housing and Revitalization
$ 848,000
Slum/Blight/ Redevelopment
$ 20,000
Home Program
$ 328,000 Public Service
Agencies $ 330,000
Demolition Activity
$ 333,000
Property Maintenance
Division
Planning & Community
Development Department

COMMUNITY DEVELOPMENTBLOCK GRANT FUND
SUMMARY2013-14 2014-15 2015-16
Adopted Estimated Actual Budget Actual Budget
SOURCESSpecial Assessments/Interest Earnings 63,637 16,000 44,000 16,000Intergovernmental/Other Grants 1,707,100 2,356,155 2,356,155 2,215,516Other Revenue 88,366 0 34,721 0Transfers (To)/From - Reprogrammable Funds 293,481 0 101,454 0
TOTAL SOURCES 2,152,584 2,372,155 2,536,330 2,231,516
USESSalaries & Wages 311,832 361,160 364,092 389,925Employee Benefits & Payroll Taxes 120,994 159,145 156,264 154,765Materials & Supplies 5,169 11,272 8,672 10,272Utilities & Other Outside Services 1,558,036 2,227,754 1,698,986 1,463,907Property Ins & Other 6,637 12,830 9,648 8,585Transfers Out 197,057 197,994 197,994 204,062Operating Capital Equip 0 0 0 0
TOTAL USES 2,199,725 2,970,155 2,435,656 2,231,516
Net Surplus (Deficit) to/from Reprogrammed Fnds (47,141) (598,000) 100,674 0
Interest & Other1%
CDBG Entitlement
Funds87%
HOME Grant12%
Fund Revenue Sources
Salaries & Wages
18%
Employee Benefits &
Payroll Taxes
7%Materials &
Supplies0%
Utilities & Other
Outside Services
66%
Transfers Out9%
Fund Uses
11 - 26

COMMUNITY DEVELOPMENT BLOCK GRANT FUNDREVENUES2013-14 2014-15 2015-16
Adopted Estimated Actual Budget Actual Budget
RentsFarn Land Lease 0 0 0 0
0 0 0 0
Other RevenuesLoss on Sale of Fixed Assets (16,224) 0 (1,608) 0Recovery/Reimbursements 71,926 0 20,119 0Other Revenue 32,664 0 16,210 0
88,366 0 34,721 0Special Assessments
Principal 62,332 15,000 36,000 15,000Interest on Special Assessments 1,305 1,000 8,000 1,000
63,637 16,000 44,000 16,000Intergovernmental
Home Program Grant 173,557 335,855 335,855 328,374Community Development Block Grant 1,428,041 1,893,300 1,893,300 1,887,142American Rec Reinvst Grant 51,542 127,000 127,000 0Federal HMIS Grant 53,960 0 0 0
1,707,100 2,356,155 2,356,155 2,215,516Interfund Transfers In
Transfer from General Fund 0 0 0 0Transfer from Rehab Loan Fund 190,548 0 29,003 0Transfer from HOME Revolv Fund 102,933 0 72,451 0
293,481 0 101,454 0
Transfer from/(to) Reprogrammable FundsRegrogrammable Funds 0 598,000 0 0
Total 2,152,584 2,970,155 2,536,330 2,231,516
Revolving Loan Fund & Line-of-Credit BalancesRevolving Loan Fund Balances: Line-of-Credit Balances:
Rehab, Rental Rehab, & Reprogrammed for FY2013/14 $330,937Historic Preservation Loans: $1,120,244 Reprogrammed for FY2012/13 280,331
Home Loans: 1,791,444 Reprogrammed for FY2011/12 105,047Reserved Fund Balance: $2,911,688 $716,315
EXPENDITURES2013-14 2014-15 2015-16
Adopted Estimated Actual Budget Actual Budget
Salaries & Wages Base Salaries/Wages 311,832 361,160 364,092 389,925
311,832 361,160 364,092 389,925
The revolving loan and line-of-credit balances are as of 2/28/15 and represent amounts available for, but not currently appropriated in, the city budget.
11 - 27
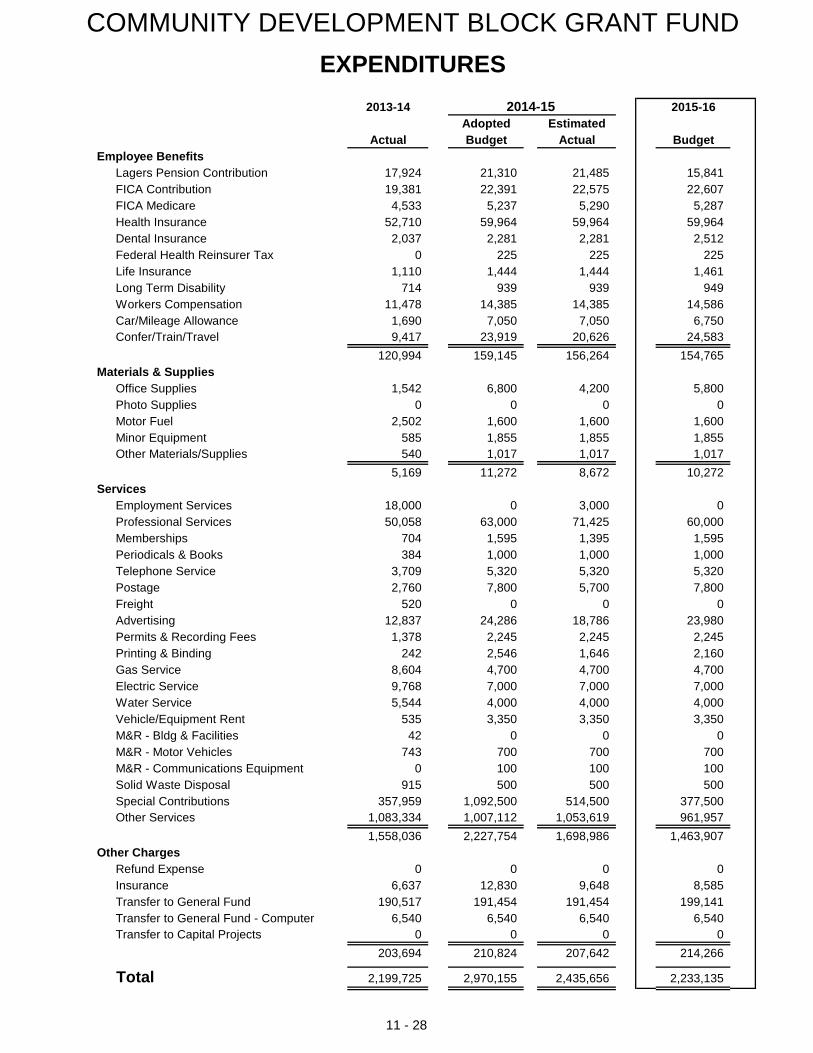
COMMUNITY DEVELOPMENT BLOCK GRANT FUND
EXPENDITURES2013-14 2014-15 2015-16
Adopted Estimated Actual Budget Actual Budget
Employee BenefitsLagers Pension Contribution 17,924 21,310 21,485 15,841FICA Contribution 19,381 22,391 22,575 22,607FICA Medicare 4,533 5,237 5,290 5,287Health Insurance 52,710 59,964 59,964 59,964Dental Insurance 2,037 2,281 2,281 2,512Federal Health Reinsurer Tax 0 225 225 225Life Insurance 1,110 1,444 1,444 1,461Long Term Disability 714 939 939 949Workers Compensation 11,478 14,385 14,385 14,586Car/Mileage Allowance 1,690 7,050 7,050 6,750Confer/Train/Travel 9,417 23,919 20,626 24,583
120,994 159,145 156,264 154,765Materials & Supplies
Office Supplies 1,542 6,800 4,200 5,800Photo Supplies 0 0 0 0Motor Fuel 2,502 1,600 1,600 1,600Minor Equipment 585 1,855 1,855 1,855Other Materials/Supplies 540 1,017 1,017 1,017
5,169 11,272 8,672 10,272Services
Employment Services 18,000 0 3,000 0Professional Services 50,058 63,000 71,425 60,000Memberships 704 1,595 1,395 1,595Periodicals & Books 384 1,000 1,000 1,000Telephone Service 3,709 5,320 5,320 5,320Postage 2,760 7,800 5,700 7,800Freight 520 0 0 0Advertising 12,837 24,286 18,786 23,980Permits & Recording Fees 1,378 2,245 2,245 2,245Printing & Binding 242 2,546 1,646 2,160Gas Service 8,604 4,700 4,700 4,700Electric Service 9,768 7,000 7,000 7,000Water Service 5,544 4,000 4,000 4,000Vehicle/Equipment Rent 535 3,350 3,350 3,350M&R - Bldg & Facilities 42 0 0 0M&R - Motor Vehicles 743 700 700 700M&R - Communications Equipment 0 100 100 100Solid Waste Disposal 915 500 500 500Special Contributions 357,959 1,092,500 514,500 377,500Other Services 1,083,334 1,007,112 1,053,619 961,957
1,558,036 2,227,754 1,698,986 1,463,907Other Charges
Refund Expense 0 0 0 0Insurance 6,637 12,830 9,648 8,585Transfer to General Fund 190,517 191,454 191,454 199,141Transfer to General Fund - Computer 6,540 6,540 6,540 6,540Transfer to Capital Projects 0 0 0 0
203,694 210,824 207,642 214,266
Total 2,199,725 2,970,155 2,435,656 2,233,135
11 - 28

11 - 29
The Gaming Initiatives Fund is a special revenue fund established July 1, 1995 to track revenues derived from the riverfront casino located on the City’s Missouri River Waterfront. Revenues are received from the State of Missouri based on state statutes. A lease agreement with casino owners provided approximately $400,000 a year and was ended by the casino owners in mid-FY2010. Revenues are shared equally with Buchanan County. Although the City reports annually to the State of Missouri on how the gambling revenues are spent, there are no legal restrictions on their use. City Council has adopted an informal policy of not using funds for ordinary operating expenditures. Actual expenditures are approved during each annual budget process. Riverfront and economic development activities have also become a major focus for this fund.
TOTAL BUDGETED RESOURCES: $ 1,044,000 PLANNED USE BY PROGRAM:
GAMING INITIATIVES FUND
Gaming Funded Initiatives
$ 1,044,000
Mayor & City Council
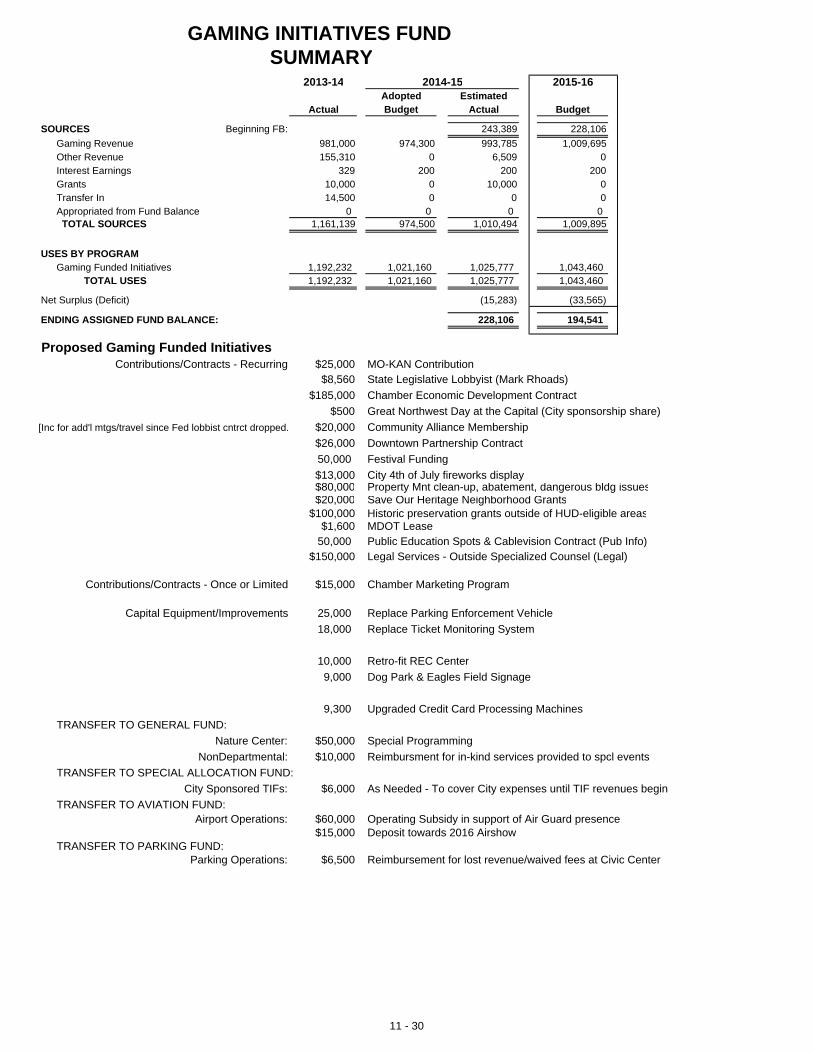
GAMING INITIATIVES FUND SUMMARY
2013-14 2014-15 2015-16Adopted Estimated
Actual Budget Actual Budget
SOURCES Beginning FB: 243,389 228,106
Gaming Revenue 981,000 974,300 993,785 1,009,695Other Revenue 155,310 0 6,509 0Interest Earnings 329 200 200 200Grants 10,000 0 10,000 0Transfer In 14,500 0 0 0Appropriated from Fund Balance 0 0 0 0TOTAL SOURCES 1,161,139 974,500 1,010,494 1,009,895
USES BY PROGRAMGaming Funded Initiatives 1,192,232 1,021,160 1,025,777 1,043,460
TOTAL USES 1,192,232 1,021,160 1,025,777 1,043,460
Net Surplus (Deficit) (15,283) (33,565)
ENDING ASSIGNED FUND BALANCE: 228,106 194,541
Proposed Gaming Funded Initiatives Contributions/Contracts - Recurring $25,000 MO-KAN Contribution
$8,560 State Legislative Lobbyist (Mark Rhoads)
$185,000 Chamber Economic Development Contract
$500 Great Northwest Day at the Capital (City sponsorship share)
[Inc for add'l mtgs/travel since Fed lobbist cntrct dropped. $20,000 Community Alliance Membership
$26,000 Downtown Partnership Contract
50,000 Festival Funding
$13,000 City 4th of July fireworks display$80,000 Property Mnt clean-up, abatement, dangerous bldg issues$20,000 Save Our Heritage Neighborhood Grants
$100,000 Historic preservation grants outside of HUD-eligible areas$1,600 MDOT Lease
50,000 Public Education Spots & Cablevision Contract (Pub Info)$150,000 Legal Services - Outside Specialized Counsel (Legal)
Contributions/Contracts - Once or Limited $15,000 Chamber Marketing Program
Capital Equipment/Improvements 25,000 Replace Parking Enforcement Vehicle
18,000 Replace Ticket Monitoring System
10,000 Retro-fit REC Center
9,000 Dog Park & Eagles Field Signage
9,300 Upgraded Credit Card Processing Machines
TRANSFER TO GENERAL FUND:
Nature Center: $50,000 Special Programming
NonDepartmental: $10,000 Reimbursment for in-kind services provided to spcl events
TRANSFER TO SPECIAL ALLOCATION FUND:
City Sponsored TIFs: $6,000 As Needed - To cover City expenses until TIF revenues begin
TRANSFER TO AVIATION FUND:Airport Operations: $60,000 Operating Subsidy in support of Air Guard presence
$15,000 Deposit towards 2016 AirshowTRANSFER TO PARKING FUND:
Parking Operations: $6,500 Reimbursement for lost revenue/waived fees at Civic Center
11 - 30
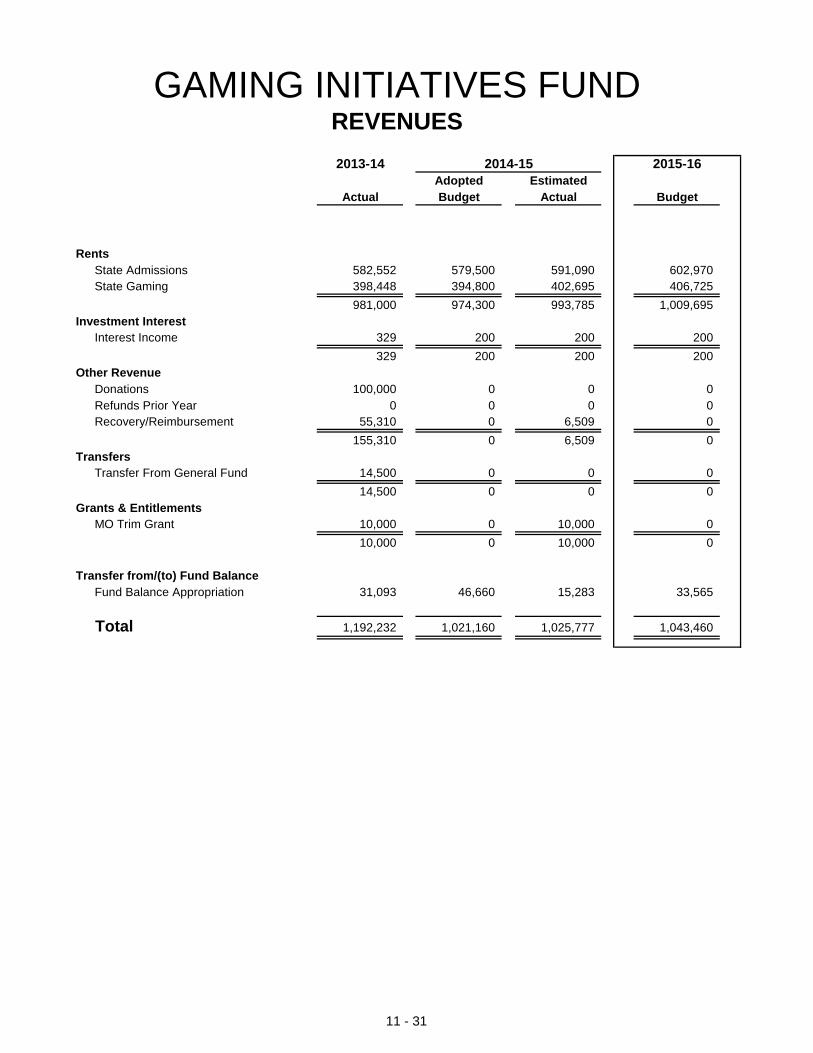
GAMING INITIATIVES FUNDREVENUES2013-14 2014-15 2015-16
Adopted Estimated Actual Budget Actual Budget
RentsState Admissions 582,552 579,500 591,090 602,970State Gaming 398,448 394,800 402,695 406,725
981,000 974,300 993,785 1,009,695Investment Interest
Interest Income 329 200 200 200
329 200 200 200Other Revenue
Donations 100,000 0 0 0Refunds Prior Year 0 0 0 0Recovery/Reimbursement 55,310 0 6,509 0
155,310 0 6,509 0Transfers
Transfer From General Fund 14,500 0 0 0
14,500 0 0 0Grants & Entitlements
MO Trim Grant 10,000 0 10,000 0
10,000 0 10,000 0
Transfer from/(to) Fund BalanceFund Balance Appropriation 31,093 46,660 15,283 33,565
Total 1,192,232 1,021,160 1,025,777 1,043,460
11 - 31
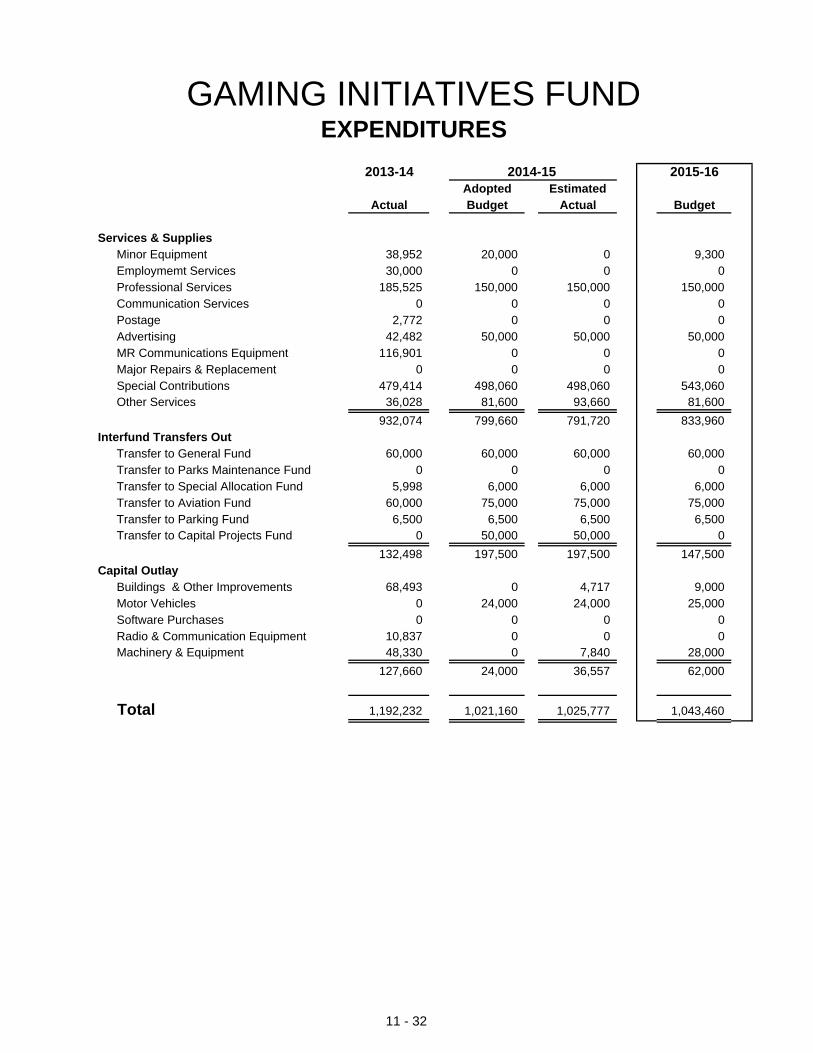
GAMING INITIATIVES FUNDEXPENDITURES
2013-14 2014-15 2015-16Adopted Estimated
Actual Budget Actual Budget
Services & SuppliesMinor Equipment 38,952 20,000 0 9,300Employmemt Services 30,000 0 0 0Professional Services 185,525 150,000 150,000 150,000Communication Services 0 0 0 0Postage 2,772 0 0 0Advertising 42,482 50,000 50,000 50,000MR Communications Equipment 116,901 0 0 0Major Repairs & Replacement 0 0 0 0Special Contributions 479,414 498,060 498,060 543,060Other Services 36,028 81,600 93,660 81,600
932,074 799,660 791,720 833,960Interfund Transfers Out
Transfer to General Fund 60,000 60,000 60,000 60,000Transfer to Parks Maintenance Fund 0 0 0 0Transfer to Special Allocation Fund 5,998 6,000 6,000 6,000Transfer to Aviation Fund 60,000 75,000 75,000 75,000Transfer to Parking Fund 6,500 6,500 6,500 6,500Transfer to Capital Projects Fund 0 50,000 50,000 0
132,498 197,500 197,500 147,500Capital Outlay
Buildings & Other Improvements 68,493 0 4,717 9,000Motor Vehicles 0 24,000 24,000 25,000Software Purchases 0 0 0 0Radio & Communication Equipment 10,837 0 0 0Machinery & Equipment 48,330 0 7,840 28,000
127,660 24,000 36,557 62,000
Total 1,192,232 1,021,160 1,025,777 1,043,460
11 - 32
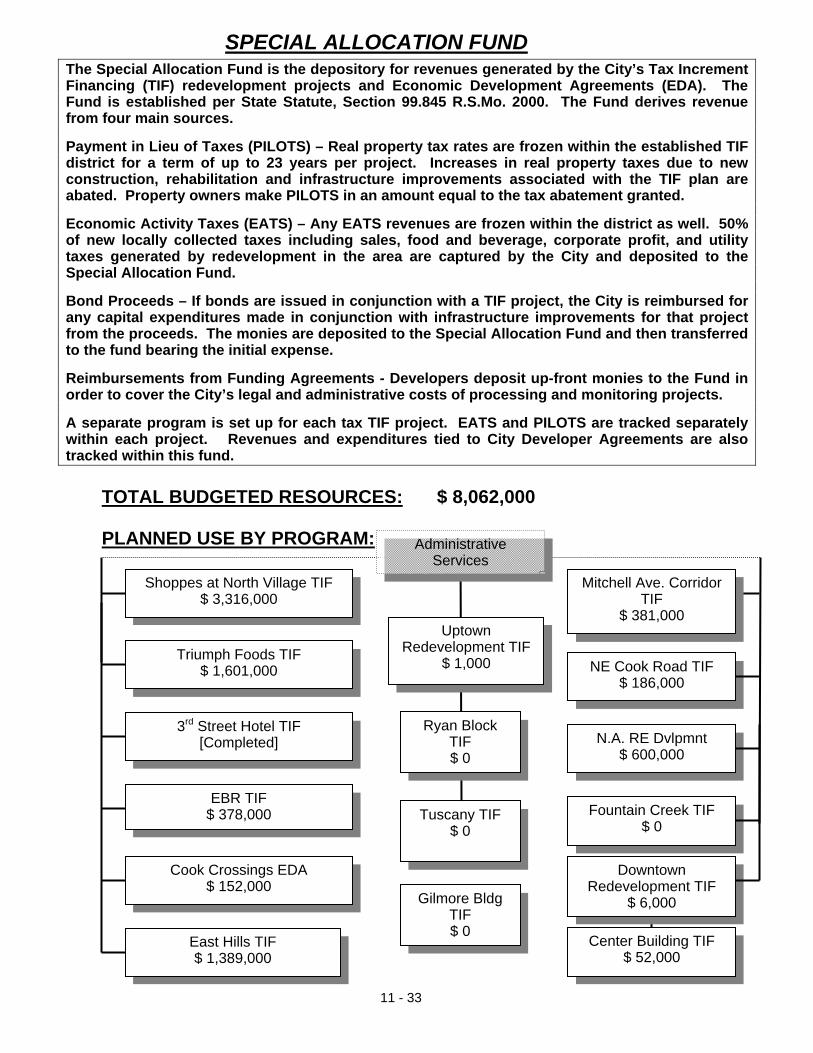
11 - 33
The Special Allocation Fund is the depository for revenues generated by the City’s Tax Increment Financing (TIF) redevelopment projects and Economic Development Agreements (EDA). The Fund is established per State Statute, Section 99.845 R.S.Mo. 2000. The Fund derives revenue from four main sources. Payment in Lieu of Taxes (PILOTS) – Real property tax rates are frozen within the established TIF district for a term of up to 23 years per project. Increases in real property taxes due to new construction, rehabilitation and infrastructure improvements associated with the TIF plan are abated. Property owners make PILOTS in an amount equal to the tax abatement granted. Economic Activity Taxes (EATS) – Any EATS revenues are frozen within the district as well. 50% of new locally collected taxes including sales, food and beverage, corporate profit, and utility taxes generated by redevelopment in the area are captured by the City and deposited to the Special Allocation Fund. Bond Proceeds – If bonds are issued in conjunction with a TIF project, the City is reimbursed for any capital expenditures made in conjunction with infrastructure improvements for that project from the proceeds. The monies are deposited to the Special Allocation Fund and then transferred to the fund bearing the initial expense. Reimbursements from Funding Agreements - Developers deposit up-front monies to the Fund in order to cover the City’s legal and administrative costs of processing and monitoring projects. A separate program is set up for each tax TIF project. EATS and PILOTS are tracked separately within each project. Revenues and expenditures tied to City Developer Agreements are also tracked within this fund.
TOTAL BUDGETED RESOURCES: $ 8,062,000
PLANNED USE BY PROGRAM:
SPECIAL ALLOCATION FUND
Administrative Services
Shoppes at North Village TIF $ 3,316,000
Cook Crossings EDA $ 152,000
Triumph Foods TIF $ 1,601,000
Uptown Redevelopment TIF
$ 1,000
N.A. RE Dvlpmnt $ 600,000
EBR TIF $ 378,000
3rd Street Hotel TIF [Completed]
Ryan Block TIF $ 0
Mitchell Ave. Corridor TIF
$ 381,000
NE Cook Road TIF $ 186,000
East Hills TIF $ 1,389,000
Fountain Creek TIF $ 0
Downtown Redevelopment TIF
$ 6,000
Center Building TIF $ 52,000
Tuscany TIF $ 0
Gilmore Bldg TIF $ 0
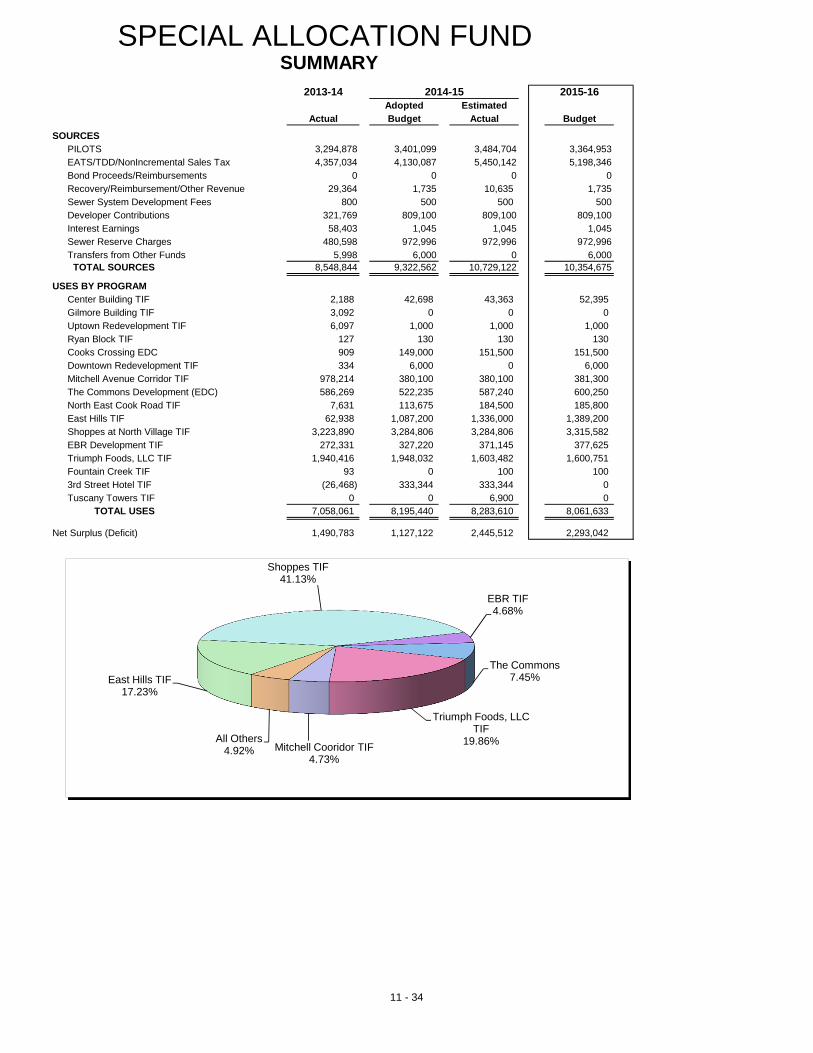
SPECIAL ALLOCATION FUND SUMMARY
2013-14 2014-15 2015-16Adopted Estimated
Actual Budget Actual Budget
SOURCESPILOTS 3,294,878 3,401,099 3,484,704 3,364,953EATS/TDD/NonIncremental Sales Tax 4,357,034 4,130,087 5,450,142 5,198,346Bond Proceeds/Reimbursements 0 0 0 0Recovery/Reimbursement/Other Revenue 29,364 1,735 10,635 1,735Sewer System Development Fees 800 500 500 500Developer Contributions 321,769 809,100 809,100 809,100Interest Earnings 58,403 1,045 1,045 1,045Sewer Reserve Charges 480,598 972,996 972,996 972,996Transfers from Other Funds 5,998 6,000 0 6,000
TOTAL SOURCES 8,548,844 9,322,562 10,729,122 10,354,675
USES BY PROGRAMCenter Building TIF 2,188 42,698 43,363 52,395Gilmore Building TIF 3,092 0 0 0Uptown Redevelopment TIF 6,097 1,000 1,000 1,000Ryan Block TIF 127 130 130 130Cooks Crossing EDC 909 149,000 151,500 151,500Downtown Redevelopment TIF 334 6,000 0 6,000Mitchell Avenue Corridor TIF 978,214 380,100 380,100 381,300The Commons Development (EDC) 586,269 522,235 587,240 600,250North East Cook Road TIF 7,631 113,675 184,500 185,800East Hills TIF 62,938 1,087,200 1,336,000 1,389,200Shoppes at North Village TIF 3,223,890 3,284,806 3,284,806 3,315,582EBR Development TIF 272,331 327,220 371,145 377,625Triumph Foods, LLC TIF 1,940,416 1,948,032 1,603,482 1,600,751Fountain Creek TIF 93 0 100 1003rd Street Hotel TIF (26,468) 333,344 333,344 0Tuscany Towers TIF 0 0 6,900 0
TOTAL USES 7,058,061 8,195,440 8,283,610 8,061,633
Net Surplus (Deficit) 1,490,783 1,127,122 2,445,512 2,293,042
All Others4.92%
East Hills TIF17.23%
Shoppes TIF41.13%
EBR TIF4.68%
The Commons7.45%
Triumph Foods, LLC TIF
19.86%Mitchell Cooridor TIF
4.73%
11 - 34
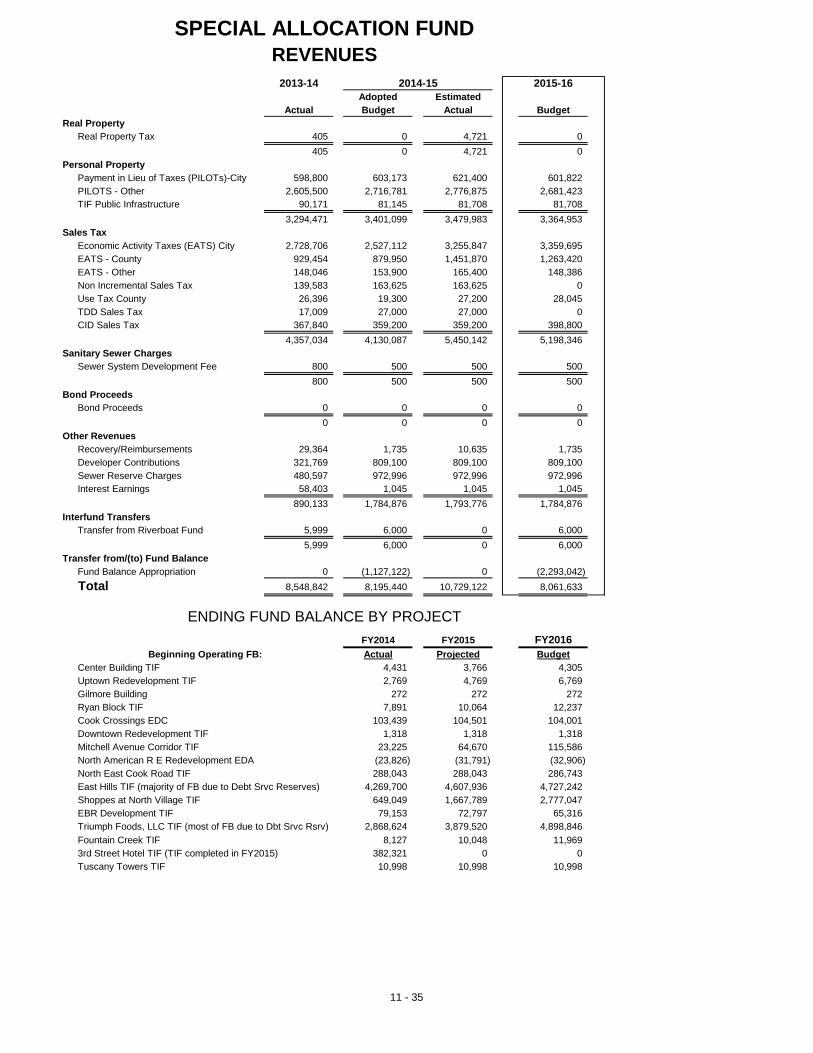
SPECIAL ALLOCATION FUNDREVENUES
2013-14 2014-15 2015-16Adopted Estimated
Actual Budget Actual BudgetReal Property
Real Property Tax 405 0 4,721 0
405 0 4,721 0Personal Property
Payment in Lieu of Taxes (PILOTs)-City 598,800 603,173 621,400 601,822PILOTS - Other 2,605,500 2,716,781 2,776,875 2,681,423TIF Public Infrastructure 90,171 81,145 81,708 81,708
3,294,471 3,401,099 3,479,983 3,364,953Sales Tax
Economic Activity Taxes (EATS) City 2,728,706 2,527,112 3,255,847 3,359,695EATS - County 929,454 879,950 1,451,870 1,263,420EATS - Other 148,046 153,900 165,400 148,386Non Incremental Sales Tax 139,583 163,625 163,625 0Use Tax County 26,396 19,300 27,200 28,045TDD Sales Tax 17,009 27,000 27,000 0CID Sales Tax 367,840 359,200 359,200 398,800
4,357,034 4,130,087 5,450,142 5,198,346Sanitary Sewer Charges
Sewer System Development Fee 800 500 500 500
800 500 500 500Bond Proceeds
Bond Proceeds 0 0 0 0
0 0 0 0Other Revenues
Recovery/Reimbursements 29,364 1,735 10,635 1,735Developer Contributions 321,769 809,100 809,100 809,100Sewer Reserve Charges 480,597 972,996 972,996 972,996Interest Earnings 58,403 1,045 1,045 1,045
890,133 1,784,876 1,793,776 1,784,876Interfund Transfers
Transfer from Riverboat Fund 5,999 6,000 0 6,000
5,999 6,000 0 6,000Transfer from/(to) Fund Balance
Fund Balance Appropriation 0 (1,127,122) 0 (2,293,042)
Total 8,548,842 8,195,440 10,729,122 8,061,633
ENDING FUND BALANCE BY PROJECT
FY2014 FY2015 FY2016Beginning Operating FB: Actual Projected Budget
Center Building TIF 4,431 3,766 4,305Uptown Redevelopment TIF 2,769 4,769 6,769Gilmore Building 272 272 272Ryan Block TIF 7,891 10,064 12,237Cook Crossings EDC 103,439 104,501 104,001Downtown Redevelopment TIF 1,318 1,318 1,318Mitchell Avenue Corridor TIF 23,225 64,670 115,586North American R E Redevelopment EDA (23,826) (31,791) (32,906)North East Cook Road TIF 288,043 288,043 286,743East Hills TIF (majority of FB due to Debt Srvc Reserves) 4,269,700 4,607,936 4,727,242Shoppes at North Village TIF 649,049 1,667,789 2,777,047EBR Development TIF 79,153 72,797 65,316Triumph Foods, LLC TIF (most of FB due to Dbt Srvc Rsrv) 2,868,624 3,879,520 4,898,846
Fountain Creek TIF 8,127 10,048 11,9693rd Street Hotel TIF (TIF completed in FY2015) 382,321 0 0Tuscany Towers TIF 10,998 10,998 10,998
11 - 35
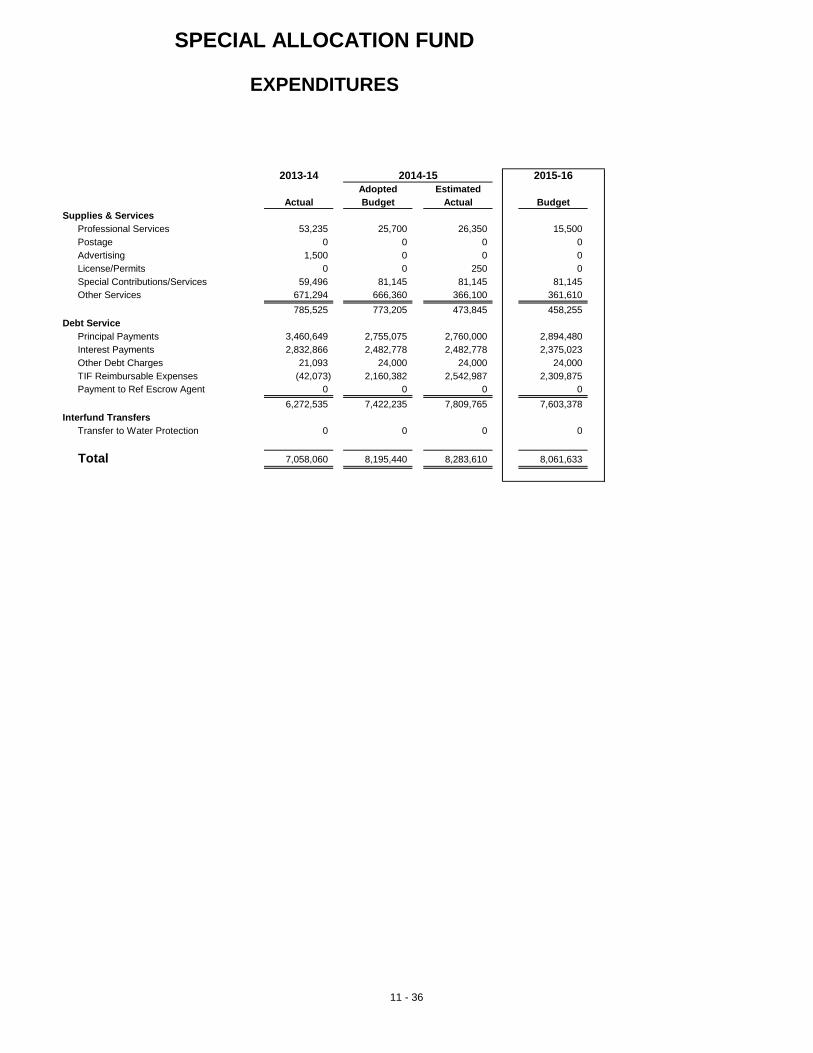
SPECIAL ALLOCATION FUND
EXPENDITURES
2013-14 2014-15 2015-16Adopted Estimated
Actual Budget Actual BudgetSupplies & Services
Professional Services 53,235 25,700 26,350 15,500Postage 0 0 0 0Advertising 1,500 0 0 0License/Permits 0 0 250 0Special Contributions/Services 59,496 81,145 81,145 81,145Other Services 671,294 666,360 366,100 361,610
785,525 773,205 473,845 458,255Debt Service
Principal Payments 3,460,649 2,755,075 2,760,000 2,894,480Interest Payments 2,832,866 2,482,778 2,482,778 2,375,023Other Debt Charges 21,093 24,000 24,000 24,000TIF Reimbursable Expenses (42,073) 2,160,382 2,542,987 2,309,875Payment to Ref Escrow Agent 0 0 0 0
6,272,535 7,422,235 7,809,765 7,603,378Interfund Transfers
Transfer to Water Protection 0 0 0 0
Total 7,058,060 8,195,440 8,283,610 8,061,633
11 - 36
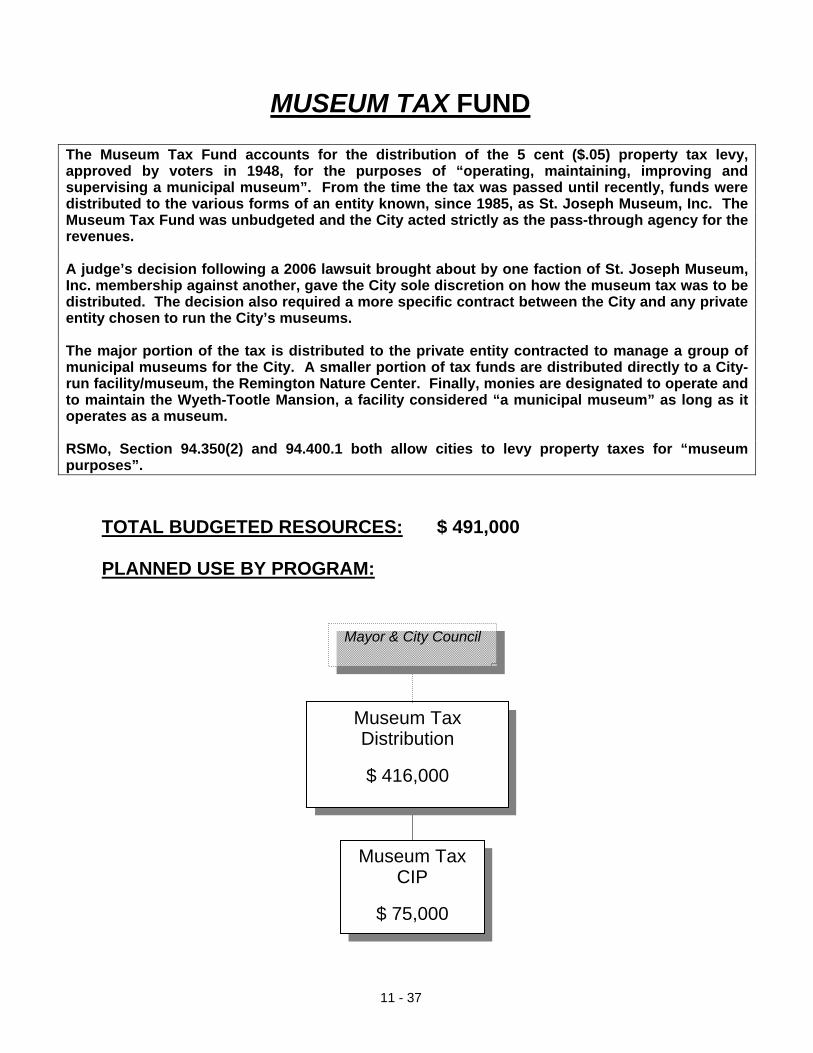
11 - 37
The Museum Tax Fund accounts for the distribution of the 5 cent ($.05) property tax levy, approved by voters in 1948, for the purposes of “operating, maintaining, improving and supervising a municipal museum”. From the time the tax was passed until recently, funds were distributed to the various forms of an entity known, since 1985, as St. Joseph Museum, Inc. The Museum Tax Fund was unbudgeted and the City acted strictly as the pass-through agency for the revenues. A judge’s decision following a 2006 lawsuit brought about by one faction of St. Joseph Museum, Inc. membership against another, gave the City sole discretion on how the museum tax was to be distributed. The decision also required a more specific contract between the City and any private entity chosen to run the City’s museums. The major portion of the tax is distributed to the private entity contracted to manage a group of municipal museums for the City. A smaller portion of tax funds are distributed directly to a City-run facility/museum, the Remington Nature Center. Finally, monies are designated to operate and to maintain the Wyeth-Tootle Mansion, a facility considered “a municipal museum” as long as it operates as a museum. RSMo, Section 94.350(2) and 94.400.1 both allow cities to levy property taxes for “museum purposes”.
TOTAL BUDGETED RESOURCES: $ 491,000 PLANNED USE BY PROGRAM:
MUSEUM TAX FUND
Museum Tax Distribution
$ 416,000
Mayor & City Council
Museum Tax CIP
$ 75,000
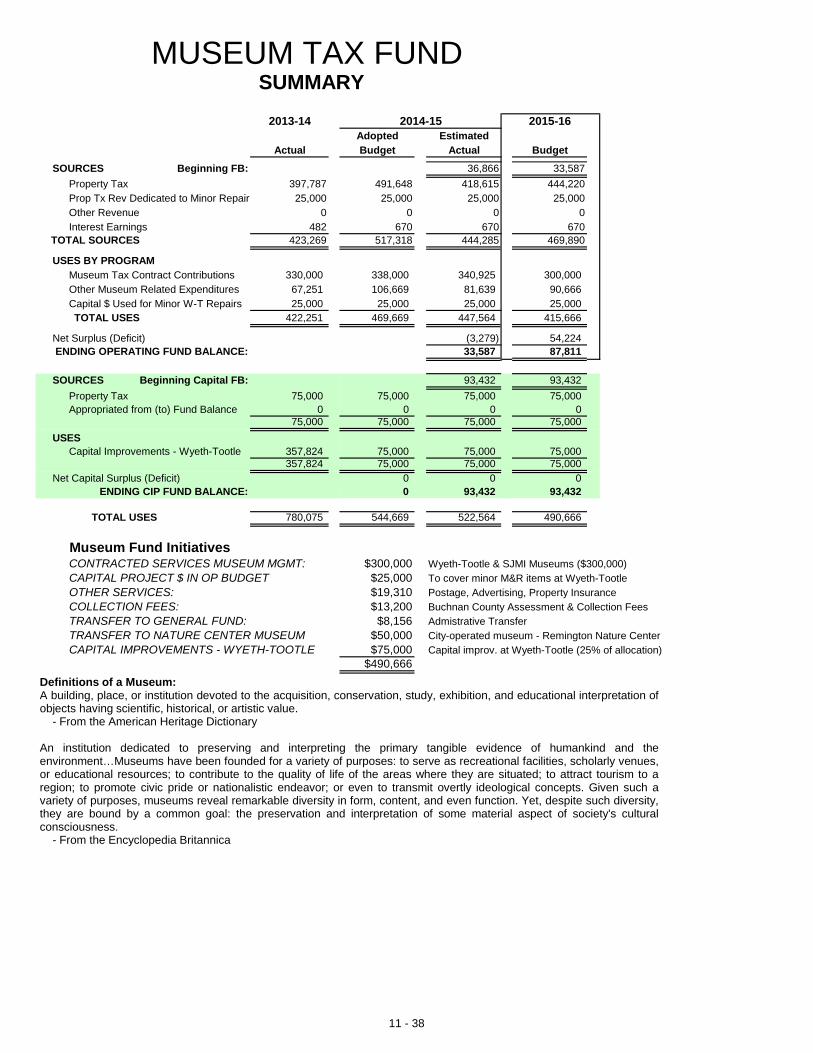
MUSEUM TAX FUND SUMMARY
2013-14 2014-15 2015-16Adopted Estimated
Actual Budget Actual Budget
SOURCES Beginning FB: 36,866 33,587
Property Tax 397,787 491,648 418,615 444,220Prop Tx Rev Dedicated to Minor Repair 25,000 25,000 25,000 25,000Other Revenue 0 0 0 0Interest Earnings 482 670 670 670
TOTAL SOURCES 423,269 517,318 444,285 469,890
USES BY PROGRAMMuseum Tax Contract Contributions 330,000 338,000 340,925 300,000Other Museum Related Expenditures 67,251 106,669 81,639 90,666Capital $ Used for Minor W-T Repairs 25,000 25,000 25,000 25,000TOTAL USES 422,251 469,669 447,564 415,666
Net Surplus (Deficit) (3,279) 54,224ENDING OPERATING FUND BALANCE: 33,587 87,811
SOURCES Beginning Capital FB: 93,432 93,432
Property Tax 75,000 75,000 75,000 75,000Appropriated from (to) Fund Balance 0 0 0 0
75,000 75,000 75,000 75,000
USESCapital Improvements - Wyeth-Tootle 357,824 75,000 75,000 75,000
357,824 75,000 75,000 75,000
Net Capital Surplus (Deficit) 0 0 0ENDING CIP FUND BALANCE: 0 93,432 93,432
TOTAL USES 780,075 544,669 522,564 490,666
Museum Fund InitiativesCONTRACTED SERVICES MUSEUM MGMT: $300,000 Wyeth-Tootle & SJMI Museums ($300,000)CAPITAL PROJECT $ IN OP BUDGET $25,000 To cover minor M&R items at Wyeth-TootleOTHER SERVICES: $19,310 Postage, Advertising, Property InsuranceCOLLECTION FEES: $13,200 Buchnan County Assessment & Collection FeesTRANSFER TO GENERAL FUND: $8,156 Admistrative TransferTRANSFER TO NATURE CENTER MUSEUM $50,000 City-operated museum - Remington Nature CenterCAPITAL IMPROVEMENTS - WYETH-TOOTLE $75,000 Capital improv. at Wyeth-Tootle (25% of allocation)
$490,666
Definitions of a Museum:A building, place, or institution devoted to the acquisition, conservation, study, exhibition, and educational interpretation ofobjects having scientific, historical, or artistic value.
- From the American Heritage Dictionary
An institution dedicated to preserving and interpreting the primary tangible evidence of humankind and theenvironment…Museums have been founded for a variety of purposes: to serve as recreational facilities, scholarly venues,or educational resources; to contribute to the quality of life of the areas where they are situated; to attract tourism to aregion; to promote civic pride or nationalistic endeavor; or even to transmit overtly ideological concepts. Given such avariety of purposes, museums reveal remarkable diversity in form, content, and even function. Yet, despite such diversity,they are bound by a common goal: the preservation and interpretation of some material aspect of society's culturalconsciousness.
- From the Encyclopedia Britannica
11 - 38
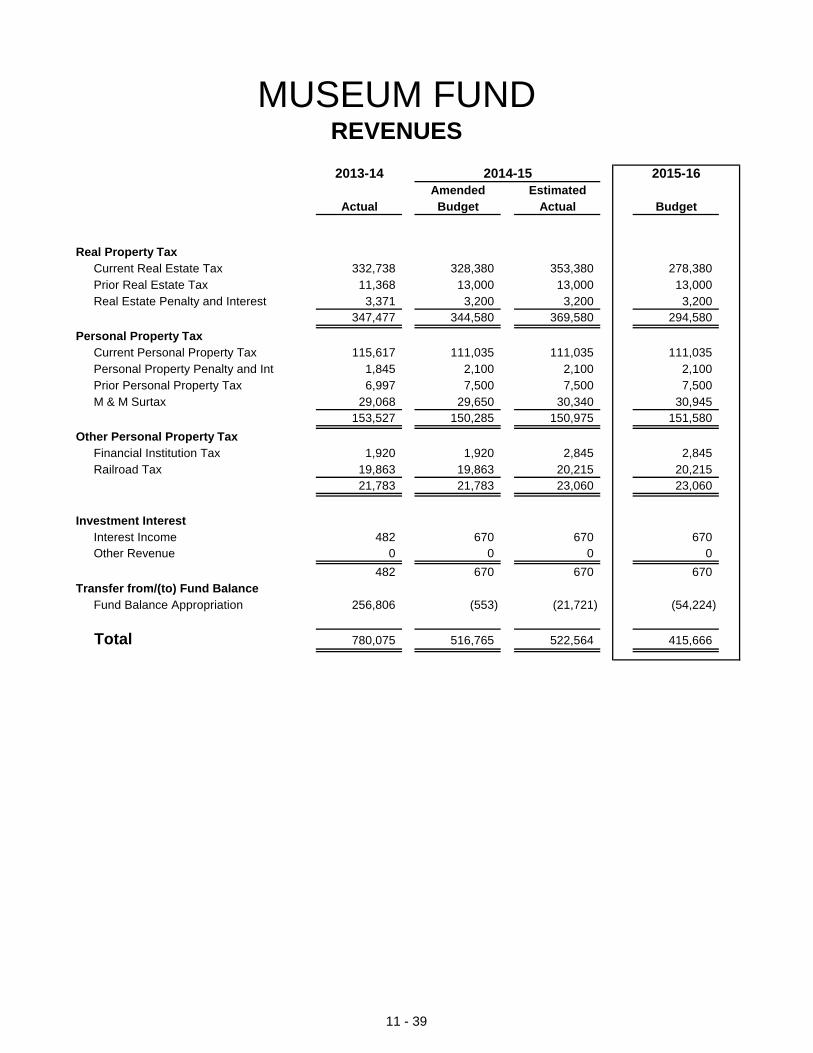
MUSEUM FUNDREVENUES2013-14 2014-15 2015-16
Amended Estimated Actual Budget Actual Budget
Real Property TaxCurrent Real Estate Tax 332,738 328,380 353,380 278,380Prior Real Estate Tax 11,368 13,000 13,000 13,000Real Estate Penalty and Interest 3,371 3,200 3,200 3,200
347,477 344,580 369,580 294,580
Personal Property TaxCurrent Personal Property Tax 115,617 111,035 111,035 111,035Personal Property Penalty and Int 1,845 2,100 2,100 2,100Prior Personal Property Tax 6,997 7,500 7,500 7,500M & M Surtax 29,068 29,650 30,340 30,945
153,527 150,285 150,975 151,580
Other Personal Property TaxFinancial Institution Tax 1,920 1,920 2,845 2,845Railroad Tax 19,863 19,863 20,215 20,215
21,783 21,783 23,060 23,060
Investment Interest
Interest Income 482 670 670 670Other Revenue 0 0 0 0
482 670 670 670Transfer from/(to) Fund Balance
Fund Balance Appropriation 256,806 (553) (21,721) (54,224)
Total 780,075 516,765 522,564 415,666
11 - 39
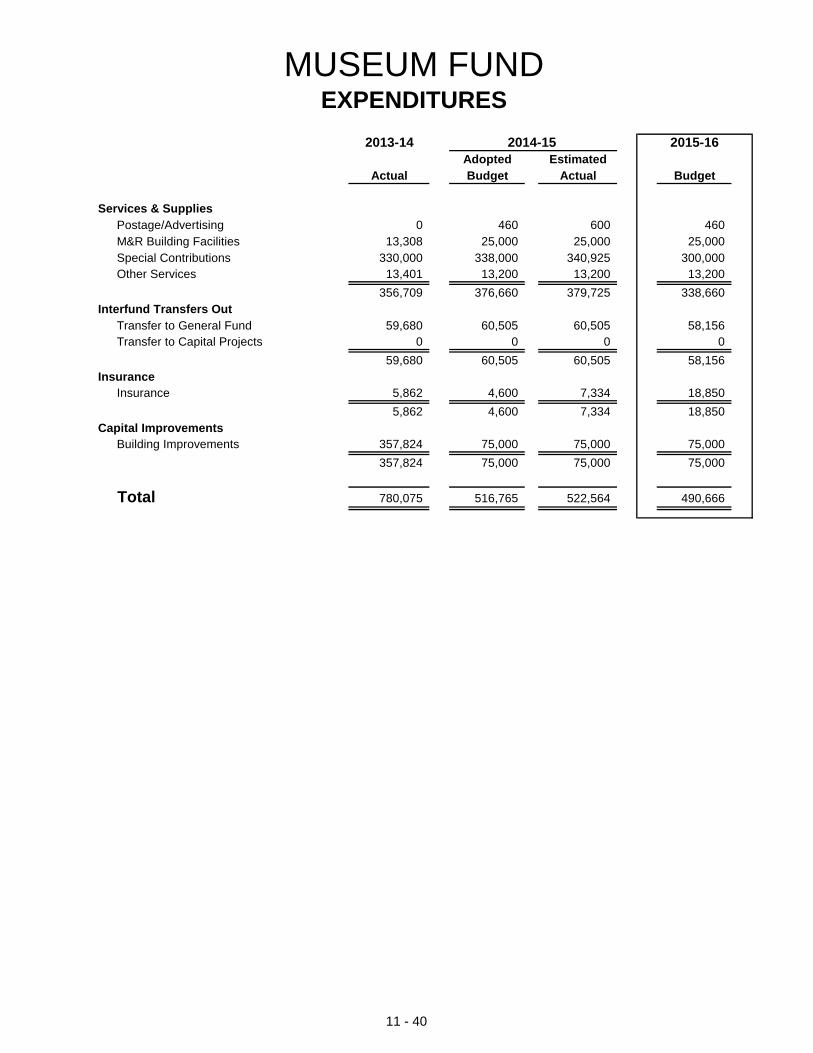
MUSEUM FUNDEXPENDITURES
2013-14 2014-15 2015-16Adopted Estimated
Actual Budget Actual Budget
Services & SuppliesPostage/Advertising 0 460 600 460M&R Building Facilities 13,308 25,000 25,000 25,000Special Contributions 330,000 338,000 340,925 300,000Other Services 13,401 13,200 13,200 13,200
356,709 376,660 379,725 338,660Interfund Transfers Out
Transfer to General Fund 59,680 60,505 60,505 58,156Transfer to Capital Projects 0 0 0 0
59,680 60,505 60,505 58,156Insurance
Insurance 5,862 4,600 7,334 18,850
5,862 4,600 7,334 18,850Capital Improvements
Building Improvements 357,824 75,000 75,000 75,000
357,824 75,000 75,000 75,000
Total 780,075 516,765 522,564 490,666
11 - 40
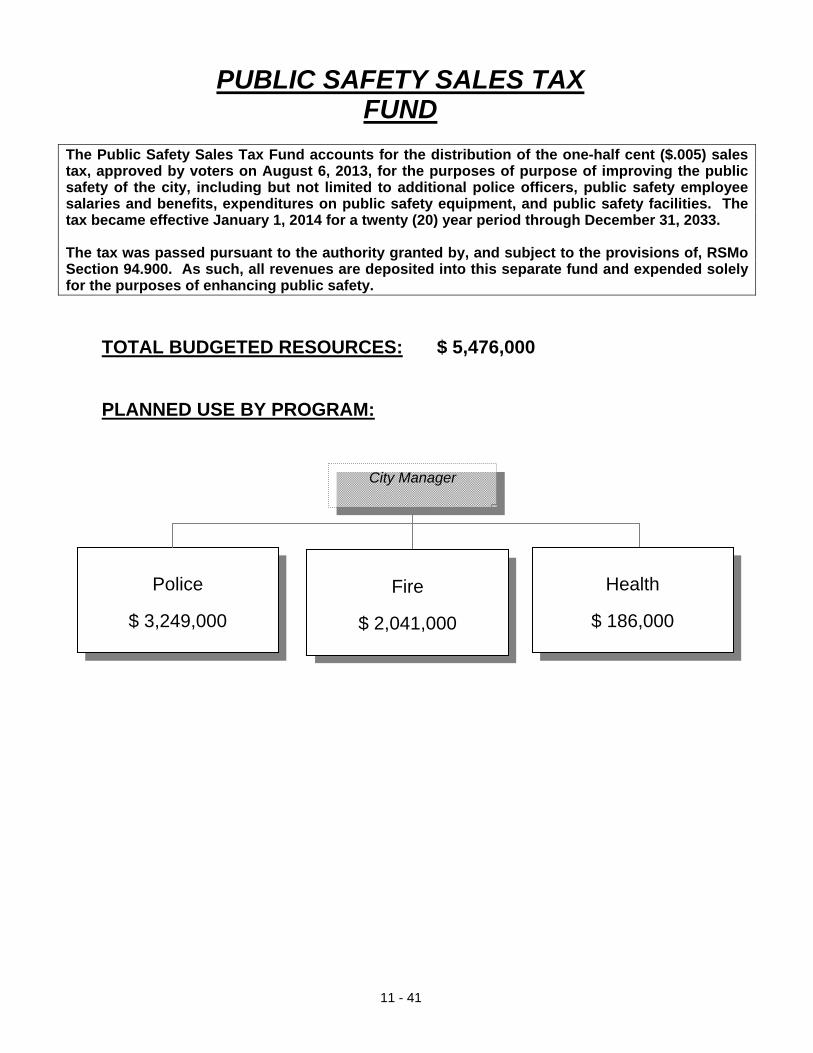
11 - 41
The Public Safety Sales Tax Fund accounts for the distribution of the one-half cent ($.005) sales tax, approved by voters on August 6, 2013, for the purposes of purpose of improving the public safety of the city, including but not limited to additional police officers, public safety employee salaries and benefits, expenditures on public safety equipment, and public safety facilities. The tax became effective January 1, 2014 for a twenty (20) year period through December 31, 2033. The tax was passed pursuant to the authority granted by, and subject to the provisions of, RSMo Section 94.900. As such, all revenues are deposited into this separate fund and expended solely for the purposes of enhancing public safety.
TOTAL BUDGETED RESOURCES: $ 5,476,000 PLANNED USE BY PROGRAM:
PUBLIC SAFETY SALES TAX FUND
Fire
$ 2,041,000
City Manager
Police
$ 3,249,000
Health
$ 186,000
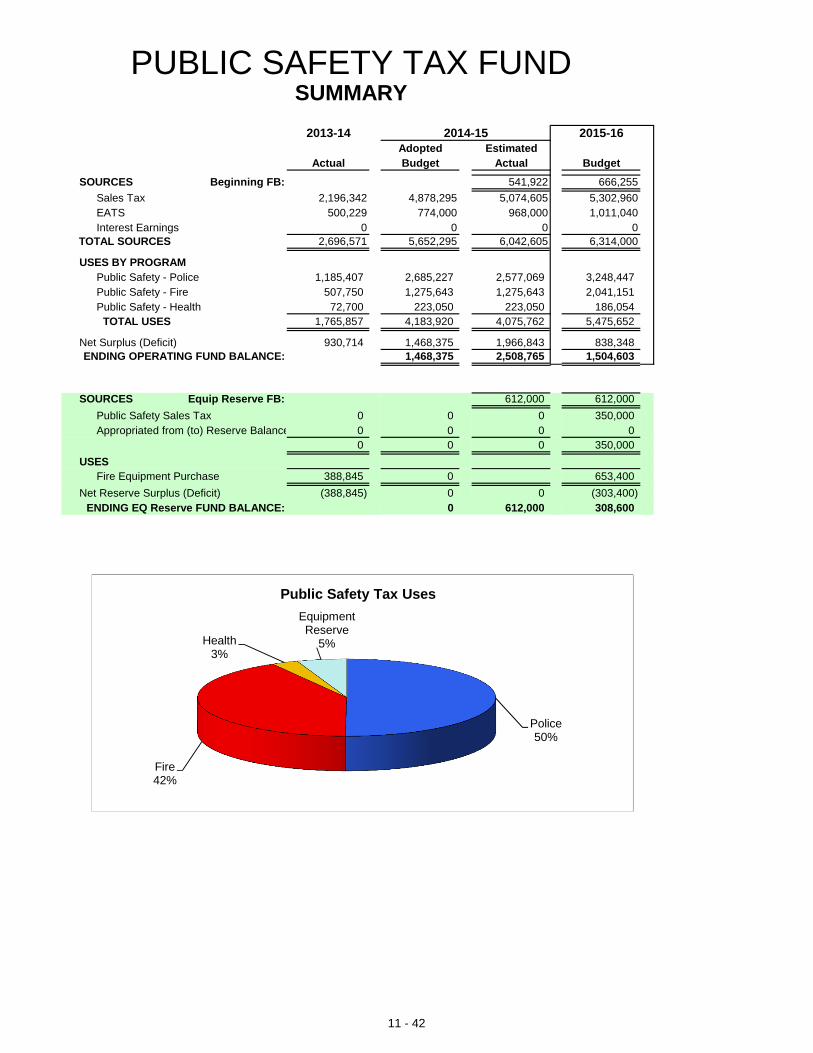
PUBLIC SAFETY TAX FUNDSUMMARY
2013-14 2014-15 2015-16Adopted Estimated
Actual Budget Actual BudgetSOURCES Beginning FB: 541,922 666,255
Sales Tax 2,196,342 4,878,295 5,074,605 5,302,960EATS 500,229 774,000 968,000 1,011,040Interest Earnings 0 0 0 0
TOTAL SOURCES 2,696,571 5,652,295 6,042,605 6,314,000
USES BY PROGRAMPublic Safety - Police 1,185,407 2,685,227 2,577,069 3,248,447Public Safety - Fire 507,750 1,275,643 1,275,643 2,041,151Public Safety - Health 72,700 223,050 223,050 186,054
TOTAL USES 1,765,857 4,183,920 4,075,762 5,475,652
Net Surplus (Deficit) 930,714 1,468,375 1,966,843 838,348ENDING OPERATING FUND BALANCE: 1,468,375 2,508,765 1,504,603
SOURCES Equip Reserve FB: 612,000 612,000
Public Safety Sales Tax 0 0 0 350,000Appropriated from (to) Reserve Balance 0 0 0 0
0 0 0 350,000
USESFire Equipment Purchase 388,845 0 653,400
Net Reserve Surplus (Deficit) (388,845) 0 0 (303,400)ENDING EQ Reserve FUND BALANCE: 0 612,000 308,600
Police50%
Fire42%
Health3%
Equipment Reserve
5%
Public Safety Tax Uses
11 - 42
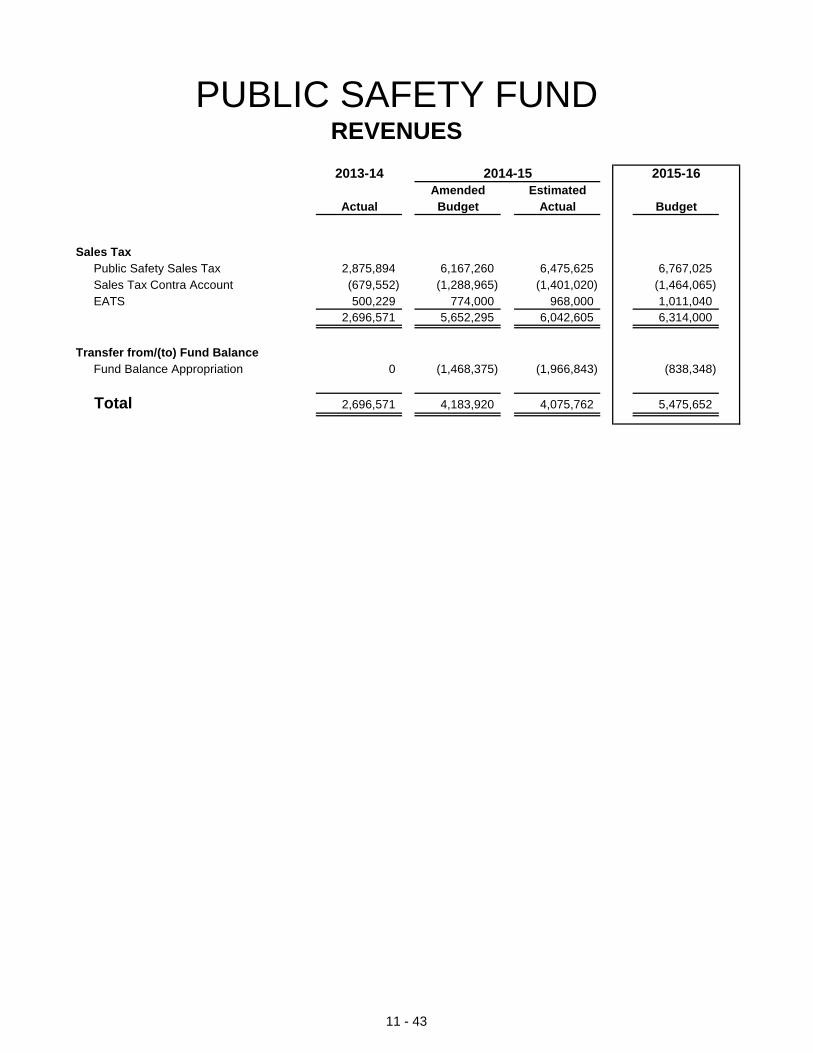
PUBLIC SAFETY FUNDREVENUES2013-14 2014-15 2015-16
Amended Estimated Actual Budget Actual Budget
Sales TaxPublic Safety Sales Tax 2,875,894 6,167,260 6,475,625 6,767,025Sales Tax Contra Account (679,552) (1,288,965) (1,401,020) (1,464,065)EATS 500,229 774,000 968,000 1,011,040
2,696,571 5,652,295 6,042,605 6,314,000
Transfer from/(to) Fund Balance
Fund Balance Appropriation 0 (1,468,375) (1,966,843) (838,348)
Total 2,696,571 4,183,920 4,075,762 5,475,652
11 - 43
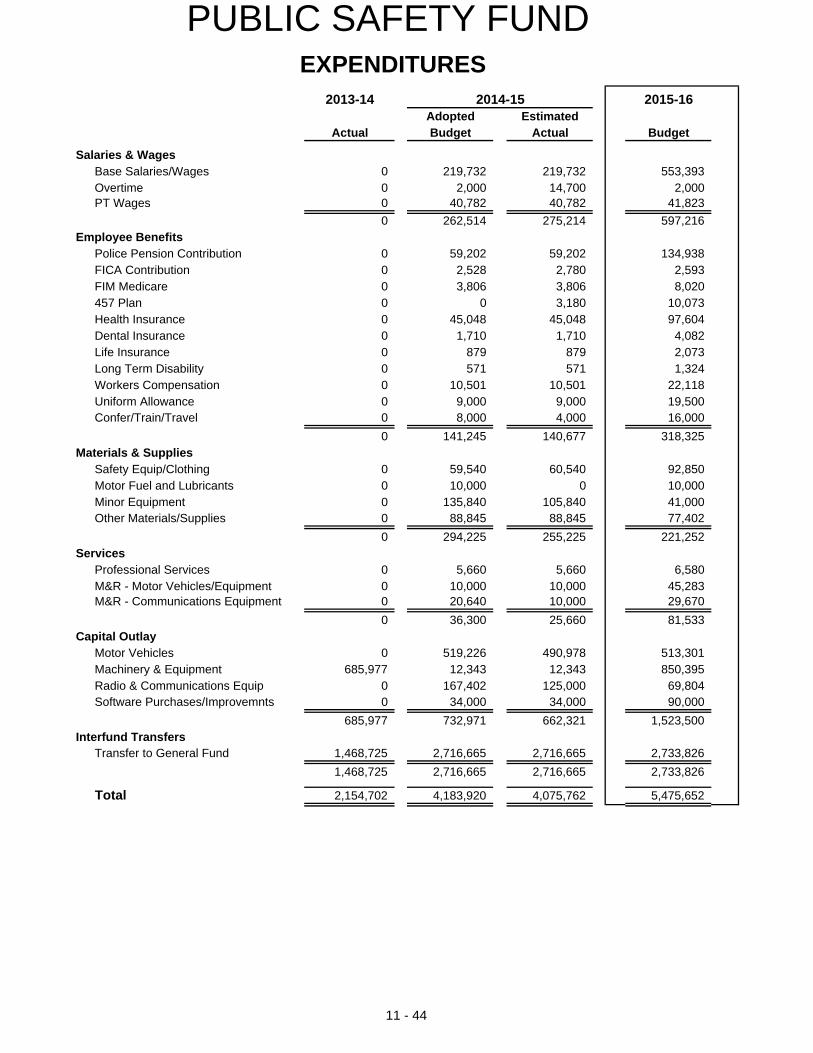
PUBLIC SAFETY FUND EXPENDITURES
2013-14 2014-15 2015-16Adopted Estimated
Actual Budget Actual Budget
Salaries & Wages Base Salaries/Wages 0 219,732 219,732 553,393Overtime 0 2,000 14,700 2,000PT Wages 0 40,782 40,782 41,823
0 262,514 275,214 597,216Employee Benefits
Police Pension Contribution 0 59,202 59,202 134,938FICA Contribution 0 2,528 2,780 2,593FIM Medicare 0 3,806 3,806 8,020457 Plan 0 0 3,180 10,073Health Insurance 0 45,048 45,048 97,604Dental Insurance 0 1,710 1,710 4,082Life Insurance 0 879 879 2,073Long Term Disability 0 571 571 1,324Workers Compensation 0 10,501 10,501 22,118Uniform Allowance 0 9,000 9,000 19,500Confer/Train/Travel 0 8,000 4,000 16,000
0 141,245 140,677 318,325Materials & Supplies
Safety Equip/Clothing 0 59,540 60,540 92,850Motor Fuel and Lubricants 0 10,000 0 10,000Minor Equipment 0 135,840 105,840 41,000Other Materials/Supplies 0 88,845 88,845 77,402
0 294,225 255,225 221,252Services
Professional Services 0 5,660 5,660 6,580M&R - Motor Vehicles/Equipment 0 10,000 10,000 45,283M&R - Communications Equipment 0 20,640 10,000 29,670
0 36,300 25,660 81,533Capital Outlay
Motor Vehicles 0 519,226 490,978 513,301Machinery & Equipment 685,977 12,343 12,343 850,395Radio & Communications Equip 0 167,402 125,000 69,804Software Purchases/Improvemnts 0 34,000 34,000 90,000
685,977 732,971 662,321 1,523,500Interfund Transfers
Transfer to General Fund 1,468,725 2,716,665 2,716,665 2,733,826
1,468,725 2,716,665 2,716,665 2,733,826
Total 2,154,702 4,183,920 4,075,762 5,475,652
11 - 44
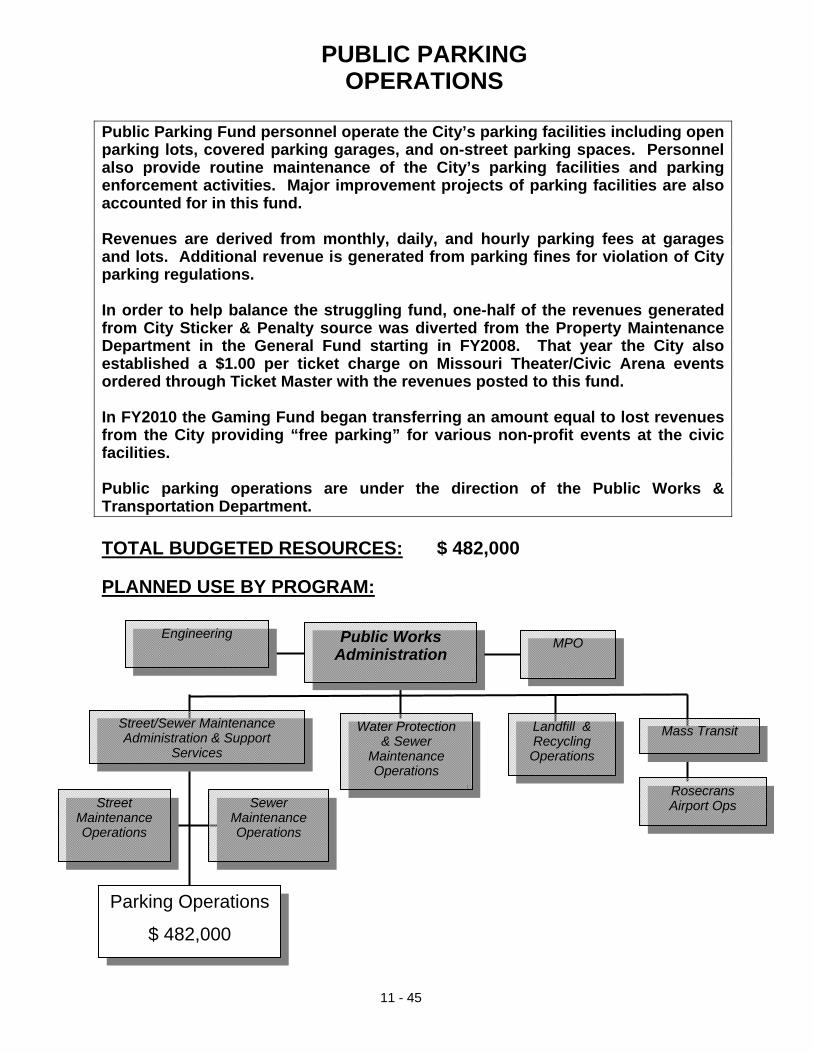
11 - 45
Public Parking Fund personnel operate the City’s parking facilities including open parking lots, covered parking garages, and on-street parking spaces. Personnel also provide routine maintenance of the City’s parking facilities and parking enforcement activities. Major improvement projects of parking facilities are also accounted for in this fund. Revenues are derived from monthly, daily, and hourly parking fees at garages and lots. Additional revenue is generated from parking fines for violation of City parking regulations. In order to help balance the struggling fund, one-half of the revenues generated from City Sticker & Penalty source was diverted from the Property Maintenance Department in the General Fund starting in FY2008. That year the City also established a $1.00 per ticket charge on Missouri Theater/Civic Arena events ordered through Ticket Master with the revenues posted to this fund. In FY2010 the Gaming Fund began transferring an amount equal to lost revenues from the City providing “free parking” for various non-profit events at the civic facilities. Public parking operations are under the direction of the Public Works & Transportation Department.
TOTAL BUDGETED RESOURCES: $ 482,000 PLANNED USE BY PROGRAM:
PUBLIC PARKINGOPERATIONS
Public WorksAdministration
Street Maintenance Operations
Street/Sewer Maintenance Administration & Support
Services
Mass Transit
MPO
Engineering
Sewer Maintenance Operations
Rosecrans Airport Ops
Water Protection & Sewer
Maintenance Operations
Landfill & Recycling Operations
Parking Operations
$ 482,000
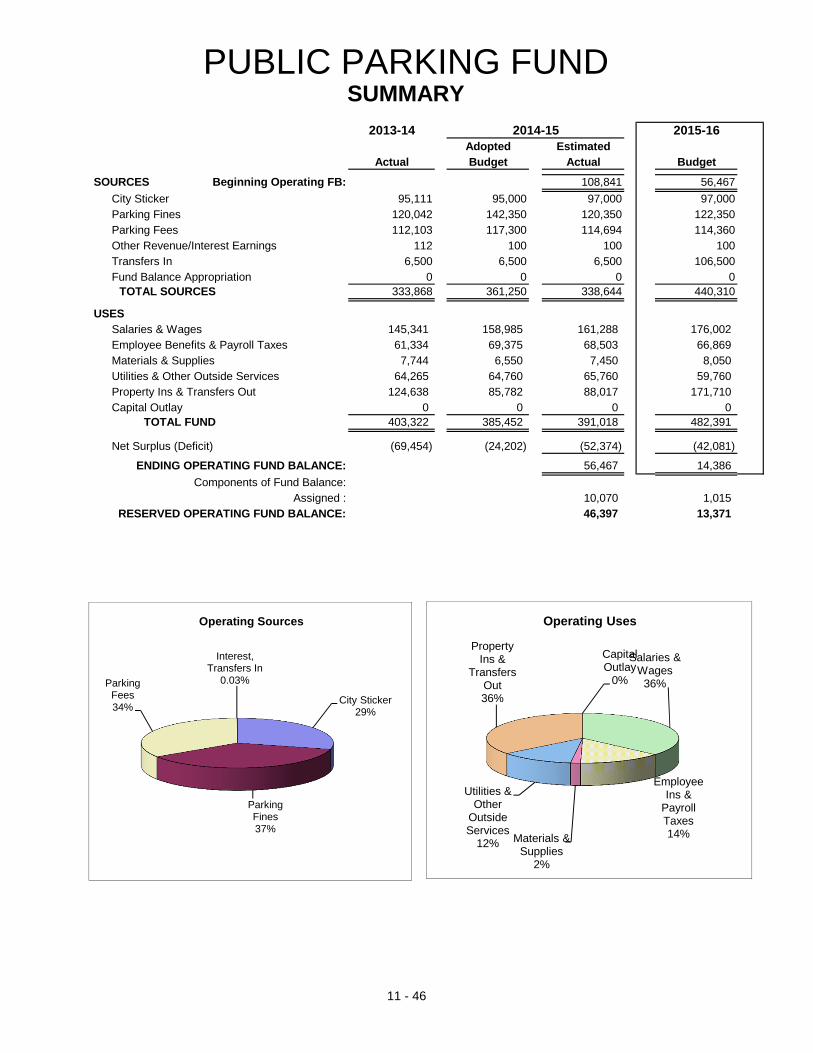
PUBLIC PARKING FUNDSUMMARY
2013-14 2014-15 2015-16Adopted Estimated
Actual Budget Actual Budget
SOURCES Beginning Operating FB: 108,841 56,467
City Sticker 95,111 95,000 97,000 97,000Parking Fines 120,042 142,350 120,350 122,350Parking Fees 112,103 117,300 114,694 114,360Other Revenue/Interest Earnings 112 100 100 100Transfers In 6,500 6,500 6,500 106,500Fund Balance Appropriation 0 0 0 0
TOTAL SOURCES 333,868 361,250 338,644 440,310
USESSalaries & Wages 145,341 158,985 161,288 176,002Employee Benefits & Payroll Taxes 61,334 69,375 68,503 66,869Materials & Supplies 7,744 6,550 7,450 8,050Utilities & Other Outside Services 64,265 64,760 65,760 59,760Property Ins & Transfers Out 124,638 85,782 88,017 171,710Capital Outlay 0 0 0 0
TOTAL FUND 403,322 385,452 391,018 482,391
Net Surplus (Deficit) (69,454) (24,202) (52,374) (42,081)
ENDING OPERATING FUND BALANCE: 56,467 14,386
Components of Fund Balance:Assigned : 10,070 1,015
RESERVED OPERATING FUND BALANCE: 46,397 13,371
Salaries & Wages
36%
Employee Ins &
Payroll Taxes14%Materials &
Supplies2%
Utilities & Other
Outside Services
12%
Property Ins &
Transfers Out36%
Capital Outlay
0%
Operating Uses
City Sticker29%
Parking Fines37%
Parking Fees34%
Interest, Transfers In
0.03%
Operating Sources
11 - 46
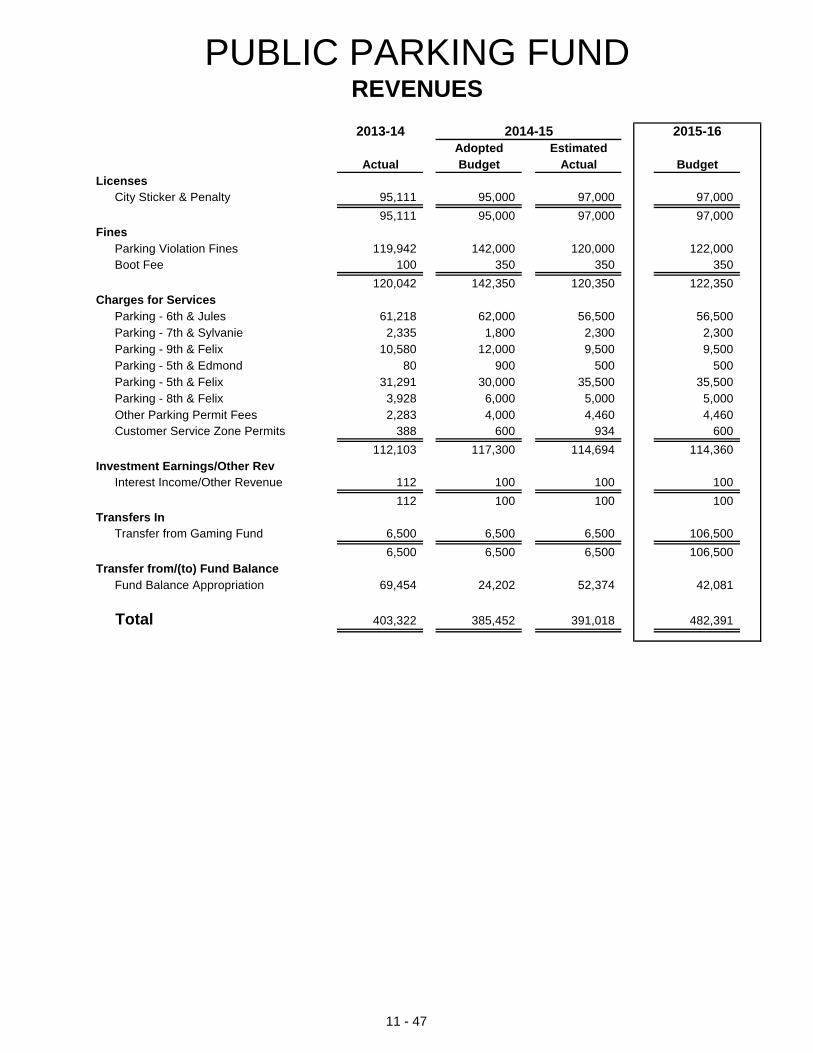
PUBLIC PARKING FUNDREVENUES2013-14 2014-15 2015-16
Adopted Estimated Actual Budget Actual Budget
LicensesCity Sticker & Penalty 95,111 95,000 97,000 97,000
95,111 95,000 97,000 97,000Fines
Parking Violation Fines 119,942 142,000 120,000 122,000Boot Fee 100 350 350 350
120,042 142,350 120,350 122,350Charges for Services
Parking - 6th & Jules 61,218 62,000 56,500 56,500Parking - 7th & Sylvanie 2,335 1,800 2,300 2,300Parking - 9th & Felix 10,580 12,000 9,500 9,500Parking - 5th & Edmond 80 900 500 500Parking - 5th & Felix 31,291 30,000 35,500 35,500Parking - 8th & Felix 3,928 6,000 5,000 5,000Other Parking Permit Fees 2,283 4,000 4,460 4,460Customer Service Zone Permits 388 600 934 600
112,103 117,300 114,694 114,360Investment Earnings/Other Rev
Interest Income/Other Revenue 112 100 100 100
112 100 100 100Transfers In
Transfer from Gaming Fund 6,500 6,500 6,500 106,500
6,500 6,500 6,500 106,500Transfer from/(to) Fund Balance
Fund Balance Appropriation 69,454 24,202 52,374 42,081
Total 403,322 385,452 391,018 482,391
11 - 47
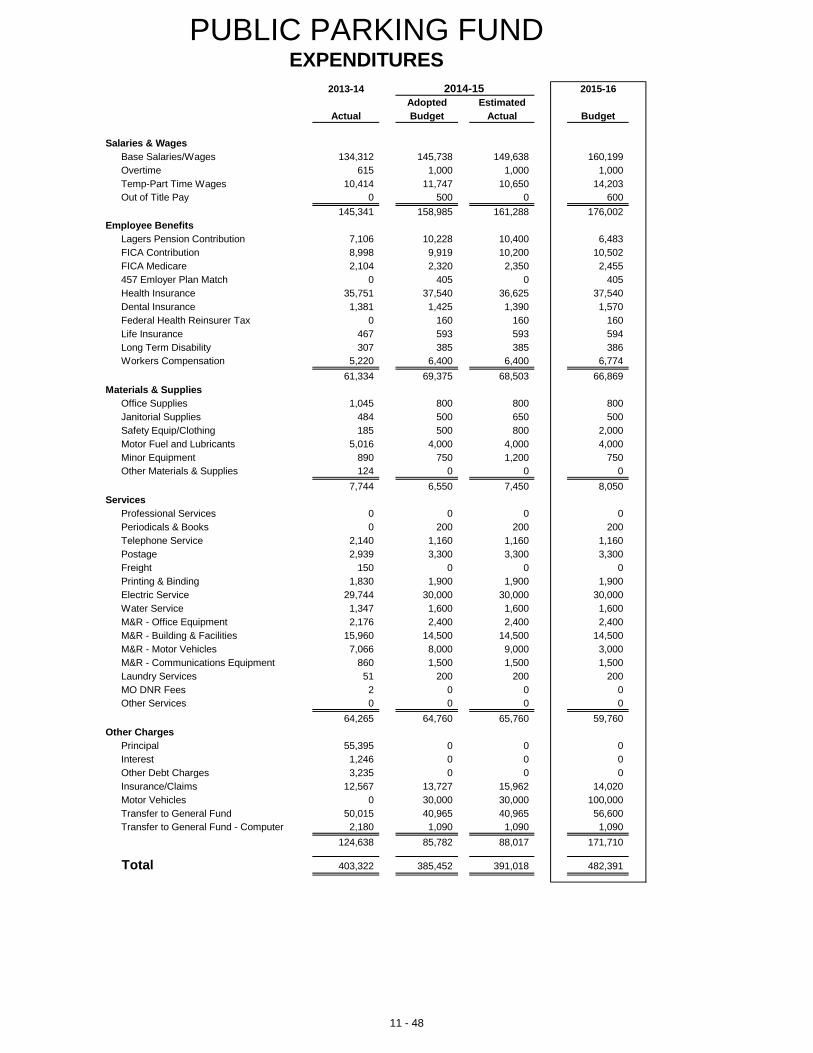
PUBLIC PARKING FUNDEXPENDITURES
2013-14 2014-15 2015-16Adopted Estimated
Actual Budget Actual Budget
Salaries & WagesBase Salaries/Wages 134,312 145,738 149,638 160,199Overtime 615 1,000 1,000 1,000Temp-Part Time Wages 10,414 11,747 10,650 14,203Out of Title Pay 0 500 0 600
145,341 158,985 161,288 176,002Employee Benefits
Lagers Pension Contribution 7,106 10,228 10,400 6,483FICA Contribution 8,998 9,919 10,200 10,502FICA Medicare 2,104 2,320 2,350 2,455457 Emloyer Plan Match 0 405 0 405Health Insurance 35,751 37,540 36,625 37,540Dental Insurance 1,381 1,425 1,390 1,570Federal Health Reinsurer Tax 0 160 160 160Life Insurance 467 593 593 594Long Term Disability 307 385 385 386Workers Compensation 5,220 6,400 6,400 6,774
61,334 69,375 68,503 66,869Materials & Supplies
Office Supplies 1,045 800 800 800Janitorial Supplies 484 500 650 500Safety Equip/Clothing 185 500 800 2,000Motor Fuel and Lubricants 5,016 4,000 4,000 4,000Minor Equipment 890 750 1,200 750Other Materials & Supplies 124 0 0 0
7,744 6,550 7,450 8,050Services
Professional Services 0 0 0 0Periodicals & Books 0 200 200 200Telephone Service 2,140 1,160 1,160 1,160Postage 2,939 3,300 3,300 3,300Freight 150 0 0 0Printing & Binding 1,830 1,900 1,900 1,900Electric Service 29,744 30,000 30,000 30,000Water Service 1,347 1,600 1,600 1,600M&R - Office Equipment 2,176 2,400 2,400 2,400M&R - Building & Facilities 15,960 14,500 14,500 14,500M&R - Motor Vehicles 7,066 8,000 9,000 3,000M&R - Communications Equipment 860 1,500 1,500 1,500Laundry Services 51 200 200 200MO DNR Fees 2 0 0 0Other Services 0 0 0 0
64,265 64,760 65,760 59,760Other Charges
Principal 55,395 0 0 0Interest 1,246 0 0 0Other Debt Charges 3,235 0 0 0Insurance/Claims 12,567 13,727 15,962 14,020Motor Vehicles 0 30,000 30,000 100,000Transfer to General Fund 50,015 40,965 40,965 56,600Transfer to General Fund - Computer 2,180 1,090 1,090 1,090
124,638 85,782 88,017 171,710
Total 403,322 385,452 391,018 482,391
11 - 48

11- 49
The Water Protection Fund accounts for the revenues and expenditures associated with the operation, maintenance, and expansion of the City’s sewage treatment facilities and the citywide collections network of sewer lines and pump stations under the direction of the Public Works Department. And the billing of sewer services under the direction of the Administrative Services Department. Fund revenues are derived through sewer service charges. Major capital improvements to facilities and infrastructure are financed by a series of Sewer Revenue Bonds, Sate Revolving Loan Fund (SRF) Revenue Bonds, Missouri Development Finance Board (MDFB) loans/bonds, and Industrial Development Authority (IDA) loan/bond. These revenues and related construction costs and debt service are accounted for and reported in the Sewer CIP Program.
TOTAL BUDGETED RESOURCES: $ 30,465,000 PLANNED USE BY PROGRAM:
WATER PROTECTION
Public WorksAdministration
Street Maintenance Operations
Street/Sewer Maintenance Administration & Support
Services
Mass Transit
MPO
Engineering
Public Parking Operations
Rosecrans Airport Ops
Water Protection
Plant Administration
$ 12,177,000
Landfill & Recycling Operations
Sewer Maintenance
$ 4,593,000
Laboratory
$764,000
Water Protection
Plant
$7,478,000
Sewer Improvement Projects
$ 4,763,000
Administrative Services
Utility Billing
$690,000
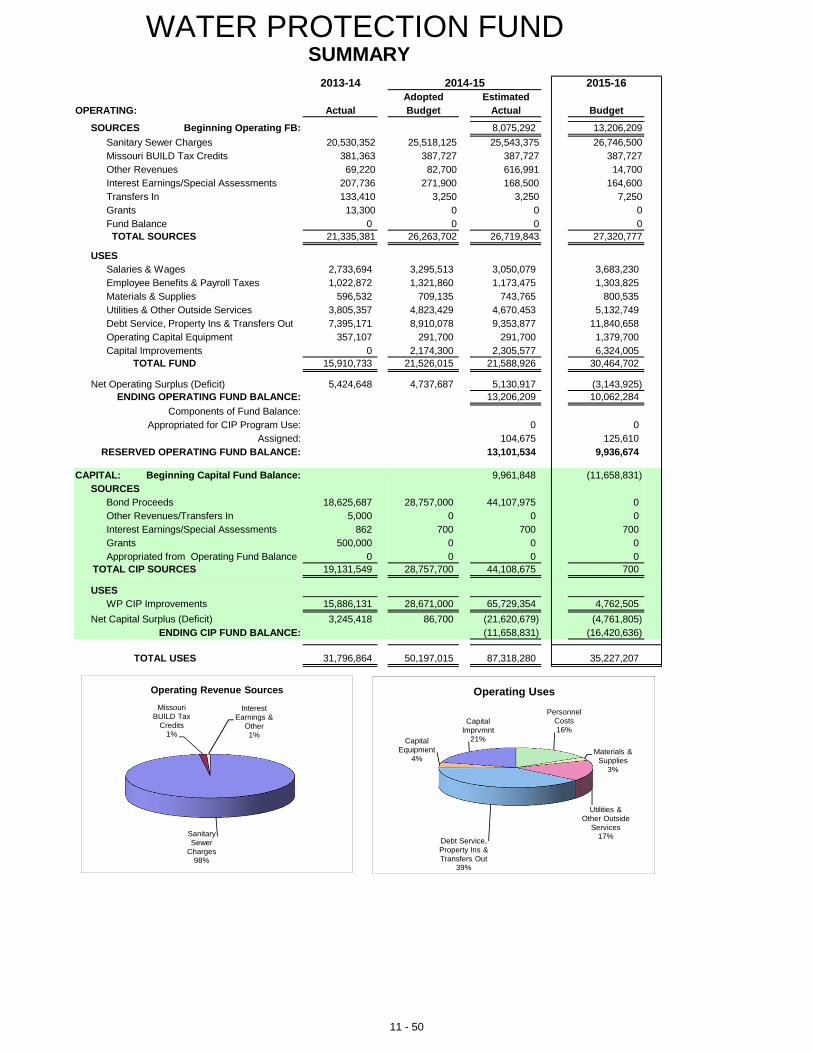
WATER PROTECTION FUND SUMMARY
2013-14 2014-15 2015-16Adopted Estimated
OPERATING: Actual Budget Actual Budget
SOURCES Beginning Operating FB: 8,075,292 13,206,209
Sanitary Sewer Charges 20,530,352 25,518,125 25,543,375 26,746,500Missouri BUILD Tax Credits 381,363 387,727 387,727 387,727Other Revenues 69,220 82,700 616,991 14,700Interest Earnings/Special Assessments 207,736 271,900 168,500 164,600Transfers In 133,410 3,250 3,250 7,250Grants 13,300 0 0 0Fund Balance 0 0 0 0TOTAL SOURCES 21,335,381 26,263,702 26,719,843 27,320,777
USESSalaries & Wages 2,733,694 3,295,513 3,050,079 3,683,230Employee Benefits & Payroll Taxes 1,022,872 1,321,860 1,173,475 1,303,825Materials & Supplies 596,532 709,135 743,765 800,535Utilities & Other Outside Services 3,805,357 4,823,429 4,670,453 5,132,749Debt Service, Property Ins & Transfers Out 7,395,171 8,910,078 9,353,877 11,840,658Operating Capital Equipment 357,107 291,700 291,700 1,379,700Capital Improvements 0 2,174,300 2,305,577 6,324,005
TOTAL FUND 15,910,733 21,526,015 21,588,926 30,464,702
Net Operating Surplus (Deficit) 5,424,648 4,737,687 5,130,917 (3,143,925)ENDING OPERATING FUND BALANCE: 13,206,209 10,062,284
Components of Fund Balance:Appropriated for CIP Program Use: 0 0
Assigned: 104,675 125,610RESERVED OPERATING FUND BALANCE: 13,101,534 9,936,674
CAPITAL: Beginning Capital Fund Balance: 9,961,848 (11,658,831)SOURCES
Bond Proceeds 18,625,687 28,757,000 44,107,975 0Other Revenues/Transfers In 5,000 0 0 0Interest Earnings/Special Assessments 862 700 700 700Grants 500,000 0 0 0Appropriated from Operating Fund Balance 0 0 0 0
TOTAL CIP SOURCES 19,131,549 28,757,700 44,108,675 700
USESWP CIP Improvements 15,886,131 28,671,000 65,729,354 4,762,505
Net Capital Surplus (Deficit) 3,245,418 86,700 (21,620,679) (4,761,805)ENDING CIP FUND BALANCE: (11,658,831) (16,420,636)
TOTAL USES 31,796,864 50,197,015 87,318,280 35,227,207
Personnel Costs16%
Materials & Supplies
3%
Utilities & Other Outside
Services17%
Debt Service, Property Ins & Transfers Out
39%
Capital Equipment
4%
Capital Imprvmnt
21%
Operating Uses
Sanitary Sewer
Charges98%
Missouri BUILD Tax
Credits1%
Interest Earnings &
Other1%
Operating Revenue Sources
11 - 50
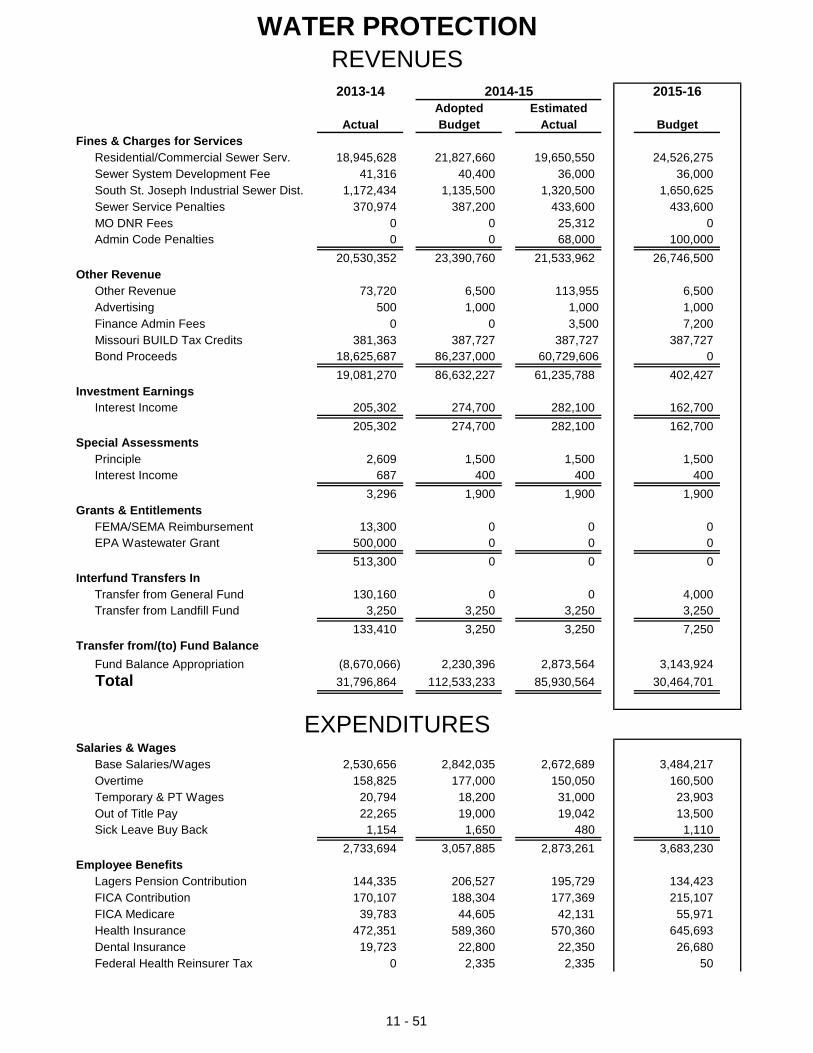
WATER PROTECTIONREVENUES2013-14 2014-15 2015-16
Adopted Estimated Actual Budget Actual Budget
Fines & Charges for ServicesResidential/Commercial Sewer Serv. 18,945,628 21,827,660 19,650,550 24,526,275Sewer System Development Fee 41,316 40,400 36,000 36,000South St. Joseph Industrial Sewer Dist. 1,172,434 1,135,500 1,320,500 1,650,625Sewer Service Penalties 370,974 387,200 433,600 433,600MO DNR Fees 0 0 25,312 0Admin Code Penalties 0 0 68,000 100,000
20,530,352 23,390,760 21,533,962 26,746,500Other Revenue
Other Revenue 73,720 6,500 113,955 6,500Advertising 500 1,000 1,000 1,000Finance Admin Fees 0 0 3,500 7,200Missouri BUILD Tax Credits 381,363 387,727 387,727 387,727Bond Proceeds 18,625,687 86,237,000 60,729,606 0
19,081,270 86,632,227 61,235,788 402,427Investment Earnings
Interest Income 205,302 274,700 282,100 162,700
205,302 274,700 282,100 162,700Special Assessments
Principle 2,609 1,500 1,500 1,500Interest Income 687 400 400 400
3,296 1,900 1,900 1,900Grants & Entitlements
FEMA/SEMA Reimbursement 13,300 0 0 0EPA Wastewater Grant 500,000 0 0 0
513,300 0 0 0Interfund Transfers In
Transfer from General Fund 130,160 0 0 4,000Transfer from Landfill Fund 3,250 3,250 3,250 3,250
133,410 3,250 3,250 7,250Transfer from/(to) Fund Balance
Fund Balance Appropriation (8,670,066) 2,230,396 2,873,564 3,143,924
Total 31,796,864 112,533,233 85,930,564 30,464,701
EXPENDITURESSalaries & Wages
Base Salaries/Wages 2,530,656 2,842,035 2,672,689 3,484,217Overtime 158,825 177,000 150,050 160,500Temporary & PT Wages 20,794 18,200 31,000 23,903Out of Title Pay 22,265 19,000 19,042 13,500Sick Leave Buy Back 1,154 1,650 480 1,110
2,733,694 3,057,885 2,873,261 3,683,230Employee Benefits
Lagers Pension Contribution 144,335 206,527 195,729 134,423FICA Contribution 170,107 188,304 177,369 215,107FICA Medicare 39,783 44,605 42,131 55,971Health Insurance 472,351 589,360 570,360 645,693Dental Insurance 19,723 22,800 22,350 26,680Federal Health Reinsurer Tax 0 2,335 2,335 50
11 - 51
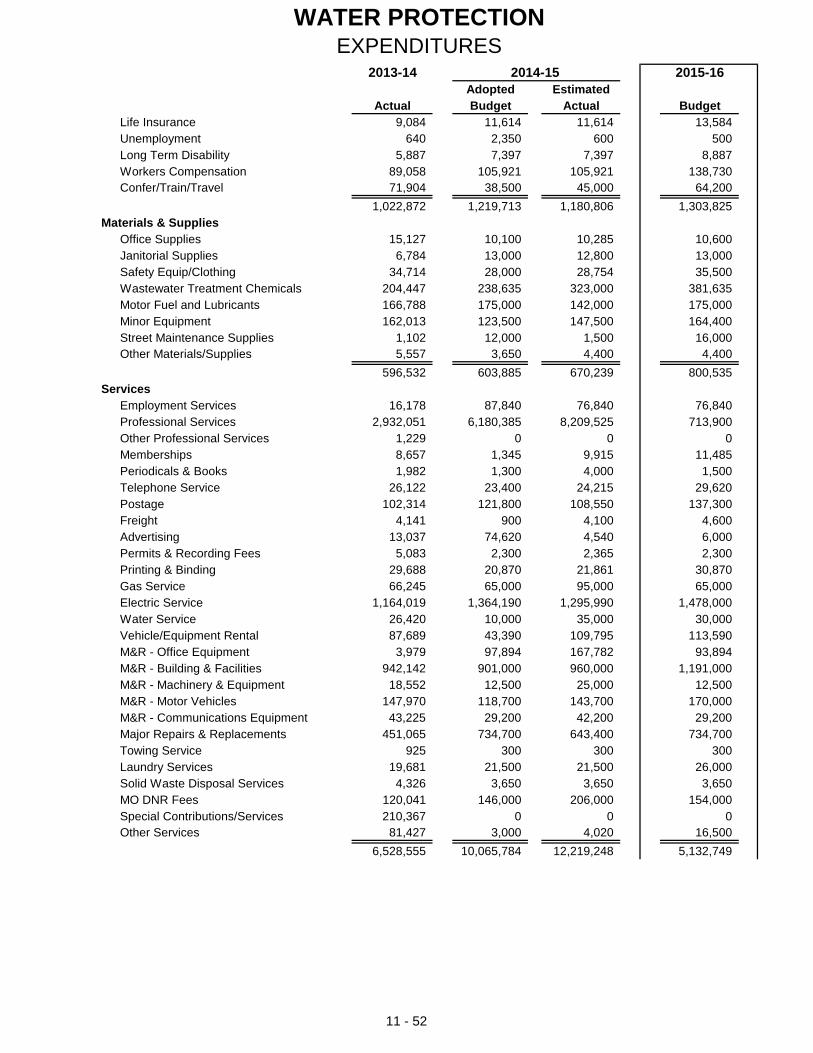
WATER PROTECTIONEXPENDITURES
2013-14 2014-15 2015-16Adopted Estimated
Actual Budget Actual BudgetLife Insurance 9,084 11,614 11,614 13,584Unemployment 640 2,350 600 500Long Term Disability 5,887 7,397 7,397 8,887Workers Compensation 89,058 105,921 105,921 138,730Confer/Train/Travel 71,904 38,500 45,000 64,200
1,022,872 1,219,713 1,180,806 1,303,825Materials & Supplies
Office Supplies 15,127 10,100 10,285 10,600Janitorial Supplies 6,784 13,000 12,800 13,000Safety Equip/Clothing 34,714 28,000 28,754 35,500Wastewater Treatment Chemicals 204,447 238,635 323,000 381,635Motor Fuel and Lubricants 166,788 175,000 142,000 175,000Minor Equipment 162,013 123,500 147,500 164,400Street Maintenance Supplies 1,102 12,000 1,500 16,000Other Materials/Supplies 5,557 3,650 4,400 4,400
596,532 603,885 670,239 800,535Services
Employment Services 16,178 87,840 76,840 76,840Professional Services 2,932,051 6,180,385 8,209,525 713,900Other Professional Services 1,229 0 0 0Memberships 8,657 1,345 9,915 11,485Periodicals & Books 1,982 1,300 4,000 1,500Telephone Service 26,122 23,400 24,215 29,620Postage 102,314 121,800 108,550 137,300Freight 4,141 900 4,100 4,600Advertising 13,037 74,620 4,540 6,000Permits & Recording Fees 5,083 2,300 2,365 2,300Printing & Binding 29,688 20,870 21,861 30,870Gas Service 66,245 65,000 95,000 65,000Electric Service 1,164,019 1,364,190 1,295,990 1,478,000Water Service 26,420 10,000 35,000 30,000Vehicle/Equipment Rental 87,689 43,390 109,795 113,590M&R - Office Equipment 3,979 97,894 167,782 93,894M&R - Building & Facilities 942,142 901,000 960,000 1,191,000M&R - Machinery & Equipment 18,552 12,500 25,000 12,500M&R - Motor Vehicles 147,970 118,700 143,700 170,000M&R - Communications Equipment 43,225 29,200 42,200 29,200Major Repairs & Replacements 451,065 734,700 643,400 734,700Towing Service 925 300 300 300Laundry Services 19,681 21,500 21,500 26,000Solid Waste Disposal Services 4,326 3,650 3,650 3,650MO DNR Fees 120,041 146,000 206,000 154,000Special Contributions/Services 210,367 0 0 0Other Services 81,427 3,000 4,020 16,500
6,528,555 10,065,784 12,219,248 5,132,749
11 - 52
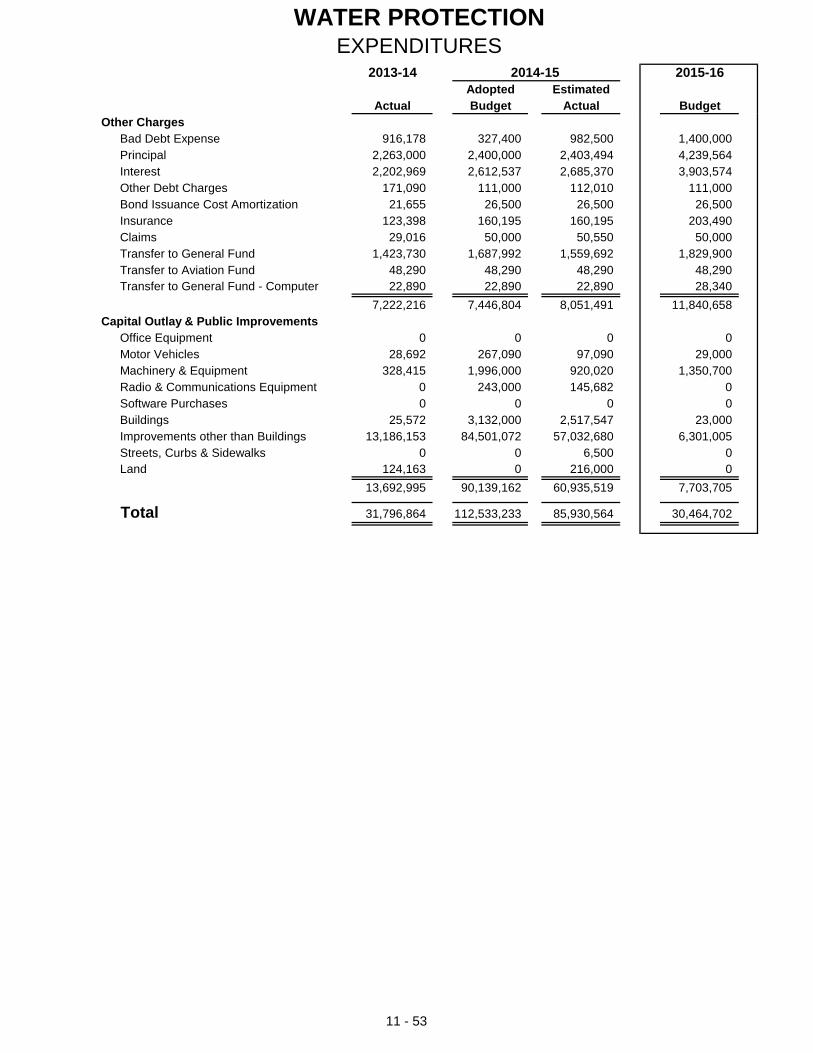
WATER PROTECTIONEXPENDITURES
2013-14 2014-15 2015-16Adopted Estimated
Actual Budget Actual BudgetOther Charges
Bad Debt Expense 916,178 327,400 982,500 1,400,000Principal 2,263,000 2,400,000 2,403,494 4,239,564Interest 2,202,969 2,612,537 2,685,370 3,903,574Other Debt Charges 171,090 111,000 112,010 111,000Bond Issuance Cost Amortization 21,655 26,500 26,500 26,500Insurance 123,398 160,195 160,195 203,490Claims 29,016 50,000 50,550 50,000Transfer to General Fund 1,423,730 1,687,992 1,559,692 1,829,900Transfer to Aviation Fund 48,290 48,290 48,290 48,290Transfer to General Fund - Computer 22,890 22,890 22,890 28,340
7,222,216 7,446,804 8,051,491 11,840,658Capital Outlay & Public Improvements
Office Equipment 0 0 0 0Motor Vehicles 28,692 267,090 97,090 29,000Machinery & Equipment 328,415 1,996,000 920,020 1,350,700Radio & Communications Equipment 0 243,000 145,682 0Software Purchases 0 0 0 0Buildings 25,572 3,132,000 2,517,547 23,000Improvements other than Buildings 13,186,153 84,501,072 57,032,680 6,301,005Streets, Curbs & Sidewalks 0 0 6,500 0Land 124,163 0 216,000 0
13,692,995 90,139,162 60,935,519 7,703,705
Total 31,796,864 112,533,233 85,930,564 30,464,702
11 - 53
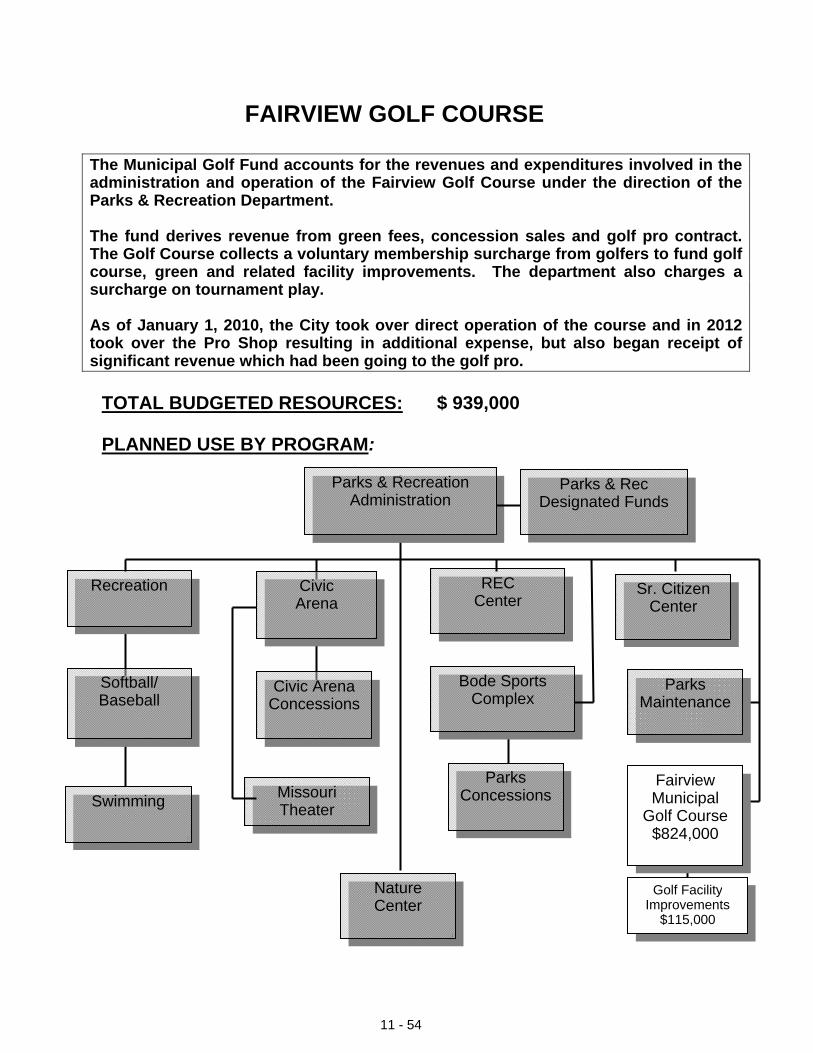
11 - 54
The Municipal Golf Fund accounts for the revenues and expenditures involved in the administration and operation of the Fairview Golf Course under the direction of the Parks & Recreation Department. The fund derives revenue from green fees, concession sales and golf pro contract. The Golf Course collects a voluntary membership surcharge from golfers to fund golf course, green and related facility improvements. The department also charges a surcharge on tournament play. As of January 1, 2010, the City took over direct operation of the course and in 2012 took over the Pro Shop resulting in additional expense, but also began receipt of significant revenue which had been going to the golf pro.
TOTAL BUDGETED RESOURCES: $ 939,000
PLANNED USE BY PROGRAM:
FAIRVIEW GOLF COURSE
Parks & Recreation Administration
Recreation
Swimming
REC Center
Missouri Theater
Softball/ Baseball
Sr. Citizen Center
Bode Sports Complex
Fairview Municipal
Golf Course $824,000
Civic Arena
Civic Arena Concessions
Parks & Rec Designated Funds
Parks Concessions
Nature Center
Parks Maintenance
Golf FacilityImprovements
$115,000

MUNICIPAL GOLF COURSE FUND SUMMARY
2013-14 2014-15 2015-16Adopted Estimated
Actual Budget Actual Budget
SOURCES Beginning Operating FB: 50,325 69,670
Golf Charges 772,392 810,585 796,500 887,395Other Revenue 6,881 3,000 1,389 3,000Investment Earnings -60 0 0 0Transfer In 60,245 0 0 0Fund Balance Appropriaton 0 0 0 0TOTAL SOURCES 839,458 813,585 797,889 890,395
USESSalaries & Wages 303,387 324,480 326,433 341,669Employee Benefits & Payroll Taxes 74,923 83,192 82,353 78,801Materials & Supplies 218,910 186,900 194,000 186,900Utilities & Other Outside Services 184,455 131,700 103,615 136,200Property Ins & Claims 4,714 53,635 38,957 52,684Transfers Out 53,068 33,536 33,200 26,135Operating Capital Equipment 0 12,000 -14 1,731
839,457 825,443 778,544 824,120
Net Surplus (Deficit) 19,345 66,275
ENDING OPERATING FUND BALANCE: 69,670 135,945
Components of Fund Balance:Assigned: 9,310 (990)
RESERVED OPERATING FUND BALANCE: 60,360 134,955
Beginning Capital Fund Balance: 517 3,153SOURCES
Golf Surcharge 22,992 23,500 22,500 22,000Interest Earnings/Transfers In 0 100 100 100Transfers In 0 0 0 100,000TOTAL SOURCES 22,992 23,600 22,600 122,100
USESGolf Improvements, Capital Project 22,475 0 19,964 115,014
Net Capital Surplus (Deficit) 517 23,600 2,636 7,086ENDING CIP FUND BALANCE: 3,153 10,239
TOTAL USES 861,932 825,443 798,508 939,134
Personnel Costs51%
Materials & Supplies
23%
Utilities & Other
Outside Services
17%
Property Ins &
Claims6%
Transfers Out3%
Operating Uses
Golf Charges99.7%
Other Revenue
0.3%
Operating Revenue Sources
11 - 55
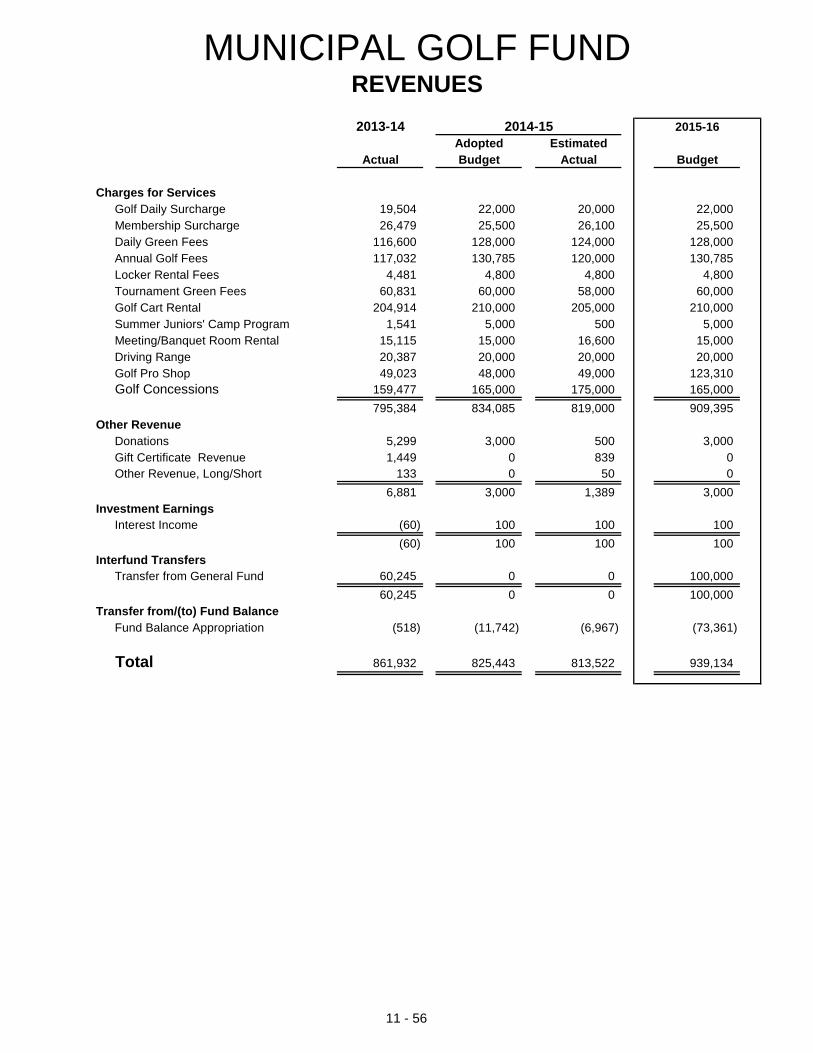
MUNICIPAL GOLF FUNDREVENUES2013-14 2014-15 2015-16
Adopted Estimated Actual Budget Actual Budget
Charges for ServicesGolf Daily Surcharge 19,504 22,000 20,000 22,000Membership Surcharge 26,479 25,500 26,100 25,500Daily Green Fees 116,600 128,000 124,000 128,000Annual Golf Fees 117,032 130,785 120,000 130,785Locker Rental Fees 4,481 4,800 4,800 4,800Tournament Green Fees 60,831 60,000 58,000 60,000Golf Cart Rental 204,914 210,000 205,000 210,000Summer Juniors' Camp Program 1,541 5,000 500 5,000Meeting/Banquet Room Rental 15,115 15,000 16,600 15,000Driving Range 20,387 20,000 20,000 20,000Golf Pro Shop 49,023 48,000 49,000 123,310Golf Concessions 159,477 165,000 175,000 165,000
795,384 834,085 819,000 909,395Other Revenue
Donations 5,299 3,000 500 3,000Gift Certificate Revenue 1,449 0 839 0Other Revenue, Long/Short 133 0 50 0
6,881 3,000 1,389 3,000Investment Earnings
Interest Income (60) 100 100 100
(60) 100 100 100Interfund Transfers
Transfer from General Fund 60,245 0 0 100,000
60,245 0 0 100,000Transfer from/(to) Fund Balance
Fund Balance Appropriation (518) (11,742) (6,967) (73,361)
Total 861,932 825,443 813,522 939,134
11 - 56
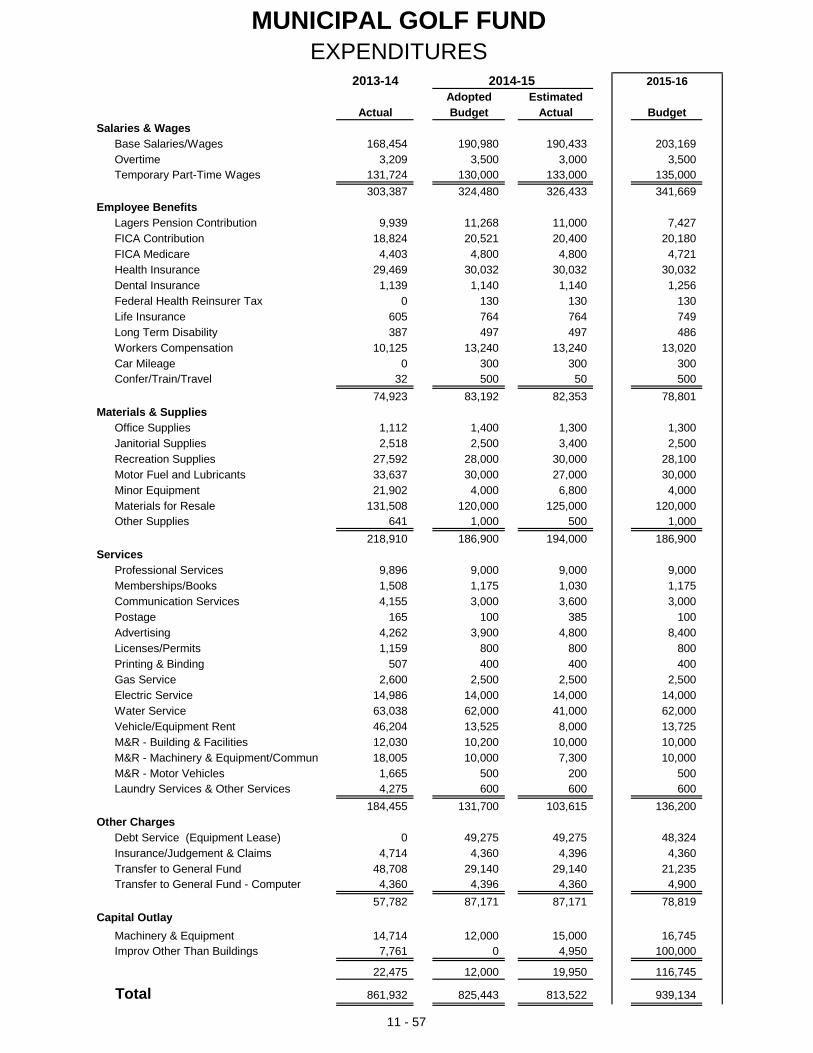
MUNICIPAL GOLF FUNDEXPENDITURES
2013-14 2014-15 2015-16Adopted Estimated
Actual Budget Actual BudgetSalaries & Wages
Base Salaries/Wages 168,454 190,980 190,433 203,169Overtime 3,209 3,500 3,000 3,500Temporary Part-Time Wages 131,724 130,000 133,000 135,000
303,387 324,480 326,433 341,669Employee Benefits
Lagers Pension Contribution 9,939 11,268 11,000 7,427FICA Contribution 18,824 20,521 20,400 20,180FICA Medicare 4,403 4,800 4,800 4,721Health Insurance 29,469 30,032 30,032 30,032Dental Insurance 1,139 1,140 1,140 1,256Federal Health Reinsurer Tax 0 130 130 130Life Insurance 605 764 764 749Long Term Disability 387 497 497 486Workers Compensation 10,125 13,240 13,240 13,020Car Mileage 0 300 300 300Confer/Train/Travel 32 500 50 500
74,923 83,192 82,353 78,801Materials & Supplies
Office Supplies 1,112 1,400 1,300 1,300Janitorial Supplies 2,518 2,500 3,400 2,500Recreation Supplies 27,592 28,000 30,000 28,100Motor Fuel and Lubricants 33,637 30,000 27,000 30,000Minor Equipment 21,902 4,000 6,800 4,000Materials for Resale 131,508 120,000 125,000 120,000Other Supplies 641 1,000 500 1,000
218,910 186,900 194,000 186,900Services
Professional Services 9,896 9,000 9,000 9,000Memberships/Books 1,508 1,175 1,030 1,175Communication Services 4,155 3,000 3,600 3,000Postage 165 100 385 100Advertising 4,262 3,900 4,800 8,400Licenses/Permits 1,159 800 800 800Printing & Binding 507 400 400 400Gas Service 2,600 2,500 2,500 2,500Electric Service 14,986 14,000 14,000 14,000Water Service 63,038 62,000 41,000 62,000Vehicle/Equipment Rent 46,204 13,525 8,000 13,725M&R - Building & Facilities 12,030 10,200 10,000 10,000M&R - Machinery & Equipment/Commun 18,005 10,000 7,300 10,000M&R - Motor Vehicles 1,665 500 200 500Laundry Services & Other Services 4,275 600 600 600
184,455 131,700 103,615 136,200Other Charges
Debt Service (Equipment Lease) 0 49,275 49,275 48,324Insurance/Judgement & Claims 4,714 4,360 4,396 4,360Transfer to General Fund 48,708 29,140 29,140 21,235Transfer to General Fund - Computer 4,360 4,396 4,360 4,900
57,782 87,171 87,171 78,819Capital Outlay
Machinery & Equipment 14,714 12,000 15,000 16,745Improv Other Than Buildings 7,761 0 4,950 100,000
22,475 12,000 19,950 116,745
Total 861,932 825,443 813,522 939,134
11 - 57
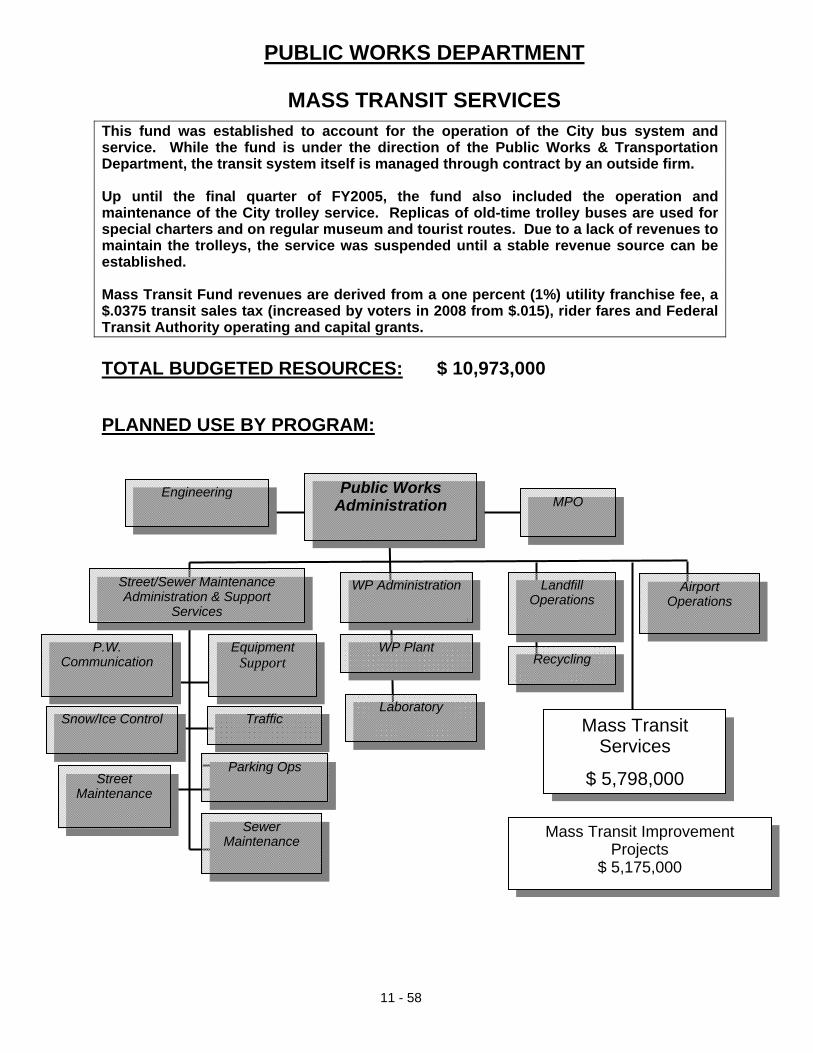
11 - 58
This fund was established to account for the operation of the City bus system and service. While the fund is under the direction of the Public Works & Transportation Department, the transit system itself is managed through contract by an outside firm. Up until the final quarter of FY2005, the fund also included the operation and maintenance of the City trolley service. Replicas of old-time trolley buses are used for special charters and on regular museum and tourist routes. Due to a lack of revenues to maintain the trolleys, the service was suspended until a stable revenue source can be established. Mass Transit Fund revenues are derived from a one percent (1%) utility franchise fee, a $.0375 transit sales tax (increased by voters in 2008 from $.015), rider fares and Federal Transit Authority operating and capital grants.
TOTAL BUDGETED RESOURCES: $ 10,973,000 PLANNED USE BY PROGRAM:
PUBLIC WORKS DEPARTMENT
MASS TRANSIT SERVICES
Public WorksAdministration
Street Maintenance
Traffic
Snow/Ice Control
Street/Sewer Maintenance Administration & Support
Services
Equipment Support
Airport Operations
MPO
P.W. Communication
Engineering
Sewer Maintenance
Parking Ops
Laboratory
WP Plant
WP Administration
Recycling
Landfill Operations
Mass Transit Services
$ 5,798,000
Mass Transit Improvement Projects
$ 5,175,000
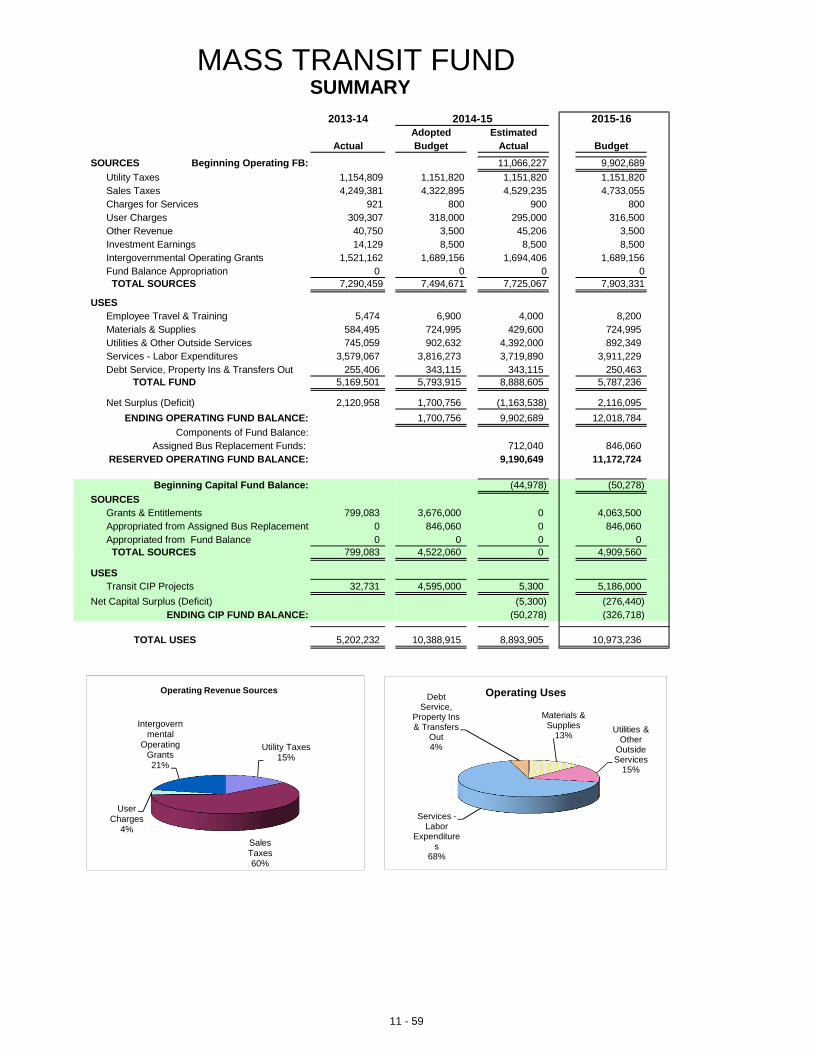
MASS TRANSIT FUND SUMMARY
2013-14 2014-15 2015-16Adopted Estimated
Actual Budget Actual BudgetSOURCES Beginning Operating FB: 11,066,227 9,902,689
Utility Taxes 1,154,809 1,151,820 1,151,820 1,151,820Sales Taxes 4,249,381 4,322,895 4,529,235 4,733,055Charges for Services 921 800 900 800User Charges 309,307 318,000 295,000 316,500Other Revenue 40,750 3,500 45,206 3,500Investment Earnings 14,129 8,500 8,500 8,500Intergovernmental Operating Grants 1,521,162 1,689,156 1,694,406 1,689,156Fund Balance Appropriation 0 0 0 0TOTAL SOURCES 7,290,459 7,494,671 7,725,067 7,903,331
USESEmployee Travel & Training 5,474 6,900 4,000 8,200Materials & Supplies 584,495 724,995 429,600 724,995Utilities & Other Outside Services 745,059 902,632 4,392,000 892,349Services - Labor Expenditures 3,579,067 3,816,273 3,719,890 3,911,229Debt Service, Property Ins & Transfers Out 255,406 343,115 343,115 250,463
TOTAL FUND 5,169,501 5,793,915 8,888,605 5,787,236
Net Surplus (Deficit) 2,120,958 1,700,756 (1,163,538) 2,116,095
ENDING OPERATING FUND BALANCE: 1,700,756 9,902,689 12,018,784
Components of Fund Balance:Assigned Bus Replacement Funds: 712,040 846,060
RESERVED OPERATING FUND BALANCE: 9,190,649 11,172,724
Beginning Capital Fund Balance: (44,978) (50,278)
SOURCESGrants & Entitlements 799,083 3,676,000 0 4,063,500Appropriated from Assigned Bus Replacement 0 846,060 0 846,060Appropriated from Fund Balance 0 0 0 0TOTAL SOURCES 799,083 4,522,060 0 4,909,560
USESTransit CIP Projects 32,731 4,595,000 5,300 5,186,000
Net Capital Surplus (Deficit) (5,300) (276,440)ENDING CIP FUND BALANCE: (50,278) (326,718)
TOTAL USES 5,202,232 10,388,915 8,893,905 10,973,236
Materials & Supplies
13%Utilities &
Other Outside Services
15%
Services -Labor
Expenditures
68%
Debt Service,
Property Ins & Transfers
Out4%
Operating Uses
Utility Taxes15%
Sales Taxes60%
User Charges
4%
Intergovernmental
Operating Grants21%
Operating Revenue Sources
11 - 59

MASS TRANSIT FUNDREVENUES
2013-14 2014-15 2015-16Adopted Estimated
Actual Budget Actual BudgetUtility Franchise Fees
Gas 249,782 250,200 265,000 257,390Electric 701,229 758,430 740,000 720,600Water 150,140 151,320 151,320 150,730Utility Taxes - TIF portion 53,658 23,100 23,100 23,100
1,154,809 1,183,050 1,179,420 1,151,820Sales Tax
Sales Tax 4,537,451 4,588,170 4,542,290 5,063,690Sales Tax Contra Account (1,000,959) (1,041,575) (959,514) (1,111,230)EATS (TIF generated sales tax) 712,889 744,020 712,900 780,595
4,249,381 4,290,615 4,295,676 4,733,055Charges for Services
Fare Box Revenue 189,300 190,000 188,000 190,000Ticket Sales - Adult 55,180 52,000 60,000 60,000Ticket Sales - Youth 2,985 4,500 3,000 4,500Ticket Sales - Senior/Handicapped 37,185 33,700 37,000 37,000Ticket Sales - Commissions 11,669 13,000 12,000 13,000Advertising 12,988 13,500 13,000 12,000
309,307 306,700 313,000 316,500Other Revenue
Recovery/Reimbursments 27,372 0 340 800Concessions / Other Revenue 14,299 4,900 6,300 3,500
41,671 4,900 6,640 4,300Investment Earnings
Interest Income 14,129 8,500 8,500 8,500
14,129 8,500 8,500 8,500Intergovernmental
Federal Transit Authority - Capital 559,155 1,632,000 15,500 4,063,500Federal Transit Authority - Operations 1,511,885 1,689,156 1,689,156 1,689,156American Rec Reinvest Capital 239,928 0 0 0State Operating Grant 9,277 0 11,500 0
2,320,245 3,321,156 1,716,156 5,752,656Transfer from/(to) Fund Balance
Fund Balance Appropriation (2,887,309) (1,492,352) (2,001,795) (993,595)
Total 5,202,233 7,622,569 5,517,597 10,973,236
11 - 60
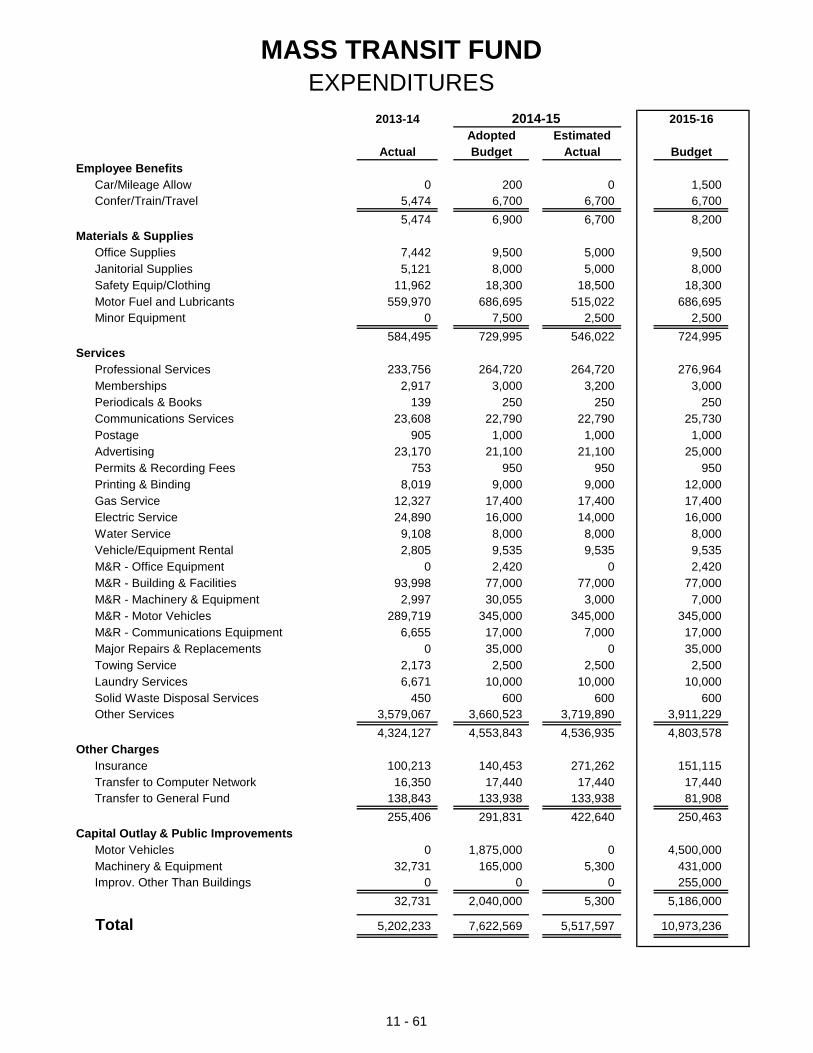
MASS TRANSIT FUNDEXPENDITURES
2013-14 2014-15 2015-16Adopted Estimated
Actual Budget Actual BudgetEmployee Benefits
Car/Mileage Allow 0 200 0 1,500Confer/Train/Travel 5,474 6,700 6,700 6,700
5,474 6,900 6,700 8,200Materials & Supplies
Office Supplies 7,442 9,500 5,000 9,500Janitorial Supplies 5,121 8,000 5,000 8,000Safety Equip/Clothing 11,962 18,300 18,500 18,300Motor Fuel and Lubricants 559,970 686,695 515,022 686,695Minor Equipment 0 7,500 2,500 2,500
584,495 729,995 546,022 724,995Services
Professional Services 233,756 264,720 264,720 276,964Memberships 2,917 3,000 3,200 3,000Periodicals & Books 139 250 250 250Communications Services 23,608 22,790 22,790 25,730Postage 905 1,000 1,000 1,000Advertising 23,170 21,100 21,100 25,000Permits & Recording Fees 753 950 950 950Printing & Binding 8,019 9,000 9,000 12,000Gas Service 12,327 17,400 17,400 17,400Electric Service 24,890 16,000 14,000 16,000Water Service 9,108 8,000 8,000 8,000Vehicle/Equipment Rental 2,805 9,535 9,535 9,535M&R - Office Equipment 0 2,420 0 2,420M&R - Building & Facilities 93,998 77,000 77,000 77,000M&R - Machinery & Equipment 2,997 30,055 3,000 7,000M&R - Motor Vehicles 289,719 345,000 345,000 345,000M&R - Communications Equipment 6,655 17,000 7,000 17,000Major Repairs & Replacements 0 35,000 0 35,000Towing Service 2,173 2,500 2,500 2,500Laundry Services 6,671 10,000 10,000 10,000Solid Waste Disposal Services 450 600 600 600Other Services 3,579,067 3,660,523 3,719,890 3,911,229
4,324,127 4,553,843 4,536,935 4,803,578Other Charges
Insurance 100,213 140,453 271,262 151,115Transfer to Computer Network 16,350 17,440 17,440 17,440Transfer to General Fund 138,843 133,938 133,938 81,908
255,406 291,831 422,640 250,463Capital Outlay & Public Improvements
Motor Vehicles 0 1,875,000 0 4,500,000Machinery & Equipment 32,731 165,000 5,300 431,000Improv. Other Than Buildings 0 0 0 255,000
32,731 2,040,000 5,300 5,186,000
Total 5,202,233 7,622,569 5,517,597 10,973,236
11 - 61
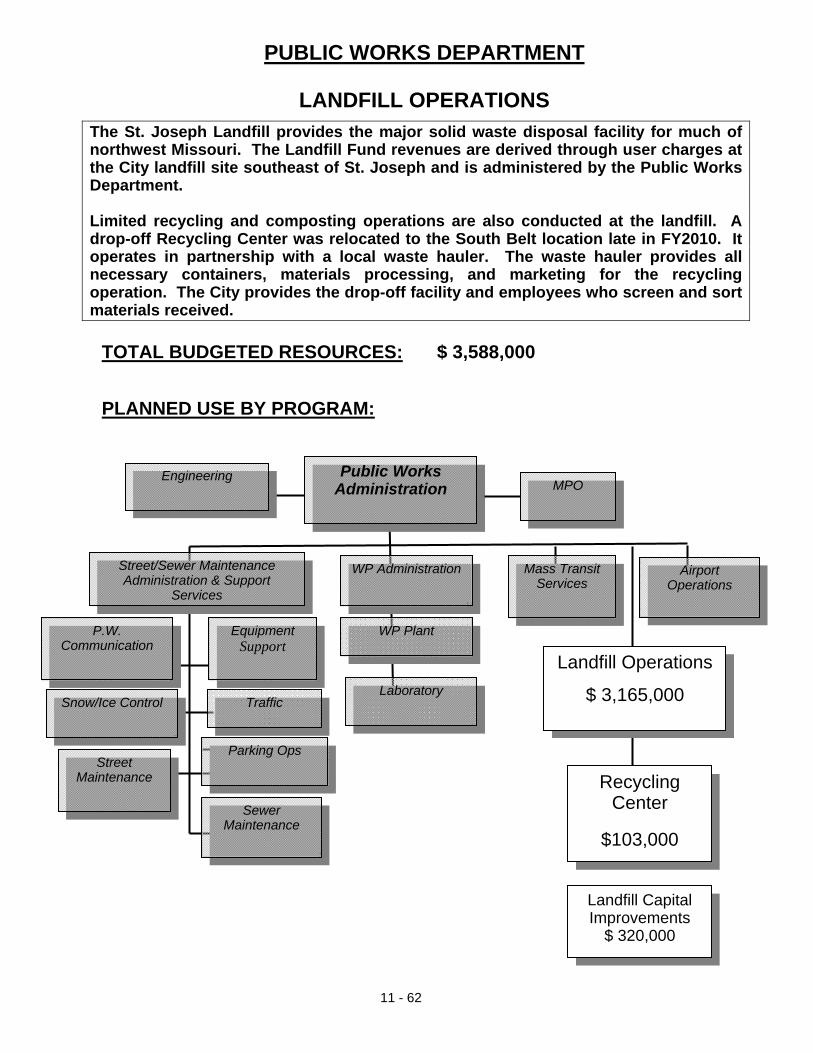
11 - 62
The St. Joseph Landfill provides the major solid waste disposal facility for much of northwest Missouri. The Landfill Fund revenues are derived through user charges at the City landfill site southeast of St. Joseph and is administered by the Public Works Department. Limited recycling and composting operations are also conducted at the landfill. A drop-off Recycling Center was relocated to the South Belt location late in FY2010. It operates in partnership with a local waste hauler. The waste hauler provides all necessary containers, materials processing, and marketing for the recycling operation. The City provides the drop-off facility and employees who screen and sort materials received.
TOTAL BUDGETED RESOURCES: $ 3,588,000 PLANNED USE BY PROGRAM:
PUBLIC WORKS DEPARTMENT
LANDFILL OPERATIONS
Public WorksAdministration
Street Maintenance
Traffic
Snow/Ice Control
Street/Sewer Maintenance Administration & Support
Services
Equipment Support
Airport Operations
MPO
P.W. Communication
Engineering
Sewer Maintenance
Parking Ops
Laboratory
WP Plant
WP Administration Mass Transit Services
Landfill Operations
$ 3,165,000
Recycling Center
$103,000
Landfill Capital Improvements
$ 320,000
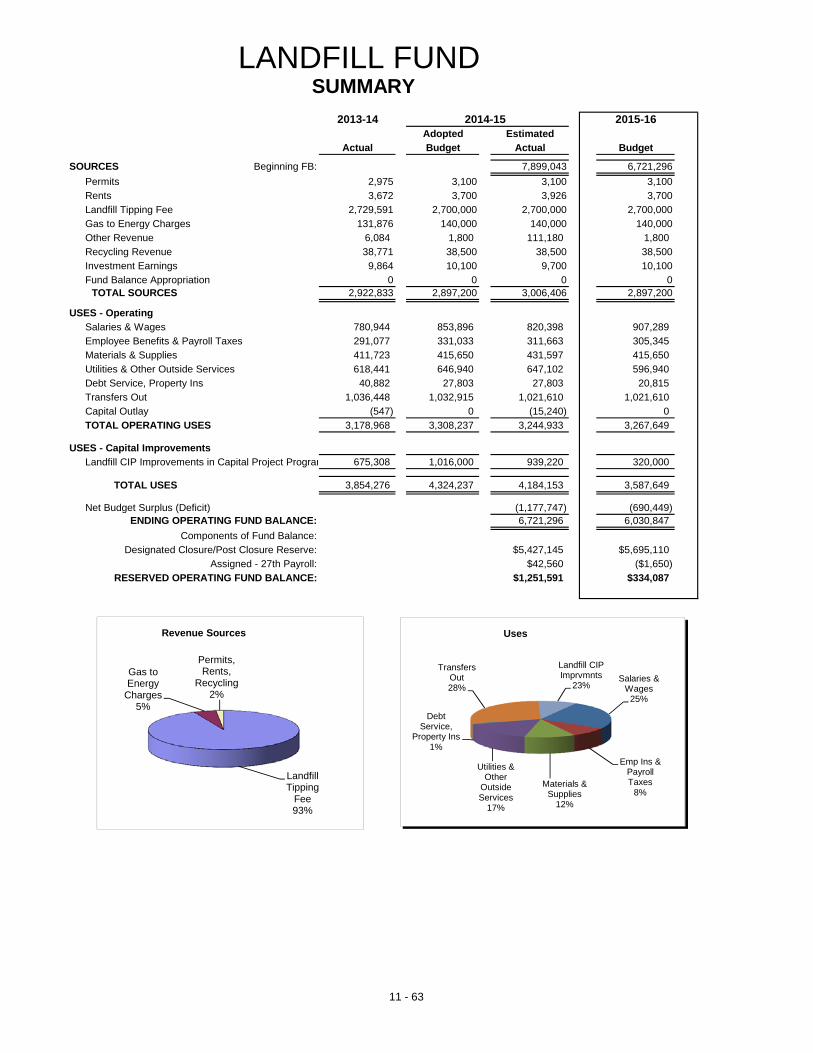
LANDFILL FUND SUMMARY
2013-14 2014-15 2015-16Adopted Estimated
Actual Budget Actual Budget
SOURCES Beginning FB: 7,899,043 6,721,296
Permits 2,975 3,100 3,100 3,100
Rents 3,672 3,700 3,926 3,700
Landfill Tipping Fee 2,729,591 2,700,000 2,700,000 2,700,000
Gas to Energy Charges 131,876 140,000 140,000 140,000
Other Revenue 6,084 1,800 111,180 1,800
Recycling Revenue 38,771 38,500 38,500 38,500
Investment Earnings 9,864 10,100 9,700 10,100
Fund Balance Appropriation 0 0 0 0TOTAL SOURCES 2,922,833 2,897,200 3,006,406 2,897,200
USES - OperatingSalaries & Wages 780,944 853,896 820,398 907,289
Employee Benefits & Payroll Taxes 291,077 331,033 311,663 305,345
Materials & Supplies 411,723 415,650 431,597 415,650
Utilities & Other Outside Services 618,441 646,940 647,102 596,940
Debt Service, Property Ins 40,882 27,803 27,803 20,815
Transfers Out 1,036,448 1,032,915 1,021,610 1,021,610
Capital Outlay (547) 0 (15,240) 0
TOTAL OPERATING USES 3,178,968 3,308,237 3,244,933 3,267,649
USES - Capital ImprovementsLandfill CIP Improvements in Capital Project Program 675,308 1,016,000 939,220 320,000
TOTAL USES 3,854,276 4,324,237 4,184,153 3,587,649
Net Budget Surplus (Deficit) (1,177,747) (690,449)ENDING OPERATING FUND BALANCE: 6,721,296 6,030,847
Components of Fund Balance:
Designated Closure/Post Closure Reserve: $5,427,145 $5,695,110
Assigned - 27th Payroll: $42,560 ($1,650)
RESERVED OPERATING FUND BALANCE: $1,251,591 $334,087
Salaries & Wages
25%
Emp Ins & Payroll Taxes
8%Materials &
Supplies12%
Utilities & Other
Outside Services
17%
Debt Service,
Property Ins1%
Transfers Out28%
Landfill CIP Imprvmnts
23%
Uses
Landfill Tipping
Fee93%
Gas to Energy
Charges5%
Permits, Rents,
Recycling2%
Revenue Sources
11 - 63
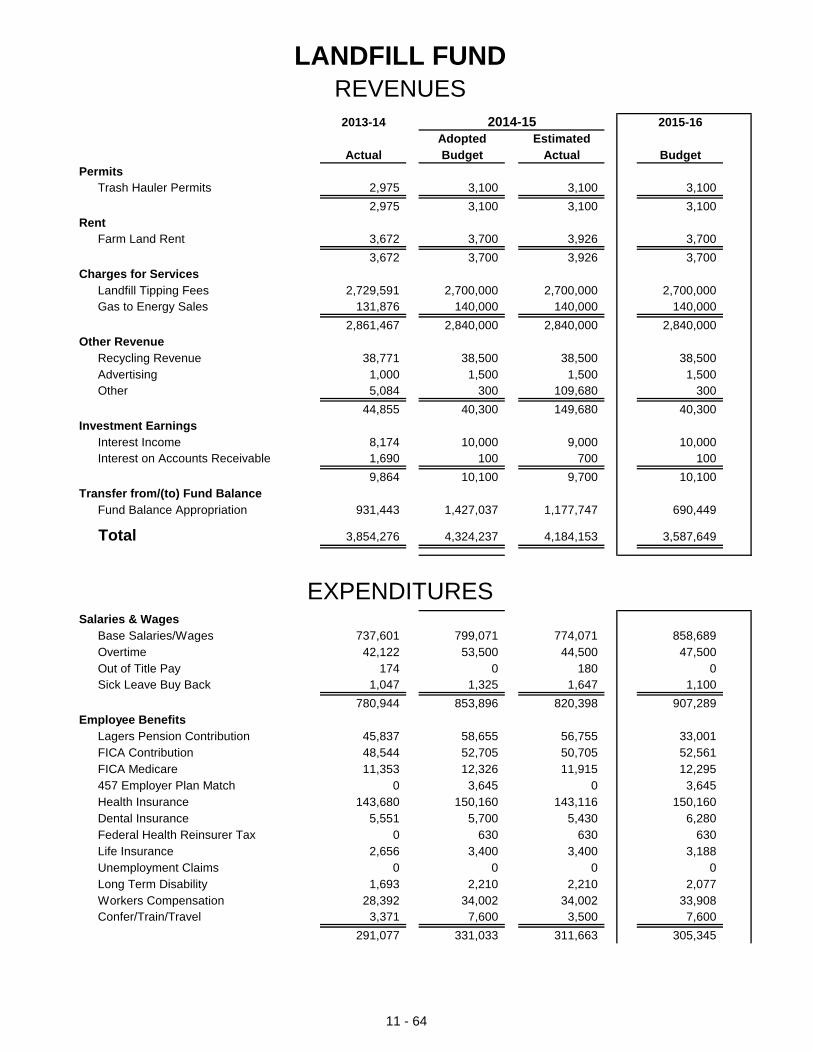
LANDFILL FUNDREVENUES
2013-14 2014-15 2015-16Adopted Estimated
Actual Budget Actual BudgetPermits
Trash Hauler Permits 2,975 3,100 3,100 3,100
2,975 3,100 3,100 3,100Rent
Farm Land Rent 3,672 3,700 3,926 3,700
3,672 3,700 3,926 3,700Charges for Services
Landfill Tipping Fees 2,729,591 2,700,000 2,700,000 2,700,000Gas to Energy Sales 131,876 140,000 140,000 140,000
2,861,467 2,840,000 2,840,000 2,840,000Other Revenue
Recycling Revenue 38,771 38,500 38,500 38,500Advertising 1,000 1,500 1,500 1,500Other 5,084 300 109,680 300
44,855 40,300 149,680 40,300Investment Earnings
Interest Income 8,174 10,000 9,000 10,000Interest on Accounts Receivable 1,690 100 700 100
9,864 10,100 9,700 10,100Transfer from/(to) Fund Balance
Fund Balance Appropriation 931,443 1,427,037 1,177,747 690,449
Total 3,854,276 4,324,237 4,184,153 3,587,649
EXPENDITURESSalaries & Wages
Base Salaries/Wages 737,601 799,071 774,071 858,689Overtime 42,122 53,500 44,500 47,500Out of Title Pay 174 0 180 0Sick Leave Buy Back 1,047 1,325 1,647 1,100
780,944 853,896 820,398 907,289Employee Benefits
Lagers Pension Contribution 45,837 58,655 56,755 33,001FICA Contribution 48,544 52,705 50,705 52,561FICA Medicare 11,353 12,326 11,915 12,295457 Employer Plan Match 0 3,645 0 3,645Health Insurance 143,680 150,160 143,116 150,160Dental Insurance 5,551 5,700 5,430 6,280Federal Health Reinsurer Tax 0 630 630 630Life Insurance 2,656 3,400 3,400 3,188Unemployment Claims 0 0 0 0Long Term Disability 1,693 2,210 2,210 2,077Workers Compensation 28,392 34,002 34,002 33,908Confer/Train/Travel 3,371 7,600 3,500 7,600
291,077 331,033 311,663 305,345
11 - 64
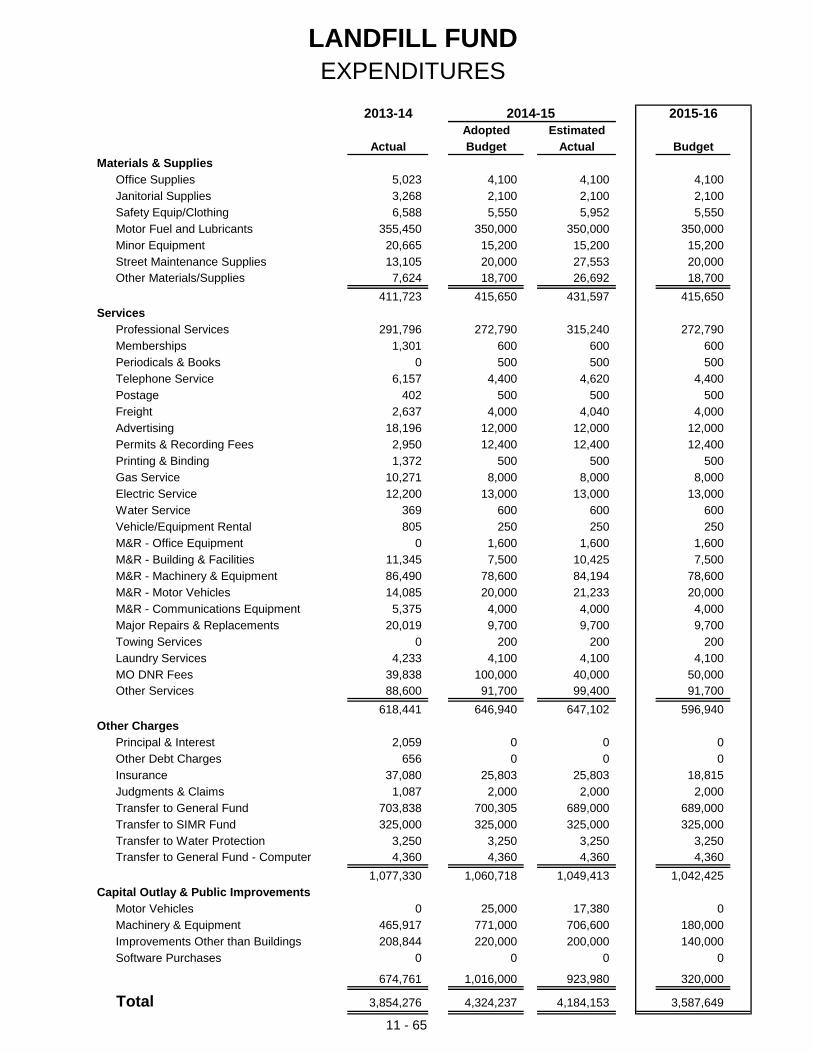
LANDFILL FUNDEXPENDITURES
2013-14 2014-15 2015-16Adopted Estimated
Actual Budget Actual BudgetMaterials & Supplies
Office Supplies 5,023 4,100 4,100 4,100Janitorial Supplies 3,268 2,100 2,100 2,100Safety Equip/Clothing 6,588 5,550 5,952 5,550Motor Fuel and Lubricants 355,450 350,000 350,000 350,000Minor Equipment 20,665 15,200 15,200 15,200Street Maintenance Supplies 13,105 20,000 27,553 20,000Other Materials/Supplies 7,624 18,700 26,692 18,700
411,723 415,650 431,597 415,650Services
Professional Services 291,796 272,790 315,240 272,790Memberships 1,301 600 600 600Periodicals & Books 0 500 500 500Telephone Service 6,157 4,400 4,620 4,400Postage 402 500 500 500Freight 2,637 4,000 4,040 4,000Advertising 18,196 12,000 12,000 12,000Permits & Recording Fees 2,950 12,400 12,400 12,400Printing & Binding 1,372 500 500 500Gas Service 10,271 8,000 8,000 8,000Electric Service 12,200 13,000 13,000 13,000Water Service 369 600 600 600Vehicle/Equipment Rental 805 250 250 250M&R - Office Equipment 0 1,600 1,600 1,600M&R - Building & Facilities 11,345 7,500 10,425 7,500M&R - Machinery & Equipment 86,490 78,600 84,194 78,600M&R - Motor Vehicles 14,085 20,000 21,233 20,000M&R - Communications Equipment 5,375 4,000 4,000 4,000Major Repairs & Replacements 20,019 9,700 9,700 9,700Towing Services 0 200 200 200Laundry Services 4,233 4,100 4,100 4,100MO DNR Fees 39,838 100,000 40,000 50,000Other Services 88,600 91,700 99,400 91,700
618,441 646,940 647,102 596,940Other Charges
Principal & Interest 2,059 0 0 0Other Debt Charges 656 0 0 0Insurance 37,080 25,803 25,803 18,815Judgments & Claims 1,087 2,000 2,000 2,000Transfer to General Fund 703,838 700,305 689,000 689,000Transfer to SIMR Fund 325,000 325,000 325,000 325,000Transfer to Water Protection 3,250 3,250 3,250 3,250Transfer to General Fund - Computer 4,360 4,360 4,360 4,360
1,077,330 1,060,718 1,049,413 1,042,425Capital Outlay & Public Improvements
Motor Vehicles 0 25,000 17,380 0Machinery & Equipment 465,917 771,000 706,600 180,000Improvements Other than Buildings 208,844 220,000 200,000 140,000Software Purchases 0 0 0 0
674,761 1,016,000 923,980 320,000
Total 3,854,276 4,324,237 4,184,153 3,587,649
11 - 65
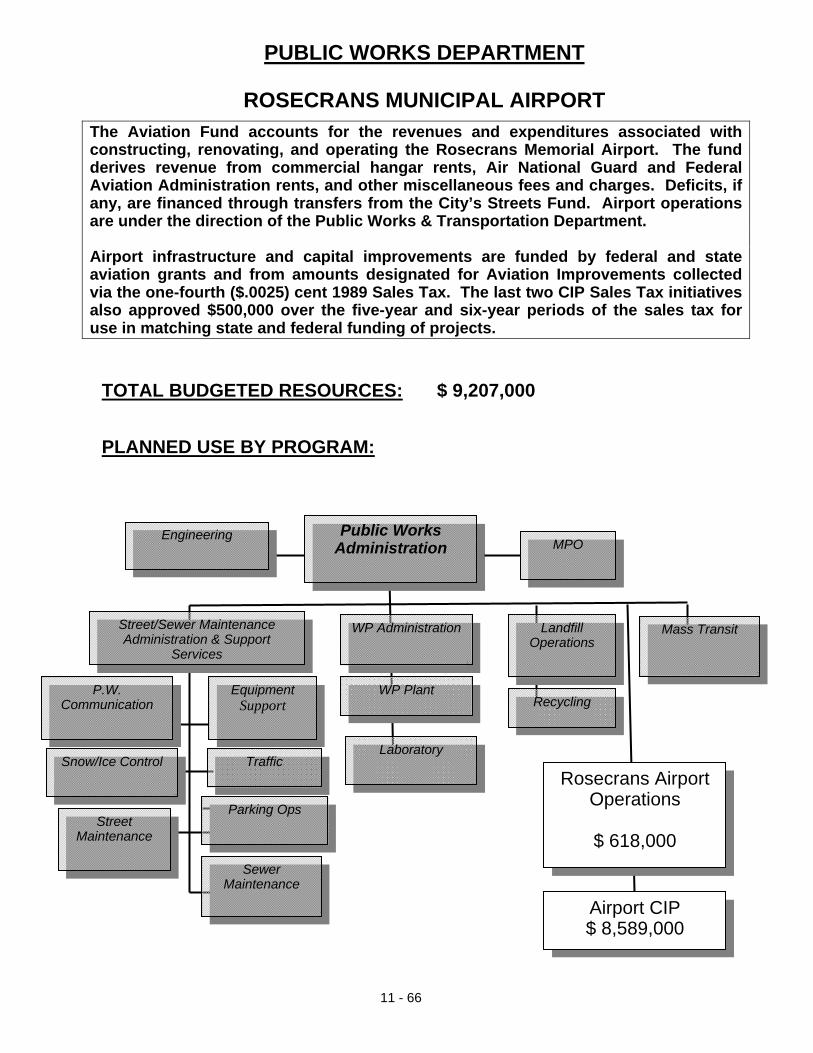
11 - 66
The Aviation Fund accounts for the revenues and expenditures associated with constructing, renovating, and operating the Rosecrans Memorial Airport. The fund derives revenue from commercial hangar rents, Air National Guard and Federal Aviation Administration rents, and other miscellaneous fees and charges. Deficits, if any, are financed through transfers from the City’s Streets Fund. Airport operations are under the direction of the Public Works & Transportation Department. Airport infrastructure and capital improvements are funded by federal and state aviation grants and from amounts designated for Aviation Improvements collected via the one-fourth ($.0025) cent 1989 Sales Tax. The last two CIP Sales Tax initiatives also approved $500,000 over the five-year and six-year periods of the sales tax for use in matching state and federal funding of projects.
TOTAL BUDGETED RESOURCES: $ 9,207,000 PLANNED USE BY PROGRAM:
PUBLIC WORKS DEPARTMENT
ROSECRANS MUNICIPAL AIRPORT
Public WorksAdministration
Street Maintenance
Traffic
Snow/Ice Control
Street/Sewer Maintenance Administration & Support
Services
Equipment Support
Mass Transit
MPO
P.W. Communication
Engineering
Sewer Maintenance
Parking Ops
Laboratory
WP Plant
WP Administration
Recycling
Landfill Operations
Rosecrans Airport Operations
$ 618,000
Airport CIP $ 8,589,000
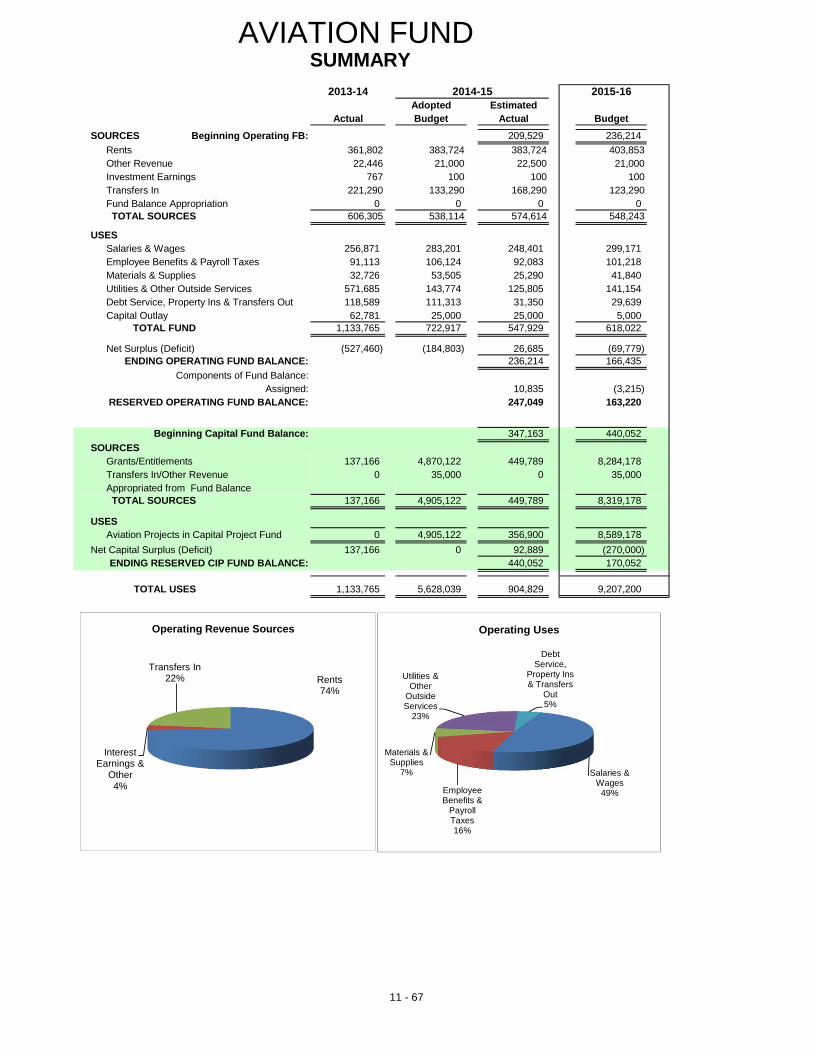
AVIATION FUND SUMMARY
2013-14 2014-15 2015-16Adopted Estimated
Actual Budget Actual BudgetSOURCES Beginning Operating FB: 209,529 236,214
Rents 361,802 383,724 383,724 403,853Other Revenue 22,446 21,000 22,500 21,000Investment Earnings 767 100 100 100Transfers In 221,290 133,290 168,290 123,290Fund Balance Appropriation 0 0 0 0TOTAL SOURCES 606,305 538,114 574,614 548,243
USESSalaries & Wages 256,871 283,201 248,401 299,171Employee Benefits & Payroll Taxes 91,113 106,124 92,083 101,218Materials & Supplies 32,726 53,505 25,290 41,840Utilities & Other Outside Services 571,685 143,774 125,805 141,154Debt Service, Property Ins & Transfers Out 118,589 111,313 31,350 29,639Capital Outlay 62,781 25,000 25,000 5,000
TOTAL FUND 1,133,765 722,917 547,929 618,022
Net Surplus (Deficit) (527,460) (184,803) 26,685 (69,779)ENDING OPERATING FUND BALANCE: 236,214 166,435
Components of Fund Balance:Assigned: 10,835 (3,215)
RESERVED OPERATING FUND BALANCE: 247,049 163,220
Beginning Capital Fund Balance: 347,163 440,052
SOURCESGrants/Entitlements 137,166 4,870,122 449,789 8,284,178Transfers In/Other Revenue 0 35,000 0 35,000Appropriated from Fund BalanceTOTAL SOURCES 137,166 4,905,122 449,789 8,319,178
USESAviation Projects in Capital Project Fund 0 4,905,122 356,900 8,589,178
Net Capital Surplus (Deficit) 137,166 0 92,889 (270,000)ENDING RESERVED CIP FUND BALANCE: 440,052 170,052
TOTAL USES 1,133,765 5,628,039 904,829 9,207,200
Salaries & Wages
49%Employee Benefits &
Payroll Taxes16%
Materials & Supplies
7%
Utilities & Other
Outside Services
23%
Debt Service,
Property Ins & Transfers
Out5%
Operating Uses
Rents74%
Interest Earnings &
Other4%
Transfers In22%
Operating Revenue Sources
11 - 67

AVIATION FUNDREVENUES
2013-14 2014-15 2015-16Adopted Estimated
Actual Budget Actual BudgetRents
Airport Hangar Rent 92,603 94,488 94,488 94,488Airport Restaurant Rent 3,720 5,100 5,100 5,100Life Net Lease 6,125 6,195 6,195 6,195Farm Land Rent 48,547 48,548 48,548 68,675Air National Guard Rent 51,570 76,511 76,511 76,511BMS Warehouse Rent 12,667 7,430 7,430 7,430F.B.O. Lease 79,058 79,537 79,537 79,537Federal Aviation Administration Rent 67,512 65,915 65,915 65,917
361,802 383,724 383,724 403,853Other Revenue
Sale of Gas & Oil 19,316 19,750 19,750 19,750Recycling Revenue 1,368 0 0 0Recovery/Reimbursements/Other Rev 1,762 1,250 2,750 1,250
22,446 21,000 22,500 21,000Investment Earnings
Interest Income 767 100 100 100
767 100 100 100Intergovernmental
Federal Aviation Administration 88,525 315,000 159,113 8,284,178State Airport Aid Grant 0 0 0 0FEMA/SEMA Reimbursements (14,980) 0 0 0MO Air National Guard Grant 63,621 4,555,122 290,676 0
137,166 4,870,122 449,789 8,284,178Interfund Transfers In
Transfer from General Fund 113,000 45,000 45,000 0Transfer from Gaming Fund 60,000 75,000 75,000 75,000Transfer from Water Protection Fund 48,290 48,290 48,290 48,290Transfer from CIP Sales Tax Fund 0 0 0 35,000
221,290 168,290 168,290 158,290Transfer from/(to) Fund Balance
Fund Balance Appropriation 390,294 184,803 (119,574) (8,249,399)
Total 1,133,765 5,628,039 904,829 618,022
EXPENDITURES2013-14 2014-15 2015-16
Adopted Estimated Actual Budget Actual Budget
Salaries & Wages Base Salaries/Wages 249,145 269,901 239,901 285,371Overtime 7,726 13,300 8,500 13,800Temporary/Part-Time Wages 0 0 0 0
256,871 283,201 248,401 299,171Employee Benefits
Lagers Pension Contribution 14,869 18,121 17,541 10,921FICA Contribution 15,983 16,522 15,400 17,364FICA Medicare 3,738 3,864 3,625 4,061457 Employer Plan Match 0 1,215 0 1,215Health Insurance 41,788 44,202 35,000 45,048Dental Insurance 1,615 1,710 1,330 1,884Federal Health Reinsurer Tax 0 160 160 160Life Insurance 886 1,013 1,110 1,130
11 - 68
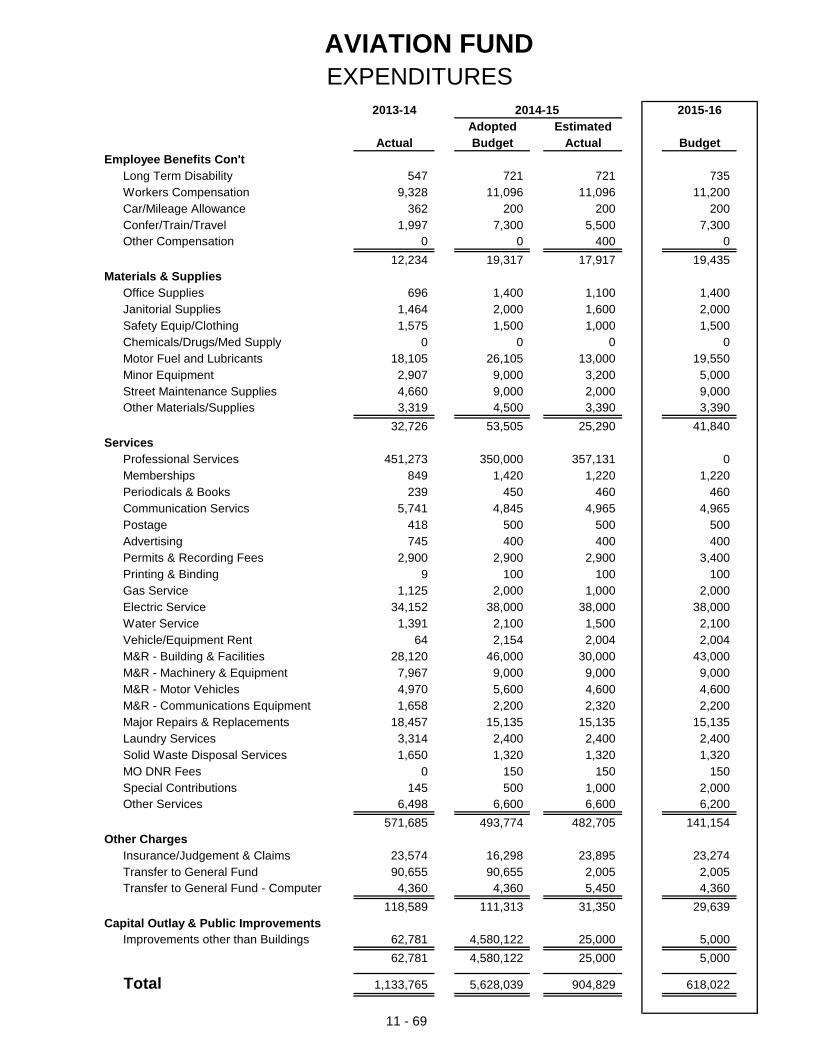
AVIATION FUNDEXPENDITURES
2013-14 2014-15 2015-16Adopted Estimated
Actual Budget Actual BudgetEmployee Benefits Con't
Long Term Disability 547 721 721 735Workers Compensation 9,328 11,096 11,096 11,200Car/Mileage Allowance 362 200 200 200Confer/Train/Travel 1,997 7,300 5,500 7,300Other Compensation 0 0 400 0
12,234 19,317 17,917 19,435Materials & Supplies
Office Supplies 696 1,400 1,100 1,400Janitorial Supplies 1,464 2,000 1,600 2,000Safety Equip/Clothing 1,575 1,500 1,000 1,500Chemicals/Drugs/Med Supply 0 0 0 0Motor Fuel and Lubricants 18,105 26,105 13,000 19,550Minor Equipment 2,907 9,000 3,200 5,000Street Maintenance Supplies 4,660 9,000 2,000 9,000Other Materials/Supplies 3,319 4,500 3,390 3,390
32,726 53,505 25,290 41,840Services
Professional Services 451,273 350,000 357,131 0Memberships 849 1,420 1,220 1,220Periodicals & Books 239 450 460 460Communication Servics 5,741 4,845 4,965 4,965Postage 418 500 500 500Advertising 745 400 400 400Permits & Recording Fees 2,900 2,900 2,900 3,400Printing & Binding 9 100 100 100Gas Service 1,125 2,000 1,000 2,000Electric Service 34,152 38,000 38,000 38,000Water Service 1,391 2,100 1,500 2,100Vehicle/Equipment Rent 64 2,154 2,004 2,004M&R - Building & Facilities 28,120 46,000 30,000 43,000M&R - Machinery & Equipment 7,967 9,000 9,000 9,000M&R - Motor Vehicles 4,970 5,600 4,600 4,600M&R - Communications Equipment 1,658 2,200 2,320 2,200Major Repairs & Replacements 18,457 15,135 15,135 15,135Laundry Services 3,314 2,400 2,400 2,400Solid Waste Disposal Services 1,650 1,320 1,320 1,320MO DNR Fees 0 150 150 150Special Contributions 145 500 1,000 2,000Other Services 6,498 6,600 6,600 6,200
571,685 493,774 482,705 141,154Other Charges
Insurance/Judgement & Claims 23,574 16,298 23,895 23,274Transfer to General Fund 90,655 90,655 2,005 2,005Transfer to General Fund - Computer 4,360 4,360 5,450 4,360
118,589 111,313 31,350 29,639Capital Outlay & Public Improvements
Improvements other than Buildings 62,781 4,580,122 25,000 5,000
62,781 4,580,122 25,000 5,000
Total 1,133,765 5,628,039 904,829 618,022
11 - 69
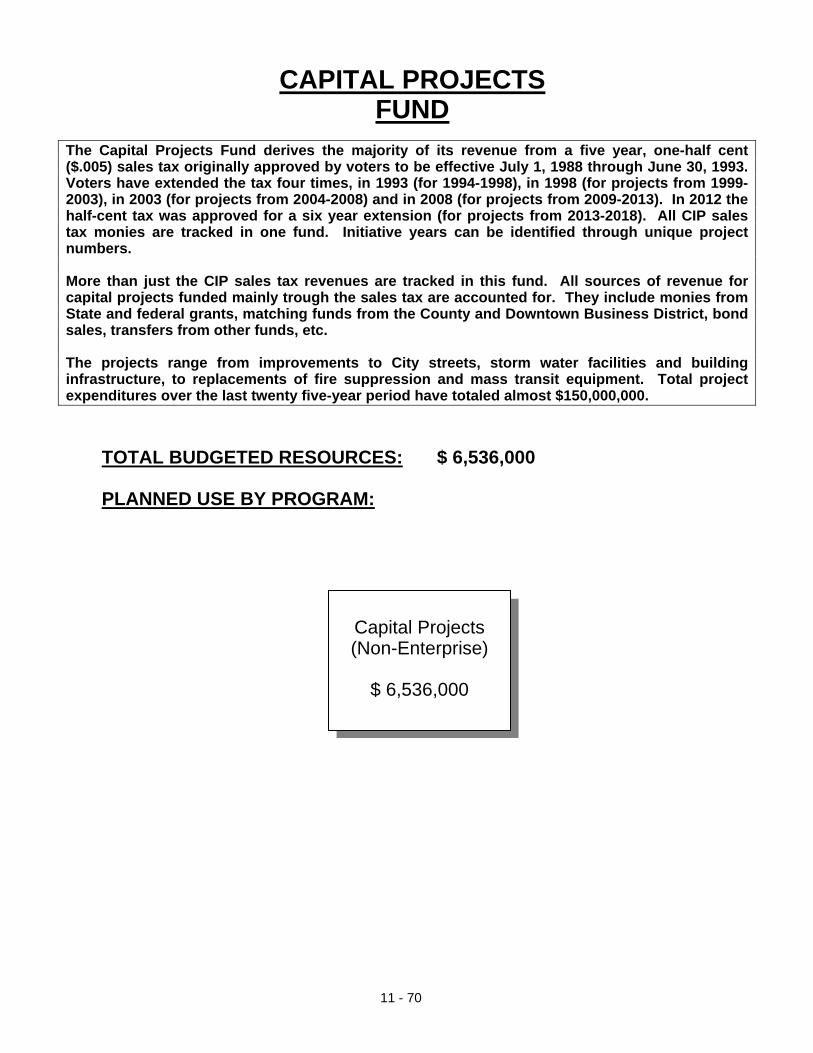
11 - 70
The Capital Projects Fund derives the majority of its revenue from a five year, one-half cent ($.005) sales tax originally approved by voters to be effective July 1, 1988 through June 30, 1993. Voters have extended the tax four times, in 1993 (for 1994-1998), in 1998 (for projects from 1999-2003), in 2003 (for projects from 2004-2008) and in 2008 (for projects from 2009-2013). In 2012 the half-cent tax was approved for a six year extension (for projects from 2013-2018). All CIP sales tax monies are tracked in one fund. Initiative years can be identified through unique project numbers. More than just the CIP sales tax revenues are tracked in this fund. All sources of revenue for capital projects funded mainly trough the sales tax are accounted for. They include monies from State and federal grants, matching funds from the County and Downtown Business District, bond sales, transfers from other funds, etc. The projects range from improvements to City streets, storm water facilities and building infrastructure, to replacements of fire suppression and mass transit equipment. Total project expenditures over the last twenty five-year period have totaled almost $150,000,000.
TOTAL BUDGETED RESOURCES: $ 6,536,000 PLANNED USE BY PROGRAM:
CAPITAL PROJECTS FUND
Capital Projects (Non-Enterprise)
$ 6,536,000
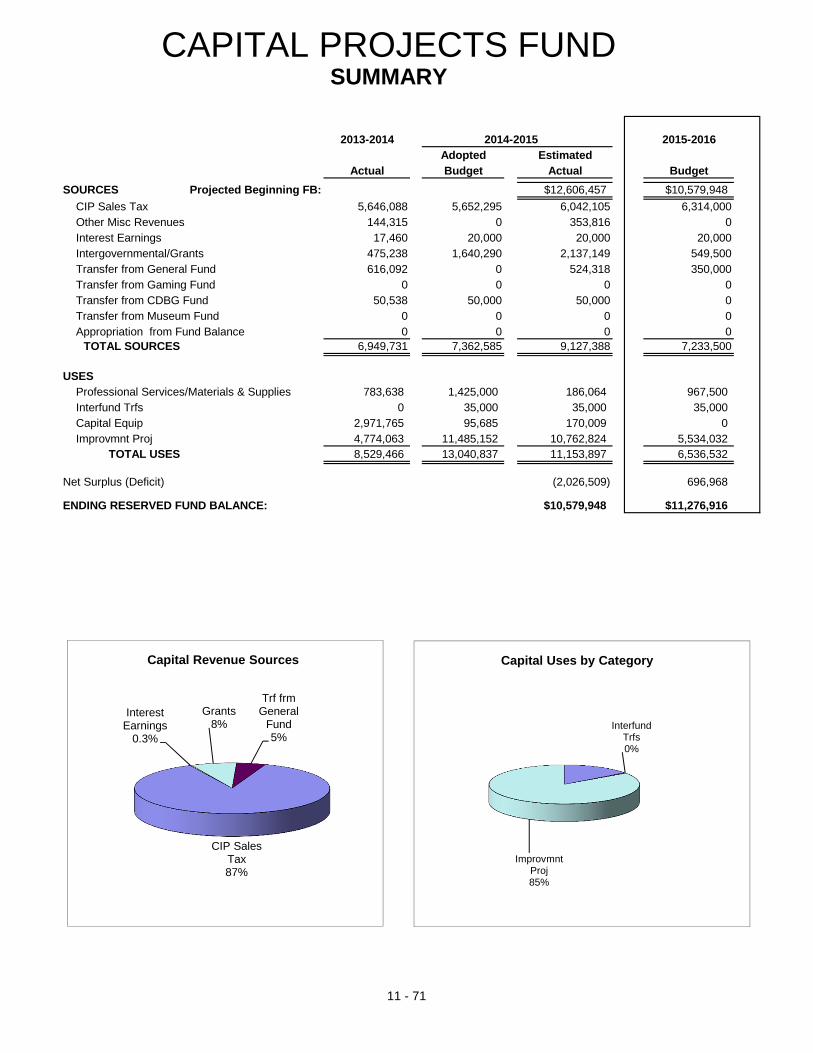
CAPITAL PROJECTS FUNDSUMMARY
2013-2014 2014-2015 2015-2016Adopted Estimated
Actual Budget Actual BudgetSOURCES Projected Beginning FB: $12,606,457 $10,579,948
CIP Sales Tax 5,646,088 5,652,295 6,042,105 6,314,000Other Misc Revenues 144,315 0 353,816 0Interest Earnings 17,460 20,000 20,000 20,000Intergovernmental/Grants 475,238 1,640,290 2,137,149 549,500Transfer from General Fund 616,092 0 524,318 350,000Transfer from Gaming Fund 0 0 0 0Transfer from CDBG Fund 50,538 50,000 50,000 0Transfer from Museum Fund 0 0 0 0Appropriation from Fund Balance 0 0 0 0
TOTAL SOURCES 6,949,731 7,362,585 9,127,388 7,233,500
USESProfessional Services/Materials & Supplies 783,638 1,425,000 186,064 967,500Interfund Trfs 0 35,000 35,000 35,000Capital Equip 2,971,765 95,685 170,009 0Improvmnt Proj 4,774,063 11,485,152 10,762,824 5,534,032
TOTAL USES 8,529,466 13,040,837 11,153,897 6,536,532
Net Surplus (Deficit) (2,026,509) 696,968
ENDING RESERVED FUND BALANCE: $10,579,948 $11,276,916
CIP Sales Tax 87%
Interest Earnings
0.3%
Grants8%
Trf frm General
Fund5%
Capital Revenue Sources
Interfund Trfs0%
Improvmnt Proj85%
Capital Uses by Category
11 - 71
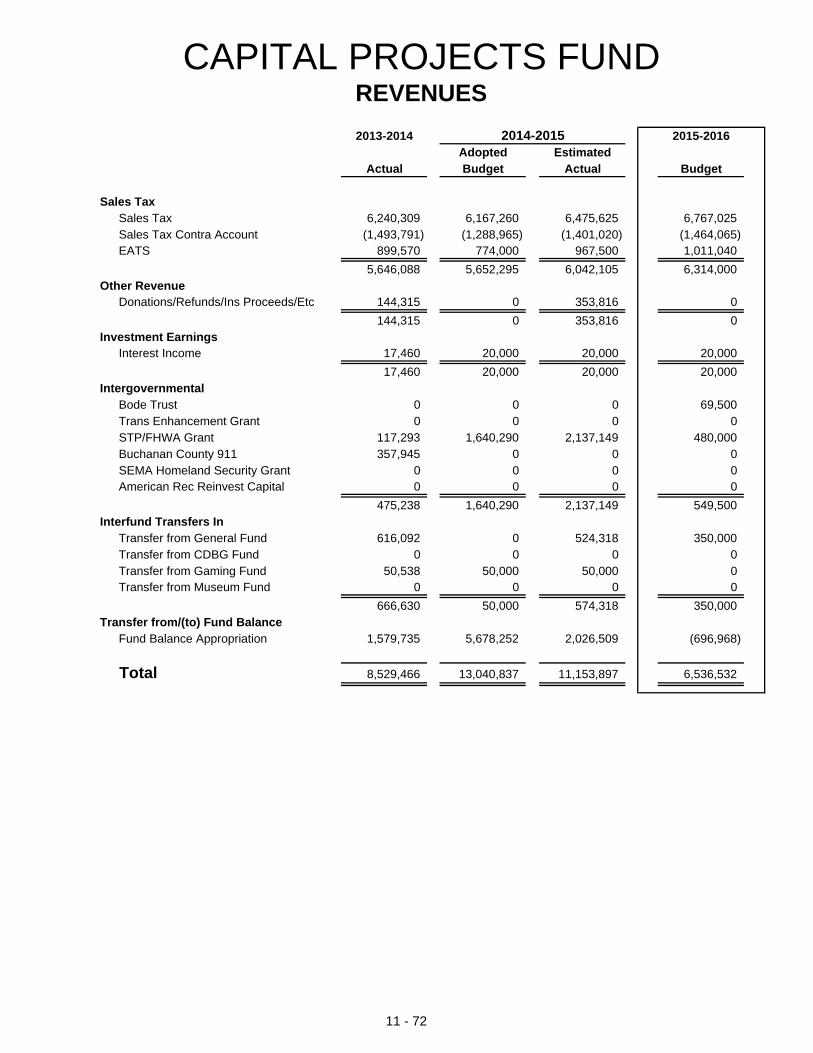
CAPITAL PROJECTS FUNDREVENUES2013-2014 2014-2015 2015-2016
Adopted Estimated Actual Budget Actual Budget
Sales TaxSales Tax 6,240,309 6,167,260 6,475,625 6,767,025Sales Tax Contra Account (1,493,791) (1,288,965) (1,401,020) (1,464,065)EATS 899,570 774,000 967,500 1,011,040
5,646,088 5,652,295 6,042,105 6,314,000Other Revenue
Donations/Refunds/Ins Proceeds/Etc 144,315 0 353,816 0
144,315 0 353,816 0Investment Earnings
Interest Income 17,460 20,000 20,000 20,000
17,460 20,000 20,000 20,000Intergovernmental
Bode Trust 0 0 0 69,500Trans Enhancement Grant 0 0 0 0STP/FHWA Grant 117,293 1,640,290 2,137,149 480,000Buchanan County 911 357,945 0 0 0SEMA Homeland Security Grant 0 0 0 0American Rec Reinvest Capital 0 0 0 0
475,238 1,640,290 2,137,149 549,500Interfund Transfers In
Transfer from General Fund 616,092 0 524,318 350,000Transfer from CDBG Fund 0 0 0 0Transfer from Gaming Fund 50,538 50,000 50,000 0Transfer from Museum Fund 0 0 0 0
666,630 50,000 574,318 350,000Transfer from/(to) Fund Balance
Fund Balance Appropriation 1,579,735 5,678,252 2,026,509 (696,968)
Total 8,529,466 13,040,837 11,153,897 6,536,532
11 - 72
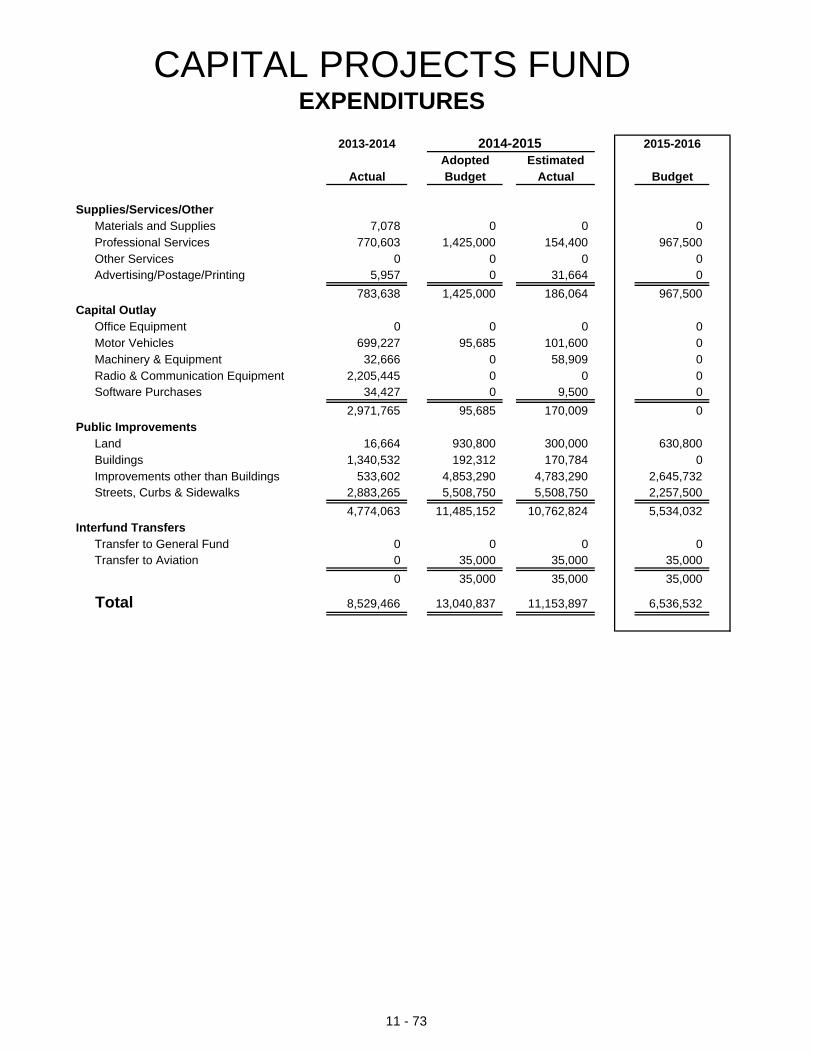
CAPITAL PROJECTS FUNDEXPENDITURES
2013-2014 2014-2015 2015-2016Adopted Estimated
Actual Budget Actual Budget
Supplies/Services/OtherMaterials and Supplies 7,078 0 0 0Professional Services 770,603 1,425,000 154,400 967,500Other Services 0 0 0 0Advertising/Postage/Printing 5,957 0 31,664 0
783,638 1,425,000 186,064 967,500Capital Outlay
Office Equipment 0 0 0 0Motor Vehicles 699,227 95,685 101,600 0Machinery & Equipment 32,666 0 58,909 0Radio & Communication Equipment 2,205,445 0 0 0Software Purchases 34,427 0 9,500 0
2,971,765 95,685 170,009 0Public Improvements
Land 16,664 930,800 300,000 630,800Buildings 1,340,532 192,312 170,784 0Improvements other than Buildings 533,602 4,853,290 4,783,290 2,645,732Streets, Curbs & Sidewalks 2,883,265 5,508,750 5,508,750 2,257,500
4,774,063 11,485,152 10,762,824 5,534,032Interfund Transfers
Transfer to General Fund 0 0 0 0Transfer to Aviation 0 35,000 35,000 35,000
0 35,000 35,000 35,000
Total 8,529,466 13,040,837 11,153,897 6,536,532
11 - 73
12 - 1
Debt
This section includes financial data on current debt obligations and describes the relationship between current debt levels and legal debt limits. Detailed information of type and amount of debt by fund is included.
• Municipal Debt - Discussion • Legal Debt Margin Determination • Summary of Existing Municipal Debt • Future Debt Service – Each Type by Fund
MUNICIPAL DEBT DISCUSSION
12 - 3
Debt Management
The City of St. Joseph’s primary objective in debt management is to keep the level of indebtedness within available resources as well as within the legal debt limitations established by Missouri Law, at a minimum cost to the taxpayer.
The City issues and incurs debt in order to fund capital improvement projects, purchase major capital equipment facilities, and respond to other special funding needs. Total municipal debt issued and outstanding is $124,521,468 with maturities extending through the year 2036. Total principal and interest payments through maturity totals $176,839,896. Of this total, $54,150,000 in principal and $24,075,328 in interest represent bonds issued in conjunction with, and paid with revenues generated by, Tax Increment Financing projects. The following is a discussion of common types of municipal debt instruments used by the City, their legal basis, and types of projects for which they can be used.
Types of Municipal Debt
Public Building Authority (PBA) Bonds The Public Building Authority issues bonds to investors using the bond proceeds to construct/improve facilities or purchase equipment. These assets are leased to the City under an arrangement where the lease payments to the Authority equal the bond payments to investors. Leases between the Authority and the City do not require voter authorization and are subject to annual appropriation of funds by the City Council. The leases are not considered “bonds” of the City for purposes of applying statutory bond limits. The Authority is considered the issuer of the bonds and holds title to the asset during the term of the lease. The City has entered into twelve individual facility and equipment lease agreements with the Authority for facilities such as parking garage repairs, downtown mall removal, Patee Market renovations, public safety communications systems equipment, heating and air conditioning systems, and various computer equipment. To take advantage of the low interest rates available in 2004, the City refinanced its PBA bonds for a total savings in future interest of $100,800. Final payments of the PBA Bonds occurred in FY2014 and no new issues expected during the Fiscal Year.
Special Obligation (S.O.) Capital Improvement Bonds Special Obligation Bonds are issued directly by the City of St. Joseph and do not require voter authorization. They are subject to annual appropriation of funds by the City Council and in relation to smaller Public Authority Bond (PBA) offerings, have lower issuance costs. No collateral is pledged to secure S.O. bonds, which are not considered “bonds” when applying statutory bond limits. Total principal of S.O. Bonds outstanding at July 1, 2010, is $0. The final payment occurred in FY2008 in the Golf Fund. No new issues are planned for the Fiscal Year.
Revenue Bonds Revenue Bonds require voter authorization of 2/3rds or 4/7ths majority and are used to fund capital facility costs. Bond repayment is secured solely from the earnings generated by the facility constructed or improved with the bond proceeds. The identified revenue stream is pledged for repayment of the bonds. In 1992 voters authorized, $19.6 million in revenue bonds for improvements at the Water Protection Facility. These bonds were issued under the Missouri Leveraged State Water Pollution Control Revolving Fund Program established by the State Environmental Improvement and Energy Resources Authority (EIERA) in cooperation with the Missouri Department of Natural Resources and the Missouri Clean Water Commission. The EIERA bond issuance program allows the City to benefit from reduced interest rates. In FY 1999 the City undertook the advance refunding of the 1992 Series Sewerage Bonds. The substantially lower coupon interest rates of the issue, now paid off, saved the City a $387,136 in debt service. The remaining $750,000 in EIERA bonds authorized for issuance was sold August
MUNICIPAL DEBT DISCUSSION
12 - 4
2003 and is being used in the Triumph Food TIF project. Revenue Bonds outstanding at July 1, 2014, total $2,730,000. On April 5th, 2011, St. Joseph City voters approved issuance of Sewer Revenue Bonds up to the maximum amount of $105 million. Sale of the first set of bonds under the auspices of the MDFB (see below), in the amount of $32,400,000 was issued in May 2011. In 2012 the next bond sale, done as a part of the State’s SRF program, was completed for $14,660,000. SRF financing totaling $56,000,000 was finalized in spring of FY14. Another set of SRF, or other bond financing, will be needed in early FY15 to fund the upcoming necessary mandated projects.
General Obligation (G.O.) Bonds The Missouri State Constitution permits a city, by vote of 2/3rds or 4/7ths majority, to incur general obligation indebtedness for “city purposes” in an amount not to exceed 10% of the assessed value of taxable tangible property. Additional bonded indebtedness equal to an additional 10% of the assessed value may be issued for the purpose of acquiring right-of-way, construction, extending and improving streets and avenues and/or sanitary sewer systems. Additional bonded indebtedness equal to 10% of the assessed value may be issued for purchasing or constructing waterworks, and electric or other light plants. All such indebtedness may not exceed 20% of the assessed value of taxable tangible property. Total assessed valuation of taxable property at January 1, 2014, is $980,423,320 and the legal debt margin is $196,084,664.
The City irrevocably appropriates and pledges property tax receipts in an amount sufficient to pay debt service; principal, interest and related expenditures, on any outstanding general obligation bonds. In the event that receipts pledged are not sufficient to pay these obligations, the City is obligated to levy additional property taxes sufficient to make debt service payments. Repayment of the G.O. Bonds is secured by the full faith and credit of the City. There is consideration of going to the voters for approval on a G.O. Bond for street improvements, but no firm date has been determined.
Capital Lease Obligations The City regularly enters into capital lease arrangements for the purchase of machinery, heavy equipment, and computers. Provisions of the lease arrangements include fixed monthly payments over the lease term and a bargain purchase option of $1 at the end of the lease period. The lease agreements do not require voter approval and are subject to annual appropriation of funds by the City Council. The City’s seven current capital lease arrangements have an outstanding balance of $357,820 and are scheduled to be paid out by FY2018.
Other Debt – Current Bond Rating: AA+
• MDFB Infrastructure Improvement Loans. February 17, 2004, the Missouri Development Finance Board authorized issuance of a series of infrastructure facilities improvement bonds and to loan the proceeds of those bonds to the City for projects relating to improving the City sewer system’s capacity as well as several Tax Increment Financing (TIF) Redevelopment agreements. • Stockyards Redevelopment Project - MDFB Series 2004A - $9,170,000 issued and
the loan proceeds used to fund $7,000,000 of TIF reimbursable expenditures. $5.6 million were used to reimburse a portion of the acquisition and demolition costs incurred by Triumph Foods, LLC, as approved in the Redevelopment Agreement with that company. $1.4 million used to cover costs of certain traffic and
MUNICIPAL DEBT DISCUSSION
12 - 5
infrastructure improvements related to the project. This issue was refinanced in 2011 for an estimated interest savings of $1.7 million over the span of the debt. TIF Incremental tax revenues and Chapter 100 PILOTS are used to pay the debt service on this loan which extends to 2030.
• Stockyards Redevelopment Project – The original MDFB Series 2004B issued $10,475,000 and the loan proceeds used to fund $7.0 million of the cost of on-site wastewater treatment facility at Triumph Foods. $1.497 million is being used toward a portion of the $10.5 million capacity and process improvements being made at the City’s wastewater treatment plant. With favorable interest rates, this series was refinanced in 2012 for significant interest payments. Triumph Foods will be making Sewer Reserve Charge payments to the City in an amount to cover the debt service on this loan which extends to 2024.
• Sewerage System Improvements Project – MDFB Series 2004C issued $11,720,000 and the loan proceeds used to fund the remaining $9.6 million of the capacity and process improvement project at the City’s wastewater treatment plant. Project costs are also being covered by a $1,000,000 contribution by Buchanan County and through several EPA grants. $700,000 was used as a grant from the City to Triumph Foods in order for the company to purchase its portion of a $3.5 million BUILD Missouri bond issue in late Spring 2005. Debt service payments extend to 2025 and will be covered by revenues from the Sewer Fund and from monies generated by the tax credits from the Missouri BUILD program.
• Public Safety Improvements Project – MDFB Series 2004D - $6,860,000 issue and the loan proceeds used to fund several public safety projects within the City. $3.530 million was used as the City’s portion of the new $8.4 million pubic safety communications system. Buchanan County and Heartland Hospital share in the cost of the total project. $905,000 was used in the purchase of two fire pumpers. Debt service for these two projects was spread over the last three years of the currently authorized CIP Sales Tax and was retired in 2008. The remaining $2.425 million went towards the City’s portion of the $5.7 million expansion at the Law Enforcement Center. Debt service payments are coming from the City’s General Fund and will be retired in 2024.
• In May 2011 the MDFB authorized a $22,275,000 issue (Series 2011E) to cover the planning and construction of the new disinfection system required at the water protection plant. Debt on this loan extends to 2036 and is covered by sewer system revenues.
• IDA Tax Increment Revenue Bonds
In March 2005 the Industrial Development Authority of St. Joseph (IDA) authorized the issuance of a series of bonds relating to the North County Redevelopment Project. • Shoppes at North Village Project – IDA Series 2005A - $26,000,000 issue and the
proceeds used to fund a portion of the TIF reimbursable expenditures for this project. A portion of the $22.112 million issue will go to repaying the City of St. Joseph and Buchanan County for infrastructure improvements made for the Shoppes project. This includes extension and improvement of the Northridge sewer lines and construction of the four-lane parkway through the development. TIF Incremental PILOTS and EATS revenues will be used to pay the debt service on this loan which extends to 2028.
• Shoppes at North Village Project – IDA Series 2005B - $16,985,000 issue and the proceeds used to fund the remainder of the developer’s TIF reimbursable expenditures. TIF Incremental PILOTS and EATS revenues will be used to pay the debt service on this loan which extends to 2028.

MUNICIPAL DEBT DISCUSSION
12 - 6
In April 2007 the IDA authorized the issuance of $5,110,000 in TIF bonds relating to the Mitchell Avenue Redevelopment Project. The bonds were purchased by the American Family Insurance Company, the “developer” of that TIF. PILOTS are repaying the debt which extends to 2027.
Financial Impact of Municipal Debt on Operating Budgets
With the exception of the TIF-related bond issues, all future debt service payments must come from operating funds. As a result, debt service requirements are an important consideration when preparing annual operating budgets.
GENERAL OBLIGATION BOND INDEBTEDNESSLEGAL DEBT MARGIN DETERMINATION
Assessed Valuation at January 1, 2014 $980,423,321
Legal Debt Margin: Any Legal "City Purpose" - Art. VI, Sec 26b Debt Limitation at 5% of assessed valuation......................................................... $49,021,166
Additional Debt Margin: Any Legal "City Purpose" - Art. VI. Sec 26c Debt Limitation at 5% of assessed valuation......................................................... $49,021,166
Legal Debt Margin: Streets, Storm or Sanitary Sewers - Art VI. Sec 26d Debt Limitation at 10% of assessed valuation....................................................... $98,042,332
Debt Applicable to Limitation: Total General Obligation Bonded debt ...................................... $0 Less amount available in Debt Service Fund…….. 0
0
Legal Debt Margin $196,084,664
The City, by agreement, has irrevocably appropriated and pledged property tax receipts in an amountsufficient to pay principal and interest on the outstanding general obligation bonds. In the event that receiptspledged are not sufficient to pay these obligations, the City is obligated to levy additional property taxessufficient to pay these debts.
The Missouri State Constitution permits a City, by vote of two-thirds of the voting electorate, to incur generalobligation indebtedness for "City Purposes" not to exceed 10% of the assessed value of taxable tangibleproperty; and to incur additional general obligation indebtedness not to exceed, in the aggregate, an additional10% of the assessed value of taxable tangible property, for the purpose of acquiring right-of-way,construction, extending and improving streets and avenues and/or sanitary or storm sewer systems; and anadditional 10% for purchasing or constructing waterworks, electric or other light plants, provided that the totalgeneral obligation indebtedness of the City does not exceed 20% of the assessed valuation of taxableproperty.
12 - 7
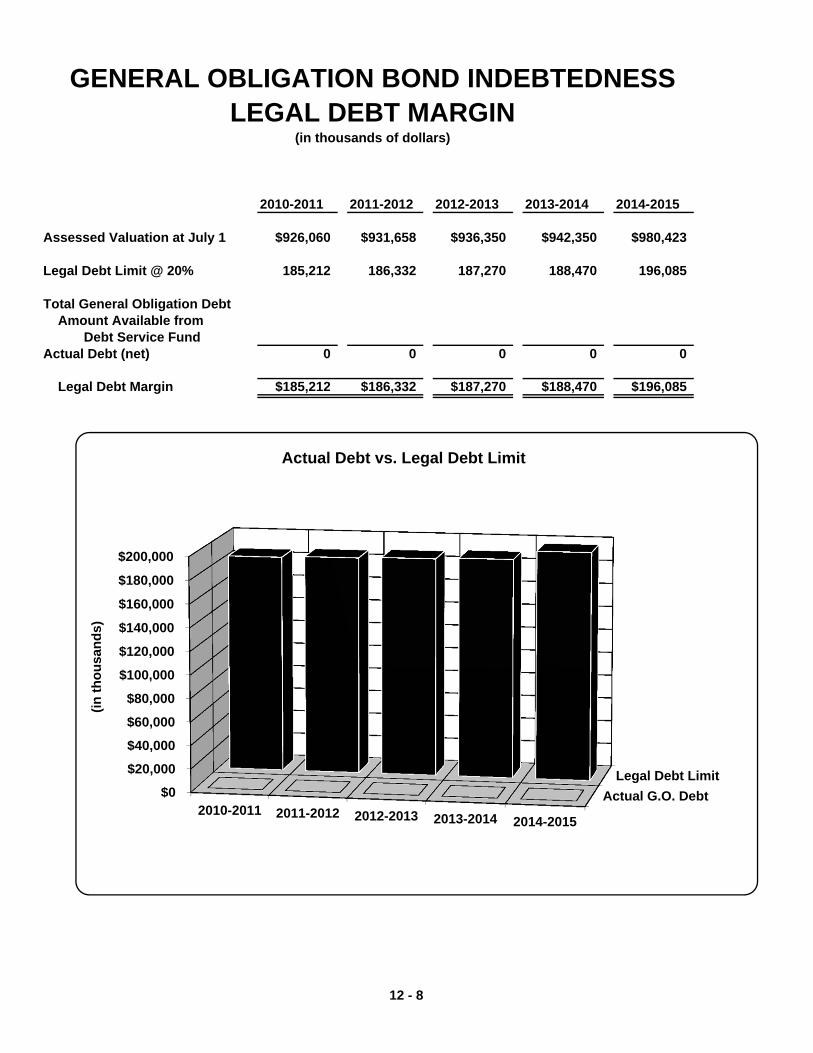
GENERAL OBLIGATION BOND INDEBTEDNESSLEGAL DEBT MARGIN
(in thousands of dollars)
2010-2011 2011-2012 2012-2013 2013-2014 2014-2015
Assessed Valuation at July 1 $926,060 $931,658 $936,350 $942,350 $980,423
Legal Debt Limit @ 20% 185,212 186,332 187,270 188,470 196,085
Total General Obligation Debt Amount Available from Debt Service FundActual Debt (net) 0 0 0 0 0
Legal Debt Margin $185,212 $186,332 $187,270 $188,470 $196,085
Actual G.O. DebtLegal Debt Limit
$0
$20,000
$40,000
$60,000
$80,000
$100,000
$120,000
$140,000
$160,000
$180,000
$200,000
2010-2011 2011-2012 2012-2013 2013-2014 2014-2015
Actual Debt vs. Legal Debt Limit
(in th
ousa
nds)
12 - 8
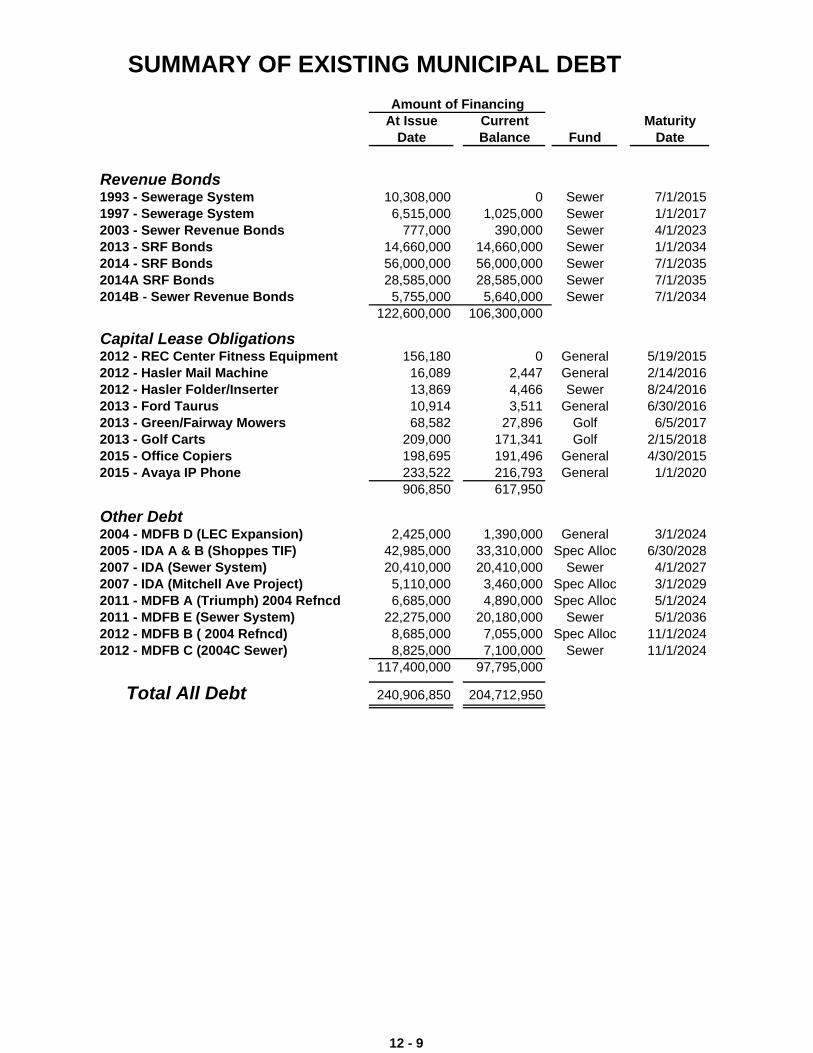
SUMMARY OF EXISTING MUNICIPAL DEBTAmount of Financing
At Issue Current MaturityDate Balance Fund Date
Revenue Bonds1993 - Sewerage System 10,308,000 0 Sewer 7/1/20151997 - Sewerage System 6,515,000 1,025,000 Sewer 1/1/20172003 - Sewer Revenue Bonds 777,000 390,000 Sewer 4/1/20232013 - SRF Bonds 14,660,000 14,660,000 Sewer 1/1/20342014 - SRF Bonds 56,000,000 56,000,000 Sewer 7/1/20352014A SRF Bonds 28,585,000 28,585,000 Sewer 7/1/20352014B - Sewer Revenue Bonds 5,755,000 5,640,000 Sewer 7/1/2034
122,600,000 106,300,000
Capital Lease Obligations2012 - REC Center Fitness Equipment 156,180 0 General 5/19/20152012 - Hasler Mail Machine 16,089 2,447 General 2/14/20162012 - Hasler Folder/Inserter 13,869 4,466 Sewer 8/24/20162013 - Ford Taurus 10,914 3,511 General 6/30/20162013 - Green/Fairway Mowers 68,582 27,896 Golf 6/5/20172013 - Golf Carts 209,000 171,341 Golf 2/15/20182015 - Office Copiers 198,695 191,496 General 4/30/20152015 - Avaya IP Phone 233,522 216,793 General 1/1/2020
906,850 617,950
Other Debt2004 - MDFB D (LEC Expansion) 2,425,000 1,390,000 General 3/1/20242005 - IDA A & B (Shoppes TIF) 42,985,000 33,310,000 Spec Alloc 6/30/20282007 - IDA (Sewer System) 20,410,000 20,410,000 Sewer 4/1/20272007 - IDA (Mitchell Ave Project) 5,110,000 3,460,000 Spec Alloc 3/1/20292011 - MDFB A (Triumph) 2004 Refncd 6,685,000 4,890,000 Spec Alloc 5/1/20242011 - MDFB E (Sewer System) 22,275,000 20,180,000 Sewer 5/1/20362012 - MDFB B ( 2004 Refncd) 8,685,000 7,055,000 Spec Alloc 11/1/20242012 - MDFB C (2004C Sewer) 8,825,000 7,100,000 Sewer 11/1/2024
117,400,000 97,795,000
Total All Debt 240,906,850 204,712,950
12 - 9
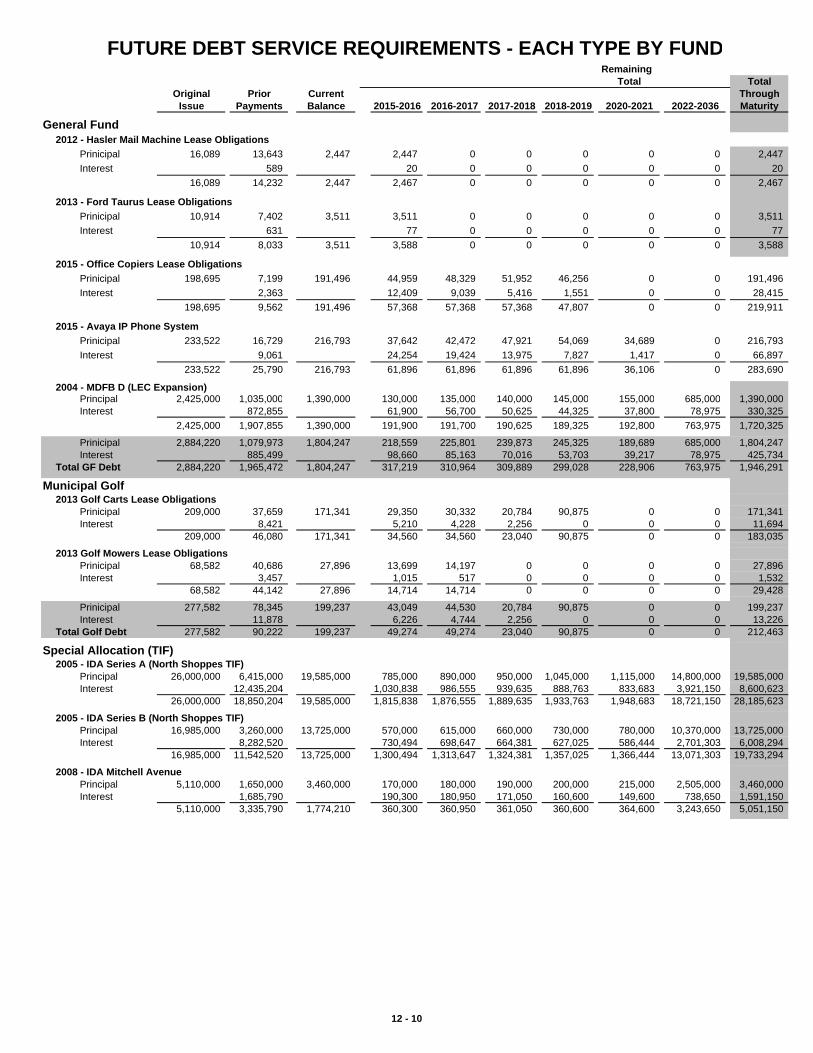
FUTURE DEBT SERVICE REQUIREMENTS - EACH TYPE BY FUNDRemaining
Total TotalOriginal Prior Current Through
Issue Payments Balance 2015-2016 2016-2017 2017-2018 2018-2019 2020-2021 2022-2036 Maturity
General Fund 2012 - Hasler Mail Machine Lease Obligations
Prinicipal 16,089 13,643 2,447 2,447 0 0 0 0 0 2,447
Interest 589 20 0 0 0 0 0 20
16,089 14,232 2,447 2,467 0 0 0 0 0 2,467
2013 - Ford Taurus Lease ObligationsPrinicipal 10,914 7,402 3,511 3,511 0 0 0 0 0 3,511
Interest 631 77 0 0 0 0 0 77
10,914 8,033 3,511 3,588 0 0 0 0 0 3,588
2015 - Office Copiers Lease ObligationsPrinicipal 198,695 7,199 191,496 44,959 48,329 51,952 46,256 0 0 191,496
Interest 2,363 12,409 9,039 5,416 1,551 0 0 28,415
198,695 9,562 191,496 57,368 57,368 57,368 47,807 0 0 219,911
2015 - Avaya IP Phone SystemPrinicipal 233,522 16,729 216,793 37,642 42,472 47,921 54,069 34,689 0 216,793
Interest 9,061 24,254 19,424 13,975 7,827 1,417 0 66,897
233,522 25,790 216,793 61,896 61,896 61,896 61,896 36,106 0 283,690
2004 - MDFB D (LEC Expansion)Principal 2,425,000 1,035,000 1,390,000 130,000 135,000 140,000 145,000 155,000 685,000 1,390,000Interest 872,855 61,900 56,700 50,625 44,325 37,800 78,975 330,325
2,425,000 1,907,855 1,390,000 191,900 191,700 190,625 189,325 192,800 763,975 1,720,325
Prinicipal 2,884,220 1,079,973 1,804,247 218,559 225,801 239,873 245,325 189,689 685,000 1,804,247Interest 885,499 98,660 85,163 70,016 53,703 39,217 78,975 425,734
Total GF Debt 2,884,220 1,965,472 1,804,247 317,219 310,964 309,889 299,028 228,906 763,975 1,946,291
Municipal Golf 2013 Golf Carts Lease Obligations
Prinicipal 209,000 37,659 171,341 29,350 30,332 20,784 90,875 0 0 171,341Interest 8,421 5,210 4,228 2,256 0 0 0 11,694
209,000 46,080 171,341 34,560 34,560 23,040 90,875 0 0 183,035
2013 Golf Mowers Lease ObligationsPrinicipal 68,582 40,686 27,896 13,699 14,197 0 0 0 0 27,896Interest 3,457 1,015 517 0 0 0 0 1,532
68,582 44,142 27,896 14,714 14,714 0 0 0 0 29,428
Prinicipal 277,582 78,345 199,237 43,049 44,530 20,784 90,875 0 0 199,237Interest 11,878 6,226 4,744 2,256 0 0 0 13,226
Total Golf Debt 277,582 90,222 199,237 49,274 49,274 23,040 90,875 0 0 212,463
Special Allocation (TIF)2005 - IDA Series A (North Shoppes TIF)
Principal 26,000,000 6,415,000 19,585,000 785,000 890,000 950,000 1,045,000 1,115,000 14,800,000 19,585,000Interest 12,435,204 1,030,838 986,555 939,635 888,763 833,683 3,921,150 8,600,623
26,000,000 18,850,204 19,585,000 1,815,838 1,876,555 1,889,635 1,933,763 1,948,683 18,721,150 28,185,623
2005 - IDA Series B (North Shoppes TIF)Principal 16,985,000 3,260,000 13,725,000 570,000 615,000 660,000 730,000 780,000 10,370,000 13,725,000Interest 8,282,520 730,494 698,647 664,381 627,025 586,444 2,701,303 6,008,294
16,985,000 11,542,520 13,725,000 1,300,494 1,313,647 1,324,381 1,357,025 1,366,444 13,071,303 19,733,294
2008 - IDA Mitchell AvenuePrincipal 5,110,000 1,650,000 3,460,000 170,000 180,000 190,000 200,000 215,000 2,505,000 3,460,000Interest 1,685,790 190,300 180,950 171,050 160,600 149,600 738,650 1,591,150
5,110,000 3,335,790 1,774,210 360,300 360,950 361,050 360,600 364,600 3,243,650 5,051,150
12 - 10
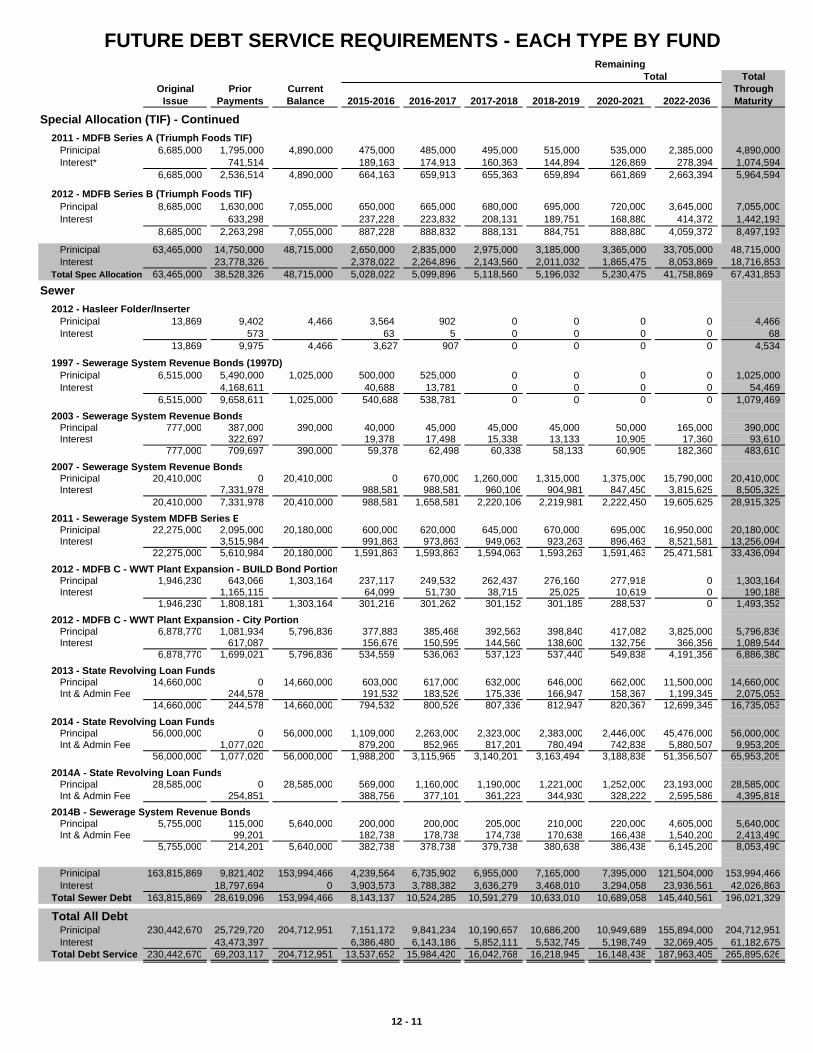
FUTURE DEBT SERVICE REQUIREMENTS - EACH TYPE BY FUNDRemaining
Total TotalOriginal Prior Current Through
Issue Payments Balance 2015-2016 2016-2017 2017-2018 2018-2019 2020-2021 2022-2036 Maturity
Special Allocation (TIF) - Continued2011 - MDFB Series A (Triumph Foods TIF)
Prinicipal 6,685,000 1,795,000 4,890,000 475,000 485,000 495,000 515,000 535,000 2,385,000 4,890,000Interest* 741,514 189,163 174,913 160,363 144,894 126,869 278,394 1,074,594
6,685,000 2,536,514 4,890,000 664,163 659,913 655,363 659,894 661,869 2,663,394 5,964,594
2012 - MDFB Series B (Triumph Foods TIF)Principal 8,685,000 1,630,000 7,055,000 650,000 665,000 680,000 695,000 720,000 3,645,000 7,055,000Interest 633,298 237,228 223,832 208,131 189,751 168,880 414,372 1,442,193
8,685,000 2,263,298 7,055,000 887,228 888,832 888,131 884,751 888,880 4,059,372 8,497,193
Prinicipal 63,465,000 14,750,000 48,715,000 2,650,000 2,835,000 2,975,000 3,185,000 3,365,000 33,705,000 48,715,000Interest 23,778,326 2,378,022 2,264,896 2,143,560 2,011,032 1,865,475 8,053,869 18,716,853
Total Spec Allocation 63,465,000 38,528,326 48,715,000 5,028,022 5,099,896 5,118,560 5,196,032 5,230,475 41,758,869 67,431,853
Sewer2012 - Hasleer Folder/Inserter
Prinicipal 13,869 9,402 4,466 3,564 902 0 0 0 0 4,466Interest 573 63 5 0 0 0 0 68
13,869 9,975 4,466 3,627 907 0 0 0 0 4,534
1997 - Sewerage System Revenue Bonds (1997D)Prinicipal 6,515,000 5,490,000 1,025,000 500,000 525,000 0 0 0 0 1,025,000Interest 4,168,611 40,688 13,781 0 0 0 0 54,469
6,515,000 9,658,611 1,025,000 540,688 538,781 0 0 0 0 1,079,469
2003 - Sewerage System Revenue BondsPrincipal 777,000 387,000 390,000 40,000 45,000 45,000 45,000 50,000 165,000 390,000Interest 322,697 19,378 17,498 15,338 13,133 10,905 17,360 93,610
777,000 709,697 390,000 59,378 62,498 60,338 58,133 60,905 182,360 483,610
2007 - Sewerage System Revenue BondsPrinicipal 20,410,000 0 20,410,000 0 670,000 1,260,000 1,315,000 1,375,000 15,790,000 20,410,000Interest 7,331,978 988,581 988,581 960,106 904,981 847,450 3,815,625 8,505,325
20,410,000 7,331,978 20,410,000 988,581 1,658,581 2,220,106 2,219,981 2,222,450 19,605,625 28,915,325
2011 - Sewerage System MDFB Series EPrinicipal 22,275,000 2,095,000 20,180,000 600,000 620,000 645,000 670,000 695,000 16,950,000 20,180,000Interest 3,515,984 991,863 973,863 949,063 923,263 896,463 8,521,581 13,256,094
22,275,000 5,610,984 20,180,000 1,591,863 1,593,863 1,594,063 1,593,263 1,591,463 25,471,581 33,436,094
2012 - MDFB C - WWT Plant Expansion - BUILD Bond PortionPrincipal 1,946,230 643,066 1,303,164 237,117 249,532 262,437 276,160 277,918 0 1,303,164Interest 1,165,115 64,099 51,730 38,715 25,025 10,619 0 190,188
1,946,230 1,808,181 1,303,164 301,216 301,262 301,152 301,185 288,537 0 1,493,352
2012 - MDFB C - WWT Plant Expansion - City PortionPrincipal 6,878,770 1,081,934 5,796,836 377,883 385,468 392,563 398,840 417,082 3,825,000 5,796,836Interest 617,087 156,676 150,595 144,560 138,600 132,756 366,356 1,089,544
6,878,770 1,699,021 5,796,836 534,559 536,063 537,123 537,440 549,838 4,191,356 6,886,380 2013 - State Revolving Loan Funds
Principal 14,660,000 0 14,660,000 603,000 617,000 632,000 646,000 662,000 11,500,000 14,660,000Int & Admin Fee 244,578 191,532 183,526 175,336 166,947 158,367 1,199,345 2,075,053
14,660,000 244,578 14,660,000 794,532 800,526 807,336 812,947 820,367 12,699,345 16,735,053
2014 - State Revolving Loan FundsPrincipal 56,000,000 0 56,000,000 1,109,000 2,263,000 2,323,000 2,383,000 2,446,000 45,476,000 56,000,000Int & Admin Fee 1,077,020 879,200 852,965 817,201 780,494 742,838 5,880,507 9,953,205
56,000,000 1,077,020 56,000,000 1,988,200 3,115,965 3,140,201 3,163,494 3,188,838 51,356,507 65,953,205
2014A - State Revolving Loan FundsPrincipal 28,585,000 0 28,585,000 569,000 1,160,000 1,190,000 1,221,000 1,252,000 23,193,000 28,585,000Int & Admin Fee 254,851 388,756 377,101 361,223 344,930 328,222 2,595,586 4,395,818
2014B - Sewerage System Revenue BondsPrincipal 5,755,000 115,000 5,640,000 200,000 200,000 205,000 210,000 220,000 4,605,000 5,640,000Int & Admin Fee 99,201 182,738 178,738 174,738 170,638 166,438 1,540,200 2,413,490
5,755,000 214,201 5,640,000 382,738 378,738 379,738 380,638 386,438 6,145,200 8,053,490
Prinicipal 163,815,869 9,821,402 153,994,466 4,239,564 6,735,902 6,955,000 7,165,000 7,395,000 121,504,000 153,994,466Interest 18,797,694 0 3,903,573 3,788,382 3,636,279 3,468,010 3,294,058 23,936,561 42,026,863
Total Sewer Debt 163,815,869 28,619,096 153,994,466 8,143,137 10,524,285 10,591,279 10,633,010 10,689,058 145,440,561 196,021,329
Total All DebtPrinicipal 230,442,670 25,729,720 204,712,951 7,151,172 9,841,234 10,190,657 10,686,200 10,949,689 155,894,000 204,712,951Interest 43,473,397 6,386,480 6,143,186 5,852,111 5,532,745 5,198,749 32,069,405 61,182,675
Total Debt Service 230,442,670 69,203,117 204,712,951 13,537,652 15,984,420 16,042,768 16,218,945 16,148,438 187,963,405 265,895,626
12 - 11
GLOSSARY
12 - 13
Accrual Accounting – A method of accounting in which revenues are recorded when measurable and earned, and expenses are recognized when a good or service is used. see also modified accrual accounting Acronym – An abbreviation used to stand for a phrase, compound word, name, etc. It is used to save space, to avoid repetition of long words and phrases, or simply to conform to conventional usage. The list of the most commonly used acronyms in the Budget Document includes: CAP Community Appearance Plan CDBG Community Development Block Grant (Fund) CIP Capital Improvement Plan (or Capital Improvement Project) depending on context EATS Economic Activity Taxes FB Fund Balance FY Fiscal Year GASB General Accounting Standards Board GFOA Government Finance Officer Association G.O. General Obligation (Bond) HUD (Department of) Housing and Urban Development IDA Industrial Development Authority LINC Linking Individuals, Neighborhoods & Community MDFB Missouri Development Finance Board MDNR Missouri Department of Natural Resources MoDOT Missouri Department of Transportation PILOTS Payment In Lieu of Taxes SIMR Street Improvement Maintenance & Repair (Fund) TIF Tax Increment Financing TDD Transportation Development District WIC Women, Infants and Children (federal grant program) WP Water Protection WWT Wastewater Treatment Ad Valorem Taxes - General Property Taxes levied on the assessed valuation of real and personal property. Annual Budget and Program of Services - The budget is a policy document, a financial plan, an operations guide, and a communications device covering a specified period of time. The City of St. Joseph prepares an annual operating budget matching planned revenues and expenditures to municipal services. The City's annual fiscal year budgeting period is from July 1 through June 30. Annual Period - Unless otherwise stated refers to the twelve-month fiscal year commencing July 1 and concluding June 30. see also fiscal year Appropriation - A legal authorization granted by the City Council permitting the City to incur obligations and to make expenditures of resources. Appropriation Ordinance - The official document adopted by the City Council establishing the legal authority to incur obligations and to make expenditures of resources. Assessed Valuation - The basis for determining property taxes. Assessed valuation determines the value of real and personal property. Personal property located in Missouri is assessed at 33% of its fair market value. Real estate property is assessed at 19%, 32%, and 12% of fair market value for residential, commercial, and agricultural property, respectively.
GLOSSARY
12 - 14
Bonded Debt - A form of borrowing (debt financing) which reflects a written promise from the City to repay a sum of money on a specific date at a specified interest rate. Bonds are used to finance large capital projects such as construction or repair of buildings, streets, and sewer infrastructure and purchase of high cost machinery and equipment. Budget Message - The letter of transmittal from the City Manager which provides the City Council and the public with the general summary of the most important aspects of the budget, changes from previous fiscal years, and his views and recommendations. Budgetary Control - The control or management of a governmental unit or enterprise in accordance with an approved budget for the purpose of keeping expenditures within the limitations of authorized appropriations and available revenues. Budgetary Units - Formal cost centers including programs, departments, and funds used for fiscal oversight, compliance, and control. Capital Asset Capitalization Policy - A set of self-imposed conditions required to capitalize and /or depreciate fixed assets purchased or constructed by the City. The purpose of the policy is to provide a reasonable basis for identifying and qualifying assets based on asset cost, estimated economic useful life, and related factors. Generally, infrastructure, assets costing less than $5,000, and assets having an estimated economic useful life of less than 1 year may not be capitalized because they do not warrant the effort of tracking and depreciating the asset. Capital Improvement Program - The Capital Improvement Program is a five-year plan providing a summary of proposed capital projects including project costs and related financing plan. A Capital Improvement Program document is prepared and updated annually. The document serves as a planning tool identifying projects based on assigned priorities and providing for the coordinated implementation of selected projects. Capital Improvement Programs are adopted by Council Resolution with or without amendment after a public hearing, on or before the last day of the month six months prior to the beginning of the fiscal year. Capital Lease Obligations - Capital Lease Obligations allow the City to acquire capital assets under fixed monthly payment arrangements over a specified lease term. Such lease Assets are considered City assets. Title to the assets transfers to the City at the end of the lease term and after payment of a one dollar ($1.00) bargain purchase option. Leases between the Vendor and the City do not require voter approval and are subject to annual appropriation by the City Council. Capital Outlay - Purchases of fixed assets having a value equal to or greater than five thousand dollars ($5,000) and having an estimated economic useful life of more than one (1) year. Examples of capital outlay include, but are not necessarily limited to office furniture and equipment, computer hardware and software, vehicles, machinery and equipment, and communications equipment. Capital Projects - Projects which are identified in the Capital Improvement Program document or the Annual Budget document and which are accounted for in either a Governmental or Proprietary Type Fund. The financial resources and expenditures of capital projects are generally kept separate from other municipal operations by coding such amounts to a CIP Project Program account in the appropriate fund. Capital Projects Fund - A Governmental Type Fund utilized to account for current financial resources and expenditures related to the acquisition, construction, or repair of capital projects other than those financed by Proprietary Type (Enterprise) Funds.
GLOSSARY
12 - 15
Civic Facilities - Refers to City owned Civic Arena and Missouri Theater facilities the operations and capital improvements of which are accounted for in the Parks, Recreation & Civic Facilities Fund. Community Development Block Grant (CDBG) - A Federal grant awarded to the City through the United States Department of Housing & Urban Development (HUD), whose objective is to provide decent housing, a suitable living environment and expanding economic opportunities for low to moderate income persons. Debt Service - Total annual payments of principal and interest on bonded indebtedness. Debt Service Fund - A Governmental Type Fund utilized to account for current property tax receipts the use of which is restricted for payment of the City's General Obligation (G.O.) Bond debt. Department - A major budgetary unit of organization in the City, which has been assigned overall management responsibility for an operation or a group of related operations and activities within a functional area. Departments are often comprised of one or more program reporting entities in one or more funds. Depreciation - A systematic adjustment to book value of a capital asset to recognize the decline in value of an asset due to usage, passage of time, and other similar factors. Depreciation, while required for generally accepted accounting purposes, is not a budgetary expenditure since it does not involve commitments for future expenditures of monies. Economic Activity Taxes – Commonly referred to as EATS, this is the term used in TIF projects to refer to 50% of the total additional revenue from taxes that are imposed by the City or other taxing districts, which are generated by economic activities (e.g., sales taxes, utility taxes) within the Redevelopment Area designated by the TIF Commission and approved by City Council. Encumbrance - Commitment related to an unperformed contract for goods and services. An encumbrance is evidenced by a purchase order and may not be used for any purpose other than that specified in the purchase order and/or related contract. Enterprise Funds - A Proprietary Type Fund utilized to account for operations and activities financed and operated in a manner similar to private sector business organizations. The costs (including depreciation) of providing goods or services to the general public are intended to be financed or recovered primarily through user charges. Six enterprise funds have been established the City including Aviation, Public Parking, Water Protection, Municipal Golf, Mass Transit, and Landfill. Expenditure/Expense - Funds paid or to be paid for acquisition of goods or services. Expenditure/Expense Detail - The line item total for each expenditure/expense account within a department and/or program. Fiscal Year - The twelve month period to which the operating budget applies. In St. Joseph, the fiscal year is from July 1 through June 30. see also annual period Franchise Fees - A franchise fee assessed major utility companies for the privilege of using public rights-of-way and property within the City limits. The City currently assesses franchise fees to St. Joseph Light & Power, KPL Gas Company, Southwestern Bell, Missouri-American Water Company, St. Joseph Cable Vision.
GLOSSARY
12 - 16
Function/Functional Classification - A high level of summarization used in the City's Annual Budget and Program of Services. Functional classification represents a grouping of related operations and activities which may cross organizational and formal budgetary unit boundaries. Functional classification, while not a formal budgetary unit, is aimed at providing information on a broad range of financial and performance data for related City services. Fund - A major budgetary unit with revenues and expenditures segregated to carrying-out specific activities. The City maintains fifteen funds for budgeting purposes which are broadly classified as either a government type fund or a proprietary type fund. The City's sixteen funds include General; Streets Maintenance; Parks Maintenance; Community Development Block Grant; Riverboat Gaming; Special Allocation; Museum Tax Initiatives; Debt Service; Aviation; Public Parking; Sewer; Municipal Golf; Mass Transit; Landfill; and Capital Project Funds. Fund Accounting - The accounts of the City are organized on the basis of funds, departments, and programs (budgetary units) and are used to demonstrate legal compliance and to aid in financial management by segregating financial transactions of various City functions and activities. Fund Balance - The amount by which the reported value of City assets exceeds the reported value of its liabilities in a particular Fund. Fund balance is reduced for appropriated expenditures and increased for recorded revenues. GASB 54 dictates the components of fund balance. The four components involving actual cash are:
• Restricted fund balance – Monies which have an externally enforceable limitation on use imposed by grantors, contributors, laws or regulations of other governments, constitutional provisions or enabling legislation.
• Committed fund balance – Monies which have self imposed limitations on use set in place by the City Council. Formal action by the Council is required to remove the limitation.
• Assigned fund balance – Monies with an intended use established by either the City Council or by the City Manager.
• Unassigned fund balance – formally referred to as “unrestricted”, this is the surplus of resources available in the general fund after any restricted, committed and/or assigned monies are deducted.
GASB 34 – A General Accounting Standards Board (GASB) standard issued in June 1999, requiring a new CAFR reporting model for all state and local entities. The model is designed to provide an analysis of government’s functions more closely resembling the financial statements of private commerce and industry. GASB 54 – See information under Fund Balance definition above. General Fund - A Governmental Type Fund in which all revenues and expenditures are accounted for, if not specifically allocated by law or contractual agreement, to another specific fund. With the exception of subvention or grant revenues restricted for specific uses, the General Fund resources can be utilized for any legitimate governmental purpose. Departments accounted for within the General Fund are Mayor & City Council, City Clerk, Municipal Court, City Manager, Personnel & Risk Management, Legal, Community Development Services, Financial Services, Technology & Communications, Customer Assistance, Police, Fire, Public Works, Parks Recreation & Civic Facilities, and Public Health. General Obligation (G.O.) Bonds - General Obligation bonds can be issued for any qualified "city purpose" in an amount not to exceed 20% of assessed value of taxable tangible property and are backed by the full faith and credit of the City. G.O. Bonds require voter approval of 2/3rds or 4/7ths majorities.
GLOSSARY
12 - 17
Goal – A long-term, continuing target of the organization. A broad statement of intended accomplishments and/or description of general conditions deemed desirable. Goal statements are specified at the fund, department and/or program level and communicated in the Annual Budget document. Governmental Type Fund - A fund having a measurement focus on current financial resources thereby eliminating the need for revenue and expenditure accruals. The City has four categories of Governmental Type Funds including the General Fund, Special Revenue Funds, Proprietary (Enterprise) Funds, and Capital Project Fund. Industrial Development Authority (IDA) – A board appointed by the City Council, it develops, advances, encourages and promotes, subject to the limitations imposed by the Industrial Development Authority Act, commercial, industrial, agricultural and manufacturing facilities in the City. The IDA provides the financial vehicle(s) through which businesses can obtain funding for expanding and/or establishing themselves in the community. Infrastructure – Physical systems or structures that when installed become indistinguishable, inseparable, or otherwise part of surrounding appurtenant structures. Completed infrastructure and related depreciation are not recorded as assets in the financial records of the City. Examples of infrastructure include sewer lines; streetlights; streets, curbs, and gutters; retaining walls, etc. Interest on Investments - Revenues derived from the investment earnings of unrestricted and restricted cash. The City invests primarily in repurchase agreements, full faith and credit obligations of the U.S. Government, and fully collateralized Certificates of Deposit. Interest on unrestricted cash investments is credited to respective fund accounts based on an average monthly pooled cash balance. Interest earned on restricted cash investments such as cash proceeds from bond issuances and cash reserves established by bond covenants, are tracked separately and credited to the appropriate fund. Interfund Transfers - Amounts transferred from one fund to another. Line-item Budget - A budget that reports budgeted amounts for individual detailed expenditure categories (salary, telephone, office supplies, etc...). The City of St. Joseph provides a line-item budget at the department and fund level. Program level revenues and expenditures are summarized and not reported in the budget on a line-item budget basis. Long-term Debt - Debt with an original maturity in excess of one year from date of issuance. Minor Equipment - Category of assets expensed for accounting and budgetary control purposes because they do not satisfy the City's capital asset capitalization policy. Modified Accrual Accounting – A form of accrual accounting in which (1) expenditures are recognized when the goods or services are received and (2) revenues, such as taxes, are recognized when measurable and available to pay expenditures in the current accounting period. see also accrual accounting. Operating Budget - The portion of the budget that pertains to basic operations of the various municipal funds, departments, and programs. Payment in Lieu of Taxes - Commonly referred to as PILOTs, this is the term used in TIF projects or in Chapter 100 Agreements to refer to those revenues from real property in the Redevelopment Area as designated by the TIF Commission (when linked to a TIF) and approved by City Council. These revenues

GLOSSARY
12 - 18
are used to retire TIF Obligations and pay other reimbursable project costs which taxing districts would have received had the City not adopted the TIF or granted the Chapter 100 tax abatements. Personnel Costs - Cost of wages, salaries, payroll taxes, retirement, and costs of other employee benefits for all City employees. Program - The lowest budgetary unit reporting as practiced by the City of St. Joseph. Related programs are rolled forward and included in the appropriate department and fund. Programs are groupings of related activities organized to accomplish basic goals and objectives. Program Summary - The Program Summary provides descriptions of program services and activities, program outcomes and indicators, program revenues, program expenditures, program capital outlay, and staffing levels. The Program Summary is designed to assist the user to better understand the nature, extent, costs, and benefits of program services and functions. Proprietary Type Fund - A fund having a measurement focus on the flow of economic resources and determination of net income including current and non-current financial resources. Since non-current economic resources must be considered, revenue and expenditure accruals are considered. The City budgets one category of Proprietary Type Fund. (See Enterprise Funds). Public Building Authority (PBA) Bonds/Leases - The PBA issues bonds to investors using the bond proceeds to purchase equipment or construct public improvements which are leased to the City under an arrangement where the lease payments to the PBA equal the bond payments to the investors. Leases between the PBA and the City do not require voter approval and are subject to annual appropriation. Reimbursable Project Costs – refers to those costs incurred by the Developer and/or the City that, as approved in a Redevelopment Agreement, are to be funded or reimbursed from PILOTS, EATS, or other TIF-related revenue sources. Revenue - Amounts the City of St. Joseph receives and/or earns as income including, but not limited to, such items as taxes, user fees, franchise fees, licenses, bond proceeds, rents, grants, fines, forfeitures, and interest earnings. Revenue Bonds - Revenue bonds are sold to fund capital improvements when sufficient earnings can be generated from the improvements to repay the bond debt. Revenue bonds require voter approval of 2/3rds or 4/7ths majorities. Risk Management - An organized attempt to protect an organization's assets against accidental loss in the most cost-effective manner. The City employs a full-time Risk Manager to coordinate this effort. The Risk Management Program is described in the Budget Document under the Human Resources Department in the General Fund. Sales Tax - A tax remitted to the City by the State applied to the sales of goods and services within City limits. Special Allocation Fund – the fund established by the City into which, as required by State Statute, all PILOTS, EATS, and other TIF revenues are deposited for the purpose of paying redevelopment project costs and TIF obligations. Special Revenue Fund - A Governmental Type Fund utilized to account for the proceeds from specific revenue sources (other than from trusts or capital improvement projects) the expenditures of which are
GLOSSARY
12 - 19
legally restricted for specific purposes. The City maintains six budgeted Special Revenue Funds including the Streets Maintenance; Parks Maintenance Fund; Special Allocation Fund; Gaming Initiatives Fund, Museum Tax Initiatives Fund; and the Community Development Block Grant Fund. Subventions - Revenues collected by the State or other government entity which are allocated to the City on a formula basis. The major subventions received by the City from the State include motor vehicle sales tax, road and bridge tax, motor vehicle fee increases, and gasoline tax. Tax Increment Financing – commonly known as a TIF project or TIF redevelopment project, a TIF is an economic development tool established by state statutes which provides a means for local governments to help finance the redevelopment of area that are blighted, substandard, or economically underutilized and that would not otherwise be developed without public assistance. TIF provides a mechanism to capture future increases in real property taxes and economic activity taxes (e.g., local sales taxes, utility taxes) associated with the redevelopment of the property in an established TIF district. Transportation Development District – commonly known as a TDD, is a special purpose district authorized to finance, undertake and maintain transportation related public improvements benefiting the district. A TDD project includes any bridge, street, intersection, signing or signalization, parking lot, garage, etc., related to transportation needs of the district. The district can use one or more funding mechanisms to fund a project---special assessments, property tax, sales tax, tolls. User Fees - Receipt of a fee for providing a direct and specifically identifiable service to a particular customer.