FY 19-20 Adopted Budget Document - Friendswood, TX
319
-
Upload
khangminh22 -
Category
Documents
-
view
2 -
download
0
Transcript of FY 19-20 Adopted Budget Document - Friendswood, TX


Budget cover designed by Katy Blanchard
CITY OF FRIENDSWOOD, TEXAS
ADOPTED ANNUAL BUDGET October 1, 2019 - September 30, 2020
Mayor Mike Foreman
Mayor Pro Tem Sally Branson
Council Members
Steve Rockey ................................................................................ Position 1 Trish Hanks .................................................................................. Position 3 Robert J Griffon ............................................................................. Position 4 John Scott .................................................................................... Position 5 Brent Erenwert .............................................................................. Position 6
Budget Team
Morad Kabiri ............................................................................... City Manager Steven Rhea ................................................................ Assistant City Manager Aubrey Harbin .......................................... Director of Community Development Brian Mansfield ............................................................................ Fire Marshal James Toney ....................................................... Parks and Recreation Director Jildardo Arias................................................................ Director of Engineering Karen Capps.............................................. Economic Development Coordinator Matt Riley .............................................................................. Library Director Melinda Welsh .......................................................................... City Secretary Rene Ibarra .................................................................. Director of Public Works Robert B. Wieners ......................................................................... Police Chief Katina Hampton ............................................Director of Administrative Services Rhonda Bloskas ................................ Deputy Director of Administrative Services Jennifer Walker ......................................................................Budget Manager Emily Peltier ..........................................................................Financial Analyst

CITY OF FRIENDSWOOD Organization Chart
Fire Marshal
Administration Investigations/Inspections Emergency Management FVFD Contract
Parks & Recreation
Administration Recreation Programs Park Operations Facility Operations
Citizens of Friendswood
City Attorney
Municipal Judge
Mayor and City Council
City Secretary Administration Records Management Elections
City Manager
Administration Public Information
Boards, Committees, & Commissions
Administrative Services
Finance Utility Billing Municipal Court HR / Risk Management Information Technology
Community Development
Administration Planning Inspections/Code Enforcement
Police Department
Administration Communications Patrol Criminal Investigations Animal Control
Public Works Administration Streets / Sidewalks Drainage Operations Water Utilities & Operations Sewer Utilities & Operations Library Services
Friendswood Public Library
Assistant City Manager
Economic Development
Engineering Engineering Projects
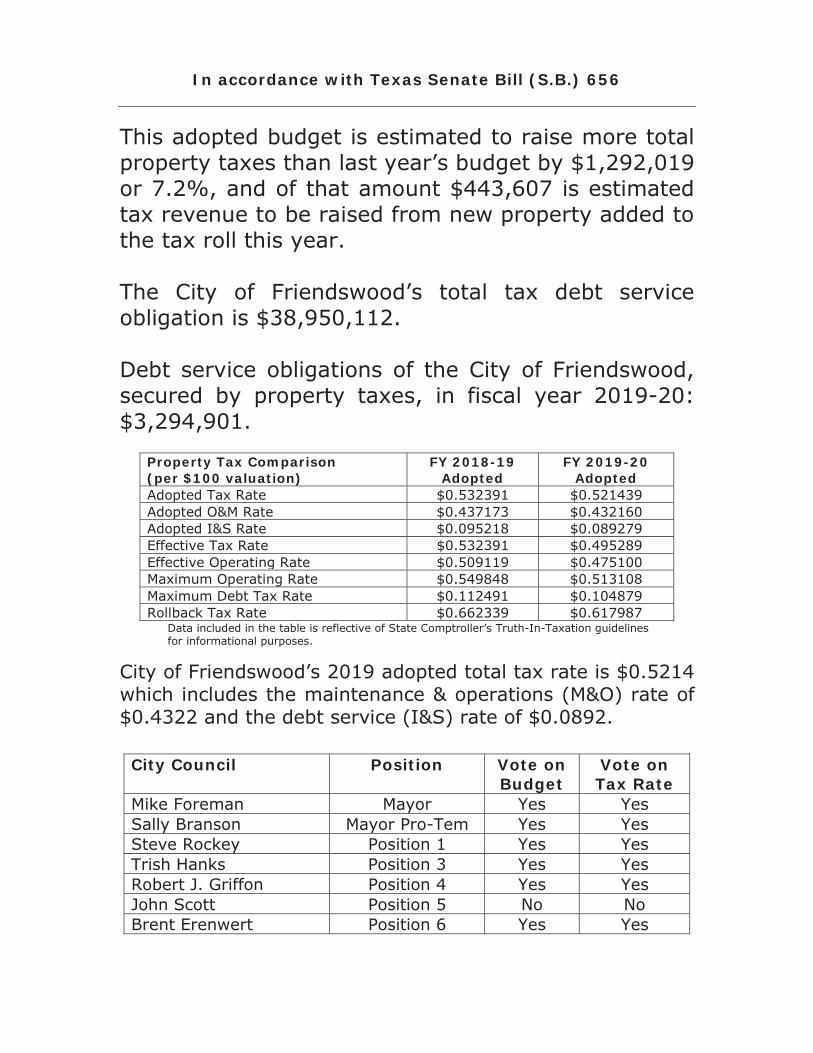
In accordance with Texas Senate Bill (S.B.) 656
This adopted budget is estimated to raise more total property taxes than last year’s budget by $1,292,019 or 7.2%, and of that amount $443,607 is estimated tax revenue to be raised from new property added to the tax roll this year. The City of Friendswood’s total tax debt service obligation is $38,950,112. Debt service obligations of the City of Friendswood, secured by property taxes, in fiscal year 2019-20: $3,294,901.
Property Tax Comparison (per $100 valuation)
FY 2018-19 Adopted
FY 2019-20 Adopted
Adopted Tax Rate $0.532391 $0.521439 Adopted O&M Rate $0.437173 $0.432160 Adopted I&S Rate $0.095218 $0.089279 Effective Tax Rate $0.532391 $0.495289 Effective Operating Rate $0.509119 $0.475100 Maximum Operating Rate $0.549848 $0.513108 Maximum Debt Tax Rate $0.112491 $0.104879 Rollback Tax Rate $0.662339 $0.617987
Data included in the table is reflective of State Comptroller’s Truth-In-Taxation guidelines for informational purposes.
City of Friendswood’s 2019 adopted total tax rate is $0.5214 which includes the maintenance & operations (M&O) rate of $0.4322 and the debt service (I&S) rate of $0.0892.
City Council Position Vote on
Budget Vote on Tax Rate
Mike Foreman Mayor Yes Yes Sally Branson Mayor Pro-Tem Yes Yes Steve Rockey Position 1 Yes Yes Trish Hanks Position 3 Yes Yes Robert J. Griffon Position 4 Yes Yes John Scott Position 5 No No Brent Erenwert Position 6 Yes Yes

Distinguished Budget Presentation Award The Government Finance Officers Association of the United States and Canada (GFOA) presented a Distinguished Budget Presentation Award to the City of Friendswood. Texas for its annual budget for the fiscal year beginning October 1, 2018. In order to receive this award, a governmental unit must publish a budget document that meets program criteria as a policy document, as an operations guide, as a financial plan, and as a communications device. This award is valid for a period of one year only. We believe our current budget continues to conform to program requirements, and we are submitting it to GFOA to determine its eligibility for another award.

Guide to Use of the Budget The primary purpose of this document is to plan both the operating and capital improvement expenditures in accordance with the policies of the City of Friendswood. By adoption of this budget, the City Council establishes the level of services to be provided, the amount of taxes and utility rates to be charged and the various programs and activities to be provided. The PDF version of the Budget is bookmarked and the table of contents are linked to the respective pages. The Introduction and Overview section includes the City Manager’s budget message with a “budget-in-brief” summary. Also featured in this section is an Overview of the City; detailing community and population demographics, Fiscal Year Fact Sheet of the City’s property tax base, staffing summary, utility customer count and utility rates. This section presents City Council’s mission statement and strategic goals and long range planning tools used to guide the City’s budget process. The Financial Structure, Policy and Process section begins with flowcharts listing of each of the City’s funds. Fund narratives follow providing definitions for each fund utilized by the City and the funds’ basis of accounting and budgeting. A matrix correlating the City’s fund uses by functioning unit (City department) is incorporated. The City’s Financial Management Policy with adopted revisions is included. Budget provisions from the City’s Charter are included and details of the budget process and this year’s budget calendar close this section. The Financial Summaries section provides the revenues, expenditures and estimated ending fund balance for the City’s governmental funds as well as enterprise funds. Governmental funds include General Fund, Police Investigation Fund, Fire/EMS Donation Fund, Municipal Court Fund, Sidewalk Installation Fund, Park Land Dedication Fund, Streets Maintenance Fund, Tax Debt Service Fund, 1776 Park Trust Fund and General Obligation Bond Construction Funds. Enterprise funds include Water and Sewer Operation Fund, Water and Sewer Revenue Bond Construction Funds, Water and Sewer CIP/Impact Fee Funds, and Water and Sewer Revenue Debt Service Fund. Additional funds are the Vehicle Replacement Fund and Friendswood Downtown Economic Development Fund. A description of each fund precedes the fund schedules and includes the basis of budgeting. The section also includes detailed revenue schedules by fund and account element/object and inter-fund transfer schedules. The next section is reserved for the Debt & Capital section. The tax and revenue Debt Service portion of this section contains summary schedules, tax debt service and revenue debt service to maturity charts and payment schedules for each bond issue of the City. Currently, the City’s Capital Improvement Plan is being reviewed by the Community Development Department and City departmental Directors. The budget document includes available information from the Capital Improvement Program for the upcoming budget year by fund and project as well as the detail by object account. The next section is entitled Departmental Information. Each department includes: (1) an organizational chart depicting the department structure; (2) department narrative, goals, objectives and performance measures; (3) department summary with department totals across all funds and a departmental staffing table showing the full-time equivalents. The general ledger account number segment for fund, department and division accounts are included for cross-reference to the detail division budgets. The detailed departmental pages are formatted to include FY18 actual; FY19 original budget; FY19 amended budget; year to date 6/30/19 actual expenditures; year-end estimate for FY19; and FY20 adopted budget data. The Supplemental Information section contains a sales tax revenue comparison schedule, estimated tax valuations, historical tax levy and tax rate comparisons, including graphs, City-wide personnel schedule, departmental decision package recommendations, and glossary of budget terminology and acronyms.

Table of Contents INTRODUCTION AND OVERVIEW
City Manager’s Budget Message .................................................................. 10 Budget in Brief ......................................................................................... 12 Changes to the Proposed Budget ................................................................ 18 City Overview........................................................................................... 19 Community Demographics ......................................................................... 22 Infographic Summary ................................................................................ 24 Fiscal Year Fact Sheet ............................................................................... 25 Vision & Mission Statement and Strategic Goals............................................ 27 Planning for the Future .............................................................................. 30
FINANCIAL STRUCTURE, POLICY, AND PROCESS
Fund Flowchart ......................................................................................... 34 Fund Definitions ....................................................................................... 35 Financial Management Policy ...................................................................... 38 Charter Budget Provisions .......................................................................... 51 Budget Process ......................................................................................... 54 Budget Calendar ....................................................................................... 55
FINANCIAL SUMMARIES
Budget Summary (All Funds) ..................................................................... 56 Revenues and Expenditures by Fund ........................................................... 57 General Fund ........................................................................................... 58 Special Revenue Funds .............................................................................. 60
Police Investigation Fund ................................................................. 61 Fire/EMS Donation Fund ................................................................... 62 Municipal Court Fund ....................................................................... 63
Tax Debt Service Fund .............................................................................. 64 Capital Project Fund .................................................................................. 66
2010 General Obligation Fund ........................................................... 67 2015-2017 General Obligation Fund .................................................. 68 Sidewalk Installation Fund ................................................................ 69 Park Land Dedication Fund ............................................................... 70 Streets Improvement Fund ............................................................... 71 Friendswood Downtown Economic Development Improvement Fund ...... 72
1776 Park Trust Fund ................................................................................ 73 Enterprise Funds ...................................................................................... 75
Water and Sewer Operation Fund ...................................................... 77 2006 Water and Sewer Bond Construction Fund .................................. 78 2009 Water and Sewer Bond Construction Fund .................................. 79 2016 Water and Sewer Bond Construction Fund .................................. 80 2018 Water and Sewer Bond Construction Fund .................................. 81 Water CIP/Impact Fee Fund .............................................................. 82 Sewer CIP/Impact Fee Fund ............................................................. 83 Water and Sewer Revenue Debt Service Fund ..................................... 84
Vehicle Replacement Fund ......................................................................... 85 Revenue Summary Chart and Schedules by Fund ......................................... 88 General and Administrative Transfers .......................................................... 95
Table of Contents DEBT SERVICE AND CAPITAL IMPROVEMENTS
Summary of Debt Service Funds ................................................................. 98 Tax Debt Service to Maturity Chart ............................................................. 99 Tax Debt Service Fund Summary .............................................................. 100 Summary Schedule of Tax Debt Service to Maturity .................................... 102
2010 General Obligation Bonds ....................................................... 102 2012 General Obligation Refunding Bonds ........................................ 103 2014 General Obligation Refunding Bonds ........................................ 103 2015 General Obligation Bonds ....................................................... 103 2016 General Obligation Bonds ....................................................... 104 2017 General Obligation Bonds ....................................................... 104
Capital Leases ........................................................................................ 104 Revenue Debt Service to Maturity Chart .................................................... 105 Water and Sewer Debt Service Fund Summary ........................................... 106 Summary Schedule of Water and Sewer Revenue Debt Service to Maturity .... 108
2001 W/S Revenue Bonds (Refinanced as 2010B G.O. Bonds) ............ 108 2006 W/S Revenue Bonds (Refinanced as 2014 G.O. Bonds) .............. 108 2006 W/S Refund Bonds (Refinanced as 2016 G.O. Bonds) ................ 109 2016 W/S Revenue Bonds .............................................................. 109 2009 W/S Revenue Bonds (Refinanced as 2016A G.O. Bonds) ............ 110 2018 W/S Revenue Bonds .............................................................. 110
Capital Improvement Program Capital Improvement Program (CIP Summary) ........................................... 112 Capital Improvement Program Development .............................................. 113 Capital Improvement Program Focus ......................................................... 114 CIP Funding Uses Chart ........................................................................... 115 Capital Improvement Program Impact on Operating Budget ......................... 115 Capital Improvement Program Funding ..................................................... 117 Fiscal Year 2013-14 General Obilgations Bond Election ................................ 118 Street Improvements & Economic Development Improvements Funds ........... 118 CIP Funding Sources Chart ...................................................................... 119 Significant Routine & Non-Routine Capital Expenditures ............................... 119 Proposed CIP Five Year Schedule .............................................................. 120 Project Budget Summary by Fund ............................................................. 121 General Fund Projects Schedule................................................................ 122 G.O. Bonds Projects Schedule .................................................................. 124 Police Investigations Fund Projects Schedule .............................................. 126 Municipal Court Fund Projects Schedule ..................................................... 127 Park Land Dedication Fund Projects Schedule ............................................. 128 Street Improvements Fund Projects Schedule ............................................ 129 Economic Development Improvements Fund Projects Schedule .................... 130 Water and Sewer Operation Fund Projects Schedule .................................... 131 Water and Sewer Bond Projects Schedule .................................................. 133 Excerpts from the Proposed Capital Improvement Plan
General Obligation Projects Description ............................................ 137 Utility Services Projects Description ................................................. 141 General Obligation Projects beyond Five Year Plan ............................. 152 Water & Sewer Revenue Projects beyond Five Year Plan..................... 153 Completed CIP Projects Listing ........................................................ 154

Table of Contents DEPARTMENTAL INFORMATION
Department Summary ............................................................................. 156 Expenditures by Department and Category Charts ...................................... 157 Mayor and Council .................................................................................. 158 City Secretary ........................................................................................ 164 City Manager.......................................................................................... 175 Administrative Services ........................................................................... 184 Police .................................................................................................... 203 Fire Marshal ........................................................................................... 216 Community Development ........................................................................ 227 Public Works .......................................................................................... 238 Engineering .......................................................................................... 261 Library Services ...................................................................................... 268 Parks and Recreation .............................................................................. 274
SUPPLEMENTAL INFORMATION
Personnel Department Three Year Personnel Schedule ............................................................ 293
Decision Packages and Forces at Work Decision Packages included in the Budget .............................................. 295 Decision Packages not included in the Budget ........................................ 296
Tax Information
Estimated Ad Valorem Tax Collections - Current Roll .......................... 298 Historical Tax Rate Comparision ...................................................... 299 Sales Tax Revenue Comparison....................................................... 300
Glossary ................................................................................................ 301 Acronyms .............................................................................................. 309
Budget and Tax Rate Adopted Ordinances ................................................. 310
October 7, 2019
Honorable Mayor and City Council: As Fiscal Year 2018-19 comes to a close, I would like to take this opportunity to reflect on the milestones achieved this past year as well as present to you the budget for the upcoming fiscal year. FY19 was and is one of continued progress and resiliency. As a result of the devastation brought on by Hurricane Harvey in 2017, Friendswood came together as never before. FY19 continued this spirit with a number of citizen led efforts in collaboration with outside agencies to shape Friendswood’s future. Partnerships were forged and reinforced; and plans prepared for a bond election to address the needs of our community moving forward. This year’s budget is similar to prior ones in which Staff undertook a thorough evaluation of each expense and revenue; inclusive of hundreds of hours of careful thought, lively discussion, and focused teamwork. Some of the milestones achieved this past fiscal year included the:
Continuation and completion of a record number of street projects throughout the City; Completion of the Greenbriar sidewalks near the Friendswood High School; Completion of new restroom and shower facilities at the City Pool; Completion of a new Dog Park; Completion of improvements to Old City Park; Commencement of EMS billing with no issues; and Restructuring of operational functions as it relates to engineering activities and capital
projects. All of this and much more was done with the lowest tax rate in the last 39 years. Moving forward, however, the City of Friendswood will face challenges. Some of these were brought on by Hurricane Harvey, others were brought on by national events such as the tragedy that took place at Santa Fe High School, and some brought on by the State legislature. This year’s budget will focus on resiliency and moving forward across all fronts. How are we positioning ourselves for the future and the issues at hand? Well, we’re investing in our most valuable asset, our staff. Included within the budget is funding for merit. Two: we’re being dynamic, evaluating the needs for the City across multiple areas and making adjustments. As an example, this year we separated engineering from the Public Works department and have created an additional engineering role. This was done to address the increased demand for such services, as well prepare for the pursuit and implementation of the largest bond program the City has ever had. With regard to Public Safety, staff is also putting the final touches on new contracts with the Friendswood Volunteer Fire Department for Fire and EMS services. This year’s budget includes increased funding for a fully staffed EMS department to meet the needs of our population.
10

City Council is commended for decades of setting and maintaining standards in financial transparency, public safety, emergency medical services, infrastructure, and recreational facilities development. The City has been repeatedly recognized by numerous organizations, resulting in accolades such as budget presentation and financial reporting recognition, Safest City, “Best Places to Live,” and “Best Places for Families” awards. They signify a tangible quality embedded in the City’s team approach to not only its budgeting process, but all operations; the City’s core values, “TRAQ” which stands for Trust, Respect, Accountability, and Quality. With these values, City Staff will continue to seek efficiencies in delivering services with limited resources. On behalf of the City Staff, especially the Budget Team that pours wisdom, time, and energy into the process which creates this plan, I thank the Mayor and City Council for providing guidance to develop the budget. We all look forward to the days ahead and the opportunity to serve Friendswood residents, business owners, and visitors with the service and quality they expect. Respectfully submitted,
Morad Kabiri, City Manager
11

Budget in Brief The pages that follow summarize the City of Friendswood’s fiscal year 2019-20 adopted budget.
Revenue 1. The budget includes total revenue projections of $79.5 million in all funds. This is an increase of
$20.9 million over the fiscal year 2018-19 adopted budget. The majority of this increase, $14.9 million is the City’s plan to use fund balance/retained earnings to offset expenditures. These expenditures include capital improvement projects slated for completion in FY20. Below are the highlights of the revenue projections:
Property tax revenue reflects an increase for tax year 2019 of about 7.2% over prior year budget projections related to new construction and property tax value increases to cover operating expenses and debt service obligations related to the general obligation bonds authorized by voters in 2013.
Sales tax revenue budget is up approximately 5.0% based on fiscal year 2018-19 collections and includes revenue from the 1/8 of 1% sales tax for downtown economic development and 3/8 of 1% sales tax for streets maintenance.
Franchise tax revenue budget is up 28.6% based on fiscal year 2018-2019 collections and takes into account the Texas New Mexico Power (TNMP) franchise fee rate increase.
Intergovernmental revenues are projected to increase 6.4% from prior year as a result of the estimated increase in the inter-local agreement for school resource officers with FISD.
Charges for Services budget is expected to increase 21% from prior year adopted budget. As a result of the Utility Rate Study conducted in FY19, the City’s utility rates were increased. The adopted budget reflects a projected increase in utility charges for services of $3.3 million or 27% to support operations and infrastructure improvement needs. The charges for services budget in the General Fund is expected to decrease 41% due to removing charges for EMS services from revenues as shown in the FY19 Budget. In the adopted budget, the FVFD contract has been reduced by the estimated revenue FVFD will receive from EMS billings.
Municipal Court fines and fees in the adopted budget are expected to increase by approximately 11.4% based on an increase in number of traffic tickets processed during FY19 and anticipated continuation of this trend into FY20.
Interest earnings are expected to increase by about 139.9% from prior year adopted budget based on increased earnings received in FY19. This increase is primarily due to unexpended 2018 Water and Sewer Bond proceeds.
Vehicle Replacement Fund lease payments are expected to increase by 25.5% due to purchases related to Hurricane Harvey, new additions to the plan, shortfall recapture and increase inflationary factor to support future replacement costs.
2. The FY20 adopted budget was developed with a tax rate of $0.5214 per $100 valuation. As a result, approximately $443,607 more in property tax revenue is expected to be generated from properties added to the tax roll this year.
The adopted maintenance and operations (M&O) rate is $0.4322 and the interest and sinking or debt service (I&S) rate is projected to be $0.0892.
12
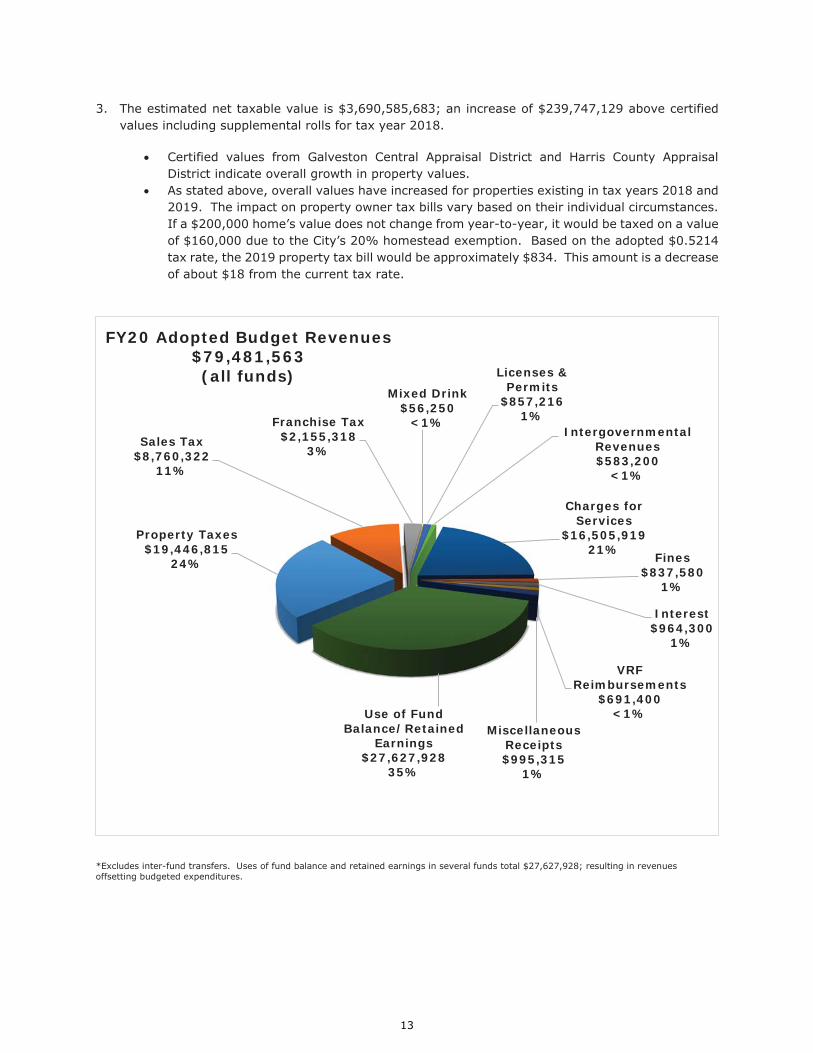
3. The estimated net taxable value is $3,690,585,683; an increase of $239,747,129 above certified values including supplemental rolls for tax year 2018.
Certified values from Galveston Central Appraisal District and Harris County Appraisal District indicate overall growth in property values.
As stated above, overall values have increased for properties existing in tax years 2018 and 2019. The impact on property owner tax bills vary based on their individual circumstances. If a $200,000 home’s value does not change from year-to-year, it would be taxed on a value of $160,000 due to the City’s 20% homestead exemption. Based on the adopted $0.5214 tax rate, the 2019 property tax bill would be approximately $834. This amount is a decrease of about $18 from the current tax rate.
*Excludes inter-fund transfers. Uses of fund balance and retained earnings in several funds total $27,627,928; resulting in revenues offsetting budgeted expenditures.
Property Taxes$19,446,815
24%
Sales Tax$8,760,322
11%
Franchise Tax$2,155,318
3%
Mixed Drink$56,250
<1%
Licenses & Permits
$857,216 1%
Intergovernmental Revenues$583,200
<1%
Charges for Services
$16,505,919 21% Fines
$837,580 1%
Interest$964,300
1%
VRF Reimbursements
$691,400 <1%
Miscellaneous Receipts$995,315
1%
Use of Fund Balance/Retained
Earnings $27,627,928
35%
FY20 Adopted Budget Revenues$79,481,563 (all funds)
13

Historical Revenue Budget (All Funds)
Revenue Source
FY20 FY19 FY18
Adopted Percent Change
PY Adopted
Percent Change
PY Adopted
Percent Change
PY
Property Taxes* $19,446,815 7.2% $18,126,202 0.1% $18,107,319 1.2
Sales Tax $8,760,322 5.0% $8,339,990 10.3% $7,561,857 13.8
Franchise Tax $2,155,318 28.6% $1,675,966 -1.9% $1,709,283 3.1
Mixed Drink $56,250 1.8% $55,282 21.9% $45,364 9.6
Licenses & Permits $857,216 1.0% $849,000 0.9% $841,816 7.9
Intergovernmental Revenues $583,200 6.4% $548,017 118.8% $250,491 4.6
Charges for Services $16,505,919 21.0% $13,636,879 7.0% $12,749,484 7.7
Fines $837,580 11.4% $751,960 5.2% $714,605 -8.2
Interest** $964,300 139.9% $401,953 95.2% $205,942 63.3
VRF Reimbursements $691,400 25.5% $550,817 44.7% $380,684 1.3
Miscellaneous Receipts $995,315 7.5% $926,078 -7.3% $998,926 -85.3
Fund Balance/Retained Earnings*** $27,627,928 116.4% $12,766,009 -0.1% $12,780,958 148.8
Total $79,481,563 35.6% $58,628,153 4.0% $56,346,729 7.7% * Amounts include prior year delinquent property tax collections with penalty and interest. ** Includes interest earnings on unexpended bond proceeds. *** Fund Balance/Retained Earnings used for capital improvements expenses.
Expenses 1. The adopted budget appropriates approximately $79.3 million in expenditures, excluding inter-
fund transfers. This is an increase of approximately $21 million or 36.1% from the fiscal year 2018-19 adopted budget. The increase in this year’s budget is, like the previous two years, related to capital improvements and debt service obligations related to the General Obligation Bonds authorized in 2013 and the Water and Sewer Revenue Bonds issued in 2016 and 2018. In addition, capital improvements afforded by the streets and downtown economic development corporation sales tax are included. Public Works and General Government expenditures have increased 46.2% and 13.2%, respectively, over prior year budget as a result of forces at work. These items are outlined in item #4 below.
2. Personnel costs make up almost 70% of the City’s operational budget. The adopted budget
includes staffing of 237.35 full-time equivalents (FTE). Adopted changes in personnel expenditures include:
The addition of a Director of Engineering and a Deputy Director of Engineering due to the
creation of an Engineering department separate from Public Works Addition of 1 full-time Administrative Services department Administrative Assistant Addition of 1 full-time Parks Laborer The City’s TMRS contribution rate increase from 15.90% to 16.03% on January 1, 2020 There is no change in health insurance from prior year. The adopted budget includes decisions packages for funding merit in both the General
Fund ($475,549) and Water and Sewer Fund ($57,904). This equates to an average of 2.75%. Merit is awarded based on individual employee performance.
14

A pay plan adjustment for Public Safety employees of approximately $5,000 will be funded through vacancies in the departments.
3. Maintaining the City’s current service levels requires additional funding for non-personnel related
operational expenses. The Supplemental Information section of the adopted budget includes a detailed listing of the expenditures.
Forces at Work total $269,950 (General Fund) and $4,772,340 (Water and Sewer Fund). Decision Packages total $1,554,119 (General Fund) and $507,904 (Water and Sewer
Fund). 4. Details for the forces at work and decision packages mentioned immediately above are as follows:
General Fund: Public Works Software (Tyler EAM) - $85,000 Security Cameras - $66,000 Tyler Operating Systems Upgrade - $15,000 IT Services to Fire Stations - $20,000 Replace Dual Purpose K-9 $32,900 Replace Mobile Data Terminals (MDT) - $31,050 Geographic Information System (GIS) Services Update - $20,000 Private Fiber Replacement City Hall to Library & City Hall to Activity Building (funded by PEG funds) - $150,000 City Hall Conference Rooms Tech Upgrades (funded by PEG funds) - $177,000 Know BE 4 Cybersecurity Training (funded by PEG funds) - $11,000 Wage Increase for Summer Day Camp Staff (funded by user fees) - $44,043 City Wide Merit 2.75% - $475,549 Skid Steer Loader (lease to purchase) - $101,000 Streets Sweeper Vacuum Unit (lease to purchase) - $205,000 One – Ton Dump Truck (lease to purchase) - $60,000 Ambulance (lease to purchase) - $203,000 ASO Administrative Assistant wages and related benefits and supplies - $ 65,651 Parks Laborer wages and related benefits $61,876
Water & Sewer Fund: Blackhawk WWTP – Aeration System Upgrade - $2,569,413 Blackhawk WWTP Re-rating - $348,795 Blackhawk WWTP Additional Capacity (Year 3 of 6) - $633,130 SEWPP - FY 2012-2017 Program Balance (Year 2 of 3) - $411,002 SEWPP - FY 2019-2023 Program Balance (5 years) - $810,000 City Wide Merit 2.75% - $57,904 Vacuum/Jet Combination Sewer Truck (lease to purchase) - $450,000
5. In addition to the FY20 forces at work and decision packages, the adopted budget includes the
following: $4,692,001 for streets improvements
$500,000 as a current services level priority $4,192,001 funded by additional 3/8 of 1% sales tax
$1,555,041 for downtown economic development $300,000 for sewer line maintenance in the Water & Sewer Fund $1,011,451 for G.O. Bond projects authorized in 2013 (street and park improvements) $2,906,809 for Sewer Projects to be funded with the 2016 Water and Sewer Revenue
Bonds $16,484,200 for Water and Sewer Projects to be funded with the 2018 Water and Sewer
Revenue Bonds
15
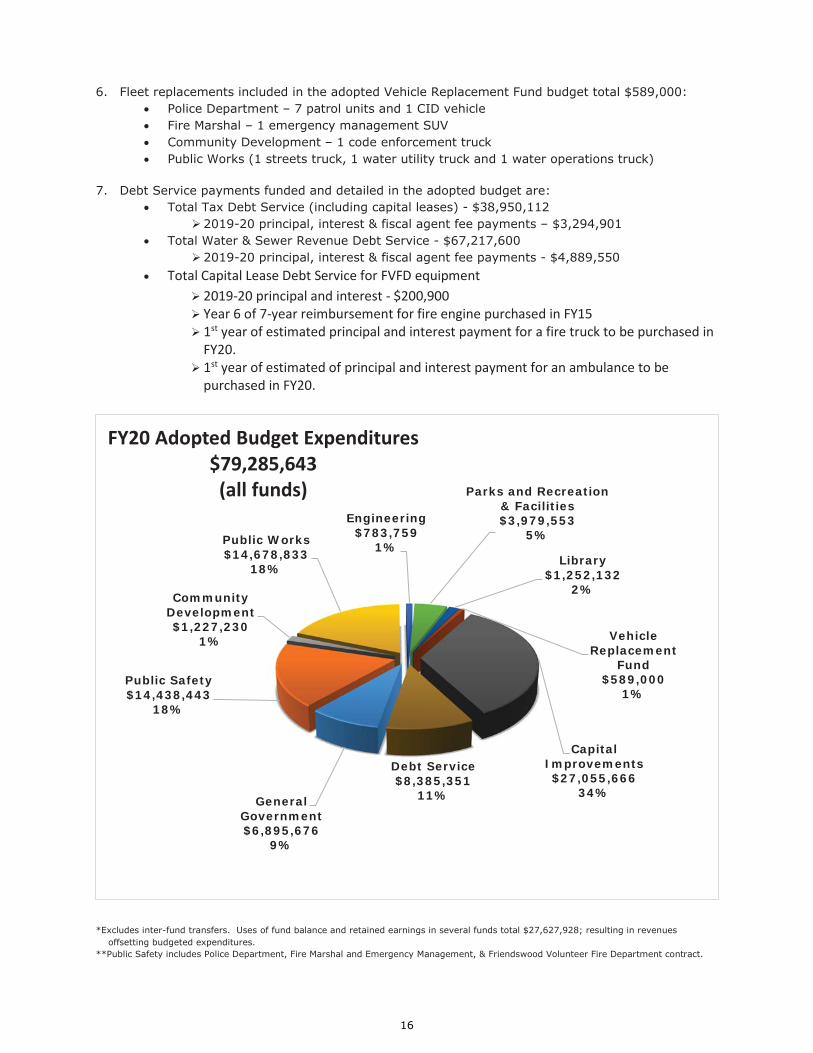
6. Fleet replacements included in the adopted Vehicle Replacement Fund budget total $589,000: Police Department – 7 patrol units and 1 CID vehicle Fire Marshal – 1 emergency management SUV Community Development – 1 code enforcement truck Public Works (1 streets truck, 1 water utility truck and 1 water operations truck)
7. Debt Service payments funded and detailed in the adopted budget are: Total Tax Debt Service (including capital leases) - $38,950,112
2019-20 principal, interest & fiscal agent fee payments – $3,294,901 Total Water & Sewer Revenue Debt Service - $67,217,600
2019-20 principal, interest & fiscal agent fee payments - $4,889,550 Total Capital Lease Debt Service for FVFD equipment
2019-20 principal and interest - $200,900 Year 6 of 7-year reimbursement for fire engine purchased in FY15 1st year of estimated principal and interest payment for a fire truck to be purchased in FY20. 1st year of estimated of principal and interest payment for an ambulance to be purchased in FY20.
*Excludes inter-fund transfers. Uses of fund balance and retained earnings in several funds total $27,627,928; resulting in revenues
offsetting budgeted expenditures. **Public Safety includes Police Department, Fire Marshal and Emergency Management, & Friendswood Volunteer Fire Department contract.
General Government$6,895,676
9%
Public Safety$14,438,443
18%
Community Development $1,227,230
1%
Public Works $14,678,833
18%
Engineering $783,759
1%
Parks and Recreation & Facilities$3,979,553
5%
Library$1,252,132
2%
Vehicle Replacement
Fund$589,000
1%
Capital Improvements$27,055,666
34%
Debt Service$8,385,351
11%
FY20 Adopted Budget Expenditures$79,285,643(all funds)
16

Expenditure
FY20 FY19 FY18
Adopted Percent Change
PY Adopted
Percent Change
PY Adopted
Percent Change
PY General Government* $6,895,676 13.2% $6,091,221 1.1% $6,026,860 6.9%
Public Safety $14,438,443 3.0% $14,023,544 9.1% $12,851,212 -0.5%
Community Development $1,227,230 8.1% $1,135,338 13.2% $1,002,600 3.2%
Public Works $14,678,833 46.2% $10,040,042 5.1% $9,556,685 5.5%
Engineering $783,759 - $0 - $0 -
Parks & Recreation $3,979,553 15.6% $3,441,934 0.9% $3,409,931 4.1%
Library $1,252,132 1.1% $1,239,090 1.9% $1,216,055 5.0%
Vehicle Replacement $589,000 85.9% $316,766 -16.9% $381,413 41.7%
Capital Improvements $27,055,666 76.8% $15,300,664 3.7% $14,756,720 19.2%
Debt Service $8,385,351 25.4% $6,684,276 -5.9% $7,102,761 10.1%
Total $79,285,643 36.1% $58,272,875 3.50% $56,304,237 8.0%
*General Government includes the following departments: Mayor & Council City Secretary Administrative Services
Finance Municipal Court Human Resources Insurance Risk Management Information Technology Utility Billing
17

Changes to the FY20 Proposed Budget
Original Proposed FY20 Revenue Estimate $29,510,086
Changes to Revenue:Changes from the proposed tax rate to the adopted tax rate $123,754
Total Changes to Funding Available $123,754
Revised FY20 Revenue Estimates $29,633,840
Original Proposed FY20 Expenditure Estimate $29,985,635
Changes to Expenditures:Additional amount to Senior Activity Center Community Events 5,000$
Additional Decision Packages added:ASO Admin Assistant Position (FTE 1.0) $65,651Parks Laborer Position (FTE 1.0) $61,876
Total Changes to Expenditures Estimates 132,527$
Revised FY20 Expenditure Estimates $30,118,162
Original Proposed Use of Fund Balance ($475,549)
Change in amount to fund balance ($8,773)
Increase (Decrease) in Revised Use of Fund Balance in the General Fund ($484,322)
GENERAL FUND (001)
18

City of Friendswood, Texas City Overview
Community It’s no surprise why Friendswood has been nationally recognized as one of the best places to live in the country. With low tax rates, outstanding public education, and the lowest crime rate in the region, Friendswood is the perfect place to live, work, and play. The city features beautiful parks and lush landscaping, along with a championship golf course. Children academically excel via two superior public school systems – Friendswood ISD and Clear Creek ISD. These attributes perfectly match Friendswood’s affluent resident base of well-educated, high-income families. More than 50% of residents work in executive, professional, and managerial positions and generate an average household income of over $140,000 – one of the highest in the Houston area. History Friendswood was founded as a Quaker colony by Frank J. Brown. Only three Quaker colonies were ever established in Texas with the other two being Estacado, in the Texas Panhandle and View Point in Lipscomb County. After looking at Alvin and Galveston, Brown located a tract of more than 1,500 acres and negotiated with J. C. League for the property in 1895. Brown suggested that they name the community Friendswood, in honor of the Society of Friends which helped establish the city. Friendswood remained predominantly Quaker until 1958, when a local Baptist church was organized. The community incorporated in 1960. With the location of the NASA Johnson Space Center ten miles away in 1962, many community residents began to commute there or to Houston, and Friendswood became a bedroom suburb.
19

City Overview Today Now, after 120 plus years, Friendswood has grown to around 41,216 residents. The Quaker values can still be seen through community involvement. Residents participate in city civic and education events and Fourth of July celebrations. As with any city, the goal is planning for continued quality growth to create a well-balanced community. Friendswood offers single-family residential housing in pleasant park-like settings, tucked-away from the busy stream of vehicular traffic. Friendswood is committed to attracting more local enterprises. This will complement and enhance the unique community environment carefully built in Friendswood over the past 100 years; one that is cherished by residents and business owners alike. Location Encompassing 21 square miles, Friendswood is located in southeast Texas near the Texas Gulf Coast, between downtown Houston and Galveston, spanning across two counties – northern Galveston County and southern Harris County. Residents and visitors can access Friendswood through FM 2351, FM 518, and FM 528 (NASA Parkway). Hobby Airport and Ellington Airport are located within a 15 minute drive from Friendswood, and Bush Intercontinental Airport is just 45 minutes away. Major sectors of the area’s economic base include aerospace, specialty chemicals, health care, retail, and tourism.
20

City Overview
Education The Friendswood Independent School District (FISD) was established on December 21, 1948. FISD district covers 15 square miles and borders the Alvin, Pearland and Clear Creek school districts. FISD is a unique school district. They are located next door to the fourth largest city in the United States and surrounded by large school districts. FISD is in a great location for enrichment learning in Space, Engineering, Medicine, Marine Biology and Petrochemical areas. Clear Creek Independent School District (CCISD) is nestled along the NASA Johnson Space Center in Houston and the boating waters of the Gulf of Mexico, CCISD proudly serves the educational growth of more than 42,000 students. CCISD is the 28th largest school district in Texas, out of 1,199 districts. CCISD district spans 103 square miles, 13 municipalities, and two counties (Harris and Galveston). Business Friendswood is the perfect choice for many types of commercial enterprises. Target markets include professional offices, retail, commercial, and light industrial developments. A key City focus is to encourage redevelopment of the downtown area and development of the City’s panhandle area. City leaders have approved special tools and incentives to revitalize downtown to promote mixed-use, multi-story developments with pedestrian streetscapes and other amenities. The City offers competitive business incentives, including a municipal grant program, tax abatement that includes “green” development, freeport tax exemption, and downtown development fee waivers. Quality Lifestyle As with any City, the goal is planning for continued quality growth to create a well-balanced community. Friendswood officers single-family residential housing in pleasant, park-like settings, tucked-away from the busy stream of vehicular traffic. Friendswood is committed to attracting more local enterprises that will complement and enhance the unique community environment that has been carefully built over the past 100 years; one that has come to be cherished by residents and business owners alike. Long Term Planning A Multi-Year Financial Plan (MYFP) was developed in 2006. Originally, staff was directed to develop a plan to forecast the City’s financial condition through 2020, the projected build-out date. The first version of this plan was drafted and later reduced in scope to a five year projection. At this time, the MYFP will continue to help plan and forecast in five year increments. The MYFP is based on the City’s strategic planning efforts, including the Comprehensive Land Use Plan, Vision 2020 and the Capital Improvements Plan. Departmental operational plans funding requirements to provide programs and services are included in the MYFP as well. Funding needs and available resources, both current and alternative revenue enhancements, are identified. Expenditures are projected based on departmental needs assessments and are organized based on “one-time” and “on-going” expenditures. In collaboration with Council, the plan is updated at least annually and serves as the basis of budget development.
21

Community Demographics
Demographics Land size 21.2 sq. miles Friendswood population est. 41,216 Number of households 14,842 Population by age
Under 14 years 19% 15-19 years 8% 20-44 years 28% 45-64 years 31% 65 years and over 14%
Median Age – 41 Average household size - 2.82 2018 est. annual household income -
$140,321 98% high school graduation rate 44% of residents have a bachelor’s degree 16% of residents have a graduate degree Houston DMA population- 6,820,783 Labor Force and Economic Base Labor Pool: 18-65 Friendswood: 20,438 Houston Area: 3,453,216 Employment by occupation
48% Managerial/Professional 10% Service Occupations 26% Sales and Office 8% Construction/Maintenance 8% Production/Transportation
Bay Area Predominant Business Categories Aerospace and Aviation Medical and Life Sciences Information Technology Specialty Chemicals Tourism Maritime
Top Employers Friendswood ISD H.E. Butt Grocery Company Kroger Texas, LP (2 locations) City of Friendswood Clear Creek ISD UTMB (4 locations) Friendship Haven Healthcare &
Rehabilitation U.S. Post Office McDonald’s (2 locations) Atria Assisted Living and Memory Care Top Non-Residential Taxpayers Texas-New Mexico Power Co. A-S 108 Friendswood Crossing LP The Beldon Friendswood LLC H.E. Butt Grocery Company Comcast of Houston LLC HCP Friendswood LLC –
Brookdale Senior Living CHP Friendswood SNF LLC Frontier Land VPLL Friendswood Huntington Woods Kroger Texas LP Financial Status City Bond Rating:
Standard and Poor’s: General Obligation “AA+” Revenue Bonds “AA-”
Tax Year 2019 Assessed Value: $4,583,286,494
Tax Year 2019 Taxable Value: $3,690,585,683
Actual FY17-18 Sales tax revenue: $8,419,956 Projected FY19-20 Sales tax revenue: $8,760,322 Total sales tax rate: 8.25% 6.25% State 2.00% City Tax Year 2019 City property tax rate: $0.5214
$0.4321 General Fund $0.0893 Debt Service
22

Community Demographics Quality of Life 2018 Avg homestead value: $294,213 2018 Avg taxable home value: $235,370 2018 Avg new home value: $435,131 2018 Cost of Living Index, Annual Average
Houston 95.0 Atlanta 102.7 Chicago 120.8 Miami 116.9 Los Angeles 146.8 Washington, DC 161.0 New York 240.6
2017 Low crime rate per 1,000 population
Friendswood 8.93 Alvin 20.16 Galveston 40.12 Houston 52.24 League City 17.23 Pearland 16.48 Sugar Land 15.15 Webster 80.81 Texas City 39.80
Education Served by 2 Public School Districts
(in order by land area served) Friendswood ISD - 5A
Web: www.fisdk12.net Clear Creek ISD - 6A
Web: www.ccisd.net
Recreation 10 City parks 2 County parks 266 acres of green space, nature trails and sports fields
Adult, Youth, and senior programs Annual special events with 10,000 attendees include July 4 celebration, Memorial Day Celebration, Flap Jack Fun Run, Santa in the Park, Daddy & Daughter Dance, Youth Fishing Derby, Youth Sports Day Program, Movies in the Park, and Concerts
23

ADOPTED BUDGETFY2020
OPERATINGFUNDS
FY 2018
$79.5 MILLION
$79.3 MILLION
rrevenue eexpenditure
WHERE DOES THE MONEY COME FROM?
PROPERTY TAX
PERMITS &LICENSES
GRANTS & INTERLOCAL
FINES OTHER TAX
UTILITY SERVICES
COMMUNITY SERVICES
OTHER
WHERE DO THE DOLLARS GO?
GENERAL GOVERNMENT
PARKS & RECREATION
DEBT SERVICE
FLEET REPLACEMENT
PUBLIC SAFETY
COMMUNITY DEVELOPMENT & PUBLIC
WORKS
Over the last 40 years, the City’s total tax rate has decreased by 25 cents
DID YOU KNOW? Over
Citydec
D
CAPITALIMPROVEMENTS IM
LIBRARY
TENGINEERING
24
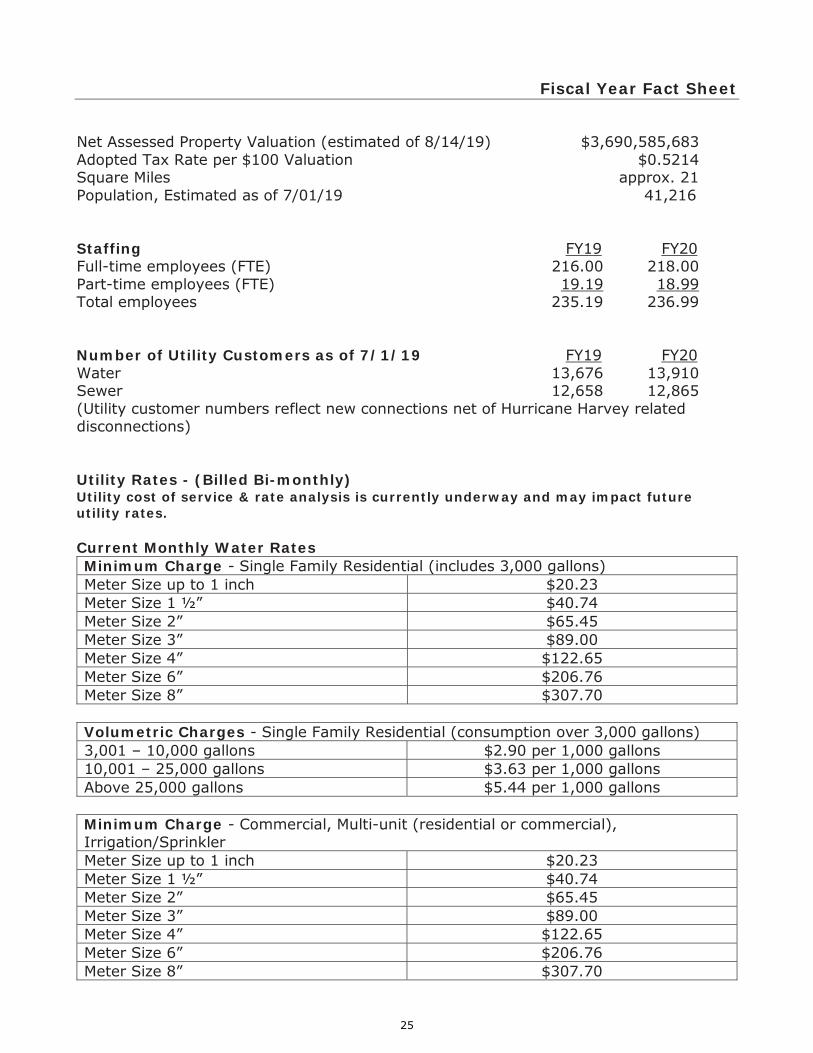
Fiscal Year Fact Sheet Net Assessed Property Valuation (estimated of 8/14/19) $3,690,585,683 Adopted Tax Rate per $100 Valuation $0.5214 Square Miles approx. 21 Population, Estimated as of 7/01/19 41,216 Staffing FY19 FY20 Full-time employees (FTE) 216.00 218.00 Part-time employees (FTE) 19.19 18.99 Total employees 235.19 236.99 Number of Utility Customers as of 7/1/19 FY19 FY20 Water 13,676 13,910 Sewer 12,658 12,865 (Utility customer numbers reflect new connections net of Hurricane Harvey related disconnections) Utility Rates - (Billed Bi-monthly) Utility cost of service & rate analysis is currently underway and may impact future utility rates. Current Monthly Water Rates Minimum Charge - Single Family Residential (includes 3,000 gallons) Meter Size up to 1 inch $20.23 Meter Size 1 ½” $40.74 Meter Size 2” $65.45 Meter Size 3” $89.00 Meter Size 4” $122.65 Meter Size 6” $206.76 Meter Size 8” $307.70
Volumetric Charges - Single Family Residential (consumption over 3,000 gallons) 3,001 – 10,000 gallons $2.90 per 1,000 gallons 10,001 – 25,000 gallons $3.63 per 1,000 gallons Above 25,000 gallons $5.44 per 1,000 gallons
Minimum Charge - Commercial, Multi-unit (residential or commercial), Irrigation/Sprinkler Meter Size up to 1 inch $20.23 Meter Size 1 ½” $40.74 Meter Size 2” $65.45 Meter Size 3” $89.00 Meter Size 4” $122.65 Meter Size 6” $206.76 Meter Size 8” $307.70
25
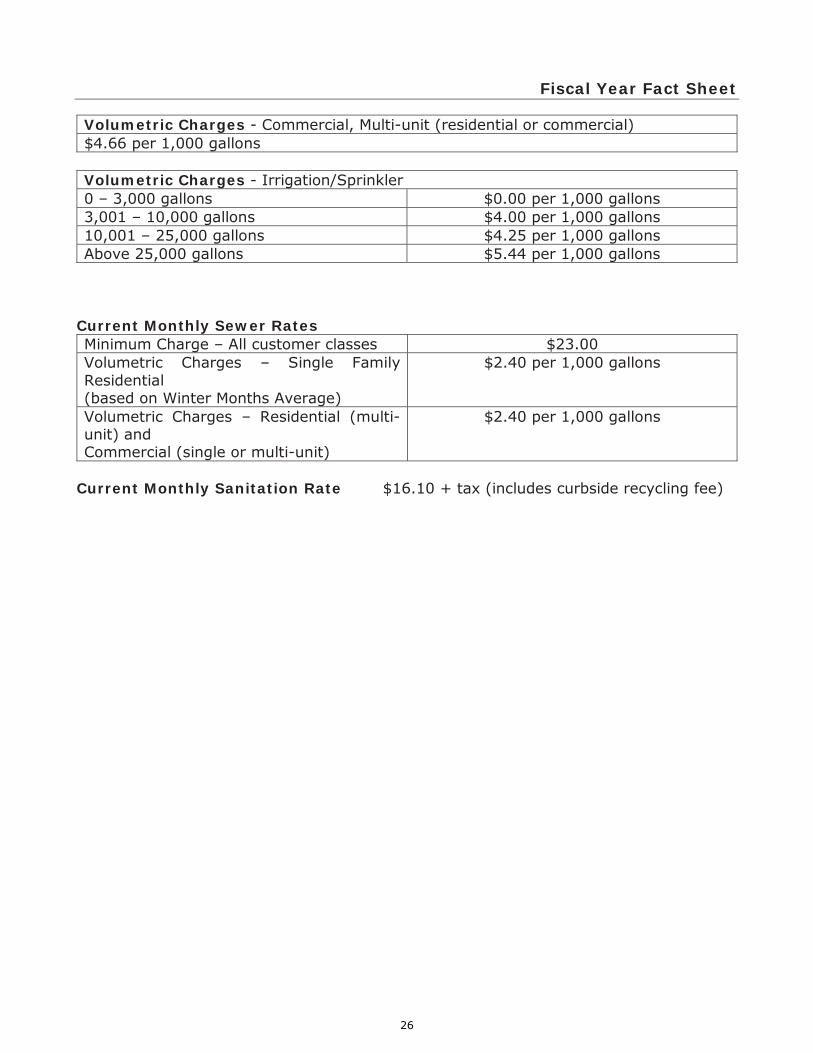
Fiscal Year Fact Sheet Volumetric Charges - Commercial, Multi-unit (residential or commercial) $4.66 per 1,000 gallons
Volumetric Charges - Irrigation/Sprinkler 0 – 3,000 gallons $0.00 per 1,000 gallons 3,001 – 10,000 gallons $4.00 per 1,000 gallons 10,001 – 25,000 gallons $4.25 per 1,000 gallons Above 25,000 gallons $5.44 per 1,000 gallons
Current Monthly Sewer Rates Minimum Charge – All customer classes $23.00 Volumetric Charges – Single Family Residential (based on Winter Months Average)
$2.40 per 1,000 gallons
Volumetric Charges – Residential (multi-unit) and Commercial (single or multi-unit)
$2.40 per 1,000 gallons
Current Monthly Sanitation Rate $16.10 + tax (includes curbside recycling fee)
26

Vision & Mission Statement, Guiding Principles, Council Philosophy, and Strategic Goals
Adopted by Resolution
City of Friendswood Mission Statement It is the mission of the Council and staff of the City of Friendswood to provide the highest level of service to our citizens at the greatest value.
Guiding Principles
We Believe That Visionary Planning is Essential We Believe That Proactive, Responsive, Effective Leadership is Essential We Believe That Ongoing Interactive Communication is Essential
Council Philosophy
To act in the best interest of the citizens To consistently demonstrate respect to the staff To invest our resources effectively for our future To handle our disagreements/conflicts in a respectful manner that keeps our image
positive with the public and each other
Together we build our future
in a friendly place to live,
work, play, learn, and worship
Communication
Economic Development
Preservation
Partnerships
Public Safety
Organizational Development
27

Strategic Goals
1. Communication
Build and expand external partnerships Better educate and inform our citizens to increase ownership and involvement in city
government Utilize conflict/issue resolution processes
2. Economic Development
Build and expand external partnerships Expand existing vision Systemize regional detention Educate and inform citizens to increase ownership in Economic Development Research economic viability before and after 2020
3. Preservation
Build and expand external partnerships Shape future growth to preserve Friendswood’s distinctiveness and quality of life Preserve and maintain infrastructure
4. Partnerships
Build and expand external partnerships Remove any distinction of citizenship based upon county location
5. Public Safety
Build and expand external partnerships Ensure a safe environment
6. Organizational Development
Leadership o Communicate clear messages to citizens and employees about our values
and why we are doing what we are doing o Build team identity with boards, employees, council, and volunteers
Values o Communicate TRAQ as the core values to volunteers, citizens, council
and all employees o Continue to focus on issues—not people
Personnel o Develop a plan for staffing levels that result in quality city services and the
accomplishment of our mission statement o Provide training and development for City employees to meet current and
future staff leadership needs
Process and Planning o Continue strategic planning process to meet future needs o Continue to develop plans to increase community involvement throughout
the City
28

Strategic Goal Matrix
Departmental mission and goals which correlate with a City goal are indicated below in blue.
May
or &
Cou
ncil
City
Sec
reta
ry's
Offi
ce
City
Man
ager
's O
ffice
Adm
inis
trativ
e Se
rvic
es O
ffice
Polic
e D
ept.
Fire
Mar
shal
's O
ffice
Com
mun
ity D
evel
opm
ent D
ept.
Publ
ic W
orks
Engi
neer
ing
Libr
ary
Park
s an
d R
ecre
atio
n
1) Communication 2) Economic Dev.
3) Preservation
4) Partnerships
5) Public Safety
6) Organizational Dev.
29
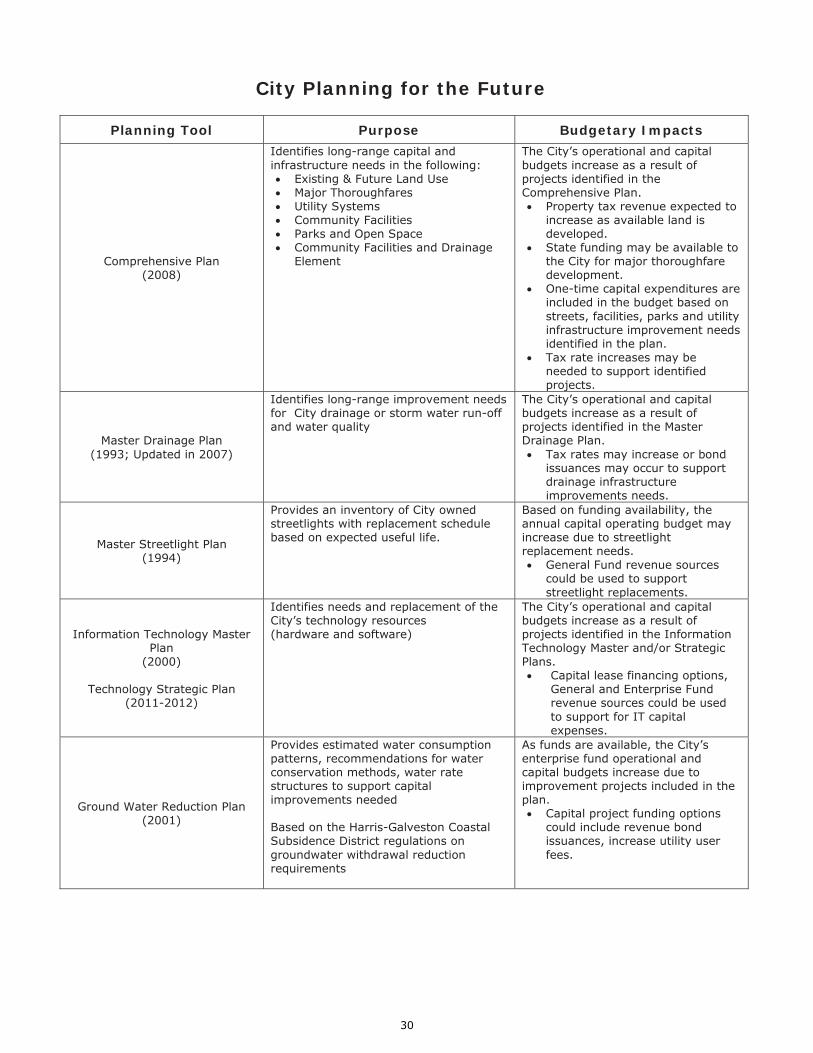
City Planning for the Future
Planning Tool Purpose Budgetary Impacts
Comprehensive Plan (2008)
Identifies long-range capital and infrastructure needs in the following:
Existing & Future Land Use Major Thoroughfares Utility Systems Community Facilities Parks and Open Space Community Facilities and Drainage
Element
The City’s operational and capital budgets increase as a result of projects identified in the Comprehensive Plan.
Property tax revenue expected to increase as available land is developed.
State funding may be available to the City for major thoroughfare development.
One-time capital expenditures are included in the budget based on streets, facilities, parks and utility infrastructure improvement needs identified in the plan.
Tax rate increases may be needed to support identified projects.
Master Drainage Plan (1993; Updated in 2007)
Identifies long-range improvement needs for City drainage or storm water run-off and water quality
The City’s operational and capital budgets increase as a result of projects identified in the Master Drainage Plan.
Tax rates may increase or bond issuances may occur to support drainage infrastructure improvements needs.
Master Streetlight Plan (1994)
Provides an inventory of City owned streetlights with replacement schedule based on expected useful life.
Based on funding availability, the annual capital operating budget may increase due to streetlight replacement needs.
General Fund revenue sources could be used to support streetlight replacements.
Information Technology Master Plan
(2000)
Technology Strategic Plan (2011-2012)
Identifies needs and replacement of the City’s technology resources (hardware and software)
The City’s operational and capital budgets increase as a result of projects identified in the Information Technology Master and/or Strategic Plans.
Capital lease financing options, General and Enterprise Fund revenue sources could be used to support for IT capital expenses.
Ground Water Reduction Plan (2001)
Provides estimated water consumption patterns, recommendations for water conservation methods, water rate structures to support capital improvements needed Based on the Harris-Galveston Coastal Subsidence District regulations on groundwater withdrawal reduction requirements
As funds are available, the City’s enterprise fund operational and capital budgets increase due to improvement projects included in the plan.
Capital project funding options could include revenue bond issuances, increase utility user fees.
30
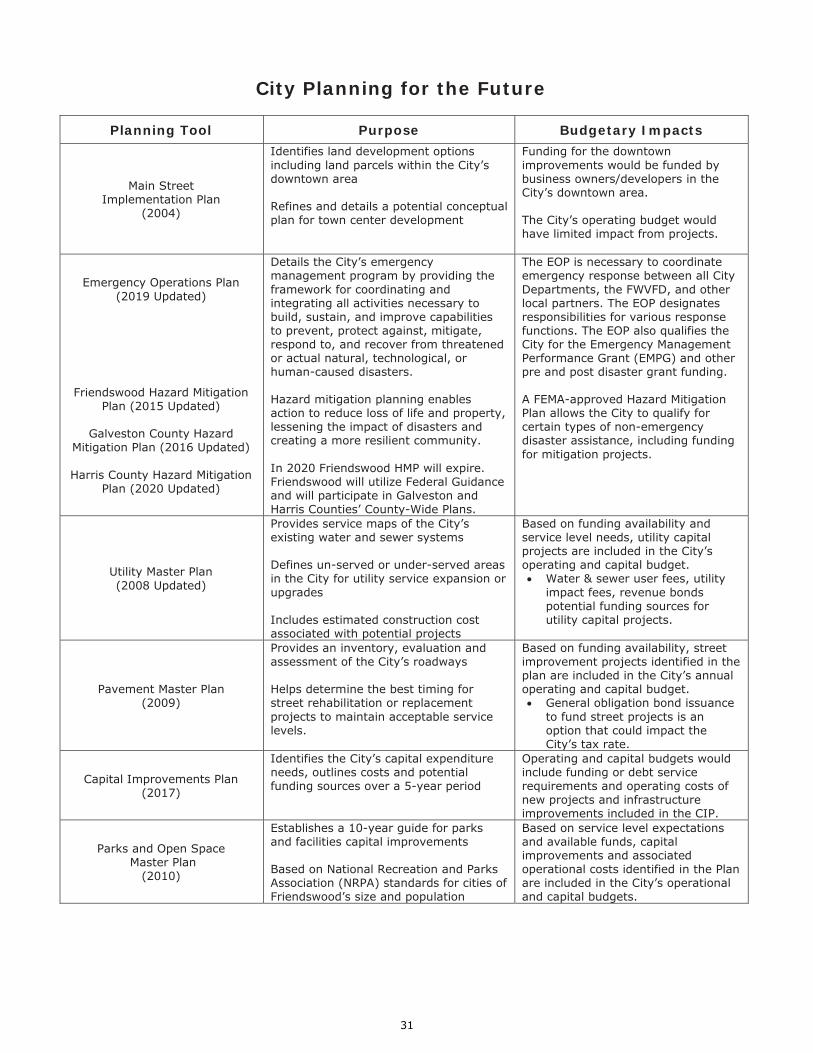
City Planning for the Future
Planning Tool Purpose Budgetary Impacts
Main Street Implementation Plan
(2004)
Identifies land development options including land parcels within the City’s downtown area Refines and details a potential conceptual plan for town center development
Funding for the downtown improvements would be funded by business owners/developers in the City’s downtown area. The City’s operating budget would have limited impact from projects.
Emergency Operations Plan (2019 Updated)
Friendswood Hazard Mitigation Plan (2015 Updated)
Galveston County Hazard
Mitigation Plan (2016 Updated)
Harris County Hazard Mitigation Plan (2020 Updated)
Details the City’s emergency management program by providing the framework for coordinating and integrating all activities necessary to build, sustain, and improve capabilities to prevent, protect against, mitigate, respond to, and recover from threatened or actual natural, technological, or human-caused disasters. Hazard mitigation planning enables action to reduce loss of life and property, lessening the impact of disasters and creating a more resilient community. In 2020 Friendswood HMP will expire. Friendswood will utilize Federal Guidance and will participate in Galveston and Harris Counties’ County-Wide Plans.
The EOP is necessary to coordinate emergency response between all City Departments, the FWVFD, and other local partners. The EOP designates responsibilities for various response functions. The EOP also qualifies the City for the Emergency Management Performance Grant (EMPG) and other pre and post disaster grant funding. A FEMA-approved Hazard Mitigation Plan allows the City to qualify for certain types of non-emergency disaster assistance, including funding for mitigation projects.
Utility Master Plan (2008 Updated)
Provides service maps of the City’s existing water and sewer systems Defines un-served or under-served areas in the City for utility service expansion or upgrades Includes estimated construction cost associated with potential projects
Based on funding availability and service level needs, utility capital projects are included in the City’s operating and capital budget.
Water & sewer user fees, utility impact fees, revenue bonds potential funding sources for utility capital projects.
Pavement Master Plan (2009)
Provides an inventory, evaluation and assessment of the City’s roadways Helps determine the best timing for street rehabilitation or replacement projects to maintain acceptable service levels.
Based on funding availability, street improvement projects identified in the plan are included in the City’s annual operating and capital budget.
General obligation bond issuance to fund street projects is an option that could impact the City’s tax rate.
Capital Improvements Plan (2017)
Identifies the City’s capital expenditure needs, outlines costs and potential funding sources over a 5-year period
Operating and capital budgets would include funding or debt service requirements and operating costs of new projects and infrastructure improvements included in the CIP.
Parks and Open Space Master Plan
(2010)
Establishes a 10-year guide for parks and facilities capital improvements Based on National Recreation and Parks Association (NRPA) standards for cities of Friendswood’s size and population
Based on service level expectations and available funds, capital improvements and associated operational costs identified in the Plan are included in the City’s operational and capital budgets.
31
City Planning for the Future
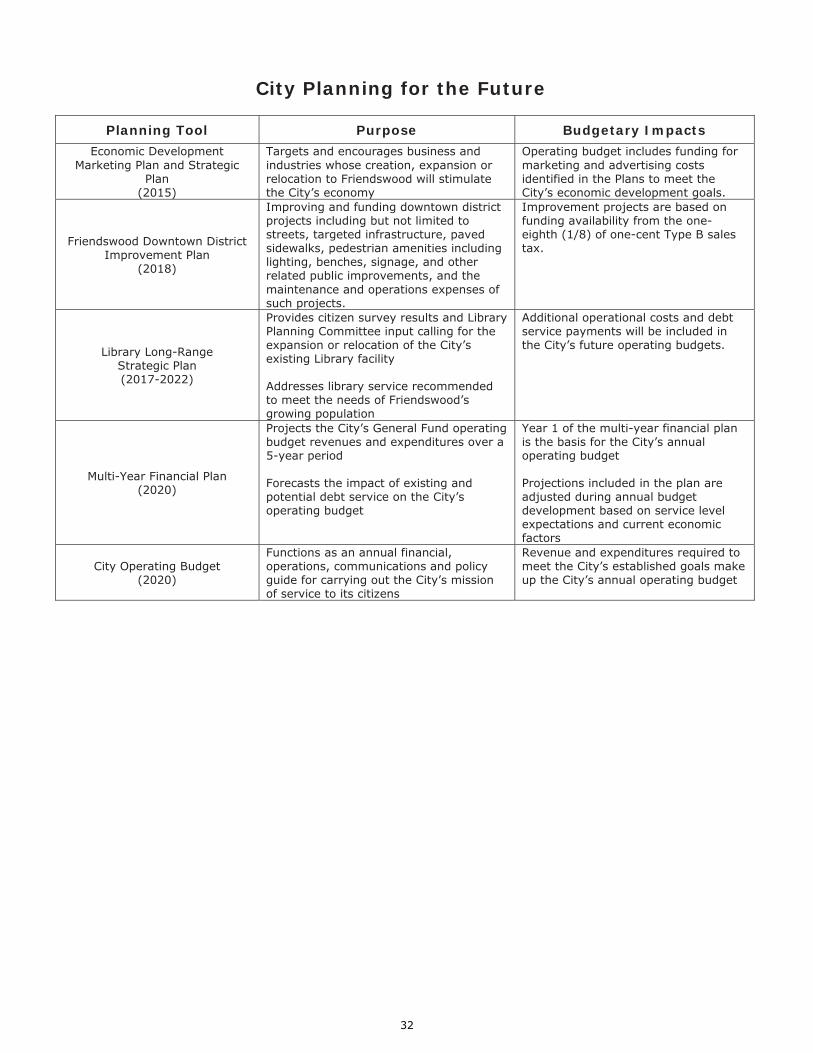
Planning Tool Purpose Budgetary Impacts Economic Development
Marketing Plan and Strategic Plan
(2015)
Targets and encourages business and industries whose creation, expansion or relocation to Friendswood will stimulate the City’s economy
Operating budget includes funding for marketing and advertising costs identified in the Plans to meet the City’s economic development goals.
Friendswood Downtown District Improvement Plan
(2018)
Improving and funding downtown district projects including but not limited to streets, targeted infrastructure, paved sidewalks, pedestrian amenities including lighting, benches, signage, and other related public improvements, and the maintenance and operations expenses of such projects.
Improvement projects are based on funding availability from the one-eighth (1/8) of one-cent Type B sales tax.
Library Long-Range Strategic Plan (2017-2022)
Provides citizen survey results and Library Planning Committee input calling for the expansion or relocation of the City’s existing Library facility Addresses library service recommended to meet the needs of Friendswood’s growing population
Additional operational costs and debt service payments will be included in the City’s future operating budgets.
Multi-Year Financial Plan (2020)
Projects the City’s General Fund operating budget revenues and expenditures over a 5-year period Forecasts the impact of existing and potential debt service on the City’s operating budget
Year 1 of the multi-year financial plan is the basis for the City’s annual operating budget Projections included in the plan are adjusted during annual budget development based on service level expectations and current economic factors
City Operating Budget (2020)
Functions as an annual financial, operations, communications and policy guide for carrying out the City’s mission of service to its citizens
Revenue and expenditures required to meet the City’s established goals make up the City’s annual operating budget
32

This page is intentionally left blank.
33

Fund Flowchart
The City of Friendswood utilizes the funds shown above to account for revenue and expenditure transactions.
Basis of Budgeting and Accounting:
Accrual basis – transactions affecting the fund are recorded or recognized when they occur; rather than when the actual cash is received or payment is made
Modified Accrual basis – transactions affecting the fund are recorded or recognized when they become “measurable” and “available” to finance expenditures of the current accounting period
GOVERNMENTALFUNDS
GENERAL FUNDModified Accural Basis of Accounting/Budgeting
DEPARTMENTSGeneral Government
Public SafetyCommunity Development
Public WorksEngineering
LibraryParks and Recreation
SPECIAL REVENUE FUNDSPolice InvestigationFire/EMS Donations
Municipal Court Fund
DEBT SERVICE FUND (TAXES)
Modified Accrual Basis of Accounting/Budgeting
1776 PARK TRUST FUNDAccrual Basis of
Accounting/Budgeting
CAPITAL PROJECT FUNDSModified Accrual Basis of Accounting/Budgeting
CIP FUNDSSidewalk Installation Fund
Parkland Dedication Fund
Street/Economic Development Fund
General Obligation Bonds
PROPRIETARY FUNDAccrual Basis of Accounting/Budgeting
ENTERPRISE FUNDSWater & Sewer Operations
2006 Water & Sewer Bond Construction2009 Water & Sewer Bond Construction2016 Water & Sewer Bond Construction2018 Water & Sewer Bond Construction
Water CIP/Impact FeeSewer CIP/Impact Fee
Water & Sewer Revenue Debt Service
INTERNAL SERVICE FUNDVehicle Replacement
34
Fund Definitions
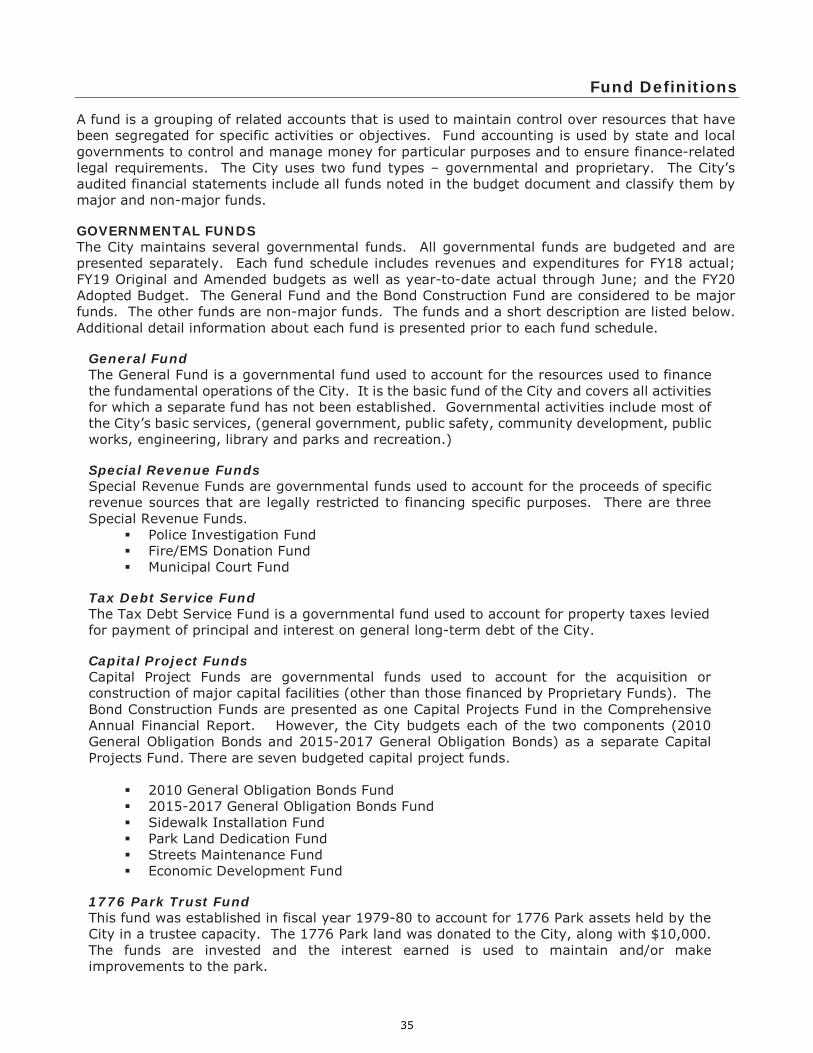
A fund is a grouping of related accounts that is used to maintain control over resources that have been segregated for specific activities or objectives. Fund accounting is used by state and local governments to control and manage money for particular purposes and to ensure finance-related legal requirements. The City uses two fund types – governmental and proprietary. The City’s audited financial statements include all funds noted in the budget document and classify them by major and non-major funds. GOVERNMENTAL FUNDS The City maintains several governmental funds. All governmental funds are budgeted and are presented separately. Each fund schedule includes revenues and expenditures for FY18 actual; FY19 Original and Amended budgets as well as year-to-date actual through June; and the FY20 Adopted Budget. The General Fund and the Bond Construction Fund are considered to be major funds. The other funds are non-major funds. The funds and a short description are listed below. Additional detail information about each fund is presented prior to each fund schedule.
General Fund The General Fund is a governmental fund used to account for the resources used to finance the fundamental operations of the City. It is the basic fund of the City and covers all activities for which a separate fund has not been established. Governmental activities include most of the City’s basic services, (general government, public safety, community development, public works, engineering, library and parks and recreation.)
Special Revenue Funds Special Revenue Funds are governmental funds used to account for the proceeds of specific revenue sources that are legally restricted to financing specific purposes. There are three Special Revenue Funds.
Police Investigation Fund Fire/EMS Donation Fund Municipal Court Fund
Tax Debt Service Fund The Tax Debt Service Fund is a governmental fund used to account for property taxes levied for payment of principal and interest on general long-term debt of the City.
Capital Project Funds Capital Project Funds are governmental funds used to account for the acquisition or construction of major capital facilities (other than those financed by Proprietary Funds). The Bond Construction Funds are presented as one Capital Projects Fund in the Comprehensive Annual Financial Report. However, the City budgets each of the two components (2010 General Obligation Bonds and 2015-2017 General Obligation Bonds) as a separate Capital Projects Fund. There are seven budgeted capital project funds.
2010 General Obligation Bonds Fund 2015-2017 General Obligation Bonds Fund Sidewalk Installation Fund Park Land Dedication Fund Streets Maintenance Fund Economic Development Fund
1776 Park Trust Fund This fund was established in fiscal year 1979-80 to account for 1776 Park assets held by the City in a trustee capacity. The 1776 Park land was donated to the City, along with $10,000. The funds are invested and the interest earned is used to maintain and/or make improvements to the park.
35

Fund Definitions
PROPRIETARY FUNDS The City maintains two types of proprietary funds. The City uses the Enterprise fund for water and sewer operations. The enterprise fund reports the same functions presented as business-type activities. The second proprietary fund is the Internal Service Fund. This fund is used to account for fleet management services. The funds and a short description follow. Additional detail information about each fund is presented prior to each fund schedule.
Enterprise Fund The Enterprise Fund is used to budget for the acquisition, operation and maintenance of governmental facilities and services that are entirely or predominantly self-supporting by user charges. The business-type activities of the Enterprise Fund include the City’s water and sewer system. The Enterprise Fund is maintained in seven separate funds in the City’s accounting system, but presented as one Enterprise Fund in the Comprehensive Annual Financial Report. However, the City budgets each of the eight components as separate Water and Sewer funds. The budgeted Water and Sewer Funds include:
Water and Sewer Operation Fund 2006 Water and Sewer Bond Construction Fund 2009 Water and Sewer Bond Construction Fund 2016 Water and Sewer Bond Construction Fund 2018 Water and Sewer Bond Construction Fund Water CIP/Impact Fee Fund Sewer CIP/Impact Fee Fund Water and Sewer Revenue Debt Service Fund
Internal Service Fund This internal service fund was established in fiscal year 2001-02 and is used to account for acquisition and replacement of City vehicles costing less than $50,000. The budgeted Internal Service fund includes:
Vehicle Replacement Fund
36

The following table correlates the City’s fund uses by functioning unit. The shaded boxes in blue indicate the departments which utilize the fund identified.
FUND DEPARTMENT M/CC CSO CMO ASO PD FMO CDD PW ENG LIB PR General Operating Police Investigation Fire/EMS Donations Municipal Court Fund Park Land Dedication Streets Improvement Economic Devel Improvements
Tax Debt Service 1776 Park Trust Capital Project Funds Water & Sewer Operating
Water & Sewer Bonds Water CIP/Impact Fees
Sewer CIP/Impact Fees
Water & Sewer Tax Debt
Vehicle Replacement
M/CC -Mayor & City Council CSO -City Secretary’s Office CMO -City Manager’s Office ASO -Administrative Services Office PD -Police Department FMO -Fire Marshal’s Office CDD -Community Development Dept. PW -Public Works ENG -Engineering LIB -Library PR -Parks & Recreation
37

Financial Management Policy (with adopted revisions 10-1-2018)
38
Financial Management Policy (with adopted revisions)
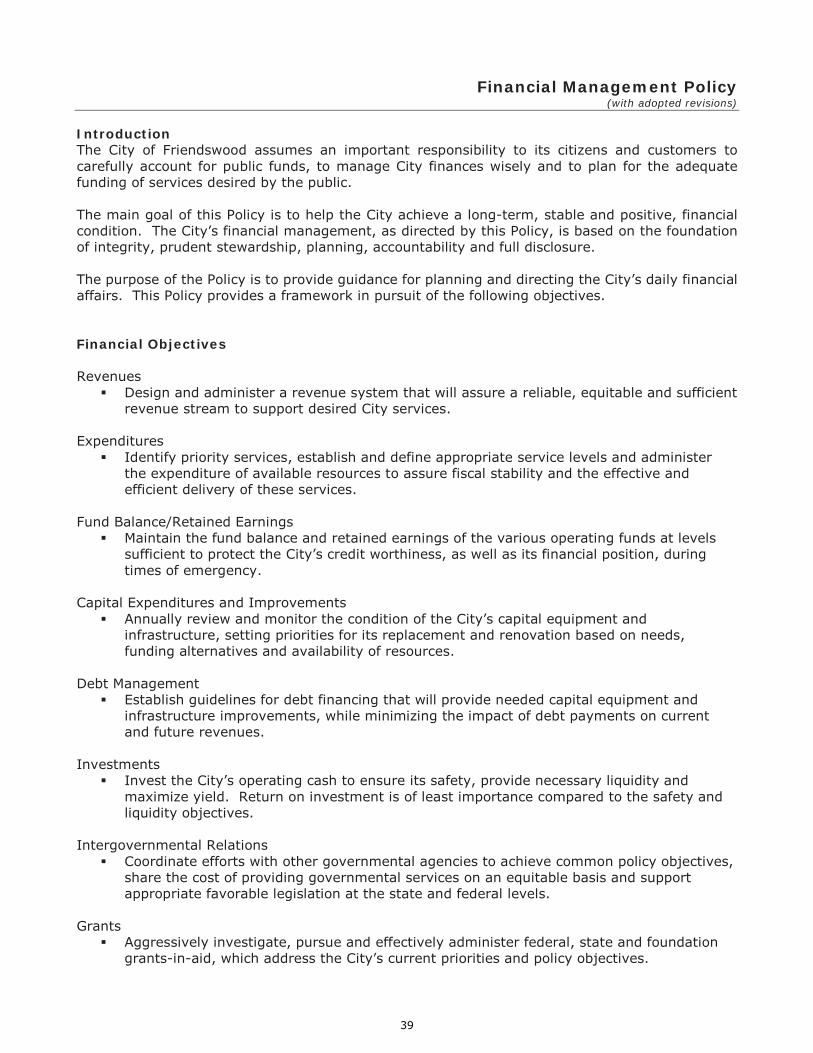
Introduction The City of Friendswood assumes an important responsibility to its citizens and customers to carefully account for public funds, to manage City finances wisely and to plan for the adequate funding of services desired by the public. The main goal of this Policy is to help the City achieve a long-term, stable and positive, financial condition. The City’s financial management, as directed by this Policy, is based on the foundation of integrity, prudent stewardship, planning, accountability and full disclosure. The purpose of the Policy is to provide guidance for planning and directing the City’s daily financial affairs. This Policy provides a framework in pursuit of the following objectives. Financial Objectives Revenues
Design and administer a revenue system that will assure a reliable, equitable and sufficient revenue stream to support desired City services.
Expenditures Identify priority services, establish and define appropriate service levels and administer
the expenditure of available resources to assure fiscal stability and the effective and efficient delivery of these services.
Fund Balance/Retained Earnings
Maintain the fund balance and retained earnings of the various operating funds at levels sufficient to protect the City’s credit worthiness, as well as its financial position, during times of emergency.
Capital Expenditures and Improvements
Annually review and monitor the condition of the City’s capital equipment and infrastructure, setting priorities for its replacement and renovation based on needs, funding alternatives and availability of resources.
Debt Management Establish guidelines for debt financing that will provide needed capital equipment and
infrastructure improvements, while minimizing the impact of debt payments on current and future revenues.
Investments Invest the City’s operating cash to ensure its safety, provide necessary liquidity and
maximize yield. Return on investment is of least importance compared to the safety and liquidity objectives.
Intergovernmental Relations
Coordinate efforts with other governmental agencies to achieve common policy objectives, share the cost of providing governmental services on an equitable basis and support appropriate favorable legislation at the state and federal levels.
Grants
Aggressively investigate, pursue and effectively administer federal, state and foundation grants-in-aid, which address the City’s current priorities and policy objectives.
39

Financial Management Policy (with adopted revisions)
Economic Development Initiate, encourage and participate in economic development efforts to create job
opportunities and strengthen the local economy and tax base. Fiscal Monitoring
Analyze financial data and prepare reports that reflect the City’s financial performance and economic condition.
Accounting, Auditing and Financial Reporting
Comply with prevailing federal, state and local statutes and regulations. Conform to generally accepted accounting principles as promulgated by the Governmental Accounting Standards Board (GASB), American Institute of Certified Public Accountants (AICPA) and the Government Finance Officers Association (GFOA).
Internal Control
Maintain an environment to provide management with reasonable assurance that assets are safeguarded against loss from unauthorized use or disposition.
Risk Management
Prevent and/or reduce financial impact to the City of claims and losses through prevention and transfer of liability.
Budget
Develop and maintain a balanced budget (defined as a term signifying budgeted expenditures being offset by budgeted revenues), which presents a clear understanding of goals, service levels and performance standards. The document shall, to the extent possible, be “user-friendly” for citizens.
I. Revenues
The City shall use the following guidelines to design and administer a revenue system that will assure a reliable, equitable and sufficient revenue stream to support desired City services. Balance and Diversification in Revenue Sources
The City shall strive to maintain a balanced and diversified revenue system to protect the City from fluctuations in any one source due to changes in economic conditions, which adversely impact that source.
User Fees
For services that benefit specific users, where possible, the City shall establish and collect fees to recover the full direct and indirect cost of those services. City staff shall review user fees on a regular basis to calculate their full cost recovery levels, to compare them to the current fee structure and to recommend adjustments where necessary.
Property Tax Revenues/Tax Rate
The City shall endeavor to reduce its reliance on property tax revenues by revenue diversification, implementation and continued use of user fees and economic development. The City shall also strive to stabilize its tax rate and minimize tax rate increases.
40
Financial Management Policy (with adopted revisions)
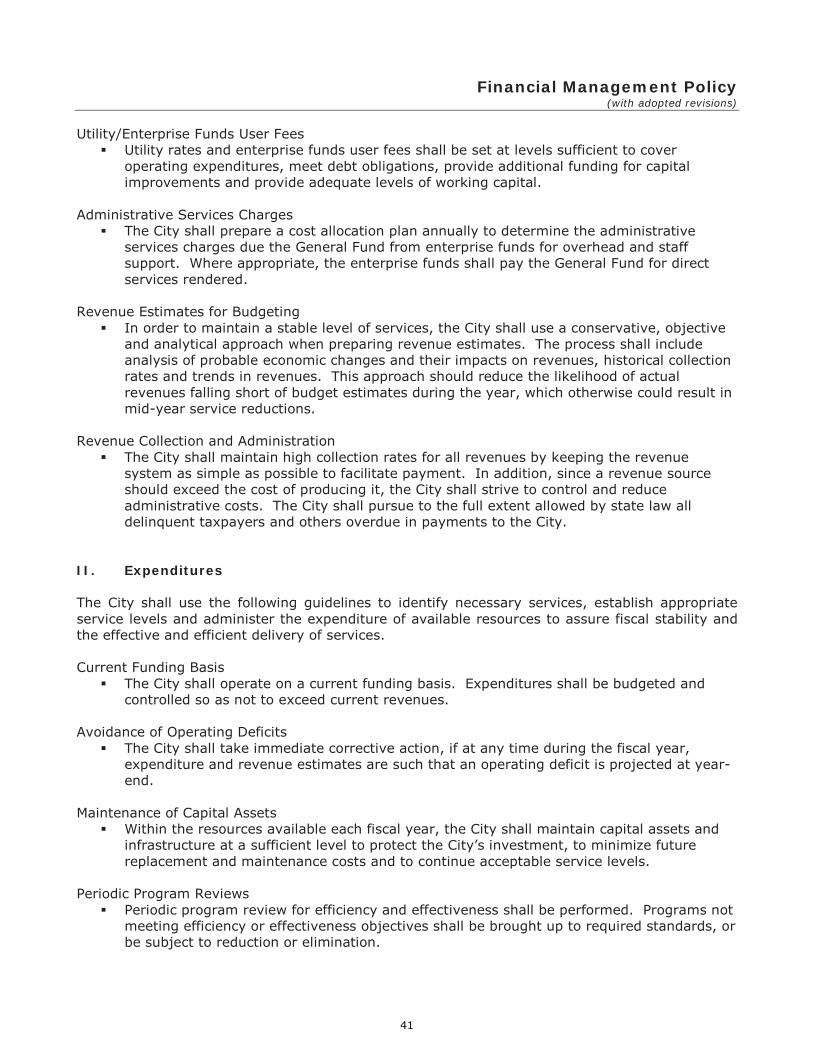
Utility/Enterprise Funds User Fees
Utility rates and enterprise funds user fees shall be set at levels sufficient to cover operating expenditures, meet debt obligations, provide additional funding for capital improvements and provide adequate levels of working capital.
Administrative Services Charges
The City shall prepare a cost allocation plan annually to determine the administrative services charges due the General Fund from enterprise funds for overhead and staff support. Where appropriate, the enterprise funds shall pay the General Fund for direct services rendered.
Revenue Estimates for Budgeting
In order to maintain a stable level of services, the City shall use a conservative, objective and analytical approach when preparing revenue estimates. The process shall include analysis of probable economic changes and their impacts on revenues, historical collection rates and trends in revenues. This approach should reduce the likelihood of actual revenues falling short of budget estimates during the year, which otherwise could result in mid-year service reductions.
Revenue Collection and Administration
The City shall maintain high collection rates for all revenues by keeping the revenue system as simple as possible to facilitate payment. In addition, since a revenue source should exceed the cost of producing it, the City shall strive to control and reduce administrative costs. The City shall pursue to the full extent allowed by state law all delinquent taxpayers and others overdue in payments to the City.
II. Expenditures The City shall use the following guidelines to identify necessary services, establish appropriate service levels and administer the expenditure of available resources to assure fiscal stability and the effective and efficient delivery of services.
Current Funding Basis
The City shall operate on a current funding basis. Expenditures shall be budgeted and controlled so as not to exceed current revenues.
Avoidance of Operating Deficits
The City shall take immediate corrective action, if at any time during the fiscal year, expenditure and revenue estimates are such that an operating deficit is projected at year-end.
Maintenance of Capital Assets
Within the resources available each fiscal year, the City shall maintain capital assets and infrastructure at a sufficient level to protect the City’s investment, to minimize future replacement and maintenance costs and to continue acceptable service levels.
Periodic Program Reviews
Periodic program review for efficiency and effectiveness shall be performed. Programs not meeting efficiency or effectiveness objectives shall be brought up to required standards, or be subject to reduction or elimination.
41

Financial Management Policy (with adopted revisions)
Purchasing The City shall make every effort to maximize any discounts offered by creditors/vendors.
The City will follow state law and the City of Friendswood Purchasing Manual concerning formal bidding procedures and approval by the City Council. For purchases where competitive bidding is not required, the City shall obtain the most favorable terms and pricing possible.
The City Manager, or his designee, shall have the authority to approve and sign contracts
and/or purchases for budgeted goods or services that do not exceed the state law bid limitation of $50,000. Contracts or purchases for items in excess of the state law bid limit shall be placed on a Council agenda for action authorizing the Mayor, or his designee’s, signature.
III. Fund Balance/Working Capital/Net Assets
The City shall use the following guidelines to maintain the fund balance and retained earnings of the various operating funds at levels sufficient to protect the City's creditworthiness as well as its financial position from unforeseeable emergencies. General Fund Unassigned Fund Balance
The City shall strive to maintain the General Fund unassigned fund balance at a minimum of 90 days of prior year audited operating expenditures.
Any unassigned funds after the fiscal year-end audit will be allowed to accumulate to build this 90-day reserve.
After the General Fund has gathered sufficient resources, additional unassigned funds will be allowed to accumulate for future General Fund capital improvements.
Unrestricted Net Position of Other Operating Funds; Water and Sewer Working Capital
In other operating funds, the City shall strive to maintain a positive unrestricted net position to provide sufficient reserves for emergencies and revenue shortfalls. The minimum working capital in the Water and Sewer Fund shall be 90 days of prior year
audited operating expenses.
Any unrestricted funds after the fiscal year-end audit will be allowed to accumulate to build this 90-day reserve.
After these funds have gathered sufficient resources, additional unrestricted funds will be allowed to accumulate in working capital for future utility/operating fund capital improvements.
Use of Fund Balance/ Working Capital
Fund Balance/ Working Capital may be used in one or a combination of the following ways: o Emergencies; o One-time expenditures that do not increase recurring operating costs; o Major capital purchases; and o Start-up expenditures for new programs undertaken at mid-year, provided such
action is considered in the context of multiyear projections of program revenues and expenditures.
42

Financial Management Policy (with adopted revisions)
Should such use reduce the balance below the appropriate level set as the objective for
that fund, the City shall take action necessary to restore the unassigned fund balance or working capital to acceptable levels within three years.
IV. Capital Expenditures and Improvements The City shall annually review and monitor the condition of the City’s capital equipment and infrastructure, setting priorities for its replacement and renovation based on needs, funding alternatives and availability of resources. Capital Improvements Planning Program
The City shall annually review the Capital Improvements Planning Program (CIP), the current status of the City’s infrastructure, replacement and renovation needs and potential new projects and update the program as appropriate. All projects, ongoing and proposed, shall be prioritized based on an analysis of current needs and resource availability. For every project, all operation, maintenance and replacement costs shall be fully costed. The CIP shall also present the City’s long-term borrowing plan, debt payment schedules and other debt outstanding or planned, including general obligation bonds, revenue bonds and certificates of obligation.
Replacement of City Vehicles
The City shall annually prepare a schedule for the replacement of its vehicles. Within the resources available each fiscal year, the City shall replace these assets according to this schedule.
The Vehicle Replacement Fund will purchase all City vehicles. Departments will then make annual contributions to this fund, based on the life expectancy of their equipment, to replace the funds used to purchase vehicles.
Heavy equipment that cost more than $50,000 may be funded by one of the capital expenditure financing methods discussed below.
Capital Expenditures Financing
The City recognizes that there are several methods of financing capital items. It can budget the funds from current revenues; take the funds from fund balance/working capital, as allowed by the Fund Balance/working capital Policy; utilize funds from grants; or it can borrow the money through some form of debt instrument. Debt financing includes general obligation bonds, revenue bonds, certificates of obligation and capital lease agreements.
Capitalization Threshold for Tangible Capital Assets The Government Finance Officers Association (GFOA) recommends that “best practice” guidelines be followed in establishing capitalization thresholds for tangible capital-type items. Accordingly, the following criteria shall be established with the adoption of this policy.
Individual items costing $5,000 or more will be capitalized and depreciated according to Governmental Accounting Standards Board rules. This amount will be adjusted as changes are recommended in GFOA’s “best practices” guidelines.
Tangible capital-type items will only be capitalized if they have any estimated useful life of at least five years following the date of acquisition.
Capitalization thresholds will be applied to individual items rather than to groups of similar items (e.g., desks and tables).
Adequate control procedures at the department level will be established to ensure adequate control over non-capitalized tangible items.
43

Financial Management Policy (with adopted revisions)
V. Debt Management The City shall use the following guidelines for debt financing used to provide needed capital equipment and infrastructure improvements, while minimizing the impact of debt payments on current and future revenues. Use of Debt Financing
Debt financing, to include general obligation bonds, revenue bonds, certificates of obligation and capital lease agreements, shall only be used to acquire capital assets.
Amortization of Debt
Amortization of debt shall be structured in accordance with a multi-year capital improvement plan. The term of a debt issue will never exceed the useful life of the capital asset being financed.
Affordability Targets
The City shall use an objective, analytical approach to determine whether it can afford to assume new debt beyond the amount it retires each year. This process shall compare generally accepted standards of affordability to the current values for the City. These standards shall include debt per capita, debt as a percent of taxable value and debt service payments as a percent of current revenues and current expenditures. The process shall also examine the direct costs and benefits of the proposed expenditures as determined in the City’s annual update of the Capital Improvements Planning Program. The decision on whether or not to assume new debt shall be based on these costs and benefits and on the City’s ability to afford new debt as determined by the aforementioned standards.
Sale Process
The City shall use a competitive bidding process in the sale of debt unless the nature of the issue warrants a negotiated bid.
Rating Agencies Presentation
Full disclosure of operations and open lines of communication shall be made available to the rating agencies. City staff, with assistance of financial advisors, shall prepare the necessary materials and presentation to the rating agencies.
Continuing Disclosure
The City is committed to continuing disclosure of financial and pertinent credit information relevant to the City’s outstanding issues.
Debt Refunding
City staff and the financial advisor shall monitor the municipal bond market for opportunities to obtain interest savings by refunding outstanding debt. A proposed refunding of debt, for interest cost savings, should provide a present value benefit as a percent of refunded principal of at least 3%.
44
Financial Management Policy (with adopted revisions)
Continuing Compliance with Federal Tax Covenants
Arbitrage Compliance Federal income tax laws generally restrict the ability to earn arbitrage in connection with the Obligations. The Responsible Person (as defined below) will review the Closing Documents periodically (at least once a year) to ascertain if an exception to arbitrage compliance applies.
o Procedures applicable to Obligations issued for construction and acquisition purposes.
With respect to the investment and expenditure of the proceeds of the Obligations that are issued to finance public improvements or to acquire land or personal property, the Issuer's City Manager (such officer, together with other employees of the Issuer who report to such officer, is collectively, the "Responsible Person") will:
o Instruct the appropriate person who is primarily responsible for the construction,
renovation or acquisition of the facilities financed with the Obligations (the "Project") that (i) binding contracts for the expenditure of at least 5% of the proceeds of the Obligations are entered into within 6 months of the date of closing of the Obligations (the "Issue Date") and that (ii) the Project must proceed with due diligence;
o Monitor that at least 85% of the proceeds of the Obligations to be used for the
construction, renovation or acquisition of the Project are expended within 3 years of the Issue Date;
o Monitor the yield on the investments purchased with proceeds of the Obligations and
restrict the yield of such investments to the yield on the Obligations after 3 years of the Issue Date;
o Monitor all amounts deposited into a sinking fund or funds pledged (directly or
indirectly) to the payment of the Obligations, such as the Interest and Sinking Fund, to assure that the maximum amount invested within such applicable fund at a yield higher than the yield on the Obligations does not exceed an amount equal to the debt service on the Obligations in the succeeding 12 month period plus a carryover amount equal to one-twelfth of the principal and interest payable on the Obligations for the immediately preceding 12-month period; and
o Ensure that no more than 50% of the proceeds of the Obligations are invested in an
investment with a guaranteed yield for 4 years or more.
Procedures applicable to Obligations with a debt service reserve fund. In addition to the foregoing, if the Issuer issues Obligations that are secured by a debt service reserve fund, the Responsible Person will:
o Assure that the maximum amount of any reserve fund for the Obligations invested
at a yield higher than the yield on the Obligations will not exceed the lesser of (1) 10% of the principal amount of the Obligations, (2) 125% of the average annual debt service on the Obligations measured as of the Issue Date, or (3) 100% of the maximum annual debt service on the Obligations as of the Issue Date.
Procedures applicable to Escrow Accounts for Refunding Issues. In addition to the foregoing,
if the Issuer issues Obligations and proceeds are deposited to an escrow fund to be administered pursuant to the terms of an escrow agreement, the Responsible Person will:
45

Financial Management Policy (with adopted revisions)
o Monitor the actions of the escrow agent to ensure compliance with the applicable provisions of the escrow agreement, including with respect to reinvestment of cash balances;
o Contact the escrow agent on the date of redemption of obligations being refunded to
ensure that they were redeemed; and
o Monitor any unspent proceeds of the refunded obligations to ensure that the yield on any investments applicable to such proceeds are invested at the yield on the applicable obligations or otherwise applied (see Closing Documents).
Procedures applicable to all Tax-exempt Obligation Issues. For all issuances of Obligations,
the Responsible Person will:
o Maintain any official action of the Issuer (such as a reimbursement resolution) stating the Issuer's intent to reimburse with the proceeds of the Obligations any amount expended prior to the Issue Date for the acquisition, renovation or construction of the facilities;
o Ensure that the applicable information return (e.g., IRS Form 8038-G, 8038-GC, or
any successor forms) is timely filed with the IRS; and
o Assure that, unless excepted from rebate and yield restriction under section 148(f) of the Code, excess investment earnings are computed and paid to the U.S. government at such time and in such manner as directed by the IRS (i) at least every 5 years after the Issue Date and (ii) within 30 days after the date the Obligations are retired.
Private Business Use
Generally, to be tax-exempt, only an insignificant amount of the proceeds of each issue of Obligations can benefit (directly or indirectly) private businesses. The Responsible Persons will review the Closing Documents periodically (at least once a year) for the purpose of determining that the use of the facilities financed or refinanced with the proceeds of the Obligations (the "Project") do not violate provisions of federal tax law that pertain to private business use. In addition, the Responsible Persons will:
o Develop procedures or a "tracking system" to identify all property financed with tax-exempt debt;
o Monitor and record the date on which the Project is substantially complete and
available to be used for the purpose intended;
o Monitor and record whether, at any time the Obligations are outstanding, any person, other than the Issuer, the employees of the Issuer, the agents of the Issuer or members of the general public has any contractual right (such as a lease, purchase, management or other service agreement) with respect to any portion of the facilities;
o Monitor and record whether, at any time the Obligations are outstanding, any person,
other than the Issuer, the employees of the Issuer, the agents of the Issuer or members of the general public has a right to use the output of the facilities (e.g., water, gas, electricity);
46

Financial Management Policy (with adopted revisions)
o Monitor and record whether, at any time the Obligations are outstanding, any person, other than the Issuer, the employees of the Issuer, the agents of the Issuer or members of the general public has a right to use the facilities to conduct or to direct the conduct of research;
o Monitor and record whether, at any time the Obligations are outstanding, any person,
other than the Issuer, has a naming right for the facilities or any other contractual right granting an intangible benefit;
o Monitor and record whether, at any time the Obligations are outstanding, the facilities
are sold or otherwise disposed of; and
o Take such action as is necessary to remediate any failure to maintain compliance with the covenants contained in the Order related to the public use of the Project.
Record Retention
The Responsible Person will maintain or cause to be maintained all records relating to the investment and expenditure of the proceeds of the Obligations and the use of the facilities financed or refinanced thereby for a period ending three (3) years after the complete extinguishment of the Obligations. If any portion of the Obligations is refunded with the proceeds of another series of tax-exempt Obligations, such records shall be maintained until the three (3) years after the refunding Obligations are completely extinguished. Such records can be maintained in paper or electronic format.
Responsible Persons
Each Responsible Person shall receive appropriate training regarding the Issuer's accounting system, contract intake system, facilities management and other systems necessary to track the investment and expenditure of the proceeds and the use of the Project financed or refinanced with the proceeds of the Obligations. The foregoing notwithstanding, each Responsible Person shall report to the Council whenever experienced advisors and agents may be necessary to carry out the purposes of these instructions for the purpose of seeking Council approval to engage or utilize existing advisors and agents for such purposes.
47

Financial Management Policy (with adopted revisions)
VI. Investments The City’s cash shall be invested in such a manner so as to ensure the absolute safety of principal and interest, to meet the liquidity needs of the City and to achieve the highest possible yield in accordance with the City’s Investment Policy. Interest earned from investments shall be distributed to the City’s funds from which the money was provided. VII. Intergovernmental Relations The City shall coordinate efforts with other governmental agencies to achieve common policy objectives, share the cost of providing government services on an equitable basis and support appropriate favorable legislation at the state and federal levels. Interlocal Cooperation in Delivery of Services
In order to promote the effective and efficient delivery of services, the City shall work with other local jurisdictions to share on an equitable basis the costs of services, to share facilities and to develop joint programs to improve service to its citizens.
Legislative Program
The City shall cooperate with other jurisdictions to actively oppose any state or federal regulation or proposal that mandates additional City programs or services and does not provide the funding necessary for implementation.
VIII. Grants The City shall seek to obtain and effectively administer federal, state and foundation grants-in-aid that address the City’s current and future priorities and policy objectives. Grant Guidelines
The City shall seek to obtain those grants that are consistent with priority needs and objectives identified by Council.
Indirect Costs
The City shall recover indirect costs to the maximum amount allowed by the funding source. The City may waive or reduce indirect costs if doing so will significantly increase the effectiveness of the grant.
Grant Review
The City shall review all grant submittals requiring an in-kind match requirement to determine their potential impact on the operating budget, and the extent to which they meet the City’s policy objectives. If there is a cash match requirement, the source of funding shall be identified and approved prior to application.
Prior to submission, all grant requests will be reviewed by Administrative Services to ensure the benefits to the City exceed the administrative costs incurred throughout the life of the grant.
Grant Program Termination
The City shall terminate grant-funded programs and associated positions as directed by the City Council when grant funds are no longer available, unless alternate funding is identified.
48

Financial Management Policy (with adopted revisions)
IX. Economic Development The City shall initiate, encourage and participate in economic development efforts to create job opportunities and strengthen the local economy and tax base. Commitment to Expansion and Diversification
The City shall encourage and participate in economic development efforts to expand Friendswood’s economy and tax base, to increase local employment and to invest when there is a defined, specific long-term return. These efforts shall not only focus on new areas, but on established sections of the City where development can generate additional jobs and other economic benefits.
Tax Abatements
The City of Friendswood is committed to the promotion of quality development in all parts of the City. On a case-by-case basis, the City will give consideration to providing tax abatement on the increment in value added to a particular property by a specific development proposal, which meets the economic goals and objectives of the City.
The tax abatement shall not apply to any portion of the inventory or land value of the project.
Tax abatement may be offered on improvements to real property owned by the applicant and/or on new personal property brought to the site by the applicant.
Tax abatement will not be ordinarily considered for projects which would be developed without such incentives unless it can be demonstrated that higher development standards or other development and community goals will be achieved through the use of the abatement.
Increase Non-Residential Share of Tax Base
The City’s economic development program shall seek to expand the non-residential share of the tax base to decrease the tax burden on residential homeowners.
Coordinate Efforts With Other Jurisdictions
The City’s economic development program shall encourage close cooperation with other local jurisdictions to promote the economic well-being of this area.
X. Fiscal Monitoring Reports shall be prepared and presented on a regular basis that analyze, evaluate and forecast the City’s financial performance and economic condition. Financial Status and Performance Reports
Monthly reports shall be prepared comparing expenditures and revenues to original and amended budgets. Explanatory notes will be included, as needed.
XI. Accounting, Auditing and Financial Reporting The City shall comply with prevailing local, state and federal regulations. Its accounting practices and financial reporting shall conform to generally accepted accounting principles as promulgated by the Governmental Accounting Standards Board (GASB), American Institute of Certified Public Accountants (AICPA) and the Government Finance Officers Association (GFOA). The City Council
49

Financial Management Policy (with adopted revisions)
shall select an independent firm of certified public accountants to perform an annual audit of its accounting and financial reporting practices. XII. Internal Control The Director of Administrative Services is responsible for developing citywide, written guidelines on accounting, handling of cash and other financial matters. The Director of Administrative Services will assist Department Directors as needed, in tailoring these guidelines into detailed written procedures to fit each department’s specific requirements. Each Department Director is responsible to ensure that good internal controls are followed throughout his or her department, that all guidelines on accounting and internal controls are implemented and that all independent auditor internal control recommendations are addressed. XIII. Risk Management The City will utilize a safety program, an employee health program and a risk management program to prevent and/or reduce the financial impact to the City due to claims and losses. Transfer of liability for claims through transfer to other entities through insurance and/or by contract will be utilized where appropriate. Prevention of loss through the safety program and the employee health program will be employed. XIV. Operating Budget The City shall establish an operating budget that shall link revenues and expenditures to City Council goals, service and performance standards. Any transfer of intradepartmental appropriations shall be authorized, in writing, by the City Manager. Transfers from personnel expenditure category line items to non-personnel expenditure category line items of the adopted budget are permitted, with City Manager approval, when the expense for which the transfer is made is directly related to personnel. No transfer of more than $50,000 shall be authorized by the City Manager without prior approval of the City Council. Written justification shall be attached to each request to the City Manager for a transfer of appropriation and, if authorized, the written justification shall be attached to the City Manager’s written authorization. All applicable bidding and purchasing laws shall be followed. New capital projects or projects not otherwise provided for in the budget shall not be funded through transfers.
50
Charter Budget Provisions (excerpt from City of Friendswood Charter)
51
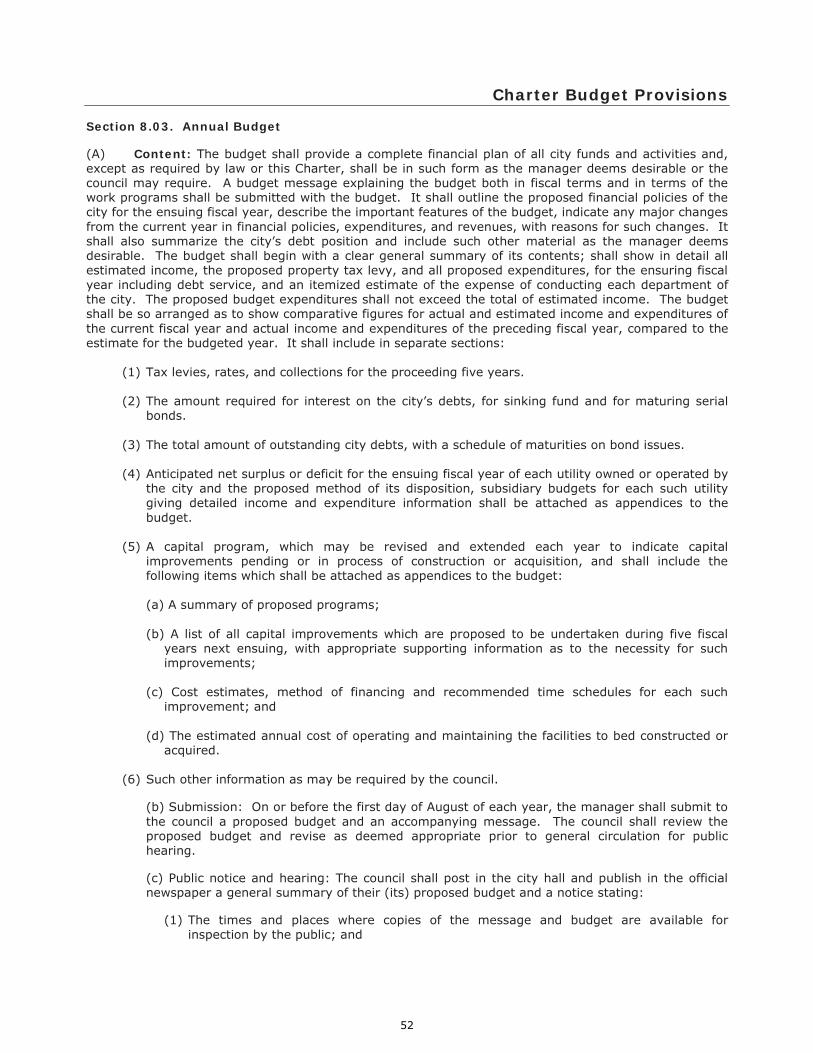
Charter Budget Provisions
Section 8.03. Annual Budget (A) Content: The budget shall provide a complete financial plan of all city funds and activities and, except as required by law or this Charter, shall be in such form as the manager deems desirable or the council may require. A budget message explaining the budget both in fiscal terms and in terms of the work programs shall be submitted with the budget. It shall outline the proposed financial policies of the city for the ensuing fiscal year, describe the important features of the budget, indicate any major changes from the current year in financial policies, expenditures, and revenues, with reasons for such changes. It shall also summarize the city’s debt position and include such other material as the manager deems desirable. The budget shall begin with a clear general summary of its contents; shall show in detail all estimated income, the proposed property tax levy, and all proposed expenditures, for the ensuring fiscal year including debt service, and an itemized estimate of the expense of conducting each department of the city. The proposed budget expenditures shall not exceed the total of estimated income. The budget shall be so arranged as to show comparative figures for actual and estimated income and expenditures of the current fiscal year and actual income and expenditures of the preceding fiscal year, compared to the estimate for the budgeted year. It shall include in separate sections:
(1) Tax levies, rates, and collections for the proceeding five years. (2) The amount required for interest on the city’s debts, for sinking fund and for maturing serial
bonds. (3) The total amount of outstanding city debts, with a schedule of maturities on bond issues. (4) Anticipated net surplus or deficit for the ensuing fiscal year of each utility owned or operated by
the city and the proposed method of its disposition, subsidiary budgets for each such utility giving detailed income and expenditure information shall be attached as appendices to the budget.
(5) A capital program, which may be revised and extended each year to indicate capital
improvements pending or in process of construction or acquisition, and shall include the following items which shall be attached as appendices to the budget:
(a) A summary of proposed programs; (b) A list of all capital improvements which are proposed to be undertaken during five fiscal
years next ensuing, with appropriate supporting information as to the necessity for such improvements;
(c) Cost estimates, method of financing and recommended time schedules for each such
improvement; and (d) The estimated annual cost of operating and maintaining the facilities to bed constructed or
acquired.
(6) Such other information as may be required by the council.
(b) Submission: On or before the first day of August of each year, the manager shall submit to the council a proposed budget and an accompanying message. The council shall review the proposed budget and revise as deemed appropriate prior to general circulation for public hearing.
(c) Public notice and hearing: The council shall post in the city hall and publish in the official newspaper a general summary of their (its) proposed budget and a notice stating:
(1) The times and places where copies of the message and budget are available for
inspection by the public; and
52

Charter Budget Provisions
(2) The time and place, not less than ten nor more than 30 days after such publication, for a public hearing on the budget.
(d) Amendment before adoption: After the public hearing, the council may adopt the budget with or without amendment. In amending the budget, it may add or increase programs or amounts and may delete or decrease any programs or amounts, except expenditures required by law or for debt services or for estimated cash deficit, provided that no amendment to the budget shall increase the authorized expenditures to an amount greater than the total of estimated income plus funds available form prior years.
(e) Adoption: The council shall adopt its annual budget by ordinance, on one reading, by the 15th day of September or as soon thereafter as practical. If the council fails to adopt an annual budget before the start of the fiscal year to which it applies, appropriations of the last budget adopted shall be considered as adopted for the current fiscal year on a month to month, pro rata basis, until the annual budget is adopted. Adoption of the budget shall require an affirmative vote of at least a majority of all members of the council. Adoption of the budget shall constitute appropriations of the amounts specified therein as expenditures from the funds indicated.
(Res. No. R88-15, § 3, 5-9-1988; Res. No. R2002, § 7, 2-18-2002, election 5-4-2002)
State law reference – Budgets, V.T.C.A., Local Government Code § 102.001 et seq. Section 8.04. Amendments after adoption
(a) Supplemental appropriations: If during the fiscal year the manager certifies that there are available for appropriation revenues in excess of those estimated in the budget, the council by ordinance may make supplemental appropriation for the year up to the amount of such excess.
(b) Emergency appropriations: To meet a public emergency created by a natural disaster or
manmade calamity affecting life, health, property, or the public peace, the council may make emergency appropriations, not to exceed ten percent of the current fiscal year’s budgeted receipts. Such appropriations may be made by emergency ordinance in accordance with the provisions of this Charter. To the extent that there are no available unappropriated revenues to meet such appropriations, the council may be such emergency ordinance authorize the issuance of emergency notes, which may be renewed from time to time.
(c) Reduction of appropriations: If at any time during the fiscal year it appears probable to the
manager that the revenues available will be insufficient to meet the amount appropriated, he/she shall report to the council without delay, indicating the estimated amount of the deficit, any remedial action taken by him and his recommendations as to any other steps to be taken. The council shall then take such further action as it deems necessary to prevent or minimize any deficit and for that purpose it may by ordinance reduce one or more appropriations.
(d) Transfer of appropriations: At any time during the fiscal year the manager may transfer part or
all of any unencumbered appropriation balance among programs within a department, division, or office and, upon written request by the manager, the council may ordinance transfer part or all of any unencumbered appropriation balance from one department, office or agency to another.
(e) Limitations: No appropriation for debt service may be reduced or transferred, and no
appropriation may be reduced below any amount required by law to be appropriated or by more than the amount of the unencumbered balance thereof.
(f) Effective date: The supplemental and emergency appropriations and reduction or transfer of
appropriations authorized by this section may be effective immediately upon adoption of the ordinance. (Res. No. R88-15, § 3, 5-9-1988)
State law reference - Budgets, V.T.C.A., Local Government Code § 102.001 et seq.
53
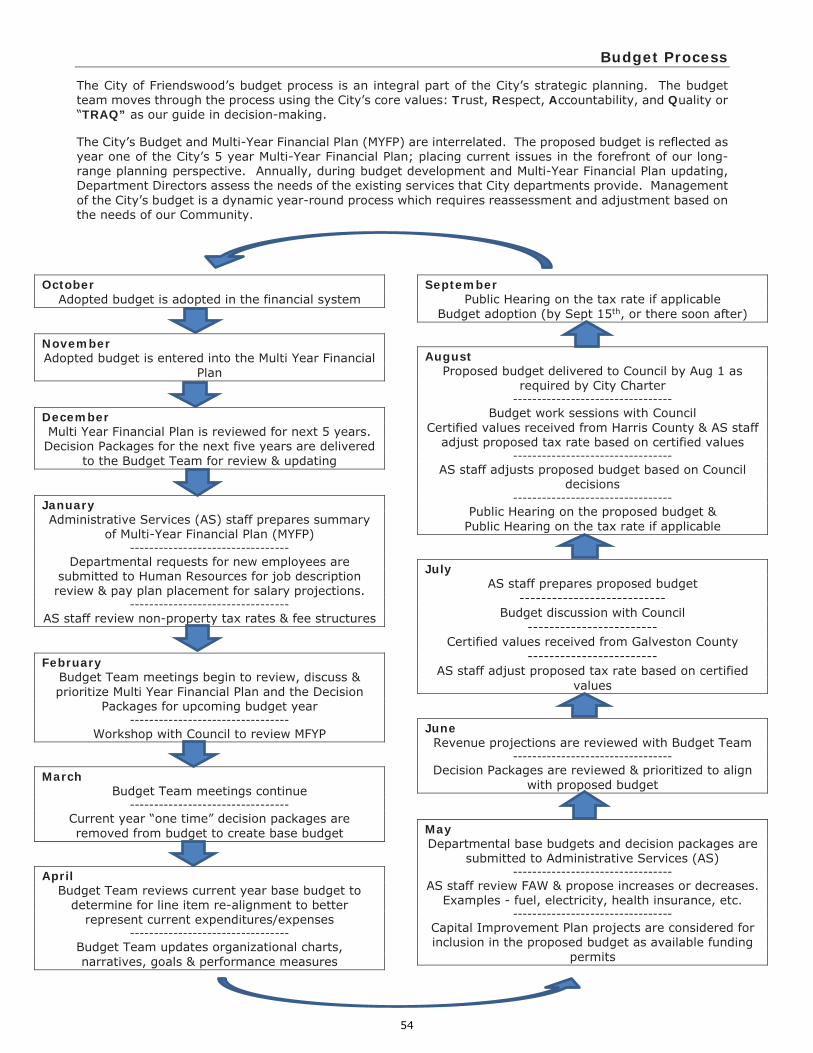
Budget Process
The City of Friendswood’s budget process is an integral part of the City’s strategic planning. The budget team moves through the process using the City’s core values: Trust, Respect, Accountability, and Quality or “TRAQ” as our guide in decision-making. The City’s Budget and Multi-Year Financial Plan (MYFP) are interrelated. The proposed budget is reflected as year one of the City’s 5 year Multi-Year Financial Plan; placing current issues in the forefront of our long-range planning perspective. Annually, during budget development and Multi-Year Financial Plan updating, Department Directors assess the needs of the existing services that City departments provide. Management of the City’s budget is a dynamic year-round process which requires reassessment and adjustment based on the needs of our Community.
October
Adopted budget is adopted in the financial system
November Adopted budget is entered into the Multi Year Financial
Plan
December Multi Year Financial Plan is reviewed for next 5 years. Decision Packages for the next five years are delivered
to the Budget Team for review & updating
January Administrative Services (AS) staff prepares summary
of Multi-Year Financial Plan (MYFP) ---------------------------------
Departmental requests for new employees are submitted to Human Resources for job description review & pay plan placement for salary projections.
--------------------------------- AS staff review non-property tax rates & fee structures
February
Budget Team meetings begin to review, discuss & prioritize Multi Year Financial Plan and the Decision
Packages for upcoming budget year ---------------------------------
Workshop with Council to review MFYP
March
Budget Team meetings continue ---------------------------------
Current year “one time” decision packages are removed from budget to create base budget
April
Budget Team reviews current year base budget to determine for line item re-alignment to better
represent current expenditures/expenses ---------------------------------
Budget Team updates organizational charts, narratives, goals & performance measures
September
Public Hearing on the tax rate if applicable Budget adoption (by Sept 15th, or there soon after)
August
Proposed budget delivered to Council by Aug 1 as required by City Charter
--------------------------------- Budget work sessions with Council
Certified values received from Harris County & AS staff adjust proposed tax rate based on certified values
--------------------------------- AS staff adjusts proposed budget based on Council
decisions ---------------------------------
Public Hearing on the proposed budget & Public Hearing on the tax rate if applicable
July
AS staff prepares proposed budget ---------------------------
Budget discussion with Council ------------------------
Certified values received from Galveston County ------------------------
AS staff adjust proposed tax rate based on certified values
June Revenue projections are reviewed with Budget Team
--------------------------------- Decision Packages are reviewed & prioritized to align
with proposed budget
May Departmental base budgets and decision packages are
submitted to Administrative Services (AS) ---------------------------------
AS staff review FAW & propose increases or decreases. Examples - fuel, electricity, health insurance, etc.
--------------------------------- Capital Improvement Plan projects are considered for inclusion in the proposed budget as available funding
permits
54
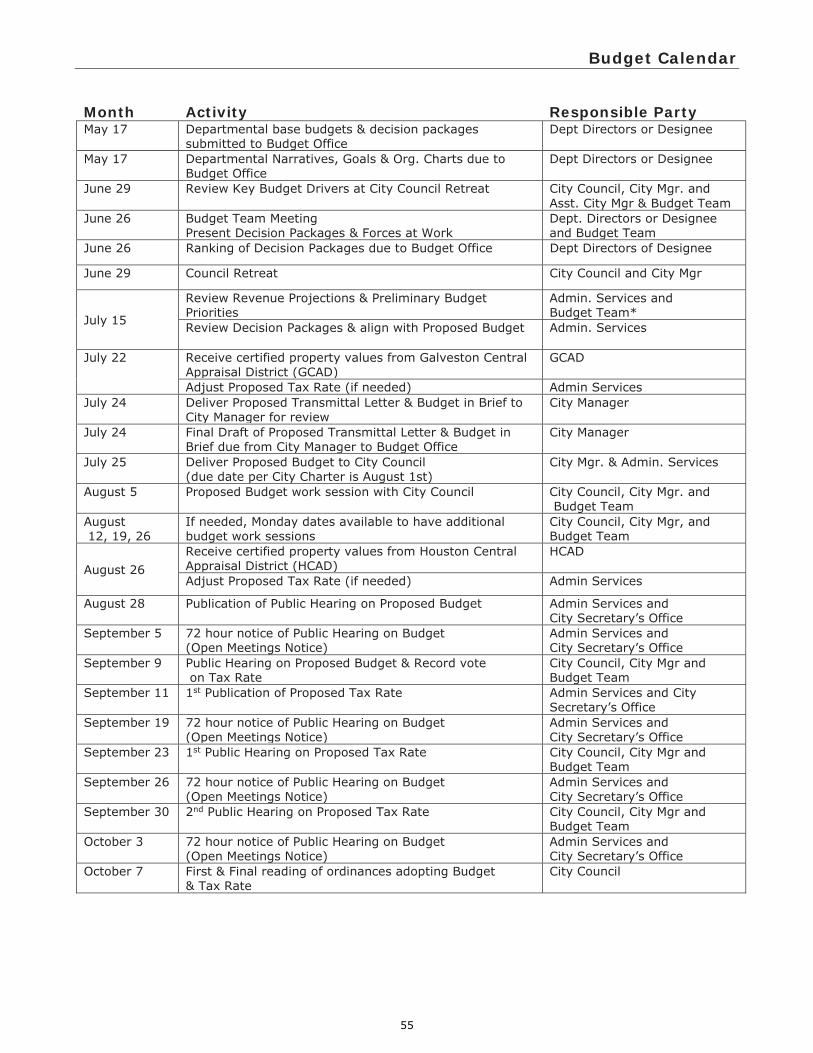
Budget Calendar
Month
Activity
Responsible Party
May 17 Departmental base budgets & decision packages submitted to Budget Office
Dept Directors or Designee
May 17 Departmental Narratives, Goals & Org. Charts due to Budget Office
Dept Directors or Designee
June 29 Review Key Budget Drivers at City Council Retreat City Council, City Mgr. and Asst. City Mgr & Budget Team
June 26 Budget Team Meeting Present Decision Packages & Forces at Work
Dept. Directors or Designee and Budget Team
June 26 Ranking of Decision Packages due to Budget Office Dept Directors of Designee
June 29 Council Retreat City Council and City Mgr
July 15
Review Revenue Projections & Preliminary Budget Priorities
Admin. Services and Budget Team*
Review Decision Packages & align with Proposed Budget Admin. Services
July 22 Receive certified property values from Galveston Central Appraisal District (GCAD)
GCAD
Adjust Proposed Tax Rate (if needed) Admin Services July 24 Deliver Proposed Transmittal Letter & Budget in Brief to
City Manager for review City Manager
July 24 Final Draft of Proposed Transmittal Letter & Budget in Brief due from City Manager to Budget Office
City Manager
July 25 Deliver Proposed Budget to City Council (due date per City Charter is August 1st)
City Mgr. & Admin. Services
August 5 Proposed Budget work session with City Council City Council, City Mgr. and Budget Team
August 12, 19, 26
If needed, Monday dates available to have additional budget work sessions
City Council, City Mgr, and Budget Team
August 26 Receive certified property values from Houston Central Appraisal District (HCAD)
HCAD
Adjust Proposed Tax Rate (if needed) Admin Services
August 28 Publication of Public Hearing on Proposed Budget Admin Services and City Secretary’s Office
September 5 72 hour notice of Public Hearing on Budget (Open Meetings Notice)
Admin Services and City Secretary’s Office
September 9 Public Hearing on Proposed Budget & Record vote on Tax Rate
City Council, City Mgr and Budget Team
September 11 1st Publication of Proposed Tax Rate Admin Services and City Secretary’s Office
September 19 72 hour notice of Public Hearing on Budget (Open Meetings Notice)
Admin Services and City Secretary’s Office
September 23 1st Public Hearing on Proposed Tax Rate City Council, City Mgr and Budget Team
September 26 72 hour notice of Public Hearing on Budget (Open Meetings Notice)
Admin Services and City Secretary’s Office
September 30 2nd Public Hearing on Proposed Tax Rate City Council, City Mgr and Budget Team
October 3 72 hour notice of Public Hearing on Budget (Open Meetings Notice)
Admin Services and City Secretary’s Office
October 7 First & Final reading of ordinances adopting Budget & Tax Rate
City Council
55

FY18ACTUAL
FY19ORIGINAL
BUDGET
FY19AMENDED
BUDGET
FY19YTD
6/30/19
FY19YEAR ENDESTIMATE
FY20ADOPTED
BUDGETREVENUES
TAXES $27,770,704 $28,197,440 $28,197,440 $23,877,966 $28,479,482 $30,418,705
PERMITS AND LICENSES 820,228 849,000 849,000 516,666 $685,240 857,216
INTERGOVERNMENTAL REVENUES 4,381,336 548,017 652,101 772,388 $871,040 583,200
CHARGES FOR SERVICES 12,145,158 13,636,879 13,640,059 7,516,325 $13,011,822 16,505,919
FINES 695,397 751,960 751,960 629,858 $839,775 837,580
INTEREST EARNED 525,559 401,953 401,953 769,494 990,129 964,300
VRP REIMBURSEMENTS 380,684 550,817 550,817 413,046 $550,817 691,400
MISCELLANEOUS RECEIPTS 3,151,321 926,078 1,067,226 22,872,391 23,222,701 995,315
1,885,804 12,766,009 16,581,074 6,581,206 $11,672,997 27,627,928
TOTAL REVENUES $51,756,191 $58,628,153 $62,691,630 $63,949,339 $80,324,003 $79,481,563
EXPENDITURES
GENERAL GOVERNMENT $6,134,572 $6,091,221 $6,427,972 $4,384,436 $6,194,854 $6,895,676
PUBLIC SAFETY 17,492,858 14,023,544 14,353,044 10,034,839 13,970,089 14,438,443
COMMUNITY DEVELOPMENT 994,804 1,135,338 1,135,338 781,398 1,086,926 1,227,230
PUBLIC WORKS 8,579,413 10,040,042 12,277,088 8,252,086 11,928,281 14,678,833
ENGINEERING 0 0 0 0 0 783,759
PARKS AND RECREATION 3,629,507 3,441,934 3,897,361 2,680,416 3,890,708 3,979,553
LIBRARY 1,214,027 1,239,090 1,300,219 862,982 1,242,823 1,252,132
VEHICLE REPLACEMENT FUND 748,917 316,766 660,357 516,504 660,357 589,000
CAPITAL IMPROVEMENTS 3,117,545 15,300,664 14,825,402 6,250,846 12,388,532 27,055,666
DEBT SERVICE 6,616,359 6,684,276 7,295,768 5,465,609 7,305,267 8,385,351
TOTAL EXPENDITURES $48,528,002 $58,272,875 $62,172,549 $39,229,116 $58,667,837 $79,285,643* ** ***
Totals above exclude interfund transfers.
* Amended budget includes prior year encumbrances.
** Year end expenditure estimate reflects the depletion of several capital improvement funds at project completion.
*** Net income reflects use of fund balance or retained earnings for operating expenditures. FY20 uses totaling $27,627,928 for operational expenditures in the following funds:
General Fund - $484,322Municipal Court Fund - $807Park Land Dedication Fund - $75,734Streets Improvement Fund - $2,533,501Economic Development Improvements Fund - $1,021,6512015/2016/2017 General Obligation Bonds Fund - $893,641Water & Sewer Fund - $3,617,8632016 Water & Sewer Bond Construction Fund - $2,848,0992018 Water & Sewer Bond Construction Fund - $16,152,310
BUDGET SUMMARYFUND SUMMARY
(ALL FUNDS)
USE OF FUND BALANCE/RETAINED EARNINGS
56

FY18ACTUAL
FY19ORIGINAL
BUDGET
FY19AMENDED
BUDGET
FY19YTD
6/30/19
FY19YEAR ENDESTIMATE
FY20ADOPTED
BUDGETREVENUES
GENERAL FUND $30,800,441 $26,265,433 $26,506,486 $22,289,953 $26,811,838 $28,238,573
POLICE INVESTIGATION FUND 264,260 1,307 1,307 16,026 $16,986 4,720
FIRE/EMS DONATION FUND 235,161 176,337 176,337 171,000 $227,874 200,900
MUNICIPAL COURT FUND 28,072 29,002 29,002 22,906 $30,324 52,280
SIDEWALK INSTALLATION FUND 305 245 245 310 $388 420
PARK LAND DEDICATION FUND 49,437 43,232 43,232 25,620 $34,160 32,430
STREETS IMPROVEMENT FUND 1,587,054 1,546,740 1,546,740 967,006 $1,644,296 1,658,500
ECONOMIC DEVELOPMENT IMPROVEMENTS FUND 526,928 514,172 514,172 442,914 $577,021 549,390
TAX DEBT SERVICE FUND 3,183,988 3,243,148 3,243,148 3,183,829 $3,250,472 3,332,531
GO BOND CONSTRUCTION FUNDS 114,567 86,403 86,403 86,659 $115,540 117,810
VEHICLE REPLACEMENT FUND 675,832 557,395 557,395 435,581 $574,737 698,350
WATER & SEWER FUND 11,860,854 12,743,968 12,751,327 7,347,961 $12,816,888 16,108,331
2006 WATER & SEWER BOND CONSTRUCTION FUND 1,189 0 0 823 $1,088 0
2009 WATER & SEWER BOND CONSTRUCTION FUND 6,122 0 0 6,464 $8,546 0
2016 WATER & SEWER BOND CONSTRUCTION FUND 61,588 58,710 58,710 56,665 $75,115 58,710
2018 WATER & SEWER BOND CONSTRUCTION FUND 0 0 0 22,004,603 $22,071,309 331,890
WATER & SEWER CIP/IMPACT FEE FUNDS 464,431 588,453 588,453 287,663 $366,985 441,300
WATER & SEWER REVENUE DEBT SERVICE FUND 9,795 7,307 7,307 21,873 $27,094 27,130
1776 PARK TRUST FUND 363 292 292 277 $345 370
USE OF FUND BALANCE/RETAINED EARNINGS 1,885,804 12,766,009 16,581,074 6,581,206 $11,672,997 27,627,928
TOTAL REVENUES $51,756,191 $58,628,153 $62,691,630 $63,949,339 $80,324,003 $79,481,563***
EXPENDITURES
GENERAL FUND $31,431,381 $28,211,899 $32,123,724 $21,106,494 $31,143,565 $30,118,162
POLICE INVESTIGATION FUND 97,465 0 116,457 28,557 116,457 0
FIRE/EMS DONATION FUND 235,415 176,337 176,337 154,488 226,965 200,900
MUNICIPAL COURT FUND 12,597 36,828 46,828 23,528 46,828 53,087
SIDEWALK INSTALLATION FUND 0 0 0 0 0 0
PARK LAND DEDICATION FUND 109,113 167,819 190,177 201,069 201,069 108,164
STREETS IMPROVEMENT FUND 0 4,093,608 1,700,000 1,207,197 1,700,000 4,192,001
ECONOMIC DEVELOPMENT IMPROVEMENTS FUND 318,998 914,015 43,818 34,554 43,818 1,555,041
TAX DEBT SERVICE FUND 3,216,880 3,217,119 3,217,119 2,445,538 3,217,118 3,294,901
GO BOND CONSTRUCTION FUNDS 951,509 6,367,114 5,046,909 2,867,151 5,035,955 1,011,451
VEHICLE REPLACEMENT FUND 748,917 316,766 660,357 516,504 660,357 589,000
WATER & SEWER FUND 7,367,833 8,479,162 11,552,413 7,333,496 11,404,603 13,882,377
2006 WATER & SEWER BOND CONSTRUCTION FUND 0 0 0 0 44,157 0
2009 WATER & SEWER BOND CONSTRUCTION FUND 0 0 0 0 346,829 0
2016 WATER & SEWER BOND CONSTRUCTION FUND 696,294 2,960,108 3,065,966 131,514 238,172 2,906,809
2018 WATER & SEWER BOND CONSTRUCTION FUND 0 0 275,000 221,535 275,000 16,484,200
WATER & SEWER CIP/IMPACT FEE FUNDS 0 0 0 0 0 0
WATER & SEWER REVENUE DEBT SERVICE FUND 3,333,675 3,332,100 3,943,592 2,957,491 3,953,092 4,889,550
1776 PARK TRUST FUND 7,925 0 13,852 0 13,852 0
TOTAL EXPENDITURES $48,528,002 $58,272,875 $62,172,549 $39,229,116 $58,667,837 $79,285,643* ** ***
Totals above exclude interfund transfers.
* Amended budget includes prior year encumbrances.
** Year end expenditure estimate reflects the depletion of several capital improvement funds at project completion.
*** Net income reflects use of fund balance or retained earnings for operating expenditures. FY20 uses totaling $27,627,928 for operational expenditures in the following funds:
General Fund - $484,322Municipal Court Fund - $807Park Land Dedication Fund - $75,734Streets Improvement Fund - $2,533,501Economic Development Improvements Fund - $1,021,6512015/2016/2017 General Obligation Bonds Fund - $893,641Water & Sewer Fund - $3,617,8632016 Water & Sewer Bond Construction Fund - $2,848,0992018 Water & Sewer Bond Construction Fund - $16,152,310
REVENUES AND EXPENDITURES BY FUND
57

GENERAL FUND
The General Fund accounts for the resources used to finance the fundamental operations of the City. It is the basic fund of the City and covers all activities for which a separate fund has not been established. The basis of budgeting for the General Fund is modified accrual and is the same as the basis of accounting used in the Comprehensive Annual Financial Report. The principal sources of revenue of the General Fund include property taxes, sales and use taxes, franchise taxes, fines and forfeitures, permits and fees, and charges for services. Expenditures include general government, public safety, community development, public works, and engineering, library and parks and recreation.
58

FY18ACTUAL
FY19ORIGINAL
BUDGET
FY19AMENDED
BUDGET
FY19YTD
6/30/19
FY19YEAR ENDESTIMATE
FY20ADOPTED
BUDGETREVENUES
PROPERTY TAX $14,487,465 $14,888,335 $14,888,335 $14,586,785 $14,805,670 $16,126,914SALES TAX 6,326,825 6,294,492 6,294,492 3,788,222 6,488,330 6,597,532FRANCHISE 1,617,121 1,675,966 1,675,966 967,244 1,753,890 2,155,318MIXED DRINKS 68,989 55,282 55,282 26,010 55,290 56,250LICENSES AND PERMITS 820,228 849,000 849,000 516,666 685,240 857,216INTERGOVERNMENTAL REVENUES 4,381,336 548,017 652,101 772,388 871,040 583,200CHARGES FOR SERVICES 366,759 776,645 779,825 293,211 368,410 459,083FINES AND FORFEITURES 669,847 724,960 724,960 609,559 812,710 788,580INTEREST EARNED 166,817 118,783 118,783 180,120 240,140 237,790OTHER 1,400,614 333,953 463,732 544,100 725,470 376,690ASSET DISPOSITION 9,135 0 4,010 5,648 5,648 0
TOTAL REVENUES $30,315,136 $26,265,433 $26,506,486 $22,289,953 $26,811,838 $28,238,573
EXPENDITURESMAYOR & COUNCIL $396,163 $319,784 $338,192 $220,102 $319,737 $369,058CITY SECRETARY 505,696 537,488 543,192 363,785 522,078 558,704CITY MANAGER 1,137,780 1,015,737 1,169,231 798,144 1,149,994 1,046,768ADMINISTRATIVE SERVICES 3,532,622 3,642,527 3,801,672 2,586,296 3,643,288 4,313,528POLICE 10,694,515 11,210,483 11,387,934 7,857,684 11,278,299 11,872,801FRIENDSWOOD VOLUNTEER FIRE ** 1,620,288 1,819,298 1,819,298 1,375,424 1,547,072 0FIRE MARSHAL ** 4,898,382 915,655 941,247 657,738 889,525 2,512,555COMMUNITY DEVELOPMENT 994,804 1,135,338 1,135,338 781,398 1,086,926 1,227,230PUBLIC WORKS 2,174,048 2,434,565 2,729,104 1,736,351 2,512,179 2,098,781ENGINEERING*** 0 0 0 0 0 387,052LIBRARY SERVICES 1,214,027 1,239,090 1,300,219 862,982 1,242,823 1,252,132PARKS AND RECREATION 3,629,507 3,441,934 3,897,361 2,680,416 3,890,708 3,979,553
TOTAL OPERATIONS $30,797,832 $27,711,899 $29,062,788 $19,920,320 $28,082,629 $29,618,162
STREETS $633,549 $500,000 $1,960,197 $685,230 $1,960,197 $500,000DRAINAGE 0 0 1,000,000 500,000 1,000,000 0PARKS 0 0 100,739 944 100,739 0EQUIPMENT 0 0 0 0 0 0FACILITY 0 0 0 0 0 0
TOTAL IMPROVEMENTS $633,549 $500,000 $3,060,936 $1,186,174 $3,060,936 $500,000
TOTAL EXPENDITURES $31,431,381 $28,211,899 $32,123,724 $21,106,494 $31,143,565 $30,118,162
OPERATING TRANSFERS IN $1,420,489 $1,457,690 $1,472,690 $1,108,264 $1,472,690 $1,395,267
OPERATING TRANSFERS OUT (47,000) 0 (45,633) (45,633) (45,633) 0
CAPITAL LEASE PROCEEDS 485,305 0 0 0 0 0
USE OF FUND BALANCE 0 0 0 0 0 484,322
INCREASE (DECREASE) IN FUND BALANCE $742,549 ($488,776) ($4,190,181) $2,246,090 ($2,904,670) $0
BEGINNING FUND BALANCE $13,542,757 $14,285,306 $14,285,306 $14,285,306 $14,285,306 $11,380,636
ENDING FUND BALANCE $14,285,306 $13,796,530 $10,095,125 $16,531,396 $11,380,636 $11,380,636* *
*
**
***
GENERAL FUND (001)FUND SUMMARY
Projected fund balance at September 30, 2019 is $11.4 million. Of the $11.4M, approximately $1M is considered non-spendable or restricted and another $1M has been assigned for future projects leaving a remaining unassigned fund balance of $9.4M, which includes a 90-day operating reserve of $7.0 million as set forth in the City's financial policies.
The reserve is designed "to protect the City's creditworthiness as well as its financial position from unforeseeable emergencies."
The policies state that "additional undesignated funds will be allowed to accumulate in a fund designated for future General Fund capital improvements."
In the FY20 Budget, the FVFD Contract is included in the Fire Marshal's Budget. The total contract with FVFD for FY20 is $2,558,300. Quarterly payments of the contract amount will be reduced by $1,080,000 which is the expected revenue FVFD will receive from EMS billings.
For budget presentation, the Engineering Department's FY18 actual expenditures and all of FY19 amounts are included within the Public Works department.
59

SPECIAL REVENUE FUNDS These funds are used to account for the proceeds of specific revenue sources that are legally restricted to financing specific purposes. The basis of budgeting for all Special Revenue Funds is the modified accrual method and is the same as the basis of accounting used in the Comprehensive Annual Financial Report. The following describes the various types of Special Revenue Funds used by the City:
Police Investigation Fund This fund is used to account for revenues that are restricted to police investigation expenditures.
Fire/EMS Donation Fund This fund is used to account for revenues that are restricted for Fire/EMS capital outlays and debt repayments. The principal sources of revenues are donations received from residents and proceeds from the sale of capital equipment. The revenues are used to purchase fire trucks, ambulances and other capital equipment for four fire stations and Friendswood volunteer fire fighting and emergency medical services personnel.
Municipal Court Fund In 1999, the State Legislature authorized a Court Technology and Court Security Fee for Municipal Court fines. In 2019, the State Legislature authorized additional fees for truancy and jury services. Those who pay citations at the Friendswood Municipal Court contribute to this fund. The fees collected can be used to fund court related security, and technology projects, juvenile services and any expenses incurred related to jury services.
60
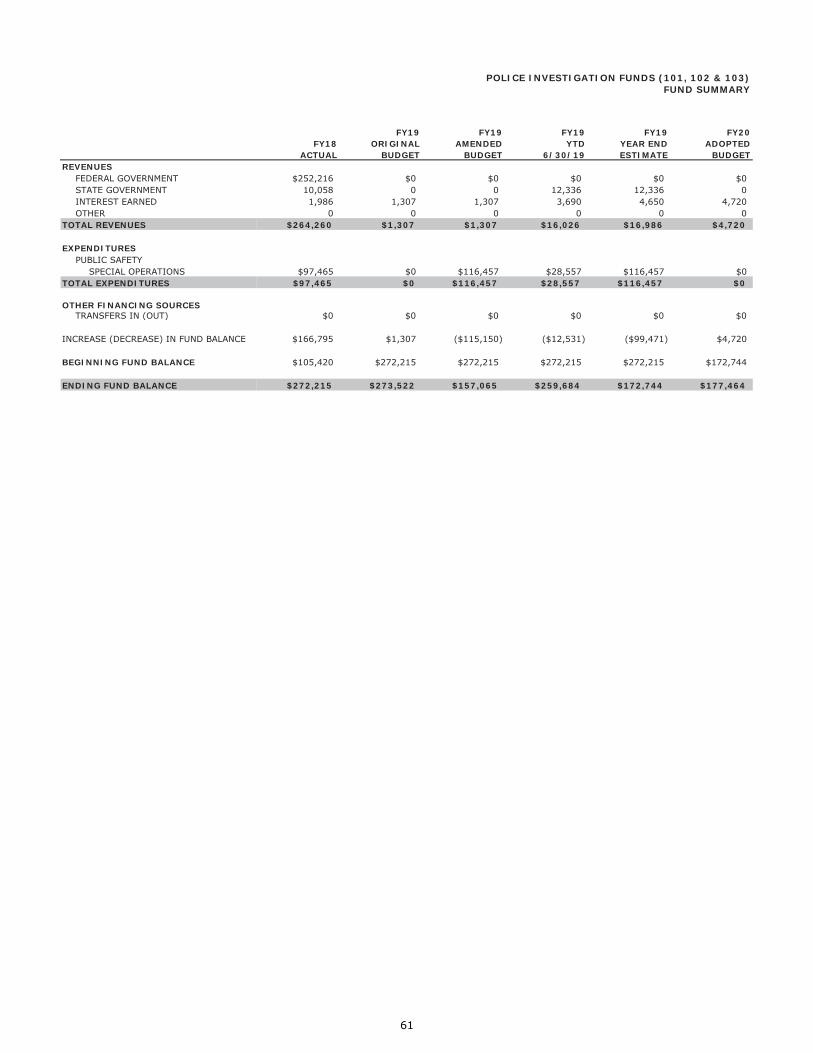
FY18ACTUAL
FY19ORIGINAL
BUDGET
FY19AMENDED
BUDGET
FY19YTD
6/30/19
FY19YEAR ENDESTIMATE
FY20ADOPTED
BUDGETREVENUES
FEDERAL GOVERNMENT $252,216 $0 $0 $0 $0 $0STATE GOVERNMENT 10,058 0 0 12,336 12,336 0INTEREST EARNED 1,986 1,307 1,307 3,690 4,650 4,720OTHER 0 0 0 0 0 0
TOTAL REVENUES $264,260 $1,307 $1,307 $16,026 $16,986 $4,720
EXPENDITURESPUBLIC SAFETY
SPECIAL OPERATIONS $97,465 $0 $116,457 $28,557 $116,457 $0TOTAL EXPENDITURES $97,465 $0 $116,457 $28,557 $116,457 $0
OTHER FINANCING SOURCESTRANSFERS IN (OUT) $0 $0 $0 $0 $0 $0
INCREASE (DECREASE) IN FUND BALANCE $166,795 $1,307 ($115,150) ($12,531) ($99,471) $4,720
BEGINNING FUND BALANCE $105,420 $272,215 $272,215 $272,215 $272,215 $172,744
ENDING FUND BALANCE $272,215 $273,522 $157,065 $259,684 $172,744 $177,464
FUND SUMMARYPOLICE INVESTIGATION FUNDS (101, 102 & 103)
61

FY18ACTUAL
FY19ORIGINAL
BUDGET
FY19AMENDED
BUDGET
FY19YTD
6/30/19
FY19YEAR ENDESTIMATE
FY20ADOPTED
BUDGETREVENUES
DONATIONS $233,686 $175,000 $175,000 $170,249 226,999 $200,000INTEREST EARNED 1,475 1,337 1,337 751 875 $900REIMBURSEMENTS 0 0 0 0 0 0ASSET DISPOSITION 0 0 0 0 0 0
$235,161 $176,337 $176,337 $171,000 $227,874 $200,900
EXPENDITURESPUBLIC SAFETY $169,611 $41,280 $41,280 $91,908 $91,908 $0DEBT SERVICE 65,804 135,057 135,057 62,580 135,057 200,900
TOTAL EXPENDITURES $235,415 $176,337 $176,337 $154,488 $226,965 $200,900
OTHER FINANCING SOURCESTRANSFERS IN (OUT) $0 $0 $0 $0 $0 $0SALE OF CAPITAL ASSETS 0 0 0 0 0 $0
TOTAL OTHER FINANCING SOURCES $0 $0 $0 $0 $0 $0
INCREASE (DECREASE) IN FUND BALANCE ($254) $0 $0 $16,512 $909 $0
BEGINNING FUND BALANCE $71,671 $71,417 $71,417 $71,417 $71,417 $72,326
ENDING FUND BALANCE $71,417 $71,417 $71,417 $87,929 $72,326 $72,326
In previous years, donated funds were disbursed to the Friendswood Volunteer Fire Department (FVFD) on a quarterly basisto purchase capital equipment. Beginning in FY20, donated funds will be retained by the City and used to purchase capital equipment for use by FVFD.
FY20 Debt Service includes the following:
6th of 7 principal & interest payment for a fire truck purchased in FY151st of 7principal and interest payment for a fire truck to be purchased in FY201st of 5 estimated principal & interest payment for an ambulance to be purchased in FY20
FIRE/EMS DONATION FUND (131)
TOTAL REVENUES
FUND SUMMARY
62

FY18ACTUAL
FY19ORIGINAL
BUDGET
FY19AMENDED
BUDGET
FY19YTD
6/30/19
FY19YEAR ENDESTIMATE
FY20ADOPTED
BUDGET
REVENUESCOURT SECURITY FEES $10,948 $12,000 $12,000 $8,699 $11,599 $17,700COURT TECHNOLOGY FEES 14,602 15,000 15,000 11,600 15,467 16,000COURT TRUANCY PREVENTION FEES 0 0 0 0 0 15,000COURT JURY SERVICES FEES 0 0 0 0 0 300INTEREST EARNED 2,522 2,002 2,002 2,607 3,259 3,280
TOTAL REVENUES $28,072 $29,002 $29,002 $22,906 $30,324 $52,280
EXPENDITURESCOURT SECURITY PROJECTS $12,597 $22,430 $32,430 $20,998 $32,430 $19,487COURT TECHNOLOGY PROJECTS 0 14,398 14,398 2,530 14,398 $33,600COURT TRUANCY PREVENTION PROJECTS 0 0 0 0 0 0COURT JURY SERVICES PROJECTS 0 0 0 0 0 0
TOTAL EXPENDITURES $12,597 $36,828 $46,828 $23,528 $46,828 $53,087
OPERATING TRANSFERS OUT $0 $0 $0 $0 $0 $0
INCREASE (DECREASE) IN FUND BALANCE $15,475 ($7,826) ($17,826) ($622) ($16,504) ($807)
BEGINNING FUND BALANCE $212,053 $227,528 $227,528 $227,528 $227,528 $211,024
ENDING FUND BALANCE $227,528 $219,702 $209,702 $226,906 $211,024 $210,217*
*As of 6/30/2019, the fund balance equity share of the Municipal Court Fund is approximately:Court Security is 66.9%Court Technology is 33.1%
MUNICIPAL COURT FUND (150)FUND SUMMARY
63
TAX DEBT SERVICE FUND
The Tax Debt Service Fund is used to account for property taxes levied for payment of principal and interest on all general long-term debt of the City. The basis of budgeting for the Tax Debt Service Fund is the modified accrual method and is the same as the basis of accounting reported in the Comprehensive Annual Financial Report. Debt Limits As a City Council-City Manager form of government, the City of Friendswood is not limited by law in the amount of debt it may issue. The City’s Charter states: “In keeping with the Constitution of the State of Texas and not contrary thereto, the City of Friendswood shall have the power to borrow money on the credit of the City for any public purpose not now or hereafter prohibited by the Constitution and laws of the State of Texas, and shall have the right to issue all tax bonds, revenue bonds, funding and refunding bonds, time warrants and other evidence of indebtedness as now authorized or as may hereafter be authorized to be issued by cities and towns by the laws of the State of Texas.” Article 11, Section 5 of the State of Texas Constitution states in part: “but no tax for any purpose shall ever be lawful for any one year, which shall exceed two and one-half percent (2.5%) of the taxable property of such city.” This means the City of Friendswood (as a Home-Rule city) cannot adopt a tax rate greater than $2.50 per $100 taxable property value. This year’s adopted budget reflects a tax rate of $0.5214 per $100 of net assessed value at 100% collection on a projected net assessed tax base of $3,690,585,683. Per the City’s Financial Advisor, using the Texas Attorney General’s guideline for home-rule cities, the City’s legal debt margin is based on a tax rate of $1.35 per $100 of net assessed property value with a projected 99% collection of the tax levy. For FY20, the City’s legal debt margin is $43,909,576. This means the City could issue debt (bonds) up to an amount that generates a maximum annual debt service requirement of $43,909,576 or less. Legal Debt Margin Calculation Data needed for the calculation includes the City’s estimated net assessed property valuation ($3,690,585,683), the Texas Constitution home-rule cities maximum debt service requirement amount ($43,909,576) and the City’s maximum annual debt service requirement amount ($5,913,331). To determine the City’s maximum legal debt service requirement, divide the estimated net assessed value by $100 and multiply by the Texas Attorney General home-rule maximum tax rate of $1.35. $3,690,585,683 / $100 x $1.35 = $49,822,907 The City’s maximum annual G.O. debt service requirement of $5,913,331 is taken from the debt service to maturity schedules found in the Debt & Capital section of the budget document. To determine the City’s legal debt margin, subtract the City’s maximum annual debt service requirement amount from the City’s maximum legal debt service requirement amount. Friendswood’s Legal Debt Margin = $49,822,907 minus $5,913,331 or $43,909,576 According to the City’s Financial Advisor, a debt margin of $43,909,576 translates into additional debt capacity of about $565 million in bonds (depending on factors such as the number of sales and the interest environment).
64
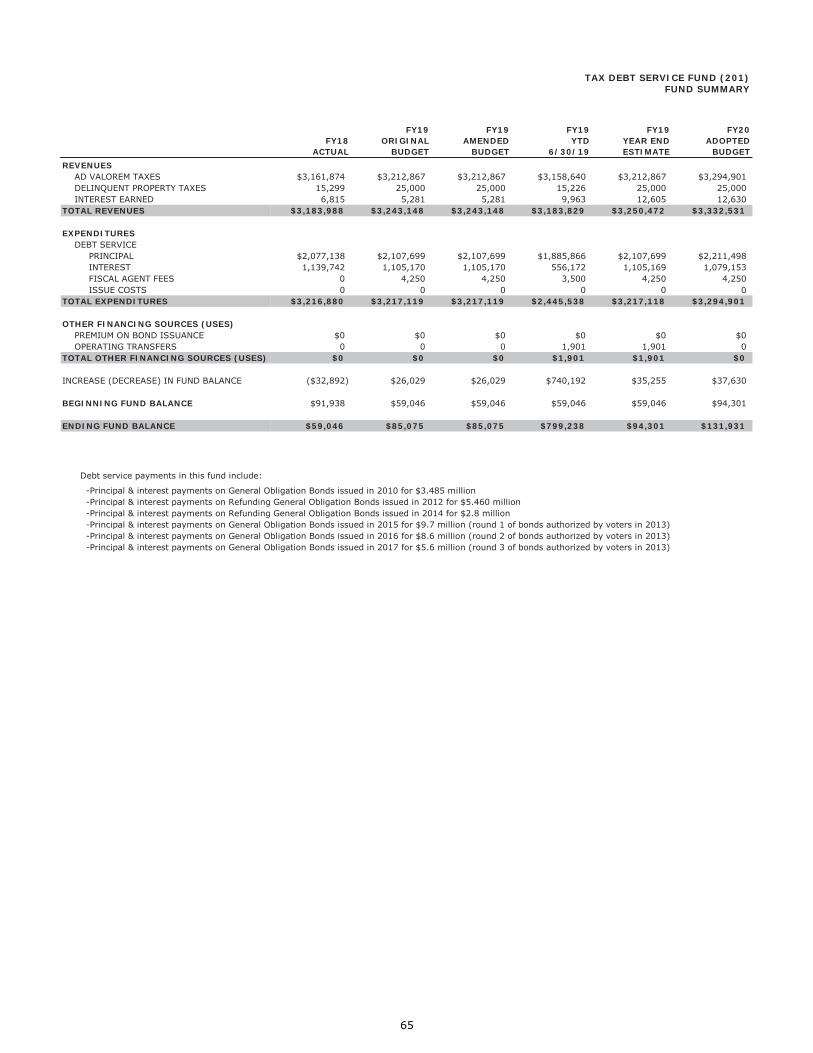
FY18ACTUAL
FY19ORIGINAL
BUDGET
FY19AMENDED
BUDGET
FY19YTD
6/30/19
FY19YEAR ENDESTIMATE
FY20ADOPTED
BUDGETREVENUES
AD VALOREM TAXES $3,161,874 $3,212,867 $3,212,867 $3,158,640 $3,212,867 $3,294,901DELINQUENT PROPERTY TAXES 15,299 25,000 25,000 15,226 25,000 25,000INTEREST EARNED 6,815 5,281 5,281 9,963 12,605 12,630
$3,183,988 $3,243,148 $3,243,148 $3,183,829 $3,250,472 $3,332,531
EXPENDITURESDEBT SERVICE
PRINCIPAL $2,077,138 $2,107,699 $2,107,699 $1,885,866 $2,107,699 $2,211,498INTEREST 1,139,742 1,105,170 1,105,170 556,172 1,105,169 1,079,153FISCAL AGENT FEES 0 4,250 4,250 3,500 4,250 4,250ISSUE COSTS 0 0 0 0 0 0
TOTAL EXPENDITURES $3,216,880 $3,217,119 $3,217,119 $2,445,538 $3,217,118 $3,294,901
OTHER FINANCING SOURCES (USES)PREMIUM ON BOND ISSUANCE $0 $0 $0 $0 $0 $0OPERATING TRANSFERS 0 0 0 1,901 1,901 0
TOTAL OTHER FINANCING SOURCES (USES) $0 $0 $0 $1,901 $1,901 $0
($32,892) $26,029 $26,029 $740,192 $35,255 $37,630
BEGINNING FUND BALANCE $91,938 $59,046 $59,046 $59,046 $59,046 $94,301
ENDING FUND BALANCE $59,046 $85,075 $85,075 $799,238 $94,301 $131,931
Debt service payments in this fund include:
-Principal & interest payments on General Obligation Bonds issued in 2010 for $3.485 million -Principal & interest payments on Refunding General Obligation Bonds issued in 2012 for $5.460 million -Principal & interest payments on Refunding General Obligation Bonds issued in 2014 for $2.8 million -Principal & interest payments on General Obligation Bonds issued in 2015 for $9.7 million (round 1 of bonds authorized by voters in 2013) -Principal & interest payments on General Obligation Bonds issued in 2016 for $8.6 million (round 2 of bonds authorized by voters in 2013) -Principal & interest payments on General Obligation Bonds issued in 2017 for $5.6 million (round 3 of bonds authorized by voters in 2013)
TAX DEBT SERVICE FUND (201)FUND SUMMARY
INCREASE (DECREASE) IN FUND BALANCE
TOTAL REVENUES
65

CAPITAL PROJECT FUNDS
2010 General Obligation Bond Fund This fund is used to account for proceeds of the sale of Permanent Improvement Bonds. The bonds, in the amount of $20,085,000, were approved by voter election on February 1, 2003 to fund improvements for: Public Safety Facilities $ 7,380,000 Drainage 5,575,000
Streets and Thoroughfares 4,055,000 Centennial Park 3,075,000 Total $20,085,000
The final portion of the authorized bonds totaling $3.485 million was issued in 2010 for street reconstruction of Blackhawk Blvd., Wandering Trails and Oak Vista Lane commenced. This will complete all of the projects associated with the bonds authorized by voters in 2003. 2015 – 2017 General Obligation Bonds Fund This fund is used to account for the proceeds of the general obligation bonds in the amount of $24,085,000 approved by voters on November 5, 2013. These bonds were approved to fund the following improvements: Public Safety Facilities (Fire Stations) $ 6,656,000 Library Expansion 2,525,000 Parks Improvements & Land Acquisition 7,285,000 Streets and Thoroughfares 7,710,000 Total $24,085,000 Sidewalk Installation Fund This fund is used to account for receipts from developers to install sidewalks in neighborhood developments. The fund will be closed out at the completion of the project(s). Park Land Dedication Fund This fund is used to account for receipts from developers to build or enhance City parks. The receipts remain in the fund until such time as the Community Services department submits a decision package during the budget preparation process to use the funds for specific park projects or submits a request to the City Manager and City Council for a supplemental appropriation. In September 2012, City Council approved the collection of community park fees only; eliminating the collection of neighborhood park fees. Also in September 2012, City Council authorized full use of fund balance of this fund for development/improvements at Lake Friendswood, Centennial Park, Stevenson Park, Imperial Estates and 1776 Park proposed by the Parks Sub-Committee appointed by City Council. Streets Maintenance Fund This fund is used to account for revenues collected from the optional additional 3/8 of 1% sales tax adopted by voters in May 2016 for maintenance of the City’s existing streets. Economic Development Fund This fund is used to account for revenues collected from the optional additional 1/8 of 1% percent 4B sales tax adopted by voters in May 2016 for improvements in the City’s downtown area. The basis of budgeting for the Capital Projects Fund is the modified accrual method and is the same as the basis of accounting used in the Comprehensive Annual Financial Report.
66

FY18ACTUAL
FY19ORIGINAL
BUDGET
FY19AMENDED
BUDGET
FY19YTD
6/30/19
FY19YEAR ENDESTIMATE
FY20ADOPTED
BUDGETREVENUES
INTEREST EARNED $575 $0 $0 $16 $16 $0TOTAL REVENUES $575 $0 $0 $16 $16 $0
EXPENDITURES
CAPITAL IMPROVEMENTSPUBLIC WORKS
STREETS & DRAINAGE $25,900 $0 $0 $0 $0 $0TOTAL EXPENDITURES $25,900 $0 $0 $0 $0 $0
OTHER FINANCING SOURCES (USES)OPERATING TRANSFERS 0 0 0 (1,901) (1,901) 0
TOTAL OTHER FINANCING SOURCES (USES) $0 $0 $0 ($1,901) ($1,901) $0
($25,325) $0 $0 ($1,885) ($1,885) $0
BEGINNING FUND BALANCE $27,210 $1,885 $1,885 $1,885 $1,885 $0
ENDING FUND BALANCE $1,885 $1,885 $1,885 $0 $0 $0*
*This fund was closed during fiscal year end FY19 with the completion of street projects included in the 2010 General Obligation Bond issuance.
2010 GENERAL OBLIGATION FUND (252)FUND SUMMARY
INCREASE (DECREASE) IN FUND BALANCE
67
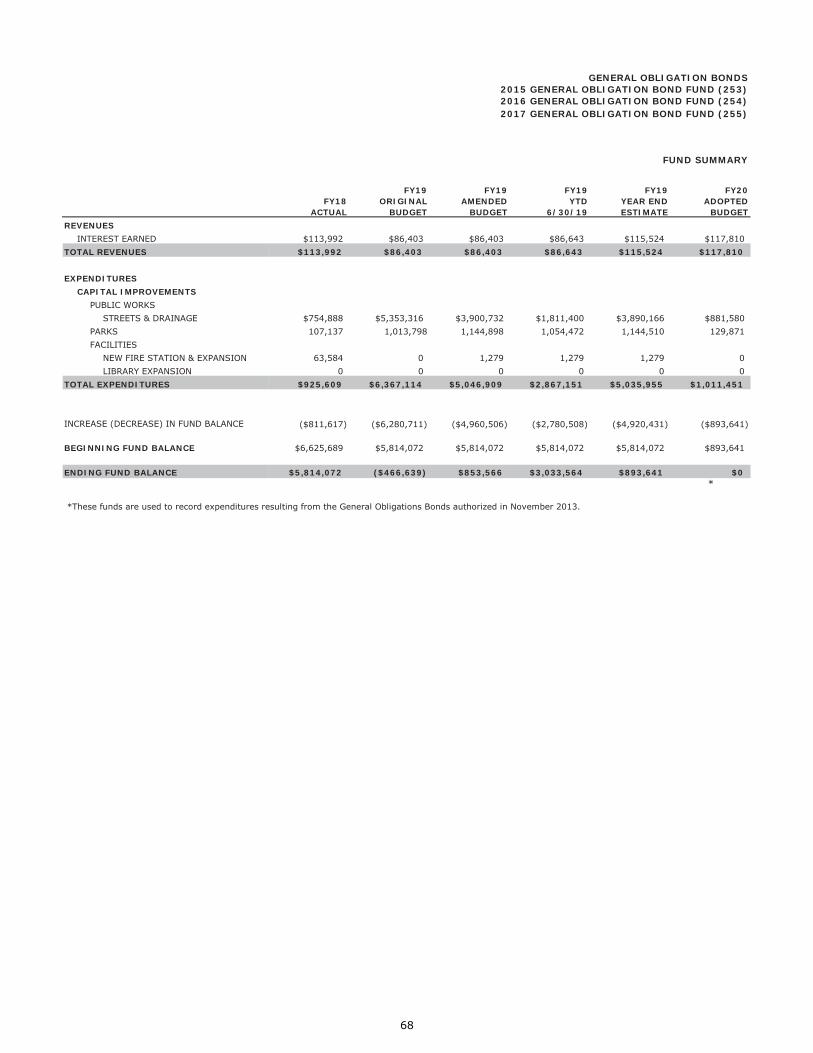
FY18ACTUAL
FY19ORIGINAL
BUDGET
FY19AMENDED
BUDGET
FY19YTD
6/30/19
FY19YEAR ENDESTIMATE
FY20ADOPTED
BUDGETREVENUES
INTEREST EARNED $113,992 $86,403 $86,403 $86,643 $115,524 $117,810TOTAL REVENUES $113,992 $86,403 $86,403 $86,643 $115,524 $117,810
EXPENDITURES
CAPITAL IMPROVEMENTSPUBLIC WORKS
STREETS & DRAINAGE $754,888 $5,353,316 $3,900,732 $1,811,400 $3,890,166 $881,580PARKS 107,137 1,013,798 1,144,898 1,054,472 1,144,510 129,871FACILITIES
NEW FIRE STATION & EXPANSION 63,584 0 1,279 1,279 1,279 0LIBRARY EXPANSION 0 0 0 0 0 0
TOTAL EXPENDITURES $925,609 $6,367,114 $5,046,909 $2,867,151 $5,035,955 $1,011,451
($811,617) ($6,280,711) ($4,960,506) ($2,780,508) ($4,920,431) ($893,641)
BEGINNING FUND BALANCE $6,625,689 $5,814,072 $5,814,072 $5,814,072 $5,814,072 $893,641
ENDING FUND BALANCE $5,814,072 ($466,639) $853,566 $3,033,564 $893,641 $0*
*These funds are used to record expenditures resulting from the General Obligations Bonds authorized in November 2013.
INCREASE (DECREASE) IN FUND BALANCE
2016 GENERAL OBLIGATION BOND FUND (254)
GENERAL OBLIGATION BONDS
2017 GENERAL OBLIGATION BOND FUND (255)
2015 GENERAL OBLIGATION BOND FUND (253)
FUND SUMMARY
68
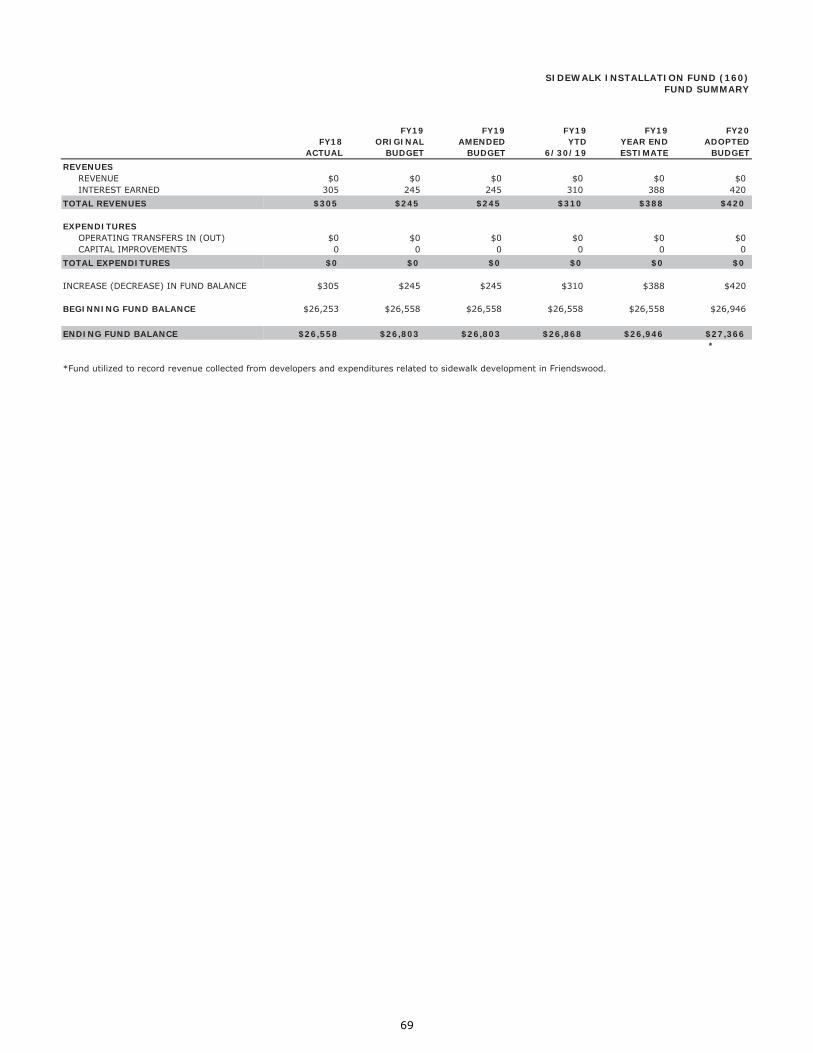
FY18ACTUAL
FY19ORIGINAL
BUDGET
FY19AMENDED
BUDGET
FY19YTD
6/30/19
FY19YEAR ENDESTIMATE
FY20ADOPTED
BUDGETREVENUES
REVENUE $0 $0 $0 $0 $0 $0INTEREST EARNED 305 245 245 310 388 420
$305 $245 $245 $310 $388 $420
EXPENDITURESOPERATING TRANSFERS IN (OUT) $0 $0 $0 $0 $0 $0CAPITAL IMPROVEMENTS 0 0 0 0 0 0
$0 $0 $0 $0 $0 $0
INCREASE (DECREASE) IN FUND BALANCE $305 $245 $245 $310 $388 $420
BEGINNING FUND BALANCE $26,253 $26,558 $26,558 $26,558 $26,558 $26,946
ENDING FUND BALANCE $26,558 $26,803 $26,803 $26,868 $26,946 $27,366*
*Fund utilized to record revenue collected from developers and expenditures related to sidewalk development in Friendswood.
SIDEWALK INSTALLATION FUND (160)FUND SUMMARY
TOTAL REVENUES
TOTAL EXPENDITURES
69
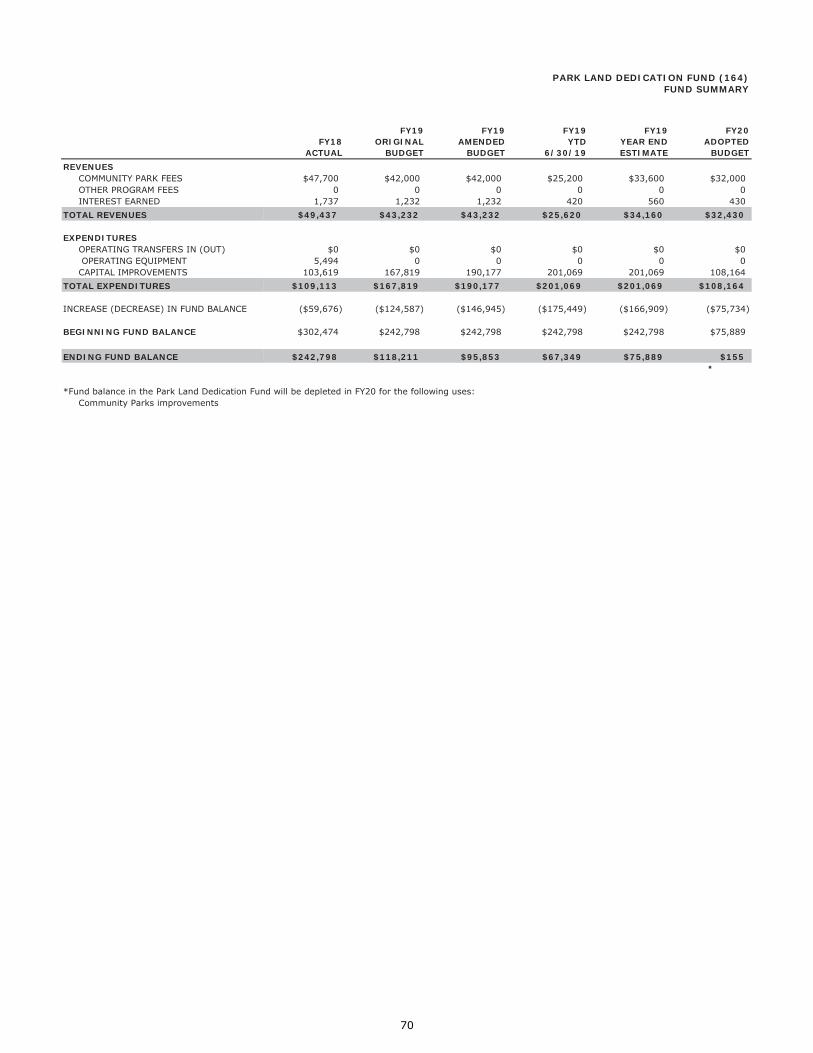
FY18ACTUAL
FY19ORIGINAL
BUDGET
FY19AMENDED
BUDGET
FY19YTD
6/30/19
FY19YEAR ENDESTIMATE
FY20ADOPTED
BUDGETREVENUES
COMMUNITY PARK FEES $47,700 $42,000 $42,000 $25,200 $33,600 $32,000OTHER PROGRAM FEES 0 0 0 0 0 0INTEREST EARNED 1,737 1,232 1,232 420 560 430
$49,437 $43,232 $43,232 $25,620 $34,160 $32,430
EXPENDITURESOPERATING TRANSFERS IN (OUT) $0 $0 $0 $0 $0 $0 OPERATING EQUIPMENT 5,494 0 0 0 0 0CAPITAL IMPROVEMENTS 103,619 167,819 190,177 201,069 201,069 108,164
$109,113 $167,819 $190,177 $201,069 $201,069 $108,164
INCREASE (DECREASE) IN FUND BALANCE ($59,676) ($124,587) ($146,945) ($175,449) ($166,909) ($75,734)
BEGINNING FUND BALANCE $302,474 $242,798 $242,798 $242,798 $242,798 $75,889
ENDING FUND BALANCE $242,798 $118,211 $95,853 $67,349 $75,889 $155*
*Fund balance in the Park Land Dedication Fund will be depleted in FY20 for the following uses:Community Parks improvements
PARK LAND DEDICATION FUND (164)FUND SUMMARY
TOTAL REVENUES
TOTAL EXPENDITURES
70

FY18ACTUAL
FY19ORIGINAL
BUDGET
FY19AMENDED
BUDGET
FY19YTD
6/30/19
FY19YEAR ENDESTIMATE
FY20ADOPTED
BUDGETREVENUES
SALES TAXES $1,569,848 $1,534,124 $1,534,124 $937,957 $1,607,926 $1,622,100OTHER PROGRAM FEES 0 0 0 0 0 0INTEREST EARNED 17,206 12,616 12,616 29,049 36,370 36,400
$1,587,054 $1,546,740 $1,546,740 $967,006 $1,644,296 $1,658,500
EXPENDITURESOPERATING TRANSFERS IN (OUT) $0 $0 $0 $0 $0 $0CAPITAL IMPROVEMENTS 0 4,093,608 1,700,000 1,207,197 1,700,000 $4,192,001
$0 $4,093,608 $1,700,000 $1,207,197 $1,700,000 $4,192,001
INCREASE (DECREASE) IN FUND BALANCE $1,587,054 ($2,546,868) ($153,260) ($240,191) ($55,704) ($2,533,501)
BEGINNING FUND BALANCE $1,002,151 $2,589,205 $2,589,205 $2,589,205 $2,589,205 $2,533,501
ENDING FUND BALANCE $2,589,205 $42,337 $2,435,945 $2,349,014 $2,533,501 ($0)*
*Fund established in FY17 to record sales tax revenue collected for City streets maintenance and improvements.
City of Friendswood's sales tax rate increased from 7.75% to 8.25% with voter approval in May 2016. The 1/2 cent sales tax rate increase is distributed in the following manner:
$0.00375 for Streets maintenance and improvements$0.00125 for Economic Development improvements in the City's downtown area
STREETS IMPROVEMENT FUND (170)FUND SUMMARY
TOTAL REVENUES
TOTAL EXPENDITURES
71

FY18ACTUAL
FY19ORIGINAL
BUDGET
FY19AMENDED
BUDGET
FY19YTD
6/30/19
FY19YEAR ENDESTIMATE
FY20ADOPTED
BUDGETREVENUES
SALES TAXES $523,283 $511,374 $511,374 $397,882 $530,509 $540,690REIMBURSEMENTS 0 0 0 37,832 37,832 0INTEREST EARNED 3,645 2,798 2,798 7,200 8,680 8,700
$526,928 $514,172 $514,172 $442,914 $577,021 $549,390
EXPENDITURESOPERATING TRANSFERS IN (OUT) $17,500 $16,000 $16,000 $11,997 $16,000 $16,000ADMINISTRATIVE EXPENSES 0 2,000 2,000 25 2,000 2,000CONTRACT/PLANNING SERVICES 318,998 0 0 0 0 0CAPITAL IMPROVEMENTS 0 912,015 41,818 34,529 41,818 1,553,041
$336,498 $930,015 $59,818 $46,551 $59,818 $1,571,041
$190,430 ($415,843) $454,354 $396,363 $517,203 ($1,021,651)
BEGINNING FUND BALANCE $314,017 $504,447 $504,447 $504,447 $504,447 $1,021,651
ENDING FUND BALANCE $504,447 $88,604 $958,801 $900,810 $1,021,651 ($0)*
*Fund established in FY17 to record sales tax revenue collected for economic development improvements of the City's downtown area.
City of Friendswood's sales tax rate increased from 7.75% to 8.25% with voter approval in May 2016. The 1/2 cent sales tax rate increase is distributed in the following manner:
$0.00125 for Economic Development improvements in the City's downtown area$0.00375 for Streets maintenance and improvements
FRIENDSWOOD DOWNTOWN ECONOMIC DEVELOPMENT IMPROVEMENT FUND (175)FUND SUMMARY
TOTAL REVENUES
TOTAL EXPENDITURES
INCREASE (DECREASE) IN FUND BALANCE
72
1776 PARK TRUST FUND This fund was established in fiscal year 1979-80 to account for 1776 Park assets held by the City in a trustee capacity. The 1776 Park land was donated to the City, along with $10,000. The funds are invested and the interest earned is used to maintain the park. The 1776 Park Trust Fund basis of accounting is accrual. The basis of budgeting is accrual with the following exceptions:
Capital equipment and improvements are budgeted as an expense and reclassified for reporting purposes.
Depreciation is not budgeted.
73

FY18ACTUAL
FY19ORIGINAL
BUDGET
FY19AMENDED
BUDGET
FY19YTD
6/30/19
FY19YEAR ENDESTIMATE
FY20ADOPTED
BUDGETOTHER FINANCING SOURCES
INTEREST EARNED $363 $292 $292 $277 $345 $370$363 $292 $292 $277 $345 $370
NON-OPERATING EXPENSES
$7,925 $0 $13,852 $0 $13,852 $0$7,925 $0 $13,852 $0 $13,852 $0
($7,562) $292 ($13,560) $277 ($13,507) $370
BEGINNING FUND BALANCE $31,869 $24,307 $24,307 $24,307 $24,307 $10,800
ENDING FUND BALANCE $24,307 $24,599 $10,747 $24,584 $10,800 $11,170*
* Of the fund balance total, $10,000 is principal amount donated to the City when this fund was established.
INCREASE (DECREASE) IN FUND BALANCE
TOTAL EXPENDITURES 1776 PARK IMPROVEMENTS
1776 PARK TRUST FUND (701)FUND SUMMARY
TOTAL OTHER FINANCING SOURCES
74

ENTERPRISE FUNDS
The Enterprise Funds are used to budget for the acquisition, operation and maintenance of governmental facilities and services that are entirely or predominantly self-supporting by user charges. The operations of the water and sewer system are budgeted in several funds but are accounted for in one Enterprise Fund in the Comprehensive Annual Financial Report to reflect the results of operations similar to private enterprise.
The accrual basis of accounting is used for reporting purposes in the Comprehensive Annual Financial Report, whereby revenues are recognized in the period in which they are earned and expenses are recognized in the period in which they are incurred. The basis of budgeting also uses the accrual basis with the following exceptions:
Capital equipment and improvements are budgeted as an expense and reclassified for
reporting purposes Depreciation is not budgeted Debt Principal payments are budgeted as an expense and reclassified for reporting
purposes Bond issuance costs are budgeted for the full amount in the year of the bond sale and
reclassified for reporting purposes Interfund transfers between the Enterprise Funds are budgeted as income and expense
and reclassified for reporting purposes
The budgeted Enterprise Funds include: Water and Sewer Operation Fund 2006 Water and Sewer Bond Construction Fund 2009 Water and Sewer Bond Construction Fund 2016 Water and Sewer Bond Construction Fund 2018 Water and Sewer Bond Construction Fund Water CIP/Impact Fee Fund Sewer CIP/Impact Fee Fund Water and Sewer Revenue Debt Service Fund
Water and Sewer Operation Fund The Water and Sewer Operation Fund is used to budget income and expenses directly related to operations of the water and sewer system. The basis of budgeting is the accrual basis with the following exceptions:
Capital equipment and improvements are budgeted as an expense and reclassified for reporting purposes
Depreciation is not budgeted Interfund transfers between the Enterprise Funds are budgeted as income and expense
and reclassified for reporting purposes Water and Sewer Bond Construction Funds The Water and Sewer Bond Construction Funds are used to account for proceeds on the sale of water and sewer revenue bonds for system improvements. The basis of budgeting uses the accrual basis with the following exceptions:
75

Capital equipment and improvements are budgeted as an expense and reclassified for reporting purposes
Depreciation is not budgeted Interfund transfers between the Enterprise Funds are budgeted as income and expense
and reclassified for reporting purposes Water and Sewer CIP/Impact Fee Funds
The Water and Sewer CIP/Impact Fee Funds are used to account for impact fees assessed and collected on new development. The impact fees are transferred to the Water and Sewer Revenue Debt Service Fund to make principal and interest payments on the water and sewer revenue debt issued to construct new water system improvements. The basis of budgeting also uses the accrual basis with the following exceptions:
Interfund transfers between the Enterprise Funds are budgeted as income and expense
and reclassified for reporting purposes
Water CIP/Impact Fee Fund
The Water CIP/Impact Fee Fund is used to account for impact fees assessed and collected on new development. The impact fees are transferred to the Water and Sewer Revenue Debt Service Fund to make principal and interest payments on the Water Revenue Debt issued to construct new water system improvements. Sewer CIP/Impact Fee Fund
The Sewer CIP/Impact Fee Fund is used to account for impact fees assessed and collected on new development. The impact fees are transferred to the Water and Sewer Revenue Debt Service Fund to make principal and interest payments on the Sewer Revenue Debt issued to construct new sewer system improvements. Water and Sewer Revenue Debt Service Fund The Water and Sewer Revenue Debt Service Fund is used to account for payment of principal and interest on all enterprise fund long-term debt of the City. The basis of budgeting uses the accrual basis with the following exceptions:
Debt Principal payments are budgeted as an expense and reclassified for reporting
purposes Bond issuance costs are budgeted for the full amount in the year of the bond sale and
reclassified for reporting purposes Interfund transfers between the Enterprise Funds are budgeted as income and expense
and reclassified for reporting purposes
76

FY18ACTUAL
FY19ORIGINAL
BUDGET
FY19AMENDED
BUDGET
FY19YTD
6/30/19
FY19YEAR ENDESTIMATE
FY20ADOPTED
BUDGETOPERATING REVENUES
WATER REVENUES $6,456,020 $7,079,811 $7,079,811 $3,597,029 $6,608,201 $9,070,883SEWER REVENUES 4,861,038 5,194,823 5,194,823 3,339,994 5,670,280 6,536,753ADMINISTRATIVE FEES 304,790 340,125 340,125 289,000 382,479 356,625SALES OF WATER METERS 43,617 35,000 35,000 22,795 30,000 30,000MISCELLANEOUS RECEIPTS 76,727 0 7,359 8,802 11,908 0
$11,742,192 $12,649,759 $12,657,118 $7,257,620 $12,702,868 $15,994,261
OPERATING EXPENSES
ADMINISTRATIVE SERVICES 562,311 $573,685 $573,685 $416,084 557,757 $605,618PUBLIC WORKS
ADMINISTRATION 169,731 179,159 180,119 125,757 173,602 247,981WATER UTILITIES 729,266 897,072 964,734 595,605 929,917 765,949SEWER UTILITIES 488,685 642,137 652,239 453,210 642,033 616,778WATER OPERATIONS 2,138,219 2,452,727 2,892,992 1,592,228 2,892,992 3,618,455SEWER OPERATIONS 2,435,060 3,037,630 4,457,883 3,499,041 4,457,883 7,081,236UTILITY CUSTOMER SERVICE 221,998 238,227 241,492 175,159 238,133 249,653STORM 80,467 0 0 0 0 0ENGINEERING/CAPITAL PROJECTS 141,939 158,525 158,525 74,735 81,542 0
TOTAL PUBLIC WORKS $6,405,365 $7,605,477 $9,547,984 $6,515,735 $9,416,102 $12,580,052ENGINEERING** $0 $0 $0 $0 $0 396,707
6,967,676 8,179,162 10,121,669 6,931,819 9,973,859 13,582,377
$4,774,516 $4,470,597 2,535,449$ 325,801$ 2,729,009$ $2,411,884
NON-OPERATINGREVENUES (EXPENSES)INTEREST EARNED $118,662 $94,209 $94,209 $90,341 $114,020 $114,070CAPITAL IMPROVEMENTS (400,157) (300,000) (1,430,744) (401,677) (1,430,744) (300,000)TRANSFERS IN (OUT) (4,721,224) (4,223,790) (4,238,790) (3,182,842) (4,238,790) (5,843,817)
TOTAL NON OPERATING ($5,002,719) ($4,429,581) ($5,575,325) ($3,494,178) ($5,555,514) ($6,029,747)
NET INCOME/(LOSS) ($228,203) $41,016 ($3,039,876) ($3,168,377) ($2,826,505) ($3,617,863)
BEGINNING WORKING CAPITAL $10,916,603 $10,688,400 $10,688,400 $10,688,400 $10,688,400 $7,861,895
ENDING WORKING CAPITAL $10,688,400 $10,729,416 $7,648,524 $7,520,023 $7,861,895 $4,244,032*
* The projected retained earnings at September 30, 2019 is $7.9 million. The balance includes a 90-day operating reserve of $2.6 million, as set forth in the City's financial policies. The reserve is designed "to protect the City utility fund's creditworthiness as well as its financial position from unforeseeable emergencies." The policies state "additional undesignated funds will be allowed to accumulate in a fund designated for futureutility/operating capital improvements."
Water and Sewer Fund retained earnings designations/commitments are as follows: Contingency for Possible Future 36" and 42" Distribution Line Repairs $100,000
The FY20 budget for Water and Sewer Revenue takes into account a rate increase in January 2020. The effect of the rate increase on a bi-monthly utility bill is listed below:
Minimum Single-Family Residential 14.75%Average Single- Family Residential 25.05%Average Commercial 26.85%Average Irrigation 13.03%
** For the proposed budget presentation the FY18 actual expenditures and all of FY19 amounts are included in the Public Works department.
WATER AND SEWER OPERATION FUND (401)
TOTAL REVENUES
OPERATING INCOME
TOTAL EXPENDITURES
FUND SUMMARY
77

FY18ACTUAL
FY19ORIGINAL
BUDGET
FY19AMENDED
BUDGET
FY19YTD
6/30/19
FY19YEAR ENDESTIMATE
FY20ADOPTED
BUDGETNON-OPERATING REVENUES
INTEREST EARNED $1,189 $0 $0 $823 $1,088 $0TRANSFERS FROM W/S OPERATION FUND 0 0 0 0 0 0MISCELLANEOUS 0 0 0 0 0 0
$1,189 $0 $0 $823 $1,088 $0
CAPITAL FINANCING ACTIVITIESCAPITAL IMPROVEMENTS
PUBLIC WORKSDISTRIBUTION SYSTEM IMPROVEMENTS (WATER) $0 $0 $0 $0 $0 $0COLLECTION SYSTEM IMPROVEMENTS (SEWER) 0 0 0 0 44,157 0
$0 $0 $0 $0 $44,157 $0
NON-OPERATING EXPENSESTRANSFERS IN (OUT) $0 $0 $0 $0 $0 $0
TOTAL NON-OPERATING EXPENSES $0 $0 $0 $0 $0 $0
NET INCOME $1,189 $0 $0 $823 ($43,069) $0
BEGINNING FUND BALANCE $41,880 $43,069 $43,069 $43,069 $43,069 $0
ENDING FUND BALANCE $43,069 $43,069 $43,069 $43,892 $0 $0
Water & Sewer Bond Construction Fund retained earnings are expected to be depleted in FY19 with completion of water and sewer capital improvement projects funded by the 2006 water & sewer revenue bond issuance.
2006 WATER AND SEWER BOND CONSTRUCTION FUND (418)FUND SUMMARY
TOTAL REVENUES
TOTAL EXPENDITURES
78

FY18ACTUAL
FY19ORIGINAL
BUDGET
FY19AMENDED
BUDGET
FY19YTD
6/30/19
FY19YEAR ENDESTIMATE
FY20ADOPTED
BUDGETNON-OPERATING REVENUES
INTEREST EARNED $6,122 $0 $0 $6,464 $8,546 $00 0 0 0 0 0
MISCELLANEOUS 0 0 0 0 0 0$6,122 $0 $0 $6,464 $8,546 $0
CAPITAL FINANCING ACTIVITIESCAPITAL IMPROVEMENTS
PUBLIC WORKSDISTRIBUTION SYSTEM IMPROVEMENTS (WATER) $0 $0 $0 $0 $346,829 $0COLLECTION SYSTEM IMPROVEMENTS (SEWER) 0 0 0 0 0 0
$0 $0 $0 $0 $346,829 $0
NON-OPERATING EXPENSESTRANSFERS IN (OUT) $0 $0 $0 $0 $0 $0
TOTAL NON-OPERATING EXPENSES $0 $0 $0 $0 $0 $0
NET INCOME $6,122 $0 $0 $6,464 ($338,283) $0
BEGINNING FUND BALANCE $332,161 $338,283 $338,283 $338,283 $338,283 $0
ENDING FUND BALANCE $338,283 $338,283 $338,283 $344,747 $0 $0*
* 2009 Water & Sewer Bond Construction Fund retained earnings expected to be depleted in FY19 due to anticipatedcompletion of the water and sewer capital improvement projects funded by the 2009 water & sewer revenue bond issue.
TOTAL REVENUES
2009 WATER AND SEWER BOND CONSTRUCTION FUND (419)FUND SUMMARY
TOTAL EXPENDITURES
TRANSFERS FROM W/S REVENUE DEBT
79

FY18ACTUAL
FY19ORIGINAL
BUDGET
FY19AMENDED
BUDGET
FY19YTD
6/30/19
FY19YEAR ENDESTIMATE
FY20ADOPTED
BUDGETNON-OPERATING REVENUES
INTEREST EARNED $61,588 $58,710 $58,710 $56,665 $75,115 $58,7100 0 0 0 0 0
BOND PROCEEDS 0 0 0 0 0 0MISCELLANEOUS 0 0 0 0 0 0
$61,588 $58,710 $58,710 $56,665 $75,115 $58,710
CAPITAL FINANCING ACTIVITIESCAPITAL IMPROVEMENTS
PUBLIC WORKSDISTRIBUTION SYSTEM IMPROVEMENTS (WATER) $0 $0 $0 $0 $0 $0COLLECTION SYSTEM IMPROVEMENTS (SEWER) 696,294 2,960,108 3,065,966 131,514 238,172 2,906,809
$696,294 $2,960,108 $3,065,966 $131,514 $238,172 $2,906,809
NON-OPERATING EXPENSESTRANSFERS IN (OUT) $0 $0 $0 $0 $0 $0
TOTAL NON-OPERATING EXPENSES $0 $0 $0 $0 $0 $0
NET INCOME ($634,706) ($2,901,398) ($3,007,256) ($74,849) ($163,057) ($2,848,099)
BEGINNING FUND BALANCE $3,645,862 $3,011,156 $3,011,156 $3,011,156 $3,011,156 $2,848,099
ENDING FUND BALANCE $3,011,156 $109,758 $3,900 $2,936,307 $2,848,099 $0*
* 2016 Water & Sewer Bond Construction Fund established upon the issuance of the 2016 Water & Sewer Revenue bonds to complete the following capital improvements projects:
Blackhawk Wastewater Treatment Plant - 3rd Clarifier addition (City's portion of the expenditures) - $3,999,530Lift Station 23 (Crazy Horse Lift Station) replacement - $1,620,000
Ending retained earnings expected to decrease in FY20 due to use of funds for planned capital projects.
2016 WATER AND SEWER BOND CONSTRUCTION FUND (420)FUND SUMMARY
TRANSFERS FROM W/S REVENUE DEBT
TOTAL REVENUES
TOTAL EXPENDITURES
80

FY18ACTUAL
FY19ORIGINAL
BUDGET
FY19AMENDED
BUDGET
FY19YTD
6/30/19
FY19YEAR ENDESTIMATE
FY20ADOPTED
BUDGETNON-OPERATING REVENUES
INTEREST EARNED $0 $0 $0 $265,174 $331,880 $331,8900 0 0 0 0 0
BOND PROCEEDS 0 0 0 20,170,000 20,170,000 0PREMIUM ON BONDS 0 0 0 1,569,429 1,569,429 0
$0 $0 $0 $22,004,603 $22,071,309 $331,890
CAPITAL FINANCING ACTIVITIESCAPITAL IMPROVEMENTS
PUBLIC WORKSDISTRIBUTION SYSTEM IMPROVEMENTS (WATER) $0 $0 $0 $0 $0 $9,292,200COLLECTION SYSTEM IMPROVEMENTS (SEWER) 0 0 275,000 0 275,000 7,192,000
$0 $0 $275,000 $0 $275,000 $16,484,200
NON-OPERATING EXPENSESBOND ISSUE COSTS $0 $0 $0 $221,535 $0 $0TRANSFERS out 0 0 0 1,514,560 0 0
TOTAL NON-OPERATING EXPENSES $0 $0 $0 $1,736,095 $0 $0
NET INCOME $0 $0 ($275,000) $20,268,508 $21,796,309 ($16,152,310)
BEGINNING FUND BALANCE $0 $0 $0 $0 $0 $21,796,309
ENDING FUND BALANCE $0 $0 ($275,000) $20,268,508 $21,796,309 $5,643,999*
* 2018 Water & Sewer Bond Construction Fund established upon the issuance of the 2018 Water & Sewer Revenue bonds. Below is a list of water and sewer projects that will be started in 2019:
Combine Lift Stations #1 and #17 $1,594,000Sanitary Sewer System Assessment Phase IV - Constru 1,464,000 Lift Station #23 Reconstruction 2,540,000 Lift Station #4 Reconstruction 1,594,000 Water Plan #1 Tank Rehabilitation 1,207,000 42-inch Water Main Replacement 2,531,200 Sanitary Sewer System Assessment Phase V and VI 275,000 Second Elevated Water Storage Tank Rehabilitation 954,000 Surface Water Station #3 4,600,000
$16,759,200
2018 WATER AND SEWER BOND CONSTRUCTION FUND (421)FUND SUMMARY
TRANSFERS FROM W/S REVENUE DEBT
TOTAL REVENUES
TOTAL EXPENDITURES
81

FY18ACTUAL
FY19ORIGINAL
BUDGET
FY19AMENDED
BUDGET
FY19YTD
6/30/19
FY19YEAR ENDESTIMATE
FY20ADOPTED
BUDGETNON-OPERATING REVENUES
IMPACT FEES $333,150 $417,600 $417,600 $188,163 $250,803 $313,200INTEREST EARNED 1,804 1,720 1,720 619 863 880MISCELLANEOUS 0 0 0 0 0 0
TOTAL NON-OPERATING REVENUES $334,954 $419,320 $419,320 $188,782 $251,666 $314,080
NON-OPERATING EXPENSESTRANSFERS OUT $400,000 $400,000 $400,000 $266,667 $300,000 $300,000
TOTAL NON-OPERATING EXPENSES $400,000 $400,000 $400,000 $266,667 $300,000 $300,000
NET INCOME ($65,046) $19,320 $19,320 ($77,885) ($48,334) $14,080
BEGINNING FUND BALANCE $152,542 $87,496 $87,496 $87,496 $87,496 $39,162
ENDING FUND BALANCE $87,496 $106,816 $106,816 $9,611 $39,162 $53,242*
* Expected increase of 36.0% to Retained Earnings in this fund due to: Residential development is expected to exceed that of FY19 (150 new residential home starts are projected).
WATER CIP/IMPACT FEE FUND (480)FUND SUMMARY
82

FY18ACTUAL
FY19ORIGINAL
BUDGET
FY19AMENDED
BUDGET
FY19YTD
6/30/19
FY19YEAR ENDESTIMATE
FY20ADOPTED
BUDGETNON-OPERATING REVENUES
IMPACT FEES $128,191 $168,000 $168,000 $97,928 $114,128 $126,000INTEREST EARNED 1,286 1,133 1,133 953 1,191 1,220MISCELLANEOUS 0 0 0 0 0 0
TOTAL NON-OPERATING REVENUES $129,477 $169,133 $169,133 $98,881 $115,319 $127,220
NON-OPERATING EXPENSESTRANSFERS OUT $150,000 $150,000 $150,000 $112,500 $150,000 $125,000
TOTAL NON-OPERATING EXPENSES $150,000 $150,000 $150,000 $112,500 $150,000 $125,000
NET INCOME ($20,523) $19,133 $19,133 ($13,619) ($34,681) $2,220
BEGINNING FUND BALANCE $108,163 $87,640 $87,640 $87,640 $87,640 $52,959
ENDING FUND BALANCE $87,640 $106,773 $106,773 $74,021 $52,959 $55,179
* Expected increase of 4.2% to Retained Earnings in this fund due to: Residential development is expected to exceed that of FY19 (150 new residential home starts are projected).
SEWER CIP/IMPACT FEE FUND (580)FUND SUMMARY
83
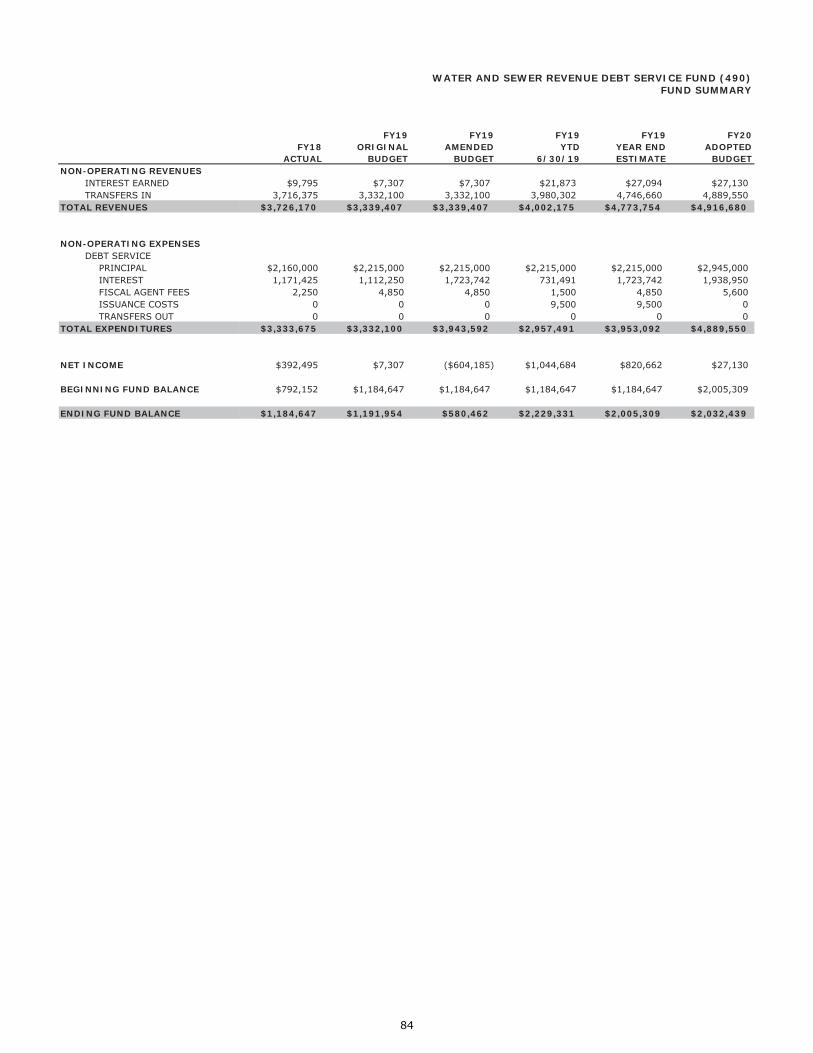
FY18ACTUAL
FY19ORIGINAL
BUDGET
FY19AMENDED
BUDGET
FY19YTD
6/30/19
FY19YEAR ENDESTIMATE
FY20ADOPTED
BUDGETNON-OPERATING REVENUES
INTEREST EARNED $9,795 $7,307 $7,307 $21,873 $27,094 $27,130TRANSFERS IN 3,716,375 3,332,100 3,332,100 3,980,302 4,746,660 4,889,550
TOTAL REVENUES $3,726,170 $3,339,407 $3,339,407 $4,002,175 $4,773,754 $4,916,680
NON-OPERATING EXPENSESDEBT SERVICE
PRINCIPAL $2,160,000 $2,215,000 $2,215,000 $2,215,000 $2,215,000 $2,945,000INTEREST 1,171,425 1,112,250 1,723,742 731,491 1,723,742 1,938,950FISCAL AGENT FEES 2,250 4,850 4,850 1,500 4,850 5,600ISSUANCE COSTS 0 0 0 9,500 9,500 0TRANSFERS OUT 0 0 0 0 0 0
TOTAL EXPENDITURES $3,333,675 $3,332,100 $3,943,592 $2,957,491 $3,953,092 $4,889,550
NET INCOME $392,495 $7,307 ($604,185) $1,044,684 $820,662 $27,130
BEGINNING FUND BALANCE $792,152 $1,184,647 $1,184,647 $1,184,647 $1,184,647 $2,005,309
ENDING FUND BALANCE $1,184,647 $1,191,954 $580,462 $2,229,331 $2,005,309 $2,032,439
WATER AND SEWER REVENUE DEBT SERVICE FUND (490)FUND SUMMARY
84

VEHICLE REPLACEMENT FUND
This internal service fund was established in fiscal year 2001-02 with startup funds, in the amount of $120,188, from the General Fund which were repaid in fiscal years 2002-03 and 2003-04. Ownership of all City vehicles was transferred from the departments to the Vehicle Replacement Fund with the following exclusions:
1. Vehicles purchased for use by the Friendswood Volunteer Fire Department 2. Vehicles costing in excess of $50,000
Criteria used to determine the replacement schedule is vehicle type, usage type, average annual mileage and maintenance costs. Replacement schedule is as follows:
Life (Years) Vehicle Types
3 - 4 Police Patrol Vehicles
6-8 Police Non-Patrol
10 Cars, Light Trucks, SUVs
15 Heavy Duty Trucks, Vans, Coaches
Since the plan’s inception in 2001-02, vehicle replacement costs have increased with some exceeding the $50,000 threshold for inclusion in the plan. As a result, the Vehicle Replacement Plan and Vehicle Replacement Fund are under review for necessary revisions. The Vehicle Replacement Fund basis of budgeting is accrual basis with the following exceptions:
Capital equipment and improvements are budgeted as an expense and reclassified
for reporting purposes Depreciation is not budgeted Interfund transfers between the Enterprise Funds are budgeted as income and
expense and reclassified for reporting purposes
85
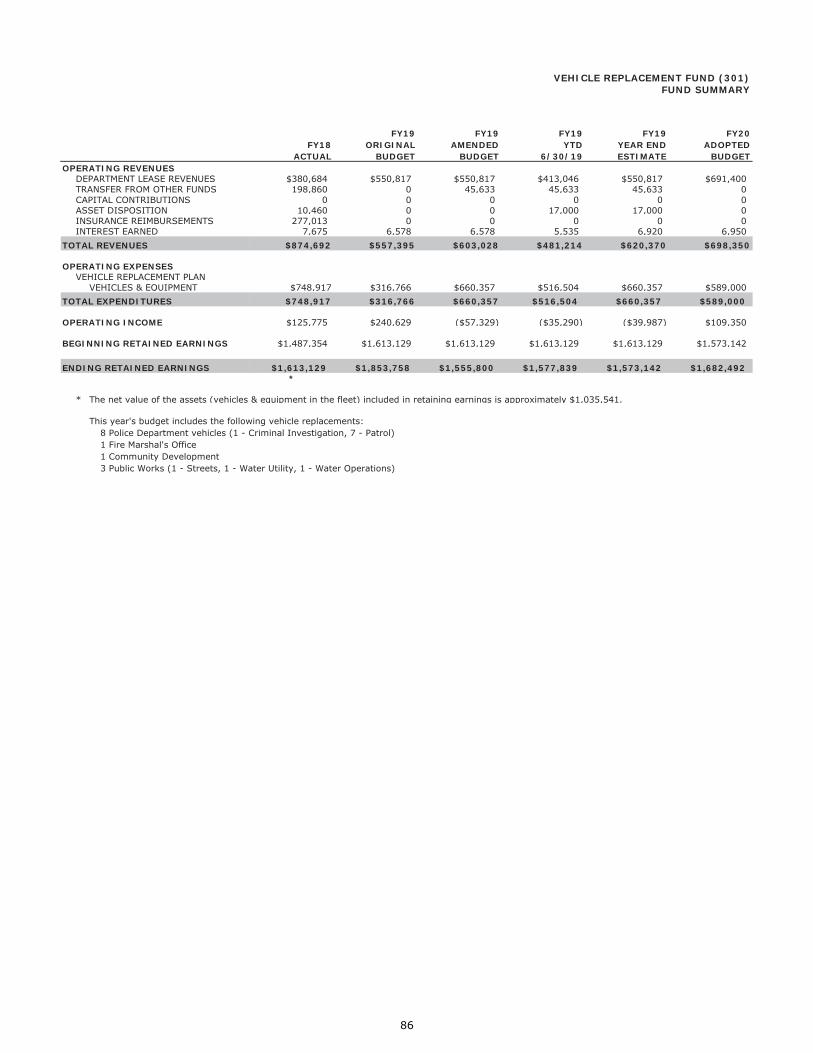
FY18ACTUAL
FY19ORIGINAL
BUDGET
FY19AMENDED
BUDGET
FY19YTD
6/30/19
FY19YEAR ENDESTIMATE
FY20ADOPTED
BUDGETOPERATING REVENUES
DEPARTMENT LEASE REVENUES $380,684 $550,817 $550,817 $413,046 $550,817 $691,400TRANSFER FROM OTHER FUNDS 198,860 0 45,633 45,633 45,633 0CAPITAL CONTRIBUTIONS 0 0 0 0 0 0ASSET DISPOSITION 10,460 0 0 17,000 17,000 0INSURANCE REIMBURSEMENTS 277,013 0 0 0 0 0INTEREST EARNED 7,675 6,578 6,578 5,535 6,920 6,950
TOTAL REVENUES $874,692 $557,395 $603,028 $481,214 $620,370 $698,350
OPERATING EXPENSESVEHICLE REPLACEMENT PLAN
VEHICLES & EQUIPMENT $748,917 $316,766 $660,357 $516,504 $660,357 $589,000TOTAL EXPENDITURES $748,917 $316,766 $660,357 $516,504 $660,357 $589,000
OPERATING INCOME $125,775 $240,629 ($57,329) ($35,290) ($39,987) $109,350
BEGINNING RETAINED EARNINGS $1,487,354 $1,613,129 $1,613,129 $1,613,129 $1,613,129 $1,573,142
ENDING RETAINED EARNINGS $1,613,129 $1,853,758 $1,555,800 $1,577,839 $1,573,142 $1,682,492*
* The net value of the assets (vehicles & equipment in the fleet) included in retaining earnings is approximately $1,035,541.
This year's budget includes the following vehicle replacements:8 Police Department vehicles (1 - Criminal Investigation, 7 - Patrol)1 Fire Marshal's Office 1 Community Development 3 Public Works (1 - Streets, 1 - Water Utility, 1 - Water Operations)
VEHICLE REPLACEMENT FUND (301)FUND SUMMARY
86

Revenue Summary Chart and Schedules by Fund
87
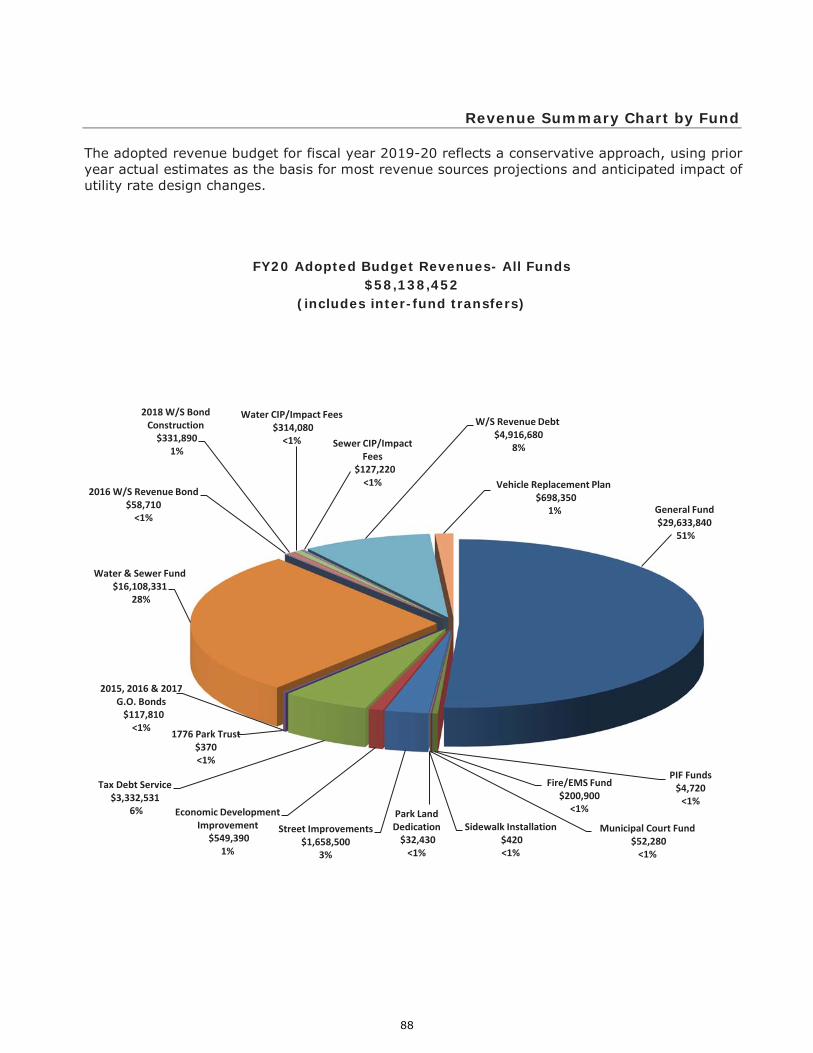
Revenue Summary Chart by Fund The adopted revenue budget for fiscal year 2019-20 reflects a conservative approach, using prior year actual estimates as the basis for most revenue sources projections and anticipated impact of utility rate design changes.
FY20 Adopted Budget Revenues- All Funds $58,138,452
(includes inter-fund transfers)
General Fund$29,633,840
51%
PIF Funds$4,720
<1%
Fire/EMS Fund$200,900
<1%
Municipal Court Fund$52,280
<1%
Sidewalk Installation$420 <1%
Park Land Dedication
$32,430 <1%
Street Improvements$1,658,500
3%
Economic Development Improvement
$549,390 1%
Tax Debt Service$3,332,531
6%
2015, 2016 & 2017 G.O. Bonds
$117,810 <1%
1776 Park Trust$370 <1%
Water & Sewer Fund$16,108,331
28%
2016 W/S Revenue Bond$58,710
<1%
2018 W/S Bond Construction
$331,890 1%
Water CIP/Impact Fees$314,080
<1% Sewer CIP/Impact Fees
$127,220 <1%
W/S Revenue Debt$4,916,680
8%
Vehicle Replacement Plan$698,350
1%
88

REVENUE SCHEDULES001 - GENERAL FUND
ACCOUNT DESCRIPTIONFY 18
ACTUAL
FY19ORIGINAL
BUDGET
FY19AMENDED
BUDGET
FY19YTD
6/30/19
FY19YEAR ENDESTIMATE
FY20ADOPTED
BUDGETCURRENT PROPERTY TAXES $14,392,346 $14,710,673 $14,710,673 $14,502,368 $14,710,673 $15,949,252DELINQUENT PROPERTY TAXES 95,119 177,662 177,662 84,417 177,662 177,662SALES TAX 6,326,825 6,294,492 6,294,492 3,788,222 6,488,330 6,597,532TNMPCO FRANCHISE 539,629 565,000 565,000 307,558 565,000 647,040HL&P FRANCHISE 135,043 148,000 148,000 58,023 148,000 168,260MUNICIPAL ROW ACCESS FEES 135,498 155,000 155,000 93,800 155,000 109,200ENTEX FRANCHISE 90,544 94,544 94,544 115,870 115,870 119,870CABLE FRANCHISE 335,981 392,661 392,661 180,359 392,660 484,280VIDEO SERVICE FRANCHISE 196,103 263,017 263,017 97,291 263,010 194,000PEG FEES 106,417 0 0 57,073 57,080 338,000WASTE CONNECTIONS TX FRANCHISE 77,906 57,744 57,744 57,270 57,270 94,668MIXED DRINK TAX 68,989 55,282 55,282 26,010 55,290 56,250TAXES 22,500,400$ 22,914,075$ 22,914,075$ 19,368,261$ 23,185,845$ 24,936,014$
WRECKER PERMITS 60 20 20 15 20 20ALCOHOLIC BEVERAGE PERMIT 13,667 10,000 10,000 4,300 4,300 10,000NOISE ORDINANCE PERMIT 240 200 200 210 210 200ANIMAL ESTABLISHMENT PERMIT 10 0 0 10 10 0NETWORK NODES AND POLES 4,500 10,000 10,000 0 0 10,000AFTER HOURS INSPECTION 0 75 75 0 0 75BUILDING PERMITS 377,483 397,024 397,024 252,884 337,180 395,330ELECTRIC PERMITS 42,008 55,205 55,205 34,310 45,740 58,970GAS PERMIT FEE 4,472 0 0 0 - 0PLUMBING PERMITS 45,960 64,525 64,525 35,019 46,690 67,250DEVELOPMENT PERMITS 150 475 475 150 200 500AIR CONDITIONING PERMITS 20,225 24,750 24,750 18,515 24,690 25,000PLAN INSPECTION FEES 180,121 188,055 188,055 105,434 140,580 190,000RE INSPECTION FEES 125 90 90 265 350 200SIGN PERMITS 1,196 1,525 1,525 226 300 1,000ALARM PERMITS 91,184 91,215 91,215 58,371 77,828 92,830BANNER PERMIT FEE 575 500 500 450 600 500ANIMAL LICENSES 1,110 900 900 515 550 900ELECTRICAL LICENSES 0 400 400 0 0 400CONTRACTOR LICENSE REGIST 33,100 0 0 1,950 1,950 0METRICOM INC AGREEMENT 4,042 4,041 4,041 4,042 4,042 4,041LICENSES AND PERMITS 820,228$ 849,000$ 849,000$ 516,666$ 685,240$ 857,216$
BUREAU OF JUSTICE GRANTS 5,963 0 0 2,783 2,783 0FEMA GRANTS 3,400,849 0 98,063 320,982 320,982 0HOMELAND SECURITY GRANTS 91,980 0 0 0 0 0TX STATE LIBRARY GRANTS 9,837 0 6,021 0 0 0CRIMINAL JUSTICE DIVISION 69,813 52,000 52,000 30,050 52,000 52,000LAW ENFORCEMENT TRAINING 5,142 5,142 5,142 5,135 5,135 5,140EMERGENCY MGMT DIVISION 33,315 38,481 38,481 16,896 38,480 38,480TX DEPT OF PUBLIC SAFETY 489,698 0 0 0 0 0LOCAL GOVERNMENTS 13,000 12,000 12,000 10,000 12,000 12,000BAYOU VISTA 0 730 730 0 0 0FRIENDSWOOD ISD 229,913 412,494 412,494 356,068 412,490 448,410CLEAR CREEK ISD 31,826 27,170 27,170 30,474 27,170 27,170INTERGOVERNMENTAL 4,381,336$ 548,017$ 652,101$ 772,388$ 871,040$ 583,200$
CREDIT CARD FEES 13,515 30,000 30,000 25,840 34,460 34,000EMS BILLING 0 405,000 405,000 0 0 0PLATT FEES 12,700 7,350 7,350 6,600 7,350 7,350COMMERCIAL SITE PLAN 3,000 5,000 5,000 8,000 9,000 5,000REZONING FEES 900 2,000 2,000 2,700 3,000 2,000BOARD OF ADJUSTMENT FEES 600 700 700 0 0 300VACATION OF EASEMENT/R-O-W 0 400 400 300 300 400ZONING COMPLIANCE CERT 2,700 2,100 2,100 2,475 2,700 2,500BID SPEC DOCUMENTS 0 100 100 72 72 100ANIMAL CNTRL/SHELTER FEES 1,088 2,650 2,650 845 2,650 1,500ANIMAL ADOPTION FEES 6,540 12,500 12,500 3,838 5,110 10,000SWIMMING POOL FEES 35,438 29,000 29,000 32,649 43,530 45,000RECREATION PROGRAM/EVENTS 8,550 6,000 6,000 7,030 7,500 10,000AMPHITHEATER RENTAL FEES 0 0 0 150 150 300CONCESSION AGREEMENTS 350 1,500 1,500 0 500 500LAKE FRIENDSWOOD FEES 1,300 2,500 2,500 0 500 1,500SPORTS COMPLEX FEES 1,625 3,000 3,000 4,494 5,500 5,000OLD CITY PARK FEES 25 5,000 5,000 0 0 8,000STEVENSON PARK FEES 20 2,500 2,500 240 320 2,500PAVILION FEES 18,655 14,500 14,500 10,475 13,960 19,500GAZEBO FEES 2,225 2,500 2,500 1,400 2,500 2,350LEAVESLEY PARK FEES 30,304 29,000 29,000 24,269 32,350 34,000
89
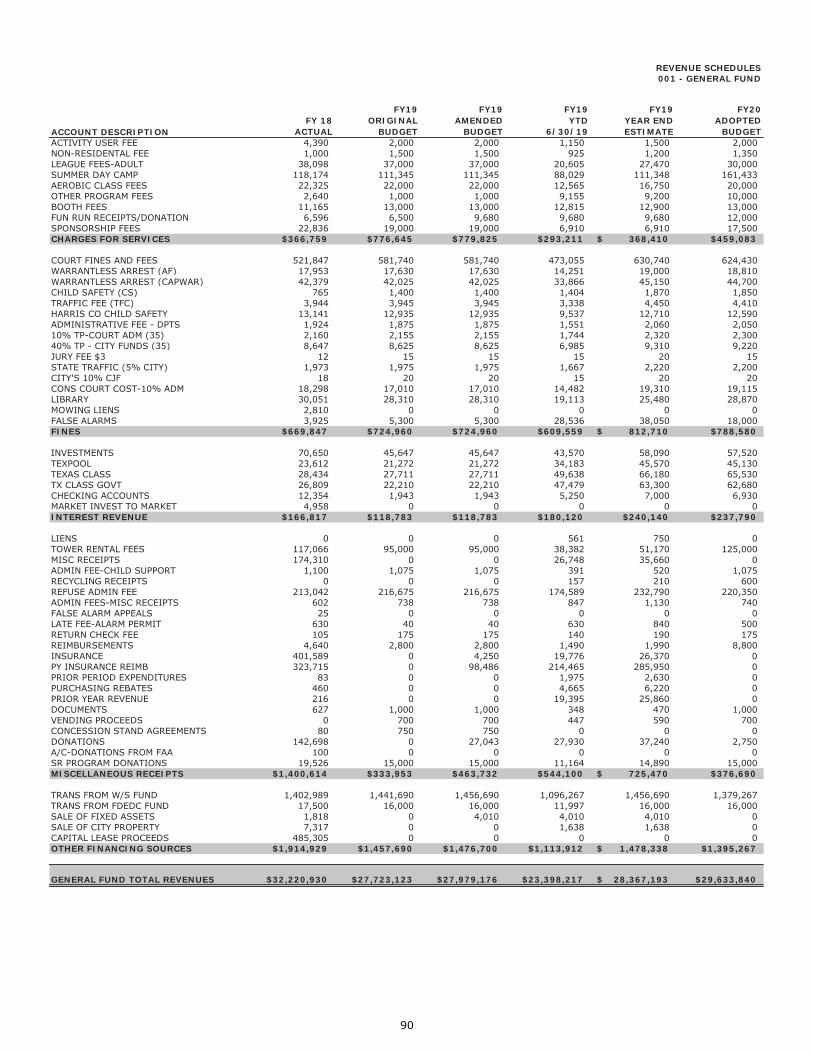
REVENUE SCHEDULES001 - GENERAL FUND
ACCOUNT DESCRIPTIONFY 18
ACTUAL
FY19ORIGINAL
BUDGET
FY19AMENDED
BUDGET
FY19YTD
6/30/19
FY19YEAR ENDESTIMATE
FY20ADOPTED
BUDGETACTIVITY USER FEE 4,390 2,000 2,000 1,150 1,500 2,000NON-RESIDENTAL FEE 1,000 1,500 1,500 925 1,200 1,350LEAGUE FEES-ADULT 38,098 37,000 37,000 20,605 27,470 30,000SUMMER DAY CAMP 118,174 111,345 111,345 88,029 111,348 161,433AEROBIC CLASS FEES 22,325 22,000 22,000 12,565 16,750 20,000OTHER PROGRAM FEES 2,640 1,000 1,000 9,155 9,200 10,000BOOTH FEES 11,165 13,000 13,000 12,815 12,900 13,000FUN RUN RECEIPTS/DONATION 6,596 6,500 9,680 9,680 9,680 12,000SPONSORSHIP FEES 22,836 19,000 19,000 6,910 6,910 17,500CHARGES FOR SERVICES $366,759 $776,645 $779,825 $293,211 368,410$ $459,083
COURT FINES AND FEES 521,847 581,740 581,740 473,055 630,740 624,430WARRANTLESS ARREST (AF) 17,953 17,630 17,630 14,251 19,000 18,810WARRANTLESS ARREST (CAPWAR) 42,379 42,025 42,025 33,866 45,150 44,700CHILD SAFETY (CS) 765 1,400 1,400 1,404 1,870 1,850TRAFFIC FEE (TFC) 3,944 3,945 3,945 3,338 4,450 4,410HARRIS CO CHILD SAFETY 13,141 12,935 12,935 9,537 12,710 12,590ADMINISTRATIVE FEE - DPTS 1,924 1,875 1,875 1,551 2,060 2,05010% TP-COURT ADM (35) 2,160 2,155 2,155 1,744 2,320 2,30040% TP - CITY FUNDS (35) 8,647 8,625 8,625 6,985 9,310 9,220JURY FEE $3 12 15 15 15 20 15STATE TRAFFIC (5% CITY) 1,973 1,975 1,975 1,667 2,220 2,200CITY'S 10% CJF 18 20 20 15 20 20CONS COURT COST-10% ADM 18,298 17,010 17,010 14,482 19,310 19,115LIBRARY 30,051 28,310 28,310 19,113 25,480 28,870MOWING LIENS 2,810 0 0 0 0 0FALSE ALARMS 3,925 5,300 5,300 28,536 38,050 18,000FINES $669,847 $724,960 $724,960 $609,559 812,710$ $788,580
INVESTMENTS 70,650 45,647 45,647 43,570 58,090 57,520TEXPOOL 23,612 21,272 21,272 34,183 45,570 45,130TEXAS CLASS 28,434 27,711 27,711 49,638 66,180 65,530TX CLASS GOVT 26,809 22,210 22,210 47,479 63,300 62,680CHECKING ACCOUNTS 12,354 1,943 1,943 5,250 7,000 6,930MARKET INVEST TO MARKET 4,958 0 0 0 0 0INTEREST REVENUE $166,817 $118,783 $118,783 $180,120 $240,140 $237,790
LIENS 0 0 0 561 750 0TOWER RENTAL FEES 117,066 95,000 95,000 38,382 51,170 125,000MISC RECEIPTS 174,310 0 0 26,748 35,660 0ADMIN FEE-CHILD SUPPORT 1,100 1,075 1,075 391 520 1,075RECYCLING RECEIPTS 0 0 0 157 210 600REFUSE ADMIN FEE 213,042 216,675 216,675 174,589 232,790 220,350ADMIN FEES-MISC RECEIPTS 602 738 738 847 1,130 740FALSE ALARM APPEALS 25 0 0 0 0 0LATE FEE-ALARM PERMIT 630 40 40 630 840 500RETURN CHECK FEE 105 175 175 140 190 175REIMBURSEMENTS 4,640 2,800 2,800 1,490 1,990 8,800INSURANCE 401,589 0 4,250 19,776 26,370 0PY INSURANCE REIMB 323,715 0 98,486 214,465 285,950 0PRIOR PERIOD EXPENDITURES 83 0 0 1,975 2,630 0PURCHASING REBATES 460 0 0 4,665 6,220 0PRIOR YEAR REVENUE 216 0 0 19,395 25,860 0DOCUMENTS 627 1,000 1,000 348 470 1,000VENDING PROCEEDS 0 700 700 447 590 700CONCESSION STAND AGREEMENTS 80 750 750 0 0 0DONATIONS 142,698 0 27,043 27,930 37,240 2,750A/C-DONATIONS FROM FAA 100 0 0 0 0 0SR PROGRAM DONATIONS 19,526 15,000 15,000 11,164 14,890 15,000MISCELLANEOUS RECEIPTS $1,400,614 $333,953 $463,732 $544,100 725,470$ $376,690
TRANS FROM W/S FUND 1,402,989 1,441,690 1,456,690 1,096,267 1,456,690 1,379,267TRANS FROM FDEDC FUND 17,500 16,000 16,000 11,997 16,000 16,000SALE OF FIXED ASSETS 1,818 0 4,010 4,010 4,010 0SALE OF CITY PROPERTY 7,317 0 0 1,638 1,638 0CAPITAL LEASE PROCEEDS 485,305 0 0 0 0 0OTHER FINANCING SOURCES $1,914,929 $1,457,690 $1,476,700 $1,113,912 1,478,338$ $1,395,267
GENERAL FUND TOTAL REVENUES $32,220,930 $27,723,123 $27,979,176 $23,398,217 28,367,193$ $29,633,840
90

REVENUE SCHEDULESOTHER FUNDS
ACCOUNT DESCRIPTIONFY 18
ACTUAL
FY19ORIGINAL
BUDGET
FY19AMENDED
BUDGET
FY19YTD
6/30/19
FY19YEAR ENDESTIMATE
FY20ADOPTED
BUDGET101 - POLICE SEIZURE - FEDERAL
SEIZED REVENUES-FEDERAL $252,216 $0 $0 $0 $0 $0INTERGOVERNMENTAL REVENUE $252,216 $0 $0 $0 $0 $0
INVESTMENTS 914 466 466 772 929 900TEXPOOL 195 152 152 507 675 660TEXAS CLASS 226 198 198 726 918 930TX CLASS GOVT 224 163 163 713 893 930CHECKING ACCOUNTS 0 10 10 22 29 30
INTEREST REVENUE $1,559 $989 $989 $2,740 $3,444 $3,450
TOTAL POLICE SEIZURE - FEDERAL FUND $253,775 $989 $989 $2,740 $3,444 $3,450
.102 - POLICE SEIZURE - STATE
SEIZED REVENUES-STATE $4,515 $0 $0 $12,336 $12,336 $0SEIZED REVENUES-COUNTY 5,543 0 0 0 0 0
INTERGOVERNMENTAL REVENUE $10,058 $0 $0 $12,336 $12,336 $0INVESTMENTS 71 53 53 64 80 80TEXPOOL 19 17 17 42 50 60TEXAS CLASS 24 24 24 60 80 80TX CLASS GOVT 224 163 163 713 900 930CHECKING ACCOUNTS 1 0 0 6 8 10
INTEREST REVENUE $339 $257 $257 $885 $1,118 $1,160
TOTAL POLICE SEIZURE - STATE FUND $10,397 $257 $257 $13,221 $13,454 $1,160
103 - FEDERAL TREASURY FUNDINVESTMENTS $45 $25 $25 $14 $19 $20TEXPOOL 13 11 11 13 17 20TEXAS CLASS 15 14 14 19 25 30TX CLASS GOVT 14 11 11 18 24 30CHECKING ACCOUNTS 1 0 0 1 3 10
INTEREST REVENUE $88 $61 $61 $65 $88 $110
TOTAL FEDERAL TREASURY FUND $88 $61 $61 $65 $88 $110
131 - FIRE/EMS DONATION FUNDINVESTMENTS $734 $586 $586 $168 $180 $180TEXPOOL 222 223 223 147 175 180TEXAS CLASS 266 285 285 210 245 250TX CLASS GOVT 237 225 225 205 250 260CHECKING ACCOUNTS 16 18 18 21 25 30
INTEREST REVENUE $1,475 $1,337 $1,337 $751 $875 $900DONATIONS 233,686 175,000 175,000 170,249 226,999 200,000
MISCELLANOUS RECEIPTS $233,686 $175,000 $175,000 $170,249 $226,999 $200,000
TOTAL FIRE/EMS DONATION FUND $235,161 $176,337 $176,337 $171,000 $227,874 $200,900
150 - MUNICIPAL COURT FUNDBLDG SECURITY FUND $10,948 $12,000 $12,000 $8,700 $11,600 $17,700TECHNOLOGY FUND 14,602 15,000 15,000 11,599 15,465 16,000TRUANCY PREVENTION FEES 0 0 0 0 0 15,000JURY SERVICE FEES 0 0 0 0 0 300
MUNICIPAL COURT FEES $25,550 $27,000 $27,000 $20,299 $27,065 $49,000INVESTMENTS 1,253 836 836 711 946 820TEXPOOL 373 336 336 474 633 610TEXAS CLASS 451 448 448 680 908 870TX CLASS GOVT 419 358 358 667 889 870CHECKING ACCOUNTS 26 24 24 75 100 110
INTEREST REVENUE $2,522 $2,002 $2,002 $2,607 $3,476 $3,280
TOTAL MUNICIPAL COURT FUND $28,072 $29,002 $29,002 $22,906 $30,541 $52,280
160 - SIDEWALK INSTALL FUNDINVESTMENTS $153 $105 $105 $85 $103 $100TEXPOOL 45 41 41 57 70 80TEXAS CLASS 54 55 55 81 100 110TX CLASS GOVT 50 44 44 79 103 110CHECKING ACCOUNTS 3 0 0 8 12 20
INTEREST REVENUE $305 $245 $245 $310 $388 $420
TOTAL SIDEWALK INSTALL FUND $305 $245 $245 $310 $388 $420
91
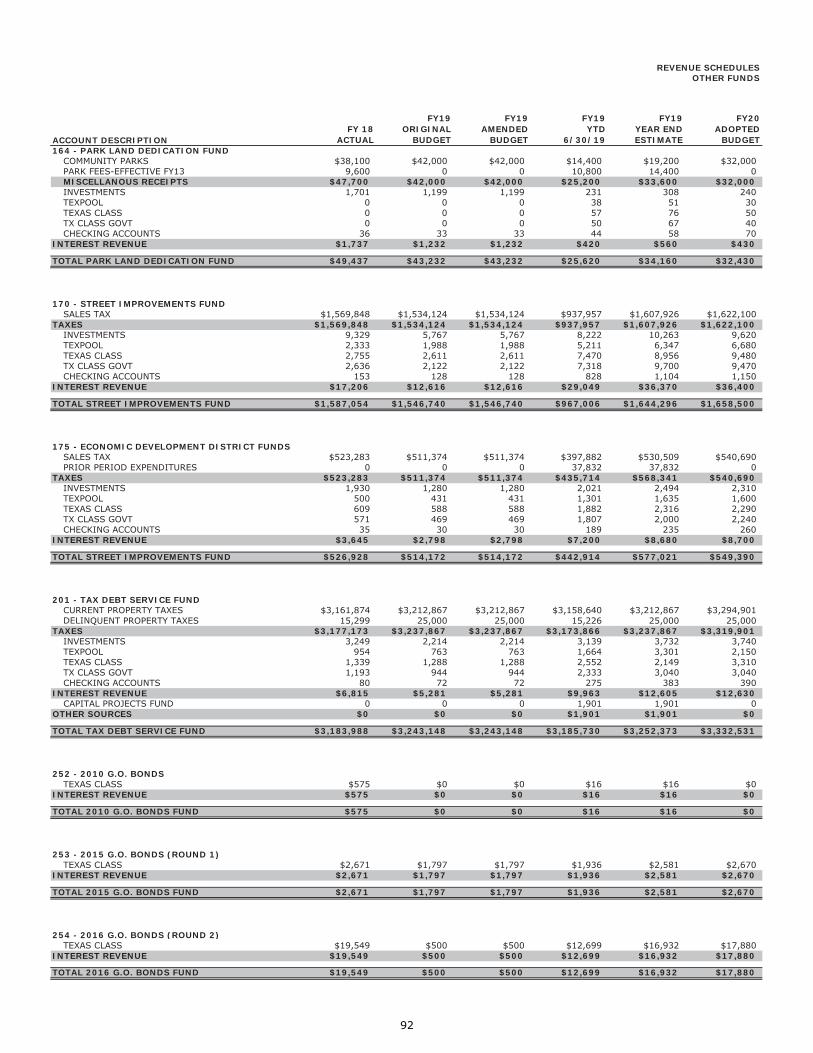
REVENUE SCHEDULESOTHER FUNDS
ACCOUNT DESCRIPTIONFY 18
ACTUAL
FY19ORIGINAL
BUDGET
FY19AMENDED
BUDGET
FY19YTD
6/30/19
FY19YEAR ENDESTIMATE
FY20ADOPTED
BUDGET164 - PARK LAND DEDICATION FUND
COMMUNITY PARKS $38,100 $42,000 $42,000 $14,400 $19,200 $32,000PARK FEES-EFFECTIVE FY13 9,600 0 0 10,800 14,400 0MISCELLANOUS RECEIPTS $47,700 $42,000 $42,000 $25,200 $33,600 $32,000INVESTMENTS 1,701 1,199 1,199 231 308 240TEXPOOL 0 0 0 38 51 30TEXAS CLASS 0 0 0 57 76 50TX CLASS GOVT 0 0 0 50 67 40CHECKING ACCOUNTS 36 33 33 44 58 70
INTEREST REVENUE $1,737 $1,232 $1,232 $420 $560 $430
TOTAL PARK LAND DEDICATION FUND $49,437 $43,232 $43,232 $25,620 $34,160 $32,430
170 - STREET IMPROVEMENTS FUNDSALES TAX $1,569,848 $1,534,124 $1,534,124 $937,957 $1,607,926 $1,622,100
TAXES $1,569,848 $1,534,124 $1,534,124 $937,957 $1,607,926 $1,622,100INVESTMENTS 9,329 5,767 5,767 8,222 10,263 9,620TEXPOOL 2,333 1,988 1,988 5,211 6,347 6,680TEXAS CLASS 2,755 2,611 2,611 7,470 8,956 9,480TX CLASS GOVT 2,636 2,122 2,122 7,318 9,700 9,470CHECKING ACCOUNTS 153 128 128 828 1,104 1,150
INTEREST REVENUE $17,206 $12,616 $12,616 $29,049 $36,370 $36,400
TOTAL STREET IMPROVEMENTS FUND $1,587,054 $1,546,740 $1,546,740 $967,006 $1,644,296 $1,658,500
175 - ECONOMIC DEVELOPMENT DISTRICT FUNDSSALES TAX $523,283 $511,374 $511,374 $397,882 $530,509 $540,690PRIOR PERIOD EXPENDITURES 0 0 0 37,832 37,832 0
TAXES $523,283 $511,374 $511,374 $435,714 $568,341 $540,690INVESTMENTS 1,930 1,280 1,280 2,021 2,494 2,310TEXPOOL 500 431 431 1,301 1,635 1,600TEXAS CLASS 609 588 588 1,882 2,316 2,290TX CLASS GOVT 571 469 469 1,807 2,000 2,240CHECKING ACCOUNTS 35 30 30 189 235 260
INTEREST REVENUE $3,645 $2,798 $2,798 $7,200 $8,680 $8,700
TOTAL STREET IMPROVEMENTS FUND $526,928 $514,172 $514,172 $442,914 $577,021 $549,390
201 - TAX DEBT SERVICE FUNDCURRENT PROPERTY TAXES $3,161,874 $3,212,867 $3,212,867 $3,158,640 $3,212,867 $3,294,901DELINQUENT PROPERTY TAXES 15,299 25,000 25,000 15,226 25,000 25,000
TAXES $3,177,173 $3,237,867 $3,237,867 $3,173,866 $3,237,867 $3,319,901INVESTMENTS 3,249 2,214 2,214 3,139 3,732 3,740TEXPOOL 954 763 763 1,664 3,301 2,150TEXAS CLASS 1,339 1,288 1,288 2,552 2,149 3,310TX CLASS GOVT 1,193 944 944 2,333 3,040 3,040CHECKING ACCOUNTS 80 72 72 275 383 390
INTEREST REVENUE $6,815 $5,281 $5,281 $9,963 $12,605 $12,630CAPITAL PROJECTS FUND 0 0 0 1,901 1,901 0
OTHER SOURCES $0 $0 $0 $1,901 $1,901 $0
TOTAL TAX DEBT SERVICE FUND $3,183,988 $3,243,148 $3,243,148 $3,185,730 $3,252,373 $3,332,531
252 - 2010 G.O. BONDSTEXAS CLASS $575 $0 $0 $16 $16 $0
INTEREST REVENUE $575 $0 $0 $16 $16 $0
TOTAL 2010 G.O. BONDS FUND $575 $0 $0 $16 $16 $0
253 - 2015 G.O. BONDS (ROUND 1)TEXAS CLASS $2,671 $1,797 $1,797 $1,936 $2,581 $2,670
INTEREST REVENUE $2,671 $1,797 $1,797 $1,936 $2,581 $2,670
TOTAL 2015 G.O. BONDS FUND $2,671 $1,797 $1,797 $1,936 $2,581 $2,670
254 - 2016 G.O. BONDS (ROUND 2)TEXAS CLASS $19,549 $500 $500 $12,699 $16,932 $17,880
INTEREST REVENUE $19,549 $500 $500 $12,699 $16,932 $17,880
TOTAL 2016 G.O. BONDS FUND $19,549 $500 $500 $12,699 $16,932 $17,880
92

REVENUE SCHEDULESOTHER FUNDS
ACCOUNT DESCRIPTIONFY 18
ACTUAL
FY19ORIGINAL
BUDGET
FY19AMENDED
BUDGET
FY19YTD
6/30/19
FY19YEAR ENDESTIMATE
FY20ADOPTED
BUDGET255 - 2017 G.O. BONDS FUND (ROUND 3)
TEXAS CLASS $91,772 $84,106 $84,106 $72,008 $96,011 $97,260INTEREST REVENUE $91,772 $84,106 $84,106 $72,008 $96,011 $97,260
TOTAL 2017 G.O. BONDS FUND $91,772 $84,106 $84,106 $72,008 $96,011 $97,260
401 - WATER AND SEWER FUNDSINGLE FMLY RES 4,851,142 5,352,069 5,352,069 2,684,935 4,799,111 6,587,598SINGLE COMMERCIAL 332,745 369,011 369,011 239,710 450,017 617,725MULTI FMLY RES 305,121 312,696 312,696 214,360 443,623 608,948MULTI COMMERCIAL 49,179 51,636 51,636 41,349 70,949 97,390SPRINKLER ONLY 817,491 884,065 884,065 351,134 701,252 962,587OTHER 99,312 110,334 110,334 65,752 143,249 196,635OTHER BILLED WATER REVENUE 1,030 0 0 (211) (211) 0SINGLE FMLY RES 4,349,021 4,642,272 4,642,272 3,012,687 5,068,710 5,843,257SINGLE COMMERCIAL 239,876 266,988 266,988 157,962 279,365 322,055MULTI FMLY RES 213,534 222,663 222,663 131,527 243,886 281,154MULTI COMMERCIAL 32,739 34,315 34,315 24,119 39,177 45,163OTHER 25,868 28,585 28,585 13,699 39,142 45,124CHARGES FOR SERVICES $11,317,058 $12,274,634 $12,274,634 $6,937,023 $12,278,270 $15,607,636INVESTMENTS 57,219 39,926 39,926 24,218 27,780 27,790TEXPOOL 17,069 15,615 15,615 16,510 21,470 21,480TEXAS CLASS 20,784 20,946 20,946 23,455 30,200 30,210TX CLASS GOVT 19,086 16,606 16,606 23,388 30,700 30,710CHECKING ACCOUNTS 1,199 1,116 1,116 2,770 3,870 3,880MARKING INVEST TO MARKET 3,306 0 0 0 0 0INTEREST REVENUE $118,663 $94,209 $94,209 $90,341 $114,020 $114,070CREDIT CARD FEE $41,074 $85,000 $85,000 $81,252 $108,340 $100,000MISC RECEIPTS 1,070 0 0 0 0 0ADMIN FEE-CHILD SUPPORT 323 0 0 175 230 0ADMIN FEES 198,783 200,000 200,000 156,511 208,680 200,000SAME DAY SERVICE FEE 7,050 5,400 5,400 5,175 6,900 6,900DISCONNECT/RECONNECT FEE 47,625 42,000 42,000 30,975 41,300 42,000TAMPERING FEE 6,800 5,000 5,000 3,900 5,200 5,000PULLED METER FEES 0 500 500 400 400 500BROKEN LOCK FEE 75 25 25 166 224 25METER REPLACEMENT FEE 130 0 0 0 0 0MISC RECEIPTS 0 0 0 8,206 8,210 0RETURN CHECK FEE 2,930 2,200 2,200 2,240 2,900 2,200INSURANCE 24,437 0 7,359 8,802 11,908 0PY INSURANCE REIMB 31,399 0 0 0 0 0PRIOR PERIOD EXPENDITURES 19,821 0 0 0 0 0SALE OF WATER METERS 43,616 35,000 35,000 22,795 30,000 30,000
MISCELLANOUS RECEIPTS $425,133 $375,125 $382,484 $320,597 $424,292 $386,625
TOTAL WATER AND SEWER FUND $11,860,854 $12,743,968 $12,751,327 $7,347,961 $12,816,582 $16,108,331
418 - 2006 W/S BOND CONSTRUCTION FUNDTEXAS CLASS $1,189 $0 $0 $823 $1,088 $0
INTEREST REVENUE $1,189 $0 $0 $823 $1,088 $0
TOTAL 2006 W/S BOND CONSTRUCTION FUND $1,189 $0 $0 $823 $1,088 $0
419 - 2009 W/S BOND CONSTRUCTION FUNDTEXAS CLASS $6,122 $0 $0 $6,464 $8,546 $0
INTEREST REVENUE $6,122 $0 $0 $6,464 $8,546 $0
TOTAL 2009 W/S BOND CONSTRUCTION FUND $6,122 $0 $0 $6,464 $8,546 $0
420 - 2016 W/S BOND CONSTRUCTION FUNDTEXAS CLASS $61,588 $58,710 $58,710 $56,665 $75,115 $58,710
INTEREST REVENUE $61,588 $58,710 $58,710 $56,665 $75,115 $58,710
TOTAL 2016 W/S BOND CONSTRUCTION FUND $61,588 $58,710 $58,710 $56,665 $75,115 $58,710
421 - 2018 W/S BOND CONSTRUCTION FUNDBOND PROCEEDS $0 $0 $0 $20,170,000 $20,170,000 $0PREMIUM 0 0 0 1,569,429 1,569,429 0
OTHER FINANCING SOURCES $0 $0 $0 $21,739,429 $21,739,429 $0TEXAS CLASS 0 0 0 265,174 331,880 331,890
INTEREST REVENUE $0 $0 $0 $265,174 $331,880 $331,890
TOTAL 2018 W/S BOND CONSTRUCTION FUND $0 $0 $0 $22,004,603 $22,071,309 $331,890
93
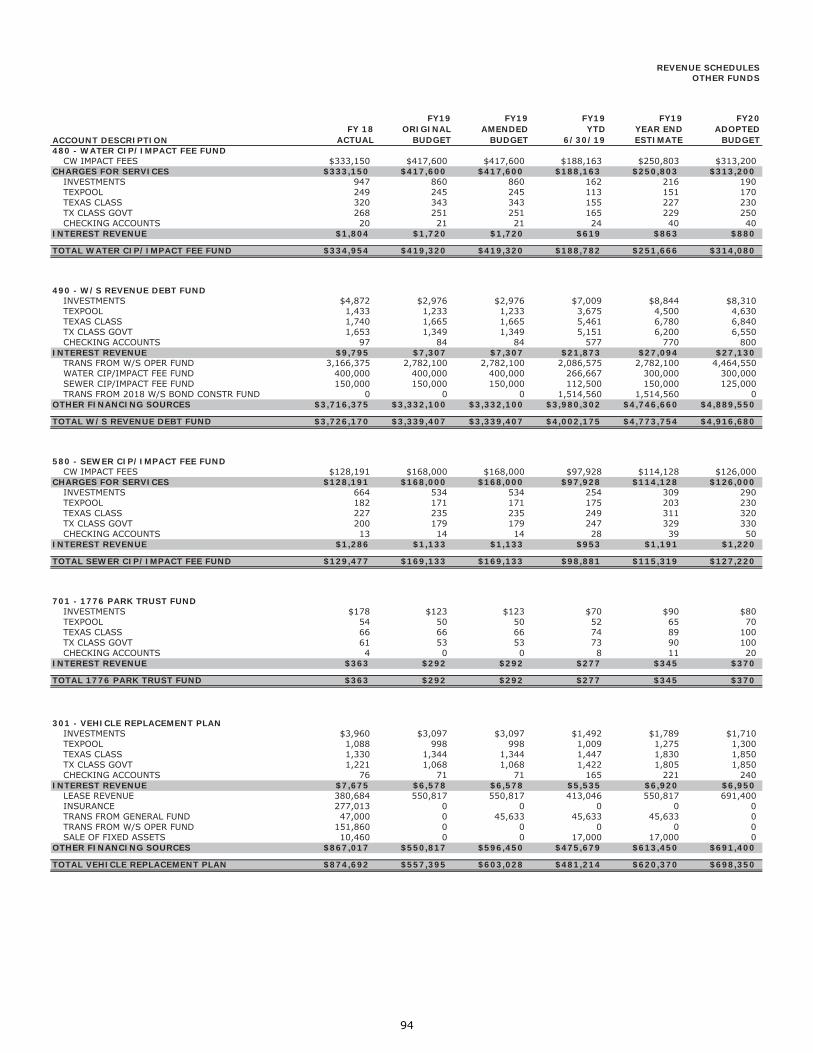
REVENUE SCHEDULESOTHER FUNDS
ACCOUNT DESCRIPTIONFY 18
ACTUAL
FY19ORIGINAL
BUDGET
FY19AMENDED
BUDGET
FY19YTD
6/30/19
FY19YEAR ENDESTIMATE
FY20ADOPTED
BUDGET480 - WATER CIP/IMPACT FEE FUND
CW IMPACT FEES $333,150 $417,600 $417,600 $188,163 $250,803 $313,200CHARGES FOR SERVICES $333,150 $417,600 $417,600 $188,163 $250,803 $313,200
INVESTMENTS 947 860 860 162 216 190TEXPOOL 249 245 245 113 151 170TEXAS CLASS 320 343 343 155 227 230TX CLASS GOVT 268 251 251 165 229 250CHECKING ACCOUNTS 20 21 21 24 40 40
INTEREST REVENUE $1,804 $1,720 $1,720 $619 $863 $880
TOTAL WATER CIP/IMPACT FEE FUND $334,954 $419,320 $419,320 $188,782 $251,666 $314,080
490 - W/S REVENUE DEBT FUNDINVESTMENTS $4,872 $2,976 $2,976 $7,009 $8,844 $8,310TEXPOOL 1,433 1,233 1,233 3,675 4,500 4,630TEXAS CLASS 1,740 1,665 1,665 5,461 6,780 6,840TX CLASS GOVT 1,653 1,349 1,349 5,151 6,200 6,550CHECKING ACCOUNTS 97 84 84 577 770 800
INTEREST REVENUE $9,795 $7,307 $7,307 $21,873 $27,094 $27,130TRANS FROM W/S OPER FUND 3,166,375 2,782,100 2,782,100 2,086,575 2,782,100 4,464,550WATER CIP/IMPACT FEE FUND 400,000 400,000 400,000 266,667 300,000 300,000SEWER CIP/IMPACT FEE FUND 150,000 150,000 150,000 112,500 150,000 125,000TRANS FROM 2018 W/S BOND CONSTR FUND 0 0 0 1,514,560 1,514,560 0
OTHER FINANCING SOURCES $3,716,375 $3,332,100 $3,332,100 $3,980,302 $4,746,660 $4,889,550
TOTAL W/S REVENUE DEBT FUND $3,726,170 $3,339,407 $3,339,407 $4,002,175 $4,773,754 $4,916,680
580 - SEWER CIP/IMPACT FEE FUNDCW IMPACT FEES $128,191 $168,000 $168,000 $97,928 $114,128 $126,000
CHARGES FOR SERVICES $128,191 $168,000 $168,000 $97,928 $114,128 $126,000INVESTMENTS 664 534 534 254 309 290TEXPOOL 182 171 171 175 203 230TEXAS CLASS 227 235 235 249 311 320TX CLASS GOVT 200 179 179 247 329 330CHECKING ACCOUNTS 13 14 14 28 39 50
INTEREST REVENUE $1,286 $1,133 $1,133 $953 $1,191 $1,220
TOTAL SEWER CIP/IMPACT FEE FUND $129,477 $169,133 $169,133 $98,881 $115,319 $127,220
701 - 1776 PARK TRUST FUNDINVESTMENTS $178 $123 $123 $70 $90 $80TEXPOOL 54 50 50 52 65 70TEXAS CLASS 66 66 66 74 89 100TX CLASS GOVT 61 53 53 73 90 100CHECKING ACCOUNTS 4 0 0 8 11 20
INTEREST REVENUE $363 $292 $292 $277 $345 $370
TOTAL 1776 PARK TRUST FUND $363 $292 $292 $277 $345 $370
301 - VEHICLE REPLACEMENT PLANINVESTMENTS $3,960 $3,097 $3,097 $1,492 $1,789 $1,710TEXPOOL 1,088 998 998 1,009 1,275 1,300TEXAS CLASS 1,330 1,344 1,344 1,447 1,830 1,850TX CLASS GOVT 1,221 1,068 1,068 1,422 1,805 1,850CHECKING ACCOUNTS 76 71 71 165 221 240
INTEREST REVENUE $7,675 $6,578 $6,578 $5,535 $6,920 $6,950LEASE REVENUE 380,684 550,817 550,817 413,046 550,817 691,400INSURANCE 277,013 0 0 0 0 0TRANS FROM GENERAL FUND 47,000 0 45,633 45,633 45,633 0TRANS FROM W/S OPER FUND 151,860 0 0 0 0 0SALE OF FIXED ASSETS 10,460 0 0 17,000 17,000 0
OTHER FINANCING SOURCES $867,017 $550,817 $596,450 $475,679 $613,450 $691,400
TOTAL VEHICLE REPLACEMENT PLAN $874,692 $557,395 $603,028 $481,214 $620,370 $698,350
94

General and Administrative Transfers
95

TRANSFERS TO OTHER FUNDS
FY18ACTUAL
FY19ORIGINAL
BUDGET
FY19AMENDED
BUDGET
FY19YTD
6/30/2019
FY19YEAR ENDESTIMATE
FY20ADOPTED
BUDGET
GENERAL FUNDVEHICLE REPLACEMENT FUND $47,000 $0 $45,633 $45,633 $45,633 $0TOTAL $47,000 $0 $45,633 $45,633 $45,633 $0
FRIENDSWOOD ECONOMIC DEVELOPMENT FUNDGENERAL FUND $17,500 $16,000 $16,000 $11,997 $16,000 $16,000TOTAL $17,500 $16,000 $16,000 $11,997 $16,000 $16,000
GO BOND CONSTRUCTION FUNDS TAX DEBT SERVICE FUND $0 $0 $0 $1,901 $1,901 $0TOTAL $0 $0 $0 $1,901 $1,901 $0
WATER & SEWER OPERATING FUNDGENERAL FUND $1,402,989 $1,441,690 $1,456,690 $1,096,267 $1,456,690 $1,379,267VEHICLE REPLACEMENT FUND 151,860 0 0 0 0 0W/S REVENUE DEBT SERVICE FUND 3,166,375 2,782,100 2,782,100 2,086,575 2,782,100 4,464,550TOTAL $4,721,224 $4,223,790 $4,238,790 $3,182,842 $4,238,790 $5,843,817
WATER CIP/IMPACT FEE FUNDW/S REVENUE DEBT SERVICE FUND $400,000 $400,000 $400,000 $266,667 $300,000 $300,000TOTAL $400,000 $400,000 $400,000 $266,667 $300,000 $300,000
SEWER CIP/IMPACT FEE FUNDW/S REVENUE DEBT SERVICE FUND $150,000 $150,000 $150,000 $112,500 $150,000 $125,000TOTAL $150,000 $150,000 $150,000 $112,500 $150,000 $125,000
WATER AND SEWER BOND FUNDS2018 WATER/SEWER BOND FUND $0 $0 $0 $1,514,560 $1,514,560 $0TOTAL $0 $0 $0 $1,514,560 $1,514,560 $0
TOTAL TRANSFERS TO OTHER FUNDS $5,335,724 $4,789,790 $4,850,423 $5,136,100 $6,266,884 $6,284,817
96

TRANSFERS FROM OTHER FUNDS
FY18ACTUAL
FY19ORIGINAL
BUDGET
FY19AMENDED
BUDGET
FY19YTD
6/30/2019
FY19YEAR ENDESTIMATE
FY20ADOPTED
BUDGET
GENERAL FUNDECONOMIC DEVELOPMENT IMPROVEMENT FUND $17,500 $16,000 $16,000 $11,997 $16,000 $16,000W/S OPERATION FUND 1,402,989 1,441,690 1,456,690 1,096,267 1,456,690 1,379,267TOTAL $1,420,489 $1,457,690 $1,472,690 $1,108,264 $1,472,690 $1,395,267
TAX DEBT SERVICE FUNDGO Bonds Construction Funds $0 $0 $0 $1,901 $1,901 $0TOTAL $0 $0 $0 $1,901 $1,901 $0
VEHICLE REPLACEMENT FUNDGENERAL FUND $47,000 $0 $45,633 $45,633 $45,633 $0W/S OPERATION FUND 151,860 0 0 0 0 0TOTAL $198,860 $0 $45,633 $45,633 $45,633 $0
WATER & SEWER REVENUE DEBT SERVICE FUNDW/S OPERATING FUND $3,166,375 $2,782,100 $2,782,100 $2,086,575 $2,782,100 $4,464,550WATER CIP/IMPACT FEE FUND 400,000 400,000 400,000 266,667 300,000 300,000SEWER CIP/IMPACT FEE FUND 150,000 150,000 150,000 112,500 150,000 125,0002018 W/S BOND FUND 0 0 0 1,514,560 1,514,560 0TOTAL $3,716,375 $3,332,100 $3,332,100 $3,980,302 $4,746,660 $4,889,550
TOTAL TRANSFERS FROM OTHER FUNDS $5,335,724 $4,789,790 $4,850,423 $5,136,100 $6,266,884 $6,284,817
97

FY18 ACTUAL
FY19 ORIGINAL
BUDGET
FY19 AMENDED
BUDGET
FY19 YTD
6/30/19
FY19 YEAR ENDESTIMATE
FY20ADOPTED
BUDGET
GENERAL OBLIGATION BONDS $1,732,744 $1,741,182 $1,741,182 $1,327,016 $1,741,182 $1,738,131
CERTIFICATES OF OBLIGATIONS 0 0 0 0 0 0
REFUNDING BONDS 4,098,375 4,088,150 4,088,150 3,521,300 4,097,650 4,090,550
REVENUE BONDS 405,400 405,850 1,017,342 479,841 1,017,342 1,962,400
OTHER TAX DEBT 314,036 314,037 314,037 74,872 314,036 393,370
TOTAL $6,550,555 $6,549,219 $7,160,711 $5,403,029 $7,170,210 $8,184,451
Legal Debt Margin CalculationBy way of reference, the Home Rule Cities calculation of the legal debt margin for the City of Friendswood is below:
Estimated net assessed value:$3,690,585,683
For Texas Constitution Legal Debt Margin for Friendswood: Divide the estimated net assessed value by $100 and multiply by the Texas Attorney General home rule tax rate of $1.35. Then, subtract the maximumannual debt service requirement amount for existing General Obligation (G.O.) debt.
$49,822,907 City of Friendswood's Maximum Legal Debt Service Requirement (based on tax rate of $1.35 per $100 value)
5,913,331 City of Friendswood's maximum annual debt service requirement for existing G.O. debt (will occur in fiscal year 2021)
$43,909,576 City of Friendswood's FY20 Debt Margin
According to the City's Financial Advisor, a debt margin of $43,909,576 translates into additional debt capacity of approximately $565 million in bonds(depending on factors such as the number of sales and the interest environment).
Per the City's Financial Advisor using the Texas Attorney General's guideline for home rule cities, the City's legal debt margin is based on a tax rate of $1.35 per $100 of net assessed property value with projected 100% collection of the tax levy. For FY20, the City's legal debt margin is $43,909,576. This means the City could issue debt (bonds) up to an amount that generates a maximum annual debt service requirement of less than $43,909,576.
DEBT SERVICE FUNDS OVERVIEW
In FY 2015-16, the City refinanced the remainder of its 2006 Series Water & Sewer Revenue Bonds as a portion of the Series 2016 General Obligation Bonds and refinanced a portion of its 2009 Series Water & Sewer Revenue Bonds as a portion of the Series 2016A General Obligation Bonds. Debt service payments on the Series 2014, 2016 and 2016A Bonds will be supported by the Water & Sewer Fund. This refinancing strategy did not alter the maturity date of the outstanding debt and resulted in a significant rate difference that will lower the interest amount due over the life of the bonds.
SUMMARY OF DEBT SERVICE FUNDS
The Tax Debt Service Fund is used to account for property taxes levied for payment of principal and interest on all general long-term debt of the City. The basis of budgeting for the Tax Debt Service Fund is the modified accrual method and is the same as the basis of accounting reported in the Comprehensive Annual Financial Report (CAFR).
As a City Council - City Manager form of government, the City of Friendswood is not limited by law in the amount of debt it may issue. The City's Charter states: "In keeping with the Constitution of the State of Texas and not contrary thereto, the City of Friendswood shall have the power to borrow money on the credit of the City for any public purpose not now or hereafter prohibited by the Constitution and laws of the State of Texas, and shall have the right to issue all tax bonds, revenue bonds, funding and refunding bonds, time warrants and other evidence of indebtedness as now authorized or as may hereafter be authorized to be issued by cities and towns by the laws of the State of Texas.
Article 11, Section 5 of the State of Texas Constitution states in part: "but no tax for any purpose shall ever be lawful for any one year, which shall exceed two and one-half percent (2.5%) of the taxable property of such city". This means the City of Friendswood (as a Home Rule city) cannot adopt a tax rate greater than $2.50 per $100 taxable property valuation.
In FY 2010-11, the City refinanced its 2001 Series Water & Sewer Revenue Bonds as Series 2010B General Obligation Bonds. Debt service payments on the Series 2010B Bonds will be supported by the Water & Sewer Fund. This refinancing strategy did not alter the maturity date of the outstanding debt and resulted in a significant rate difference that will lower the interest amount due over the life of the bonds.
CITY OF FRIENDSWOOD LEGAL DEBT MARGIN INFORMATION
In FY 2014-15, the City refinanced its 2006 Series Water & Sewer Revenue Bonds as a portion of the Series 2014 General Obligation Bonds. Debt service payments on the Series 2014 Bonds will be supported by the Water & Sewer Fund. This refinancing strategy did not alter the maturity date of the outstanding debt and resulted in a significant rate difference that will lower the interest amount due over the life of the bonds.
The Water and Sewer Revenue Debt Service Fund is used to account for payment of principal and interest on all enterprise fund long-term debt of the City issued for utility capital improvements. Accrual basis of budgeting and accounting are used in the Water & Sewer Revenue Debt Service Fund with the following exceptions: debt principal payments are budgeted as expenses, bond issuance costs are for the full amount in the bond sale year, interfund transfers between Enterprise Funds are budgeted as income and expense. The expenses are reclassified for reporting purposes in the CAFR.
98

YEAR PRINCIPAL INTEREST TOTAL
2020 2,211,498 1,079,153 3,290,651 2021 2,360,750 1,018,853 3,379,603 2022 2,450,385 945,720 3,396,105 2023 2,419,590 870,048 3,289,638 2024 2,494,397 793,327 3,287,724 2025 2,365,000 711,219 3,076,219 2026 2,445,000 631,731 3,076,731 2027 2,530,000 543,128 3,073,128 2028 2,630,000 444,369 3,074,369 2029 2,735,000 340,794 3,075,794 2030 2,845,000 231,450 3,076,450 2031 2,970,000 104,350 3,074,350 2032 165,000 29,806 194,806 2033 175,000 21,731 196,731 2034 180,000 13,300 193,300 2035 190,000 4,513 194,513
TOTAL $31,166,620 $7,783,492 $38,950,112
* excludes fiscal agent fees associated with the outstanding bonds.
-
0.5
1.0
1.5
2.0
2.5
3.0
3.5
4.0
Mill
ions
TAX DEBT SERVICE TO MATURITY
PRINCIPAL INTEREST
99

TAX DEBT SERVICE FUND
FY18 ACTUAL
FY19 ORIGINAL
BUDGET
FY19 AMENDED
BUDGET
FY19 YTD
6/30/19
FY19 YEAR ENDESTIMATE
FY20ADOPTED
BUDGETGENERAL OBLIGATION BONDS PRINCIPAL $870,000 $900,000 $900,000 $900,000 $900,000 $920,000 INTEREST 860,494 838,182 838,182 424,766 838,182 815,131 ISSUANCE COST 0 0 0 0 0 0 PAYING AGENT FEES 2,250 3,000 3,000 2,250 3,000 3,000 TOTAL $1,732,744 $1,741,182 $1,741,182 $1,327,016 $1,741,182 $1,738,131
REFUNDING BONDS PRINCIPAL $905,000 $915,000 $915,000 $915,000 $915,000 $935,000 INTEREST 263,850 245,650 245,650 127,400 245,650 227,150 ISSUANCE COST 0 0 0 0 0 0 PAYING AGENT FEES 1,250 1,250 1,250 1,250 1,250 1,250 TOTAL $1,170,100 $1,161,900 $1,161,900 $1,043,650 $1,161,900 $1,163,400
OTHER TAX DEBT PRINCIPAL $303,083 $292,699 $292,699 $70,866 $292,699 $356,498 INTEREST 10,953 21,338 21,338 4,006 21,337 36,872 ISSUANCE COST 0 0 0 0 0 0 PAYING AGENT FEES 0 0 0 0 0 0 TOTAL $314,036 $314,037 $314,037 $74,872 $314,036 $393,370
CERTIFICATES OF OBLIGATION PRINCIPAL $0 $0 $0 $0 $0 $0 INTEREST 0 0 0 0 0 0 ISSUANCE COST 0 0 0 0 0 0 PAYING AGENT FEES 0 0 0 0 0 0 TOTAL $0 $0 $0 $0 $0 $0
TOTAL TAX DEBT SERVICE FUND $3,216,880 $3,217,119 $3,217,119 $2,445,538 $3,217,118 $3,294,901
100

93-13 PRINCIPAL - 2010 GO BONDS $125,000 $130,000 $130,000 $130,000 $130,000 $135,000 93-15 PRINCIPAL - 2012 REFUNDING GO BONDS 825,000 840,000 840,000 840,000 840,000 855,000 93-16 PRINCIPAL - 2014 REFUNDING GO BONDS 80,000 75,000 75,000 75,000 75,000 80,000 93-17 PRINCIPAL - 2015 GO BONDS 435,000 450,000 450,000 450,000 450,000 460,000 93-18 PRINCIPAL - 2016 GO BONDS 110,000 115,000 115,000 115,000 115,000 120,000 93-20 PRINCIPAL - 2017 GO BONDS 200,000 205,000 205,000 205,000 205,000 205,000 BOND AND GO PRINCIPAL $1,775,000 $1,815,000 $1,815,000 $1,815,000 $1,815,000 $1,855,000
93-71 PRINCIPAL - 17 COMPUTER REFRESH $129,323 $131,640 $131,640 $0 $131,640 $0 93-75 PRINCIPAL - 17 FVFD RADIO REPLACEMENT 69,579 70,866 70,866 70,866 70,866 72,177 93-76 PRINCIPAL - 18 RADIO REPLACEMENT 104,181 90,193 90,193 0 90,193 93,503 93-77 PRINCIPAL - 20 CAPITAL EQUIPMENT 0 0 0 0 0 190,818 OTHER DEBT PRINCIPAL $303,083 $292,699 $292,699 $70,866 $292,699 $356,498
93-13 INTEREST - 2010 GO BONDS $110,300 $106,475 $106,475 $54,213 $106,475 $101,825 93-15 INTEREST - 2012 REFUNDING GO BONDS 183,700 167,050 167,050 87,725 167,050 150,100 93-16 INTEREST - 2014 REFUNDING GO BONDS 80,150 78,600 78,600 39,675 78,600 77,050 93-17 INTEREST - 2015 GO BONDS 235,744 224,682 224,682 115,153 224,682 213,306 93-18 INTEREST - 2016 GO BONDS 332,600 329,225 329,225 165,475 329,225 326,300 93-20 INTEREST - 2017 GO BONDS 181,850 177,800 177,800 89,925 177,800 173,700 BOND AND GO INTEREST $1,124,344 $1,083,832 $1,083,832 $552,166 $1,083,832 $1,042,281
93-71 INTEREST - 17 COMPUTER REFRESH $5,660 $3,344 $3,344 $0 $3,344 $0 93-75 INTEREST - 17 FVFD RADIO REPLACEMENT 5,293 4,007 4,007 4,006 4,006 2,695 93-76 INTEREST - 18 PD RADIO REPLACEMENT 0 13,987 13,987 0 13,987 10,677 93-77 INTEREST - 20 CAPITAL EQUIPMENT 0 0 0 0 0 23,500 OTHER DEBT INTEREST $10,953 $21,338 $21,338 $4,006 $21,337 $36,872
93-13 FISCAL FEES - 10 GO BONDS $750 $750 $750 $750 $750 $750 93-15 FISCAL FEES - 12 REFUNDING GO BONDS 500 500 500 500 500 500 93-16 FISCAL FEES - 14 REFUNDING GO BONDS 750 750 750 750 750 750 93-17 FISCAL FEES - 15 GO BONDS 750 750 750 750 750 750 93-18 FISCAL FEES - 16 GO BONDS 750 750 750 750 750 750 93-20 FISCAL FEES - 17 GO BONDS 0 750 750 0 750 750 FISCAL AGENT FEES $3,500 $4,250 $4,250 $3,500 $4,250 $4,250
93-16 ISSUE COSTS - 14 REFUNDING GO BONDS $0 $0 $0 $0 $0 $0 93-17 ISSUE COSTS - 15 GO BONDS 0 0 0 0 0 0 93-18 ISSUE COSTS - 16 GO BONDS 0 0 0 0 0 0 93-20 ISSUE COSTS - COMPUTER REFRESH 0 0 0 0 0 0 93-21 ISSUE COSTS - PD RADIO REPLACEMENT 0 0 0 0 0 0 93-71 ISSUE COSTS - 17 COMPUTER REFRESH 0 0 0 0 0 0 93-76 ISSUE COSTS - 18 PD RADIO REPLACEMENT 0 0 0 0 0 0 ISSUE COSTS $0 $0 $0 $0 $0 $0
TOTAL FOR TAX DEBT SERVICE FUND $3,216,880 $3,217,119 $3,217,119 $2,445,538 $3,217,118 $3,294,901
DEBT SERVICETAX DEBT SERVICE FUND
ACCOUNT LISTING
FY18ACTUAL
FY19 ORIGINAL
BUDGET
FY19 AMENDED
BUDGET
FY19 YTD
6/30/19
FY19YEAR END ESTIMATE
FY 20ADOPTED
BUDGET
101

YEAR PRINCIPAL INTEREST TOTAL2020 2,211,498 1,079,153 3,290,651 2021 2,360,750 1,018,853 3,379,603 2022 2,450,385 945,720 3,396,105 2023 2,419,590 870,048 3,289,638 2024 2,494,397 793,327 3,287,724 2025 2,365,000 711,219 3,076,219 2026 2,445,000 631,731 3,076,731 2027 2,530,000 543,128 3,073,128 2028 2,630,000 444,369 3,074,369 2029 2,735,000 340,794 3,075,794 2030 2,845,000 231,450 3,076,450 2031 2,970,000 104,350 3,074,350 2032 165,000 29,806 194,806 2033 175,000 21,731 196,731 2034 180,000 13,300 193,300 2035 190,000 4,513 194,513
TOTAL $31,166,620 $7,783,492 $38,950,112
YEAR PRINCIPAL INTEREST TOTAL2020 135,000 101,825 236,825 2021 140,000 96,325 236,325 2022 145,000 90,625 235,625 2023 140,000 84,925 224,925 2024 155,000 79,025 234,025 2025 155,000 72,825 227,825 2026 170,000 66,325 236,325 2027 135,000 60,225 195,225 2028 140,000 54,725 194,725 2029 145,000 49,025 194,025 2030 150,000 43,125 193,125 2031 160,000 36,925 196,925 2032 165,000 29,806 194,806 2033 175,000 21,731 196,731 2034 180,000 13,300 193,300 2035 190,000 4,513 194,513
TOTAL $2,480,000 $905,250 $3,385,250
Tax Debt Service Fund
Schedule of 2010 General Obligation BondsBy Maturity Date
Summary Schedule of Tax Debt Service to Maturity
102

Tax Debt Service Fund
YEAR PRINCIPAL INTEREST TOTAL2020 855,000 150,100 1,005,100 2021 880,000 128,350 1,008,350 2022 910,000 99,225 1,009,225 2023 555,000 73,588 628,588 2024 580,000 53,725 633,725 2025 610,000 32,900 642,900 2026 635,000 11,113 646,113
TOTAL $5,025,000 549,000 5,574,000
YEAR PRINCIPAL INTEREST TOTAL2020 80,000 77,050 157,050 2021 75,000 75,125 150,125 2022 80,000 72,800 152,800 2023 480,000 64,400 544,400 2024 480,000 47,600 527,600 2025 500,000 28,000 528,000 2026 450,000 9,000 459,000
TOTAL $2,145,000 $373,975 $2,518,975
YEAR PRINCIPAL INTEREST TOTAL2020 460,000 213,306 673,306 2021 475,000 200,431 675,431 2022 490,000 185,956 675,956 2023 505,000 171,031 676,031 2024 520,000 155,656 675,656 2025 535,000 141,169 676,169 2026 605,000 126,919 731,919 2027 1,025,000 105,903 1,130,903 2028 1,055,000 77,944 1,132,944 2029 1,085,000 48,519 1,133,519 2030 1,120,000 16,800 1,136,800
TOTAL $7,875,000 $1,443,634 $9,318,634
Schedule of 2012 General Obligation Refunding Bonds
Schedule of 2014 General Obligation Refund Bonds
By Maturity Date
Schedule of 2015 General Obligation BondsBy Maturity Date
By Maturity Date
103

Tax Debt Service Fund
YEAR PRINCIPAL INTEREST TOTAL2020 120,000 326,300 446,300 2021 125,000 323,850 448,850 2022 125,000 321,350 446,350 2023 125,000 318,850 443,850 2024 130,000 316,300 446,300 2025 130,000 313,050 443,050 2026 140,000 308,300 448,300 2027 900,000 283,000 1,183,000 2028 940,000 237,000 1,177,000 2029 990,000 188,750 1,178,750 2030 1,035,000 138,125 1,173,125 2031 2,245,000 56,125 2,301,125
TOTAL $7,005,000 $3,131,000 $10,136,000
YEAR PRINCIPAL INTEREST TOTAL2020 205,000 173,700 378,700 2021 300,000 167,150 467,150 2022 400,000 157,650 557,650 2023 410,000 147,525 557,525 2024 420,000 136,100 556,100 2025 435,000 123,275 558,275 2026 445,000 110,075 555,075 2027 470,000 94,000 564,000 2028 495,000 74,700 569,700 2029 515,000 54,500 569,500 2030 540,000 33,400 573,400 2031 565,000 11,300 576,300
TOTAL $5,200,000 $1,283,375 $6,483,375
YEAR PRINCIPAL INTEREST TOTAL
2020 356,498 36,872 393,370 2021 365,750 27,622 393,372 2022 300,385 18,114 318,499 2023 204,590 9,729 214,319 2024 209,397 4,921 214,318
TOTAL $1,436,620 $97,258 $1,533,878
By Maturity Date
Estimated Obligations Under Capital Leases
Schedule of 2016 General Obligation BondsBy Maturity Date
Schedule of 2017 General Obligation Bonds
104

YEAR PRINCIPAL INTEREST TOTAL
2020 2,945,000 1,938,950 4,883,950 2021 3,035,000 1,844,050 4,879,050 2022 2,645,000 1,750,425 4,395,425 2023 2,735,000 1,657,800 4,392,800 2024 2,835,000 1,554,475 4,389,475 2025 2,955,000 1,439,125 4,394,125 2026 3,135,000 1,311,550 4,446,550 2027 3,185,000 1,174,100 4,359,100 2028 3,330,000 1,031,825 4,361,825 2029 3,600,000 874,400 4,474,400 2030 3,770,000 702,700 4,472,700 2031 2,115,000 574,100 2,689,100 2032 2,200,000 487,800 2,687,800 2033 2,290,000 398,000 2,688,000 2034 2,380,000 306,400 2,686,400 2035 1,730,000 226,000 1,956,000 2036 1,800,000 155,400 1,955,400 2037 1,465,000 90,100 1,555,100 2038 1,520,000 30,400 1,550,400
TOTAL $49,670,000 $17,547,600 $67,217,600
* excludes fiscal agent fees associated with the outstanding bonds.
- 0.5 1.0 1.5 2.0 2.5 3.0 3.5 4.0 4.5 5.0
MIL
LIO
NS
REVENUE DEBT SERVICE TO MATURITY
PRINCIPAL INTEREST
105

WATER AND SEWER DEBT SERVICE FUND
FY18 ACTUAL
FY19 ORIGINAL
BUDGET
FY19 AMENDED
BUDGET
FY19 YTD
6/30/19
FY19 YEAR ENDESTIMATE
FY20ADOPTED
BUDGETREVENUE BONDS PRINCIPAL $225,000 $230,000 $230,000 $230,000 $230,000 $905,000 INTEREST 179,650 175,100 786,592 249,091 786,592 1,055,900 ISSUANCE COST 0 0 0 0 0 0 PAYING AGENT FEES 750 750 750 750 750 1,500 TOTAL $405,400 $405,850 $1,017,342 $479,841 $1,017,342 $1,962,400
REFUNDING BONDS PRINCIPAL $1,935,000 $1,985,000 $1,985,000 $1,985,000 $1,985,000 $2,040,000 INTEREST 991,775 937,150 937,150 482,400 937,150 883,050 ISSUANCE COST 0 0 0 9,500 9,500 0 PAYING AGENT FEES 1,500 4,100 4,100 750 4,100 4,100 TOTAL $2,928,275 $2,926,250 $2,926,250 $2,477,650 $2,935,750 $2,927,150
OTHER TAX DEBT PRINCIPAL $0 $0 $0 $0 $0 $0 INTEREST 0 0 0 0 0 0 ISSUANCE COST 0 0 0 0 0 0 PAYING AGENT FEES 0 0 0 0 0 0 TOTAL $0 $0 $0 $0 $0 $0
CERTIFICATES OF OBLIGATION PRINCIPAL $0 $0 $0 $0 $0 $0 INTEREST 0 0 0 0 0 0 ISSUANCE COST 0 0 0 0 0 0 PAYING AGENT FEES 0 0 0 0 0 0 TOTAL $0 $0 $0 $0 $0 $0
TOTAL W/S DEBT SERVICE FUND $3,333,675 $3,332,100 $3,943,592 $2,957,491 $3,953,092 $4,889,550
106

93-13 PRINCIPAL - 10 REFUND GO BONDS (2001 W/S) $560,000 $580,000 $580,000 $580,000 $580,000 $605,000 93-16 PRINCIPAL - 14 REFUND GO BONDS (2006 W/S) 5,000 5,000 5,000 5,000 5,000 5,000 93-18 PRINCIPAL - 16 REFUND GO BONDS (2006 W/S) 965,000 980,000 980,000 980,000 980,000 1,010,000 93-19 PRINCIPAL - 16A REFUND GO BONDS (2009 W/S) 405,000 420,000 420,000 420,000 420,000 420,000 93-54 PRINCIPAL - 16 W/S BONDS 225,000 230,000 230,000 230,000 230,000 235,000 93-55 PRINCIPAL - 18 W/S BONDS 0 0 0 0 0 670,000 BOND PRINCIPAL $2,160,000 $2,215,000 $2,215,000 $2,215,000 $2,215,000 $2,945,000
93-13 INTEREST - 10 REFUND GO BONDS (2001 W/S) $75,000 $57,900 $57,900 $33,300 $57,900 $37,100 93-16 INTEREST - 14 REFUND GO BONDS (2006 W/S) 214,150 214,050 214,050 107,050 214,050 213,950 93-18 INTEREST - 16 REFUND GO BONDS (2006 W/S) 376,075 346,900 346,900 180,800 346,900 322,100 93-19 INTEREST - 16A REFUND GO BONDS (2009 W/S) 326,550 318,300 318,300 161,250 318,300 309,900 93-54 INTEREST - 16 W/S BONDS 179,650 175,100 175,100 88,700 175,100 170,450 93-55 INTEREST - 18 W/S BONDS 0 0 611,492 160,391 611,492 885,450 BOND INTEREST $1,171,425 $1,112,250 $1,723,742 $731,491 $1,723,742 $1,938,950
93-14 FISCAL FEES - 10 REFUND GO BONDS (2001 W/S) $750 $750 $750 $750 $750 $750 93-16 FISCAL FEES - 14 REFUND GO BONDS (2006 W/S) 0 1,850 1,850 0 1,850 1,850 93-18 FISCAL FEES - 16 REFUND GO BONDS (2006 W/S) 0 750 750 0 750 750 93-19 FISCAL FEES - 16A REFUND GO BONDS (2009 W/S) 750 750 750 0 750 750 93-54 FISCAL FEES - 16 W/S BONDS 750 750 750 750 750 750 93-55 FISCAL FEES - 18 W/S BONDS 0 0 0 0 0 750 FISCAL AGENT FEES $2,250 $4,850 $4,850 $1,500 $4,850 $5,600
93-13 ISSUE COSTS - 10 REFUND GO BONDS (2001 W/S) $0 $0 $0 $0 $0 $0 93-16 ISSUE COSTS - 14 REFUND GO BONDS (2006 W/S) 0 0 0 0 0 0 93-18 ISSUE COSTS - 16 REFUND GO BONDS (2006 W/S) 0 0 0 0 0 0 93-19 ISSUE COSTS - 16A REFUND GO BONDS (2009 W/S) 0 0 0 0 0 0 93-55 ISSUE COSTS - 18 W/S BONDS 0 0 0 9,500 9,500 0 95-10 ISSUE COSTS - OTHER FINANCING USES 0 0 0 0 0 0 ISSUE COSTS $0 $0 $0 $9,500 $9,500 $0
TOTAL FOR WATER AND SEWER DEBT FUND $3,333,675 $3,332,100 $3,943,592 $2,957,491 $3,953,092 $4,889,550
DEBT SERVICEWATER AND SEWER FUND
ACCOUNT LISTING
FY18ACTUAL
FY19 ORIGINAL
BUDGET
FY19 AMENDED
BUDGET
FY19 YTD
6/30/19
FY19YEAR END ESTIMATE
FY 20ADOPTED
BUDGET
107

WASTE WASTE WASTEWATER WATER WATER WATER WATER WATER
YEAR PRINCIPAL PRINCIPAL INTEREST INTEREST TOTAL TOTAL TOTAL
2020 2,468,800 476,200 1,449,738 489,212 3,918,538 965,412 4,883,950 2021 2,548,000 487,000 1,371,868 472,182 3,919,868 959,182 4,879,050 2022 2,138,600 506,400 1,295,953 454,472 3,434,553 960,872 4,395,425 2023 2,211,000 524,000 1,221,813 435,987 3,432,813 959,987 4,392,800 2024 2,291,600 543,400 1,137,748 416,727 3,429,348 960,127 4,389,475 2025 2,387,200 567,800 1,043,828 395,297 3,431,028 963,097 4,394,125 2026 2,546,000 589,000 941,248 370,302 3,487,248 959,302 4,446,550 2027 2,564,800 620,200 831,303 342,797 3,396,103 962,997 4,359,100 2028 2,681,800 648,200 716,438 315,387 3,398,238 963,587 4,361,825 2029 2,923,800 676,200 587,723 286,677 3,511,523 962,877 4,474,400 2030 3,064,000 706,000 447,528 255,172 3,511,528 961,172 4,472,700 2031 1,376,000 739,000 349,808 224,292 1,725,808 963,292 2,689,100 2032 1,433,000 767,000 293,628 194,172 1,726,628 961,172 2,687,800 2033 1,491,800 798,200 235,132 162,868 1,726,932 961,068 2,688,000 2034 1,548,800 831,200 176,120 130,280 1,724,920 961,480 2,686,400 2035 864,000 866,000 129,664 96,336 993,664 962,336 1,956,000 2036 899,200 900,800 94,400 61,000 993,600 961,800 1,955,400 2037 937,600 527,400 57,664 32,436 995,264 559,836 1,555,100 2038 972,800 547,200 19,456 10,944 992,256 558,144 1,550,400
TOTAL 37,348,800$ 12,321,200$ 12,401,060$ 5,146,540$ 49,749,860$ 17,467,740$ 67,217,600$
100% WASTE WASTE WASTEWATER WATER WATER WATER WATER WATER
YEAR PRINCIPAL PRINCIPAL INTEREST INTEREST TOTAL TOTAL TOTAL
2020 605,000 - 37,100 - 642,100 - 642,100 2021 625,000 - 12,500 - 637,500 - 637,500
TOTAL 1,230,000$ -$ 49,600$ -$ 1,279,600$ -$ 1,279,600$
100% WASTE WASTE WASTEWATER WATER WATER WATER WATER WATER
YEAR PRINCIPAL PRINCIPAL INTEREST INTEREST TOTAL TOTAL TOTAL
2020 5,000 - 213,950 - 218,950 - 218,950 2021 10,000 - 213,750 - 223,750 - 223,750 2022 875,000 - 200,475 - 1,075,475 - 1,075,475 2023 905,000 - 173,775 - 1,078,775 - 1,078,775 2024 930,000 - 141,600 - 1,071,600 - 1,071,600 2025 975,000 - 103,500 - 1,078,500 - 1,078,500 2026 - - 84,000 - 84,000 - 84,000 2027 1,025,000 - 63,500 - 1,088,500 - 1,088,500 2028 1,075,000 - 21,500 - 1,096,500 - 1,096,500
TOTAL 5,800,000$ -$ 1,216,050$ -$ 7,016,050$ -$ 7,016,050$
DEBT SUPPORTED BY WATERWORKS AND SEWER SYSTEMREVENUE BONDS BY MATURITY DATE
WATER AND WASTEWATER REVENUE DEBT SERVICE
SUMMARY SCHEDULE OF REVENUE DEBT SERVICE TO MATURITY
SCHEDULE OF 2001 WATERWORKS AND WASTEWATER SYSTEM(REFINANCED AS SERIES 2010B GENERAL OBLIGATION BONDS)
DEBT SUPPORTED BY WATERWORKS AND SEWER SYSTEM
SCHEDULE OF 2006 WATERWORKS AND WASTEWATER SYSTEM(REFINANCED AS A PORTION OF THE SERIES 2014 GENERAL OBLIGATION BONDS)
108
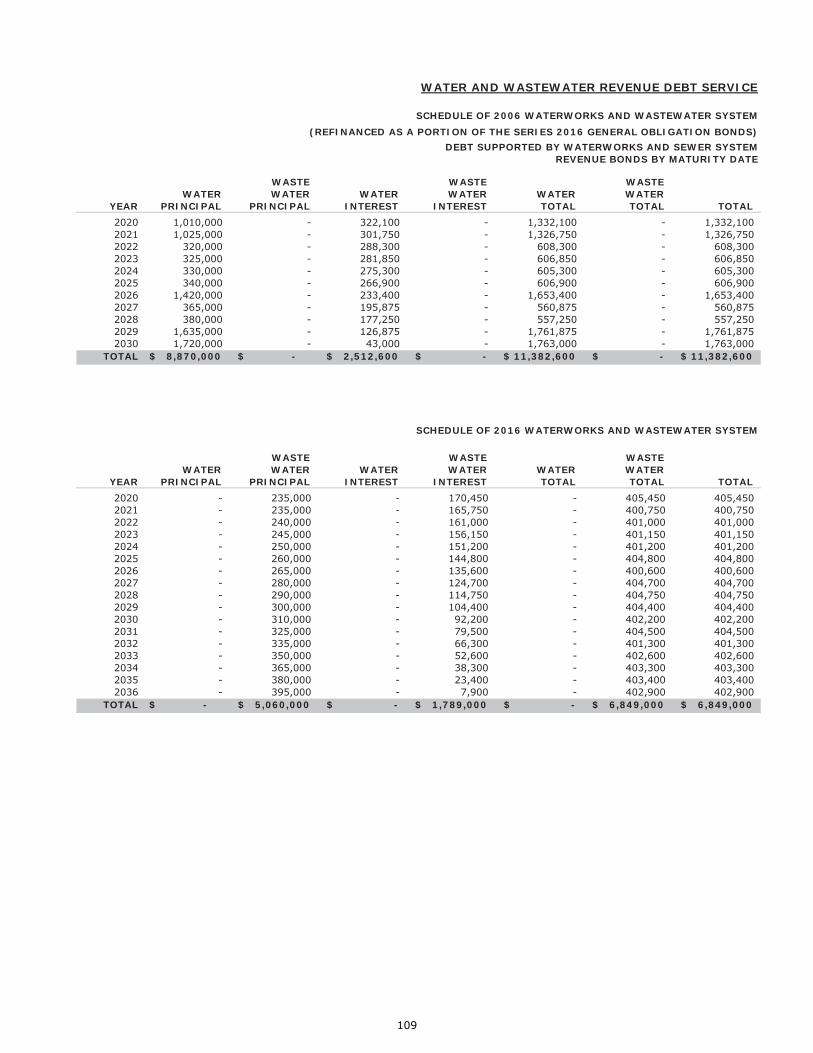
WATER AND WASTEWATER REVENUE DEBT SERVICE
WASTE WASTE WASTEWATER WATER WATER WATER WATER WATER
YEAR PRINCIPAL PRINCIPAL INTEREST INTEREST TOTAL TOTAL TOTAL2020 1,010,000 - 322,100 - 1,332,100 - 1,332,100 2021 1,025,000 - 301,750 - 1,326,750 - 1,326,750 2022 320,000 - 288,300 - 608,300 - 608,300 2023 325,000 - 281,850 - 606,850 - 606,850 2024 330,000 - 275,300 - 605,300 - 605,300 2025 340,000 - 266,900 - 606,900 - 606,900 2026 1,420,000 - 233,400 - 1,653,400 - 1,653,400 2027 365,000 - 195,875 - 560,875 - 560,875 2028 380,000 - 177,250 - 557,250 - 557,250 2029 1,635,000 - 126,875 - 1,761,875 - 1,761,875 2030 1,720,000 - 43,000 - 1,763,000 - 1,763,000
TOTAL 8,870,000$ -$ 2,512,600$ -$ 11,382,600$ -$ 11,382,600$
WASTE WASTE WASTEWATER WATER WATER WATER WATER WATER
YEAR PRINCIPAL PRINCIPAL INTEREST INTEREST TOTAL TOTAL TOTAL2020 - 235,000 - 170,450 - 405,450 405,450 2021 - 235,000 - 165,750 - 400,750 400,750 2022 - 240,000 - 161,000 - 401,000 401,000 2023 - 245,000 - 156,150 - 401,150 401,150 2024 - 250,000 - 151,200 - 401,200 401,200 2025 - 260,000 - 144,800 - 404,800 404,800 2026 - 265,000 - 135,600 - 400,600 400,600 2027 - 280,000 - 124,700 - 404,700 404,700 2028 - 290,000 - 114,750 - 404,750 404,750 2029 - 300,000 - 104,400 - 404,400 404,400 2030 - 310,000 - 92,200 - 402,200 402,200 2031 - 325,000 - 79,500 - 404,500 404,500 2032 - 335,000 - 66,300 - 401,300 401,300 2033 - 350,000 - 52,600 - 402,600 402,600 2034 - 365,000 - 38,300 - 403,300 403,300 2035 - 380,000 - 23,400 - 403,400 403,400 2036 - 395,000 - 7,900 - 402,900 402,900
TOTAL -$ 5,060,000$ -$ 1,789,000$ -$ 6,849,000$ 6,849,000$
SCHEDULE OF 2016 WATERWORKS AND WASTEWATER SYSTEM
REVENUE BONDS BY MATURITY DATEDEBT SUPPORTED BY WATERWORKS AND SEWER SYSTEM
(REFINANCED AS A PORTION OF THE SERIES 2016 GENERAL OBLIGATION BONDS)SCHEDULE OF 2006 WATERWORKS AND WASTEWATER SYSTEM
109
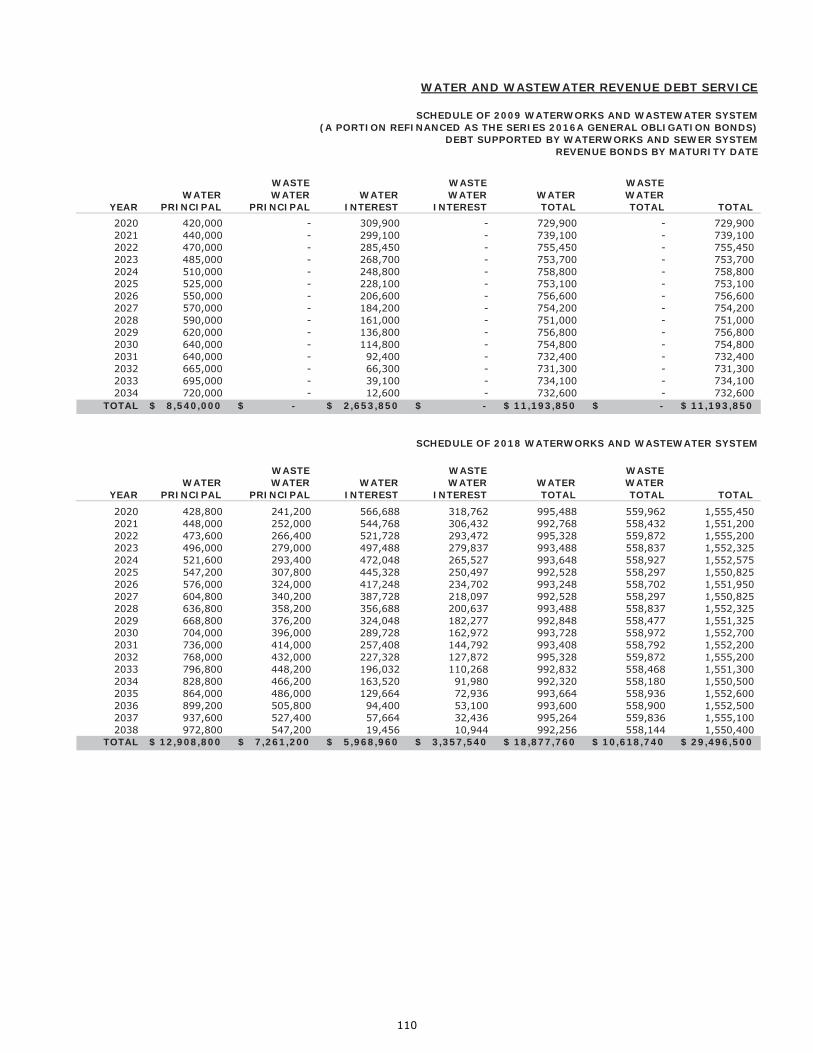
WATER AND WASTEWATER REVENUE DEBT SERVICE
WASTE WASTE WASTEWATER WATER WATER WATER WATER WATER
YEAR PRINCIPAL PRINCIPAL INTEREST INTEREST TOTAL TOTAL TOTAL2020 420,000 - 309,900 - 729,900 - 729,900 2021 440,000 - 299,100 - 739,100 - 739,100 2022 470,000 - 285,450 - 755,450 - 755,450 2023 485,000 - 268,700 - 753,700 - 753,700 2024 510,000 - 248,800 - 758,800 - 758,800 2025 525,000 - 228,100 - 753,100 - 753,100 2026 550,000 - 206,600 - 756,600 - 756,600 2027 570,000 - 184,200 - 754,200 - 754,200 2028 590,000 - 161,000 - 751,000 - 751,000 2029 620,000 - 136,800 - 756,800 - 756,800 2030 640,000 - 114,800 - 754,800 - 754,800 2031 640,000 - 92,400 - 732,400 - 732,400 2032 665,000 - 66,300 - 731,300 - 731,300 2033 695,000 - 39,100 - 734,100 - 734,100 2034 720,000 - 12,600 - 732,600 - 732,600
TOTAL 8,540,000$ -$ 2,653,850$ -$ 11,193,850$ -$ 11,193,850$
WASTE WASTE WASTEWATER WATER WATER WATER WATER WATER
YEAR PRINCIPAL PRINCIPAL INTEREST INTEREST TOTAL TOTAL TOTAL
2020 428,800 241,200 566,688 318,762 995,488 559,962 1,555,450 2021 448,000 252,000 544,768 306,432 992,768 558,432 1,551,200 2022 473,600 266,400 521,728 293,472 995,328 559,872 1,555,200 2023 496,000 279,000 497,488 279,837 993,488 558,837 1,552,325 2024 521,600 293,400 472,048 265,527 993,648 558,927 1,552,575 2025 547,200 307,800 445,328 250,497 992,528 558,297 1,550,825 2026 576,000 324,000 417,248 234,702 993,248 558,702 1,551,950 2027 604,800 340,200 387,728 218,097 992,528 558,297 1,550,825 2028 636,800 358,200 356,688 200,637 993,488 558,837 1,552,325 2029 668,800 376,200 324,048 182,277 992,848 558,477 1,551,325 2030 704,000 396,000 289,728 162,972 993,728 558,972 1,552,700 2031 736,000 414,000 257,408 144,792 993,408 558,792 1,552,200 2032 768,000 432,000 227,328 127,872 995,328 559,872 1,555,200 2033 796,800 448,200 196,032 110,268 992,832 558,468 1,551,300 2034 828,800 466,200 163,520 91,980 992,320 558,180 1,550,500 2035 864,000 486,000 129,664 72,936 993,664 558,936 1,552,600 2036 899,200 505,800 94,400 53,100 993,600 558,900 1,552,500 2037 937,600 527,400 57,664 32,436 995,264 559,836 1,555,100 2038 972,800 547,200 19,456 10,944 992,256 558,144 1,550,400
TOTAL 12,908,800$ 7,261,200$ 5,968,960$ 3,357,540$ 18,877,760$ 10,618,740$ 29,496,500$
SCHEDULE OF 2018 WATERWORKS AND WASTEWATER SYSTEM
REVENUE BONDS BY MATURITY DATE
SCHEDULE OF 2009 WATERWORKS AND WASTEWATER SYSTEM(A PORTION REFINANCED AS THE SERIES 2016A GENERAL OBLIGATION BONDS)
DEBT SUPPORTED BY WATERWORKS AND SEWER SYSTEM
110
Capital Improvement Program
111

Capital Improvement Program_____________________________________________________________
Capital Improvements Program (CIP) Summary
The Capital Improvements Program (CIP) is a five-year planning tool used to identify capital expenditure needs of the City of Friendswood. The program and plan outlines capital improvements costs and potential funding sources. In addition to information taken from the City’s CIP plan, this section of the budget document, will provide estimates for future operating impact (if any) related to each capital improvement project included.
The City’s capital improvements program consists of a capital budget which includes projected expenditures for the current fiscal year. Capital expenditures, defined as tangible assets or projects with estimated cost of at least $5,000 and a useful life of at least five (5) years, are part of the capital budget. The second part of the City’s CIP is the capital program which consists of anticipated capital expenditures to be purchased or projects to be completed in the future; beyond the current fiscal year. The CIP categorizes and accounts for key capital requirements related to expenditures excluded from the capital outlay of the departmental operating budgets. Our City’s CIP includes significantly costly, non-recurring projects with multiple year life expectancies. These tangible items or projects become fixed assets for the City. Examples include:
Building construction, additions or renovations (Ex.– Fire Station, Activity Center)Park improvements (Ex.- Sportspark, Restrooms, Pavilions, Parking Lots)Major repairs or construction of streets (Ex.– Woodlawn, Blackhawk BoulevardPhase II)Water and sewer improvements (Ex.– Lift Station #23 Rehabilitation)Drainage improvements (Ex.– Mud Gully Detention & Conveyance)Major equipment replacements/purchases (Ex.– Dump Truck)
Upon approval by City Council and funding source confirmation, the projects proposed in the CIP for the current fiscal year will commence. The remaining unfunded projects in the future years of the plan will be included in the operating budget, annually, as City Council determines continued relevance of the projects and approves funding sources. The City utilizes General Obligation Bonds, Revenue Bonds, Water and Sewer Operating Fund Working Capital, and unassigned fund balance reserves to support its Capital Improvements Program. The proposed projects included in this section of the operating budget document are grouped by funding source and sorted by estimated year of the project’s completion.
The City’s CIP plan, a document published separately of the City’s operating budget, was most recently approved by City Council in May 2017. Information from the City’s CIP plan is included in this section of our budget document. It reflects the capital improvements identified, to date, for inclusion in the City’s future capital budget and the capital program.
112

Capital Improvement Program_____________________________________________________________
Developing the Capital Improvements Program (CIP)
Goals & ObjectivesCity Council and the City’s financial policies set the framework for building the annual capital improvement plan. Additionally, the following factors are considered in our CIP development and implementation:
Other Long-range Financial Planning Tools The capital improvements proposed in the CIP are directly impacted by the City’s other strategic and long-term planning tools. Our Multi-Year Financial Plan (MYFP) is a five year projection of operational expenses, property values, tax rate estimates, outstanding debtand anticipated new one-time or ongoing programs. CIP project cost estimates are includedin the MYFP’s anticipated new one-time or on-going programs.
The City’s Master Plans, such as the Parks and Open Space Master Plan, Streets Master Plan and Utility Drainage Master Plan also help to determine capital improvement needs and priorities. Take the Parks and Open Space Master Plan for example. The plan’s timeframe is one to ten years and provides guidelines for Parks and Facility improvements as our City’s population grows. Based on National Recreation and Parks Association (NRPA) Standards, our Plan recommends 100 acres of park land space per 1,000 residents. With the purchase of 27.7 acres of land in fiscal year 2016, the City currently has approximately 357 acres park land. At build-out, population is estimated to be 58,012. To meet the Parks and Open Space Master Plan standard, 580 acres of park land will be needed. As our population grows toward build-out, park land acquisition will become more of a priority in the City’s CIP. The City also has a Pavement Master Plan that determines street construction and major repair projects for inclusion in the CIP. Population growth and life cycles of existing streets are driving factors in the prioritizing Pavement Master Plan capital improvements.
During the ongoing development of the CIP, stakeholders examine the relationship between the capital improvements identified and goals outlined in City’s Vision 2020 Plan. This plan was implemented in 1997 with foresight of the City’s build-out projected for the year 2020.Vision 2020 calls for:
Developing Tax Base (improve tax base mix)Improved Infrastructure (water, sewer)Retaining Values (quality of life)Maintaining Quality of SchoolsImproved DrainageMaintaining High Level of Public ServiceBeing a Whole Life Community (homes, jobs,amenities)
Incorporating Vision 2020 in the Master PlanAttracting a College/UniversityDevelopment of a City Civic CenterMaintaining Visual Image (prevent undesirableland uses)Transportation ImprovementAdditional Parks and Recreational DevelopmentBeing Sensitive to the Environment
Financial Debt Capacity
Community Development Opportunities
Land Availability
Staffing Resources
Stakeholder Input
Direction from City Council
How much can the City borrow for improvements?
Is new residential/commercial building expected in the City?
Is the City nearing its build-out capacity?
Can existing staff levels manage the CIP projects?
Staff, Citizens, Committees, Boards and Commissions
Project Priorities and Available Funding
113
Capital Improvement Program_____________________________________________________________
Capital Improvement Program Focus
The main goal of City’s Capital Improvement Program is to preserve the existing quality of life for Friendswood citizens as the community develops by proactively approachinganticipated needs of the City, forecasting improvement projects and securing financial resources. According to the proposed plan, “the program is also intended to depict financial challenges of the City’s growth and maintenance of infrastructure that characterize the City’s future and the associated funding requirements to meet these objectives.”
As previously stated, population growth is a major driver for our CIP development and implementation. The 2010 census estimated Friendswood’s population at 35,805. The population at the end of June 2019 was approximately 41,216; a 15.11% increase in 10 yearsand an increase of 41.94% since the 2000 census estimate of 29,037. As previously stated, by our community’s complete build-out in 10 to 20 years, the anticipated population is about 58,012.
As a result of this projected growth and its subsequent impact, the CIP focus over the next five years will be almost equally balanced between utility infrastructure and drainage improvements to streets, parks, facilities and drainage improvements. Proceeds from the general obligations bonds authorized in November 2013, unassigned fund balance in the City’s General Fund and Park Land Dedication funds will support streets, parks, facilities and drainage projects. Water and Sewer Operating Fund working capital and Water and Sewer Revenue Bonds approved in 2006, 2009, 2016, and 2018 will allow for rehabilitation of lift stations and water plants, and waste water treatment plant improvements in the CIP.
The capital budget (year 1 of the CIP) totals $27,055,666 and includes repairs as prescribed in the City’s streets maintenance master plan (based on severity of disrepair) and sewer line maintenance. It also includes, and lists below, almost $1 million for ongoing phases of several of the bond projects authorized in 2013 and $19.7 million for water and sewer utility projects.
Streets Improvements – Blackhawk Boulevard (Link Road to Edenvale)Parks Improvements – Restrooms, Pavilions, Parking Lots and Walking TrailsWater and Sewer Utilities Improvements –Lift Station #23, Surface WaterStations #3, Water Plant #1, 42” Water Main Replacement, Sanitary SewerAssessment, Lift Station #4, Lift Station #1 & #17 Combination
Further portions of this document will show that 67% of the CIP funding uses during the next five years are proposed utility improvements. Streets, facilities, parks and drainage improvement projects make up the other 33% of the CIP program. Beyond the next five years, the proposed CIP focus will shift toward streets, drainage and facilities improvements consisting of 61% of the plan. Utilities projects will then make up 39% of the plan.
114
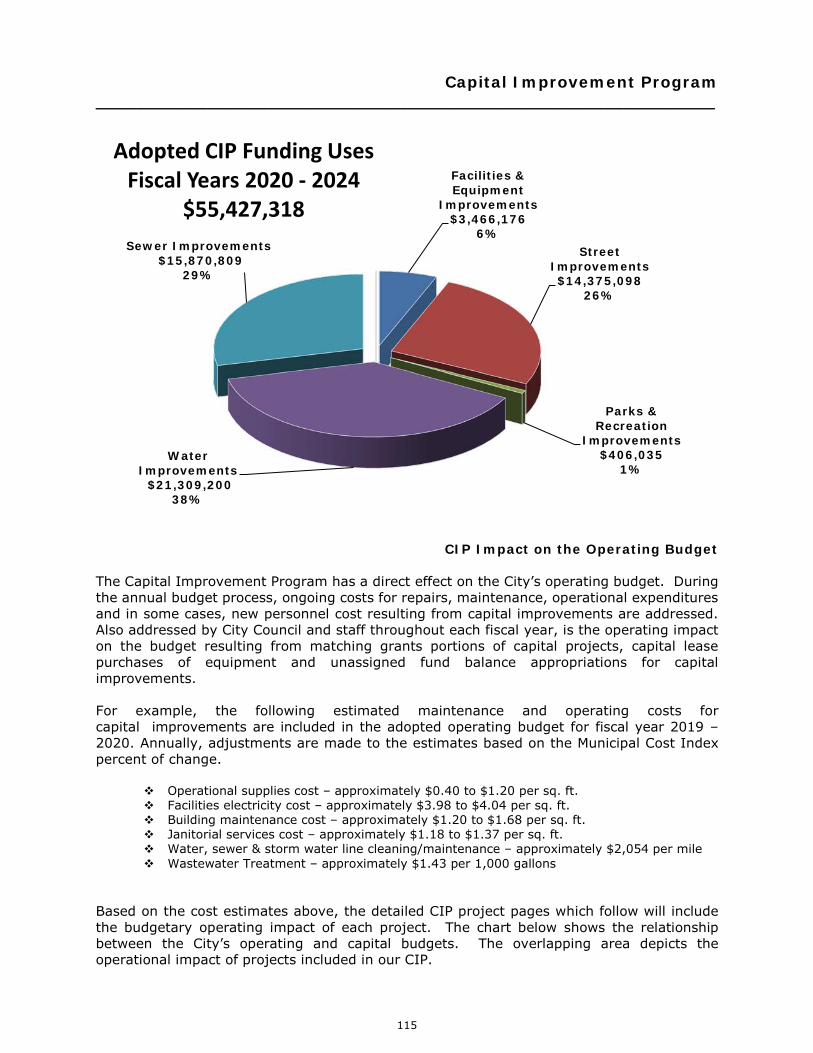
Capital Improvement Program_____________________________________________________________
CIP Impact on the Operating Budget
The Capital Improvement Program has a direct effect on the City’s operating budget. During the annual budget process, ongoing costs for repairs, maintenance, operational expenditures and in some cases, new personnel cost resulting from capital improvements are addressed. Also addressed by City Council and staff throughout each fiscal year, is the operating impact on the budget resulting from matching grants portions of capital projects, capital lease purchases of equipment and unassigned fund balance appropriations for capital improvements.
For example, the following estimated maintenance and operating costs forcapital improvements are included in the operating budget for fiscal year 2019 –2020. Annually, adjustments are made to the estimates based on the Municipal Cost Index percent of change.
Operational supplies cost – approximately $0.40 to $1.20 per sq. ft.Facilities electricity cost – approximately $3.98 to $4.04 per sq. ft.Building maintenance cost – approximately $1.20 to $1.68 per sq. ft.Janitorial services cost – approximately $1.18 to $1.37 per sq. ft.Water, sewer & storm water line cleaning/maintenance – approximately $2,054 per mileWastewater Treatment – approximately $1.43 per 1,000 gallons
Based on the cost estimates above, the detailed CIP project pages which follow will include the budgetary operating impact of each project. The chart below shows the relationship between the City’s operating and capital budgets. The overlapping area depicts the operational impact of projects included in our CIP.
Facilities & Equipment
Improvements$3,466,176
6%Street
Improvements$14,375,098
26%
Parks & Recreation
Improvements$406,035
1%Water
Improvements$21,309,200
38%
Sewer Improvements$15,870,809
29%
CIP Funding Uses Fiscal Years 2020 - 2024
$55,427,318
115

Capital Improvement Program_____________________________________________________________
Due to the nature of some of the projects in the CIP and the timeframe in which capital improvements will be completed or acquired, quantifying or estimating this impact is challenging. As explained in the City’s CIP, costs of the projects included in the plan are determined at current dollars. Then, an inflationary factor is added to surmise future project cost for the planned date of completion. The inflationary factor is supported by the Houston Chapter of Associated General Contractors, the U.S. Department of Labor and Engineering News Report.
The overall impact of the facility, street, drainage, water and sewer Capital Improvements Program projects will be positive for the City upon completion because upgraded or new infrastructure results in lower on-going maintenance costs for the City. However, useful life cycles of infrastructure will remain a factor. Therefore, replacement needs are continuous and often offset the maintenance savings from new infrastructure.
Staff takes special care in timing CIP projects that may require debt service support to maintain the City’s property tax rate at a level that will not burden its citizens. As a result, the City’s capital improvement program includes proposed unfunded projects totaling $111.3million; of which, $67.6 million is to be general obligation funds supported and $43.7 million is supported by service revenue. As previously stated, projects will be included in the capital budget, annually, by priority and as funding sources are approved by City Council. Debt level limits and revenue projections are critical in this process because CIP projects funded by property tax supported debt have an indirect impact on the operating budget through resulting principal and interest payment requirements.
FY20Operating Budget
$79,153,116
FY20 Capital Budget$27,055,666FY20 Annual Capital Project
Operating Impact$62,055 (estimated)
116
Capital Improvement Program_____________________________________________________________
Capital Improvements Program Funding
The CIP cites funding as the greatest challenge for the plan due to the aggressive nature of our City’s plan and increasing construction costs currently resulting from economic declines in the oil and gas industry. This challenge means the City has to utilize a variety of sources for funding capital expenditures. In previous years, the City has issued General Obligation Bonds, Certificates of Obligation and Revenue Bonds to support the Capital Improvements Plan.
In fiscal year 2009, the City issued water and sewer revenue bonds totaling $12.1 million to complete water and sewer capital improvements. The rehabilitations of three (3) of the City’s water plants occurred in FY15. In fiscal year 2016, the City completed a bond issuance of $5.6 million to complete the construction of a 3rd clarifier at the Blackhawk Waste Water Treatment Plant and replacement of the City’s lift station #23 (Crazy Horse). Along with these projects, the City’s 5-year CIP includes replacement of a 42” water main and FM 528 water line, additional water plant rehabilitations and lift station replacements. The funding source for the projects has not been determined; but may require water and sewer revenue bond funding for completion.
In December 2018, the City issued Water & Sewer revenue bonds totaling $20 million. Planned utility projects will include sanitary sewer assessment phase IV through VII, lift station #1 #4 #17 and #23 reconstruction, water plant #1 tank rehabilitation, 42” water main replacement, second elevated water storage rehabilitation, surface water station #3, & sanitary sewer plant additional capacity.
Currently, the City is considering a general obligations bond issuance of $80.6 million to fund various projects including but not limited to: civic center, emergency shelter, major drainage improvements, public works facility, major street and sidewalk improvements, walking trails, playgrounds, swimming pool rehabilitation, green parking, various park improvements, & public safety building and fire station expansions. It is possible the bond package will be presented to voters as early as the November 2019 election.
Water and Sewer Fund working capital, if available, may be a potential funding source for the second elevated water storage tank rehab and central 16” interconnect projects planned for FY20
Other funding sources such as state and federal grants, donations, inter-local agreements, capital leases and unassigned fund balance reserves have been utilized to pay for capitalexpenditures. The City anticipates continuing the use of these funding sources to support the capital improvements program in the future.
117

Capital Improvement Program_____________________________________________________________
Fiscal Year 2013-14 General Obligations Bond Election
At the direction of our City Council in 2012, the City Manager solicited citizen participation to form an advisory group to evaluate the community’s needs and make a recommendation regarding a potential general obligations bond election. During 2013, the citizens’ group actively met and assessed the needs of the City relating to facilities, parks and streets & drainage. The group also explored financing options to address the identified needs.
The consensus of the group was to put the needs to a vote of the Friendswood residents by way of a bond election held in November 2013. In the weeks preceding the election, a series of Town Hall meetings provided a platform to discuss the advisory group’s findings and the bond election with other citizens.
The bond election passed with voters approving four (4) propositions totaling $24,085,000. These included $7.7 million for street improvements, $7.3 million for parks improvements including land purchase, $2.5 million to expand the City’s existing library and $6.6 to build a new fire station and expand the City’s existing Fire Station #4. The projects will have a future annual budgetary impact of approximately $75,000 resulting from additional operating cost such as utilities, janitorial services, mowing services and insurance.
While taking into consideration the City’s financial impact of debt issuance costs and annual debt service payments, City Council approved a plan to issue bonds in 3 phases to complete all projects within a time period of five to seven years. The FY15 budget included $9.4 million to complete projects identified in the 1st round of the bonds. Included in the FY16 budget was $8.6 million for the 2nd round of the bonds. City Council appropriated $6.1 million during FY17 to finish out the round 3 projects that were scheduled for completion in years 1 and 2 of the City’s CIP. This year’s budget reflects residual bond proceeds totaling about $1 million.
Initial project descriptions are included in this section of the budget. Greater details will beincluded in future budget documents as projects are included in each year’s capital budget.
Street Improvements and Economic Development Improvements Funds
In the May 2016 election, City of Friendswood voters approved an additional half-cent sales tax; of which 3/8 will support streets improvements and 1/8 will support economic development improvements to the City’s downtown area. During the 5-year CIP plan, the sales tax for street improvements is projected to equal about $6.2 million and the economic development improvements sales tax is expected to generate approximately $2.0 million.
The voter-approved will sunset, or expire, in FY 2020.Friendswood voters will have the option to reapprove this sales tax in May 2020.
118
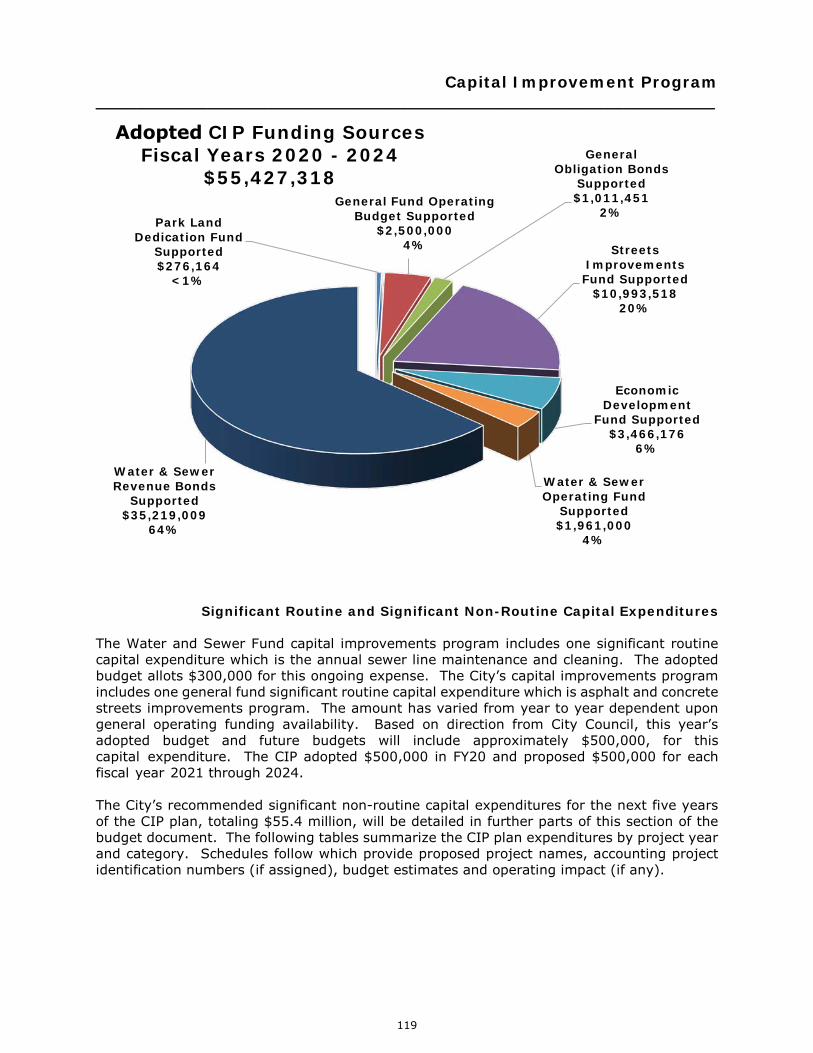
Capital Improvement Program_____________________________________________________________
Significant Routine and Significant Non-Routine Capital Expenditures
The Water and Sewer Fund capital improvements program includes one significant routine capital expenditure which is the annual sewer line maintenance and cleaning. The adopted budget allots $300,000 for this ongoing expense. The City’s capital improvements program includes one general fund significant routine capital expenditure which is asphalt and concrete streets improvements program. The amount has varied from year to year dependent upon general operating funding availability. Based on direction from City Council, this year’s adopted budget and future budgets will include approximately $500,000, for this capital expenditure. The CIP $500,000 in FY20 and $500,000 for eachfiscal year 2021 through 2024.
The City’s recommended significant non-routine capital expenditures for the next five years of the CIP plan, totaling $55.4 million, will be detailed in further parts of this section of the budget document. The following tables summarize the CIP plan expenditures by project year and category. Schedules follow which provide proposed project names, accounting project identification numbers (if assigned), budget estimates and operating impact (if any).
Park Land Dedication Fund
Supported$276,164
<1%
General Fund Operating Budget Supported
$2,500,0004%
General Obligation Bonds
Supported$1,011,451
2%
Streets Improvements Fund Supported
$10,993,51820%
Economic Development
Fund Supported$3,466,176
6%
Water & Sewer Operating Fund
Supported$1,961,000
4%
Water & Sewer Revenue Bonds
Supported$35,219,009
64%
CIP Funding SourcesFiscal Years 2020 - 2024
$55,427,318
119

Capital Improvement Program_____________________________________________________________
Proposed General Obligations Funds 2020 2021 2022 2023 2024
Total 5 Year Plan
DrainageEstimated Cost $ - $ - $ - $ - $ - $ -
Authorized Funds $ - $ - $ - $ - $ - $ -Supplemental Funds Needed $ - $ - $ - $ - $ - $ -
Facilities & EquipmentEstimated Cost $ 1,553,041 $ 471,169 $ 475,881 $ 480,639 $ 485,446 $ 3,466,176
Authorized Funds $ 1,553,041 $ 471,169 $ 475,881 $ 480,639 $ 485,446 $ 3,466,176 Supplemental Funds Needed $ - $ - $ - $ - $ - $ -
ParksEstimated Cost $ 238,035 $ 42,000 $ 42,000 $ 42,000 $ 42,000 $ 406,035
Authorized Funds $ 238,035 $ 42,000 $ 42,000 $ 42,000 $ 42,000 $ 406,035 Supplemental Funds Needed $ - $ - $ - $ - $ - $ -
StreetsEstimated Cost $ 5,573,581 $ 2,175,085 $ 2,191,836 $ 2,208,754 $ 2,225,842 $ 14,375,098
Authorized Funds $ 5,573,581 $ 2,175,085 $ 2,191,836 $ 2,208,754 $ 2,225,842 $ 14,375,098 Supplemental Funds Needed $ - $ - $ - $ - $ - $ -
Total G.O. FundsEstimated Cost $ 7,364,657 $ 2,688,254 $ 2,709,717 $ 2,731,393 $ 2,753,288 $ 18,247,309
Authorized Funds $ 7,364,657 $ 2,688,254 $ 2,709,717 $ 2,731,393 $ 2,753,288 $ 18,247,309 Supplemental Funds Needed $ - $ - $ - $ - $ - $ -
Proposed Utility Funds 2020 2021 2022 2023 2024 Total 5 Year Plan
Sewer ImprovementsEstimated Cost $ 10,398,809 $ 300,000 $ 400,000 $ 300,000 $ 4,472,000 $ 15,870,809
Authorized Funds $ 10,398,809 $ 300,000 $ 400,000 $ 300,000 $ 4,472,000 $ 15,870,809 Supplemental Funds Needed $ - $ - $ - $ - $ - $ -
Water ImprovementsEstimated Cost $ 9,292,200 $ - $10,284,000 $ 461,000 $ 1,272,000 $ 21,309,200
Authorized Funds $ 9,292,200 $ - $10,284,000 $ - $ 1,272,000 $ 20,848,200 Supplemental Funds Needed $ - $ - $ - $ 461,000 $ - $ 461,000
Total Utility FundsEstimated Cost $ 19,691,009 $ 300,000 $10,684,000 $ 761,000 $ 5,744,000 $ 37,180,009
Authorized Funds $ 19,691,009 $ 300,000 $10,684,000 $ 300,000 $ 5,744,000 $ 36,719,009 Supplemental Funds Needed $ - $ - $ - $ 461,000 $ - $ 461,000
120

FY18 Actual
FY19 Original Budget
FY19 Amended
Budget
FY19YTD
6/30/19
FY19Year End Estimate
FY20 Adopted
Budget
$1,511,693 $500,000 $3,060,936 $1,186,174 $1,974,138 $500,000
Economic DevelopmentAdministration Grant Fund 0 0 0 0 0 0
Texas Department ofRural Affairs Grant Fund 0 0 0 0 0 0
Police Investigations Fund 40,792 0 93,295 8,295 93,295 0
Municipal Court Fund 0 0 10,000 10,000 10,000 0
Park Land Dedication Fund 109,114 167,819 190,177 201,069 201,069 108,164
Streets Improvements Fund 0 4,093,608 1,700,000 1,207,197 1,700,000 4,192,001
Economic Development Improvements Fund 0 912,015 41,818 34,529 41,818 1,553,041
951,509 6,367,114 5,046,910 2,883,209 5,035,954 1,011,451
418,157 300,000 1,430,744 401,677 1,276,300 300,000
2006 Water and Sewer0 0 0 0 44,157 0
0 0 0 0 346,829 0
696,294 2,960,108 3,065,966 131,514 238,172 2,906,809
2018 Water and SewerConstruction Fund 0 0 275,000 0 275,000 16,484,200
1776 Park Trust Fund 7,925 0 0 0 13,852 0
Water and SewerFunding to be Determined 0 0 0 0 0 0
$3,735,483 $15,300,664 $14,914,846 $6,063,663 $11,250,584 $27,055,666
Capital Projects
Construction Funds
General Fund
Project Summary by Fund
General Obligation
Water and Sewer Fund
Construction Fund
2009 Water and SewerConstruction Fund
2016 Water and SewerConstruction Fund
121
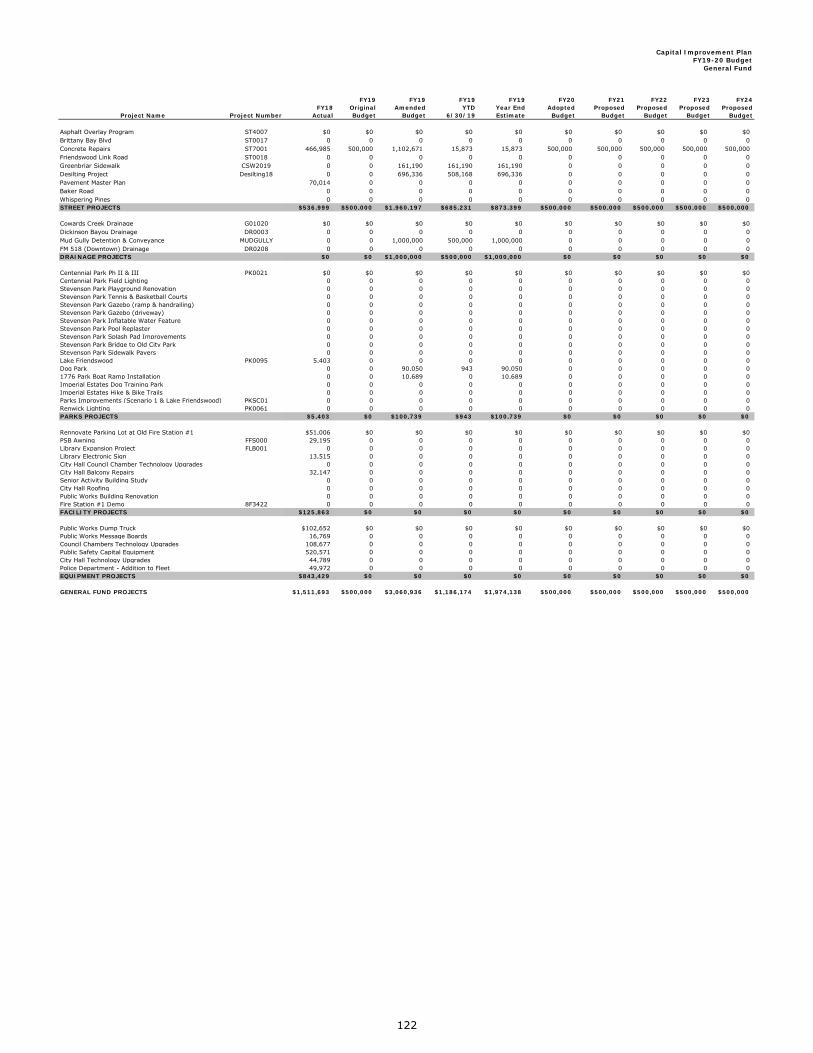
Asphalt Overlay Program ST4007 $0 $0 $0 $0 $0 $0 $0 $0 $0 $0Brittany Bay Blvd ST0017 0 0 0 0 0 0 0 0 0 0Concrete Repairs ST7001 466,985 500,000 1,102,671 15,873 15,873 500,000 500,000 500,000 500,000 500,000Friendswood Link Road ST0018 0 0 0 0 0 0 0 0 0 0Greenbriar Sidewalk CSW2019 0 0 161,190 161,190 161,190 0 0 0 0 0Desilting Project Desilting18 0 0 696,336 508,168 696,336 0 0 0 0 0Pavement Master Plan 70,014 0 0 0 0 0 0 0 0 0Baker Road 0 0 0 0 0 0 0 0 0 0Whispering Pines 0 0 0 0 0 0 0 0 0 0STREET PROJECTS $536,999 $500,000 $1,960,197 $685,231 $873,399 $500,000 $500,000 $500,000 $500,000 $500,000
Cowards Creek Drainage G01020 $0 $0 $0 $0 $0 $0 $0 $0 $0 $0Dickinson Bayou Drainage DR0003 0 0 0 0 0 0 0 0 0 0Mud Gully Detention & Conveyance MUDGULLY 0 0 1,000,000 500,000 1,000,000 0 0 0 0 0FM 518 (Downtown) Drainage DR0208 0 0 0 0 0 0 0 0 0 0DRAINAGE PROJECTS $0 $0 $1,000,000 $500,000 $1,000,000 $0 $0 $0 $0 $0
Centennial Park Ph II & III PK0021 $0 $0 $0 $0 $0 $0 $0 $0 $0 $0Centennial Park Field Lighting 0 0 0 0 0 0 0 0 0 0Stevenson Park Playground Renovation 0 0 0 0 0 0 0 0 0 0Stevenson Park Tennis & Basketball Courts 0 0 0 0 0 0 0 0 0 0Stevenson Park Gazebo (ramp & handrailing) 0 0 0 0 0 0 0 0 0 0Stevenson Park Gazebo (driveway) 0 0 0 0 0 0 0 0 0 0Stevenson Park Inflatable Water Feature 0 0 0 0 0 0 0 0 0 0Stevenson Park Pool Replaster 0 0 0 0 0 0 0 0 0 0Stevenson Park Splash Pad Improvements 0 0 0 0 0 0 0 0 0 0Stevenson Park Bridge to Old City Park 0 0 0 0 0 0 0 0 0 0Stevenson Park Sidewalk Pavers 0 0 0 0 0 0 0 0 0 0Lake Friendswood PK0095 5,403 0 0 0 0 0 0 0 0 0Dog Park 0 0 90,050 943 90,050 0 0 0 0 01776 Park Boat Ramp Installation 0 0 10,689 0 10,689 0 0 0 0 0Imperial Estates Dog Training Park 0 0 0 0 0 0 0 0 0 0Imperial Estates Hike & Bike Trails 0 0 0 0 0 0 0 0 0 0Parks Improvements (Scenario 1 & Lake Friendswood) PKSC01 0 0 0 0 0 0 0 0 0 0Renwick Lighting PK0061 0 0 0 0 0 0 0 0 0 0PARKS PROJECTS $5,403 $0 $100,739 $943 $100,739 $0 $0 $0 $0 $0
Rennovate Parking Lot at Old Fire Station #1 $51,006 $0 $0 $0 $0 $0 $0 $0 $0 $0PSB Awning FFS000 29,195 0 0 0 0 0 0 0 0 0Library Expansion Project FLB001 0 0 0 0 0 0 0 0 0 0Library Electronic Sign 13,515 0 0 0 0 0 0 0 0 0City Hall Council Chamber Technology Upgrades 0 0 0 0 0 0 0 0 0 0City Hall Balcony Repairs 32,147 0 0 0 0 0 0 0 0 0Senior Activity Building Study 0 0 0 0 0 0 0 0 0 0City Hall Roofing 0 0 0 0 0 0 0 0 0 0Public Works Building Renovation 0 0 0 0 0 0 0 0 0 0Fire Station #1 Demo 8F3422 0 0 0 0 0 0 0 0 0 0FACILITY PROJECTS $125,863 $0 $0 $0 $0 $0 $0 $0 $0 $0
Public Works Dump Truck $102,652 $0 $0 $0 $0 $0 $0 $0 $0 $0Public Works Message Boards 16,769 0 0 0 0 0 0 0 0 0Council Chambers Technology Upgrades 108,677 0 0 0 0 0 0 0 0 0Public Safety Capital Equipment 520,571 0 0 0 0 0 0 0 0 0City Hall Technology Upgrades 44,789 0 0 0 0 0 0 0 0 0Police Department - Addition to Fleet 49,972 0 0 0 0 0 0 0 0 0EQUIPMENT PROJECTS $843,429 $0 $0 $0 $0 $0 $0 $0 $0 $0
GENERAL FUND PROJECTS $1,511,693 $500,000 $3,060,936 $1,186,174 $1,974,138 $500,000 $500,000 $500,000 $500,000 $500,000
FY24Proposed
Budget
Capital Improvement PlanFY19-20 Budget
General Fund
Project NumberFY18
ActualProject Name
FY20Adopted
Budget
FY21Proposed
Budget
FY19OriginalBudget
FY19Amended
Budget
FY23Proposed
Budget
FY22Proposed
Budget
FY19Year EndEstimate
FY19YTD
6/30/19
122

General Fund (001)Capital Improvement Projects
Account Listing
FY18 Actual
FY19 Original Budget
FY19 Amended
Budget
FY19 YTD
6/30/19
FY19 Year End Estimate
FY20 Adopted Budget
58-00 Operating Equipment $0 $0 $0 $0 $0 $066-10 Building Renovations 7,414 0 0 0 0 078-00 Contract Services 0 0 0 0 0 081-12 Environmental Testing 0 0 0 0 0 081-20 Buildings 0 0 0 0 0 081-40 Building Renovations 38,249 0 0 0 0 082-30 Parking/Driveways 0 0 0 0 0 083-00 Vehicles 0 0 0 0 0 084-00 Capital Operating Equipment 108,677 0 0 0 0 088-00 Capital Equipment 44,789 0 0 0 0 085-91 Construction (Contracted) 0 0 0 0 0 085-96 Surveying 0 0 0 0 0 085-97 Soil/Concrete Testing 0 0 0 0 0 0General Government Total $199,128 $0 $0 $0 $0 $0
58-00 Operating Equipment <$5000 $0 $0 $0 $0 $0 $066-00 Facility Maintenance 0 0 0 0 0 074-00 Operating Services 0 0 0 0 0 078-00 Contract Services 0 0 0 0 0 081-20 Buildings 41,476 0 0 0 0 082-30 Parking/Driveways/Sidewalks 9,530 0 0 0 0 083-00 Vehicles 0 0 0 0 0 084-00 Capital Operating Equipment 0 0 0 0 0 085-81 Preliminary Study 0 0 0 0 0 085-82 Design Engineering 0 0 0 0 0 085-83 Architectural Services 0 0 0 0 0 085-91 Construction (Contracted) 0 0 0 0 0 088-00 Capital Equipment 570,542 0 0 0 0 0Public Safety Total $621,548 $0 $0 $0 $0 $0
65-10 Street Maintenance $0 $0 $696,336 $508,168 $696,336 $071-30 Engineering Services 0 0 0 0 0 078-00 Contract Services 70,014 0 0 0 0 081-11 Easements And Row 0 0 0 0 0 083-00 Vehicles 0 0 0 0 0 084-00 Capital Operating Equipment 16,769 0 0 0 0 085-10 Street & Sidewalk Improv 0 0 0 0 0 085-11 Concrete Streets 0 0 0 0 0 085-12 Asphalt Streets 466,985 500,000 1,102,671 15,872 15,872 500,00085-21 Sidewalks 0 0 161,190 161,190 161,190 085-30 Drainage Improvements 0 0 1,000,000 500,000 1,000,000 085-91 Construction (Contracted) 0 0 0 0 0 085-96 Surveying 0 0 0 0 0 085-97 Construction Testing 0 0 0 0 0 088-00 Capital Equipment 102,652 0 0 0 0 0Public Works Total $656,420 $500,000 $2,960,197 $1,185,230 $1,873,399 $500,000
58-00 Operating Equipment < $5000 $0 $0 $0 $0 $0 $065-61 Swimming Pool Maintenance 0 0 0 0 065-64 Park Trail/Sidewalk Maintenance 0 0 0 0 0 081-20 Buildings 0 0 0 0 0 081-40 Building Renovations 0 0 0 0 0 082-30 Other Property Imprvmnts/Parking 0 0 0 0 0 084-00 Capital Operating Equipment 29,195 0 0 0 0 085-60 Parks Improvements 0 0 100,739 943 100,739 085-82 Design Engineering 0 0 0 0 0 085-91 Construction (Contracted) 0 0 0 0 0 085-96 Surveying 0 0 0 0 0 085-97 Soil/Concrete Testing 0 0 0 0 0 085-98 Misc Construction Costs 0 0 0 0 0 085-99 Geotechnical Services 0 0 0 0 0 088-00 Capital Equipment 5,403 0 0 0 0 0Culture & Recreation Total $34,598 $0 $100,739 $943 $100,739 $0
81-10 Land $0 $0 $0 $0 $0 $081-12 Environmental Assess 0 0 0 0 0 081-13 Appraisals 0 0 0 0 0 081-15 Storm Water Detention 0 0 0 0 0 085-96 Surveying 0 0 0 0 0 0Financial Admin Total $0 $0 $0 $0 $0 $0
GENERAL FUND PROJECTS $1,511,693 $500,000 $3,060,936 $1,186,174 $1,974,138 $500,000
123

Capital Improvement PlanFY19-20 Budget
Proposed General Obligation Projects
Projects to be determined (FY14) $0 $0 $0 $0 $0 $0 $0 $0 $0 $0Shadowbend (FM 518 to Woodlawn) GO1510 0 0 0 0 0 0 0 0 0Woodlawn (FM 2351 to Shadowbend) GO1516 52,442 0 0 0 0 0 0 0 0 0Townes Road (Lucian to Crofter Glen) GO1511 0 0 0 0 0 0 0 0 0 0Mary Ann (FM 518 to Christina) GO1509 0 0 0 0 0 0 0 0 0 0Blackhawk Boulevard GO1515 728,346 5,353,316 3,900,732 1,811,400 3,890,166 881,580 0 0 0 0Winding Road (Melody to Riverside) GO1512 0 0 0 0 0 0 0 0 0 0Friendswood Link Road ST0018 0 0 0 0 0 0 0 0 0 0Oak Vista Drive 0 0 0 0 0 0 0 0 0 0Wandering Trail 0 0 0 0 0 0 0 0 0 0Other Street Improvements (as needed) 0 0 0 0 0 0 0 0 0 0STREET PROJECTS $780,788 $5,353,316 $3,900,732 $1,811,400 $3,890,166 $881,580 $0 $0 $0 $0
Annalea Whitehall Drain Phase II - IV $0 $0 $0 $0 $0 $0 $0 $0 $0 $0Clover Acres Drainage DR0205 0 0 0 0 0 0 0 0 0 0Coward Creek Watershed G00120 0 0 0 0 0 0 0 0 0 0Glennshannon Drainage DR0204 0 0 0 0 0 0 0 0 0 0Mission Estates Outfall 0 0 0 0 0 0 0 0 0 0Praire Wilde Drainage DR0207 0 0 0 0 0 0 0 0 0 0Sun Meadow Drainage Phase II - V 0 0 0 0 0 0 0 0 0 0W. Edgewood (FM 2351) Drainage Outfall Wegner Ditch 0 0 0 0 0 0 0 0 0 0Woodlawn Drainage DR0202 0 0 0 0 0 0 0 0 0 0Library Expansion Project-Drawings 0 0 0 0 0 0 0 0 0 0Baker Road Detention 0 0 0 0 0 0 0 0 0 0Shadowbend Drainage Phase II 0 0 0 0 0 0 0 0 0 0Shadowbend Drainage Phase III 0 0 0 0 0 0 0 0 0 0Melody Lane Drainage 0 0 0 0 0 0 0 0 0 0FM 518 Drainage Improvements 0 0 0 0 0 0 0 0 0 0Mud Gully Detention & Conveyance 0 0 0 0 0 0 0 0 0 0Southern Panhandle Reg. Detention 0 0 0 0 0 0 0 0 0 0Northern Panhandle Reg. Detention 0 0 0 0 0 0 0 0 0 0DRAINAGE PROJECTS $0 $0 $0 $0 $0 $0 $0 $0 $0 $0
Centennial Park Ph II & III PK0021 $0 $0 $0 $0 $0 $0 $0 $0 $0 $0Stevenson Park Improvements 0 650,000 632,171 595,012 632,171 0 0 0 0 0Centennial Park Basketball Pavilion GO1504 257 0 0 0 0 0 0 0 0 0Lake Friendswood Improvements GO1506? 3,000 0 0 0 0 0 0 0 0 01776 Park, Imperial Estates Improvements 0 0 0 0 0 0 0 0 0 0Expansion of Existing Parks 0 0 0 0 0 0 0 0 0 0Friendswood Sports Park Improvements GO1507 0 0 0 0 0 0 0 0 0 0Brick Pavers for Downtown PAVERS 350 0 0 0 0 0 0 0 0 0Old City Park 103,530 363,798 512,727 475,518 512,338 129,871 0 0 0 0PARKS PROJECTS $107,137 $1,013,798 $1,144,898 $1,070,529 $1,144,509 $129,871 $0 $0 $0 $0
Fire Station #4 Expansion FFS000 $53,246 $0 $1,279 $502 $502 $0 $0 $0 $0 $0New Fire Station Construction at PSB GO1502 10,338 0 0 777 $777 0 0 0 0 0Public Safety Bldg Ph I FPS001 0 0 0 0 $0 0 0 0 0 0Animal Control Building 779827 0 0 0 0 $0 0 0 0 0 0Library Expansion FLB001 0 0 0 0 $0 0 0 0 0 0City Hall Parking Lot Expansion PKLOT 0 0 0 0 $0 0 0 0 0 0Civic Center 0 0 0 0 $0 0 0 0 0 0Records Retention Center 0 0 0 0 $0 0 0 0 0 0FACILITY PROJECTS $63,584 $0 $1,279 $1,279 $1,279 $0 $0 $0 $0 $0
GENERAL OBLIGATION FUND PROJECTS $951,509 $6,367,114 $5,046,910 $2,883,209 $5,035,954 $1,011,451 $0 $0 $0 $0
Source for Future Years: The Capital Improvement Program Manual
FY24Proposed
Budget
FY21Proposed
Budget
FY22Proposed
Budget
FY19YTD
6/30/19Project Name
FY20 Adopted
Budget
FY23Proposed
BudgetFY18
Actual
FY19Year EndEstimate
Project Number
FY19OriginalBudget
FY19Amended
Budget
124

General Obligation Bonds Fund (250 - 255)Capital Improvement Projects
Account Listing
FY18 Actual
FY19 Original Budget
FY19 Amended
Budget
FY19 YTD
6/30/19
FY19 Year End Estimate
FY20 Adopted
Budget
81-20 Buildings $0 $0 $0 $0 $0 $085-83 Architectural Services 0 0 0 0 0 085-91 Construction (Contracted) 0 0 0 0 0 0General Government Total $0 $0 $0 $0 $0 $0
85-82 Design Engineering $2,267 $0 $1,279 $1,279 $1,279 $085-83 Architectural Services 0 0 0 0 0 085-91 Construction (Contracted) 61,317 0 0 0 0 085-97 Soil/Concrete Testing 0 0 0 0 0 088-00 Capital Equipment 0 0 0 0 0 0Public Safety Total $63,584 $0 $1,279 $1,279 $1,279 $0
85-10 Street & Sidewalk Improv $7,913 $0 $0 $0 $0 $085-11 Concrete Streets 487,041 0 3,667,873 1,717,185 3,667,873 085-12 Asphalt Streets 0 0 0 0 0 085-19 Other Street Improvements 1,951 0 0 0 0 085-30 Drainage Improvements 0 0 0 0 0 085-81 Preliminary Engineering 0 0 0 0 0 085-82 Design Engineering 231,690 0 134,784 48,911 134,703 085-84 Constr Administration 0 0 0 0 0 085-90 CIP Contingency 0 0 10,486 0 0 085-91 Construction (Contracted) 39,012 5,353,316 3,565 3,565 3,565 881,58085-96 Surveying 0 0 0 0 0 085-97 Construction Testing 13,182 0 72,265 29,979 72,265 085-98 Misc Construction Costs 0 0 11,760 11,760 11,760 0Public Works Total $780,788 $5,353,316 $3,900,732 $1,811,400 $3,890,166 $881,580
58-00 Operating Equipment < $5000 $0 $0 $0 $7,330 $7,330 $078-30 Rental 0 0 0 0 0 081-13 Appraisals 0 0 0 0 0 082-20 Lighting 0 0 0 0 0 082-30 Parking/Driveways/Sidewalks 39,516 0 137,727 137,738 137,738 082-40 Fence 0 0 27,236 0 27,236 085-60 Parks Improvements 259 0 0 0 0 085-65 Restrooms 0 0 878,314 844,761 878,314 085-82 Design Engineering 0 0 0 1,500 1,500 085-85 Construction Inspection 0 0 0 0 0 085-90 CIP Contingency 0 0 17,456 0 0 085-91 Construction (Contracted) 64,362 1,013,798 0 8,227 8,227 129,87185-92 Materials (In-House) 0 0 5,261 1,843 5,261 085-96 Surveying 3,000 0 3,500 2,000 3,500 085-97 Soil/Concrete Testing 0 0 0 0 0 085-98 Misc Construction Costs 0 0 70,032 67,130 70,031 085-99 Geotechnical Services 0 0 0 0 0 088-00 Capital Equipment 0 0 5,372 0 5,372 0Culture & Recreation Total $107,137 $1,013,798 $1,144,898 $1,070,530 $1,144,510 $129,871
GENERAL OBLIGATION BOND FUND PROJECTS $951,509 $6,367,114 $5,046,910 $2,883,209 $5,035,954 $1,011,451
125

Capital Improvement PlanFY19-20 Budget
Police Investigations FundsFunds 101, 102 and 103
Public Safety Capital Equipment $40,792 $0 $93,295 $8,295 $93,295 $0 $0 $0 $0 $0POLICE CAPITAL EQUIPMENT PROJECTS $40,792 $0 $93,295 $8,295 $93,295 $0 $0 $0 $0 $0
POLICE INVESTIGATIONS FUND PROJECTS $40,792 $0 $93,295 $8,295 $93,295 $0 $0 $0 $0 $0
Police Investigations Funds (101, 102 & 103)Capital Improvement ProjectsAccount Listing
FY18 Actual
FY19 Original Budget
FY19 Amended
Budget
FY19 YTD
6/30/19
FY19 Year End Estimate
FY20 Adopted
Budget
84-00 Capital Operating Equipment $0 $0 $0 $0 $0 $088-00 Capital Equipment 40,792 0 93,295 8,295 93,295 0Police Capital Equipment Projects Total $40,792 $0 $93,295 $8,295 $93,295 $0
POLICE INVESTIAGTION FUND PROJECTS $40,792 $0 $93,295 $8,295 $93,295 $0
FY19YTD
6/30/19Project NameFY18
Actual
FY19OriginalBudget
FY19Amended
Budget
FY23Proposed
Budget
FY24Proposed
Budget
FY19Year EndEstimate
FY20Adopted
Budget
FY21Proposed
Budget
FY22Proposed
Budget
126

Capital Improvement PlanFY19-20 Budget
Municipal Court FundFund 150
Security Cameras $0 $0 $10,000 $10,000 $10,000 $0 $0 $0 $0 $0Security Projects 0 0 0 0 0 0 0 0 0 0
0 0 0 0 0 0 0 0 0 0BUILDING SECURITY $0 $0 $10,000 $10,000 $10,000 $0 $0 $0 $0 $0
Technology Projects $0 $0 $0 $0 $0 $0 $0 0 $0 $0COURT TECHNOLOGY $0 $0 $0 $0 $0 $0 $0 $0 $0 $0
MUNICIPAL COURT FUND PROJECTS $0 $0 $10,000 $10,000 $10,000 $0 $0 $0 $0 $0
Municipal Court Fund (150)Capital Improvement ProjectsAccount Listing
FY18 Actual
FY19 Original Budget
FY19 Amended
Budget
FY19 YTD
6/30/19
FY19 Year End Estimate
FY20 Adopted
Budget
78-00 Contract Services $0 $0 $0 $0 $0 $088-00 Capital Equipment 0 0 10,000 10,000 10,000 0Public Works Total $0 $0 $10,000 $10,000 $10,000 $0
MUNICIPAL COURT FUND PROJECTS $0 $0 $10,000 $10,000 $10,000 $0
FY19YTD
6/30/19Project NameFY18
Actual
FY19OriginalBudget
FY19Amended
Budget
FY23Proposed
Budget
FY24Proposed
Budget
FY19Year EndEstimate
FY20Adopted
Budget
FY21Proposed
Budget
FY22Proposed
Budget
127
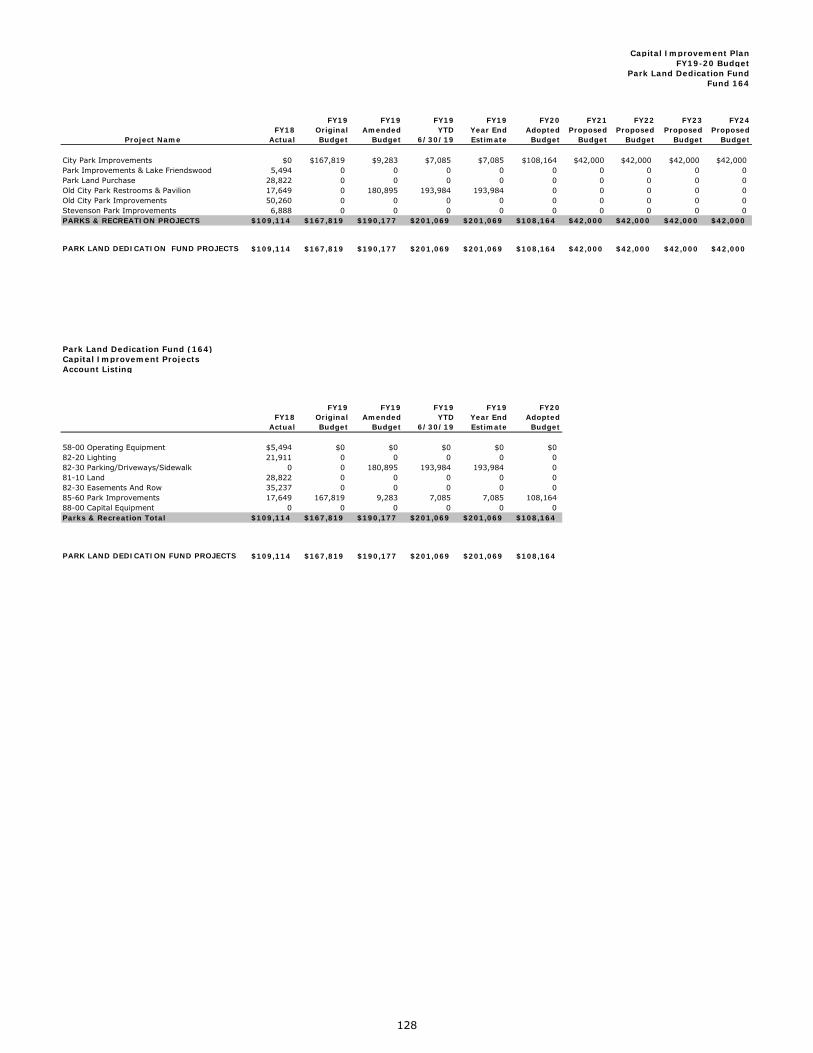
Capital Improvement PlanFY19-20 Budget
Park Land Dedication FundFund 164
City Park Improvements $0 $167,819 $9,283 $7,085 $7,085 $108,164 $42,000 $42,000 $42,000 $42,000Park Improvements & Lake Friendswood 5,494 0 0 0 0 0 0 0 0 0Park Land Purchase 28,822 0 0 0 0 0 0 0 0 0Old City Park Restrooms & Pavilion 17,649 0 180,895 193,984 193,984 0 0 0 0 0Old City Park Improvements 50,260 0 0 0 0 0 0 0 0 0Stevenson Park Improvements 6,888 0 0 0 0 0 0 0 0 0PARKS & RECREATION PROJECTS $109,114 $167,819 $190,177 $201,069 $201,069 $108,164 $42,000 $42,000 $42,000 $42,000
PARK LAND DEDICATION FUND PROJECTS $109,114 $167,819 $190,177 $201,069 $201,069 $108,164 $42,000 $42,000 $42,000 $42,000
Park Land Dedication Fund (164)Capital Improvement ProjectsAccount Listing
FY18 Actual
FY19 Original Budget
FY19 Amended
Budget
FY19 YTD
6/30/19
FY19 Year End Estimate
FY20 Adopted
Budget
58-00 Operating Equipment $5,494 $0 $0 $0 $0 $082-20 Lighting 21,911 0 0 0 0 082-30 Parking/Driveways/Sidewalk 0 0 180,895 193,984 193,984 081-10 Land 28,822 0 0 0 0 082-30 Easements And Row 35,237 0 0 0 0 085-60 Park Improvements 17,649 167,819 9,283 7,085 7,085 108,16488-00 Capital Equipment 0 0 0 0 0 0Parks & Recreation Total $109,114 $167,819 $190,177 $201,069 $201,069 $108,164
PARK LAND DEDICATION FUND PROJECTS $109,114 $167,819 $190,177 $201,069 $201,069 $108,164
Project Name
FY23Proposed
Budget
FY19Year EndEstimate
FY24Proposed
Budget
FY19YTD
6/30/19
FY22Proposed
BudgetFY18
Actual
FY19OriginalBudget
FY19Amended
Budget
FY20Adopted
Budget
FY21Proposed
Budget
128

Capital Improvement PlanFY19-20 Budget
Street Improvements FundFund 170
Street Improvements $0 $4,093,608 $1,700,000 $1,207,197 $1,700,000 $4,192,001 $1,675,085 $1,691,836 $1,708,754 $1,725,842STREET IMPROVEMENTS PROJECTS $0 $4,093,608 $1,700,000 $1,207,197 $1,700,000 $4,192,001 $1,675,085 $1,691,836 $1,708,754 $1,725,842
STREET IMPROVEMENTS FUND PROJECTS $0 $4,093,608 $1,700,000 $1,207,197 $1,700,000 $4,192,001 $1,675,085 $1,691,836 $1,708,754 $1,725,842
Street Improvements Fund (170)Capital Improvement ProjectsAccount Listing
FY18 Actual
FY19 Original Budget
FY19 Amended
Budget
FY19 YTD
6/30/19
FY19 Year End Estimate
FY20 Adopted Budget
85-12 Asphalt Streets $0 $4,093,608 $1,700,000 $1,207,197 $1,700,000 $4,192,001Street Improvements Total $0 $4,093,608 $1,700,000 $1,207,197 $1,700,000 $4,192,001
STREET IMPROVEMENTS FUND PROJECTS $0 $4,093,608 $1,700,000 $1,207,197 $1,700,000 $4,192,001
FY23Proposed
Budget
FY24Proposed
Budget
FY19Year EndEstimate
FY20AdoptedBudget
FY21Proposed
Budget
FY22Proposed
Budget
FY19YTD
6/30/19Project NameFY18
Actual
FY19OriginalBudget
FY19Amended
Budget
129

Capital Improvement PlanFY19-20 Budget
Economic Development Improvements FundFund 175
Economic Development Improvements $0 $912,015 $41,818 $34,529 $41,818 $1,553,041 $471,169 $475,881 $480,639 $485,446ECONOMIC DEVELOPMENT IMPROVEMENTS PROJECTS $0 $912,015 $41,818 $34,529 $41,818 $1,553,041 $471,169 $475,881 $480,639 $485,446
ECONOMIC DEVELOPMENT IMPROVEMENTS FUND PROJECTS $0 $912,015 $41,818 $34,529 $41,818 $1,553,041 $471,169 $475,881 $480,639 $485,446
Economic Development Improvements Fund (175)Capital Improvement ProjectsAccount Listing
FY18 Actual
FY19 Original Budget
FY19 Amended
Budget
FY19 YTD
6/30/19
FY19 Year End Estimate
FY20 Adopted Budget
85-91 Construction (Contracted) $0 $912,015 $41,818 $34,529 $41,818 $1,553,041Economic Development Improvements Total $0 $912,015 $41,818 $34,529 $41,818 $1,553,041
ECONOMIC DEVELOPMENT IMPROVEMENTS FUND PROJECTS $0 $912,015 $41,818 $34,529 $41,818 $1,553,041
FY23Proposed
Budget
FY24Proposed
Budget
FY19Year EndEstimate
FY20AdoptedBudget
FY21Proposed
Budget
FY22Proposed
Budget
FY19YTD
6/30/19Project NameFY18
Actual
FY19OriginalBudget
FY19Amended
Budget
130

Capital Improvement PlanFY19 -20 Budget
Water and Sewer FundFund 401
COH Raw Water System Buy-In $0 $0 $0 $0 $0 $0 $0 $0 $0 $042" Water Main Replacement 0 0 0 0 0 0 0 0 0 0Water Plant #1 Rehab 0 0 0 0 0 0 0 0 0 0Water Plant #2 Rehab 0 0 0 0 0 0 0 0 0 0Water Plant #3 Rehab 0 0 0 0 0 0 0 0 0 0Water Plant #4 Rehab 0 0 0 0 0 0 0 0 0 0Water Plant #7 Rehab 0 0 0 0 0 0 0 0 0 0Mandale Rd. Waterline Extension 0 0 0 0 0 0 0 0 0 0Waterlines-Blkhwk/Oak Vista/Wand'g Trl 50,565 0 375,408 335,338 375,408 0 0 0 0 0Waterlines- Frwd Link/Whispering Pines 0 0 0 0 0 0 0 0 0 0Utility Impact Fee Update Study 0 0 0 0 0 0 0 0 0 0Surface Water Station #2 0 0 59,300 0 59,290 0 0 0 0 0Central 16" Interconnect 0 0 0 0 0 0 0 0 0 0West Water Interconnect 0 0 0 0 0 0 0 0 0 0DISTRIBUTION PROJECTS $50,565 $0 $434,708 $335,338 $434,698 $0 $0 $0 $0 $0
Sewer Line Maint & Cleaning $240,316 $300,000 $793,758 $66,339 $793,758 $300,000 $300,000 $300,000 $300,000 $300,000Sewer Line PSB 0 0 0 0 0 0 0 0 0 0Utility Master Plan 0 0 0 0 0 0 0 0 0 0Sewer Line System Assessment 0 0 0 0 0 0 0 0 0 0Software Support Services (GIS) 0 0 0 0 0 0 0 0 0 0Blackhawk WWTP Rehab 70,356 0 202,278 0 47,834 0 0 0 0 0Stadium Lane Parking Sewer Line 0 0 0 0 0 0 0 0 0 0Blackhawk Blvd Phase II 0 0 0 0 0 0 0 0 0 0Eagle Lake Lift Station Improvement 0 0 0 0 0 0 0 0 0 0Lift Station #18 Replacement 38,920 0 0 0 0 0 0 0 0 0Lift Station Structural Platform Design 18,000 0 0 0 0 0 0 0 0 0San Joaquin Lift Station Improvements 0 0 0 0 0 0 0 0 0 0Public works Building Renovations 0 0 0 0 0 0 0 0 0 0Public Works Capital Operating Equipment 0 0 0 0 0 0 0 0 0 0COLLECTION PROJECTS $367,592 $300,000 $996,036 $66,339 $841,592 $300,000 $300,000 $300,000 $300,000 $300,000
WATER & SEWER FUND PROJECTS $418,157 $300,000 $1,430,744 $401,677 $1,276,290 $300,000 $300,000 $300,000 $300,000 $300,000
Source for Future Years: The Capital Improvement Program Manual
Project Name
FY19Year EndEstimate
FY19YTD
6/30/19
FY23 Proposed
Budget
FY24 Proposed
Budget
FY20Adopted
BudgetFY18
Actual
FY19OriginalBudget
FY19Amended
Budget
FY21Proposed
Budget
FY22Proposed
Budget
131

Water and Sewer Fund (401)Capital Improvement Projects
Account Listing
FY18 Actual
FY19 Original Budget
FY19 Amended
Budget
FY189 YTD
6/30/19
FY19 Year End Estimate
FY20 Adopted Budget
54-76 Water Meters-Repl Program $0 $0 $0 $0 $0 $054-78 Fire Hydrant Program 0 0 0 0 0 066-10 Building Renovations 0 0 0 0 0 082-30 Parking/Driveways/Sidewalks 0 0 59,300 0 59,300 083-00 Vehicles 0 0 0 0 0 084-00 Capital Operating Equip 0 0 0 0 0 085-41 Distribution Lines 0 0 0 0 0 085-81 Preliminary Engineering 0 0 0 0 0 085-82 Design Engineering 0 0 0 0 0 085-85 Construction Inspection 0 0 0 0 0 085-91 Construction (Contracted) 50,565 0 375,408 335,338 375,408 085-96 Surveying 0 0 0 0 0 085-97 Soil/Concrete Testing 0 0 0 0 0 085-99 Geotechnical Services 0 0 0 0 0 088-00 Capital Equipment 0 0 0 0 0 0Water (Distribution System) $50,565 $0 $434,708 $335,338 $434,708 $0
65-51 Collection Line Maintenance $240,316 $300,000 $793,758 $66,339 $793,758 $300,00066-10 Building Renovations 0 0 0 0 0 078-00 Engineering Services 18,000 0 0 0 0 085-51 Collection Lines 0 0 0 0 0 085-81 Preliminary Engineering 0 0 0 0 0 085-82 Design Engineering 70,356 0 202,278 0 47,834 085-91 Construction (Contracted) 38,920 0 0 0 0 085-96 Surveying 0 0 0 0 0 085-97 Soil/Concrete Testing 0 0 0 0 0 0Sewer (Collection System) $367,592 $300,000 $996,036 $66,339 $841,592 $300,000
WATER & SEWER PROJECTS $418,157 $300,000 $1,430,744 $401,677 $1,276,300 $300,000
132

Capital Improvement PlanFY19-20 Budget
Water and Sewer Bonds Projects
Surface Water Station #3 UW0007 $0 $0 $0 $0 $0 $4,600,000 $0 $0 $0 $0Blackhawk Waterline UW0012 0 0 0 0 0 0 0 0 0 0Water Plant #1 Rehabilitation 0 0 0 0 0 1,207,000 0 0 0 0Water Plant #2 Rehabilitation UW0017 0 0 0 0 346,829 0 0 0 0 0Water Plant #3 Rehabilitation 0 0 0 0 0 0 0 0 0 636,000Water Plant #4 Rehabilitation 0 0 0 0 0 0 0 0 0 636,000Water Plant #5 Rehabilitation UW0018 0 0 0 0 0 0 0 0 0 0Water Plant #6 Rehabilitation UW0019 0 0 0 0 0 0 0 0 0 0Water Plant #7 Rehabilitation UW0026 0 0 0 0 0 0 0 0 0 0Deepwood Force Main US0007 0 0 0 0 0 0 0 0 0 0Beamer Road Water Line UW0032 0 0 0 0 0 0 0 0 0 042" Water Main Replacement 0 0 0 0 0 2,531,200 0 0 0COH Raw Water System Buy-In UW0510 0 0 0 0 0 0 0 0 0 0Second Take Point Phase II UW0521 0 0 0 0 0 0 0 0 0 0COH Raw Water System Buy-In 0 0 0 0 0 0 0 10,284,000 0 0Second Elevated Water Storage Tank Rehab 0 0 0 0 0 954,000 0 0 0 0DISTRIBUTION PROJECTS $0 $0 $0 $0 $346,829 $9,292,200 $0 $10,284,000 $0 $1,272,000
Combine Lift Stations 1 & 17 $0 $0 $0 $0 $0 $1,594,000 $0 $0 $0 $0Sanitary Sewer Assessment Phase IV 0 0 0 0 0 1,464,000 0 0 0 0Sanitary Sewer Assessment Phase V & VI 0 0 275,000 0 275,000 0 0 0 0 0Sanitary Sewer Assessment Phase VII 0 0 0 0 0 0 0 100,000 0 0Sanitary Sewer Assessment Phase VIII 0 0 0 0 0 0 0 0 0 1,800,000Sanitary Sewer Plant Additional Capacity 0 0 0 0 0 0 0 0 0 1,000,000Blackhawk WWTP Rehab 616,847 2,960,108 1,394,973 2,468 73,336 1,403,957 0 0 0 0Lift Station #2 Rehabilitation 0 0 0 0 0 0 0 0 0 0Lift Station #4 Rehabilitation 0 0 0 0 0 1,594,000 0 0 0 0Lift Station #22 Rehabilitation 0 0 0 0 0 0 0 0 0 1,372,000Lift Station #23 Replacement/Rehabilitation LS023 79,447 0 1,670,993 129,046 208,993 4,042,852 0 0 0 0COLLECTION SYSTEM PROJECTS $696,294 $2,960,108 $3,340,966 $131,514 $557,329 $10,098,809 $0 $100,000 $0 $4,172,000
WATER & SEWER BONDS FUND PROJECTS $696,294 $2,960,108 $3,340,966 $131,514 $904,158 $19,391,009 $0 $10,384,000 $0 $5,444,000
Source for Future Years: The Capital Improvement Program Manual
Some projects may be, ultimately, funded from Water & Sewer Fund working capital.
FY24 Proposed
BudgetProject Name
FY19YTD
6/30/19
FY21Proposed
Budget
FY23 Proposed
Budget
FY22Proposed
Budget
FY19Year EndEstimate
FY20Adopted
BudgetProject Number
FY19OriginalBudget
FY19Amended
BudgetFY18
Actual
133
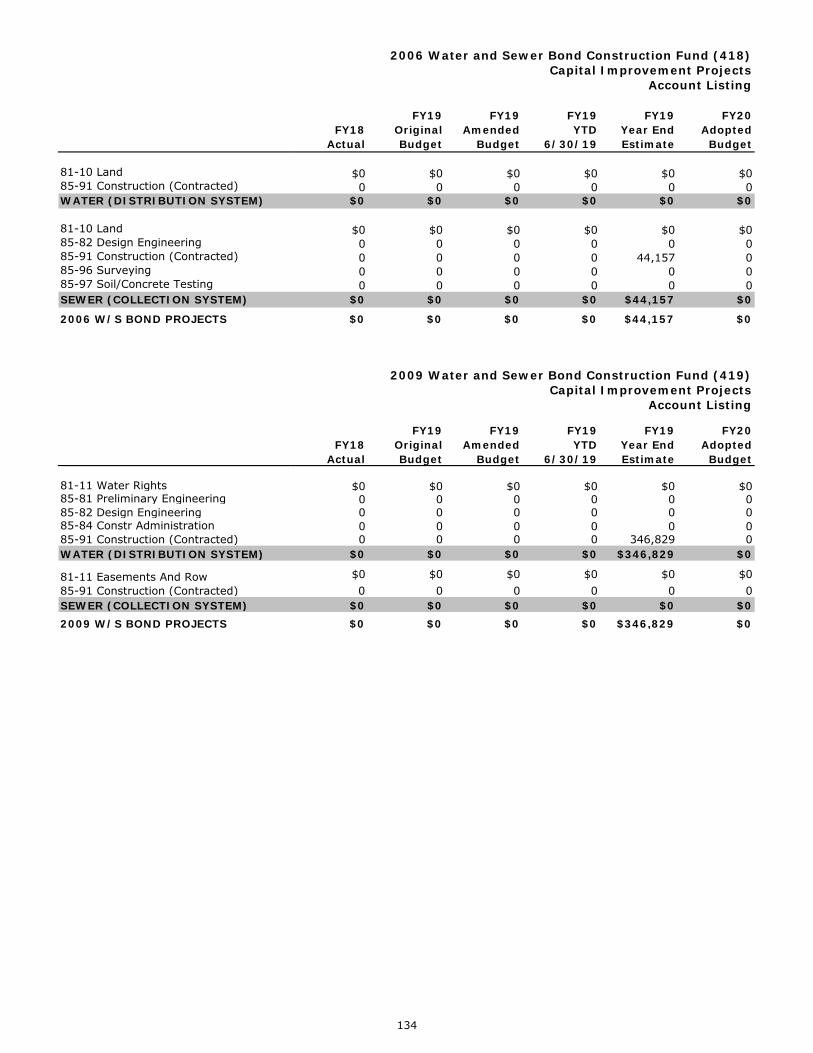
FY18 Actual
FY19 Original Budget
FY19 Amended
Budget
FY19 YTD
6/30/19
FY19 Year End Estimate
FY20 Adopted
Budget
81-10 Land $0 $0 $0 $0 $0 $0 85-91 Construction (Contracted) 0 0 0 0 0 0 WATER (DISTRIBUTION SYSTEM) $0 $0 $0 $0 $0 $0
81-10 Land $0 $0 $0 $0 $0 $0 85-82 Design Engineering 0 0 0 0 0 0 85-91 Construction (Contracted) 0 0 0 0 44,157 0 85-96 Surveying 0 0 0 0 0 0 85-97 Soil/Concrete Testing 0 0 0 0 0 0 SEWER (COLLECTION SYSTEM) $0 $0 $0 $0 $44,157 $0
2006 W/S BOND PROJECTS $0 $0 $0 $0 $44,157 $0
FY18 Actual
FY19 Original Budget
FY19 Amended
Budget
FY19 YTD
6/30/19
FY19 Year End Estimate
FY20 Adopted
Budget
81-11 Water Rights $0 $0 $0 $0 $0 $0 85-81 Preliminary Engineering 0 0 0 0 0 0 85-82 Design Engineering 0 0 0 0 0 0 85-84 Constr Administration 0 0 0 0 0 0 85-91 Construction (Contracted) 0 0 0 0 346,829 0 WATER (DISTRIBUTION SYSTEM) $0 $0 $0 $0 $346,829 $0
81-11 Easements And Row $0 $0 $0 $0 $0 $0 85-91 Construction (Contracted) 0 0 0 0 0 0 SEWER (COLLECTION SYSTEM) $0 $0 $0 $0 $0 $02009 W/S BOND PROJECTS $0 $0 $0 $0 $346,829 $0
2009 Water and Sewer Bond Construction Fund (419)Capital Improvement Projects
Account Listing
2006 Water and Sewer Bond Construction Fund (418)Capital Improvement Projects
Account Listing
134

FY18 Actual
FY19 Original Budget
FY19 Amended
Budget
FY19 YTD
6/30/19
FY19 Year End Estimate
FY20 Adopted Budget
81-10 Land $0 $0 $0 $0 $0 $0 81-11 Water Rights 0 0 0 0 0 0 81-13 Appraisals 0 0 0 0 0 0 85-41 Distribution Lines 0 0 0 0 0 0 85-43 Water Purification Plants 0 0 0 0 0 0 85-81 Preliminary Engineering 0 0 0 0 0 0 85-82 Design Engineering 0 0 0 0 0 0 85-84 Constr Administration 0 0 0 0 0 0 85-91 Construction (Contracted) 0 0 0 0 0 0 85-96 Surveying 0 0 0 0 0 0 85-97 Soil/Concrete Testing 0 0 0 0 0 0 85-99 Geotechnical Services 0 0 0 0 0 0 Water (Distribution System) $0 $0 $0 $0 $0 $0
81-10 Land $0 $0 $0 $0 $0 $0 81-11 Easements And Row 0 0 0 0 0 0 81-13 Appraisals 0 0 0 0 0 0 85-51 Collection Lines 0 0 0 0 0 0 85-52 Lift Station Improvemt 0 0 130,700 50,753 130,700 0 85-81 Preliminary Engineering 79,447 0 78,293 78,293 78,293 0 85-82 Design Engineering 0 0 0 0 0 0 85-91 Construction (Contracted) 616,847 2,960,108 29,179 2,468 29,179 2,906,809 85-96 Surveying 0 0 0 0 0 0 85-97 Soil/Concrete Testing 0 0 0 0 0 0 88-00 Capital Equipment 0 0 2,827,794 0 0 0 Sewer (Collection System) $696,294 $2,960,108 $3,065,966 $131,514 $238,172 $2,906,809
2016 W/S BOND PROJECTS $696,294 $2,960,108 $3,065,966 $131,514 $238,172 $2,906,809
FY18 Actual
FY19 Original Budget
FY19 Amended
Budget
FY19 YTD
6/30/19
FY19 Year End Estimate
FY20 Adopted Budget
81-11 Water Rights $0 $0 $0 $0 $0 $0 81-13 Appraisals 0 0 0 0 0 0 85-41 Distribution Lines 0 0 0 0 0 0 85-43 Water Purification Plants 0 0 0 0 0 0 85-81 Preliminary Engineering 0 0 0 0 0 0 85-82 Design Engineering 0 0 0 0 0 0 85-84 Constr Administration 0 0 0 0 0 0 85-91 Construction (Contracted) 0 0 0 0 0 9,292,200 85-96 Surveying 0 0 0 0 0 0 85-97 Soil/Concrete Testing 0 0 0 0 0 0 85-98 Misc Construction Costs 0 0 0 0 0 0 85-99 Geotechnical Services 0 0 0 0 0 0 WATER (DISTRIBUTION SYSTEM) $0 $0 $0 $0 $0 $9,292,200
81-11 Easements And Row $0 $0 $0 $0 $0 $0 81-13 Appraisals 0 0 0 0 0 0 85-51 Collection Lines 0 0 0 0 0 0 85-52 Lift Station Improvemt 0 0 0 0 0 0 85-81 Preliminary Engineering 0 0 275,000 0 275,000 0 85-82 Design Engineering 0 0 0 0 0 0 85-84 Constr Administration 0 0 0 0 0 0 85-91 Construction (Contracted) 0 0 0 0 0 7,192,000 85-96 Surveying 0 0 0 0 0 0 85-97 Soil/Concrete Testing 0 0 0 0 0 0 85-98 Misc Construction 0 0 0 0 0 0 85-99 Geotechnical Services 0 0 0 0 0 0 SEWER (COLLECTION SYSTEM) $0 $0 $275,000 $0 $275,000 $7,192,0002018 W/S BOND PROJECTS $0 $0 $275,000 $0 $275,000 $16,484,200
TOTAL W/S BONDS FUND PROJECTS $696,294 $2,960,108 $3,340,966 $131,514 $513,172 $19,391,009
Account Listing
2016 Water and Sewer Bond Construction Fund (420)Capital Improvement Projects
Account Listing
2018 Water and Sewer Bond Construction Fund (421)Capital Improvement Projects
135
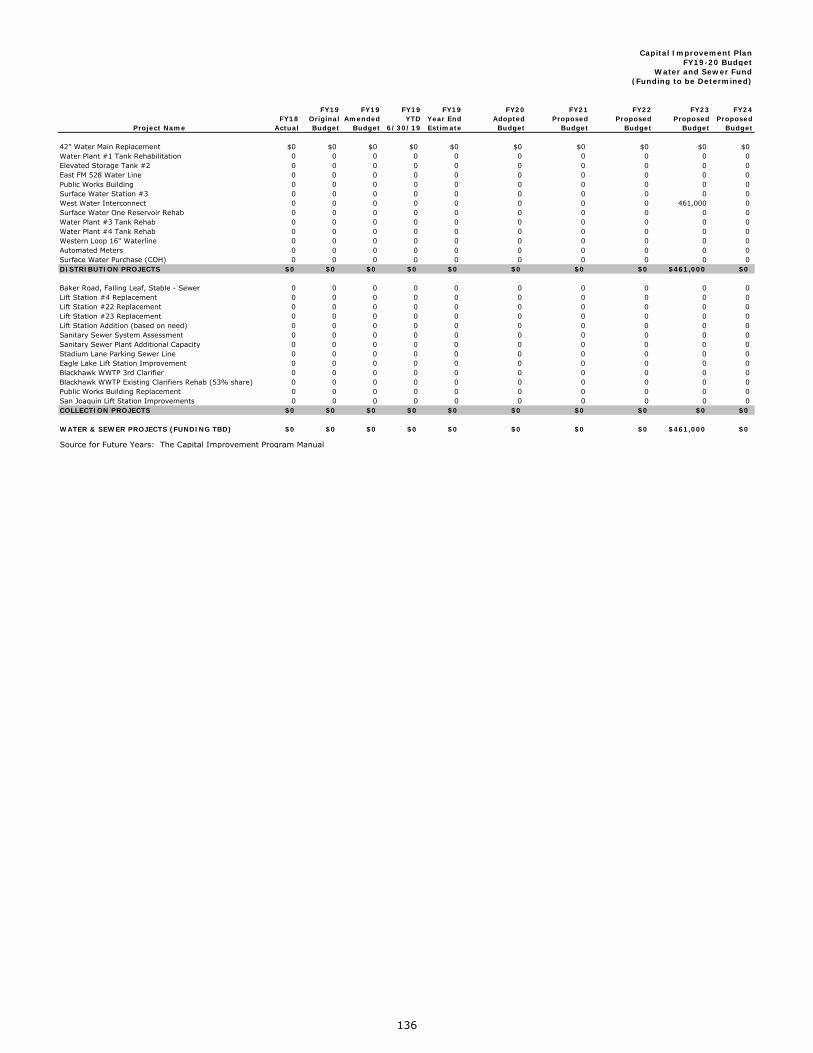
Capital Improvement PlanFY19-20 Budget
Water and Sewer Fund(Funding to be Determined)
42" Water Main Replacement $0 $0 $0 $0 $0 $0 $0 $0 $0 $0Water Plant #1 Tank Rehabilitation 0 0 0 0 0 0 0 0 0 0Elevated Storage Tank #2 0 0 0 0 0 0 0 0 0 0East FM 528 Water Line 0 0 0 0 0 0 0 0 0 0Public Works Building 0 0 0 0 0 0 0 0 0 0Surface Water Station #3 0 0 0 0 0 0 0 0 0 0West Water Interconnect 0 0 0 0 0 0 0 0 461,000 0Surface Water One Reservoir Rehab 0 0 0 0 0 0 0 0 0 0Water Plant #3 Tank Rehab 0 0 0 0 0 0 0 0 0 0Water Plant #4 Tank Rehab 0 0 0 0 0 0 0 0 0 0Western Loop 16" Waterline 0 0 0 0 0 0 0 0 0 0Automated Meters 0 0 0 0 0 0 0 0 0 0Surface Water Purchase (COH) 0 0 0 0 0 0 0 0 0 0DISTRIBUTION PROJECTS $0 $0 $0 $0 $0 $0 $0 $0 $461,000 $0
Baker Road, Falling Leaf, Stable - Sewer 0 0 0 0 0 0 0 0 0 0Lift Station #4 Replacement 0 0 0 0 0 0 0 0 0 0Lift Station #22 Replacement 0 0 0 0 0 0 0 0 0 0Lift Station #23 Replacement 0 0 0 0 0 0 0 0 0 0Lift Station Addition (based on need) 0 0 0 0 0 0 0 0 0 0Sanitary Sewer System Assessment 0 0 0 0 0 0 0 0 0 0Sanitary Sewer Plant Additional Capacity 0 0 0 0 0 0 0 0 0 0Stadium Lane Parking Sewer Line 0 0 0 0 0 0 0 0 0 0Eagle Lake Lift Station Improvement 0 0 0 0 0 0 0 0 0 0Blackhawk WWTP 3rd Clarifier 0 0 0 0 0 0 0 0 0 0Blackhawk WWTP Existing Clarifiers Rehab (53% share) 0 0 0 0 0 0 0 0 0 0Public Works Building Replacement 0 0 0 0 0 0 0 0 0 0San Joaquin Lift Station Improvements 0 0 0 0 0 0 0 0 0 0COLLECTION PROJECTS $0 $0 $0 $0 $0 $0 $0 $0 $0 $0
WATER & SEWER PROJECTS (FUNDING TBD) $0 $0 $0 $0 $0 $0 $0 $0 $461,000 $0
Source for Future Years: The Capital Improvement Program Manual
Project Name
FY21Proposed
Budget
FY23 Proposed
Budget
FY19Year EndEstimate
FY22Proposed
Budget
FY19YTD
6/30/19
FY24 Proposed
Budget
FY20AdoptedBudget
FY18Actual
FY19OriginalBudget
FY19Amended
Budget
136

Capital Improvement Program_____________________________________________________________
SIGNIFICANT NON-RECURRING
GENERAL OBLIGATION PROJECTS
(Planned for FY20 – FY24)
137

Capital Improvement Program_____________________________________________________________
Project Name: Mud Gully Detention and Conveyance
Project Type: Drainage
Subtype: Construction
Completion Year: 2020
Total Budget: $1,000,000
Funding Source: Unassigned General Fund Reserves
DescriptionThe City of Friendswood, in participation with the Galveston County Consolidated Drainage District, Harris County Flood Control District, Harris County, and Galveston County will undertake the Mud Gully Detention and Channel Improvements. This will include 120-Acre Detention Basin providing 1,550 acre-feet of detention capacity and approximately 1 mile of conveyance improvements.
Justification The above improvements would drop the surface elevation of Clear Creek and the Mud Gully, and provide benefits to over 700 structures that are within the 100-year flood plain. This is a component of the Clear Creek Federal Flood Control project which is being re-evaluated by the U.S. Army Corps of Engineers.
Operating ImpactThis project will not result in any additional operating cost for the City.
Project Name: Street Improvements (funded by G.O. Bonds authorized in 2013)
Project Type: Thoroughfare
Subtype: Construction
Completion Year: 2018-2020
Total Budget: $6,464,476
Funding Source: General Obligation Bonds (authorized 11/13)
DescriptionThe 2013 bond election included a proposition for street improvements identified in the City’s Pavement Management Master Plan as needing repair/replacement. The proposed improvements will replace damaged roadways.
The project will consist of Shadow BendAvenue, Winding Road, Woodlawn Drive,Townes Road, Mary Ann Drive & Blackhawk Boulevard.
JustificationAs identified in the Master Plan, replacing these roadways will help reduce on-going operation & maintenance costs for both the City and motorists traveling in Friendswood.
Operating Impact Annual estimated street maintenance cost is $3,761 per mile. This project consists of 2.84 total miles. Upon completion, this project’s annual maintenance cost would be approximately $10,680.
138

Capital Improvement Program_____________________________________________________________
Project Name: 1776 Park Improvements
Project Type: Park Facilities
Subtype: Construction
Completion Year: TBD
Total Budget: $430,000
Funding Source: Not yet determined
DescriptionIn an effort to upgrade area parks, and make them more usable to the residents, there are different items being used around the City to enhance existing Parks. Next door to 1776 Park in the Imperial Estates is a new Frisbee Golf Course. This project will add a Kayak
Launch, and 6’ wide trails to the existing amenities at this park.
Justification The demand for versatile Parks for all ages and all types of activities require the City to add and enhance the existing City fields.
Council Goal#6 Maintain High Level of Public Service
Project Name: Old City Park
Project Type: Parks
Subtype: Construction
Completion Year: 2020
Total Budget: $1,102,000
Funding Source: Voter Approved 2013 Park Bonds
DescriptionThe proposed plan has identified the requirement to renovate and update Old City Park. The park has been connected to Stevenson Park via a footbridge. Additional amenities include a dog park, 10’ wide
sidewalk, paved parking for 45 vehicles, new entry road from Briarmeadow and Merriewood, new picnic pavilion, new restroom building, playground equipment, and improved drainage throughout the site.
JustificationSince 1993, the Parks and Recreation Board have recommended the connection of Old City Park and Stevenson Park via a footbridge. Once connected, additional parking for special events such as the annual Fourth of July Celebration, Concerts-In-The-Parks, the Halloween Festival, and the Car Show can be accommodated. During the spring and summer soccer seasons, the existing gravel entry road generates extensive amounts of dust and debris that settle on nearby resident’s homes and vehicles. Paving the entry way and providing paved parking at the site will resolve this issue and will create a safe environment.
Council Goal#14 Develop Additional Parks
139

Capital Improvement Program_____________________________________________________________
Project Name: Wegner Ditch – Tributary II
Project Type: Drainage
Subtype: Construction
Completion Year: TBD
Total Budget: TBD
Funding Source: Grant + Cost Share
DescriptionIn 2004, the Texas Department of Transportation (TXDOT) prepared a comprehensive Drainage Plan for the F.M. 2351 corridor between F.M. 518 and the proposed Brittany Bay Boulevard. The purpose of the study was to identify critical drainage issues that would affect the widening of the roadway to 5 lanes and then propose solutions that could be addressed by the various agencies affected by the project. Three problem areas were identified. This project addresses problem area 2 and is a joint project between the City, Galveston Consolidated Drainage District, and TXDOT. The project calls for the construction of outfall (box culvert or ditch) located between Garden Street and
Sunset Drive. The outfall facility would extend from F.M. 2351 all the way to Cowards Creek, for a distance of 3300 feet.
JustificationThe proposed outfall would address several drainage areas along the F.M. corridor that currently do not have outfall drainage. The benefits would be realized on both sides of F.M. 2351, from Stadium Drive to Oak Drive.In addition, the proposed project wouldfacilitate the development of the roadway andrelieve traffic congestion along the corridorwithin the city limits of Friendswood.
Council Goal#5 Improve Drainage
*The Galveston County Consolidated Drainage District is currently constructing this project through agrant with CDBG. The City’s cost share was in the amount of $75,000 for Engineering and Surveying,which was paid in FY 2010
140

Capital Improvement Program_____________________________________________________________
SIGNIFICANT NON-RECURRING
UTILITY SERVICES PROJECTS
(Planned for FY20 – FY24)
141
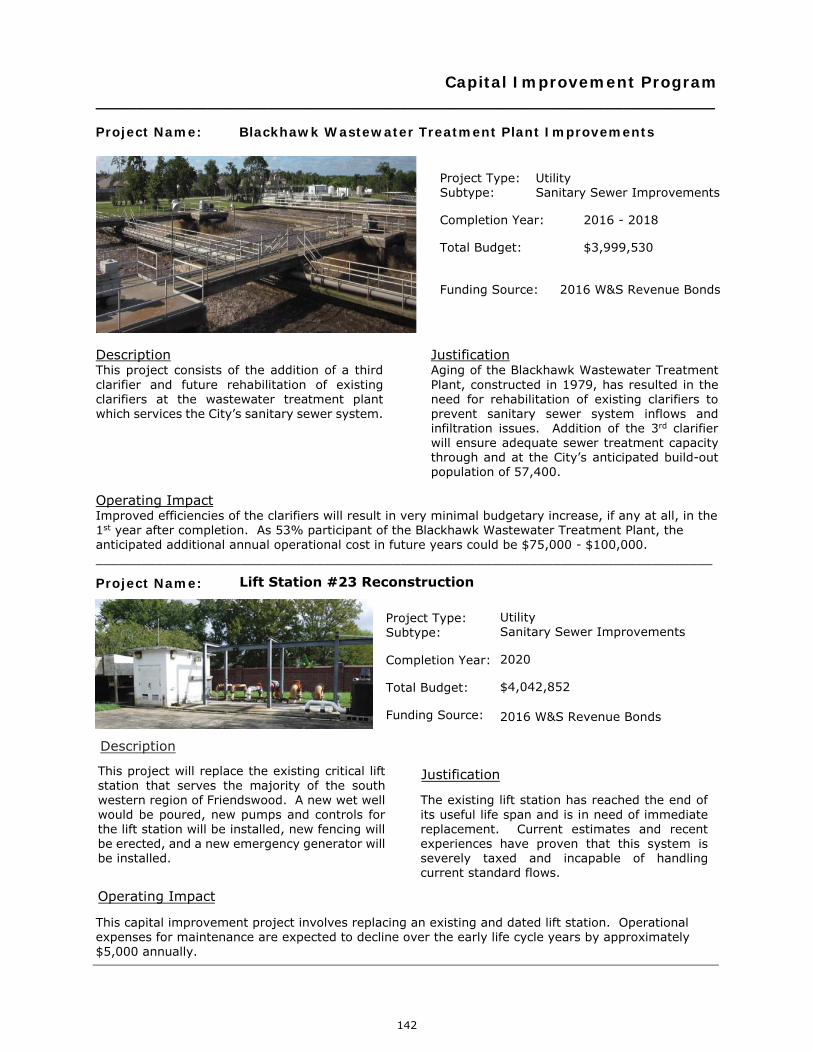
Capital Improvement Program_____________________________________________________________
Project Name: Blackhawk Wastewater Treatment Plant Improvements
Project Type: UtilitySubtype: Sanitary Sewer Improvements
Completion Year: 2016 - 2018
Total Budget: $3,999,530
Funding Source: 2016 W&S Revenue Bonds
DescriptionThis project consists of the addition of a third clarifier and future rehabilitation of existing clarifiers at the wastewater treatment plant which services the City’s sanitary sewer system.
JustificationAging of the Blackhawk Wastewater Treatment Plant, constructed in 1979, has resulted in the need for rehabilitation of existing clarifiers to prevent sanitary sewer system inflows and infiltration issues. Addition of the 3rd clarifier will ensure adequate sewer treatment capacity through and at the City’s anticipated build-out population of 57,400.
Operating Impact Improved efficiencies of the clarifiers will result in very minimal budgetary increase, if any at all, in the 1st year after completion. As 53% participant of the Blackhawk Wastewater Treatment Plant, the anticipated additional annual operational cost in future years could be $75,000 - $100,000._________________________________________________________________________________
UtilitySanitary Sewer Improvements
2020
$4,042,852
2016 W&S Revenue Bonds
Project Type:Subtype:
Completion Year:
Total Budget:
Funding Source:
Justification
The existing lift station has reached the end of its useful life span and is in need of immediate replacement. Current estimates and recent experiences have proven that this system is severely taxed and incapable of handling current standard flows.
This project will replace the existing critical lift station that serves the majority of the south western region of Friendswood. A new wet well would be poured, new pumps and controls for the lift station will be installed, new fencing will be erected, and a new emergency generator will be installed.
Operating Impact
This capital improvement project involves replacing an existing and dated lift station. Operational expenses for maintenance are expected to decline over the early life cycle years by approximately $5,000 annually.
Project Name:
142

Capital Improvement Program_____________________________________________________________
Project Name: Lift Station #4 Replacement
Project Type: Utility Subtype: Sanitary Sewer Improvements
Completion Year: TBD
Total Budget: $1,594,000
Funding Source: Not yet identified
DescriptionThis project would replace the existing lift station that serves the Polly Ranch area. A new wet well would be poured, new pumps and controls for the lift station would be installed, and new fencing will be erected.
JustificationThe existing lift station at Polly Ranch has reached the end of its useful life span and is in need of replacement. Current estimates indicate that this system will be severely taxed and incapable of handling even normal combined flows in the next few years.
Operating ImpactThis capital improvement project involves replacing an existing and dated lift station. Operational expenses for maintenance are expected to decline over the early life cycle years by approximately $5,000 annually.
Project Name: Lift Station #1 & #17 Combination/Reconstruction
Project Type: Utility Subtype: Sanitary Sewer Improvements
Completion Year: TBD
Total Budget: $1,594,000
Funding Source: Not yet identified
DescriptionComplete reconstruction of the Lift Station #17 facilities would include wet well, pumps and controls. The reuse of existing generator is possible. The new installation would replace a facility over 30 years old and in deteriorating condition. In general terms, the project would have within its definition the installation of three submersible sewage pumps of the 15 to 20 HP range, controls and associated instrumentation should be in stainless enclosures and placed above the flood level. A new fence should also
be included in this project. The current 480 Volt, 3 Phase 150 amp service and natural gas for the generator is existent at this site.
JustificationThis lift station serves the Wedgewood area bordered by Clear Creek to the west, Blackhawk Boulevard to the east, F.M. 2351 to the north, and Shady Oaks Drive to the south. The facility also receives sewage from lift station number 37 located at our surface water station number 2 plant. It is in terms of flow, within the 10 largest lift station facilities in the city.
Operating ImpactThis capital improvement project involves replacing an existing and dated lift station. Operational expenses for maintenance are expected to decline over the early life cycle years by approximately $5,000 (each) annually.
143

Capital Improvement Program_____________________________________________________________
Project Name: Sanitary Sewer Assessment (Phases IV)
Project Type: Utility Subtype: Sanitary Sewer Improvements
Completion Year: 2020-2021
Total Budget: $1,464,000
Funding Source: 2018 Series W/S Bond
DescriptionBasins Eight and Eighteen was part of the original group of areas experiencing the greatest inflow and infiltration. Basins Eight and Eighteen consist of approximately 75,029 linear feet of gravity sanitary sewer lines and 179 manholes. Basin Eight encompasses the western portion of FM 2351 (Coward Creek subdivision) from Sunset to Hackney and from Falling Leaf to the city limits across from FM 2351. Basin Eighteen encompasses the eastern most portion of the city along Bay Area Boulevard. The subdivisions of Friendswood Oaks and Terra Bella primary areas.
JustificationAs part of the Sanitary Sewer System Assessment Phase I an overall master plan was developed to further investigate specific basins based on the original flow monitoring data.
Phase IV will be the construction of the design plans from Phase III.
Operating ImpactThis capital improvement project is not expected to result in annual operating costs or savings. However, upon completion the City will not face the fines and penalties enforced by TECQ for infiltration/inflow violations.
Project Name: Lift Station #22 Reconstruction
Project Type: Utility Subtype: Sanitary Sewer Improvements
Completion Year: 2024-2025
Total Budget: $1,372,000Funding Source: 2018 Series W/S BondDescriptionThis project would replace the existing lift station that serves the Forest Bend area. A new wet well would be poured, new pumps and controls for the lift station would be installed, and new fencing will be erected.
Justification The existing lift station at Forest Bend has reached the end of its useful life span and is in need of replacement. Current estimates indicate that this system will be severely taxed and incapable of handling even normal combined flows in the next few years.
Operating ImpactThis capital improvement project involves replacing an existing and dated lift station. Operational expenses for maintenance are expected to decline over the early life cycle years by approximately $5,000 annually._________________________________________________________________________________
144

Capital Improvement Program_____________________________________________________________
Project Name: Second Elevated Water Storage Tank Rehabilitation
Project Type: Utility
Subtype: Water Plant Improvements
Completion Year: 2020-2021
Total Budget: $954,000
Funding Source: 2018 Series W/S Bond
DescriptionThe rehabilitation of the existing elevated storage tank will include the sand blasting and painting of the storage tank and some minor repairs to pumping equipment.
JustificationA preventive maintenance program would prolong the life of the facilities. The ground storage needs to be painted every 10 to 12 years to assure its integrity and usefulness.
Operating ImpactNo additional maintenance and operational cost are associated with this capital improvement as it is a rehab to an existing water storage tank. Approximate future cost of repeating this rehab in 10 to 12 yearsis $484K.
Project Name: Water Plant #3 Tank Rehabilitation
Project Type: Utility Subtype: Water Distribution Improvements
Completion Year: 2024-2025
Total Budget: $636,000
Funding Source: 2018 Series W/S Bond
DescriptionThe rehabilitation will include the sand blasting and painting of the ground storage tank and some minor repair/ replacement of pumps and control equipment.
JustificationThis is part of a preventive maintenance effort to prolong the life of the facilities. Ground storage tanks require painting every 10 to 12 years to assure its integrity and usefulness, and more importantly to meet required State TCEQ water quality mandates.
Operating Impact No additional cost or budgetary savings are anticipated due to the nature and scope of this project.
145

Capital Improvement Program_____________________________________________________________
Project Name: 42 Inch Water Main Replacement
Project Type: Utility
Subtype: Water Distribution Improvements
Completion Year: TBD
Budget: $12,656,000
Funding Source: $2,531,000 of $12,656,000 funded by 2018 Series W/S Bond
DescriptionThis is a co-participation project with the City of Houston and other participants in the upgrade of the main north / south surface water transmission pipeline from the Southeast Water Purification Plant along State Highway 3. Texas Department of Transportation plans to widen State Highway 3 and it will be necessary to remove the existing pipeline from the State right-of-way in preparation for that project. This presents an opportunity to up-size this transmission line when it is removed from the easement. The removal / construction project will be managed by the City of Houston and Participant’s cost share will be based on a pro-rata use according to their distribution allocation. Friendswood’s distribution allocation from this line is balanced by its distribution
allocation from the 36-inch line on Beamer. Replacement and movement of the 42-inch line to a location outside of the Highway 3 ROW is planned for completion by 2015 in order for Texas Department of Transportation (TxDOT) project to proceed on schedule.
JustificationThe City of Friendswood is a participant in the operation and maintenance of the 42 inch Water Line. That pro-rata participation is reduced by its participation in the Beamer Road 36 inch transmission line. The City is dependent on these as the source of surface water required to meet the Ground Water Reduction Plan as established in 2001, and to meet growing population requirements through build-out.
Operating ImpactThe City is currently charged $0.64 per gallon for surface water received through this waterline.Completion of this capital improvement project will not result in any additional water to the City; therefore no additional operating costs are expected.
146

Capital Improvement Program_____________________________________________________________
Project Name: Water Plant #4 Tank Rehabilitation
Project Type: Utility Subtype: Water Distribution Improvements
Completion Year: 2024-2025
Total Budget: $636,000
Funding Source: 2018 Series W/S Bond
DescriptionThe rehabilitation will include the sand blasting and painting of the ground storage tank and some minor repairs to the required pumping equipment.
JustificationPreventive maintenance program prolongs the life of the facilities. The ground storage needs to be painted every 10 to 12 years to assure its integrity and usefulness, and more importantly to meet required State TCEQ water quality mandates.
Operating Impact No additional cost or budgetary savings are anticipated due to the nature and scope of this project.
Project Name: West Water Interconnect
Project Type: Utility Subtype: Water Distribution Improvements
Completion Year: TBD
Total Budget: $418,000
Funding Source: Water & Sewer Working Capital
DescriptionThe proposed improvements would extend an independent 12” to interconnect the existing 16” transmission water main line on Wilderness Trails to the 12’ main on F.M. 528.
JustificationCurrently, limited un-looped water lines service various developments throughout the southern region of Friendswood, therefore limiting the availability of needed constant water pressure on the farther western regions of Friendswood. The proposed transmission water main would provide the needed direct constant supply of water to this proposed area, ultimately providing development opportunities along the far western regions of FM 528.
Operating Impact This capital improvement project involves adding a total of approximately 5 miles to the City’s existing waterlines. Based on projected future waterline maintenance cost of approximately $2,244 per mile, additional annual operating maintenance cost for this project will be about $11,222.
147

Capital Improvement Program_____________________________________________________________
Project Name: Western Loop 16” Waterline
Project Type: Utility Subtype: Water Distribution Improvements
Completion Year: TBD
Total Budget: $1,200,000
Funding Source: Not yet identified
DescriptionThis project consists of extending waterlines from water plant #4 connecting to existing City waterlines in the western portion of our service area.
JustificationThe project would improve water pressure along FM 528 and open the western portion of the City for development opportunities.
Operating ImpactThis capital improvement project involves adding a total of approximately 5 miles to the City’s existing waterlines. Based on current waterline maintenance cost of approximately $1,936 per mile, additional annual operating maintenance cost for this project will be about $9,680.
Project Name: COH Raw Water System Buy-In
Project Type: Utility Subtype: Water Distribution Improvements
Completion Year: 2022
Total Budget: $10,284,000
Funding Source: 2018 Series W/S Bond
DescriptionThis is a purchase of raw water capacity from the City of Houston through their centralization of the Raw Water feed system to the Southeast Water Purification Plant. The City of Houston has for years operated and maintained their raw water collection and distribution system used for providing the water supply to treatment facilities individually. A decision was taken recently to share the costs of operations, maintenance, and improvements out among the municipal customer-participants currently acting as co-owners in the treatment and transmission facilities. In order for Houston to continue supplying raw water in future and prevent the sole burden of the cost being shared only by Houston all future co-participants desire more capacity are to share the cost. In order to do this fairly, all raw water supplies are group to create a raw water system with a 200 MGD capacity.
JustificationThis is a component of the Surface Water supply-treatment and distribution system that the City has bought into as an outgrowth of the 2001 Ground Water Reduction Plan. The City of Houston is sharing out the cost of this system with its co-participants.
148

Capital Improvement Program_____________________________________________________________
Project Name: Sanitary Sewer Assessment (Phases V & VI)
Project Type: Utility Subtype: Sanitary Sewer Improvements
Completion Year: 2019-2020
Total Budget: $275,000
Funding Source: 2018 Series W/S Bond
DescriptionBasins Five and Twenty are part of the second tier group of areas experiencing the greatest inflow and infiltration. Basins Eight, Eighteen, and One were studied as part of Phase II and Phase V. Basins Five and Twenty consists of approximately 67,770 linear feet of gravity sanitary sewer lines and 352 manholes. Basin Five encompasses the northern portion of the city from FM 2351 to the city limits west of FM 518 down to the drainage ditch east of North Sunset Drive. Basin Twenty encompasses the southern portion of Blackhawk Boulevard (Wedgewood Village) from Cedar Gulley to Friendswood Link Road and from the city limits down to Clear Creek.
JustificationAs part of the Sanitary Sewer System Assessment Phase I an overall master plan was developed to further investigate specific basins based on the original flow monitoring data. Phase VI will be the third such in-depth investigation into specific basins._________________________________________________________________________________
Project Name: Sanitary Sewer Assessment (Phases VII)
Project Type: Utility Subtype: Sanitary Sewer Improvements
Completion Year: 2022-2023
Total Budget: $100,000
Funding Source: 2018 Series W/S Bond
DescriptionBasins One, Five, and Twenty will have comprehensive studies conducted on their systems to determine deficiencies. Based on the results, engineering will need to be designed to correct the areas. Basins One, Five, and Twenty consists of approximately 100,000 linear feet of gravity sanitary sewer lines and 625 manholes. Basin One encompasses the northern portion of Blackhawk Boulevard (Wedgewood Village) from Cedar Gulley to FM 2351 and from Beamer Road to Clear Creek on FM 2351. Basin Five encompasses the northern portion of the city from FM 2351 to the city limits west of FM 518 down to the drainage ditch east of North Sunset Drive. Basin Twenty encompasses the southern portion of Blackhawk Boulevard (Wedgewood Village) from Cedar Gulley to Friendswood Link Road and from the city limits down to Clear Creek. The limits of the areas needed to be designed will become clearer after completion of Phases V and VI.
JustificationAs part of the Sanitary Sewer System Assessment Phase I an overall master plan was developed to further investigate specific basins based on the original flow monitoring data. Phases V and VI will be the second and third such in-depth investigations into specific basins. This will be the second engineering design project for the assessment._________________________________________________________________________________
149

Capital Improvement Program_____________________________________________________________
Project Name: Sanitary Sewer Assessment (Phases VIII)
Project Type: Utility Subtype: Sanitary Sewer Improvements
Completion Year: 2024-2025
Total Budget: $1,800,000
Funding Source: 2018 Series W/S Bond
DescriptionBasins One, Five, and Twenty will have comprehensive studies conducted on their systems to determine deficiencies. Based on the results, engineering will need to be designed to correct the areas. Basins One, Five, and Twenty consists of approximately 100,000 linear feet of gravity sanitary sewer lines and 625 manholes. Basin One encompasses the northern portion of Blackhawk Boulevard (Wedgewood Village) from Cedar Gulley to FM 2351 and from Beamer Road to Clear Creek on FM 2351. Basin Five encompasses the northern portion of the city from FM 2351 to the city limits west of FM 518 down to the drainage ditch east of North Sunset Drive. Basin Twenty encompasses the southern portion of Blackhawk Boulevard (Wedgewood Village) from Cedar Gulley to Friendswood Link Road and from the city limits down to Clear Creek. The limits of the areas needed to be designed will become clearer after completion of Phases V and VI. Phase VIII will be the construction of the design plans from Phase VII.
JustificationAs part of the Sanitary Sewer System Assessment Phase I an overall master plan was developed tofurther investigate specific basins based on the original flow monitoring data. Phases V and VI will be the second and third such in-depth investigations into specific basins. This will be the second construction project for the assessment._________________________________________________________________________________
Project Name: Water Plant #1 Tank Rehabilitation
Project Type: Utility Subtype: Water Distribution Improvements
Completion Year: TBD
Total Budget: $1,207,000
Funding Source: Not yet identified
DescriptionThe project includes sand blasting and painting of both ground storage tanks and some minor equipment repairs and replacements.
JustificationA preventative maintenance program prolongs the life of the facilities. The ground storage tanks require blasting and painting every 10 to 12 years to assure their integrity and usefulness.
Operating Impact No additional cost or budgetary savings are anticipated due to the nature and scope of this project.
150

Capital Improvement Program_____________________________________________________________
Project Name: Central 16” Interconnect
Project Type: Utility Subtype: Water Distribution Improvements
Completion Year: TBD
Total Budget: $110,000
Funding Source: Water & Sewer Fund Working Capital
DescriptionThis project consists of installation of approximately 3,000 linear feet of 16” waterlines to connect water service along Wilderness Trails to the 12” main waterline on FM 528.
JustificationThe project would improve water pressure and provide potable water to the southernmost area of the City along FM 528.
Operating ImpactThis capital improvement project involves adding a total of approximately 3,000 linear feet (or 0.576 miles) to the City’s existing waterlines. Based on current waterline maintenance cost of approximately $1,880 per mile, additional annual operating maintenance cost for this project will be about $1,083.
Project Name: Surface Water One Reservoir Rehabilitation
Project Type: Utility Subtype: Water Distribution Improvements
Completion Year: TBD
Total Budget: $950,000
Funding Source: Not yet identified
DescriptionThe project includes sand blasting and painting of both ground storage tanks and some minor equipment repairs and replacements.
JustificationA preventive maintenance program prolongs thelife of the facilities. The ground storage tanks require blasting and painting every 10 to 12 years to assure their integrity and usefulness, and more importantly to meet required State TCEQ water quality mandates.
Operating Impact Due to the nature and scope of this capital improvements project, no additional cost of budgetary savings are expected. _________________________________________________________________________________
151

Capital Improvement Program_____________________________________________________________
CIP Program - General Government Projects Beyond 5-Year CIP
PROJECT Estimated Cost*
OtherFunds
Other Funding Source
Annalea/Whitehall Drainage Improvements** $1,207,000 $0
Brittany Bay Blvd Phase II $9,084,000 $6,203,100 Development Contribution
Fire Station #4 3rd Bay $917,000 $0
FM 518 Drainage Improvements Phase II $3,871,000 $0
Hike and Bike Connecting Trails $5,804,000 $0
Northern Panhandle Regional Detention $8,192,000 $0
Parks Maintenance Building Phase 1 & 2 $2,377,000 $0
Public Works Building $4,480,000 $0
Records Retention Center $675,000 $0
Shadowbend Drainage Improvements** $438,000 $0
Southern Panhandle Regional Detention $22,967,000 $0
Sunmeadow Drainage Improvements** $2,583,000 $0
Street Maintenance Master Plan $5,000,000 $0
Total Estimates $67,595,000 $6,203,100
*In 2017 Dollars
**Multiple Phases in the Future
152

Capital Improvement Program_____________________________________________________________
CIP – Water & Sewer Projects Beyond 5-Year CIP
PROJECT Estimated Cost OtherFunds
Other Funding Source
Baker Road, Falling Leaf, Stable – Sewer $1,203,000 $0
Beamer Road Sanitary Sewer** $4,210,000 $0
Beamer Road Water Line** $2,043,000 $0
East Water Loop $1,354,000 $0
El Dorado/Lundy Lane Sanitary Sewer $3,880,000 $0
FM 528 - Falcon Ridge to Windsong Sanitary Sewer $1,005,000 $0FM 528 - Lundy Lane to Tower Estates Sanitary Sewer $1,585,000 $0
Friendswood Lakes Water Loop $358,000 $0
San Joaquin Estates Water Line Replacement $1,913,000 $0
San Joaquin Water Loop $358,000 $0
Sanitary Sewer System Assessment 10 Year Plan $7,153,000 $0
Sixteen Inch Transmission Line Phase II $1,290,000 $0
South FM 518 Water Line $878,000 $0
South Friendswood Service Area Water Loop $955,000 $0
Stable Road – Water $251,000 $0
Water Plant #5 Tank Rehabilitation $1,587,000 $0
Water Plant #6 Tank Rehabilitation $636,000 $0
West Transmission Line $9,064,000 $0
West Water Interconnect $461,000 $0
Wilderness Trails Water Loop $292,000 $0
Windsong Lane – Water $167,000 $0
Windsong Sanitary Sewer $3,061,000 $0
Total Estimates $43,704,000 $0
*In 2017 Dollars
**Multiple Phases in the Future
153

Capital Improvement Program_____________________________________________________________
Capital Projects completed since CIP Program Inception (1999)
City FacilitiesLibrary Expansion & RenovationsPublic Safety BuildingFire Station #4Fire Station at PSBPublic Works Security GatePublic Works Wash BayLibrary Land AcquisitionPublic Works Vehicle Storage BuildingMunicipal Court RenovationsAnimal Control FacilityFire Station #3 RehabilitationEmergency Generators – Fire Stations 1 & 2
City Parks & RecreationCentennial Park - Phases 1, 2 & 3Friendswood Sports ParkStevenson Park Jogging TrailStevenson Park Playground RenovationCentennial Park Field #33 Lighting Stevenson Park Gazebo Driveway Stevenson Park Gazebo RampStevenson Park Gazebo Hand-railingSportspark ImprovementsStevenson Park Splash Pad, lighting, trailsCentennial Basketball PavilionStevenson Park Pool RestroomsOld City Park Restrooms & Pavilion
Street & Parking Lot PavingSunset DriveFriendswood Link Road ExtensionAdditional City Hall ParkingActivity Building ParkingBlackhawk Blvd Reconstruction (Phase 1)Oak Vista Court ReconstructionWandering Trail ReconstructionBaker Road ReconstructionFire Station #3 ParkingLibrary ParkingMelody Lane ReconstructionSunnyview/Skyview ReconstructionStadium Lane ParkingW. Shadowbend/Woodlawn ReconstructionWhitaker Drive ConstructionTownes Rd Reconstruction (Lucian to Crofterglen)Mary Ann Dr Reconstruction (FM 518 to Christina)Winding Rd Reconstruction (Melody to Riverside)Friendswood Link Road (Phase 2)Old City Park Parking LotGreenbriar Sidewalks
Drainage Annalea/Whitehall/Kings Park – Phase 1Clover Acres FM 518 – Phase 1Glennshannon – Phase 1Sunmeadow – Phase 1W. Shadowbend/Woodlawn – Phase 1
Water and Sewer UtilitiesBlackhawk FM 2351 WaterlineE. Heritage 8” Sanitary Sewer16” Waterline (Melody to Sunset)Autumn Creek Sewer LineAdditional Water Purchase2nd Surface Water Take Point & System Loop24” Trunk LineMoore/Mandale Waterline LoopBay Area Blvd WaterlineWWTP Waterline Loop 8”Longwood Park Water & SewerWater Plant #1 RehabilitationWater Plant #3 RehabilitationWater Plant #4 RehabilitationSan Joaquin Estates SewerSecond Elevated TankSun Meadow Lift StationSouth Friendswood Force MainBlackhawk Waterline16” Transmission Waterline (Sunset to WW#4)FM 2351/Beamer Rd. UtilitiesLift Station Emergency GeneratorsLift Station #6 ReplacementBlackhawk/Oak Vista/Wandering Trail waterlinesWater Plant #2 ReplacementWater Plant #5 RehabilitationWater Plant #6 RehabilitationWater Plant #7 ReplacementLift Station #18 RehabilitationLift Station #3 ReplacementFriendswood Link/Whispering Pines water linesFriendswood Link/Whispering Pines sewer linesPublic Works heavy equipment purchasesUtility Impact Fee Study - 2013Utility Cost of Service & Rate Study – 2014SCADA System Upgrade – Phase IUtility Impact Fee Study - 2019
154
This page is intentionally left blank.
155

DEPARTMENT SUMMARY
EXPENDITURE BY DIVISION
DEPARTMENTFY18
ACTUAL
FY19ORIGINAL
BUDGET
FY19AMENDED
BUDGET
FY19 YTD
6/30/19
FY19YEAR ENDESTIMATE
FY20ADOPTED
BUDGET
% CHANGE INBUDGET FROM
FY19 TO FY20
MAYOR AND COUNCIL $396,163 $319,784 $338,192 $220,102 $319,737 $369,058 15.4%CITY SECRETARY'S OFFICE 505,696 537,488 543,192 363,785 522,078 558,704 3.9%CITY MANAGER'S OFFICE 1,137,780 1,015,737 1,169,231 798,144 1,149,994 1,046,768 3.1%ADMINISTRATIVE SERVICES 4,094,933 4,216,212 4,375,357 3,002,380 4,201,045 4,919,146 16.7%POLICE 10,694,515 11,210,483 11,387,934 7,857,684 11,278,299 11,872,801 5.9%FIRE MARSHAL'S OFFICE 4,898,382 915,655 941,247 657,738 889,525 2,512,555 174.4%FWD VOLUNTEER FIRE DEPT 1,620,288 1,819,298 1,819,298 1,375,424 1,547,072 0 -100.0%COMMUNITY DEVELOPMENT 994,804 1,135,338 1,135,338 781,398 1,086,926 1,227,230 8.1%PUBLIC WORKS 8,579,413 10,040,042 12,277,088 8,252,086 11,913,976 14,678,833 46.2%ENGINEERING 0 0 0 0 0 783,759 0.0%LIBRARY 1,214,027 1,239,090 1,300,219 862,982 1,242,823 1,252,132 1.1%PARKS & RECREATION 3,629,507 3,441,934 3,897,361 2,680,416 3,890,708 3,979,553 15.6%DEPARTMENT TOTAL $37,765,508 $35,891,061 $39,184,457 $26,852,139 $38,042,183 $43,200,539 20.4%
EXPENDITURE BY CLASSIFICATION
CLASSIFICATIONFY18
ACTUAL
FY19ORIGINAL
BUDGET
FY19AMENDED
BUDGET
FY19 YTD
6/30/19
FY19YEAR ENDESTIMATE
FY20ADOPTED
BUDGET
% CHANGE INBUDGET FROM
FY19 TO FY20
SALARIES AND BENEFITS $20,481,531 $21,839,723 $21,842,223 $15,313,622 $21,462,307 $23,215,869 6.3%SUPPLIES 1,756,961 1,358,213 1,495,207 921,347 1,389,800 1,461,170 7.6%MAINTENANCE 1,196,852 1,529,244 1,629,663 923,920 1,539,961 1,473,960 -3.6%SERVICES 13,236,897 10,601,916 12,739,171 8,721,964 12,211,316 15,155,237 42.9%CAPITAL OUTLAY 878,140 388,264 895,990 420,666 865,703 448,500 15.5%OTHER 215,127 173,701 582,204 550,620 573,096 1,445,803 732.4%CLASSIFICATION TOTAL $37,765,508 $35,891,061 $39,184,457 $26,852,139 $38,042,183 $43,200,539 20.4%
PERSONNEL SUMMARY BY DIVISION
DIVISIONFY18
ACTUAL
FY19ORIGINAL
BUDGET
FY19AMENDED
BUDGET
FY19 YTD
6/30/19
FY19YEAR ENDESTIMATE
FY20ADOPTED
BUDGET
% CHANGE INBUDGET FROM
FY19 TO FY20
MAYOR AND COUNCIL 2.10 2.10 2.10 2.10 2.10 2.10 0.0%CITY SECRETARY'S OFFICE 5.20 5.20 5.20 5.20 5.20 5.00 -3.8%CITY MANAGER'S OFFICE 5.40 5.40 5.40 5.00 5.00 5.00 -7.4%ADMINISTRATIVE SERVICES 27.60 27.60 27.60 27.60 27.60 28.60 3.6%POLICE 87.72 90.38 90.38 90.38 90.38 90.38 0.0%FIRE MARSHAL'S OFFICE 6.60 6.60 6.60 7.20 7.20 7.20 9.1%COMMUNITY DEVELOPMENT 10.70 10.70 10.70 10.70 10.70 10.70 0.0%PUBLIC WORKS 46.30 47.30 47.30 47.30 43.30 43.30 -8.5%ENGINEERING 0.00 0.00 0.00 0.00 6.00 6.00 0.0%LIBRARY 14.97 14.97 14.97 14.97 14.97 14.97 0.0%PARKS & RECREATION 22.50 22.50 22.50 22.50 23.10 24.10 7.1%PERSONNEL TOTAL 229.09 232.75 232.75 232.95 235.55 237.35 2.0%
156

FY18 ACTUAL EXPENDITU FY19 ADOPTED BUDGET FY20 ADOPTED BUDGETMAYOR AND COUNCIL 396,163 319,784 369,058CITY SECRETARY'S OFFICE 505,696 537,488 558,704CITY MANAGER'S OFFICE 1,137,780 1,015,737 1,046,768ADMINISTRATIVE SERVICES 4,094,933 4,216,212 4,919,146POLICE 10,694,515 11,210,483 11,872,801FWD VOLUNTEER FIRE DEPT 4,898,382 915,655 2,512,555FIRE MARSHAL'S OFFICE 1,620,288 1,819,298 0COMMUNITY DEVELOPMENT 994,804 1,135,338 1,227,230PUBLIC WORKS 8,579,413 10,040,042 14,678,833ENGINEERING 0 0 783,759LIBRARY 1,214,027 1,239,090 1,252,132PARKS & RECREATION 3,629,507 3,441,934 3,979,553
TOTAL 37,765,508$ 35,891,061$ 43,200,539$
FY18 ACTUAL EXPENDITU FY19 ADOPTED BUDGET FY20 ADOPTED BUDGETSALARIES AND BENEFITS 20,481,531 21,839,723 23,215,869SUPPLIES 1,756,961 1,358,213 1,461,170MAINTENANCE 1,196,852 1,529,244 1,473,960SERVICES 13,236,897 10,601,916 15,155,237CAPITAL OUTLAY 878,140 388,264 448,500OTHER 215,127 173,701 1,445,803
TOTAL $37,765,508 $35,891,061 $43,200,539
0
2,000,000
4,000,000
6,000,000
8,000,000
10,000,000
12,000,000
14,000,000
16,000,000
FY18 ACTUAL EXPENDITURES FY19 ADOPTED BUDGET FY20 ADOPTED BUDGET
EXPENDITURES BY DEPARTMENT
MAYOR AND COUNCIL
CITY SECRETARY'S OFFICE
CITY MANAGER'S OFFICE
ADMINISTRATIVE SERVICES
POLICE
FWD VOLUNTEER FIRE DEPT
FIRE MARSHAL'S OFFICE
COMMUNITY DEVELOPMENT
PUBLIC WORKS
ENGINEERING
LIBRARY
PARKS & RECREATION
0
5,000,000
10,000,000
15,000,000
20,000,000
25,000,000
FY18 ACTUAL EXPENDITURES FY19 ADOPTED BUDGET FY20 ADOPTED BUDGET
EXPENDITURES BY CATEGORY
SALARIES AND BENEFITS
SUPPLIES
MAINTENANCE
SERVICES
CAPITAL OUTLAY
OTHER
157

Mayor and Council
Citizens ofFriendswood
Mayor and Council
CitySecretary
CityAttorney
Municipal Judge
CityManager
Boards, Committees,
and Commissions
158
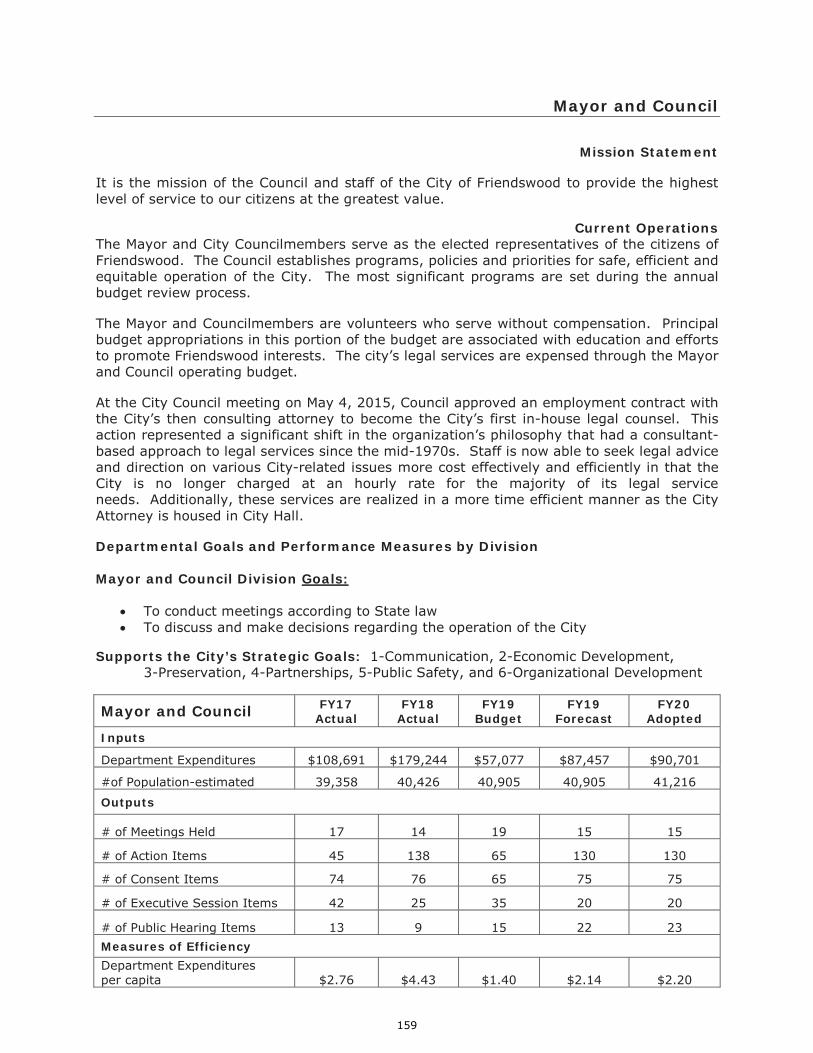
Mayor and Council
Mission Statement It is the mission of the Council and staff of the City of Friendswood to provide the highest level of service to our citizens at the greatest value.
Current Operations
The Mayor and City Councilmembers serve as the elected representatives of the citizens of Friendswood. The Council establishes programs, policies and priorities for safe, efficient and equitable operation of the City. The most significant programs are set during the annual budget review process. The Mayor and Councilmembers are volunteers who serve without compensation. Principal budget appropriations in this portion of the budget are associated with education and efforts to promote Friendswood interests. The city’s legal services are expensed through the Mayor and Council operating budget. At the City Council meeting on May 4, 2015, Council approved an employment contract with the City’s then consulting attorney to become the City’s first in-house legal counsel. This action represented a significant shift in the organization’s philosophy that had a consultant-based approach to legal services since the mid-1970s. Staff is now able to seek legal advice and direction on various City-related issues more cost effectively and efficiently in that the City is no longer charged at an hourly rate for the majority of its legal service needs. Additionally, these services are realized in a more time efficient manner as the City Attorney is housed in City Hall.
Departmental Goals and Performance Measures by Division Mayor and Council Division Goals:
To conduct meetings according to State law To discuss and make decisions regarding the operation of the City
Supports the City’s Strategic Goals: 1-Communication, 2-Economic Development,
3-Preservation, 4-Partnerships, 5-Public Safety, and 6-Organizational Development
Mayor and Council FY17 Actual
FY18 Actual
FY19 Budget
FY19 Forecast
FY20 Adopted
Inputs
Department Expenditures $108,691 $179,244 $57,077 $87,457 $90,701
#of Population-estimated 39,358 40,426 40,905 40,905 41,216
Outputs
# of Meetings Held 17 14 19 15 15
# of Action Items 45 138 65 130 130
# of Consent Items 74 76 65 75 75
# of Executive Session Items 42 25 35 20 20
# of Public Hearing Items 13 9 15 22 23 Measures of Efficiency Department Expenditures per capita $2.76 $4.43 $1.40 $2.14 $2.20
159

Mayor and Council City Attorney Division Goals:
To conduct meetings according to State law To discuss and make decisions regarding the operation of the City
Supports the City’s Strategic Goals: 1-Communication, 2-Economic Development, 3-Preservation, 4-Partnerships, 5-Public Safety, and 6-Organizational Development
City Attorney FY17 Actual
FY18 Actual
FY19 Budget
FY19 Forecast
FY20 Adopted
Inputs # of full time equivalents * (FTE) 1.0 2.1 2.1 2.1 2.1 Department Expenditures $190,851 $216,919 $262,707 $232,280 $279,458
Measures of Efficiency
Monthly Operational Cost $15,904 $18,707 $21,892 $19,357 $23,288 Department Expenditures per capita $4.85 $5.37 $6.42 $5.68 $6.78
*In FY18, the prosecutor positions were moved from the Municipal Court division.
160

MAYOR AND COUNCILDEPARTMENT SUMMARY
EXPENDITURE BY DIVISION
DIVISIONFY18
ACTUAL
FY19ORIGINAL
BUDGET
FY19AMENDED
BUDGET
FY19 YTD
6/30/19
FY19YEAR ENDESTIMATE
FY20ADOPTED
BUDGET
% CHANGE INBUDGET FROM
FY19 TO FY20
GOVERNING BODY $179,244 $57,077 $87,885 $59,858 $87,457 $90,701 58.9%CITY ATTORNEY 216,919 262,707 250,307 160,244 232,280 278,458 6.0%DEPARTMENT TOTAL $396,163 $319,784 $338,192 $220,102 $319,737 $369,159 15.4%
EXPENDITURE BY CLASSIFICATION
CLASSIFICATIONFY18
ACTUAL
FY19ORIGINAL
BUDGET
FY19AMENDED
BUDGET
FY19 YTD
6/30/19
FY19YEAR ENDESTIMATE
FY20ADOPTED
BUDGET
% CHANGE INBUDGET FROM
FY19 TO FY20
SALARIES $214,174 $243,807 $243,807 $158,634 $228,236 $257,278 5.5%SUPPLIES 7,160 4,511 6,361 4,713 6,078 9,200 103.9%SERVICES 66,152 71,466 88,024 56,755 85,423 102,580 43.5%CAPITAL OUTLAY 108,677 0 0 0 0 0 0.0%CLASSIFICATION TOTAL $396,163 $319,784 $338,192 $220,102 $319,737 $369,058 15.4%
PERSONNEL SUMMARY BY DIVISION
DIVISIONFY18
ACTUAL
FY19ORIGINAL
BUDGET
FY19AMENDED
BUDGET
FY19 YTD
6/30/19
FY19YEAR ENDESTIMATE
FY20ADOPTED
BUDGET
% CHANGE INBUDGET FROM
FY19 TO FY20
GOVERNING BODY 0.00 0.00 0.00 0.00 0.00 0.00 0.0%CITY ATTORNEY 2.10 2.10 2.10 2.10 2.10 2.10 0.0%PERSONNEL TOTAL 2.10 2.10 2.10 2.10 2.10 2.10 0.0%
161

0101 - GOVERNING BODY
ACCOUNT NUMBER ACCOUNT NAMEFY18
ACTUAL
FY19ORIGINAL
BUDGET
FY19AMENDED
BUDGET
FY19 YTD
6/30/19
FY19YEAR ENDESTIMATE
FY20ADOPTED
BUDGET50 - SUPPLIES001-0101-411.5100 OFFICE SUPPLIES $396 $0 $0 $0 $0 $0001-0101-411.5200 PERSONNEL SUPPLIES 417 132 132 124 165 250001-0101-411.5400 OPERATING SUPPLIES 5,458 4,079 4,779 3,449 4,599 6,000001-0101-411.5800 OPERATING EQUIPMENT<$5000 0 0 1,150 1,014 1,014 2,500
TOTAL SUPPLIES $6,271 $4,211 $6,061 $4,587 $5,778 $8,750
70 - SERVICES001-0101-411.7110 LEGAL SERVICES $2,125 $0 $13,811 $13,811 $13,811 $0001-0101-411.7119 OTHER LEGAL SERVICES 15,768 28,581 33,313 7,949 33,313 28,580001-0101-411.7400 OPERATING SERVICES 1,086 1,238 4,208 3,164 4,208 1,280001-0101-411.7401 POSTAL / COURIER SERVICES 3 0 0 0 0 0001-0101-411.7510 TRAINING 2,754 2,000 2,900 2,872 2,872 6,080001-0101-411.7520 TRAVEL EXPENSES & REIMBURSE 1,672 3,300 6,200 6,116 6,116 10,830001-0101-411.7530 MEMBERSHIPS 7,225 7,276 12,391 12,391 12,391 24,080001-0101-411.7800 CONTRACT SERVICES 29,988 0 0 0 0 101001-0101-411.7910 COMMUNITY EVENTS/PROGRAMS 3,675 10,471 9,001 8,968 8,968 11,000
TOTAL SERVICES $64,296 $52,866 $81,824 $55,271 $81,679 $81,951
80 - CAPITAL OUTLAY001-0101-411.8400 CAPITAL OPERATING EQUIP $108,677 $0 $0 $0 $0 $0
TOTAL CAPITAL OUTLAY $108,677 $0 $0 $0 $0 $0
0101 - GOVERNING BODY $179,244 $57,077 $87,885 $59,858 $87,457 $90,701
162

0102 - CITY ATTORNEY
ACCOUNT NUMBER ACCOUNT NAMEFY18
ACTUAL
FY19ORIGINAL
BUDGET
FY19AMENDED
BUDGET
FY19 YTD
6/30/19
FY19YEAR ENDESTIMATE
FY20ADOPTED
BUDGET40 - SALARIES & BENEFITS001-0102-411.4110 FULLTIME SALARIES & WAGES $144,471 $150,673 $151,823 $106,406 $151,823 $157,234001-0102-411.4143 LONGEVITY PAY 0 60 60 85 85 140001-0102-411.4149 CELL PHONE ALLOWANCE 1,200 1,200 50 50 50 0001-0102-411.4220 PART-TIME WAGES W/O BENEFITS 23,725 45,380 45,380 16,975 29,633 46,572001-0102-411.4710 SOCIAL SECURITY/MEDICARE 12,866 13,603 13,603 8,164 13,603 14,006001-0102-411.4720 TMRS RETIREMENT 23,147 24,233 24,233 16,956 24,233 25,196001-0102-411.4810 HEALTH/DENTAL INSURANCE 7,433 7,433 7,433 8,902 7,433 12,665001-0102-411.4820 LIFE INSURANCE 461 420 420 342 420 435001-0102-411.4830 DISABILITY INSURANCE 484 441 441 383 441 535001-0102-411.4840 WORKERS COMP INSURANCE 271 284 284 197 284 323001-0102-411.4850 EAP SERVICES 116 58 58 87 116 58001-0102-411.4890 FLEX PLAN ADMINISTRATION 0 22 22 87 115 114
TOTAL SALARIES & BENEFITS $214,174 $243,807 $243,807 $158,634 $228,236 $257,278
50 - SUPPLIES001-0102-411.5100 OFFICE SUPPLIES $94 $0 $0 $0 $0 $0001-0102-411.5200 PERSONNEL SUPPLIES 0 0 0 0 0 150001-0102-411.5400 OPERATING SUPPLIES 0 300 300 126 300 300001-0102-411.5800 OPERATING EQUIPMENT<$5000 795 0 0 0 0 0
TOTAL SUPPLIES $889 $300 $300 $126 $300 $450
70 - SERVICES001-0102-411.7400 OPERATING SERVICES $25 $1,000 $1,000 $30 $150 $1,000001-0102-411.7401 POSTAL / COURIER SERVICES 7 100 100 94 94 100001-0102-411.7510 TRAINING 874 1,000 1,000 504 1,000 1,530001-0102-411.7520 TRAVEL EXPENSES & REIMBURSE 0 1,000 1,000 0 1,000 1,990001-0102-411.7530 MEMBERSHIPS 70 500 500 240 500 3,110001-0102-411.7540 PUBLICATIONS 880 15,000 2,600 616 1,000 13,000
TOTAL SERVICES $1,856 $18,600 $6,200 $1,484 $3,744 $20,730
0102 - CITY ATTORNEY $216,919 $262,707 $250,307 $160,244 $232,280 $278,458
163

City Secretary
City Secretary’sOffice
Municipal Clerk Election Services Records Management
164
City Secretary
Mission Statement
The City Secretary’s office provides a conduit of information regarding the operation of the City of Friendswood to the citizens of Friendswood, elected officials, City Staff, and other interested parties in accordance with State law, the charter of the City of Friendswood and other rules and regulations as adopted.
Current Operations
Municipal Clerk The department of the City Secretary is staffed by five employees. The City Secretary reports directly to the Mayor and City Council. Services provided by the City Secretary’s office focus on administrative, records (internal and external), elections and providing information to the citizens of Friendswood, elected officials and City Staff. The City Secretary’s office provides information, as requested, regarding operations of the City to the community as a whole, including the Mayor, Councilmembers, City Staff, citizens and interested parties; maintains custody of all municipal records; administers the Records Management Program; and, recommends rules and regulations to be adopted by ordinance to protect the safety and security of the municipal records. Additionally, the City Secretary’s office attends and records the minutes of all official meetings of Council, attests to all instruments requiring execution, administers and coordinates the City election with Galveston County as the election services provider for both counties. These duties also include coordinating the appointments of volunteers to the boards, committees and commissions, providing staff support for Council activities, managing the bid process, publishing official notices of the City, issuing certain licenses and permits, coordinating updates to the Friendswood Code of Ordinances, Council meeting agenda and agenda packet process, and performing other duties and responsibilities that may be required. All meetings held by Council have met the Open Meetings Act requirements. As per the Open Meetings Act, all meetings are open to the public, except when there is a necessity to meet in Executive Session (closed to the public) under the provisions of Section 551, Texas Government Code, to discuss only very specific topics as allowed by law. Election Services The City Secretary’s office administers and coordinates with Galveston County all City elections as called for in accordance with Texas Municipal Laws and Charter provisions of the City of Friendswood. Records Management Program According to Chapter 1248, Acts of the 71st Legislature, a Records Management Program is required. This program provides for an efficient, economical and effective control over the creation, distribution, organization, maintenance, use, and disposition of all City records through a comprehensive system of integrated procedures for the management of records or their ultimate disposition in accordance with State law. A centralized Records Storage Center has been established and a Records Management Program has been developed and implemented. Accordingly, records from all departments, allowed by law to be destroyed, are reviewed annually or bi-annually, as needed, and scheduled for destruction. This process provides record storage space for ongoing implementation of the retention schedule.
165

City Secretary A systematic computerized scanning and indexing of all records of City Council meetings and other records is ongoing and provides for efficient retrieval and search capabilities that provides information to the Mayor and Council, all city departments, and all citizens on an as-needed basis and is available on the City’s website for round-the-clock access. This provides for a searchable index of the official City records and City minutes in hard copy and/or in electronic format. This important information is easily accessible to all.
Highlights of the Budget
Election Services This budget year there will be a Bond Election in November 2019 as well as a General Election in May 2020 for Council Position No. 2 and Position No. 5. Records Management Program The FY20 budget continues to provide for the Records Management Program. A records storage area that is part of the Public Safety Building houses Police, Municipal Court and Fire Marshal/Emergency Operations Center’s records. Discussions have been ongoing regarding projecting and planning for an alternative records storage location to replace the existing records storage center for the City Manager’s office, Administrative Services, Community Services, Public Works, Community Development, Library, and City Secretary’s office. The current records storage center is at an off-site storage facility that is climate controlled and built to withstand 120 MPH winds. In addition to managing the records manually, the City Secretary’s office uses the Laserfiche Records Management Module to enhance the Records Management Program electronically. With the Records Management Edition, records policies are enforced regardless of records’ format, location or content. It also automates life cycle management from document creation to final disposition, runs reports detailing where records are in their life cycle and which records are eligible for transfer, accession or destruction, logs all system activity, providing an audit trail that can be used to prove adherence to the Records Management Plan and compliance regulations, ensures the future accessibility of archived records with storage, safeguards records with comprehensive access controls, supports compliance with the Texas State Library Retention Schedule, regulations, and also reduces litigation risks associated with expired and outdated records. In the FY 2010-11 budget, Council approved the Freedom of Information Act (FOIA/GOVQA) Systems software to assist with implementing the Texas Public Information Act. With the volume of public information requests the City receives, this system manages the process by handling and automating all aspects of the public information request process, saving valuable Staff time with improved oversight and reporting. This web based system has streamlined the public information request process by coordinating, with the City Secretary’s Records Division oversight and management, with all City departments throughout the life of a request from start to finish. The goal to make requests for public information an automated, streamlined process for both citizens and staff is now achieved through the implementation of the FOIA system. Additionally, the City Attorney’s office is connected to the FOIA/GOVQA system in order to further streamline the public information request process and to reduce response time, which has proven to be quite successful. Records Coordinators and Backup Records Coordinators are trained in the use of the FOIA/GOVQA software and policies of the Records Management Program with updated training as necessary. The program consists of managing the Records Centers, the records retention
166

City Secretary program, the public information request process and coordination with all departments on all aspects of records management. Records and Laserfiche Program The FY20 budget continues to fund the records and Laserfiche program. The scanning of all records of City Council meetings and other documents will carry on as well as continuing the program for citywide access to many documents. (i.e. minutes, ordinances, resolutions, contracts, deeds, easements, vehicle titles, etc.) This program allows additional electronic capability for all departments to search, access and retrieve city records and continue to scan most documents approved by Council and make available to City Staff for search, retrieval, e-mail and print capabilities. This process eliminates the need for hard copies to be produced and stored by numerous departments. The Laserfiche program has been in place since 2005 and will continue as a permanent service of the City Secretary’s office, with the expansion of records provided as technology and funds allow. In 2009, the City Secretary’s office implemented Laserfiche Weblink so citizens and the general public may access the City’s records from the City’s website. Laserfiche Weblink publishes select documents in a Laserfiche repository to the Internet in read-only format. This project continues to be very successful and provides easy access for the public to review the City’s documents that are commonly requested through the Public Information Act.
Highlights of the Budget Departmental Goals and Performance Measures by Division
Municipal Clerk Goals:
1. To effectively utilize electronic opportunities to provide for greater communication with the public, elected officials, City Staff and City Attorney
2. To provide Council meeting notices for all meetings held 3. To provide the public with information regarding the administration of the City that will
be discussed in those meetings 4. To provide support and information to Council and citizens in preparing and attending
Council meetings 5. To take minutes of each meeting held and record City Council action and workshop
discussions
167
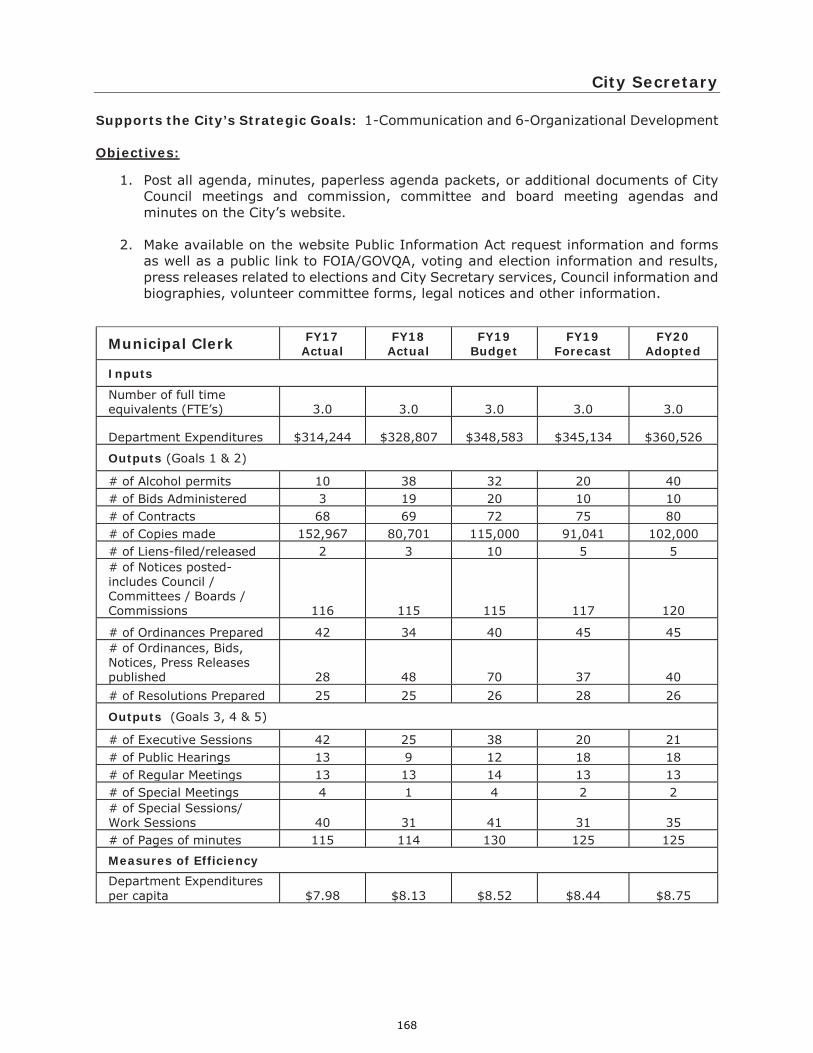
City Secretary Supports the City’s Strategic Goals: 1-Communication and 6-Organizational Development Objectives:
1. Post all agenda, minutes, paperless agenda packets, or additional documents of City Council meetings and commission, committee and board meeting agendas and minutes on the City’s website.
2. Make available on the website Public Information Act request information and forms as well as a public link to FOIA/GOVQA, voting and election information and results, press releases related to elections and City Secretary services, Council information and biographies, volunteer committee forms, legal notices and other information.
Municipal Clerk FY17 Actual
FY18 Actual
FY19 Budget
FY19 Forecast
FY20 Adopted
Inputs
Number of full time equivalents (FTE’s) 3.0 3.0 3.0 3.0 3.0
Department Expenditures $314,244 $328,807 $348,583 $345,134 $360,526
Outputs (Goals 1 & 2)
# of Alcohol permits 10 38 32 20 40 # of Bids Administered 3 19 20 10 10 # of Contracts 68 69 72 75 80 # of Copies made 152,967 80,701 115,000 91,041 102,000 # of Liens-filed/released 2 3 10 5 5 # of Notices posted- includes Council / Committees / Boards / Commissions 116 115 115 117 120
# of Ordinances Prepared 42 34 40 45 45 # of Ordinances, Bids, Notices, Press Releases published 28 48 70 37 40 # of Resolutions Prepared 25 25 26 28 26
Outputs (Goals 3, 4 & 5)
# of Executive Sessions 42 25 38 20 21 # of Public Hearings 13 9 12 18 18 # of Regular Meetings 13 13 14 13 13 # of Special Meetings 4 1 4 2 2 # of Special Sessions/ Work Sessions 40 31 41 31 35 # of Pages of minutes 115 114 130 125 125
Measures of Efficiency Department Expenditures per capita $7.98 $8.13 $8.52 $8.44 $8.75
168

City Secretary Election Services Division: Goals:
Provide accurate and impartial general and special elections to serve the voters of the City of Friendswood for the City’s elections.
To also provide Staff support and election services to the Galveston County Consolidated Drainage District for general and special elections.
Supports the City’s Strategic Goals: 1-Communication, 6-Organizational Development
Election Services FY17 Actual
FY18 Actual
FY19 Budget
FY19 Forecast
FY20 Adopted
Inputs
# of full time equivalents (FTE’s) 0.2 0.2 0.2 0.2 0.0 Department Expenditures $15,190 $23,244 $28,335 $17,141 $35,540 # of Registered Voters 27,409 27,759 28,200 28,112 28,250
Outputs
# of General Elections Held 1 1 1 1 1 # of Special Elections Held 1 0 0 0 1 # of Election Challenges 0 0 0 0 0 # of Irregularities 0 0 0 0 0
Measures of Effectiveness
Total # of Voters for General Elections 3,245 4,177 4,250 1,746 2,500 Total # of Voters Special Election 3,245 0 0 0 2,000
Measures of Efficiency
Department Expenditures per registered voter $0.55 $0.84 $1.00 $0.61 $1.26 Department Expenditures per capita $0.39 $0.57 $0.69 $0.42 $0.86
169

City Secretary
Records Management Division: Goals:
Provide efficient, economical and effective control over the creation, distribution, organization, maintenance, use, and disposition of all City records through a comprehensive system of integrated procedures for the management of records and/or ultimate disposition in accordance with State law.
Continue the ongoing Laserfiche scanning program of all minutes, approved documents of City Council, and other relevant documents.
Continue enhancement of programs for citywide access to minutes, ordinances, resolutions, contracts, deeds, easements, vehicle titles, most permanent documents, etc.
Continue providing electronic capability for search, access and retrieval of all permanent records for use by department users, and provide continued Laserfiche training as needed for those users.
Supports the City’s Strategic Goals: 1-Communication, 6-Organizational Development Objectives:
Records Management Program – Provides City information to requestors timely, efficiently and according to State law.
The Laserfiche program has provided invaluable research on many levels and has saved numerous hours of exploration and retrieval time.
Preserve City data in a systematic computerized manner in order not to lose these historical records of action taken by City Council.
Records Management
FY17 Actual
FY18 Actual
FY19 Budget
FY19 Forecast
FY20 Adopted
Inputs
# of full time equivalents (FTE’s) 2.0 2.0 2.0 2.0 2.0 Department Expenditures $113,370 $153,645 $160,570 $159,803 $162,638
Outputs
# of Public Information Requests Processed 1,204 1,406 1,345 1,500 1,600 # of Pages Provided to Public 11,456 18,298 13,500 27,171 21,000 # of Attorney General Opinions Obtained 26 46 28 40 45 # of Scanning & Laserfiche Documents 724 717 850 725 750
Measures of Efficiency
Department Expenditures per capita $2.88 $3.80 $3.93 $3.91 $3.95
170

CITY SECRETARY'S OFFICEDEPARTMENT SUMMARY
EXPENDITURE BY CLASSIFICATION
DIVISIONFY18
ACTUAL
FY19ORIGINAL
BUDGET
FY19AMENDED
BUDGET
FY19 YTD
6/30/19
FY19YEAR ENDESTIMATE
FY20ADOPTED
BUDGET
% CHANGE INBUDGET FROM
FY19 TO FY20MUNICIPAL CLERK $328,807 $348,583 $353,154 $251,422 $345,134 $360,526 3.4%ELECTION SERVICES 23,244 28,335 28,335 250 17,141 35,540 25.4%RECORDS MANAGEMENT 153,645 160,570 161,703 112,113 159,803 162,638 1.3%DEPARTMENT TOTAL $505,696 $537,488 $543,192 $363,785 $522,078 $558,704 3.9%
CLASSIFICATIONFY18
ACTUAL
FY19ORIGINAL
BUDGET
FY19AMENDED
BUDGET
FY19 YTD
6/30/19
FY19YEAR ENDESTIMATE
FY20ADOPTED
BUDGET
% CHANGE INBUDGET FROM
FY19 TO FY20
SALARIES $444,742 $466,393 $466,393 $330,013 $452,373 $475,264 1.9%SUPPLIES 15,958 7,247 13,570 9,433 12,577 7,920 9.3%MAINTENANCE 555 525 525 0 0 0 -100.0%SERVICES 44,441 63,323 62,704 24,339 57,128 75,520 19.3%CAPITAL OUTLAY 0 0 0 0 0 0 0.0%CLASSIFICATION TOTAL $505,696 $537,488 $543,192 $363,785 $522,078 $558,704 3.9%
PERSONNEL SUMMARY BY DIVISION
DIVISIONFY18
ACTUAL
FY19ORIGINAL
BUDGET
FY19AMENDED
BUDGET
FY19 YTD
6/30/19
FY19YEAR ENDESTIMATE
FY20ADOPTED
BUDGET
% CHANGE INBUDGET FROM
FY19 TO FY20
MUNICIPAL CLERK 3.00 3.00 3.00 3.00 3.00 3.00 0.0%ELECTION SERVICES 0.20 0.20 0.20 0.20 0.20 0.00 -100.0%RECORDS MANAGEMENT 2.00 2.00 2.00 2.00 2.00 2.00 0.0%PERSONNEL TOTAL 5.20 5.20 5.20 5.20 5.20 5.00 -3.8%
171
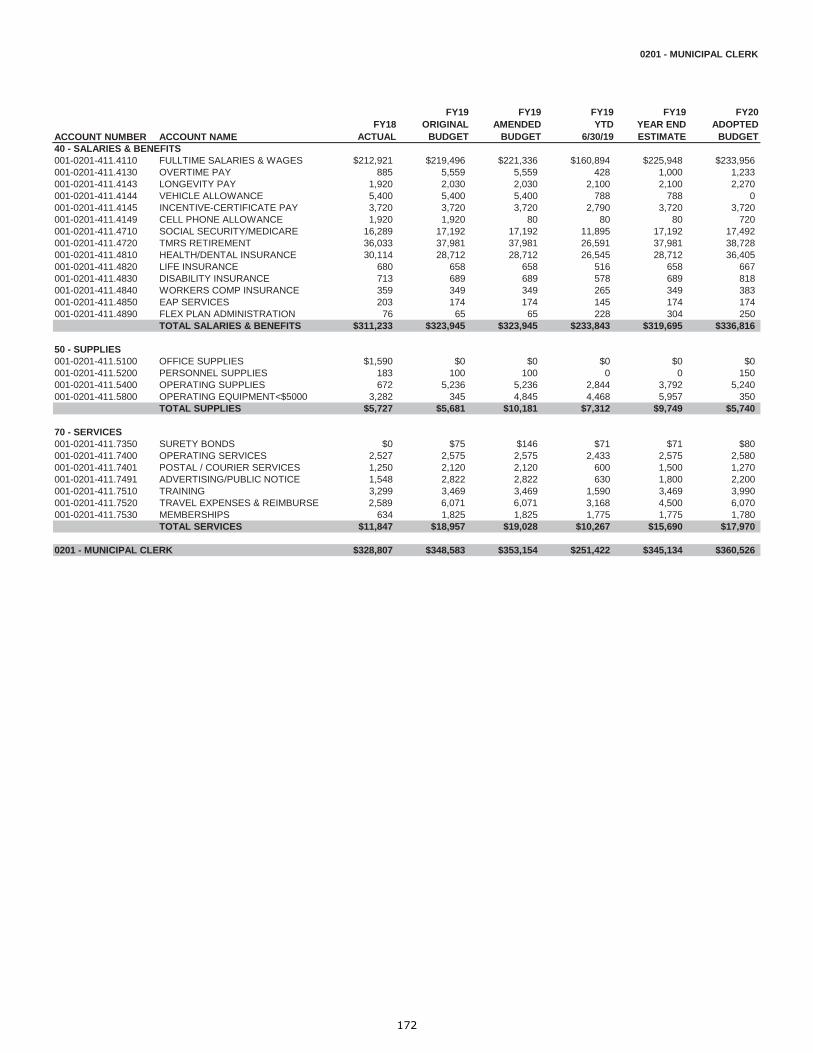
0201 - MUNICIPAL CLERK
ACCOUNT NUMBER ACCOUNT NAMEFY18
ACTUAL
FY19ORIGINAL
BUDGET
FY19AMENDED
BUDGET
FY19 YTD
6/30/19
FY19YEAR ENDESTIMATE
FY20ADOPTED
BUDGET40 - SALARIES & BENEFITS001-0201-411.4110 FULLTIME SALARIES & WAGES $212,921 $219,496 $221,336 $160,894 $225,948 $233,956001-0201-411.4130 OVERTIME PAY 885 5,559 5,559 428 1,000 1,233001-0201-411.4143 LONGEVITY PAY 1,920 2,030 2,030 2,100 2,100 2,270001-0201-411.4144 VEHICLE ALLOWANCE 5,400 5,400 5,400 788 788 0001-0201-411.4145 INCENTIVE-CERTIFICATE PAY 3,720 3,720 3,720 2,790 3,720 3,720001-0201-411.4149 CELL PHONE ALLOWANCE 1,920 1,920 80 80 80 720001-0201-411.4710 SOCIAL SECURITY/MEDICARE 16,289 17,192 17,192 11,895 17,192 17,492001-0201-411.4720 TMRS RETIREMENT 36,033 37,981 37,981 26,591 37,981 38,728001-0201-411.4810 HEALTH/DENTAL INSURANCE 30,114 28,712 28,712 26,545 28,712 36,405001-0201-411.4820 LIFE INSURANCE 680 658 658 516 658 667001-0201-411.4830 DISABILITY INSURANCE 713 689 689 578 689 818001-0201-411.4840 WORKERS COMP INSURANCE 359 349 349 265 349 383001-0201-411.4850 EAP SERVICES 203 174 174 145 174 174001-0201-411.4890 FLEX PLAN ADMINISTRATION 76 65 65 228 304 250
TOTAL SALARIES & BENEFITS $311,233 $323,945 $323,945 $233,843 $319,695 $336,816
50 - SUPPLIES001-0201-411.5100 OFFICE SUPPLIES $1,590 $0 $0 $0 $0 $0001-0201-411.5200 PERSONNEL SUPPLIES 183 100 100 0 0 150001-0201-411.5400 OPERATING SUPPLIES 672 5,236 5,236 2,844 3,792 5,240001-0201-411.5800 OPERATING EQUIPMENT<$5000 3,282 345 4,845 4,468 5,957 350
TOTAL SUPPLIES $5,727 $5,681 $10,181 $7,312 $9,749 $5,740
70 - SERVICES001-0201-411.7350 SURETY BONDS $0 $75 $146 $71 $71 $80001-0201-411.7400 OPERATING SERVICES 2,527 2,575 2,575 2,433 2,575 2,580001-0201-411.7401 POSTAL / COURIER SERVICES 1,250 2,120 2,120 600 1,500 1,270001-0201-411.7491 ADVERTISING/PUBLIC NOTICE 1,548 2,822 2,822 630 1,800 2,200001-0201-411.7510 TRAINING 3,299 3,469 3,469 1,590 3,469 3,990001-0201-411.7520 TRAVEL EXPENSES & REIMBURSE 2,589 6,071 6,071 3,168 4,500 6,070001-0201-411.7530 MEMBERSHIPS 634 1,825 1,825 1,775 1,775 1,780
TOTAL SERVICES $11,847 $18,957 $19,028 $10,267 $15,690 $17,970
0201 - MUNICIPAL CLERK $328,807 $348,583 $353,154 $251,422 $345,134 $360,526
172
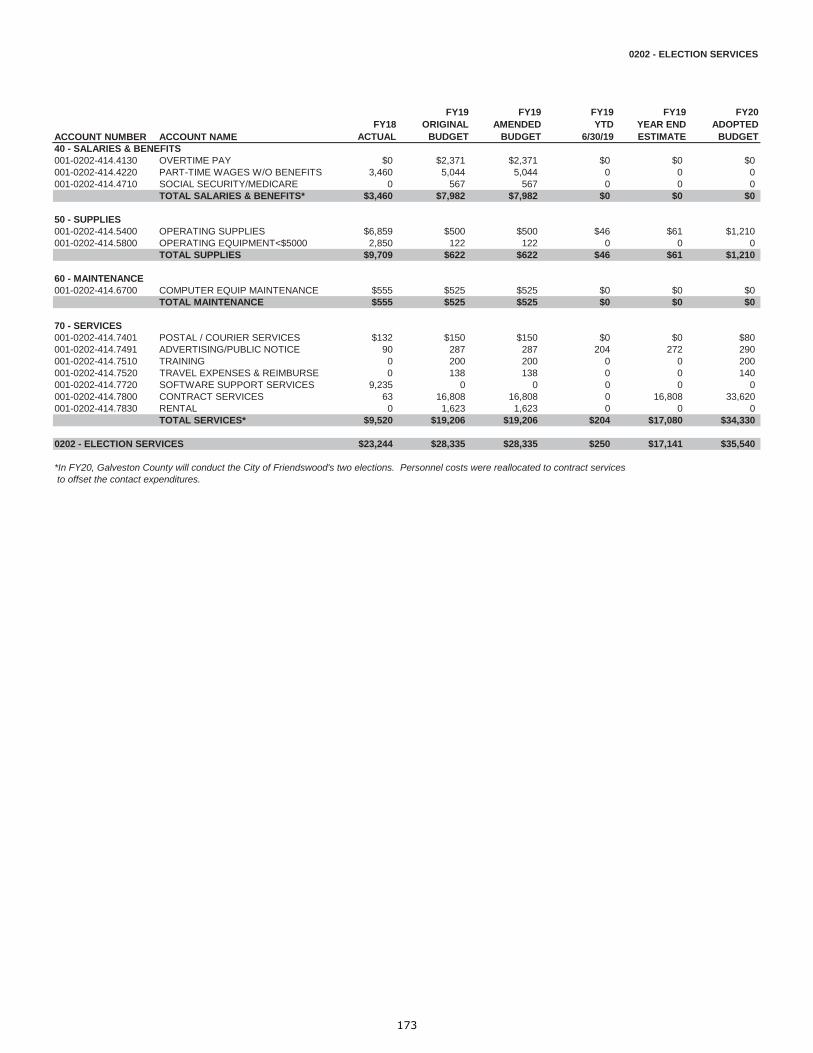
0202 - ELECTION SERVICES
ACCOUNT NUMBER ACCOUNT NAMEFY18
ACTUAL
FY19ORIGINAL
BUDGET
FY19AMENDED
BUDGET
FY19 YTD
6/30/19
FY19YEAR ENDESTIMATE
FY20ADOPTED
BUDGET40 - SALARIES & BENEFITS001-0202-414.4130 OVERTIME PAY $0 $2,371 $2,371 $0 $0 $0001-0202-414.4220 PART-TIME WAGES W/O BENEFITS 3,460 5,044 5,044 0 0 0001-0202-414.4710 SOCIAL SECURITY/MEDICARE 0 567 567 0 0 0
TOTAL SALARIES & BENEFITS* $3,460 $7,982 $7,982 $0 $0 $0
50 - SUPPLIES001-0202-414.5400 OPERATING SUPPLIES $6,859 $500 $500 $46 $61 $1,210001-0202-414.5800 OPERATING EQUIPMENT<$5000 2,850 122 122 0 0 0
TOTAL SUPPLIES $9,709 $622 $622 $46 $61 $1,210
60 - MAINTENANCE001-0202-414.6700 COMPUTER EQUIP MAINTENANCE $555 $525 $525 $0 $0 $0
TOTAL MAINTENANCE $555 $525 $525 $0 $0 $0
70 - SERVICES001-0202-414.7401 POSTAL / COURIER SERVICES $132 $150 $150 $0 $0 $80001-0202-414.7491 ADVERTISING/PUBLIC NOTICE 90 287 287 204 272 290001-0202-414.7510 TRAINING 0 200 200 0 0 200001-0202-414.7520 TRAVEL EXPENSES & REIMBURSE 0 138 138 0 0 140001-0202-414.7720 SOFTWARE SUPPORT SERVICES 9,235 0 0 0 0 0001-0202-414.7800 CONTRACT SERVICES 63 16,808 16,808 0 16,808 33,620001-0202-414.7830 RENTAL 0 1,623 1,623 0 0 0
TOTAL SERVICES* $9,520 $19,206 $19,206 $204 $17,080 $34,330
0202 - ELECTION SERVICES $23,244 $28,335 $28,335 $250 $17,141 $35,540
*In FY20, Galveston County will conduct the City of Friendswood's two elections. Personnel costs were reallocated to contract services to offset the contact expenditures.
173

0203 - RECORDS MANAGEMENT
ACCOUNT NUMBER ACCOUNT NAMEFY18
ACTUAL
FY19ORIGINAL
BUDGET
FY19AMENDED
BUDGET
FY19 YTD
6/30/19
FY19YEAR ENDESTIMATE
FY20ADOPTED
BUDGET40 - SALARIES & BENEFITS001-0203-419.4110 FULLTIME SALARIES & WAGES $76,185 $77,160 $77,160 $56,336 $77,160 $79,985001-0203-419.4130 OVERTIME PAY 1,988 4,440 4,440 1,301 2,500 4,562001-0203-419.4131 HOLIDAY HRS WORKED 0 0 0 102 102 0001-0203-419.4143 LONGEVITY PAY 320 420 420 465 465 580001-0203-419.4145 INCENTIVE-CERTIFICATE PAY 2,540 3,120 3,120 2,340 3,120 3,120001-0203-419.4710 SOCIAL SECURITY/MEDICARE 5,196 5,510 5,510 3,893 5,510 5,785001-0203-419.4720 TMRS RETIREMENT 12,877 13,580 13,580 9,636 13,580 14,128001-0203-419.4810 HEALTH/DENTAL INSURANCE 29,472 29,472 29,472 21,490 29,472 29,472001-0203-419.4820 LIFE INSURANCE 241 235 235 178 235 231001-0203-419.4830 DISABILITY INSURANCE 253 247 247 200 247 284001-0203-419.4840 WORKERS COMP INSURANCE 791 123 123 96 123 140001-0203-419.4850 EAP SERVICES 136 116 116 97 116 116001-0203-419.4890 FLEX PLAN ADMINISTRATION 50 43 43 36 48 45
TOTAL SALARIES & BENEFITS $130,049 $134,466 $134,466 $96,170 $132,678 $138,448
50 - SUPPLIES001-0203-419.5100 OFFICE SUPPLIES $309 $0 $0 $0 $0 $0001-0203-419.5200 PERSONNEL SUPPLIES 150 70 70 30 70 150001-0203-419.5400 OPERATING SUPPLIES 23 474 474 315 474 420001-0203-419.5800 OPERATING EQUIPMENT<$5000 40 400 2,223 1,730 2,223 400
TOTAL SUPPLIES $522 $944 $2,767 $2,075 $2,767 $970
70 - SERVICES001-0203-419.7350 SURETY BONDS $71 $71 $71 $0 $0 $0001-0203-419.7400 OPERATING SERVICES 2,862 7,390 6,385 540 6,385 6,630001-0203-419.7411 PROFESSIONAL/CODE SERVICE 4,931 9,091 9,016 4,708 9,016 7,000001-0203-419.7510 TRAINING 1,290 1,035 1,387 1,010 1,347 1,090001-0203-419.7520 TRAVEL EXPENSES & REIMBURSE 2,658 1,921 2,029 2,029 2,029 2,560001-0203-419.7530 MEMBERSHIPS 150 240 170 170 170 520001-0203-419.7720 SOFTWARE SUPPORT SERVICES 5,700 0 0 0 0 0001-0203-419.7800 CONTRACT SERVICES 5,412 5,412 5,412 5,411 5,411 5,420
TOTAL SERVICES $23,074 $25,160 $24,470 $13,868 $24,358 $23,220
0203 - RECORDS MANAGEMENT $153,645 $160,570 $161,703 $112,113 $159,803 $162,638
174

City Manager
City Manager
Administrative
Services
Fire Marshal / Emergency
Management
Assistant City
Manager
Police
Department
Library Services
Economic Development
Community Development
Parks and Recreation
Public Works
Engineering
175
City Manager
Mission Statement The City Manager provides for the general administration of the City carrying out the City Council’s policies and objectives. All City programs, services, and operations are directed and coordinated by the City Manager. The City Manager’s Office is represented by two divisions: Administration and Economic Development. There are a total of five full-time employees in the department.
Current Operations Administration This division encompasses the City Manager’s core administrative and oversight functions; as well as communication management and organizational development and planning. Division staff provides wide-range administrative support activities for the City Manager including: policy research, program analysis, Council agenda development, departmental records coordination, project administration, general public information, and management of citizen requests for service. Economic Development In order to provide Friendswood a more stable economic future by expanding the city’s commercial tax base, this division is responsible for developing and administering programs to retain and attract businesses that are compatible with our community’s vision and values. The Economic Development Coordinator administers programs to assist with business prospect recruitment, marketing, and retention. The Coordinator also serves as liaison between City staff, business leaders, and economic development organizations. Staff support also provides for the City’s Community and Economic Development Committee (CEDC) and the Friendswood Downtown Economic Development Corporation.
Highlights of the Budget The FY 2019-20 Budget continues to fund important citywide communications programs, including the Focus on Friendswood newsletter as well as the City’s Public-Educational-Governmental (PEG) access channel. This year will mark the fourteenth year that the City’s PEG channel is utilized, and the twelfth full year that City Council and Board, Commission and Committee meetings will be televised on the channel. In correlation with each department, the City Manager's Office’s activities are intended to achieve the City's overall strategic goals. Fiscal Year 2019 achievements are mentioned within each department's section. In addition, the City has a history of placing an emphasis on developing and mentoring our most important piece of infrastructure – our Staff. The City Manager’s Office places great importance in the growth, development and leadership skills of our employees, and to that end, this is the eleventh straight year that we have budgeted funds for Staff development services.
176
City Manager The City’s Economic Development office generates news releases, media information and contacts, printed materials, direct mail campaigns, and a quarterly electronic newsletter. The Economic Development Office also sponsors an annual broker/developer workshop focused on the benefits of doing business in Friendswood. Approximately 50 Houston area real estate brokers, developers, and bank representatives attend this event. The Economic Development Coordinator participates in regional, state, and national site visits, tradeshows, and conferences to promote commercial development to the city. To maximize our resources, the City continues to participate in regional economic development partnerships that advocate and pursue issues that are important for retaining and strengthening the economic base and business climate of our area.
2019-2020 Departmental Goals and Performance Measures by division
City Manager Administration: Goals:
Provide professional management and leadership that support the success of the organization.
Deliver responsive, quality customer service to the City Council, citizens, and other agencies
Support vital community connections with our citizens, neighborhood and civic associations, and news media
Supports the City’s Strategic Goals: 1-Communications, 4-Partnerships, and
6-Organizational Development Objective A:
Conduct strategic planning activities Ensure that departmental work plans are supportive of City Council goals Prepare information on City services, events, and policies for outside agencies as
requested. Promote interaction and collaboration with Friendswood citizens and civic associations
177

City Manager
City Manager Administration
FY17 Actual
FY18 Actual
FY19 Budget
FY19 Forecast
FY20 Adopted
Inputs # of full time equivalents (FTE) 4.4 4.4 4.4 4.0 4.0
Department Expenditures $724,703 $906,209 $763,562 $874,874 $791,681
Outputs # of Long-Range Planning Sessions Conducted with City Council 2 2 2 2 2 # of Long-Range Planning Projects by Staff 2 2 2 2 2 # of Senior Staff development initiatives 1 1 1 1 1 Agenda Preparation (# of City Council agenda items) 250 307 300 310 310 # of Council meetings attended 17 14 20 20 20 # of Association meetings attended by Staff 12 12 12 15 15
Measures of Efficiency
Monthly Operational Cost $60,392 $75,517 $63,630 $72,906 $65,973 Division Expenditures per capita $18.41 $22.42 $18.67 $21.39 $19.21
178

City Manager Objective B:
Enhance communication by proactively sharing timely, accurate information about City services, initiatives, and issues.
Outputs (number of) FY17 Actual
FY18 Actual
FY19 Budget
FY19 Forecast
FY20 Adopted
Releases, advisories, or tip sheets prepared 220 210 220 220 220 City-related news articles written 925 860 870 870 820 Annual page views on the City’s website 900,000 913,336 1,000,000 1,000,000 1,000,100
Agendas 3,250 2,988 4,200 4,200 4,100
City newsletters 8,856 8,784 8,900 8,900 8,550 Community Development 3,490 3,400 13,750 13,750 14,950
Construction Updates 4,795 4,804 13,750 13,750 14,950
Economic Development* 4,031 4,453 4,600 4,600 4,120
Emergency Management 8,014 8,668 13,750 13,750 14,950
Events and Recreation 7,482 8,048 13,750 13,750 14,950
General City** 8,590 8,167 13,750 13,750 14,950
Law enforcement 9,101 10,023 10,150 10,150 9,800
Legal Notices 2,738 3,034 3,200 3,200 3,150
Library 4,018 3,939 13,750 13,750 14,950 Planning and Zoning agendas 2,738 3,505 4,200 4,200 3,150
*In FY 17, the “Agendas” email list absorbed Planning and Zoning agendas.
**In FY 17, the “General City” email list absorbed the following: Community Development, Construction Updates, Emergency Management, Events and Recreation, and Library. It was retitled “News-including Emergency messages and Library Services/Programs.”
Objective C:
Actively distribute information and gather feedback about City policies, services, and events.
Outputs (number of) FY17 Actual
FY18 Actual
FY19 Budget
FY19 Forecast
FY20 Adopted
Focus on Friendswood monthly newsletter editions e-mailed 8,400 8,500 8,600 8,500 8,475 City Meetings Broadcast on PEG channel 30 32 30 32 32 Community videos produced 12 125 48 200 230
Number of Facebook “Likes” 4,025 11,793 10,000 13,000 14,500
Number of Twitter followers* 2,429 4,205 4,150 4,750 5,000
*Beginning FY17 the newsletter is emailed to those who subscribe to Focus on Friendswood Newsletter
179

City Manager Economic Development Division: Goals:
To advance an economic development program that upholds community values, builds on investments made in the community, and supports the expectations of the City’s level of service
Supports the City’s Strategic Goals: 1- Communication, 2-Economic Development,
4-Partnerships, and 6-Organizational Development Objectives:
Identify and recruit businesses interested in relocating to, expanding in, or starting a new business in the City of Friendswood
Continue to strengthen and build relationships with brokers, developers, site selection consultants, and the regional economic development network
Provide support and information to the CEDC in preparing and attending committee meetings and carrying out their initiatives
Economic Development
FY17 Actual
FY18 Actual
FY19 Budget
FY19 Forecast
FY20 Adopted
Inputs
# of full time equivalents (FTE) 1.0 1.0 1.0 1.0 1.0
Department Expenditures $252,000 $231,572 $252,175 $275,120 $255,087 Outputs Chamber & Regional Partnership meetings attended 30 17 15 17 18
Trade Shows attended 3 3 4 3 3 Quarterly Electronic Newsletter distribution to potential business prospects, developers, and brokers 1,270 7,100 10,000 7,100 7,400 New Businesses, Expansions, & Remodels in the Downtown Neighborhood Empowerment Zone (NEZ#1) 25 20 35 20 35
Business Prospect Inquiries 115 120 130 130 130 Friendswood Civilian Labor Force/Unemployment Rate
19,805/ 4.3%
19,500/ 3.2%
19,600/ 3.0%
19,600/ 3.0%
19,620/ 3.2%
CEDC meetings attended 13 10 12 10 10
Discussion Items 35 15 14 15 15 Measures of Efficiency
Monthly Operational Cost $21,000 $19,298 $21,015 $22,927 $21,257 Division Expenditures per capita $6.40 $5.73 $6.16 $6.73 $6.19
Attendees at the Broker Developer Day hosted by CEDC will no longer be a metric used, as the event will no longer be held.
180

CITY MANAGER'S OFFICEDEPARTMENT SUMMARY
EXPENDITURE BY DIVISION
DIVISIONFY18
ACTUAL
FY19ORIGINAL
BUDGET
FY19AMENDED
BUDGET
FY19 YTD
6/30/19
FY19YEAR ENDESTIMATE
FY20ADOPTED
BUDGET
% CHANGE INBUDGET FROM
FY19 TO FY20
ADMINISTRATION $906,208 $763,562 $890,736 $593,871 $874,874 $791,681 3.7%ECONOMIC DEVELOPMENT 231,572 252,175 278,495 204,273 275,120 255,087 1.2%DEPARTMENT TOTAL $1,137,780 $1,015,737 $1,169,231 $798,144 $1,149,994 $1,046,768 3.1%
EXPENDITURE BY CLASSIFICATION
CLASSIFICATIONFY18
ACTUAL
FY19ORIGINAL
BUDGET
FY19AMENDED
BUDGET
FY19 YTD
6/30/19
FY19YEAR ENDESTIMATE
FY20ADOPTED
BUDGET
% CHANGE INBUDGET FROM
FY19 TO FY20
SALARIES $1,004,273 $853,013 $847,513 $599,617 $841,429 $868,568 1.8%SUPPLIES 22,021 27,780 32,646 21,215 26,636 28,780 3.6%MAINTENANCE 0 0 0 0 0 0 0.0%SERVICES 111,486 134,944 289,072 177,312 281,929 149,420 10.7%CLASSIFICATION TOTAL $1,137,780 $1,015,737 $1,169,231 $798,144 $1,149,994 $1,046,768 3.1%
PERSONNEL SUMMARY BY DIVISION
DIVISIONFY18
ACTUAL
FY19ORIGINAL
BUDGET
FY19AMENDED
BUDGET
FY19 YTD
6/30/19
FY19YEAR ENDESTIMATE
FY20ADOPTED
BUDGET
% CHANGE INBUDGET FROM
FY19 TO FY20
ADMINISTRATION 4.40 4.40 4.40 4.00 4.00 4.00 0.0%ECONOMIC DEVELOPMENT 1.00 1.00 1.00 1.00 1.00 1.00 0.0%PERSONNEL TOTAL 5.40 5.40 5.40 5.00 5.00 5.00 -7.4%
181

0301 - ADMINISTRATION
ACCOUNT NUMBER ACCOUNT NAMEFY18
ACTUAL
FY19ORIGINAL
BUDGET
FY19AMENDED
BUDGET
FY19 YTD
6/30/19
FY19YEAR ENDESTIMATE
FY20ADOPTED
BUDGET40 - SALARIES & BENEFITS001-0301-413.4110 FULLTIME SALARIES & WAGES $445,262 $493,953 $495,153 $349,446 $496,353 $511,815001-0301-413.4130 OVERTIME PAY 7,466 4,938 4,938 3,707 4,943 5,138001-0301-413.4143 LONGEVITY PAY 3,678 1,475 1,475 1,550 1,550 1,790001-0301-413.4144 VEHICLE ALLOWANCE 6,075 0 0 0 0 0001-0301-413.4149 CELL PHONE ALLOWANCE 3,150 3,600 2,400 900 1,200 1,200001-0301-413.4190 ACCRUED PAYROLL 163,602 0 0 0 0 0001-0301-413.4220 PART-TIME WAGES W/O BENEFITS 11,821 14,091 8,591 2,931 2,931 0001-0301-413.4710 SOCIAL SECURITY/MEDICARE 37,152 33,627 33,627 23,936 31,915 33,807001-0301-413.4720 TMRS RETIREMENT 100,193 80,382 80,382 56,594 79,459 83,243001-0301-413.4810 HEALTH/DENTAL INSURANCE 49,202 44,931 44,931 33,557 44,934 52,470001-0301-413.4820 LIFE INSURANCE 1,378 1,326 1,326 1,072 1,429 1,357001-0301-413.4821 TERM LIFE INSURANCE 851 0 0 0 0 0001-0301-413.4830 DISABILITY INSURANCE 1,511 1,459 1,459 1,260 1,681 1,750001-0301-413.4840 WORKERS COMP INSURANCE 1,004 760 760 568 758 822001-0301-413.4850 EAP SERVICES 276 290 290 208 277 232001-0301-413.4890 FLEX PLAN ADMINISTRATION 102 86 86 165 219 177
TOTAL SALARIES & BENEFITS $832,723 $680,918 $675,418 $475,894 $667,649 $693,801
50 - SUPPLIES001-0301-413.5100 OFFICE SUPPLIES $1,042 $0 $0 $0 $0 $0001-0301-413.5200 PERSONNEL SUPPLIES 4,467 400 400 0 0 400001-0301-413.5221 5 STAR FUNCTION SUPPLIES 7,350 8,900 10,700 10,048 10,700 8,900001-0301-413.5400 OPERATING SUPPLIES 3,062 7,480 6,480 3,752 5,003 7,480001-0301-413.5800 OPERATING EQUIPMENT<$5000 2,659 5,000 9,166 5,575 7,433 5,000
TOTAL SUPPLIES $18,580 $21,780 $26,746 $19,375 $23,136 $21,780
70 - SERVICES001-0301-413.7221 5 STAR FUNCTION SERVICES $4,384 $4,600 $2,800 $683 $2,800 $4,600001-0301-413.7350 SURETY BONDS 86 0 0 0 0 0001-0301-413.7400 OPERATING SERVICES 1,872 2,631 3,631 2,743 3,657 2,630001-0301-413.7401 POSTAL / COURIER SERVICES 150 750 750 101 500 750001-0301-413.7421 FRIENDSWOOD NEWSLETTER 819 1,000 1,000 819 1,092 1,000001-0301-413.7492 SPECIAL EVENTS 0 500 500 0 500 500001-0301-413.7510 TRAINING 1,010 3,823 3,823 1,325 1,767 3,820001-0301-413.7520 TRAVEL EXPENSES & REIMBURSE 647 4,584 4,584 4,279 5,705 4,580001-0301-413.7530 MEMBERSHIPS 1,483 2,300 2,300 2,272 2,272 2,300001-0301-413.7612 TELEPHONE/COMMUNICATIONS 0 676 676 89 89 680001-0301-413.7800 CONTRACT SERVICES 40,067 40,000 89,896 36,550 87,095 55,240001-0301-413.7801 GRANT SERVICES 4,387 0 78,612 49,741 78,612 0
TOTAL SERVICES $54,905 $60,864 $188,572 $98,602 $184,089 $76,100
0301 - CITY MANAGER ADMIN $906,208 $763,562 $890,736 $593,871 $874,874 $791,681
182

0303 - ECONOMIC DEVELOPMENT
ACCOUNT NUMBER ACCOUNT NAMEFY18
ACTUAL
FY19ORIGINAL
BUDGET
FY19AMENDED
BUDGET
FY19 YTD
6/30/19
FY19YEAR ENDESTIMATE
FY20ADOPTED
BUDGET40 - SALARIES & BENEFITS001-0303-419.4110 FULLTIME SALARIES & WAGES $114,473 $116,801 $117,951 $87,946 $122,563 $127,459001-0303-419.4143 LONGEVITY PAY 1,095 1,135 1,135 1,155 1,155 1,215001-0303-419.4144 VEHICLE ALLOWANCE 5,400 5,400 5,400 788 788 0001-0303-419.4145 INCENTIVE-CERTIFICATE PAY 1,500 0 0 1,125 1,500 1,500001-0303-419.4149 CELL PHONE ALLOWANCE 1,200 1,200 50 50 50 0001-0303-419.4710 SOCIAL SECURITY/MEDICARE 8,726 8,769 8,769 6,516 8,769 9,531001-0303-419.4720 TMRS RETIREMENT 19,649 19,365 19,365 14,493 19,365 20,841001-0303-419.4810 HEALTH/DENTAL INSURANCE 18,461 18,461 18,461 10,751 18,461 13,041001-0303-419.4820 LIFE INSURANCE 369 344 344 283 377 360001-0303-419.4830 DISABILITY INSURANCE 387 361 361 318 361 443001-0303-419.4840 WORKERS COMP INSURANCE 196 179 179 145 193 206001-0303-419.4850 EAP SERVICES 68 58 58 48 58 58001-0303-419.4890 FLEX PLAN ADMINISTRATION 26 22 22 105 140 113
TOTAL SALARIES & BENEFITS $171,550 $172,095 $172,095 $123,723 $173,780 $174,767
50 - SUPPLIES001-0303-419.5100 OFFICE SUPPLIES $19 $0 $0 $0 $0 $0001-0303-419.5400 OPERATING SUPPLIES 3,422 6,000 5,900 1,840 3,500 7,000
TOTAL SUPPLIES $3,441 $6,000 $5,900 $1,840 $3,500 $7,000
70 - SERVICES001-0303-419.7400 OPERATING SERVICES $5,763 $9,600 $10,920 $7,841 $10,455 $9,600001-0303-419.7401 POSTAL / COURIER SERVICES 0 200 200 0 0 200001-0303-419.7491 ADVERTISING/PUBLIC NOTICE 11,194 22,000 22,000 14,750 20,000 22,000001-0303-419.7510 TRAINING 2,100 3,090 3,090 1,045 3,090 3,090001-0303-419.7520 TRAVEL EXPENSES & REIMBURSE 3,584 3,800 3,800 2,854 3,805 3,800001-0303-419.7530 MEMBERSHIPS 1,940 2,215 2,315 1,720 2,315 2,460001-0303-419.7800 CONTRACT SERVICES 20,000 33,175 33,175 25,500 33,175 32,170001-0303-419.7921 PRGM 380 ECON DEV GRANTS 12,000 0 25,000 25,000 25,000 0
TOTAL SERVICES $56,581 $74,080 $100,500 $78,710 $97,840 $73,320
0303 - ECONOMIC DEVELOPMENT $231,572 $252,175 $278,495 $204,273 $275,120 $255,087
183

Administrative Services
AdministrativeServices
Information TechnologyFinance Municipal
Court
Utility Billing
OtherAdministrative
Functions
Human Resources
Risk Management
Insurance
Risk Management
Safety
184

Administrative Services
Department Mission The goal of the Administrative Services Department is to provide superior administrative and financial support; while efficiently managing the City of Friendswood’s resources. The department services, both, external and internal customers through its four diverse programs or divisions: Finance, Human Resources/Risk Management, Municipal Court Administration, and Information Technology. The main services provided by the department are financial analysis, budgeting, utility billing, personnel relations, court proceedings and technology service.
Current Operations Finance is responsible for several areas.
Accounting function of the department is responsible for the City’s day to day operations of all financial activities including accounts payable, payroll, revenue collection, debt management, financial reporting and grant reporting. The division ensures adherence to accounting standards, Charter requirements and State law. Accounting staff, working with external auditors, performs the annual audit and prepares the Comprehensive Annual Financial Report.
Fiscal Operations function of the department is responsible for developing and managing the City’s adopted budget, coordinating utility billing, collection and customer information functions, and processing payments for the alarm permit/fines program. With oversight from the City’s Investment Committee and in accordance with the City’s Investment Policy, staff assists the Director of Administrative Services with reporting the investment of the City’s financial resources.
Purchasing function of the department is responsible for generating purchase orders daily and ensuring compliance with local, state and federal regulations in the City’s procurement of goods and services. Working in conjunction with City departments, the Purchasing Coordinator, develops bid/proposal specifications, maintains service contracts/agreements, oversees the P-card program and properly disposes of assets which have surpassed useful life cycles.
Municipal Court is responsible for bringing fair and impartial conclusion to all misdemeanor cases filed in the City by maintaining accurate records of all court cases filed and disposed of, as well as processing payments and serving warrants. With the exception of holidays, Municipal Court sessions are Wednesday evenings and periodic Wednesday mornings of each month. The court keeps a schedule that minimizes the delay in setting court dates and promotes efficient operations. Human Resources/Risk Management is responsible for all human resource and risk management functions, which includes personnel recruitment and retention, compensation, EEO compliance, employee benefits, training and development, new employee orientation, employee safety, unemployment claims, liability and property insurance claims, personnel policy interpretation and updates. Information Technology (IT) is responsible for providing reliable computer systems and phone services with a timely and efficient systems support to all departments by maximizing technology related resources, maintaining a current standard of hardware and software, and offering technical guidance and planning for future systems direction and support. It is our mission to continue to research and enable a broad range of new services and technology projects where innovations are expected to improve service delivery or provide new or enhanced public services more efficiently. IT delivers EPIC (Excellent, Proactive, Impactful, Customer-focused) technology services to enhance the community experience.
185

Administrative Services
Departmental Accomplishments in FY 2018-19
Earned the City’s 31th GFOA Award for Excellence in Financial Reporting
Earned the City’s 16th GFOA Distinguished Budget Presentation Award
Implemented Tyler Technology EnerGov Building Dept. software
Cyber Security Public Training for Cyber Security Awareness Month in October
Various facility security camera replacement projects initiated
Successful student internship for Information Technology Department
Replacement of phone system with VoIP phone system
Formulating deployment of NIST Best Practices for Cybersecurity
Implementation of commercial fiber connection to Blackhawk facility
Implementation of redundant internet connection housed at city hall for connectivity
Implementation of Civic Clerk for an agenda solution
Hosted TAGITM regional summit for neighboring municipality IT departments
Replacement of body camera and in-car dash camera system for PD
Cybersecurity in-person training program put into effect
Currently at $150,000 in annual savings made from phone circuit audits
Build out of IT infrastructure needs within the Blackhawk facility to move staff into
building
Two factor authentication for compliance requirements
Wireless backhaul between city hall and the new pool office building
Expanded centralization of the City’s purchasing function
Expanded procurement card program
Highlights of the Budget The following forces at work and decision packages are included with the FY20 adopted budget. Forces at Work (FAW)
Description Type Amount
Public Works Software Program (FAW) One Time Cost Ongoing Cost
$65,000 $20,000
Security Cameras One Time Cost Ongoing Cost
$56,000 $10,000
Tyler Operating System upgrades One Time Cost $15,000
IT Services to Fire Stations One Time Cost Ongoing Cost
$15,000 $5,000
186

Administrative Services
Decision Packages
Description Type Amount Private Fiber Replacement CH to Library and CH to Activity Bldg (PEG Funding)
One Time Cost Ongoing Cost $150,000
CH Conference Rooms Tech Upgrades (PEG Funding) One Time Cost Ongoing Cost $177,000
KnowBe4 Cybersecurity Training (PEF Funding) One Time Cost Ongoing Cost $11,000
CITY WIDE MERIT 2.75% General Fund
Water & Sewer Fund $475,549 $57,904
ASO Admin Assistant Position (FTE 1.0) One Time Cost Ongoing Cost
$1,000 $64,651
The following decision packages are not included with the FY20 adopted budget.
Description Type Amount
Additional Internet Services and Firewall One Time Cost Ongoing Cost
$22,100
Network Attached Storage (NAS) Data Protection One Time Cost Ongoing Cost $25,000
IT Business Analyst I One Time Cost Ongoing Cost
$100,504
Wellness Program One Time Cost Ongoing Cost
$15,000
187

Administrative Services
Major Departmental Goals for FY 2019-20
Earn GFOA’s Certificate of Achievement for Excellence in Financial Reporting for the 32nd consecutive year
Earn GFOA’s Distinguished Budget Award special recognition for performance measures and capital project section of the FY20 budget document
Revise the City’s Vehicle Replacement Plan Continue to implement program for procurement cards Continue to develop and monitor a community service program to support indigence
issues in Municipal Court Train and certify all court security personnel Train associate judge Continue to expand computer server virtualization and redundancy for protecting
the data with Blackhawk facility Continue enhancement of the Utility Billing page of the City’s website to improve
customer service Standardized IT Procedures and Policies Enhanced User Security Awareness Training and Cyber Security training Maintaining the IT infrastructure to accommodate new technology Implement a Disaster Recovery plan for servers and data Develop a Computer Replacement Program to fund a rolling technology refresh Replace aged fiber circuits from city hall to the library and activities center Student internship for Information Technology Department with FISD Add firewall’s for security to redundant internet connection housed at city hall Partnership with FSID to get school security cameras to stream to PD Partnership with FISD to get SRO’s city desktops in school to perform PD duties
remotely Install NTP appliance to resolve time sync issues Incode ESS/CSS deployment SD-WAN solutions for phone and internet redundancy Public Works software solution Various facility security camera replacement projects
AFIS service circuit move Various PEG Channel upgrade projects Development of an internal ISOC/NOC (information security operations
center/network operations center) for IT Expansion of wireless backhaul at new pool office to include pump room and add on
security cameras Mobility solutions to increase staff efficiency out in the field
188

Administrative Services
Supports the City’s Strategic Goals: 1-Communication, 2-Economic Development, 4-Partnerships, 5-Public Safety, and 6-Organizational Development
Performance Measures by Division Finance & Other Admin Functions*
FY17 Actual
FY18 Actual
FY19 Budget
FY19 Forecast
FY20 Adopted
Inputs # of full time equivalents (FTE)* 12.0 12.0 12.0 12.0 13.0 Division Expenditures* $1,539,486 $1,522,617 $1,700,693 $1,600,755 $1,785,073
Outputs
Number of Prepared CAFR 1 1 1 1 1 Number of monthly financial reports prepared 0 6 12 12 12 Number of proposed & adopted budget documents prepared 2 2 2 2 2
# of A/P check runs 60 60 50 58 50 # of A/P paper checks issued/EFT
4,096/ 2,846
3,630/ 1,393
3,500/ 1,200
2,772/ 1,583
2,447/ 1,773
# of P-Card transactions / spend total** n/a
606 / $76,257**
1,830 / $243,806
2,439 / $325,076
3,756 / $466,680
Utility bills generated 78,409 84,723 79,500 86,000 86,000 Number of False Alarms billed
Data not available 1,306 -- 1,500 1,500
Measures of Effectiveness
GFOA CAFR Awards earned 29 30 31 31 32
% of Financial Reports delivered monthly by 15th ** n/a n/a 100% 75% 100%
GFOA Budget Awards earned 13 14 16 16 17 % Proposed & adopted budgets delivered by charter requirement dates 100% 100% 100% 100% 100% % of bi-monthly billings produced by the 15th & 30th/31st of ea. month (4 utility cycles – 13,670 accounts) 99% 100% 100% 100% 100%
Measures of Efficiency
Monthly operational cost* $128,291 $128,312 $141,724 $133,396 $148,756 Division expenditures per capita* $39.11 $38.09 $41.58 $39.13 $43.31
*Includes Finance divisions within the General Fund and Water & Sewer Fund. **Began tracking new measure in FY19. P-card program started April 2018.
189
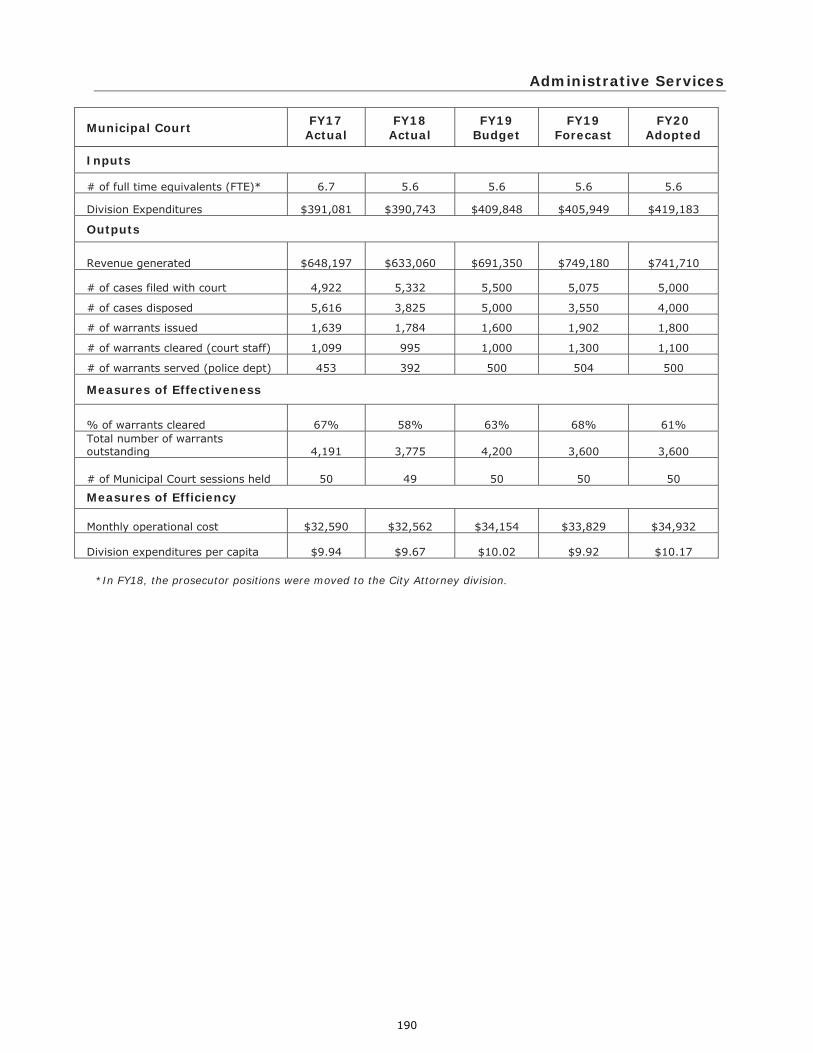
Administrative Services
Municipal Court FY17 Actual
FY18 Actual
FY19 Budget
FY19 Forecast
FY20 Adopted
Inputs
# of full time equivalents (FTE)* 6.7 5.6 5.6 5.6 5.6
Division Expenditures $391,081 $390,743 $409,848 $405,949 $419,183
Outputs
Revenue generated $648,197 $633,060 $691,350 $749,180 $741,710
# of cases filed with court 4,922 5,332 5,500 5,075 5,000
# of cases disposed 5,616 3,825 5,000 3,550 4,000
# of warrants issued 1,639 1,784 1,600 1,902 1,800
# of warrants cleared (court staff) 1,099 995 1,000 1,300 1,100
# of warrants served (police dept) 453 392 500 504 500
Measures of Effectiveness
% of warrants cleared 67% 58% 63% 68% 61% Total number of warrants outstanding 4,191 3,775 4,200 3,600 3,600
# of Municipal Court sessions held 50 49 50 50 50
Measures of Efficiency
Monthly operational cost $32,590 $32,562 $34,154 $33,829 $34,932
Division expenditures per capita $9.94 $9.67 $10.02 $9.92 $10.17 *In FY18, the prosecutor positions were moved to the City Attorney division.
190

Administrative Services
Human Resources, Insurance, & Risk Management
FY17 Actual
FY18 Actual
FY19 Budget
FY19 Forecast
FY20 Adopted
Inputs
City’s total full time equivalents (FTE) 225.09 229.09 232.75 235.55 237.35 Division’s # of FTE 5 5 5 5 5
Division Expenditures $847,006 $887,346 $974,232 $937,746 $1,030,697
Outputs
# of Job Requisitions Processed 43 35 40 40 40
# of criminal background checks completed 85 76 80 80 80
# of employees trained during new hire orientation 42 28 60 45 45
# of employees trained during safety meetings 428 494 475 500 525
Measures of Effectiveness
Total # of applications processed 8,388 9,892 9,000 10,000 10,000
Total # of new hire orientation sessions held 6 3 11 11 11
Total # of safety meetings and programs conducted 21 18 36 20 22
Total # of work-related reportable incidents 4 1 2 2 2
Measures of Efficiency
Employee Turnover Rate 13.2% 12.7% 10% 11% 12%
Monthly operational cost $70,584 $73,946 $81,186 $78,146 $85,891
Division expenditures per City’s total full time equivalents (FTE) $3,763 $3,873 $4,186 $3,981 $4,343
191

Administrative Services
Information Technology
FY17 Actual
FY18 Actual
FY19 Budget
FY19 Forecast
FY20 Adopted
Inputs City’s total full time equivalents (FTE) 225.09 229.09 232.75 235.55 237.35 # of full time equivalents (FTE’s) 4 5 5 5 5
Division Expenditures $1,090,037 $1,294,227 $1,131,439 $1,256,595 $1,684,193
Outputs
# of users supported 220 220 220 220 220
# of work orders closed 1,862 2,801 2,800 3,275 3,500
# of PC’s/laptops/iPads supported 240 275 240 325 340
# of servers supported 37 45 37 56 60
# of printers/scanners supported 43/21 47/47 43/21 49/47 50/50
# of applications supported 40+ 40+ 40+ 40+ 40+
# of networks supported 30 net/ subnet
33 net/subnet
35 net/ subnet
35 net/subnet 40 net/subnet
Measures of Effectiveness % of Server, software, network availability during normal business hours 99.9% 99.9% 99.9% 99.9% 99.9%
% of support hours 45% 45% 55% 52% 50%
% of project hours 55% 55% 45% 48% 50%
Average time to close work orders (hours) < 1 hour 8 hours 8 hour 16 hours 16 hours
Measures of Efficiency
Average # of work order request closed per month 180.25 233 240 284 310
Division expenditures per full time employee (FTE) $4,843 $5,649 $4,861 $5,335 $7,096
Division expenditures per capita $27.70 $32.01 $27.66 $30.72 $40.86
192

ADMINISTRATIVE SERVICESDEPARTMENT SUMMARY
EXPENDITURE BY DIVISION
DIVISIONFY18
ACTUAL
FY19ORIGINAL
BUDGET
FY19AMENDED
BUDGET
FY19 YTD
6/30/19
FY19YEAR ENDESTIMATE
FY20ADOPTED
BUDGET
% CHANGE INBUDGET
FROMFY19 TO FY20
FINANCE $912,660 $1,020,604 $1,021,424 $693,002 $995,058 $1,123,653 10.1%OTHER FUNCTIONS 180,821 240,904 240,904 132,744 183,031 217,900 -9.5%MUNICIPAL COURT 390,743 409,848 409,848 283,134 405,949 419,183 2.3%HUMAN RESOURCES 420,794 485,898 486,648 285,244 460,233 481,429 -0.9%INSURANCE (GF) 169,350 176,400 176,400 147,513 170,500 207,241 17.5%RISK MANAGEMENT (GF) 164,027 177,434 177,434 112,133 171,922 179,929 1.4%INFORMATION TECHNOLOGY 1,294,227 1,131,439 1,289,014 932,526 1,256,595 1,684,193 48.9%UTILITY BILLING (W/S) 429,136 439,185 438,594 297,413 422,666 443,520 1.0%INSURANCE (W/S) 133,175 134,500 135,091 118,671 135,091 162,098 20.5%DEPARTMENT TOTAL $4,094,933 $4,216,212 $4,375,357 $3,002,380 $4,201,045 $4,919,146 16.7%
EXPENDITURE BY CLASSIFICATION
CLASSIFICATIONFY18
ACTUAL
FY19ORIGINAL
BUDGET
FY19AMENDED
BUDGET
FY19 YTD
6/30/19
FY19YEAR ENDESTIMATE
FY20ADOPTED
BUDGET
% CHANGE INBUDGET
FROMFY19 TO FY20
SALARIES & BENEFITS $2,422,137 $2,596,024 $2,596,024 $1,835,503 $2,580,883 $2,741,539 5.6%SUPPLIES 309,494 86,560 103,203 53,150 93,493 133,420 54.1%MAINTENANCE 58,527 73,051 73,051 27,502 69,067 72,060 0.0%SERVICES 1,269,481 1,413,705 1,404,178 934,406 1,281,690 1,558,519 10.2%CAPITAL OUTLAY 35,294 35,264 189,793 151,819 175,912 402,000 1040.0%OTHER 0 11,608 9,108 0 0 11,608 0.0%CLASSIFICATION TOTAL $4,094,933 $4,216,212 $4,375,357 $3,002,380 $4,201,045 $4,919,146 16.7%
PERSONNEL SUMMARY BY DIVISION
DIVISIONFY18
ACTUAL
FY19ORIGINAL
BUDGET
FY19AMENDED
BUDGET
FY19 YTD
6/30/19
FY19YEAR ENDESTIMATE
FY20ADOPTED
BUDGET
% CHANGE INBUDGET
FROMFY19 TO FY20
FINANCE - (GF) 8.00 8.00 8.00 8.00 8.00 9.00 12.5%FINANCE - (W/S) 4.00 4.00 4.00 4.00 4.00 4.00 0.0%MUNICIPAL COURT 5.60 5.60 5.60 5.60 5.60 5.60 0.0%HUMAN RESOURCES 4.00 4.00 4.00 4.00 4.00 4.00 0.0%RISK MANAGEMENT - (GF) 1.00 1.00 1.00 1.00 1.00 1.00 0.0%INFORMATION TECHNOLOGY 5.00 5.00 5.00 5.00 5.00 5.00 0.0%PERSONNEL TOTAL 27.60 27.60 27.60 27.60 27.60 28.60 0.0%
193

0401 - FINANCE
ACCOUNT NUMBER ACCOUNT NAMEFY18
ACTUAL
FY19ORIGINAL
BUDGET
FY19AMENDED
BUDGET
FY19 YTD
6/30/19
FY19YEAR ENDESTIMATE
FY20ADOPTED
BUDGET40 - SALARIES & BENEFITS001-0401-415.4110 FULLTIME SALARIES & WAGES $584,238 $630,610 $636,310 $452,627 $640,922 $701,966001-0401-415.4130 OVERTIME PAY 1,128 1,317 1,317 1,043 1,391 1,798001-0401-415.4131 HOLIDAY HRS WORKED 0 0 0 184 184 0001-0401-415.4143 LONGEVITY PAY 3,666 3,800 3,800 3,740 3,740 4,205001-0401-415.4144 VEHICLE ALLOWANCE 5,513 5,400 5,400 788 788 0001-0401-415.4145 INCENTIVE-CERTIFICATE PAY 13,050 14,100 14,100 11,025 14,700 14,100001-0401-415.4149 CELL PHONE ALLOWANCE 5,850 6,000 300 250 250 0001-0401-415.4190 ACCRUED PAYROLL 1,335 0 0 0 0 0001-0401-415.4710 SOCIAL SECURITY/MEDICARE 44,030 47,313 47,313 33,492 47,313 52,644001-0401-415.4720 TMRS RETIREMENT 97,722 105,450 105,450 74,746 105,450 115,564001-0401-415.4810 HEALTH/DENTAL INSURANCE 66,664 74,102 74,102 60,324 74,102 93,323001-0401-415.4820 LIFE INSURANCE 1,839 1,712 1,712 1,432 1,909 1,957001-0401-415.4830 DISABILITY INSURANCE 1,964 1,826 1,826 1,636 2,181 2,431001-0401-415.4840 WORKERS COMP INSURANCE 974 1,364 1,364 745 1,364 1,139001-0401-415.4850 EAP SERVICES 547 465 465 387 516 538001-0401-415.4890 FLEX PLAN ADMINISTRATION 202 173 173 561 748 728
TOTAL SALARIES & BENEFITS $828,722 $893,632 $893,632 $642,980 $895,558 $990,393
50 - SUPPLIES001-0401-415.5100 OFFICE SUPPLIES $3,724 $0 $0 $0 $0 $0001-0401-415.5200 PERSONNEL SUPPLIES 317 405 405 0 405 570001-0401-415.5400 OPERATING SUPPLIES 2,088 7,660 7,660 3,473 7,000 7,960001-0401-415.5800 OPERATING EQUIPMENT<$5000 4,497 515 515 300 515 520
TOTAL SUPPLIES $10,626 $8,580 $8,580 $3,773 $7,920 $9,050
70 - SERVICES001-0401-415.7120 AUDIT SERVICES $38,395 $34,380 $34,380 $18,930 $34,380 $34,380001-0401-415.7140 CONSULTING SERVICES 11,692 14,425 15,245 0 15,245 7,520001-0401-415.7400 OPERATING SERVICES 2,198 2,655 6,137 5,686 6,137 3,420001-0401-415.7401 POSTAL / COURIER SERVICES 1,950 2,500 2,500 1,363 2,500 2,500001-0401-415.7497 RECRUITMENT ADVERTISING 0 500 500 0 0 0001-0401-415.7510 TRAINING 6,658 16,220 13,388 9,169 13,388 19,830001-0401-415.7520 TRAVEL EXPENSES & REIMBURSE 9,545 11,450 11,450 5,976 11,450 13,750001-0401-415.7530 MEMBERSHIPS 1,724 1,832 1,832 1,110 1,480 2,180001-0401-415.7800 CONTRACT SERVICES 1,150 34,430 33,780 4,015 7,000 40,630
TOTAL SERVICES $73,312 $118,392 $119,212 $46,249 $91,580 $124,210
0401 - FINANCE $912,660 $1,020,604 $1,021,424 $693,002 $995,058 $1,123,653
194
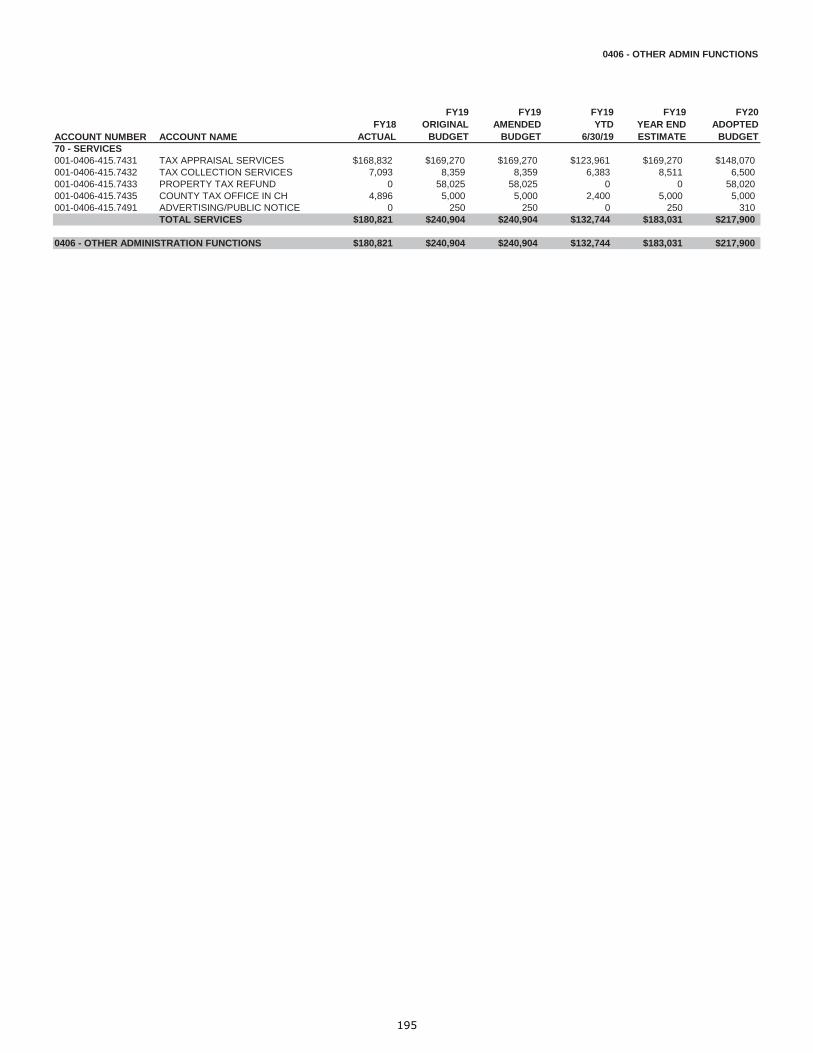
0406 - OTHER ADMIN FUNCTIONS
ACCOUNT NUMBER ACCOUNT NAMEFY18
ACTUAL
FY19ORIGINAL
BUDGET
FY19AMENDED
BUDGET
FY19 YTD
6/30/19
FY19YEAR ENDESTIMATE
FY20ADOPTED
BUDGET70 - SERVICES001-0406-415.7431 TAX APPRAISAL SERVICES $168,832 $169,270 $169,270 $123,961 $169,270 $148,070001-0406-415.7432 TAX COLLECTION SERVICES 7,093 8,359 8,359 6,383 8,511 6,500001-0406-415.7433 PROPERTY TAX REFUND 0 58,025 58,025 0 0 58,020001-0406-415.7435 COUNTY TAX OFFICE IN CH 4,896 5,000 5,000 2,400 5,000 5,000001-0406-415.7491 ADVERTISING/PUBLIC NOTICE 0 250 250 0 250 310
TOTAL SERVICES $180,821 $240,904 $240,904 $132,744 $183,031 $217,900
0406 - OTHER ADMINISTRATION FUNCTIONS $180,821 $240,904 $240,904 $132,744 $183,031 $217,900
195

0409 - MUNICIPAL COURT
ACCOUNT NUMBER ACCOUNT NAMEFY18
ACTUAL
FY19ORIGINAL
BUDGET
FY19AMENDED
BUDGET
FY19 YTD
6/30/19
FY19YEAR ENDESTIMATE
FY20ADOPTED
BUDGET40 - SALARIES & BENEFITS001-0409-412.4110 FULLTIME SALARIES & WAGES $198,471 $202,314 $202,314 $144,943 $202,314 $208,292001-0409-412.4130 OVERTIME PAY 2,878 7,000 7,000 2,067 2,755 3,596001-0409-412.4143 LONGEVITY PAY 628 650 650 720 720 970001-0409-412.4145 INCENTIVE-CERTIFICATE PAY 9,230 4,200 4,200 7,240 9,650 9,000001-0409-412.4190 ACCRUED PAYROLL 1,486 0 0 0 0 0001-0409-412.4220 PART-TIME WAGES W/O BENEFITS 63,603 68,280 68,280 45,228 68,280 69,826001-0409-412.4710 SOCIAL SECURITY/MEDICARE 20,539 21,282 21,282 15,114 21,282 22,050001-0409-412.4720 TMRS RETIREMENT 33,799 34,159 34,159 24,663 34,159 35,520001-0409-412.4810 HEALTH/DENTAL INSURANCE 33,212 29,109 29,109 21,505 29,109 29,493001-0409-412.4820 LIFE INSURANCE 711 589 589 463 617 604001-0409-412.4830 DISABILITY INSURANCE 753 618 618 519 692 742001-0409-412.4840 WORKERS COMP INSURANCE 435 413 413 316 423 461001-0409-412.4850 EAP SERVICES 440 232 232 295 394 232001-0409-412.4890 FLEX PLAN ADMINISTRATION 100 86 86 72 96 87
TOTAL SALARIES & BENEFITS $366,285 $368,932 $368,932 $263,145 $370,491 $380,873
50 - SUPPLIES001-0409-412.5100 OFFICE SUPPLIES $5,525 $0 $0 $0 $0 $0001-0409-412.5200 PERSONNEL SUPPLIES 190 280 280 0 0 280001-0409-412.5400 OPERATING SUPPLIES 345 5,200 5,200 3,549 4,732 5,500
TOTAL SUPPLIES $6,060 $5,480 $5,480 $3,549 $4,732 $5,780
70 - SERVICES001-0409-412.7350 SURETY BONDS $0 $100 $100 $0 $0 $0001-0409-412.7400 OPERATING SERVICES 0 1,000 1,000 0 0 1,000001-0409-412.7401 POSTAL / COURIER SERVICES 2,838 4,000 4,000 1,932 2,576 4,000001-0409-412.7510 TRAINING 1,486 9,980 9,980 6,596 8,794 6,970001-0409-412.7520 TRAVEL EXPENSES & REIMBURSE 723 2,500 2,500 120 1,500 2,700001-0409-412.7530 MEMBERSHIPS 235 320 320 160 320 360001-0409-412.7540 PUBLICATIONS 36 36 36 16 36 0001-0409-412.7800 CONTRACT SERVICES 13,080 17,500 17,500 7,616 17,500 17,500
TOTAL SERVICES $18,398 $35,436 $35,436 $16,440 $30,726 $32,530
0409 - MUNICIPAL COURT $390,743 $409,848 $409,848 $283,134 $405,949 $419,183
196

0410 - HUMAN RESOURCES
ACCOUNT NUMBER ACCOUNT NAMEFY18
ACTUAL
FY19ORIGINAL
BUDGET
FY19AMENDED
BUDGET
FY19 YTD
6/30/19
FY19YEAR ENDESTIMATE
FY20ADOPTED
BUDGET40 - SALARIES & BENEFITS001-0410-415.4110 FULLTIME SALARIES & WAGES $211,619 $226,580 $227,730 $165,668 $227,730 $229,258001-0410-415.4120 PART-TIME WAGES 31,777 31,077 31,077 12,274 31,077 31,593001-0410-415.4130 OVERTIME PAY 2,477 2,573 2,573 3,753 5,004 3,083001-0410-415.4143 LONGEVITY PAY 1,385 1,545 1,545 1,610 1,610 1,785001-0410-415.4145 INCENTIVE-CERTIFICATE PAY 5,850 4,200 4,200 4,200 4,200 6,000001-0410-415.4149 CELL PHONE ALLOWANCE 1,200 1,200 50 50 50 0001-0410-415.4710 SOCIAL SECURITY/MEDICARE 18,775 19,701 19,701 13,769 19,701 19,989001-0410-415.4720 TMRS RETIREMENT 40,408 42,612 42,612 29,850 42,612 43,503001-0410-415.4810 HEALTH/DENTAL INSURANCE 21,008 21,008 21,008 17,049 21,008 24,343001-0410-415.4820 LIFE INSURANCE 677 636 636 509 678 656001-0410-415.4830 DISABILITY INSURANCE 709 665 665 569 759 806001-0410-415.4840 WORKERS COMP INSURANCE 404 4,669 4,669 349 4,466 4,430001-0410-415.4850 EAP SERVICES 334 290 290 223 297 174001-0410-415.4880 UNEMPLOYMENT COMPENSATION 0 25,000 25,000 0 0 25,000001-0410-415.4890 FLEX PLAN ADMINISTRATION 76 65 65 228 304 249
TOTAL SALARIES & BENEFITS $336,699 $381,821 $381,821 $250,101 $359,496 $390,869
50 - SUPPLIES001-0410-415.5200 PERSONNEL SUPPLIES $224 $450 $450 $0 $300 $450001-0410-415.5223 STAFF DEV PROG SUPPLIES 0 3,750 3,750 43 3,750 3,750001-0410-415.5400 OPERATING SUPPLIES 3,234 5,700 5,700 937 5,700 5,700001-0410-415.5800 OPERATING EQUIPMENT<$5000 1,151 1,000 0 0 0 1,800
TOTAL SUPPLIES $4,609 $10,900 $9,900 $980 $9,750 $11,700
70 - SERVICES001-0410-415.7120 AUDIT SERVICES $0 $2,500 $2,500 $0 $0 $2,500001-0410-415.7140 CONSULTING SERVICES 0 2,500 2,500 0 0 2,500001-0410-415.7212 MEDICAL EXAMINATIONS 12,731 16,872 16,872 8,324 16,872 16,880001-0410-415.7220 PERSONNEL EVENTS/PROGRAMS 3,820 9,800 10,550 2,404 10,550 9,800001-0410-415.7223 STAFF DEV PROG SERVICES 259 6,400 6,000 0 6,000 6,400001-0410-415.7400 OPERATING SERVICES 14,287 1,500 1,900 1,730 12,000 6,480001-0410-415.7401 POSTAL / COURIER SERVICES 89 375 375 48 150 370001-0410-415.7491 ADVERTISING/PUBLIC NOTICE 150 350 350 0 350 350001-0410-415.7496 CRIMINAL HISTORY SERVICES 1,695 8,090 6,090 838 2,000 8,090001-0410-415.7497 RECRUITMENT ADVERTISING 0 500 500 175 250 500001-0410-415.7510 TRAINING 4,224 7,325 7,325 2,533 5,500 7,330001-0410-415.7520 TRAVEL EXPENSES & REIMBURSE 9,220 12,650 12,650 3,608 10,000 12,650001-0410-415.7530 MEMBERSHIPS 819 1,540 1,540 990 1,540 1,540001-0410-415.7612 TELEPHONE/COMMUNICATIONS 0 350 350 (216) 350 350001-0410-415.7710 SOFTWARE LICENSE FEE 31,520 19,300 19,300 8,040 19,300 0001-0410-415.7800 CONTRACT SERVICES 672 3,125 6,125 5,689 6,125 3,120
TOTAL SERVICES $79,486 $93,177 $94,927 $34,163 $90,987 $78,860
0410 - HUMAN SERVICES $420,794 $485,898 $486,648 $285,244 $460,233 $481,429
197

0411 - INSURANCE
ACCOUNT NUMBER ACCOUNT NAMEFY18
ACTUAL
FY19ORIGINAL
BUDGET
FY19AMENDED
BUDGET
FY19 YTD
6/30/19
FY19YEAR ENDESTIMATE
FY20ADOPTED
BUDGET70 - SERVICES001-0411-415.7313 MOBILE EQUIPMENT $3,339 $3,350 $3,350 $3,109 $3,350 $3,350001-0411-415.7321 GENERAL LIABILITY 7,610 7,600 7,600 6,999 7,600 7,600001-0411-415.7323 PUBLIC OFFICIAL 15,634 15,700 14,099 13,474 14,099 14,100001-0411-415.7324 CRIME & ACCIDENT COVERAGE 2,262 2,350 2,350 2,262 2,350 2,350001-0411-415.7331 WINDSTORM 83,866 80,000 80,000 59,350 80,000 112,441001-0411-415.7332 REAL & PERSONAL PROPERTY 55,339 60,000 61,601 61,601 61,601 60,000001-0411-415.7333 FLOOD 700 900 900 718 900 900001-0411-415.7350 SURETY BONDS 600 2,000 2,000 0 600 2,000001-0411-415.7380 PRIOR YEAR INSURANCE 0 4,500 4,500 0 0 4,500
TOTAL SERVICES $169,350 $176,400 $176,400 $147,513 $170,500 $207,241
0411 - INSURANCE $169,350 $176,400 $176,400 $147,513 $170,500 $207,241
198

0412 - RISK MANAGEMENT
ACCOUNT NUMBER ACCOUNT NAMEFY18
ACTUAL
FY19ORIGINAL
BUDGET
FY19AMENDED
BUDGET
FY19 YTD
6/30/19
FY19YEAR ENDESTIMATE
FY20ADOPTED
BUDGET40 - SALARIES & BENEFITS001-0412-415.4110 FULLTIME SALARIES & WAGES $74,789 $83,114 $84,314 $62,684 $88,926 $93,139001-0412-415.4130 OVERTIME PAY 5,167 0 0 0 0 0001-0412-415.4131 HOLIDAY HRS WORKED 442 0 0 0 0 0001-0412-415.4143 LONGEVITY PAY 940 975 975 1,000 1,000 1,055001-0412-415.4144 VEHICLE ALLOWANCE 5,400 5,400 5,400 788 788 0001-0412-415.4145 INCENTIVE-CERTIFICATE PAY 3,300 2,700 2,700 2,925 3,300 3,900001-0412-415.4149 CELL PHONE ALLOWANCE 1,200 1,200 0 50 50 0001-0412-415.4710 SOCIAL SECURITY/MEDICARE 6,114 6,274 6,274 4,624 6,274 6,897001-0412-415.4720 TMRS RETIREMENT 14,498 14,895 14,895 10,734 14,895 15,705001-0412-415.4810 HEALTH/DENTAL INSURANCE 18,461 18,461 18,461 13,461 18,461 18,461001-0412-415.4820 LIFE INSURANCE 236 254 254 200 266 271001-0412-415.4830 DISABILITY INSURANCE 248 266 266 224 299 334001-0412-415.4840 WORKERS COMP INSURANCE 145 154 154 107 143 155001-0412-415.4850 EAP SERVICES 68 58 58 48 65 58001-0412-415.4890 FLEX PLAN ADMINISTRATION 25 22 22 105 140 114
TOTAL SALARIES & BENEFITS $131,033 $133,773 $133,773 $96,950 $134,607 $140,089
50 - SUPPLIES001-0412-415.5200 PERSONNEL SUPPLIES $30 $2,500 $2,500 $0 $1,500 $2,500001-0412-415.5400 OPERATING SUPPLIES 2,134 4,370 4,370 604 3,500 3,760001-0412-415.5800 OPERATING EQUIPMENT<$5000 14,218 6,200 6,200 2,810 6,200 4,700
TOTAL SUPPLIES $16,382 $13,070 $13,070 $3,414 $11,200 $10,960
70 - SERVICES001-0412-415.7212 MEDICAL EXAMINATIONS $1,697 $8,281 $8,281 $0 $4,000 $3,000001-0412-415.7220 PERSONNEL EVENTS/PROGRAMS 10,004 12,035 12,035 9,128 12,035 13,000001-0412-415.7400 OPERATING SERVICES 0 1,000 1,000 0 1,000 0001-0412-415.7510 TRAINING 2,082 2,475 2,475 1,338 2,475 3,870001-0412-415.7520 TRAVEL EXPENSES & REIMBURSE 2,424 6,200 6,200 1,043 6,200 8,410001-0412-415.7530 MEMBERSHIPS 405 600 600 260 405 600
TOTAL SERVICES $16,612 $30,591 $30,591 $11,769 $26,115 $28,880
0412 - RISK MANAGEMENT $164,027 $177,434 $177,434 $112,133 $171,922 $179,929
199

0416 - INFORMATION TECHNOLOGY
ACCOUNT NUMBER ACCOUNT NAMEFY18
ACTUAL
FY19ORIGINAL
BUDGET
FY19AMENDED
BUDGET
FY19 YTD
6/30/19
FY19YEAR ENDESTIMATE
FY20ADOPTED
BUDGET40 - SALARIES & BENEFITS001-0416-419.4110 FULLTIME SALARIES & WAGES $323,819 $374,402 $375,602 $268,439 $375,602 $388,785001-0416-419.4130 OVERTIME PAY 13,846 8,545 8,545 6,003 10,000 8,785001-0416-419.4131 HOLIDAY HRS WORKED 358 0 0 188 189 0001-0416-419.4143 LONGEVITY PAY 2,050 2,100 2,100 2,135 2,135 2,500001-0416-419.4145 INCENTIVE-CERTIFICATE PAY 3,825 3,600 3,600 5,625 7,500 8,100001-0416-419.4149 CELL PHONE ALLOWANCE 5,250 6,000 4,800 3,450 4,800 4,800001-0416-419.4190 ACCRUED PAYROLL 5,121 0 0 0 0 0001-0416-419.4710 SOCIAL SECURITY/MEDICARE 25,687 28,802 28,802 20,938 28,802 30,382001-0416-419.4720 TMRS RETIREMENT 56,298 62,942 62,942 45,491 62,942 66,116001-0416-419.4810 HEALTH/DENTAL INSURANCE 51,463 53,427 53,427 38,957 53,427 53,427001-0416-419.4820 LIFE INSURANCE 1,034 1,073 1,073 857 1,073 1,118001-0416-419.4830 DISABILITY INSURANCE 1,091 1,123 1,123 962 1,123 1,374001-0416-419.4840 WORKERS COMP INSURANCE 1,821 1,461 1,461 1,108 1,461 1,596001-0416-419.4850 EAP SERVICES 300 290 290 242 290 290001-0416-419.4890 FLEX PLAN ADMINISTRATION 112 108 108 177 236 200
TOTAL SALARIES & BENEFITS $492,075 $543,873 $543,873 $394,572 $549,580 $567,473
50 - SUPPLIES001-0416-419.5200 PERSONNEL SUPPLIES $204 $200 $200 $0 $200 $200001-0416-419.5400 OPERATING SUPPLIES 5,198 4,950 4,950 1,228 4,950 7,350001-0416-419.5700 COMPUTER SUPPLIES 2,132 2,400 2,400 950 2,400 0001-0416-419.5800 OPERATING EQUIPMENT<$5000 260,847 37,820 55,463 37,161 49,548 60,200001-0416-419.5820 SECURITY CAMERA EQUIPMENT 0 0 0 0 0 25,000
TOTAL SUPPLIES $268,381 $45,370 $63,013 $39,339 $57,098 $92,750
60 - MAINTENANCE001-0416-419.6700 COMPUTER EQUIP MAINT $58,102 $72,277 $72,277 $27,077 $68,500 $71,280
TOTAL MAINTENANCE $58,102 $72,277 $72,277 $27,077 $68,500 $71,280
70 - SERVICES001-0416-419.7400 OPERATING SERVICES $24,818 $15,000 $4,903 $857 $4,902 $30,500001-0416-419.7510 TRAINING 8,674 24,300 24,300 17,410 24,300 22,680001-0416-419.7520 TRAVEL EXPENSES & REIMBURSE 2,745 4,500 4,500 4,114 4,500 6,600001-0416-419.7530 MEMBERSHIPS 150 375 375 175 375 180001-0416-419.7710 SOFTWARE LICENSE FEES 0 0 0 0 0 19,300001-0416-419.7720 SOFTWARE SUPPORT SERVICES 292,549 278,170 278,170 245,639 278,170 361,620001-0416-419.7723 SOFTWARE SUBSCRIPTION SERV 25,816 16,750 16,750 10,793 16,750 17,550001-0416-419.7730 INTERNET/WIRELESS SERVICE 47,480 68,560 68,560 40,506 54,008 65,260001-0416-419.7800 CONTRACT SERVICES 38,143 27,000 22,500 225 22,500 27,000
TOTAL SERVICES $440,375 $434,655 $420,058 $319,719 $405,505 $550,690
80 - CAPITAL OUTLAY001-0416-419.8400 CAPITAL OPERATING EQUIP $0 $0 $154,529 $140,649 $140,648 $0001-0416-419.8800 CAPITAL EQUIPMENT 35,294 35,264 35,264 11,170 35,264 402,000
TOTAL CAPITAL OUTLAY $35,294 $35,264 $189,793 $151,819 $175,912 $402,000
0416 - INFORMATION TECHNOLOGY $1,294,227 $1,131,439 $1,289,014 $932,526 $1,256,595 $1,684,193
200

401-0401 - UTILITY BILLING (W/S)
ACCOUNT NUMBER ACCOUNT NAMEFY18
ACTUAL
FY19ORIGINAL
BUDGET
FY19AMENDED
BUDGET
FY19 YTD
6/30/19
FY19YEAR ENDESTIMATE
FY20ADOPTED
BUDGET40 - SALARIES & BENEFITS401-0401-415.4110 FULLTIME SALARIES & WAGES $177,570 $181,950 $181,950 $129,177 $179,236 $187,903401-0401-415.4130 OVERTIME PAY 3,329 3,072 3,072 1,322 2,363 3,185401-0401-415.4143 LONGEVITY PAY 2,155 2,305 2,305 2,390 2,390 2,625401-0401-415.4145 INCENTIVE-CERTIFICATE PAY 900 900 900 675 900 900401-0401-415.4710 SOCIAL SECURITY/MEDICARE 13,064 13,328 13,328 9,935 13,328 14,639401-0401-415.4720 TMRS RETIREMENT 29,193 30,022 30,022 21,257 30,022 31,158401-0401-415.4810 HEALTH/DENTAL INSURANCE 39,295 40,761 40,761 21,384 40,761 29,349401-0401-415.4820 LIFE INSURANCE 563 520 520 413 550 529401-0401-415.4830 DISABILITY INSURANCE 591 546 546 463 617 651401-0401-415.4840 WORKERS COMP INSURANCE 291 271 271 212 282 308401-0401-415.4850 EAP SERVICES 271 232 232 194 258 232401-0401-415.4890 FLEX PLAN ADMINISTRATION 101 86 86 333 444 363
TOTAL SALARIES & BENEFITS $267,323 $273,993 $273,993 $187,755 $271,151 $271,842
50 - SUPPLIES401-0401-415.5100 OFFICE SUPPLIES $1,989 $0 $0 $0 $0 $0401-0401-415.5200 PERSONNEL SUPPLIES 109 160 160 0 0 180401-0401-415.5400 OPERATING SUPPLIES 1,338 2,800 2,800 2,095 2,793 2,800401-0401-415.5800 OPERATING EQUIPMENT<$5000 0 200 200 0 0 200
TOTAL SUPPLIES $3,436 $3,160 $3,160 $2,095 $2,793 $3,180
60 - MAINTENANCE401-0401-415.6800 EQUIPMENT MAINTENANCE $425 $774 $774 $425 $567 $780
TOTAL MAINTENANCE $425 $774 $774 $425 $567 $780
70 - SERVICES401-0401-415.7120 AUDIT SERVICES $21,355 $19,320 $19,320 $12,620 $19,320 $21,320401-0401-415.7350 SURETY BONDS 0 2,300 390 0 0 0401-0401-415.7400 OPERATING SERVICES 589 700 1,489 1,474 1,964 700401-0401-415.7401 POSTAL / COURIER SERVICES 39,901 36,000 38,500 28,900 38,533 38,300401-0401-415.7510 TRAINING 50 4,020 4,020 1,010 1,346 2,480401-0401-415.7520 TRAVEL EXPENSES & REIMBURSE 388 2,420 2,420 1,179 1,572 3,420401-0401-415.7530 MEMBERSHIPS 140 140 140 60 140 140401-0401-415.7710 SOFTWARE LICENSE FEE 2,569 3,150 3,150 2,115 3,150 3,150401-0401-415.7800 CONTRACT SERVICES 92,960 81,600 82,130 59,780 82,130 86,600
TOTAL SERVICES $157,952 $149,650 $151,559 $107,138 $148,155 $156,110
90 - OTHER401-0401-415.9830 PROVISION FOR UNCOLL A/R $0 $11,608 $9,108 $0 $0 $11,608
TOTAL OTHER $0 $11,608 $9,108 $0 $0 $11,608
401-0401 - FINANCE (W/S) $429,136 $439,185 $438,594 $297,413 $422,666 $443,520
201

401-0411 - INSURANCE (W/S)
ACCOUNT NUMBER ACCOUNT NAMEFY18
ACTUAL
FY19ORIGINAL
BUDGET
FY19AMENDED
BUDGET
FY19 YTD
6/30/19
FY19YEAR ENDESTIMATE
FY20ADOPTED
BUDGET70 - SERVICES401-0411-415.7313 MOBILE EQUIPMENT $2,130 $2,200 $2,073 $2,073 $2,073 $2,080401-0411-415.7321 GENERAL LIABILITY 5,073 5,200 4,580 4,579 4,580 4,580401-0411-415.7323 PUBLIC OFFICIAL 9,982 10,000 8,542 8,541 8,542 8,540401-0411-415.7324 CRIME & ACCIDENT COVERAGE 1,290 1,300 3,697 3,697 3,697 4,000401-0411-415.7331 WINDSTORM 68,623 65,000 64,975 48,559 64,975 91,998401-0411-415.7332 REAL & PERSONAL PROPERTY 45,277 50,000 50,399 50,398 50,399 50,000401-0411-415.7333 FLOOD 800 800 825 824 825 900
TOTAL SERVICES $133,175 $134,500 $135,091 $118,671 $135,091 $162,098
401-0411 - INSURANCE (W/S) $133,175 $134,500 $135,091 $118,671 $135,091 $162,098
202

Police Department
PoliceDepartment
Staff Services
Patrol Operations
Criminal Investigations
Records and
Communication
Animal Control
PatrolD.O.T.
Program
Police Investigation
Fund
203

Police
Mission Statement The Friendswood Police Department is organized, equipped, and trained to provide responsive service in a community-police partnership. The Department focuses all available resources to promote community safety, suppress crime, ensure the safe, orderly movement of traffic, and protect the constitutional rights of all persons.
Fiscal Year 2019 Accomplishments
Friendswood continues to be one of the safest cities in Texas with a crime rate of 9.18 crimes per 1,000 residents. In January 2019, Friendswood was ranked as one of the top ten safest cities in Texas, a recognition based on the total number of crimes per 1,000 residents plus other factors. The Department actively seeks alternative revenue streams to maintain and improve service levels to City residents. Grant funding and special partnerships enable the Police Department to finance programs and services that benefit the community. Current programs and partnerships include: Crime Victim Assistance program, Bulletproof Vest Partnership, cost sharing programs with Clear Creek Independent School District and Friendswood Independent School District for school safety programs. During FY19, the Department added two more military style Light Medium Tactical Vehicles (LMTV) bring the fleet of high water rescue vehicles to four. This fiscal year also completed the retrofit and upgrade of the Department’s boat fleet and grant funding was used to upgrade the mobile command post. Current Operations The purpose of intelligence-led community policing is to provide rapid police services, criminal investigations, and collaborative problem solving initiatives for the community.
First Response-This activity is mandated by Art. 2.13, Code of Criminal Procedure (CCP). Provides emergency response to 9-1-1 calls, enforce traffic and criminal laws and address problems related to order maintenance and quality of life. Provide preventative patrol and police services designed to respond to calls for service and to suppress criminal activity.
Traffic Enforcement-Mandated by Ch. 543 of the Transportation Code. The purpose is
to investigate accidents, analyze collisions, target enforcement efforts and coordinate multiple agencies to facilitate traffic management in order to improve traffic safety. Included in this category is the Commercial Vehicle Inspection program.
Detain and House Prisoners-Detain prisoners in locked cells while awaiting a
magistrate or transfer to another jail facility. Fingerprint and photograph prisoners. Inventory, secure and store prisoners’ personal property until release or transfer. Document activities including monitoring meals, intake and release of prisoners, secure all fines and bonds collected from prisoners and deposit to Municipal Court.
Animal Control-Mandated by Ch 10, Friendswood Code of Ordinances. The primary
function and intent of the animal control division is protection of the health, safety and welfare of the citizens of the City by controlling the animal population and establishing uniform rules and regulations for the control and eradication of rabies.
204

Police
Organized Crime-This activity is mandated by Art. 2.13, CCP; Ch. 481, Health and Safety Code; Ch. 61, CCP. This functional area investigates the possession, manufacture, and illegal sale of controlled substances, gang related crime and gathers and disseminates information regarding criminal activity to the patrol division. Work with other law enforcement in an undercover capacity, working in a multi-agency task force setting.
Criminal Investigations The purpose of criminal investigations is to provide investigative support that requires a particularly high level of expertise. This service is provided to police officers, victims, external members of the criminal justice agencies, and the public, in order to protect victims and the public.
Centralized Investigations-This is a core activity mandated by Art. 2.13, CCP. The Department has pooled its investigative resources into one division that conducts criminal investigations (homicide, robbery, child abuse, family violence, deviant crimes, forgery and other financial crimes, juvenile investigations and auto theft); sex offender registration and recovery of stolen property.
Field Support Unit – Identify and target organized criminal activity and groups committing offenses that display specific patterns. Use a flexible operating schedule to adapt to the needs of the department and the community in response to known or suspected criminal activity. Provide targeted enforcement in neighborhoods and other areas affected by crime to suppress criminal activity and improve safety for residents. Use specialized investigative techniques and equipment to address known or suspected criminal activity.
Forensic Services-These services are critical to the police investigator and to the
successful prosecution of criminal cases. It includes fingerprint identification, crime laboratory, evidence control, crime scene investigation, and photography and evidence collection.
Victim Services-This activity is mandated by Ch. 56, CCP. Provide for assistance to
crime victims and provide community education and referral programs related to crime victim issues.
Operations Support Operations support provides intake and processing of police calls for service. It provides fleet, equipment and facility maintenance services so that police services can be delivered effectively. Information resources are also provided along with administrative and fiscal support to police department employees so they can perform their jobs safely and efficiently. In addition, professional development and training are provided to employees so that they can perform their duties in accordance with department values. Specialized critical incident management is also included in this functional area.
Communications-Mandated by Ch. 77, Health and Safety Code. Serve as primary call taker for all emergency calls for Police, Fire, and EMS. Take call information and dispatch units to calls for service. Input information into the computer aided dispatch system. Receive and send information such as driver license checks, vehicle registrations, and officer location to the field units as necessary.
205

Police
Emergency Services-Includes the specially trained and equipped teams of officers for tactical and hostage negotiations support. These highly trained officers are responsible for formulating and executing action plans to manage critical incidents.
Community Partnerships-Assist in crime prevention and problem solving, work with
residents and businesses to solve problems that lead to crime, community liaison to improve communication and understanding of police operations. Programs in the category include the school resource officers and Drug Abuse Resistance Education (DARE).
Administration-Manage all police programs to maximize efficiency and provide effective delivery of services. Manage the budget for the department, ensuring that the department is fiscally responsible. Maintain open communication with other department and governmental agencies. Coordinate investigation of internal and external complaints of alleged police personnel misconduct of both sworn officers and civilians. Manage records and provide reports to the public, other law enforcement agencies and City Hall. Coordinate special projects and plan for the future growth of department in size and service. Coordinate, manage, and research all existing and new grants available for the department. Prepare and submit grant preapproval requests to City Council prior to applying for grants.
Recruitment and Training – Program seeks qualified police officer and non-sworn
applicants, conducts initial screening interviews to determine if basic requirements are satisfied, tests applicants for basic skills, compatible behavior traits and conducts background investigations. Trains and monitors employees so that the department has highly qualified and competent staff members to meet the expectations of the public.
Internal Affairs-Activity is mandated by Sec. 143.312, Local Government Code.
Includes investigation of potential policy violations in a timely manner and provides feedback to the public in order to maintain trust and confidence in internal affairs investigations process.
Public Information-Coordinate and provide departmental information to the public
including press releases, releases of suspect descriptions, crime alerts, and interact with the public at community events. Provide copies of recorded events in response to public information or court requests.
Vehicle and Equipment Maintenance-Provide maintenance and support of City vehicles
and equipment for the department to ensure dependable transportation and operations. Manage fleet and all equipment used for police services on a 24 hour, seven day a week schedule.
206

Police
Highlights of the Budget
The Fiscal Year 2020 budget for the police department addresses requirements to maintain current operations without a request for any additional sworn peace officer positions. The current full authorized sworn strength is 66 peace officers. The current staffing at Animal Control includes two full time Animal Control officers, one full time Animal Control shelter manager/volunteer coordinator and an Animal Control Supervisor. The Crime Victim Liaison position has been partially funded by a federal Victims of Crime Act grant managed by the Governor’s office for the past 20 years. The last application for continued funding was filed in early 2018 and we were awarded two years of funding. The budget includes funding for replacement vehicles from the Vehicle Replacement Fund. Based on annual mileage of 25,000 per year, there will be a need to replace seven marked patrol vehicles and one staff vehicles. At time of replacement each vehicle has over 100,000 miles. The following forces at work are included with the FY20 adopted budget.
Description Type Amount
FAW – K-9 Replacement One Time Cost Ongoing Cost
$27,500 $5,400
FAW – Replacement Mobile Data Terminals (MDT) One Time Cost $31,050
207

Police
2020 Departmental Goals and Performance Measures Major Departmental Goals:
Use Intelligence-Led Policing to increase efficiency in service delivery Provide quality police services to our community Improve traffic safety Actively involve residents and the business community in crime prevention and
promoting community safety awareness Improve the quality of Animal Control Services
Supports the City’s Strategic Goals: 1-Communication, 5-Public Safety, and 6-Organizational Development
Police Department FY17 Actual
FY18 Actual
FY19 Budget
FY19 Forecast
FY20 Adopted
Inputs
# of full time sworn peace officers 64 64 66 66 66
Department Expenditures $9,456,189 $10,694,515 $11,210,483 $11,278,299 $11,872,801
Outputs
Total # of Arrests 919 1,179 1,000 1,000 1,000 # of Police Calls For Service 16,258 16,443 22,626 17,000 17,000 # of Domestic Animals Impounded 559 525 525 525 525
Measures of Effectiveness
Crime Rate 8.91 9.18 10.00 10.00 10.00
Offense Clearance Rate 61 66 64 65 65
# of Traffic Accidents 534 514 515 530 530
# of Animal Adoptions 246 266 250 250 250
Measures of Efficiency
Average Response Time 9:13 8:23 10:00 10:00 10:00
#minutes from request to arrival – Priority 1 4:45 4:15 5:00 5:00 5:00
Monthly Operating Costs $788,016 $891,210 $934,207 $939,858 $989,400
Department Expenditures per Capita $240.26 $264.55 $274.06 $275.72 $288.06
208

POLICE DEPARTMENTDEPARTMENT SUMMARY
EXPENDITURE BY DIVISION
DIVISIONFY18
ACTUAL
FY19ORIGINAL
BUDGET
FY19AMENDED
BUDGET
FY19 YTD
6/30/19
FY19YEAR ENDESTIMATE
FY20ADOPTED
BUDGET
% CHANGE INBUDGET
FROMFY19 TO FY20
ADMINISTRATION $912,990 $977,484 $962,555 $610,743 $925,358 $976,636 -0.1%COMMUNICATIONS 1,211,103 1,218,936 1,215,336 833,318 1,220,405 1,222,102 0.3%PATROL 6,260,299 6,463,588 6,649,222 4,738,429 6,647,052 7,096,409 9.8%PATROL-DOT PROGRAM 131,970 126,587 126,587 43,243 45,636 124,805 -1.4%CRIMINAL INVESTIGATIONS 1,782,328 1,995,861 1,997,100 1,340,715 2,012,448 2,024,004 1.4%ANIMAL CONTROL 395,825 428,027 437,135 291,236 427,400 428,845 0.2%DEPARTMENT TOTAL $10,694,515 $11,210,483 $11,387,934 $7,857,684 $11,278,299 $11,872,801 5.9%
EXPENDITURE BY CLASSIFICATION
CLASSIFICATIONFY18
ACTUAL
FY19ORIGINAL
BUDGET
FY19AMENDED
BUDGET
FY19 YTD
6/30/19
FY19YEAR ENDESTIMATE
FY20ADOPTED
BUDGET
% CHANGE INBUDGET
FROMFY19 TO FY20
SALARIES AND BENEFITS $8,942,395 $9,677,706 $9,677,146 $6,930,868 $9,747,617 $10,227,811 5.7%SUPPLIES 402,914 424,280 426,693 247,675 363,866 447,370 5.4%MAINTENANCE 196,110 307,381 298,439 160,153 250,630 335,810 9.2%SERVICES 582,555 783,116 798,481 521,020 745,010 815,310 4.1%CAPITAL OUTLAY 570,541 18,000 187,176 (2,033) 171,176 46,500 0.0%CLASSIFICATION TOTAL $10,694,515 $11,210,483 $11,387,934 $7,857,684 $11,278,299 $11,872,801 5.9%
PERSONNEL SUMMARY BY DIVISION
DIVISIONFY18
ACTUAL
FY19ORIGINAL
BUDGET
FY19AMENDED
BUDGET
FY19 YTD
6/30/19
FY19YEAR ENDESTIMATE
FY20ADOPTED
BUDGET
% CHANGE INBUDGET
FROMFY19 TO FY20
ADMINISTRATION 5.00 5.00 5.00 5.00 5.00 5.00 0.0%COMMUNICATIONS 13.60 13.60 13.60 13.60 13.60 13.60 0.0%PATROL 51.12 53.78 53.78 53.78 53.78 53.78 0.0%PATROL-DOT PROGRAM 1.00 1.00 1.00 1.00 1.00 1.00 0.0%CRIMINAL INVESTIGATIONS 13.00 13.00 13.00 13.00 13.00 13.00 0.0%ANIMAL CONTROL 4.00 4.00 4.00 4.00 4.00 4.00 0.0%PERSONNEL TOTAL 87.72 90.38 90.38 90.38 90.38 90.38 0.0%
209
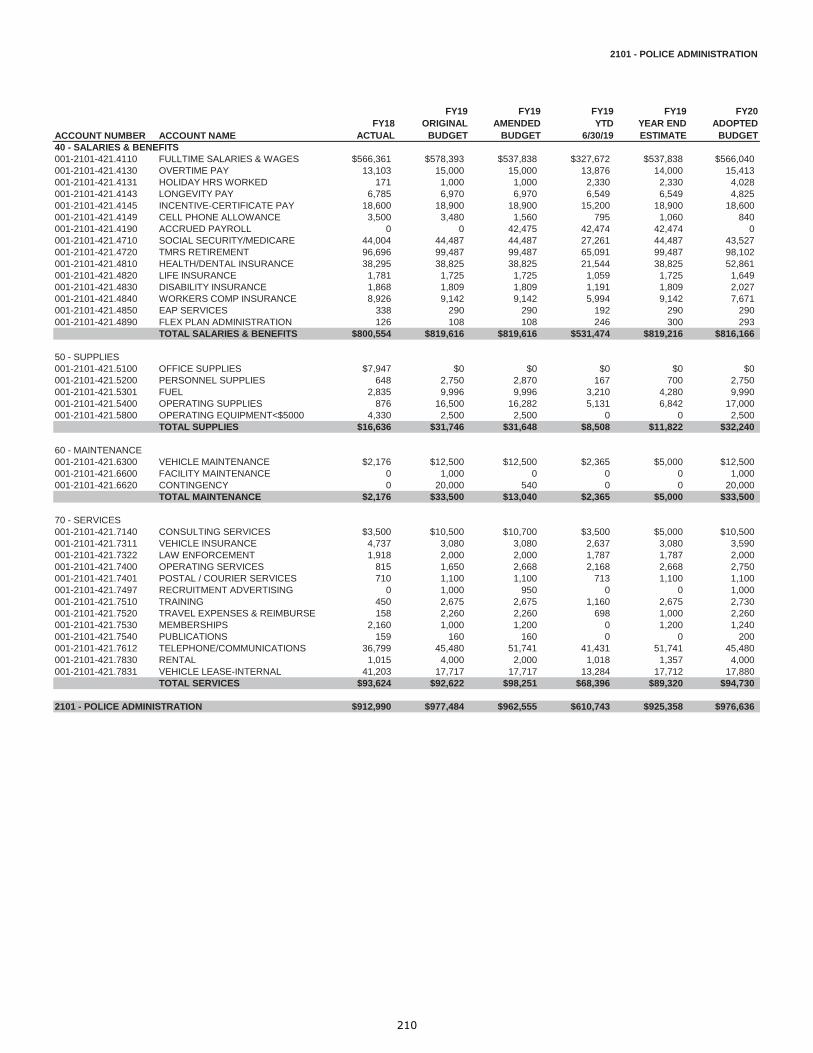
2101 - POLICE ADMINISTRATION
ACCOUNT NUMBER ACCOUNT NAMEFY18
ACTUAL
FY19ORIGINAL
BUDGET
FY19AMENDED
BUDGET
FY19 YTD
6/30/19
FY19YEAR ENDESTIMATE
FY20ADOPTED
BUDGET40 - SALARIES & BENEFITS001-2101-421.4110 FULLTIME SALARIES & WAGES $566,361 $578,393 $537,838 $327,672 $537,838 $566,040001-2101-421.4130 OVERTIME PAY 13,103 15,000 15,000 13,876 14,000 15,413001-2101-421.4131 HOLIDAY HRS WORKED 171 1,000 1,000 2,330 2,330 4,028001-2101-421.4143 LONGEVITY PAY 6,785 6,970 6,970 6,549 6,549 4,825001-2101-421.4145 INCENTIVE-CERTIFICATE PAY 18,600 18,900 18,900 15,200 18,900 18,600001-2101-421.4149 CELL PHONE ALLOWANCE 3,500 3,480 1,560 795 1,060 840001-2101-421.4190 ACCRUED PAYROLL 0 0 42,475 42,474 42,474 0001-2101-421.4710 SOCIAL SECURITY/MEDICARE 44,004 44,487 44,487 27,261 44,487 43,527001-2101-421.4720 TMRS RETIREMENT 96,696 99,487 99,487 65,091 99,487 98,102001-2101-421.4810 HEALTH/DENTAL INSURANCE 38,295 38,825 38,825 21,544 38,825 52,861001-2101-421.4820 LIFE INSURANCE 1,781 1,725 1,725 1,059 1,725 1,649001-2101-421.4830 DISABILITY INSURANCE 1,868 1,809 1,809 1,191 1,809 2,027001-2101-421.4840 WORKERS COMP INSURANCE 8,926 9,142 9,142 5,994 9,142 7,671001-2101-421.4850 EAP SERVICES 338 290 290 192 290 290001-2101-421.4890 FLEX PLAN ADMINISTRATION 126 108 108 246 300 293
TOTAL SALARIES & BENEFITS $800,554 $819,616 $819,616 $531,474 $819,216 $816,166
50 - SUPPLIES001-2101-421.5100 OFFICE SUPPLIES $7,947 $0 $0 $0 $0 $0001-2101-421.5200 PERSONNEL SUPPLIES 648 2,750 2,870 167 700 2,750001-2101-421.5301 FUEL 2,835 9,996 9,996 3,210 4,280 9,990001-2101-421.5400 OPERATING SUPPLIES 876 16,500 16,282 5,131 6,842 17,000001-2101-421.5800 OPERATING EQUIPMENT<$5000 4,330 2,500 2,500 0 0 2,500
TOTAL SUPPLIES $16,636 $31,746 $31,648 $8,508 $11,822 $32,240
60 - MAINTENANCE001-2101-421.6300 VEHICLE MAINTENANCE $2,176 $12,500 $12,500 $2,365 $5,000 $12,500001-2101-421.6600 FACILITY MAINTENANCE 0 1,000 0 0 0 1,000001-2101-421.6620 CONTINGENCY 0 20,000 540 0 0 20,000
TOTAL MAINTENANCE $2,176 $33,500 $13,040 $2,365 $5,000 $33,500
70 - SERVICES001-2101-421.7140 CONSULTING SERVICES $3,500 $10,500 $10,700 $3,500 $5,000 $10,500001-2101-421.7311 VEHICLE INSURANCE 4,737 3,080 3,080 2,637 3,080 3,590001-2101-421.7322 LAW ENFORCEMENT 1,918 2,000 2,000 1,787 1,787 2,000001-2101-421.7400 OPERATING SERVICES 815 1,650 2,668 2,168 2,668 2,750001-2101-421.7401 POSTAL / COURIER SERVICES 710 1,100 1,100 713 1,100 1,100001-2101-421.7497 RECRUITMENT ADVERTISING 0 1,000 950 0 0 1,000001-2101-421.7510 TRAINING 450 2,675 2,675 1,160 2,675 2,730001-2101-421.7520 TRAVEL EXPENSES & REIMBURSE 158 2,260 2,260 698 1,000 2,260001-2101-421.7530 MEMBERSHIPS 2,160 1,000 1,200 0 1,200 1,240001-2101-421.7540 PUBLICATIONS 159 160 160 0 0 200001-2101-421.7612 TELEPHONE/COMMUNICATIONS 36,799 45,480 51,741 41,431 51,741 45,480001-2101-421.7830 RENTAL 1,015 4,000 2,000 1,018 1,357 4,000001-2101-421.7831 VEHICLE LEASE-INTERNAL 41,203 17,717 17,717 13,284 17,712 17,880
TOTAL SERVICES $93,624 $92,622 $98,251 $68,396 $89,320 $94,730
2101 - POLICE ADMINISTRATION $912,990 $977,484 $962,555 $610,743 $925,358 $976,636
210

2110 - POLICE COMMUNICATIONS
ACCOUNT NUMBER ACCOUNT NAMEFY18
ACTUAL
FY19ORIGINAL
BUDGET
FY19AMENDED
BUDGET
FY19 YTD
6/30/19
FY19YEAR ENDESTIMATE
FY20ADOPTED
BUDGET40 - SALARIES & BENEFITS001-2110-421.4110 FULLTIME SALARIES & WAGES $653,170 $698,442 $698,442 $448,679 $670,000 $714,585001-2110-421.4130 OVERTIME PAY 71,969 30,500 30,500 66,682 75,909 44,839001-2110-421.4131 HOLIDAY HRS WORKED 19,704 20,000 20,000 15,337 20,000 25,550001-2110-421.4143 LONGEVITY PAY 8,646 8,475 8,475 8,635 8,635 9,250001-2110-421.4145 INCENTIVE-CERTIFICATE PAY 40,933 59,280 59,280 27,970 59,280 40,450001-2110-421.4149 CELL PHONE ALLOWANCE 840 840 840 595 840 840001-2110-421.4190 ACCRUED PAYROLL 1,625 0 0 0 0 0001-2110-421.4220 PART-TIME WAGES W/O BENEFITS 15,147 25,409 25,409 35,324 42,099 25,227001-2110-421.4710 SOCIAL SECURITY/MEDICARE 58,992 60,792 60,792 44,241 60,792 62,569001-2110-421.4720 TMRS RETIREMENT 126,449 130,397 130,397 90,208 130,397 130,804001-2110-421.4810 HEALTH/DENTAL INSURANCE 100,093 114,063 114,063 68,118 114,063 95,342001-2110-421.4820 LIFE INSURANCE 2,081 2,250 2,250 1,496 2,250 2,104001-2110-421.4830 DISABILITY INSURANCE 2,194 2,317 2,317 1,691 2,317 2,601001-2110-421.4840 WORKERS COMP INSURANCE 1,357 1,214 1,214 1,813 2,417 2,012001-2110-421.4850 EAP SERVICES 929 1,104 1,104 755 1,104 755001-2110-421.4890 FLEX PLAN ADMINISTRATION 319 281 281 769 1,025 834
TOTAL SALARIES & BENEFITS $1,104,448 $1,155,364 $1,155,364 $812,313 $1,191,128 $1,157,762
50 - SUPPLIES001-2110-421.5200 PERSONNEL SUPPLIES $1,869 $4,000 $3,858 $2,289 $3,052 $4,000001-2110-421.5400 OPERATING SUPPLIES 2,172 2,700 2,700 544 725 2,700001-2110-421.5800 OPERATING EQUIPMENT<$5000 779 3,000 3,000 683 910 3,000
TOTAL SUPPLIES $4,820 $9,700 $9,558 $3,516 $4,687 $9,700
60 - MAINTENANCE001-2110-421.6800 EQUIPMENT MAINTENANCE $28,211 $36,207 $36,207 $12,274 $16,365 $36,250
TOTAL MAINTENANCE $28,211 $36,207 $36,207 $12,274 $16,365 $36,250
70 - SERVICES001-2110-421.7212 MEDICAL EXAMINATIONS $225 $600 $600 $225 $300 $600001-2110-421.7350 SURETY BONDS 71 142 284 142 189 560001-2110-421.7400 OPERATING SERVICES 22,211 4,500 4,500 937 1,249 5,070001-2110-421.7401 POSTAL / COURIER SERVICES 0 500 500 0 0 500001-2110-421.7510 TRAINING 16,226 3,445 3,445 1,650 3,445 6,270001-2110-421.7520 TRAVEL EXPENSES & REIMBURSE 961 1,600 1,600 895 1,193 2,100001-2110-421.7530 MEMBERSHIPS 658 1,210 1,210 468 624 1,220001-2110-421.7611 ELECTRICITY 1,221 2,068 2,068 898 1,225 2,070001-2110-421.7612 TELEPHONE/COMMUNICATIONS 0 3,600 0 0 0 0001-2110-421.7710 SOFTWARE LICENSE FEES 11,500 0 0 0 0 0
TOTAL SERVICES $53,073 $17,665 $14,207 $5,215 $8,225 $18,390
80 - CAPITAL OUTLAY001-2110-421.8800 CAPITAL EQUIPMENT $20,551 $0 $0 $0 $0 $0
TOTAL CAPITAL OUTLAY $20,551 $0 $0 $0 $0 $0
2110 - COMMUNICATIONS $1,211,103 $1,218,936 $1,215,336 $833,318 $1,220,405 $1,222,102
211

2120 - POLICE PATROL
ACCOUNT NUMBER ACCOUNT NAMEFY18
ACTUAL
FY19ORIGINAL
BUDGET
FY19AMENDED
BUDGET
FY19 YTD
6/30/19
FY19YEAR ENDESTIMATE
FY20ADOPTED
BUDGET40 - SALARIES & BENEFITS001-2120-421.4110 FULLTIME SALARIES & WAGES $2,760,246 $3,191,101 $3,164,107 $2,206,820 $3,042,426 $3,406,331001-2120-421.4120 PART-TIME WAGES 26,430 66,268 66,268 39,124 52,165 66,354001-2120-421.4130 OVERTIME PAY 458,242 389,338 394,338 412,068 519,423 475,707001-2120-421.4131 HOLIDAY HRS WORKED 110,705 95,000 95,000 106,811 132,414 117,613001-2120-421.4143 LONGEVITY PAY 22,450 21,785 21,785 22,255 22,255 24,790001-2120-421.4145 INCENTIVE-CERTIFICATE PAY 162,020 186,370 186,370 114,450 186,370 167,730001-2120-421.4149 CELL PHONE ALLOWANCE 5,785 5,700 4,500 2,948 4,500 4,200001-2120-421.4190 ACCRUED PAYROLL 10,467 0 21,794 21,794 21,794 0001-2120-421.4220 PART-TIME WAGES W/O BENEFITS 68,645 54,544 54,544 58,249 70,665 56,087001-2120-421.4710 SOCIAL SECURITY/MEDICARE 262,300 271,126 271,126 216,735 271,126 319,220001-2120-421.4720 TMRS RETIREMENT 564,456 641,437 641,437 465,723 641,437 694,477001-2120-421.4810 HEALTH/DENTAL INSURANCE 448,276 495,922 495,922 358,885 495,922 615,438001-2120-421.4820 LIFE INSURANCE 8,520 9,756 9,756 6,974 9,756 10,457001-2120-421.4830 DISABILITY INSURANCE 9,280 11,598 11,598 7,948 11,598 12,908001-2120-421.4840 WORKERS COMP INSURANCE 53,527 59,689 59,689 42,948 59,689 64,037001-2120-421.4850 EAP SERVICES 3,076 3,252 3,252 2,360 3,252 2,961001-2120-421.4890 FLEX PLAN ADMINISTRATION 861 1,037 1,037 1,351 1,800 1,839
TOTAL SALARIES & BENEFITS $4,975,286 $5,503,923 $5,502,523 $4,087,443 $5,546,592 $6,040,149
50 - SUPPLIES001-2120-421.5200 PERSONNEL SUPPLIES $61,453 $64,700 $65,992 $42,659 $56,879 $71,900001-2120-421.5300 VEHICLE SUPPLIES 39 1,500 1,500 148 197 1,500001-2120-421.5301 FUEL 127,432 144,525 144,525 90,019 129,024 144,520001-2120-421.5400 OPERATING SUPPLIES 31,275 39,670 39,670 26,997 38,670 44,070001-2120-421.5410 PDRAD PROGRAM SUPPLIES 1,325 0 0 0 0 0001-2120-421.5800 OPERATING EQUIPMENT<$5000 81,112 45,100 43,198 23,211 43,198 45,850
TOTAL SUPPLIES $302,636 $295,495 $294,885 $183,034 $267,968 $307,840
60 - MAINTENANCE001-2120-421.6300 VEHICLE MAINTENANCE $99,631 $130,360 $139,892 $107,803 $143,737 $148,160001-2120-421.6400 OPERATING MAINTENANCE 8 2,000 2,672 689 1,000 3,000001-2120-421.6800 EQUIPMENT MAINTENANCE 35,421 53,714 55,528 21,510 55,528 51,300
TOTAL MAINTENANCE $135,060 $186,074 $198,092 $130,002 $200,265 $202,460
70 - SERVICES001-2120-421.7212 MEDICAL EXAMINATIONS $900 $2,000 $2,000 $1,800 $1,400 $2,000001-2120-421.7311 VEHICLE INSURANCE 24,796 31,201 31,201 23,526 31,201 28,690001-2120-421.7322 LAW ENFORCEMENT 27,626 29,000 29,000 26,464 29,000 29,000001-2120-421.7340 ANIMAL MORTALITY INS 2,709 3,964 3,964 2,091 2,091 4,200001-2120-421.7400 OPERATING SERVICES 15,327 17,490 17,490 13,016 17,354 22,990001-2120-421.7401 POSTAL / COURIER SERVICES 942 1,000 1,000 727 968 1,000001-2120-421.7497 RECRUITMENT ADVERTISING 0 526 576 572 572 600001-2120-421.7498 JUDGMENTS & DAMAGE CLAIMS 1,750 4,900 4,900 1,525 3,000 4,900001-2120-421.7510 TRAINING 26,111 15,125 27,025 14,918 27,025 27,580001-2120-421.7520 TRAVEL EXPENSES & REIMBURSE 8,189 15,775 10,275 4,037 10,275 15,800001-2120-421.7530 MEMBERSHIPS 825 1,580 1,580 65 825 1,580001-2120-421.7540 PUBLICATIONS 0 190 190 0 0 200001-2120-421.7710 SOFTWARE LICENSE FEES 1,125 8,000 8,000 4,236 8,000 10,550001-2120-421.7831 VEHICLE LEASE-INTERNAL 192,189 329,345 329,345 247,005 329,340 350,370
TOTAL SERVICES $302,489 $460,096 $466,546 $339,982 $461,051 $499,460
80 - CAPITAL OUTLAY001-2120-421.8300 VEHICLES $49,972 $0 $0 $0 $0 $0001-2120-421.8800 CAPITAL EQUIPMENT 494,856 18,000 187,176 (2,033) 171,176 46,500
TOTAL CAPITAL OUTLAY $544,828 $18,000 $187,176 ($2,033) $171,176 $46,500
2120 - PATROL $6,260,299 $6,463,588 $6,649,222 $4,738,429 $6,647,052 $7,096,409
212

2125 - PATROL DOT PROGRAM
ACCOUNT NUMBER ACCOUNT NAMEFY18
ACTUAL
FY19ORIGINAL
BUDGET
FY19AMENDED
BUDGET
FY19 YTD
6/30/19
FY19YEAR ENDESTIMATE
FY20ADOPTED
BUDGET40 - SALARIES & BENEFITS001-2125-421.4110 FULLTIME SALARIES & WAGES $62,824 $62,648 $62,648 $14,460 $14,460 $62,447001-2125-421.4130 OVERTIME PAY 9,619 1,500 1,500 3,906 3,906 1,541001-2125-421.4131 HOLIDAY HRS WORKED 4,244 0 0 539 539 0001-2125-421.4143 LONGEVITY PAY 375 415 415 435 435 0001-2125-421.4145 INCENTIVE-CERTIFICATE PAY 3,100 3,900 3,900 2,925 2,925 1,800001-2125-421.4710 SOCIAL SECURITY/MEDICARE 5,479 4,609 4,609 1,552 1,552 4,710001-2125-421.4720 TMRS RETIREMENT 12,653 10,920 10,920 3,550 3,550 11,158001-2125-421.4810 HEALTH/DENTAL INSURANCE 17,036 18,461 18,461 4,438 4,438 18,957001-2125-421.4820 LIFE INSURANCE 182 189 189 55 55 189001-2125-421.4830 DISABILITY INSURANCE 190 199 199 58 58 232001-2125-421.4840 WORKERS COMP INSURANCE 1,179 1,003 1,003 325 325 1,019001-2125-421.4850 EAP SERVICES 63 58 58 17 17 59001-2125-421.4890 FLEX PLAN ADMINISTRATION 23 22 22 6 6 23
TOTAL SALARIES & BENEFITS $116,967 $103,924 $103,924 $32,266 $32,266 $102,135
50 - SUPPLIES001-2125-421.5200 PERSONNEL SUPPLIES $291 $500 $500 $271 $271 $500001-2125-421.5300 VEHICLE SUPPLIES 0 250 250 0 0 250001-2125-421.5301 FUEL 3,159 2,479 2,479 2,009 2,009 2,480001-2125-421.5400 OPERATING SUPPLIES 299 750 750 27 27 750001-2125-421.5800 OPERATING EQUIPMENT<$5000 483 750 750 0 0 750
TOTAL SUPPLIES $4,232 $4,729 $4,729 $2,307 $2,307 $4,730
60 - MAINTENANCE001-2125-421.6300 VEHICLE MAINTENANCE $2,128 $1,000 $1,000 $0 $0 $1,000
TOTAL MAINTENANCE $2,128 $1,000 $1,000 $0 $0 $1,000
70 - SERVICES001-2125-421.7311 VEHICLE INSURANCE $854 $871 $871 $585 $871 $800001-2125-421.7400 OPERATING SERVICES 105 800 800 345 345 800001-2125-421.7510 TRAINING 1,450 3,250 3,250 767 767 3,250001-2125-421.7520 TRAVEL EXPENSES & REIMBURSE 0 3,015 3,015 82 82 3,090001-2125-421.7530 MEMBERSHIPS 550 600 600 600 600 600001-2125-421.7831 VEHICLE LEASE-INTERNAL 5,684 8,398 8,398 6,291 8,398 8,400
TOTAL SERVICES $8,643 $16,934 $16,934 $8,670 $11,063 $16,940
2125 - PATROL DOT $131,970 $126,587 $126,587 $43,243 $45,636 $124,805
213

2130 - POLICE CRIMINAL INVESTIGATIONS
ACCOUNT NUMBER ACCOUNT NAMEFY18
ACTUAL
FY19ORIGINAL
BUDGET
FY19AMENDED
BUDGET
FY19 YTD
6/30/19
FY19YEAR ENDESTIMATE
FY20ADOPTED
BUDGET40 - SALARIES & BENEFITS001-2130-421.4110 FULLTIME SALARIES & WAGES $993,178 $1,152,417 $1,153,617 $762,858 $1,153,617 $1,115,533001-2130-421.4130 OVERTIME PAY 100,997 71,000 71,000 82,370 105,826 111,953001-2130-421.4131 HOLIDAY HRS WORKED 13,167 4,000 4,000 1,887 12,000 5,110001-2130-421.4143 LONGEVITY PAY 9,770 10,240 10,240 11,780 11,780 9,965001-2130-421.4145 INCENTIVE-CERTIFICATE PAY 50,260 55,653 55,653 33,808 55,653 51,600001-2130-421.4149 CELL PHONE ALLOWANCE 5,298 6,125 4,925 2,835 4,925 4,500001-2130-421.4150 CLOTHING ALLOWANCE 9,100 8,800 8,800 4,300 8,800 8,400001-2130-421.4190 ACCRUED PAYROLL 0 0 0 4,184 4,184 0001-2130-421.4710 SOCIAL SECURITY/MEDICARE 84,218 92,466 92,466 64,960 92,466 91,197001-2130-421.4720 TMRS RETIREMENT 187,449 208,664 208,664 143,864 208,664 201,363001-2130-421.4810 HEALTH/DENTAL INSURANCE 150,403 165,190 165,190 102,517 165,190 171,833001-2130-421.4820 LIFE INSURANCE 3,106 3,581 3,581 2,291 3,581 3,235001-2130-421.4830 DISABILITY INSURANCE 3,297 3,794 3,794 2,594 3,794 4,026001-2130-421.4840 WORKERS COMP INSURANCE 15,479 17,240 17,240 11,830 17,240 16,449001-2130-421.4850 EAP SERVICES 870 871 871 617 871 813001-2130-421.4890 FLEX PLAN ADMINISTRATION 324 324 324 403 537 487
TOTAL SALARIES & BENEFITS $1,626,916 $1,800,365 $1,800,365 $1,233,098 $1,849,128 $1,796,464
50 - SUPPLIES001-2130-421.5200 PERSONNEL SUPPLIES $2,569 $4,500 $4,500 $3,037 $4,049 $4,500001-2130-421.5301 FUEL 26,387 31,461 31,461 18,109 24,145 31,460001-2130-421.5400 OPERATING SUPPLIES 6,692 8,500 8,500 1,911 7,000 8,700001-2130-421.5800 OPERATING EQUIPMENT<$5000 7,208 7,750 8,350 2,556 8,350 16,950
TOTAL SUPPLIES $42,856 $52,211 $52,811 $25,613 $43,544 $61,610
60 - MAINTENANCE001-2130-421.6300 VEHICLE MAINTENANCE $18,693 $34,100 $33,600 $13,047 $19,000 $46,100001-2130-421.6800 EQUIPMENT MAINTENANCE 1,995 4,500 4,500 0 2,000 4,500
TOTAL MAINTENANCE $20,688 $38,600 $38,100 $13,047 $21,000 $50,600
70 - SERVICES001-2130-421.7311 VEHICLE INSURANCE $12,793 $12,100 $12,100 $9,342 $12,100 $11,890001-2130-421.7322 LAW ENFORCEMENT 5,755 5,850 5,850 5,361 5,361 5,850001-2130-421.7400 OPERATING SERVICES 20,528 14,895 18,195 15,202 20,269 24,500001-2130-421.7401 POSTAL / COURIER SERVICES 364 500 500 266 375 500001-2130-421.7498 JUDGMENTS & DAMAGE CLAIMS 0 0 500 0 0 0001-2130-421.7510 TRAINING 6,928 16,205 13,205 1,842 7,000 13,210001-2130-421.7520 TRAVEL EXPENSES & REIMBURSE 6,163 7,067 7,067 1,543 6,500 7,070001-2130-421.7530 MEMBERSHIPS 1,465 1,670 1,670 1,430 1,670 1,810001-2130-421.7612 TELEPHONE/COMMUNICATIONS 1,929 3,240 3,579 1,757 2,343 3,240001-2130-421.7710 SOFTWARE LICENSE FEES 1,200 2,100 2,100 1,425 2,100 2,100001-2130-421.7831 VEHICLE LEASE-INTERNAL 29,581 41,058 41,058 30,789 41,058 45,160
TOTAL SERVICES $86,706 $104,685 $105,824 $68,957 $98,776 $115,330
80 - CAPITAL OUTLAY001-2130-421.8400 CAPITAL OPERATING EQUIP $5,162 $0 $0 $0 $0 $0
TOTAL CAPITAL OUTLAY $5,162 $0 $0 $0 $0 $0
2130 - CRIMINAL INVESTIGATIONS $1,782,328 $1,995,861 $1,997,100 $1,340,715 $2,012,448 $2,024,004
214

2150 - ANIMAL CONTROL
ACCOUNT NUMBER ACCOUNT NAMEFY18
ACTUAL
FY19ORIGINAL
BUDGET
FY19AMENDED
BUDGET
FY19 YTD
6/30/19
FY19YEAR ENDESTIMATE
FY20ADOPTED
BUDGET40 - SALARIES & BENEFITS001-2150-441.4110 FULLTIME SALARIES & WAGES $187,471 $185,410 $185,410 $137,353 $183,137 $191,638001-2150-441.4130 OVERTIME PAY 32,598 15,000 15,000 22,841 30,455 24,413001-2150-441.4131 HOLIDAY HRS WORKED 88 350 350 749 998 1,010001-2150-441.4143 LONGEVITY PAY 1,380 1,530 1,530 1,620 1,620 1,845001-2150-441.4145 INCENTIVE-CERTIFICATE PAY 1,200 1,200 1,200 900 1,200 1,200001-2150-441.4149 CELL PHONE ALLOWANCE 420 420 1,260 823 823 1,680001-2150-441.4710 SOCIAL SECURITY/MEDICARE 15,451 13,984 13,984 11,232 13,984 15,145001-2150-441.4720 TMRS RETIREMENT 35,458 32,524 32,524 26,147 32,524 33,964001-2150-441.4810 HEALTH/DENTAL INSURANCE 38,560 38,560 38,560 28,117 38,560 38,560001-2150-441.4820 LIFE INSURANCE 563 549 549 415 552 527001-2150-441.4830 DISABILITY INSURANCE 609 591 591 479 638 668001-2150-441.4840 WORKERS COMP INSURANCE 4,054 4,078 4,078 2,984 3,978 3,798001-2150-441.4850 EAP SERVICES 271 232 232 194 258 232001-2150-441.4890 FLEX PLAN ADMINISTRATION 101 86 86 420 560 455
TOTAL SALARIES & BENEFITS $318,224 $294,514 $295,354 $234,274 $309,287 $315,135
50 - SUPPLIES001-2150-441.5200 PERSONNEL SUPPLIES $833 $2,000 $2,000 $784 $1,500 $2,000001-2150-441.5301 FUEL 9,535 7,749 7,749 6,395 8,526 7,750001-2150-441.5400 OPERATING SUPPLIES 18,516 17,650 16,313 13,384 18,000 18,500001-2150-441.5800 OPERATING EQUIPMENT<$5000 2,850 3,000 7,000 4,134 5,512 3,000
TOTAL SUPPLIES $31,734 $30,399 $33,062 $24,697 $33,538 $31,250
60 - MAINTENANCE001-2150-441.6300 VEHICLE MAINTENANCE $7,847 $12,000 $12,000 $2,465 $8,000 $12,000
TOTAL MAINTENANCE $7,847 $12,000 $12,000 $2,465 $8,000 $12,000
70 - SERVICES001-2150-441.7212 MEDICAL EXAMINATIONS $0 $1,800 $0 $0 $0 $1,800001-2150-441.7311 VEHICLE INSURANCE 2,263 2,309 2,309 1,629 2,309 2,510001-2150-441.7400 OPERATING SERVICES 3,533 4,980 7,280 4,127 5,525 7,380001-2150-441.7410 ADOPTION RELATED SERVICES 19,057 35,000 40,945 15,027 25,035 30,000001-2150-441.7498 JUDGMENTS & DAMAGE CLAIMS 0 500 500 0 0 500001-2150-441.7510 TRAINING 745 4,700 3,860 675 2,000 3,400001-2150-441.7520 TRAVEL EXPENSES & REIMBURSE 2,403 3,084 3,084 2,223 2,964 3,100001-2150-441.7530 MEMBERSHIPS 200 200 200 200 200 200001-2150-441.7620 JANITORIAL SERVICES 0 30,000 30,000 0 30,000 0001-2150-441.7800 CONTRACT SERVICES 1,151 1,000 1,000 267 1,000 1,000001-2150-441.7831 VEHICLE LEASE-INTERNAL 8,668 7,541 7,541 5,652 7,542 20,570
TOTAL SERVICES $38,020 $91,114 $96,719 $29,800 $76,575 $70,460
2150 - ANIMAL CONTROL $395,825 $428,027 $437,135 $291,236 $427,400 $428,845
215

Fire Marshal’s Office
Fire Marshal/ Emergency Management
Fire Marshal Administration
Emergency Management
FVFD Contract Services
216

Fire Marshal
Mission Statement
It is the mission of the Friendswood Fire Marshal’s Office and the Office of Emergency Management to provide the highest quality of services to the people who live, work and visit the City of Friendswood.
Current Operations
Fire Marshal’s Office
The Fire Marshal’s Office (FMO) has the primary responsibility of fire prevention for the City of Friendswood. Fire prevention activities include: investigating fires, hazardous material incidents,and environmental incidents. The FMO investigates fires for origin and cause, and is responsible for filing appropriate criminal charges that may arise from an investigation. Conduct life safety inspections of business/commercial occupancies, review of new building plans, and design approval of fire alarm and sprinkler systems. Fire safety public education programs are presented year round by request from the public. The FMO also enforces fire lane violations, illegal use of fireworks, life safety violations, and issues citations as warranted. The FMO coordinates with pipeline companies to maintain current mapping of pipeline locations and company contactinformation.
The Fire Marshal, Deputy Director, and three (3) Deputy Fire Marshals are state certified peace officers, arson investigators, fire inspectors, and instructors. The part-time inspectors are state certified fire inspectors.
Office of Emergency Management
The Office of Emergency Management (OEM) is responsible for the emergency preparedness program with the Fire Marshal serving as the Emergency Management Coordinator. The OEM is responsible for maintaining and implementing the city’s Emergency Operations Plan (EOP) and 22 supplemental Annexes. The OEM also develops and maintains the Local Hazard Mitigation Plan (LMP), Debris Management Plan, Pandemic Plan, Continuity of Operations Plan (COOP), Records Emergency Action Plan (REAP), and participates with all communities in Galveston County througha cooperative planning effort. These plans are reviewed, updated and exercised to ensure that the city is capable of responding to and recovering from any emergency event. Planning also enables the city to qualify for any potential disaster recovery funds which will assist in the recovery and rebuilding process.
The OEM develops and distributes emergency preparedness materials to citizens and businesses through our public education outreach program. To maintain compliance with the National Incident Management System (NIMS), OEM staff members continue to conduct training programs for emergency management operations and response procedures for all city staff members and elected officials.
The Fire Marshal’s Office maintains the Emergency Operations Center (EOC) which enables quick activation providing support for emergency or non-emergency operations. The OEM strives to improve the City’s Public Safety response capabilities through planning efforts and coordination with Harris and Galveston Counties.
217
Fire Marshal
FVFD Contract Services
The Fire Marshal’s Office is designated as the contract administrator for fire suppression, ground emergency medical services and emergency medical billing.
Fire SuppressionThe Friendswood Volunteer Fire Department Inc. (FVFD) is the contract holder for fire suppression. The Friendswood Volunteer Fire Department is responsible to respond to fire related calls, vehicle accidents, assist EMS and conduct public education. The FVFD operates and manages equipment and volunteer personnel for 4 fire stations. The FVFD operates a paid part-time day crew staff from Fire Station #1.
EMSThe Friendswood Volunteer Fire Department Inc. (FVFD) is the contract holder for ground emergency medical services. Friendswood EMS services are provided in accordance with Texas Department of State Health Services (TDSHS) requirements for emergency medical providers. Friendswood EMS operates two – 24/7 staffed ambulances, from Fire Stations #1 and #4.
Medical Billing In January 2019, the City began charging fees for ground emergency medical services. Emergicon Emergency Medical Billing is the contract holder for invoicing and collecting revenue for the City’s ambulance fees. Emergicon remits the revenue collected net of the 6% contracted collection fee. The FY19 budget included revenue estimate of approximately $405K. The ambulance billing revenue is projected to exceed $1M in FY20.
218

Fire Marshal
Accomplishments in Fiscal Year 2019
Completed a total of 670 annual inspections and 778 follow-up type inspections on all commercial businesses, institutions, foster homes, nursing homes, daycares and apartment complexes for a grand total of 1,448 inspections within the city, to ensure compliance with fire and life safety codes.
Instructed and informed the public in aspects of fire safety and prevention, along with emergency preparedness training, through awareness and education programs. Provided a total of 23 public education classes with 1,328 attendees.
Reviewed, updated and submitted 4 Supplemental Annexes of the City’s Emergency Operation Plan (EOP) to the state for review and approval.
Grants Awardedo FY 2018 State Homeland Security Grant Program (SHSP) for $22,313; these funds
were used for the Mobile Operations Center (MOC) trailer for Friendswood Police Department.
o FY 2018 Emergency Management Performance Grant (EMPG) for $33,315; funding supports the city’s emergency management program.
Highlights of the Budget
2019-2020 Departmental Goals and Performance Measures
Major Departmental Goals:
Conduct thorough annual fire prevention inspections in all facilities (commercial businesses, apartment complexes, schools, city facilities, day care facilities, foster homes and nursing homes) within the City to reduce the number of fire code violations, life safety hazards and the number of fires.
Participate in the Design Review Committee (DRC) meetings to address developer and contractor questions during the conceptual stages of the development process.
Review and complete all submitted plan reviews within two working days (48 hours).
Instruct, educate, and inform the public in aspects of fire safety and prevention, along with emergency preparedness training, through awareness and educational programs.
Review or update the emergency preparedness planning documents within a five-year cycle per FEMA and Texas Department of Emergency Management (TDEM) guidelines.
Meet and maintain state and federal mandated continuing education training requirements for full-time employees.
Supports the City’s Strategic Goals: 1-Communication, 4-Partnerships, 5- Public Safety, and 6-Organizational Development
219
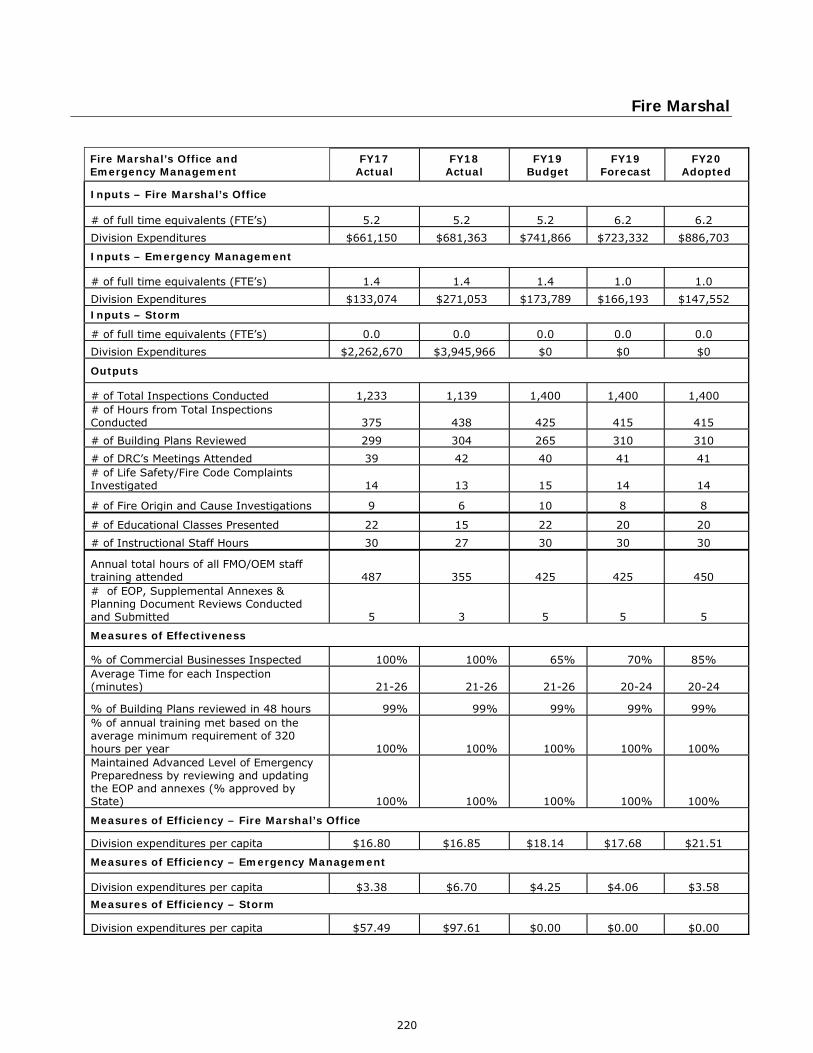
Fire Marshal
Fire Marshal’s Office and Emergency Management
FY17Actual
FY18Actual
FY19Budget
FY19Forecast
FY20Adopted
Inputs – Fire Marshal’s Office
# of full time equivalents (FTE’s) 5.2 5.2 5.2 6.2 6.2Division Expenditures $661,150 $681,363 $741,866 $723,332 $886,703
Inputs – Emergency Management
# of full time equivalents (FTE’s) 1.4 1.4 1.4 1.0 1.0Division Expenditures $133,074 $271,053 $173,789 $166,193 $147,552Inputs – Storm
# of full time equivalents (FTE’s) 0.0 0.0 0.0 0.0 0.0Division Expenditures $2,262,670 $3,945,966 $0 $0 $0
Outputs
# of Total Inspections Conducted 1,233 1,139 1,400 1,400 1,400# of Hours from Total Inspections Conducted 375 438 425 415 415# of Building Plans Reviewed 299 304 265 310 310# of DRC’s Meetings Attended 39 42 40 41 41# of Life Safety/Fire Code Complaints Investigated 14 13 15 14 14
# of Fire Origin and Cause Investigations 9 6 10 8 8
# of Educational Classes Presented 22 15 22 20 20# of Instructional Staff Hours 30 27 30 30 30
Annual total hours of all FMO/OEM staff training attended 487 355 425 425 450# of EOP, Supplemental Annexes & Planning Document Reviews Conducted and Submitted 5 3 5 5 5
Measures of Effectiveness
% of Commercial Businesses Inspected 100% 100% 65% 70% 85%Average Time for each Inspection (minutes) 21-26 21-26 21-26 20-24 20-24
% of Building Plans reviewed in 48 hours 99% 99% 99% 99% 99%% of annual training met based on the average minimum requirement of 320 hours per year 100% 100% 100% 100% 100%Maintained Advanced Level of Emergency Preparedness by reviewing and updating the EOP and annexes (% approved by State) 100% 100% 100% 100% 100%
Measures of Efficiency – Fire Marshal’s Office
Division expenditures per capita $16.80 $16.85 $18.14 $17.68 $21.51
Measures of Efficiency – Emergency Management
Division expenditures per capita $3.38 $6.70 $4.25 $4.06 $3.58Measures of Efficiency – Storm
Division expenditures per capita $57.49 $97.61 $0.00 $0.00 $0.00
220

Fire Marshal
FVFD Contract Services FY17Actual
FY18Actual
FY19Budget
FY19Forecast
FY20Adopted
Inputs
# of full time equivalents (FTE’s) 0 0 0 0 0
Division Expenditures $1,962,734 $1,620,288 $1,819,298 $1,547,072 $1,478,300
Outputs – Fire
# of Fire Incidents 690 734 750 650 700
Outputs – EMS
# of EMS Incidents 2,909 2,986 3,013 3,020 3,050
# of EMS Transports 1,545 1,600 1,650 1,650 1,675
Measures of Efficiency
Division expenditures per capita $49.87 $40.08 $44.48 $37.82 $35.87
221

FIRE MARSHAL'S OFFICEDEPARTMENT SUMMARY
EXPENDITURE BY DIVISION
DIVISIONFY18
ACTUAL
FY19ORIGINAL
BUDGET
FY19AMENDED
BUDGET
FY19 YTD
6/30/19
FY19YEAR ENDESTIMATE
FY20ADOPTED
BUDGET
% CHANGE INBUDGET FROM
FY19 TO FY20
ADMINISTRATION $681,363 $741,866 $758,563 $545,255 $723,332 $886,703 19.5%EMERGENCY MANAGEMENT 271,053 173,789 182,684 112,483 166,193 147,552 -15.1%STORM (GF) 3,945,966 0 0 0 0 0 0.0%FVFD 1,620,288 1,819,298 1,819,298 1,375,424 1,547,072 1,478,300 0.0%DEPARTMENT TOTAL $6,518,670 $2,734,953 $2,760,545 $2,033,162 $2,436,597 $2,512,555 -8.1%
EXPENDITURE BY CLASSIFICATION
CLASSIFICATIONFY18
ACTUAL
FY19ORIGINAL
BUDGET
FY19AMENDED
BUDGET
FY19 YTD
6/30/19
FY19YEAR ENDESTIMATE
FY20ADOPTED
BUDGET
% CHANGE INBUDGET FROM
FY19 TO FY20
SALARIES AND BENEFITS $722,778 $765,264 $765,264 $552,279 $737,741 $864,245 12.9%SUPPLIES 274,470 47,850 51,128 27,832 47,598 56,300 17.7%MAINTENANCE 13,652 13,512 13,512 7,127 11,092 10,050 -25.6%SERVICES 5,507,770 1,908,327 1,908,327 1,423,754 1,617,996 1,581,960 -17.1%CAPITAL OUTLAY 0 0 22,314 22,170 22,170 0 0.0%CLASSIFICATION TOTAL $6,518,670 $2,734,953 $2,760,545 $2,033,162 $2,436,597 $2,512,555 -8.1%
PERSONNEL SUMMARY BY DIVISION
DIVISIONFY18
ACTUAL
FY19ORIGINAL
BUDGET
FY19AMENDED
BUDGET
FY19 YTD
6/30/19
FY19YEAR ENDESTIMATE
FY20ADOPTED
BUDGET
% CHANGE INBUDGET FROM
FY19 TO FY20
ADMINISTRATION 5.20 5.20 5.20 6.20 6.20 6.20 19.2%EMERGENCY MANAGEMENT 1.40 1.40 1.40 1.00 1.00 1.00 -28.6%PERSONNEL TOTAL 6.60 6.60 6.60 7.20 7.20 7.20 9.1%
222
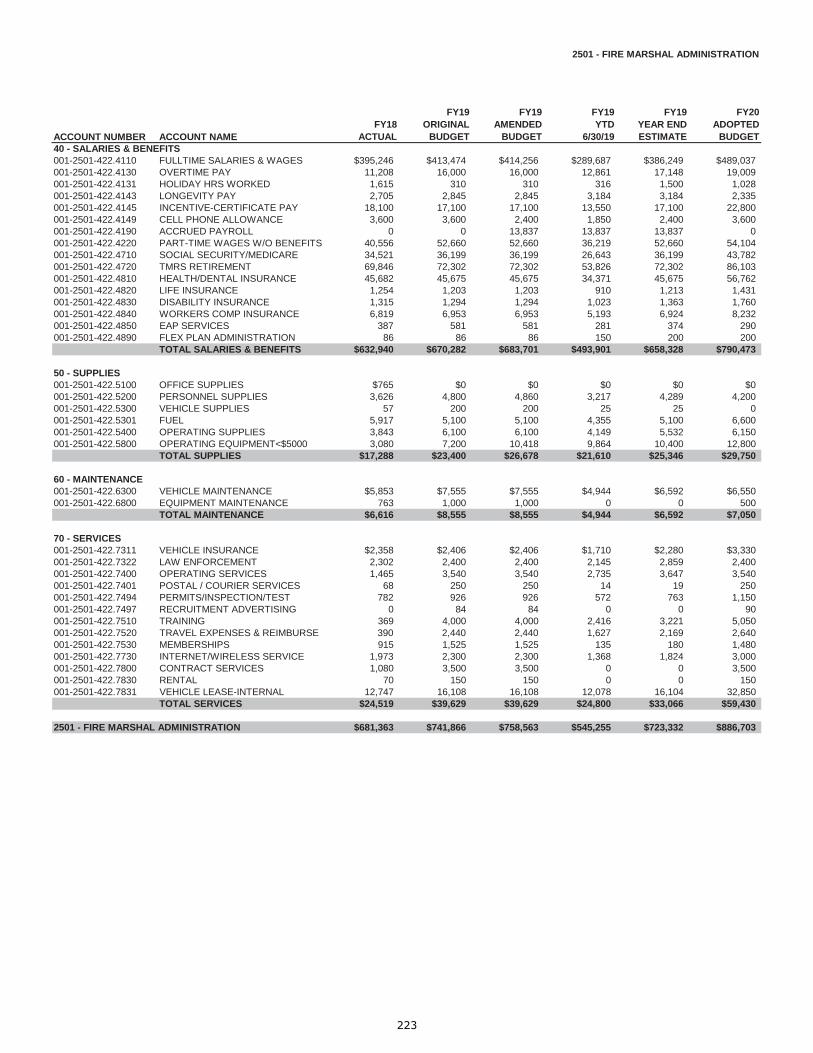
2501 - FIRE MARSHAL ADMINISTRATION
ACCOUNT NUMBER ACCOUNT NAMEFY18
ACTUAL
FY19ORIGINAL
BUDGET
FY19AMENDED
BUDGET
FY19 YTD
6/30/19
FY19YEAR ENDESTIMATE
FY20ADOPTED
BUDGET40 - SALARIES & BENEFITS001-2501-422.4110 FULLTIME SALARIES & WAGES $395,246 $413,474 $414,256 $289,687 $386,249 $489,037001-2501-422.4130 OVERTIME PAY 11,208 16,000 16,000 12,861 17,148 19,009001-2501-422.4131 HOLIDAY HRS WORKED 1,615 310 310 316 1,500 1,028001-2501-422.4143 LONGEVITY PAY 2,705 2,845 2,845 3,184 3,184 2,335001-2501-422.4145 INCENTIVE-CERTIFICATE PAY 18,100 17,100 17,100 13,550 17,100 22,800001-2501-422.4149 CELL PHONE ALLOWANCE 3,600 3,600 2,400 1,850 2,400 3,600001-2501-422.4190 ACCRUED PAYROLL 0 0 13,837 13,837 13,837 0001-2501-422.4220 PART-TIME WAGES W/O BENEFITS 40,556 52,660 52,660 36,219 52,660 54,104001-2501-422.4710 SOCIAL SECURITY/MEDICARE 34,521 36,199 36,199 26,643 36,199 43,782001-2501-422.4720 TMRS RETIREMENT 69,846 72,302 72,302 53,826 72,302 86,103001-2501-422.4810 HEALTH/DENTAL INSURANCE 45,682 45,675 45,675 34,371 45,675 56,762001-2501-422.4820 LIFE INSURANCE 1,254 1,203 1,203 910 1,213 1,431001-2501-422.4830 DISABILITY INSURANCE 1,315 1,294 1,294 1,023 1,363 1,760001-2501-422.4840 WORKERS COMP INSURANCE 6,819 6,953 6,953 5,193 6,924 8,232001-2501-422.4850 EAP SERVICES 387 581 581 281 374 290001-2501-422.4890 FLEX PLAN ADMINISTRATION 86 86 86 150 200 200
TOTAL SALARIES & BENEFITS $632,940 $670,282 $683,701 $493,901 $658,328 $790,473
50 - SUPPLIES001-2501-422.5100 OFFICE SUPPLIES $765 $0 $0 $0 $0 $0001-2501-422.5200 PERSONNEL SUPPLIES 3,626 4,800 4,860 3,217 4,289 4,200001-2501-422.5300 VEHICLE SUPPLIES 57 200 200 25 25 0001-2501-422.5301 FUEL 5,917 5,100 5,100 4,355 5,100 6,600001-2501-422.5400 OPERATING SUPPLIES 3,843 6,100 6,100 4,149 5,532 6,150001-2501-422.5800 OPERATING EQUIPMENT<$5000 3,080 7,200 10,418 9,864 10,400 12,800
TOTAL SUPPLIES $17,288 $23,400 $26,678 $21,610 $25,346 $29,750
60 - MAINTENANCE001-2501-422.6300 VEHICLE MAINTENANCE $5,853 $7,555 $7,555 $4,944 $6,592 $6,550001-2501-422.6800 EQUIPMENT MAINTENANCE 763 1,000 1,000 0 0 500
TOTAL MAINTENANCE $6,616 $8,555 $8,555 $4,944 $6,592 $7,050
70 - SERVICES001-2501-422.7311 VEHICLE INSURANCE $2,358 $2,406 $2,406 $1,710 $2,280 $3,330001-2501-422.7322 LAW ENFORCEMENT 2,302 2,400 2,400 2,145 2,859 2,400001-2501-422.7400 OPERATING SERVICES 1,465 3,540 3,540 2,735 3,647 3,540001-2501-422.7401 POSTAL / COURIER SERVICES 68 250 250 14 19 250001-2501-422.7494 PERMITS/INSPECTION/TEST 782 926 926 572 763 1,150001-2501-422.7497 RECRUITMENT ADVERTISING 0 84 84 0 0 90001-2501-422.7510 TRAINING 369 4,000 4,000 2,416 3,221 5,050001-2501-422.7520 TRAVEL EXPENSES & REIMBURSE 390 2,440 2,440 1,627 2,169 2,640001-2501-422.7530 MEMBERSHIPS 915 1,525 1,525 135 180 1,480001-2501-422.7730 INTERNET/WIRELESS SERVICE 1,973 2,300 2,300 1,368 1,824 3,000001-2501-422.7800 CONTRACT SERVICES 1,080 3,500 3,500 0 0 3,500001-2501-422.7830 RENTAL 70 150 150 0 0 150001-2501-422.7831 VEHICLE LEASE-INTERNAL 12,747 16,108 16,108 12,078 16,104 32,850
TOTAL SERVICES $24,519 $39,629 $39,629 $24,800 $33,066 $59,430
2501 - FIRE MARSHAL ADMINISTRATION $681,363 $741,866 $758,563 $545,255 $723,332 $886,703
223

2510 - FIRE MARSHAL EMERGENCY MANAGEMENT
ACCOUNT NUMBER ACCOUNT NAMEFY18
ACTUAL
FY19ORIGINAL
BUDGET
FY19AMENDED
BUDGET
FY19 YTD
6/30/19
FY19YEAR ENDESTIMATE
FY20ADOPTED
BUDGET40 - SALARIES & BENEFITS001-2510-422.4110 FULLTIME SALARIES & WAGES $46,991 $48,491 $48,491 $33,976 $48,491 $48,491001-2510-422.4130 OVERTIME PAY 279 1,442 1,442 342 456 1,490001-2510-422.4143 LONGEVITY PAY 985 1,025 1,025 1,045 1,045 1,105001-2510-422.4145 INCENTIVE-CERTIFICATE PAY 1,500 1,500 1,500 1,125 1,500 1,500001-2510-422.4149 CELL PHONE ALLOWANCE 720 720 720 510 720 720001-2510-422.4220 PART-TIME WAGES W/O BENEFITS 18,159 19,832 6,413 6,412 6,412 0001-2510-422.4710 SOCIAL SECURITY/MEDICARE 5,179 5,513 5,513 3,268 4,357 4,015001-2510-422.4720 TMRS RETIREMENT 8,017 8,482 8,482 5,889 8,482 8,535001-2510-422.4810 HEALTH/DENTAL INSURANCE 7,433 7,433 7,433 5,420 7,433 7,433001-2510-422.4820 LIFE INSURANCE 149 147 147 109 144 143001-2510-422.4830 DISABILITY INSURANCE 156 154 154 122 162 176001-2510-422.4840 WORKERS COMP INSURANCE 109 105 105 69 91 84001-2510-422.4850 EAP SERVICES 136 116 116 73 96 58001-2510-422.4890 FLEX PLAN ADMINISTRATION 25 22 22 18 24 22
TOTAL SALARIES & BENEFITS $89,838 $94,982 $81,563 $58,378 $79,413 $73,772
50 - SUPPLIES001-2510-422.5100 OFFICE SUPPLIES $546 $0 $0 $0 $0 $0001-2510-422.5200 PERSONNEL SUPPLIES 0 500 500 0 150 500001-2510-422.5301 FUEL 2,101 3,800 3,800 2,327 3,102 3,800001-2510-422.5400 OPERATING SUPPLIES 5,958 7,150 7,150 2,355 6,500 7,150001-2510-422.5800 OPERATING EQUIPMENT<$5000 126,659 13,000 13,000 1,540 12,500 15,100
TOTAL SUPPLIES $135,264 $24,450 $24,450 $6,222 $22,252 $26,550
60 - MAINTENANCE001-2510-422.6800 EQUIPMENT MAINTENANCE $5,589 $4,957 $4,957 $2,183 $4,500 $3,000
TOTAL MAINTENANCE $5,589 $4,957 $4,957 $2,183 $4,500 $3,000
70 - SERVICES001-2510-422.7350 SURETY BOND $0 $0 $0 $0 $0 $80001-2510-422.7400 OPERATING SERVICES 21,446 15,450 15,450 11,467 15,288 12,600001-2510-422.7510 TRAINING 1,348 2,665 2,665 949 1,400 1,400001-2510-422.7520 TRAVEL EXPENSES & REIMBURSE 1,600 4,250 4,250 4,135 4,135 4,250001-2510-422.7530 MEMBERSHIPS 400 1,490 1,490 490 1,490 1,620001-2510-422.7612 TELEPHONE/COMMUNICATIONS 4,738 5,525 5,525 4,366 5,525 5,660001-2510-422.7730 INTERNET/WIRELESS SERVICE 2,675 3,520 3,520 2,123 3,520 2,120001-2510-422.7800 CONTRACT SERVICES 8,155 6,500 6,500 0 6,500 6,500001-2510-422.7841 ENVIRONMENTAL CLEAN UP 0 10,000 10,000 0 0 10,000
TOTAL SERVICES $40,362 $49,400 $49,400 $23,530 $37,858 $44,230
80 - CAPITAL OUTLAY001-2510-422.8800 CAPITAL EQUIPMENT $0 $0 $22,314 $22,170 $22,170 $0
TOTAL CAPITAL OUTLAY $0 $0 $22,314 $22,170 $22,170 $0
2510 - FIRE MARSHAL EMERGENCY MANAGEMENT $271,053 $173,789 $182,684 $112,483 $166,193 $147,552
224

2201 - FIRE/EMS CONTRACT SERVICES
ACCOUNT NUMBER ACCOUNT NAMEFY18
ACTUAL
FY19ORIGINAL
BUDGET
FY19AMENDED
BUDGET
FY19 YTD
6/30/19
FY19YEAR ENDESTIMATE
FY20ADOPTED
BUDGET70 - SERVICES001-2201-422.7850 FIRE CONTRACT SERVICES $0 $0 $0 $0 $0 $1,103,300001-2201-422.7851 EMS CONTRACT SERVICES 0 0 0 0 0 375,000001-2201-422.7861 FIRE/EMS SERVICES 1,584,298 1,784,298 1,784,298 1,338,224 1,509,872 0001-2201-422.7862 FIRE/EMS SERVICE RUNS 35,990 35,000 35,000 37,200 37,200 0
TOTAL SERVICES $1,620,288 $1,819,298 $1,819,298 $1,375,424 $1,547,072 $1,478,300
2201 - FIRE/EMS CONTRACT SERVICES $1,620,288 $1,819,298 $1,819,298 $1,375,424 $1,547,072 $1,478,300
225

2513 - FIRE MARSHAL / TS OR HURRICANE
ACCOUNT NUMBER ACCOUNT NAMEFY18
ACTUAL
FY19ORIGINAL
BUDGET
FY19AMENDED
BUDGET
FY19 YTD
6/30/19
FY19YEAR ENDESTIMATE
FY20ADOPTED
BUDGET50 - SUPPLIES001-2513-422.5501 EMERGENCY - MATERIALS/SUPPLIES $27,755 $0 $0 $0 $0 $0001-2513-422.5801 EMERGENCY - EQUIPMENT $94,163 $0 $0 $0 $0 $0
TOTAL SUPPLIES $121,918 $0 $0 $0 $0 $0
60 - MAINTENANCE001-2513-422.6300 VEHICLE MAINTENANCE $1,447 $0 $0 $0 $0 $0
TOTAL MAINTENANCE $1,447 $0 $0 $0 $0 $0
70 - SERVICES001-2513-422.7800 CONTRACT SERVICES $3,790,320 $0 $0 $0 $0 $0001-2513-422.7971 EMERGENCY - SERVICES $32,281 $0 $0 $0 $0 $0
TOTAL SERVICES $3,822,601 $0 $0 $0 $0 $0
2513 - FIRE MARSHAL / TS OR HURRICANE $3,945,966 $0 $0 $0 $0 $0
226
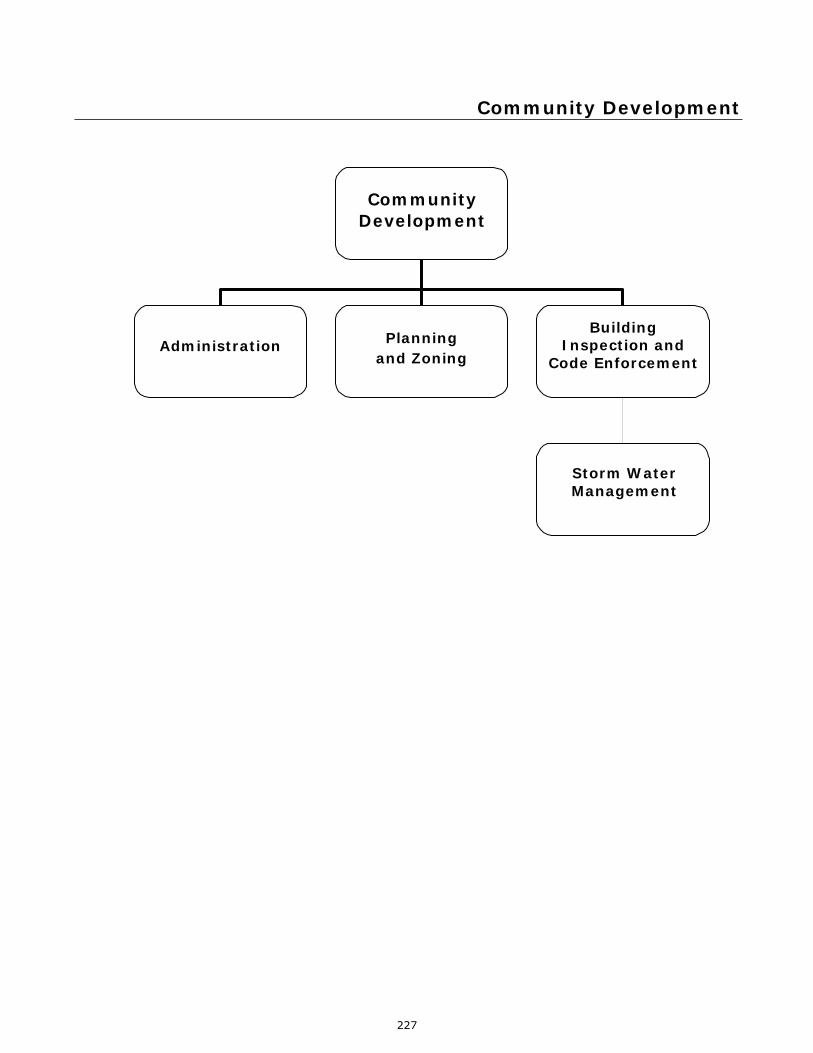
Community Development
CommunityDevelopment
Administration Planning and Zoning
Building Inspection and
Code Enforcement
Storm WaterManagement
227

Community Development
Mission Statement
Community Development is comprised of several areas of responsibility consisting of Administration, Building Permits/Inspections, Code Enforcement/Storm Water Management, and Planning & Zoning. Together, the department strives to ensure that all developers, builders, and residents within the City, including the City government itself, comply with city ordinances and State requirements in order to maintain the safety and quality of life that so many Friendswood citizens value and appreciate. Our staff provides advanced planning and outstanding services in order to help improve mobility, drainage and utility systems, safe buildings, and a clean environment.
Accomplishments in Fiscal Year 2018-2019 Our staff accomplished the following: Training Educated and informed employees have a broader knowledge base and with the wide variety of certifications, staff becomes more versatile and better able to assist citizens and perform their job duties. To that end, the City encourages employees to further their education, and maintain certifications and licenses through professional development. Examples of some of those required certifications and licenses include State Plumbing Inspector; building, electrical and mechanical inspector; Certified Floodplain Manager; Code Enforcement Certification; Advanced Code Enforcement Certification; and Permit Technician. Currently, the 11 staff members hold 16 certificates. The current departmental goal is for 25 certificates. Individually, the goal is for each employee to obtain at least one International Code Council (ICC) or other applicable certificate; however, some positions require multiple certifications. Obtaining these licenses and certifications affects the department’s budget as far as costs for training, travel, exams and continuing education required to maintain the certificates and licenses. Certification Current Goal
Certified Building Official 1 1 Certified Planner 0 1 Permit Technician 1 3 Zoning Inspector 0 1 Code Enforcement Officer 3 3 Advanced Code Enforcement Officer 2 2 State Plumbing Inspector 4 4 Building Inspector 1 2 Residential Combination Inspector 2 4 Residential Energy Inspector/Plans Examiner 1 2 Certified Floodplain Manager 1 2
228

Community Development
Software The department continues to spend significant time working diligently to transition to the CDD portion of the City’s enterprise software, Energov. As of January 1, 2018, the department officially began using the Energov to issue permits and schedule inspections and to track Code Enforcement cases. The software includes connectivity to iPads for code enforcement officers and inspectors, which provides them with tools and resources while out in the field and allows them to result inspections and add pictures to records for documentation purposes. Energov, as well as all of the Tyler Technology software products, is being redesigned to the HTML 5 platform since Silverlight will be obsolete in October 2021. We are on track to receive the updated versions of software, but this will also take some additional training to learn the new software. The Community Development Department’s budget consists of three divisions:
Administration Planning and Zoning Inspections/Code Enforcement (which also encompasses building permits and storm
water management)
Current Operations Building Permits & Inspections The building division is responsible for reviewing plans and issuing permits for building, electrical, plumbing and mechanical work; as well as inspecting the work as it is completed. Inspectors take on a great responsibility in enforcing building code standards adopted by City Council and those set forth by the State. The Building Official is also the City’s Floodplain Administrator and coordinates the City’s participation in the Community Rating System (CRS) program, which recognizes and encourages community floodplain management activities that exceed the minimum NFIP standards. Depending upon the level of participation, flood insurance premium rates for policyholders can be reduced up to 45%. Besides the benefit of reduced insurance rates, CRS floodplain management activities enhance public safety, reduce damages to property and public infrastructure, avoid economic disruption and losses, reduce human suffering, and protect the environment. Code Enforcement & Storm Water Management Code Enforcement personnel investigates complaints concerning the possibility of unlawful work done without proper permits, licenses, occupancy, land use violations, substandard and dangerous buildings complaints, sign violations, and high grass and weed complaints. Storm water management is a program designed to reduce the amount of pollutants discharged from cities and urbanized areas into creeks and streams. The City of Friendswood’s program has been developed in accordance with the guidelines set forth by Texas Commission on Environmental Quality. Planning & Zoning The Planning & Zoning division’s primary responsibility is to ensure development adheres to the principles set forth in the City’s Comprehensive Plan. Through the application of the Subdivision Ordinance and Zoning Ordinance, development is shaped to ensure compatibility with existing uses, as well as to maintain the health, safety, and general welfare of the community.
229
Community Development
Planning staff oversees the Geographic Information Systems (GIS) database and maps, review and approval of plats, site plans and construction plans by all required departments, as well as processing zone changes. This division also works with the Planning and Zoning Commission to obtain approvals and recommendations as required. The department also works with the following boards as needed:
Zoning Board of Adjustments Construction Board of Adjustment and Appeals Building and Standards Commission
Other departmental functions/accomplishments The Community Development Department provides and distributes information to citizens and developers in as many formats as possible.
Development Review Committee (DRC) meetings - provide the community’s owners and developers with valuable information regarding the steps to develop or build on their properties. Representatives from the following City departments attend DRC meetings: Planning, Public Works, Building, Parks & Recreation, Economic Development, Fire Marshal’s Office, and the Police Department. Outside agency representatives from Galveston County Consolidated Drainage District and Galveston County Health District also attend.
Builder Meetings – the Building Division hosts meetings as needed to provide contractors with current information regarding changes in ordinances, fees and processes.
Pre-Construction Meetings – required prior to any contractor starting construction on a job site for a new commercial building; the general contractor and all subcontractors are required to attend.
Planning & Zoning (P&Z) and Zoning Board of Adjustment (ZBOA) Agenda Packets/Video Archives – similar to City Council’s agenda packets, the P&Z and ZBOA agenda packets are made available on the City’s web site. Meetings are also videotaped and made available on the City’s PEG channel and YouTube, as well as recorded on DVD for historical recordation/reference.
Highlights of the Budget The following force at work decision package is included with the FY20 adopted budget.
Description Type Amount
Geographic Information Systems (GIS) Services Update One Time Cost $20,000
230
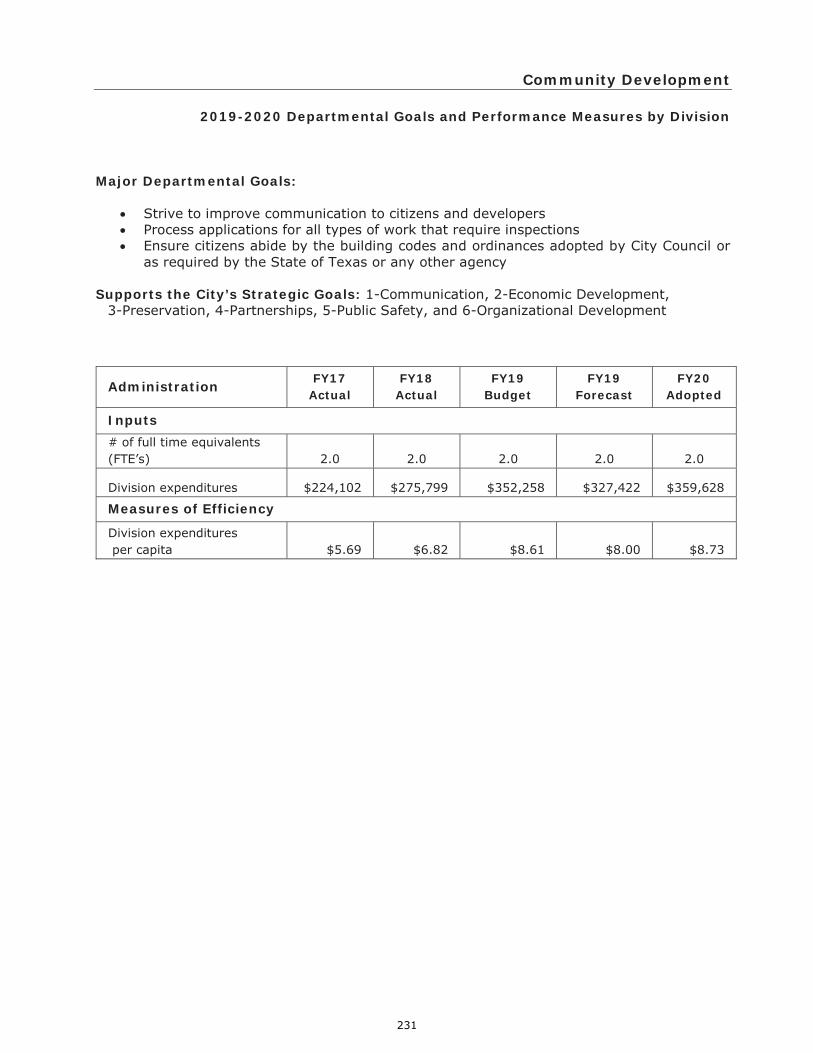
Community Development
2019-2020 Departmental Goals and Performance Measures by Division
Major Departmental Goals:
Strive to improve communication to citizens and developers Process applications for all types of work that require inspections Ensure citizens abide by the building codes and ordinances adopted by City Council or
as required by the State of Texas or any other agency Supports the City’s Strategic Goals: 1-Communication, 2-Economic Development,
3-Preservation, 4-Partnerships, 5-Public Safety, and 6-Organizational Development
Administration FY17 Actual
FY18 Actual
FY19 Budget
FY19 Forecast
FY20 Adopted
Inputs # of full time equivalents (FTE’s) 2.0 2.0 2.0 2.0 2.0
Division expenditures $224,102 $275,799 $352,258 $327,422 $359,628
Measures of Efficiency
Division expenditures per capita $5.69 $6.82 $8.61 $8.00 $8.73
231

Community Development
Planning and Zoning Division FY17
Actual FY18
Actual FY19
Budget FY19
Forecast FY20
Adopted
Inputs
# of full time equivalents (FTE’s) 4.6 4.0 4.0 4.0 4.0
Division Expenditures $260,727 $294,109 $327,191 $326,743 $388,280
Outputs (Number of meetings or application types processed)
DRC Meetings 53 53 11 19 42
Planning & Zoning Meetings 25 23 13 22 23
Certificates of Platting Exemption 7 6 2 3 5
Preliminary Plats 4 3 4 7 5
Final Plats 9 10 6 10 10
Commercial Site Plans 11 8 9 15 11
Zone Changes 9 4 6 10 8
Appeals/Variances/Special Exceptions 3 6 1 2 4
Measures of Effectiveness (**Average number of days to complete plan review for the following application types)
Commercial Site Plan 20 13 9 12 10
Final Plat 12 7 11 10 10
Preliminary Plat 15 7 14 10 10
Measures of Efficiency
Division expenditures per capita $6.62 $7.28 $8.00 $7.99 $9.42 **A number of factors change review times from year to year, including the number of corrections needed once
submissions are reviewed and time between a plan’s submittal and the next Planning and Zoning Commission meeting.
232

Community Development
Inspections and Code Enforcement
FY17 Actual
FY18 Actual
FY19 Budget
FY19 Forecast
FY20 Adopted
Inputs
# of full time equivalents (FTE’s) 4.9 4.7 4.7 4.7 4.7
Division Expenditures $408,836 $424,896 $455,889 $432,761 $479,322
Outputs (Number of Permits Issued)
New Single Family Residential 201 152 55 94 150
Residential Addition/Alteration 1,217 1,919 546 936 1,357
New Multi-Family Residential 20 bldgs
(108 units) 0 0 0 80
New Commercial 14 7 9 15 12
Commercial Addition/Alteration 67 88 35 60 71
Number of Inspections 11,923 14,511 4,999 8,569 11,667
Code Enforcement Case Actions n/a 49* 70 120 92
Code Enforcement Complaints n/a 107* 69 118 130 Measures of Effectiveness (**Average number of days to complete plan review for the following permit types)
Plan review time for residential permits…………………………………………………………………...3-5 business days
Plan review time for commercial permits…………………………………………………………….….7-10 business days
% of Inspections done within 24 hours of notification…………………………………….…………………………….100%
Measures of Efficiency
Division expenditures per capita $10.39 $10.51 $11.15 $10,58 $11.63
** A number of factors affect review times including the various types of permits, additional documentation needed for flood zones, and extent of corrections needed once submissions are reviewed.
233
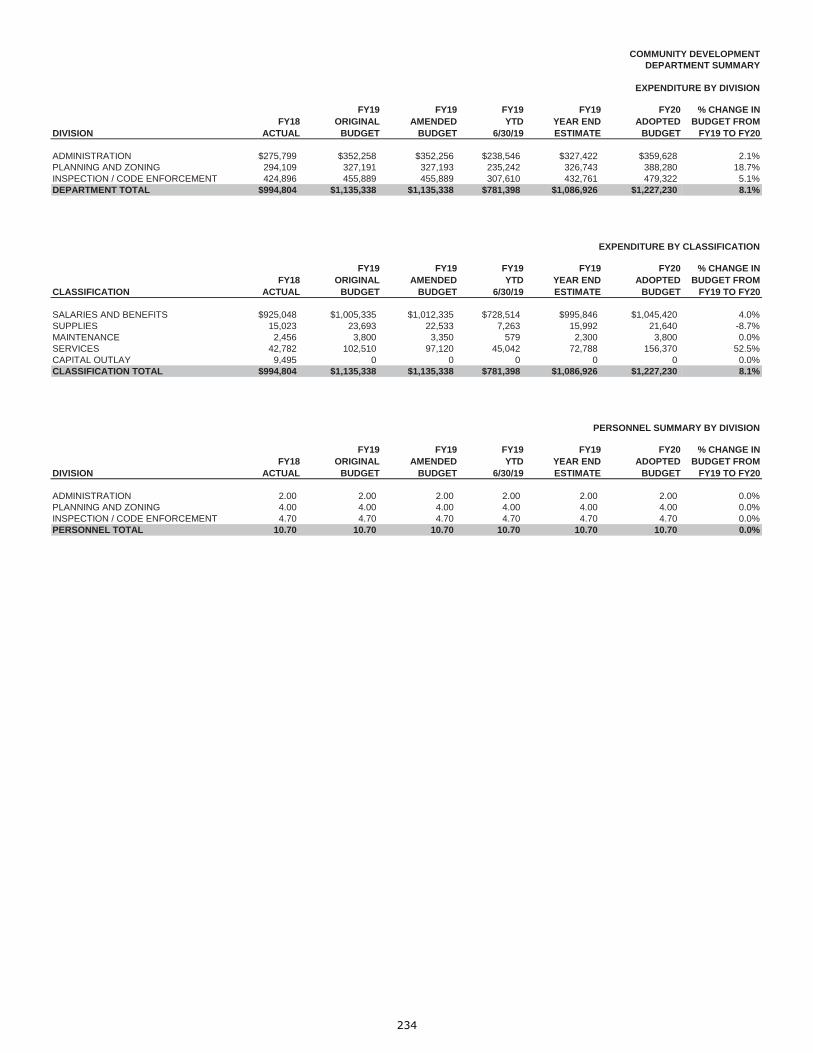
COMMUNITY DEVELOPMENTDEPARTMENT SUMMARY
EXPENDITURE BY DIVISION
DIVISIONFY18
ACTUAL
FY19ORIGINAL
BUDGET
FY19AMENDED
BUDGET
FY19 YTD
6/30/19
FY19YEAR ENDESTIMATE
FY20ADOPTED
BUDGET
% CHANGE INBUDGET FROM
FY19 TO FY20
ADMINISTRATION $275,799 $352,258 $352,256 $238,546 $327,422 $359,628 2.1%PLANNING AND ZONING 294,109 327,191 327,193 235,242 326,743 388,280 18.7%INSPECTION / CODE ENFORCEMENT 424,896 455,889 455,889 307,610 432,761 479,322 5.1%DEPARTMENT TOTAL $994,804 $1,135,338 $1,135,338 $781,398 $1,086,926 $1,227,230 8.1%
EXPENDITURE BY CLASSIFICATION
CLASSIFICATIONFY18
ACTUAL
FY19ORIGINAL
BUDGET
FY19AMENDED
BUDGET
FY19 YTD
6/30/19
FY19YEAR ENDESTIMATE
FY20ADOPTED
BUDGET
% CHANGE INBUDGET FROM
FY19 TO FY20
SALARIES AND BENEFITS $925,048 $1,005,335 $1,012,335 $728,514 $995,846 $1,045,420 4.0%SUPPLIES 15,023 23,693 22,533 7,263 15,992 21,640 -8.7%MAINTENANCE 2,456 3,800 3,350 579 2,300 3,800 0.0%SERVICES 42,782 102,510 97,120 45,042 72,788 156,370 52.5%CAPITAL OUTLAY 9,495 0 0 0 0 0 0.0%CLASSIFICATION TOTAL $994,804 $1,135,338 $1,135,338 $781,398 $1,086,926 $1,227,230 8.1%
PERSONNEL SUMMARY BY DIVISION
DIVISIONFY18
ACTUAL
FY19ORIGINAL
BUDGET
FY19AMENDED
BUDGET
FY19 YTD
6/30/19
FY19YEAR ENDESTIMATE
FY20ADOPTED
BUDGET
% CHANGE INBUDGET FROM
FY19 TO FY20
ADMINISTRATION 2.00 2.00 2.00 2.00 2.00 2.00 0.0%PLANNING AND ZONING 4.00 4.00 4.00 4.00 4.00 4.00 0.0%INSPECTION / CODE ENFORCEMENT 4.70 4.70 4.70 4.70 4.70 4.70 0.0%PERSONNEL TOTAL 10.70 10.70 10.70 10.70 10.70 10.70 0.0%
234

3501 - COMMUNITY DEVELOPMENT ADMIN
ACCOUNT NUMBER ACCOUNT NAMEFY18
ACTUAL
FY19ORIGINAL
BUDGET
FY19AMENDED
BUDGET
FY19 YTD
6/30/19
FY19YEAR ENDESTIMATE
FY20ADOPTED
BUDGET40 - SALARIES & BENEFITS001-3501-419.4110 FULLTIME SALARIES & WAGES $180,522 $232,865 $235,165 $166,840 $223,454 $241,460001-3501-419.4143 LONGEVITY PAY 1,085 1,160 1,160 1,205 1,205 1,320001-3501-419.4144 VEHICLE ALLOWANCE 5,400 5,400 5,400 788 788 0001-3501-419.4145 INCENTIVE-CERTIFICATE PAY 1,800 1,800 1,800 1,350 1,800 1,800001-3501-419.4149 CELL PHONE ALLOWANCE 2,400 2,400 100 100 100 0001-3501-419.4710 SOCIAL SECURITY/MEDICARE 13,842 17,907 17,907 12,503 17,907 18,026001-3501-419.4720 TMRS RETIREMENT 30,394 38,848 38,848 27,101 38,848 39,157001-3501-419.4810 HEALTH/DENTAL INSURANCE 25,781 26,101 26,101 19,032 26,101 26,101001-3501-419.4820 LIFE INSURANCE 556 587 587 514 587 646001-3501-419.4830 DISABILITY INSURANCE 612 645 645 604 645 832001-3501-419.4840 WORKERS COMP INSURANCE 484 816 816 434 816 387001-3501-419.4850 EAP SERVICES 136 116 116 97 116 116001-3501-419.4890 FLEX PLAN ADMINISTRATION 50 43 43 36 48 43
TOTAL SALARIES & BENEFITS $263,062 $328,688 $328,688 $230,604 $312,415 $329,888
50 - SUPPLIES001-3501-419.5100 OFFICE SUPPLIES $3,454 $0 $0 $0 $0 $0001-3501-419.5200 PERSONNEL SUPPLIES 38 250 250 208 215 330001-3501-419.5400 OPERATING SUPPLIES 467 5,950 4,985 1,657 4,209 6,100001-3501-419.5800 OPERATING EQUIPMENT<$5000 120 4,750 4,750 393 1,000 1,550
TOTAL SUPPLIES $4,079 $10,950 $9,985 $2,258 $5,424 $7,980
70 - SERVICES001-3501-419.7350 SURETY BONDS $0 $0 $0 $0 $0 $100001-3501-419.7400 OPERATING SERVICES 0 0 963 963 1,283 0001-3501-419.7401 POSTAL / COURIER SERVICES 721 2,300 2,300 511 850 2,300001-3501-419.7510 TRAINING 3,182 4,250 4,250 2,225 3,200 6,610001-3501-419.7520 TRAVEL EXPENSES & REIMBURSE 3,284 4,800 4,800 1,555 3,500 11,170001-3501-419.7530 MEMBERSHIPS 749 1,270 1,270 430 750 1,100001-3501-419.7730 INTERNET/WIRELESS SERVICES 722 0 0 0 0 480
TOTAL SERVICES $8,658 $12,620 $13,583 $5,684 $9,583 $21,760
3501 - COMMUNITY DEVELOPMENT ADMIN $275,799 $352,258 $352,256 $238,546 $327,422 $359,628
235
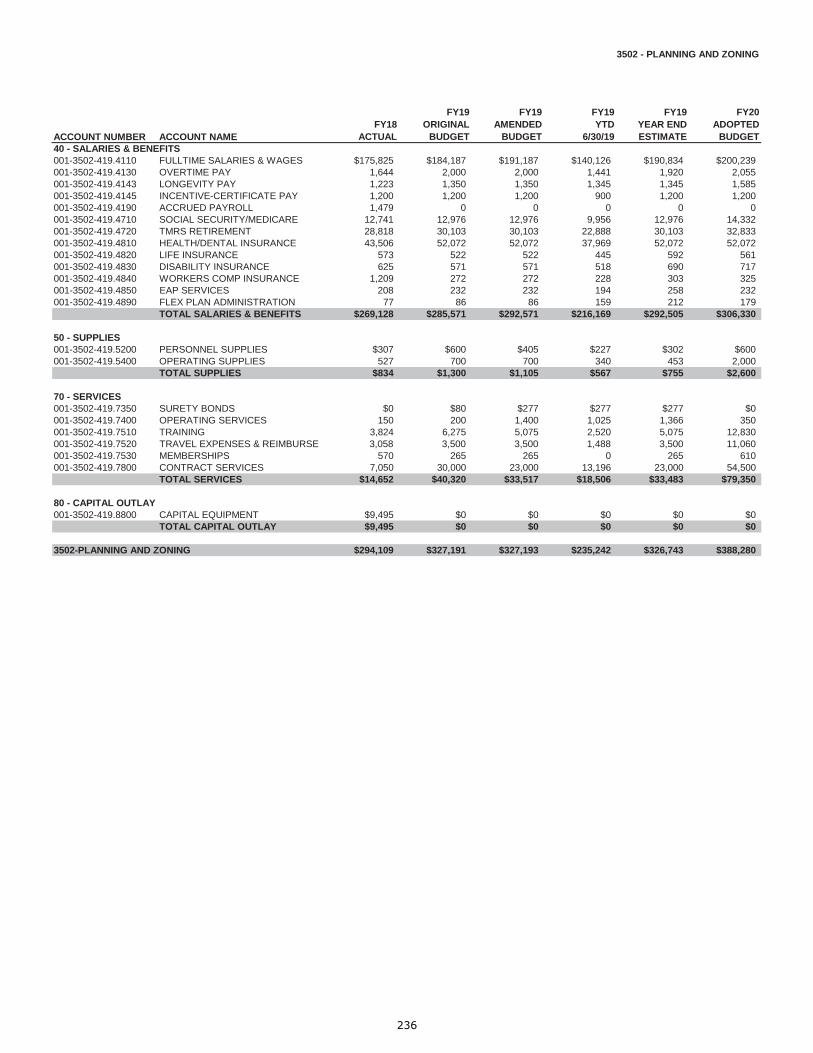
3502 - PLANNING AND ZONING
ACCOUNT NUMBER ACCOUNT NAMEFY18
ACTUAL
FY19ORIGINAL
BUDGET
FY19AMENDED
BUDGET
FY19 YTD
6/30/19
FY19YEAR ENDESTIMATE
FY20ADOPTED
BUDGET40 - SALARIES & BENEFITS001-3502-419.4110 FULLTIME SALARIES & WAGES $175,825 $184,187 $191,187 $140,126 $190,834 $200,239001-3502-419.4130 OVERTIME PAY 1,644 2,000 2,000 1,441 1,920 2,055001-3502-419.4143 LONGEVITY PAY 1,223 1,350 1,350 1,345 1,345 1,585001-3502-419.4145 INCENTIVE-CERTIFICATE PAY 1,200 1,200 1,200 900 1,200 1,200001-3502-419.4190 ACCRUED PAYROLL 1,479 0 0 0 0 0001-3502-419.4710 SOCIAL SECURITY/MEDICARE 12,741 12,976 12,976 9,956 12,976 14,332001-3502-419.4720 TMRS RETIREMENT 28,818 30,103 30,103 22,888 30,103 32,833001-3502-419.4810 HEALTH/DENTAL INSURANCE 43,506 52,072 52,072 37,969 52,072 52,072001-3502-419.4820 LIFE INSURANCE 573 522 522 445 592 561001-3502-419.4830 DISABILITY INSURANCE 625 571 571 518 690 717001-3502-419.4840 WORKERS COMP INSURANCE 1,209 272 272 228 303 325001-3502-419.4850 EAP SERVICES 208 232 232 194 258 232001-3502-419.4890 FLEX PLAN ADMINISTRATION 77 86 86 159 212 179
TOTAL SALARIES & BENEFITS $269,128 $285,571 $292,571 $216,169 $292,505 $306,330
50 - SUPPLIES001-3502-419.5200 PERSONNEL SUPPLIES $307 $600 $405 $227 $302 $600001-3502-419.5400 OPERATING SUPPLIES 527 700 700 340 453 2,000
TOTAL SUPPLIES $834 $1,300 $1,105 $567 $755 $2,600
70 - SERVICES001-3502-419.7350 SURETY BONDS $0 $80 $277 $277 $277 $0001-3502-419.7400 OPERATING SERVICES 150 200 1,400 1,025 1,366 350001-3502-419.7510 TRAINING 3,824 6,275 5,075 2,520 5,075 12,830001-3502-419.7520 TRAVEL EXPENSES & REIMBURSE 3,058 3,500 3,500 1,488 3,500 11,060001-3502-419.7530 MEMBERSHIPS 570 265 265 0 265 610001-3502-419.7800 CONTRACT SERVICES 7,050 30,000 23,000 13,196 23,000 54,500
TOTAL SERVICES $14,652 $40,320 $33,517 $18,506 $33,483 $79,350
80 - CAPITAL OUTLAY001-3502-419.8800 CAPITAL EQUIPMENT $9,495 $0 $0 $0 $0 $0
TOTAL CAPITAL OUTLAY $9,495 $0 $0 $0 $0 $0
3502-PLANNING AND ZONING $294,109 $327,191 $327,193 $235,242 $326,743 $388,280
236

3528 - INSPECTION / CODE ENFORCEMENT
ACCOUNT NUMBER ACCOUNT NAMEFY18
ACTUAL
FY19ORIGINAL
BUDGET
FY19AMENDED
BUDGET
FY19 YTD
6/30/19
FY19YEAR ENDESTIMATE
FY20ADOPTED
BUDGET40 - SALARIES & BENEFITS001-3528-424.4110 FULLTIME SALARIES & WAGES $255,625 $260,761 $260,761 $185,853 $258,804 $272,095001-3528-424.4130 OVERTIME PAY 7,070 4,330 4,330 2,713 4,330 5,138001-3528-424.4143 LONGEVITY PAY 2,807 1,982 1,982 2,049 2,049 2,360001-3528-424.4145 INCENTIVE-CERTIFICATE PAY 2,600 2,400 2,400 2,700 3,600 3,600001-3528-424.4149 CELL PHONE ALLOWANCE 2,628 2,718 2,718 1,925 2,718 2,718001-3528-424.4190 ACCRUED PAYROLL 3,359 0 0 0 0 0001-3528-424.4220 PART-TIME WAGES 1,385 0 0 0 0 0001-3528-424.4710 SOCIAL SECURITY/MEDICARE 19,500 19,281 19,281 13,785 19,281 20,466001-3528-424.4720 TMRS RETIREMENT 41,714 43,414 43,414 31,073 43,414 45,774001-3528-424.4810 HEALTH/DENTAL INSURANCE 52,571 53,351 53,351 39,108 53,351 53,633001-3528-424.4820 LIFE INSURANCE 795 751 751 594 792 776001-3528-424.4830 DISABILITY INSURANCE 866 818 818 692 923 994001-3528-424.4840 WORKERS COMP INSURANCE 1,480 895 895 701 935 1,025001-3528-424.4850 EAP SERVICES 343 273 273 228 303 273001-3528-424.4890 FLEX PLAN ADMINISTRATION 115 102 102 320 426 350
TOTAL SALARIES & BENEFITS $392,858 $391,076 $391,076 $281,741 $390,926 $409,202
50 - SUPPLIES001-3528-424.5200 PERSONNEL SUPPLIES $1,587 $2,070 $2,070 $1,403 $1,871 $2,900001-3528-424.5300 VEHICLE SUPPLIES 21 1,600 1,600 0 500 400001-3528-424.5301 FUEL 4,983 4,448 4,448 2,638 4,117 4,440001-3528-424.5400 OPERATING SUPPLIES 3,052 2,825 2,825 397 2,825 2,820001-3528-424.5800 OPERATING EQUIPMENT<$5000 467 500 500 0 500 500
TOTAL SUPPLIES $10,110 $11,443 $11,443 $4,438 $9,813 $11,060
60 - MAINTENANCE001-3528-424.6300 VEHICLE MAINTENANCE $2,456 $3,800 $3,350 $579 $2,300 $3,800
TOTAL MAINTENANCE $2,456 $3,800 $3,350 $579 $2,300 $3,800
70 - SERVICES001-3528-424.7311 VEHICLE INSURANCE $2,139 $2,183 $2,183 $1,548 $2,183 $2,200001-3528-424.7400 OPERATING SERVICES 0 0 450 115 153 450001-3528-424.7441 CODE ENFORCEMENT SERVICES 1,237 1,750 3,250 2,515 3,250 1,750001-3528-424.7498 JUDGMENTS & DAMAGE CLAIMS 500 1,000 1,000 0 0 1,000001-3528-424.7510 TRAINING 2,652 7,570 6,070 2,319 3,092 6,510001-3528-424.7520 TRAVEL EXPENSES & REIMBURSE 2,178 9,350 9,350 2,918 5,890 9,350001-3528-424.7530 MEMBERSHIPS 210 486 486 480 480 1,620001-3528-424.7730 INTERNET/WIRELESS SERVICE 2,545 3,500 3,500 2,393 3,500 3,500001-3528-424.7800 CONTRACT SERVICES 0 5,000 5,000 0 0 5,000001-3528-424.7831 VEHICLE LEASE-INTERNAL 7,911 10,431 10,431 7,821 10,431 15,580001-3528-424.7842 STORM WATER MANAGEMENT 100 8,300 8,300 743 743 8,300
TOTAL SERVICES $19,472 $49,570 $50,020 $20,852 $29,722 $55,260
3528-INSPECTION/CODE ENFORCEMENT $424,896 $455,889 $455,889 $307,610 $432,761 $479,322
237
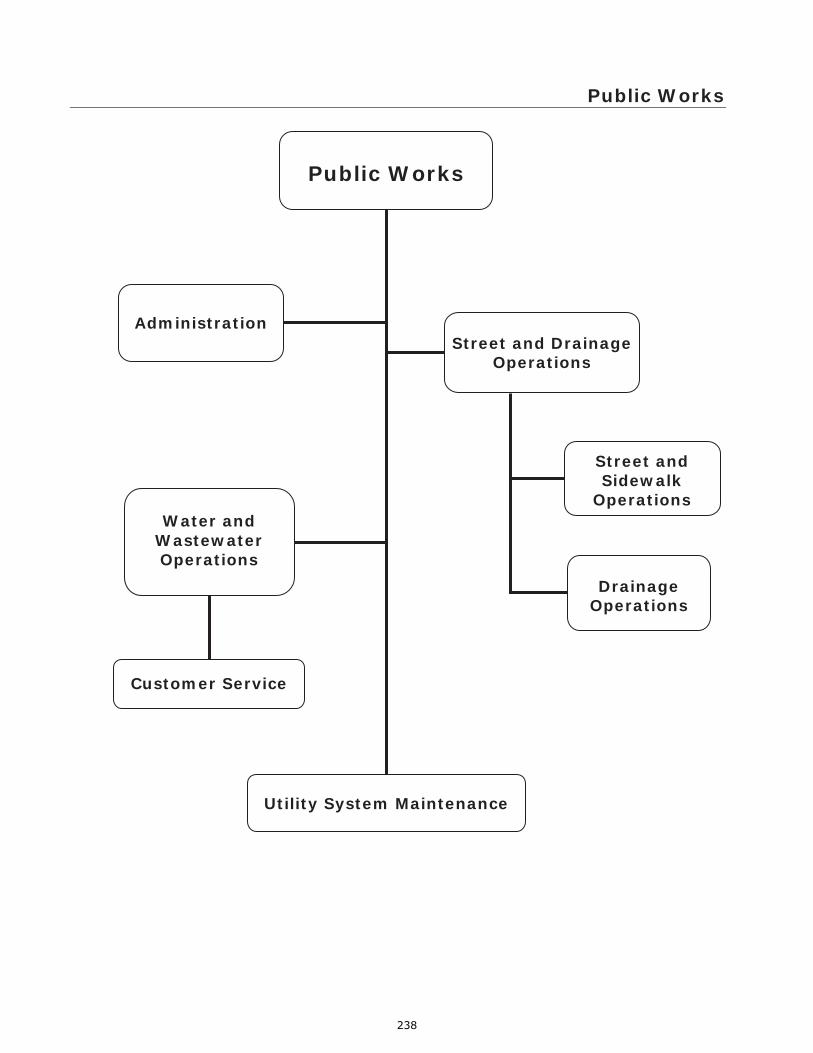
Public Works
Public Works
Administration
Water and Wastewater Operations
Street and Drainage Operations
Street and Sidewalk
Operations
Drainage Operations
Customer Service
Utility System Maintenance
238

Public Works
Mission Statement
The Public Works Department makes every effort to improve the quality of life by providing advance planning and outstanding services that improve drainage and utility systems for all citizens, businesses, and visitors.
Fiscal Year 2017 – 18 Accomplishments
Our staff accomplished the following:
6,425 linear feet of sidewalks were raised 680 linear feet of sidewalks were removed and replaced 594 linear feet of curb replacement 6,425 square feet of streets were raised 432 signs repaired through work orders were completed 37 signs were replaced through the Sign Replacement Program 21 street banners were hung 38 fire hydrants repaired, installed, or audited 61 meters changed out 601 bacteriological samples were collected 52 lead and copper samples were collected 308 dead end fire hydrants flushed 157 non-dead fire hydrants flushed 2,190 utility billing work orders 467 repairs to vehicles 191 repairs to equipment
The following were completed through the Sewer Rehab Project:
3,209 linear feet of cleaning and TV inspection of sanitary sewer lines 3,209 linear feet of Cured in Place Pipe, CIPP Liner for sanitary sewer lines 0 linear feet of Pipe Bursting (enlargement) 0 linear feet of Remove and Replace pipe 1 point repairs 20 manhole replacements
Current Operations Current operations emphasize long-range planning practices and programs that cover a variety of activities within the Department, such as:
Concrete Street Repair and Asphalt Overlay Programs Sanitary Sewer Rehabilitation Program
239

Public Works Street Maintenance Program This is the fifteenth year of this program. This program is intended to be an on-going maintenance project to repair and reconstruct existing concrete streets, sidewalks, curbs, sealing and asphalt overlays. The two of the past three year’s allotments were included with the 2013 Bond Funds for the Projects to reconstruct Mary Ann Drive, West Shadowbend Avenue, Townes, and Winding Roads. A portion of this past year’s allotment is currently being applied towards acquiring an updated paving study for the City. Included in this year’s budget is $500,000 for this program. Sanitary Sewer Rehabilitation Program This program will begin its seventeenth year and is the City’s primary effort to reduce the amount of inflow & infiltration (I&I) into the wastewater collection system. Through this program, a portion of the wastewater collection system determined via “in-house” investigation, is cleaned and inspected by camera. Damaged and deteriorated sections are located and a suitable method of pipe replacement/ rehabilitation is selected for the repair. Included in this year’s budget is $500,000 for this program. Additionally, we have coordinated and completed working with RJN Group for the first two phases of a formal Sanitary Sewer System Assessment Study to determine critical sources of I&I in our system. A third party engineer has been contracted and we are currently in the preliminary design phase for rehabilitation (Phase III). Phase IV will encompass actual rehabilitation based on RJN’s assessment. RJN has been contracted for Phases V & VI to complete further assessment of the City’s Sanitary Sewer System for rehabilitation. Meter Change out Program This program replaces the old and dead (non- functioning) water meters. New water meters provide accurate measurements and record correct water usage resulting in a reduction of lost revenue and unaccounted water. This program will also assist in complying with the water conservation plan. Water Wise Program Water Wise Program is to educate students about water conservation. The City of Friendswood through an inter-local agreement with Harris-Galveston Coastal Subsidence District sponsors a water conservation program known as "Learning to Be Water Wise & Energy Efficient". The City has sponsored Bales Intermediate and Windsong Intermediate and will continue to do so.
240

Public Works Water Operations Harris-Galveston Coastal Subsidence District (HGCSD) requires 80% of the City’s total water usage is purchased surface water. The City has managed to meet this requirement since its conception in 2001. It has been and will be a goal to meet it again this year and years to come. Prior to this mandate the City experienced ranges between 60-70%. As the population continues to grow, the need for water will grow as well. The City has purchased additional surface water in order to meet the future demands.
Highlights of the Budget The following decision packages are included in the FY20 adopted budget. General Fund
Description Type Amount
Skid Steer Loader (Lease to Purchase) One Time Costs $101,000
Street Sweeper/ Vacuum (Lease to Purchase) One Time Costs $205,000 Water and Sewer Fund
Description Type Amount
Blackhawk WWTP Aeration System Upgrade One Time Costs $2,569,413
Blackhawk WWTP Re-rating One Time Costs $348,795
Blackhawk WWTP Additional Capacity (Year 3 of 6) One Time Costs $633,130
SEWPP-FY 2012-2017 Program Balance (Year 2 of 3) One Time Costs $411,002
SEWPP-FY 2019-2023 Program Balance (Year 1 of 5) One Time Costs $810,000
Vacuum/ Jet Combination Truck (Lease to Purchase) One Time Costs $450,000
The following decision packages are not included with the FY20 adopted budget. General Fund
Description Type Amount
Industrial Zero Turn Riding Mower One Time Costs Ongoing Costs
$14,000 $1,050
Message Board One Time Costs Ongoing Costs
$20,000 $75
241

Public Works Water and Sewer
Description Type Amount
Pump & Piping Changes SWS#2 One Time Costs $45,000
6” Pump Replacements for LS 8,17,22, & 36 One Time Costs $78,000
PW Administrative Secretary One Time Costs Ongoing Costs
$2,700 $56,243
LS#2 Spare Pump One Time Costs $25,000
Control Replacement SWS #1 One Time Costs $55,000
Control Replacement SWS #2 One Time Costs $65,000
Operations Maintenance Worker Ongoing Costs $56,208
1-Ton Truck w/ Utility Bed – Mechanic One Time Costs Ongoing Costs
$60,000 $4,000
Mechanic Tools One Time Costs $30,000
Crew Leader (FTE 1.0) Ongoing Costs $70,351
Class 5 truck W/ Service Body One Time Costs Ongoing Costs
$61,000 $4,500
PW116 Replacement backhoe One Time Costs Ongoing Costs
$90,000 $4,500
242
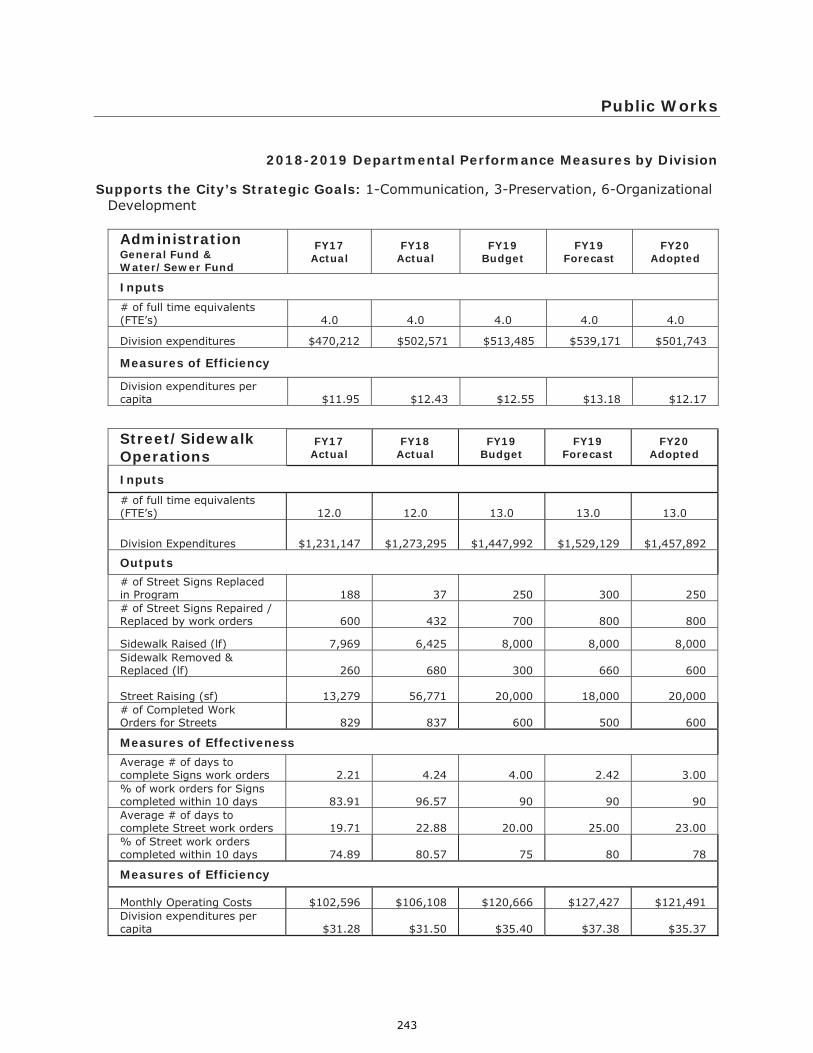
Public Works
2018-2019 Departmental Performance Measures by Division
Supports the City’s Strategic Goals: 1-Communication, 3-Preservation, 6-Organizational Development
Administration General Fund & Water/Sewer Fund
FY17 Actual
FY18 Actual
FY19 Budget
FY19 Forecast
FY20 Adopted
Inputs # of full time equivalents (FTE’s) 4.0 4.0 4.0 4.0 4.0
Division expenditures $470,212 $502,571 $513,485 $539,171 $501,743
Measures of Efficiency
Division expenditures per capita $11.95 $12.43 $12.55 $13.18 $12.17
Street/Sidewalk Operations
FY17 Actual
FY18 Actual
FY19 Budget
FY19 Forecast
FY20 Adopted
Inputs
# of full time equivalents (FTE’s) 12.0 12.0 13.0 13.0 13.0
Division Expenditures $1,231,147 $1,273,295 $1,447,992 $1,529,129 $1,457,892
Outputs
# of Street Signs Replaced in Program 188 37 250 300 250 # of Street Signs Repaired / Replaced by work orders 600 432 700 800 800
Sidewalk Raised (lf) 7,969 6,425 8,000 8,000 8,000 Sidewalk Removed & Replaced (lf) 260 680 300 660 600
Street Raising (sf) 13,279 56,771 20,000 18,000 20,000 # of Completed Work Orders for Streets 829 837 600 500 600
Measures of Effectiveness Average # of days to complete Signs work orders 2.21 4.24 4.00 2.42 3.00 % of work orders for Signs completed within 10 days 83.91 96.57 90 90 90 Average # of days to complete Street work orders 19.71 22.88 20.00 25.00 23.00 % of Street work orders completed within 10 days 74.89 80.57 75 80 78
Measures of Efficiency
Monthly Operating Costs $102,596 $106,108 $120,666 $127,427 $121,491 Division expenditures per capita $31.28 $31.50 $35.40 $37.38 $35.37
243
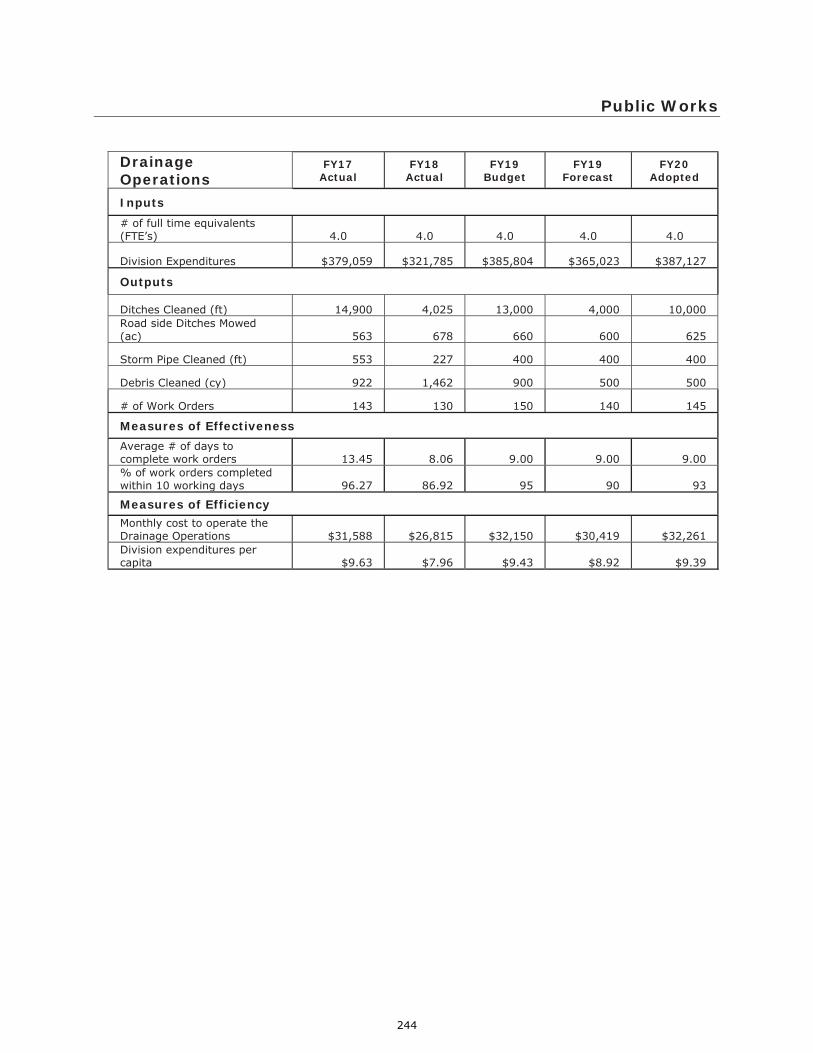
Public Works
Drainage Operations
FY17 Actual
FY18 Actual
FY19 Budget
FY19 Forecast
FY20 Adopted
Inputs
# of full time equivalents (FTE’s) 4.0 4.0 4.0 4.0 4.0
Division Expenditures $379,059 $321,785 $385,804 $365,023 $387,127
Outputs
Ditches Cleaned (ft) 14,900 4,025 13,000 4,000 10,000 Road side Ditches Mowed (ac) 563 678 660 600 625
Storm Pipe Cleaned (ft) 553 227 400 400 400
Debris Cleaned (cy) 922 1,462 900 500 500
# of Work Orders 143 130 150 140 145
Measures of Effectiveness
Average # of days to complete work orders 13.45 8.06 9.00 9.00 9.00 % of work orders completed within 10 working days 96.27 86.92 95 90 93
Measures of Efficiency Monthly cost to operate the Drainage Operations $31,588 $26,815 $32,150 $30,419 $32,261 Division expenditures per capita $9.63 $7.96 $9.43 $8.92 $9.39
244
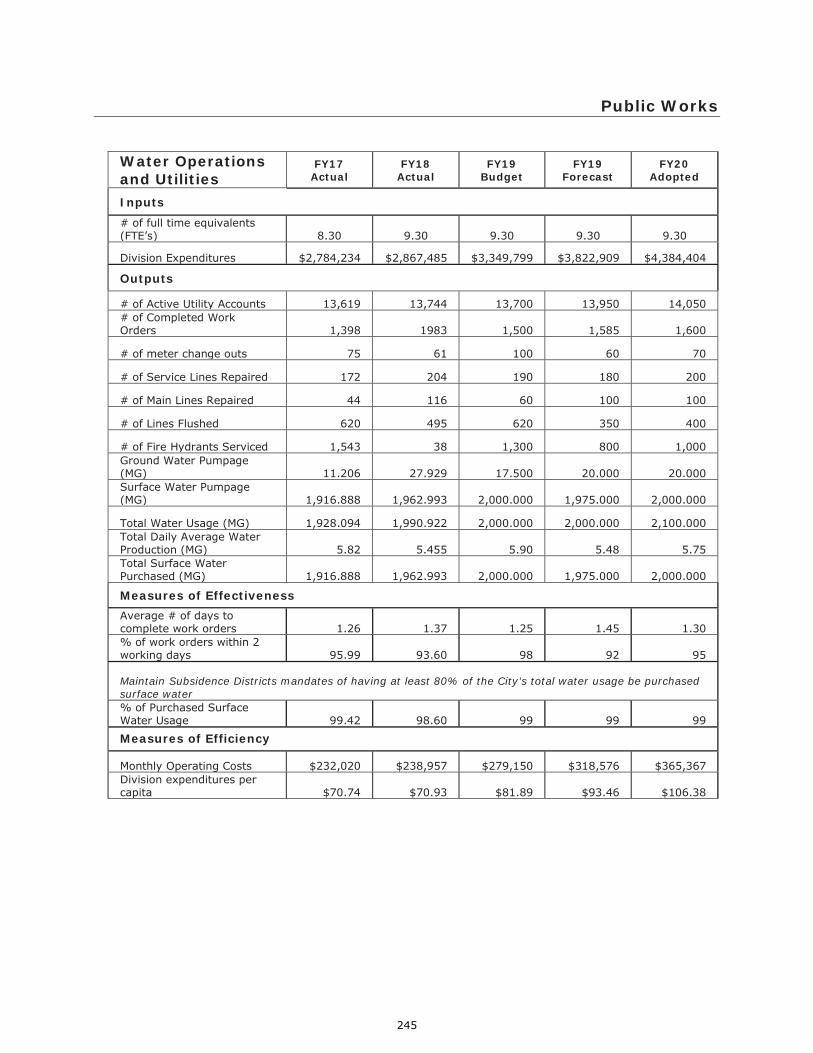
Public Works
Water Operations and Utilities
FY17 Actual
FY18 Actual
FY19 Budget
FY19 Forecast
FY20 Adopted
Inputs # of full time equivalents (FTE’s) 8.30 9.30 9.30 9.30 9.30
Division Expenditures $2,784,234 $2,867,485 $3,349,799 $3,822,909 $4,384,404
Outputs
# of Active Utility Accounts 13,619 13,744 13,700 13,950 14,050 # of Completed Work Orders 1,398 1983 1,500 1,585 1,600
# of meter change outs 75 61 100 60 70
# of Service Lines Repaired 172 204 190 180 200
# of Main Lines Repaired 44 116 60 100 100
# of Lines Flushed 620 495 620 350 400
# of Fire Hydrants Serviced 1,543 38 1,300 800 1,000 Ground Water Pumpage (MG) 11.206 27.929 17.500 20.000 20.000 Surface Water Pumpage (MG) 1,916.888 1,962.993 2,000.000 1,975.000 2,000.000
Total Water Usage (MG) 1,928.094 1,990.922 2,000.000 2,000.000 2,100.000 Total Daily Average Water Production (MG) 5.82 5.455 5.90 5.48 5.75 Total Surface Water Purchased (MG) 1,916.888 1,962.993 2,000.000 1,975.000 2,000.000
Measures of Effectiveness Average # of days to complete work orders 1.26 1.37 1.25 1.45 1.30 % of work orders within 2 working days 95.99 93.60 98 92 95
Maintain Subsidence Districts mandates of having at least 80% of the City’s total water usage be purchased surface water % of Purchased Surface Water Usage 99.42 98.60 99 99 99
Measures of Efficiency
Monthly Operating Costs $232,020 $238,957 $279,150 $318,576 $365,367 Division expenditures per capita $70.74 $70.93 $81.89 $93.46 $106.38
245

Public Works
Sewer Operations and Utilities
FY17 Actual
FY18 Actual
FY19 Budget
FY19 Forecast
FY20 Adopted
Inputs
# of full time equivalents (FTE’s) 10.00 11.00 11.00 11.00 11.00
Division Expenditures $2,666,948 $2,923,745 $3,679,767 $5,085,611 $7,698,014
Outputs
# of Completed Work Orders 514 564 600 750 700 Sewer Treatment Total All Flows (MG) 1,199.541 1,137.697 1,240.000 1,240.000 1,250.000 Sewer Treatment Total Daily Average (MG) 3.286 3.117 3.35 3.35 3.35
# of Service Lines Repaired 85 85 85 125 100
# of Main Lines repaired 7 10 10 6 8
# of Sewer Lines cleaned ft. 18,073 20,175 25,000 21,400 22,000
# of Manholes repaired 6 7 15 6 7 # of Sewer Main Stoppages 32 29 40 36 38 # of Service Lines Stoppages 116 112 130 145 130
# of Lift Station repairs 907 908 900 875 900
Measures of Effectiveness
Average # of days to complete work orders 1.35 1.53 1.35 1.35 1.35 % of work orders completed within 2 working days 94.36 90.43 94.00 91.00 92.00
Measures of Efficiency
Monthly cost to operate the City’s Sewer Operations $222,246 $243,645 $306,647 $423,801 $641,501 Division expenditures per capita $67.76 $72.32 $89.96 $124.33 $186.77
246
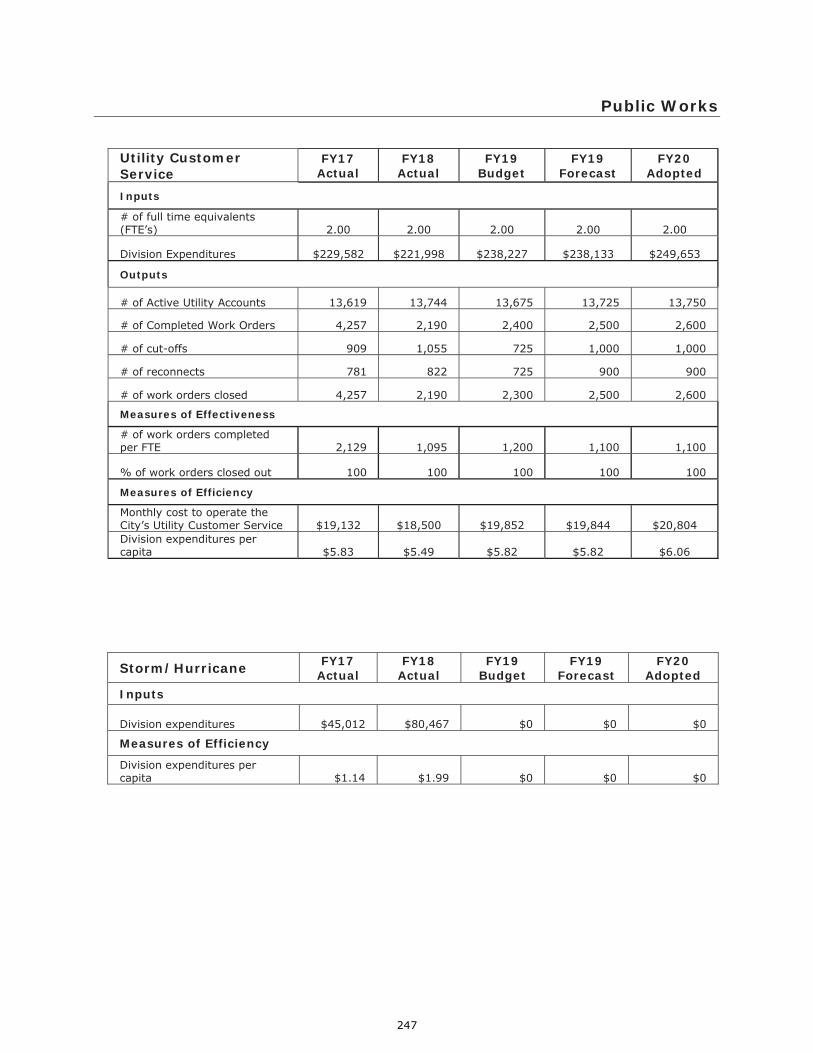
Public Works
Utility Customer Service
FY17 Actual
FY18 Actual
FY19 Budget
FY19 Forecast
FY20 Adopted
Inputs
# of full time equivalents (FTE’s) 2.00 2.00 2.00 2.00 2.00
Division Expenditures $229,582 $221,998 $238,227 $238,133 $249,653
Outputs
# of Active Utility Accounts 13,619 13,744 13,675 13,725 13,750
# of Completed Work Orders 4,257 2,190 2,400 2,500 2,600
# of cut-offs 909 1,055 725 1,000 1,000
# of reconnects 781 822 725 900 900
# of work orders closed 4,257 2,190 2,300 2,500 2,600
Measures of Effectiveness
# of work orders completed per FTE 2,129 1,095 1,200 1,100 1,100
% of work orders closed out 100 100 100 100 100
Measures of Efficiency
Monthly cost to operate the City’s Utility Customer Service $19,132 $18,500 $19,852 $19,844 $20,804 Division expenditures per capita $5.83 $5.49 $5.82 $5.82 $6.06
Storm/Hurricane FY17 Actual
FY18 Actual
FY19 Budget
FY19 Forecast
FY20 Adopted
Inputs
Division expenditures $45,012 $80,467 $0 $0 $0
Measures of Efficiency
Division expenditures per capita $1.14 $1.99 $0 $0 $0
247

PUBLIC WORKSDEPARTMENT SUMMARY
EXPENDITURE BY DIVISION
DIVISIONFY18
ACTUAL
FY19ORIGINAL
BUDGET
FY19AMENDED
BUDGET
FY19 YTD
6/30/19
FY19YEAR ENDESTIMATE
FY20ADOPTED
BUDGET
% CHANGE INBUDGET
FROMFY19 TO FY20
ADMINISTRATION (GF) $332,843 $334,326 $408,917 $279,903 $365,569 $253,762 -24.1%STREET/SIDEWALK OPERATIONS 1,273,295 1,447,992 1,619,813 1,009,618 1,529,129 1,457,892 0.7%DRAINAGE OPERATIONS 321,785 385,804 428,131 258,200 365,023 387,127 0.3%ENGINEERING & CAPITAL PROJ (GF)* 246,125 266,443 272,243 188,630 252,458 0 -100.0%ADMINISTRATION (W/S) 169,731 179,159 180,119 125,757 173,602 247,981 38.4%WATER UTILITIES & OPERATIONS 2,867,485 3,349,799 3,857,726 2,187,833 3,822,909 4,384,404 30.9%SEWER UTILITIES & OPERATIONS 2,923,745 3,679,767 5,110,122 3,952,251 5,085,611 7,698,014 109.2%CUSTOMER SERVICE (W/S) 221,998 238,227 241,492 175,159 238,133 249,653 4.8%STORM (W/S) 80,467 0 0 0 0 0 0.0%ENGINEERING & CAPITAL PROJ (W/S)* 141,939 158,525 158,525 74,735 81,542 0 0.0%DEPARTMENT TOTAL $8,579,413 $10,040,042 $12,277,088 $8,252,086 $11,913,976 $14,678,833 46.2%
EXPENDITURE BY CLASSIFICATION
CLASSIFICATIONFY18
ACTUAL
FY19ORIGINAL
BUDGET
FY19AMENDED
BUDGET
FY19 YTD
6/30/19
FY19YEAR ENDESTIMATE
FY20ADOPTED
BUDGET
% CHANGE INBUDGET
FROMFY19 TO FY20
SALARIES & BENEFITS $3,328,473 $3,649,795 $3,646,755 $2,431,696 $3,367,101 $3,255,040 -10.8%SUPPLIES 350,414 357,262 444,109 305,812 434,908 359,400 0.6%MAINTENANCE 552,061 787,700 819,620 422,134 791,363 694,200 -11.9%SERVICES 4,116,573 4,748,192 6,381,668 4,372,457 6,335,930 8,935,998 88.2%CAPITAL OUTLAY 16,765 335,000 411,840 169,367 411,578 0 -100.0%OTHER 215,127 162,093 573,096 550,620 573,096 1,434,195 784.8%CLASSIFICATION TOTAL $8,579,413 $10,040,042 $12,277,088 $8,252,086 $11,913,976 $14,678,833 46.2%
PERSONNEL SUMMARY BY DIVISION
DIVISIONFY18
ACTUAL
FY19ORIGINAL
BUDGET
FY19AMENDED
BUDGET
FY19 YTD
6/30/19
FY19YEAR ENDESTIMATE
FY20ADOPTED
BUDGET
% CHANGE INBUDGET
FROMFY19 TO FY20
ADMINISTRATION - (GF) 2.40 2.40 2.40 2.00 2.00 2.40 0.0%ADMINISTRATION - (W/S) 1.60 1.60 1.60 2.00 2.00 1.60 0.0%STREET/SIDEWALK OPERATIONS 13.00 13.00 13.00 13.00 13.00 13.00 0.0%DRAINAGE OPERATIONS 4.00 4.00 4.00 4.00 4.00 4.00 0.0%WATER UTILITIES 6.00 6.00 6.00 6.00 6.00 6.00 0.0%SEWER UTILITIES 6.00 7.00 7.00 7.00 7.00 7.00 0.0%WATER OPERATIONS 3.30 3.30 3.30 3.30 3.30 3.30 0.0%SEWER OPERATIONS 4.00 4.00 4.00 4.00 4.00 4.00 0.0%UTILITY CUSTOMER SERVICE - (W/S) 2.00 2.00 2.00 2.00 2.00 2.00 0.0%ENGINEERING & CAPITAL PROJ - (GF)* 2.60 2.60 2.60 2.60 0.00 0.00 -100.0%ENGINEERING & CAPITAL PROJ - (W/S)* 1.40 1.40 1.40 1.40 0.00 0.00 -100.0%PERSONNEL TOTAL 46.30 47.30 47.30 47.30 43.30 43.30 0.0%
*In FY19, the Engineering division was separated from the Public Works department. A new department was created for Engineering and Capital Projects. The division number 3770 was kept the same.For budget presentation the FY18 actual expenditures and all of FY19 amounts are included in the Public Works department.
248
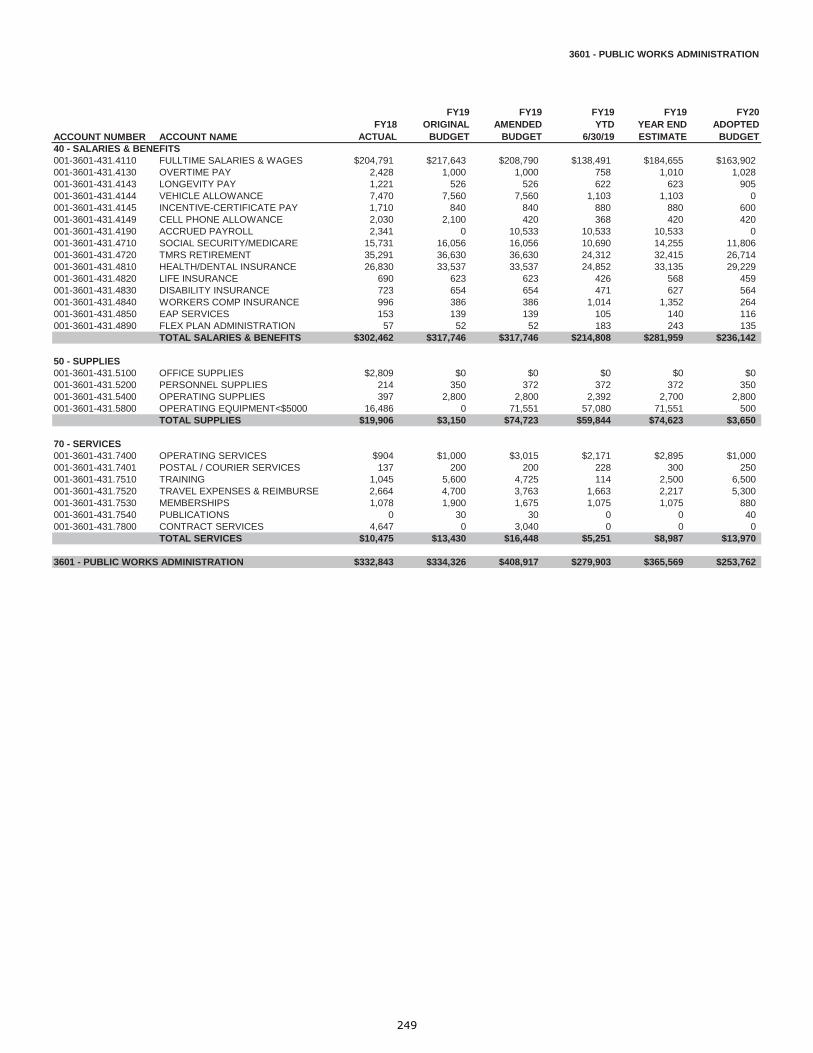
3601 - PUBLIC WORKS ADMINISTRATION
ACCOUNT NUMBER ACCOUNT NAMEFY18
ACTUAL
FY19ORIGINAL
BUDGET
FY19AMENDED
BUDGET
FY19 YTD
6/30/19
FY19YEAR ENDESTIMATE
FY20ADOPTED
BUDGET40 - SALARIES & BENEFITS001-3601-431.4110 FULLTIME SALARIES & WAGES $204,791 $217,643 $208,790 $138,491 $184,655 $163,902001-3601-431.4130 OVERTIME PAY 2,428 1,000 1,000 758 1,010 1,028001-3601-431.4143 LONGEVITY PAY 1,221 526 526 622 623 905001-3601-431.4144 VEHICLE ALLOWANCE 7,470 7,560 7,560 1,103 1,103 0001-3601-431.4145 INCENTIVE-CERTIFICATE PAY 1,710 840 840 880 880 600001-3601-431.4149 CELL PHONE ALLOWANCE 2,030 2,100 420 368 420 420001-3601-431.4190 ACCRUED PAYROLL 2,341 0 10,533 10,533 10,533 0001-3601-431.4710 SOCIAL SECURITY/MEDICARE 15,731 16,056 16,056 10,690 14,255 11,806001-3601-431.4720 TMRS RETIREMENT 35,291 36,630 36,630 24,312 32,415 26,714001-3601-431.4810 HEALTH/DENTAL INSURANCE 26,830 33,537 33,537 24,852 33,135 29,229001-3601-431.4820 LIFE INSURANCE 690 623 623 426 568 459001-3601-431.4830 DISABILITY INSURANCE 723 654 654 471 627 564001-3601-431.4840 WORKERS COMP INSURANCE 996 386 386 1,014 1,352 264001-3601-431.4850 EAP SERVICES 153 139 139 105 140 116001-3601-431.4890 FLEX PLAN ADMINISTRATION 57 52 52 183 243 135
TOTAL SALARIES & BENEFITS $302,462 $317,746 $317,746 $214,808 $281,959 $236,142
50 - SUPPLIES001-3601-431.5100 OFFICE SUPPLIES $2,809 $0 $0 $0 $0 $0001-3601-431.5200 PERSONNEL SUPPLIES 214 350 372 372 372 350001-3601-431.5400 OPERATING SUPPLIES 397 2,800 2,800 2,392 2,700 2,800001-3601-431.5800 OPERATING EQUIPMENT<$5000 16,486 0 71,551 57,080 71,551 500
TOTAL SUPPLIES $19,906 $3,150 $74,723 $59,844 $74,623 $3,650
70 - SERVICES001-3601-431.7400 OPERATING SERVICES $904 $1,000 $3,015 $2,171 $2,895 $1,000001-3601-431.7401 POSTAL / COURIER SERVICES 137 200 200 228 300 250001-3601-431.7510 TRAINING 1,045 5,600 4,725 114 2,500 6,500001-3601-431.7520 TRAVEL EXPENSES & REIMBURSE 2,664 4,700 3,763 1,663 2,217 5,300001-3601-431.7530 MEMBERSHIPS 1,078 1,900 1,675 1,075 1,075 880001-3601-431.7540 PUBLICATIONS 0 30 30 0 0 40001-3601-431.7800 CONTRACT SERVICES 4,647 0 3,040 0 0 0
TOTAL SERVICES $10,475 $13,430 $16,448 $5,251 $8,987 $13,970
3601 - PUBLIC WORKS ADMINISTRATION $332,843 $334,326 $408,917 $279,903 $365,569 $253,762
249

3610 - STREET / SIDEWALK OPERATION
ACCOUNT NUMBER ACCOUNT NAMEFY18
ACTUAL
FY19ORIGINAL
BUDGET
FY19AMENDED
BUDGET
FY19 YTD
6/30/19
FY19YEAR ENDESTIMATE
FY20ADOPTED
BUDGET40 - SALARIES & BENEFITS001-3610-431.4110 FULLTIME SALARIES & WAGES $400,182 $517,900 $502,771 $327,968 $447,290 $496,893001-3610-431.4130 OVERTIME PAY 21,287 10,179 10,179 15,301 27,401 16,440001-3610-431.4131 HOLIDAY HRS WORKED 430 0 0 0 0 0001-3610-431.4143 LONGEVITY PAY 5,703 4,250 4,250 4,487 4,487 6,775001-3610-431.4145 INCENTIVE-CERTIFICATE PAY 3,725 3,300 3,300 2,175 2,900 1,800001-3610-431.4149 CELL PHONE ALLOWANCE 2,545 2,580 1,380 983 1,310 840001-3610-431.4190 ACCRUED PAYROLL 4,661 0 13,289 13,288 13,288 0001-3610-431.4710 SOCIAL SECURITY/MEDICARE 31,642 37,409 37,409 26,284 35,045 36,728001-3610-431.4720 TMRS RETIREMENT 69,531 85,843 85,843 57,963 77,284 83,692001-3610-431.4810 HEALTH/DENTAL INSURANCE 76,826 140,328 140,328 76,059 101,412 136,618001-3610-431.4820 LIFE INSURANCE 1,312 1,483 1,483 1,044 1,393 1,400001-3610-431.4830 DISABILITY INSURANCE 1,409 1,577 1,577 1,195 1,593 1,751001-3610-431.4840 WORKERS COMP INSURANCE 15,610 18,107 18,107 13,183 17,577 19,339001-3610-431.4850 EAP SERVICES 707 755 755 571 762 755001-3610-431.4890 FLEX PLAN ADMINISTRATION 263 281 281 212 283 281
TOTAL SALARIES & BENEFITS $635,833 $823,992 $820,952 $540,713 $732,025 $803,312
50 - SUPPLIES001-3610-431.5200 PERSONNEL SUPPLIES $12,013 $14,040 $14,040 $8,661 $13,548 $14,620001-3610-431.5301 FUEL 29,950 24,660 24,660 24,752 29,003 24,660001-3610-431.5400 OPERATING SUPPLIES 12,766 9,800 9,800 8,365 11,153 11,000001-3610-431.5474 SIGN MATERIALS 29,490 31,000 35,453 30,882 35,453 33,000001-3610-431.5800 OPERATING EQUIPMENT<$5000 12,253 11,250 11,250 7,529 10,040 11,250
TOTAL SUPPLIES $96,472 $90,750 $95,203 $80,189 $99,197 $94,530
60 - MAINTENANCE001-3610-431.6300 VEHICLE MAINTENANCE $8,182 $23,000 $23,000 $10,073 $13,431 $23,000001-3610-431.6510 STREET MAINTENANCE 55,051 75,000 60,780 20,631 60,780 75,000001-3610-431.6515 BRIDGE MAINTENANCE 0 1,000 1,000 0 0 1,000001-3610-431.6517 TRAFFIC LIGHT MAINTENANCE 1,612 2,000 3,000 2,736 3,647 2,000001-3610-431.6520 SIDEWALK MAINTENANCE 11,687 15,000 15,000 3,662 15,000 15,000001-3610-431.6800 EQUIPMENT MAINTENANCE 14,983 18,000 26,595 24,146 32,195 19,000
TOTAL MAINTENANCE $91,515 $134,000 $129,375 $61,248 $125,053 $135,000
70 - SERVICES001-3610-431.7311 VEHICLE INSURANCE $4,973 $6,438 $6,438 $4,599 $6,438 $7,510001-3610-431.7400 OPERATING SERVICES 550 1,000 1,832 732 975 2,000001-3610-431.7497 RECRUITMENT ADVERTISING 0 300 300 0 300 300001-3610-431.7498 JUDGMENTS & DAMAGE CLAIMS 0 500 1,324 1,324 1,765 1,000001-3610-431.7510 TRAINING 25 950 950 66 150 950001-3610-431.7520 TRAVEL EXPENSES & REIMBURSE 0 25 25 0 25 30001-3610-431.7611 ELECTRICITY 414,749 367,266 367,266 279,928 373,236 367,260001-3610-431.7612 TELEPHONE/COMMUNICATIONS 0 0 64 23 31 250001-3610-431.7800 CONTRACT SERVICES 1,500 500 125,500 28,709 125,500 500001-3610-431.7830 RENTAL 0 6,150 6,150 0 0 6,150001-3610-431.7831 VEHICLE LEASE-INTERNAL 10,909 16,121 16,121 12,087 16,121 39,100
TOTAL SERVICES $432,706 $399,250 $525,970 $327,468 $524,541 $425,050
80 - CAPITAL OUTLAY001-3610-431.8400 CAPITAL OPERATING EQUIP $16,769 $0 $48,313 $0 $48,313 $0
TOTAL CAPITAL OUTLAY $16,769 $0 $48,313 $0 $48,313 $0
3610 - STREETS / SIDEWALK OPERATIONS $1,273,295 $1,447,992 $1,619,813 $1,009,618 $1,529,129 $1,457,892
250

3620 - DRAINAGE OPERATIONS
ACCOUNT NUMBER ACCOUNT NAMEFY18
ACTUAL
FY19ORIGINAL
BUDGET
FY19AMENDED
BUDGET
FY19 YTD
6/30/19
FY19YEAR ENDESTIMATE
FY20ADOPTED
BUDGET40 - SALARIES & BENEFITS001-3620-431.4110 FULLTIME SALARIES & WAGES $160,753 $191,492 $176,926 $88,910 $138,546 $182,722001-3620-431.4130 OVERTIME PAY 6,295 6,138 6,138 5,260 7,500 8,220001-3620-431.4131 HOLIDAY HRS WORKED 0 0 0 0 0 0001-3620-431.4143 LONGEVITY PAY 4,576 4,445 4,445 4,515 4,515 2,215001-3620-431.4145 INCENTIVE-CERTIFICATE PAY 1,500 1,500 1,500 825 1,100 3,915001-3620-431.4149 CELL PHONE ALLOWANCE 1,140 1,140 1,140 628 835 420001-3620-431.4190 ACCRUED PAYROLL 2,632 0 14,566 14,565 14,565 0001-3620-431.4710 SOCIAL SECURITY/MEDICARE 12,057 13,754 13,754 8,017 12,689 13,483001-3620-431.4720 TMRS RETIREMENT 27,534 32,652 32,652 18,257 28,343 31,618001-3620-431.4810 HEALTH/DENTAL INSURANCE 45,692 55,384 55,384 22,308 39,743 49,588001-3620-431.4820 LIFE INSURANCE 542 567 567 280 573 525001-3620-431.4830 DISABILITY INSURANCE 568 594 594 307 509 644001-3620-431.4840 WORKERS COMP INSURANCE 5,575 6,905 6,905 4,256 5,675 7,299001-3620-431.4850 EAP SERVICES 237 232 232 126 167 232001-3620-431.4890 FLEX PLAN ADMINISTRATION 88 86 86 47 62 86
TOTAL SALARIES & BENEFITS $269,189 $314,889 $314,889 $168,301 $254,822 $300,967
50 - SUPPLIES001-3620-431.5200 PERSONNEL SUPPLIES $4,063 $5,680 $5,680 $2,876 $4,834 $5,860001-3620-431.5301 FUEL 3,748 3,330 3,330 847 3,129 3,330001-3620-431.5400 OPERATING SUPPLIES 773 1,000 1,000 78 775 1,000001-3620-431.5800 OPERATING EQUIPMENT<$5000 1,533 1,700 1,700 1,245 1,660 1,700
TOTAL SUPPLIES $10,117 $11,710 $11,710 $5,046 $10,398 $11,890
60 - MAINTENANCE001-3620-431.6300 VEHICLE MAINTENANCE $470 $3,000 $3,000 $488 $1,651 $3,000001-3620-431.6530 DRAINAGE MAINTENANCE 19,279 37,300 38,627 32,474 38,627 37,300001-3620-431.6800 EQUIPMENT MAINTENANCE 8,944 10,500 16,500 14,164 18,885 11,500
TOTAL MAINTENANCE $28,693 $50,800 $58,127 $47,126 $59,163 $51,800
70 - SERVICES001-3620-431.7311 VEHICLE INSURANCE $2,606 $1,709 $1,709 $1,233 $1,644 $1,410001-3620-431.7498 JUDGMENTS & DAMAGE CLAIMS 1,000 500 500 0 0 1,000001-3620-431.7510 TRAINING 0 200 200 0 0 100001-3620-431.7800 CONTRACT SERVICES 0 0 35,000 35,000 35,000 0001-3620-431.7830 RENTAL 0 4,000 4,000 0 2,000 4,000001-3620-431.7831 VEHICLE LEASE-INTERNAL 10,180 1,996 1,996 1,494 1,996 15,960
TOTAL SERVICES $13,786 $8,405 $43,405 $37,727 $40,640 $22,470
3620 - DRAINAGE OPERATIONS $321,785 $385,804 $428,131 $258,200 $365,023 $387,127
251

3770 - ENGINEERING & CAPITAL PROJECTS (GF)
ACCOUNT NUMBER ACCOUNT NAMEFY18
ACTUAL
FY19ORIGINAL
BUDGET
FY19AMENDED
BUDGET
FY19 YTD
6/30/19
FY19YEAR ENDESTIMATE
FY20ADOPTED
BUDGET40 - SALARIES & BENEFITS001-3770-431.4110 FULLTIME SALARIES & WAGES $155,958 $156,446 $157,166 $114,829 $153,105 $0001-3770-431.4130 OVERTIME PAY 1,543 500 500 1,240 1,653 0001-3770-431.4131 HOLIDAY HRS WORKED 51 0 0 0 0 0001-3770-431.4143 LONGEVITY PAY 851 950 950 1,007 1,007 0001-3770-431.4145 INCENTIVE-CERTIFICATE PAY 4,980 3,900 3,900 3,735 3,900 0001-3770-431.4149 CELL PHONE ALLOWANCE 1,800 1,800 1,080 795 1,060 0001-3770-431.4710 SOCIAL SECURITY/MEDICARE 12,084 11,949 11,949 8,930 11,906 0001-3770-431.4720 TMRS RETIREMENT 26,262 26,094 26,094 19,354 25,805 0001-3770-431.4810 HEALTH/DENTAL INSURANCE 23,980 23,980 23,980 17,486 23,314 0001-3770-431.4820 LIFE INSURANCE 477 437 437 352 468 0001-3770-431.4830 DISABILITY INSURANCE 516 474 474 407 542 0001-3770-431.4840 WORKERS COMP INSURANCE 550 443 443 360 479 0001-3770-431.4850 EAP SERVICES 176 151 151 126 167 0001-3770-431.4890 FLEX PLAN ADMINISTRATION 65 56 56 47 62 0
TOTAL SALARIES & BENEFITS $229,293 $227,180 $227,180 $168,668 $223,468 $0
50 - SUPPLIES001-3770-431.5200 PERSONNEL SUPPLIES $1,088 $2,135 $2,135 $1,340 $2,135 $0001-3770-431.5301 FUEL 1,640 2,432 2,432 1,521 2,027 0001-3770-431.5400 OPERATING SUPPLIES 521 650 650 211 650 0001-3770-431.5800 OPERATING EQUIPMENT<$5000 3,631 500 500 0 500 0
TOTAL SUPPLIES $6,880 $5,717 $5,717 $3,072 $5,312 $0
60 - MAINTENANCE001-3770-431.6300 VEHICLE MAINTENANCE $894 $4,500 $4,500 $350 $1,500 $0
TOTAL MAINTENANCE $894 $4,500 $4,500 $350 $1,500 $0
70 - SERVICES001-3770-431.7311 VEHICLE INSURANCE $985 $2,650 $2,650 $1,242 $1,656 $0001-3770-431.7400 OPERATING SERVICES 1,209 4,200 4,200 0 0 0001-3770-431.7497 RECRUITMENT ADVERTISING 0 400 400 0 0 0001-3770-431.7498 JUDGMENTS & DAMAGE CLAIMS 0 500 500 0 0 0001-3770-431.7510 TRAINING 30 3,000 3,000 0 0 0001-3770-431.7520 TRAVEL EXPENSES & REIMBURSE 813 700 700 0 0 0001-3770-431.7530 MEMBERSHIPS 90 500 500 50 100 0001-3770-431.7540 PUBLICATIONS 15 90 90 0 90 0001-3770-431.7612 TELEPHONE/COMMUNICATIONS 0 0 0 0 0 0001-3770-431.7800 CONTRACT SERVICES 2,545 7,800 13,600 8,345 11,126 0001-3770-431.7831 VEHICLE LEASE-INTERNAL 3,371 9,206 9,206 6,903 9,206 0
TOTAL SERVICES $9,058 $29,046 $34,846 $16,540 $22,178 $0
3770 - ENGINEERING & CAPITAL PROJECTS (GF) $246,125 $266,443 $272,243 $188,630 $252,458 $0
252

401-3601 - PUBLIC WORKS ADMIN (W/S)
ACCOUNT NUMBER ACCOUNT NAMEFY18
ACTUAL
FY19ORIGINAL
BUDGET
FY19AMENDED
BUDGET
FY19 YTD
6/30/19
FY19YEAR ENDESTIMATE
FY20ADOPTED
BUDGET40 - SALARIES & BENEFITS401-3601-434.4110 FULLTIME SALARIES & WAGES $105,202 $110,516 $111,236 $79,992 $110,956 $156,463401-3601-434.4130 OVERTIME PAY 751 1,000 1,000 498 1,864 1,028401-3601-434.4143 LONGEVITY PAY 1,308 1,364 1,364 1,404 1,404 1,445401-3601-434.4144 VEHICLE ALLOWANCE 3,105 3,240 3,240 473 473 0401-3601-434.4145 INCENTIVE-CERTIFICATE PAY 2,640 2,460 2,460 1,960 1,960 3,240401-3601-434.4149 CELL PHONE ALLOWANCE 1,140 1,140 420 328 328 420401-3601-434.4710 SOCIAL SECURITY/MEDICARE 8,125 8,552 8,552 5,954 8,552 11,489401-3601-434.4720 TMRS RETIREMENT 18,118 19,093 19,093 13,473 19,093 26,032401-3601-434.4810 HEALTH/DENTAL INSURANCE 17,067 16,971 16,971 15,279 16,971 28,972401-3601-434.4820 LIFE INSURANCE 368 318 318 280 374 447401-3601-434.4830 DISABILITY INSURANCE 386 333 333 318 424 549401-3601-434.4840 WORKERS COMP INSURANCE 1,147 235 235 864 1,152 257401-3601-434.4850 EAP SERVICES 108 93 93 78 105 116401-3601-434.4890 FLEX PLAN ADMINISTRATION 43 35 35 29 39 43
TOTAL SALARIES & BENEFITS $159,508 $165,350 $165,350 $120,930 $163,695 $230,501
50 - SUPPLIES401-3601-434.5100 OFFICE SUPPLIES $1,147 $0 $0 $0 $0 $0401-3601-434.5200 PERSONNEL SUPPLIES 140 300 372 371 500 300401-3601-434.5400 OPERATING SUPPLIES 313 1,300 1,300 1,273 1,697 1,800401-3601-434.5477 WATER CONSERVE LITERATURE 0 1,500 1,500 0 0 0401-3601-434.5800 OPERATING EQUIPMENT<$5000 2,671 0 0 0 0 500
TOTAL SUPPLIES $4,271 $3,100 $3,172 $1,644 $2,197 $2,600
70 - SERVICES401-3601-434.7212 MEDICAL EXAMINATIONS $0 $1,324 $1,324 $0 $1,324 $0401-3601-434.7400 OPERATING SERVICES 2,994 1,625 2,815 2,109 2,812 4,450401-3601-434.7401 POSTAL / COURIER SERVICES 578 1,000 1,000 415 750 1,400401-3601-434.7422 CONSUMER CONFIDENCE RPT 414 500 500 414 414 500401-3601-434.7510 TRAINING 850 3,700 3,398 30 850 4,500401-3601-434.7520 TRAVEL EXPENSES & REIMBURSE 919 2,000 2,000 12 1,000 3,300401-3601-434.7530 MEMBERSHIPS 197 530 530 203 530 690401-3601-434.7540 PUBLICATIONS 0 30 30 0 30 40
TOTAL SERVICES $5,952 $10,709 $11,597 $3,183 $7,710 $14,880
401-3601 - PUBLIC WORKS ADMIN (W/S) $169,731 $179,159 $180,119 $125,757 $173,602 $247,981
253
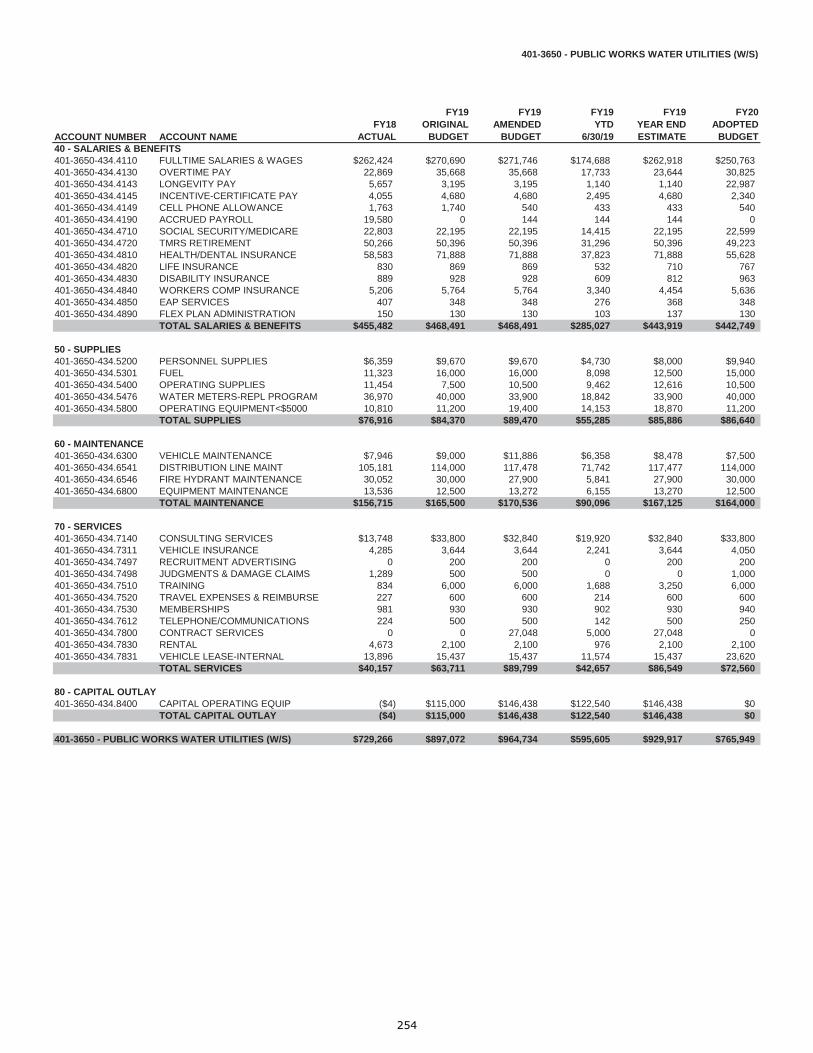
401-3650 - PUBLIC WORKS WATER UTILITIES (W/S)
ACCOUNT NUMBER ACCOUNT NAMEFY18
ACTUAL
FY19ORIGINAL
BUDGET
FY19AMENDED
BUDGET
FY19 YTD
6/30/19
FY19YEAR ENDESTIMATE
FY20ADOPTED
BUDGET40 - SALARIES & BENEFITS401-3650-434.4110 FULLTIME SALARIES & WAGES $262,424 $270,690 $271,746 $174,688 $262,918 $250,763401-3650-434.4130 OVERTIME PAY 22,869 35,668 35,668 17,733 23,644 30,825401-3650-434.4143 LONGEVITY PAY 5,657 3,195 3,195 1,140 1,140 22,987401-3650-434.4145 INCENTIVE-CERTIFICATE PAY 4,055 4,680 4,680 2,495 4,680 2,340401-3650-434.4149 CELL PHONE ALLOWANCE 1,763 1,740 540 433 433 540401-3650-434.4190 ACCRUED PAYROLL 19,580 0 144 144 144 0401-3650-434.4710 SOCIAL SECURITY/MEDICARE 22,803 22,195 22,195 14,415 22,195 22,599401-3650-434.4720 TMRS RETIREMENT 50,266 50,396 50,396 31,296 50,396 49,223401-3650-434.4810 HEALTH/DENTAL INSURANCE 58,583 71,888 71,888 37,823 71,888 55,628401-3650-434.4820 LIFE INSURANCE 830 869 869 532 710 767401-3650-434.4830 DISABILITY INSURANCE 889 928 928 609 812 963401-3650-434.4840 WORKERS COMP INSURANCE 5,206 5,764 5,764 3,340 4,454 5,636401-3650-434.4850 EAP SERVICES 407 348 348 276 368 348401-3650-434.4890 FLEX PLAN ADMINISTRATION 150 130 130 103 137 130
TOTAL SALARIES & BENEFITS $455,482 $468,491 $468,491 $285,027 $443,919 $442,749
50 - SUPPLIES401-3650-434.5200 PERSONNEL SUPPLIES $6,359 $9,670 $9,670 $4,730 $8,000 $9,940401-3650-434.5301 FUEL 11,323 16,000 16,000 8,098 12,500 15,000401-3650-434.5400 OPERATING SUPPLIES 11,454 7,500 10,500 9,462 12,616 10,500401-3650-434.5476 WATER METERS-REPL PROGRAM 36,970 40,000 33,900 18,842 33,900 40,000401-3650-434.5800 OPERATING EQUIPMENT<$5000 10,810 11,200 19,400 14,153 18,870 11,200
TOTAL SUPPLIES $76,916 $84,370 $89,470 $55,285 $85,886 $86,640
60 - MAINTENANCE401-3650-434.6300 VEHICLE MAINTENANCE $7,946 $9,000 $11,886 $6,358 $8,478 $7,500401-3650-434.6541 DISTRIBUTION LINE MAINT 105,181 114,000 117,478 71,742 117,477 114,000401-3650-434.6546 FIRE HYDRANT MAINTENANCE 30,052 30,000 27,900 5,841 27,900 30,000401-3650-434.6800 EQUIPMENT MAINTENANCE 13,536 12,500 13,272 6,155 13,270 12,500
TOTAL MAINTENANCE $156,715 $165,500 $170,536 $90,096 $167,125 $164,000
70 - SERVICES401-3650-434.7140 CONSULTING SERVICES $13,748 $33,800 $32,840 $19,920 $32,840 $33,800401-3650-434.7311 VEHICLE INSURANCE 4,285 3,644 3,644 2,241 3,644 4,050401-3650-434.7497 RECRUITMENT ADVERTISING 0 200 200 0 200 200401-3650-434.7498 JUDGMENTS & DAMAGE CLAIMS 1,289 500 500 0 0 1,000401-3650-434.7510 TRAINING 834 6,000 6,000 1,688 3,250 6,000401-3650-434.7520 TRAVEL EXPENSES & REIMBURSE 227 600 600 214 600 600401-3650-434.7530 MEMBERSHIPS 981 930 930 902 930 940401-3650-434.7612 TELEPHONE/COMMUNICATIONS 224 500 500 142 500 250401-3650-434.7800 CONTRACT SERVICES 0 0 27,048 5,000 27,048 0401-3650-434.7830 RENTAL 4,673 2,100 2,100 976 2,100 2,100401-3650-434.7831 VEHICLE LEASE-INTERNAL 13,896 15,437 15,437 11,574 15,437 23,620
TOTAL SERVICES $40,157 $63,711 $89,799 $42,657 $86,549 $72,560
80 - CAPITAL OUTLAY401-3650-434.8400 CAPITAL OPERATING EQUIP ($4) $115,000 $146,438 $122,540 $146,438 $0
TOTAL CAPITAL OUTLAY ($4) $115,000 $146,438 $122,540 $146,438 $0
401-3650 - PUBLIC WORKS WATER UTILITIES (W/S) $729,266 $897,072 $964,734 $595,605 $929,917 $765,949
254
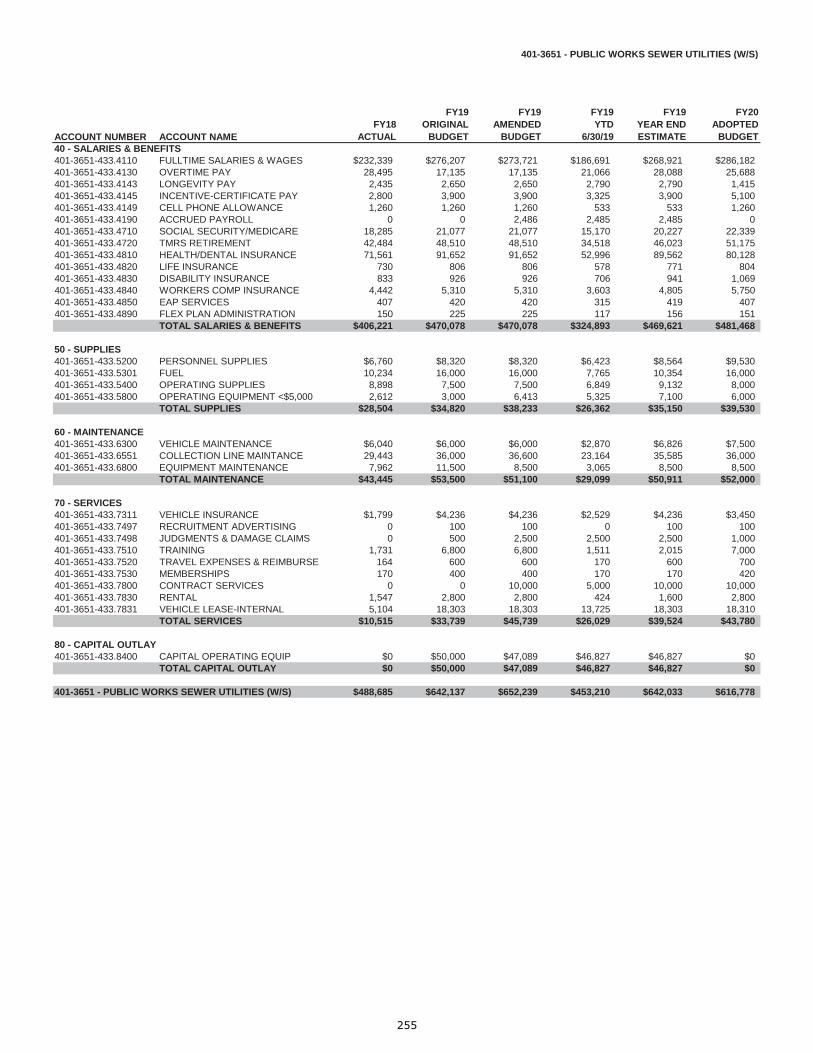
401-3651 - PUBLIC WORKS SEWER UTILITIES (W/S)
ACCOUNT NUMBER ACCOUNT NAMEFY18
ACTUAL
FY19ORIGINAL
BUDGET
FY19AMENDED
BUDGET
FY19 YTD
6/30/19
FY19YEAR ENDESTIMATE
FY20ADOPTED
BUDGET40 - SALARIES & BENEFITS401-3651-433.4110 FULLTIME SALARIES & WAGES $232,339 $276,207 $273,721 $186,691 $268,921 $286,182401-3651-433.4130 OVERTIME PAY 28,495 17,135 17,135 21,066 28,088 25,688401-3651-433.4143 LONGEVITY PAY 2,435 2,650 2,650 2,790 2,790 1,415401-3651-433.4145 INCENTIVE-CERTIFICATE PAY 2,800 3,900 3,900 3,325 3,900 5,100401-3651-433.4149 CELL PHONE ALLOWANCE 1,260 1,260 1,260 533 533 1,260401-3651-433.4190 ACCRUED PAYROLL 0 0 2,486 2,485 2,485 0401-3651-433.4710 SOCIAL SECURITY/MEDICARE 18,285 21,077 21,077 15,170 20,227 22,339401-3651-433.4720 TMRS RETIREMENT 42,484 48,510 48,510 34,518 46,023 51,175401-3651-433.4810 HEALTH/DENTAL INSURANCE 71,561 91,652 91,652 52,996 89,562 80,128401-3651-433.4820 LIFE INSURANCE 730 806 806 578 771 804401-3651-433.4830 DISABILITY INSURANCE 833 926 926 706 941 1,069401-3651-433.4840 WORKERS COMP INSURANCE 4,442 5,310 5,310 3,603 4,805 5,750401-3651-433.4850 EAP SERVICES 407 420 420 315 419 407401-3651-433.4890 FLEX PLAN ADMINISTRATION 150 225 225 117 156 151
TOTAL SALARIES & BENEFITS $406,221 $470,078 $470,078 $324,893 $469,621 $481,468
50 - SUPPLIES401-3651-433.5200 PERSONNEL SUPPLIES $6,760 $8,320 $8,320 $6,423 $8,564 $9,530401-3651-433.5301 FUEL 10,234 16,000 16,000 7,765 10,354 16,000401-3651-433.5400 OPERATING SUPPLIES 8,898 7,500 7,500 6,849 9,132 8,000401-3651-433.5800 OPERATING EQUIPMENT <$5,000 2,612 3,000 6,413 5,325 7,100 6,000
TOTAL SUPPLIES $28,504 $34,820 $38,233 $26,362 $35,150 $39,530
60 - MAINTENANCE401-3651-433.6300 VEHICLE MAINTENANCE $6,040 $6,000 $6,000 $2,870 $6,826 $7,500401-3651-433.6551 COLLECTION LINE MAINTANCE 29,443 36,000 36,600 23,164 35,585 36,000401-3651-433.6800 EQUIPMENT MAINTENANCE 7,962 11,500 8,500 3,065 8,500 8,500
TOTAL MAINTENANCE $43,445 $53,500 $51,100 $29,099 $50,911 $52,000
70 - SERVICES401-3651-433.7311 VEHICLE INSURANCE $1,799 $4,236 $4,236 $2,529 $4,236 $3,450401-3651-433.7497 RECRUITMENT ADVERTISING 0 100 100 0 100 100401-3651-433.7498 JUDGMENTS & DAMAGE CLAIMS 0 500 2,500 2,500 2,500 1,000401-3651-433.7510 TRAINING 1,731 6,800 6,800 1,511 2,015 7,000401-3651-433.7520 TRAVEL EXPENSES & REIMBURSE 164 600 600 170 600 700401-3651-433.7530 MEMBERSHIPS 170 400 400 170 170 420401-3651-433.7800 CONTRACT SERVICES 0 0 10,000 5,000 10,000 10,000401-3651-433.7830 RENTAL 1,547 2,800 2,800 424 1,600 2,800401-3651-433.7831 VEHICLE LEASE-INTERNAL 5,104 18,303 18,303 13,725 18,303 18,310
TOTAL SERVICES $10,515 $33,739 $45,739 $26,029 $39,524 $43,780
80 - CAPITAL OUTLAY401-3651-433.8400 CAPITAL OPERATING EQUIP $0 $50,000 $47,089 $46,827 $46,827 $0
TOTAL CAPITAL OUTLAY $0 $50,000 $47,089 $46,827 $46,827 $0
401-3651 - PUBLIC WORKS SEWER UTILITIES (W/S) $488,685 $642,137 $652,239 $453,210 $642,033 $616,778
255
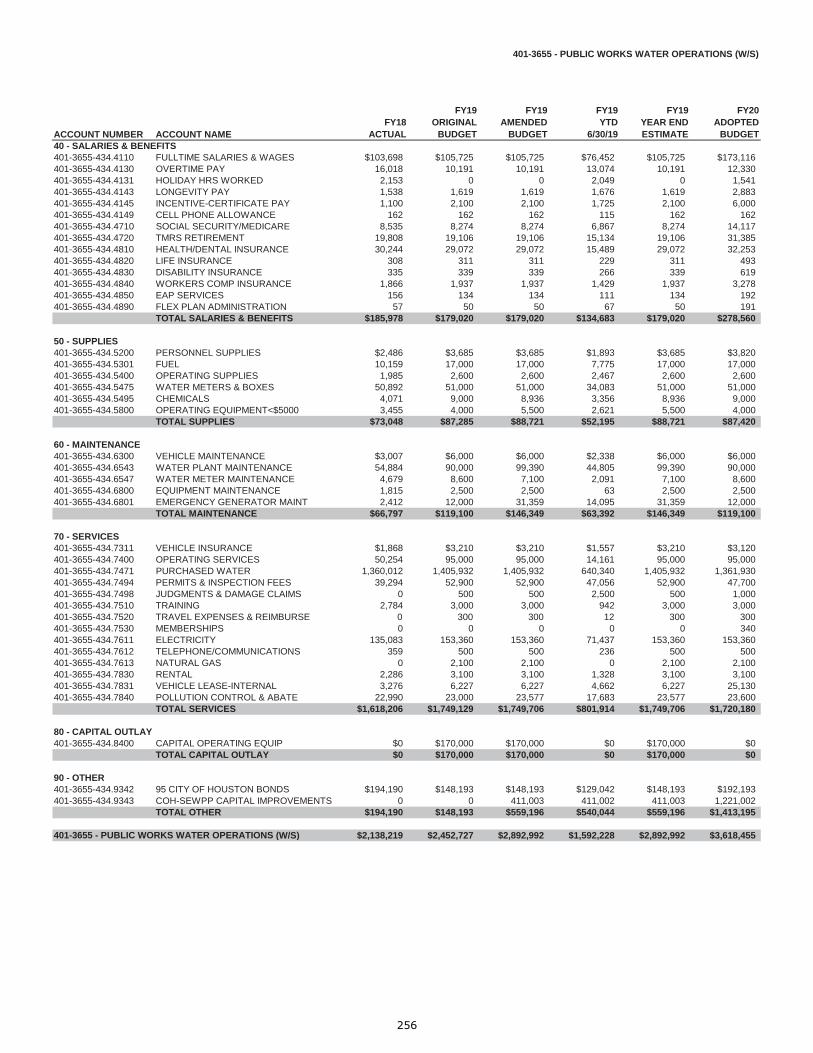
401-3655 - PUBLIC WORKS WATER OPERATIONS (W/S)
ACCOUNT NUMBER ACCOUNT NAMEFY18
ACTUAL
FY19ORIGINAL
BUDGET
FY19AMENDED
BUDGET
FY19 YTD
6/30/19
FY19YEAR ENDESTIMATE
FY20ADOPTED
BUDGET40 - SALARIES & BENEFITS401-3655-434.4110 FULLTIME SALARIES & WAGES $103,698 $105,725 $105,725 $76,452 $105,725 $173,116401-3655-434.4130 OVERTIME PAY 16,018 10,191 10,191 13,074 10,191 12,330401-3655-434.4131 HOLIDAY HRS WORKED 2,153 0 0 2,049 0 1,541401-3655-434.4143 LONGEVITY PAY 1,538 1,619 1,619 1,676 1,619 2,883401-3655-434.4145 INCENTIVE-CERTIFICATE PAY 1,100 2,100 2,100 1,725 2,100 6,000401-3655-434.4149 CELL PHONE ALLOWANCE 162 162 162 115 162 162401-3655-434.4710 SOCIAL SECURITY/MEDICARE 8,535 8,274 8,274 6,867 8,274 14,117401-3655-434.4720 TMRS RETIREMENT 19,808 19,106 19,106 15,134 19,106 31,385401-3655-434.4810 HEALTH/DENTAL INSURANCE 30,244 29,072 29,072 15,489 29,072 32,253401-3655-434.4820 LIFE INSURANCE 308 311 311 229 311 493401-3655-434.4830 DISABILITY INSURANCE 335 339 339 266 339 619401-3655-434.4840 WORKERS COMP INSURANCE 1,866 1,937 1,937 1,429 1,937 3,278401-3655-434.4850 EAP SERVICES 156 134 134 111 134 192401-3655-434.4890 FLEX PLAN ADMINISTRATION 57 50 50 67 50 191
TOTAL SALARIES & BENEFITS $185,978 $179,020 $179,020 $134,683 $179,020 $278,560
50 - SUPPLIES401-3655-434.5200 PERSONNEL SUPPLIES $2,486 $3,685 $3,685 $1,893 $3,685 $3,820401-3655-434.5301 FUEL 10,159 17,000 17,000 7,775 17,000 17,000401-3655-434.5400 OPERATING SUPPLIES 1,985 2,600 2,600 2,467 2,600 2,600401-3655-434.5475 WATER METERS & BOXES 50,892 51,000 51,000 34,083 51,000 51,000401-3655-434.5495 CHEMICALS 4,071 9,000 8,936 3,356 8,936 9,000401-3655-434.5800 OPERATING EQUIPMENT<$5000 3,455 4,000 5,500 2,621 5,500 4,000
TOTAL SUPPLIES $73,048 $87,285 $88,721 $52,195 $88,721 $87,420
60 - MAINTENANCE401-3655-434.6300 VEHICLE MAINTENANCE $3,007 $6,000 $6,000 $2,338 $6,000 $6,000401-3655-434.6543 WATER PLANT MAINTENANCE 54,884 90,000 99,390 44,805 99,390 90,000401-3655-434.6547 WATER METER MAINTENANCE 4,679 8,600 7,100 2,091 7,100 8,600401-3655-434.6800 EQUIPMENT MAINTENANCE 1,815 2,500 2,500 63 2,500 2,500401-3655-434.6801 EMERGENCY GENERATOR MAINT 2,412 12,000 31,359 14,095 31,359 12,000
TOTAL MAINTENANCE $66,797 $119,100 $146,349 $63,392 $146,349 $119,100
70 - SERVICES401-3655-434.7311 VEHICLE INSURANCE $1,868 $3,210 $3,210 $1,557 $3,210 $3,120401-3655-434.7400 OPERATING SERVICES 50,254 95,000 95,000 14,161 95,000 95,000401-3655-434.7471 PURCHASED WATER 1,360,012 1,405,932 1,405,932 640,340 1,405,932 1,361,930401-3655-434.7494 PERMITS & INSPECTION FEES 39,294 52,900 52,900 47,056 52,900 47,700401-3655-434.7498 JUDGMENTS & DAMAGE CLAIMS 0 500 500 2,500 500 1,000401-3655-434.7510 TRAINING 2,784 3,000 3,000 942 3,000 3,000401-3655-434.7520 TRAVEL EXPENSES & REIMBURSE 0 300 300 12 300 300401-3655-434.7530 MEMBERSHIPS 0 0 0 0 0 340401-3655-434.7611 ELECTRICITY 135,083 153,360 153,360 71,437 153,360 153,360401-3655-434.7612 TELEPHONE/COMMUNICATIONS 359 500 500 236 500 500401-3655-434.7613 NATURAL GAS 0 2,100 2,100 0 2,100 2,100401-3655-434.7830 RENTAL 2,286 3,100 3,100 1,328 3,100 3,100401-3655-434.7831 VEHICLE LEASE-INTERNAL 3,276 6,227 6,227 4,662 6,227 25,130401-3655-434.7840 POLLUTION CONTROL & ABATE 22,990 23,000 23,577 17,683 23,577 23,600
TOTAL SERVICES $1,618,206 $1,749,129 $1,749,706 $801,914 $1,749,706 $1,720,180
80 - CAPITAL OUTLAY401-3655-434.8400 CAPITAL OPERATING EQUIP $0 $170,000 $170,000 $0 $170,000 $0
TOTAL CAPITAL OUTLAY $0 $170,000 $170,000 $0 $170,000 $0
90 - OTHER401-3655-434.9342 95 CITY OF HOUSTON BONDS $194,190 $148,193 $148,193 $129,042 $148,193 $192,193401-3655-434.9343 COH-SEWPP CAPITAL IMPROVEMENTS 0 0 411,003 411,002 411,003 1,221,002
TOTAL OTHER $194,190 $148,193 $559,196 $540,044 $559,196 $1,413,195
401-3655 - PUBLIC WORKS WATER OPERATIONS (W/S) $2,138,219 $2,452,727 $2,892,992 $1,592,228 $2,892,992 $3,618,455
256

401-3656 - PUBLIC WORKS SEWER OPERATIONS (W/S)
ACCOUNT NUMBER ACCOUNT NAMEFY18
ACTUAL
FY19ORIGINAL
BUDGET
FY19AMENDED
BUDGET
FY19 YTD
6/30/19
FY19YEAR ENDESTIMATE
FY20ADOPTED
BUDGET40 - SALARIES & BENEFITS401-3656-433.4110 FULLTIME SALARIES & WAGES $282,006 $276,460 $278,300 $200,439 $278,300 $223,808401-3656-433.4130 OVERTIME PAY 17,998 13,708 13,708 13,011 13,708 15,413401-3656-433.4131 HOLIDAY HRS WORKED 2,491 0 0 1,890 0 1,028401-3656-433.4143 LONGEVITY PAY 3,970 4,150 4,150 4,270 4,150 3,470401-3656-433.4145 INCENTIVE-CERTIFICATE PAY 5,800 5,100 5,100 5,875 5,100 6,000401-3656-433.4149 CELL PHONE ALLOWANCE 1,920 1,920 80 80 80 0401-3656-433.4710 SOCIAL SECURITY/MEDICARE 21,861 22,239 22,239 16,740 22,239 18,826401-3656-433.4720 TMRS RETIREMENT 47,119 48,061 48,061 35,899 48,061 39,981401-3656-433.4810 HEALTH/DENTAL INSURANCE 40,422 40,416 40,416 29,647 40,416 29,648401-3656-433.4820 LIFE INSURANCE 832 818 818 624 818 645401-3656-433.4830 DISABILITY INSURANCE 900 882 882 722 882 823401-3656-433.4840 WORKERS COMP INSURANCE 4,860 5,281 5,281 3,693 5,281 4,348401-3656-433.4850 EAP SERVICES 339 290 290 242 290 232401-3656-433.4890 FLEX PLAN ADMINISTRATION 126 108 108 177 108 86
TOTAL SALARIES & BENEFITS $430,644 $419,433 $419,433 $313,309 $419,433 $344,308
50 - SUPPLIES401-3656-433.5200 PERSONNEL SUPPLIES $3,479 $5,980 $5,980 $3,106 $5,980 $6,160401-3656-433.5301 FUEL 10,813 15,000 15,000 9,319 15,000 15,000401-3656-433.5400 OPERATING SUPPLIES 1,541 2,600 2,600 1,944 2,600 2,600401-3656-433.5800 OPERATING EQUIPMENT <$5,000 480 600 600 511 600 600
TOTAL SUPPLIES $16,313 $24,180 $24,180 $14,880 $24,180 $24,360
60 - MAINTENANCE401-3656-433.6300 VEHICLE MAINTENANCE $1,508 $7,500 $7,500 $3,747 $4,995 $9,000401-3656-433.6552 LIFT STATION MAINTENANCE 139,130 198,000 209,333 122,074 209,333 110,000401-3656-433.6800 EQUIPMENT MAINTENANCE 330 3,300 3,300 47 1,500 3,300401-3656-433.6801 EMERGENCY GENERATOR MAINT 22,787 47,000 35,000 4,746 25,000 47,000
TOTAL MAINTENANCE $163,755 $255,800 $255,133 $130,614 $240,828 $169,300
70 - SERVICES401-3656-433.7311 VEHICLE INSURANCE $2,407 $3,800 $3,800 $1,881 $3,800 $4,070401-3656-433.7400 OPERATING SERVICES 9,520 9,600 9,859 6,421 9,859 9,600401-3656-433.7473 BLACKHAWK WW OPERATIONS 1,632,522 2,118,700 3,539,361 2,908,090 3,539,361 6,302,588401-3656-433.7498 JUDGMENTS & DAMAGE CLAIMS 0 500 500 0 500 1,000401-3656-433.7510 TRAINING 1,618 4,000 4,000 2,367 4,000 4,000401-3656-433.7520 TRAVEL EXPENSES & REIMBURSE 0 400 400 90 400 400401-3656-433.7530 MEMBERSHIPS 0 360 360 0 360 340401-3656-433.7611 ELECTRICITY 116,764 121,676 121,676 90,162 121,676 121,670401-3656-433.7613 NATURAL GAS 10,346 10,470 10,470 7,546 10,470 10,470401-3656-433.7800 CONTRACT SERVICES 18,000 40,000 40,000 2,650 40,000 40,000401-3656-433.7830 RENTAL 174 1,000 1,000 105 1,000 1,000401-3656-433.7831 VEHICLE LEASE-INTERNAL 12,060 13,811 13,811 10,350 13,811 27,130
TOTAL SERVICES $1,803,411 $2,324,317 $3,745,237 $3,029,662 $3,745,237 $6,522,268
90 - OTHER401-3656-433.9061 BLACKHAWK WWTP OPER RESERVE $20,937 $13,900 $13,900 $10,576 $13,900 $21,000
TOTAL OTHER $20,937 $13,900 $13,900 $10,576 $13,900 $21,000
401-3656 - PUBLIC WORKS SEWER OPERATIONS (W/S) $2,435,060 $3,037,630 $4,457,883 $3,499,041 $4,443,578 $7,081,236
257
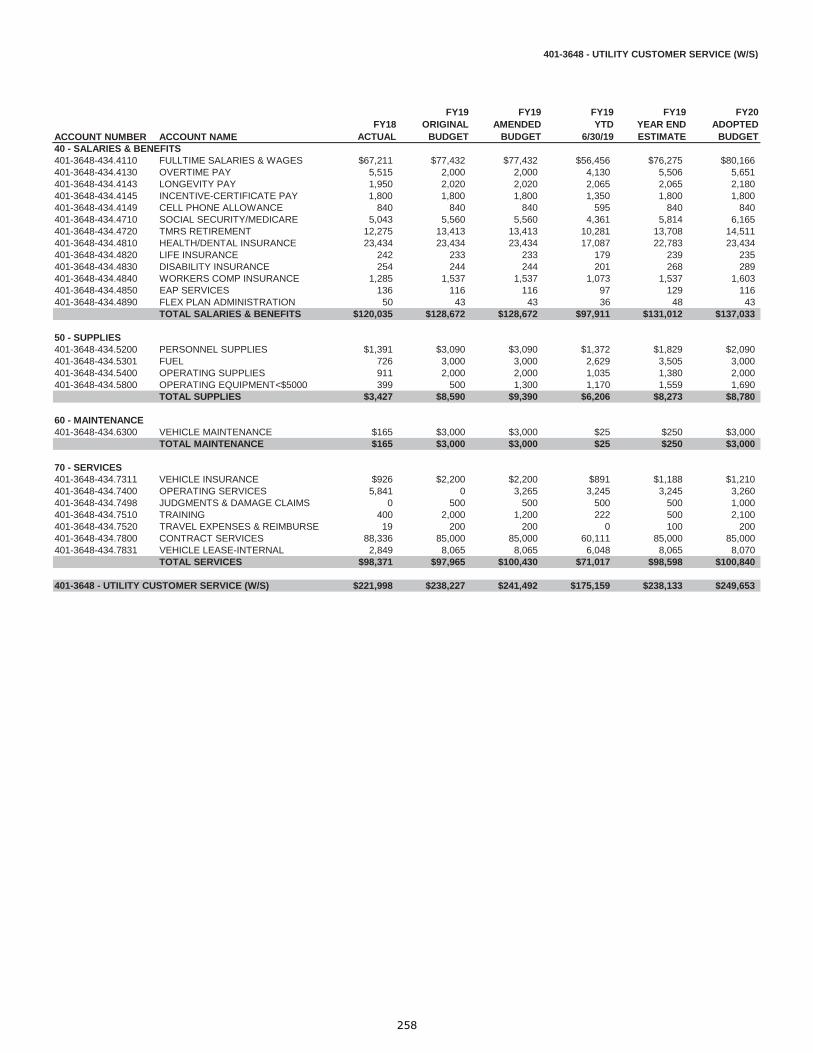
401-3648 - UTILITY CUSTOMER SERVICE (W/S)
ACCOUNT NUMBER ACCOUNT NAMEFY18
ACTUAL
FY19ORIGINAL
BUDGET
FY19AMENDED
BUDGET
FY19 YTD
6/30/19
FY19YEAR ENDESTIMATE
FY20ADOPTED
BUDGET40 - SALARIES & BENEFITS401-3648-434.4110 FULLTIME SALARIES & WAGES $67,211 $77,432 $77,432 $56,456 $76,275 $80,166401-3648-434.4130 OVERTIME PAY 5,515 2,000 2,000 4,130 5,506 5,651401-3648-434.4143 LONGEVITY PAY 1,950 2,020 2,020 2,065 2,065 2,180401-3648-434.4145 INCENTIVE-CERTIFICATE PAY 1,800 1,800 1,800 1,350 1,800 1,800401-3648-434.4149 CELL PHONE ALLOWANCE 840 840 840 595 840 840401-3648-434.4710 SOCIAL SECURITY/MEDICARE 5,043 5,560 5,560 4,361 5,814 6,165401-3648-434.4720 TMRS RETIREMENT 12,275 13,413 13,413 10,281 13,708 14,511401-3648-434.4810 HEALTH/DENTAL INSURANCE 23,434 23,434 23,434 17,087 22,783 23,434401-3648-434.4820 LIFE INSURANCE 242 233 233 179 239 235401-3648-434.4830 DISABILITY INSURANCE 254 244 244 201 268 289401-3648-434.4840 WORKERS COMP INSURANCE 1,285 1,537 1,537 1,073 1,537 1,603401-3648-434.4850 EAP SERVICES 136 116 116 97 129 116401-3648-434.4890 FLEX PLAN ADMINISTRATION 50 43 43 36 48 43
TOTAL SALARIES & BENEFITS $120,035 $128,672 $128,672 $97,911 $131,012 $137,033
50 - SUPPLIES401-3648-434.5200 PERSONNEL SUPPLIES $1,391 $3,090 $3,090 $1,372 $1,829 $2,090401-3648-434.5301 FUEL 726 3,000 3,000 2,629 3,505 3,000401-3648-434.5400 OPERATING SUPPLIES 911 2,000 2,000 1,035 1,380 2,000401-3648-434.5800 OPERATING EQUIPMENT<$5000 399 500 1,300 1,170 1,559 1,690
TOTAL SUPPLIES $3,427 $8,590 $9,390 $6,206 $8,273 $8,780
60 - MAINTENANCE401-3648-434.6300 VEHICLE MAINTENANCE $165 $3,000 $3,000 $25 $250 $3,000
TOTAL MAINTENANCE $165 $3,000 $3,000 $25 $250 $3,000
70 - SERVICES401-3648-434.7311 VEHICLE INSURANCE $926 $2,200 $2,200 $891 $1,188 $1,210401-3648-434.7400 OPERATING SERVICES 5,841 0 3,265 3,245 3,245 3,260401-3648-434.7498 JUDGMENTS & DAMAGE CLAIMS 0 500 500 500 500 1,000401-3648-434.7510 TRAINING 400 2,000 1,200 222 500 2,100401-3648-434.7520 TRAVEL EXPENSES & REIMBURSE 19 200 200 0 100 200401-3648-434.7800 CONTRACT SERVICES 88,336 85,000 85,000 60,111 85,000 85,000401-3648-434.7831 VEHICLE LEASE-INTERNAL 2,849 8,065 8,065 6,048 8,065 8,070
TOTAL SERVICES $98,371 $97,965 $100,430 $71,017 $98,598 $100,840
401-3648 - UTILITY CUSTOMER SERVICE (W/S) $221,998 $238,227 $241,492 $175,159 $238,133 $249,653
258

401-2513 - FIRE MARSHAL TS OR HURRICANE (WS)
ACCOUNT NUMBER ACCOUNT NAMEFY18
ACTUAL
FY19ORIGINAL
BUDGET
FY19AMENDED
BUDGET
FY19 YTD
6/30/19
FY19YEAR ENDESTIMATE
FY20ADOPTED
BUDGET50 - SUPPLIES401-2513-422.5501 EMERGENCY-MATERIALS/SUPPLIES $1,724 $0 $0 $0 $0 $0401-2513-422.5801 EMERGENCY-EQUIPMENT 11,572 0 0 0 0 0
TOTAL SUPPLIES $13,296 $0 $0 $0 $0 $0
70 - SERVICES401-2513-422.7971 EMERGENCY - SERVICES $67,171 $0 $0 $0 $0 $0
TOTAL SERVICES $67,171 $0 $0 $0 $0 $0
401-2513 - FIRE MARSHAL TS OR HURRICANE (WS) $80,467 $0 $0 $0 $0 $0
259

401-3770 - ENGINEERING & CAPITAL PROJECTS (W/S)
ACCOUNT NUMBER ACCOUNT NAMEFY18
ACTUAL
FY19ORIGINAL
BUDGET
FY19AMENDED
BUDGET
FY19 YTD
6/30/19
FY19YEAR ENDESTIMATE
FY20ADOPTED
BUDGET40 - SALARIES & BENEFITS401-3770-434.4110 FULLTIME SALARIES & WAGES $83,335 $83,348 $83,585 $42,369 $43,726 $0401-3770-434.4130 OVERTIME PAY 662 3,500 3,500 98 98 0401-3770-434.4143 LONGEVITY PAY 573 545 545 457 654 0401-3770-434.4145 INCENTIVE-CERTIFICATE PAY 4,620 3,300 3,300 990 990 0401-3770-434.4149 CELL PHONE ALLOWANCE 1,020 1,020 540 133 133 0401-3770-434.4190 ACCRUED PAYROLL 242 0 243 491 3,529 0401-3770-434.4710 SOCIAL SECURITY/MEDICARE 6,194 6,229 6,229 3,234 3,585 0401-3770-434.4720 TMRS RETIREMENT 14,355 14,628 14,628 7,089 7,819 0401-3770-434.4810 HEALTH/DENTAL INSURANCE 21,860 21,495 21,495 6,632 6,632 0401-3770-434.4820 LIFE INSURANCE 262 254 254 146 146 0401-3770-434.4830 DISABILITY INSURANCE 274 265 265 160 161 0401-3770-434.4840 WORKERS COMP INSURANCE 299 249 249 587 587 0401-3770-434.4850 EAP SERVICES 95 81 81 49 49 0401-3770-434.4890 FLEX PLAN ADMINISTRATION 37 30 30 18 18 0
TOTAL SALARIES & BENEFITS $133,828 $134,944 $134,944 $62,453 $68,127 $0
50 - SUPPLIES $0401-3770-434.5200 PERSONNEL SUPPLIES $728 $1,390 $1,390 $645 $645 $0401-3770-434.5301 FUEL 517 2,000 2,000 348 230 0401-3770-434.5400 OPERATING SUPPLIES 19 200 200 96 96 0401-3770-434.5800 OPERATING EQUIPMENT<$5000 0 0 0 0 0 0
TOTAL SUPPLIES $1,264 $3,590 $3,590 $1,089 $971 $0
60 - MAINTENANCE $0401-3770-434.6300 VEHICLE MAINTENANCE $82 $1,500 $1,500 $184 $184 $0
TOTAL MAINTENANCE $82 $1,500 $1,500 $184 $184 $0
70 - SERVICES $0401-3770-434.7130 ENGINEERING SERVICES $1,207 $10,000 $10,000 $7,467 $7,700 $0401-3770-434.7311 VEHICLE INSURANCE 986 1,100 1,100 459 459 0401-3770-434.7498 JUDGMENTS & DAMAGE CLAIMS 0 500 500 0 0 0401-3770-434.7510 TRAINING 70 2,000 2,000 0 0 0401-3770-434.7520 TRAVEL EXPENSES & REIMBURSE 648 500 500 0 0 0401-3770-434.7530 MEMBERSHIPS 120 280 280 50 50 0401-3770-434.7540 PUBLICATIONS 15 60 60 0 0 0401-3770-434.7612 TELEPHONE/COMMUNICATIONS 0 0 0 0 0 0401-3770-434.7831 VEHICLE LEASE-INTERNAL 3,719 4,051 4,051 3,033 4,051 0
TOTAL SERVICES $6,765 $18,491 $18,491 $11,009 $12,260 $0
401-3770 - ENGINEERING & CAPITAL PROJECTS (W/S) $141,939 $158,525 $158,525 $74,735 $81,542 $0
260

Engineering
Engineering
Engineering
Projects
261
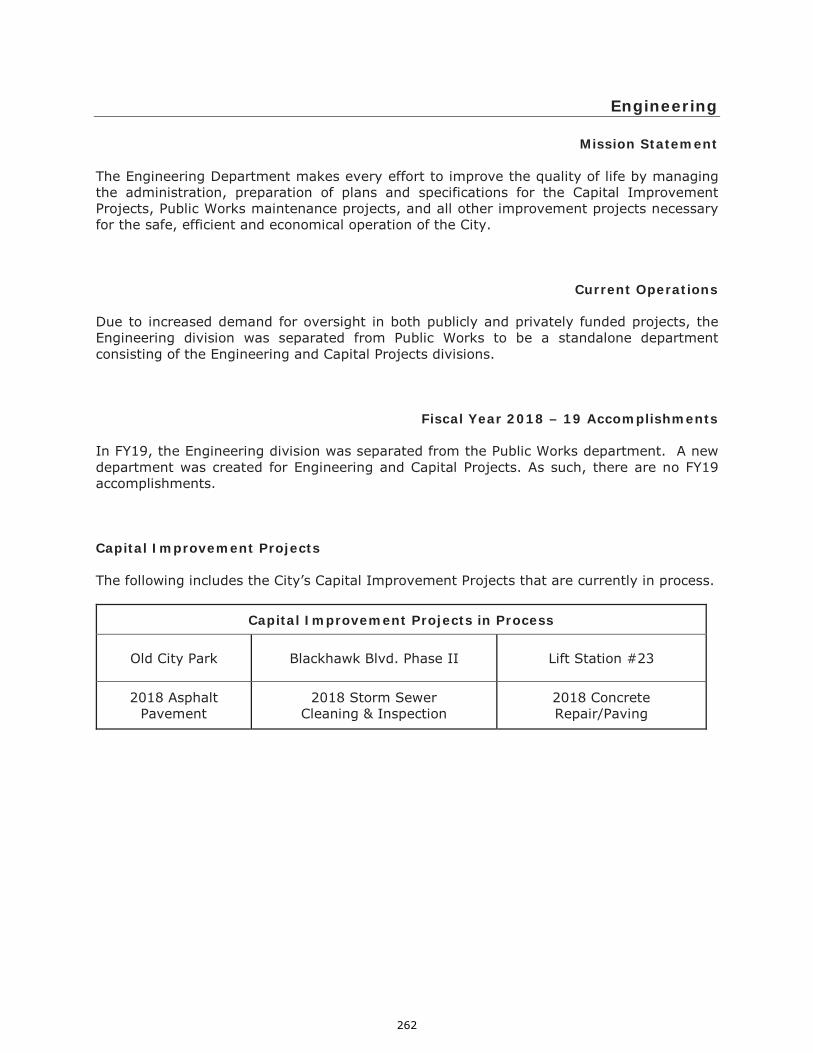
Engineering
Mission Statement
The Engineering Department makes every effort to improve the quality of life by managing the administration, preparation of plans and specifications for the Capital Improvement Projects, Public Works maintenance projects, and all other improvement projects necessary for the safe, efficient and economical operation of the City.
Current Operations
Due to increased demand for oversight in both publicly and privately funded projects, the Engineering division was separated from Public Works to be a standalone department consisting of the Engineering and Capital Projects divisions.
Fiscal Year 2018 – 19 Accomplishments In FY19, the Engineering division was separated from the Public Works department. A new department was created for Engineering and Capital Projects. As such, there are no FY19 accomplishments. Capital Improvement Projects
The following includes the City’s Capital Improvement Projects that are currently in process.
Capital Improvement Projects in Process
Old City Park Blackhawk Blvd. Phase II Lift Station #23
2018 Asphalt Pavement
2018 Storm Sewer Cleaning & Inspection
2018 Concrete Repair/Paving
262
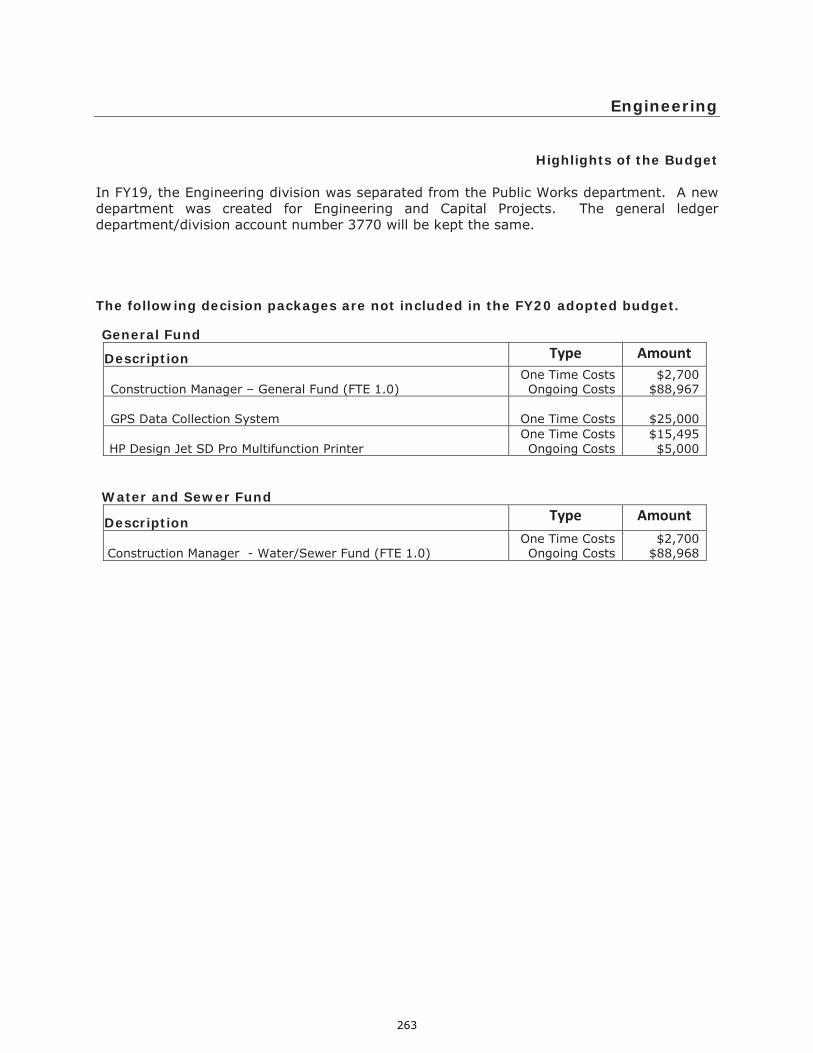
Engineering
Highlights of the Budget
In FY19, the Engineering division was separated from the Public Works department. A new department was created for Engineering and Capital Projects. The general ledger department/division account number 3770 will be kept the same. The following decision packages are not included in the FY20 adopted budget. General Fund
Description Type Amount
Construction Manager – General Fund (FTE 1.0) One Time Costs Ongoing Costs
$2,700 $88,967
GPS Data Collection System
One Time Costs $25,000
HP Design Jet SD Pro Multifunction Printer One Time Costs Ongoing Costs
$15,495 $5,000
Water and Sewer Fund
Description Type Amount
Construction Manager - Water/Sewer Fund (FTE 1.0) One Time Costs Ongoing Costs
$2,700 $88,968
263

Engineering
2018-2019 Departmental Performance Measures by Division
Supports the City’s Strategic Goals: 1-Communication, 3-Preservation, 6-Organizational Development
Engineering and Capital Projects General Fund & Water/Sewer Fund
FY17 Actual
FY18 Actual
FY19 Budget
FY19 Forecast
FY20 Adopted
Inputs
# of full time equivalents (FTE’s) 4.0 4.0 4.0 6.0 6.0
Division Expenditures $376,180 $388,064 $424,968 $334,000 $783,759
Outputs
# of Construction Plan Review 43 39 30 40 40
# of Construction Right of Way Permits 95 106 85 110 115
# of Development Permits 16 13 10 15 15
# of CIP Projects Completed 8 2 5 7 4
# of construction site visits per workday 30 35 40 40 40
# of Residential Sections Completed 5 4 5 4 4
Measures of Effectiveness
Average days for plan reviews 5 5 5 5 5
% of Field inspections completed within 24 hours of notification 90% 95% 100% 90% 100%
Measures of Efficiency
Monthly Operating Costs $31,348 $32,339 $35,414 $27,833 $63,313
Division expenditures per capita $9.56 $9.60 $10.39 $8.17 $19.02
264

ENGINEERING / CAPITAL PROJECTSDEPARTMENT SUMMARY
EXPENDITURE BY DIVISION
DIVISIONFY18
ACTUAL
FY19ORIGINAL
BUDGET
FY19AMENDED
BUDGET
FY19 YTD
6/30/19
FY19YEAR ENDESTIMATE
FY20ADOPTED
BUDGET
% CHANGE INBUDGET
FROMFY19 TO FY20
ENGINEERING/CAPITAL PROJECTS (GF) $0 $0 $0 $0 $0 $387,052 0.0%ENGINEERING/CAPITAL PROJECTS (W/S) 0 0 0 0 0 396,707 0.0%DEPARTMENT TOTAL $0 $0 $0 $0 $0 $783,759 0.0%
EXPENDITURE BY CLASSIFICATION
CLASSIFICATIONFY18
ACTUAL
FY19ORIGINAL
BUDGET
FY19AMENDED
BUDGET
FY19 YTD
6/30/19
FY19YEAR ENDESTIMATE
FY20ADOPTED
BUDGET
% CHANGE INBUDGET
FROMFY19 TO FY20
SALARIES & BENEFITS 0 0 0 0 0 705,189 0.0%SUPPLIES 0 0 0 0 0 23,270 0.0%MAINTENANCE 0 0 0 0 0 6,000 0.0%SERVICES 0 0 0 0 0 49,300 0.0%CAPITAL OUTLAY 0 0 0 0 0 0 0.0%OTHER 0 0 0 0 0 0 0.0%CLASSIFICATION TOTAL $0 $0 $0 $0 $0 $783,759 0.0%
PERSONNEL SUMMARY BY DIVISION
DIVISIONFY18
ACTUAL
FY19ORIGINAL
BUDGET
FY19AMENDED
BUDGET
FY19 YTD
6/30/19
FY19YEAR ENDESTIMATE
FY20ADOPTED
BUDGET
% CHANGE INBUDGET
FROMFY19 TO FY20
ENGINEERING/CAPITAL PROJECTS (GF) 0.00 0.00 0.00 0.00 3.00 3.00 0.0%ENGINEERING/CAPITAL PROJECTS (W/S) 0.00 0.00 0.00 0.00 3.00 3.00 0.0%PERSONNEL TOTAL 0.00 0.00 0.00 0.00 6.00 6.00 0.0%
*In FY19, the Engineering division was separated from the Public Works department. A new department was created for Engineering and Capital Projects. The division number 3770 was kept the same.For budget presentation the FY18 actual expenditures and all of FY19 amounts are included in the Public Works department.
265

3770 - ENGINEERING & CAPITAL PROJECTS (GF)
ACCOUNT NUMBER ACCOUNT NAMEFY18
ACTUAL
FY19ORIGINAL
BUDGET
FY19AMENDED
BUDGET
FY19 YTD
6/30/19
FY19YEAR ENDESTIMATE
FY20ADOPTED
BUDGET40 - SALARIES & BENEFITS001-3770-431.4110 FULLTIME SALARIES & WAGES $0 $0 $0 $0 $0 $237,511001-3770-431.4130 OVERTIME PAY 0 0 0 0 0 1,028001-3770-431.4131 HOLIDAY HRS WORKED 0 0 0 0 0 0001-3770-431.4143 LONGEVITY PAY 0 0 0 0 0 555001-3770-431.4145 INCENTIVE-CERTIFICATE PAY 0 0 0 0 0 3,000001-3770-431.4149 CELL PHONE ALLOWANCE 0 0 0 0 0 1,080001-3770-431.4710 SOCIAL SECURITY/MEDICARE 0 0 0 0 0 17,532001-3770-431.4720 TMRS RETIREMENT 0 0 0 0 0 38,933001-3770-431.4810 HEALTH/DENTAL INSURANCE 0 0 0 0 0 37,892001-3770-431.4820 LIFE INSURANCE 0 0 0 0 0 655001-3770-431.4830 DISABILITY INSURANCE 0 0 0 0 0 823001-3770-431.4840 WORKERS COMP INSURANCE 0 0 0 0 0 554001-3770-431.4850 EAP SERVICES 0 0 0 0 0 174001-3770-431.4890 FLEX PLAN ADMINISTRATION 0 0 0 0 0 65
TOTAL SALARIES & BENEFITS $0 $0 $0 $0 $0 $339,802
50 - SUPPLIES001-3770-431.5200 PERSONNEL SUPPLIES $0 $0 $0 $0 $0 $2,150001-3770-431.5301 FUEL 0 0 0 0 0 2,430001-3770-431.5400 OPERATING SUPPLIES 0 0 0 0 0 1,500001-3770-431.5800 OPERATING EQUIPMENT<$5000 0 0 0 0 0 6,400
TOTAL SUPPLIES $0 $0 $0 $0 $0 $12,480
60 - MAINTENANCE001-3770-431.6300 VEHICLE MAINTENANCE $0 $0 $0 $0 $0 $4,500
TOTAL MAINTENANCE $0 $0 $0 $0 $0 $4,500
70 - SERVICES001-3770-431.7311 VEHICLE INSURANCE $0 $0 $0 $0 $0 $1,690001-3770-431.7400 OPERATING SERVICES 0 0 0 0 0 4,200001-3770-431.7497 RECRUITMENT ADVERTISING 0 0 0 0 0 400001-3770-431.7498 JUDGMENTS & DAMAGE CLAIMS 0 0 0 0 0 1,000001-3770-431.7510 TRAINING 0 0 0 0 0 3,000001-3770-431.7520 TRAVEL EXPENSES & REIMBURSE 0 0 0 0 0 700001-3770-431.7530 MEMBERSHIPS 0 0 0 0 0 1,190001-3770-431.7540 PUBLICATIONS 0 0 0 0 0 120001-3770-431.7612 TELEPHONE/COMMUNICATIONS 0 0 0 0 0 960001-3770-431.7800 CONTRACT SERVICES 0 0 0 0 0 7,800001-3770-431.7831 VEHICLE LEASE-INTERNAL 0 0 0 0 0 9,210
TOTAL SERVICES $0 $0 $0 $0 $0 $30,270
3770 - ENGINEERING & CAPITAL PROJECTS (GF) $0 $0 $0 $0 $0 $387,052
266

401-3770 - ENGINEERING & CAPITAL PROJECTS (W/S)
ACCOUNT NUMBER ACCOUNT NAMEFY18
ACTUAL
FY19ORIGINAL
BUDGET
FY19AMENDED
BUDGET
FY19 YTD
6/30/19
FY19YEAR ENDESTIMATE
FY20ADOPTED
BUDGET40 - SALARIES & BENEFITS401-3770-434.4110 FULLTIME SALARIES & WAGES $0 $0 $0 $0 $0 $243,513401-3770-434.4130 OVERTIME PAY 0 0 0 0 0 3,596401-3770-434.4143 LONGEVITY PAY 0 0 0 0 0 0401-3770-434.4145 INCENTIVE-CERTIFICATE PAY 0 0 0 0 0 3,000401-3770-434.4149 CELL PHONE ALLOWANCE 0 0 0 0 0 0401-3770-434.4190 ACCRUED PAYROLL 0 0 0 0 0 0401-3770-434.4710 SOCIAL SECURITY/MEDICARE 0 0 0 0 0 17,317401-3770-434.4720 TMRS RETIREMENT 0 0 0 0 0 40,043401-3770-434.4810 HEALTH/DENTAL INSURANCE 0 0 0 0 0 55,384401-3770-434.4820 LIFE INSURANCE 0 0 0 0 0 682401-3770-434.4830 DISABILITY INSURANCE 0 0 0 0 0 838401-3770-434.4840 WORKERS COMP INSURANCE 0 0 0 0 0 591401-3770-434.4850 EAP SERVICES 0 0 0 0 0 174401-3770-434.4890 FLEX PLAN ADMINISTRATION 0 0 0 0 0 249
TOTAL SALARIES & BENEFITS $0 $0 $0 $0 $0 $365,387
50 - SUPPLIES $0401-3770-434.5200 PERSONNEL SUPPLIES $0 $0 $0 $0 $0 $1,390401-3770-434.5301 FUEL 0 0 0 0 0 2,000401-3770-434.5400 OPERATING SUPPLIES 0 0 0 0 0 1,000401-3770-434.5800 OPERATING EQUIPMENT<$5000 0 0 0 0 0 6,400
TOTAL SUPPLIES $0 $0 $0 $0 $0 $10,790
60 - MAINTENANCE $0401-3770-434.6300 VEHICLE MAINTENANCE $0 $0 $0 $0 $0 $1,500
TOTAL MAINTENANCE $0 $0 $0 $0 $0 $1,500
70 - SERVICES $0401-3770-434.7130 ENGINEERING SERVICES $0 $0 $0 $0 $0 $10,000401-3770-434.7311 VEHICLE INSURANCE 0 0 0 0 0 630401-3770-434.7498 JUDGMENTS & DAMAGE CLAIMS 0 0 0 0 0 500401-3770-434.7510 TRAINING 0 0 0 0 0 2,000401-3770-434.7520 TRAVEL EXPENSES & REIMBURSE 0 0 0 0 0 500401-3770-434.7530 MEMBERSHIPS 0 0 0 0 0 300401-3770-434.7540 PUBLICATIONS 0 0 0 0 0 80401-3770-434.7612 TELEPHONE/COMMUNICATIONS 0 0 0 0 0 960401-3770-434.7831 VEHICLE LEASE-INTERNAL 0 0 0 0 0 4,060
TOTAL SERVICES $0 $0 $0 $0 $0 $19,030
401-3770 - ENGINEERING & CAPITAL PROJECTS (W/S) $0 $0 $0 $0 $0 $396,707
267

Library Services
Library Services
Friendswood Public Library
268

Library Services
Mission Statement The mission of the Friendswood Public Library is to provide all persons in the community confidential access to materials that can improve their minds, and also to provide an environment in which individuals may freely pursue intellectual, educational, and recreational interests through diverse services and resources in a variety of formats.
Current Operations
The Friendswood Public Library serves as an informational, educational, and recreational resource to all citizens of Friendswood. Currently the library collection consists of over 102,000 physical items and 64 magazine and newspaper subscriptions. The library also provides access to over 69,000 downloadable e-books, audiobooks and videos. The physical collection also includes popular and educational videos, compact discs, audiobooks, pre-loaded tablets, and electronic resources. Adult services staff serve the community through reference services online, in-person and by phone. Outreach opportunities in the use of library services and online resources are also provided throughout the year. The Library also provides internet computers, access to several software applications including word processing and spreadsheet software, 3-D and poster printing, scanning services, and a fee based printing service. Classes are offered in basic computer skills, basic software applications, library technologies, and use of electronic resources. Electronic resources include full text articles from over 1,200 periodicals and reference works, an auto repair database, online foreign language courses, career and college test preparation, genealogy databases, software and technology training, and an online guide to fiction and nonfiction literature. Adult educational and cultural programs are provided throughout the year. Through the library, citizens may download best-selling audiobooks, eBooks, videos and popular magazines 24/7 to their PC, tablet, or smart phone at home, in the office or from anywhere in the world. Children’s services include elementary, toddler and preschool ages. Story times are offered three times per week and outreach story times are provided at area preschool and child care facilities. Special programs for children and young adults are offered throughout the year with a special emphasis on summer reading for children of all ages. After school programs are offered several times a week during the school year for upper elementary and junior high age children. Saturday and evening family story times are offered monthly. The library’s major purpose is to encourage a love of reading, to promote lifelong learning and to provide a community space for the exchange of ideas and access to information.
269
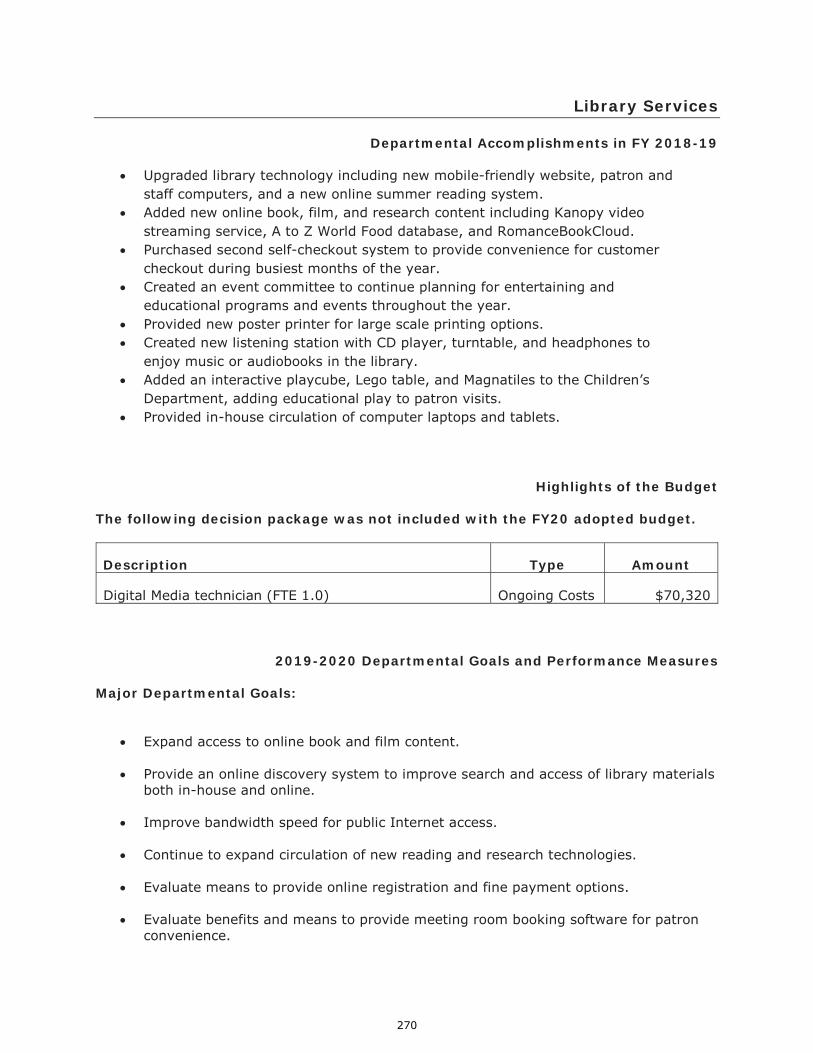
Library Services
Departmental Accomplishments in FY 2018-19
Upgraded library technology including new mobile-friendly website, patron and staff computers, and a new online summer reading system.
Added new online book, film, and research content including Kanopy video streaming service, A to Z World Food database, and RomanceBookCloud.
Purchased second self-checkout system to provide convenience for customer checkout during busiest months of the year.
Created an event committee to continue planning for entertaining and educational programs and events throughout the year.
Provided new poster printer for large scale printing options. Created new listening station with CD player, turntable, and headphones to
enjoy music or audiobooks in the library. Added an interactive playcube, Lego table, and Magnatiles to the Children’s
Department, adding educational play to patron visits. Provided in-house circulation of computer laptops and tablets.
Highlights of the Budget The following decision package was not included with the FY20 adopted budget.
Description Type Amount
Digital Media technician (FTE 1.0) Ongoing Costs $70,320
2019-2020 Departmental Goals and Performance Measures
Major Departmental Goals:
Expand access to online book and film content.
Provide an online discovery system to improve search and access of library materials both in-house and online.
Improve bandwidth speed for public Internet access.
Continue to expand circulation of new reading and research technologies.
Evaluate means to provide online registration and fine payment options.
Evaluate benefits and means to provide meeting room booking software for patron
convenience.
270

Library Services
Library Department FY17 Actual
FY18 Actual
FY19 Budget
FY19 Forecast
FY20 Adopted
Inputs
#of full time equivalents (FTE's) 14.97 14.97 14.97 14.97 14.97
Division Expenditures $1,172,245 $1,214,027 $1,239,090 $1,242,823 $1,252,132
Outputs
# of Total physical items in library collection 98,472 102,000 102,000 102,000 105,000 # of Total electronic items in library collection 65,546 70,000 70,000 70,000 75,000 # of Items catalogued & processed 9,074 8,508 9,000 9,000 9,000
# of programs 783 880 1000 1050 1100 # of Computers available public use 32 32 32 34 34
# of Reading club signups 2,228 2,074 2,400 2,400 2,500
Measures of Effectiveness
# of Items checked out 341,048 346,203 350,000 350,000 375,000 # of Attendance at programs 33,110 33,806 34,000 34,000 38,000 # of Computer usage 22,212 21,077 23,000 23,000 24,000 # of Library visits 180,303 186,169 187,000 187,000 190,000 # of Reading club completion 80% 84% 85% 85% 85% # of Reference transactions 41,784 43,820 44,000 44,000 45,000 # of Loans received from other libraries 1,271 1,618 1,700 1,700 1,800 # of Loans provided to other libraries 667 659 675 675 700
Measures of Efficiency
Circulation per capita* 8.34 7.8 8.0 8.0 9.0 Items per capita* 3.74 3.88 3.90 3.90 3.90 Sq. footage per capita* 0.48 0.47 0.51 0.51 0.51
Monthly Operating Costs $97,687 $101,169 $103,258 $103,569 $104,344 Department expenditures per capita $29.78 $30.03 $30.29 $30.38 $30.38
*Per capita data is from the Texas State Library Annual Report
271

LIBRARY SERVICESDEPARTMENT SUMMARY
EXPENDITURE BY DIVISION
DIVISIONFY18
ACTUAL
FY19ORIGINAL
BUDGET
FY19AMENDED
BUDGET
FY19 YTD
6/30/19
FY19YEAR ENDESTIMATE
FY20ADOPTED
BUDGET
% CHANGE INBUDGET FROM
FY19 TO FY20
LIBRARY SERVICES $1,214,027 $1,239,090 $1,300,219 $862,982 $1,242,823 $1,252,132 1.1%DEPARTMENT TOTAL $1,214,027 $1,239,090 $1,300,219 $862,982 $1,242,823 $1,252,132 1.1%
EXPENDITURE BY CLASSIFICATION
CLASSIFICATIONFY18
ACTUAL
FY19ORIGINAL
BUDGET
FY19AMENDED
BUDGET
FY19 YTD
6/30/19
FY19YEAR ENDESTIMATE
FY20ADOPTED
BUDGET
% CHANGE INBUDGET FROM
FY19 TO FY20
SALARIES AND BENEFITS $1,023,783 $1,060,156 $1,060,156 $716,251 $1,005,539 $1,074,142 1.3%SUPPLIES 156,483 154,469 182,772 107,653 181,300 154,470 0.0%MAINTENANCE 240 840 840 240 520 440 -47.6%SERVICES 20,006 23,625 31,754 19,666 30,767 23,080 -2.3%CAPITAL OUTLAY 13,515 0 24,697 19,172 24,697 0 0.0%CLASSIFICATION TOTAL $1,214,027 $1,239,090 $1,300,219 $862,982 $1,242,823 $1,252,132 1.1%
PERSONNEL SUMMARY BY DIVISION
DIVISIONFY18
ACTUAL
FY19ORIGINAL
BUDGET
FY19AMENDED
BUDGET
FY19 YTD
6/30/19
FY19YEAR ENDESTIMATE
FY20ADOPTED
BUDGET
% CHANGE INBUDGET FROM
FY19 TO FY20
LIBRARY SERVICES 14.97 14.97 14.97 14.97 14.97 14.97 0.0%PERSONNEL TOTAL 14.97 14.97 14.97 14.97 14.97 14.97 0.0%
272
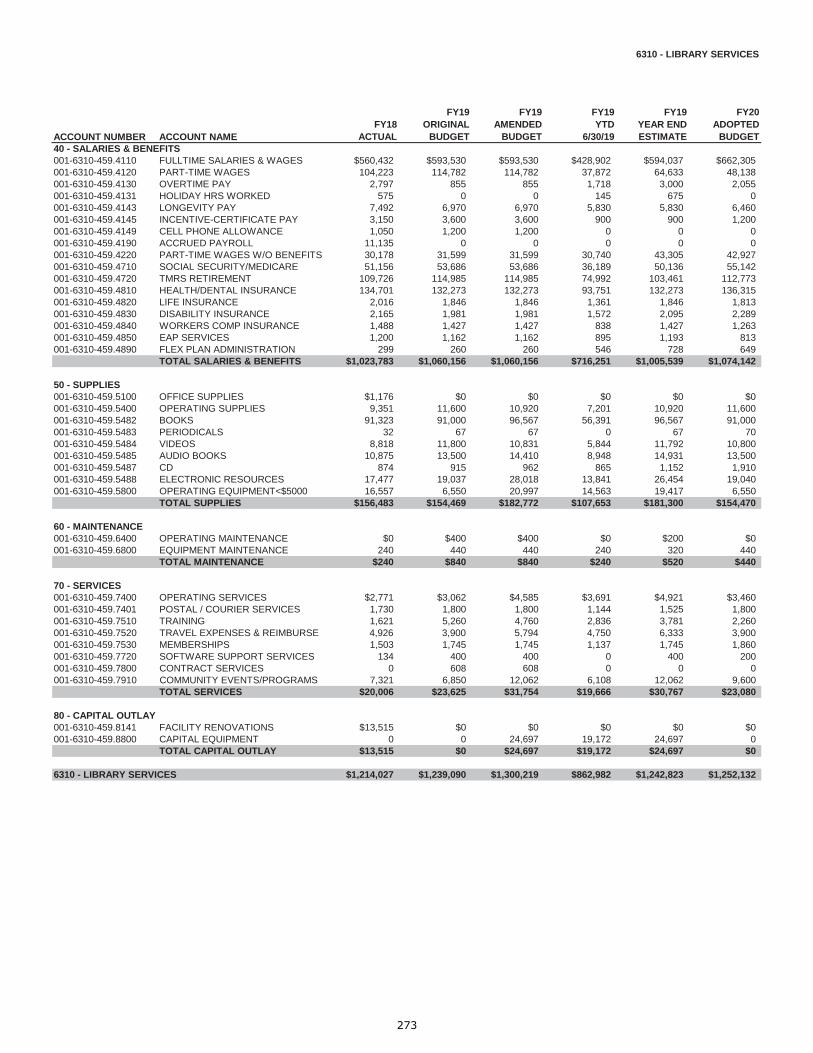
6310 - LIBRARY SERVICES
ACCOUNT NUMBER ACCOUNT NAMEFY18
ACTUAL
FY19ORIGINAL
BUDGET
FY19AMENDED
BUDGET
FY19 YTD
6/30/19
FY19YEAR ENDESTIMATE
FY20ADOPTED
BUDGET40 - SALARIES & BENEFITS001-6310-459.4110 FULLTIME SALARIES & WAGES $560,432 $593,530 $593,530 $428,902 $594,037 $662,305001-6310-459.4120 PART-TIME WAGES 104,223 114,782 114,782 37,872 64,633 48,138001-6310-459.4130 OVERTIME PAY 2,797 855 855 1,718 3,000 2,055001-6310-459.4131 HOLIDAY HRS WORKED 575 0 0 145 675 0001-6310-459.4143 LONGEVITY PAY 7,492 6,970 6,970 5,830 5,830 6,460001-6310-459.4145 INCENTIVE-CERTIFICATE PAY 3,150 3,600 3,600 900 900 1,200001-6310-459.4149 CELL PHONE ALLOWANCE 1,050 1,200 1,200 0 0 0001-6310-459.4190 ACCRUED PAYROLL 11,135 0 0 0 0 0001-6310-459.4220 PART-TIME WAGES W/O BENEFITS 30,178 31,599 31,599 30,740 43,305 42,927001-6310-459.4710 SOCIAL SECURITY/MEDICARE 51,156 53,686 53,686 36,189 50,136 55,142001-6310-459.4720 TMRS RETIREMENT 109,726 114,985 114,985 74,992 103,461 112,773001-6310-459.4810 HEALTH/DENTAL INSURANCE 134,701 132,273 132,273 93,751 132,273 136,315001-6310-459.4820 LIFE INSURANCE 2,016 1,846 1,846 1,361 1,846 1,813001-6310-459.4830 DISABILITY INSURANCE 2,165 1,981 1,981 1,572 2,095 2,289001-6310-459.4840 WORKERS COMP INSURANCE 1,488 1,427 1,427 838 1,427 1,263001-6310-459.4850 EAP SERVICES 1,200 1,162 1,162 895 1,193 813001-6310-459.4890 FLEX PLAN ADMINISTRATION 299 260 260 546 728 649
TOTAL SALARIES & BENEFITS $1,023,783 $1,060,156 $1,060,156 $716,251 $1,005,539 $1,074,142
50 - SUPPLIES001-6310-459.5100 OFFICE SUPPLIES $1,176 $0 $0 $0 $0 $0001-6310-459.5400 OPERATING SUPPLIES 9,351 11,600 10,920 7,201 10,920 11,600001-6310-459.5482 BOOKS 91,323 91,000 96,567 56,391 96,567 91,000001-6310-459.5483 PERIODICALS 32 67 67 0 67 70001-6310-459.5484 VIDEOS 8,818 11,800 10,831 5,844 11,792 10,800001-6310-459.5485 AUDIO BOOKS 10,875 13,500 14,410 8,948 14,931 13,500001-6310-459.5487 CD 874 915 962 865 1,152 1,910001-6310-459.5488 ELECTRONIC RESOURCES 17,477 19,037 28,018 13,841 26,454 19,040001-6310-459.5800 OPERATING EQUIPMENT<$5000 16,557 6,550 20,997 14,563 19,417 6,550
TOTAL SUPPLIES $156,483 $154,469 $182,772 $107,653 $181,300 $154,470
60 - MAINTENANCE001-6310-459.6400 OPERATING MAINTENANCE $0 $400 $400 $0 $200 $0001-6310-459.6800 EQUIPMENT MAINTENANCE 240 440 440 240 320 440
TOTAL MAINTENANCE $240 $840 $840 $240 $520 $440
70 - SERVICES001-6310-459.7400 OPERATING SERVICES $2,771 $3,062 $4,585 $3,691 $4,921 $3,460001-6310-459.7401 POSTAL / COURIER SERVICES 1,730 1,800 1,800 1,144 1,525 1,800001-6310-459.7510 TRAINING 1,621 5,260 4,760 2,836 3,781 2,260001-6310-459.7520 TRAVEL EXPENSES & REIMBURSE 4,926 3,900 5,794 4,750 6,333 3,900001-6310-459.7530 MEMBERSHIPS 1,503 1,745 1,745 1,137 1,745 1,860001-6310-459.7720 SOFTWARE SUPPORT SERVICES 134 400 400 0 400 200001-6310-459.7800 CONTRACT SERVICES 0 608 608 0 0 0001-6310-459.7910 COMMUNITY EVENTS/PROGRAMS 7,321 6,850 12,062 6,108 12,062 9,600
TOTAL SERVICES $20,006 $23,625 $31,754 $19,666 $30,767 $23,080
80 - CAPITAL OUTLAY001-6310-459.8141 FACILITY RENOVATIONS $13,515 $0 $0 $0 $0 $0001-6310-459.8800 CAPITAL EQUIPMENT 0 0 24,697 19,172 24,697 0
TOTAL CAPITAL OUTLAY $13,515 $0 $24,697 $19,172 $24,697 $0
6310 - LIBRARY SERVICES $1,214,027 $1,239,090 $1,300,219 $862,982 $1,242,823 $1,252,132
273

Parks and Recreation
Parks and Recreation
Facility
Operations
City Hall
Public Safety
Animal Shelter
Fire Stations-
#1, 2, 3, & 4
Library
Public Works
Parks Ops
Activity Building
Administration Recreation Services
Park Operations
Steven Schulz Sportspark
Wesley J. Canning Sportspark
Lake Friendswood
Renwick Park
Stevenson Park
Centennial Park
Old City Park
Leavesley Park
1776 Memorial Park
Tropical Storm Allison
Buyout Properties
Keep Friendswood
Beautiful
July 4th
Senior Programs
Stevenson Park Pool
Summer Day Camp
274
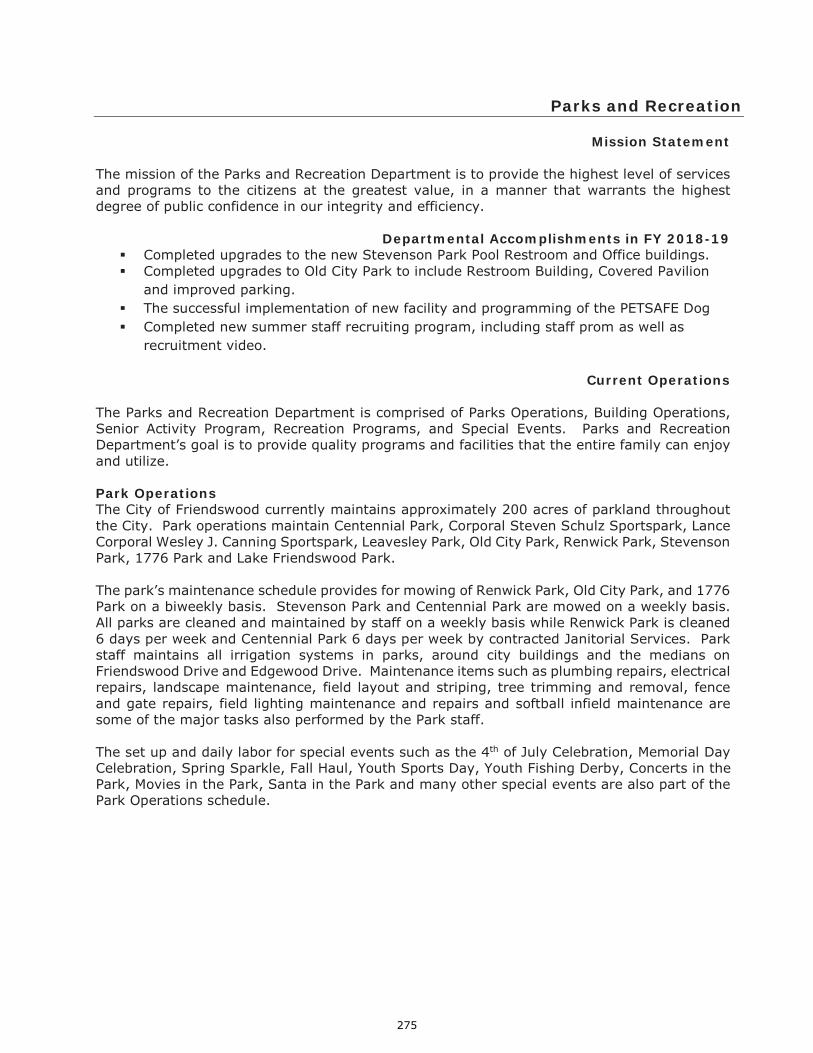
Parks and Recreation
Mission Statement The mission of the Parks and Recreation Department is to provide the highest level of services and programs to the citizens at the greatest value, in a manner that warrants the highest degree of public confidence in our integrity and efficiency.
Departmental Accomplishments in FY 2018-19 Completed upgrades to the new Stevenson Park Pool Restroom and Office buildings. Completed upgrades to Old City Park to include Restroom Building, Covered Pavilion
and improved parking. The successful implementation of new facility and programming of the PETSAFE Dog Completed new summer staff recruiting program, including staff prom as well as
recruitment video.
Current Operations The Parks and Recreation Department is comprised of Parks Operations, Building Operations, Senior Activity Program, Recreation Programs, and Special Events. Parks and Recreation Department’s goal is to provide quality programs and facilities that the entire family can enjoy and utilize. Park Operations The City of Friendswood currently maintains approximately 200 acres of parkland throughout the City. Park operations maintain Centennial Park, Corporal Steven Schulz Sportspark, Lance Corporal Wesley J. Canning Sportspark, Leavesley Park, Old City Park, Renwick Park, Stevenson Park, 1776 Park and Lake Friendswood Park. The park’s maintenance schedule provides for mowing of Renwick Park, Old City Park, and 1776 Park on a biweekly basis. Stevenson Park and Centennial Park are mowed on a weekly basis. All parks are cleaned and maintained by staff on a weekly basis while Renwick Park is cleaned 6 days per week and Centennial Park 6 days per week by contracted Janitorial Services. Park staff maintains all irrigation systems in parks, around city buildings and the medians on Friendswood Drive and Edgewood Drive. Maintenance items such as plumbing repairs, electrical repairs, landscape maintenance, field layout and striping, tree trimming and removal, fence and gate repairs, field lighting maintenance and repairs and softball infield maintenance are some of the major tasks also performed by the Park staff. The set up and daily labor for special events such as the 4th of July Celebration, Memorial Day Celebration, Spring Sparkle, Fall Haul, Youth Sports Day, Youth Fishing Derby, Concerts in the Park, Movies in the Park, Santa in the Park and many other special events are also part of the Park Operations schedule.
275

Parks and Recreation Facility Operations The Parks and Recreation Department is responsible for the maintenance and upkeep of the City Hall Building, the Public Safety Building, Friendswood Public Library, the Activities Building, the Public Works Building, Animal Control Building and Fire Stations 1, 2, 3, and 4. Maintenance and upkeep of all City facilities are done on a scheduled basis. Special projects and other maintenance requests are performed on a work order priority system. Janitorial services are accomplished through contract services. Building Operations shares the same staff as Parks Operations. All work order requests for anything from moving boxes, to setting up chairs and tables, to major HVAC repairs are handled by this same staff. As the City grows and more facilities are built, the amount of work order requests steadily increases. The staff is being cross trained to handle a wide variety of tasks. Recreation Programs The goal is to provide fun and safe recreational programs/events for citizens of all ages. The objective is to focus on recreational activities that impact both need and interest of the community. Recreational programs include the Senior Activity Program, Summer Day Camp, Sesquicentennial Swimming Pool, Adult Sport Leagues and Tournaments, Youth Events and Fitness Classes. The Parks and Recreation Department does not plan or organize youth sports programs; however, the department does serve as a liaison between the citizens of Friendswood and the Friendswood Area Swim Team, Friendswood BeastMode, Friendswood Colts, Friendswood Broncos, Friendswood Girls Softball Association, Friendswood Little League, Friendswood Youth Lacrosse and the Dynamo/Dash Soccer Club.
Highlights of the Budget Program Improvements Continue working with the Keep Friendswood Beautiful Committee/Parks subcommittee as we move forward with implementation of our 2020 strategic Parks and Trails Master Plan. Additional park improvements include the development of the new Pool Restroom and Office Buildings located at Stevenson Park. Recreation Programs
Continue Concert-In-The Park Series with 9 concerts from May through June Continue Movies –In-The Park Series with 5 movies from July through August Plan and Program the 125th Annual Fourth of July Celebration Plan and Program the 17th Annual Youth Fishing Derby Plan and Program the 10th Annual Santa in the Park Plan and Program the 7th Annual Daddy Daughter Dance Plan and Program the youth competition events, such as MLB Pitch, Hit & Run and
Flapjack 5K Fun Run and Walk Plan and program a variety of recreational programs for adults and senior citizens
276

Parks and Recreation The following decision packages are included in the FY20 adopted budget: Description Type Amount
Wage Increase for Summer Day Camp Staff Ongoing Costs $44,043
1 Ton Dump Truck (not in VRP) Lease to Purchase One Time Cost $60,000
Parks Laborer (FTE 1.0) Ongoing Cost $61,876 The following decision packages are not included in the FY20 adopted budget:
Description Type Amount
Parks Open Space Master Plan One Time Cost $185,000
Wage Increase for Pool Staff Ongoing Cost $35,755
¾ Ton Regular Cab Truck (for Laborer) (Add to VRP) One Time Cost $32,642
Pull Behind Man Lift One Time Cost $43,060
Replace existing Tool cat One Time Cost $55,000
Replace Carpet & Flooring at PSB One Time Cost $68,000
Turf Tractor One Time Cost $50,000
Replace Backstop Fencing Fabric at Steven Schultz Sportspark One Time Cost $58,000
Stevenson Park Walking Trail Curbs One Time Cost $250,000
Skate Park One Time Cost $75,000
277

Parks and Recreation
Departmental Performance Measures by Division
Major Departmental Goals for FY 2019-20 Offer fun and safe recreational programs/events for all citizens of all ages. Continue to provide a fun and safe environment that provides seniors with unique
activities that offer wellness for the mind and body. Continue to offer existing programs and special events while developing new programs
and amenities as the demand or interest increases Implementation of our 2020 strategic Parks and Trails Master Plan. Developing and improving new and existing parkland and green space with desirable
park amenities. Updating, improving and expanding beautification projects at all city facilities to
include additional Monarch Waystation similar to the 1st of its kind in Stevenson Park
Supports City’s Strategic Goals: 1-Communication, 2-Preservation, 4-Partnerships, 5-Public Safety, and 6-Organizational Development
Administration FY17 Actual
FY18 Actual
FY19 Budget
FY19 Forecast
FY20 Adopted
Inputs
# of full time equivalents (FTE’s) 2.0 2.0 2.0 2.0 2.0
Division Expenditures $267,911 $279,140 $291,429 $285,803 $295,965
Outputs
# of grants applied for 2 4 4 3 4 # of committees and subcommittees 5 5 5 5 5
# of news alert subscribers 10,300 10,755 11,000 13,500 14,000 # of educational brochures produced 1 2 2 2 2 Revenue Collected for Facility Reservations $48,389 54,464 $62,000 $65,000 $70,000
Measures of Effectiveness
Department rating on Facebook (1-5 rating) n/a n/a n/a 4.8 4.9 Number of Likes for Facebook Posting 900 1,750 2,250 6,000 7,000
Measures of Efficiency
Monthly Operations Cost $22,326 $23,262 $24,286 $23,817 $24,664 Division Expenditures per capita $6.81 $6.90 $7.12 $6.99 $7.18
278

Parks and Recreation
Recreation Programs FY17 Actual
FY18 Actual
FY19 Budget
FY19 Forecast
FY20 Adopted
Inputs
# of Full-Time Equivalents (FTE’s) 9.3 9.7 9.7 10.3 10.3 # of summer camp seasonal workers 16 16 17 17 17 # of Stevenson park pool seasonal workers 16 16 17 17 16
Division Expenditures $918,684 $956,140 $998,413 $1,011,329 $1,094,772
Outputs
# of Fitness Class scheduled 1,600 1,115 1,200 1,200 1,300
# of fitness program types 10 8 10 10 10 # of trips offered by Senior Citizen Program 50 51 53 55 56 # of events offered by Senior Citizen Program 65 68 70 80 83 # of weekly programs offered by Senior Citizen Program 32 30 32 33 34 # of visits to Sesquicentennial Pool 13,201 10,863 10,000 10,000 11,000 Total # of participants registered for Summer Camp 540 540 540 540 540 Total # of participants registered for Swim Lessons 98 184 250 265 300 # of teams registered in adult leagues 170 162 165 163 165
Measures of Effectiveness
% of Events actually held 100% 95% 100% 98% 98% % of households registered using CivicRec 75% 82% 80% 90% 92% Average monthly attendance at Senior Citizen Programs 1,487 1,486 1,500 1,490 1,500 % of participants “satisfied” with Summer Camp Program 95% 95% 95% 97% 98% % of participants “satisfied” with Swim Lesson Program n/a 85% 90% 92% 93% % of participants “satisfied” with Fitness Programs 88% 92% 90% 90% 92% % of participants “satisfied” with Senior Citizen Program 93% 95% 96% 97% 98%
Measures of Efficiency
Monthly Operational Costs $76,557 $79,678 $83,201 $84,277 $91,231 Division Expenditures per capita $23.34 $23.65 $24.41 $24.72 $26.56
279

Parks and Recreation
Parks Operations FY17 Actual
FY18 Actual
FY19 Budget
FY19 Forecast
FY20 Adopted
Inputs
# of full time equivalents (FTE’s)* 10.8 10.8 10.8 10.8 11.8
Division Expenditures $1,273,062 $1,431,972 $1,457,615 $1,508,470 $1,538,536
Outputs
Total # of Maintenance Work Orders for Parks/Facilities logged 1,085 875 1,200 1,300 1,420
Total acres of Athletic fields 80.3 105.6 115.2 115.2 115.2
Total acres of Park turf areas 110.08 110.08 110.08 110.08 110.08
# of Parks maintained by the City 8 8 8 8 8
# of Special Projects Requested 6 6 6 6 7
# of parks mowed 8 8 8 8 8
Total dollars spent for dead tree removal $11,200 $13,600 $22,964 $25,000 $23,575
Measures of Effectiveness
# of Parks work orders completed within 5 days 85 80 85 85 88
% of Work Orders for Parks completed within 5 Days 92% 94% 94% 94% 95%
Measures of Efficiency
Monthly Operational Cost $113,444 $108,498 $120,801 $125,706 $128,211
Division Expenditures per capita $34.59 $33.08 $35.86 $36.88 $37.33 *Correction was made for FY17 and FY8 to correct the FTE’s for 3 part-time park laborer staff at 0.60 FTE
280

Parks and Recreation
Facility Operations FY17
Actual FY18
Actual FY19
Budget FY19
Forecast FY20
Adopted
Inputs
Division Expenditures $880,210 $962,255 $694,477 $1,085,106 $1,050,280
Outputs
Total square footage of City building facilities 102,623 97,027 133,719 135,339 135,339 Total # of Maintenance Work Orders for Buildings logged 555 555 625 650 678
Measures of Effectiveness
# of work orders completed within 5 days 525 550 600 624 631 % of Work Orders for Building Maintenance completed within 5 days 91.5% 93.5% 94% 96% 95% Average janitorial services cost per sq. foot (not including supplies) $1.98 $1.42 $2.05 $2.06 $2.10
Measures of Efficiency
Monthly Operational Costs $73,351 $80,188 $57,873 $90,426 $87,523 Division Expenditures per capita $22.36 $23.80 $16.98 $26.53 $25.48
281

PARKS AND RECREATIONDEPARTMENT SUMMARY
EXPENDITURE BY DIVISION
DIVISIONFY18
ACTUAL
FY19ORIGINAL
BUDGET
FY19AMENDED
BUDGET
FY19 YTD
6/30/19
FY19YEAR ENDESTIMATE
FY20ADOPTED
BUDGET
% CHANGE INBUDGET FROM
FY19 TO FY20
ADMINISTRATION $279,140 $291,429 $291,797 $191,826 $285,803 $295,965 1.6%RECREATION PROGRAM 956,140 998,413 1,019,273 654,641 1,011,329 1,094,772 9.7%PARKS OPERATIONS 1,431,972 1,457,615 1,481,325 1,048,517 1,508,470 1,538,536 5.6%FACILITY OPERATIONS 962,255 694,477 1,104,966 785,432 1,085,106 1,050,280 51.2%DEPARTMENT TOTAL $3,629,507 $3,441,934 $3,897,361 $2,680,416 $3,890,708 $3,979,553 15.6%
EXPENDITURE BY CLASSIFICATION
CLASSIFICATIONFY18
ACTUAL
FY19ORIGINAL
BUDGET
FY19AMENDED
BUDGET
FY19 YTD
6/30/19
FY19YEAR ENDESTIMATE
FY20ADOPTED
BUDGET
% CHANGE INBUDGET FROM
FY19 TO FY20
SALARIES AND BENEFITS $1,453,728 $1,522,230 $1,526,830 $1,030,247 $1,505,542 $1,701,373 11.8%SUPPLIES 203,024 224,561 212,192 136,601 207,352 219,400 -2.3%MAINTENANCE 373,251 342,435 420,326 306,185 414,989 351,600 2.7%SERVICES 1,475,651 1,352,708 1,677,843 1,147,213 1,702,655 1,707,180 26.2%CAPITAL OUTLAY 123,853 0 60,170 60,170 60,170 0 0.0%CLASSIFICATION TOTAL $3,629,507 $3,441,934 $3,897,361 $2,680,416 $3,890,708 $3,979,553 15.6%
PERSONNEL SUMMARY BY DIVISION
DIVISIONFY18
ACTUAL
FY19ORIGINAL
BUDGET
FY19AMENDED
BUDGET
FY19 YTD
6/30/19
FY19YEAR ENDESTIMATE
FY20ADOPTED
BUDGET
% CHANGE INBUDGET FROM
FY19 TO FY20
ADMINISTRATION 2.00 2.00 2.00 2.00 2.00 2.00 0.0%RECREATION PROGRAM 9.70 9.70 9.70 9.70 10.30 10.30 6.2%PARKS OPERATIONS 10.80 10.80 10.80 10.80 10.80 11.80 9.3%PERSONNEL TOTAL 22.50 22.50 22.50 22.50 23.10 24.10 15.4%
282

6401 - PARKS & RECREATION ADMINISTRATION
ACCOUNT NUMBER ACCOUNT NAMEFY18
ACTUAL
FY19ORIGINAL
BUDGET
FY19AMENDED
BUDGET
FY19 YTD
6/30/19
FY19YEAR ENDESTIMATE
FY20ADOPTED
BUDGET40 - SALARIES & BENEFITS001-6401-451.4110 FULLTIME SALARIES & WAGES $172,018 $179,902 $181,102 $130,589 $179,119 $188,935001-6401-451.4130 OVERTIME PAY 2,690 1,238 1,238 1,029 2,500 2,055001-6401-451.4131 HOLIDAY HRS WORKED 423 0 0 81 400 0001-6401-451.4143 LONGEVITY PAY 1,615 1,690 1,690 1,735 1,735 1,850001-6401-451.4144 VEHICLE ALLOWANCE 5,400 5,400 5,400 788 788 0001-6401-451.4149 CELL PHONE ALLOWANCE 1,620 1,620 420 348 465 420001-6401-451.4710 SOCIAL SECURITY/MEDICARE 13,351 13,840 13,840 9,836 13,840 14,179001-6401-451.4720 TMRS RETIREMENT 29,167 30,280 30,280 21,417 30,280 30,941001-6401-451.4810 HEALTH/DENTAL INSURANCE 18,461 18,461 18,461 13,461 18,461 18,461001-6401-451.4820 LIFE INSURANCE 545 515 515 421 561 529001-6401-451.4830 DISABILITY INSURANCE 571 540 540 472 629 650001-6401-451.4840 WORKERS COMP INSURANCE 2,312 319 319 213 284 306001-6401-451.4850 EAP SERVICES 136 116 116 97 129 116001-6401-451.4890 FLEX PLAN ADMINISTRATION 50 43 43 36 48 43
TOTAL SALARIES & BENEFITS $248,359 $253,964 $253,964 $180,523 $249,239 $258,485
50 - SUPPLIES001-6401-451.5100 OFFICE SUPPLIES $2,495 $0 $0 $0 $0 $0001-6401-451.5200 PERSONNEL SUPPLIES 201 350 718 541 718 350001-6401-451.5400 OPERATING SUPPLIES 1,325 3,650 3,650 1,238 2,600 3,500001-6401-451.5800 OPERATING EQUIPMENT<$5000 133 500 500 35 250 500
TOTAL SUPPLIES $4,154 $4,500 $4,868 $1,814 $3,568 $4,350
70 - SERVICES001-6401-451.7400 OPERATING SERVICES $100 $100 $963 $963 $1,283 $100001-6401-451.7401 POSTAL / COURIER SERVICES 202 400 400 164 218 400001-6401-451.7510 TRAINING 709 1,140 1,140 770 1,027 1,210001-6401-451.7520 TRAVEL EXPENSES & REIMBURSE 1,201 2,850 2,850 2,165 2,886 2,940001-6401-451.7530 MEMBERSHIPS 445 475 475 445 445 480001-6401-451.7800 CONTRACT SERVICES 23,970 28,000 27,137 4,982 27,137 28,000
TOTAL SERVICES $26,627 $32,965 $32,965 $9,489 $32,996 $33,130
6401 - PARKS & RECREATION ADMINISTRATION $279,140 $291,429 $291,797 $191,826 $285,803 $295,965
283
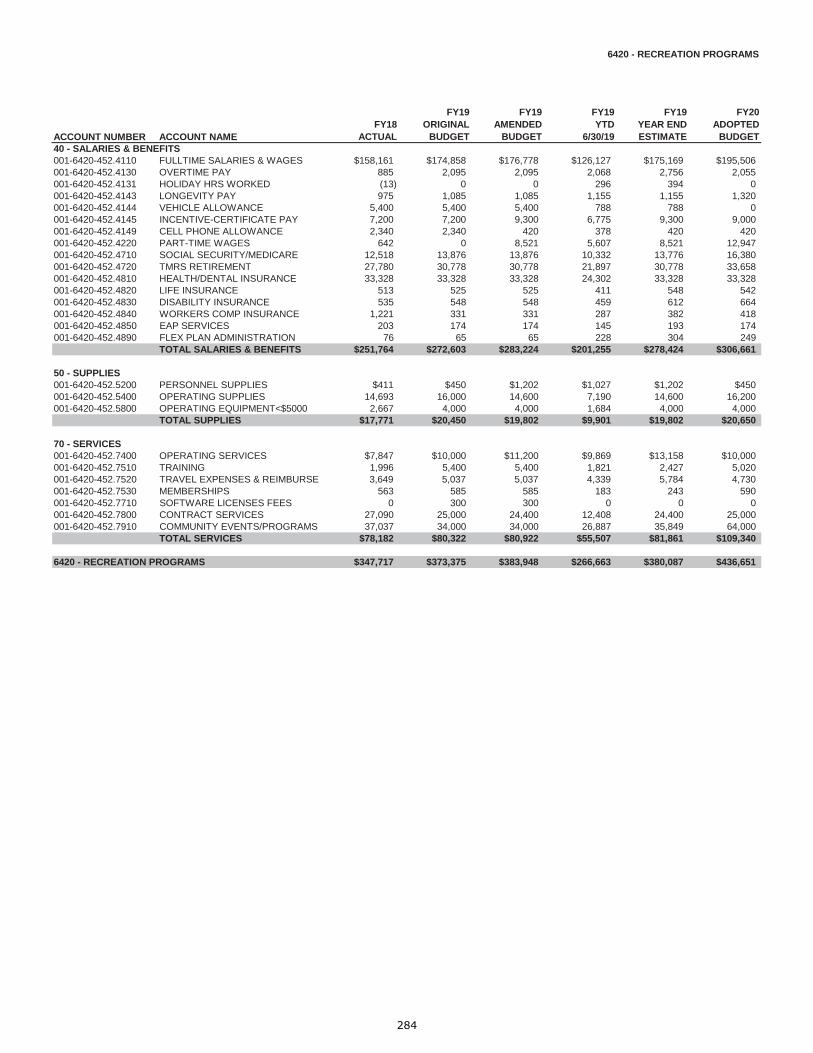
6420 - RECREATION PROGRAMS
ACCOUNT NUMBER ACCOUNT NAMEFY18
ACTUAL
FY19ORIGINAL
BUDGET
FY19AMENDED
BUDGET
FY19 YTD
6/30/19
FY19YEAR ENDESTIMATE
FY20ADOPTED
BUDGET40 - SALARIES & BENEFITS001-6420-452.4110 FULLTIME SALARIES & WAGES $158,161 $174,858 $176,778 $126,127 $175,169 $195,506001-6420-452.4130 OVERTIME PAY 885 2,095 2,095 2,068 2,756 2,055001-6420-452.4131 HOLIDAY HRS WORKED (13) 0 0 296 394 0001-6420-452.4143 LONGEVITY PAY 975 1,085 1,085 1,155 1,155 1,320001-6420-452.4144 VEHICLE ALLOWANCE 5,400 5,400 5,400 788 788 0001-6420-452.4145 INCENTIVE-CERTIFICATE PAY 7,200 7,200 9,300 6,775 9,300 9,000001-6420-452.4149 CELL PHONE ALLOWANCE 2,340 2,340 420 378 420 420001-6420-452.4220 PART-TIME WAGES 642 0 8,521 5,607 8,521 12,947001-6420-452.4710 SOCIAL SECURITY/MEDICARE 12,518 13,876 13,876 10,332 13,776 16,380001-6420-452.4720 TMRS RETIREMENT 27,780 30,778 30,778 21,897 30,778 33,658001-6420-452.4810 HEALTH/DENTAL INSURANCE 33,328 33,328 33,328 24,302 33,328 33,328001-6420-452.4820 LIFE INSURANCE 513 525 525 411 548 542001-6420-452.4830 DISABILITY INSURANCE 535 548 548 459 612 664001-6420-452.4840 WORKERS COMP INSURANCE 1,221 331 331 287 382 418001-6420-452.4850 EAP SERVICES 203 174 174 145 193 174001-6420-452.4890 FLEX PLAN ADMINISTRATION 76 65 65 228 304 249
TOTAL SALARIES & BENEFITS $251,764 $272,603 $283,224 $201,255 $278,424 $306,661
50 - SUPPLIES001-6420-452.5200 PERSONNEL SUPPLIES $411 $450 $1,202 $1,027 $1,202 $450001-6420-452.5400 OPERATING SUPPLIES 14,693 16,000 14,600 7,190 14,600 16,200001-6420-452.5800 OPERATING EQUIPMENT<$5000 2,667 4,000 4,000 1,684 4,000 4,000
TOTAL SUPPLIES $17,771 $20,450 $19,802 $9,901 $19,802 $20,650
70 - SERVICES001-6420-452.7400 OPERATING SERVICES $7,847 $10,000 $11,200 $9,869 $13,158 $10,000001-6420-452.7510 TRAINING 1,996 5,400 5,400 1,821 2,427 5,020001-6420-452.7520 TRAVEL EXPENSES & REIMBURSE 3,649 5,037 5,037 4,339 5,784 4,730001-6420-452.7530 MEMBERSHIPS 563 585 585 183 243 590001-6420-452.7710 SOFTWARE LICENSES FEES 0 300 300 0 0 0001-6420-452.7800 CONTRACT SERVICES 27,090 25,000 24,400 12,408 24,400 25,000001-6420-452.7910 COMMUNITY EVENTS/PROGRAMS 37,037 34,000 34,000 26,887 35,849 64,000
TOTAL SERVICES $78,182 $80,322 $80,922 $55,507 $81,861 $109,340
6420 - RECREATION PROGRAMS $347,717 $373,375 $383,948 $266,663 $380,087 $436,651
284
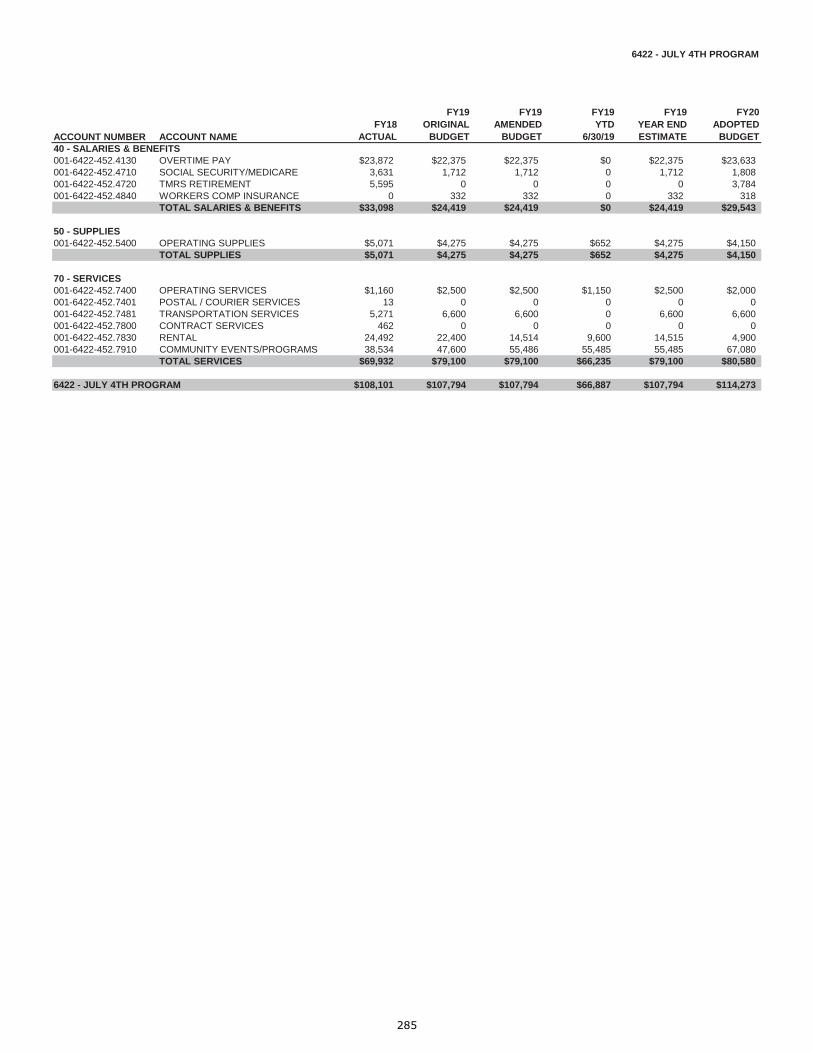
6422 - JULY 4TH PROGRAM
ACCOUNT NUMBER ACCOUNT NAMEFY18
ACTUAL
FY19ORIGINAL
BUDGET
FY19AMENDED
BUDGET
FY19 YTD
6/30/19
FY19YEAR ENDESTIMATE
FY20ADOPTED
BUDGET40 - SALARIES & BENEFITS001-6422-452.4130 OVERTIME PAY $23,872 $22,375 $22,375 $0 $22,375 $23,633001-6422-452.4710 SOCIAL SECURITY/MEDICARE 3,631 1,712 1,712 0 1,712 1,808001-6422-452.4720 TMRS RETIREMENT 5,595 0 0 0 0 3,784001-6422-452.4840 WORKERS COMP INSURANCE 0 332 332 0 332 318
TOTAL SALARIES & BENEFITS $33,098 $24,419 $24,419 $0 $24,419 $29,543
50 - SUPPLIES001-6422-452.5400 OPERATING SUPPLIES $5,071 $4,275 $4,275 $652 $4,275 $4,150
TOTAL SUPPLIES $5,071 $4,275 $4,275 $652 $4,275 $4,150
70 - SERVICES001-6422-452.7400 OPERATING SERVICES $1,160 $2,500 $2,500 $1,150 $2,500 $2,000001-6422-452.7401 POSTAL / COURIER SERVICES 13 0 0 0 0 0001-6422-452.7481 TRANSPORTATION SERVICES 5,271 6,600 6,600 0 6,600 6,600001-6422-452.7800 CONTRACT SERVICES 462 0 0 0 0 0001-6422-452.7830 RENTAL 24,492 22,400 14,514 9,600 14,515 4,900001-6422-452.7910 COMMUNITY EVENTS/PROGRAMS 38,534 47,600 55,486 55,485 55,485 67,080
TOTAL SERVICES $69,932 $79,100 $79,100 $66,235 $79,100 $80,580
6422 - JULY 4TH PROGRAM $108,101 $107,794 $107,794 $66,887 $107,794 $114,273
285
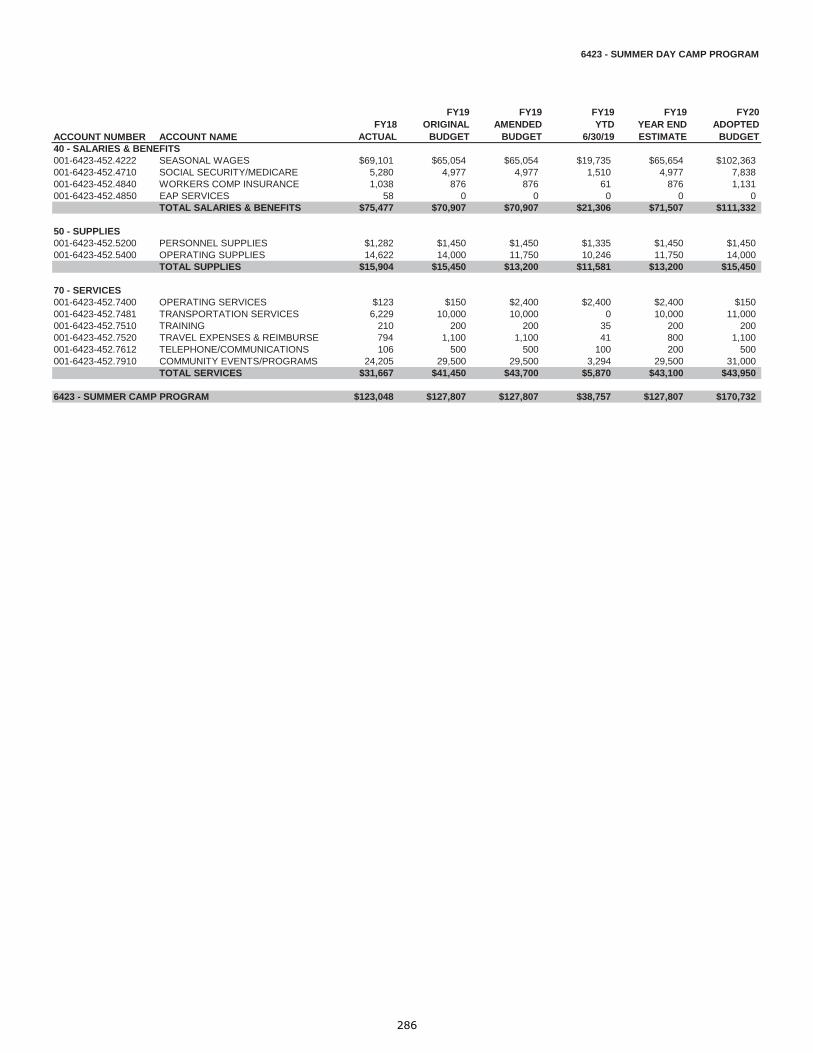
6423 - SUMMER DAY CAMP PROGRAM
ACCOUNT NUMBER ACCOUNT NAMEFY18
ACTUAL
FY19ORIGINAL
BUDGET
FY19AMENDED
BUDGET
FY19 YTD
6/30/19
FY19YEAR ENDESTIMATE
FY20ADOPTED
BUDGET40 - SALARIES & BENEFITS001-6423-452.4222 SEASONAL WAGES $69,101 $65,054 $65,054 $19,735 $65,654 $102,363001-6423-452.4710 SOCIAL SECURITY/MEDICARE 5,280 4,977 4,977 1,510 4,977 7,838001-6423-452.4840 WORKERS COMP INSURANCE 1,038 876 876 61 876 1,131001-6423-452.4850 EAP SERVICES 58 0 0 0 0 0
TOTAL SALARIES & BENEFITS $75,477 $70,907 $70,907 $21,306 $71,507 $111,332
50 - SUPPLIES001-6423-452.5200 PERSONNEL SUPPLIES $1,282 $1,450 $1,450 $1,335 $1,450 $1,450001-6423-452.5400 OPERATING SUPPLIES 14,622 14,000 11,750 10,246 11,750 14,000
TOTAL SUPPLIES $15,904 $15,450 $13,200 $11,581 $13,200 $15,450
70 - SERVICES001-6423-452.7400 OPERATING SERVICES $123 $150 $2,400 $2,400 $2,400 $150001-6423-452.7481 TRANSPORTATION SERVICES 6,229 10,000 10,000 0 10,000 11,000001-6423-452.7510 TRAINING 210 200 200 35 200 200001-6423-452.7520 TRAVEL EXPENSES & REIMBURSE 794 1,100 1,100 41 800 1,100001-6423-452.7612 TELEPHONE/COMMUNICATIONS 106 500 500 100 200 500001-6423-452.7910 COMMUNITY EVENTS/PROGRAMS 24,205 29,500 29,500 3,294 29,500 31,000
TOTAL SERVICES $31,667 $41,450 $43,700 $5,870 $43,100 $43,950
6423 - SUMMER CAMP PROGRAM $123,048 $127,807 $127,807 $38,757 $127,807 $170,732
286

6424 - KEEP FRIENDSWOOD BEAUTIFUL COMMITTEE
ACCOUNT NUMBER ACCOUNT NAMEFY18
ACTUAL
FY19ORIGINAL
BUDGET
FY19AMENDED
BUDGET
FY19 YTD
6/30/19
FY19YEAR ENDESTIMATE
FY20ADOPTED
BUDGET50 - SUPPLIES001-6424-458.5200 PERSONNEL SUPPLIES $191 $200 $200 $130 $200 $200001-6424-458.5400 OPERATING SUPPLIES 17,013 15,500 14,612 13,962 14,612 14,480
TOTAL SUPPLIES $17,204 $15,700 $14,812 $14,092 $14,812 $14,680
60 - MAINTENANCE001-6424-458.6210 LANDSCAPING $4,648 $7,800 $16,153 $15,906 $16,153 $5,000
TOTAL MAINTENANCE $4,648 $7,800 $16,153 $15,906 $16,153 $5,000
70 - SERVICES001-6424-458.7400 OPERATING SERVICES $13,908 $13,100 $15,333 $14,531 $15,333 $16,930001-6424-458.7510 TRAINING 823 900 1,202 1,201 1,202 1,350001-6424-458.7520 TRAVEL EXPENSES & REIMBURSE 1,295 2,400 2,400 451 1,875 2,700001-6424-458.7530 MEMBERSHIPS 150 150 150 150 150 150001-6424-458.7910 COMMUNITY EVENTS/PROGRAMS* 37,047 25,000 35,000 37,511 37,512 0001-6424-458.7922 KFB BEAUTIFICATION GRANTS 2,000 2,000 2,000 0 0 2,000
TOTAL SERVICES $55,223 $43,550 $56,085 $53,844 $56,072 $23,130
6424 - KEEP FRIENDSWOOD BEAUTIFUL COMMITTEE $77,075 $67,050 $87,050 $83,842 $87,037 $42,810
287
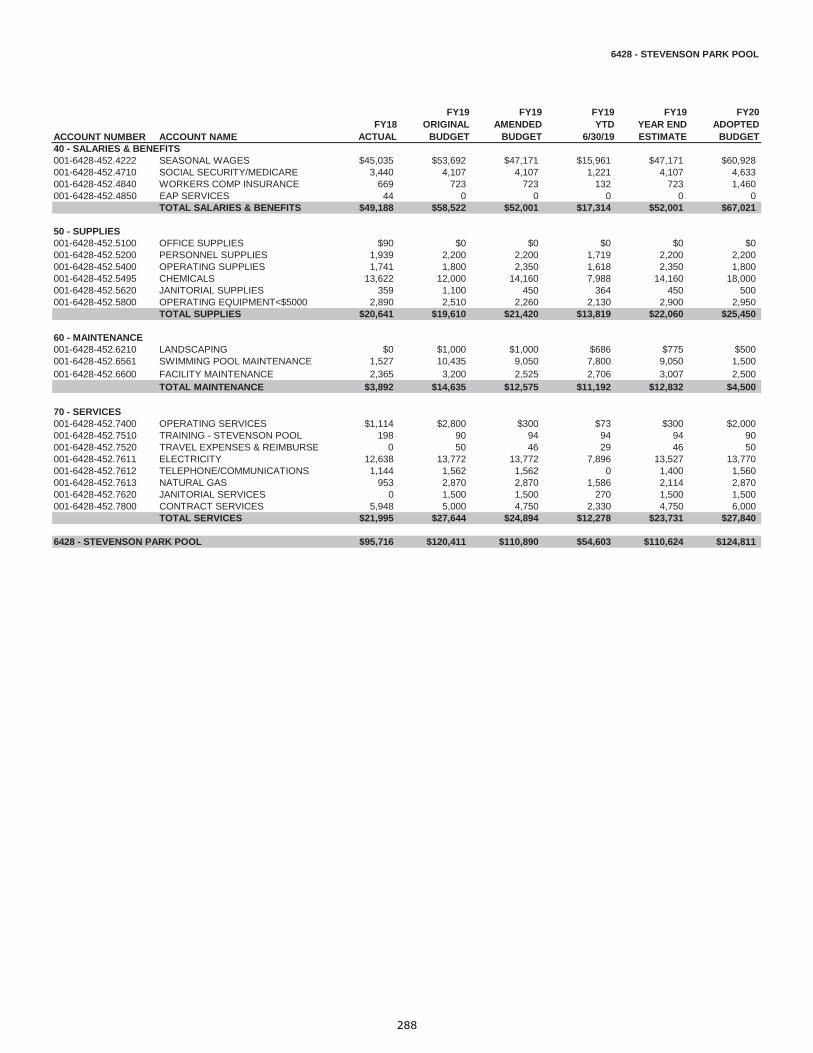
6428 - STEVENSON PARK POOL
ACCOUNT NUMBER ACCOUNT NAMEFY18
ACTUAL
FY19ORIGINAL
BUDGET
FY19AMENDED
BUDGET
FY19 YTD
6/30/19
FY19YEAR ENDESTIMATE
FY20ADOPTED
BUDGET40 - SALARIES & BENEFITS001-6428-452.4222 SEASONAL WAGES $45,035 $53,692 $47,171 $15,961 $47,171 $60,928001-6428-452.4710 SOCIAL SECURITY/MEDICARE 3,440 4,107 4,107 1,221 4,107 4,633001-6428-452.4840 WORKERS COMP INSURANCE 669 723 723 132 723 1,460001-6428-452.4850 EAP SERVICES 44 0 0 0 0 0
TOTAL SALARIES & BENEFITS $49,188 $58,522 $52,001 $17,314 $52,001 $67,021
50 - SUPPLIES001-6428-452.5100 OFFICE SUPPLIES $90 $0 $0 $0 $0 $0001-6428-452.5200 PERSONNEL SUPPLIES 1,939 2,200 2,200 1,719 2,200 2,200001-6428-452.5400 OPERATING SUPPLIES 1,741 1,800 2,350 1,618 2,350 1,800001-6428-452.5495 CHEMICALS 13,622 12,000 14,160 7,988 14,160 18,000001-6428-452.5620 JANITORIAL SUPPLIES 359 1,100 450 364 450 500001-6428-452.5800 OPERATING EQUIPMENT<$5000 2,890 2,510 2,260 2,130 2,900 2,950
TOTAL SUPPLIES $20,641 $19,610 $21,420 $13,819 $22,060 $25,450
60 - MAINTENANCE001-6428-452.6210 LANDSCAPING $0 $1,000 $1,000 $686 $775 $500001-6428-452.6561 SWIMMING POOL MAINTENANCE 1,527 10,435 9,050 7,800 9,050 1,500001-6428-452.6600 FACILITY MAINTENANCE 2,365 3,200 2,525 2,706 3,007 2,500
TOTAL MAINTENANCE $3,892 $14,635 $12,575 $11,192 $12,832 $4,500
70 - SERVICES001-6428-452.7400 OPERATING SERVICES $1,114 $2,800 $300 $73 $300 $2,000001-6428-452.7510 TRAINING - STEVENSON POOL 198 90 94 94 94 90001-6428-452.7520 TRAVEL EXPENSES & REIMBURSE 0 50 46 29 46 50001-6428-452.7611 ELECTRICITY 12,638 13,772 13,772 7,896 13,527 13,770001-6428-452.7612 TELEPHONE/COMMUNICATIONS 1,144 1,562 1,562 0 1,400 1,560001-6428-452.7613 NATURAL GAS 953 2,870 2,870 1,586 2,114 2,870001-6428-452.7620 JANITORIAL SERVICES 0 1,500 1,500 270 1,500 1,500001-6428-452.7800 CONTRACT SERVICES 5,948 5,000 4,750 2,330 4,750 6,000
TOTAL SERVICES $21,995 $27,644 $24,894 $12,278 $23,731 $27,840
6428 - STEVENSON PARK POOL $95,716 $120,411 $110,890 $54,603 $110,624 $124,811
288

6429 - SENIOR ACTIVITY CENTER
ACCOUNT NUMBER ACCOUNT NAMEFY18
ACTUAL
FY19ORIGINAL
BUDGET
FY19AMENDED
BUDGET
FY19 YTD
6/30/19
FY19YEAR ENDESTIMATE
FY20ADOPTED
BUDGET40 - SALARIES & BENEFITS001-6429-452.4110 FULLTIME SALARIES & WAGES $94,980 $96,067 $96,067 $68,874 $91,832 $105,071001-6429-452.4120 PART-TIME WAGES 18,868 20,045 20,045 8,365 8,365 0001-6429-452.4130 OVERTIME PAY 6,912 872 872 4,889 6,519 3,083001-6429-452.4131 HOLIDAY HRS WORKED 263 0 0 0 0 0001-6429-452.4143 LONGEVITY PAY 1,255 1,325 1,325 1,370 1,370 2,010001-6429-452.4145 INCENTIVE-CERTIFICATE PAY 600 600 600 450 450 600001-6429-452.4220 PART-TIME WAGES 0 0 0 3,989 7,695 16,029001-6429-452.4710 SOCIAL SECURITY/MEDICARE 8,649 8,363 8,363 6,245 8,326 9,276001-6429-452.4720 TMRS RETIREMENT 19,507 18,966 18,966 13,017 17,355 17,569001-6429-452.4810 HEALTH/DENTAL INSURANCE 25,583 25,576 25,576 18,112 24,149 18,444001-6429-452.4820 LIFE INSURANCE 289 263 263 204 272 295001-6429-452.4830 DISABILITY INSURANCE 315 287 287 236 314 363001-6429-452.4840 WORKERS COMP INSURANCE 1,994 1,763 1,763 1,413 1,883 2,026001-6429-452.4850 EAP SERVICES 136 174 174 92 122 116001-6429-452.4890 FLEX PLAN ADMINISTRATION 50 43 43 34 45 43
TOTAL SALARIES & BENEFITS $179,401 $174,344 $174,344 $127,290 $168,697 $174,925
50 - SUPPLIES001-6429-452.5100 OFFICE SUPPLIES $1,001 $0 $0 $0 $0 $0001-6429-452.5200 PERSONNEL SUPPLIES 0 150 658 637 849 150001-6429-452.5301 FUEL 2,446 3,240 3,240 1,496 2,994 3,240001-6429-452.5400 OPERATING SUPPLIES 2,228 4,000 3,300 2,278 3,037 3,000001-6429-452.5800 OPERATING EQUIPMENT<$5000 4,589 5,400 5,400 1,972 5,400 4,500
TOTAL SUPPLIES $10,264 $12,790 $12,598 $6,383 $12,280 $10,890
60 - MAINTENANCE001-6429-452.6300 VEHICLE MAINTENANCE $857 $2,000 $2,000 $777 $1,050 $2,000
TOTAL MAINTENANCE $857 $2,000 $2,000 $777 $1,050 $2,000
70 - SERVICES001-6429-452.7311 VEHICLE INSURANCE $1,658 $1,692 $1,692 $1,197 $1,692 $1,630001-6429-452.7401 POSTAL / COURIER SERVICES 20 50 50 5 25 50001-6429-452.7498 JUDGMENTS & DAMAGE CLAIMS 0 500 500 0 0 500001-6429-452.7510 TRAINING 125 200 200 95 130 150001-6429-452.7520 TRAVEL EXPENSES & REIMBURSE 22 250 250 0 100 200001-6429-452.7612 TELEPHONE/COMMUNICATIONS 97 150 150 0 150 150001-6429-452.7910 COMMUNITY EVENTS/PROGRAMS 12,039 10,000 10,000 8,142 13,856 15,000
TOTAL SERVICES $13,961 $12,842 $12,842 $9,439 $15,953 $17,680
6429 - SENIOR ACTIVITY CENTER $204,483 $201,976 $201,784 $143,889 $197,980 $205,495
289

6430 - PARKS OPERATIONS
ACCOUNT NUMBER ACCOUNT NAMEFY18
ACTUAL
FY19ORIGINAL
BUDGET
FY19AMENDED
BUDGET
FY19 YTD
6/30/19
FY19YEAR ENDESTIMATE
FY20ADOPTED
BUDGET40 - SALARIES & BENEFITS001-6430-456.4110 FULLTIME SALARIES & WAGES $348,344 $393,747 $394,947 $285,397 $390,530 $442,150001-6430-456.4120 PART-TIME WAGES 57,204 54,098 54,098 34,016 54,098 54,459001-6430-456.4130 OVERTIME PAY 16,290 7,734 8,234 7,333 9,777 10,275001-6430-456.4131 HOLIDAY HRS WORKED 800 0 0 638 850 0001-6430-456.4143 LONGEVITY PAY 2,325 2,725 2,725 2,895 2,895 3,400001-6430-456.4145 INCENTIVE-CERTIFICATE PAY 2,700 2,400 2,400 2,925 3,900 3,900001-6430-456.4149 CELL PHONE ALLOWANCE 3,450 3,660 2,460 1,793 2,460 2,460001-6430-456.4710 SOCIAL SECURITY/MEDICARE 30,986 33,672 33,672 24,295 32,393 37,797001-6430-456.4720 TMRS RETIREMENT 68,257 74,066 74,066 53,317 71,088 82,694001-6430-456.4810 HEALTH/DENTAL INSURANCE 75,920 85,915 85,915 62,248 82,997 104,766001-6430-456.4820 LIFE INSURANCE 1,134 1,119 1,119 893 1,190 1,308001-6430-456.4830 DISABILITY INSURANCE 1,203 1,187 1,187 1,013 1,351 1,520001-6430-456.4840 WORKERS COMP INSURANCE 6,854 6,257 6,257 4,966 6,620 7,642001-6430-456.4850 EAP SERVICES 765 697 697 581 774 653001-6430-456.4890 FLEX PLAN ADMINISTRATION 209 194 194 249 332 382
TOTAL SALARIES & BENEFITS $616,441 $667,471 $667,971 $482,559 $661,255 $753,406
50 - SUPPLIES001-6430-456.5200 PERSONNEL SUPPLIES $7,668 $10,400 $10,584 $5,586 $8,448 $10,500001-6430-456.5300 VEHICLE SUPPLIES 47 105 105 79 105 0001-6430-456.5301 FUEL 16,033 9,281 9,281 12,233 16,310 9,280001-6430-456.5400 OPERATING SUPPLIES 18,618 26,000 16,000 8,221 15,961 26,000001-6430-456.5600 FACILITY SUPPLIES 2,796 8,000 3,801 1,747 3,800 8,000001-6430-456.5620 JANITORIAL SUPPLIES 6,808 8,000 8,000 3,640 6,852 8,000001-6430-456.5800 OPERATING EQUIPMENT<$5000 30,905 36,000 34,576 23,710 31,613 30,000
TOTAL SUPPLIES $82,875 $97,786 $82,347 $55,216 $83,089 $91,780
60 - MAINTENANCE001-6430-456.6210 LANDSCAPING $44,986 $29,000 $20,000 $13,131 $17,507 $24,000001-6430-456.6220 LIGHTING MAINTENANCE 17,342 14,000 9,000 4,200 8,600 19,000001-6430-456.6240 FENCE MAINTENANCE 1,575 1,500 0 0 0 0001-6430-456.6300 VEHICLE MAINTENANCE 9,912 4,000 12,000 8,168 10,891 7,100001-6430-456.6400 OPERATING MAINTENANCE 39,237 35,000 31,000 28,850 38,467 35,000001-6430-456.6600 FACILITY MAINTENANCE 87,786 62,000 76,650 69,132 82,175 80,000001-6430-456.6800 EQUIPMENT MAINTENANCE 4,074 8,000 5,329 5,250 6,999 4,000
TOTAL MAINTENANCE $204,912 $153,500 $153,979 $128,731 $164,639 $169,100
70 - SERVICES001-6430-456.7311 VEHICLE INSURANCE $4,343 $5,318 $5,318 $3,996 $5,328 $5,150001-6430-456.7400 OPERATING SERVICES 350 500 1,500 4,500 6,000 500001-6430-456.7498 JUDGMENTS & DAMAGE CLAIMS 1,000 500 500 0 0 500001-6430-456.7510 TRAINING 1,545 1,640 1,640 530 1,640 1,640001-6430-456.7520 TRAVEL EXPENSES & REIMBURSE 613 968 968 695 927 970001-6430-456.7530 MEMBERSHIPS 355 320 320 200 320 320001-6430-456.7611 ELECTRICITY 84,409 125,452 125,452 53,628 125,452 125,450001-6430-456.7612 TELEPHONE/COMMUNICATIONS 0 0 0 1,027 1,369 1,400001-6430-456.7613 NATURAL GAS 229 530 530 98 200 530001-6430-456.7620 JANITORIAL SERVICES 52,935 34,800 34,800 41,517 55,355 55,360001-6430-456.7625 SAFETY SERVICES 3,693 3,800 3,800 1,334 1,778 3,800001-6430-456.7680 MOWING SERVICES 331,910 330,398 325,398 209,668 325,398 291,000001-6430-456.7690 HOA MAINTENANCE FEES 1,650 2,130 2,130 1,650 1,650 2,130001-6430-456.7800 CONTRACT SERVICES 7,553 2,500 4,500 948 4,500 2,500001-6430-456.7830 RENTAL 14,419 3,000 3,000 1,800 2,400 3,000001-6430-456.7831 VEHICLE LEASE-INTERNAL 17,337 27,002 27,002 20,250 27,000 30,000
TOTAL SERVICES $522,341 $538,858 $536,858 $341,841 $559,317 $524,250
80 - CAPITAL OUTLAY001-6430-456.8400 CAPITAL OPERATING EQUIP $0 $0 $8,105 $8,105 $8,105 $0001-6430-456.8800 CAPITAL EQUIPMENT 5,403 0 32,065 32,065 32,065 0
TOTAL CAPITAL OUTLAY $5,403 $0 $40,170 $40,170 $40,170 $0
6430 - PARKS OPERATIONS $1,431,972 $1,457,615 $1,481,325 $1,048,517 $1,508,470 $1,538,536
290
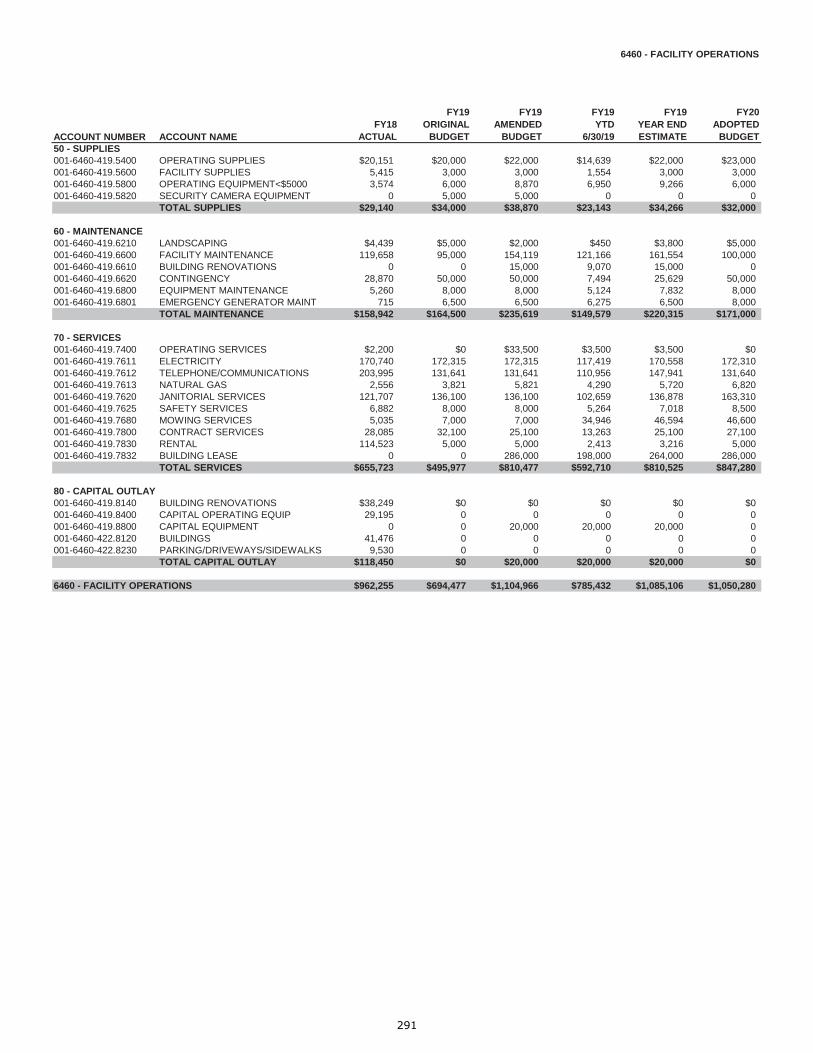
6460 - FACILITY OPERATIONS
ACCOUNT NUMBER ACCOUNT NAMEFY18
ACTUAL
FY19ORIGINAL
BUDGET
FY19AMENDED
BUDGET
FY19 YTD
6/30/19
FY19YEAR ENDESTIMATE
FY20ADOPTED
BUDGET50 - SUPPLIES001-6460-419.5400 OPERATING SUPPLIES $20,151 $20,000 $22,000 $14,639 $22,000 $23,000001-6460-419.5600 FACILITY SUPPLIES 5,415 3,000 3,000 1,554 3,000 3,000001-6460-419.5800 OPERATING EQUIPMENT<$5000 3,574 6,000 8,870 6,950 9,266 6,000001-6460-419.5820 SECURITY CAMERA EQUIPMENT 0 5,000 5,000 0 0 0
TOTAL SUPPLIES $29,140 $34,000 $38,870 $23,143 $34,266 $32,000
60 - MAINTENANCE001-6460-419.6210 LANDSCAPING $4,439 $5,000 $2,000 $450 $3,800 $5,000001-6460-419.6600 FACILITY MAINTENANCE 119,658 95,000 154,119 121,166 161,554 100,000001-6460-419.6610 BUILDING RENOVATIONS 0 0 15,000 9,070 15,000 0001-6460-419.6620 CONTINGENCY 28,870 50,000 50,000 7,494 25,629 50,000001-6460-419.6800 EQUIPMENT MAINTENANCE 5,260 8,000 8,000 5,124 7,832 8,000001-6460-419.6801 EMERGENCY GENERATOR MAINT 715 6,500 6,500 6,275 6,500 8,000
TOTAL MAINTENANCE $158,942 $164,500 $235,619 $149,579 $220,315 $171,000
70 - SERVICES001-6460-419.7400 OPERATING SERVICES $2,200 $0 $33,500 $3,500 $3,500 $0001-6460-419.7611 ELECTRICITY 170,740 172,315 172,315 117,419 170,558 172,310001-6460-419.7612 TELEPHONE/COMMUNICATIONS 203,995 131,641 131,641 110,956 147,941 131,640001-6460-419.7613 NATURAL GAS 2,556 3,821 5,821 4,290 5,720 6,820001-6460-419.7620 JANITORIAL SERVICES 121,707 136,100 136,100 102,659 136,878 163,310001-6460-419.7625 SAFETY SERVICES 6,882 8,000 8,000 5,264 7,018 8,500001-6460-419.7680 MOWING SERVICES 5,035 7,000 7,000 34,946 46,594 46,600001-6460-419.7800 CONTRACT SERVICES 28,085 32,100 25,100 13,263 25,100 27,100001-6460-419.7830 RENTAL 114,523 5,000 5,000 2,413 3,216 5,000001-6460-419.7832 BUILDING LEASE 0 0 286,000 198,000 264,000 286,000
TOTAL SERVICES $655,723 $495,977 $810,477 $592,710 $810,525 $847,280
80 - CAPITAL OUTLAY001-6460-419.8140 BUILDING RENOVATIONS $38,249 $0 $0 $0 $0 $0001-6460-419.8400 CAPITAL OPERATING EQUIP 29,195 0 0 0 0 0001-6460-419.8800 CAPITAL EQUIPMENT 0 0 20,000 20,000 20,000 0001-6460-422.8120 BUILDINGS 41,476 0 0 0 0 0001-6460-422.8230 PARKING/DRIVEWAYS/SIDEWALKS 9,530 0 0 0 0 0
TOTAL CAPITAL OUTLAY $118,450 $0 $20,000 $20,000 $20,000 $0
6460 - FACILITY OPERATIONS $962,255 $694,477 $1,104,966 $785,432 $1,085,106 $1,050,280
291

Personnel by Department Schedule
292
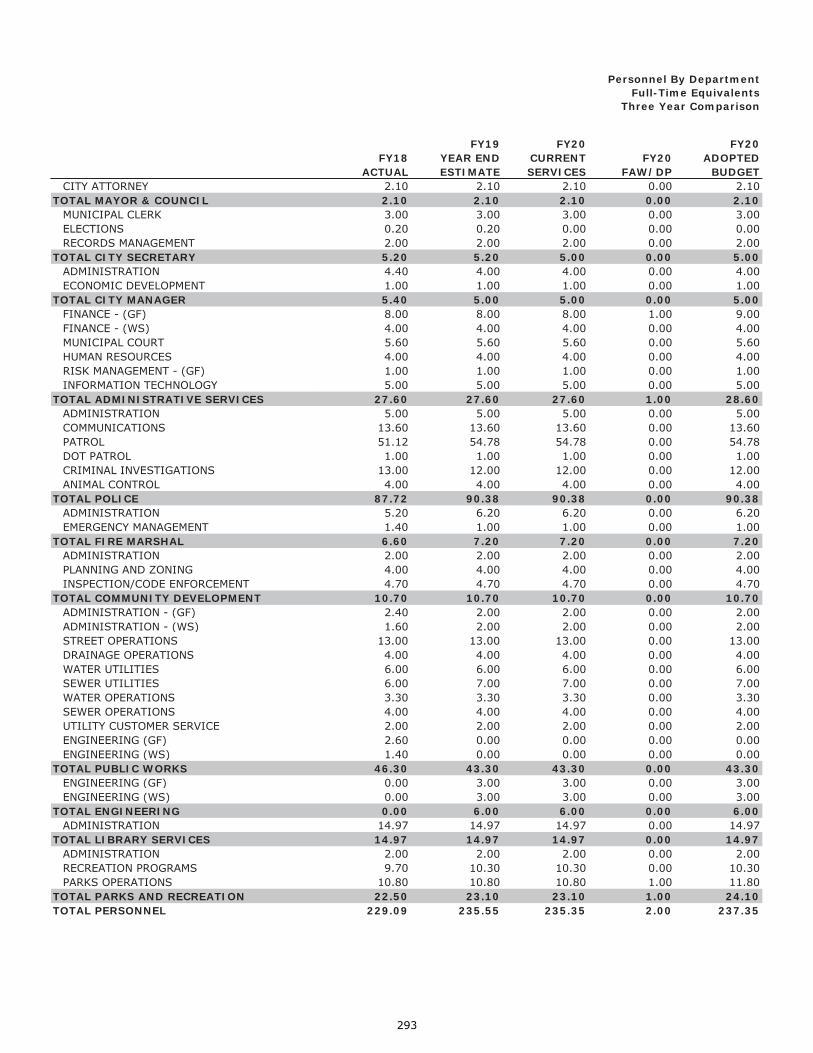
FY18ACTUAL
FY19YEAR ENDESTIMATE
FY20CURRENTSERVICES
FY20FAW/DP
FY20ADOPTED
BUDGETCITY ATTORNEY 2.10 2.10 2.10 0.00 2.10
TOTAL MAYOR & COUNCIL 2.10 2.10 2.10 0.00 2.10MUNICIPAL CLERK 3.00 3.00 3.00 0.00 3.00ELECTIONS 0.20 0.20 0.00 0.00 0.00RECORDS MANAGEMENT 2.00 2.00 2.00 0.00 2.00
TOTAL CITY SECRETARY 5.20 5.20 5.00 0.00 5.00ADMINISTRATION 4.40 4.00 4.00 0.00 4.00ECONOMIC DEVELOPMENT 1.00 1.00 1.00 0.00 1.00
TOTAL CITY MANAGER 5.40 5.00 5.00 0.00 5.00FINANCE - (GF) 8.00 8.00 8.00 1.00 9.00FINANCE - (WS) 4.00 4.00 4.00 0.00 4.00MUNICIPAL COURT 5.60 5.60 5.60 0.00 5.60HUMAN RESOURCES 4.00 4.00 4.00 0.00 4.00RISK MANAGEMENT - (GF) 1.00 1.00 1.00 0.00 1.00INFORMATION TECHNOLOGY 5.00 5.00 5.00 0.00 5.00
TOTAL ADMINISTRATIVE SERVICES 27.60 27.60 27.60 1.00 28.60ADMINISTRATION 5.00 5.00 5.00 0.00 5.00COMMUNICATIONS 13.60 13.60 13.60 0.00 13.60PATROL 51.12 54.78 54.78 0.00 54.78DOT PATROL 1.00 1.00 1.00 0.00 1.00CRIMINAL INVESTIGATIONS 13.00 12.00 12.00 0.00 12.00ANIMAL CONTROL 4.00 4.00 4.00 0.00 4.00
TOTAL POLICE 87.72 90.38 90.38 0.00 90.38ADMINISTRATION 5.20 6.20 6.20 0.00 6.20EMERGENCY MANAGEMENT 1.40 1.00 1.00 0.00 1.00
TOTAL FIRE MARSHAL 6.60 7.20 7.20 0.00 7.20ADMINISTRATION 2.00 2.00 2.00 0.00 2.00PLANNING AND ZONING 4.00 4.00 4.00 0.00 4.00INSPECTION/CODE ENFORCEMENT 4.70 4.70 4.70 0.00 4.70
TOTAL COMMUNITY DEVELOPMENT 10.70 10.70 10.70 0.00 10.70ADMINISTRATION - (GF) 2.40 2.00 2.00 0.00 2.00ADMINISTRATION - (WS) 1.60 2.00 2.00 0.00 2.00STREET OPERATIONS 13.00 13.00 13.00 0.00 13.00DRAINAGE OPERATIONS 4.00 4.00 4.00 0.00 4.00WATER UTILITIES 6.00 6.00 6.00 0.00 6.00SEWER UTILITIES 6.00 7.00 7.00 0.00 7.00WATER OPERATIONS 3.30 3.30 3.30 0.00 3.30SEWER OPERATIONS 4.00 4.00 4.00 0.00 4.00UTILITY CUSTOMER SERVICE 2.00 2.00 2.00 0.00 2.00ENGINEERING (GF) 2.60 0.00 0.00 0.00 0.00ENGINEERING (WS) 1.40 0.00 0.00 0.00 0.00
TOTAL PUBLIC WORKS 46.30 43.30 43.30 0.00 43.30ENGINEERING (GF) 0.00 3.00 3.00 0.00 3.00ENGINEERING (WS) 0.00 3.00 3.00 0.00 3.00
TOTAL ENGINEERING 0.00 6.00 6.00 0.00 6.00ADMINISTRATION 14.97 14.97 14.97 0.00 14.97
TOTAL LIBRARY SERVICES 14.97 14.97 14.97 0.00 14.97ADMINISTRATION 2.00 2.00 2.00 0.00 2.00RECREATION PROGRAMS 9.70 10.30 10.30 0.00 10.30PARKS OPERATIONS 10.80 10.80 10.80 1.00 11.80
TOTAL PARKS AND RECREATION 22.50 23.10 23.10 1.00 24.10TOTAL PERSONNEL 229.09 235.55 235.35 2.00 237.35
Personnel By DepartmentFull-Time Equivalents
Three Year Comparison
293

Decision Packages and Forces at Work
294

FY 2019-20 DECISION PACKAGES(Included in the Adopted Budget)
GENERAL FUND
DEPT DESCRIPTIONONE TIME
COSTONGOING
COST TOTAL
OUTSIDEREVENUESOURCES
NETTOTAL
ASO/IT Public Works Software (Tyler EAM) $65,000 $20,000 $85,000 $0 $85,000
ASO/IT Security Cameras $56,000 $10,000 $66,000 $0 $66,000
ASO/IT Tyler Operating Systems Upgrade $15,000 $0 $15,000 $0 $15,000
ASO/IT IT Services to Fire Stations $15,000 $5,000 $20,000 $0 $20,000
PD/Patrol Replace Dual Purpose K-9 $27,500 $5,400 $32,900 $0 $32,900
PD/Patrol Replace MDTs $31,050 $0 $31,050 $0 $31,050
CDD GIS Services Update $20,000 $0 $20,000 $0 $20,000
TOTAL FORCES AT WORK $229,550 $40,400 $269,950 $0 $269,950
DEPT DESCRIPTIONONE TIME
COSTONGOING
COST TOTAL
OUTSIDEREVENUESOURCES
NETTOTAL
ASO/ITPrivate Fiber Replacement-CH>Lib & CH>AB (PEG Funds) $150,000 $0 $150,000 $150,000 $0
ASO/ITCH Conference Rooms Tech Upgrades (PEG Funds) $177,000 $0 $177,000 $177,000 $0
ASO/ITKnow BE 4 Cybersecurity Training (PEG Funds) $11,000 $0 $11,000 $11,000 $0
Parks/Rec Wage Increase for Summer Day Camp Staff $0 $44,043 $44,043 $44,043 $0
City Wide City Wide Merit 2.75% $0 $475,549 $475,549 $0 $475,549
PW/StreetsSkid Steer Loader (not VRP) Lease to Purchase $101,000 $0 $101,000 $101,000 $0
PW/StreetsStreets Sweeper & Vacuum Unit (not VRP) Lease to Purchase $205,000 $0 $205,000 $205,000 $0
Parks/PK OpsDump Truck-1 ton (not VRP) Lease to Purchase $60,000 $0 $60,000 $60,000 $0
FM-FVFDAmbulance Lease to Purchase $203,000 $0 $203,000 $203,000 $0
ASO ASO Admin Assistant Position (FTE 1.0) $1,000 $64,651 $65,651 $0 $65,651
Parks/PK Ops Parks Laborer Position (FTE 1.0) $0 $61,876 $61,876 $0 $61,876
TOTAL DECISION PACKAGES $908,000 $646,119 $1,554,119 $951,043 $603,076
TOTAL FAW & DECISION PACKAGES FOR GENERAL FUND $1,137,550 $686,519 $1,824,069 $951,043 $873,026
WATER AND SEWER FUND
DEPT DESCRIPTIONONE TIME
COSTONGOING
COST TOTAL
OUTSIDEREVENUESOURCES
NETTOTAL
Swr Ops Blkhwk WWTP-Aeration System Upgrade $2,569,413 $0 $2,569,413 $2,569,413
Swr Ops Blkhwk WWTP Re-Rating $348,795 $0 $348,795 $348,795
Swr Ops Blackhawk WWTP Additional Capacity (Year 3 of 6) $633,130 $0 $633,130 $633,130
Wtr Ops SEWPP-FY 2012-2017 Program Balance (Year 2 of 3) $0 $411,002 $411,002 $411,002
Wtr Ops SEWPP-FY 2019-2023 Program Balance (5 yrs) $0 $810,000 $810,000 $810,000
TOTAL FORCES AT WORK $3,551,338 $1,221,002 $4,772,340 $0 $4,772,340
DEPT DESCRIPTIONONE TIME
COSTONGOING
COST TOTAL
OUTSIDEREVENUESOURCES
NETTOTAL
City Wide City Wide Merit 2.75% $0 $57,904 $57,904 $0 $57,904
Swr UtlVacuum/Jet Combination Sewer Truck (not VRP) Lease to Purchase $450,000 $0 $450,000 $450,000 $0
TOTAL DECISION PACKAGES $450,000 $57,904 $507,904 $450,000 $57,904
TOTAL FAW & DECISION PACKAGES FOR WATER & SEWER FUND $4,001,338 $1,278,906 $5,280,244 $450,000 $4,830,244
295

FY 2019-20 DECISION PACKAGES(Not included in the Adopted Budget)
GENERAL FUND
DEPT DESCRIPTIONONE TIME
COSTONGOING
COST TOTAL
ASO/IT Additional Internet Services & Firewall $10,000 $12,100 $22,100
Engineering Construction Manager Position (FTE 1.0) $2,700 $88,967 $91,667
Library Digital Media Technician Position (FTE 1.0) $0 $70,320 $70,320
ASO/IT Network Attached Storage (NAS) Data Protection $25,000 $0 $25,000
Engineering GPS Data Collection System Upgrade $25,000 $0 $25,000
Parks/Admin Parks Open Space Master Plan $185,000 $0 $185,000
Parks/Rec Wage Increase for Pool Staff $0 $35,755 $35,755
Engineering HP Design Jet SD Pro Multifunction Printer $15,495 $5,000 $20,495
Parks/PK Ops 3/4 Ton Truck Regular Cab (for Laborer) (Add to VRP) $32,642 $0 $32,642
ASO/IT IT Business Analyst I Position (FTE 1.0) $0 $100,504 $100,504
Parks/PK Ops 55' Pull Behind Man Lift $43,060 $0 $43,060
Parks/PK Ops Tool CAT Replacement $55,000 $0 $55,000
PW/Streets Industrial Zero Turn Riding Mower $14,000 $1,050 $15,050
ASO/HR Wellness Program $0 $15,000 $15,000
PW/Streets Message Board $20,000 $75 $20,075
Park/Fac Ops Replace Carpet & Flooring at PSB $68,000 $0 $68,000
Parks/PK Ops Turf Tractor $50,000 $0 $50,000
Parks/PK Ops Replace Fencing Fabric at Sportspark for Adult Fields $58,000 $0 $58,000
Parks/PK Ops Stevenson Park Walking Trail Curbs $250,000 $0 $250,000
Parks/PK Ops Skate Park $75,000 $0 $75,000
UNFUNDED DECISION PACKAGES TOTAL (GENERAL FUND) 928,897$ 328,771$ 1,257,668$
WATER AND SEWER FUND
DEPT DESCRIPTIONONE TIME
COSTONGOING
COST TOTAL
Engineering Construction Manager Position (FTE 1.0) $2,700 $88,968 $91,668
Wtr Ops Pump & Piping Changes for SWS#2 $45,000 $0 $45,000
Swr Ops 6" Pump Replacements (LS #8,17,22,36) $78,000 $0 $78,000
Admin Administrative Secretary Position (FTE 1.0) $2,700 $56,628 $59,328
Swr Ops LS #2 Spare Pump $25,000 $0 $25,000
Wtr Ops Control Replacement for SWS #1 $55,000 $0 $55,000
Wtr Ops Control Replacement for SWS #2 $65,000 $0 $65,000
Wtr Ops Operations Maintenance Worker Position (FTE 1.0) $0 $56,208 $56,208
Swr Ops Truck with utility bed (1 Ton) (Add to VRP) $60,000 $4,000 $64,000
Swr Ops Mechanic tools & equipment $30,000 $0 $30,000
Wtr Utl Crew Leader Position (FTE 1.0) $0 $70,846 $70,846
Wtr Utl Class 5 Truck w/service body (Add to VRP) $61,000 $4,500 $65,500
Swr Utl Backhoe-replace PW116 (not VRP) $90,000 $4,500 $94,500
UNFUNDED DECISION PACKAGES TOTAL (WATER & SEWER FUND) $514,400 $285,650 $800,050
296

Tax Information
297

Estimated Taxable Value as of August 14, 2019 $3,145,649,820
Divided by 100 100
Rate Base $31,456,498
Tax Rate 0.5214-$0.5214
Estimated Tax Levy $16,402,645
Estimated Collection Rate 100%
Adjusted Tax Collections, 2018-19 $16,402,645
Estimated Value of Properties in ARB Review Status $171,550,821Divided by 100 100Rate Base $1,715,508Tax Rate 0.5214Estimated Tax Levy $894,533
Estimated Value Over 65 Frozen Ceilings $373,385,042Divided by 100 100Rate Base $3,733,850Tax Rate 0.5214Estimated Collection Rate & Levy of Over 65 Frozen Ceilings 100% $1,946,975
ESTIMATED TOTAL TAX LEVY $19,244,153
Total PercentFiscal Taxable Increase Year Tax Assessed Homestead Tax Total Over
Ending Year Value Exemption Rate Tax Levy Prior Year
2004-05 2004 $1,757,469,314 20% $0.6385 $11,221,442 4.0%
2005-06 2005 $1,840,094,487 20% $0.6040 $11,114,170 -1.0%
2006-07 2006 $2,011,630,820 20% $0.5821 $11,708,758 5.3%
2007-08 2007 $2,134,576,240 20% $0.5764 $12,303,697 5.1%
2008-09 2008 $2,242,178,295 20% $0.5797 $12,998,473 5.6%
2009-10 2009 $2,271,459,062 20% $0.5797 $13,167,648 1.3%
2010-11 2010 $2,336,118,472 20% $0.5851 $13,668,629 3.8%
2011-12 2011 $2,362,929,430 20% $0.5902 $13,947,215 2.0%
2012-13 2012 $2,392,531,721 20% $0.5970 $14,283,414 2.4%
2013-14 2013 $2,502,557,278 20% $0.5914 $14,653,660 2.6%
2014-15 2014 $2,633,486,696 20% $0.5914 $15,440,708 5.4%
2015-16 2015 $2,926,095,717 20% $0.5687 $16,403,663 6.2%
2016-17 2016 $3,173,373,806 20% $0.5460 $17,009,094 3.7%
2017-18 2017 $3,408,383,083 20% $0.5273 $17,569,799 3.3%
2018-19 2018 $3,450,838,554 20% $0.5324 $17,952,134 2.2%
2019-20 2019 $3,690,585,683 20% $0.5214 $19,244,153 7.2%
ESTIMATED AD VALOREM TAX COLLECTIONS - GCAD & HCAD Certified Roll
TAXABLE VALUE AND LEVY COMPARISON
298

Fiscal
Year Tax Year
General
Fund
Service
Fund
Total
Tax Rate*
2009-10 2009 $0.4997 $0.0800 $0.5797
2010-11 2010 $0.5198 $0.0653 $0.5851
2011-12 2011 $0.5218 $0.0684 $0.5797
2012-13 2012 $0.5307 $0.0663 $0.5970
2013-14 2013 $0.5303 $0.0611 $0.5914
2014-15 2014 $0.5303 $0.0611 $0.5914
2015-16 2015 $0.4972 $0.0715 $0.5687
2016-17 2016 $0.4620 $0.0840 $0.5460
2017-18 2017 $0.4323 $0.0950 $0.5273
2018-19 2018 $0.4372 $0.0952 $0.5324
2019-20 2019 $0.4322 $0.0892 $0.5214
* Tax Rate Includes 20% Homestead Exemption
Historical Tax Rate Comparison
0.0
0.1
0.2
0.3
0.4
0.5
0.6
0.7
Tax Rate Comparison
GeneralFund
DebtService Fund
299

FY20 FY20 FY20 FY20Month of FY18 FY19 Adopted Adopted Adopted AdoptedReceipt Actual Forecast General Fund Streets* Economic Dev** Budget
December $598,088 $533,224 $542,324 $116,335 $38,778 $697,437
January 633,491 496,420 505,520 121,897 40,632 $668,049
February 981,045 734,825 743,925 189,063 63,020 $996,008
March 568,179 492,683 501,783 109,337 36,446 $647,566
April 542,022 469,193 478,293 104,647 34,882 $617,822
May 873,752 594,726 603,826 168,091 56,029 $827,946
June 618,206 462,615 471,714 119,300 39,766 $630,780
July 571,512 428,942 438,042 109,974 36,657 $584,673
August 861,100 647,505 656,605 166,010 55,336 $877,951
September 631,494 474,015 483,115 121,530 40,509 $645,154
October 665,169 500,604 509,704 128,347 42,782 $680,833
November 875,898 653,579 662,681 167,569 55,853 $886,103
Total $8,419,956 $6,488,331 $6,597,532 $1,622,100 $540,690 $8,760,322
*Fund established in FY17 to record sales tax revenue collected for City streets maintenance and improvements.**Fund established in FY17 to record sales tax revenue collected for economic development improvements of the City's downtown area.
City of Friendswood's sales tax rate increased from 7.75% to 8.25% with voter approval in May 2016. The 1/2 cent sales tax rate increase is City of Friendswood's sales tax rate increased from 7.75% to 8.25% with voter approval in May 2016. The 1/2 cent sales tax rate increase is distributed in the following manner:
$0.00375 for Streets maintenance and improvemnts$0.00125 for Economic Development improvements in the City's downtown area
Sales Tax Revenue ComparisonFY18 through FY20
300
Glossary Abbreviations and Acronyms
(reviewed and updated annually)
301

Glossary
ACCRUAL BASIS Recognition of the financial effects of transactions, events and circumstances in the period(s) in which they occur regardless of when the cash is received or paid. AD VALOREM TAX A tax based on value (e.g., a property tax). AMORTIZATION The process of paying the principal amount of an issue of bonds by the periodic payments either directly to bondholders or to a sinking fund for the benefit of bondholders. Payments are usually calculated to include interest in addition to a partial payment of the original principal amount. APPROPRIATION A legal authorization granted by a legislative body (City Council) to make expenditures and to incur obligations for specific purposes. An appropriation usually is limited in amount and time it may be expended. ARBITRAGE Transactions by which securities are bought and sold in different markets at the same time for the sake of profit arising from a difference in prices in the two markets. With respect to the issuance of municipal bonds, arbitrage usually refers to the difference between the interest paid on the bonds issued and the interest earned by investing the bond proceeds in other securities. ASSESSED VALUATION A valuation set upon real estate or other property by a government as a basis for levying taxes. ASSETS Resources owned by the City which have monetary value. ASSIGNED FUND BALANCE Fund balance amounts that are self-imposed by the City to be used for particular purpose. Fund balance can be assigned by the City Council or the City Manager, pursuant to the City’s fund balance policy. BALANCED BUDGET A budgeting term used to signify budgeted expenditures are offset by budgeted revenues. In some instances reserves set aside for a specific use could be included to offset budgeted expenditures; i.e. election equipment reserves set aside in previous fiscal years to replace outdated equipment in a future fiscal year. BASIS OF ACCOUNTING A term used to refer to when revenues, expenditures, expenses, and transfers-and the related assets and liabilities-are recognized in the accounts and reported in the financial statements. Specifically, it relates to the timing of the measurements made, regardless of the nature of the measurement, on either the cash or the accrual method. BOND A written promise to pay a specified sum of money, called the face value or principal amount, at a specified date or dates in the future, called the maturity date(s), together with periodic interest at a specified rate.
302

Glossary
BUDGET A plan of financial operation embodying an estimate of proposed expenditures for any given period and the proposed means of financing them. BUDGET AMENDMENT A term used to refer to a change to the budget after adoption. Additional revenue or fund balance/retained earnings appropriations to fund expenditures not included in the original adopted budget. BUDGET CALENDAR A time table with deadlines when particular tasks must be completed in order for council to approve the spending plan before the beginning of the next fiscal year. BUDGET TRANSFER A term used to refer to the reallocation of appropriated funds between revenue or expenditure accounts within a department. CAPITAL EXPENDITURES Expenditures resulting in the acquisition of or addition to fixed assets which are individually priced at more than $5,000. CAPITAL IMPROVEMENT PROGRAM (CIP) A term used to refer to a group of related infrastructure improvements planned for the future. The program can be, either, a five or a ten year plan. CAPITAL LEASE An agreement that conveys the right to use property, plant or equipment, usually for a stated period of time, that meets one or more of the criteria set forth in SFAS No. 13 for lease capitalization. CAPITAL PROJECTS FUND A fund created to account for financial resources to be used for the acquisition or construction of major capital facilities (other than those financed by proprietary funds and trust funds). COMPETITIVE BIDDING A process of issuing a public bid with the intent that companies will put together their best proposal and compete for a specific project. By law, this process is required for every government agency that issues a bid. Competitive bidding creates a transparent environment that is open and fair. COMPREHENSIVE ANNUAL FINANCIAL REPORT (CAFR) A set of financial statements comprising the financial report of the municipality that complies with the accounting requirements promulgated by the Government Accounting Standards Board (GASB). The auditor’s report is usually attached to the CAFR. CONTINGENCY A budgeted account set aside to meet unforeseen circumstances. COST The amount of money or other consideration exchanged for property or services. Costs may be incurred even before the money is paid; that is, as soon as liability is incurred. Ultimately, however, money or other consideration must be given in exchange. CURRENT ASSETS Those assets that can be easily converted to cash within the current year.
303

Glossary
CURRENT LIABILITIES Debt or other legal obligations arising out of transactions in the past which must be liquidated, renewed, or refunded within one year. DEBT SERVICE Annual payments of interest and principle that the City owes on money that it has borrowed. DEBT SERVICE FUND A fund established to account for the accumulation of resources for and the payment of general long-term debt principal and interest (sometimes referred to as a SINKING FUND) DEBT SERVICE REQUIREMENTS The amount of money required to pay interest on outstanding debt, serial maturities of principal for serial bonds and required contributions to accumulate monies for future retirement of term bonds. DELINQUENT TAXES Taxes remaining unpaid on and after the date to which a penalty for nonpayment is attached. Even though the penalty may be subsequently waived and a portion of the taxes may be abated or canceled, the unpaid balances continue to be delinquent taxes until abated, canceled, paid or converted into tax liens. DEPARTMENT An organizational unit of the City which is responsible for overall management of a group of related major governmental functions, such as Public Works. DEPRECIATION Gradual conversion of the cost of a tangible fixed or capital asset as an operational cost over the projected useful life of an asset. The book value of an asset is reduced due to usage and a large expense is spread proportionately over a fixed period of time. EFFECTIVE TAX RATE When compared to the same property, the tax rate which produces the same effect in terms of the total amount of taxes compared to the prior year. ENCUMBRANCES Budget authority that is set aside to pay for expenditures that have been committed either by authorization of a purchase order or by a contract. ENTERPRISE FUND A fund established to account for operations that are financed and operated in a manner similar to private business enterprises where the intent of the governing body is that costs of providing goods or services to the general public on a continuing basis be financed or recovered primarily through user charges. EXPENDITURES Decreases in net financial resources. Expenditures include current operating expenses requiring the present or future use of net current assets, debt service and capital outlays. EXPENSES Reduction in net financial resources which represents the operational cost of doing business. FISCAL YEAR A 12-month period to which the annual operating budget applies and at the end of which a
304

Glossary
government determines its financial position and the results of its operations. The City’s fiscal year is October thru September. FIXED ASSETS The least liquid of assets such as land, buildings, equipment, and other improvements. FORCES AT WORK (FAW) A budget term used to describe supplemental department expenditures as a result of federal and/or state unfunded mandates or local governmental laws or actions or market impacts. FRANCHISE A special privilege granted by a government, permitting the continued use of public property, such as city streets, and usually involving the elements of monopoly and regulation. FULL TIME EQUIVALENT (FTE) The number of hours per year that a full time employee is expected to work. Two workers who each work half that number of hours together equal one full time equivalent. The hours of a number of part timers or temporary workers can be added up to see how many full time positions they are equivalent to. FUND A fiscal and accounting entity with a self-balancing set of accounts in which cash and other financial resources, all related liabilities and residual equities, or balances, and changes therein, are recorded and segregated to carry on specific activities or attain certain objectives in accordance with special regulations, restrictions or limitations. FUND BALANCE The difference between fund assets and fund liabilities of governmental funds. GENERAL FUND (GF) The fund used to account for all financial resources, except those required to be accounted for in another fund. GENERAL OBLIGATION BONDS Bonds for the payment of which the full faith and credit of the issuing government is pledged. In issuing its general obligation bonds, the City of Friendswood pledges to levy whatever property tax is needed to repay the bonds for a particular year. Bonds cannot be issued without voter approval and are usually issued with maturities of between 15 and 30 years. GENERALLY ACCEPTED ACCOUNTING PRINCIPLES (GAAP) Uniform minimum standards and guidelines for financial accounting and reporting. They govern the form and content of the financial statements of an entity. GAAP encompass the conventions, rules and procedures necessary to define accepted accounting practice at a particular time. They include not only broad guidelines of general application, but also detailed practices and procedures. GAAP provide a standard by which to measure financial presentations. The primary authoritative body on the application of GAAP to state and local governments is the GASB. GOVERNMENTAL ACCOUNTING STANDARDS BOARD (GASB) An independent, non-profit agency responsible for the promulgation of accounting and financial reporting procedures for governmental entities. GOVERNMENTAL FUND TYPES Those funds through which most governmental functions are typically financed. The acquisition, use and financial resources and the related current liabilities are accounted for
305

Glossary
through governmental funds (General, Special Revenue, Debt Service and Capital Projects Funds). GRANTS A payment of money from one governmental unit to another or from a government to a not- for-profit. Grants are often earmarked for a specific purpose or program. IMPACT FEES Fees charged to developers to cover, in whole or in part, the anticipated cost of improvements that will be necessary as a result of the development. INTERFUND TRANSFERS All inter-fund transactions except loans, quasi-external transactions and reimbursements. INTERGOVERNMENTAL REVENUES Revenues from other governments in the forms of grants, entitlements, shared revenues or payment in lieu of taxes. INTERNAL SERVICE FUND A fund used to account for the financing of goods or services provided by one department or agency to other departments or agencies of a government, or to other governments, on a cost-reimbursement basis. LEVY (1) (Verb) to impose taxes, special assessments or service charges for the support of government activities. (2) (Noun) the total amount of taxes, special assessments or service charges imposed by a government. LIABILITIES Probable future sacrifices of economic benefits, arising from present obligations of a particular entity to transfer or provide services to other entities in the future as a result of past transactions or events. LIQUIDITY Usually refers to the ability to convert assets (such as investments) into cash. LONG-TERM DEBT Debt with a maturity of more than one year after the date of issuance. MAINTENANCE The act of keeping capital assets in a state of good repair. It includes preventative maintenance, normal periodic repairs; replacement of parts, structural components and so forth and other activities needed to maintain the asset so that it continues to provide normal services and achieves its optimum life. MAJOR FUND A governmental fund or enterprise fund reported as a separate column in the basic fund financial statements. The general fund is always a major fund. Otherwise, major funds are funds whose revenues, expenditures/expenses, assets, or liabilities (excluding extraordinary items) are at least 10% of corresponding totals for all governmental or enterprise funds and at least 5% of the aggregate amount for all governmental and enterprise funds for the same item. Any other government or enterprise fund may be reported as a major fund if the government’s officials believe that fund is particularly important to financial statement users. MATURITY
306
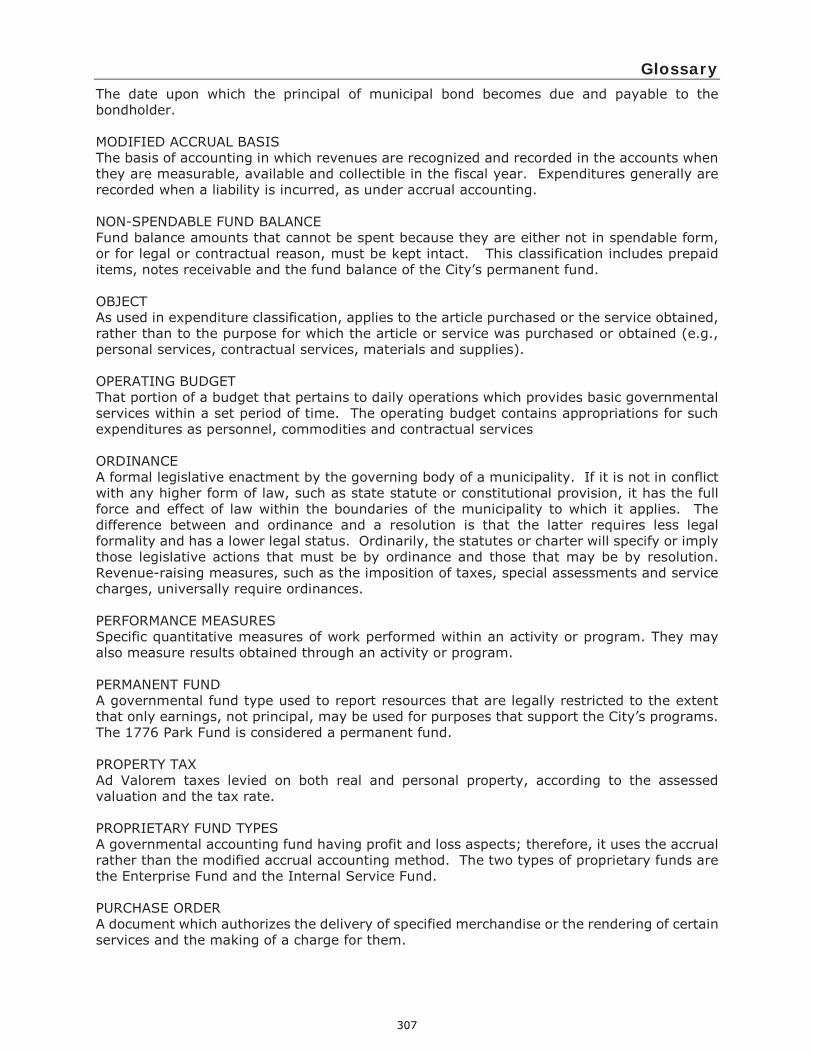
Glossary
The date upon which the principal of municipal bond becomes due and payable to the bondholder. MODIFIED ACCRUAL BASIS The basis of accounting in which revenues are recognized and recorded in the accounts when they are measurable, available and collectible in the fiscal year. Expenditures generally are recorded when a liability is incurred, as under accrual accounting. NON-SPENDABLE FUND BALANCE Fund balance amounts that cannot be spent because they are either not in spendable form, or for legal or contractual reason, must be kept intact. This classification includes prepaid items, notes receivable and the fund balance of the City’s permanent fund. OBJECT As used in expenditure classification, applies to the article purchased or the service obtained, rather than to the purpose for which the article or service was purchased or obtained (e.g., personal services, contractual services, materials and supplies). OPERATING BUDGET That portion of a budget that pertains to daily operations which provides basic governmental services within a set period of time. The operating budget contains appropriations for such expenditures as personnel, commodities and contractual services ORDINANCE A formal legislative enactment by the governing body of a municipality. If it is not in conflict with any higher form of law, such as state statute or constitutional provision, it has the full force and effect of law within the boundaries of the municipality to which it applies. The difference between and ordinance and a resolution is that the latter requires less legal formality and has a lower legal status. Ordinarily, the statutes or charter will specify or imply those legislative actions that must be by ordinance and those that may be by resolution. Revenue-raising measures, such as the imposition of taxes, special assessments and service charges, universally require ordinances. PERFORMANCE MEASURES Specific quantitative measures of work performed within an activity or program. They may also measure results obtained through an activity or program. PERMANENT FUND A governmental fund type used to report resources that are legally restricted to the extent that only earnings, not principal, may be used for purposes that support the City’s programs. The 1776 Park Fund is considered a permanent fund. PROPERTY TAX Ad Valorem taxes levied on both real and personal property, according to the assessed valuation and the tax rate. PROPRIETARY FUND TYPES A governmental accounting fund having profit and loss aspects; therefore, it uses the accrual rather than the modified accrual accounting method. The two types of proprietary funds are the Enterprise Fund and the Internal Service Fund. PURCHASE ORDER A document which authorizes the delivery of specified merchandise or the rendering of certain services and the making of a charge for them.
307

Glossary
REFUNDING BONDS Bonds issued to retire bonds already outstanding. RESTRICTED FUND BALANCE Fund balance amounts that are constrained for specific purposes which are imposed by providers, such as creditors or amounts restricted due to constitutional provision or enabling legislation. This classification includes retirement of long-term debt, construction programs, City ordinances, and other federal and state grants. RETAINED EARNINGS An equity account reflecting the accumulated earnings of an enterprise or internal service fund. REVENUES (1) Increases in the net current assets of a governmental fund type from other than expenditure refunds and residual equity transfers. Also, general long-term debt proceeds and operating transfers are classified as "other financing sources" rather than as revenues. (2) Increases in the net total assets of a proprietary fund type from other than expense refunds, capital contributions and residual equity transfers. Also, operating transfers in are classified separately from revenues. REVENUE BONDS Bonds whose principal and interest are payable exclusively from earnings of an enterprise fund. SPECIAL REVENUE FUND A fund used to account for the proceeds of specific revenue sources (other than expendable trusts or major capital projects) that are legally restricted to expenditure for specified purposes. GAAP only requires the use of special revenue funds when legally mandated. TAX RATE The amount of tax stated in terms of a unit of the tax base (e.g., 25 mills per dollar of assessed valuation of taxable property.) TAX ROLL The official list showing the amount of taxes levied against each taxpayer or property. Frequently, the tax roll and the assessment roll are combined, but even in these cases the two can be distinguished. UNASSIGNED FUND BALANCE Includes the residual positive fund balance within the general fund which has not been classified as either non-spendable, restricted, committed or assigned. Unassigned fund balance may also include negative balances for any governmental fund if expenditures exceed amounts restricted, committed, or assigned for those specific purposes. VEHICLE REPLACEMENT PLAN (VRP) A term used to refer to a plan of vehicle fleet replacements over the next ten years. WORKING CAPITAL The difference between current assets and current liabilities of enterprise funds.
308

Abbrevations and Acronyms
A AED: Automated External Defibrillator AICPA: American Institute of Certified Public Accountants ASO: Administrative Services Office B BA: Budget Amendment BPI: Bond Project Impact BT: Budget Transfer C CAFR: Comprehensive Annual Financial Report CCISD: Clear Creek Independent School District CDD: Community Development Department CEDC: Community and Economic Development Committee CFS: Calls for Services CID: Criminal Investigation Division CIP: Capital Improvement Plan CMO: City Manager’s Office CS: Community Services CSO: City Secretary’s Office CCP: Code of Criminal Procedure D DARE: Drug Abuse Resistance Education DOT: Department of Transportation DRC: Development Review Committee E EDA: Economic Development Administration EEO: Equal Employment Opportunity EMPG: Emergency Management Performance
Grant EMS: Emergency Medical Service ERP: Enterprise Resource Plan ETR: Effective Tax Rate F FAA: Friendswood Animal Alliance FEMA: Federal Emergency Management Agency FISD: Friendswood Independent School District FMO: Fire Marshal’s Office FOIA: Freedom of Information Act FSU: Field Service Unit FTE: Full Time Equivalent FVFD: Friendswood Volunteer Fire Department FY: Fiscal Year G GAAP: Generally Accepted Accounting Principles GASB: Governmental Accounting Standards Board GCCDD: Galveston County Consolidated Drainage District GF: General Fund GFOA: Governmental Finance Officers Association GIS: Geographic Information System GO: General Obligation GLO: General Land Office GPM: Gallons per Minute GTOT: Government Treasurers Organization of TX
H HIDTA: High Intensity Drug Trafficking Area Program HVAC: Heating, Ventilation, and Air Conditioning) System I I&I: Interest Infiltration and Inflow I&S: Interest and Sinking
(tax rate used for debt retirement) IRS: Internal Revenue Service K KFB: Keep Friendswood Beautiful L LEOSE: Law Enforcement Officer Standards and Education M M&CC: Mayor and City Council M&O: Maintenance and Operations
(tax rate used for general operations) MCI: Municipal Cost Index MYFP: Multi Year Financial Plan P PD: Police Department PEG: Public Education Governmental PIF: Police Investigation Fund PSB: Public Safety Building PW: Public Works S SAN: Storage Area Network SECO: State Energy Conservation Office SETCIC: Southwest Texas Crime Information Center T TAGO: Texas Attorney General’s Office TDRA: Texas Disaster Recovery Assistance TDSHS: Texas Dept of State Health Services TMRS: Texas Municipal Retirement System V VOCA: Victims of Crimes Act VRF: Vehicle Replacement Fund VRP: Vehicle Replacement Plan W W&S: Water and Sewer W/S: Water and Sewer Y YTD: Year to date Z ZZB: Zero Based Budgeting
(revenues & expenses net to zero)
309

Adopted Budget and Tax Rate Ordinances
310

311

312

313
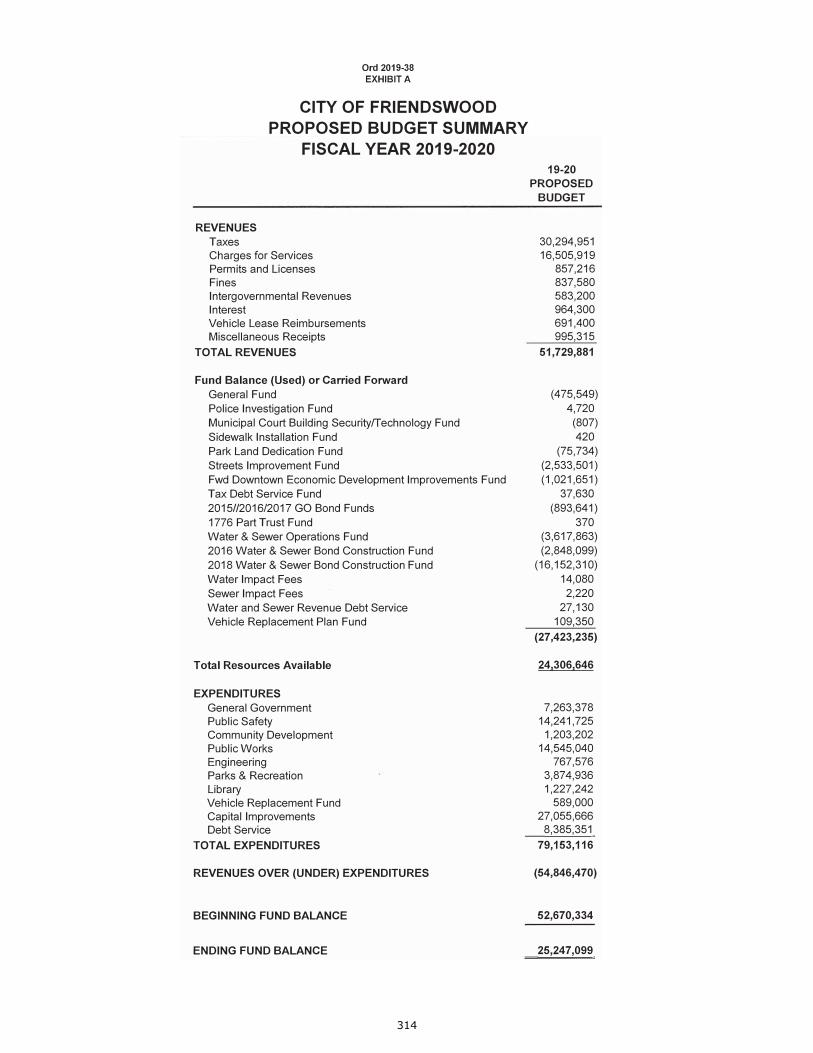
314

315

316

317
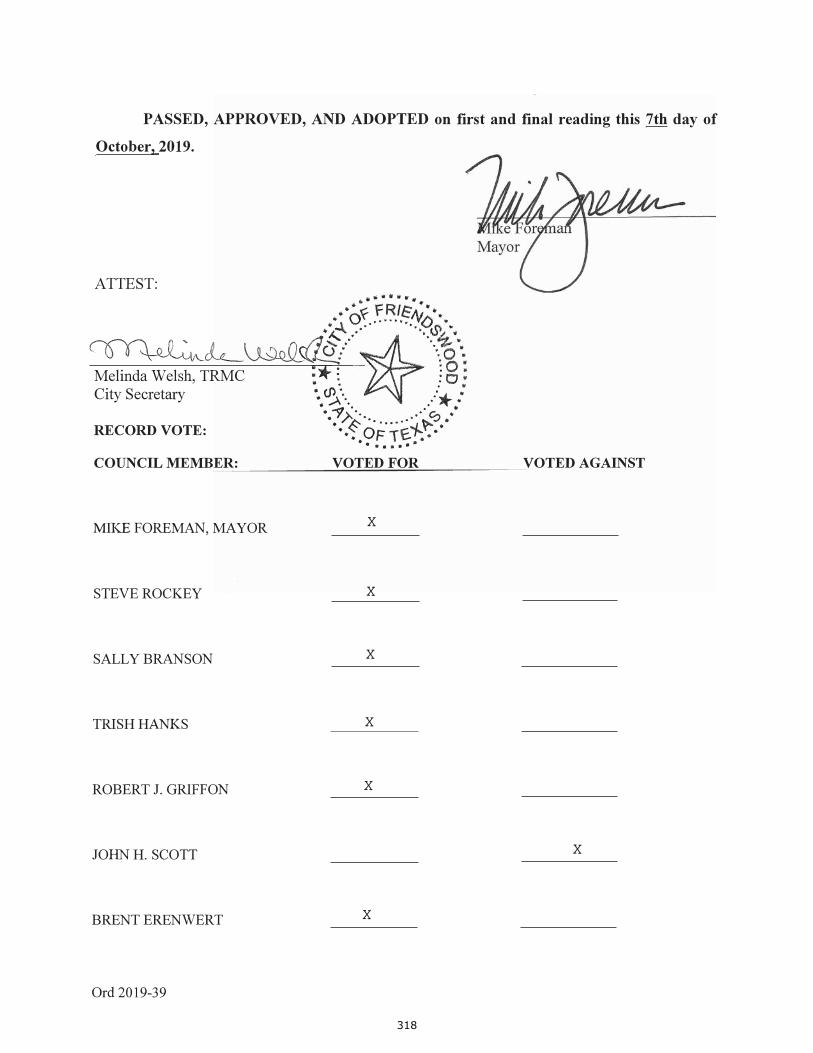
318

This page is intentionally left blank.
319