county board adopted budget summary format
71
2019 COUNTY BOARD ADOPTED BUDGET SUMMARY FORMAT
-
Upload
khangminh22 -
Category
Documents
-
view
1 -
download
0
Transcript of county board adopted budget summary format

2019 COUNTY BOARD ADOPTED BUDGET
SUMMARY FORMAT

Office of County Administrator 212 6th Street North La Crosse, WI 54601-3200 608-785-9700 Phone 608-789-4821 Fax www.lacrossecounty.org
TO: La Crosse County Board of Supervisors FROM: Steve O’Malley, County Administrator DATE: November 20, 2018 SUBJECT: 2019 Adopted Budget Herein presented is the 2019 County Board Adopted Budget in summary format, including the line item detail for all changes made to the County Administrator’s Recommended Budget. This format provides quick reference to the Public Hearing Presentation, Property Tax Comparisons, Highlights of Accomplishments, Budget Summaries, Approved Fees & Charges and Debt Retirement Schedules for the 2019 Fiscal Year.
The adopted budget continues to rely on our strong financial position through use of Fund Balances and Sales Tax Reserves, yet still preserves options and protects our services as much as possible against future funding uncertainties.

LA CROSSE COUNTY APPROVED 2019 BUDGET SUMMARY
Page County Administrator’s Public Hearing Presentation 4
Summary of 2019 Budget with Comparison to 2016-2018 Budgets 6
Comparison of Budgeted Expenses & Revenues for 2018 & 2019 7
2019 Budgeted Expenditures & Revenues Pie Chart 8
Approved County Board Changes to Administrator’s Proposed Budget 9
County Property Valuations vs. Tax Levy 2003 thru 2019 10
2019 Apportionment Pie Chart 11
2018-2019 Tax Levy Comparison by Org 12
2019 Budget Summary by Department 14
User Fees, Charges for Services, and Permit Revenues 31
Long Range Capital Plan 51
Fund Balance Usage 60
Audited Fund Balances and Cash Flow Requirements 62
Excess Sales Tax 64
Funds to Outside Agencies 65
Debt Retirement Schedules 66

2019County Administrator Recommended Budget
November 12, 2018
Property Tax Levy (expressed in millions)
2018 Adopted
Operating Levy $26.539
Library $ 2.004
Debt $ 5.783
$ 34.326
$3.75 Mill Rate per thousand
2019 Recommended
Operating Levy $26.658
Library $ 2.087
Debt $ 6.138
$ 34.934
1.63% Increase
vs. 1.73% value of New Construction
$3.67 Mill Rate per thousand
La Crosse County Tax Rate 2014 thru 2019
3.96
3.89 3.89 3.89
3.75
3.67
2014 2015 2016 2017 2018 2019
Tax Rate per $1000 valuation decreased by ‐ 7% since 2014
2018 vs. 2019 ProposedTax Rate per $1000 valuation decreases by 8 cents or ‐2.1 %
Human
Services, 29.92%
Cts & Public Sfty,
13.18%
Highway, 9.13%Solid Waste,
7.68%
Debt Service,
4.04%
Hlth,
Aging, NH, 22.47%
Gen Govt, other,
12.20%
Library , 1.39%2019
Expenditures
$156.447 million‐3.55%
Human
Services, 25.15%
Cts &
Public Sfty, 33.86%
Highway, 7.05%
Debt Service,
12.22%
Hlth, Aging, NH,
5.73%
Gen Govt, other,
11.88%
Library , 4.12%
2019 Tax Levy
$34.938 million
Property Taxes are
22% of
Total Annual Revenues
$91,195,000
$86,748,061
$83,509,904
$79,069,697
2016 2017 2018 2019
Total All County Debt
While 2019 Budget borrows $2.5 million for Roads,
Total Outstanding Principal of outstanding debt continues to decline
Since 2016the County pays off more in Outstanding Principal each year than new borrowing
4

0.91
0.82
0.61
0.570.53
0.550.60
0.62
0.45 0.460.40
0.52
0.48
0.36
0.44
0.52 0.520.55
0.57
0.62
0.660.63
0.65
0.00
0.10
0.20
0.30
0.40
0.50
0.60
0.70
0.80
0.90
1.00
Historical Context Debt Tax Rate 1996 – 2019
1996 Equalized Value $3.1 Billion
G.O. Debt = .93% of Debt to EV
2019 Equalized Value $9.498 Billion
G.O. Debt = .78% of Debt to EV
2019 Budget Priorities and Results
Service Continuation in all major areas
No Health Insurance increase or changes in coverage.
Some market adjustments plus across the board 1.75%,
Highway increase levy $269k & restructure use of debt
Goose Island (GI) upgrade with Federal Land Access grant
Emergency Radio sites: Mindoro $395k in 2019, 4 sites left)
Design evaluations: Hillview Health Center & Jail receiving
Uses fund balance for small Capital Projects w/o borrowing
1st yr of 5 yr plan toward $5 million yr for Highway
Personnel -9.31 FTE Levy supported positions, -2.20 FTENon-Levy supported positions and -29.66 HV/LV campuses
1,172.51
1,193.77 1,192.21
1,155.71
1,135.80
1,098.11
2014 2015 2016 2017 2018 2019
La Crosse County Budgeted Full Time Equivalent Employees (FTE's)
LA CROSSE COUNTY PROPERTY TAXES ARE AMONG THE LOWEST IN THE STATE (County Portion of Taxes)
2019 Levy per Capita (per person) – Compared with all 72 WI Counties
$223.59 $243.35
$268.74 $277.53 $274.40 $292.25 $296.45
$309.77 $313.53
$357.40
$‐
$50
$100
$150
$200
$250
$300
$350
2019 County Tax Levies La Crosse County 6th Lowest per Capita
The only counties with a lower levy per year have lower populationDodge County 25% less people, 2.3% lower levy
Eau Claire County 13.7% less people, 2.3% lower levy
La Crosse County Tax Levy is 23% LESS than Avg. of similar Counties2019 County Property Tax Levy per (Millions)
Counties most similar to La Crosse by Population (89,947 – 160,349)
$34,019,076
$34,033,789
$34,834,624
$37,296,183
$44,438,507
$49,407,461
$49,489,841
$58,906,852
$67,635,689
$0 $20,000,000 $40,000,000 $60,000,000 $80,000,000
Eau Claire 102,816
Dodge 89,947
La Crosse 119193
Washington 135,920
Fond du Lac 104,035
Sheboygan 115,924
Marathon 135,922
Walworth 103,535
Rock 160,349
Average Tax Levy is $45.6 million per year, $10.7 million more per
year than La Crosse
5

2016 2017 2018 2019ADOPTED ADOPTED ADOPTED ADOPTEDBUDGET BUDGET BUDGET BUDGET
TOTAL BUDGETED EXPENDITURES AND OTHER USES $170,499,239 $163,331,623 $162,209,431 $157,375,893Deduct Enterprise Funds ($47,197,640) ($46,587,923) ($44,043,674) ($39,021,288)Deduct State Forest Tax ($1,479,484) ($1,534,862) $0 $0Deduct State Special Charges ($171) $0 ($162) $0Deduct Appropriated Revenues and Other Sources Included in Above ($59,063,921) ($62,617,754) ($62,830,254) ($66,047,762)
NET BUDGET REQUESTS $62,758,023 $52,591,084 $55,335,341 $52,306,843
Deduct Reserve Money applied and borrowing ($18,481,049) ($6,994,220) ($9,059,662) ($5,022,219)
COUNTY LEVY REQUIREMENTS $44,276,974 $45,596,864 $46,275,679 $47,284,624
County Sales Tax Applied ($11,600,000) ($11,950,000) ($11,950,000) ($12,400,000)
NET COUNTY LEVY $32,676,974 $33,646,864 $34,325,679 $34,884,624
COUNTY TAX LEVY: Operating Levy $25,654,017 $26,042,162 $26,538,526 $26,658,455 Special Purpose - Libraries $1,810,988 $1,935,774 $2,004,310 $2,087,548 Debt Service Levy $5,211,969 $5,668,928 $5,782,843 $6,138,621
$32,676,974 $33,646,864 $34,325,679 $34,884,624
COUNTY MILL RATE: Operating Levy 3.051 3.009 2.901 2.807 Special Purpose - Libraries 0.215 0.224 0.219 0.220 Debt Service Levy 0.620 0.655 0.632 0.646
3.886 3.888 3.752 3.673
Change from Prior Year: Mill Rate: Percent -0.15% 0.05% -3.50% -2.11%
Dollars: Amount $1,100,119 $969,890 $678,815 $558,945 Percent 3.484% 2.968% 2.017% 1.628%
COUNTY EQUALIZED VALUATION REDUCED BY TID INCREMENT: Total Value 8,408,267,300 8,656,333,800 9,149,390,900 9,497,563,500 Percentage Change from Prior Year 3.62% 2.95% 5.70% 3.81%
LA CROSSE COUNTY 2019 BUDGET WITH COMPARISON TO 2016-2018 BUDGETS
6

2018 2019Budgeted % of Budgeted % of
Categories of Expenses Expenses Total Expenses Total
Health, Human Services, Welfare & Mental Health 58,863,391 36.29% 56,457,102 35.87%Public Safety & Emergency Services 15,204,460 9.37% 15,527,290 9.87%Public Works 14,711,385 9.07% 14,987,472 9.52%Financial Administration 1,471,426 0.91% 1,425,124 0.91%General Administration 3,896,319 2.40% 3,929,000 2.50%Other General Government 1,419,762 0.88% 1,449,094 0.92%Debt Service 6,086,872 3.75% 6,319,374 4.02%Legislative, Judicial, & Executive 3,762,139 2.32% 3,816,344 2.42%Legal 1,631,626 1.01% 1,677,447 1.07%Property Records & Control 479,479 0.30% 528,596 0.34%Buildings 2,801,884 1.73% 3,874,578 2.46%Cultural, Library, & Recreation 3,028,454 1.87% 3,109,363 1.98%Agriculture, Natural Resources, & Economic Development 3,548,199 2.19% 3,666,533 2.33%Miscellaneous, Retirement Contributions & Unemployment 1,260,361 0.78% 1,587,288 1.01%TOTAL BUDGETED EXPENDITURES 118,165,757 72.85% 118,354,605 75.21%
Plus Enterprise FundsCarroll Heights Apartments 244,558 0.15% 246,547 0.16%Hillview Terrace 957,609 0.59% 955,300 0.61%Hillview Nursing Home 15,690,808 9.67% 13,722,803 8.72%Lakeview Agency Fund 7,148,065 4.41% 7,146,735 4.54%Lakeview Capital Assets 294,403 0.18% 767,118 0.49%Lakeview Other Entities 3,938,249 2.43% 4,150,142 2.64%Household Hazardous Waste 496,363 0.31% 466,697 0.30%Solid Waste Management 15,273,619 9.42% 11,565,946 7.35%
SUB-TOTAL BUDGETED EXPENSE ENTERPRISE FUNDS 44,043,674 27.15% 39,021,288 24.79%
GRAND TOTAL BUDGETED EXPENDITURES 162,209,431 100.00% 157,375,893 100.00%
2018 2019Budgeted % of Budgeted % of
Categories of Revenues Revenues Total Revenues Total
Revenues set by State 3,814,698 2.35% 3,268,376 2.08%Revenues set by County 9,714,263 5.99% 9,345,548 5.94%Revenues set by State & County 3,564,072 2.20% 4,896,367 3.11%Property Taxes 34,171,629 21.07% 34,723,713 22.06%State Forestry & Other Taxes 162 0.00% - 0.00%Sales Tax 11,950,000 7.37% 12,400,000 7.88%Funded from Borrowing 2,700,000 1.66% 2,450,000 1.56%Intergovernmental - Federal & State 45,474,861 28.03% 48,317,167 30.70%Intergovernmental - Non Profit & Other 3,250 0.00% - 0.00%Interdepartmental 413,160 0.25% 364,800 0.23%Prior Year Reserves & Fund Adjustments 6,359,662 3.92% 2,588,634 1.64%TOTAL BUDGETED REVENUES 118,165,757 72.85% 118,354,605 75.21%
Plus Enterprise FundsRevenues set by State 5,869,145 3.62% 5,842,844 3.71%Revenues set by County 27,675,789 17.06% 26,604,242 16.90%Revenues set by State & County 7,053,208 4.35% 6,155,574 3.91%Property Taxes 154,050 0.09% 160,911 0.10%Intergovernmental - Federal & State 76,950 0.05% 75,150 0.05%Funded From Long Term Borrowing - 0.00% - 0.00%Prior Year Reserves & Fund Adjustments 3,214,532 1.98% 182,567 0.12%
SUB-TOTAL BUDGETED REVENUE ENTERPRISE FUNDS 44,043,674 27.15% 39,021,288 24.79%
GRAND TOTAL BUDGETED REVENUES 162,209,431 100.00% 157,375,893 100.00%
COMPARIONS OF BUDGETED EXPENSES AND BUDGETED REVENUES FOR 2018 AND 2019
7

8

Dept Org Account Description
Revenue & Other
Sources Expense100.185.2140 60001.01 Earnings 26,979 100.185.2140 60005.01 FICA 1,684 100.185.2140 60005.02 Medicare 394 100.185.2140 60005.03 Retirement 2,932 100.185.2140 60005.07 PEHP Expense (14,152) 100.185.2140 60001.01 Earnings 14,152 100.155.1480 60700.04 Salary Contingency (31,989) 650.650.1000 60001.01 Earnings 15,034 650.650.1000 60005.01 FICA 932 650.650.1000 60005.02 Medicare 218 650.650.1000 60005.03 Retirement 985 650.650.1000 99999.01 Fund Balance Usage 17,169 100.135.1210 60005.04 Health Insurance 600,000 100.135.1210 66000.00 Other Misc Expenses (600,000) 100.155.1360 47400.03 Indirect Cost Revenue 13,365 100.155.1480 60700.05 Operating Contingency 13,365 255.660.1000 71000.14 Indirect Costs Internal 13,365 255.660.1000 60510.00 Transportation Services (13,365) 100.185.2170 80200.00 Other Capital Assets (118,750) 100.185.2170 99999.01 Fund Balance Usage 118,750
Debt Service 300.735.6040 99999.13 Fund Balance Usage - Debt Service 50,000 210.470.4940 43560.04 State Aid Human Services Base allocation 1,200,000 210.470.4940 43560.09 State Aid Human Services Community Mental Health 240,000 210.470.4940 46591.10 Client Fees Client Cost Share 35,000 210.470.4940 60300.08 Client Care Services Community Living 201,500 210.470.4940 60300.13 Client Care Services Inpatient 605,000 210.470.4940 60300.23 Client Care Services Respite Care 2,000 210.470.4940 60300.49 Client Care Services COP-Like 50,000 210.470.4940 60300.77 Client Care Services Local Hospital 25,000 210.470.4940 60300.78 Client Care Services State Hospital - Adults 395,000 210.470.4940 60300.79 Client Care Services State Hospital - Kids 175,000 210.450.1000 43560.04 State Aid Human Services Base allocation (1,200,000) 210.450.1000 43560.09 State Aid Human Services Community Mental Health (240,000) 210.450.1000 46591.01 Client Fees General Client Fees (35,000) 210.450.1000 60300.08 Client Care Services Community Living (201,500) 210.450.1000 60300.13 Client Care Services Inpatient (1,200,000) 210.450.1000 60300.23 Client Care Services Respite Care (2,000) 210.450.1000 60300.49 Client Care Services COP-Like (50,000) 210.410.1000 61105.02 Rental Car Rental Car Fuel Expense 1,000 210.410.1000 60730.00 Dupl/Printing (internal) No Sub Account (1,000) 611.750.6700 80100.00 Other Capital Equipment 300,000 611.220.1000 60200.01 General Professional Services 50,000 611.220.6310 99999.01 Fund Balance Usage 350,000 710.170.7515 43790.01 Grants from Other Governments - Bureau of Indian Affairs 685,000 710.795.7720 43537.00 State Aid Other Transportation (18,128) 710.170.7505 68600.00 Capital CIP Bridges Highway Expenses 140,319 710.170.7515 68600.00 Capital Reconditioning & Reconstructing Highway Expenses 526,553 710.770.1000 99999.04 From Borrowing 1,000,000 710.770.1000 99999.20 Short Term Borrowing (1,000,000)
Net effect on levy (50,000)$
2017 2018 2019Operating 3.009 2.9006 2.8069
Library 0.224 0.2191 0.2198Debt 0.655 0.632 0.6463
Total Mill Rate 3.888 3.7517 3.673
Human Services Set-up new account line to be consistent across department
Highway Move short term borrowing to long term
Retirees Insurance Move expense from other Misc to more accurate fringe line
Jail
Solid WasteOperations Manager vacancy filled
at higher pay classification than budgeted
APPROVED COUNTY BOARD CHANGES To the Administrator's Proposed Budget
Explanation
2019 effect of 2019-2021 Sheriff Deputies bargaining contract
Sheriff
Highway
2019 State Aid for roads will be $18,128 less than budgeted and
adjust projects to maximize grant revenue
Hillview Additional capital expenses for 2019
MILL RATE COMPARISON
Correct Error in calculation of amount to 85.21 Grant
Indirect Costs & Aging Transportation Programs
Apply Debt Service Fund Bal
Human Services Set-up new division to separate clinic from out of home care costs
Jail Scanner to be purchased in 2018
9

TABLE ICOUNTY PROPERTY VALUATION VS TAX LEVY
1 2 3 4 5 6 7Year Assessment Period Difference County State & County Col 4 / Col 2 CountyNo for Budget Year Assessment From Prior Year Tax Levy Tax Levy Mill Rate $ Per $1000
(See Note Below)1 2003 for 2004 5,496,493,200 +436,998,500 21,480,124 22,604,268 0.003910 3.912 2004 for 2005 5,977,036,900 +480,543,700 23,378,200 24,600,835 0.003910 3.913 2005 for 2006 6,422,072,400 +445,035,500 24,011,046 25,241,135 0.003740 3.744 2006 for 2007 7,010,337,200 +588,264,800 25,920,292 27,171,822 0.003700 3.705 2007 for 2008 7,478,344,900 +468,007,700 26,900,533 28,197,561 0.003600 3.606 2008 for 2009 7,574,955,100 +96,610,200 28,213,018 29,533,251 0.003725 3.737 2009 for 2010 7,750,936,600 +175,981,500 28,948,785 30,302,745 0.003735 3.748 2010 for 2011 7,681,814,500 -69,122,100 29,489,345 30,836,039 0.003839 3.849 2011 for 2012 7,630,015,700 -51,798,800 29,489,345 30,826,469 0.003865 3.8710 2012 for 2013 7,710,762,800 +80,747,100 29,839,209 31,193,028 0.003870 3.8711 2013 for 2014 7,809,766,300 +99,003,500 30,947,346 32,315,811 0.003963 3.9612 2014 for 2015 8,114,231,000 +304,464,700 31,576,855 33,008,972 0.003892 3.8913 2015 for 2016 8,408,267,300 +294,036,300 32,676,974 34,156,629 0.003886 3.8914 2016 for 2017 8,656,333,800 +248,066,500 33,646,864 35,181,726 0.003887 3.8915 2017 for 2018 9,149,390,900 +493,057,100 34,325,679 34,325,841 0.003752 3.7516 2018 for 2019 9,497,563,500 +348,172,600 34,884,624 34,884,624 * 0.003673 3.67
TABLE IICOMPARISON FOR INCREASES OR DECREASES FOR SAME PERIOD
Assessment Percent ChangeYear Assessment Period Difference Based From County Percent Mill Rate PercentNo for Budget Year on Previous Year Previous Year Tax Levy Diff. Change $ Difference Change
1 2003 for 2004 +436,998,500 +8.64 +1,413,740 +7.05 -.06 -1.512 2004 for 2005 +480,543,700 +8.74 +1,898,076 +8.84 +.00 +.003 2005 for 2006 +445,035,500 +7.45 +632,846 +2.71 -.17 -4.354 2006 for 2007 +588,264,800 +9.16 +1,909,246 +7.95 -.04 -1.075 2007 for 2008 +468,007,700 +6.68 +980,241 +3.78 -.10 -2.706 2008 for 2009 +96,610,200 +1.29 +1,312,485 +4.88 +.13 +3.477 2009 for 2010 +175,981,500 +2.32 +735,767 +2.61 +.01 +.278 2010 for 2011 -69,122,100 -.89 +540,560 +1.87 +.10 +2.789 2011 for 2012 -51,798,800 -.67 +0 +.00 +.03 +.6810 2012 for 2013 +80,747,100 +1.06 +349,864 +1.19 +.01 +.1311 2013 for 2014 +99,003,500 +1.28 +1,108,137 +3.71 +.09 +2.4012 2014 for 2015 +304,464,700 +3.90 +629,509 +2.03 -.07 -1.7913 2015 for 2016 +294,036,300 +3.62 +1,100,119 +3.48 -.01 -.1514 2016 for 2017 +248,066,500 +2.95 +969,890 +2.97 +.00 +.0315 2017 for 2018 +493,057,100 +5.70 +678,815 +2.02 -.14 -3.4716 2018 for 2019 +348,172,600 +3.81 +558,945 +1.63 -.08 -2.11
County Tax Levy includes La Crosse County Library and Winding Rivers Library Systems. County Library and WRLS are not assessed to the City of La Crosse. * For 2019 there is no state forestry tax or state special charges
10

City of La Crosse ; 33.7%
City of Onalaska; 21.6%
Vil of Holmen; 7.1%
Tn of Onalaska ; 6.2%
Tn of Shelby; 4.9%
Vil of West Salem; 4.5%
Tn of Holland; 4.5%
Tn of Campbell; 3.9%
Tn of Hamilton; 2.9%
Tn of Greenfield; 1.9%
Tn of Farmington; 1.9%
Tn of Medary; 1.9%
Tn of Barre; 1.3% Tn of Burns; 1.1%
Vil of Bangor; 0.9%Tn of Bangor; 0.7%
Tn of Washington; 0.6%
Vil of Rockland; 0.4%
Apportionment - 2019 County Budget
11

Org/Fund2018 Budgeted
Expenses 2018 Budgeted
Revenues
(From)/To Fund Balance,
Borrowing or Other Sources
2018 Board Approved
2019 Budgeted Expenses
2019 Budgeted Revenues
(From)/To Fund Balance,
Borrowing or Other Sources
2019 Board Approved
Increase (Decrease) in
Levy100.100.1000 County Board/Board Chair 294,342 - - 294,342 293,456 - - 293,456 (886) 100.105.1000 Courts 2,636,572 1,041,500 - 1,595,072 2,669,396 1,046,500 - 1,622,896 27,824 100.107.1000 Family Court Commissioner 155,079 12,000 - 143,079 159,381 11,500 - 147,881 4,802 100.110.1000 Corporation Counsel 513,789 - - 513,789 530,168 - - 530,168 16,379 100.110.1030 Mediation & Family Court Svcs 244,072 33,950 - 210,122 252,439 33,950 - 218,489 8,367 100.110.1060 Child Support 1,089,213 966,753 - 122,460 1,133,380 990,737 - 142,643 20,183 100.115.1000 D.A. 612,651 20,150 - 592,501 616,880 15,350 - 601,530 9,029 100.115.1090 Victim Witness 232,830 116,023 - 116,807 227,935 106,984 - 120,951 4,144 100.120.1000 Medical Examiner 272,356 169,621 - 102,735 302,464 172,350 - 130,114 27,379 100.125.1000 County Clerk 182,844 44,710 - 138,134 220,410 44,610 - 175,800 37,666 100.125.1120 Elections 172,353 13,025 (20,000) 139,328 114,578 13,025 - 101,553 (37,775) 100.130.1000 County Administrator 432,074 - - 432,074 441,672 - - 441,672 9,598 100.130.1180 Economic Development 357,788 2,400 (355,388) - 386,873 2,400 (384,473) - - 100.130.1190 Bluffland Protection 104,154 9,640 (75,000) 19,514 110,356 9,640 (79,000) 21,716 2,202 100.135.1000 Personnel 636,889 - (60,000) 576,889 615,730 - - 615,730 38,841 100.135.1210 Retirees 400,000 - - 400,000 600,000 - - 600,000 200,000 100.135.1240 Unemployment Comp 25,000 - - 25,000 20,000 - - 20,000 (5,000) 100.135.1270 Section 125 12,000 - - 12,000 12,750 - - 12,750 750 100.140.1000 I.T. 2,340,101 1,652 - 2,338,449 2,485,157 2,255 - 2,482,902 144,453 100.140.1330 Document Graphic Svcs 19,382 - - 19,382 13,757 - - 13,757 (5,625) 100.145.1000 Treasurer 277,719 616,600 - (338,881) 296,756 555,450 - (258,694) 80,187 100.150.1000 Finance 863,373 2,300 - 861,073 791,202 2,500 - 788,702 (72,371) 100.155.1360 Indirect Cost 7,750 1,897,856 - (1,890,106) 7,800 3,262,708 - (3,254,908) (1,364,802) 100.155.1370 Insurance 281,040 - - 281,040 299,900 - - 299,900 18,860 100.155.1390 External Audit 25,008 - - 25,008 24,515 - - 24,515 (493) 100.155.1420 ERP System 114,732 - (114,732) - 84,441 (84,441) - - 100.155.1450 Non-Department 112,285 16,627,417 (43,060) (16,558,192) 112,535 17,533,971 (43,060) (17,464,496) (906,304) 100.155.1480 G.F. Contingency 429,374 - - 429,374 539,653 - - 539,653 110,279 100.155.1510 Jeans Day 12,500 12,500 - - 15,200 15,200 - - - 100.155.1540 Historic Sites 1,340 - - 1,340 1,340 - - 1,340 - 100.155.1545 Historical Society 25,000 - - 25,000 25,000 - - 25,000 - 100.155.1570 Neighborhood Revitalizaiton 25,000 - (25,000) - - - - 100.155.1580 Small Capital Projects 450,000 - (450,000) - 395,000 - (395,000) - - 100.155.1590 Coalition to End Homelessness 500,000 - (500,000) - - - - 100.155.1630 Badger Coulee - - - - - - - - - 100.155.1630 Park Plaza - - - - - - - - - 100.157.1000 Occupational Health 210,434 22,489 - 187,945 237,228 19,900 - 217,328 29,383 100.160.XXXX Facilities 3,612,117 1,009,840 (243,400) 2,358,877 4,659,364 1,438,032 (822,481) 2,398,851 39,974 100.175.1000 Register of Deeds 357,552 726,830 - (369,278) 390,915 760,000 - (369,085) 193 100.180.1000 Zoning 814,792 134,087 - 680,705 636,367 129,555 - 506,812 (173,893) 100.180.2110 Surveyor - 177,542 3,900 - 173,642 173,642 100.185.2140 Sheriff - Patrol 4,954,792 174,420 (172,000) 4,608,372 5,206,165 249,920 (132,435) 4,823,810 215,438 100.185.2170 Jail 7,147,174 483,580 - 6,663,594 7,233,476 464,830 - 6,768,646 105,052 100.190.1000 Emergency Services 2,484,525 - - 2,484,525 2,509,752 - - 2,509,752 25,227 100.190.2200 Emergency Mgmt 86,256 65,000 - 21,256 101,439 76,582 - 24,857 3,601 100.190.2230 Emerg. Svcs - SARA Hazmat 81,713 35,500 - 46,213 81,458 38,918 - 42,540 (3,673) 100.195.1000 Veterans Service 282,709 13,000 - 269,709 292,305 13,000 - 279,305 9,596 100.195.2260 Veterans Relief 21,020 - - 21,020 21,550 - - 21,550 530 100.195.2290 Vet Mentor 1,909 - - 1,909 3,648 1,739 - 1,909 - 100.200.1000 UW Extension 476,780 15,130 (30,000) 431,650 422,316 15,130 - 407,186 (24,464) 100.200.2320 WNEP 3,997 - - 3,997 3,997 - - 3,997 - 100.200.2470 Harbor Commission 6,200 18,300 12,100 - 4,250 18,300 14,050 - - 100.200.XXXX Community Orgs, Family Living, 4-H, Ag 33,002 33,002 - - 33,002 33,002 - - - 100.205.1000 Land Conservation 888,827 433,751 (5,000) 450,076 776,471 314,819 - 461,652 11,576 100.210.1000 MPO 299,332 300,924 1,592 - 317,682 303,089 5,407 20,000 20,000
200 Health 5,024,512 2,919,153 - 2,105,359 4,922,515 2,793,004 - 2,129,511 24,152 210 Human Services (Excluding MVHS) 40,502,817 30,370,721 (55,719) 10,076,377 38,397,115 27,711,790 - 10,685,325 608,948 220 HS MVHS 1,596,120 25,000 (63,120) 1,508,000 1,764,045 25,000 - 1,739,045 231,045 230 WREA 6,687,106 6,271,786 (103,938) 311,382 6,650,348 6,335,624 - 314,724 3,342 255 Aging/Elderly Services 3,407,623 2,798,083 (14,085) 595,455 3,589,699 2,817,686 - 772,013 176,558 265 Estate Donation 31,000 10,000 (21,000) - - - - - -
270.675.1000 Land Recording 121,927 128,000 6,073 - 137,681 179,000 41,319 - - 275.680.1000 Special Assessment Jail 110,616 133,762 23,146 - 119,191 134,000 14,809 - -
280/281 CDBG Revolving Loans 1,394,644 1,394,644 - - 1,681,959 1,681,959 - - - 283.700.1000 Revolving Loan 6,474 6,474 - - 10,474 10,474 - - - 284.705.XXXX Business Park 276,333 200,506 (75,827) - 236,835 202,415 (34,420) - - 298.720.1000 Old Landfill 42,123 - (42,123) - 42,965 - (42,965) - - 299.710.1000 Computer Revolving Loan - - - - - - - - -
La Crosse County 2019 Budget
Department
12
rNugent
Text Box
12

Org/Fund2018 Budgeted
Expenses 2018 Budgeted
Revenues
(From)/To Fund Balance,
Borrowing or Other Sources
2018 Board Approved
2019 Budgeted Expenses
2019 Budgeted Revenues
(From)/To Fund Balance,
Borrowing or Other Sources
2019 Board Approved
Increase (Decrease) in
LevyDepartment400 Capital Projects - - - - - - - - -
Internal Service710 Highway 14,669,262 5,040,110 (6,329,152) 3,300,000 14,944,507 8,476,577 (2,898,776) 3,569,154 269,154 770 WMMIC 92,000 92,000 - - 85,000 85,000 - - - 775 Workers Comp 413,160 413,160 - - 364,800 364,800 - - -
Enterprise611.220.6310 Hillview 15,690,808 15,441,988 (248,820) - 13,722,803 13,003,827 (718,976) - - 615.760.1000 Hillview Terrace 957,609 1,098,874 141,265 - 955,300 1,065,186 109,886 - - 618.765.1000 Carroll Heights 244,558 396,692 152,134 - 246,547 380,852 134,305 - - 621.220.1000 Lakeview 7,148,065 7,148,065 - - 7,146,735 7,146,735 - - - 623.650.1000 Regent 452,655 456,417 3,762 - 502,831 463,539 (39,292) - - 624.770.1000 Maplewood 849,220 860,378 11,158 - 830,099 868,471 38,372 - - 625.650.1000 Neshonoc Manor 873,709 960,680 86,971 - 902,913 957,754 54,841 - - 626.650.1000 Ravenwood 1,206,200 1,245,065 38,865 - 1,313,803 1,320,403 6,600 - - 627.650.1000 Monarch Manor 556,465 592,545 36,080 - 600,496 596,402 (4,094) - - 628.775.1000 Lakeview Capital Assets 294,403 375,000 80,597 - 767,118 795,425 28,307 - - 650.650.1000 Solid Waste 15,273,619 11,761,038 (3,512,581) - 11,565,946 11,740,105 174,159 - - 680.785.1000 Household Haz. Materials 496,363 338,350 (3,963) 154,050 466,697 339,111 33,325 160,911 6,861
TOTAL OPERATING 154,041,132 115,532,441 (11,970,165) 26,538,526 148,877,473 117,194,985 (5,024,033) 26,658,455 119,929
290.650.1000 Library 2,056,644 76,955 - 1,979,689 2,154,425 91,498 - 2,062,927 83,238 290.715.1000 WRLS 24,621 24,621 24,621 - - 24,621 -
TOTAL LIBRARY 2,081,265 76,955 - 2,004,310 2,179,046 91,498 - 2,087,548 83,238
300 Refundings & LEC Debt 6,086,872 - (304,029) 5,782,843 6,319,374 - (180,753) 6,138,621 355,778
TOTAL DEBT 6,086,872 - (304,029) 5,782,843 6,319,374 - (180,753) 6,138,621 355,778
TOTAL COUNTY LEVY 162,209,269 115,609,396 (12,274,194) 34,325,679 157,375,893 117,286,483 (5,204,786) 34,884,624 558,945 Summary State Forestry - - - -
State Charges 162 162 - - (162)
TOTAL STATE & COUNTY TAX 162,209,431 115,609,396 (12,274,194) 34,325,841 157,375,893 117,286,483 (5,204,786) 34,884,624 558,783
Operating Levy 26,538,526 26,658,455 0.45%Library & WRLS 2,004,310 2,087,548 4.15%Debt Service 5,782,843 6,138,621 6.15%
Total Levy w/New Debt 34,325,679 34,884,624 1.63%
2018 Actual Operating Levy without State Charges 26,538,5262017 2018 2019 457,790
Operating 3.009 2.901 2.807 18,046Library 0.224 0.219 0.220 2,388 Debt 0.655 0.632 0.646 Personal Property Aid (358,295)Total Mill Rate 3.888 3.752 3.673 Maximum operating levy 2019 26,658,455
Amount (over) under max operating limit 0
2017 2018 2019 2018 2019Equalized Value (less TID Incr) 8,656,333,800 9,149,390,900 9,497,563,500 Gross Expenditures 162,209,269 157,375,893 % of Incr over Prev. Year 2.95% 5.70% 3.81% TOTAL GROSS EXPENDITURES 162,209,269 157,375,893 (4,833,376) -2.98%
Amount of Increase
(Decrease) from
Percent of Increase
(Decrease) from
MILL RATE COMPARISON Increase (Decrease) necessary to meet:
2019 Allowable due to Net New ConstructionTerminated TID
TID Subtration %
Comparison of Equalized ValuesComparison of Gross Expenditures
13

La Crosse County 2019 Budget Summary
2016 Actual
2017Actual
2018Adopted
2018 Estimate
2019 Requested
2019 Administrator
Recommended
2019Board
Approved100.100.1000 COUNTY BOARDFrom Self Insurance HRA 975 - - - - - - Total Revenues / Sources 975 - - - - - -
Salary & Fringe Expense 234,248 232,885 238,012 238,012 238,575 239,326 239,326 Operating Expense 45,405 77,035 56,330 90,194 54,130 54,130 54,130 Total Expenses / Uses 279,653 309,920 294,342 328,206 292,705 293,456 293,456
Net Funding 278,678 309,920 294,342 328,206 292,705 293,456 293,456
100.105.1000 CLERK OF COURTSRevenues 1,050,862 1,031,666 1,041,500 1,002,500 1,046,500 1,046,500 1,046,500 From Self Insurance HRA 12,488 - - - - - - Total Revenues / Sources 1,063,350 1,031,666 1,041,500 1,002,500 1,046,500 1,046,500 1,046,500
Salary & Fringe Expense 1,622,705 1,621,134 1,718,839 1,671,000 1,713,823 1,733,532 1,733,532 Operating Expense 797,670 768,507 917,733 900,415 933,423 935,864 935,864 Capital Expense - - - - - - - Total Expenses / Uses 2,420,375 2,389,641 2,636,572 2,571,415 2,647,246 2,669,396 2,669,396
Net Funding 1,357,025 1,357,975 1,595,072 1,568,915 1,600,746 1,622,896 1,622,896
100.107.1000 FAMILY COURT COMMISSIONERRevenues 10,769 10,536 12,000 11,500 11,500 11,500 11,500 From Self Insurance HRA 1,200 - - - - - - Total Revenues / Sources 11,969 10,536 12,000 11,500 11,500 11,500 11,500
Salary & Fringe Expense 188,582 192,078 199,869 199,869 200,890 203,671 203,671 Operating Expense (44,404) (47,827) (44,790) (49,840) (44,290) (44,290) (44,290) Total Expenses / Uses 144,178 144,251 155,079 150,029 156,600 159,381 159,381
Net Funding 132,209 133,715 143,079 138,529 145,100 147,881 147,881
100.110.1000 CORPORATION COUNSELRevenues 111 80 - - - - - From Self Insurance HRA 3,250 - - - - - - Total Revenues / Sources 3,361 80 - - - - -
Salary & Fringe Expense 567,123 544,266 619,495 619,495 632,741 641,392 641,392 Operating Expense (74,953) (103,385) (105,706) (128,906) (111,224) (111,224) (111,224) Total Expenses / Uses 492,170 440,881 513,789 490,589 521,517 530,168 530,168
Net Funding 488,809 440,801 513,789 490,589 521,517 530,168 530,168
100.110.1030 MEDIATION-FAM COURT SVCSRevenues 32,486 35,845 33,950 32,185 33,950 33,950 33,950 From Self Insurance HRA 1,200 - - - - - - Total Revenues / Sources 33,686 35,845 33,950 32,185 33,950 33,950 33,950
Salary & Fringe Expense 209,364 228,918 238,722 238,722 240,663 243,989 243,989 Operating Expense 7,345 7,967 5,350 9,682 8,450 8,450 8,450 Total Expenses / Uses 216,709 236,885 244,072 248,404 249,113 252,439 252,439
Net Funding 183,023 201,040 210,122 216,219 215,163 218,489 218,489
100.110.1060 CHILD SUPPORTRevenues 905,873 923,550 966,753 958,703 983,382 990,737 990,737 From Self Insurance HRA 5,238 - - - - - - Total Revenues / Sources 911,111 923,550 966,753 958,703 983,382 990,737 990,737
Salary & Fringe Expense 777,555 804,258 824,402 821,486 855,417 866,561 866,561 Operating Expense 211,099 225,132 264,811 267,542 267,319 266,819 266,819 Total Expenses / Uses 988,654 1,029,390 1,089,213 1,089,028 1,122,736 1,133,380 1,133,380
Net Funding 77,543 105,840 122,460 130,325 139,354 142,643 142,643
14

2016 Actual
2017Actual
2018Adopted
2018 Estimate
2019 Requested
2019 Administrator
Recommended
2019Board
Approved
100.115.1000 D.A. PROSECUTIONRevenues 21,129 16,671 20,150 13,300 15,350 15,350 15,350 From Self Insurance HRA 4,350 - - - - - - Total Revenues / Sources 25,479 16,671 20,150 13,300 15,350 15,350 15,350
Salary & Fringe Expense 555,664 546,717 569,527 539,632 550,399 580,380 580,380 Operating Expense 37,351 42,120 43,124 31,929 36,700 36,500 36,500 Total Expenses / Uses 593,015 588,837 612,651 571,561 587,099 616,880 616,880
Net Funding 567,536 572,166 592,501 558,261 571,749 601,530 601,530
100.115.1090 VICTIM-WITNESS SERVICERevenues 102,073 95,040 116,023 106,590 106,984 106,984 106,984 From Self Insurance HRA 1,800 - - - - - - Total Revenues / Sources 103,873 95,040 116,023 106,590 106,984 106,984 106,984
Salary & Fringe Expense 193,666 179,484 205,884 193,942 191,064 196,115 196,115 Operating Expense 21,434 24,105 26,946 28,120 31,820 31,820 31,820 Total Expenses / Uses 215,100 203,589 232,830 222,062 222,884 227,935 227,935
Net Funding 111,227 108,549 116,807 115,472 115,900 120,951 120,951
100.120.1000 MEDICAL EXAMINERRevenues 162,155 177,721 169,621 170,080 172,350 172,350 172,350 Total Revenues / Sources 162,155 177,721 169,621 170,080 172,350 172,350 172,350
Salary & Fringe Expense 160,932 177,496 179,095 196,303 183,070 179,799 179,799 Operating Expense 81,960 124,094 93,261 124,005 122,865 122,665 122,665 Total Expenses / Uses 242,892 301,590 272,356 320,308 305,935 302,464 302,464
Net Funding 80,737 123,869 102,735 150,228 133,585 130,114 130,114
100.125.1000 COUNTY CLERKRevenues 50,352 55,442 44,710 50,705 44,610 44,610 44,610 From Self Insurance HRA 1,300 - - - - - - Total Revenues / Sources 51,652 55,442 44,710 50,705 44,610 44,610 44,610
Salary & Fringe Expense 248,477 242,499 260,079 260,079 263,839 265,945 265,945 Operating Expense (74,479) (41,440) (77,235) (75,309) (45,335) (45,535) (45,535) Total Expenses / Uses 173,998 201,059 182,844 184,770 218,504 220,410 220,410
Net Funding 122,346 145,617 138,134 134,065 173,894 175,800 175,800
100.125.1120 ELECTIONSRevenues 19,416 17,000 13,025 17,010 13,025 13,025 13,025 From Fund Balance - - 20,000 20,000 - - - Total Revenues / Sources 19,416 17,000 33,025 37,010 13,025 13,025 13,025
Operating Expense 159,778 83,919 172,353 164,887 114,578 114,578 114,578 Capital Expense - - - - - - - Total Expenses / Uses 159,778 83,919 172,353 164,887 114,578 114,578 114,578
Net Funding 140,362 66,919 139,328 127,877 101,553 101,553 101,553
100.130.1000 COUNTY ADMINISTRATORFrom Self Insurance HRA 1,450 - - - - - - Total Revenues / Sources 1,450 - - - - - -
Salary & Fringe Expense 415,603 423,431 434,297 434,297 437,983 444,289 444,289 Operating Expense (5,249) (4,841) (2,223) (1,943) (2,629) (2,617) (2,617) Total Expenses / Uses 410,354 418,590 432,074 432,354 435,354 441,672 441,672
Net Funding 408,904 418,590 432,074 432,354 435,354 441,672 441,672
15

2016 Actual
2017Actual
2018Adopted
2018 Estimate
2019 Requested
2019 Administrator
Recommended
2019Board
Approved100.130.1180 ECONOMIC DEVELOPMENTRevenues 20,824 944 2,400 31,200 2,400 2,400 2,400 Excess Sales Tax 277,136 288,888 355,388 376,520 381,806 384,473 384,473 From Self Insurance HRA 600 - - - - - - Total Revenues / Sources 298,560 289,832 357,788 407,720 384,206 386,873 386,873
Salary & Fringe Expense 100,724 103,209 103,452 171,670 172,692 175,126 175,126 Operating Expense 197,836 186,623 254,336 236,050 211,514 211,747 211,747 Total Expenses / Uses 298,560 289,832 357,788 407,720 384,206 386,873 386,873
Net Funding - - - - - - -
100.130.1190 BLUFFLAND PROTECTIONRevenues - - 9,640 9,640 9,640 9,640 9,640 From Cap X 2020 Fund Balance - - 75,000 - 79,000 79,000 79,000 Total Revenues / Sources - - 84,640 9,640 88,640 88,640 88,640
Salary & Fringe Expense - - 29,154 24,684 29,164 29,679 29,679 Operating Expense - 4,124 75,000 2,038 80,677 80,677 80,677 Total Expenses / Uses - 4,124 104,154 26,722 109,841 110,356 110,356
Net Funding - 4,124 19,514 17,082 21,201 21,716 21,716
100.135.1000 PERSONNELRevenues 187 194 - - - - - From Salary Contingency - - 60,000 - - - - From Self Insurance HRA 3,600 - - - - - - Total Revenues / Sources 3,787 194 60,000 - - - -
Salary & Fringe Expense 477,766 500,465 513,989 513,989 525,420 538,220 538,220 Operating Expense 58,109 40,424 122,900 57,310 61,110 77,510 77,510 Total Expenses / Uses 535,875 540,889 636,889 571,299 586,530 615,730 615,730
Net Funding 532,088 540,695 576,889 571,299 586,530 615,730 615,730
100.135.1210 RETIREES INSURANCEFrom Salary Contingency - - - - 100,000 - - Total Revenues / Sources - - - - 100,000 - -
Salary & Fringe Expense 330,936 579,396 400,000 500,000 500,000 600,000 600,000 Total Expenses / Uses 330,936 579,396 400,000 500,000 500,000 600,000 600,000
Net Funding 330,936 579,396 400,000 500,000 400,000 600,000 600,000
100.135.1240 UNEMPLOYMENT COMPTotal Revenues / Sources - - - - - - -
Salary & Fringe Expense 51,183 50,234 69,500 50,000 50,000 50,000 50,000 Operating Expense (44,146) (39,527) (44,500) (36,000) (30,000) (30,000) (30,000) Total Expenses / Uses 7,037 10,707 25,000 14,000 20,000 20,000 20,000
Net Funding 7,037 10,707 25,000 14,000 20,000 20,000 20,000
100.135.1270 SECTION 125Revenues 5,571 8,581 - - - - - Total Revenues / Sources 5,571 8,581 - - - - -
Operating Expense 11,847 12,061 12,000 12,750 12,750 12,750 12,750 Total Expenses / Uses 11,847 12,061 12,000 12,750 12,750 12,750 12,750
Net Funding 6,276 3,480 12,000 12,750 12,750 12,750 12,750
16

2016 Actual
2017Actual
2018Adopted
2018 Estimate
2019 Requested
2019 Administrator
Recommended
2019Board
Approved100.140.1000 INFORMATION TECHNOLOGYRevenues 7,038 1,572 1,652 1,652 2,255 2,255 2,255 From Self Insurance HRA 9,663 - - - - - - From Comp Rev Loan FB 60,000 40,000 - - - - - Total Revenues / Sources 76,701 41,572 1,652 1,652 2,255 2,255 2,255
Salary & Fringe Expense 1,790,226 1,987,815 2,101,616 2,056,148 2,048,556 2,160,239 2,160,239 Operating Expense 196,803 193,140 221,335 341,595 213,712 209,268 209,268 Capital Expense 104,701 75,941 17,150 30,150 115,650 115,650 115,650 Total Expenses / Uses 2,091,730 2,256,896 2,340,101 2,427,893 2,377,918 2,485,157 2,485,157
Net Funding 2,015,029 2,215,324 2,338,449 2,426,241 2,375,663 2,482,902 2,482,902
100.140.1330 DOCUMENT GRAPHIC SERVICESRevenues 4,915 - - - - - - From Self Insurance HRA 1,200 - - - - - - Total Revenues / Sources 6,115 - - - - - -
Salary & Fringe Expense 179,434 138,377 147,072 146,508 142,637 144,582 144,582 Operating Expense (97,973) (118,124) (127,690) (125,752) (130,825) (130,825) (130,825) Total Expenses / Uses 81,461 20,253 19,382 20,756 11,812 13,757 13,757
Net Funding 75,346 20,253 19,382 20,756 11,812 13,757 13,757
100.145.1000 TREASURERRevenues 1,023,305 745,856 616,600 616,200 555,450 555,450 555,450 From Self Insurance HRA 750 - - - - - - Total Revenues / Sources 1,024,055 745,856 616,600 616,200 555,450 555,450 555,450
Salary & Fringe Expense 197,228 186,008 229,764 214,320 240,684 242,421 242,421 Operating Expense 44,241 127,068 47,955 53,605 54,535 54,335 54,335 Total Expenses / Uses 241,469 313,076 277,719 267,925 295,219 296,756 296,756
Net Funding (782,586) (432,780) (338,881) (348,275) (260,231) (258,694) (258,694)
100.150.1000 FINANCERevenues 2,808 2,470 2,300 2,500 2,500 2,500 2,500 From Self Insurance HRA 5,775 - - - - - - Total Revenues / Sources 8,583 2,470 2,300 2,500 2,500 2,500 2,500
Salary & Fringe Expense 962,727 948,307 844,808 757,649 760,481 770,906 770,906 Operating Expense (108,658) (152,212) 18,565 15,196 20,296 20,296 20,296 Total Expenses / Uses 854,069 796,095 863,373 772,845 780,777 791,202 791,202
Net Funding 845,486 793,625 861,073 770,345 778,277 788,702 788,702
100.155.1360 INDIRECT COST CONTRACTRevenues 1,814,478 1,771,581 1,897,856 1,897,856 3,214,137 3,249,343 3,262,708 Total Revenues / Sources 1,814,478 1,771,581 1,897,856 1,897,856 3,214,137 3,249,343 3,262,708
Operating Expense 7,500 8,164 7,750 7,650 7,800 7,800 7,800 Total Expenses / Uses 7,500 8,164 7,750 7,650 7,800 7,800 7,800
Net Funding (1,806,978) (1,763,417) (1,890,106) (1,890,206) (3,206,337) (3,241,543) (3,254,908)
100.155.1370 INSURANCETotal Revenues / Sources - - - - - - -
Operating Expense 285,815 200,359 281,040 295,154 299,900 299,900 299,900 Total Expenses / Uses 285,815 200,359 281,040 295,154 299,900 299,900 299,900
Net Funding 285,815 200,359 281,040 295,154 299,900 299,900 299,900
17

2016 Actual
2017Actual
2018Adopted
2018 Estimate
2019 Requested
2019 Administrator
Recommended
2019Board
Approved100.155.1390 EXTERNAL AUDITINGTotal Revenues / Sources - - - - - - -
Operating Expense 24,279 24,637 25,008 25,057 24,515 24,515 24,515 Total Expenses / Uses 24,279 24,637 25,008 25,057 24,515 24,515 24,515
Net Funding 24,279 24,637 25,008 25,057 24,515 24,515 24,515
100.155.1420 ERP SYSTEMFrom Fund Balance 30,559 - 114,732 264,552 83,977 84,441 84,441 Total Revenues / Sources 30,559 - 114,732 264,552 83,977 84,441 84,441
Salary & Fringe Expense 92,577 75,857 - - - - - Operating Expense 170 40,012 114,732 114,552 43,977 44,441 44,441 Capital Expense 721,098 99,025 - 150,000 40,000 40,000 40,000 Total Expenses / Uses 813,845 214,894 114,732 264,552 83,977 84,441 84,441
Net Funding 783,286 214,894 - - - - -
100.155.1450 NON-DEPARTMENTALRevenues 17,725,198 20,360,012 16,627,417 19,457,521 16,779,721 17,533,971 17,533,971 From Salary Contingency - - 43,060 10,795 43,060 43,060 43,060 From Interest Reserve Fund - - - - - - - Total Revenues / Sources 17,725,198 20,360,012 16,670,477 19,468,316 16,822,781 17,577,031 17,577,031
Transfers Out 2,446,980 3,504,221 16,415 2,716,415 16,415 16,415 16,415 Salary & Fringe Expense - 3,652 43,060 10,795 43,060 43,060 43,060 Operating Expense 140,579 952,794 52,810 78,060 53,060 53,060 53,060 Capital Expense 91,191 - - - - - - Total Expenses / Uses 2,678,750 4,460,667 112,285 2,805,270 112,535 112,535 112,535
Net Funding (15,046,448) (15,899,345) (16,558,192) (16,663,046) (16,710,246) (17,464,496) (17,464,496)
100.155.1480 GENERAL FUND CONTINGENCYTotal Revenues / Sources - - - - - - -
Transfers Out - 500,000 - - - - - Operating Expense - - 429,374 - 410,000 526,288 507,664 Total Expenses / Uses - 500,000 429,374 - 410,000 526,288 507,664
Net Funding - 500,000 429,374 - 410,000 526,288 507,664
100.155.1510 JEANS DAYRevenues 12,611 13,280 12,500 15,200 15,200 15,200 15,200 Total Revenues / Sources 12,611 13,280 12,500 15,200 15,200 15,200 15,200
Operating Expense 12,611 13,280 12,500 15,200 15,200 15,200 15,200 Total Expenses / Uses 12,611 13,280 12,500 15,200 15,200 15,200 15,200
Net Funding - - - - - - -
100.155.1540 HISTORIC SITESRevenues - 967 - 19,033 - - - Total Revenues / Sources - 967 - 19,033 - - -
Operating Expense 943 1,178 1,340 21,502 1,340 1,340 1,340 Total Expenses / Uses 943 1,178 1,340 21,502 1,340 1,340 1,340
Net Funding 943 211 1,340 2,469 1,340 1,340 1,340
100.155.1545 HISTORICAL SOCIETIESTotal Revenues / Sources - - - - - - -
Operating Expense 25,000 25,000 25,000 25,000 25,000 25,000 25,000 Total Expenses / Uses 25,000 25,000 25,000 25,000 25,000 25,000 25,000
Net Funding 25,000 25,000 25,000 25,000 25,000 25,000 25,000
18

2016 Actual
2017Actual
2018Adopted
2018 Estimate
2019 Requested
2019 Administrator
Recommended
2019Board
Approved
100.155.1570 NEIGHBORHOOD REVITALIZATIONRevenues - - - 1,375,000 - - - From Fund Balance 35,641 212,829 25,000 25,000 - - - Total Revenues / Sources 35,641 212,829 25,000 1,400,000 - - -
Operating Expense 35,641 212,829 25,000 366,262 - - - Total Expenses / Uses 35,641 212,829 25,000 366,262 - - -
Net Revenues/Expenses - - - (1,033,738) - - - To Fund Balance - - - 1,033,738 - - - Net Funding - - - - - - -
100.155.1580 SMALL CAPITAL PROJECTSFrom Fund Balance 316,201 716,540 450,000 448,451 395,000 395,000 395,000 Total Revenues / Sources 316,201 716,540 450,000 448,451 395,000 395,000 395,000
Capital Expense 316,201 716,540 450,000 448,451 395,000 395,000 395,000 Total Expenses / Uses 316,201 716,540 450,000 448,451 395,000 395,000 395,000
Net Funding - - - - - - -
100.155.1590 LA CROSSE COLLABORATIVE TO END HOMELESSNESSExcess Sales Tax - - 500,000 50,000 - - - Total Revenues / Sources - - 500,000 50,000 - - -
Operating Expense - - 500,000 50,000 - - - Total Expenses / Uses - - 500,000 50,000 - - -
Net Funding - - - - - - - 100.155.1600 CAP X 2020From Fund Balance 18,005 37,774 - 44,404 - - - Total Revenues / Sources 18,005 37,774 - 44,404 - - -
Operating Expense - - - - - - - Capital Expense 18,005 37,774 - 44,404 - - - Total Expenses / Uses 18,005 37,774 - 44,404 - - -
Net Funding - - - - - - -
100.155.1630 BADGER COULEERevenues 75,000 472,043 - - - - - From Fund Balance - - - 53,023 - - - Total Revenues / Sources 75,000 472,043 - 53,023 - - -
Operating Expense 109,787 62,150 - - - - - Capital Expense 46,440 537 - 53,023 - - - Total Expenses / Uses 156,227 62,687 - 53,023 - - -
Net Funding 81,227 (409,356) - - - - -
100.155.1660 PARK PLAZA PROCEEDSRevenues - - - 70,223 - - - From Fund Balance (200,000) - - - - - - Total Revenues / Sources (200,000) - - 70,223 - - -
Operating Expense - - - - - - - Capital Expense 425 83,252 - 70,223 - - - Total Expenses / Uses 425 83,252 - 70,223 - - -
Net Funding 200,425 83,252 - - - - -
19

2016 Actual
2017Actual
2018Adopted
2018 Estimate
2019 Requested
2019 Administrator
Recommended
2019Board
Approved100.157.1000 OCCUPATIONAL HEALTHRevenues 13,564 17,345 22,489 19,989 19,900 19,900 19,900 From Self Insurance Fund 68,229 - - - - - - Total Revenues / Sources 81,793 17,345 22,489 19,989 19,900 19,900 19,900
Operating Expense 173,313 208,864 210,434 249,275 237,228 237,228 237,228 Total Expenses / Uses 173,313 208,864 210,434 249,275 237,228 237,228 237,228
Net Funding 91,520 191,519 187,945 229,286 217,328 217,328 217,328
FACILITIES DEPARTMENTRevenues 998,591 1,019,878 1,009,840 1,013,108 1,438,032 1,438,032 1,438,032 From Fund Balance - 145,000 243,400 243,400 722,481 822,481 822,481 From Self Insurance HRA 10,375 - - - - - - Total Revenues / Sources 1,008,966 1,164,878 1,253,240 1,256,508 2,160,513 2,260,513 2,260,513
Salary & Fringe Expense 1,858,344 1,984,886 2,151,847 2,151,847 2,153,321 2,181,869 2,181,869 Operating Expense 1,270,554 1,173,700 1,131,670 1,173,286 1,179,245 1,175,845 1,175,845 Capital Expense 580,792 581,855 328,600 537,669 1,201,650 1,301,650 1,301,650 Total Expenses / Uses 3,709,690 3,740,441 3,612,117 3,862,802 4,534,216 4,659,364 4,659,364
Net Funding 2,700,724 2,575,563 2,358,877 2,606,294 2,373,703 2,398,851 2,398,851
100.175.1000 REGISTER OF DEEDSRevenues 828,158 794,309 726,830 763,000 760,000 760,000 760,000 From Self Insurance HRA 2,500 - - - - - - Total Revenues / Sources 830,658 794,309 726,830 763,000 760,000 760,000 760,000
Salary & Fringe Expense 322,170 328,972 340,316 340,238 345,169 348,209 348,209 Operating Expense 74,245 18,329 17,236 15,736 42,706 42,706 42,706 Total Expenses / Uses 396,415 347,301 357,552 355,974 387,875 390,915 390,915
Net Funding (434,243) (447,008) (369,278) (407,026) (372,125) (369,085) (369,085)
100.180.1000 ZONINGRevenues 136,261 139,478 134,087 111,153 129,555 129,555 129,555 From Self Insurance HRA 4,775 - - - - - - Total Revenues / Sources 141,036 139,478 134,087 111,153 129,555 129,555 129,555
Salary & Fringe Expense 810,430 813,778 899,465 588,827 592,284 600,737 600,737 Operating Expense (68,062) (45,358) (84,673) 30,927 35,450 35,630 35,630 Total Expenses / Uses 742,368 768,420 814,792 619,754 627,734 636,367 636,367
Net Funding 601,332 628,942 680,705 508,601 498,179 506,812 506,812
100.180.2110 SURVEYORRevenues - - - 5,950 3,900 3,900 3,900 Total Revenues / Sources - - - 5,950 3,900 3,900 3,900
Salary & Fringe Expense 168,590 171,480 173,949 173,949 Operating Expense 3,170 3,593 3,593 3,593 Total Expenses / Uses - - - 171,760 175,073 177,542 177,542
Net Funding - - - 165,810 171,173 173,642 173,642
100.185.2140 SHERIFF LAW ENFORCEMENTRevenues 196,695 558,750 174,420 286,470 249,920 249,920 249,920 From Fund Balance - - 172,000 172,000 132,435 132,435 132,435 From Self Insurance HRA 17,713 - - - - - - Total Revenues / Sources 214,408 558,750 346,420 458,470 382,355 382,355 382,355
Salary & Fringe Expense 4,163,591 4,290,459 4,287,247 4,313,730 4,329,429 4,388,667 4,420,656 Operating Expense 429,566 856,609 495,545 597,225 673,738 673,738 673,738 Capital Expense 159,974 174,668 172,000 172,000 143,760 143,760 143,760 Total Expenses / Uses 4,753,131 5,321,736 4,954,792 5,082,955 5,146,927 5,206,165 5,238,154
Net Funding 4,538,723 4,762,986 4,608,372 4,624,485 4,764,572 4,823,810 4,855,799
20

2016 Actual
2017Actual
2018Adopted
2018 Estimate
2019 Requested
2019 Administrator
Recommended
2019Board
Approved
100.185.2170 SHERIFF JAILRevenues 703,480 461,247 483,580 460,580 464,830 464,830 464,830 From Fund Balance - - - - 118,750 118,750 - From Self Insurance HRA 29,650 - - - - - - Total Revenues / Sources 733,130 461,247 483,580 460,580 583,580 583,580 464,830
Salary & Fringe Expense 5,077,575 5,040,687 5,262,651 5,171,824 5,230,106 5,299,133 5,299,133 Operating Expense 1,714,034 1,739,862 1,884,523 1,814,823 1,933,416 1,934,343 1,934,343 Capital Expense 5,591 - - - 118,750 118,750 - Total Expenses / Uses 6,797,200 6,780,549 7,147,174 6,986,647 7,282,272 7,352,226 7,233,476
Net Funding 6,064,070 6,319,302 6,663,594 6,526,067 6,698,692 6,768,646 6,768,646
100.190.1000 EMERGENCY SERVICES Revenues - 7,760 - - - - - From Self Insurance HRA 12,375 - - - - - - Total Revenues / Sources 12,375 7,760 - - - - -
Salary & Fringe Expense 2,148,871 2,182,947 2,277,655 2,181,740 2,276,706 2,306,982 2,306,982 Operating Expense 188,307 93,940 206,870 170,692 206,270 202,770 202,770 Capital Expense 15,000 11,609 - - - - - Total Expenses / Uses 2,352,178 2,288,496 2,484,525 2,352,432 2,482,976 2,509,752 2,509,752
Net Funding 2,339,803 2,280,736 2,484,525 2,352,432 2,482,976 2,509,752 2,509,752
100.190.2200 EMERGENCY MANAGEMENTRevenues 78,359 68,059 65,000 68,804 67,582 76,582 76,582 From Self Insurance HRA 350 - - - - - - Total Revenues / Sources 78,709 68,059 65,000 68,804 67,582 76,582 76,582
Salary & Fringe Expense 126,106 127,546 129,444 69,952 70,972 72,114 72,114 Operating Expense (34,163) (44,503) (43,188) 14,575 27,825 29,325 29,325 Total Expenses / Uses 91,943 83,043 86,256 84,527 98,797 101,439 101,439
Net Funding 13,234 14,984 21,256 15,723 31,215 24,857 24,857
100.190.2230 EMERGENCY SERVICES SARA GRANTRevenues 50,318 33,984 35,500 41,450 38,918 38,918 38,918 Total Revenues / Sources 50,318 33,984 35,500 41,450 38,918 38,918 38,918
Salary & Fringe Expense - - - 60,531 61,256 62,258 62,258 Operating Expense 92,409 74,177 81,713 25,150 19,200 19,200 19,200 Total Expenses / Uses 92,409 74,177 81,713 85,681 80,456 81,458 81,458
Net Funding 42,091 40,193 46,213 44,231 41,538 42,540 42,540
100.195.1000 VETERANSRevenues 29,405 18,550 13,000 22,950 13,000 13,000 13,000 From Self Insurance HRA 1,700 - - - - - - Total Revenues / Sources 31,105 18,550 13,000 22,950 13,000 13,000 13,000
Salary & Fringe Expense 251,337 263,052 268,788 268,933 275,682 279,244 279,244 Operating Expense 20,503 26,042 13,921 22,756 13,061 13,061 13,061 Total Expenses / Uses 271,840 289,094 282,709 291,689 288,743 292,305 292,305
Net Funding 240,735 270,544 269,709 268,739 275,743 279,305 279,305
100.195.2260 VETERANS RELIEFRevenues 160 4,186 - 865 - - - Total Revenues / Sources 160 4,186 - 865 - - -
Operating Expense 20,340 20,129 21,020 25,491 21,550 21,550 21,550 Total Expenses / Uses 20,340 20,129 21,020 25,491 21,550 21,550 21,550
Net Funding 20,180 15,943 21,020 24,626 21,550 21,550 21,550
21

2016 Actual
2017Actual
2018Adopted
2018 Estimate
2019 Requested
2019 Administrator
Recommended
2019Board
Approved100.195.2290 VET MENTOR PROGRAMRevenues - - - 730 1,739 1,739 1,739 Total Revenues / Sources - - - 730 1,739 1,739 1,739
Operating Expense 988 2,341 1,909 1,709 3,648 3,648 3,648 Total Expenses / Uses 988 2,341 1,909 1,709 3,648 3,648 3,648
Net Funding 988 2,341 1,909 979 1,909 1,909 1,909
100.200.1000 UNIVERSITY EXTENTIONRevenues 18,902 27,912 15,130 15,130 15,130 15,130 15,130 Carry Forward from Prior Year - - 30,000 - - - - From Self Insurance HRA 888 - - - - - - Total Revenues / Sources 19,790 27,912 45,130 15,130 15,130 15,130 15,130
Salary & Fringe Expense 199,790 214,519 214,504 152,565 163,890 166,421 166,421 Operating Expense 160,475 165,409 262,276 234,853 255,895 255,895 255,895 Total Expenses / Uses 360,265 379,928 476,780 387,418 419,785 422,316 422,316
Net Funding 340,475 352,016 431,650 372,288 404,655 407,186 407,186
100.200.2320 UWEX WNEPTotal Revenues / Sources - - - - - - -
Operating Expense 1,999 1,160 3,997 3,997 3,997 3,997 3,997 Total Expenses / Uses 1,999 1,160 3,997 3,997 3,997 3,997 3,997
Net Funding 1,999 1,160 3,997 3,997 3,997 3,997 3,997
100.200.2350 UWEX COMMUNITY ORGSRevenues 1,809 3,114 2,000 2,000 2,000 2,000 2,000 Total Revenues / Sources 1,809 3,114 2,000 2,000 2,000 2,000 2,000
Operating Expense 1,707 2,560 2,000 2,000 2,000 2,000 2,000 Total Expenses / Uses 1,707 2,560 2,000 2,000 2,000 2,000 2,000
Net Funding (102) (554) - - - - -
100.200.2380 UWEX FAMILY LIVINGRevenues 5,670 - 5,670 5,670 5,670 5,670 5,670 Total Revenues / Sources 5,670 - 5,670 5,670 5,670 5,670 5,670
Operating Expense - - 5,670 5,670 5,670 5,670 5,670 Total Expenses / Uses - - 5,670 5,670 5,670 5,670 5,670
Net Funding (5,670) - - - - - -
100.200.2410 UWEX 4-HRevenues 20,174 1,845 14,913 14,913 14,913 14,913 14,913 Total Revenues / Sources 20,174 1,845 14,913 14,913 14,913 14,913 14,913
Operating Expense 5,260 1,558 14,913 14,913 14,913 14,913 14,913 Total Expenses / Uses 5,260 1,558 14,913 14,913 14,913 14,913 14,913
Net Funding (14,914) (287) - - - - -
100.200.2440 UWEX AGRICULTURERevenues 12,142 1,260 10,419 10,419 10,419 10,419 10,419 Total Revenues / Sources 12,142 1,260 10,419 10,419 10,419 10,419 10,419
Operating Expense 1,722 1,604 10,419 10,419 10,419 10,419 10,419 Total Expenses / Uses 1,722 1,604 10,419 10,419 10,419 10,419 10,419
Net Funding (10,420) 344 - - - - -
22

2016 Actual
2017Actual
2018Adopted
2018 Estimate
2019 Requested
2019 Administrator
Recommended
2019Board
Approved100.200.2470 HARBOR COMMISSIONRevenues 30,536 480,698 18,300 18,300 18,300 18,300 18,300 Total Revenues / Sources 30,536 480,698 18,300 18,300 18,300 18,300 18,300
Operating Expense 55,176 581,628 6,200 3,500 4,250 4,250 4,250 Total Expenses / Uses 55,176 581,628 6,200 3,500 4,250 4,250 4,250
Net Revenues/Expenses 24,640 100,930 (12,100) (14,800) (14,050) (14,050) (14,050) To Fund Balance - - 12,100 14,800 14,050 14,050 14,050 Net Funding 24,640 100,930 - - - - -
100.205.1000 LAND CONSERVATIONRevenues 495,288 418,032 433,751 382,077 314,819 314,819 314,819 From Fund Balance - - 5,000 5,000 - - - From Self Insurance HRA 3,350 - - - - - - Total Revenues / Sources 498,638 418,032 438,751 387,077 314,819 314,819 314,819
Salary & Fringe Expense 595,901 605,920 621,627 611,318 609,543 618,221 618,221 Operating Expense 341,100 237,783 267,200 189,285 158,550 158,250 158,250 Capital Expense 995 - - - - - - Total Expenses / Uses 937,996 843,703 888,827 800,603 768,093 776,471 776,471
Net Funding 439,358 425,671 450,076 413,526 453,274 461,652 461,652
100.210.1000 METROPOLITAN PLANNING ORGRevenues 307,103 301,183 300,924 301,777 303,089 303,089 303,089 From Fund Balance 46,031 - - - - - - From Self Insurance HRA 350 - - - - - - Total Revenues / Sources 353,484 301,183 300,924 301,777 303,089 303,089 303,089
Salary & Fringe Expense 178,366 180,781 187,632 181,800 184,053 187,105 187,105 Operating Expense 175,118 101,231 111,700 105,700 110,577 130,577 130,577 Transfers Out - 15,000 - - - - - Total Expenses / Uses 353,484 297,012 299,332 287,500 294,630 317,682 317,682
Net Revenues/Expenses - (4,171) (1,592) (14,277) (8,459) 14,593 14,593 To Fund Balance - 4,171 1,592 14,277 8,459 5,407 5,407 Net Funding - - - - - 20,000 20,000
FUND 200 HEALTH DEPARTMENTRevenues 3,017,331 3,148,672 2,919,153 2,870,387 2,793,004 2,793,004 2,793,004 From Fund Balance - 17,657 - 17,727 - - - From General Fund 27,402 61,125 - - - - - From Self Insurance HRA 21,088 - - - - - - Total Revenues / Sources 3,065,821 3,227,454 2,919,153 2,888,114 2,793,004 2,793,004 2,793,004
Salary & Fringe Expense 3,823,111 3,957,880 4,003,653 3,955,819 4,022,218 4,148,303 4,148,303 Operating Expense 1,003,063 1,267,265 1,015,859 1,037,654 764,052 774,212 774,212 Capital Expense 102,916 2,830 5,000 - - - - Total Expenses / Uses 4,929,090 5,227,975 5,024,512 4,993,473 4,786,270 4,922,515 4,922,515
Net Revenues/Expenses 1,863,269 2,000,521 2,105,359 2,105,359 1,993,266 2,129,511 2,129,511 To Fund Balance 165,163 65,044 - - - - - Net Funding 2,028,432 2,065,565 2,105,359 2,105,359 1,993,266 2,129,511 2,129,511
23

2016 Actual
2017Actual
2018Adopted
2018 Estimate
2019 Requested
2019 Administrator
Recommended
2019Board
ApprovedFUND 210 HUMAN SERVICESRevenues 24,160,971 22,729,409 30,370,721 27,902,583 27,664,270 27,711,790 27,711,790 From Fund Balance 302,653 1,618,995 55,719 - - - - From Self Insurance HRA 72,975 - - - - - - Total Revenues / Sources 24,536,599 24,348,404 30,426,440 27,902,583 27,664,270 27,711,790 27,711,790
Salary & Fringe Expense 13,861,374 14,994,229 16,510,716 15,596,098 16,543,562 16,749,053 16,749,053 Operating Expense 19,877,691 19,137,211 23,917,101 21,735,592 21,594,402 21,648,062 21,648,062 Capital Expense 124,029 13,791 75,000 20,073 - - - Total Expenses / Uses 33,863,094 34,145,231 40,502,817 37,351,763 38,137,964 38,397,115 38,397,115
Net Revenues/Expenses 9,326,495 9,796,827 10,076,377 9,449,180 10,473,694 10,685,325 10,685,325 To Fund Balance - - - 627,197 - - - Net Funding 9,326,495 9,796,827 10,076,377 10,076,377 10,473,694 10,685,325 10,685,325
FUND 220 HS MVHSRevenues 33,500 11,200 25,000 52,320 25,000 25,000 25,000 From Fund Balance - 55,320 63,120 6,904 - - - Total Revenues / Sources 33,500 66,520 88,120 59,224 25,000 25,000 25,000
Operating Expense 1,603,300 1,574,520 1,596,120 1,567,224 1,764,045 1,764,045 1,764,045 Total Expenses / Uses 1,603,300 1,574,520 1,596,120 1,567,224 1,764,045 1,764,045 1,764,045
Net Revenues/Expenses 1,569,800 1,508,000 1,508,000 1,508,000 1,739,045 1,739,045 1,739,045 To Fund Balance 49,131 - - - - - Net Funding 1,618,931 1,508,000 1,508,000 1,508,000 1,739,045 1,739,045 1,739,045
FUND 230 WREARevenues 5,812,444 6,348,479 6,271,786 6,271,786 6,319,137 6,335,624 6,335,624 From Fund Balance - - 103,938 - - - - From Self Insurance HRA 16,738 - - - - - - Total Revenues / Sources 5,829,182 6,348,479 6,375,724 6,271,786 6,319,137 6,335,624 6,335,624
Salary & Fringe Expense 2,535,908 2,504,669 2,622,828 2,532,800 2,621,757 2,656,696 2,656,696 Operating Expense 3,605,913 3,956,993 4,064,278 4,181,023 4,013,171 3,993,652 3,993,652 Total Expenses / Uses 6,141,821 6,461,662 6,687,106 6,713,823 6,634,928 6,650,348 6,650,348
Net Revenues/Expenses 312,639 113,183 311,382 442,037 315,791 314,724 314,724 To Fund Balance 80,584 198,664 - (130,655) - - - Net Funding 393,223 311,847 311,382 311,382 315,791 314,724 314,724
FUND 255 AGING/ADRCRevenues 4,126,446 3,827,767 2,798,083 2,802,333 2,834,086 2,817,686 2,817,686 From Fund Balance - - 14,085 - - - - From 85.21 Restricted Fund Balance 8,568 - - - - - - From Helen Bader Grant 4,282 - - - - - - From Estate Donation Fund 20,117 - - - - - - From Self Insurance HRA 12,450 - - - - - - Total Revenues / Sources 4,171,863 3,827,767 2,812,168 2,802,333 2,834,086 2,817,686 2,817,686
Salary & Fringe Expense 2,380,982 2,073,684 2,016,825 1,903,115 2,045,573 1,986,072 1,986,072 Operating Expense 2,135,594 2,164,828 1,390,798 1,345,240 1,510,180 1,603,627 1,603,627 Capital Expense - - - - - - - Transfers Out - - - 18,080 - - - Total Expenses / Uses 4,516,576 4,238,512 3,407,623 3,266,435 3,555,753 3,589,699 3,589,699
Net Revenues/Expenses 344,713 410,745 595,455 464,102 721,667 772,013 772,013 To Fund Balance 145,459 169,503 - 131,353 - - Net Funding 490,172 580,248 595,455 595,455 721,667 772,013 772,013
24

2016 Actual
2017Actual
2018Adopted
2018 Estimate
2019 Requested
2019 Administrator
Recommended
2019Board
ApprovedFUND 265 ESTATE TRUST FUNDRevenues - - 10,000 10,000 - - - From Fund Balance - - 21,000 21,000 - - - Total Revenues / Sources - - 31,000 31,000 - - -
Operating Expense - - 31,000 31,000 - - - Total Expenses / Uses - - 31,000 31,000 - - -
Net Funding - - - - - - -
FUND 270 LAND RECORDSRevenues 180,259 276,719 128,000 142,376 179,000 179,000 179,000 From Fund Balance 16,079 36,000 - - - - - Total Revenues / Sources 196,338 312,719 128,000 142,376 179,000 179,000 179,000
Salary & Fringe Expense - - - 69,441 71,600 72,691 72,691 Operating Expense 187,027 282,028 121,927 61,500 64,990 64,990 64,990 Capital Expense 9,311 - - 5,700 - - - Total Expenses / Uses 196,338 282,028 121,927 136,641 136,590 137,681 137,681
Net Revenues/Expenses - (30,691) (6,073) (5,735) (42,410) (41,319) (41,319) To Fund Balance - 30,691 6,073 5,735 42,410 41,319 41,319 Net Funding - - - - - - -
FUND 275 SPECIAL JAIL ASSESSMENTSRevenues 124,384 127,191 133,762 133,762 134,000 134,000 134,000 Transfers In - - - 30,000 - - - From Fund Balance 11,883 87,115 - 565 - - - Total Revenues / Sources 136,267 214,306 133,762 164,327 134,000 134,000 134,000
Operating Expense 86,767 86,572 110,616 117,987 76,191 76,191 76,191 Capital Expense 49,500 127,734 - 46,340 43,000 43,000 43,000 Total Expenses / Uses 136,267 214,306 110,616 164,327 119,191 119,191 119,191
Net Revenues/Expenses - - (23,146) - (14,809) (14,809) (14,809) To Fund Balance - - 23,146 - 14,809 14,809 14,809 Net Funding - - - - - - -
FUND 280 CDBG REVOLVING LOAN Revenues 113,960 - 81,569 582,859 581,909 581,909 581,909 From Fund Balance 271,207 - - - - - - Total Revenues / Sources 385,167 - 81,569 582,859 581,909 581,909 581,909
Operating Expense 385,167 - 81,569 512,958 581,909 581,909 581,909 Total Expenses / Uses 385,167 - 81,569 512,958 581,909 581,909 581,909
Net Revenues/Expenses - - - (69,901) - - - To Fund Balance - - - 69,901 - - - Net Funding - - - - - - -
FUND 281 CDBG SMALL CITY HOUSINGRevenues 839,560 634,466 1,313,075 1,100,050 1,100,050 1,100,050 1,100,050 From Fund Balance 10,825 - - - - - - Total Revenues / Sources 850,385 634,466 1,313,075 1,100,050 1,100,050 1,100,050 1,100,050
Operating Expense 850,385 607,378 1,313,075 1,100,050 1,100,050 1,100,050 1,100,050 Total Expenses / Uses 850,385 607,378 1,313,075 1,100,050 1,100,050 1,100,050 1,100,050
Net Revenues/Expenses - (27,088) - - - - - To Fund Balance - 27,088 - - - - - Net Funding - - - - - - -
25

2016 Actual
2017Actual
2018Adopted
2018 Estimate
2019 Requested
2019 Administrator
Recommended
2019Board
ApprovedFUND 282 REVOLVING LOAN HOUSINGTotal Revenues / Sources - - - - - - -
Transfers Out - - - 25,000 - - - Total Expenses / Uses - - - 25,000 - - -
Net Funding - - - 25,000 - - -
FUND 283 REVOLVING LOANRevenues 5,660 104,590 6,474 16,050 10,474 10,474 10,474 From Fund Balance - - - - - - - Total Revenues / Sources 5,660 104,590 6,474 16,050 10,474 10,474 10,474
Operating Expense - 53,746 6,474 10 10,474 10,474 10,474 Total Expenses / Uses - 53,746 6,474 10 10,474 10,474 10,474
Net Revenues/Expenses (5,660) (50,844) - (16,040) - - - To Fund Balance 5,660 50,844 - 16,040 - - - Net Funding - - - - - - -
FUND 284 BUSINESS PARKRevenues 357,775 172,437 200,506 342,807 186,000 186,000 186,000 Excess Sales Tax - 116,415 16,415 16,415 16,415 16,415 16,415 From Fund Balance - - 59,412 61,381 34,420 34,420 34,420 Total Revenues / Sources 357,775 288,852 276,333 420,603 236,835 236,835 236,835
Operating Expense 292,223 262,723 276,333 288,959 236,835 236,835 236,835 Total Expenses / Uses 292,223 262,723 276,333 288,959 236,835 236,835 236,835
Net Revenues/Expenses (65,552) (26,129) - (131,644) - - - To Fund Balance 65,552 26,129 - 131,644 - - - Net Funding - - - - - - -
FUND 290 LIBRARYRevenues 90,304 103,868 76,955 90,335 91,498 91,498 91,498 From Fund Balance - 77,472 - - - - - From Self Insurance HRA 5,150 - - - - - - Total Revenues / Sources 95,454 181,340 76,955 90,335 91,498 91,498 91,498
Salary & Fringe Expense 1,376,396 1,385,673 1,491,623 1,435,190 1,485,678 1,537,119 1,537,119 Operating Expense 497,790 670,195 565,021 595,548 617,406 617,306 617,306 Capital Expense - 36,625 - 2,300 - - - Total Expenses / Uses 1,874,186 2,092,493 2,056,644 2,033,038 2,103,084 2,154,425 2,154,425
Net Revenues/Expenses 1,778,732 1,911,153 1,979,689 1,942,703 2,011,586 2,062,927 2,062,927 To Fund Balance 8,135 - - - - - - Net Funding 1,786,867 1,911,153 1,979,689 1,942,703 2,011,586 2,062,927 2,062,927
FUND 290 WINDING RIVERS LIBRARY SYSTEMTotal Revenues / Sources - - - - - - -
Operating Expense 24,121 24,621 24,621 24,621 24,621 24,621 24,621 Total Expenses / Uses 24,121 24,621 24,621 24,621 24,621 24,621 24,621
Net Funding 24,121 24,621 24,621 24,621 24,621 24,621 24,621
FUND 298 OLD LANDFILLRevenues 7,314 3,866 - - - - - From Fund Balance 29,586 141,154 42,123 42,123 42,965 42,965 42,965 Total Revenues / Sources 36,900 145,020 42,123 42,123 42,965 42,965 42,965
Operating Expense 36,900 59,314 42,123 42,123 42,965 42,965 42,965 Capital Expense - 85,706 - - - - - Total Expenses / Uses 36,900 145,020 42,123 42,123 42,965 42,965 42,965
Net Funding - - - - - - -
26

2016 Actual
2017Actual
2018Adopted
2018 Estimate
2019 Requested
2019 Administrator
Recommended
2019Board
ApprovedFUND 299 COMPUTER REVOLVING LOANRevenues 8,657 485 - - - - - From Fund Balance 51,343 51,088 - - - - - Total Revenues / Sources 60,000 51,573 - - - - -
Transfers Out - 51,573 - - - - - Operating Expense 60,000 - - - - - - Total Expenses / Uses 60,000 51,573 - - - - -
Net Funding - - - - - - -
FUND 300 DEBT SERVICERevenues 19,429,633 350,703 - - - - - From Fund Balance - 14,113,696 304,029 304,029 130,753 130,753 180,753 Total Revenues / Sources 19,429,633 14,464,399 304,029 304,029 130,753 130,753 180,753
Operating Expense 11,176,453 20,133,327 6,086,872 6,085,522 6,319,374 6,319,374 6,319,374 Total Expenses / Uses 11,176,453 20,133,327 6,086,872 6,085,522 6,319,374 6,319,374 6,319,374
Net Revenues/Expenses (8,253,180) 5,668,928 5,782,843 5,781,493 6,188,621 6,188,621 6,138,621 To Fund Balance 13,465,149 - - - - - - Net Funding 5,211,969 5,668,928 5,782,843 5,781,493 6,188,621 6,188,621 6,138,621
FUND 400 DOWNTOWN CAMPUSRevenues 11,054,738 44,242 - - - - - From Fund Balance 2,950,255 915,595 - 49,000 - - - Total Revenues / Sources 14,004,993 959,837 - 49,000 - - -
Capital Expense 14,004,993 959,837 - 509,913 - - - Total Expenses / Uses 14,004,993 959,837 - 509,913 - - -
Net Funding - - - 460,913 - - -
FUND 611 HILLVIEW HEALTH CARE CENTERRevenues 14,975,110 15,133,951 15,441,988 14,946,618 13,003,827 13,003,827 13,003,827 Transfers In - - - 1,356 - - - From Fund Balance 1,804,314 1,388,308 248,820 - 237,015 368,976 368,976 From Self Insurance HRA 75,138 - - - - - - Total Revenues / Sources 16,854,562 16,522,259 15,690,808 14,947,974 13,240,842 13,372,803 13,372,803
Salary & Fringe Expense 12,738,124 12,161,096 12,316,267 10,470,353 10,321,531 10,453,492 10,453,492 Operating Expense 4,116,438 4,302,217 3,202,228 3,017,713 2,776,202 2,776,202 2,776,202 Capital Expense - 58,946 172,313 233,040 143,109 143,109 143,109 Total Expenses / Uses 16,854,562 16,522,259 15,690,808 13,721,106 13,240,842 13,372,803 13,372,803
Net Revenues/Expenses - - - (1,226,868) - - - To Fund Balance - - - 1,226,868 - - - Net Funding - - - - - - -
FUND 615 HILLVIEW TERRACERevenues 1,042,688 1,025,834 1,098,874 969,084 1,065,186 1,065,186 1,065,186 From Self Insurance HRA 1,700 - - - - - - Total Revenues / Sources 1,044,388 1,025,834 1,098,874 969,084 1,065,186 1,065,186 1,065,186
Salary & Fringe Expense 451,225 431,349 403,548 490,814 485,726 492,115 492,115 Operating Expense 472,290 487,996 554,061 460,874 456,255 456,255 456,255 Capital Expense - - - - 6,930 6,930 6,930 Total Expenses / Uses 923,515 919,345 957,609 951,688 948,911 955,300 955,300
Net Revenues/Expenses (120,873) (106,489) (141,265) (17,396) (116,275) (109,886) (109,886) To Fund Balance 120,873 106,489 141,265 17,396 116,275 109,886 109,886 Net Funding - - - - - - -
27

2016 Actual
2017Actual
2018Adopted
2018 Estimate
2019 Requested
2019 Administrator
Recommended
2019Board
ApprovedFUND 618 CARROLL HEIGHTS APARTMENTSRevenues 382,784 382,599 396,692 368,523 380,852 380,852 380,852 From Self Insurance HRA 950 - - - - - - Total Revenues / Sources 383,734 382,599 396,692 368,523 380,852 380,852 380,852
Salary & Fringe Expense 107,318 120,971 116,300 110,451 122,257 123,904 123,904 Operating Expense 239,436 173,586 128,258 131,006 122,643 122,643 122,643 Total Expenses / Uses 346,754 294,557 244,558 241,457 244,900 246,547 246,547
Net Revenues/Expenses (36,980) (88,042) (152,134) (127,066) (135,952) (134,305) (134,305) To Fund Balance 36,980 88,042 152,134 127,066 135,952 134,305 134,305 Net Funding - - - - - - -
FUND 621 LAKEVIEWRevenues 8,887,955 7,054,969 7,148,065 7,027,925 7,067,154 7,146,735 7,146,735 From Self Insurance HRA 55,538 - - - - - - Total Revenues / Sources 8,943,493 7,054,969 7,148,065 7,027,925 7,067,154 7,146,735 7,146,735
Salary & Fringe Expense 7,595,865 6,826,335 6,584,582 6,329,253 6,347,115 6,426,696 6,426,696 Operating Expense 1,347,628 228,634 563,483 698,672 720,039 720,039 720,039 Total Expenses / Uses 8,943,493 7,054,969 7,148,065 7,027,925 7,067,154 7,146,735 7,146,735
Net Funding - - - - - - -
FUNDS 623 - 627 LAKEVIEW - OTHER ENTITIESRevenues 2,686,967 3,898,618 4,115,085 4,065,743 4,206,569 4,206,569 4,206,569 From Fund Balance - 592,012 - - - - - Total Revenues / Sources 2,686,967 4,490,630 4,115,085 4,065,743 4,206,569 4,206,569 4,206,569
Transfers Out - 380,000 - - - - - Salary & Fringe Expense 1,382,696 2,001,315 2,548,063 2,598,090 2,672,908 2,707,226 2,707,226 Operating Expense 1,259,990 2,109,315 1,390,186 1,405,201 1,408,516 1,408,516 1,408,516 Capital Expense - - - 24,278 34,400 34,400 34,400 Total Expenses / Uses 2,642,686 4,490,630 3,938,249 4,027,569 4,115,824 4,150,142 4,150,142
Net Revenues/Expenses (44,281) - (176,836) (38,174) (90,745) (56,427) (56,427) To Fund Balance 44,281 - 176,836 38,174 90,745 56,427 56,427 Net Funding - - - - - - -
FUND 628 LAKEVIEW - CAPITAL ASSETSRevenues 294,551 597,841 375,000 795,425 795,425 795,425 795,425 Transfers In - - - 12,527 - - - From Fund Balance 679,800 267,489 - - - - - Total Revenues / Sources 974,351 865,330 375,000 807,952 795,425 795,425 795,425
Transfers Out - 67,612 - - - - - Operating Expense 974,351 797,718 214,403 169,005 681,918 681,918 681,918 Capital Expense - - 80,000 102,000 85,200 85,200 85,200 Total Expenses / Uses 974,351 865,330 294,403 271,005 767,118 767,118 767,118
Net Revenues/Expenses - - (80,597) (536,947) (28,307) (28,307) (28,307) To Fund Balance - - 80,597 536,947 28,307 28,307 28,307 Net Funding - - - - - - -
28

2016 Actual
2017Actual
2018Adopted
2018 Estimate
2019 Requested
2019 Administrator
Recommended
2019Board
ApprovedFUND 650 SOLID WASTERevenues 12,613,264 12,406,210 11,761,038 11,592,902 11,740,105 11,740,105 11,740,105 From Fund Balance - - 3,512,581 2,069,061 - - - From General Fund - 7,500 - - - - - From Self Insurance HRA 7,467 - - - - - - Total Revenues / Sources 12,620,731 12,413,710 15,273,619 13,661,963 11,740,105 11,740,105 11,740,105
Salary & Fringe Expense 728,457 823,324 885,752 753,350 799,525 809,541 826,710 Operating Expense 11,211,557 8,945,141 10,172,467 10,885,813 10,654,736 10,654,236 10,654,236 Capital Expense 88,793 51,304 4,215,400 2,022,800 85,000 85,000 85,000 Total Expenses / Uses 12,028,807 9,819,769 15,273,619 13,661,963 11,539,261 11,548,777 11,565,946
Net Revenues/Expenses (591,924) (2,593,941) - - (200,844) (191,328) (174,159) To Fund Balance 591,924 2,593,941 - - 200,844 191,328 174,159 Net Funding - - - - - - -
FUND 680 HAZARDOUS MATL DISPOSALRevenues 298,177 326,313 338,350 348,540 339,111 339,111 339,111 From Fund Balance 78,022 16,349 3,963 - - - - From Self Insurance HRA 1,600 - - - - - - Total Revenues / Sources 377,799 342,662 342,313 348,540 339,111 339,111 339,111
Salary & Fringe Expense 278,335 275,167 290,891 240,112 250,119 252,714 252,714 Operating Expense 215,564 213,858 205,472 213,920 214,133 213,983 213,983 Capital Expense - - - - - - - Total Expenses / Uses 493,899 489,025 496,363 454,032 464,252 466,697 466,697
Net Revenues/Expenses 116,100 146,363 154,050 105,492 125,141 127,586 127,586 To Fund Balance - - - 48,558 35,770 33,325 33,325 Net Funding 116,100 146,363 154,050 154,050 160,911 160,911 160,911
FUND 710 HIGHWAY DEPARTMENTRevenues 9,316,759 7,761,191 5,040,110 5,210,022 7,794,530 7,809,705 8,476,577 From Borrowing 2,597,908 2,704,311 2,700,000 2,700,000 2,650,000 2,450,000 2,450,000 From Park Plaza - - - - 248,776 248,776 248,776 From Fund Balance - - 3,629,152 3,595,426 200,000 200,000 200,000 From Self Insurance HRA 30,650 - - - - - - Total Revenues / Sources 11,945,317 10,465,502 11,369,262 11,505,448 10,893,306 10,708,481 11,375,353
Transfers Out - 38,657 - - - - - Salary & Fringe Expense 3,132,158 4,767,243 4,894,546 4,894,546 4,866,232 4,965,149 4,965,149 Operating Expense 2,542,134 2,575,688 3,239,427 3,555,902 3,582,829 3,533,748 3,568,241 Capital Expense 5,269,189 5,015,419 6,535,289 6,355,000 5,744,245 5,778,738 6,411,117 Total Expenses / Uses 10,943,481 12,397,007 14,669,262 14,805,448 14,193,306 14,277,635 14,944,507
Net Revenues/Expenses (1,001,836) 1,931,505 3,300,000 3,300,000 3,300,000 3,569,154 3,569,154 To Fund Balance 4,162,257 1,503,926 - - - - - Net Funding 3,160,421 3,435,431 3,300,000 3,300,000 3,300,000 3,569,154 3,569,154
FUND 770 WMMICRevenues 93,574 52,471 92,000 57,000 85,000 85,000 85,000 From Fund Balance 229,630 494,061 - - - - - Total Revenues / Sources 323,204 546,532 92,000 57,000 85,000 85,000 85,000
Operating Expense 323,204 546,532 92,000 57,000 85,000 85,000 85,000 Total Expenses / Uses 323,204 546,532 92,000 57,000 85,000 85,000 85,000
Net Funding - - - - - - -
FUND 775 WORKERS COMPRevenues 141,894 400,619 413,160 359,800 364,800 364,800 364,800 Total Revenues / Sources 141,894 400,619 413,160 359,800 364,800 364,800 364,800
Operating Expense 141,894 400,619 413,160 359,800 364,800 364,800 364,800 Total Expenses / Uses 141,894 400,619 413,160 359,800 364,800 364,800 364,800
Net Funding - - - - - - -
29

GRAND TOTALS2016
Actual2017
Actual2018
Approved2018
Estimate2019
Requested
2019 Administrator
Recommended
2019Board
ApprovedRevenues 147,070,435 117,023,351 115,609,396 117,463,163 115,641,657 116,606,246 117,286,483 Other Sources 10,185,985 24,202,693 12,867,937 10,640,659 5,616,853 5,535,530 5,466,780 Total Revenues / Sources 157,256,260 141,226,044 128,477,333 128,103,822 121,258,510 122,141,776 122,753,263
Transfers Out 2,446,980 4,518,406 16,415 2,759,495 16,415 16,415 16,415 Salary & Fringe Expense 75,481,150 78,122,968 81,297,406 77,499,927 79,140,850 80,414,912 80,464,070 Operating Expense 71,354,812 79,233,609 68,844,696 67,313,074 67,491,305 67,724,723 67,740,592 Capital Expense 21,709,144 8,133,393 12,050,752 10,827,364 8,156,694 8,291,187 8,804,816 Total Expenses / Uses 170,992,086 170,008,376 162,209,269 158,399,860 154,805,264 156,447,237 157,025,893
Net Revenues / Expenses 13,735,826 28,782,332 33,731,936 30,296,038 33,546,754 34,305,461 34,272,630 To Fund Balance 18,941,148 4,864,532 593,743 3,909,039 687,621 629,163 611,994 Net Funding 32,676,974 33,646,864 34,325,679 34,205,077 34,234,375 34,934,624 34,884,624
30

S.S. = State Statute
Department Account Account Name
Last
Increase Current Rate 2019 Rate
Increase/
Decrease/No
Change in Rate Units
County Clerk 100‐24200.006 Due State Dom Partner Declaration 2011 25.00$ 25.00$ No Change per declaration
County Clerk 100‐24200.007 Due State Dom Partner Term 2011 25.00$ 25.00$ No Change per termination
County Clerk 100‐24200.005 Due State Marriage License 2011 25.00$ 25.00$ No Change per license
County Clerk 100.125.1000‐44200.03 DNR License ‐ Process fee S. S. 0.15$ 0.15$ No Change per stamp/permit
County Clerk 100.125.1000‐44200.03 DNR License ‐ Process Fee S. S. 0.50$ 0.50$ No Change per license
County Clerk 100.125.1000‐44200.03 DNR License ‐ Process Fee S. S. 1.00$ 1.00$ No Change per transaction
County Clerk 100.125.1000‐44200.03 DNR RV Reg Appl‐Process Fee 2010 3.00$ 3.00$ No Change per transaction
County Clerk 100.125.1000‐44200.03 DNR RV Reg Appl‐Expedited Process Fee 2010 5.00$ 5.00$ No Change per transaction
County Clerk 100.125.1000‐45100.00 Dog License Penalty (15 to penalty‐10 to Hlth Dept) 2006 15.00$ 15.00$ No Change per penalty
County Clerk 100.125.1000‐46192.01 Timber Cutting Notice 2006 10.00$ 10.00$ No Change per notice
County Clerk 100.125.1000‐46192.01 Parade Permit 2006 50.00$ 50.00$ No Change per permit
County Clerk 100.125.1000‐46192.01 Dog Reports Request by the Public 2005 25.00$ 25.00$ No Change per request
County Clerk 100.125.1000‐46192.02 Domestic Partnership Declaration 2011 65.00$ ‐$ Decrease no longer a fee for 2019
County Clerk 100.125.1000‐46192.02 Domestic Partnership Termination 2011 65.00$ 65.00$ No Change per termination
County Clerk 100.125.1000‐46192.02 Domestic Partnership Re‐issue 2009 10.00$ ‐$ Decrease no longer a fee for 2019
County Clerk 100.125.1000‐46192.03 Marriage License 2011 45.00$ 45.00$ No Change per license
County Clerk 100.125.1000‐46192.03 Marriage License Waiver 2011 25.00$ 25.00$ No Change per waiver
County Clerk 100.125.1000‐46192.03 Marriage License Reissue ? 10.00$ 10.00$ No Change per re‐issue
County Clerk 100.125.1000‐46902.00 Book Sales (not including internal) 2009 2.00$ 2.50$ Increase per book
County Clerk 100.125.1000‐46195.03 Copier Revenue ? 0.25$ 0.25$ No Change per page
County Clerk 100.125.1120‐47310.09 WisVote Revenue 2007 25.00$ 25.00$ No Change per report
County Clerk 100.125.1120‐47310.09 WisVote Revenue 2007 5.00$ 5.00$ No Change per 1,000 voters
County Clerk 100.125.1120‐46195.03 Copier Revenue ? 0.25$ 0.25$ No Change per page
Family Court 100.105.1000‐46140.01 Cons Court Costs, Fee, Charges ? 5.00$ 5.00$ No Change per litigant
Family Court 100.107.1000‐46140.01 Families First Revenue ($35 to FCC/ $5 to Court) ? 35.00$ 35.00$ No Change per litigant
Family Court 100.107.1000‐46140.01 Families First Revenue Digital Audio Recording CD for litigant 2012 $ 10.00 $ 10.00 No Change per litigant
Register of Deeds 100.175.1000‐46130.01 Recording/Filing Fee ($15.00 of $30.00) 2011 15.00$ 15.00$ No Change per document
Register of Deeds 100.175.1000‐46130.01 Copy Fees S. S. 2.00$ 2.00$ No Change per document
Register of Deeds 100.175.1000‐46130.01 Copy Fees S. S. 1.00$ 1.00$ No Change per document
Register of Deeds 100.175.1000‐46130.01 Certification Fee S. S. 1.00$ 1.00$ No Change per document
Register of Deeds 100.175.1000‐46130.01 Military Discharge Verification S. S. 7.00$ 7.00$ No Change per verification
Register of Deeds 100.175.1000‐46130.01 Photo Copy Fee ? 0.25$ 0.25$ No Change per page
Register of Deeds 100.175.1000‐46130.01 Plat Fee‐Standard S. S. 50.00$ 50.00$ No Change per plat
Register of Deeds 100.175.1000‐46130.01 Plat Fee‐Transportation S. S. 25.00$ 25.00$ No Change per plat
Register of Deeds 100.175.1000‐46130.01 Large Plat Copy Fee 2013 10.00$ 15.00$ Increase per page
Register of Deeds 100.175.1000‐46130.01 Large Plat Copy Fee 2013 5.00$ 15.00$ Increase per page
Register of Deeds 100.175.1000‐46130.01 Vital Records Fees (Birth Cert) ($5.00 of $20.00) S. S. 5.00$ 5.00$ No Change per person
Register of Deeds 100.175.1000‐46130.01
Vital Records Fees (Death,Marriage, Domestic Partnership) ($7.00 of
$20.00) S. S. 7.00$ 7.00$ No Change 1st page
Register of Deeds 100.175.1000‐46130.01 Vital Records Fees S.S. 3.00$ 3.00$ No Change each add'l page
Register of Deeds 100.175.1000‐46130.01 Transfer Fees (20% of $3.00) S. S. 0.60$ 0.60$ No Change per $1,000
Register of Deeds 100.175.1000‐46130.02 Laredo/Tapestry ‐ 0 TO 250 Minutes 2015 100.00$ 100.00$ No Change per month/minute's
Register of Deeds 100.175.1000‐46130.02 Laredo/Tapestry ‐ 0 TO 250 Minutes 0.25$ 0.25$ No Change per month/minute's
Register of Deeds 100.175.1000‐46130.02 Laredo/Tapestry ‐ 251 TO 500 Minutes 2015 150.00$ 150.00$ No Change per month/minute's
Register of Deeds 100.175.1000‐46130.02 Laredo/Tapestry ‐ 251 TO 500 Minutes 0.25$ 0.25$ No Change per month/minute's
Register of Deeds 100.175.1000‐46130.02 Laredo/Tapestry ‐ 1,001 TO 2,000 Minutes 2015 220.00$ 220.00$ No Change per month/minute's
Register of Deeds 100.175.1000‐46130.02 Laredo/Tapestry ‐ 1,001 TO 2,000 Minutes 0.25$ 0.25$ No Change per month/minute's
Register of Deeds 100.175.1000‐46130.02 Laredo/Tapestry ‐ 501 TO 1,000 Minutes 2015 320.00$ 320.00$ No Change per month/minute's
Register of Deeds 100.175.1000‐46130.02 Laredo/Tapestry ‐ 501 TO 1,000 Minutes 0.25$ 0.25$ No Change per month/minute's
Register of Deeds 100.175.1000‐46130.02 Minutes ‐ 2001 AND UP 2015 425.00$ 425.00$ No Change per month
Mediation 100.110.1030‐46140.06 Divorce Fees ‐ Motions S. S. 25.00$ 25.00$ No Change per motion
Mediation 100.110.1030‐46140.06 Divorce Fees ‐ Filings S. S. 20.00$ 20.00$ No Change per filing
Mediation 100.110.1030‐46140.07 Marriage License Fees S. S. 20.00$ 20.00$ No Change per license
Mediation 100.110.1030‐46140.02 Step Parent Adoption 2004 350.00$ 350.00$ No Change per adoption
La Crosse County
Proposed User Fees, Charges for Services, and Permit Revenues for 2019
The 2019 Rates listed below reflect the approved 2019 rate at the time of the board approval of the budget on 11/12/18. Acutal 2019 rates may change as a result of committee action.
31

S.S. = State Statute
Department Account Account Name
Last
Increase Current Rate 2019 Rate
Increase/
Decrease/No
Change in Rate Units
La Crosse County
Proposed User Fees, Charges for Services, and Permit Revenues for 2019
The 2019 Rates listed below reflect the approved 2019 rate at the time of the board approval of the budget on 11/12/18. Acutal 2019 rates may change as a result of committee action.
Mediation 100.110.1030‐46140.01 Post Cat Fees 2007 60.00$ 60.00$ No Change per hour
Mediation 100.110.1030‐46140.08 Client Fees/Mediation S. S. 100.00$ 100.00$ No Change each occurrence
District Attorney 100.115.1000‐46195.06 Digital Discovery ? 10.00$ 10.00$ No Change Per CD/DVD
Land Conservation 100.205.1000‐44300.05 Urban Construction Site ‐ A 2009 200.00$ 200.00$ No Change per site
Land Conservation 100.205.1000‐44300.05 Urban Construction Site ‐ B < 1ac 2009 250.00$ 250.00$ No Change per site
Land Conservation 100.205.1000‐44300.05 Urban Construction Site ‐ B > 1 ac 2009 350.00$ 350.00$ No Change per site
Land Conservation 100.205.1000‐44300.05 Urban Construction Site ‐ C < 1 ac 2009 400.00$ 400.00$ No Change per site
Land Conservation 100.205.1000‐44300.05 Urban Construction Site ‐ C > 1 ac 2001 800.00$ 800.00$ No Change per site
Land Conservation 100.205.1000‐44300.05 Logging Roads ‐ D 2009 100.00$ 100.00$ No Change per road
Land Conservation 100.205.1000‐44300.05 Basic Plat 2009 800.00$ 800.00$ No Change per plat
Land Conservation 100.205.1000‐44300.05 Plats with Individual Lots 2009 40.00$ 40.00$ No Change per lot
Land Conservation 100.205.1000‐44300.05 Late Fees‐Double Permit (Varies) 2001 varies varies No Change
Land Conservation 100.205.1000‐44300.05 Non‐Compliance Inspection Fee 2009 50% of the permit fee 50% of the permit fee No Change per visit
Land Conservation 100.205.1000‐44900.04 Animal Waste Mgmt (0‐199 Animal Units) 2009 100.00$ 100.00$ No Change per animal units
Land Conservation 100.205.1000‐44900.04 Animal Waste Mgmt (> 200 Animal Units) 2009 200.00$ 200.00$ No Change per animal units
Land Conservation 100.205.1000‐44900.04 Technical Assistance Fee 2009 500.00$ 500.00$ No Change per project
Land Conservation 100.205.1000‐44300.06 ‐ Lidar Processing Fee (Minimum 1 Hour) 2009 50.00$ 50.00$ No Change per hour
Land Conservation 100.205.1000‐44300.06 ‐ Lidar Points (Minimum < or = to 5 Acres) 2009 50.00$ 50.00$ No Change percent of acreage
Land Conservation 100.205.1000‐44300.06 ‐ Lidar Points (> than 5 Acres)‐(.50/acre over 5 acres) 2009 0.50$ 0.50$ No Change percent of acreage
Land Conservation 100.205.1000‐44900.04 Livestock ‐ Split ($500 Zoning: $500 Land Con) 2007 500.00$ 500.00$ No Change per farm
Land Conservation 100.205.1000‐46820.02 Non‐Metallic Mining (50% of 170.00) 2001 85.00$ 85.00$ No Change percent of acreage
Land Conservation 100.205.1000‐44900.03 Storm Water Mgmt‐Application Fee (500) 2009 500.00$ 500.00$ No Change per site
Land Conservation 100.205.1000‐44900.03 Storm Water Mgmt‐Storm Water Permit Fee (.01/sqft) 2009 100.00$ 100.00$ No Change per plan
Land Conservation 100.205.1000‐44900.03 Storm Water Mgmt ‐ Exemption Fee 2009 500.00$ 500.00$ No Change per plan
Finance 100.150.1000‐46195.01 Garnishment Service Charge S.S. 3.00$ 3.00$ No Change per each withholding
Finance 100.150.1000‐46195.03 Copy Fees ? 0.25$ 0.25$ No Change per copy
Personnel 100.135.1000‐46195.03 Copy Fees ? 0.25$ 0.25$ No Change per copy
Harbor Commission 100.200.2470‐48900.01 Buoy Permitting Fee Pool 7 2011 5.00$ 5.00$ No Change per buoy
Harbor Commission 100.200.2470‐48900.01 Buoy Permitting Fee Pool 8 2011 10.00$ 10.00$ No Change per buoy
County Treasurer 100.145.1000‐46194.01 Photo Copy Fees ? 0.25$ 0.25$ No Change per copy
County Treasurer 100.145.1000‐46194.01 Delinquent Tax List ? 25.00$ 25.00$ No Change per list
County Treasurer 100.145.1000‐46194.03 Title Search Fees ? 150.00$ 150.00$ No Change per search
County Treasurer 100.145.1000‐48309.00 Foreclosure Fees 2012 200.00$ 200.00$ No Change per ea. Foreclosure
County Treasurer 100.145.1000‐41800.00 Interest on Taxes S.S. 1.5% per month 1.5% per month No Change percent
Medical Examiner 100.120.1000‐46193.04 Report Fees 2016 50.00$ 50.00$ No Change per report
Medical Examiner 100.120.1000‐46193.02 Death Certificate Signing Fee 2019 86.79$ 88.61$ Increase per certificate ‐ N/A for deaths under age 18
Medical Examiner 100.120.1000‐44900.02 Cremation Permit Fee 2019 153.15$ 156.37$ Increase per permit ‐ N/A for cremations under age 18
Medical Examiner 100.120.1000‐46193.01 Disinterment Fee 2019 126.50$ 129.16$ Increase each
Medical Examiner 100.120.1000‐46193.03 Morgue Use Fee 2015 1,000.00$ 1,000.00$ No Change per use
Medical Examiner 100.120.1000‐46593.00 Insurance Revenue 2015 autopsy cost + labor autopsy cost + labor No Change varies depending on negligent cause of death
Zoning 100.180.1000‐44400.02 Plat Review Fee ‐ Initial 2013 300.00$ 300.00$ No Change per each plat
Zoning 100.180.1000‐44400.02 Plat Review Fee ‐ Resubmittal 2013 150.00$ 150.00$ No Change per each plat
Zoning 100.180.1000‐44400.02 Certified Survey Map Review Fee ‐ Initial 2013 100.00$ 100.00$ No Change per map
Zoning 100.180.1000‐44400.02 Certified Survey Map Review Fee ‐ Resubmittal 2013 50.00$ 50.00$ No Change per map
Zoning 100.180.1000‐46902.00 Sale Maps/Publications ? varies varies No Change per map
Zoning 100.180.1000‐46902.00 Photocopies
Zoning 100.180.1000‐46902.00 ‐ Letter 2007 0.25$ 0.25$ No Change per page
Zoning 100.180.1000‐46902.00 ‐ Legal 2007 0.25$ 0.25$ No Change per page
Zoning 100.180.1000‐46902.00 ‐ 11 x 17 2007 0.25$ 0.25$ No Change per page
32

S.S. = State Statute
Department Account Account Name
Last
Increase Current Rate 2019 Rate
Increase/
Decrease/No
Change in Rate Units
La Crosse County
Proposed User Fees, Charges for Services, and Permit Revenues for 2019
The 2019 Rates listed below reflect the approved 2019 rate at the time of the board approval of the budget on 11/12/18. Acutal 2019 rates may change as a result of committee action.
Zoning 100.180.1000‐46902.00 Computer Generated Copies
Zoning 100.180.1000‐46902.00 ‐ Print Screen‐Tax File 2007 1.00$ 1.00$ No Change per screen
Zoning 100.180.1000‐46902.00 ‐ 911 Maps ‐ Towns & Emergency Departments 2016 8.00$ 8.00$ No Change per map
Zoning 100.180.1000‐46902.00 ‐ 911 Maps ‐ All Others 2016 13.00$ 13.00$ No Change per map
Zoning 100.180.1000‐46902.00 GIS Plots (Color)
Zoning 100.180.1000‐46902.00 ‐ 8.5 x 11 & 8.5 x 14 2016 3.50$ 3.50$ No Change each
Zoning 100.180.1000‐46902.00 ‐ 11 x 17 2016 5.50$ 5.50$ No Change each
Zoning 100.180.1000‐46902.00 ‐ 17 x 22 2016 6.00$ 6.00$ No Change each
Zoning 100.180.1000‐46902.00 ‐ 22 x 34 2016 13.00$ 13.00$ No Change each
Zoning 100.180.1000‐46902.00 ‐ 34 x 44 2016 20.00$ 20.00$ No Change each
Zoning 100.180.1000‐46902.00 Aerial Photos (B/W)&Full Color Maps (Zoning/Ward)
Zoning 100.180.1000‐46902.00 ‐ 8.5 x 11 & 8.5 x 14 2007 5.00$ 5.00$ No Change each
Zoning 100.180.1000‐46902.00 ‐ 11 x 17 2007 7.00$ 7.00$ No Change each
Zoning 100.180.1000‐46902.00 ‐ 17 x 22 2016 18.00$ 18.00$ No Change each
Zoning 100.180.1000‐46902.00 ‐ 22 x 34 2016 25.00$ 25.00$ No Change each
Zoning 100.180.1000‐46902.00 ‐ 34 x 44 2016 36.00$ 36.00$ No Change each
Zoning 100.180.1000‐46902.00 Custom Printing Request on Plotter 2016 13.00$ 13.00$ No Change per linear foot
Zoning 100.180.1000‐46902.00 Custom Mapping Projects 2015 50.00$ 50.00$ No Change per hour + materials
Zoning 100.180.1000‐46902.00 CD or DVD
Zoning 100.180.1000‐46902.00 ‐ Aerials 2007 100.00$ 100.00$ No Change per cd
Zoning 100.180.1000‐46902.00 ‐ Quads 2007 100.00$ 100.00$ No Change per quad
Zoning 100.180.1000‐46902.00 ‐ Images (JPEG,TIFF,ETC) 2007 10.00$ 10.00$ No Change per image
Zoning 100.180.1000‐46902.00 Shapefiles
Zoning 100.180.1000‐46902.00 ‐ Tax Parcels with Tax Data associated (ownerships) 2007 100.00$ 100.00$ No Change per coverage
Zoning 100.180.1000‐46902.00 ‐ All Other Coverages 2007 20.00$ 20.00$ No Change per coverage
Zoning 100.180.1000‐46902.00 Tax Roll Info (workbooks,alpha/street listing etc ) 2007 100.00$ 100.00$ No Change per cd
Zoning 100.180.1000‐46902.00 Public Hearing Minutes 2007 5.00$ 5.00$ No Change per hearing
Zoning 100.180.1000‐46902.00 6" DVD Orthophotos 2009 300.00$ 300.00$ No Change per section
Zoning 100.180.1000‐46902.00 Mailing Labels ‐ (Minimum 5.00 order) 2007 0.05$ 0.05$ No Change per label
Zoning 100.180.1000‐46902.00 Electronic Mailing Labels (excel format) 2007 30.00$ 30.00$ No Change per municipality
Zoning 100.180.1000‐46902.00 Computer Print Outs ‐ (Minimum 5.00 order) 2007 0.05$ 0.05$ No Change per sheet
Zoning 100.180.1000‐46902.00 Fax or E‐mail
Zoning 100.180.1000‐46902.00 ‐ In Town 2007 5.00$ 5.00$ No Change per query
Zoning 100.180.1000‐46902.00 ‐ Out of Town 2007 5.00$ 5.00$ No Change per query
Zoning 100.180.1000‐46902.00 ‐ Additional 2007 2.00$ 2.00$ No Change per query
Zoning 100.180.1000‐44900.04 Livestock ‐ Split ($500 Zoning: $500 Land Con) 2007 500.00$ 500.00$ No Change per permit
Zoning 100.180.1000‐44900.04 AFTER THE FACT Livestock ‐ Split ($500 Zoning: $500 Land Con) 2018 1,000.00$ 1,000.00$ No Change per permit
Zoning 100.180.1000‐44400.01 New Residential Permit 2014 240.00$ 240.00$ No Change per permit
Zoning 100.180.1000‐44400.01 AFTER THE FACT New Residential Permit 2018 480.00$ 480.00$ No Change per permit
Zoning 100.180.1000‐44400.01 Commercial Bldg/Structure/Additions 2019 372.00$ 425.00$ Increase per permit
Zoning 100.180.1000‐44400.01 AFTER THE FACT Commercial Bldg/Structure/Additions 2019 744.00$ 900.00$ Increase per permit
Zoning 100.180.1000‐44400.01 Residential Additions, Alterations,Signs < $5,000 2017 78.00$ 114.00$ Increase per permit
Zoning 100.180.1000‐44400.01 AFTER THE FACT Residential Additions, Alterations,Signs < $5,001 2018 228.00$ 228.00$ No Change per permit
Zoning 100.180.1000‐44400.01 Residential Additions, Alterations, Signs > $5,000 2008 114.00$ 114.00$ No Change per permit
Zoning 100.180.1000‐44400.01 AFTER THE FACT Residential Additions, Alterations, Signs > $5,001 2018 228.00$ 228.00$ No Change per permit
Zoning 100.180.1000‐44400.01 Floodplain or Shoreland Permit 2015 114.00$ 114.00$ No Change per permit
Zoning 100.180.1000‐44400.01 AFTER THE FACT Floodplain or Shoreland Permit 2018 228.00$ 228.00$ No Change per permit
Zoning 100.180.1000‐44400.01 Driveway Permit 2015 100.00$ 100.00$ No Change per permit
Zoning 100.180.1000‐44400.01 AFTER THE FACT Driveway Permit 2018 200.00$ 200.00$ No Change per permit
Zoning 100.180.1000‐44400.01 Appeal to Outdoor Advertising Ordinance Chapter 33 2013 305.00$ 305.00$ No Change per permit
Zoning 100.180.1000‐44400.01
AFTER THE FACT Appeal to Outdoor Advertising Ordinance Chapter
33 2018 610.00$ 610.00$ No Change per permit
Zoning 100.180.1000‐44400.01 Board of Adjustment Variance 2019 305.00$ 344.00$ Increase per permit
Zoning 100.180.1000‐44400.01 AFTER THE FACT Board of Adjustment Variance 2019 610.00$ 688.00$ Increase per permit
33

S.S. = State Statute
Department Account Account Name
Last
Increase Current Rate 2019 Rate
Increase/
Decrease/No
Change in Rate Units
La Crosse County
Proposed User Fees, Charges for Services, and Permit Revenues for 2019
The 2019 Rates listed below reflect the approved 2019 rate at the time of the board approval of the budget on 11/12/18. Acutal 2019 rates may change as a result of committee action.
Zoning 100.180.1000‐44400.01 Conditional Use Permit ‐ Administrative 2019 142.00$ 288.00$ Increase per permit
Zoning 100.180.1000‐44400.01 AFTER THE FACT Conditional Use Permit ‐ Administrative 2018 284.00$ 284.00$ No Change per permit
Zoning 100.180.1000‐44400.01 Conditional Use Permit Application 2019 445.00$ 482.00$ Increase per permit
Zoning 100.180.1000‐44400.01 AFTER THE FACT Conditional Use Permit Application 2019 890.00$ 964.00$ Increase per permit
Zoning 100.180.1000‐44400.01 Conditional Use Permit High Traffic Volume 2013 3,000.00$ 3,000.00$ No Change per permit
Zoning 100.180.1000‐44400.01 AFTER THE FACT Conditional Use Permit High Traffic Volume 2018 6,000.00$ 6,000.00$ No Change per permit
Zoning 100.180.1000‐44400.01 Conditional Use Permit High Traffic Volume post monitor 2013 2,000.00$ 2,000.00$ No Change per permit
Zoning 100.180.1000‐44400.01
AFTER THE FACT Conditional Use Permit High Traffic Volume post
monitor 2018 4,000.00$ 4,000.00$ No Change per permit
Zoning 100.180.1000‐44400.01 Conditional Use Permit Telecommunication 2004 1,000.00$ 1,000.00$ No Change per permit
Zoning 100.180.1000‐44400.01 AFTER THE FACT Conditional Use Permit Telecommunication 2018 2,000.00$ 2,000.00$ No Change per permit
Zoning 100.180.1000‐44400.01 Special Exception Permit Application 2019 445.00$ 482.00$ Increase per application
Zoning 100.180.1000‐44400.01 AFTER THE FACT Special Exception Permit Application 2019 890.00$ 964.00$ Increase per application
Zoning 100.180.1000‐44400.01 Zoning Petition Application 2019 445.00$ 482.00$ Increase per application
Zoning 100.180.1000‐44400.01 AFTER THE FACT Zoning Petition Application 2019 890.00$ 964.00$ Increase per application
Zoning 100.180.1000‐44400.01 Assessors Fee 2007 30.00$ 30.00$ No Change per hour
Zoning 100.180.1000‐46820.02 Non‐Metallic Mining 2019 85.00$ 170.00$ Increase per unreclaimed acre
Law Enforcement 100.185.2140‐44900.01 Permit Revenue 2005 Varies $10.00 ‐ $50.00 Varies $10.00 ‐ $50.00 No Change per permit
Law Enforcement 100.185.2140‐44900.01 Large Assembly Permit Fee (1‐2 Days) ? 100.00$ 100.00$ No Change per permit
Law Enforcement 100.185.2140‐44900.01 Large Assembly Permit Fee (if longer than 2 days) ? 100.00$ 100.00$ No Change per day
Law Enforcement 100.185.2140‐46210.05 General Paper Svc 2005 $35 plus mileage $35 plus mileage No Change per try + mileage
Law Enforcement 100.185.2140‐46210.05 Sheriff Sale Posting 2005 75.00$ 75.00$ No Change per posting + sale
Law Enforcement 100.185.2140‐46210.05 Sheriff Sale 2005 75.00$ 75.00$ No Change per posting + sale
Law Enforcement 100.185.2140‐46210.05 Writs of Replevin 2005
35.00 + officer's time +
mileage
35.00 + officer's time +
mileage No Change per try + officers time + mileage
Law Enforcement 100.185.2140‐46210.05 Writs of Restitution 2005
35.00 + officer's time +
mileage
35.00 + officer's time +
mileage No Change per try + officers time + mileage
Law Enforcement 100.185.2140‐46210.05 Writs of Execution 2005
35.00 + officer's time +
mileage
35.00 + officer's time +
mileage No Change per try + officers time + mileage
Law Enforcement 100.185.2140‐46210.05 Paper Service Cancellation Fee 2014 30.00$ 30.00$ No Change per attempt
Law Enforcement 100.185.2140‐46210.05 Paper Service No Found Fee 70.00$ 70.00$ No Change up to minimum of 3 attempts
Law Enforcement 100.185.2140‐46210.03 External Sheriff Svc 2001 Officer's Time + Mileage Officer's Time + Mileage No Change Officer's Time + Mileage
Law Enforcement 100.185.2140‐46210.06 Traffic Police Copy Fees 2000 0.25$ 0.25$ No Change per page
Law Enforcement 100.185.2140‐46210.04 Restitution Rev ? Varies with Judgment Varies with Judgment No Change per judgment
Law Enforcement 100.185.2140‐48902.00 Insurance Claims Reimb ? Varies with Judgment Varies with Judgment No Change per judgment
Law Enforcement 100.185.2140‐48900.01 Extradition Reimb ? Varies with Judgment Varies with Judgment No Change per judgment
Jail 100.185.2170‐46240.10 Prisoner BD ‐ Out of County 2004 55.00$ 55.00$ No Change per day
Jail 100.185.2170‐46240.09 Prisoner BD ‐ From Cities 2004 45.00$ 45.00$ No Change per day (1st Day)
Jail 100.185.2170‐46240.09 Prisoner BD ‐ From Cities 2004 90.00$ 90.00$ No Change per day (2nd Day and After)
Jail 100.185.2170‐46240.02 Confinement Fee 2004 50.00$ 50.00$ No Change per day
Jail 100.185.2170‐46240.03 Doctor/Nurse Visitation FEE 2001 3.00$ 3.00$ No Change per nurse visit
Jail 100.185.2170‐46240.03 Doctor/Nurse Visitation FEE 2001 5.00$ 5.00$ No Change per doctor visit
Jail 100.185.2170‐46240.03 OTC Medications 2001 3.00$ 3.00$ No Change per medication
Jail 100.185.2170‐46240.03 RX Medications 2001 5.00$ 5.00$ No Change per medication
Jail 100.185.2170‐46240.04 Inmate Medicine Reimb 2006 3.00$ 3.00$ No Change per each medicine
Facilities‐Prop Mgmt 100.160.1000‐47310.05 Snow Plowing 2018 65.00$ varies 60‐65.00 Increase per hour
Facilities‐Prop Mgmt 100.160.1000‐45140.00 TVRP Collections S. S. 5.00$ 5.00$ No Change per suspended ticket
Facilities‐Prop Mgmt 100.160.1000‐46330.00 Parking Lot ‐ Employee 2018 8.00$ 8.00$ No Change per permit
Facilities‐Prop Mgmt 100.160.1000‐46330.00 Parking Lot ‐ County Board 2000 20.00$ 20.00$ No Change per permit
Facilities‐Prop Mgmt 100.160.1000‐46330.00 Parking Lot ‐ Bailiff 2000 15.00$ 15.00$ No Change per permit
Facilities‐Prop Mgmt 100.160.1000‐46330.00 Parking Lot ‐ Ticket 2011 varies $12.00 ‐ $48.00 varies $12.00 ‐ $48.00 No Change per ticket
Facilities‐Prop Mgmt 100.160.1000‐46330.00 Parking Lot ‐ Meter 2002 varies varies No Change per hour
Facilities‐Prop Mgmt 100.160.1000‐46195.02 Badge/ID Card 2002 0.25$ 0.25$ No Change per clip
34

S.S. = State Statute
Department Account Account Name
Last
Increase Current Rate 2019 Rate
Increase/
Decrease/No
Change in Rate Units
La Crosse County
Proposed User Fees, Charges for Services, and Permit Revenues for 2019
The 2019 Rates listed below reflect the approved 2019 rate at the time of the board approval of the budget on 11/12/18. Acutal 2019 rates may change as a result of committee action.
Facilities‐Prop Mgmt 100.160.1000‐46195.02 Badge/ID Card 2002 0.50$ 0.50$ No Change per plastic holder
Facilities‐Prop Mgmt 100.160.1000‐46195.02 Badge/ID Card 2002 1.00$ 1.00$ No Change per lanyard
Facilities‐Prop Mgmt 100.160.1000‐46195.02 Badge/ID Card 2002 3.75$ 3.75$ No Change per zip card
Facilities‐Prop Mgmt 100.160.1000‐46195.02 Badge/ID Card 2002 0.30$ 0.30$ No Change Royal blue lanyard with ring
Facilities‐Prop Mgmt 100.160.1000‐46195.02 Badge/ID Card 2002 5.00$ 5.00$ No Change Regular badge (replacement)
Facilities‐Prop Mgmt 100.160.1000‐46195.02 Badge/ID Card 2002 15.00$ 15.00$ No Change Security badge (replacement)
Facilities‐ADMIN 100.160.1810‐48200.01 Conference Room Rent‐1133 2017 10.00$ 10.00$ No Change per hour
Facilities‐LEC 100.160.1750‐48200.01 Office Space Rent‐District Court Adm (387 total sq. ft.) 2019 17.50$ 18.50$ Increase per square feet
Facilities‐LEC 100.160.1750‐48200.07 Prob & Parole Revenue 2019 186,332.00$ 191,840.00$ Increase per contract
Facilities‐LEC 100.160.1750‐48200.06 Conference Room Rent‐1142 2017 10.00$ 10.00$ No Change per hour
Facilities‐Parks 100.165.1000‐46720.06 Shelter Fee ‐ County Resident 2017 55.00$ 55.00$ No Change per permit
Facilities‐Parks 100.165.1000‐46720.06 Shelter Fee ‐ Out of County Resident 2017 60.00$ 60.00$ No Change per permit
Facilities‐Parks 100.165.1000‐46720.06 Shelter Fee ‐ County Resident ‐ Schools and Scouts M‐F Rental 2011 27.50$ 27.50$ No Change per permit
Facilities‐Parks 100.165.1000‐46720.09 Reservation Fee 2018 8.00$ 8.00$ No Change per reservation
Facilities‐Parks 100.165.1000‐46720.09 GI Nightly Fee, rustic 2014 20.50$ 20.50$ No Change per permit
Facilities‐Parks 100.165.1000‐46720.09 GI Nightly Fee Electric (20 amp) 2019 26.00$ 26.75$ Increase per permit
Facilities‐Parks 100.165.1000‐46720.09 GI Nightly Fee Electric (30‐50 amp) 2019 27.25$ 28.25$ Increase per permit
Facilities‐Parks 100.165.1000‐46720.09 GI Nightly Fee Electric & Water (20 amp) 2019 28.00$ 29.00$ Increase per permit
Facilities‐Parks 100.165.1000‐46720.09 GI Nightly Fee Electric & Water (30‐50 amp) 2019 29.25$ 30.50$ Increase per permit
Facilities‐Parks 100.165.1000‐46720.09 GI Sr. Nightly Fee, rustic (Senior rate‐base) 2016 20.00$ 20.00$ No Change per permit
Facilities‐Parks 100.165.1000‐46720.09 GI Sr. Nightly Fee Electric (20 amp) 2019 25.50$ 26.25$ Increase per permit
Facilities‐Parks 100.165.1000‐46720.09 GI Sr. Nightly Fee Electric (30‐50 amp) 2019 26.75$ 27.75$ Increase per permit
Facilities‐Parks 100.165.1000‐46720.09 GI Sr. Nightly Fee Electric & Water (20 amp) 2019 27.50$ 28.50$ Increase per permit
Facilities‐Parks 100.165.1000‐46720.09 GI Sr. Nightly Fee Electric & Water (30‐50 amp) 2019 28.75$ 30.00$ Increase per permit
Facilities‐Parks 100.165.1000‐46720.09 GI Monthly Fee (base) 2019 415.00$ 430.00$ Increase per permit
Facilities‐Parks 100.165.1000‐46720.09 GI Monthly Fee Electric (20 amp) 2019 458.00$ 478.00$ Increase per permit
Facilities‐Parks 100.165.1000‐46720.09 GI Monthly Fee Electric (30‐50 amp) 2019 470.00$ 495.00$ Increase per permit
Facilities‐Parks 100.165.1000‐46720.09 GI Monthly Fee Electric & Water (20 amp) 2019 472.50$ 496.00$ Increase per permit
Facilities‐Parks 100.165.1000‐46720.09 GI Monthly Fee Electric & Water (30‐50 amp) 2019 484.50$ 513.00$ Increase per permit
Facilities‐Parks 100.165.1000‐46720.09 GI Seasonal Fee (base) 2019 1,300.00$ 1,350.00$ Increase per permit
Facilities‐Parks 100.165.1000‐46720.09 GI Seasonal Fee Electric (20 amp) 2019 1,540.00$ 1,595.00$ Increase per permit
Facilities‐Parks 100.165.1000‐46720.09 GI Seasonal Fee Electric (30‐50 amp) 2019 1,650.00$ 1,710.00$ Increase per permit
Facilities‐Parks 100.165.1000‐46720.09 GI Seasonal Fee Electric &Water (30‐50 amp) 2019 1,715.00$ 1,785.00$ Increase per permit
Facilities‐Parks 100.165.1000‐46720.09 GI Waterfront Seasonal Fee (base) 2019 1,600.00$ 1,650.00$ Increase per permit
Facilities‐Parks 100.165.1000‐46720.09 GI Waterfront Seasonal Fee Electric (30‐50 amp) 2019 1,950.00$ 2,010.00$ Increase per permit
Facilities‐Parks 100.165.1000‐46720.10 Vets Nightly Fee, rustic 2014 20.50$ 20.50$ No Change per permit
Facilities‐Parks 100.165.1000‐46720.10 Vets Nightly Fee Electric (20 amp) 2019 26.00$ 26.75$ Increase per permit
Facilities‐Parks 100.165.1000‐46720.10 Vets Nightly Fee Electric (30‐50 amp) 2019 27.25$ 28.25$ Increase per permit
Facilities‐Parks 100.165.1000‐46720.10 Vets Nightly Fee Electric & Water (30‐50 amp) 2019 29.25$ 30.50$ Increase per permit
Facilities‐Parks 100.165.1000‐46720.10 Vets Sr. Nightly Fee, rustic (Senior rate‐base) 2014 20.00$ 20.00$ No Change per permit
Facilities‐Parks 100.165.1000‐46720.10 Vets Sr. Nightly Fee Electric (20 amp) 2019 25.50$ 26.25$ Increase per permit
Facilities‐Parks 100.165.1000‐46720.10 Vets Sr. Nightly Fee Electric (30‐50 amp) 2019 26.75$ 27.75$ Increase per permit
Facilities‐Parks 100.165.1000‐46720.10 Vets Sr. Nightly Fee Electric & Water (30‐50 amp) 2019 28.75$ 30.00$ Increase per permit
Facilities‐Parks 100.165.1000‐46720.10 Vets Monthly Fee (base) 2019 415.00$ 430.00$ Increase per permit
Facilities‐Parks 100.165.1000‐46720.10 Vets Monthly Fee Electric (20 amp) 2019 458.00$ 478.00$ Increase per permit
Facilities‐Parks 100.165.1000‐46720.10 Vets Monthly Fee Electric (30‐50 amp) 2019 470.00$ 495.00$ Increase per permit
Facilities‐Parks 100.165.1000‐46720.10 Vets Monthly Fee Electric & Water (30‐50 amp) 2019 484.50$ 513.00$ Increase per permit
Facilities‐Parks 100.165.1000‐46720.10 Vets Seasonal Fee (base) 2019 1,275.00$ 1,325.00$ Increase per permit
Facilities‐Parks 100.165.1000‐46720.10 Vets Seasonal Fee Electric (20 amp) 2019 1,515.00$ 1,570.00$ Increase per permit
Facilities‐Parks 100.165.1000‐46720.10 Vets Seasonal Fee Electric (30‐50 amp) 2019 1,625.00$ 1,685.00$ Increase per permit
Facilities‐Parks 100.165.1000‐46720.10 Vets Seasonal Fee Electric & Water (30‐50 amp) 2019 1,690.00$ 1,760.00$ Increase per permit
Carroll Heights 618.765.1000‐46591.01 Bath tub cutout fee 2019 150.00$ 400.00$ Increase per month
Carroll Heights 618.765.1000‐51185.03 Rental‐Efficiency 2019 386.00$ 394.00$ Increase per month
Carroll Heights 618.765.1000‐51185.03 Rental‐Efficiency 2019 407.00$ 415.00$ Increase per month
Carroll Heights 618.765.1000‐51185.03 Rental‐1 Bedroom 2019 488.00$ 498.00$ Increase per month
Carroll Heights 618.765.1000‐51185.03 Rental‐1 Bedroom 2019 493.00$ 503.00$ Increase per month
35

S.S. = State Statute
Department Account Account Name
Last
Increase Current Rate 2019 Rate
Increase/
Decrease/No
Change in Rate Units
La Crosse County
Proposed User Fees, Charges for Services, and Permit Revenues for 2019
The 2019 Rates listed below reflect the approved 2019 rate at the time of the board approval of the budget on 11/12/18. Acutal 2019 rates may change as a result of committee action.
Carroll Heights 618.765.1000‐51185.03 Rental‐1 Bedroom 2019 524.00$ 535.00$ Increase per month
Carroll Heights 618.765.1000‐51185.03 Rental‐1 Bedroom 2018 529.00$ ‐$ Decrease per month (not offered in 2019)
Carroll Heights 618.765.1000‐51185.03 Rental‐1 Bedroom 2019 571.00$ 582.00$ Increase per month
Carroll Heights 618.765.1000‐51185.03 Rental‐1 Bedroom 2019 634.00$ 650.00$ Increase per month
Carroll Heights 618.765.1000‐51185.03 Rental‐1 Bedroom 2019 640.00$ 653.00$ Increase per month
Carroll Heights 618.765.1000‐51185.03 Rental‐1 Bedroom 2019 728.00$ 743.00$ Increase per month
Carroll Heights 618.765.1000‐51185.03 Rental‐2 Bedroom 2019 765.00$ 780.00$ Increase per month
Carroll Heights 618.765.1000‐51185.03 Rental‐2 Bedroom 2019 770.00$ 785.00$ Increase per month
Carroll Heights 618.765.1000‐51185.03 Rental‐2 Bedroom 2019 821.00$ 837.00$ Increase per month
Carroll Heights 618.765.1000‐51185.03 Rental‐2 Bedroom 2019 846.00$ 863.00$ Increase per month
Carroll Heights 618.765.1000‐51185.03 Rental‐2 Bedroom 2019 854.00$ 871.00$ Increase per month
Carroll Heights 618.765.1000‐51185.03 Guest Room 2018 60.00$ 60.00$ No Change per night
Carroll Heights 618.765.1000‐51185.03 Guest Suite 2018 60.00$ 60.00$ No Change per night
Carroll Heights 618.765.1000‐51185.03 Maintenance Services/hr. New ‐$ 50.00$ New per hour
Carroll Heights 618.765.1000‐51185.05 Carport Rent 2019 25.00$ 29.38$ Increase per month
Hillview 611.220.6310‐51180.06 Private PAY SNF 2019 245.00$ 250.00$ Increase per day
Hillview 611.220.6310‐51160.03 Private PAY ICF1 2018 245.00$ ‐$ Decrease per day (not offered in 2019)
Hillview 611.220.6310‐51180.04 Private PAY ISN 2017 279.00$ 279.00$ No Change per day
Hillview 611.220.6310‐51190.03 Delinquency Charge 2002 0.12$ 0.12$ No Change 1%/Month on Balance > 60 Days
Hillview 611.220.6310‐51180.01 Private Pay Bed Hold 2018 204.00$ 204.00$ No Change per day
Hillview 611.220.6310‐51180.05 Private Room charge 2012 17.00$ 17.00$ No Change per day
Hillview 611.220.6310‐51180.02 Private Hospice 2019 245.00$ 250.00$ Increase per day
Hillview 611.220.6310‐51180.07 Private Sub‐Acute 2007 331.02$ ‐$ Decrease per day (not offered in 2019)
Hillview 611.220.6310‐51120.00 Oxygen Concentrator/Day 2007 7.00$ 7.00$ No Change per day
Hillview 611.220.6310‐51120.00 Portable Oxygen/Day 2007 7.00$ 7.00$ No Change per day
Hillview 611.220.6310‐51185.02 Ancillary Svc Rent 2000 700.00$ ‐$ Decrease per month (not offered in 2019)
Hillview 611.220.6310‐51180.03 Private Pay Bed Assessment 2011 5.67$ 5.67$ No Change per day
Hillview Terrace 615.760.1000‐51185.03 Apartment Rent Revenue Studio 2019 2,000.00$ 2,050.00$ Increase per month
Hillview Terrace 615.760.1000‐51185.03 Apartment Rent Revenue 1 Bedroom 2019 2,500.00$ 2,525.00$ Increase per month
Hillview Terrace 615.760.1000‐51185.03 Apartment Rent Revenue 2 Bedroom 2019 3,100.00$ 3,130.00$ Increase per month
Hillview Terrace 615.760.1000‐51185.03 Apartment Rent Revenue‐Storage 2014 15.00$ 15.00$ No Change per month
Hillview Terrace 615.760.1000‐51185.06 Second Tenant Rent 2012 750.00$ 750.00$ No Change per month
Hillview Terrace 615.760.1000‐51135.00 Personal Care Revenue‐Assistance to daily meals 2012 100.00$ 100.00$ No Change per month
Hillview Terrace 615.760.1000‐51135.00 Personal care revenue‐CPAP Assistance 2012 300.00$ 300.00$ No Change per month
Hillview Terrace 615.760.1000‐51135.00 Personal care revenue‐Glucose Monitoring 2012 450.00$ 450.00$ No Change per month
Hillview Terrace 615.760.1000‐51135.00 Personal care revenue‐Assistance getting dressed/undressed 2012 300.00$ 300.00$ No Change per month
Hillview Terrace 615.760.1000‐51135.00 Personal care revenue‐Additional laundry 2018 75.00$ 75.00$ No Change per month
Hillview Terrace 615.760.1000‐51135.00 Personal care revenue‐Order, setup, administer medication 2012 290.00$ 290.00$ No Change per month
Hillview Terrace 615.760.1000‐51135.00 Personal care revenue‐RCA staff assistance 2018 50.00$ 50.00$ No Change per hour
Hillview Terrace 615.760.1000‐51135.00 Personal care revenue‐Set up appointments & transportation 2018 100.00$ 100.00$ No Change per month
Hillview Terrace 615.760.1000‐51135.00 Personal care revenue‐Physical assistance with shower 2012 100.00$ 100.00$ No Change per month
Hillview Terrace 615.760.1000‐51135.00 Personal care revenue‐Set‐up of shower weekly 2012 50.00$ 50.00$ No Change per month
Hillview Terrace 615.760.1000‐51135.00 Personal care revenue‐Assistance with ted hose 2012 120.00$ 120.00$ No Change per month
Hillview Terrace 615.760.1000‐51135.01 Personal care revenue‐Monthly foot care ‐$ 50.00$ Increase per month
Hillview Terrace 615.760.1000‐51135.00 RN Services 2018 100.00$ 100.00$ No Change per hour
Hillview Terrace 615.760.1000‐51135.00 Personal Care Revenue‐Whirlpool Bath 2018 60.00$ 60.00$ No Change per hour
Hillview Terrace 615.760.1000‐51135.00 Personal Care Revenue‐Whirlpool Bath Assistance 2018 100.00$ 100.00$ No Change per hour
Hillview Terrace 615.760.1000‐51135.00 Personal Care Revenue‐Maintenance (moving fee) 2012 50.00$ 50.00$ No Change per hour
Hillview Terrace 615.760.1000‐51135.00 Maintenance Services 2013 25.00$ 25.00$ No Change per hour
Hillview Terrace 615.760.1000‐51135.00 Lost Key Fee 2013 50.00$ 50.00$ No Change per occurrence
Hillview Terrace 615.760.1000‐51135.00 Additional Key 2013 3.00$ 3.00$ No Change each
Hillview Terrace 615.760.1000‐51130.00 Meal Plan Revenue 2019 300.00$ 350.00$ Increase per month
Hillview Terrace 615.760.1000‐51130.00 Meal Plan Revenue‐Breakfast meal only 2019 5.00$ 6.00$ Increase each
Hillview Terrace 615.760.1000‐51130.00 Meal Plan Revenue‐Lunch or supper meal only 2019 5.00$ 8.00$ Increase each
Hillview Terrace 615.760.1000‐51130.00 Guest Meal 2019 5.00$ 8.00$ Increase each
36

S.S. = State Statute
Department Account Account Name
Last
Increase Current Rate 2019 Rate
Increase/
Decrease/No
Change in Rate Units
La Crosse County
Proposed User Fees, Charges for Services, and Permit Revenues for 2019
The 2019 Rates listed below reflect the approved 2019 rate at the time of the board approval of the budget on 11/12/18. Acutal 2019 rates may change as a result of committee action.
Hillview Terrace 615.760.1000‐51130.00 Raw food cost (WWC tenant) 2012 180.00$ ‐$ Decrease per month (not offered in 2019)
Hillview Terrace 615.760.1000‐51130.00 Meal preparation (WWC) 2012 95.00$ ‐$ Decrease per month (not offered in 2019)
Hillview Terrace 615.760.1000‐51135.00 Personal Care Revene‐Tray delivery 2018 5.00$ 5.00$ No Change each time
Hillview Terrace 615.760.1000‐51105.00 Assessment fee 2013 600.00$ 600.00$ No Change one time only
Hillview Terrace 615.760.1000‐51185.02 Ancillary Svc Rent 2019 1.00$ 12.00$ Increase per month
Lakeview 621.220.6310‐51310.00 Private Pay SNF ‐Daily Rate 260.00$ 265.00$ Increase per day
Lakeview 621.220.6310‐51310.00 Private Pay Bed Hold ‐Daily Rate 221.00$ 225.25$ Increase per day
Lakeview 621.220.6310‐51310.00 Private Pay Bed Assessment ‐ Monthly Rate 170.00$ 170.00$ No Change per month
Lakeview 621.220.6310‐51310.00 Guest Meal 4.00$ 6.00$ Increase per meal
Ravenwood 626.650.1000‐51150.00 Daily Rate Days 1‐30 500.00$ 525.00$ Increase per day
Ravenwood 626.650.1000‐51150.00 Daily Rate 380.00$ 405.00$ Increase per day
Ravenwood 626.650.1000‐51150.00 Daily Rate ‐ Non Typical Services 500.00$ 525.00$ Increase per day
Ravenwood 626.650.1000‐51150.00 Daily Rate ‐ Bedhold 323.00$ 344.25$ Increase per day
Regent Manor 623.650.1000‐51135.00 Daily Rate ‐ Individually Negotiated ‐$ ‐$ No Change negotiated per day
Monarch Manor 627.650.1000‐51135.00 Daily Rate ‐ Individually Negotiated ‐$ ‐$ No Change negotiated per day
Maplewood 624.770.1000‐51135.00 Daily Rate ‐ Individually Negotiated ‐$ ‐$ No Change negotiated per day
Neshonoc Manor 625.650.1000‐51135.00 Daily Rate ‐ Individually Negotiated ‐$ ‐$ No Change negotiated per day
Highway 710.795.7720‐48900.01 Miscellaneous Revenue ‐ OSOW Permit New ‐$ 50.00$ New per permit
Highway 710.795.7720‐48900.01 Miscellaneous Revenue ‐ Utility Permit New ‐$ 50.00$ New per permit
Library FEES AND FINES
Library 290.650.1000‐46710.03 Books, Magazines 2009 0.10$ 0.10$ No Change per day
Library 290.650.1000‐46710.03 Videos/DVD'S,Audio,Software,Family Fun Bags 2009 0.25$ 0.25$ No Change per day
Library 290.650.1000‐46710.03 Collection Fee 2007 10.00$ 10.00$ No Change per account
Library 290.650.1000‐46710.03 Nook eReaders 2014 1.00$ 1.00$ No Change per day
Library 290.650.1000‐46710.03 Inter‐Library Loan 2011 2.00$ 2.00$ No Change per day
Library 290.650.1000‐46710.03 AV/Video/DVD Case ‐ Single 2005 2.00$ 2.00$ No Change per case
Library 290.650.1000‐46710.03 AV/Video/DVD Case ‐ Double 2005 3.00$ 3.00$ No Change per case
Library 290.650.1000‐46710.03 CD/DVD Insert 2010 3.00$ 3.00$ No Change per insert
Library 290.650.1000‐46710.03 Book Jacket or AV Bag 2005 2.00$ 2.00$ No Change per bag
Library 290.650.1000‐46710.03 New Barcode or Spine Label 2005 1.00$ 1.00$ No Change per barcode
Library 290.650.1000‐46710.03 Family Fun Bag 2013 12.00$ 12.00$ No Change per bag
Library 290.650.1000‐46710.03 Laminated Family Fun Bag Insert 2013 2.00$ 2.00$ No Change per insert
Library 290.650.1000‐46710.03 Digital Audio Case 2007 3.00$ 3.00$ No Change per case
Library 290.650.1000‐46710.03 3‐D Glasses 2013 1.50$ 1.50$ No Change per pair
Library LOST OR DAMAGED DEFAULTS
Library 290.650.1000‐46710.04 Adult Book 2003 30.00$ 30.00$ No Change per book
Library 290.650.1000‐46710.04 Audio CD (Single) 2013 8.00$ 8.00$ No Change per cd
Library 290.650.1000‐46710.04 AV Materials 2003 25.00$ 25.00$ No Change per av
Library 290.650.1000‐46710.04 Children's Book 2003 20.00$ 20.00$ No Change per book
Library 290.650.1000‐46710.04 Family Fun Bag Contents 2018 50.00$ 50.00$ No Change per bag
Library 290.650.1000‐46710.04 Magazines 2003 5.00$ 5.00$ No Change per magazine
Library 290.650.1000‐46710.04 Paperback 2003 12.00$ 12.00$ No Change per paperback
Library 290.650.1000‐46710.04 DVD/BluRay 2018 25.00$ 25.00$ No Change per video/dvd
Library 290.650.1000‐46710.04 Nook eReader 2014 150.00$ 150.00$ No Change per Reader
Library 290.650.1000‐46710.04 Nook Cover 2014 20.00$ 20.00$ No Change per cover
Library 290.650.1000‐46710.04 Nook Power Cord 2014 10.00$ 10.00$ No Change per cord
Library 290.650.1000‐46710.04 Nook Equipment Case 2014 25.00$ 25.00$ No Change per case
Library 290.650.1000‐46710.04 Nook Quick Start‐Guide 2014 2.00$ 2.00$ No Change per guide
Library 290.650.1000‐46710.04 Stylus Pen 2014 3.00$ 3.00$ No Change per stylus
Library 290.650.1000‐46710.04 Microfiber Cleaning Cloth 2014 1.00$ 1.00$ No Change per cloth
Library SALE ITEMS
Library 290.650.1000‐46710.02 Earbuds 2013 2.00$ 2.00$ No Change per pair
Library 290.650.1000‐46710.02 Flash Drives 2013 5.00$ 5.00$ No Change per item
Library 290.650.1000‐46710.02 Used Book Sale ‐ Paperback 2003 0.50$ 0.50$ No Change per paperback
37

S.S. = State Statute
Department Account Account Name
Last
Increase Current Rate 2019 Rate
Increase/
Decrease/No
Change in Rate Units
La Crosse County
Proposed User Fees, Charges for Services, and Permit Revenues for 2019
The 2019 Rates listed below reflect the approved 2019 rate at the time of the board approval of the budget on 11/12/18. Acutal 2019 rates may change as a result of committee action.
Library 290.650.1000‐46710.02 Used Book Sale ‐ Hardcover 2003 1.00$ 1.00$ No Change per hardcover
Library 290.650.1000‐46710.02 Used Book Sale ‐ AV 2003 2.00$ 2.00$ No Change per av
Library PRINTING/COPIES/FAX
Library 290.650.1000‐46195.03 Black and White Printing/Copies 2003 0.10$ 0.10$ No Change per print
Library 290.650.1000‐46195.03 Color Printing/Copies 2008 0.50$ 0.50$ No Change per print
Library 290.650.1000‐46195.03 Fax 2017 2.00$ 2.00$ No Change per fax
House Hazard Matl 680.785.1000‐46435.01 Appliances containing refrigerants 2014 20.00$ 20.00$ No Change each
House Hazard Matl 680.785.1000‐46435.04 VSQG ‐ Technical Assistance 2010 50.00$ 50.00$ No Change per hour
House Hazard Matl 680.785.1000‐46435.04 VSQG ‐ Qualitative Chemical Analysis of Unknowns 2018 20.00$ 20.00$ No Change per sample
House Hazard Matl 680.785.1000‐46435.04 VSQG Acids/Bases 2017 1.50$ 1.50$ No Change per pound
House Hazard Matl 680.785.1000‐46435.04 VSQG Organic Acids 2017 2.50$ 2.50$ No Change per pound
House Hazard Matl 680.785.1000‐46435.04 VSQG Aerosols ‐ Paint/Non‐paint 2019 1.00$ 1.25$ Increase per pound
House Hazard Matl 680.785.1000‐46435.04 VSQG Aerosols ‐ Inhalers 2017 4.00$ 4.00$ No Change per pound
House Hazard Matl 680.785.1000‐46435.04 VSQG Flammable liquids 2019 0.80$ 1.25$ Increase per pound
House Hazard Matl 680.785.1000‐46435.04 VSQG Flammable solids 2017 14.00$ 14.00$ No Change per pound
House Hazard Matl 680.785.1000‐46435.04 VSQG Paint ‐ Latex 2019 0.25$ 0.35$ Increase per pound
House Hazard Matl 680.785.1000‐46435.04 VSQG Oxidizers 2015 5.00$ 5.00$ No Change per pound
House Hazard Matl 680.785.1000‐46435.04 VSQG Peroxides 2015 12.00$ 12.00$ No Change per pound
House Hazard Matl 680.785.1000‐46435.04 VSQG Batteries 2019 0.25$ 0.50$ Increase per pound
House Hazard Matl 680.785.1000‐46435.04 VSQG Freon New ‐$ 20.00$ New each
House Hazard Matl 680.785.1000‐46435.04 VSQG Florescent Bulbs (= or < 4' ) 2019 0.50$ 0.75$ Increase each
House Hazard Matl 680.785.1000‐46435.04 VSQG Florescent Bulbs (> 4' ) 2019 0.75$ 1.50$ Increase each
House Hazard Matl 680.785.1000‐46435.04 VSQG Ultra Violet Lamps 2019 3.50$ 4.00$ Increase each
House Hazard Matl 680.785.1000‐46435.04 VSQG High Intensity Discharge/Low Pressure Sodium 2017 1.25$ 1.25$ No Change each
House Hazard Matl 680.785.1000‐46435.04 VSQG Lead Acid Battery 2017 0.25$ 0.25$ No Change per pound
House Hazard Matl 680.785.1000‐46435.04 VSQG Mercury Articles 2017 7.50$ 7.50$ No Change per pound
House Hazard Matl 680.785.1000‐46435.04 VSQG Mercury Compounds 2017 15.00$ 15.00$ No Change per pound
House Hazard Matl 680.785.1000‐46435.04 VSQG Antifreeze 2015 0.25$ 0.25$ No Change per pound
House Hazard Matl 680.785.1000‐46435.04 VSQG Oil (Non‐PCB) 2019 0.25$ 0.50$ Increase per pound
House Hazard Matl 680.785.1000‐46435.04 VSQG Oil Filters 2019 0.25$ 0.50$ Increase per pound
House Hazard Matl 680.785.1000‐46435.04 VSQG Oil Absorbents 2017 1.25$ 1.25$ No Change per pound
House Hazard Matl 680.785.1000‐46435.04 VSQG Pesticides Solids 2019 2.50$ 3.50$ Increase per pound
House Hazard Matl 680.785.1000‐46435.04 VSQG Pesticides/Others Solids/Non‐solids 2019 3.50$ 2.50$ Decrease per pound
House Hazard Matl 680.785.1000‐46435.04 VSQG Dioxins 2015 25.00$ 25.00$ No Change per pound
House Hazard Matl 680.785.1000‐46435.04 VSQG Drum Disposal ‐ 55 2019 10.00$ 25.00$ Increase each
House Hazard Matl 680.785.1000‐46435.04 VSQG Drum Disposal ‐ < 55 2011 10.00$ 10.00$ No Change each
House Hazard Matl 680.785.1000‐46435.04 VSQG PCB Ballasts 2013 1.00$ 1.00$ No Change per pound
House Hazard Matl 680.785.1000‐46435.04 VSQG Other Material or Non regulated 2017 0.25$ 0.25$ No Change per pound
House Hazard Matl 680.785.1000‐46435.04 VSQG E‐Waste (Non TV'S & Non‐PCB Ballasts) 2017 0.25$ 0.25$ No Change per pound
House Hazard Matl 680.785.1000‐46435.04 VSQG TV'S 2018 0.50$ 0.50$ No Change $15/min ‐ $.50/lb
House Hazard Matl 680.785.1000‐46435.04 VSQG Salvaged or Broken TV's/Monitors New ‐$ 0.50$ New $15/min ‐ $.50/lb
House Hazard Matl 680.785.1000‐46435.04 VSQG Sharps 2019 1.50$ 2.00$ Increase per pound
House Hazard Matl 680.785.1000‐46435.04 VSQG Sharp Container New ‐$ 9.48$ New each
House Hazard Matl 680‐24200.001 VSQG Sharp Container Tax New ‐$ 0.52$ New each‐tax
House Hazard Matl 680.785.1000‐46435.04 VSQG Medication ‐ Non Controlled 2013 1.50$ 1.50$ No Change per pound
House Hazard Matl 680.785.1000‐46435.04 Mobilization ‐ Truck < 50 Miles 2006 50.00$ 50.00$ No Change per trip
House Hazard Matl 680.785.1000‐46435.04 Mobilization ‐ Truck < 100 Miles 2010 300.00$ 300.00$ No Change per trip
House Hazard Matl 680.785.1000‐46435.04 Mobilization ‐ Truck 100 ‐ 200 Miles 2010 400.00$ 400.00$ No Change per trip
House Hazard Matl 680.785.1000‐46435.04 Mobilization ‐ Truck > 200 Miles 2010 500.00$ 500.00$ No Change per trip
House Hazard Matl 680.785.1000‐46435.04 Staff Charges ‐ Manager 2015 100.00$ 100.00$ No Change per hour
House Hazard Matl 680.785.1000‐46435.04 Staff Charges ‐ Technician 2010 50.00$ 50.00$ No Change per hour
House Hazard Matl 680.785.1000‐46435.04 55 Gal Drum ‐ Flammable Liquids 2017 200.00$ 200.00$ No Change per drum
House Hazard Matl 680.785.1000‐46435.04 55 Gal Drum ‐ Lead Paint 2015 400.00$ 400.00$ No Change per drum
House Hazard Matl 680.785.1000‐46435.04 VSQG Canisters ‐ Propane Hand‐Held 2015 5.00$ 5.00$ No Change each
House Hazard Matl 680.785.1000‐46435.04 VSQG Canisters ‐ Propane 20 lbs 2018 10.00$ 10.00$ No Change each
House Hazard Matl 680.785.1000‐46435.04 VSQG Pressurized Canisters ‐ Other 2006 Case by case Case by case No Change each
38

S.S. = State Statute
Department Account Account Name
Last
Increase Current Rate 2019 Rate
Increase/
Decrease/No
Change in Rate Units
La Crosse County
Proposed User Fees, Charges for Services, and Permit Revenues for 2019
The 2019 Rates listed below reflect the approved 2019 rate at the time of the board approval of the budget on 11/12/18. Acutal 2019 rates may change as a result of committee action.
House Hazard Matl 680.785.1000‐46435.04 VSQG Broken Florescent Bulbs 2010 1.00$ 1.00$ No Change per pound
House Hazard Matl 680.785.1000‐46435.04 Lab clean‐out service fee 2011 500.00$ 500.00$ No Change each
House Hazard Matl 680.785.1000‐46435.04 VSQG Hydrofluoric Acid 2017 12.50$ 12.50$ No Change per pound
House Hazard Matl 680.785.1000‐46435.04 VSQG Administrative Fee New ‐$ 15.00$ New each
House Hazard Matl 680.785.1000‐46435.04 VSQG Lithium Primary New ‐$ 4.00$ New per pound
House Hazard Matl 680.785.1000‐46435.04 VSQG Bloated Lithium New ‐$ 35.00$ New $100 min ‐ $35/lb
House Hazard Matl 680.785.1000‐46435.04 VSQG Neon New ‐$ 125.00$ New $125/min
House Hazard Matl 680.785.1000‐46435.04 VSQG Unused Injectables New ‐$ 5.00$ New per pound
House Hazard Matl 680.785.1000‐46435.04 VSQG Isocyanates New ‐$ 5.00$ New per pound
House Hazard Matl 680.785.1000‐46435.01 Citizen All TV and Monitors 2018 15.00$ 15.00$ No Change each
House Hazard Matl 680.785.1000‐46435.01 Citizen Computer Monitor 2017 15.00$ 15.00$ No Change each
House Hazard Matl 680.785.1000‐46435.01 Citizen Salvaged or Broken TV's/Monitors 2019 ‐$ 0.50$ New each
House Hazard Matl 680.785.1000‐46435.01 Citizen‐Non‐EED Small Applicance 2017 0.25$ 0.25$ No Change per pound
House Hazard Matl 680.785.1000‐46435.01 Citizen‐ Ultra Violet Lamps 2017 3.50$ 3.50$ No Change each
House Hazard Matl 680.785.1000‐46435.01 Citizen‐ Pressurized Canisters ‐ Other 2017 Case by case Case by case No Change each
House Hazard Matl 680.785.1000‐46435.01 Citizen ‐ Microwave 2019 ‐$ 10.00$ New each
House Hazard Matl 680.785.1000‐46435.01 Citizen ‐ Freon 2014 20.00$ 20.00$ No Change each
House Hazard Matl 680.785.1000‐46435.01 Out of County Citizen Latex Paint & Non‐Hazardous 2017 0.25$ 0.25$ No Change per pound
House Hazard Matl 680.785.1000‐46435.01 Out of County Citizen Flammable Liquids & Solvents 2018 1.25$ 1.25$ No Change per pound
House Hazard Matl 680.785.1000‐46435.02 Out of County Citizen Poison/Toxic/Corrosive 2018 3.00$ 3.00$ No Change each
House Hazard Matl 680.785.1000‐46435.02 Out of County Fluorescent Bulbs (=or<4' U, Circline & Compact) 2018 0.75$ 0.75$ No Change each
House Hazard Matl 680.785.1000‐46435.01 Out of County Fluorescent Bulbs (>4') 2018 1.50$ 1.50$ No Change each
Solid Waste 650.650.1000‐44900.01 Annual Disposal Permit 2009 300.00$ 300.00$ No Change per vehicle
Solid Waste 650.650.1000‐44900.01 Annual Disposal Permit‐Govt 1/2 price 2009 150.00$ 150.00$ No Change per vehicle
Solid Waste 650.650.1000‐44900.01 3 Day Permits 2009 25.00$ 25.00$ No Change per vehicle
Solid Waste 650.650.1000‐46431.06 RDF Facility 2016 62.00$ 62.00$ No Change per ton
Solid Waste 650.650.1000‐46431.07 Unacceptable Items Delivered‐NSP 2004 10.00$ 10.00$ No Change each
Solid Waste 650.650.1000‐46431.07 Unacceptable Items Delivered‐NSP(Tires) 2004 10.00$ 10.00$ No Change each
Solid Waste 650.650.1000‐46431.07 Unacceptable Items Delivered‐NSP(Appliances) 2004 50.00$ 50.00$ No Change each
Solid Waste 650.650.1000‐46431.07 Unacceptable Items Delivered‐NSP(Mattress) 2016 15.00$ 15.00$ No Change each
Solid Waste 650.650.1000‐46431.20 Sanitary Landfill ‐ MSW 2016 62.00$ 62.00$ No Change per ton
Solid Waste 650.650.1000‐46431.16 Demolition Landfill 2016 62.00$ 62.00$ No Change per ton
Solid Waste 650.650.1000‐46431.19 Asphalt Shingles 2019 35.00$ 39.00$ Increase per ton
Solid Waste 650.650.1000‐46431.23 Pallets and Unpainted/Untreated Wood 2018 32.00$ 32.00$ No Change per ton
Solid Waste 650.650.1000‐46431.24 Brush & Limbs 2018 32.00$ 32.00$ No Change per ton
Solid Waste 650.650.1000‐46431.25 Stumps 2018 75.00$ 75.00$ No Change per ton
Solid Waste 650.650.1000‐46431.21 Yard Waste Without Brush, no Bag 2018 50.00$ 50.00$ No Change per ton
Solid Waste 650.650.1000‐46431.22 Tires/Recycling (5.00/Car tire) 2019 250.00$ 265.00$ Increase per ton
Solid Waste 650.650.1000‐46431.32 LF‐Car Tires mixed in Waste load 2018 10.00$ 10.00$ No Change per tire
Solid Waste 650.650.1000‐46431.32 LF‐Appliances mixed in Waste load 2016 25.00$ 25.00$ No Change each
Solid Waste 650.650.1000‐46431.32 LF‐Mattresses mixed in Waste Load 2019 ‐$ 15.00$ New each
Solid Waste 650.650.1000‐46431.32 E‐Waste mixed in Waste load 2016 25.00$ 25.00$ No Change each
Solid Waste 650.650.1000‐46431.26 Friable and Non Friable Asbestos (Including slate) 2018 175.00$ 175.00$ No Change per ton
Solid Waste 650.650.1000‐46431.07 Unacceptable Items Delivered‐NSP(EWaste) 2016 25.00$ 25.00$ No Change each
Solid Waste 650.650.1000‐46432.01 Citizen‐Mattress/Boxspring 2016 15.00$ 15.00$ No Change per unit
Solid Waste 650.650.1000‐48900.08 Late Payment Rev ? 1.5% of balance 1.5% of balance No Change % of balance
Solid Waste 650.650.1000‐46431.14 Misc Special Wastes (non‐ADC) & Wastewater Grit Headworks ? 62.00$ 62.00$ No Change per ton
Solid Waste 650.650.1000‐46431.27 Petroleum Contaminated Soils (case by case basis) 2017 22‐62 22‐62 No Change per ton
Solid Waste 650.650.1000‐46431.27 Petroleum Contaminated Soils (drum surcharge) 2013 50.00$ 50.00$ No Change per drum
Solid Waste 650.650.1000‐46431.11 Foundry Sand (ADC) 2010 20.00$ 20.00$ No Change per ton
Solid Waste 650.650.1000‐Multiple accts Minimum Charge per transaction 2016 5.00$ 5.00$ No Change per transaction
Solid Waste 650.650.1000‐46431.15 Car Wash Sand (ADC) 2010 20.00$ 20.00$ No Change per ton
Solid Waste 650.650.1000‐46431.18 Street Sweeping (ADC) 2010 15.00$ 15.00$ No Change per ton
Solid Waste 650.650.1000‐46431.17 Sandblasting Sand (ADC) 2010 20.00$ 20.00$ No Change per ton
39

S.S. = State Statute
Department Account Account Name
Last
Increase Current Rate 2019 Rate
Increase/
Decrease/No
Change in Rate Units
La Crosse County
Proposed User Fees, Charges for Services, and Permit Revenues for 2019
The 2019 Rates listed below reflect the approved 2019 rate at the time of the board approval of the budget on 11/12/18. Acutal 2019 rates may change as a result of committee action.
Solid Waste 650.650.1000‐46431.10 Coal & Wool Ash 2019 22‐62 22‐62 No Change per ton
Solid Waste 650.650.1000‐46431.17 Misc Daily Cover (ADC) & Petroleum Impacted Soils 2017 15‐62 15‐62 No Change per ton
Solid Waste 650.650.1000‐46431.12 Sludge 2013 33‐62 33‐62 No Change per ton
Solid Waste 650.650.1000‐46431.13 POTW Sludge & Wastewater Sludge C‐LAZ 2019 ‐$ 62.00$ New per ton
Solid Waste 650.650.1000‐46432.05 Clean Fill Dirt 2018 25.00$ 25.00$ No Change per ton
Solid Waste 650.650.1000‐46431.16
Mobile Home Disposal Fee (C&D, home cleaned out, no tiems left in
trailer), within County Disposal System 2009 400.00$ 400.00$ No Change per single‐wide home
Solid Waste 650.650.1000‐46431.16
Mobile Home Disposal Fee (C&D, home cleaned not cleaned out &
containes items not allowed in C&D site), within County Disposal
System 2009 900.00$ 900.00$ No Change per single‐wide home
Solid Waste 650.650.1000‐46431.16
Mobile Home Disposal Fee (C&D, home cleaned out, no tiems left in
trailer), outside County Disposal System 2009 480.00$ 480.00$ No Change per single‐wide home
Solid Waste 650.650.1000‐46431.16
Mobile Home Disposal Fee (C&D, home cleaned not cleaned out &
containes items not allowed in C&D site), outside County Disposal
System 2009 1,080.00$ 1,080.00$ No Change per single‐wide home
Solid Waste 650.650.1000‐46431.29 Untarped loads 2017 5.00$ 5.00$ No Change load
Solid Waste 650.650.1000‐46432.01 Freon items ? 20.00$ 20.00$ No Change each
Solid Waste 650.650.1000‐46431.29 Wood Chips 2018 18.00$ 18.00$ No Change per ton
Solid Waste 650.650.1000‐46431.20 Ag Plastics 2017 62.00$ 62.00$ No Change per ton
Solid Waste 650.650.1000‐46431.20 MSW ‐ Non‐Profit Waste 2019 ‐$ 55.00$ New per ton
Solid Waste 650.650.1000‐46432.01 Citizen Drop off 2018 120.00$ 120.00$ No Change per ton
Solid Waste 650.650.1000‐46432.01 Citzen Microwave 2018 10.00$ 10.00$ No Change unit
Solid Waste 650.650.1000‐46432.01 Citizen Flat Fee‐any vehicle w/trailer 2015 $15 flat fee + $62/ton $15 flat fee + $62/ton No Change flat fee
Aging 255.655.5440‐48500.01 Western Wisconsin Cares (MCO) HD Meals 2019 8.75$ 9.25$ Increase per meal
Aging 255.655.5470‐48500.01 # Nutrition Meals 2009 1.77$ 1.77$ No Change per congregate meal
Aging 255.655.5440‐48500.01 # Nutrition Meals 2009 3.02$ 3.02$ No Change per home delivered meal
Aging 255.660.1000‐69000.05 ***MiniBus Copayments Zone 1a 2010 3.50$ 3.50$ No Change per round trip
Aging 255.660.1000‐69000.05 ***MiniBus Copayments Zone 1b 2010 4.00$ 4.00$ No Change per round trip
Aging 255.660.1000‐69000.05 ***MiniBus Copayments Zone 2 2010 4.50$ 4.50$ No Change per round trip
Aging 255.660.1000‐48500.01 Volunteer Driver Copayments 2012 17.50$ 17.50$ No Change per round trip
Aging 255.660.1000‐48500.01 Shared Ride Meal Site Transportation 2011 0.60$ 0.60$ No Change per one‐way trip
Health‐Environmental 200.280.1000‐44300.01 Dept of AG Food Retail (55) Non Processing 2019 194.50$ 195.50$ Increase per license‐each
Health‐Environmental 200.280.1000‐44300.01 Dept of AG Food Retail (55) Non Processing 4.50$ 4.50$ No Change state portion per license‐each
Health‐Environmental 200.280.1000‐44300.01 Dept of AG Food Retail (55) Traveling Non Processing 2019 85.50$ 195.50$ Increase per license‐each
Health‐Environmental 200.280.1000‐44300.01 Dept of AG Food Retail (55) Traveling Non Processing 4.50$ 4.50$ No Change state portion per license‐each
Health‐Environmental 200.280.1000‐44300.01 Dept of AG Food Retail (44) Very Small Non PHG or PHF < 25,000 2019 236.00$ 244.00$ Increase per license‐each
Health‐Environmental 200.280.1000‐44300.01 Dept of AG Food Retail (44) Very Small Non PHG or PHF < 25,000 6.00$ 6.00$ No Change state portion per license‐each
Health‐Environmental 200.280.1000‐44300.01
Dept of AG Food Retail (44) Traveling Very Small Non PHG or PHF <
25,000 2019 104.00$ 244.00$ Increase per license‐each
Health‐Environmental 200.280.1000‐44300.01
Dept of AG Food Retail (44) Traveling Very Small Non PHG or PHF <
25,000 6.00$ 6.00$ No Change state portion per license‐each
Health‐Environmental 200.280.1000‐44300.01 Dept of AG Food Retail (33) Small Non‐PHF 25,000 ‐ 1M 2019 354.00$ 391.00$ Increase per license‐each
Health‐Environmental 200.280.1000‐44300.01 Dept of AG Food Retail (33) Small Non‐PHF 25,000 ‐ 1M 19.00$ 19.00$ No Change state portion per license‐each
Health‐Environmental 200.280.1000‐44300.01
Dept of AG Food Retail (33) Traveling Small Non PHG or PHF <
25,000 2019 346.00$ 391.00$ Increase per license‐each
Health‐Environmental 200.280.1000‐44300.01
Dept of AG Food Retail (33) Traveling Small Non PHG or PHF <
25,000 19.00$ 19.00$ No Change state portion per license‐each
Health‐Environmental 200.280.1000‐44300.01 Dept of AG Food Retail (22) Small PHF 25,000 ‐ 1M 2019 463.50$ 483.50$ Increase per license‐each
Health‐Environmental 200.280.1000‐44300.01 Dept of AG Food Retail (22) Small PHF 25,000 ‐ 1M 26.50$ 26.50$ No Change state portion per license‐each
Health‐Environmental 200.280.1000‐44300.01 Dept of AG Food Retail (22) Traveling Small PHF < 25,000 2019 463.50$ 483.50$ Increase per license‐each
Health‐Environmental 200.280.1000‐44300.01 Dept of AG Food Retail (22) Traveling Small PHF < 25,000 26.50$ 26.50$ No Change state portion per license‐each
Health‐Environmental 200.280.1000‐44300.01 Dept of AG Food Retail (11‐1) Large PHF 1M ‐ 5M 2018 686.50$ 686.50$ No Change per license‐each
Health‐Environmental 200.280.1000‐44300.01 Dept of AG Food Retail (11‐1) Large PHF 1M ‐ 5M 68.50$ 68.50$ No Change state portion per license‐each
Health‐Environmental 200.280.1000‐44300.01 Dept of AG Food Retail (11‐1) Traveling Large PHF 1M ‐ 5M 2018 686.50$ 686.50$ No Change per license‐each
Health‐Environmental 200.280.1000‐44300.01 Dept of AG Food Retail (11‐1) Traveling Large PHF 1M ‐ 5M 68.50$ 68.50$ No Change state portion per license‐each
40

S.S. = State Statute
Department Account Account Name
Last
Increase Current Rate 2019 Rate
Increase/
Decrease/No
Change in Rate Units
La Crosse County
Proposed User Fees, Charges for Services, and Permit Revenues for 2019
The 2019 Rates listed below reflect the approved 2019 rate at the time of the board approval of the budget on 11/12/18. Acutal 2019 rates may change as a result of committee action.
Health‐Environmental 200.280.1000‐44300.01 Dept of AG Food Retail (11‐5) Very Large PHF 5M ‐ 15M 2019 686.50$ 731.50$ Increase per license‐each
Health‐Environmental 200.280.1000‐44300.01 Dept of AG Food Retail (11‐5) Very Large PHF 5M ‐ 15M 68.50$ 68.50$ No Change state portion per license‐each
Health‐Environmental 200.280.1000‐44300.01 Dept of AG Food Retail (11‐5) Traveling Very Large PHF 5M ‐ 15M 2019 686.50$ 731.50$ Increase per license‐each
Health‐Environmental 200.280.1000‐44300.01 Dept of AG Food Retail (11‐15) Traveling Very Large PHF 5M ‐ 15M 68.50$ 68.50$ No Change state portion per license‐each
Health‐Environmental 200.280.1000‐44300.01 Dept of AG Food Retail (11‐15) Very Large PHF >15M 2019 686.50$ 781.50$ Increase per license‐each
Health‐Environmental 200.280.1000‐44300.01 Dept of AG Food Retail (11‐15) Very Large PHF >15M 68.50$ 68.50$ No Change state portion per license‐each
Health‐Environmental 200.280.1000‐44300.01 Dept of AG Food Retail (11‐15) Traveling Very Large PHF >15M 2019 686.50$ 781.50$ Increase per license‐each
Health‐Environmental 200.280.1000‐44300.01 Dept of AG Food Retail (11‐15) Traveling Very Large PHF >15M 68.50$ 68.50$ No Change state portion per license‐each
Health‐Environmental 200.280.1000‐44300.01 Micro Market ‐ Single New ‐$ 40.00$ New per license‐each
Health‐Environmental 200.280.1000‐44300.01 Micro Market ‐ Single ‐$ 4.00$ state portion per license‐each
Health‐Environmental 200.280.1000‐44300.01 Micro Market ‐ Multiple New ‐$ 60.00$ New per license‐each
Health‐Environmental 200.280.1000‐44300.01 Micro Market ‐ Multiple ‐$ 6.00$ state portion per license‐each
Health‐Environmental 200.280.1000‐44300.01 Dept of AG Food Retail (22) Traveling Large PHF 1M ‐ 5M 2018 671.50$ 686.50$ Increase per license‐each
Health‐Environmental 200.280.1000‐44300.01 Dept of AG Food Retail (22) Traveling Large PHF 1M ‐ 5M 68.50$ 68.50$ No Change state portion per license‐each
Health‐Environmental 200.280.1000‐44300.01 Dept of AG Food Retail (11) Very Large PHF 5M‐15M 2018 731.50$ ‐$ Decrease per license‐each (not offered in 2019)
Health‐Environmental 200.280.1000‐44300.01 Dept of AG Food Retail (11) Very Large PHF 5M‐15M 68.50$ ‐$ Decrease state portion per license‐each (not offered in 2019)
Health‐Environmental 200.280.1000‐44300.01 Dept of AG Food Retail (22) Traveling Very Large PHF > 15M 2018 721.50$ ‐$ Decrease per license‐each (not offered in 2019)
Health‐Environmental 200.280.1000‐44300.01 Dept of AG Food Retail (22) Traveling Very Large PHF > 15M 68.51$ ‐$ Decrease state portion per license‐each (not offered in 2019)
Health‐Environmental 200.280.1000‐44300.01 Div of Health ‐ Temporary Food 2019 143.00$ 153.00$ Increase per license‐each
Health‐Environmental 200.280.1000‐44300.01 Div of Health ‐ Temporary Food 17.00$ 17.00$ No Change state portion per license‐each
Health‐Environmental 200.280.1000‐44300.01 Div of Health ‐ Temporary Food 7 Day Prepay 2019 133.00$ 143.00$ Increase per license‐each
Health‐Environmental 200.280.1000‐44300.01 Div of Health ‐ Temporary Food 7 Day Prepay 17.00$ 17.00$ No Change state portion per license‐each
Health‐Environmental 200.280.1000‐44300.01 Div of Health ‐ Temporary NA Beverage (55) 2018 133.00$ 90.50$ Decrease per license‐each
Health‐Environmental 200.280.1000‐44300.01 Div of Health ‐ Temporary NA Beverage (55) 17.00$ 4.50$ Decrease state portion per license‐each
Health‐Environmental 200.280.1000‐44300.01 Div of Health ‐ Restaurant Pre Packaged Food 2019 234.50$ 239.50$ Increase per license‐each
Health‐Environmental 200.280.1000‐44300.01 Div of Health ‐ Restaurant Pre Packaged Food 10.50$ 10.50$ No Change state portion per license‐each
Health‐Environmental 200.280.1000‐44300.01 Div of Health ‐ Restaurant Mobile Base Pre Packaged Food 2019 234.50$ 239.50$ Increase per license‐each
Health‐Environmental 200.280.1000‐44300.01 Div of Health ‐ Restaurant Mobile Base Pre Packaged Food 10.50$ 10.50$ No Change state portion per license‐each
Health‐Environmental 200.280.1000‐44300.01 Div of Health ‐ Restaurant Mobile Base Simple 2019 375.00$ 387.00$ Increase per license‐each
Health‐Environmental 200.280.1000‐44300.01 Div of Health ‐ Restaurant Mobile Base Simple 23.00$ 23.00$ No Change state portion per license‐each
Health‐Environmental 200.280.1000‐44300.01 Div of Health ‐ Restaurant Mobile Base Moderate 2019 465.00$ 477.00$ Increase per license‐each
Health‐Environmental 200.280.1000‐44300.01 Div of Health ‐ Restaurant Mobile Base Moderate 33.00$ 33.00$ No Change state portion per license‐each
Health‐Environmental 200.280.1000‐44300.01 Div of Health ‐ Restaurant Mobile Base Complex 2019 580.00$ 596.00$ Increase per license‐each
Health‐Environmental 200.280.1000‐44300.01 Div of Health ‐ Restaurant Mobile Base Complex 54.00$ 54.00$ No Change state portion per license‐each
Health‐Environmental 200.280.1000‐44300.01 Div of Health ‐ Restaurant Simple 2019 382.00$ 387.00$ Increase per license‐each
Health‐Environmental 200.280.1000‐44300.01 Div of Health ‐ Restaurant Simple 23.00$ 23.00$ No Change state portion per license‐each
Health‐Environmental 200.280.1000‐44300.01 Div of Health ‐ Restaurant Moderate 2019 474.00$ 477.00$ Increase per license‐each
Health‐Environmental 200.280.1000‐44300.01 Div of Health ‐ Restaurant Moderate 33.00$ 33.00$ No Change state portion per license‐each
Health‐Environmental 200.280.1000‐44300.01 Div of Health ‐ Restaurant Complex 2019 580.00$ 596.00$ Increase per license‐each
Health‐Environmental 200.280.1000‐44300.01 Div of Health ‐ Restaurant Complex 54.00$ 54.00$ No Change state portion per license‐each
Health‐Environmental 200.280.1000‐44300.01 Div of Health ‐ Additional Food Service 2019 115.00$ 117.00$ Increase per license‐each
Health‐Environmental 200.280.1000‐44300.01 Div of Health ‐ Additional Food Service 8.00$ 8.00$ No Change state portion per license‐each
Health‐Environmental 200.280.1000‐44300.01 Div of Health ‐ Tourist Rooming House 2019 181.00$ 189.00$ Increase per license‐each
Health‐Environmental 200.280.1000‐44300.01 Div of Health ‐ Tourist Rooming House 11.00$ 11.00$ No Change state portion per license‐each
Health‐Environmental 200.280.1000‐44300.01 Div of Health ‐ Hotel/Motel 5‐30 Rooms LH1 2019 196.50$ 199.50$ Increase per license‐each
Health‐Environmental 200.280.1000‐44300.01 Div of Health ‐ Hotel/Motel 5‐30 Rooms LH1 20.50$ 20.50$ No Change state portion per license‐each
Health‐Environmental 200.280.1000‐44300.01 Div of Health ‐ Hotel/Motel 31‐99 Rooms LH2 2019 248.00$ 252.00$ Increase per license‐each
Health‐Environmental 200.280.1000‐44300.01 Div of Health ‐ Hotel/Motel 31‐99 Rooms LH2 28.00$ 28.00$ No Change state portion per license‐each
Health‐Environmental 200.280.1000‐44300.01 Div of Health ‐ Hotel/Motel 100‐199 Rooms LH3 2019 321.50$ 324.50$ Increase per license‐each
Health‐Environmental 200.280.1000‐44300.01 Div of Health ‐ Hotel/Motel 100‐199 Rooms LH3 35.50$ 35.50$ No Change state portion per license‐each
Health‐Environmental 200.280.1000‐44300.01 Div of Health ‐ Hotel/motel 200 or more Rooms LH4 2019 420.00$ 421.00$ Increase per license‐each
Health‐Environmental 200.280.1000‐44300.01 Div of Health ‐ Hotel/motel 200 or more Rooms LH4 49.00$ 49.00$ No Change state portion per license‐each
Health‐Environmental 200.280.1000‐44300.01 Div of Health ‐ Bed and Breakfast 2019 106.00$ 139.00$ Increase per license‐each
41
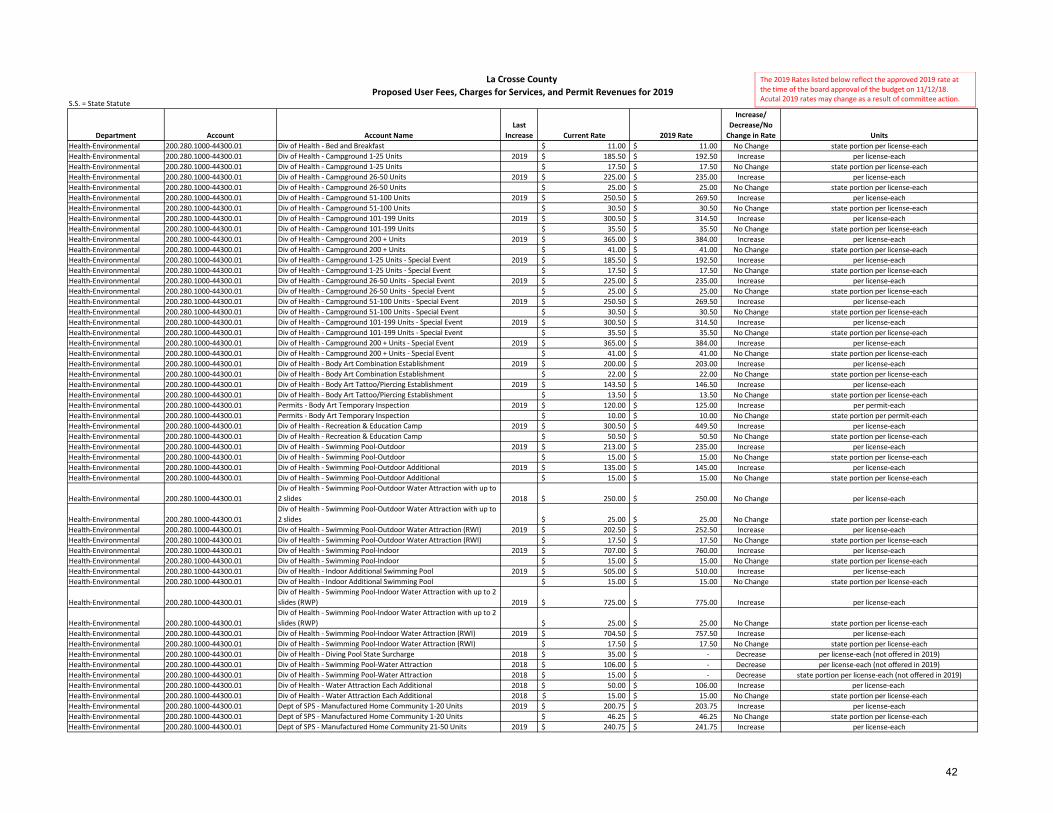
S.S. = State Statute
Department Account Account Name
Last
Increase Current Rate 2019 Rate
Increase/
Decrease/No
Change in Rate Units
La Crosse County
Proposed User Fees, Charges for Services, and Permit Revenues for 2019
The 2019 Rates listed below reflect the approved 2019 rate at the time of the board approval of the budget on 11/12/18. Acutal 2019 rates may change as a result of committee action.
Health‐Environmental 200.280.1000‐44300.01 Div of Health ‐ Bed and Breakfast 11.00$ 11.00$ No Change state portion per license‐each
Health‐Environmental 200.280.1000‐44300.01 Div of Health ‐ Campground 1‐25 Units 2019 185.50$ 192.50$ Increase per license‐each
Health‐Environmental 200.280.1000‐44300.01 Div of Health ‐ Campground 1‐25 Units 17.50$ 17.50$ No Change state portion per license‐each
Health‐Environmental 200.280.1000‐44300.01 Div of Health ‐ Campground 26‐50 Units 2019 225.00$ 235.00$ Increase per license‐each
Health‐Environmental 200.280.1000‐44300.01 Div of Health ‐ Campground 26‐50 Units 25.00$ 25.00$ No Change state portion per license‐each
Health‐Environmental 200.280.1000‐44300.01 Div of Health ‐ Campground 51‐100 Units 2019 250.50$ 269.50$ Increase per license‐each
Health‐Environmental 200.280.1000‐44300.01 Div of Health ‐ Campground 51‐100 Units 30.50$ 30.50$ No Change state portion per license‐each
Health‐Environmental 200.280.1000‐44300.01 Div of Health ‐ Campground 101‐199 Units 2019 300.50$ 314.50$ Increase per license‐each
Health‐Environmental 200.280.1000‐44300.01 Div of Health ‐ Campground 101‐199 Units 35.50$ 35.50$ No Change state portion per license‐each
Health‐Environmental 200.280.1000‐44300.01 Div of Health ‐ Campground 200 + Units 2019 365.00$ 384.00$ Increase per license‐each
Health‐Environmental 200.280.1000‐44300.01 Div of Health ‐ Campground 200 + Units 41.00$ 41.00$ No Change state portion per license‐each
Health‐Environmental 200.280.1000‐44300.01 Div of Health ‐ Campground 1‐25 Units ‐ Special Event 2019 185.50$ 192.50$ Increase per license‐each
Health‐Environmental 200.280.1000‐44300.01 Div of Health ‐ Campground 1‐25 Units ‐ Special Event 17.50$ 17.50$ No Change state portion per license‐each
Health‐Environmental 200.280.1000‐44300.01 Div of Health ‐ Campground 26‐50 Units ‐ Special Event 2019 225.00$ 235.00$ Increase per license‐each
Health‐Environmental 200.280.1000‐44300.01 Div of Health ‐ Campground 26‐50 Units ‐ Special Event 25.00$ 25.00$ No Change state portion per license‐each
Health‐Environmental 200.280.1000‐44300.01 Div of Health ‐ Campground 51‐100 Units ‐ Special Event 2019 250.50$ 269.50$ Increase per license‐each
Health‐Environmental 200.280.1000‐44300.01 Div of Health ‐ Campground 51‐100 Units ‐ Special Event 30.50$ 30.50$ No Change state portion per license‐each
Health‐Environmental 200.280.1000‐44300.01 Div of Health ‐ Campground 101‐199 Units ‐ Special Event 2019 300.50$ 314.50$ Increase per license‐each
Health‐Environmental 200.280.1000‐44300.01 Div of Health ‐ Campground 101‐199 Units ‐ Special Event 35.50$ 35.50$ No Change state portion per license‐each
Health‐Environmental 200.280.1000‐44300.01 Div of Health ‐ Campground 200 + Units ‐ Special Event 2019 365.00$ 384.00$ Increase per license‐each
Health‐Environmental 200.280.1000‐44300.01 Div of Health ‐ Campground 200 + Units ‐ Special Event 41.00$ 41.00$ No Change state portion per license‐each
Health‐Environmental 200.280.1000‐44300.01 Div of Health ‐ Body Art Combination Establishment 2019 200.00$ 203.00$ Increase per license‐each
Health‐Environmental 200.280.1000‐44300.01 Div of Health ‐ Body Art Combination Establishment 22.00$ 22.00$ No Change state portion per license‐each
Health‐Environmental 200.280.1000‐44300.01 Div of Health ‐ Body Art Tattoo/Piercing Establishment 2019 143.50$ 146.50$ Increase per license‐each
Health‐Environmental 200.280.1000‐44300.01 Div of Health ‐ Body Art Tattoo/Piercing Establishment 13.50$ 13.50$ No Change state portion per license‐each
Health‐Environmental 200.280.1000‐44300.01 Permits ‐ Body Art Temporary Inspection 2019 120.00$ 125.00$ Increase per permit‐each
Health‐Environmental 200.280.1000‐44300.01 Permits ‐ Body Art Temporary Inspection 10.00$ 10.00$ No Change state portion per permit‐each
Health‐Environmental 200.280.1000‐44300.01 Div of Health ‐ Recreation & Education Camp 2019 300.50$ 449.50$ Increase per license‐each
Health‐Environmental 200.280.1000‐44300.01 Div of Health ‐ Recreation & Education Camp 50.50$ 50.50$ No Change state portion per license‐each
Health‐Environmental 200.280.1000‐44300.01 Div of Health ‐ Swimming Pool‐Outdoor 2019 213.00$ 235.00$ Increase per license‐each
Health‐Environmental 200.280.1000‐44300.01 Div of Health ‐ Swimming Pool‐Outdoor 15.00$ 15.00$ No Change state portion per license‐each
Health‐Environmental 200.280.1000‐44300.01 Div of Health ‐ Swimming Pool‐Outdoor Additional 2019 135.00$ 145.00$ Increase per license‐each
Health‐Environmental 200.280.1000‐44300.01 Div of Health ‐ Swimming Pool‐Outdoor Additional 15.00$ 15.00$ No Change state portion per license‐each
Health‐Environmental 200.280.1000‐44300.01
Div of Health ‐ Swimming Pool‐Outdoor Water Attraction with up to
2 slides 2018 250.00$ 250.00$ No Change per license‐each
Health‐Environmental 200.280.1000‐44300.01
Div of Health ‐ Swimming Pool‐Outdoor Water Attraction with up to
2 slides 25.00$ 25.00$ No Change state portion per license‐each
Health‐Environmental 200.280.1000‐44300.01 Div of Health ‐ Swimming Pool‐Outdoor Water Attraction (RWI) 2019 202.50$ 252.50$ Increase per license‐each
Health‐Environmental 200.280.1000‐44300.01 Div of Health ‐ Swimming Pool‐Outdoor Water Attraction (RWI) 17.50$ 17.50$ No Change state portion per license‐each
Health‐Environmental 200.280.1000‐44300.01 Div of Health ‐ Swimming Pool‐Indoor 2019 707.00$ 760.00$ Increase per license‐each
Health‐Environmental 200.280.1000‐44300.01 Div of Health ‐ Swimming Pool‐Indoor 15.00$ 15.00$ No Change state portion per license‐each
Health‐Environmental 200.280.1000‐44300.01 Div of Health ‐ Indoor Additional Swimming Pool 2019 505.00$ 510.00$ Increase per license‐each
Health‐Environmental 200.280.1000‐44300.01 Div of Health ‐ Indoor Additional Swimming Pool 15.00$ 15.00$ No Change state portion per license‐each
Health‐Environmental 200.280.1000‐44300.01
Div of Health ‐ Swimming Pool‐Indoor Water Attraction with up to 2
slides (RWP) 2019 725.00$ 775.00$ Increase per license‐each
Health‐Environmental 200.280.1000‐44300.01
Div of Health ‐ Swimming Pool‐Indoor Water Attraction with up to 2
slides (RWP) 25.00$ 25.00$ No Change state portion per license‐each
Health‐Environmental 200.280.1000‐44300.01 Div of Health ‐ Swimming Pool‐Indoor Water Attraction (RWI) 2019 704.50$ 757.50$ Increase per license‐each
Health‐Environmental 200.280.1000‐44300.01 Div of Health ‐ Swimming Pool‐Indoor Water Attraction (RWI) 17.50$ 17.50$ No Change state portion per license‐each
Health‐Environmental 200.280.1000‐44300.01 Div of Health ‐ Diving Pool State Surcharge 2018 35.00$ ‐$ Decrease per license‐each (not offered in 2019)
Health‐Environmental 200.280.1000‐44300.01 Div of Health ‐ Swimming Pool‐Water Attraction 2018 106.00$ ‐$ Decrease per license‐each (not offered in 2019)
Health‐Environmental 200.280.1000‐44300.01 Div of Health ‐ Swimming Pool‐Water Attraction 2018 15.00$ ‐$ Decrease state portion per license‐each (not offered in 2019)
Health‐Environmental 200.280.1000‐44300.01 Div of Health ‐ Water Attraction Each Additional 2018 50.00$ 106.00$ Increase per license‐each
Health‐Environmental 200.280.1000‐44300.01 Div of Health ‐ Water Attraction Each Additional 2018 15.00$ 15.00$ No Change state portion per license‐each
Health‐Environmental 200.280.1000‐44300.01 Dept of SPS ‐ Manufactured Home Community 1‐20 Units 2019 200.75$ 203.75$ Increase per license‐each
Health‐Environmental 200.280.1000‐44300.01 Dept of SPS ‐ Manufactured Home Community 1‐20 Units 46.25$ 46.25$ No Change state portion per license‐each
Health‐Environmental 200.280.1000‐44300.01 Dept of SPS ‐ Manufactured Home Community 21‐50 Units 2019 240.75$ 241.75$ Increase per license‐each
42

S.S. = State Statute
Department Account Account Name
Last
Increase Current Rate 2019 Rate
Increase/
Decrease/No
Change in Rate Units
La Crosse County
Proposed User Fees, Charges for Services, and Permit Revenues for 2019
The 2019 Rates listed below reflect the approved 2019 rate at the time of the board approval of the budget on 11/12/18. Acutal 2019 rates may change as a result of committee action.
Health‐Environmental 200.280.1000‐44300.01 Dept of SPS ‐ Manufactured Home Community 21‐50 Units 83.25$ 83.25$ No Change state portion per license‐each
Health‐Environmental 200.280.1000‐44300.01 Dept of SPS ‐ Manufactured Home Community 51‐100 Units 2019 275.50$ 280.50$ Increase per license‐each
Health‐Environmental 200.280.1000‐44300.01 Dept of SPS ‐ Manufactured Home Community 51‐100 Units 129.50$ 129.50$ No Change state portion per license‐each
Health‐Environmental 200.280.1000‐44300.01 Dept of SPS ‐ Manufactured Home Community 101‐175 Units 2019 311.50$ 333.50$ Increase per license‐each
Health‐Environmental 200.280.1000‐44300.01 Dept of SPS ‐ Manufactured Home Community 101‐175 Units 166.50$ 166.50$ No Change state portion per license‐each
Health‐Environmental 200.280.1000‐44300.01 Dept of SPS ‐ Manufactured Home Community 176+ Units 2019 350.00$ 415.00$ Increase per license‐each
Health‐Environmental 200.280.1000‐44300.01 Dept of SPS ‐ Manufactured Home Community 176+ Units 185.00$ 185.00$ No Change state portion per license‐each
Health‐Environmental 200.280.1000‐44300.01 Permits‐Kennel 2019 125.00$ 130.00$ Increase per license‐each
Health‐Environmental 200.280.1000‐44300.01 Permits‐Lobster Tank/Aquarium 2019 125.00$ 130.00$ Increase per license‐each
Health‐Environmental 200.280.1000‐44300.01 Permits‐Grooming Shop 2019 125.00$ 130.00$ Increase per license‐each
Health‐Environmental 200.280.1000‐44300.01 Permits‐Pet Shop 2019 125.00$ 130.00$ Increase per license‐each
Health‐Environmental 200.280.1000‐44300.01 Permits‐Boarding 2019 125.00$ 130.00$ Increase per license‐each
Health‐Environmental 200.280.1000‐44300.01 Permits‐Animal Training Facility 2019 125.00$ 130.00$ Increase per license‐each
Health‐Environmental 200.280.1000‐44300.01 Permits‐Animal Day Care Facility 2019 125.00$ 130.00$ Increase per license‐each
Health‐Environmental 200.280.1000‐44300.01 Permits‐Horse/Stable Facility 2019 125.00$ 130.00$ Increase per license‐each
Health‐Environmental 200.280.1000‐44300.01 Permits ‐ Animal Facility Reinspection 2019 155.00$ 160.00$ Increase per inspection‐each
Health‐Environmental 200.280.1000‐44300.01 Permits‐Tavern 2018 220.00$ 220.00$ No Change per license‐each
Health‐Environmental 200.280.1000‐44300.01 Permits‐Beverage Tasting Facility 2018 220.00$ 220.00$ No Change per license‐each
Health‐Environmental 200.280.1000‐44300.01 Permits ‐ Food Retail (Inspection Only) 2018 95.00$ 95.00$ No Change per license‐each
Health‐Environmental 200.280.1000‐44300.01 Permits ‐ Restaurant (Inspection Only) 2018 95.00$ 95.00$ No Change per license‐each
Health‐Environmental 200.280.1000‐44300.01 Permits ‐ Pre Inspection Food less than $25,000 2019 200.00$ 210.00$ Increase per license‐each
Health‐Environmental 200.280.1000‐44300.01 Permits ‐ Pre Inspection Food $25,000 to $1,000,000 2019 305.00$ 310.00$ Increase per license‐each
Health‐Environmental 200.280.1000‐44300.01 Permits ‐ Pre Inspection Food $1,000,000 ‐ $5,000,000 2019 405.00$ 410.00$ Increase per license‐each
Health‐Environmental 200.280.1000‐44300.01 Permits ‐ Pre Inspection Food $5,000,000 ‐ $15,000,000 2019 405.00$ 510.00$ Increase per license‐each
Health‐Environmental 200.280.1000‐44300.01 Permits ‐ Pre Inspection Food greater than $15,000,000 2019 500.00$ 540.00$ Increase per license‐each
Health‐Environmental 200.280.1000‐44300.01 Permits ‐ Pre Inspection Restaurants Pre‐packaged Food 2019 100.00$ 210.00$ Increase per license‐each
Health‐Environmental 200.280.1000‐44300.01 Permits ‐ Pre Inspection Restaurants Simple Food 2019 205.00$ 210.00$ Increase per license‐each
Health‐Environmental 200.280.1000‐44300.01 Permits ‐ Pre Inspection Restaurants Moderate Food 2019 305.00$ 310.00$ Increase per license‐each
Health‐Environmental 200.280.1000‐44300.01 Permits ‐ Pre Inspection Restaurants Complex Food 2019 405.00$ 410.00$ Increase per license‐each
Health‐Environmental 200.280.1000‐44300.01 Permits ‐ Pre Inspection Bed & Breakfast 2019 105.00$ 110.00$ Increase per license‐each
Health‐Environmental 200.280.1000‐44300.01 Permits ‐ Pre Inspection Rec & Ed Camp 2019 315.00$ 350.00$ Increase per license‐each
Health‐Environmental 200.280.1000‐44300.01 Permits ‐ Pre Inspection Manufactured Home Community 2018 220.00$ 220.00$ No Change per license‐each
Health‐Environmental 200.280.1000‐44300.01 Permits ‐ Pre Inspection Tavern 2019 131.00$ 150.00$ Increase per license‐each
Health‐Environmental 200.280.1000‐44300.01 Permits ‐ Pre Inspection Beverage Tasting Facility 2019 131.00$ 150.00$ Increase per license‐each
Health‐Environmental 200.280.1000‐44300.01 Permits ‐ Pre Inspection Body Art 2019 94.00$ 95.00$ Increase per license‐each
Health‐Environmental 200.280.1000‐44300.01 Permits ‐ Pre Inspection Pool (per pool) 2018 200.00$ 200.00$ No Change per license‐each
Health‐Environmental 200.280.1000‐44300.01 Permits ‐ Pre Inspection Pool Water Attraction (RWI) 2018 200.00$ 200.00$ No Change per license‐each
Health‐Environmental 200.280.1000‐44300.01
Permits ‐ Pre Inspection Pool Water Attraction with up to 2 Slides
(RWT) 2019 200.00$ 250.00$ Increase per license‐each
Health‐Environmental 200.280.1000‐44300.01 Permits ‐ Pre Inspection Hotel/Motel/Tourist Rooming House 2019 194.00$ 195.00$ Increase per license‐each
Health‐Environmental 200.280.1000‐44300.01 Permits ‐ Pre Inspection Campground 2019 315.00$ 350.00$ Increase per license‐each
Health‐Environmental 200.280.1000‐44300.01 Permits ‐ Late Fee 2019 127.00$ 135.00$ Increase each
Health‐Environmental 200.280.1000‐44300.01 Permits ‐ Beaches, Public 2018 110.00$ 110.00$ No Change per license‐each
Health‐Environmental 200.280.1000‐44300.01 Permits ‐ Schools‐Central Kitchen 2018 255.00$ 255.00$ No Change per license‐each
Health‐Environmental 200.280.1000‐44300.01 Permits ‐ Schools‐Satellite Kitchen 2018 135.00$ 135.00$ No Change per license‐each
Health‐Environmental 200.280.1000‐44300.01 Permits ‐ Micro Market New ‐$ 95.00$ New per license‐each
Health‐Environmental 200.280.1000‐44300.01 Permits ‐ Plan Review Food New ‐$ 250.00$ New per license‐each
Health‐Environmental 200.280.1000‐44300.01 Permits ‐ Plan Review Recreational & Safety New ‐$ 250.00$ New per license‐each
Health‐Environmental 200.280.1000‐44300.01 Permits ‐ Outdoor Wood Fired Furnaces 2019 75.00$ 80.00$ Increase per permit‐each
Health‐Environmental 200.280.1000‐44300.01 Permits ‐ Reinspection Bed & Breakfast 2019 95.00$ 100.00$ Increase per permit‐each
Health‐Environmental 200.280.1000‐44300.01 Permits ‐ Reinspection Rec & Ed Camp 2018 100.00$ 100.00$ No Change per permit‐each
Health‐Environmental 200.280.1000‐44300.01 Permits ‐ Reinspection Tavern 2019 133.00$ 135.00$ Increase per permit‐each
Health‐Environmental 200.280.1000‐44300.01 Permits ‐ Reinspection Beverage Tasting Facility 2019 133.00$ 135.00$ Increase per permit‐each
Health‐Environmental 200.280.1000‐44300.01 Permits‐Reinspection Food Establishment New ‐$ 175.00$ New per permit‐each
Health‐Environmental 200.280.1000‐44300.01 Permits‐Reinspection Food Establishment‐2nd 2019 150.00$ 200.00$ Increase per permit‐each
Health‐Environmental 200.280.1000‐44300.01 Permits ‐ Reinspection Food Establishment 3+ 2019 170.00$ 275.00$ Increase per permit‐each
Health‐Environmental 200.280.1000‐44300.01 Permits ‐ Reinspection Body Art 2019 95.00$ 100.00$ Increase per permit‐each
43

S.S. = State Statute
Department Account Account Name
Last
Increase Current Rate 2019 Rate
Increase/
Decrease/No
Change in Rate Units
La Crosse County
Proposed User Fees, Charges for Services, and Permit Revenues for 2019
The 2019 Rates listed below reflect the approved 2019 rate at the time of the board approval of the budget on 11/12/18. Acutal 2019 rates may change as a result of committee action.
Health‐Environmental 200.280.1000‐44300.01 Permits ‐ Reinspection Pool (per pool) 2018 100.00$ 100.00$ No Change per permit‐each
Health‐Environmental 200.280.1000‐44300.01 Permits‐Reinspection Hotel/Motel/Tourist Rooming House 2019 95.00$ 100.00$ Increase per permit‐each
Health‐Environmental 200.280.1000‐44300.01 Permits‐Reinspection Campground 2019 95.00$ 100.00$ Increase per permit‐each
Health‐Environmental 200.280.1000‐44300.01 Permits‐Reinspection Manufactured Home Community 2019 95.00$ 100.00$ Increase per permit‐each
Health‐Environmental 200.280.1000‐44300.01 Permits‐Reinspection Manufactured Home Community 2+ MHC 1‐20 New ‐$ 125.00$ New per permit‐each
Health‐Environmental 200.280.1000‐44300.01
Permits‐Reinspection Manufactured Home Community 2+ MHC 21‐
50 New ‐$ 175.00$ New per permit‐each
Health‐Environmental 200.280.1000‐44300.01
Permits‐Reinspection Manufactured Home Community 2+ MHC 51‐
100 New ‐$ 205.00$ New per permit‐each
Health‐Environmental 200.280.1000‐44300.01
Permits‐Reinspection Manufactured Home Community 2+ MHC 101‐
175 New ‐$ 250.00$ New per permit‐each
Health‐Environmental 200.280.1000‐44300.01
Permits‐Reinspection Manufactured Home Community 2+ MHC
176+ New ‐$ 300.00$ New per permit‐each
Health‐Environmental 200.280.1000‐44300.01 Operating Without a License 2019 199.00$ 250.00$ Increase per permit‐each
Health‐Environmental 200.280.1000‐44300.01 Permits ‐ Site Evaluation ‐ Septic 2019 110.00$ 115.00$ Increase per permit‐each
Health‐Environmental 200.280.1000‐44300.01 Permits ‐ On‐Site Property Review 2019 95.00$ 100.00$ Increase per permit‐each
Health‐Environmental 200.280.1000‐44300.01 Permits ‐ Pumping Report Process Fee 2013 15.00$ 15.00$ No Change per permit‐each
Health‐Environmental 200.280.1000‐44300.01 Permits ‐ Pumping Report Late Fee 2018 30.00$ 30.00$ No Change per permit‐each
Health‐Environmental 200.280.1000‐44300.01 Permits ‐ CST Evaluation ‐ Pits Open 2019 170.00$ 175.00$ Increase per permit‐each
Health‐Environmental 200.280.1000‐44300.01 Permits ‐ CST Evaluation ‐ Pits Covered 2018 240.00$ 240.00$ No Change per permit‐each
Health‐Environmental 200.280.1000‐44300.01 Permits ‐ CST Evaluation ‐ Return On‐Site 2019 90.00$ 95.00$ Increase per permit‐each
Health‐Environmental 200.280.1000‐44300.01 Dept of SPS ‐ Remediation Permit 2018 270.00$ 270.00$ No Change per permit‐each
Health‐Environmental 200.280.1000‐44300.01 Permits ‐ Sanitary Permit Transfer 2019 45.00$ 50.00$ Increase per permit‐each
Health‐Environmental 200.280.1000‐44300.01 Permits ‐ Sanitary Permit Renewal 2019 45.00$ 50.00$ Increase per permit‐each
Health‐Environmental 200.280.1000‐44300.01 Permits ‐ Sanitary Permit Revision 2019 45.00$ 50.00$ Increase per permit‐each
Health‐Environmental 200.280.1000‐44300.01 Permits ‐ Return Inspection Fee 2019 90.00$ 95.00$ Increase per permit‐each
Health‐Environmental 200.280.1000‐44300.01 Permits ‐ Mound System 2019 790.00$ 795.00$ Increase per permit‐each
Health‐Environmental 200.280.1000‐44300.01 In Ground Pressure System 2018 630.00$ 630.00$ No Change per permit‐each
Health‐Environmental 200.280.1000‐44300.01 At Grade System 2019 680.00$ 685.00$ Increase per permit‐each
Health‐Environmental 200.280.1000‐44300.01 In Ground Non‐Pressure, Holding Tank, Replace Tank 2019 525.00$ 530.00$ Increase per permit‐each
Health‐Environmental 200.280.1000‐44300.01 Surcharge ‐ Large System Surcharge (1500‐3000 gpd) 2018 220.00$ 220.00$ No Change per permit‐each
Health‐Environmental 200.280.1000‐44300.01 Surcharge ‐ Large System Surcharge (3001+ gpd) 2019 430.00$ 440.00$ Increase per permit‐each
Health‐Environmental 200.280.1000‐44300.01 Permits ‐ Monitoring Wells, Each Site 2018 55.00$ 55.00$ No Change per permit‐each
Health‐Environmental 200.280.1000‐44300.01 Permits ‐ Reconnect/Repair/Renovate 2019 185.00$ 190.00$ Increase per permit‐each
Health‐Environmental 200.280.1000‐44300.01 Permits ‐ Privy (Outhouse) 2018 170.00$ 170.00$ No Change per permit‐each
Health‐Environmental 200.280.1000‐44300.01 Permits ‐ Wisconsin Fund Application 2018 165.00$ 165.00$ No Change per permit‐each
Health‐Environmental 200.280.1000‐44300.01 Permits ‐ Well Permits 2018 195.00$ 195.00$ No Change per permit‐each
Health‐Environmental 200.280.1000‐44300.01 Permits ‐ Well Permit Transfer 2018 45.00$ 45.00$ No Change per permit‐each
Health‐Environmental 200.280.1000‐46590.01 Public Health Revenue ‐ Unsafe Swimming Pool Sampling Fee 2017 26.00$ 27.00$ Increase per permit‐each
Health‐Environmental 200.280.1000‐46590.01 Public Health Revenue ‐ Unsafe Whirlpool Sampling Fee 2017 60.00$ 60.00$ No Change per permit‐each
Health‐Environmental 200.280.1000‐46590.03 Radon Test Kit, Short Term 2014 10.00$ 10.00$ No Change per test‐each
Health‐Environmental 200.280.1000‐46590.03 Radon Test Kit, Long Term 2014 21.00$ 22.00$ Increase per test‐each
Health‐Education 200.300.1000‐46590.02 Car Seat Installation 2015 25.00$ 25.00$ No Change per install
Health‐Laboratory 200.320.1000‐46594.01 Lab Fees ‐Analysis Chemical ‐ Nitrate 2018 27.00$ 27.00$ No Change per test‐each
Health‐Laboratory 200.320.1000‐46594.01 Lab Fees ‐Analysis Chemical ‐ RO Nitrate Package 2018 36.00$ 36.00$ No Change per test‐each
Health‐Laboratory 200.320.1000‐46594.01 Lab Fees ‐Analysis Chemical ‐ Nitrate ‐ Rush 2018 54.00$ 54.00$ No Change per test‐each
Health‐Laboratory 200.320.1000‐46594.01 Lab Fees ‐Analysis Chemical ‐ Arsenic ‐ Rush ‐ Contract 2016 Per Market Per Market No Change per test‐each
Health‐Laboratory 200.320.1000‐46594.01 Lab Fees ‐Analysis Chemical ‐ Arsenic ‐ Contract 2016 Per Market Per Market No Change per test‐each
Health‐Laboratory 200.320.1000‐46594.01 Lab Fees ‐Analysis Chemical ‐ Arsenic ‐ In House 2017 29.00$ 29.00$ No Change per test‐each
Health‐Laboratory 200.320.1000‐46594.01 Lab Fees ‐Analysis Chemical ‐ Arsenic ‐ In House ‐ Rush 2018 87.00$ 87.00$ No Change per test‐each
Health‐Laboratory 200.320.1000‐46594.01 Lab Fees ‐Analysis Chemical ‐ Atrazine ‐ Contract 2016 Per Market Per Market No Change per test‐each
Health‐Laboratory 200.320.1000‐46594.01 Lab Fees ‐Analysis Chemical ‐ Single Elements ‐ Contract 2017 Per Market Per Market No Change per test‐each
Health‐Laboratory 200.320.1000‐46594.01 Lab Fees ‐Analysis Chemical ‐ Nitrite ‐ Contract 2016 Per Market Per Market No Change per test‐each
Health‐Laboratory 200.320.1000‐46594.01 Lab Fees ‐Analysis Chemical ‐ pH 2018 16.00$ 16.00$ No Change per test‐each
44
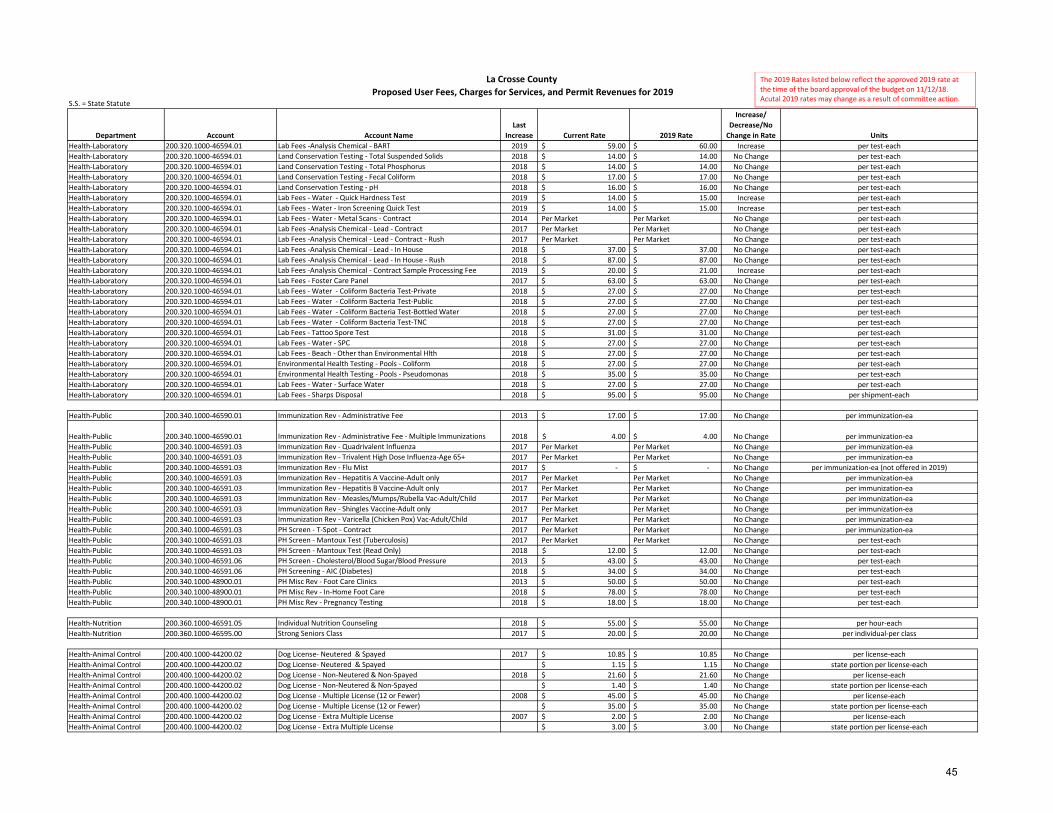
S.S. = State Statute
Department Account Account Name
Last
Increase Current Rate 2019 Rate
Increase/
Decrease/No
Change in Rate Units
La Crosse County
Proposed User Fees, Charges for Services, and Permit Revenues for 2019
The 2019 Rates listed below reflect the approved 2019 rate at the time of the board approval of the budget on 11/12/18. Acutal 2019 rates may change as a result of committee action.
Health‐Laboratory 200.320.1000‐46594.01 Lab Fees ‐Analysis Chemical ‐ BART 2019 59.00$ 60.00$ Increase per test‐each
Health‐Laboratory 200.320.1000‐46594.01 Land Conservation Testing ‐ Total Suspended Solids 2018 14.00$ 14.00$ No Change per test‐each
Health‐Laboratory 200.320.1000‐46594.01 Land Conservation Testing ‐ Total Phosphorus 2018 14.00$ 14.00$ No Change per test‐each
Health‐Laboratory 200.320.1000‐46594.01 Land Conservation Testing ‐ Fecal Coliform 2018 17.00$ 17.00$ No Change per test‐each
Health‐Laboratory 200.320.1000‐46594.01 Land Conservation Testing ‐ pH 2018 16.00$ 16.00$ No Change per test‐each
Health‐Laboratory 200.320.1000‐46594.01 Lab Fees ‐ Water ‐ Quick Hardness Test 2019 14.00$ 15.00$ Increase per test‐each
Health‐Laboratory 200.320.1000‐46594.01 Lab Fees ‐ Water ‐ Iron Screening Quick Test 2019 14.00$ 15.00$ Increase per test‐each
Health‐Laboratory 200.320.1000‐46594.01 Lab Fees ‐ Water ‐ Metal Scans ‐ Contract 2014 Per Market Per Market No Change per test‐each
Health‐Laboratory 200.320.1000‐46594.01 Lab Fees ‐Analysis Chemical ‐ Lead ‐ Contract 2017 Per Market Per Market No Change per test‐each
Health‐Laboratory 200.320.1000‐46594.01 Lab Fees ‐Analysis Chemical ‐ Lead ‐ Contract ‐ Rush 2017 Per Market Per Market No Change per test‐each
Health‐Laboratory 200.320.1000‐46594.01 Lab Fees ‐Analysis Chemical ‐ Lead ‐ In House 2018 37.00$ 37.00$ No Change per test‐each
Health‐Laboratory 200.320.1000‐46594.01 Lab Fees ‐Analysis Chemical ‐ Lead ‐ In House ‐ Rush 2018 87.00$ 87.00$ No Change per test‐each
Health‐Laboratory 200.320.1000‐46594.01 Lab Fees ‐Analysis Chemical ‐ Contract Sample Processing Fee 2019 20.00$ 21.00$ Increase per test‐each
Health‐Laboratory 200.320.1000‐46594.01 Lab Fees ‐ Foster Care Panel 2017 63.00$ 63.00$ No Change per test‐each
Health‐Laboratory 200.320.1000‐46594.01 Lab Fees ‐ Water ‐ Coliform Bacteria Test‐Private 2018 27.00$ 27.00$ No Change per test‐each
Health‐Laboratory 200.320.1000‐46594.01 Lab Fees ‐ Water ‐ Coliform Bacteria Test‐Public 2018 27.00$ 27.00$ No Change per test‐each
Health‐Laboratory 200.320.1000‐46594.01 Lab Fees ‐ Water ‐ Coliform Bacteria Test‐Bottled Water 2018 27.00$ 27.00$ No Change per test‐each
Health‐Laboratory 200.320.1000‐46594.01 Lab Fees ‐ Water ‐ Coliform Bacteria Test‐TNC 2018 27.00$ 27.00$ No Change per test‐each
Health‐Laboratory 200.320.1000‐46594.01 Lab Fees ‐ Tattoo Spore Test 2018 31.00$ 31.00$ No Change per test‐each
Health‐Laboratory 200.320.1000‐46594.01 Lab Fees ‐ Water ‐ SPC 2018 27.00$ 27.00$ No Change per test‐each
Health‐Laboratory 200.320.1000‐46594.01 Lab Fees ‐ Beach ‐ Other than Environmental Hlth 2018 27.00$ 27.00$ No Change per test‐each
Health‐Laboratory 200.320.1000‐46594.01 Environmental Health Testing ‐ Pools ‐ Coliform 2018 27.00$ 27.00$ No Change per test‐each
Health‐Laboratory 200.320.1000‐46594.01 Environmental Health Testing ‐ Pools ‐ Pseudomonas 2018 35.00$ 35.00$ No Change per test‐each
Health‐Laboratory 200.320.1000‐46594.01 Lab Fees ‐ Water ‐ Surface Water 2018 27.00$ 27.00$ No Change per test‐each
Health‐Laboratory 200.320.1000‐46594.01 Lab Fees ‐ Sharps Disposal 2018 95.00$ 95.00$ No Change per shipment‐each
Health‐Public 200.340.1000‐46590.01 Immunization Rev ‐ Administrative Fee 2013 17.00$ 17.00$ No Change per immunization‐ea
Health‐Public 200.340.1000‐46590.01 Immunization Rev ‐ Administrative Fee ‐ Multiple Immunizations 2018 4.00$ 4.00$ No Change per immunization‐ea
Health‐Public 200.340.1000‐46591.03 Immunization Rev ‐ Quadrivalent Influenza 2017 Per Market Per Market No Change per immunization‐ea
Health‐Public 200.340.1000‐46591.03 Immunization Rev ‐ Trivalent High Dose Influenza‐Age 65+ 2017 Per Market Per Market No Change per immunization‐ea
Health‐Public 200.340.1000‐46591.03 Immunization Rev ‐ Flu Mist 2017 ‐$ ‐$ No Change per immunization‐ea (not offered in 2019)
Health‐Public 200.340.1000‐46591.03 Immunization Rev ‐ Hepatitis A Vaccine‐Adult only 2017 Per Market Per Market No Change per immunization‐ea
Health‐Public 200.340.1000‐46591.03 Immunization Rev ‐ Hepatitis B Vaccine‐Adult only 2017 Per Market Per Market No Change per immunization‐ea
Health‐Public 200.340.1000‐46591.03 Immunization Rev ‐ Measles/Mumps/Rubella Vac‐Adult/Child 2017 Per Market Per Market No Change per immunization‐ea
Health‐Public 200.340.1000‐46591.03 Immunization Rev ‐ Shingles Vaccine‐Adult only 2017 Per Market Per Market No Change per immunization‐ea
Health‐Public 200.340.1000‐46591.03 Immunization Rev ‐ Varicella (Chicken Pox) Vac‐Adult/Child 2017 Per Market Per Market No Change per immunization‐ea
Health‐Public 200.340.1000‐46591.03 PH Screen ‐ T‐Spot ‐ Contract 2017 Per Market Per Market No Change per immunization‐ea
Health‐Public 200.340.1000‐46591.03 PH Screen ‐ Mantoux Test (Tuberculosis) 2017 Per Market Per Market No Change per test‐each
Health‐Public 200.340.1000‐46591.03 PH Screen ‐ Mantoux Test (Read Only) 2018 12.00$ 12.00$ No Change per test‐each
Health‐Public 200.340.1000‐46591.06 PH Screen ‐ Cholesterol/Blood Sugar/Blood Pressure 2013 43.00$ 43.00$ No Change per test‐each
Health‐Public 200.340.1000‐46591.06 PH Screening ‐ AIC (Diabetes) 2018 34.00$ 34.00$ No Change per test‐each
Health‐Public 200.340.1000‐48900.01 PH Misc Rev ‐ Foot Care Clinics 2013 50.00$ 50.00$ No Change per test‐each
Health‐Public 200.340.1000‐48900.01 PH Misc Rev ‐ In‐Home Foot Care 2018 78.00$ 78.00$ No Change per test‐each
Health‐Public 200.340.1000‐48900.01 PH Misc Rev ‐ Pregnancy Testing 2018 18.00$ 18.00$ No Change per test‐each
Health‐Nutrition 200.360.1000‐46591.05 Individual Nutrition Counseling 2018 55.00$ 55.00$ No Change per hour‐each
Health‐Nutrition 200.360.1000‐46595.00 Strong Seniors Class 2017 20.00$ 20.00$ No Change per individual‐per class
Health‐Animal Control 200.400.1000‐44200.02 Dog License‐ Neutered & Spayed 2017 10.85$ 10.85$ No Change per license‐each
Health‐Animal Control 200.400.1000‐44200.02 Dog License‐ Neutered & Spayed 1.15$ 1.15$ No Change state portion per license‐each
Health‐Animal Control 200.400.1000‐44200.02 Dog License ‐ Non‐Neutered & Non‐Spayed 2018 21.60$ 21.60$ No Change per license‐each
Health‐Animal Control 200.400.1000‐44200.02 Dog License ‐ Non‐Neutered & Non‐Spayed 1.40$ 1.40$ No Change state portion per license‐each
Health‐Animal Control 200.400.1000‐44200.02 Dog License ‐ Multiple License (12 or Fewer) 2008 45.00$ 45.00$ No Change per license‐each
Health‐Animal Control 200.400.1000‐44200.02 Dog License ‐ Multiple License (12 or Fewer) 35.00$ 35.00$ No Change state portion per license‐each
Health‐Animal Control 200.400.1000‐44200.02 Dog License ‐ Extra Multiple License 2007 2.00$ 2.00$ No Change per license‐each
Health‐Animal Control 200.400.1000‐44200.02 Dog License ‐ Extra Multiple License 3.00$ 3.00$ No Change state portion per license‐each
45

S.S. = State Statute
Department Account Account Name
Last
Increase Current Rate 2019 Rate
Increase/
Decrease/No
Change in Rate Units
La Crosse County
Proposed User Fees, Charges for Services, and Permit Revenues for 2019
The 2019 Rates listed below reflect the approved 2019 rate at the time of the board approval of the budget on 11/12/18. Acutal 2019 rates may change as a result of committee action.
Health‐Animal Control 200.400.1000‐44200.02 Dog License ‐ Penalties 2004 10.00$ 10.00$ No Change per citation‐each
46

The 2019 rates listed below reflect the approved 2019 rate at the time of the board approval of the budget on 11/13/18. Acutal 2019 rates may change as a result of committe action.
LA CROSSE COUNTY HUMAN SERVICES DEPARTMENT 2019 FEES
Section / Unit NWS Account
#
Account Name NWS Rate Type Basis of Unit Last
Change
2018 Rate 2019 Rate Explanation for Increase
(Decrease) in RateJSS / Juvenile
Detention Facility
210.520.5140‐
47310.12
General Pymts from Local Govts
WRAS ‐ Out of County
One Set Rate Daily 2014 195.00$ 195.00$ Market rate review
JSS / Juvenile
Detention Facility
210.520.5140‐
47310.12
General Pymts from Local Govts
WRAS ‐ Out of County
Juvenile Assessment Each 2018 187.50$ 240.00$ Rate calculated based on
projected 2019 budgeted costs
JSS / Juvenile
Detention Facility
210.520.5140‐
46210.07
Law Enforcement Fees WRAS In
County
One Set Rate Daily 2014 195.00$ 195.00$ Market rate review
JSS / CORE Program 210.520.5170‐
47310.12
General Pymts from Local Govts
WRAS ‐ Out of County
One Set Rate Daily 2017 250.00$ 250.00$ Market rate review
JSS / CORE Program 210.520.5170‐
47310.12
General Pymts from Local Govts
WRAS ‐ Out of County
Juvenile Assessment Each 2018 187.50$ 240.00$ Rate calculated based on
projected 2019 budgeted costs
JSS / CORE Program 210.520.5170‐
46210.07
Law Enforcement Fees WRAS In
County
One Set Rate Daily 2017 250.00$ 250.00$ Market rate review
JSS / Western Region
Adolescent Center
210.520.5200‐
47310.12
General Pymts from Local Govts
WRAS ‐ Out of County
Regular Bed Daily 2014 135.00$ 150.00$ Market rate review
JSS / Western Region
Adolescent Center
210.520.5200‐
47310.12
General Pymts from Local Govts
WRAS ‐ Out of County
Contracted Bed Daily 2015 115.00$ 115.00$ Market rate review
JSS / Western Region
Adolescent Center
210.520.5200‐
47310.12
General Pymts from Local Govts
WRAS ‐ Out of County
Juvenile Assessment Each 2018 187.50$ 240.00$ Rate calculated based on
projected 2019 budgeted costs
JSS / Western Region
Adolescent Center
210.520.5200‐
46210.07
Law Enforcement Fees WRAS In
County
Regular Bed Daily 2014 135.00$ 150.00$ Market rate review
JSS / IDP Program 210.500.5020‐
46591.14
Client Fees Monitoring Fees Taxable OWI Assess / DSP Each 2013 350.00$ 350.00$ No Change
JSS / Pretrial 210.500.5050‐
46140.05
Court Fees & Costs Deferred
Prosecution Revenue
Pre‐Charge Diversion One Time 2016 25.00$ 25.00$ No Change
JSS / Pretrial 210.500.5050‐
46140.05
Court Fees & Costs Deferred
Prosecution Revenue
Post‐Charge Diversion Monthly 2016 25.00$ 25.00$ No Change
JSS / Monitoring 210.500.5080‐
46591.09
Client Fees Monitoring Fees Taxable Daily Remote Breath
Alcohol Monitoring
Daily 2014 17.00$ 12.00$ Rate changes based on cost
calculation
JSS / Monitoring 210.500.5080‐
46591.09
Client Fees Monitoring Fees Taxable Daily GPS Monitoring ‐
Adult
Daily 2014 12.00$ 12.00$ No Change
JSS / Monitoring 210.500.5080‐
46591.09
Client Fees Monitoring Fees Taxable Lost Equipment Each 2015 Actual Cost of
Equipment +
Sales Tax
Actual Cost of
Equipment +
Sales Tax No Change
JSS / Monitoring 210.500.5080‐
46591.08
Client Fees Monitoring Fees
Nontaxable
Drug/Alcohol Testing Monthly 2005 25.00$ 50.00$ No Change
JSS / Monitoring 210.500.5080‐
46591.08
Client Fees Monitoring Fees
Nontaxable
Drug/Alcohol Testing ‐
Confirmation Test
Each 2018 40.00$ 40.00$ No Change
JSS / Monitoring 210.500.5080‐
46591.08
Client Fees Monitoring Fees
Nontaxable
Drug Court Fees Each 2005 750.00$ 750.00$ No Change
JSS / Monitoring 210.500.5080‐
46591.08
Client Fees Monitoring Fees
Nontaxable
Drug Court Credit ‐
Community Services
Each 2005 (250.00)$ (250.00)$ No Change
JSS / Youth Justice
Services
210.510.1000‐
46591.09
Client Fees Monitoring Fees Taxable Daily GPS Monitoring ‐
Juvenile
Daily 2005 5.00$ 12.00$ Rate changed to match Adult GPS
Monitoring charge. Same service.
HS Operations 210.410.4210‐
46195.03
Other General Govt Charges Copier
Revenue
One Set Rate Per Page 2007 0.25$ 0.25$ No Change
47

The 2019 rates listed below reflect the approved 2019 rate at the time of the board approval of the budget on 11/13/18. Acutal 2019 rates may change as a result of committe action.
LA CROSSE COUNTY HUMAN SERVICES DEPARTMENT 2019 FEES
Section / Unit NWS Account
#
Account Name NWS Rate Type Basis of Unit Last
Change
2018 Rate 2019 Rate Explanation for Increase
(Decrease) in RateHS Operations 210.410.4210‐
46195.08
Other General Govt Charges Copier
Revenue (non taxable)
One Set Rate Per Page 2007 0.25$ 0.25$ No Change
F&C Operations 210.420.1000‐
46602.00
Background Check Revenue No Sub
Account
One Set Rate Per Check 2007 15.00$ 15.00$ No Change
ISRS / Crisis Services 210.445.1000‐
43560.57
State Aid Human Services Medicaid Para Hourly 2018 100.00$ 125.00$ Rate changes based on cost
calculation
ISRS / Crisis Services 210.445.1000‐
43560.57
State Aid Human Services Medicaid Bach Hourly 2014 100.00$ 142.00$ Rate changes based on cost
calculation
ISRS / Crisis Services 210.445.1000‐
43560.57
State Aid Human Services Medicaid Masters Hourly 2014 100.00$ 150.00$ Rate changes based on cost
calculation
ISRS / Crisis Services 210.445.1000‐
43560.57
State Aid Human Services Medicaid PhD Hourly 2018 135.00$ 179.00$ Rate changes based on cost
calculation
ISRS / Crisis Services 210.445.1000‐
43560.57
State Aid Human Services Medicaid APNP Hourly 2018 190.00$ 235.00$ Rate changes based on cost
calculation
ISRS / Crisis Services 210.445.1000‐
46593.00
Insurance Revenue No Sub Account Para Hourly 2018 100.00$ 125.00$ Rate changes based on cost
calculation
ISRS / Crisis Services 210.445.1000‐
46593.00
Insurance Revenue No Sub Account Bach Hourly 2015 100.00$ 142.00$ Rate changes based on cost
calculation
ISRS / Crisis Services 210.445.1000‐
46593.00
Insurance Revenue No Sub Account Masters Hourly 2015 100.00$ 150.00$ Rate changes based on cost
calculation
ISRS / Crisis Services 210.445.1000‐
46593.00
Insurance Revenue No Sub Account PhD Hourly 2018 135.00$ 179.00$ Rate changes based on cost
calculation
ISRS / Crisis Services 210.445.1000‐
46593.00
Insurance Revenue No Sub Account APNP Hourly 2018 190.00$ 235.00$ Rate changes based on cost
calculation
ISRS / Crisis Services 210.445.1000‐
46591.01
Client Fees General Client Fees Para Hourly 2018 100.00$ 125.00$ Rate changes based on cost
calculation
ISRS / Crisis Services 210.445.1000‐
46591.01
Client Fees General Client Fees Bach Hourly 2015 100.00$ 142.00$ Rate changes based on cost
calculation
ISRS / Crisis Services 210.445.1000‐
46591.01
Client Fees General Client Fees Masters Hourly 2015 100.00$ 150.00$ Rate changes based on cost
calculation
ISRS / Crisis Services 210.445.1000‐
46591.01
Client Fees General Client Fees PhD Hourly 2018 135.00$ 179.00$ Rate changes based on cost
calculation
ISRS / Crisis Services 210.445.1000‐
46591.01
Client Fees General Client Fees APNP Hourly 2018 190.00$ 235.00$ Rate changes based on cost
calculation
ISRS / Youth
Collaborative Crisis
210.445.4600‐
43560.57
State Aid Human Services Medicaid Para Hourly 2018 100.00$ 125.00$ Rate changes based on cost
calculation
ISRS / Youth
Collaborative Crisis
210.445.4600‐
43560.57
State Aid Human Services Medicaid Bach Hourly 2017 100.00$ 142.00$ Rate changes based on cost
calculation
ISRS / Youth
Collaborative Crisis
210.445.4600‐
43560.57
State Aid Human Services Medicaid Masters Hourly 2017 100.00$ 150.00$ Rate changes based on cost
calculation
ISRS / Youth
Collaborative Crisis
210.445.4600‐
43560.57
State Aid Human Services Medicaid PhD Hourly 2018 135.00$ 179.00$ Rate changes based on cost
calculation
ISRS / Youth
Collaborative Crisis
210.445.4600‐
43560.57
State Aid Human Services Medicaid APNP Hourly 2018 190.00$ 235.00$ Rate changes based on cost
calculation
ISRS / MH and AODA 210.450.1000‐
43560.36
State Aid Human Services MA Case
Management
Bach Quarter Hour 2018 40.00$ 45.50$ Rate changes based on cost
calculation
48

The 2019 rates listed below reflect the approved 2019 rate at the time of the board approval of the budget on 11/13/18. Acutal 2019 rates may change as a result of committe action.
LA CROSSE COUNTY HUMAN SERVICES DEPARTMENT 2019 FEES
Section / Unit NWS Account
#
Account Name NWS Rate Type Basis of Unit Last
Change
2018 Rate 2019 Rate Explanation for Increase
(Decrease) in RateISRS / MH and AODA 210.450.1000‐
43560.57
State Aid Human Services Medicaid Bach Hourly 2018 135.00$ 182.00$ Rate changes based on cost
calculation
ISRS / MH and AODA 210.450.1000‐
43560.57
State Aid Human Services Medicaid Masters Hourly 2018 125.00$ 181.00$ Rate changes based on cost
calculation
ISRS / MH and AODA 210.450.1000‐
43560.57
State Aid Human Services Medicaid PhD Hourly 2018 155.00$ 206.00$ Rate changes based on cost
calculation
ISRS / MH and AODA 210.450.1000‐
43560.57
State Aid Human Services Medicaid APNP Hourly 2018 270.00$ 262.00$ Rate changes based on cost
calculation
ISRS / MH and AODA 210.450.1000‐
43560.57
State Aid Human Services Medicaid MD Hourly 2018 365.00$ 411.00$ Rate changes based on cost
calculation
ISRS / MH and AODA 210.450.1000‐
43560.57
State Aid Human Services Medicaid Bach (Group) Hourly 2018 16.88$ 22.75$ Rate changes based on cost
calculation
ISRS / MH and AODA 210.450.1000‐
43560.57
State Aid Human Services Medicaid Masters (Group) Hourly 2018 15.63$ 22.63$ Rate changes based on cost
calculation
ISRS / MH and AODA 210.450.1000‐
43560.57
State Aid Human Services Medicaid PhD (Group) Hourly 2018 19.38$ 25.75$ Rate changes based on cost
calculation
ISRS / MH and AODA 210.450.1000‐
43560.57
State Aid Human Services Medicaid APNP (Group) Hourly 2018 33.75$ 32.75$ Rate changes based on cost
calculation
ISRS / MH and AODA 210.450.1000‐
43560.57
State Aid Human Services Medicaid MD (Group) Hourly 2018 45.63$ 51.38$ Rate changes based on cost
calculation
ISRS / MH and AODA 210.450.1000‐
43560.39
State Aid Human Services Medicare
Clinical Services
Bach Hourly 2018 135.00$ 182.00$ Rate changes based on cost
calculation
ISRS / MH and AODA 210.450.1000‐
43560.39
State Aid Human Services Medicare
Clinical Services
Masters Hourly 2018 125.00$ 181.00$ Rate changes based on cost
calculation
ISRS / MH and AODA 210.450.1000‐
43560.39
State Aid Human Services Medicare
Clinical Services
PhD Hourly 2018 155.00$ 206.00$ Rate changes based on cost
calculation
ISRS / MH and AODA 210.450.1000‐
43560.39
State Aid Human Services Medicare
Clinical Services
APNP Hourly 2018 270.00$ 262.00$ Rate changes based on cost
calculation
ISRS / MH and AODA 210.450.1000‐
43560.39
State Aid Human Services Medicare
Clinical Services
MD Hourly 2018 365.00$ 411.00$ Rate changes based on cost
calculation
ISRS / MH and AODA 210.450.1000‐
46593.00
Insurance Revenue No Sub Account Bach Hourly 2018 135.00$ 182.00$ Rate changes based on cost
calculation
ISRS / MH and AODA 210.450.1000‐
46593.00
Insurance Revenue No Sub Account Masters Hourly 2018 125.00$ 181.00$ Rate changes based on cost
calculation
ISRS / MH and AODA 210.450.1000‐
46593.00
Insurance Revenue No Sub Account PhD Hourly 2018 155.00$ 206.00$ Rate changes based on cost
calculation
ISRS / MH and AODA 210.450.1000‐
46593.00
Insurance Revenue No Sub Account APNP Hourly 2018 270.00$ 262.00$ Rate changes based on cost
calculation
ISRS / MH and AODA 210.450.1000‐
46593.00
Insurance Revenue No Sub Account MD Hourly 2018 365.00$ 411.00$ Rate changes based on cost
calculation
ISRS / MH and AODA 210.450.1000‐
46591.01
Client Fees General Client Fees Bach Hourly 2018 135.00$ 182.00$ Rate changes based on cost
calculation
ISRS / MH and AODA 210.450.1000‐
46591.01
Client Fees General Client Fees Masters Hourly 2018 125.00$ 181.00$ Rate changes based on cost
calculation
ISRS / MH and AODA 210.450.1000‐
46591.01
Client Fees General Client Fees PhD Hourly 2018 155.00$ 206.00$ Rate changes based on cost
calculation
49

The 2019 rates listed below reflect the approved 2019 rate at the time of the board approval of the budget on 11/13/18. Acutal 2019 rates may change as a result of committe action.
LA CROSSE COUNTY HUMAN SERVICES DEPARTMENT 2019 FEES
Section / Unit NWS Account
#
Account Name NWS Rate Type Basis of Unit Last
Change
2018 Rate 2019 Rate Explanation for Increase
(Decrease) in RateISRS / MH and AODA 210.450.1000‐
46591.01
Client Fees General Client Fees APNP Hourly 2018 270.00$ 262.00$ Rate changes based on cost
calculation
ISRS / MH and AODA 210.450.1000‐
46591.01
Client Fees General Client Fees MD Hourly 2018 365.00$ 411.00$ Rate changes based on cost
calculation
ISRS / CCS Program 210.455.4720‐
43560.57
State Aid Human Services Medicaid Bach Quarter Hour 2015 21.43$ 23.00$ Rate changes based on cost
calculation
ISRS / CCS Program 210.455.4720‐
43560.57
State Aid Human Services Medicaid Masters Quarter Hour 2015 32.14$ 25.00$ Rate changes based on cost
calculation
ISRS / CCS Program 210.455.4720‐
43560.57
State Aid Human Services Medicaid APNP Quarter Hour 2017 53.57$ 45.00$ Rate changes based on cost
calculation
ISRS / CCS Program 210.455.4720‐
43560.57
State Aid Human Services Medicaid PhD Quarter Hour 2015 40.00$ 31.00$ Rate changes based on cost
calculation
ISRS / CCS Program 210.455.4720‐
43560.57
State Aid Human Services Medicaid RN Quarter Hour 2018 21.43$ 26.00$ Rate changes based on cost
calculation
ISRS / CCS Program 210.455.4720‐
43560.57
State Aid Human Services Medicaid MD Quarter Hour 2018 53.57$ 82.00$ Rate changes based on cost
calculation
ISRS / CCS Program 210.455.4720‐
43560.57
State Aid Human Services Medicaid Bach (Group) Quarter Hour 2017 5.36$ 5.75$ Rate changes based on cost
calculation
ISRS / CCS Program 210.455.4720‐
43560.57
State Aid Human Services Medicaid Masters (Group) Quarter Hour 2017 8.04$ 6.25$ Rate changes based on cost
calculation
ISRS / CCS Program 210.455.4720‐
43560.57
State Aid Human Services Medicaid APNP (Group) Quarter Hour 2018 13.39$ 11.25$ Rate changes based on cost
calculation
ISRS / CCS Program 210.455.4720‐
43560.57
State Aid Human Services Medicaid PhD (Group) Quarter Hour 2018 10.00$ 7.75$ Rate changes based on cost
calculation
ISRS / CCS Program 210.455.4720‐
43560.57
State Aid Human Services Medicaid RN (Group) Quarter Hour 2018 5.36$ 6.50$ Rate changes based on cost
calculation
ISRS / CCS Program 210.455.4720‐
43560.57
State Aid Human Services Medicaid MD (Group) Quarter Hour 2018 13.39$ 20.50$ Rate changes based on cost
calculation
ISRS / Birth to 3 210.460.4930‐
43560.36
State Aid Human Services MA Case
Management
One Rate Quarter Hour 2018 40.00$ 45.50$ Rate changes based on cost
calculation
ISRS / MVHS 220.220.1000‐
46591.10
Client Fees Client Cost Share One Rate Daily 2017 120.00$ 135.00$ Rate based on calculated cost
share charged by MVHS, which
increased from prior year
50

2020 2021 2022 2023 Unfunded
Information TechnologyCisco 3850 12 port switch 13,200$ Cisco wireless controller 17,450$ Unitrends Backup System Upgrade 85,000$
TOTAL INFORMATION TECHNOLOGY $ 115,650
Emergency DispatchRadio System Upgrade 395,000$ 400,000$ 307,000$ 468,000$ -$ -$
TOTAL EMERGENCY DISPATCH $ 395,000 $ 400,000 $ 307,000 $ 468,000 $ - $ -
ERPERP Software 40,000$
TOTAL ERP $ 40,000 $ - $ - $ - $ - $ -
Facility Department - Buildings & GroundsHealth & Human Services BuildingReplace Brick with Drywall, ceiling, lighting, flooring - Foyer Area 120,000$ Replace Carpet in Foyer 15,000$ -$ Install In ground Irrigation System 10,000$ Chilled Water Pumps/VFD Replacement 25,000$ -$ Flooring Replacement - Ongoing 10,000$ 10,000$ 10,000$ 5,000$ 5,000$ 15,000$
TOTAL HEALTH & HUMAN SERVICES BUILDING 25,000$ 35,000$ 10,000$ 5,000$ 5,000$ 145,000$ Law Enforcement CenterSolar Project 100,000$ -$ Repaint bunks, doors, frames and railings in A, E, F, G, H blocks 6,000$ -$ Wall Paper Replacement 5,000$ 25,000$ Lighting Fixture Replacement 10,000$ 30,000$ Boilers Replacement 4 and 5 55,000$ 60,000$ -$ Install In ground Irrigation System 10,000$ Court room double doors remote locking system 10,000$ Flooring Replacement 25,000$ 25,000$ 50,000$ Roof Replacement ('97 building) 190,000$ -$ Jail Receiving Buildout 345,000$ 4,455,000$ Blinds in Jail Blocks 1,300$ -$ Emergency Services Backup Communication Center, Neshonoc Center 50,000$ Water Heater in 2010 Building 12,000$ -$
TOTAL LAW ENFORCEMENT CENTER 549,300$ 60,000$ 190,000$ 35,000$ -$ 4,630,000$
La Crosse CountyLong Range Capital Improvements
Location/ProjectProjected for 2019
Future Needs
51

2020 2021 2022 2023 UnfundedLocation/ProjectProjected for 2019
Future Needs
Downtown CampusSealcoat/Concrete Replacement - Ongoing 20,000$ 5,000$ 5,000$ 5,000$ -$ 20,000$ Resurface 7th St. Lot 230,000$ Resurface Admin Lot 200,000$ Blacktop Replacement 350,000$ Streetscaping 375,000$
TOTAL DOWNTOWN CAMPUS 20,000$ 5,000$ 5,000$ 5,000$ -$ 1,175,000$ Parks & CampgroundsPark and Campground Road Repair - Ongoing 50,000$ 50,000$ 50,000$ 120,000$ Playground Equipment 90,000$ GI/VT Fire ring/Picnic Table Replacement 25,000$ 25,000$ -$ Electrical/Water Upgrades - Ongoing 35,000$ 35,000$ 35,000$ 30,000$ GI Rip Rap Shoreline 25,000$ 25,000$ -$ GI FLAP Grant Match (road improvement) 565,000$ 565,000$ -$ GI Campsite Improvement with Pad Improvement 150,000$ GI Bathhouse 2 Improvements 5,000$ 5,000$ -$ GI Bathhouse 1 ceiling and lighting replacement 7,100$ -$ GI Water Tower Cold Weather Isolation Valves 1,000$ -$ Mindoro Pavilion Floor Replacement 10,000$ -$ Vets Rip Rap Shoreline 150,000$ Vets Water Tower Cold Weather Isolation Valves 1,000$ -$ Overflow camp area - add water and toilet (GI) 5,000$ Campground store exterior log building repairs (GI) 5,000$ -$ Vets Pond Improvements 25,000$ Multipurpose Trail Neshonoc-Neshonoc South 500,000$ Ash Tree Removal & Replacement (est $400 per tree) 30,000$ 30,000$ 10,000$ 30,000$ GI Vault Toilet Facility Repair (roof, windows, dividers) 6,000$ -$ Parks share of FLAP grant (396,919)$ (396,919)$ -$
TOTAL PARKS & CAMPGROUNDS 228,181$ 203,081$ 150,000$ 135,000$ 85,000$ 1,100,000$ Ophelia's House127/129 South 7th Street - Flooring Replacement 10,000$ 5,000$ - Improve Lighting 5,000$ - Secure Entry door 1,500$
TOTAL OPHELIA'S HOUSE -$ 10,000$ -$ -$ -$ 11,500$ Alternative EnergyWind Turbine and Other Projects 100,000$
TOTAL ALTERNATIVE ENERGY -$ -$ -$ -$ -$ 100,000$
TOTAL CAPITAL IMPROVEMENTS - FACILITIES 822,481$ 313,081$ 355,000$ 180,000$ 90,000$ 7,161,500$
52

2020 2021 2022 2023 UnfundedLocation/ProjectProjected for 2019
Future Needs
Facilities Capital EquipmentXray Machine (LEC)(Replacement) 27,000$ Replace S250 Skid Steer with T650 Skid Steer 35,000$ 2,500$ 2,500$ 2,500$ 2,500$ Replace GI T650 Skid Steer 35,000$ 2,500$ 2,500$ 2,500$ Replace 2 - 72" Mowers 40,000$ Replace UTV 10,000$ Replace Water Heater in Bathhouse #1 GI (over 20 years old) 7,250$ Refrigeration Equipment (1 replacement) 3,750$ Laundry Equipment Replacement 1,750$ VOIP Phones and licenses for VT and GI shops 1,150$ Push Mower (1) (Replacement) 600$ HHS - Other Minor Equipment & Tools 1,200$ LEC - Other Minor Equipment & Tools 7,200$ Admin Bldg - Other Minor Equipment & Tools 2,000$ Park - Other Minor Equipment & Tools 10,000$ Other 14,000$ 83,500$ 83,500$ 83,500$
TOTAL CAPITAL EQUIPMENT - FACILITIES 109,900$ 88,500$ 88,500$ 88,500$ 88,500$ -$
Special Jail AssessmentGenetec - Replacement/ Life Cycle 9,000$ 10,800$ 14,500$ 13,850$ 13,850$ Commander - Replacement/ Life Cycle Plans Commander 6,250$ 2,500$ 2,500$ Network Replacements ( All Stanley System) 34,000$ 59,500$ 7,000$ 10,500$ 10,500$
TOTAL SPECIAL JAIL ASSESSMENT 43,000$ 70,300$ 27,750$ 26,850$ 26,850$ -$
Law EnforcementNew Squad Equipment 132,435$ Vehicle Install (Baycom) Striping (Trim Design) 11,325$
TOTAL LAW ENFORCEMENT 143,760$ -$ -$ -$ -$ -$
Carroll HeightsMinor Building Improvements (Ongoing) 50,000$ 50,000$ 50,000$ 50,000$ Canopy and driveway renovation 1,453,992$ 1,453,992$
CARROLL HEIGHTS TOTAL -$ 50,000$ 1,503,992$ 1,503,992$ 50,000$ -$
53
rNugent
Line

2020 2021 2022 2023 UnfundedLocation/ProjectProjected for 2019
Future Needs
Hillview TerraceMinor Building Improvements (Ongoing) -$ 10,000$ 10,000$ 10,000$ Small Capital Equipment Items - (Ongoing) -$ 10,000$ 15,000$ 15,000$ 15,000$ Replace PTAC units 6,930$ 6,930$ 6,930$
HILLVIEW TERRACE TOTAL 6,930$ 16,930$ 31,930$ 25,000$ 25,000$ -$
Hillview Health Care CenterSmall Capital Equipment Items - (Ongoing) 29,729$ 152,000$ 149,000$ 149,000$ 149,000$ 3,000$ Minor Building Improvements (Ongoing) 1,000$ 10,000$ 10,000$ 10,000$ 10,000$ -$ Hillview Remodel -$ 800,000$ 10,000,000$ Building Maintenance/upgrades identified during recent building assessment 300,000$ Pipe insulation -$ 19,500$ -$ Steam jacketed kettle -$ 25,000$ -$ Bariatric bath tub -$ 16,000$ 18,000$ 18,000$ -$ Walk-in cooler -$ 52,000$ -$ Paving replacement -$ 240,000$ -$ Replace fire sprinkler system pipes -$ 253,000$ -$ Addressable smoke detectors -$ 15,000$ -$ HVAC replacement on East Hub -$ 6,500$ -$ Remodel bath tub rooms -$ 12,250$ 12,250$ 12,250$ -$ (100) Night Stands -$ 13,500$ 13,500$ -$ (100) 1 drawer/2 drawer night wardrobe -$ 23,115$ 23,115$ -$ Blanket warmer 6,000$ -$ Lift with scale 4,745$ -$ Lift 7,880$ -$ 3/4 Ton Pickup 35,000$ -$ 7.5' snow plow 5,000$ -$ Cisco switches 22,355$ -$ ECS 10 19,400$ -$ Garland double deck oven 12,000$ -$
HILLVIEW HEALTH CARE CENTER TOTAL 443,109$ 1,384,865$ 478,865$ 189,250$ 159,000$ 10,003,000$
54

2020 2021 2022 2023 UnfundedLocation/ProjectProjected for 2019
Future Needs
Lakeview Facility FundBroda Chairs 4,800$ Full Body Lifts 14,000$ Desktop Computer 2,875$ Elitebook Laptops 8,200$ Docking Stations 200$ Tablet 1,225$ Wireless Controller Power Supply 400$ Appliance Replacement 1,500$ Floor Scrubber 10,000$ Light Fixtures 2,500$ iPhones 10,000$ Beds/Tub 20,000$ Flooring on RW 5,000$ Sweeper Attachment 4,500$
LAKEVIEW FACILITY FUND TOTAL 85,200$
RegentReclining Chair 750$ Full Body Lifts 6,950$ Wall Protection 1,000$
REGENT TOTAL 8,700$ -$ -$ -$ -$ -$
MaplewoodFloor Scrubber 1,250$ Light Fixtures 2,500$ Wall Protection 3,500$ Bed 2,100$
MAPLEWOOD TOTAL 9,350$ -$ -$ -$ -$ -$
Neshonoc Floor Scrubber 1,250$ Light Fixtures 2,500$ Wall Protection 3,500$ Bed 2,100$
NESHONOC TOTAL 9,350$ -$ -$ -$ -$ -$
RavenwoodCourtyard furniture 800$ Relaxation room equipment 1,100$ Bed 2,100$ iPhones 1,000$
RAVENWOOD TOTAL 5,000$ -$ -$ -$ -$ -$
55
rNugent
Line

2020 2021 2022 2023 UnfundedLocation/ProjectProjected for 2019
Future Needs
Monarch Bed 2,000$
MONARCH TOTAL 2,000$ -$ -$ -$ -$ -$
Solid WasteTrail development (650.650.1000-80100.00) 25,000$ 50,000$ 50,000$ -$ Landfill Vehicle (650.650.1000-80180.00) 40,000$ 40,000$ -$ Road & Roadway Improvements (650.650.1000-80100.00) 10,000$ 10,000$ 35,000$ 465,000$ -$ Fencing (650.170.7180-80140.00) 10,000$ -$ Gas to Energy (650.650.6940-80150.00) 150,000$ -$ Clay purchase for construction (650.170.7020-80100.00) 1,200,000$ -$ New Cell Construction PHV IX (650.170.7020-80100.00) 50,000$ South side drainage and maintenance road (650.170.7020-80100.00) 200,000$ -$ Surface Water Control (South and West) (650.170.7020-80100.00) 200,000$ -$ Partial CD Landfill Excavation/Shred/Relocate 50,000$ 450,000$ -$
TOTAL SOLID WASTE 85,000$ 360,000$ 375,000$ 965,000$ 1,200,000$ 50,000$
Household Hazardous Material DepartmentReplacement Flammable storage locker (680.785.1000-80100.00) 100,000$ Replacement of Truck (680.785.1000-80100.00) 45,000$ -$
TOTAL HOUSEHOLD HAZARDOUS MATERIAL DEPARTMENT -$ 45,000$ -$ -$ -$ 100,000$ GRAND TOTAL 2,324,430$
56

Road Needs List 2019
Reconditioning & Rehabilitation
1= Poor 10 = Excellent
Road From To Paser Rating Scheduled Year
Budget Cost
Construction Mileage Notes Grant County Cost Others Cost Other Info
CTH GI, GI (2), GI (3) STH 35 Termini 4 2019 1,430,927 2.74 Rural Section 1,020,650 410,277 Federal Land Access Program
CTH J STH 16 CTH U 4 2019 877,968 1.16 Rural Section & Safety Project 385,000 492,968 Indian Reservation Roads
CTH J I90 Kirking Road 4 2019 592,829 2.65 Rural Section & Safety Project 300,000 292,829 Indian Reservation Roads
CTH G (Retaining Wall) 2019 315,596 Flood Damage Repair 183,000 132,596 Partial FEMA Funding
CTH OA (Retaining Wall) 2019 140,000 Mudslide Repair and Prevention 140,000
CTH GI, GI (2), GI (3) STH 35 Termini 4 2020 1,430,927 2.74 Rural Section 1,020,649 410,278 Federal Land Access Program
CTH PI CTH 162 Vernon Cnty Line 4 2020 1,516,488 3.41 Rural Section 111,876 1,404,612 CHIP‐D
CTH TA CTH T CTH A 2 2021 868,602 2.69 Rural Section 868,602
CTH TT CTH V CTH T 2 2021 472,189 1.76 Rural Section 472,189
CTH JJ STH 162 CTH J 2 2022 901,500 2.04 Rural Section 901,500
CTH I CTH M CTH II 4 2022 995,774 1.84 Rural Section & Safety Project 995,774
CTH YY STH 14 STH 33 3 2023 1,774,513 3.59 Rural Section & Safety Project 1,774,513
CTH T Safety Improvements CTH C STH 53 7 & 8 2023 1,100,000 Safety Improvements 1,100,000
CTH XX STH 35 CTH OT 3 560,000 Design Rural and Safety 560,000 Indian Reservation Roads
CTH J CTH U I90 4 403,247 0.61 Urban Section 403,247
CTH YY STH 33 CTH M 3 & 6 3,054,196 4.345 Rural Section & Safety Project 3,054,196
CTH XX STH 35 CTH OT 3 3,860,895 5.9 Rural Section & Safety Project 2,500,000 1,360,895 Indian Reservation Roads
CTH M STH 16 Nelson Road 3 2,180,000 3.484 Rural Section & Safety Project 2,180,000
CTH J Jernander Road Kirking Road 3 2,755,861 3.83 Rural Section & Safety Project 2,755,861
CTH M CTH O CTH I 3 & 4 835,000 Rural Design and Safety 835,000
CTH M CTH O CTH I 3 & 4 5,560,000 2.65 Rural Section & Safety Project 3,720,034 1,839,966 STP Rural Dollars
CTH I CTH II 33 4 4,434,678 3.691 Rural Section & Safety Project 4,434,678
CTH DE STH 16 Balmer Road 2 & 4 4,584,299 2.91 Rural Section & Safety Project 4,584,299
CTH W CTH D CTH D 4 5,289,716 6.02 Rural Section & Safety Project 5,289,716
CTH E CTH DE McRae Rd 4 276,990 0.81 Rural Section 276,990
CTH X CTH P Monroe Cnty line 3 402,434 1.5 Rural Section 402,434
CTH D CTH M CTH M 4 55,731 0.04 Rural Section 55,731
CTH VV CTH T Lockington Rd. 4 877,306 3.27 Rural Section 877,306
CTH M CTH B CTH O 3 & 4 178,000 Plat ‐ Real Estate 178,000
CTH M CTH B CTH O 3 & 4 5,242,213 2.7 Rural Section 4,193,770 1,048,443 STP Rural Dollars
CTH B CTH J CTH U 3 & 2 1,170,000 3.86 Rural Section 1,170,000
CTH DE STH 108 CTH E 3 630,000 2.84 Rural Section 630,000
CTH H CTH G Monroe Cnty line 4, 3 & 2 871,940 3.25 Rural Section 871,940
CTH M Valley View Road STH 33 3 & 4 1,483,638 5.53 Rural Section 1,483,638
CTH M J O Johnson CTH D 3 & 4 1,148,277 4.28 Rural Section 1,148,277
CTH P Pinske Ln Endcott Dr. 4 638,528 2.38 Rural Section 638,528
DTH D William Ct. CTH W 4 2,226,799 8.3 Rural Section 2,226,799
CTH Y CTH J Monroe Cnty line 3 407,800 1.52 Rural Section 407,800
CTH H Erickson Lane CTH G 3 458,775 1.71 Rural Section 458,775
CTH NN CTH M STH 162 4 842,429 3.14 Rural Section 842,429
CTH OT STH 35 STH 35 3 543,907 1.45 Rural/Urban Section 543,907
CTH ZM CTH Z CTH OT 3 187,554 0.5 Rural Section 187,554
CTH ZN CTH ZZ CTH OT 4 945,272 2.52 Rural Section 945,272
CTH M CTH I Malzacher Rd 3 & 4 589,854 Design 589,854
CTH M CTH I Malzacher Rd 3 & 4 3,932,357 2.241 Rural Section 3,145,886 786,471 STP Rural Dollars
CTH S CTH SN CTH M 4 3,379,759 2.629 Rural Section 3,379,759
Total 72,424,768 112.53 ‐ 16,580,865 55,843,903 ‐
Small Bridge Work (<20 foot span) WorkStructure # Road Feature Crossing Scheduled Year Budget Cost Deck Area Notes Grant County Cost Others Cost Other Info
917‐1R CTH D Roberts Coulee Creek 2019 140,319 400 140,319
CTH I Br St Joes Coulee 2021 50,000 180 50,000
CTH I Br St Joes Coulee 2021 50,000 180 50,000
697‐1 CTH Q Br German Valley 2021 150,000 400 150,000
696‐1R CTH Q Br German Valley 2023 400,000 320 400,000
Total 650,000 1,080 ‐ 650,000 ‐
Bridge Design and Construction Structure # Road Feature Crossing Bridge Rating Scheduled Year Budget Cost Deck Area Notes Grant County Cost Others Cost Other Info
P32067 CTH J Fish Creek 25.3 2019 541,251 1633 sqft Construction 403,295 137,956
P320101 CTH X Berge Coulee Crk 33.7 2020 384,164 502 Sqft Construction 307,331 76,833
P32098 CTH V Long Coulee Creek 42.3 2020 576,682 1148 sqft Construction 461,346 115,336
B320004 CTH M La Crosse River 35.9 2022 683,700 6837 sqft Design 683,700
P320055 CTH D Halfway Creek 48.7 2023 725,600 1814 sqft Construction 580,480 145,120 Posted 25 Ton
P320100 CTH M Halfway Creek 40.4 2023 345,600 864 sqft Construction 276,480 69,120
P320923 Mohican Road Br. Sand Lake Coulee 50.9 76,800 1027 sqft Design 38,400 38,400
B320007 CTH M Bostwick Creek 52.6 192,700 1927 sqft Design 192,700
B320019 CTH M Larson Coulee Crk 59.3 96,300 963 sqft Design 96,300
B320004 CTH M La Crosse River 35.9 2,734,800 6837 sqft Construction 2,187,840 546,960
B320007 CTH M Bostwick Creek 52.6 770,800 1927 sqft Construction 616,640 154,160
B320014 CTH M Russian Coulee Creek 49.2 658,800 1647 sqft Construction 527,040 131,760
B320020 CTH O Bostwick Creek 53.4 297,700 2977 sqft Design 297,700
Paser Rating 1‐10
57

Road Needs List 2019
B320019 CTH M Larson Coulee Crk 59.3 96,300 963 sqft Design 96,300
B320548 CTH M Fleming Creek 56.8 284,500 2845 sqft Design 284,500
P320903 Drogseth Rd Bostwick Creek 44.9 307,200 768 sqft Construction 245,760 30,720 30,720
B320020 CTH O Bostwick Creek 53.4 1,190,800 2977 sqft Construction 952,640 238,160
B320019 CTH M Larson Coulee Crk 59.3 385,200 963 sqft Construction 308,160 77,040
B320548 CTH M Fleming Creek 56.8 1,138,000 2845 sqft Construction 910,400 227,600
P320923 Mohican Road Br. Sand Lake Coulee 50.9 410,800 1027 sqft Construction 328,640 41,080 41,080
B320050 CTH G Coon Creek 55.9 175,350 2505 sqft Design 175,350 Posted 20 Ton
P320064 CTH I Br. Bostwick Creek 78 140,420 2006 sqft Design 140,420 Posted 25 ton
P320083 CTH T Fleming Creek 88.1 157,080 2494 sqft Design 157,080 Posted 25 Ton
P320095 CTH V Sour Creek 93.3 113,820 1626 sqft Design 113,820 Posted 25 Ton
P320126 Knudson Road Halfway Creek 68.9 88,060 1258 sqft Design 44,030 44,030 Posted 20 Ton
P320163 Drectah Road Garbers Coulee Creek 86.3 145,460 2078 sqft Design 72,730 72,730 Posted 30 Ton
P320175 Breidel Coulee Rd Br. Mormon Creek 75 79,030 1129 sqft Design 39,515 39,515 Posted 20 Ton
P320910 Muenzenberger Rd Coon Creek 70.8 34,160 488 sqft Design 17,080 17,080 Posted 15 Ton
B320050 CTH G Coon Creek 55.9 701,400 2505 sqft Construction 561,120 140,280 Posted 20 Ton
P320064 CTH I Br. Bostwick Creek 78 561,680 2006 sqft Construction 449,344 112,336 Posted 25 ton
P320083 CTH T Fleming Creek 88.1 698,320 2494 sqft Construction 558,656 139,664 Posted 25 Ton
P320095 CTH V Sour Creek 93.3 455,280 1626 sqft Construction 364,224 91,056 Posted 25 Ton
P320126 Knudson Road Halfway Creek 68.9 352,240 1258 sqft Construction 281,792 35,224 35,224 Posted 20 Ton
P320163 Drectah Road Garbers Coulee Creek 86.3 581,840 2078 sqft Construction 465,472 58,184 58,184 Posted 30 Ton
P320175 Breidel Coulee Rd Br. Mormon Creek 75 316,120 1129 sqft Construction 252,896 31,612 31,612 Posted 20 Ton
P320910 Muenzenberger Rd Coon Creek 70.8 136,640 488 sqft Construction 109,312 13,664 13,664 Posted 15 Ton
Total 16,634,597 ‐ 11,148,868 5,063,490 422,239
Other Major Maintenance Projects ‐ mainly Storm Water
Road From To Paser Rating Scheduled Year
Budget Cost
Construction Mileage Notes Grant County Cost Others Cost Other Info
Brice's Prairie n/a 148,000 13.87 Design 148,000
CTH Z STH 35 Termini 6 293,542 6.19 Storm Water Proj. 293,542
CTH ZB CTH Z CTH Z 7 298,283 3.37 Storm Water Proj. 298,283
CTH ZB‐2 CTH ZB CTH ZN 7 60,546 0.25 Storm Water Proj. 60,546
CTH ZM CTH Z CTH OT 6 121,094 0.5 Storm Water Proj. 121,094
CTH ZN CTH ZB Front St. 7 139,284 2.91 Storm Water Proj. 139,284
CTH ZZ CTH ZN CTH Z 8 134,544 0.65 Storm Water Proj. 134,544
Total 1,195,293 27.74 ‐ 1,195,293 ‐
Majors & Enhancements
Road From To Paser Rating Scheduled Year
Budget Cost
Construction Mileage Notes Grant County Cost Others Cost Other Info
CTH SN East Ave North Hanson Road 3 & 4 2019 1,923,451 0.65 Urban Section Reconstruction 834,290 885,566 203,595 STP‐U/City Onalaska/Holmen
CTH PH STH 157 Jansen Place 4 2020 233,100 0.05 233,100
CTH SS STH 157 Crossing Meadows 4 2020 466,900 0.06 Urban Section 466,900
CTH U STH 162 CTH B 2 & 3 2021 1,248,374 0.58 Urban Section 1,248,374
CTH SN Hanson Road Alpine Ln. 3 & 4 2022 2,380,000 1.29 Urban Section Reconstruction 1,904,000 333,200 142,800 STP‐U/City Onalaska/Holmen
CTH OT/Commerce Intersection Improv. n/a 1,100,000 Intersection Improvement Safety 1,100,000
CTH B CTH BW Fanta Reed Place 3 1,614,277 0.75 Urban Section 1,614,277
CTH B/O Intersection Improv. n/a 250,000 Intersection Improvement 250,000
CTH B/U Intersection Improv. n/a 300,000 Intersection Improvement 300,000
CTH C Buol Rd Garland St 3 & 4 1,291,421 0.6 Part Urban w/overpass 1,291,421
CTH D CTH DH Willann Ct. 4 538,092 0.25 Urban Section Widen to 3 lanes 538,092
CTH D/DH Intersection Improv. n/a 45,000 Intersection Improvement 45,000
CTH M/B Intersection Improv. n/a 25,000 Intersection Improvement 25,000
CTH M/C Intersection Improv. n/a 300,000 Intersection Improvement 300,000
CTH MH STH 53 CTH HD n/a 600,000 1.246 Access Control 600,000
CTH N & CTH O Access Control n/a 25,000 Access Control 25,000
CTH OT/XX Intersection Improv. n/a 600,000 Intersection Improvement 600,000
CTH OT STH 35 CTH XX 3 400,000 0.64 Urban Section 400,000
CTH BW Hinkley Road Airport Road 4 4,369,310 2.03 Urban Section 4,369,310
CTH HD CTH MH STH 35 4 2,000,732 2.051 Urban/Rural Section Rehab 2,000,732
CTH B Fanta Reed Place I90 Ramp 3 270,000 0.18 Urban Section 270,000
CTH OT STH 35 CTH SN 4 2,140,000 0.76 Urban Section 2,140,000
Total 22,120,657 11.14 2,738,290 19,035,972 346,395
Resurfacing/Maintenance Overlays
Road From To Paser Rating Scheduled Year
Budget Cost
Construction Mileage Notes Grant County Cost Others Cost Other Info
CTH E STH 162 North McCrae Road 6 295,000 2.95 Improved 1998 295,000
CTH JB STH 33 STH 162 6 299,000 2.99 Improved 1998 299,000
CTH DE CTH C STH 108 6 206,000 2.06 Improved 2002 206,000
CTH ZB‐2 CTH ZB CTH ZN 5 25,000 0.25 Improved 1968 25,000
CTH ZM CTH Z CTH OT 6 50,000 0.5 Improved 1988 50,000
CTH ZB CTH Z CTH Z 7 337,000 3.37 Improved 2007 337,000
CTH ZN CTH ZB Front St. 7 291,000 2.91 Improved 2008 291,000
CTH ZZ CTH ZN CTH Z 7 65,000 0.65 Improved 2008 65,000
CTH FO CTH OA CTH F 7 185,000 1.85 Improved 2004 185,000
58

Road Needs List 2019
CTH F STH 33 Briarwood Avenue 7 310,000 3.1 Improved 2004 310,000
CTH FA CTH F Cul‐de‐sac 7 169,300 1.693 Improved 2006 169,300
CTH K STH 35 County Line 7 78,000 0.78 Improved 1997 78,000
CTH II STH 162 CTH I 7 411,000 4.11 Improved 2006 411,000
CTH G CTH H Muenzenberger Road 7 664,000 6.64 Improved 1999 664,000
CTH D STH 108 Hall Road 7 409,000 4.09 Improved 2003 409,000
CTH D Hall Road CTH W 7 444,000 4.44 Improved 2004 444,000
CTH T STH 53 Wm Severson Road 7 500,000 5 Improved 2005 500,000
CTH T STH 108 Wm Severson Road 7 542,000 5.42 Improved 1999 542,000
Total 5,280,300 52.803 ‐ 5,280,300 ‐
Capital Projects Scheduled Year
Site Work for St Joseph Shop 2019 448,776$ ‐ 448,776 ‐
St Joseph Shop Building 3,000,000 ‐ 3,000,000 ‐
Total 3,448,776 ‐ 3,448,776 ‐
Total 121,754,391 30,468,023 90,517,734 768,634
County Grant Others
TOTAL 2019 6,411,117 3,081,287 3,126,235 203,595
TOTAL 2020 4,608,261 2,707,059 1,901,202 ‐
TOTAL 2021 2,839,165 2,839,165 ‐ ‐
TOTAL 2022 4,960,974 2,914,174 1,904,000 142,800
TOTAL 2023 4,345,713 3,488,753 856,960 ‐
Unscheduled 98,729,480 75,627,615 22,679,626 422,239
TOTAL 121,894,710$ 90,658,053$ 30,468,023$ 768,634$
Road/Structure # From To Notes Paser Rating Mileage
Bridge
Rating Surface in Square Feet Budget Cost County Cost Grant Others Cost
CTH GI, GI (2), GI (3) STH 35 Termini Fed Land Access Pro 4 2.74 1,430,927 410,277 1,020,650 ‐
CTH SN East Ave North Hanson Road STP ‐ Urban 3 & 4 0.65 1,923,451 885,566 834,290 203,595
CTH J STH 16 CTH U IRR Funding 4 1.16 877,968 492,968 385,000 ‐
CTH J I90 Kirking Road IRR Funding 4 2.65 592,829 292,829 300,000 ‐
P32067 CTH J Fish Creek Local Bridge 25.3 1633 sqft 541,251 137,956 403,295 ‐
917‐1R CTH D Roberts Coulee Road 140,319 140,319 ‐ ‐
CTH G ‐ Retaining Wall CTH G 315,596 132,596 183,000 ‐
CTH OA ‐ Retaining Wall CTH OA 140,000 140,000 ‐ ‐
Capital Project:
St Joseph Shop ‐ Site Work STH 33 448,776 448,776 ‐ ‐
Total 7.20 ‐ 6,411,117$ 3,081,287$ 3,126,235$ 203,595$
Request For 2019
TOTALS
59

2017 2018 2019Budget Budget Budget
GENERAL FUNDFrom General Fund Balance
To fund Parks Capital Projects 145,000 - 60,100 To fund ERP system 258,486 114,732 84,441 To fund 911 radio system upgrade 682,000 450,000 395,000 Elections - 20,000 - Land Conservation - 5,000 - Downtown Campus 500,000 - - Sustainable La Crosse Commission 7,500 - - Carry Forward - Facilities - - 168,081 Carry Forward - Veterans (for convention) 2,279 - - Carry Forward - UWEX 48,234 30,000 - Facilities Capital - 243,400 594,300 Sheriff Capital - 172,000 132,435
Total from General Fund Balance 1,643,499 1,035,132 1,434,357
From Reg of Deeds Redaction Restricted Fund Balance To offset costs of Register of Deeds redaction costs 25,000 - -
From Salary ContingencyTransfer to Heath Self Insurance 500,000 - - To Fund B Scale Study - 60,000 - To Fund Interns 43,060 43,060 43,060
Total from Salary Contingency 543,060 103,060 43,060
From Neighborhood RevitalizationFor Housing Projects - 25,000 -
From Computer Revolving LoanTo offset IT project costs 40,000 - -
From Excess Sales TaxEconomic Development 333,272 355,388 384,473 La Crosse Collaborative to End Homelessness - 500,000 - Economic Development - Marsh Study 35,000 - - Neighborhood Revitalization 200,000 - - Business Fund Non TIF 100,000 - - Treasurer - Property Tax Chargeback, Retail 100,000 - - UW Stadium Donation 25,000 - -
Total from Excess Sales Tax 793,272 855,388 384,473
From CapX 2020 Environmental Impact FeeTo fund bluffland protection 80,000 75,000 79,000
Total from CapX 2020 80,000 75,000 79,000
From Badger CouleeTo offset cost of park improvements - - -
PARK PLAZAFor Highway - - 248,776
Total from Park Plaza reserves - - 248,776
2019 BudgetFund Balances Applied to Offset Levy
60

2017 2018 2019Budget Budget Budget
2019 BudgetFund Balances Applied to Offset Levy
DEBT SERVICE FUND BALANCEFor Downtown Campus Debt 179,083 32,559 180,753 For Highway Debt 555,661 271,470 -
734,744 304,029 180,753
BUSINESS PARK FUND BALANCEConsistent with TIF Plan 24,791 59,412 34,420
SPECIAL JAIL ASSESSMENT FUND BALANCEFrom Special Jail Assessments 19,266 - -
OLD LANDFILL From Old Landfill - Proceeds from Escrow
To offset Debt Pymt and Long Term Care Costs 78,550 42,123 42,965
AGING FUNDFrom Aging Fund Balance
To offset levy 54,636 7,043 - From Estate Donation fund
To offset levy 20,000 7,042 - From Helen Bader Grant
To offset levy - - -
Total from Aging Funding Sources 74,636 14,085 -
ESTATE TRUST FUNDGifted Hands - 21,000 -
HUMAN SERVICES FUNDFrom Human Services Fund Balance
Family & Children 100,767 - - MVHS - 63,120 - Operations - 55,719 - Clinical Services 100,766 - - WREA - 103,938 -
Total from H.S. Fund Balance 201,533 222,777 -
SELF-INSURANCE HEALTH FUNDFrom Self-Insurance Health Unrestricted Fund Balance
Occupational Health 12,870 - - Total from Self-Ins. Health Unrestricted Fund Balance 12,870 - -
TOTAL F.B. USAGE 4,271,221$ 2,757,006$ 2,447,804$
HIGHWAY UNRESTRICTED FUND BALANCEFrom Highway Fund Balance 64,727 3,629,152 200,000 Debt Service Payments - - -
Total from Highway Unrestricted Fund Balance 64,727 3,629,152 200,000
TOTAL F.B. USAGE - INFRASTRUCTURE & DEBT 64,727$ 3,629,152$ 200,000$
61

Governmental Funds
Fund Name GeneralHuman Services Debt Service CDBG Fund
CDBG Small Housing CDBG Housing
Revolving Loan Fund
Lakeview Business Park
Total Non-Major Governmental
fundsTotal Governmental
Funds2017 actual expenditures 35,419,275 46,172,817 20,133,327 11,915 607,377 - 53,746 262,723 8,946,320 111,607,500
2017 total fund balance 30,947,018 2,830,629 725,142 770,972 19,331 25,000 159,795 (132,683) 3,163,073 38,508,277 2017 fund balance Nonspendable & Restricted 5,056,020 1,146,180 725,142 770,972 19,331 25,000 159,795 (132,683) 1,727,485 9,497,242 2017 fund balance Committed & Assigned 5,981,233 1,684,449 - - - - - - 1,476,230 9,141,912 2017 fund balance Unassigned 19,909,765 - - - - - - - (40,642) 19,869,123 % of unassigned vs. expenditures 56% 0% 0% 0% 0% N/A 0% 0% 0% 18%
3 months of expenditures by fund 8,854,819 11,543,204 5,033,332 2,979 151,844 - 13,437 65,681 2,236,580 27,901,875 4 months of expenditures by fund 11,806,425 15,390,939 6,711,109 3,972 202,459 - 17,915 87,574 2,982,107 37,202,500
Nonmajor Governmental Funds
Fund Name Land RecordsSpecial Jail
Assmnt Library Old LandfillEstate
Donation HealthCapital Projects
Total NonMajor Governmental
funds2017 Actual expenditures 282,028 214,346 2,117,114 145,020 - 5,227,975 959,837 8,946,320
2017 total fund balance 205,445 (13,950) 209,288 564,385 256,664 1,480,327 460,914 3,163,073 2017 fund balance Nonspendable & Restricted 205,445 26,692 209,288 511,352 256,664 57,130 460,914 1,727,485 2017 fund balance Committed & Assigned - - - 53,033 - 1,423,197 - 1,476,230 2017 fund balance Unassigned - (40,642) - - - - - (40,642)
% of unrestricted vs. expenditures 0% -19% 0% 0% N/A 0% 0% 0%
3 months of expenditures by fund 70,507 53,587 529,279 36,255 - 1,306,994 239,959 2,236,580 4 months of expenditures by fund 94,009 71,449 705,705 48,340 - 1,742,658 319,946 2,982,107
Amounts as restricted in governmental funds include amounts restricted by contract, loan agreements, grants, committments by the Board, assignments for carryforwards, purchase orders, or are in nonspendable form, such as pre-paid items or inventories.
La Crosse County Audited 12/31/2017 Fund Balances and Cash Flow Requirements
Business Fund
62

Proprietary Funds:Enterprise FundsFund Name Hillview Carroll Heights Hillview Terrace Solid Waste HHM2017 Actual expenditures 16,219,874 294,557 832,829 9,299,812 489,025
2017 total fund balance 5,829,425 2,064,305 1,800,169 9,528,370 763,561 2017 Net invest. in capital assets & Restricted 1,808,446 307,260 972,837 7,710,578 488,189 2017 fund balance Unrestricted 4,020,979 1,757,045 827,332 1,817,792 275,372
% of unrestricted vs. expenditures 25% 597% 99% 20% 56%
3 months of expenditures by fund 4,054,969 73,639 208,207 2,324,953 122,256 4 months of expenditures by fund 5,406,625 98,186 277,610 3,099,937 163,008
Fund Name Regent ManorMaplewood
CBRFRavenwood
Nursing Home Neshonoc Manor Monarch ManorLakeview Nursing
Home Facility MVHS2017 Actual expenditures 427,318 811,266 1,207,759 873,521 549,132 589,956 8,180,856
2017 total fund balance 115,268 233,117 92,057 157,669 303,661 1,188,506 1,127,495 2017 Net invest. in capital assets & Restricted 176,463 91,131 44,632 87,259 872,745 735,268 - 2017 fund balance Unrestricted (61,195) 141,986 47,425 70,410 (569,084) 453,238 1,127,495
% of unrestricted vs. expenditures -14% 18% 4% 8% -104% 77% 14%
3 months of expenditures by fund 106,830 202,817 301,940 218,380 137,283 147,489 2,045,214 4 months of expenditures by fund 142,439 270,422 402,586 291,174 183,044 196,652 2,726,952
Internal Service Funds
Fund Name HighwaySelf-Insurance Workers Comp
Self-Insurance Health
Self-Insurance Liability
Total Internal Service Funds
2017 Actual expenditures 10,642,024 400,619 16,479,847 760,245 28,282,735
2017 total fund balance 79,246,186 803,626 6,366,949 236,132 86,652,893 2017 Net invest. in capital assets 71,150,614 - - - 71,150,614 2017 fund balance Unrestricted 8,095,572 803,626 6,366,949 236,132 15,502,279
% of unrestricted vs. expenditures 76% 201% 39% 31% 55%
3 months of expenditures by fund 2,660,506 100,155 4,119,962 190,061 7,070,684 4 months of expenditures by fund 3,547,341 133,540 5,493,282 253,415 9,427,578
La Crosse County Audited 12/31/2017 Fund Balances and Cash Flow Requirements
Solid Waste CampusHillview Campus
Lakeview Campus
63

2009 2010 2011 2012 2013 2014 2015 2016 2017 2018 2019Budgeted Sales Tax 9,725,000 9,675,000 9,500,000 9,700,000 10,200,000 10,300,000 10,950,000 11,600,000 11,950,000 11,950,000 12,400,000
Actual Sales Tax 9,272,408 9,749,517 10,201,912 10,292,560 10,561,246 11,423,778 11,814,918 12,044,352 12,447,360 11,950,000 12,400,000 *EstimatedExcess Sales Tax (452,592) 74,517 701,912 592,560 361,246 1,123,778 864,918 444,352 497,360 - -
Additions to Excess Sales Tax Balance - 74,517 701,912 592,560 361,246 1,123,778 864,918 444,352 497,360 375,000 - Use of Excess Sales Tax (252,787) (302,378) (279,717) (282,861) (343,620) (671,876) (329,007) (522,152) (503,152) (842,378) (381,806) *Budgeted
Excess Sales Tax Balance 2,429,160 2,201,299 2,623,494 2,933,193 2,950,819 3,402,721 3,938,632 3,860,832 3,855,040 3,387,662 3,005,856
* In 2009 there was no Excess Sales Tax thus nothing to add to the balance of Excess Sales Tax Account
Excess Sales Tax
64

Organization Department Org Account # 2018 Budget2019
ProposedStaffing
Positions Funding Source7 Rivers Alliance Econ. Development 100.130.1180 60770.01 $5,250 $5,250 1 part-time Excess Sales TaxDMI (Downtown Mainstreet Inc.) Membership Econ. Development 100.130.1180 60770.01 $3,000 $3,000 Paid Staff Excess Sales TaxLa Crosse Area Development Corp Econ. Development 100.130.1180 60770.01 $34,462 $34,462 2 FTE Excess Sales TaxChamber of Commerce Econ. Development 100.130.1180 60770.01 $3,090 $3,300 Paid Staff Excess Sales TaxMississippi River Regional Planning Commission Econ. Development 100.130.1180 64300.05 $52,493 $53,381 Paid Staff Excess Sales TaxCity of La Crosse Airport Contribution Econ. Development 100.130.1180 64300.02 $3,724 $3,724 Paid Staff Excess Sales TaxYWCA CASA for Kids Non-Departmental 100.155.1450 66100.00 $30,000 $30,000 Paid Staff Levy
Historic Sites Historical Sites 100.155.1540 All $1,340 $1,340 Volunteer & Paid Staff Levy
Area Historical Societies Historical Societies 100.155.1545 64300.06 $25,000 $25,000 Volunteer & Paid Staff Levy
Dive Rescue Law Enforcement 100.185.2140 60270.05 $7,700 $8,700 Volunteer LevyLa Crosse Jail Ministry Jail & Court Svcs 100.185.2170 60270.10 $38,800 $38,800 1 FTE LevyLa Crosse County Agri Society (Fair Contribution) UW Extension 100.200.1000 64000.00 $2,500 $2,500 Volunteer LevySt. Clare Health Mission Human Services 210.410.4210 60300.07 $36,000 $36,000 Paid Staff LevyBoys & Girls Club Human Services 210.510.1000 60300.46 $25,000 $25,000 Paid Staff Levy
New Horizons Shelter & Outreach Centers Human Services 255.670.1000 60300.38 $4,000 $4,000 Volunteer & Paid Staff Grant
Winding Rivers Library Winding Rivers 290.715.1000 All $24,621 $24,621 Paid Staff Levy
Memberships w/o paid or volunteer staffingMississippi River Parkway Commission Econ. Development 100.130.1180 60770.01 $3,000 $3,000 None Excess Sales TaxWisconsin Conservation Congress UW Extension 100.200.1000 60797.00 $900 $900 None Levy
Memberships w/ paid staffWisconsin Counties Association County Board 100.100.1000 60772.00 $14,077 $14,077 Paid Staff LevyNational Association of Counties County Board 100.100.1000 60772.00 $2,293 $2,293 Paid Staff Levy
2019 BUDGET - OUTSIDE AGENCIES & ASSOCIATIONS
65

66

67

2010C 2007A 2014A 2010A 2017A
GO Bonds GO Bonds GO Notes Hillview RCAC Lakeview Campus
Business Fund Business Fund Business Fund GO Bonds GO Bonds
YEAR Non-TIF TIF TIF (BAB) Totals2019 27,625 59,600 125,200 168,562 1,166,188 1,547,1752020 26,840 62,400 128,000 165,510 1,165,588 1,548,3382021 26,015 - 125,700 167,301 1,165,837 1,484,8532022 25,140 - 128,400 163,709 1,164,588 1,481,8372023 24,220 - 126,000 164,708 1,166,712 1,481,6402024 28,125 - 123,000 160,540 1,167,088 1,478,7532025 26,875 - - 161,372 1,165,712 1,353,9592026 25,625 - - 161,684 1,162,588 1,349,8972027 - - - 161,815 1,162,587 1,324,4022028 - - - 161,766 1,164,888 1,326,6542029 - - - 156,241 1,164,787 1,321,0282030 - - - 155,716 1,163,013 1,318,7292031 - - - - 1,164,812 1,164,8122032 - - - - 1,165,713 1,165,7132033 - - - - 1,165,078 1,165,0782034 - - - - 1,163,543 1,163,5432035 - - - - 1,166,669 1,166,6692036 - - - - 1,163,125 1,163,1252037 - - - - 1,162,891 1,162,891
210,465 122,000 756,300 1,948,923 22,131,407 25,169,095
DEBT FUNDING SOURCES NOTES:2019 All amounts include both interest and
Payment principal payments. Hillview Terrace 168,562$Lakeview Campus 1,166,188$ Business Fund 212,425
TOTAL 1,547,175$
LA CROSSE COUNTYDEBT RETIREMENT SCHEDULE
(Funded by other than Debt Levy or Solid Waste)
68

LA CROSSE COUNTYDEBT RETIREMENT SCHEDULE
(Highway Road Construction)
2013A 2014A 2015A 2016A 2017B 2018AGO Highway GO Highway GO Highway GO Highway GO Highway GO Highway
YEAR Bonds Bonds Notes Bonds Bonds Notes TOTAL2019 643,005 483,600 437,000 369,431 361,250 89,756 2,384,0422020 646,405 479,600 429,500 368,831 362,875 349,878 2,637,0892021 644,505 480,500 421,500 373,550 358,875 348,983 2,627,9132022 642,405 316,200 413,000 373,500 359,250 352,563 2,456,9182023 644,490 - 294,000 373,150 363,750 350,604 2,025,9942024 - - - 257,500 362,375 353,083 972,9582025 - - - - 360,550 349,985 710,5352026 - - - - 363,550 351,370 714,9202027 - - - - 252,500 352,155 604,6552028 - - - - - 258,698 258,698
3,220,810 1,759,900 1,995,000 2,115,962 3,144,975 3,157,072 15,393,719
2019DEBT FUNDING SOURCES Payment NOTES:
All amounts include both interest and
Total payment 2,384,042$ principal payments.
Less premium applied (130,753)
County tax levy 2,253,289$
69

12/31/16 Balance
2017 Principal Payments 2017 New Debt
12/31/17 Balance
2018 Principal Payments 2018 New Debt
12/31/18 Balance
2019 Principal Payments
2019 New Debt
12/31/19 Projected Balance
GOVERNMENTAL FUNDSLEC Debt
2010D Refunding Bonds 2,650,000 170,000 - 2,480,000 195,000 - 2,285,000 200,000 - 2,085,000 2009A GO Bonds 950,000 950,000 - - - - - - - - 2016A GO Refund Bonds (ref 2010 STFL) 4,920,000 350,000 - 4,570,000 370,000 - 4,200,000 375,000 - 3,825,000 2016A GO Refund Bonds (ref 2009A) 13,045,000 - - 13,045,000 1,050,000 - 11,995,000 1,075,000 - 10,920,000
Total LEC Debt 21,565,000 1,470,000 - 20,095,000 1,615,000 - 18,480,000 1,650,000 - 16,830,000 Downtown Project Remodel -
2015A GO Bonds 10,580,000 435,000 - 10,145,000 475,000 - 9,670,000 400,000 - 9,270,000 2016A GO Bonds 11,050,000 390,000 - 10,660,000 375,000 - 10,285,000 480,000 - 9,805,000
Total Downtown Project 21,630,000 825,000 - 20,805,000 850,000 - 19,955,000 880,000 - 19,075,000 Pension Liability -
2010C GO Refunding Bonds 2,165,000 240,000 - 1,925,000 250,000 - 1,675,000 255,000 - 1,420,000
Total Pension Liability 2,165,000 240,000 - 1,925,000 250,000 - 1,675,000 255,000 - 1,420,000 Business Fund
2007A Corporate Purpose Bonds 220,000 50,000 - 170,000 55,000 - 115,000 55,000 - 60,000 2010C (TIF) 195,000 95,000 - 100,000 100,000 - - - - - 2010C (Non TIF) 215,000 20,000 - 195,000 20,000 - 175,000 20,000 - 155,000 2014A GO Notes 750,000 25,000 - 725,000 25,000 - 700,000 110,000 - 590,000
Total Business Fund 1,380,000 190,000 - 1,190,000 200,000 - 990,000 185,000 - 805,000 Highway Debt (Paid through Debt Svc)
2012 A Bond 505,000 505,000 - - - - - - - - 2013 A Bond 4,155,000 560,000 - 3,595,000 570,000 - 3,025,000 580,000 - 2,445,000 2014 A Bond 2,565,000 440,000 - 2,125,000 445,000 - 1,680,000 450,000 - 1,230,000 2015 A Bond 2,485,000 380,000 - 2,105,000 365,000 - 1,740,000 350,000 - 1,390,000 2016 A Bond 2,410,000 100,000 - 2,310,000 380,000 - 1,930,000 320,000 - 1,610,000 2017 B Bond - 2,725,000 2,725,000 - - 2,725,000 260,000 - 2,465,000 2018 A Note - - - - - 2,765,000 2,765,000 25,000 - 2,740,000 2019 A Note (Estimate) - - - - - - - - 2,450,000 2,450,000
Total Highway Debt 12,120,000 1,985,000 2,725,000 12,860,000 1,760,000 2,765,000 13,865,000 1,985,000 2,450,000 14,330,000
TOTAL GOVERNMENTAL DEBT 58,860,000 4,710,000 2,725,000 56,875,000 4,675,000 2,765,000 54,965,000 4,955,000 2,450,000 52,460,000
La Crosse County: Projected Principal Balance from Year End 2016 through Year End 2019
70

12/31/16 Balance
2017 Principal Payments 2017 New Debt
12/31/17 Balance
2018 Principal Payments 2018 New Debt
12/31/18 Balance
2019 Principal Payments
2019 New Debt
12/31/19 Projected Balance
La Crosse County: Projected Principal Balance from Year End 2016 through Year End 2019
ENTERPRISE FUNDSSolid Waste
2015 STFL Revenue Loan 5,475,000 429,649 - 5,045,351 547,636 - 4,497,715 569,541 - 3,928,174 2016 STFL Revenue Loan 7,820,000 797,290 - 7,022,710 670,521 - 6,352,189 695,666 - 5,656,523
Total Solid Waste 13,295,000 1,226,939 - 12,068,061 1,218,157 - 10,849,904 1,265,207 - 9,584,697 Hillview Terrace
2010A Build America Bonds 1,785,000 110,000 - 1,675,000 110,000 - 1,565,000 115,000 - 1,450,000
Total Solid Waste 1,785,000 110,000 - 1,675,000 110,000 - 1,565,000 115,000 - 1,450,000 Lakeview Campus
2015B BAN 17,255,000 17,255,000 - - - - - - - - 2017 A GO Debt - - 16,130,000 16,130,000 - - 16,130,000 555,000 - 15,575,000
Total Lakeview Campus 17,255,000 17,255,000 16,130,000 16,130,000 - - 16,130,000 555,000 - 15,575,000
TOTAL ENTERPRISE FUND DEBT 32,335,000 18,591,939 16,130,000 29,873,061 1,328,157 - 28,544,904 1,935,207 - 26,609,697
GRAND TOTAL COUNTY DEBT 91,195,000 23,301,939 18,855,000 86,748,061 6,003,157 2,765,000 83,509,904 6,890,207 2,450,000 79,069,697
Total General Obligation Debt 60,645,000 4,820,000 18,855,000 74,680,000 4,785,000 2,765,000 72,660,000 5,625,000 2,450,000 69,485,000 Total Bond Anticipation Note 17,255,000 17,255,000 - - - - - - - - Total Revenue Loan 13,295,000 1,226,939 - 12,068,061 1,218,157 - 10,849,904 1,265,207 - 9,584,697 TOTAL DEBT 91,195,000 23,301,939 18,855,000 86,748,061 6,003,157 2,765,000 83,509,904 6,890,207 2,450,000 79,069,697
71