Fiscal Year 2017 Adopted Operating Budget - City of Palo Alto
Upload
khangminh22Category
view
2download
0
FISCAL 2022
BRANDON M. SCOTT, MAYORCITY OF BALT IMORE , MARYLAND
2 0 2 2
SUMMARY OF THE ADOPTED BUDGET
Board of Estimates:Nick J. Mosby, City Council PresidentBrandon M. Scott, MayorBill Henry, ComptrollerJim Shea, City SolicitorJason W. Mitchell, Director of Public Works
City Council:President: Nick J. MosbyVice President: Sharon Green Middleton
First District: Zeke Cohen
Second District: Danielle McCray
Third District: Ryan Dorsey
Fourth District: Mark Conway
Fifth District: Isaac “Yitzy” Schleifer
Sixth District: Sharon Green Middleton
Seventh District: James Torrence
Eighth District: Kristerfer Burnett
Ninth District: John T. Bullock
Tenth District: Phylicia Porter
Eleventh District: Eric T. Costello
Twelfth District: Robert Stokes, Sr.
Thirteenth District: Antonio Glover
Fourteenth District: Odette Ramos
Artwork Credit: The Mayor’s Office of Children and Family SuccessPhylicia Gee for Live BaltimoreBaltimore City Recreation and Parks

Government Finance Officers Association Distinguished Budget Award . . . . . . . . . . . . . . . . iii
The Mayor’s Letter . . . . . . . . . . . . . . . . . . . . . . . . . . . . . . . . . . . . . . . . . . iv
Community Guide to the Budget . . . . . . . . . . . . . . . . . . . . . . . . . . . . . . . . . . . . ix
Learn More . . . . . . . . . . . . . . . . . . . . . . . . . . . . . . . . . . . . . . . . . . . . . . xiii
Introduction 1
About Baltimore . . . . . . . . . . . . . . . . . . . . . . . . . . . . . . . . . . . . . . . . . . . . 3
Demographic Profile and Trends . . . . . . . . . . . . . . . . . . . . . . . . . . . . . . . . . . . . 5
Municipal Structure . . . . . . . . . . . . . . . . . . . . . . . . . . . . . . . . . . . . . . . . . . 7
Budget Process and Related Policies 11
Budget Process . . . . . . . . . . . . . . . . . . . . . . . . . . . . . . . . . . . . . . . . . . . . 13
Outcome Budgeting . . . . . . . . . . . . . . . . . . . . . . . . . . . . . . . . . . . . . . . . . . 15
Key Budgetary and Financial Policies . . . . . . . . . . . . . . . . . . . . . . . . . . . . . . . . . 19
Budgetary and Accounting Basis . . . . . . . . . . . . . . . . . . . . . . . . . . . . . . . . . . . 23
Operating and Capital Plan Budgetary Control . . . . . . . . . . . . . . . . . . . . . . . . . . . . . 26
Fiscal Environment 29
Economic Outlook . . . . . . . . . . . . . . . . . . . . . . . . . . . . . . . . . . . . . . . . . . . 31
Fixed Costs . . . . . . . . . . . . . . . . . . . . . . . . . . . . . . . . . . . . . . . . . . . . . . 36
Debt Service . . . . . . . . . . . . . . . . . . . . . . . . . . . . . . . . . . . . . . . . . . . . . 43
Long-Term Liabilities . . . . . . . . . . . . . . . . . . . . . . . . . . . . . . . . . . . . . . . . . 51
Budget Plan 55
Revenues and Expenditures . . . . . . . . . . . . . . . . . . . . . . . . . . . . . . . . . . . . . . 57
Expenditures: Budget Appropriation Levels . . . . . . . . . . . . . . . . . . . . . . . . . . . . . . 59
Expenditures: Recommended vs. Adopted Budget . . . . . . . . . . . . . . . . . . . . . . . . . . . 63
Expenditures: COVID-19 Federal Aid . . . . . . . . . . . . . . . . . . . . . . . . . . . . . . . . . . 64
Expenditures: Operating and Capital Fund Sources . . . . . . . . . . . . . . . . . . . . . . . . . . 66
Fund Balances . . . . . . . . . . . . . . . . . . . . . . . . . . . . . . . . . . . . . . . . . . . . 71
Agency Detail . . . . . . . . . . . . . . . . . . . . . . . . . . . . . . . . . . . . . . . . . . . . . 76
Table of Contents

TABLE OF CONTENTS Fiscal 2022 Summary of the Adopted Budget
Revenue 81
Major Revenues Forecast . . . . . . . . . . . . . . . . . . . . . . . . . . . . . . . . . . . . . . . 83
Summary of City Real Property Tax Credit Programs . . . . . . . . . . . . . . . . . . . . . . . . . . 101
Property Tax One-Cent Yield . . . . . . . . . . . . . . . . . . . . . . . . . . . . . . . . . . . . . . 102
Selected Real Property Tax Expenditures . . . . . . . . . . . . . . . . . . . . . . . . . . . . . . . 103
Revenue Estimates . . . . . . . . . . . . . . . . . . . . . . . . . . . . . . . . . . . . . . . . . . 107
Budgetary Funds and Projected Revenues . . . . . . . . . . . . . . . . . . . . . . . . . . . . . . . 138
Operating Budget 151
Overview of Operating Budget . . . . . . . . . . . . . . . . . . . . . . . . . . . . . . . . . . . . . 153
Priority Outcomes . . . . . . . . . . . . . . . . . . . . . . . . . . . . . . . . . . . . . . . . . . . 154
Priority Outcome: Prioritizing Our Youth . . . . . . . . . . . . . . . . . . . . . . . . . . . . . . . . 155
Priority Outcome: Building Public Safety . . . . . . . . . . . . . . . . . . . . . . . . . . . . . . . . 164
Priority Outcome: Clean and Healthy Communities . . . . . . . . . . . . . . . . . . . . . . . . . . 173
Priority Outcome: Equitable Neighborhood Development . . . . . . . . . . . . . . . . . . . . . . . 188
Priority Outcome: Responsible Stewardship of City Resources . . . . . . . . . . . . . . . . . . . . . 195
Priority Outcome: Other . . . . . . . . . . . . . . . . . . . . . . . . . . . . . . . . . . . . . . . . 201
Operating Budget by Agency, Service, and Fund . . . . . . . . . . . . . . . . . . . . . . . . . . . . 204
Comparison of Current and Prior Year Operating Budget . . . . . . . . . . . . . . . . . . . . . . . . 220
Permanent Full-Time Positions . . . . . . . . . . . . . . . . . . . . . . . . . . . . . . . . . . . . 221
Capital Budget 229
Overview of Capital Budget . . . . . . . . . . . . . . . . . . . . . . . . . . . . . . . . . . . . . . 231
Capital Budget Fund Sources . . . . . . . . . . . . . . . . . . . . . . . . . . . . . . . . . . . . . 235
Appendix 239
Glossary . . . . . . . . . . . . . . . . . . . . . . . . . . . . . . . . . . . . . . . . . . . . . . . 241
Ordinance of Estimates . . . . . . . . . . . . . . . . . . . . . . . . . . . . . . . . . . . . . . . . 245
Annual Property Tax Ordinance . . . . . . . . . . . . . . . . . . . . . . . . . . . . . . . . . . . . 284
Supplemental Appropriations and Transfers . . . . . . . . . . . . . . . . . . . . . . . . . . . . . . 286
Budgetary Authority and Process . . . . . . . . . . . . . . . . . . . . . . . . . . . . . . . . . . . 291
ii

PRESENTED TO
City of Baltimore Maryland
For the Fiscal Year Beginning
July 01, 2020
Executive Director
GOVERNMENT FINANCE OFFICERS ASSOCIATION
Distinguished Budget Presentation
Award
iii

BRANDON M. SCOTTMAYOR
100 Holliday Street, Room 250 Baltimore, Maryland 21202
The Honorable Members of the City Council
City Hall, Room 400
Baltimore, Maryland 21202
The Fiscal 2022 Board of Estimates Budget Plan reflects the priorities of Mayor Brandon M. Scott. The budgetplan maintains core City services, leverages federal aid to respond to the COVID-19 pandemic, and targets newinvestments tomake the City safer, cleaner, andmore efficient. The Plan totals $4.33 billion, including $3.84 billionfor operating expenses and $487.6 million for capital investment. The General Fund budget totals $2.01 billion, a4.4% increase from the Fiscal 2021 Adopted Budget.
Fiscal Context
The Fiscal 2022 Budget Plan was developed in the context of an uncertain economic environment due to thecontinuing COVID-19 pandemic. In the Fiscal 2021 budget, the City sharply wrote down General Fund revenuesources that are dependent upon visitor business activity, such as parking revenue, Hotel Tax, and ConventionCenter income. These revenue sources have reached historic lows during Fiscal 2021 and the Fiscal 2022 budgetincludes only a modest recovery to these sources. The City’s two primary General Fund revenue sources, PropertyTax and Income Tax, have also been negatively impacted by the pandemic. Commercial property assessmentsfor Group 3 grew only 0.9% over the last three years, due to low demand for real estate in the retail, hotel, andrestaurant sectors. In addition, the Maryland RELIEF Act, which exempts unemployment benefits from State andlocal taxes, is likely to negatively affect City income tax collections.
Federal aid has provided a lifeline for the City and should allow for a robust and continuing response to COVID-19in Fiscal 2022. The City was awarded $103.6 million of direct aid from the Coronavirus Aid, Relief, and EconomicSecurity (CARES) Act in March 2020. The remaining $24.5 million of that aid unspent as of the end of Fiscal 2021will be budgeted in Fiscal 2022 for continuing expenses such as cleaning costs, personal protective equipment(PPE) purchases, and to support City personnel dedicated to responding to the pandemic. Federal EmergencyManagement Agency (FEMA) reimbursement is expected for certain eligible programs such as mass vaccination,sheltering, and feeding, which will allow for the continuation of those programs into Fiscal 2022.
iv
THE MAYOR'S LETTER Fiscal 2022 Summary of the Adopted Budget

Fiscal 2022 Summary of the Adopted Budget THE MAYOR'S LETTER
American Rescue Plan
Through the State and Local Fiscal Recovery Fund, the American Rescue Plan (ARP) Act of 2021, will provide$670.3 million to the City of Baltimore to respond to the COVID-19 public health emergency and its negative eco-nomic impacts. ARP funding for projects that respond to the public health emergency or its negative economicimpacts will be available through an online application process. Funding will be available to support projects forCity agencies and organizations external to the City. ARP funds must be fully spent by December 31, 2024.
The City’s robust response to the COVID-19 public health emergency has put a strain on resources. ARP funds willbe used to support essential front-line employees, shore up the City’s financial health, modernize City government,and deliver resources and projects that builds public trust and facilitates neighborhood-level change. The Cityis expected to receive its first disbursement of American Rescue Plan Act funds in the spring of 2021. Anotherdisbursement will be received within 1 year from the first disbursement.
The City will reserve someARP funds to stabilize the City’s financial outlook over the next three years. At the urgingof many State and local governments, the ARP bill provides more flexibility on using Federal aid to backfill lostrevenue. This flexibility means that the City can preserve core services while we plan for a longer-term economicrecovery.
Budget Plan
The Fiscal 2022 Budget Plan is built around the priority areas ofMayor Scott: Prioritizing Our Youth, Building PublicSafety, Clean and Healthy Communities, Equitable Neighborhood Development, and Responsible Stewardship ofCity Resources. Collectively, these investments will begin to rebuild the public’s trust in local government to makeprogress on the key issues facing Baltimore.
Prioritizing Our Youth
The Budget Plan includes $487.6 million across all funding sources. Key highlights include:
• Total support for City Schools in Fiscal 2022 is $360.3 million. City funding supports Maintenance of Effortpayments, the 21st Century Schools program, debt service and capital funding for school renovations andupgrades, retiree benefits, school health services, and crossing guards.
• The budget continues to support the Mayor’s Office of Children and Family Success with $22.3 million infunding. The Office oversees the City’s Head Start program, the Community Action Partnership (CAP) Cen-ters, and the African-American Male Engagement program.
• The budget includes State funding of $1 million for YouthWorks and $3.5 million for the local managementboard for the Children and Youth Fund. These additional funds are provided by the State’s Community Safetyand Strengthening Act, which passed the Maryland General Assembly in 2019.
v
THE MAYOR'S LETTER Fiscal 2022 Summary of the Adopted Budget
Building Public Safety
The Budget Plan includes $1.05 billion across all funding sources. Key highlights include:
• The City will increase itsmonthly 911 fee by $0.25 per phone line to support the growing cost of 911 servicesas part of the Next Generation 911 (NG911) effort. NG911 is a state-of-the-art public safety technology thatwill improve 911 service through secure call networks, better call routing capabilities, and the integration ofcall and geo-location data for use by emergency responders.
• The Office of Emergency Management will use $500,000 of remaining CARES Act funds to purchase addi-tional PPE, such as masks, gloves, disinfectant, and hand sanitizer. The equipment will help to keep bothCity employees and residents safe during the continuing COVID-19 pandemic.
• The newly-formed Mayor’s Office of Neighborhood Safety and Engagement will leverage a private invest-ment of over $850,000 to kick-start the Group Violence Reduction Strategy (GVRS). The GVRS Strategy is anevidence-based approach designed to curtail violent crime, expand opportunities for high-risk populations,and build better relationships between police officers and the communities they serve.
Clean and Healthy Communities
The Budget Plan includes $1.2 billion across all funding sources. Key highlights include:
• The Baltimore City Health Department will manage vaccination sites across the City, including mobile vac-cination, to continue the mass vaccination effort underway both locally and nationwide. Fiscal 2022 costsare budgeted at $10 million through December and are expected to be fully reimbursable with FEMA funds.
• The City will continue tomanage an isolation site at the Lord BaltimoreHotel in an effort to control the spreadof COVID-19. The Fiscal 2022 budget includes $7.4 million for this work through December 2021 and willcontinue as long as FEMA reimbursement is available.
• The Department of Public Works (DPW) will begin distributing recycling cans for every eligible home in Bal-timore. The $8.3 million program will be made possible by a private grant and an interest-free loan, withongoing maintenance and debt service costs to be paid from the Stormwater Enterprise Fund.
• DPWwill also continue supporting a 12-month pilot Sewage Onsite Support (SOS) Cleanup Program (begunin Fiscal 2021) which provides professional cleaning, disinfection, and disposal services through 311. The$2.5 million program is funded by the Wastewater Utility Fund.
• The City will refund DPW’s graffiti removal program which was defunded as a part of the City’s Fiscal 2021savings initiative in response to COVID-19.
• The Department of Housing and Community Development (DHCD) will leverage additional General Funds toenable access of up to $2 million of State weatherization resources. DHCD expects this funding to facilitatean additional 500 home weatherization projects.
Equitable Neighborhood Development
The Budget Plan includes $130.4 million across all funding sources. Key highlights include:
• The Mayor’s Office of Children and Family Success will continue a rental relief and eviction prevention pro-gram to assist tenants that have fallen behind on payments during COVID-19. The program is supported by$31.2 million of aid from a variety of federal, State, and local sources from funds awarded in Fiscal 2021.
vi
Fiscal 2022 Summary of the Adopted Budget TABLE OF CONTENTS
• The Mayor’s Office of Employment Development (MOED) will serve 30,000 residents and continue refiningstrategies to help residents get living wage jobs, with $5.8 million in grant funding. A standardized “accesspoints” intake process will launch at career centers, in order to evaluate residents’ specific needs and directthem to relevant services.
• The City will provide Visit Baltimore a one-time loan of $6.7 million to stabilize their budget in the wake ofCOVID-19. The funds will be used to jump-start a post-COVID tourism recovery strategy, and will be paidback over five years as Hotel Tax revenue recovers.
• The Charm City Circulator will continue operating at current service levels with the support of a FederalTransit Authority grant from the CARES Act. The funds will support ongoing operating costs to combat theloss of dedicated Parking Tax revenues that were the primary source of funding for the Circulator.
Responsible Stewardship of City Resources
The Budget Plan includes $220.9 million across all funding sources. Key highlights include:
• The Baltimore City Information and Technology (BCIT) budget includes $14.5 million for Phase 2 of theEnterprise Resource Planning (ERP) system. The project will replace and integrate the City’s core financial,payroll, and human resources systems, with the goal of reducing manual data entry and improving accessto real-time financial information within one single platform.
• BCIT will be awarded an Innovation Fund loan of $200,000 to invest in an automated online messagingsystem for 311 service requests. The technology, similar to those used by online services and retailers,will provide real-time assistance to customers on frequently asked questions, which will reduce call volumepressure on the 311 Call Center.
• Finance will add one dedicated attorney to lead the new Corporate Tax Compliance Unit, which will examineself-reported taxes that aremost susceptible to under-reporting and abuse. One Finance positionwill also beadded to ensure compliance with the audit requirements that have arisen from federal and State COVID-19funding.
• The Board of Elections will continue to monitor pending State legislation that aims to institutionalize mail-invoting options. The November 2020 election improved voter access and lowered costs; higher mailing andsecurity costs were offset by lower personnel and training costs due to fewer in-person voting sites.
• The capital budget includes $15 million of one-time resources for the Department of General Services andthe Department of Transportation in anticipation of the sale of three City-owned properties. The expectedsales are the culmination of an internal workgroup, which has focused on generating real estate value fromCity assets.
Fiscal Risks
Like many state and local governments, the City’s financial outlook has changed dramatically in the wake of theCOVID-19 pandemic. The pandemic has directly exposed some new risks in the City’s financial profile, for example:
• Parking Revenues: Historically, the General Fund has netted approximately $36 million annually fromparking-related revenues such as Parking Tax, garage income, parking meter revenue, and fines andpenalties after operating expenses of the Parking Authority of Baltimore City and debt service payments forCity-owned garages. Some of this revenue is dependent upon downtown commuters who pay for parkingin either City-owned or private garages. If work-from-home options remain available to employees, manyof these commuters are unlikely to return to downtown parking garages, which could lead to a permanent
vii

THE MAYOR'S LETTER Fiscal 2022 Summary of the Adopted Budget
reduction in garage income and Parking Tax revenues.
• Commercial Real Estate Values: In Fiscal 2022, commercial property assessments grew only 0.9% on atriennial basis, compared to an average of 12.4% over the last five assessment cycles. This stagnant growthis the result of recent write-downs in value for commercial properties that have been especially vulnerableduring COVID-19 in the hotel, retail, and restaurant sectors. The Fiscal 2022 assessment was for Group 3properties, which are in the southern third of the city. Downtown properties, which are most vulnerable toCOVID-related impacts, are in Group 1 and are due to be re-assessed in Fiscal 2023.
• Convention Center Hotel: The City’s Convention Center Hotel (Hilton) was financed with $300 million oftax-exempt bonds in 2006. The repayment of debt was expected to be covered by three revenue sources:hotel operational revenue, the Hotel Tax, and Property Tax revenue generated by the Convention Center Hotelitself. The hotel has been closed during Fiscal 2021 due to COVID-19, resulting in a shortfall of resourcesrequired to make debt service payments. Per the original bond agreement, the City is required to divertup to $7 million of General Fund Hotel Tax revenue to fill the gap if necessary, and the Fiscal 2022 budgetincludes this full $7 million requirement. This requirement is likely to remain in the budget until the hotel andConvention Center industry recovers, diverting General Fund resources away from other pressing priorities.
In addition to the challenges of recovering from the COVID-19 economic disruption, the City still has some signifi-cant fiscal risks that pre-date the pandemic:
• Kirwan Education Costs: In 2020, the Maryland General Assembly passed the Blueprint for Maryland’sFuture legislation, more commonly referred to as Kirwan, which would require additional State and localcontributions to school districts. The bill was vetoed by the Governor, but the General Assembly overrodethe veto in the 2021 session. The City’s new local contribution will begin in Fiscal 2023. Per the fiscalnote drafted by the Maryland Department of Legislative Services for fiscal analysis of the bill, the City’scontribution to City Schools for operating costs will increase by $63 million compared to the current lawand grow to a $161.5 million annual increase by Fiscal 2030, totaling nearly $1 billion in additional Cityresources over the next decade.
• Police Legal Liability: The City is increasingly facing claims for decades-old accusations against the Citythat led to wrongful imprisonments. The City also has begun to settle claims related to the misconductfrom the Gun Trace Task Force (GTTF). These cases expose the City to significant financial liability.
• Fire and Police Pension: In May 2019, a judgment was reached in the Baltimore Circuit Court for BaltimoreCity on the long-standing litigation between the City and Fire and Police employees over pension reforms thatwere enacted in 2010. The judge upheld the City’s modification that extended the years of service requiredto earn a pension from 20 to 25 years. However, the judge also ruled that the City unfairly withdrew benefitsfrom already-retired employees and that those retirees are entitled to seek damages for lost benefits fromthe City.
viii

The City of Baltimore Community Guide to the Budget – Fiscal 2022
The Fiscal 2022 Budget Plan was developed in the context of an uncertain economic environment due to the con�nuing COVID-19 pandemic. Bal�more’s financial posi�on remains under heavy strain due to the con�nued repercussions of the pandemic, with many key revenue sources that fund the City’s opera�ons, such as Hotel Tax and parking-related revenues, reaching historic lows in Fiscal 2021.
While recovery from COVID-19 has begun with vaccina�on distribu�on and businesses reopening, the City and its residents con�nue to deal with the health and economic consequences of the pandemic. The Fiscal 2022 budget was developed to address these ongoing challenges, while maintaining vital City services, and reflects a modest recovery of revenue sources impacted by the pandemic.
Priori�zing Our Youth The City will provide more than $360.3 million in support for City Schools, including Maintenance of Effort payments, the 21st Century School Moderniza�on fund, teacher pension costs, re�ree health benefits, school health, and crossing guard services. The budget includes $22.3 million for the Mayor’s Office of Children and Family Success (MOCFS), which oversees the City’s Head Start program, the Community Ac�on Partnership (CAP) Centers, and African-American Male Engagement.
Building Public Safety The City will invest in Next Genera�on 911 (NG911) to improve 911 service by increasing the monthly 911 fee by $0.25. NG911 will support secure call networks, be�er call rou�ng capabili�es, and the integra�on of call and geo-loca�on data for use by emergency responders.The Mayor’s Office of Neighborhood Safety and Engagement will leverage a private investment to kick-start the Group Violence Reduc�on Strategy, an evidence-based approach designed to curtail violent crime, expand opportuni�es for high-risk popula�ons, and build be�er rela�onships between police officers and the communi�es they serve.
Clean and Healthy Communi�esThe Department of Public Works (DPW) will distribute recycling cans for eligible home in Bal�more, a $8.3 million program made possible by a private grant and an interest-free loan.DPW will also con�nue suppor�ng a 12-month pilot Sewage Onsite Support (SOS) Cleanup Program, which provides professional cleaning, disinfec�on, and disposal services through 311. The $2.5 million program is funded by the Wastewater U�lity Fund.
Equitable Neighborhood DevelopmentMOCFS will con�nue a rental relief and evic�on preven�on program to assist tenants that have fallen behind on payments during COVID-19. The program is supported by $31.2 million of aid from a variety of federal, State, and local sources from funds awarded in Fiscal 2021.The Mayor's Office of Employment Development aims to serve 30,000 residents and con�nue refining strategies to help residents get living wage jobs, with $5.8 million in grant funding.
•
•
•
•
•
•
•
•
•
Responsible Stewardship of City ResourcesThe Bal�more City Informa�on and Technology (BCIT) budget includes $14.5 million for Phase 2 of the Enterprise Resource Planning system. The project will replace and integrate the City’s core financial, payroll, and human resources systems to reduce manual data entry and improve access to real-�me financial informa�on.BCIT will u�lize an Innova�on Fund loan of $200,000 to implement an automated online messaging system for 311 service requests to provide real-�me assistance to customers on frequently asked ques�ons and reduce call volume pressure on the 311 Call Center.
•
What are we inves�ng in for Fiscal 2022?
ix
Fiscal 2022 Summary of the Adopted Budget COMMUNITY GUIDE TO THE BUDGET

COVID-19 Response Funding
• $5 million for demoli�on• $4.2 million for Public Markets• $5.6 million for City infrastructure improvements (e.g., road paving)
What does it cost to run the City?The City’s fiscal year begins on July 1st and ends on June 30th. Bal�more’s budget is required by law to be balanced each year.
Note: These numbers represent the Fiscal 2022 adopted budget. Complete financial information can be found at www.budget.baltimorecity.gov
Where does the money come from?
The General Fund is $2.0 billion and is the City’s largest fund. It includes all local taxes paid by residents, businesses and visitors. Policy-makers have the most management flexibilityover how dollars are spent.
51.9%
32.2%
15.2%
What opera�ng funds does the City manage?
Grant Funds are $1.2 billion and are legally required to support specific programs and ini�a�ves. The City receives funding from federal, State, and other special or private grantors.
Opera�ng Budget Revenue ($3.8 billion)
19.3%Charges for Services
18.4%Grants
12.1%Income Tax
10.3%Local & State Shared Taxes
32.6%Property Tax
7.3%All Other
Capital by Project Type ($487.6 million)
How is the money spent?
Opera�ng by type of expense ($3.8 billion)
Enterprise and U�lity Funds are $585 million and are used for opera�ons in which the cost of services is covered primarily through user charges, which are determined based on consump�on. Examples include water and waste water fees.
In response to the unprecedented challenges of the COVID-19 pandemic, a series of vital aid packages were passed to provide assistance to state and local governments.
The City received $103.6 million for the Coronavirus Aid, Relief, and Economic Security (CARES) Act in March 2020. This funding will con�nue to support the City into Fiscal 2022. The American Rescue Plan Act (ARPA) of 2021 will provide the City with $641 million in funds that will be spent on support projects to combat the COVID-19 public health crisis and the nega�ve economic impacts. Addi�onally, Federal Emergency Management Agency (FEMA) reimbursement is expected for certain eligible programs the City ran during the height of the pandemic such as mass vaccina�on sites, sheltering, and feeding.
This funding has provided a lifeline for the City, allowing for a robust and con�nuing response to COVID-19 in Fiscal 2022. Below are some of the ini�a�ves implemented using these funds.
• $24.3 million to support government services, including personal protec�ve equipment (PPE), solid wastecollec�on, elec�on security, and other increased administra�ve expenses
• $15.4 million to support for public health administra�on and contact tracing support• $14.8 million for small business assistance and non-profit relief programs
CARES Funding
• $29.5 million for food distribu�on in coordina�on with the Maryland Food Bank and other organiza�onsfor vulnerable community members, including iden�fied seniors
• $25.2 million for quaran�ne support, including $11.3 million for Lord Bal�more Hotel• $10 million in FEMA-reimbursable funding for managing vaccina�on and test sites across the City, including
mobile units
FEMA-reimbursable funding
• $31.2 million in exis�ng grant funding beyond CARES and FEMA funding to provide rental relief and evic�onpreven�on services
• $16.3 million in remaining CARES funding for technology upgrades, PPE, and cleaning and decontamina�onservices
• $8.2 million in remaining CARES funding to support emergency personnel that are substan�ally dedicatedto the con�nued emergency response to COVID-19
Ongoing COVID-19 Support
In July 2021, the Mayor’s Office of Recovery Programs was created specifically to oversee the distribu�on and accoun�ng of the $641 million in awarded ARPA funding, of which $141 million has been earmarked for budget stabiliza�on. $500 million has been dedicated to recovery projects to be awarded to City agencies, quasi-governmental agencies, and external organiza�ons based on an applica�on process.
0.7%
Special Purpose Funds amount to $26.9 million. They are used to budget for parking opera�ons supported by the General Fund and Conven�on Center debt service supported by the City’s Hotel Tax, a General Fund revenue source.
Public Works58.3%
14.3%Transporta�on
9.3%Community Development
6.6%
4.5%
4.1%3.9%
3.5%
Economic Development
Educa�onResponsibleStewardship
Recrea�on
Administra�on
36%of budget
11.6%
13 694
32.1%Grants
24.4%
18.6%Contractual
Services
3.7%Materials& Supplies
9.6%Debt Service
Opera�ng by Outcome ($3.8 billion)
Innova�ve Governtment
EquitableNeighborhood Development
Administra�on
29%Clean & Healthy
Communi�es
27.2%Building
Public Safety
23.2%Other
12.7%Prior�zing Our Youth
5%3.4%
COMMUNITY GUIDE TO THE BUDGET Fiscal 2022 Summary of the Adopted Budget
x

COVID-19 Response Funding
• $5 million for demoli�on• $4.2 million for Public Markets• $5.6 million for City infrastructure improvements (e.g., road paving)
What does it cost to run the City?The City’s fiscal year begins on July 1st and ends on June 30th. Bal�more’s budget is required by law to be balanced each year.
Note: These numbers represent the Fiscal 2022 adopted budget. Complete financial information can be found at www.budget.baltimorecity.gov
Where does the money come from?
The General Fund is $2.0 billion and is the City’s largest fund. It includes all local taxes paid by residents, businesses and visitors. Policy-makers have the most management flexibility over how dollars are spent.
51.9%
32.2%
15.2%
What opera�ng funds does the City manage?
Grant Funds are $1.2 billion and are legally required to support specific programs and ini�a�ves. The City receives funding from federal, State, and other special or private grantors.
Opera�ng Budget Revenue ($3.8 billion)
19.3%Charges for Services
18.4%Grants
12.1%Income Tax
10.3%Local & State Shared Taxes
32.6%Property Tax
7.3%All Other
Capital by Project Type ($487.6 million)
How is the money spent?
Opera�ng by type of expense ($3.8 billion)
Enterprise and U�lity Funds are $585 million and are used for opera�ons in which the cost of services is covered primarily through user charges, which are determined based on consump�on. Examples include water and waste water fees.
In response to the unprecedented challenges of the COVID-19 pandemic, a series of vital aid packages were passed to provide assistance to state and local governments.
The City received $103.6 million for the Coronavirus Aid, Relief, and Economic Security (CARES) Act in March 2020. This funding will con�nue to support the City into Fiscal 2022. The American Rescue Plan Act (ARPA) of 2021 will provide the City with $641 million in funds that will be spent on support projects to combat the COVID-19 public health crisis and the nega�ve economic impacts. Addi�onally, Federal Emergency Management Agency (FEMA) reimbursement is expected for certain eligible programs the City ran during the height of the pandemic such as mass vaccina�on sites, sheltering, and feeding.
This funding has provided a lifeline for the City, allowing for a robust and con�nuing response to COVID-19 in Fiscal 2022. Below are some of the ini�a�ves implemented using these funds.
• $24.3 million to support government services, including personal protec�ve equipment (PPE), solid waste collec�on, elec�on security, and other increased administra�ve expenses • $15.4 million to support for public health administra�on and contact tracing support• $14.8 million for small business assistance and non-profit relief programs
CARES Funding
• $29.5 million for food distribu�on in coordina�on with the Maryland Food Bank and other organiza�ons for vulnerable community members, including iden�fied seniors• $25.2 million for quaran�ne support, including $11.3 million for Lord Bal�more Hotel• $10 million in FEMA-reimbursable funding for managing vaccina�on and test sites across the City, including mobile units
FEMA-reimbursable funding
• $31.2 million in exis�ng grant funding beyond CARES and FEMA funding to provide rental relief and evic�on preven�on services• $16.3 million in remaining CARES funding for technology upgrades, PPE, and cleaning and decontamina�on services• $8.2 million in remaining CARES funding to support emergency personnel that are substan�ally dedicated to the con�nued emergency response to COVID-19
Ongoing COVID-19 Support
In July 2021, the Mayor’s Office of Recovery Programs was created specifically to oversee the distribu�on and accoun�ng of the $641 million in awarded ARPA funding, of which $141 million has been earmarked for budget stabiliza�on. $500 million has been dedicated to recovery projects to be awarded to City agencies, quasi-governmental agencies, and external organiza�ons based on an applica�on process.
0.7%
Special Purpose Funds amount to $26.9 million. They are used to budget for parking opera�ons supported by the General Fund and Conven�on Center debt service supported by the City’s Hotel Tax, a General Fund revenue source.
Public Works58.3%
14.3%Transporta�on
9.3%Community Development
6.6%
4.5%
4.1%3.9%
3.5%
Economic Development
Educa�onResponsibleStewardship
Recrea�on
Administra�on
36%of budget
11.6%
13 694
32.1%Grants
24.4%
18.6%Contractual
Services
3.7%Materials& Supplies
9.6%Debt Service
Opera�ng by Outcome ($3.8 billion)
Innova�ve Governtment
EquitableNeighborhood Development
Administra�on
29%Clean & Healthy
Communi�es
27.2%Building
Public Safety
23.2%Other
12.7%Prior�zing Our Youth
5%3.4%
Fiscal 2022 Summary of the Adopted Budget COMMUNITY GUIDE TO THE BUDGET
xi
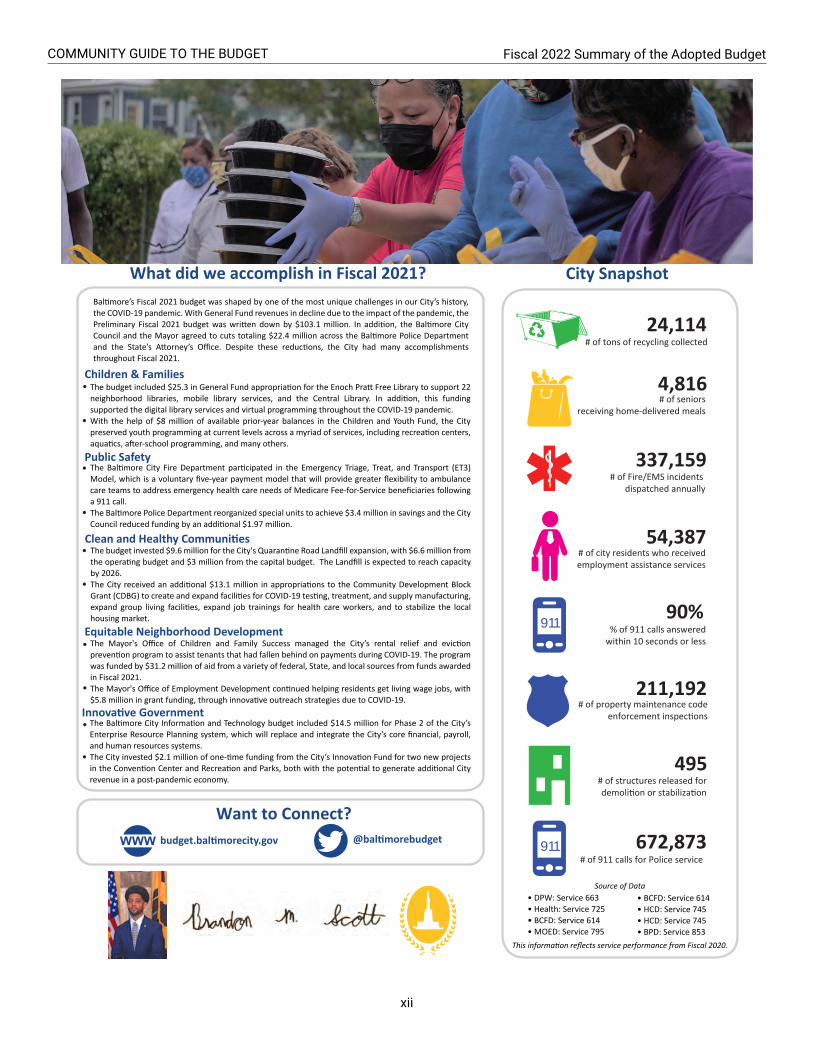
This information reflects service performance from Fiscal 2020.
Want to Connect?budget.bal�morecity.gov @bal�morebudget
City Snapshot
# of property maintenance code enforcement inspec�ons
211,192
# of tons of recycling collected24,114
# of Fire/EMS incidents dispatched annually
337,159
90%% of 911 calls answered
within 10 seconds or less
911
# of structures released for demoli�on or stabiliza�on
495
What did we accomplish in Fiscal 2021?
# of city residents who receivedemployment assistance services
54,387
# of seniorsreceiving home-delivered meals
4,816
672,873 # of 911 calls for Police service
911
• DPW: Service 663• Health: Service 725• BCFD: Service 614• MOED: Service 795
• BCFD: Service 614• HCD: Service 745• HCD: Service 745• BPD: Service 853
Source of Data
Children & FamiliesThe budget included $25.3 in General Fund appropria�on for the Enoch Pra� Free Library to support 22 neighborhood libraries, mobile library services, and the Central Library. In addi�on, this funding supported the digital library services and virtual programming throughout the COVID-19 pandemic.With the help of $8 million of available prior-year balances in the Children and Youth Fund, the City preserved youth programming at current levels across a myriad of services, including recrea�on centers, aqua�cs, a�er-school programming, and many others.
Public Safety The Bal�more City Fire Department par�cipated in the Emergency Triage, Treat, and Transport (ET3) Model, which is a voluntary five-year payment model that will provide greater flexibility to ambulance care teams to address emergency health care needs of Medicare Fee-for-Service beneficiaries following a 911 call.The Bal�more Police Department reorganized special units to achieve $3.4 million in savings and the City Council reduced funding by an addi�onal $1.97 million.
Clean and Healthy Communi�esThe budget invested $9.6 million for the City's Quaran�ne Road Landfill expansion, with $6.6 million from the opera�ng budget and $3 million from the capital budget. The Landfill is expected to reach capacity by 2026.The City received an addi�onal $13.1 million in appropria�ons to the Community Development Block Grant (CDBG) to create and expand facili�es for COVID-19 tes�ng, treatment, and supply manufacturing, expand group living facili�es, expand job trainings for health care workers, and to stabilize the local housing market.
Equitable Neighborhood DevelopmentThe Mayor's Office of Children and Family Success managed the City’s rental relief and evic�on preven�on program to assist tenants that had fallen behind on payments during COVID-19. The program was funded by $31.2 million of aid from a variety of federal, State, and local sources from funds awarded in Fiscal 2021.The Mayor's Office of Employment Development con�nued helping residents get living wage jobs, with $5.8 million in grant funding, through innova�ve outreach strategies due to COVID-19.
•
•
•
•
•
•
•
•
Innova�ve GovernmentThe Bal�more City Informa�on and Technology budget included $14.5 million for Phase 2 of the City’s Enterprise Resource Planning system, which will replace and integrate the City’s core financial, payroll, and human resources systems.The City invested $2.1 million of one-�me funding from the City’s Innova�on Fund for two new projects in the Conven�on Center and Recrea�on and Parks, both with the poten�al to generate addi�onal City revenue in a post-pandemic economy.
•
•
Bal�more’s Fiscal 2021 budget was shaped by one of the most unique challenges in our City’s history, the COVID-19 pandemic. With General Fund revenues in decline due to the impact of the pandemic, the Preliminary Fiscal 2021 budget was wri�en down by $103.1 million. In addi�on, the Bal�more City Council and the Mayor agreed to cuts totaling $22.4 million across the Bal�more Police Department and the State’s A�orney’s Office. Despite these reduc�ons, the City had many accomplishments throughout Fiscal 2021.
COMMUNITY GUIDE TO THE BUDGET Fiscal 2022 Summary of the Adopted Budget
xii

Learn More
In addition to reading through the Summary of the Adopted, below are other ways to engage with Bureau of theBudget and Management Research (BBMR) and learn more about the budget.
Other Budget Publications
Every year, three budget publications precede the Summary of the Adopted publication.
1. The Preliminary Budget publication contains the initial Fiscal 2022 budget recommendations from the De-partment of Finance.
2. The Executive Summary publication contains the Board of Estimates recommendations for the Fiscal 2022budget .
3. The Agency Detail publications, Volume I and Volume II, contain detailed Fiscal 2022 budget information byagency and service. For annotated examples of agency- and service-level information that are available inthese volumes, see the Agency Detail section.
A copy of the Executive Summary and Agency Detail budget publications can be found at the Enoch Pratt CentralLibrary in the Maryland Room for reference use. The Central Library is located at 400 Cathedral St, Baltimore, MD21201.
All other publications are available in PDF format from the BBMR website.
Capital Improvement Program
The Department of Planning develops the City’s six-year Capital Improvement Program. Information on the capitalbudget process, agency proposals, the annual equity analysis, and more details about the capital budget can befound on the Department of Planning website.
Annual Comprehensive Financial Report
The Annual Comprehensive Financial Report (ACFR) is a financial document that complies with standards set bythe Governmental Accounting Standards Board. Baltimore City’s current and past ACFRs can be accessed throughthe Department of Finance website.
Baltimore City Charter
TheCity Charter is a legal document that establishes the organization, powers, functions, and essential proceduresfor Baltimore City. It can be accessed through the Department of Legislative Reference website.
Social Media
Connect with the Bureau of the Budget and Management Research on Twitter and Facebook @baltimorebudgetfor infographics, budget process updates, event invitations, and more.
xiii

LEARN MORE Fiscal 2022 Summary of the Adopted Budget
Open Budget
Use Open Budget, an interactive Fiscal 2022 budget exploration tool, to easily drill into agency budgets. Theassociated dataset is also available through Open Data.
Community Budget Presentations and Questions
Request a community budget presentation fromamember of the Bureau of the Budget andManagement Researchor ask questions about the budget by emailing us at [email protected].
xiv

Introduction
FISCAL2022
SUMMARY OF THEADOPTED BUDGET
Introduction

Intentionally left blank.

About Baltimore
Largest Private-Sector Employers Rank
University of Maryland MedicalSystem
1
Johns Hopkins Health System 2Johns Hopkins University 3LifeBridge Health 4T. Rowe Price Group Inc. 5Exelon Corp. 6Mercy Health Services 7Ascension Saint Agnes 8Under Armour Inc. 9CareFirst BlueCross Blueshield 10
Largest Tourist Attractions Visitors peryear
Lexington Market 750,000National Aquarium 434,263Maryland Zoon in Baltimore 252,069Fort McHenry National Monument 200,000Baltimore Museum of Art 157,588Baltimore Symphony Orchestra 150,000Hippodrome Theatre at theFrance-Merrick Performing ArtsCenter
83,972
Port Discovery Children’s Museum 60,000Walters Art Museum 41,520Baltimore Museum of Industry 35,374
Largest Colleges and Universities TotalEnrollment
Johns Hopkins University 15,183Morgan State University 6,758University of Maryland, Baltimore 5,094Loyola University Maryland 4,306MICA 1,945Coppin State University 1,917Baltimore City Community College 1,579University of Baltimore 1,520Notre Dame of MarylandUniversity
893
Source: Baltimore Business Journal Book of Lists
Baltimore City was founded on July 30, 1729. In-corporated in 1797, Baltimore City became inde-pendent fromBaltimoreCounty in 1851. Baltimoreis the historic, business, education, and culturalcenter of Maryland. The City is located betweenWashington, D.C. and New York City along the In-terstate 95 corridor. It is the most populous city inMaryland and the 30th most populous city in theUnited States.
The City benefits from being in one of the wealth-iest states in the nation and is the northern an-chor of the Washington-Baltimore-Northern Vir-ginia Combined Statistical Area (CSA). This CSAis one of the largest, wealthiest and best educatedpopulation centers in the country. The City’s econ-omy has traditionally benefited from its locationand proximity to a large and diversified workforce.
Baltimore-Washington International ThurgoodMarshall Airport, Amtrak and MARC train service,and Light and Metro Rail ease the transportationof people and freight. Baltimore’s port ranks 10thnationally for the total dollar value of cargo and11th in terms of foreign cargo tonnage.
Baltimore City has an inventory of approximately9,170 hotel rooms. The Baltimore City Conven-tion Center has 300,000 square feet of exhibithalls, 85,000 square feet of meeting rooms, anda 36,672 square foot ballroom. The professionalbaseball team the Baltimore Orioles, the profes-sional football team the Baltimore Ravens, andthe professional indoor soccer team the BaltimoreBlast call Baltimore City home.
The City derives economic strength from the num-ber of jobs in the knowledge-information-basededucation and information services sectors. Theprominence of health care and knowledge-relatedindustries is reflected in the composition of theCity’s major employers.
3
INTRODUCTION Fiscal 2022 Summary of the Adopted Budget
Geography and location
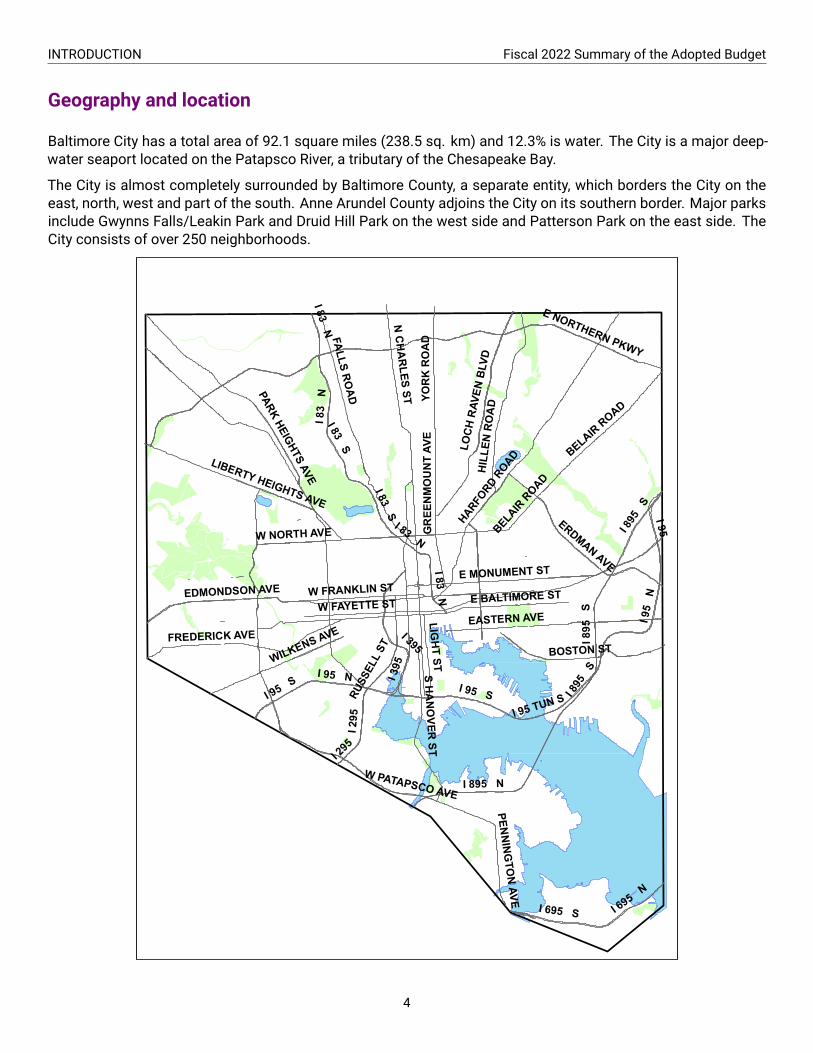
Baltimore City has a total area of 92.1 square miles (238.5 sq. km) and 12.3% is water. The City is a major deep-water seaport located on the Patapsco River, a tributary of the Chesapeake Bay.
The City is almost completely surrounded by Baltimore County, a separate entity, which borders the City on theeast, north, west and part of the south. Anne Arundel County adjoins the City on its southern border. Major parksinclude Gwynns Falls/Leakin Park and Druid Hill Park on the west side and Patterson Park on the east side. TheCity consists of over 250 neighborhoods.
I 95I 83 N
I 95
N
I 695 S I 695 N
I 95 S
I 83 S
I 295
I 895 N
HILL
EN R
OA
D
PARK HEIGHTS AVE
FREDERICK AVE
FALLS ROAD
E NORTHERN PKWY
EASTERN AVE
E MONUMENT ST
YOR
K R
OA
D
W PATAPSCO AVE
W FRANKLIN ST
LIGHT ST
E BALTIMORE ST
I 395
N CHARLES ST
GR
EEN
MO
UN
T AV
E
W FAYETTE ST
LOCH
RAV
EN B
LVD
S HA
NO
VER ST
EDMONDSON AVE
WILKENS AVE
I 95 TUN S
ERDMAN AVE
W NORTH AVE
RUSS
ELL
ST
I 895
S
BELAIR
ROAD
LIBERTY HEIGHTS AVE
HARFORD R
OAD
BOSTON ST
PENNING
TON
AVE
I 295
I 895
S
I 83 N
I 95 N
I 83
N
I 95 S
I 83 N
I 895
S
I 83 S
I 395
BELAIR ROAD
4

Demographic Profile and Trends
Based on U.S. Census data, Baltimore City has an estimated population of 585,708 as of the 2020 Census (April1, 2020) and a population density of 6,359 people per square mile.
Population Characteristics
Category 1970 1980 1990 2000 2010 2020
Total Population905,759 786,775 736,014 651,154 620,961 585,708
SexMale 47.2% 46.7% 46.7% 46.6% 47.1% 47.0%Female 52.8% 53.3% 53.3% 53.4% 52.9% 53.0%
Age0-4 years 8.4% 6.7% 8.0% 6.4% 6.6% 6.4%5-19 years 28.5% 24.2% 19.8% 21.7% 18.3% N/A20-44 years 30.6% 35.8% 41.2% 37.5% 38.1% N/A45-64 years 21.9% 20.5% 17.5% 21.2% 25.2% N/A65 years and over 10.6% 12.8% 13.6% 13.2% 11.7% 1
360.0%
RaceWhite 53.0% 43.9% 39.3% 31.6% 29.6% 30.5%Black 46.4% 54.8% 59.2% 64.3% 63.7% 62.4%Asian 0.3% 0.6% 1.1% 1.5% 2.3% 2.6%Other 0.3% 0.7% 0.4% 1.1% 2.3% 2.0%Two or More Races N/A N/A N/A 1.5% 2.1% 2.5%
Source: United States Census Bureau; estimate provided by American Community Survey
Jobs by Sector
Number of Jobs by Sector 2014 2015 2016 2017 2018 2019 2020
Construction, Mining, and Logging 10,300 10,800 11,400 11,500 11,400 11,300 10,800Manufacturing 11,500 10,800 10,600 10,600 10,900 11,200 10,800Trade, Transportation, and Utilities 40,600 42,200 43,700 44,100 43,000 40,600 44,600Financial Activities and Information 21,400 21,800 22,100 23,100 22,300 22,300 21,900Professional and Business Services 48,500 47,500 48,500 49,300 52,200 55,500 52,800Education and Health Services 110,600 113,700 115,600 118,800 120,600 120,500 115,700Leisure and Hospitality 288,000 30,000 29,400 29,700 29,900 29,300 19,600Other Services 13,600 12,500 12,500 12,400 12,700 12,500 11,100Government 73,300 72,900 72,500 72,000 72,300 70,400 70,200
Source: Baltimore Area Employment – Bureau of Labor and Statistics (BLS)
5

INTRODUCTION Fiscal 2022 Summary of the Adopted Budget
Per Capita Personal Income
78.6% 80.5% 80.9% 80.5% 80.8% 82.2% 82.6%
93.0% 93.6% 94.1% 94.9% 94.2% 94.5% 94.5%
2013 2014 2015 2016 2017 2018 2019
Percent of MD Percent of US
Baltimore City Per Capita Income as a Percent of Maryland and the United States
Perc
ent
Geographic Region 2013 2014 2015 2016 2017 2018 2019
Baltimore City 41,717 44,057 46,123 47,475 49,083 51,577 53,378Maryland 53,057 54,696 57,036 59,011 60,758 62,708 64,640United States 44,860 47,071 49,019 50,015 52,118 54,606 56,490
Source: U.S. Department of Commerce, Bureau of Economic Analysis Local Area Personal Income Accounts
6

Municipal Structure
*The Baltimore Police Department was created by an act of State legislature. The Mayor has the statutory right to hire and replace the Police Commissioner.
Planning Commission
Sheriff Social Services State's Attorney Visit Baltimore War Memorial
Commission
Enoch Pratt Free Library Family League Maryland Zoo Liquor License
Commissioners
ACTS OF STATE LEGISLATURE
Board of School Commissioners
Baltimore City Public Schools
Baltimore Museum of Art
Board of Elections Circuit Court Orphans' Court
Mayoral Offices Planning Police* Public Works Recreation & Parks Transportation
Housing & Community Dev.
Human Resources
Information & Technology Law Legislative
ReferenceGeneral Services
Cable & Comm. Equity and Civil Rights Finance Fire General
Services Health
THE PEOPLE
COMPTROLLER MAYORPRESIDENT OF CITY COUNCIL CITY COUNCIL
Council Services
BOARD OF ESTIMATES
Veterans' Commission Wage Commission Youth Commission
Public Art Commission
Public Safety Advisory Com.
Sustainability Commission
Labor Commissioner
Licensing for Towing Services
Parking Authority of Baltimore City
Hispanic Commission
Historical & Architectural Pres.
Inclusionary Housing
Employees' Retirement
Environmental Control Board
Fire & Police Retirement
Civil Service Commission
Office of the Inspector General
Board of Municipal & Zoning Appeals
Board of Recreation & Parks
Board of Finance Board of Fire Commissioners
Art Commission Board of Ethics Com. on Aging & Retirement Ed.
Commission for Women
Community Relations Com.
BOARDS AND COMMISSIONS
CHARTER AUTHORIZED
ORDINANCE AUTHORIZED
City Administrator
7

INTRODUCTION Fiscal 2022 Summary of the Adopted Budget
Under the Baltimore City Charter, the City’s executive functions are vested in the Mayor, the Board of Estimatesand an independent Comptroller. The City’s legislative functions are vested in the City Council.
Recent Charter Amendments
The City Charter establishes a strong mayoral form of government, which gives the Mayor wide discretion overCity operations and finances. In 2020, Baltimore City voters passed two Charter amendments that impact thisstructure.
The first Charter amendment established a City Administrator position, appointed by the Mayor, which is responsi-ble for overseeing day-to-day operations and delivery of services. The first City Administrator, Christopher Shorter,started in January 2021.
The second Charter amendment enables City Council to move funding with a majority vote within the GeneralFund. This broader budget authority will start with the Fiscal 2024 planning process. However, the budget processremains the same, requiring approval by the Board of Estimates and City Council before going to the Mayor forfinal approval.
Executive
Mayor
The Mayor is the chief executive officer of the City. The Mayor is elected for a term of four years and is eligible tosucceed herself or himself without limitation as to the number of terms. If the Mayor is disabled or absent fromthe City, the President of the City Council acts as ex-officioMayor. If theMayor resigns, is permanently disqualified,or dies in office, the President of the City Council becomes Mayor for the remainder of the term. The Mayor hasauthority to veto ordinances, has power of appointment of most department heads and municipal officers, serveson the Board of Estimates, and appoints two of the other four members of the Board of Estimates.
• Mayor: Brandon M. Scott
City Administrative Officer
Christopher J. Shorter
Board of Estimates
The Board of Estimates (BOE) is the highest administrative body of the City. It consists of five votingmembers: thePresident of the City Council, who serves as President of the Board, the Mayor, the Comptroller, the City Solicitor,and the Director of Public Works. The Board of Estimates is responsible for formulating and executing the fiscalpolicy of the City, with its primary policy tool being the recommended annual Ordinance of Estimates, the City’sbudget. It is also responsible for awarding contracts and supervising all purchasing by the City.
• City Council President: Nick J. Mosby• Mayor: Brandon M. Scott• Comptroller: Bill Henry• City Solicitor: Jim Shea• Director of Public Works: Jason W. Mitchell
8

Fiscal 2022 Summary of the Adopted Budget INTRODUCTION
Legislative
City Council
The City Council is the City’s legislative body, with the power to enact all ordinances and resolutions. City Councilmembers are elected from 14 districts, and the President is elected at-large, by all voters of the City.
Community members can identify their City Council district and representative using the City Council Districtlookup tool.
• President: Nick J. Mosby• Vice President: Sharon Green Middleton• First District: Zeke Cohen• Second District: Danielle McCray• Third District: Ryan Dorsey• Fourth District: Mark Conway• Fifth District: Isaac “Yitzy” Schleifer• Sixth District: Sharon Green Middleton• Seventh District: James Torrence• Eighth District: Kristerfer Burnett• Ninth District: John T. Bullock• Tenth District: Phylicia Porter• Eleventh District: Eric T. Costello• Twelfth District: Robert Stokes, Sr.• Thirteenth District: Antonio Glover• Fourteenth District: Odette Ramos
9

Intentionally left blank.

Budget Process and Related Policies
FISCAL2022
SUMMARY OF THEADOPTED BUDGET
Budget Process and Related Policies

Intentionally left blank.
Budget Process
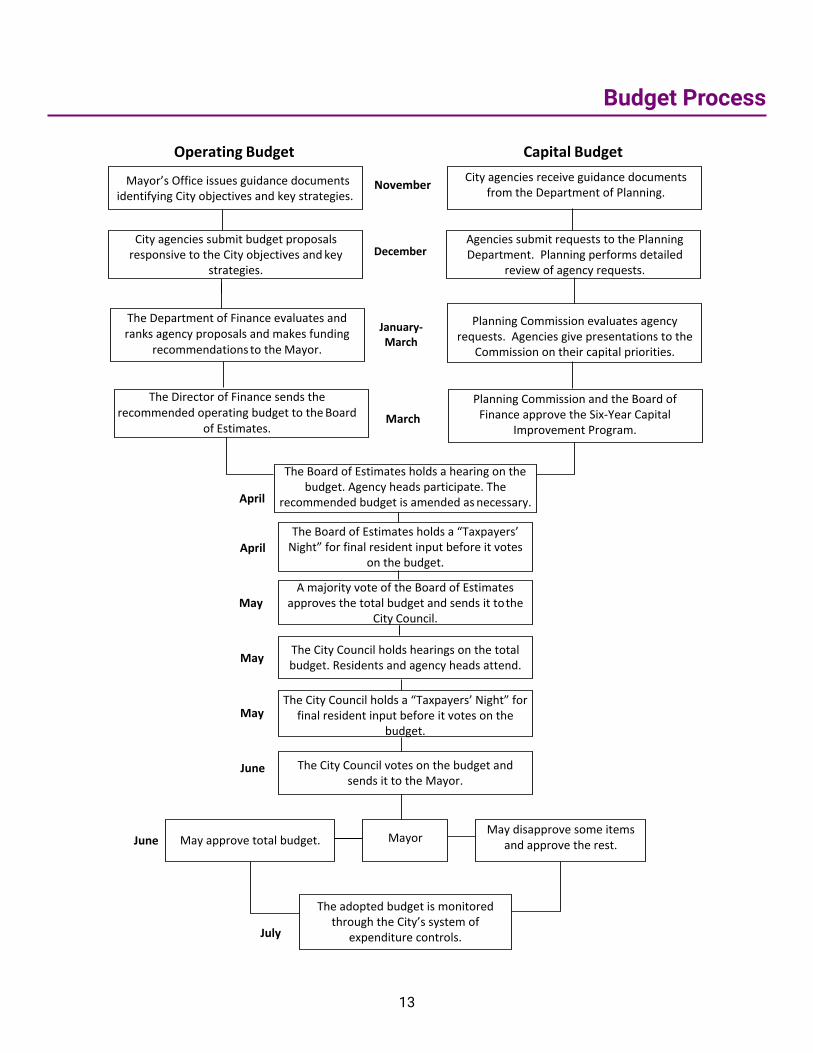
Operating Budget Capital Budget
November City agencies receive guidance documents from the Department of Planning.
City agencies submit budget proposals responsive to the City objectives and key
strategies.
The Department of Finance evaluates and ranks agency proposals and makes funding
recommendations to the Mayor.
The Director of Finance sends the recommended operating budget to the Board
of Estimates.
December
January- March
March
Agencies submit requests to the Planning Department. Planning performs detailed
review of agency requests.
Planning Commission evaluates agency requests. Agencies give presentations to the
Commission on their capital priorities.
Planning Commission and the Board of Finance approve the Six-Year Capital
Improvement Program.
April
April
May
May
May
June
The Board of Estimates holds a hearing on the budget. Agency heads participate. The
recommended budget is amended as necessary.
The Board of Estimates holds a “Taxpayers’ Night” for final resident input before it votes
on the budget.
A majority vote of the Board of Estimates approves the total budget and sends it to the
City Council.
The City Council holds hearings on the total budget. Residents and agency heads attend.
The City Council holds a “Taxpayers’ Night” for final resident input before it votes on the
budget.
The City Council votes on the budget and sends it to the Mayor.
June May approve total budget. Mayor May disapprove some items
and approve the rest.
July
The adopted budget is monitored through the City’s system of
expenditure controls.
Mayor’s Office issues guidance documents identifying City objectives and key strategies.
13

BUDGET PROCESS AND RELATED POLICIES Fiscal 2022 Summary of the Adopted Budget
Fiscal 2022 Budget Process
The Fiscal 2022 budget process prioritized strategic planning by budgeting based on priority outcomes and Cityservices, as well as the City’s Ten-Year Financial Plan. Using these plans and measures aided the City in ensur-ing the Fiscal 2022 budget was responsive to the COVID-19 pandemic, while maintaining vital City services andanticipating fiscal concerns and liabilities, such as increased education funding requirements.
The table below shows the budget calendar for Fiscal 2022. In accordance with Article VI, Section 2, of the Charterof Baltimore City (1996 Edition), a schedule is published each year to prepare the upcoming fiscal year’s budget.Article VI, Section 3 of the Charter mandates the following timeline and events:
• The Department of Finance introduce a proposed budget, operating and capital, to the Board of Estimatesat least 30 days prior to the BOE adoption of the budget.
• The BOE must hold public hearings that allow City Council members, agency heads, and City residents toshare their thoughts on the proposed budget.
• The BOE must submit a recommended budget to the City Council at least 45 days before the beginning ofthe fiscal year.
• The City Council has at least 40 days after receipt of the BOE recommended budget to enact the budget.The City Council must adopt the budget at least five days before the start of the fiscal year.
Item Description Scheduled Date Actual Date
Preliminary Budget at BOE Transmittal of Department of FinanceRecommendations to Board of Estimates
April 7, 2021 April 7, 2021
Special Meeting of the BOE Presentation of the Fiscal 2022 budget withagency heads
April 21, 2021 April 21, 2021
Taxpayer’s Night Taxpayer’s Night, including a presentation onthe Fiscal 2022 budget and public testimony
April 21, 2021 April 21, 2021
Ordinance at BOE Board of Estimates adopts proposedOrdinance of Estimates. This includestransmittal of the Executive SummaryBudget Book.
May 12, 2021 May 12, 2021
Ordinance at City Council Introduction of proposed Ordinance ofEstimates to City Council and publication intwo daily newspapers, as well as transmittalof the Agency Detail to City Council.
May 17, 2021 May 17, 2021
Taxpayers’ Night Taxpayer’s Night, including a presentation onthe Fiscal 2022 budget and public testimony
May 27, 2021 May 27, 2021
Budget Hearings Budget hearings with agency representativesto discuss the Fiscal 2022 proposed budget
May 27, 2021 May 27, 2021
Ordinance Passage Passage of Ordinance of Estimates forFiscal Year ending June 30, 2022
no later thanJune 24, 2021
June 8, 2021
14

Outcome Budgeting
Strategic
Planning
Develop plans around population-level indicators and City agency/service
performance measures
Budgeting
Agency budget proposals are based on strategic plans
Resource allocation informed by strategic priorities
Performance Management
Regular CitiStat sessions monitor
progress
Prior to Fiscal 2011, Baltimore used a traditionalagency‐centric budget process similar to whatwas used by other local governments acrossthe country. Each year, funding was allocatedto agencies based on available resources andprior‐year spending patterns, and agencies weregiven freedom to allocate their resources amonga variety of functions. Although this processkept the City’s budget in balance from a finan-cial perspective, it was unclear which agencyfunctions were most important to residents andwhich were demonstrating results.
In Fiscal 2011, Baltimore implemented an inno-vative process called Outcome Budgeting. Theprocess required agencies to make service‐levelbudget proposals that justify investments instrategies geared towards achieving citywideoutcomes and goals. Although the process hasevolved significantly over the past decade, theunderlying principle remains the same: to notonly keep Baltimore’s budget sustainably bal-anced, but also to get the best use of City re-sources by devoting resources to services that
achieve the best results for our residents.
The budget process operates in a cycle that repeats each year: first, develop a strategic plan; next, budget re-sources in a manner informed by the strategic plan; and finally, track performance against the plan. A moredetailed description of the budget process is provided below.
Strategic Planning
Priority Outcomes
TheMayor and Senior Teamfirst decide on a set of Priority Outcomes. Priority Outcomes are broadly-defined goalsfor the City. Although these have been modified and adjusted to reflect the priorities of each Mayoral administra-tion, similar themes are common. The Fiscal 2022 budget was built around five Priority Outcomes: PrioritizingOur Youth, Building Public Safety, Clean and Healthy Communities, Equitable Neighborhood Development, andResponsible Stewardship of City Resources.
Operating budget information is provided by Priority Outcome in the Operating Budget chapter.
Service-Level Budgets
Each agency organizes its budget around services, which are activities or sets of activities that agencies performthat have a clear purpose and identified costs. Budgeting by service deliberately changes the focus from agen-
15

BUDGET PROCESS AND RELATED POLICIES Fiscal 2022 Summary of the Adopted Budget
cies to services, and provides insight into exactly what it costs to carry out each specific function of government.One key advantage of this approach is that services are evaluated based on which Priority Outcome they advancerather than which agency manages the service. For example, the Department of Transportation has a wide rangeof functions that address different Priority Outcomes. Services such as Traffic Safety and Street Lighting supportBuilding Public Safety, while Parking Management and Special Events support Equitable Neighborhood Develop-ment. This approach seeks to identify and eliminate duplication of efforts across agencies, and isolate servicesthat are not contributing to desired results.
A listing of the services and funding levels by Priority Outcome can be seen in the Operating Budget chapter.
Service-Level Performance Measures
Agencies work with the Bureau of the Budget and Management Research (BBMR) and the Mayor’s Office of Per-formance and Innovation (OPI) to develop performance measures for each service. Internally, performance mea-sures allow the City to assess the service’s performance over time, and to make corrections if necessary. Ex-ternally, performance measures allow the agency to communicate the value that residents receive for their taxdollars.
There are four types of performance measures:
Type Description Example for Service 609: EmergencyMedical Services
Output How much service is being delivered Number of EMS responsesEfficiency The cost in dollars and/or time per unit of
outputPercent of EMS fees collected versus totalbillable
Effectiveness How well the service meets standards basedon customer expectations
Percent of EMS responses within 9 minutes
Outcome How much better off is the resident Percent of patients surviving cardiac arrest
Performance measures must meet the S.M.A.R.T. test:
Label Type Description
S Specific Measure is clear and focusedM Measurable Can be quantified and allow for analysisA Ambitious The target should stretch the service to improve performanceR Realistic The target should make sense given the organization’s fiscal constraintsT Time Bound There should be a clear timeframe for achieving the targeted performance
Service-level performance measures were first developed in Fiscal 2011 for larger agencies and in Fiscal 2012 forsmall and medium-sized agencies. In Fiscal 2018, the City launched a comprehensive review of all service-basedperformance measures across agencies. All performance measures, including past year actuals and the nextbudget year’s target, are reflected annually in the Agency Detail budget publication.
16

Fiscal 2022 Summary of the Adopted Budget BUDGET PROCESS AND RELATED POLICIES
Budgeting
Proposals
Agencies are asked to submit a budget proposal for each service. The budget proposal is a formal request fromthe agency to BBMR for resources for the next fiscal year. The budget proposal includes both financial informationand details about how the service impacts the City. Agencies are asked: How does your service align with thePriority Outcomes? How does your service drive improvement in one of the citywide indicators? And, what stepswill the service take to improve performance? Agencies are also provided the opportunity to submit enhancementfunding requests. Enhancement requests are for projects that will improve the efficiency and effectiveness ofagencies.
Budget Recommendations
Next, the Department of Finance shares all information with the Mayor and Senior Team, and develops the Prelim-inary Budget Plan, which is released in late March or early April. In April, the Mayor works to incorporate feedbackfrom the Board of Estimates and Taxpayers’ Night to develop a final budget recommendation, which is submittedto the Board of Estimates inMay. Once the Board of Estimates approves the budget, it is passed on to City Councilfor review. In May and June, the City Council holds hearings with agencies and hosts a Taxpayers’ Night. In June,the City Council votes on the budget and the budget is submitted to the Mayor for final passage. The final budgetmust be acted on by the City Council at least five days before the start of the fiscal year, July 1.
Performance Management
Once the budget is approved, regular performance management sessions are held between the Mayor’s SeniorTeam, OPI, and agency leadership to discuss performance, identify problems, diagnose causes, and direct re-sources to solve problems. BBMR, Department of Human Resources (DHR), and Baltimore City Informationand Technology (BCIT) staff also participate in these meetings. Performance management meetings are eitheragency-focused or topic-focused, centered on a Mayoral priority, and include multiple agencies. OPI is develop-ing a set of “Stat” meetings with the new administration and the Chief Administrative Officer (CAO), includingPoliceStat, CleanStat, and additional meetings focused around other key issues.
New Developments
BBMR considers the budget process to be a collaborative effort led by the Mayor, with input from agencies, CityCouncil members, and Baltimore City residents. BBMR is committed to building and upholding an innovativeand equitable process. Baltimore’s budget process is evolving each year. BBMR is actively working to expandcommunity input and prioritize equity into the budget process.
Community Outreach
A key part of BBMR’s role is to provide residents with insights into the budget and the budget process. Overthe years, BBMR has embraced this role with the development of the Budget Pop-Up at the Board of EstimatesTaxpayers’ Night, presentations and workshops in the community, and increasing its social media presence.
17

BUDGET PROCESS AND RELATED POLICIES Fiscal 2022 Summary of the Adopted Budget
In Fiscal 2020, BBMR piloted “Budget Pop-Ups” at Enoch Pratt Free Library Branches across the city, as well ashosting a table at the 32nd Street Farmers Market. In addition, BBMR continued presenting and attending commu-nity meetings and City agency sponsored events. In response to the COVID-19 pandemic, BBMR has expandedits virtual outreach, including the first Virtual Taxpayers’ Night, which took place in April 2020 and had over 200participants, virtual presentations to community groups, and social media updates.
BBMR is currently working to expand access to and engagement with the budget process for future budget cyclesby developing a web-based version of the budget book, launching interactive online budget tools and simulations,and restarting the Community Survey, which gathers resident input on City services and priorities.
Equity in the Budget
In the summer of 2017, Baltimore’s Department of Planning began analyzing where capital projects occurredin the City based on race, income, and age group. In 2018, the City Council established an Equity AssessmentProgram (City Council Bill 18-0223) with the intent to eliminate structural and institutional racism and other formsof discrimination. In 2019, the Equity In City Government Committee (EICG) developed a plan for implementingan equity strategy for the City. This plan included the Office of Civil Rights and Wage Enforcement becomingthe Office of Equity and Civil Rights (OECR). The newly constituted OECR began facilitating meetings with EquityOfficers across City agencies in the effort of facilitating the City’s equity strategy.
BBMR has engaged in a variety of steps to expand staff understanding of equity in the budget and beyond. In2017, BBMR participated in a peer-to-peer exchange with the City of Seattle and learned about their work aroundincorporating equity into municipal government. In 2018, BBMR partnered with Baltimore Corps to hire a Fellowon contract focused on expanding community engagement and beginning the internal work related to the EquityAssessment Program. That work led to a full-time position and since then, BBMR has continued to further incor-porate equity into everyday operations. Staff have engaged in a variety of discussions and trainings with outsideorganizations and other agencies; the office holds monthly equity chats that are facilitated by staff members oftopics of interest or external trainers and presenters; BBMR became an Associate Member of the GovernmentAlliance on Race and Equity (GARE) and has connected with other jurisdictions to learn about their work; andstaff have conducted several research projects about equity assessments, equity tools for budgeting, and bestpractices in general.
As the City continues to implement the Equity Assessment Program under Mayor Scott’s administration, the bud-get process and budget decisionswill be reviewed and assessed to further incorporate equity. Trainings facilitatedby OECR and the information provided by agencies to assess their current understanding and engagement aroundequity in their work will be the foundation for future efforts related to equity in the budget.
18

Key Budgetary and Financial Policies
The establishment of clear objectives to align budget planning and ongoing agency operations to address thelong-term issues and concerns confronting the City fails unless supported by sound fiscal management policies.This section presents major budgetary and financial policies that frame annual budget plan development andimplementation. Many supporting policies, including payroll, purchasing, and retirement, are not summarizedhere.
Operating and Capital Budget Policies
Fundamental budget policies are set forth in the City Charter.
• Balanced Budget: The adoption of a balanced budget is not mandated by the conditions stated in ArticleII of the City Charter; however, it is implicit that the revenues the City projects to receive in the next fiscalyear from all existing revenue sources must be sufficient to cover the total anticipated expenditures of thenext fiscal year. The Department of Finance recommends an operating budget to the Board of Estimatesthat includes the appropriations needed for the operation of each City agency, program, purpose, activity,and project, as well as the specific revenue sources. Total revenues are either equal or greater than therecommended appropriations, and may be supplemented, if necessary, with prior year fund balance.
• Public Hearings: The Charter mandates that the Board of Estimates and the City Council conduct publichearings on the proposed budget.
• Timely Adoption: The Charter schedule requires budget adoption no later than five days before the fiscalyear begins.
• Budget Amendment: The Charter provides means for adopting supplemental appropriations funded fromunanticipated revenues and/or new grants and sources that materialize during the year, except for propertytax revenue. The City’s policy is to minimize the use of supplemental appropriations. In addition, the Char-ter allows for and spells out the procedures for amending the budget to transfer appropriations betweenprograms within an agency and between agencies.
• Budget Monitoring and Execution: Budget analysts work closely with agency fiscal officers throughout thefiscal year, from implementing the current year budget to planning the next year’s budget. Expenditure andrevenue projections are developed and reviewed on a monthly basis. The Mayor, through the Department ofFinance, exercises appropriate fiscal management to adjust budget policies, as necessary, to live within thelimits of the current adopted plan. The City Council reviews budget performance each quarter, during thebudget development period in the fourth quarter, and during the normal course of hearings on supplementalappropriations.
• Long-Range Capital Plan: The Charter requires the Department of Planning to develop a long-range Capi-tal Improvement Plan (CIP), which is updated every year. The plan is prepared in conformance with basiccapital budgeting policies, which include appropriating funds in the year in which projects are likely to begin,financing a portion of capital improvements from current revenues, and estimating the impact of capitalprojects on the operating budget.
Fiscal 2021 and 2022 Compliance
As of publication, the City is in the process of completing budget amendment actions for the Fiscal 2021 budgetto ensure that the City closes the fiscal year with a balanced budget. In addition, the City is taking proactive efforts
19

BUDGET PROCESS AND RELATED POLICIES Fiscal 2022 Summary of the Adopted Budget
to amend the Fiscal 2022 budget to reflect a recent court ruling regarding the Fire and Police pension system. The Fiscal 2022 budget met all requirements regarding hearings, adoption, and capital funding.
Financial Forecasting Policies
The City maintains a ten-year revenue and expenditure forecast for the General Fund. The multi-year forecast provides the basis for establishing budget targets and resource allocation to meet the Mayor’s budget priorities.
Reserve Policies
In 1993, the Budget Stabilization Reserve, also known as the unassigned fund balance or Rainy Day Fund, was established. The Reserve is designed to provide budgetary flexibility should material funding shortfalls or unan-ticipated expenses occur. It may not be used to supplement a planning year budget, and funds drawn from the reserve must be replenished within five fiscal years.
In 2010, Baltimore voters approved a Charter amendment that eliminated a provision limiting the size of the unas-signed portion of the General Fund balance to 1% of budgeted revenues. This restriction had placed the City in a relatively poor position compared to other large cities and worked against the City’s interest in achieving sound fi-nancial practices. The Charter permits a $1 million contingency appropriation and the Fiscal 2022 budget included the full $1 million.
See the Unassigned Fund Balance section in Fund Balances for more details on recent contributions to the Budget Stabilization Reserve.
Financial Reporting Policies
The City has received the Government Finance Officers Association (GFOA) annual award for Excellence in Finan-cial Reporting for over 24 years and the Distinguished Budget Presentation award each year applied since Fiscal 1988. The Annual Comprehensive Financial Report is prepared in conformance with the Governmental Account-ing Standards Board requirements. The City annually prepares the required full disclosure statements to comply with Securities and Exchange Commission requirements, provides fully descriptive notes in its annual financial report and disclosure statements, and secures an unqualified independent audit report.
Investment Policies
The City’s investment policy, adopted in July 1995, covers investment objectives, types of investments, delegation of authority to invest, internal controls, and reporting requirements. The City operates on a pooled cash basis and maintains a tiered portfolio containing a pyramid of investments with a long-term base and short-term top, in order to maximize and stabilize returns. The City has maintained a ratio of current assets to current liabilities greater than 1.0 since 1989, a ratio of less than 1.0 is considered a fiscal stress warning sign.
20
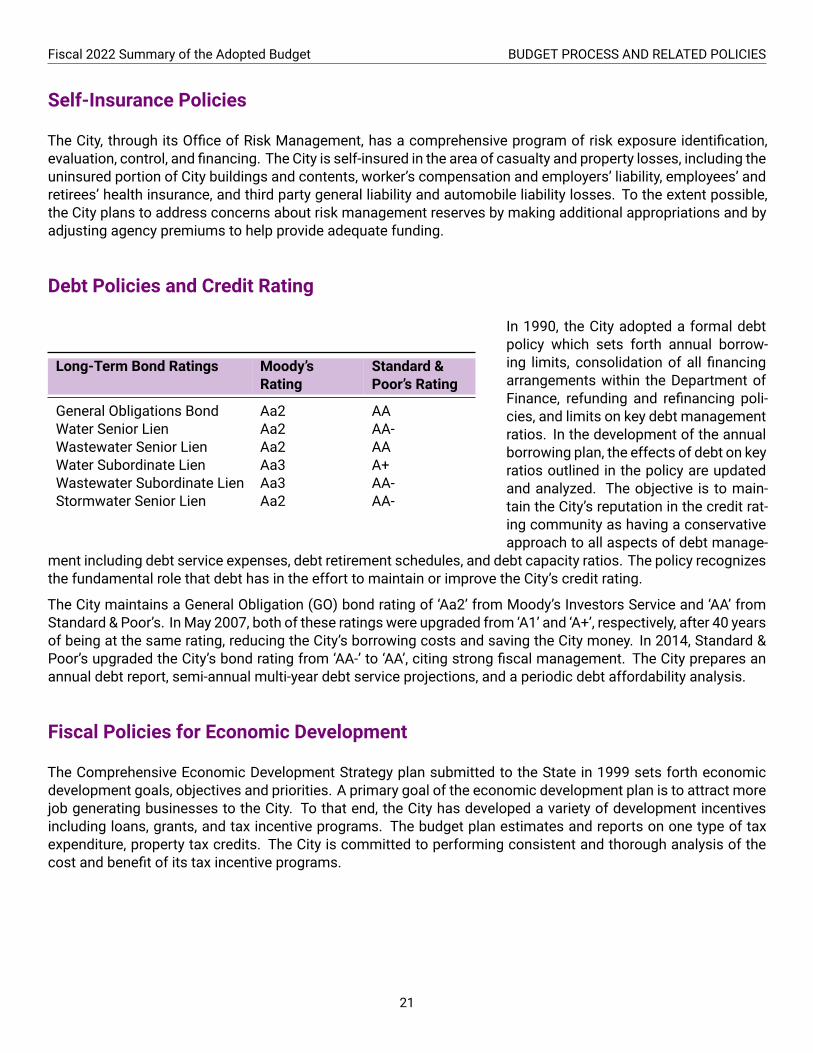
Fiscal 2022 Summary of the Adopted Budget BUDGET PROCESS AND RELATED POLICIES
Self-Insurance Policies
The City, through its Office of Risk Management, has a comprehensive program of risk exposure identification,evaluation, control, and financing. The City is self-insured in the area of casualty and property losses, including theuninsured portion of City buildings and contents, worker’s compensation and employers’ liability, employees’ andretirees’ health insurance, and third party general liability and automobile liability losses. To the extent possible,the City plans to address concerns about risk management reserves by making additional appropriations and byadjusting agency premiums to help provide adequate funding.
Debt Policies and Credit Rating
Long-Term Bond Ratings Moody’sRating
Standard &Poor’s Rating
General Obligations Bond Aa2 AAWater Senior Lien Aa2 AA-Wastewater Senior Lien Aa2 AAWater Subordinate Lien Aa3 A+Wastewater Subordinate Lien Aa3 AA-Stormwater Senior Lien Aa2 AA-
In 1990, the City adopted a formal debtpolicy which sets forth annual borrow-ing limits, consolidation of all financingarrangements within the Department ofFinance, refunding and refinancing poli-cies, and limits on key debt managementratios. In the development of the annualborrowing plan, the effects of debt on keyratios outlined in the policy are updatedand analyzed. The objective is to main-tain the City’s reputation in the credit rat-ing community as having a conservativeapproach to all aspects of debt manage-
ment including debt service expenses, debt retirement schedules, and debt capacity ratios. The policy recognizesthe fundamental role that debt has in the effort to maintain or improve the City’s credit rating.
The City maintains a General Obligation (GO) bond rating of ‘Aa2’ from Moody’s Investors Service and ‘AA’ fromStandard & Poor’s. InMay 2007, both of these ratings were upgraded from ‘A1’ and ‘A+’, respectively, after 40 yearsof being at the same rating, reducing the City’s borrowing costs and saving the City money. In 2014, Standard &Poor’s upgraded the City’s bond rating from ‘AA-’ to ‘AA’, citing strong fiscal management. The City prepares anannual debt report, semi-annual multi-year debt service projections, and a periodic debt affordability analysis.
Fiscal Policies for Economic Development
The Comprehensive Economic Development Strategy plan submitted to the State in 1999 sets forth economicdevelopment goals, objectives and priorities. A primary goal of the economic development plan is to attract morejob generating businesses to the City. To that end, the City has developed a variety of development incentivesincluding loans, grants, and tax incentive programs. The budget plan estimates and reports on one type of taxexpenditure, property tax credits. The City is committed to performing consistent and thorough analysis of thecost and benefit of its tax incentive programs.
21

BUDGET PROCESS AND RELATED POLICIES Fiscal 2022 Summary of the Adopted Budget
Fiscal Stability Practices
• Employee and Retiree Benefits Program Costs: Since total employee compensation costs are the largestshare of the City’s expenses, it is absolutely essential that options to control costs of employee benefits beexamined. The City has an ongoing joint labor-management Health Insurance Committee. Certain recom-mendations made by the committee are subject to bargaining processes with employee groups.
• Budget Emergencies: The City Charter provides a mechanism for the Department of Finance, under guide-lines approved by the Board of Estimates, to establish expenditure schedules or strict budgetary allotmentswhen warranted by financial conditions. In addition, the City Charter permits the budget to include up to $1.0million in General Fund appropriations as a contingent fund for emergencies.
22

Budgetary and Accounting Basis
Budgetary Basis
Budgets are adopted on a basis consistent with generally accepted accounting principles (GAAP), except that:
• Encumbrances are considered to be expenditures chargeable to appropriations and carried over from year-to-year.
• No depreciation is budgeted in enterprise funds.• Investments in supply inventories and assets restricted for self-insurance purposes are not considered tobe appropriable.
• Revenues accruing to sinking funds are not appropriable. Unencumbered appropriations lapse at the closeof the fiscal year unless authorized by the Board of Estimates to be carried forward to the subsequent budgetyear.
Budgetary Units
Annual appropriations authorized by City Council in the Ordinance of Estimates are by Agency/Operating Depart-ment, service (previously called “program”), and fund. Budget presentation is similar, but also presents eachservice by object of expense. The budget provides a myriad of schedules and exhibits that provide summary anddetail information from a fund, agency, and service perspective.
• Agencies/Operating Departments represent themajor unit of the operating and capital budget plans and arefurther divided into sub-units or bureaus, and divisions.
• Services represent specific activity areaswithin an agency, department and/or bureau. Budget presentationsof services summarize expenditures by object of expense, service units called activities, and by fund.
Revenues and Expenditures
Revenues are detailed by fund type (General, grant funds including federal, State and private source grants, andEnterprise), and by various revenue categories and sources. Information provided in the revenue detail for fundsother than the grant funds includes the prior year actual, the current year budget, current year projection, and theestimate for the budget year under consideration.
Expenditures are summarized by fund source for each agency. Services within the agency are summarized byobject of expense, by service units called activities, and by fund sources. Each presentation includes the prioryear actual expense, the current year budget, and the budget year request by the agency and the budget yearrecommendations.
Relationship Between Budgeting and Accounting
The major differences between the budget presentation and GAAP for governmental funds are:
• Encumbrances are recorded as a reservation of fund balance (budget) as opposed to expenditures (GAAP).
23

BUDGET PROCESS AND RELATED POLICIES Fiscal 2022 Summary of the Adopted Budget
• Certain revenues and expenses, (e.g., compensated absences) not recognized for budgetary purposes areaccrued (GAAP).
• Self-insurance contributions are recognized as expenditures for budget purposes only.
Enterprise Fund differences consist of the following:
• Encumbrances are recorded as an expense of the following accounting period (budget) as opposed to ex-penditures (GAAP).
• Certain items, e.g., principal expense and capital outlay, are recorded as expenditures for budgetary pur-poses as opposed to adjustments of the appropriate balance sheet accounts (GAAP).
• Depreciation is not recognized for budgetary purposes and recorded as an expense for GAAP.
Fund Structure
General Fund: The General Fund is the general operating fund of the City. It is supported by locally generatedrevenues and some State Aid. It is used to account for all activities of the City not accounted for in some otherfund.
Special Funds: Special Funds are used to account for all funding groups that have legally restricted or dedicateduses. These include federal or State grants, State-shared motor vehicle or highway user revenue and grants fromprivate or other non-governmental sources.
Enterprise Funds: The Enterprise Funds are used to account for operations, including debt service, that are fi-nanced and operated as an ongoing concern where costs of providing services are financed or recovered primarilythrough user charges. Enterprise Funds included in the City budget are Water and Wastewater, Parking Enterprise,Conduit and Loan and Guarantee funds.
More detail on the fund structure, including the relationship between fund sources and agencies, can be found inthe Expenditures: Operating and Capital Fund Sources section.
Accounting Basis
Organization
The City’s accounting system is organized and operated on the basis of funds and account groups, each of whichis considered a separate accounting entity. The accounting and financial reporting policies of the City conform togenerally accepted accounting principles and standards as promulgated by the Governmental Accounting Stan-dards Board and the American Institute of Certified Public Accountants.
General, Debt Service, and Capital Projects
The General, Debt Service and Capital Projects funds are computed on the modified accrual basis of accounting,whereby revenues are recorded when they become both measurable and available to finance expenditures of thecurrent period. Expenditures are recorded when goods and services are received and actual liabilities are incurredand become payable in the current period. Revenues which have been accrued meet tests of materiality andare measurable. They include property taxes collectible within 60 days; locally imposed taxes; state-collected
24

Fiscal 2022 Summary of the Adopted Budget BUDGET PROCESS AND RELATED POLICIES
and state-shared taxes; federal, state and other grant and entitlement revenues; and interest earnings. All otherrevenues are recorded when received.
Enterprise and Internal Service Funds
The accounting basis used for the Enterprise and Internal Service funds is the accrual basis of accountingwherebyrevenues are recorded at the time they are earned and expenses are recorded when liabilities are incurred.
Encumbrances
Encumbrance accounting, under which purchase orders, contracts and other commitments for the expenditure offunds are recorded to reserve that portion of the applicable appropriation, is employed in the General, Special, andCapital Projects funds. Encumbrances are treated as a reservation of fund balance for these funds.
25

Operating and Capital Plan Budgetary Control
Operating Plan
Level of Control
Budgetary control ismaintained at the service level for each operating fund (and at the project level for each capitalproject), by the encumbrance of estimated purchase or contract amounts prior to the release of purchase ordersto vendors. Purchase orders which result in an overrun of either operating or capital balances are not releaseduntil additional appropriations are made available. In addition, the City has established a program of financialvulnerability assessment to provide ongoing review of internal financial controls.
Mechanisms
• Bureau of the Budget and Management Research: All purchase requisitions are reviewed for justificationand approved for funds by an analyst in the Bureau of the Budget and Management Research. The Bureauprepares regular revenue and expenditure projections to serve as operating guides for policy makers andbudget administrators in support of budget monitoring in order to ensure that budgetary shortfalls are notincurred. All purchase requisitions and all items going before the Board of Estimates (BOE) for contractawards are reviewed for justification and approved for funds by an analyst in the bureau.
• Mayor’s Expenditure Control Committee: All personnel matters that require BOE approval must be submittedto the Expenditure Control Committee for review and recommendation prior to submission to the BOE.
• Space Utilization Committee: All actions affecting the disposition of property through sales, the leasing ofCity-owned real property and City leasing of property owned by third parties, interdepartmental leases, andthe declaration of surplus real property are reviewed by the Committee. Recommendations are developedprior to submission to the BOE for final action to assure optimum return on real estate transactions.
• Contingent Fund: This account exists to fund emergency and/or unanticipated expenditures. The City Char-ter limits the annual contingent appropriation to $1 million. Prior to approval of expenditures from the Fund,the BOE reports to the City Council the circumstances surrounding the request of the expenditure.
Appropriations
The adopted budgetary plan is prepared and appropriated on a service basis by fund. TheCity’s integrated financialmanagement system tracks spending by service, activity, and object level within each fund. Purchase orderswhichresult in an overrun of either operating or capital balances are not released until additional appropriations aremadeavailable.
Encumbered Funds
Funds encumbered for contracts, purchase orders and capital improvements are carried over to the ensuing fiscalyear upon agency request and availability of funds.
Carryovers
Unencumbered appropriations for a particular service, purpose, activity, or project may, upon the recommendationof the head of the municipal agency concerned and the Director of Finance, and with the approval of the BOE, becarried over to the subsequent fiscal year if necessary to accomplish that service, purpose, activity, or project.Appropriations which are not carried over lapse at the end of the fiscal year in which appropriated, except forspecial funds ( e.g., State and federal grants, enterprise funds, etc.), the balances of which are automaticallycarried over.
26
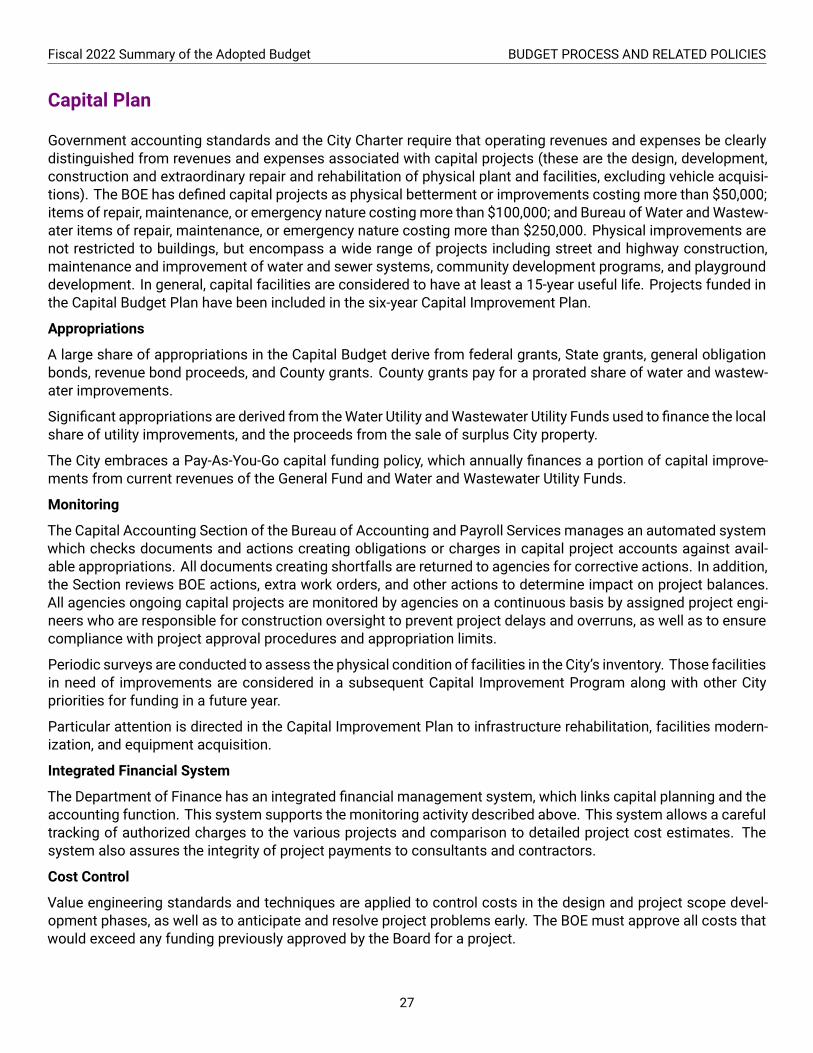
Fiscal 2022 Summary of the Adopted Budget BUDGET PROCESS AND RELATED POLICIES
Capital Plan
Government accounting standards and the City Charter require that operating revenues and expenses be clearlydistinguished from revenues and expenses associated with capital projects (these are the design, development,construction and extraordinary repair and rehabilitation of physical plant and facilities, excluding vehicle acquisi-tions). The BOE has defined capital projects as physical betterment or improvements costing more than $50,000;items of repair, maintenance, or emergency nature costingmore than $100,000; and Bureau of Water andWastew-ater items of repair, maintenance, or emergency nature costing more than $250,000. Physical improvements arenot restricted to buildings, but encompass a wide range of projects including street and highway construction,maintenance and improvement of water and sewer systems, community development programs, and playgrounddevelopment. In general, capital facilities are considered to have at least a 15-year useful life. Projects funded inthe Capital Budget Plan have been included in the six-year Capital Improvement Plan.
Appropriations
A large share of appropriations in the Capital Budget derive from federal grants, State grants, general obligationbonds, revenue bond proceeds, and County grants. County grants pay for a prorated share of water and wastew-ater improvements.
Significant appropriations are derived from theWater Utility andWastewater Utility Funds used to finance the localshare of utility improvements, and the proceeds from the sale of surplus City property.
The City embraces a Pay-As-You-Go capital funding policy, which annually finances a portion of capital improve-ments from current revenues of the General Fund and Water and Wastewater Utility Funds.
Monitoring
The Capital Accounting Section of the Bureau of Accounting and Payroll Services manages an automated systemwhich checks documents and actions creating obligations or charges in capital project accounts against avail-able appropriations. All documents creating shortfalls are returned to agencies for corrective actions. In addition,the Section reviews BOE actions, extra work orders, and other actions to determine impact on project balances.All agencies ongoing capital projects are monitored by agencies on a continuous basis by assigned project engi-neers who are responsible for construction oversight to prevent project delays and overruns, as well as to ensurecompliance with project approval procedures and appropriation limits.
Periodic surveys are conducted to assess the physical condition of facilities in the City’s inventory. Those facilitiesin need of improvements are considered in a subsequent Capital Improvement Program along with other Citypriorities for funding in a future year.
Particular attention is directed in the Capital Improvement Plan to infrastructure rehabilitation, facilities modern-ization, and equipment acquisition.
Integrated Financial System
The Department of Finance has an integrated financial management system, which links capital planning and theaccounting function. This system supports the monitoring activity described above. This system allows a carefultracking of authorized charges to the various projects and comparison to detailed project cost estimates. Thesystem also assures the integrity of project payments to consultants and contractors.
Cost Control
Value engineering standards and techniques are applied to control costs in the design and project scope devel-opment phases, as well as to anticipate and resolve project problems early. The BOE must approve all costs thatwould exceed any funding previously approved by the Board for a project.
27

Intentionally left blank.

Fiscal Environment
FISCAL2022
SUMMARY OF THEADOPTED BUDGET
Fiscal Environment

Intentionally left blank.

Economic Outlook
The last fourteen months has been one of the most challenging periods in modern history due to the COVID-19 pandemic. According to the World Health Organization, more than 136 million people worldwide have beeninfected with COVID-19 and more than 2.9 million have died of this disease as of April 14, 2021. In the US alone,more than 30.9million people have been infected andmore than 557,000 have died. In addition to the catastrophichealth and social impacts of COVID-19, impacts to the economy have been far-reaching. An analysis completedby the University of California, Santa Cruz estimates that the number of small business owners in the US declinedby nearly one million from 15 million in February 2020 to 14.1 million in December 2020. In addition, the nationalunemployment rate fluctuated from 3.3% in February 2020 to 14.7% in April 2020, and to 6.2% in February 2021.
Despite the shocks to the economy experienced as a consequence of COVID-19, there is growing consensusamong many economists and economic policy experts that economic recovery will be faster than anticipated.Economic experts have been gradually changing their view of the economy in recent weeks from ways to easethe contraction to now predicting the timing and magnitude of growth. In the April 2021 World Economic Outlook,the International Monetary Fund (IMF) reported a more optimistic view of the economy than their October 2020report. Their revised estimates show the global economy growing by 6.0% in 2021 and 4.4% in 2022, 0.8% and 0.2%more than their prior estimates. The IMF also reported that due to the positive impact of the gradual easementof lockdown restrictions, and direct fiscal support to the economy, the global economy experienced only a 3.3%contraction in 2020, which was 1.1% better than originally anticipated. Anecdotally, Mark Zandi, Chief Economistof Moody’s Analytics, is confident that the US economy will experience strong GDP growth, 6% to 7%, for thesecond half of 2021, which will extend into 2022.
Other indicators also show promising signs for a rapid recovery. In August 2020, Moody’s Analytics and CNN Busi-ness developed an indicator intended to assess and track in real time how the economy responds and behavescompared to pre-pandemic activity, using February 2020 as the base period. The indicator, called Back to NormalIndex (BNI), incorporates national government and private information from all industries at the state level. Ac-cording to this indicator, the US economy is currently operating at 86% of pre-COVID-19 levels, with certain states,such as Florida and Virginia operating at 97% and 94% respectively, while New York and Massachusetts are at74% and 78% of pre-COVID-19 activity. Maryland is still below the national average at 81%. Finally, consumerconfidence has been gradually increasing in recent months. According to the University of Michigan’s Survey ofConsumers, the monthly Index of Consumer Sentiment increased 13.1% from 71.8% in April 2020 to 84.9% inMarch 2021, the highest level since the pandemic started.
Despite these signs of optimism, there is still a long road ahead to full recovery, and it will depend on the continuingsuccess of vaccination efforts.
Year in Review
Remote Communication
One of the most notable consequences to the economy and society from COVID-19 was the unexpected and ac-celerated transition to remote social interactions and teleworking. It is unclear if this will continue in its currentform in the long-term, but it has certainly changed the perception and dynamics of socialization and workplaceenvironments moving forward. According to the Bureau of Labor Statistics, 31.0% of establishments offered tele-working, which helped employers to continue operations and employees to retain jobs. Employment and businessactivity in general would have experienced far more devastating consequences from COVID-19 if the global econ-omy did not have the technology to continue operations remotely. It is worth noting that if the spread of COVID-19
31

FISCAL ENVIRONMENT Fiscal 2022 Summary of the Adopted Budget
occurred just 10 years ago the outcomewould be very different. The availability and use of technology to continuecommunicating and operating during the months of mandatory lockdown have been the difference between whatis now considered an “about to end” economic slowdown and the potential long-term recession.
Teleworking and remote communication not only enabled the continuity of the economy in a unique form, but alsoallowed education, health, and other service based systems and related industries to continue operations.
Residential Real Estate
Despite an initial disruption in real estate activity in the later part of March 2020, the City’s residential real estatemarket has been strong. Social distancing and lockdown policies resulted in individuals looking for livable spacesthat can also be accommodated for teleworking. Additionally, the continued availability of cheap borrowing condi-tions for new mortgages and refinancing transactions changed the prevailing market conditions and incentivizedthe demand for real estate.
The volume of residential sales experienced during the last twelve months is only comparable to those witnessedduring the housing boom in the early 2000s. According to data from Bright MLS, Inc., residential sales in March2021 were 37.2% higher than March 2020 sales. In the first quarter of 2021, 2,439 units sold, a 37.2% increase insales from than the first quarter of 2020. The total number of transactions for the last twelvemonths totaled 9,918,15.7% higher than the prior twelve months. In March 2021, the City registered the historic highest average saleprice of residential properties of $226,814, aswell as the highest annual average value of $205,577. These averagevalues were 9.9% and 11.9% higher than those registered in March 2020 and calendar year 2019 respectively.Properties sold in March 2021 were listed for an average of 40 days, which is the lowest on average on record,even beating the 41-day average in July 2005 during the housing boom.
The chart below illustrates the trend in the number of transactions and average value for residential properties inthe City over the last 20 years.
$185,632
$205,57712,305
9,396
2,000
4,000
6,000
8,000
10,000
12,000
14,000
$60,000
$80,000
$100,000
$120,000
$140,000
$160,000
$180,000
$200,000
$220,000
$240,000
2001 2002 2003 2004 2005 2006 2007 2008 2009 2010 2011 2012 2013 2014 2015 2016 2017 2018 2019 2020
Baltimore City - Trends in Residential Real Estate (Annual Average Price and Total Unts Sold)
Average Price Units SoldSource: BrightMLS
The favorable conditions of the City’s residential real estate market are also reflected in key revenue sources.The average yield per transaction subject to transfer taxes was 16.3% higher than the same period last year, asdemonstrated by the $36.0 million in transfer taxes collected as of the first quarter of Fiscal 2021, $4.8 million
32

Fiscal 2022 Summary of the Adopted Budget FISCAL ENVIRONMENT
or 15.5% higher than the same period of Fiscal 2020. Similarly, with the continued help of low interest rates,transactions subject to recordation tax reached a record level with 19,656 transactions processed as of March2021, 22.7% or 3,638 more transactions than in 2020, generating $32.1 million in revenues, 3.9 million or 13.8%higher than last year. It is uncertain if this pace of activity will continue, but the current strength of the residentialreal estate market will help to offset some of the weakness on the commercial side of the market.
Employment
The City’s labormarket experienced instability during the last year due to COVID-19. Prior to the pandemic, the Cityregistered the lowest unemployment rate since 1990 at 4.4% in the last quarter of 2019 and 4.8% during the firstquarter of 2020. However, as social distancing, lockdown, and travel restrictions were implemented many of thejobs in the service sectors, and those that were not able to be retained by teleworking alternatives, were drasticallyreduced. Between the first and second quarter of 2020, the total number of jobs located in the City were reducedby 4.7%, which is equivalent to more than 17,600 positions. The vast majority of these jobs, 57.6% or more than10,200 positions, corresponded to jobs in the Leisure and Hospitality sector. Between these two quarters, jobsoccupied by City residents declined by more than 28,300 or 10.2%, while the number of unemployed residentsincreased by 121.3% from 14,113 in the first quarter to 31,237 unemployed residents in the second quarter of2020 for an increase in the unemployment rate from 4.8% to 11.2%.
Currently, the City’s unemployment rate averaged 8.3% between January and February 2021, improving from the9.9% and 8.9% of the third and fourth quarters of 2020 respectively. This improved behavior correlates to how theeconomy has gradually responded to easement of social distancing and lockdown restrictions, and more recentlyto growing vaccination rate. This represents an important feature of the economic slowdown due to COVID-19 andthe promising recovery path in the short-term. Core sectors of the economy did not experience drastic operatingand production disruptions and maintained close to normal levels of employment. Only those jobs that couldnot be offered due to the nature of the work, specifically those requiring social interactions, were paused, but noteliminated. Demand for those services still exists, but they are restricted, which means that job absorption willresume as vaccinations continue and social distancing restrictions are reduced. The following chart illustratesthe unemployment rate over the last 10 years.
8.3%
0
50,000
100,000
150,000
200,000
250,000
300,000
4%
6%
8%
10%
12%
14%
16%
Q1
Q3
Q1
Q3
Q1
Q3
Q1
Q3
Q1
Q3
Q1
Q3
Q1
Q3
Q1
Q3
Q1
Q3
Q1
Q3
Q1
Q3
Q1
2010 2011 2012 2013 2014 2015 2016 2017 2018 2019 2020 2021
2010 - 2021 Baltimore City - Trend in Employment(Quarterly Averages)
Unemployment Rate Labor Force Employment
33

FISCAL ENVIRONMENT Fiscal 2022 Summary of the Adopted Budget
Tourism and Hospitality
The sectors most severely impacted by COVID-19 were the tourism and hospitality sectors. Many travel andrecreational activities have been paused since the beginning of the pandemic. As of February 2021, the BWIAirportreported a reduction in visitors of 62.9% or 8.5 million compared to last year. The City’s Convention Center facilitystopped hosting events and was converted to a site hospital. Professional sports were temporarily suspended,and when reopened accepted fewer fans for games. Admissions to art venues and life entertainment eventswere prohibited and many hotels in the City were closed to the public or used as preventive and treatment careaccommodations for COVID-19 patients. The inventory of taxable hotel rooms was reduced by 17.3% from theannual average of 10,717 to 8,862 rooms as of January 2020 and 2021 respectively. Additionally, prior to COVID-19, the City averaged an annual 64.2% occupancy rate, which has decreased to 28.4% since March 2020. Thefollowing chart illustrates the trend of hotel room inventory and occupancy rate as two key indicators of the City’slodging activity.
14.9%
29.6%
7,159 7,000
7,500
8,000
8,500
9,000
9,500
10,000
10,500
11,000
11,500
12,000
10%
20%
30%
40%
50%
60%
70%
80%
Jan
-17
Ap
r-1
7
Jul-
17
Oct
-17
Jan
-18
Ap
r-1
8
Jul-
18
Oct
-18
Jan
-19
Ap
r-1
9
Jul-
19
Oct
-19
Jan
-20
Ap
r-2
0
Jul-
20
Oct
-20
Jan
-21
Baltimore City - Trend in Hotel Room Inventory and Occupancy Rate(Monthly)
Occupancy Rate Room Inventory
The full reactivation of these industries will rely on the success of the global vaccination rollout. Further, mostindustry experts do not expect a full recovery in this industry until 2024.
Risks
Even with the growing optimism of an economic recovery, there are two major areas of risks for the City’s sustain-able financial health: commercial real estate and parking related activities.
Commercial Real Estate
Commercial properties represent 37.1% of the City’s property tax base and account for more than $347 million inannual real property tax revenues. As a result of COVID-19, many companies implemented work from home poli-cies and many retailers were forced to temporarily or permanently close doors, vacating an important inventoryof office and retail space throughout the City, but especially in the Downtown area where real estate is predomi-nantly leased. According to Newmark Research, the City’s office market registered a 14.2% vacancy rate in officespace during the first quarter of Fiscal 2021, 1.2% higher than the first quarter of Fiscal 2020. The reduced needfor working space has caused leases to be prematurely terminated, not renewed, or discounted, which directly
34
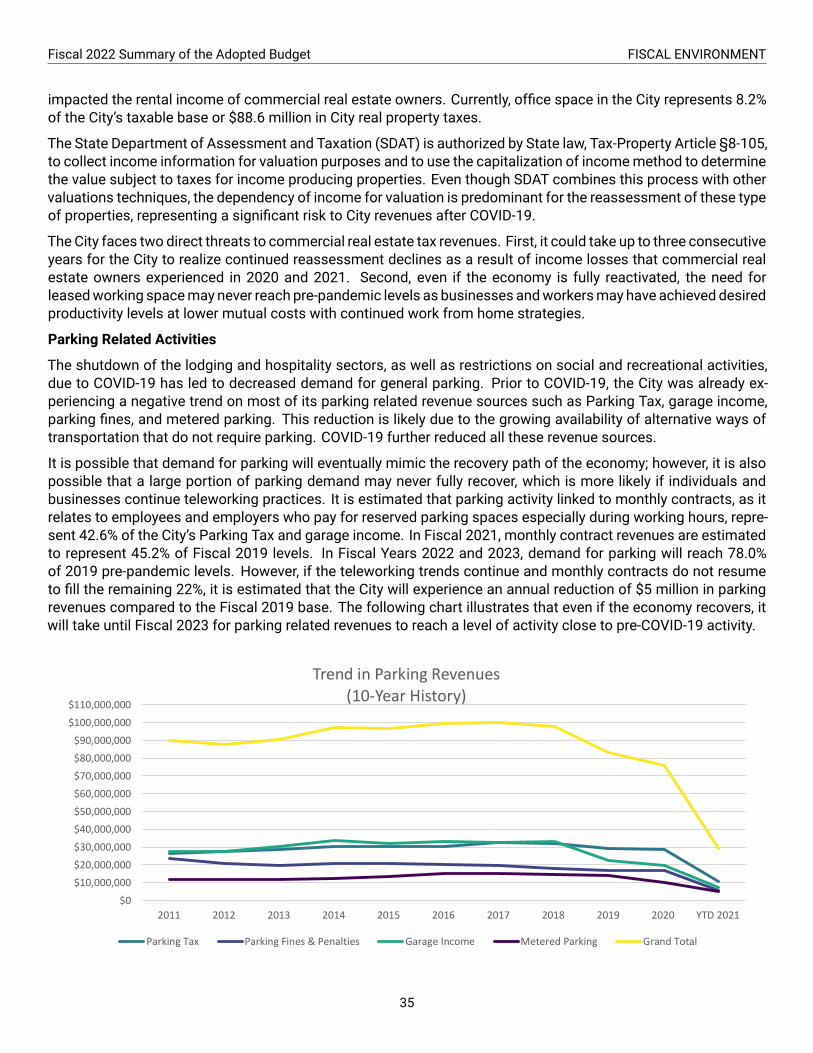
Fiscal 2022 Summary of the Adopted Budget FISCAL ENVIRONMENT
impacted the rental income of commercial real estate owners. Currently, office space in the City represents 8.2%of the City’s taxable base or $88.6 million in City real property taxes.
The State Department of Assessment and Taxation (SDAT) is authorized by State law, Tax-Property Article §8-105,to collect income information for valuation purposes and to use the capitalization of incomemethod to determinethe value subject to taxes for income producing properties. Even though SDAT combines this process with othervaluations techniques, the dependency of income for valuation is predominant for the reassessment of these typeof properties, representing a significant risk to City revenues after COVID-19.
The City faces two direct threats to commercial real estate tax revenues. First, it could take up to three consecutiveyears for the City to realize continued reassessment declines as a result of income losses that commercial realestate owners experienced in 2020 and 2021. Second, even if the economy is fully reactivated, the need forleasedworking spacemay never reach pre-pandemic levels as businesses andworkersmay have achieved desiredproductivity levels at lower mutual costs with continued work from home strategies.
Parking Related Activities
The shutdown of the lodging and hospitality sectors, as well as restrictions on social and recreational activities,due to COVID-19 has led to decreased demand for general parking. Prior to COVID-19, the City was already ex-periencing a negative trend on most of its parking related revenue sources such as Parking Tax, garage income,parking fines, and metered parking. This reduction is likely due to the growing availability of alternative ways oftransportation that do not require parking. COVID-19 further reduced all these revenue sources.
It is possible that demand for parking will eventually mimic the recovery path of the economy; however, it is alsopossible that a large portion of parking demand may never fully recover, which is more likely if individuals andbusinesses continue teleworking practices. It is estimated that parking activity linked to monthly contracts, as itrelates to employees and employers who pay for reserved parking spaces especially during working hours, repre-sent 42.6% of the City’s Parking Tax and garage income. In Fiscal 2021, monthly contract revenues are estimatedto represent 45.2% of Fiscal 2019 levels. In Fiscal Years 2022 and 2023, demand for parking will reach 78.0%of 2019 pre-pandemic levels. However, if the teleworking trends continue and monthly contracts do not resumeto fill the remaining 22%, it is estimated that the City will experience an annual reduction of $5 million in parkingrevenues compared to the Fiscal 2019 base. The following chart illustrates that even if the economy recovers, itwill take until Fiscal 2023 for parking related revenues to reach a level of activity close to pre-COVID-19 activity.
$0
$10,000,000
$20,000,000
$30,000,000
$40,000,000
$50,000,000
$60,000,000
$70,000,000
$80,000,000
$90,000,000
$100,000,000
$110,000,000
2011 2012 2013 2014 2015 2016 2017 2018 2019 2020 YTD 2021
Trend in Parking Revenues(10-Year History)
Parking Tax Parking Fines & Penalties Garage Income Metered Parking Grand Total
35

Fixed Costs
In general, “fixed costs” are expenses that theCity is required to pay by lawor contract and cannot be easily reducedin the short-term. As shown in the chart below, the City’s fixed costs include contributions to employee pensionsystems, health care for retirees, the State-mandated Maintenance of Effort (MOE) contribution to Baltimore CityPublic Schools (BCPS), and payment of debt service.
FY12 Actual
FY13 Actual
FY14 Actual
FY15 Actual
FY16 Actual
FY17 Actual
FY18 Actual
FY19 Actual
FY20 Actual
FY21 Budget
FY22 Budget
200M
400M
600M
800M
Other Debt Service Retiree Health BCPS Required Contribution Pension
General Fund Fixed Costs Trend
Dol
lars
Pension Costs: The City funds three pension systems for sworn fire and police employees, civil service employees,and elected officials.
Retiree Health: Of 23,184 retirees eligible to enroll in City retiree healthcare plans, 14,340 or 62% are enrolled inplans. Among those retirees enrolled in plans, 8,856 are City retirees and 5,484 are retirees of City Schools orState librarians. The City pays 50% of the healthcare premium cost for the majority of enrolled retirees basedupon years of service. Prescription drug coverage is bundled with medical coverage for retirees over the age of65 enrolled in City plans. The City pays 80% of the premium of the prescription drug premium cost for the 2,466retirees under the age of 65 enrolled in a prescription drug plan.
Debt Service: The City Charter mandates that payment of the principal and interest on municipal debt must befunded. The General Fund budget includes funding to pay debt on General Obligation Bonds used for capitalprojects, county transportation bonds, Tax Increment Financing (TIF), Conditional Purchase Agreements (CPA),and economic development loans from the State.
City Schools Required Contribution: State law requires that Baltimore City maintain its education funding effortfrom year to year on a per-pupil basis and pay a portion of the normal cost of the teacher pension system.
Other: Workers’ compensation claims; insurance and liability costs; a State-mandated contribution to BaltimoreCity Community College; gas, electric, sewer and water costs; and tipping fees for solid waste disposal.
36

Fiscal 2022 Summary of the Adopted Budget FISCAL ENVIRONMENT
Fixed Cost Trends
From Fiscal 2009 to Fiscal 2012, fixed costs grew from only 43.8% of General Fund revenues to 47.7% of GeneralFund revenues. Since Fiscal 2013, due to a series of reforms, fixed costs have leveled off at approximately 40.5%of General Fund revenues, as represented by the line in the graph below.
1,524M 1,487M1,551M 1,560M 1,596M
1,671M 1,683M
1,862M1,798M
1,887M 1,943M 1,940M 1,933M2,008M
668M 702M 721M 745M 739M 750M 748M 766M 800M 817M 783M 785M 818M 814M
43.8%47.2% 46.5% 47.7% 46.3%
44.9% 44.4%41.2%
44.5% 43.3%40.3% 40.4%
42.3%40.5%
FY09 Actual
FY10 Actual
FY11 Actual
FY12 Actual
FY13 Actual
FY14 Actual
FY15 Actual
FY16 Actual
FY17 Actual
FY18 Actual
FY19 Actual
FY20 Actual
FY21 Budget
FY22 Budget
30%
40%
50%
60%
70%
Revenues Fixed Costs Fixed Costs at a Percent of Revenue
Fixed Costs vs Revenues
Dol
lars
in m
illion
s
In the Fiscal 2022 budget, fixed costs decreased by $4.4 million from the Fiscal 2021 budgeted levels. The de-crease is primarily related to reductions in retiree health costs and was partially offset by growth in pension costs.
Employees’ Retirement Systems
In 2010, the City reformed the Fire and Police Employee Retirement System (FPERS), which had grown in cost by81% from $48 million Fiscal 2005 to $87.5 million in Fiscal 2010. These reforms included:
• Replacing the variable benefit with a cost of living adjustment capped at 2%.• Modifying age and years of service requirement to 25 years of completed service or age 55 with 15 years ofcompleted service.
• Increasing employee contributions from 6% to 10% over a four-year period from Fiscal 2011 to Fiscal 2014.• Extending the time-period used for calculating average final compensation from 18 months to 3 years.
The F&P reform effort also called for a New Hires pension plan, for new sworn entrants to the City workforce. CityCouncil legislation was proposed in 2015 but was not acted on. The funded status of the system has continuedto decline, from 82.0% in Fiscal 2011 to 69.1% in Fiscal 2020.
In 2013, the City also reformed the Employee Retirement System (ERS) for civilian employees. These reformsincluded:
• For existing civilian employees hired before July 1, 2014, phasing in employee contributions of 1% of salaryper year up to a cap of 5% contributions in Fiscal 2019.
37

FISCAL ENVIRONMENT Fiscal 2022 Summary of the Adopted Budget
• Creating a new retirement system for employees hired after July 1, 2014. These employees can choose toenter the new Retirement Savings Plan (RSP) with mandatory employee contributions plus a City match, or ahybrid plan, which includes a mix of RSP and a guaranteed benefit under the Employee Retirement System.
In May 2019, a judgment was reached in the Baltimore Circuit Court on the longstanding litigation between theCity and Fire and Police employees over pension reforms that were enacted in 2010. The judge upheld the City’smodification that extended the years of service required to earn a pension from 20 to 25 years. But the judge alsoruled that the City unfairly withdrew benefits from already‐retired employees, and that those retirees are entitledto seek damages for lost benefits from the City.
For the Fiscal 2020 year-end report which informed the Fiscal 2022 budget, both the ERS and F&P systems fellshort of their return benchmark, leading to higher than expected cost growth. The ERS system reported a 0.6%investment return against a 7.0% benchmark, and FPERS reported a -0.5% investment return against a 7.25%benchmark. Although reforms have stabilized the pension systems, costs continue to grow rapidly on the F&Ppension side due to inaction on a new hires F&P pension system. The chart below shows the long-term effects: aperiod of rapid growth from Fiscal 2009 to Fiscal 2012; a period of stability from Fiscal 2012 to Fiscal 2016 afterreforms on both F&P and ERS; and then rapid growth in F&P costs thereafter
37.2M47.6M
61.0M74.4M 80.7M 84.1M 86.5M
75.6M92.2M
77.4M 80.6M 78.5M92.6M 95.9M
74.6M87.5M
104.4M 101.0M 101.0M113.0M 118.4M 119.5M
127.2M 134.5M 139.3M 146.8M 150.2M161.2M
111.8M
135.1M
165.4M175.4M 181.7M
197.1M204.9M
195.1M
219.4M 211.9M219.9M 225.3M
242.8M257.1M
FY09 Actual
FY10 Actual
FY11 Actual
FY12 Actual
FY13 Actual
FY14 Actual
FY15 Actual
FY16 Actual
FY17 Actual
FY18 Actual
FY19 Actual
FY20 Actual
FY21 Budget
FY22 Budget
Employee Retirement Systems Fire and Police Retirement Systems Total Contribution
Contribution to Employee Retirement Systems (All Funds)
Dol
lars
ERS figures also include Library, Sheriff's Office, and Elected Officials.
38

Fiscal 2022 Summary of the Adopted Budget FISCAL ENVIRONMENT
Health Care for Employees and Retirees
From Fiscal 2005 to Fiscal 2010, the City’s cost of providing medical and drug benefits to its employees andretirees grew by $69 million, or 40%, from $172.2 million to $241.7 million.
These costs were on an unsustainable path, and could no longer be ignored as the City faced the fiscal conse-quences of the Great Recession. Several changes to health care plans have been made that have collectivelyreduced the City’s costs by $150 million compared to baseline estimates. The recent changes are summarizedbelow both graphically and sequentially:
225.3M212.7M
203.8M 209.5M223.9M
236.1M
211.8M 214.4M 209.9M199.9M
262.2M272.7M 280.9M
295.5M312.6M
327.6M340.4M
353.7M367.5M
381.8M396.7M
FY09 Actual
FY10 Actual
FY11 Actual
FY12 Actual
FY13 Actual
FY14 Actual
FY15 Actual
FY16 Actual
FY17 Actual
FY18 Actual
FY19 Actual
FY20 Actual
FY21 Budget
FY22 Budget
With Health Care Changes Without Health Care Changes
Baltimore City Health Care Costs
Dol
lars
255.1M240.0M
253.3M243.4M
241.7M234.0M
Fiscal 2011 Changes
• 10% prescription drug premium co-share for retirees
Fiscal 2012 Changes
• Prescription co-pay tier adjustments for retirees• Reduce the number of Medicare supplemental plan options for retirees from five to two• $100 annual pharmacy deductible for retirees• Drug Quantity Management• Prescription Drug Prior Authorization• Mandatory pre-certification/enhanced utilization review/case management• Step Therapy
39

FISCAL ENVIRONMENT Fiscal 2022 Summary of the Adopted Budget
• As of January 1, 2013, the City pays 79.2% of premium costs for a new standard network medical benefitplan that requires deductibles and co-insurance. Employees can opt to pay the full incremental cost for amedical plan with lower out-of-pocket costs. The City also requires all employees and retirees to pay 20%of their prescription drug premium costs.
Fiscal 2014 Changes
• The City conducted a dependent eligibility audit to ensure that health care benefits are not provided to in-eligible recipients. As a result of the audit, approximately 1,500 ineligible dependents were dropped fromcoverage, saving $4.5 million.
Fiscal 2017 Changes
• The City shifted several health care plans to a self-funded model, which decreases external administrativecosts and provides the City with greater flexibility in determining premiums. This shift decreased City costsby $7 million in calendar year 2017.
• The City reduced Medicare supplemental plan reimbursements paid by the City from 100% to 80%, whichdecreased costs by $8.6 million in calendar year 2017.
Fiscal 2019 Changes
• The City rebid health care and prescription drug coverage contracts and switched from Express Scripts toCVS Caremark. The shift from 9 to 4 health care providers and the new prescription drug provider saved theCity nearly $35 million.
Fiscal 2020 Changes
• There were no changes to healthcare policy, but the City is seeing a greater percentage of retirees not en-rolling in City sponsored plans.
Fiscal 2021 Changes
• The City plans to negotiate changes to active employee benefit plan designs for the plan year beginning Jan-uary 1, 2021. It will also offer more cost effective Medicare Advantage Plans to the City’s Retirees. ExpectedGeneral Fund savings is approximately $4.8 million for half of Fiscal Year 2021.
Fiscal 2022 Changes
• In January of 2021, the City offered a newMedicare Advantage Plan (MAPD) to retirees, in place of the Medi-care Supplement Plan offered previously. The MAPD plan bundles medical and prescription drug coverageunder one premium and offers similar benefits as the supplemental plan, but with expected savings to theCity of $33.3 million in Fiscal 2022 for retiree healthcare. The City raised active employee premium rates inJanuary of 2021 due to increasing health claim costs, resulting in a projected cost increase to the City foractive employee healthcare of $22.8 million in Fiscal 2022. Net healthcare savings for Fiscal 2022 for bothretirees and active employees is $10.5 million (all funds). Fiscal 2022 represents the first full-year effect ofthe changes implemented in January 2021.
The Long-Term Liabilities section contains more detail regarding healthcare-related fiscal risks.
40
Fiscal 2013 Changes
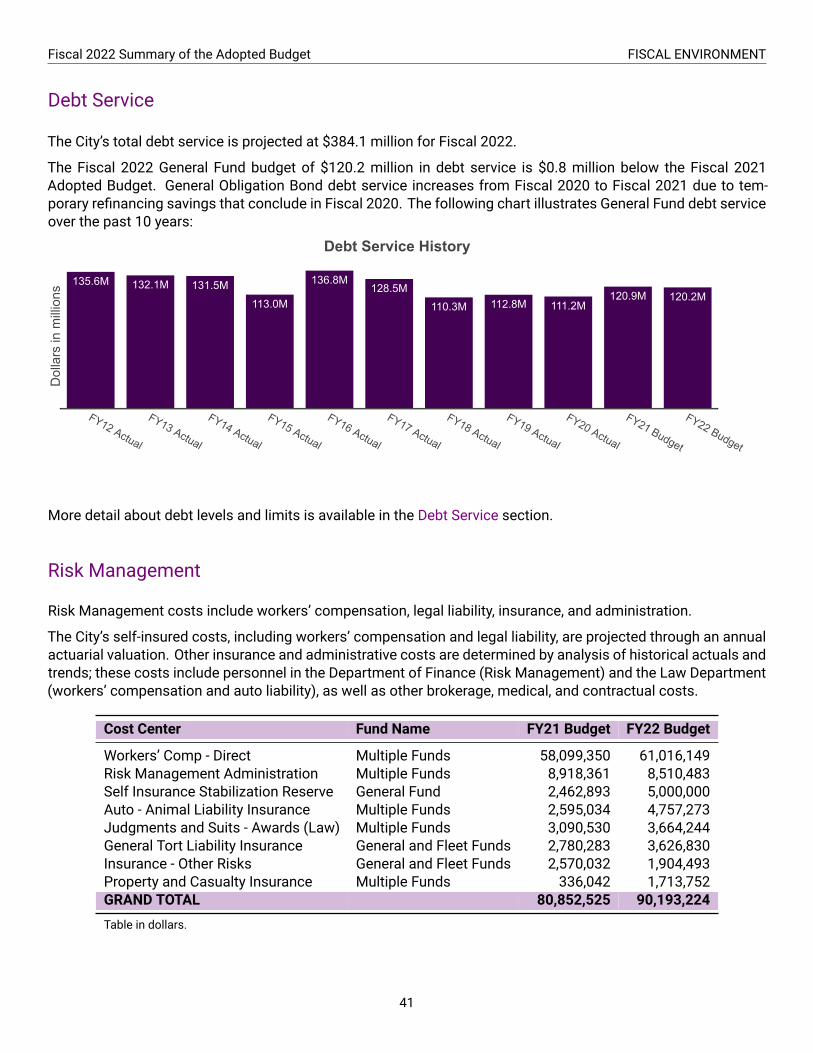
Fiscal 2022 Summary of the Adopted Budget FISCAL ENVIRONMENT
Debt Service
The City’s total debt service is projected at $384.1 million for Fiscal 2022.
The Fiscal 2022 General Fund budget of $120.2 million in debt service is $0.8 million below the Fiscal 2021Adopted Budget. General Obligation Bond debt service increases from Fiscal 2020 to Fiscal 2021 due to tem-porary refinancing savings that conclude in Fiscal 2020. The following chart illustrates General Fund debt serviceover the past 10 years:
135.6M 132.1M 131.5M113.0M
136.8M128.5M
110.3M 112.8M 111.2M120.9M 120.2M
FY12 Actual
FY13 Actual
FY14 Actual
FY15 Actual
FY16 Actual
FY17 Actual
FY18 Actual
FY19 Actual
FY20 Actual
FY21 Budget
FY22 Budget
Debt Service History
Dol
lars
in m
illion
s
More detail about debt levels and limits is available in the Debt Service section.
Risk Management
Risk Management costs include workers’ compensation, legal liability, insurance, and administration.
The City’s self-insured costs, including workers’ compensation and legal liability, are projected through an annualactuarial valuation. Other insurance and administrative costs are determined by analysis of historical actuals andtrends; these costs include personnel in the Department of Finance (Risk Management) and the Law Department(workers’ compensation and auto liability), as well as other brokerage, medical, and contractual costs.
Cost Center Fund Name FY21 Budget FY22 Budget
Workers’ Comp - Direct Multiple Funds 58,099,350 61,016,149Risk Management Administration Multiple Funds 8,918,361 8,510,483Self Insurance Stabilization Reserve General Fund 2,462,893 5,000,000Auto - Animal Liability Insurance Multiple Funds 2,595,034 4,757,273Judgments and Suits - Awards (Law) Multiple Funds 3,090,530 3,664,244General Tort Liability Insurance General and Fleet Funds 2,780,283 3,626,830Insurance - Other Risks General and Fleet Funds 2,570,032 1,904,493Property and Casualty Insurance Multiple Funds 336,042 1,713,752GRAND TOTAL 80,852,525 90,193,224
Table in dollars.
41

FISCAL ENVIRONMENT Fiscal 2022 Summary of the Adopted Budget
Whilemost costs are budgeted centrally within the City’s Self-Insurance Fund, Service 126, workers’ compensationis allocated across City agencies, and administrative costs are captured within the Risk Management and Lawservices. The Fiscal 2022 budget represents an annual contribution into the City’s Risk Management Fund topay workers’ compensation claims. The City’s annual contribution required to cover claims, updated annually, isinformed by the actuarial firm the City works with to forecast risk liabilities.
Workers’ compensation funding is allocated on a per position basis and different costs are assigned per positionbased on the agency. Agencies have varying levels of risk for workers’ compensation per the nature of the workcarried out in different agencies, with Police and Fire employees being at highest risk for injury on the job. Agencyallocations are informed by prior year claims with regard to the volume, severity, and longevity of claims the Citymust pay out for employees injured on the job. The Fiscal 2022 budget includes an increase in the per positioncontribution required among Police and Fire positions due to new high value workers’ compensation claims forinjuries sustained by employees in those agencies. The workers’ compensation contributions for Public Worksand Transportation declined in Fiscal 2022.
42

Debt Service
After expenses for personnel, contractual services and grants, subsidies and contributions, the single largest typeof expenditure made in the City budget plan is for debt service payments. Debt Service pays the interest andprincipal costs on the bonds issued by the City to build capital projects. In the formulation of the annual budget,the City Council is empowered by the Charter to reduce all appropriations except “such amounts as are for thepayment of interest and principal of the municipal debt.” Because of this provision the bonds are backed by the“full faith and credit” of the City.
Issuing debt, particularly General Obligation and tax-supported bonds, allows the City to spread the cost of large-scale projects among the generations that will ultimately benefit from them.
The Fiscal 2022 appropriation for all funds is $768.3million, $65.4million higher than the Fiscal 2021 appropriationlevel.
Fund Name FY19 Actual FY20 Actual FY21 Budget FY22 Budget
General Obligation DebtGeneral 59.7 65.2 73.7 76.2Stormwater Utility 0.5 0.6 0.7 0.7
Conditional Purchase AgreementsGeneral 21.6 17.8 11.4 8.2Internal Service 21.0 22.1 22.7 23.0Wastewater Utility 0.0 0.0 0.0 1.0Stormwater Utility 0.0 0.0 0.0 0.1Federal 2.7 (4.2) 0.0 0.0Special Revenue 0.5 0.0 0.0 0.3
Revenue BondsGeneral 18.8 13.5 15.7 14.2Convention Center Bond 4.5 1.8 0.0 0.0Wastewater Utility 79.9 86.6 94.3 119.2Water Utility 56.0 67.4 76.8 85.7Stormwater Utility 2.1 4.9 9.7 7.9Parking Enterprise 9.3 9.4 8.7 9.4
Tax Increment FinancingGeneral 13.6 15.3 17.6 21.7
Other Debt Service(0.8) (0.6) 2.6 (0.2)
Internal Service 0.0 0.0 0.0 0.0Convention Center Bond 0.0 0.0 0.0 0.0Wastewater Utility 1.4 1.7 1.2 0.2Water Utility 0.2 0.3 0.4 0.0Stormwater Utility 0.1 0.2 0.1 0.2Parking Enterprise 0.5 0.5 0.8 0.6Special Revenue 16.4 15.8 15.2 15.8
Total307.9 318.3 351.4 384.1
Table in millions of dollars.
43

FISCAL ENVIRONMENT Fiscal 2022 Summary of the Adopted Budget
Types of Debt Service Payments
Revenue Bonds 236.4M (61.5%)
General Obligation Debt 76.9M (20.0%)
Conditional Purchase Agreements 32.5M (8.5%)
Tax Increment Financing 21.7M (5.7%)
Other Debt Service 16.6M (4.3%)
GRAND TOTAL: 384.1 million
General Obligation Bonds
60.2M65.8M
74.3M 76.9M
FY19 Actual FY20 Actual FY21 Budget FY22 Budget
Dol
lars
in m
illion
s
General Obligation (GO) Bonds are borrowed funds usedfor capital projects that are repaid from future GeneralFund revenue. They are important because they givethe City flexibility to fund projects for which there are noother fund sources available. By law, GO Bonds are sup-ported by the full faith and credit of the City. This meansthat, in the unlikely event of a default, the City will use itstaxing authority to repay the bonds.
Every two years, the City must get permission from vot-ers through a ballot referendum to issue these bondsto borrow funds for capital projects. The questions aresometimes referred to as loan authorizations, as voters
are authorizing the City to issue debt that will be paid back over time. Each bond issue question refers to a “loan”dedicated to a broad purpose, such as affordable housing or community and economic development. In 2020,voters were asked to authorize $80 million in GO bonds per year for fiscal years 2022 and 2023.
The State Constitution requires that GO debt may not have a term longer than 40 years. In general, the City’sdebt has a maximum maturity of no more than 20 years. Payment of this long-term debt is a first requirement forrevenues derived from local property taxing powers. The City has no statutory limitation on the property tax levy.
44

Fiscal 2022 Summary of the Adopted Budget FISCAL ENVIRONMENT
The following table shows the principal and interest required to service the existing General Obligation Bond debtof the City until maturity:
Payment Type 2023 2024 2025 2026-2030
2031-2035
2036-2040
2041-2045
2046-2050
2051-2055
Total
General Obligation BondsPrincipal 60.1 37.9 39.7 183.1 127.3 85.6 11.0 0.0 0.0 544.8Interest 21.3 19.0 17.1 59.3 26.1 6.9 0.2 0.0 0.0 149.9SWAP 0.1 0.0 0.0 0.1
Education General Obligation BondsPrincipal 19.3 13.3 14.0 61.1 32.1 17.1 2.6 0.0 0.0 159.5Interest 6.7 5.8 5.2 16.4 6.1 1.4 0.0 0.0 0.0 41.7
Stormwater General Obligation BondsPrincipal 0.5 0.2 0.2 0.7 0.9 0.8 0.0 0.0 0.0 3.4Interest 0.1 0.1 0.1 0.4 0.2 0.1 0.0 0.0 0.0 1.0
TOTAL108.2 76.4 76.4 321.1 192.7 111.9 13.8 0.0 0.0 900.4
Table in millions of dollars.
Conditional Purchase Agreements
45.8M
35.6M 34.0M 32.5M
FY19 Actual FY20 Actual FY21 Budget FY22 Budget
Dol
lars
in m
illion
s
Conditional Purchase Agreements (CPAs) are long-termcapital leases with annual principal and interest pay-ment schedules that must be met for the City to acquirethe asset. The City has entered into various CPAs toconstruct or purchase facilities and/or to acquire equip-ment.
CPAsdo not constitute a debt of theCitywithin themean-ing of any constitutional or statutory limit, nor are theysupported by a pledge of the full faith and credit or taxingpower of the City. In contrast to GO debt, the City is notobligated to make annual appropriations. In the eventthe City fails to meet scheduled payments, the agree-
ments are terminated and the City loses the right to use or acquire the financed asset. The City appropriatespayments for facilities and equipment that continue to meet the City’s public service objectives.
45

FISCAL ENVIRONMENT Fiscal 2022 Summary of the Adopted Budget
The following table shows the principal and interest required to service the existing CPA debt of the City untilmaturity:
Payment Type 2023 2024 2025 2026-2030
2031-2035
2036-2040
2041-2045
2046-2050
2051-2055
Total
Conditional Purchase AgreementPrincipal 26.3 23.2 18.8 48.0 6.2 0.0 0.0 0.0 0.0 122.6Interest 3.5 2.8 2.1 4.3 0.4 0.0 0.0 0.0 0.0 13.1
TOTAL29.8 26.0 20.9 52.3 6.6 0.0 0.0 0.0 0.0 135.6
Table in millions of dollars.
Revenue Bonds
170.6M 183.7M205.1M
236.4M
FY19 Actual FY20 Actual FY21 Budget FY22 Budget
Dol
lars
in m
illion
s
Revenue bond financing supports the capital require-ment needs of enterprise operations, including the Park-ing Enterprise fund. The revenue generated by the oper-ations is pledged to support debt service payments ofthese funds. Revenue bonds are not general obligationsof the City. In the case of the Parking Enterprise Fund,revenues fromparking taxes, parking fines and penalties,and other parking revenues provide an additional secu-rity for the payment of debt service. Parking revenues inexcess of parking debt service and operating expensesare transferred to the General Fund.
Under provisions of Subtitle 4, Maryland Industrial LandAct (MILA), and Title 5, Maryland Industrial and Commercial Redevelopment Fund (MICRF), of Article 83A of theAnnotated Code of Maryland, the City and other subdivisions of the State, may borrow funds for industrial or com-mercial development projects. The funds may be loaned to private enterprises for the development of specificprojects. In the case of MICRF loans, the funds borrowed from the State may also be used to insure or guaranteeprojects. The State sets the interest rate, term, and repayment provisions of the loans. In both cases, the City isliable for repayment of principal and interest amounts on the loans in the event of failure or default of the privateenterprise. Such loans are not considered general obligations of the City. The City uses these loan programs aspart of its economic development program to stabilize and expand employment and tax base. Payments frombusinesses utilizing these programs provide General Fund revenue supporting expenses for this borrowing pro-gram.
46

Fiscal 2022 Summary of the Adopted Budget FISCAL ENVIRONMENT
The following table shows the principal and interest required to service the existing Revenue Bond debt of the Cityuntil maturity:
Payment Type 2023 2024 2025 2026-2030
2031-2035
2036-2040
2041-2045
2046-2050
2051-2055
Total
Water Utility Fund Revenue BondsPrincipal 35.4 37.5 38.9 212.6 251.7 240.8 209.3 111.9 10.8 1,148.9Interest 39.2 37.9 36.6 164.4 125.4 80.0 39.6 10.7 0.2 534.1SWAP (0.1) (0.1) (0.1) (0.1) (0.3) (0.2) (0.2) (0.0) (0.9)
Wastewater Utility Fund Revenue BondsPrincipal 55.1 60.8 69.1 345.8 388.4 336.5 258.5 126.9 37.5 1,678.6Interest 52.2 50.8 49.0 214.9 155.6 94.3 41.2 12.5 1.3 671.9
Convention Center Headquarters Revenue BondsPrincipal 3.5 4.0 4.6 30.8 44.4 56.7 72.4 43.4 259.8Interest 12.9 12.7 12.5 58.4 48.9 36.3 20.2 3.1 205.0
Parking Facilities Revenue BondsPrincipal 5.2 5.6 5.7 34.2 27.8 1.2 0.0 0.0 0.0 79.7Interest 0.8 0.8 0.7 2.3 0.9 0.0 0.0 0.0 0.0 5.6SWAP 3.4 3.2 3.0 10.8 2.0 0.0 0.0 0.0 0.0 22.4
Transportation Revenue BondsPrincipal 11.2 11.7 7.7 38.4 18.2 0.0 0.0 0.0 0.0 87.2Interest 3.3 2.8 2.3 6.8 1.2 0.0 0.0 0.0 0.0 16.4
Stormwater Revenue BondsPrincipal 3.4 3.5 3.4 18.2 13.2 9.5 11.3 13.7 0.0 76.2Interest 2.9 2.7 2.6 10.9 7.8 5.8 4.1 1.6 0.0 38.3
TOTAL228.4 233.9 236.0 1,148.5 1,085.3 860.9 656.5 323.7 49.9 4,823.0
Table in millions of dollars.
47

FISCAL ENVIRONMENT Fiscal 2022 Summary of the Adopted Budget
Tax Increment Financing Bonds
13.6M15.3M
17.6M
21.7M
FY19 Actual FY20 Actual FY21 Budget FY22 Budget
Dol
lars
in m
illion
s
Tax Increment Financing (TIF) bonds are widely usedfinancing mechanisms that have been adopted by theCity for public improvements, such as development ofland and public infrastructure, within designated devel-opment districts. TIF bonds are anticipated to increasein Fiscal 2022 due to the sale of the first round of bondsfor the Port Covington Development.
The tax increment is the difference between the amountof property tax revenue generated prior to and after thepublic improvements are made. A bond is issued basedupon the expectation of increased real property taxesand proceeds from this bond are used to pay for improve-
ments. The tax increment is used to cover debt payments on the bonds.
Taxes remain the same within the development district unless the tax increment is not sufficient to cover debtservice. TIF bonds are backed by a local law that allows for a supplemental tax to be levied in the developmentdistrict in the case of a tax increment shortfall. When the bonds are repaid, all TIF revenues revert to the GeneralFund.
The following table shows the principal and interest required to service the existing TIF debt of the City untilmaturity:
Payment Type 2023 2024 2025 2026-2030
2031-2035
2036-2040
2041-2045
2046-2050
2051-2055
Total
TIF Special Obligation BondsPrincipal 4.6 5.1 7.1 47.6 63.7 86.0 60.4 48.7 10.8 334.0Interest 15.5 15.2 15.0 69.0 55.8 38.3 18.4 7.0 0.2 234.5
TOTAL20.1 20.4 22.1 116.6 119.5 124.3 78.8 55.8 11.0 568.5
Table in millions of dollars.
Other Debt Service
17.8M 17.9M20.3M
16.6M
FY19 Actual FY20 Actual FY21 Budget FY22 Budget
Dol
lars
in m
illion
s
Other Debt service includes borrowing-related costs fordebt service, State debt pay-offs for closed surplusschools transferred to the City, and other debt-issuancerelated overhead costs.
48

Fiscal 2022 Summary of the Adopted Budget FISCAL ENVIRONMENT
The following table shows the principal and interest required to service the existing other debt of the City untilmaturity:
Payment Type 2023 2024 2025 2026-2030
2031-2035
2036-2040
2041-2045
2046-2050
2051-2055
Total
Long-term Financing with Federal GovernmentPrincipal 2.3 2.4 2.3 1.0 0.0 0.0 0.0 0.0 0.0 8.0Interest 0.2 0.1 0.1 0.0 0.0 0.0 0.0 0.0 0.0 0.4
TOTAL2.5 2.5 2.3 1.0 0.0 0.0 0.0 0.0 0.0 8.4
Table in millions of dollars.
Debt Management Policy
The amount of debt authorized and issued annually is subject to limits incorporated in the City’s debt policy. Thispolicy, adopted by the Board of Estimates on August 22, 1990, sets forth borrowing limits for the capital budgetprocess and establishes guidelines for capital budget plans. The policy is subject to review every five years or asrecommended by the Director of Finance. The current policy limit on annual General Obligation borrowing is $80million. The City’s annual cash borrowing is guided by authorized project requirements.
City policy consolidates most financing arrangements in the Bureau of Treasury Management and recognizesconditional purchase agreements as debt service for the purpose of evaluating the City’s financial condition andbudget planning. The policy also calls for scheduling debt service payments to minimize fluctuations in annualbudgetary requirements and increased utilization of pay-as-you-go (PAYGO) financing, in which capital projectsfunded from current year General Fund revenues, to reduce borrowing requirements.
In Fiscal 1992 and 1993, the Maryland General Assembly enacted legislation and City voters ratified local legisla-tion permitting the City to issue GO Bonds with call provisions and to refinance debt, thus allowing the City to takeadvantage of favorable interest rates and achieve debt service expense savings. The City first took advantage ofthis legal authorization in an April 1992 GO Bond sale. Legislation enacted and approved by the City voters hasimproved debt management by authorizing:
1. the City to negotiate GO Bond sales;2. the Board of Finance to structure debt maturities and interest payment schedules;3. the Board of Finance to approve fixed, variable, or other interest rates on bonds; and4. the City to issue “mini bonds” in denominations as small as $500.
Legal Debt Limits
All GO debt is secured by the full faith and credit of the City. The City has unlimited taxing authority with respectto property taxes to support GO debt service requirements. The City is not constrained by any legal limits on theamount of its GO debt, but is guided by prudent limits set forth in local debt policy. In addition to conservativedebt management policies, the City is controlled in the amount of debt that may be incurred by the Constitution ofMaryland, which requires a three-step procedure for the creation of debt by the City of Baltimore. First, there must
49

FISCAL ENVIRONMENT Fiscal 2022 Summary of the Adopted Budget
be an act of the Maryland General Assembly or a resolution of the majority of the City’s delegates to the GeneralAssembly. Then, pursuant to State authorization, the Mayor and City Council must approve an ordinance. Finally,the voters of the City must ratify the debt issuance.
Effects of Existing Debt on Current and Future Operations
Based on traditional debt ratio evaluation criteria, current debt burdens and those forecasted, the City’s debt iswithin acceptable limits. As a result of the annual debt review by the rating agencies, the City maintains a GObond rating of Aa2 with Moody’s Investor Service and AA with Standard & Poor’s. These credit ratings reflect thejudgment of the rating agencies that the City has strong capacity to pay principal and interest on debt. Debt servicerequirements, in and of themselves, do not place an unusual burden on the resource base of the City. Selecteddebt management factors are listed below.
• The City’s net GO debt is below the 4% industry standard for tax supported debt as percentage of actualtaxable value of property (1.1%, 2020).
• In addition, net GO debt is below the $2,250 per capita figure established in the City’s debt policy ($826.67,2020).
• The City is not constrained by any legal limits on its debt authorization limit but is guided by prudent limitsset forth in local debt policy.
• The City has no overlapping debt and no instance of default.• The City has unlimited taxing authority with respect to property taxes.
Principal and interest obligations of the Water and Wastewater Utility and Parking Enterprise funds are payablefrom the earnings of the respective funds. Appropriate ratios of pledged revenues tomaximumannual debt serviceobligations must be and are maintained for the respective funds.
General Debt is made up of GO bonds and bond anticipation notes. Conditional purchase agreements or capitallease obligations do not constitute a pledge of the full faith and credit or taxing powers of the City. The agree-ments are subject to termination if sufficient funds are not appropriated by the City Council. Revenue debt iscomposed of Water Utility, Wastewater Utility, Parking Enterprise, Stormwater Utility, and Convention Center rev-enue financings. Other debt consists of tax increment financing (TIF) and long-term financing with the State andfederal governments.
The City issued the 2013B bonds to refunded Series 1998A, 2001A, 2003A, 2003B, 2004A, and 2005A. The amor-tization was structured to pay off the refunded bonds within the same 20-year maturity schedule of the originalbonds. The last large payment will occur in Fiscal 2023 in the amount of $21.6million; therefore, the next paymentin Fiscal 2024 will drop significantly.
The City does not have a GO statutory debt limit, but is subject to a three-step process described in “Legal DebtLimits” above. Outstanding debt per capita and the ratio to assessed value may increase, but still remain belowdanger point thresholds. Revenue debt service constitutes the largest increase due primarily to continued borrow-ings for the Water and Wastewater Utility funds. A large portion of these borrowings is in response to the City’sconsent decree between the City, U.S. Environmental Protection Agency, and theMaryland Department of the Envi-ronment to reduce sanitary sewer overflows during heavy rainfall, water meter upgrades, and water infrastructurereplacement. Most of this additional debt service will be paid over a 30-year amortization period.
Revenue debt limits are established from time to time by the City Council and are issued in accordance with theirrespective bond indentures. The City has a TIF policy in effect that places limits on the types of TIF projects and,among other things, requires the project demonstrate it can pay for City services and is consistent with the City’seconomic and development goals.
50

Long-Term Liabilities
There are significant fiscal risks that affect Baltimore’s strategic plan. These liabilities take the form of RecurringLiabilities and One-Time Liabilities, which are described in detail below.
Recurring Liabilities
Pensions and Retiree Health Care
2,087.7M
1,469.0M
558.6M 1,247.8M
530.2M686.1M
Fiscal 2011 Valuations Fiscal 2020 Valuations
Employee Retirement Systems
Fire and Police Retirement System
Other Post-Employment Benefits
Pensions and Retiree Health Care
Dol
lars
in m
illion
s
3,176.5M3,402.8M
As with many cities and states across the coun-try, Baltimore faces large-scale, long-term liabil-ities associated with retiree pension and healthbenefits. Pensions and retiree health plans havepay-as-you-go costs equal to the benefits dis-tributed or claimed that year, but they also haveaccrued obligations to be paid in the future. Actu-aries determine the amount of assets that mustbe set aside now to ensure adequate resourcesare available in the future. The chart to the rightshows that long-term liabilities have increasedbetween Fiscal 2011 and 2020.
The primary driver of the increase is the Fireand Police (F&P) pension system. A new hiresF&P plan, which would have required new swornmembers to enter a new more sustainable pen-sion system, was proposed in 2015, but was notacted on by City Council. The funded status ofthe F&P pension system has continued to de-cline, from 82% in Fiscal 2011 to 69.1% in Fiscal2020, which in turn has led to growth in the un-funded liability.
Liabilities related toOther Post-Employment Ben-efits (OPEB liability) and retiree healthcare have continued to decline due to a series of reform efforts undertakenover the last decade that are described above. Liabilities are expected to decline even further in the Fiscal 2021valuation when the impact of the Medicare Advantage Plan shift is taken into account.
Liabilities for the FPERS and ERS pension plans continue to grow due to ongoing amortization of prior year in-vestment losses, the steady decrease in number of active employees, the growing number of retirees, and theadoption of more conservative actuarial methods. For the Fiscal 2020 year-end actuarial report, the funded ratiofor ERS increased from 73.0% to 73.3% and FPERS declined from 69.8% to 69.1%.
Convention Center Hotel
The Baltimore Hotel Corporation (BHC) is a non-profit entity that was formed to own, develop, and manage theConvention Center Hotel. The construction was financed with $300 million of tax-exempt municipal bonds in2006.
51

FISCAL ENVIRONMENT Fiscal 2022 Summary of the Adopted Budget
The repayment of debt is paid from two dedicated revenue sources: Property Tax revenues generated by the Hotelabove the baseline level and Hotel Tax revenues generated by the Convention Center Hotel, also known as “site-specific Hotel Tax”. If those revenues are not sufficient to cover the debt service cost, the City must contribute tocover the deficit, not to exceed 25% of general Hotel Tax revenue ($8 million).
Due to COVID-19, the City expects to cover an estimated $16.8 million of additional costs for the ConventionCenter Hotel from Fiscal 2021 to 2023.
Quarantine Road Landfill
The City’s Quarantine Road landfill is nearing the end of its useful life and on track to reach capacity in 2026 basedupon current waste generation conditions. State and federal laws and regulations require that a landfill is covered,maintained, and monitored for a minimum of thirty years after closure.
The City makes annual contributions to a Landfill Trust Fund to plan for future closure costs, estimated at $32.6million, and new landfill development costs, estimated to cost from $85 million to $102 million.
The landfill development plan, which combines Quarantine Road Landfill and Millennium Landfill to provide anadditional 11 years of capacity, is expected to begin by Fiscal 2024. The Fiscal 2022 contribution to the full costof development is $9.9 million, which includes $6.9 million in operating costs and $3 million in capital costs.
Landfill Closure Landfill Development
Fiscal Year Contribution Balance Contribution Balance
2022 1.0 27.7 8.9 49.42023 1.0 28.7 9.0 58.52024 1.0 29.7 9.1 67.62025 1.0 30.7 9.3 76.92026 0.7 31.4 9.4 86.32027 0.0 31.4 10.5 96.8
One-Time Liabilities
Fire and Police Pension Lawsuit
Fire and Police union sued the City over F&P pension reforms passed in 2010. Following years of litigation, theMaryland Court of Appeals upheld the City’s change to active members in August 2021.
Retirees whowere vested when the law changedwere collectively seeking damages from the City. The calculationof damages is based on the difference betweenwhat would have been received under the old variable cost of livingadjustment (COLA) and the new tiered COLA. Based on the recent court ruling and final cost determinations, theCity anticipates a payment of $35.5 million from Fund Balance and is currently going through the supplementaryappropriation process to enable the City to appropriate these funds in Fiscal 2022.
52

Fiscal 2022 Summary of the Adopted Budget FISCAL ENVIRONMENT
General Legal Liability
The City is facing multiple lawsuits, which include suits related to: wrongful imprisonment; compliance with theAmericans with Disabilities Act; compliance with the Clean Air Act, a local ordinance that raises emission stan-dards for City waste incinerators; and damages to businesses from the 2015 civil unrest. The City anticipates thatseveral of these lawsuits will require payments that will impact future budget years.
53

Intentionally left blank.
Budget Plan
FISCAL2022
SUMMARY OF THEADOPTED BUDGET
Budget Plan

Intentionally left blank.

Revenues and Expenditures
The total Fiscal 2022 appropriation plan for the City of Baltimore is $4.33 billion. This is an increase of $483.8million or 12.6% above the Fiscal 2021 Adopted budget.
The City typically adopts a balanced budget, with planned expenditures equal to anticipated revenue. In Fiscal2021, the City Council exercised its power to reduce the the expenditure appropriation included in the Fiscal 2021Ordinance of Estimates and voted to pass an amended budget whereby expenditures were less than anticipatedrevenue for Fiscal 2021. See the Key Budgetary and Financial Policies for more information.
Revenue and Expenditure Summary
Revenues by Revenue Source FY20 Actual† FY21 Budget FY22Estimate
DollarChange *
PercentChange *
Property Taxes 920,660,520 947,731,706 969,960,000 22,228,294 0.3%Income Taxes 396,539,613 381,216,000 385,620,000 4,404,000 0.1%Other Local Taxes 478,431,293 429,929,830 429,252,980 (676,850) 0.0%Licenses, Permits, and Fines 84,562,366 73,742,000 79,258,000 5,516,000 0.1%State Grants 246,961,870 259,080,843 318,656,575 59,575,732 0.7%Use of Money and Property 85,332,622 70,554,297 46,774,024 (23,780,273) -0.3%Federal Grants 199,130,353 252,458,806 1,028,931,151 776,472,345 9.0%Charges for Current Services 584,346,189 567,421,402 609,355,641 41,934,239 0.5%Special and Other Revenues 250,986,288 440,784,072 302,982,076 (137,801,996) -1.6%Borrowed Proceeds 249,641,000 466,538,000 214,518,000 (252,020,000) -2.9%From (To) Fund Balance 8,300,000 23,873,650 3,552,635 (20,321,015) -0.2%Transfers In (Out) (154,157,460) (56,764,915) (57,811,596) (1,046,681) 0.0%TOTAL REVENUES 3,350,734,654 3,856,565,691 4,331,049,486 474,483,795 5.5%
Expenditures by PriorityOutcome
FY20 Actual† FY21 Budget FY22 Budget DollarChange *
PercentChange *
Building Public Safety 676,286,406 957,605,894 1,045,596,352 87,990,458 1.0%Capital Improvement 627,464,000 823,212,000 487,572,000 (335,640,000) -3.9%Clean & Healthy Communities 708,193,027 1,033,791,764 1,113,823,505 80,031,741 0.9%Equitable Neighborhood Dev. 101,712,230 136,374,754 130,403,519 (5,971,235) -0.1%Other 754,261,512 252,912,333 892,299,564 639,387,231 7.4%Prioritizing Our Youth 357,494,407 481,348,821 487,565,414 6,216,593 0.1%Responsible Stewardship 122,890,297 161,982,669 173,789,132 11,806,463 0.1%TOTAL EXPENDITURES 3,348,301,879 3,847,228,235 4,331,049,486 483,821,251 5.6%
Table in dollars.* Change is calculated between Fiscal 2021 and Fiscal 2022† When total revenues exceed expenditures at the end of a fiscal year, the difference is added to the corresponding fund’s fund balance.
57

BUDGET PLAN Fiscal 2022 Summary of the Adopted Budget
Revenues and Expenditures by Fund
Revenues by Revenue Source GeneralFund
SpecialPurpose
Funds
Grant Funds EnterpriseFunds
CapitalProject Funds
Total
Property Taxes 969,960,000 0 0 0 0 969,960,000Income Taxes 385,620,000 0 0 0 0 385,620,000Other Local Taxes 365,350,000 19,630,000 0 24,272,980 20,000,000 429,252,980Licenses, Permits, and Fines 62,961,000 530,000 0 15,767,000 0 79,258,000State Grants 101,664,000 0 164,840,575 0 52,152,000 318,656,575Use of Money and Property 14,150,000 3,100 0 32,620,924 0 46,774,024Federal Grants 52,000,000 0 937,263,151 0 39,668,000 1,028,931,151Charges for Current Services 46,185,000 2,555,962 0 560,614,679 0 609,355,641Special and Other Revenues 4,840,129 0 136,907,947 0 161,234,000 302,982,076Borrowed Proceeds 0 0 0 0 214,518,000 214,518,000From (To) Fund Balance 4,432,000 0 0 (879,365) 0 3,552,635Transfers In (Out) (14,411,129) 4,189,017 0 (47,589,484) 0 (57,811,596)TOTAL REVENUES 1,992,751,000 26,908,079 1,239,011,673 584,806,734 487,572,000 4,331,049,486
Table in dollars.
Expenditures by Priority Outcome GeneralFund
SpecialPurpose
Funds
Grant Funds EnterpriseFunds
CapitalProject Funds
Total
Prioritizing Our Youth 370,698,619 0 116,468,858 397,937 0 487,565,414Building Public Safety 923,404,516 0 122,191,836 0 0 1,045,596,352Clean & Healthy Communities 296,510,120 0 255,782,997 561,530,388 0 1,113,823,505Equitable Neighborhood Dev 59,936,570 23,864,120 24,143,333 22,459,496 0 130,403,519Responsible Stewardship 146,273,603 3,038,959 24,237,657 238,913 0 173,789,132Other 195,927,572 5,000 696,186,992 180,000 0 892,299,564Capital Improvement 0 0 0 0 487,572,000 487,572,000TOTAL EXPENDITURES 1,992,751,000 26,908,079 1,239,011,673 584,806,734 487,572,000 4,331,049,486
Table in dollars.
58

Expenditures: Budget Appropriation Levels
Operating Plan 3.8B (88.7%)
Capital Plan 487.6M (11.3%)
GRAND TOTAL: 4.3 billion
Fiscal 2022 Amount DollarChange*
Percent Change*
Operating Plan 3,843,477,486 +819,461,251 27.1%Capital Plan 487,572,000 -335,640,000 -40.8%Total 4,331,049,486 +483,821,251 12.6%
The total Fiscal 2022 appropriationplan for the City of Baltimore is $4.33billion. This is an increase of $483.8million or 12.6% above the Fiscal2021 Adopted budget.
The two components of the total ap-propriation plan are the OperatingBudget Plan and the Capital Improve-ment Plan. The operating budgetfunds the daily business of the City,specifically covering programs, ser-vices, staff, and supplies. The capi-tal budget funds physical infrastruc-ture projects for the City, specificallymajor renovations and replacementsthat are long-term investments.
The operating budget is $3.84 billion,which is an increase of $819.5 mil-lion or 27.1%. The capital budget is$487.6million, which is a decrease of$335.6 million or 40.8%. The capitalbudget is subject to cyclical changesdue to the timing of large construc-tion projects.
Budget Priorities
While Mayor Scott’s Priority Outcomes are the foundation of the Fiscal 2022 budget, responding to the COVID-19pandemic and maintaining vital City services were critical priorities of this budget.
COVID-19 Response
Baltimore City has implemented a multifaceted approach to the COVID-19 pandemic through direct public healthand economic support to City residents and employees. Information on coronavirus infection rates, vaccinationrates, and more is available through the City’s COVID-19 dashboard.
The Baltimore City Health Department leads the City’s public health response, managing vaccination and testingsites across the City, including mobile vaccination, as well as contact tracing. In addition, the City provided shel-tering and isolation sites to reduce the spread of the virus. The City also provided economic support throughfood distribution sites, eviction prevention and rental relief programs, and assistance to small businesses andnonprofits. Finally, the City took extensive efforts to support employees and maintain City services by investing inpersonal protective equipment, telework capabilities, overtime and hazard pay, and additional staffing, as needed.
59

BUDGET PLAN Fiscal 2022 Summary of the Adopted Budget
City Services
The Fiscal 2022 budget ensures that vital City services remain intact, while also expanding services in severalareas to improve quality of life for residents across the City. Beginning in the fall of 2021, the Department of PublicWorks (DPW) will begin distributing recycling cans for every eligible home in Baltimore. In addition, DPW will alsocontinue supporting a 12-month pilot Sewage Onsite Support (SOS) Cleanup Program (begun in Fiscal 2021),which provides professional cleaning, disinfection, and disposal services through 311. During the Fiscal 2021budget process, the City wrote down the proposed budget by $103million, which including cutting twoDPWgraffitiremoval crews. These crews have been reinstated in this year’s budget. Finally, the City is leveraging existingresources and new policies to improve current services by reallocating General Funds to support WeatherizationServices, allowing the City to access up to $2 million of State funds, and increasing the monthly 911 fee by $0.25per phone line to improve the reliability of the City’s 911 services.
Fiscal Risks
Like many state and local governments, the City’s financial outlook has changed dramatically in the wake of theCOVID-19 pandemic. The pandemic has directly exposed some new risks in the City’s financial profile, for example:
Historic Revenue Lows
In the Fiscal 2021 budget, the City reduced the preliminary budget by $103 million, sharply writing down GeneralFund revenue sources that are dependent upon visitor business activity, such as parking revenue, Hotel Tax, andConvention Center income. Since these revenue sources reached historic lows during Fiscal 2021, the Fiscal2022 budget estimates only a modest recovery to these sources. In addition, while a strong housing market led tobetter-than-expected Recordation and Transfer Tax revenues in Fiscal 2021, commercial property assessmentsfor property tax assessment Group 3] grew only 0.9% over the last three years, due to low demand for real estatein the retail, hotel, and restaurant sectors, negatively impacting Fiscal 2022 Property Tax estimates. See theMajorRevenues Forecast section for more detail.
COVID-19 and Federal Aid
The City’s robust response to the COVID-19 public health emergency has put a strain on resources. Federal aidhas provided a lifeline for the City, enabling the City to sustain the strong response to COVID-19 in Fiscal 2022.
The City was awarded $103.6million of direct aid from the Coronavirus Aid, Relief, and Economic Security (CARES)Act in March 2020. The remaining $24.5 million of that aid unspent as of the end of Fiscal 2021 is budgeted inFiscal 2022 for continuing expenses such as cleaning costs, personal protective equipment (PPE) purchases, andto support City personnel dedicated to responding to the pandemic. Federal Emergency Management Agency(FEMA) reimbursement is expected for certain eligible programs such as mass vaccination, sheltering, and feed-ing, which will allow for the continuation of those programs into Fiscal 2022.
The City will receive $641 million from the American Rescue Plan Act (ARPA) of 2021, down from initial esti-mates of $670.3 million. While some ARPA funds will be utilized to stabilize the City’s financial outlook over thenext three years, ARPA funds will be used to support essential front-line employees, shore up the City’s finan-cial health, modernize City government, and deliver resources and projects that builds public trust and facilitatesneighborhood-level change.
See the Expenditures: COVID-19 Federal Aid for more detail.
60

Fiscal 2022 Summary of the Adopted Budget BUDGET PLAN
In addition to the challenges of recovering from the COVID-19 economic disruption, the City still has some signifi-cant fiscal risks that pre-date the pandemic:
Kirwan
In 2020, the Maryland General Assembly passed the Blueprint for Maryland’s Future legislation, more commonlyreferred to as Kirwan, which requires additional State and local contributions to school districts. The bill wasvetoed by the Governor, but the General Assembly overrode the veto in the 2021 session. The City’s new local con-tribution will begin in Fiscal 2023. Per the fiscal note drafted by the Maryland Department of Legislative Servicesfor fiscal analysis of the bill, the City’s contribution to City Schools for operating costs will increase by at least $63million compared to the current law and grow to a $161.5million annual increase by Fiscal 2030, totaling nearly $1billion in additional City resources over the next decade. See the Priority Outcome: Prioritizing Our Youth sectionfor more detail.
Fire and Police Pension
In August 2021, a judgment was upheld by the Maryland Court of Appeals on the long-standing litigation betweenBaltimore City and Fire and Police employees over pension reforms that were enacted in 2010. The judge upheldthe City’s modification that extended the years of service required to earn a pension from 20 to 25 years. However,the judge also agreed with a lower court’s ruling that the City unfairly withdrew benefits from already-retired em-ployees and that those retirees are entitled to seek damages for lost benefits from the City. See the Long-TermLiabilities section for more detail.
61
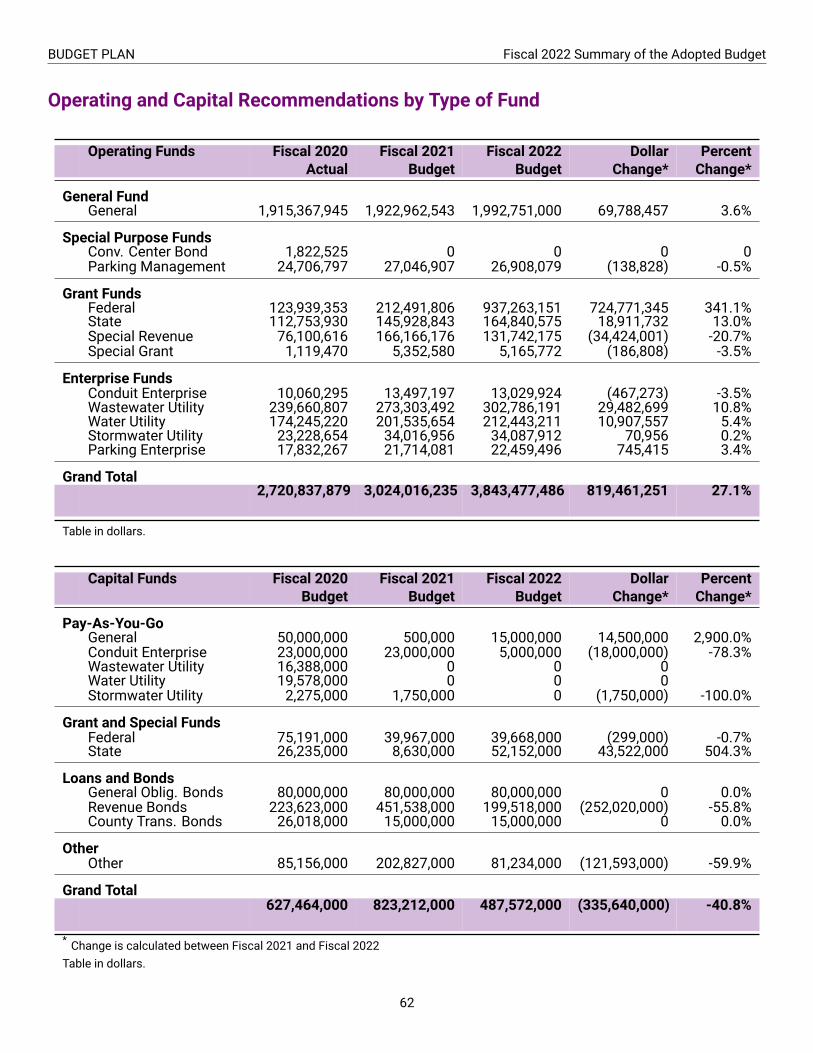
BUDGET PLAN Fiscal 2022 Summary of the Adopted Budget
Operating and Capital Recommendations by Type of Fund
Operating Funds Fiscal 2020Actual
Fiscal 2021Budget
Fiscal 2022Budget
DollarChange*
PercentChange*
General FundGeneral 1,915,367,945 1,922,962,543 1,992,751,000 69,788,457 3.6%
Special Purpose FundsConv. Center Bond 1,822,525 0 0 0 0Parking Management 24,706,797 27,046,907 26,908,079 (138,828) -0.5%
Grant FundsFederal 123,939,353 212,491,806 937,263,151 724,771,345 341.1%State 112,753,930 145,928,843 164,840,575 18,911,732 13.0%Special Revenue 76,100,616 166,166,176 131,742,175 (34,424,001) -20.7%Special Grant 1,119,470 5,352,580 5,165,772 (186,808) -3.5%
Enterprise FundsConduit Enterprise 10,060,295 13,497,197 13,029,924 (467,273) -3.5%Wastewater Utility 239,660,807 273,303,492 302,786,191 29,482,699 10.8%Water Utility 174,245,220 201,535,654 212,443,211 10,907,557 5.4%Stormwater Utility 23,228,654 34,016,956 34,087,912 70,956 0.2%Parking Enterprise 17,832,267 21,714,081 22,459,496 745,415 3.4%
Grand Total2,720,837,879 3,024,016,235 3,843,477,486 819,461,251 27.1%
Table in dollars.
Capital Funds Fiscal 2020Budget
Fiscal 2021Budget
Fiscal 2022Budget
DollarChange*
PercentChange*
Pay-As-You-GoGeneral 50,000,000 500,000 15,000,000 14,500,000 2,900.0%Conduit Enterprise 23,000,000 23,000,000 5,000,000 (18,000,000) -78.3%Wastewater Utility 16,388,000 0 0 0Water Utility 19,578,000 0 0 0Stormwater Utility 2,275,000 1,750,000 0 (1,750,000) -100.0%
Grant and Special FundsFederal 75,191,000 39,967,000 39,668,000 (299,000) -0.7%State 26,235,000 8,630,000 52,152,000 43,522,000 504.3%
Loans and BondsGeneral Oblig. Bonds 80,000,000 80,000,000 80,000,000 0 0.0%Revenue Bonds 223,623,000 451,538,000 199,518,000 (252,020,000) -55.8%County Trans. Bonds 26,018,000 15,000,000 15,000,000 0 0.0%
OtherOther 85,156,000 202,827,000 81,234,000 (121,593,000) -59.9%
Grand Total627,464,000 823,212,000 487,572,000 (335,640,000) -40.8%
* Change is calculated between Fiscal 2021 and Fiscal 2022Table in dollars.
62

Expenditures: Recommended vs. Adopted Budget
The preliminary budget is first introduced on behalf of the Department of Finance to the Board of Estimates (BOE).The BOE holds a special meeting with the Department of Finance and agency heads to discuss the budget. Inaddition, the BOE hosts a Taxpayers’ Night for residents to share their thoughts on the budget. Following theseevents, the BOE votes on the preliminary budget and, if approved, the recommended budget is sent to City Councilfor review. The City Council hosts a Taxpayers’ Night similar to the BOE, as well as a week of budget hearingswith agencies. After these events, the City Council votes on the recommended budget. The City Council approvedbudget is then sent to theMayor for review. TheMayor may approve the total budget or use their authority to issuea line item veto, vetoing some items and approving the rest of the budget.
During the Fiscal 2022 budget process, City Council had the authority to decrease funding, not to reallocate it. InNovember 2020, voters approved an amendment to the City Charter that will allow City Council to move fundingwith a majority vote within the General Fund. This broader budget authority will start with the Fiscal 2024 planningprocess. There were no changes made to the Fiscal 2022 budget by the City Council or Mayor during the process.
Fund Name Recommended Budget Adopted Budget Change
General 2,007,751,000 2,007,751,000 0Conduit Enterprise 18,029,924 18,029,924 0Wastewater Utility 302,786,191 302,786,191 0Water Utility 212,443,211 212,443,211 0Stormwater Utility 34,087,912 34,087,912 0Parking Enterprise 22,459,496 22,459,496 0Parking Management 26,908,079 26,908,079 0Federal 976,931,151 976,931,151 0State 216,992,575 216,992,575 0Special Revenue 131,742,175 131,742,175 0Special Grant 5,165,772 5,165,772 0General Obligation Bonds 80,000,000 80,000,000 0Revenue Bonds 199,518,000 199,518,000 0County Transportation Bonds 15,000,000 15,000,000 0Other 81,234,000 81,234,000 0Grand Total 4,331,049,486 4,331,049,486 0
63

Expenditures: COVID-19 Federal Aid
The City of Baltimore has received multiple sources of federal aid to assist in the response to the COVID-19 pan-demic.
Fiscal 2020
In Fiscal 2020, $103.6 million in direct aid was received by the City from the Coronavirus Aid, Relief, and EconomicSecurity (CARES) Act Coronavirus Relief Fund. The CARES Act also provided additional funding in the form ofgrants for existing programs for specific purposes. In March 2020, the federal government declared a nationwideemergency, effective January 2020 and continuing, to make emergency aid available from the Federal EmergencyManagement Agency (FEMA), which is reimbursement-based.
In Fiscal 2020, the City of Baltimore spent $14.7 million in CARES Act funding. These funds were spent in thelast quarter of the fiscal year, during the initial response to the public health emergency. Highlights of Fiscal 2020federal aid expenditures include:
• $5.5 million to the Baltimore Development Corporation for grants to small businesses• $2.7 million to increase telework capabilities for City employees• $1.8 million to purchase personal protective equipment (PPE) and other public health supplies• $1.2 million to provide additional support to Emergency Medical Services
Fiscal 2021
The Consolidated Appropriations Act, passed in December 2020, provided the City with an additional $17.7millionfor the purpose of rental relief and eviction prevention above what the City has committed from other sources.Spending of these funds have already begun and will continue into Fiscal 2022. In March 2021, President Bidensigned into law the American Rescue Plan Act (ARPA), a $1.9 trillion economic stimulus package. The City willreceive approximately $641 million in direct federal aid dedicated to state and local governments, approximately$30 million less than initially estimated when drafting the Fiscal 2022 budget. The Mayor’s Office of RecoveryPrograms, led by the Chief Recovery Officer, has been established to plan, organize, implement, and oversee theprocess to access funds.
The City is actively preparing and submitting applications for expenses eligible for FEMA reimbursement. Some ofthese costs include food distribution, vaccination sites, quarantining and sheltering, PPE, and frontline response.As of publication, the City does not have final decisions on many of the submitted applications.
The City expects to spend $64.4 million of CARES Act funding by the end of Fiscal 2021. Highlights of Fiscal 2021federal aid expenditures include:
• $10 million dedicated to rental relief and eviction prevention• $4.3 million in additional support to Baltimore Development Corporation for small business assistance andto support local manufacturing of PPE
• $5 million in support of nonprofit relief
Aid is also being directed to support City personnel dedicated to responding to the pandemic, contact tracing,additional PPE, upgrades to public buildings to promote social distancing, and bilingual and bicultural educationand outreach to Baltimore’s Latinx community.
64

Fiscal 2022 Summary of the Adopted Budget BUDGET PLAN
Fiscal 2022
The table below contains $52 million in planned expenditures for Fiscal 2022 utilizing the remaining $24.5 millionin CARESAct funds and $27.5million in expected FEMA reimbursement throughDecember 2021. These budgetedexpenditures are included in the General Fund in Fiscal 2022.
The table also contains the amount expected to be received from ARPA. This funding will be spent over multi-ple fiscal years and will be appropriated to Federal Funds. The Office of Recovery Programs is coordinating anapplication process for ARPA funds that is open to City agencies, quasi-agencies, and nonprofit organizations.
Agency Item Amount
CARES Act FundingEnoch Pratt Free Library Cleaning and Disinfecting of Libraries 300,000Fire COVID-Related Emergency Medical Services (EMS) Calls* 4,750,000General Services Cleaning and Disinfecting of Public Buildings 700,000Health Contact Tracing 1,200,000
Personal Protective Equipment (PPE) 500,000Community Public Health Response Efforts 6,300,000Health Department Personnel Dedicated to COVID* 2,000,000
Office of Information andTechnology
Software - Employee COVID Screening and Telework 900,000
Other Administrative Support - COVID Safety and FinancialCoordination
300,000
Other Emergency Response Costs* 7,150,000Public Works Solid Waste Collection Support 400,000
Projected FEMA Reimbursement FundingHealth COVID Call Center Support 1,600,000
COVID Communications Coordination 50,000COVID Isolation Center 7,350,000COVID Testing Staffing 2,700,000COVID Vaccination Program 10,000,000COVID-Related Software Development 350,000Employee COVID Testing 400,000Food Distribution to Vulnerable Populations 5,050,000
American Rescue Plan FundingM-R: American Rescue Plan Expected Funding 670,273,285
GRAND TOTALGRAND TOTAL 722,273,285
* Denotes CARES Act support for existing City personnel redeployed to COVID response efforts.
Table in dollars.
65

Expenditures: Operating and Capital Fund Sources
The Fiscal 2022 total operating and capital appropriations of $4.3 billion are budgeted in the funds in the belowtable.
Fund Name Operating Budget Capital Budget Total
General 1,992,751,000 15,000,000 2,007,751,000Conduit Enterprise 13,029,924 5,000,000 18,029,924Wastewater Utility 302,786,191 0 302,786,191Water Utility 212,443,211 0 212,443,211Stormwater Utility 34,087,912 0 34,087,912Parking Enterprise 22,459,496 0 22,459,496Parking Management 26,908,079 0 26,908,079Federal 937,263,151 39,668,000 976,931,151State 164,840,575 52,152,000 216,992,575Special Revenue 131,742,175 0 131,742,175Special Grant 5,165,772 0 5,165,772General Obligation Bonds 0 80,000,000 80,000,000Revenue Bonds 0 199,518,000 199,518,000County Transportation Bonds 0 15,000,000 15,000,000Other 0 81,234,000 81,234,000Total 3,843,477,486 487,572,000 4,331,049,486
Table in dollars.
Fund Structure
General Fund 2.0B (44.5%)
Grant Funds 1.2B (27.7%)
Enterprise Funds 584.8M (13.1%)
Capital Project Funds 487.6M (10.9%)Internal Service Fund 143.3M (3.2%)
Special Purpose Funds 26.9M (0.6%)
GRAND TOTAL: 4.5 billion
Fund sources can be grouped into six types. Each type, and the individual fund sources that comprise it, aredescribed in the following sections.
66

Fiscal 2022 Summary of the Adopted Budget BUDGET PLAN
Major funds are those whose revenues or expenditures constitute more than 10% of the total appropriated budget.All of the budgeted funds are audited in the Annual Comprehensive Financial Report (ACFR).
Fund Name Major Fund Budgeted Audited
GovernmentGeneral
General x x x
GrantsFederal x x x
State x x x
Special Grant x x x
Special Revenue* x x x
Special PurposeParking Management† x
Convention Center Bond† x
CapitalGeneral Obligation Bonds x x x
Revenue Bonds x x x
County Transportation Bonds x x x
Internal ServiceInternal Service x x
ProprietaryEnterprise
Water Utility x x x
Wastewater Utility x x x
Stormwater Utility x x x
Conduit Enterprise x x
Parking Enterprise x x x
FiduciaryFiduciary
Fiduciary x
* Community Development Block Grant, Baltimore Casino, Housing Trust Fund,State Video Lottery Terminal, School Construction, Children and Youth, andTable Games funds are considered non-major; all other Special Revenue fundsare considered major.
† Rolled into General Fund in ACFR
67

BUDGET PLAN Fiscal 2022 Summary of the Adopted Budget
General Fund
The General Fund is the City’s largest and principal fund, supported by locally generated revenues and some StateAid. The General Fund is used to budget and account for all activities not required by law, accounting practice, ormanagement objective to be separately budgeted. These funds have the most flexibility in how they can be spent.
The charts below show General Fund revenue trends for three major revenue sources (Property Tax, Income tax,and State Aid) and budget trends for three large agencies (Fire, Police, and Transportation).
48.0% 46.8% 48.4%45.6%
48.7% 49.8% 49.6% 50.9% 52.7% 51.5%
17.5% 17.0% 17.8% 18.6% 18.6% 18.4% 19.1% 20.4% 19.7% 19.2%
4.8% 5.1% 5.0% 4.4% 3.7% 4.0% 4.3% 5.8% 7.6% 8.2%
FY13 Actual
FY14 Actual
FY15 Actual
FY16 Actual
FY17 Actual
FY18 Actual
FY19 Actual
FY20 Actual
FY21 Budget
FY22 Budget
Property Taxes Income Taxes State Aid
Select Revenues and State Aid as a Percent of General Fund Revenue
Perc
ent
12.4% 12.6% 12.5% 11.9% 12.8% 12.9% 12.9% 13.4% 12.7% 12.9%
25.4% 25.0%26.4% 26.8% 27.2% 26.7% 26.9% 26.5% 26.0% 26.2%
5.8%7.2% 7.3% 7.8%
6.0% 6.4% 6.6% 6.4% 6.6% 6.3%
FY13 Actual
FY14 Actual
FY15 Actual
FY16 Actual
FY17 Actual
FY18 Actual
FY19 Actual
FY20 Actual
FY21 Budget
FY22 Budget
Fire Police Transportation
Select Agency Expenditures as a Percent of General Fund Expenditures
Perc
ent
68

Fiscal 2022 Summary of the Adopted Budget BUDGET PLAN
Special Purpose Budget Funds
The City’s budget contains two special purpose budgetary funds, the ParkingManagement and Convention CenterBond funds. These funds are merged with the General Fund in the City’s Comprehensive Annual Financial Report.The ParkingManagement Fund budgets for the operations of on-street parking activities and operations of parkingfacilities supported by the General Fund. The Convention Center Bond Fund budgets for debt service supported bythe City’s Hotel Tax, a General Fund revenue source. The City completed its final Convention Center debt servicepayment in Fiscal 2020, with future year contributions being made to offset future expansion or renovation costs.
Grant Funds
These funds are used to budget and account for all activities that have restricted uses supported by dedicatedrevenue. This group consists of federal, State, special revenue, and private grant funds.
Enterprise Funds
These funds are used to budget and account for operations, including debt service, that are financed and operatedas an ongoing concern. Costs of providing services, including depreciation, are financed or recovered primarilythrough user charges or other dedicated revenues. Enterprise funds in the City’s budget are the Conduit, Parking,Stormwater Utility, Water Utility, and Wastewater Utility funds. Repayment of debt service expenses incurred bythe City Industrial Development Authority, an enterprise fund, are reflected in the debt service payments of therespective funds that have utilized Authority financing.
Internal Service Funds
The budget includes proprietary type funds accounting for the financing of goods and services provided by certainCity agencies to other agencies on a cost reimbursement basis. These include: Mobile Equipment, Printing andGraphics, Municipal Post Office, Municipal Telephone Exchange, Risk Management, Public Buildings, Unemploy-ment Insurance, Hardware and Software Replacement, and 800 MHz Radio Maintenance.
Capital Project Funds
All revenue sources, including loan proceeds, intergovernmental grants, certain dedicated revenues, and fundtransfers comprised of Pay-As-You-Go support from current revenues of other funds are budgeted and accountedfor in this fund group.
69

BUDGET PLAN Fiscal 2022 Summary of the Adopted Budget
Agency Use of Fund Sources
The table below shows the relationship between fund sources and City agencies for Fiscal 2022.
Agency Name CapitalProjectFunds
EnterpriseFunds
GeneralFund
GrantFunds
InternalService
Fund
SpecialPurpose
Funds
Board of Elections 0.0 0.0 7.1 0.0 0.0 0.0City Council 0.0 0.0 8.6 0.0 0.0 0.0Comptroller 0.0 0.0 7.9 0.0 14.5 0.0Council Services 0.0 0.0 0.8 0.0 0.0 0.0Courts: Circuit Court 0.0 0.0 17.7 9.0 0.0 0.0Courts: Orphans’ Court 0.0 0.0 0.7 0.0 0.0 0.0Employees’ Retirement Systems 0.0 0.0 0.0 12.6 0.0 0.0Enoch Pratt Free Library 0.0 0.0 28.5 15.2 0.0 0.0Finance 0.0 0.2 28.2 0.2 8.3 3.0Fire 0.0 0.0 256.8 47.4 0.0 0.0General Services 12.8 0.0 13.1 2.6 96.2 0.0Health 0.0 0.0 77.6 130.4 0.0 0.0Housing and Community Development 56.3 0.0 42.0 70.7 0.0 0.0Human Resources 0.0 0.0 12.4 0.0 2.3 0.0Law 0.0 0.0 12.2 0.0 8.8 0.0Legislative Reference 0.0 0.0 1.4 0.0 0.0 0.0Liquor License Board 0.0 0.0 2.5 0.0 0.0 0.0M-R: American Rescue Plan Act 0.0 0.0 0.0 680.3 0.0 0.0M-R: Art and Culture 0.0 0.0 9.6 0.1 0.0 0.0M-R: Baltimore City Public Schools 19.0 0.0 275.3 0.0 0.0 0.0M-R: Cable and Communications 0.0 0.0 0.7 0.7 0.0 0.0M-R: Civic Promotion 0.0 0.0 10.6 0.0 0.0 0.0M-R: Conditional Purchase Agreements 0.0 0.0 4.0 0.0 0.0 0.0M-R: Contingent Fund 0.0 0.0 1.0 0.0 0.0 0.0M-R: Convention Center Hotel 0.0 0.0 12.1 0.0 0.0 0.0M-R: Convention Complex 0.0 0.0 11.2 10.7 0.0 0.0M-R: Debt Service 0.0 0.0 88.6 15.8 0.0 0.0M-R: Educational Grants 0.0 0.0 11.3 13.6 0.0 0.0M-R: Employees’ Retirement Contribution 0.0 0.0 2.2 0.0 0.0 0.0M-R: Environmental Control Board 0.0 0.0 1.6 0.3 0.0 0.0M-R: Health and Welfare Grants 0.0 0.0 1.4 0.0 0.0 0.0M-R: Innovation Fund 0.0 0.0 0.0 0.2 0.0 0.0M-R: Miscellaneous General Expenses 0.0 0.2 25.6 0.1 0.0 0.0M-R: Office of Children and Family Success 0.0 0.4 4.4 35.1 0.0 0.0M-R: Office of Employment Development 0.0 0.0 8.5 26.2 0.0 0.0M-R: Office of Homeless Services 0.0 0.0 12.4 55.7 0.0 0.0M-R: Office of Information and Technology 7.0 0.0 37.5 0.1 13.2 0.0M-R: Office of Neighborhood Safety andEngagement
0.0 0.0 8.7 16.2 0.0 0.0
M-R: Office of the Inspector General 0.0 0.0 2.3 0.0 0.0 0.0M-R: Office of the Labor Commissioner 0.0 0.0 1.0 0.0 0.0 0.0M-R: Retirees’ Benefits 0.0 0.0 33.2 0.0 0.0 0.0M-R: Self-Insurance Fund 0.0 0.0 23.9 0.0 0.0 0.0M-R: TIF Debt Service 0.0 0.0 17.5 0.0 0.0 0.0Mayoralty 7.5 0.0 11.6 1.6 0.0 0.0Municipal and Zoning Appeals 0.0 0.0 0.5 0.0 0.0 0.0Office of Equity and Civil Rights 0.0 0.0 2.7 0.2 0.0 0.0Planning (1.3) 0.0 7.0 3.2 0.0 0.0Police 0.0 0.0 521.7 33.4 0.0 0.0Public Works 279.2 548.5 96.4 13.0 0.0 0.0Recreation and Parks 32.2 0.0 45.7 14.1 0.0 0.0Sheriff 0.0 0.0 21.7 2.9 0.0 0.0State’s Attorney 0.0 0.0 38.4 12.0 0.0 0.0Transportation 74.7 35.5 125.2 15.6 0.0 23.9Grand Total 487.6 584.8 1,992.8 1,239.0 143.3 26.9Table in millions of dollars.
70

Fund Balances
Fund Balance Categories
A fund balance is the accumulated difference between actual revenues and expenditures over time in each fund.The City utilizes generally accepted accounting principles (GAAP) and classifies its GAAP fund balance into thefollowing categories:
Nonspendable fund balance
Nonspendable fund balance includes activity that is not in spendable form such as inventories, prepaid amounts,long-term portions of loans and notes receivable, and activities that are legally or contractually required to remainintact such as principal balance in a permanent fund.
Restricted fund balance
Restricted fund balance has constraints placed upon the use of the resources either by external creditors, grantors,contributors, or imposed by law through a constitutional provision or enabling legislation.
Committed fund balance
Committed fund balance can be used only for specific purposes pursuant to constraints imposed by the formalvote of the Board of Estimates (BOE), the City’s highest level decision-making authority. Amounts in this categorymay be redeployed for other purposes with the formal vote of the BOE. Committed amounts cannot be used forany other purpose unless the City removes or changes the specific use by taking the same type of action it usedto previously commit the amounts.
Assigned fund balance
Assigned fund balance includes amounts that are constrained by the City to be used for specific purposes, but areneither restricted nor committed for a stated intended use as established by the BOE. The BOE has delegated theauthority to assign amounts for a specific purpose to the City’s Director of Finance. These are resources wherethe constraints/restrictions are less binding than that for committed funds. For governmental funds, other thanthe General Fund, this is the residual amount within the fund that is not restricted or committed.
Unassigned fund balance
Unassigned fund balance is the residual amount of the General Fund not included in the four categories describedabove. The General Fund is the only positive unassigned fund balance amount. In other governmental funds, ifexpenditures incurred for the specific purpose exceed the amounts restricted, committed, or assigned to thosepurposes, negative unassigned fund balance may be reported.
71

BUDGET PLAN Fiscal 2022 Summary of the Adopted Budget
Fund Balances for Governmental Funds
As of June 30, 2020, the City’s governmental funds reported combined ending fund balances of $975.9 million.The focus of the City’s governmental funds is to provide information on near-term inflows, outflows, and balancesof resources that are available for spending. Such information is useful in assessing the City’s financing require-ments.
Types ofmajor governmental funds reported by theCity include theGeneral Fund, Grants funds, andCapital Projectfunds. Data from the remaining governmental funds are combined into a single, aggregated presentation as othernon-major funds. Projected fund balances for Fiscal 2021 and Fiscal 2022 are unaudited.
FY11* FY12 FY13 FY14 FY15 FY16 FY17 FY18 FY19 FY20
Restricted Nonspendable Unassigned Assigned
Fund Balance for All Governmental Funds
Dol
lars
in m
illion
s
279.2M 253.6M315.7M
269.9M 269.0M
659.1M722.6M
848.8M
981.9M 975.9M
* During Fiscal 2011, the City implemented GASB Statement No. 54 which changed the format for fund balance presentation.
72
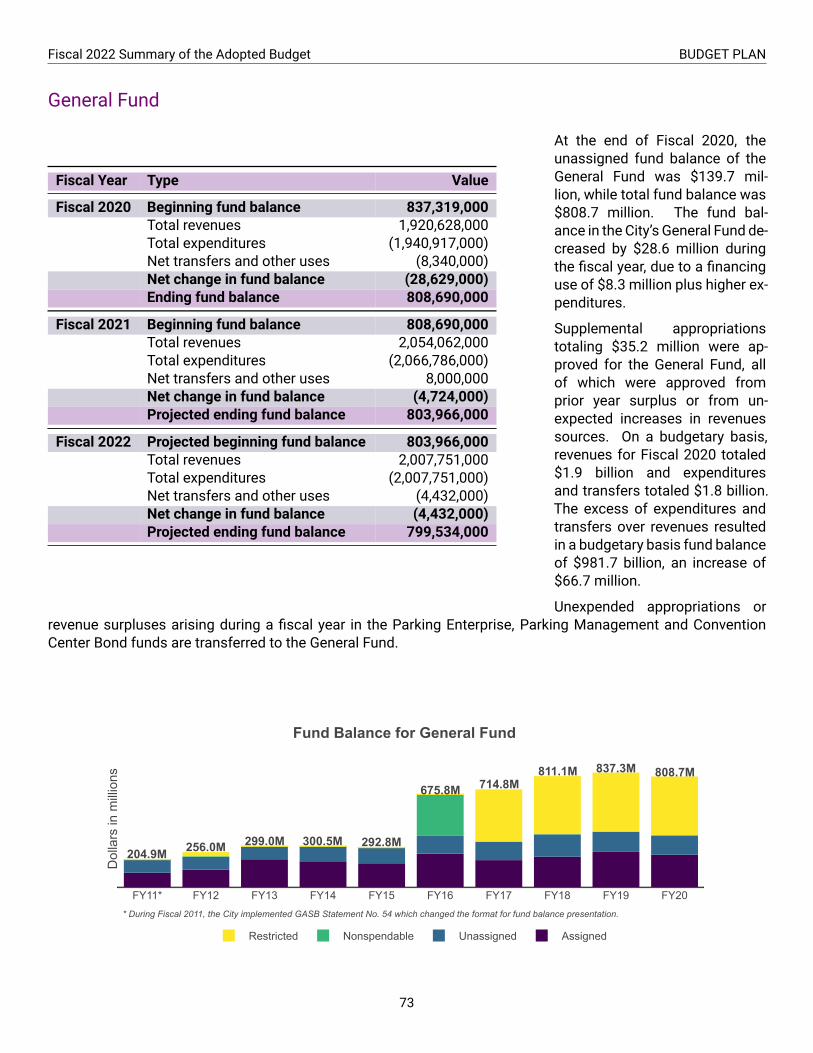
Fiscal 2022 Summary of the Adopted Budget BUDGET PLAN
General Fund
Fiscal Year Type Value
Beginning fund balance 837,319,000Total revenues 1,920,628,000Total expenditures (1,940,917,000)Net transfers and other uses (8,340,000)Net change in fund balance (28,629,000)
Fiscal 2020
Ending fund balance 808,690,000
Beginning fund balance 808,690,000Total revenues 2,054,062,000Total expenditures (2,066,786,000)Net transfers and other uses 8,000,000Net change in fund balance (4,724,000)
Fiscal 2021
Projected ending fund balance 803,966,000
Projected beginning fund balance 803,966,000Total revenues 2,007,751,000Total expenditures (2,007,751,000)Net transfers and other uses (4,432,000)Net change in fund balance (4,432,000)
Fiscal 2022
Projected ending fund balance 799,534,000
At the end of Fiscal 2020, theunassigned fund balance of theGeneral Fund was $139.7 mil-lion, while total fund balance was$808.7 million. The fund bal-ance in the City’s General Fund de-creased by $28.6 million duringthe fiscal year, due to a financinguse of $8.3 million plus higher ex-penditures.
Supplemental appropriationstotaling $35.2 million were ap-proved for the General Fund, allof which were approved fromprior year surplus or from un-expected increases in revenuessources. On a budgetary basis,revenues for Fiscal 2020 totaled$1.9 billion and expendituresand transfers totaled $1.8 billion.The excess of expenditures andtransfers over revenues resultedin a budgetary basis fund balanceof $981.7 billion, an increase of$66.7 million.
Unexpended appropriations orrevenue surpluses arising during a fiscal year in the Parking Enterprise, Parking Management and ConventionCenter Bond funds are transferred to the General Fund.
FY11* FY12 FY13 FY14 FY15 FY16 FY17 FY18 FY19 FY20
Restricted Nonspendable Unassigned Assigned
Fund Balance for General Fund
Dol
lars
in m
illion
s
204.9M 256.0M 299.0M 300.5M 292.8M
675.8M 714.8M811.1M 837.3M 808.7M
* During Fiscal 2011, the City implemented GASB Statement No. 54 which changed the format for fund balance presentation.
73

BUDGET PLAN Fiscal 2022 Summary of the Adopted Budget
Assigned and Unassigned Fund Balance
Assigned and unassigned fund balance are particularly useful measures of the City’s net resources. They showthe amount earmarked for specific purposes by the City or available for spending at the end of the fiscal year,respectively
The assigned fund balance includes earmarks for general legal liability, implementation of the City’s EnterpriseResource Planning system, and a match for school construction under the 21st Century Schools program.
The unassigned fund balance is also known as the Budget Stabilization Reserve, or the Rainy Day Fund. TheBudget Stabilization Reserve has a $141.9 million balance, representing about 7.1% of the General Fund. The Citydid not contribute to the Reserve in Fiscal 2020 and used this funding to address shortfalls in revenue resultingfrom the COVID-19 pandemic. The Fiscal 2022 budget includes a $5 million contribution to the reserve. See theKey Budgetary and Financial Policies section for more information on Reserve Policies.
Grant Funds
Fiscal Year Type Value
Beginning fund balance 21,606,000Total revenues 236,726,000Total expenditures (273,949,000)Net transfers and other uses 15,617,000Net change in fund balance (21,606,000)
Fiscal 2020
Ending fund balance 0
Beginning fund balance 0Total revenues 348,421,000Total expenditures (348,421,000)Net transfers and other uses 0Net change in fund balance 0
Fiscal 2021
Projected ending fund balance 0
Projected beginning fund balance 0Total revenues 1,102,104,000Total expenditures (1,102,104,000)Net transfers and other uses 0Net change in fund balance 0
Fiscal 2022
Projected ending fund balance 0
The Grants Revenue Fund is usedto account for the spending ofvarious Federal, State and specialpurpose grant funds. Most ofthese grants are funded on an ex-penditure reimbursement basis.Should any portion of the grantsreceivable be determined uncol-lectable, the balance may be writ-ten off against the General Fund.
The Grants Revenue Fund had anassigned fund balance of $0 mil-lion, a decrease of $21.6 millionover prior year. This decreasewas primarily caused by higherexpenditures in the Grants Rev-enue Fund.
74

Fiscal 2022 Summary of the Adopted Budget BUDGET PLAN
Capital Project Funds
Fiscal Year Type Value
Beginning fund balance 87,946,000Total revenues 167,792,000Total expenditures (258,800,000)Net transfers and other uses 112,528,000Net change in fund balance 21,520,000
Fiscal 2020
Ending fund balance 109,466,000
TheCapital Fund has an assignedand restricted fund balance of$109.5 million, an increase of$21.5 million over prior year. Thisincrease was primarily caused byproceeds from the sale of gen-eral obligation bonds. Capitalproject appropriations are consid-ered expended until they are de-appropriated.
Non-Major Funds
Fiscal Year Type Value
Beginning fund balance 34,986,000Total revenues 66,619,000Total expenditures (41,958,000)Net transfers and other uses (1,898,000)Net change in fund balance 22,763,000
Fiscal 2020
Ending fund balance 57,749,000
Non-Major governmental fundsinclude the Community Devel-opment Block Grant, BaltimoreCasino, Housing Trust Fund,State Video Lottery Terminal,School Construction, Childrenand Youth, and Table Gamesfunds.
75

Agency Detail
The Agency Detail publications, volume I and volume II, contain Fiscal 2022 budget information by agency andservice. Please refer to these volumes for further detail to support the information in this Summary of the AdoptedBudget publication.
Agency-Level
The agency-level detail section, which is available for every agency in the City, has the following seven components:
• A1: Agency organizational chart• A2: Agency description• A3: Agency operating budget by fund, with key operating budget items• A4: Agency capital budget• A5: Agency operating budget by service• A6: Agency operating budget by object• A7: Agency budgeted positions by service
Below is an annotated example of an agency-level detail section.
A1:
Age
ncy
org
aniz
atio
nal
ch
art,
wh
ich
sh
ow
s th
e se
rvic
es w
ith
in e
ach
age
ncy
.
76

Fiscal 2022 Summary of the Adopted Budget BUDGET PLAN
A2:
Age
ncy
d
escr
ipti
on
.
A3:
Age
ncy
op
erat
ing
bu
dge
t n
um
ber
s b
y fu
nd
, wit
h k
ey
op
erat
ing
bu
dge
t it
ems
exp
ecte
d d
uri
ng
fisc
al y
ear.
A4:
Age
ncy
cap
ital
bu
dge
t n
um
ber
s b
y fu
nd
, wit
h k
ey
cap
ital
bu
dge
t it
ems
exp
ecte
d
du
rin
g fi
scal
yea
r.
77

BUDGET PLAN Fiscal 2022 Summary of the Adopted Budget
A5:
Age
ncy
op
erat
ing
bu
dge
t b
y se
rvic
e.
A6:
Age
ncy
o
per
atin
g b
ud
get
by
ob
ject
.
A7:
Age
ncy
bu
dge
ted
p
osi
tio
ns
by
serv
ice.
78

Fiscal 2022 Summary of the Adopted Budget BUDGET PLAN
Service-Level
The service-level detail section, which is available for every service in the City, has the following four components:
• S1: Service description and operating budget and positions by fund• S2: Service performance measures• S3: Service key operating budget items• S4: Service change table• S5: Service operating budget by object and activity• S6: Service permanent full-time funded positions by fund
Below is an annotated example of a service-level detail section.
S1:
Serv
ice
des
crip
tio
n,
bu
dge
t, a
nd
po
siti
on
info
rmat
ion
.
S2:
Serv
ice
per
form
ance
M
easu
res
wit
h b
rief
exp
lan
atio
n.
S3:
Key
o
per
atin
g b
ud
get
item
s ex
pe
cted
in
this
ser
vice
d
uri
ng
fisc
al y
ear.
79

BUDGET PLAN Fiscal 2022 Summary of the Adopted Budget
S4:
Ch
ange
tab
le li
stin
g al
l th
e
chan
ges –
wit
h o
r w
ith
ou
t se
rvic
e im
pac
t –
bet
wee
n f
isca
l yea
rs.
This
d
emo
nst
rate
s fi
xed
co
st
adju
stm
ents
an
d b
ud
get
dec
isio
ns.
S5:
Op
erat
ing
bu
dge
t b
y o
bje
ct a
nd
ac
tivi
ty
S6:
Nu
mb
er a
nd
co
st o
f fu
nd
ed
fu
ll-ti
me
per
man
ent
po
siti
on
s b
y fu
nd
80
Revenue
FISCAL2022
SUMMARY OF THEADOPTED BUDGET
Revenue

Intentionally left blank.
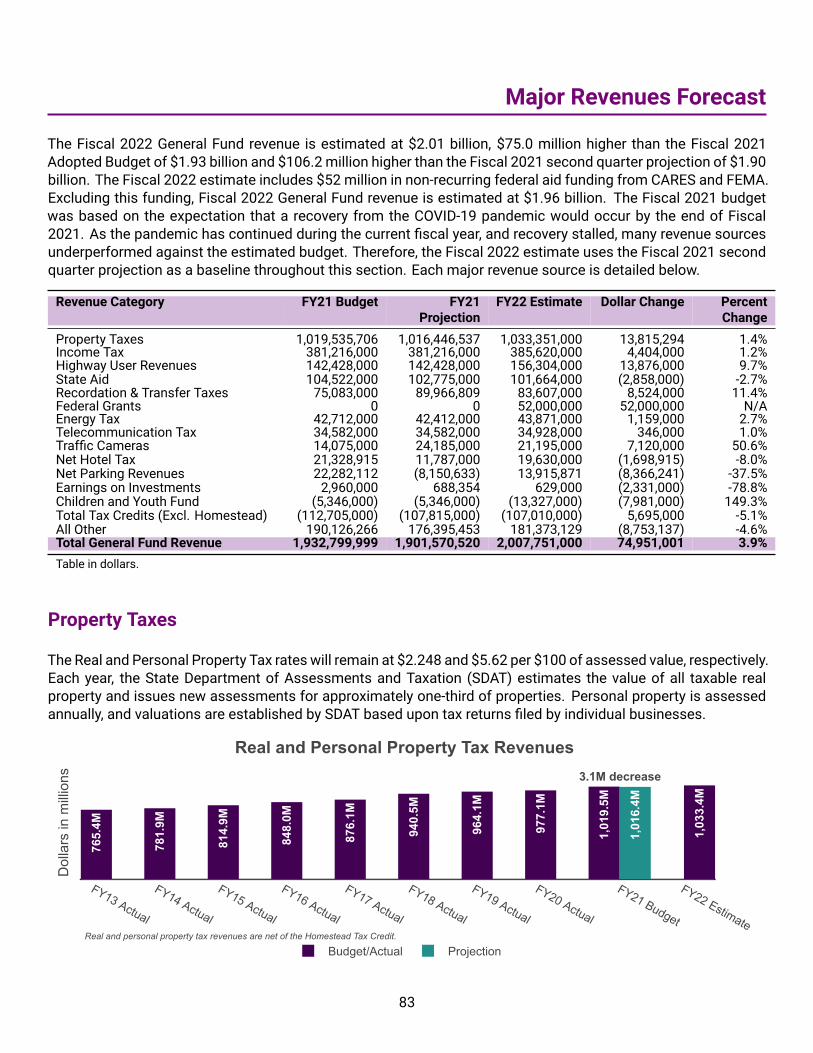
Major Revenues Forecast
The Fiscal 2022 General Fund revenue is estimated at $2.01 billion, $75.0 million higher than the Fiscal 2021Adopted Budget of $1.93 billion and $106.2 million higher than the Fiscal 2021 second quarter projection of $1.90billion. The Fiscal 2022 estimate includes $52 million in non-recurring federal aid funding from CARES and FEMA.Excluding this funding, Fiscal 2022 General Fund revenue is estimated at $1.96 billion. The Fiscal 2021 budgetwas based on the expectation that a recovery from the COVID-19 pandemic would occur by the end of Fiscal2021. As the pandemic has continued during the current fiscal year, and recovery stalled, many revenue sourcesunderperformed against the estimated budget. Therefore, the Fiscal 2022 estimate uses the Fiscal 2021 secondquarter projection as a baseline throughout this section. Each major revenue source is detailed below.
Revenue Category FY21 Budget FY21Projection
FY22 Estimate Dollar Change PercentChange
Property Taxes 1,019,535,706 1,016,446,537 1,033,351,000 13,815,294 1.4%Income Tax 381,216,000 381,216,000 385,620,000 4,404,000 1.2%Highway User Revenues 142,428,000 142,428,000 156,304,000 13,876,000 9.7%State Aid 104,522,000 102,775,000 101,664,000 (2,858,000) -2.7%Recordation & Transfer Taxes 75,083,000 89,966,809 83,607,000 8,524,000 11.4%Federal Grants 0 0 52,000,000 52,000,000 N/AEnergy Tax 42,712,000 42,412,000 43,871,000 1,159,000 2.7%Telecommunication Tax 34,582,000 34,582,000 34,928,000 346,000 1.0%Traffic Cameras 14,075,000 24,185,000 21,195,000 7,120,000 50.6%Net Hotel Tax 21,328,915 11,787,000 19,630,000 (1,698,915) -8.0%Net Parking Revenues 22,282,112 (8,150,633) 13,915,871 (8,366,241) -37.5%Earnings on Investments 2,960,000 688,354 629,000 (2,331,000) -78.8%Children and Youth Fund (5,346,000) (5,346,000) (13,327,000) (7,981,000) 149.3%Total Tax Credits (Excl. Homestead) (112,705,000) (107,815,000) (107,010,000) 5,695,000 -5.1%All Other 190,126,266 176,395,453 181,373,129 (8,753,137) -4.6%Total General Fund Revenue 1,932,799,999 1,901,570,520 2,007,751,000 74,951,001 3.9%Table in dollars.
Property Taxes
The Real and Personal Property Tax rates will remain at $2.248 and $5.62 per $100 of assessed value, respectively.Each year, the State Department of Assessments and Taxation (SDAT) estimates the value of all taxable realproperty and issues new assessments for approximately one-third of properties. Personal property is assessedannually, and valuations are established by SDAT based upon tax returns filed by individual businesses.
1,01
9.5M
1,03
3.4M
765.
4M
781.
9M
814.
9M
848.
0M
876.
1M
940.
5M
964.
1M
977.
1M
1,01
6.4M
FY13 Actual
FY14 Actual
FY15 Actual
FY16 Actual
FY17 Actual
FY18 Actual
FY19 Actual
FY20 Actual
FY21 Budget
FY22 Estimate
Budget/Actual Projection
Real and Personal Property Tax Revenues
Dol
lars
in m
illion
s 3.1M decrease
Real and personal property tax revenues are net of the Homestead Tax Credit.
83

REVENUE Fiscal 2022 Summary of the Adopted Budget
The Fiscal 2022 Real and Personal PropertyTax revenues are projected at $1.03 billion,representing an increase of $13.8 millionfrom $1.02 billion in Fiscal 2021. Real Prop-erty Taxes, excluding the $22.6 million re-duction for the Assessment Tax Credit (ATC)cost, also known as the Homestead TaxCredit, are estimated to yield $915.5 million,an increase of 1.9% or $17.0 million from theFiscal 2021 budget. Personal Property Taxesare estimated to yield $117.9million in Fiscal2022, a decrease of 2.6% or $3.2million fromthe Fiscal 2021 Budget.
Real property revenues are net of the Home-stead Tax Credit, which protects owner-occupied residential properties from assess-ment increases that exceed 4% growth. Forexample, if an eligible property were to expe-rience an annual increase in assessment of10%, the taxable valuewould only increase by4% due to theHomestead Tax Credit, generat-ing tax savings to the property owner. Over-all, the City’s Homestead Tax Credit cost isprojected to decrease by $1.6 million from$24.2 million in Fiscal 2021 to $22.6 millionin Fiscal 2022.
Fiscal Year AssessmentGroup
Full CashValue
AssessmentIncrease
Fiscal 2011 Group 1 (2.6%)Fiscal 2012 Group 2 (8.7%)Fiscal 2013 Group 3 (6.8%)Fiscal 2014 Group 1 (3.1%)Fiscal 2015 Group 2 7.0%Fiscal 2016 Group 3 9.6%Fiscal 2017 Group 1 10.9%Fiscal 2018 Group 2 6.2%Fiscal 2019 Group 3 3.6%Fiscal 2020 Group 1 8.4%Fiscal 2021 Group 2 8.2%Fiscal 2022 Group 3 3.9%
For Fiscal 2022, SDAT reassessed Group 3, which is indicatedby the lower shaded area on the map above.
Assessments for properties in Group 3 grew on average 3.9%over three years. This figure includes 0.9% growth for com-mercial property assessments and 6.5% growth for residen-tial property assessments. Comparatively, growth across theState averaged 8.1%, which reflects commercial assessmentgrowth of 9.7% and residential assessment growth of 7.5%.The Fiscal 2022 reassessment represents the eighth consec-utive year of assessment increases in the City after four con-secutive years of decline.
Assessment increases are phased in over three years, while as-sessment decreases are taken immediately. Group 3 assess-ment data shows that out of 70,314 taxable properties, 13,998will experience immediate decline in Fiscal 2022. Among theproperties that have declined in value, 12,753 or 91.1% are res-idential properties.
84

Fiscal 2022 Summary of the Adopted Budget REVENUE
Property Tax Credits
The Fiscal 2022 estimate includes a total of $107.0 million of foregone property tax revenue due to the cost of taxcredits and incentive programs, not including the Homestead Tax Credit, which is addressed separately.
In Fiscal 2020, the City reached a significant milestone in fully implementing the 20 Cents by 2020 program. Thistax reduction program, formally known as the Targeted Homeowners Tax Credit (THTC), provides tax relief forowner-occupied properties. The average effective rate for owner-occupied properties with the credit is estimatedat $2.048 per $100 of assessed value, and now saves the average homeownermore than $330 annually in propertytaxes. In Fiscal 2022, the City will maintain this rate for owner-occupied residents. The following chart shows thehistory of the program to date.
2012 2014 2016 2018 2020 2022
Property Tax Rate Effective Rate
Effective Property Tax Rate History (Per $100 of Assessed Value)
2.248
2.048
$0.20 Property Tax Reduction
2.0742.048
2.155
2.130 2.124 2.107
2.249
2.100
2.2682.248
2.268
Dol
lars
From Fiscal 2012 to Fiscal 2016, tax credit and incentive programs, excluding the Homestead Tax Credit, ac-counted for an annual average cost of $41.2 million or 5.4% of the real property tax revenues. In Fiscal 2022,these programs are expected to cost $107.0 million or 11.4% of the estimated real property taxes. Including theHomestead Tax Credit, foregone real property tax revenue due to tax credits and incentive programs is estimatedat $129.6 million or 13.8%.
14.8%
12.5%13.7% 13.5% 14.3% 14.8%
13.8%
5.4%
8.2%9.8% 10.2%
11.6% 12.2% 11.4%
FY12-16 Avg. Cost FY17 Actual FY18 Actual FY19 Actual FY20 Actual FY21 Budget FY22 Estimate
Total Tax Credits (Incl. Homestead) Total Tax Credits (Excl. Homestead)
Tax Credits as a Percent of Real Property
Perc
ent
85

REVENUE Fiscal 2022 Summary of the Adopted Budget
Tax Credit History Cost as a Percentage of Real Property Tax
Tax Credits FY12-16Avg. Cost
FY17Actual
FY18Actual
FY19Actual
FY20Actual
FY21Budget
FY22Estimate
Real Property Tax 763.8 815.8 851.6 856.9 893.3 922.7 938.1Targeted Homeowners (12.2) (26.3) (26.1) (30.4) (33.5) (35.0) (31.3)Enterprise Zone Tax Credit (13.4) (17.2) (24.0) (23.4) (20.5) (24.5) (20.8)Historic Property (7.3) (9.4) (9.5) (11.2) (10.5) (11.1) (12.1)Brownfield and Other (5.2) (9.2) (15.6) (13.1) (20.3) (18.7) (18.5)Supplemental Homeowner’s (0.0) (0.0) (1.4) (1.6) (1.2) (1.4) (1.4)High-Performance Market-RateRental Housing
(0.1) (2.6) (5.0) (4.4) (15.2) (18.9) (20.1)
Newly Constructed Dwellings (3.0) (2.3) (2.0) (2.2) (1.7) (2.1) (1.8)Public Safety Officer (0.0) (0.0) (0.0) (1.1) (0.7) (0.9) (0.9)
Total Tax Credits (Excl. ATC) (41.2) (67.0) (83.6) (87.5) (103.6) (112.7) (107.0)Homestead (ATC) (72.2) (35.1) (33.1) (28.4) (24.1) (24.2) (22.6)Total Tax Credits (Incl. ATC) (113.4) (102.1) (116.7) (116.0) (127.8) (136.9) (129.6)Table in millions of dollars.
Income Tax
381.
2M
385.
6M
278.
5M
284.
4M
300.
0M 346.
7M
335.
2M
346.
8M
371.
6M
395.
9M
381.
2MFY13 Actual
FY14 Actual
FY15 Actual
FY16 Actual
FY17 Actual
FY18 Actual
FY19 Actual
FY20 Actual
FY21 Budget
FY22 Estimate
Budget/Actual Projection
Income Tax Revenue
Dol
lars
in m
illion
s
The Fiscal 2022 estimate for local Income Tax is $385.6 million. This estimate is $4.4 million or 1.2% higher thanboth the Fiscal 2021 Adopted Budget and Fiscal 2021 second quarter projection of $381.2 million. The City’sIncome Tax rate is 3.2%, the maximum allowed under State law.
The COVID-19 pandemic continues to have a significant impact on the labor market, especially in the hardest hitsectors of retail, tourism, and hospitality. The local and national unemployment rates are expected to remainhigher than pre-pandemic levels. As of December 2020, the local unemployment rate was 7.9% and the nationalrate was 6.7%, compared to the March 2020 pre-pandemic rates of 4.8% locally and 3.6% nationally. While unem-ployment rates remain high, these are down from the April 2020 unemployment peaks of 11.6% locally and 14.7%nationally.
The pandemic’s influence on employment has been uneven, with a disproportionately higher impact on lower in-come individuals and a lesser impact on City residents with middle and higher incomes. The unequal impact,
86

Fiscal 2022 Summary of the Adopted Budget REVENUE
coupled with federal CARES Act and State assistance programs, led to no change in income tax withholding re-ceipts, which continue to remain strong. The Maryland RELIEF Act, enacted in February 2021, will provide a taxexemption on unemployment benefits received by recipients for Tax Years 2020 and 2021. It is estimated this willlead to a reduction in income tax receipts for the City by an estimated $2.3 million in Fiscal 2022.
The City’s taxable income base remains strong even amidst the pandemic. The most recent data from the State’sannual Income Tax Summary report shows the number of high‐income households, defined as those earningabove $100,000, has increased by 67.0% during the period of 2010 to 2019, making up 14.4% of all taxable returns.Additionally, despite population losses and a decrease in the number of tax returns filed, the City has seen anincrease in its taxable income, showing that the population in Baltimore City is on average earning a higher levelof income than in years past. The average taxable value per return for tax year 2019 was $1,356, up 2.7% from taxyear 2018.
State Highway User Revenue
142.
4M
156.
3M
129.
9M
132.
3M
137.
7M
142.
2M
139.
3M
146.
2M
146.
1M
134.
7M
142.
4M
FY13 Actual
FY14 Actual
FY15 Actual
FY16 Actual
FY17 Actual
FY18 Actual
FY19 Actual
FY20 Actual
FY21 Budget
FY22 Estimate
Budget/Actual Projection
State Highway User Revenue
Dol
lars
in m
illion
s
The Fiscal 2022 projection for Highway User Revenue (HUR) is $156.3 million. This is an increase of $13.9 millionor 9.7% from both the Fiscal 2021 Adopted Budget and Fiscal 2021 second quarter projection of $142.4 million.
HUR is generated by the Fuel Tax, Titling Tax, Vehicle Registration Fees, Corporate Income Tax, and a portion of theSales and Use Tax. These funds are distributed to localities by the State. Driving and car purchasing habits, whichimpact the amount of revenue generated, were affected by COVID-19 and will continue to evolve as the pandemiccontinues and vaccination and response efforts expand. The Fiscal 2022 estimate is based on the State forecastand assumes a rebound to pre-COVID Fiscal 2020 expectations.
A change to State law in 2018 raised the City’s share of total Statewide HUR from 7.7% to 8.3% for each fiscal yearfrom Fiscal 2020 to Fiscal 2025, which is reflected in the HUR figures above. The City’s HUR is still $71.0 millionor 31.2% below the Fiscal 2007 peak of $227.3 million. During the Great Recession, local shares of HUR werereduced and some funds were shifted to the State’s General Fund. The result for the City was a sharp reductionin funds available for transportation related capital projects.
87

REVENUE Fiscal 2022 Summary of the Adopted Budget
227.3M
156.3M
FY06 Actual
FY07 Actual
FY08 Actual
FY09 Actual
FY10 Actual
FY11 Actual
FY12 Actual
FY13 Actual
FY14 Actual
FY15 Actual
FY16 Actual
FY17 Actual
FY18 Actual
FY19 Actual
FY20 Actual
FY21 Budget
FY22 Estimate
150M
200M
State Highway User Revenue (Historical)
Dol
lars
in m
illion
s
State law requires that HUR funds must be used by local governments for eligible transportation-related uses.Eligible uses include street construction or maintenance, transportation facilities, street cleaning, police enforce-ment of traffic laws, stormwater drainage of roads, street lighting, and maintenance of footpaths and bicycletrails. These expenditures must equal or exceed the amount of revenue from HUR, demonstrating that the City iscompliant with State law. Any HUR-eligible costs greater than revenue are subsidized by the General Fund.
Service Fiscal 2022Budget
Transportation500 - Street Lighting 20.1681 - Administration 10.1683 - Street Management 34.3684 - Traffic Management 11.6685 - Special Events (Special Event Support only) 1.2688 - Snow and Ice Control 6.8689 - Vehicle Impounding and Disposal 8.3690 - Sustainable Transportation 4.4691 - Public Rights-of-Way Landscape Management 4.5692 - Bridge and Culvert Management 3.8696 - Street Cuts Management 0.8697 - Traffic Safety (Pedestrian Safety, Traffic Engineering, Sign Fabrication, Street Markings only) 6.0
Public Works661 - Public Right-of-Way Cleaning (Cleaning Business Dist., Street & Alley, Graffiti Removal only) 16.3660/676 - DPW Admin (admin. costs allocated for HUR-eligible activities on budget basis) 1.1
Recreation and Parks654 - Urban Forestry (Tree Maintenance only) 3.1
Police816 - Special Operations Section (Traffic Section, Traffic Safety, Crossing Guards only) 8.0
Debt Service123 - General Debt Service (Highways only) 14.6
Capital Budget Projects4.5
TotalBudgeted HUR-Eligible Expenses Total 159.5Projected HUR Revenue 156.3HUR-Eligible Expenses Subsidized by General Fund 3.2
Table in millions of dollars.
88
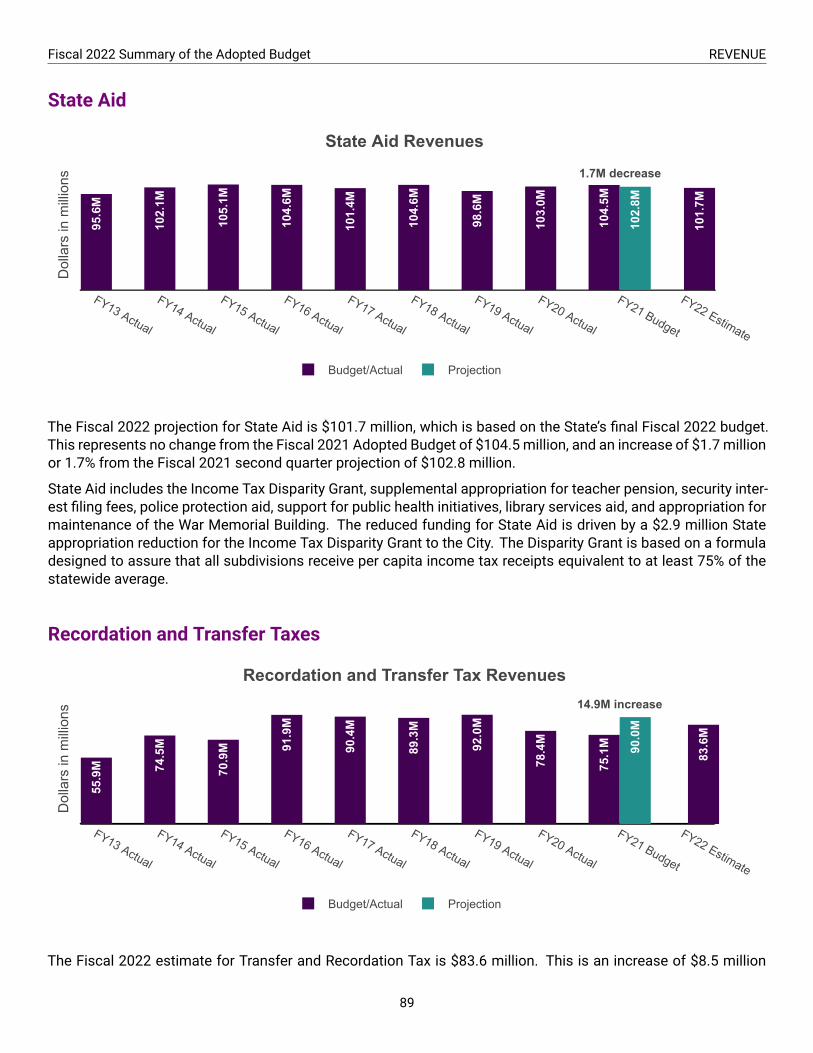
Fiscal 2022 Summary of the Adopted Budget REVENUE
State Aid
104.
5M
101.
7M
95.6
M
102.
1M
105.
1M
104.
6M
101.
4M
104.
6M
98.6
M
103.
0M
102.
8M
FY13 Actual
FY14 Actual
FY15 Actual
FY16 Actual
FY17 Actual
FY18 Actual
FY19 Actual
FY20 Actual
FY21 Budget
FY22 Estimate
Budget/Actual Projection
State Aid Revenues
Dol
lars
in m
illion
s 1.7M decrease
The Fiscal 2022 projection for State Aid is $101.7 million, which is based on the State’s final Fiscal 2022 budget.This represents no change from the Fiscal 2021 Adopted Budget of $104.5 million, and an increase of $1.7 millionor 1.7% from the Fiscal 2021 second quarter projection of $102.8 million.
State Aid includes the Income Tax Disparity Grant, supplemental appropriation for teacher pension, security inter-est filing fees, police protection aid, support for public health initiatives, library services aid, and appropriation formaintenance of the War Memorial Building. The reduced funding for State Aid is driven by a $2.9 million Stateappropriation reduction for the Income Tax Disparity Grant to the City. The Disparity Grant is based on a formuladesigned to assure that all subdivisions receive per capita income tax receipts equivalent to at least 75% of thestatewide average.
Recordation and Transfer Taxes
75.1
M
83.6
M
55.9
M 74.5
M
70.9
M 91.9
M
90.4
M
89.3
M
92.0
M
78.4
M
90.0
M
FY13 Actual
FY14 Actual
FY15 Actual
FY16 Actual
FY17 Actual
FY18 Actual
FY19 Actual
FY20 Actual
FY21 Budget
FY22 Estimate
Budget/Actual Projection
Recordation and Transfer Tax Revenues
Dol
lars
in m
illion
s 14.9M increase
The Fiscal 2022 estimate for Transfer and Recordation Tax is $83.6 million. This is an increase of $8.5 million
89

REVENUE Fiscal 2022 Summary of the Adopted Budget
or 11.4% from the Fiscal 2021 Adopted Budget of $75.1 million, but a decrease of $6.4 million or 7.1% from theFiscal 2021 second quarter projection of $90.0 million.
Recordation and Transfer Tax receipts depend on the number and value of real estate transactions. RecordationTax receipts, in particular, are also driven by refinancing activity. These revenues are highly sensitive to changesin the real estate market and can change dramatically from year to year. For example, receipts from these tworevenue sources reached a combined peak of $116.7million in Fiscal 2006 during the pre‐Great Recession housingboom. After the collapse of the housingmarket two years later, they fell to $41.2million in Fiscal 2011, a decline of$75.5 million or 64.7%. Under the current circumstances, the City is experiencing unprecedented market activityfor both home sales and refinancing transactions. Real estate listing data from Bright MLS shows that the numberor residential properties sold are up an average of 20%, home sales price is up an average of 26%, and averagedays on the market are down 27% compared to the prior year. Market activity in Fiscal 2022 is expected to remainrobust, but down from the current market boom as mortgage rates tick up and the residential home sales marketslows down.
In Fiscal 2019, the City Council enacted City Council Bill 18‐0221 that implemented a “Yield Tax” on transactionsover $1 million and directed the revenue to the Affordable Housing Trust Fund. The Yield Tax is 0.15% of thecollected Recordation Tax and 0.6% of the collected Transfer Tax. Although the law exempts transactions under$1 million, most of the City’s General Fund Transfer and Recordation revenue comes from high‐value transactions.During calendar year 2020, the top 1.0% of transactions, those over $1 million, produced nearly 39.6% of theTransfer and Recordation revenue. Even a minor impact on housing transactions due to the law could lead tolower General Fund revenue.
Energy Taxes
42.7
M
43.9
M
39.3
M
40.9
M
41.0
M
41.2
M
39.7
M
42.0
M
43.1
M
41.7
M
42.4
M
FY13 Actual
FY14 Actual
FY15 Actual
FY16 Actual
FY17 Actual
FY18 Actual
FY19 Actual
FY20 Actual
FY21 Budget
FY22 Estimate
Budget/Actual Projection
Energy Tax Revenues
Dol
lars
in m
illion
s 0.3M decrease
The Fiscal 2022 estimate for Energy Tax is $43.9 million. This is an increase of $1.2 million or 2.7% from theFiscal 2021 Adopted Budget of $42.7 million, and an increase of $1.5 million or 3.4% from the Fiscal 2021 secondquarter projection of $42.4 million.
Energy Tax revenues include Electricity, Gas, Steam, Fuel Oil, and Liquid Petroleum Gas Taxes. The Fiscal 2022estimate is based on adjustments to rates and historical usage trends. In recent years, efficiencies in usage havebeen offset by rate increases; however, unseasonably warm or cold weather can also impact total revenues. Tele-work extending into at least early Fiscal 2022 will continue to lead to an increase in residential versus commercialenergy consumption.
90

Fiscal 2022 Summary of the Adopted Budget REVENUE
The Baltimore City Code mandates that the City’s Energy Tax be levied as a unit tax based on the number of unitsof energy delivered to users in Baltimore City. The units are as follows: kilowatt‐hours for electricity, therms fornatural gas, pounds for steam, and gallons for fuel oil and liquefied petroleum gas.
In accordance with Article 28, Section 25‐14, the annual energy tax rates are adjusted by the annual percentagechange in the Baltimore‐Columbia‐Towson Consumer Price Index (CPI) as reported by the United States Depart-ment of Labor. The metric is calculated by comparing December of the preceding calendar year to the Decemberof the next preceding calendar year. The CPI used for Fiscal 2022 is 1.43%, down from 1.83% in Fiscal 2021.
User Group Electricity(kWh)
Natural Gas(therm)
Fuel Oil (gal) LPG (gal) Steam (lbs)
Commercial 0.008946 0.115686 0.132216 0.161360 0.002814Residential 0.002865 0.034001 0.047719 0.051110 0.000808Nonprofit 0.006273 0.091899 0.114113 0.140314 0.001664
Net Parking Revenues
22.3
M
13.9
M
30.3
M 43.4
M
37.7
M 48.1
M
33.5
M
33.6
M
31.9
M
29.2
M
(8.2
M)
FY13 Actual
FY14 Actual
FY15 Actual
FY16 Actual
FY17 Actual
FY18 Actual
FY19 Actual
FY20 Actual
FY21 Budget
FY22 Estimate
Budget/Actual Projection
Parking Revenues (Net Transfer to the General Fund)
Dol
lars
in m
illion
s
30.4M decrease
The Fiscal 2022 Budget for the Net Parking revenue is estimated at $13.9million, $8.4million lower than the Fiscal2021 Budget of $22.3 million, but $22.1 million higher than the Fiscal 2021 second quarter projection which isestimated to reflect a deficit of $8.2 million.
Parking revenues are dependent upon vehicle usage, City enforcement of traffic laws, demand for garages, parkinglots, andmetered spaces. Primary generators of parking revenues include the Parking Tax, meters, fines, penaltieson fines, and income from City‐owned garages. Prior to Fiscal 2021, the City began experiencing a trend towardslower parking revenues as a consequence of the increased use of ridesharing alternatives such as Uber, Lyft,and scooters. However, the impact of COVID‐19 to the overall parking industry has caused parking revenues toexperience a major decline in Fiscal 2021.
Parking tax revenue has declined more than 55% compared to pre-pandemic average activity. Revenues from cus-tomers with monthly parking contracts have experienced a decline of over 40% while transient parking revenueshave decreased by more than 70%. The Fiscal 2021 second quarter projection assumes this trend will continuethrough calendar 2021, which explains the anticipated 30% reduction in the Fiscal 2022 revenue compared to pre-pandemic levels. Similarly, metered parking revenues have seen a 50% decline in Fiscal 2021 and are estimated to
91

REVENUE Fiscal 2022 Summary of the Adopted Budget
experience a 25% decline for Fiscal 2022 compared to pre-pandemic activity. Revenues from City-owned garageshave declined by 60% compared to pre-pandemic levels, with a 75% decline in revenues from transient parkingcustomers and a 45% decline from customers with monthly contracts. The Fiscal 2022 Budget for this revenuesource is estimated to be 30% lower than the receipts generated at the pre-pandemic average level of activity.
Shutdownsof facilities, permanent closure of sport and amusement venues, and teleworking policies are expectedto continue to reduce the use of parking facilities and services into Fiscal 2022.
Telecommunication Tax
34.6
M
34.9
M
33.3
M
33.4
M
33.5
M
33.8
M
34.4
M
32.8
M
34.5
M
35.8
M
34.6
M
FY13 Actual
FY14 Actual
FY15 Actual
FY16 Actual
FY17 Actual
FY18 Actual
FY19 Actual
FY20 Actual
FY21 Budget
FY22 Estimate
Budget/Actual Projection
Telecommunication Tax Revenue
Dol
lars
in m
illion
s
The Fiscal 2022 estimate for Telecommunication Tax revenue is $34.9 million, which is $0.3 million or 1.0% higherthan both the Fiscal 2021 Adopted Budget and Fiscal 2021 second quarter projection. The TelecommunicationTax is charged at a rate of $0.40 per month for each Centrex local exchange line and $4 per month for otherwireless or wired lines.
Hotel Tax
21.3
M
19.6
M25.9
M
26.7
M
26.7
M
29.6
M
30.5
M
28.4
M
28.5
M
21.9
M
11.8
M
FY13 Actual
FY14 Actual
FY15 Actual
FY16 Actual
FY17 Actual
FY18 Actual
FY19 Actual
FY20 Actual
FY21 Budget
FY22 Estimate
Budget/Actual Projection
Hotel Tax Revenue (Net Transfer to the General Fund)
Dol
lars
in m
illion
s
9.5M decrease
Amounts shown in plot represent total tax less Convention Center bonded debt service.
92
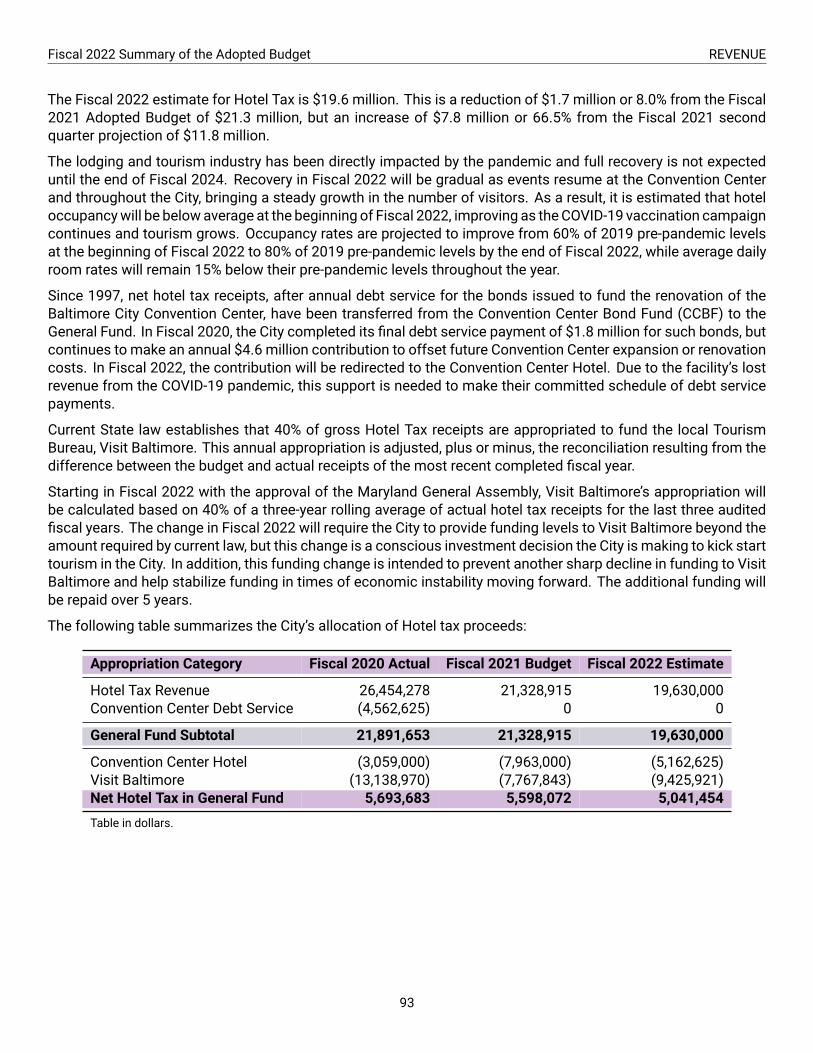
Fiscal 2022 Summary of the Adopted Budget REVENUE
The Fiscal 2022 estimate for Hotel Tax is $19.6 million. This is a reduction of $1.7 million or 8.0% from the Fiscal2021 Adopted Budget of $21.3 million, but an increase of $7.8 million or 66.5% from the Fiscal 2021 secondquarter projection of $11.8 million.
The lodging and tourism industry has been directly impacted by the pandemic and full recovery is not expecteduntil the end of Fiscal 2024. Recovery in Fiscal 2022 will be gradual as events resume at the Convention Centerand throughout the City, bringing a steady growth in the number of visitors. As a result, it is estimated that hoteloccupancywill be belowaverage at the beginning of Fiscal 2022, improving as theCOVID-19 vaccination campaigncontinues and tourism grows. Occupancy rates are projected to improve from 60% of 2019 pre-pandemic levelsat the beginning of Fiscal 2022 to 80% of 2019 pre-pandemic levels by the end of Fiscal 2022, while average dailyroom rates will remain 15% below their pre-pandemic levels throughout the year.
Since 1997, net hotel tax receipts, after annual debt service for the bonds issued to fund the renovation of theBaltimore City Convention Center, have been transferred from the Convention Center Bond Fund (CCBF) to theGeneral Fund. In Fiscal 2020, the City completed its final debt service payment of $1.8 million for such bonds, butcontinues to make an annual $4.6 million contribution to offset future Convention Center expansion or renovationcosts. In Fiscal 2022, the contribution will be redirected to the Convention Center Hotel. Due to the facility’s lostrevenue from the COVID-19 pandemic, this support is needed to make their committed schedule of debt servicepayments.
Current State law establishes that 40% of gross Hotel Tax receipts are appropriated to fund the local TourismBureau, Visit Baltimore. This annual appropriation is adjusted, plus or minus, the reconciliation resulting from thedifference between the budget and actual receipts of the most recent completed fiscal year.
Starting in Fiscal 2022 with the approval of the Maryland General Assembly, Visit Baltimore’s appropriation willbe calculated based on 40% of a three-year rolling average of actual hotel tax receipts for the last three auditedfiscal years. The change in Fiscal 2022 will require the City to provide funding levels to Visit Baltimore beyond theamount required by current law, but this change is a conscious investment decision the City is making to kick starttourism in the City. In addition, this funding change is intended to prevent another sharp decline in funding to VisitBaltimore and help stabilize funding in times of economic instability moving forward. The additional funding willbe repaid over 5 years.
The following table summarizes the City’s allocation of Hotel tax proceeds:
Appropriation Category Fiscal 2020 Actual Fiscal 2021 Budget Fiscal 2022 Estimate
Hotel Tax Revenue 26,454,278 21,328,915 19,630,000Convention Center Debt Service (4,562,625) 0 0
General Fund Subtotal 21,891,653 21,328,915 19,630,000
Convention Center Hotel (3,059,000) (7,963,000) (5,162,625)Visit Baltimore (13,138,970) (7,767,843) (9,425,921)Net Hotel Tax in General Fund 5,693,683 5,598,072 5,041,454
Table in dollars.
93

REVENUE Fiscal 2022 Summary of the Adopted Budget
The following pie chart shows the distribution of Hotel Tax revenues.
Visit Baltimore 9.4M (48.0%)
Convention Center Hotel 5.2M (26.3%)
Net Hotel Tax in General Fund 5.0M (25.7%)
GRAND TOTAL: 19.6 million
In calendar year 2019, the Baltimore Tourism Investment District (TID) was created and a 2% surcharge in additionto the 9.5% Hotel Tax began to be levied in December 2019. This 2% surcharge is managed by Visit Baltimore andfunds additional marketing strategies to promote the City and increase tourism.
Speed and Red Light Camera Violations
14.1
M 21.2
M
20.3
M
2.5M
0.5M
0.2M
0.1M
15.9
M
26.3
M 30.7
M
24.2
M
FY13 Actual
FY14 Actual
FY15 Actual
FY16 Actual
FY17 Actual
FY18 Actual
FY19 Actual
FY20 Actual
FY21 Budget
FY22 Estimate
Budget/Actual Projection
Speed and Red Light Camera Violation Revenues
Dol
lars
in m
illion
s 10.1M increase
Traffic camera revenue for Fiscal 2022 is projected at $21.2 million; an increase of $7.1 million or 50.6% from theprior year budget of $14.1 million and a decrease of $3.0 million or 12.4% from the Fiscal 2021 second quarterprojection of $21.2 million.
The Fiscal 2021 Budget projected a decline in citations due to expected decreases in traffic. However, in Fiscal2021 the program experienced some of the highest citation totals ever recorded as speeding increased due to lesstraffic congestion. The Fiscal 2021 Budget projected 273,000 paid citations and the Fiscal 2021 second quarterprojection increased that projection to 487,000 due to this shift in behavior. The Fiscal 2022 estimate takes intoaccount the behavior experienced during the COVID-19 shutdown and drivers adaptive behavior, which leads toless citations issued over time, and projects a decline of 64,000 or 13.2% paid citations from the second quarter
94

Fiscal 2022 Summary of the Adopted Budget REVENUE
projection. In Fiscal 2022 the City plans to have deploy 150 speed, 150 red-light and six vehicle height cameras.By State Law, cameras are located within a half-mile radius of schools and are added based on requests directlyfrom constituents after a review process by the City’s Department of Transportation.
Earnings on Investments
3.0M 0.
6M
0.4M 1.1M
(0.2
M)
0.8M 2.
4M
5.3M
12.0
M
11.7
M
0.7M
FY13 Actual
FY14 Actual
FY15 Actual
FY16 Actual
FY17 Actual
FY18 Actual
FY19 Actual
FY20 Actual
FY21 Budget
FY22 Estimate
Budget/Actual Projection
Earnings on Investments Revenue
Dol
lars
in m
illion
s
2.3M decrease
The City anticipates earning $0.6 million on cash investments for Fiscal 2022, which is $2.3 million less thanthe Fiscal 2021 Adopted Budget and $60,000 or 8.6% lower than the Fiscal 2021 second quarter projection of$688,354. The expected earnings are 96% lower than Fiscal 2007 when these returns peaked at $16.2 million.Earnings on investments are the returns on the daily cash balances in the City Treasury and are a function ofinterest rates. The Fiscal 2022 estimate is based on average annual interest rate assumptions of 0.09% providedby the City’s Bureau of Treasury Management. The Federal Reserve has stated their intent to maintain interestrates at the current low levels for the foreseeable future, leading to less interest earned by the City on short-terminvestments.
Other Sources of Revenue
190.
1M
181.
4M
142.
7M 188.
5M
169.
9M
230.
2M
182.
5M
196.
7M
202.
2M
163.
4M
176.
4M
FY13 Actual
FY14 Actual
FY15 Actual
FY16 Actual
FY17 Actual
FY18 Actual
FY19 Actual
FY20 Actual
FY21 Budget
FY22 Estimate
Budget/Actual Projection
All Other Revenue
Dol
lars
in m
illion
s 13.7M decrease
95

REVENUE Fiscal 2022 Summary of the Adopted Budget
In addition to the major revenues referenced in this section, the City has over 150 other General Fund revenuesources.
The Fiscal 2022 estimate for other sources of revenue is $181.4 million. This is a decline of $8.8 million or 4.6%from the Fiscal 2021 Adopted Budget of $190.1 million, and an increase of $5.0 million or 2.8% from the Fiscal2021 second quarter projection of $176.4 million.
The largest examples of other sources of revenue include annual contributions from utility funds for central Cityservices ($16.0 million), video lottery terminals ($12.6 million), sanitation and waste removal related revenues($10.6 million), and building construction related permits and fees ($9.3 million). Two smaller components ofother sources of revenue, Admission and Amusement tax ($7.0 million) and Convention Center ($5.3 million) areboth continuing to experience pandemic related disruptions, with expected recovery during Fiscal 2022 as eventsin the City resume and tourism continues to grow. These two sources are estimated to be $577,000 or 4.9% higherthan the Fiscal 2021 Budget, and $7.2 million or 142.8% higher than the Fiscal 2021 second quarter projection.
To compensate for recent declines in parking revenues, the City passed legislation to conform City Code withState law, enabling the City to impose taxes on transportation network services, such as Uber and Lyft. Thesetaxes will be collected by the State and remitted to the City. The City is projected to receive approximately $2.5million from this tax in Fiscal 2022.
Casino: Video Lottery Terminals and Table Games
14.0M 14.0M 14.0M
13.7M
9.3M
14.8M
8.0M
2.2M
2.1M
5.4M
3.0M
4.4M
3.2M
3.2M
3.2M
FY20 Budget FY21 Budget FY22 Estimate
Casino Parking Garage
Table Games Revenue
Park Heights/Pimlico
South Baltimore/Horseshoe
Horseshoe Ground Lease
Dol
lars
in m
illion
s
44.3M
31.8M
38.5M
The City receives casino-related rev-enue to support local neighborhoods im-pacted by the Pimlico Race Track andHorseshoe Casino, as well as support forcitywide school construction, BaltimoreCity Recreation and Parks projects, prop-erty tax relief, and the General Fund at-large.
96

Fiscal 2022 Summary of the Adopted Budget REVENUE
Horseshoe Ground Lease Agreement Revenue - $14.0 million
• The Horseshoe Casino ground lease payment to the City is calculated at either 2.99% of the Casino’s grossgaming revenue, comprised of both Table Games and Video Lottery Terminals, or an alternate minimumpayment amount determined by the contract, whichever is higher.
• The Fiscal 2022 estimated payment is the minimum payment of $14.0 million.• Of this amount, 90% is allocated to the General Fund to support the Targeted Homeowners Tax Credit (THTC)and 10% is dedicated to school construction.
Horseshoe Ground Lease Allocation FY22Estimate*
THTC 90.0% 12.6School construction 10.0% 1.4Minimum Ground Lease Payment 14.0* Column in millions of dollars.
South Baltimore/Horseshoe Casino Local Impact Fund - $14.8 million - Baltimore City Allocation: 27%
• The State combines gross terminal revenue from Video Lottery Terminals (VLTs) at the Maryland Live, MGMNational Harbor, and Horseshoe Casinos.
• 5.5% of total combined VLT revenue is used as the starting point for the City’s local impact fund allocation.• 82% of the 5.5% total combined VLT revenue is then equally divided among Baltimore City, Anne Arundel,and Prince George’s counties, with the City receiving approximately 27.3% of this amount.
• The Fiscal 2022 estimate for Baltimore City is $14.8 million, $5.5 million more than the Fiscal 2021 AdoptedBudget.
• State law requires that 50% of the City’s allocation must be remitted to the South Baltimore Gateway Com-munity Benefits District to support local projects.
• The remaining 50% is budgeted for core City services within one mile of the casino area, such as the Policesub-station, Fire unit, traffic enforcement, sanitation, and employment development.
South Baltimore/Horseshoe Allocation FY22Estimate*
South Baltimore District 50.0% 7.4Horseshoe One-Mile Radius 50.0% 7.4Baltimore City Allocation 14.8* Column in millions of dollars.
Park Heights/Pimlico Local Impact Fund - $2.1 million - Baltimore City Allocation: 18%
• The remaining 18% of the 5.5% of total combined VLT revenue is dedicated to Baltimore City, less requiredwithholding.
• Of the 18% distribution, $1.5 million is withheld for Prince George’s County and smaller jurisdictions;$500,000 is withheld for communities within 3 miles of the Laurel Race Course, $2.4 million is withheld forPark Heights Renaissance, and $3.5million is withheld for the State Lottery Fund for Pimlico redevelopment.
97

REVENUE Fiscal 2022 Summary of the Adopted Budget
• The Fiscal 2022 projection for Baltimore City is $2.1 million, $0.1 million less than the Fiscal 2021 AdoptedBudget.
• At least 75% of the funds must be spent in the Park Heights neighborhood; the remaining funding must bespent within a one-mile radius of the Pimlico Race Track.
Park Heights/Pimlico Allocation FY22Estimate*
Park Heights 75.0% 1.6Pimlico One-Mile Radius 25.0% 0.5Baltimore City Allocation 2.1* Column in millions of dollars.
Table Games Revenue - $4.4 million - Baltimore City Allocation: 5%
• Baltimore City receives 5% of gross Table Games revenue generated solely by the Horseshoe Casino.• The Fiscal 2022 projection for Baltimore City is $4.4 million, $1.4 million more than the Fiscal 2021 AdoptedBudget.
• State law requires that 50% of the funding be used to support citywide recreation and parks projects andthat 50% be allocated for school construction debt service.
Table Games Revenue Allocation FY22Estimate*
Recreation and Parks 50.0% 2.2School construction 50.0% 2.2Baltimore City Allocation 4.4* Column in millions of dollars.
Casino Parking Garage Property Tax Agreement - $3.2 million
• As part of the Horseshoe Casino Ground Lease Agreement, the City grants a partial credit on the Real Prop-erty Tax due from the Casino’s garage.
• If the net tax due is less than $3.2 million, the Casino must make an additional contribution so that the totalminimum guarantee to the City equals $3.2 million.
• The Casino garage’s Real Property Tax net of credits has never exceeded $3.2 million, and the Fiscal 2022projection continues to assume the minimum guarantee.
• This revenue supports the General Fund at large.Casino Parking Garage FY22 Estimate 1 Minimum Guarantee 3200000
98

Fiscal 2022 Summary of the Adopted Budget REVENUE
Gambling Local Impact Aid Expenditures
In Fiscal 2022, the City projects receipt of $9.1 million of Local Impact Aid funding, consisting of $6.9 million ofBaltimore Casino and $2.2 million of Pimlico funds. This funding may be used at the discretion of City leadersin collaboration with local communities. The following tables show Fiscal 2022 budgeted operating and capitalexpenditures for these funds.
Operating Budget - Projects
Agency Project Description FY22Estimate
Baltimore Casino Funded ProjectsMayoralty Project Coordination 60,000Housing and CommunityDevelopment
Casino Support - Homeownership Incentives 150,000
M-R: Office of Children and FamilySuccess
Educational Partnerships 78,000
M-R: Office of Neighborhood Safetyand Engagement
Crime Cameras 280,000
Community Outreach 100,000M-R: Office of EmploymentDevelopment
Employment Connection 570,000
Job Training 50,000YouthWorks Summer Youth Jobs 500,000
M-R: Office of Homeless Services Homelessness Strategies 237,188M-R: Office of InformationTechnology
Casino Support-Fiberoptic Infrastructure 70,000
Planning Environmental Education 40,000Planning Studies: Middle Branch 400,000
Police Police Coverage 1,542,959Public Works Sanitation Staffing 362,908
Cleaning Waterways 250,000Recreation and Parks Carroll Park District Operations 150,000Transportation Casino Support-Complete Streets 50,000
Baltimore Casino Funds Total 4,891,055
Pimlico Impact Aid Funded ProjectsDepartment of Transportation INSPIRE Pedestrian improvements and
Traffic Calming10,000
M-R: Art and Culture Public Art 60,000M-R: Office of Criminal Justice Public Safety 75,000Planning Community Based Projects 53,000
PCDA Admin 60,000Pimlico Impact Aid Funds Total 258,000
Table in dollars.
99
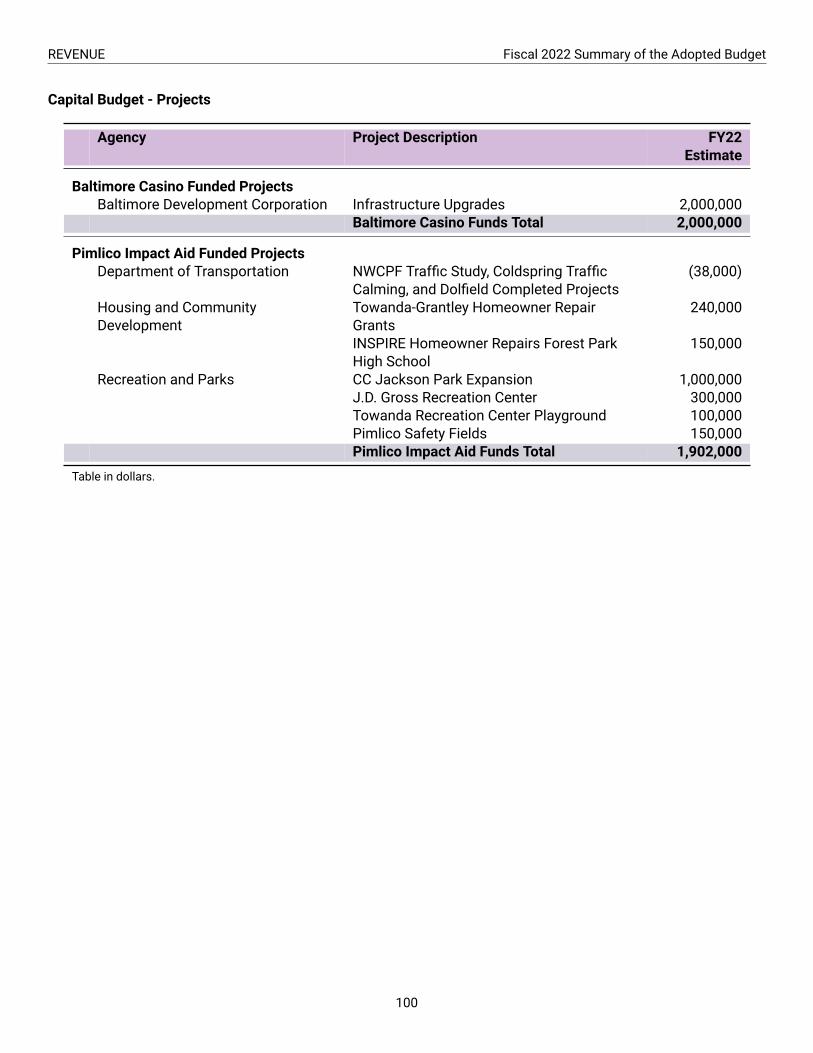
REVENUE Fiscal 2022 Summary of the Adopted Budget
Capital Budget - Projects
Agency Project Description FY22Estimate
Baltimore Casino Funded ProjectsBaltimore Development Corporation Infrastructure Upgrades 2,000,000
Baltimore Casino Funds Total 2,000,000
Pimlico Impact Aid Funded ProjectsDepartment of Transportation NWCPF Traffic Study, Coldspring Traffic
Calming, and Dolfield Completed Projects(38,000)
Housing and CommunityDevelopment
Towanda-Grantley Homeowner RepairGrants
240,000
INSPIRE Homeowner Repairs Forest ParkHigh School
150,000
Recreation and Parks CC Jackson Park Expansion 1,000,000J.D. Gross Recreation Center 300,000Towanda Recreation Center Playground 100,000Pimlico Safety Fields 150,000Pimlico Impact Aid Funds Total 1,902,000
Table in dollars.
100

Summary of City Real Property Tax Credit Programs
The table below describes tax expenditure costs for all locally authorized Real Property Tax Credit programs. InFiscal 2022, the City budget estimates Real Property Tax Credit expenditures totaling approximately $129.6million.This represents a decrease of $1.3 million compared to the total Fiscal 2020 projected expense of nearly $131.0million.
Homestead Tax (104% Assessment Phase-In)
A 4% taxable assessment increase cap on owner-occupied dwellings. 23,136,000 22,618,000
Targeted Homeowners Tax Credit
An annual credit based on improvement assessment values. The credit is granted to 35,000,000 31,348,000
owner-occupied properties only.
Enterprise Zone Property Tax Credit (EZTC)
A 10-year tax credit (80% in the first 5 taxable years and declining by 10 percentage points 22,395,000 20,816,000
thereafter) in designated State Enterprise Zones on the increased value of a commercial
property after improvements. Includes Enterprise Zone Tax Credit costs for real property,
personal property, and PILOT projects.
Historic Restoration and Rehabilitation Property Tax Credit
A 10-year tax credit (100% for projects with costs below $3.5 million; and 80% in the first 11,600,000 12,081,000
5 taxable years and declining by 10 percentage points thereafter for projects with costs
above $3.5 million) on the increased value of a historic property due to improvements.
Brownfields Property Tax Credit
A five-year tax credit (50%, except for projects that spend more than $250,000 in eligible 22,000,000 18,004,000
work, in which case it is 70%) on the increased value of brownfields sites after eligible
improvements are made. For sites located in a State-designated Enterprise Zone areas, the
credit is for a 10-year period.
Supplemental Homeowner’s Property Tax Credit
An annual credit providing additional tax relief to low-income City residents eligible for the 1,450,000 1,450,000
existing State Homeowner’s tax credit.
High-Performance Market-Rate Rental Housing Property Tax Credit
A 15 and 10-year tax credit (15-year if project is located within a targeted area and 10-year 13,370,000 20,109,000
for all other City locations) on the increased assessment value of improvements on the
construction or conservation of high-performance market rental housing. The 15-year
credit is 100% for the first two taxable years, 80% for the following three, 70% and 60% for
the next two, 50% for the following three, and declining by 10 percentage point annually
thereafter. The 10- year credit is structured the same as the EZTC.
Newly Constructed Dwelling Property Tax Credit
A five-year tax credit (50% in the first taxable year and declining by 10 percentage points 1,250,000 1,802,000
thereafter) on newly constructed or city owned, vacant rehabbed dwellings.
Other Local Option Property Tax Credits
Includes costs of the Low-Income Employee, Public Safety Officers, Neighborhood Preservation, Vacant 750,000 1,400,000
Dwellings, Fallen Heroes, Portability, and Cemetery Dwellings property tax credit programs.
Total 130,951,000 129,628,000
Fiscal 2021 Projection Fiscal 2022 Estimate
101
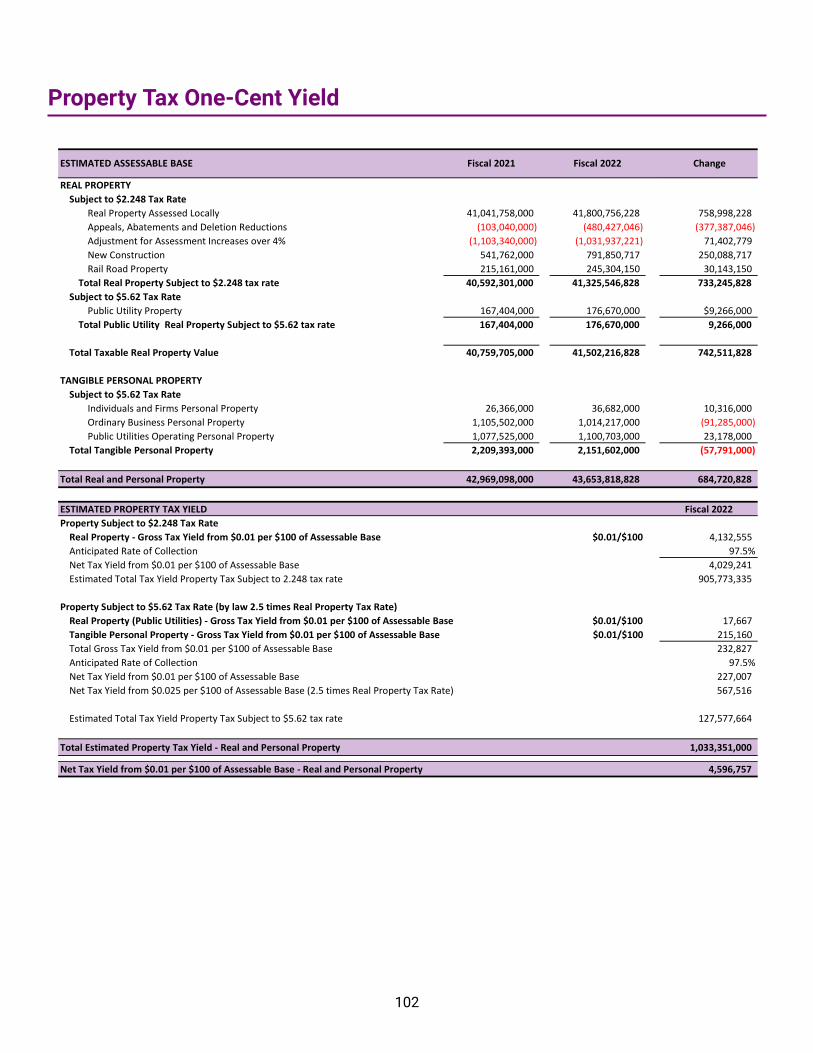
Property Tax One-Cent Yield
REAL PROPERTY Subject to $2.248 Tax Rate
Real Property Assessed Locally 41,041,758,000 41,800,756,228 758,998,228Appeals, Abatements and Deletion Reductions (103,040,000) (480,427,046) (377,387,046)Adjustment for Assessment Increases over 4% (1,103,340,000) (1,031,937,221) 71,402,779New Construction 541,762,000 791,850,717 250,088,717Rail Road Property 215,161,000 245,304,150 30,143,150
Total Real Property Subject to $2.248 tax rate 40,592,301,000 41,325,546,828 733,245,828Subject to $5.62 Tax Rate
Public Utility Property 167,404,000 176,670,000 $9,266,000Total Public Utility Real Property Subject to $5.62 tax rate 167,404,000 176,670,000 9,266,000
Total Taxable Real Property Value 40,759,705,000 41,502,216,828 742,511,828
TANGIBLE PERSONAL PROPERTYSubject to $5.62 Tax Rate
Individuals and Firms Personal Property 26,366,000 36,682,000 10,316,000Ordinary Business Personal Property 1,105,502,000 1,014,217,000 (91,285,000)Public Utilities Operating Personal Property 1,077,525,000 1,100,703,000 23,178,000
Total Tangible Personal Property 2,209,393,000 2,151,602,000 (57,791,000)
Total Real and Personal Property 42,969,098,000 43,653,818,828 684,720,828
ESTIMATED PROPERTY TAX YIELD Fiscal 2022Property Subject to $2.248 Tax Rate
Real Property - Gross Tax Yield from $0.01 per $100 of Assessable Base $0.01/$100 4,132,555Anticipated Rate of Collection 97.5%Net Tax Yield from $0.01 per $100 of Assessable Base 4,029,241Estimated Total Tax Yield Property Tax Subject to 2.248 tax rate 905,773,335
Property Subject to $5.62 Tax Rate (by law 2.5 times Real Property Tax Rate)Real Property (Public Utilities) - Gross Tax Yield from $0.01 per $100 of Assessable Base $0.01/$100 17,667Tangible Personal Property - Gross Tax Yield from $0.01 per $100 of Assessable Base $0.01/$100 215,160Total Gross Tax Yield from $0.01 per $100 of Assessable Base 232,827Anticipated Rate of Collection 97.5%Net Tax Yield from $0.01 per $100 of Assessable Base 227,007Net Tax Yield from $0.025 per $100 of Assessable Base (2.5 times Real Property Tax Rate) 567,516
Estimated Total Tax Yield Property Tax Subject to $5.62 tax rate 127,577,664
Total Estimated Property Tax Yield - Real and Personal Property 1,033,351,000
Net Tax Yield from $0.01 per $100 of Assessable Base - Real and Personal Property 4,596,757
ESTIMATED ASSESSABLE BASE Fiscal 2021 Fiscal 2022 Change
102
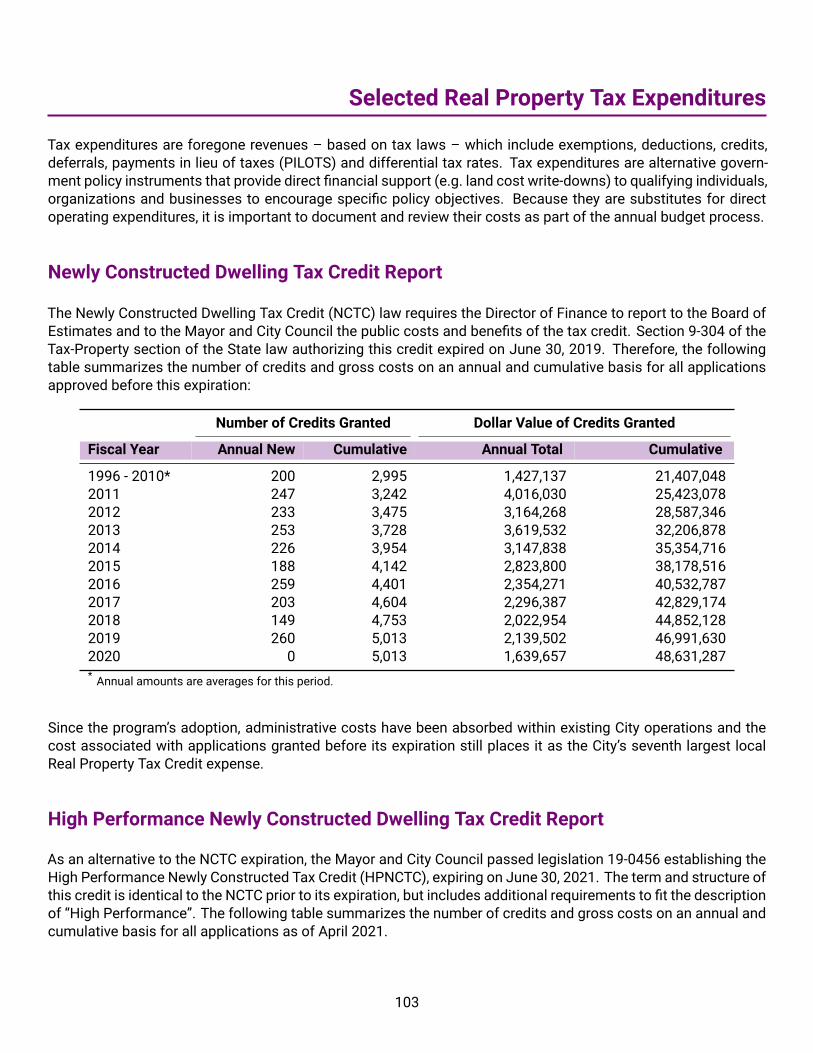
Selected Real Property Tax Expenditures
Tax expenditures are foregone revenues – based on tax laws – which include exemptions, deductions, credits,deferrals, payments in lieu of taxes (PILOTS) and differential tax rates. Tax expenditures are alternative govern-ment policy instruments that provide direct financial support (e.g. land cost write-downs) to qualifying individuals,organizations and businesses to encourage specific policy objectives. Because they are substitutes for directoperating expenditures, it is important to document and review their costs as part of the annual budget process.
Newly Constructed Dwelling Tax Credit Report
The Newly Constructed Dwelling Tax Credit (NCTC) law requires the Director of Finance to report to the Board ofEstimates and to the Mayor and City Council the public costs and benefits of the tax credit. Section 9-304 of theTax-Property section of the State law authorizing this credit expired on June 30, 2019. Therefore, the followingtable summarizes the number of credits and gross costs on an annual and cumulative basis for all applicationsapproved before this expiration:
Number of Credits Granted Dollar Value of Credits Granted
Fiscal Year Annual New Cumulative Annual Total Cumulative
1996 - 2010* 200 2,995 1,427,137 21,407,0482011 247 3,242 4,016,030 25,423,0782012 233 3,475 3,164,268 28,587,3462013 253 3,728 3,619,532 32,206,8782014 226 3,954 3,147,838 35,354,7162015 188 4,142 2,823,800 38,178,5162016 259 4,401 2,354,271 40,532,7872017 203 4,604 2,296,387 42,829,1742018 149 4,753 2,022,954 44,852,1282019 260 5,013 2,139,502 46,991,6302020 0 5,013 1,639,657 48,631,287* Annual amounts are averages for this period.
Since the program’s adoption, administrative costs have been absorbed within existing City operations and thecost associated with applications granted before its expiration still places it as the City’s seventh largest localReal Property Tax Credit expense.
High Performance Newly Constructed Dwelling Tax Credit Report
As an alternative to the NCTC expiration, the Mayor and City Council passed legislation 19-0456 establishing theHigh Performance Newly Constructed Tax Credit (HPNCTC), expiring on June 30, 2021. The term and structure ofthis credit is identical to the NCTC prior to its expiration, but includes additional requirements to fit the descriptionof “High Performance”. The following table summarizes the number of credits and gross costs on an annual andcumulative basis for all applications as of April 2021.
103

REVENUE Fiscal 2022 Summary of the Adopted Budget
Number of Credits Granted Dollar Value of Credits Granted
Fiscal Year Annual Total Cumulative Annual Total Cumulative
2020 21 21 54,918 54,9182021 57 78 341,805 396,723
Analysis
Due to the expiration of the NCTC the following report only analyzes the impact of the HPNCTC. The online appli-cations for the former NCTC and HPNCTC include a survey completed by the recipients of these benefits and theDepartment of Finance has published its results since 2000. In preparing this report, the Department of Financehas reviewed and processed 57 HPNCTC applications during Fiscal 2021.
The City promoted the HPNCTC program in several ways. The Office of Homeownership in the Department ofHousing and Community Development highlighted the HPNCTC in its realtor seminars, and provided informationabout the credit on the City government and Live Baltimore websites. Results from current applicants showedthat the most popular source of information promoting the credit were developers and realtors both with 34.6%of the responses.
The distribution of HPNCTC granted during Fiscal 2021 indicates the use of the credit is concentrated. Half ofthe credits granted during Fiscal 2021 are located within two neighborhoods, Greektown and Medfield. However,much of the HPNCTC is focused away from centrally-located areas such as Downtown and the Inner Harbor.Neighborhoods receiving the highest number of credits have been spread throughout parts of the City outsidewaterfront locations. In Fiscal 2021, Greektown, Medfield, Middle East, Hampden and Brewers Hill are the fiveneighborhoods with the most tax credits.
Data indicates that high income households with higher than average priced homes still represent a substantialportion of the program’s applicants. Nearly 100% of all survey respondents have incomes above the City’s medianincome of $50,379 and 65.4% have incomes above the state’s median household income of $84,805. In Fiscal2021, 57.7% of the HPNCTC survey respondents have incomes above $100,000.
The intent of the HPNCTC program is to attract new residents to the City to create a stronger taxable base. Evi-dence has shown that the credit workedmore as an incentive for current City residents who were already propertyowners than attracting new residents. Even though 65.4% of all respondents were first-time home buyers, thesurvey results show that 50.0% of the respondents in Fiscal 2020-2021 already lived in the City prior to purchasingthe new home. Of this year’s survey respondents, 79.5% reported that they were only looking in the City for theirnew home.
Fiscal 2021 survey results show that 66.7% of the respondents knew about the credit prior to purchasing theirhomes and 84.6% of applicants who responded felt that the availability of the credit influenced their decision topurchase property. While historical data suggests that the credit did not significantly incentivize new residentsor investment, serving merely as a financial bonus for established developers and affluent residents, current yeardata indicates a changing sentiment.
Maps on the following pages detail the location of properties that have received a NCTC and HPNCTC. The maplabeled “Fiscal Year 2015 – Fiscal Year 2019” indicates properties to which the City has granted a NCTC duringthe last five years of the program, from Fiscal 2015 to Fiscal 2019. The map labeled “Fiscal Year 2020 – FiscalYear 2021” indicates properties that received the HPNCTC in fiscals 2020 and 2021. Properties that received thecredit in Fiscal 2021 will receive the credit once again in Fiscal 2022 as long as they continue to meet eligibilityrequirements.
104

Fiscal 2022 Summary of the Adopted Budget REVENUE
!
!
!
!
!
!
!!!
!
!
!
!
!
!
!!
!!
!!
!!!!!!!!!!!!!!!!!!!!!!!
!
!!
!!!!!!!!
!!!!!!!!!!
!!!!
!!
!
!!!!!!!!!!!!!
!!!!
!!
!
!
!
!
!
!!!!!!!!!!!
!
!!!!!!!!!!!
!!!!
!!!!!!!
!
!!!!!
!!!!!!!
!!
!
!
!!!!!!!!
!
!!
!
!
!
!
!
!!
!!!!
!
!
!
!
!
!
!
!
!
!
!!!!
!
!
!
!
!
!!
!
!
!
!
!
!
!!! !!!!!
!
!!
!
!!
!
!
!
!
!
!
!
!
!
!
!
!!
!!
!
!
!
!
!!
!
!
!!
!
!!!!!
!
!!!!!
!!
!
!!!!
!
!
!
!
!
!!!!!!!!!!
!!
!
!
!! !!
!
!
!!
!!
!!
!
!!!
!!
!!!!
!!
!
!!!
!
!
!
!!
!
!
!
!!!
!
!
!
!
!
!
!
!
!
!!
!
!
!
!
!
!
!
!
!
!
!
!
!
!
!
!
!
!
!
!
!
!
!
!!
!
!
!
!!
!
!
!
!
!
!
!
!
!
!
!!!
!
!
!
!
!!!!!
!
!!!
!
!!!
!!
!
!!!
!!!!!!!!!!!!!!!!!!!!!!!!
!
!!
!
!
!
!
!
!!!
!
!
!
!
!
!!!!!
!!!
!
!
!
!!!!
!
!
!
!!!!
!
!!!!
!!
!
!
!!
!
!
!
!!
!!
!!!!!!
!
!!
!
!
!
!
!
!
!!!
!
!!!
!
!
!
!
!
!
!
!!!!
!
! !
!
!!
!
!
!
!
!
!!
!!
!
!
!
!
!
!
!
!!!
!!!!!
!
!
!
!!!
!
!
!!
!
!
!
!
!
!
!
!
!
!!
!
!
!
!! !
!
!
!
!
!
!
!
!!
!!
! !
!!
!
!
!
!!
!
!
!
!
!
!!
!
!
!
!
!!
!!!
!
!!!!
!
!
!
!
!
!
!!
!
!!
!
!!
!
!
!
!
!!
!
!
!
!
!!
!
!
!
!
!
!
!
!!
!
!
!!
!
!
!
!
!
!
!!
!
!
!
!
!
!
!
!
!
!
!!
!
!
!!
!
!!
!
!
!
!
!
!
!
!
!!
!
!
!
!
!
!
!
!
!
!!
!
!
!
!
!
!!
!
!
!
!
!
!
!
!
!
!
!
!
!
!
!
!!
!!
!!
!!
!
!!
!
!
!
!
!
!
! !
!!
!
!
!!!
!
!
!
!!
!
!
!
!
!
!
!
!
!!!!
!!
!
!!!!
!
!
!
!
!!
!
!
!
!
!
!
!
!
!
!
!
!
!
!
!
!
!
!
!
!
!
!!
!
!
!
!
!
!
!
!
!
!
!!
!
!
!
!
!
! !
!
!
!
!
!
!
!!!
!!
!
!
!!!
!
!
!!! !
!
!
!
!
!
!
!
!!!
! !
!
!
!
!
!
!
!
!
! !!
!
!
!
!
!
!
!!
!!
!
!
!
!
!
!
!
!
!
!
!!
!
!
!
!
!!
!
!!
!
!
!
!
!
!
!
!!
!
!!
!
!
!
! !
!
!!
!
!
!
!!
!
!
!
!
! !
!!
!
!!
!
!
!
!
!
!
!
!
!
!!
!
!
!
!!!
!
!
!
!
!
!
!!
!!!
!
!
!
!
!!
!
!
!
!!
! !!
!!
!!
!
!
!
!
!
!!
!
!
!
!
!
!!
!
!
!
!
!
!
!
!
!!!
!
!
!
!
!
!
!
!
!!
!
!!
!!
!
!
!
!!!!
!
!
!
!
!
!!
!
!!!!
!!
!
!!
!!
!
!!!
!
!!!!!
!
!
!
!!
!
!
!!!
!
!
!
!
!
!
!
Frankford
Glen
Hamilton HillsCheswolde
Canton
Mount Washington
WalthersonGuilford
Hampden
Glenham-Belhar
Franklintown
Oliver
Beechfield
Downtown
Woodberry
Cross Country
Overlea
Locust Point Industrial Area
Riverside
Medfield
Park Circle
Fells Point
Uplands
West Forest ParkRemington
Reservoir Hill
North Roland Park/Poplar Hill
Greektown
Orchard Ridge
Better Waverly
Inner Harbor
Pen Lucy
Barclay
Middle East
Lake WalkerThe Orchards
Loyola/Notre Dame
Taylor Heights
Jonestown
Federal Hill
CARE
Washington Village/Pigtown
Penn North
Madison Park Mid-Town Belvedere
Locust Point
Johnston Square
Highlandtown
Bellona-Gittings
Washington Hill
Mount Holly
Original Northwood
Wyman Park
South Baltimore
Central Forest Park
Harwood
Upper Fells Point
Brewers Hill
Druid Heights
Patterson Park Neighborhood
Hoes Heights
Greenmount West
Union Square
Sharp-Leadenhall
Panway/Braddish Avenue
Patterson Place
µ
0 1 2 3 40.5Miles
City of BaltimoreNewly Constructed Tax Credits by Neighborhood
Fiscal Year 2015 - Fiscal Year 2019
Neighborhoods with Newly Constructed Tax Credits(Neighborhood Name, Number of Credits)
Greektown, 278
Uplands, 141
Canton, 51
Downtown, 46
Inner Harbor, 43
Locust Point Industrial Area, 42
Locust Point, 39
Hampden, 35
Brewers Hill, 35
Middle East, 34
Washington Village/Pigtown, 34
Hoes Heights, 33
South Baltimore, 30
Riverside, 27
Barclay, 12
Johnston Square, 12
Medfield, 12
Upper Fells Point, 12
Greenmount West, 12
Fells Point, 9
Beechfield, 9
Remington, 8
Patterson Place, 7
Cheswolde, 7
Orchard Ridge, 6
Patterson Park Neighborhood, 5
Oliver, 5
Taylor Heights, 5
Woodberry, 5
Washington Hill, 5
Cross Country, 5
Glen, 4
Guilford, 3
Franklintown, 3
Highlandtown, 3
Bellona-Gittings, 3
Hamilton Hills, 2
Glenham-Belhar, 2
Mount Washington, 2
Park Circle, 2
Reservoir Hill, 2
Madison Park, 2
Wyman Park, 2
Harwood, 2
CARE, 1
Central Forest Park, 1
Druid Heights, 1
Federal Hill, 1
Frankford, 1
Better Waverly, 1
Jonestown, 1
Lake Walker, 1
Loyola/Notre Dame, 1
Mid-Town Belvedere, 1
Mount Holly, 1
North Roland Park/Poplar Hill, 1
Original Northwood, 1
Overlea, 1
Panway/Braddish Avenue, 1
Pen Lucy, 1
Penn North, 1
Sharp-Leadenhall, 1
The Orchards, 1
Union Square, 1
Waltherson, 1
West Forest Park, 1
105

REVENUE Fiscal 2022 Summary of the Adopted Budget
!
!!
!
!
!!!!!!!!!!!!!
!
!
!
!!!
!
!!!!!!!!
!!!!
!!!!
!!!!!!!!!!!!
!
!!
!!!!!!!!!!!!
!
!!!
!!!
!!
!
Cheswolde
Canton
Hampden
Cross Country
Riverside
Medfield
Fells Point
West Forest Park
Greektown
Barclay
Middle East
East Baltimore Midway
Brewers Hill
Greenmount West
Sharp-Leadenhall
µ
0 1 2 3 40.5Miles
City of BaltimoreHigh Performance Newly Constructed Tax Credits by Neighborhood
FY 2020 - FY 2021
Neighborhoods with High Performance Newly Constructed Tax Credits (Neighborhood Name, Number of Credits)
Greektown, 27
Medfield, 12
Middle East, 8
Hampden, 7
Brewers Hill, 6
Canton, 4
Fells Point, 4
Greenmount West, 2
Sharp-Leadenhall, 2
East Baltimore Midway, 1
Riverside, 1
West Forest Park, 1
Cross Country, 1
Barclay, 1
Cheswolde, 1
106

Revenue Estimates
Funds Detail for Operating and Capital
A001 - General Fund
A001 - General Fund - Account FY20 Actual FY21 Budget FY21Projection
FY22Estimate
Dollar Change
LOCAL TAXESReal and Personal Property Taxes - Current Year
001 - Real Property 893,335,879 922,655,000 921,072,000 938,072,000 15,417,000
004 - Personal Property - Ordinary Business Corps 55,698,649 60,576,000 57,349,624 55,574,000 (5,002,000)
007 - Personal Property - Individuals & Firms 2,233,626 1,444,706 2,117,913 2,010,000 565,294
008 - Personal Property - Public Utilities 59,901,997 59,043,000 59,043,000 60,313,000 1,270,000
Real and Personal Property Taxes - Prior Years010 - Real Property 2,505,365 2,500,000 2,500,000 2,198,000 (302,000)
011 - Personal Property 659,488 2,500,000 2,500,000 2,500,000 0
Real and Personal Property Taxes - Other Revenues016 - Video Lottery Terminals 12,600,000 12,600,000 12,600,000 12,600,000 0
021 - Penalties and Interest 6,986,024 7,306,000 7,306,000 7,432,000 126,000
022 - Discounts (2,244,761) (2,400,000) (2,320,000) (2,397,000) 3,000
023 - Supplemental Homeowner’s Tax Credit (1,233,355) (1,450,000) (1,450,000) (1,450,000) 0
024 - Tax Sale Expense 521,518 0 0 0 0
025 - Newly Constructed Dwellings Tax Credit (1,680,465) (2,100,000) (1,250,000) (1,802,000) 298,000
Real and Personal Property Taxes - Current Year027 - Phase in Tax Credit (24,129,451) (24,183,000) (23,136,000) (22,618,000) 1,565,000
Real and Personal Property Taxes - Other Revenues028 - Other Property Tax Credits (20,299,486) (18,726,000) (22,000,000) (18,504,000) 222,000
029 - Enterprise Zone Tax Credit (20,516,637) (24,518,000) (22,395,000) (20,816,000) 3,702,000
030 - Cemetery Dwellings Tax Credit (19,071) 0 0 0 0
031 - Public Safety Officer Tax Credit (688,699) (900,000) (750,000) (900,000) 0
032 - Historic Property Tax Credits (10,489,014) (11,114,000) (11,600,000) (12,081,000) (967,000)
038 - Tax Increment Financing Districts 16,223,534 18,395,000 17,178,887 21,286,000 2,891,000
039 - Targeted Homeowners Tax Credit (33,493,698) (35,000,000) (35,000,000) (31,348,000) 3,652,000
040 - High-Performance Market-Rate RentalHousing Tax Credit
(15,210,923) (18,897,000) (13,370,000) (20,109,000) (1,212,000)
Sales and Service041 - Heavy Equipment Gross Receipts 126,361 150,000 150,000 150,000 0
107

REVENUE Fiscal 2022 Summary of the Adopted Budget
(continued)
A001 - General Fund - Account FY20 Actual FY21 Budget FY21Projection
FY22Estimate
Dollar Change
045 - Gas 10,588,781 14,250,000 13,950,000 14,637,000 387,000
046 - Electricity 21,121,004 27,502,000 27,502,000 28,249,000 747,000
047 - Fuel Oil 212,309 273,000 273,000 280,000 7,000
049 - Steam 582,587 1,191,000 1,191,000 1,223,000 32,000
050 - Telephone 36,145,058 34,582,000 34,582,000 34,928,000 346,000
051 - Homeless Relief Assistance Tax 202,177 500,000 200,000 500,000 0
052 - Hotel Tax (transferred from CC Fund) 21,891,653 21,328,915 11,787,000 19,630,000 (1,698,915)
053 - Property Transfer 40,154,300 37,520,000 46,814,249 43,995,000 6,475,000
054 - Liquid Petroleum Gas 134,691 127,000 127,000 130,000 3,000
055 - Refund Reserve - Gas (4,013) (263,000) (263,000) (270,000) (7,000)
056 - Refund Reserve - Electricity (3,753) (368,000) (368,000) (378,000) (10,000)
Payment in Lieu of Taxes060 - Housing Authority 15,102 100,000 1,210,000 100,000 0
062 - Urban Renewal 107,233 150,000 300,000 150,000 0
063 - Off-Street Parking Properties 363,881 807,000 360,000 807,000 0
064 - Maryland Port and Stadium Authorities 4,464,594 1,621,000 1,621,000 1,653,000 32,000
065 - Apartments 3,759,650 4,072,000 4,200,000 4,072,000 0
067 - Economic Development 1,929,854 1,400,000 2,285,000 1,400,000 0
068 - Annual Nonprofit Contributions 5,069,724 6,000,000 6,000,000 6,000,000 0
Other Local Taxes075 - Tax Sale Fees and Other 10,596 400,000 400,000 400,000 0
076 - Simulated Slot Machines 623,992 695,000 695,000 695,000 0
077 - Billboard tax 1,457,639 1,400,000 1,400,000 1,414,000 14,000
078 - Taxicab Excise tax 148,384 1,767,000 1,200,000 2,520,000 753,000
079 - Dockless Vehicle Excise Tax 143,683 0 100,000 162,000 162,000
Income Tax081 - Income Tax - State Collected 371,199,340 366,155,000 366,155,000 369,355,000 3,200,000
083 - Unallocated Withholding - Regular 15,164,044 7,414,000 7,414,000 8,667,000 1,253,000
084 - Income Tax - Fiduciary Returns 10,176,229 7,647,000 7,647,000 7,598,000 (49,000)
Locally Imposed - State Collected085 - Admissions 5,939,322 5,955,000 1,604,566 6,987,000 1,032,000
086 - Recordation 38,165,405 37,563,000 43,152,560 39,612,000 2,049,000
State Shared
108
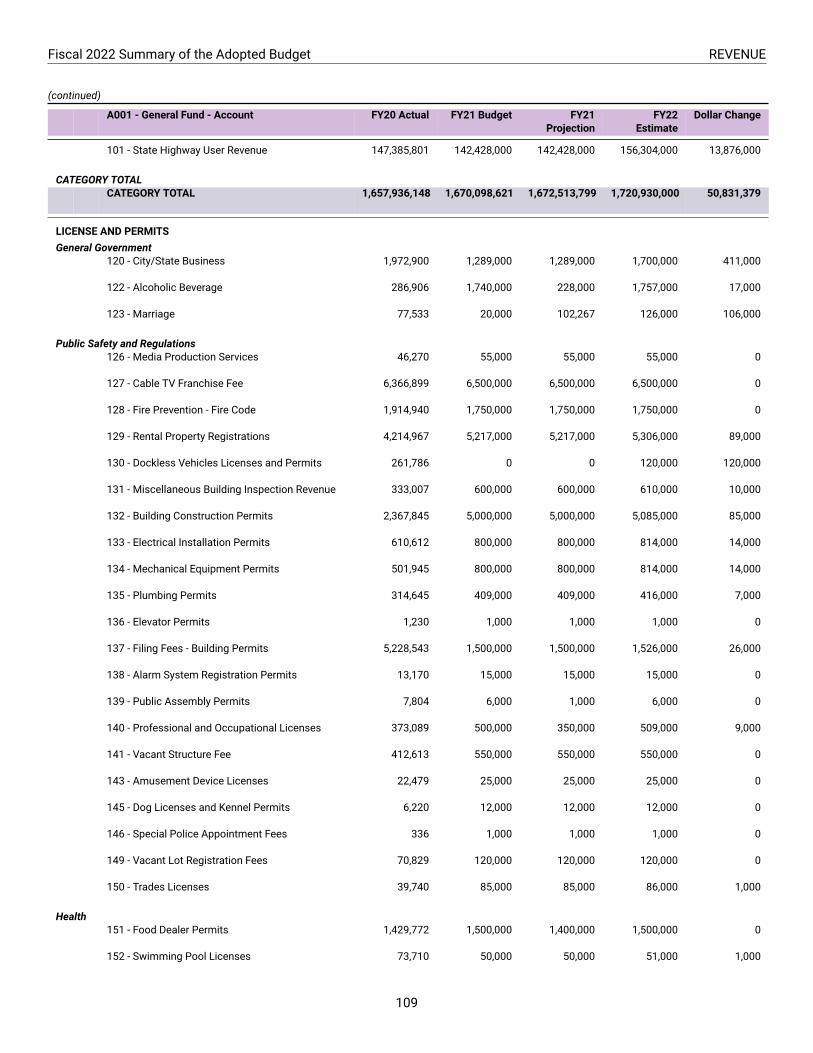
Fiscal 2022 Summary of the Adopted Budget REVENUE
(continued)
A001 - General Fund - Account FY20 Actual FY21 Budget FY21Projection
FY22Estimate
Dollar Change
101 - State Highway User Revenue 147,385,801 142,428,000 142,428,000 156,304,000 13,876,000
CATEGORY TOTALCATEGORY TOTAL 1,657,936,148 1,670,098,621 1,672,513,799 1,720,930,000 50,831,379
LICENSE AND PERMITSGeneral Government
120 - City/State Business 1,972,900 1,289,000 1,289,000 1,700,000 411,000
122 - Alcoholic Beverage 286,906 1,740,000 228,000 1,757,000 17,000
123 - Marriage 77,533 20,000 102,267 126,000 106,000
Public Safety and Regulations126 - Media Production Services 46,270 55,000 55,000 55,000 0
127 - Cable TV Franchise Fee 6,366,899 6,500,000 6,500,000 6,500,000 0
128 - Fire Prevention - Fire Code 1,914,940 1,750,000 1,750,000 1,750,000 0
129 - Rental Property Registrations 4,214,967 5,217,000 5,217,000 5,306,000 89,000
130 - Dockless Vehicles Licenses and Permits 261,786 0 0 120,000 120,000
131 - Miscellaneous Building Inspection Revenue 333,007 600,000 600,000 610,000 10,000
132 - Building Construction Permits 2,367,845 5,000,000 5,000,000 5,085,000 85,000
133 - Electrical Installation Permits 610,612 800,000 800,000 814,000 14,000
134 - Mechanical Equipment Permits 501,945 800,000 800,000 814,000 14,000
135 - Plumbing Permits 314,645 409,000 409,000 416,000 7,000
136 - Elevator Permits 1,230 1,000 1,000 1,000 0
137 - Filing Fees - Building Permits 5,228,543 1,500,000 1,500,000 1,526,000 26,000
138 - Alarm System Registration Permits 13,170 15,000 15,000 15,000 0
139 - Public Assembly Permits 7,804 6,000 1,000 6,000 0
140 - Professional and Occupational Licenses 373,089 500,000 350,000 509,000 9,000
141 - Vacant Structure Fee 412,613 550,000 550,000 550,000 0
143 - Amusement Device Licenses 22,479 25,000 25,000 25,000 0
145 - Dog Licenses and Kennel Permits 6,220 12,000 12,000 12,000 0
146 - Special Police Appointment Fees 336 1,000 1,000 1,000 0
149 - Vacant Lot Registration Fees 70,829 120,000 120,000 120,000 0
150 - Trades Licenses 39,740 85,000 85,000 86,000 1,000
Health151 - Food Dealer Permits 1,429,772 1,500,000 1,400,000 1,500,000 0
152 - Swimming Pool Licenses 73,710 50,000 50,000 51,000 1,000
109

REVENUE Fiscal 2022 Summary of the Adopted Budget
(continued)
A001 - General Fund - Account FY20 Actual FY21 Budget FY21Projection
FY22Estimate
Dollar Change
154 - Solid Waste Collection Permits 224,901 158,000 158,000 158,000 0
Highways163 - Minor Privilege Permits 1,373,192 1,500,000 910,500 1,500,000 0
164 - Public Utility Pole Permits 56,000 560,000 560,000 560,000 0
169 - Permits and Inspections - Private Paving 18,555 58,000 20,000 58,000 0
170 - Development Agreement Fee 403,919 511,000 511,000 520,000 9,000
171 - Street Cut Permits 1,603,150 778,000 778,000 778,000 0
173 - Special Event Permits 125,914 171,000 25,000 171,000 0
CATEGORY TOTALCATEGORY TOTAL 30,755,421 32,281,000 29,822,767 33,200,000 919,000
FINES AND FORFEITSFines and Forfeits
177 - Court-Ordered Restitution and Misc Fines 7,603 42,000 10,000 42,000 0
178 - Civil Citations 21,110 26,000 26,000 26,000 0
179 - Sheriff Revenue 108,244 200,000 100,000 200,000 0
180 - Forfeitures Drug/Gambling Contraband 499,393 1,500,000 1,500,000 1,500,000 0
181 - Minimum Wage Violations 307,706 50,000 165,282 50,000 0
182 - Environmental Control Board Fines 4,231,362 6,500,000 6,500,000 6,500,000 0
185 - Bad Check Charge 35,090 30,000 39,400 30,000 0
187 - Liquor Board Fines 104,100 178,000 30,000 178,000 0
188 - Library Fines 46,746 40,000 40,000 40,000 0
191 - Red Light Fines 14,481,747 6,400,000 10,060,000 8,820,000 2,420,000
193 - Speed Cameras 16,162,267 7,500,000 14,100,000 12,200,000 4,700,000
194 - Commercial Truck Enforcement 83,500 175,000 25,000 175,000 0
CATEGORY TOTALCATEGORY TOTAL 36,088,868 22,641,000 32,595,682 29,761,000 7,120,000
USE OF MONEYUse of Money
200 - Earnings on Investments 11,539,034 2,960,000 688,354 629,000 (2,331,000)
206 - Interest on Property Sale Proceeds 39,876 60,000 60,000 60,000 0
207 - Interest on Gambling/Drug Confiscated Cash 86,186 35,000 35,000 35,000 0
227 - Principal - CDFC Loan 200,672 0 0 0 0
228 - Interest - CDFC Loan 51,774 0 0 0 0
110

Fiscal 2022 Summary of the Adopted Budget REVENUE
(continued)
A001 - General Fund - Account FY20 Actual FY21 Budget FY21Projection
FY22Estimate
Dollar Change
255 - Principal - Economic Development LoanProgram
294,284 300,000 300,000 300,000 0
256 - Interest - Economic Development LoanProgram
51,060 70,000 70,000 70,000 0
259 - Interest - Community Development FundLoans
8,860 2,000 2,000 2,000 0
260 - Principal - Community Development FundLoans
9,627 10,000 10,000 10,000 0
CATEGORY TOTALCATEGORY TOTAL 12,281,373 3,437,000 1,165,354 1,106,000 (2,331,000)
USE OF PROPERTYUse of Property
201 - Rental of City Property 3,703,579 2,450,000 2,450,000 3,500,000 1,050,000
202 - Interest Differential Off-Street Parking 32,395 0 0 0 0
209 - Expressway Air Space Leases 11,813 12,000 12,000 12,000 0
210 - Rental from Inner Harbor Shoreline 592,099 830,000 600,000 830,000 0
214 - SW Resource Recovery Facility - Lease 2,053,520 2,218,000 2,218,000 2,395,000 177,000
240 - Harbor Shoreline - Docking Fees 0 20,000 20,000 20,000 0
241 - Rental from Community Centers 159,269 80,000 160,000 80,000 0
243 - Rentals from Wharfage - Piers and Docks 11,871 15,000 10,000 15,000 0
244 - Rental of City Poles 1,048,965 225,000 401,683 180,000 (45,000)
246 - Royal Farm Arena Naming Rights 187,500 250,000 250,000 250,000 0
247 - Convention Center 8,431,076 5,717,000 3,440,000 5,262,000 (455,000)
248 - Municipal Advertising 0 500,000 0 500,000 0
CATEGORY TOTALCATEGORY TOTAL 16,232,087 12,317,000 9,561,683 13,044,000 727,000
OTHER REVENUESPrivate Grants
280 - Civil Defense 76,279 300,000 300,000 300,000 0
590 - Interest - Enoch Pratt Endowment 25,000 25,000 25,000 25,000 0
592 - Voluntary Payment in Lieu of Taxes 100,000 0 0 0 0
General Government865 - Vacant Struct & Boarding Fees 1,415,059 1,400,000 1,400,000 1,400,000 0
868 - CHAP - Miscellaneous Revenue 22,900 33,000 20,000 33,000 0
872 - Miscellaneous Revenue 3,021,418 1,625,316 1,625,316 2,010,129 384,813
873 - Penalties and Interest Excl Real and Personal 857,184 1,000,000 1,000,000 1,017,000 17,000
877 - Sale of Scrap/Recycled Metal 16,872 28,000 28,000 28,000 0
111

REVENUE Fiscal 2022 Summary of the Adopted Budget
(continued)
A001 - General Fund - Account FY20 Actual FY21 Budget FY21Projection
FY22Estimate
Dollar Change
879 - Legal Settlement Proceeds 3,050,561 0 1,155,130 0 0
880 - Innovation Fund 2,000 0 0 0 0
881 - Gainsharing 5,979 0 0 0 0
Public Safety and Regulations885 - Police - Miscellaneous 16,950 27,000 27,000 27,000 0
CATEGORY TOTALCATEGORY TOTAL 8,610,202 4,438,316 5,580,446 4,840,129 401,813
FEDERAL GRANTSFederal Grants
281- CARES Act - Revenue 0 0 0 24,500,000 24,500,000
282- FEMA Reimbursement 0 0 0 27,500,000 27,500,000
CATEGORY TOTALCATEGORY TOTAL 0 0 0 52,000,000 52,000,000
STATE AIDState Aid
401 - Targeted Aid (Income Tax Disparity) 76,580,403 79,052,000 79,052,000 76,194,000 (2,858,000)
403 - Teachers Retirement Supplemental Grant 10,047,596 10,048,000 10,048,000 10,048,000 0
415 - Local Health Operations 12,273,495 8,747,000 7,000,000 8,747,000 0
475 - Library Services 8,894,618 6,500,000 6,500,000 6,500,000 0
482 - War Memorial 176,828 175,000 175,000 175,000 0
CATEGORY TOTALCATEGORY TOTAL 107,972,940 104,522,000 102,775,000 101,664,000 (2,858,000)
CHARGES FOR CURRENT SERVICESGeneral Government
618 - Transcriber Service Charges 114,163 46,000 46,000 46,000 0
620 - RBDL Administration Fee 7,406 4,000 4,000 4,000 0
621 - Bill Drafting Service 22,404 25,000 25,000 25,000 0
623 - Zoning Appeal Fees 51,548 80,000 80,000 80,000 0
628 - Civil Marriage Ceremonies 8,730 12,000 12,000 12,000 0
632 - Lien Reports 2,012,928 1,858,950 2,025,048 1,915,000 56,050
633 - Election Filing Fees 10,708 5,000 5,000 5,000 0
634 - Surveys Sales of Maps and Records 9,973 17,000 10,000 17,000 0
636 - 3rd Party Disability Recoveries 36,071 51,000 30,000 51,000 0
638 - Semi - Annual Tax Payment Fee 971,357 413,000 800,000 426,000 13,000
112

Fiscal 2022 Summary of the Adopted Budget REVENUE
(continued)
A001 - General Fund - Account FY20 Actual FY21 Budget FY21Projection
FY22Estimate
Dollar Change
639 - Tax Roll Service Charge 724,501 34,000 105,000 34,000 0
649 - Vending Machine Commissions 45,242 40,000 40,000 40,000 0
651 - Reimbursement for Use of City Vehicles 23,765 18,000 18,000 18,000 0
654 - Charges for Central City Services 13,454,518 15,376,000 15,376,000 15,922,000 546,000
Public Safety and Regulations657 - Liquor Board Advertising Fees 113,452 108,000 51,362 108,000 0
659 - Sale of Accident and Incident Reports 300,989 384,000 384,000 384,000 0
660 - Stadium Security Service Charges 1,136,713 970,000 150,000 1,270,000 300,000
661 - Port Fire Protection (MPA) 1,399,940 1,400,000 1,400,000 1,400,000 0
662 - Sheriff - District Court Service 3,635,642 5,400,000 600,000 3,800,000 (1,600,000)
663 - False Alarm Fees 50,555 200,000 50,000 200,000 0
664 - Fire Dept - Sales of Reports 27,705 32,000 32,000 32,000 0
666 - Child Support Enforcement 96,992 345,000 0 345,000 0
668 - Deputy Sheriff Enforcement 4,059 0 0 0 0
Health680 - Miscellaneous Environmental Fees 9,170 19,500 19,500 19,500 0
Highways696 - Street Cut Fees 154,625 0 0 0 0
Health700 - New Health Plan Review 93,403 60,000 60,000 100,000 40,000
701 - Hazard Analysis Critical Control Point Plan 400 500 500 500 0
Social Services706 - Sheriff - DHR Service Agreement 35,155 0 0 0 0
Recreation and Culture773 - Video Rental and Other Charges 16,521 10,000 10,000 10,000 0
777 - Swimming Pool Passes 154,510 50,000 50,000 178,000 128,000
Highways785 - Impounding Cars - Storage 2,535,603 3,043,000 3,043,000 3,500,000 457,000
787 - Impounding Cars - Towing 1,205,588 1,403,000 1,403,000 1,750,000 347,000
789 - Fallsway Private Tow - Rebate 14,175 0 0 0 0
791 - General Revenue Highways 4,636,319 3,585,000 3,585,000 3,585,000 0
792 - Traffic Engineering 2,482,765 328,000 328,000 328,000 0
Sanitation and Waste Removal795 - Landfill Disposal Tipping Fees 6,856,116 6,200,000 6,200,000 6,943,000 743,000
113

REVENUE Fiscal 2022 Summary of the Adopted Budget
(continued)
A001 - General Fund - Account FY20 Actual FY21 Budget FY21Projection
FY22Estimate
Dollar Change
796 - Boards and Commissions Pre-Qualifications 86,809 50,000 50,000 50,000 0
797 - Solid Waste Surcharge 3,481,570 2,595,000 3,094,012 2,621,000 26,000
799 - Southwest Resource Recovery Facility 1,584,545 966,000 966,000 966,000 0
CATEGORY TOTALCATEGORY TOTAL 47,606,635 45,128,950 40,052,422 46,185,000 1,056,050
REVENUE TRANSFERSRevenue Transfers
952 - From Parking Management Fund 29,171,434 22,282,112 (8,150,633) 13,915,871 (8,366,241)
957 - From (To) Children’s Fund (13,105,000) (5,346,000) (5,346,000) (13,327,000) (7,981,000)
967 - From (To) Federal (2,139,105) 0 0 0 0
CATEGORY TOTALCATEGORY TOTAL 13,927,329 16,936,112 (13,496,633) 588,871 (16,347,241)
FUND BALANCEPrior Year Fund Balance
999 - Prior Year Fund Balance 8,300,000 21,000,000 21,000,000 4,432,000 (16,568,000)
FUND TOTALA001 - GENERAL FUND TOTAL
FUND TOTAL 1,939,711,003 1,932,799,999 1,901,570,520 2,007,751,000 74,951,001
114

Fiscal 2022 Summary of the Adopted Budget REVENUE
B022 - Convention Center Bond Fund
B022 - Convention Center Bond Fund - Account FY20 Actual FY21 Budget FY21Projection
FY22Estimate
Dollar Change
LOCAL TAXESSales and Service
052 - Hotel Tax 26,454,278 21,328,915 11,787,000 19,630,000 (1,698,915)
REVENUE TRANSFERSRevenue Transfers
953 - Transfer to General Fund (21,891,653) (21,328,915) (11,787,000) (19,630,000) 1,698,915
FUND TOTALB022 - CONVENTION CENTER BOND FUND TOTAL
FUND TOTAL 4,562,625 0 0 0 0
115

REVENUE Fiscal 2022 Summary of the Adopted Budget
B024 - Conduit Enterprise Fund
B024 - Conduit Enterprise Fund - Account FY20 Actual FY21 Budget FY21Projection
FY22Estimate
Dollar Change
USE OF PROPERTYUse of Property
249 - Conduit Rental 35,986,110 36,497,197 36,444,957 18,029,924 (18,467,273)
FUND TOTALB024 - CONDUIT ENTERPRISE FUND TOTAL
FUND TOTAL 35,986,110 36,497,197 36,444,957 18,029,924 (18,467,273)
116

Fiscal 2022 Summary of the Adopted Budget REVENUE
B070 - Wastewater Utility Fund
B070 - Wastewater Utility Fund - Account FY20 Actual FY21 Budget FY21Projection
FY22Estimate
Dollar Change
CHARGES FOR CURRENT SERVICESCharges - Current Services
825 - Sewerage Charges - City 212,700,424 191,073,325 214,427,872 220,870,667 29,797,342
826 - Sewerage Charges - Counties 64,007,887 71,999,297 86,373,280 72,880,602 881,305
Other Revenues830 - Sanitation and Waste Removal - General 1,463,013 1,759,821 1,759,821 1,759,821 0
Charges - Current Services832 - Industrial Waste Surcharge - City 5,541,635 5,568,952 5,568,952 5,568,952 0
Fund Balance834 - From (To) Fund Balance 0 673,102 12,605,033 (1,929,904) (2,603,006)
Other Revenues836 - Reimbursable Billing Costs (308,255) 0 0 0 0
Charges - Current Services837 - Pretreatment Permits 344,994 345,167 345,167 345,167 0
Fines and Forfeits838 - Non - Compliance Fines 11,650 7,750 7,750 7,750 0
Charges - Current Services839 - Penalties (1,631) 1,876,078 5,628,233 3,283,136 1,407,058
CATEGORY TOTALCATEGORY TOTAL 283,759,717 273,303,492 326,716,108 302,786,191 29,482,699
USE OF MONEY AND PROPERTYUse of Money and Property
835 - Interest Income 4,303,782 0 0 0 0
FUND TOTALB070 - WASTEWATER UTILITY FUND TOTAL
FUND TOTAL 288,063,499 273,303,492 326,716,108 302,786,191 29,482,699
117

REVENUE Fiscal 2022 Summary of the Adopted Budget
B071 - Water Utility Fund
B071 - Water Utility Fund - Account FY20 Actual FY21 Budget FY21Projection
FY22Estimate
Dollar Change
CHARGES FOR CURRENT SERVICESCharges - Current Services
839 - Metered Water - Carroll County 871,514 770,659 770,659 846,954 76,295
840 - Metered Water - City 119,965,894 104,146,776 109,878,305 126,086,959 21,940,183
841 - Metered Water - Baltimore County 40,667,566 58,383,943 64,476,336 58,306,696 (77,247)
842 - Metered Water - Anne Arundel County 0 (61,784) (61,784) (61,784) 0
843 - Metered Water - Howard County 41,913,978 30,594,203 30,594,203 33,623,029 3,028,826
844 - Metered Water - Harford County 240,848 524,304 524,304 524,304 0
846 - Special Water Supply Service (4,172,771) (10,536,090) (10,536,090) (10,083,966) 452,124
848 - Private Fire Protection Service 1,703,179 1,333,948 1,333,948 1,333,948 0
849 - Fire Hydrant Permits 65,392 74,679 74,679 74,679 0
Use of Money and Property851 - Water - Rental Real Property 77,886 100,235 100,235 100,235 0
Other Revenues852 - Sundry Water 881,510 1,063,682 1,063,682 1,063,682 0
Charges - Current Services854 - Water Charges to City Agencies (1,223,398) 2,031,098 2,031,098 2,198,694 167,596
Fund Balance855 - From (To) Fund Balance 0 4,017,500 0 (4,853,355) (8,870,855)
Use of Money and Property856 - Interest Income 4,357,509 0 0 0 0
Charges - Current Services857 - Reimbursable Billing Costs 115,470 7,216,423 7,216,423 0 (7,216,423)
858 - Penalties 883,935 1,876,078 5,628,233 3,283,136 1,407,058
Other Revenues859 - Scrap Meters 10,600 0 0 0 0
CATEGORY TOTALCATEGORY TOTAL 206,359,112 201,535,654 213,094,231 212,443,211 10,907,557
FUND TOTALB071 - WATER UTILITY FUND TOTAL
FUND TOTAL 206,359,112 201,535,654 213,094,231 212,443,211 10,907,557
118

Fiscal 2022 Summary of the Adopted Budget REVENUE
B072 - Stormwater Utility Fund
B072 - Stormwater Utility Fund - Account FY20 Actual FY21 Budget FY21Projection
FY22Estimate
Dollar Change
FINES AND FORFEITSFines and Forfeits
189 - 5,700 0 0 0 0
CHARGES FOR CURRENT SERVICESCharges - Current Services
790 - Stormwater Management Fee 136,170 0 0 0 0
791 - 70,506 0 0 0 0
825 - Stormwater Fee 33,419,043 32,893,306 32,893,306 34,967,277 2,073,971
845 - Penalties (25,329) 0 0 0 0
CATEGORY TOTALCATEGORY TOTAL 33,600,390 32,893,306 32,893,306 34,967,277 2,073,971
USE OF MONEY AND PROPERTYUse of Money and Property
835 - Interest Income 1,190,918 0 0 0 0
REVENUE TRANSFERSRevenue Transfers
900 - From (To) Fund Balance 0 2,873,650 2,873,650 (879,365) (3,753,015)
FUND TOTALB072 - STORMWATER UTILITY FUND TOTAL
FUND TOTAL 34,797,008 35,766,956 35,766,956 34,087,912 (1,679,044)
119

REVENUE Fiscal 2022 Summary of the Adopted Budget
B075 - Parking Enterprise Fund
B075 - Parking Enterprise Fund - Account FY20 Actual FY21 Budget FY21Projection
FY22Estimate
Dollar Change
LOCAL TAXESLocal Taxes
044 - Parking Garages and Lots Tax 0 24,200,000 24,200,000 24,272,980 72,980
LICENSE AND PERMITSLicense and Permits
165 - Open Air Garage Permits 425,562 830,000 830,000 830,000 0
FINES AND FORFEITSFines and Forfeits
181 - Parking Fines 10,809,047 12,100,000 12,100,000 10,136,000 (1,964,000)
182 - Penalties on Parking Fines 6,042,411 5,400,000 5,400,000 4,801,000 (599,000)
CATEGORY TOTALCATEGORY TOTAL 16,851,458 17,500,000 17,500,000 14,937,000 (2,563,000)
USE OF MONEY AND PROPERTYUse of Money and Property
579 - Garage Income 15,335,692 18,300,000 18,300,000 14,591,000 (3,709,000)
CHARGES FOR CURRENT SERVICESCharges - Current Services
664 - Parking Meters 10,333,458 11,600,000 11,600,000 10,418,000 (1,182,000)
REVENUE TRANSFERSRevenue Transfers
952 - From (To) Parking Management Fund (50,700,967) (45,875,919) (45,850,328) (37,734,888) 8,141,031
953 - From (To) Special Fund (5,780,702) (4,840,000) (4,840,000) (4,854,596) (14,596)
CATEGORY TOTALCATEGORY TOTAL (56,481,669) (50,715,919) (50,690,328) (42,589,484) 8,126,435
FUND TOTALB075 - PARKING ENTERPRISE FUND TOTAL
FUND TOTAL (13,535,499) 21,714,081 21,739,672 22,459,496 745,415
120

Fiscal 2022 Summary of the Adopted Budget REVENUE
B076 - Parking Management Fund
B076 - Parking Management Fund - Account FY20 Actual FY21 Budget FY21Projection
FY22Estimate
Dollar Change
LICENSE AND PERMITSLicense and Permits
141 - Residential Parking Permits 435,357 490,000 490,000 530,000 40,000
USE OF MONEY AND PROPERTYUse of Money and Property
201 - Rental of Property 2,660 3,100 3,100 3,100 0
CHARGES FOR CURRENT SERVICESCharges - Current Services
759 - Temporary Parking Lots 127,060 125,000 125,000 125,000 0
760 - Parking Garages 1,973,741 2,150,000 2,150,000 1,745,962 (404,038)
866 - Booting Fee 440,766 530,000 530,000 530,000 0
867 - ZIPCAR Income 75,750 75,000 75,000 75,000 0
872 - Miscellaneous Revenue 69,560 80,000 80,000 80,000 0
CATEGORY TOTALCATEGORY TOTAL 2,686,877 2,960,000 2,960,000 2,555,962 (404,038)
REVENUE TRANSFERSRevenue Transfers
950 - From Parking Enterprise Fund 50,700,967 45,875,919 45,850,328 37,734,888 (8,141,031)
952 - From (To) General Fund (29,171,434) (22,282,112) (22,415,544) (13,915,871) 8,366,241
CATEGORY TOTALCATEGORY TOTAL 21,529,533 23,593,807 23,434,784 23,819,017 225,210
FUND TOTALB076 - PARKING MANAGEMENT FUND TOTAL
FUND TOTAL 24,654,427 27,046,907 26,887,884 26,908,079 (138,828)
121

REVENUE Fiscal 2022 Summary of the Adopted Budget
Funds Detail for Operating
Federal Funds - Service FY20Actual
FY21Budget
FY22Budget
DollarChange
Prioritizing Our Youth308 Maternal and Child Health 0 20,151,259 20,947,655 796,396310 School Health Services 0 157,705 306,468 148,763316 Youth and Trauma Services 0 1,039,989 453,193 (586,796)446 Educational Grants 0 300,000 300,000 0605 Head Start 0 7,790,297 8,021,215 230,918648 Community Recreation Centers 0 439,661 439,661 0740 Dawson Center 0 402,456 342,289 (60,167)741 Community Action Partnership 0 1,052,599 18,850,191 17,797,592797 Workforce Services for Out of SchoolYouth-Youth Opportunity
0 1,124,412 991,323 (133,089)
798 Youth Works Summer Job Program 0 2,000,000 2,001,816 1,816800 Workforce Services for WIOA FundedYouth
0 3,260,315 4,118,574 858,259
PRIORITY OUTCOME TOTAL 0 37,718,693 56,772,385 19,053,692
Building Public Safety115 Prosecution of Criminals 0 1,796,589 1,825,120 28,531307 Substance Use Disorder and MentalHealth
0 1,347,824 1,361,843 14,019
315 Emergency Services - Health 0 668,764 704,910 36,146600 Administration - Fire 0 1,600,000 1,600,000 0602 Fire Suppression and Emergency Rescue 0 2,424,656 1,026,850 (1,397,806)608 Emergency Management 0 1,795,858 5,480,263 3,684,405617 Criminal Justice Coordination 0 1,130,078 1,499,039 368,961618 Neighborhood Safety and Engagement 0 1,646,370 3,451,129 1,804,759621 Administrative Bureau 0 264,137 276,316 12,179622 Police Patrol 0 2,500,000 2,500,000 0623 Criminal Investigation Division 0 766,086 1,580,240 814,154626 Data Driven Strategies 0 0 4,447,967 4,447,967642 Crime Laboratory and Evidence Control 0 530,702 430,409 (100,293)697 Traffic Safety 0 524,190 488,426 (35,764)786 Victim and Witness Services 0 2,601,351 2,711,564 110,213796 Workforce Services for Ex-Offenders 0 557,000 557,000 0807 Compliance Bureau 0 25,460 25,893 433816 Special Operations Section 0 145,000 145,085 85853 Patrol Support Services 0 605,750 576,912 (28,838)889 Child Support Enforcement 0 1,100,000 1,100,000 0PRIORITY OUTCOME TOTAL 0 22,029,815 31,788,966 9,759,151
Clean and Healthy Communities303 Clinical Services 0 1,792,441 1,882,302 89,861305 Healthy Homes 0 1,021,902 921,094 (100,808)
122

Fiscal 2022 Summary of the Adopted Budget REVENUE
(continued)
Federal Funds - Service FY20Actual
FY21Budget
FY22Budget
DollarChange
356 Administration - Homeless Services 0 4,240,570 4,720,258 479,688593 Community Support Projects 0 25,083,253 42,078,452 16,995,199611 Fire Code Enforcement 0 171,867 171,867 0613 Fire Facilities Maintenance andReplacement
0 3,628,628 3,690,315 61,687
661 Public Right-of-Way Cleaning 0 2,046,000 2,046,000 0662 Vacant and Abandoned PropertyCleaning and Boarding
0 1,100,000 1,175,000 75,000
663 Waste Removal and Recycling 0 0 850,000 850,000670 Administration - Water and Wastewater 0 0 300,000 300,000671 Water Management 0 204,600 254,600 50,000673 Wastewater Management 0 0 1,400,000 1,400,000674 Surface Water Management 0 100,000 675,000 575,000681 Administration - DOT 0 560,962 0 (560,962)690 Sustainable Transportation 0 0 10,600 10,600715 Administration - Health 0 5,620,731 5,793,584 172,853718 Chronic Disease Prevention 0 45,471 45,882 411720 HIV Treatment Services for theUninsured
0 28,676,268 30,211,064 1,534,796
721 Senior Centers 0 1,861,384 1,627,554 (233,830)722 Administration - CARE 0 242,857 257,877 15,020723 Advocacy for Seniors 0 108,693 112,326 3,633725 Community Services for Seniors 0 3,711,222 3,834,268 123,046731 Facilities Management 0 1,023,000 0 (1,023,000)737 Administration - HCD 0 1,238,222 1,030,722 (207,500)742 Promote Homeownership 0 185,368 199,551 14,183745 Housing Code Enforcement 0 363,986 360,000 (3,986)748 Affordable Housing 0 717,564 985,398 267,834750 Housing Rehabilitation Services 0 6,121,682 6,224,470 102,788762 Historic Preservation 0 100,000 100,000 0763 Comprehensive Planning and ResourceManagement
0 150,000 150,000 0
765 Planning for a Sustainable Baltimore 0 518,105 250,000 (268,105)893 Homeless Prevention and SupportServices for the Homeless
0 237,844 260,503 22,659
894 Outreach to the Homeless 0 928,367 944,150 15,783895 Temporary Housing for the Homeless 0 9,448,356 9,455,978 7,622896 Permanent Housing for the Homeless 0 29,935,410 34,167,501 4,232,091PRIORITY OUTCOME TOTAL 0 131,184,753 156,186,316 25,001,563
Equitable Neighborhood Development111 Economic Recovery 0 10,000,000 0 (10,000,000)792 Workforce Public Assistance 0 2,877,547 3,054,440 176,893794 Administration - MOED 0 0 28,939 28,939
123

REVENUE Fiscal 2022 Summary of the Adopted Budget
(continued)
Federal Funds - Service FY20Actual
FY21Budget
FY22Budget
DollarChange
795 Workforce Services for BaltimoreResidents
0 6,126,530 6,352,180 225,650
PRIORITY OUTCOME TOTAL 0 19,004,077 9,435,559 (9,568,518)
Responsible Stewardship of City Resources110 Circuit Court 0 2,153,572 2,388,927 235,355125 Executive Direction and Control -Mayoralty
0 315,896 321,266 5,370
PRIORITY OUTCOME TOTAL 0 2,469,468 2,710,193 240,725
Other110 Circuit Court 1,240,273 0 0 0111 Economic Recovery 0 0 680,284,732 680,284,732115 Prosecution of Criminals 522,548 0 0 0122 Miscellaneous General Expenses 0 85,000 85,000 0125 Executive Direction and Control -Mayoralty
391,946 0 0 0
303 Clinical Services 2,442,205 0 0 0305 Healthy Homes 656,328 0 0 0307 Substance Use Disorder and MentalHealth
118,183 0 0 0
308 Maternal and Child Health 18,546,617 0 0 0310 School Health Services 150,990 0 0 0315 Emergency Services - Health 588,466 0 0 0316 Youth and Trauma Services 771,372 0 0 0356 Administration - Homeless Services 1,722,147 0 0 0593 Community Support Projects 7,681,515 0 0 0602 Fire Suppression and Emergency Rescue 2,573,938 0 0 0605 Head Start 7,539,746 0 0 0613 Fire Facilities Maintenance andReplacement
1,921,404 0 0 0
617 Criminal Justice Coordination 275,091 0 0 0618 Neighborhood Safety and Engagement 827,117 0 0 0622 Police Patrol 258,184 0 0 0623 Criminal Investigation Division 998,503 0 0 0624 Target Violent Criminals 48,719 0 0 0626 Data Driven Strategies 1,316,092 0 0 0642 Crime Laboratory and Evidence Control 304,141 0 0 0662 Vacant and Abandoned PropertyCleaning and Boarding
1,063,456 0 0 0
697 Traffic Safety 21,501 0 0 0715 Administration - Health 747,447 0 0 0718 Chronic Disease Prevention 15,599 0 0 0720 HIV Treatment Services for theUninsured
21,286,957 0 0 0
124

Fiscal 2022 Summary of the Adopted Budget REVENUE
(continued)
Federal Funds - Service FY20Actual
FY21Budget
FY22Budget
DollarChange
721 Senior Centers 1,220,032 0 0 0722 Administration - CARE 332,306 0 0 0723 Advocacy for Seniors 65,844 0 0 0725 Community Services for Seniors 4,500,848 0 0 0737 Administration - HCD 579,226 0 0 0740 Dawson Center 263,767 0 0 0741 Community Action Partnership 805,087 0 0 0742 Promote Homeownership 190,633 0 0 0745 Housing Code Enforcement 160,000 0 0 0748 Affordable Housing 392,591 0 0 0750 Housing Rehabilitation Services 1,933,909 0 0 0758 Coordination of Public Safety Strategy -Administration
178,421 0 0 0
765 Planning for a Sustainable Baltimore 13,085 0 0 0786 Victim and Witness Services 1,862,600 0 0 0792 Workforce Public Assistance 2,566,599 0 0 0794 Administration - MOED (74,492) 0 0 0795 Workforce Services for BaltimoreResidents
3,401,242 0 0 0
797 Workforce Services for Out of SchoolYouth-Youth Opportunity
534,865 0 0 0
798 Youth Works Summer Job Program 2,080,760 0 0 0800 Workforce Services for WIOA FundedYouth
2,156,829 0 0 0
893 Homeless Prevention and SupportServices for the Homeless
15,520,219 0 0 0
894 Outreach to the Homeless 1,089,019 0 0 0895 Temporary Housing for the Homeless 621,266 0 0 0896 Permanent Housing for the Homeless 9,514,212 0 0 0PRIORITY OUTCOME TOTAL 123,939,353 85,000 680,369,732 680,284,732
FUND TOTALFUND TOTAL 123,939,353 212,491,806 937,263,151 724,771,345
125

REVENUE Fiscal 2022 Summary of the Adopted Budget
Federal Funds - Service FY20Actual
FY21Budget
FY22Budget
DollarChange
Prioritizing Our Youth308 Maternal and Child Health 0 20,151,259 20,947,655 796,396310 School Health Services 0 157,705 306,468 148,763316 Youth and Trauma Services 0 1,039,989 453,193 (586,796)446 Educational Grants 0 300,000 300,000 0605 Head Start 0 7,790,297 8,021,215 230,918648 Community Recreation Centers 0 439,661 439,661 0740 Dawson Center 0 402,456 342,289 (60,167)741 Community Action Partnership 0 1,052,599 18,850,191 17,797,592797 Workforce Services for Out of SchoolYouth-Youth Opportunity
0 1,124,412 991,323 (133,089)
798 Youth Works Summer Job Program 0 2,000,000 2,001,816 1,816800 Workforce Services for WIOA FundedYouth
0 3,260,315 4,118,574 858,259
PRIORITY OUTCOME TOTAL 0 37,718,693 56,772,385 19,053,692
Building Public Safety115 Prosecution of Criminals 0 1,796,589 1,825,120 28,531307 Substance Use Disorder and MentalHealth
0 1,347,824 1,361,843 14,019
315 Emergency Services - Health 0 668,764 704,910 36,146600 Administration - Fire 0 1,600,000 1,600,000 0602 Fire Suppression and Emergency Rescue 0 2,424,656 1,026,850 (1,397,806)608 Emergency Management 0 1,795,858 5,480,263 3,684,405617 Criminal Justice Coordination 0 1,130,078 1,499,039 368,961618 Neighborhood Safety and Engagement 0 1,646,370 3,451,129 1,804,759621 Administrative Bureau 0 264,137 276,316 12,179622 Police Patrol 0 2,500,000 2,500,000 0623 Criminal Investigation Division 0 766,086 1,580,240 814,154626 Data Driven Strategies 0 0 4,447,967 4,447,967642 Crime Laboratory and Evidence Control 0 530,702 430,409 (100,293)697 Traffic Safety 0 524,190 488,426 (35,764)786 Victim and Witness Services 0 2,601,351 2,711,564 110,213796 Workforce Services for Ex-Offenders 0 557,000 557,000 0807 Compliance Bureau 0 25,460 25,893 433816 Special Operations Section 0 145,000 145,085 85853 Patrol Support Services 0 605,750 576,912 (28,838)889 Child Support Enforcement 0 1,100,000 1,100,000 0PRIORITY OUTCOME TOTAL 0 22,029,815 31,788,966 9,759,151
Clean and Healthy Communities303 Clinical Services 0 1,792,441 1,882,302 89,861305 Healthy Homes 0 1,021,902 921,094 (100,808)356 Administration - Homeless Services 0 4,240,570 4,720,258 479,688593 Community Support Projects 0 25,083,253 42,078,452 16,995,199611 Fire Code Enforcement 0 171,867 171,867 0
126

Fiscal 2022 Summary of the Adopted Budget REVENUE
(continued)
Federal Funds - Service FY20Actual
FY21Budget
FY22Budget
DollarChange
613 Fire Facilities Maintenance andReplacement
0 3,628,628 3,690,315 61,687
661 Public Right-of-Way Cleaning 0 2,046,000 2,046,000 0662 Vacant and Abandoned PropertyCleaning and Boarding
0 1,100,000 1,175,000 75,000
663 Waste Removal and Recycling 0 0 850,000 850,000670 Administration - Water and Wastewater 0 0 300,000 300,000671 Water Management 0 204,600 254,600 50,000673 Wastewater Management 0 0 1,400,000 1,400,000674 Surface Water Management 0 100,000 675,000 575,000681 Administration - DOT 0 560,962 0 (560,962)690 Sustainable Transportation 0 0 10,600 10,600715 Administration - Health 0 5,620,731 5,793,584 172,853718 Chronic Disease Prevention 0 45,471 45,882 411720 HIV Treatment Services for theUninsured
0 28,676,268 30,211,064 1,534,796
721 Senior Centers 0 1,861,384 1,627,554 (233,830)722 Administration - CARE 0 242,857 257,877 15,020723 Advocacy for Seniors 0 108,693 112,326 3,633725 Community Services for Seniors 0 3,711,222 3,834,268 123,046731 Facilities Management 0 1,023,000 0 (1,023,000)737 Administration - HCD 0 1,238,222 1,030,722 (207,500)742 Promote Homeownership 0 185,368 199,551 14,183745 Housing Code Enforcement 0 363,986 360,000 (3,986)748 Affordable Housing 0 717,564 985,398 267,834750 Housing Rehabilitation Services 0 6,121,682 6,224,470 102,788762 Historic Preservation 0 100,000 100,000 0763 Comprehensive Planning and ResourceManagement
0 150,000 150,000 0
765 Planning for a Sustainable Baltimore 0 518,105 250,000 (268,105)893 Homeless Prevention and SupportServices for the Homeless
0 237,844 260,503 22,659
894 Outreach to the Homeless 0 928,367 944,150 15,783895 Temporary Housing for the Homeless 0 9,448,356 9,455,978 7,622896 Permanent Housing for the Homeless 0 29,935,410 34,167,501 4,232,091PRIORITY OUTCOME TOTAL 0 131,184,753 156,186,316 25,001,563
Equitable Neighborhood Development111 Economic Recovery 0 10,000,000 0 (10,000,000)792 Workforce Public Assistance 0 2,877,547 3,054,440 176,893794 Administration - MOED 0 0 28,939 28,939795 Workforce Services for BaltimoreResidents
0 6,126,530 6,352,180 225,650
PRIORITY OUTCOME TOTAL 0 19,004,077 9,435,559 (9,568,518)
127

REVENUE Fiscal 2022 Summary of the Adopted Budget
(continued)
Federal Funds - Service FY20Actual
FY21Budget
FY22Budget
DollarChange
Responsible Stewardship of City Resources110 Circuit Court 0 2,153,572 2,388,927 235,355125 Executive Direction and Control -Mayoralty
0 315,896 321,266 5,370
PRIORITY OUTCOME TOTAL 0 2,469,468 2,710,193 240,725
Other110 Circuit Court 1,240,273 0 0 0111 Economic Recovery 0 0 680,284,732 680,284,732115 Prosecution of Criminals 522,548 0 0 0122 Miscellaneous General Expenses 0 85,000 85,000 0125 Executive Direction and Control -Mayoralty
391,946 0 0 0
303 Clinical Services 2,442,205 0 0 0305 Healthy Homes 656,328 0 0 0307 Substance Use Disorder and MentalHealth
118,183 0 0 0
308 Maternal and Child Health 18,546,617 0 0 0310 School Health Services 150,990 0 0 0315 Emergency Services - Health 588,466 0 0 0316 Youth and Trauma Services 771,372 0 0 0356 Administration - Homeless Services 1,722,147 0 0 0593 Community Support Projects 7,681,515 0 0 0602 Fire Suppression and Emergency Rescue 2,573,938 0 0 0605 Head Start 7,539,746 0 0 0613 Fire Facilities Maintenance andReplacement
1,921,404 0 0 0
617 Criminal Justice Coordination 275,091 0 0 0618 Neighborhood Safety and Engagement 827,117 0 0 0622 Police Patrol 258,184 0 0 0623 Criminal Investigation Division 998,503 0 0 0624 Target Violent Criminals 48,719 0 0 0626 Data Driven Strategies 1,316,092 0 0 0642 Crime Laboratory and Evidence Control 304,141 0 0 0662 Vacant and Abandoned PropertyCleaning and Boarding
1,063,456 0 0 0
697 Traffic Safety 21,501 0 0 0715 Administration - Health 747,447 0 0 0718 Chronic Disease Prevention 15,599 0 0 0720 HIV Treatment Services for theUninsured
21,286,957 0 0 0
721 Senior Centers 1,220,032 0 0 0722 Administration - CARE 332,306 0 0 0723 Advocacy for Seniors 65,844 0 0 0725 Community Services for Seniors 4,500,848 0 0 0
128

Fiscal 2022 Summary of the Adopted Budget REVENUE
(continued)
Federal Funds - Service FY20Actual
FY21Budget
FY22Budget
DollarChange
737 Administration - HCD 579,226 0 0 0740 Dawson Center 263,767 0 0 0741 Community Action Partnership 805,087 0 0 0742 Promote Homeownership 190,633 0 0 0745 Housing Code Enforcement 160,000 0 0 0748 Affordable Housing 392,591 0 0 0750 Housing Rehabilitation Services 1,933,909 0 0 0758 Coordination of Public Safety Strategy -Administration
178,421 0 0 0
765 Planning for a Sustainable Baltimore 13,085 0 0 0786 Victim and Witness Services 1,862,600 0 0 0792 Workforce Public Assistance 2,566,599 0 0 0794 Administration - MOED (74,492) 0 0 0795 Workforce Services for BaltimoreResidents
3,401,242 0 0 0
797 Workforce Services for Out of SchoolYouth-Youth Opportunity
534,865 0 0 0
798 Youth Works Summer Job Program 2,080,760 0 0 0800 Workforce Services for WIOA FundedYouth
2,156,829 0 0 0
893 Homeless Prevention and SupportServices for the Homeless
15,520,219 0 0 0
894 Outreach to the Homeless 1,089,019 0 0 0895 Temporary Housing for the Homeless 621,266 0 0 0896 Permanent Housing for the Homeless 9,514,212 0 0 0PRIORITY OUTCOME TOTAL 123,939,353 85,000 680,369,732 680,284,732
FUND TOTALFUND TOTAL 123,939,353 212,491,806 937,263,151 724,771,345
129

REVENUE Fiscal 2022 Summary of the Adopted Budget
Federal Funds - Service FY20Actual
FY21Budget
FY22Budget
DollarChange
Prioritizing Our Youth308 Maternal and Child Health 0 20,151,259 20,947,655 796,396310 School Health Services 0 157,705 306,468 148,763316 Youth and Trauma Services 0 1,039,989 453,193 (586,796)446 Educational Grants 0 300,000 300,000 0605 Head Start 0 7,790,297 8,021,215 230,918648 Community Recreation Centers 0 439,661 439,661 0740 Dawson Center 0 402,456 342,289 (60,167)741 Community Action Partnership 0 1,052,599 18,850,191 17,797,592797 Workforce Services for Out of SchoolYouth-Youth Opportunity
0 1,124,412 991,323 (133,089)
798 Youth Works Summer Job Program 0 2,000,000 2,001,816 1,816800 Workforce Services for WIOA FundedYouth
0 3,260,315 4,118,574 858,259
PRIORITY OUTCOME TOTAL 0 37,718,693 56,772,385 19,053,692
Building Public Safety115 Prosecution of Criminals 0 1,796,589 1,825,120 28,531307 Substance Use Disorder and MentalHealth
0 1,347,824 1,361,843 14,019
315 Emergency Services - Health 0 668,764 704,910 36,146600 Administration - Fire 0 1,600,000 1,600,000 0602 Fire Suppression and Emergency Rescue 0 2,424,656 1,026,850 (1,397,806)608 Emergency Management 0 1,795,858 5,480,263 3,684,405617 Criminal Justice Coordination 0 1,130,078 1,499,039 368,961618 Neighborhood Safety and Engagement 0 1,646,370 3,451,129 1,804,759621 Administrative Bureau 0 264,137 276,316 12,179622 Police Patrol 0 2,500,000 2,500,000 0623 Criminal Investigation Division 0 766,086 1,580,240 814,154626 Data Driven Strategies 0 0 4,447,967 4,447,967642 Crime Laboratory and Evidence Control 0 530,702 430,409 (100,293)697 Traffic Safety 0 524,190 488,426 (35,764)786 Victim and Witness Services 0 2,601,351 2,711,564 110,213796 Workforce Services for Ex-Offenders 0 557,000 557,000 0807 Compliance Bureau 0 25,460 25,893 433816 Special Operations Section 0 145,000 145,085 85853 Patrol Support Services 0 605,750 576,912 (28,838)889 Child Support Enforcement 0 1,100,000 1,100,000 0PRIORITY OUTCOME TOTAL 0 22,029,815 31,788,966 9,759,151
Clean and Healthy Communities303 Clinical Services 0 1,792,441 1,882,302 89,861305 Healthy Homes 0 1,021,902 921,094 (100,808)356 Administration - Homeless Services 0 4,240,570 4,720,258 479,688593 Community Support Projects 0 25,083,253 42,078,452 16,995,199611 Fire Code Enforcement 0 171,867 171,867 0
130

Fiscal 2022 Summary of the Adopted Budget REVENUE
(continued)
Federal Funds - Service FY20Actual
FY21Budget
FY22Budget
DollarChange
613 Fire Facilities Maintenance andReplacement
0 3,628,628 3,690,315 61,687
661 Public Right-of-Way Cleaning 0 2,046,000 2,046,000 0662 Vacant and Abandoned PropertyCleaning and Boarding
0 1,100,000 1,175,000 75,000
663 Waste Removal and Recycling 0 0 850,000 850,000670 Administration - Water and Wastewater 0 0 300,000 300,000671 Water Management 0 204,600 254,600 50,000673 Wastewater Management 0 0 1,400,000 1,400,000674 Surface Water Management 0 100,000 675,000 575,000681 Administration - DOT 0 560,962 0 (560,962)690 Sustainable Transportation 0 0 10,600 10,600715 Administration - Health 0 5,620,731 5,793,584 172,853718 Chronic Disease Prevention 0 45,471 45,882 411720 HIV Treatment Services for theUninsured
0 28,676,268 30,211,064 1,534,796
721 Senior Centers 0 1,861,384 1,627,554 (233,830)722 Administration - CARE 0 242,857 257,877 15,020723 Advocacy for Seniors 0 108,693 112,326 3,633725 Community Services for Seniors 0 3,711,222 3,834,268 123,046731 Facilities Management 0 1,023,000 0 (1,023,000)737 Administration - HCD 0 1,238,222 1,030,722 (207,500)742 Promote Homeownership 0 185,368 199,551 14,183745 Housing Code Enforcement 0 363,986 360,000 (3,986)748 Affordable Housing 0 717,564 985,398 267,834750 Housing Rehabilitation Services 0 6,121,682 6,224,470 102,788762 Historic Preservation 0 100,000 100,000 0763 Comprehensive Planning and ResourceManagement
0 150,000 150,000 0
765 Planning for a Sustainable Baltimore 0 518,105 250,000 (268,105)893 Homeless Prevention and SupportServices for the Homeless
0 237,844 260,503 22,659
894 Outreach to the Homeless 0 928,367 944,150 15,783895 Temporary Housing for the Homeless 0 9,448,356 9,455,978 7,622896 Permanent Housing for the Homeless 0 29,935,410 34,167,501 4,232,091PRIORITY OUTCOME TOTAL 0 131,184,753 156,186,316 25,001,563
Equitable Neighborhood Development111 Economic Recovery 0 10,000,000 0 (10,000,000)792 Workforce Public Assistance 0 2,877,547 3,054,440 176,893794 Administration - MOED 0 0 28,939 28,939795 Workforce Services for BaltimoreResidents
0 6,126,530 6,352,180 225,650
PRIORITY OUTCOME TOTAL 0 19,004,077 9,435,559 (9,568,518)
131

REVENUE Fiscal 2022 Summary of the Adopted Budget
(continued)
Federal Funds - Service FY20Actual
FY21Budget
FY22Budget
DollarChange
Responsible Stewardship of City Resources110 Circuit Court 0 2,153,572 2,388,927 235,355125 Executive Direction and Control -Mayoralty
0 315,896 321,266 5,370
PRIORITY OUTCOME TOTAL 0 2,469,468 2,710,193 240,725
Other110 Circuit Court 1,240,273 0 0 0111 Economic Recovery 0 0 680,284,732 680,284,732115 Prosecution of Criminals 522,548 0 0 0122 Miscellaneous General Expenses 0 85,000 85,000 0125 Executive Direction and Control -Mayoralty
391,946 0 0 0
303 Clinical Services 2,442,205 0 0 0305 Healthy Homes 656,328 0 0 0307 Substance Use Disorder and MentalHealth
118,183 0 0 0
308 Maternal and Child Health 18,546,617 0 0 0310 School Health Services 150,990 0 0 0315 Emergency Services - Health 588,466 0 0 0316 Youth and Trauma Services 771,372 0 0 0356 Administration - Homeless Services 1,722,147 0 0 0593 Community Support Projects 7,681,515 0 0 0602 Fire Suppression and Emergency Rescue 2,573,938 0 0 0605 Head Start 7,539,746 0 0 0613 Fire Facilities Maintenance andReplacement
1,921,404 0 0 0
617 Criminal Justice Coordination 275,091 0 0 0618 Neighborhood Safety and Engagement 827,117 0 0 0622 Police Patrol 258,184 0 0 0623 Criminal Investigation Division 998,503 0 0 0624 Target Violent Criminals 48,719 0 0 0626 Data Driven Strategies 1,316,092 0 0 0642 Crime Laboratory and Evidence Control 304,141 0 0 0662 Vacant and Abandoned PropertyCleaning and Boarding
1,063,456 0 0 0
697 Traffic Safety 21,501 0 0 0715 Administration - Health 747,447 0 0 0718 Chronic Disease Prevention 15,599 0 0 0720 HIV Treatment Services for theUninsured
21,286,957 0 0 0
721 Senior Centers 1,220,032 0 0 0722 Administration - CARE 332,306 0 0 0723 Advocacy for Seniors 65,844 0 0 0725 Community Services for Seniors 4,500,848 0 0 0
132

Fiscal 2022 Summary of the Adopted Budget REVENUE
(continued)
Federal Funds - Service FY20Actual
FY21Budget
FY22Budget
DollarChange
737 Administration - HCD 579,226 0 0 0740 Dawson Center 263,767 0 0 0741 Community Action Partnership 805,087 0 0 0742 Promote Homeownership 190,633 0 0 0745 Housing Code Enforcement 160,000 0 0 0748 Affordable Housing 392,591 0 0 0750 Housing Rehabilitation Services 1,933,909 0 0 0758 Coordination of Public Safety Strategy -Administration
178,421 0 0 0
765 Planning for a Sustainable Baltimore 13,085 0 0 0786 Victim and Witness Services 1,862,600 0 0 0792 Workforce Public Assistance 2,566,599 0 0 0794 Administration - MOED (74,492) 0 0 0795 Workforce Services for BaltimoreResidents
3,401,242 0 0 0
797 Workforce Services for Out of SchoolYouth-Youth Opportunity
534,865 0 0 0
798 Youth Works Summer Job Program 2,080,760 0 0 0800 Workforce Services for WIOA FundedYouth
2,156,829 0 0 0
893 Homeless Prevention and SupportServices for the Homeless
15,520,219 0 0 0
894 Outreach to the Homeless 1,089,019 0 0 0895 Temporary Housing for the Homeless 621,266 0 0 0896 Permanent Housing for the Homeless 9,514,212 0 0 0PRIORITY OUTCOME TOTAL 123,939,353 85,000 680,369,732 680,284,732
FUND TOTALFUND TOTAL 123,939,353 212,491,806 937,263,151 724,771,345
133

REVENUE Fiscal 2022 Summary of the Adopted Budget
Federal Funds - Service FY20Actual
FY21Budget
FY22Budget
DollarChange
Prioritizing Our Youth308 Maternal and Child Health 0 20,151,259 20,947,655 796,396310 School Health Services 0 157,705 306,468 148,763316 Youth and Trauma Services 0 1,039,989 453,193 (586,796)446 Educational Grants 0 300,000 300,000 0605 Head Start 0 7,790,297 8,021,215 230,918648 Community Recreation Centers 0 439,661 439,661 0740 Dawson Center 0 402,456 342,289 (60,167)741 Community Action Partnership 0 1,052,599 18,850,191 17,797,592797 Workforce Services for Out of SchoolYouth-Youth Opportunity
0 1,124,412 991,323 (133,089)
798 Youth Works Summer Job Program 0 2,000,000 2,001,816 1,816800 Workforce Services for WIOA FundedYouth
0 3,260,315 4,118,574 858,259
PRIORITY OUTCOME TOTAL 0 37,718,693 56,772,385 19,053,692
Building Public Safety115 Prosecution of Criminals 0 1,796,589 1,825,120 28,531307 Substance Use Disorder and MentalHealth
0 1,347,824 1,361,843 14,019
315 Emergency Services - Health 0 668,764 704,910 36,146600 Administration - Fire 0 1,600,000 1,600,000 0602 Fire Suppression and Emergency Rescue 0 2,424,656 1,026,850 (1,397,806)608 Emergency Management 0 1,795,858 5,480,263 3,684,405617 Criminal Justice Coordination 0 1,130,078 1,499,039 368,961618 Neighborhood Safety and Engagement 0 1,646,370 3,451,129 1,804,759621 Administrative Bureau 0 264,137 276,316 12,179622 Police Patrol 0 2,500,000 2,500,000 0623 Criminal Investigation Division 0 766,086 1,580,240 814,154626 Data Driven Strategies 0 0 4,447,967 4,447,967642 Crime Laboratory and Evidence Control 0 530,702 430,409 (100,293)697 Traffic Safety 0 524,190 488,426 (35,764)786 Victim and Witness Services 0 2,601,351 2,711,564 110,213796 Workforce Services for Ex-Offenders 0 557,000 557,000 0807 Compliance Bureau 0 25,460 25,893 433816 Special Operations Section 0 145,000 145,085 85853 Patrol Support Services 0 605,750 576,912 (28,838)889 Child Support Enforcement 0 1,100,000 1,100,000 0PRIORITY OUTCOME TOTAL 0 22,029,815 31,788,966 9,759,151
Clean and Healthy Communities303 Clinical Services 0 1,792,441 1,882,302 89,861305 Healthy Homes 0 1,021,902 921,094 (100,808)356 Administration - Homeless Services 0 4,240,570 4,720,258 479,688593 Community Support Projects 0 25,083,253 42,078,452 16,995,199611 Fire Code Enforcement 0 171,867 171,867 0
134
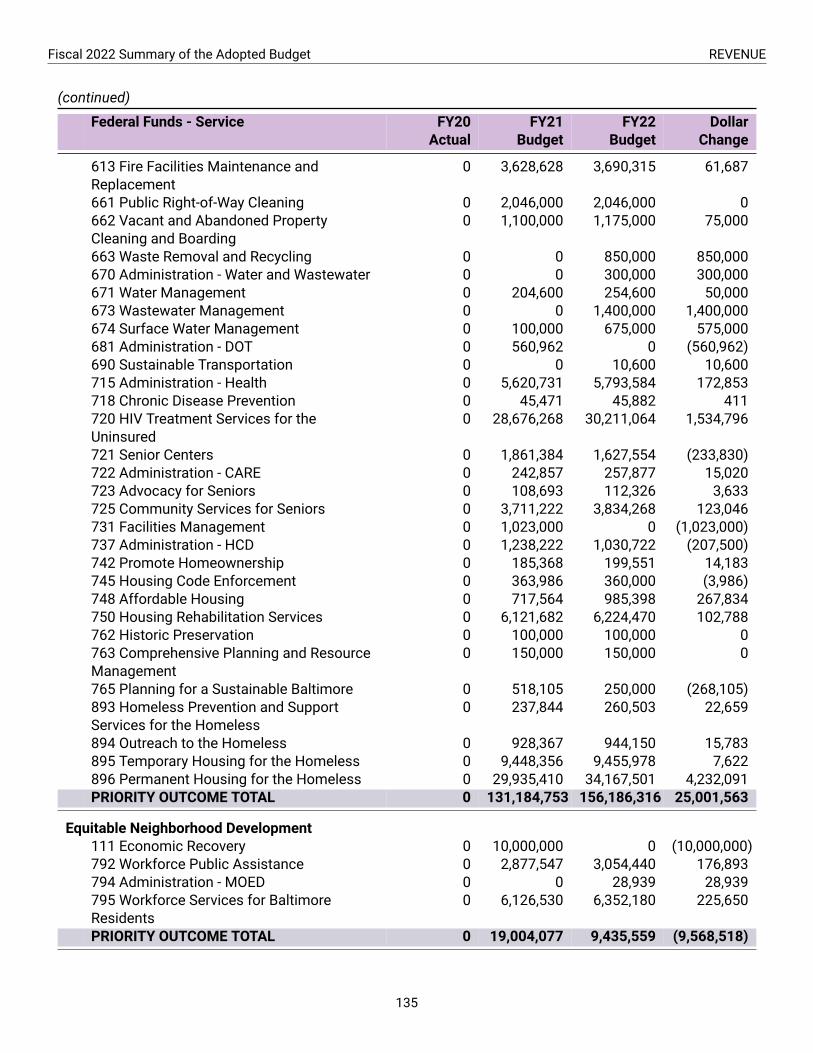
Fiscal 2022 Summary of the Adopted Budget REVENUE
(continued)
Federal Funds - Service FY20Actual
FY21Budget
FY22Budget
DollarChange
613 Fire Facilities Maintenance andReplacement
0 3,628,628 3,690,315 61,687
661 Public Right-of-Way Cleaning 0 2,046,000 2,046,000 0662 Vacant and Abandoned PropertyCleaning and Boarding
0 1,100,000 1,175,000 75,000
663 Waste Removal and Recycling 0 0 850,000 850,000670 Administration - Water and Wastewater 0 0 300,000 300,000671 Water Management 0 204,600 254,600 50,000673 Wastewater Management 0 0 1,400,000 1,400,000674 Surface Water Management 0 100,000 675,000 575,000681 Administration - DOT 0 560,962 0 (560,962)690 Sustainable Transportation 0 0 10,600 10,600715 Administration - Health 0 5,620,731 5,793,584 172,853718 Chronic Disease Prevention 0 45,471 45,882 411720 HIV Treatment Services for theUninsured
0 28,676,268 30,211,064 1,534,796
721 Senior Centers 0 1,861,384 1,627,554 (233,830)722 Administration - CARE 0 242,857 257,877 15,020723 Advocacy for Seniors 0 108,693 112,326 3,633725 Community Services for Seniors 0 3,711,222 3,834,268 123,046731 Facilities Management 0 1,023,000 0 (1,023,000)737 Administration - HCD 0 1,238,222 1,030,722 (207,500)742 Promote Homeownership 0 185,368 199,551 14,183745 Housing Code Enforcement 0 363,986 360,000 (3,986)748 Affordable Housing 0 717,564 985,398 267,834750 Housing Rehabilitation Services 0 6,121,682 6,224,470 102,788762 Historic Preservation 0 100,000 100,000 0763 Comprehensive Planning and ResourceManagement
0 150,000 150,000 0
765 Planning for a Sustainable Baltimore 0 518,105 250,000 (268,105)893 Homeless Prevention and SupportServices for the Homeless
0 237,844 260,503 22,659
894 Outreach to the Homeless 0 928,367 944,150 15,783895 Temporary Housing for the Homeless 0 9,448,356 9,455,978 7,622896 Permanent Housing for the Homeless 0 29,935,410 34,167,501 4,232,091PRIORITY OUTCOME TOTAL 0 131,184,753 156,186,316 25,001,563
Equitable Neighborhood Development111 Economic Recovery 0 10,000,000 0 (10,000,000)792 Workforce Public Assistance 0 2,877,547 3,054,440 176,893794 Administration - MOED 0 0 28,939 28,939795 Workforce Services for BaltimoreResidents
0 6,126,530 6,352,180 225,650
PRIORITY OUTCOME TOTAL 0 19,004,077 9,435,559 (9,568,518)
135

REVENUE Fiscal 2022 Summary of the Adopted Budget
(continued)
Federal Funds - Service FY20Actual
FY21Budget
FY22Budget
DollarChange
Responsible Stewardship of City Resources110 Circuit Court 0 2,153,572 2,388,927 235,355125 Executive Direction and Control -Mayoralty
0 315,896 321,266 5,370
PRIORITY OUTCOME TOTAL 0 2,469,468 2,710,193 240,725
Other110 Circuit Court 1,240,273 0 0 0111 Economic Recovery 0 0 680,284,732 680,284,732115 Prosecution of Criminals 522,548 0 0 0122 Miscellaneous General Expenses 0 85,000 85,000 0125 Executive Direction and Control -Mayoralty
391,946 0 0 0
303 Clinical Services 2,442,205 0 0 0305 Healthy Homes 656,328 0 0 0307 Substance Use Disorder and MentalHealth
118,183 0 0 0
308 Maternal and Child Health 18,546,617 0 0 0310 School Health Services 150,990 0 0 0315 Emergency Services - Health 588,466 0 0 0316 Youth and Trauma Services 771,372 0 0 0356 Administration - Homeless Services 1,722,147 0 0 0593 Community Support Projects 7,681,515 0 0 0602 Fire Suppression and Emergency Rescue 2,573,938 0 0 0605 Head Start 7,539,746 0 0 0613 Fire Facilities Maintenance andReplacement
1,921,404 0 0 0
617 Criminal Justice Coordination 275,091 0 0 0618 Neighborhood Safety and Engagement 827,117 0 0 0622 Police Patrol 258,184 0 0 0623 Criminal Investigation Division 998,503 0 0 0624 Target Violent Criminals 48,719 0 0 0626 Data Driven Strategies 1,316,092 0 0 0642 Crime Laboratory and Evidence Control 304,141 0 0 0662 Vacant and Abandoned PropertyCleaning and Boarding
1,063,456 0 0 0
697 Traffic Safety 21,501 0 0 0715 Administration - Health 747,447 0 0 0718 Chronic Disease Prevention 15,599 0 0 0720 HIV Treatment Services for theUninsured
21,286,957 0 0 0
721 Senior Centers 1,220,032 0 0 0722 Administration - CARE 332,306 0 0 0723 Advocacy for Seniors 65,844 0 0 0725 Community Services for Seniors 4,500,848 0 0 0
136
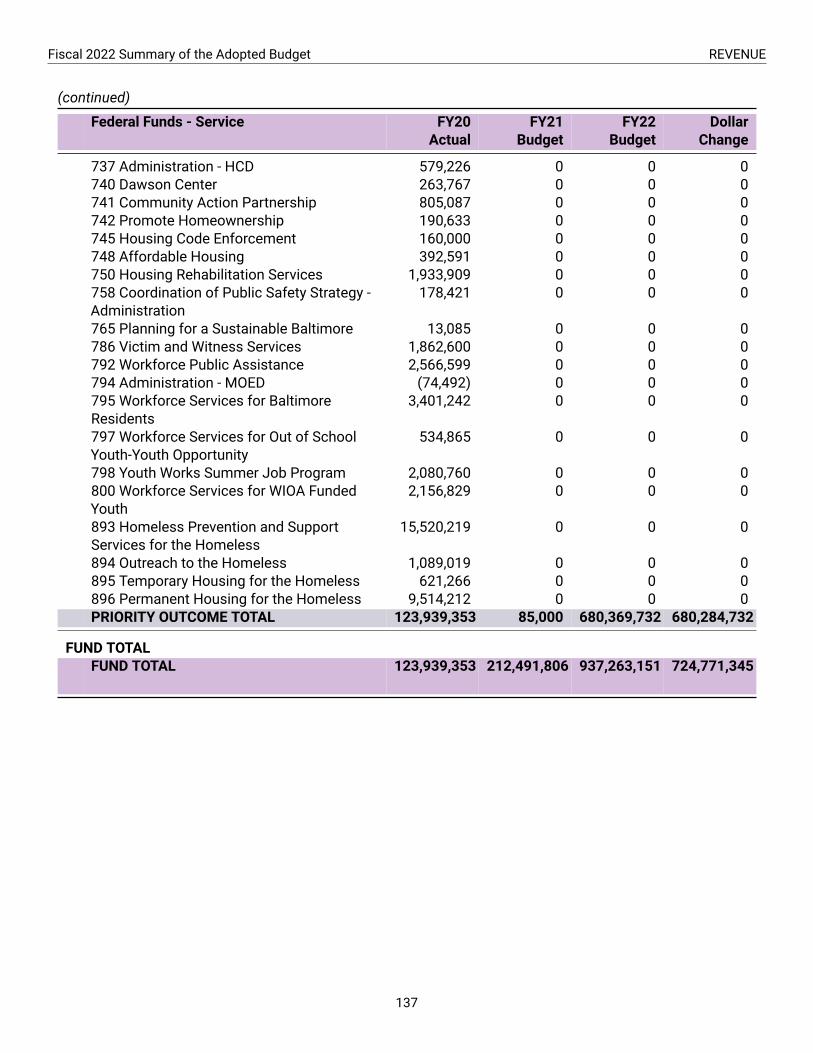
Fiscal 2022 Summary of the Adopted Budget REVENUE
(continued)
Federal Funds - Service FY20Actual
FY21Budget
FY22Budget
DollarChange
737 Administration - HCD 579,226 0 0 0740 Dawson Center 263,767 0 0 0741 Community Action Partnership 805,087 0 0 0742 Promote Homeownership 190,633 0 0 0745 Housing Code Enforcement 160,000 0 0 0748 Affordable Housing 392,591 0 0 0750 Housing Rehabilitation Services 1,933,909 0 0 0758 Coordination of Public Safety Strategy -Administration
178,421 0 0 0
765 Planning for a Sustainable Baltimore 13,085 0 0 0786 Victim and Witness Services 1,862,600 0 0 0792 Workforce Public Assistance 2,566,599 0 0 0794 Administration - MOED (74,492) 0 0 0795 Workforce Services for BaltimoreResidents
3,401,242 0 0 0
797 Workforce Services for Out of SchoolYouth-Youth Opportunity
534,865 0 0 0
798 Youth Works Summer Job Program 2,080,760 0 0 0800 Workforce Services for WIOA FundedYouth
2,156,829 0 0 0
893 Homeless Prevention and SupportServices for the Homeless
15,520,219 0 0 0
894 Outreach to the Homeless 1,089,019 0 0 0895 Temporary Housing for the Homeless 621,266 0 0 0896 Permanent Housing for the Homeless 9,514,212 0 0 0PRIORITY OUTCOME TOTAL 123,939,353 85,000 680,369,732 680,284,732
FUND TOTALFUND TOTAL 123,939,353 212,491,806 937,263,151 724,771,345
137

Budgetary Funds and Projected Revenues
General Fund
Local Taxes 1.6B (77.9%)
State Highway User Revenue 156.3M (7.8%)
State Grants 101.7M (5.1%)Federal Grants 52.0M (2.6%)
Charges for Current Services 46.2M (2.3%)Licenses and Permits 33.2M (1.7%)
Fines and Forfeits 29.8M (1.5%)Use of Money and Property 14.1M (0.7%)
Other Revenues 9.9M (0.5%)
Policy and Objectives
The General Fund is the City’s principal fund, containing revenues which finance appropriations for both ongoingoperating expenses andPay-As-You-Go (PAYGO) capital projects. The budget for this fund includes all unrestrictedrevenues that support appropriations not required to be budgeted in another fund. Appropriations approved in theOrdinance of Estimates or in supplemental appropriationsmay be for any program or activity not prohibited by theCity Charter, public local law or other applicable law. The top five major types of revenues (Property Tax, IncomeTax, State Shared Tax, Other Local Tax, and State Grants) comprise 90.8% of the $2.01 billion Fiscal 2022 budget.Revenue Transfers represent revenue in excess of expense requirements in certain other funds that are availableto the General Fund, most significantly the Parking Management Fund.
Major Revenues
Local Taxes: Local Taxes, not including State Highway User Revenues, represent 77.9% of total General Fundrevenues and funding sources. The largest share (67.5%) of local taxes comes fromcurrent year Real andPersonalProperty Tax receipts. Budgeted Income Tax revenue represents 23.6% of local tax revenues. Sales and Servicetax levies are imposed on energy consumption, telecommunication lines, and hotel occupancy. These revenues
138
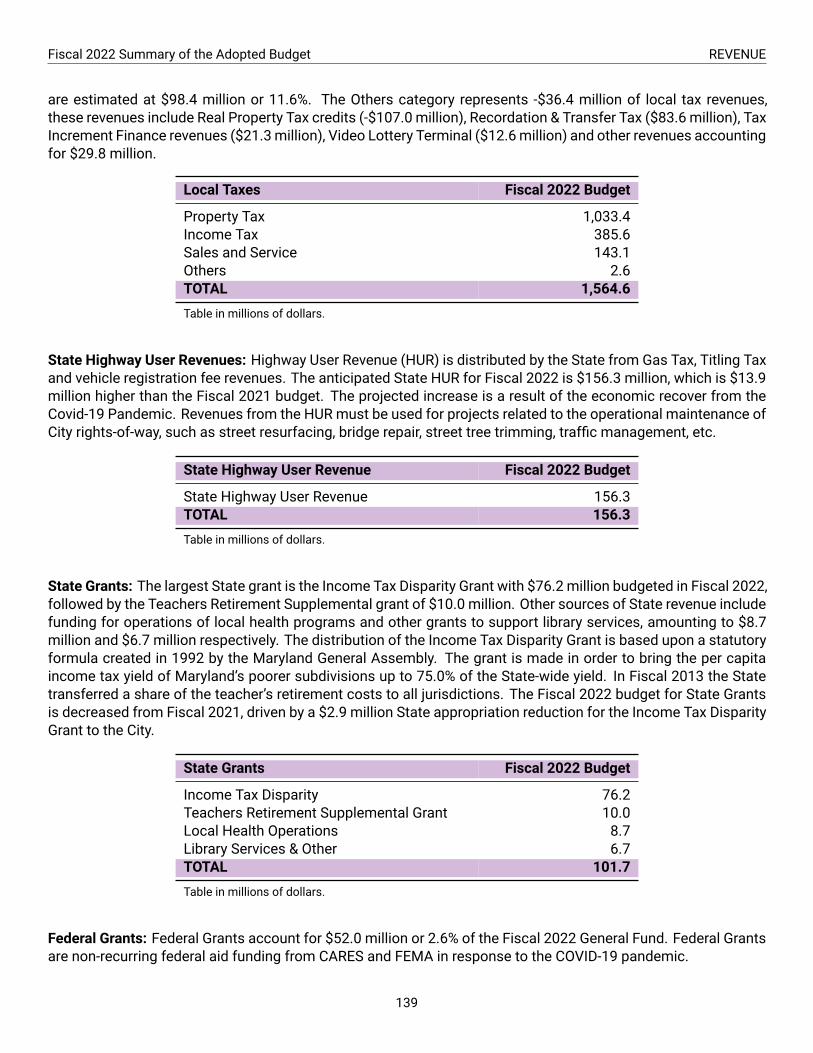
Fiscal 2022 Summary of the Adopted Budget REVENUE
are estimated at $98.4 million or 11.6%. The Others category represents -$36.4 million of local tax revenues,these revenues include Real Property Tax credits (-$107.0 million), Recordation & Transfer Tax ($83.6 million), TaxIncrement Finance revenues ($21.3million), Video Lottery Terminal ($12.6million) and other revenues accountingfor $29.8 million.
Local Taxes Fiscal 2022 Budget
Property Tax 1,033.4Income Tax 385.6Sales and Service 143.1Others 2.6TOTAL 1,564.6
Table in millions of dollars.
State Highway User Revenues: Highway User Revenue (HUR) is distributed by the State from Gas Tax, Titling Taxand vehicle registration fee revenues. The anticipated State HUR for Fiscal 2022 is $156.3 million, which is $13.9million higher than the Fiscal 2021 budget. The projected increase is a result of the economic recover from theCovid-19 Pandemic. Revenues from the HUR must be used for projects related to the operational maintenance ofCity rights-of-way, such as street resurfacing, bridge repair, street tree trimming, traffic management, etc.
State Highway User Revenue Fiscal 2022 Budget
State Highway User Revenue 156.3TOTAL 156.3
Table in millions of dollars.
State Grants: The largest State grant is the Income Tax Disparity Grant with $76.2 million budgeted in Fiscal 2022,followed by the Teachers Retirement Supplemental grant of $10.0 million. Other sources of State revenue includefunding for operations of local health programs and other grants to support library services, amounting to $8.7million and $6.7 million respectively. The distribution of the Income Tax Disparity Grant is based upon a statutoryformula created in 1992 by the Maryland General Assembly. The grant is made in order to bring the per capitaincome tax yield of Maryland’s poorer subdivisions up to 75.0% of the State-wide yield. In Fiscal 2013 the Statetransferred a share of the teacher’s retirement costs to all jurisdictions. The Fiscal 2022 budget for State Grantsis decreased from Fiscal 2021, driven by a $2.9 million State appropriation reduction for the Income Tax DisparityGrant to the City.
State Grants Fiscal 2022 Budget
Income Tax Disparity 76.2Teachers Retirement Supplemental Grant 10.0Local Health Operations 8.7Library Services & Other 6.7TOTAL 101.7
Table in millions of dollars.
Federal Grants: Federal Grants account for $52.0 million or 2.6% of the Fiscal 2022 General Fund. Federal Grantsare non-recurring federal aid funding from CARES and FEMA in response to the COVID-19 pandemic.
139

REVENUE Fiscal 2022 Summary of the Adopted Budget
Federal Grants Fiscal 2022 Budget
Federal Grants 52.0TOTAL 52.0
Table in millions of dollars.
Charges for Current Services: These revenues account for $46.2 million or 2.3% of the Fiscal 2022 General Fund.In the Charges for Current Services group, revenues that derive from overhead charges to City enterprise funds,Impounding Vehicle and Highway Fees, and Sanitation and Waste Removal account for $34.3 million or 74.3% ofthe category total. The remaining $11.9 million revenues come from lien report fees, District Court services, portfire protection reimbursement, stadium security service charges and a wide variety of other services rendered bythe City.
Charges for Current Services Fiscal 2022 Budget
Charges for Central City Services 15.9Other 10.8Sanitation and Waste Removal 10.6Impounding Vehicles and Highway Fees 8.8TOTAL 46.2
Table in millions of dollars.
Licenses and Permits: These revenues account for $33.2 million or 1.7% of the Fiscal 2022 General Fund. Threemajor groups comprise Licenses and Permits: Public Safety & Regulations; Business, Alcoholic Beverage, andMarriage Licenses; and all Other Licenses & Permits. The Public Safety and Regulation group, composed of build-ing, housing, animal control and certain trades’ permits, accounts for the majority of the revenue in this categoryat $24.3 million. The 5% Cable Franchise Fee is captured within the Public Safety & Regulations group. The City’spower to raise revenues from this source is constrained by Federal and State law. Certain license fees, includingalcoholic beverage, marriage and some business licenses are also set by State law. Other Licenses & Permitsincludes Food Dealer Permits, Minor Privilege Permits, and Special Event Permits.
Licenses and Permits Fiscal 2022 Budget
Public Safety and Regulations 24.3Other Licenses and Permits 5.3Business, Alcoholic Beverage, and MarriageLicenses
3.6
TOTAL 33.2
Table in millions of dollars.
Fines and Forfeits: These revenues account for $29.8 million or 1.5% of the Fiscal 2022 General Fund. Finesand Forfeits are primarily composed of Traffic Camera ticketing, environmental citations, and forfeiture revenues.The Fiscal 2022 traffic camera revenue estimate is $21.2 million, or 71.2% of Fines and Forfeits. Revenues fromenvironmental citations represent $6.5 million or 21.8% of the total revenue in this category. Revenues from For-feitures Drug/Gambling Contraband total $1.5 million or 5.0% of the total for this category.
140

Fiscal 2022 Summary of the Adopted Budget REVENUE
Fines and Forfeits Fiscal 2022 Budget
Traffic Cameras 21.2Environmental Control Board 6.5Forfeitures Drug/Gambling Contraband 1.5Other 0.6TOTAL 29.8
Table in millions of dollars.
Use of Money and Property: These revenues account for $14.1 million or 0.7% of the Fiscal 2022 General Fund.The largest Use of Money and Property revenue source is the revenue associated with the Convention Center.Total income generated by the Convention Center accounts for $5.3 million or 37.2% of this group. Other largerevenue sources in this category include the Rental of City Property ($3.5M), and revenue tied to the SouthwestResource Recovery Facility lease ($2.4M). All other revenues in this category amount to $3.0 million.
Use of Money and Property Fiscal 2022 Budget
Convention Center 5.3Rental of City Property 3.5Southwest Resource Recovery Facility 2.4Other 2.4Earnings on Investments 0.6TOTAL 14.1
Table in millions of dollars.
Other Revenues and Transfers: In addition to the revenues listed above, the General Fund receives about $9.9million, or 0.5%, in other revenues and net transfers from other funds. Other Revenues include $4.4 million fromFund Balance. There are two major components to the Revenue Transfers portion of the budget: the transferfrom the parking funds, $13.9 million, and the transfer to the Children’s Fund. In Fiscal 2017, City residents votedto pass ameasure that would dedicate funding to this fund. The total transfer to this fund is $13.3million in Fiscal2022.
Other Revenues Fiscal 2022 Budget
Other Revenues 9.3Revenue Transfers 0.6TOTAL 9.9
Table in millions of dollars.
141
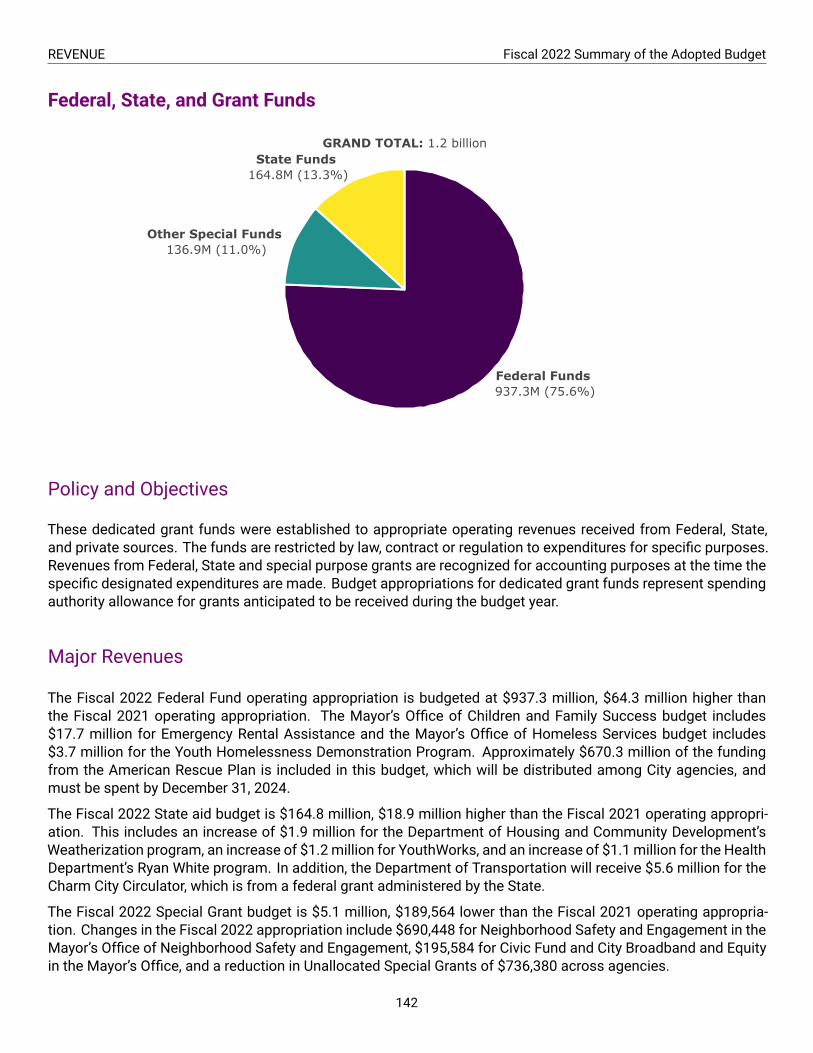
REVENUE Fiscal 2022 Summary of the Adopted Budget
Federal, State, and Grant Funds
Federal Funds 937.3M (75.6%)
State Funds 164.8M (13.3%)
Other Special Funds 136.9M (11.0%)
GRAND TOTAL: 1.2 billion
Policy and Objectives
These dedicated grant funds were established to appropriate operating revenues received from Federal, State,and private sources. The funds are restricted by law, contract or regulation to expenditures for specific purposes.Revenues from Federal, State and special purpose grants are recognized for accounting purposes at the time thespecific designated expenditures are made. Budget appropriations for dedicated grant funds represent spendingauthority allowance for grants anticipated to be received during the budget year.
Major Revenues
The Fiscal 2022 Federal Fund operating appropriation is budgeted at $937.3 million, $64.3 million higher thanthe Fiscal 2021 operating appropriation. The Mayor’s Office of Children and Family Success budget includes$17.7 million for Emergency Rental Assistance and the Mayor’s Office of Homeless Services budget includes$3.7 million for the Youth Homelessness Demonstration Program. Approximately $670.3 million of the fundingfrom the American Rescue Plan is included in this budget, which will be distributed among City agencies, andmust be spent by December 31, 2024.
The Fiscal 2022 State aid budget is $164.8 million, $18.9 million higher than the Fiscal 2021 operating appropri-ation. This includes an increase of $1.9 million for the Department of Housing and Community Development’sWeatherization program, an increase of $1.2 million for YouthWorks, and an increase of $1.1 million for the HealthDepartment’s Ryan White program. In addition, the Department of Transportation will receive $5.6 million for theCharm City Circulator, which is from a federal grant administered by the State.
The Fiscal 2022 Special Grant budget is $5.1 million, $189,564 lower than the Fiscal 2021 operating appropria-tion. Changes in the Fiscal 2022 appropriation include $690,448 for Neighborhood Safety and Engagement in theMayor’s Office of Neighborhood Safety and Engagement, $195,584 for Civic Fund and City Broadband and Equityin the Mayor’s Office, and a reduction in Unallocated Special Grants of $736,380 across agencies.
142

Fiscal 2022 Summary of the Adopted Budget REVENUE
Special Revenue Funds
Policy and Objectives
These dedicated revenue funds were are derived from a variety of revenue sources that are restricted to a specificuse by law, mandate, or policy. Budget appropriations for dedicated revenue funds represent spending authorityallowance for revenue anticipated to be received during the budget year.
Major Revenues
Fiscal 2022 Special Revenue Funds are estimated at $131.7 million, a $34.4 million decrease from Fiscal 2021.This includes an increase of $1.5 million for 911 Emergency Telephone Service, $578,128 in additional revenuededicated to School Construction, and $352,117 in Planning for a Sustainable Baltimore.
Water, Wastewater, and Stormwater Funds
City 126.1M
Baltimore County 58.3M
Other Revenues (9.2M)
Other Counties 34.9M
City Agencies 2.2M
City 220.9M
Other Counties 72.9M
Other Revenues 8.6M
Stormwater Fee 35.0M
Other Revenues(0.8M)
Stormwater Utility Fund
Water Utility Fund
Wastewater Utility Fund
Grand Total: 548.8 million
Totals may not equal sum of parts due to rounding. Chart in millions of dollars.
Policy and Objectives
A Charter Amendment approved in 1978 established the Water and Wastewater Utility Funds as two separateenterprises. The utility funds must be financially self-sustaining, as well as operated without profit or loss to otherCity funds. The establishment of these two funds enables the City to issue revenue bonds to finance related capitalimprovements. Ordinance 941, passed in December 1978, requires the Board of Estimates, upon recommendationof the Director of Finance and the Director of Public Works, to establish rates and charges sufficient to make the
143

REVENUE Fiscal 2022 Summary of the Adopted Budget
two utility funds self-supporting. Nearly all the funding sources for the utility operations come from the sale ofservices. Rates vary depending on volume, level of treatment and distribution costs. In the case of industrialusers, rates vary according to the types of contaminants discharged into the Wastewater system. For Fiscal Year2022 the rates for water, wastewater and stormwater are increasing by 9.0% from the Fiscal 2021 rates to fundadditional capital projects for the system.
Major Revenues
Water Utility: The Fiscal 2022 Water Utility Fund Revenues are estimated at $212.3 million, 0.4% lower than theFiscal 2021 Budget. The City supplies treated water to its residents, as well as to residents of Baltimore, Harford,and Howard counties. Untreated water is sold at wholesale rates to Carroll and Harford counties. The rate sched-ules are established pursuant to Board of Estimates’ actions and, in the case of Baltimore County, are subject toprovisions of State law and City/County agreements regarding cost allocation. The law and agreement with Balti-more County obligate the City to supply water at cost. The City and County allocate operating and maintenancecosts on all jointly used facilities. Baltimore City customers, including City agencies, are expected to account forabout $128.3 million or 60.4% of total user charges in Fiscal 2022. Baltimore County customers provide $58.3million or 27.5%, and the remaining balance comes from Carroll, Harford and Howard counties, late penalties, andother minor service charges.
Wastewater Utility: The Fiscal 2022Wastewater Utility Fund revenues are estimated at $302.3 million, 7.5% lowerthan the Fiscal 2021 Budget. Baltimore and Anne Arundel counties, pursuant to agreements with the City, pay intothe Wastewater Utility Fund a proportional amount based on the sewage treated at the Back River and Patapscotreatment plants. These counties also pay a portion of the capital expenses of jointly used wastewater facilities.City customers, including City agencies, provide approximately 73.1% or $220.9 million of total user charges whileBaltimore and Anne Arundel counties and other service charges comprise the balance.
Stormwater Utility Fund: The Fiscal 2022 Stormwater Utility Fund revenues are estimated at $34.1 million, 2.3%lower than the Fiscal 2021 Budget. The Stormwater Utility Fund, established for the Fiscal 2014 Budget, wascreated with the purpose of planning and budgeting for the capital and operating expenses associated with theCity’s stormwater management system. In 2012, the Maryland General Assembly passed a law mandating thatcertain jurisdictions, including the City, create a watershed protection program beginning July 1, 2013. A user feeprovides a dedicated revenue source for the purpose of enabling the City to meet State and federal water qualityrequirements, improving water quality and flood control, reducing runoff into the harbor, and expanding greenspace.
144

Fiscal 2022 Summary of the Adopted Budget REVENUE
Parking Enterprise Fund
Transfer to Parking
Management37.7M
Transfer to Cirulator Special Fund 4.9M
Appropriations22.5M
Uses
Garage Income14.6M
Parking Tax24.3M
Parking Fines and Penalties
14.9M
Parking Meters10.4M
Open Air Garage Permits
0.8M
Sources
Total Fund Sources: 65.0 million Net Fund Sources: 22.5 million
Totals may not equal sum of parts due to rounding. Chart in millions of dollars.
Policy and Objectives
The Parking Enterprise Fund was established in 1983 to budget for parking related revenues and debt serviceexpenses resulting from parking revenue bonds, notes and other revenue obligations. The City issues debt to fi-nance acquisition or construction of parking facilities. Revenue from garage operations and installment purchasepayments received from developers are deposited in the fund and are designated to support the debt serviceobligation of the fund. Parking taxes, open-air garage licenses, parking fines, penalties on parking fines and park-ing meter revenues also are deposited in this fund. These revenues provide a guaranteed flow of income andan additional security for the payment of debt service. Providing that debt service obligations and other securityrequirements of the fund are met, the City is permitted to transfer monies from the Parking Enterprise Fund. Rev-enues in excess of debt service and operating expense requirements are transferred to the Parking ManagementFund.
Major Revenues
The Fiscal 2022 Parking Enterprise Fund revenues are estimated to total $22.5million. The Parking Taxes, ParkingFine, Penalties on Parking Fines, and Garage Income generate $53.8 million or 82.7% of the Parking EnterpriseFund revenues. Twenty percent of the Parking Tax rate continues to fund operations and capital expenses for thefree harbor bus shuttle service, the Charm City Circulator. Out of this total, $22.5 million is to support operatingand debt service requirements, $4.8 million to be transferred to the Circulator Special Fund, and the remaining$37.7 million to be transferred to the Parking Management Fund.
145
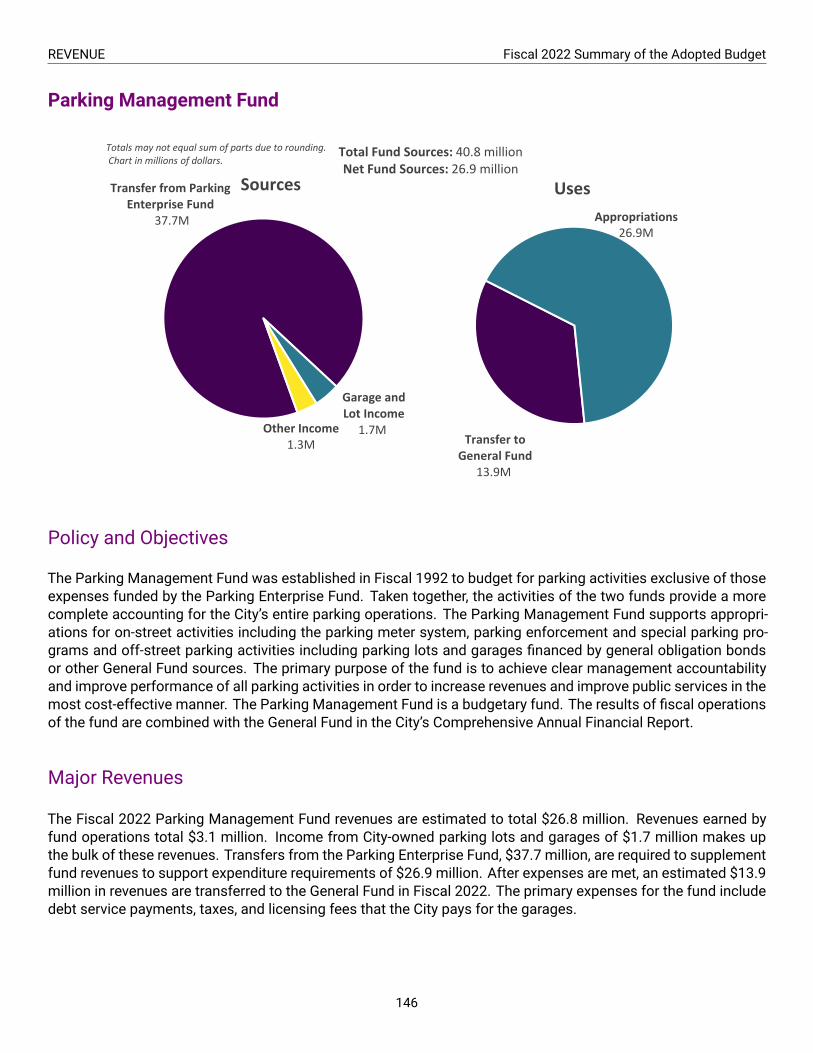
REVENUE Fiscal 2022 Summary of the Adopted Budget
Parking Management Fund
Transfer to General Fund
13.9M
Appropriations26.9M
UsesTransfer from Parking Enterprise Fund
37.7M
Garage and Lot Income
1.7MOther Income1.3M
Sources
Total Fund Sources: 40.8 millionNet Fund Sources: 26.9 million
Totals may not equal sum of parts due to rounding.Chart in millions of dollars.
Policy and Objectives
The Parking Management Fund was established in Fiscal 1992 to budget for parking activities exclusive of thoseexpenses funded by the Parking Enterprise Fund. Taken together, the activities of the two funds provide a morecomplete accounting for the City’s entire parking operations. The Parking Management Fund supports appropri-ations for on-street activities including the parking meter system, parking enforcement and special parking pro-grams and off-street parking activities including parking lots and garages financed by general obligation bondsor other General Fund sources. The primary purpose of the fund is to achieve clear management accountabilityand improve performance of all parking activities in order to increase revenues and improve public services in themost cost-effective manner. The Parking Management Fund is a budgetary fund. The results of fiscal operationsof the fund are combined with the General Fund in the City’s Comprehensive Annual Financial Report.
Major Revenues
The Fiscal 2022 Parking Management Fund revenues are estimated to total $26.8 million. Revenues earned byfund operations total $3.1 million. Income from City-owned parking lots and garages of $1.7 million makes upthe bulk of these revenues. Transfers from the Parking Enterprise Fund, $37.7 million, are required to supplementfund revenues to support expenditure requirements of $26.9 million. After expenses are met, an estimated $13.9million in revenues are transferred to the General Fund in Fiscal 2022. The primary expenses for the fund includedebt service payments, taxes, and licensing fees that the City pays for the garages.
146

Fiscal 2022 Summary of the Adopted Budget REVENUE
Convention Center Bond Fund
Policy and Objectives
The Convention Center Bond Fund was established in Fiscal 1995 to budget for hotel tax revenue to be dedicatedto support the payment of principal and interest associated with City indebtedness incurred to finance one-thirdof the $151.0million cost of the joint City-State expansion of the Baltimore Convention Center. The fully expandedand renovated Convention Center facility reopened in April 1997. The Convention Center Bond Fund is a budgetaryfund. The results of fiscal operations of the fund are combined with the General Fund in the City’s ComprehensiveAnnual Financial Report. In Fiscal 2020 the City completed its final debt service payment of $1.8 million for thebonds issued to fund the 1997 renovation of the Baltimore City Convention Center. The City intended to continuemaking annual contributions to the Convention Center Bond Fund to offset future Convention Center expansionor renovation costs; however, due to the lost revenues from the Covid-19 pandemic, the City will be transferringall Fiscal 2022 hotel tax proceeds to the General Fund.
Major Revenues
Fiscal 2022 hotel tax receipts are estimated to be $19.6 million. The sole revenue source for the fund is the 9.5%sales and service tax levied on transient room rentals at hotels, motels, short term residential rentals and bed andbreakfast facilities located in the City. As a result of legislation enacted by the 1997 Maryland General Assembly,the City must appropriate 40.0% of its total hotel tax receipts to support the operations of Visit Baltimore, Inc. Thelegislative requirement for promotion funding is mandated through Fiscal 2027.
Conduit Enterprise Fund
Policy and Objectives
The Conduit Enterprise Fund was established in Fiscal 2002. The fund accounts for revenue from charges tonon-City entities and City agencies renting space in the City-owned and operated underground conduit system.The conduit system is a unique public resource that provides access to substantial portions of the public rightof way without the necessity of opening and closing streets and disrupting traffic that is common in many urbanareas. The fund will appropriately highlight the costs of operations and funding reserve requirements in orderto achieve clear management accountability and improve performance of conduit-related operations in the mostcost-effective manner.
Major Revenues
The Fiscal 2022 receipts are estimated at $13.0 million. The sole revenue source for the fund is the rental chargelevied on City agency and other non-City users of the conduit system. Total expenses for the fund are appropriatedat $13.0million. Rental receipts in excess of the current operating expenses are reserved for maintenance, capitaland other requirements of the conduit system. The revenue potential from the conduit resource is enhanced as aresult of Ordinance 00-116, which grants authority to establish both City and non-City charges for use of the publicright of way that reflect the value of the right of way. The current rate for conduit occupancy is $2.20 per linearfoot.
147

REVENUE Fiscal 2022 Summary of the Adopted Budget
Capital Fund
Loans and Bonds 294.5M (60.4%)
Grant and Special Funds 91.8M (18.8%)
Other 81.2M (16.7%)
Pay-As-You-Go 20.0M (4.1%)
GRAND TOTAL: 487.6 million
Policy and Objectives
Governmental accounting standards and the City Charter require operating revenues and expenses to be clearlydistinguished from revenues and expenses associated with capital projects, e.g., the design, development, con-struction and extraordinary repair and rehabilitation of physical plant and facilities. The Board of Estimates hasdefined capital projects as physical improvements that cost more than $50,000; equipment and items of repairand maintenance that cost more than $100,000; Bureau of Water and Wastewater items of repair, maintenanceor emergency nature costing more than $250,000; and the salaries other than those that are properly capitalizedas part of the project cost. Each capital project appropriation reflects all revenue sources used to finance theparticular project. Major revenues are received from various sources, all of which comprise this fund.
Major Revenues
Excluding Pay-As-You Go funding, three types of funding sources (grants, loans and bonds, and all other) total$467.6 million and comprise 95.9% of the Fiscal 2022 capital appropriations of $453.7 million. The magnitude ofthe various funding sources changes significantly from year-to-year due to the timing of projects and grant funding.For instance, in Fiscal 2022, Revenue Bonds are budgeted to decrease by $252.0 million to $199.5 million, Stategrant funding is budgeted to increase by $43.3 million to $52.2 million, and Pay-As-You-Go appropriations arebudgeted to decrease by $23.2 million to $20.0 million.
The largest funding sources in the Fiscal 2022 capital budget are $294.5 million, or 60.4%, in Revenue, GeneralObligation, andCounty Transportation bonds; $91.8million, or 18.8%, in Federal andState grants; and $20.0million,or 4.1%, in Pay-As-You-Go funding from current operating revenues. Other funding sources make up $81.2 million,or 16.8%, of the total capital budget for Fiscal 2022.
148

Fiscal 2022 Summary of the Adopted Budget REVENUE
Internal Service Fund
Policy and Objectives
This fund finances goods and/or services provided by certain City agencies to other City agencies on a cost re-imbursement basis. In Fiscal 2022, $143.4 million has been adopted for vehicle fleet repair and maintenance,print shop, post office, telephone, energy, telecommunication, risk management, rental of public buildings, andunemployment and worker’s compensation services. These funds are to operate on a fully self-supporting basis,including the financing of reserves for capital equipment replacement.
149

Intentionally left blank.

Operating Budget
FISCAL2022
SUMMARY OF THEADOPTED BUDGET
Operating Budget

Intentionally left blank.

Overview of Operating Budget
Total Operating Budget: 3.84 billion
Where the Money Comes from
Property Taxes 1.0B (32.7%)
Charges for Services 613.5M (19.4%)
Income Tax 385.6M (12.2%)
Federal Grants 299.0M (9.5%)
State Grants 278.0M (8.8%)
Other Local Taxes 169.9M (5.4%)State Shared Taxes 141.3M (4.5%)
Special Revenues 118.4M (3.8%)All Other 97.6M (3.1%)
Use of Money and Property 14.1M (0.4%)
Special Grants 5.3M (0.2%)
How the Money is Used
Grants & Subsidies 1.3B (32.2%)
Salaries 952.4M (24.4%)
Contractual 723.9M (18.6%)
Other Personnel Costs 452.5M (11.6%)
Debt Service 375.0M (9.6%)
Materials & Supplies 142.5M (3.7%)
Totals may not equal 100% due to rounding. Charts in millions.
153
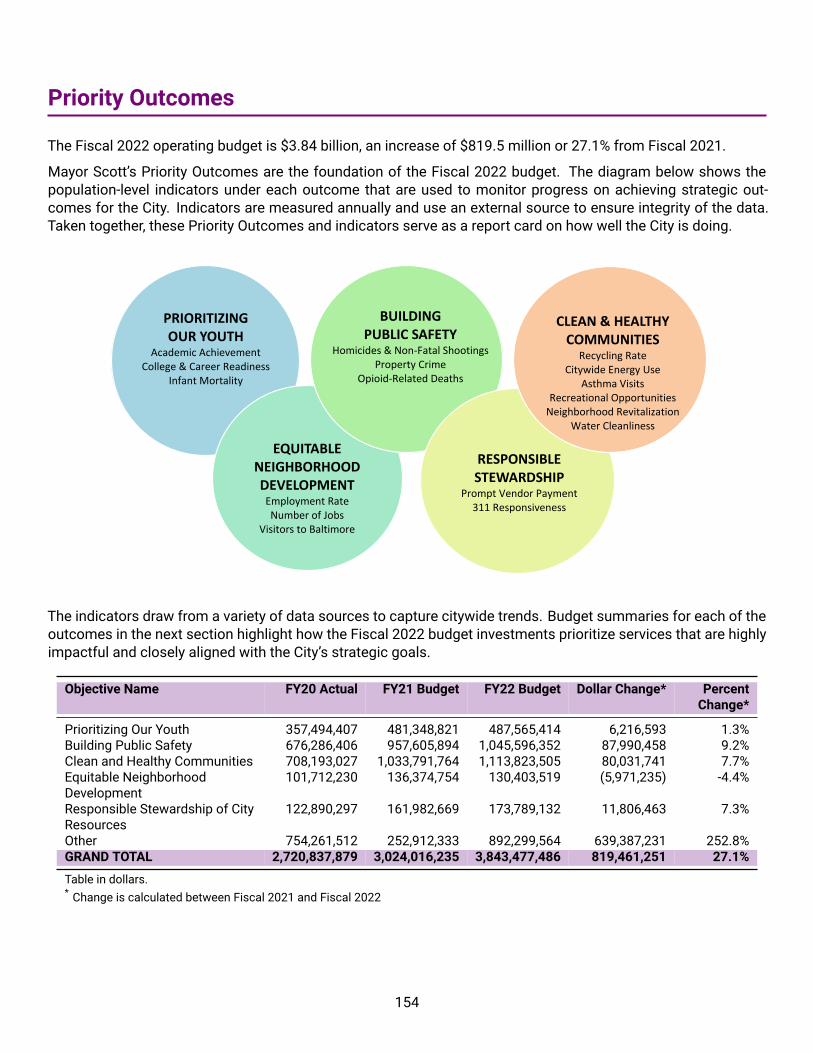
Priority Outcomes
The Fiscal 2022 operating budget is $3.84 billion, an increase of $819.5 million or 27.1% from Fiscal 2021.
Mayor Scott’s Priority Outcomes are the foundation of the Fiscal 2022 budget. The diagram below shows thepopulation-level indicators under each outcome that are used to monitor progress on achieving strategic out-comes for the City. Indicators are measured annually and use an external source to ensure integrity of the data.Taken together, these Priority Outcomes and indicators serve as a report card on how well the City is doing.
PRIORITIZING OUR YOUTH
Academic Achievement College & Career Readiness
Infant Mortality
RESPONSIBLE STEWARDSHIP
Prompt Vendor Payment 311 Responsiveness
CLEAN & HEALTHY COMMUNITIES
Recycling Rate Citywide Energy Use
Asthma Visits Recreational Opportunities
Neighborhood Revitalization Water Cleanliness
BUILDING PUBLIC SAFETY
Homicides & Non-Fatal Shootings Property Crime
Opioid-Related Deaths
EQUITABLE NEIGHBORHOOD DEVELOPMENT
Employment Rate Number of Jobs
Visitors to Baltimore
The indicators draw from a variety of data sources to capture citywide trends. Budget summaries for each of theoutcomes in the next section highlight how the Fiscal 2022 budget investments prioritize services that are highlyimpactful and closely aligned with the City’s strategic goals.
Objective Name FY20 Actual FY21 Budget FY22 Budget Dollar Change* PercentChange*
Prioritizing Our Youth 357,494,407 481,348,821 487,565,414 6,216,593 1.3%Building Public Safety 676,286,406 957,605,894 1,045,596,352 87,990,458 9.2%Clean and Healthy Communities 708,193,027 1,033,791,764 1,113,823,505 80,031,741 7.7%Equitable NeighborhoodDevelopment
101,712,230 136,374,754 130,403,519 (5,971,235) -4.4%
Responsible Stewardship of CityResources
122,890,297 161,982,669 173,789,132 11,806,463 7.3%
Other 754,261,512 252,912,333 892,299,564 639,387,231 252.8%GRAND TOTAL 2,720,837,879 3,024,016,235 3,843,477,486 819,461,251 27.1%
Table in dollars.* Change is calculated between Fiscal 2021 and Fiscal 2022
154
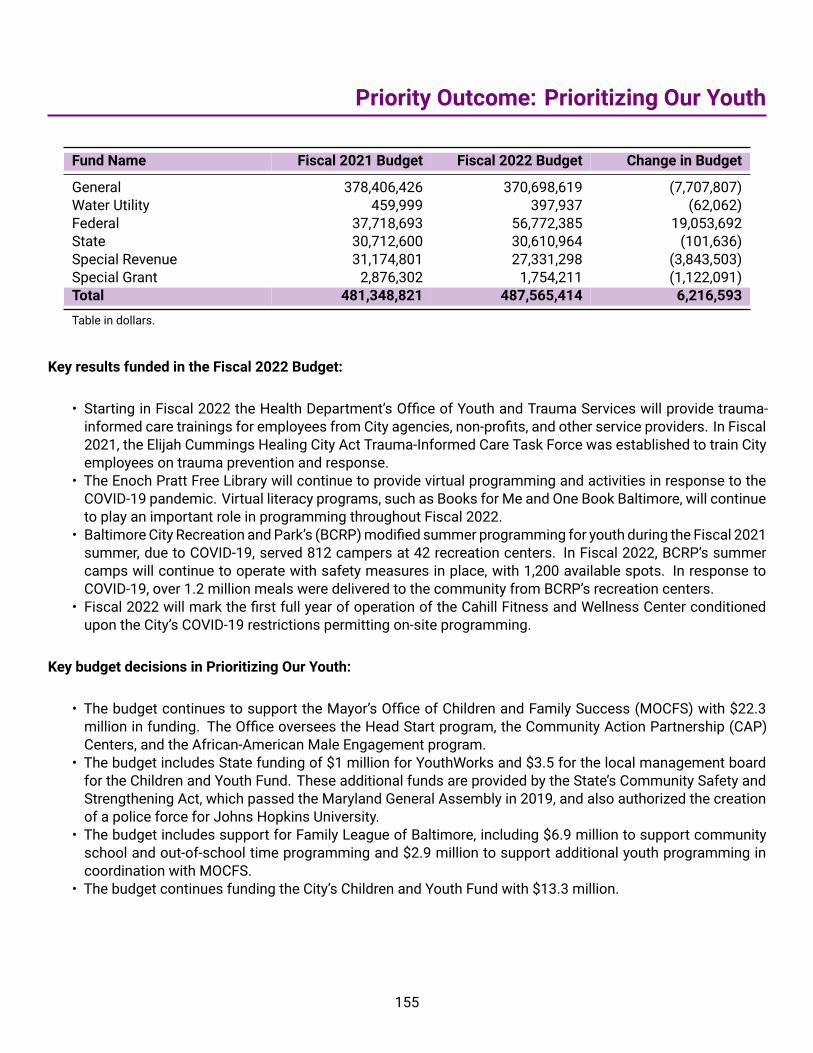
Priority Outcome: Prioritizing Our Youth
Fund Name Fiscal 2021 Budget Fiscal 2022 Budget Change in Budget
General 378,406,426 370,698,619 (7,707,807)Water Utility 459,999 397,937 (62,062)Federal 37,718,693 56,772,385 19,053,692State 30,712,600 30,610,964 (101,636)Special Revenue 31,174,801 27,331,298 (3,843,503)Special Grant 2,876,302 1,754,211 (1,122,091)Total 481,348,821 487,565,414 6,216,593
Table in dollars.
Key results funded in the Fiscal 2022 Budget:
• Starting in Fiscal 2022 the Health Department’s Office of Youth and Trauma Services will provide trauma-informed care trainings for employees from City agencies, non-profits, and other service providers. In Fiscal2021, the Elijah Cummings Healing City Act Trauma-Informed Care Task Force was established to train Cityemployees on trauma prevention and response.
• The Enoch Pratt Free Library will continue to provide virtual programming and activities in response to theCOVID-19 pandemic. Virtual literacy programs, such as Books for Me and One Book Baltimore, will continueto play an important role in programming throughout Fiscal 2022.
• Baltimore City Recreation andPark’s (BCRP)modified summer programming for youth during the Fiscal 2021summer, due to COVID-19, served 812 campers at 42 recreation centers. In Fiscal 2022, BCRP’s summercamps will continue to operate with safety measures in place, with 1,200 available spots. In response toCOVID-19, over 1.2 million meals were delivered to the community from BCRP’s recreation centers.
• Fiscal 2022 will mark the first full year of operation of the Cahill Fitness and Wellness Center conditionedupon the City’s COVID-19 restrictions permitting on-site programming.
Key budget decisions in Prioritizing Our Youth:
• The budget continues to support the Mayor’s Office of Children and Family Success (MOCFS) with $22.3million in funding. The Office oversees the Head Start program, the Community Action Partnership (CAP)Centers, and the African-American Male Engagement program.
• The budget includes State funding of $1 million for YouthWorks and $3.5 for the local management boardfor the Children and Youth Fund. These additional funds are provided by the State’s Community Safety andStrengthening Act, which passed the Maryland General Assembly in 2019, and also authorized the creationof a police force for Johns Hopkins University.
• The budget includes support for Family League of Baltimore, including $6.9 million to support communityschool and out-of-school time programming and $2.9 million to support additional youth programming incoordination with MOCFS.
• The budget continues funding the City’s Children and Youth Fund with $13.3 million.
155

OPERATING BUDGET Fiscal 2022 Summary of the Adopted Budget
Indicator: Academic Achievement
2010 2012 2014 2016 2018
20%
40%
60%
80%
3rd Grade Reading 3rd Grade Math 8th Grade Reading 8th Grade Math
% of 3rd and 8th Graders Scoring 'Advanced' or 'Proficient' on MSA/PARCC/MCAP*
Source: Maryland State Department of Education, Maryland School Report Card *Maryland replaced the MSA with the PARCC in 2015 and the PARCC with the MCAP in 2019.
The COVID-19 pandemic led to a shift to virtual learning for students across the country. Due to the challenges re-lated to access to proper technology and internet, aswell as test administration, the newMaryland ComprehensiveAssessment Program (MCAP) for academic year 2019-2020 was postponed to in fall 2021.
Positive Factors
• Quality instruction: Common Core, principalleadership, phonics, tutoring
• Literacy-rich environments: access to booksand extended learning opportunities
• Improving school climate and environment
• Campaign for Grade Level Reading / B’MoreRead More
Negative Factors
• Low student attendance rates and highchronic absenteeism
• Principal and teacher turnover rates
• Summer learning loss
• Lack of concentrated literacy focus between3rd and 8th grades
• Behavioral health challenges
• Technology and internet access challengesduring COVID-19
The Fiscal 2022 budget invests in services and programs that will support positive movement on the AcademicAchievement indicator:
The Enoch Pratt Free Library Fiscal 2022 budget includes a $27.6million General Fund appropriation to support thehealthy and safe reopening of neighborhood libraries and the Central Library, including $300,000 in CARES fundingto support more frequent cleanings. In addition, this funding will continue to fund the digital library services andvirtual programming, such as the Books for Me and One Book Baltimore programs. Books for Me is currentlyserving 89 families and provides them with a tablet, hotspot, and books. One Book Baltimore provides free booksto 7th and 8th grade students.
During the COVID-19 pandemic and into Fiscal 2022, Family League Community School Coordinators and Out-of-School time sitemanagers, in partnershipwith theMayor’s Office of Children and Family Success andCity Schools,are supporting reopening schools, student engagement and attendance, food and technology distribution, studenthousing, and family engagement.
156
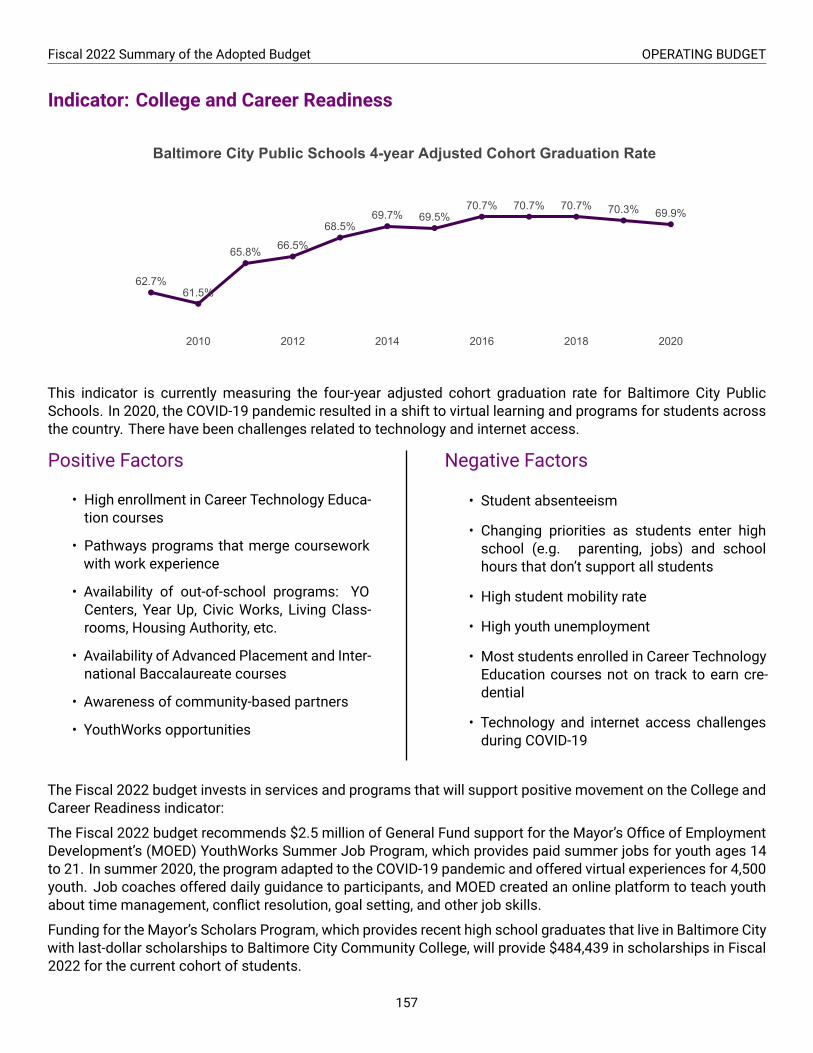
Fiscal 2022 Summary of the Adopted Budget OPERATING BUDGET
Indicator: College and Career Readiness
62.7%61.5%
65.8% 66.5%
68.5%69.7% 69.5%
70.7% 70.7% 70.7% 70.3% 69.9%
2010 2012 2014 2016 2018 2020
Baltimore City Public Schools 4-year Adjusted Cohort Graduation Rate
This indicator is currently measuring the four-year adjusted cohort graduation rate for Baltimore City PublicSchools. In 2020, the COVID-19 pandemic resulted in a shift to virtual learning and programs for students acrossthe country. There have been challenges related to technology and internet access.
Positive Factors
• High enrollment in Career Technology Educa-tion courses
• Pathways programs that merge courseworkwith work experience
• Availability of out-of-school programs: YOCenters, Year Up, Civic Works, Living Class-rooms, Housing Authority, etc.
• Availability of Advanced Placement and Inter-national Baccalaureate courses
• Awareness of community-based partners
• YouthWorks opportunities
Negative Factors
• Student absenteeism
• Changing priorities as students enter highschool (e.g. parenting, jobs) and schoolhours that don’t support all students
• High student mobility rate
• High youth unemployment
• Most students enrolled in Career TechnologyEducation courses not on track to earn cre-dential
• Technology and internet access challengesduring COVID-19
The Fiscal 2022 budget invests in services and programs that will support positive movement on the College andCareer Readiness indicator:
The Fiscal 2022 budget recommends $2.5 million of General Fund support for the Mayor’s Office of EmploymentDevelopment’s (MOED) YouthWorks Summer Job Program, which provides paid summer jobs for youth ages 14to 21. In summer 2020, the program adapted to the COVID-19 pandemic and offered virtual experiences for 4,500youth. Job coaches offered daily guidance to participants, and MOED created an online platform to teach youthabout time management, conflict resolution, goal setting, and other job skills.
Funding for the Mayor’s Scholars Program, which provides recent high school graduates that live in Baltimore Citywith last-dollar scholarships to Baltimore City Community College, will provide $484,439 in scholarships in Fiscal2022 for the current cohort of students.
157

OPERATING BUDGET Fiscal 2022 Summary of the Adopted Budget
Indicator: Infant Mortality
13.5
11.010.5
9.710.3 10.4
8.48.8 8.7
9.28.8
2010 2012 2014 2016 2018
# of Deaths of Children Less than One Year of Age Per 1,000 Live Births
This information is sourced from the Maryland Department of Health Vital Statistics Infant Mortality Reports.Annual data is reported in the fall for the prior year.
Positive Factors
• Multi-agency and multi-government collabo-ration, such as the B’more for Healthy BabiesInitiative
• Population-level behavioral changes
• Community-based initiatives
• Improvements in access and quality of care
• Home visiting programs
Negative Factors
• Complex needs due to mental health, sub-stance abuse, unsafe homes, job loss
• Inefficient paper-based prenatal risk assess-ments
• Lack of safe, stable housing
• Continued practice of co-sleeping
• Insufficient education, outreach, and re-sources for families
The Fiscal 2022 budget invests in services and programs that will support positive movement on the Infant Mor-tality indicator:
The Fiscal 2022 budget includes $3.1million of General Fund support for programsdelivered byMaternal andChildHealth and Family League, including a nurse home-visiting program, services to infants and toddlers, nutritionsupport, and family planning services. Home visiting programs work to reduce risk factors such as substanceuse, high levels of stress, pre-term labor, and chronic health conditions such as hypertension and diabetes. Dueto the COVID-19 pandemic, all recent home visiting services have occurred via virtual telehealth sessions.
Continued funding for five Community Action Partnership (CAP) Centers across the City. CAP Centers, which aremanaged by the Mayor’s Office of Children and Family Success, provide a variety of family assistance programswith the goal of helping residentsmaintain safe and stable housing. These Programs include utility bill assistance,rental relief, food security, and financial literacy services.
158

Fiscal 2022 Summary of the Adopted Budget OPERATING BUDGET
Operating Budget for Prioritizing Our Youth
Service Fund Name Fiscal 2021Budget
Fiscal 2022Budget
Change inBudget
Courts: Orphans’ Court817 Orphans’ Court General 617,892 694,393 76,501
Enoch Pratt Free Library788 Information Services General 26,185,090 28,481,175 2,296,085
State 14,270,492 14,184,508 (85,984)Special Revenue 996,122 1,041,700 45,578SERVICE TOTAL 41,451,704 43,707,383 2,255,679AGENCY TOTAL 41,451,704 43,707,383 2,255,679
Health308 Maternal and Child Health General 1,995,168 2,011,772 16,604
Federal 20,151,259 20,947,655 796,396State 1,869,220 1,962,478 93,258Special Revenue 894,644 921,345 26,701Special Grant 1,186,302 1,223,183 36,881SERVICE TOTAL 26,096,593 27,066,433 969,840
310 School Health Services General 15,711,762 15,725,944 14,182Federal 157,705 306,468 148,763State 507,856 506,367 (1,489)Special Revenue 5,024,751 5,194,693 169,942Special Grant 25,000 25,000 0SERVICE TOTAL 21,427,074 21,758,472 331,398
316 Youth and Trauma Services General 687,692 768,215 80,523Federal 1,039,989 453,193 (586,796)State 739,756 388,454 (351,302)Special Grant 0 41,028 41,028SERVICE TOTAL 2,467,437 1,650,890 (816,547)AGENCY TOTAL 49,991,104 50,475,795 484,691
Housing and Community Development604 Before and After Care General 125,081 253,503 128,422740 Dawson Center General 46,992 31,609 (15,383)
Federal 402,456 342,289 (60,167)SERVICE TOTAL 449,448 373,898 (75,550)AGENCY TOTAL 574,529 627,401 52,872
M-R: Baltimore City Public Schools352 Baltimore City Public Schools General 287,346,700 275,306,538 (12,040,162)
M-R: Educational Grants446 Educational Grants General 11,340,311 11,325,031 (15,280)
Federal 300,000 300,000 0Special Revenue 16,926,000 13,327,000 (3,599,000)
159

OPERATING BUDGET Fiscal 2022 Summary of the Adopted Budget
(continued)
Service Fund Name Fiscal 2021Budget
Fiscal 2022Budget
Change inBudget
SERVICE TOTAL 28,566,311 24,952,031 (3,614,280)AGENCY TOTAL 28,566,311 24,952,031 (3,614,280)
M-R: Health and Welfare Grants385 Health and Welfare Grants General 1,336,592 1,359,314 22,722
M-R: Office of Children and Family Success109 Administration Children andFamily Success
General 2,810,544 3,006,132 195,588
Special Revenue 280,775 78,000 (202,775)SERVICE TOTAL 3,091,319 3,084,132 (7,187)
605 Head Start General 587,384 605,866 18,482Federal 7,790,297 8,021,215 230,918State 138,754 141,113 2,359Special Revenue 152,990 0 (152,990)SERVICE TOTAL 8,669,425 8,768,194 98,769
741 Community Action Partnership General 709,080 763,240 54,160Water Utility 459,999 397,937 (62,062)Federal 1,052,599 18,850,191 17,797,592State 7,562,517 7,985,898 423,381SERVICE TOTAL 9,784,195 27,997,266 18,213,071AGENCY TOTAL 21,544,939 39,849,592 18,304,653
M-R: Office of Employment Development791 BCPS Alternative OptionsAcademy for Youth
State 198,941 214,784 15,843
797 Workforce Services for Out ofSchool Youth Youth Opportunity
General 3,089,492 3,191,275 101,783
Federal 1,124,412 991,323 (133,089)State 100,000 100,000 0Special Revenue 132,781 0 (132,781)Special Grant 165,000 165,000 0SERVICE TOTAL 4,611,685 4,447,598 (164,087)
798 Youth Works Summer JobProgram
General 2,359,955 2,564,529 204,574
Federal 2,000,000 2,001,816 1,816State 3,653,409 3,376,891 (276,518)Special Revenue 1,747,469 1,065,000 (682,469)Special Grant 1,200,000 0 (1,200,000)SERVICE TOTAL 10,960,833 9,008,236 (1,952,597)
800 Workforce Services for WIOAFunded Youth
Federal 3,260,315 4,118,574 858,259
AGENCY TOTAL 19,031,774 17,789,192 (1,242,582)
160

Fiscal 2022 Summary of the Adopted Budget OPERATING BUDGET
(continued)
Service Fund Name Fiscal 2021Budget
Fiscal 2022Budget
Change inBudget
644 Administration Recreation andParks
General 5,168,854 5,276,628 107,774
State 1,671,655 1,750,471 78,816SERVICE TOTAL 6,840,509 7,027,099 186,590
645 Aquatics General 2,526,786 2,708,100 181,314647 Youth and Adult Sports General 831,042 866,843 35,801
Special Revenue 173,945 184,345 10,400SERVICE TOTAL 1,004,987 1,051,188 46,201
648 Community Recreation Centers General 14,930,009 15,758,512 828,503Federal 439,661 439,661 0Special Revenue 1,721,132 2,256,260 535,128Special Grant 300,000 300,000 0SERVICE TOTAL 17,390,802 18,754,433 1,363,631
649 Special Facilities ManagementRecreation
Special Revenue 3,124,192 3,262,955 138,763
AGENCY TOTAL 30,887,276 32,803,775 1,916,499
GRAND TOTALTOTAL OPERATING BUDGET 481,348,821 487,565,414 6,216,593LESS INTERNAL SERVICE 0 0 0
TOTAL OPERATINGAPPROPRIATONS
481,348,821 487,565,414 6,216,593
Table in dollars.
161
Recreation and Parks

OPERATING BUDGET Fiscal 2022 Summary of the Adopted Budget
Special Exhibit: City Support for Baltimore City Public Schools
Public schools in Maryland are funded by both local governments and the State. By design, State EducationAid to public schools is distributed inversely to local wealth, whereby the less affluent school districts receivemore State Education Aid. Wealth is measured in terms of county property values and personal income; by bothmeasures, Baltimore is at or near the bottom per capital wealth calculation among Maryland jurisdictions. SinceBaltimore City is among those jurisdictions with the least wealth as calculated for State Education Aid purposes inMaryland, City Schools received 70%of its funding from theState in Fiscal 2021. Other lowwealth jurisdictions thatcontribute less than a quarter of the shared cost of education funding between the State and the local jurisdictioninclude Allegany, Caroline, Somerset, and Wicomico Counties.
Kirwan
The Commission on Innovation and Excellence in Education, more commonly referred to as the Kirwan Commis-sion, was created by legislation in 2016 to generate recommendations to improve education across Marylandthrough funding, policies, and resources. One main goal for the Commission was to establish a new funding for-mula for school funding across Maryland. The Commission completed its work in December 2019 and legislationto implement the recommendations was introduced during the Maryland General Assembly’s 2020 session as theBlueprint for Maryland’s Future, House Bill 1300. The legislation was passed by the General Assembly and vetoedby the Governor. A veto-override vote was successfully held during the General Assembly’s 2021 session.
Blueprint for Maryland’s Future will dramatically change the current education funding formula in Maryland andwill have a significant impact on the City’s required contribution to City Schools. The bill would require additionalState Aid of $258.9 million over the amount required by current law in Fiscal 2023 for City Schools, growing to$584.5million in Fiscal 2030. The bill also requires a significant increase in local support for City Schools, growingfrom $63 million in additional support over the amount required by current law in Fiscal 2023 to $161.5 million byFiscal 2030. This represents a 52% increase in the level of direct local support for City Schools by Fiscal 2030,the highest rate of increase of local support proposed among Maryland’s jurisdictions. During the 2021 session,House Bill 1372 (HB1372) passed, updating the 2020 session Kirwan bill, most notably amending the Fiscal 2022State funding requirements and delaying the increased local contribution to Fiscal 2023.
Fiscal 2022
As of publication, newly adopted and pending State legislation will impact the calculation of the City’s Mainte-nance of Effort (MOE) contribution in the Fiscal 2022 adopted budget. Under the current law, prior to passage oflegislation during the current General Assembly session, the City’s required MOE contribution was expected to be$275.3 million, with the prior year’s MOE amount adjusted to reflect $18 million in retiree health savings for CitySchools retirees over the prior fiscal year. These savings reflect a new Medicare Advantage plan offered to Cityand Schools retirees as of January 1, 2021 and have no impact on the level of operating budget support providedby the City given that retiree healthcare for City Schools employees is administered by the City. The operatingbudget also includes $24.8 million in debt service for prior year bonds issued by the City in support of school ren-ovations and upgrades, as well as $15.8 million in projected beverage tax and casino-related revenue in supportof the 21st Century Schools program. The capital budget includes $19 million in new General Obligation (GO)Bond funding in support of new school renovation and upgrade projects. With the veto-override of the Blueprintfor Maryland’s Future, the Built to Learn Act passed by the Maryland General Assembly in 2020 will go into effect,bringing additional State and City support for a new round of 21st Century School buildings. In Fiscal 2021, the
162

Fiscal 2022 Summary of the Adopted Budget OPERATING BUDGET
City set aside funds for new 21st Century Schools to be built or renovated under Built to Learn, to be drawn downfrom over many years. Finally, the City is providing $20.5 million to support the school health and crossing guardprograms.
Support for City Schools
163
Expense FY20 Actual FY21 Budget FY22 Budget
Direct Operating Support245,327,571 257,541,343 263,528,46929,805,357 29,805,357 11,778,069
Maintenance of EffortRetiree Health BenefitsCATEGORY TOTAL 280,520,288 287,346,700 275,306,538
Support for City Schools Programs14,325,838 15,711,762 15,725,9441,052,273 4,718,771 4,883,5124,635,694 5,140,809 4,898,603
School Nurse Program (General Fund portion)School Nurse Program (City Schools Fund portion)School Crossing GuardsCATEGORY TOTAL 18,961,532 25,571,342 25,508,059
Capital - City Support of City Schools20,147,257 24,373,887 24,812,70019,000,000 19,000,000 19,000,000
Debt Service for School ConstructionGO Bond support for School Construction ProjectsCATEGORY TOTAL 44,534,617 43,373,887 43,812,700
Capital - City Support for 21st Century School Buildings Program2,640,880 1,521,132 2,056,2602,050,000 1,400,000 1,400,000
11,095,904 12,268,000 12,311,000
Table Games Aid - School ConstructionCasino Lease Contribution - School ConstructionBeverage Tax Contribution - School ConstructionCATEGORY TOTAL 15,786,784 15,189,132 15,767,260
Capital - Built to Learn Act Supplemental School Construction Program0 30,000,000 0Fund Balance - School Construction
CATEGORY TOTAL 0 30,000,000 0
TOTAL CITY SUPPORT FOR BCPS 349,028,501 401,481,061 360,394,557* The City support for City Schools reflects $18M in retiree health care savings. Pending legislation may result in a
change in the City’s MOE calculation in the final adopted budget.

Priority Outcome: Building Public Safety
Fund Name Fiscal 2021 Budget Fiscal 2022 Budget Change in Budget
General 852,606,480 923,404,516 70,798,036Federal 22,029,815 31,788,966 9,759,151State 43,072,956 46,701,499 3,628,543Special Revenue 39,397,757 42,498,252 3,100,495Special Grant 498,886 1,203,119 704,233Total 957,605,894 1,045,596,352 87,990,458
Table in dollars.
Key results funded in the Fiscal 2022 Budget:
• The Safe Streets program expects to mediate 2,000 conflicts in high‐crime neighborhoods to prevent es-calation to violence in Fiscal 2022. Violence Interrupters are being trained in outreach work and will beginworking with a caseload of participants on a longer-term basis to connect participants to high-quality re-sources and access meaningful alternatives to provide for themselves and their families.
• The Mayor’s Office of Neighborhood Safety and Engagement (MONSE) plans to increase the number of non-custodial parent and child interactions supervised at the visitation center from 400 visits to 450 visits peryear. The agency has implemented a Court Watch program to provide increased assistance and enhancedaccess to Court staff and victims in need of visitation services.
• The Baltimore Police Department (BPD) aims to increase the percentage of time police officers spend onproactive policing to 30% as part of the agency’s strategic efforts to respond to violence. BPD will accom-plish this by establishing its first Community Collaboration Council to scale up and sustainably ensure in-clusive stakeholder engagement in reforming BPD’s policies, training, activities, and decision-making overtime.
• The Baltimore City Fire Department (BCFD) plans to complete 8,000 Home Safety Inspections during Fiscal2022. BCFD visits all neighborhoods through the Saturday Safety Sweep Program at least once annually.
Key budget decisions in Building Public Safety:
• The reliability of the City’s 911 services will be greatly improved with the implementation of Next Genera-tion 911 (NG911) systems. NG911 will create a faster, more resilient system through secure call networks,better call routing, and integration of call and geo-location data for emergency responders. To support thistechnology, the City will increase its monthly 911 fee by $0.25 per phone line.
• BPD will implement a Records Management System (RMS) to transition the agency from paper-based todigital processes. It will prevent duplication of work during evidence-gathering. The time saved by RMS willallow the officers to spend more time on community engagement.
• BCFD will continue participation in the Emergency Triage, Treat, and Transport (ET3) Model, a five-year pay-ment model that provides greater flexibility to ambulance care teams to address emergency health careneeds of Medicare Fee-for-Service beneficiaries. ET3 aims to provide person-centered care, encourage ap-propriate utilization of emergency medical services (EMS), and increase efficiency in the EMS system.
• MONSE will leverage $600,000 of private investment to kick-start the Group Violence Reduction Strategy(GVRS), an evidence-based approach designed to curtail violent crime, expand opportunities for high-riskpopulations, and build better relationships between police officers and the communities they serve.
• The recommended budget includes $232,000 to fund the implementation of the new Maryland ElectronicCourts case management system for the State’s Attorney’s Office.
164

Fiscal 2022 Summary of the Adopted Budget OPERATING BUDGET
Indicator: Homicides & Non-Fatal Shootings
401 369
635 666 703 680770
724
282234 240 224 197 217 235 211
342 318 342 309 348 333
2008 2010 2012 2014 2016 2018 2020
Total Non-Fatal Shootings Total Homicides
Total Non-Fatal Shootings and Homicides (All Weapons)
Source: Batimore Police Department Open Data; Baltimore Sun
This information is sourced from the Baltimore Police Department’s Open Data resource, a publicly available andeasily accessible online data archive. This indicator measures number of homicides (from all weapons) andnon-fatal shootings that occur in Baltimore on an annual basis. These figures do not include police-involved orself-inflicted incidents.
Positive Factors
• Targeted enforcement of specific neighbor-hoods and known violent offenders
• Use of technology to assist with gunshot de-tection and criminal investigations
Negative Factors
• Violence in the drug and gun marketplace
• Barriers to legitimate economic opportunity,particularly for low-skill individuals and/orthose with a criminal background
The Fiscal 2022 budget invests in services and programs that will support positive movement on the Non-FatalShootings and Homicides indicator:
The Mayor’s Office of Neighborhood Safety and Engagement continues to support the Safe Streets program thatworks to interrupt cycles of violence through conflict mediation between high-risk individuals and prevent shoot-ings and homicides throughout Baltimore City. In addition to the ten existing sites across the City utilized foroutreach and mediation, the Safe Streets program has been granted additional funding to operate a trauma busto be used in responding to shooting incidents around the city. The bus will be staffed by a rotation of resourceproviders who can provide on-the-spot referrals and services in response to community needs following an inci-dent of violence.
To improve the percentage of homicide cases cleared, and reach their goal of 56% in Fiscal 2022, the PoliceDepartment has including a case check list for continuity and consistency and created an Exceptional Clearanceboard to discuss each case for policy and process compliance. These processes, along with adding additionaltraining and personnel to Homicide, have proven helpful in increasing the percentage of cases cleared resultingin the arrest of individuals directly associated with violence in the City.
165

OPERATING BUDGET Fiscal 2022 Summary of the Adopted Budget
Indicator: Property Crime
4,566 4,5544,758 4,660
4,9094,618
4,8374,545 4,600
4,4754,235
3,083
2010 2012 2014 2016 2018 2020
Total Property Crime per 100,000 Residents
Source: Batimore Police Department Open Data; United States Census
Property crime data includes burglary, larceny, theft, and motor vehicle theft. Because they may involve violence,arson and vandalism incidents are excluded. The COVID-19 pandemic played a substantial role in the decline ofproperty crime throughout the City due to stay at home orders keeping citizens at home which deterred propertycrime.
Positive Factors
• Focus on community-based policing in-creases officer presence in communities
• Employment and recreational opportunitiesfor Baltimore youth, such as YouthWorks
Negative Factors
• Available resources for responding to, inves-tigating, and processing property crimes
• Barriers to upward economic mobility andcommunity support systems
The Fiscal 2022 budget invests in services and programs that will support positive movement on the PropertyCrimes indicator:
In Fiscal 2022, the BPDwill continue their efforts to becomemore engagedwith citizens by increasing foot patrols,business checks, and directed patrols. Since implementing themicro-zone strategy in Fiscal 2021, the Departmenthas seen the level of community cooperation increase significantly.
BPD reformed their recruitment efforts resulting in an increase in applications received, from 4,023 in Fiscal 2019to 8,544 in Fiscal 2020. Furthermore, by standardizing the fitness requirements and improving the Police Academyenvironment to emphasize critical thinking, communication, service, and organizational change, the BPD has beenable to increase the graduation rate of recruits who meet certification standards.
The CitiWatch program continues to modernize its network of CCTV cameras by upgrading the software thatsupports cameramonitoring and linking cameras in public-private partnerships. As BPD’s public safety technologyimproves, CitiWatch will seek to enhance overall workflow and operations to ensure that new resources are beingmaximized to help prevent crime. While the goal is to always deter and prevent crime, it also seeks to increasethe perception of safety. MONSE will seek additional grant funding in Fiscal 2022 to expand the rebate programimplemented in Fiscal 2021 that offers residents financial incentives to install home security cameras and registerthem with CitiWatch. Police officers can request footage if crimes occur near those cameras.
166

Fiscal 2022 Summary of the Adopted Budget OPERATING BUDGET
Indicator: Opioid-Related Deaths
199139 142
189 212275
354
628692
814 854
2010 2012 2014 2016 2018
Total Number of Opioid-Related Deaths
Source: Maryland Department of Health Annual Overdose Death Reports
This indicator captures all deaths that occurred in the City of Baltimore (including non-residents) related to opioids.In previous years, this indicator only included deaths from heroin. As the number of deaths from fentanyl hasgrown (120 deaths in 2015 to 851 deaths in 2019) and now exceeds heroin-related fatalities, the indicator waschanged to better illustrate the scale of this crisis. Data is not yet available for 2020.
Positive Factors
• Tougher legal and regulatory stance on opi-oid prescription drugs, reducing abuse thatleads to addiction
• Use of Naloxone to reverse overdoses andtraining on harm reduction practices
Negative Factors
• Increasing prevalence of fentanyl, which ismore potent than prescription drugs or heroin
• Mixture of heroin with other substances, in-cluding fentanyl, without users’ knowledge
The Fiscal 2022 budget invests in efforts that will support positive movement on the Opioid-Related Deaths indi-cator:
The Baltimore City Health Department (BCHD) continues its syringe exchange program and Overdose ResponseProgram that trains individuals in responding to opioid-related overdoses with Naloxone and other interventions.In Fiscal 2022, the agency aims to exchange 1.9 million needles, as well as train and provide 3,500 residents inthe use of naloxone.
BCHD’s Opioid Intervention Team developed a strategic plan with six goals:
1. Prevent problematic opioid use2. Reduce opioid-related morbidity and mortality3. Enhance local systems to inform strategy4. Ensure access to substance use disorder (SUD) treatment5. Expand access to SUD treatment within the justice system6. Expand alternatives to incarceration for people with SUD.
167

OPERATING BUDGET Fiscal 2022 Summary of the Adopted Budget
To achieve these goals, they are working in partnership with Behavioral Health System Baltimore and other or-ganizations to increase awareness of the risks of opioid use and misuse among children and youth, increaseawareness of access points for naloxone and harm reduction education, and improve access to treatment.
168

Fiscal 2022 Summary of the Adopted Budget OPERATING BUDGET
Operating Budget for Building Public Safety
Service Fund Name Fiscal 2021Budget
Fiscal 2022Budget
Change inBudget
Fire600 Administration Fire General 9,550,556 10,135,951 585,395
Federal 1,600,000 1,600,000 0State 350,000 350,000 0SERVICE TOTAL 11,500,556 12,085,951 585,395
602 Fire Suppression andEmergency Rescue
General 162,475,629 171,709,992 9,234,363
Federal 2,424,656 1,026,850 (1,397,806)State 1,420,339 1,420,686 347SERVICE TOTAL 166,320,624 174,157,528 7,836,904
608 Emergency Management General 870,805 1,055,116 184,311Federal 1,795,858 5,480,263 3,684,405State 67,000 267,000 200,000SERVICE TOTAL 2,733,663 6,802,379 4,068,716
609 Emergency Medical Services General 32,341,664 34,531,156 2,189,492State 1,343,438 1,344,177 739Special Revenue 20,035,571 19,837,221 (198,350)SERVICE TOTAL 53,720,673 55,712,554 1,991,881
610 Fire and EmergencyCommunity Outreach
General 392,034 423,794 31,760
612 Fire Investigation General 749,195 802,069 52,874614 Fire Communications andDispatch
General 8,901,044 8,657,415 (243,629)
State 3,000 3,051 51Special Revenue 9,226,149 10,678,871 1,452,722SERVICE TOTAL 18,130,193 19,339,337 1,209,144
615 Fire Training and Education General 4,755,552 4,545,391 (210,161)AGENCY TOTAL 258,302,490 273,869,003 15,566,513
Health307 Substance Use Disorder andMental Health
General 1,533,047 1,563,356 30,309
Federal 1,347,824 1,361,843 14,019State 1,804,827 1,806,734 1,907SERVICE TOTAL 4,685,698 4,731,933 46,235
315 Emergency Services Health General 920,394 36,490,083 35,569,689Federal 668,764 704,910 36,146State 8,470,708 8,637,338 166,630Special Grant 498,886 524,087 25,201SERVICE TOTAL 10,558,752 46,356,418 35,797,666AGENCY TOTAL 15,244,450 51,088,351 35,843,901
Housing and Community Development
169

OPERATING BUDGET Fiscal 2022 Summary of the Adopted Budget
(continued)
Service Fund Name Fiscal 2021Budget
Fiscal 2022Budget
Change inBudget
752 Community Outreach Services General 1,466,905 1,431,415 (35,490)
Law871 Police Legal Affairs General 2,243,178 2,148,597 (94,581)
Liquor License Board851 Liquor License Compliance General 1,187,954 1,366,903 178,949
M-R: Office of Employment Development796 Workforce Services for ExOffenders
General 189,287 199,697 10,410
Federal 557,000 557,000 0State 983,794 951,403 (32,391)SERVICE TOTAL 1,730,081 1,708,100 (21,981)AGENCY TOTAL 1,730,081 1,708,100 (21,981)
M-R: Office of Neighborhood Safety and Engagement617 Criminal Justice Coordination General 744,496 738,498 (5,998)
Federal 1,130,078 1,499,039 368,961State 1,023,000 1,500,000 477,000SERVICE TOTAL 2,897,574 3,737,537 839,963
618 Neighborhood Safety andEngagement
General 3,643,620 3,917,262 273,642
Federal 1,646,370 3,451,129 1,804,759State 5,046,951 7,225,000 2,178,049Special Revenue 1,138,584 1,150,000 11,416Special Grant 0 679,032 679,032SERVICE TOTAL 11,475,525 16,422,423 4,946,898
757 CitiWatch General 2,706,297 2,941,312 235,015Special Revenue 179,460 305,000 125,540SERVICE TOTAL 2,885,757 3,246,312 360,555
758 Coordination of Public SafetyStrategy Administration
General 1,130,143 1,113,778 (16,365)
State 45,000 45,000 0Special Revenue 300,000 300,000 0SERVICE TOTAL 1,475,143 1,458,778 (16,365)AGENCY TOTAL 18,733,999 24,865,050 6,131,051
Office of Equity and Civil Rights848 Police Community Relations General 691,685 728,486 36,801
Police621 Administrative Bureau General 90,702,081 84,280,608 (6,421,473)
Federal 264,137 276,316 12,179State 495,750 852,250 356,500Special Revenue 5,807,032 6,048,498 241,466SERVICE TOTAL 97,269,000 91,457,672 (5,811,328)
170

Fiscal 2022 Summary of the Adopted Budget OPERATING BUDGET
(continued)
Service Fund Name Fiscal 2021Budget
Fiscal 2022Budget
Change inBudget
622 Police Patrol General 222,983,670 225,563,431 2,579,761Federal 2,500,000 2,500,000 0State 4,281,488 4,189,589 (91,899)Special Revenue 1,469,485 1,400,140 (69,345)SERVICE TOTAL 231,234,643 233,653,160 2,418,517
623 Criminal Investigation Division General 55,152,054 53,525,250 (1,626,804)Federal 766,086 1,580,240 814,154State 4,371,226 4,005,463 (365,763)SERVICE TOTAL 60,289,366 59,110,953 (1,178,413)
626 Data Driven Strategies General 7,577,452 7,299,707 (277,745)Federal 0 4,447,967 4,447,967State 978,872 1,175,833 196,961SERVICE TOTAL 8,556,324 12,923,507 4,367,183
628 Public Integrity Bureau General 9,160,770 12,517,320 3,356,550State 0 144,034 144,034SERVICE TOTAL 9,160,770 12,661,354 3,500,584
635 Recruitment Section General 18,342,060 33,790,603 15,448,543State 0 255,367 255,367SERVICE TOTAL 18,342,060 34,045,970 15,703,910
642 Crime Laboratory and EvidenceControl
General 22,141,935 21,992,312 (149,623)
Federal 530,702 430,409 (100,293)State 0 255,910 255,910SERVICE TOTAL 22,672,637 22,678,631 5,994
807 Compliance Bureau General 34,673,425 22,923,196 (11,750,229)Federal 25,460 25,893 433State 2,265,945 1,998,288 (267,657)SERVICE TOTAL 36,964,830 24,947,377 (12,017,453)
816 Special Operations Section General 23,713,500 40,281,473 16,567,973Federal 145,000 145,085 85SERVICE TOTAL 23,858,500 40,426,558 16,568,058
853 Patrol Support Services General 15,910,128 19,551,891 3,641,763Federal 605,750 576,912 (28,838)State 3,099,775 3,050,031 (49,744)SERVICE TOTAL 19,615,653 23,178,834 3,563,181AGENCY TOTAL 527,963,783 555,084,016 27,120,233
Sheriff881 Courthouse Security General 4,095,269 4,100,564 5,295882 Deputy Sheriff Enforcement General 10,770,075 10,784,661 14,586
State 50,000 50,000 0Special Revenue 239,980 1,750,000 1,510,020SERVICE TOTAL 11,060,055 12,584,661 1,524,606
883 Service of Protective andPeace Orders
General 2,284,288 2,312,054 27,766
171

OPERATING BUDGET Fiscal 2022 Summary of the Adopted Budget
(continued)
Service Fund Name Fiscal 2021Budget
Fiscal 2022Budget
Change inBudget
884 District Court Sheriff Services General 2,692,305 2,777,035 84,730889 Child Support Enforcement General 1,752,886 1,769,708 16,822
Federal 1,100,000 1,100,000 0SERVICE TOTAL 2,852,886 2,869,708 16,822AGENCY TOTAL 22,984,803 24,644,022 1,659,219
State’s Attorney115 Prosecution of Criminals General 27,008,528 28,386,555 1,378,027
Federal 1,796,589 1,825,120 28,531State 6,917,188 7,118,639 201,451Special Revenue 320,216 325,660 5,444SERVICE TOTAL 36,042,521 37,655,974 1,613,453
781 Administration State’s Attorney General 7,634,737 8,074,813 440,076786 Victim and Witness Services General 1,866,465 1,940,214 73,749
Federal 2,601,351 2,711,564 110,213State 54,655 55,706 1,051SERVICE TOTAL 4,522,471 4,707,484 185,013AGENCY TOTAL 48,199,729 50,438,271 2,238,542
Transportation500 Street Lighting General 20,876,886 20,117,007 (759,879)684 Traffic Management General 11,054,645 10,881,532 (173,113)
Special Revenue 681,280 692,862 11,582SERVICE TOTAL 11,735,925 11,574,394 (161,531)
689 Vehicle Impounding andDisposal
General 8,229,565 8,267,972 38,407
697 Traffic Safety General 17,490,271 17,766,339 276,068Federal 524,190 488,426 (35,764)Special Revenue 0 10,000 10,000SERVICE TOTAL 18,014,461 18,264,765 250,304AGENCY TOTAL 58,856,837 58,224,138 (632,699)
GRAND TOTALTOTAL OPERATING BUDGET 957,605,894 1,045,596,352 87,990,458LESS INTERNAL SERVICE 0 0 0
TOTAL OPERATINGAPPROPRIATONS
957,605,894 1,045,596,352 87,990,458
Table in dollars.
172
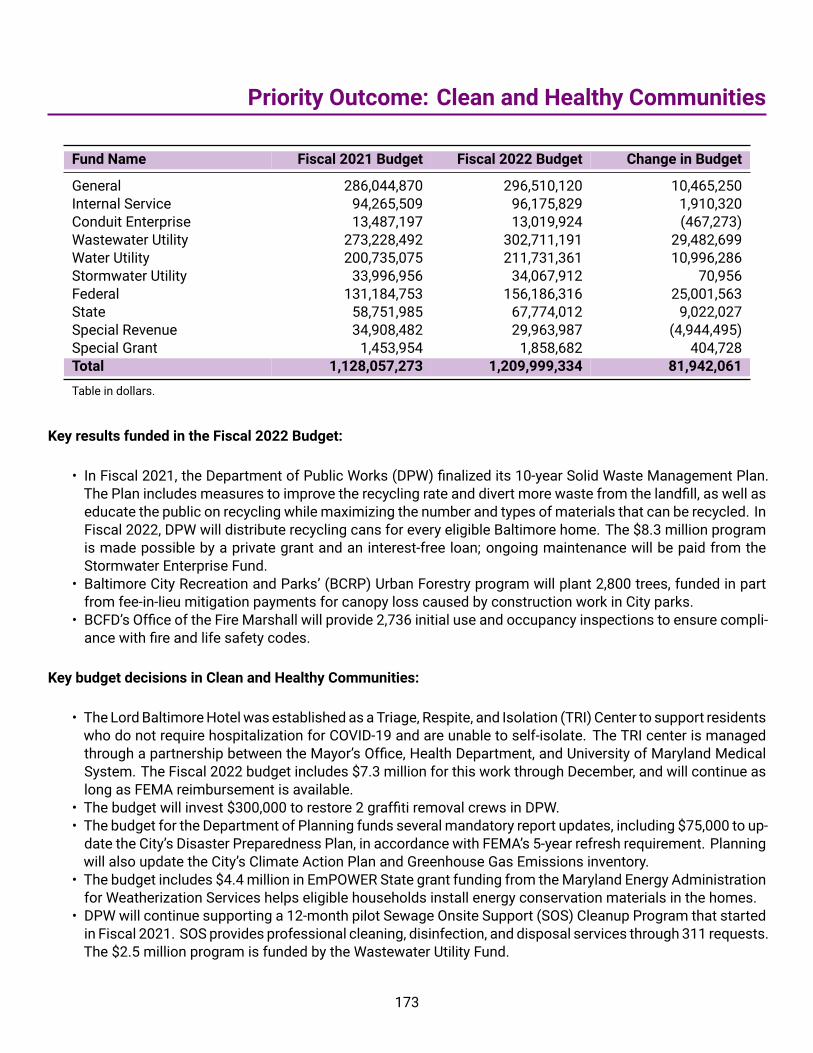
Priority Outcome: Clean and Healthy Communities
Fund Name Fiscal 2021 Budget Fiscal 2022 Budget Change in Budget
General 286,044,870 296,510,120 10,465,250Internal Service 94,265,509 96,175,829 1,910,320Conduit Enterprise 13,487,197 13,019,924 (467,273)Wastewater Utility 273,228,492 302,711,191 29,482,699Water Utility 200,735,075 211,731,361 10,996,286Stormwater Utility 33,996,956 34,067,912 70,956Federal 131,184,753 156,186,316 25,001,563State 58,751,985 67,774,012 9,022,027Special Revenue 34,908,482 29,963,987 (4,944,495)Special Grant 1,453,954 1,858,682 404,728Total 1,128,057,273 1,209,999,334 81,942,061
Table in dollars.
Key results funded in the Fiscal 2022 Budget:
• In Fiscal 2021, the Department of Public Works (DPW) finalized its 10-year Solid Waste Management Plan.The Plan includes measures to improve the recycling rate and divert more waste from the landfill, as well aseducate the public on recycling while maximizing the number and types of materials that can be recycled. InFiscal 2022, DPW will distribute recycling cans for every eligible Baltimore home. The $8.3 million programis made possible by a private grant and an interest-free loan; ongoing maintenance will be paid from theStormwater Enterprise Fund.
• Baltimore City Recreation and Parks’ (BCRP) Urban Forestry program will plant 2,800 trees, funded in partfrom fee-in-lieu mitigation payments for canopy loss caused by construction work in City parks.
• BCFD’s Office of the Fire Marshall will provide 2,736 initial use and occupancy inspections to ensure compli-ance with fire and life safety codes.
Key budget decisions in Clean and Healthy Communities:
• The LordBaltimoreHotelwas established as aTriage, Respite, and Isolation (TRI) Center to support residentswho do not require hospitalization for COVID-19 and are unable to self-isolate. The TRI center is managedthrough a partnership between the Mayor’s Office, Health Department, and University of Maryland MedicalSystem. The Fiscal 2022 budget includes $7.3 million for this work through December, and will continue aslong as FEMA reimbursement is available.
• The budget will invest $300,000 to restore 2 graffiti removal crews in DPW.• The budget for the Department of Planning funds several mandatory report updates, including $75,000 to up-date the City’s Disaster Preparedness Plan, in accordance with FEMA’s 5-year refresh requirement. Planningwill also update the City’s Climate Action Plan and Greenhouse Gas Emissions inventory.
• The budget includes $4.4million in EmPOWER State grant funding from theMaryland Energy Administrationfor Weatherization Services helps eligible households install energy conservation materials in the homes.
• DPW will continue supporting a 12-month pilot Sewage Onsite Support (SOS) Cleanup Program that startedin Fiscal 2021. SOS provides professional cleaning, disinfection, and disposal services through 311 requests.The $2.5 million program is funded by the Wastewater Utility Fund.
173

OPERATING BUDGET Fiscal 2022 Summary of the Adopted Budget
Indicator: Recycling Rate
30%
33%
27% 28%30%
19%
29%
18%20%
24% 24% 24%
2008 2010 2012 2014 2016 2018
Recycling Rate
Source: Maryland Department of the Environment, Maryland Solid Waste Management and Diversion Report The 2019 figure reported in the Preliminary Budget Plan has been corrected from the Mandatory Recycling Rate to the City's actual recycling rate.
The City’s recycling rate is provided by the Maryland Recycling Act, or MRA. MRA data includes private and com-mercial recycling rates, in addition to the public recycling data collected by the Department of Public Works (DPW).After 2012, ash from incinerated waste was no longer considered a recyclable material for use as a landfill covermaterial; this reduced the City’s MRA-defined recycling rate.
Positive Factors
• Single-stream recycling and 1+1 collections
• City school recycling initiatives
• Education/Awareness
Negative Factors
• Few direct incentives or penalties associatedwith household recycling
• Gaps in environmental literacy – not knowingwhat items are recyclable or when recyclingtakes place
• Global changes in the demand for recycledgoods makes recycling more costly
The Fiscal 2022 budget invests in services and programs that will support positive movement on the RecyclingRate indicator:
DPW will begin the distribution of recycling cans for every eligible home in Baltimore. The $8.3 million programwill be made possible by a private grant and an interest-free loan, with ongoing maintenance and debt servicecosts to be paid from the Stormwater Enterprise Fund. 65-gallon recycling carts will be supplied to approximately200,000 serviced locations to expand access and participation in Baltimore City’s recycling program.
In 2020, the City received a grant to implement a recycling education campaign from The Recycling Partnershipvalued at $250,000 in cash and $150,000 in in-kind support. This grant will fund a comprehensive public outreachcampaign in Fiscal 2022 on anti-contamination to decrease the amount of contaminated recycling collected bycrews.
174

Fiscal 2022 Summary of the Adopted Budget OPERATING BUDGET
Indicator: Citywide Energy Use
294
322 321
288
350365
349339
329
364
346
299
2010 2012 2014 2016 2018 2020
Citywide Gas Energy Usage (therms)
Source: Baltimore Gas and Electric
6,2076,343 6,250 6,344
6,904
6,443 6,484 6,449 6,437 6,388 6,272
5,629
2010 2012 2014 2016 2018 2020
Citywide Electric Energy Usage (kWh)
Source: Baltimore Gas and Electric
These data points come directly from the Baltimore Gas and Electric Company and include all residential, com-mercial, and industrial energy consumption.
Positive Factors
• The Baltimore Energy Challenge
• Smart metering projects for City buildingsand energy retrofits
• Increased telecommuting and decreased uti-lization of commercial spaces during COVID-19
Negative Factors
• Declining or limited tree canopy and “Heat Is-land Effect” which increases energy demand
• Lack of public information and educationabout energy use
• Low price of natural gas
The Fiscal 2022 budget invests in services and programs that will reduce energy usage:
The recommended budget includes a $400,000 reduction in the rent the Department of General Services chargesCity agencies that occupy City-owned buildings due to calculated energy savings.
The Department of Housing and Community Development (DHCD) budget includes additional and reallocatedfunds for Weatherization Services, including a reallocation of $317,000 in General Funds to support three program
175

OPERATING BUDGET Fiscal 2022 Summary of the Adopted Budget
core positions and an additional $60,000 General Fund enhancement to fund the non-personnel costs required.These funds will allow DHCD to access up to $2 million of State funds and hire additional grant funded field staffto increase services delivered to the residents of Baltimore City.
176

Fiscal 2022 Summary of the Adopted Budget OPERATING BUDGET
Indicator: Asthma Visits
2,544
3,031
3,525 3,588
3,132
3,369
3,602
3,415
3,007
2010 2012 2014 2016
Number of Childhood Asthma ER Visits per 100,000 People
Source: Baltimore City Health Department
Asthma is a chronic lung disease that impacts more than 25 million people throughout the United States. Thenumber of childhood asthma ER visits per 100,000 people is used as a headlinemeasure for prevalence of chronicdisease and conditions within the City of Baltimore.
Positive Factors
• Ongoing medical management of asthmathrough medication and education
• Asthma home visiting programs identify andreduce household asthma triggers
• School and home renovations remove moldand other asthma triggers
Negative Factors
• Quality of Baltimore’s housing stock andhousing insurance policies (i.e. historical dis-criminatory practices such as redlining)
• Lack of preventative care; more dependencyon Emergency Rooms to treat asthma
• Tobacco smoke in the child’s environment
• Declining federal and State grant funding forthe asthma program
The Fiscal 2022 budget invests in services and programs that will help reduce childhood asthma:
Due to COVID-19, the Baltimore City Health Department is conducting virtual home visits for the Healthy HomeProgram in order to address major home-based sources of chronic health issues for children with asthma, inspec-tions/education for pregnant and postpartum women living in hazardous housing.
The Health Department’s Community Asthma Program provides home visits for Baltimore children with asthmaand expects 80% percent of children in the asthma program to have improved symptoms. The service works toreduce emergency room visits, the number of symptom days, and absences from school due to asthma.
The Health Department helps students manage their asthma by keeping an Asthma Action Plan (AAPlan) onfile in the health suites in partnership with City Schools. The AAPlan provides school health professionals withindividualized treatment plans for each student with asthma.
177

OPERATING BUDGET Fiscal 2022 Summary of the Adopted Budget
Indicator: Recreational Opportunities
525,327 496,443
783,037
939,710 882,355
1,038,658 1,019,390
847,423
132,488
2012 2014 2016 2018 2020
Number of Visits to City Operated Recreation Facilities
Source: Baltimore City Recreation and Parks
The indicator captures the reported number of visits to City-operated recreation facilities, which includes recre-ation centers, city pools, and horticulture facilities (Rawlings Conservatory and Cylburn Arboretum). Also includedin this indicator is total enrollment in youth and adult sports programs. The number of visitors significantlydropped due to COVID-19 related closures. All recreation facilities closed in March 2020 and began offeringmodified programming at the beginning of July with capacity restrictions. The agency anticipates operations toincrease in Fiscal 2022 as more people get vaccinated and social distancing guidelines are relaxed.
Positive Factors
• Collaborative programs with other City agen-cies have increased Recreation Center atten-dance
• Extended hours at recreation centers - cur-rently disrupted by
• Investment of capital funds for new and ren-ovated rec center facilities
Negative Factors
• Inefficient customer experience signing upand paying for programs
• BCRP currently has modified operatingschedules due to COVID-19 restrictions andto support social distancing guidelines
The Fiscal 2022 budget invests in services and programs that will support positive movement on the RecreationFacility Visits indicator:
The budget includes an additional $813,000 in General Funds to support the operations and outfitting of the re-cently renovated Cahill Recreation Center, which will open in Fiscal 2022, as pandemic-related restrictions allow.
The Fiscal 2022 capital budget includes $2.4 million in funding for City pool improvements, including continuedfunding for designing and building the new Walter P Carter Pool. These funds also cover renovation and repairsto pools and bath houses including the Towanda, Coldstream, and Druid Hill pools.
178

Fiscal 2022 Summary of the Adopted Budget OPERATING BUDGET
Indicator: Neighborhood Revitalization
16,46116,810
16,084 15,957 16,05316,357
16,70816,969
16,61016,771 16,836
16,458
2010 2012 2014 2016 2018 2020
16k
17k
Number of Vacant Residential Buildings
Source: Baltimore City Department of Housing and Community Development
Neighborhood spatial change and the presence of vacant and abandoned properties have profound negative im-pacts on afflicted communities. Vacant properties decrease surrounding property values, affect the health of localhousing markets, may pose safety hazards, and can increase migration from affected neighborhoods.
Vacant properties are defined as any residential buildings that have been deemed uninhabitable by building codestandards, and given vacant building notices by the Department of Housing and Community Development (DHCD).
Positive Factors
• Vacants to Value, Baltimore HomeownershipIncentive Program (B-HiP), and other homebuying incentive programs
• Marketing efforts and incentives such as LiveNear Your Work that attract new residentsand keep current residents
Negative Factors
• Declining city population
• Redlining and discriminatory policies thatparticularly target Black communities
The Fiscal 2022 budget invests in services and programs that will support addressing the vacant property indica-tor:
The Fiscal 2022 capital budget includes $18.5 million in General Obligation (GO) Bonds for DHCD and programsfor demolition, homeownership incentives, development incentives, and affordable housing.
Senate Bill 509 (SB0509) was passed by the Maryland General Assembly and signed into law by the Governorin 2019, which enables Maryland jurisdictions to create an in rem foreclosure process. In rem foreclosure is aprocess that would allow the City increased flexibility in filing foreclosures, maintain due process for owners, andenable DHCD to more efficiently acquire properties for redevelopment.
Fiscal 2022will be the first year of implementation for the Tax Sale Exemption Program, passed by the City Councilin 2020, 20-0593: Tax Sales-Properties Exempt From Sale. Through this Program, coordinated by DHCD and theDepartment of Finance, low-income homeowners who are at risk of going to tax sale can apply to be removedfrom the tax sale list for the current fiscal year.
179

OPERATING BUDGET Fiscal 2022 Summary of the Adopted Budget
Indicator: Water Cleanliness
2014 2015 2016 2017 2018 2019 2020
500
1000
1500
Herring Run Moores Run Jones Falls Gwynns Falls
Geometric Mean for E.coli in Baltimore City Watersheds (MPN*/100 ml)
Source: Baltimore City Department of Public Works * Most Probable Number
DPW measures fecal bacteria at 23 stations throughout Baltimore. The City is required to meet State and localwater quality standards, including bacteriological standards identified under State law as part of the 2002 ConsentDecree. Data are divided into four watersheds across the City. When pollutants enter waterways, it is detrimentalto the environment and public health. Although the Moores Run watershed results increased, they are withinacceptable ranges for this pollutant.
Positive Factors
• Trees and green infrastructure along water-ways
• Proactive sewer maintenance and sewer re-pairs required through the Consent Decree
Negative Factors
• Sanitary sewer overflows and leaks fromsewer pipes
• Discharges to the storm water system
The Fiscal 2022 budget invests in services and programs that will support positive movement on the cleanlinessof City waterways indicator:
Trees in the parks, on the sidewalks and in themedians are all cared for by BCRP’s Urban Forestry Division. Forestryprunes and removes trees to ensure public safety and clears roadways aftermajor storms. The Fiscal 2022 budgetinvests an additional $25,000 in contractual services for their woodwaste removal at Camp Small, Baltimore City’swood re-utilization facility for its public trees.
TheCitywillmaintain its tree canopy cover of 28% throughBCRP’sUrban Forestry division. Improving theCity’s treecanopy can have numerous benefits, including reducing summer peak temperatures and air pollution, providingwildlife habitat, providing aesthetic benefits, and improving social ties among neighbors. In addition, a robust treecanopy can enhance property values and attract businesses and residents.
180
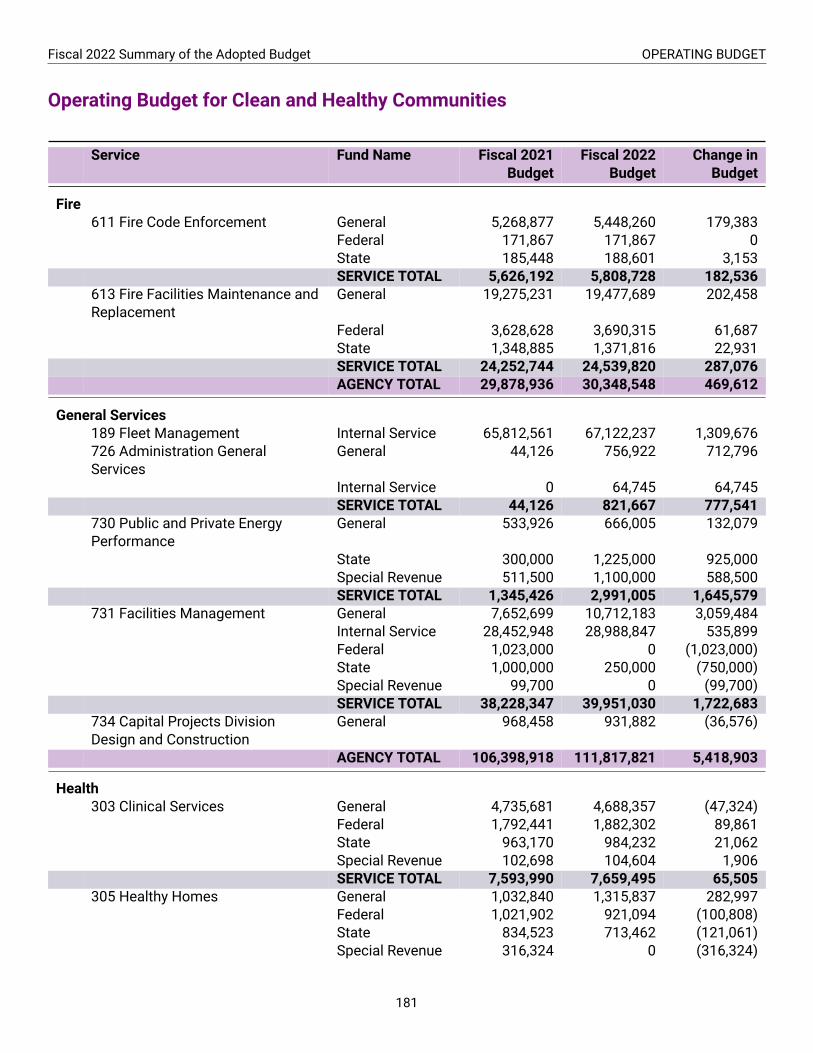
Fiscal 2022 Summary of the Adopted Budget OPERATING BUDGET
Operating Budget for Clean and Healthy Communities
Service Fund Name Fiscal 2021Budget
Fiscal 2022Budget
Change inBudget
Fire611 Fire Code Enforcement General 5,268,877 5,448,260 179,383
Federal 171,867 171,867 0State 185,448 188,601 3,153SERVICE TOTAL 5,626,192 5,808,728 182,536
613 Fire Facilities Maintenance andReplacement
General 19,275,231 19,477,689 202,458
Federal 3,628,628 3,690,315 61,687State 1,348,885 1,371,816 22,931SERVICE TOTAL 24,252,744 24,539,820 287,076AGENCY TOTAL 29,878,936 30,348,548 469,612
General Services189 Fleet Management Internal Service 65,812,561 67,122,237 1,309,676726 Administration GeneralServices
General 44,126 756,922 712,796
Internal Service 0 64,745 64,745SERVICE TOTAL 44,126 821,667 777,541
730 Public and Private EnergyPerformance
General 533,926 666,005 132,079
State 300,000 1,225,000 925,000Special Revenue 511,500 1,100,000 588,500SERVICE TOTAL 1,345,426 2,991,005 1,645,579
731 Facilities Management General 7,652,699 10,712,183 3,059,484Internal Service 28,452,948 28,988,847 535,899Federal 1,023,000 0 (1,023,000)State 1,000,000 250,000 (750,000)Special Revenue 99,700 0 (99,700)SERVICE TOTAL 38,228,347 39,951,030 1,722,683
734 Capital Projects DivisionDesign and Construction
General 968,458 931,882 (36,576)
AGENCY TOTAL 106,398,918 111,817,821 5,418,903
Health303 Clinical Services General 4,735,681 4,688,357 (47,324)
Federal 1,792,441 1,882,302 89,861State 963,170 984,232 21,062Special Revenue 102,698 104,604 1,906SERVICE TOTAL 7,593,990 7,659,495 65,505
305 Healthy Homes General 1,032,840 1,315,837 282,997Federal 1,021,902 921,094 (100,808)State 834,523 713,462 (121,061)Special Revenue 316,324 0 (316,324)
181

OPERATING BUDGET Fiscal 2022 Summary of the Adopted Budget
(continued)
Service Fund Name Fiscal 2021Budget
Fiscal 2022Budget
Change inBudget
SERVICE TOTAL 3,205,589 2,950,393 (255,196)311 Health Services for Seniors Special Revenue 5,244,140 5,371,030 126,890715 Administration Health General 4,582,757 4,833,711 250,954
Federal 5,620,731 5,793,584 172,853State 2,315,986 2,325,004 9,018Special Revenue 1,700,000 1,700,000 0Special Grant 200,000 200,000 0SERVICE TOTAL 14,419,474 14,852,299 432,825
716 Animal Services General 3,374,999 3,415,556 40,557717 Environmental InspectionServices
General 3,065,526 3,142,652 77,126
Special Revenue 33,537 34,107 570SERVICE TOTAL 3,099,063 3,176,759 77,696
718 Chronic Disease Prevention General 241,466 252,151 10,685Federal 45,471 45,882 411State 536,772 457,022 (79,750)Special Revenue 31,302 27,600 (3,702)SERVICE TOTAL 855,011 782,655 (72,356)
720 HIV Treatment Services for theUninsured
General 1,289,372 1,356,402 67,030
Federal 28,676,268 30,211,064 1,534,796State 23,256,972 23,891,789 634,817SERVICE TOTAL 53,222,612 55,459,255 2,236,643
721 Senior Centers General 1,490,638 1,289,073 (201,565)Federal 1,861,384 1,627,554 (233,830)State 349,049 350,535 1,486Special Revenue 99,391 101,081 1,690Special Grant 16,432 16,432 0SERVICE TOTAL 3,816,894 3,384,675 (432,219)
722 Administration CARE General 589,957 442,038 (147,919)Federal 242,857 257,877 15,020SERVICE TOTAL 832,814 699,915 (132,899)
723 Advocacy for Seniors General 93,605 93,985 380Federal 108,693 112,326 3,633State 350,212 286,740 (63,472)Special Revenue 388,489 401,241 12,752SERVICE TOTAL 940,999 894,292 (46,707)
724 Direct Care and SupportPlanning
State 2,647,756 2,740,012 92,256
Special Revenue 37,738 37,861 123SERVICE TOTAL 2,685,494 2,777,873 92,379
725 Community Services forSeniors
General 198,519 201,158 2,639
Federal 3,711,222 3,834,268 123,046State 998,947 1,015,929 16,982
182
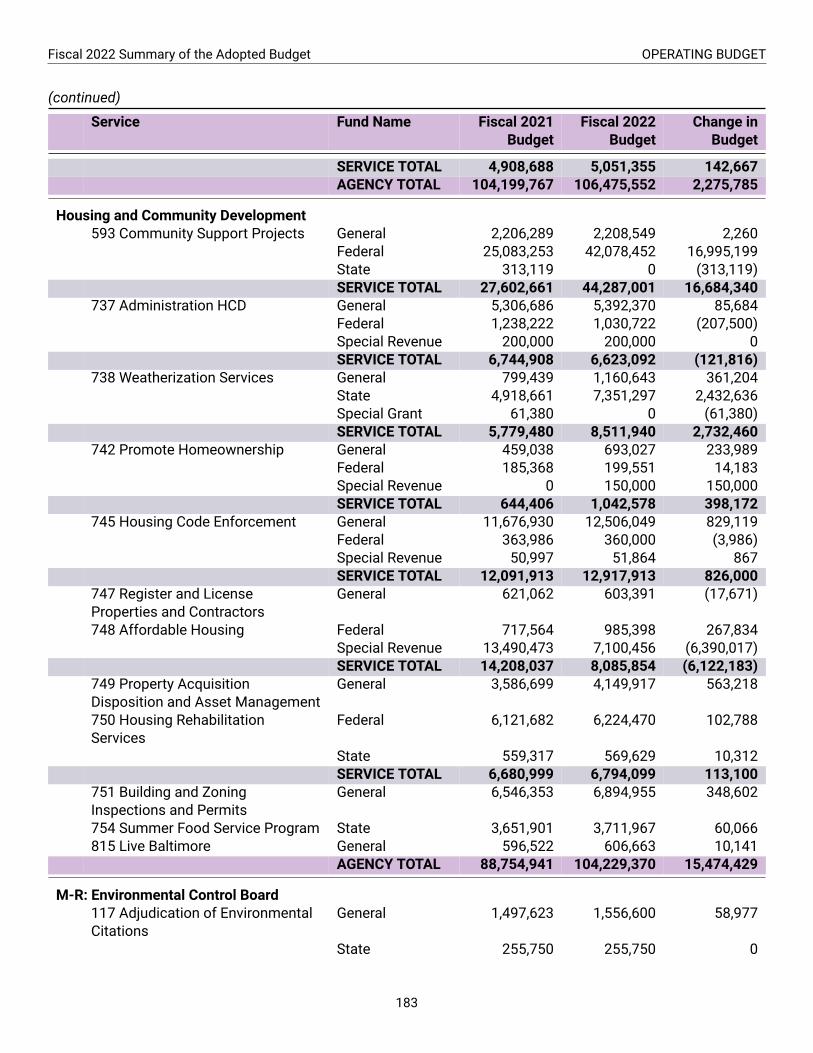
Fiscal 2022 Summary of the Adopted Budget OPERATING BUDGET
(continued)
Service Fund Name Fiscal 2021Budget
Fiscal 2022Budget
Change inBudget
SERVICE TOTAL 4,908,688 5,051,355 142,667AGENCY TOTAL 104,199,767 106,475,552 2,275,785
Housing and Community Development593 Community Support Projects General 2,206,289 2,208,549 2,260
Federal 25,083,253 42,078,452 16,995,199State 313,119 0 (313,119)SERVICE TOTAL 27,602,661 44,287,001 16,684,340
737 Administration HCD General 5,306,686 5,392,370 85,684Federal 1,238,222 1,030,722 (207,500)Special Revenue 200,000 200,000 0SERVICE TOTAL 6,744,908 6,623,092 (121,816)
738 Weatherization Services General 799,439 1,160,643 361,204State 4,918,661 7,351,297 2,432,636Special Grant 61,380 0 (61,380)SERVICE TOTAL 5,779,480 8,511,940 2,732,460
742 Promote Homeownership General 459,038 693,027 233,989Federal 185,368 199,551 14,183Special Revenue 0 150,000 150,000SERVICE TOTAL 644,406 1,042,578 398,172
745 Housing Code Enforcement General 11,676,930 12,506,049 829,119Federal 363,986 360,000 (3,986)Special Revenue 50,997 51,864 867SERVICE TOTAL 12,091,913 12,917,913 826,000
747 Register and LicenseProperties and Contractors
General 621,062 603,391 (17,671)
748 Affordable Housing Federal 717,564 985,398 267,834Special Revenue 13,490,473 7,100,456 (6,390,017)SERVICE TOTAL 14,208,037 8,085,854 (6,122,183)
749 Property AcquisitionDisposition and Asset Management
General 3,586,699 4,149,917 563,218
750 Housing RehabilitationServices
Federal 6,121,682 6,224,470 102,788
State 559,317 569,629 10,312SERVICE TOTAL 6,680,999 6,794,099 113,100
751 Building and ZoningInspections and Permits
General 6,546,353 6,894,955 348,602
754 Summer Food Service Program State 3,651,901 3,711,967 60,066815 Live Baltimore General 596,522 606,663 10,141
AGENCY TOTAL 88,754,941 104,229,370 15,474,429
M-R: Environmental Control Board117 Adjudication of EnvironmentalCitations
General 1,497,623 1,556,600 58,977
State 255,750 255,750 0
183
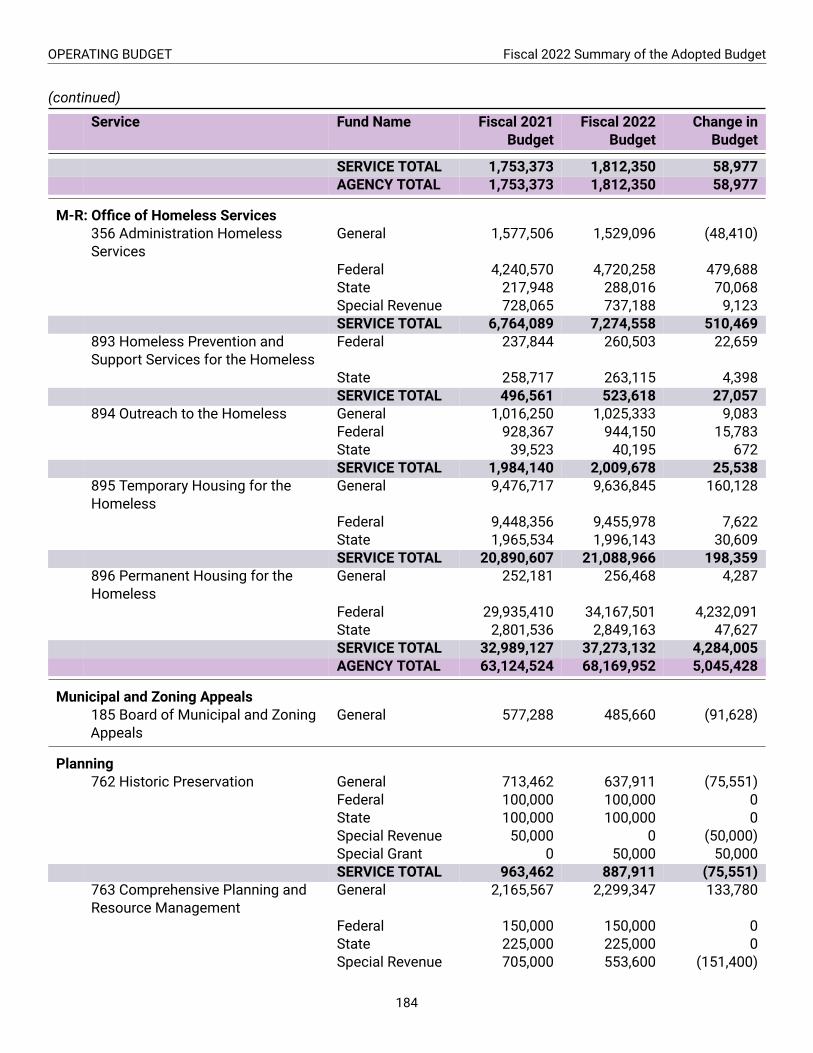
OPERATING BUDGET Fiscal 2022 Summary of the Adopted Budget
(continued)
Service Fund Name Fiscal 2021Budget
Fiscal 2022Budget
Change inBudget
SERVICE TOTAL 1,753,373 1,812,350 58,977AGENCY TOTAL 1,753,373 1,812,350 58,977
M-R: Office of Homeless Services356 Administration HomelessServices
General 1,577,506 1,529,096 (48,410)
Federal 4,240,570 4,720,258 479,688State 217,948 288,016 70,068Special Revenue 728,065 737,188 9,123SERVICE TOTAL 6,764,089 7,274,558 510,469
893 Homeless Prevention andSupport Services for the Homeless
Federal 237,844 260,503 22,659
State 258,717 263,115 4,398SERVICE TOTAL 496,561 523,618 27,057
894 Outreach to the Homeless General 1,016,250 1,025,333 9,083Federal 928,367 944,150 15,783State 39,523 40,195 672SERVICE TOTAL 1,984,140 2,009,678 25,538
895 Temporary Housing for theHomeless
General 9,476,717 9,636,845 160,128
Federal 9,448,356 9,455,978 7,622State 1,965,534 1,996,143 30,609SERVICE TOTAL 20,890,607 21,088,966 198,359
896 Permanent Housing for theHomeless
General 252,181 256,468 4,287
Federal 29,935,410 34,167,501 4,232,091State 2,801,536 2,849,163 47,627SERVICE TOTAL 32,989,127 37,273,132 4,284,005AGENCY TOTAL 63,124,524 68,169,952 5,045,428
Municipal and Zoning Appeals185 Board of Municipal and ZoningAppeals
General 577,288 485,660 (91,628)
Planning762 Historic Preservation General 713,462 637,911 (75,551)
Federal 100,000 100,000 0State 100,000 100,000 0Special Revenue 50,000 0 (50,000)Special Grant 0 50,000 50,000SERVICE TOTAL 963,462 887,911 (75,551)
763 Comprehensive Planning andResource Management
General 2,165,567 2,299,347 133,780
Federal 150,000 150,000 0State 225,000 225,000 0Special Revenue 705,000 553,600 (151,400)
184

Fiscal 2022 Summary of the Adopted Budget OPERATING BUDGET
(continued)
Service Fund Name Fiscal 2021Budget
Fiscal 2022Budget
Change inBudget
Special Grant 0 75,000 75,000SERVICE TOTAL 3,245,567 3,302,947 57,380
765 Planning for a SustainableBaltimore
General 1,317,800 1,553,443 235,643
Federal 518,105 250,000 (268,105)State 542,748 510,200 (32,548)Special Revenue 75,000 482,046 407,046Special Grant 926,142 663,000 (263,142)SERVICE TOTAL 3,379,795 3,458,689 78,894
768 Administration Planning General 1,512,590 1,370,724 (141,866)AGENCY TOTAL 9,101,414 9,020,271 (81,143)
Public Works660 Administration Solid Waste General 2,304,687 2,262,856 (41,831)661 Public Right of Way Cleaning General 18,031,225 18,173,437 142,212
Stormwater Utility 4,152,328 4,824,640 672,312Federal 2,046,000 2,046,000 0Special Revenue 1,622,021 1,635,908 13,887SERVICE TOTAL 25,851,574 26,679,985 828,411
662 Vacant and AbandonedProperty Cleaning and Boarding
General 12,124,600 11,730,011 (394,589)
Federal 1,100,000 1,175,000 75,000SERVICE TOTAL 13,224,600 12,905,011 (319,589)
663 Waste Removal and Recycling General 32,216,421 35,662,755 3,446,334Federal 0 850,000 850,000State 0 500,000 500,000Special Revenue 204,600 1,650,000 1,445,400Special Grant 250,000 604,250 354,250SERVICE TOTAL 32,671,021 39,267,005 6,595,984
664 Waste Re Use and Disposal General 25,593,910 26,856,145 1,262,235Stormwater Utility 0 4,000,000 4,000,000SERVICE TOTAL 25,593,910 30,856,145 5,262,235
670 Administration Water andWastewater
WastewaterUtility
26,504,789 29,635,596 3,130,807
Water Utility 18,377,957 18,983,578 605,621Federal 0 300,000 300,000Special Revenue 0 400,000 400,000Special Grant 0 250,000 250,000SERVICE TOTAL 44,882,746 49,569,174 4,686,428
671 Water Management Water Utility 86,728,786 88,897,680 2,168,894Federal 204,600 254,600 50,000SERVICE TOTAL 86,933,386 89,152,280 2,218,894
672 Water and WastewaterConsumer Services
WastewaterUtility
13,468,223 14,071,415 603,192
Water Utility 10,931,837 8,541,030 (2,390,807)
185

OPERATING BUDGET Fiscal 2022 Summary of the Adopted Budget
(continued)
Service Fund Name Fiscal 2021Budget
Fiscal 2022Budget
Change inBudget
Stormwater Utility 4,158,622 1,790,907 (2,367,715)SERVICE TOTAL 28,558,682 24,403,352 (4,155,330)
673 Wastewater Management WastewaterUtility
127,605,593 128,036,256 430,663
Federal 0 1,400,000 1,400,000State 300,000 750,000 450,000SERVICE TOTAL 127,905,593 130,186,256 2,280,663
674 Surface Water Management WastewaterUtility
1,741,591 1,737,528 (4,063)
Water Utility 450,725 559,991 109,266Stormwater Utility 25,686,006 23,452,365 (2,233,641)Federal 100,000 675,000 575,000State 510,000 510,000 0SERVICE TOTAL 28,488,322 26,934,884 (1,553,438)
675 Engineering and ConstructionManagement Water andWastewater
WastewaterUtility
102,457,449 127,438,865 24,981,416
Water Utility 84,245,770 94,749,082 10,503,312SERVICE TOTAL 186,703,219 222,187,947 35,484,728
676 Administration DPW General 2,833,998 1,752,457 (1,081,541)WastewaterUtility
1,450,847 1,791,531 340,684
SERVICE TOTAL 4,284,845 3,543,988 (740,857)AGENCY TOTAL 607,402,585 657,948,883 50,546,298
Recreation and Parks646 Park Maintenance General 13,056,596 13,490,118 433,522
State 3,933,185 3,761,052 (172,133)Special Revenue 1,823,996 450,000 (1,373,996)SERVICE TOTAL 18,813,777 17,701,170 (1,112,607)
650 Horticulture General 1,307,879 1,391,279 83,400Special Revenue 483,485 511,564 28,079SERVICE TOTAL 1,791,364 1,902,843 111,479
651 Recreation for Seniors General 477,710 493,760 16,050Special Revenue 38,500 38,500 0SERVICE TOTAL 516,210 532,260 16,050
652 Therapeutic Recreation General 489,992 513,371 23,379653 Park Programs and Events General 0 577,141 577,141
Special Revenue 1,121,889 1,182,198 60,309SERVICE TOTAL 1,121,889 1,759,339 637,450
654 Urban Forestry General 4,573,199 4,639,125 65,926AGENCY TOTAL 27,306,431 27,048,108 (258,323)
Transportation548 Conduits Conduit
Enterprise13,487,197 13,019,924 (467,273)
186

Fiscal 2022 Summary of the Adopted Budget OPERATING BUDGET
(continued)
Service Fund Name Fiscal 2021Budget
Fiscal 2022Budget
Change inBudget
681 Administration DOT General 9,749,799 10,074,127 324,328Federal 560,962 0 (560,962)SERVICE TOTAL 10,310,761 10,074,127 (236,634)
683 Street Management General 34,189,988 35,629,558 1,439,570688 Snow and Ice Control General 6,726,609 6,830,313 103,704690 Sustainable Transportation General 4,514,539 958,092 (3,556,447)
Federal 0 10,600 10,600State 3,071,326 8,292,343 5,221,017Special Revenue 5,749,637 5,943,139 193,502SERVICE TOTAL 13,335,502 15,204,174 1,868,672
691 Public Rights of WayLandscape Management
General 3,977,994 4,506,539 528,545
692 Bridge and CulvertManagement
General 3,707,953 3,838,316 130,363
694 Survey Control General 238,371 274,262 35,891696 Street Cuts Management General 980,051 813,703 (166,348)727 Real Property Management General 2,604,670 2,451,903 (152,767)
AGENCY TOTAL 89,559,096 92,642,819 3,083,723
GRAND TOTALTOTAL OPERATING BUDGET 1,128,057,273 1,209,999,334 81,942,061LESS INTERNAL SERVICE 94,265,509 96,175,829 1,910,320
TOTAL OPERATINGAPPROPRIATONS
1,033,791,764 1,113,823,505 80,031,741
Table in dollars.
187

Priority Outcome: Equitable Neighborhood Development
Fund Name Fiscal 2021 Budget Fiscal 2022 Budget Change in Budget
General 59,522,600 59,936,570 413,970Parking Enterprise 21,714,081 22,459,496 745,415Parking Management 27,041,907 23,864,120 (3,177,787)Federal 19,004,077 9,435,559 (9,568,518)State 6,983,211 12,751,643 5,768,432Special Revenue 1,857,878 1,905,131 47,253Special Grant 251,000 51,000 (200,000)Total 136,374,754 130,403,519 (5,971,235)
Table in dollars.
Key results funded in the Fiscal 2022 Budget:
• The Emerging Technology Center, which helps Baltimore entrepreneurs launch and sustain technology busi-nesses, will aim to create 300 jobs with all current companies being served.
• The Mayor’s Office of Employment Development (MOED), in partnership with the Health Department, hashired Career Navigators to work with the Health Department’s temporary staff who have been hired as con-tact tracers and supporting positions. Career Navigators will provide connections to support services, jobreadiness, resume assistance, and next steps to occupational training once the contact tracing positionsend.
• Community Job Hubs will provide 500 residents with job search assistance, interview preparation, train-ing recommendations, and other services to help them get secure employment. Community Job Hubs arestaffed by MOED workforce professionals working in collaboration with three local non-profit organizations,providing access for residents not located near the City’s main career centers.
Key budget decisions in Equitable Neighborhood Development:
• The budget includes funding for MOED to deliver workforce and training services in a virtual format due tothe COVID-19 pandemic.
• MOED’s budget includes $5.8million in grant funds to serve 30,000 residents and continue refining strategiesto help residents get living wage jobs. A standardized “access points” intake process will launch at careercenters, in order to evaluate residents’ specific needs and direct them to relevant services.
• This budget includes a one-time loan of $6.7 million to Visit Baltimore to stabilize their budget due to COVID-19’s impact on tourism. The funds will be paid back over five years as Hotel Tax receipts recover. This loanwill be used to reboot tourism and regain revenue lost to a decline in tourism and parking revenue.
• The Circulator will continue operating at current service levels with the support of a $5.6 million FederalTransit Authority grant from the CARES Act. The funds will support ongoing operating costs, and to combatthe loss of dedicated parking tax revenues that were the primary source of funding for the Circulator.
• The Baltimore Development Corporation (BDC) continues to access and seek out all sources of funding thatcould be used to support businesses during the COVID-19 pandemic to help facilitate economic growtheither through the attraction and expansion of businesses or job growth.
• In Fiscal 2022, the Liquor License Board will implement a new cloud-based software contract, which willimprove agency effectiveness and efficiency related to constituent services, inspection management, per-mitting, revenue collections, and application submission and review.
188

Fiscal 2022 Summary of the Adopted Budget OPERATING BUDGET
Indicator: Employment Rate
54.1% 54.4% 52.7% 54.7% 53.8% 53.9% 56.9% 56.9% 58.1% 57.1%
88.8% 89.4% 89.8% 90.3% 91.4% 92.5% 93.4% 93.7% 94.3% 91.7%
2010 2012 2014 2016 2018
Ages 16 and Older Employment Rate Labor Force Employment Rate
City Resident Employment Rate
Source: U.S. Census Bureau American Community Survey 5-Year Estimates; U.S. Bureau of Labor Statistics, Local Area Unemployment Statistics
The labor force employment rate is the percentage of people in the labor force (i.e. those seeking work) who areemployed, or the inverse of the unemployment rate for Baltimore City. The employment rate for ages 16 and oldershows the percent of people employed out of all working-age city residents, including those who are not seekingwork due to school attendance, retirement, discouragement, or other reasons. The 16 and older data is a newmetric for how the City is measuring the employment rate. In prior years the City has used the employment rateindicator for ages 16-64. This indicator has been phased out by the Census. The latest data available is two yearsprior to current calendar year.
Positive Factors
• Workforce development collaboration andprogramming among City, private, and non-profit groups
• Expansion of key industries, including thehealth and technology sectors, within Balti-more City
• An increase in the number of small busi-ness start-ups and self-employed individualswithin the City
Negative Factors
• Barriers to employment including institu-tional racial disparities, lack of access tochildcare and reliable transportation, and in-sufficient entry points to expanding sectorspaying livable wages
• An education system with barriers that limitsexposure of youth to the skills and trainingneeded to be competitive in the global econ-omy
• External economic factors, such as theCOVID-19 pandemic and school and busi-ness closures disrupting employment
The Fiscal 2022 budget invests in services and programs that will to support positive movement on the Employ-ment Rate indicator:
MOED reinvented the Community Job Hubs (CJH) by hiring full-time Career Development Facilitators (CDFs) todeliver career counseling and intensive job coaching. Despite losing nearly a third of the year due to the COVID-19pandemic and subsequent building closures, MOED pivoted to operate remotely and delivered services to 559residents. To increase job placements, a full-time Business Services Representative (BSR) was hired to marketservices to employers which will lead to 269 job placements.
189

OPERATING BUDGET Fiscal 2022 Summary of the Adopted Budget
Indicator: Number of Jobs
351.2 351.7356.0 358.2 361.4 363.7 366.6
371.0
384.0
373.4
2010 2012 2014 2016 2018
Annual Average of Non-Farm Jobs in Baltimore City (in Thousands)
Source: U.S. Bureau of Labor Statistics, Current Employment Statistics
Non-farm payrolls, which are captured by the U.S. Bureau of Labor Statistics Current Employment Statistics (CES)dataset, include all public and non-public sector jobs (full-time and part-time) in the City of Baltimore, with theexception of farm workers, household workers, proprietors, armed services, and the self-employed.
Positive Factors
• General improvement in the local economy
• Ametropolitan region with a highly-educated,millennial workforce
• Increased public and private investment inthe region
Negative Factors
• Barriers to job growth and private develop-ment, including both the negative perceptionof Baltimore and limitations on ease of doingbusiness with the City
• The COVID-19 pandemic had an adverse im-pact on tourism and the hospitality industry
The Fiscal 2022 budget invests in services and programs that will support positive movement on the Jobs inBaltimore indicator:
BDC continues to offer a variety of programs that are designed to help provide assistance to businesses seekingto remain or locate in the City. These programs include multiple loan programs, the Enterprise Zone tax creditprogram, the Foreign Trade Zone, and Tax Increment Financing.
The City’s Emerging Technologies Center (ETC) was named one of the top 5 best public business incubators inthe world by UBI Global. Every year, ETC performs a long-term planning session with its board to reflect on howto continue to innovate and stay ahead of the growing changes in technology, and entrepreneurship.
190

Fiscal 2022 Summary of the Adopted Budget OPERATING BUDGET
Indicator: Visitors to Baltimore
20.421.3
22.323.3
23.924.5
25.225.9 26.2
26.7 27.0
2010 2012 2014 2016 2018
Total Number of Visitors to Baltimore (in Millions)
Source: Visit Baltimore
This dataset comes from Visit Baltimore and includes domestic visitors to Baltimore for leisure and businesstravel. Comparative statistics assessing the impact of COVID-19 in 2020 will be available mid calendar year 2021.
Positive Factors
• Baltimore is conveniently located in proxim-ity to other East Coast cities with destina-tion events, art and culture institutions, world-class sports teams, and other celebratedtourist attractions
• Public and Private investment in areas that at-tract visitors and tourists.
Negative Factors
• Limited shopping options
• A negative perception of safety compoundedby strained police-community relations
• An aging Convention Center that struggles tocompete with larger, newer, East Coast con-vention facilities
• The COVID-19 pandemic had an adverse im-pact on the tourism and hospitality industries
The Fiscal 2022 budget invests in services and programs that will support positive movement on the Visitors toBaltimore indicator:
The Fiscal 2022 budget includes a one-time loan of $6.7 million to Visit Baltimore to stabilize their budget due toCOVID-19’s impact on tourism.
Baltimore City experienced a sharp decline in Hotel Tax collected in the City due to the travel restrictions causedby the COVID-19 pandemic. The latest travel forecast from Tourism Economics expects a slow recovery for thehotel and tourism sector with room demand expected to reach around 80% of 2019 levels by the third quarter of2021, with a full rebound not expected until the third quarter of 2023.
191

OPERATING BUDGET Fiscal 2022 Summary of the Adopted Budget
Operating Budget for Equitable Neighborhood Development
Service Fund Name Fiscal 2021Budget
Fiscal 2022Budget
Change inBudget
Housing and Community Development809 Retention Expansion andAttraction of Businesses
General 2,342,730 2,382,556 39,826
Special Revenue 165,769 165,769 0SERVICE TOTAL 2,508,499 2,548,325 39,826
810 Real Estate Development General 2,342,730 2,382,556 39,826Special Revenue 165,769 165,769 0SERVICE TOTAL 2,508,499 2,548,325 39,826
811 Inner Harbor Coordination General 443,441 450,979 7,538813 Technology DevelopmentEmerging Technology Center
General 833,934 866,160 32,226
AGENCY TOTAL 6,294,373 6,413,789 119,416
Law869 Minority and Women’sBusiness Opportunity Office
General 511,170 723,436 212,266
Liquor License Board850 Liquor Licensing General 1,112,928 1,159,972 47,044
M-R: American Rescue Plan Act111 Economic Recovery Federal 10,000,000 0 (10,000,000)
M-R: Art and Culture493 Art and Culture Grants General 6,497,627 7,061,336 563,709824 Events Art Culture and Film General 2,431,323 2,472,656 41,333
Special Revenue 50,000 60,000 10,000SERVICE TOTAL 2,481,323 2,532,656 51,333
828 Bromo Seltzer Arts Tower General 100,693 102,405 1,712AGENCY TOTAL 9,079,643 9,696,397 616,754
M-R: Civic Promotion590 Civic Promotion Grants General 1,175,643 1,195,629 19,986820 Convention Sales and TourismMarketing
General 7,794,837 9,453,409 1,658,572
AGENCY TOTAL 8,970,480 10,649,038 1,678,558
M-R: Convention Center Hotel535 Convention Center Hotel General 12,456,302 12,120,648 (335,654)
M-R: Convention Complex540 Royal Farms Arena Operations General 606,237 584,363 (21,874)855 Convention Center General 12,362,139 10,601,181 (1,760,958)
State 6,409,831 10,678,363 4,268,532SERVICE TOTAL 18,771,970 21,279,544 2,507,574
192
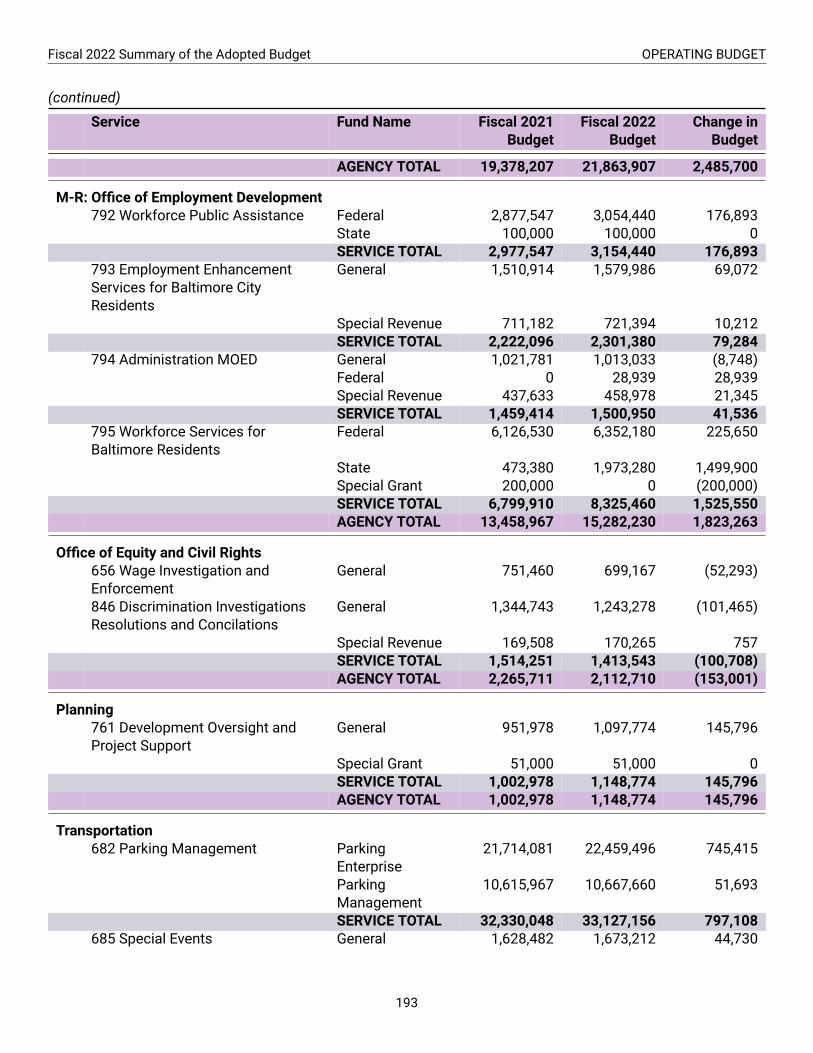
Fiscal 2022 Summary of the Adopted Budget OPERATING BUDGET
(continued)
Service Fund Name Fiscal 2021Budget
Fiscal 2022Budget
Change inBudget
AGENCY TOTAL 19,378,207 21,863,907 2,485,700
M-R: Office of Employment Development792 Workforce Public Assistance Federal 2,877,547 3,054,440 176,893
State 100,000 100,000 0SERVICE TOTAL 2,977,547 3,154,440 176,893
793 Employment EnhancementServices for Baltimore CityResidents
General 1,510,914 1,579,986 69,072
Special Revenue 711,182 721,394 10,212SERVICE TOTAL 2,222,096 2,301,380 79,284
794 Administration MOED General 1,021,781 1,013,033 (8,748)Federal 0 28,939 28,939Special Revenue 437,633 458,978 21,345SERVICE TOTAL 1,459,414 1,500,950 41,536
795 Workforce Services forBaltimore Residents
Federal 6,126,530 6,352,180 225,650
State 473,380 1,973,280 1,499,900Special Grant 200,000 0 (200,000)SERVICE TOTAL 6,799,910 8,325,460 1,525,550AGENCY TOTAL 13,458,967 15,282,230 1,823,263
Office of Equity and Civil Rights656 Wage Investigation andEnforcement
General 751,460 699,167 (52,293)
846 Discrimination InvestigationsResolutions and Concilations
General 1,344,743 1,243,278 (101,465)
Special Revenue 169,508 170,265 757SERVICE TOTAL 1,514,251 1,413,543 (100,708)AGENCY TOTAL 2,265,711 2,112,710 (153,001)
Planning761 Development Oversight andProject Support
General 951,978 1,097,774 145,796
Special Grant 51,000 51,000 0SERVICE TOTAL 1,002,978 1,148,774 145,796AGENCY TOTAL 1,002,978 1,148,774 145,796
Transportation682 Parking Management Parking
Enterprise21,714,081 22,459,496 745,415
ParkingManagement
10,615,967 10,667,660 51,693
SERVICE TOTAL 32,330,048 33,127,156 797,108685 Special Events General 1,628,482 1,673,212 44,730
193

OPERATING BUDGET Fiscal 2022 Summary of the Adopted Budget
(continued)
Service Fund Name Fiscal 2021Budget
Fiscal 2022Budget
Change inBudget
687 Inner Harbor ServicesTransportation
General 1,301,508 1,072,834 (228,674)
693 Parking Enforcement ParkingManagement
16,425,940 13,196,460 (3,229,480)
695 Dock Master Special Revenue 158,017 162,956 4,939AGENCY TOTAL 51,843,995 49,232,618 (2,611,377)
GRAND TOTALTOTAL OPERATING BUDGET 136,374,754 130,403,519 (5,971,235)LESS INTERNAL SERVICE 0 0 0
TOTAL OPERATINGAPPROPRIATONS
136,374,754 130,403,519 (5,971,235)
Table in dollars.
194

Priority Outcome: Responsible Stewardship of City Resources
Fund Name Fiscal 2021 Budget Fiscal 2022 Budget Change in Budget
General 138,978,966 146,273,603 7,294,637Internal Service 43,953,753 47,121,100 3,167,347Water Utility 265,580 238,913 (26,667)Parking Management 0 3,038,959 3,038,959Federal 2,469,468 2,710,193 240,725State 6,393,091 6,987,457 594,366Special Revenue 13,603,126 14,241,247 638,121Special Grant 272,438 298,760 26,322Total 205,936,422 220,910,232 14,973,810
Table in dollars.
Key results funded in the Fiscal 2022 Budget:
• A request for proposal (RFP) will be issued in Fiscal 2022 for a comprehensive assessment of the City’s pro-curement policies and practices. The goal of the RFP is to reform the City’s procurement policies, systems,processes, and overall capacity.
• In Fiscal 2022, the Minority and Women’s Business Opportunity Office expects to certify over 1,565 busi-nesses.
• Baltimore City Information and Technology (BCIT) plans to combat cyber attacks with its new cyber aware-ness training tool, which is designed to provide computer-based training to City employees and contractors.BCIT expects to train 100% of all City employees in Fiscal 2022.
• The Department of Finance Bureau of the Budget and Management Research aims to increase the numberof Baltimore City residents engaged in the annual budget planning process by more than 3,000 residentsthrough community events, social media, Taxpayers’ Night, and other engagement opportunities.
Key budget decisions in Responsible Stewardship of City Resources:
• As a result of Question K, a ballot measure passed in the November 2020 General Election, the Fiscal 2022recommended budget uses existing resources to establish the position of City Administrator. The Fiscal2022 includes $1 million across all funds to support the City Administrator’s Office.
• The Mayor’s Office will hire a Director of Broadband and Digital Equity, which will be funded with grant sup-port, making Baltimore one of the first cities in the nation to have this position. This role will focus on howto expand high-speed, affordable internet access to over 60,000 Baltimore households that are currentlywithout this critical necessity.
• The Fiscal 2022 budget includes $100,000 in General Fund support for the translation of vital documentsacross City agencies, providing residents access to services in languages beyond English.
• The budget for BCIT includes $14.5 million for Phase 2 of the Enterprise Resource Planning (ERP) system,which includes functions such as financial accounting, budgets, banking and settlement, customer accounts,business assets, projects, procurement, and grant management.
• In an effort to decrease the overwhelming call volume on the 311-call center, BCIT will receive an Innova-tion Fund loan of $200,000 to invest in real-time messaging technology for 311 service requests to provideassistance to customers on frequently asked questions.
• A dedicated attorney will be added to the Department of Finance to lead the Corporate Tax and ComplianceUnit, which will review and examine self-reported taxes that are susceptible to abuse and underreporting.
195

OPERATING BUDGET Fiscal 2022 Summary of the Adopted Budget
Indicator: Prompt Vendor Payment
71%
76% 75%
70%
64%
69%
48%52%
68%
2012 2014 2016 2018 2020
% of Vendors Paid on Time
Source: Baltimore City Department of Finance
The prompt vendor payment rate is the percent of invoices paid within 30 days of receipt. In 2020, there were120,000 invoices paid. Sixty Eight percent or 81,600 were paid within 30 days. The overall cycle time to payinvoices remained at 55 days on average in 2020.
Positive Factors
• Increased training of City Staff and vendorson procurement processes.
• Availability of new training resources suchas new manuals, templates, and intranet por-tals.
Negative Factors
• A higher level of Staff turnover has had im-pact on prompt invoice payment
• Employee and vendor filing errors
• Prior year cyber attack contributed tomissinginformation and invoice documentation
The Fiscal 2022 budget invests in services and programs that will support positive movement on the PromptVendor Payment indicator:
Finance’s Bureau of Procurement will continue to provide training to City staff and vendors on the proper proce-dures in order tominimize delays due to incomplete or inaccurate documentation. Often times City employees andvendors lack full understanding of the procurement process, which inadvertently impacts the City’s ability to suc-cessfully complete the procurement process and make timely payments to vendors. In Fiscal 2020, Procurementexceeded its goal and trained 673 employees and vendors.
The City plans to overhaul the Bureau of Procurement in an effort to modernize its outdated procurement policiesand processes. An RFP is currently open for a comprehensive assessment with the goal of reforming the City’sprocurement regulations, policies, systems, administrative processes, technology, and overall capacity.
196

Fiscal 2022 Summary of the Adopted Budget OPERATING BUDGET
Indicator: 311 Responsiveness
9.2
10.2
7.2
9.410.2
13.2
2015 2016 2017 2018 2019 2020
Average Time to Close for 311 Service Requests (Days)
This indicator measures howmany days it takes various agencies responding to 311 calls for service to completethe request. This figure includes all categories of 311 requests opened and closed within the fiscal year excepttraffic calming studies, which average 6 months. In Fiscal 2020, the City took an average of 13.2 days to close a311 request. This measure was created in 2015.
Positive Factors
• Improved coordination between agencies
Negative Factors
• The need to streamline processes and poli-cies based on the request type
• Staffing and service disruptions due toCOVID-19
The Fiscal 2022 budget invests in services and programs that will support positive movement on the 311 Respon-siveness indicator:
The 311 Call Center is the City’s call intake system where residents can request services and receive generalinformation. The 311 Call Center is also responsible for the development, implementation, and continuing supportof the Customer Service Request System, which provides universal, standardized, and inter-agency call intake andwork order management.
The City plans to continue implementing systems that will allow for more efficient utilization of City resources byawarding BCIT with an Innovation Fund loan to invest in 311 service request technology that will provide real-timeassistance to customers on frequently asked questions.
197

OPERATING BUDGET Fiscal 2022 Summary of the Adopted Budget
Operating Budget for Responsible Stewardship of City Resources
Service Fund Name Fiscal 2021Budget
Fiscal 2022Budget
Change inBudget
Board of Elections899 Fair Conduct of Elections General 7,428,423 7,095,321 (333,102)
City Council100 City Council General 8,179,164 8,593,872 414,708
Comptroller130 Executive Direction and ControlComptroller
General 1,698,700 1,881,101 182,401
131 Audits General 5,082,109 4,977,617 (104,492)132 Real Estate Acquisition andManagement
General 1,043,554 1,007,758 (35,796)
133 Municipal Telephone Exchange Internal Service 10,732,691 10,216,235 (516,456)136 Municipal Post Office Internal Service 941,093 4,262,998 3,321,905
AGENCY TOTAL 19,498,147 22,345,709 2,847,562
Council Services103 Council Services General 794,090 798,867 4,777
Courts: Circuit Court110 Circuit Court General 17,657,644 17,667,259 9,615
Federal 2,153,572 2,388,927 235,355State 5,974,379 6,561,627 587,248SERVICE TOTAL 25,785,595 26,617,813 832,218AGENCY TOTAL 25,785,595 26,617,813 832,218
Employees’ Retirement Systems152 Employees’ Retirement SystemAdministration
Special Revenue 5,619,931 5,859,075 239,144
154 Fire and Police RetirementSystem Administration
Special Revenue 5,723,018 5,854,594 131,576
155 Retirement Savings Plan Special Revenue 872,109 848,728 (23,381)AGENCY TOTAL 12,215,058 12,562,397 347,339
Finance148 Revenue Collection General 6,437,091 8,247,297 1,810,206
Water Utility 265,580 238,913 (26,667)ParkingManagement
0 3,038,959 3,038,959
SERVICE TOTAL 6,702,671 11,525,169 4,822,498150 Treasury and DebtManagement
General 1,254,755 1,277,407 22,652
698 Administration Finance General 1,813,523 2,036,766 223,243699 Procurement General 3,300,236 4,182,739 882,503
Internal Service 0 232,131 232,131
198

Fiscal 2022 Summary of the Adopted Budget OPERATING BUDGET
(continued)
Service Fund Name Fiscal 2021Budget
Fiscal 2022Budget
Change inBudget
SERVICE TOTAL 3,300,236 4,414,870 1,114,634700 Surplus Property Disposal Special Revenue 151,133 161,349 10,216701 Printing Services Internal Service 3,672,135 3,755,074 82,939702 Accounts Payable General 892,289 910,666 18,377703 Payroll General 3,612,749 3,758,870 146,121704 Accounting General 2,212,411 3,058,262 845,851707 Risk Management forEmployee Injuries
Internal Service 5,436,993 4,332,698 (1,104,295)
708 Operating Budget Management General 1,887,254 2,133,175 245,921710 Fiscal Integrity and Recovery General 1,197,953 1,192,794 (5,159)711 Finance Project Management General 1,373,154 1,403,877 30,723
AGENCY TOTAL 33,507,256 39,960,977 6,453,721
Human Resources770 Administration HumanResources
General 3,824,968 4,151,698 326,730
771 Benefits Administration General 2,615,410 3,716,955 1,101,545Internal Service 2,369,868 2,342,739 (27,129)SERVICE TOTAL 4,985,278 6,059,694 1,074,416
772 Civil Service Management General 3,455,947 3,623,553 167,606773 Learning and Development General 891,666 863,451 (28,215)
AGENCY TOTAL 13,157,859 14,698,396 1,540,537
Law860 Administration Law General 1,361,662 1,650,622 288,960861 Controversies General 4,841,821 5,536,242 694,421
Internal Service 2,723,652 3,053,293 329,641SERVICE TOTAL 7,565,473 8,589,535 1,024,062
862 Transactions General 1,929,801 2,114,938 185,137Internal Service 86,221 0 (86,221)SERVICE TOTAL 2,016,022 2,114,938 98,916
872 Workers’ CompensationPractice
General 0 72,910 72,910
Internal Service 4,476,049 5,750,460 1,274,411SERVICE TOTAL 4,476,049 5,823,370 1,347,321AGENCY TOTAL 15,419,206 18,178,465 2,759,259
Legislative Reference106 Legislative Reference Services General 741,867 812,997 71,130107 Archives and RecordsManagement
General 561,521 576,493 14,972
AGENCY TOTAL 1,303,388 1,389,490 86,102
M-R: Cable and Communications876 Media Production General 720,363 665,017 (55,346)
Special Revenue 676,001 676,001 0
199

OPERATING BUDGET Fiscal 2022 Summary of the Adopted Budget
(continued)
Service Fund Name Fiscal 2021Budget
Fiscal 2022Budget
Change inBudget
SERVICE TOTAL 1,396,364 1,341,018 (55,346)AGENCY TOTAL 1,396,364 1,341,018 (55,346)
M-R: Innovation Fund833 Innovation Fund Special Revenue 0 200,000 200,000
M-R: Office of Information and Technology802 Administration General 2,691,631 2,677,929 (13,702)803 Enterprise Innovation andApplication Services
General 22,389,776 19,437,624 (2,952,152)
804 311 Call Center General 5,287,451 5,181,661 (105,790)805 Enterprise IT Delivery Services General 8,396,949 10,203,861 1,806,912
Internal Service 13,515,051 13,175,472 (339,579)Special Revenue 0 70,000 70,000SERVICE TOTAL 21,912,000 23,449,333 1,537,333AGENCY TOTAL 52,280,858 50,746,547 (1,534,311)
M-R: Office of the Inspector General836 Inspector General General 1,808,349 2,253,984 445,635
M-R: Office of the Labor Commissioner128 Labor Contract Negotiationsand Administration
General 906,751 957,075 50,324
Mayoralty125 Executive Direction and ControlMayoralty
General 10,687,934 11,552,945 865,011
Federal 315,896 321,266 5,370State 418,712 425,830 7,118Special Revenue 560,934 571,500 10,566Special Grant 272,438 298,760 26,322SERVICE TOTAL 12,255,914 13,170,301 914,387AGENCY TOTAL 12,255,914 13,170,301 914,387
GRAND TOTALTOTAL OPERATING BUDGET 205,936,422 220,910,232 14,973,810LESS INTERNAL SERVICE 43,953,753 47,121,100 3,167,347
TOTAL OPERATINGAPPROPRIATONS
161,982,669 173,789,132 11,806,463
Table in dollars.
200

Priority Outcome: Other
Fund Name Fiscal 2021 Budget Fiscal 2022 Budget Change in Budget
General 207,403,201 195,927,572 (11,475,629)Conduit Enterprise 10,000 10,000 0Wastewater Utility 75,000 75,000 0Water Utility 75,000 75,000 0Stormwater Utility 20,000 20,000 0Parking Management 5,000 5,000 0Federal 85,000 680,369,732 680,284,732State 15,000 15,000 0Special Revenue 45,224,132 15,802,260 (29,421,872)Total 252,912,333 892,299,564 639,387,231
Table in dollars.
Budget appropriations included in this section include centralized fixed costs of City operations, including debtservice, retiree health benefits, self-insurance costs, and contributions to the City’s retirement systems for grant-funded positions.
Key budget decisions in Other:
• The Fiscal 2022 budget includes $33.3 million in retiree healthcare savings with a new Medicare AdvantagePart plan offered to retirees in place of the Medicare Supplement Plan offered previously. This includes$18.2 million in healthcare savings for City Schools retirees.
• The budget includes a $5 million contribution to the Rainy Day fund, an increase of $1 million over the Fiscal2021 budget. In Fiscal 2021, $8 million was withdrawn from the Rainy Day Fund and the City is required toreplenish that withdrawal over a five year period.
• The decrease in the Special Revenue budget is due to a one-time contribution set aside for school construc-tion in Fiscal 2021 per the passage of the Build to Learn Act.
201
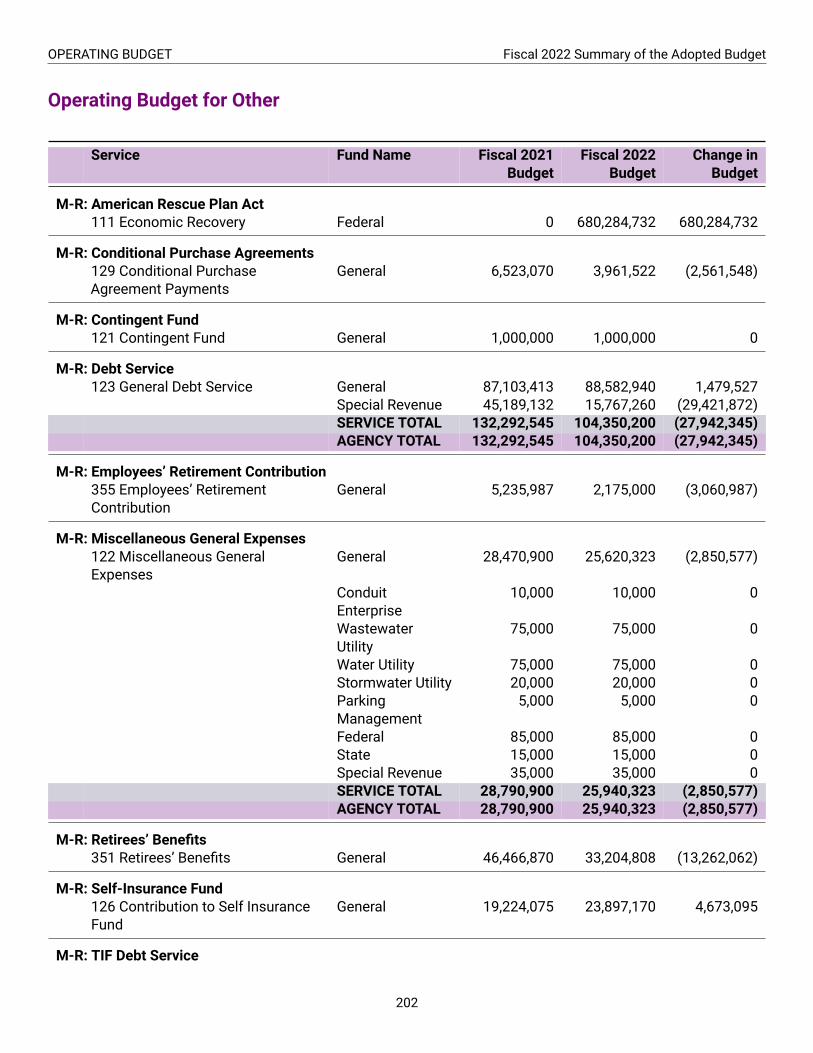
OPERATING BUDGET Fiscal 2022 Summary of the Adopted Budget
Operating Budget for Other
Service Fund Name Fiscal 2021Budget
Fiscal 2022Budget
Change inBudget
M-R: American Rescue Plan Act111 Economic Recovery Federal 0 680,284,732 680,284,732
M-R: Conditional Purchase Agreements129 Conditional PurchaseAgreement Payments
General 6,523,070 3,961,522 (2,561,548)
M-R: Contingent Fund121 Contingent Fund General 1,000,000 1,000,000 0
M-R: Debt Service123 General Debt Service General 87,103,413 88,582,940 1,479,527
Special Revenue 45,189,132 15,767,260 (29,421,872)SERVICE TOTAL 132,292,545 104,350,200 (27,942,345)AGENCY TOTAL 132,292,545 104,350,200 (27,942,345)
M-R: Employees’ Retirement Contribution355 Employees’ RetirementContribution
General 5,235,987 2,175,000 (3,060,987)
M-R: Miscellaneous General Expenses122 Miscellaneous GeneralExpenses
General 28,470,900 25,620,323 (2,850,577)
ConduitEnterprise
10,000 10,000 0
WastewaterUtility
75,000 75,000 0
Water Utility 75,000 75,000 0Stormwater Utility 20,000 20,000 0ParkingManagement
5,000 5,000 0
Federal 85,000 85,000 0State 15,000 15,000 0Special Revenue 35,000 35,000 0SERVICE TOTAL 28,790,900 25,940,323 (2,850,577)AGENCY TOTAL 28,790,900 25,940,323 (2,850,577)
M-R: Retirees’ Benefits351 Retirees’ Benefits General 46,466,870 33,204,808 (13,262,062)
M-R: Self-Insurance Fund126 Contribution to Self InsuranceFund
General 19,224,075 23,897,170 4,673,095
M-R: TIF Debt Service
202
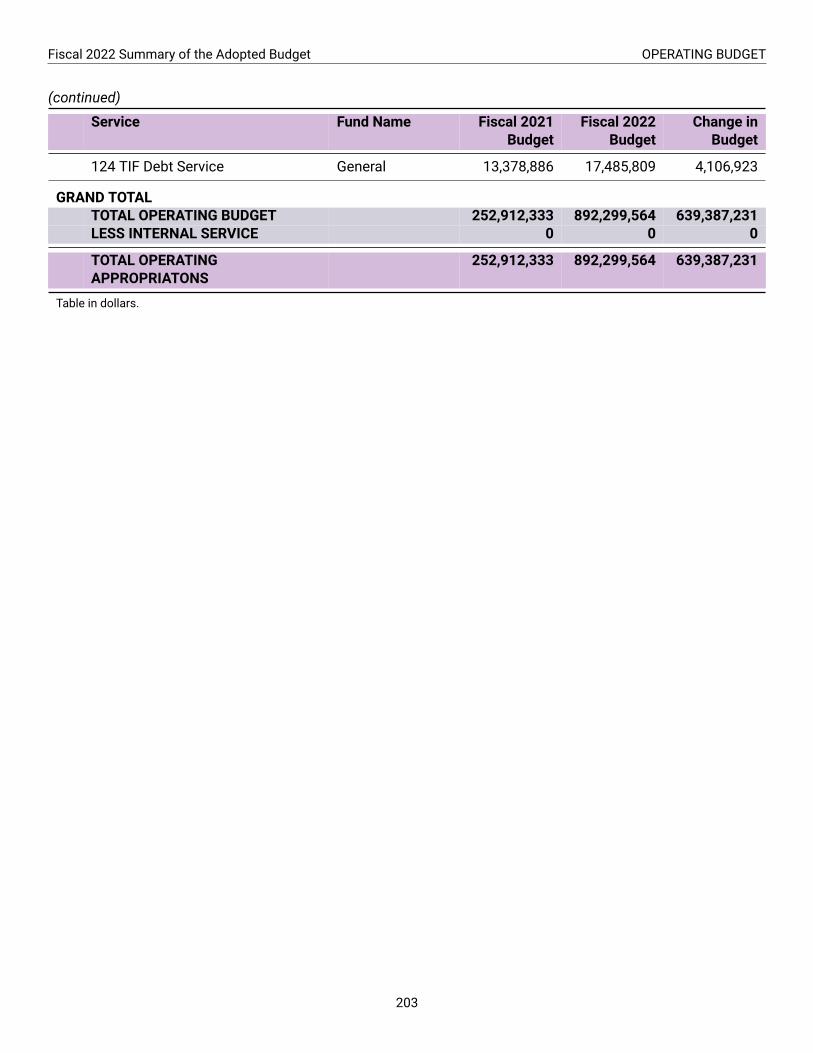
Fiscal 2022 Summary of the Adopted Budget OPERATING BUDGET
(continued)
Service Fund Name Fiscal 2021Budget
Fiscal 2022Budget
Change inBudget
124 TIF Debt Service General 13,378,886 17,485,809 4,106,923
GRAND TOTALTOTAL OPERATING BUDGET 252,912,333 892,299,564 639,387,231LESS INTERNAL SERVICE 0 0 0
TOTAL OPERATINGAPPROPRIATONS
252,912,333 892,299,564 639,387,231
Table in dollars.
203

Operating Budget by Agency, Service, and Fund
Service Fund Name Fiscal 2021Budget
Fiscal 2022Budget
Change inBudget
Board of Elections899 Fair Conduct of Elections General 7,428,423 7,095,321 (333,102)
City Council100 City Council General 8,179,164 8,593,872 414,708
Comptroller130 Executive Direction and ControlComptroller
General 1,698,700 1,881,101 182,401
131 Audits General 5,082,109 4,977,617 (104,492)132 Real Estate Acquisition andManagement
General 1,043,554 1,007,758 (35,796)
133 Municipal Telephone Exchange Internal Service 10,732,691 10,216,235 (516,456)136 Municipal Post Office Internal Service 941,093 4,262,998 3,321,905
AGENCY TOTAL 19,498,147 22,345,709 2,847,562
Council Services103 Council Services General 794,090 798,867 4,777
Courts: Circuit Court110 Circuit Court General 17,657,644 17,667,259 9,615
Federal 2,153,572 2,388,927 235,355State 5,974,379 6,561,627 587,248SERVICE TOTAL 25,785,595 26,617,813 832,218AGENCY TOTAL 25,785,595 26,617,813 832,218
Courts: Orphans’ Court817 Orphans’ Court General 617,892 694,393 76,501
Employees’ Retirement Systems152 Employees’ Retirement SystemAdministration
Special Revenue 5,619,931 5,859,075 239,144
154 Fire and Police RetirementSystem Administration
Special Revenue 5,723,018 5,854,594 131,576
155 Retirement Savings Plan Special Revenue 872,109 848,728 (23,381)AGENCY TOTAL 12,215,058 12,562,397 347,339
Enoch Pratt Free Library788 Information Services General 26,185,090 28,481,175 2,296,085
State 14,270,492 14,184,508 (85,984)Special Revenue 996,122 1,041,700 45,578SERVICE TOTAL 41,451,704 43,707,383 2,255,679AGENCY TOTAL 41,451,704 43,707,383 2,255,679
Finance148 Revenue Collection General 6,437,091 8,247,297 1,810,206
Water Utility 265,580 238,913 (26,667)
204
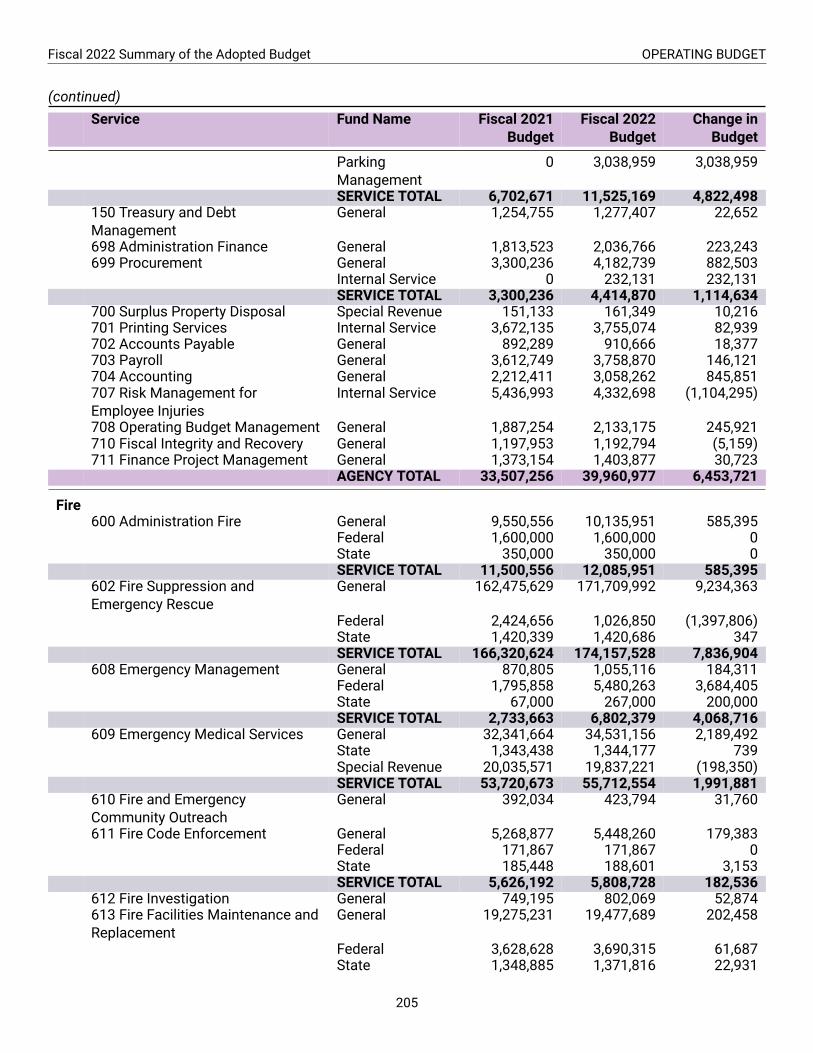
Fiscal 2022 Summary of the Adopted Budget OPERATING BUDGET
(continued)Service Fund Name Fiscal 2021
BudgetFiscal 2022
BudgetChange in
Budget
ParkingManagement
0 3,038,959 3,038,959
SERVICE TOTAL 6,702,671 11,525,169 4,822,498150 Treasury and DebtManagement
General 1,254,755 1,277,407 22,652
698 Administration Finance General 1,813,523 2,036,766 223,243699 Procurement General 3,300,236 4,182,739 882,503
Internal Service 0 232,131 232,131SERVICE TOTAL 3,300,236 4,414,870 1,114,634
700 Surplus Property Disposal Special Revenue 151,133 161,349 10,216701 Printing Services Internal Service 3,672,135 3,755,074 82,939702 Accounts Payable General 892,289 910,666 18,377703 Payroll General 3,612,749 3,758,870 146,121704 Accounting General 2,212,411 3,058,262 845,851707 Risk Management forEmployee Injuries
Internal Service 5,436,993 4,332,698 (1,104,295)
708 Operating Budget Management General 1,887,254 2,133,175 245,921710 Fiscal Integrity and Recovery General 1,197,953 1,192,794 (5,159)711 Finance Project Management General 1,373,154 1,403,877 30,723
AGENCY TOTAL 33,507,256 39,960,977 6,453,721
Fire600 Administration Fire General 9,550,556 10,135,951 585,395
Federal 1,600,000 1,600,000 0State 350,000 350,000 0SERVICE TOTAL 11,500,556 12,085,951 585,395
602 Fire Suppression andEmergency Rescue
General 162,475,629 171,709,992 9,234,363
Federal 2,424,656 1,026,850 (1,397,806)State 1,420,339 1,420,686 347SERVICE TOTAL 166,320,624 174,157,528 7,836,904
608 Emergency Management General 870,805 1,055,116 184,311Federal 1,795,858 5,480,263 3,684,405State 67,000 267,000 200,000SERVICE TOTAL 2,733,663 6,802,379 4,068,716
609 Emergency Medical Services General 32,341,664 34,531,156 2,189,492State 1,343,438 1,344,177 739Special Revenue 20,035,571 19,837,221 (198,350)SERVICE TOTAL 53,720,673 55,712,554 1,991,881
610 Fire and EmergencyCommunity Outreach
General 392,034 423,794 31,760
611 Fire Code Enforcement General 5,268,877 5,448,260 179,383Federal 171,867 171,867 0State 185,448 188,601 3,153SERVICE TOTAL 5,626,192 5,808,728 182,536
612 Fire Investigation General 749,195 802,069 52,874613 Fire Facilities Maintenance andReplacement
General 19,275,231 19,477,689 202,458
Federal 3,628,628 3,690,315 61,687State 1,348,885 1,371,816 22,931
205

OPERATING BUDGET Fiscal 2022 Summary of the Adopted Budget
(continued)Service Fund Name Fiscal 2021
BudgetFiscal 2022
BudgetChange in
Budget
SERVICE TOTAL 24,252,744 24,539,820 287,076614 Fire Communications andDispatch
General 8,901,044 8,657,415 (243,629)
State 3,000 3,051 51Special Revenue 9,226,149 10,678,871 1,452,722SERVICE TOTAL 18,130,193 19,339,337 1,209,144
615 Fire Training and Education General 4,755,552 4,545,391 (210,161)AGENCY TOTAL 288,181,426 304,217,551 16,036,125
General Services189 Fleet Management Internal Service 65,812,561 67,122,237 1,309,676726 Administration GeneralServices
General 44,126 756,922 712,796
Internal Service 0 64,745 64,745SERVICE TOTAL 44,126 821,667 777,541
730 Public and Private EnergyPerformance
General 533,926 666,005 132,079
State 300,000 1,225,000 925,000Special Revenue 511,500 1,100,000 588,500SERVICE TOTAL 1,345,426 2,991,005 1,645,579
731 Facilities Management General 7,652,699 10,712,183 3,059,484Internal Service 28,452,948 28,988,847 535,899Federal 1,023,000 0 (1,023,000)State 1,000,000 250,000 (750,000)Special Revenue 99,700 0 (99,700)SERVICE TOTAL 38,228,347 39,951,030 1,722,683
734 Capital Projects DivisionDesign and Construction
General 968,458 931,882 (36,576)
AGENCY TOTAL 106,398,918 111,817,821 5,418,903
Health303 Clinical Services General 4,735,681 4,688,357 (47,324)
Federal 1,792,441 1,882,302 89,861State 963,170 984,232 21,062Special Revenue 102,698 104,604 1,906SERVICE TOTAL 7,593,990 7,659,495 65,505
305 Healthy Homes General 1,032,840 1,315,837 282,997Federal 1,021,902 921,094 (100,808)State 834,523 713,462 (121,061)Special Revenue 316,324 0 (316,324)SERVICE TOTAL 3,205,589 2,950,393 (255,196)
307 Substance Use Disorder andMental Health
General 1,533,047 1,563,356 30,309
Federal 1,347,824 1,361,843 14,019State 1,804,827 1,806,734 1,907SERVICE TOTAL 4,685,698 4,731,933 46,235
308 Maternal and Child Health General 1,995,168 2,011,772 16,604Federal 20,151,259 20,947,655 796,396State 1,869,220 1,962,478 93,258Special Revenue 894,644 921,345 26,701
206

Fiscal 2022 Summary of the Adopted Budget OPERATING BUDGET
(continued)Service Fund Name Fiscal 2021
BudgetFiscal 2022
BudgetChange in
Budget
Special Grant 1,186,302 1,223,183 36,881SERVICE TOTAL 26,096,593 27,066,433 969,840
310 School Health Services General 15,711,762 15,725,944 14,182Federal 157,705 306,468 148,763State 507,856 506,367 (1,489)Special Revenue 5,024,751 5,194,693 169,942Special Grant 25,000 25,000 0SERVICE TOTAL 21,427,074 21,758,472 331,398
311 Health Services for Seniors Special Revenue 5,244,140 5,371,030 126,890315 Emergency Services Health General 920,394 36,490,083 35,569,689
Federal 668,764 704,910 36,146State 8,470,708 8,637,338 166,630Special Grant 498,886 524,087 25,201SERVICE TOTAL 10,558,752 46,356,418 35,797,666
316 Youth and Trauma Services General 687,692 768,215 80,523Federal 1,039,989 453,193 (586,796)State 739,756 388,454 (351,302)Special Grant 0 41,028 41,028SERVICE TOTAL 2,467,437 1,650,890 (816,547)
715 Administration Health General 4,582,757 4,833,711 250,954Federal 5,620,731 5,793,584 172,853State 2,315,986 2,325,004 9,018Special Revenue 1,700,000 1,700,000 0Special Grant 200,000 200,000 0SERVICE TOTAL 14,419,474 14,852,299 432,825
716 Animal Services General 3,374,999 3,415,556 40,557717 Environmental InspectionServices
General 3,065,526 3,142,652 77,126
Special Revenue 33,537 34,107 570SERVICE TOTAL 3,099,063 3,176,759 77,696
718 Chronic Disease Prevention General 241,466 252,151 10,685Federal 45,471 45,882 411State 536,772 457,022 (79,750)Special Revenue 31,302 27,600 (3,702)SERVICE TOTAL 855,011 782,655 (72,356)
720 HIV Treatment Services for theUninsured
General 1,289,372 1,356,402 67,030
Federal 28,676,268 30,211,064 1,534,796State 23,256,972 23,891,789 634,817SERVICE TOTAL 53,222,612 55,459,255 2,236,643
721 Senior Centers General 1,490,638 1,289,073 (201,565)Federal 1,861,384 1,627,554 (233,830)State 349,049 350,535 1,486Special Revenue 99,391 101,081 1,690Special Grant 16,432 16,432 0SERVICE TOTAL 3,816,894 3,384,675 (432,219)
722 Administration CARE General 589,957 442,038 (147,919)Federal 242,857 257,877 15,020SERVICE TOTAL 832,814 699,915 (132,899)
723 Advocacy for Seniors General 93,605 93,985 380
207

OPERATING BUDGET Fiscal 2022 Summary of the Adopted Budget
(continued)Service Fund Name Fiscal 2021
BudgetFiscal 2022
BudgetChange in
Budget
Federal 108,693 112,326 3,633State 350,212 286,740 (63,472)Special Revenue 388,489 401,241 12,752SERVICE TOTAL 940,999 894,292 (46,707)
724 Direct Care and SupportPlanning
State 2,647,756 2,740,012 92,256
Special Revenue 37,738 37,861 123SERVICE TOTAL 2,685,494 2,777,873 92,379
725 Community Services forSeniors
General 198,519 201,158 2,639
Federal 3,711,222 3,834,268 123,046State 998,947 1,015,929 16,982SERVICE TOTAL 4,908,688 5,051,355 142,667AGENCY TOTAL 169,435,321 208,039,698 38,604,377
Housing and Community Development593 Community Support Projects General 2,206,289 2,208,549 2,260
Federal 25,083,253 42,078,452 16,995,199State 313,119 0 (313,119)SERVICE TOTAL 27,602,661 44,287,001 16,684,340
604 Before and After Care General 125,081 253,503 128,422737 Administration HCD General 5,306,686 5,392,370 85,684
Federal 1,238,222 1,030,722 (207,500)Special Revenue 200,000 200,000 0SERVICE TOTAL 6,744,908 6,623,092 (121,816)
738 Weatherization Services General 799,439 1,160,643 361,204State 4,918,661 7,351,297 2,432,636Special Grant 61,380 0 (61,380)SERVICE TOTAL 5,779,480 8,511,940 2,732,460
740 Dawson Center General 46,992 31,609 (15,383)Federal 402,456 342,289 (60,167)SERVICE TOTAL 449,448 373,898 (75,550)
742 Promote Homeownership General 459,038 693,027 233,989Federal 185,368 199,551 14,183Special Revenue 0 150,000 150,000SERVICE TOTAL 644,406 1,042,578 398,172
745 Housing Code Enforcement General 11,676,930 12,506,049 829,119Federal 363,986 360,000 (3,986)Special Revenue 50,997 51,864 867SERVICE TOTAL 12,091,913 12,917,913 826,000
747 Register and LicenseProperties and Contractors
General 621,062 603,391 (17,671)
748 Affordable Housing Federal 717,564 985,398 267,834Special Revenue 13,490,473 7,100,456 (6,390,017)SERVICE TOTAL 14,208,037 8,085,854 (6,122,183)
749 Property AcquisitionDisposition and Asset Management
General 3,586,699 4,149,917 563,218
750 Housing RehabilitationServices
Federal 6,121,682 6,224,470 102,788
State 559,317 569,629 10,312
208
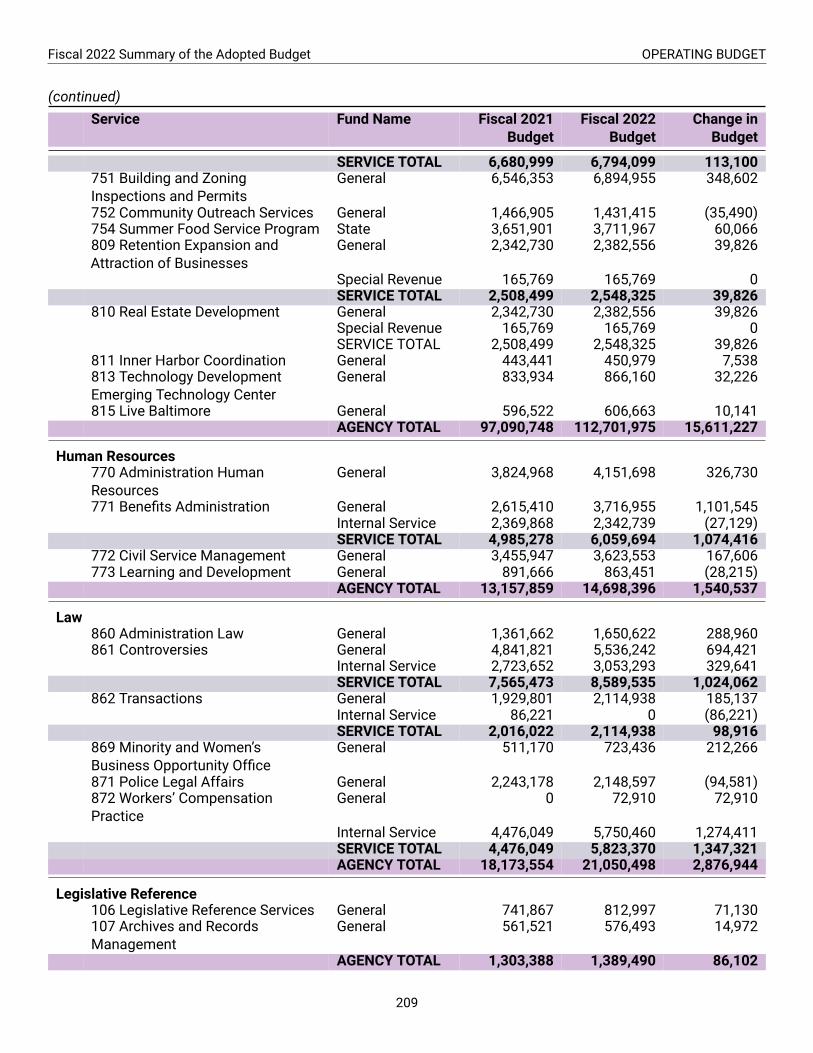
Fiscal 2022 Summary of the Adopted Budget OPERATING BUDGET
(continued)Service Fund Name Fiscal 2021
BudgetFiscal 2022
BudgetChange in
Budget
SERVICE TOTAL 6,680,999 6,794,099 113,100751 Building and ZoningInspections and Permits
General 6,546,353 6,894,955 348,602
752 Community Outreach Services General 1,466,905 1,431,415 (35,490)754 Summer Food Service Program State 3,651,901 3,711,967 60,066809 Retention Expansion andAttraction of Businesses
General 2,342,730 2,382,556 39,826
Special Revenue 165,769 165,769 0SERVICE TOTAL 2,508,499 2,548,325 39,826
810 Real Estate Development General 2,342,730 2,382,556 39,826Special Revenue 165,769 165,769 0SERVICE TOTAL 2,508,499 2,548,325 39,826
811 Inner Harbor Coordination General 443,441 450,979 7,538813 Technology DevelopmentEmerging Technology Center
General 833,934 866,160 32,226
815 Live Baltimore General 596,522 606,663 10,141AGENCY TOTAL 97,090,748 112,701,975 15,611,227
Human Resources770 Administration HumanResources
General 3,824,968 4,151,698 326,730
771 Benefits Administration General 2,615,410 3,716,955 1,101,545Internal Service 2,369,868 2,342,739 (27,129)SERVICE TOTAL 4,985,278 6,059,694 1,074,416
772 Civil Service Management General 3,455,947 3,623,553 167,606773 Learning and Development General 891,666 863,451 (28,215)
AGENCY TOTAL 13,157,859 14,698,396 1,540,537
Law860 Administration Law General 1,361,662 1,650,622 288,960861 Controversies General 4,841,821 5,536,242 694,421
Internal Service 2,723,652 3,053,293 329,641SERVICE TOTAL 7,565,473 8,589,535 1,024,062
862 Transactions General 1,929,801 2,114,938 185,137Internal Service 86,221 0 (86,221)SERVICE TOTAL 2,016,022 2,114,938 98,916
869 Minority and Women’sBusiness Opportunity Office
General 511,170 723,436 212,266
871 Police Legal Affairs General 2,243,178 2,148,597 (94,581)872 Workers’ CompensationPractice
General 0 72,910 72,910
Internal Service 4,476,049 5,750,460 1,274,411SERVICE TOTAL 4,476,049 5,823,370 1,347,321AGENCY TOTAL 18,173,554 21,050,498 2,876,944
Legislative Reference106 Legislative Reference Services General 741,867 812,997 71,130107 Archives and RecordsManagement
General 561,521 576,493 14,972
AGENCY TOTAL 1,303,388 1,389,490 86,102
209

OPERATING BUDGET Fiscal 2022 Summary of the Adopted Budget
(continued)Service Fund Name Fiscal 2021
BudgetFiscal 2022
BudgetChange in
Budget
Liquor License Board850 Liquor Licensing General 1,112,928 1,159,972 47,044851 Liquor License Compliance General 1,187,954 1,366,903 178,949
AGENCY TOTAL 2,300,882 2,526,875 225,993
M-R: American Rescue Plan Act111 Economic Recovery Federal 10,000,000 680,284,732 670,284,732
M-R: Art and Culture493 Art and Culture Grants General 6,497,627 7,061,336 563,709824 Events Art Culture and Film General 2,431,323 2,472,656 41,333
Special Revenue 50,000 60,000 10,000SERVICE TOTAL 2,481,323 2,532,656 51,333
828 Bromo Seltzer Arts Tower General 100,693 102,405 1,712AGENCY TOTAL 9,079,643 9,696,397 616,754
M-R: Baltimore City Public Schools352 Baltimore City Public Schools General 287,346,700 275,306,538 (12,040,162)
M-R: Cable and Communications876 Media Production General 720,363 665,017 (55,346)
Special Revenue 676,001 676,001 0SERVICE TOTAL 1,396,364 1,341,018 (55,346)AGENCY TOTAL 1,396,364 1,341,018 (55,346)
M-R: Civic Promotion590 Civic Promotion Grants General 1,175,643 1,195,629 19,986820 Convention Sales and TourismMarketing
General 7,794,837 9,453,409 1,658,572
AGENCY TOTAL 8,970,480 10,649,038 1,678,558
M-R: Conditional Purchase Agreements129 Conditional PurchaseAgreement Payments
General 6,523,070 3,961,522 (2,561,548)
M-R: Contingent Fund121 Contingent Fund General 1,000,000 1,000,000 0
M-R: Convention Center Hotel535 Convention Center Hotel General 12,456,302 12,120,648 (335,654)
M-R: Convention Complex540 Royal Farms Arena Operations General 606,237 584,363 (21,874)855 Convention Center General 12,362,139 10,601,181 (1,760,958)
State 6,409,831 10,678,363 4,268,532SERVICE TOTAL 18,771,970 21,279,544 2,507,574AGENCY TOTAL 19,378,207 21,863,907 2,485,700
M-R: Debt Service123 General Debt Service General 87,103,413 88,582,940 1,479,527
Special Revenue 45,189,132 15,767,260 (29,421,872)
210

Fiscal 2022 Summary of the Adopted Budget OPERATING BUDGET
(continued)Service Fund Name Fiscal 2021
BudgetFiscal 2022
BudgetChange in
Budget
SERVICE TOTAL 132,292,545 104,350,200 (27,942,345)AGENCY TOTAL 132,292,545 104,350,200 (27,942,345)
M-R: Educational Grants446 Educational Grants General 11,340,311 11,325,031 (15,280)
Federal 300,000 300,000 0Special Revenue 16,926,000 13,327,000 (3,599,000)SERVICE TOTAL 28,566,311 24,952,031 (3,614,280)AGENCY TOTAL 28,566,311 24,952,031 (3,614,280)
M-R: Employees’ Retirement Contribution355 Employees’ RetirementContribution
General 5,235,987 2,175,000 (3,060,987)
M-R: Environmental Control Board117 Adjudication of EnvironmentalCitations
General 1,497,623 1,556,600 58,977
State 255,750 255,750 0SERVICE TOTAL 1,753,373 1,812,350 58,977AGENCY TOTAL 1,753,373 1,812,350 58,977
M-R: Health and Welfare Grants385 Health and Welfare Grants General 1,336,592 1,359,314 22,722
M-R: Innovation Fund833 Innovation Fund Special Revenue 0 200,000 200,000
M-R: Miscellaneous General Expenses122 Miscellaneous GeneralExpenses
General 28,470,900 25,620,323 (2,850,577)
ConduitEnterprise
10,000 10,000 0
WastewaterUtility
75,000 75,000 0
Water Utility 75,000 75,000 0Stormwater Utility 20,000 20,000 0ParkingManagement
5,000 5,000 0
Federal 85,000 85,000 0State 15,000 15,000 0Special Revenue 35,000 35,000 0SERVICE TOTAL 28,790,900 25,940,323 (2,850,577)AGENCY TOTAL 28,790,900 25,940,323 (2,850,577)
M-R: Office of Children and Family Success109 Administration Children andFamily Success
General 2,810,544 3,006,132 195,588
Special Revenue 280,775 78,000 (202,775)SERVICE TOTAL 3,091,319 3,084,132 (7,187)
605 Head Start General 587,384 605,866 18,482Federal 7,790,297 8,021,215 230,918
211

OPERATING BUDGET Fiscal 2022 Summary of the Adopted Budget
(continued)Service Fund Name Fiscal 2021
BudgetFiscal 2022
BudgetChange in
Budget
State 138,754 141,113 2,359Special Revenue 152,990 0 (152,990)SERVICE TOTAL 8,669,425 8,768,194 98,769
741 Community Action Partnership General 709,080 763,240 54,160Water Utility 459,999 397,937 (62,062)Federal 1,052,599 18,850,191 17,797,592State 7,562,517 7,985,898 423,381SERVICE TOTAL 9,784,195 27,997,266 18,213,071AGENCY TOTAL 21,544,939 39,849,592 18,304,653
M-R: Office of Employment Development791 BCPS Alternative OptionsAcademy for Youth
State 198,941 214,784 15,843
792 Workforce Public Assistance Federal 2,877,547 3,054,440 176,893State 100,000 100,000 0
SERVICE TOTAL 2,977,547 3,154,440 176,893793 Employment EnhancementServices for Baltimore CityResidents
General 1,510,914 1,579,986 69,072
Special Revenue 711,182 721,394 10,212SERVICE TOTAL 2,222,096 2,301,380 79,284
794 Administration MOED General 1,021,781 1,013,033 (8,748)Federal 0 28,939 28,939Special Revenue 437,633 458,978 21,345SERVICE TOTAL 1,459,414 1,500,950 41,536
795 Workforce Services forBaltimore Residents
Federal 6,126,530 6,352,180 225,650
State 473,380 1,973,280 1,499,900Special Grant 200,000 0 (200,000)SERVICE TOTAL 6,799,910 8,325,460 1,525,550
796 Workforce Services for ExOffenders
General 189,287 199,697 10,410
Federal 557,000 557,000 0State 983,794 951,403 (32,391)SERVICE TOTAL 1,730,081 1,708,100 (21,981)
797 Workforce Services for Out ofSchool Youth Youth Opportunity
General 3,089,492 3,191,275 101,783
Federal 1,124,412 991,323 (133,089)State 100,000 100,000 0Special Revenue 132,781 0 (132,781)Special Grant 165,000 165,000 0SERVICE TOTAL 4,611,685 4,447,598 (164,087)
798 Youth Works Summer JobProgram
General 2,359,955 2,564,529 204,574
Federal 2,000,000 2,001,816 1,816State 3,653,409 3,376,891 (276,518)Special Revenue 1,747,469 1,065,000 (682,469)Special Grant 1,200,000 0 (1,200,000)
212

Fiscal 2022 Summary of the Adopted Budget OPERATING BUDGET
(continued)Service Fund Name Fiscal 2021
BudgetFiscal 2022
BudgetChange in
Budget
SERVICE TOTAL 10,960,833 9,008,236 (1,952,597)800 Workforce Services for WIOAFunded Youth
Federal 3,260,315 4,118,574 858,259
AGENCY TOTAL 34,220,822 34,779,522 558,700
M-R: Office of Homeless Services356 Administration HomelessServices
General 1,577,506 1,529,096 (48,410)
Federal 4,240,570 4,720,258 479,688State 217,948 288,016 70,068Special Revenue 728,065 737,188 9,123SERVICE TOTAL 6,764,089 7,274,558 510,469
893 Homeless Prevention andSupport Services for the Homeless
Federal 237,844 260,503 22,659
State 258,717 263,115 4,398SERVICE TOTAL 496,561 523,618 27,057
894 Outreach to the Homeless General 1,016,250 1,025,333 9,083Federal 928,367 944,150 15,783State 39,523 40,195 672SERVICE TOTAL 1,984,140 2,009,678 25,538
895 Temporary Housing for theHomeless
General 9,476,717 9,636,845 160,128
Federal 9,448,356 9,455,978 7,622State 1,965,534 1,996,143 30,609SERVICE TOTAL 20,890,607 21,088,966 198,359
896 Permanent Housing for theHomeless
General 252,181 256,468 4,287
Federal 29,935,410 34,167,501 4,232,091State 2,801,536 2,849,163 47,627SERVICE TOTAL 32,989,127 37,273,132 4,284,005AGENCY TOTAL 63,124,524 68,169,952 5,045,428
M-R: Office of Information and Technology802 Administration General 2,691,631 2,677,929 (13,702)803 Enterprise Innovation andApplication Services
General 22,389,776 19,437,624 (2,952,152)
804 311 Call Center General 5,287,451 5,181,661 (105,790)805 Enterprise IT Delivery Services General 8,396,949 10,203,861 1,806,912
Internal Service 13,515,051 13,175,472 (339,579)Special Revenue 0 70,000 70,000SERVICE TOTAL 21,912,000 23,449,333 1,537,333AGENCY TOTAL 52,280,858 50,746,547 (1,534,311)
M-R: Office of Neighborhood Safety and Engagement617 Criminal Justice Coordination General 744,496 738,498 (5,998)
Federal 1,130,078 1,499,039 368,961State 1,023,000 1,500,000 477,000SERVICE TOTAL 2,897,574 3,737,537 839,963
618 Neighborhood Safety andEngagement
General 3,643,620 3,917,262 273,642
213
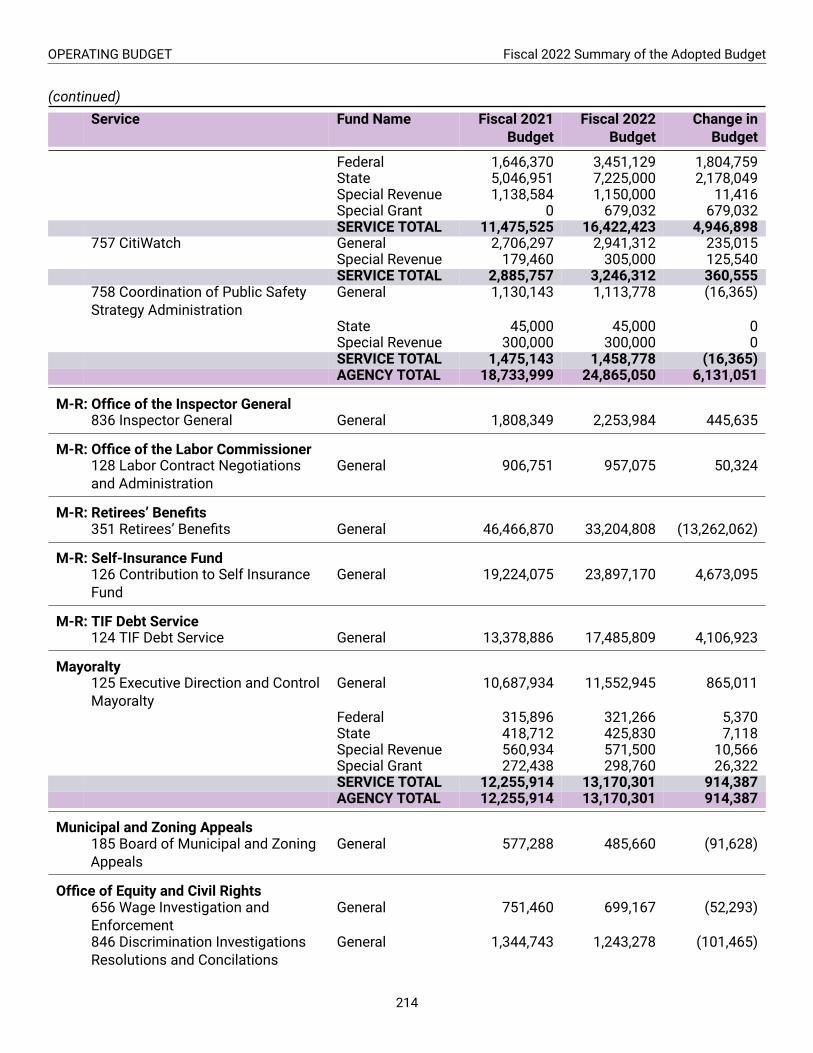
OPERATING BUDGET Fiscal 2022 Summary of the Adopted Budget
(continued)Service Fund Name Fiscal 2021
BudgetFiscal 2022
BudgetChange in
Budget
Federal 1,646,370 3,451,129 1,804,759State 5,046,951 7,225,000 2,178,049Special Revenue 1,138,584 1,150,000 11,416Special Grant 0 679,032 679,032SERVICE TOTAL 11,475,525 16,422,423 4,946,898
757 CitiWatch General 2,706,297 2,941,312 235,015Special Revenue 179,460 305,000 125,540SERVICE TOTAL 2,885,757 3,246,312 360,555
758 Coordination of Public SafetyStrategy Administration
General 1,130,143 1,113,778 (16,365)
State 45,000 45,000 0Special Revenue 300,000 300,000 0SERVICE TOTAL 1,475,143 1,458,778 (16,365)AGENCY TOTAL 18,733,999 24,865,050 6,131,051
M-R: Office of the Inspector General836 Inspector General General 1,808,349 2,253,984 445,635
M-R: Office of the Labor Commissioner128 Labor Contract Negotiationsand Administration
General 906,751 957,075 50,324
M-R: Retirees’ Benefits351 Retirees’ Benefits General 46,466,870 33,204,808 (13,262,062)
M-R: Self-Insurance Fund126 Contribution to Self InsuranceFund
General 19,224,075 23,897,170 4,673,095
M-R: TIF Debt Service124 TIF Debt Service General 13,378,886 17,485,809 4,106,923
Mayoralty125 Executive Direction and ControlMayoralty
General 10,687,934 11,552,945 865,011
Federal 315,896 321,266 5,370State 418,712 425,830 7,118Special Revenue 560,934 571,500 10,566Special Grant 272,438 298,760 26,322SERVICE TOTAL 12,255,914 13,170,301 914,387AGENCY TOTAL 12,255,914 13,170,301 914,387
Municipal and Zoning Appeals185 Board of Municipal and ZoningAppeals
General 577,288 485,660 (91,628)
Office of Equity and Civil Rights656 Wage Investigation andEnforcement
General 751,460 699,167 (52,293)
846 Discrimination InvestigationsResolutions and Concilations
General 1,344,743 1,243,278 (101,465)
214

Fiscal 2022 Summary of the Adopted Budget OPERATING BUDGET
(continued)Service Fund Name Fiscal 2021
BudgetFiscal 2022
BudgetChange in
Budget
Special Revenue 169,508 170,265 757SERVICE TOTAL 1,514,251 1,413,543 (100,708)
848 Police Community Relations General 691,685 728,486 36,801AGENCY TOTAL 2,957,396 2,841,196 (116,200)
Planning761 Development Oversight andProject Support
General 951,978 1,097,774 145,796
Special Grant 51,000 51,000 0SERVICE TOTAL 1,002,978 1,148,774 145,796
762 Historic Preservation General 713,462 637,911 (75,551)Federal 100,000 100,000 0State 100,000 100,000 0Special Revenue 50,000 0 (50,000)Special Grant 0 50,000 50,000SERVICE TOTAL 963,462 887,911 (75,551)
763 Comprehensive Planning andResource Management
General 2,165,567 2,299,347 133,780
Federal 150,000 150,000 0State 225,000 225,000 0Special Revenue 705,000 553,600 (151,400)Special Grant 0 75,000 75,000SERVICE TOTAL 3,245,567 3,302,947 57,380
765 Planning for a SustainableBaltimore
General 1,317,800 1,553,443 235,643
Federal 518,105 250,000 (268,105)State 542,748 510,200 (32,548)Special Revenue 75,000 482,046 407,046Special Grant 926,142 663,000 (263,142)SERVICE TOTAL 3,379,795 3,458,689 78,894
768 Administration Planning General 1,512,590 1,370,724 (141,866)AGENCY TOTAL 10,104,392 10,169,045 64,653
Police621 Administrative Bureau General 90,702,081 84,280,608 (6,421,473)
Federal 264,137 276,316 12,179State 495,750 852,250 356,500Special Revenue 5,807,032 6,048,498 241,466SERVICE TOTAL 97,269,000 91,457,672 (5,811,328)
622 Police Patrol General 222,983,670 225,563,431 2,579,761Federal 2,500,000 2,500,000 0State 4,281,488 4,189,589 (91,899)Special Revenue 1,469,485 1,400,140 (69,345)SERVICE TOTAL 231,234,643 233,653,160 2,418,517
623 Criminal Investigation Division General 55,152,054 53,525,250 (1,626,804)Federal 766,086 1,580,240 814,154State 4,371,226 4,005,463 (365,763)SERVICE TOTAL 60,289,366 59,110,953 (1,178,413)
626 Data Driven Strategies General 7,577,452 7,299,707 (277,745)Federal 0 4,447,967 4,447,967
215

OPERATING BUDGET Fiscal 2022 Summary of the Adopted Budget
(continued)Service Fund Name Fiscal 2021
BudgetFiscal 2022
BudgetChange in
Budget
State 978,872 1,175,833 196,961SERVICE TOTAL 8,556,324 12,923,507 4,367,183
628 Public Integrity Bureau General 9,160,770 12,517,320 3,356,550State 0 144,034 144,034SERVICE TOTAL 9,160,770 12,661,354 3,500,584
635 Recruitment Section General 18,342,060 33,790,603 15,448,543State 0 255,367 255,367SERVICE TOTAL 18,342,060 34,045,970 15,703,910
642 Crime Laboratory and EvidenceControl
General 22,141,935 21,992,312 (149,623)
Federal 530,702 430,409 (100,293)State 0 255,910 255,910SERVICE TOTAL 22,672,637 22,678,631 5,994
807 Compliance Bureau General 34,673,425 22,923,196 (11,750,229)Federal 25,460 25,893 433State 2,265,945 1,998,288 (267,657)SERVICE TOTAL 36,964,830 24,947,377 (12,017,453)
816 Special Operations Section General 23,713,500 40,281,473 16,567,973Federal 145,000 145,085 85SERVICE TOTAL 23,858,500 40,426,558 16,568,058
853 Patrol Support Services General 15,910,128 19,551,891 3,641,763Federal 605,750 576,912 (28,838)State 3,099,775 3,050,031 (49,744)SERVICE TOTAL 19,615,653 23,178,834 3,563,181AGENCY TOTAL 527,963,783 555,084,016 27,120,233
Public Works660 Administration Solid Waste General 2,304,687 2,262,856 (41,831)661 Public Right of Way Cleaning General 18,031,225 18,173,437 142,212
Stormwater Utility 4,152,328 4,824,640 672,312Federal 2,046,000 2,046,000 0Special Revenue 1,622,021 1,635,908 13,887SERVICE TOTAL 25,851,574 26,679,985 828,411
662 Vacant and AbandonedProperty Cleaning and Boarding
General 12,124,600 11,730,011 (394,589)
Federal 1,100,000 1,175,000 75,000SERVICE TOTAL 13,224,600 12,905,011 (319,589)
663 Waste Removal and Recycling General 32,216,421 35,662,755 3,446,334Federal 0 850,000 850,000State 0 500,000 500,000Special Revenue 204,600 1,650,000 1,445,400Special Grant 250,000 604,250 354,250SERVICE TOTAL 32,671,021 39,267,005 6,595,984
664 Waste Re Use and Disposal General 25,593,910 26,856,145 1,262,235Stormwater Utility 0 4,000,000 4,000,000SERVICE TOTAL 25,593,910 30,856,145 5,262,235
670 Administration Water andWastewater
WastewaterUtility
26,504,789 29,635,596 3,130,807
Water Utility 18,377,957 18,983,578 605,621Federal 0 300,000 300,000
216
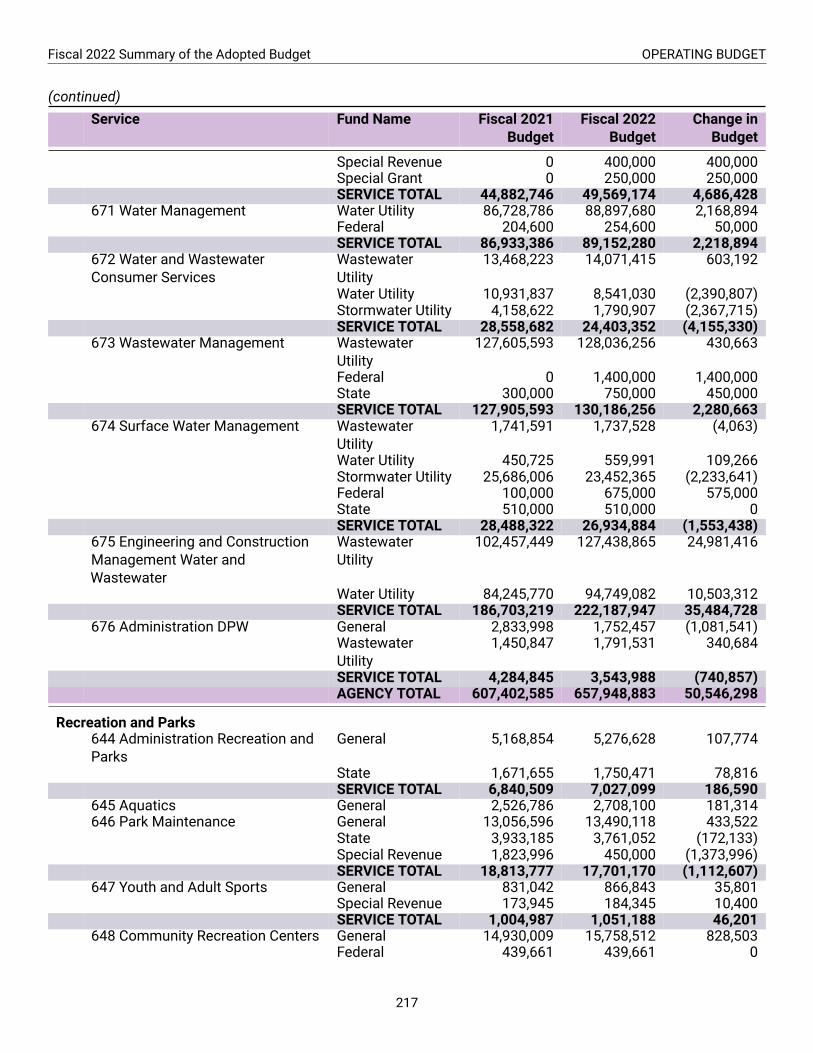
Fiscal 2022 Summary of the Adopted Budget OPERATING BUDGET
(continued)Service Fund Name Fiscal 2021
BudgetFiscal 2022
BudgetChange in
Budget
Special Revenue 0 400,000 400,000Special Grant 0 250,000 250,000SERVICE TOTAL 44,882,746 49,569,174 4,686,428
671 Water Management Water Utility 86,728,786 88,897,680 2,168,894Federal 204,600 254,600 50,000SERVICE TOTAL 86,933,386 89,152,280 2,218,894
672 Water and WastewaterConsumer Services
WastewaterUtility
13,468,223 14,071,415 603,192
Water Utility 10,931,837 8,541,030 (2,390,807)Stormwater Utility 4,158,622 1,790,907 (2,367,715)SERVICE TOTAL 28,558,682 24,403,352 (4,155,330)
673 Wastewater Management WastewaterUtility
127,605,593 128,036,256 430,663
Federal 0 1,400,000 1,400,000State 300,000 750,000 450,000SERVICE TOTAL 127,905,593 130,186,256 2,280,663
674 Surface Water Management WastewaterUtility
1,741,591 1,737,528 (4,063)
Water Utility 450,725 559,991 109,266Stormwater Utility 25,686,006 23,452,365 (2,233,641)Federal 100,000 675,000 575,000State 510,000 510,000 0SERVICE TOTAL 28,488,322 26,934,884 (1,553,438)
675 Engineering and ConstructionManagement Water andWastewater
WastewaterUtility
102,457,449 127,438,865 24,981,416
Water Utility 84,245,770 94,749,082 10,503,312SERVICE TOTAL 186,703,219 222,187,947 35,484,728
676 Administration DPW General 2,833,998 1,752,457 (1,081,541)WastewaterUtility
1,450,847 1,791,531 340,684
SERVICE TOTAL 4,284,845 3,543,988 (740,857)AGENCY TOTAL 607,402,585 657,948,883 50,546,298
Recreation and Parks644 Administration Recreation andParks
General 5,168,854 5,276,628 107,774
State 1,671,655 1,750,471 78,816SERVICE TOTAL 6,840,509 7,027,099 186,590
645 Aquatics General 2,526,786 2,708,100 181,314646 Park Maintenance General 13,056,596 13,490,118 433,522
State 3,933,185 3,761,052 (172,133)Special Revenue 1,823,996 450,000 (1,373,996)SERVICE TOTAL 18,813,777 17,701,170 (1,112,607)
647 Youth and Adult Sports General 831,042 866,843 35,801Special Revenue 173,945 184,345 10,400SERVICE TOTAL 1,004,987 1,051,188 46,201
648 Community Recreation Centers General 14,930,009 15,758,512 828,503Federal 439,661 439,661 0
217

OPERATING BUDGET Fiscal 2022 Summary of the Adopted Budget
(continued)Service Fund Name Fiscal 2021
BudgetFiscal 2022
BudgetChange in
Budget
Special Revenue 1,721,132 2,256,260 535,128Special Grant 300,000 300,000 0SERVICE TOTAL 17,390,802 18,754,433 1,363,631
649 Special Facilities ManagementRecreation
Special Revenue 3,124,192 3,262,955 138,763
650 Horticulture General 1,307,879 1,391,279 83,400Special Revenue 483,485 511,564 28,079SERVICE TOTAL 1,791,364 1,902,843 111,479
651 Recreation for Seniors General 477,710 493,760 16,050Special Revenue 38,500 38,500 0SERVICE TOTAL 516,210 532,260 16,050
652 Therapeutic Recreation General 489,992 513,371 23,379653 Park Programs and Events General 0 577,141 577,141
Special Revenue 1,121,889 1,182,198 60,309SERVICE TOTAL 1,121,889 1,759,339 637,450
654 Urban Forestry General 4,573,199 4,639,125 65,926AGENCY TOTAL 58,193,707 59,851,883 1,658,176
Sheriff881 Courthouse Security General 4,095,269 4,100,564 5,295882 Deputy Sheriff Enforcement General 10,770,075 10,784,661 14,586
State 50,000 50,000 0Special Revenue 239,980 1,750,000 1,510,020SERVICE TOTAL 11,060,055 12,584,661 1,524,606
883 Service of Protective andPeace Orders
General 2,284,288 2,312,054 27,766
884 District Court Sheriff Services General 2,692,305 2,777,035 84,730889 Child Support Enforcement General 1,752,886 1,769,708 16,822
Federal 1,100,000 1,100,000 0SERVICE TOTAL 2,852,886 2,869,708 16,822AGENCY TOTAL 22,984,803 24,644,022 1,659,219
State’s Attorney115 Prosecution of Criminals General 27,008,528 28,386,555 1,378,027
Federal 1,796,589 1,825,120 28,531State 6,917,188 7,118,639 201,451Special Revenue 320,216 325,660 5,444SERVICE TOTAL 36,042,521 37,655,974 1,613,453
781 Administration State’s Attorney General 7,634,737 8,074,813 440,076786 Victim and Witness Services General 1,866,465 1,940,214 73,749
Federal 2,601,351 2,711,564 110,213State 54,655 55,706 1,051SERVICE TOTAL 4,522,471 4,707,484 185,013AGENCY TOTAL 48,199,729 50,438,271 2,238,542
Transportation500 Street Lighting General 20,876,886 20,117,007 (759,879)548 Conduits Conduit
Enterprise13,487,197 13,019,924 (467,273)
681 Administration DOT General 9,749,799 10,074,127 324,328
218

Fiscal 2022 Summary of the Adopted Budget OPERATING BUDGET
(continued)Service Fund Name Fiscal 2021
BudgetFiscal 2022
BudgetChange in
Budget
Federal 560,962 0 (560,962)SERVICE TOTAL 10,310,761 10,074,127 (236,634)
682 Parking Management ParkingEnterprise
21,714,081 22,459,496 745,415
ParkingManagement
10,615,967 10,667,660 51,693
SERVICE TOTAL 32,330,048 33,127,156 797,108683 Street Management General 34,189,988 35,629,558 1,439,570684 Traffic Management General 11,054,645 10,881,532 (173,113)
Special Revenue 681,280 692,862 11,582SERVICE TOTAL 11,735,925 11,574,394 (161,531)
685 Special Events General 1,628,482 1,673,212 44,730687 Inner Harbor ServicesTransportation
General 1,301,508 1,072,834 (228,674)
688 Snow and Ice Control General 6,726,609 6,830,313 103,704689 Vehicle Impounding andDisposal
General 8,229,565 8,267,972 38,407
690 Sustainable Transportation General 4,514,539 958,092 (3,556,447)Federal 0 10,600 10,600State 3,071,326 8,292,343 5,221,017Special Revenue 5,749,637 5,943,139 193,502SERVICE TOTAL 13,335,502 15,204,174 1,868,672
691 Public Rights of WayLandscape Management
General 3,977,994 4,506,539 528,545
692 Bridge and CulvertManagement
General 3,707,953 3,838,316 130,363
693 Parking Enforcement ParkingManagement
16,425,940 13,196,460 (3,229,480)
694 Survey Control General 238,371 274,262 35,891695 Dock Master Special Revenue 158,017 162,956 4,939696 Street Cuts Management General 980,051 813,703 (166,348)697 Traffic Safety General 17,490,271 17,766,339 276,068
Federal 524,190 488,426 (35,764)Special Revenue 0 10,000 10,000SERVICE TOTAL 18,014,461 18,264,765 250,304
727 Real Property Management General 2,604,670 2,451,903 (152,767)AGENCY TOTAL 200,259,928 200,099,575 (160,353)
GRAND TOTALTOTAL OPERATING BUDGET 3,162,235,497 3,986,774,415 824,538,918LESS INTERNAL SERVICE 138,219,262 143,296,929 5,077,667
TOTAL OPERATINGAPPROPRIATONS
3,024,016,235 3,843,477,486 819,461,251
Table in dollars.
219

Comparison of Current and Prior Year Operating Budget
Summary by Fund
Fund Name Fiscal 2021Budget
Fiscal 2022Budget
Change inBudget
General 1,922,962,543 1,992,751,000 69,788,457Conduit Enterprise 13,497,197 13,029,924 (467,273)Wastewater Utility 273,303,492 302,786,191 29,482,699Water Utility 201,535,654 212,443,211 10,907,557Stormwater Utility 34,016,956 34,087,912 70,956Parking Enterprise 21,714,081 22,459,496 745,415Parking Management 27,046,907 26,908,079 (138,828)Federal 212,491,806 937,263,151 724,771,345State 145,928,843 164,840,575 18,911,732Special Revenue 166,166,176 131,742,175 (34,424,001)Special Grant 5,352,580 5,165,772 (186,808)Total 3,024,016,235 3,843,477,486 819,461,251
Table in dollars.
Internal Service Fund by Agency
Agency Name Fiscal 2021Budget
Fiscal 2022Budget
Change inBudget
Comptroller 11,673,784 14,479,233 2,805,449Finance 9,109,128 8,319,903 (789,225)General Services 94,265,509 96,175,829 1,910,320Human Resources 2,369,868 2,342,739 (27,129)Law 7,285,922 8,803,753 1,517,831M-R: Office of Information andTechnology
13,515,051 13,175,472 (339,579)
Total 138,219,262 143,296,929 5,077,667
Table in dollars.
220

Permanent Full-Time Positions
There are 13,747 full-time, permanent positions budgeted for Fiscal 2022. Of those positions, 9,403, or 68%, are supported by the General Fund.
For position information by agency and service, please refer to the Agency Detail publication.
14,021 14,006 13,984
13,447 13,275 13,29913,543 13,694 13,717 13,747
FY13 FY14 FY15 FY16 FY17 FY18 FY19 FY20 FY21 FY22
Dol
lars
By Fund
3,872 3,868 3,858 3,871 3,883 3,958 4,044 4,108 4,330 4,344
10,149 10,138 10,126 9,576 9,392 9,341 9,499 9,586 9,387 9,403
FY13 FY14 FY15 FY16 FY17 FY18 FY19 FY20 FY21 FY22
General Fund All Other Funds
# of
Per
man
ent F
ull-T
ime
Posi
tions
14,021 14,006 13,984 13,447 13,275 13,299 13,543 13,694 13,717 13,747
221

OPERATING BUDGET Fiscal 2022 Summary of the Adopted Budget
Fund Name Fiscal 2020 Actual Fiscal 2021Budget
Fiscal 2022Budget
PositionChange*
General 9,586 9,387 9,403 16Internal Service 461 452 440 -12Conduit Enterprise 119 120 120 0Wastewater Utility 872 899 890 -9Water Utility 940 950 949 -1Stormwater Utility 146 146 146 0Parking Management 154 154 164 10Federal 514 569 595 26State 408 480 477 -3Special Revenue 479 550 554 4Special Grant 15 10 9 -1Total 13,694 13,717 13,747 30* Change is calculated between Fiscal 2021 and Fiscal 2022
222
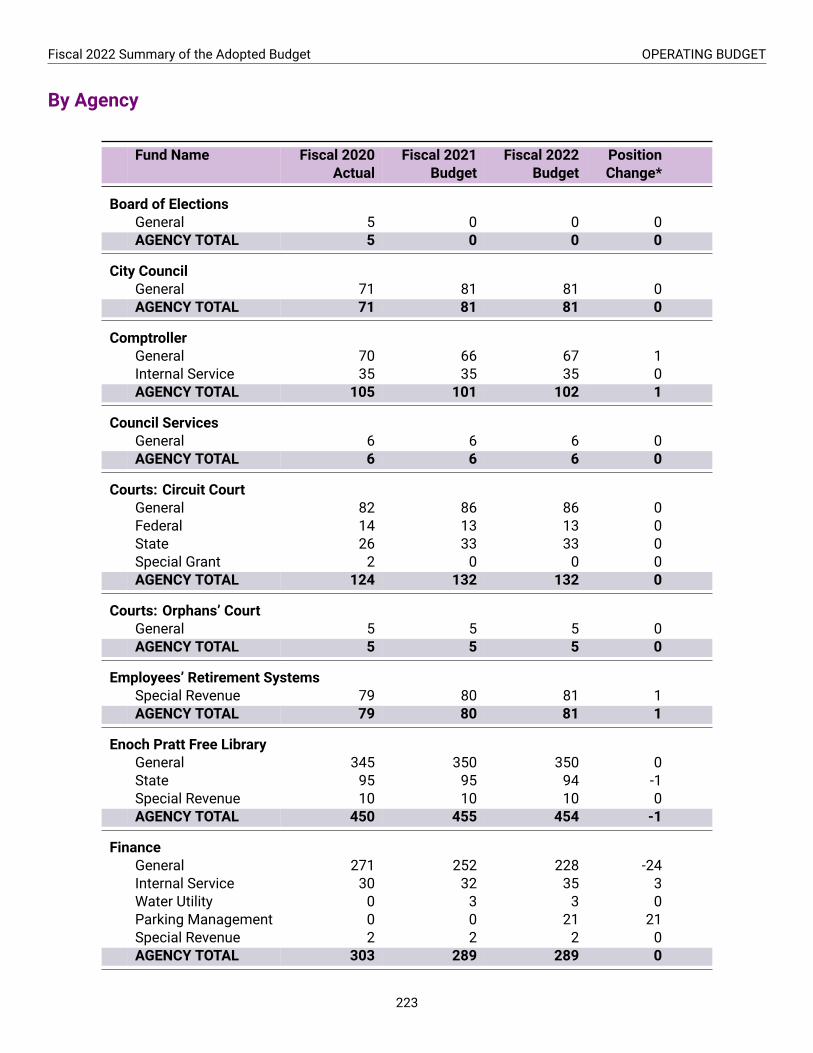
Fiscal 2022 Summary of the Adopted Budget OPERATING BUDGET
By Agency
Fund Name Fiscal 2020Actual
Fiscal 2021Budget
Fiscal 2022Budget
PositionChange*
Board of ElectionsGeneral 5 0 0 0AGENCY TOTAL 5 0 0 0
City CouncilGeneral 71 81 81 0AGENCY TOTAL 71 81 81 0
ComptrollerGeneral 70 66 67 1Internal Service 35 35 35 0AGENCY TOTAL 105 101 102 1
Council ServicesGeneral 6 6 6 0AGENCY TOTAL 6 6 6 0
Courts: Circuit CourtGeneral 82 86 86 0Federal 14 13 13 0State 26 33 33 0Special Grant 2 0 0 0AGENCY TOTAL 124 132 132 0
Courts: Orphans’ CourtGeneral 5 5 5 0AGENCY TOTAL 5 5 5 0
Employees’ Retirement SystemsSpecial Revenue 79 80 81 1AGENCY TOTAL 79 80 81 1
Enoch Pratt Free LibraryGeneral 345 350 350 0State 95 95 94 -1 Special Revenue 10 10 10 0AGENCY TOTAL 450 455 454 -1
FinanceGeneral 271 252 228 -24 Internal Service 30 32 35 3Water Utility 0 3 3 0Parking Management 0 0 21 21Special Revenue 2 2 2 0AGENCY TOTAL 303 289 289 0
223
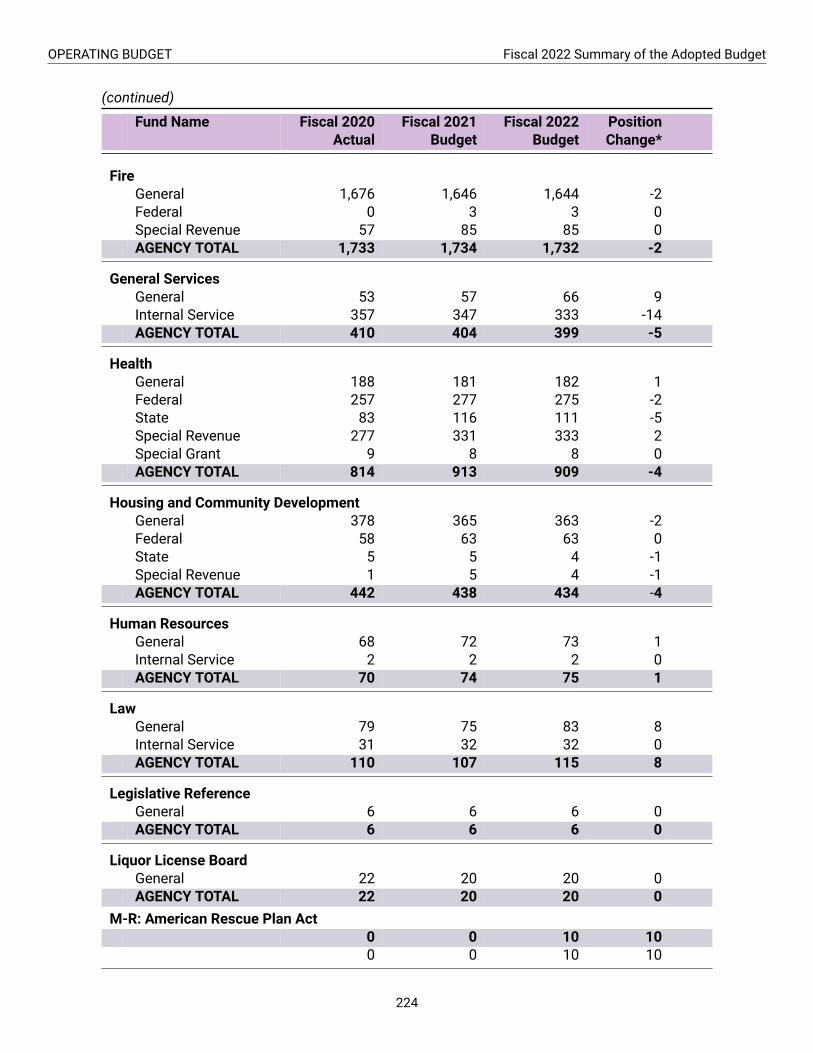
OPERATING BUDGET Fiscal 2022 Summary of the Adopted Budget
(continued)
Fund Name Fiscal 2020Actual
Fiscal 2021Budget
Fiscal 2022Budget
PositionChange*
FireGeneral 1,676 1,646 1,644 -2 Federal 0 3 3 0Special Revenue 57 85 85 0AGENCY TOTAL 1,733 1,734 1,732 -2
General ServicesGeneral 53 57 66 9Internal Service 357 347 333 -14 AGENCY TOTAL 410 404 399 -5
HealthGeneral 188 181 182 1Federal 257 277 275State 83 116 111
-2 -5
Special Revenue 277 331 333 2Special Grant 9 8 8 0AGENCY TOTAL 814 913 909 -4
Housing and Community DevelopmentGeneral 378 365 363 -2 Federal 58 63 63 0State 5 5 4 -1 Special Revenue 1 5 4AGENCY TOTAL 442 438 434
-1 -4
Human ResourcesGeneral 68 72 73 1Internal Service 2 2 2 0AGENCY TOTAL 70 74 75 1
LawGeneral 79 75 83 8Internal Service 31 32 32 0AGENCY TOTAL 110 107 115 8
Legislative ReferenceGeneral 6 6 6 0AGENCY TOTAL 6 6 6 0
Liquor License BoardGeneral 22 20 20 0AGENCY TOTAL 22 20 20 0
M-R: American Rescue Plan Act0 0 10 100 0 10 10
224

Fiscal 2022 Summary of the Adopted Budget OPERATING BUDGET
(continued)
Fund Name Fiscal 2020Actual
Fiscal 2021Budget
Fiscal 2022Budget
PositionChange*
M-R: Cable and CommunicationsGeneral 4 4 4 0AGENCY TOTAL 4 4 4 0
M-R: Convention ComplexGeneral 151 147 145 -2AGENCY TOTAL 151 147 145 -2
M-R: Environmental Control BoardGeneral 8 8 8 0AGENCY TOTAL 8 8 8 0
M-R: Office of Children and Family SuccessGeneral 8 21 23 2Water Utility 0 3 4 1Federal 18 17 18 1State 85 88 88 0AGENCY TOTAL 111 129 133 4
M-R: Office of Employment DevelopmentGeneral 45 45 45 0Federal 110 113 112 -1State 6 6 6 0Special Revenue 7 7 8 1AGENCY TOTAL 168 171 171 0
M-R: Office of Homeless ServicesGeneral 18 16 16 0Federal 15 31 38 7State 0 0 1 1Special Revenue 18 3 3 0AGENCY TOTAL 51 50 58 8
M-R: Office of Information and TechnologyGeneral 144 142 156 14Internal Service 6 4 3 -1AGENCY TOTAL 150 146 159 13
M-R: Office of Neighborhood Safety and EngagementGeneral 14 15 15 0Federal 4 2 2 0AGENCY TOTAL 18 17 17 0
M-R: Office of the Inspector GeneralGeneral 13 15 18 3AGENCY TOTAL 13 15 18 3
225

OPERATING BUDGET Fiscal 2022 Summary of the Adopted Budget
(continued)
Fund Name Fiscal 2020Actual
Fiscal 2021Budget
Fiscal 2022Budget
PositionChange*
M-R: Office of the Labor CommissionerGeneral 6 6 6 0AGENCY TOTAL 6 6 6 0
MayoraltyGeneral 83 74 76 2Special Revenue 1 0 0 0Special Grant 4 2 1 -1AGENCY TOTAL 88 76 77 1
Municipal and Zoning AppealsGeneral 10 4 4 0AGENCY TOTAL 10 4 4 0
Office of Equity and Civil RightsGeneral 21 23 22AGENCY TOTAL 21 23 22
-1-1
PlanningGeneral 57 48 48 0Special Revenue 0 0 1 1AGENCY TOTAL 57 48 49 1
PoliceGeneral 3,158 3,100 3,091 -9Federal 13 13 24 11State 60 71 73 2Special Revenue 10 9 9 0AGENCY TOTAL 3,241 3,193 3,197 4
Public WorksGeneral 753 713 729 16Wastewater Utility 872 899 890 -9Water Utility 940 944 942 -2Stormwater Utility 146 146 146 0Special Revenue 3 3 3 0AGENCY TOTAL 2,714 2,705 2,710 5
Recreation and ParksGeneral 300 341 348 7State 2 18 19 1Special Revenue 12 13 13 0AGENCY TOTAL 314 372 380 8
SheriffGeneral 218 213 212 -1AGENCY TOTAL 218 213 212 -1
226

Fiscal 2022 Summary of the Adopted Budget OPERATING BUDGET
(continued)
Fund Name Fiscal 2020Actual
Fiscal 2021Budget
Fiscal 2022Budget
PositionChange*
State’s AttorneyGeneral 326 319 319 0Federal 22 34 34 0State 45 47 47 0AGENCY TOTAL 393 400 400 0
TransportationGeneral 924 865 858 -7Conduit Enterprise 119 120 120 0Parking Management 154 154 143 -11Federal 3 3 3 0State 1 1 1 0Special Revenue 2 2 2 0AGENCY TOTAL 1,203 1,145 1,127 -18
TOTAL13,694 13,717 13,747 30
* Change is calculated between Fiscal 2021 and Fiscal 2022
227

Intentionally left blank.

Capital Budget
FISCAL2022
SUMMARY OF THEADOPTED BUDGET
Capital Budget

Intentionally left blank.

Overview of Capital Budget
Total Capital Budget: 487.6 million
Where the Money Comes From
Revenue Bonds 199.5M (40.9%)
Other 81.2M (16.7%)
General Obligation Bonds 80.0M (16.4%)
State 52.2M (10.7%)
Federal 39.7M (8.1%)General 15.0M (3.1%)
County Transportation Bonds 15.0M (3.1%)Conduit Enterprise 5.0M (1.0%)
How the Money is Used
Public Works 284.2M (58.3%)
Transportation 69.7M (14.3%)
Community Development 45.4M (9.3%)
Recreation 32.2M (6.6%)
Education 20.2M (4.1%)
Economic Development 18.8M (3.9%)
Administration 17.0M (3.5%)
Totals may not equal 100% due to rounding. Charts in millions.
231

CAPITAL BUDGET Fiscal 2022 Summary of the Adopted Budget
The Fiscal 2022 capital budget is $487.57 million, a decrease of $335,640,000 or 40.8% from Fiscal 2021. Thecapital budget can fluctuate considerably from year to year due to project schedules, the timing of borrowing,and the availability of grant funding. Per Board of Estimates policy, a capital project is a physical betterment orimprovement costing more than $50,000 and any preliminary studies relative to that project. It does not includeprojects that cost less than $50,000, vehicular equipment, repairs and maintenance costing less than $100,000,and salaries for positions that are not part of the cost of the project. The chart below shows capital expendituresfor the last few fiscal years.
FY16 FY17 FY18 FY19 FY20 FY21 FY22
Other Loans and Bonds Grant and Special Funds Pay-As-You-Go
Dol
lars
666.9M
524.0M
1.1B
680.9M627.5M
823.2M
487.6M
Capital Funds FY19 Budget FY20 Budget FY21 Budget FY22 Budget
Pay-As-You-GoGeneral 25.2 50.0 0.5 15.0
Conduit Enterprise 20.0 23.0 23.0 5.0Wastewater Utility 8.1 16.4 0.0 0.0
Water Utility 9.1 19.6 0.0 0.0Stormwater Utility 4.7 2.3 1.7 0.0
Grant and Special FundsFederal 66.3 75.2 40.0 39.7
State 79.9 26.2 8.6 52.2
Loans and BondsGeneral Oblig. Bonds 65.0 80.0 80.0 80.0
Revenue Bonds 244.1 223.6 451.5 199.5County Trans. Bonds 15.0 26.0 15.0 15.0
OtherOther 143.5 85.2 202.8 81.2
Table in millions of dollars.
232

Fiscal 2022 Summary of the Adopted Budget CAPITAL BUDGET
Capital Budget Process
The capital budget process operates on the same timeline as the operating budget process, but is completedas part of a six-year Capital Improvement Plan (CIP), which the Planning Commission submits to the Board ofEstimates. The budget process begins in late September as the Department of Planning works with participat-ing agencies to solicit project requests, prioritize projects for funding, and prepare the six-year CIP. The majorcapital budget agencies are the Departments of Information Technology, General Services, Recreation and Parks,Transportation, Public Works, Housing and Community Development, as well as the Baltimore Development Cor-poration and City School System. Once the Planning Commission approves the six-year CIP, it moves on to theBoard of Finance and then the Board of Estimates for their review and approval. Once approved, the first year ofthe CIP is submitted to City Council as part of the Ordinance of Estimates. Finally, the Ordinance of Estimates isformally adopted by the City Council and signed by the Mayor.
In Fiscal 2022, themajor capital budget agencies, Mayor’s Office of Equity and Civil Rights, Department of Finance,and City Council President’s Office participated in a CIP Oversight Committee, to review and assess capital projectrequests. The Committee evaluated proposals based on the following criteria:
• Equity• Health and safety• Condition of assets• State or federal mandate• Return on investment• Environmental impact• Collaboration and alignment of projects• Quality of life• Alignment with Citywide plans, such as Framework for Community Development and INSPIRE
Department of Planning staff considered these assessments and made a recommendation to the Planning Com-mission for the six-year CIP.
Funding Considerations
Funding for capital programs comes from either current revenues (referred to as “Pay-As-You-Go” or “PAYGO”) orfrom borrowed funds (referred to as “Loans and Bonds”). Loan and bond fund amounts are constrained by theneed to ensure that future repayment of debt service can be made from the City’s operating budget. Discretionarysources are limited to General Obligation (GO) bonds and PAYGO capital. The City follows the requirements of theGO bond authorization, which specifies how that source can be spent. The City alsomust ensure that outstandingdebt meets reasonable benchmarks and does not put an undue financial burden on future generations. Every fiveyears, the City partners with an external expert to evaluate the City’s debt burden and make recommendations onappropriate annual borrowing levels.
As in many older cities, Baltimore’s aging infrastructure often leads to higher costs for the City, either throughemergency repairs, maintenance needs, or energy inefficiency. In addition, many City assets and buildings werebuilt decades ago and might not best meet current City needs. Therefore, capital budget planning requires theCity to prioritize limited resources in upgrading and maintaining City structures and infrastructure. The City mustbalance these infrastructure needs with community and economic development activities.
233

CAPITAL BUDGET Fiscal 2022 Summary of the Adopted Budget
Community Engagement
There are several ways residents and other stakeholders can get involved in the capital budget process. Theprocess to develop the CIP starts with agencies, so one of the best ways to get involved is to engage directlywith agencies. This can be done through planning processes, neighborhood liaison officers, or using the 311system. Besides working directly with agencies, the Planning Commission has several public hearings on thecapital budget throughout the year, including CIP information sessions, presentations fromagencies, and hearingsto vote on the six-year CIP.
Capital Projects Impact on Operating Budget
Policy
In Fiscal 2004, the capital budget was redesigned to incorporate a set of mandatory operating budget impactfields. Agencies must identify and project reasonably quantifiable revenue and expenditure impacts of capitalprojects on the operating budget following completion.
Fiscal 2022 Operating Impact of Capital Projects
Most of Baltimore City’s capital program focuses on capital infrastructure maintenance and replacement. Newfacility projects or expansions with operating impacts are limited. For Fiscal 2022, agencies did not report anycapital projects that will have a significant impact on the operating budget.
The City pays debt service, the interest and principal costs on the bonds issued by the City to build capital projects,through the operating budget.
234

Capital Budget Fund Sources
Capital Funds Fiscal 2020Budget
Fiscal 2021Budget
Fiscal 2022Budget
DollarChange*
PercentChange*
Pay-As-You-GoGeneral 50,000,000 500,000 15,000,000 14,500,000 2 900.0%Conduit Enterprise 23,000,000 23,000,000 5,000,000 (18,000,000) -78.3%Wastewater Utility 16,388,000 0 0 0Water Utility 19,578,000 0 0 0Stormwater Utility 2,275,000 1,750,000 0 (1,750,000) -100.0%
Grant and Special FundsFederal 75,191,000 39,967,000 39,668,000 (299,000) -0.7%State 26,235,000 8,630,000 52,152,000 43,522,000 504.3%
Loans and BondsGeneral Oblig. Bonds 80,000,000 80,000,000 80,000,000 0 0.0%Revenue Bonds 223,623,000 451,538,000 199,518,000 (252,020,000) -55.8%County Trans. Bonds 26,018,000 15,000,000 15,000,000 0 0.0%
OtherOther 85,156,000 202,827,000 81,234,000 (121,593,000) -59.9%
GRAND TOTALGRAND TOTAL 627,464,000 823,212,000 487,572,000 (335,640,000) -40.8%
* Change is calculated between Fiscal 2021 and Fiscal 2022
Table in dollars.
General Fund Backed Sources
The City’s General Fund typically supports several fund sources in the capital budget, including capital GeneralFunds (PAYGO capital), General Obligation Bonds (debt), General Funds - Highway User Revenues (PAYGO capitaldedicated to transportation), and County Transportation Revenue Bonds (debt dedicated to transportation).
General Funds and Highway User Revenue
A portion of the City’s General Fund revenue is dedicated to capital improvements. Using recurring General Fundsfor PAYGO is considered to be good fiscal practice, as it reduces the City’s debt burden. General funds (PAYGO)are one of themost flexible revenue sources available to the City, and can be used for priority projects for which noother fund source is available. In addition, the City dedicates a portion of its annual State Highway User Revenue(HUR) allocation to capital improvements. HUR is collected by the State and allocated to jurisdictions for certaineligible uses, such as transportation projects. The Fiscal 2022 budget includes $15 million in General Fundsand HUR for capital projects for Baltimore City Information Technology (BCIT), the Department of Transportation(DOT), the and Department of Housing and Community Development (DHCD). This is an increase of $14.5 million
235

CAPITAL BUDGET Fiscal 2022 Summary of the Adopted Budget
from Fiscal 2021, when the revenue shortfall due to the COVID-19 pandemic resulted in only $500,000 in PAYGOfunding available for capital projects.
General Obligation Bonds
In 2020, voters authorized $80million in General Obligation bonds per year for Fiscal 2022 and 2023. General Obli-gation bonds must be used for affordable housing, schools, public infrastructure, and community and economicdevelopment in accordance with the loan authorization approved by voters. The debt service to repay the bondsis paid from the City’s future General Fund revenue.
MDOT County Transportation Revenue Bonds
Following the dramatic loss of HUR funds in 2010, the City has partnered with the Maryland Department of Trans-portation since 2014 to issue $15 million annually in MDOT County Transportation Revenue Bonds to be repaidwith future General Fund Highway User Revenue. These funds must be used on eligible projects, such as trans-portation projects.
Federal and State Funds
The Fiscal 2022 budget includes approximately $40 million in federal Funds and $52million in State Funds. Someagencies routinely have access to federal and State Funds, while other agencies must rely on local fund sources.Below are some examples of federal and State Funds:
• DOT typically receives $30 million per year in federal Highway Transportation funds. The City must providea 20% match for eligible projects such as bridges.
• Baltimore City Recreation and Parks typically receives $6 to $7million per year in ProgramOpen Space fundsfrom the State. Some of these funds require a 25% match from the City. In FY22, Recreation and Parksreceived an additional allocation of $13 million from the State, above what is normally allocated throughProgram Open Space.
• DHCD receives federal Community Development Block Grant (CDBG) funds to be used for capital projectsthat serve low and moderate income residents.
Utility Funds
The Water, Wastewater, and Stormwater programs within the Department of Public Works are fully funded withenterprise revenue, which include the fees paid for water, sewer, and stormwater services. Capital projects withinthese programs are paid for by a combination of current utility fund revenue, debt that will be repaid by futureutility funds like revenue bonds and State or federal loans, and other sources such as County grants. The Fiscal2022 funding for the utility programs totals $274.4 million.
236

Fiscal 2022 Summary of the Adopted Budget CAPITAL BUDGET
Six-Year Capital Plan
Fund Name FY22 FY23 FY24 FY25 FY26 FY27
Pay-As-You-GoGeneral 15,000,000 15,000,000 15,000,000 15,000,000 15,000,000 15,000,000Conduit Enterprise 5,000,000 36,000,000 36,000,000 36,000,000 36,000,000 36,000,000
Grant and Special FundsFederal 39,668,000 51,329,000 42,247,000 42,215,000 40,950,000 40,950,000State 52,152,000 16,800,000 11,500,000 9,000,000 8,500,000 7,500,000
Loans and BondsGen. Oblig. Bonds 80,000,000 80,000,000 80,000,000 80,000,000 80,000,000 80,000,000Revenue Bonds 199,518,000 471,581,000 298,645,000 88,913,000 293,850,000 205,676,000County Trans. Bonds 15,000,000 15,000,000 15,000,000 15,000,000 15,000,000 15,000,000
OtherOther 81,234,000 276,030,000 34,687,000 66,003,000 75,292,000 57,059,000
GRAND TOTALGRAND TOTAL 487,572,000 961,740,000 533,079,000 352,131,000 564,592,000 457,185,000
Table in dollars.
237

Intentionally left blank.

Appendix
FISCAL2022
SUMMARY OF THEADOPTED BUDGET
Appendix

Intentionally left blank.
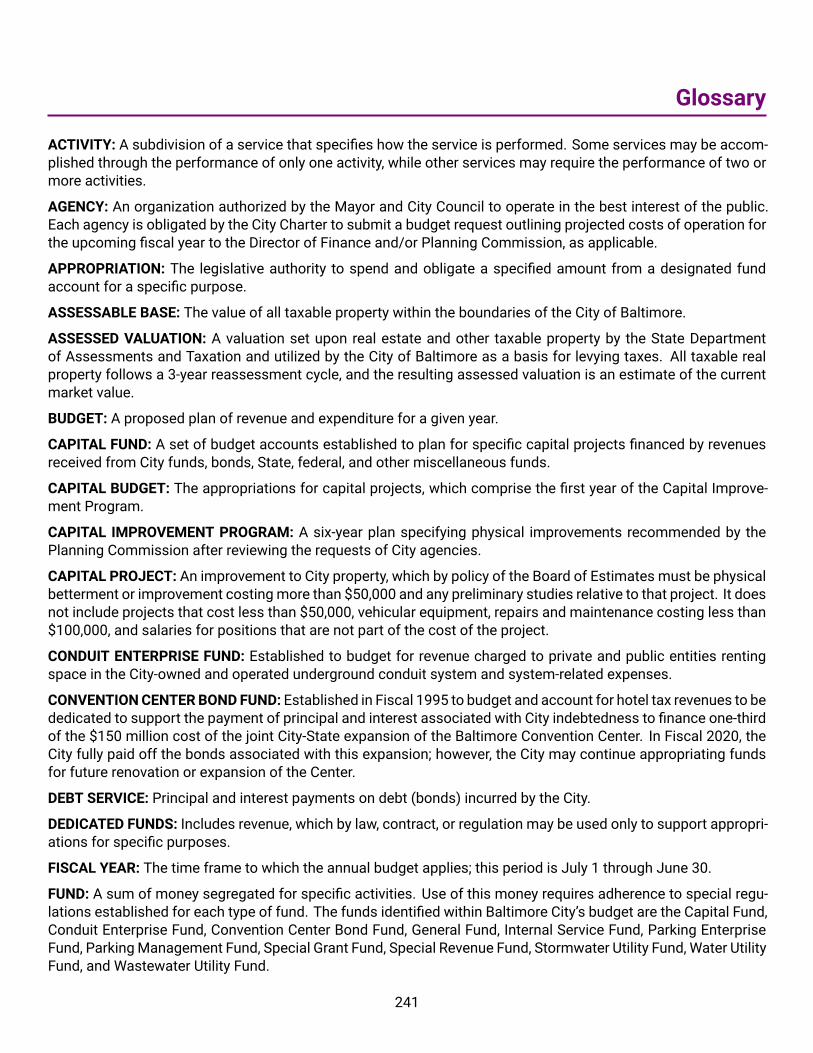
Glossary
ACTIVITY: A subdivision of a service that specifies how the service is performed. Some services may be accom-plished through the performance of only one activity, while other services may require the performance of two ormore activities.
AGENCY: An organization authorized by the Mayor and City Council to operate in the best interest of the public.Each agency is obligated by the City Charter to submit a budget request outlining projected costs of operation forthe upcoming fiscal year to the Director of Finance and/or Planning Commission, as applicable.
APPROPRIATION: The legislative authority to spend and obligate a specified amount from a designated fundaccount for a specific purpose.
ASSESSABLE BASE: The value of all taxable property within the boundaries of the City of Baltimore.
ASSESSED VALUATION: A valuation set upon real estate and other taxable property by the State Departmentof Assessments and Taxation and utilized by the City of Baltimore as a basis for levying taxes. All taxable realproperty follows a 3-year reassessment cycle, and the resulting assessed valuation is an estimate of the currentmarket value.
BUDGET: A proposed plan of revenue and expenditure for a given year.
CAPITAL FUND: A set of budget accounts established to plan for specific capital projects financed by revenuesreceived from City funds, bonds, State, federal, and other miscellaneous funds.
CAPITAL BUDGET: The appropriations for capital projects, which comprise the first year of the Capital Improve-ment Program.
CAPITAL IMPROVEMENT PROGRAM: A six-year plan specifying physical improvements recommended by thePlanning Commission after reviewing the requests of City agencies.
CAPITAL PROJECT: An improvement to City property, which by policy of the Board of Estimates must be physicalbetterment or improvement costingmore than $50,000 and any preliminary studies relative to that project. It doesnot include projects that cost less than $50,000, vehicular equipment, repairs and maintenance costing less than$100,000, and salaries for positions that are not part of the cost of the project.
CONDUIT ENTERPRISE FUND: Established to budget for revenue charged to private and public entities rentingspace in the City-owned and operated underground conduit system and system-related expenses.
CONVENTIONCENTERBOND FUND: Established in Fiscal 1995 to budget and account for hotel tax revenues to bededicated to support the payment of principal and interest associated with City indebtedness to finance one‐thirdof the $150 million cost of the joint City‐State expansion of the Baltimore Convention Center. In Fiscal 2020, theCity fully paid off the bonds associated with this expansion; however, the City may continue appropriating fundsfor future renovation or expansion of the Center.
DEBT SERVICE: Principal and interest payments on debt (bonds) incurred by the City.
DEDICATED FUNDS: Includes revenue, which by law, contract, or regulation may be used only to support appropri-ations for specific purposes.
FISCAL YEAR: The time frame to which the annual budget applies; this period is July 1 through June 30.
FUND: A sum of money segregated for specific activities. Use of this money requires adherence to special regu-lations established for each type of fund. The funds identified within Baltimore City’s budget are the Capital Fund,Conduit Enterprise Fund, Convention Center Bond Fund, General Fund, Internal Service Fund, Parking EnterpriseFund, ParkingManagement Fund, Special Grant Fund, Special Revenue Fund, Stormwater Utility Fund, Water UtilityFund, and Wastewater Utility Fund.
241

APPENDIX Fiscal 2022 Summary of the Adopted Budget
FUND BALANCE: A fund balance is the accumulated difference between actual revenues and expenditures overtime in each fund.
FUNDING SOURCE: Income/revenue received which supports an appropriation.
GENERAL FUND:Acentral fund intowhichmost of theCity’s tax and unrestricted revenues are budgeted to supportbasic City operations and pay-as-you-go (PAYGO) capital projects.
GENERAL OBLIGATION BOND: A municipal bond backed by the full faith and credit of the jurisdiction. Everytwo years, the City of Baltimore must get permission from voters through a ballot referendum to issue GeneralObligationBonds (GOBonds). GObonds are borrowed funds that are used for capital projects, including affordablehousing, schools, public infrastructure, and community and economic development. The debt service to repay thebonds is paid from the City’s future General Fund revenue.
GRANT: A contribution made from either the private sector to the City or by one governmental unit to another unit.The contribution is usually made to support a specified service, function, or project.
INDICATOR: A measure that represents a quality of life improvement that the City tracks and is ultimately aimingto improve. The City has 17 measurable Indicators organized within each of the Priority Outcomes that reflectmany of the City’s greatest challenges.
INTERNAL SERVICE FUND: Established to budget for the financing of goods and/or services provided by certainCity agencies to other City agencies or programs on a cost reimbursement basis.
LOAN AND GUARANTEE ENTERPRISE FUND: Established to budget for the self-supporting program of loans andguarantees administered by theDepartment of Finance pursuant to policies and procedures approved by the Boardof Estimates. Closed in Fiscal 2018 and transferred into General Fund in Fiscal 2019.
OBJECT OF EXPENDITURE: A group of similar services, commodities, equipment, or personnel costs used toclarify spending within the budget. Objects of expenditure identified within Baltimore City’s budget are:
• Salaries: Payment to personnel for services rendered to the City including overtime, shift differential, sickleave conversion, full-time, part-time, and contractual personnel costs.
• Other Personnel Costs: Payment for benefits provided to City personnel including City contributions forSocial Security, retirement, health plans, and prescription drug costs.
• Contractual Services: Payment for services rendered to the City under contractual arrangements, such asrents and telephone service.
• Materials and Supplies: Payment for consumable materials and supplies, such as custodial supplies andheating fuel.
• Equipment: Payment for replacement or procurement of City property other than real property.• Grants, Subsidies and Contributions: Payment in support of various non-profit or private sector activities,which will provide health, welfare, educational, cultural, and/or promotional benefits to residents of Balti-more.
• Debt Service: Payments for interest and principal of bonds issued by or on behalf of the City.• Capital Improvements: Payment for the acquisition of real property or improvements made to existing Cityproperty.
OPERATING BUDGET: A plan, approved by the Mayor and City Council, for appropriating funds to agencies for op-erating costs during the fiscal year. This plan establishes legal expenditure limits and will reflect appropriationsbudgeted according to services, sources of funding, and costs of service operation other than capital improve-ments over $50,000; items of repair, maintenance or emergency nature over $100,000; or Bureau of Water andWastewater items of repair, maintenance, or emergency nature over $250,000.
242

Fiscal 2022 Summary of the Adopted Budget APPENDIX
ORDINANCE OF ESTIMATES: A bill enacted by the City Council, and approved by the Mayor, which gives legaleffect to the appropriations included in the annual budget.
OTHER POST EMPLOYMENTBENEFITS (OPEB): The Government Accounting Standards Board (GASB)mandatesthat OPEB be recorded as accrued liabilities in the annual financial statements of governmental entities. Annualcontribution to a Post-Employment Benefits Trust Fund is required.
OUTCOME BUDGETING: A budget process that aligns resources with results that matter most to residents. It’s abudgeting tool that integrates strategic planning, long-range financial planning, and performance management.
OVERTIME: Payments to employees eligible for additional compensation for services rendered after a regularlyscheduled work period subject to negotiated labor contracts and the federal Fair Labor Standards Act.
PARKING ENTERPRISE FUND: Established to budget for operating and debt service expenses for City financedgarages substantially supported by revenues derived from operation of these garages.
PARKING MANAGEMENT FUND: Established to budget for the administration of the City’s parking garages andlots, parking enforcement activities, and operation of garages and lots financed with General Obligation Bonds.
PAY-AS-YOU-GO (PAYGO): Capital projects funded from current year General Fund revenues.
PERFORMANCEMEASURES: Specific performancemetrics that show the results or public benefits of the servicesprovided. The benefits can be in the form of an amount of products or services provided (outputs); reflect the costper unit of output or outcome (efficiency); gauge howwell a servicemeets customer expectations (effectiveness);or changes in attitudes, behaviors, knowledge, skills, and conditions as a result of the service (outcome).
POSITIONS: Represents those permanent full and part-time jobs that have a job number assigned.
• Permanent Full-Time: Payments to an employee filling a permanent full-time budgeted position for servicesrendered on a continuing basis.
• Permanent Part-Time: Payments to an employee who works less than a full-time schedule.
PRIORITY OUTCOMES: Goals established by the Mayor for improving the quality of life for Baltimore’s residents.The current Priority Outcomes are:
• Prioritizing Our Youth• Building Public Safety• Clean and Healthy Communities• Equitable Neighborhood Development• Responsible Stewardship of City Resources
REVENUE: Income generated by taxes, fines, penalties, notes, bonds, investment income, property rental, usercharges, federal grants, State grants, private grants, county grants, and miscellaneous services.
SERVICE: Replaces program in the budget structure. An activity or set of activities performed by an agency thathas: identifiable costs for budgeting purposes; a clear public purpose andmeasurable objectives; and clear lines ofaccountability for its performance and fiscalmanagement. Services are themeans to achieving desired outcomesfor City residents. Each Service has a unique three-digit numeric code used to identify services within an agency.
SEVERANCE PAY: Payments to permanent full-time and part-time employees due to them for accumulated leavebalances, including vacation, personal, sick, etc., pursuant to provisions of negotiated labor agreements.
SPECIAL FUNDS: Established to budget for revenues derived from certain State, federal, and private governmentalgrants, as well as other revenue sources that are restricted to expenditures for specific purposes.
243

APPENDIX Fiscal 2022 Summary of the Adopted Budget
STIPENDS: Payments to participants in certain grant-funded programs for a specific purpose.
STORMWATERUTILITY FUND: Established to budget for the operating and capital expenses of the City’s stormwa-ter management system.
SUB-OBJECT OF EXPENDITURE: A subdivision of an object of expenditure in which groups of similar services orrelated articles are further delineated into more specific types of expenditures.
SUPPLEMENTARY APPROPRIATIONS: Additional spending authority provided by the City Council and approvedby theMayor derived from revenues from any source, other than the full rate property tax and other taxes, imposedin excess of or in addition to those relied upon by the Board of Estimates in determining the tax levy required tobalance the annual Ordinance of Estimates. These appropriations include grants from private or governmentalsources that could not be expected with reasonable certainty at the time of the formulation of the proposedOrdinance of Estimates, additional appropriations for services included in the annual budget made necessary bya material change in circumstances, or new services which could not be reasonably anticipated at the time offormulation of the Ordinance of Estimates.
All such appropriations must be embodied in a separate ordinance limited to a single service, purpose, activity, orproject and provide the revenue necessary to support the appropriation.
TARGET: Targets are the annual numerical benchmarks an agency aims to achieve for a performance measure.
TRANSFERS: Charges or expenditure reimbursements used as follows:
• To reimburse a program for costs which are charged as overhead to special grants.• To transfer expenditures between funds in order to adjust the amounts derived from various sources for amulti-funded program rather than split each object and sub-object of expenditure.
• To reimburse a program for services rendered where the reimbursement is calculated on a fee basis ratherthan for specific expenditures.
WASTEWATER UTILITY FUND: Established to budget for the operating and capital expenses of the City’s sewagefacilities.
WATER UTILITY FUND: Established to budget for the operating and capital expenses of the City’s water supplysystem.
244

EXPLANATION: CAPITALS indicate matter added to existing law. [Brackets] indicate matter deleted from existing law. Underlining indicates matter added to the bill by amendment. Strike out indicates matter stricken from the bill by amendment or deleted from existing law by amendment.
CITY OF BALTIMORE
ORDINANCE
Council Bill 21-0080
Introduced by: The Council PresidentAt the request of: The Administration (Department of Finance)Introduced and read first time: May 17, 2021Assigned to: Ways and Means CommitteeCommittee Report: FavorableCouncil action: Adopted Read second time: June 8, 2021
AN ORDINANCE CONCERNING
1 Ordinance of Estimates for the Fiscal Year Ending June 30, 2022
2 FOR the purpose of providing the appropriations estimated to be needed by each agency of the3 City of Baltimore for operating programs and capital projects during the Fiscal 2022 year.
4 BY authority of5 Article IV - Board of Estimates6 Section 3 et seq.7 Baltimore City Charter8 (1996 Edition)
9 SECTION 1. BE IT ORDAINED BY THE MAYOR AND CITY COUNCIL OF BALTIMORE, That the10 following amounts or so much thereof as shall be sufficient are hereby appropriated subject to the11 provisions hereinafter set forth for the purpose of carrying out the programs included in the12 operating budget and the projects listed in the capital budget from the amounts estimated to be13 available in the designated funds during the fiscal year ending June 30, 2022.
14 A. Operating Budget
15 Board of Elections 16 899 Fair Conduct of Elections 17 General Fund Appropriation $7,095,321
18 City Council 19 100 City Council 20 General Fund Appropriation $8,593,872
21 Comptroller 22 130 Executive Direction and Control - Comptroller 23 General Fund Appropriation $1,881,101
dlr21-0498(4)~3rd/08Jun21OrdEstFY22/21-0080~3rd Reader/Finance:DLR:td:td
Ordinance of Estimates
245

Council Bill 21-0080
1 131 Audits 2 General Fund Appropriation $4,977,617
3 132 Real Estate Acquisition and Management 4 General Fund Appropriation $1,007,758
5 Council Services 6 103 Council Services 7 General Fund Appropriation $798,867
8 Courts: Circuit Court 9 110 Circuit Court
10 Federal Fund Appropriation $2,388,927 11 General Fund Appropriation $17,667,259 12 State Fund Appropriation $6,561,627
13 Courts: Orphans’ Court 14 817 Orphans' Court 15 General Fund Appropriation $694,393
16 Employees’ Retirement Systems 17 152 Employees' Retirement System - Administration 18 Special Revenue Fund Appropriation $5,859,075
19 154 Fire and Police Retirement System - Administration 20 Special Revenue Fund Appropriation $5,854,594
21 155 Retirement Savings Plan 22 Special Revenue Fund Appropriation $848,728
23 Enoch Pratt Free Library 24 788 Information Services 25 General Fund Appropriation $28,481,175 26 Special Revenue Fund Appropriation $1,041,700 27 State Fund Appropriation $14,184,508
28 Finance 29 148 Revenue Collection 30 General Fund Appropriation $8,247,297 31 Parking Management Fund Appropriation $3,038,959 32 Water Utility Fund Appropriation $238,913
33 150 Treasury and Debt Management 34 General Fund Appropriation $1,277,407
35 698 Administration - Finance 36 General Fund Appropriation $2,036,766
37 699 Procurement 38 General Fund Appropriation $4,182,739
dlr21-0498(4)~3rd/08Jun21OrdEstFY22/21-0080~3rd Reader/Finance:DLR:td:td - 2 -
APPENDIX Fiscal 2022 Summary of the Adopted Budget
246

Council Bill 21-0080
1 700 Surplus Property Disposal 2 Special Revenue Fund Appropriation $161,349
3 702 Accounts Payable 4 General Fund Appropriation $910,666
5 703 Payroll 6 General Fund Appropriation $3,758,870
7 704 Accounting 8 General Fund Appropriation $3,058,262
9 708 Operating Budget Management 10 General Fund Appropriation $2,133,175
11 710 Fiscal Integrity and Recovery 12 General Fund Appropriation $1,192,794
13 711 Finance Project Management 14 General Fund Appropriation $1,403,877
15 Fire 16 600 Administration - Fire 17 Federal Fund Appropriation $1,600,000 18 General Fund Appropriation $10,135,951 19 State Fund Appropriation $350,000
20 602 Fire Suppression and Emergency Rescue 21 Federal Fund Appropriation $1,026,850 22 General Fund Appropriation $171,709,992 23 State Fund Appropriation $1,420,686
24 608 Emergency Management 25 Federal Fund Appropriation $5,480,263 26 General Fund Appropriation $1,055,116 27 State Fund Appropriation $267,000
28 609 Emergency Medical Services 29 General Fund Appropriation $33,531,156 30 Special Revenue Fund Appropriation $19,837,221 31 State Fund Appropriation $1,344,177
32 610 Fire and Emergency Community Outreach 33 General Fund Appropriation $423,794
34 611 Fire Code Enforcement 35 Federal Fund Appropriation $171,867 36 General Fund Appropriation $5,448,260 37 State Fund Appropriation $188,601
dlr21-0498(4)~3rd/08Jun21OrdEstFY22/21-0080~3rd Reader/Finance:DLR:td:td - 3 -
Fiscal 2022 Summary of the Adopted Budget APPENDIX
247

Council Bill 21-0080
1 612 Fire Investigation 2 General Fund Appropriation $802,069
3 613 Fire Facilities Maintenance and Replacement 4 Federal Fund Appropriation $3,690,315 5 General Fund Appropriation $19,477,689 6 State Fund Appropriation $1,371,816
7 614 Fire Communications and Dispatch 8 General Fund Appropriation $9,657,415 9 Special Revenue Fund Appropriation $10,678,871
10 State Fund Appropriation $3,051
11 615 Fire Training and Education 12 General Fund Appropriation $4,545,391
13 General Services 14 726 Administration - General Services15 General Fund Appropriation $756,922
16 730 Public and Private Energy Performance 17 General Fund Appropriation $666,005 18 Special Revenue Fund Appropriation $1,100,000 19 State Fund Appropriation $1,225,000
20 731 Facilities Management 21 General Fund Appropriation $10,712,183 22 State Fund Appropriation $250,000
23 734 Capital Projects Division - Design and Construction24 General Fund Appropriation $931,882
25 Health 26 303 Clinical Services 27 Federal Fund Appropriation $1,882,302 28 General Fund Appropriation $4,688,357 29 Special Revenue Fund Appropriation $104,604 30 State Fund Appropriation $984,232
31 305 Healthy Homes 32 Federal Fund Appropriation $921,094 33 General Fund Appropriation $1,315,837 34 State Fund Appropriation $713,462
35 307 Substance Use Disorder and Mental Health 36 Federal Fund Appropriation $1,361,843 37 General Fund Appropriation $1,563,356 38 State Fund Appropriation $1,806,734
dlr21-0498(4)~3rd/08Jun21OrdEstFY22/21-0080~3rd Reader/Finance:DLR:td:td - 4 -
APPENDIX Fiscal 2022 Summary of the Adopted Budget
248

Council Bill 21-0080
1 308 Maternal and Child Health 2 Federal Fund Appropriation $20,947,655 3 General Fund Appropriation $2,011,772 4 Special Grant Fund Appropriation $1,223,183 5 Special Revenue Fund Appropriation $921,345 6 State Fund Appropriation $1,962,478
7 310 School Health Services 8 Federal Fund Appropriation $306,468 9 General Fund Appropriation $15,725,944
10 Special Grant Fund Appropriation $25,000 11 Special Revenue Fund Appropriation $5,194,693 12 State Fund Appropriation $506,367
13 311 Health Services for Seniors 14 Special Revenue Fund Appropriation $5,371,030
15 315 Emergency Services - Health 16 Federal Fund Appropriation $704,910 17 General Fund Appropriation $36,490,083 18 Special Grant Fund Appropriation $524,087 19 State Fund Appropriation $8,637,338
20 316 Youth and Trauma Services 21 Federal Fund Appropriation $453,193 22 General Fund Appropriation $768,215 23 Special Grant Fund Appropriation $41,028 24 State Fund Appropriation $388,454
25 715 Administration - Health 26 Federal Fund Appropriation $5,793,584 27 General Fund Appropriation $4,833,711 28 Special Grant Fund Appropriation $200,000 29 Special Revenue Fund Appropriation $1,700,000 30 State Fund Appropriation $2,325,004
31 716 Animal Services 32 General Fund Appropriation $3,415,556
33 717 Environmental Inspection Services 34 General Fund Appropriation $3,142,652 35 Special Revenue Fund Appropriation $34,107
36 718 Chronic Disease Prevention37 Federal Fund Appropriation $45,882 38 General Fund Appropriation $252,151 39 Special Revenue Fund Appropriation $27,600 40 State Fund Appropriation $457,022
dlr21-0498(4)~3rd/08Jun21OrdEstFY22/21-0080~3rd Reader/Finance:DLR:td:td - 5 -
Fiscal 2022 Summary of the Adopted Budget APPENDIX
249

Council Bill 21-0080
1 720 HIV Treatment Services for the Uninsured 2 Federal Fund Appropriation $30,211,064 3 General Fund Appropriation $1,356,402 4 State Fund Appropriation $23,891,789
5 721 Senior Centers 6 Federal Fund Appropriation $1,627,554 7 General Fund Appropriation $1,289,073 8 Special Grant Fund Appropriation $16,432 9 Special Revenue Fund Appropriation $101,081
10 State Fund Appropriation $350,535
11 722 Administration - CARE 12 Federal Fund Appropriation $257,877 13 General Fund Appropriation $442,038
14 723 Advocacy for Seniors 15 Federal Fund Appropriation $112,326 16 General Fund Appropriation $93,985 17 Special Revenue Fund Appropriation $401,241 18 State Fund Appropriation $286,740
19 724 Direct Care and Support Planning 20 Special Revenue Fund Appropriation $37,861 21 State Fund Appropriation $2,740,012
22 725 Community Services for Seniors 23 Federal Fund Appropriation $3,834,268 24 General Fund Appropriation $201,158 25 State Fund Appropriation $1,015,929
26 Housing and Community Development 27 593 Community Support Projects 28 Federal Fund Appropriation $42,078,452 29 General Fund Appropriation $2,208,549
30 604 Before and After Care 31 General Fund Appropriation $253,503
32 737 Administration - HCD 33 Federal Fund Appropriation $1,030,722 34 General Fund Appropriation $5,392,370 35 Special Revenue Fund Appropriation $200,000
36 738 Weatherization Services 37 General Fund Appropriation $1,160,643 38 State Fund Appropriation $7,351,297
dlr21-0498(4)~3rd/08Jun21OrdEstFY22/21-0080~3rd Reader/Finance:DLR:td:td - 6 -
APPENDIX Fiscal 2022 Summary of the Adopted Budget
250

Council Bill 21-0080
1 740 Dawson Center 2 Federal Fund Appropriation $342,289 3 General Fund Appropriation $31,609
4 742 Promote Homeownership 5 Federal Fund Appropriation $199,551 6 General Fund Appropriation $693,027 7 Special Revenue Fund Appropriation $150,000
8 745 Housing Code Enforcement 9 Federal Fund Appropriation $360,000
10 General Fund Appropriation $12,506,049 11 Special Revenue Fund Appropriation $51,864
12 747 Register and License Properties and Contractors 13 General Fund Appropriation $603,391
14 748 Affordable Housing 15 Federal Fund Appropriation $985,398 16 Special Revenue Fund Appropriation $7,100,456
17 749 Property Acquisition, Disposition and Asset Management 18 General Fund Appropriation $4,149,917
19 750 Housing Rehabilitation Services 20 Federal Fund Appropriation $6,224,470 21 State Fund Appropriation $569,629
22 751 Building and Zoning Inspections and Permits 23 General Fund Appropriation $6,894,955
24 752 Community Outreach Services 25 General Fund Appropriation $1,431,415
26 754 Summer Food Service Program 27 State Fund Appropriation $3,711,967
28 809 Retention, Expansion, and Attraction of Businesses 29 General Fund Appropriation $2,382,556 30 Special Revenue Fund Appropriation $165,769
31 810 Real Estate Development 32 General Fund Appropriation $2,382,556 33 Special Revenue Fund Appropriation $165,769
34 811 Inner Harbor Coordination 35 General Fund Appropriation $450,979
36 813 Technology Development - Emerging Technology Center 37 General Fund Appropriation $866,160
dlr21-0498(4)~3rd/08Jun21OrdEstFY22/21-0080~3rd Reader/Finance:DLR:td:td - 7 -
Fiscal 2022 Summary of the Adopted Budget APPENDIX
251

Council Bill 21-0080
1 815 Live Baltimore 2 General Fund Appropriation $606,663
3 Human Resources 4 770 Administration - Human Resources 5 General Fund Appropriation $4,151,698 6 771 Benefits Administration 7 General Fund Appropriation $3,716,9558 9 772 Civil Service Management
10 General Fund Appropriation $3,623,553
11 773 Learning and Development 12 General Fund Appropriation $863,451
13 Law 14 860 Administration - Law 15 General Fund Appropriation $1,650,622
16 861 Controversies 17 General Fund Appropriation $5,536,242
18 862 Transactions 19 General Fund Appropriation $2,114,938
20 869 Minority and Women's Business Opportunity Office 21 General Fund Appropriation $723,436
22 871 Police Legal Affairs 23 General Fund Appropriation $2,148,597
24 872 Workers' Compensation Practice 25 General Fund Appropriation $72,910
26 Legislative Reference 27 106 Legislative Reference Services 28 General Fund Appropriation $812,997
29 107 Archives and Records Management 30 General Fund Appropriation $576,493
31 Liquor License Board 32 850 Liquor Licensing 33 General Fund Appropriation $1,159,972
34 851 Liquor License Compliance 35 General Fund Appropriation $1,366,903
dlr21-0498(4)~3rd/08Jun21OrdEstFY22/21-0080~3rd Reader/Finance:DLR:td:td - 8 -
APPENDIX Fiscal 2022 Summary of the Adopted Budget
252

Council Bill 21-0080
1 M-R: American Rescue Plan Act2 111 Economic Recovery 3 Federal Fund Appropriation $680,284,732
4 M-R: Art and Culture5 493 Art and Culture Grants 6 General Fund Appropriation $7,061,336
7 824 Events, Art, Culture, and Film 8 General Fund Appropriation $2,472,656 9 Special Revenue Fund Appropriation $60,000
10 828 Bromo Seltzer Arts Tower 11 General Fund Appropriation $102,405
12 M-R: Baltimore City Public Schools13 352 Baltimore City Public Schools 14 General Fund Appropriation $275,306,538
15 M-R: Cable and Communications16 876 Media Production 17 General Fund Appropriation $665,017 18 Special Revenue Fund Appropriation $676,001
19 M-R: Civic Promotion20 590 Civic Promotion Grants 21 General Fund Appropriation $1,195,629
22 820 Convention Sales and Tourism Marketing 23 General Fund Appropriation $9,453,409
24 M-R: Conditional Purchase Agreements25 129 Conditional Purchase Agreement Payments 26 General Fund Appropriation $3,961,522
27 M-R: Contingent Fund28 121 Contingent Fund 29 General Fund Appropriation $1,000,000
30 M-R: Convention Center Hotel31 535 Convention Center Hotel 32 General Fund Appropriation $12,120,648
33 M-R: Convention Complex34 540 Royal Farms Arena Operations 35 General Fund Appropriation $584,363
36 855 Convention Center 37 General Fund Appropriation $10,601,181 38 State Fund Appropriation $10,678,363
dlr21-0498(4)~3rd/08Jun21OrdEstFY22/21-0080~3rd Reader/Finance:DLR:td:td - 9 -
Fiscal 2022 Summary of the Adopted Budget APPENDIX
253

Council Bill 21-0080
1 M-R: Debt Service 2 123 General Debt Service 3 General Fund Appropriation $88,582,940 4 Special Revenue Fund Appropriation $15,767,260
5 M-R: Educational Grants 6 446 Educational Grants 7 Federal Fund Appropriation $300,000 8 General Fund Appropriation $11,325,031 9 Special Revenue Fund Appropriation $13,327,000
10 M-R: Employees' Retirement Contribution 11 355 Employees' Retirement Contribution 12 General Fund Appropriation $2,175,000
13 M-R: Environmental Control Board 14 117 Adjudication of Environmental Citations 15 General Fund Appropriation $1,556,600 16 State Fund Appropriation $255,750
17 M-R: Health and Welfare Grants 18 385 Health and Welfare Grants 19 General Fund Appropriation $1,359,314
20 M-R: Innovation Fund 21 833 Innovation Fund 22 Special Revenue Fund Appropriation $200,000
23 M-R: Miscellaneous General Expenses 24 122 Miscellaneous General Expenses 25 Conduit Enterprise Fund Appropriation $10,000 26 Federal Fund Appropriation $85,000 27 General Fund Appropriation $25,620,323 28 Parking Management Fund Appropriation $5,000 29 Special Revenue Fund Appropriation $35,000 30 State Fund Appropriation $15,000 31 Stormwater Utility Fund Appropriation $20,000 32 Wastewater Utility Fund Appropriation $75,000 33 Water Utility Fund Appropriation $75,000
34 M-R: Office of Children and Family Success 35 109 Administration - Children and Family Success 36 General Fund Appropriation $3,006,132 37 Special Revenue Fund Appropriation $78,000
38 605 Head Start 39 Federal Fund Appropriation $8,021,215 40 General Fund Appropriation $605,866 41 State Fund Appropriation $141,113
dlr21-0498(4)~3rd/08Jun21OrdEstFY22/21-0080~3rd Reader/Finance:DLR:td:td - 10 -
APPENDIX Fiscal 2022 Summary of the Adopted Budget
254

Council Bill 21-0080
1 741 Community Action Partnership 2 Federal Fund Appropriation $18,850,191 3 General Fund Appropriation $763,240 4 State Fund Appropriation $7,985,898 5 Water Utility Fund Appropriation $397,937
6 M-R: Office of Employment Development7 791 BCPS Alternative Options Academy for Youth 8 State Fund Appropriation $214,784
9 792 Workforce Public Assistance 10 Federal Fund Appropriation $3,054,440 11 State Fund Appropriation $100,000
12 793 Employment Enhancement Services for Baltimore City Residents 13 General Fund Appropriation $1,579,986 14 Special Revenue Fund Appropriation $721,394
15 794 Administration - MOED 16 Federal Fund Appropriation $28,939 17 General Fund Appropriation $1,013,033 18 Special Revenue Fund Appropriation $458,978
19 795 Workforce Services for Baltimore Residents 20 Federal Fund Appropriation $6,352,180 21 State Fund Appropriation $1,973,280
22 796 Workforce Services for Ex-Offenders 23 Federal Fund Appropriation $557,000 24 General Fund Appropriation $199,697 25 State Fund Appropriation $951,403
26 797 Workforce Services for Out of School Youth-Youth Opportunity 27 Federal Fund Appropriation $991,323 28 General Fund Appropriation $3,191,275 29 Special Grant Fund Appropriation $165,000 30 State Fund Appropriation $100,000
31 798 Youth Works Summer Job Program 32 Federal Fund Appropriation $2,001,816 33 General Fund Appropriation $2,564,529 34 Special Revenue Fund Appropriation $1,065,000 35 State Fund Appropriation $3,376,891
36 800 Workforce Services for WIOA Funded Youth 37 Federal Fund Appropriation $4,118,574
dlr21-0498(4)~3rd/08Jun21OrdEstFY22/21-0080~3rd Reader/Finance:DLR:td:td - 11 -
Fiscal 2022 Summary of the Adopted Budget APPENDIX
255
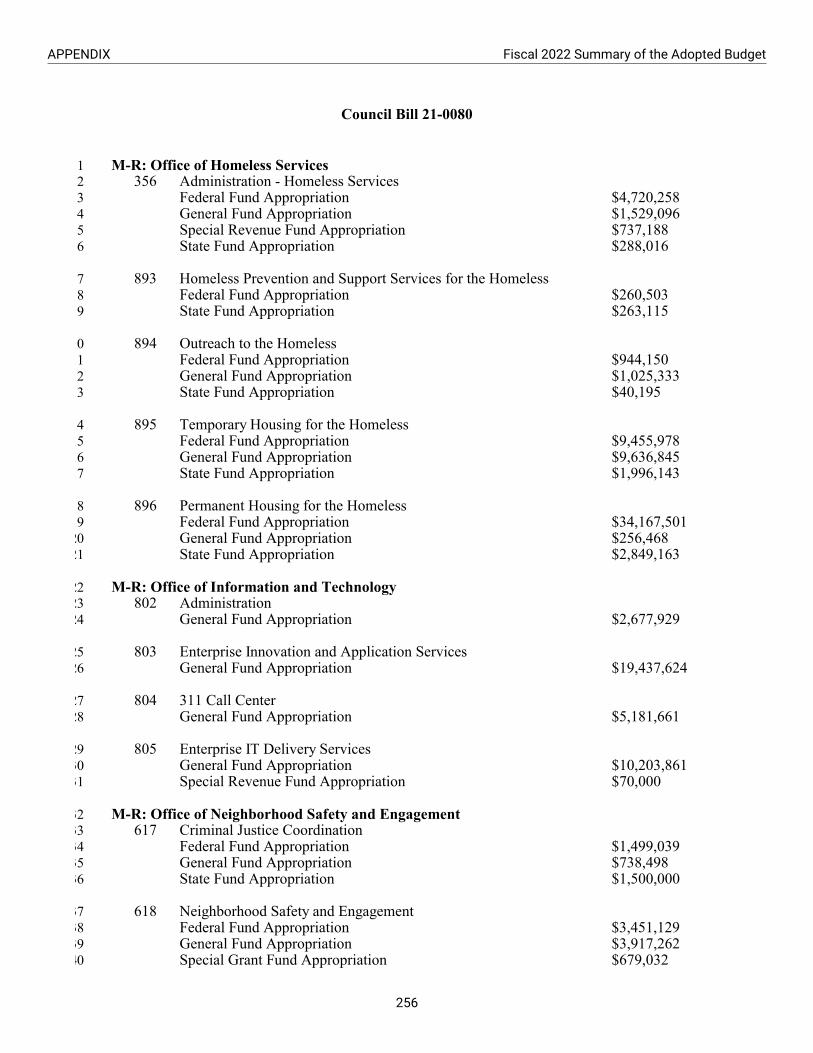
Council Bill 21-0080
1 M-R: Office of Homeless Services2 356 Administration - Homeless Services 3 Federal Fund Appropriation $4,720,258 4 General Fund Appropriation $1,529,096 5 Special Revenue Fund Appropriation $737,188 6 State Fund Appropriation $288,016
7 893 Homeless Prevention and Support Services for the Homeless 8 Federal Fund Appropriation $260,503 9 State Fund Appropriation $263,115
10 894 Outreach to the Homeless 11 Federal Fund Appropriation $944,150 12 General Fund Appropriation $1,025,333 13 State Fund Appropriation $40,195
14 895 Temporary Housing for the Homeless 15 Federal Fund Appropriation $9,455,978 16 General Fund Appropriation $9,636,845 17 State Fund Appropriation $1,996,143
18 896 Permanent Housing for the Homeless 19 Federal Fund Appropriation $34,167,501 20 General Fund Appropriation $256,468 21 State Fund Appropriation $2,849,163
22 M-R: Office of Information and Technology23 802 Administration 24 General Fund Appropriation $2,677,929
25 803 Enterprise Innovation and Application Services 26 General Fund Appropriation $19,437,624
27 804 311 Call Center 28 General Fund Appropriation $5,181,661
29 805 Enterprise IT Delivery Services 30 General Fund Appropriation $10,203,861 31 Special Revenue Fund Appropriation $70,000
32 M-R: Office of Neighborhood Safety and Engagement33 617 Criminal Justice Coordination 34 Federal Fund Appropriation $1,499,039 35 General Fund Appropriation $738,498 36 State Fund Appropriation $1,500,000
37 618 Neighborhood Safety and Engagement 38 Federal Fund Appropriation $3,451,129 39 General Fund Appropriation $3,917,262 40 Special Grant Fund Appropriation $679,032
dlr21-0498(4)~3rd/08Jun21OrdEstFY22/21-0080~3rd Reader/Finance:DLR:td:td - 12 -
APPENDIX Fiscal 2022 Summary of the Adopted Budget
256
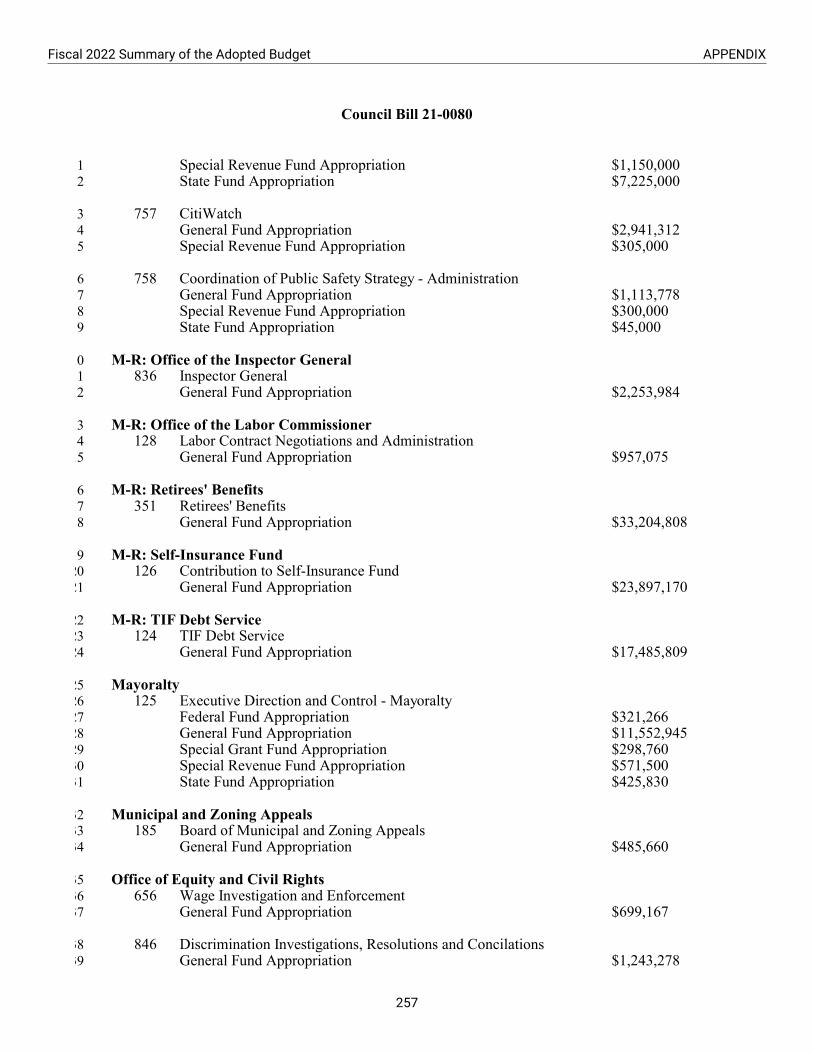
Council Bill 21-0080
1 Special Revenue Fund Appropriation $1,150,000 2 State Fund Appropriation $7,225,000
3 757 CitiWatch 4 General Fund Appropriation $2,941,312 5 Special Revenue Fund Appropriation $305,000
6 758 Coordination of Public Safety Strategy - Administration 7 General Fund Appropriation $1,113,778 8 Special Revenue Fund Appropriation $300,000 9 State Fund Appropriation $45,000
10 M-R: Office of the Inspector General 11 836 Inspector General 12 General Fund Appropriation $2,253,984
13 M-R: Office of the Labor Commissioner 14 128 Labor Contract Negotiations and Administration 15 General Fund Appropriation $957,075
16 M-R: Retirees' Benefits 17 351 Retirees' Benefits 18 General Fund Appropriation $33,204,808
19 M-R: Self-Insurance Fund 20 126 Contribution to Self-Insurance Fund 21 General Fund Appropriation $23,897,170
22 M-R: TIF Debt Service 23 124 TIF Debt Service 24 General Fund Appropriation $17,485,809
25 Mayoralty 26 125 Executive Direction and Control - Mayoralty 27 Federal Fund Appropriation $321,266 28 General Fund Appropriation $11,552,945 29 Special Grant Fund Appropriation $298,760 30 Special Revenue Fund Appropriation $571,500 31 State Fund Appropriation $425,830
32 Municipal and Zoning Appeals 33 185 Board of Municipal and Zoning Appeals 34 General Fund Appropriation $485,660
35 Office of Equity and Civil Rights 36 656 Wage Investigation and Enforcement 37 General Fund Appropriation $699,167
38 846 Discrimination Investigations, Resolutions and Concilations 39 General Fund Appropriation $1,243,278
dlr21-0498(4)~3rd/08Jun21OrdEstFY22/21-0080~3rd Reader/Finance:DLR:td:td - 13 -
Fiscal 2022 Summary of the Adopted Budget APPENDIX
257

Council Bill 21-0080
1 Special Revenue Fund Appropriation $170,265
2 848 Police Community Relations 3 General Fund Appropriation $728,486
4 Planning 5 761 Development Oversight and Project Support 6 General Fund Appropriation $1,097,774 7 Special Grant Fund Appropriation $51,000
8 762 Historic Preservation 9 Federal Fund Appropriation $100,000
10 General Fund Appropriation $637,911 11 Special Grant Fund Appropriation $50,000 12 State Fund Appropriation $100,000
13 763 Comprehensive Planning and Resource Management 14 Federal Fund Appropriation $150,000 15 General Fund Appropriation $2,299,347 16 Special Grant Fund Appropriation $75,000 17 Special Revenue Fund Appropriation $553,600 18 State Fund Appropriation $225,000
19 765 Planning for a Sustainable Baltimore 20 Federal Fund Appropriation $250,000 21 General Fund Appropriation $1,553,443 22 Special Grant Fund Appropriation $663,000 23 Special Revenue Fund Appropriation $482,046 24 State Fund Appropriation $510,200
25 768 Administration - Planning 26 General Fund Appropriation $1,370,724
27 Police 28 621 Administrative Bureau 29 Federal Fund Appropriation $276,316 30 General Fund Appropriation $84,280,608 31 Special Revenue Fund Appropriation $6,048,498 32 State Fund Appropriation $852,250
33 622 Police Patrol 34 Federal Fund Appropriation $2,500,000 35 General Fund Appropriation $225,563,431 36 Special Revenue Fund Appropriation $1,400,140 37 State Fund Appropriation $4,189,589
38 623 Criminal Investigation Division 39 Federal Fund Appropriation $1,580,240 40 General Fund Appropriation $53,525,250 41 State Fund Appropriation $4,005,463
dlr21-0498(4)~3rd/08Jun21OrdEstFY22/21-0080~3rd Reader/Finance:DLR:td:td - 14 -
APPENDIX Fiscal 2022 Summary of the Adopted Budget
258
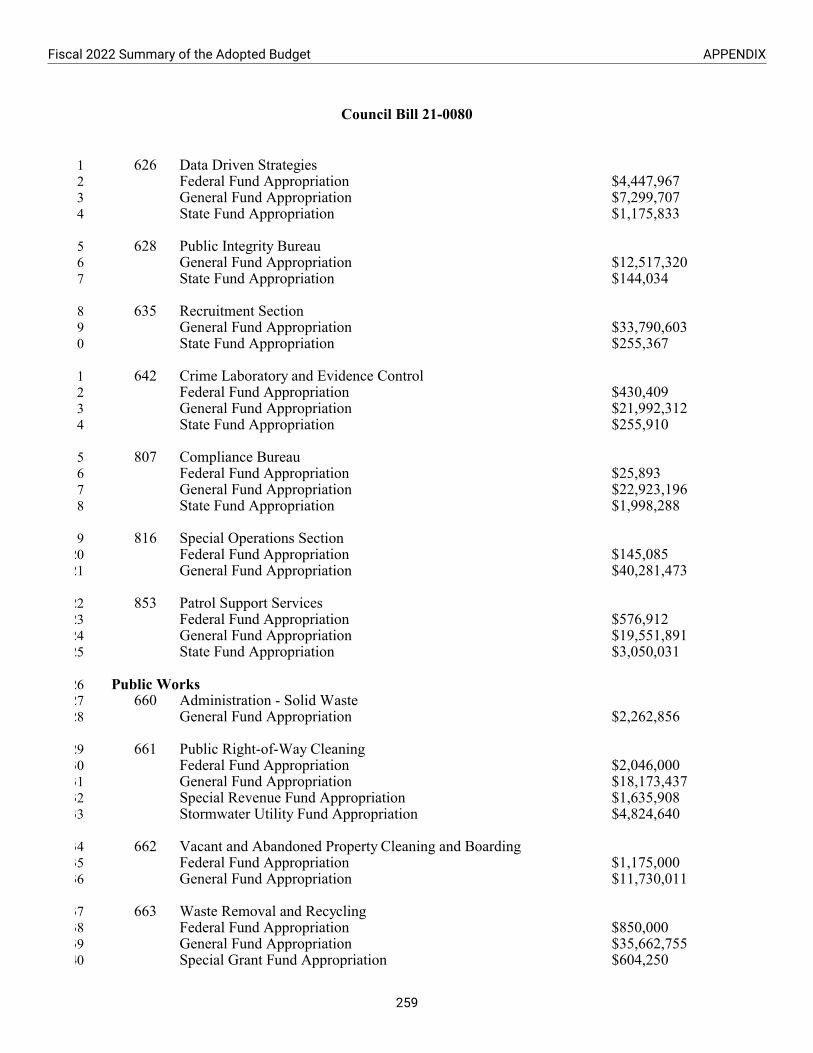
Council Bill 21-0080
1 626 Data Driven Strategies 2 Federal Fund Appropriation $4,447,967 3 General Fund Appropriation $7,299,707 4 State Fund Appropriation $1,175,833
5 628 Public Integrity Bureau 6 General Fund Appropriation $12,517,320 7 State Fund Appropriation $144,034
8 635 Recruitment Section 9 General Fund Appropriation $33,790,603
10 State Fund Appropriation $255,367
11 642 Crime Laboratory and Evidence Control 12 Federal Fund Appropriation $430,409 13 General Fund Appropriation $21,992,312 14 State Fund Appropriation $255,910
15 807 Compliance Bureau 16 Federal Fund Appropriation $25,893 17 General Fund Appropriation $22,923,196 18 State Fund Appropriation $1,998,288
19 816 Special Operations Section 20 Federal Fund Appropriation $145,085 21 General Fund Appropriation $40,281,473
22 853 Patrol Support Services 23 Federal Fund Appropriation $576,912 24 General Fund Appropriation $19,551,891 25 State Fund Appropriation $3,050,031
26 Public Works 27 660 Administration - Solid Waste 28 General Fund Appropriation $2,262,856
29 661 Public Right-of-Way Cleaning 30 Federal Fund Appropriation $2,046,000 31 General Fund Appropriation $18,173,437 32 Special Revenue Fund Appropriation $1,635,908 33 Stormwater Utility Fund Appropriation $4,824,640
34 662 Vacant and Abandoned Property Cleaning and Boarding 35 Federal Fund Appropriation $1,175,000 36 General Fund Appropriation $11,730,011
37 663 Waste Removal and Recycling 38 Federal Fund Appropriation $850,000 39 General Fund Appropriation $35,662,755 40 Special Grant Fund Appropriation $604,250
dlr21-0498(4)~3rd/08Jun21OrdEstFY22/21-0080~3rd Reader/Finance:DLR:td:td - 15 -
Fiscal 2022 Summary of the Adopted Budget APPENDIX
259

Council Bill 21-0080
1 Special Revenue Fund Appropriation $1,650,000 2 State Fund Appropriation $500,000
3 664 Waste Re-Use and Disposal 4 General Fund Appropriation $26,856,145 5 Stormwater Utility Fund Appropriation $4,000,000
6 670 Administration - Water and Wastewater 7 Federal Fund Appropriation $300,000 8 Special Grant Fund Appropriation $250,000 9 Special Revenue Fund Appropriation $400,000
10 Wastewater Utility Fund Appropriation $29,635,596 11 Water Utility Fund Appropriation $18,983,578
12 671 Water Management 13 Federal Fund Appropriation $254,600 14 Water Utility Fund Appropriation $88,897,680
15 672 Water and Wastewater Consumer Services 16 Stormwater Utility Fund Appropriation $1,790,907 17 Wastewater Utility Fund Appropriation $14,071,415 18 Water Utility Fund Appropriation $8,541,030
19 673 Wastewater Management 20 Federal Fund Appropriation $1,400,000 21 State Fund Appropriation $750,000 22 Wastewater Utility Fund Appropriation $128,036,256
23 674 Surface Water Management 24 Federal Fund Appropriation $675,000 25 State Fund Appropriation $510,000 26 Stormwater Utility Fund Appropriation $23,452,365 27 Wastewater Utility Fund Appropriation $1,737,528 28 Water Utility Fund Appropriation $559,991
29 675 Engineering and Construction Management - Water and Wastewater 30 Wastewater Utility Fund Appropriation $127,438,865 31 Water Utility Fund Appropriation $94,749,082
32 676 Administration - DPW 33 General Fund Appropriation $1,752,457 34 Wastewater Utility Fund Appropriation $1,791,531
35 Recreation and Parks 36 644 Administration - Recreation and Parks 37 General Fund Appropriation $5,276,628 38 State Fund Appropriation $1,750,471
39 645 Aquatics 40 General Fund Appropriation $2,708,100
dlr21-0498(4)~3rd/08Jun21OrdEstFY22/21-0080~3rd Reader/Finance:DLR:td:td - 16 -
APPENDIX Fiscal 2022 Summary of the Adopted Budget
260
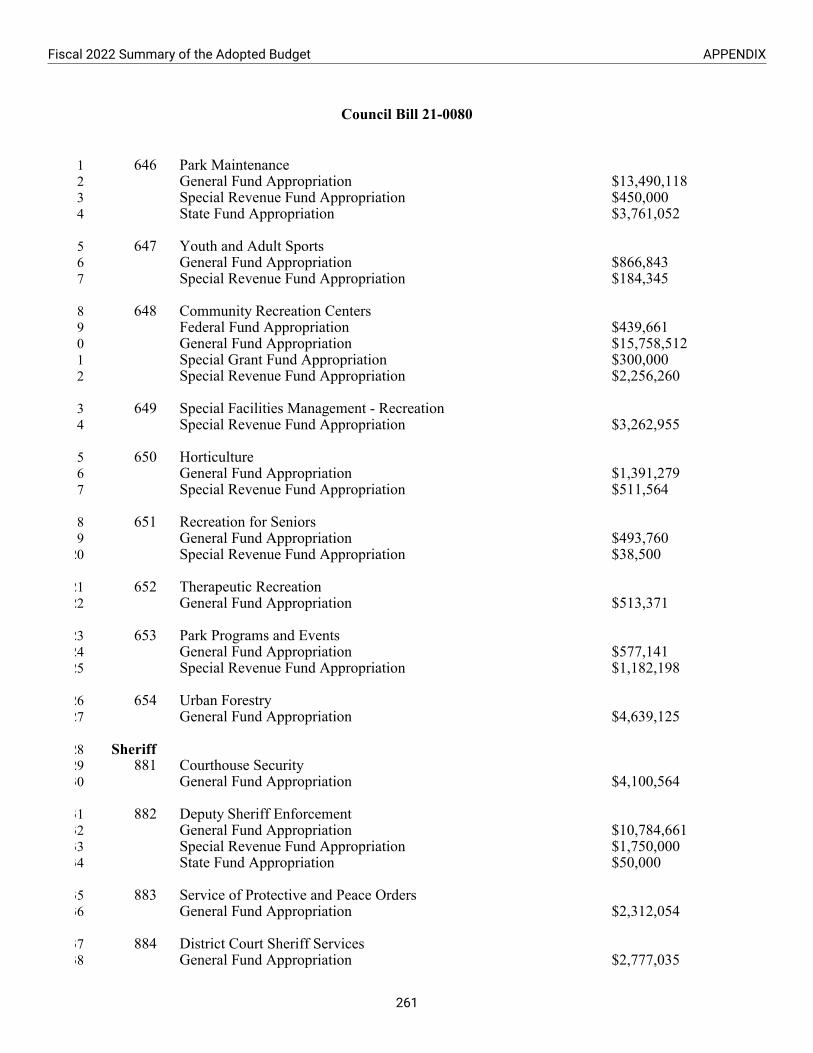
Council Bill 21-0080
1 646 Park Maintenance 2 General Fund Appropriation $13,490,118 3 Special Revenue Fund Appropriation $450,000 4 State Fund Appropriation $3,761,052
5 647 Youth and Adult Sports 6 General Fund Appropriation $866,843 7 Special Revenue Fund Appropriation $184,345
8 648 Community Recreation Centers 9 Federal Fund Appropriation $439,661
10 General Fund Appropriation $15,758,512 11 Special Grant Fund Appropriation $300,000 12 Special Revenue Fund Appropriation $2,256,260
13 649 Special Facilities Management - Recreation 14 Special Revenue Fund Appropriation $3,262,955
15 650 Horticulture 16 General Fund Appropriation $1,391,279 17 Special Revenue Fund Appropriation $511,564
18 651 Recreation for Seniors 19 General Fund Appropriation $493,760 20 Special Revenue Fund Appropriation $38,500
21 652 Therapeutic Recreation 22 General Fund Appropriation $513,371
23 653 Park Programs and Events 24 General Fund Appropriation $577,141 25 Special Revenue Fund Appropriation $1,182,198
26 654 Urban Forestry 27 General Fund Appropriation $4,639,125
28 Sheriff 29 881 Courthouse Security 30 General Fund Appropriation $4,100,564
31 882 Deputy Sheriff Enforcement 32 General Fund Appropriation $10,784,661 33 Special Revenue Fund Appropriation $1,750,000 34 State Fund Appropriation $50,000
35 883 Service of Protective and Peace Orders 36 General Fund Appropriation $2,312,054
37 884 District Court Sheriff Services 38 General Fund Appropriation $2,777,035
dlr21-0498(4)~3rd/08Jun21OrdEstFY22/21-0080~3rd Reader/Finance:DLR:td:td - 17 -
Fiscal 2022 Summary of the Adopted Budget APPENDIX
261

Council Bill 21-0080
1 889 Child Support Enforcement 2 Federal Fund Appropriation $1,100,000 3 General Fund Appropriation $1,769,708
4 State's Attorney 5 115 Prosecution of Criminals 6 Federal Fund Appropriation $1,825,120 7 General Fund Appropriation $28,386,555 8 Special Revenue Fund Appropriation $325,660 9 State Fund Appropriation $7,118,639
10 781 Administration - State's Attorney 11 General Fund Appropriation $8,074,813
12 786 Victim and Witness Services 13 Federal Fund Appropriation $2,711,564 14 General Fund Appropriation $1,940,214 15 State Fund Appropriation $55,706
16 Transportation 17 500 Street Lighting 18 General Fund Appropriation $20,117,007
19 548 Conduits 20 Conduit Enterprise Fund Appropriation $13,019,924
21 681 Administration - DOT 22 General Fund Appropriation $10,074,127
23 682 Parking Management 24 Parking Enterprise Fund Appropriation $22,459,496 25 Parking Management Fund Appropriation $10,667,660
26 683 Street Management 27 General Fund Appropriation $35,629,558
28 684 Traffic Management 29 General Fund Appropriation $10,881,532 30 Special Revenue Fund Appropriation $692,862
31 685 Special Events 32 General Fund Appropriation $1,673,212
33 687 Inner Harbor Services - Transportation 34 General Fund Appropriation $1,072,834
35 688 Snow and Ice Control 36 General Fund Appropriation $6,830,313
dlr21-0498(4)~3rd/08Jun21OrdEstFY22/21-0080~3rd Reader/Finance:DLR:td:td - 18 -
APPENDIX Fiscal 2022 Summary of the Adopted Budget
262
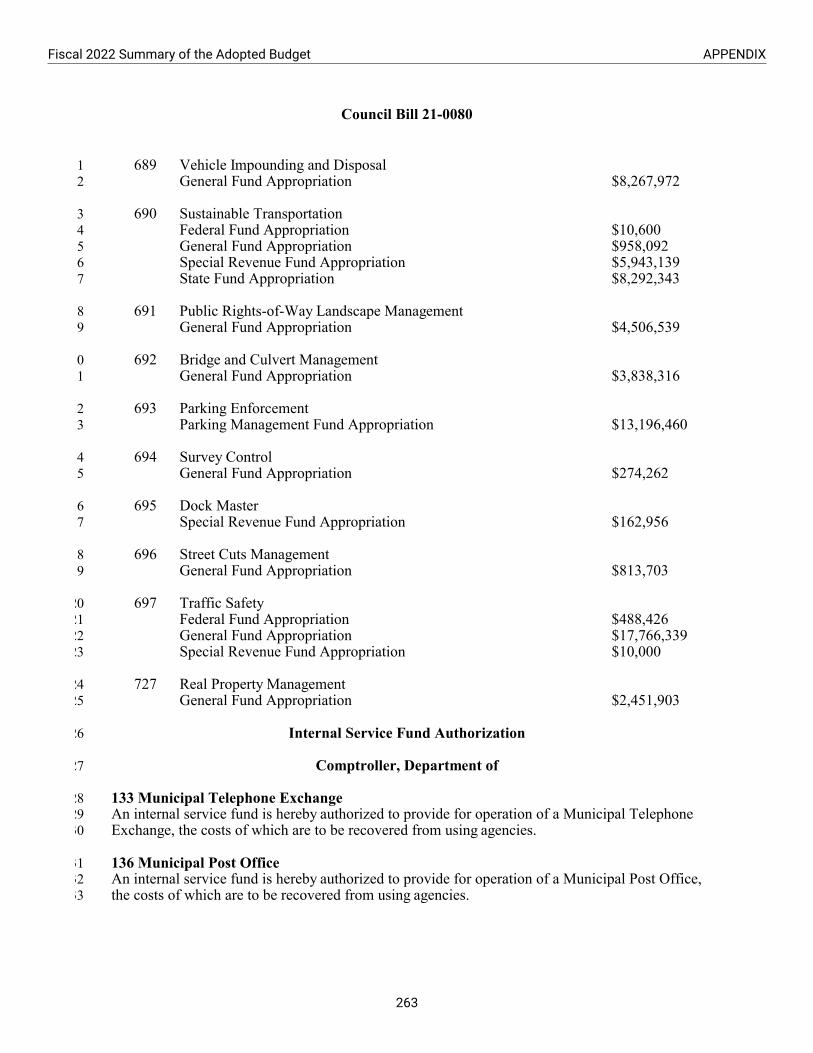
Council Bill 21-0080
1 689 Vehicle Impounding and Disposal 2 General Fund Appropriation $8,267,972
3 690 Sustainable Transportation 4 Federal Fund Appropriation $10,600 5 General Fund Appropriation $958,092 6 Special Revenue Fund Appropriation $5,943,139 7 State Fund Appropriation $8,292,343
8 691 Public Rights-of-Way Landscape Management 9 General Fund Appropriation $4,506,539
10 692 Bridge and Culvert Management 11 General Fund Appropriation $3,838,316
12 693 Parking Enforcement 13 Parking Management Fund Appropriation $13,196,460
14 694 Survey Control 15 General Fund Appropriation $274,262
16 695 Dock Master 17 Special Revenue Fund Appropriation $162,956
18 696 Street Cuts Management 19 General Fund Appropriation $813,703
20 697 Traffic Safety 21 Federal Fund Appropriation $488,426 22 General Fund Appropriation $17,766,339 23 Special Revenue Fund Appropriation $10,000
24 727 Real Property Management 25 General Fund Appropriation $2,451,903
26 Internal Service Fund Authorization
27 Comptroller, Department of
28 133 Municipal Telephone Exchange29 An internal service fund is hereby authorized to provide for operation of a Municipal Telephone30 Exchange, the costs of which are to be recovered from using agencies.
31 136 Municipal Post Office32 An internal service fund is hereby authorized to provide for operation of a Municipal Post Office,33 the costs of which are to be recovered from using agencies.
dlr21-0498(4)~3rd/08Jun21OrdEstFY22/21-0080~3rd Reader/Finance:DLR:td:td - 19 -
Fiscal 2022 Summary of the Adopted Budget APPENDIX
263

Council Bill 21-0080
1 Finance, Department of
2 701 Printing Services3 An internal service fund is hereby authorized to provide for operation of a Municipal4 Reproduction and Printing Service, the costs of which are to be recovered from using agencies.
5 707 Risk Management for Employee Injuries6 An internal service fund is hereby authorized to provide for a Self-Insurance Program for7 administration of the Employee Health Clinic and Employee Safety and Workers' Compensation8 Claims Processing, the costs of which are to be recovered from the Self-Insurance Fund.
9 General Services, Department of
10 189 Fleet Management11 An internal service fund is hereby authorized to provide for operation of a Central Automotive12 and Mechanical Repair Service, the costs of which are to be recovered from using agencies.
13 731 Facilities Management14 An internal service fund is hereby authorized to provide for the maintenance of City buildings,15 the costs are which are to be recovered from using agencies.
16 Human Resources, Department of
17 771 Benefits Administration 18 An internal service fund is hereby authorized to provide for the operation of the Unemployment19 Insurance function, the costs of which are to be recovered from contributions from various fund20 sources.
21 Law, Department of
22 861 Controversies and 862 Transactions23 An internal service fund is hereby authorized to provide for a Self-Insurance Program covering24 Automotive Equipment, Police Animal Liability, Employee Liability.
25 872 Workers' Compensation Practice26 An internal service fund is hereby authorized to provide for a Self-Insurance Program covering27 the administration of Workers' Compensation claims.
28 Mayoralty-Related
29 805 Enterprise IT Delivery Services30 An internal service fund is hereby authorized to provide for the operation of the 800 Megahertz31 emergency response system and the maintenance and replacement of computer hardware and32 software, the costs of which are to be recovered from using agencies.
dlr21-0498(4)~3rd/08Jun21OrdEstFY22/21-0080~3rd Reader/Finance:DLR:td:td - 20 -
APPENDIX Fiscal 2022 Summary of the Adopted Budget
264

Council Bill 21-0080
1 B. Capital Budget
2 SECTION 2. AND BE IT FURTHER ORDAINED, That the Capital Improvement Appropriations3 herein made are for the following Construction Projects.
4 Baltimore Development Corporation
5 601-013 Citywide Facade Improvements6 General Obligation Bonds $350,000
7 601-053 Inner Harbor - Infrastructure Improvements8 General Obligation Bonds $250,000
9 601-060 Business Park Upgrades10 General Obligation Bonds $100,000
11 601-063 Lexington Market12 General Obligation Bonds $900,000
13 601-064 Innovation Fund14 General Obligation Bonds $500,000
15 601-080 MICRO Loan16 General Obligation Bonds $500,000
17 601-092 Baltimore City Animal Care Facility18 Casino Area Local Impact Aid - VLT Revenue $3,500,000
19 601-093 Northwood Commons Streetscaping20 General Obligation Bonds $500,000
21 601-098 Warner Street Entertainment Corridor22 Casino Area Local Impact Aid - VLT Revenue $600,000 23 Other State Funds $3,000,000
24 601-099 Black Arts & Entertainment District25 General Obligation Bonds $400,000
26 601-860 Industrial & Commercial Financing27 General Obligation Bonds $250,000
28 Convention Center
29 534-001 Convention Center Annual Contribution30 General Obligation Bonds $200,000 31 Other Funds (Not Classified Above) $200,000
dlr21-0498(4)~3rd/08Jun21OrdEstFY22/21-0080~3rd Reader/Finance:DLR:td:td - 21 -
Fiscal 2022 Summary of the Adopted Budget APPENDIX
265
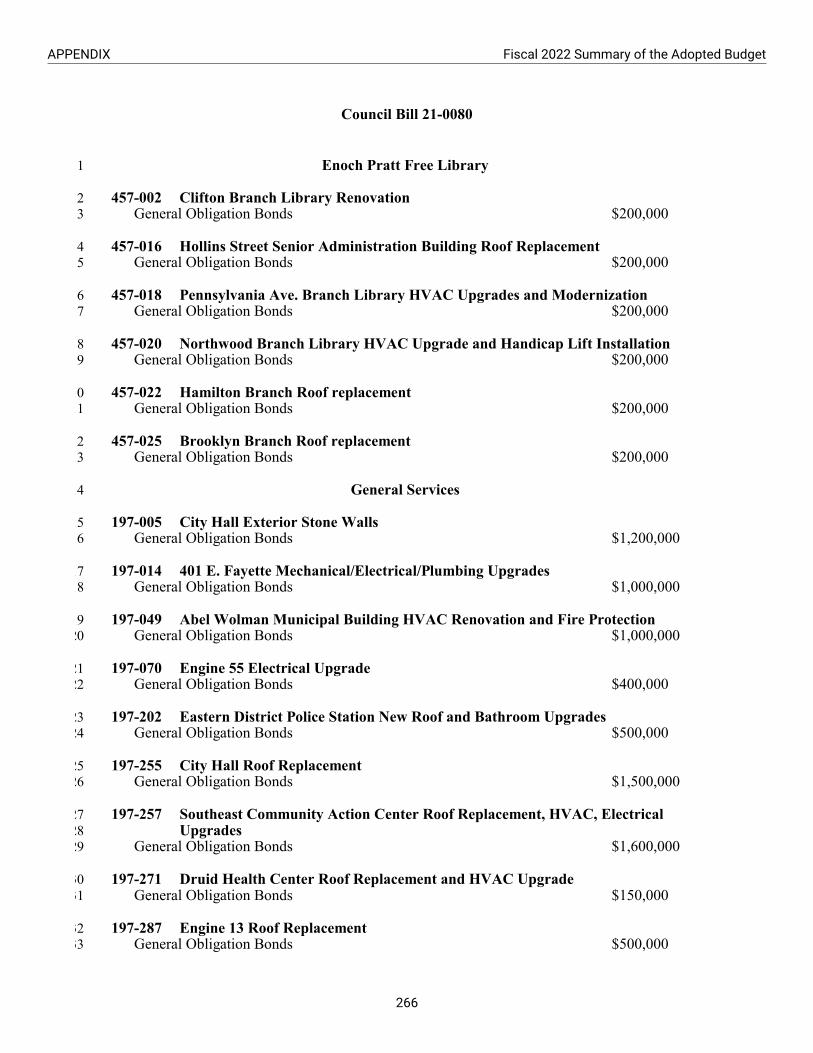
Council Bill 21-0080
1 Enoch Pratt Free Library
2 457-002 Clifton Branch Library Renovation 3 General Obligation Bonds $200,000
4 457-016 Hollins Street Senior Administration Building Roof Replacement 5 General Obligation Bonds $200,000
6 457-018 Pennsylvania Ave. Branch Library HVAC Upgrades and Modernization 7 General Obligation Bonds $200,000
8 457-020 Northwood Branch Library HVAC Upgrade and Handicap Lift Installation 9 General Obligation Bonds $200,000
10 457-022 Hamilton Branch Roof replacement 11 General Obligation Bonds $200,000
12 457-025 Brooklyn Branch Roof replacement 13 General Obligation Bonds $200,000
14 General Services
15 197-005 City Hall Exterior Stone Walls 16 General Obligation Bonds $1,200,000
17 197-014 401 E. Fayette Mechanical/Electrical/Plumbing Upgrades 18 General Obligation Bonds $1,000,000
19 197-049 Abel Wolman Municipal Building HVAC Renovation and Fire Protection 20 General Obligation Bonds $1,000,000
21 197-070 Engine 55 Electrical Upgrade 22 General Obligation Bonds $400,000
23 197-202 Eastern District Police Station New Roof and Bathroom Upgrades 24 General Obligation Bonds $500,000
25 197-255 City Hall Roof Replacement 26 General Obligation Bonds $1,500,000
27 197-257 Southeast Community Action Center Roof Replacement, HVAC, Electrical 28 Upgrades29 General Obligation Bonds $1,600,000
30 197-271 Druid Health Center Roof Replacement and HVAC Upgrade 31 General Obligation Bonds $150,000
32 197-287 Engine 13 Roof Replacement 33 General Obligation Bonds $500,000
dlr21-0498(4)~3rd/08Jun21OrdEstFY22/21-0080~3rd Reader/Finance:DLR:td:td - 22 -
APPENDIX Fiscal 2022 Summary of the Adopted Budget
266

Council Bill 21-0080
1 197-291 Fire Boat Pier Reconstruction 2 General Obligation Bonds $1,000,000
3 197-326 Northwestern Police District Station Window Replacement 4 General Obligation Bonds $300,000
5 197-330 Southeastern Police Station HVAC Upgrade 6 General Obligation Bonds $600,000
7 197-331 Druid Health Clinic Relocation 8 Other State Funds $1,500,000
9 Housing and Community Development
10 588-002 Emergency Stabilization Program 11 General Funds $995,000 12 General Obligation Bonds $5,000
13 588-005 Urgent Demolition 14 General Obligation Bonds $1,000,000
15 588-006 HOME Program 16 General Obligation Bonds $100,000 17 Other Federal Funds $500,000 18 Other Funds (Not Classified Above) $4,000,000
19 588-012 Whole Block Demolition 20 Community Development Block Grants $2,057,000 21 General Obligation Bonds $2,100,000
22 588-017 Citywide Acquisition and Relocation 23 General Obligation Bonds $250,000
24 588-019 Baltimore Homeownership Incentive Program 25 Community Development Block Grants $1,500,000 26 General Obligation Bonds $1,300,000
27 588-026 Affordable Housing Fund 28 General Obligation Bonds $4,250,000
29 588-030 CORE: Whole Block and Half Block Demolition 30 Other State Funds $3,000,000
31 588-036 Southeast Baltimore Redevelopment/Choice 32 General Obligation Bonds $500,000
33 588-044 Community Catalyst Grants 34 General Funds $1,500,000
dlr21-0498(4)~3rd/08Jun21OrdEstFY22/21-0080~3rd Reader/Finance:DLR:td:td - 23 -
Fiscal 2022 Summary of the Adopted Budget APPENDIX
267

Council Bill 21-0080
1 588-045 Land Management Administration 2 Sale of City Real Property $900,000
3 588-046 800 Block of Edmondson Ave 4 General Obligation Bonds $500,000
5 588-049 Affordable Homeownership 6 General Obligation Bonds $100,000
7 588-052 Housing Upgrades to Benefit Seniors (HUBS) 8 General Obligation Bonds $500,000
9 588-053 Baltimore Shines - Low Income Solar Program 10 Community Development Block Grants $500,000
11 588-054 Low-Income Mortgage Program 12 General Obligation Bonds $400,000
13 588-055 Park Heights Infrastructure 14 Other State Funds $5,000,000
15 588-058 Southwest Impact Investment Area 16 General Obligation Bonds $200,000
17 588-059 East Impact Investment Area 18 General Obligation Bonds $600,000
19 588-060 West Impact investment Area 20 General Obligation Bonds $600,000
21 588-071 CHM Triangle Redevelopment 22 General Obligation Bonds $1,200,000
23 588-072 Johnston Square Acquisition and Relocation 24 General Obligation Bonds $200,000
25 588-073 Lead Hazard Reduction Program 26 General Obligation Bonds $750,000
27 588-075 SE Baltimore Redevelopment Affordable Housing 28 General Obligation Bonds $500,000
29 588-077 Park Heights Impact Investment Area 30 General Obligation Bonds $100,000
31 588-078 CDBG Subrecipient Capital Projects 32 Community Development Block Grants $2,250,000
33 588-079 Homeowner Repairs Grant - Towanda Grantley 34 Pimlico Area Local Impact Aid - VLT Revenue $240,000
dlr21-0498(4)~3rd/08Jun21OrdEstFY22/21-0080~3rd Reader/Finance:DLR:td:td - 24 -
APPENDIX Fiscal 2022 Summary of the Adopted Budget
268

Council Bill 21-0080
1 588-080 INSPIRE Homeowner Repairs - Forest Park HS2 Pimlico Area Local Impact Aid - VLT Revenue $150,000
3 588-082 Madison Park North Redevelopment Project4 Other State Funds $500,000
5 588-932 Poppleton Acquisition, Demolition & Relocation6 General Obligation Bonds $250,000
7 588-933 Uplands Redevelopment (Sites A&B)8 General Obligation Bonds $1,000,000
9 588-935 Healthy Neighborhoods10 General Obligation Bonds $400,000
11 588-983 Demolition of Blighted Structures12 General Funds $1,000,000
13 588-986 Housing Repair Assistance Programs14 Community Development Block Grants $1,500,000 15 General Obligation Bonds $1,000,000
16 588-989 Loan Repayment17 Community Development Block Grants $1,361,000
18 588-996 Land Management - City Owned Property19 General Obligation Bonds $650,000
20 M-R: Baltimore City Public Schools
21 417-005 Programmatic Space Upgrades22 General Obligation Bonds $500,0002324 417-212 Systemic Improvements (FY 2022-2027)25 General Obligation Bonds $16,107,000
26 418-010 Maree G. Farring EM #20327 General Obligation Bonds $1,143,000
28 418-177 Armistead Gardens ES # 24329 General Obligation Bonds $1,250,000
30 M-R: Office of Information and Technology
31 117-029 Citywide Cyber-Security Systems Upgrades32 General Funds $400,000
33 117-041 Citywide Agencies Network Cabling and Wiring Upgrade34 General Funds $650,000
dlr21-0498(4)~3rd/08Jun21OrdEstFY22/21-0080~3rd Reader/Finance:DLR:td:td - 25 -
Fiscal 2022 Summary of the Adopted Budget APPENDIX
269

Council Bill 21-0080
1 117-046 Citywide Data Center Fiber Divergence2 General Funds $1,475,000
3 117-048 Replace Unmanaged Network Hubs, Cables and Switches 4 General Funds $500,000
5 117-054 Remediation of End of Life Systems 6 General Funds $400,000
7 117-055 T1 Migration to Ethernet 8 General Funds $450,000
9 117-057 Replace End-of-Support (EOS) Network Phase 2 10 General Funds $375,000
11 117-058 Broadband Connectivity for Public Housing Development 12 General Funds $1,000,000
13 117-059 Application Integration Upgrade 14 General Funds $400,000
15 117-060 Upgrade Baltimore City's Resident Web Access 16 General Funds $675,000
17 117-061 Upgrade Mainframe Components to Modern and Flexible Computing Platforms18 General Funds $300,000
19 117-062 Upgrade Network Management Software 20 General Funds $375,000
21 Mayoralty-Related
22 127-021 INSPIRE Plan Implementation 23 General Obligation Bonds $500,000
24 127-063 Maryland Science Center Kids Room Exhibit Elevator 25 General Obligation Bonds $75,000
26 127-070 National Aquarium Glass Pyramid Repair 27 General Obligation Bonds $200,000
28 127-071 Peale Center Interior Renovations 29 General Obligation Bonds $100,000
30 127-091 Middle Branch Master Plan 31 Other State Funds $500,000
32 127-092 Eubie Blake Center Fire Suppression and Related Improvements 33 General Obligation Bonds $180,000
dlr21-0498(4)~3rd/08Jun21OrdEstFY22/21-0080~3rd Reader/Finance:DLR:td:td - 26 -
APPENDIX Fiscal 2022 Summary of the Adopted Budget
270

Council Bill 21-0080
1 127-093 Le Mondo Stabilization, Facade, and Envelope Repair 2 General Obligation Bonds $50,000
3 127-096 USS Contellation Critical Dry Docking 4 General Obligation Bonds $100,000
5 127-097 Strand Theater HVAC Upgrade 6 General Obligation Bonds $50,000
7 127-101 American Visionary Art Museum Electric Switchgear Replacement 8 General Obligation Bonds $90,000
9 127-102 Baltimore Museum of Industry Elevator Repair 10 General Obligation Bonds $50,000
11 127-104 East Baltimore Historical Library 12 General Obligation Bonds $100,000
13 127-107 Baltimore Center Stage Public Restroom Renovation 14 General Obligation Bonds $50,000
15 127-108 Star-Spangled Banner Flag House Wall Reconstruction and Survey 16 General Obligation Bonds $100,000
17 127-109 Walters Art Museum Roof Replacement 18 General Obligation Bonds $150,000
19 127-110 Baltimore National Heritage Area FY22 Small Capital Grant Program 20 General Obligation Bonds $100,000
21 127-112 MOHS Shelter Improvements 22 General Obligation Bonds $900,000
23 127-113 Penn Station redevelopment 24 Other State Funds $4,000,000
25 127-114 Waverly Community greenspace 26 Other State Funds $250,000
27 Planning
28 188-004 Critical Area Buffer Program 29 Critical Area Buffer Offset Funds ($670,000)
30 188-005 Critical Area Stormwater Program 31 Critical Area Stormwater Management Funds ($591,000)
dlr21-0498(4)~3rd/08Jun21OrdEstFY22/21-0080~3rd Reader/Finance:DLR:td:td - 27 -
Fiscal 2022 Summary of the Adopted Budget APPENDIX
271
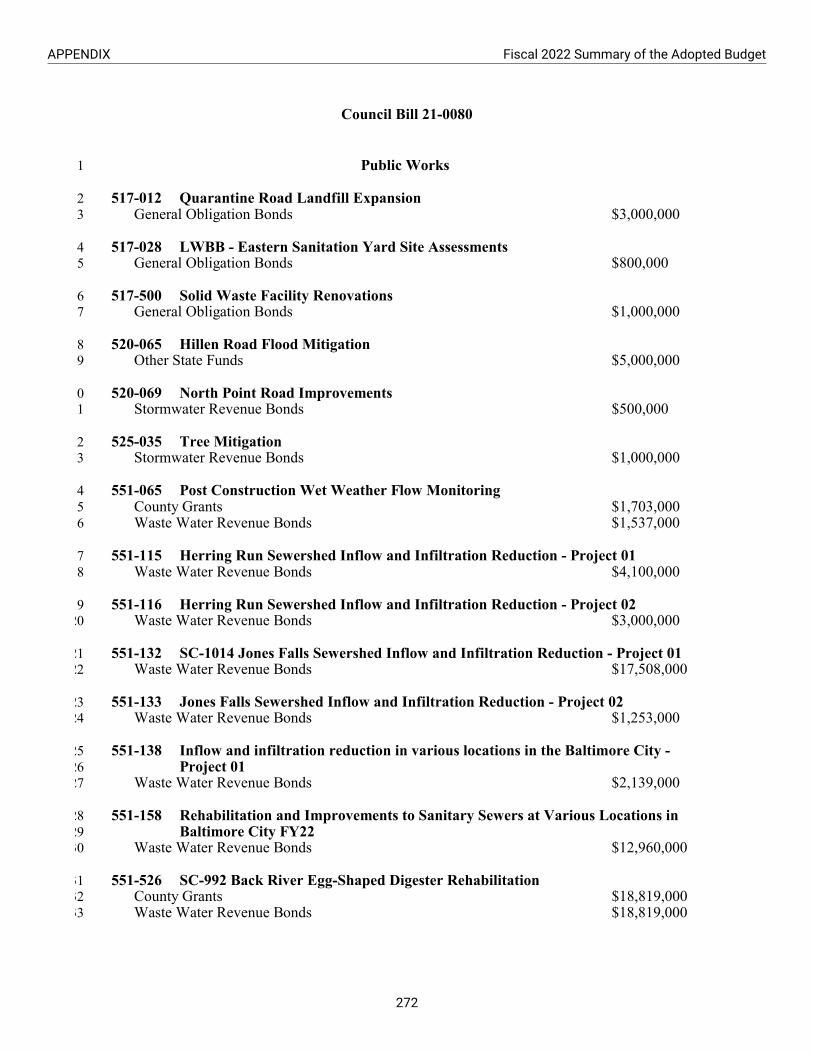
Council Bill 21-0080
1 Public Works
2 517-012 Quarantine Road Landfill Expansion 3 General Obligation Bonds $3,000,000
4 517-028 LWBB - Eastern Sanitation Yard Site Assessments 5 General Obligation Bonds $800,000
6 517-500 Solid Waste Facility Renovations 7 General Obligation Bonds $1,000,000
8 520-065 Hillen Road Flood Mitigation 9 Other State Funds $5,000,000
10 520-069 North Point Road Improvements 11 Stormwater Revenue Bonds $500,000
12 525-035 Tree Mitigation 13 Stormwater Revenue Bonds $1,000,000
14 551-065 Post Construction Wet Weather Flow Monitoring 15 County Grants $1,703,00016 Waste Water Revenue Bonds $1,537,000
17 551-115 Herring Run Sewershed Inflow and Infiltration Reduction - Project 01 18 Waste Water Revenue Bonds $4,100,000
19 551-116 Herring Run Sewershed Inflow and Infiltration Reduction - Project 02 20 Waste Water Revenue Bonds $3,000,000
21 551-132 SC-1014 Jones Falls Sewershed Inflow and Infiltration Reduction - Project 01 22 Waste Water Revenue Bonds $17,508,000
23 551-133 Jones Falls Sewershed Inflow and Infiltration Reduction - Project 02 24 Waste Water Revenue Bonds $1,253,000
25 551-138 Inflow and infiltration reduction in various locations in the Baltimore City - 26 Project 0127 Waste Water Revenue Bonds $2,139,000
28 551-158 Rehabilitation and Improvements to Sanitary Sewers at Various Locations in 29 Baltimore City FY22 30 Waste Water Revenue Bonds $12,960,000
31 551-526 SC-992 Back River Egg-Shaped Digester Rehabilitation 32 County Grants $18,819,000 33 Waste Water Revenue Bonds $18,819,000
dlr21-0498(4)~3rd/08Jun21OrdEstFY22/21-0080~3rd Reader/Finance:DLR:td:td - 28 -
APPENDIX Fiscal 2022 Summary of the Adopted Budget
272

Council Bill 21-0080
1 551-609 SC-866 Southwest Diversion Pressure Sewer Improvements2 County Grants $7,344,000 3 Waste Water Revenue Bonds $7,056,000
4 557-011 Washington Boulevard Pump Station Rehabilitation5 Water Revenue Bonds $7,694,000
6 557-036 Curtis Bay Tank Rehabilitation7 County Grants $3,615,000 8 Water Revenue Bonds $3,615,000
9 557-051 Montebello Lake Dredging10 County Grants $9,334,000 11 Water Revenue Bonds $13,997,000
12 557-074 WC-1258|WM Replacement Lambeth Rd, Kimble Et al13 Water Revenue Bonds $10,859,000
14 557-114 WC-1395 Montebello WFP 2 Dehumidification Improvements15 Water Revenue Bonds $533,000
16 557-126 WC-1283 WM Replacement Reisterstown Road Vicinity17 Water Revenue Bonds $12,583,000
18 557-139 WC-1384 Earthen Dam Rehabilitation19 County Grants $5,400,000 20 Water Revenue Bonds $5,400,000
21 557-158 WC-1380 Concrete Dam Rehabilitation22 County Grants $3,450,000 23 Water Revenue Bonds $3,450,000
24 557-159 Madison St 30" Main25 Water Revenue Bonds $5,754,000
26 557-168 WC-1382 Montebello 1 Finished Reservoir Structure Study27 County Grants $1,920,000 28 Water Revenue Bonds $2,880,0002930 557-175 WC-1282|WM Replacement and Rehab at Franklin Square31 Water Revenue Bonds $14,944,000
32 557-220 Program No. 1318 - Program Management Services for City of33 Baltimore's Water Main Replacement Prg 34 Water Revenue Bonds $1,802,000
35 557-223 Watershed Comprehensive Plan36 Water Revenue Bonds $500,000
dlr21-0498(4)~3rd/08Jun21OrdEstFY22/21-0080~3rd Reader/Finance:DLR:td:td - 29 -
Fiscal 2022 Summary of the Adopted Budget APPENDIX
273

Council Bill 21-0080
1 557-233 WC-TBD Urgent Need Water Infrastructure Rehabilitation Phase I FY2022 2 County Grants $8,084,000 3 Water Revenue Bonds $2,111,000
4 557-234 WC-TBD Urgent Need Water Infrastructure Rehabilitation and Improvements- 5 Phase II- FY22 6 County Grants $1,427,000 7 Water Revenue Bonds $8,768,000
8 557-235 WCTBD Urgent Need Water Infrastructure Rehabilitation and Improvements- 9 Phase III- FY22
10 County Grants $1,427,000 11 Water Revenue Bonds $8,768,000
12 557-237 WC TBD: Patapsco Ave and Vicinity Water Main Replacements 13 Water Revenue Bonds $211,000
14 557-238 WC TBD: Woodring Ave and Vicinity Water Main Replacements 15 Water Revenue Bonds $529,000
16 557-239 WC TBD: Mount St and Vicinity Water Main Replacements 17 Water Revenue Bonds $8,586,000
18 557-240 WC TBD: Gibbons Ave and Vicinity Water Main Replacements 19 Water Revenue Bonds $426,000
20 557-241 WC1418 Yale Heights Water Main Replacement 21 Water Revenue Bonds $433,000
22 557-242 WC1417 Ridgely's Delight Water Main Replacement 23 Water Revenue Bonds $373,000
24 557-243 WC-1416 E. Madison St. and Vicinity Water Main Replacement 25 Water Revenue Bonds $155,000
26 557-244 WC-TBD Water Main Replacements Various Locations 27 Water Revenue Bonds $637,000
28 557-245 WC-TBD: Perkins Development Water Main Replacements 29 Water Revenue Bonds $222,000
30 557-246 WC TBD: Patterson Park East Vicinity Water Main Replacements 31 Water Revenue Bonds $886,000
32 557-247 WC TBD: Walker Ave and Vicinity Water Main Replacements 33 Water Revenue Bonds $529,000
34 557-249 Belair Road 24" Water Main 35 Water Revenue Bonds $1,943,000
dlr21-0498(4)~3rd/08Jun21OrdEstFY22/21-0080~3rd Reader/Finance:DLR:td:td - 30 -
APPENDIX Fiscal 2022 Summary of the Adopted Budget
274

Council Bill 21-0080
1 557-696 Chlorine Handling Safety Improvements WC-13272 County Grants $7,372,000 3 Water Revenue Bonds $11,058,000
4 Recreation and Parks
5 474-017 Riverside Athletic Field Renovation6 General Obligation Bonds $100,000 7 State Open Space Matching Grants $300,000
8 474-039 Park Maintenance Facility (Gwynns Falls)9 General Obligation Bonds $100,000
10 474-051 Winans Meadow Nature Center11 General Obligation Bonds $150,000
12 474-052 Druid Hill Park: Reptile House13 General Obligation Bonds $100,000
14 474-067 Pimlico Safety Academy Field15 Pimlico Area Local Impact Aid - VLT Revenue $150,000
16 474-073 Park Field House Renovations17 General Obligation Bonds $275,000 18 State Open Space Matching Grants $800,000
19 474-078 Federal Hill Slope Stabilization20 State Open Space Grants $350,000
21 474-079 Bocek Park Athletic Center (ESA, Gym & BB Court)22 State Open Space Grants $600,000
23 474-085 Patterson Boat Lake24 General Obligation Bonds $100,000 25 State Open Space Matching Grants $300,000
26 474-095 Gwynns Falls Athletic Field Renovation27 General Obligation Bonds $100,000 28 Other State Funds $1,750,000 29 State Open Space Matching Grants $300,000
30 474-097 Fred B. Leidig Field & Field House31 Other State Funds $500,000
32 474-106 Druid Hill Park Lake - Phase I Design33 State Open Space Grants $400,000
34 474-114 CHOICE Neighborhood Recreation Facilities - Chick Webb Rec. Center35 General Obligation Bonds $2,650,000 36 Other State Funds $500,000
dlr21-0498(4)~3rd/08Jun21OrdEstFY22/21-0080~3rd Reader/Finance:DLR:td:td - 31 -
Fiscal 2022 Summary of the Adopted Budget APPENDIX
275

Council Bill 21-0080
1 State Open Space Grants $600,000 2 State Open Space Matching Grants $750,000
3 474-116 Walter P Carter Pool4 General Obligation Bonds $400,000
5 474-121 Reedbird Park Improvements Phase II6 General Obligation Bonds $250,000 7 Other State Funds $4,000,000 8 State Open Space Matching Grants $750,000
9 474-122 CC Jackson Park Expansion10 Pimlico Area Local Impact Aid - VLT Revenue $1,000,000
11 474-126 Park Trail Improvements12 General Obligation Bonds $150,000
13 474-128 Tree Baltimore14 General Obligation Bonds $100,000
15 474-130 Pool Improvements16 General Obligation Bonds $1,500,000 17 Other State Funds $3,000,000
18 474-133 Easterwood Park Improvements19 General Obligation Bonds $350,000 20 Other State Funds $500,000
21 474-135 Garrett Park Improvements22 General Obligation Bonds $100,000
23 474-146 Park Building Renovations24 General Obligation Bonds $1,000,000
25 474-147 Parkview Recreation Center (Design)26 General Obligation Bonds $400,000 27 Other State Funds $1,500,000
28 474-148 Dewees Park Improvements29 State Open Space Grants $250,000
30 474-149 Middle Branch Park31 Other State Funds ($500,000)
32 474-150 J.D Gross Recreation Center33 Pimlico Area Local Impact Aid - VLT Revenue $300,000
34 474-151 Comprehensive Plan35 General Obligation Bonds $300,000
dlr21-0498(4)~3rd/08Jun21OrdEstFY22/21-0080~3rd Reader/Finance:DLR:td:td - 32 -
APPENDIX Fiscal 2022 Summary of the Adopted Budget
276
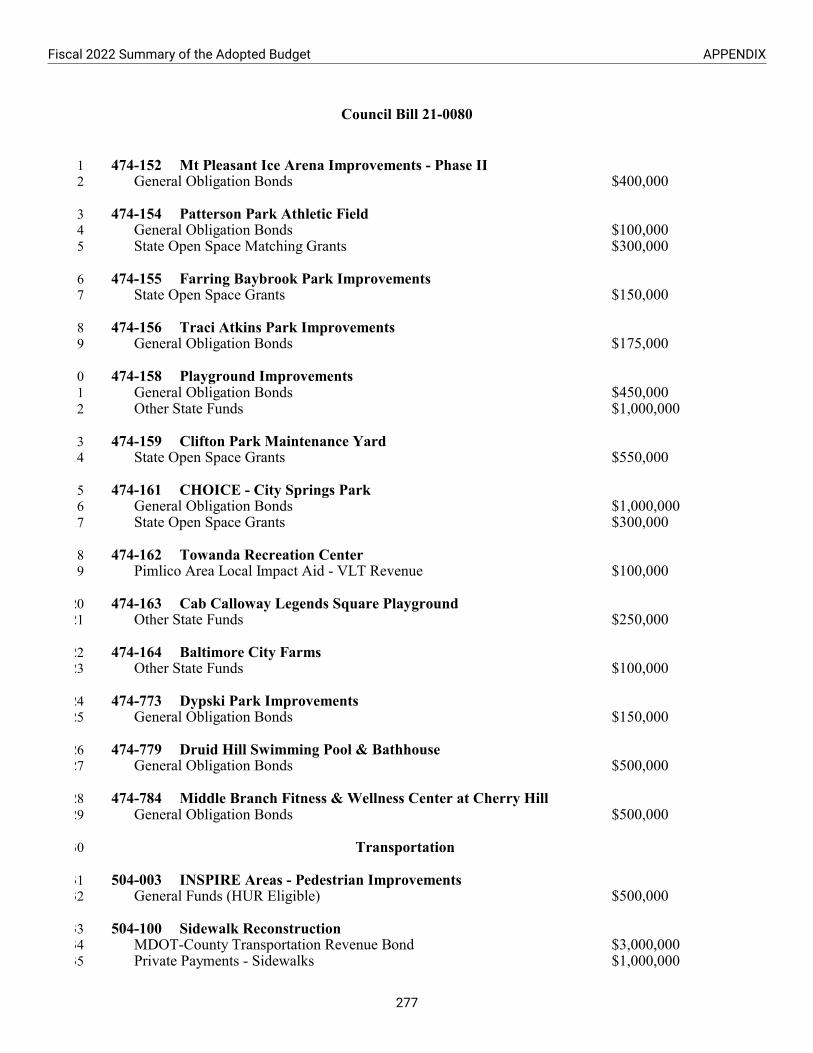
Council Bill 21-0080
1 474-152 Mt Pleasant Ice Arena Improvements - Phase II 2 General Obligation Bonds $400,000
3 474-154 Patterson Park Athletic Field 4 General Obligation Bonds $100,0005 State Open Space Matching Grants $300,000
6 474-155 Farring Baybrook Park Improvements 7 State Open Space Grants $150,000
8 474-156 Traci Atkins Park Improvements 9 General Obligation Bonds $175,000
10 474-158 Playground Improvements 11 General Obligation Bonds $450,000 12 Other State Funds $1,000,000
13 474-159 Clifton Park Maintenance Yard 14 State Open Space Grants $550,000
15 474-161 CHOICE - City Springs Park 16 General Obligation Bonds $1,000,000 17 State Open Space Grants $300,000
18 474-162 Towanda Recreation Center 19 Pimlico Area Local Impact Aid - VLT Revenue $100,000
20 474-163 Cab Calloway Legends Square Playground 21 Other State Funds $250,000
22 474-164 Baltimore City Farms 23 Other State Funds $100,000
24 474-773 Dypski Park Improvements 25 General Obligation Bonds $150,000
26 474-779 Druid Hill Swimming Pool & Bathhouse 27 General Obligation Bonds $500,000
28 474-784 Middle Branch Fitness & Wellness Center at Cherry Hill 29 General Obligation Bonds $500,000
30 Transportation
31 504-003 INSPIRE Areas - Pedestrian Improvements 32 General Funds (HUR Eligible) $500,000
33 504-100 Sidewalk Reconstruction 34 MDOT-County Transportation Revenue Bond $3,000,000 35 Private Payments - Sidewalks $1,000,000
dlr21-0498(4)~3rd/08Jun21OrdEstFY22/21-0080~3rd Reader/Finance:DLR:td:td - 33 -
Fiscal 2022 Summary of the Adopted Budget APPENDIX
277

Council Bill 21-0080
1 504-200 Alley Reconstruction2 General Funds (HUR Eligible) $800,000 3 Private Payments - Alleys $200,000
4 506-007 Waterview Avenue over Ramp to 295 Bridge Replacement (BC5403)5 Federal Highway Transportation Funds $735,000 6 General Obligation Bonds $180,000
7 506-011 Brehms Lane over Herring Run Bridge Replacement (BC4501)8 Federal Highway Transportation Funds $600,000 9 General Obligation Bonds $150,000
10 506-017 Harford Road Bridge Over CSX11 Federal Highway Transportation Funds $1,750,000
12 506-754 Annual Urgent Needs Bridge Repairs13 MDOT-County Transportation Revenue Bond $1,000,000
14 506-761 Remington Ave Bridge Over Stoney Run (BC 3456)15 General Obligation Bonds $950,000
16 506-762 Radecke Ave Bridge over Moores Run (BC 4405)17 General Obligation Bonds $150,000
18 507-003 Russell Street Bridge (BC 5103) & Monroe Street Ramp (BC 5221) over CSX19 Federal Highway Transportation Funds $8,578,000 20 General Obligation Bonds $1,670,000
21 508-019 Citywide Bike and Pedestrian Improvements / Bike Master Plan22 General Obligation Bonds $500,000
23 508-029 Materials and Compliance Testing24 General Obligation Bonds $150,000
25 508-044 Rehabilitation of 25th Street - Greenmount Ave to Kirk Ave26 Federal Highway Transportation Funds $1,262,000 27 General Obligation Bonds $118,000
28 508-046 Park Heights Avenue from W. Rogers Avenue to Strathmore Avenue29 Federal Highway Transportation Funds $2,743,000 30 General Obligation Bonds $118,000
31 508-051 Fremont Avenue Rehabilitation from Lafayette Ave to Presstman32 Federal Highway Transportation Funds $2,148,000 33 General Funds (HUR Eligible) $105,000
34 508-053 Madison Street Rehabilitation from N. Milton Avenue to Edison Highway35 Federal Highway Transportation Funds $680,000 36 General Obligation Bonds $100,000
dlr21-0498(4)~3rd/08Jun21OrdEstFY22/21-0080~3rd Reader/Finance:DLR:td:td - 34 -
APPENDIX Fiscal 2022 Summary of the Adopted Budget
278
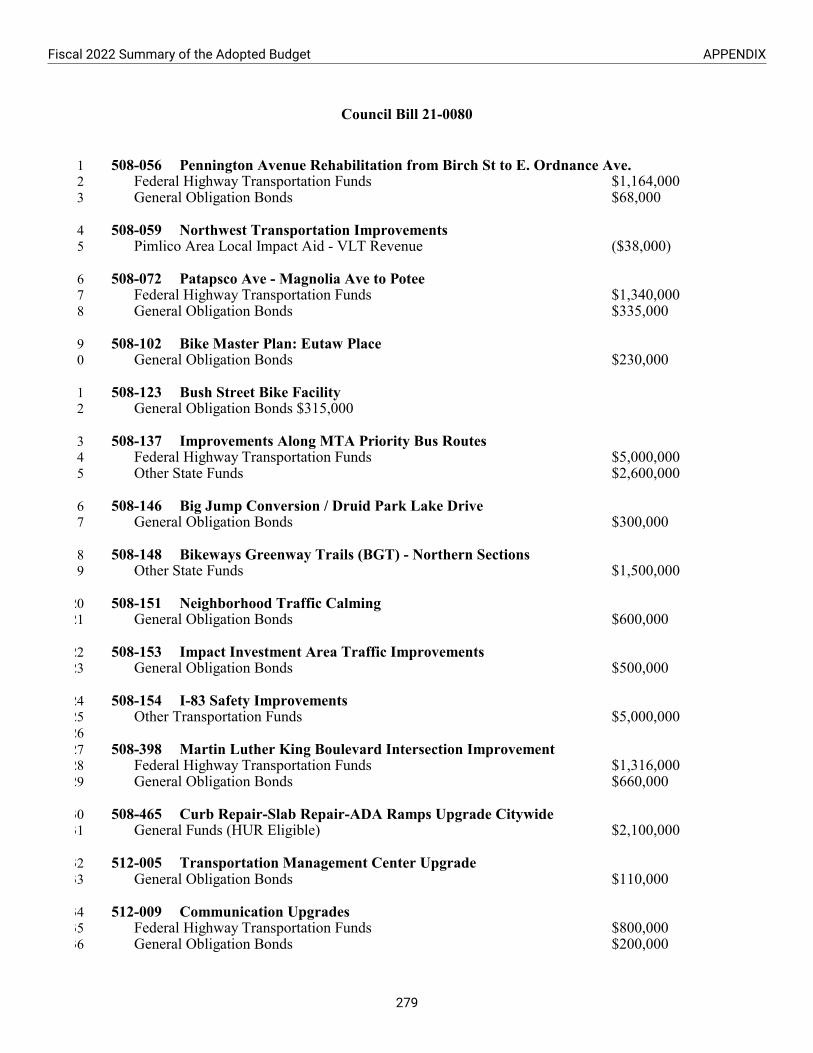
Council Bill 21-0080
1 508-056 Pennington Avenue Rehabilitation from Birch St to E. Ordnance Ave.2 Federal Highway Transportation Funds $1,164,000 3 General Obligation Bonds $68,000
4 508-059 Northwest Transportation Improvements5 Pimlico Area Local Impact Aid - VLT Revenue ($38,000)
6 508-072 Patapsco Ave - Magnolia Ave to Potee7 Federal Highway Transportation Funds $1,340,000 8 General Obligation Bonds $335,000
9 508-102 Bike Master Plan: Eutaw Place10 General Obligation Bonds $230,000
11 508-123 Bush Street Bike Facility12 General Obligation Bonds $315,000
13 508-137 Improvements Along MTA Priority Bus Routes14 Federal Highway Transportation Funds $5,000,000 15 Other State Funds $2,600,000
16 508-146 Big Jump Conversion / Druid Park Lake Drive17 General Obligation Bonds $300,000
18 508-148 Bikeways Greenway Trails (BGT) - Northern Sections19 Other State Funds $1,500,000
20 508-151 Neighborhood Traffic Calming21 General Obligation Bonds $600,000
22 508-153 Impact Investment Area Traffic Improvements23 General Obligation Bonds $500,000
24 508-154 I-83 Safety Improvements25 Other Transportation Funds $5,000,000 2627 508-398 Martin Luther King Boulevard Intersection Improvement28 Federal Highway Transportation Funds $1,316,000 29 General Obligation Bonds $660,000
30 508-465 Curb Repair-Slab Repair-ADA Ramps Upgrade Citywide31 General Funds (HUR Eligible) $2,100,000
32 512-005 Transportation Management Center Upgrade33 General Obligation Bonds $110,000
34 512-009 Communication Upgrades35 Federal Highway Transportation Funds $800,000 36 General Obligation Bonds $200,000
dlr21-0498(4)~3rd/08Jun21OrdEstFY22/21-0080~3rd Reader/Finance:DLR:td:td - 35 -
Fiscal 2022 Summary of the Adopted Budget APPENDIX
279

Council Bill 21-0080
1 512-011 Traffic Mitigation Zone - Southeast2 Other Funds (Not Classified Above) $1,300,000
3 512-015 Towards Zero - Traffic Safety Improvements4 General Funds (HUR Eligible) $1,000,000
5 514-002 Resurfacing JOC - Urgent Needs6 MDOT-County Transportation Revenue Bond $2,000,000
7 514-214 Resurfacing - Northwest8 MDOT-County Transportation Revenue Bond $2,250,000
9 514-215 Resurfacing - Southwest10 MDOT-County Transportation Revenue Bond $2,250,000
11 514-216 Resurfacing - Southeast12 MDOT-County Transportation Revenue Bond $2,250,000
13 514-846 Resurfacing - Northeast14 MDOT-County Transportation Revenue Bond $2,250,000
15 527-008 Belair Rd-Reconstruction (601-007/508-004)16 Federal Highway Transportation Funds $1,500,000
17 527-055 GIS Asset Inventory18 General Obligation Bonds $430,000
19 527-056 Pavement Condition Survey & Pavement Management Information System20 Federal Highway Transportation Funds $384,000 21 General Obligation Bonds $816,000
22 562-001 Reactive Conduit Maintenance23 Private Payments - Conduits $1,000,000
24 562-003 Proactive Conduit Maintenance25 Private Payments - Conduits $1,000,000
26 563-001 Conduit Corridor Construction27 Private Payments - Conduits $3,000,000
28 SECTION 3. AND BE IT FURTHER ORDAINED, That the amounts set forth in Section 2 above29 designated deappropriations and enclosed in parentheses shall revert to the surpluses of the30 respective funds and be available for appropriation by this or subsequent ordinances.
dlr21-0498(4)~3rd/08Jun21OrdEstFY22/21-0080~3rd Reader/Finance:DLR:td:td - 36 -
APPENDIX Fiscal 2022 Summary of the Adopted Budget
280

Council Bill 21-0080
1 SECTION 4. AND BE IT FURTHER ORDAINED, That:
2 (a) The City reasonably expects to reimburse the expenditures described in Subsection (b) of3 this Section with the proceeds of one or more obligations (as such term is used in Treas.4 Reg. Section 1.150-1(b) to be incurred by the City (or any entity controlled by the City5 within the meaning of Treas. Reg. Section 1.150-1). The City intends that this Section of6 this Ordinance of Estimates (as this Ordinance of Estimates may be amended from time7 to time) shall serve as a declaration of the City's reasonable intention to reimburse8 expenditures as required by Treas. Reg. Section 1.150-2 and any successor regulation.
9 (b) The City intends that this declaration will cover all reimbursement of expenditures for10 capital projects or programs approved in the capital budget contained in this Ordinance of11 Estimates to the extent that the City has appropriated in this Ordinance of Estimates to12 pay the cost thereof from one or more obligations to be issued by the City (or any entity13 controlled by the City within the meaning of Treas. Reg. Section 1.150-1). The term14 "obligation" (as such term is defined in Treas. Reg. Section 1.150(b) and as used in this15 Section) includes general obligation bonds and notes, revenue bonds and notes, leases,16 conditional purchase agreements and other obligations of the City (or any entity17 controlled by the City within the meaning of Treas. Reg. Section 1.150-1).
18 (c) The maximum anticipated debt expected to be incurred by the City to reimburse the cost19 of each capital project or program in this Ordinance of Estimates is the applicable20 appropriation listed in this Ordinance of Estimates from the proceeds of one or more21 obligations, as such appropriations may be increased or decreased.
22 SECTION 5. AND BE IT FURTHER ORDAINED, That the foregoing appropriations in summary23 consist of:
24 FUND NAME OPERATING CAPITAL TOTAL
25 General $1,992,751,000 $15,000,000 $2,007,751,000 26 Conduit Enterprise $13,029,924 $5,000,000 $18,029,924 27 Wastewater Utility $302,786,191 $0 $302,786,191 28 Water Utility $212,443,211 $0 $212,443,211 29 Stormwater Utility $34,087,912 $0 $34,087,912 30 Parking Enterprise $22,459,496 $0 $22,459,496 31 Parking Management $26,908,079 $0 $26,908,079 32 Federal $937,263,151 $39,668,000 $976,931,151 33 State $164,840,575 $52,152,000 $216,992,575 34 Special Revenue $131,742,175 $0 $131,742,175 35 Special Grant Funds $5,165,772 $295,752,000* $300,917,772 36 General Obligation Bonds $0 $80,000,000 $80,000,000
37 GRAND TOTAL $3,843,477,486 $487,572,000 $4,331,049,486
38 *Consisting of:39 Capital Revenue Bonds $199,518,000.0040 County Transportation Bonds $15,000,000.0041 Other $81,234,000.0042 GRAND TOTAL $295,752,000.00
dlr21-0498(4)~3rd/08Jun21OrdEstFY22/21-0080~3rd Reader/Finance:DLR:td:td - 37 -
Fiscal 2022 Summary of the Adopted Budget APPENDIX
281
Council Bill 21-0080
1 Approved by the Board of Estimates:
2 ___________________________________3 President
4 ___________________________________5 Mayor
6 ___________________________________7 Comptroller
8 ___________________________________9 Acting Director of Public Works
10 ___________________________________11 City Solicitor
12 BOARD OF ESTIMATES
13 APPROVED BY THE BOARD OF ESTIMATES
14 ___________________________________15 PRESIDENT
16 ___________________________________17 MAYOR
18 ___________________________________19 COMPTROLLER
20 ___________________________________21 ACTING DIRECTOR OF PUBLIC WORKS
22 ___________________________________23 CITY SOLICITOR
24 BOARD OF ESTIMATES
25 _____________________________26 DATE
27 ______________________________28 CLERK
dlr21-0498(4)~3rd/08Jun21OrdEstFY22/21-0080~3rd Reader/Finance:DLR:td:td - 38 -
APPENDIX Fiscal 2022 Summary of the Adopted Budget
282

Council Bill 21-0080
Certified as duly passed this _____ day of _____________, 20___
_____________________________________President, Baltimore City Council
Certified as duly delivered to His Honor, the Mayor,
this _____ day of _____________, 20___
_____________________________________Chief Clerk
Approved this _____ day of _____________, 20___
_____________________________________Mayor, Baltimore City
dlr21-0498(4)~3rd/08Jun21OrdEstFY22/21-0080~3rd Reader/Finance:DLR:td:td - 39 -
8 June 21
8 June 21
Natawna B. Austin
Approved for Form and Legal Sufficiency. This 8th Day of June, 2021.
i� 'i. bi..P� Chief Solicitor
J t) h '--�
-!-
L
Fiscal 2022 Summary of the Adopted Budget APPENDIX
283

Annual Property Tax Ordinance
284

Fiscal 2022 Summary of the Adopted Budget APPENDIX
285

Supplemental Appropriations and Transfers
Expenditures for each adopted annual budget may not legally exceed appropriations at the agency level. Ad-ministratively, the Department of Finance has the authority to transfer appropriations between activities withinthe same program of an agency. The Board of Estimates has the authority to transfer appropriations betweenprograms within the same agency. Only the City Council can authorize the transfer of appropriations betweenagencies.
The City Charter permits further appropriations for programs included in the original Ordinance of Estimatesmadenecessary by material changes in circumstances, additional appropriations for new programs, or grant awardsthat could not be reasonably anticipated when formulating the original Ordinance of Estimates. These changesrequire supplemental appropriation ordinances recommended by the Board of Estimates and ordained by the CityCouncil.
Due to the COVID-19 pandemic, the City incurred new expenses in an attempt to both control the spread of thevirus and to minimize the economic hardships to its residents. These expenses included costs to maintain coreCity services, health response expenses, isolation and quarantine for vulnerable populations, resident assistanceprograms for food and rental assistance, and small business support. Fiscal 2021 closeout required 27 supple-mental appropriations to ensure a balanced budget. These actions were funded by local revenue sources and fed-eral Coronoavirus Aid, Relief, and Economic Security (CARES) Act and Federal Emergency Management Agency(FEMA) funding.
The Fiscal 2021 Operating Budget was amended with the following supplementals and/or transfers:
Ordinance Agency AppropriationAction
Amount Reason
General Fund21-0126 Board of Elections Supplemental 600,000 Action required to balance the
agency budget due to variances frombudget resulting from the COVID-19pandemic, specifically printing andsecurity expenses.
21-0127 Department ofGeneral Services
Supplemental 600,000 Action required to balance theagency budget due to variances frombudget resulting from the COVID-19pandemic, specifically securityexpenses.
21-0128 Department ofGeneral Services
Supplemental 12,383 Action required to balance theagency budget due to variances frombudget resulting from the COVID-19pandemic, specifically buildingimprovement expenses.
21-0129 Department ofGeneral Services
Supplemental 3,100,000 Action required to balance theagency budget due to variances frombudget resulting from the COVID-19pandemic, specifically food securityprogram expenses.
286
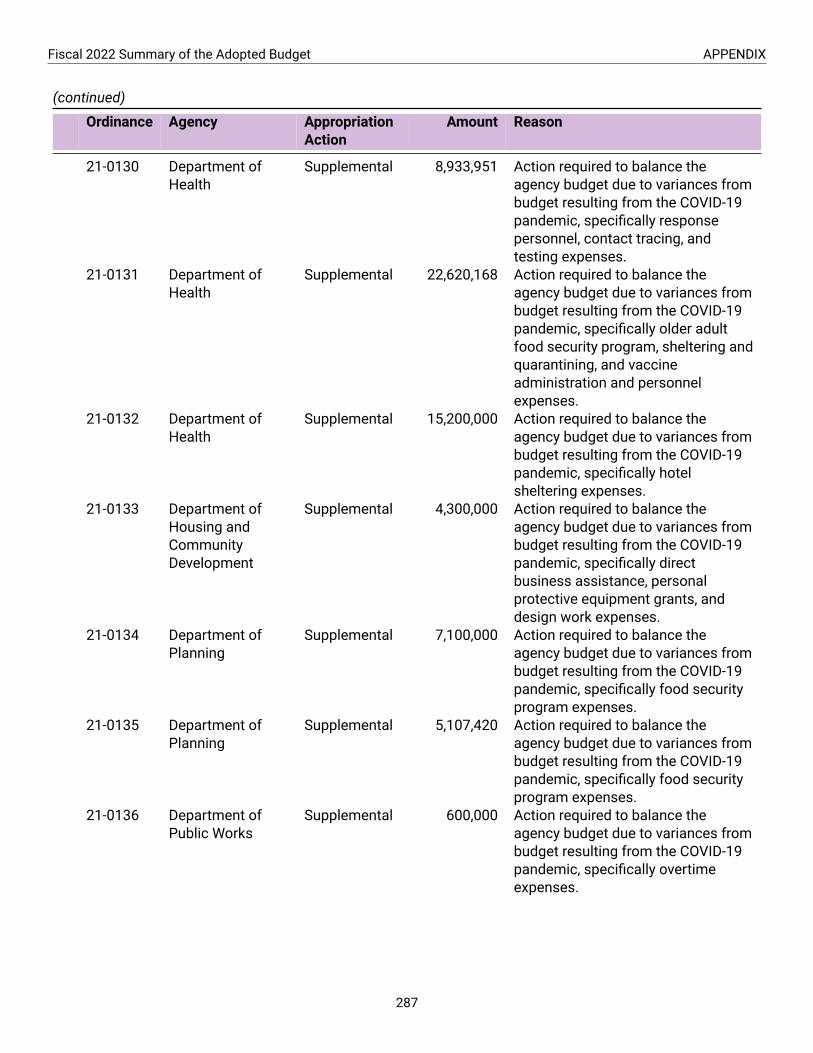
Fiscal 2022 Summary of the Adopted Budget APPENDIX
(continued)
Ordinance Agency AppropriationAction
Amount Reason
21-0130 Department ofHealth
Supplemental 8,933,951 Action required to balance theagency budget due to variances frombudget resulting from the COVID-19pandemic, specifically responsepersonnel, contact tracing, andtesting expenses.
21-0131 Department ofHealth
Supplemental 22,620,168 Action required to balance theagency budget due to variances frombudget resulting from the COVID-19pandemic, specifically older adultfood security program, sheltering andquarantining, and vaccineadministration and personnelexpenses.
21-0132 Department ofHealth
Supplemental 15,200,000 Action required to balance theagency budget due to variances frombudget resulting from the COVID-19pandemic, specifically hotelsheltering expenses.
21-0133 Department ofHousing andCommunityDevelopment
Supplemental 4,300,000 Action required to balance theagency budget due to variances frombudget resulting from the COVID-19pandemic, specifically directbusiness assistance, personalprotective equipment grants, anddesign work expenses.
21-0134 Department ofPlanning
Supplemental 7,100,000 Action required to balance theagency budget due to variances frombudget resulting from the COVID-19pandemic, specifically food securityprogram expenses.
21-0135 Department ofPlanning
Supplemental 5,107,420 Action required to balance theagency budget due to variances frombudget resulting from the COVID-19pandemic, specifically food securityprogram expenses.
21-0136 Department ofPublic Works
Supplemental 600,000 Action required to balance theagency budget due to variances frombudget resulting from the COVID-19pandemic, specifically overtimeexpenses.
287

APPENDIX Fiscal 2022 Summary of the Adopted Budget
(continued)
Ordinance Agency AppropriationAction
Amount Reason
21-0137 Department ofPublic Works
Supplemental 1,630,016 Action required to balance theagency budget due to variances frombudget resulting from the COVID-19pandemic, specifically solid wastecontractor and collection routingsoftware expenses.
21-0138 Fire Department Supplemental 2,350,000 Action required to balance theagency budget for the cost ofoperating two fire suppressioncompanies.
21-0139 Fire Department Supplemental 114,009 Action required to balance theagency budget due to variances frombudget resulting from the COVID-19pandemic, specifically first responderquarantine expenses.
21-0140 Fire Department Supplemental 12,684,471 Action required to balance theagency budget due to variances frombudget resulting from the COVID-19pandemic, specifically emergencymedical services, personal protectiveequipment, and buildingimprovement expenses.
21-0141 Liquor LicenseBoard
Supplemental 104,264 Action required to balance theagency budget due to variances frombudget resulting from the COVID-19pandemic, specifically teleworktechnology expenses.
21-0142 Mayoralty Supplemental 50,305 Action required to balance theagency budget due to variances frombudget resulting from the COVID-19pandemic, specifically communityoutreach expenses.
21-0143 Mayoralty-Related:Civic Promotion
Supplemental 5,000,000 Action required to balance theagency budget due to variances frombudget resulting from the COVID-19pandemic, specifically tourismsupport and messaging expenses.
21-0144 Mayoralty-Related:Convention CenterHotel
Supplemental 2,500,000 Action required to balance theagency budget due to variances frombudget resulting from the COVID-19pandemic, specifically debt serviceexpenses.
288

Fiscal 2022 Summary of the Adopted Budget APPENDIX
(continued)
Ordinance Agency AppropriationAction
Amount Reason
21-0145 Mayoralty-Related:ConventionComplex
Supplemental 1,499,510 Action required to balance theagency budget due to variances frombudget resulting from the COVID-19pandemic, specifically building safetyand technology improvementexpenses.
21-0146 Mayoralty-Related:EducationalGrants
Supplemental 4,000,000 Action required to balance theagency budget due to variances frombudget resulting from the COVID-19pandemic, specifically childcareprovider support expenses.
21-0147 Mayoralty-Related:MiscellaneousGeneral Expenses
Supplemental 7,002,637 Action required to balance theagency budget due to variances frombudget resulting from the COVID-19pandemic, specifically technologyupgrades, nonprofit grants, and costtracking and compliance expenses.
21-0148 Mayoralty-Related:Office of Childrenand FamilySuccess
Supplemental 7,383,249 Action required to balance theagency budget due to variances frombudget resulting from the COVID-19pandemic, specifically evictionprevention program expenses.
21-0149 Mayoralty-Related:Office ofInformation andTechnology
Supplemental 857,509 Action required to balance theagency budget due to variances frombudget resulting from the COVID-19pandemic, specifically teleworktechnology and temperaturescreening software expenses.
21-0150 Mayoralty-Related:Office of theInspector General
Supplemental 400,000 Action required to balance theagency budget due to variances frombudget resulting from unbudgetedpositions.
21-0151 Police Department Supplemental 6,500,000 Action required to balance theagency budget due to variances frombudget resulting from the COVID-19pandemic, specifically overtimeexpenses.
289
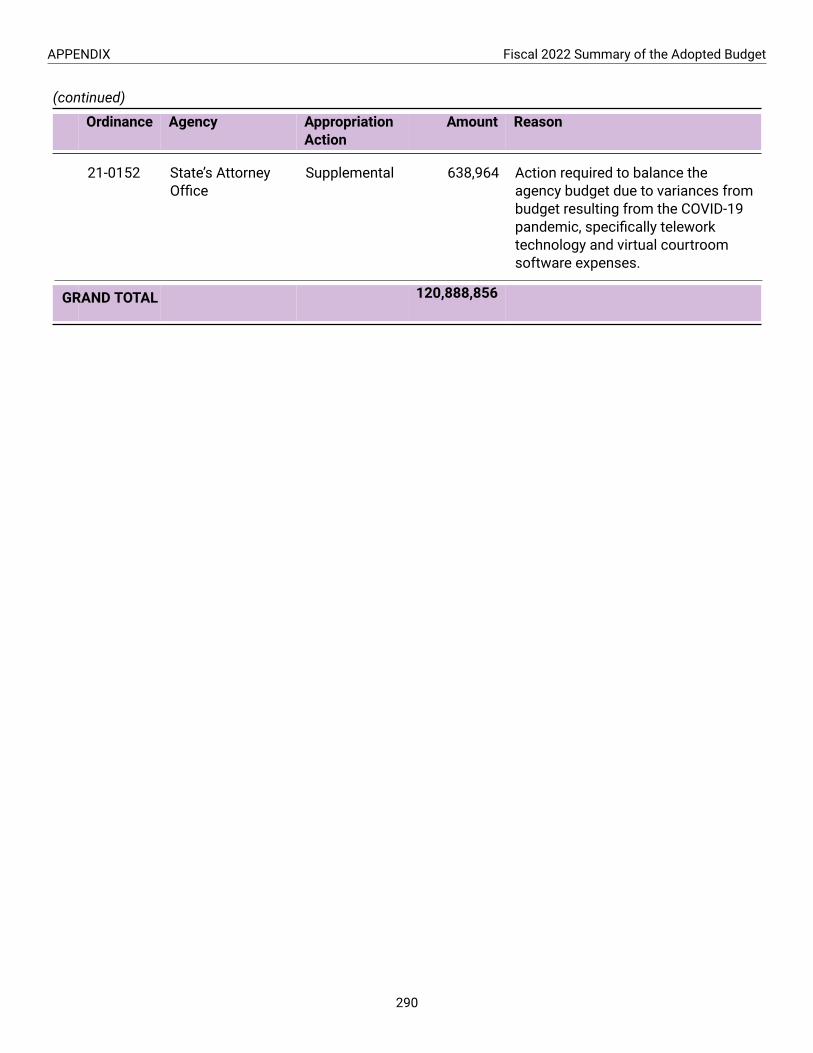
APPENDIX Fiscal 2022 Summary of the Adopted Budget
(continued)
Ordinance Agency AppropriationAction
Amount Reason
120,888,856
290
21-0152 State’s AttorneyOffice
Supplemental 638,964 Action required to balance theagency budget due to variances frombudget resulting from the COVID-19pandemic, specifically teleworktechnology and virtual courtroomsoftware expenses.
GRAND TOTAL

Excerpts from the Charter of Baltimore City (2018 Edition) relative to budget authority, the budget process, and the Ordinance of Estimates.
ARTICLE VI BOARD OF ESTIMATES
§ 1. Establishment and organization.
(a) In general.
There shall be a Board of Estimates composed of the Mayor, President of the City Council,Comptroller, City Solicitor, and Director of Public Works, none of whom shall receive anyadditional salary as members of the Board.
The President of the City Council shall be President of the Board, and one of the members shallact as Secretary.
The Board may employ such employees as may be necessary to discharge its duties; theirnumber and compensation shall be fixed in the Ordinance of Estimates.
(b) Meetings.
The first meeting of the Board in every year shall be called by notice from the Mayor orPresident of the City Council personally served upon members of the Board. Subsequentmeetings shall be called as the Board may direct.
(c) Representatives.
If a member is unable to attend a Board meeting, that member’s representative, as designated inthe Charter, may attend and exercise the powers of the member. The Mayor may designate amunicipal officer or member of the Mayor’s personal staff to represent the Mayor and exercisethe Mayor’s power at Board meetings in the Mayor’s absence.
§ 2. Powers and duties.
The Board of Estimates shall formulate and execute the fiscal policy of the City to the extent, and inthe manner provided for, in the Charter. To exercise its powers and perform its duties, the Board may promulgate rules and regulations and summon before it the heads of departments, bureaus or divisions, municipal officers, and members of commissions and boards.
§ 3. Fiscal year; Budget schedule.
(a) Fiscal year.
The fiscal, budget, and accounting year of the City shall begin on the first day of July and end onthe thirtieth day of June in every year unless otherwise provided by law.
(b) Notice and hearing.
At least thirty days prior to the adoption by the Board of Estimates of a proposed Ordinance ofEstimates the Board shall make public the Director of Finance’s recommended operating budget,the Planning Commission’s recommended capital budget and long-range capital improvement
Budgetary Authority and Process
291

program, and the reports of the Director of Finance and Planning Commission on these documents.
Thereafter, the Board shall hold public hearings at which members of the City Council, heads of municipal agencies, and citizens shall have the opportunity to appear before the Board to speak for or against the inclusion of any appropriation in the proposed Ordinance of Estimates.
(c) Submission to Council.
The Board of Estimates shall submit to the City Council the proposed Ordinance of Estimates forthe next fiscal year at least forty-five days before the beginning of that fiscal year.
(d) Adoption by Council.
The City Council shall have at least forty days after receipt of the Board’s proposed Ordinanceof Estimates to enact an Ordinance of Estimates. The City Council shall adopt an Ordinance ofEstimates at least five days prior to the beginning of the fiscal year to which it is applicable if theBoard of Estimates submits its proposed Ordinance of Estimates within the period prescribed bySection 3(c).
§ 4. Assistance from Finance Director and Planning Commission.
To assist the Board of Estimates in the preparation of the proposed Ordinance of Estimates:
(a) Recommendations on agency estimates.
The Director of Finance shall submit for the consideration of the Board a recommendedoperating budget, which shall include the estimates submitted by the municipal agencies for thenext fiscal year, the recommendations of the Director of Finance thereon, and all other estimatesfor appropriations to be made in the next fiscal year, other than for capital improvements;provided, however, the estimates for the Fire Department shall include such amounts, if any, asmay be determined by a final decision of a board of arbitration convened to arbitrate unresolvednegotiations between the City and the certified employee organizations representing the firefighters and fire officers, as prescribed by existing Section 53 of Article VII.
(b) Recommendations on capital budget, etc.
The Planning Commission shall submit for the consideration of the Board a recommendedcapital budget, a recommended long-range capital improvement program, and a report on both.The Director and Board of Finance shall review the recommended capital budget and program,and make a report and recommendations about both to the Board of Estimates.
§ 5. Preparation of proposed Ordinance of Estimates.
(a) Contents.
After receiving the recommendations of the Department of Finance and the PlanningCommission, the Board shall prepare its proposed Ordinance of Estimates, which shall consistof:
APPENDIX Fiscal 2022 Summary of the Adopted Budget
292
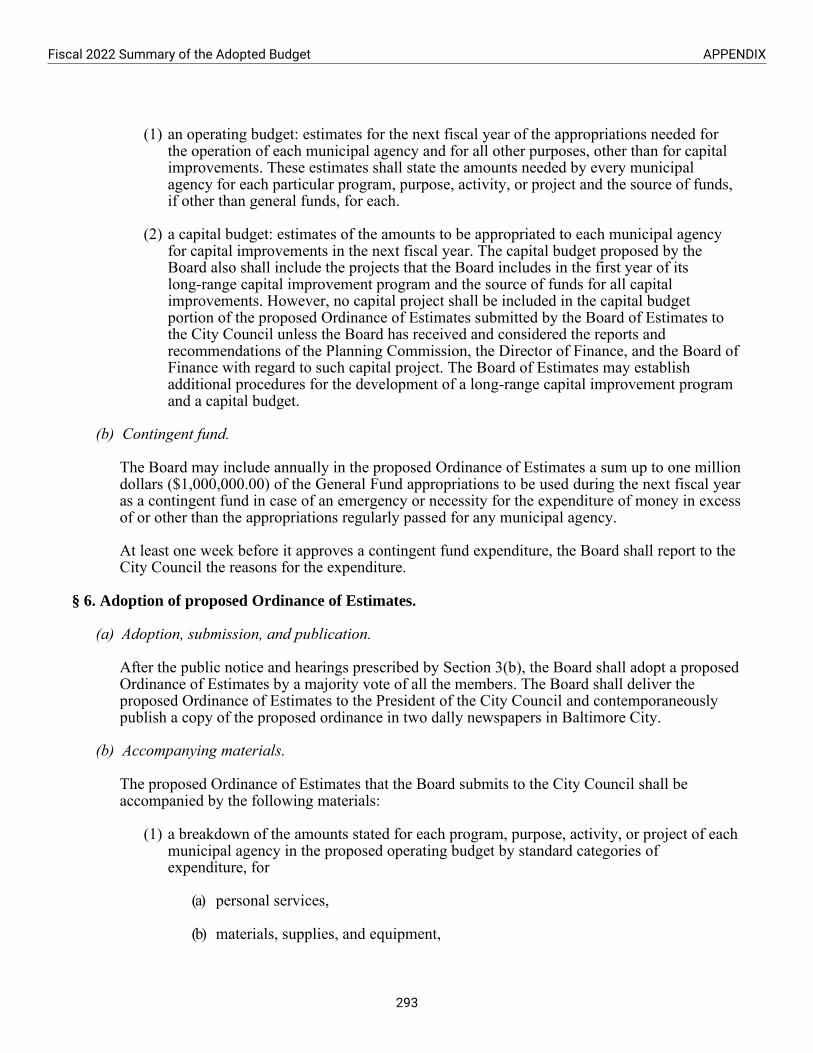
(1) an operating budget: estimates for the next fiscal year of the appropriations needed forthe operation of each municipal agency and for all other purposes, other than for capitalimprovements. These estimates shall state the amounts needed by every municipalagency for each particular program, purpose, activity, or project and the source of funds,if other than general funds, for each.
(2) a capital budget: estimates of the amounts to be appropriated to each municipal agencyfor capital improvements in the next fiscal year. The capital budget proposed by theBoard also shall include the projects that the Board includes in the first year of itslong-range capital improvement program and the source of funds for all capitalimprovements. However, no capital project shall be included in the capital budgetportion of the proposed Ordinance of Estimates submitted by the Board of Estimates tothe City Council unless the Board has received and considered the reports andrecommendations of the Planning Commission, the Director of Finance, and the Board ofFinance with regard to such capital project. The Board of Estimates may establishadditional procedures for the development of a long-range capital improvement programand a capital budget.
(b) Contingent fund.
The Board may include annually in the proposed Ordinance of Estimates a sum up to one milliondollars ($1,000,000.00) of the General Fund appropriations to be used during the next fiscal yearas a contingent fund in case of an emergency or necessity for the expenditure of money in excessof or other than the appropriations regularly passed for any municipal agency.
At least one week before it approves a contingent fund expenditure, the Board shall report to theCity Council the reasons for the expenditure.
§ 6. Adoption of proposed Ordinance of Estimates.
(a) Adoption, submission, and publication.
After the public notice and hearings prescribed by Section 3(b), the Board shall adopt a proposedOrdinance of Estimates by a majority vote of all the members. The Board shall deliver theproposed Ordinance of Estimates to the President of the City Council and contemporaneouslypublish a copy of the proposed ordinance in two dally newspapers in Baltimore City.
(b) Accompanying materials.
The proposed Ordinance of Estimates that the Board submits to the City Council shall beaccompanied by the following materials:
(1) a breakdown of the amounts stated for each program, purpose, activity, or project of eachmunicipal agency in the proposed operating budget by standard categories ofexpenditure, for
(a) personal services,
(b) materials, supplies, and equipment,
Fiscal 2022 Summary of the Adopted Budget APPENDIX
293

(c) debt service, and
(d) such other categories as the Board of Estimates may deem advisable.
The personal services category shall include the compensation of every officer and salaried employee of the City; provided, however, that the salaries for employees in the same classification who have a uniform salary or salary range may be combined into a single entry, which shall indicate the number of such employees, their aggregate salaries, and the name or title of the classification.
(2) a comparison by standard categories of expenditures of the appropriations contained in
the proposed operating budget with
(a) the amounts requested by the municipal agencies in their budget submissions
(b) the amounts appropriated for the current fiscal year and
(c) the amounts expended in the prior fiscal year;
(3) detailed information about the sources of funds to meet the aggregate total of the appropriations contained in the proposed Ordinance of Estimates;
(4) the long-range capital improvement program adopted by the Board and for each capital
project included in the capital budget, the following:
a brief description and location,
the total estimated cost,
the appropriations authorized to date,
the appropriations proposed for the next fiscal year,
the appropriations required thereafter to complete the project, and
the estimated additional annual maintenance and operation cost.
(5) a statement setting out:
(a) the revenues which the City can reasonably expect to receive in the next fiscal year from all existing sources of revenue at existing rates other than the full rate property tax but including amounts believed to be collectible from taxes for prior years and including an estimate of the surplus expected at the end of the current fiscal year;
(b) the difference between the revenues expected under (a) above and the total
amount of appropriations provided in the proposed Ordinance of Estimates;
(c) the estimated taxable basis for the next ensuing fiscal year for the levy of full rate property taxes;
APPENDIX Fiscal 2022 Summary of the Adopted Budget
294

(d) the rate for the levy of full rate property taxes which, given the revenues expected under (a) above, the total appropriations in the proposed Ordinance of Estimates, and the taxable basis, will be necessary to raise sufficient total revenues to cover total anticipated expenditures;
(e) new sources of revenue or new rates on existing sources of revenue, and the
amounts which can reasonably be expected from each of them, which the Board of Estimates believes should be adopted for the next fiscal year; also the rate for the levy of full rate property taxes which, in view of such new sources of revenue or new rates on existing sources of revenue, will be necessary to bring total expected revenues for the next fiscal year into balance with total anticipated expenditures for the year;
(6) a message from the Mayor explaining the major emphasis and objectives of the City’s
budget for the next fiscal year;
(7) such other information as the Board of Estimates may deem advisable.
§ 7. Enactment of Ordinance of Estimates.
(a) Introduction; Authorized cuts.
Upon receipt of the proposed Ordinance of Estimates and the accompanying materials, the President of the City Council shall promptly cause it to be introduced in the City Council, and the Council shall thereafter hold public hearings on the proposed Ordinance of Estimates.
By a majority vote of its members, the City Council may reduce or eliminate any of the amounts in the proposed Ordinance of Estimates, except:
(1) amounts fixed by law;
(2) amounts for the Fire Department established by a board of arbitration and included in the proposed Ordinance of Estimates; and
(3) amounts for the payment of the interest and principal of the municipal debt.
(b) Increases and additions precluded.
The City Council shall not have the power to increase the amounts fixed by the Board or to insert any amount for any new purpose in the proposed Ordinance of Estimates. If the carrying out of a particular program, purpose, activity, or project depends upon action by a body other than the City, the City Council may insert a specific provision in the proposed Ordinance of Estimates making the appropriation for the particular program, purpose, activity or project contingent upon such action.
(c) Revenue ordinances.
As soon as practicable after the passage of the Ordinance of Estimates, the City Council shall enact such revenue ordinances as are necessary to produce sufficient expected revenues, as
Fiscal 2022 Summary of the Adopted Budget APPENDIX
295

estimated by the Board of Estimates, to cover the total anticipated expenditures authorized by the Ordinance of Estimates. The Council may adopt revenue sources or revenue rates other than those proposed by the Board and in each such instance the estimate of the revenue to be yielded by such a source or rate shall be made by the Board of Estimates.
The Board of Estimates shall, taking into account any reductions and eliminations made by the City Council in the anticipated expenditures contained in the proposed Ordinance of Estimates and the revenues to be derived from all existing sources and from any new sources or new rates enacted by the City Council, certify to the Council the difference between the anticipated expenditures for the next fiscal year contained in the Ordinance of Estimates and all expected revenues other than from the full rate property tax. The Board shall then state a rate for the levy of full rate property taxes sufficient to realize the amount required to meet the said difference and the ordinance making the annual levy of full rate property taxes shall fix a rate not less than that stated by the Board so that it shall not be necessary at any time for the City to create a floating debt to meet any deficiency, and it shall not be lawful for the City to create a floating debt for any such purpose.
§ 8. Deficiencies; Supplementary appropriations.
(a) Deficiencies.
No temporary loan shall be authorized or made to pay any deficiency arising from a failure to realize sufficient income from all sources to meet the amounts provided in the Ordinance of Estimates, but the City may temporarily borrow money for its use in anticipation of the receipts of taxes levied for any year. In case of any such deficiency the Board of Estimates shall effect reductions (which need not be pro rata) in appropriations other than those for the payment of the principal and interest of the City debt and such amounts as are fixed by law and contained in the Ordinance of Estimates, except to the extent that the City Council shall, upon the recommendation of the Board of Estimates, enact an ordinance which shall supply revenues to meet all or any part of such deficiency. No emergency loan shall be made except in accordance with the provisions of Article XI of the Constitution of Maryland.
(b) Supplementary appropriations — when authorized.
Except as provided herein, the Ordinance of Estimates shall include all the moneys to be appropriated by the City for all purposes for the fiscal year for which the ordinance is applicable.
Additional appropriations shall be permitted during the fiscal year only in the following circumstances and under the following conditions:
(1) Excess revenues.
Revenues from any source other than the full rate property tax and other taxes imposed under the authority of Article II, in excess of or in addition to those relied upon by the Board of Estimates in determining the tax levy required to balance the budget, may be made available for expenditure by the municipal agency responsible for the production of such revenues by a supplementary appropriation ordinance recommended to the City Council by the Board of Estimates, duly passed by the City Council by a majority vote of its members and approved by the Mayor.
APPENDIX Fiscal 2022 Summary of the Adopted Budget
296

(2) Unanticipated grants.
Grants from private or governmental sources which could not be expected with reasonable certainty at the time of the formulation of the proposed Ordinance of Estimates may be made available to the appropriate municipal agency for expenditure by a supplementary appropriation ordinance recommended to the City Council by the Board of Estimates, duly passed by the City Council by a majority vote of its members and approved by the Mayor.
(3) Material changes; New programs.
Further appropriations for programs included in the proposed Ordinance of Estimates made necessary by a material change in circumstances, or additional appropriations for new programs which could not reasonably be anticipated at the time of the formulation of the proposed Ordinance of Estimates may be made available to the appropriate municipal agency for expenditure by a supplementary appropriation ordinance recommended to the City Council by the Board of Estimates, duly passed by the City Council by a vote of three-fourths of its members and approved by the Mayor.
(c) Supplementary appropriations – Requisites of ordinance.
Every such further or additional appropriation shall be embodied in a separate ordinance limited to a single program, purpose, activity or project therein stated, and each such supplementary appropriation ordinance shall also, anything contained in the Charter to the contrary notwithstanding, provide the revenue necessary to pay the appropriation by a source, other than the full rate property tax, imposed under the authority of Article II. The revenue shall be levied and collected as directed in the ordinance. The estimate of the revenues to be derived from any source proposed in a supplementary appropriation ordinance shall be made by the Board of Estimates.
§ 9. Uses of appropriations.
(a) In general.
Following the passage of the Ordinance of Estimates and the enactment of the revenue measures necessary to achieve a balance between expected revenues and anticipated expenditures for the next fiscal year, the sums contained in the Ordinance of Estimates shall, after the beginning of the fiscal year to which it is applicable, be and become appropriated for the purposes therein named.
No appropriation provided for in the Ordinance of Estimates shall be used for any purpose other than that named in that ordinance, except:
(1) the Board of Estimates may increase the amount for a particular program, purpose,
activity, or project or introduce an amount for a new program, purpose, activity or project by transferring thereto amounts already appropriated to that agency; and
(2) upon the recommendation of the Board of Estimates, the City Council by ordinance may
authorize the transfer of an appropriation contained in the Ordinance of Estimates from one municipal agency to another municipal agency;
Fiscal 2022 Summary of the Adopted Budget APPENDIX
297

provided, however, that new or different amounts for capital projects from those stated in the capital budget portion of the Ordinance of Estimates shall not be authorized unless the Board of Estimates has received and considered the reports and recommendations thereon of the Planning Commission and the Director of Finance.
(b) Expenditure schedule.
Upon the authorization of the Board of Estimates and under procedures established by the Board, the Director of Finance shall establish an expenditure schedule, applicable to any or all municipal agencies whenever, in the opinion of the Board, financial conditions warrant such budgetary allotments.
(c) Carry-overs; Lapses.
(1) Appropriations contained in the Ordinance of Estimates for a particular program, purpose, activity, or project may, upon the recommendation of the head of the municipal agency concerned and the Director of Finance, and with the approval of the Board of Estimates, be carried over to fiscal years subsequent to the one for which the appropriation is initially made if necessary to accomplish that program, purpose, activity, or project.
(2) Funds encumbered for contracts, projects or other actual commitments and funds dedicated
by any act of Congress or by State law or by the terms of any private grant to some specific purpose shall be carried over to the next fiscal year.
(3) All appropriations not so carried over shall lapse at the end of the fiscal year from which
made, except as provided in paragraph (4) of this subsection.
(4) Any balance remaining in the fund of the water, sanitary wastewater, or stormwater utility (under Section 18 of this article) at the end of the fiscal year shall remain to the credit of that utility and an estimate of that balance shall be included in that utility’s budget for the next year as an estimated receipt.
(d) Surpluses.
(1) In case of any surplus arising in any fiscal year by reason of an excess of revenue over the expenditures (including any appropriation carried over) for that year, the surplus shall become a part of the general revenue of the City and shall be available for the general expenditures of the City for the next fiscal year, in accordance with the Ordinance of Estimates for that year. An estimate of the surplus shall be made by the Board of Estimates and included in expected revenues for the next year.
(2) However, any surplus or retained earnings of the water, sanitary wastewater, or stormwater
utility fund (under § 18 of this article) at the end of the fiscal year shall remain to the credit of that utility and the estimate of that balance shall be included in that utility’s budget for the next year as an estimated receipt.
(Res. 10-019, ratified Nov. 2, 2010; Res. 12-004, ratified Nov. 6, 2012.
APPENDIX Fiscal 2022 Summary of the Adopted Budget
298

ARTICLE VII EXECUTIVE DEPARTMENTS
DEPARTMENT OF FINANCE
§ 5. Department of Finance: Established.
There is a Department of Finance, the head of which shall be the Director of Finance.
§ 6. Department of Finance: Director.
(a) Duties; Qualifications.
The Director of Finance shall supervise and direct the Department. The Director shall have substantial experience in financial administration.
(b) Appointment; Term.
The Director shall be appointed, must be confirmed, and shall serve, pursuant to Article IV, Section 6.
(c) Salary.
The Director’s salary shall be set in the Ordinance of Estimates.
§ 7. Department of Finance: Deputy Director; Employees.
(a) Deputy – Appointment.
The Director shall appoint a Deputy Director of Finance pursuant to this section.
(b) Deputy – As Acting Director.
Whenever a vacancy shall occur in the office of Director, or whenever the Director shall be incapacitated or otherwise unavailable for duty for any cause, the Deputy Director appointed pursuant to this section shall be the Acting Director.
(c) Other employees.
The Director may appoint such other employees as provided in the Ordinance of Estimates.
§ 8. Department of Finance: Budget preparation.
In accordance with rules established by the Board of Estimates, the Department shall prepare the preliminary operating budget for the consideration of the Board of Estimates, shall make reports and recommendations on the capital budget and capital improvement program, and shall otherwise participate in the making of the proposed Ordinance of Estimates.
Fiscal 2022 Summary of the Adopted Budget APPENDIX
299

§ 9. Department of Finance: Budget administration.
Under the direction of the Board of Estimates, the Director shall implement the Ordinance of Estimates. In the interest of economy and efficiency, the Director shall survey the administration and organization of municipal agencies to support the Director’s recommendations to the Board of Estimates on the budget requests of the agencies and the Director’s reports to the Mayor on measures which might be taken to improve the organization and administration of City government.
APPENDIX Fiscal 2022 Summary of the Adopted Budget
300

Chief Administrative Officer: Christopher J. Shorter
Finance Director:Henry J. Raymond
Acting Deputy Finance Directors:Robert CennameYoanna Moisides
Assistant Budget Directors:Pedro Aponte
Mira GreenMaggie Keenan
Aaron Moore
Budget Management Analysts:John Burklew
Yolanda CampJaime CramerUnyime Ekpa
Philip S. GearSamantha Louie
Christopher Quintyne
Revenue and Long-Term Financial Planning Analysts:Scott CarpenterZhenya Egorova
Data Lead:Lillian Nguyen
Legislative and Engagement Lead:Mara James
Information Systems Analyst:William Kyei
Executive Assistant:Jeanine Murphy
The City of Baltimore budget publications are available at the Enoch Pratt Free Library Central Branch in the Maryland Room
and online at budget.baltimorecity.gov.
For additional information, contact the Department of Finance, Bureau of the Budget and Management Research:
469 City Hall - 100 N. Holliday Street; Baltimore, MD 21202P: 410.396.5944 or Email: [email protected].
Department of Finance Bureau of the Budget and Management Research
469 City Hall,100 N. Holliday Street Baltimore, Maryland 21202
410-396-5944
Copyright © 2022 FDOKUMEN