Doctors give advice on teen mental health - | Palo Alto Online |
Upload
khangminh22Category
view
1download
0
• CITY OF PALO ALTO FISCAL YEAR 2016 PROPOSED BUDGET 1


• CITY OF PALO ALTO FISCAL YEAR 2017 ADOPTED BUDGET 1
Fiscal Year 2017 AdoptedOperating Budget
City CouncilPatrick Burt, Mayor
Gregory Scharff, Vice Mayor
Marc Berman
Tom DuBois
Eric Filseth
Karen Holman
Liz Kniss
Greg Schmid
Cory Wolbach
James Keene, City Manager
Suzanne Mason, Assistant City Manager
Ed Shikada, Assistant City Manager
Lalo Perez, Director of Administrative Services/Chief Financial Officer
David Ramberg & Joe Saccio, Assistant Director of Administrative Services
Kiely Nose, Budget Manager, Office of Management and Budget
Eric Filseth, Finance Committee Chair

2 • C
City of Palo AltoThe government of the City of Palo Alto exists to promote and sustain a superior quality of life in Palo Alto. In partnership with our community,
our goal is to deliver cost-effective services in a personal, responsive and innovative manner.
Our ValuesQuality
Superior delivery of services
CourtesyProviding service with respect and concern
EfficiencyProductive, effective use of resources
IntegrityStraight-forward, honest and fair relations
InnovationExcellence in creative thought and implementation
ITY OF PALO ALTO FISCAL YEAR 2017 ADOPTED BUDGET


4 • CITY OF PALO ALTO FISCAL YEAR 2017 ADOPTED BUDGET

TABLE OF CONTENTS
CITY OF PALO ALTO FISCAL YEAR 2017 ADOPTED BUDGET 5


TABLE OF CONTENTS
Table of Contents
I Introduction. . . . . . . . . . . . . . . . . . . . . . . . . . . . . . . . . . . . . . . . . . . . . . . . . . . . . . . .11Transmittal Letter . . . . . . . . . . . . . . . . . . . . . . . . . . . . . . . . . . . . . . . . . . . . . . . . . . 13Budget Acknowledgments . . . . . . . . . . . . . . . . . . . . . . . . . . . . . . . . . . . . . . . . . .29City of Palo Alto Organizational Chart . . . . . . . . . . . . . . . . . . . . . . . . . . . . . . . . 31Palo Alto at a Glance . . . . . . . . . . . . . . . . . . . . . . . . . . . . . . . . . . . . . . . . . . . . . . .33The Budget Process and Document . . . . . . . . . . . . . . . . . . . . . . . . . . . . . . . . . . 41Budget Awards . . . . . . . . . . . . . . . . . . . . . . . . . . . . . . . . . . . . . . . . . . . . . . . . . . . .48
II Citywide Funds . . . . . . . . . . . . . . . . . . . . . . . . . . . . . . . . . . . . . . . . . . . . . . . . . . . . 53Citywide Funds Overview . . . . . . . . . . . . . . . . . . . . . . . . . . . . . . . . . . . . . . . . . . .55Citywide Revenues by Category . . . . . . . . . . . . . . . . . . . . . . . . . . . . . . . . . . . . . 57Citywide Expenses by Category . . . . . . . . . . . . . . . . . . . . . . . . . . . . . . . . . . . . .59Citywide Projected Operating Fund Balance . . . . . . . . . . . . . . . . . . . . . . . . . . 61Citywide Average Salary . . . . . . . . . . . . . . . . . . . . . . . . . . . . . . . . . . . . . . . . . . . .63Major Capital Projects. . . . . . . . . . . . . . . . . . . . . . . . . . . . . . . . . . . . . . . . . . . . . . .67
III General Fund. . . . . . . . . . . . . . . . . . . . . . . . . . . . . . . . . . . . . . . . . . . . . . . . . . . . . . 77General Fund Overview . . . . . . . . . . . . . . . . . . . . . . . . . . . . . . . . . . . . . . . . . . . . .79General Fund Reserves . . . . . . . . . . . . . . . . . . . . . . . . . . . . . . . . . . . . . . . . . . . . 90General Fund Revenue Descriptions. . . . . . . . . . . . . . . . . . . . . . . . . . . . . . . . . 90Total General Fund Revenue by Category . . . . . . . . . . . . . . . . . . . . . . . . . . . .94Total General Fund Expenditures by Department. . . . . . . . . . . . . . . . . . . . . .97General Fund Expense by Category . . . . . . . . . . . . . . . . . . . . . . . . . . . . . . . . . .99
IV Enterprise Funds. . . . . . . . . . . . . . . . . . . . . . . . . . . . . . . . . . . . . . . . . . . . . . . . . . 101Enterprise Funds Overview. . . . . . . . . . . . . . . . . . . . . . . . . . . . . . . . . . . . . . . . . 103Enterprise Fund Reserves . . . . . . . . . . . . . . . . . . . . . . . . . . . . . . . . . . . . . . . . . . .112
V Internal Service Funds . . . . . . . . . . . . . . . . . . . . . . . . . . . . . . . . . . . . . . . . . . . . . .117Internal Service Funds Overview . . . . . . . . . . . . . . . . . . . . . . . . . . . . . . . . . . . . .119Internal Service Funds Reserves . . . . . . . . . . . . . . . . . . . . . . . . . . . . . . . . . . . . .121
VI Special Revenue Funds . . . . . . . . . . . . . . . . . . . . . . . . . . . . . . . . . . . . . . . . . . . . 123Special Revenue Funds Overview . . . . . . . . . . . . . . . . . . . . . . . . . . . . . . . . . . . 125
VII Debt Service Funds . . . . . . . . . . . . . . . . . . . . . . . . . . . . . . . . . . . . . . . . . . . . . . . 139Debt Service Funds Overview . . . . . . . . . . . . . . . . . . . . . . . . . . . . . . . . . . . . . . 141
VIII City Departments . . . . . . . . . . . . . . . . . . . . . . . . . . . . . . . . . . . . . . . . . . . . . . . . . 149City Attorney . . . . . . . . . . . . . . . . . . . . . . . . . . . . . . . . . . . . . . . . . . . . . . . . . . . . . .151City Auditor. . . . . . . . . . . . . . . . . . . . . . . . . . . . . . . . . . . . . . . . . . . . . . . . . . . . . . . 159City Clerk . . . . . . . . . . . . . . . . . . . . . . . . . . . . . . . . . . . . . . . . . . . . . . . . . . . . . . . . . 169City Council. . . . . . . . . . . . . . . . . . . . . . . . . . . . . . . . . . . . . . . . . . . . . . . . . . . . . . . 179
TABLE OF CONTENTS • CITY OF PALO ALTO FISCAL YEAR 2017 ADOPTED BUDGET 7

TABLE OF CONTENTS
8 TAB
City Manager. . . . . . . . . . . . . . . . . . . . . . . . . . . . . . . . . . . . . . . . . . . . . . . . . . . . . . 183Administrative Services . . . . . . . . . . . . . . . . . . . . . . . . . . . . . . . . . . . . . . . . . . . . 193
General Fund. . . . . . . . . . . . . . . . . . . . . . . . . . . . . . . . . . . . . . . . . . . . . . . . . . . 199Printing and Mailing Services . . . . . . . . . . . . . . . . . . . . . . . . . . . . . . . . . . . 207
Community Services . . . . . . . . . . . . . . . . . . . . . . . . . . . . . . . . . . . . . . . . . . . . . . . .211Golf Course Financials . . . . . . . . . . . . . . . . . . . . . . . . . . . . . . . . . . . . . . . . . .229Human Service Contracts . . . . . . . . . . . . . . . . . . . . . . . . . . . . . . . . . . . . . . . 231
Development Services . . . . . . . . . . . . . . . . . . . . . . . . . . . . . . . . . . . . . . . . . . . . .233Fire . . . . . . . . . . . . . . . . . . . . . . . . . . . . . . . . . . . . . . . . . . . . . . . . . . . . . . . . . . . . . 249Human Resources . . . . . . . . . . . . . . . . . . . . . . . . . . . . . . . . . . . . . . . . . . . . . . . . .263
General Fund. . . . . . . . . . . . . . . . . . . . . . . . . . . . . . . . . . . . . . . . . . . . . . . . . . 268General Liabilities Insurance Program. . . . . . . . . . . . . . . . . . . . . . . . . . . . .275Workers' Compensation Fund . . . . . . . . . . . . . . . . . . . . . . . . . . . . . . . . . . .279
Information Technology. . . . . . . . . . . . . . . . . . . . . . . . . . . . . . . . . . . . . . . . . . . .285Library . . . . . . . . . . . . . . . . . . . . . . . . . . . . . . . . . . . . . . . . . . . . . . . . . . . . . . . . . . 299Office of Emergency Services . . . . . . . . . . . . . . . . . . . . . . . . . . . . . . . . . . . . . 309Office of Sustainability . . . . . . . . . . . . . . . . . . . . . . . . . . . . . . . . . . . . . . . . . . . . . 317Planning & Community Environment . . . . . . . . . . . . . . . . . . . . . . . . . . . . . . . .325Police . . . . . . . . . . . . . . . . . . . . . . . . . . . . . . . . . . . . . . . . . . . . . . . . . . . . . . . . . . . . 341Public Works. . . . . . . . . . . . . . . . . . . . . . . . . . . . . . . . . . . . . . . . . . . . . . . . . . . . . .355
General Fund. . . . . . . . . . . . . . . . . . . . . . . . . . . . . . . . . . . . . . . . . . . . . . . . . . 360Refuse Fund . . . . . . . . . . . . . . . . . . . . . . . . . . . . . . . . . . . . . . . . . . . . . . . . . . . 371Storm Drainage Fund . . . . . . . . . . . . . . . . . . . . . . . . . . . . . . . . . . . . . . . . . . . 381Wastewater Treatment Fund . . . . . . . . . . . . . . . . . . . . . . . . . . . . . . . . . . . 390Airport Fund . . . . . . . . . . . . . . . . . . . . . . . . . . . . . . . . . . . . . . . . . . . . . . . . . . 399Vehicle Replacement and Maintenance Fund . . . . . . . . . . . . . . . . . . . . . 406
Utilities . . . . . . . . . . . . . . . . . . . . . . . . . . . . . . . . . . . . . . . . . . . . . . . . . . . . . . . . . . . 415Electric Fund . . . . . . . . . . . . . . . . . . . . . . . . . . . . . . . . . . . . . . . . . . . . . . . . . . 423Fiber Optics Fund . . . . . . . . . . . . . . . . . . . . . . . . . . . . . . . . . . . . . . . . . . . . . 437Gas Fund . . . . . . . . . . . . . . . . . . . . . . . . . . . . . . . . . . . . . . . . . . . . . . . . . . . . . 444Wastewater Collection Fund. . . . . . . . . . . . . . . . . . . . . . . . . . . . . . . . . . . . 456Water Fund . . . . . . . . . . . . . . . . . . . . . . . . . . . . . . . . . . . . . . . . . . . . . . . . . . . 466
Non-Departmental . . . . . . . . . . . . . . . . . . . . . . . . . . . . . . . . . . . . . . . . . . . . . . . 479
IX Employee Information . . . . . . . . . . . . . . . . . . . . . . . . . . . . . . . . . . . . . . . . . . . . .485General Benefits Fund . . . . . . . . . . . . . . . . . . . . . . . . . . . . . . . . . . . . . . . . . . . . 487Retiree Health Benefit Fund . . . . . . . . . . . . . . . . . . . . . . . . . . . . . . . . . . . . . . . . 491Table of Organization. . . . . . . . . . . . . . . . . . . . . . . . . . . . . . . . . . . . . . . . . . . . . 493
X Supplemental Information . . . . . . . . . . . . . . . . . . . . . . . . . . . . . . . . . . . . . . . . . 511Financial Policies . . . . . . . . . . . . . . . . . . . . . . . . . . . . . . . . . . . . . . . . . . . . . . . . . . 513Budget Adoption Ordinance . . . . . . . . . . . . . . . . . . . . . . . . . . . . . . . . . . . . . . . 517Appropriations Limit Resolution and Calculation . . . . . . . . . . . . . . . . . . . . . 521Glossary . . . . . . . . . . . . . . . . . . . . . . . . . . . . . . . . . . . . . . . . . . . . . . . . . . . . . . . . . .525
LE OF CONTENTS • CITY OF PALO ALTO FISCAL YEAR 2017 ADOPTED BUDGET


10 • CITY OF PALO ALTO FISCAL YEAR 2017 ADOPTED BUDGET

INTRODUCTION
CITY OF PALO ALTO FISCAL YEAR 2017 ADOPTED BUDGET 11


TRANSMITTAL LETTER
Transmittal Letter
April 25, 2016
To the Honorable Mayor and City Council:
2017 Fiscal Year Proposed Operating Budget Transmittal
Dear Mayor and Council Members:
In accordance with the City Charter, I am submitting the City of Palo Alto’s Fiscal Year 2017 Pro-posed Operating Budget. This budget reflects a strong local economy that has led to stable rev-enues which support a wide array of programs and initiatives. The proposed budget will maintain the high quality of services and facilities the community values and addresses the pri-orities identified by the City Council. In addition, it includes competitive wages for City employ-ees that will assist in the challenge of our time and location in attracting and retaining a well-qualified workforce needed to meet the high expectations of our community.
With such prosperity, we are experiencing many challenges associated with the growing job demand and appeal of Silicon Valley. These challenges include: increased traffic and congestion, expensive housing, increasing demand for services, and conflicting views of the nature and pace of change. And despite a positive revenue picture, we have had to include one-time funding strategies in order to address demands for policy interventions due to the impacts of growth and several ill-timed mandated funding shifts. These are temporary fixes that will require resolu-tion in the Fiscal Year 2018 budget process.
In advance of preparing the Budget, staff presented the 2017-2026 General Fund Long Term Financial Forecast (LTFF). The Forecast is used to help inform the preparation of the base bud-get for the upcoming budget cycle; determine potential fiscal challenges the City may face in the future; and project the impact of salary and benefit increases, new programs, and changing economic conditions.
The FY 2017 Forecast showed emerging challenges for Fiscal Years 2017 and 2018 as well as borderline outcomes in the following three years when increasing salary and pension contribu-tions are taken into account. The City will have to be prudent as we consider responding to an ambitious community policy agenda and maintenance of our high quality services and the need to attract and retain a well-qualified workforce to provide these services. Understandably, our community has been reluctant to support any significant reductions in scope of what we do as a local government. In fact, the demands and conflicts emerging from our vibrant economy have heightened the intensity of the “Palo Alto Process,” with new analyses and data generation demands, and deep dives into complex problem solving within an engaged public process across a wide range of issues.
TRANSMITTAL LETTER • CITY OF PALO ALTO FISCAL YEAR 2017 ADOPTED BUDGET 13

TRANSMITTAL LETTER
14 TR
Economic Outlook and RevenuesThe backdrop for the LRFF and this FY 2017 Proposed Budget are robust Bay Area and State economies. Job growth and its inverse, unemployment, are moving in positive directions. As Steve Levy reported in a February Jobs Newsletter, “California added 451,600 jobs in the past 12 months” and “saw a decline in the State unemployment rate to 5.5%, the lowest since August 2007.” As proof of a vibrant, local recovery, “Bay Area job levels are now 12.5% above pre-reces-sion peaks.” Although economic headwinds are appearing at the national level –evidenced by factors such as stock market volatility, plunging oil prices, a weaker Chinese economy, and his-toric gaps between rich and poor- the local tech economy is flourishing.
The thriving recovery, however, has acted to intensify “longstanding challenges” such as trans-portation, housing, and infrastructure needs. The City of Palo Alto is acutely familiar with these challenges, and is acting, reflected in the Council’s proactive funding of our $128 million Infra-structure Plan and a range of initiatives to combat burgeoning traffic and transportation prob-lems. The perennial problem of sufficient and affordable housing continues to challenge our community and Silicon Valley in general, amid a heated residential property market. Ironically, the recovery that brought significant relief from the Great Recession has intensified longstand-ing issues.
REVENUESCitywide revenues of $544.4 million and the use of reserves and fund balances of $81.8 million are recommended to fund the FY 2017 citywide expenses budget of $626.1. Use of reserves and fund balances does include the carryover of funds anticipated to be reappropriated from FY 2016 to FY 2017, for example, approximately $28.1 million is anticipated to be reappropriated in the General Capital Improvement Fund.
Citywide revenues of $544.4 million reflect a $57.1 million increase (11.7 percent) over the FY 2016 Adopted Budget of $487.3 million. The three drivers in revenues this year are: Revenues from other agencies ($23.5 million), of which $21.3 million comes from State Revolving Fund proceeds for various capital improvement projects in the Wastewater Treatment Fund; Net sales of utility commodities ($19.8 million); and Tax revenues ($8.7 million).
In total, General Fund revenues are anticipated to account for $9.2 million of the city-wide change in revenues, increasing from $183.9 million in the FY 2016 Adopted Budget to $193.1 mil-lion in the FY 2017 Proposed Budget. Major tax revenues in the General Fund account for over 56 percent of the total revenues and are increasing $8.7 million to $108.4 million – accounting for over 90 percent of the year over year change in General Fund revenues. When the FY 2017 Proposed Budget is compared to the FY 2016 Adjusted Budget, year-over-year growth of 2.0 percent is seen. Below are a few of the major assumptions:
Transient Occupancy and Property tax revenues are expected to increase by $4.3 million or 23 percent and $2.8 million or 8 percent, respectively, over last year’s Adopted Budget. The emergence of new hotels (FY 2017 will be the first full year of operations for all), a Transient Occupancy Tax (TOT) rate increase of 2 percent, business driven demand for rooms, and a stout residential and commercial property market have propelled these key revenue sources upward.
ANSMITTAL LETTER • CITY OF PALO ALTO FISCAL YEAR 2017 ADOPTED BUDGET
TRANSMITTAL LETTER
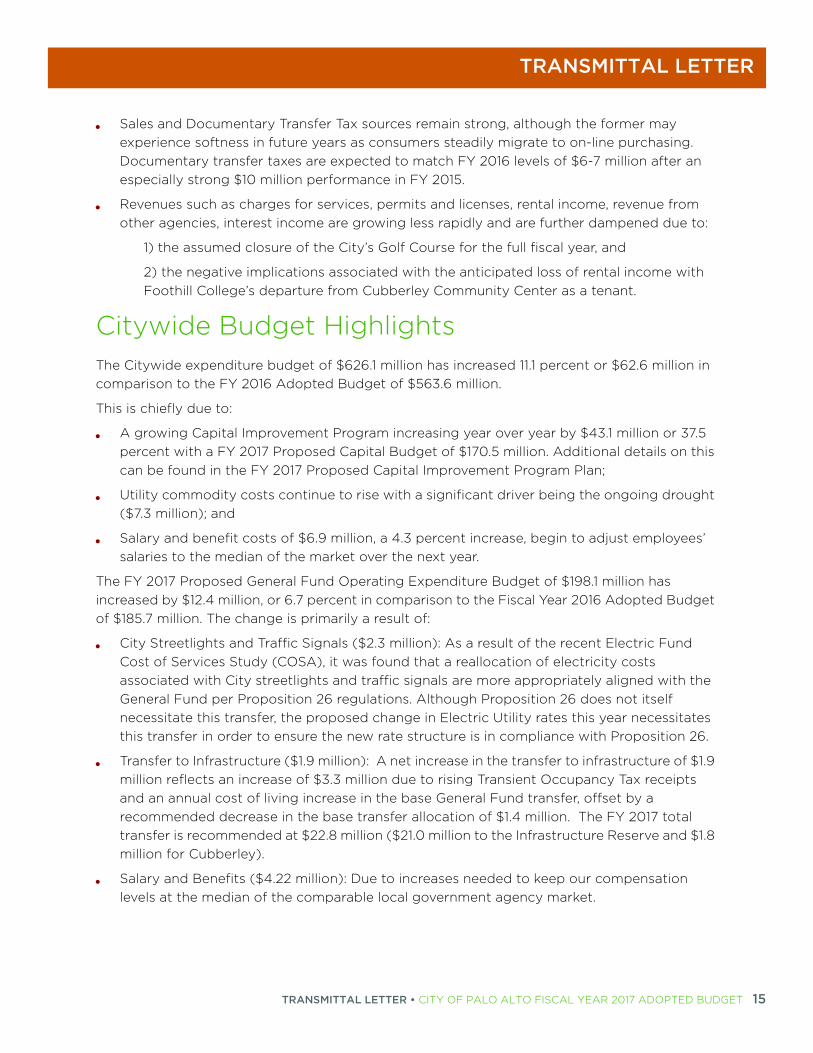
Sales and Documentary Transfer Tax sources remain strong, although the former may experience softness in future years as consumers steadily migrate to on-line purchasing. Documentary transfer taxes are expected to match FY 2016 levels of $6-7 million after an especially strong $10 million performance in FY 2015.
Revenues such as charges for services, permits and licenses, rental income, revenue from other agencies, interest income are growing less rapidly and are further dampened due to:
1) the assumed closure of the City’s Golf Course for the full fiscal year, and
2) the negative implications associated with the anticipated loss of rental income with Foothill College’s departure from Cubberley Community Center as a tenant.
Citywide Budget Highlights The Citywide expenditure budget of $626.1 million has increased 11.1 percent or $62.6 million in comparison to the FY 2016 Adopted Budget of $563.6 million.
This is chiefly due to:
A growing Capital Improvement Program increasing year over year by $43.1 million or 37.5 percent with a FY 2017 Proposed Capital Budget of $170.5 million. Additional details on this can be found in the FY 2017 Proposed Capital Improvement Program Plan;
Utility commodity costs continue to rise with a significant driver being the ongoing drought ($7.3 million); and
Salary and benefit costs of $6.9 million, a 4.3 percent increase, begin to adjust employees’ salaries to the median of the market over the next year.
The FY 2017 Proposed General Fund Operating Expenditure Budget of $198.1 million has increased by $12.4 million, or 6.7 percent in comparison to the Fiscal Year 2016 Adopted Budget of $185.7 million. The change is primarily a result of:
City Streetlights and Traffic Signals ($2.3 million): As a result of the recent Electric Fund Cost of Services Study (COSA), it was found that a reallocation of electricity costs associated with City streetlights and traffic signals are more appropriately aligned with the General Fund per Proposition 26 regulations. Although Proposition 26 does not itself necessitate this transfer, the proposed change in Electric Utility rates this year necessitates this transfer in order to ensure the new rate structure is in compliance with Proposition 26.
Transfer to Infrastructure ($1.9 million): A net increase in the transfer to infrastructure of $1.9 million reflects an increase of $3.3 million due to rising Transient Occupancy Tax receipts and an annual cost of living increase in the base General Fund transfer, offset by a recommended decrease in the base transfer allocation of $1.4 million. The FY 2017 total transfer is recommended at $22.8 million ($21.0 million to the Infrastructure Reserve and $1.8 million for Cubberley).
Salary and Benefits ($4.22 million): Due to increases needed to keep our compensation levels at the median of the comparable local government agency market.
TRANSMITTAL LETTER • CITY OF PALO ALTO FISCAL YEAR 2017 ADOPTED BUDGET 15

TRANSMITTAL LETTER
16 TR
“Budget Uncertainty” Reserve ($2.0 million): There are a number of capital and operating budgets still in flux at this time but which may require additional funding during the Fiscal year. This reserve is proposed for FY 2017 to provide needed flexibility to respond during the year.
Citywide, full-time equivalent (FTE) benefitted positions are increasing by a net 12.0 positions or 1.2 percent from 1,040.10 FTEs in the FY 2016 Adopted Budget to 1,052.10 in the FY 2017 Pro-posed Budget. This year-over-year increase is attributed to attributed to an increase of 2.0 FTEs during FY 2016 and an increase of 10.0 FTEs recommended in this budget. In December 2015, the City Council added 1.0 Project Manager to manage the Infrastructure Management System and in February 2016 1.0 Management Analyst was approved to manage the Business Registry Program.
The overall objective in this Proposed Budget is to deliver a high level of service to the commu-nity, tackle the most immediate and difficult issues facing our City, move forward on the Coun-cil’s priorities, while maintaining the City’s solid financial standing. A key component of achieving these aims is to attract and retain talented employees. Since the Great Recession in 2008 and its accompanying personnel reductions, we have asked employees to work harder and become more efficient. This has occurred, but with a thriving labor market, we are now experiencing recruitment and retention challenges which are further exacerbated by high hous-ing costs, lengthy commutes to work and competitive wage and benefit packages offered in other jurisdictions or by other employers. Adding critical positions in areas experiencing signifi-cant increases in demand and wage increases included in recently adopted labor agreements will help the City maintain the workforce needed to serve the community’s needs. While I under-stand the desire to reduce the supply of employees, this is impossible to achieve without a reduction in services, staff work and engagement, and impact on Council priorities.
Council Priorities On January 30, 2016, the City Council adopted the following priorities:
The Built Environment: Housing, Parking, Livability, Mobility, with a particular emphasis on Mobility
Infrastructure
Healthy City, Healthy Community
Completion of the Comprehensive Plan 2015-2030 Update with increased focus from Council
With a few modifications, the FY 2016 priorities continue and reemphasize those adopted in January 2015. Significant additional resources are included in the Proposed Operating and Cap-ital Budgets to further advance Council’s agenda and community concerns.
ANSMITTAL LETTER • CITY OF PALO ALTO FISCAL YEAR 2017 ADOPTED BUDGET
TRANSMITTAL LETTER
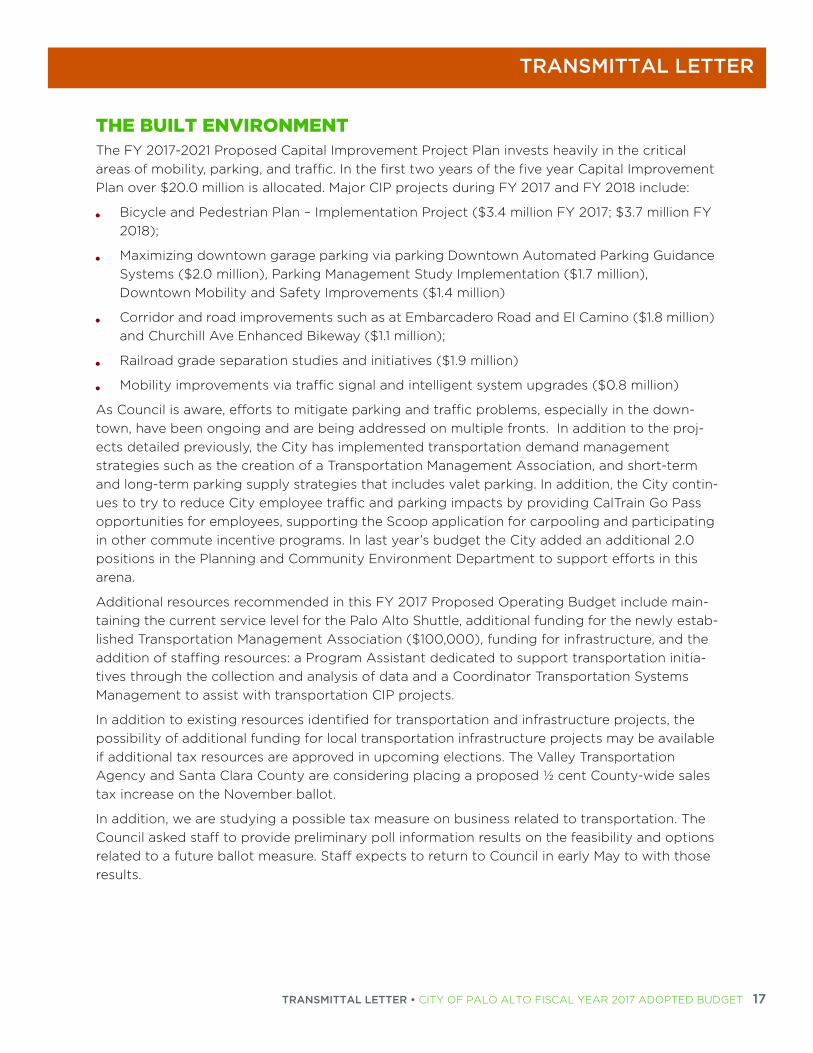
THE BUILT ENVIRONMENTThe FY 2017-2021 Proposed Capital Improvement Project Plan invests heavily in the critical areas of mobility, parking, and traffic. In the first two years of the five year Capital Improvement Plan over $20.0 million is allocated. Major CIP projects during FY 2017 and FY 2018 include:
Bicycle and Pedestrian Plan – Implementation Project ($3.4 million FY 2017; $3.7 million FY 2018);
Maximizing downtown garage parking via parking Downtown Automated Parking Guidance Systems ($2.0 million), Parking Management Study Implementation ($1.7 million), Downtown Mobility and Safety Improvements ($1.4 million)
Corridor and road improvements such as at Embarcadero Road and El Camino ($1.8 million) and Churchill Ave Enhanced Bikeway ($1.1 million);
Railroad grade separation studies and initiatives ($1.9 million)
Mobility improvements via traffic signal and intelligent system upgrades ($0.8 million)
As Council is aware, efforts to mitigate parking and traffic problems, especially in the down-town, have been ongoing and are being addressed on multiple fronts. In addition to the proj-ects detailed previously, the City has implemented transportation demand management strategies such as the creation of a Transportation Management Association, and short-term and long-term parking supply strategies that includes valet parking. In addition, the City contin-ues to try to reduce City employee traffic and parking impacts by providing CalTrain Go Pass opportunities for employees, supporting the Scoop application for carpooling and participating in other commute incentive programs. In last year’s budget the City added an additional 2.0 positions in the Planning and Community Environment Department to support efforts in this arena.
Additional resources recommended in this FY 2017 Proposed Operating Budget include main-taining the current service level for the Palo Alto Shuttle, additional funding for the newly estab-lished Transportation Management Association ($100,000), funding for infrastructure, and the addition of staffing resources: a Program Assistant dedicated to support transportation initia-tives through the collection and analysis of data and a Coordinator Transportation Systems Management to assist with transportation CIP projects.
In addition to existing resources identified for transportation and infrastructure projects, the possibility of additional funding for local transportation infrastructure projects may be available if additional tax resources are approved in upcoming elections. The Valley Transportation Agency and Santa Clara County are considering placing a proposed ½ cent County-wide sales tax increase on the November ballot.
In addition, we are studying a possible tax measure on business related to transportation. The Council asked staff to provide preliminary poll information results on the feasibility and options related to a future ballot measure. Staff expects to return to Council in early May to with those results.
TRANSMITTAL LETTER • CITY OF PALO ALTO FISCAL YEAR 2017 ADOPTED BUDGET 17

TRANSMITTAL LETTER
18 TR
INFRASTRUCTURECouncil’s Infrastructure Plan is being implemented in the FY 2017-2021 Proposed Capital Improvement Project Plan. Based on initial plan estimates, the total cost of the Infrastructure Plan is $128.8 million ($158.8 million when including the $30 million reserve for anticipated cost increases). Infrastructure projects include:
A new Public Safety Building ($57.0 million)
Bicycle Pedestrian Transportation Plan ($20.0 million)
A new Downtown parking garage ($13.0 million)
A new California Avenue area parking garage ($9.6 million)
Replacement of Fire Station 4 ($7.5 million)
Charleston/Arastradero Corridor Improvements ($7.5 million)
Replacement of Fire Station 3 ($6.7 million)
Byxbee Park Completion ($2.8 million)
Highway 101 Bicycle/Pedestrian Bridge Gap Funding ($4.7 million)
Infrastructure Contingency Reserve ($30.0 million)
In the Operating Budget, 1.0 Project Manager for Infrastructure was approved in December 2015 who will oversee the new Infrastructure Management System, a key recommendation from the Infrastructure Commission.
Additional resources are recommended in this budget for Tree Trimming Services (increase of $569,000 for a total cost of $1.0 million annually for a 15 year cycle) as well as the Urban Forest Master Plan ($200,000) in the Public Works Department.
HEALTHY CITY, HEALTHY COMMUNITYIn addition to the infrastructure projects that will promote the general safety and health of our community, programs and projects spearheaded by various departments in the City will further contribute to the recreational and health needs of our City.
The 2017-2021 CIP includes funding totaling $30.7 million for Parks and Open Space for parks amenities, open space, trails, levee, tennis and basketball courts, and soccer field improvements of which $17.5 million is allocated in FY 2017. The majority of the FY 2017 resources are pro-grammed for the City Golf Course Reconfiguration ($10.3 million).
Departments continue to work to ensure the health of the City and Community through pro-grams such as our Police Department’s participation in regional and statewide initiatives designed to ensure vehicle occupant safety and combat drunk driving and the offering of two weekly Adult English as a Second Language conversation groups (beginning and advanced) with volunteer support as part of the New Americans program for non-native speakers to meet and practice English.
This budget includes a recommendation to continue funding of $125,000 to Santa Clara County, leveraging a matching contribution, to be dedicated for the Homeless Program.
ANSMITTAL LETTER • CITY OF PALO ALTO FISCAL YEAR 2017 ADOPTED BUDGET

TRANSMITTAL LETTER
COMPREHENSIVE PLANThe FY 2017 budget will continue to support the Comprehensive Plan Update. Efforts this fiscal year will focus on completing the work of the Citizens Advisory Committee (CAC) and bringing a full suite of recommended policies and programs forward for review and consideration by the Planning and Transportation Commission and the City Council. At the same time, staff will be working with the Comprehensive Plan consultants to analyze a Fifth “Quality of Life” Scenario as part of the Environmental Impact Report (EIR), and to prepare a Final EIR consisting of responses to comments received on the Draft EIR (published in February 2016) and the supple-mental analysis of the Fifth Scenario (planned for publication and public comment later this year). Staff will also be working with a subcommittee of the CAC to ensure that principles of sustainability are incorporated into elements of the Comprehensive Plan, consistent with the draft Sustainability and Climate Action Plan (SCAP).
This budget includes a recommendation for a $250,000 contingency for potential use for sus-tainability activities including but not limited to engagement and implementation of the SCAP.
Additional Budget Highlights Project Safety Net ($1.0 million General Fund): This assumes little to no Stanford Funding is
available for this purpose in FY 2017. Staff is working to implement an Intrusion Detection System (IDS) pilot which may be able to reduce the use of contract safety guards in the future.
Budget Uncertainty Reserve ($2.0 million General Fund): A $2.0 million Reserve to address looming potentially costly projects such as the negotiations with Stanford for Fire Response Services, the Junior Museum and Zoo rebuild, the City Golf Course renovation and reconfiguration, and uncertainty over Animal Services costs for the Shelter.
This budget assumes the closing of the City’s Golf Course beginning in FY 2017 for the renovation and reconfiguration of the course resulting in a net savings to the General Fund of $0.2 million.
Contract increases in the Refuse Fund, contributing to recommended rate structure modifications, are estimated to generate additional revenues of $743,000 to partially offset the increased expenses for GreenWaste ($473,000) and SmartStation ($410,000).
Salary and Benefits Expenditures
The most significant asset the City has in serving our community is our employees. Local gov-ernment services are primarily delivered by employees whether they are police officers, utility linemen, librarians, or planners. It should not be surprising, therefore, that 59 percent of the Fis-cal Year 2017 General Fund Proposed Budget is attributable to salaries and benefits. As a result of recent labor negotiations, the City will be increasing employee salaries reflecting cost of liv-ing and market driven increases aimed at placing Palo Alto employee compensation at the median of comparable California jurisdictions.
TRANSMITTAL LETTER • CITY OF PALO ALTO FISCAL YEAR 2017 ADOPTED BUDGET 19

TRANSMITTAL LETTER
20 T
This budget proposed the addition of 10 FTEs across all funds, a one percent increase in staff-ing. The level of FTEs in FY 2017 would be 1,052.10. (The net year over year increase of 12.0 FTEs is attributed to an increase of 2.0 FTEs approved by Council during Fiscal Year 2016 and an increase of 10.0 FTEs recommended in this budget.) The table below summarizes the changes in positions from the FY 2016 Adopted Budget to this FY 2017 Proposed Budget. This budget recommends the following net position additions by funding source: 3.23 in the General Fund, 2.52 in Enterprise funds, and 4.25 in Other Funds.
* Other Funds include Internal Service Funds, Special Revenue Funds, and the Capital Improvement Fund
**Project Manager for Infrastructure Management System, and Management Analyst for Business Registry Program
A summary of the 10.0 FTE recommended positions additions in FY 2017 are outlined below and additional details can be found in the respective departments:
1.0 Building/Planning Technician to cover the front counter and intake planning entitlement applications (Planning/Development Services);
1.0 Program Assistant II to support transportation systems and programs (0.65 FTE in Other Funds and 0.35 in General Fund). (Planning)
0.50 Coordinator Transportation System Management to assist with bicycle capital improvement projects (increases a current 0.50 Coordinator Transportation System Management to a 1.00 full time position). (Planning)
Position Changes
FY 2016 Adopted to FY 2017 Proposed BudgetGeneral Fund Enterprise Funds Other Funds* Total
Fiscal Year 2016 Adopted Budget 599.31 351.09 89.70 1,040.10
Fiscal Year 2016 ApprovedAdjustments** 1.40 - 0.60 2.00
Fiscal Year 2016 Modified Budget
600.71 351.09 90.30 1,042.10
Fiscal Year 2017 Net Increase 2.85 4.00 3.15 10.00
Fiscal Year 2017 Reallocation 0.38 (1.48) 1.10 0.00
Subtotal FY 2017Recommended Adjustments 3.23 2.52 4.25 10.00
Fiscal Year 2017 Adopted Budget
603.94 353.61 94.55 1,052.10
RANSMITTAL LETTER • CITY OF PALO ALTO FISCAL YEAR 2017 ADOPTED BUDGET

TRANSMITTAL LETTER
1.0 Senior Engineer for the $200 million CIP for a major renovation at the Regional Water Quality Control Plant and for which our partners will pay their fair share. (Public Works)
1.0 Senior Engineer for the Recycled Water Program to meet City and State goals for reducing use of potable water. (Public Works)
1.0 Management Analyst in the Environmental Services Division for analytical support for Refuse and Wastewater Treatment. (Public Works)
1.0 Street Maintenance Assistant for post closure maintenance of the landfill offset by a reduction of 0.86 FTE hourly positions. (Public Works)
1.0 Program Assistant I for the Bryant Street Garage Teen Program offset by a reduction of 0.71 FTE hourly positions. (Community Services)
0.50 Senior Librarian to legitimize current staffing levels and increase a 0.50 Senior Librarian to a 1.00 FTE full time position. This is offset by the elimination of equivalent of 1.00 FTE hourly position reductions. (Library)
1.0 Senior Human Resources Administrator to manage Citywide Workers’ Compensation activities. (Human Resources)
1.0 Desktop Technician supporting HelpDesk requests citywide offset by a reduction of 1.00 FTE hourly positions. (Information Technology)
SALARY & BENEFITS To lower the trajectory of benefit expense growth, the City Council has implemented, through negotiations with its labor groups, a number of important changes. These include:
New labor agreements finalized in FY 2016 with Police Officers Association, Police Management Association, International Association of Firefighters, and Service Employees’ international Union employees to pay part of the City’s or employer’s share of pension contributions, increasing employee contributions between 12.5 and 33% over the next three years and slowing the growth in the City’s cost. Even with these changes, the City’s pension costs rise.
Continued employees payment of the CalPERS employee contribution (between 6 percent to 9 percent of salary) except for the members of the Fire Chiefs' Association.
Employees sharing the cost of health plans and adoption of City fixed payments toward premiums that will further reduce costs.
Creating a less costly second pension tier with the state implementing a third tier effective January 1, 2013). Increasing numbers of employees are included in lower pension formula tiers as existing employees retire and new employees are hired.
The table below depicts citywide pension rates from the FY 2017-2026 LRFF. The rates shown for FY 2016 were incorporated into the budget and carried forward to FY 2017 with a few adjustments. As a reminder, staff did include CalPERS latest 5-year pension projections as well as the City’s Actuary’s 5-year projection for the remaining years.
TRANSMITTAL LETTER • CITY OF PALO ALTO FISCAL YEAR 2017 ADOPTED BUDGET 21

TRANSMITTAL LETTER
22 TR
The City is facing substantial pension rate increases over time, especially for public safety per-sonnel. In comparison to the Fiscal Year 2016 Adopted Budget, citywide pension costs are increasing by approximately $3.6 million, or 11.7 percent, from $30.6 million to $34.2 million in this budget. In the Fiscal Year 2017 Proposed Budget, pension rates for miscellaneous groups are increasing by 1.2 percentage points (from 27.7 percent to 28.9 percent) and pension rates for safety groups are increasing by a significant 3.5 percentage points (from 41.9 percent to 45.4 percent). These increases continue into the future, presenting high budget hurdles. Such loom-ing cost increases indicate that further pension cost sharing with employees will be necessary.
One of the primary reasons for the continuously increasing pension costs is an unfunded liabil-ity of $295.6 million in the City's pension plan (for all funds). Furthermore, the City's Retiree Healthcare Trust Fund carries an unfunded liability of $143.6 million which is in the process of being updated. Continuing with past practice, this budget assumes the full payment of the Annual Required Contribution (ARC) for retiree pension and healthcare costs. With the pay-ment of the ARC, it is assumed, all things being equal, that within 30 years the City will pay off its obligations and unfunded liabilities for pension and retiree healthcare costs.
Pension Rates By Plan (Fiscal Year)Pension Plans 2016 2017 2018 2019 2020 2021 2022 2023 2024 2025 2026
Miscellaneous 27.7% 28.9% 31.0% 33.1% 35.2% 35.9% 36.4% 36.2% 36.0% 35.8% 32.6%
Safety 41.9% 45.4% 48.8% 52.1% 55.5% 56.4% 57.3% 56.9% 56.5% 56.0% 55.7%
$16.12 $16.83 $16.43 $16.65
$19.90 $21.48
$24.70 $27.44
$30.59
$34.16 $4.70
$6.08
$3.53 $2.96
$3.18 $0.73
$0.10
$0.13
$0.03
$0.03
$0
$5
$10
$15
$20
$25
$30
$35
$40
FY 2008 FY 2009 FY 2010 FY 2011 FY 2012 FY 2013 FY 2014 FY 2015 FY 2016 FY 2017
Employer Contribution Employee Portion Paid by City
10 Year Trend ‐ Citywide Pension Expense ($Millions)
ANSMITTAL LETTER • CITY OF PALO ALTO FISCAL YEAR 2017 ADOPTED BUDGET

TRANSMITTAL LETTER
There are factors, however, that could tip the scales toward even higher annual costs and liabili-ties. These include:
The assumed interest earnings in the trust funds currently at 7.5% is not achieved over time.
Demographic assumptions pertaining to employees and retirees may change (e.g.: retirees living longer).
Healthcare costs rising faster than assumed.
Any of the above changes in future years can increase the unfunded liability for pension and healthcare benefits. On April 4, 2016 staff presented to the Finance Committee a “Poor PERS Return” scenario which assumed returns of between 0.2 and 4.1 percent. The impact from lower returns dropped what was a cumulative surplus of $31.8 million over ten years in the base sce-nario (based on a 7.5 percent rate of return) to a surplus of $7.3 million in the “Poor PERS Return” scenario (between 0.2 to 4.1 percent), a dramatic $24.5 million or 77 percent decline. This demonstrates how sensitive the General Fund budget is to potential fluctuations in returns on trust funds.
The City of Palo Alto is not alone in struggling with pension and health care costs and liabilities. We were proactive in implementing a Tier 2 pension plan in 2010 and welcomed the State Tier 3 pension plan in 2013. Although these new tiers have reduced expense growth in the long-term (one third of the employees are in Tiers 2 and 3), other strategies are needed to cope with pen-sion expense, especially in terms of market volatility.
Along with the City’s Actuary (Bartel Associates), staff has presented to the Finance Committee the idea of funding a Section 115 Trust that is separate from PERS. This trust would act as a mit-igation reserve if the City were unable to meet its annual ARC contribution or if PERS rates spiked due to lower investment returns. The Finance Committee approved of this concept and it will come to the full Council for consideration shortly. Building this reserve over time would cushion the General Fund from budget or service reductions. I recommended to the Council a $1.3 million funding start from the FY 2015 surplus and have asked staff to explore additional funding options and policies to present the Council for consideration in the coming months.
The table below from the Long Range Financial Forecast depicts the rising retiree health care costs between FY 2016 and FY 2026.
Retiree Healthcare Annual Required Contributions (by Fiscal Year)
Fund 2016 2017 2018 2019 2020 2021 2022 2023 2024 2025 2026
General Fund $10.0 $10.9 $11.2 $11.6 $12.0 $12.4 $12.8 $13.2 $13.6 $14.0 $14.5
Non-General Funds
$4.8 $5.2 $5.4 $5.6 $5.8 $5.9 $6.1 $6.3 $6.6 $6.8 $7.0
TOTAL $14.8 $16.1 $16.6 $17.2 $17.8 $18.3 $18.9 $19.5 $20.2 $20.8 $21.5
TRANSMITTAL LETTER • CITY OF PALO ALTO FISCAL YEAR 2017 ADOPTED BUDGET 23

TRANSMITTAL LETTER
24 T
* Employee contribution represents employees' contributions towards future retiree medical costs and the current retiree medical liability.** Medical costs invariably increase with age; however, the City's medical premiums are calculated as a blended rate between retirees and active employees. The implied subsidy identifies the employer cost for allowing retirees to participate in the City's healthcare plan at the active employee rates.
The table above depicts the rising per employee health care costs between FY 2008 and FY 2019. Between FY 2008, when the City's healthcare expense was at $22.9 million and this bud-get, the City's healthcare expense more than doubled to $37.2 million. As can be seen from the chart below, the primary reason for the increase in cost is the retiree healthcare benefit. In FY 2008, the City paid $4.9 million while in FY 2017, the total benefit cost, including the contribu-tions from employees, amounts to $16.1 million. During the same period, the healthcare premium costs increased due to increased healthcare costs and the increase in number of retirees. With FY 2008, the City started to pay the annual required contribution (ARC) for retiree healthcare. With the payment of the ARC, all things being equal, the City will pay off the unfunded liability within 30 years.
Fiscal Year 2017 Funding ChallengesWith the short and long-term challenges facing the City in the next ten years, it becomes essen-tial to determine funding priorities. Here are some of the short and long-term challenges we face, a number of which are outlined further in the Long Range Financial Forecast:
$13.3 $13.5 $13.7 $14.3 $14.9 $15.9 $16.7 $17.3 $19.1 $18.1 $18.8 $19.5
$4.9 $5.4 $7.0 $8.0 $8.0 $8.6 $8.7 $9.0
$9.7 $10.5 $11.3 $12.2
$4.7 $2.5 $3.1 $1.8
$3.9 $2.9 $2.9 $2.0 $1.8 $3.3
$2.9 $2.5
$0.7 $1.3 $1.5 $1.3 $1.2 $1.9 $2.1 $2.3
$2.4 $2.4
$0
$5
$10
$15
$20
$25
$30
$35
$40
2008 2009 2010 2011 2012 2013 2014 2015 2016ModBgt
2017Budget
2018Project
2019Project
Citywide Healthcare Costs (in millions)
Employee Medical Premiums Retiree Medical Premiums Unfunded Liability ContributionEmployee Contribution* Implied Subsidy**
RANSMITTAL LETTER • CITY OF PALO ALTO FISCAL YEAR 2017 ADOPTED BUDGET

TRANSMITTAL LETTER
SHORT-TERM FUNDING CHALLENGES This proposed budget includes a reallocation of $2.3 million in annual streetlight and traffic
signal costs from the Electric to General Fund as a consequence of State Proposition 26. One-time funding solutions identified for FY 2017 will offset this expense in FY 2017, but the City will be required to identify ongoing funding options in FY 2018. In order to absorb part of this expense, $1.4 million is being reduced from the General Fund transfer to Infrastructure.
The City and Stanford are currently exploring a new service level agreement for Fire Response Services.
This proposed budget includes additional funding of $0.7 million in loans to the Palo Alto Airport (total to date is $2.3 million through FY 2016). Re-payment of these loans is anticipated to begin in FY 2018 at the earliest.
Parks and Recreation Master Plan anticipated to be presented to the City Council this calendar year.
Capital costs related to City assets managed by non-profits such as the Avenidas Senior Center, the Palo Alto History Museum, and the Ventura Child Care Center.
The Animal Shelter operations and escalating costs; the City is currently exploring a possible partnership and alternative service delivery model that could mitigate future increases and enhance services provided at the Shelter.
LONG-TERM FUNDING CHALLENGES Rising annual pension and health care costs.
Unfunded long-term pension and retiree healthcare liabilities currently estimated at $439 million for all funds.
Infrastructure Plan projects whose costs are rising above the original $126 million projection and which will be subject to prevailing wage requirements and new operating costs.
Improvements/amenities for 7.7 acres owned by City in foothills.
Operating funds to support new City assets: Public Safety Building, parking garages, and possible Post Office acquisition.
Animal Shelter and potential Golf Course subsidies.
Cubberley Community Center Master Plan expenses in excess of the dedicated Cubberley infrastructure funding as agreed to between the School District and the City. These include long term capital and operating costs associated with potentially enhanced community services at Cubberley, pending the outcome of our revived master planning effort.
The Cadillac Healthcare Federal Excise Tax with an expected impact in calendar year 2020.
Upward pressure on salaries to stay competitive in the high cost Bay Area and maintain a work force equal to the demands of our community.
Costs associated with adaptation to climate change, including sea level rise, for example.
TRANSMITTAL LETTER • CITY OF PALO ALTO FISCAL YEAR 2017 ADOPTED BUDGET 25

TRANSMITTAL LETTER
26 TR
Such long-term challenges will further pressure our resources and require tough decisions. Sooner than later, this will require permanent solutions to the one-time adjustments made in this Proposed Budget.
One-Time Budget Balancing Solutions General Fund staffing is still below the 2009 level; however, work demands as a result of com-munity needs continue to increase. The General Fund is experiencing significant expense increases due to State propositions requiring the transfer of street lights and traffic signal costs from the Electric Fund to the General Fund. Furthermore, Stanford is requesting a lower cost for fire and paramedic services, as well as budget increases addressing Council priorities and increases to salaries and benefits. To accommodate these changes, we have been forced to bal-ance the Proposed FY 2017 General Fund Budget with several one-time solutions including:
Allocated charges to other City departments and funds, which is the revenue source for these funds, will be reduced or eliminated in the General Benefits, General Liabilities, and Workers' Compensation funds. As a result, citywide savings of $5.0 million are anticipated in all funds, of which $3.1 million is realized in the General Fund. It has been determined that each of these funds have sufficient fund balance to draw down and overall balances are anticipated to remain above $0.3 million despite this action.
Proceeds from the sale of the property co-owned with former City Manager Frank Benest yielded approximately $2 million into the General Fund. Staff recommends $1 million be used to offset costs associated with Council priorities the FY17 operating budget and that the remaining funds be transferred to the Infrastructure Reserve. (This recommendation is reflected in the Budget Stabilization Reserve figures below.)
Temporarily lowering of the Budget Stabilization Reserve target of 18.5% to 17.96 percent to allow the use of $4.9 million.
The Budget Stabilization Reserve (BSR) is anticipated to end FY 2016 at approximately $40.5 million. With the one time use of $4.9 million, the reserve will drop to $35.6 million.
While making one-time adjustments is not the ideal solution and having the BSR around 18% is below the previous Council target of 18.5%, (although within the established 15-20% range), it is important that we buy some time to allow the Council to make informed decisions that may require service reductions or new revenues, both of which require community and stakeholder involvement. It will be important to have recommendations providing structural fixes going for-ward and it will be part of the FY 2018 Proposed Budget process. The goal will be to reset the BSR back to the 18.5% target level.
Utility Rate Changes Unfortunately, a perfect storm, or lack thereof, has hit utility rates for FY 2017. The drought, water conservation efforts, warm weather, Hetch Hetchy system capital costs, required treat-ment plant rehabilitation work, and enhanced recycling efforts through our refuse collection service have caused rates to increase across all of the City’s utilities. This is the first year in
ANSMITTAL LETTER • CITY OF PALO ALTO FISCAL YEAR 2017 ADOPTED BUDGET

TRANSMITTAL LETTER
recent memory that rate increases across service areas have been necessary in the same year. For example, electric rates have not risen since FY 2009.
As a consequence of the proposed rate changes, the average residential utility bill is expected to rise by 8.7 percent or $22.42 monthly. Rates are projected to rise in the next few years as well. The increases for FY 2017 are as follows:
AcknowledgmentsAs we look forward to solving the challenges before us, we should be proud of our many achievements to date. In a region where change is swift and expectations high, it is important to celebrate our many accomplishments as we move into the future.
I would like to thank City Council for your leadership and our Executive Leadership Team and the entire staff for providing outstanding services to our community. Special thanks to Lalo Perez, our Chief Financial Officer, Kiely Nose, Budget Manager who recently jumped into the budget fray, and her stellar team – Michael Bruckner, Paul Harper, Steve Guagliardo, and Sean O'Shea – who have worked countless hours during evenings and on weekends to construct and produce this budget. Additional thanks to Joe Saccio and Tarun Narayan. Finally, I must praise staff across all departments who contributed greatly to this budget.
We are pleased to work with a dedicated Council, a professional City workforce, and a highly engaged community. Staff and I stand ready to discuss issues and respond to and to respond to Council questions on the Proposed FY 2017 Budget.
Recommended Rate ChangesUtility Percentage Change
Electric 11%
Gas 8%
Wastewater 9%
Water Utility 6%
Refuse 9%
Storm Drain 3.2%
TRANSMITTAL LETTER • CITY OF PALO ALTO FISCAL YEAR 2017 ADOPTED BUDGET 27

TRANSMITTAL LETTER
28 TR
Council Amendments to the Proposed BudgetThe proceeding transmittal letter was submitted as part of the Proposed FY 2017 Budget; how-ever, subsequent to this submittal, the Finance Committee and the City Council had a series of Budget Hearings to review and consider the recommendations made by staff. As a result of these hearings, several modifications to the Proposed document were ultimately approved by the City Council as part of the Adoption of the City’s FY 2017 Budget, see the Action Minutes from the June 13, 2016 Council Meeting, item number nine, here: http://www.cityofpaloalto.org/civicax/filebank/documents/52916. This Adopted FY 2017 Budget document reflects these changes which are summarized in City Council Staff Report #6932 on the City’s website here: http://www.cityofpaloalto.org/civicax/filebank/documents/52691; as well as in an at places memo submitted to the City Council at the June 13, 2016 City Council Meeting, which is on the City’s website here: http://www.cityofpaloalto.org/civicax/filebank/documents/52869. Total adopted expenditures for FY 2017, across all funds, are $641.8 million, which is an increase of $15.7 million from the Proposed level of $626.1 million.
Respectfully Submitted,
James Keene
City Manager
ANSMITTAL LETTER • CITY OF PALO ALTO FISCAL YEAR 2017 ADOPTED BUDGET

BUDGET ACKNOWLEDGMENTS
Budget AcknowledgmentsDepartment Budget Coordinators
Administrative ServicesMary Figone
City AttorneyStacy Lavelle
City AuditorDeniz Tunc
City ClerkBeth Minor
City ManagerKhashayar Alaee
Community ServicesKeri Russell
Development ServicesJessie Deschamps
FireAmber Cameron
Human ResourcesKhashayar Alaee
Information TechnologySherrie Wong
LibraryEvelyn Cheng
Planning & Community EnvironmentSherry Nikzat
Police/Office of Emergency ServicesIan Hagerman
Public WorksGina Magliocco
UtilitiesAnna Vuong
Budget Document Producers - Office of Management & Budget StaffLalo Perez Sean O’SheaKiely Nose Chaitali PaliwalMichael Bruckner Monica WilliamsPaul Harper Eric Bilimoria (Special Assistance)Steve Guagliardo Myrna McCaleb (Special Assistance)
Image CreditsAll artwork produced by children enrolled in Palo Alto Art Center Children’s Fine Art camps and classes offered by the Community Services Department. For more information, please visit www.cityofpaloalt.org/gov/depts/csd/artcenter.
BUDGET ACKNOWLEDGMENTS • CITY OF PALO ALTO FISCAL YEAR 2017 ADOPTED BUDGET 29

CITY OF PALO ALTO ORGANIZATIONAL CHART
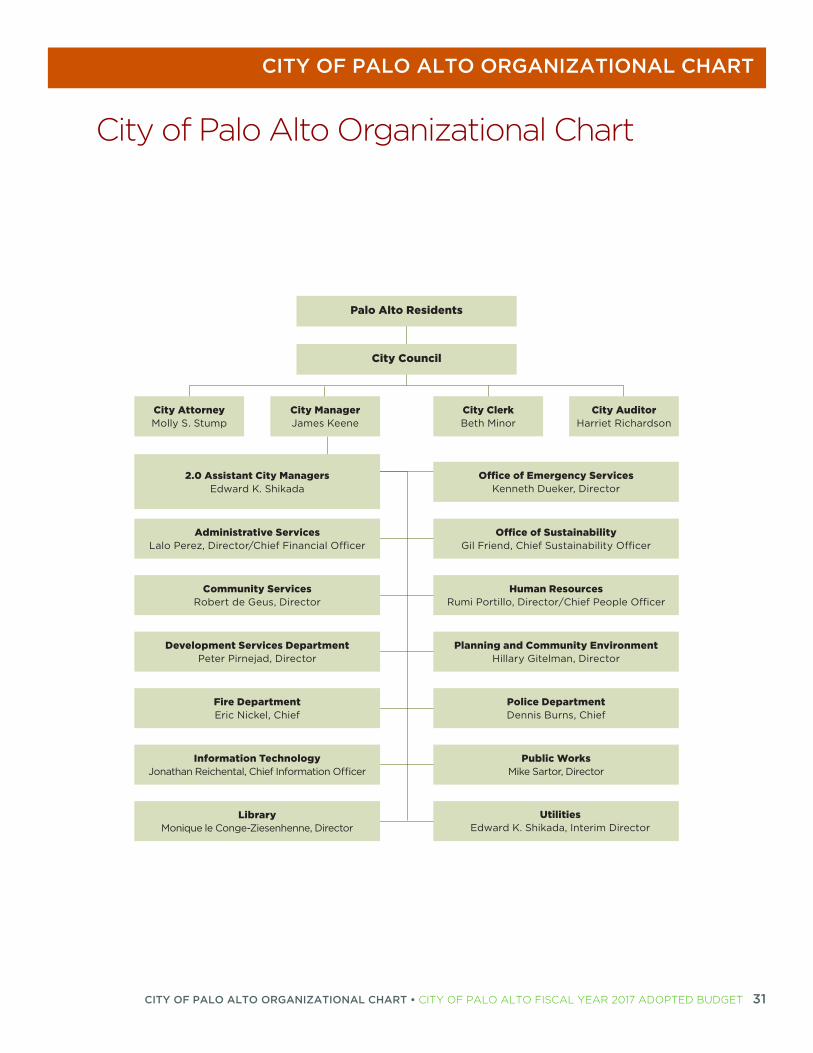
City of Palo Alto Organizational Chart
Palo Alto Residents
City Council
City Attorney Molly S. Stump
2.0 Assistant City Managers Edward K. Shikada
Office of Emergency Services Kenneth Dueker, Director
Administrative Services Lalo Perez, Director/Chief Financial Officer
Office of Sustainability Gil Friend, Chief Sustainability Officer
Development Services Department Peter Pirnejad, Director
Planning and Community Environment Hillary Gitelman, Director
Information Technology Jonathan Reichental, Chief Information Officer
Public Works Mike Sartor, Director
Community Services Robert de Geus, Director
Human Resources , Director/Chief People Officer
Fire Department Eric Nickel, Chief
Police Department Dennis Burns, Chief
Library Monique le Conge-Ziesenhenne, Director
Utilities , Director
City Clerk Beth Minor
City Manager James Keene
City Auditor Harriet Richardson
CITY OF PALO ALTO ORGANIZATIONAL CHART • CITY OF PALO ALTO FISCAL YEAR 2017 ADOPTED BUDGET 31


PALO ALTO AT A GLANCE
Palo Alto at a Glance
INCORPORATIONApril 23, 1894
GOVERNMENTPalo Alto is a charter city operating under the Council-Manager form of government
COUNTYSanta Clara County
www.sccsgov.org
SCHOOL DISTRICTPalo Alto Unified School District
www.pausd.org
LOCATION33 miles south of San Francisco; 17 miles north of San Jose; and 356 miles north of Los Angeles
CLIMATEMediterranean climate with cool, wet winters and warm, dry summers
AREA25.85 square miles
ELEVATION30 feet above sea level
PARKS, PRESERVES AND OPEN SPACE8,410 acres
CREDIT RATINGAAA
PALO ALTO AT A GLANCE • CITY OF PALO ALTO FISCAL YEAR 2017 ADOPTED BUDGET 33

PALO ALTO AT A GLANCE
34 P
POPULATIONPalo Alto’s population was 66,968 in 2015. This rep-resents a 1.4 percent increase over the previous year and a 14 percent increase since 2000. Approximately 24.2 percent of the population is under the age of 18, and the median age is 41.3. Approximately 48.7percent of the population is female, and 51.3 percent of the population is male.
EDUCATIONPalo Alto has one of the most outstanding educational systems in the nation. In a recent survey, Palo Alto was named one of California’s most educated cities. Over 98.1 percent of Palo Alto residents aged 25 or over have received a high school diploma. Close to 80.4 percent have obtained a bachelor’s degree and nearly 52.1 per-cent have earned a post-graduate or professional degree.
School enrollments in Palo Alto increased to 12,532, or 19.1 percent, between 2005 and 2015. In school-year 2013-14, Palo Alto and Gunn high schools had a com-bined average SAT score of 1,932. The average scores for the United, California, and Santa Clara County were 1,490 1,487, and 1,673, respectively.
INCOMEPalo Alto’s median household income on average for 2014 was $151,370 and the per capita income in 2014 was $83,387 As of 2014, 66.2 percent of all households in Palo Alto had an annual income of greater than $100,000.
PERSONS PER HOUSEHOLDThe average number of persons per household in Palo Alto owner-occupied and renter-occupied homes was 2.50 in 2014, compared to 2.26 per household in 2000.
HOUSING UNITSIn 2014, 57.6 percent of the 27,963 housing units were owner-occupied and 42.4 percent were renter-occupied. In 2000, there were 26,048 housing units – 55.4 percent owner occupied, 41.4 percent renter-occupied, and 3.2 percent were vacant. There were 7.4 percent more total housing units from 2000 to 2014.
ALO ALTO AT A GLANCE • CITY OF PALO ALTO FISCAL YEAR 2017 ADOPTED BUDGET

PALO ALTO AT A GLANCE
DEVELOPMENTThe City issued approximately 2,599 residential and 1,245 commercial building permits in Fiscal Year 2015. The combined valuation for all permits was $479.8 mil-lion.
OFFICE AND INDUSTRIAL RENTAL ACTIVITYPalo Alto’s net rentable office space totaled approxi-mately 7.0 million square feet as of the fourth quarter of 2015. The vacancy rate during this same time period was 2.2 percent compared to 6.2 percent for the Silicon Val-ley market. Average asking rents in Palo Alto and the Sil-icon Valley were, respectively, $8.35 and $4.41 per square foot, as of the fourth quarter of 2015.
Net rentable square footage for industrial facilities in Palo Alto was 1.6 million, with a vacancy rate of 0.3 per-cent and average asking rent of $2.68 per square foot for manufacturing and $1.84 per square foot for warehouse. The Silicon Valley market had an average vacancy rate of 3.9 percent and asking rent averaged $0.85 per square foot for manufacturing and $0.71 for warehouse.
Net rentable space for Research and Development (R&D) facilities in Palo Alto totaled 10.6 million square
feet with a vacancy factor of 1.2 percent and average ask-ing rent of $5.80 per square foot. The vacancy rate for the Silicon Valley market was 7.5 percent with an aver-age asking rent of $2.15 per square foot.
RETAIL SALES AND SALES TAX REVENUEPalo Alto sales and use tax revenue totaled $29.7 million in Fiscal Year 2015, an increase of $0.3 million, or 0.9 percent. Due to a one-time accounting reporting change, this represents 14 months of sales tax receipt instead of 12 months. The prior year’s (Fiscal Year 2014) sales tax
receipt was also higher than normal due to large one-time receipts from a single business.
The City’s largest segment, general retail sales, totaled $839 million or 0.5 percent over Fiscal Year 2014. Retail sales, which represent 32.3 percent of sales tax receipts, have been steadily eroding due to on-line sales .Restau-rants and food products sales totaled $432.1 million or 9.0 percent growth over Fiscal Year 2014.
Top 25 Major Sales/Use Tax Contributors, FY 2015Anderson Honda Integrated Archive Systems Tesla Lease TrustApple Stores Loral Space Systems Tesla MotorsAudi Palo Alto Macy’s Department Store Tiffany & CompanyBloomingdales Magnussen’s Toyota Urban OutfittersCritchfield Mechanical Neiman Marcus Department Store Valero Service StationsCVS/Pharmacy Nordstrom Department Stores Varian Medical SystemsEat Club Pottery Barn Kids Wilkes BashfordFry’s Electronics Shell Service StationsHewlett-Packard Stanford University Hospital
PALO ALTO AT A GLANCE • CITY OF PALO ALTO FISCAL YEAR 2017 ADOPTED BUDGET 35

PALO ALTO AT A GLANCE
36 P
PALO ALTO BUSINESSESAs the birthplace of the Silicon Valley, Palo Alto is the home to Stanford University and thousands of innova-tive companies including Hewlett-Packard, IDEO, Tesla, Flipboard, Palantir Technologies, Xerox Palo Alto Research Center, Wilson Sonsini Goodrich & Rosati, Manatt Phelps Phillips, Accel Ventures, Survey Monkey, Theranos, Genencor, Tencent, Skype, Nest, the Institute for the Future and many other leading technology and business services firms.
Palo Alto was named the 2015 most livable U.S. city and again named among the top 6 livable U.S. cities in 2016 due to its economy, climate and natural beauty, parks
and recreational activities, excellent public school sys-tem, university presence, proximity to three major air-ports (Oakland, San Jose and San Francisco) and rail service, world-class medical facilities, excellent retail centers and restaurants and its highly acclaimed city ser-vices.
Businesses are drawn to Palo Alto not only because of its great location, workforce, and entrepreneurial culture, but also because of incentives including: great local utili-ties (including dark fiber), no payroll tax and no busi-ness license tax. Also, the City's Development Center is a "one-stop" service center staffed by the Planning, Build-ing, Public Works, Utilities and Fire departments.
Principal Property Taxpayers, FY 2015Rank Taxpayer Taxable Assessed Value
1 Leland Stanford Jr. University $3,783,665
2 Loral Space and Communications $214,151
3 EOSII Palo Alto Technology Center LLC $119,308
4 Whisman Ventures, LLC $109,807
5 Google Inc $103,834
6 SI 43 LLC $75,318
7 BVK Hamilton Ave LLC $67,933
8 Ronald & Ann Williams Charitable Foundation $61,457
9 PPC Forest Towers, LLC $55,558
10 Blackhawk Parent ,LLC $52,461
Total $4,643,492
ALO ALTO AT A GLANCE • CITY OF PALO ALTO FISCAL YEAR 2017 ADOPTED BUDGET

PALO ALTO AT A GLANCE
EMPLOYMENTThe City had 34,428 employed residents in 2016. Due to its location on the Peninsula and the presence of Stan-ford University, the City is a job importer versus exporter, and the number of jobs in the City is nearly 95,742. Palo Alto’s unemployment rate was 2.7 percent in 2015, which was considerably lower than the nation (5.3 percent), state (6.2 percent), and county (4.2 percent), during the same period.
LARGEST EMPLOYERSPalo Alto’s top ten employers reflect jobs ranging from education and healthcare to technology and schools, as of June 30, 2015.
Principal Employers, FY 2015Rank Employer Number of Employees
1 Stanford University 11,300
2 Stanford Healthcare 5,900
3 Lucille Packard Children's Hospital 4,200
4 Veteran's Affairs Palo Alto Healthcare System 3,900
5 VMWare, Inc 3,500
6 SAP 3,500
7 Space Systems/Loral 2,800
8 Hewlett-Packard Company 2,500
9 Palo Alto Medical Foundation 2,200
10 Colubris Networks,Inc 1,400
Total 41,200
PALO ALTO AT A GLANCE • CITY OF PALO ALTO FISCAL YEAR 2017 ADOPTED BUDGET 37

PALO ALTO AT A GLANCE
38 PA
Parks, Recreation & Community CentersItem (FY 2015) Number
Parks 36
Parks Acreage 162 acres
Playgrounds 29
Community Centers 4
Zoo 1
Golf Courses 1
Gymnasiums/Fitness Rooms 6
Youth Centers 1
Walking/Biking Trails 41.19 miles
LibrariesItem (FY 2015) Number
Library Branches 5
Items Checked Out (Circulation) 1,499,406
Books (Inventory) 247,088
eBooks & eMusic (Inventory) 73,793
Audio/Visual - DVD/CDs (Inventory)
51,178
Reference Questions 73,580
Public SafetyItem (FY 2015) Number
Police
Police Stations 1
Sworn Police Personnel (FY 2015) 93
Police Vehicles 28
Motorcycles 5
Canine Units 2
Number of Calls for Service 58,243
Item (FY 2015) Number
Fire
Fire Stations 7
Sworn Fire Personnel (FY 2015) 107
Fire Engines 10
Fire Trucks 1
Ambulances 3
Number of Calls for Service 8,548
LO ALTO AT A GLANCE • CITY OF PALO ALTO FISCAL YEAR 2017 ADOPTED BUDGET

PALO ALTO AT A GLANCE
Infrastructure, Maintenance & Development ActivityItem (FY 2015) Number
Street Miles 471 miles
Street Miles Resurfaced Annually 30.7 miles
Building Permits Issued Annually 3,844 permits
Number of Fire Inspections 1,981 permits
Active Capital Improvement Projects
207 projects
Capital Improvement Projects Exp.
$58.0 million
Miles of Water Municipal Mains 236 miles
Gallons of Water Delivered (Daily) 9.5 million
Miles of Municipal Wastewater Mains
216 miles
Gallons of Wastewater Treated 2.3 billion
Miles of Gas Mains 210 miles
Overhead Electrical Line Miles 117 miles
Underground Electrical Line Miles
175 miles
Fiber Optic Backbone Miles 42 miles
PALO ALTO AT A GLANCE • CITY OF PALO ALTO FISCAL YEAR 2017 ADOPTED BUDGET 39

PALO ALTO AT A GLANCE
40 P
SOURCES:POPULATION:U.S. Census Bureau, 2014 American Community Survey, Demographic and Housing Estimates, 1-Year Estimates., Table DP05.
EDUCATION:U.S. Census Bureau, 2014 American Community Survey, Educational Attainment, 1-Year Estimates, Table S1501
California Department of Education, Data Reporting Office
California Department of Education, SAT District Level Scores, Data and Statistics, Dataquest by State, County or District.
www.collegboard.org for national level SAT scores.
INCOME:2014 American Community Survey 1-Year Estimates, Selected Economic Characteristics, Table DP03
PERSONS PER HOUSEHOLD AND HOUSING UNITS:2014 American Community Survey 1-Year Estimates, Selected Housing Characteristics, Tables, DP04, DP05
DEVELOPMENT:City of Palo Alto Planning and Development Depart-ment
OFFICE AND INDUSTRIAL RENTAL ACTIVITY:CBRE Silicon Valley Office MarketView Q4 2015
CBRE Silicon Valley Industrial MarketView Q4 20145
CBRE Silicon Valley R&D MarketView Q4 2015
RETAIL SALES AND SALES TAX REVENUE:City of Palo Alto Sales Tax Digest Summary 2014 (Office of the City Auditor)
City of Palo Alto 2014-2015 Comprehensive Annual Financial Report (CAFR)
TOP 25 MAJOR SALES/USE TAX CONTRIBUTORS:City of Palo Alto Sales Tax Digest Summary Third Quar-ter Sales (July-September– 2015), Top 25 Major Sales/Use Tax Contributors, Year-Ended 3th Quarter 20145
PRINCIPAL PROPERTY TAXPAYERS:City of Palo Alto 2014-2015 Comprehensive Annual Financial Report (CAFR)
EMPLOYMENT:2014 American Community Survey, 1-Year Estimates, Table B08501 and DP03.
PALO ALTO BUSINESSES:Livability, Top 100 Best Places to Live
City of Palo Alto Economic Development
LARGEST EMPLOYERS:City of Palo Alto 2014-2015 Comprehensive Annual Financial Report (CAFR)
SustainabilityItem (FY 2015) Number
Total Tons of Material Recycled or Composted 50,546 tons
Total Megawatt-hours Purchased from Eligible Renewable Sources* 221,023 hours
Percent of Electric Portfolio Purchased from Eligible Renewable Sources 22.88%
Percent of Electric Portfolio Purchased from Carbon Neutral Sources** 100%
* Calendar year 2015. “Eligible Renewable Sources” are wind, solar, small hydroelectric, and biogas gener-ators whose output is directly purchased by the City under a power purchase agreement.
* Calendar year 2015. “Carbon Neutral Sources” include eligible renewable (24%), hydroelectric power (10%), and power from unspecified sources matched with renewable energy credits (50%). The City’s goal is to purchase all energy from eligible renewable sources starting in 2017.
ALO ALTO AT A GLANCE • CITY OF PALO ALTO FISCAL YEAR 2017 ADOPTED BUDGET

THE BUDGET PROCESS AND DOCUMENT
The Budget Process and DocumentBasis for Budget DevelopmentThe budget is the City’s financial plan for delivering effective services and efficiently managing the revenues which support those services. The City’s charter and municipal code provide broad governance for preparation of the operating and capital budgets. The budget is also developed based on the following:
The City Council’s top priorities and other City Council directives
The City's Long Range Financial Forecast, which is updated annually and presented to the Finance Committee and the City Council prior to the release of the proposed budget
Service level prioritization as identified by the City Manager
Availability and sustainability of revenues
Legal mandates
Prioritization criteria outlined in the capital budget
The City's policies regarding land use and community design, transportation, housing, natural environment, business and economics as outlined in the Comprehensive Plan
The review of the operating and capital budgets is structured around public hearings con-ducted by the Finance Committee and prior to Council adoption of the budget in order to incorporate community input into the decision making process.
City Council Top Four PrioritiesOn an ongoing basis, the City is committed to providing high quality, cost effective services that reflect the City’s core values and strategic goals. In addition, each year the City Council estab-lishes top priorities, which are topics or service areas that will receive particular, unusual, and significant attention during the year. The top priorities guide both budget development and department priority-setting. The following are the City Council’s top priorities for 2016:
The Built Environment: Housing, Parking and Livability, and Mobility
Infrastructure Strategy and Implementation
Healthy City, Healthy Community
Completion of the Comprehensive Plan update with increased focus from Council
Operating and Capital Budgets - Calendar of ActivitiesSeptember - November: Operating budget preparation begins with determination of the base budget for the upcoming year. The base budget establishes the current year adopted budget service levels with updated costs, removes one-time revenue and expenses, and adds ongoing
THE BUDGET PROCESS AND DOCUMENT • CITY OF PALO ALTO FISCAL YEAR 2017 ADOPTED BUDGET 41

THE BUDGET PROCESS AND DOCUMENT
42 T
expenditures as approved by the City Council. The capital budget preparation process begins with department staff and appointed committees meeting to review and discuss potential mod-ifications to the five-year capital plan.
November - December: Budget guidelines and timeframes for development of the operating and capital budgets as well as the annual municipal fee schedule are developed and distributed.
January: Departments submit requests to reallocate staffing and non-salary resources for the upcoming year to meet changing operational needs. The reallocation process results in no net change to the level of resources allocated to the department overall. The General Fund CIP Committee, consisting of senior managers in the Public Works, Community Services, Adminis-trative Services, and Planning and Community Environment Departments, reviews requests for General Fund capital projects.
February: Departmental requests for changes and/or augmentations to the base budget are submitted to the Office of Management and Budget (OMB) for analysis. Departments provide targeted outcomes and performance measures associated with requests for resource or service level augmentations. Departments also submit updates to the budget document regarding goals and objectives, significant accomplishments, and key performance and workload mea-sures. OMB staff begins review of operating and capital budget requests.
March: Internal budget hearings are held with the City Manager to discuss department budget requests and OMB’s budget recommendations.
April: OMB staff complete preparation of the proposed operating and capital budget docu-ments based on the City Manager’s direction.
May: The City Manager releases and presents the proposed operating and capital budgets to the City Council and posts the budget document on the City’s Open Budget website. The Finance Committee conducts a series of public hearings and recommends the budget with or without amendments to the City Council.
June: Final adoption by the City Council occurs after a public hearing in June. All changes made during the public process are incorporated into the adopted budget documents which are dis-tributed to City libraries as well as posted on the City's website and Open Budget website by early August.
HE BUDGET PROCESS AND DOCUMENT • CITY OF PALO ALTO FISCAL YEAR 2017 ADOPTED BUDGET

THE BUDGET PROCESS AND DOCUMENT
BUDGET HEARINGSWith City Council and Finance Committee
FY 2017 Proposed Budget
Date Description Time/Location Departments Attending
Monday, April 25 City Council 6:00 PMCouncil Chambers
Transmittal of proposed capital and operating budgets to Council and forward to Finance Committee for discussion
Tuesday, May 3 Finance Committee 6:00 PMCouncil Chambers
Budget Kickoff; Departments/Funds:‐ Council Appointed Officials & Council ‐ Office of Sustainability‐ General Liability Fund‐ Human Resources, Employee Benefits Funds‐ Information Technology (capital & operating)‐ Administrative Services, Print & Mail Funds‐ Non‐Departmental
Thursday, May 5 Finance CommitteeSpecial Meeting
6:00 PMCouncil Chambers
‐ Fire‐ Police‐ Office of Emergency Services‐ Community Services‐ Library
Tuesday, May 10 Finance CommitteeSpecial Meeting
6:00 PMCouncil Chambers
‐ Retiree Health Benefits Fund‐ Planning & Community Environment‐ Special Revenue Funds (including Parking District & Stanford Development Agreement Fund)‐ Development Services
Thursday, May 12 Finance CommitteeSpecial Meeting
6:00 PMCouncil Chambers
‐ Municipal Fee Schedule ‐ Public Works: General Fund, Storm Drain, Refuse, Wastewater Treatment, Vehicle Replacement, related capital
Tuesday, May 17 Finance Committee 7:00 PMCouncil Chambers
‐ Utilities (Capital & Operating)‐ General Fund Capital
Monday, May 23 Finance CommitteeSpecial Meeting
1:00 PMMitchell Park Library
‐ Wrap‐up with Finance Committee
Monday, June 13 City Council 6:00 PMCouncil Chambers
Public Hearing ‐ Budget Approval & Adoption
THE BUDGET PROCESS AND DOCUMENT • CITY OF PALO ALTO FISCAL YEAR 2017 ADOPTED BUDGET 43

THE BUDGET PROCESS AND DOCUMENT
44 T
Understanding the Budget DocumentThe operating budget document includes city-wide information as well as information specific to each fund and each department. The City receives revenue from numerous different sources, many of which have restrictions on how they can be used. Separate funds are established to account for the different types of revenues and allowable uses of those revenues. The annual budget information is available after the publication of the annual Adopted Budget, which occurs in August. In august, the annual budget will also be available on the City’s Open Budget website, discussed below.
General Fund: This is the primary fund used to account for all general revenues of the City (e.g. property, sales, transient occupancy and utility user taxes). In general, these funds are allocated at the discretion of the City Council. This revenue is used to support citywide services such as public safety, community services, planning and community environment, and administrative support services.
Enterprise Funds: These funds are established to function as self-supporting operations wherein expenditures are entirely offset by fees or charges for services. For example, the City of Palo Alto provides a variety of utility services (electric, gas, water, etc.) for the community. Revenues from fees or charges are accounted for in separate enterprise funds and can only be used to pay for expenses related to those services.
Internal Service Funds: These funds are established to account for a variety of business services provided by one City department (or division) to other City departments. Information technol-ogy, fleet maintenance, printing and mailing, general employee benefits, liability and workers’ compensation services are provided to all City departments through internal service funds. Departments are charged for these services based on their respective utilization.
Capital Fund: Revenues and expenses for capital projects are also accounted for in a separate fund. Capital projects are those that have a minimum cost of $50,000 for each standalone or combined project. Additionally, the project must have a useful life of at least five to seven years and/or extend the life of an existing asset or provide a new use for an existing asset for at least five years. The City produces a standalone budget document for capital projects that includes detailed information about each project.
Special Revenue Funds: These funds are used to account for the proceeds of revenues that are designated for specific or restricted uses. These funds include gas tax funds from the state, in-lieu housing fees assessed for the City's Below Market Rate housing projects, and transportation mitigation fees paid by developers. Other special revenue funds include assessments for park-ing lot bond payments, parking permit revenues, Community Development Block Grants (CDBG) funds from the federal government, and development impact fees related to libraries, parks, and community centers.
Debt Service Fund: Debt financing is occasionally undertaken for the purchase, replacement, or rehabilitation of capital assets. A separate fund is established to account for these non-operat-ing expenses.
HE BUDGET PROCESS AND DOCUMENT • CITY OF PALO ALTO FISCAL YEAR 2017 ADOPTED BUDGET

THE BUDGET PROCESS AND DOCUMENT
Open BudgetIn order to facilitate understanding and transparency of the budget document, the City pro-vides budget information through OpenGov, an online tool that provides users with different views of the City’s budget data by fund, department, revenues, and expenditures. The tool can be accessed by visiting www.paloalto.opengov.com. The City invites you to use the online tool to:
Search seven years of budget and financial data
View trends in revenues and expenditures over time
Drill down into expenses by department or account type
Display the data as graphs or charts
Download into Excel
Share with friends using email or social media
Send comments directly to the City online
HOW DOES IT WORK?Governmental budgets are composed of funds, departments, and accounts. Using a pull-down filter you can choose the combination you want to explore.
By clicking on one these icons, you can choose whether you want to display graphs showing changes over the years, a pie chart for a single year, or download portions into Excel.
For example, you can also cut and paste any illustration into another document, send it to friends using email or Twitter, or post it on Facebook.
THE BUDGET PROCESS AND DOCUMENT • CITY OF PALO ALTO FISCAL YEAR 2017 ADOPTED BUDGET 45

THE BUDGET PROCESS AND DOCUMENT
46 T
Department and Enterprise Fund InformationThe budget document includes the following information for each department and enterprise fund:
Mission Statement, Purpose, and Description: introduces the department.
Organizational Chart: depicts full-time equivalent (FTE) positions, which report to a department director. The total FTE count in the organizational chart may not match the total FTE count in a department section, if positions are budgeted in a fund not included in the particular depart-ment section. For example, the Administrative Services Assistant Director oversees the SAP functional team and the positions are budgeted in the Technology Fund.
Accomplishments: identifies the department’s noteworthy accomplishments over the past one or two fiscal years.
Initiatives: highlights the major work plan items for the department for the upcoming Fiscal Year.
Goals and Objectives: identifies major goals as well as activities that support achievement of those goals.
Key Performance Measures: lists key department performance measures related to some goals and objectives. Performance Measures are grouped by its intended outcome such as Quality, Cost, Cycle Time, Customer Satisfaction, and Sustainability identified with icons as follows:
Workload Measures: identifies key quantifiable department outputs.
Budget Summary: summarizes key expenditure, revenue, and position data for the department and/or fund for several fiscal years (FY 2014 Actuals, FY 2015 Actuals, FY 2016 Adopted, and FY 2017 Budget). Revenues are shown as either internal or external depending on their source. External revenues include grant funds as well as fees collected when providing certain services such as inspections, plan checks and recreational programs. Internal revenues are those that are received from another City department. For example, the Utilities Department reimburses the Attorney's Office for legal services.
Staffing: lists all full-time equivalent (FTE) positions and their respective salary in a department based on their actual level of compensation.
Budget Reconciliation: outlines the major base budget and adopted budget expenditure and revenue changes from the previously adopted budget to the newly presented proposed or
Quality
Cost
Cycle Time
Customer Satisfaction
Sustainability
HE BUDGET PROCESS AND DOCUMENT • CITY OF PALO ALTO FISCAL YEAR 2017 ADOPTED BUDGET

THE BUDGET PROCESS AND DOCUMENT
adopted budget. Base budget reconciliation changes include updated salary and benefits cost in accordance with the salary and benefits structure approved the City Council, deletion of one-time expenditures, or addition of ongoing expenditures as approved by the City Council. The budget change table itemizes expenditure and revenue recommendations and the net impact on the fund.
Budget Changes: describes service level changes compared to the prior fiscal year as well as the anticipated performance impact as it relates to Quality, Cost, Cycle Time, Customer Satis-faction, and Sustainability.
BUDGETARY BASISThe budget is prepared in accordance with Generally Accepted Accounting Principles. The bud-get for governmental funds has been prepared on a modified accrual basis. The modified accrual basis recognizes expenditures when the related fund liability is incurred. Revenues are recognized when they become both measurable and available. “Measurable” means the amount of the transaction can be determined and “available” means collectible within the current period or soon enough thereafter to be used to pay liabilities of the current period.
FUND STRUCTURE AND ACCOUNTING BASISThe accounts of the City are made up of funds that help organize and account for restricted resources. A fund is defined as a fiscal and accounting entity with a self-balancing set of accounts (comprised of assets, liabilities, fund equity, revenues, and expenditures), which are segregated for the purpose of carrying out specific activities or attaining certain objectives in accordance with regulatory requirements. The City has the following fund type categories:
Governmental Fund TypesThe governmental funds include the General, Special Revenue, Debt Service, and Capital Project Funds. Governmental Funds are reported using the current financial resources measurement focus and the modified accrual basis of accounting.
Proprietary Fund TypesThe proprietary funds, which include the Enterprise and Internal Service Funds, are used to account for the City's business-type activities. Proprietary funds are reported using the eco-nomic resources measurement focus and the full accrual basis of accounting. Revenues are recorded when earned, and expenses are recorded at the time liabilities are incurred, regardless of when the related cash flows take place.
Fiduciary Fund TypesThe Fiduciary Funds track assets held by the City in trust or as an agent for various assessment and community facilities districts. These funds are not included in the budget process.
Agency Fund TypesThe Agency Funds are custodial in nature and do not involve measurement of results of opera-tions. The City maintains three agency funds, which are not included in the budget process.
THE BUDGET PROCESS AND DOCUMENT • CITY OF PALO ALTO FISCAL YEAR 2017 ADOPTED BUDGET 47
BUDGET AWARDS
48 B
Budget Awards
UDGET AWARDS • CITY OF PALO ALTO FISCAL YEAR 2017 ADOPTED BUDGET

BUDGET AWARDS
BUDGET AWARDS • CITY OF PALO ALTO FISCAL YEAR 2017 ADOPTED BUDGET 49

BUDGET AWARDS
50 B
UDGET AWARDS • CITY OF PALO ALTO FISCAL YEAR 2017 ADOPTED BUDGET

52 •
CITY OF PALO ALTO FISCAL YEAR 2017 ADOPTED BUDGET
CITYWIDE FUNDS
CITY OF PALO ALTO FISCAL YEAR 2017 ADOPTED BUDGET 53


CITYWIDE FUNDS OVERVIEW
Citywide Funds Overview
Fund Structure
General Fund CapitalSpecial Revenue Fund
Housing In-Lieu
Street Improvement
2010 Library General Obligation
Utility Users Tax
Public Benefits
Community Development
2002 Certificate of Participation
Capital ProjectsGeneral Operating
Special Districts
Federal & State Revenues
Business Improvement
Stanford Development
Traffic Mitigation & Parking in-Lieu
Debt Service
CITYWIDE FUNDS OVERVIEW • CITY OF PALO ALTO FISCAL YEAR 2017 ADOPTED BUDGET 55

CITYWIDE FUNDS OVERVIEW
56 C
Wastewater Treatment
Vehicle Replacement & Maintenance
Refuse
Fiber OpticsRetiree Health
BenefitsInformation Technology
General Liability Insurance
Airport
Storm DrainageWorkers’
CompensationGeneral BenefitsElectric
Water
Wastewater Collection
Printing & Mailing Services
Gas
Enterprise Internal Service
ITYWIDE FUNDS OVERVIEW • CITY OF PALO ALTO FISCAL YEAR 2017 ADOPTED BUDGET

CITYWIDE FUNDS OVERVIEW
Citywide Revenues by CategoryFY 2014 Actuals
FY 2015 Actuals
FY 2016AdoptedBudget
FY 2017AdoptedBudget
FY 2017 Change $
FY 2017 Change %
Charges for Services 26,422 27,794 28,022 27,715 (307) (1.10)
From Other Agencies 4,536 5,102 2,934 26,396 23,462 799.66
Return on Investments 9,612 6,320 8,143 8,162 19 0.23
Sales Taxes 29,424 29,675 27,630 29,150 1,520 5.50
Charges to Other Funds 12,029 11,197 12,919 11,775 (1,144) (8.86)
Other Revenue 24,263 25,479 31,534 37,676 6,142 19.48
Documentary Transfer Tax 8,143 10,051 6,852 6,747 (105) (1.53)
Other Taxes and Fines 2,155 1,945 2,229 2,071 (158) (7.09)
Property Taxes 35,555 38,836 39,862 43,747 3,885 9.75
Rental Income 14,221 15,431 15,469 15,340 (129) (0.83)
Transient Occupancy Tax 12,255 16,669 18,791 23,134 4,343 23.11
Permits and Licenses 8,957 9,076 9,719 10,264 545 5.61
Utility Users Tax 11,008 10,861 11,189 12,379 1,190 10.64
Net Sales 260,201 157,218 272,002 291,761 19,759 7.26
Total 458,780 365,655 487,295 546,317 59,022 12.11
CITYWIDE FUNDS OVERVIEW • CITY OF PALO ALTO FISCAL YEAR 2017 ADOPTED BUDGET 57

CITYWIDE FUNDS OVERVIEW
58 C
Citywide Revenue by Category
$0
$50
$100
$150
$200
$250
$300
$350
3 Year Trend ‐ Citywide Revenues by Category ($M illions)
FY 2015 Actuals FY 2016 Adopted FY 2017 Adopted
1 23
4
5
6
7
8
9
10
11
12
13 14
$546.3 Million/FY 2017 Adopted1. Other Taxes and Fines ‐ $2.1/0.4%
2. Transient Occupancy Tax ‐ $23.1/4.2%
3. From Other Agencies ‐ $26.4/4.8%
4. Sales Taxes ‐ $29.2/5.3%
5. Documentary Transfer Tax ‐ $6.7/1.2%
6. Charges for Services ‐ $27.7/5.1%
7. Return on Investments ‐ $8.2/1.5%
8. Other Revenue ‐ $37.7/6.9%
9. Permits and Licenses ‐ $10.3/1.9%
10. Property Taxes ‐ $43.7/8.0%
11. Utility Users Tax ‐ $12.4/2.3%
12. Net Sales ‐ $291.8/53.4%
13. Charges to Other Funds ‐ $11.8/2.2%
14. Rental Income ‐ $15.3/2.8%
ITYWIDE FUNDS OVERVIEW • CITY OF PALO ALTO FISCAL YEAR 2017 ADOPTED BUDGET

CITYWIDE FUNDS OVERVIEW
Citywide Expenses by CategoryFY 2014 Actuals
FY 2015 Actuals
FY 2016AdoptedBudget
FY 2017AdoptedBudget
FY 2017 Change $
FY 2017 Change %
General Expense 20,296 12,303 18,124 20,545 2,421 13.36
Rents & Leases 11,114 7,139 13,275 13,626 351 2.64
Net Transfers (299) (1,755) 10,824 11,236 412 3.81
Allocated Charges 41,600 34,040 45,332 45,704 372 0.82
Contract Services 26,856 32,561 36,314 38,708 2,394 6.59
Facilities & Equipment 947 506 676 613 (63) (9.32)
Salary & Benefits 140,204 136,433 158,392 164,801 6,409 4.05
Supplies & Material 6,594 8,269 8,215 8,610 395 4.81
Debt Service 18,090 8,577 20,957 21,424 467 2.23
Capital Improvement Program 71,194 79,715 114,962 172,738 57,776 50.26
Utility Purchase 119,622 46,317 136,488 143,786 7,298 5.35
Total 456,219 364,105 563,559 641,791 78,232 13.88
CITYWIDE FUNDS OVERVIEW • CITY OF PALO ALTO FISCAL YEAR 2017 ADOPTED BUDGET 59

CITYWIDE FUNDS OVERVIEW
60 C
Citywide Expense by Category
‐ $ 2 0
$ 0
$ 2 0
$ 4 0
$ 6 0
$ 8 0
$ 1 0 0
$ 1 2 0
$ 1 4 0
$ 1 6 0
$ 1 8 0
$ 2 0 0
3 Y e a r T r e n d ‐ C i t y w i d e E x p e n s e s b y C a t e g o r y
( $ M i l l i o n s )
F Y 2 0 1 5 A c t u a l s F Y 2 0 1 6 A d o p t e d F Y 2 0 1 7 A d o p t e d
1 23
4
5
6
78
9
10
11
$641.8 Million/FY 2017 Adopted 1. Facilities & Equipment ‐ $0.6/0.1%
2. Contract Services ‐ $38.7/6.0%
3. Supplies & Material ‐ $8.6/1.4%
4. Allocated Charges ‐ $45.7/7.1%
5. Net Transfers ‐ $11.2/1.8%
6. Capital Improvement Program ‐ $172.7/26.9%
7. Rents & Leases ‐ $13.6/2.1%
8. Utility Purchase ‐ $143.8/22.4%
9. General Expense ‐ $20.5/3.2%
10. Salary & Benefits ‐ $164.8/25.7%
11. Debt Service ‐ $21.4/3.3%
ITYWIDE FUNDS OVERVIEW • CITY OF PALO ALTO FISCAL YEAR 2017 ADOPTED BUDGET

CITYWIDE FUNDS OVERVIEW
Citywide Projected Operating Fund Balance
FUND
PROJECTED ENDING
BALANCE 06/30/2016
ESTIMATED REVENUES
NET FUND TRANSFERS
ESTIMATED EXPENDITURES
PROJECTED ENDING
BALANCE 06/30/17
GENERAL FUND $ 41,144 $ 175,032 $ (3,576) $ 171,293 $ 41,307
CAPITAL FUND $ 54,982 $ 11,244 $ 33,960 $ 70,557 $ 29,629
DEBT SERVICE
Parking 2002 COPS (Taxable) Debt 251 0 243 243 251
Library Bonds 6,640 4,655 0 4,655 6,640
Total Debt Service 6,891 4,655 243 4,898 6,891
ENTERPRISE
Electric Fund $ 101,204 $ 150,243 ($ 9,322) $ 162,395 $ 79,730
Fiber Optics Fund 21,130 5,253 (104) 4,028 22,251
Gas Fund 16,206 36,182 (7,002) 37,739 7,647
Wastewater Collection Fund 8,716 19,270 (256) 23,149 4,581
Water Fund 38,383 41,586 75 57,541 22,503
Refuse Fund 361 31,176 (44) 30,566 927
Storm Drain Fund 11,901 6,827 (12) 12,569 6,147
Wastewater Treatment Fund 9,562 48,444 (320) 48,303 9,383
Airport Fund (1,690) 3,712 (704) 2,911 (1,593)
Total Enterprise $ 205,773 $ 342,693 ($ 17,689) $ 379,201 $ 151,576
CITYWIDE FUNDS OVERVIEW • CITY OF PALO ALTO FISCAL YEAR 2017 ADOPTED BUDGET 61
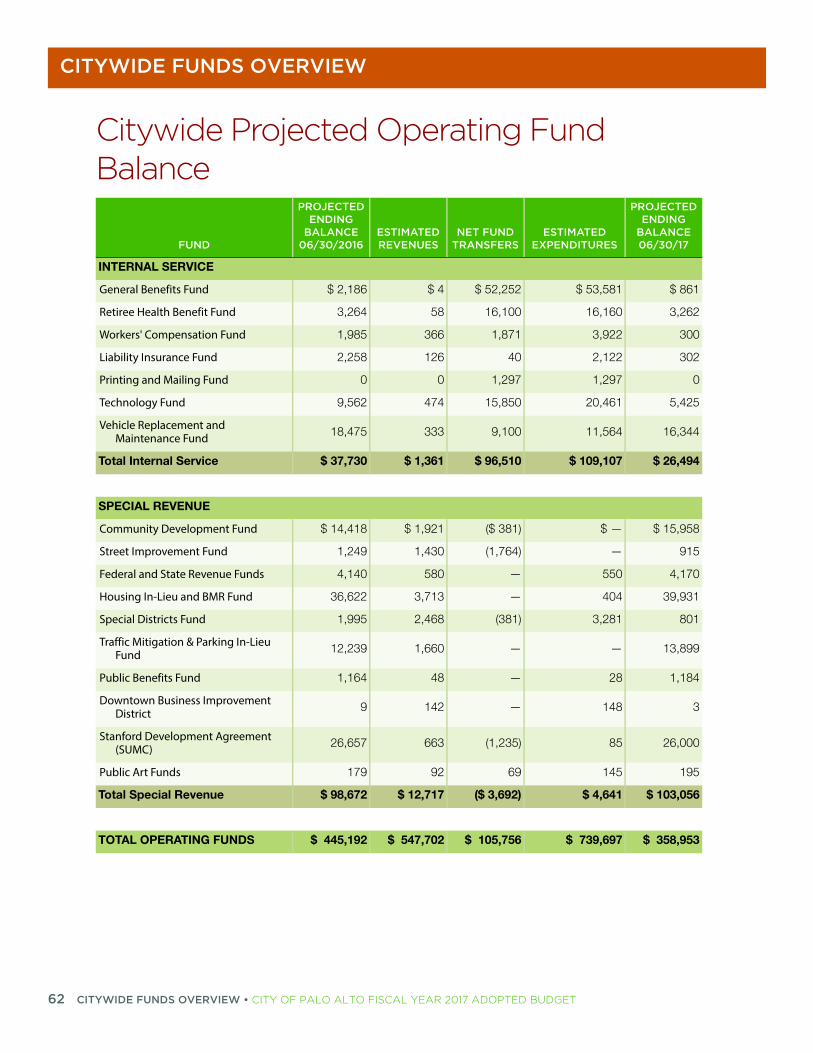
CITYWIDE FUNDS OVERVIEW
62 C
INTERNAL SERVICE
General Benefits Fund $ 2,186 $ 4 $ 52,252 $ 53,581 $ 861
Retiree Health Benefit Fund 3,264 58 16,100 16,160 3,262
Workers' Compensation Fund 1,985 366 1,871 3,922 300
Liability Insurance Fund 2,258 126 40 2,122 302
Printing and Mailing Fund 0 0 1,297 1,297 0
Technology Fund 9,562 474 15,850 20,461 5,425
Vehicle Replacement and Maintenance Fund 18,475 333 9,100 11,564 16,344
Total Internal Service $ 37,730 $ 1,361 $ 96,510 $ 109,107 $ 26,494
SPECIAL REVENUE
Community Development Fund $ 14,418 $ 1,921 ($ 381) $ — $ 15,958
Street Improvement Fund 1,249 1,430 (1,764) — 915
Federal and State Revenue Funds 4,140 580 — 550 4,170
Housing In-Lieu and BMR Fund 36,622 3,713 — 404 39,931
Special Districts Fund 1,995 2,468 (381) 3,281 801
Traffic Mitigation & Parking In-Lieu Fund 12,239 1,660 — — 13,899
Public Benefits Fund 1,164 48 — 28 1,184
Downtown Business Improvement District 9 142 — 148 3
Stanford Development Agreement (SUMC) 26,657 663 (1,235) 85 26,000
Public Art Funds 179 92 69 145 195
Total Special Revenue $ 98,672 $ 12,717 ($ 3,692) $ 4,641 $ 103,056
TOTAL OPERATING FUNDS $ 445,192 $ 547,702 $ 105,756 $ 739,697 $ 358,953
Citywide Projected Operating Fund Balance
FUND
PROJECTED ENDING
BALANCE 06/30/2016
ESTIMATED REVENUES
NET FUND TRANSFERS
ESTIMATED EXPENDITURES
PROJECTED ENDING
BALANCE 06/30/17
ITYWIDE FUNDS OVERVIEW • CITY OF PALO ALTO FISCAL YEAR 2017 ADOPTED BUDGET

CITYWIDE FUNDS OVERVIEW
Citywide Average Salary
CATEGORYMgmt/
Professional
Utilities Mgmt/
ProfessionalFire Chief
Association IAFF
Police Mgmt
Association PAPOA SEIUWeighted Average
Citywide Average Salary & Benefits
Full-Time Equivalent (FTE) 224.35 48.00 5.00 99.00 7.00 83.00 585.75 1,052.10
Percent of City 21.3% 4.6% 0.5% 9.4% 0.7% 7.9% 55.7% 100%
Salary (1) $132,796 $155,920 $175,005 $118,550 $190,906 $123,945 $84,338 $105,196
In-Lieu Holiday n/a n/a n/a $4,928 n/a $2,420 $177 $744
Incentive Pay (2) n/a n/a n/a $792 n/a $1,154 $357 $363
Overtime n/a n/a n/a $14,574 n/a $13,012 $4,334 $4,783
Management Leave (80 Hours) $5,108 $5,997 $6,731 n/a $7,343 n/a n/a $11,732
Pension Employer Portion
Misc 28.89%; Safety 45.43%$36,556 $42,910 $73,288 $49,601 $79,947 $51,931 $23,348 $32,302
Pension Employee Portion Paid by City
FCA 3.9% (3)n/a n/a $6,582 n/a n/a n/a n/a $31
Medicare $1,926 $2,261 $2,538 $1,719 $2,768 $1,797 $1,224 $1,525
Medical $16,416 $19,602 $18,675 $17,441 $20,317 $16,642 $17,091 $17,055
Dental/Vision $2,142 $2,349 $2,219 $2,382 $2,508 $2,165 $2,097 $2,149
Retiree Medical (4) $5,474 $7,063 $8,200 $7,711 $11,714 $9,530 $1,566 $5,842
Workers' Compensation $1,901 $1,454 n/a $3,491 n/a $3,603 $1,258 $1,778
Life Insurance/LTD/SUI $648 $648 $648 $648 $648 $648 $648 $648
Non-salary Benefits (5) $3,567 $3,210 $2,647 $150 $2,647 $3,493 $157 $1,309
Average Salary and Benefits $206,534 $241,412 $296,532 $221,988 $318,797 $230,341 $136,594 $185,457
Isolate Holiday Pay from Salary Category
Salary, includes holidays $132,796 $155,920 $175,005 $118,550 $190,906 $123,945 $84,338 $105,196
Holidays (assumes 11 9-hour days) $6,321 $7,421 $8,330 $5,643 $9,086 $5,899 $4,014 $5,007
Salary, excludes holidays $126,476 $148,499 $166,675 $112,907 $181,820 $118,046 $80,324 $100,189
1) Salary is calculated at actual pay rate (base pay and special pays, as applicable) as of February 2016 adjusted for step increases in accordance with applicable Memoranda of Understanding with the City's bargaining groups or pay for performance increases for Management and Professional employees.2) Incentive pay includes: Fair Labor and Standards Act Charges and Night Shift Differential pay.3) The City will pay 3.9% of FCA employee pension contributions in accordance with the Memorandum of Understanding.4) Annual amount incurred for active employees (normal cost only).5) Non-salary Benefits include professional development for Management, Utilities Management, FCA and PMA; tuition reimbursement for FCA and PMA; and management excess benefit for Management, Utilities Management, FCA and PMA. Does not include administrative fees for General Benefits and Workers' Compensation Funds.
CITYWIDE FUNDS OVERVIEW • CITY OF PALO ALTO FISCAL YEAR 2017 ADOPTED BUDGET 63

CITYWIDE FUNDS OVERVIEW
64 C
0
100
200
300
400
500
600
700
FY 2007 FY 2008 FY 2009 FY 2010 FY 2011 FY 2012 FY 2013 FY 2014 FY 2015 FY 2016 FY 2017
General Fund FTE Enterprise Fund FTE Other Funds FTE
10Year Trend ‐Citywide FTE by Fund
ITYWIDE FUNDS OVERVIEW • CITY OF PALO ALTO FISCAL YEAR 2017 ADOPTED BUDGET

CITYWIDE FUNDS OVERVIEW
950
975
1000
1025
1050
1075
1100
FY 2007 FY 2008 FY 2009 FY 2010 FY 2011 FY 2012 FY 2013 FY 2014 FY 2015 FY 2016 FY 2017
10 Year Trend ‐ Total Citywide FTE (FY 2017 Adopted)
Total Citywide FTE
CITYWIDE FUNDS OVERVIEW • CITY OF PALO ALTO FISCAL YEAR 2017 ADOPTED BUDGET 65

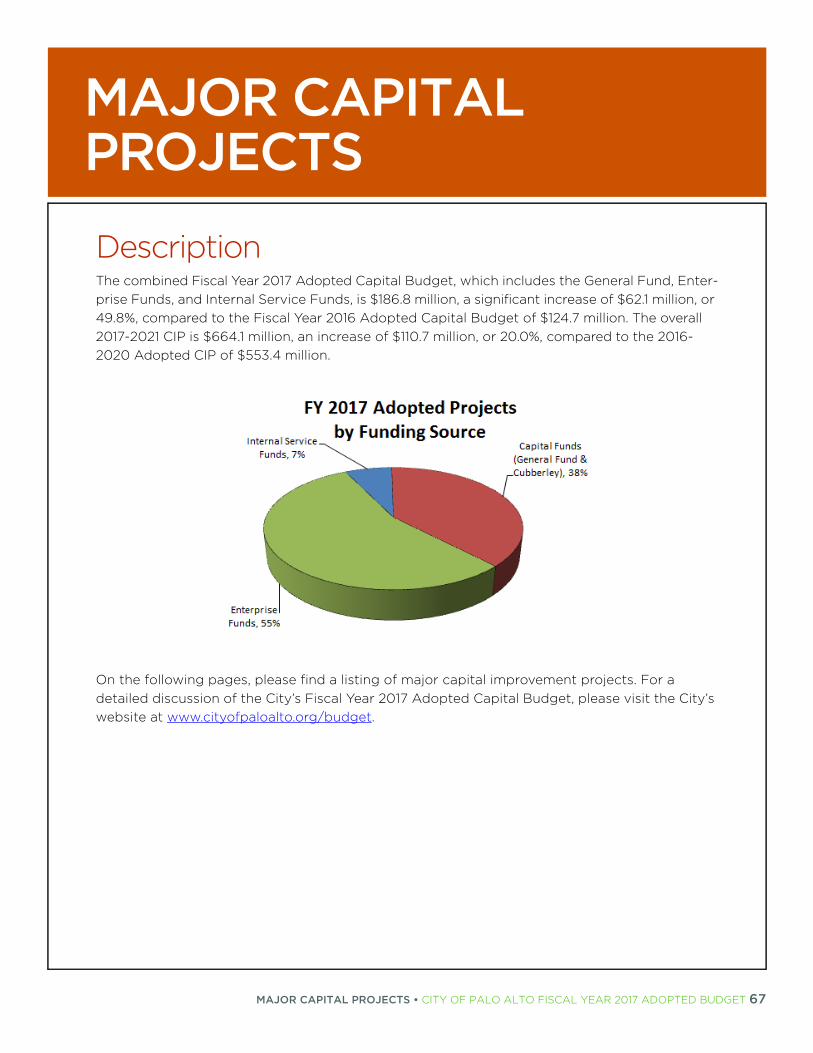
MAJOR CAPITAL PROJECTS
MAJOR CAPITAL PROJECTSDescriptionThe combined Fiscal Year 2017 Adopted Capital Budget, which includes the General Fund, Enter-prise Funds, and Internal Service Funds, is $186.8 million, a significant increase of $62.1 million, or 49.8%, compared to the Fiscal Year 2016 Adopted Capital Budget of $124.7 million. The overall 2017-2021 CIP is $664.1 million, an increase of $110.7 million, or 20.0%, compared to the 2016-2020 Adopted CIP of $553.4 million.
On the following pages, please find a listing of major capital improvement projects. For a detailed discussion of the City’s Fiscal Year 2017 Adopted Capital Budget, please visit the City’s website at www.cityofpaloalto.org/budget.
MAJOR CAPITAL PROJECTS • CITY OF PALO ALTO FISCAL YEAR 2017 ADOPTED BUDGET 67

MAJOR CAPITAL PROJECTS
68 M
Fund, Project Title, & DescriptionFY 2017 Budget
Five Year CIP Cost
Total Project Cost
Airport Fund: Airport Apron Reconstruction (AP-16000) $739,953 $739,953 $1,025,076
This project provides funding for the design and reconstruction of the Palo Alto Airport apron in multiple phases within the existing footprint.
Operating Impact
This project is not anticipated to impact operating expenses.
Capital Improvement Fund: New Public Safety Building (PE-15001) $3,213,712 $56,724,888 $57,843,823
This project provides funding for the design and construction of a new Public Safety Building on Lot C-6 in the California Avenue commercial area. Design and environmental consultant services will be needed, including the development of preliminary plans, cost estimates and special studies as part of an Environmental Impact Report and site evaluation for the approximately 44,500 square foot facility. The size and programming of the new facility were developed by the 2006 Blue Ribbon Task Force with adjustments for current and future projected program needs during the Infrastructure Blue Ribbon Commission process.
Operating Impact
This project is anticipated to impact operating expenses in the future. As these costs are quantified, adjustments will be brought forward in future budgets, as necessary.
Capital Improvement Fund: Street Maintenance (PE-86070) $6,634,615 $25,759,812 $25,759,812
This project provides funding for annual resurfacing, slurry seal, crack seal, and reconstruction of various city streets.
Operating Impact
This project is not anticipated to impact operating expenses.
Capital Improvement Fund: New Downtown Parking Garage (PE-15007) $1,420,977 $13,506,187 $13,688,965
This project provides funding for a new public parking garage in the University Avenue commercial area. The preferred location has been identified as Lot D at the corner of Waverley Street and Hamilton Avenue. An alternate location, Lot G behind the Post Office is also investigated. The project will also evaluate the feasibility of including retail and stacked parking as part of the new structure. Design and environmental consultant services will be needed, including the development of preliminary plans and cost estimates, and completion of the project's environmental review.
Operating Impact
This project is anticipated to impact operating expenses in the future. As these costs are quantified, adjustments will be brought forward in future budgets, as necessary.
Capital Improvement Fund: Charleston/Arastradero Corridor Project (PE-13011) $3,128,332 $9,622,876 $11,316,196
This project provides funding for the reconfiguration of the Charleston/Arastradero corridor including engineering design and construction of new landscaped median islands, bulb outs, enhanced bike lanes, new street trees, and lighting. During the design phase, opportunities for including “green infrastructure” features such as infiltration basins and porous hardscape surfaces will be explored. The conceptual design and CEQA review for the entire corridor was completed in Fall 2015 and NEPA is expected to be completed in Summer 2016. Final design for the corridor will be done in Fiscal Year 2017.
Operating Impact
This project is anticipated to impact operating expenses in the future. As these costs are quantified, adjustments will be brought forward in future budgets, as necessary.
AJOR CAPITAL PROJECTS • CITY OF PALO ALTO FISCAL YEAR 2017 ADOPTED BUDGET

MAJOR CAPITAL PROJECTS
Capital Improvement Fund: Sidewalk Repairs (PO-89003) $2,437,177 $10,072,486 $10,072,486
This project provides funding for sidewalk repairs as part of an annual district-based rehabilitation program, alleviating the backlog of sidewalk repairs and enhancing pedestrian comfort and safety.
Operating Impact
This project is not anticipated to impact operating expenses.
Capital Improvement Fund: Golf Reconfiguration & Baylands Athletic Center Improvements (PG-13003) $10,291,001 $10,291,001 $11,294,974
This project provides funding for the renovation of the Municipal Golf Course in accordance with the Council-approved conceptual plan. The project includes less turf, raising the elevation of the course with imported soil, replacement of the irrigation and drainage systems and space for athletic fields.
Operating Impact
Maintenance of the golf course is budgeted in the Community Services Department. It is anticipated that the complete reconstruction of the golf course on a smaller footprint with less turf and a more efficient irrigation system will reduce maintenance costs (particularly water costs) and extend the useful life of this asset. There will be cost savings while the golf course is closed for construction and ongoing savings once the new upgraded course is opened for public play. The cost to operate and maintain the golf course will be reviewed annually, and any incremental savings will be proposed each year through the annual budget process.
Capital Improvement Fund: Highway 101 Pedestrian/Bicycle Overpass Project (PE-11011) $338,385 $12,009,575 $15,266,401
This project provides funding for a new pedestrian/bicycle bridge across Highway 101 at Adobe Creek. The City conducted a design competition that resulted in three innovative designs. Following the competition, the City Council selected a design team to continue with design and completion of the CEQA and NEPA documents. It is anticipated that construction on the bridge will start in spring 2017.
Operating Fund
This project is anticipated to impact operating expenses in the future. As these costs are quantified, adjustments will be brought forward in future budgets, as necessary.
Capital Improvement Fund: Bicycle and Pedestrian Plan Implementation (PL-04010) $2,242,795 $17,943,619 $17,943,619
This project provides funding for the design and construction of bicycle boulevards, enhanced bikeways, shared-use paths, bicycle parking and a citywide bicycle sharing system in accordance with the Palo Alto Bicycle and Pedestrian Transportation Plan, which was adopted by the City Council in 2012. Effective Fiscal Year 2017, this project includes two projects that were formerly listed as separate CIP projects: CIP Project PL-14001, Midtown Connector, and PL-11001, Dinah Summerhill Pedestrian/Bicycle Path.
The Dinah Summerhill project includes construction of pedestrian/bicycle path on a public easement on the pan handle parcel of the Dinah’s Hotel property, and the Midtown Connector project includes construction of a new shared-use path along the levees of the Matadero Creek between Waverly Street and Greer Road as well as a study/master plan of improvements between Alma Street and Highway 101.
Operating Impact
This project is anticipated to impact operating expenses in the future. As these costs are quantified, adjustments will be brought forward in future budgets, as necessary.
Fund, Project Title, & DescriptionFY 2017 Budget
Five Year CIP Cost
Total Project Cost
MAJOR CAPITAL PROJECTS • CITY OF PALO ALTO FISCAL YEAR 2017 ADOPTED BUDGET 69

MAJOR CAPITAL PROJECTS
70 M
Capital Improvement Fund: Fire Station 3 Replacement (PE-15003) $6,352,703 $6,408,506 $7,219,814
This project provides funding to replace Fire Station 3 at the corner of Newell and Embarcadero Roads. The replacement facility will be based on the prior Replacement Study and Needs Assessment prepared in 2005.
Operating Impact
This project is anticipated to impact operating expenses in the future. As these costs are quantified, adjustments will be brought forward in future budgets, as necessary.
Capital Improvement Fund: Lucie Stern Buildings Mechanical and Electrical Upgrades (PE-14015) $2,817,970 $2,817,970 $3,247,248
This project provides funding to replace and upgrade mechanical and/or electrical systems, fire/life safety and finishes as necessary at Lucie Stern Children’s Theater; Lucie Stern Theater and Scene Shop; and Lucie Stern Community Center. The systems will meet current code and user needs, and optimize operational and energy efficiency.
Operating Impact
This project is not anticipated to impact operating expenses.
Capital Improvement Fund: El Camino Median Landscape Improvements (PE-13017) $326,445 $1,102,445 $1,141,438
This project provides funding for median improvements on El Camino Real. The improvements will include water conservation measures such as new drip irrigation systems and new drought tolerant trees, shrubs, and groundcover. Median designs will be consistent with the goals and objectives of the March 2007 El Camino Real Master Planning Study, and will also consider any relevant guidance from the Grand Boulevard Initiative.
Operating Impact
This project is anticipated to impact operating expenses in the future. The costs detailed in the table above represent current estimates for annually increased water usage and maintenance of the median landscaping for the Cambridge Avenue to Grant Avenue medians; however, these costs will be reviewed throughout the construction of the project. Adjustments may be brought forward for City Council consideration upon completion of the project.
Capital Improvement Fund: Municipal Service Center Lighting, Mechanical, and Electrical Improvements (PF-16006) $1,433,328 $1,433,328 $1,474,543
This project provides for the replacement of original mechanical and electrical systems and lighting installed in 1966 at buildings A, B, and C of the Municipal Service Center.
Operating Impact
This project may impact operating expenses in future years. As the scope of this project is better defined through the design process, operating impacts will be reviewed and adjustments may be brought forward as part of the annual budget process, as necessary.
Capital Improvement Fund: Ventura Buildings Improvements (PE-15011) $779,328 $819,928 $878,413
This project provides funding to replace or upgrade the mechanical and electrical systems. To comply with Americans with Disabilities Act, accessibility improvements are also included; these needs are typically addressed concurrently with city-planned projects.
Operating Impact
This project may impact operating expenses in future years. As these costs are quantified, adjustments may be brought forward as part of the annual budget process, as necessary.
Fund, Project Title, & DescriptionFY 2017 Budget
Five Year CIP Cost
Total Project Cost
AJOR CAPITAL PROJECTS • CITY OF PALO ALTO FISCAL YEAR 2017 ADOPTED BUDGET

MAJOR CAPITAL PROJECTS
Capital Improvement Fund: Stanford/Palo Alto Playing Fields Soccer Turf Replacement (PG-13001) $493,437 $493,437 $1,499,979
This project provides funding for replacement of synthetic turf at the Stanford/Palo Alto Playing Fields.
Operating Impact
This project is not anticipated to impact operating expenses.
Capital Improvement Fund: Baylands Nature Interpretive Center Facility Improvements (PE-15029) $676,546 $676,546 $889,452
This project provides funding for renovation improvements to the Baylands Nature Interpretive Center including replacement of decking, railing, structural framing members, exterior wood siding, flooring, cabinetry, and/or doors and restrooms.
Operating Impact
This project is not anticipated to impact operating expenses.
Cubberley Property Infrastructure Fund: Cubberley Roof Replacements (CB-16002) $807,390 $2,745,319 $2,745,319
This project provides funding to replace or restore failing roofs at the Cubberley Community Center. In some instances, a full replacement is necessary. In lieu of replacing the entire roof, a more cost-effective roof restoration process is planned where feasible. A fluid applied, reinforced waterproofing system will be applied over the existing roof. This roofing system also meets current cool roofing codes to optimize energy efficiency.
Operating Impact
This project is not anticipated to impact operating expenses.
Cubberley Property Infrastructure Fund: Cubberley Community Center Master Plan (CB-16001) $212,414 $276,513 $477,291
This project provides funding to develop a master plan for the future of Cubberley Community Center complex. The plan will include a prioritization for future projects to replace failing systems, improve reliability for use as an emergency shelter, and support tenant needs. The Master Plan is a requirement of the new lease with Palo Alto Unified School District.
Operating Impact
This project is not anticipated to impact operating expenses.
Electric Fund: Underground System Rebuild (EL-16001) $400,000 $1,750,000 $1,750,000
Underground primary electric cables and equipment have a limited life span and need to be replaced before they fail and cause outages. This project will replace underground electric equipment in areas that were originally installed, i.e. not part of an Underground District. Work will include the replacement of deteriorated electrical cables, transformers, switches and enclosures. Installation of new equipment will bring the electrical system up to current construction standards.
Operating Impact
This project is not anticipated to impact operating expenses.
Electric Fund: Colorado/Hopkins System Improvement (EL-15000) $825,000 $1,575,000 $1,575,000
This project will replace deteriorating equipment which will increase system capacity and improve service reliability for the areas served by Hopkins and Colorado substations and adjacent substations.
Operating Impact
This project is not anticipated to impact operating expenses.
Fund, Project Title, & DescriptionFY 2017 Budget
Five Year CIP Cost
Total Project Cost
MAJOR CAPITAL PROJECTS • CITY OF PALO ALTO FISCAL YEAR 2017 ADOPTED BUDGET 71

MAJOR CAPITAL PROJECTS
72 M
Electric Fund: Rebuild Underground District 24 (EL-10006) $1,075,560 $1,075,560 $2,701,199
This project will rebuild and replace the underground electric system in Underground District 24. Work will include the replacement of deteriorated electrical cable, transformers, switches, and enclosures. Installation of new equipment will bring the electrical system up to current construction standards.
Operating Impact
This project is not anticipated to impact operating expenses.
Electric Fund: Reconfigure Quarry Feeders (EL-14005) $786,364 $786,364 $1,030,454
This project includes the reconfiguration of how distribution circuits are connected to each substation transformer at Quarry Substation. The circuits will be more evenly divided between the 4 transformers at this substation to provide greater operating flexibility during outages.
Operating Impact
This project is not anticipated to impact operating expenses.
Electric Fund: Underground District 47 (EL-11010) $744,038 $744,038 $2,555,574
This project includes the design costs to underground the existing overhead distribution system. Undergrounding will be completed in Fiscal Year 2016 and the overhead system will be removed.
Operating Impact
This project is not anticipated to impact operating expenses.
Electric Fund: Underground Distribution System Security (EL-13007) $290,534 $890,534 $891,362
This project funds the purchase and installation of equipment to secure underground electric distribution facilities used to provide electricity to utility customers in the City of Palo Alto, from vandalism, tampering, and theft to facilitate a safe, secure, and reliable electric system.
Operating Impacts
This project is not anticipated to impact operating expenses.
Fiber Optics Fund: Fiber Optic System Rebuild (FO-16000) $1,250,000 $1,250,000 $2,400,000
This system capacity improvement project rebuilds portions of the “dark” fiber optic network around Palo Alto which, in turn, is leased to parties providing telecommunication services to citizens and businesses in Palo Alto. The rebuild projects will install new aerial duct or substructures (conduit and boxes), along with additional fiber backbone cables to increase capacity for sections of the dark fiber ring that are at or near capacity, and allow the Utilities Department to meet customer requests for service. The rebuild project areas are mainly comprised of the Stanford Research Park, Palo Alto Internet Exchange, and Downtown areas.
Operating Impacts
This project is not anticipated to impact operating expenses.
Refuse Fund: Household Hazardous Waste Station Improvements(RF-16001) $148,346 $148,346 $515,254
This project will provide for a new canopy structure at the City's Household Hazardous Waste Station, located at the Regional Water Quality Control Plant. The canopy will be constructed out of metal purlin roofing material and will provide for separation of the collected household hazardous waste from the rain. The new canopy structure will tie into four existing footings that were installed in 2013. A new fire sprinkler system, lights, and gutters will also be installed on the canopy.
Operating Impacts
This project is not anticipated to impact operating expenses.
Fund, Project Title, & DescriptionFY 2017 Budget
Five Year CIP Cost
Total Project Cost
AJOR CAPITAL PROJECTS • CITY OF PALO ALTO FISCAL YEAR 2017 ADOPTED BUDGET

MAJOR CAPITAL PROJECTS
Storm Drainage Fund: Matadero Creek Storm Water Pump Station and Trunk Line Improvements (SD-13003) $5,842,372 $5,842,372 $6,490,072
This project will provide funding for construction upgrades to the Matadero Creek Storm Water Pump Station and the trunk storm drain pipelines that flow to the pump station. The Matadero Creek Storm Water Pump Station serves a low-lying 1250-acre area of southeastern Palo Alto.
Operating Impacts
This project is not anticipated to impact operating expenses.
Storm Drainage Fund: Channing Avenue/Lincoln Avenue Storm Drain Improvements (SD-11101) $132,687 $132,687 $7,676,274
This project will provide funding for the installation of 5,800 linear feet of 36-inch to 60-inch diameter storm drain along Channing and Lincoln Avenues over three project phases.
Operating Impacts
This project is not anticipated to impact operating expenses.
Technology Fund: Radio Infrastructure Replacement (TE-05000) $2,203,004 $3,420,417 $3,420,417
This project funds the annual replacement of various items in the City's telecommunications infrastructure inventory in accordance with a life-cycle replacement schedule. The City operates two radio systems (UHF frequency band and VHF frequency band) with five radio sites for each system.
Most recently, the City has participated with 14 other local agencies in an effort organized by the Silicon Valley Regional Interoperability Authority to move towards a county-wide 700 Mhz radio communication system. This project provides funding for the City's share of establishing an interoperable radio communication system within the region.
Upon completion of the project, the law enforcement, fire and rescue service, emergency medial response, and disaster recovery units within the participating agencies will be able to communicate via an integrated voice and data communications system.
Operating Impact
This project is anticipated to impact operating expenses in the future. As these costs are quantified, adjustments will be brought forward in future budgets, as necessary.
Technology Fund: Development Center Blueprint Technology Enhancements (TE-12001) $626,731 $626,731 $1,738,002
This project will allow for the provision of technology enhancements to the Development Services Department. Some areas of enhancement include installation of a walk-in queuing system; conversion of current Accela reports to Crystal Reports; configuration and implementation of Accela Citizen Access; creation of web self service and publications sites; creation of a functioning Geographic Information System and Accela interface; permit centric mobile applications; electronic plan review system, automated permit tracking system; development of expired permit notification; purchase of field ready hardware and associated data plans to support inspections; and creation of performance reports/metrics.
Operating Impact
This project is not anticipated to impact operating expenses.
Fund, Project Title, & DescriptionFY 2017 Budget
Five Year CIP Cost
Total Project Cost
MAJOR CAPITAL PROJECTS • CITY OF PALO ALTO FISCAL YEAR 2017 ADOPTED BUDGET 73

MAJOR CAPITAL PROJECTS
74 M
Technology Fund: Public Safety Computer-Aided Dispatch Replacement (TE-09000) $420,168 $420,168 $1,400,000
This project replaces the existing 1999 public safety Computer Aided Dispatch (CAD) and Records Management System (RMS) that is beyond the reliable life-cycle for this type of technology. This project will jointly acquire new CAD and RMS systems with the cities of Mountain View and Los Altos, as well as integrate this technology with the current Fire Records Management System.
Operating Impacts
This project is anticipated to impact operating expenses in the future. As these costs are quantified, adjustments will be brought forward in future budgets, as necessary.
Wastewater Treatment Fund: New Anaerobic Digesters to Replace Incinerators (WQ-16001) $2,984,829 $3,384,900 $3,384,900
This project provides funding for design and construction of the anaerobic digesters, biogas utilization, electric co-generation, and a thermal hydrolysis process which precedes the anaerobic digestion. The digesters are the final stage in the biosolids treatment, producing biosolids for beneficial use.
Operating Impacts
This project is not anticipated to impact operating expenses.
Wastewater Treatment Fund: Fixed Film Reactor Rehabilitation (WQ-14004) $1,847,703 $19,652,750 $19,652,750
This project provides funding for the rehabilitation of fixed film reactors which provide biological treatment, helping the City to comply with discharge permit limits. The two reactors, which came online in 1980, need replacement of core structural components including fiberglass barriers, steel supports, and concrete underdrains. Process components need replacement including biofilter media, 20-foot deep plastic media, rotating distributor mechanisms, electrical motor control centers, and process piping and pumping.
Operating Impacts
This project is not anticipated to impact operating expenses.
Wastewater Treatment Fund: Primary Sedimentation Tank Rehabilitation (WQ-14003) $1,239,612 $7,464,647 $7,464,647
This project provides funding for new protective coatings on each of four concrete primary sedimentation tanks and replacement of rotating parts. Installed in 1972, each tank is 220 feet long by 41 feet wide and removes settleable solids and grease. The four tanks need their structural concrete recoated to ensure the reinforcing steel bars within the concrete are not attacked by penetrating corrosive sewer gases. An industrial coating contractor would install a new protective coating on the concrete to extend the life of concrete by approximately 30 years. Rotating parts are also worn and need replacement.
Operating Impacts
This project is not anticipated to impact operating expenses.
Wastewater Treatment Fund: New Laboratory and Environmental Services Building (WQ-14002) $423,995 $22,098,931 $22,098,931
This project provides funding for the design of a new building that will consolidate staff and provide a larger and updated laboratory.
Operating Impacts
This project is not anticipated to impact operating expenses.
Fund, Project Title, & DescriptionFY 2017 Budget
Five Year CIP Cost
Total Project Cost
AJOR CAPITAL PROJECTS • CITY OF PALO ALTO FISCAL YEAR 2017 ADOPTED BUDGET

MAJOR CAPITAL PROJECTS
Wastewater Treatment Fund: Facility Condition Assessment and Retrofit (WQ-04011) $2,508,221 $7,168,079 $7,168,079
This project provides funding for the structural condition assessment of existing plant facilities and, once issues are identified, the construction of repair and retrofits. Concrete and metal structures are evaluated for evidence of damage caused by corrosion, weathering, age, and ground movement.
Operating Impacts
This project is not anticipated to impact operating expenses.
Wastewater Treatment Fund: Plant Master Plan (WQ-10001) $2,849,484 $2,849,484 $5,024,240
This project provides funding for the planning and program management for the long range facilities plan completed in July 2012. Program management includes the project definitions of long range capital projects, acquisition of funding for new large capital projects, preparation of City issued design consultant Request for Proposal packages, and ancillary services related to the implementation of the plan.
Operating Impacts
This project is not anticipated to impact operating expenses.
Fund, Project Title, & DescriptionFY 2017 Budget
Five Year CIP Cost
Total Project Cost
MAJOR CAPITAL PROJECTS • CITY OF PALO ALTO FISCAL YEAR 2017 ADOPTED BUDGET 75

76 • CITY OF PALO ALTO FISCAL YEAR 2017 ADOPTED BUDGET

GENERAL FUND
CITY OF PALO ALTO FISCAL YEAR 2017 ADOPTED BUDGET 77


GENERAL FUND OVERVIEW
General Fund OverviewFISCAL YEAR 2017-2026 GENERAL FUND LONG RANGE FINANCIAL FORECASTThe Fiscal Year (FY) 2017-2026 General Fund Long Range Financial Forecast (LRFF) was pre-sented to the Finance Committee in December 2015 and to the City Council in April 2016. As of the April 2016 City Council report, the LRFF projected a deficit of $0.6 million in FY 2017. Solid tax revenues and a strong local economy show a rebounding from the Great Recession. While these results are welcome, rising benefit and other costs diminish a more positive outlook over the next 10 years. Since the December forecast, which cited upbeat economic indicators, several clouds have been hovering over the local, state, national and world economies making less clear what direction they will take. These include: a severe drop in world stock markets, a stronger dollar weakening U.S. exports, further evidence of a slowing Chinese economy, sharply declining oil prices, and increased uncertainty about global growth. Economists appear to be evenly divided over the course of the economy with some citing strong employment data and rising wages while others are concerned about weaker corporate profits, lower exports, and looming interest rate hikes. Worried about the economy faltering, the Federal Reserve recently post-poned two expected rate increases in 2016. Staff does understand the difficulty of forecasting a recession, but historical trends show that a downturn will occur during the term of this Forecast, especially since the country is nearly seven years into a recovery. By virtue of a recession’s unpredictability, local jurisdictions tend to react late to a downturn, so fiscal discipline and a focus on priorities is a recommended, proactive strategy.
The revised, base Fiscal Year (FY) 2017 to 2026 General Fund Long Range Financial Forecast (Forecast) projects a General Fund (GF) deficit of $0.64 million in FY 2017, a $0.20 million defi-cit in FY 2018, and a $0.08 million surplus in FY 2020. This projection reflected a financial shift downward as the City began the FY 2017 budget process.
The table includes a calculation for the net operating margin which reflects the year over year change of surpluses and shortfalls. With the net operating margin, it is assumed that each short-fall is addressed completely with ongoing solutions in the year it appears, and that each surplus is completely expended with ongoing expenditures. Based on these assumptions, the cumula-
Adopted
2016 2017 2018 2019 2020 2021 2022 2023 2024 2025 2026
Total Revenue $185,672 $193,953 $202,919 $211,814 $218,393 $225,361 $232,916 $241,044 $249,421 $256,757 $265,5644.5% 4.6% 9.2% 7.6% 6.4% 6.7% 7.0% 7.1% 6.5% 6.5%
Total Expenditures $185,672 $194,594 $203,116 $211,035 $218,469 $225,124 $231,522 $237,091 $242,852 $249,079 $253,5064.8% 4.4% 3.9% 3.5% 3.0% 2.8% 2.4% 2.4% 2.6% 1.8%
Net One‐Time Surplus/(Shortfall) $0 ($641) ($198) $779 ($76) $238 $1,395 $3,953 $6,569 $7,678 $12,058
Cumulative Net Operating Margin (One‐Time) $31,755
Net Operating Margin $0 ($198) $779 ($854) $313 $1,157 $2,558 $2,616 $1,109 $4,381
Cumulative Net Operating Margin $11,861
Assumes that the annual shortfalls are solved with ongoing solutions and annual surpluses are spent for ongoing expenditures.
GENERAL FUND OVERVIEW • CITY OF PALO ALTO FISCAL YEAR 2017 ADOPTED BUDGET 79

GENERAL FUND OVERVIEW
80 G
tive net operating margin, or ongoing surplus, during the forecast period is approximately $11.9 million.
A continuously improving economic climate is noted by the majority of national, state, regional, and local economic indicators. This Forecast assumes a continued, gradual growth of the national economy with positive impacts to the local economy, which is reflected in the esti-mates of economically sensitive revenues. Consistent with previous forecasts, the methodology for calculating changes for out-years of the Forecast (FY 2017 to FY 2026) are based on a his-torical analysis of increases using the Compounded Annual Growth Rate (CAGR) with adjust-ments factored in for known items. By using the historical average growth rate that incorporates the up and down cycles over the past 10 or 20 years, there is no single year in which a downturn is depicted. Instead, past downturns (e.g. dot.com bust and Great Recession) have been fac-tored into the compound growth rate used to forecast future revenue streams. Staff performed a reasonableness test of the results and made appropriate changes to the CAGR analysis.
Since the Great Recession, the City Council has approved various strategies to reduce the costs of salaries and benefits. These strategies include: (1) employees paying their own CalPERS con-tribution (between 6 percent to 9 percent of salary) except for the members of the Fire Chiefs’ Association; (2) sharing the cost of health plan costs at 90/10; (3) creating a second pension tier (and the state implemented a third tier effective January 1, 2013); (4) reducing professional development expenses; (5) cost of living freezes for four years; and (6) terminating the Variable Management Compensation Plan. Continuing with previous actions to curtail the growth of benefits costs, the City has pursued cost sharing models such as sharing the cost of future health plan costs beginning in 2014 and continuing through current negotiations. However, in comparison to market studies to comparable agencies, the salaries of our employees, primarily safety employees, have fallen behind. The City has recently reached agreement with four bar-gaining groups – Palo Alto Police Officers’ Association (PAPOA), International Association of Firefighters Union Local 1319 (IAFF), Services Employees’ International Union (SEIU), and Palo Alto Police Management Association (PAPMA) – which were approved by the City Council April 11, 2016 in City Managers’ Report # 6789 Adoption of MOA for PMA, POA, SEIU, IAFF, and con-tinues negotiations with its remaining bargaining groups. It is the City’s desire to retain and attract a talented workforce. Therefore, this Forecast includes salary and benefits increases to adjust employees’ salaries to the median of the market over the next few years.
As of March 2016, 34 percent of employees received Tier 2 and Tier 3 pension benefits. The impact of employees hired during the last five years has had little impact on unfunded pension plan liabilities, the benefits of the lower pensions will be a long-term cost reduction. Per the lat-est CalPERS valuations for the Miscellaneous and Safety employees, the combined unfunded pension liability amounts to $294.7 million for all funds.The General Fund portion totals $193 mil-lion. Adding on the unfunded liability for the retiree healthcare plan in the amount of $143.6 mil-lion of which $99.7 million is the General Fund share. The total unfunded liability for the two benefits totals $438.3 citywide with the General Fund share totaling $292.7 million. The recently approved labor agreements include employees increasing their share of the pension contribu-tion: safety labor by 28 to 33 percent and miscellaneous employees by 12.5 to 16 percent, which will help partially offset increases in pension costs.
In June 2014, the City Council approved the Infrastructure Plan. The plan provides funding for a new Public Safety building, replacement of two Fire Stations, the Bicycle Pedestrian Transporta-
ENERAL FUND OVERVIEW • CITY OF PALO ALTO FISCAL YEAR 2017 ADOPTED BUDGET

GENERAL FUND OVERVIEW
tion Plan, two parking garages, and other projects. For detail regarding the projects and funding plan, please refer to the Fiscal Year 2017 Proposed Capital Budget. At time of approval of the $126 million projected plan, the plan had a funding gap of $7.5 million; however, through addi-tional transfers from the General Fund, the earmarked additional TOT receipts, and the anticipa-tion of issuing additional Certificates of Participation (COPs), the plan is funded at $128.8 million ($158.8 million including a $30.0 million contingency reserve funded by COPs accommodated by higher than anticipated TOT revenues).
Despite improving revenue receipts as projected forward, the City continues to face challenges related to the increasing costs of infrastructure, rising benefits costs, and unfunded long-term liabilities. This fiscal outlook which reflects a need for caution still does not include a number of both known and unknown impacts with both short and long term implications, some of which are addressed in the FY 2017 Adopted Budget. Below is a list of a few of the known/unknows that are not included in the LRFF:
New staffing and program requests;
One-time expenditures of $3.0 million approved in the FY 2016 Adopted Budget;
Cost implications that may arise such as current negotiations with Stanford University for Fire services, support for the Parks Master Plan, and loans to the Palo Alto airport;
Potential costs in excess of the Council approved $126 million Infrastructure Plan after full design; prevailing wage requirements; construction costs; and operating budget impacts from new facilities;
A shift in annual streetlight and traffic signal costs from the Electric Fund to the General Fund as a consequence of State propositions;
Potential acquisition of the downtown Palo Alto Post Office with associated operating expenses;
Parks Master Plan expenditures to be determined in FY 2016;
Operating and capital costs related to a new Junior Museum and Zoo facility;
Capital costs related to City assets managed by non-profits such as Avenidas Senior Center, the Palo Alto History Museum, and the Ventura Child Care Center;
Funding long-term pension and retiree healthcare liabilities ($438 million citywide; $293 million General Fund).
FISCAL YEAR 2017 GENERAL FUND BUDGETAs part of the development of the Fiscal Year 2017 Budget, the General Fund revenues and expenditures are updated from the release of the Fiscal Year 2017-2026 General Fund Long Range Financial Forecast. The FY 2017 Budget estimated revenues of $195.1 million reflects growth of 6.1% over the FY 2016 Adopted Budget level of $183.9 million. However, once adjusted for the FY 2016 approved adjustments, the FY 2016 Adjusted Budget is approximately $188.7 million from which the FY 2017 Adopted Budget reflects growth of 3.4%. However, General Fund expenditures of $194.2 million reflect growth of 4.6% from the FY 2016 Adopted Budget level of $185.7 million, or an $8.5 million increase.
GENERAL FUND OVERVIEW • CITY OF PALO ALTO FISCAL YEAR 2017 ADOPTED BUDGET 81

GENERAL FUND OVERVIEW
82 G
At this time, staff projects the FY 2016 Budget Stabilization Reserve (BSR) to end the year at approximately $41.1 million, or 22.2 percent of the FY 2016 Adopted Budget expenditure levels which includes the anticipated recognition of $2.0 million in proceeds from the sale of property co-owned with the previous City Manager, as well as additional excess revenues and expendi-ture savings based on current tracking levels. This additional balance is primarily attributed to major tax revenues and departmental vacancy savings. This is an excess of $6.8 million when compared to the target level of 18.5% of the FY 2016 Adopted Budget expenses; however, when compared to FY 2017 budgeted expenditures of $194.2 million, the BSR is at 21.3 percent or $5.2 million above the 18.5% targeted funding level.
REVENUESBased on a continued, gradual growth of the regional economy and Fiscal Year 2016 year-to-date major tax revenue receipts, this budget assumes further growth in Sales Tax, Property Tax, and Transient Occupancy Tax in comparison to the Fiscal Year 2016 Adopted Budget. This Fis-cal Year 2017 Budget assumes increases to major tax revenue receipts by approximately $10.9 million, or 11.0 percent, from $99.5 million to $110.4 million when compared to the FY 2016 Adopted Budget. Growth in major tax revenues reflect more than 90 percent of the change from the FY 2016 Adopted Budget for all General Fund revenues.
It is important to note that nearly 50 percent of the growth in tax revenue ($4.3 million) is due to increases in the Transient Occupancy Tax which just saw a rate increase from 12.0 percent to 14.0 percent as approved by the voters in November 2014. Of this increase, all the revenue asso-ciated with this 2.0 percent increase and revenues associated with new hotels has been ear-marked for the City Council Infrastructure Plan (originally $125.8 million). Revenues such as charges for services, permits and licenses, rental income, revenue from other agencies, interest income are growing less rapidly and are further dampened due to: 1) the assumed closure of the City’s Golf Course for the full fiscal year and 2) the negative implications associated with the anticipated loss of rental income association with Foothill College’s departure from Cubberley Community Center as a tenant.
The following sections discuss the City's major revenue sources and their projected levels as well as major expenditure categories for Fiscal Year 2016 and 2017.
SALES TAXSales taxes have risen reasonably well from the Great Recession. Since a low of $17.9 million in FY 2010 they are projected to grow to $29.2 million in FY 2017. Sectors showing growth that is expected to continue into FY 2017 are restaurants, food markets, and furniture/appliance. The latter includes, for example, the Apple and Microsoft stores and Fry’s. Areas experiencing weak sales include department and apparel stores, electronic equipment, and business services. Auto sales, a key component of sales tax receipts, showed modest growth in FY 2016 and is expected to turn in a stronger performance in FY 2017.
As reported in the recent ten year forecast, there are concerns over future growth in this reve-nue category. Internet retail sales are steadily eroding brick and mortar receipts at a steady pace. Each critical fourth quarter that includes the all-important holiday season brings negative news that more and more Black Friday and Cyber Monday business have moved on-line. The City’s sales tax consultant believes that on-line sales may reduce future retail sales growth by 1
ENERAL FUND OVERVIEW • CITY OF PALO ALTO FISCAL YEAR 2017 ADOPTED BUDGET

GENERAL FUND OVERVIEW
percent annually. This trend will be monitored carefully since sales tax represents 15 percent of General Fund revenue. Other sales tax concerns being monitored are the effects of Hewlett Packard’s breakup into two companies and the amount of Stanford Hospital construction use tax dissipating as the projects wind down.
PROPERTY TAXProperty tax from residential and commercial parcels continues to surge. Defying gravity, reve-nues are anticipated to rise to $39.0 million in FY 2017, nearly $2.4 million above the adjusted budget for FY 2016 and $13.2 million above the Great Recession low of $25.8 million. Contribut-ing factors to this upswing are: single family home sales that well-exceed asking prices and have multiple bids; a robust commercial property market; and the unleashing of latent property val-ues from the sale of long held homes that were “shielded” from assessed value appreciation by Proposition 13.
The following chart is taken from a realtor (JeffandSteve.com) web site. It shows the ascent in median home prices, especially since the 2009 recession year. Although the median home price shows a decline from 2015 to 2016, it is apparent from property tax receipts in FY 2016 that this dip has not affected the City’s property tax revenues.
City property tax estimates are based on information received from quarterly meetings with the Santa Clara County Assessor’s Office. The estimate includes appeals on record with the Asses-sor’s Office, additions to the roll, and movements in assessed values. This FY 2017 Adopted Budget uses historical growth rates and information on any extraordinary transactions available to staff.
In a recent fiscal study for the updated Comprehensive Plan, consultants projected annual prop-erty growth to equal 7 percent. This is higher than the growth rate used in the City’s ten year forecast and this higher growth rate appears to be materializing in FY 2016 receipts. This may result in higher revenues than expected for FY 2016.
GENERAL FUND OVERVIEW • CITY OF PALO ALTO FISCAL YEAR 2017 ADOPTED BUDGET 83

GENERAL FUND OVERVIEW
84 G
TRANSIENT OCCUPANCY TAX (TOT)As with property taxes, TOT is performing exceptionally well. The advent of several new hotels, a proposed expansion of one, and the potential addition of two new hotels on San Antonio Road shows that Palo Alto is a destination point for travelers and a most desirable market. A recent news article indicating an hotelier intends to charge nearly $800 per day (includes food, drink, and concierge services) validates the high demand for hotel rooms in Palo Alto.
Occupancy and room rate data indicate that at the end of FY 2016 around 78 to 79 percent of the rooms available will have been occupied and that the average daily room rate will hover around $250. The addition of rooms due to the new hotels has somewhat constrained occu-pancy levels hitting the 80 to 85 percent rates representing full occupancy, but room rates have risen dramatically and exceed those in prior years. The addition of higher end hotels has enhanced this revenue source both for the General Fund and for the Infrastructure Management Plan project funding.
The budget of $23.1 million for FY 2017 includes a full operational year for the new hotels com-ing on line in FY 2016 as well as the TOT increase from 12 to 14 percent. This is compared to the FY 2016 Adopted Budget level of $18.8 million and a revised FY 2016 year-end estimate of $22.6 million. As approved by the City Council, beginning in January 2015 the revenue from a voter approved 2 percent Transient Occupancy Tax (TOT) increase plus revenue from new hotels has been earmarked for transfer to the General Capital Improvement Fund, specifically for the City Council Infrastructure Plan.
UTILITY USERS TAXThe Utility Users Tax revenue budget for FY 2017 fully includes the two changes approved by voters in November 2014: the telephone UUT rate reduction from 5.0 percent to 4.75 percent and the elimination of the large utility user discount. Staff expected that telephone revenues would decline annually by an estimated $0.16 million. Instead, revenues from this source in FY 2016 have exceeded those in FY 2015. Unfortunately, the City does not receive detailed informa-tion from service providers that would help explain trends in this revenue source. The City receives a “lump-sum” check from telephone companies on a monthly basis. Revenues in FY 2017 are budgeted at $3.4 million.
Utility receipts from the UUT are based on the Utilities Department’s five-year revenue projec-tions. Rates for FY 2017 are increasing substantially: electric rates will increase by an average of 11 percent; gas by 8 percent; and water by 6 percent. These steep increases are a consequence of the severe drought conditions, lower customer usage, capital expenses passed through for the Hetch Hetchy projects, and the City’s need to cover its fixed costs. Although increasing rates should result in higher UUT revenues, customers have been reducing usage, particularly in water as a response to drought conditions. Warm weather conditions can result in less gas usage and UUT revenue as well. For FY 2017 the General Fund is expected to realize $9.0 million from utility sales.
Combined, telephone and utility UUT revenues for the FY 2017 Budget are estimated at $12.4 million, representing growth of 2.0% over the revised FY 2016 year-end estimate of $12.1 million.
ENERAL FUND OVERVIEW • CITY OF PALO ALTO FISCAL YEAR 2017 ADOPTED BUDGET

GENERAL FUND OVERVIEW
DOCUMENTARY TRANSFER TAX (DTT)After an exceptional year in FY 2015 with receipts reaching $10.1 million, the DTT is returning to more “normal” levels. In fact, it is expected that year end FY 2016 receipts will fall below the cur-rent FY 2016 Adjusted Budget of $7.1 million by approximately $600,000. Through mid-April, revenues are running 15 percent below the same prior year period. Several major commercial transactions along Page Mill road occurred in FY 2015 with a remittance of $3.6 million in late April. At this time, it is anticipated that the City will realize $6.8 million in FY 2017.
As stated in prior analyses, this revenue source can be unpredictable given that the volume and mix of commercial and residential transactions can vary significantly from year to year. A com-parison of FY 2015 receipts to expected FY 2016 revenues will validate this observation.
OTHER TAXES AND FINESStaff anticipates that revenues in this category will decrease slightly in Fiscal Year 2017 to $2.0 million when compared to the FY 2016 Adopted Budget of $2.2 million. The largest source of revenue in this category is derived from parking violations revenue, and based on current track-ing levels, staff estimates will hold flat in Fiscal Year 2017 at $1.6 million, a slight decline from FY 2015 levels of $1.7 million.
CHARGES FOR SERVICESThis revenue category consists of charges to Stanford for fire services, paramedic services, golf-related fees, arts and science classes, and plan check fees. In comparison to the Fiscal Year 2016 Adopted Budget revenue estimate of $25.4 million, the Fiscal Year 2017 Budget estimate remains flat. The primary reasons for this reflects the net impact of: increased reimbursements for Stanford Fire Services and paramedic services ($0.8 million); increased Planning fees imple-menting the recently approved Planning Fee Study ($0.4 million); offset by a realignment of Development Services revenues ($0.7 million) and assumed closure of the City’s Golf Course for the full fiscal year ($0.5 million).
On October 8, 2013, the City received a Notice of Termination letter from Stanford with the intention to terminate the contract with the City no sooner than one year and no later than two years from the date of the notice. During the termination period as well as in the past few months, the City continued to negotiate with Stanford to settle on a service level and cost. As outlined in CMR #6505 Stanford Fire Agreement 3rd Amendment, the Third Amendment pro-vides for continuation of fire services for one year at a fixed fee of $6.5 million, while allowing the time needed to facilitate negotiation of financial terms for a new long term agreement. This budget assumes a Stanford reimbursement of $8.1 million for Office of Emergency Services (OES) and fire services (excluding both Capital and vehicle reimbursements) and $0.7 million for Public Safety Dispatch Services a net reimbursement of $8.8 million. The $8.1 million reim-bursement assumes the previous contract calculation of 30.3% of the Fire and Office of Emer-gency budgets. Stanford and the City are in a mediation process to determine appropriate reimbursement for City fire services. Depending on the outcome of mediation significant adjust-ments to the assumed reimbursement level of fire services in the General Fund will most likely be necessary.
GENERAL FUND OVERVIEW • CITY OF PALO ALTO FISCAL YEAR 2017 ADOPTED BUDGET 85

GENERAL FUND OVERVIEW
86 G
PERMITS AND LICENSESPermits and Licenses consist of payments to the City for issuance of Building Permits, Fire Per-mits, and miscellaneous health and safety-related licenses. In comparison to the Fiscal Year 2016 Adopted Budget revenue estimate of $8.2 million, the Fiscal Year 2017 Budget estimate of $8.8 million represents an increase of $0.5 million, or 6.6 percent, primarily due to an increase in Planning and Community Environment Fees as a result of the Planning Fee Study ($0.2 million), a realignment of building permit fee estimates ($0.2 million), and a slight general increase in Public Works fees ($0.1 million).
RETURN ON INVESTMENTDespite a recent and modest increase by the Federal Reserve Board in interest rates, yields on the City’s investment portfolio remain stubbornly low. At its peak in FY 2002, the General Fund earned $4.2 million in interest income. For FY 2017, earnings of $0.98 million are expected. This is marginally higher than the $0.82 million budgeted in FY 2016.
RENTAL INCOMEThe largest source of rental income comes from the City’s Enterprise Funds and the Cubberley Community Center. Compared to the Fiscal Year 2016 Adopted Budget, rental income will decline $0.3 million, or 1.8 percent, from $15.3 million to $15.0 million for the Fiscal Year 2017 Budget. The decrease includes a projected loss of $0.5 million in rental income due to Foothill College’s departure from Cubberley. It is anticipated that the departure timeline will be slightly accelerated compared to these assumptions and therefore additional loss in revenues could be seen. Staff will pursue and recommend replacement tenants to offset this significant loss. Slight annual rental increases for enterprise funded departments at General Fund properties partially offset this decrease and are based on an assessment of these properties that was conducted in Fiscal Year 2015.
CHARGES TO OTHER FUNDSThis revenue category is the reimbursement received by the General Fund for the provision of administrative and other services to Enterprise and Internal Service Funds. The General Fund charges these funds for legal, human resources, finance, and general administration services based on cost allocations from the last completed fiscal year. Total administrative cost plan charges decreased by $1.2 million or 9.8 percent from the Fiscal Year 2016 Adopted Budget level of $11.9 million to the Fiscal Year 2017 Budget of $10.8 million due to a refinement of the cost allocation plan to more accurately align direct funded versus indirect funded services and lower internal service fund allocated costs offset by higher salaries and benefits costs.
OTHER REVENUESThis revenue category is mainly comprised of Animal Services revenue from neighboring cities; the Palo Alto Unified School District's (PAUSD) share of maintenance for athletic fields; and other one-time revenue sources such as grants. Compared to the Fiscal Year 2016 Adopted Budget of $1.6 million, other revenues are $0.2 million lower in the Fiscal Year 2017 Budget at $1.4 million mainly due to a one-time grant from the Valley Transit Authority in Fiscal Year 2016 in the amount of $0.3 million for the Fry's site Master Plan in the Planning, and Community Envi-ronment Department.
ENERAL FUND OVERVIEW • CITY OF PALO ALTO FISCAL YEAR 2017 ADOPTED BUDGET

GENERAL FUND OVERVIEW
OPERATING TRANSFERS-INIn comparison to the Fiscal Year 2016 Adopted Budget transfer-in amount of $18.6 million, the Fiscal Year 2017 Budget amount of $20.0 million represents an increase of $1.4 million due to a correction in the calculation for the equity transfer from the Enterprise Funds as approved in the FY 2016 Mid-Year Budget Review. The largest component of this revenue category is the $18.8 million equity transfer from the Enterprise Funds. The equity transfer represents the return on the initial investment the City made when the Utility Department was created more than 100 years ago. In accordance with a methodology approved by Council in June 2009, the equity transfer is calculated by applying a rate of return to the capital asset base of the Electric and Gas Funds. The rate of return is based on PG&E's rate of return on equity as approved by the California Public Utilities Commission (CPUC).
EXPENSESFiscal Year 2017 Budget expenditures amount to $194.2 million for the General Fund, an increase of approximately $8.5 million, or 4.6 percent, compared to the Fiscal Year 2016 Adopted Budget of $185.7 million. Details of major expenditure categories are discussed below.
SALARY AND BENEFITSSalary and benefit costs in the Fiscal Year 2017 Budget total $116.4 million, a $3.8 million or 3.4 percent increase compared to the Fiscal Year 2016 Adopted Budget of $112.6 million. The main reasons for the increase in salary and benefits costs are increased salaries and City CalPERS contributions for pensions and increased healthcare costs.
After a number of years of cost containment strategies, the City has found in market studies to comparable agencies, the salaries of our employees, primarily safety employees, have fallen behind. The City has recently reached agreement with four bargaining groups – Palo Alto Police Officers’ Association (PAPOA), International Association of Firefighters Union Local 1319 (IAFF), Services Employees’ International Union (SEIU), and Palo Alto Police Management Association (PAPMA) – which were approved by the City Council on April 11, 2016 in City Managers’ Report # 6789 Adoption of MOA for PMA, POA, SEIU, IAFF, and continues negotiations with its remaining bargaining groups. It is the City’s desire to retain and attract a talented workforce; therefore, this budget includes significant salary and benefits increases to adjust employees’ salaries to the median of the market over the next few years. Salaries of $70.7 million in FY 2017 Budget reflect a 5.5 percent increase from FY 2016 Adopted Budget levels of $67.3 million, or a $3.4 mil-lion increase.
In addition, the Miscellaneous pension rate rose 1.2 percent from 27.7 percent to 28.9 percent while Safety rose 3.5 percent from 41.9 percent to 45.5 percent. When these rate increases are compounded with the growth in salaries, pension costs are increasing 10.0 percent from the FY 2016 Adopted Budget (from $19.2 million to 21.2 million). This FY 2017 figure does assume the recently approved labor agreements which include employees increasing their share of the pen-sion contribution: safety labor by 28 to 33 percent and miscellaneous employees by 12.5 to 16 percent, which will help partially offset increases in pension costs. Lastly, health care expendi-tures are increasing 6.8 percent ($0.8 million) from FY 2016 Adopted Budget levels of 12.5 mil-lion.
GENERAL FUND OVERVIEW • CITY OF PALO ALTO FISCAL YEAR 2017 ADOPTED BUDGET 87

GENERAL FUND OVERVIEW
88 G
The FY 2017 Budget reflects a change in the methodology of budgeting salaries and benefits. The Fiscal Year 2016 Adopted Budget, included a salary reserve that has was intended to be used to fund potential employee salary increases pending final contract terms to be reached prior to the distribution of funding. With the recent City Council approved labor agreements, the agreed upon terms have been implemented and are reflected as part of the FY 2017 budget, resulting in these increased costs being budgeted directly in departmental budgets. Therefore, when comparing salary and benefit increases in departmental budget summaries in this docu-ment, significant increases (potentially above this average increase of 5.5 percent) may be seen reflecting the essentially two year jump in salary levels beginning June 30, 2015 to July 1, 2016 as well as a reflection of actual employee compensation levels.
Offsetting these increased costs is a reduction in other benefit costs and retiree health of $1.9 million and $0.3 million respectively. The significant reduction in Other Benefits reflects a one-time reduction in Worker’s Compensation expenses in departmental allocations of $1.7 million. This budget includes a recommended one-time budget balancing strategy to freeze the allo-cated charges budgeted in City departments and funds and the corresponding transfer in to various internal services funds including the Workers’ Compensation Fund. Sufficient fund bal-ance remains in these funds to continue to fund the programmed FY 2017 expenditure activities for workers compensation claims. It is anticipated that this freeze on allocated charges will result in a $0.3 million fund balance. This change to the allocated charges for workers’ compen-sation is reflected in each of the department sections "Budget Summary" and "Budget Recon-ciliation," most notably in the "Dollars by Category" section you will see significant year over year variances when compared to the FY 2016 Adopted Budget. It is anticipated that as part of the Fiscal Year 2018 base budget process, these allocations will be reinstated to the levels nec-essary to fund the ongoing expenditure activities.
It is important to note, that with this budget, anticipated General Fund vacancy savings totaling $2.2 million are spread across departmental appropriations based on a historical vacancy trend analysis.
NON-DEPARTMENTAL EXPENSESNon-departmental appropriations include expenses that are not directly related to the opera-tion of a particular department such as payments to the Palo Alto Unified School District (PAUSD) as part of the Cubberley Community Center lease or debt service. As a result of nego-tiations with PAUSD, $1.9 million will be transferred annually from the General Fund to the Cub-berley Infrastructure Fund for infrastructure improvements.
A transfer from the General Fund to reimburse the Electric Fund for electricity costs associated with City streetlight and traffic signal costs in the amount of $2.3 million was approved by the City Council. As part of the Electric Fund Cost of Services Analysis (COSA), these costs were identified as more appropriately aligned with the General Fund. This transfer will be evaluated over the next year and the long term implications on staffing and workload impacts will be revisited in the development of the Fiscal Year 2018 budget process.
This section of the budget includes a program uncertainty reserve of $2.0 million for unantici-pated program financial implications that may arise during Fiscal Year 2017. During the develop-ment of the FY 2017 Budget, a number of significant initiatives were underway such as the renovation of the City’s Golf Course, the Parks Master Plan, the Junior Museum and Zoo new site
ENERAL FUND OVERVIEW • CITY OF PALO ALTO FISCAL YEAR 2017 ADOPTED BUDGET

GENERAL FUND OVERVIEW
build and partnership, and negotiations with Stanford University for fire services. Each of these projects were too early in the planning phases to identify concrete financial implications as anal-ysis and discussions needed to continue. Therefore, staff set this reserve aside for planning pur-poses only to proactively plan for these major initiatives and any variations in financial implications from those assumed in the FY 2017 budget.
CONTINGENCY ACCOUNTSContingency accounts are budgeted appropriations that are used at the discretion of the City Council, City Manager, City Attorney, or Chief People Officer to fund unanticipated expenses. For FY 2017, a $500,000 contingency was included for Planning and Community Environment, a $250,000 contingency was included for the Office of Sustainability, and a $50,000 contin-gency was included for Human Services Resource Allocation Plan (HSRAP). The City Council approves any use of the City Council contingency and the Planning and Transportation Contin-gency and the City Manager has to approve any use of any other contingency. The Fiscal Year 2017 Adopted Budget includes $1.5 million in these accounts.
OPERATING TRANSFERS OUTFunds are transferred to the Capital Infrastructure, Cubberley Infrastructure, Debt Service, and Technology Internal Service Funds on an annual basis. In Fiscal Year 2017, $23.4 million is pro-grammed to be transferred to these funds. In addition, $230,000 will be transferred to the Res-idential Preferential Parking Fund for start-up costs associated with the development of two new Residential Preferential Parking Permit programs. This represents a $0.9 million, or 4.0 per-cent, increase compared to the Fiscal Year 2016 Adopted Budget of $22.7 million. This year over year change of $0.9 million reflects the net implications of a new transfer to the Electric Fund to reimburse for costs associated with the electricity costs for streetlights and traffic signals ($2.3 million), significantly higher TOT receipts resulting in a higher transfer to the Capital Improve-ment Fund ($3.0 million) and a need for a higher General Fund subsidy to the Airport Fund increasing the transfer $0.4 million (from $0.3 million to $0.7 million). These increases are par-tially offset by a one-time reduction in the base General Fund transfer amount to the Capital Improvement Fund in the amount of $5.7 million in recognition of the fact that the Capital Improvement Fund has adequate resources to address its “catch-up” and “keep-up” needs, the deferral of projects that will not start in FY 2017, and the increased funding needs in the General Fund and to partially offset the (cost) transfer of the streetlights and traffic signals from the Electric Fund. This would budget a $18.5 million transfer from the General Fund of which $10.5 million base transfer and an additional $8.0 million in Transient Occupancy Tax (TOT) revenues.
RESERVESThe City's general reserve is referred to as the Budget Stabilization Reserve, or BSR. By policy, the City maintains a reserve level of 15-20 percent of the General Fund operating budget, with a targeted goal of 18.5 percent. City Council approval is required prior to setting reserves lower than 15 percent. The City Manager is authorized, at his/her discretion, to transfer any amount in excess of 18.5 percent to the Capital Projects Infrastructure Reserve. The Fiscal Year 2017 Bud-get is projected to have a $41.4 million BSR balance, or 21.3 percent of the Fiscal Year 2017 Gen-eral Fund expenditure budget. This reflects a lower figure than in previous years due both the significant increase in total General Fund costs of 4.6% compared to the FY 2016 Adopted Bud-
GENERAL FUND OVERVIEW • CITY OF PALO ALTO FISCAL YEAR 2017 ADOPTED BUDGET 89

GENERAL FUND OVERVIEW
90 G
get as well as the recommended use of this reserve as a one-time balancing strategy in FY 2017 to provide a bridge to staff to complete a more thorough review of services and service delivery to bring forward ongoing recommended changes to how the City of Palo Alto conducts busi-ness and remain fiscally prudent. The goal will be to strategically allocate excess funding and reset the BSR back to the 18.5 percent target level.
General Fund Revenue DescriptionsPROPERTY TAXUnder current law, all taxable real and personal property is subject to a basic tax rate of one percent of assessed value collected by local jurisdictions and school districts for general service
General Fund ReservesFY 2015 Actual
FY 2016 Adopted Changes
FY 2016Net
Adjustments
Projected06/30/
2016
FY 2017 Projected Changes
Projected 06/30/
2017
Budget Stabilization Reserve (BSR) Activity:
BSR 48,198 (2,123) (4,931) 41,144 163 41,307
Other Reserve Activity:
Human Services Resource Allocation Process (HSRAP) Reserve — — — 50 — 50
Encumbrance & Reappropriation 7,305 — — 7,305 — 7,305
Inventory of Materials & Supplies 3,667 — — 3,667 — 3,667
Notes Receivable, Prepaid Items, Interfund Advances, & Unrealized Gains and Losses
3,300 — — 3,300 — 3,300
Total Reserves 62,470 (2,123) (4,931) 55,466 163 55,629
1) The BSR is projected to be 21.31 percent of the FY 2017 Expense Budget at the end of FY 2017.
2) City reserve policy indicates a 15-20 percent range, with an 18.5 percent target.
3) Minimum FY 2017 BSR $29.1 million (15 percent); Maximum FY 2017 BSR $38.8 million (20 percent); Target FY 2017 BSR $35.9 million (18.5 percent)
4) Projected FY 2016 Net Adjustments assumes year-to-date City Council approved budget adjustments, midyear adjustments, additional tax revenue and expenditure savings, and forthcoming adjustments. This adjustment includes the earmarked $2.0 million for a potential Pension Trust Fund although this funding remains in the BSR account.
5) Projected FY 2016 Budget Surplus of approximately $4.9 million will be carried forward to FY 2017 for FY 2017 expenditures.
6) The Human Services Resource Allocation Process Reserve is recommended to be carried forward to FY 2017.
ENERAL FUND OVERVIEW • CITY OF PALO ALTO FISCAL YEAR 2017 ADOPTED BUDGET

GENERAL FUND OVERVIEW
purposes. There are other taxes and levies on a typical property tax bill such as parcel, General Obligation bond, and special assessments.
On June 6, 1978, California voters approved Proposition 13, a seminal change in property tax levies. The proposition, which added Article XIII A to the state constitution, placed limits on increases in the valuation of real property. The major change was that the assessed value of real property could only be adjusted upward annually by the change in the California Consumer Price Index (CCPI) up to a maximum of two percent per year. One exception to this rule, how-ever, is that when property changes ownership and/or is substantially altered or newly-con-structed, it would be reassessed at full market value in the first year and then subject to the CCPI or two percent cap thereafter.
Another important exception to the formula for increasing assessed valuations and taxes is that during periods of declining property values (e.g., recessions), the County Assessor has the flexi-bility to decrease assessments whether through appeal by property owners or through the Assessor’s analysis of value declines. In effect, this reduces the property valuation and tax. As market conditions improve, however, and values return or increase, the Assessor can then increase assessed values and taxes.
In following years, another amendment to the constitution was passed that allows local govern-ments and school districts to raise property taxes above one percent to finance general obliga-tion (GO) bond sales. This change has to be approved by two-thirds of those voting in a local GO bond election. For school districts, however, the voting threshold for approving GO bonds was subsequently lowered to fifty-five percent.
Dating back to the early 1990s, the state has made numerous and complex adjustments to local jurisdiction property tax revenues to solve its budget shortfalls. In one such action in 1992, which is known as the ‘Educational Revenue Augmentation Funds (ERAF), the state shifted mil-lions of dollars in local government funds to school districts. As a consequence of this action the City of Palo Alto has foregone a cumulative $86 million through Fiscal Year 2014 limiting its ability to meet its infrastructure needs.
The County of Santa Clara administers and collects property taxes and remits the appropriate amounts (based on law and a complex formula) to local jurisdictions. Contrary to commonly held views, the City receives a relatively small portion of the basic one percent property tax. In fact, the City receives 9 percent or 9 cents for every property tax dollar a property owner pays to the county. The majority of the tax dollar paid or 57 percent goes to the school district, 15 percent goes to the county, and the remaining goes to special districts and to the State.
SALES AND USE TAXThe Sales Tax is a tax imposed on retailers for the privilege of selling tangible personal property such as clothing, automobiles, and computers. Currently, and according to State law, sales tax is not applied to personal services such as legal, dental, or consultant services. The Use Tax is a form of sales tax and is applied, for example, on the sale of tangible goods from an out-of-state vendor.
The City receives a specific portion or percentage of the sales tax paid by a consumer. Of the current 8.75 percent tax rate paid for goods sold within Palo Alto, the City receives 1.0 percent point of the purchase price or 11.4 percent for each tax dollar paid. The remaining sales tax dol-
GENERAL FUND OVERVIEW • CITY OF PALO ALTO FISCAL YEAR 2017 ADOPTED BUDGET 91

GENERAL FUND OVERVIEW
92 G
lars are distributed as follows: State of California (5.75 percentage points), Santa Clara County (0.885 percentage point), Santa Clara Valley Transportation Authority (0.625 percentage point), and the Public Safety Fund (0.5 percentage point).
Sales tax rates may differ across jurisdictions since local jurisdictions have some flexibility on a countywide level (e.g. county or city) to increase the local portion of the sales tax with voter approval. The local Sales and Use Tax is collected and administered by the State Board of Equalization.
TRANSIENT OCCUPANCY TAXThe Transient Occupancy Tax rate in Palo Alto is 14 percent and is applied to the daily rate charged by a hotel, motel, and lodging establishment. The rate only applies to stays of 30 days or less. In November 2014, Palo Alto voters approved increasing the tax rate from 12 percent to 14 percent. The rate increase was effective as of January 1, 2015.
DOCUMENTARY TRANSFER TAXThis tax is applied to the sale of real property within Palo Alto at the time property ownership is transferred. The current rate is $3.30 per thousand dollars of sale value. A house that sells for $1.5 million, for example, would result in the City collecting $4,950. This tax is collected by Santa Clara County and then remitted to the City. The county also levies a transfer tax of $1.10 per thousand dollars of sales value that is in addition to Palo Alto’s tax.
UTILITY USERS TAXThe Utility Users Tax is charged to all users of electricity, gas, water, and telephone services. The current tax rate is for electricity, gas, and water is 5 percent and for telephone is 4.75 percent. This general tax was passed by voters in 1987 and has not changed since that time. In November 2014, Palo Alto voters approved decreasing the telephone utility user tax rate from 5 percent to 4.75 percent. This tax decrease became effective on April 1, 2015 due to Public Utility Commission advance noticing requirements.
OTHER TAXES AND FINESThe largest source of revenue in this category is derived from parking violations revenue. Other revenue items in this category include traffic violations, administrative citations, and library fines and fees.
CHARGES FOR SERVICESDepartmental charges are comprised of fees charged for services which are primarily provided by the following departments: Community Services, Development Services, Planning and Com-munity, Police, and Public Works. Charges for Services from departments are approved annu-ally by the City Council through the adoption of the Municipal Fee Schedule.
The City has two separate agreements with Stanford University to provide Fire Response ser-vices and Dispatch services. As part of these agreements to reimburse the City for Stanford’s proportional share of these services, Stanford is charged 30.3 percent of the Fire Department’s net cost and 16 percent of the Police Department’s Communication and Dispatch Division. On October 8, 2013, the City received a Notice of Termination letter from Stanford with the inten-tion to terminate the contract with the City no sooner than one year and no later than two years
ENERAL FUND OVERVIEW • CITY OF PALO ALTO FISCAL YEAR 2017 ADOPTED BUDGET

GENERAL FUND OVERVIEW
from the date of the notice. During the termination period as well as in the past few months, the City continued to negotiate with Stanford to settle on a service level and cost. As outlined in CMR #6505 Stanford Fire Agreement 3rd Amendment, the Third Amendment provides for continuation of fire services for one year at a fixed fee of $6.5 million, while allowing the time needed to facilitate negotiation of financial terms for a new long term agreement. Stanford and the City are in a mediation process to determine appropriate reimbursement for City fire services. Depending on the outcome of mediation significant adjustments to the assumed reimbursement level of fire services in the General Fund may be necessary.
PERMITS AND LICENSESThe City requires payment for the issuance of Building Permits, Fire Permits, and miscellaneous health and safety-related licenses and permits as approved annually by the City Council through the adoption of the Municipal Fee Schedule.
RETURN ON INVESTMENTThe City invests idle funds in order to earn interest. The total income varies with the market rates of interest and the funds available to invest. The basic principles underlying Palo Alto’s investment philosophy is to ensure the safety of public funds; provide that sufficient money is always available to meet current expenditures; and achieve a reasonable rate of return.
RENTAL INCOMEThe General Fund charges rent to internal and external entities. The majority of rental income is derived from the Enterprise Funds and the Cubberley Community Center.
REVENUE FROM OTHER AGENCIESThis revenue category includes revenue received from a variety of other local government agen-cies, the state, and the federal government usually due to grants or contracts for services.
CHARGES TO OTHER FUNDSThe General Fund recuperates the cost for services provided by internal services departments such as Administrative Services, Council Appointees, and People Strategy and Operations to Enterprise, Internal, and Special Revenue funds through allocated charges.
OTHER REVENUEMajor revenue sources in this category are Animal Services charges to Los Altos and Los Altos Hills, reimbursements from PAUSD for its share of Cubberley and athletic field maintenance, donations from non-profits for City libraries, and miscellaneous revenues.
OPERATING TRANSFERS-INOperating Transfers include the equity transfer from the Electric and Gas Funds as well as trans-fers from the University Ave Parking Permit Fund. In accordance with a methodology approved by Council in June 2009, the equity transfer is calculated by applying a rate of return to the capital asset base of the Electric and Gas Funds. This rate of return is based on PG&E’s rate of return on equity as approved by the California Public Utilities Commission (CPUC). In addition, the Fiscal Year 2017 Proposed Budget recommends a transfer to the Electric Fund for costs associated with City streetlight and traffic signal electric costs.
GENERAL FUND OVERVIEW • CITY OF PALO ALTO FISCAL YEAR 2017 ADOPTED BUDGET 93
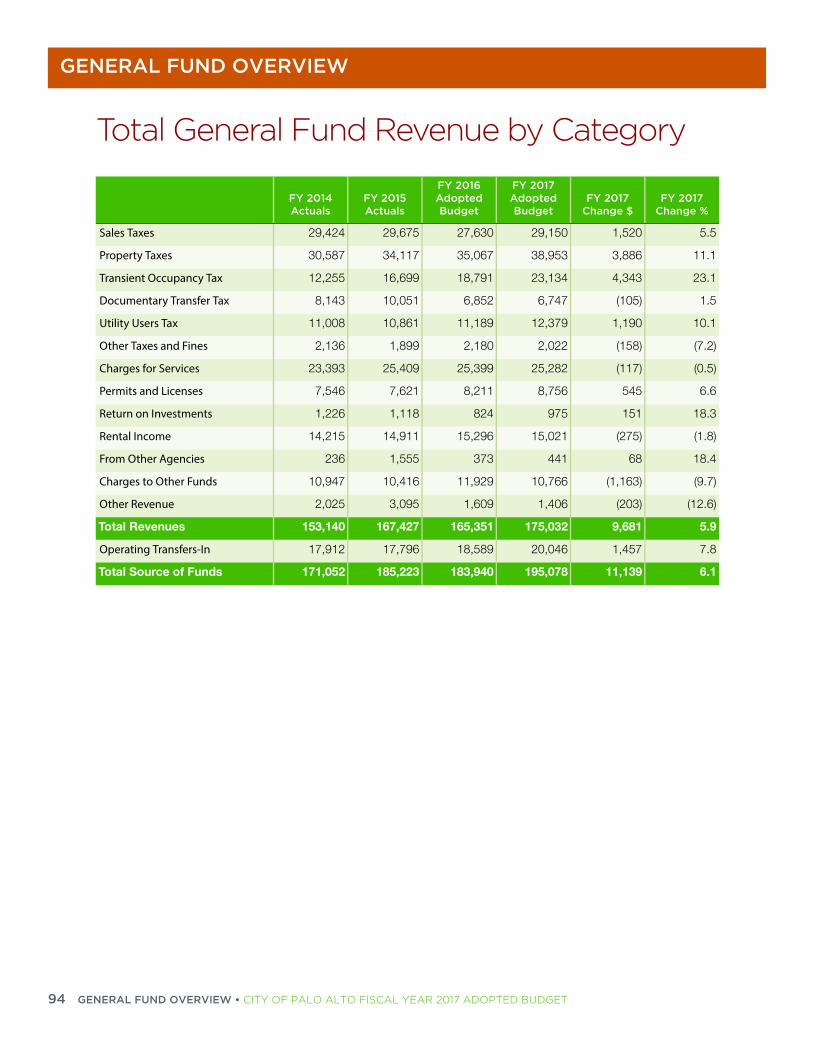
GENERAL FUND OVERVIEW
94 G
Total General Fund Revenue by Category
FY 2014 Actuals
FY 2015 Actuals
FY 2016 Adopted Budget
FY 2017 Adopted Budget
FY 2017 Change $
FY 2017 Change %
Sales Taxes 29,424 29,675 27,630 29,150 1,520 5.5
Property Taxes 30,587 34,117 35,067 38,953 3,886 11.1
Transient Occupancy Tax 12,255 16,699 18,791 23,134 4,343 23.1
Documentary Transfer Tax 8,143 10,051 6,852 6,747 (105) 1.5
Utility Users Tax 11,008 10,861 11,189 12,379 1,190 10.1
Other Taxes and Fines 2,136 1,899 2,180 2,022 (158) (7.2)
Charges for Services 23,393 25,409 25,399 25,282 (117) (0.5)
Permits and Licenses 7,546 7,621 8,211 8,756 545 6.6
Return on Investments 1,226 1,118 824 975 151 18.3
Rental Income 14,215 14,911 15,296 15,021 (275) (1.8)
From Other Agencies 236 1,555 373 441 68 18.4
Charges to Other Funds 10,947 10,416 11,929 10,766 (1,163) (9.7)
Other Revenue 2,025 3,095 1,609 1,406 (203) (12.6)
Total Revenues 153,140 167,427 165,351 175,032 9,681 5.9
Operating Transfers-In 17,912 17,796 18,589 20,046 1,457 7.8
Total Source of Funds 171,052 185,223 183,940 195,078 11,139 6.1
ENERAL FUND OVERVIEW • CITY OF PALO ALTO FISCAL YEAR 2017 ADOPTED BUDGET

GENERAL FUND OVERVIEW
General Fund Revenue by Category
$0
$5,000
$10,000
$15,000
$20,000
$25,000
$30,000
$35,000
$40,000
3 Year Trend ‐ General Fund Revenues by Category ($Millions)
FY 2015 Actuals FY 2016 Adopted Budget FY 2017 Adopted Budget
14.9%
20.0%
11.9%3.5%6.3%
1.0%
13.0%
4.5%
0.5%
7.7%
0.2%
5.5%
0.7%
10.3%
$195.1 Million/FY 2017 Adopted
1. Sales Taxes ‐ $29.15/14.9%
2. Property Taxes ‐ $38.95/20%
3. Transient Occupancy Tax ‐ $23.13/11.9%
4. Documentary Transfer Tax ‐ $6.75/3.5%
5. Utility Users Tax ‐ $12.38/6.3%
6. Other Taxes and Fines ‐ $2.02/1%
7. Charges for Services ‐ $25.28/13%
8. Permits and Licenses ‐ $8.76/4.5%
9. Return on Investments ‐ $0.98/0.5%
10. Rental Income ‐ $15.02/7.7%
11. From Other Agencies ‐ $0.44/0.2%
12. Charges to Other Funds ‐ $10.77/5.5%
13. Other Revenues ‐ $1.41/0.7%
14. Operating Transfers In ‐ $20.05/10.3%
GENERAL FUND OVERVIEW • CITY OF PALO ALTO FISCAL YEAR 2017 ADOPTED BUDGET 95

GENERAL FUND OVERVIEW
96 G
$0.0
$5.0
$10.0
$15.0
$20.0
$25.0
$30.0
$35.0
$40.0
2007 2008 2009 2010 2011 2012 2013 2014 2015 2016 2017
Property Tax Sales Tax Charges for Services Rental Income Utility User's Tax Documentary Transfer Tax
10 Year Trend ‐ Top General Fund Revenues (Millions)
ENERAL FUND OVERVIEW • CITY OF PALO ALTO FISCAL YEAR 2017 ADOPTED BUDGET

GENERAL FUND OVERVIEW
%
2.1
2.5
3.9
3.2
0.1
4.2)
2.4
2.3
9.1
5.6)
5.1
7.1
7.6)
7.9
1.5)
3.5
8.0
4.5
1.5)
80
4.9
Total General Fund Expenditures by Department
FY 2014 Actuals
FY 2015 Actuals
FY 2016 Adopted Budget
FY 2017 Adopted Budget
FY 2017 Change $
FY 2017Change
Administrative Services 7,093 7,133 7,635 7,798 163
City Attorney 2,560 2,586 3,101 3,179 77
City Auditor 1,016 1,100 1,175 1,221 46
City Clerk 1,113 1,079 1,328 1,370 43
City Council 494 361 455 501 47 1
City Manager 2,770 2,365 3,008 2,882 (126) (
Community Services 22,542 23,042 24,804 25,390 585
Development Services — 9,893 11,901 12,169 268
Fire 28,194 26,191 26,532 28,940 2,869
Human Resources 3,129 3,263 3,555 3,357 (197) (
Library 7,340 7,980 8,555 8,992 437
Non-Departmental 8,350 7,296 8,662 10,139 1,477 1
Office of Emergency Services 928 1,169 1,051 971 (56) (
Office of Sustainability 93 496 423 499 76 1
Planning and Community Environment 13,264 7,434 8,900 8,768 (132) (
Police 33,314 34,560 36,859 38,137 1,278
Public Works 13,183 13,274 15,017 16,224 1,207
Sub-Total Departments 145,382 149,221 162,959 170,544 7,585
Transfer to Infrastructure 17,234 19,678 20,877 18,486 (2,391) (1
Operating Transfers-Out 1,580 2,606 1,834 5,136 3,302 1
Total 164,197 171,505 185,672 194,166 8,496
GENERAL FUND OVERVIEW • CITY OF PALO ALTO FISCAL YEAR 2017 ADOPTED BUDGET 97

GENERAL FUND OVERVIEW
98 G
Total General Fund Expense by CategoryFY 2014 Actuals
FY 2015 Actuals
FY 2016 Adopted Budget
FY 2017 Adopted Budget
FY 2017 Change $
FY 2017 Change %
Salary & Benefits 98,925 102,531 112,648 116,394 3,746 3.3
Contract Services 14,340 14,919 17,360 17,539 179 1.0
Supplies & Material 3,510 3,844 3,665 3,835 170 4.6
General Expense 11,138 10,314 10,308 13,551 3,243 31.5
Debt Service 429 428 431 432 1 0.2
Rents & Leases 1,303 1,319 1,492 1,530 38 2.6
Facilities & Equipment 452 414 622 511 (111) (17.9)
Allocated Charges 15,285 15,452 16,433 16,752 318 1.9
Total Expenses 145,383 149,221 162,959 170,544 7,585 4.7
Transfer to Infrastructure 17,234 19,678 20,877 18,486 (2,391) (11.5)
Operating Transfers-Out 1,580 2,606 1,834 5,136 3,302 180.0
Total Use of Funds 164, 197 171,505 185,672 194,166 8,496 4.6
ENERAL FUND OVERVIEW • CITY OF PALO ALTO FISCAL YEAR 2017 ADOPTED BUDGET

GENERAL FUND OVERVIEW
General Fund Expense by Category
$0
$20,000
$40,000
$60,000
$80,000
$100,000
$120,000
3 Year Trend ‐ General Fund Expenses by Category ($Millions)
FY 2015 Actuals FY 2016 Adopted Budget FY 2017 Adopted Budget
59.9%
9.0%
2.0%
7.0%
0.2%
0.8%
0.3%8.6%
12.2%
$194.2 Million/FY 2017 Adopted
1. Salary & Benefits ‐ $116.39/59.9%
2. Contract Services ‐ $17.54/9%
3. Supplies & Materials ‐ $3.84/2%
4. General Expense ‐ $13.55/7%
5. Debt Service ‐ $0.43/0.2%
6. Rents & Leases ‐ $1.53/0.8%
7. Facilities & Equip‐ $0.51/0.3%
8. Allocated Charges ‐ $16.75/8.6%
9. Transfers ‐ $23.62/12.2%
GENERAL FUND OVERVIEW • CITY OF PALO ALTO FISCAL YEAR 2017 ADOPTED BUDGET 99

100
• CITY OF PALO ALTO FISCAL YEAR 2017 ADOPTED BUDGET
ENTERPRISE FUNDS
CITY OF PALO ALTO FISCAL YEAR 2017 ADOPTED BUDGET 101

ENTERPRISE FUNDS OVERVIEW
Enterprise Funds OverviewThe City of Palo Alto’s utility and public works operations are comprised of the Electric, Fiber Optics, Gas, Water, Wastewater Collection, Refuse, Wastewater Treatment, Storm Drainage, and Airport Funds. A financial summary of the funds follows this overview followed by discussion and pertinent information in each fund section.
REVENUESThe total combined budgeted revenues of the Enterprise Funds for Fiscal Year 2017 is $347.2 million, which is $56 million, or 19 percent, higher than the previous fiscal year. The collective increase is partially attributable to: a increase of $15.2 million in utility fees for electric sales; a $9.5 million increase in Operating Transfers-In due to capital projects funding adjustments and new projects. The revenue increase is also driven by net sales in several Enterprise funds due to planned rate increases. Water Fund rates are increasing 6.0 percent but revenues are flat due to water usage declining, while the Wastewater Collection and Refuse funds are both planning 9.0 percent increases which will result in net sales revenue increases of $0.9 million and $0.5 million, respectively.
EXPENDITURESAggregated budgeted expenditures of the Enterprise Funds are $382.8 million in Fiscal Year 2017, compared to $351.2 million in Fiscal Year 2016. This represents an increase of $31.6 million. The increase is partially attributable to a $16.7 increase in Capital Improvement Program (CIP) costs, including $13.9 million increase in Wastewater Treatment Fund capital expenditures and a $5.3 million in Electric Fund projects. Of the net $16.7 million increase in CIP costs, this reflects $27.9 million for the continuation of projects previously approved and appropriated by the City Council in prior fiscal years. Commodity purchase costs also increased by $5.1 million for Enter-prise Funds. Electric supply costs increased by $10.1 million and the Refuse fund by $0.5 million, while Gas supply costs decreased by $3.2 million, and Water supply costs by $1.3 million.
Other significant increases consist of increases in salaries and benefits of $2.3 million, for medi-cal contributions and other benefits adjustments; and an increase of $0.8 million for facilities rental and equipment.
UTILITY RATE CHANGESThis Fiscal Year 2017 Budget includes utility rate adjustments for fiber optics, refuse, storm drain, water, and wastewater charges. The average monthly residential Utilities bill is expected to increase by $22.42 from $256.28 to $278.70. The City’s fiber optics rate will adjust according to a contractual 3.2 percent Consumer Price Index increase.
In general, the size and timing of rate adjustments takes into account current and future reve-nue requirements and reserve levels. They may also cushion the impacts on customer bills by spreading rate adjustments during consecutive or alternate years.
Electric Fund - 11.0 percent rate increase to replenish reserves that were depleted over the past few years to offset the low hydro output and recover operational costs.
ENTERPRISE FUNDS OVERVIEW • CITY OF PALO ALTO FISCAL YEAR 2017 ADOPTED BUDGET 103

ENTERPRISE FUNDS OVERVIEW
104
Gas Fund - 8.0 percent rate increase to recover increased local transportation costs and major capital investments by PG&E to increase the safety and reliability of the backbone pipeline and local transmission system.
Water Fund - 6.0 percent rate increase to match increasing water supply costs, particularly the cost of water supplied by the San Francisco Public Utilities Commission (SFPUC), which is issuing debt to fund major improvements to the Hetch Hetchy transmission system as well as increased local operation costs.
Wastewater Collection Fund - 9.0 percent rate increase based on capital project cost increases, and continuing increases in treatment and operations costs.
Fiber Optics Fund - A contractual 3.2 percent Consumer Price Index (CPI) increase.
Storm Drainage Fund - A rate increase of 3.2 percent, increasing the monthly charge for the fee per Equivalent Residential Unit to adjust for a Consumer Price Index increase, as approved by voters.
Refuse Fund - A residential and commercial rate increase of 9.0 percent and 5.0 percent respectively, the second year of increases in a three year plan to balance refuse revenues with costs, and the implementation of a new residential food scrap collection program.
RENTEnterprise Funds pay market-based rental fees for the sites needed to conduct their business operations. The rent paid for City-owned sites was adjusted due to an independent appraisal of all sites, and as appropriate, an annual CPI increase of 2.6 percent. The rent for Fiscal Year 2017 represents a $0.3 million increase from Fiscal Year 2016.
EQUITY TRANSFERSIn Fiscal Year 2010, the Council adopted a change to the methodology used to calculate the equity transfer from Utilities Funds to General Fund. Under the Utilities Enterprise Methodology, the equity transfers are based on a rate of return on the asset base in the Electric and Gas Funds. This rate of return is based on Pacific Gas and Electric’s (PG&E) rate of return on equity as approved by the California Public Utilities Commission (CPUC). The equity transfer from the Electric and Gas Funds is projected to increase by $891,000 from $17.9 million in Fiscal Year 2016 to $18.8 million in Fiscal Year 2017.
RESERVESThe financial revenue and expense forecasts are estimates at a single point in time; some Utili-ties Reserves serve as “balancing accounts“ which mitigate the risk of commodity price swings and insure against default by our wholesale suppliers. Other Reserves are used to provide cash for replacement parts during an emergency infrastructure failure, or serve as temporary “park-ing“ for planned expenditures. Reserve levels that are above guidelines are returned to custom-ers in the form of lower future rates, or used to pay for expenses, which also result in lower future rates.
Continuing a new practice established in Fiscal Year 2016, the reappropriation of Capital project budgets for the continuation of projects previously approved and appropriated by the City Council in prior fiscal years is shown as expenditures in the the operating budget for each
ENTERPRISE FUNDS OVERVIEW • CITY OF PALO ALTO FISCAL YEAR 2017 ADOPTED BUDGET
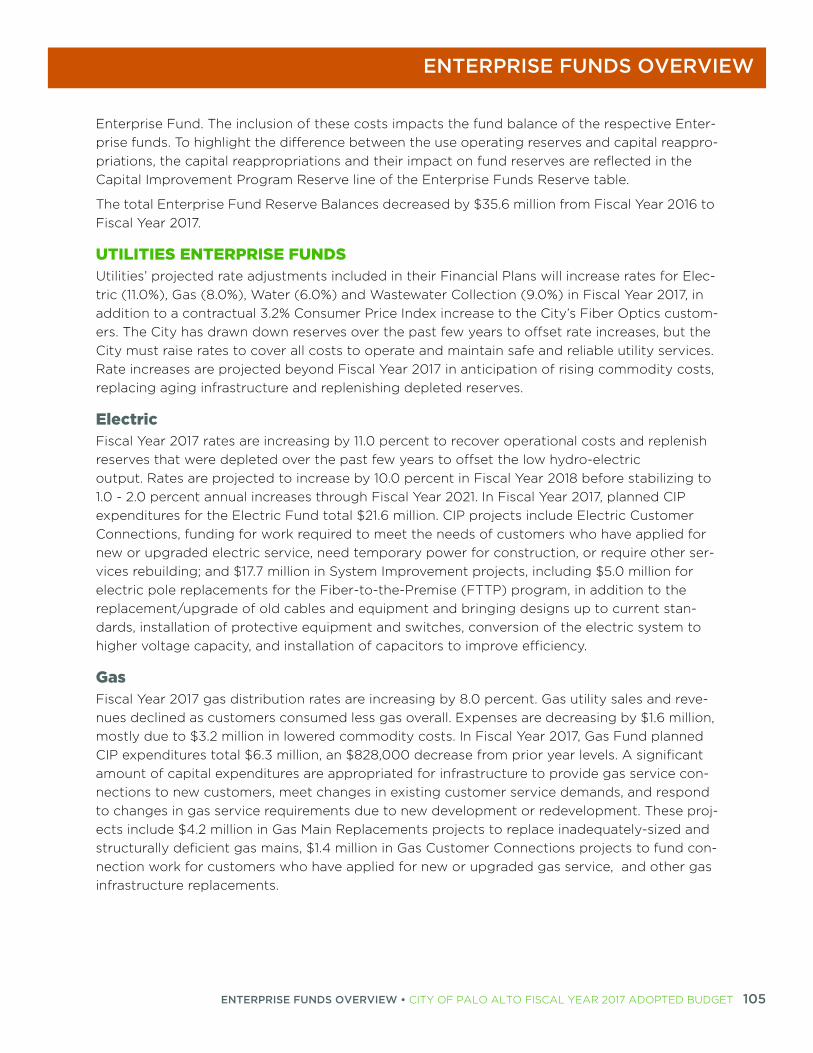
ENTERPRISE FUNDS OVERVIEW
Enterprise Fund. The inclusion of these costs impacts the fund balance of the respective Enter-prise funds. To highlight the difference between the use operating reserves and capital reappro-priations, the capital reappropriations and their impact on fund reserves are reflected in the Capital Improvement Program Reserve line of the Enterprise Funds Reserve table.
The total Enterprise Fund Reserve Balances decreased by $35.6 million from Fiscal Year 2016 to Fiscal Year 2017.
UTILITIES ENTERPRISE FUNDSUtilities’ projected rate adjustments included in their Financial Plans will increase rates for Elec-tric (11.0%), Gas (8.0%), Water (6.0%) and Wastewater Collection (9.0%) in Fiscal Year 2017, in addition to a contractual 3.2% Consumer Price Index increase to the City’s Fiber Optics custom-ers. The City has drawn down reserves over the past few years to offset rate increases, but the City must raise rates to cover all costs to operate and maintain safe and reliable utility services. Rate increases are projected beyond Fiscal Year 2017 in anticipation of rising commodity costs, replacing aging infrastructure and replenishing depleted reserves.
ElectricFiscal Year 2017 rates are increasing by 11.0 percent to recover operational costs and replenish reserves that were depleted over the past few years to offset the low hydro-electric output. Rates are projected to increase by 10.0 percent in Fiscal Year 2018 before stabilizing to 1.0 - 2.0 percent annual increases through Fiscal Year 2021. In Fiscal Year 2017, planned CIP expenditures for the Electric Fund total $21.6 million. CIP projects include Electric Customer Connections, funding for work required to meet the needs of customers who have applied for new or upgraded electric service, need temporary power for construction, or require other ser-vices rebuilding; and $17.7 million in System Improvement projects, including $5.0 million for electric pole replacements for the Fiber-to-the-Premise (FTTP) program, in addition to the replacement/upgrade of old cables and equipment and bringing designs up to current stan-dards, installation of protective equipment and switches, conversion of the electric system to higher voltage capacity, and installation of capacitors to improve efficiency.
GasFiscal Year 2017 gas distribution rates are increasing by 8.0 percent. Gas utility sales and reve-nues declined as customers consumed less gas overall. Expenses are decreasing by $1.6 million, mostly due to $3.2 million in lowered commodity costs. In Fiscal Year 2017, Gas Fund planned CIP expenditures total $6.3 million, an $828,000 decrease from prior year levels. A significant amount of capital expenditures are appropriated for infrastructure to provide gas service con-nections to new customers, meet changes in existing customer service demands, and respond to changes in gas service requirements due to new development or redevelopment. These proj-ects include $4.2 million in Gas Main Replacements projects to replace inadequately-sized and structurally deficient gas mains, $1.4 million in Gas Customer Connections projects to fund con-nection work for customers who have applied for new or upgraded gas service, and other gas infrastructure replacements.
ENTERPRISE FUNDS OVERVIEW • CITY OF PALO ALTO FISCAL YEAR 2017 ADOPTED BUDGET 105

ENTERPRISE FUNDS OVERVIEW
106 E
WaterFiscal Year 2017 water utility rates are increasing 6.0 percent due to an increase in wholesale water supply rates. The water utility financial forecasts flat revenues for Fiscal Year 2017 due to decreased water sales during last year’s drought conditions, mandatory usage reductions imposed by the state, which offset the rate increases. Wholesale water costs are projected to rise to 7.5 percent per year, on average, through Fiscal Year 2020, and then will stabilize to 2.0 - 3.0 percent increases through Fiscal Year 2024. Water financial forecasts are seven years long due to the length of the SFPUC Water System Improvement Program (WSIP) which is expected to be completed within this forecast period. In Fiscal Year 2017, $9.6 million is budgeted in the Water Fund for CIP expenditures. The Water Fund CIP primarily involves the water main replacements and other projects focused on reliability. Included proposals are $6.3 million to fund water main replacement projects, and $2.6 million to fund water system improvements, such as water meters water service hydrant replacement.
Wastewater CollectionWastewater Collection Fiscal Year 2017 are increasing by 9.0 percent, due to capital projects costs for main replacement projects. The utility has accumulated reserves due to a temporary reduction in CIP spending in Fiscal Year 2014 (related to staff vacancies), and is drawing these reserves down over the course of a five-year forecast period to smooth the transition to higher rates. Rates are projected to increase 6.0-10.0 percent annually through 2021, with a projected tapering in the out years. The Wastewater Collection Fund has budgeted $4.8 million for Fiscal Year 2017 CIP expenditures. Included are infrastructure projects to rehabilitate collection sys-tems and manholes, and to reduce groundwater and rainfall seepage into the pipelines.
Fiber OpticsUtilities provides commercial dark fiber optic services within the boundaries of the City of Palo Alto. In September 2006, Council approved the Dark Fiber Licensing Agreement allowing the commercial fiber optic fees charged under the EDF-1 and EDF-2 rate schedules to be adjusted annually in accordance with the Consumer Price Index (CPI). EDF-1 was a promotional rate and was closed to new Dark Fiber licenses in 2006. Customer expenses for engineering, construc-tion and connection to the fiber optic backbone are charged under EDF-2 rates. New fiber cus-tomers are enrolled under Dark Fiber Licensing Services Rate Schedule EDF-3. As CPI increases are implemented for the EDF-l rate, some customers may voluntarily choose to move from the EDF-l rate to the EDF-3 rate for cost saving purposes. The Fiber Optics rate will have a contrac-tual 3.2 percent CPI increase to the City’s Fiber Optics customers. $1.7 million of Capital Proj-ects are proposed in the Fiber Optics Fund for Fiscal Year 2017, including $1.25 million to rebuild portions of the dark fiber optics network.
PUBLIC WORKS ENTERPRISE FUNDS
RefuseThe City’s Refuse Fund continues to work with Palo Alto’s residential and commercial communi-ties to achieve the City’s Zero Waste goals to reduce the amount of waste disposed in landfills by 90 percent or more by 2021, exceeding the State of California’s solid waste diversion require-ments of 50 percent now and 75 percent by 2020. The City’s Zero Waste programs have
NTERPRISE FUNDS OVERVIEW • CITY OF PALO ALTO FISCAL YEAR 2017 ADOPTED BUDGET

ENTERPRISE FUNDS OVERVIEW
increased the City’s current waste diversion rate to 80 percent. In addition, the City will com-plete the capping of the landfill during 2016 and will adjust some staffing requirements in Fiscal Year 2017 to provide adequate resources to ensure all post-closure safety and regulatory requirements are met. This includes increasing an hourly position to full-time (0.52 FTE change) to monitor methane gas related to the 109 gas wells at the landfill, service the 23 leach-ate pumps, 17 condensate submersible pumps and the newly prepared pump cleaning station at the landfill’s post-closure maintenance facility. As a result of the landfill closure, the Refuse Fund CIP is winding down as well. A programmed expense of ($0.2 million) for the Household Haz-ardous Waste Station Collection Facility is proposed for Fiscal Year 2017 and is the only remain-ing capital expenditures in the fund.
Storm DrainThe Storm Drainage Fee increase approved by property owners in April 2005 continues to pro-vide funding for high priority storm drain capital improvements. In Fiscal Year 2017, projects include an update to the Matadero Creek Storm Water Pump Station Improvements ($5.8 mil-lion), Channing Avenue/Lincoln Avenue Storm Drain Improvements ($0.1 million), and other Storm Drain System Replacement and Rehabilitation projects ($1.8 million). In the absence of another ballot measure approved by property owners, the storm drainage fee increase will expire after Fiscal Year 2017. Future funding for storm drainage capital improvements will require the reauthorization of the storm drainage fee by property owners. Staff is currently working with a city manager-appointed blue ribbon committee to generate a recommendation for storm drain funding beyond Fiscal Year 2017, including a potential ballot measure in fall 2016. If the funding measure is not successful, the Storm Drainage Fund will not have the funding to address its ongoing infrastructure needs. It is anticipated that without reauthorization of the enhanced fee, fund revenues will decrease from $6.6 million in proposed Fiscal Year 2017 Oper-ating Budget to $2.2 million. It is expected that all seven projects identified in the original ballot measure will be completed in Fiscal Year 2017. In accordance with the 2005 approved ballot measure, the storm drain fee will increase by 3.2% or the current Consumer Price Index for Fis-cal Year 2017.
Wastewater TreatmentFiscal Year 2017 revenues in the Wastewater Treatment Fund are expected to increase by $24.9 million or 106 percent from Fiscal Year 2016 adopted levels. The majority of the increase, $21.3 million, is the result of expected State Revolving Fund Loans for programmed 2017-2021 capital improvement expenditures for the New Dewatering and Loadout Facility ($14.6 million), reim-bursement for the Plant Master Plan ($3.2 million) and the Fixed Film Reactor Rehabilitation Project ($1.9 million). As the Wastewater Treatment Plant upgrade—as outlined in the Long Range Facilities Plan—begins to ramp-up, additional State Revolving Fund Loans will be pur-sued. In addition, partner revenue increases are also included in the revenue forecast for the Wastewater Fund in Fiscal Year 2017. The increase in partner revenue includes adjustments for ongoing activities as well as the budget proposals outlined in the Wastewater Treatment Fund section of the Public Works Department. Major adjustments included the replacement of a Flat-bed Crane Truck ($320,000) as well as the addition of two full-time Senior Engineer positions ($446,000) to support the City’s nascent Recycled Water Program as well as providing increased project management support for the delivery of capital improvements.
ENTERPRISE FUNDS OVERVIEW • CITY OF PALO ALTO FISCAL YEAR 2017 ADOPTED BUDGET 107

ENTERPRISE FUNDS OVERVIEW
108 E
8
1
0
1
9
9
7
6
1
3
AirportThe City of Palo Alto assumed responsibility from Santa Clara County for operations of the air-port in August of 2014. Preparations for the transition began in Fiscal Year 2012, and have been funded by loans from the General Fund. In Fiscal Year 2017 the loan from the General Fund to the Airport Fund will total $704,150, up $400,000 from Fiscal Year 2016. Since 2011, including the 2017 amount, the General Fund has loaned a cumulative total of $2.7 million to the Airport Fund. Under the terms of the ground lease with the County, which is due to expire in 2017, operational management and control of the Airport was granted to the County, including the right to sublease to the Fixed Base Operators (FBOs) and other interested parties. While the City assumed operations of the Palo Alto Airport in Fiscal Year 2015, two years before the lease with the County would otherwise expire, the Airport does not have the ability to increase reve-nues from current levels to cover operating and non-grant funded capital expenses. Once the subleases with the Fixed Base Operators expire and revenues can be increased, it is anticipated that the Airport Fund will begin to pay back the General Fund for loans issued in prior years, and the reserve levels in the fund can be increased. The 2017-2021 CIP includes $2.6 million in capital expenditures, offset by $2.2 million in Federal Aviation Grants. Major projects include construction on the Airport Perimeter Fence ($1.8 million) and the Airport Apron Reconstruc-tion ($0.8 million).
Enterprise Funds Summary
Fund Summary ($000)
Electric Fund
Gas Fund
Water Fund
Refuse Fund
Waste-water
Treatment Fund
Waste-water
Collection Fund
Storm Drainage
FundAirport Fund
Fiber Optics Fund Total
Revenues
Charges for Services 230 20 10 38 0 10 90 0 0 32
Net Sales 131,990 34,606 39,346 28,107 26,849 17,948 6,650 533 4,887 289,98
Other Revenue 15,515 1,030 878 2,576 0 1,046 0 295 0 21,34
Return on Investments 2,508 526 775 179 199 267 130 2 366 4,95
Charges to Other Funds 289 208 155 276 51 30 0 0 0 1,00
From Other Agencies 0 0 577 13 21,341 0 0 2,178 0 24,10
Operating Transfers-In 2,679 0 244 13 0 0 0 704 0 3,62
Other Taxes and Fines 0 0 0 0 4 0 2 0 0
Total 153,211 36,390 41,985 31,189 48,444 19,300 6,827 3,712 5,253 346,31
Expenses
Allocated Charges 8,829 4,173 4,028 1,774 5,221 2,734 1,176 299 559 28,79
NTERPRISE FUNDS OVERVIEW • CITY OF PALO ALTO FISCAL YEAR 2017 ADOPTED BUDGET

ENTERPRISE FUNDS OVERVIEW
7
5
0
3
6
4
2
6
3
8
1
6
Contract Services 7,018 1,446 828 6,432 1,878 248 531 8 458 18,84
Debt Service 8,957 803 3,223 565 1,469 129 949 0 0 16,09
Supplies & Material 873 498 610 144 1,993 386 95 57 9 4,66
General Expense 3,931 780 568 113 479 122 179 30 14 6,03
Utility Purchase 86,441 12,337 18,900 16,253 0 9,855 0 0 0 143,78
Salary & Benefits 14,732 5,861 6,461 2,586 11,853 2,613 1,348 625 1,055 47,13
Operating Transfers-Out 255 484 324 57 320 286 12 0 104 1,84
Rents & Leases 5,440 710 2,877 2,547 0 390 46 11 75 12,09
Facilities & Equipment 44 20 2 3 8 3 8 15 0 10
Capital Improvement Program
26,129 11,111 20,044 148 25,402 6,669 8,237 2,570 1,858 102,16
Equity Transfer 12,035 6,726 0 0 0 0 0 0 0 18,76
Total 174,684 44,949 57,865 30,622 48,623 23,435 12,581 3,615 4,132 400,50
Enterprise Funds Summary
Fund Summary ($000)
Electric Fund
Gas Fund
Water Fund
Refuse Fund
Waste-water
Treatment Fund
Waste-water
Collection Fund
Storm Drainage
FundAirport Fund
Fiber Optics Fund Total
ENTERPRISE FUNDS OVERVIEW • CITY OF PALO ALTO FISCAL YEAR 2017 ADOPTED BUDGET 109

ENTERPRISE FUNDS OVERVIEW
110 E
$0
$20,000
$40,000
$60,000
$80,000
$100,000
$120,000
$140,000
$160,000
$180,000
3 Year Trend ‐ Enterprise Funds Revenues by Fund ($Thousands)
FY 2015 Actuals FY 2016 Adopted FY 2017 Adopted
44.2%
10.5%12.1%
9.0%
14.0%
5.6%2.0% 1.1% 1.5%
$346.3 Million/FY 2017 Adopted
1. Electric Fund ‐ $153.21/44.2%
2. Gas Fund ‐ $36.39/10.5%
3. Water Fund ‐ $41.99/12.1%
4. Refuse Fund ‐ $31.19/9%
5. WW Treatment Fund ‐ $48.44/14%
6. WW Collection Fund ‐ $19.3/5.6%
7. Storm Drainage Fund‐ $6.83/2%
8. Airport Fund ‐ $3.71/1.1%
9. Fiber Optics Fund ‐ $5.25/1.5%
NTERPRISE FUNDS OVERVIEW • CITY OF PALO ALTO FISCAL YEAR 2017 ADOPTED BUDGET

ENTERPRISE FUNDS OVERVIEW
$0
$20,000
$40,000
$60,000
$80,000
$100,000
$120,000
$140,000
$160,000
$180,000
3 Year Trend ‐ Enterprise Funds Expenses by Fund ($Thousands)
FY 2015 Actuals FY 2016 Adopted FY 2017 Adopted
43.6%
11.2%
14.4%
7.6%
12.1%
5.9%
3.1%0.9% 1.0%
$400.5 Million/FY 2017 Adopted
1. Electric Fund ‐ $174.68/43.6%
2. Gas Fund ‐ $44.95/11.2%
3. Water Fund ‐ $57.87/14.4%
4. Refuse Fund ‐ $30.62/7.6%
5. WW Treatment Fund ‐ $48.62/12.1%
6. WW Collection Fund ‐ $23.44/5.9%
7. Storm Drainage Fund‐ $12.58/3.1%
8. Airport Fund ‐ $3.62/0.9%
9. Fiber Optics Fund ‐ $4.13/1%
ENTERPRISE FUNDS OVERVIEW • CITY OF PALO ALTO FISCAL YEAR 2017 ADOPTED BUDGET 111

ENTERPRISE FUNDS OVERVIEW
112 E
Enterprise Fund Reserves
Reserves ($000)
FY 2016Projected
EndingBalance
FY 2017Changes
FY 2017Projected
EndingBalance
FY 2017Reserve
GuidelineRange
Electric Fund
Supply Rate Stabilization 14,441 158 14,599
Supply Operations 39,900 (15,393) 24,507 25,185 - 44,801
Hydro Stabilization 11,400 0 11,400
Electric Special Projects 51,838 0 51,838
Public Benefit 2,574 0 2,574
Central Valley O&M 0 0 0
Underground Loan 730 0 730
Capital Improvement Projects 8,233 (6,239) 1,994
GASB 68 Pension Reserve (27,912) 0 (27,912)
Subtotal 101,204 (21,474) 79,730
Gas Fund
Rate Stabilization 6,805 (735) 6,070
Operations 16,632 (2,478) 14,154 5,982 - 11,964
Debt Service Reserve 0 0 0
Capital Improvement Projects 5,412 (5,346) 66
GASB 68 Pension Reserve (12,643) 0 (12,643)
Subtotal 16,206 (8,559) 7,647
Wastewater Collection Fund
Rate Stabilization 4,292 (307) 3,985
Operations 9,660 (1,986) 7,674 4,027- 8,055
Capital Improvement Projects 1,842 (1,842) 0
GASB 68 Pension Reserve (7,078) 0 (7,078)
Subtotal 8,716 (4,135) 4,581
NTERPRISE FUNDS OVERVIEW • CITY OF PALO ALTO FISCAL YEAR 2017 ADOPTED BUDGET

ENTERPRISE FUNDS OVERVIEW
Water Fund
Rate Stabilization 6,579 (934) 5,645
Operations 28,826 (416) 28,410 6,902 - 13,803
Capital Improvement Projects 14,865 (14,530) 335
GASB 68 Pension Reserve (11,887) 0 (11,887)
Subtotal 38,383 (15,880) 22,503
Refuse Fund
Rate Stabilization 4,323 609 4,932 2,811 - 5,621
Landfill Corrective Action Reserve 721 0 721
Capital Improvement Projects 310 (43) 267
GASB 68 Pension Reserve (4,993) 0 (4,993)
Subtotal 361 566 927
Storm Drainage Fund
Rate Stabilization 8,633 (4,173) 4,460
Capital Improvement Projects 6,260 (1,581) 4,679
GASB 68 Pension Reserve (2,992) 0 (2,992)
Subtotal 11,901 (5,754) 6,147
Wastewater Treatment Fund
Emergency Plant Replacement 1,980 0 1,980 1,936 (max.)
Rate Stabilization 12,887 12,045 24,932 3,481 - 6,962
Capital Improvement Projects 12,224 (12,224) 0
GASB 68 Pension Reserve (17,529) 0 (17,529)
Subtotal 9,562 (179) 9,383
Enterprise Fund Reserves
Reserves ($000)
FY 2016Projected
EndingBalance
FY 2017Changes
FY 2017Projected
EndingBalance
FY 2017Reserve
GuidelineRange
ENTERPRISE FUNDS OVERVIEW • CITY OF PALO ALTO FISCAL YEAR 2017 ADOPTED BUDGET 113

ENTERPRISE FUNDS OVERVIEW
114 E
Fiber Optics Fund
Emergency Plant Replacement 1,000 0 1,000 1,000 (min.)
Rate Stabilization 21,678 1,279 22,957 896 - 1,793
Capital Improvements Projects 139 (158) (19)
GASB 68 Pension Reserve (1,687) 0 (1,687)
Subtotal 21,130 1,221 22,251
Airport Fund
Fund Reserves (1,299) 103 (1,196)
Capital Improvement Projects 6 (6) 0
GASB 68 Pension Reserve (397) 0 (397)
Subtotal (1,690) 97 (1,593)
TOTAL RESERVES 205,773 (54,197) 151,576
Summary of Reserves
Emergency Plant Replacement 2,980 0 2,980
Rate Stabilization 91,038 7,942 98,980
Operations 95,018 (20,273) 74,745
Capital 49,291 (41,969) 7,322
Electric Special Projects 51,838 0 51,838
Public Benefit 2,574 0 2,574
Central Valley O&M 0 0 0
Underground Loan 730 0 730
Landfill Corrective Action Reserve 721 0 721
Fund Reserves (1,299) 103 (1,196)
GASB 68 Pension Reserve (87,118) 0 (87,118)
TOTAL RESERVES 205,773 (54,197) 151,576
Landfill Closure and Postclosure Care Liability 10,997 0 10,997
TOTAL RESERVES AND FULLY-FUNDED LIABILITY
216,770 (54,197) 162,573
Enterprise Fund Reserves
Reserves ($000)
FY 2016Projected
EndingBalance
FY 2017Changes
FY 2017Projected
EndingBalance
FY 2017Reserve
GuidelineRange
NTERPRISE FUNDS OVERVIEW • CITY OF PALO ALTO FISCAL YEAR 2017 ADOPTED BUDGET

ENTERPRISE FUNDS OVERVIEW
Residential Monthly Utility Cost Information
Utility
AdjustedFY 2016
Bill
AdoptedFY 2017
Bill *$
Difference%
Difference
Electric 42.76 49.75 6.99 16.3%
Water (1) 82.51 87.24 4.73 5.7%
Gas (2) 34.68 37.43 2.75 7.9%
Wastewater 31.95 34.83 2.88 9.0%
Refuse 43.75 47.69 3.94 9.0%
Storm Drain (3) 12.63 13.03 0.40 3.1%
User Tax 8.00 8.72 0.72 9.0%
Total Monthly Bill 252.22 278.69 22.41 8.9%
COMMENTS:
1) Water FY 2016 Adjusted Rate effective September 15, 20152) Gas FY 2016 Adjusted Rate based on monthly market rates3) Storm Drain FY 2017 Adopted increase based on CPI index
* Adopted FY 2017 Rates effective July 1, 2016
ENTERPRISE FUNDS OVERVIEW • CITY OF PALO ALTO FISCAL YEAR 2017 ADOPTED BUDGET 115

116 •
CITY OF PALO ALTO FISCAL YEAR 2017 ADOPTED BUDGET
INTERNAL SERVICE FUNDS
CITY OF PALO ALTO FISCAL YEAR 2017 ADOPTED BUDGET 117


INTERNAL SERVICE FUNDS OVERVIEW
Internal Service Funds Overview
Internal Service Funds OverviewInternal Service Funds provide services to City departments and recover their costs through user charges. Charges for employee benefits (health, pension, life insurance, etc.) and workers’ compensation are reflected in the departments’ salary and benefit accounts. The remaining user charges are included in the “allocated charges“ expenditure category within each department or fund.
As one-time budget balancing strategy for Fiscal Year 2017, the allocated charges to other City departments and funds, which is the revenue source for these funds, will be reduced or elimi-nated in the General Benefits, General Liabilities, and Workers’ Compensation funds. As a result, citywide savings of $5.0 million are anticipated in all funds, of which $3.1 million is realized in the General Fund. Each of these funds have been determined to have sufficient fund balance to draw down and overall balances are anticipated to remain above $0.3 million despite this action. This change to the allocated charges for these funds is reflected in each of the department sec-tions “Budget Summary“ and “Budget Reconciliation,“ most notably in the “Dollars by Cate-gory“ section. It is anticipated that as part of the Fiscal Year 2018 base budget process, these allocations will be reinstated to the levels necessary to fund the ongoing expenditure activities.
GENERAL BENEFITS FUNDThis fund reflects costs for a variety of employee benefits, including pension, health, dental, vision, and life insurance. Funds are also included for payments made to employees who elect to waive healthcare coverage under a City plan because they have other coverage. As discussed in the overview section, costs for employee health benefits as well as pension benefits are pro-jected to increase in Fiscal Year 2017; however, as a budget balancing strategy in Fiscal Year 2017, benefit costs will not be allocated to departments and the unrestricted fund balance in this fund will be used instead. It is anticipated that these costs will again be allocated to depart-ments as part of the Fiscal Year 2018 budget and beyond.
GENERAL LIABILITIES INSURANCE PROGRAM FUNDThis fund reflects costs for the City’s Liability program. In Fiscal Year 2017, costs are projected to decrease as compared to the Fiscal Year 2016 adopted budget based on an actuarial analysis of the trend of the City’s liability costs over the past few years. As a budget balancing strategy in Fiscal Year 2017, general liability costs will not be allocated to departments and the unrestricted fund balance in this fund will be used instead. It is anticipated that these costs will again be allocated to departments as part of the Fiscal Year 2018 budget and beyond.
PRINTING AND MAILING SERVICES FUNDThis fund reflects costs for central copying, printing, and mailing services provided to City departments. An overview of the Fund is included in the Administrative Services Department section of this document.
INTERNAL SERVICE FUNDS OVERVIEW • CITY OF PALO ALTO FISCAL YEAR 2017 ADOPTED BUDGET 119

INTERNAL SERVICE FUNDS OVERVIEW
120 I
76
71
49
RETIREE HEALTH BENEFITS FUNDThis fund reflects costs for medical insurance provided to retired City employees. In addition, this fund includes payments for the unfunded liability for future medical benefits that will be provided to current and future retirees.
TECHNOLOGY FUNDThis fund reflects costs associated with citywide Information Technology (IT) activities. IT staff maintain critical desktop, software, and infrastructure replacements and maintenance activities for all City departments, including the Utilities Department. The overview for the Information Technology Department contains information about projects and activities for Fiscal Year 2017.
VEHICLE REPLACEMENT AND MAINTENANCE FUNDThis fund reflects costs for providing maintenance and replacement of vehicles and equipment used by City departments. In Fiscal Year 2017, $8.9 million is allocated for vehicles and equip-ment that are due for replacement. Of the $8.9 million, $4.9 million is for the continuation of projects approved by City Council in prior fiscal years. In addition, although this Capital Improvement Program (CIP) shows programmed expenditures of $3.3 million for Fiscal Year 2017 (VR-17000), $2.9 million is being set aside in a reserve until a backlog of vehicle replace-ments from Fiscal Years 2015 and 2016 have been completed. The 2017-2021 CIP reflects fund-ing totaling $22.0 million over the next five years for vehicle replacements. The current reserve balance in the Vehicle Replacement Fund reflects funding allocated from City departments and committed to the proposed five year plan.
WORKERS’ COMPENSATION FUNDThis fund reflects costs for the City’s Workers’ Compensation program, which includes both administrative costs as well as payments made to eligible employees. Fiscal Year 2017 costs are projected to remain the same compared to the Fiscal Year 2016 adopted budget. As a budget balancing strategy in Fiscal Year 2017, only half of the workers’ compensation costs will be allo-cated to departments and the unrestricted fund balance in this fund will be used instead. It is anticipated that the full workers’ compensation costs will again be allocated to departments as part of the Fiscal Year 2018 budget and beyond.
Internal Service Funds Summary
Fund Summary ($000)
Vehicle Replacement
and Maintenance
FundTechnology
Fund
Printing and
Mailing Services
General Benefits
Fund
Workers' Compensation Program
Fund
General Liabilities Insurance Program
Fund
Retiree Health Benefit Fund Total
Revenues
Return on Investments 178 343 0 4 366 126 58 1,0
Charges to Other Funds 8,885 13,788 1,297 0 0 0 0 23,9
Other Revenue 155 131 0 54,544 1,871 40 13,808 70,5
NTERNAL SERVICE FUNDS OVERVIEW • CITY OF PALO ALTO FISCAL YEAR 2017 ADOPTED BUDGET

INTERNAL SERVICE FUNDS OVERVIEW
48
44
58
00
49
94
71
76
17
08
42
63
78
Operating Transfers-In 478 2,078 0 0 0 0 2,292 4,8
Total 9,697 16,340 1,297 54,548 2,237 166 16,158 100,4
Expenses
General Expense 67 575 286 0 696 2,034 0 3,6
Rents & Leases 183 352 365 0 0 0 0 9
Supplies & Material 1,354 115 80 0 0 0 0 1,5
Allocated Charges 1,385 1,114 195 0 0 0 0 2,6
Contract Services 354 5,492 115 215 7 88 0 6,2
Salary & Benefits 2,119 7,056 256 53,366 3,219 0 16,160 82,1
Capital Improvement Program
6,102 4,915 0 0 0 0 0 11,0
Operating Transfers-Out 0 16 0 2,292 0 0 0 2,3
Facilities & Equipment 0 842 0 0 0 0 0 8
Transfer to Infrastructure 263 0 0 0 0 0 0 2
Total 11,827 20,477 1,297 55,873 3,922 2,122 16,160 111,6
Internal Service Funds ReservesVehicle
Replacement and
Maintenance Fund
Technology Fund
Printing and
Mailing Fund
General Benefits
Fund
Workers' Compensation Fund
Liability Insurance
Fund
Retiree Health Benefit Fund
Total Internal Service Funds
Changes to Unrestricted assets
June 30, 2016 Projected Unrestricted Assets
$18,475 $ 9,562 $ — $ 2,186 $ 1,985 $ 2,258 $ 3,264 $ 37, 730
FY 2017 Proposed Changes $ (2,131) $ (4,137) $ — $ (1,325) $ (1,685) $ (1,956) $ (2) $ (11,236)
June 30, 2017 Projected Unrestricted Assets
$ 16,344 $ 5,425 $ — $ 861 $ 300 $ 302 $ 3,262 $ 26,494
Internal Service Funds Summary
Fund Summary ($000)
Vehicle Replacement
and Maintenance
FundTechnology
Fund
Printing and
Mailing Services
General Benefits
Fund
Workers' Compensation Program
Fund
General Liabilities Insurance Program
Fund
Retiree Health Benefit Fund Total
INTERNAL SERVICE FUNDS OVERVIEW • CITY OF PALO ALTO FISCAL YEAR 2017 ADOPTED BUDGET 121

122
• CITY OF PALO ALTO FISCAL YEAR 2017 ADOPTED BUDGET
SPECIAL REVENUE FUNDS
CITY OF PALO ALTO FISCAL YEAR 2017 ADOPTED BUDGET 123


SPECIAL REVENUE FUNDS OVERVIEW
A
Special Revenue Funds OverviewSpecial Revenue Funds comprise revenues that have either restrictions on their use or special reporting requirements, such as development impact fees for community centers, libraries, parks, public facilities, and transportation; gas tax revenues from the state; housing mitigation fees assessed on commercial and industrial projects; in-lieu fees for the City’s Below Market Rate (BMR) housing program; transportation mitigation fees paid by developers; parking in-lieu fees from commercial projects in the downtown area; parking permit revenues; and Community Development Block Grants (CDBG) from the federal government.
PUBLIC ART FUNDAdministered by the Community Services Department, the Public Art Fund was created in Fis-cal Year 2014 to support the City’s Public Art Program which seeks to increase the public’s daily exposure to art through the commissioning and acquisition of a diverse range of artworks inte-grated into the City’s urban environment. The Public Art Program strives to build the City’s rep-utation as a dynamic public art locale with works of diverse styles, disciplines, and the highest aesthetic standards. Funding for the Public Art Program is determined by the Municipal Code’s direction of 1 percent for Art in Private Development that states construction projects in excess of 10,000 square feet, requiring Architectural Review and having an estimated construction value of more than $200,000, have the option of commissioning artwork on the development site equal to the cost of 1 percent of the estimated construction valuation, or paying the 1 per-cent to the Public Art Fund. In Fiscal Year 2017, the projected revenue for the Public Art Fund is $0.2 million. Additionally, although not accounted for in this fund, the City requires that for cer-tain City funded projects a 1 percent public art expense is set aside (please refer to the Fiscal Year 2017 – 2021 Capital Improvement Plan for further detail).
COMMUNITY DEVELOPMENT FUNDSRevenue in this category comes from development impact fees for community centers, libraries, parks, public facilities, and transportation. The development impact fees collected from new developments provides funding for the City’s infrastructure related to community centers, libraries, parks, public safety facility, general government facilities, and the Charleston-Aras-tradero Corridor. The projected revenue within the development impact fee funds is $1.9 million for Fiscal Year 2017. The Fiscal Year 2017 - 2021 Capital Improvement Plan includes a transfer of $2.8 million in Fiscal Year 2018 from Park Impact Fees for the Byxbee Park Completion Project. These funds have been reserved for this activity.
STREET IMPROVEMENT FUNDS (SIF)Revenue in this category comes from the state gas tax and from federal and state grants ear-marked for street improvements. This fund provides funding for transportation and traffic-related capital projects. Based on projected gas tax revenues and interest income, revenues are estimated to be $1.4 million for Fiscal Year 2017. This level of receipts is consistent with the Fis-cal Year 2017 level of $1.4 million. In Fiscal Year 2017, $1.4 million is programmed to be trans-ferred to the Capital Improvement Fund for various citywide transportation projects that include various projects for Street Maintenance and Safe Routes to School. This level is main-
SPECIAL REVENUE FUNDS OVERVIEW • CITY OF PALO ALTO FISCAL YEAR 2017 ADOPTED BUDGET 125

SPECIAL REVENUE FUNDS OVERVIEW
126 S
tained through the Fiscal Year 2017 – 2021 Capital Improvement Plan in order to achieve the City’s goal of reaching a citywide average Pavement Condition Index (PCI) score of 85 by 2019.
FEDERAL AND STATE REVENUE FUNDSThe Federal and State Revenue Fund consists primarily of Community Development Block Grant (CDBG) funds. CDBG funds are grants from the U.S. Housing and Urban Development Department (HUD). They are used for a wide variety of community projects such as affordable housing, public services, and project expenditures. CDBG project expenditures draw upon pro-gram income and prior year allocations that have been unspent. For Fiscal Year 2017, Agency requests totaled $845,000 and the Fiscal Year 2017 budget totals $754,000 as presented and approved by the Finance Committee on April 5, 2016 and City Council on June 13, 2016. A more detailed presentation of CDBG funding for Fiscal Year 2017 is provided in this section.
HOUSING IN-LIEU FUNDSIn-lieu housing revenues come from fees required of commercial, industrial, and residential developers. These fees are used to provide housing for the City’s Subsidized Housing Program. For Fiscal Year 2017, $3.6 million in in-lieu fees are anticipated, a $1.7 million decrease from the $5.3 million assumed in the Fiscal Year 2016. Decreases of $887,500 in Residential Housing In-Lieu revenue and of $719,000 in the Commercial Housing In-Lieu revenue are anticipated based on historical tracking and PCE staff projections. In Fiscal Year 2015, the City reserved $8.0 mil-lion in affordable housing funds, $6.8 million from residential and $1.2 million from commercial, for specific use in conjunction with the Buena Vista Mobile Home Park.
SPECIAL DISTRICTS FUNDSRevenue in this category comes from parking permits and is used for maintenance, repair, and beautification of parking facilities and public areas within the University and California Avenue business districts. Special district funds also include the City’s Residential Parking Permit (RPP) program.
In Fiscal Year 2017, minor changes to align staffing with the volume of work necessary for administering the University Avenue Parking District are recommended. A portion of a Trans-portation Program Assistant II in PCE is recommended to be budgeted in this Fund in order to provide enhanced reporting capacity for the parking district. Additionally, a contractual increase for street sweeping is included ($39,709) as approved in the Fiscal Year 2016 Mid-Year Budget Review. Transfers to the Capital Improvement Fund for University Avenue Parking Improvements ($82,676) and Parking Wayfinding ($600,000) projects are also included. A more detailed presentation of University Ave Parking Permit funding for Fiscal Year 2017 is pro-vided in this section.
The California Ave Parking Permit Fund is also recommended to have a portion of the Transpor-tation Program Assistant II position in PCE budgeted in the fund, in order to provide reporting capacity. The street-sweeping contractual increase for the California Avenue Parking district in Fiscal Year 2017 is $64,638 as approved in the Fiscal Year 2016 Mid-Year Budget Review. A more detailed presentation of California Ave Parking Permit funding for Fiscal Year 2017 is provided in this section.
PECIAL REVENUE FUNDS OVERVIEW • CITY OF PALO ALTO FISCAL YEAR 2017 ADOPTED BUDGET

SPECIAL REVENUE FUNDS OVERVIEW
Although both the University Avenue Parking Permit Fund and the California Avenue Parking Permit Fund are anticipated to maintain positive fund balances through this Fiscal Year 2017 Proposed Budget, programmed Capital Improvement costs in Fiscal Year 2018 would cause the California Avenue Parking Permit Fund to have a negative fund balance. Staff will continue to monitor the performance of the funds and will bring recommendations for potential actions to maintain a positive fund balance, including increasing the rates that are charged by the parking garages, as appropriate during Fiscal Year 2017.
In Fiscal Year 2015, the City Council approved the creation of the Downtown Residential Parking Permit (RPP) program to mitigate parking congestion issues in downtown neighborhoods. This program has now entered its second phase, and the City Council approved the transfer of $230,000 from the General Fund to the Residential Preferential Parking Permit Fund in order to provide start-up funding for two new districts in FY 2017. The progress of RPP will continue to be monitored and additional areas will be brought to City Council as appropriate.
TRAFFIC MITIGATION AND PARKING IN-LIEU FUNDSTraffic mitigation fee revenue is derived from fees paid by developers of new, non-residential projects to alleviate additional traffic congestion resulting from new development. Parking in-lieu fees result from commercial projects in assessment district areas which contribute a fee for future parking spaces in lieu of providing the required spaces within the project area itself. In Fiscal Year 2017, anticipated revenue from traffic mitigation and parking in-lieu funds is $1.7 mil-lion. The Fiscal Year 2016 - 2020 Capital Improvement Plan included a transfer of $1.3 million in Fiscal Year 2016 for design costs associated with the construction of a new downtown parking garage. An additional $2.7 million is projected to be transferred in Fiscal Year 2019 for construc-tion of the downtown parking garage. These funds have been reserved for this activity.
PUBLIC BENEFIT FUNDSRevenue in these funds is a result of a senior housing project on Hamilton Avenue and contribu-tions and mitigation fees paid for Planned Community Zone approvals. The Hamilton Avenue funds will continue to be used by Avenidas (formerly Senior Coordinating Council) to provide services to seniors.
DOWNTOWN BUSINESS IMPROVEMENT DISTRICT (BID)The Downtown Business Improvement District (BID) was established by an ordinance adopted in January 2004 to promote the downtown business community through a variety of efforts including beautification, advocacy, and marketing. The BID continually surveys its member busi-nesses to determine what its priorities should be. Two priorities identified were street cleanli-ness and issues related to the homeless in downtown. New events have been implemented to bring business downtown and new communications tools, such as social media and downtown walking maps, are available. Other programs that help keep Downtown Palo Alto safe, spotless, and successful will advance as the Palo Alto Business and Professional Association continues to operate the Downtown Palo Alto BID for Fiscal Year 2017.
STANFORD UNIVERSITY MEDICAL CENTER (SUMC)In 2011, the City of Palo Alto entered into a Development Agreement between the City of Palo Alto and the Stanford University Medical Center Parties (SUMC). Funds received in Fiscal Year
SPECIAL REVENUE FUNDS OVERVIEW • CITY OF PALO ALTO FISCAL YEAR 2017 ADOPTED BUDGET 127

SPECIAL REVENUE FUNDS OVERVIEW
128 S
2012 as part of this agreement were used in Fiscal Years 2013, 2014, and beyond as outlined in the agreement and approved by the City Council. Over the course of the agreement, Stanford is due to pay the City $44.3 million, of which the City has received $32.5 million. As part of the Development Agreement, the City is expecting to receive the remaining $11.8 million upon issu-ance of a use and occupancy permit for the new Stanford University Medical Center in the next two years. The funds received per the development agreement are allocated for specific pur-poses which include funding for the City Council approved Infrastructure Plan. As outlined in the agreement, expenses and revenues for each category must be accounted for separately. A more detailed presentation of the Stanford University Medical Center funding for Fiscal Year 2017 is provided in this section.
Community Health and Safety: Funds are to be distributed to selected community health pro-grams that benefit residents of the City. In Fiscal Year 2017, funds in this category are partially allocated to Project Safety Net (PSN), which strives to develop and implement a mental health plan for Palo Alto youth. Through Fiscal Year 2016, all but $85,000 of the funds that the City Council had previously allocated towards PSN has been expended, and those remaining funds are recommended to be used for the continued work of the PSN collaborative. In Fiscal Year 2016, PSN’s community collaborative filled the previously vacant Director position as part of an ongoing effort to advance the efforts of the complex and large collaborative. The youth well-being and suicide prevention collaborative continues to focus on increased effectiveness by fur-ther defining: goals and objectives, partner commitment, accountability, and how to best mea-sure outcomes and progress. In addition, in Fiscal Year 2015, the City Council approved additional funding for the Track Watch Security program at Palo Alto rail crossings. As part of the Fiscal Year 2017 budget, the additional costs associated with the PSN collaborative, beyond the remaining $85,000, are budgeted in the General Fund in the Community Services Depart-ment, as discussed in that Department’s section of this document. The costs for the Track Watch Security program are budgeted in the General Fund in the Police Department, as dis-cussed in that Department’s section of this document. The projected Fiscal Year 2017 balance for Community Health and Safety is $2.6 million, representing initial receipt of funds from Stan-ford, the accrual of interest since funds were initially received from Stanford, and funds expended on Project Safety Net through Fiscal Year 2016.
Intermodal Transit: Funds are to enhance the pedestrian and bicycle connection from the Transit Center to the El Camino/Quarry Road intersection. The projected 2017 beginning balance in this category is $2.1 million. The Fiscal Year 2017 – 2021 Capital Improvement Plan includes a transfer of $441,000 in Fiscal Year 2017 for enhancing the public right-of-way.
Quarry Road Improvements: Funds are to improve and enhance the public right-of-way at the pedestrian and bicycle connection from El Camino to Welch Road along Quarry Road. The pro-jected 2017 beginning balance in this category is $359,000. The Fiscal Year 2017 – 2021 Capital Improvement Plan includes a transfer of the remaining balance in Fiscal Year 2017 for enhancing the public right-of-way.
Infrastructure, Sustainable Neighborhoods and Communities, and Affordable Housing: Funds in this category are to be used in connection with infrastructure, sustainable neighborhoods and communities, and affordable housing. The projected 2017 beginning balance in this category is $14.0 million. The Fiscal Year 2017 - 2021 Capital Improvement Plan includes transfers of $1.6 mil-
PECIAL REVENUE FUNDS OVERVIEW • CITY OF PALO ALTO FISCAL YEAR 2017 ADOPTED BUDGET

SPECIAL REVENUE FUNDS OVERVIEW
lion for the Charleston/Arastadero Corridor Project, $2.8 million for the construction of a new Public Safety Building, and $6.0 million for the replacement of Fire Station 3 in Fiscal Year 2017.
Climate Change: Funds are to be used for projects and programs for a sustainable community, including programs identified in the City’s Climate Action Plan. The projected 2017 beginning balance for this category is $5.1 million. Included in the City Council approved Infrastructure Plan is the continuation of the Bike and Pedestrian Plan at a cumulative cost of $20.0 million. The Fis-cal Year 2017 – 2021 Capital Improvement Plan includes a transfer of $1.2 million in Fiscal Year 2017.
Stanford Hospital Expansion Cost Mitigation: Funds are being held in this category for the pur-pose of assuring that City costs associated with the project do not exceed revenues to the City. The projected 2017 beginning balance for this category is $2.7 million.
SPECIAL REVENUE FUNDS OVERVIEW • CITY OF PALO ALTO FISCAL YEAR 2017 ADOPTED BUDGET 129

SPECIAL REVENUE FUNDS OVERVIEW
130 S
Special Revenue Summary by Fund Type
Fund Summary ($000)
Public Art
Fund
Com. Dev.
Funds
Bus. Improv. District
Housing In-Lieu Funds
Street Improv. Fund
Federal & State
Rev. Funds
Public Benefits
Fund
Special District Funds
Traffic Mitig. & Parking In-Lieu Funds
Stan. Univ.
Medical Center Fund Total
Revenues
Charges for Services 90 1,689 0 0 0 0 0 0 257 0 2,036
Return on Investments 2 232 2 124 13 2 18 27 153 663 1,236
Other Revenue 0 0 0 3,580 0 136 30 0 1,250 0 4,996
From Other Agencies 0 0 0 0 1,416 442 0 0 0 0 1,859
Rental Income 0 0 0 9 0 0 0 0 0 0 9
Net Sales 0 0 0 0 0 0 0 890 0 0 890
Operating Transfers-In 69 0 0 0 0 0 0 400 0 0 469
Permits and Licenses 0 0 0 0 0 0 0 1,508 0 0 1,508
Property Taxes 0 0 140 0 0 0 0 0 0 0 140
Other Taxes and Fines 0 0 0 0 0 0 0 43 0 0 43
Total 161 1,921 142 3,713 1,430 580 48 2,868 1,660 663 13,185
Expenses
Salary & Benefits 144 0 0 4 0 64 0 1,033 0 28 1,273
General Expense 1 0 148 100 0 486 28 13 0 0 776
Allocated Charges 0 0 0 0 0 0 0 159 0 0 159
Transfer to Infrastructure 0 381 0 0 1,400 0 0 683 0 12,350 14,814
Supplies & Material 0 0 0 0 0 0 0 111 0 0 111
Contract Services 0 0 0 300 0 0 0 1,966 0 57 2,322
Operating Transfers-Out 0 0 0 0 364 0 0 98 0 0 461
Total 145 381 148 404 1,764 550 28 4,062 0 12,435 19,916
PECIAL REVENUE FUNDS OVERVIEW • CITY OF PALO ALTO FISCAL YEAR 2017 ADOPTED BUDGET

SPECIAL REVENUE FUNDS OVERVIEW
Consolidated Special Revenues FundsFund Summary
($000)FY 2014 Actuals
FY 2015 Actuals
FY 2016 Adopted Budget
FY 2017 Adopted Budget
FY 2017 Change $
FY 2017 Change %
Revenues
Gas Tax 2,083 2,083 1,644 1,416 (228) (13.87)%
Federal & State Grants 140 140 — — — 0.00%
Federal CDBG 468 372 442 442 — 0.00%
Housing In-Lieu 1,400 6,169 4,876 3,400 (1,476) (30.27)%
Traffic Mitigation Fees 1,335 3,508 1,717 1,517 (200) (11.65)%
Developer Impact Fees 2,267 1,492 1,479 1,679 200 13.52%
Parking Mitigation Fees 2,038 2,123 2,398 2,398 — 0.00%
BID Assessment 94 86 140 140 — 0.00%
SUMC — — — — — 0.00%
Interest Income 1,352 1,482 1,368 1,236 (132) (9.65)%
Other Revenue 525 480 488 488 — 0.00%
Subtotal Revenues 11,702 17,935 14,552 12,716 (1,836) (12.62)%
Operating Transfers-In
Technology Fund 14 12 12 12 — 0.00%
SUMC Fund — — — — — 0.00%
Capital Projects Fund 260 300 — — — 0.00%
Utility Administration Fund 27 24 24 24 — 0.00%
General Fund 153 274 202 433 231 114.36%
Subtotal Operating Transfers-In 454 610 238 469 231 97.06%
Total Source of Funds 12,156 18,545 14,790 13,185 (1,605) (11.02)%
Expenses
General Expenses 3,056 2,978 3,525 4,556 1,031 29.25%
SUMC 131 393 567 85 (482) (85.01)%
Subtotal Expenses 3,187 3,371 4,092 4,641 549 13.42%
Operating Transfers-Out
General Fund 424 — 422 461 39 9.24%
Capital Projects Fund 4,676 5,446 5,333 14,814 9,481 177.78%
Subtotal Operating Transfers-Out 5,100 5,446 5,755 15,275 9,520 165.42%
Total Use of Funds 8,287 8,817 9,847 19,916 10,069 102.25%
Net to (from) Reserves 3,869 9,728 4,943 (6,731) (11,674) (236.17)%
SPECIAL REVENUE FUNDS OVERVIEW • CITY OF PALO ALTO FISCAL YEAR 2017 ADOPTED BUDGET 131

SPECIAL REVENUE FUNDS OVERVIEW
132 S
Community Development Block GrantFY 2016 Adopted
FY 2017 Agency
RequestsFY 2017 Adopted
SOURCE OF FUNDS
Housing & Urban Development, current year $ 442,460 $ — $ 441,253
Housing & Urban Development, prior years — — —
Prior Year Excess/Reallocation (1) $ 303,164 — 213,165
Program Income
Palo Alto Housing Corporation $ 136,049 $ — $ 100,000
TOTAL SOURCE OF FUNDS $ 881,673 $ — $ 754,418
USE OF FUNDS
Public Service
Palo Alto Housing Corporation - SRO Resident Support Services $ 24,861 $ 42,874 $ 22,983
Catholic Charities - Long-Term Care Ombudsman 5,422 6,500 5,012
YWCA/Support Network for Battered Women - Domestic Violence 8,676 10,000 8,020
InnVision/Shelter Network - Opportunity Center 38,499 50,000 35,592
Silicon Valley Independent Living Center 5,422 10,000 5,012
Subtotal: Public Service $ 82,880 $ 119,374 $ 76,619
Planning and Administration
Project Sentinel/Fair Housing Services $ 32,016 $ 32,016 $ 30,941
City of Palo Alto - CDBG Administration includes 0.75 FTE CDBG Administrative Staff 83,686 80,000 77,310
Subtotal: Planning and Administration $ 115,702 $ 112,016 $ 108,241
Housing, Economic Development & Capital Projects
Downtown Streets Team/Workforce Development $ 290,723 $ 314,100 $ 290,273
MidPen Housing - Palo Alto Gardens Rehab Project 392,368 300,000 279,285
City of Palo Alto - Microenterprise Assistance Program — — —
Subtotal: Housing, Economic Development & Capital Projects $ 683,091 $ 614,100 $ 569,558
TOTAL USE OF FUNDS $ 881,673 $ 845,490 $ 754,418
1) Funds received in excess of revenue estimate for local program income (prior fiscal years)
PECIAL REVENUE FUNDS OVERVIEW • CITY OF PALO ALTO FISCAL YEAR 2017 ADOPTED BUDGET

SPECIAL REVENUE FUNDS OVERVIEW
University Avenue Parking Permit FundFY 2016 Adopted
FY 2016 Adjusted1
FY 2017 Adopted
University Avenue Parking Permit Fund
Revenues
Permit Sales $ 1,402,000 $ 1,402,000 $ 1,402,000
Day Passes 312,000 312,000 312,000
Ticket Machine 215,000 215,000 215,000
Transfer from Other Funds for City Share 169,935 169,935 169,935
Investment Income 21,800 21,800 21,800
Total Revenue $ 2,120,735 $ 2,120,735 $ 2,120,735
Expenditures
Administration
Positions 1.63 1.63 1.42
Salaries $ 105,358 $ 105,358 $ 91,448
Benefits 86,612 86,612 79,579
Miscellaneous Supplies 20,880 35,880 20,880
Bank card charges for ticket machines 6,000 6,000 6,000
Indirect costs — — —
Subtotal Administration $ 218,850 $ 233,850 $ 197,907
Maintenance
Positions 3.87 3.87 3.87
Salaries $ 221,875 $ 221,875 $234,507
Benefits 202,685 202,685 220,754
Supplies 60,090 60,090 60,090
Twinkle lights — — —
Valet Program (Lots R, CC, CW, & S) 465,572 484,078 465,572
Weekly garage maintenance 27,500 27,500 27,500
Annual power washing - walls 25,000 25,000 25,000
Daily custodial 40,000 65,209 40,000
Elevator maintenance 28,600 29,285 28,600
Fire sprinkler maintenance 12,400 12,400 12,400
Landscaping 16,451 16,451 16,451
1) The FY 2016 Adjusted column reflects the carryforward funding in the expenditures amount for pertinent contracts from FY 2015.
SPECIAL REVENUE FUNDS OVERVIEW • CITY OF PALO ALTO FISCAL YEAR 2017 ADOPTED BUDGET 133

SPECIAL REVENUE FUNDS OVERVIEW
134 S
Downtown Streets Team 61,543 69,702 61,543
Streets Team Peer Counseling 11,000 11,000 11,000
Civic Center, Lot Q sweeping 6,276 6,276 6,276
Annual steam clean R, S/L, J lots 3,840 3,840 3,840
Univ. sidewalk steam clean, monthly 10,620 16,920 10,620
Downtown area steam clean monthly 75,700 122,195 75,700
Lytton Plaza steam clean 2x per month 4,500 4,500 4,500
Lot S/L fountain maintenance 1,800 1,800 1,800
Glass Repair 2,000 2,000 2,000
Street Sweeping 10,721 12,281 50,430
Indirect charges — — —
Subtotal Maintenance $ 1,288,173 $ 1,395,087 $ 1,358,583
Police Patrol
Positions 0.50 0.50 0.50
Salaries $ 57,105 $ 57,105 $ 57,105
Benefits 40,707 40,707 40,707
Subtotal Patrols $ 97,812 $ 97,812 $ 97,812
Other
Utilities $ 124,288 $ 124,288 $ 138,012
Transfer to CIP Fund 332,988 332,988 682,676
Subtotal Other $ 457,276 $ 457,276 $820,688
Total Operating Expenses $ 2,062,111 $ 2,184,025 $ 2,474,990
Income from Operations $ 58,624 $ (63,290) $ (354,255)
University Avenue Parking Permit FundFY 2016 Adopted
FY 2016 Adjusted1
FY 2017 Adopted
1) The FY 2016 Adjusted column reflects the carryforward funding in the expenditures amount for pertinent contracts from FY 2015.
PECIAL REVENUE FUNDS OVERVIEW • CITY OF PALO ALTO FISCAL YEAR 2017 ADOPTED BUDGET

SPECIAL REVENUE FUNDS OVERVIEW
California Avenue Parking Permit FundFY 2016 Adopted
FY 2016 Adjusted1
FY 2017 Adopted
Revenues
Permit Sales $ 125,000 $ 125,000 $ 125,000
Day Passes 70,000 70,000 70,000
Investment Income 5,200 5,200 5,200
Total Revenue $ 200,200 $ 200,200 $ 200,200
Expenditures
Administration
Positions 0.65 0.65 0.56
Salaries $ 31,429 $ 31,429 $ 32,223
Benefits 24,887 24,887 28,196
Miscellaneous Supplies 8,453 8,453 8,453
Subtotal Administration $ 64,769 $ 64,769 $ 68,872
Maintenance
Positions 0.43 0.43 0.43
Salaries $ 33,891 $ 33,891 $ 35,858
Benefits 23,567 23,567 25,884
Supplies 7,855 7,855 7,855
Garage maintenance 5,255 6,135 5,255
Sweeping Ted Thompson and Cambridge garages 4,008 5,048 4,008
Fire sprinkler maintenance 1,453 1,453 1,453
Steam Cleaning 7,060 7,940 7,060
Landscaping 9,253 9,253 9,253
Facilities repair 637 637 637
Street Sweeping 17,463 17,463 82,101
Indirect charges — — —
Subtotal Maintenance $ 110,442 $113,242 $ 179,364
Other
Utilities $ 18,518 $ 18,518 $ 20,623
Transfer to CIP Fund — — —
Subtotal Other $ 18,518 $ 18,518 $ 20,623
1) The FY 2016 Adjusted column reflects the carryforward funding in the expenditures amount for pertinent contracts from FY 2015.
SPECIAL REVENUE FUNDS OVERVIEW • CITY OF PALO ALTO FISCAL YEAR 2017 ADOPTED BUDGET 135

SPECIAL REVENUE FUNDS OVERVIEW
136 S
Total Operating Expenses $ 193,729 $ 196,529 $ 268,859
Income from Operations $ 6,471 $ 3,671 $ (68,659)
Stanford Development AgreementFY 2016 Estimate
FY 2017 Adopted Change
SOURCE OF FUNDS
Unrestricted - Community Health and Safety $3,708,370 $ 2,589,295 $ (1,119,075)
Unrestricted - Stanford Hospital Expansion Cost Mitigation 2,683,969 2,743,756 59,787
Unrestricted - Intermodal Transit 2,088,054 2,134,567 46,513
Unrestricted - Quarry Road Improvements 441,183 359,007 (82,176)
Unrestricted - Neighborhoods and Communities and Affordable Housing 14,699,186 13,926,619 (772,567)
Unrestricted - Climate Change 6,133,785 5,070,419 (1,063,366)
Total Beginning Fund Balance 29,754,547 26,823,662 (2,930,885)
Revenue
Interest - Community Health and Safety $ 82,606 $ 63,980 $ (18,626)
Interest - Stanford Hospital Expansion Cost Mitigation 59,787 67,797 8,010
Interest - Intermodal Transit 46,513 52,744 6,232
Interest - Quarry Road Improvements 9,828 8,871 (957)
Interest - Neighborhoods and Communities and Affordable Housing 327,433 344,120 16,687
Interest - Climate Change 136,634 125,288 (11,346)
Total Revenue $ 662,800 $ 662,800 0
Transfers In
Total Transfers $ — $ — $ —
TOTAL SOURCE OF FUNDS $ 30,417,347 $ 27,486,462 $ (2,930,885)
USE OF FUNDS
Expenditures
Community Health and Safety: Project Safety Net Director $ 78,673 $ 85,000 $ 6,327
Community Health and Safety: Project Safety Net Coordinator 32,665 — (32,665)
California Avenue Parking Permit FundFY 2016 Adopted
FY 2016 Adjusted1
FY 2017 Adopted
1) The FY 2016 Adjusted column reflects the carryforward funding in the expenditures amount for pertinent contracts from FY 2015.
PECIAL REVENUE FUNDS OVERVIEW • CITY OF PALO ALTO FISCAL YEAR 2017 ADOPTED BUDGET

SPECIAL REVENUE FUNDS OVERVIEW
Community Health and Safety: Project Safety Net Supplies 5,773 — (5,773)
Community Health and Safety: Project Safety Net Contracts 1,084,344 — (1,084,344)
Print & Mail Allocated Charges 226 — (226)
Total Operating Expenditures 1,201,681 85,000 (1,116,681)
Transfers Out
Neighborhood and Communities and Affordable Housing: Capital Improvement Fund $ 1,100,000 $10,350,000 9,250,000
Climate Change: Capital Improvement Fund 1,200,000 1,200,000 —
Intermodal Transit: Capital Improvement Fund — 441,000 441,000
Quarry Road Improvements: Capital Improvement Fund 92,004 359,000 266,996
Total Transfers 2,392,004 12,350,000 9,957,996
Total Expenditures $ 3,593,685 $ 12,435,000 $ 8,841,315
Ending Fund Balance
Unrestricted - Community Health and Safety $ 2,589,295 $ 2,568,275 $ (21,020)
Unrestricted - Stanford Hospital Expansion Cost Mitigation 2,743,756 2,811,553 67,797
Unrestricted - Intermodal Transit 2,134,567 1,746,311 (388,256)
Unrestricted - Quarry Road Improvements 359,007 8,877 (350,129)
Unrestricted - Neighborhoods and Communities and Affordable Housing 13,926,619 3,920,739 (10,005,880)
Unrestricted - Climate Change 5,070,419 3,995,706 (1,074,712)
Total Ending Fund Balance 26,823,662 15,051,462 (11,772,200)
TOTAL USE OF FUNDS $ 30,417,347 $ 27,786,462 $ (2,930,885)
Stanford Development AgreementFY 2016 Estimate
FY 2017 Adopted Change
SPECIAL REVENUE FUNDS OVERVIEW • CITY OF PALO ALTO FISCAL YEAR 2017 ADOPTED BUDGET 137

138
• CITY OF PALO ALTO FISCAL YEAR 2017 ADOPTED BUDGET
DEBT SERVICE FUNDS
CITY OF PALO ALTO FISCAL YEAR 2017 ADOPTED BUDGET 139


DEBT SERVICE FUNDS OVERVIEW
a
Debt Service Funds OverviewCITY OF PALO ALTO DEBT POLICYThe City of Palo Alto recognizes the need for spending a prudent amount every year for ongo-ing capital replacement and rehabilitation needs. An ongoing capital improvement plan is vital to ensuring the future viability of services. To achieve this priority, the City funds its regular and ongoing capital needs primarily on a ‘pay-as-you-go’ basis. There are, however, special or extraordinary capital improvement projects, refinancing of existing debt, and purchase of major and multiple pieces of equipment in which it is appropriate to consider debt financing. The City’s new Debt Policy establishes the guidelines to support the decision-making process for issuing debt.
DEBT POLICY GUIDELINESThe City’s Debt Policy provides guidelines for refinancing existing debt; detailing the responsi-bilities of City staff engaged in issuing debt; delineating the debt instruments or vehicles (e.g. General Obligation Bonds or Certificates of Participation) the City can utilize; and describing sit-uations in which tax-exempt and taxable debt can be used. The depth and breadth of the policy serve to guide current and future staff. Below are highlights of the Debt Policy guidelines for the use of debt and other financing.
A. Debt may be judiciously used when some or all of the following conditions exist:
Estimated future revenue is sufficient to ensure the payment of annual debt service.
Other financing options have been explored and are not viable for the timely or economic acquisition or completion of a capital project.
A capital project is mandated by federal or state authorities with no other viable funding option available.
The capital project or asset lends itself to debt financing rather than pay-as-you-go funding based on the expected useful life of the project.
Debt will not be used to fund ongoing operating expenses of the City except for situations in which cash flow problems arise and the City may need to issue short-term Tax or Revenue Anticipation Notes.
Annual debt service shall not exceed 10 percent of annual operating expenses for the General Fund unless an exception is approved by Council. For all other City funds annual debt service shall not exceed 15 percent of annual operating expenses unless an exception is approved by Council.
B. Minimize borrowing costs by:
Maximizing the use of existing resources for capital projects and equipment needs.
Issuing tax-exempt debt except in instances where IRS regulations require taxable bonds.
Striving to obtain the highest credit ratings possible.
DEBT SERVICE FUNDS OVERVIEW • CITY OF PALO ALTO FISCAL YEAR 2017 ADOPTED BUDGET 141

DEBT SERVICE FUNDS OVERVIEW
142 D
Maintaining a competitive bid process on bond sales except for situations in which negotiated or private placement sales meet City objectives. In negotiated or private placement sales, City staff will work with its Financial Advisor to review proposed interest rates and proposed fees.
Ensuring that the type of debt and debt structure developed ensure advantageous marketing of each issue.
C. Linking debt to appropriate revenue sources and project users:
When possible, tie project financing directly to users of a specific facility or use. Examples include renovation of the Golf Course where user fees can offset debt service or replacing gas mains where gas rates can be increased to cover debt expense.
Using debt in the Enterprise Funds so as to avoid significant spikes in user rates by smoothing out costs over time.
In addition to capital projects, the City can finance essential equipment and vehicles. These assets range from public safety vehicles to utility equipment. The underlying asset must have a minimum useful life of three years. Short-term financings, including loans and capital lease pur-chase agreements, are executed to meet such needs. It has been the City’s practice to fund these purchases with existing resources; however, debt financing flexibility for future needs remains an option.
Also, the Chief Financial Officer or Director of Administrative Services, supported by Treasury Division, will periodically evaluate its existing debt and execute re-financings when economi-cally beneficial. A refinancing may include the issuance of bonds to refund existing bonds or the issuance of bonds in order to refund other obligations. A net present value analysis, both in dol-lar and percentage terms, will be conducted to determine whether a re-financing is optimal. As a ‘rule of thumb,” a minimum 3 percent net present value savings will be used as a basis to begin re-financing efforts. As with new debt, all refinancing must be approved by Council.
LEGAL DEBT LIMITBased upon the assessed valuation of $27.2 billion for the fiscal year ending June 30, 2015, the City is limited to general obligation indebtedness of $0.95 billion. As of June 30, 2015, the amount of debt applicable to the debt limit is $71.8 million, which is well below its legal debt limit. The debt amount is related to the voter approved general obligation bonds to renovate and build out the City’s libraries including the Mitchell Park Library and Community Center.
DEBT OBLIGATIONSSummaries of the City of Palo Alto debt activity for Fiscal Year 2016 are provided in the follow-ing section.
DEBT OBLIGATION DESCRIPTIONS
2002B Downtown Parking Improvement Project Certificates of Participation (COPs)On January 16, 2002, the City issued $3.6 million of COPs to finance the construction of certain improvements to the non-parking area contained in the City’s Bryant/Florence Garage complex. Due to lower construction costs, $0.9 million in par bonds were paid off early in Janu-
EBT SERVICE FUNDS OVERVIEW • CITY OF PALO ALTO FISCAL YEAR 2017 ADOPTED BUDGET

DEBT SERVICE FUNDS OVERVIEW
ary 2005. Principal payments are due annually on March 1 and interest payments semi-annually on March 1 and September 1, and are payable from lease revenues received by the Corporation from the City’s available funds.
2010A and 2013A General Obligation (GO) Bonds:On June 30, 2010, the City issued the first series of $55.3 million and on June 26, 2013 the sec-ond series of $20.6 million of GO bonds to finance costs for constructing a new Mitchell Park Library and Community Center, as well as substantial improvements to the Main Library and the Downtown Library. Principal payments are due annually on August 1 and interest payments semi-annually on February 1 and August 1 from 2 percent to 5 percent, and are payable from property tax revenues.
The pledge of future Net Revenues for the above 2010 and 2013 bonds ends upon repayment of the $50.4 million and $19.9 million principal and $35.7 million and $13.5 million interest as the remaining debt service on the bonds, which is scheduled to occur in Fiscal Year 2041 and Fiscal Year 2044, respectively.
2011 Golf Course Master Lease-Purchase AgreementOn August 2, 2011, the City entered into a master lease-purchase agreement with JP Morgan Chase Bank, N.A. to finance redemption of the 1998 Golf Course COPs. The lease is secured by a first priority security interest in eighteen Fire Department emergency vehicles. Lease pro-ceeds were $3.2 million. Principal payments are due annually on September 1 and interest pay-ments are due semi-annually on September 1 and March 1 at a rate of 2.49 percent, payable from General Fund revenues. As of June 30, 2016, there are $1.3 million in principal and $47,121 in interest outstanding.
1995 Utility Revenue Bonds, Series AThe City issued Utility Revenue Bonds on February 1, 1995 to finance certain extensions and improvements to the City’s Storm Drainage and Surface Water System. The Bonds are special obligations of the City payable solely from and secured by a pledge of and lien upon the reve-nues derived by the City from the funds, services and facilities of all Enterprise Funds except the Refuse Fund and the Fiber Optics Fund. Principal payments are payable annually on June 1, and interest payments semi-annually on June 1 and December 1. A $2.9 million 6.25 percent term bond is due June 1, 2020. In lieu of a reserve fund, the Bonds are secured by a Surety Bond issued by AMBAC Indemnity Corporation.
The pledge of future Net Revenues for the above funds ends upon repayment of the $2.8 million principal and $558,000 interest as the remaining debt service on the bonds, which is scheduled to occur in 2020.
1999 Utility Revenue and Refunding Bonds, Series AThe City issued Utility Revenue Bonds on February 1, 1995 to finance certain extensions and improvements to the City’s Storm Drainage and Surface Water System. The Bonds are special obligations of the City payable solely from and secured by a pledge of and lien upon the reve-nues derived by the City from the funds, services and facilities of all Enterprise Funds except the Refuse Fund and the Fiber Optics Fund. Principal payments are payable annually on June 1, and interest payments semi-annually on June 1 and December 1. A $2.9 million 6.25 percent term
DEBT SERVICE FUNDS OVERVIEW • CITY OF PALO ALTO FISCAL YEAR 2017 ADOPTED BUDGET 143

DEBT SERVICE FUNDS OVERVIEW
144 D
bond is due June 1, 2020. In lieu of a reserve fund, the Bonds are secured by a Surety Bond issued by AMBAC Indemnity Corporation.
The pledge of future Net Revenues for the above funds ends upon repayment of the $2.4 million principal and $379,375 interest as the remaining debt service on the bonds, which is scheduled to occur in 2020.
2007 Electric System Clean Renewable Energy Tax Credit Bonds:On November 1, 2007 the City issued $1.5 million of Electric Utility Clean Renewable Energy Tax Credit Bonds (CREBS), 2007 Series A, to finance the City’s photovoltaic solar panel project. The bonds do not bear interest. In lieu of receiving periodic interest payments, bondholders are allowed federal income tax credit in an amount equal to a credit rate for such CREBS multiplied by the outstanding principal amount of the CREBS owned by the bondholders. The Bonds are payable solely from and secured solely by a pledge of the Net Revenues of the Electric system and other funds pledged therefore under the Indenture.
The pledge of future Electric Fund Net Revenues ends upon repayment of the $0.6 million remaining debt service on the bonds, which is scheduled to occur in 2022.
2009 Water Revenue Bonds, Series AOn October 6, 2009, the City issued Water Revenue Bonds in the amount of $35.5 million to finance certain improvements to the City’s water utility system. Principal payments are due annually on June 1, and interest payments are due semi-annually on June 1 and December 1, from 1.80 percent to 5.95 percent. The final debt service payment will be made in 2035. When these bonds were issued they were designated as “Direct Payment Build America Bonds” under the provisions of the American Recovery and Reinvestment Act of 2009 (“Build America Bonds“). The City expected to receive a cash subsidy payment from the United States Treasury equal to 35 percent of the interest payable on the 2009 bonds, however, due to the United States federal government budget (sequestration) cuts, in calendar year 2013, the receipts are 32 percent of interest payable. The lien on the 1995 Bonds on the Net Revenues is senior to the lien on Net Revenues securing the 2009 Bonds and the 2002 Bonds. The City received subsidy payments amounting to $534,538, which represents 32.8 percent of the two interest payments due on June 1, 2015 and December 1, 2015.
The pledge of future Net Revenues of the above funds ends upon repayment of the $29.8 mil-lion principal and $19.0 million interest as the remaining debt service on the bonds as of June 30, 2016, which is scheduled to occur in June 2035.
2007 State Water Resources LoanIn October 2007, the City approved the $9.0 million loan agreement with State Water Resources Control Board (SWRCB) to finance the City’s Mountain View/Moffett Area reclaimed water pipeline project. Under the terms of the contract, the City agreed to repay $9.0 million to the State in exchange for receiving $7.5 million in proceeds to be used to fund the Project. The dif-ference between the repayment obligation and proceeds amounts to $1.5 million and represents in-substance interest on the outstanding balance. Loan proceeds are drawn down as the project progresses and debt service payments commence on June 30, 2010. Concurrently with the loan, the City entered into various other agreements including a cost sharing arrangement with
EBT SERVICE FUNDS OVERVIEW • CITY OF PALO ALTO FISCAL YEAR 2017 ADOPTED BUDGET

DEBT SERVICE FUNDS OVERVIEW
the City of Mountain View. Pursuant to that agreement, the City of Mountain View agreed to finance a portion of the project with a $5 million loan repayable to the City. This loan has been recorded as “Due from other government agencies” in the financial statements.
The pledge of future Net Revenues of the above funds ends upon repayment of the $4.8 million principal and $1.0 million in-substance interest as the remaining debt service on the bonds as of June 30, 2016, which is scheduled to occur in 2029.
2009 State Water Resources LoanIn October 2009, the City approved an $8.5 million loan agreement with the State Water Resources Control Board (SWRCB) to finance the City’s Ultraviolet Disinfection project. As of June 30, 2011, the full loan in the amount of $8.5 million was drawn down and became outstanding. Interest in the amount of $96,000 was accrued and added to the outstanding bal-ance.
The pledge of future Net Revenues of the above funds ends upon repayment of the $6.8 million principal and $1.5 million interest as the remaining debt service on the bonds as of June 30, 2016, which is scheduled to occur in November 2030.
2011 Utility Revenue Bonds, Series AOn September 22, 2011 the City issued Utility Revenue Bonds to refinance the 2002 Utility reve-nue bonds which were issued for certain improvements to the City’s water and natural gas util-ity system. The refinancing resulted in net present value savings of 16.9 percent and cash savings over 15 years of $4.0 million. Principal payments are due annually on June 1, and interest payments are due semi-annually on June 1 and December 1 from 3 percent to 4 percent. The Revenue Bonds are secured by net revenues generated by the Water Services and Gas Services Funds.
The pledge of future Net Revenues of the above funds ends upon repayment of the $12.3 million principal and $2.1 million interest as the remaining debt service on the bonds as of June 30, 2016, which is scheduled to occur in 2026.
DEBT SERVICE FUNDS OVERVIEW • CITY OF PALO ALTO FISCAL YEAR 2017 ADOPTED BUDGET 145

DEBT SERVICE FUNDS OVERVIEW
146 D
Debt Service FundsFY 2014 Actuals
FY 2015 Actuals
FY 2016AdoptedBudget
FY 2017 AdoptedBudget
FY 2017 Change $
FY 2017 Change %
Revenues
Property Tax 4,711 4,158 4,655 4,655 0 0.00
Subtotal Revenues 4,711 4,158 4,655 4,655 0 0.00
General Fund Operating Transfers
Parking 2002B COPS Taxable 231 238 243 243 0 0.00
Subtotal General Fund Operating Transfers 231 238 243 243 0 0.00
Total Source of Funds 4,942 4,396 4,898 4,898 0 0.00
Expenses
Parking 2002B COPS Taxable Principal 130 145 150 150 0 0.00
Parking 2002B COPS Taxable Interest 101 93 93 93 0 0.00
Library GO Bonds Principal 1,020 1,420 1,445 1,445 0 0.00
Library GO Bonds Interest 2,958 3,262 3,210 3,210 0 0.00
Subtotal Expenses 4,209 4,920 4,898 4,898 0 0.00
Total Expenditures 4,209 4,920 4,898 4,898 0 0.00
Net to (from) Reserves 733 (524) 0 0 0 0.00
EBT SERVICE FUNDS OVERVIEW • CITY OF PALO ALTO FISCAL YEAR 2017 ADOPTED BUDGET


148
• CITY OF PALO ALTO FISCAL YEAR 2017 ADOPTED BUDGET
CITY DEPARTMENTS
CITY OF PALO ALTO FISCAL YEAR 2017 ADOPTED BUDGET 149


CITY ATTORNEY
CITY ATTORNEYMission StatementThe Office of the City Attorney’s mission is to serve Palo Alto and its policymakers by providing legal representation of the highest quality.
PurposeThe purpose of the Office of the City Attorney is to partner with City leaders to find creative approaches to the opportuni-ties and challenges that face Palo Alto; draft contracts, legislation, legal opinions, and other legal documents and negotiate on behalf of the City; provide training and advice on how to manage risk and comply with the law; and enforce the municipal code and defend the City when it is sued.
CITY ATTORNEY • CITY OF PALO ALTO FISCAL YEAR 2017 ADOPTED BUDGET 151

CITY ATTORNEY
152 C
1.00 Principal City Attorney2.00 Senior Assistant City Attorney1.00 Assistant City Attorney2.00 Senior Deputy City Attorney1.00 Legal Fellow
1.00 Senior Management Analyst1.00 Secretary to City Attorney1.00 Senior Legal Secretary1.00 Claims Investigator
FY 201 POSITION TOTALS12.00 - Full-time
This organizational chart represents citywide Full-Time Equivalents (FTEs) for this department. The Department Summary tables summarize FTEs by
position allocation.
CITY ATTORNEYMolly S. Stump
ITY ATTORNEY • CITY OF PALO ALTO FISCAL YEAR 2017 ADOPTED BUDGET

CITY ATTORNEY
DescriptionThe Office of the City Attorney legally represents the City by: providing legal advice and/or training to the City Council, City Manager, boards, commissions, and operating departments; investigating and resolving claims against the City; defending the City in litigation and administrative actions; initiating and prosecuting litigation on behalf of the City; and drafting and approving contracts, legislation, and other legal documents.
Accomplishments Drafted ordinance to preserve retail uses on California Avenue
Drafted ordinance and resolution establishing Phase 2 of the Downtown Residential Preferential Parking district
Drafted multiple Power Purchase Agreements with renewable energy providers to support the City’s carbon-neutral electric portfolio
Settled Monroe Place below-market-rate housing litigation for over $3 million payable to the City’s affordable housing fund
Negotiated lease for solar facilities atop four City-owned parking garages, and negotiated third-party energy efficiency contracts valued at over $6 million
Assisted City and SF Creek JPA to obtain state and federal permits for critical flood control projects
Advised on preparation of Draft Environmental Impact Report for the Comprehensive Plan Update
Drafted ordinance establishing local minimum wage
InitiativesPerform legal services to:
Assist with development of redundant electric transmission connection to enhance electric service reliability
Draft agreements for potential Google Fiber project, including exploration of co-build opportunities
Support sustainability initiatives and proposals
Update City’s public works contracting procedures to enhance streamlining and support efficient project management
Advise regarding completion of the Comprehensive Plan Update
Support completion of electric utility cost of service study and new rate design
CITY ATTORNEY • CITY OF PALO ALTO FISCAL YEAR 2017 ADOPTED BUDGET 153

CITY ATTORNEY
154 C
Provide ethics training for staff and local officials
Update legal documentation regarding affordable housing and art in private developments
Goals and ObjectivesGOAL 1Advance the public interest by providing high-quality legal representation to the City.
Objectives: Enhance relationships with clients as trusted advisors and strategic partners.
Provide practical and effective advice that includes creative solutions to difficult problems.
Propose alternative, legally acceptable ways to accomplish public objectives when the City encounters legal obstacles.
Regularly brief City employees on legal developments that impact their areas of service.
Inform the public about the City’s legal program through the City Attorney’s website.
GOAL 2Evaluate all claims and litigation promptly, resolving disputes where appropriate, and vigorously defending the City’s interests.
Objectives: Thoroughly investigate to promptly and appropriately resolve claims.
Increase transparency by publicly reporting claim filings and resolutions.
Advocate effectively in court and before administrative agencies when legal actions are brought against the City.
GOAL 3Identify and reduce exposure to legal risks.
Objectives: Identify legal risks and craft strategies to reduce the City’s exposure.
Provide relevant training to City officials and staff to reduce legal risk exposure.
Create user-friendly tools to assist new and existing employees in complying with public service requirements, such as ethics, conflicts of interest, open meeting, and public records laws.
ITY ATTORNEY • CITY OF PALO ALTO FISCAL YEAR 2017 ADOPTED BUDGET

CITY ATTORNEY
Key Performance Measures
Workload Measures
CLAIMS RESOLUTIONGoal Evaluate all claims and litigation promptly, resolving disputes where appropriate,
and vigorously defending the City's interests.
Objective Thoroughly investigate to promptly and appropriately resolve claims.
FY 2014 Actuals
FY 2015 Actuals
FY 2016 Adopted
FY 2016 Estimated
FY 2017 Adopted
Percent of claims resolved within 45 days of filing 92.00% 93.00% 92.00% 90.00% 90.00%
Description This measure tracks the number of claims that are resolved within 45 days of filing.
Purpose
Thorough investigation to promptly and appropriately resolve claims is a core responsibility of the Office of the City Attorney. This measure is important because timely processing of claims demonstrates responsiveness to residents' concerns and safeguards public resources by reducing unnecessary lawsuits.
Status The number of claims resolved within 45 days may go up or down in part due to the complexity of a claim.
REDUCTION OF LEGAL RISKGoal Identify and reduce exposure to legal risks.
Objective Provide relevant training to City officials and staff to reduce legal risk exposure.
FY 2014 Actuals
FY 2015 Actuals
FY 2016 Adopted
FY 2016 Estimated
FY 2017 Adopted
Percent of surveyed who agree/strongly agree that the training provided is useful and relevant
100.00% 90.00% 95.00% 90.00% 90.00%
Description
This measure tracks the usefulness and relevance of the training provided by the Office of the City Attorney to City staff. By collecting this data, we can assess the relevance and usefulness of the training provided, and revise our training as needs change.
Purpose Knowledgeable staff is less likely to make errors thereby reducing the exposure of liability to the City.
Status
In the fall of 2014 the Office of the City Attorney conducted Brown Act Training. The training was well received by the attendees. In FY 2016, the Office of the City Attorney will conduct training on the Brown Act, Ethics, Public Records and contracting.
FY 2014 Actuals
FY 2015 Actuals
FY 2016 Adopted
FY 2016 Estimated
FY 2017 Adopted
Number of claims handled 78 99 100 95 95
CITY ATTORNEY • CITY OF PALO ALTO FISCAL YEAR 2017 ADOPTED BUDGET 155
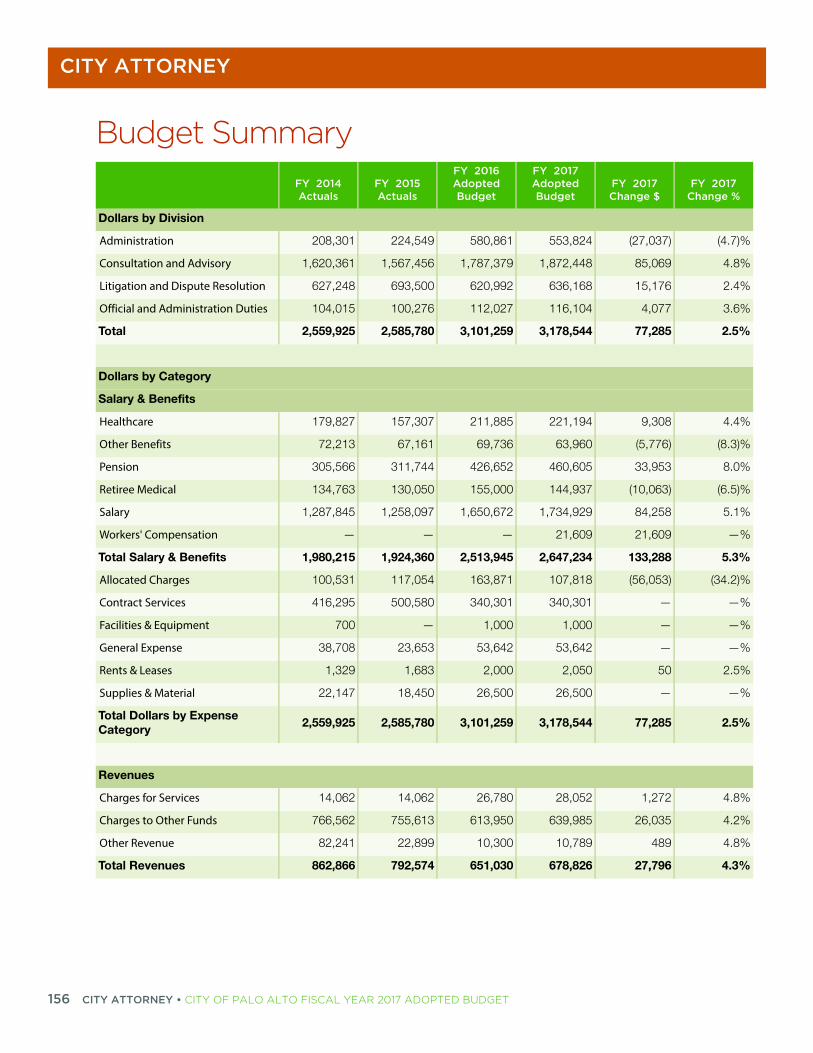
CITY ATTORNEY
156 C
%
7)%
8%
4%
6%
5%
4%
3)%
0%
5)%
1%
%
3%
2)%
%
%
%
5%
%
5%
8%
2%
8%
3%
Budget SummaryFY 2014 Actuals
FY 2015 Actuals
FY 2016 Adopted Budget
FY 2017 Adopted Budget
FY 2017 Change $
FY 2017Change
Dollars by Division
Administration 208,301 224,549 580,861 553,824 (27,037) (4.
Consultation and Advisory 1,620,361 1,567,456 1,787,379 1,872,448 85,069 4.
Litigation and Dispute Resolution 627,248 693,500 620,992 636,168 15,176 2.
Official and Administration Duties 104,015 100,276 112,027 116,104 4,077 3.
Total 2,559,925 2,585,780 3,101,259 3,178,544 77,285 2.
Dollars by Category
Salary & Benefits
Healthcare 179,827 157,307 211,885 221,194 9,308 4.
Other Benefits 72,213 67,161 69,736 63,960 (5,776) (8.
Pension 305,566 311,744 426,652 460,605 33,953 8.
Retiree Medical 134,763 130,050 155,000 144,937 (10,063) (6.
Salary 1,287,845 1,258,097 1,650,672 1,734,929 84,258 5.
Workers' Compensation — — — 21,609 21,609 —
Total Salary & Benefits 1,980,215 1,924,360 2,513,945 2,647,234 133,288 5.
Allocated Charges 100,531 117,054 163,871 107,818 (56,053) (34.
Contract Services 416,295 500,580 340,301 340,301 — —
Facilities & Equipment 700 — 1,000 1,000 — —
General Expense 38,708 23,653 53,642 53,642 — —
Rents & Leases 1,329 1,683 2,000 2,050 50 2.
Supplies & Material 22,147 18,450 26,500 26,500 — —
Total Dollars by Expense Category
2,559,925 2,585,780 3,101,259 3,178,544 77,285 2.
Revenues
Charges for Services 14,062 14,062 26,780 28,052 1,272 4.
Charges to Other Funds 766,562 755,613 613,950 639,985 26,035 4.
Other Revenue 82,241 22,899 10,300 10,789 489 4.
Total Revenues 862,866 792,574 651,030 678,826 27,796 4.
ITY ATTORNEY • CITY OF PALO ALTO FISCAL YEAR 2017 ADOPTED BUDGET

CITY ATTORNEY
%
%
%
%
%
73
13
22
98
—
09
53
10
67
45
93
83
83
%
Positions by Division
Administration 0.47 1.47 1.47 1.47 — —
Consultation and Advisory 6.56 7.31 7.31 7.31 — —
Litigation and Dispute Resolution 1.61 1.86 1.86 1.86 — —
Official and Administration Duties 0.36 0.36 0.36 0.36 — —
Total 9.00 11.00 11.00 11.00 — —
Staffing
Job ClassificationFY 2014 Actuals
FY 2015 Actuals
FY 2016 Adopted Budget
FY 2017 Adopted Budget
FY 2017 Change $
FY 2017Salary
Assistant City Attorney 1.00 1.00 1.00 1.00 — 162,1
City Attorney 1.00 1.00 1.00 1.00 — 258,4
Claims Investigator 1.00 1.00 1.00 1.00 — 93,7
Legal Fellow — 1.00 1.00 1.00 — 94,0
Legal Services Administrator 1.00 1.00 — — —
Principal Attorney — 1.00 1.00 1.00 — 215,0
Secretary to City Attorney 1.00 1.00 1.00 1.00 — 92,9
Senior Assistant City Attorney 2.00 2.00 2.00 2.00 — 376,9
Senior Deputy City Attorney 1.00 1.00 1.00 1.00 — 122,9
Senior Legal Secretary 1.00 1.00 1.00 1.00 — 71,9
Senior Management Analyst — — 1.00 1.00 — 117,9
Sub-total: Full-Time Equivalent Positions
9.00 11.00 11.00 11.00 — 1,606,1
Total Positions 9.00 11.00 11.00 11.00 — 1,606,1
Budget SummaryFY 2014 Actuals
FY 2015 Actuals
FY 2016 Adopted Budget
FY 2017 Adopted Budget
FY 2017 Change $
FY 2017Change
CITY ATTORNEY • CITY OF PALO ALTO FISCAL YEAR 2017 ADOPTED BUDGET 157

CITY ATTORNEY
158 C
Budget ReconciliationPositions Expenditures Revenues
Net General Fund
Prior Year Budget 11.00 3,101,259 651,030 2,450,229
Adjustments to Costs of Ongoing Activities
Salary and Benefits Adjustments — 133,288 — 133,288
Rent Adjustment — 50 — 50
General Fund Cost Allocation Plan Charges Adjustment — — 26,035 (26,035)
General Liability Insurance Allocated Charges Adjustment — (51,240) — (51,240)
Information Technology Allocated Charges Adjustment — (2,790) — (2,790)
Printing & Mailing Allocated Charges Adjustment — (2,023) — (2,023)
Outside Agency Revenue Adjustment — — 489 (489)
Development Agreement Fee Revenue Adjustment — — 1,272 (1,272)
Adjustments to Costs of Ongoing Activities — 77,285 27,796 49,489
Total FY 2017 Base Budget 11.00 3,178,544 678,826 2,499,718
Total FY 2017 Adopted Budget 11.00 3,178,544 678,826 2,499,718
ITY ATTORNEY • CITY OF PALO ALTO FISCAL YEAR 2017 ADOPTED BUDGET

CITY AUDITOR
CITY AUDITORMission StatementThe mission of the Office of the City Auditor is to promote honest, efficient, effective, economical, and fully accountable and transparent City government.
PurposeThe purpose of the Office of the City Audi-tor is to conduct internal audits and exam-inations of any City department, program, service, activity, or fiscal transaction to provide the City Council and City manage-ment with information and evaluations regarding the effectiveness and efficiency with which City resources are employed, the adequacy of the system of internal
controls, and compliance with City policies and procedures, and regulatory requirements. In addition, the City Auditor’s Office ensures that City depart-ments and officers responsible for accounting and financial management activ-ities comply with statutory requirements and accounting standards, and provides other analyses of financial and operating data as directed by the City Council.
CITY AUDITOR • CITY OF PALO ALTO FISCAL YEAR 2017 ADOPTED BUDGET 159

CITY AUDITOR
160 C
3.00 Senior Performance Auditor1.00 Performance Auditor II1.00 Performance Auditor I
FY 201 POSITION TOTALS6.00 - Full-time
This organizational chart represents citywide Full-Time Equivalents (FTEs) for this department. The Department Summary tables summarize FTEs by
position allocation.
CITY AUDITORHarriet Richardson
ITY AUDITOR • CITY OF PALO ALTO FISCAL YEAR 2017 ADOPTED BUDGET

CITY AUDITOR
DescriptionThe Office of the City Auditor conducts performance audits and reviews of City departments, programs, and services. Performance audits provide the City Council, City management, and public with independent and objective information regarding the economy, efficiency, and effectiveness of City programs and activities. The Office of the Auditor (OCA) coordinates the annual citizen survey and issues the annual City of Palo Alto Performance Report summarizing costs, workload, and performance results for City services over the last ten years.
Each fiscal year, the Office presents an annual audit work plan for City Council approval. The Office will continue to report quarterly to the City Council on the status of audit projects.
The Office contracts with an independent certified public accountant for the City’s annual external financial audit. The Office also conducts and coordinates revenue monitoring of sales and use tax.
Accomplishments Received the 2015 Exemplary Knighton Award in the medium audit shop category from the
Association of Local Government Auditors (ALGA) for the Police Department: Palo Alto Animal Services Audit.
Identified and confirmed the City’s receipt of $116,937 in sales and use tax recoveries through the end of Fiscal Year 2015.
Published the Utility Meter Audit: Procurement, Inventory, and Retirement, which provided fifteen recommendations to ensure efficiency and effectiveness of procuring, managing, and retiring utility meters.
Published the Audit of Parking Funds, which presented eight recommendations related to the City’s parking in-lieu and parking permit fees.
Compiled the results of the 2015 National Citizen Survey™ into data visualization software that allows users to view the results of each question or multiple questions based on selected demographics or geographic areas of Palo Alto.
CITY AUDITOR • CITY OF PALO ALTO FISCAL YEAR 2017 ADOPTED BUDGET 161

CITY AUDITOR
162 C
Initiatives Meter Routes Audit: Evaluate the process for establishing routes and assigning them to
meter readers to determine if the process optimizes available resources and uses them efficiently.
Public Benefits Audit: Evaluate whether benefits and funds are properly accounted for; if funds are used in accordance with relevant regulations, policies, and governing documents; and if the funds generated the anticipated benefits.
Procurement Processes Audit: Assess the efficiency and effectiveness of the procurement process. The audit will focus on efficiency, consistency in application of processes, compliance with City regulations and policies, and use of best practices.
Contract Risk and Oversight Audit: Develop a systematic, data-driven process to identify high-risk expenditures and revenues that should occur under formal contracts. Audit selected high-risk contracts to determine if the City has received the goods and/or services it paid for and/or the revenues to which it is entitled and that the contracts are needed and do not result in unnecessary overlaps in services.
Citywide Analytic Development and Continuous Monitoring: Develop and implement a continuous monitoring system to increase audit efficiency and coverage through the use of read-only access to City data. The project will involve developing data analytics to identify high-risk areas and improvement opportunities in the City’s core processes, such as procure-to-pay and time and expense.
Utilities Asset Management Audit: Evaluate the effectiveness of the Utilities Department’s asset management practices, including whether the department effectively implements best practices in infrastructure asset management and whether its practices allow efficient identification of the location and condition of its physical assets.
Mobile Device Utilization and Security Audit: Identify the existence and effectiveness of security controls over selected mobile devices used to access City data, and to assess the adequacy of the City’s mobile computing security policies and procedures, governance, and the City’s risk assessment of these devices.
Impact Fees Audit: Evaluate the processes for determining the amount of each type of fee and who should be assessed the fee. Evaluate the processes for assessing and collecting established impact fees to determine if they are collected as required, are assessed fairly among those required to pay, and if they achieve the intended benefits.
Sales and Use Tax Monitoring: The OCA monitors sales and use tax payments due to the City both through its own analysis and through partnering with a third party specialist. Claims are submitted to the State Board of Equalization to redirect misallocated tax proceeds to the City.
Performance Report (formerly the Service Efforts and Accomplishments Report) and Citizen-Centric Reporting (CCR): these reports are designed to provide the residents of Palo Alto, the City Council, and City staff with important data and information regarding the performance of the City. Additionally, the OCA publishes the annual National Citizen Survey
ITY AUDITOR • CITY OF PALO ALTO FISCAL YEAR 2017 ADOPTED BUDGET

CITY AUDITOR
which provides insight into residents’ perceptions of the City’s performance and allows the City to compare itself to other jurisdictions.
Administration of the Fraud, Waste, and Abuse Hotline: Incident routing and monitoring is administered by the OCA and the City Auditor is a member of the Hotline Review Committee with the City Manager and the City Attorney. Additionally, certain incidents may require investigation by OCA staff.
Goals and ObjectivesGOAL 1Add value and improve the City’s operations by providing independent, objective analysis and information regarding the stewardship, performance, and/or cost of City policies, programs, or operations to assist the City Council and management in making informed decisions.
Objectives: Focus on the City’s highest risks by maintaining an effective, systematic, and documented
process that identifies the most significant strategic, operational, financial, and regulatory risks to the achievement of the City’s objectives.
Provide impactful audit services through timely and value-added communication to key stakeholders regarding the effectiveness and efficiency with which City resources are employed, the adequacy of internal controls, and compliance with provisions of laws, regulations, contracts, grant agreements, and City policies and procedures.
Maintain an effective follow-up process to monitor and evaluate the adequacy, effectiveness, and timeliness of actions taken by management to address audit recommendations and report to the City Council whether city management has implemented the recommendation or has assumed the risk of not taking action.
GOAL 2Provide the residents of Palo Alto, City Council, City staff, and other stakeholders with informa-tion on past performance to strengthen public accountability, improve government efficiency and effectiveness, and support future decision-making.
Objectives: Administer the National Citizen Survey to collect data from survey respondents regarding
the quality of City services.
Publish the City of Palo Alto Performance Report to provide consistent, reliable information on the performance of City services.
Contract with the City’s external auditor for the completion of the City’s Comprehensive Annual Financial Report (CAFR) and the Single Audit Report.
CITY AUDITOR • CITY OF PALO ALTO FISCAL YEAR 2017 ADOPTED BUDGET 163

CITY AUDITOR
164 C
GOAL 3Maintain efficient and effective audit processes.
Objectives: Maintain an efficient and effective system of quality control by regularly performing internal
and external assessments, and periodically updating the Office of the City Auditor’s policies and procedures to ensure compliance with professional standards and incorporation of applicable leading industry practices.
Maintain an adequately skilled, knowledgeable, and competent staff of audit professionals.
Communicate the engagement’s objectives, scope, conclusions, and recommendations accurately, objectively, clearly, concisely, constructively, completely, and in a timely manner.
Key Performance MeasuresNUMBER OF MAJOR WORK PRODUCTS PER AUDIT STAFF
GoalFocus on the City's highest risks by maintaining an effective, systematic, and documented process that identifies the most significant strategic, operational, financial, and regulatory risks to the achievement of the City's objectives.
Objective
Provide impactful audit services through timely and value-added communication to key stakeholders regarding the effectiveness and efficiency with which City resources are employed, the adequacy of internal controls, and compliance with provisions of laws, regulations, contracts, grant agreements, and City policies and procedures.
FY 2014 Actuals
FY 2015 Actuals
FY 2016 Adopted
FY 2016 Estimated
FY 2017 Adopted
Number of major work products per audit staff. 1.14 1.14 1.50 1.20 1.50
Description This measure targets the number of major work products generated by each audit staff.
Purpose In order to provide timely impactful audit services, the Office of the City Auditor has a target to complete 1.5 major work products per audit staff.
Status This is a relatively new measure and has not been tracked previously.
ITY AUDITOR • CITY OF PALO ALTO FISCAL YEAR 2017 ADOPTED BUDGET

CITY AUDITOR
PERCENT OF AUDIT RECOMMENDATIONS IMPLEMENTED OVER THE LAST FIVE YEARS.
Goal
Add value and improve the City's operations by providing independent, objective analysis and information regarding the stewardship, performance, and/or cost of City policies, programs, or operations to assist the City Council and management in making informed decisions.
Objective
Maintain an effective follow-up process to monitor and evaluate the adequacy, effectiveness, and timeliness of actions taken by management to address the audit recommendations and report to the City Council whether City management has implemented the recommendation or has assumed the risk of not taking action.
FY 2014 Actuals
FY 2015 Actuals
FY 2016 Adopted
FY 2016 Estimated
FY 2017 Adopted
Percent of audit recommendations implemented over the last five years.
44.00% 42.00% 75.00% 51.00% 75.00%
DescriptionThis measures the effectiveness of audit recommendations. Recommendations are effective when they are addressed to parties that have authority to act and when the recommended actions are specific, cost-effective, and measurable.
Purpose Each audit recommendation is provided to specifically enhance and improve the effectiveness and efficiency of the respective entity being audited.
Status
Departments are responsible to follow up on audit recommendations every six months from the date of issuance to the Policy and Services Committee with the goal of encouraging management to implement all audit recommendations in a timely manner. The City Auditor's Office must sign off on all audit recommendations before they are considered complete.
RATIO OF SALES TAX REVENUE RECOVERIES TO COST
Goal
Add value and improve the City's operations by providing independent, objective analysis and information regarding the stewardship, performance, and/or cost of City policies, programs, or operations to assist the City Council and management in making informed decisions.
ObjectiveFocus on the City's highest risks by maintaining an effective, systematic, and documented process that identifies the most significant strategic, operational, financial, and regulatory risks to the achievement of the City's objectives.
FY 2014 Actuals
FY 2015 Actuals
FY 2016 Adopted
FY 2016 Estimated
FY 2017 Adopted
Ratio of sales tax revenue recoveries to cost. 4:1 4:1 2:1 1:1 2:1
Description This measure is a ratio of sales tax revenue recovered by our in-house staff and our consultant to the total cost (salary and benefits plus contracted cost).
Purpose To determine the effectiveness of cost recovery efforts for sales and use tax revenues.
Status The Office of the City Auditor updates the amount of revenue generated on a quarterly basis. This is a relatively new measure.
CITY AUDITOR • CITY OF PALO ALTO FISCAL YEAR 2017 ADOPTED BUDGET 165

CITY AUDITOR
166 C
%
9%
9%
9%
7)%
1%
5)%
5%
%
0%
6)%
2%
1)%
4)%
9%
4)%
%
)%
Workload MeasuresFY 2014 Actuals
FY 2015 Actuals
FY 2016 Adopted
FY 2016 Estimated
FY 2017 Adopted
Number of major work products issued. 4 4 6 6 7
Budget SummaryFY 2014 Actuals
FY 2015 Actuals
FY 2016 Adopted Budget
FY 2017 Adopted Budget
FY 2017 Change $
FY 2017Change
Dollars by Division
Audit Services 1,016,315 1,099,838 1,174,927 1,221,149 46,222 3.
Total 1,016,315 1,099,838 1,174,927 1,221,149 46,222 3.
Dollars by Category
Salary & Benefits
Healthcare 46,759 33,295 37,725 47,864 10,139 26.
Other Benefits 24,991 30,419 27,881 24,331 (3,550) (12.
Pension 111,839 141,379 160,092 169,812 9,720 6.
Retiree Medical 4,277 31,684 37,000 34,598 (2,402) (6.
Salary 474,117 562,385 619,378 641,056 21,679 3.
Workers' Compensation — — — 8,800 8,800 —
Total Salary & Benefits 661,982 799,161 882,075 926,461 44,385 5.
Allocated Charges 51,226 54,966 56,852 45,689 (11,163) (19.
Contract Services 258,833 221,644 218,219 231,719 13,500 6.
General Expense 39,993 19,014 14,060 13,760 (300) (2.
Supplies & Material 4,281 5,051 3,721 3,521 (200) (5.
Total Dollars by Expense Category
1,016,315 1,099,838 1,174,927 1,221,149 46,222 3.
Revenues
Charges to Other Funds 529,524 690,666 832,990 795,992 (36,998) (4.
Sales Taxes 201,456 59,302 150,000 150,000 — —
Total Revenues 730,980 749,968 982,990 945,992 (36,998) (3.8
ITY AUDITOR • CITY OF PALO ALTO FISCAL YEAR 2017 ADOPTED BUDGET

CITY AUDITOR
%
%
—
67
—
42
47
89
45
45
%
Positions by Division
Audit Services 4.50 4.50 5.00 5.00 — —
Total 4.50 4.50 5.00 5.00 — —
Staffing
Job ClassificationFY 2014 Actuals
FY 2015 Actuals
FY 2016 Adopted Budget
FY 2017 Adopted Budget
FY 2017 Change $
FY 2017Salary
Administrative Assistant 1.00 1.00 — — —
City Auditor 1.00 1.00 1.00 1.00 — 173,3
Performance Auditor 0.50 0.50 — — —
Performance Auditor I — — 1.00 1.00 — 77,5
Performance Auditor II — — 1.00 1.00 — 105,2
Senior Performance Auditor 2.00 2.00 2.00 2.00 — 237,3
Sub-total: Full-Time Equivalent Positions
4.50 4.50 5.00 5.00 — 593,5
Total Positions 4.50 4.50 5.00 5.00 — 593,5
Budget SummaryFY 2014 Actuals
FY 2015 Actuals
FY 2016 Adopted Budget
FY 2017 Adopted Budget
FY 2017 Change $
FY 2017Change
CITY AUDITOR • CITY OF PALO ALTO FISCAL YEAR 2017 ADOPTED BUDGET 167

CITY AUDITOR
168 C
Budget ReconciliationPositions Expenditures Revenues
Net General Fund
Prior Year Budget 5.00 1,174,927 982,990 191,937
Adjustments to Costs of Ongoing Activities
Salaries and Benefits Adjustments — 44,385 — 44,385
Nation Citizen Survey Cost Adjustment — 13,500 — 13,500
General Expense Adjustment — (300) — (300)
Supplies & Materials Adjustment — (200) — (200)
General Fund Cost Allocation Plan Charges Adjustment — — (36,998) 36,998
General Liability Allocated Charges Adjustment — (4,480) — (4,480)
Information Technology Allocated Charges Adjustment — (3,964) — (3,964)
Printing and Mailing Allocated Charges Adjustment — (2,719) — (2,719)
Adjustments to Costs of Ongoing Activities — 46,222 (36,998) 83,220
Total FY 2017 Base Budget 5.00 1,221,149 945,992 275,157
Total FY 2017 Adopted Budget 5.00 1,221,149 945,992 275,157
ITY AUDITOR • CITY OF PALO ALTO FISCAL YEAR 2017 ADOPTED BUDGET

CITY CLERK
CITY CLERKMission StatementThe City Clerk’s Office is dedicated to providing excellent service to the public, City Staff, and the City Council through personal assistance and the use of information technologies. The Office seeks to provide timely and accessible service in response to all inquiries and requests for public information and records, with the goal to provide resources to enable the public to research information independently. Administration of elections, public records request processing, records management, and
the legislative process are also handled by the Office.
PurposeThe purpose of the City Clerk’s Office is to provide high quality public service by connecting the public with the legislative process; ensure the City’s legisla-tive processes are open and transparent; facilitate the preservation of Palo Alto’s legislative history, including approved minutes; assist with public records requests, claims, applications for appointment to boards and commissions, and elections administration; update and maintain City Ordinances and Municipal Code, provide access to legislative meeting information, and coordinate State-ments of Economic Interest as well as campaign and other financial disclosure related filings; and ensure the City Clerk and City Council webpages are current and accurate.
CITY CLERK • CITY OF PALO ALTO FISCAL YEAR 2017 ADOPTED BUDGET 169

CITY CLERK
170 C
FY 201 POSITION TOTALS5.75 - Full-time0.48 - Hourly
This organizational chart represents citywide Full-Time Equivalents (FTEs) for this department. The Department Summary tables summarize FTEs by
position allocation.
1.00 Assistant City Clerk
2.00 Administrative Associate III
1.00 Deputy City Clerk
0.75 Parking Examiner
CITY CLERKBeth Minor
ITY CLERK • CITY OF PALO ALTO FISCAL YEAR 2017 ADOPTED BUDGET

CITY CLERK
DescriptionThe City Clerk’s Office provides a wide range of public services, including: providing support to the City Council, City staff, and public by providing copies of agendas and associated reports and documents, which includes posting and publishing legal notices, and scheduling public hearings; transcribing meeting minutes, recording of ordinances and resolutions; engaging in records management, elections, and board and commission recruitments; and processing of public records requests.
Accomplishments Successful transition to new City Clerk.
Updated Citywide Records Retention Schedule with the assistance of every Department.
Successfully managed the Mayor’s State of the City address at Mitchell Park Community Center.
Moved to using DocuSign to process Ordinances and Resolutions for signature.
Reduced the number of Council packets distributed weekly.
Prepared and published 62 City Council meeting agendas and packets, and 30 Finance and Policy and Services Committees agendas and packets.
Supported 384 plus hours of Council and Council Standing Committee meetings.
Updated the Council’s Agenda Webpage to a table format, making it easier for the public to view the agenda, minutes and videos of Council meetings.
Worked with Planning Staff to transition their agenda process for PTC, ARB and HRB to be more automated.
Reviewed all hard copy records contained within the office for either destruction or offsite storage to accommodate the move of the Hearing Officer staff member from Cubberley Community Center to the Clerk’s Office on the 7th floor.
Successful integration of NetFile for reporting of Fair Political Practices campaign forms and Statement of Economic Interest Forms.
Initiatives Run a successful Council election in November.
Assist with upgrade to the Council Chambers audio/video system.
Streamline the Citywide records destruction process.
CITY CLERK • CITY OF PALO ALTO FISCAL YEAR 2017 ADOPTED BUDGET 171

CITY CLERK
172 C
Update and complete the Continuity of Operation Plan for the department.
Work with Board and Commission Staff Liaisons to transition their webpages to a table format for their agendas, minutes, and meeting videos providing uniformity across the City webpages.
Continue research of Board and Commission recruitment process and application automation.
Goals and ObjectivesGOAL 1Lead the agenda management process and records management program promoting transpar-ency, accountability, and effective service delivery.
Objectives: Ensure that preparation and distribution of the Council’s agenda packets are timely,
accurate, and responsive.
Transcribe and post Council action minutes within one week of meeting date.
Effectively manage the annual records destruction process and update to the Records Retention Schedule for all City departments.
GOAL 2Respond to the legislative needs of the City Council, staff, and the community in a timely and effective manner.
Objectives: Utilize technology to enhance access of legislative items, such as agendas, reports,
ordinances, resolutions, and minutes on the City Council and City Clerk webpages.
Encourage online filing of campaign statements in compliance with the Fair Political Practices Commission (FPPC) requirements.
Encourage staff and Council Candidates to use online filing of Statement of Economic Interest Statements and Campaign Forms.
GOAL 3Effectively administer appointments to boards and commissions.
Objectives: Improve new boards and commissions recruitment process, including expanding application
accessibility, advertising strategies, and interview processes.
Create and maintain community partnerships to enhance the public’s knowledge of, and interest in, serving on boards and commissions.
ITY CLERK • CITY OF PALO ALTO FISCAL YEAR 2017 ADOPTED BUDGET
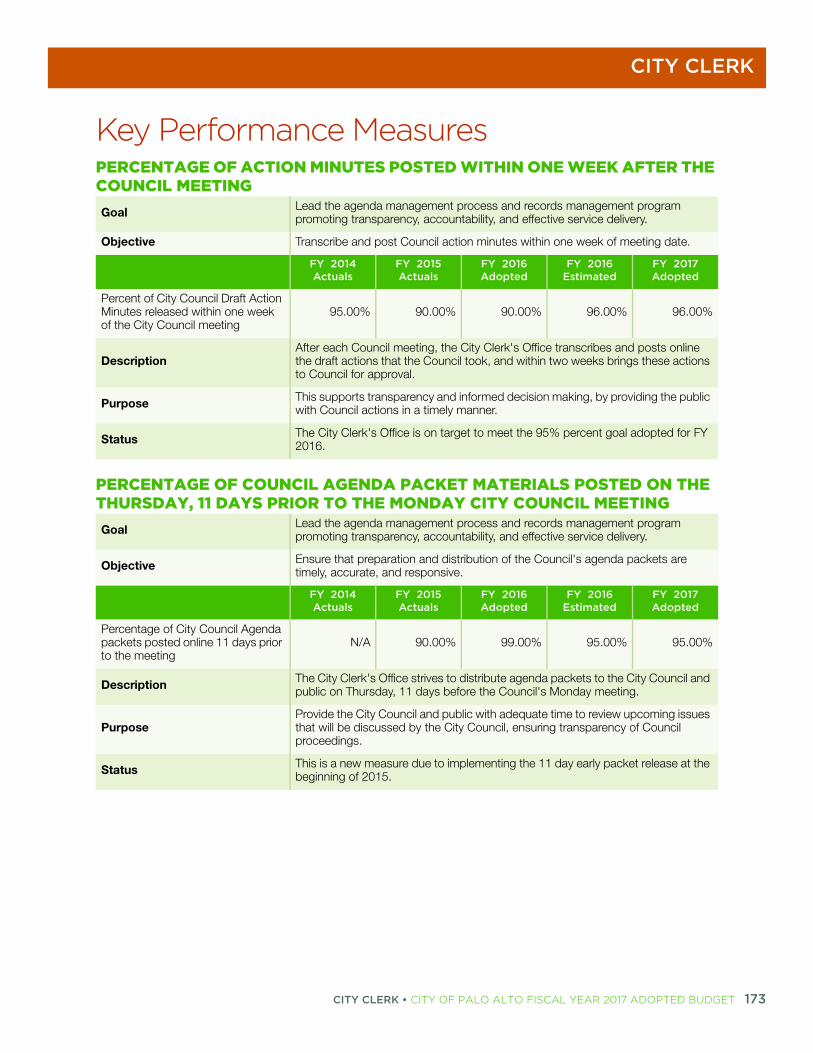
CITY CLERK
Key Performance MeasuresPERCENTAGE OF ACTION MINUTES POSTED WITHIN ONE WEEK AFTER THE COUNCIL MEETINGGoal Lead the agenda management process and records management program
promoting transparency, accountability, and effective service delivery.
Objective Transcribe and post Council action minutes within one week of meeting date.
FY 2014 Actuals
FY 2015 Actuals
FY 2016 Adopted
FY 2016 Estimated
FY 2017 Adopted
Percent of City Council Draft Action Minutes released within one week of the City Council meeting
95.00% 90.00% 90.00% 96.00% 96.00%
DescriptionAfter each Council meeting, the City Clerk's Office transcribes and posts online the draft actions that the Council took, and within two weeks brings these actions to Council for approval.
Purpose This supports transparency and informed decision making, by providing the public with Council actions in a timely manner.
Status The City Clerk's Office is on target to meet the 95% percent goal adopted for FY 2016.
PERCENTAGE OF COUNCIL AGENDA PACKET MATERIALS POSTED ON THE THURSDAY, 11 DAYS PRIOR TO THE MONDAY CITY COUNCIL MEETINGGoal Lead the agenda management process and records management program
promoting transparency, accountability, and effective service delivery.
Objective Ensure that preparation and distribution of the Council's agenda packets are timely, accurate, and responsive.
FY 2014 Actuals
FY 2015 Actuals
FY 2016 Adopted
FY 2016 Estimated
FY 2017 Adopted
Percentage of City Council Agenda packets posted online 11 days prior to the meeting
N/A 90.00% 99.00% 95.00% 95.00%
Description The City Clerk's Office strives to distribute agenda packets to the City Council and public on Thursday, 11 days before the Council's Monday meeting.
PurposeProvide the City Council and public with adequate time to review upcoming issues that will be discussed by the City Council, ensuring transparency of Council proceedings.
Status This is a new measure due to implementing the 11 day early packet release at the beginning of 2015.
CITY CLERK • CITY OF PALO ALTO FISCAL YEAR 2017 ADOPTED BUDGET 173

CITY CLERK
174 C
Workload Measures
PERCENTAGE OF PUBLIC RECORDS REQUESTS RESPONDED TO WITHIN THE TEN DAYS REQUIRED BY LAWGoal Respond to the legislative needs of the City Council, staff, and the community in a
timely and effective manner.
Objective Provide excellent customer service to the public.
FY 2014 Actuals
FY 2015 Actuals
FY 2016 Adopted
FY 2016 Estimated
FY 2017 Adopted
Percentage of Public Records Requests (PRR) responded to within the required 10 days
90.00% 81.00% 98.00% 96.00% 98.00%
DescriptionPublic Records requests are required to be addressed within ten days of receipt. This could be the actual response or a request for an extension of time to gather the requested data.
PurposeProvide the public with information that is held by the City and is subject to public disclosure; ensure that a response is received by the requestor within the allotted ten days.
Status The City is on target to reach the FY 2016 goal of 96 percent timely response to public records requests within 10 days.
FY 2014 Actuals
FY 2015 Actuals
FY 2016 Adopted
FY 2016 Estimated
FY 2017 Adopted
Number of City Council Meeting Action minutes posted annually 23 43 45 52 50
Number of weekly agenda packets produced annually 41 42 46 42 45
Number of public records requests received annually 160 313 300 228 275
Number of applications processed for open board and commission seats
26 51 50 40 50
ITY CLERK • CITY OF PALO ALTO FISCAL YEAR 2017 ADOPTED BUDGET

CITY CLERK
%
1)%
1%
3%
7%
1)%
4%
2%
9)%
1)%
%
3%
5)%
2%
%
2%
8%
%
5%
%
2%
8%
2)%
8%
)%
Budget SummaryFY 2014 Actuals
FY 2015 Actuals
FY 2016 Adopted Budget
FY 2017 Adopted Budget
FY 2017 Change $
FY 2017Change
Dollars by Division
Administration 146,738 135,067 135,095 125,569 (9,526) (7.
Administrative Citations 170,615 135,750 191,469 193,554 2,085 1.
Council Support Services 542,538 556,772 717,384 762,758 45,374 6.
Election/Conflict of Interest 108,073 91,844 116,764 118,779 2,015 1.
Legislative Records Management 66,747 82,723 83,905 82,169 (1,737) (2.
Public Information 77,932 76,555 83,090 87,599 4,510 5.
Total 1,112,644 1,078,713 1,327,707 1,370,429 42,722 3.
Dollars by Category
Salary & Benefits
Healthcare 71,926 57,814 102,623 85,251 (17,372) (16.
Other Benefits 34,930 19,297 25,291 22,495 (2,796) (11.
Overtime 6,557 6,748 6,696 6,696 — —
Pension 122,487 103,414 136,692 149,361 12,669 9.
Retiree Medical 73,489 79,667 86,000 80,416 (5,584) (6.
Salary 541,667 470,239 550,767 584,996 34,229 6.
Workers' Compensation — — — 8,081 8,081 —
Total Salary & Benefits 851,055 737,179 908,070 937,296 29,226 3.
Allocated Charges 132,491 161,423 134,941 148,187 13,245 9.
Contract Services 56,150 119,921 222,320 222,320 — —
General Expense 54,621 46,781 47,341 47,591 250 0.
Supplies & Material 18,327 13,410 15,035 15,035 — —
Total Dollars by Expense Category
1,112,644 1,078,713 1,327,707 1,370,429 42,722 3.
Revenues
Charges for Services 35 288 1,950 2,043 93 4.
Charges to Other Funds 477,579 399,786 534,477 511,957 (22,520) (4.
Other Revenue 965 313 3,000 3,143 143 4.
Total Revenues 478,579 400,387 539,427 517,142 (22,285) (4.1
CITY CLERK • CITY OF PALO ALTO FISCAL YEAR 2017 ADOPTED BUDGET 175
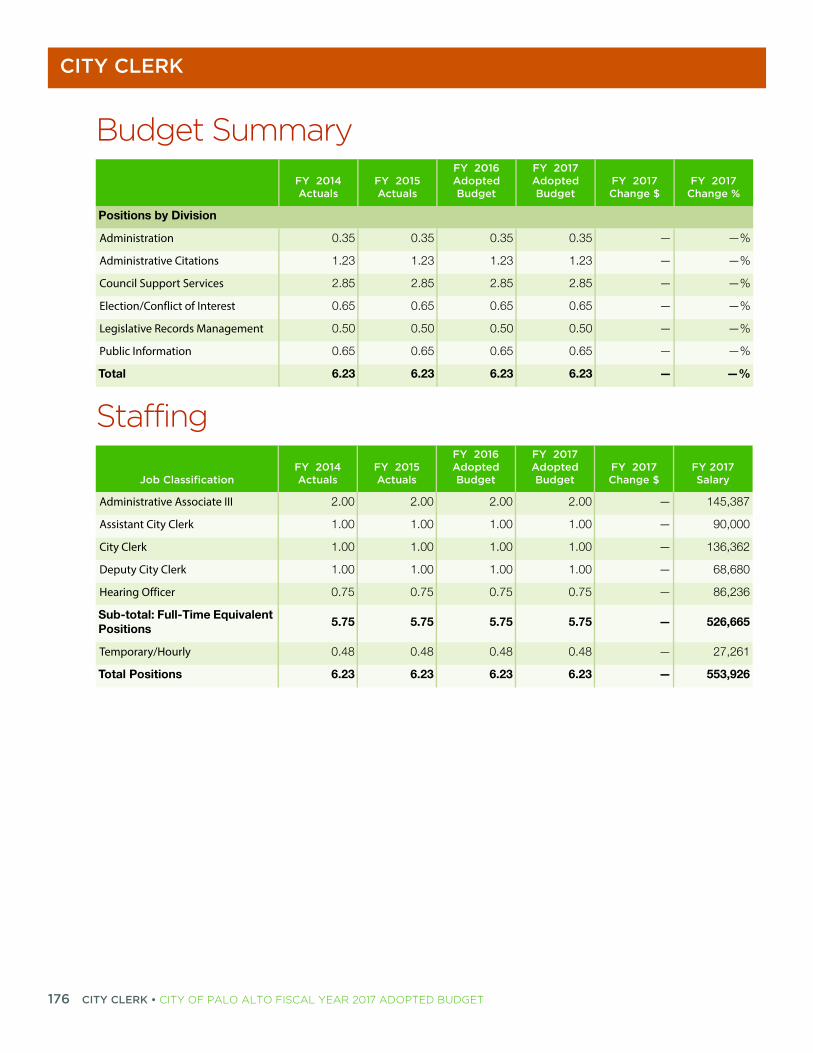
CITY CLERK
176 C
%
%
%
%
%
%
%
87
00
62
80
36
65
61
26
%
Positions by Division
Administration 0.35 0.35 0.35 0.35 — —
Administrative Citations 1.23 1.23 1.23 1.23 — —
Council Support Services 2.85 2.85 2.85 2.85 — —
Election/Conflict of Interest 0.65 0.65 0.65 0.65 — —
Legislative Records Management 0.50 0.50 0.50 0.50 — —
Public Information 0.65 0.65 0.65 0.65 — —
Total 6.23 6.23 6.23 6.23 — —
Staffing
Job ClassificationFY 2014 Actuals
FY 2015 Actuals
FY 2016 Adopted Budget
FY 2017 Adopted Budget
FY 2017 Change $
FY 2017Salary
Administrative Associate III 2.00 2.00 2.00 2.00 — 145,3
Assistant City Clerk 1.00 1.00 1.00 1.00 — 90,0
City Clerk 1.00 1.00 1.00 1.00 — 136,3
Deputy City Clerk 1.00 1.00 1.00 1.00 — 68,6
Hearing Officer 0.75 0.75 0.75 0.75 — 86,2
Sub-total: Full-Time Equivalent Positions
5.75 5.75 5.75 5.75 — 526,6
Temporary/Hourly 0.48 0.48 0.48 0.48 — 27,2
Total Positions 6.23 6.23 6.23 6.23 — 553,9
Budget SummaryFY 2014 Actuals
FY 2015 Actuals
FY 2016 Adopted Budget
FY 2017 Adopted Budget
FY 2017 Change $
FY 2017Change
ITY CLERK • CITY OF PALO ALTO FISCAL YEAR 2017 ADOPTED BUDGET

CITY CLERK
Budget ReconciliationPositions Expenditures Revenues
Net General Fund
Prior Year Budget 6.23 1,327,707 539,427 788,280
Base Adjustments
Adjustments to Costs of Ongoing Activities
Salaries and Benefits Adjustments — 29,227 — 29,227
General Expense Adjustment (Management Development Funds) — 250 — 250
General Fund Cost Allocation Plan Charges Adjustment — — (22,521) 22,521
General Liability Insurance Allocated Charges Adjustment — (7,560) — (7,560)
Information Technology Allocated Charges Adjustment — (7,041) — (7,041)
Printing and Mailing Allocated Charges Adjustment — 27,846 — 27,846
Miscellaneous Revenue Adjustments — — 143 (143)
Fee Revenue Adjustments (Photocopy, Special Service, Parking Exam Hearing) — — 93 (93)
Adjustments to Costs of Ongoing Activities — 42,722 (22,285) 65,007
Total FY 2017 Base Budget 6.23 1,370,429 517,142 853,287
Total FY 2017 Adopted Budget 6.23 1,370,429 517,142 853,287
CITY CLERK • CITY OF PALO ALTO FISCAL YEAR 2017 ADOPTED BUDGET 177

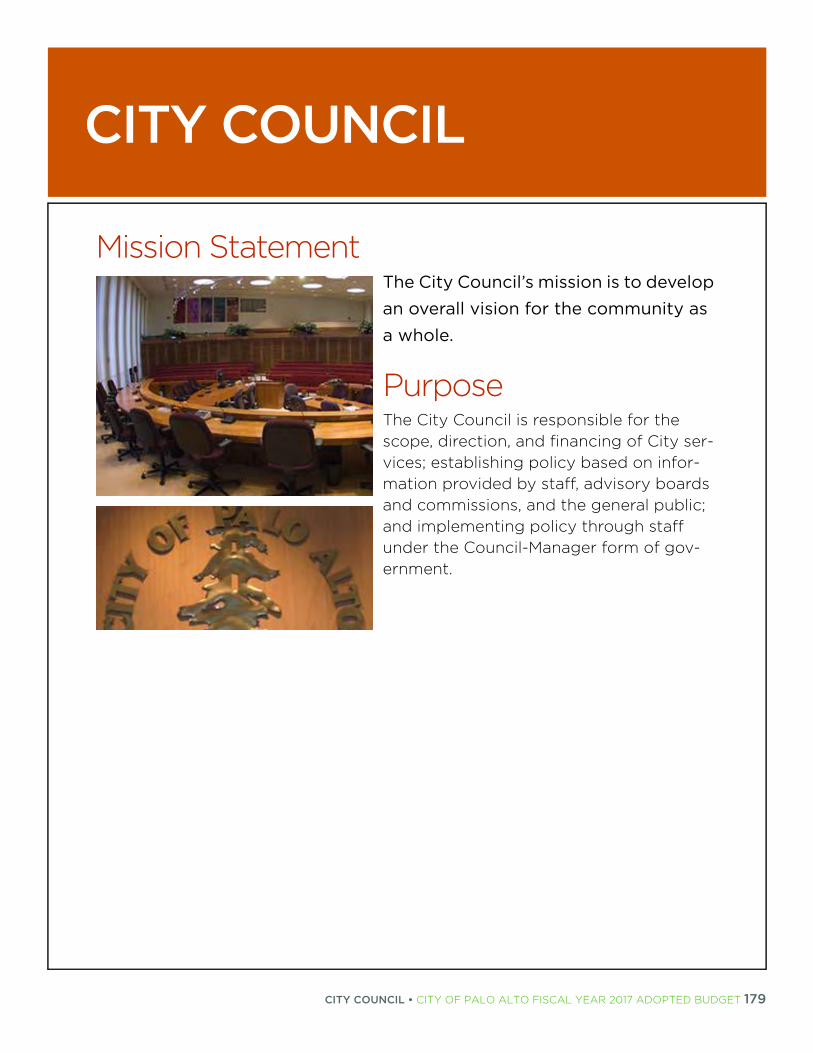
CITY COUNCIL
CITY COUNCILMission StatementThe City Council’s mission is to develop an overall vision for the community as a whole.
PurposeThe City Council is responsible for the scope, direction, and financing of City ser-vices; establishing policy based on infor-mation provided by staff, advisory boards and commissions, and the general public; and implementing policy through staff under the Council-Manager form of gov-ernment.
CITY COUNCIL • CITY OF PALO ALTO FISCAL YEAR 2017 ADOPTED BUDGET 179

CITY COUNCIL
180 C
%
3%
3%
4%
5)%
9%
5)%
3%
%
8%
0%
%
%
%
3%
DescriptionUnder the Council-Manager form of government, the City Council is responsible for the legislative functions of the City such as establishing policies and priorities, developing an overall vision, and approving the annual spending plan for the City. The terms of the Mayor and the Vice-Mayor are one year, expiring at the first meeting in January. The terms of Council members are four years, and the General Municipal Election is held in even-numbered years on the first Tuesday after the first Monday in November.
Budget SummaryFY 2014 Actuals
FY 2015 Actuals
FY 2016 Adopted Budget
FY 2017 Adopted Budget
FY 2017 Change $
FY 2017Change
Dollars by Division
City Council Operations 493,578 360,551 454,687 501,444 46,757 10.
Total 493,578 360,551 454,687 501,444 46,757 10.
Dollars by Category
Salary & Benefits
Healthcare 106,140 95,567 101,795 116,473 14,678 14.
Other Benefits 11,330 10,172 10,711 4,762 (5,948) (55.
Pension 16,709 13,700 17,394 25,026 7,633 43.
Retiree Medical 127,147 77,652 89,000 83,222 (5,778) (6.
Salary 65,939 67,310 64,800 86,400 21,600 33.
Workers' Compensation — — — 1,227 1,227 —
Total Salary & Benefits 327,265 264,401 283,700 317,110 33,410 11.
Allocated Charges 711 1,219 2,602 15,949 13,347 513.
Contract Services 108,764 44,712 108,000 108,000 — —
General Expense 54,043 47,199 57,455 57,455 — —
Supplies & Material 2,795 3,021 2,930 2,930 — —
Total Dollars by Expense Category
493,578 360,551 454,687 501,444 46,757 10.
ITY COUNCIL • CITY OF PALO ALTO FISCAL YEAR 2017 ADOPTED BUDGET

CITY COUNCIL
5)%
)%
%
%
00
00
00
%
Revenues
Charges to Other Funds 111,799 91,042 103,509 77,099 (26,410) (25.
Total Revenues 111,799 91,042 103,509 77,099 (26,410) (25.5
Positions by Division
City Council Operations 9.00 9.00 9.00 9.00 — —
Total 9.00 9.00 9.00 9.00 — —
Staffing
Job ClassificationFY 2014 Actuals
FY 2015 Actuals
FY 2016 Adopted Budget
FY 2017 Adopted Budget
FY 2017 Change $
FY 2017Salary
City Council 9.00 9.00 9.00 9.00 — 86,4
Sub-total: Full-Time Equivalent Positions
9.00 9.00 9.00 9.00 — 86,4
Total Positions 9.00 9.00 9.00 9.00 — 86,4
Budget SummaryFY 2014 Actuals
FY 2015 Actuals
FY 2016 Adopted Budget
FY 2017 Adopted Budget
FY 2017 Change $
FY 2017Change
CITY COUNCIL • CITY OF PALO ALTO FISCAL YEAR 2017 ADOPTED BUDGET 181

CITY COUNCIL
182 C
Budget ReconciliationPositions Expenditures Revenues
Net General Fund
Prior Year Budget 9.00 454,687 103,509 351,178
Base Adjustments
Adjustments to Costs of Ongoing Activities
Salaries and Benefits Adjustments — 33,410 — 33,410
General Fund Cost Allocation Plan Charges Adjustment — — (26,410) 26,410
General Liability Insurance Allocated Charges Adjustment — (2,285) — (2,285)
Information Technology Allocated Charges Adjustment — 15,949 — 15,949
Print & Mail Allocated Charges Adjustment — (317) — (317)
Adjustments to Costs of Ongoing Activities — 46,757 (26,410) 73,167
Total FY 2017 Base Budget 9.00 501,444 77,099 424,345
Total FY 2017 Adopted Budget 9.00 501,444 77,099 424,345
ITY COUNCIL • CITY OF PALO ALTO FISCAL YEAR 2017 ADOPTED BUDGET

CITY MANAGER
CITY MANAGERMission StatementThe City Manager’s Office provides leadership and professional management to the City government in service to City Council policies, priorities and the community’s civic values.
PurposeThe office is guided by the principles of place, community, stewardship, civics, and values.
CITY MANAGER • CITY OF PALO ALTO FISCAL YEAR 2017 ADOPTED BUDGET 183

CITY MANAGER
184 C
SUPPORT1.00 Executive Assistant to the City
Manager 1.00 Administrative Assistant1.00 Administrative Associate III
OPERATIONS2.00 Assistant City Manager
COMMUNICATIONS1.00 Chief Communications Officer1.00 Communications Manager
ECONOMIC VITALITY & SPECIAL PROJECTS
1.00 Manager Economic Development
CITY MANAGERJames Keene
FY 201 POSITION TOTALS9.00 - Full-time
This organizational chart represents citywide Full-Time Equivalents (FTEs) for this department. The Department Summary tables summarize FTEs by
position allocation.
ITY MANAGER • CITY OF PALO ALTO FISCAL YEAR 2017 ADOPTED BUDGET

CITY MANAGER
DescriptionThe City Manager’s Office provides strategic leadership and guidance to the City operations and services for the City of Palo Alto through the following areas (including incubation of new programs):
ADMINISTRATION AND CITY MANAGEMENTProvides the organizational support and leadership necessary to implement Council programs and policies to meet the City’s current and future needs; ensures City operations demonstrate transparency and fiduciary responsibility to the public; builds a strong service culture and pro-vides ongoing, informative communications to City employees regarding key objectives, chal-lenges and accomplishments.
PLACE AND NEIGHBORHOODSFosters an informed and engaged community; develops mutual understanding and support between City government and the community by proactively communicating public informa-tion, creating and supporting community partnerships, and facilitating citizen involvement; cul-tivates livability by recognizing the distinctiveness and diversity of Palo Alto and its neighborhoods.
ECONOMIC VITALITYDevelops programs in support of a healthy, prosperous economic environment; maintains col-laborative relationships with residents and businesses to facilitate desired economic activity.
Accomplishments Supported City Council priority setting and agenda planning while providing leadership and
guidance to organization.
Advanced organizational planning, work plans, and performance management through strategy sessions with Executive Leadership Team.
Collaborated with City Council’s Appointed Officers Committee to restructure performance review program for City Manager, City Attorney, City Auditor, and City Clerk.
Continued partnership with the Planning and Community Environment Department on critical land use and transportation initiatives: Our Palo Alto, Comprehensive Plan Redraft, Parking and Retail Preservation Ordinance.
Obtained 93% compliance in year one of the Business Registry and launched phase two of the business registry online tool, including software and user experience enhancements, and back-end upgrades, and planning for phase three - integration with other systems and processes at the Development Center.
Partnered with Community Services Department, business groups and service providers to produce events such as Downtown Summer Concert Series, Meet the Street Event, and California Avenue Trick or Treating, highlighting available resources for small businesses.
CITY MANAGER • CITY OF PALO ALTO FISCAL YEAR 2017 ADOPTED BUDGET 185
CITY MANAGER
186 C
Launched the Digital Commenter, a new online commenting tool, in coordination with the Planning and Community Environment Department.
Continued communications support of Our Palo Alto and key Transportation programs.
Produced multiple community forums including a three-day For the Love of Palo Alto series aimed at increasing community participation, feedback and engagement.
Produced and published multi-platform communications content related to City Council and organizational goals and programs; further expanded social media channel reach and provided responsive, informed and timely information to community, public and media stakeholders.
Implemented City’s Ethics Training program.
Advanced partnership with City Auditor to ensure audit progress reports were reviewed in a timely fashion at City Council’s Policy & Services Committee.
Administered the Know Your Neighbor Grant Program encouraging neighborhood activities that foster a sense of community.
Continued to advance the Animal Services Assessment, in partnership with the Police Department, leading to the final stages of a Request for Proposal.
Advanced efforts to address impacts of air traffic by engaging citizens, Congress, FAA, and other stakeholders. Assembled noise, air traffic, legislative and legal consultant to support the community education and advocacy activities.
Completed restoration of the vegetation along the Bol Park Bike Path in response to the US Veterans Administration - Palo Alto Hospital development project.
Maintained City’s state and federal legislative program by advancing City Council and City department initiatives.
Initiatives Continue to support the City Council priority setting process and lead organization
performance management initiatives.
Update of City website to enhance usability, responsiveness and visual appeal.
Further advance the city’s digital engagement and online presence through responsiveness and quality content to both inform and engage the community.
Provide strategic communications support to departments across the city with a focus on programs and projects under the Council priorities.
Continue partnership with the Planning Department on critical land use and transportation initiatives: Our Palo Alto, Comprehensive Plan Redraft, Parking, and Mobility.
Continue progress on Business Registry and launch phase 3: integration with other permits/ systems at the Development Center.
Strengthen partnership with business groups and service providers to create new/enhance annual events that highlight local businesses, and highlight available resources for small businesses.
ITY MANAGER • CITY OF PALO ALTO FISCAL YEAR 2017 ADOPTED BUDGET

CITY MANAGER
Continue advocacy and regional partnership with stakeholders regarding impacts from air traffic.
Continue to administer the Know Your Neighbors Grant Program.
Continue City’s comprehensive state and federal legislative program.
Goals and ObjectivesGOAL 1Implement the City Council’s policy direction and ensure their goals and objectives are achieved in a timely manner.
Objectives: Provide timely, accurate, and results-oriented financial and operational reports.
Lead the development of citywide business plans that support achievement of the Council’s policies and priorities.
Maintain a highly qualified, engaged, and effective workforce to successfully attain the City’s goals and objectives.
GOAL 2Lead the City’s management team to ensure the provision of high-quality, cost-effective, and customer-focused services.
Objectives: Provide data and analytics to support informed decision-making processes.
Improve the efficiency of the City’s infrastructure, facilities, and equipment to support environmental and fiscal sustainability.
Facilitate a high level of citizen satisfaction with City services.
GOAL 3Advocate sound financial planning by developing and implementing Operating and Capital Improvement Plan (CIP) budgets.
Objectives: Advance structural reforms to ensure the City lives within our means.
Expand the use of innovation, performance management, and community partnerships to maintain and/or enhance public services.
Balance and manage economic growth and sustainability initiatives.
CITY MANAGER • CITY OF PALO ALTO FISCAL YEAR 2017 ADOPTED BUDGET 187

CITY MANAGER
188 C
GOAL 4Promote and sustain citizen participation and engagement in public matters.
Objectives: Engage public and private partners to advance community initiatives.
Expand outreach efforts and communications platforms to broaden citizen participation in local government and community matters.
Ensure timely and responsive resolution to citizens’ inquiries.
Preserve transparency and enhance communication with the public.
Key Performance MeasuresCITIZEN SATISFACTIONGoal Lead the City's management team to ensure the provision of high-quality, cost-
effective, and customer-focused services.
Objective Facilitate a high level of citizen satisfaction with City services.
FY 2014 Actuals
FY 2015 Actuals
FY 2016 Adopted
FY 2016 Estimated
FY 2017 Adopted
Percent of surveyed who rated the Quality of City Services as "Good" or "Excellent"
83.00% 85.00% 87.00% 86.00% 87.00%
Percent of surveyed who rated the Value of Services for the Taxes Paid as "Good" or "Excellent"
66.00% 65.00% 70.00% 67.00% 67.00%
Percent of surveyed who rated the Overall Image/Reputation of the City as "Good" or "Excellent"
92.00% 88.00% 96.00% 90.00% 92.00%
Description
The City participates in the National Citizen Survey (NCS), which is a collaborative effort between National Research Center, Inc. and the International City/County Management Association. The NCS is an annual survey of approximately 500 jurisdictions in the United States whose residents evaluate local government services and give their opinion about the quality of life in the community.
Purpose Residents' feedback on the quality of services provided by the City allows staff to evaluate performance and identify opportunities for improvement.
Status The City's investment in facilities and programs lead staff to predict that these indicators will increase for Fiscal Year 2017.
ITY MANAGER • CITY OF PALO ALTO FISCAL YEAR 2017 ADOPTED BUDGET
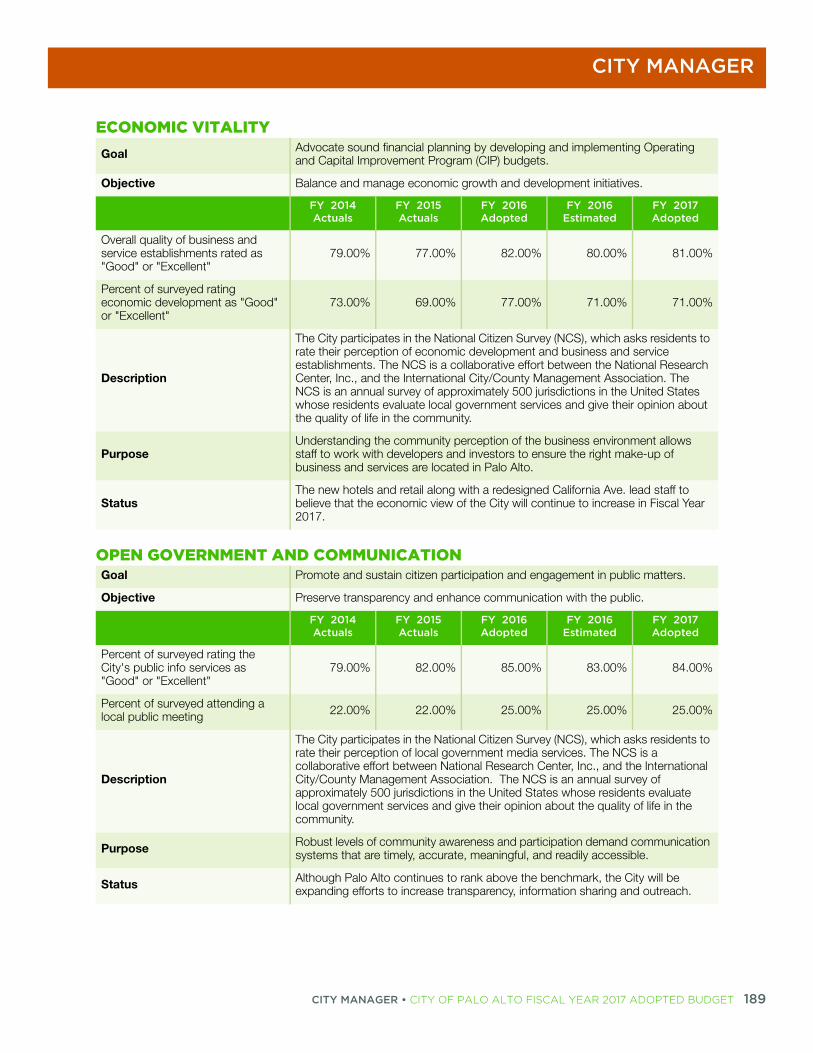
CITY MANAGER
ECONOMIC VITALITYGoal Advocate sound financial planning by developing and implementing Operating
and Capital Improvement Program (CIP) budgets.
Objective Balance and manage economic growth and development initiatives.
FY 2014 Actuals
FY 2015 Actuals
FY 2016 Adopted
FY 2016 Estimated
FY 2017 Adopted
Overall quality of business and service establishments rated as "Good" or "Excellent"
79.00% 77.00% 82.00% 80.00% 81.00%
Percent of surveyed rating economic development as "Good" or "Excellent"
73.00% 69.00% 77.00% 71.00% 71.00%
Description
The City participates in the National Citizen Survey (NCS), which asks residents to rate their perception of economic development and business and service establishments. The NCS is a collaborative effort between the National Research Center, Inc., and the International City/County Management Association. The NCS is an annual survey of approximately 500 jurisdictions in the United States whose residents evaluate local government services and give their opinion about the quality of life in the community.
PurposeUnderstanding the community perception of the business environment allows staff to work with developers and investors to ensure the right make-up of business and services are located in Palo Alto.
StatusThe new hotels and retail along with a redesigned California Ave. lead staff to believe that the economic view of the City will continue to increase in Fiscal Year 2017.
OPEN GOVERNMENT AND COMMUNICATIONGoal Promote and sustain citizen participation and engagement in public matters.
Objective Preserve transparency and enhance communication with the public.
FY 2014 Actuals
FY 2015 Actuals
FY 2016 Adopted
FY 2016 Estimated
FY 2017 Adopted
Percent of surveyed rating the City's public info services as "Good" or "Excellent"
79.00% 82.00% 85.00% 83.00% 84.00%
Percent of surveyed attending a local public meeting 22.00% 22.00% 25.00% 25.00% 25.00%
Description
The City participates in the National Citizen Survey (NCS), which asks residents to rate their perception of local government media services. The NCS is a collaborative effort between National Research Center, Inc., and the International City/County Management Association. The NCS is an annual survey of approximately 500 jurisdictions in the United States whose residents evaluate local government services and give their opinion about the quality of life in the community.
Purpose Robust levels of community awareness and participation demand communication systems that are timely, accurate, meaningful, and readily accessible.
Status Although Palo Alto continues to rank above the benchmark, the City will be expanding efforts to increase transparency, information sharing and outreach.
CITY MANAGER • CITY OF PALO ALTO FISCAL YEAR 2017 ADOPTED BUDGET 189

CITY MANAGER
190 C
%
4)%
6%
7%
)%
2)%
7%
%
6%
0)%
1%
4%
9%
3)%
5)%
%
%
%
7%
Workload MeasuresFY 2014 Actuals
FY 2015 Actuals
FY 2016 Adopted
FY 2016 Estimated
FY 2017 Adopted
Number of City Council and City Council Committee meetings 103 87 100 90 90
Total Hours of City Council and City Council Committee meetings 334 353 390 340 300
Budget SummaryFY 2014 Actuals
FY 2015 Actuals
FY 2016 Adopted Budget
FY 2017 Adopted Budget
FY 2017 Change $
FY 2017Change
Dollars by Division
Administration and City Management 2,247,824 1,773,746 2,511,482 2,350,270 (161,211) (6.
Economic Development 303,747 323,762 261,545 273,615 12,071 4.
Public Communication 220,495 269,974 237,146 260,103 22,957 9.
Total 2,772,067 2,367,482 3,010,172 2,883,989 (126,183) (4.2
Dollars by Category
Salary & Benefits
Healthcare 144,252 94,919 184,745 160,273 (24,472) (13.
Other Benefits 110,389 94,343 58,700 84,359 25,659 43.
Overtime 9 126 — — — —
Pension 284,372 229,622 368,728 415,331 46,604 12.
Retiree Medical 136,616 105,936 126,693 112,770 (13,923) (11.
Salary 1,356,945 1,028,485 1,454,683 1,558,120 103,437 7.
Workers' Compensation 6,042 2,750 5,110 20,310 15,200 297.
Total Salary & Benefits 2,038,625 1,556,181 2,198,658 2,351,162 152,504 6.
Allocated Charges 108,104 117,868 156,448 127,757 (28,691) (18.
Contract Services 405,920 583,831 561,185 311,185 (250,000) (44.
Facilities & Equipment 73,824 1,364 — — — —
General Expense 132,009 95,175 79,391 79,391 — —
Operating Transfers-Out 2,039 2,039 2,039 2,039 — —
Rents & Leases 69 64 150 154 4 2.
ITY MANAGER • CITY OF PALO ALTO FISCAL YEAR 2017 ADOPTED BUDGET

CITY MANAGER
%
)%
3%
%
3%
%
%
%
%
83
97
05
—
18
—
01
76
12
11
03
—
03
%
Supplies & Material 11,477 10,960 12,301 12,301 — —
Total Dollars by Expense Category
2,772,067 2,367,482 3,010,172 2,883,989 (126,184) (4.2
Revenues
Charges to Other Funds 737,702 749,418 923,641 935,746 12,104 1.
Other Revenue 14,837 — — — — —
Total Revenues 752,539 749,418 923,641 935,746 12,104 1.
Positions by Division
Administration and City Management 7.10 7.10 7.10 7.10 — —
Economic Development 1.05 1.10 1.00 1.00 — —
Public Communication 0.90 0.90 0.90 0.90 — —
Total 9.05 9.10 9.00 9.00 — —
Staffing
Job ClassificationFY 2014 Actuals
FY 2015 Actuals
FY 2016 Adopted Budget
FY 2017 Adopted Budget
FY 2017 Change $
FY 2017Salary
Administrative Assistant 1.00 1.00 1.00 1.00 — 77,5
Administrative Associate III 1.00 1.00 1.00 1.00 — 63,2
Assistant City Manager 1.00 2.00 2.00 2.00 — 464,0
Assistant to the City Manager 1.00 — — — —
Chief Communications Officer 1.00 1.00 1.00 1.00 — 191,3
Chief Sustainability Officer 0.05 0.05 — — —
City Manager 1.00 1.00 1.00 1.00 — 285,0
Executive Assistant to the City Manager 1.00 1.00 1.00 1.00 — 97,6
Manager Communications 1.00 1.00 1.00 1.00 — 122,0
Manager Economic Development 1.00 1.00 1.00 1.00 — 145,9
Sub-total: Full-Time Equivalent Positions
9.05 9.05 9.00 9.00 — 1,446,8
Temporary/Hourly — 0.05 — — —
Total Positions 9.05 9.10 9.00 9.00 — 1,446,8
Budget SummaryFY 2014 Actuals
FY 2015 Actuals
FY 2016 Adopted Budget
FY 2017 Adopted Budget
FY 2017 Change $
FY 2017Change
CITY MANAGER • CITY OF PALO ALTO FISCAL YEAR 2017 ADOPTED BUDGET 191

CITY MANAGER
192 C
Budget ReconciliationPositions Expenditures Revenues
Net General Fund
Prior Year Budget 9.00 3,010,172 923,641 2,086,531
Base Adjustments
One Time Prior Year Expenditures Deleted
Animal Services Transition Funding — (250,000) — (250,000)
One Time Prior Year Expenditures — (250,000) — (250,000)
Adjustments to Costs of Ongoing Activities
Salaries and Benefits Adjustments — 152,504 — 152,504
Rents & Leases Expenditure Adjustments — 4 — 4
General Fund Cost Allocation Plan Charges Adjustment — — 12,105 (12,105)
General Liability Insurance Allocated Charges Adjustment — (10,685) — (10,685)
Information Technology Allocated Charges Adjustment — (26,063) — (26,063)
Printing and Mailing Allocated Charges Adjustment — 8,057 — 8,057
Adjustments to Costs of Ongoing Activities — 123,817 12,105 111,712
Total FY 2017 Base Budget 9.00 2,883,989 935,746 1,948,243
Total FY 2017 Adopted Budget 9.00 2,883,989 935,746 1,948,243
ITY MANAGER • CITY OF PALO ALTO FISCAL YEAR 2017 ADOPTED BUDGET

ADMINISTRATIVE SERVICES
ADMINISTRATIVE SERVICESMission StatementThe Administrative Services Department strives to provide proactive financial and analytical support to City departments and decision makers, and to safeguard and facilitate the optimal use of City resources.
PurposeThe purpose of the Administrative Services Department is to provide excellent cus-tomer service to decision makers, the pub-lic, employees, and City departments; to provide analytical, organizational, and administrative support for a wide variety
of projects; to record, monitor, and protect City assets in a responsible manner; to provide essential financial management and forecasting reports; and to pre-pare and present financial reporting to various committees and City Council.
ADMINISTRATIVE SERVICES • CITY OF PALO ALTO FISCAL YEAR 2017 ADOPTED BUDGET 193
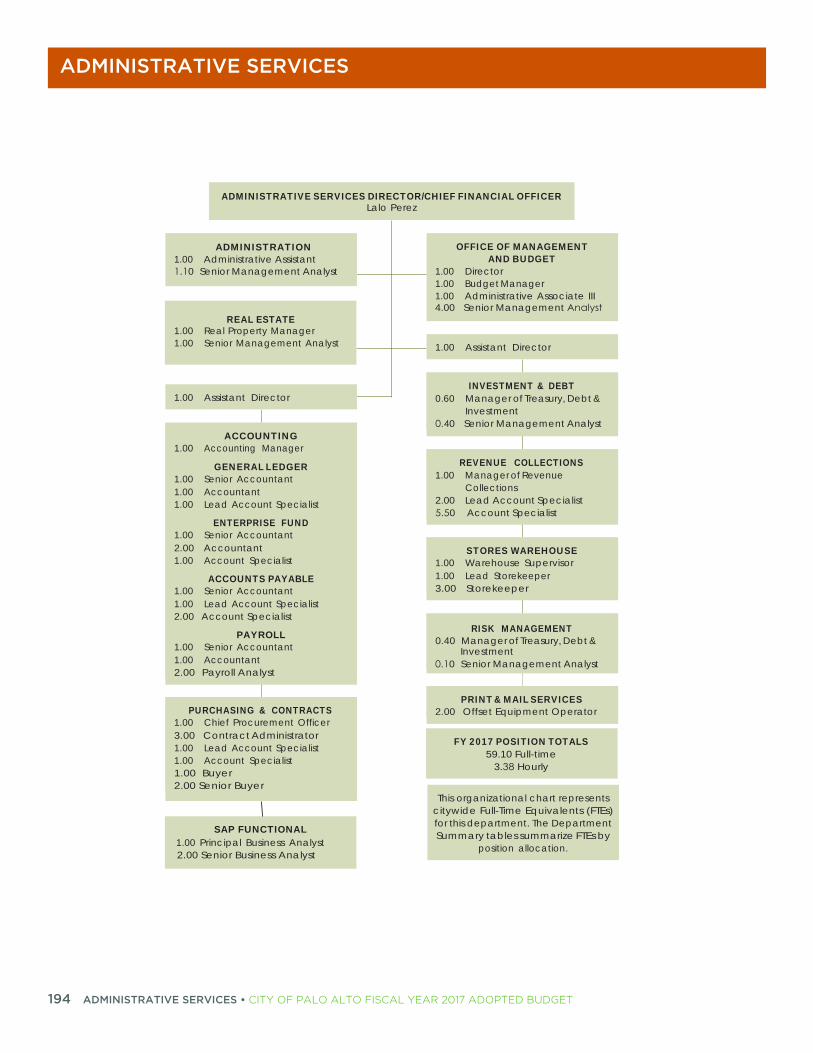
ADMINISTRATIVE SERVICES
194 A
ACCOUNTING1.00 Accounting Manager
GENERAL LEDGER1.00 Senior Accountant1.00 Accountant1.00 Lead Account Specialist
ENTERPRISE FUND1.00 Senior Accountant2.00 Accountant1.00 Account Specialist
ACCOUNTS PAYABLE1.00 Senior Accountant1.00 Lead Account Specialist2.00 Account Specialist
PAYROLL1.00 Senior Accountant1.00 Accountant2.00 Payroll Analyst
PURCHASING & CONTRACTS1.00 Chief Procurement Officer3.00 Contract Administrator1.00 Lead Account Specialist1.00 Account Specialist1.00 Buyer2.00 Senior Buyer
FY 2017 POSITION TOTALS59.10 Full-time
3. Hourly
This organizational chart representscitywide Full-Time Equivalents (FTEs)for this department. The DepartmentSummary tables summarize FTEs by
position allocation.
INVESTMENT & DEBT0.60 Manager of Treasury, Debt &
Investment. 0 Senior Management Analyst
REVENUE COLLECTIONS1.00 Manager of Revenue
Collections2.00 Lead Account Specialist
. 0 Account Specialist
STORES WAREHOUSE1.00 Warehouse Supervisor1.00 Lead Storekeeper3.00 Storekeeper
RISK MANAGEMENT0.40 Manager of Treasury, Debt &
PRINT & MAILSERVICES2.00 Offset Equipment Operator
SAP FUNCTIONAL1.00 Principal Business Analyst2.00 Senior Business Analyst
1.00 Assistant Director
1.00 Assistant Director
ADMINISTRATIVE SERVICES DIRECTOR/CHIEF FINANCIAL OFFICERLalo Perez
ADMINISTRATION1.00 Administrative Assistant. 0 Senior Management Analyst
OFFICE OF MANAGEMENTAND BUDGET
1.00 Director1.00 Budget Manager1.00 Administrative Associate III4.00 Senior Management
REAL ESTATE1.00 Real Property Manager1.00 Senior Management Analyst
Investment. 0 Senior Management Analyst
DMINISTRATIVE SERVICES • CITY OF PALO ALTO FISCAL YEAR 2017 ADOPTED BUDGET

ADMINISTRATIVE SERVICES
DescriptionThe Administrative Services Department is responsible for the following functions:
ADMINISTRATIONProvides financial, analytical, budget, strategic, and administrative support services for the department and organization.
ACCOUNTINGPerforms financial transactions and provides accurate, timely and reliable financial information for internal and external customers, including vendor payments, payroll, and financial reporting.
PURCHASING AND CONTRACTSWorks with departments to facilitate their purchasing and contracting needs in a timely, effi-cient, and customer-oriented manner.
OFFICE OF MANAGEMENT AND BUDGET (OMB)Oversees the citywide budget preparation, review and analysis, performance measures, and budget monitoring.
PROPERTY MANAGEMENT AND ACQUISITIONProvides asset management, acquires property rights, manages leasing of City’s properties, pre-pares real estate agreements, completes easement acquisition/vacation, negotiates real estate deals and provides real estate services citywide.
TREASURYCollects, safeguards, and invests revenue; issues and manages debt; and provides print shop and warehouse services.
Accomplishments Completed the Fiscal Year 2017-2026 General Fund Long Range Financial Forecast to assist
the City Council in their decision-making.
Facilitated the maintenance of the City’s AAA credit rating, which results in the lowest possible borrowing costs.
Managed the City’s real estate leases resulting in revenue of $915,000.
ADMINISTRATIVE SERVICES • CITY OF PALO ALTO FISCAL YEAR 2017 ADOPTED BUDGET 195

ADMINISTRATIVE SERVICES
196 A
Continued implementation of a strategic plan for the department emphasizing four focus areas: customer service, innovation, best practices, and employee excellence. Specific projects include:
Customer survey and related improvements to payroll intranet site
Implement innovative eProcurement system, PlanetBids
Best practices for Accounts Payable electronic payments, using ACH where possible
Employee excellence focus on employee rating form, training plans, and specific goals improving customer service and responsiveness
Continued implementation of the citywide procurement process improvements to improve efficiency and align with industry best practices, including new eProcurement system PlantBids, new key metrics reporting, knowledge management solution, and electronic document management.
Continued to expand DocuSign eSignature and electronic workflow for key department forms and facilitated the expanded citywide rollout of DocuSign.
Successfully applied to State of California to collect City’s Utility Users Tax on pre-paid wireless activity. This is a new revenue source.
Successfully negotiated, with City Attorney’s Office, the collection of the City’s Transient Occupancy Tax on Airbnb rentals. This is a new revenue source.
Of the 14 recommendations in the Inventory Management Audit, seven have been completed. ASD is working with the Utilities and Public Works Departments to finalize the remaining seven.
Explored and identified options for Council to address long-term unfunded liabilities for pension.
Managed, marketed, and executed the sale of Transfer Development Rights (TDR) for the rehabilitation of the Roth Building in the amount of $2.88 million.
Facilitated the innovative and first-time lease for installation of solar panels and electric chargers in four city-owned garages.
Completed the transition to paper free workflow in Purchasing and continued to expand scanning and electronic archiving in ASD and other city departments.
Implemented the Government Accounting Standards Board (GASB) Statement 68 for new reporting of pension liability in the City’s financial statements.
Shifted to a greater percentage of 100% recycled paper and remanufactured toners, helping to reduce the City’s consumption.
Participated in citywide emergency preparation and planning to ensure financial support and reporting will be part of a coordinated emergency response effort.
DMINISTRATIVE SERVICES • CITY OF PALO ALTO FISCAL YEAR 2017 ADOPTED BUDGET

ADMINISTRATIVE SERVICES
Initiatives Continue implementation of the ASD strategic plan in four focus areas: high quality
customer service, innovation and continuous improvement, best practices, and employee excellence, including: customer support resources in purchasing, payroll and accounting; and implementation of electronic forms.
Implement new procurement process improvement recommendations, including the new eProcurement system for managing solicitations and vendor relations and contract management.
Implement department-wide, technology-focused, core competency training such as: SAP module specific training for support resources and SAP reporting training in the human resources and payroll modules.
Move current manual garage parking permit process to Residential Parking Permit on-line platform.
Establish a cooperative purchasing mall to streamline the purchasing process while ensuring competitive pricing and compliance with policies and procedures.
Explore and identify healthcare long-term liability funding beyond the annual contributions.
In conjunction with the Office of Emergency Services, continue to build out the financial support for emergency preparation to include templates for federal financial reporting after a disaster.
Identify funding sources and investment options for Council to consider to address the City’s unfunded liabilities for pension and healthcare.
Develop new open data financial dashboards for budget and city financial information and to enhance transparency and accountability.
Continue implementation of the paperless office program to the Accounting and Real Estate divisions of the Department.
ADMINISTRATIVE SERVICES • CITY OF PALO ALTO FISCAL YEAR 2017 ADOPTED BUDGET 197
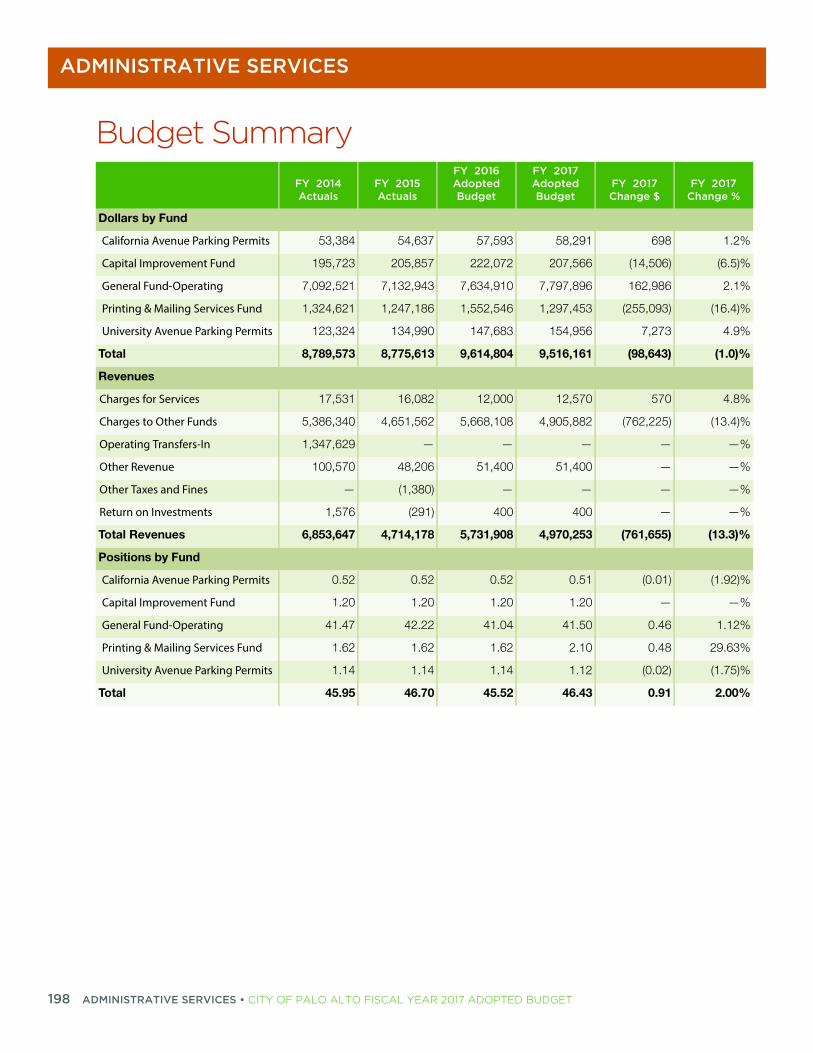
ADMINISTRATIVE SERVICES
198 A
%
2%
5)%
1%
4)%
9%
)%
8%
4)%
%
%
%
%
)%
2)%
%
2%
3%
5)%
0%
Budget SummaryFY 2014 Actuals
FY 2015 Actuals
FY 2016 Adopted Budget
FY 2017 Adopted Budget
FY 2017 Change $
FY 2017Change
Dollars by Fund
California Avenue Parking Permits 53,384 54,637 57,593 58,291 698 1.
Capital Improvement Fund 195,723 205,857 222,072 207,566 (14,506) (6.
General Fund-Operating 7,092,521 7,132,943 7,634,910 7,797,896 162,986 2.
Printing & Mailing Services Fund 1,324,621 1,247,186 1,552,546 1,297,453 (255,093) (16.
University Avenue Parking Permits 123,324 134,990 147,683 154,956 7,273 4.
Total 8,789,573 8,775,613 9,614,804 9,516,161 (98,643) (1.0
Revenues
Charges for Services 17,531 16,082 12,000 12,570 570 4.
Charges to Other Funds 5,386,340 4,651,562 5,668,108 4,905,882 (762,225) (13.
Operating Transfers-In 1,347,629 — — — — —
Other Revenue 100,570 48,206 51,400 51,400 — —
Other Taxes and Fines — (1,380) — — — —
Return on Investments 1,576 (291) 400 400 — —
Total Revenues 6,853,647 4,714,178 5,731,908 4,970,253 (761,655) (13.3
Positions by Fund
California Avenue Parking Permits 0.52 0.52 0.52 0.51 (0.01) (1.9
Capital Improvement Fund 1.20 1.20 1.20 1.20 — —
General Fund-Operating 41.47 42.22 41.04 41.50 0.46 1.1
Printing & Mailing Services Fund 1.62 1.62 1.62 2.10 0.48 29.6
University Avenue Parking Permits 1.14 1.14 1.14 1.12 (0.02) (1.7
Total 45.95 46.70 45.52 46.43 0.91 2.0
DMINISTRATIVE SERVICES • CITY OF PALO ALTO FISCAL YEAR 2017 ADOPTED BUDGET
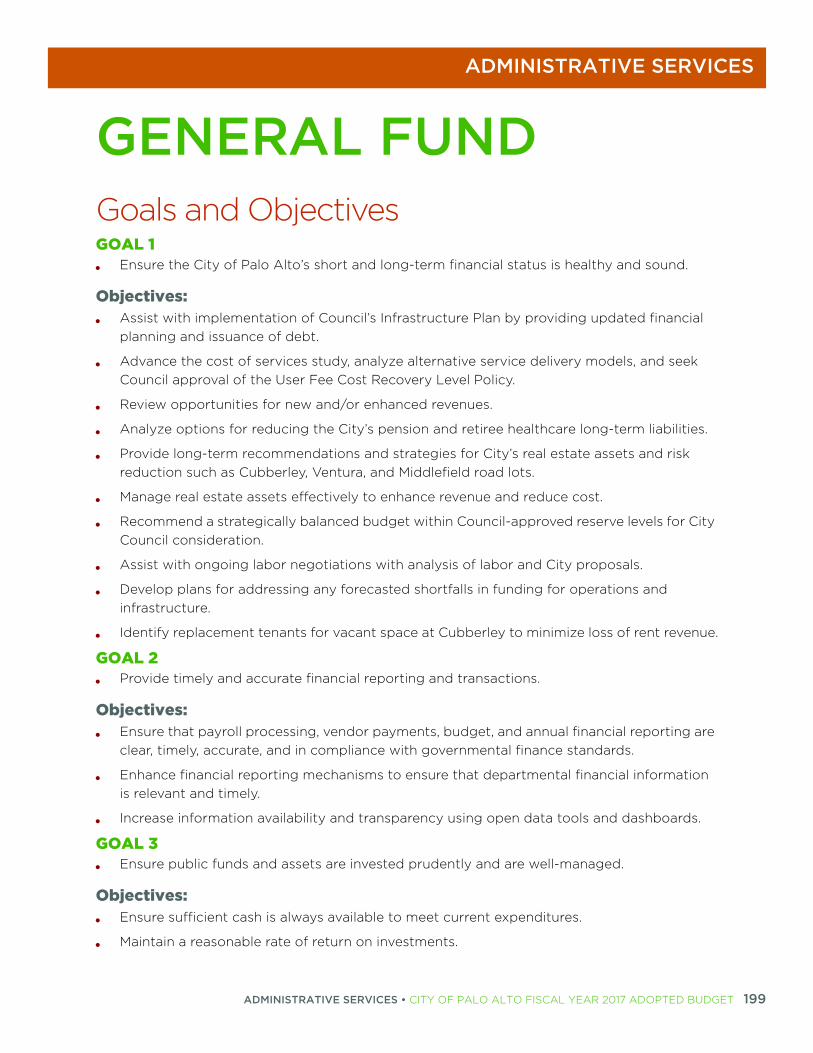
ADMINISTRATIVE SERVICES
GENERAL FUNDGoals and ObjectivesGOAL 1 Ensure the City of Palo Alto’s short and long-term financial status is healthy and sound.
Objectives: Assist with implementation of Council’s Infrastructure Plan by providing updated financial
planning and issuance of debt.
Advance the cost of services study, analyze alternative service delivery models, and seek Council approval of the User Fee Cost Recovery Level Policy.
Review opportunities for new and/or enhanced revenues.
Analyze options for reducing the City’s pension and retiree healthcare long-term liabilities.
Provide long-term recommendations and strategies for City’s real estate assets and risk reduction such as Cubberley, Ventura, and Middlefield road lots.
Manage real estate assets effectively to enhance revenue and reduce cost.
Recommend a strategically balanced budget within Council-approved reserve levels for City Council consideration.
Assist with ongoing labor negotiations with analysis of labor and City proposals.
Develop plans for addressing any forecasted shortfalls in funding for operations and infrastructure.
Identify replacement tenants for vacant space at Cubberley to minimize loss of rent revenue.
GOAL 2 Provide timely and accurate financial reporting and transactions.
Objectives: Ensure that payroll processing, vendor payments, budget, and annual financial reporting are
clear, timely, accurate, and in compliance with governmental finance standards.
Enhance financial reporting mechanisms to ensure that departmental financial information is relevant and timely.
Increase information availability and transparency using open data tools and dashboards.
GOAL 3 Ensure public funds and assets are invested prudently and are well-managed.
Objectives: Ensure sufficient cash is always available to meet current expenditures.
Maintain a reasonable rate of return on investments.
ADMINISTRATIVE SERVICES • CITY OF PALO ALTO FISCAL YEAR 2017 ADOPTED BUDGET 199
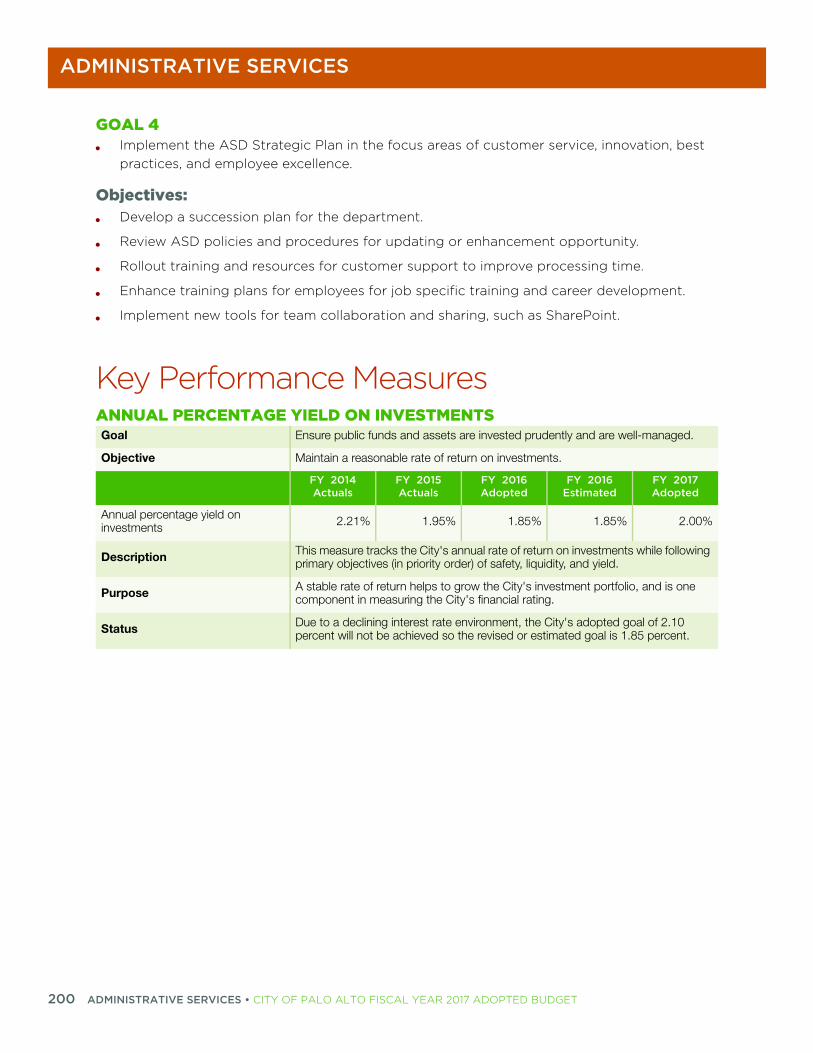
ADMINISTRATIVE SERVICES
200
GOAL 4 Implement the ASD Strategic Plan in the focus areas of customer service, innovation, best
practices, and employee excellence.
Objectives: Develop a succession plan for the department.
Review ASD policies and procedures for updating or enhancement opportunity.
Rollout training and resources for customer support to improve processing time.
Enhance training plans for employees for job specific training and career development.
Implement new tools for team collaboration and sharing, such as SharePoint.
Key Performance MeasuresANNUAL PERCENTAGE YIELD ON INVESTMENTSGoal Ensure public funds and assets are invested prudently and are well-managed.
Objective Maintain a reasonable rate of return on investments.
FY 2014 Actuals
FY 2015 Actuals
FY 2016 Adopted
FY 2016 Estimated
FY 2017 Adopted
Annual percentage yield on investments 2.21% 1.95% 1.85% 1.85% 2.00%
Description This measure tracks the City's annual rate of return on investments while following primary objectives (in priority order) of safety, liquidity, and yield.
Purpose A stable rate of return helps to grow the City's investment portfolio, and is one component in measuring the City's financial rating.
Status Due to a declining interest rate environment, the City's adopted goal of 2.10 percent will not be achieved so the revised or estimated goal is 1.85 percent.
ADMINISTRATIVE SERVICES • CITY OF PALO ALTO FISCAL YEAR 2017 ADOPTED BUDGET

ADMINISTRATIVE SERVICES
Workload Measures
AVERAGE PROCESSING TIME FOR PURCHASE REQUISITIONSGoal Implement performance management programs to support and enhance
communication, accountability, and positive outcomes.
Objective Continue developing and implementing Procurement and Inventory process improvements.
FY 2014 Actuals
FY 2015 Actuals
FY 2016 Adopted
FY 2016 Estimated
FY 2017 Adopted
Track the average time from receipt of a Purchase Requisition to issuance of Purchase Order (Days)
30 25 15 23 23
Description
The City is required to follow procurement rules and regulations as outlined in the Municipal Code and State Law to ensure open and fair competition and the most cost-effective use of tax dollars. In compliance with existing rules and regulations, ASD endeavors to provide goods and services as quickly as possible to City departments.
PurposeTo measure the average processing time for Purchase Requisitions in order to identify processing improvements while being compliant with existing rules and regulations.
StatusIn Fiscal Year 2017, the Purchasing Division will build on process improvements with increased training and new software solutions to increase efficiency and turnaround time.
FY 2014 Actuals
FY 2015 Actuals
FY 2016 Adopted
FY 2016 Estimated
FY 2017 Adopted
Number of P-card (City credit card) transactions 17,885 17,799 19,000 17,800 18,000
Number of purchase orders and purchase requisitions processed 2,047 1,694 1,750 1,784 1,784
Total amount of cash and investments - as of June 30 (Millions)
$472 $545 $516 $509 $500
ADMINISTRATIVE SERVICES • CITY OF PALO ALTO FISCAL YEAR 2017 ADOPTED BUDGET 201

ADMINISTRATIVE SERVICES
202
%
8%
)%
)%
7%
)%
6%
1%
7%
)%
%
3%
)%
9%
)%
7%
)%
)%
%
)%
0%
%
1%
Budget SummaryFY 2014 Actuals
FY 2015 Actuals
FY 2016 Adopted Budget
FY 2017 Adopted Budget
FY 2017 Change $
FY 2017Change
Dollars by Division
Accounting 1,751,790 1,693,803 1,958,610 2,090,866 132,256 6.
Administration 692,367 683,735 686,172 679,892 (6,280) (0.9
Office of Management and Budget 1,231,281 1,162,381 1,393,539 1,314,523 (79,015) (5.7
Purchasing 1,598,009 1,581,425 1,497,480 1,508,372 10,892 0.
Real Estate 532,047 669,499 643,402 623,443 (19,959) (3.1
Treasury 1,287,026 1,342,101 1,455,706 1,580,800 125,094 8.
Total 7,092,520 7,132,944 7,634,910 7,797,896 162,986 2.
Dollars by Category
Salary & Benefits
Healthcare 575,728 561,528 635,597 716,258 80,661 12.
Other Benefits 158,000 157,648 169,464 138,100 (31,363) (18.5
Overtime 24,134 35,716 33,723 33,723 — —
Pension 876,252 898,851 1,030,429 1,105,467 75,038 7.
Retiree Medical 381,699 523,211 574,000 536,733 (37,267) (6.5
Salary 3,763,900 3,777,732 4,041,979 4,280,155 238,176 5.
Workers' Compensation 85,141 19,488 71,995 58,206 (13,789) (19.2
Total Salary & Benefits 5,864,853 5,974,174 6,557,186 6,868,642 311,456 4.
Allocated Charges 393,601 392,693 448,276 363,446 (84,831) (18.9
Contract Services 535,484 379,154 316,321 261,921 (54,400) (17.2
Facilities & Equipment 20,506 3,693 6,200 6,200 — —
General Expense 221,431 331,358 249,105 239,374 (9,731) (3.9
Rents & Leases 11,153 12,363 12,364 12,856 492 4.
Supplies & Material 45,493 39,508 45,457 45,457 — —
Total Dollars by Expense Category
7,092,521 7,132,943 7,634,910 7,797,896 162,986 2.
ADMINISTRATIVE SERVICES • CITY OF PALO ALTO FISCAL YEAR 2017 ADOPTED BUDGET

ADMINISTRATIVE SERVICES
8%
)%
%
%
)%
3%
0%
)%
3%
)%
2%
2%
89
35
17
36
54
46
24
23
68
39
08
%
Revenues
Charges for Services 17,531 16,082 12,000 12,570 570 4.
Charges to Other Funds 4,059,493 3,387,378 4,115,962 3,608,829 (507,132) (12.3
Other Revenue 100,570 48,206 51,400 51,400 — —
Other Taxes and Fines — (1,380) — — — —
Total Revenues 4,177,595 3,450,285 4,179,362 3,672,800 (506,562) (12.1
Positions by Division
Accounting 14.28 13.90 12.90 13.60 0.70 5.4
Administration 1.05 1.30 1.60 2.08 0.48 30.0
Office of Management and Budget 6.81 6.82 6.62 6.02 (0.60) (9.06
Purchasing 9.57 9.83 9.35 9.53 0.18 1.9
Real Estate 2.50 2.60 2.80 2.32 (0.48) (17.11
Treasury 7.26 7.77 7.77 7.95 0.18 2.3
Total 41.47 42.22 41.04 41.50 0.46 1.1
Staffing
Job ClassificationFY 2014 Actuals
FY 2015 Actuals
FY 2016 Adopted Budget
FY 2017 Adopted Budget
FY 2017 Change $
FY 2017Salary
Account Specialist 5.95 5.95 4.95 5.88 0.93 357,2
Account Specialist-Lead 4.59 4.59 4.59 4.05 (0.54) 263,6
Accountant 2.00 2.00 3.00 3.00 — 241,2
Administrative Assistant 1.00 1.00 1.00 1.00 — 86,3
Administrative Associate III 1.00 1.00 1.00 1.00 — 68,3
Assistant Director Administrative Services 1.65 1.65 1.75 1.65 (0.10) 311,6
Buyer 2.00 2.00 2.00 1.00 (1.00) 89,6
Chief Procurement Officer 1.00 1.00 1.00 1.00 — 135,8
Contracts Administrator 1.70 1.70 1.70 1.70 — 175,3
Director Administrative Services/CFO 0.70 0.70 0.70 0.80 0.10 180,5
Director Office of Management and Budget 1.00 1.00 1.00 1.00 — 163,5
Budget SummaryFY 2014 Actuals
FY 2015 Actuals
FY 2016 Adopted Budget
FY 2017 Adopted Budget
FY 2017 Change $
FY 2017Change
ADMINISTRATIVE SERVICES • CITY OF PALO ALTO FISCAL YEAR 2017 ADOPTED BUDGET 203

ADMINISTRATIVE SERVICES
204
15
09
15
06
59
68
—
52
43
67
36
48
37
94
43
37
Manager Accounting 1.00 1.00 1.00 1.00 — 149,1
Manager Budget — — 1.00 1.00 — 150,0
Manager Real Property 1.00 1.00 1.00 1.00 — 138,2
Manager Revenue Collections — — 0.70 0.62 (0.08) 84,5
Manager Treasury, Debt & Investments — — 1.00 0.60 (0.40) 79,7
Payroll Analyst 2.00 2.00 2.00 2.00 — 136,5
Principal Management Analyst 1.00 1.00 — — —
Senior Accountant 3.00 3.00 3.00 3.00 — 291,0
Senior Buyer — — — 1.00 1.00 90,5
Senior Management Analyst 5.90 5.90 4.20 4.90 0.70 605,3
Storekeeper — — — 1.00 1.00 65,4
Storekeeper-Lead 1.00 1.00 1.00 0.20 (0.80) 14,1
Warehouse Supervisor 0.50 0.50 0.50 0.20 (0.30) 18,8
Sub-total: Full-Time Equivalent Positions
37.99 37.99 38.09 38.60 0.51 3,896,8
Temporary/Hourly 3.48 4.23 2.95 2.90 (0.05) 253,4
Total Positions 41.47 42.22 41.04 41.50 0.46 4,150,3
Budget ReconciliationPositions Expenditures Revenues
Net General Fund
Prior Year Budget 41.04 7,634,910 4,179,362 3,455,548
Base Adjustments
One Time Prior Year Expenditures Deleted
Priority Based Budgeting Consultant Support — (60,000) — (60,000)
One Time Prior Year Expenditures Deleted — (60,000) — (60,000)
Adjustments to Costs of Ongoing Activities
Salary and Benefits Adjustments — 185,520 — 185,520
Temporary Salaries Adjustment — 62,442 — 62,442
Net Position Reallocations in/out of Administrative Services (0.50) (59,764) — (59,764)
Rents & Leases Adjustment — 491 — 491
Staffing
Job ClassificationFY 2014 Actuals
FY 2015 Actuals
FY 2016 Adopted Budget
FY 2017 Adopted Budget
FY 2017 Change $
FY 2017Salary
ADMINISTRATIVE SERVICES • CITY OF PALO ALTO FISCAL YEAR 2017 ADOPTED BUDGET

ADMINISTRATIVE SERVICES
General Expense Adjustment (Management Development) — (9,730) — (9,730)
Charges for Service Adjustment (Easement Fee & Returned Items) — — 570 (570)
General Fund Cost Allocation Plan Charges Adjustment — — (507,132) 507,132
General Liability Allocation Charges Adjustment — (46,465) — (46,465)
Information Technology Allocated Charges Adjustment — (27,236) — (27,236)
Printing and Mailing Allocated Charges Adjustment — (22,796) — (22,796)
Vehicle Equipment Maintenance Allocated Charges Adjustment — 11,670 — 11,670
Adjustments to Costs of Ongoing Activities (0.50) 94,132 (506,562) 600,694
Total FY 2017 Base Budget 40.54 7,669,042 3,672,800 3,996,242
Budget Adjustments
1 Temporary Management Specialist (e-Procurement and SAP) 0.48 74,880 — 74,880
2 Temporary Purchasing Contract Administration Specialist 0.48 53,974 — 53,974
Total Budget Adjustments 0.96 128,854 — 128,854
Total FY 2017 Adopted Budget 41.50 7,797,896 3,672,800 4,125,096
Budget ReconciliationPositions Expenditures Revenues
Net General Fund
ADMINISTRATIVE SERVICES • CITY OF PALO ALTO FISCAL YEAR 2017 ADOPTED BUDGET 205

ADMINISTRATIVE SERVICES
206
Budget AdjustmentsBudget Adjustments Positions Expenditures Revenues
Net General Fund
1 Temporary Management Specialist (e-Procurement and SAP) 0.48 74,880 0 74,880
This action adds 0.48 FTE temporary Management Specialist (one-time) to continue implementation of e-Procurement and financial system training. This position will train current staff on new procedures for e-Procurement, which will increase efficiency in the Purchasing Division, and lead training efforts in the Financial System software (Ongoing costs: $0)
Performance Results
The new procedures and training led by this position will increase efficiencies within the Purchasing Division, and will help staff more effectively utilize the Financial System tools.
2 Temporary Purchasing Contract Administration Specialist 0.48 53,974 0 53,974
This action adds 0.48 FTE Temporary Purchasing Contract Administration Specialist (one-time) to continue service levels and support the increase in purchasing workload. This request continues funding initially approved at the FY 2016 Midyear Budget Review. (Ongoing costs: $0)
Performance Results
The position will improve purchasing contract cycle time, which improve performance for customer departments.
ADMINISTRATIVE SERVICES • CITY OF PALO ALTO FISCAL YEAR 2017 ADOPTED BUDGET

ADMINISTRATIVE SERVICES
PRINTING AND MAILING SERVICESAccomplishments Maintained California Green Business certification in calendar year 2016.
Processed 340,000 utility bills.
Maintained timelines for producing council packets.
Initiatives Maintain a high level of customer service for Printing and Mailing.
Provide quality printing products.
Continue to improve ability to produce color requests.
Goals and ObjectivesGOAL 1 Provide timely and high quality services for City departments, City Council, and
Committees.
Objectives: Continue analyzing additional cost saving options.
Ensure timely distribution of mail and utility bills.
Ensure timely creation and distribution of City Council and Committee packets.
Reduce outsourcing of color job requests with the implementation of new color equipment.
ADMINISTRATIVE SERVICES • CITY OF PALO ALTO FISCAL YEAR 2017 ADOPTED BUDGET 207

ADMINISTRATIVE SERVICES
208
%
)%
)%
1%
)%
%
9%
)%
7%
5%
6%
4%
)%
)%
)%
)%
%
)%
)%
%
)%
3%
3%
Budget SummaryFY 2014 Actuals
FY 2015 Actuals
FY 2016 Adopted Budget
FY 2017 Adopted Budget
FY 2017 Change $
FY 2017Change
Dollars by Fund
Printing & Mailing Services Fund 1,324,621 1,247,186 1,552,546 1,297,453 (255,093) (16.4
Total 1,324,621 1,247,186 1,552,546 1,297,453 (255,093) (16.4
Dollars by Category
Salary & Benefits
Healthcare 30,475 30,672 31,428 35,546 4,118 13.
Other Benefits 3,554 3,358 3,402 2,355 (1,047) (30.8
Overtime 877 2,458 — — — —
Pension 24,988 21,394 27,429 29,316 1,887 6.
Retiree Medical 40,156 61,815 64,000 59,845 (4,155) (6.5
Salary 98,730 103,410 103,081 127,551 24,471 23.
Workers' Compensation 226 204 193 1,439 1,246 645.
Total Salary & Benefits 199,006 223,311 229,533 256,053 26,519 11.
Allocated Charges 116,102 154,758 188,477 194,794 6,317 3.
Contract Services 178,157 67,886 165,511 114,711 (50,800) (30.7
Facilities & Equipment — — 53,000 — (53,000) (100.0
General Expense 352,000 354,264 398,500 286,975 (111,525) (28.0
Rents & Leases 379,638 317,932 437,267 364,662 (72,605) (16.6
Supplies & Material 99,720 129,034 80,258 80,258 — —
Total Dollars by Expense Category
1,324,621 1,247,186 1,552,546 1,297,453 (255,093) (16.4
Revenues
Charges to Other Funds 1,326,847 1,264,184 1,552,146 1,297,053 (255,093) (16.4
Return on Investments 1,576 (291) 400 400 — —
Total Revenues 1,328,423 1,263,893 1,552,546 1,297,453 (255,093) (16.4
Positions by Division
Printing and Mailing 1.62 1.62 1.62 2.10 0.48 29.6
Total 1.62 1.62 1.62 2.10 0.48 29.6
ADMINISTRATIVE SERVICES • CITY OF PALO ALTO FISCAL YEAR 2017 ADOPTED BUDGET

ADMINISTRATIVE SERVICES
30
45
—
75
10
85
Staffing
Job ClassificationFY 2014 Actuals
FY 2015 Actuals
FY 2016 Adopted Budget
FY 2017 Adopted Budget
FY 2017 Change $
FY 2017Salary
Manager Revenue Collections — — 0.10 0.10 — 13,6
Offset Equipment Operator 1.52 1.52 1.52 1.52 — 91,7
Senior Management Analyst 0.10 0.10 — — —
Sub-total: Full-Time Equivalent Positions
1.62 1.62 1.62 1.62 — 105,3
Temporary/Hourly — — — 0.48 0.48 20,7
Total Positions 1.62 1.62 1.62 2.10 0.48 126,0
Budget Reconciliation
Positions Expenditures Revenues
Net Printing and
Mailing Services
Prior Year Budget 1.62 1,552,546 1,552,546 —
Base Adjustments
One Time Prior Year Expenditures Deleted
Postage Meter Replacement — (53,000) — (53,000)
One Time Prior Year Expenditures Deleted — (53,000) — (53,000)
Adjustments to Costs of Ongoing Activities
Salary and Benefits Adjustments 0.48 26,420 — 26,420
Postage and Printing Expenditure Adjustment — (111,625) — (111,625)
Contract Services Expenditure Adjustment — (50,800) — (50,800)
Rents and Leases Expenditure Adjustment — (72,605) — (72,605)
ADMINISTRATIVE SERVICES • CITY OF PALO ALTO FISCAL YEAR 2017 ADOPTED BUDGET 209

ADMINISTRATIVE SERVICES
210 A
General Fund Administrative Cost Plan Adjustment — 5,419 — 5,419
Print & Mail Allocation Charges Adjustment — 10,648 — 10,648
General Liability Allocation Charges Adjustment — (1,867) — (1,867)
Information Technology Allocated Charges Adjustment — (7,683) — (7,683)
Charges to Other Funds - Print and Mail Services Revenue Adjustment — — (255,493) 255,493
Return on Investments Revenue Adjustments — — 400 (400)
Adjustments to Costs of Ongoing Activities 0.48 (202,093) (255,093) 53,000
Total FY 2017 Base Budget 2.10 1,297,453 1,297,453 —
Total FY 2017 Adopted Budget 2.10 1,297,453 1,297,453 —
Budget Reconciliation
Positions Expenditures Revenues
Net Printing and
Mailing Services
DMINISTRATIVE SERVICES • CITY OF PALO ALTO FISCAL YEAR 2017 ADOPTED BUDGET

COMMUNITY SERVICES
COMMUNITY SERVICESMission StatementThe Community Services Department’s mission is to engage individuals and families in creating a strong and healthy community through parks, recreation, social services, arts, and sciences.
PurposeThe purpose of the Community Services Department is to provide a diverse range of quality programs and services that are highly valued and relevant to the needs of the community. Community Services aims to develop and provide programs for increased knowledge, creativity, artistic
expression, physical activity, social help, and enjoyment of the outdoors; seeks to be responsible stewards of the many unique community assets including open space, parks and their related interpretive centers, Children’s Theatre, Palo Alto Art Center, Junior Museum and Zoo and three community centers at Cub-berley, Mitchell Park and Lucie Stern and the Palo Alto Public Art collection; seeks to provide comfortable, safe, and attractive facilities; strives for sustain-able practices that lower our carbon footprint; and develops and maintains mutually beneficial partnerships and collaborations with local organizations, businesses, individuals and foundations to achieve our mission.
COMMUNITY SERVICES • CITY OF PALO ALTO FISCAL YEAR 2017 ADOPTED BUDGET 211

COMMUNITY SERVICES
212 C
COMMUNITY SERVICES DIRECTORRobert de Geus
HUMAN SERVICES1.00 Human Services Manager1.00 Management Assistant
ADMINISTRATION2.00 Assistant Director1.00 Senior Management Analyst1.00 Management Analyst1.00 Administrative Assistant 1.00 Administrative Associate III
OPEN SPACE, PARKS& GOLF DIVISION
1.00 Division Manager,Open Space, Parks & Golf
1.00 Open Space, Parks & Golf Superintendent
1.00 Program Assistant II
OPEN SPACE2.00 Community Services
Manager5.00 Park Ranger
PARKS ADMINISTRATION1.00 Parks Superintendent
CITY PARKS & FACILITIES2.00 Inspector, Field
Services1.00 Parks Crew - Lead2.00 Sprinkler System
Repair Person1.00 Parks Maintenance
Person
ATHLETIC FIELDMAINTENANCE PROGRAM1.00 Community Services
Manager1.00 Parks Crew - Lead1.00 Parks Maintenance
Person2.00 Sprinkler System
Repair Person5.00 Park Maintenance
Person
CAPITAL PROJECTS1.00 Coordinator Public
RECREATION DIVISION1.00 Recreation
Superintendent
LUCIE STERNCOMMUNITY CENTER
1.00 Community ServicesManager
2.00 Program Assistant I2.00 Coordinator,
RecreationPrograms
MITCHELL PARKCOMMUNITY CENTER
1.00 Community ServicesSenior ProgramManager
1.00 Program Assistant I1.00 Program Assistant I2.00 Coordinator, Recreation
Programs
CUBBERLEYCOMMUNITY CENTER
1.00 Community ServicesManager
.00 Program Assistant I
.00 Program Assistant I2.00 Building Service
Person - Lead2.00 Building Service
Person
ARTS & SCIENCESDIVISION
PALO ALTO ART CENTER1.00 Community Services
Senior ProgramManager
5.00 Producer Arts &Sciences
1.00 Program Assistant I
PUBLIC ART PROGRAM1.00 Community Services
Senior ProgramManager
1.00 Program Assistant II
CHILDREN’S THEATRE1.00 Community Services
Senior ProgramManager
1.00 Theatre Specialist3. Producer Arts &
Sciences1.00 Program Assistant I
JUNIOR MUSEUM AND ZOO1.00 Community Services
Senior ProgramManager
3.75 Producer Arts &Sciences
2.75 JMZ Educator1.00 Program Assistant I
Works Projects This organizational chart represents citywide Full-TimeEquivalents (FTEs) for this department. The DepartmentSummary table summarizes FTEs by position allocation.
FY 2017 POSITION TOTALS - Full-time 6 - Hourly
Pro
OMMUNITY SERVICES • CITY OF PALO ALTO FISCAL YEAR 2017 ADOPTED BUDGET

COMMUNITY SERVICES
DescriptionThe Community Services Department operates three divisions and an Office of Human Services, providing the following services to the community:
ARTS AND SCIENCESProvides visual and performing arts, music and dance, and science programs to youth and adults, including a focus on family programs. The division manages the Art Center, Junior Museum and Zoo, Children’s Theatre, Community Theatre, Cubberley Theatre, the Public Art Program, the Cubberley Artist Studios Program, and the MakeX studio.
OPEN SPACE, PARKS, AND GOLFMaintains nature interpretive centers and operates more than 4,000 acres of open space and urban parkland. The division offers programs in ecology and natural history in open space, maintenance of facilities for outdoor recreational use in City parks, and a full-service golf com-plex.
RECREATIONProvides a diverse range of programs and activities for the community, establishing a culture of health and well-being for families and individuals of all ages. Programs include childhood learning, youth development, teen services, summer camps, organized sports, aquatics, special events, and a wide variety of adult recreation classes. The Recreation Division manages and operates three community centers and the Rinconada Pool.
OFFICE OF HUMAN SERVICESProvides funding and coordinates grants to nonprofit organizations through the Human Ser-vices Resource Allocation Process (HSRAP). Provides oversight of the afterschool child care program, Palo Alto Mediation Program, the Family Resources database, and serves as a key liai-son to local social services organizations and child care providers.
Accomplishments The Parks, Open Space and Golf Division continued to make significant headway in
improving Palo Alto’s Open Space preserves. Open Space staff, Public Works and the Fire Department worked together to further implement the Foothills Fire Management Plan. The evacuation routes for Page Mill Road, Arastradero Road, and Los Trancos Road have been cleared significantly, increasing the safety of those routes.
The Magical Bridge Playground Project at Mitchell Park was completed and a grand opening was held on April 18, 2015. The Magical Bridge Playground is extremely popular with park visitors. The playground offers a vibrant selection of play, discovery, and imagination inspiring components; and is an inviting place where children of all abilities can come together to play and socialize without physical or social barriers.
COMMUNITY SERVICES • CITY OF PALO ALTO FISCAL YEAR 2017 ADOPTED BUDGET 213

COMMUNITY SERVICES
214 C
The Open Space, Parks and Golf Division continued to make significant headway on completing capital improvement projects including Scott Park, El Camino Park, Monroe Park, and City Hall landscape Improvement. Several projects are in process now and will be completed by the end of FY 2016 including Community Garden Irrigation Replacement, Baylands Interim Plan, Batting Cages at Baylands Athletic Center, and Bowden Park.
Public Art Program Temporary Public Art Installation – The Public Art Program is committed to sponsoring dynamic, rotating exhibitions that reflect diverse styles and perspectives. “Rondo I” by Bruce Beasley was installed in October 2015. “Rondo I” will remain in front of City Hall until September 2016, kicking off a series of ongoing temporary public art installations on King Plaza. As part of the Public Art Master Plan process, the Public Art Program commissioned artists Chris Treggiari and Peter Focault to engage more than 300 residents on the future of public art through their social practice work.
The public art program unveiled a dynamic interactive new media artwork in the lobby of City Hall by Susan Narduli. “Conversation” beautifully displays the public comments and news feeds from local, national and global sources, a visual reflection of the open and transparent government we strive to be. This new-media interactive artwork celebrates freedom of speech and expression. It is the voice of our community making up the ever-changing visual narrative.
The Palo Alto Children’s Theatre continued its seven year trend of record attendance reaching more than 45,000 audience members annually. In collaboration with the Friends of the Palo Alto Children’s Theatre (FOPACT), the theatre expanded its Dance in Schools programs to all PAUSD Elementary Schools. Outreach Theatre Productions continue to serve PAUSD Elementary grades 3-5. Through transportation grants and camp scholarships provided by FOPACT, the theatre provided access and arts education to nearly 6,000 students attending productions, in classes and camps. The Teen Arts Council, a Children’s Theatre initiative, continued growth through new programs and outreach to Bay Area teens.
The Palo Alto Art Center served a record number of 91,099 visitors in FY 2015. Thanks to the support of the Art Center, the Art Center Foundation, and the ‘Our Palo Alto’ Initiative, this year we worked with artist Kate Pocrass to create “This is Happiness: Palo Alto“, a free artistic map of Palo Alto available to visitors in the exhibition Front Yard/Backstreet.
The Palo Alto Art Center kicked off the Institute of Museum and Library Services funded project “Creative Ecology” with artist Linda Gass in collaboration with the Junior Museum and Zoo. Creative Ecology is an innovative art and science residency program that promotes learning about and appreciation of the natural world through the creative process, engaging artists, art and science educators, and the larger community.
The Junior Museum and Zoo (JMZ) increased the number of students served in its elementary school Science Outreach Program from 10,696 in FY 2014 to 13,280 in FY 2015 and estimates that it will reach 17,415 students in FY 2016, representing year-over-year growth of 20% and 31% respectively. Many schools increased their program requests but the greatest growth was programming four new Title 1 schools funded by the Friends of the PAJMZ and the County of Santa Clara.
The JMZ launched an ambitious Accessibility & Inclusion Initiative funded by the Packard Foundation and the Brin Wojcicki Foundation. The Initiative aims to improve access to the
OMMUNITY SERVICES • CITY OF PALO ALTO FISCAL YEAR 2017 ADOPTED BUDGET

COMMUNITY SERVICES
JMZ and its programs for children with disabilities and their families. The Initiative provides training for staff, accessibility reviews of the existing JMZ site and plans for the new JMZ, two years of bimonthly Superfamily Sundays Events for families with children who have disabilities, development of on-site support resources, and focus groups to help JMZ designers broaden their ability to design spaces, exhibits and programs for children of all abilities.
Cubberley Artist Studio Program (CASP) launched its community programming initiative with more than 25 events to date, free and open to the public in the newly anointed Art Lab (U7), including panels on arts and the environment, arts and sciences, sewing clinics, toddler maker space open houses, and the art of Japanese tea ceremony. CASP launched its first annual Meet the Artists event as well as its first annual Community Artists Exhibition.
MakeX moved from the Library Department to CSD’s Arts & Sciences Division and continues to serve approximately 100 teens a month with a unique maker space run by teens for teens. In addition to their presence at Stanford’s international maker conference Fablearn, CASP artists helped them create an inaugural exhibition in the Art Lab.
The Office of Human Services, along with the Human Relations Commission (HRC), hosted four very successful community forums in the past year focused on senior services, veteran homelessness, domestic violence, and implicit bias. The forums brought together subject experts, providers and the community to dialogue together and encourage those present to take action to address key areas of need.
The Bryant Street Garage Fund Grant Program has seen tremendous success and growth over the past year with $13,346 spent to fund 16 teen initiated and led projects including clickPA, Project Enybody, DocX Unmasked Documentary, and many more. All teens who receive funding through the Bryant Street Garage Fund are required to fill out an evaluation at the end of their project. Highlights from the results of those surveys include that 100% of the teens felt that their project was a success and 80% of the teens spent 40 hours or more on their project.
Mitchell Park Community Center (MPCC) continues to be in high demand since its opening in December 2014. In 2015, facility rentals generated over $126,000 in revenue with 4,980 hours reserved for 559 events with 50,668 in estimated attendance. Customer satisfaction surveys indicate 100% of renters would refer the facility to a friend, and 100% of renters saying they would rent the facility again. MPCC also hosted 77 non-profit events, 313 administrative events (City of Palo Alto affiliated events), and 14 Co-Sponsored events (no room charge). MPCC is also host to a variety of CSD programs from the Art Center, Children’s Theatre, and Recreation Special Interest. In 2015, these programs served 662 participants with 1,187 program hours and generated $149,138 in program revenue.
Mitchell Park Teen Center is fully staffed and operating with a free after school program, LEAP (Learning Enrichment Afterschool Program), and free drop-in hours daily. Teen Center staff serve an average of 56 teens per week during drop-in hours and 85 students are enrolled in LEAP. The teen center also hosted 18 events with a total of 1,158 attendees.
Lucie Stern Community Center (LSCC) has been a historical presence in the Palo Alto community since its opening in 1934. Lucie Stern rentals range from regularly scheduled fitness and wellness classes to meetings and celebratory events such as weddings and
COMMUNITY SERVICES • CITY OF PALO ALTO FISCAL YEAR 2017 ADOPTED BUDGET 215

COMMUNITY SERVICES
216 C
quinceañeras. In 2015, facility rentals generated $179,189 in revenue ($49,189 over the 2015 projected goal of $130,000) with 5,530 hours reserved for 390 events with 84,998 guests in estimated attendance. Customer satisfaction surveys indicate that 86% of renters would rent the facility again. Lucie Stern also hosted 101 basic rentals, 67 non-profit events (50% discount off resident fees), 221 administrative events (City of Palo Alto affiliated events at no charge), and 5 Co-Sponsored events (no room charge). LSCC plays host to many CSD programs, summer camps, and classes from the Art Center, Children’s Theatre, Aquatics, and Special Interests. In 2015, these programs served 979 participants with 5,930 program hours and generated $167,170 in revenue for the department.
Cubberley Community Center continues to provide the community with valuable and unique rental and lease spaces. In 2015, facility rentals generated $1.3 million in revenue and hosted numerous events: theater performances, dance shows, lectures, karate classes, basketball games and a wide range of other activities. Cubberley is also home to Community Artists, dance studios, schools and daycare centers. An estimated 600,000 people visit Cubberley every year and the programs hosted on campus continue to provide positive experiences and lasting memories for everyone who visits.
Initiatives The Open Space, Parks, and Golf Division will focus on completing a number of projects
including the Parks, Trails, Natural Open Space and Recreation Master Plan. The master plan will provide the City with guidance regarding future renovations and capital improvement needs for parks, trails, open space and recreation facilities.
The Buckeye Creek Hydrology Study, once completed, will provide a recommendation to resolve the creek’s erosion and flooding problems, as well as insight on the best uses of the 7.7 acres property at Foothills Park. Finally, the Byxbee Interim Plan Project and the Stanford Palo Alto Synthetic Turf Replacement Project will be completed in FY 2017.
The Open Space, Parks, and Golf Division will begin work on the Baylands Comprehensive Conservation Plan, which will provide guidance on habitat protection, environmental education, and recreational opportunities at the Baylands Nature Preserve.
The Project Safety Net Community Collaborative (PSN), with its newly hired Executive Director, will transition to a Collective Impact model of community collaboration. A more rigorous and specific form of collaboration among organizations that aims to improve PSN’s overall effectiveness in youth suicide prevention and youth health and well-being in Palo Alto.
Community Services will continue to host popular special events the community has enjoyed for generations, including the May Fete parade and the Chili Cook-Off. The Special Events Program will also explore opportunities for new events that promote the City Council’s priorities of Healthy City, Healthy Community and will focus on offering a diverse range of events that encourage participation from all community members.
Recreation will increase Special Interest classes based on current trends and in response to community requests and feedback. This will ensure that Community Services is providing the most up-to-date and relevant classes for all ages.
OMMUNITY SERVICES • CITY OF PALO ALTO FISCAL YEAR 2017 ADOPTED BUDGET

COMMUNITY SERVICES
The Recreation Division will continue to provide and expand services for teens by focusing on programs and events like “The Drop” Teen Center and LEAP After School Program that provide safe places for teens to learn and grow. Additional programs and events that foster a culture of inclusion, awareness, and empathy will also be provided while opportunities for new events are explored. Teen programs such as the Bryant Street Grant Program, Youth Community Service, and teen leadership groups will continue to provide opportunities for teens to develop their leadership skills and be innovative thinkers.
Community Services will evaluate the Aquatics Program to determine if service delivery could be improved and enhanced over the long-term through a third-party provider. This initiative arose from increasing difficulties with pool staff shortages, which compromises the summer Learn to Swim program and limits community access to Rinconada Pool for adults and families. This evaluation will include outreach to the various pool users to obtain their feedback on the future of the Aquatics Program. A report back with recommendations for this program is anticipated to be brought back to City Council in fall 2016.
A Healthy City Healthy Community Resolution was adopted by Council to “encourage healthy social, cultural and physical environments that promote and support health, well-being and creative expression for ourselves, our families and our communities.” In support of this Council priority, Community Services will lead a group of dedicated stakeholders to advance the objectives of the Resolution and support Palo Alto as a healthy city and community. The stakeholder group will establish specific metrics to measure progress and staff will provide an annual report to Council.
Community Services, working alongside the City Manager’s Office and the Palo Alto Unified School District, will embark on a process to develop a shared vision for the future of the Cubberley Community Center that represents the educational and community needs of the School District and the City. The first step is to develop an inclusive, collaborative and adaptable process that will provide the road map to achieving the best outcome for the community.
Pending regulatory permits, staff plans to begin the renovation and reconfiguration of the existing Palo Alto Municipal Golf Course. The need for Golf Course reconfiguration work was initially triggered by the San Francisquito Creek Joint Powers Authority’s (JPA) upcoming project to realign the San Francisquito Creek channel for the purpose of increased flood protection within Palo Alto and neighboring communities. The goals of the Golf Course reconfiguration project are: reconfigure the Golf Course to accommodate the necessary flood control work of the JPA and to allow for future recreation fields for the City; restore the golf asset as a point of pride to the community; conserve resources by transforming the fully turfed course to one with more naturalized areas that are in harmony with the Baylands area; and promote Palo Alto by establishing a “must play” golf experience in the region.
Community Services will foster a culture of lifelong learning and inspiration for staff that propels all staff into pursuing personal excellence in the workplace, thereby increasing their performance, creative problem solving skills and maximized contribution to the agency. The culture of lifelong learning will include outstanding professional development and team building opportunities.
COMMUNITY SERVICES • CITY OF PALO ALTO FISCAL YEAR 2017 ADOPTED BUDGET 217

COMMUNITY SERVICES
218 C
The Office of Human Services will continue its leadership with the Human Services Resource Allocation Process (HSRAP), homeless services, child care initiatives, and to evaluate Palo Alto’s senior services needs especially in the area of senior transportation.
City staff and Friends of the Palo Alto Junior Museum and Zoo will continue to develop draft terms for a potential public private partnership to rebuild the aging Junior Museum and Zoo facility for Council consideration in FY 2017, in accordance to a City Council approved Letter of Intent between the two parties.
The Palo Alto Children’s Theatre, with support from the Friends of the Palo Alto Children’s Theatre, has launched a new plays initiative, commissioning two new works in its first year: THE BALLAD OF PHINEAS MCBOOF by award-winning local children’s musician Doctor Noize, which will premiere in fall 2016, and MOON SHOT, a new play by Chicago company Theater Unspeakable exploring the historic 1969 moon landing, which premieres in winter 2017.
The Art Center reopens the long-anticipated renovated auditorium space as a rental and program space for the community. The renovated auditorium features enhanced acoustics and a state-of-the-art sound and projection system.
The Art Center launches an Institute of Museum and Library Services funded initiative to develop Discovery Kits for families in the Art Center galleries. These kits will enrich the experience of families who visit the Art Center through engaging art activities they can do together.
The Public Art Program will implement the Public Art Master Plan and associated policies and governance, the result of an eighteen-month process, with over 40 meetings, community input and envisioning.
The Public Art Program Staff will oversee the first public art projects to be installed associated with the public art in private development ordinance. Artist selection and design development will begin for several large municipal projects for art this year, such as the highway 101 bike/pedestrian bridge, the Junior Museum and Zoo, and the Fire Station 3 Replacement.
The Cubberley Artist Studio Program works in partnership with the Arts & Sciences Division to bring in more grant dollars, offer more cultural programming to the community, and create an enlivened destination.
The MakeX Program seeks to build a new cadre of teen mentors as the original mentors go off to college.
OMMUNITY SERVICES • CITY OF PALO ALTO FISCAL YEAR 2017 ADOPTED BUDGET

COMMUNITY SERVICES
Goals and ObjectivesGOAL 1Provide high-quality, relevant, and diverse services and programs to the public.
Objectives: Achieve a high level of customer satisfaction for all programs and services offered by the
department.
Increase public awareness of, and participation in, recreational services.
Ensure programs are responsive to a broad range of needs within the community.
GOAL 2Ensure parks and recreational areas are safe and environmentally sensitive.
Objectives: Maintain grounds to be in good condition and facilities to be in good repair.
Protect public land and utilize best management practices for environmental preservation.
GOAL 3Provide innovative, well-managed programs and services.
Objectives: Increase and diversify community involvement and volunteerism.
Monitor cost recovery to facilitate sustainability of programs and services.
Explore partnerships with other agencies to maximize services for the public.
Key Performance MeasuresCOMMUNITY SERVICES DEPARTMENT ONLINE REGISTRATION AND EFFICIENCYGoal Provide innovative, well managed programs and services.
Objective Increase online class registration.
FY 2014 Actuals
FY 2015 Actuals
FY 2016 Adopted
FY 2016 Estimated
FY 2017 Adopted
Percent of class registrations occurring online 55.00% 64.00% 66.00% 66.00% 68.00%
Description Increase self-service, efficient and convenient online class registration processes.
Purpose Increase staff productivity and capacity.
Status Currently, online class registration is the preferred method of registration.
COMMUNITY SERVICES • CITY OF PALO ALTO FISCAL YEAR 2017 ADOPTED BUDGET 219

COMMUNITY SERVICES
220
COMMUNITY SERVICES DEPARTMENT OPEN SPACE AND PARKSGoal Ensure parks and recreational areas are safe and environmentally sensitive.
Objective Protect public land and utilize best management practices for environmental preservation.
FY 2014 Actuals
FY 2015 Actuals
FY 2016 Adopted
FY 2016 Estimated
FY 2017 Adopted
Percent of surveyed who rate the City's success in preserving natural areas as "Good" or "Excellent"
80.00% 64.00% 85.00% 80.00% 81.00%
Description
This measure tracks resident responses when asked to rate Palo Alto's preservation of natural areas such as open space and green belts in an annual National Citizen Survey (NCS). The Department maintains and manages 4,029 acres of open space including Foothills Park, Baylands Nature Preserve, Pearson-Arastradero Preserve and Esther Clark Nature Preserve. The City participates in the NCS, which asks residents to rate their perception of local government services. The NCS is an annual survey of approximately 500 jurisdictions in the United States whose residents evaluate local government services and give their opinions about the quality of life in the community.
Purpose It is important for the City to solicit feedback from and respond to residents regarding the services and programs we provide.
Status Palo Alto ranked in the 94th percentile (14th of 207 jurisdictions surveyed) for preservation of natural areas such as open space and green belts.
COMMUNITY SERVICES DEPARTMENT PROGRAMS AND SERVICESGoal Provide high quality, relevant, and diverse services and programs to the public.
Objective Ensure programs are responsive to a broad range of needs within the community.
FY 2014 Actuals
FY 2015 Actuals
FY 2016 Adopted
FY 2016 Estimated
FY 2017 Adopted
Percent of surveyed who rate recreation programs/classes as "Good" or "Excellent"
87.00% 84.00% 88.00% 87.00% 88.00%
Description
The Department's motto is "Engage, Create, Enjoy!" to enhance the quality of life. We offer diverse experiences for children, teens, and adults of all ages. This measure tracks resident responses when asked to rate Palo Alto's recreation programs or classes in the annual National Citizen Survey (NCS). The City participates in the NCS, which asks residents to rate their perception of local government services. The NCS is an annual survey of approximately 500 jurisdictions in the United States whose residents evaluate local government services and give their opinions about the quality of life in the community.
Purpose It is important for the City to solicit feedback from and respond to residents regarding the services and programs we provide.
StatusPalo Alto's ratings were significantly higher than the survey benchmark (average ratings in all other cities). Residents' ratings ranked Palo Alto 16th of 294 cities surveyed, or in the 95th percentile.
COMMUNITY SERVICES • CITY OF PALO ALTO FISCAL YEAR 2017 ADOPTED BUDGET

COMMUNITY SERVICES
%
5%
1%
6)%
5%
4%
2%
4)%
%
7%
5)%
3%
0%
2%
0)%
0)%
1)%
0%
%
3%
Workload MeasuresFY 2014 Actuals
FY 2015 Actuals
FY 2016 Adopted
FY 2016 Estimated
FY 2017 Adopted
Total Enrollment in classes/camps in arts, sciences, recreation, and open space programs
14,647 14,622 16,400 15,000 15,500
Average Enrollment in classes/camps in arts, sciences, recreation, and open space programs
18 20 21 20 21
Budget SummaryFY 2014 Actuals
FY 2015 Actuals
FY 2016 Adopted Budget
FY 2017 Adopted Budget
FY 2017 Change $
FY 2017Change
Dollars by Division
Administration and Human Services 3,491,920 3,774,060 3,893,905 3,914,460 20,555 0.
Arts and Sciences 4,895,800 5,049,313 5,578,305 5,919,433 341,128 6.
Open Space, Parks and Golf 9,053,654 8,919,376 9,150,850 8,910,489 (240,361) (2.
Recreation and Cubberley 5,107,334 5,306,247 6,188,411 6,652,338 463,927 7.
Total 22,548,708 23,048,996 24,811,471 25,396,719 585,249 2.
Dollars by Category
Salary & Benefits
Healthcare 1,415,922 1,462,442 1,606,988 1,851,810 244,822 15.
Other Benefits 248,651 211,846 248,684 202,918 (45,765) (18.
Overtime 91,870 119,244 101,795 101,795 — —
Pension 1,361,988 1,483,780 1,698,908 1,828,928 130,020 7.
Retiree Medical 804,476 945,877 1,015,000 949,101 (65,899) (6.
Salary 7,327,071 7,738,298 8,691,379 9,064,569 373,190 4.
Workers' Compensation 84,820 53,412 71,731 128,423 56,692 79.
Total Salary & Benefits 11,334,800 12,014,899 13,434,485 14,127,545 693,060 5.
Allocated Charges 4,698,393 4,383,256 4,555,418 4,553,717 (1,702) (0.
Contract Services 4,200,662 4,151,067 4,151,292 4,027,259 (124,033) (3.
Facilities & Equipment 26,493 46,190 95,700 70,700 (25,000) (26.
General Expense 1,654,005 1,718,713 1,823,964 1,878,714 54,750 3.
Operating Transfers-Out 6,990 6,990 6,990 6,990 — —
Rents & Leases 21,922 18,642 24,466 25,040 574 2.
COMMUNITY SERVICES • CITY OF PALO ALTO FISCAL YEAR 2017 ADOPTED BUDGET 221

COMMUNITY SERVICES
222
7)%
4%
2)%
%
%
0%
6%
8%
)%
5)%
0%
7%
5%
8%
40
01
84
60
42
55
52
93
%
Supplies & Material 605,445 709,239 719,157 706,755 (12,402) (1.
Total Dollars by Expense Category
22,548,709 23,048,996 24,811,472 25,396,719 585,247 2.
Revenues
Charges for Services 5,439,205 5,096,059 4,432,254 4,201,741 (230,514) (5.
Charges to Other Funds 55,505 55,688 58,338 58,338 — —
From Other Agencies 16,038 9,500 — 44,885 44,885 —
Other Revenue 589,875 679,981 680,009 741,009 61,000 9.
Other Taxes and Fines 1,162 700 1,000 1,026 26 2.
Rental Income 821,672 965,673 899,364 915,806 16,442 1.
Total Revenues 6,923,457 6,807,601 6,070,965 5,962,805 (108,161) (1.8
Positions by Division
Administration and Human Services 4.91 5.91 5.96 5.79 (0.17) (2.8
Arts and Sciences 43.82 44.67 44.64 45.89 1.25 2.8
Open Space, Parks and Golf 31.68 31.68 31.83 32.87 1.04 3.2
Recreation and Cubberley 53.12 55.74 59.03 59.71 0.68 1.1
Total 133.53 138.00 141.46 144.26 2.80 1.9
Staffing
Job ClassificationFY 2014 Actuals
FY 2015 Actuals
FY 2016 Adopted Budget
FY 2017 Adopted Budget
FY 2017 Change $
FY 2017Salary
Administrative Assistant 1.00 1.00 1.00 1.00 — 86,3
Administrative Associate III 0.75 0.75 1.00 1.00 — 60,4
Assistant Director Community Services 2.00 2.00 2.00 2.00 — 323,1
Building Serviceperson 2.00 2.00 2.00 2.00 — 110,3
Building Serviceperson-Lead 2.00 2.00 2.00 2.00 — 118,1
Coordinator Recreation Programs 4.00 4.00 4.00 4.00 — 298,7
Director Community Services 1.00 1.00 1.00 1.00 — 189,6
Division Manager Open Space, Parks and Golf 1.00 1.00 1.00 1.00 — 144,3
Budget SummaryFY 2014 Actuals
FY 2015 Actuals
FY 2016 Adopted Budget
FY 2017 Adopted Budget
FY 2017 Change $
FY 2017Change
COMMUNITY SERVICES • CITY OF PALO ALTO FISCAL YEAR 2017 ADOPTED BUDGET

COMMUNITY SERVICES
94
36
75
31
28
51
14
55
52
44
93
47
77
13
73
84
23
04
32
91
88
—
32
93
25
Heavy Equipment Operator 0.07 0.07 0.07 0.07 — 5,5
Inspector, Field Services 2.00 2.00 2.00 2.00 — 180,7
Junior Museum & Zoo Educator 2.25 2.75 2.75 2.75 — 191,8
Management Analyst — 1.00 1.00 1.00 — 99,6
Management Assistant 1.00 1.00 1.00 1.00 — 79,1
Manager Community Services 6.00 5.00 5.00 5.00 — 452,3
Manager Community Services Senior Program 4.00 5.00 4.00 4.00 — 444,7
Manager Human Services — — 1.00 1.00 — 119,5
Park Maintenance Person 6.00 6.00 6.00 6.00 — 389,8
Park Maintenance-Lead 1.00 1.00 1.00 1.00 — 77,5
Park Ranger 5.00 5.00 5.00 5.00 — 347,4
Parks/Golf Crew-Lead 2.00 2.00 2.00 2.00 — 145,5
Producer Arts/Science Programs 11.75 11.75 12.50 12.50 — 1,014,1
Program Assistant I 6.75 6.75 7.00 8.00 1.00 530,8
Program Assistant II 4.00 4.00 4.00 4.00 — 290,6
Project Manager — — — 0.10 0.10 9,9
Senior Management Analyst 1.00 1.00 1.00 1.00 — 123,3
Sprinkler System Representative 4.00 4.00 4.00 4.00 — 272,1
Superintendent Community Services 2.00 2.00 2.00 2.00 — 213,6
Superintendent Recreation — — 1.00 1.00 — 112,0
Theater Specialist 1.00 1.00 1.00 1.00 — 90,4
Volunteer Coordinator 0.75 0.75 — — —
Sub-total: Full-Time Equivalent Positions
74.32 75.82 77.32 78.42 1.10 6,522,5
Temporary/Hourly 59.21 62.18 64.14 65.84 1.70 2,521,4
Total Positions 133.53 138.00 141.46 144.26 2.80 9,044,0
Staffing
Job ClassificationFY 2014 Actuals
FY 2015 Actuals
FY 2016 Adopted Budget
FY 2017 Adopted Budget
FY 2017 Change $
FY 2017Salary
COMMUNITY SERVICES • CITY OF PALO ALTO FISCAL YEAR 2017 ADOPTED BUDGET 223

COMMUNITY SERVICES
224
Budget ReconciliationPositions Expenditures Revenues
Net General Fund
Prior Year Budget 141.46 24,811,472 6,070,965 18,740,507
Base Adjustments
One-Time Prior Year Expenditures and Revenues Deleted
Santa Clara County Homeless Services Funding — (125,000) — (125,000)
Foothills Fire Management Plan Contractual Services Funding Alignment — (18,500) — (18,500)
Community Center Furniture Replacement — (25,000) — (25,000)
One-Time Prior Year Expenditures 141.46 (168,500) — (168,500)
Adjustments to Costs of Ongoing Activities
Salary and Benefit Adjustments 1.26 561,363 — 561,363
Revenue and Expenditure Adjustments — 57,955 198,727 (140,772)
Friends of the Palo Alto Children's Theatre Donation — 45,000 45,000 —
Arts Center Creative Ecology Grant Funding — 44,885 44,885 —
Magical Bridge Playground Maintenance — 40,000 — 40,000
Friends of the Junior Museum and Zoo Santa Clara Title I School Contract through FY 2018 / Charges for Services
— 25,232 25,000 232
MakeX Program - Teen Services Program Reallocation from Library 0.48 24,941 — 24,941
PACCC / Avenidas Consumer Price Index Adjustments — 23,757 — 23,757
Additional Parkland Maintenance Contract Alignment — 20,000 — 20,000
Recreation Summer Camp Transportation / Charges for Services — 18,000 18,000 —
Art Center Institute of Museum and Library Services Grant — 16,000 16,000 —
PAUSD Water Cost Charges Alignment — 13,541 — 13,541
Human Services Resource Allocation Program Consumer Price Index Adjustments — 11,353 — 11,353
Little Explorers Adventures Alignment — 8,000 8,000 —
Art Center Adult Studio Classes — 3,000 3,000 —
Human Services Reallocation from Salary to Contract to align with service delivery (0.02) — — —
Youth Community Service Reallocation from Salary to Contract to align with service delivery (0.85) — — —
COMMUNITY SERVICES • CITY OF PALO ALTO FISCAL YEAR 2017 ADOPTED BUDGET

COMMUNITY SERVICES
Centralization of Fingerprinting in Human Resources — (10,000) — (10,000)
Children's Theatre Vocal Lessons Service Delivery Change — (20,000) (20,000) —
Children's Theatre Ballroom Dancing Service Delivery Change — (23,000) (23,000) —
Golf Course Operation Service Changes (closed beginning July 2016) — (601,190) (542,428) (58,762)
Information Technology Allocated Charges Adjustment — (88,459) — (88,459)
Print & Mail Allocated Charges Adjustment — (35,576) — (35,576)
Liability Insurance Allocated Charges Adjustment — (141,483) — (141,483)
Utilities Allocated Charges Adjustment — 178,514 — 178,514
Vehicle Maintenance Allocated Charges Adjustment — 188,783 — 188,783
Adjustments to Costs of Ongoing Activities 0.87 360,616 (226,816) 587,432
Total FY 2017 Base Budget 142.33 25,003,588 5,844,149 19,159,439
Budget Adjustments
1 Project Safety Net Community Collaborative — 185,000 — 185,000
2 Santa Clara County Homeless Services Funding — 125,000 — 125,000
3 CSD Service Delivery Enhancements and Alignment 0.68 89,327 122,306 (32,979)
4 Open Space Technicians 0.96 39,084 — 39,084
5 Bryant Street Garage Teen Program Staffing 0.29 32,806 — 32,806
6 JMZ Market Analysis and Collections Management — 30,600 — 30,600
7 Golf Course Renovation — (108,686) (3,650) (105,036)
Total FY 2017 Budget Adjustments 1.93 393,131 118,656 274,475
Total FY 2017 Adopted Budget 144.26 25,396,719 5,962,805 19,433,914
Budget ReconciliationPositions Expenditures Revenues
Net General Fund
COMMUNITY SERVICES • CITY OF PALO ALTO FISCAL YEAR 2017 ADOPTED BUDGET 225
COMMUNITY SERVICES
226
Budget AdjustmentsBudget Adjustments Positions Expenditures Revenues
Net General Fund
1 Project Safety Net Community Collaborative 0.00 185,000 0 185,000
This action adds $185,000 in funding for continued efforts related to the Project Safety Net Community Collaborative (PSN). The initial allocated of $2.0 million set aside for PSN from the Stanford Development Fund were largely expended through FY 2016 on means restriction such as fencing, brush removal, and track guards (estimated $1.5 million) and the remainder on the Community Collaborative (estimated $415,000), leaving a balance of $85,000 for future PSN costs. The total annual costs for the collaborative are estimated to be $270,000, including funding for a director, a part-time administrative associate, and other activities conducted by CSD (publishing, outreach, etc.) associated with the collaborative. Therefore, it is recommended that in Fiscal Year 2017 the remaining Stanford Development Funds of $85,000 and this General Fund allocation of $185,000 fund the full program. Beginning in Fiscal Year 2018, it is assumed that the Stanford Development Funds originally allocated towards PSN will be exhausted and the full $270,000 will budgeted in the CSD General Fund. The costs for means restriction, which were also previously borne by the Stanford Development Fund, are recommended to be added to the Police Department General Fund budget, since the Police Department manages the track watch contract. A separate budget adjustment is located in the Police Department in this document. (Ongoing costs: $270,000)
Performance Results
This action will sustain the PSN collaborative as it transitions to the Collective Impact framework. As part of this transition, the collaborative will evaluate and recommend a long term fiscal agent for PSN, either through the creation of a separate 501c(3) tax exempt organization or through an established nonprofit or partner organization to continue to serve as a 'backbone' organization for PSN.
2 Santa Clara County Homeless Services Funding 0.00 125,000 0 125,000
This action establishes $125,000 in ongoing funding for continued efforts related to Santa Clara County’s North County Homeless Initiatives. The City of Palo Alto had previously approved two years of funding at $125,000 each year, but that funding ended in FY 2016. This funding will ensure that the City can continue its collaboration with the County, wherein the City’s funding offsets the cost of a case manager and the County provides housing vouchers for up to 20 homeless individuals per year. An item scheduled for City Council consideration on May 9, 2016 outlines this agreement with the County and recommends a continuing of this partnership. So far, 14 homeless individuals have been housed through the program. (Ongoing costs: $125,000)
Performance Results
This action will ensure that the quality of homeless services provided will remain high and that the City will continue to cost effectively address the many facets and aspects of homelessness.
COMMUNITY SERVICES • CITY OF PALO ALTO FISCAL YEAR 2017 ADOPTED BUDGET
COMMUNITY SERVICES
3 CSD Service Delivery Enhancements and Alignment 0.68 89,327 122,306 (32,979)
This action recognizes various expenses and revenues associated with new services or current service delivery offered by the Arts and Sciences and Recreation divisions in the Community Services Department. These program adjustments reflect necessary resources and revenue offsets for Art Center Marketing Materials, enhanced staffing at the Children’s Theatre, enhanced staffing at the Community Theatre, a Mitchell Park Preschool Program, and janitorial services for rentals at Mitchell Park Community Center. (Ongoing Savings: $32,806) Additional details can be found below:
- Addition of 0.48 Arts & Science Technician II - H position and adds 0.06 to an existing 0.42 Arts and Science Technician II - H position (for a total of 0.48 position) to support the year-round theatre scene shop for the Palo Alto Children’s Theatre, offset by the recognition of additional revenue associated with productions. These additional positions will support the maintenance of safe working conditions for youth participants and maintain the high-quality standards of production that have been developed.
- Increased funding of $30,000 will provide for the development and opening of a pre-school program at the Mitchell Park Community Center through a third party contractor. There has been significant demand for a pre-school program, and the Mitchell Park Community Center has a room designated for that purpose. The program will be evaluated on an ongoing basis for cost-recovery levels, effectiveness of service delivery, and customer satisfaction.
- Increased funding of $15,000 for producing high-quality aesthetically pleasing marketing materials. The quality and appearance of Art Center printed materials, such as exhibition announcements, event postcards, event posters, and program brochures are paramount to the success of Art Center programs in terms of revenue generation and attendance. As a visual art center, the Art Center printed materials often feature original works of art that require exact color matching. The City's print shop is unable to provide exact color matching, and as a result, the printed materials must be outsourced to a fully equipped print shop.
- Increase the current Community Theatre House Manager position from 0.34 FTE to 0.48 FTE to align with the City's agreements with the Community Theatre partners (TheatreWorks, West Bay Opera, and Palo Alto Players). As part of these agreements, the City is contractually obligated to provide a house manager for performances, and this action provides needed resources until such time as the contracts change.
- Increases contractual expenses by $4,500 to enable the City to provide janitorial services as part of room rental packages, offset by commensurate revenues. Currently, customers who rent rooms are required to clean up and have expressed interest in being able to have that included in the rental agreement.
- Recognize an additional $32,806 in revenues associated with the increase in room rental activity at Mitchell Park Community Center which has experienced a significant uptick in rentals since it opened after its remodel.
Performance Results
The enhanced service delivery levels and new services offered by the Community Services Department will increase the quality of services and customer service levels as a result.
4 Open Space Technicians 0.96 39,084 0 39,084
This action adds two 0.48 Open Space Technician - H positions to provide necessary resources for adequate maintenance of City parkland. These two additional positions will address a backlog of deferred maintenance, current maintenance, and prepare for additional maintenance needs with the opening of another phase of Byxbee Park and recently added 7.7 acres at Foothill Park. Maintenance of open space areas include trails maintenance, picnic site maintenance, litter removal, invasive vegetation removal, gate and fencing repair, and graffiti abatement. (Ongoing costs: $39,084)
Performance Results
This action supports positive visitor experiences within City parkland while addressing the backlog of maintenance.
Budget AdjustmentsBudget Adjustments Positions Expenditures Revenues
Net General Fund
COMMUNITY SERVICES • CITY OF PALO ALTO FISCAL YEAR 2017 ADOPTED BUDGET 227
COMMUNITY SERVICES
228
5 Bryant Street Garage Teen Program Staffing 0.29 32,806 0 32,806
This action adds a 1.0 Program Assistant I, offset by the elimination of a 0.25 Recreation Leader III, a vacant 0.46 Recreation Leader III, and the partial use of existing Bryant Street Garage program funds set aside for the Teen Program, to align the necessary resources with the capacity of the Bryant Street Garage Teen Programs offered by the Community Services Department. The programs recruit and engage local adult mentors through interactions with business, non-profits, and other entities in order to facilitate the success of grant funded projects that are developed, created, and implemented by local teens. This level of engagement requires a considerable amount of facilitation, coordination, and relationship-building in order to be successful. The teen programs administered through the Bryant Street Garage program are experiencing intensive demand that is expected to continue for the foreseeable future. The conversion of part-time staff to full-time staff will provide resources to enhance the scope and effectiveness of the program. (Ongoing costs: $32,806)
Performance Results
This action will increase the quality of the services administered through the Bryant Street Garage Program and decrease the cycle time associated with grants administration. A full-time position will also increase the customer satisfaction associated with the program and the sustainability of the program will be bolstered through greater continuity of programs achieved through less staff turnover.
6 JMZ Market Analysis and Collections Management 0.00 30,600 0 30,600
This action provides $30,600 in one-time contractual funding to assist in working through implications of funding a new JMZ Building. The Friends of the Junior Museum and Zoo and the City of Palo Alto are currently working through the implications of a new JMZ building at the Lucie Stern Community Center Complex, and a consultant to provide a market analysis of the PAJMZ ($20,000) will furnish independent expertise on the costs, and revenues, associated with the new design. Due to the particular nature of museum revenues, the capacity to provide an expert analysis on the myriad factors that would affect revenue is not available within the City. In addition, assistance in conducting an inventory of the current collections and materials ($10,600) showcased at the JMZ is needed for meticulous documentation of the materials due the unique nature of the JMZ collection. With the upcoming temporary move of the JMZ while the new building is being constructed, an accurate catalog and inventory of all exhibits and materials in the JMZ collection is especially important. (Ongoing costs: $0)
Performance Results
The addition of funding for a consultant to provide a market analysis of the Palo Alto Junior Museum and Zoo will ensure that costs are adequately managed in a sustainable fashion, while the Collections inventory and management will help ensure that the cycle time for replacement is adequate and the department is ready for a smooth temporary transition as a result of the move.
7 Golf Course Renovation 0.00 (108,686) (3,650) (105,036)
This action further adjusts the Golf Course budget to reflect an anticipated closure in July 2016 due to course reconfiguration. The budgeted expenditures are reduced by $109,000 and revenues are reduced by $4,000 from previous closure projections for Fiscal Year 2017 of $609,000 and $542,000 in expense and revenue adjustments, respectively, assumed in the Fiscal Year 2017-2026 Long Range Financial Forecast. The total expense reduction of $710,000 reflects a 54% decrease to a total of $603,000 and the total revenue reduction of $546,000 reflects a 70% decrease to an estimated revenue of $232,000. The additional expenditure reductions are primarily driven by further reductions in water expenses ($75,000). Due to the delay in course renovations previously approved by Council, the City has requested the National Golf Foundation to revise their financial plan for the course which was originally issued in April 2012. Staff anticipates bringing forward a revised construction plan for Council approval in June 2016, concurrent to the development of the FY 2017 Budget. (Ongoing Savings: $0)
Performance Results
This action aligns anticipated budget to with an anticipated closure starting FY 2017.
Budget AdjustmentsBudget Adjustments Positions Expenditures Revenues
Net General Fund
COMMUNITY SERVICES • CITY OF PALO ALTO FISCAL YEAR 2017 ADOPTED BUDGET

COMMUNITY SERVICES
GOLF COURSE FINANCIALSFY 2014Actuals
FY 2015Actuals
FY 2016Projected
FY 2017Adopted *
REVENUES
Tournament fees $ 4,037 $ 37,517 $ — $ —
Green Fees 1,051,731 854,279 774,719 —
Monthly play cards 51,679 68,521 69,278 —
Driving range 313,633 296,933 289,511 154,322
Cart/club rentals 225,310 216,541 189,037 —
Proshop lease 25,051 24,818 24,000 18,000
Restaurant lease 53,487 39,191 26,400 18,000
Restaurant Utilities 16,260 16,980 18,000 18,000
Other Fee 20,075 22,239 24,000 24,000
Total Revenue $ 1,761,263 $ 1,577,019 $ 1,318,495 $ 232,322
EXPENDITURES
Operating Expenses
Salaries $ 77,372 $ 52,627 $ 102,731 $ 77,755
Benefits 45,263 33,056 46,811 52,160
Advertising & Publishing 7,916 5,599 15,000 15,000
Supplies and Materials 6,986 1,106 20,000 10,000
General Expense 1,038 74 — 1,450
Facilities and Equipment Purchases — 10,647 10,000 5,000
Allocated Charges 401,188 328,504 330,651 157,750
Subtotal $ 539,763 $ 431,613 $ 525,193 $ 319,115
Contract Services
Golf Maintenance $ 780,755 $ 831,130 $ 790,802 $ 217,896
Miscellaneous 8,462 — — —
Range fees 119,181 112,835 147,614 31,710
Cart Rentals 86,034 81,767 56,615 —
Club Rentals 4,666 4,880 6,490 —
Fixed management fees 338,292 319,057 345,332 30,500
Credit card fees 30,000 — 12,671 4,166
Subtotal $ 1,367,390 $ 1,349,668 $ 1,359,524 $ 284,272
* The Golf Course is anticipated to be closed from July 1, 2016 through September 2017 for renovation.
COMMUNITY SERVICES • CITY OF PALO ALTO FISCAL YEAR 2017 ADOPTED BUDGET 229

COMMUNITY SERVICES
Total Operating Expenses $ 1,907,153 $ 1,781,281 $ 1,884,717 $ 603,787
Income From Operations $ (145,890) $ (204,263) $ (469,772) $ (371,065)
Debt Expenses
Debt Service (refunded) $ 429,020 $ 429,020 $ 429,020 $ 429,020
Loan payment to General Fund for CIP Projects PG-08001 and PG-07700 — — — —
Subtotal $ 429,020 $ 429,020 $ 429,020 $ 429,020
Cost Plan Charges 27,349 20,459 25,000 25,000
Net Income (Loss) $ (602,259) $ (653,742) $ (923,792) $ (825,085)
Golf Rounds 46,257 42,048 35,354 —
* The Golf Course is anticipated to be closed from July 1, 2016 through September 2017 for renovation.
GOLF COURSE FINANCIALSFY 2014Actuals
FY 2015Actuals
FY 2016Projected
FY 2017Adopted *
CITY OF PALO ALTO FISCAL YEAR 2017 ADOPTED BUDGET 230COMMUNITY SERVICES •

COMMUNITY SERVICES
HUMAN SERVICE CONTRACTS
Human Services Contracts
FY 2016AdoptedBudget
FY 2016AgencyAward
FY 2017Base
Budget
FY 2017Agency
Request1
FY 2017AdoptedBudget
EXPENDITURE CATEGORY
Avenidas - Senior Services2 $ 453,897 $ 453,897 $ 453,897 $ 442,395 $ 465,698
PACC - Child Care Subsidy and Outreach2 459,841 459,841 459,841 448,188 471,797
Sole Source Contractors Subtotal $ 913,738 $ 913,738 $ 913,738 $ 890,583 $ 937,495
HUMAN SERVICES RESOURCE ALLOCATION PROCESS
Abilities United $ 42,477 $ 42,477 $ 42,477 $ 41,632 $ 43,582
Adolescent Counseling Services 115,770 115,770 115,770 116,000 118,780
Community Technology Alliance 8,348 8,348 8,348 10,000 8,565
Downtown Streets Team 37,991 37,991 37,991 65,000 38,978
DreamCatchers 12,936 12,936 12,936 20,000 13,272
InnVision Shelter Network 33,510 33,510 33,510 35,334 34,381
La Comida de California 34,570 34,570 34,570 35,500 35,469
MayView Community Health Center 25,650 25,650 25,650 25,000 26,317
Momentum for Mental Health 33,003 33,003 33,003 38,000 33,861
Palo Alto Housing Corporation 19,010 19,010 19,010 48,185 19,504
Peninsula HealthCare Connection Inc 28,212 28,212 28,212 41,200 28,945
Senior Adults Legal Assistance 13,687 13,687 13,687 13,750 14,043
Vista Center for the Blind & Visually Impaired 10,906 10,906 10,906 31,500 11,190
Youth Community Service 20,590 20,590 20,590 21,500 21,125
Two-Year Contractors Subtotal $ 436,659 $ 436,659 $ 436,659 $ 542,601 $ 448,013
Amount Yet to Be Allocated — — — — —
Human Services Reserve (One-Time)3 50,000 — 50,000 — 50,000
TOTAL $ 1,400,397 $ 1,350,397 $ 1,400,397 $ 1,433,184 $ 1,435,508
1) Human Services contracts are requested as part of a two-year cycle and the agencies requested the same level of funding across each year of the cycle. The FY 2017 Agency Request reflects the request made for each year.
2) Not part of the Human Services Resource Allocation Process.
3) The Human Services Reserve was created in Fiscal Year 2015 as a one-time funding source and reappropriated to2016 through the reappropriation process. Staff will request that this reserve be reappropriated to FY 2017 through the same process. In addition, City Council also approved an additional $50,000 in on-going contingency funding as part of the Adoption of the FY 2017 Budget, to be made available for emerging needs outside of the regular request cycle. This funding is displayed in the non-departmental section of this document.
CITY OF PALO ALTO FISCAL YEAR 2017 ADOPTED BUDGET 231COMMUNITY SERVICES •


DEVELOPMENT SERVICES
DEVELOPMENT SERVICESMission StatementThe mission of the Development Services Department is to work collaboratively with other departments to provide citizens, business owners, developers, and applicants reliable and predictable expectations in the review, permitting, and inspection of development projects that meet the minimum municipal and building code requirements to ensure the health, safety, and welfare of the public.
PurposeThe Development Services Department
ensures all building construction complies with a set of rules that specify the minimum standards for constructed objects. The main purpose of Development Services is to protect the public health, safety, and general welfare as they relate to the construction and occupancy of buildings and structures.
DEVELOPMENT SERVICES • CITY OF PALO ALTO FISCAL YEAR 2017 ADOPTED BUDGET 233

DEVELOPMENT SERVICES
234
ADMINISTRATION1.00 Administrative Assistant1.00 Senior Management Analyst
BUILDING SERVICES1.00 Chief Building Official1.00 Assistant Chief Building Official1.00 Planning Manager1.00 Development Center Manager1.00 Administrative Associate III2.00 Administrative Associate II4.00 Building Inspector Specialist3.00 Development Project
Coordinator III2.00 Development Project
Coordinator II
PLANNING SERVICES*5. FTE
PUBLIC WORKS* FTE
FIRE INSPECTION* FTE
DEVELOPMENT SERVICES DIRECTORPeter Pirnejad
FY 201 POSITION TOTALS.00 - Full-time
3.38 - Hourly
* Development Services activitiescross over to the Fire, Planning
and Community Environment, and Public Works departments. Thisorganizational chart represents
the city-wide Full-Time Equivalents (FTEs) for Development Services
of .00 FTEs as well as the functional support from the other
departments. The Department Summary tables summarize FTEs
by position allocation.
DEVELOPMENT SERVICES • CITY OF PALO ALTO FISCAL YEAR 2017 ADOPTED BUDGET
DEVELOPMENT SERVICES
DescriptionThe Development Services Department is responsible for the following functions:
ADMINISTRATIONLeads the organization, provides personnel, contract, budget, and project management sup-port, and liaises with other departments.
PLANNINGWorks collaboratively with City staff, consultants, and external customers to provide a link between the City’s entitlement review and building processes. Planning is also responsible for gathering and analyzing data in support of land use policy; reviewing projects for potential envi-ronmental impacts on the City and its residents; and ensuring compliance with the Zoning Ordi-nance and Comprehensive Plan.
BUILDINGProtects the public’s health, safety, and general welfare as they relate to the construction and occupancy of buildings and structures by enforcing laws and regulations that govern the design, construction, use and occupancy of buildings. Building also provides timely and profes-sional review of plans and documents for all building permit applications to ensure that the pro-posed work complies with all state and local code requirements. Following permit issuance, building inspectors ensure that construction complies with the approved plans and adopted codes in the plan review, permitting, and inspections of all buildings governed by the City of Palo Alto.
PUBLIC WORKSProvides engineering support with concern for City-owned facilities, streets, sidewalks, storm drains, and parks infrastructure as well as for the urban forest.
GREEN BUILDINGAssists and encourages applicants for all residential and non-residential projects to incorporate sustainable building materials best practices, to maximize a project’s energy and water use effi-ciency, and to maintain that level of efficiency into the future. The Green Building contractual staff works with other departments to ensure that sustainable measures are incorporated into buildings from design through construction and continue in the monitoring of building perfor-mance.
FIRE PREVENTION BUREAUEnsures compliance with the Fire Code for the safety of occupants and protection of property. They perform fire sprinkler and fire alarm plan checks, permitting, and field inspections with the goal of ensuring all construction complies with local and national codes. The Fire Prevention Bureau works closely with applicants and residents, priding themselves for the level of service they provide customers whether its keeping a project on schedule or public safety education.
DEVELOPMENT SERVICES • CITY OF PALO ALTO FISCAL YEAR 2017 ADOPTED BUDGET 235

DEVELOPMENT SERVICES
236
UTILITIESEnsures new construction compliance with standards for water, gas, wastewater, and electric utilities. Projects are required to comply, and integrate, with the City’s existing utility infrastruc-ture in accordance with local and applicable laws.
PROJECT COORDINATIONDevelopment Services provides a one-stop-shop service model that assigns a project coordina-tor to every project that applies for a building permit to ensure they are helped through the cross-departmental review process. This model ensures that the majority of permits continue to be issued over-the-counter and those applications that need more time to be reviewed are completed in accordance with established performance guidelines.
Accomplishments Adopted Green Building and Energy Reach Code ordinances maintaining Palo
Alto’s leadership position in promoting sustainable and high-performance building design and construction.
Reviewed and engaged stakeholder input into the new 2016 Building and Energy Codes and proposed a new reach code for both the Green Building and Energy Codes.
Began facilitating a public process to revise the City’s policies on seismic retrofitting of soft-story and unreinforced masonry buildings.
Implemented processes for electronic plan reviews through Accela Citizen Access (ACA), beginning with Solar photovoltaic plan review.
Continued to track and notify applicants through email on the status of City department approvals and/or expired permits.
Worked collaboratively with the Emergency Operation Center (EOC) to create an Emergency Preparation Plan for the Development Center. This plan will be reviewed and updated annually.
Launched the Green Halo/Accela integration project to assist contractors with sign-up and tracking of their recycling activities and streamline City processes.
Created an additional workstation at the front counter of the Development Center to decrease customer wait times and create better customer flow at the counter.
Completed study to evaluate fee levels to ensure Development Services costs are fully recoverable.
Entered into Citywide contract to digitally archive historical permit data to improve transparency and provide easy customer access.
Continued to work with the Utilities Department in studying the viability and cost effectiveness of Electrification/Fuel Switching from Gas to Electric appliances in single family residential construction.
DEVELOPMENT SERVICES • CITY OF PALO ALTO FISCAL YEAR 2017 ADOPTED BUDGET

DEVELOPMENT SERVICES
Continued to work with the Economic Development Department on the administration of the fully automated Business Registry process with the goal of administering our second year which will be the first year of renewals.
Began to automate portions of the Use and Occupancy Permit Process and work toward the integration with Business Registry process.
Initiated process to develop a tool that is able to track and prioritize all City-related work in the Right of Way as well as provide notice to citizens and commuters through a single purpose application.
A more comprehensive list of accomplishments was prepared and published on the City website as part of the Departments annual Action Plan.
Initiatives Work collaboratively with the Economic Development manager to implement Phase II of the
Business Registry program and integrate the existing Use and Occupancy permit process.
Work with the City Manager’s Office to develop a notification tool that is able to track and prioritize all construction work in the Right of Way.
Develop and deploy an energy efficient building code that considers the goal of reaching Zero Net Energy and Carbon Buildings.
Complete Phase I or II of Electrification Workplan to explore potential building code changes as part of the evaluation and technical feasibility of implementing electrification projects and programs.
Complete Fee Study and revise valuation based fees to ensure that all costs are fully recoverable and the department is self-supporting.
Adopt and implement new building codes and local amendments per new ordinance effective January 2017.
Continue to implement a Pre-Walk program to help tenants identify and correct accessibility problems before they submit for plan check to avoid delays in their construction projects.
Create checklists for business/commercial plan reviews.
Create new expired permit notification process to inform applicant when the building permit expires.
Update, implement, and promote a new Utilities “deferral form” to allow a later submittal date for the Utilities portion of applicant designs, expediting the issuance of building permits.
Revise, document, and enforce requirements issued by the Regional Water Quality Control Board governing the treatment and discharge of storm water into the public storm drain system.
DEVELOPMENT SERVICES • CITY OF PALO ALTO FISCAL YEAR 2017 ADOPTED BUDGET 237

DEVELOPMENT SERVICES
238
Goals and ObjectivesGOAL 1Provide a high level of customer service and decrease application review, processing, and per-mit issuance times.
Objectives: Decrease number of days to issue a permit.
Increase the number of over the counter plan checks that result in a permit issuance.
Interpret and apply building code through inspection and enforcement.
GOAL 2Work collaboratively with City departments, which support development services, to ade-quately staff and respond to workload demands and achieve excellent customer service out-comes.
Objectives: Provide customers with clear, succinct, and consistent guidelines.
Implement facility and technology enhancements.
Develop performance measures with internal and external stakeholders.
DEVELOPMENT SERVICES • CITY OF PALO ALTO FISCAL YEAR 2017 ADOPTED BUDGET

DEVELOPMENT SERVICES
Key Performance MeasuresAVERAGE NUMBER OF DAYS FROM ISSUANCE TO FINALGoal Provide a high level of customer service and decrease the total time to approve
the construction phase of a commercial tenant improvement.
Objective Decrease number of days from permit issuance to final inspection.
FY 2014 Actuals
FY 2015 Actuals
FY 2016 Adopted
FY 2016 Estimated
FY 2017 Adopted
Average number of days between permit issuance and temporary occupancy or final inspection
139 156 135 140 135
Description This measure tracks the amount of time it takes to inspect and approve commercial tenant improvement for occupancy.
Purpose
Moving new tenants into their space as quickly as possible is essential for the financial health and long-term success of new businesses. It is also important in promoting the general economic vitality of the City by reducing the number of days commercial spaces stay vacant and out of production. The goal is to provide the necessary information and coordination early in the construction phase which results in a positive outcome for the business owner while enhancing the economy of Palo Alto. Meanwhile, inspectors need to ensure construction complies with ever increasing requirements added to the building and green codes.
Status
The increase in days from permit issuance to final inspection is primarily due to additional workloads that have resulted from increased Green Building and Energy requirements. Over the past year, Development Services has experienced improvement in this number as the department works to adapt to workloads. The department is also working towards further efficiencies through development of an App that facilitates inspection scheduling. Though Development Services has experienced slower issuance to final as compared to prior years or targets, this is still in the range the department considers normal to complete a tenant improvement, and is somewhat dependent on the contractors' workload and efficiency.
DEVELOPMENT SERVICES • CITY OF PALO ALTO FISCAL YEAR 2017 ADOPTED BUDGET 239

DEVELOPMENT SERVICES
240
INSURANCE SERVICES OFFICE (ISO) RATINGGoal Exemplify the City's commitment to well-enforced building codes and a
commitment to health, safety, and general welfare.
Objective Obtain and maintain the highest rating (level 1)
FY 2014 Actuals
FY 2015 Actuals
FY 2016 Adopted
FY 2016 Estimated
FY 2017 Adopted
Insurance Services Office (ISO) Rating 2 1 1 1 1
Description
ISO administers the Building Code Effectiveness Grading Schedule (BCEGS) program for the property/casualty insurance industry. The BCEGS program assesses the building codes in effect in a particular community and how the community enforces its building codes, assigning each municipality a grade of 1 (exemplary commitment to building code enforcement) to 10.
Purpose
Municipalities with well-enforced, up-to-date codes demonstrate less property damage due to fire and natural disasters. This can be reflected in the citizens' insurance rates. BCEGS helps communities by: 1. Improving building codes (by encouraging the adoption of the most current codes), building departments, and code enforcement; 2. Promoting construction of better, more catastrophe-resistant buildings; 3. Reducing property losses from catastrophes; and 4. Reducing the economic and social disruption that results from catastrophes' serious and widespread destruction.
Status
Since receiving a rating of 4 in 2006, the Development Services department has made an effort to implement better staff training, certifications, public awareness and outreach programs. Development Services has received an Insurance Service Office (ISO) Class 1 rating and is one of only three cities in California to be honored with this distinguished award. The Class 1 rating indicates that the City maintains the highest standards for structural safety in the nation which reduces costs to Palo Alto property owners.
DEVELOPMENT SERVICES • CITY OF PALO ALTO FISCAL YEAR 2017 ADOPTED BUDGET

DEVELOPMENT SERVICES
PERCENT OF PERMITS ISSUED ON TIME
GoalWork collaboratively with City departments, which support development services, to adequately staff and respond to workload demands and achieve excellent customer service outcomes.
Objective Provide customers with clear, succinct, and consistent guidelines.
FY 2014 Actuals
FY 2015 Actuals
FY 2016 Adopted
FY 2016 Estimated
FY 2017 Adopted
Percent of permits initiated within a given period where all department reviews are completed
65.00% 73.00% 80.00% 80.00% 85.00%
Description
This measure tracks the percentage of time building permit plan reviews are completed by the estimated due date provided to the customer at permit submittal. This includes projects that are submitted for the standard 30-day review period and may require multi-departmental review and approval.
Purpose
Customers depend upon the accuracy and dependability of estimated due dates to plan their construction projects. They may move out of their house or enter into a lease on a commercial tenant space based on the estimated timeline provided by Development Services. Being successful at adhering to timelines reduces costs for developers and property owners and has a direct correlation to the economic vitality of the City.
Status
The department continues to work on implementing streamlining initiatives and innovative technologies to improve cross-departmental collaboration to improve results. Technology upgrades such as transitioning from Accela V360 to Accela version 8.0, and Accela Citizen Access, have improved the ability to streamline the exchange of information between the applicant and reviewer. This has helped put more control in the hands of the applicant, allowing them to apply for and research permits online. Further contributing to process improvement, the department has fully integrated the Fire permitting process from a paper based system to digital, and has automated Public Works, Photovoltaic, and Electric Vehicle Charger permitting. Lastly, automated reminders and a performance dashboard have been put into place to help a reviewer track, report, and prioritize plans that are late or coming due. Development Services anticipates to continue experiencing improved performance as a result of these initiatives.
DEVELOPMENT SERVICES • CITY OF PALO ALTO FISCAL YEAR 2017 ADOPTED BUDGET 241

DEVELOPMENT SERVICES
242
Workload Measures
PERCENT OF PERMITS ISSUED OVER THE COUNTERGoal Provide a high level of customer service and decrease application review,
processing. and permit issuance times.
Objective Increase the number of over the counter (OTC) plan checks that result in same day permit issuance.
FY 2014 Actuals
FY 2015 Actuals
FY 2016 Adopted
FY 2016 Estimated
FY 2017 Adopted
Percent of permits that are reviewed and approved by all necessary departments over-the-counter.
64.00% 66.00% 68.00% 69.00% 69.00%
Description
This measure tracks the percentage of permits that can be successfully reviewed and approved by all the affected City departments (over the counter) while the customer waits. This requires that Public Works, Planning, Utilities, and the Fire Prevention Bureau also review and approve the application for permit issuance. Without complete approval, the permit cannot be issued.
Purpose
To streamline the process so customers make as few trips as possible to the Development Center to obtain a permit. It is also beneficial to City staff, resulting in less reviewing and processing time than if the plans were taken in for review. This process also reduces waste as fewer plans are created and distributed for various departmental reviews.
Status
The department is continuously looking for areas to improve the ability to issue same day permits and over the past year has focused on adding necessary staff from other departments, making key information available to the counter staff by utilizing technologies, standardizing processes, and improving public outreach, education, and formalized training. While the department has seen great improvement in some areas, the ability to issue permits over the counter is a function of every division and supporting department being able to review and approve (with or without corrections). Over the past year, supporting departments have struggled to maintain staffing levels, impacting the ability to improve this measure. Until departments come to full staffing, Development Services anticipates slower progress in the ability to process permits OTC.
FY 2014 Actuals
FY 2015 Actuals
FY 2016 Adopted
FY 2016 Estimated
FY 2017 Adopted
Number of building permit applications 4,038 3,853 3,867 3,992 4,121
Number of building permits issued 3,624 3,844 3,960 4,128 4,303
Fire permit inspections 1,741 1,981 1,700 2,274 2,300
DEVELOPMENT SERVICES • CITY OF PALO ALTO FISCAL YEAR 2017 ADOPTED BUDGET

DEVELOPMENT SERVICES
%
8%
4%
9)%
%
7)%
6)%
6)%
3%
6%
4)%
%
2%
5)%
6)%
1%
)%
9%
4%
5)%
4%
6%
%
3%
Budget SummaryFY 2014 Actuals
FY 2015 Actuals
FY 2016 Adopted Budget
FY 2017 Adopted Budget
FY 2017 Change $
FY 2017Change
Dollars by Division
Administration — 2,013,944 2,401,887 2,540,932 139,045 5.
Building — 4,260,844 5,188,124 5,522,448 334,324 6.
Fire — 1,691,504 2,104,687 2,043,291 (61,396) (2.
GIS — 122,424 — — — —
Green Building — 162,731 306,125 304,000 (2,125) (0.
Planning — 663,360 871,191 787,300 (83,891) (9.
Public Works — 978,389 1,028,814 971,230 (57,584) (5.
Total — 9,893,196 11,900,829 12,169,201 268,372 2.
Dollars by Category
Salary & Benefits
Healthcare — 560,362 679,578 724,106 44,527 6.
Other Benefits — 80,329 121,448 90,624 (30,825) (25.
Overtime — 93,806 47,500 47,500 — —
Pension — 935,780 1,127,705 1,141,124 13,419 1.
Retiree Medical — 370,316 414,002 387,121 (26,880) (6.
Salary — 3,402,255 4,147,265 4,082,729 (64,536) (1.
Workers' Compensation — 532 2,174 59,091 56,917 2,618.
Total Salary & Benefits — 5,443,380 6,539,672 6,532,293 (7,378) (0.1
Allocated Charges — 850,114 877,233 972,831 95,598 10.
Contract Services — 2,351,628 2,947,394 3,107,674 160,280 5.
Facilities & Equipment — 5,553 23,800 6,300 (17,500) (73.
General Expense — 240,364 408,330 418,080 9,750 2.
Rents & Leases — 978,451 1,062,425 1,090,048 27,623 2.
Supplies & Material — 23,706 41,975 41,975 — —
Total Dollars by Expense Category
— 9,893,196 11,900,828 12,169,201 268,372 2.
DEVELOPMENT SERVICES • CITY OF PALO ALTO FISCAL YEAR 2017 ADOPTED BUDGET 243

DEVELOPMENT SERVICES
244
0)%
%
%
6%
9%
)%
1%
8)%
9)%
%
%
%
4)%
)%
40
71
44
75
—
60
94
56
16
88
—
%
Revenues
Charges for Services — 6,613,781 7,662,624 6,974,082 (688,542) (9.
Charges to Other Funds — 66,351 21,797 21,797 — —
Other Revenue — 153 — — — —
Other Taxes and Fines — 7,000 4,139 4,247 108 2.
Permits and Licenses — 5,397,801 6,513,884 6,700,758 186,875 2.
Total Revenues — 12,085,087 14,202,444 13,700,885 (501,559) (3.5
Positions by Division
Administration — 4.66 3.25 5.21 1.96 60.3
Building — 15.61 18.17 17.21 (0.96) (5.2
Fire — 8.37 9.23 7.08 (2.15) (23.2
GIS — 0.65 — — — —
Green Building — 0.85 — — — —
Planning — 5.83 5.69 5.69 — —
Public Works — 6.00 5.36 4.72 (0.64) (11.9
Total — 41.97 41.70 39.91 (1.79) (4.29
Staffing
Job ClassificationFY 2014 Actuals
FY 2015 Actuals
FY 2016 Adopted Budget
FY 2017 Adopted Budget
FY 2017 Change $
FY 2017Salary
Administrative Assistant — 1.00 1.00 1.00 — 86,3
Administrative Associate II — 3.02 3.02 3.00 (0.02) 203,8
Administrative Associate III — 1.01 1.01 1.00 (0.01) 72,8
Assistant Chief Building Official — — 1.00 1.00 — 116,8
Assistant Director Public Works — 0.02 0.02 — (0.02)
Associate Engineer — 0.16 0.16 0.02 (0.14) 1,8
Associate Planner — 0.90 0.90 0.90 — 84,3
Building Inspector Specialist — 3.00 4.00 4.00 — 365,3
Building/Planning Technician — 1.80 1.80 2.30 0.50 145,4
Chief Building Official — 1.00 1.00 1.00 — 157,7
Chief Planning Official — 0.20 0.20 — (0.20)
Budget SummaryFY 2014 Actuals
FY 2015 Actuals
FY 2016 Adopted Budget
FY 2017 Adopted Budget
FY 2017 Change $
FY 2017Change
DEVELOPMENT SERVICES • CITY OF PALO ALTO FISCAL YEAR 2017 ADOPTED BUDGET

DEVELOPMENT SERVICES
44
22
60
86
15
97
72
11
—
95
74
29
08
51
65
85
38
05
39
—
56
62
—
70
82
45
96
45
28
—
89
Code Enforcement Officer — 0.50 0.40 0.40 — 35,9
Code Enforcement-Lead — — 0.20 0.20 — 17,8
Deputy Chief/Fire Marshal — 0.84 0.85 0.80 (0.05) 129,2
Development Project Coordinator II — 2.00 2.00 2.00 — 136,5
Development Project Coordinator III — 3.00 3.00 3.00 — 268,7
Development Services Director — 1.00 1.00 1.00 — 191,2
Engineer — 0.62 0.62 0.64 0.02 72,7
Engineering Technician III — 2.10 2.10 1.78 (0.32) 134,8
Fire Fighter — 1.00 1.00 — (1.00)
Fire Inspector — 4.00 4.00 3.20 (0.80) 428,1
Hazardous Materials Inspector — 1.90 1.90 1.60 (0.30) 223,6
Industrial Waste Inspector — 0.01 0.01 0.01 — 8
Industrial Waste Investigator — 0.21 0.21 0.35 0.14 32,6
Inspector, Field Services — 0.70 0.70 0.68 (0.02) 61,4
Management Analyst — 0.01 0.01 1.01 1.00 100,1
Manager Development Center — 1.00 1.00 1.00 — 118,1
Manager Environmental Control Program — 0.10 0.10 0.10 — 12,1
Manager Planning — 1.80 2.00 2.00 — 258,6
Manager Urban Forestry — 0.04 0.04 0.04 — 5,5
Manager Watershed Protection — 0.05 0.05 — (0.05)
Planner — 0.80 0.25 0.17 (0.08) 16,4
Planning Arborist — 0.25 0.25 0.25 — 27,3
Plans Check Engineer — 1.00 — — —
Project Engineer — 0.15 0.13 0.03 (0.10) 3,6
Project Manager — 0.07 0.07 0.07 — 6,5
Senior Engineer — 0.68 0.68 0.46 (0.22) 67,8
Senior Industrial Waste Investigator — 0.01 0.01 0.01 — 9
Senior Management Analyst — 1.00 1.00 1.00 — 114,5
Senior Planner — 0.40 0.36 0.24 (0.12) 24,4
Senior Technologist — 0.50 — — —
Supervisor Inspection and Surveying — 0.27 0.27 0.27 — 30,9
Staffing
Job ClassificationFY 2014 Actuals
FY 2015 Actuals
FY 2016 Adopted Budget
FY 2017 Adopted Budget
FY 2017 Change $
FY 2017Salary
DEVELOPMENT SERVICES • CITY OF PALO ALTO FISCAL YEAR 2017 ADOPTED BUDGET 245

DEVELOPMENT SERVICES
246
—
13
84
97
Surveyor, Public Works — 0.47 — — —
Sub-total: Full-Time Equivalent Positions
— 38.59 38.32 36.53 (1.79) 3,756,2
Temporary/Hourly — 3.38 3.38 3.38 — 213,6
Total Positions — 41.97 41.70 39.91 (1.79) 3,969,8
Budget ReconciliationPositions Expenditures Revenues
Net General Fund
Prior Year Budget 41.70 11,900,828 14,202,444 (2,301,616)
Base Adjustments
One-Time Prior Year Expenditures and Revenues Deleted
Development Services Center Buildout — (20,000) — (20,000)
Green Building Cost Effectiveness Study — (50,000) — (50,000)
Development Services Department Fee Study — (40,000) — (40,000)
One-Time Prior Year Expenditures and Revenues
— (110,000) — (110,000)
Adjustments to Costs of Ongoing Activities
Revenue and Expenditure Adjustments — (157,774) (370,891) 213,117
Salary and Benefits Adjustments 1.00 544,330 — 544,330
Mayfield Development Contract Services — 371,280 371,280 —
Rental Charges Adjustments — 27,623 — 27,623
Vehicle Maintenance Charges — 66,408 — 66,408
Information Technology Allocated Charges Adjustment — 134,364 — 134,364
Liability Insurance Allocated Charges Adjustment — (77,718) — (77,718)
Print & Mail Allocated Charges Adjustment — (28,192) — (28,192)
Adjustments to Costs of Ongoing Activities 1.00 880,321 389 879,932
Total FY 2017 Base Budget 42.70 12,671,149 14,202,833 (1,531,684)
Staffing
Job ClassificationFY 2014 Actuals
FY 2015 Actuals
FY 2016 Adopted Budget
FY 2017 Adopted Budget
FY 2017 Change $
FY 2017Salary
DEVELOPMENT SERVICES • CITY OF PALO ALTO FISCAL YEAR 2017 ADOPTED BUDGET

DEVELOPMENT SERVICES
Budget Adjustments
1 Landscape Review and Green Building Consultant — 50,000 50,000 —
2 Front Counter Planning Technician 0.50 55,974 55,974 —
3 Realignment of Fire Prevention, Planning, and Public Works' Staff (3.29) (607,922) (607,922) —
Total Budget Adjustments (2.79) (501,948) (501,948) —
Total FY 2017 Adopted Budget 39.91 12,169,201 13,700,885 (1,531,684)
Budget AdjustmentsBudget Adjustments Positions Expenditures Revenues
Net General Fund
1 Landscape Review and Green Building Consultant 0.00 50,000 50,000 0
This action adds $50,000 in revenues and expenses for additional consultant plan-check services associated with establishing a permit process for landscape projects separate from the standard building permit process. All cities are required to either adopt the State Department of Water Resources (DWR) Model Water Efficient Landscape Ordinance (MWELO) or adopt a local or regional ordinance at least as effective as the model ordinance in saving water. Enabling a separate permit process for landscape projects in order to facilitate that effectiveness will require additional consultant time to complete plan checks and inspections. As part of the development of the 2017 Municipal Fee Schedule, a separate fee for landscape permits will be recommended, and the revenues from those fees are anticipated to offset the additional costs of processing the permits.
Performance Results
This action will ensure appropriate cost recovery levels and a high level of customer service are maintained while meeting the state requirements.
Budget ReconciliationPositions Expenditures Revenues
Net General Fund
DEVELOPMENT SERVICES • CITY OF PALO ALTO FISCAL YEAR 2017 ADOPTED BUDGET 247

DEVELOPMENT SERVICES
248
2 Front Counter Planning Technician 0.50 55,974 55,974 0
This action adds 0.5 Planning Technician to the Development Services Department to provide front desk support at the Development Services counter to answer planning related questions as part of the development review process. This work was previously done by planners from Planning and Community Environment (PCE) that would rotate through the Development Center. Now that work will be consolidated into one half time position in lieu of the planner rotations. Those positions have been eliminated from the Development Services staffing and reallocated to PCE as discussed below. The other 0.5 of the Planning Technician position will be funded through PCE and will be responsible for the intake of planning entitlement applications at the Development Center. (Ongoing costs: $55,974)
Performance Results
This action will ensure a high level of customer satisfaction with the front counter of Development Services.
3 Realignment of Fire Prevention, Planning, and Public Works' Staff -3.29 (607,922) (607,922) 0
This action reallocates 2.15 FTE to the Fire Department, 0.64 FTE to Public Works, and 0.5 FTE to PCE from the Development Services Department (as discussed above) and reduces the revenue estimate by a corresponding amount. Development Services and its partner departments continue to examine the staffing complement necessary to align the permitting function of Development Services with each individual department’s expertise and this shift represents the iterative effort for FY 2017. This action aligns permitting staffing between Development Services and its partner departments by reallocating small portions of various positions that were determined not to be directly related to the permitting function of Development Services. There is no service delivery change for this shift for Development Services, since this represents the portion of positions that were not working on Development Services work. The shift in staff allocation back to the respective department is discussed in each department section of this budget document, and is represented as an addition for each department. (Ongoing costs: $0)
Performance Results
This action ensures that costs for development services permitting are aligned with the work being performed and appropriately billed to customers through fees and that the high level of quality of those services is maintained.
Budget AdjustmentsBudget Adjustments Positions Expenditures Revenues
Net General Fund
DEVELOPMENT SERVICES • CITY OF PALO ALTO FISCAL YEAR 2017 ADOPTED BUDGET

FIRE
FIREMission StatementWe are a professional team of men and women dedicated to safeguarding and enriching the lives of anyone, anytime, anywhere with compassion and pride.
PurposeThe purpose of the Fire Department is to protect life, property, and the environment from fire, hazardous materials, and other disasters; to provide rapid emergency response, proactive code enforcement, modern fire prevention methods, and pro-gressive safety education for our citizens and coworkers; and to promote customer satisfaction by maintaining quality, profes-sional, and friendly service to others.
FIRE • CITY OF PALO ALTO FISCAL YEAR 2017 ADOPTED BUDGET 249
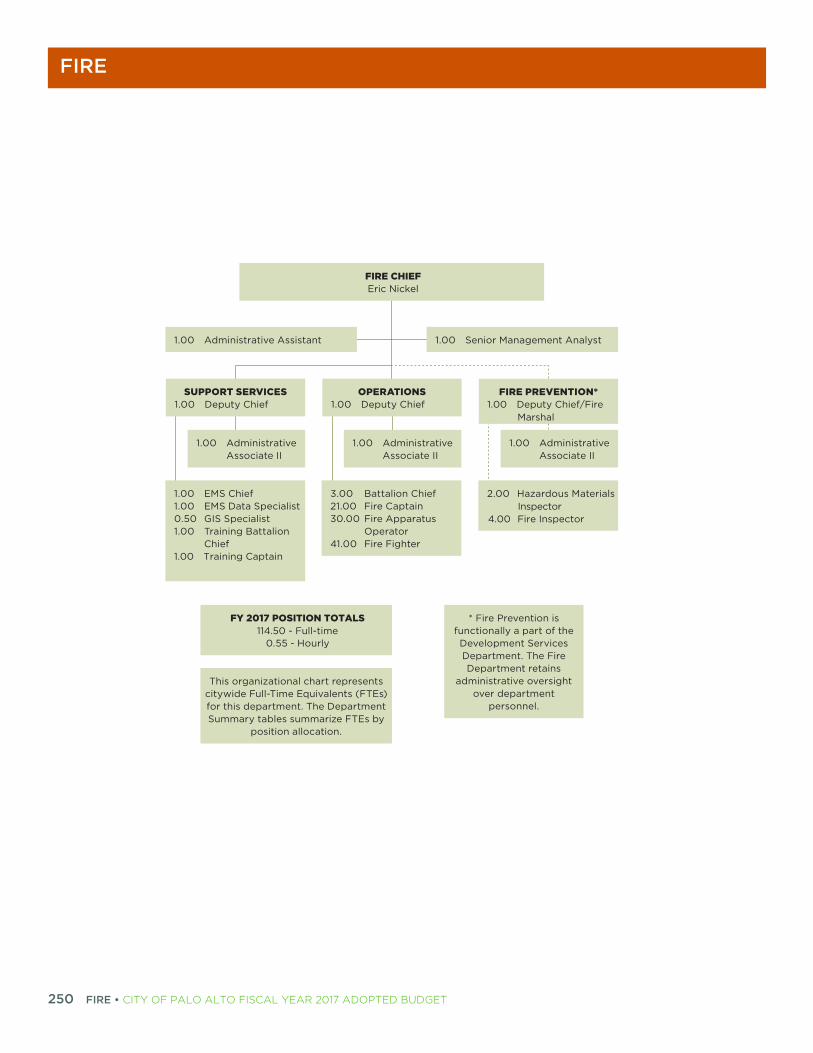
FIRE
250
1.00 EMS Chief1.00 EMS Data Specialist0.50 GIS Specialist1.00 Training Battalion
Chief1.00 Training Captain
3.00 Battalion Chief21.00 Fire Captain 30.00 Fire Apparatus
Operator41.00 Fire Fighter
2.00 Hazardous Materials Inspector
4.00 Fire Inspector
1.00 Administrative Assistant 1.00 Senior Management Analyst
1.00 Administrative Associate II
1.00 Administrative Associate II
1.00 Administrative Associate II
SUPPORT SERVICES1.00 Deputy Chief
OPERATIONS1.00 Deputy Chief
FIRE PREVENTION*1.00 Deputy Chief
FIRE CHIEFEric Nickel
11 . 0 - Full-time 0.55 - Hourly
This organizational chart represents citywide Full-Time Equivalents (FTEs) for this department. The Department Summary tables summarize FTEs by
position allocation.
* Fire Prevention isfunctionally a part of the Development Services Department. The Fire Department retains
administrative oversight over department
personnel.
FIRE • CITY OF PALO ALTO FISCAL YEAR 2017 ADOPTED BUDGET

FIRE
DescriptionThe Fire Department provides a wide range of community and employee related services for the City of Palo Alto through the following service programs:
FIRE SUPPRESSIONMaintain a state of readiness to effectively respond to emergency and non-emergency calls. Provide a means for a safer Palo Alto through community outreach, public education, and pre-vention.
EMERGENCY MEDICAL SERVICESIn an emergency setting, rapid assessment, treatment and transport of patients to definitive care in a safe and efficient manner.
FIRE PREVENTION BUREAUImprove the quality of life for the Palo Alto community through risk assessment, code enforce-ment, fire investigation, public education, and hazardous materials management.
EMPLOYEE FIRE/EMS CERTIFICATION TRAININGProvide training to certify that staff maintain safe, efficient, and effective practices when responding to emergencies. Ensure personnel are familiar with and able to utilize the most up to date and proven techniques. Training specific to required EMT and/or Paramedic re-certification is also incorporated.
Accomplishments Responded to 135 fire incidents in Fiscal Year 2015 with 86% of responses within 8 minutes.
Responded to 5,270 medical/rescue calls in Fiscal Year 2015; 99% of paramedic calls for service were responded to within 12 minutes and 92% of emergency medical calls within 8 minutes.
Conducted 1,964 Fire Inspections in Fiscal Year 2015, a 13% increase from the prior fiscal year.
Emergency Medical Services (EMS) revenue totaled approximately $3.05 million in Fiscal Year 2015, a nearly 50% increase over the last five years.
More than doubled the number of safety presentations and demonstrations through expanded outreach efforts, providing a total of 218 events in Fiscal Year 2015.
Completed Standards of Cover Study assessing the risks in the community and making recommendations to maximize resources to enhance service to the community.
Developed key succession planning tools and robust training schedule to prepare the next generation of fire professionals.
FIRE • CITY OF PALO ALTO FISCAL YEAR 2017 ADOPTED BUDGET 251

FIRE
252
Implemented Medical Priority Dispatch and finalized Auto Aid agreements with local agencies, providing enhanced response for the community.
Coordinated with national and regional partners on the planning and security efforts of Super Bowl 50.
Completed successful negotiations with Local IAFF 1319 for a new labor contract.
Celebrated the 40th Anniversary of providing Paramedic and Ambulance Service.
Hired and successfully graduated 2 fire recruits in the Santa Clara County Joint Fire Academy.
The Department maintained its Class 2 Insurance Services Office (ISO) ranking.
Initiatives Develop and implement operational enhancements and recommendations from the
Standards of Cover, with a focus on optimizing the Operational Readiness of the Department.
Continue to invest in and focus on training plans, professional certifications and succession planning efforts to develop a highly effective and prepared emergency response workforce.
Support efforts to modernize and replace essential public safety facilities, investing in updating equipment, and station furniture.
Evaluate community and public health risks and explore evidence-based prevention programs to reduce those risks.
Continue to work with Stanford University to renegotiate a service delivery contract for Emergency Response Services to the campus.
Goals and ObjectivesGOAL 1Arrive at the scene of emergencies safely and in a timely manner within the Department’s tar-geted response times.
Objectives: Promote timely adherence to Santa Clara County’s clinical protocols and ensure consistent
medical care in both Advanced and Basic Life Support (ALS/BLS) to the Palo Alto and Stanford communities.
Provide the highest level of patient care and response standards by ensuring Palo Alto ambulances respond to all ambulance calls for service.
Fire response time will be within 8 minutes 90 percent of the time.
Advanced Life Support (ALS) response times will be within 12 minutes 90 percent of the time.
FIRE • CITY OF PALO ALTO FISCAL YEAR 2017 ADOPTED BUDGET

FIRE
GOAL 2Ensure reasonable life safety conditions through inspection programs.
Objectives: Perform periodic inspections of all facilities within department’s designated target cycle
time.
Identify and direct abatement of conditions or operating procedures which could cause an increase in probability or severity of a fire or hazardous materials release.
GOAL 3Develop, maintain, and sustain a comprehensive community risk reduction program that engages the whole community.
Objectives: Support the Office of Emergency Services, the Palo Alto and Stanford Citizen Corps Council
and the Emergency Services Volunteers in training and preparation in the areas of Medical Disaster Operations, Triage, Fire Suppression, and Light Search and Rescue.
Complete an Integrated Risk Assessment and Management Plan designed to identify and quantify community risks and mitigation strategies.
Identify high-risk communities within the City of Palo Alto and design risk reduction programs for the highest risk groups.
GOAL 4Enhance training and maintain all certifications required by governing agencies such as the State Fire Marshal’s Office and Santa Clara County Emergency Medical Services Office.
Objectives: Document all training through the Joint Apprenticeship Committee (JAC).
Maintain the required minimum of 20 hours/month per employee of fire related training.
Maintain, as mandated, records of training related to EMS and EMT/Paramedic certification.
GOAL 5Internalize commitment to excellence in public service by continuously evaluating the assis-tance provided, identifying areas needing improvement, and implementing mitigation methods.
Objective: Maintain awareness of service quality by focusing on customers’ view of assistance that was
provided.
FIRE • CITY OF PALO ALTO FISCAL YEAR 2017 ADOPTED BUDGET 253

FIRE
254
Key Performance MeasuresFIRE DEPARTMENT RESPONSE TIMESGoal Arrive at the scene of emergencies safely and in a timely manner within the
department's targeted response times.
Objective Fire and EMS response times will be within 8 minutes, and Advanced Life Support (ALS) response times will be within 12 minutes 90 percent of the time.
FY 2014 Actuals
FY 2015 Actuals
FY 2016 Adopted
FY 2016 Estimated
FY 2017 Adopted
Percent of responses to EMS calls within 8 minutes 90.00% 92.00% 90.00% 92.00% 90.00%
Percent of responses to paramedic calls within 12 minutes 98.00% 99.00% 99.00% 98.00% 99.00%
Percent of responses to fire emergencies within 8 minutes 86.00% 83.00% 90.00% 90.00% 90.00%
Description This measure tracks the percentage of calls for service that are within established response time percentiles.
PurposeQuick response times can mean the difference between short and long-term recovery, the extent and severity of injury, and most importantly, the difference between life and death.
Status
In Fiscal Year 2015, the Fire Department responded to 99 percent of paramedic calls for service within 12 minutes and responded to 92 percent of emergency medical calls within 8 minutes. The Department responded to 83 percent of fire calls within 8 minutes; however, this is typical of historical performance. The Fire Department is in the process of conducting a Community Focused Integrated Risk Management Assessment, which is expected to help management identify data informed ways to improve performance in this area.
FIRES CONTAINED TO ROOM OF ORIGINGoal Limit structural fire damage to the room or area of origin.
Objective Contain fires to the room or area of origin 90% of the time.
FY 2014 Actuals
FY 2015 Actuals
FY 2016 Adopted
FY 2016 Estimated
FY 2017 Adopted
Percent of fires contained to the room or area of origin. 53.00% 92.00% 90.00% 75.00% 90.00%
Description This measure tracks the percentage of fires that are contained to the room of origin.
Purpose Containing a fire to the room of origin limits damage and spread of the fire.
Status
In Fiscal Year 2015, the Department limited 92 percent of fires to the room of origin which was above the goal of 90 percent. This measure can vary significantly from year to year because of the small number of structure fires the Department responds to each year. It is expected that the number of fires contained to area of origin will be low in Fiscal Year 2016. In the first half of Fiscal Year 2016 there have been three building fires within Palo Alto and one on Stanford. Two of which were not contained to room or area of origin as the fire had spread throughout the entire structure prior to arriving on scene, despite a response time under 8 minutes.
FIRE • CITY OF PALO ALTO FISCAL YEAR 2017 ADOPTED BUDGET

FIRE
Workload Measures
PERCENT OF SURVEYED RESIDENTS RATING FIRE DEPARTMENT SERVICES GOOD OR EXCELLENT
GoalInternalize commitment to excellence in public service by continuously evaluating the assistance provided, identifying areas needing improvement, and implementing mitigation methods.
Objective Maintain awareness of service quality by focusing on customers' view of assistance that was provided.
FY 2014 Actuals
FY 2015 Actuals
FY 2016 Adopted
FY 2016 Estimated
FY 2017 Adopted
Percent of surveyed residents rating fire services good or excellent 95.00% 97.00% 90.00% 95.00% 95.00%
Percent of surveyed residents rating fire prevention services good or excellent
85.00% 85.00% 85.00% 85.00% 85.00%
Percent of surveyed residents rating ambulance/EMS services good or excellent
97.00% 95.00% 90.00% 95.00% 95.00%
Description
This measure tracks the percent of surveyed residents rating fire and emergency services good or excellent, as well as Fire Prevention Services, as reported monthly from the Customer Satisfaction Survey. Collecting this data allows the Department to compare itself to nationwide benchmarking data prepared by the National Research Center.
Purpose Citizen satisfaction with Fire Department services is an important assessment of the overall quality of fire services offered to the community.
Status More than 90 percent of surveyed residents have rated fire and EMS/ambulance services good or excellent in each of the last ten years.
FY 2014 Actuals
FY 2015 Actuals
FY 2016 Adopted
FY 2016 Estimated
FY 2017 Adopted
Number of ambulance transports 3,648 3,862 3,650 3,750 3,750
Fire calls average response time (Minutes) 6:01 4:57 6:00 5:45 5:45
Medical/rescue calls average response time (Minutes) 5:42 5:11 6:00 5:45 5:45
Number of fire calls for service 150 135 150 150 150
Number of medical/rescue calls for service 4,757 5,270 4,800 5,200 5,200
Number of all other calls for service 2,922 3,143 2,900 2,900 2,950
Total number of calls for service 7,829 8,548 7,850 8,250 8,300
FIRE • CITY OF PALO ALTO FISCAL YEAR 2017 ADOPTED BUDGET 255

FIRE
256
%
)%
1%
)%
)%
5%
1%
4%
)%
2%
9%
2%
7%
)%
0%
)%
)%
)%
4%
)%
1%
Budget SummaryFY 2014 Actuals
FY 2015 Actuals
FY 2016 Adopted Budget
FY 2017 Adopted Budget
FY 2017 Change $
FY 2017Change
Dollars by Division
Administration 1,945,134 1,981,824 1,370,596 1,063,714 (306,882) (22.4
Emergency Response 23,311,464 22,921,088 23,490,538 25,851,773 2,361,236 10.
Environmental Safety Management 1,733,252 119,869 268,617 240,826 (27,791) (10.3
Records and Information Management 297,590 304,232 404,459 310,202 (94,257) (23.3
Training and Personnel 907,407 863,963 997,470 1,480,777 483,308 48.
Total 28,194,847 26,190,976 26,531,679 28,947,292 2,415,613 9.
Dollars by Category
Salary & Benefits
Healthcare 2,027,932 1,856,739 2,055,608 2,186,317 130,710 6.
Other Benefits 327,002 307,179 275,716 225,618 (50,098) (18.2
Overtime 2,561,323 2,171,315 1,382,714 1,413,714 31,000 2.
Pension 4,017,288 4,208,876 4,295,773 5,324,358 1,028,585 23.
Retiree Medical 2,221,868 2,287,736 2,380,926 2,433,066 52,140 2.
Salary 11,786,410 10,943,398 10,830,552 12,861,242 2,030,690 18.
Workers' Compensation 1,081,608 792,688 914,825 338,640 (576,185) (63.0
Total Salary & Benefits 24,023,431 22,567,930 22,136,114 24,782,955 2,646,841 12.
Allocated Charges 2,872,342 2,655,297 2,971,923 2,860,444 (111,478) (3.8
Contract Services 534,692 349,717 591,325 516,325 (75,000) (12.7
Facilities & Equipment 117,488 132,113 207,200 157,200 (50,000) (24.1
General Expense 195,346 180,838 209,472 264,722 55,250 26.
Supplies & Material 451,548 305,080 415,645 365,645 (50,000) (12.0
Total Dollars by Expense Category
28,194,847 26,190,976 26,531,679 28,947,291 2,415,613 9.
FIRE • CITY OF PALO ALTO FISCAL YEAR 2017 ADOPTED BUDGET

FIRE
7%
%
3%
%
%
8%
0%
%
%
%
%
7%
1%
27
96
09
14
07
31
78
58
78
09
%
Revenues
Charges for Services 11,172,052 11,628,005 11,474,300 11,778,932 304,632 2.
Charges to Other Funds 192,398 161,322 161,322 161,322 — —
From Other Agencies — 319,454 80,000 129,000 49,000 61.
Other Revenue 57,652 221,498 57,000 57,000 — —
Other Taxes and Fines 275 — 1,000 1,000 — —
Permits and Licenses 528,427 2,970 15,000 15,713 713 4.
Total Revenues 11,950,804 12,333,249 11,788,622 12,142,967 354,345 3.
Positions by Division
Administration 3.50 4.00 3.00 3.00 — —
Emergency Response 103.11 99.07 99.07 99.07 — —
Environmental Safety Management 9.66 0.48 0.48 0.48 — —
Records and Information Management 1.50 1.50 1.50 1.50 — —
Training and Personnel 3.00 3.00 3.00 5.15 2.15 71.6
Total 120.77 108.05 107.05 109.20 2.15 2.0
Staffing
Job ClassificationFY 2014 Actuals
FY 2015 Actuals
FY 2016 Adopted Budget
FY 2017 Adopted Budget
FY 2017 Change $
FY 2017Salary
40-Hour Training Battalion Chief — 1.00 1.00 1.00 — 156,7
40-Hour Training Captain 1.00 — 1.00 1.00 — 139,7
Administrative Assistant 1.50 1.50 1.00 1.00 — 77,2
Administrative Associate II 3.00 2.00 2.00 2.00 — 135,9
Battalion Chief 3.00 3.00 3.00 3.00 — 447,8
Business Analyst 0.80 0.80 0.80 0.80 — 100,9
Deputy Chief/Fire Marshal 0.84 — — 0.05 0.05 8,0
Deputy Director Technical Services Division 0.20 0.20 0.20 0.20 — 36,1
Deputy Fire Chief 2.00 2.00 2.00 2.00 — 384,7
Emergency Medical Service Director 1.00 1.00 1.00 1.00 — 137,0
Budget SummaryFY 2014 Actuals
FY 2015 Actuals
FY 2016 Adopted Budget
FY 2017 Adopted Budget
FY 2017 Change $
FY 2017Change
FIRE • CITY OF PALO ALTO FISCAL YEAR 2017 ADOPTED BUDGET 257

FIRE
258
44
08
49
99
82
47
05
38
—
01
80
86
66
Emergency Medical Services Data Specialist 1.00 1.00 1.00 1.00 — 72,8
Fire Apparatus Operator 30.00 30.00 30.00 30.00 — 3,530,6
Fire Captain 22.00 22.00 21.00 21.00 — 2,815,4
Fire Chief 1.00 1.00 1.00 1.00 — 223,5
Fire Fighter 41.00 40.00 40.00 41.00 1.00 4,295,3
Fire Inspector 4.00 — — 0.80 0.80 107,0
Geographic Information System Specialist 0.50 0.50 0.50 0.50 — 53,2
Hazardous Materials Inspector 1.90 — — 0.30 0.30 41,9
Police Chief 0.50 0.50 — — —
Senior Management Analyst 0.50 1.00 1.00 1.00 — 131,6
Sub-total: Full-Time Equivalent Positions
115.74 107.50 106.50 108.65 2.15 12,896,0
Temporary/Hourly 5.03 0.55 0.55 0.55 — 49,5
Total Positions 120.77 108.05 107.05 109.20 2.15 12,945,6
Budget ReconciliationPositions Expenditures Revenues
Net General Fund
Prior Year Budget 107.05 26,531,679 11,788,622 14,743,057
Base Adjustments
One-Time Prior Year Expenditures Deleted
Regional Fire and Emergency Medical Services Efficiency Study — (75,000) — (75,000)
Community Public Health Consultant Study — (50,000) — (50,000)
Automated External Defibrillators — (50,000) — (50,000)
Fire Station Furniture, Fixtures, and Equipment - Phase 1 — (50,000) — (50,000)
New Ambulance Build-out and Equipment — (30,000) — (30,000)
International Fire Department Accreditation - Phase 1 — (25,000) — (25,000)
Emergency Medical Equipment — (20,000) — (20,000)
One-Time Prior Year Expenditures — (300,000) — (300,000)
Staffing
Job ClassificationFY 2014 Actuals
FY 2015 Actuals
FY 2016 Adopted Budget
FY 2017 Adopted Budget
FY 2017 Change $
FY 2017Salary
FIRE • CITY OF PALO ALTO FISCAL YEAR 2017 ADOPTED BUDGET

FIRE
Adjustments to Costs of Ongoing Activities
Salary and Benefits Adjustments — 2,656,650 — 2,656,650
Medical Transport Reimbursement/Revenue from Other Agencies — 49,000 49,000 —
Paramedic Services Revenue Adjustment — — 270,520 (270,520)
Permits and Licenses Revenue Adjustment — — 738 (738)
Stanford Emergency Fire Services Revenue Adjustment (Align Fiscal Year 2017 Expenditures with Stanford Fire Agreement 2nd Amendment)
— — 454,312 (454,312)
Plan Checking Fee Revenue Correction (Approved in Fiscal Year 2016 Mid Year) — — (269,000) 269,000
Management Development Adjustment — (750) — (750)
Vehicle Maintenance Allocated Charges Adjustments — 254,641 — 254,641
General Liability Insurance Allocated Charges Adjustments — (187,386) — (187,386)
Information Technology Allocated Charges Adjustments — (188,987) — (188,987)
Print and Mail Allocated Charges Adjustments — 5,073 — 5,073
Utilities Allocated Charges Adjustments — 5,180 — 5,180
Adjustments to Costs of Ongoing Activities — 2,593,421 505,570 2,087,851
Total FY 2017 Base Budget 107.05 28,825,100 12,294,192 16,530,908
Budget Adjustments
1 Realignment of Fire Prevention Staff from Development Services Department 2.15 412,867 — 412,867
2 Fire Station Furniture, Fixtures, and Equipment - Phase 2 — 125,000 — 125,000
3 California Incident Command Certification System Training — 38,000 — 38,000
4 Fire Services Staffing — (453,676) (151,225) (302,451)
Total Budget Adjustments 2.15 122,191 (151,225) 273,416
Total FY 2017 Adopted Budget 109.20 28,947,291 12,142,967 16,804,324
Budget ReconciliationPositions Expenditures Revenues
Net General Fund
FIRE • CITY OF PALO ALTO FISCAL YEAR 2017 ADOPTED BUDGET 259

FIRE
260
Budget AdjustmentsBudget Adjustments Positions Expenditures Revenues
Net General Fund
1 Realignment of Fire Prevention Staff from Development Services Department 2.15 412,867 0 412,867
This action reallocates 2.15 FTE to the Fire Department from the Development Services Department. Development Services and its partner departments continue to examine the staffing complement necessary to align the permitting function of Development Services with each individual department’s expertise, and this shift represents the iterative effort for FY 2017. This action aligns permitting staffing between Development Services and the Fire Department by reallocating small portions of various positions that were determined not to be directly related to the permitting function of Development Services. There is no service delivery change for this shift, since this represents the portion of Fire positions that are in fire suppression training and not working on fire inspections. Additional discussion regarding this shift can be found in the Development Services Department section of this document. (Ongoing Costs: $412,867)
Performance Results
This action ensures that costs for development services permitting are aligned with the work being performed and that the high level of quality of those services is maintained.
2 Fire Station Furniture, Fixtures, and Equipment - Phase 2 0.00 125,000 0 125,000
In Fiscal Year 2015, the Fire Department performed an assessment of the furniture, fixtures, and equipment (FF&E) at all seven fire stations. This study determined that the dorm and day room furniture along with the exercise equipment and the kitchen fixtures were at or beyond their useful life and needed replacement. In Fiscal Year 2016, $50,000 was appropriated for Phase 1 of the FF&E replacement to purchase bed frames and mattresses for all stations, day room recliners for all stations, dining chairs for three stations, and kitchen fixtures for Fire Station 2. In Fiscal Year 2017, $125,000 will be appropriated to upgrade exercise equipment at five of the seven fire stations. Annually, the need for further replacement of aging FF&E will be assessed and prioritized based on the replacement schedule and funding will be appropriated as part of future budget processes. (Ongoing Costs: $0)
Performance Results
Replacement of fire station FF&E will increase the quality of the fire stations and increase the morale of the Fire Department personnel who are stationed there. Updated exercise equipment promotes the City's Wellness Program and helps to maintain healthy, fit, and capable fire service personnel throughout their career. In addition, promoting Wellness in the Fire Department is in alignment with national standards for fire personnel safety and wellness and has shown to decrease injury and disability rates.
FIRE • CITY OF PALO ALTO FISCAL YEAR 2017 ADOPTED BUDGET

FIRE
3 California Incident Command Certification System Training 0.00 38,000 0 38,000
The California Incident Command Certification System (CICCS) sets standard roles and responsibilities for regional firefighting activities to ensure firefighters deployed to Statewide firefighting efforts (strike teams) are safe and appropriately equipped. This funding will allow the Fire Department's Captains and Battalion Chiefs to complete the required ongoing CICCS training to serve in command post positions when deployed to Statewide strike team incidents. (Ongoing Costs: $38,000)
Performance Results
As part of the Statewide Mutual Aide Program, the Palo Alto Fire Department is expected to send available strike teams to fire incidents around California when requested. Participating in the CICCS training is mandated by the State in order to participate in these strike teams. In addition, this training will enhance the leadership and tactical skills of the Fire Department command staff for higher quality fire fighting in Palo Alto.
4 Fire Services Staffing 0.00 (453,676) (151,225) (302,451)
This action eliminates funding equivalent to the average cost of 2.0 full time sworn fire positions in Fiscal Year 2017. The salary and benefit savings are partially offset by a loss in Charges for Services revenue as a result of the contract terms with Stanford University to reimburse the City for providing Fire Services to the University. An overall assessment of the Fire Department's staffing needs will be done in Fiscal Year 2017 as part of the development of the Fiscal Year 2018 Budget to determine if these positions are needed on an ongoing basis. (Ongoing Savings: $0)
Performance Results
Freezing these positions for a year will have minimal impact on the services provided by the Department since the positions are currently vacant.
Budget AdjustmentsBudget Adjustments Positions Expenditures Revenues
Net General Fund
FIRE • CITY OF PALO ALTO FISCAL YEAR 2017 ADOPTED BUDGET 261


HUMAN RESOURCES
HUMAN RESOURCESMission StatementThe Human Resources Department’s mission is to recruit, develop, and retain a diverse, well-qualified, and professional workforce that reflects the high standards of the community we serve, and to lead City departments in positive employee relations, talent management, succession planning, and employee engagement.
PurposeThe purpose of Human Resources is to lead strategic planning to align employee skills, staffing, and productivity with City goals in order to deliver premier services
to the residents of Palo Alto and to City staff; to support City departments and employees in achieving their key goals and objectives through dedicated Human Resources Business Partners; to provide a range of services to City employees, including new employee orientation, staffing and recruitment man-agement, talent and skill development, performance assessment, and safety and wellness programs; and to deliver employee relations, compensation, job classification, risk management, and organization development services effi-ciently to City departments.
HUMAN RESOURCES • CITY OF PALO ALTO FISCAL YEAR 2017 ADOPTED BUDGET 263

HUMAN RESOURCES
264
HUMAN RESOURCES EMPLOYEE AND LABOR RELATIONS
ADMINISTRATION1.00 Human Rescources
Representative2.00 Human Resources Technician
HUMAN RESOURCES BUSINESS PARTNERS
4.00 Senior Human Resources Administrator
1.00 Senior Management Analyst 1.00 Administrative Assistant
1.00 Manager Employee Relations & Training
HUMAN RESOURCES DIRECTOR/ CHIEF PEOPLE OFFICER
FY 201 POSITION TOTALS1 .00 - Full-time
1. - Hourly
HUMAN RESOURCES INFORMATION SYSTEMS COMPENSATION AND
BENEFITS OPERATIONS1.00 Human Resources
Representative 2.00 Human Resources Technician
1.00 Assistant Director of Human Resources
1.00 Manager Employee Benefits
This organizational chart represents citywide Full-Time Equivalents (FTEs) for this department. The Department Summary tables summarize FTEs by
position allocation.
.00 Senior Human Resources Administrator
HUMAN RESOURCES • CITY OF PALO ALTO FISCAL YEAR 2017 ADOPTED BUDGET

HUMAN RESOURCES
DescriptionPeople Strategy and Operations provides guidance to City departments in the following areas:
TOTAL COMPENSATIONAdminister salary, health, pension, and other benefits.
EMPLOYEE AND LABOR RELATIONSProvide guidance to City staff to enhance performance, create a positive work environment, and effectively resolve complaints, grievances and other problems.
ORGANIZATION AND EMPLOYEE DEVELOPMENTIdentify and implement training and development opportunities to enhance skills, innovation, and leadership of City staff members.
TALENT MANAGEMENTRecruit, select, and onboard employees who have a passion for public service and the right knowledge, skills, and abilities to take on increasingly complex public service roles.
RISK MANAGEMENT, SAFETY, AND WORKERS COMPENSATIONSupport workplace safety, reduce injuries, and actively manage risk and other potential liabili-ties.
Accomplishments Built, tested, and soft launched NEOGOV on-boarding platform for all new hires
Conducted successful employee health fair
Introduced online benefits-open enrollment for all benefited City staff
Conducted bargaining and reached agreement with the International Association of Fire Fighters (IAFF), Palo Alto Peace Officers’ Association (PAPOA), Palo Alto Police Management Association (PAPMA), and Service Employees International Union (SEIU)
Continued contract negotiations with Utilities Managers and Professionals Association of Palo Alto (UMPAPA)
Recruited 267 positions for the City of Palo Alto including Human Resources Director, Principal Attorney, Budget Manager, and Assistant Library Director
Coordinated customized Ethics Training for all full-time City Staff in accordance with City Council priorities
Implemented mandatory Preventing Workplace Harassment e-learning course to ensure staff compliance
Transitioned to Kaiser-on-the Job for staff occupational medicine needs
HUMAN RESOURCES • CITY OF PALO ALTO FISCAL YEAR 2017 ADOPTED BUDGET 265

HUMAN RESOURCES
266
Initiated Employee Wellness program and offered staff healthy living education and a variety of physical activity programs
Developed an updated on-line Personnel Action Form (PAF) to streamline City-wide transaction approval process
Updated and configured Human Resources workforce database (SAP) to improve service delivery efficiency related to personnel transactions
Down-sized physical file space by digitizing archived department files
Provided succession planning data to business partners
Provided employee data to meet new Affordable Care Act (ACA) reporting requirements by engaging the services of an IT secure third party vendor
Implemented paid sick leave for limited hourly employees
Updated salary schedules for affected hourly employees in accordance with the new minimum wage ordinance
InitiativesDEPARTMENT EFFECTIVENESS Digitize all personnel records
Complete Human Resources workforce database (SAP) work plan to improve service delivery efficiency of transactions in benefits and salary administration
TALENT MANAGEMENT Launch the job application on-boarding platform system (NEOGOV) that will be integrated
with the Human Resources workforce database (SAP)
Collaborate with Public Safety departments to design recruitment outreach
Update new hire screening process for out-of-state employment candidates
ORGANIZATION AND EMPLOYEE DEVELOPMENT Design an updated City-wide employee training program
Increase e-learning options for City-wide training
RISK MANAGEMENT, SAFETY AND WORKERS COMPENSATION Complete Request For Proposal (RFP) for ergonomic services including office and field
employee training
Review and update injury and illness program for effectiveness
Utilize electronic procurement program to improve efficiencies related to insurance review
HUMAN RESOURCES • CITY OF PALO ALTO FISCAL YEAR 2017 ADOPTED BUDGET
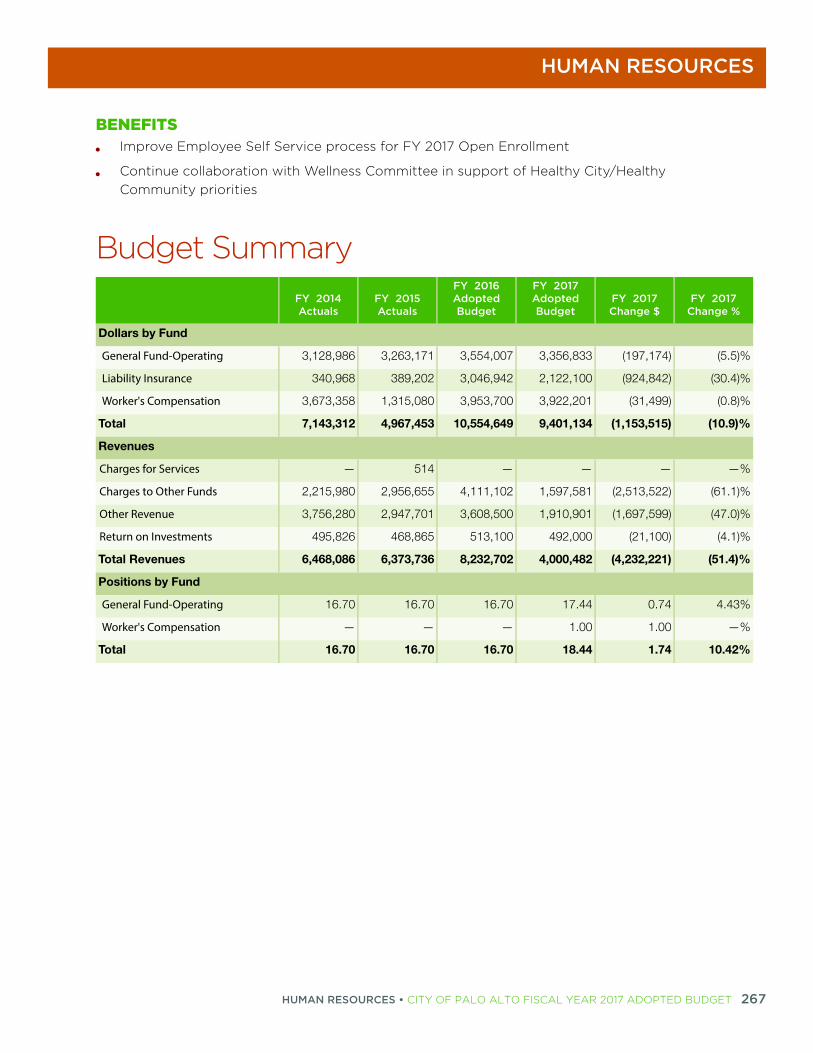
HUMAN RESOURCES
%
5)%
4)%
8)%
)%
%
1)%
0)%
1)%
)%
3%
%
2%
BENEFITS Improve Employee Self Service process for FY 2017 Open Enrollment
Continue collaboration with Wellness Committee in support of Healthy City/Healthy Community priorities
Budget SummaryFY 2014 Actuals
FY 2015 Actuals
FY 2016 Adopted Budget
FY 2017 Adopted Budget
FY 2017 Change $
FY 2017Change
Dollars by Fund
General Fund-Operating 3,128,986 3,263,171 3,554,007 3,356,833 (197,174) (5.
Liability Insurance 340,968 389,202 3,046,942 2,122,100 (924,842) (30.
Worker's Compensation 3,673,358 1,315,080 3,953,700 3,922,201 (31,499) (0.
Total 7,143,312 4,967,453 10,554,649 9,401,134 (1,153,515) (10.9
Revenues
Charges for Services — 514 — — — —
Charges to Other Funds 2,215,980 2,956,655 4,111,102 1,597,581 (2,513,522) (61.
Other Revenue 3,756,280 2,947,701 3,608,500 1,910,901 (1,697,599) (47.
Return on Investments 495,826 468,865 513,100 492,000 (21,100) (4.
Total Revenues 6,468,086 6,373,736 8,232,702 4,000,482 (4,232,221) (51.4
Positions by Fund
General Fund-Operating 16.70 16.70 16.70 17.44 0.74 4.4
Worker's Compensation — — — 1.00 1.00 —
Total 16.70 16.70 16.70 18.44 1.74 10.4
HUMAN RESOURCES • CITY OF PALO ALTO FISCAL YEAR 2017 ADOPTED BUDGET 267

HUMAN RESOURCES
268
GENERAL FUNDGoals and ObjectivesGOAL 1Implement a Comprehensive Talent Management Program that will enable the City to attract, develop, and retain a committed workforce.
Objectives: Invigorate the recruitment process to decrease time to fill and increase quality of hires.
Reduce turnover with higher quality of hires and improved performance coaching.
GOAL 2Enhance City culture of engagement and innovation.
Objectives: Ensure employee attendance rate is high.
Enhance learning opportunities through a comprehensive employee training program.
Increase employee communication through all media, including an enhanced department website.
Continue to implement a Wellness Program with 15 percent employee participation.
GOAL 3Implement improvements to the department’s operational systems especially employment, leave of absence, and benefit administration to ensure responsiveness and effectiveness of Human Resources staff performance.
Objectives: Strengthen oversight of benefit plan costs and processes.
Improve Human Resources ability to meet customer needs and provide superior customer service.
HUMAN RESOURCES • CITY OF PALO ALTO FISCAL YEAR 2017 ADOPTED BUDGET

HUMAN RESOURCES
Key Performance MeasuresEMPLOYEE ATTENDANCEGoal Enhance City culture of employee engagement and innovation.
Objective Maintain high employee attendance rate.
FY 2014 Actuals
FY 2015 Actuals
FY 2016 Adopted
FY 2016 Estimated
FY 2017 Adopted
Attendance 94.70% 95.28% 96.00% 96.00% 96.00%
Description This measure will track the attendance of employees in terms of percentage of time present.
Purpose
Attendance is a proxy metric for engagement and productivity. Absenteeism hinders City operations, and results in inefficiency when employees assume additional responsibilities because of unexpected absences. The Department of Labor benchmark for attendance is 96 percent, allowing for absenteeism rate of 4 percent. Under this standard, absenteeism is defined to include unscheduled time away from work (not including vacations or holidays and scheduled/approved Workers Compensation, ADA or FMLA leave).
StatusThe actual attendance for Fiscal Year 2015 of 95.28% slightly exceeded the Fiscal Year 2015 estimate of 95.10%. Future attendance rates are expected to remain at approximately 96%.
RECRUITMENTGoal Implement a comprehensive Talent Management Program that will enable the City
to attract, develop, and retain a committed workforce.
Objective Invigorate the recruitment process to decrease time to fill and increase quality of hires.
FY 2014 Actuals
FY 2015 Actuals
FY 2016 Adopted
FY 2016 Estimated
FY 2017 Adopted
Recruitment - Days to fill a position 116 110 80 95 95
Description This measure will provide the average number of days to fill a position from requisition approval until a hiring decision is made.
Purpose
A strong recruitment strategy is the foundation of talent management and should be accomplished in a focused, timely manner to provide departments with quality candidates as expeditiously as possible. This measure aligns with the International City/County Management Association's (ICMA) human resource metrics and is a standard tool as defined in the Society of Human Resource Management.
StatusThe number of days to fill a position decreased slightly in Fiscal Year 2015 to 110 days from 114 days in Fiscal Year 2014. This is estimated to decrease again in Fiscal Year 2016 to 95 days and remain at that level in Fiscal Year 2017.
HUMAN RESOURCES • CITY OF PALO ALTO FISCAL YEAR 2017 ADOPTED BUDGET 269

HUMAN RESOURCES
270
SUCCESSION PLANNINGGoal Implement a comprehensive Talent Management Program that will enable the City
to attract, develop, and retain a committed workforce.
Objective Develop a strategic staffing plan for each department that identifies key roles and a succession plan.
FY 2014 Actuals
FY 2015 Actuals
FY 2016 Adopted
FY 2016 Estimated
FY 2017 Adopted
Percent of key roles with succession plan in place 75.00% 75.00% 95.00% 95.00% N/A
DescriptionThis measure tracks the number of key senior management roles, defined as Division Manager, Assistant Director, and Director, and technical roles defined by each department director, that have a succession plan in place.
Purpose
Succession planning is a focused process for keeping talent in the pipeline. The age demographics of the workplace lead the HR Department to expect a turnover of as much as half the staff over the next ten years, making succession planning imperative.
StatusThis measure is recommended to be discontinued as each City department will lead their own succession planning. Human Resources will continue to provide retirement eligibility and assistance as needed.
TURNOVERGoal Implement a comprehensive Talent Management Program that will enable the City
to attract, develop, and retain a committed workforce.
Objective Reduce turnover with higher quality of hires and improved performance coaching.
FY 2014 Actuals
FY 2015 Actuals
FY 2016 Adopted
FY 2016 Estimated
FY 2017 Adopted
Turnover - Voluntary Turnover 5.10% 4.48% N/A 6.45% 6.45%
Turnover - Total Turnover 8.44% 8.44% N/A 9.57% 9.57%
Turnover - Involuntary Turnover 0.21% 1.35% N/A 0.42% 0.42%
Turnover - Retirement Turnover 3.13% 2.60% N/A 2.70% 2.70%
Description This metric provides data to identify trends when there is turnover, including voluntary exits, involuntary separations and retirements.
Purpose
Employees who are qualified, are a good match for the organization, and who are engaged, are not expected to leave the City. If turnover is high, the City incurs additional costs of hiring new staff. Initiatives such as offering a robust training program provides employees with skills and knowledge to keep productivity at an optimal level.
Status
It is recommended that this measure be revised from measuring employee turnover during the first year of employment to monitoring overall employee turnover among benefited regular full-time employees within the City in categories identified above.
HUMAN RESOURCES • CITY OF PALO ALTO FISCAL YEAR 2017 ADOPTED BUDGET

HUMAN RESOURCES
%
)%
4%
1%
)%
9%
)%
)%
)%
%
3%
)%
9%
)%
9%
)%
)%
%
3%
5%
Workload MeasuresFY 2014 Actuals
FY 2015 Actuals
FY 2016 Adopted
FY 2016 Estimated
FY 2017 Adopted
Employee personnel transactions 3,014 2,665 3,650 3,991 3,800
Percentage of employees participating in Citywide training program*
N/A N/A N/A N/A 85.00%
*This is a new measure for Fiscal Year 2017. Historical data is being collected by the Department to include in the Fiscal Year 2018 Budget.
Budget SummaryFY 2014 Actuals
FY 2015 Actuals
FY 2016 Adopted Budget
FY 2017 Adopted Budget
FY 2017 Change $
FY 2017Change
Dollars by Division
Administration, Employee Org Development and HR Systems 1,039,650 1,181,368 1,319,254 1,077,202 (242,052) (18.3
Benefits and Compensation 546,889 517,409 484,875 515,689 30,813 6.
Employee and Labor Relations 863,757 870,907 981,725 982,601 875 0.
Recruitment 439,857 425,311 477,231 467,526 (9,705) (2.0
Risk Mgmt, Safety, Workers' Compensation 238,833 268,176 290,921 313,816 22,895 7.
Total 3,128,986 3,263,171 3,554,007 3,356,833 (197,174) (5.5
Dollars by Category
Salary & Benefits
Healthcare 217,517 253,153 255,850 249,523 (6,327) (2.5
Other Benefits 78,007 88,882 90,785 80,549 (10,236) (11.3
Overtime 1,176 1,603 — — — —
Pension 365,919 406,181 458,634 478,432 19,798 4.
Retiree Medical 186,650 174,472 205,000 191,690 (13,310) (6.5
Salary 1,611,985 1,686,158 1,743,194 1,811,523 68,329 3.
Workers' Compensation 38,821 8,288 32,832 26,449 (6,383) (19.4
Total Salary & Benefits 2,500,075 2,618,735 2,786,295 2,838,166 51,871 1.
Allocated Charges 124,082 132,717 168,334 131,060 (37,274) (22.1
Contract Services 383,496 371,146 483,309 269,309 (214,000) (44.3
Facilities & Equipment 2,680 250 4,150 4,150 — —
General Expense 60,329 85,104 49,349 50,490 1,141 2.
Rents & Leases 43,000 43,000 43,000 44,088 1,088 2.
HUMAN RESOURCES • CITY OF PALO ALTO FISCAL YEAR 2017 ADOPTED BUDGET 271

HUMAN RESOURCES
272
%
)%
%
)%
)%
1%
4%
%
%
%
3%
52
68
01
—
29
47
88
14
27
%
Supplies & Material 15,323 12,219 19,570 19,570 — —
Total Dollars by Expense Category
3,128,986 3,263,171 3,554,007 3,356,833 (197,174) (5.5
Revenues
Charges for Services — 54 — — — —
Charges to Other Funds 1,800,290 1,693,299 1,742,260 1,597,581 (144,680) (8.3
Total Revenues 1,800,290 1,693,353 1,742,260 1,597,581 (144,680) (8.3
Positions by Division
Administration, Employee Org Development and HR Systems 4.65 4.65 4.99 5.36 0.37 7.4
Benefits and Compensation 2.61 2.61 2.51 2.88 0.37 14.7
Employee and Labor Relations 4.69 4.69 4.60 4.60 — —
Recruitment 3.01 3.01 3.00 3.00 — —
Risk Mgmt, Safety, Workers' Compensation 1.74 1.74 1.60 1.60 — —
Total 16.70 16.70 16.70 17.44 0.74 4.4
Staffing
Job ClassificationFY 2014 Actuals
FY 2015 Actuals
FY 2016 Adopted Budget
FY 2017 Adopted Budget
FY 2017 Change $
FY 2017Salary
Administrative Assistant 1.00 1.00 1.00 1.00 — 86,1
Assistant Director Human Resources 1.00 1.00 1.00 1.00 — 179,1
Director Human Resources/CPO 1.00 1.00 1.00 1.00 — 204,0
Human Resources Assistant 4.00 4.00 — — —
Human Resources Representative 2.00 2.00 2.00 2.00 — 140,1
Human Resources Technician — — 4.00 4.00 — 297,4
Manager Employee Benefits 1.00 1.00 1.00 1.00 — 116,1
Manager Employee Relations 1.00 1.00 1.00 1.00 — 133,5
Senior Human Resources Administrator 4.00 4.00 4.00 4.00 — 388,4
Budget SummaryFY 2014 Actuals
FY 2015 Actuals
FY 2016 Adopted Budget
FY 2017 Adopted Budget
FY 2017 Change $
FY 2017Change
HUMAN RESOURCES • CITY OF PALO ALTO FISCAL YEAR 2017 ADOPTED BUDGET

HUMAN RESOURCES
12
38
93
31
Senior Management Analyst 1.00 1.00 1.00 1.00 — 127,2
Sub-total: Full-Time Equivalent Positions
16.00 16.00 16.00 16.00 — 1,672,2
Temporary/Hourly 0.70 0.70 0.70 1.44 0.74 65,3
Total Positions 16.70 16.70 16.70 17.44 0.74 1,737,6
Budget ReconciliationPositions Expenditures Revenues
Net General Fund
Prior Year Budget 16.70 3,554,007 1,742,260 1,811,747
Base Adjustments
One-Time Prior Year Expenditures and Revenues Deleted
Human Resources Data Analytics Consultant — (214,000) — (214,000)
One-Time Prior Year Expenditures and Revenues
— (214,000) — (214,000)
Adjustments to Costs of Ongoing Activities
Salary and Benefits Adjustments — 18,066 — 18,066
Management Development — (1,000) — (1,000)
General Fund Administrative Cost Plan Adjustment — — (144,679) 144,679
Rents and Leases — 1,088 — 1,088
General Liability Insurance Allocated Charges Adjustment — (19,205) — (19,205)
Information Technology Allocated Charges Adjustment — (13,912) — (13,912)
Printing and Mailing Allocated Charges Adjustment — (4,158) — (4,158)
Adjustments to Costs of Ongoing Activities — (19,121) (144,679) 125,558
Total FY 2017 Base Budget 16.70 3,320,886 1,597,581 1,723,305
Budget Adjustments
1 Temporary Staffing Adjustment for Administrative Services 0.74 35,947 — 35,947
Total Budget Adjustments 0.74 35,947 — 35,947
Total FY 2017 Adopted Budget 17.44 3,356,833 1,597,581 1,759,252
Staffing
Job ClassificationFY 2014 Actuals
FY 2015 Actuals
FY 2016 Adopted Budget
FY 2017 Adopted Budget
FY 2017 Change $
FY 2017Salary
HUMAN RESOURCES • CITY OF PALO ALTO FISCAL YEAR 2017 ADOPTED BUDGET 273

HUMAN RESOURCES
274
Budget AdjustmentsBudget Adjustments Positions Expenditures Revenues
Net General Fund
1 Temporary Staffing Adjustment for Administrative Services 0.74 35,947 0 35,947
This action increases one 0.22 FTE Management Specialist position to 0.48 FTE, and legitimizes another Management Specialist position that was previously funded with vacancy savings to 0.48 FTE in order to align funding with the administrative workload needs of the Department. As a result, the Department will have three 0.48 FTE Management Specialist positions to assist the full-time Human Resources Assistant positions with daily administrative activities such as records maintenance, answering phone calls and correspondence, assisting with recruitments and training sessions, running reports in SAP, and staffing the front desk to assist customers that walk into the office. (Ongoing Costs: $33,805)
Performance Results
With this staffing alignment, the Department will be able to maintain current service levels while minimizing salary and benefit costs to the City, including long term pension liability.
HUMAN RESOURCES • CITY OF PALO ALTO FISCAL YEAR 2017 ADOPTED BUDGET

HUMAN RESOURCES
GENERAL LIABILITIES INSURANCE PROGRAMDescriptionThe City’s General Liability Program provides funding to cover flood, property, public employee crime, and various other insurance policies for City-owned equipment and machinery. The City is self-insured for the first $1 million in losses per occurrence and participates in a Joint Powers Authority for coverage up to $150 million per occurrence.
Accomplishments Coordinated physical assessment of all City’s facilities and update of property insurance
values.
Initiated a City-wide safety committee to research proactive measures to address City vehicle collisions.
In development of the Fiscal Year 2017 budget, this fund was analyzed by an outside consultant resulting in a more accurate allocation methodology of costs by department and fund. In addition, based on the lower number of incidents and associated expenses experienced over the last couple of years, staff is reducing the actuarial calculation funding from a 90 percent to an 85 percent confidence level. This results in savings to this fund and other City funds throughout the organization.
Initiatives Implement safety committee recommendations to decrease annual City vehicle collisions.
Develop City construction project liability insurance guidelines.
Research an alternative third party source to obtain DMV driving records.
As a budget balancing strategy in Fiscal Year 2017, general liability costs will not be allocated to other City departments and funds. See the Internal Service Fund Overview section of this document for further discussion.
HUMAN RESOURCES • CITY OF PALO ALTO FISCAL YEAR 2017 ADOPTED BUDGET 275

HUMAN RESOURCES
276
Goals and ObjectivesGOAL 1Reduce liability exposure to the City.
Objectives: Reduce liability exposure to the City for employee-involved vehicle collision.
Review DMV records on an annual basis for all employees whose job duties require that they drive City vehicles.
Provide a proactive defensive driving course to all employees involved in vehicle collisions involving City vehicles regardless of fault.
Reduce the number of claims related to City vehicle collision losses.
Key Performance MeasuresCITY VEHICLE COLLISION LOSSGoal Reduce liability exposure to the City.
Objective Reduce the number of claims related to City vehicle collision losses.
FY 2014 Actuals
FY 2015 Actuals
FY 2016 Adopted
FY 2016 Estimated
FY 2017 Adopted
Annual number of claims related to City vehicle collision losses 12 25 15 20 20
Description This measure will provide data to identify trends.
Purpose Analyzing claim trends will assist risk management staff in developing programs designed to reduce employee involved vehicle collisions.
Status
The number of employee involved vehicle collisions has increased despite increased attendance in training programs and discussions with staff at department safety meetings. Additional training such as online and onsite training will be implemented targeting specific collisions.
DEFENSIVE DRIVING TRAININGGoal Reduce liability exposure to the City.
Objective Provide defensive driver training.
FY 2014 Actuals
FY 2015 Actuals
FY 2016 Adopted
FY 2016 Estimated
FY 2017 Adopted
Attendance at mandatory and proactive defensive driver training 39 56 50 50 40
Description This measure tracks the number of employees completing a proactive defensive driving class.
PurposeProviding supplemental training will increase knowledge and awareness about safe driving behavior in order to protect employee and public safety, in addition to preventing future claims against the City.
Status Attendance in defensive driving class has remained steady.
HUMAN RESOURCES • CITY OF PALO ALTO FISCAL YEAR 2017 ADOPTED BUDGET

HUMAN RESOURCES
%
%
%
%
2%
)%
)%
%
)%
%
)%
)%
Budget SummaryFY 2014 Actuals
FY 2015 Actuals
FY 2016 Adopted Budget
FY 2017 Adopted Budget
FY 2017 Change $
FY 2017Change
Dollars by Category
Salary & Benefits
Other Benefits — 34,886 — — — —
Workers' Compensation — 271,376 — — — —
Total Salary & Benefits — 306,262 — — — —
Contract Services 61,654 28,625 86,500 88,400 1,900 2.
General Expense 279,314 54,315 2,960,442 2,033,700 (926,742) (31.3
Total Dollars by Expense Category
340,968 389,202 3,046,942 2,122,100 (924,842) (30.4
Revenues
Charges for Services — 460 — — — —
Charges to Other Funds 415,690 1,263,356 2,368,842 — (2,368,842) (100.0
Other Revenue 516,796 206,453 40,000 40,000 — —
Return on Investments 107,980 95,670 133,900 126,300 (7,600) (5.7
Total Revenues 1,040,466 1,565,939 2,542,742 166,300 (2,376,442) (93.5
HUMAN RESOURCES • CITY OF PALO ALTO FISCAL YEAR 2017 ADOPTED BUDGET 277

HUMAN RESOURCES
278
Budget Reconciliation
Positions Expenditures Revenues
Net General
Liabilities Insurance Program
Prior Year Budget — 3,046,942 2,542,742 504,200
Base Adjustments
Adjustments to Costs of Ongoing Activities
General Liability Insurance Claims Adjustments — (917,700) (2,368,842) 1,451,142
Property Loss Adjustments — 4,448 — 4,448
Audit and Financial Services Adjustments — 1,900 — 1,900
Umbrella Excess Liability Adjustments — (11,990) — (11,990)
Special Liability Adjustments — (1,500) — (1,500)
Return on Investment Adjustments — — (7,600) 7,600
Adjustments to Costs of Ongoing Activities — (924,842) (2,376,442) 1,451,600
Total FY 2017 Base Budget — 2,122,100 166,300 1,955,800
Total FY 2017 Adopted Budget — 2,122,100 166,300 1,955,800
HUMAN RESOURCES • CITY OF PALO ALTO FISCAL YEAR 2017 ADOPTED BUDGET
HUMAN RESOURCES
WORKERS' COMPENSATION FUNDDescriptionThe Workers’ Compensation Program provides wage and medical benefits for employees who sustain an injury or develop an occupational illness within the course and scope of employment.
Accomplishments Led New Employee Orientation to ensure employees understand safe work practices and
injury prevention strategies.
Transitioned occupational health provider to improve services and treatment for City employees recovering from workplace injuries.
In development of the Fiscal Year 2017 budget, this fund was analyzed by an outside consultant resulting in a more accurate allocation methodology of costs by department and fund. In addition, based on the lower number of incidents and associated expenses experienced over the last couple of years, staff is reducing the actuarial calculation funding from a 90 percent to an 85 percent confidence level. This results in savings to this fund and other City funds throughout the organization.
Initiatives Conduct regular work-site inspections and safety audits to ensure compliance with policies
and procedures.
Research and develop tracking and metrics for return to work from occupational injuries cases.
As a budget balancing strategy in Fiscal Year 2017, general liability costs will not be allocated to other City departments and funds. See the Internal Service Fund Overview section of this document for further discussion.
HUMAN RESOURCES • CITY OF PALO ALTO FISCAL YEAR 2017 ADOPTED BUDGET 279

HUMAN RESOURCES
280
Goals and ObjectivesGOAL 1Provide a safe environment for employees.
Objectives: Provide workplace safety training for all departments.
Comply with all requirements of the Occupational Safety and Health Act (OSHA).
GOAL 2Minimize loss of productivity and disruption of services.
Objectives: Facilitate early return to work program.
Reduce the number of costly lost time claims filed and days away from work.
Key Performance MeasuresDOLLAR AMOUNT OF CLAIMS PAIDGoal Minimize loss of productivity and disruption of services.
Objective Reduce the number of costly lost time claims filed and days away from work.
FY 2014 Actuals
FY 2015 Actuals
FY 2016 Adopted
FY 2016 Estimated
FY 2017 Adopted
Total dollar amount of claims paid 2,451,242 2,184,857 2,500,000 1,900,000 1,800,000
Description This measure tracks the total cost paid for work-related illness and injury claims in a given fiscal year. As claims develop, prior year total costs paid are revised.
Purpose Effective workplace safety and loss control programs lessen the use of public funds for work-related employee injuries and illness.
Status
In Fiscal Year 2015, the total cost of workers compensation claims decreased and this trend is expected to continue into Fiscal Year 2016. The Fiscal Year 2017 proposed cost is based on preliminary developing data in Fiscal Year 2016. City staff continues to work with third-party administrator to improve analysis and measurement reports.
HUMAN RESOURCES • CITY OF PALO ALTO FISCAL YEAR 2017 ADOPTED BUDGET

HUMAN RESOURCES
%
%
9%
%
%
)%
)%
0%
9%
)%
)%
)%
)%
NUMBER OF CLAIMSGoal Minimize loss of productivity and disruption of services.
Objective Reduce the number of costly lost time claims filed and days away from work.
FY 2014 Actuals
FY 2015 Actuals
FY 2016 Adopted
FY 2016 Estimated
FY 2017 Adopted
Number of Workers' Compensation Claims Filed 111 80 75 75 75
Description This measure tracks the total employee workers compensation claim volume filed each fiscal year.
PurposeEffective workplace safety and injury prevention program lessen the use of public funds for work-related injuries and illness. In addition to claim costs, the expense of paying overtime or hiring additional staff is mitigated.
Status
It is recommended that the previous measure "Percent of City incident rate in comparison to California local government incident rate" be deleted and replaced with a "Number of Workers' Compensation Claims Filed" measure. The total number of claims has decreased in Fiscal Year 2015 to 80 from the Fiscal Year 2014 level of 111. This trend is anticipated to continue into Fiscal Years 2016 and 2017.
Budget SummaryFY 2014 Actuals
FY 2015 Actuals
FY 2016 Adopted Budget
FY 2017 Adopted Budget
FY 2017 Change $
FY 2017Change
Dollars by Category
Salary & Benefits
Healthcare — — — 26,404 26,404 —
Other Benefits 232,050 230,006 239,000 243,527 4,527 1.
Pension — — — 29,902 29,902 —
Salary — — — 109,381 109,381 —
Workers' Compensation 2,982,526 621,334 3,143,300 2,810,086 (333,214) (10.6
Total Salary & Benefits 3,214,577 851,340 3,382,300 3,219,301 (162,999) (4.8
Contract Services 4,750 2,375 5,000 6,900 1,900 38.
General Expense 454,032 461,365 566,400 696,000 129,600 22.
Total Dollars by Expense Category
3,673,359 1,315,080 3,953,700 3,922,201 (31,499) (0.8
Revenues
Other Revenue 3,239,484 2,741,248 3,568,500 1,870,901 (1,697,599) (47.6
Return on Investments 387,846 373,195 379,200 365,700 (13,500) (3.6
Total Revenues 3,627,331 3,114,444 3,947,700 2,236,601 (1,711,099) (43.3
HUMAN RESOURCES • CITY OF PALO ALTO FISCAL YEAR 2017 ADOPTED BUDGET 281

HUMAN RESOURCES
282
%
%
75
75
75
%
Positions by Division
Workers’ Compensation — — — 1.00 1.00 —
Total — — — 1.00 1.00 —
Staffing
Job ClassificationFY 2014 Actuals
FY 2015 Actuals
FY 2016 Adopted Budget
FY 2017 Adopted Budget
FY 2017 Change $
FY 2017Salary
Senior Human Resources Administrator — — — 1.00 1.00 101,2
Sub-total: Full-Time Equivalent Positions
— — — 1.00 1.00 101,2
Total Positions — — — 1.00 1.00 101,2
Budget Reconciliation
Positions Expenditures Revenues
Net Workers'
Compensation Fund
Prior Year Budget — 3,953,700 3,947,700 6,000
Base Adjustments
Adjustments to Costs of Ongoing Activities
Umbrella Excess Liability Adjustments — 128,600 — 128,600
Workers' Compensation Assessment Adjustments — 5,000 — 5,000
Audit and Financial Services Adjustments — 1,900 — 1,900
Workers' Compensation Insurance Claims Adjustments — (338,214) (1,697,599) 1,359,385
Return on Investment Adjustments — — (13,500) 13,500
Adjustments to Costs of Ongoing Activities — (202,714) (1,711,099) 1,508,385
Total FY 2017 Base Budget — 3,750,986 2,236,601 1,514,385
Budget Adjustments
1 Workers' Compensation Management Staffing 1.00 171,215 — 171,215
Total Budget Adjustments 1.00 171,215 — 171,215
Total FY 2017 Adopted Budget 1.00 3,922,201 2,236,601 1,685,600
Budget SummaryFY 2014 Actuals
FY 2015 Actuals
FY 2016 Adopted Budget
FY 2017 Adopted Budget
FY 2017 Change $
FY 2017Change
HUMAN RESOURCES • CITY OF PALO ALTO FISCAL YEAR 2017 ADOPTED BUDGET

HUMAN RESOURCES
Budget Adjustments
Budget Adjustments Positions Expenditures Revenues
Net Workers'
Compensation Fund
1 Workers' Compensation Management Staffing 1.00 171,215 0 171,215
This action adds a Senior Human Resources Administrator position to manage and oversee the City's Workers' Compensation Program and Workers' Compensation Internal Service Fund. Currently, workers' compensation related issues are handled on an as needed basis by several positions in the Human Resources Department. This position will be a dedicated workers' compensation resource for the City and it will be able to proactively manage workers' compensation issues, instead of just reacting to claims and safety complaints. Some of the processes that will be implemented by this position are as follows, but not limited to: analyzing loss history to identify trends; identifying, evaluating, and developing best practices for the reduction or elimination of workers' compensation and safety exposures; regularly auditing injured employee salary continuation for accuracy; monitoring the return-to-work program; and coordinating the training of employees in safety and loss prevention techniques to prevent workplace injuries and accidents. (Ongoing Costs: $171,215)
Performance Results
Active management of the Workers' Compensation Fund and related workers' compensation activities citywide by a dedicated position will increase the quality of service provided to employees who file claims, decrease the time it takes to process claims, and focus on preventing workplace injuries and accidents to reduce overall Workers' Compensation program costs throughout the City.
HUMAN RESOURCES • CITY OF PALO ALTO FISCAL YEAR 2017 ADOPTED BUDGET 283

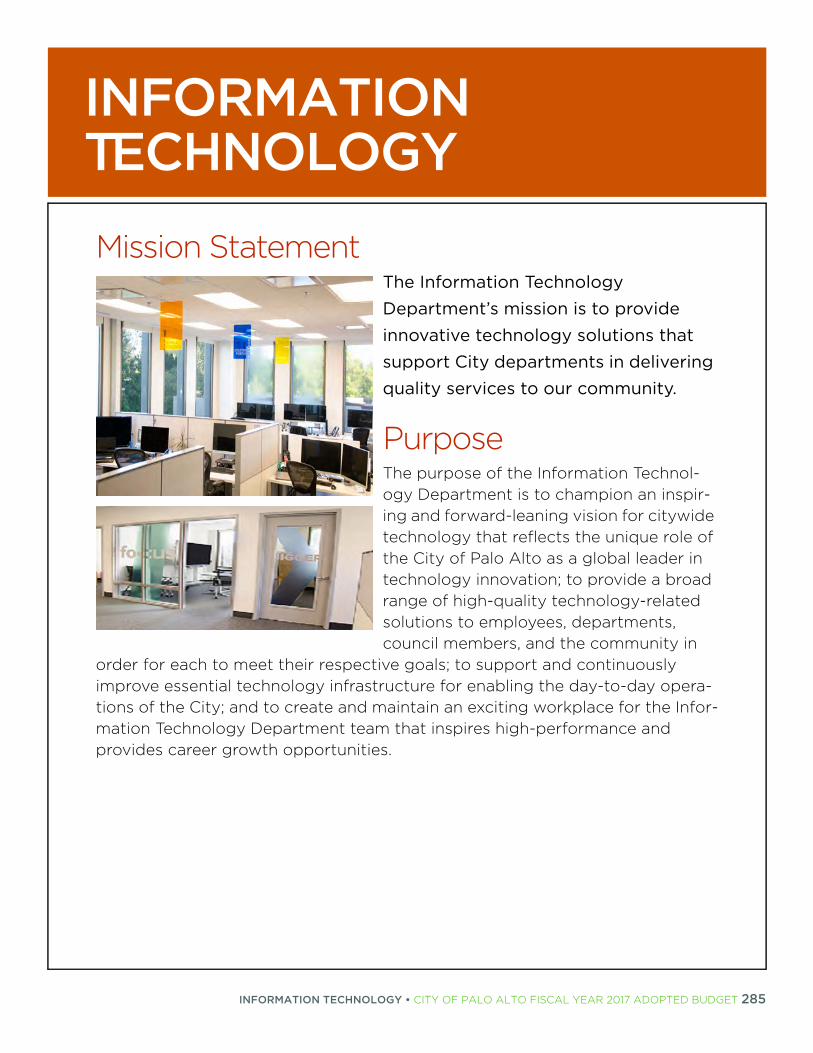
INFORMATION TECHNOLOGY
INFORMATION TECHNOLOGYMission StatementThe Information Technology Department’s mission is to provide innovative technology solutions that support City departments in delivering quality services to our community.
PurposeThe purpose of the Information Technol-ogy Department is to champion an inspir-ing and forward-leaning vision for citywide technology that reflects the unique role of the City of Palo Alto as a global leader in technology innovation; to provide a broad range of high-quality technology-related solutions to employees, departments, council members, and the community in
order for each to meet their respective goals; to support and continuously improve essential technology infrastructure for enabling the day-to-day opera-tions of the City; and to create and maintain an exciting workplace for the Infor-mation Technology Department team that inspires high-performance and provides career growth opportunities.
INFORMATION TECHNOLOGY • CITY OF PALO ALTO FISCAL YEAR 2017 ADOPTED BUDGET 285

INFORMATION TECHNOLOGY
286
INFORMATION SECURITY SERVICES1.00 Security Manager
IT PROJECT SERVICES 1.00 IT Manager5.00 Senior Technologist1.00 Business Analyst
IT OPERATIONS1.00 I T Manager
.00 Senior Technologist
.00 Desktop Technician
1.00 Senior Management Analyst1.00 T chnologist
IT ENTERPRISE SERVICES1.00 IT Manager5.00 Senior Technologist
CHIEF INFORMATION OFFICERJonathan Reichental
3 .00 - Full-time. 8 - Hourly
This organizational chart represents citywide Full-Time Equivalents (FTEs) for this department. The Department Summary tables summarize FTEs by
position allocation.
INFORMATION TECHNOLOGY • CITY OF PALO ALTO FISCAL YEAR 2017 ADOPTED BUDGET

INFORMATION TECHNOLOGY
DescriptionInformation Technology’s vision statement is, “to build and enable a leading smart and digital city.” A digital city broadly adopts innovative Internet-based technologies to enable quality services and processes between city employees, citizens, visitors and businesses. Being smart means using these same digital city capabilities in an intelligent manner, with integrated technology and active citizen participation.
Beginning in Fiscal Year 2013, the Information Technology Department embarked on a multi-year journey to transform itself into being a provider of higher-value information technology solutions and make steady progress towards building a leading digital city.
The Information Technology Department provides a wide range of services for the City of Palo Alto through the following operational divisions:
OFFICE OF THE CIO (OCIO)The OCIO provides leadership and strategic direction for the City of Palo Alto’s use of technol-ogy. The OCIO provides advisory services to City Departments regarding opportunities to lever-age technology to improve government services. In addition, the division sets IT policies and directions for the IT Department and the City. This division is often the public facing component of the team and is responsible for fostering mutually beneficial public-private, technology related partnerships. The core services include IT strategic planning, financial management, contract management, communications, work force development, overall department adminis-tration, and data analytics.
IT PROJECT SERVICESProvides customer-centric project management services to City departments for technology projects. Services include: business analysis, consultation, project management, project man-agement training, and governance. Our focus is the delivery of business value to our customers. Governance ensures that technology initiatives across the City are visible across the organiza-tion. We help IT work on the right things at the right time for the right reasons to increase value delivery to our end-users and reduce the risks associated with technology deployment.
IT OPERATIONSMaintains and supports all deployed back-end and front-end City technologies including the process of retiring products and services. The team also ratifies standards working alongside
INFORMATION TECHNOLOGY • CITY OF PALO ALTO FISCAL YEAR 2017 ADOPTED BUDGET 287

INFORMATION TECHNOLOGY
288
other IT divisions. Services include service desk, infrastructure support, server hosting, office automation software support, technical training and support, and asset management.
IT ENTERPRISE SERVICESResponsible for maintaining a core set of large enterprise-wide ERP systems like SAP and Geographic Information Systems (GIS) for supporting financial business processes, information flow, reporting, and data analytics for the City. These services include all aspects of Enterprise Systems management such as planning, integration, administration, support, maintenance, gov-ernance, and change management.
INFORMATION SECURITY SERVICESResponsible for developing and implementing a citywide information security program that includes the preservation of the availability, integrity, and confidentiality of City information resources. These services include security policy and procedures, legal compliance, risk management, disaster recovery and security audit.
Accomplishments Awarded Leading Digital City by the Center for Digital Government - Palo Alto named 4th
top City in the category of population of 75,000 or less.
Fire Station Phone and Police Department Network Upgrades completed.
Cloud-based Communication and Productivity Suite Implementation - Moved to an online-based communication and collaboration suite, which includes e-mail, calendaring, instant messaging, document storage, forms and workflows, and other communication tools.
Data Center and Computer Cloud Backup Implementation - Researched, selected and implemented an enterprise, cloud-based data center back-up solution to ensure the availability of data center data in the event that a recovery is necessary.
Internet Redundancy Implementation - Implemented a redundant internet connection in the event internet services become unavailable.
SharePoint Online Migration - Upgraded existing internal SharePoint Intranet and collaboration sites to SharePoint Online and migrated the content from all sites to the new version.
Virtual Private Cloud Implementation - Implemented a primary and redundant Storage Area Network (SAN) to establish a virtual private cloud.
Electronic Signature Operationalization - Implemented electronic signature citywide and trained key departmental staff.
Document Scanning and Retrieval System Implementation - Implemented scanning and records retention cloud solution citywide to reduce paper storage space and to provide more efficient and quicker retrieval of information.
INFORMATION TECHNOLOGY • CITY OF PALO ALTO FISCAL YEAR 2017 ADOPTED BUDGET

INFORMATION TECHNOLOGY
InitiativesThe following initiatives will be worked on by the Information Technology Department in Fiscal Year 2017, but not necessarily completed in Fiscal Year 2017. As circumstances dictate, projects will be reprioritized or rescheduled as appropriate:
Council Chambers Equipment Replacement – Remove the old analog equipment and install a 100 percent digital system. This was budgeted in Fiscal Year 2016, but due to delays, is anticipated to be completed in Fiscal Year 2017.
Enterprise Asset Management System (EAMS) Implementation - Implemented an EAMS to maintain an up-to-date inventory of the City’s infrastructure, its catch-up and keep-up needs, and available funding.
Service Management System Replacement - Migrate the City’s existing technology work order management tool, Track-It, to a next generation cloud-based solution for Work Order management, Asset Management, License Management and CMDB (configuration management database) management.
Data Center Failover Site Selection & Implementation - Select redundant offsite data center site to be used in case of disaster that will take over if primary data center fails.
Analytics Platform Implementation - Implement an enterprise-wide business intelligence tool that can be used citywide to help drive the City as a data-driven decision making organization.
Next Generation City Website - Implement a next generation, best of breed, City of Palo Alto website that will include content redesign, support for mobile device viewing, upgraded architecture, and an upgraded platform.
Tri-Cities CAD Upgrade - Upgrade existing CAD system to the next available version of the software.
Project Management Application - Select and install a project management application to view, monitor, and analyze projects to obtain a unified view of current and future projects.
Goals and ObjectivesGOAL 1Design and implement high-priority digital capabilities for City staff, residents, visitors, and local businesses.
Objectives: Develop and “pilot” new services that will increase the community’s access to online self-
services.
Maintain a governance model and roadmap for mobile application deployment to ensure quality and valuable mobile capabilities are deployed to our community.
INFORMATION TECHNOLOGY • CITY OF PALO ALTO FISCAL YEAR 2017 ADOPTED BUDGET 289

INFORMATION TECHNOLOGY
290
Deploy and maintain platforms and processes for supporting best-in-class open and participative government to enrich our democracy.
Maintain an ongoing program of civic innovation activities to be ahead of the curve in government technology and include broad participation from innovators in the public and private sectors.
Execute the 3-year GIS strategy that will increase GIS capabilities and bring value to a larger number of stakeholders.
GOAL 2Maintain and mature an IT governance model.
Objectives: Maintain and mature a citywide IT governance process to ensure alignment between
technology priorities, project risks, City goals, and available funds.
Maintain and keep current an accurate 3-year IT roadmap.
GOAL 3Standardize and enhance IT service delivery.
Objectives: Organize IT service delivery around the principles of the Information Technology
Infrastructure Library (ITIL) in order to provide high quality, consistent, and efficient IT services.
Establish and maintain division processes, staff responsibilities, and performance measures.
Execute appropriate training for IT staff to support established processes.
Maintain an actionable IT dashboard.
Manage a program to provide a career path and learning opportunities for the City’s technology staff.
GOAL 4Upgrade and enhance technology infrastructure, communications systems, and information security capabilities.
Objectives: Upgrade our data center with emphasis on a “cloud-first“ approach to lower cost and
support needs.
Decommission all unnecessary systems and rationalize core services with a focus on software-as-a-service.
Maintain and improve the confidentiality, integrity, and availability of information across the City’s system.
Ensure a fully-tested disaster recovery and continuity program for a core set of City systems.
INFORMATION TECHNOLOGY • CITY OF PALO ALTO FISCAL YEAR 2017 ADOPTED BUDGET
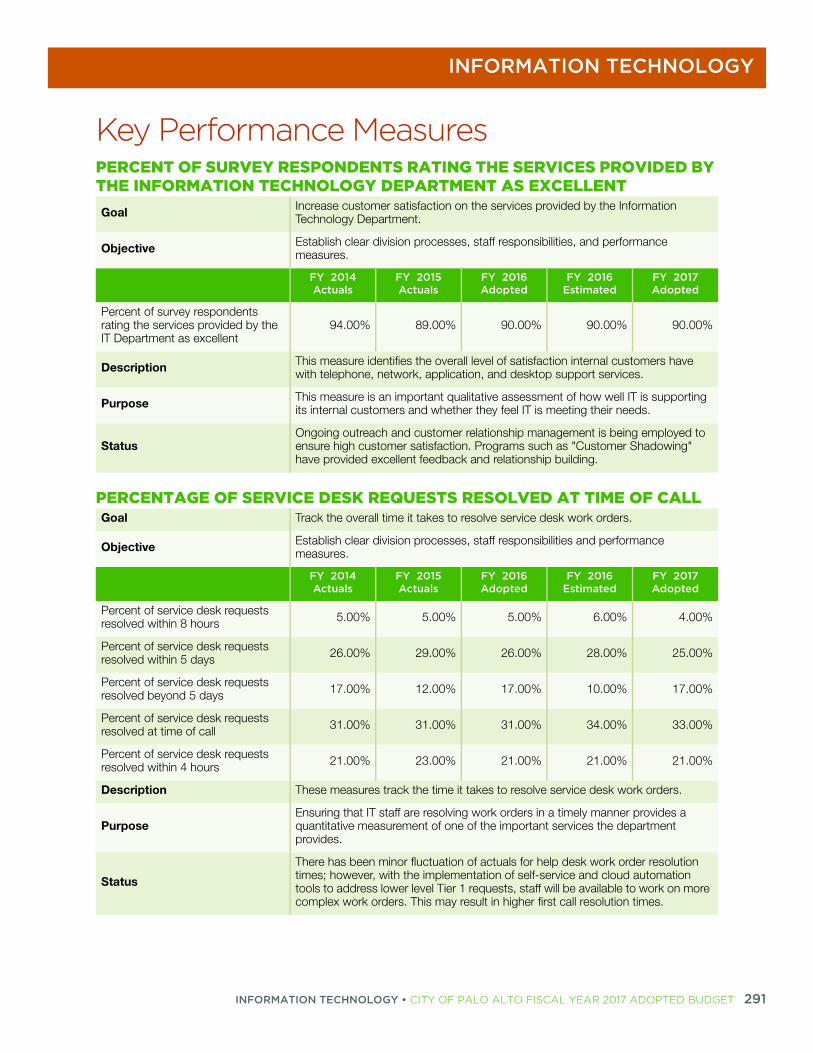
INFORMATION TECHNOLOGY
Key Performance MeasuresPERCENT OF SURVEY RESPONDENTS RATING THE SERVICES PROVIDED BY THE INFORMATION TECHNOLOGY DEPARTMENT AS EXCELLENTGoal Increase customer satisfaction on the services provided by the Information
Technology Department.
Objective Establish clear division processes, staff responsibilities, and performance measures.
FY 2014 Actuals
FY 2015 Actuals
FY 2016 Adopted
FY 2016 Estimated
FY 2017 Adopted
Percent of survey respondents rating the services provided by the IT Department as excellent
94.00% 89.00% 90.00% 90.00% 90.00%
Description This measure identifies the overall level of satisfaction internal customers have with telephone, network, application, and desktop support services.
Purpose This measure is an important qualitative assessment of how well IT is supporting its internal customers and whether they feel IT is meeting their needs.
StatusOngoing outreach and customer relationship management is being employed to ensure high customer satisfaction. Programs such as "Customer Shadowing" have provided excellent feedback and relationship building.
PERCENTAGE OF SERVICE DESK REQUESTS RESOLVED AT TIME OF CALLGoal Track the overall time it takes to resolve service desk work orders.
Objective Establish clear division processes, staff responsibilities and performance measures.
FY 2014 Actuals
FY 2015 Actuals
FY 2016 Adopted
FY 2016 Estimated
FY 2017 Adopted
Percent of service desk requests resolved within 8 hours 5.00% 5.00% 5.00% 6.00% 4.00%
Percent of service desk requests resolved within 5 days 26.00% 29.00% 26.00% 28.00% 25.00%
Percent of service desk requests resolved beyond 5 days 17.00% 12.00% 17.00% 10.00% 17.00%
Percent of service desk requests resolved at time of call 31.00% 31.00% 31.00% 34.00% 33.00%
Percent of service desk requests resolved within 4 hours 21.00% 23.00% 21.00% 21.00% 21.00%
Description These measures track the time it takes to resolve service desk work orders.
PurposeEnsuring that IT staff are resolving work orders in a timely manner provides a quantitative measurement of one of the important services the department provides.
Status
There has been minor fluctuation of actuals for help desk work order resolution times; however, with the implementation of self-service and cloud automation tools to address lower level Tier 1 requests, staff will be available to work on more complex work orders. This may result in higher first call resolution times.
INFORMATION TECHNOLOGY • CITY OF PALO ALTO FISCAL YEAR 2017 ADOPTED BUDGET 291

INFORMATION TECHNOLOGY
292
%
8)%
9%
3)%
4%
3)%
)%
4%
5)%
%
9%
5)%
2%
3%
6%
4)%
8)%
0)%
8)%
7%
4)%
Workload MeasuresFY 2014 Actuals
FY 2015 Actuals
FY 2016 Adopted
FY 2016 Estimated
FY 2017 Adopted
IT expenditure per workstation $4,491 $5,226 $4,500 $5,600 $5,808
Number of closed help desk requests 9,348 9,885 9,870 10,506 11,556
Number of datasets published on open data platforms N/A 84 72 90 102
Budget SummaryFY 2014 Actuals
FY 2015 Actuals
FY 2016 Adopted Budget
FY 2017 Adopted Budget
FY 2017 Change $
FY 2017Change
Dollars by Division
CIP Technology Fund 2,004,619 1,235,268 5,160,457 4,915,087 (245,370) (4.
Enterprise Systems 2,557,969 2,339,887 3,226,423 3,611,975 385,552 11.
Office of the CIO 4,023,703 2,780,458 3,490,955 3,165,386 (325,569) (9.
Operations 4,614,178 6,716,926 6,782,891 7,351,849 568,958 8.
Project Services 1,062,758 607,169 1,820,892 1,433,174 (387,718) (21.
Total 14,263,227 13,679,707 20,481,618 20,477,470 (4,147) (0.0
Dollars by Category
Salary & Benefits
Healthcare 551,622 531,064 666,547 742,824 76,278 11.
Other Benefits 138,862 134,178 186,889 154,168 (32,721) (17.
Overtime 32,854 17,379 18,585 18,585 — —
Pension 785,667 673,950 1,102,084 1,200,041 97,957 8.
Retiree Medical 174,510 264,356 320,000 299,224 (20,776) (6.
Salary 3,299,889 3,464,454 4,322,391 4,591,711 269,321 6.
Workers' Compensation 6,165 2,374 5,214 49,078 43,864 841.
Total Salary & Benefits 4,989,570 5,087,755 6,621,710 7,055,632 433,922 6.
Allocated Charges 1,063,646 952,033 1,118,446 1,114,193 (4,253) (0.
Capital Improvement Program 2,004,040 1,235,268 5,160,457 4,915,087 (245,370) (4.
Contract Services 3,029,750 3,882,450 5,660,344 5,492,521 (167,823) (3.
Facilities & Equipment 552,080 1,599,760 874,693 841,573 (33,120) (3.
General Expense 511,121 496,789 544,480 575,480 31,000 5.
Operating Transfers-Out 1,276,638 53,219 53,895 16,485 (37,410) (69.
INFORMATION TECHNOLOGY • CITY OF PALO ALTO FISCAL YEAR 2017 ADOPTED BUDGET

INFORMATION TECHNOLOGY
6%
5%
%
)%
0%
5%
0%
%
6%
8%
9)%
%
%
1%
82
45
32
70
—
54
—
83
%
Rents & Leases 263,153 267,047 342,594 351,501 8,907 2.
Supplies & Material 73,894 105,387 105,000 115,000 10,000 9.
Transfer to Infrastructure 499,335 — — — — —
Total Dollars by Expense Category
14,263,227 13,679,707 20,481,618 20,477,471 (4,147) (0.0
Revenues
Charges to Other Funds 11,245,988 11,718,436 13,253,289 13,788,468 535,179 4.
Operating Transfers-In 1,412,959 2,349,175 1,294,328 2,077,785 783,457 60.
Other Revenue 53,873 53,576 16,400 130,864 114,464 698.
Return on Investments 434,425 352,985 343,300 343,300 — —
Total Revenues 13,147,246 14,474,172 14,907,317 16,340,417 1,433,100 9.
Positions by Division
Enterprise Systems 11.00 9.50 9.00 11.50 2.50 27.7
Office of the CIO 4.10 6.10 8.10 6.10 (2.00) (24.6
Operations 13.96 13.96 13.48 13.48 — —
Project Services 5.10 4.10 5.00 5.00 — —
Total 34.16 33.66 35.58 36.08 0.50 1.4
Staffing
Job ClassificationFY 2014 Actuals
FY 2015 Actuals
FY 2016 Adopted Budget
FY 2017 Adopted Budget
FY 2017 Change $
FY 2017Salary
Administrative Assistant 1.00 1.00 1.00 1.00 — 83,7
Assistant Director Administrative Services 0.10 0.10 — 0.10 0.10 18,4
Business Analyst — — 1.00 1.00 — 128,8
Desktop Technician 5.00 5.00 5.00 6.00 1.00 484,2
Director Administrative Services/CFO 0.10 0.10 0.10 — (0.10)
Director Information Technology/CIO 1.00 1.00 1.00 1.00 — 210,4
Management Analyst 1.00 1.00 — — —
Manager Information Technology 4.00 4.00 4.00 4.00 — 549,7
Budget SummaryFY 2014 Actuals
FY 2015 Actuals
FY 2016 Adopted Budget
FY 2017 Adopted Budget
FY 2017 Change $
FY 2017Change
INFORMATION TECHNOLOGY • CITY OF PALO ALTO FISCAL YEAR 2017 ADOPTED BUDGET 293

INFORMATION TECHNOLOGY
294
55
13
—
01
40
09
62
46
76
22
Manager Information Technology Security 1.00 1.00 1.00 1.00 — 141,8
Principal Business Analyst — — 1.00 1.00 — 137,1
Principal Management Analyst 1.00 1.00 — — —
Senior Business Analyst 2.00 — 2.00 2.00 — 250,7
Senior Management Analyst — 2.00 1.00 1.00 — 114,9
Senior Technologist 12.00 13.50 15.00 16.00 1.00 1,975,1
Technologist 4.00 2.00 2.00 1.00 (1.00) 116,2
Sub-total: Full-Time Equivalent Positions
32.20 31.70 34.10 35.10 1.00 4,211,5
Temporary/Hourly 1.96 1.96 1.48 0.98 (0.50) 92,9
Total Positions 34.16 33.66 35.58 36.08 0.50 4,304,5
Budget Reconciliation
Positions Expenditures Revenues
Net Technology
Fund
Prior Year Budget 35.58 20,481,617 14,907,317 5,574,300
Base Adjustments
One-Time Prior Year Expenditures and Revenues Deleted
Council Chamber Recording Equipment — (350,000) (187,145) (162,855)
Enterprise Resource Planning System Selection — (250,000) — (250,000)
IT Service Management System — (200,000) — (200,000)
Docusign First Year Costs — (24,500) (13,100) (11,400)
Pitney Bowes Utility Bill Printing Upgrade — (12,000) — (12,000)
Utilities Customer Service Bill Improvements — — (243,000) 243,000
Capital Improvement Project Funding — (5,160,457) — (5,160,457)
Restoration of Prior Year One-time deletions — 50,000 — 50,000
One-Time Prior Year Expenditures and Revenues
— (5,946,957) (443,245) (5,503,712)
Adjustments to Costs of Ongoing Activities
Salary and Benefits Adjustments 0.50 362,132 — 362,132
Capital Improvement Funding Adjustments — 4,915,087 1,140,912 3,774,175
Application Replacement and Maintenance — 197,557 — 197,557
Staffing
Job ClassificationFY 2014 Actuals
FY 2015 Actuals
FY 2016 Adopted Budget
FY 2017 Adopted Budget
FY 2017 Change $
FY 2017Salary
INFORMATION TECHNOLOGY • CITY OF PALO ALTO FISCAL YEAR 2017 ADOPTED BUDGET

INFORMATION TECHNOLOGY
Telecommunication Services — 16,600 — 16,600
Infrastructure Replacement and Maintenance — 41,877 — 41,877
Rental Expense Adjustment — 8,907 — 8,907
Desktop Replacement and Maintenance — (40,120) — (40,120)
Enterprise Systems Service and Maintenance — (20,357) — (20,357)
Administrative Services Department Staffing Alignment — (6,563) — (6,563)
General Fund Administrative Cost Plan Allocated Charges Adjustments — 24,359 — 24,359
General Liability Insurance Allocated Charges Adjustments — (35,336) — (35,336)
Printing and Mailing Allocated Charges Adjustment — (390) — (390)
Utilities Allocated Charges Adjustments — 3,062 — 3,062
Vehicle Allocated Charges Adjustments — 4,051 — 4,051
Charges to Other Funds - Information Technology Services — — 551,952 (551,952)
Transfers to Other Funds — (37,410) — (37,410)
Information Technology Surcharge Revenue — — 69,126 (69,126)
Adjustments to Costs of Ongoing Activities 0.50 5,433,456 1,761,990 3,671,466
Total FY 2017 Base Budget 36.08 19,968,116 16,226,062 3,742,054
Budget Adjustments
1 SAP Consultant for Human Resources — 125,000 — 125,000
2 Data Center Failover Redundancy — 120,000 — 120,000
3 Accela Enhancements — 100,000 — 100,000
4 HelpDesk Desktop Staffing — 59,024 59,024 —
5 Project Management Application Pilot — 50,000 — 50,000
6 Annual Security Testing — 35,000 35,000 —
7 Information Technology Operations Staffing — 20,331 20,331 —
Total Budget Adjustments — 509,355 114,355 395,000
Total FY 2017 Adopted Budget 36.08 20,477,471 16,340,417 4,137,054
Budget Reconciliation
Positions Expenditures Revenues
Net Technology
Fund
INFORMATION TECHNOLOGY • CITY OF PALO ALTO FISCAL YEAR 2017 ADOPTED BUDGET 295

INFORMATION TECHNOLOGY
296
Budget Adjustments
Budget Adjustments Positions Expenditures Revenues
Net Technology
Fund
1 SAP Consultant for Human Resources 0.00 125,000 0 125,000
This action provides one-time funding of $125,000 from the Technology Surcharge Fee and the Technology Fund Reserve to continue contractual services for further alignment of SAP functionality with Human Resources' business practices. It is anticipated that the additional work will enable integration of the Personnel Action Form with SAP and DocuSign, as well as redesign the organizational structure and position control systems within SAP. Finally, advances related to integrating SAP with CalPers' system for management of active and retired employees and launch of the Manager Self-Service module to increase management oversight capabilities within SAP. This proposal is subject to the IT Governance process, and although funding is approved as part of this action, the final form of the solution will be determined through the governance process. (Ongoing costs: $0)
Performance Results
This action will reduce the cost and cycle times associated with employee management through SAP, and increase the quality and customer satisfaction of interactions with SAP.
2 Data Center Failover Redundancy 0.00 120,000 0 120,000
This action allocates $120,000 from the Technology Surcharge Fee and other non-general fund departments to identify, build-out and deploy the equipment for a redundant, secondary site to deploy and support a small number of critical data center infrastructure, e.g. VPN, SAN, StorSimple, and Internet Connection. The current primary data center for the City is located in a highly vulnerable location. An event such as an earthquake could make our core systems inaccessible for a significantly long period. (Ongoing costs: $40,000)
Performance Results
This action aligns with the City's commitment to ensure the right level of disaster recovery and business continuity processes are in place. This is a core component of that essential commitment.
INFORMATION TECHNOLOGY • CITY OF PALO ALTO FISCAL YEAR 2017 ADOPTED BUDGET

INFORMATION TECHNOLOGY
3 Accela Enhancements 0.00 100,000 0 100,000
This action allocates $100,000 from the Technology Fund Reserve to provide enhancements and customization to Accela, which the City of Palo Alto uses for permitting purposes. Additional functionality that would be added includes tracking of performance measures, ability to create and track e-mail campaigns, agenda planning, creation of detailed parcel reports, permit project tracking, consolidate code enforcement (311 activities) to one central repository and the ability to create and maintain dashboards. This proposal is subject to the IT Governance process, and although funding is recommended as part of this action, the final form of the solution will be determined through the governance process. (Ongoing costs: $0)
Performance Results
This action will significantly increase the quality of services associated with Accela and the City's permitting efforts and increase customer satisfaction as a result of enhanced functionality.
4 HelpDesk Desktop Staffing 0.00 59,024 59,024 0
This action reclassifies 1.0 Staff Specialist H to 1.0 Desktop Technician in order to administratively remedy a position that was incorrectly categorized in previous budgets and more appropriately align the classification of the employee with the body of work being performed. Previously, 1.0 Staff Specialist H was budgeted, however staffed with a single incumbent that worked 2,080 hours in a single year. This action ensures that the position is classified appropriately and that the City remains in compliance with applicable labor law.
Performance Results
The correction of this position's classification aligns the classification with the commensurate duties of the position.
5 Project Management Application Pilot 0.00 50,000 0 50,000
This action allocates $50,000 from the Technology Fund Reserve to procure and operationalize a Project Management solution for use by the Information Technology Department. This solution will allow IT staff to have a unified view of projects for the Project Management Office (PMO). Currently, the IT project portfolio is not visible as a whole. Capability of keeping projects on-track, and managing projects in the pipeline will be enabled. Governance will be able to use this tool to more effectively engage with the Governance Review Board (GRB). Additionally, the work of individual project managers on any given day can be viewed, enforcing more accurate scheduling for the PMs. With all projects under one roof, the PMO can balance the distribution of projects more efficiently. Use of the Project Management solution will be evaluated for potential use on a city-wide basis. (Ongoing costs: $10,000)
Performance Results
This proposal allows for better distribution of projects by the Project Management Office providing better efficiency. Since there is not currently a tool in place that allows for this type of unified view of City projects, ITD will be able to evaluate the usefulness of this tool to inform potential expansion to other City departments.
Budget Adjustments
Budget Adjustments Positions Expenditures Revenues
Net Technology
Fund
INFORMATION TECHNOLOGY • CITY OF PALO ALTO FISCAL YEAR 2017 ADOPTED BUDGET 297

INFORMATION TECHNOLOGY
298
6 Annual Security Testing 0.00 35,000 35,000 0
This action adds $35,000 for security penetration testing to be conducted by an outside contractor. The Information Technology department recently completed a security risk assessment and based on that assessment it was recommended to conduct regular penetration testing against the City's network. Network penetration testing can detect the vulnerabilities associated with the City's network and will enable the Information Technology department to proactively respond to those vulnerabilities. This will increase the resiliency of the City's network against potential threats and ensure continuity of operations. (Ongoing costs: $35,000)
Performance Results
This action will increase the quality of the City's network security.
7 Information Technology Operations Staffing 0.00 20,331 20,331 0
This action reclassifies 1.0 Technologist to 1.0 Senior Technologist to increase capacity in ITD Operations. As ITD matures to meet the needs of the City, demands for technology will also increase, therefore needing additional leadership capabilities. This reclassification will facilitate project management, server and cloud services administration, and labor and mobile computing management.
Performance Results
This reclassification will increase quality of services offered by Information Technology and increase customer satisfaction.
Budget Adjustments
Budget Adjustments Positions Expenditures Revenues
Net Technology
Fund
INFORMATION TECHNOLOGY • CITY OF PALO ALTO FISCAL YEAR 2017 ADOPTED BUDGET

LIBRARY
LIBRARYMission StatementThe Library Department connects and strengthens our diverse community through knowledge, resources, and opportunities. We inspire and nurture innovation, discovery, and delight.
PurposeThe purpose of the Library Department is to provide exceptional, responsive public service to Palo Alto residents and employ-ees; to promote exploration of library resources to support learning, recreation, and personal enrichment; to foster a love of reading, creative expression, and com-munity engagement for all ages; and to develop library facilities, technology, and
staff to create a welcoming, inclusive environment in which to share valuable resources and skilled expertise.
LIBRARY • CITY OF PALO ALTO FISCAL YEAR 2017 ADOPTED BUDGET 299

LIBRARY
300
ADMINISTRATIONPUBLIC SERVICES DIVISION
RINCONADA LIBRARY
CHILDREN’S LIBRARY
MITCHELL PARK LIBRARY
COLLEGE TERRACE LIBRARY
DOWNTOWN LIBRARY
INFORMATION TECHNOLOGY & COLLECTIONS DIVISION
COLLECTIONS & TECHNOLOGY
DIGITAL SERVICES & E - BRANCH
FY 201 POSITION TOTALS
This organizational chart represents citywide Full-Time Equivalents (FTEs) for this department. The Department Summary tables summarize FTEs by
position allocation.
LIBRARY DIRECTORMonique le Conge Ziesenhenne
LIBRARY • CITY OF PALO ALTO FISCAL YEAR 2017 ADOPTED BUDGET

LIBRARY
DescriptionThe Library provides a wide range of public services for the City of Palo Alto through the following:
PUBLIC SERVICES & PROGRAMSOffers a variety of programs free of charge to library users of all ages, interests, and abilities, to provide educational, self-help, recreational, technological, and multi-lingual outreach. When appropriate, partners with other civic, non-profit, business, and educational organizations to present these programs.
INFORMATION, TECHNOLOGY, & COLLECTIONSProvides opportunities for the public to access a variety of technologies, both inside and out-side library facilities, including hardware devices, online databases, free WiFi, mobile applica-tions, and experimental partnerships. Library collections include a diverse selection of print and non-print materials, as well as digital resources such as electronic books, magazines, and music, to meet the educational, informational, and recreational needs of its clientele, reflecting the vari-ety of languages, cultures, and interests of our community.
BUILDINGS, SUPPORT, & ADMINISTRATIONProvides information, training, and support for City employees and the public, and ensures that all aspects of library services and policies are delivered with the highest degree of public stew-ardship in mind. By funding major facility renovations and improvements to three libraries through a dedicated library bond, and two previous renovation projects, Palo Alto has modern libraries offering comfortable, inviting, and flexible spaces for everyone in our community to gather and learn.
Accomplishments Increased open hours of service.
Increased the percent of residents satisfied with Library Services, as measured by the National Citizens Survey, from 81% to 91%.
Implemented Sierra, the replacement Integrated Library System (ILS) in February 2016.
Initiated two Adult ESL conversation groups (beginning and advanced) with volunteer support as part of the New Americans program. Weekly, non-native speakers meet to learn and practice English language learning.
Created a Teen Library Advisory Board (TLAB) to advise library staff on collections, programs, and other services relevant to teens.
Participated in the annual regional Silicon Valley Reads events with author visits on the topic of drought.
Incorporated tips, for parents and caregivers to practice at home to encourage reading and language development, into story times.
LIBRARY • CITY OF PALO ALTO FISCAL YEAR 2017 ADOPTED BUDGET 301

LIBRARY
302
Received a grant from the Pacific Library Partnership to support Bike Outreach, including a bike mobile, two bicycle repair stations (one each at Mitchell Park and Rinconada Libraries), creation of a Safe Routes to Libraries map, and bicycle safety training for children. The bike mobile project allows staff to set up at schools, farmers’ markets, and other outreach events with a small collection and library card distribution, while modeling practices that are environmentally conscious and limit our contribution to traffic.
Worked with Public Works Department to evaluate best solutions and install new drive-up book drops at Mitchell Park and Rinconada Libraries. The new drive-up book drops will be installed by the end of 2016.
Initiatives Implement recommendations from workflow analysis and make changes to equipment and
procedures related to Circulation functions following completion of lean library practices, completed in Fiscal Year 2016.
Finalize eBranch requirements and implementation evaluation to enhance Library users’ on-line and mobile experience.
Complete the library’s procedure manual to ensure that new processes reflect the completion of updated buildings provide staff with appropriate guidance and align with existing policies.
Continue development of the New Americans program, including workshops on citizenship, American culture, and similar topics for adult learners.
Work with the schools to make sure that all Kindergarten students have a library card.
Implement inclusive programming for children who have differing needs and abilities.
Goals and ObjectivesGOAL ACreate a variety of opportunities for learning and provide effective tools for improving all types of literacy.
Strategies: Provide early childhood literacy programs based on current research in child development
and learning.
Create opportunities for community members to acquire the necessary skills to succeed in an increasingly digital world.
Provide a portal to American culture, language, and civic life.
Ensure that the library’s collections, technology, and buildings support the evolving requirements of 21st Century lifelong learning.
GOAL BStrengthen the community and the library through effective partnerships.
LIBRARY • CITY OF PALO ALTO FISCAL YEAR 2017 ADOPTED BUDGET

LIBRARY
Strategies: Support Project Safety Net’s programs to promote youth well-being and support the 41
Developmental Assets.
Increase collaboration with Palo Alto’s public and private schools and their school librarians.
Support library stakeholders in their advocacy and fundraising activities.
Connect librarians to community organizations in order to support their goals and participate in their activities by bringing library resources and services directly to them.
GOAL CFacilitate civic participation and effective community engagement.
Strategies: Provide a forum to explore issues of local interest and current events.
Engage community members, with particular attention to teens and seniors, in library services as volunteers and program advisors.
GOAL DExpand virtual customer experiences.
Strategies: Make the library e-branch as usable and useful on mobile devices as on PCs and laptops.
Grow digital collections to a robust level to meet increasing demand.
Make discovery and use of library collections, services, and resources more simple.
GOAL EFoster a culture of excellence, continuous improvement, and risk-taking.
Strategies: Attract, develop, and retain the most talented employees.
Provide opportunities and resources for all employees to continue developing their skills and knowledge.
Embrace and reward creativity and innovation.
LIBRARY • CITY OF PALO ALTO FISCAL YEAR 2017 ADOPTED BUDGET 303

LIBRARY
304
%
8%
2%
8)%
1%
Key Performance Measures
Workload Measures
NUMBER OF TEENS WHO PARTICIPATE IN THE LIBRARY'S PROGRAMS FOR TEENS, INCLUDING THE SUMMER READING PROGRAMGoal Develop and provide library services and programs supporting the 41
Developmental Assets for Adolescents Model.
Objective Encourage adolescents between the ages of 12 and 18 to read for pleasure three or more hours a week (Developmental Asset #25).
FY 2014 Actuals
FY 2015 Actuals
FY 2016 Adopted
FY 2016 Estimated
FY 2017 Adopted
Number of teens who participate in the Library's reading programs for teens
1,188 2,746 1,089 6,452 6,785
Description This measure tracks the level of interest and participation in the library's recreational reading programs.
Purpose Adolescents who enjoy reading are more likely to grow up into healthy, caring, and responsible adults.
Status
In Fiscal Year 2015 participation was down because the two largest branch libraries were closed. In Fiscal Year 2016, participation has increased because of the opening of Mitchell Park and Rinconada libraries, with implementation of new teen programs.
FY 2014 Actuals
FY 2015 Actuals
FY 2016 Adopted
FY 2016 Estimated
FY 2017 Adopted
Meeting Room Reservations 1,027 4,339 1,863 6,206 6,516
Number of visits to library branches 678,180 810,962 957,338 910,752 956,290
Number of virtual visits to the library 1,041,540 1,163,467 1,309,690 1,264,398 1,327,618
Checkouts of library materials 1,364,872 1,499,406 1,466,018 1,696,528 1,781,354
Annual Turnover rate of library collections 3.77 3.49 2.00 2.67 3.00
Budget SummaryFY 2014 Actuals
FY 2015 Actuals
FY 2016 Adopted Budget
FY 2017 Adopted Budget
FY 2017 Change $
FY 2017Change
Dollars by Division
Administration 883,901 975,012 592,312 845,777 253,465 42.
Collection and Technical Services 2,336,044 2,518,152 2,274,430 2,505,504 231,073 10.
Public Services 4,120,164 4,486,403 5,688,121 5,640,221 (47,900) (0.
Total 7,340,109 7,979,566 8,554,864 8,991,501 436,638 5.
LIBRARY • CITY OF PALO ALTO FISCAL YEAR 2017 ADOPTED BUDGET

LIBRARY
4%
3)%
%
9%
5)%
8%
6%
0%
0%
2%
9)%
2%
6%
8)%
1%
8%
%
8%
4)%
)%
%
5%
1)%
)%
%
Dollars by Category
Salary & Benefits
Healthcare 765,426 763,758 968,420 991,346 22,926 2.
Other Benefits 118,164 103,221 121,673 100,627 (21,047) (17.
Overtime 35,780 43,747 68,783 68,783 — —
Pension 673,223 740,890 941,472 1,034,342 92,871 9.
Retiree Medical 412,842 441,876 466,000 435,745 (30,255) (6.
Salary 3,246,616 3,495,803 4,120,962 4,278,886 157,924 3.
Workers' Compensation 5,944 9,155 5,037 51,358 46,321 919.
Total Salary & Benefits 5,257,995 5,598,450 6,692,347 6,961,088 268,741 4.
Allocated Charges 665,188 740,610 586,451 785,733 199,283 34.
Contract Services 295,659 282,135 338,580 342,552 3,972 1.
Facilities & Equipment 6,860 19,708 46,092 19,400 (26,692) (57.
General Expense 97,609 91,709 66,780 80,930 14,150 21.
Rents & Leases — — 500 513 13 2.
Supplies & Material 1,016,798 1,246,954 824,114 801,286 (22,828) (2.
Total Dollars by Expense Category
7,340,109 7,979,567 8,554,864 8,991,502 436,638 5.
Revenues
Charges for Services 18,273 17,130 21,850 22,888 1,038 4.
From Other Agencies 72,500 — 7,000 7,000 — —
Other Revenue 511,414 354,719 17,100 18,100 1,000 5.
Other Taxes and Fines 153,511 125,769 198,800 154,297 (44,503) (22.
Total Revenues 755,697 497,618 244,750 202,285 (42,465) (17.4
Positions by Division
Administration 0.40 0.40 0.40 0.40 — —
Collection and Technical Services 10.85 10.80 11.64 13.24 1.60 13.7
Public Services 45.27 48.27 52.52 49.94 (2.58) (4.9
Total 56.52 59.47 64.56 63.58 (0.98) (1.52
Budget SummaryFY 2014 Actuals
FY 2015 Actuals
FY 2016 Adopted Budget
FY 2017 Adopted Budget
FY 2017 Change $
FY 2017Change
LIBRARY • CITY OF PALO ALTO FISCAL YEAR 2017 ADOPTED BUDGET 305

LIBRARY
306
40
14
32
42
62
91
85
—
98
32
02
72
55
14
39
81
20
Staffing
Job ClassificationFY 2014 Actuals
FY 2015 Actuals
FY 2016 Adopted Budget
FY 2017 Adopted Budget
FY 2017 Change $
FY 2017Salary
Administrative Assistant 1.00 1.00 1.00 1.00 — 86,3
Assistant Director Library Services 1.00 1.00 1.00 1.00 — 149,7
Business Analyst 1.00 1.00 1.00 1.00 — 128,8
Coordinator Library Programs 1.00 1.00 1.00 1.00 — 86,6
Director Libraries 1.00 1.00 1.00 1.00 — 187,8
Division Head Library Services 1.00 1.00 1.00 1.00 — 119,3
Librarian 5.00 6.70 7.00 7.00 — 456,8
Library Assistant 5.50 4.50 — — —
Library Associate 5.00 7.00 7.00 7.00 — 445,9
Library Specialist 7.00 7.00 12.50 12.50 — 726,0
Management Assistant 1.00 1.00 1.00 1.00 — 75,5
Manager Library Services 4.00 4.00 4.00 4.00 — 395,1
Senior Librarian 8.25 8.50 8.50 9.00 0.50 662,2
Supervising Librarian — — 2.00 2.00 — 172,0
Sub-total: Full-Time Equivalent Positions
41.75 44.70 48.00 48.50 0.50 3,692,6
Temporary/Hourly 14.77 14.77 16.56 15.08 (1.48) 637,7
Total Positions 56.52 59.47 64.56 63.58 (0.98) 4,330,4
LIBRARY • CITY OF PALO ALTO FISCAL YEAR 2017 ADOPTED BUDGET

LIBRARY
Budget ReconciliationPositions Expenditures Revenues
Net General Fund
Prior Year Budget 64.56 8,554,864 244,750 8,310,114
Base Adjustments
One-Time Prior Year Expenditures and Revenues Deleted
Library Opening Hours and Service Enhancements Start-up costs — (29,500) — (29,500)
One-Time Prior Year Expenditures and Revenues
— (29,500) — (29,500)
Adjustments to Costs of Ongoing Activities
Revenue and Expenditure Adjustments — 2,028 (43,465) 45,493
Salary and Benefits Adjustments — 291,374 — 291,374
MakeX Program - Teen Services Program Reallocation to Community Services (0.48) (24,941) — (24,941)
Pacific Library Partnership Building Up the Bicycles Grant — 1,000 1,000 —
Centralization of Fingerprinting in Human Resources — (300) — (300)
Information Technology Allocated Charges Adjustment — 217,650 — 217,650
Liability Insurance Allocated Charges Adjustment — (46,198) — (46,198)
Print & Mail Allocated Charges Adjustment — 9,579 — 9,579
Utilities Allocated Charges Adjustment — 15,308 — 15,308
Vehicle Replacement Allocated Charges Adjustment — 2,944 — 2,944
Adjustments to Costs of Ongoing Activities (0.48) 468,444 (42,465) 510,909
Total FY 2017 Base Budget 64.08 8,993,808 202,285 8,791,523
Budget Adjustments
1 Senior Librarian at Rinconada Library (0.50) (2,307) — (2,307)
Total Budget Adjustments (0.50) (2,307) — (2,307)
Total FY 2017 Adopted Budget 63.58 8,991,501 202,285 8,789,216
LIBRARY • CITY OF PALO ALTO FISCAL YEAR 2017 ADOPTED BUDGET 307

LIBRARY
308
Budget AdjustmentsBudget Adjustments Positions Expenditures Revenues
Net General Fund
1 Senior Librarian at Rinconada Library -0.50 (2,307) 0 (2,307)
This action will convert a half-time Senior Librarian at Rinconada Library to full-time with offsetting allocations in part-time hourly staff. This action will enable 1.0 Senior Librarian to support the Rinconada Library, providing an appropriate level of professional level management support and consistent supervision. These changes are necessary as a result of enhanced hours at Rinconada Library following the facility renovation, and to provide additional resources for work on the reference database, general Library marketing, and the Foundation Center grants collection and services. (Ongoing savings: $2,307)
Performance Results
The increase in professional level staffing at Rinconada Library will ensure that Library patrons, particularly students, non-profits, and researchers will benefit from more fully developed library services for educational, community, and personal enrichment. This position will interact regularly with a variety of customers and will present library instruction on various specific research topics to improve the public use of paid databases and online resources.
LIBRARY • CITY OF PALO ALTO FISCAL YEAR 2017 ADOPTED BUDGET

OFFICE OF EMERGENCY SERVICES
OFFICE OF EMERGENCY SERVICESMission StatementThe Office of Emergency Services mission is to prevent, prepare for and mitigate, respond to, and recover from all hazards.
PurposeThe Office of Emergency Services purpose is to develop, maintain, and sustain a city-wide, comprehensive, all-hazard, risk-based emergency management program that engages the whole community.
OFFICE OF EMERGENCY SERVICES • CITY OF PALO ALTO FISCAL YEAR 2017 ADOPTED BUDGET 309

OFFICE OF EMERGENCY SERVICES
310 O
3.00 - Full-time 0.48 - Hourly
This organizational chart represents citywide Full-Time Equivalents (FTEs) for this department. The Department Summary tables summarize FTEs by
position allocation.
1.00 Office of Emergency Services Coordinator
1.00 Program Assistant
EMERGENCY SERVICES DIRECTORKenneth Dueker
FFICE OF EMERGENCY SERVICES • CITY OF PALO ALTO FISCAL YEAR 2017 ADOPTED BUDGET

OFFICE OF EMERGENCY SERVICES
DescriptionThe Office of Emergency Services develops, maintains, and sustains a citywide, comprehensive, all-hazard, risk-based emergency management program that engages the whole community.
Accomplishments Completed City of Palo Alto Emergency Operations Plan (EOP).
Activated Emergency Operations Center (EOC) as a regional partner in support of Super Bowl 50 operations.
Spearheaded a community-based winter storm preparedness program using Emergency Services Volunteers (ESVs) to advise individual homeowners on the use of sand bags in preparation for the El Niño season.
Formed a Multi-Agency Coordination (MAC) system for partner agencies with joint responsibilities for emergencies involving the San Francisquito Creek.
Obtained certification by the National Weather Service as a “StormReady Community“.
Continued to develop the Emergency Services Volunteer (ESV) program and general community public safety awareness through ongoing public education sessions, training, and exercises and expanded program training to include creek monitoring.
Opened a new Public Safety Substation at the Stanford Shopping Center.
Continued to work with our regional public safety partners on a wide range of events, ranging from visits by the President of the United States and other dignitaries to mass-gatherings and high-risk events, including the Super Bowl. The Mobile Emergency Operations Center (MEOC) and other specialized OES vehicles were deployed to the majority of these events.
Restructured the Palo Alto/Stanford Citizen Corps Council, an advisory emergency planning and coordination group that includes Stanford University, health care, schools, neighborhoods, private business sector, and other stakeholders.
Surveyed, mapped, and updated data entry for a number of critical infrastructure and key resource sites, including the Palo Alto Unified School District.
Initiatives Comprehensive, All-Hazard Planning: Ongoing updates as required to the Local Hazard
Mitigation and Adaptation Plan (LHMAP), Threat and Hazard Identification and Risk Assessment (THIRA), and development of other needed plans and documents such as the Continuity of Operations Plan (COOP). OES is also coordinating with the Comprehensive Plan, as applicable.
OFFICE OF EMERGENCY SERVICES • CITY OF PALO ALTO FISCAL YEAR 2017 ADOPTED BUDGET 311

OFFICE OF EMERGENCY SERVICES
312 O
Situational Awareness: Implementing technology and other best practices to improve the efficacy of the City’s EOC and other facilities.
Goals and ObjectivesGOAL 1Promote operational readiness of the City to implement the emergency management cycle (mitigate, prepare, respond, recover).
Objectives: Execute a training and exercise plan for designated staff assigned to the EOC, MEOC,
Department Operations Center, or other assignments.
Maintain emergency management facilities, critical infrastructure, and equipment to ensure they are fully mission capable.
Coordinate development of new technologies for emergency management.
Acquire grant funding to improve capabilities of preparedness and response resources.
GOAL 2Engage the whole community to prepare for all hazards.
Objectives: Administer the City ESV program to provide a cadre of trained volunteer first responders.
Form business neighborhoods to promote continuity of business operations.
Outreach to the citizenry to encourage emergency preparedness.
GOAL 3Maintain policies and plans related to disasters, critical incidents and city safety.
Objectives: Lead a process to identify threats and hazards and to assess risks the City faces.
Maintain awareness of threats through coordination with Law Enforcement agencies and other public safety partners.
Participate in regional planning efforts.
Revise the Emergency Operations Plan and associated supporting plans and annexes through an adaptive planning process.
FFICE OF EMERGENCY SERVICES • CITY OF PALO ALTO FISCAL YEAR 2017 ADOPTED BUDGET

OFFICE OF EMERGENCY SERVICES
Key Performance Measures
Workload Measures
READINESS OF OFFICE OF EMERGENCY SERVICES (OES) RESOURCESGoal Promote operational readiness of the City to implement the emergency
management cycle (mitigate, prepare, respond, recover).
Objective Maintain OES emergency management facilities, critical infrastructure, and equipment fully mission capable.
FY 2014 Actuals
FY 2015 Actuals
FY 2016 Adopted
FY 2016 Estimated
FY 2017 Adopted
Percent of Office of Emergency Services resources that are able to respond effectively to hazards
100.00% 97.00% 95.00% 100.00% 95.00%
Description
OES must be able to implement response procedures to an all-hazards threat matrix at any time. OES strives to maintain fully mission capable status to respond effectively to all hazards. However, given the specialized and discreet inventory of equipment, it is not feasible to maintain all systems to a 100 percent readiness standard, although this is estimated to be achieved in Fiscal Year 2016. Therefore, the goal is to meet a 95 percent readiness rate, allowing some flexibility for unscheduled equipment maintenance during the year.
Purpose Critical resources will improve the City's ability to manage a response.
Status
The MEOC was 97 percent fully mission capable in Fiscal Year 2015. The EOC is functioning as an information intelligence center hub and staffed during the day on a regular basis. Other assets, such as the MEOC Support Vehicle were also fully operational.
FY 2014 Actuals
FY 2015 Actuals
FY 2016 Adopted
FY 2016 Estimated
FY 2017 Adopted
Grant contributions received $13,986 $24,500 $15,000 $0 $15,000
Number of presentations, training sessions, and exercises 184 193 80 200 150
Number of deployments of the EOC, MEOC, and ICP 26 47 50 50 50
OFFICE OF EMERGENCY SERVICES • CITY OF PALO ALTO FISCAL YEAR 2017 ADOPTED BUDGET 313

OFFICE OF EMERGENCY SERVICES
314 O
%
6)%
)%
9%
3)%
%
3%
4)%
2%
3%
9%
0)%
8)%
9)%
1%
5)%
)%
%
0)%
)%
%
%
Budget SummaryFY 2014 Actuals
FY 2015 Actuals
FY 2016 Adopted Budget
FY 2017 Adopted Budget
FY 2017 Change $
FY 2017Change
Dollars by Division
Emergency Services 928,257 1,169,201 1,051,358 970,969 (80,389) (7.
Total 928,257 1,169,201 1,051,358 970,969 (80,389) (7.6
Dollars by Category
Salary & Benefits
Healthcare 29,462 38,817 35,705 36,026 321 0.
Other Benefits 12,209 13,064 13,891 12,050 (1,842) (13.
Overtime 1,227 480 — — — —
Pension 70,203 80,731 84,894 91,918 7,025 8.
Retiree Medical 55,860 61,790 69,157 51,613 (17,545) (25.
Salary 304,799 364,197 356,729 375,206 18,477 5.
Workers' Compensation 4,585 (1,522) 3,879 7,885 4,006 103.
Total Salary & Benefits 478,345 557,557 564,254 574,698 10,443 1.
Allocated Charges 42,934 37,031 40,104 29,272 (10,832) (27.
Contract Services 209,934 354,897 230,000 150,000 (80,000) (34.
Facilities & Equipment 134,914 151,328 139,000 135,000 (4,000) (2.
General Expense 20,635 22,509 23,500 32,700 9,200 39.
Supplies & Material 41,495 45,879 54,500 49,300 (5,200) (9.
Total Dollars by Expense Category
928,257 1,169,201 1,051,358 970,969 (80,389) (7.6
Revenues
Charges to Other Funds 94,623 94,623 94,623 94,623 — —
From Other Agencies — — 40,000 — (40,000) (100.
Total Revenues 94,623 94,623 134,623 94,623 (40,000) (29.7
Positions by Division
Emergency Services 3.48 3.48 3.48 3.48 — —
Total 3.48 3.48 3.48 3.48 — —
FFICE OF EMERGENCY SERVICES • CITY OF PALO ALTO FISCAL YEAR 2017 ADOPTED BUDGET

OFFICE OF EMERGENCY SERVICES
47
09
87
43
17
60
Staffing
Job ClassificationFY 2014 Actuals
FY 2015 Actuals
FY 2016 Adopted Budget
FY 2017 Adopted Budget
FY 2017 Change $
FY 2017Salary
Director Office of Emergency Services 1.00 1.00 1.00 1.00 — 142,1
Office of Emergency Services Coordinator 1.00 1.00 1.00 1.00 — 116,2
Program Assistant 1.00 1.00 1.00 1.00 — 64,9
Sub-total: Full-Time Equivalent Positions
3.00 3.00 3.00 3.00 — 323,3
Temporary/Hourly 0.48 0.48 0.48 0.48 — 30,9
Total Positions 3.48 3.48 3.48 3.48 — 354,2
OFFICE OF EMERGENCY SERVICES • CITY OF PALO ALTO FISCAL YEAR 2017 ADOPTED BUDGET 315

OFFICE OF EMERGENCY SERVICES
316 O
Budget ReconciliationPositions Expenditures Revenues
Net General Fund
Prior Year Budget 3.48 1,051,358 134,623 916,735
Base Adjustments
One-Time Prior Year Expenditures and Revenues Deleted
Safe Schools Mapping Project — (80,000) (40,000) (40,000)
One-Time Prior Year Expenditures and Revenues
— (80,000) (40,000) (40,000)
Adjustments to Costs of Ongoing Activities
Salary and Benefits Adjustments — 10,443 — 10,443
Vehicle Maintenance Allocated Charges Adjustments — 7,301 — 7,301
General Liability Insurance Allocated Charges Adjustments — (3,382) — (3,382)
Print and Mail Allocated Charges Adjustment — (14,751) — (14,751)
Adjustments to Costs of Ongoing Activities — (389) — (389)
Total FY 2017 Base Budget 3.48 970,969 94,623 876,346
Total FY 2017 Adopted Budget 3.48 970,969 94,623 876,346
FFICE OF EMERGENCY SERVICES • CITY OF PALO ALTO FISCAL YEAR 2017 ADOPTED BUDGET

OFFICE OF SUSTAINABILITY
OFFICE OF SUSTAINABILITYMission StatementThe Office of Sustainability leads the organization, residents, businesses and visitors in promoting a culture of environmental sustainability by developing, coordinating, and leading initiatives citywide, regionally, and through partnerships with the community.
PurposeThe purpose of the Office of Sustainability is to promote and facilitate an environmen-tally sustainable future in ways that improve quality of life, grow prosperity and build resilience, and provide leadership in
the region and to other communities.
OFFICE OF SUSTAINABILITY • CITY OF PALO ALTO FISCAL YEAR 2017 ADOPTED BUDGET 317
OFFICE OF SUSTAINABILITY
318 O
FY 201 POSITION TOTALS1.00 - Full-time
This organizational chart represents citywide Full-Time Equivalents (FTEs) for this department. The Department Summary tables summarize FTEs by
position allocation.
CHIEF SUSTAINABILITY OFFICERGil Friend
FFICE OF SUSTAINABILITY • CITY OF PALO ALTO FISCAL YEAR 2017 ADOPTED BUDGET

OFFICE OF SUSTAINABILITY
DescriptionThe City’s Office of Sustainability, led by the Chief Sustainability Officer, focuses on the following areas:
STRATEGIC PLANNING:Create, update, and organize City department plans that enhance sustainability.
POLICY AND PROGRAM COORDINATION:Work with City Council and City staff to design and implement policies and programs that advance the City’s sustainability goals.
INTERGOVERNMENTAL RELATIONS:Collaborate with international, federal, state, county, special districts, and other non-govern-mental organizations to leverage resources and advance these goals.
Accomplishments Completed draft Sustainability and Climate Action Plan, informed by 300+ person
community climate summit, polls and external Advisory Board.
Initiated sustainability performance dashboard to streamline collection, analysis and reporting of key sustainability indicators; resolved data access hurdles; loaded utility data.
Developed Letter of Intent for collaboration with Finland Ministry of Transportation and Communications on development of ‘mobility as a service” (MaaS); convened quarterly meetings on MaaS with regional jurisdictions and employers, co-sponsored with Joint Venture Silicon Valley; worked with Planning and Community Environment Department, Transportation Management Association and City’s Executive Leadership Team to develop and advance MaaS pilot programs.
Worked with Fleet and Administrative Services Department to establish ‘Electric Vehicle First” policy for City fleet.
Participated in multi-city collaborations on alternative mobility, sustainable procurement, Zero Net Energy (ZNE) buildings, and municipal sustainability finance.
Conducted Study Sessions with City Council and Utilities Advisory Commission regarding the Sustainability and Climate Action Plan, shuttle program, and MaaS.
Worked with the not-for-profit, Empowerment Institute to establish a Memorandum of Understanding for the ‘Cool Blocks” program and develop an initial ten block pilot of the program.
Signed Palo Alto onto the global Compact of Mayors, a global cooperative effort among mayors and city officials committed to reducing local greenhouse gas emissions, enhancing resilience to climate change, and tracking progress transparently.
OFFICE OF SUSTAINABILITY • CITY OF PALO ALTO FISCAL YEAR 2017 ADOPTED BUDGET 319

OFFICE OF SUSTAINABILITY
320
Raised $350,000 in grant funding for City sustainability initiatives, including County Alternative Mobility planning; EV education, outreach and charging stations; Multi-City ZNE peer exchange and a Sustainability Finance Scan.
Initiatives Further develop Sustainability and Climate Action Plan (S/CAP)
Implement sustainability performance dashboard.
Develop and improve sustainability performance tracking systems.
Pilot local and regional “mobility as a service“ initiatives
Goals and ObjectivesGOAL 1:Establish bold, coherent and grounded direction, goals and plans
Objectives: Complete and adopt Sustainability and Climate Action Plan (S/CAP)
Work with City Departments to develop specific S/CAP implementation strategies and plans
Assess and refine policies to ensure alignment with City sustainability commitments
Deploy sustainability performance dashboard, and use to educate and engagement internal and external stakeholders
GOAL 2:Integrate sustainability policies, programs and practices into City operations and community actions.
Objectives: Upgrade existing ‘environmentally preferable purchasing” (EPP) initiatives to ‘default to
green” wherever feasible.
Assess and improve operations and processes.
Review and implement ‘total cost of operations” (TCO) and externality policies in CIP and operating budgets.
Explore development of internal carbon pricing in City management and operations.
GOAL 3:Foster experimentation, alliances and big leaps
Objectives: Develop regional ‘mobility as a service” (MaaS) initiatives and pilot programs.
Develop external funding resources for sustainability initiatives.
Develop electrification/fuel switching strategies.
OFFICE OF SUSTAINABILITY • CITY OF PALO ALTO FISCAL YEAR 2017 ADOPTED BUDGET

OFFICE OF SUSTAINABILITY
%
9%
9%
4%
8)%
%
6%
5%
5)%
%
)%
3%
1%
%
%
9%
8)%
)%
0)%
Budget SummaryFY 2014 Actuals
FY 2015 Actuals
FY 2016 Adopted Budget
FY 2017 Adopted Budget
FY 2017 Change $
FY 2017Change
Dollars by Division
Sustainability 92,597 496,204 423,116 498,701 75,585 17.
Total 92,597 496,204 423,116 498,701 75,585 17.
Dollars by Category
Salary & Benefits
Healthcare 5,834 9,691 19,152 20,001 849 4.
Other Benefits 1,560 4,473 6,842 5,488 (1,354) (19.
Overtime — 450 — — — —
Pension 10,932 18,466 43,390 46,690 3,299 7.
Retiree Medical — 6,572 7,307 12,530 5,223 71.
Salary 43,106 146,842 269,251 176,259 (92,992) (34.
Workers' Compensation — — — 2,257 2,257 —
Total Salary & Benefits 61,432 186,494 345,943 263,225 (82,718) (23.9
Allocated Charges 210 1,779 673 48,976 48,303 7,177.
Contract Services 23,233 287,328 61,750 171,750 110,000 178.
General Expense 6,509 19,342 13,500 13,500 — —
Supplies & Material 1,214 1,260 1,250 1,250 — —
Total Dollars by Expense Category
92,597 496,204 423,116 498,701 75,585 17.
Revenues
Charges to Other Funds — — 144,142 124,202 (19,940) (13.
Total Revenues — — 144,142 124,202 (19,940) (13.8
Positions by Division
Sustainability 0.50 1.00 2.00 1.00 (1.00) (50.0
OFFICE OF SUSTAINABILITY • CITY OF PALO ALTO FISCAL YEAR 2017 ADOPTED BUDGET 321

OFFICE OF SUSTAINABILITY
322
96
96
—
96
Staffing
Job ClassificationFY 2014 Actuals
FY 2015 Actuals
FY 2016 Adopted Budget
FY 2017 Adopted Budget
FY 2017 Change $
FY 2017Salary
Chief Sustainability Officer 0.50 0.50 1.00 1.00 — 163,1
Sub-total: Full-Time Equivalent Positions
0.50 0.50 1.00 1.00 — 163,1
Temporary/Hourly — 0.50 1.00 — (1.00)
Total Positions 0.50 1.00 2.00 1.00 (1.00) 163,1
Budget ReconciliationPositions Expenditures Revenues
Net General Fund
Prior Year Budget 2.00 423,116 144,142 278,974
One Time Prior Year Expenditures Deleted
Sustainability Temporary Staffing (1.00) (105,508) — (105,508)
One Time Prior Year Expenditures (1.00) (105,508) — (105,508)
Adjustments to Costs of Ongoing Activities
Salaries and Benefits Adjustments — 22,790 — 22,790
General Liability Insurance Allocated Charges Adjustments — (560) — (560)
Print & Mail Allocated Charges Adjustments — 1,294 — 1,294
Information Technology Allocated Charges Adjustment — 47,569 — 47,569
General Fund Cost Plan Allocation Charges Adjustments — — (19,941) 19,941
Adjustments to Costs of Ongoing Activities — 71,093 (19,941) 91,034
Total FY 2017 Base Budget 1.00 388,701 124,201 246,500
Budget Adjustments
1 Sustainability Initiatives Contract Funding — 110,000 — 110,000
Total Budget Adjustments — 110,000 — 110,000
Total FY 2017 Adopted Budget 1.00 498,701 124,201 374,500
OFFICE OF SUSTAINABILITY • CITY OF PALO ALTO FISCAL YEAR 2017 ADOPTED BUDGET

OFFICE OF SUSTAINABILITY
Budget AdjustmentsBudget Adjustments Positions Expenditures Revenues
Net General Fund
1 Sustainability Initiatives Contract Funding 0.00 110,000 0 (110,000)
This action adds funding to the contract budget for the Office of Sustainability. This category of funding will give the Office of Sustainability increased flexibility in how to implement sustainability initiatives, including Climate Action Plan recommendations, sustainability dashboards for measuring performance, mobility as a service (MaaS) programs, and community engagement. The contract funding replaces a 1.0 FTE temporary Management Specialist position that was first established in FY 2015 and continued in FY 2016 with “one-time” funding. In FY 2016, the Office of Sustainability raised $350,000 in various grants towards sustainability efforts.
Performance Results
This action will give the Office of Sustainability flexibility to most effectively implement Sustainability programs and initiatives, including the Climate Action Plan.
OFFICE OF SUSTAINABILITY • CITY OF PALO ALTO FISCAL YEAR 2017 ADOPTED BUDGET 323


PLANNING & COMMUNITY ENVIRONMENT
PLANNING & COMMUNITY ENVIRONMENTMission StatementThe mission of the Planning and Community Environment Department is to provide the City Council and the community with creative guidance on, and effective implementation of land use development, planning, transportation, housing and environmental policies, and plans and programs that maintain and enhance the City as a safe, vital, and attractive community.
PurposeThe Planning and Community Environment
Department is responsible for a range of planning and implementation actions aimed at preserving and enhancing the quality of life in Palo Alto, ensuring wise transportation investments, and facilitating land use and development decisions through consistent and transparent processes.
PLANNING & COMMUNITY ENVIRONMENT • CITY OF PALO ALTO FISCAL YEAR 2017 ADOPTED BUDGET 325

PLANNING & COMMUNITY ENVIRONMENT
326
CURRENT PLANNING1.00 Chief Planning Official*1.00 Planning Manager4.00 Senior Planner*3.00 Planner*1.00 Code Enforcement Lead*2.00 Code Enforcement Officer*
OPERATIONS1.00 Assistant Director
PLANNING/DEVELOPMENT SERVICES
1.00 Planning Manager*1.00 Associate Planner*
.00 Building/Planning Technician*
TRANSPORTATION1.00 Chief Transportation Official1.00 Transportation Planning
ADVANCE PLANNING1.00 Planning Manager3.00 Senior Planner1.00 Planner1.00 Business Analyst
ADMINISTRATION1.00 Senior ManagementAnalyst
.00 Administrative Associate III1.00 Administrative Associate I1.00 Administrative Assistant
DIRECTOR PLANNING& COMMUNITY ENVIRONMENT
Hillary Gitelman
FY 201 POSITION TOTALS - Full-time - Hourly
This organizational chart represents citywide Full-Time Equivalents (FTEs) for this department. The Department Summary tables summarize FTEs by
position allocation.
*Portions of these positionsare functionally part of the
Development Services Department. The Planning and
Community Environment Department retains
administrative oversight over department personnel.
PLANNING & COMMUNITY ENVIRONMENT • CITY OF PALO ALTO FISCAL YEAR 2017 ADOPTED BUDGET

PLANNING & COMMUNITY ENVIRONMENT
DescriptionThe Planning and Community Environment Department is responsible for the following functions:
ADVANCE PLANNINGThis division is responsible for updating and maintaining the City’s Comprehensive Plan, includ-ing its Housing Element. The division also prepares zoning ordinance amendments, site-specific plans, and is responsible for data and analysis to support a wide variety of planning projects.
TRANSPORTATION AND PARKINGThis division is responsible for transportation planning and for the City’s transportation infra-structure. The division also conducts traffic studies and is responsible for traffic engineering, transportation demand management initiatives, shuttle services, parking supply and manage-ment, and implementation of the City’s Bicycle and Pedestrian Plan.
CURRENT PLANNINGThis division is responsible for the review of public and private projects pursuant to the Califor-nia Environmental Quality Act (CEQA), the City’s Zoning Ordinance, and the Comprehensive Plan. Activities include the review of applications submitted for planning entitlements, review of applications for building permits submitted at the Development Center, and providing gen-eral information to the public regarding the City’s zoning and Comprehensive Plan provisions.
CODE ENFORCEMENTThis division is responsible for enforcement of code requirements and conditions of approval.
ADMINISTRATIONThis division provides personnel, contract, budget, and project support for the department and also supports the Planning and Transportation Commission, Architectural Review Board, His-toric Resources Board, Bicycle and Pedestrian Advisory Committee, Comprehensive Plan Citi-zens’ Advisory Committee, and other public meetings.
Accomplishments Prepared an urgency ordinance to preserve ground floor retail
Implemented $2 million traffic signal upgrade
Convened the Comprehensive Plan Summit and Citizens’ Advisory Committee (CAC)
Implemented Downtown Residential Preferential Parking (RPP) Phase 1
Conducted a Downtown Commute Survey and launched a Downtown Transportation Management Association (TMA)
Reviewed Vision and Goals for all Comprehensive Plan Elements with the City Council
Prepared the first annual zoning code cleanup ordinance
PLANNING & COMMUNITY ENVIRONMENT • CITY OF PALO ALTO FISCAL YEAR 2017 ADOPTED BUDGET 327

PLANNING & COMMUNITY ENVIRONMENT
328
Processed two Single Story Overlay (SSO) districts and initiated review of the Individual Review (IR) Guidelines
Prepared an interim ordinance establishing a Office/Research & Development Annual Limit
Received approval for five Bicycle Boulevard Concept Plans
Major approvals at 2555 Park, 261 Hamilton, 385 Sherman, 430 Forest, Stanford Shopping Center
Presented 51 action items to the City Council (55% of the total for 2015) and conducted 9 study sessions
Convened 82 total meetings of the Planning and Transportation Commission (PTC), Architectural Review Board (ARB), Historic Resources Board (HRB), Director’s Hearings, Comprehensive Plan CAC, and Palo Alto Bicycle and Pedestrian Advisory Committee (PABAC), along with 13 additional public meetings and 12 bicycle rodeos
Reviewed over 1,300 building permits for zoning compliance
Processed over 70 IR projects, of which 2 were appealed; processed 79 staff-level Architectural Reviews and 23 ARB level reviews
Initiatives Make significant progress on the Comprehensive Plan Update
Implement and monitor Phase 2 of the Downtown RPP and institute RPP programs in Evergreen Park and Southgate
Replace and enhance parking signage to help drivers locate parking downtown
Complete a study of paid parking downtown and support planning and design of a new parking structure
Support the work of the Transportation Management Association and conduct the annual survey of commute patterns downtown
Complete Concept Plan Line Studies for projects to implement the 2012 Bicycle and Pedestrian Plan
Initiate traffic safety improvements and complete the first phase of a speed survey
Develop a “fifth and sixth scenario” for analysis as part of the Comprehensive Plan Environmental Impact Report (EIR)
PLANNING & COMMUNITY ENVIRONMENT • CITY OF PALO ALTO FISCAL YEAR 2017 ADOPTED BUDGET

PLANNING & COMMUNITY ENVIRONMENT
Goals and ObjectivesGOAL 1Increase the public’s trust in the City’s planning functions, reaffirming the role of the Compre-hensive Plan as the City’s fundamental land use and transportation policy document, maintain-ing transparency and objectivity, and providing ample data and a reasonable basis for recommendations.
Objectives: Improve the review times for Individual Review (IR) applications, architectural review
applications (AR), and building permit applications.
Improve the review times for Individual Review (IR) applications and building permit applications.
GOAL 2Deliver ongoing programs that improve people’s lives, including code enforcement, housing, historic preservation, community block grant, and transportation and parking programs.
Objectives: Continue the City’s significant commitment to Safe Routes to School.
Manage the City’s Community Development Block Grant (CDBG) and Below Market Rate (BMR) housing programs.
Respond to citizen complaints and effectively abate zoning and building code violations.
GOAL 3Design and implement programs that encourage transportation alternatives to single occu-pancy vehicle trips and improve traffic flow and parking availability.
Objectives: Implement residential parking programs downtown.
Operate a shuttle system and support a Transportation Management Association dedicated to decreasing the use of single occupant vehicles.
Respond to work order requests related to parking and traffic and oversee operation of the City’s transportation infrastructure.
PLANNING & COMMUNITY ENVIRONMENT • CITY OF PALO ALTO FISCAL YEAR 2017 ADOPTED BUDGET 329

PLANNING & COMMUNITY ENVIRONMENT
330
Key Performance MeasuresCODE ENFORCEMENT
GoalDeliver ongoing programs that improve people’s lives, including code enforcement, housing, historic preservation, community block grant, and transportation and parking programs.
Objective Respond to citizen complaints and effectively abate zoning and building code violations.
FY 2014 Actuals
FY 2015 Actuals
FY 2016 Adopted
FY 2016 Estimated
FY 2017 Adopted
Percent of surveyed residents rating the quality of code enforcement as good or excellent
62.00% 59.00% 60.00% 60.00% 70.00%
Description This measure tracks residents' opinions through data collected in the National Citizen Survey.
Purpose This measure can be used to measure changes in satisfaction as service enhancements to the code enforcement function are implemented.
Status The department received a Code Enforcement Lead position in the FY16 budget and filled the position in January, 2016.
INDIVIDUAL REVIEW AND BUILDING PLAN CHECKS
Goal
Increase the public's trust in the City's planning functions, reaffirming the role of the Comprehensive Plan as the City's fundamental land use and transportation policy document, maintaining transparency and objectivity, and providing ample data and a reasonable basis for recommendations.
ObjectiveImprove the review times for Individual Review (IR) applications, architectural review applications (AR), and building permit applications for Single-Family Individual Reviews.
FY 2014 Actuals
FY 2015 Actuals
FY 2016 Adopted
FY 2016 Estimated
FY 2017 Adopted
Percent of Planning Review of building plan checks completed within 30 days of application intake
87.00% 81.00% 95.00% 87.00% 95.00%
Percent of IRs and staff level ARs completed within 90 days of complete application
44.00% 31.00% 60.00% 44.00% 85.00%
DescriptionThese measures track the percentage of IRs, staff level ARs, and building plan checks completed within an expected time frame and assures applications of good quality and responsiveness to applicants.
Purpose
The Single-Family Individual Review process was established by Palo Alto Municipal Code (PAMC) 18.12.110 to preserve the character of Palo Alto neighborhoods by placing specific requirements relating to streetscape, massing, and privacy of new two-story homes and upper story additions within the R-1 zoning district. Staff level architectural reviews and planning review of building plan checks ensure compliance with land use and development standards.
Status
Staff level architectural reviews (ARs) were not included as a performance measure prior to Fiscal Year 2017; percentages through Fiscal Year 2016 for that measure reflect only the percent of IR applications completed within 90 days of submission of complete application. Factors that affect results in this area include staff vacancy levels, applicant delays, and application volume.
PLANNING & COMMUNITY ENVIRONMENT • CITY OF PALO ALTO FISCAL YEAR 2017 ADOPTED BUDGET

PLANNING & COMMUNITY ENVIRONMENT
Workload Measures
TRANSPORTATION AND PARKINGGoal Design and implement programs that encourage transportation alternatives to
single occupancy vehicle trips and improve traffic flow and parking availability.
ObjectiveImplement a suite of short-term parking and Transportation Demand Management programs concurrent with neighborhood parking restrictions in downtown.
FY 2014 Actuals
FY 2015 Actuals
FY 2016 Adopted
FY 2016 Estimated
FY 2017 Adopted
Number of shuttle bus boardings 134,362 152,571 142,000 180,000 153,000
Description This measure tracks the annual usage of the shuttle program.
Purpose This measure is used to track changes in satisfaction with the shuttle program.
Status
The City expanded shuttle service to relieve traffic and parking demands in FY 2015. One of the routes is not managed by the City, so reductions occurred between FY 2015 and FY 2016 but ridership increased with the addition of an East Palo Alto route, funded by the City of East Palo Alto. Ridership is expected to decrease in FY 2017 because East Palo Alto is withdrawing this support. If necessary, the department will bring forward a budget adjustment for City Council consideration as part of FY 2017. The department is also currently assessing opportunities to expand the shuttle system and monitoring a VTA planning process that could have dramatic impacts on local transit service.
FY 2014 Actuals
FY 2015 Actuals
FY 2016 Adopted
FY 2016 Estimated
FY 2017 Adopted
Number of planning and Architectural Review Board applications completed
136 174 130 135 135
Average number of days for Planning to first review building permit applications
19 21 20 20 20
Average number of days from Individual Review (IR) application to approval
134 143 126 140 126
PLANNING & COMMUNITY ENVIRONMENT • CITY OF PALO ALTO FISCAL YEAR 2017 ADOPTED BUDGET 331

PLANNING & COMMUNITY ENVIRONMENT
332
%
6%
%
9)%
)%
0%
9)%
%
8%
5)%
0%
0%
5%
5)%
2)%
2%
1)%
%
%
%
)%
Budget SummaryFY 2014 Actuals
FY 2015 Actuals
FY 2016 Adopted Budget
FY 2017 Adopted Budget
FY 2017 Change $
FY 2017Change
Dollars by Division
Administration 1,107,041 1,209,749 1,351,782 1,738,825 387,043 28.
Building 5,802,183 55,175 — — — —
Planning and Transportation 6,362,180 6,176,863 7,555,518 7,037,050 (518,468) (6.
Total 13,271,404 7,441,786 8,907,300 8,775,875 (131,425) (1.5
Dollars by Category
Salary & Benefits
Healthcare 775,225 425,712 581,037 598,213 17,176 3.
Other Benefits 142,775 94,285 114,100 87,926 (26,174) (22.
Overtime 59,895 44,233 60,754 60,753 — —
Pension 1,027,419 659,237 872,420 966,262 93,842 10.
Retiree Medical 508,835 287,667 321,025 300,159 (20,866) (6.
Salary 4,273,514 2,866,179 3,114,802 3,396,040 281,238 9.
Workers' Compensation 10,527 14,011 6,731 40,521 33,790 502.
Total Salary & Benefits 6,798,190 4,391,324 5,070,870 5,449,874 379,005 7.
Allocated Charges 1,064,611 611,709 765,855 677,530 (88,326) (11.
Contract Services 4,098,213 2,121,541 2,657,873 2,226,339 (431,534) (16.
Facilities & Equipment 11,865 14,316 22,850 39,350 16,500 72.
General Expense 457,084 260,923 343,995 336,925 (7,070) (2.
Operating Transfers-Out 7,607 7,607 7,607 7,607 — —
Rents & Leases 770,223 1,444 — — — —
Supplies & Material 63,612 32,923 38,250 38,250 — —
Total Dollars by Expense Category
13,271,405 7,441,787 8,907,300 8,775,875 (131,425) (1.5
PLANNING & COMMUNITY ENVIRONMENT • CITY OF PALO ALTO FISCAL YEAR 2017 ADOPTED BUDGET

PLANNING & COMMUNITY ENVIRONMENT
0%
%
%
5)%
6%
1%
%
8%
8%
%
5)%
3%
40
33
—
84
41
61
77
—
82
13
—
16
36
%
Revenues
Charges for Services 4,987,868 549,617 581,423 1,023,225 441,802 76.
Charges to Other Funds 55,092 6,694 — — — —
Operating Transfers-In 128,000 128,000 128,000 128,000 — —
Other Revenue 7,542 221,280 485,900 220,900 (265,000) (54.
Other Taxes and Fines 281,768 (1,312) 15,000 15,390 390 2.
Permits and Licenses 5,892,017 881,750 605,691 842,239 236,548 39.
Rental Income (77) 83 — — — —
Total Revenues 11,352,209 1,786,111 1,816,014 2,229,754 413,740 22.
Positions by Division
Administration 1.50 2.30 5.20 6.91 1.71 32.8
Building 21.85 0.10 — — — —
Planning and Transportation 30.63 26.53 26.72 25.53 (1.19) (4.4
Total 53.98 28.93 31.92 32.44 0.52 1.6
Staffing
Job ClassificationFY 2014 Actuals
FY 2015 Actuals
FY 2016 Adopted Budget
FY 2017 Adopted Budget
FY 2017 Change $
FY 2017Salary
Administrative Assistant 2.00 1.00 1.00 1.00 — 86,3
Administrative Associate I 1.00 1.00 1.00 1.00 — 62,5
Administrative Associate II 3.80 1.00 1.00 — (1.00)
Administrative Associate III 2.00 2.00 2.00 3.00 1.00 206,0
Assistant Director PCE 1.00 1.00 1.00 1.00 — 192,4
Associate Engineer 1.00 1.00 1.00 1.00 — 100,9
Associate Planner 1.00 0.10 0.10 0.10 — 9,3
Building Inspector Specialist 3.00 — — — —
Building/Planning Technician 2.00 0.20 0.20 0.70 0.50 43,6
Business Analyst — 1.00 1.00 1.00 — 128,3
Chief Building Official 1.00 — — — —
Chief Planning Official 1.00 0.80 0.80 1.00 0.20 142,4
Chief Transportation Official 0.90 0.50 0.50 0.70 0.20 117,2
Budget SummaryFY 2014 Actuals
FY 2015 Actuals
FY 2016 Adopted Budget
FY 2017 Adopted Budget
FY 2017 Change $
FY 2017Change
PLANNING & COMMUNITY ENVIRONMENT • CITY OF PALO ALTO FISCAL YEAR 2017 ADOPTED BUDGET 333
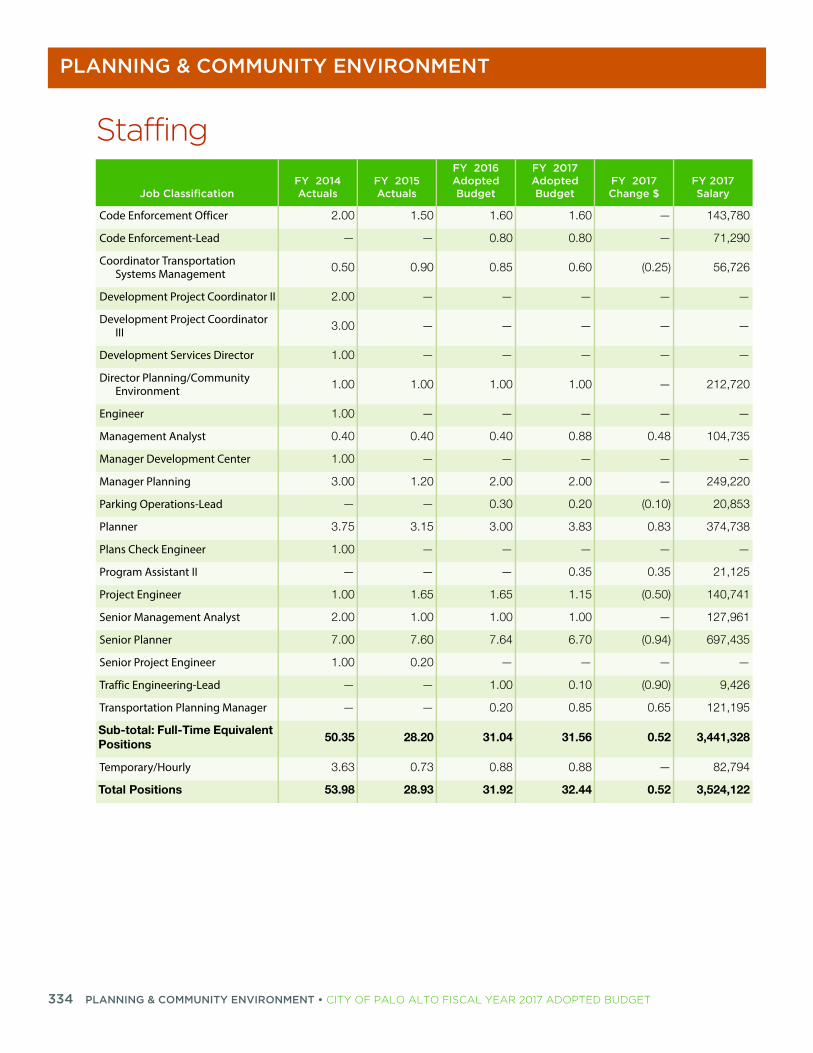
PLANNING & COMMUNITY ENVIRONMENT
334
80
90
26
—
—
—
20
—
35
—
20
53
38
—
25
41
61
35
—
26
95
28
94
22
Code Enforcement Officer 2.00 1.50 1.60 1.60 — 143,7
Code Enforcement-Lead — — 0.80 0.80 — 71,2
Coordinator Transportation Systems Management 0.50 0.90 0.85 0.60 (0.25) 56,7
Development Project Coordinator II 2.00 — — — —
Development Project Coordinator III 3.00 — — — —
Development Services Director 1.00 — — — —
Director Planning/Community Environment 1.00 1.00 1.00 1.00 — 212,7
Engineer 1.00 — — — —
Management Analyst 0.40 0.40 0.40 0.88 0.48 104,7
Manager Development Center 1.00 — — — —
Manager Planning 3.00 1.20 2.00 2.00 — 249,2
Parking Operations-Lead — — 0.30 0.20 (0.10) 20,8
Planner 3.75 3.15 3.00 3.83 0.83 374,7
Plans Check Engineer 1.00 — — — —
Program Assistant II — — — 0.35 0.35 21,1
Project Engineer 1.00 1.65 1.65 1.15 (0.50) 140,7
Senior Management Analyst 2.00 1.00 1.00 1.00 — 127,9
Senior Planner 7.00 7.60 7.64 6.70 (0.94) 697,4
Senior Project Engineer 1.00 0.20 — — —
Traffic Engineering-Lead — — 1.00 0.10 (0.90) 9,4
Transportation Planning Manager — — 0.20 0.85 0.65 121,1
Sub-total: Full-Time Equivalent Positions
50.35 28.20 31.04 31.56 0.52 3,441,3
Temporary/Hourly 3.63 0.73 0.88 0.88 — 82,7
Total Positions 53.98 28.93 31.92 32.44 0.52 3,524,1
Staffing
Job ClassificationFY 2014 Actuals
FY 2015 Actuals
FY 2016 Adopted Budget
FY 2017 Adopted Budget
FY 2017 Change $
FY 2017Salary
PLANNING & COMMUNITY ENVIRONMENT • CITY OF PALO ALTO FISCAL YEAR 2017 ADOPTED BUDGET

PLANNING & COMMUNITY ENVIRONMENT
Budget ReconciliationPositions Expenditures Revenues
Net General Fund
Prior Year Budget 31.92 8,907,300 1,816,014 7,091,286
Base Adjustments
One-Time Prior Year Expenditures and Revenues Deleted
Fry's Master Plan Funding — (300,000) (265,000) (35,000)
Parking Fee Study — (100,000) — (100,000)
Seismic Inventory Funding — (100,000) — (100,000)
Transportation Management Authority Initialization Funding — (100,000) — (100,000)
Scanning and Storage Contractual Funding — (75,000) — (75,000)
Traffic Impact Fee Nexus Study Finding — (55,000) — (55,000)
Individual Review Process Peer Review Study Funding — (50,000) — (50,000)
Safe Routes to School Biennial Conference Funding — (1,500) — (1,500)
Technology for new positions — (11,000) — (11,000)
One-Time Prior Year Expenditures and Revenues
— (792,500) (265,000) (527,500)
Adjustments to Costs of Ongoing Activities
Revenue and Expenditure Adjustments — (29,604) 56,778 (86,382)
Salary and Benefits Adjustment — 261,751 — 261,751
Position Realignment (1.31) (163,046) — (163,046)
Fiber Optic License Fee Allocated Charges Adjustment — 2,582 — 2,582
Information Technology Allocated Charges Adjustment — 12,380 — 12,380
Liability Insurance Allocated Charges Adjustment — (73,399) — (73,399)
Print & Mail Allocated Charges Adjustment — (29,888) — (29,888)
Adjustments to Costs of Ongoing Activities (1.31) (19,224) 56,778 (76,002)
Total FY 2017 Base Budget 30.61 8,095,576 1,607,792 6,487,784
Budget Adjustments
1 On-Call Contractual Services — 165,000 165,000 —
2 Transportation Management Authority — 100,000 — 100,000
3 Planning/Development Services Staffing Alignment 0.50 95,060 — 95,060
4 Management Analyst Alignment 0.48 86,196 — 86,196
PLANNING & COMMUNITY ENVIRONMENT • CITY OF PALO ALTO FISCAL YEAR 2017 ADOPTED BUDGET 335

PLANNING & COMMUNITY ENVIRONMENT
336
5 Scanning and Storage Funding — 75,000 — 75,000
6 Palo Alto Shuttle — 60,000 — 60,000
7 Planning Technician 0.50 53,474 — 53,474
8 Transportation Program Assistant 0.35 39,214 — 39,214
9 Administrative Associate Classification Alignment — 6,355 — 6,355
10 Revenue Alignment — — 456,962 (456,962)
Total Budget Adjustments 1.83 680,299 621,962 58,337
Total FY 2017 Adopted Budget 32.44 8,775,875 2,229,754 6,546,121
Budget AdjustmentsBudget Adjustments Positions Expenditures Revenues
Net General Fund
1 On-Call Contractual Services 0.00 165,000 165,000 0
This net-zero action increases revenues and expenses for on-call contractual services. The Planning and Community Environment Department uses on-call consultants for a number of cost recovery contracts (where the applicant pays for the contract) but these expenses were previously unbudgeted. This action more accurately aligns projected revenues and expenses with the budget, and provides necessary expert resources while augmenting staff resources for expected activity levels. (Ongoing costs: $0)
Performance Results
The incorporation of revenues and expenses for on-call consultant contracts into the budget will increase costing accuracy by ensuring that customers are charged an appropriate amount for the body and volume of work performed. Use of consultants to augment staff allows for responsive services and allows the City to effectively respond to fluctuating demand in applications.
Budget ReconciliationPositions Expenditures Revenues
Net General Fund
PLANNING & COMMUNITY ENVIRONMENT • CITY OF PALO ALTO FISCAL YEAR 2017 ADOPTED BUDGET

PLANNING & COMMUNITY ENVIRONMENT
2 Transportation Management Authority 0.00 100,000 0 100,000
This action adds $100,000 in one-time funding for pilot programs of the new of the Transportation Management Association (TMA) and would be subject to a funding agreement between the City and the TMA. This funding augments the funds already included in the FY 2017 Base Budget for the establishment of the TMA. The additional funding will also ensure that the City can pay its share as a member of the TMA and that a commute survey can be conducted in FY 2017 to assess the effectiveness of Transportation Demand Management (TDM) efforts downtown.(Ongoing costs: $0)
Performance Results
This action will ensure a high level of quality associated with the services of the Transportation Management Authority and assist in mitigating transportation impacts to the City through strengthened relationships with local businesses. Conducting an annual downtown commute survey provides important data to measure the effectiveness of TMA and TDM programs.
3 Planning/Development Services Staffing Alignment 0.50 95,060 0 95,060
Development Services and its partner departments continue to examine the staffing complement necessary to align the permitting function of Development Services with each individual department's expertise and this shift represents the iterative effort for FY 2017. This action aligns permitting staffing between Planning and Community Environment and the Development Services Department. Small portions of various positions, specifically six Senior Planner positions, two Planner positions, two Project Engineers, and the Chief Planning Official, are all recommended to be shifted from Development Services back to the Planning and Community Environment Department. Additionally, this cost is reflected as a reduction to Development Services in that department’s section of this document. (Ongoing costs: $95,060)
Performance Results
This action will ensure customer satisfaction and appropriate cost of services by making sure that fee supported activities across the City are staffed appropriately.
4 Management Analyst Alignment 0.48 86,196 0 86,196
This action adds 0.48 Management Analyst to the Planning & Community Environment to provide necessary support for financial tracking and process improvements. This position would assist with the handling and tracking of fees and funds associated with service delivery, including impact fees and in-lieu fees. This position will also track time associated with fees that require a deposit, in order to ensure that staff time and contract costs are tracked accurately and that customers are accurately billed for amounts in excess of the initial deposit resulting in improved cost-recovery. The Management Analyst will analyze departmental business process and make recommendations for improvements, as well as track and report on the status of projects related to fees and process improvements. The Management Analyst will also provide additional oversight capacity for administering the department’s budget and contracts, including those associated with capital projects. The full position will be split among the Planning and Community Environment Department (88%), the Residential Housing In-Lieu Fund (1%), the Commercial Housing In-Lieu Fund (1%), and the Capital Improvement Fund (10%). (Ongoing costs: $86,196)
Performance Results
The addition of the Management Analyst will provide resources necessary to ensure that costs are accurately tracked and that the quality of internal business processes is improved.
Budget AdjustmentsBudget Adjustments Positions Expenditures Revenues
Net General Fund
PLANNING & COMMUNITY ENVIRONMENT • CITY OF PALO ALTO FISCAL YEAR 2017 ADOPTED BUDGET 337

PLANNING & COMMUNITY ENVIRONMENT
338
5 Scanning and Storage Funding 0.00 75,000 0 75,000
This action continues one-time funding of $75,000 for a scanning and storage contract, originally funded in FY 2016. Planning documents need to be scanned, archived, and electronically uploaded for integration with Geographic Information Systems (GIS) and other planning systems. Digitization will ensure that development-related planning documents are available electronically and indexed in a manner that is consistent with the Planning and Community Environment Department’s business practices. The funding provided in FY 2016 reduced the backlog, but additional resources are needed to continue this effort. (Ongoing costs: $50,000)
Performance Results
This action will provide the Planning & Community Environment Department with on-demand access to digitized development-related planning documents and ensure that records are retained in a high-quality manner consistent with business practices. This contract will minimize staff time dedicated to this activity, allowing department resources to be used most effectively for core functions and services.
6 Palo Alto Shuttle 0.00 60,000 0 60,000
This action adds $60,000 in funding to ensure the ongoing operations of the Palo Alto Shuttle. As a result of a loss of grant funding for FY 2017, the City of Palo Alto's share of costs to operate service on existing shuttle routes will increase. A separate item is anticipated to be brought forward for City Council consideration in Spring 2016 to explore potential strategies for enhancing the service delivery of the Palo Alto Shuttle program by increasing the shuttle's routes and level of service. (Ongoing costs: $60,000)
Performance Results
This action will maintain current levels of customer satisfaction with the shuttle.
7 Planning Technician 0.50 53,474 0 53,474
This action adds 0.5 Planning Technician to the Planning and Community Environment Department to provide front desk support at the Development Services counter for planning application intake appointment. Previously, this function was performed by various planner positions. The service delivery change for those positions is addressed in the Planning/Development Services proposal discussed above. Addition of a full-time Planning Technician, with the other 0.5 budgeted in Development Services as discussed in that section of this document, will provide consistent coverage and ensure a single point of contact for permit applicants at the front counter. (Ongoing costs: $53,474)
Performance Results
The addition of a Planning Technician to staff the front counter of the Development Services Department will ensure a high level of customer satisfaction among permit applicants.
8 Transportation Program Assistant 0.35 39,214 0 39,214
This action adds 0.35 Program Assistant II to the Planning and Community Environment Department (PCE) to collect and analyze data to support the City's various transportation programs and projects. This analysis will be used to inform the evaluation of existing programs, potential creation of new programs, and will support outreach for new capital improvement projects. The position will also be used to update Council on cost-recovery levels for the parking funds, for developing and monitoring Safe Routes to School Programs, and for coordinating with other Transportation staff as well as Revenue Collections staff. This position will be split among the Planning and Community Environment Department (35%), University Avenue Parking Fund (10%), California Avenue Parking Fund (5%), the Residential Preferential Parking Fund (30%), and the Capital Improvement Fund (20%) for a total cost of $107,781. (Ongoing costs: $39,948)
Performance Results
The addition of a Program Assistant II will increase the quality and reliability of data analysis related to the City's parking and transportation programs and projects.
Budget AdjustmentsBudget Adjustments Positions Expenditures Revenues
Net General Fund
PLANNING & COMMUNITY ENVIRONMENT • CITY OF PALO ALTO FISCAL YEAR 2017 ADOPTED BUDGET

PLANNING & COMMUNITY ENVIRONMENT
9 Administrative Associate Classification Alignment 0.00 6,355 0 6,355
This action reclassifies 1.0 Administrative Associate II to 1.0 Administrative Associate III to meet the administrative needs of the Planning and Community Environment Department. The department currently has an administrative pool of 2.0 Administrative Associate IIIs, 1.0 Administrative Associate II and 1.0 Administrative Associate I. The Administrative Associate I serves as a receptionist, schedules appointments, answers the phone (including the main number for the City) and maintains the City calendar. The other positions are responsible for more difficult clerical and administrative work. In addition, PCE is responsible for supporting three boards, two advisory committees, and many public workshops. This reclassification would enable any of the three Administrative Associate IIIs to support these activities. This reclassification will also enable each of the three members of the administrative pool to provide general support to department managers, serve as liaisons to other departments, and work on complex administrative tasks. (Ongoing costs: $6,386)
Performance Results
This action will increase the quality of service from the department, decrease cycle time for coordinating with other departments and boards, and increase customer satisfaction from the three Boards that PCE is responsible for supporting.
10 Revenue Alignment 0.00 0 456,962 (456,962)
This action recognizes $456,692 in additional revenues as a result of the first phase of implementation of the Planning Fee Study. As approved by the City Council in City Manager's Report #6338 significant adjustments were adopted for the Planning and Community Environment’s Municipal Fees and a two phase approach for increases was directed. This two phase increase to the Municipal Fees is intended to achieve greater cost recovery for the fee-funded activities, ultimately reducing the current General Fund subsidy of these activities. These new fee levels and associated increases in revenues will be monitored closely throughout Fiscal Year 2017 in order to ensure this additional revenue is realized. As part of the Fiscal Year 2018 budget, the second phase of increases and corresponding revenue adjustments will be brought forward as part of the budget process. (Ongoing savings: $456,692)
Performance Results
The recognition of additional revenues associated with recommended fee increases will more accurately capture the cost of the Department’s fee funded activities and help ensure that the expenses are commensurate with the revenue.
Budget AdjustmentsBudget Adjustments Positions Expenditures Revenues
Net General Fund
PLANNING & COMMUNITY ENVIRONMENT • CITY OF PALO ALTO FISCAL YEAR 2017 ADOPTED BUDGET 339


POLICE
POLICEMission StatementTo proudly serve and protect the public with respect and integrity.
PurposeThe purpose of the Police Department is to apprehend and prosecute offenders and resolve investigations in a timely and thor-ough manner; to provide professional pub-lic safety services through comprehensive hiring, training, and development of employees and volunteers; to minimize injury and property damage by promoting a safe and orderly flow of pedestrian, bicy-cle, and vehicular traffic; to ensure the pro-tection and well-being of animals and people by providing responsive and proac-
tive animal services; and to manage, enforce, and resolve vehicle parking regu-lations and issues in an effort to facilitate the timely movement of vehicles and provide for public safety within the City.
POLICE • CITY OF PALO ALTO FISCAL YEAR 2017 ADOPTED BUDGET 341

POLICE
342
ANIMAL SERVICES1.00 Superintendent,
Animal Services1.00 Veterinarian1.00 Animal Control
Officer - Lead3.00 Animal Control
Officer2.00 Animal Service
Specialist II2.00 Veterinarian
Technician
POLICE PERSONNEL SERVICES1.00 Police Lieutenant1.00 Police Agent/Officer1.00 Administrative Associate II1.00 Program Assistant II
ADMINISTRATION1.00 Assistant Chief of Police1.00 Senior Management Analyst1.00 Administrative Assistant
TECHNICAL SERVICES1.00 Deputy Director,
Technical Services1.00 Court Liaison2.00 Business Analyst1.00 Crime Analyst1.00 Code Enforcement
Officer1.00 Communications
Technician0.50 GIS Specialist
DISPATCHING SERVICES1.00 Public Safety
Communications Manager
4.00 Public Safety Dispatcher - Lead
.00 Public Safety Dispatcher
INFORMATION MANAGEMENT
1.00 Public Safety Program Manager
1.00 Police Records Specialist - Lead
6.00 Police Records Specialist
FIELD SERVICES1.00 Police Captain1.00 Police Agent/Officer1.00 Administrative
Associate II
FIELD SERVICES (PATROL)3.00 Police Lieutenant10.00 Police Sergeant50.00 Police Agent/
Officer
TRAFFIC, PARKING, & SPECIAL EVENT SERVICES1.00 Police Lieutenant2.00 Police Sergeant 6.00 Police Agent/Officer1.00 Public Safety
Program Manager9.00 Community Service
Officer
INVESTIGATIVE SERVICES1.00 Police Captain1.00 Administrative
Associate II2.00 Police Sergeant11.00 Police Agent/
Officer2.00 Property/Evidence
Technician
POLICE CHIEFDennis Burns
FY 201 POSITION TOTALS15 . 0 - Full-time
3.38 - Hourly
This organizational chart represents citywide Full-Time Equivalents (FTEs) for this department. The Department Summary tables summarize FTEs by
position allocation.
POLICE • CITY OF PALO ALTO FISCAL YEAR 2017 ADOPTED BUDGET

POLICE
DescriptionThe Police Department provides a wide range of public safety services for the City of Palo Alto through the following divisions:
FIELD SERVICESResponsible for police response, critical incident resolution, regional assistance response, and police services for special events.
TECHNICAL SERVICESProvides 911 dispatch services for police, fire, utilities, public works, Stanford, and police infor-mation management.
INVESTIGATIONSConducts police investigations, oversees storage and maintenance of evidence, and coordinates some youth services activities.
TRAFFIC SERVICESResponsible for traffic enforcement, complaint resolution, and school safety.
PARKING SERVICESResponsible for parking enforcement, parking citations and adjudication, and abandoned vehi-cle abatement.
POLICE PERSONNEL SERVICESOversees police hiring, retention, personnel records, and training.
ANIMAL SERVICESProvides animal control, pet recovery/adoption services, animal care, animal health and welfare, and regional animal services.
Accomplishments Received 135 citizen commendations in Fiscal Year 2015 recognizing members of the
Department performing their duties exceeding even the highest standards of the Department.
Participated in several regional initiatives which promote emergency preparedness and response capabilities, including the Silicon Valley Regional Interoperability Authority.
Continued the development of the joint Records Management System (RMS) system in partnership with Mountain View and Los Altos.
Participated in regional and statewide initiatives designed to ensure vehicle occupant safety and combat drunk driving.
POLICE • CITY OF PALO ALTO FISCAL YEAR 2017 ADOPTED BUDGET 343

POLICE
344
Initiatives Build-out Tri-City (Mountain View, Los Altos, Palo Alto) Fiber Ring to support shared public
safety applications.
Replace 9-1-1 phone equipment with a new regional system.
Continue progress on the new Public Safety building.
Develop new curriculum for Citizens Police Academy.
Migrate to the new 700 MHz regional radio system as part of the county-wide effort led by the Silicon Valley Regional Interoperability Authority.
Complete and implement new regional Records Management System.
Goals and ObjectivesGOAL 1Protect and serve the public through proactive and effective policing, animal services, and emergency preparedness.
Objectives: Reduce crime rates, traffic violations and accidents.
Respond promptly to urgent calls for service.
Apprehend and assist with prosecution of offenders.
Provide assistance, enforcement, and guidance to the community regarding animal services.
Provide assistance to the community in the event of a disaster.
GOAL 2Cultivate, enhance, and foster trustworthy relationships with the community.
Objectives: Increase quality and timeliness of response to citizens’ complaints regarding use of force,
canine investigations, and other internal affairs matters.
Train and educate all employees in the community policing philosophies.
Continue to consult with national experts in the field of promoting fair and equitable policing.
Create opportunities for increased communication, visibility, and interaction with community members.
Maintain and enhance the community’s satisfaction with police services.
POLICE • CITY OF PALO ALTO FISCAL YEAR 2017 ADOPTED BUDGET

POLICE
GOAL 3Minimize injury and property damage by promoting a safe and orderly flow of pedestrian, bicy-cle, and vehicular traffic.
Objectives: Enforce traffic laws, with an emphasis on speed reduction, red light violations, and bicycle
and pedestrian safety around schools.
Participate in regional and statewide initiatives designed to ensure vehicle occupant safety through the use of safety belts and to reduce deaths and injuries in crashes involving alcohol, speed, red light running, and aggressive driving.
GOAL 4Ensure the protection and well-being of animals and people by providing responsive animal ser-vices and spay/neuter advocacy.
Objectives: Provide assistance, enforcement, and guidance to the community regarding animals.
Promote responsible pet ownership through adoption counseling, education, and support services.
GOAL 5Manage, enforce, and resolve vehicle parking regulations and issues in an effort to facilitate the timely movement of vehicles and provide for public safety within the City.
Objectives: Monitor compliance with parking regulations and time limits and issue citations for
infractions.
Efficiency process abandoned and stored vehicle complaints.
Key Performance MeasuresANIMAL SERVICES RESPONSE TIMESGoal Protect and serve the public through proactive and effective policing, animal
services, and emergency preparedness.
Objective Respond promptly to animal calls for service.
FY 2014 Actuals
FY 2015 Actuals
FY 2016 Adopted
FY 2016 Estimated
FY 2017 Adopted
Percent of Palo Alto live animal calls responded to within 45 minutes 91.00% 88.00% 90.00% 90.00% 90.00%
Description A 45 minute response time to live animal calls is the threshold of service set by the Animal Services Division.
Purpose Live animal calls require the most timely response because they are generally life threatening or represent higher danger crimes in progress.
Status The Division responded to 88 percent of live animal calls within 45 minutes in Fiscal Year 2015.
POLICE • CITY OF PALO ALTO FISCAL YEAR 2017 ADOPTED BUDGET 345

POLICE
346
PERCENT OF SURVEYED RESIDENTS RATING POLICE DEPARTMENT SERVICES GOOD OR EXCELLENTGoal Cultivate, enhance and foster trustworthy relationships with the community.
Objective Maintain and enhance the community's satisfaction with police services.
FY 2014 Actuals
FY 2015 Actuals
FY 2016 Adopted
FY 2016 Estimated
FY 2017 Adopted
Animal Control Services 80.00% 80.00% 80.00% 80.00% 80.00%
Crime Prevention Services 80.00% 79.00% 80.00% 80.00% 80.00%
Traffic Enforcement Services 62.00% 60.00% 66.00% 66.00% 66.00%
Overall Police Services 87.00% 88.00% 90.00% 90.00% 90.00%
Description
These measures track the percent of residents rating overall and division specific police services to the community as good or excellent. This data is collected as part of the National Citizen's Survey that is conducted annually by the International City/County Management Association (ICMA) and allows the City to compare itself to other municipalities.
Purpose Community satisfaction with the Police Department is an important assessment of the quality of services provided to the City and its residents.
Status
Overall the Police Department has maintained a high level of customer satisfaction year over year and looks to continue this trend in Fiscal Year 2017. Compared to other local municipalities the Department ranked similarly for satisfaction with police services, crime prevention services, and traffic enforcement services and ranked higher for satisfaction with animal control services.
POLICE DEPARTMENT RESPONSE TIMESGoal Respond promptly to urgent calls for service.
Objective Protect and serve the public through proactive and effective policing, animal services, and emergency preparedness.
FY 2014 Actuals
FY 2015 Actuals
FY 2016 Adopted
FY 2016 Estimated
FY 2017 Adopted
Percent of urgent calls responded to within 10 minutes 77.00% 74.00% 90.00% 80.00% 90.00%
Percent of emergency calls responded to within 6 minutes 72.00% 75.00% 90.00% 80.00% 90.00%
Description Percent of emergency calls responded to within 6 minutes and percent of urgent calls responded to within 10 minutes
Purpose Emergency and urgent calls require the most timely police response because they are generally life threatening or represent higher danger crimes in progress.
Status
The Department's average response time for emergency calls was 5:40 in Fiscal Year 2015, lower than its 6:00 minute target. The Department's average urgent call response time was 8:38, above its 8:00 target. The Department attributes the increase in response times from Fiscal Year 2014 to methodology changes in how response times are calculated associated with the virtual consolidation of Computer Aided Dispatch (CAD) services with the partner cities of Mountain View and Los Altos.
POLICE • CITY OF PALO ALTO FISCAL YEAR 2017 ADOPTED BUDGET

POLICE
%
)%
2%
)%
3%
3%
6%
5%
)%
5%
Workload MeasuresFY 2014 Actuals
FY 2015 Actuals
FY 2016 Adopted
FY 2016 Estimated
FY 2017 Adopted
Number of police calls for service 58,559 59,795 56,000 59,000 59,000
Number of Part I crimes 1,540 1,595 1,600 1,600 1,600
Number of Part II crimes 2,557 3,050 2,400 2,750 2,750
Average response time for emergency calls (Goal: within 6 minutes)
5:34 5:40 5:30 5:30 5:30
Average response time for urgent calls (Goal: within 8 minutes) 7:57 8:38 8:00 8:00 8:00
Total number of Palo Alto animal service calls 3,093 2,579 3,100 2,750 2,750
Number of regional animal services calls (Los Altos and Los Altos Hills) 695 566 700 700 700
Budget SummaryFY 2014 Actuals
FY 2015 Actuals
FY 2016 Adopted Budget
FY 2017 Adopted Budget
FY 2017 Change $
FY 2017Change
Dollars by Division
Administration 649,829 678,034 601,260 527,862 (73,398) (12.2
Animal Services 1,328,403 1,559,074 1,619,275 1,719,360 100,085 6.
Field Services 16,037,164 15,616,047 18,334,452 16,864,818 (1,469,634) (8.0
Investigations and Crime Prevention Services 3,271,354 4,186,251 3,517,240 5,214,939 1,697,699 48.
Parking Services 1,090,030 1,192,659 1,298,471 1,418,946 120,475 9.
Police Personnel Selection 1,357,838 1,514,692 1,100,394 1,371,056 270,663 24.
Technical Services 7,065,609 7,392,315 7,674,213 8,478,991 804,778 10.
Traffic Services 2,513,303 2,420,441 2,713,962 2,541,463 (172,500) (6.4
Total 33,313,529 34,559,514 36,859,267 38,137,435 1,278,168 3.
POLICE • CITY OF PALO ALTO FISCAL YEAR 2017 ADOPTED BUDGET 347
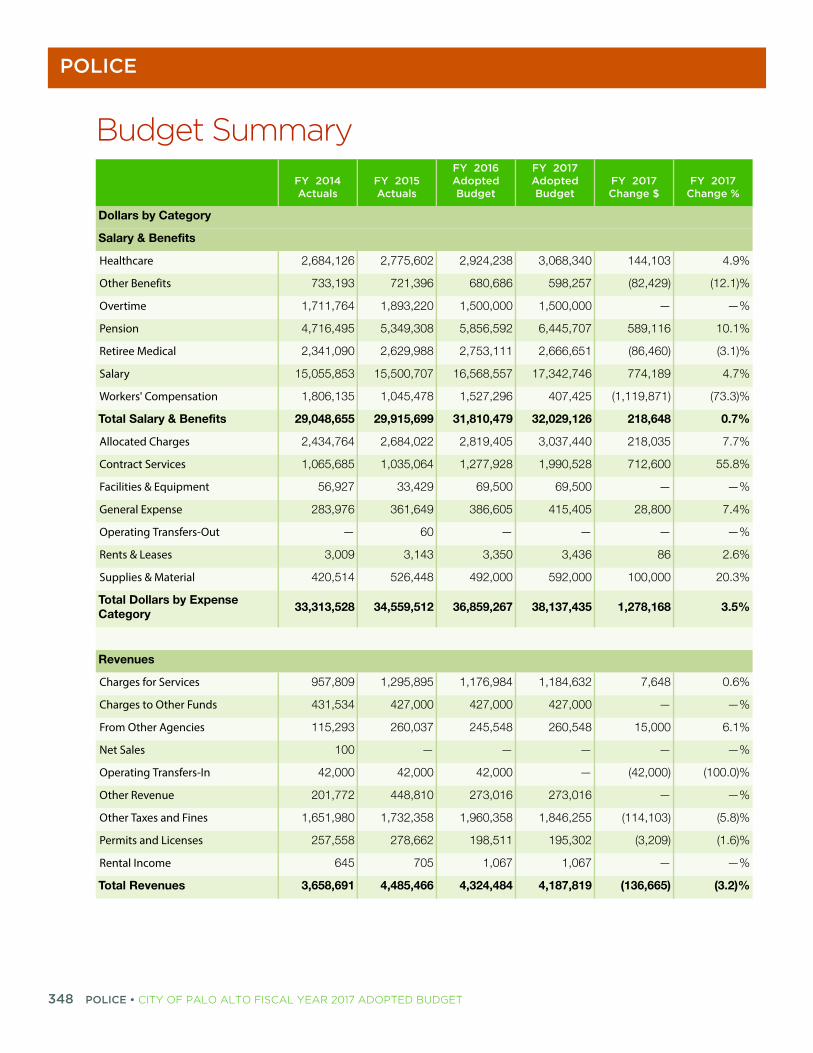
POLICE
348
9%
)%
%
1%
)%
7%
)%
7%
7%
8%
%
4%
%
6%
3%
5%
6%
%
1%
%
)%
%
)%
)%
%
)%
%
Dollars by Category
Salary & Benefits
Healthcare 2,684,126 2,775,602 2,924,238 3,068,340 144,103 4.
Other Benefits 733,193 721,396 680,686 598,257 (82,429) (12.1
Overtime 1,711,764 1,893,220 1,500,000 1,500,000 — —
Pension 4,716,495 5,349,308 5,856,592 6,445,707 589,116 10.
Retiree Medical 2,341,090 2,629,988 2,753,111 2,666,651 (86,460) (3.1
Salary 15,055,853 15,500,707 16,568,557 17,342,746 774,189 4.
Workers' Compensation 1,806,135 1,045,478 1,527,296 407,425 (1,119,871) (73.3
Total Salary & Benefits 29,048,655 29,915,699 31,810,479 32,029,126 218,648 0.
Allocated Charges 2,434,764 2,684,022 2,819,405 3,037,440 218,035 7.
Contract Services 1,065,685 1,035,064 1,277,928 1,990,528 712,600 55.
Facilities & Equipment 56,927 33,429 69,500 69,500 — —
General Expense 283,976 361,649 386,605 415,405 28,800 7.
Operating Transfers-Out — 60 — — — —
Rents & Leases 3,009 3,143 3,350 3,436 86 2.
Supplies & Material 420,514 526,448 492,000 592,000 100,000 20.
Total Dollars by Expense Category
33,313,528 34,559,512 36,859,267 38,137,435 1,278,168 3.
Revenues
Charges for Services 957,809 1,295,895 1,176,984 1,184,632 7,648 0.
Charges to Other Funds 431,534 427,000 427,000 427,000 — —
From Other Agencies 115,293 260,037 245,548 260,548 15,000 6.
Net Sales 100 — — — — —
Operating Transfers-In 42,000 42,000 42,000 — (42,000) (100.0
Other Revenue 201,772 448,810 273,016 273,016 — —
Other Taxes and Fines 1,651,980 1,732,358 1,960,358 1,846,255 (114,103) (5.8
Permits and Licenses 257,558 278,662 198,511 195,302 (3,209) (1.6
Rental Income 645 705 1,067 1,067 — —
Total Revenues 3,658,691 4,485,466 4,324,484 4,187,819 (136,665) (3.2
Budget SummaryFY 2014 Actuals
FY 2015 Actuals
FY 2016 Adopted Budget
FY 2017 Adopted Budget
FY 2017 Change $
FY 2017Change
POLICE • CITY OF PALO ALTO FISCAL YEAR 2017 ADOPTED BUDGET

POLICE
%
%
)%
2%
%
9%
%
)%
%
40
71
49
72
89
17
96
62
93
93
01
01
34
05
38
15
%
Positions by Division
Administration 2.80 2.30 3.30 3.30 — —
Animal Services 10.66 10.66 10.66 10.66 — —
Field Services 63.80 66.80 68.80 61.80 (7.00) (10.17
Investigations and Crime Prevention Services 18.28 15.28 14.28 21.28 7.00 49.0
Parking Services 8.75 8.75 8.75 8.75 — —
Police Personnel Selection 6.20 5.20 4.10 5.10 1.00 24.3
Technical Services 37.13 37.13 37.00 37.00 — —
Traffic Services 10.49 11.49 11.49 10.49 (1.00) (8.70
Total 158.11 157.61 158.38 158.38 — —
Staffing
Job ClassificationFY 2014 Actuals
FY 2015 Actuals
FY 2016 Adopted Budget
FY 2017 Adopted Budget
FY 2017 Change $
FY 2017Salary
Administrative Assistant 0.50 0.50 1.00 1.00 — 86,3
Administrative Associate II 3.00 3.00 3.00 3.00 — 203,8
Animal Control Officer 4.00 3.00 3.00 3.00 — 192,5
Animal Control Officer-Lead — 1.00 1.00 1.00 — 68,6
Animal Services Specialist II 2.00 2.00 2.00 2.00 — 139,5
Assistant Police Chief 1.00 1.00 1.00 1.00 — 198,6
Business Analyst 1.20 1.20 1.20 1.20 — 151,3
Code Enforcement Officer 1.00 1.00 1.00 1.00 — 89,8
Communications Technician 1.00 1.00 1.00 1.00 — 93,2
Community Service Officer 8.50 8.50 8.50 8.50 — 557,2
Court Liaison Officer 1.00 1.00 1.00 1.00 — 89,1
Crime Analyst 1.00 1.00 1.00 1.00 — 89,1
Deputy Director Technical Services Division 0.80 0.80 0.80 0.80 — 144,6
Geographic Information System Specialist 0.50 0.50 0.50 0.50 — 53,2
Police Agent 19.00 19.00 19.00 19.00 — 2,439,5
Police Captain 2.00 2.00 2.00 2.00 — 369,1
Budget SummaryFY 2014 Actuals
FY 2015 Actuals
FY 2016 Adopted Budget
FY 2017 Adopted Budget
FY 2017 Change $
FY 2017Change
POLICE • CITY OF PALO ALTO FISCAL YEAR 2017 ADOPTED BUDGET 349

POLICE
350
49
30
69
66
66
05
14
08
28
96
00
—
—
98
31
34
89
12
71
92
63
Police Chief 0.50 0.50 1.00 1.00 — 226,4
Police Lieutenant 5.00 5.00 5.00 5.00 — 862,5
Police Officer 50.00 50.00 50.00 50.00 — 5,560,2
Police Records Specialist II 6.00 6.00 6.00 6.00 — 372,2
Police Records Specialist-Lead 1.00 1.00 1.00 1.00 — 70,8
Police Sergeant 14.00 14.00 14.00 14.00 — 1,997,6
Program Assistant II 1.00 1.00 1.00 1.00 — 74,1
Property Evidence Technician 2.00 2.00 2.00 2.00 — 137,0
Public Safety Communications Manager — — 1.00 1.00 — 125,0
Public Safety Dispatcher 16.00 16.00 16.00 16.00 — 1,387,1
Public Safety Dispatcher-Lead 4.00 4.00 4.00 4.00 — 442,6
Public Safety Manager I 2.00 2.00 — — —
Public Safety Manager II 1.00 1.00 — — —
Public Safety Program Manager — — 2.00 2.00 — 234,4
Senior Management Analyst 1.50 1.00 1.00 1.00 — 138,6
Superintendent Animal Services 1.00 1.00 1.00 1.00 — 82,0
Veterinarian 1.00 1.00 1.00 1.00 — 121,9
Veterinarian Technician 2.00 2.00 2.00 2.00 — 119,9
Sub-total: Full-Time Equivalent Positions
154.50 154.00 155.00 155.00 — 16,919,1
Temporary/Hourly 3.61 3.61 3.38 3.38 — 222,3
Total Positions 158.11 157.61 158.38 158.38 — 17,141,5
Staffing
Job ClassificationFY 2014 Actuals
FY 2015 Actuals
FY 2016 Adopted Budget
FY 2017 Adopted Budget
FY 2017 Change $
FY 2017Salary
POLICE • CITY OF PALO ALTO FISCAL YEAR 2017 ADOPTED BUDGET

POLICE
Budget ReconciliationPositions Expenditures Revenues
Net General Fund
Prior Year Budget 158.38 36,859,267 4,324,484 32,534,783
Base Adjustments
One-Time Prior Year Expenditures and Revenues Deleted
Police Community Services Staffing — 101,488 — 101,488
Police Field Patrol, Body Worn Cameras — (70,000) — (70,000)
Parking Citation Handheld Devices — (26,400) — (26,400)
One-Time Prior Year Expenditures and Revenues
— 5,088 — 5,088
Adjustments to Costs of Ongoing Activities
Salary and Benefits Adjustments — 218,647 — 218,647
Management Development — (1,200) — (1,200)
Stanford Emergency Communication Services Revenue Adjustment — — 35,490 (35,490)
POST Training Reimbursement — 15,000 15,000 —
Other Taxes and Fines — — (114,103) 114,103
Transfer from Technology Fund — — (42,000) 42,000
Charges for Services — — (27,843) 27,843
Permits and Licenses — — (3,209) 3,209
Vehicle Maintenance Allocated Charges Adjustments — 392,345 — 392,345
General Liability Insurance Allocated Charges Adjustments — (287,867) — (287,867)
Information Technology Allocated Charges Adjustment — 127,988 — 127,988
Printing and Mailing Allocated Charges Adjustment — (15,326) — (15,326)
Utilities Allocated Charges Adjustment — 895 — 895
Rents and Leases — 86 — 86
Adjustments to Costs of Ongoing Activities — 450,568 (136,665) 587,233
Total FY 2017 Base Budget 158.38 37,314,923 4,187,819 33,127,104
Budget Adjustments
1 Project Safety Net - Track Watch Program — 824,000 — 824,000
2 Police Vehicle Modems — 100,000 — 100,000
3 Police Community Services Staffing — (101,488) — (101,488)
Total Budget Adjustments — 822,512 — 822,512
Total FY 2017 Adopted Budget 158.38 38,137,435 4,187,819 33,949,616
POLICE • CITY OF PALO ALTO FISCAL YEAR 2017 ADOPTED BUDGET 351
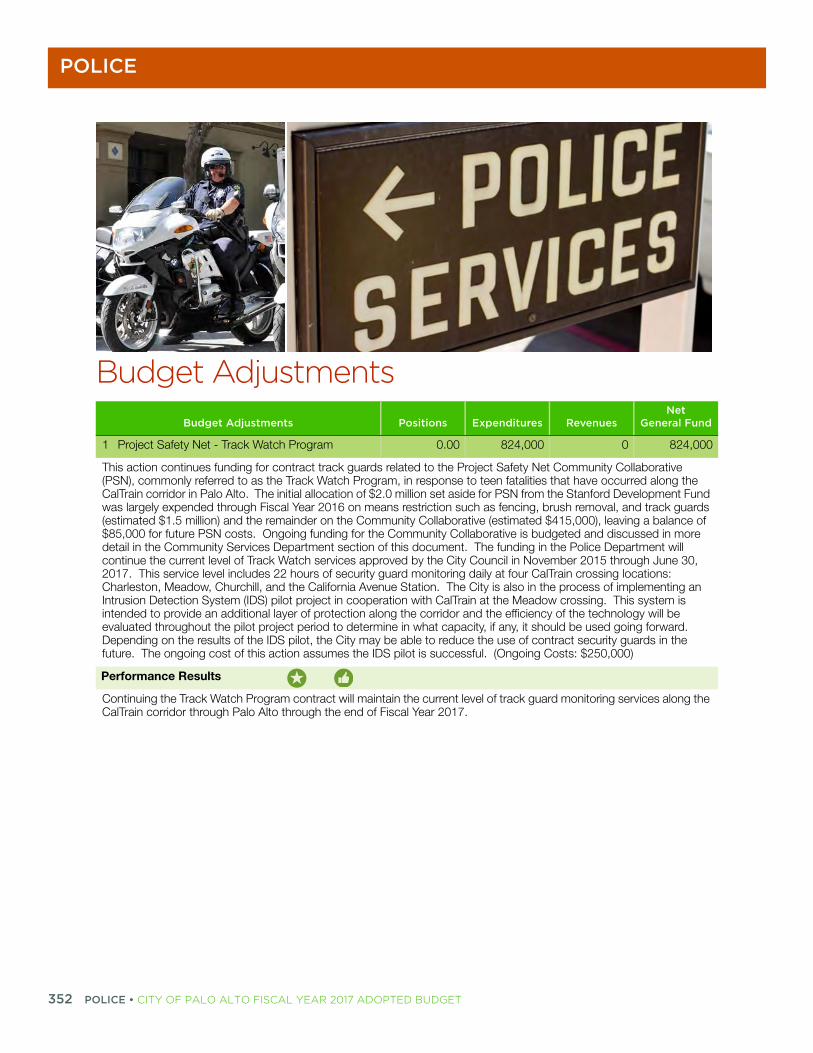
POLICE
352
Budget AdjustmentsBudget Adjustments Positions Expenditures Revenues
Net General Fund
1 Project Safety Net - Track Watch Program 0.00 824,000 0 824,000
This action continues funding for contract track guards related to the Project Safety Net Community Collaborative (PSN), commonly referred to as the Track Watch Program, in response to teen fatalities that have occurred along the CalTrain corridor in Palo Alto. The initial allocation of $2.0 million set aside for PSN from the Stanford Development Fund was largely expended through Fiscal Year 2016 on means restriction such as fencing, brush removal, and track guards (estimated $1.5 million) and the remainder on the Community Collaborative (estimated $415,000), leaving a balance of $85,000 for future PSN costs. Ongoing funding for the Community Collaborative is budgeted and discussed in more detail in the Community Services Department section of this document. The funding in the Police Department will continue the current level of Track Watch services approved by the City Council in November 2015 through June 30, 2017. This service level includes 22 hours of security guard monitoring daily at four CalTrain crossing locations: Charleston, Meadow, Churchill, and the California Avenue Station. The City is also in the process of implementing an Intrusion Detection System (IDS) pilot project in cooperation with CalTrain at the Meadow crossing. This system is intended to provide an additional layer of protection along the corridor and the efficiency of the technology will be evaluated throughout the pilot project period to determine in what capacity, if any, it should be used going forward. Depending on the results of the IDS pilot, the City may be able to reduce the use of contract security guards in the future. The ongoing cost of this action assumes the IDS pilot is successful. (Ongoing Costs: $250,000)
Performance Results
Continuing the Track Watch Program contract will maintain the current level of track guard monitoring services along the CalTrain corridor through Palo Alto through the end of Fiscal Year 2017.
POLICE • CITY OF PALO ALTO FISCAL YEAR 2017 ADOPTED BUDGET

POLICE
2 Police Vehicle Modems 0.00 100,000 0 100,000
This action will fund the replacement of modems in 27 police vehicles. The current modems are having problems maintaining connectivity with wireless signals for the in car Mobile Data Computers (MDCs). Losing connection causes multiple issues including possible data loss, inability to connect to various law enforcement systems including the 9-1-1 Emergency Communications Center, and overall safety for sworn personnel in the field. (Ongoing Costs: $12,000)
Performance Results
The new modems will maintain better connectivity between the MDCs and wireless signals, increasing the ability of the sworn personnel in the field to access information from various sources and have the most up to date data at all times.
3 Police Community Services Staffing 0.00 (101,488) 0 (101,488)
The Fiscal Year 2017 Operating Budget includes nine Community Services Officers (CSOs) in the Police Department. CSOs are responsible for enforcing the City's parking regulations, which generates approximately $1.6 million in revenue annually. In 2011, Stanford University initiated reconstruction of the Stanford Medical Center, which reduced the number of publicly available parking spaces traditionally enforced by the CSOs. As a result, the Police Department has not filled one vacant CSO position since July 2013. This action freezes the vacant CSO position for Fiscal Year 2017. As the Medical Center continues to come online, which should be mostly complete in 2017, additional public parking will become available and may restore the need for parking enforcement in this area. During the construction staff will evaluate other technologies, which may create additional efficiencies for CSOs and may result in budget recommendations for Fiscal Year 2018. After exploring and possibly implementing various efficiency measures, staff will evaluate the appropriate staffing level and determine if the City needs to fill the vacant CSO position when the Medical Center reconstruction project is completed. (Ongoing Savings: $0)
Performance Results
Freezing this position for an additional year will have minimal impact on the services provided by the Department.
Budget AdjustmentsBudget Adjustments Positions Expenditures Revenues
Net General Fund
POLICE • CITY OF PALO ALTO FISCAL YEAR 2017 ADOPTED BUDGET 353


PUBLIC WORKS
PUBLIC WORKSMission StatementTo preserve and enhance the quality of life for Palo Alto residents and visitors by providing efficient, safe, and cost effective services in partnership with our citizens while maintaining City assets, and being environmental stewards of the community.
PurposeThe purpose of the Public Works Depart-ment is to ensure the City’s valuable infra-structure is well-maintained and available well into the future; promote the protec-tion and enhancement of Palo Alto’s Urban Forest; enhance the quality of life for resi-dents and visitors to Palo Alto by prevent-ing pollution of the creeks and bay, promoting reuse and recycling, and encouraging use of alternative fuel vehi-cles; ensure continuous operation of the Regional Water Quality Control Plant; pro-vide efficient and cost effective garbage, recyclables and yard trimmings
collection, processing, and disposal; deliver timely support to City departments in the area of engineering services; operate a safe and financially sustainable general aviation airport; and effectively manage the City’s Capital Improvement Fund, including the Council Infrastructure Plan, as well as refuse, wastewater treatment, storm drainage, airport and fleet operations.
PUBLIC WORKS • CITY OF PALO ALTO FISCAL YEAR 2017 ADOPTED BUDGET 355

PUBLIC WORKS
356
PUBLIC WORKS DIRECTORMike Sartor
ENVIRONMENTAL SERVICES1.00 Asstistant Director, Environ
WATER QUALITY CONTROL PLANT1.00 Water Quality Control Plant Manager2.00 Administrative Associate II2.00 Assistant Manger WQCP.00 Senior Engineer
3.00 Supervisor WQC Operations6.00 Senior Operator, WQC16.00Plant Operator II1.00 Manager Laboratory Services1.00 Senior Chemist3.00 Chemist3.00 Lab Technician2.00 Electrician Lead3.00 Electrician1.00 Senior Mechanic7.00 Mechanic1.00 Senior Technologist1.00 Project Engineer1.00 Technologist
WATERSHED PROTECTION1.00 Watershed Protection Manager 2.00 Manager Environmental Controls2.00 Program Assistant II1.00
2.00 Associate Engineer1.00 Senior Waste Investigator2.00 I ndustrial Waste Investigator3.00 I ndustrial Waste Inspector
SOLID WASTE1.00 Manager Solid Waste3.00 Manager Environmental Controls.00 Zero Waste Coordinator
1.00 Program Assistant I.00 Environmental Specialist
1.00 1.00 Landfill Technician
PUBLIC SERVICES1.00 Assistant Director, Public Services1.00 Management Analyst1.00 Administrative Associate III3.00 Administrative Associate II0.50 Administrative Associate I
FACILITIES MAINTENANCE 1.00 Facilities Manager1.00 Facilities, Maintenance Operations2.00 Facilities Maintenance-Lead6.00 Facilities 2.00 Facilities Painter
1.00 Facilities Carpenter1.00 Electrician2.00 Building Service Person-Lead1.00 Building Service Person1.00 Engineering Technician III
FLEET1.00 Fleet Manager1.00 Assistant Fleet Manager1.00 Project Manager2.00 Fleet Services Coordinator2.00 Motor Equipment Mechanic-Lead2.00 Equipment Maintenance Service
Person6.00 Motor Equipment Mechanic II
URBAN FORESTRY1.00 Manager Urban Forester1.00 Planning Arborist*2.00 Project Manager (0.75 Utl Line Clr)2.00 Tree Maintenance Special
(1.00 Utl Line Clr)1.00 Tree Trim/Line Clear-Lead7.00 Tree Trim/Line Clear
TRAFFIC CONTROL/STREET SWEEPING
1.00 Manager, Maintenance Operations1.00 Project Manager2.00 Street Sweeper Operator 2.00 Street Maintenance Assistant1.00 Coordinator, Public Works Projects 2.00 Traffic Control Maintenance II 2.00 Traffic Control Maintenance I
STORM DRAIN/STREET MAINTENANCE
1.00 Manager, Maintenance Operations2.00 Heavy Equipment Operator-Lead3.00 Heavy Equipment Operator 4.00 Equipment Operator1.00 Cement Finisher-Lead3.00 Cement Finisher
ENGINEERING SERVICES1.00 Assistant Director, Engineering
Services1.00 Management Analyst1.00 Administrative Associate III1.00 Administrative Associate I
FIELD SERVICES (SURVEY AND INSPECTION)
1.00 Supervisor Inspections/Survey2.00 I nspector-Field Service1.00 Surveyor
CIP PROGRAM (STRUCTURES, STREETS & SIDEWALKS, STORM
DRAIN, PARKS)1.00 Senior Project Manager3.00 Senior Engineer1.00 Architect/Park Planner.00 Project Engineer.00 Engineer
3.00 Associate Engineer1.00 Project Manager
PRIVATE DEVELOPMENT1.00 Senior Engineer3.00 Engineering Technician III
AIRPORT DIVISION1.00 Airport Manager1.00 Manager, Maintenance Operations1.00 Management Analyst
* These positions
1.00-Administrative Assistant 1.00-Senior Management Analyst
FY 201 POSITION TOTALS.50 - Full-time
1 - Hourly
This organizational chart represents citywide Full-Time Equivalents (FTEs) for this department. The Department Summary tables summarize FTEs by
position allocation.
PUBLIC WORKS • CITY OF PALO ALTO FISCAL YEAR 2017 ADOPTED BUDGET
PUBLIC WORKS
DescriptionThe Public Works Department is responsible for operations and capital projects in the following areas:
ENGINEERING SERVICESDesigns and constructs City-owned facilities, streets, sidewalks, storm drains, parks, and airport infrastructure; provides engineering support to City departments for construction in the public right of way.
PUBLIC SERVICESMaintains and renovates City-owned and leased structures, streets, sidewalks, storm drains, street signage and parking lots; manages the City’s Urban Forest; street sweeping program; and maintains the City’s fleet.
ENVIRONMENTAL SERVICESOperates and maintains the Regional Water Quality Control Plant; maintains a Pretreatment Program for control of industrial and commercial dischargers; provides pollution and waste prevention information and programs to residents and businesses; manages the City’s solid waste programs, household hazardous waste programs, and the postclosure maintenance and monitoring of the City’s closed landfill.
AIRPORT OPERATIONSOperates the Palo Alto Airport which includes maintenance of Airport facilities and grounds; management of contracts with the Fixed Base Operators (tenants/lessees); liaison with the FAA and the Palo Alto flying community; and ensures compliance with FAA regulations.
Accomplishments Continued progress toward goal of citywide average Pavement Condition Index score of 85,
representing very good to excellent street conditions, by 2019. The 2015 calendar year-end score was 82.
Continued implementation of the Council Infrastructure Plan, with completion of site selection for the new Public Safety Building and California Avenue Area Parking Garage projects, initiation of design for the Fire Station No. 3 Replacement project, selection of a design team for the Adobe Creek/Highway 101 Bicycle and Pedestrian Bridge project, and continued design progress for the Charleston/Arastradero Corridor project.
Earned accreditation from the American Public Works Association; the first agency to do so in Silicon Valley.
Successfully implemented citywide residential food scraps collection program and developed a commercial recycling and composting ordinance.
Completed Mitigated Negative Declaration environmental documentation for the sludge dewatering and truck loadout facility and completed 100% design of the project.
PUBLIC WORKS • CITY OF PALO ALTO FISCAL YEAR 2017 ADOPTED BUDGET 357

PUBLIC WORKS
358
%
2%
0%
3)%
9)%
5%
8%
0%
Initiatives Continue implementation of the Council Infrastructure Plan, managing the projects as a
program with project management emphasis on maintaining scope, schedule, and budget.
Complete the Matadero Creek Stormwater Pump Station project and the last phase of the Channing/Lincoln Avenue Storm Drain Improvements project. These projects are the last two of the seven high-priority storm drain projects outlined in the 2005 storm drainage fee measure.
Complete the initial implementation of the Infrastructure Management System to include Infrastructure Blue Ribbon Commission inventory and cost projections and associated reporting capabilities.
Continue working toward the goals and objectives identified in the Urban Forest Master Plan.
Continue implementing organizational efficiencies as outlined in the Facility Study, specifically analyzing the organizational structure and asset management process recommendations for implementation.
Complete the core tasks of the Advance Water Purification Feasibility Study to improve recycled water quality and award a contract for a recycled water strategic plan and groundwater study of indirect potable reuse.
Budget SummaryFY 2014 Actuals
FY 2015 Actuals
FY 2016 Adopted Budget
FY 2017 Adopted Budget
FY 2017 Change $
FY 2017Change
Dollars by Fund
Airport Enterprise Fund 466,228 1,388,174 1,536,747 3,614,921 2,078,174 135.
General Fund-Operating 13,199,355 13,290,684 15,033,586 16,241,018 1,207,432 8.
Refuse Fund - Operating 30,095,729 30,326,089 31,030,958 30,622,382 (408,576) (1.
Storm Drainage - Operating 4,190,250 4,956,193 12,827,773 12,581,125 (246,648) (1.
Vehicle Replacement & Maintenance Fund 7,534,873 8,540,029 11,322,468 11,827,273 504,805 4.
Wastewater Treatment - Operating 21,217,375 22,779,682 36,600,357 48,623,161 12,022,804 32.
Total 76,703,809 81,280,851 108,351,888 123,509,879 15,157,991 14.
PUBLIC WORKS • CITY OF PALO ALTO FISCAL YEAR 2017 ADOPTED BUDGET
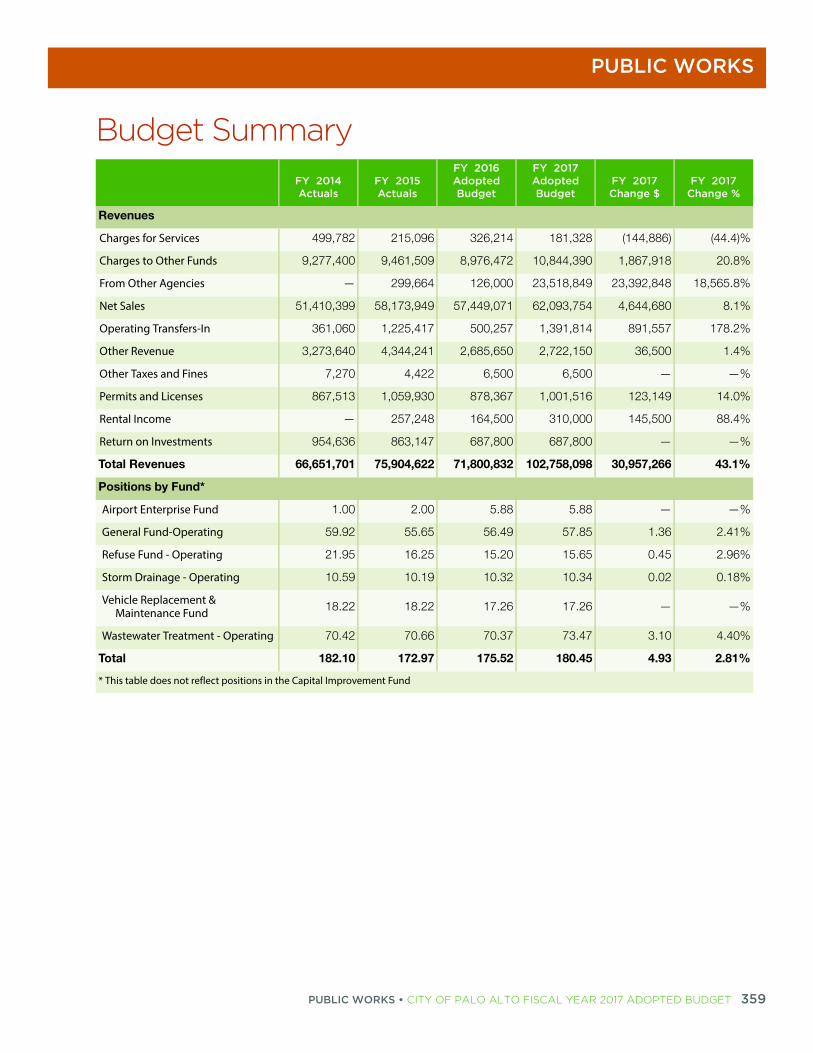
PUBLIC WORKS
4)%
8%
8%
1%
2%
4%
%
0%
4%
%
1%
%
1%
6%
8%
%
0%
1%
%
Revenues
Charges for Services 499,782 215,096 326,214 181,328 (144,886) (44.
Charges to Other Funds 9,277,400 9,461,509 8,976,472 10,844,390 1,867,918 20.
From Other Agencies — 299,664 126,000 23,518,849 23,392,848 18,565.
Net Sales 51,410,399 58,173,949 57,449,071 62,093,754 4,644,680 8.
Operating Transfers-In 361,060 1,225,417 500,257 1,391,814 891,557 178.
Other Revenue 3,273,640 4,344,241 2,685,650 2,722,150 36,500 1.
Other Taxes and Fines 7,270 4,422 6,500 6,500 — —
Permits and Licenses 867,513 1,059,930 878,367 1,001,516 123,149 14.
Rental Income — 257,248 164,500 310,000 145,500 88.
Return on Investments 954,636 863,147 687,800 687,800 — —
Total Revenues 66,651,701 75,904,622 71,800,832 102,758,098 30,957,266 43.
Positions by Fund*
Airport Enterprise Fund 1.00 2.00 5.88 5.88 — —
General Fund-Operating 59.92 55.65 56.49 57.85 1.36 2.4
Refuse Fund - Operating 21.95 16.25 15.20 15.65 0.45 2.9
Storm Drainage - Operating 10.59 10.19 10.32 10.34 0.02 0.1
Vehicle Replacement & Maintenance Fund 18.22 18.22 17.26 17.26 — —
Wastewater Treatment - Operating 70.42 70.66 70.37 73.47 3.10 4.4
Total 182.10 172.97 175.52 180.45 4.93 2.8
* This table does not reflect positions in the Capital Improvement Fund
Budget SummaryFY 2014 Actuals
FY 2015 Actuals
FY 2016 Adopted Budget
FY 2017 Adopted Budget
FY 2017 Change $
FY 2017Change
PUBLIC WORKS • CITY OF PALO ALTO FISCAL YEAR 2017 ADOPTED BUDGET 359
PUBLIC WORKS
360
GENERAL FUNDGoals and ObjectivesGOAL 1Ensure the City’s assets and infrastructure inventory are updated and well-maintained.
Objectives: Implement an Infrastructure Management System (IMS) to support planning, budgeting, and
accountability for the City’s assets in accordance with the Infrastructure Blue Ribbon Commission’s recommendations.
Maintain and enhance the overall condition of the City’s streets while effectively communicating the program’s accomplishments to the public.
Complete Sidewalk Program Evaluation Study to determine potential changes to the current sidewalk repairs program upon completion of the 30-year sidewalk district cycle.
GOAL 2Provide high quality, cost-effective oversight of the City’s capital improvement and facilities maintenance programs.
Objectives: Continue implementation of the Council Infrastructure Plan for the Public Safety Building
and other key infrastructure needs, managing the projects as a program with project management emphasis on maintaining scope, schedule, and budget.
Provide cost-effective custodial and facilities maintenance services.
Complete construction of the Baylands Interpretive Center renovation, while completing design of the boardwalk replacement and initiating applications for regulatory permits.
Implement the recommendations identified in the Facilities Organization Study.
Begin implementing improvements to the Municipal Service Center.
GOAL 3Preserve the public’s health and safety to ensure a vibrant, sustainable community for future generations.
Objectives: Complete the Environmental Impact Report for and select an alternative to proceed with a
Newell Road Bridge flood protection project.
Ensure compliance with all applicable regulations related to the public’s health and safety.
Maintain the health of the City’s urban forest.
Ensure proper tree clearance of all utility lines.
PUBLIC WORKS • CITY OF PALO ALTO FISCAL YEAR 2017 ADOPTED BUDGET
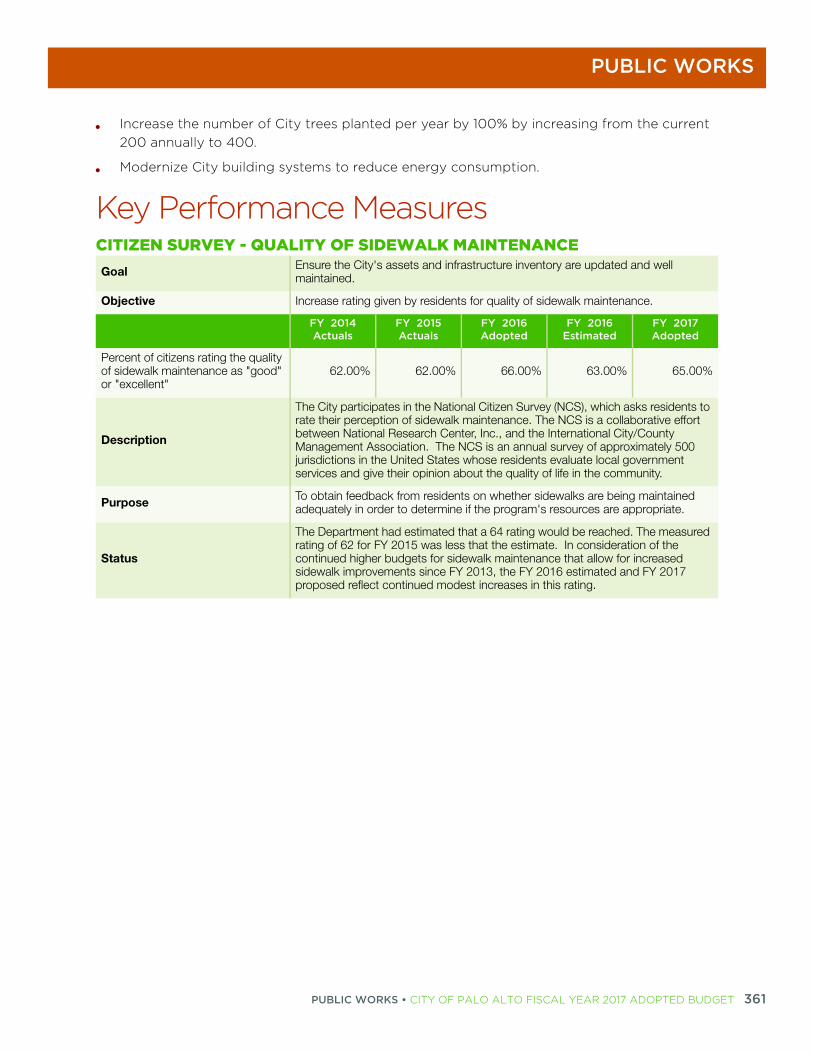
PUBLIC WORKS
Increase the number of City trees planted per year by 100% by increasing from the current 200 annually to 400.
Modernize City building systems to reduce energy consumption.
Key Performance MeasuresCITIZEN SURVEY - QUALITY OF SIDEWALK MAINTENANCEGoal Ensure the City's assets and infrastructure inventory are updated and well
maintained.
Objective Increase rating given by residents for quality of sidewalk maintenance.
FY 2014 Actuals
FY 2015 Actuals
FY 2016 Adopted
FY 2016 Estimated
FY 2017 Adopted
Percent of citizens rating the quality of sidewalk maintenance as "good" or "excellent"
62.00% 62.00% 66.00% 63.00% 65.00%
Description
The City participates in the National Citizen Survey (NCS), which asks residents to rate their perception of sidewalk maintenance. The NCS is a collaborative effort between National Research Center, Inc., and the International City/County Management Association. The NCS is an annual survey of approximately 500 jurisdictions in the United States whose residents evaluate local government services and give their opinion about the quality of life in the community.
Purpose To obtain feedback from residents on whether sidewalks are being maintained adequately in order to determine if the program's resources are appropriate.
Status
The Department had estimated that a 64 rating would be reached. The measured rating of 62 for FY 2015 was less that the estimate. In consideration of the continued higher budgets for sidewalk maintenance that allow for increased sidewalk improvements since FY 2013, the FY 2016 estimated and FY 2017 proposed reflect continued modest increases in this rating.
PUBLIC WORKS • CITY OF PALO ALTO FISCAL YEAR 2017 ADOPTED BUDGET 361

PUBLIC WORKS
362
CITIZEN SURVEY - STREET MAINTENANCEGoal Ensure the City's assets and infrastructure inventory are updated and well
maintained.
Objective Increase rating given by residents for quality of street maintenance.
FY 2014 Actuals
FY 2015 Actuals
FY 2016 Adopted
FY 2016 Estimated
FY 2017 Adopted
Percent of citizens rating the quality of street repair as "good" or "excellent"
54.00% 51.00% 62.00% 53.00% 55.00%
Description
The City participates in the National Citizen Survey (NCS), which asks residents to rate their perception of street maintenance. The NCS is a collaborative effort between National Research Center, Inc., and the International City/County Management Association. The NCS is an annual survey of approximately 500 jurisdictions in the United States whose residents evaluate local government services and give their opinion about the quality of life in the community.
Purpose To obtain feedback from residents on whether streets are being maintained adequately in order to determine if the program's resources are appropriate.
Status
The Department estimated a 59 percent rating would be reached. The measured rating of 51 for FY 2015 was less than the estimate. In consideration of the continued higher budgets for street maintenance that allow for increased paving since FY 2012, the FY 2016 estimated and FY 2017 proposed reflect continued modest increases in this rating.
CITIZEN SURVEY - STREET TREE MAINTENANCEGoal Preserve the public's health and safety to ensure a vibrant, sustainable
community for future generations.
Objective Increase rating given by residents for quality of street tree maintenance.
FY 2014 Actuals
FY 2015 Actuals
FY 2016 Adopted
FY 2016 Estimated
FY 2017 Adopted
Percent of citizens rating street tree maintenance "good" or "excellent" 80.00% 73.00% 79.00% 75.00% 75.00%
Description This measure assesses the residents' level of satisfaction with the City's street tree maintenance program.
Purpose To obtain feedback from residents on whether street trees are being maintained adequately in order to determine if the program's resources are appropriate.
Status
The Department has been achieving between 66 and 80 percent satisfaction and is estimating a slightly lower rating for FY 2015 due to drought conditions which has increased the number of tree removals leaving less time for the trimming of trees. Satisfaction numbers should increase slightly for FY16 due to extra watering of trees offered during 2nd year of drought.
PUBLIC WORKS • CITY OF PALO ALTO FISCAL YEAR 2017 ADOPTED BUDGET

PUBLIC WORKS
PAVEMENT CONDITION SCOREGoal Ensure the City's assets and infrastructure inventory are updated and well
maintained.
Objective Maintain and enhance the overall condition of the City's streets.
FY 2014 Actuals
FY 2015 Actuals
FY 2016 Adopted
FY 2016 Estimated
FY 2017 Adopted
Pavement Condition Score 78 79 81 82 83
DescriptionThis measure tracks the condition of the City's streets based on an index published by the Metropolitan Transportation Commission (MTC) as well as changes in that score.
Purpose Improving the condition of our streets reduces overall maintenance costs and increases ride satisfaction.
Status
PCI scores are rated as follows: 80+= very good or excellent, 70-79 = good, 60-69 = fair, 50-59 = at-risk, 25-49 = poor, and 0-24 = failed. The City Council has a goal of raising the citywide average PCI score to 85 by FY 2019. The FY 2016 estimate PCI is higher than the FY 2016 adopted goal. The Department remains on schedule to meet the citywide average goal. Annual reports by MTC indicate that Palo Alto now has one of the highest citywide average PCI scores in Santa Clara and San Mateo Counties.
RESPONSE TO POTHOLE NOTIFICATIONGoal Ensure the City's assets and infrastructure inventory are updated and well
maintained.
Objective Increase rating.
FY 2014 Actuals
FY 2015 Actuals
FY 2016 Adopted
FY 2016 Estimated
FY 2017 Adopted
Percent of potholes repaired within 15 days of notification 75.00% 90.00% 88.00% 88.00% 90.00%
Description This measure records the number of potholes that are repaired within 15 days of the Department being notified of the problem.
Purpose The Department has set a goal of repairing potholes within 15 days in order to ensure streets are maintained and repaired in a timely manner.
Status
The Department has been making the repairs within 15 days 90 percent of the time. Increased inspection of adjacent areas to increase cost effectiveness and increase PCI scores has resulted in additional work. Since implementation of Palo Alto 311, notifications of potholes has increased substantially. To maintain a 15 day turnaround, increase the percentage repaired in 15 days to 90%, reduce degradation of streets and impacts to drivers additional funding for temporary staff was granted in FY 2016.
PUBLIC WORKS • CITY OF PALO ALTO FISCAL YEAR 2017 ADOPTED BUDGET 363

PUBLIC WORKS
364
%
)%
9%
7%
0%
3%
0%
7%
)%
%
4%
Workload MeasuresFY 2014 Actuals
FY 2015 Actuals
FY 2016 Adopted
FY 2016 Estimated
FY 2017 Adopted
Number of tree related electrical service disruptions 7 3 3 6 5
Total of trees maintained by the City 35,386 35,281 35,390 35,281 35,390
Number of street lane miles resurfaced annually 36 31 48 44 50
Percent of lane miles resurfaced annually 8.00% 7.00% 10.00% 9.00% 10.00%
Total square footage of facilities maintained 1,611,432 1,656,280 1,656,280 1,657,480 1,657,480
Cost per square foot for custodial services $1.08 $1.06 $1.07 $1.00 $1.06
Cost per square footage for maintenance services $1.89 $1.85 $1.86 $1.86 $1.86
Number of facilities work order requests completed 7,182 6,987 7,500 7,368 7,200
Number of trees trimmed annually 5,055 6,976 5,500 5,040 5,500
Budget SummaryFY 2014 Actuals
FY 2015 Actuals
FY 2016 Adopted Budget
FY 2017 Adopted Budget
FY 2017 Change $
FY 2017Change
Dollars by Division
General Fund Administration 1,212,005 1,277,626 1,327,085 1,125,088 (201,997) (15.2
General Fund Engineering Services 1,654,651 1,372,467 962,795 1,260,014 297,219 30.
General Fund Public Services: Streets 2,638,988 2,789,069 3,572,812 3,703,544 130,731 3.
General Fund Public Services: Structures and Grounds 5,094,012 5,110,365 6,237,881 6,361,428 123,547 2.
General Fund Public Services: Trees 2,599,698 2,741,156 2,933,013 3,790,944 857,931 29.
Total 13,199,356 13,290,684 15,033,586 16,241,018 1,207,432 8.
Dollars by Category
Salary & Benefits
Healthcare 970,660 974,952 1,103,803 1,166,476 62,673 5.
Other Benefits 175,190 160,606 154,594 120,371 (34,223) (22.1
Overtime 158,054 208,125 172,085 172,085 — —
Pension 1,137,524 1,163,507 1,209,290 1,383,966 174,676 14.
PUBLIC WORKS • CITY OF PALO ALTO FISCAL YEAR 2017 ADOPTED BUDGET

PUBLIC WORKS
)%
7%
)%
2%
0%
5%
)%
)%
%
5%
8%
0%
7%
)%
%
%
%
0%
)%
9%
1%
)%
8%
1%
1%
%
Retiree Medical 755,589 905,286 965,380 902,348 (63,033) (6.5
Salary 4,337,837 4,407,539 4,533,404 4,972,445 439,040 9.
Workers' Compensation 163,353 160,675 138,133 69,461 (68,672) (49.7
Total Salary & Benefits 7,698,207 7,980,691 8,276,689 8,787,150 510,461 6.
Allocated Charges 2,595,986 2,509,483 2,684,622 2,845,051 160,429 6.
Contract Services 1,746,903 1,764,632 2,814,612 3,221,892 407,280 14.
Facilities & Equipment — 5,664 6,646 2,146 (4,500) (67.7
General Expense 63,694 72,241 111,569 81,029 (30,540) (27.4
Operating Transfers-Out 16,574 16,574 16,574 16,574 — —
Rents & Leases 288,061 91,504 170,000 174,302 4,302 2.
Supplies & Material 789,930 849,895 952,874 1,112,874 160,000 16.
Total Dollars by Expense Category
13,199,355 13,290,684 15,033,587 16,241,018 1,207,431 8.
Revenues
Charges for Services 208,940 115,235 8,714 53,828 45,114 517.
Charges to Other Funds 1,635,172 1,834,299 2,037,816 1,631,873 (405,943) (19.9
Operating Transfers-In 164,490 164,490 196,107 196,107 — —
Other Revenue 18,400 34,531 6,000 6,000 — —
Other Taxes and Fines — (975) — — — —
Permits and Licenses 867,513 1,059,930 878,367 1,001,516 123,149 14.
Total Revenues 2,894,514 3,207,512 3,127,004 2,889,324 (237,679) (7.6
Positions by Division
General Fund Administration 2.95 2.95 2.95 3.05 0.10 3.3
General Fund Engineering Services 10.44 6.55 3.47 4.56 1.09 31.4
General Fund Public Services: Streets 14.88 14.88 18.98 18.02 (0.96) (5.04
General Fund Public Services: Structures and Grounds 18.34 18.34 18.16 18.81 0.65 3.5
General Fund Public Services: Trees 13.31 12.93 12.93 13.41 0.48 3.7
Total 59.92 55.65 56.49 57.85 1.36 2.4
Budget SummaryFY 2014 Actuals
FY 2015 Actuals
FY 2016 Adopted Budget
FY 2017 Adopted Budget
FY 2017 Change $
FY 2017Change
PUBLIC WORKS • CITY OF PALO ALTO FISCAL YEAR 2017 ADOPTED BUDGET 365

PUBLIC WORKS
366
27
88
84
07
45
33
80
29
04
07
08
55
79
13
04
68
68
53
—
69
55
23
91
39
64
76
52
45
46
75
87
13
Staffing
Job ClassificationFY 2014 Actuals
FY 2015 Actuals
FY 2016 Adopted Budget
FY 2017 Adopted Budget
FY 2017 Change $
FY 2017Salary
Administrative Assistant 1.00 1.00 1.00 1.00 — 78,7
Administrative Associate I 0.60 0.60 0.60 0.60 — 31,2
Administrative Associate II 2.65 2.63 2.63 2.65 0.02 180,0
Administrative Associate III — — — 0.01 0.01 7
Assistant Director Public Works 1.30 1.28 0.85 0.87 0.02 139,1
Associate Engineer 0.30 0.30 0.30 0.30 — 28,6
Building Serviceperson 1.00 1.00 1.00 1.00 — 55,1
Building Serviceperson-Lead 1.80 1.80 1.80 1.80 — 106,3
Cement Finisher — — 3.00 3.00 — 238,4
Cement Finisher-Lead — — 0.26 0.26 — 22,1
Coordinator Public Works Projects — — 1.00 0.50 (0.50) 45,4
Director Public Works/City Engineer 1.00 1.00 1.00 1.00 — 204,7
Electrician 0.80 0.80 0.80 0.80 — 75,7
Engineer 0.30 0.30 0.40 0.66 0.26 73,7
Engineering Technician III 3.20 1.20 1.20 1.47 0.27 116,6
Equipment Operator 3.46 3.46 3.46 3.46 — 249,1
Facilities Carpenter 1.00 1.00 1.00 1.00 — 79,4
Facilities Maintenance-Lead 1.85 1.85 1.85 1.85 — 184,4
Facilities Mechanic 5.55 5.55 5.55 — (5.55)
Facilities Painter 1.75 1.75 1.75 1.75 — 139,0
Facilities Technician — — — 5.55 5.55 486,4
Heavy Equipment Operator 2.13 2.13 2.33 2.33 — 191,7
Heavy Equipment Operator-Lead 0.85 0.85 0.85 0.85 — 75,4
Inspector, Field Services 1.33 0.83 0.10 0.11 0.01 9,9
Landscape Architect Park Planner — — 0.10 0.10 — 11,8
Management Analyst 0.60 0.60 0.70 0.70 — 73,3
Manager Facilities — — 0.90 0.90 — 127,3
Manager Maintenance Operations 1.95 1.95 1.20 1.20 — 158,2
Manager Urban Forestry 1.00 0.96 0.96 0.96 — 132,9
Manager Watershed Protection — — — 0.05 0.05 6,7
Planning Arborist 1.00 0.75 0.75 0.75 — 82,0
Project Engineer 0.30 0.30 0.40 0.50 0.10 56,9
PUBLIC WORKS • CITY OF PALO ALTO FISCAL YEAR 2017 ADOPTED BUDGET

PUBLIC WORKS
14
99
56
07
77
76
—
04
32
63
02
73
90
85
75
Project Manager 1.70 1.63 1.63 2.58 0.95 256,2
Senior Engineer 2.10 1.47 0.57 0.79 0.22 115,2
Senior Management Analyst 1.11 1.11 1.11 1.11 — 108,8
Senior Project Manager 0.10 0.10 0.10 0.10 — 14,5
Supervisor Inspection and Surveying 0.80 0.53 0.10 0.10 — 11,4
Surveyor, Public Works 0.78 0.31 0.10 0.33 0.23 30,1
Traffic Controller Maintainer-Lead 1.00 1.00 — — —
Traffic Controller Maintainer I 1.94 1.94 1.94 1.94 — 141,3
Traffic Controller Maintainer II 2.00 2.00 2.00 2.00 — 123,3
Tree Maintenance Person 1.00 1.00 1.00 1.00 — 75,5
Tree Trim/Line Clear 7.00 7.00 7.00 7.00 — 520,7
Tree Trim/Line Clear-Lead 1.00 1.00 1.00 1.00 — 79,5
Sub-total: Full-Time Equivalent Positions
57.25 52.98 54.29 55.93 1.64 4,939,1
Temporary/Hourly 2.67 2.67 1.90 1.92 0.02 103,9
Total Positions 59.92 55.65 56.19 57.85 1.66 5,043,1
Budget ReconciliationPositions Expenditures Revenues
Net General Fund
Prior Year Budget 56.49 15,033,587 3,127,004 11,906,583
Base Adjustments
One-Time Prior Year Expenditures and Revenues Deleted
University Avenue Enhancements and Funding Realignments — (360,000) — (360,000)
Urban Forest Master Plan — (122,000) — (122,000)
Contractual Street Tree Pruning — (50,000) — (50,000)
Foothills Park Fire Management Plan- Roadside Clearing — (9,300) — (9,300)
New Position Technology Equipment — (3,500) — (3,500)
One-Time Prior Year Expenditures and Revenues
— (544,800) — (544,800)
Staffing
Job ClassificationFY 2014 Actuals
FY 2015 Actuals
FY 2016 Adopted Budget
FY 2017 Adopted Budget
FY 2017 Change $
FY 2017Salary
PUBLIC WORKS • CITY OF PALO ALTO FISCAL YEAR 2017 ADOPTED BUDGET 367

PUBLIC WORKS
368
Adjustments to Costs of Ongoing Activities
Salary and Benefit Adjustment — 307,928 — 307,928
Charges for Services Revenue Alignment — — 123,563 (123,563)
Public Works Division Reallocations from Development Services 0.60 100,173 — 100,173
Engineering Services Division FTE Reallocations 0.49 68,654 — 68,654
Public Services Division FTE Reallocations 0.65 48,922 — 48,922
Reclassify 5.55 FTE Facilities Maintenance Workers to Facilities Technician — 23,544 — 23,544
Reclassify 1.00 FTE Manager Maintenance Operations to Project Engineer — 15,601 — 15,601
San Francisquito Watershed Project City Contribution — 6,000 — 6,000
Rents & Leases Expenditure Alignment — 4,302 — 4,302
Temporary Salaries Adjustment (0.38) (47,903) — (47,903)
Parking Assessment District Technology Expenditures — (650) — (650)
Vehicle Replacement and Maintenance Allocated Charges Adjustment — 401,040 — 401,040
Information Technology Allocated Charges Adjustment — 57,649 — 57,649
Storm Drain Sales Allocated Charges Adjustment — 27,655 — 27,655
Landfill Charges Allocated Charges Adjustment — 13,758 — 13,758
Refuse Sales Allocated Charges Adjustment — 3,572 — 3,572
Fiber Allocated Charges Adjustment — 6,351 — 6,351
Green Sales to City Allocated Charges Adjustment — 264 — 264
Print & Mail Allocated Charges Adjustment — (10,406) — (10,406)
General Liability Insurance Allocated Charges Adjustment — (339,453) — (339,453)
Public Works Administration Allocated Charges Adjustment — — (405,943) 405,943
Adjustments to Costs of Ongoing Activities 1.36 687,001 (282,380) 969,381
Total FY 2017 Base Budget 57.85 15,175,788 2,844,624 12,331,164
Budget Adjustments
1 Tree Trimming Services — 738,930 — 738,930
2 Urban Forest Master Plan — 200,000 — 200,000
Budget ReconciliationPositions Expenditures Revenues
Net General Fund
PUBLIC WORKS • CITY OF PALO ALTO FISCAL YEAR 2017 ADOPTED BUDGET

PUBLIC WORKS
3 Library Facilities Bed Bug Inspection and Maintenance — 52,000 — 52,000
4 Urban Forest Individual Review — 44,700 44,700 —
5 Municipal Services Center Security Guard Contract — 29,600 — 29,600
Total Budget Adjustments — 1,065,230 44,700 1,020,530
Total FY 2017 Adopted Budget 57.85 16,241,018 2,889,324 13,351,694
Budget AdjustmentsBudget Adjustments Positions Expenditures Revenues
Net General Fund
1 Tree Trimming Services 0.00 738,930 0 738,930
This action adds $738,930 to the base budget of $410,000 for tree trimming services throughout the City. In Fiscal Year 2016, staff rebid the tree trimming contract and the lowest bidder submitted a proposal requiring an additional $1.0 million to maintain services at current levels, which would provide for a 7-year tree maintenance cycle. With this recommendation, the tree maintenance cycle will be extended to 10 years and allow for pruning a total of 3,415 trees per year, which include services for parks and open space trees not serviced under the previous contract. (Ongoing: $738,930)
Performance Results
This action will ensure that adequate resources are available to maintain the City's tree canopy; however, the cycle time will be increased as a result and if extended beyond Fiscal Year 2017, may increase tree mortality rates, failure and removals.
Budget ReconciliationPositions Expenditures Revenues
Net General Fund
PUBLIC WORKS • CITY OF PALO ALTO FISCAL YEAR 2017 ADOPTED BUDGET 369

PUBLIC WORKS
370
2 Urban Forest Master Plan 0.00 200,000 0 200,000
This action provides funding for the second year of the Urban Forest Master Plan in the amount of $200,000. Funding in the amount of $39,000 will support hiring of hourly and contract staffing, allowing permanent staff to continue focusing on programmatic elements of the plan. Funding in the amount of $161,000 provides for expanding the existing Urban Forest software as well as the purchase of new software to better inventory and quantify benefits of the Urban Forest. (Ongoing: $0)
Performance Results
This funding allows for continued implementation of the Urban Forest Master Plan, which serves as a guiding document for ensuring the careful, cost effective, and sustainable management of the City's tree infrastructure.
3 Library Facilities Bed Bug Inspection and Maintenance 0.00 52,000 0 52,000
In Fiscal Year 2016, two Palo Alto libraries were closed due to a bed bug contamination, a recent occurrence in many Bay Area libraries. Although bed bugs are not likely to spread disease, the Environmental Protection Agency (EPA) does classify bed bugs as a public health pest. In order to provide proper treatment for mitigation, this action provides $52,000 in funding, of which $30,000 will be used to provide regular inspections of all libraries and the balance of $22,000 for treatment when and where necessary. (Ongoing: $22,000)
Performance Results
This action provides sufficient resources for proactive inspections and treatments to ensure Library facilities and operations are not impeded.
4 Urban Forest Individual Review 0.00 44,700 44,700 0
This action adds a new Urban Forest Individual Review (IR) fee to the FY 2017 Municipal Fee Schedule and contract funding to provide Urban Forest Individual Review. The Urban Forestry Section currently reviews Individual Review (planning) applications for new two-story homes; however, there is no fee component included in the current IR fee to recuperate costs of providing this review. Staff is proposing a fee of $559 to accommodate the estimated 80 Individual Review applications reviewed annually, for a total revenue estimate of $44,700. In addition, staff is recommending a commensurate amount in contract funding for a qualified consulting arborist to review IR applications with an Urban Forest component. (Ongoing: $44,700)
Performance Results
With the implementation of the new Urban Forest Individual Review fee, City Council cost recovery goals will be met.
5 Municipal Services Center Security Guard Contract 0.00 29,600 0 29,600
This action provides funding for a security guard contractor at the Municipal Services Center (MSC). Currently, the guard station at the MSC is unmanned and staff has noticed an increase in trespassing into the MSC. The new security guard contractor will ensure that only permitted vehicles and persons enter the MSC. The total cost of the security guard contract is estimated to be $80,000 annually and will be shared proportionally by the MSC tenants. As a result, the cost sharing is $29,600 for Public Works General Fund; $28,800 for Utilities Administration; $16,000 for Public Works Vehicle Maintenance & Replacement Fund; $5,600 for Administrative Services General Fund. (Ongoing: $16,000)
Performance Results
This action ensures that no unauthorized access to the Municipal Services Center will occur which may prevent loss or damage to City property.
Budget AdjustmentsBudget Adjustments Positions Expenditures Revenues
Net General Fund
PUBLIC WORKS • CITY OF PALO ALTO FISCAL YEAR 2017 ADOPTED BUDGET

PUBLIC WORKS
REFUSE FUNDDescriptionPublic Works provides refuse related services on a user charge basis to Palo Alto’s residents and businesses. Refuse Fund goals are to minimize waste generation, maximize recycling and reuse to meet and exceed the City’s Zero Waste goals, to protect the environment by safely collecting and disposing of hazardous household waste, and to maintain and monitor the City’s closed landfill.
Accomplishments Successfully implemented a residential food scraps collection program citywide. Residents
are now able to combine their food scraps, food soiled paper and compostable plastics with their yard trimmings in the green carts. The combined material is transported to a nearby facility where it is anaerobically digested to produce sustainable electricity and compost.
Developed a commercial recycling and composting ordinance that will require everyone to subscribe to all three waste collection services (garbage, recycling and compost) and to sort their wastes properly. Implemented the first phase of the ordinance that included large generators, food service establishments and multi-family residences.
Continued promoting an expanded home composting campaign in an effort to increase participation citywide. The expanded home composting campaign is a focused outreach and incentive-based campaign that emphasizes sustainable local composting for those who participate. Compost bins will be given to residents who take a free home composting workshop.
Continued promoting a food waste reduction campaign focused on building local and regional partnerships and improving message outreach to create behavioral change.
Completed the capping of the Palo Alto Landfill using an innovative environmentally friendly “evapo-transpirative” soil cap that saved the City $1 million in costs from the original engineer’s estimate and generated over $1 million in revenue by accepting clean soils at the landfill. Received regulatory agency approval of the closure as well as regulatory agency approval to eliminate the closure financial assurance reserve.
Completed the settlement repair of the previously closed sections of the landfill by importing soil, establishing drainage features, constructing pathways and seeding with native grasses.
Began installation of a canopy over the City’s Household Hazardous Waste Station unloading and sorting area to reduce stormwater impacts.
PUBLIC WORKS • CITY OF PALO ALTO FISCAL YEAR 2017 ADOPTED BUDGET 371

PUBLIC WORKS
372
Successfully implemented the transition to automated collection service for residents that resulted in new cart placement requirements, the change-out of all personal cans to carts and some changes to collection days. Conducted extensive outreach to residents and created alternative cart placement arrangements for challenging areas.
Initiatives Implement the second phase of the recycling and composting ordinance for mid-sized
commercial customers. Continue outreach and training to achieve near 100% compliance with the ordinance on the first phase of commercial customers.
Continue to develop strategies for and implement outreach campaigns to promote residential customer use of green carts to divert food scraps from landfilling and raise awareness of the benefits of composting and food waste reduction to localize sustainable material management.
Implement a post closure inspection and maintenance program at the City’s closed landfill with a goal of 100% regulatory compliance.
Continue pilot program working with GoBox to develop and foster reusable takeout container service in the downtown area. Consider expanding the pilot area to other areas if effective in reducing disposable container waste.
Develop and implement a downtown alley clean-up pilot with the goal of reducing litter and increasing diversion of waste from landfills.
Develop a pilot to accept residents from PARWQCP partner cities at the City’s Household Hazardous Waste (HHW) Station with a goal of offering a more convenient HHW drop off schedule and reduce the disposal of hazardous products down the drain.
Goals and ObjectivesGOAL 1Minimize waste generation and maximize recycling and reuse programs in order to achieve zero waste to landfills by 2021.
Objectives: Promote recycling, composting, and reuse through educational programs and outreach in
order to increase public participation.
Reduce landfilled waste by implementing the recycling and composting ordinance approved by Council in January 2016.
GOAL 2Protect the environment by providing convenient, weekly local household hazardous waste col-lection services to residents and small businesses.
PUBLIC WORKS • CITY OF PALO ALTO FISCAL YEAR 2017 ADOPTED BUDGET

PUBLIC WORKS
Objectives: Increase participation with the City’s household hazardous waste collection services
through educational programs and outreach.
Promote the reuse of good household products to residents at the City’s Household Hazardous Waste Station reuse storage cabinets.
GOAL 3Effectively manage the City’s closed landfill to meet all regulatory requirements and to minimize the impacts of postclosure maintenance on Byxbee Park users.
Objectives: Perform annual settlement repairs of the landfill areas to minimize the impacts of periodic
larger repairs to park users.
Develop and maintain a comprehensive preventative maintenance program for the landfill environmental control systems.
Key Performance MeasuresAVERAGE AMOUNT OF GARBAGE (IN POUNDS) GENERATED PER RESIDENT AND DISPOSED IN LANDFILLS EACH DAYGoal Minimize waste generation and maximize recycling and reuse programs in order
to achieve zero waste to landfills by 2021.
Objective Promote recycling, composting, and reuse through educational programs and outreach in order to increase public participation.
FY 2014 Actuals
FY 2015 Actuals
FY 2016 Adopted
FY 2016 Estimated
FY 2017 Adopted
Average amount of garbage (in pounds) generated per resident and disposed in landfills each day
3.9 3.6 3.9 3.6 3.5
DescriptionThe daily average amount of garbage disposed per resident is a measure of how much waste is being disposed in landfills. This measure is universally used by the State and municipalities.
Purpose This measure helps track waste generation and can help verify if the City is meeting its City's zero waste goals.
Status
The average number of pounds disposed per day per resident has been fairly flat since 2010 when the City implemented several zero waste programs that raised the City's waste diversion rate (from landfills) from 62% to near 80%. Implementing new compostables initiatives should help divert more compost material (food scraps) from the garbage to the green cart thereby lowering this average.
The recently reported statewide average disposal rate is 4.5 pounds per person per day, which is higher compared to Palo Alto's 3.6 pounds of garbage disposed per resident per day. The average disposal rates for nearby cities is 4.6, with Menlo Park at 4.9 pounds of garbage disposed per person, Mountain View at 3.8, Redwood City at 4.5, Santa Clara at 6.1 and Sunnyvale at 3.6 pounds of garbage disposed per person per day.
PUBLIC WORKS • CITY OF PALO ALTO FISCAL YEAR 2017 ADOPTED BUDGET 373

PUBLIC WORKS
374
NUMBER OF HOUSEHOLDS SERVICED THROUGH THE HOUSEHOLD HAZARDOUS WASTE PROGRAM ON AN ANNUAL BASISGoal Protect the environment by providing convenient, weekly and local household
hazardous waste collection services to residents and small businesses.
Objective
Increase participation with the City's household hazardous waste collection services through educational programs and outreach.
Promote the reuse of good household products to City residents at the City’s Household Hazardous Waste Station reuse storage cabinets.
FY 2014 Actuals
FY 2015 Actuals
FY 2016 Adopted
FY 2016 Estimated
FY 2017 Adopted
Annual number of Households Serviced through the Household Hazardous Waste Program
4,878 4,757 4,500 4,800 4,900
DescriptionThe number of households serviced at the City household hazardous waste station is a direct measurement of the usage of the program and it indirectly relates to the convenience and public awareness of the program.
Purpose
The purpose of tracking this measure is to confirm that residents are utilizing the City's household hazardous waste collection program to property dispose of their unused hazardous products so that they are not disposed in the garbage or down the drain.
Status
The City's household hazardous waste program has one of the highest public participation rates in the state at approximately 17%. By comparison, the County of Santa Clara Household Hazardous Waste Program in 2015 had a participation rate of 3.9% and the overall State's average was 5.3%.
PERCENTAGE OF HOUSEHOLDS WITH MINI-CAN GARBAGE SERVICEGoal Minimize waste generation and maximize recycling and reuse programs in order
to achieve zero waste to landfills by 2021.
Objective Promote recycling, composting, and reuse through educational programs and outreach in order to increase public participation.
FY 2014 Actuals
FY 2015 Actuals
FY 2016 Adopted
FY 2016 Estimated
FY 2017 Adopted
Percentage of households with Mini-Can garbage service 33.00% 35.00% N/A 37.00% 39.00%
Description
The percentage of households with mini-can garbage service is a good measure of residential garbage generation. Residents reducing their garbage to the smallest container size available is an indication that residential participation of the City's recycling and composting programs is high.
Purpose The purpose of tracking this measure is to help verify if residents are reducing their garbage generation in order to achieve zero waste to landfills by 2021.
Status
Palo Alto residents have continued the trend of decreasing the size of their garbage carts by diverting their recyclable and compostable waste to the blue and green carts thereby decreasing the amount of garbage landfilled. Residents with larger garbage containers are also trending toward smaller garbage carts.
PUBLIC WORKS • CITY OF PALO ALTO FISCAL YEAR 2017 ADOPTED BUDGET

PUBLIC WORKS
%
)%
)%
9%
0%
)%
8%
)%
0%
)%
%
6%
)%
3%
)%
1%
)%
)%
1%
)%
%
Workload MeasuresFY 2014 Actuals
FY 2015 Actuals
FY 2016 Adopted
FY 2016 Estimated
FY 2017 Adopted
Percentage of commercial customers with compost service 26.00% 28.00% N/A 33.00% 40.00%
Tons of materials collected by the City for recycling or composting 49,594 50,546 52,000 52,000 53,000
Budget SummaryFY 2014 Actuals
FY 2015 Actuals
FY 2016 Adopted Budget
FY 2017 Adopted Budget
FY 2017 Change $
FY 2017Change
Dollars by Division
CIP Refuse Fund 1,661,485 2,251,098 1,469,460 129,346 (1,340,114) (91.2
Refuse Administration 4,546,824 4,174,034 4,283,177 4,129,842 (153,335) (3.6
Refuse Collection, Hauling and Disposal: Operations 5,221,628 5,313,757 4,888,959 5,422,561 533,602 10.
Refuse Collection, Hauling and Disposal: Payment to GreenWaste
13,942,606 14,381,492 15,779,523 16,252,909 473,386 3.
Refuse Solid Waste: Operations 2,918,144 2,637,257 3,301,857 3,291,430 (10,427) (0.3
Refuse Street Sweeping 1,805,042 1,568,451 1,307,982 1,396,295 88,313 6.
Total 30,095,729 30,326,089 31,030,958 30,622,382 (408,576) (1.3
Dollars by Category
Salary & Benefits
Healthcare 295,291 214,655 192,487 250,172 57,685 30.
Other Benefits 61,117 51,883 51,435 40,028 (11,407) (22.2
Overtime 42,769 42,197 41,789 41,789 — —
Pension 372,627 313,090 339,522 385,625 46,103 13.
Retiree Medical 344,616 354,975 366,980 361,874 (5,106) (1.4
Salary 1,781,878 1,619,171 1,372,268 1,486,259 113,991 8.
Workers' Compensation 34,351 64,275 29,052 20,894 (8,158) (28.1
Total Salary & Benefits 2,932,648 2,660,245 2,393,534 2,586,641 193,107 8.
Allocated Charges 2,596,815 2,108,339 2,123,066 1,773,866 (349,201) (16.4
Capital Improvement Program 1,634,687 2,169,658 1,316,750 129,346 (1,187,404) (90.2
Contract Services 5,540,177 5,650,771 6,061,178 6,431,700 370,522 6.
Debt Service 616,667 577,583 565,440 564,841 (599) (0.1
Facilities & Equipment 194 — 3,000 3,000 — —
PUBLIC WORKS • CITY OF PALO ALTO FISCAL YEAR 2017 ADOPTED BUDGET 375

PUBLIC WORKS
376
2%
8%
6%
%
)%
0%
)%
)%
1%
9%
%
7%
%
%
%
7%
%
)%
%
1%
%
6%
%
General Expense 60,594 68,606 106,525 113,147 6,622 6.
Operating Transfers-Out 28,719 42,289 27,915 57,437 29,522 105.
Rents & Leases 2,638,452 2,538,983 2,482,251 2,546,790 64,539 2.
Supplies & Material 104,170 128,125 143,706 143,706 — —
Transfer to Infrastructure — — 28,070 — (28,070) (100.0
Utility Purchase 13,942,606 14,381,492 15,779,523 16,252,909 473,386 3.
Total Dollars by Expense Category
30,095,729 30,326,088 31,030,958 30,622,383 (408,576) (1.3
Revenues
Charges for Services 176,535 26,411 187,500 37,500 (150,000) (80.0
Charges to Other Funds 298,322 300,932 250,552 275,932 25,380 10.
Net Sales 26,955,936 27,490,337 27,576,342 28,107,116 530,774 1.
Operating Transfers-In 124,187 1,060,927 — 13,325 13,325 —
Other Revenue 3,011,336 3,677,792 2,431,150 2,546,150 115,000 4.
Other Taxes and Fines 5,270 5,800 — — — —
Rental Income — 78,628 30,000 30,000 — —
Return on Investments 227,832 234,454 178,900 178,900 — —
Total Revenues 30,799,417 32,875,280 30,654,444 31,188,923 534,479 1.
Positions by Division
CIP Refuse Fund 0.65 0.65 0.65 0.65 — —
Refuse Administration 0.54 0.59 0.48 0.43 (0.05) (10.42
Refuse Collection, Hauling and Disposal: Operations 1.00 1.00 1.00 1.00 — —
Refuse Solid Waste: Operations 10.37 10.37 10.39 10.89 0.50 4.8
Refuse Street Sweeping 9.39 3.64 2.68 2.68 — —
Total 21.95 16.25 15.20 15.65 0.45 2.9
Budget SummaryFY 2014 Actuals
FY 2015 Actuals
FY 2016 Adopted Budget
FY 2017 Adopted Budget
FY 2017 Change $
FY 2017Change
PUBLIC WORKS • CITY OF PALO ALTO FISCAL YEAR 2017 ADOPTED BUDGET

PUBLIC WORKS
49
29
29
—
—
—
47
23
58
94
—
—
60
03
71
61
75
48
16
44
93
—
84
90
—
00
74
60
34
Staffing
Job ClassificationFY 2014 Actuals
FY 2015 Actuals
FY 2016 Adopted Budget
FY 2017 Adopted Budget
FY 2017 Change $
FY 2017Salary
Account Specialist 0.15 0.15 0.15 0.10 (0.05) 6,3
Accountant 0.10 0.10 0.10 0.10 — 9,1
Assistant Director Public Works 0.35 0.35 0.35 0.35 — 62,2
Business Analyst 0.11 0.11 — — —
Chief Sustainability Officer 0.05 0.05 — — —
Coordinator Public Works Projects 1.00 1.00 1.00 — (1.00)
Deputy Chief/Fire Marshal 0.04 0.04 0.03 0.03 — 4,8
Environmental Specialist 1.00 1.00 1.00 2.00 1.00 192,4
Facilities Maintenance-Lead — — — 1.00 1.00 97,5
Hazardous Materials Inspector 0.02 0.02 0.02 0.02 — 2,7
Heavy Equipment Operator 0.71 — — — —
Heavy Equipment Operator-Lead 0.71 — — — —
Landfill Technician 1.00 1.00 1.00 1.00 — 91,4
Management Analyst 2.10 1.10 0.10 0.43 0.33 43,3
Manager Environmental Control Program 1.00 2.00 3.00 3.00 — 361,7
Manager Maintenance Operations 0.46 0.46 0.46 0.46 — 60,6
Manager Solid Waste 1.00 1.00 1.00 1.00 — 139,7
Program Assistant I 1.00 1.00 1.00 1.00 — 68,9
Project Manager 0.20 0.20 0.20 0.20 — 18,4
Senior Accountant 0.10 0.10 0.10 0.10 — 11,1
Senior Management Analyst 0.08 0.08 0.08 0.08 — 9,5
Senior Technologist 0.11 0.11 — — —
Street Maintenance Assistant — — — 1.00 1.00 50,6
Street Sweeper Operator 5.96 1.63 1.63 1.63 — 119,2
Surveyor, Public Works 0.11 0.11 0.35 — (0.35)
Zero Waste Coordinator 2.00 2.00 2.00 1.00 (1.00) 87,2
Sub-total: Full-Time Equivalent Positions
19.36 13.61 13.57 14.50 0.93 1,437,5
Temporary/Hourly 2.59 2.64 1.63 1.15 (0.48) 60,7
Total Positions 21.95 16.25 15.20 15.65 0.45 1,498,3
PUBLIC WORKS • CITY OF PALO ALTO FISCAL YEAR 2017 ADOPTED BUDGET 377

PUBLIC WORKS
378
Budget ReconciliationPositions Expenditures Revenues
Net Refuse Fund
Prior Year Budget 15.20 31,030,958 30,654,444 376,514
Base Adjustments
One-Time Prior Year Expenditures and Revenues Deleted
Transfer to Capital Improvement Fund for Municipal Services Center Lighting, Mechanical, and Electrical Improvements
— (28,070) — (28,070)
One-Time Prior Year Expenditures and Revenues
— (28,070) — (28,070)
Adjustments to Costs of Ongoing Activities
Salary and Benefit Adjustment (0.05) 94,448 — 94,448
GreenWaste Annual Contract Increase — 473,386 — 473,386
SmartStation Annual Contract Increase — 410,156 — 410,156
Rents & Leases Expenditure Alignment — 64,539 — 64,539
Reclassification of 1.0 FTE Zero Waste Coordinator to Environmental Specialist — 7,512 — 7,512
Management & Professional Development Alignment — 5,750 — 5,750
Reclassification of 1.0 FTE Coordinator Public Works to Facilities Maintenance Lead — 5,187 — 5,187
Janitorial Services Funding Alignment — (40,233) — (40,233)
Commercial Refuse Hauling Service Rate Structure Modification — — 300,000 (300,000)
Residential Refuse Hauling Service Rate Structure Modification — — 263,000 (263,000)
Commercial Debris Boxes Rate Structure Modification — — 179,500 (179,500)
Industrial Refuse Hauling Service Rate Structure Modification — — (100,000) 100,000
Capital Expenditure Funding Adjustment — (1,168,404) (150,000) (1,018,404)
Transfer to Information Technology Fund — 29,522 — 29,522
Transfer to Capital Improvement Fund — (28,070) 13,325 (41,395)
Refuse Fund Capital Project Staffing Alignment (0.35) (41,554) — (41,554)
Vehicle Replacement and Maintenance Allocated Charges Adjustment — 86,598 — 86,598
Refuse Sales Allocated Charges Adjustment — 7,504 28,654 (21,150)
Storm Drain Sales Allocated Charges Adjustment — 2,641 — 2,641
Print & Mail Allocated Charges Adjustment — (29,487) — (29,487)
PUBLIC WORKS • CITY OF PALO ALTO FISCAL YEAR 2017 ADOPTED BUDGET

PUBLIC WORKS
General Fund Cost Allocation Plan Adjustment — (39,573) — (39,573)
Public Works Administration Allocated Charges Adjustment — (54,824) — (54,824)
Information Technology Allocated Charges Adjustment — (132,284) — (132,284)
General Liability Allocated Charges Adjustment — (189,776) — (189,776)
Adjustments to Costs of Ongoing Activities (0.40) (536,962) 534,479 (1,071,441)
Total FY 2017 Base Budget 14.80 30,493,996 31,188,923 (694,927)
Budget Adjustments
1 Landfill Maintenance Staffing 0.52 71,978 — 71,978
2 Environmental Services Division Administration Staffing 0.33 56,409 — 56,409
Total Budget Adjustments 0.85 128,387 — 128,387
Total FY 2017 Adopted Budget 15.65 30,622,383 31,188,923 (566,540)
Budget ReconciliationPositions Expenditures Revenues
Net Refuse Fund
PUBLIC WORKS • CITY OF PALO ALTO FISCAL YEAR 2017 ADOPTED BUDGET 379

PUBLIC WORKS
380
Budget AdjustmentsBudget Adjustments Positions Expenditures Revenues
Net Refuse Fund
1 Landfill Maintenance Staffing 0.52 71,978 0 71,978
This action converts a 0.48 FTE Maintenance Assistant hourly position to a 1.0 full-time equivalent position in response to changing workload requirements as a result of the completion of the Landfill Capping project. Due to the changing nature of the landfill, a full-time position is required to monitor methane gas related to the 109 gas wells at the landfill, service the 23 leachate pumps, 17 condensate submersible pumps and the newly prepared pump cleaning station at the landfillís post-closure maintenance facility. With the additional hours, the Maintenance Assistant will also address minimum staffing requirements needed to service the landfill.
Performance Results
With the additional hours provided, landfill maintenance staff will have the necessary resources to service the landfill in the post-closure environment to ensure all regulatory and safety requirements are met.
2 Environmental Services Division Administration Staffing 0.33 56,409 0 56,409
This action adds a 1.0 FTE Management Analyst position to the Environmental Services Division in the Public Works department and is a 33%/67% cost share between the Refuse Fund and the Wastewater Treatment Fund. Currently, the Environmental Services Division is the only Public Works division without a dedicated full-time analyst to serve as liaison for the division, managing administrative staff, providing operating and capital budget analysis, project tracking, procurement oversight, and providing general administrative oversight. Further, the Management Analyst will assist division managers with ongoing sustainability efforts, rate structure assessments, and serve as a central point of contact for the division.
Performance Results
This addition of this position fills a critical need in the Environmental Services Division to provide vital analytical and administrative support for division managers.
PUBLIC WORKS • CITY OF PALO ALTO FISCAL YEAR 2017 ADOPTED BUDGET

PUBLIC WORKS
STORM DRAINAGE FUNDDescriptionThe City’s Storm Drainage services are funded through user fees charged to property owners of developed parcels in Palo Alto. Storm Drainage Fund activities include operation, maintenance, replacement and augmentation of the storm drainage system to ensure adequate local drainage. Storm Drainage Fund goals include reduction of stormwater runoff and stormwater quality protection for discharge to creeks and San Francisco Bay.
Accomplishments Started construction of the final phase of the high-priority Channing/Lincoln Avenue Storm
Drain Improvement Project; installation of new storm drain along Lincoln Avenue between Middlefield Road and Alma Street to reduce local street flooding.
Completed design for capacity upgrades to the Matadero Creek Storm Water Pump Station, improving storm drain system performance for a 1,200-acre low-lying area of the Midtown and Palo Verde neighborhoods.
Convened a blue ribbon committee of residents to provide recommendations to the city manager on future funding of the Storm Drainage Fund in light of the upcoming June 2017 sunset of the fee structure approved by property owners in 2005.
Completed projects to-date include San Francisquito Creek Storm Water Pump Station, Gailen/Bibbits Storm Drain Improvements, Alma Street Storm Drain Improvements, Clara Drive Storm Drain Improvements, Southgate Neighborhood Storm Drain Improvements and phases 1 and 2 of the Channing/Lincoln Storm Drain Improvements (phase 3 is currently under construction).
Expanded Polystyrene Ordinance, which regulates sale and use of certain polystyrene products in Palo Alto to include food service ware, coolers, and other items.
Actively participated in the negotiation of the countywide Municipal Regional Permit for stormwater.
PUBLIC WORKS • CITY OF PALO ALTO FISCAL YEAR 2017 ADOPTED BUDGET 381

PUBLIC WORKS
382
Initiatives Complete the remaining high-priority storm drain projects outlined in the 2005 storm
drainage fee ballot measure.
Secure City Council approval of the Storm Drain Blue Ribbon Committee recommendations for future Storm Drainage Fund programs and capital improvements and an associated funding plan, potentially including a storm drain funding ballot measure to be presented to property owners for approval in fall 2016.
Work cooperatively with San Francisquito Creek Joint Powers Authority on implementing the Bay-to-Highway 101 flood control project, providing flood protection to residents and businesses along lower San Francisquito Creek.
Commence development of a green infrastructure plan for the City to comply with new State of California stormwater regulations.
Comply with new Municipal Regional Permit for stormwater regulations.
Goals and ObjectivesGOAL 1Effectively manage the storm drain system to ensure adequate local drainage.
Objectives: Complete construction of the last phase of the Channing/Lincoln Avenue Storm Drain
Improvements project.
Substantially complete the construction of capacity upgrades to the Matadero Creek Storm Water Pump Station serving the Midtown and Palo Verde neighborhoods.
Assist San Francisquito Creek Joint Powers Authority with the implementation of the Bay-to-Highway 101 flood control project to protect people and property from flooding along lower San Francisquito Creek.
Systematically clean storm drain lines to prevent backups and ponding on city streets.
GOAL 2Reduce storm water runoff and protect the quality of waters discharged to creeks and San Francisco Bay.
Objectives: Continue implementation of measures, including green infrastructure planning, to comply
with the new Municipal Regional Stormwater Discharge Permit (MRP 2.0) adopted in late 2015.
Conduct regular inspections of commercial facilities, industrial facilities and construction sites to ensure compliance with storm water discharge regulations.
PUBLIC WORKS • CITY OF PALO ALTO FISCAL YEAR 2017 ADOPTED BUDGET

PUBLIC WORKS
Implement our Long-Term Trash Reduction Plan in order to achieve a 70% reduction in the volume of trash entering local creeks and San Francisco Bay through local storm drains, as required in the MRP 2.0.
Key Performance MeasuresCITIZEN SURVEY - STORM DRAINGoal Effectively manage the storm drainage system to ensure adequate local drainage.
Objective Increase rating given by residents for quality of storm drainage.
FY 2014 Actuals
FY 2015 Actuals
FY 2016 Adopted
FY 2016 Estimated
FY 2017 Adopted
Percent rating the quality of storm drainage good or excellent 80.00% 71.00% 80.00% 80.00% 80.00%
Description
The City participates in the National Citizen Survey (NCS), which asks residents to rate their perception of storm drain management. The NCS is a collaborative effort between the National Research Center, Inc. and the International City/County Management Association. The NCS is an annual survey of approximately 500 jurisdictions in the United States whose residents evaluate local government services and give their opinion about the quality of life in the community.
Purpose To obtain feedback from residents on whether storm drains are being maintained adequately in order to determine if the program's resources are appropriate.
StatusThe Department has been achieving between 71 and 80 percent satisfaction and is estimating to maintain a 80 percent rating, which is above the benchmark of other cities.
NUMBER OF CAPITAL PROJECTS ON THE 2005 STORM DRAINAGE FEE BALLOT MEASURE COMPLETEDGoal Effectively manage the storm drainage system to ensure adequate local drainage.
Objective
To manage a capital improvement program that utilizes annual revenues and staff resources in an efficient manner in order to complete the seven capital improvement projects that were identified in the 2005 storm drainage fee ballot measure before the fee sunsets in June 2017.
FY 2014 Actuals
FY 2015 Actuals
FY 2016 Adopted
FY 2016 Estimated
FY 2017 Adopted
Number of projects completed (Storm Drain) 4 5 5 6 7
Description
Public Works Engineering Services staff manages a capital improvement program to increase the capacity and maintain the condition of the storm drainage system infrastructure in accordance with the 2005 storm drainage fee ballot measure approved by a majority of property owners.
Purpose The storm drain system must be improved and maintained on a regular basis so that it will continue to provide service to the community.
StatusStaff has completed five of the seven capital improvement projects identified in the 2005 Storm Drainage Fee Measure, and has the final two projects scheduled for completion in FY 2017 (prior to the June 2017 fee sunset).
PUBLIC WORKS • CITY OF PALO ALTO FISCAL YEAR 2017 ADOPTED BUDGET 383

PUBLIC WORKS
384
%
)%
2%
8%
5%
2%
)%
PERCENT OF INSPECTIONS IN COMPLIANCE WITH STORM WATER REGULATIONSGoal Reduce stormwater runoff and protect the quality of waters discharged to creeks
and San Francisco Bay.
Objective Conduct regular inspections to ensure compliance.
FY 2014 Actuals
FY 2015 Actuals
FY 2016 Adopted
FY 2016 Estimated
FY 2017 Adopted
Percent of inspections in compliance with storm water regulations
79.00% 83.00% 80.00% 80.00% 80.00%
Description
Watershed Protection staff conducts a comprehensive program of public outreach and education, site inspections, and enforcement actions in order to prevent pollutants from contaminating stormwater runoff. Inspections are conducted at industrial facilities, commercial facilities, construction sites and other outdoor activities. Industrial facilities include varied activities such as research, laboratories, manufacturing, and other processing. Commercial facilities typically serve the public and include categories such as photo shops, food service establishments, dry cleaners, dentists, and other sales or services.
Purpose
Stormwater pollution prevention activities are required by the Municipal Regional Stormwater Discharge Permit issued to the City by the San Francisco Bay Regional Water Quality Control Board. Controlling pollutant discharges to the storm drain system helps to improve the water quality in local creeks and San Francisco Bay.
Status
Watershed Protection staff conducts an inspection program for industrial and commercial facilities and assesses them for compliance with stormwater regulations. In FY 2015, inspected sites included 39 industries, 106 automotive facilities and approximately one third of the 363 restaurants on the inspection list. The FY 2015 estimated compliance rate was reduced from the adopted 87% to 80% based on the previous year as well as data to date, indicating that many new businesses are being inspected that may not yet be aware of the requirements. Watershed Protection staff educates these businesses on what it takes to be in compliance with stormwater regulations.
Budget SummaryFY 2014 Actuals
FY 2015 Actuals
FY 2016 Adopted Budget
FY 2017 Adopted Budget
FY 2017 Change $
FY 2017Change
Dollars by Division
CIP Storm Drainage Fund 1,450,517 1,997,511 9,001,046 8,236,570 (764,476) (8.5
Storm Drainage Administration 592,644 642,955 937,296 1,079,934 142,639 15.
Storm Drainage Miscellaneous 441,853 419,956 776,520 961,412 184,892 23.
Storm Drainage Operations and Maintenance 1,544,128 1,763,750 1,993,027 2,162,693 169,666 8.
Storm Drainage Systems Improvement Flood Control 161,108 132,021 119,885 140,516 20,632 17.
Total 4,190,250 4,956,193 12,827,774 12,581,126 (246,648) (1.9
PUBLIC WORKS • CITY OF PALO ALTO FISCAL YEAR 2017 ADOPTED BUDGET

PUBLIC WORKS
)%
)%
%
8%
2%
4%
1%
6%
1%
)%
3%
%
%
3%
9%
5%
%
)%
%
0%
%
%
%
%
8%
%
Dollars by Category
Salary & Benefits
Healthcare 199,521 201,833 161,229 155,369 (5,860) (3.6
Other Benefits 26,578 26,763 25,689 22,086 (3,603) (14.0
Overtime 30,098 51,113 49,429 49,429 — —
Pension 234,892 198,264 203,204 221,026 17,822 8.
Retiree Medical 75,176 45,811 51,214 63,585 12,371 24.
Salary 665,991 681,761 779,251 820,955 41,705 5.
Workers' Compensation 7,609 6,519 6,434 15,129 8,695 135.
Total Salary & Benefits 1,239,863 1,212,064 1,276,448 1,347,579 71,130 5.
Allocated Charges 739,196 963,829 995,955 1,176,104 180,148 18.
Capital Improvement Program 1,269,045 1,794,596 8,819,746 8,236,570 (583,176) (6.6
Contract Services 367,002 447,347 460,754 531,379 70,625 15.
Debt Service 435,711 404,493 949,300 949,300 — —
Facilities & Equipment — — 7,621 7,621 — —
General Expense 9,234 16,453 171,900 179,260 7,360 4.
Operating Transfers-Out 41,757 15,463 5,970 12,112 6,142 102.
Rents & Leases 33,102 34,895 45,079 46,201 1,122 2.
Supplies & Material 55,339 67,054 95,000 95,000 — —
Total Dollars by Expense Category
4,190,250 4,956,193 12,827,774 12,581,125 (246,648) (1.9
Revenues
Charges for Services 114,308 70,944 90,000 90,000 — —
Net Sales 6,064,331 6,206,943 6,112,770 6,604,644 491,874 8.
Operating Transfers-In 13,723 — — — — —
Other Revenue 5,553 63 — — — —
Other Taxes and Fines — (1,403) 2,500 2,500 — —
Return on Investments 159,627 158,873 129,700 129,700 — —
Total Revenues 6,357,542 6,435,420 6,334,970 6,826,844 491,874 7.
Budget SummaryFY 2014 Actuals
FY 2015 Actuals
FY 2016 Adopted Budget
FY 2017 Adopted Budget
FY 2017 Change $
FY 2017Change
PUBLIC WORKS • CITY OF PALO ALTO FISCAL YEAR 2017 ADOPTED BUDGET 385

PUBLIC WORKS
386
3%
)%
)%
6%
8%
49
64
62
93
74
20
76
—
48
11
36
16
90
20
34
53
36
93
55
42
%
Positions by Division
CIP Storm Drainage Fund 2.20 2.20 2.15 2.17 0.02 0.9
Storm Drainage Administration 0.69 0.69 0.65 0.60 (0.05) (7.69
Storm Drainage Operations and Maintenance 7.00 6.78 6.98 6.98 (0.00) (0.02
Storm Drainage Systems Improvement Flood Control 0.70 0.52 0.54 0.59 0.05 9.2
Total 10.59 10.19 10.32 10.34 0.02 0.1
Staffing
Job ClassificationFY 2014 Actuals
FY 2015 Actuals
FY 2016 Adopted Budget
FY 2017 Adopted Budget
FY 2017 Change $
FY 2017Salary
Account Specialist 0.15 0.15 0.15 0.10 (0.05) 6,3
Accountant 0.05 0.05 0.05 0.05 — 4,5
Administrative Associate I 0.10 0.10 0.10 0.10 — 5,3
Administrative Associate II 0.15 0.15 0.15 0.15 — 10,1
Administrative Associate III 0.10 0.10 0.10 0.10 — 7,0
Assistant Director Public Works 0.20 0.20 0.20 0.20 — 32,2
Associate Engineer — — — 0.19 0.19 16,1
Business Analyst 0.02 0.02 — — —
Electrician 0.10 0.10 0.10 0.10 — 8,5
Electrician-Lead 1.00 1.00 1.00 1.00 — 101,4
Engineer 1.00 1.00 1.00 0.90 (0.10) 102,3
Engineering Technician III 0.30 0.20 0.20 0.25 0.05 18,6
Equipment Operator 0.54 0.54 0.54 0.54 — 39,5
Heavy Equipment Operator 0.90 0.90 0.90 0.90 — 74,7
Heavy Equipment Operator-Lead 1.15 1.15 1.15 1.15 — 102,1
Industrial Waste Inspector 0.20 0.19 0.19 0.19 — 15,7
Industrial Waste Investigator 1.20 0.99 0.99 0.80 (0.19) 74,5
Management Analyst 0.20 0.20 0.20 0.20 — 20,4
Manager Environmental Control Program 0.40 0.40 0.40 0.40 — 48,5
Manager Maintenance Operations 0.50 0.50 0.50 0.50 — 52,8
Budget SummaryFY 2014 Actuals
FY 2015 Actuals
FY 2016 Adopted Budget
FY 2017 Adopted Budget
FY 2017 Change $
FY 2017Change
PUBLIC WORKS • CITY OF PALO ALTO FISCAL YEAR 2017 ADOPTED BUDGET

PUBLIC WORKS
77
12
44
05
—
73
49
70
02
52
54
Project Engineer 0.85 0.81 0.83 0.83 — 101,5
Project Manager 0.15 0.15 0.15 0.15 — 13,8
Senior Accountant 0.10 0.10 0.10 0.10 — 11,1
Senior Engineer 0.80 0.76 0.76 0.76 — 118,3
Senior Technologist 0.02 0.02 — — —
Surveyor, Public Works — — — 0.12 0.12 10,9
Technologist 0.30 0.30 0.30 0.30 — 38,6
Traffic Controller Maintainer I 0.06 0.06 0.06 0.06 — 4,3
Sub-total: Full-Time Equivalent Positions
10.54 10.14 10.12 10.14 0.02 1,040,3
Temporary/Hourly 0.05 0.05 0.20 0.20 — 9,1
Total Positions 10.59 10.19 10.32 10.34 0.02 1,049,4
Budget Reconciliation
Positions Expenditures Revenues
Net Storm
Drainage Fund
Prior Year Budget 10.32 12,827,774 6,334,970 6,492,804
Base Adjustments
Adjustments to Costs of Ongoing Activities
Salary and Benefit Adjustment (0.05) 67,645 — 67,645
Santa Clara Urban Runoff Pollution Prevention Program and National Pollutant Discharge Elimination System Permit Fees
— 20,625 — 20,625
Public Works Division Position Reallocations from Development Services 0.05 5,509 — 5,509
Management & Professional Development Alignment — 2,360 — 2,360
Rents & Leases Expenditure Alignment — 1,122 — 1,122
Transfer to Information Technology Fund — 6,142 — 6,142
Capital Expenditure Funding Adjustment — (583,176) — (583,176)
Storm Drainage Fund Capital Project Staffing Alignment 0.02 (2,024) — (2,024)
Technology Fund Allocated Charges Adjustment — 131,814 — 131,814
Staffing
Job ClassificationFY 2014 Actuals
FY 2015 Actuals
FY 2016 Adopted Budget
FY 2017 Adopted Budget
FY 2017 Change $
FY 2017Salary
PUBLIC WORKS • CITY OF PALO ALTO FISCAL YEAR 2017 ADOPTED BUDGET 387

PUBLIC WORKS
388
General Fund Cost Allocation Plan Adjustment — 66,215 — 66,215
Vehicle Replacement and Maintenance Allocated Charges Adjustment — 51,869 — 51,869
Storm Drain Sales Allocated Charges Adjustment — 97 298,151 (298,054)
Print & Mail Allocated Charges Adjustment — (7,147) — (7,147)
Public Works Administration Allocated Charges Adjustment — (41,117) — (41,117)
General Liability Insurance Allocated Charges Adjustment — (21,583) — (21,583)
Adjustments to Costs of Ongoing Activities 0.02 (301,649) 298,151 (599,800)
Total FY 2017 Base Budget 10.34 12,526,125 6,633,121 5,893,004
Budget Adjustments
1 Storm Drainage Fee and Storm Rate Rebate Consumer Price Increase Adjustments — 5,000 193,723 (188,723)
2 Green Infrastructure Plan — 50,000 — 50,000
Total Budget Adjustments — 55,000 193,723 (138,723)
Total FY 2017 Adopted Budget 10.34 12,581,125 6,826,844 5,754,281
Budget Reconciliation
Positions Expenditures Revenues
Net Storm
Drainage Fund
PUBLIC WORKS • CITY OF PALO ALTO FISCAL YEAR 2017 ADOPTED BUDGET

PUBLIC WORKS
Budget Adjustments
Budget Adjustments Positions Expenditures Revenues
Net Storm
Drainage Fund
1 Storm Drainage Fee and Storm Rate Rebate Consumer Price Increase Adjustments 0.00 5,000 193,723 (188,723)
This action provides $5,000 in additional expenses for Storm Water Rebates related to rain barrels, permeable pavement, cisterns, and green roofs. The goal of the rebate program is to help Palo Alto residents, businesses, and City departments implement measures that will reduce the amount of runoff flowing into the storm drain system and/or improve the quality of that runoff. Further, this action recognizes an additional $193,723 in Storm Drainage fee revenue, a factor equivalent to the Consumer Price Index (CPI) for San Francisco Bay Area for 2016. As approved by the voters in the April 2005 ballot initiative, Storm Drainage fees can be increased annually by the CPI. (Ongoing: $5,000)
Performance Results
Storm water runoff quality will improve and the volume of runoff will be reduced. Further, the CPI increase will ensure that the Storm Drain fund has adequate resources for operations and capital investments.
2 Green Infrastructure Plan 0.00 50,000 0 50,000
This action adds $50,000 in one-time funding for the Green Infrastructure Plan framework to satisfy regulatory requirements for the new Municipal Regional Permit due June 2017. The Plan is intended to describe how co-permittees will shift their impervious surfaces and storm drain infrastructure from traditional, runoff flowing directly into the storm drain, to a green, sustainable system that slows runoff by dispersing it to vegetated areas, harvests and uses runoff, promotes infiltration and evapotranspiration, and uses bio-retention and other green infrastructure practices to clean stormwater runoff. The plan will also identify means and methods to prioritize particular areas and projects within each Permittee’s jurisdiction, at appropriate geographic and time scales, for implementation of green infrastructure projects. (Ongoing: $0)
Performance Results
The resulting Green Infrastructure Plan will ensure Storm Drain operations are compliant with all current regulatory requirements.
PUBLIC WORKS • CITY OF PALO ALTO FISCAL YEAR 2017 ADOPTED BUDGET 389
PUBLIC WORKS
390
WASTEWATER TREATMENT FUNDDescriptionThe City’s Regional Water Quality Control Plant (RWQCP) operates 24 hours a day to treat all wastewater from the five partner cities’ regional service area (Mountain View, Los Altos, Los Altos Hills, Stanford, and East Palo Alto Sanitary District) and to ensure the compliance with regulations protecting the San Francisco Bay and the environment.
Accomplishments Completed implementation of a system to provide permanent alkalinity adjustments that
address regulatory limits in the plant’s treated final effluent after experiencing two pH violations in late 2014. As the pH of the Water Quality Control Plant’s effluent has become too low, magnesium hydroxide is now being added to raise the pH, reduce acidity, and meet the regulatory limit. This addition is a new, ongoing cost to the Water Quality Control Plant.
Completed an Environmental Impact Report for a new pipeline system to deliver recycled water to south Palo Alto and the Stanford Research Park along Page Mill Road. This new system is the third phase of the Master Plan for Recycled Water approved by Council.
Kept the plant running while addressing aging infrastructure, including emergency repairs in July at the dual media filter facility upon failure of a bypass isolation plug that led to facility flooding and in the secondary treatment system in October upon the failure of pipe supports for a 42-inch diameter pipe.
Compliance with new and comprehensive Clean Air Act and Bay Area Air Quality Management District rules and regulations for the Plant’s sewage sludge incinerators.
Completed Mitigated Negative Declaration environmental documentation for the sludge dewatering and truck loadout facility and completed 100% design of the project. When complete, the two sludge-burning incinerators will be retired.
Awarded a contract for Advanced Water Purification Feasibility Study to improve recycled water quality.
PUBLIC WORKS • CITY OF PALO ALTO FISCAL YEAR 2017 ADOPTED BUDGET

PUBLIC WORKS
Initiatives Complete State Revolving Fund loan financing for sludge dewatering and truck loadout
facility. Complete planning and design for fixed film reactor and primary sedimentation tank rehabilitations, and the lab/environmental services building as part of fulfilling the Long Range Facilities Plan.
Award a construction contract for the sludge dewatering and truck loadout facility.
Complete core tasks of the Advanced Water Purification Feasibility Study to improve recycled water quality.
Award a contract for a recycled water strategic plan and groundwater study of indirect potable reuse.
Goals and ObjectivesGOAL 1Protect the environment and the public’s health.
Objectives: Conduct regular inspections of commercial permitees to ensure compliance with all
regulations.
Complete new capital improvement projects to ensure the plant’s reliability.
Conduct ongoing operation and maintenance.
GOAL 2Operate high quality, cost-effective and visually neutral facilities.
Objectives: Mitigate cost increases through effective maintenance of equipment and analysis of
potential operational efficiencies.
PUBLIC WORKS • CITY OF PALO ALTO FISCAL YEAR 2017 ADOPTED BUDGET 391

PUBLIC WORKS
392
Key Performance Measures
Workload Measures
DISCHARGE TESTS IN COMPLIANCEGoal Protect the environment and the public's health.
Objective Maintain 99% discharge test compliance.
FY 2014 Actuals
FY 2015 Actuals
FY 2016 Adopted
FY 2016 Estimated
FY 2017 Adopted
Percent of wastewater treatment discharge tests in compliance
99.77% 99.40% 99.00% 99.00% 99.00%
Description
The plant has numerous effluent limits and requirements to meet as part of its NPDES discharge permit for water discharged to the south San Francisco Bay. 100 percent compliance with these limits is the goal of the city; the RWQCP normally achieves these levels of compliance.
PurposeThe percent discharge tests in compliance is an indicator of the compliance of the RWQCP treatment system’s final water with the limits established in the NPDES discharge permit.
Status Over 99% of discharge tests are expected to be in compliance with discharge limits.
PERCENT OF PASSED FISH ACUTE TOXICITY BIOASSAY TESTSGoal Protect the environment and the public's health.
Objective Obtain fish acute toxicity bioassays with 100% survival.
FY 2014 Actuals
FY 2015 Actuals
FY 2016 Adopted
FY 2016 Estimated
FY 2017 Adopted
Percent of passed fish acute toxicity bioassay tests 100.00% 100.00% 100.00% 100.00% 100.00%
Description Percent of acute fish toxicity bioassay tests passed with 100% survival.
Purpose Fish survival in the bioassay is an indicator that plant discharges to the Bay are safe for receiving water marine life.
Status In Fiscal Year 2014, all acute toxicity bioassay tests passed with 100% survival rate.
FY 2014 Actuals
FY 2015 Actuals
FY 2016 Adopted
FY 2016 Estimated
FY 2017 Adopted
Millions of gallons of recycled water delivered 208 200 250 250 250
Number of inspections performed annually (Wastewater Treatment) 443 450 350 450 450
Millions of gallons processed by the Palo Alto's Regional Water Quality Control Plant
7,186 6,512 7,200 6,692 6,692
PUBLIC WORKS • CITY OF PALO ALTO FISCAL YEAR 2017 ADOPTED BUDGET

PUBLIC WORKS
%
7%
6%
8%
9%
8%
1%
)%
%
9%
)%
7%
)%
2%
7%
8%
)%
8%
%
2%
%
%
7%
8%
%
Budget SummaryFY 2014 Actuals
FY 2015 Actuals
FY 2016 Adopted Budget
FY 2017 Adopted Budget
FY 2017 Change $
FY 2017Change
Dollars by Division
CIP Wastewater Treatment Fund 3,252,622 3,942,615 15,420,413 25,402,299 9,981,886 64.
Wastewater Treatement Systems Improvement Operations 14,026,176 15,454,625 14,706,867 15,242,863 535,996 3.
Wastewater Treatment Administration 572,962 150,934 3,210,392 4,392,669 1,182,277 36.
Wastewater Treatment Environmental Compliance 3,365,615 3,231,508 3,262,685 3,585,331 322,646 9.
Total 21,217,375 22,779,682 36,600,357 48,623,161 12,022,804 32.
Dollars by Category
Salary & Benefits
Healthcare 1,195,498 1,241,619 1,300,058 1,391,730 91,672 7.
Other Benefits 182,239 176,763 185,434 153,519 (31,915) (17.2
Overtime 320,264 319,520 310,126 310,126 — —
Pension 1,383,872 1,161,782 1,705,555 1,907,929 202,374 11.
Retiree Medical 601,837 818,840 867,451 816,321 (51,130) (5.9
Salary 5,583,274 6,049,547 6,602,553 7,175,029 572,477 8.
Workers' Compensation 222,057 126,044 187,771 98,482 (89,289) (47.6
Total Salary & Benefits 9,489,042 9,894,116 11,158,947 11,853,137 694,189 6.
Allocated Charges 4,689,962 4,998,053 5,187,010 5,220,764 33,755 0.
Capital Improvement Program 3,250,898 3,942,436 15,224,796 25,402,299 10,177,503 66.
Contract Services 1,458,586 1,401,097 1,888,354 1,878,354 (10,000) (0.5
Debt Service 546,780 514,387 816,937 1,468,851 651,914 79.
Facilities & Equipment 4,809 1,427 7,500 7,500 — —
General Expense 450,765 351,575 431,040 479,483 48,443 11.
Operating Transfers-Out — 13,572 — 320,000 320,000 —
Rents & Leases 12 — — — — —
Supplies & Material 1,326,522 1,663,018 1,885,773 1,992,773 107,000 5.
Total Dollars by Expense Category
21,217,375 22,779,682 36,600,357 48,623,160 12,022,803 32.
Revenues
Charges to Other Funds 51,968 59,566 51,500 51,500 — —
PUBLIC WORKS • CITY OF PALO ALTO FISCAL YEAR 2017 ADOPTED BUDGET 393

PUBLIC WORKS
394
%
7%
%
%
%
%
5%
3%
0%
)%
7%
0%
49
22
14
39
35
71
—
83
—
62
81
10
%
From Other Agencies — — — 21,340,874 21,340,874 —
Net Sales 18,390,132 23,958,834 23,205,379 26,848,624 3,643,246 15.
Operating Transfers-In 58,660 — — — — —
Other Revenue 2,358 102,619 — — — —
Other Taxes and Fines 2,000 1,000 4,000 4,000 — —
Return on Investments 331,731 251,940 199,200 199,200 — —
Total Revenues 18,836,849 24,373,959 23,460,078 48,444,198 24,984,120 106.
Positions by Division
CIP Wastewater Treatment Fund 0.30 0.30 0.30 1.30 1.00 333.3
Wastewater Treatement Systems Improvement Operations 55.63 56.13 55.69 56.36 0.67 1.2
Wastewater Treatment Administration 0.69 0.74 0.64 0.59 (0.05) (7.81
Wastewater Treatment Environmental Compliance 13.80 13.49 13.74 15.22 1.48 10.7
Total 70.42 70.66 70.37 73.47 3.10 4.4
Staffing
Job ClassificationFY 2014 Actuals
FY 2015 Actuals
FY 2016 Adopted Budget
FY 2017 Adopted Budget
FY 2017 Change $
FY 2017Salary
Account Specialist 0.15 0.15 0.15 0.10 (0.05) 6,3
Accountant 0.25 0.25 0.25 0.25 — 22,8
Administrative Associate II 2.00 2.00 2.00 2.00 — 135,9
Assistant Director Public Works 0.75 0.75 0.75 0.75 — 139,3
Assistant Manager WQCP 2.00 2.00 2.00 2.00 — 257,3
Associate Engineer 1.50 1.35 1.35 1.80 0.45 169,0
Buyer 1.00 1.00 1.00 — (1.00)
Chemist 3.00 3.00 3.00 3.00 — 267,3
Chief Sustainability Officer 0.05 0.05 — — —
Deputy Chief/Fire Marshal 0.04 0.04 0.04 0.04 — 6,4
Electrician 2.90 2.90 2.90 2.90 — 266,3
Electrician-Lead 1.00 1.00 1.00 1.00 — 101,4
Budget SummaryFY 2014 Actuals
FY 2015 Actuals
FY 2016 Adopted Budget
FY 2017 Adopted Budget
FY 2017 Change $
FY 2017Change
PUBLIC WORKS • CITY OF PALO ALTO FISCAL YEAR 2017 ADOPTED BUDGET

PUBLIC WORKS
—
94
56
09
54
—
46
41
54
15
36
83
28
84
40
44
44
90
29
75
12
51
12
07
98
34
82
18
02
41
43
Environmental Specialist 1.00 1.00 1.00 — (1.00)
Hazardous Materials Inspector 0.02 0.02 0.02 0.02 — 2,7
Industrial Waste Inspector 2.80 2.80 2.80 2.80 — 232,1
Industrial Waste Investigator 0.80 0.80 0.80 0.35 (0.45) 32,6
Laboratory Technician WQC 2.50 3.00 3.00 3.00 — 230,8
Maintenance Mechanic 7.00 7.00 7.00 — (7.00)
Management Analyst — — — 0.67 0.67 66,4
Manager Environmental Control Program 1.60 1.50 1.50 1.50 — 186,7
Manager Laboratory Services 1.00 1.00 1.00 1.00 — 131,9
Manager Water Quality Control Plant 1.00 1.00 1.00 1.00 — 169,9
Manager Watershed Protection 1.00 0.95 0.95 0.95 — 128,7
Plant Mechanic 0.00 0.00 0.00 7.00 7.00 613,0
Program Assistant II 2.00 2.00 2.00 2.00 — 148,2
Project Engineer 1.00 1.00 1.00 1.00 — 122,3
Project Manager — — — 1.00 1.00 99,8
Senior Accountant 0.10 0.10 0.10 0.10 — 11,1
Senior Buyer — — — 1.00 1.00 90,5
Senior Chemist 1.00 1.00 1.00 1.00 — 101,3
Senior Engineer 1.00 1.00 1.00 3.00 2.00 410,0
Senior Industrial Waste Investigator 1.00 0.99 0.99 0.99 — 98,6
Senior Management Analyst 0.13 0.13 0.13 0.13 — 14,3
Senior Mechanic 1.00 1.00 1.00 1.00 — 96,4
Senior Operator WQC 6.00 6.00 6.00 6.00 — 614,1
Senior Technologist 1.00 1.00 1.00 1.00 — 128,1
Storekeeper 1.00 1.00 1.00 1.00 — 66,0
Supervisor WQCP Operations 3.00 3.00 3.00 3.00 — 326,4
Technologist 0.70 0.70 0.70 0.70 — 90,1
WQC Plant Operator II 16.00 16.00 16.00 16.00 — 1,404,6
Sub-total: Full-Time Equivalent Positions
68.29 68.48 68.43 71.05 2.62 6,990,3
Temporary/Hourly 2.13 2.18 1.94 2.42 0.48 189,0
Total Positions 70.42 70.66 70.37 73.47 3.10 7,179,3
Staffing
Job ClassificationFY 2014 Actuals
FY 2015 Actuals
FY 2016 Adopted Budget
FY 2017 Adopted Budget
FY 2017 Change $
FY 2017Salary
PUBLIC WORKS • CITY OF PALO ALTO FISCAL YEAR 2017 ADOPTED BUDGET 395
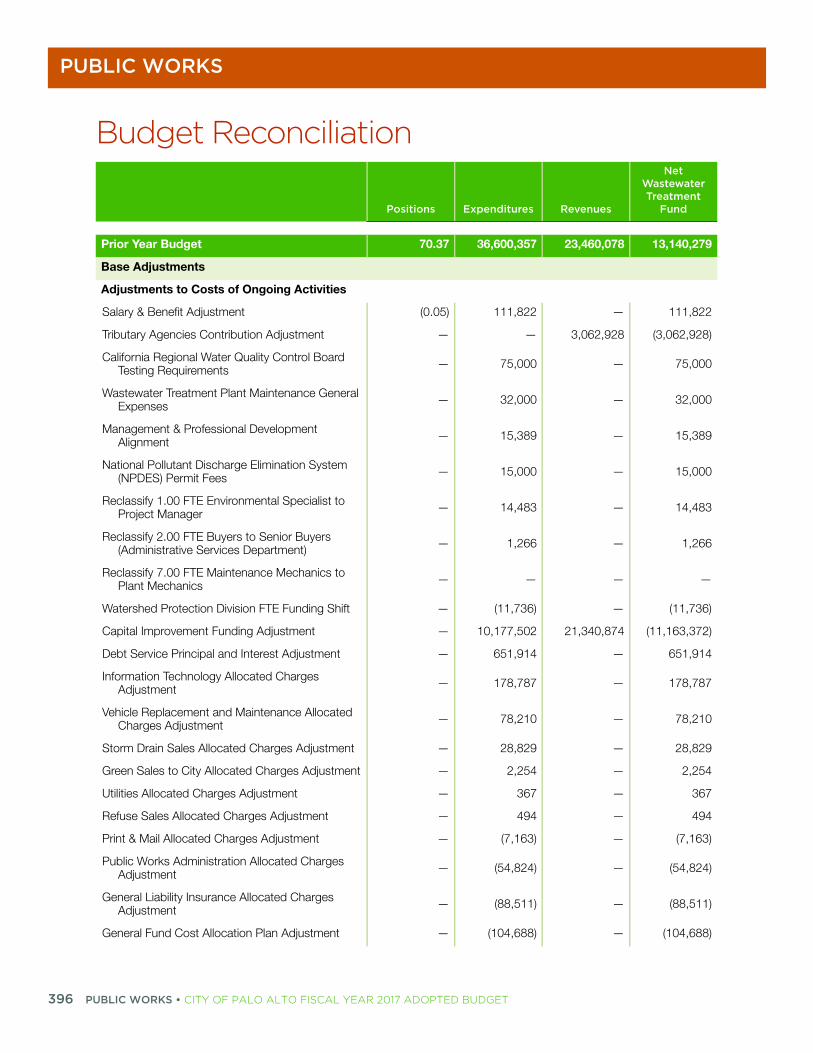
PUBLIC WORKS
396
Budget Reconciliation
Positions Expenditures Revenues
Net Wastewater Treatment
Fund
Prior Year Budget 70.37 36,600,357 23,460,078 13,140,279
Base Adjustments
Adjustments to Costs of Ongoing Activities
Salary & Benefit Adjustment (0.05) 111,822 — 111,822
Tributary Agencies Contribution Adjustment — — 3,062,928 (3,062,928)
California Regional Water Quality Control Board Testing Requirements — 75,000 — 75,000
Wastewater Treatment Plant Maintenance General Expenses — 32,000 — 32,000
Management & Professional Development Alignment — 15,389 — 15,389
National Pollutant Discharge Elimination System (NPDES) Permit Fees — 15,000 — 15,000
Reclassify 1.00 FTE Environmental Specialist to Project Manager — 14,483 — 14,483
Reclassify 2.00 FTE Buyers to Senior Buyers (Administrative Services Department) — 1,266 — 1,266
Reclassify 7.00 FTE Maintenance Mechanics to Plant Mechanics — — — —
Watershed Protection Division FTE Funding Shift — (11,736) — (11,736)
Capital Improvement Funding Adjustment — 10,177,502 21,340,874 (11,163,372)
Debt Service Principal and Interest Adjustment — 651,914 — 651,914
Information Technology Allocated Charges Adjustment — 178,787 — 178,787
Vehicle Replacement and Maintenance Allocated Charges Adjustment — 78,210 — 78,210
Storm Drain Sales Allocated Charges Adjustment — 28,829 — 28,829
Green Sales to City Allocated Charges Adjustment — 2,254 — 2,254
Utilities Allocated Charges Adjustment — 367 — 367
Refuse Sales Allocated Charges Adjustment — 494 — 494
Print & Mail Allocated Charges Adjustment — (7,163) — (7,163)
Public Works Administration Allocated Charges Adjustment — (54,824) — (54,824)
General Liability Insurance Allocated Charges Adjustment — (88,511) — (88,511)
General Fund Cost Allocation Plan Adjustment — (104,688) — (104,688)
PUBLIC WORKS • CITY OF PALO ALTO FISCAL YEAR 2017 ADOPTED BUDGET

PUBLIC WORKS
Adjustments to Costs of Ongoing Activities (0.05) 11,116,395 24,403,802 (13,287,407)
Total FY 2017 Base Budget 70.32 47,716,752 47,863,880 (147,128)
Budget Adjustments
1 Replace Flatbed Crane Truck — 320,000 204,864 115,136
2 Wastewater Treatment Capital Program Staffing 1.00 223,107 142,833 80,274
3 Wastewater Treatment Recycled Water Program Staffing 1.00 223,107 142,833 80,274
4 Environmental Services Division Administration Staffing 1.15 140,194 89,788 50,406
Total Budget Adjustments 3.15 906,408 580,318 326,090
Total FY 2017 Adopted Budget 73.47 48,623,160 48,444,198 178,962
Budget Adjustments
Budget Adjustments Positions Expenditures Revenues
Net Wastewater Treatment
Fund
1 Replace Flatbed Crane Truck 0.00 320,000 204,864 115,136
This action provides $320,000 in one-time funding to replace a 1986 GMC 700 truck with a 23-ton rated flatbed crane used at the Wastewater Treatment Plant to lift various loads. The vehicle is approximately 30 years old, has exceeded its useful life, and has been subject to frequent repairs resulting in availability issues. When the crane truck is out of service, the plant must procure a contracted and insured crane operator which creates delays and disrupts the workflow of operation and maintenance activities. The proposed replacement boom truck will also be a 23-ton crane truck with a 100-foot boom extension to reach additional wastewater storage tanks not serviceable with the existing crane. The new crane truck will have new safety features and will also be able to: 1. lower workers into locations not accessible by ladder; 2. add filter media (anthracite coal) into the Dual Media Filter facility filters; 3. help position parts and tools at the top of the fixed film reactors; and 4. assist contractors with time sensitive work, safely speeding up projects, additionally saving the cost of contracted crane operators and equipment. The cost of this proposal is offset through the City’s partnership agreement with participating tributary agencies. (Ongoing: $0)
Performance Results
The new crane truck will result in fewer delays in operations and maintenance work at the Wastewater Treatment Plant as well as cost savings for repair, maintenance, and contract support.
Budget Reconciliation
Positions Expenditures Revenues
Net Wastewater Treatment
Fund
PUBLIC WORKS • CITY OF PALO ALTO FISCAL YEAR 2017 ADOPTED BUDGET 397

PUBLIC WORKS
398
2 Wastewater Treatment Capital Program Staffing 1.00 223,107 142,833 80,274
This action adds a 1.0 FTE Senior Engineer to support the Wastewater Treatment Plant’s $200 million capital improvement project. The City's Wastewater Treatment Plant is 44 years old with aging major infrastructure, critically needed to be kept in a state of repair, renewal, and upgrade. The current engineering group consists of a 1.0 FTE Senior Engineer and a 1.0 FTE Project Engineer. Under the current model, resources are allocated to projects related to maintenance of the existing plant while proposed improvements are being deferred. With the additional Senior Engineer position, adequate resources will be available to devote to maintenance projects as well as completing projects related to the $200 million renovation of the Wastewater Treatment Plant. The cost of this proposal is offset through the City's partnership agreement with participating tributary agencies. (Ongoing: $220,465)
Performance Results
With the additional 1.0 FTE Senior Engineer, deferred maintenance projects will be completed in addition to projects related to the overhaul of the plant.
3 Wastewater Treatment Recycled Water Program Staffing 1.00 223,107 142,833 80,274
This action adds a 1.0 FTE Senior Engineer position to support the Watershed Section's Recycled Water Program. The Watershed Protection Group is the regulatory and planning arm of the Wastewater Treatment Plant. The current drought has increased the appeal of producing more recycled water to be used for non-potable sources. In November 2015, City Council approved an Environmental Impact Report to expand recycled water to South Palo Alto and Stanford Research Park. Beginning in 2015, the City became a participating agency in a Joint Recycled Water Committee with the Santa Clara Valley Water District, City of Mountain View and the City of East Palo Alto. Currently, the Watershed Section is without a dedicated staff person to coordinate these initiatives. The new Senior Engineer position will help increase participation in the Recycled Water Truck Fill program, which has increased from less than 10 permits to over 60 permits. The Senior Engineer will also ensure that the Recycled Water program is in compliance with new Recycled Water regulations and will implement future nutrient reduction efforts that may be required in the next permit cycle. The cost of this proposal is offset through the City’s partnership agreement with participating tributary agencies. (Ongoing: $220,465)
Performance Results
This position will represent the City in regional recycled water efforts in addition to providing technical review, project management, and consultant review of the City's Recycled Water program.
4 Environmental Services Division Administration Staffing 1.15 140,194 89,788 50,406
This action adds a 1.0 FTE Management Analyst position to the Environmental Services Division in the Public Works department and is a 33%/67% cost share between the Refuse Fund and the Wastewater Treatment Fund. Currently, the Environmental Services division is the only Public Works division without a dedicated full-time analyst to serve as the administrative liaison for the division, managing administrative staff, providing operating and capital budget analysis, project tracking, procurement oversight, and providing general administrative oversight. Further, the Management Analyst will assist division managers with ongoing sustainability efforts, rate structure assessments, and serve as a central point of contact for the division. Further, this action adds 0.48 FTE Administrative Specialist I - H to support new regulatory requirements for the wastewater and stormwater permits. The cost of this proposal is offset through the City's partnership agreement with participating tributary agencies.
Performance Results
This addition of these positions will fill a critical need in the Environmental Services Division to provide needed administrative support for division managers in support of City operations and regulatory requirements.
Budget Adjustments
Budget Adjustments Positions Expenditures Revenues
Net Wastewater Treatment
Fund
PUBLIC WORKS • CITY OF PALO ALTO FISCAL YEAR 2017 ADOPTED BUDGET

PUBLIC WORKS
AIRPORT FUNDDescriptionThe Palo Alto Airport serves as a general aviation reliever airport to the Bay Area’s major air carrier airports. It is the third busiest airport in the Bay Area, averaging 180,000 annual operations; open 24 hours each day, 365 days annually; and has a Federal Aviation Administration staffed air traffic control tower.
Accomplishments City Council adopted a resolution establishing interim minimum standards and leasing
policies for the airport.
Initiated evaluation of existing fixed based operator (FBO) leases to identify alternatives for the fee and rental structure for facilities and services and provide options for leasing and managing property after the current 2017 leases expire.
Initiated the process of replacing the Interim Minimum Standards with permanent standards and the cooperation of airport stakeholders.
Initiatives Begin design of the Airport Apron Reconstruction project.
Develop a transition plan for operating the Palo Alto Airport after the current FBO leases expire in 2017.
Continue planning for needed capital improvements.
Continue seeking grant funding opportunities from the Federal Aviation Administration and other appropriate agencies for airport capital improvements.
PUBLIC WORKS • CITY OF PALO ALTO FISCAL YEAR 2017 ADOPTED BUDGET 399
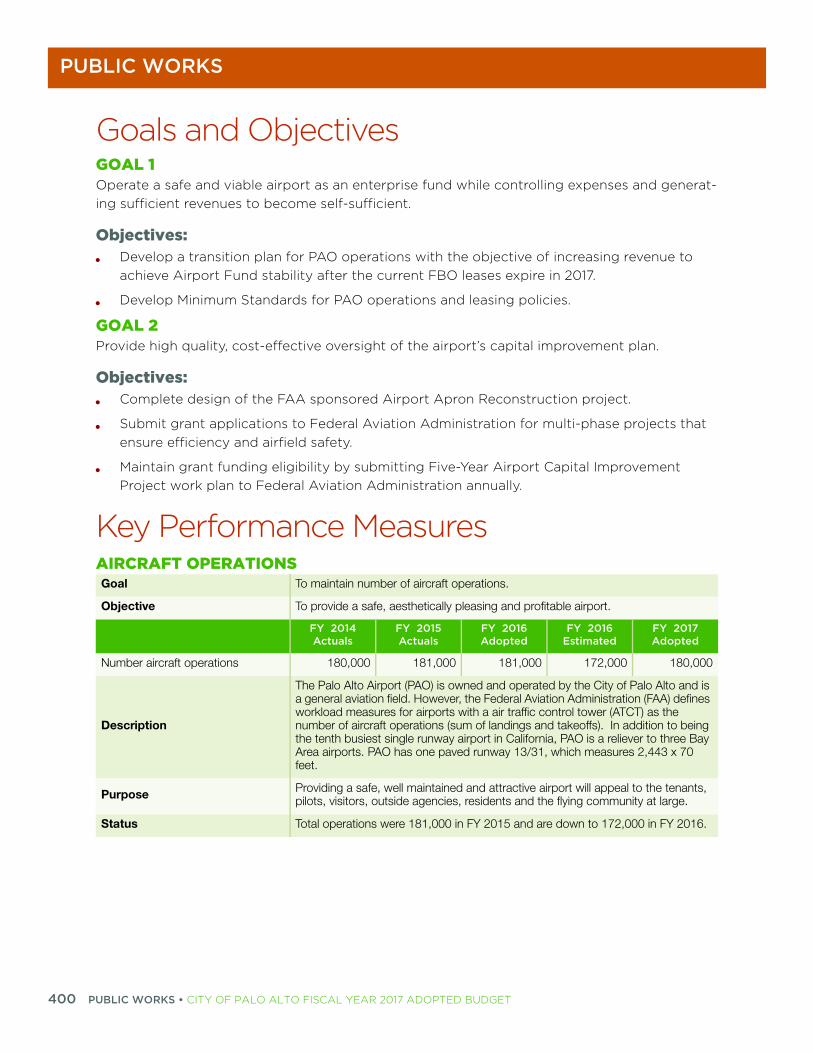
PUBLIC WORKS
400
Goals and ObjectivesGOAL 1Operate a safe and viable airport as an enterprise fund while controlling expenses and generat-ing sufficient revenues to become self-sufficient.
Objectives: Develop a transition plan for PAO operations with the objective of increasing revenue to
achieve Airport Fund stability after the current FBO leases expire in 2017.
Develop Minimum Standards for PAO operations and leasing policies.
GOAL 2Provide high quality, cost-effective oversight of the airport’s capital improvement plan.
Objectives: Complete design of the FAA sponsored Airport Apron Reconstruction project.
Submit grant applications to Federal Aviation Administration for multi-phase projects that ensure efficiency and airfield safety.
Maintain grant funding eligibility by submitting Five-Year Airport Capital Improvement Project work plan to Federal Aviation Administration annually.
Key Performance MeasuresAIRCRAFT OPERATIONSGoal To maintain number of aircraft operations.
Objective To provide a safe, aesthetically pleasing and profitable airport.
FY 2014 Actuals
FY 2015 Actuals
FY 2016 Adopted
FY 2016 Estimated
FY 2017 Adopted
Number aircraft operations 180,000 181,000 181,000 172,000 180,000
Description
The Palo Alto Airport (PAO) is owned and operated by the City of Palo Alto and is a general aviation field. However, the Federal Aviation Administration (FAA) defines workload measures for airports with a air traffic control tower (ATCT) as the number of aircraft operations (sum of landings and takeoffs). In addition to being the tenth busiest single runway airport in California, PAO is a reliever to three Bay Area airports. PAO has one paved runway 13/31, which measures 2,443 x 70 feet.
Purpose Providing a safe, well maintained and attractive airport will appeal to the tenants, pilots, visitors, outside agencies, residents and the flying community at large.
Status Total operations were 181,000 in FY 2015 and are down to 172,000 in FY 2016.
PUBLIC WORKS • CITY OF PALO ALTO FISCAL YEAR 2017 ADOPTED BUDGET

PUBLIC WORKS
%
%
6%
6%
2%
0%
7%
%
8%
7%
3%
%
9%
PERCENTAGE OF TIE-DOWNS LEASEDGoal To maximize vacant tie down spaces.
Objective To increase tenant occupancy by providing a safe, aesthetically pleasing and profitable airport.
FY 2014 Actuals
FY 2015 Actuals
FY 2016 Adopted
FY 2016 Estimated
FY 2017 Adopted
N/A 63.00% 68.00% 68.00% 70.00%
Description
The City of Palo Alto operates and maintains the Palo Alto Airport and provides airport users with safe transportation options with a high level of airport services. The airport has a total of 510 tie-down spaces. Of these, the City administers 350 tie-down spaces for aircraft storage that can be leased directly from the City.
Purpose
Utilizing the available spaces will increase revenue and will provide funding to revitalize the Palo Alto Airport without changing or increasing the current airport footprint. Tie-down and apron areas that are in disrepair are not available for leasing and unsightly. Providing a safe, well maintained and attractive airport will appeal to the tenants, pilots, visitors, outside agencies, residents and the flying community at large.
StatusAirport staff are responsible for maintaining 102.4 acres of airport facilities, infrastructure and equipment; and managing over 250 current tenant leases. In FY 2016 the percentage of leased tie-downs is at 68%.
Budget SummaryFY 2014 Actuals
FY 2015 Actuals
FY 2016 Adopted Budget
FY 2017 Adopted Budget
FY 2017 Change $
FY 2017Change
Dollars by Division
Airport Administration 417,278 756,719 713,548 713,668 120 —
Airport Operations 48,950 249,815 194,315 331,597 137,283 70.
CIP Airport Fund — 381,639 628,884 2,569,655 1,940,771 308.
Total 466,228 1,388,174 1,536,747 3,614,921 2,078,174 135.
Dollars by Category
Salary & Benefits
Healthcare 26,247 55,463 66,327 78,914 12,587 19.
Other Benefits 5,702 11,485 12,613 13,588 975 7.
Overtime — 32,946 — — — —
Pension 33,105 23,933 70,993 81,535 10,542 14.
Retiree Medical — 8,740 8,407 9,053 647 7.
Salary 131,084 342,207 400,561 433,679 33,118 8.
Workers' Compensation — — — 8,420 8,420 —
Total Salary & Benefits 196,139 474,774 558,901 625,188 67,913 11.
PUBLIC WORKS • CITY OF PALO ALTO FISCAL YEAR 2017 ADOPTED BUDGET 401

PUBLIC WORKS
402
2%
6%
%
)%
5%
6%
%
2%
)%
6%
)%
5%
)%
2%
%
9%
)%
0%
)%
%
%
Allocated Charges 112,999 92,487 257,405 299,112 41,706 16.
Capital Improvement Program — 381,639 628,884 2,569,655 1,940,771 308.
Contract Services 105,792 385,850 7,500 7,500 — —
Facilities & Equipment — — 16,500 15,000 (1,500) (9.1
General Expense 51,298 35,935 5,900 30,180 24,280 411.
Rents & Leases — 6,698 5,000 11,630 6,630 132.
Supplies & Material — 10,790 56,656 56,656 — —
Total Dollars by Expense Category
466,228 1,388,174 1,536,747 3,614,921 2,078,174 135.
Revenues
Charges for Services — 2,506 40,000 — (40,000) (100.0
From Other Agencies — 299,664 126,000 2,177,975 2,051,975 1,628.
Net Sales — 517,835 554,580 533,370 (21,210) (3.8
Operating Transfers-In — — 304,150 704,150 400,000 131.
Other Revenue — — 93,500 15,000 (78,500) (84.0
Rental Income — 178,620 134,500 280,000 145,500 108.
Return on Investments 3,896 848 1,700 1,700 — —
Total Revenues 3,896 999,473 1,254,430 3,712,195 2,457,765 195.
Positions by Division
Airport Administration 1.00 2.00 2.96 2.00 (0.96) (32.43
Airport Operations — — 0.50 2.42 1.92 384.0
CIP Airport Fund — — 2.42 1.46 (0.96) (39.67
Total 1.00 2.00 5.88 5.88 — —
Budget SummaryFY 2014 Actuals
FY 2015 Actuals
FY 2016 Adopted Budget
FY 2017 Adopted Budget
FY 2017 Change $
FY 2017Change
PUBLIC WORKS • CITY OF PALO ALTO FISCAL YEAR 2017 ADOPTED BUDGET

PUBLIC WORKS
60
83
80
23
26
49
Staffing
Job ClassificationFY 2014 Actuals
FY 2015 Actuals
FY 2016 Adopted Budget
FY 2017 Adopted Budget
FY 2017 Change $
FY 2017Salary
Management Analyst — 1.00 1.00 1.00 — 97,7
Manager Airport 1.00 1.00 1.00 1.00 — 147,7
Manager Maintenance Operations — — 1.00 1.00 — 107,6
Sub-total: Full-Time Equivalent Positions
1.00 2.00 3.00 3.00 — 353,2
Temporary/Hourly — — 2.88 2.88 — 158,0
Total Positions 1.00 2.00 5.88 5.88 — 511,2
Budget ReconciliationPositions Expenditures Revenues
Net Airport Fund
Prior Year Budget 5.88 1,536,747 1,254,430 282,317
Base Adjustments
One Time Prior Year Expenditures Deleted
New Position Technology Equipment — (1,500) — (1,500)
One Time Prior Year Expenditures Deleted — (1,500) — (1,500)
Adjustments to Costs of Ongoing Activities
Salary and Benefit Adjustments — 66,285 — 66,285
Capital Expenditure Funding Adjustment — 1,940,771 2,051,975 (111,204)
Airport Tie-Down Fees Revenue Adjustment — — (94,210) 94,210
Rental Income Revenue Adjustment — — 100,000 (100,000)
General Aviation Liability Insurance Adjustment — 24,280 — 24,280
Rents & Leases Expenditure Alignment — 130 — 130
General Fund Cost Allocation Plan Adjustment — 56,950 — 56,950
Information Technology Allocated Charges Adjustment — 8,183 — 8,183
Print & Mail Allocated Charges Adjustment — 3,274 — 3,274
Refuse Allocated Charges Adjustment — 1,833 — 1,833
General Liability Insurance Allocated Charges Adjustment — (1,121) — (1,121)
Public Works Administration Allocated Charges Adjustment — (27,411) — (27,411)
Adjustments to Costs of Ongoing Activities — 2,073,174 2,057,765 15,409
PUBLIC WORKS • CITY OF PALO ALTO FISCAL YEAR 2017 ADOPTED BUDGET 403

PUBLIC WORKS
404
Total FY 2017 Base Budget 5.88 3,608,421 3,312,195 296,226
Budget Adjustments
1 Airport Day Rental Equipment — 6,500 — 6,500
2 Transfers from the General Fund — — 400,000 (400,000)
Total Budget Adjustments — 6,500 400,000 (393,500)
Total FY 2017 Adopted Budget 5.88 3,614,921 3,712,195 (97,274)
Budget ReconciliationPositions Expenditures Revenues
Net Airport Fund
PUBLIC WORKS • CITY OF PALO ALTO FISCAL YEAR 2017 ADOPTED BUDGET

PUBLIC WORKS
Budget AdjustmentsBudget Adjustments Positions Expenditures Revenues
Net Airport Fund
1 Airport Day Equipment Rental 0.00 6,500 0 6,500
This action adds $6,500 in general expenses for the annual Palo Alto Airport Days event and provides funding for tents, restrooms, and additional recycling containers. The Palo Alto airport is the tenth busiest single runway airport in California and is a general aviation field that is a reliever to three Bay Area airports. There are exhibits and tours of the airport including the Federal Aviation Administration (FAA) Tower that make Palo Alto Airport Day a fun, interesting, and educational outing for the community. This open house offers the community a chance to see the inner workings of their airport and better understand and appreciate its value. (Ongoing: $6,500)
Performance Results
Increased funding for this community event will provide a better experience for event patrons.
2 Transfers from the General Fund 0.00 0 400,000 (400,000)
In Fiscal Year 2016, the General Fund loaned the Airport Fund $304,150, which was the amount required to ensure that the Public Works Department had sufficient staffing and resources to operate and maintain the airport. The General Fund Long Range Financial Forecast assumed a continuation of the loan in the amount of $304,150. For Fiscal Year 2017, the transfer to the Airport Fund is $704,150, a net increase of $400,000, providing the airport with sufficient funds to support ongoing operations and capital improvements, including the creation and implementation of a business plan, ensuring the long-term financial health of the Airport Fund. It is anticipated that after Fiscal Year 2017 there will no longer be a need for a loan from the General Fund and the Airport Fund will be able to begin repayments to the General Fund beginning in Fiscal Year 2019. (Ongoing: $0)
Performance Results
This action will ensure that the Airport has adequate resources to support operations in Fiscal Year 2017 and begin repayment of General Fund loans in Fiscal Year 2019.
PUBLIC WORKS • CITY OF PALO ALTO FISCAL YEAR 2017 ADOPTED BUDGET 405

PUBLIC WORKS
406
VEHICLE REPLACEMENT AND MAINTENANCE FUNDDescriptionThe Vehicle Replacement and Maintenance Fund is an internal service fund providing fleet management services for City vehicles and heavy equipment. Timely maintenance and replacement of vehicles and equipment ensures safe, reliable, and efficient use of resources. This program also provides for safe, efficient fuel storage and dispensing facilities while pursuing alternative fuel technologies, and minimizing the pollution and carbon footprint generated by the City’s vehicle fleet.
Accomplishments Delivered 25 vehicles: three hybrid sedans; two electric sedans; one gasoline sedan; four
pickups; one patch truck; five SUVs; three vans; one marked police vehicle; one tractor; two vacuum flush trucks; and two pieces of equipment.
Updated internal Vehicle and Equipment Use, Maintenance and Replacement Policy in response to City Auditor’s Fleet Utilization and Replacement Audit.
Initiatives Continue implementing Fleet Operational Study recommendations by improving fleet
technology, increasing the number of electric and alternative fuel vehicles/equipment in the fleet, performing a cost analysis of fleet functions, updating the replacement rate model and improving staff training.
Replace older, less fuel efficient vehicles/equipment with newer, more efficient vehicles/equipment to reduce the City’s carbon footprint.
Improve replacement parts inventory management processes
PUBLIC WORKS • CITY OF PALO ALTO FISCAL YEAR 2017 ADOPTED BUDGET

PUBLIC WORKS
Goals and ObjectivesGOAL 1Ensure the City’s vehicles, equipment and storage/dispensing facilities are safe and reliable, and energy efficient to reduce Green House Gas (GHG) emissions.
Objectives: Continue increasing the number of electric and alternative fuel vehicles/equipment.
Continue providing staff training for safe operation and maintenance of vehicles/equipment and fueling stations.
Annually review and update the 5-year vehicle and equipment replacement CIP to maximize cost-effectiveness, reduce GHG emissions and explore opportunities to reduce the fleet.
GOAL 2Provide cost-effective preventive maintenance and repair services.
Objectives: Continue to implement Operational Study recommendations.
Investigate parts inventory alternatives, including outsourcing management.
Key Performance MeasuresPERCENT OF NON-EMERGENCY VEHICLES IN FLEET THAT ARE USING ALTERNATE FUEL OR TECHNOLOGIESGoal Ensure the City’s vehicles, equipment, and storage/dispensing facilities are safe,
reliable, and energy efficient.
Objective Increase the number of alternative fuel and electric vehicles.
FY 2014 Actuals
FY 2015 Actuals
FY 2016 Adopted
FY 2016 Estimated
FY 2017 Adopted
Percentage of non-emergency vehicles in fleet that are using alternate fuel or technologies
25.00% 26.00% 25.00% 25.00% 26.00%
Description The City fleet is comprised of vehicles and equipment that are primarily gasoline, diesel and compressed natural gas (cng).
Purpose In order to move toward a lower emissions goal the City fleet needs to increase their environmentally friendly fueled and alternative technology vehicles.
StatusThe City's fleet used a total of 315,811 gallons of fuel in 2015 between unleaded, diesel and natural gas. It used 81,025 gallons of compressed natural gas which equates to 26% of alternative fuel use.
PUBLIC WORKS • CITY OF PALO ALTO FISCAL YEAR 2017 ADOPTED BUDGET 407

PUBLIC WORKS
408
%
)%
4%
5%
)%
)%
%
7%
8%
)%
)%
)%
)%
4%
4%
6%
%
6%
)%
Workload MeasuresFY 2014 Actuals
FY 2015 Actuals
FY 2016 Adopted
FY 2016 Estimated
FY 2017 Adopted
Number of vehicles that are alternatively fueled or electric 61 51 75 55 58
Number of vehicles repair and preventative maintenance work orders
4,741 4,492 4,750 4,642 4,700
Total number of vehicles and equipment in the City's fleet 555 552 553 553 555
Budget SummaryFY 2014 Actuals
FY 2015 Actuals
FY 2016 Adopted Budget
FY 2017 Adopted Budget
FY 2017 Change $
FY 2017Change
Dollars by Division
Vehicle Operations and Maintenance 4,686,571 5,632,076 6,123,988 5,725,646 (398,342) (6.5
Vehicle Replacement and Additions 2,848,302 2,907,952 5,198,481 6,101,627 903,147 17.
Total 7,534,873 8,540,029 11,322,469 11,827,273 504,805 4.
Dollars by Category
Salary & Benefits
Healthcare 220,931 258,993 337,288 309,089 (28,199) (8.4
Other Benefits 29,173 42,091 46,928 37,357 (9,571) (20.4
Overtime 14,475 11,269 52,445 52,445 — —
Pension 210,016 169,489 330,282 349,065 18,784 5.
Retiree Medical 88,948 77,399 84,577 86,962 2,385 2.
Salary 926,538 1,096,352 1,299,835 1,262,605 (37,230) (2.9
Workers' Compensation 124,984 8,176 105,692 20,965 (84,727) (80.2
Total Salary & Benefits 1,615,066 1,663,769 2,257,046 2,118,488 (138,558) (6.1
Allocated Charges 1,049,779 1,225,445 1,655,928 1,385,344 (270,585) (16.3
Capital Improvement Program 2,804,565 2,833,512 5,196,913 6,101,627 904,714 17.
Contract Services 310,277 261,007 284,900 354,470 69,570 24.
General Expense 44,340 63,760 63,000 66,530 3,530 5.
Operating Transfers-Out — 1,070,249 — — — —
Rents & Leases 110,288 112,929 178,670 183,316 4,646 2.
Supplies & Material 1,600,558 1,309,357 1,654,300 1,354,300 (300,000) (18.1
PUBLIC WORKS • CITY OF PALO ALTO FISCAL YEAR 2017 ADOPTED BUDGET

PUBLIC WORKS
0%
5%
9%
%
%
%
1%
%
%
%
41
57
85
31
15
53
22
—
40
45
74
%
Transfer to Infrastructure — — 31,711 263,198 231,487 730.
Total Dollars by Expense Category
7,534,873 8,540,028 11,322,469 11,827,273 504,805 4.
Revenues
Charges to Other Funds 7,291,939 7,266,712 6,636,604 8,885,085 2,248,481 33.
Operating Transfers-In — — — 478,232 478,232 —
Other Revenue 235,993 529,235 155,000 155,000 — —
Return on Investments 231,550 217,032 178,300 178,300 — —
Total Revenues 7,759,482 8,012,979 6,969,904 9,696,617 2,726,713 39.
Positions by Division
Vehicle Operations and Maintenance 16.82 16.82 15.86 15.86 — —
Vehicle Replacement and Additions 1.40 1.40 1.40 1.40 — —
Total 18.22 18.22 17.26 17.26 — —
Staffing
Job ClassificationFY 2014 Actuals
FY 2015 Actuals
FY 2016 Adopted Budget
FY 2017 Adopted Budget
FY 2017 Change $
FY 2017Salary
Administrative Associate III 1.00 1.00 1.00 1.00 — 72,8
Assistant Director Public Works 0.25 0.25 0.25 0.25 — 39,4
Assistant Fleet Manager 1.00 1.00 1.00 1.00 — 94,8
Equipment Maintenance Service Person 2.00 2.00 2.00 2.00 — 109,8
Fleet Services Coordinator 2.00 2.00 2.00 2.00 — 142,6
Management Analyst 0.20 0.20 0.20 0.20 — 21,1
Manager Fleet 1.00 1.00 1.00 1.00 — 119,2
Mobile Service Technician 1.00 — — — —
Motor Equipment Mechanic II 7.00 6.00 6.00 6.00 — 500,4
Motor Equipment Mechanic-Lead — 2.00 2.00 2.00 — 176,5
Project Manager 1.00 1.00 1.00 1.00 — 83,6
Budget SummaryFY 2014 Actuals
FY 2015 Actuals
FY 2016 Adopted Budget
FY 2017 Adopted Budget
FY 2017 Change $
FY 2017Change
PUBLIC WORKS • CITY OF PALO ALTO FISCAL YEAR 2017 ADOPTED BUDGET 409

PUBLIC WORKS
410
93
56
74
30
Senior Management Analyst 0.08 0.08 0.08 0.08 — 9,5
Sub-total: Full-Time Equivalent Positions
16.53 16.53 16.53 16.53 — 1,370,2
Temporary/Hourly 1.69 1.69 0.73 0.73 — 57,8
Total Positions 18.22 18.22 17.26 17.26 — 1,428,1
Budget Reconciliation
Positions Expenditures Revenues
Net Vehicle
Replacement and
Maintenance Fund
Prior Year Budget 17.26 11,322,469 6,969,904 4,352,565
Base Adjustments
One-Time Prior Year Expenditures and Revenues Deleted
Transfer to Capital Improvement Fund for Municipal Services Center Lighting, Mechanical, and Electrical Improvements
— (31,711) — (31,711)
One-Time Prior Year Expenditures and Revenues
— (31,711) — (31,711)
Adjustments to Costs of Ongoing Activities
Salary & Benefit Adjustment — (107,298) — (107,298)
Rents & Leases Expenditure Alignment — 4,646 — 4,646
Management & Professional Development Alignment — 3,980 — 3,980
Establish Fuel Reserve — (300,000) — (300,000)
Capital Expenditure Funding Alignment — 904,714 320,000 584,714
Transfer to Capital Improvement Fund — 231,487 — 231,487
Vehicle Replacement and Maintenance Allocated Charges Adjustment — 32,722 2,248,481 (2,215,759)
Print & Mail Allocated Charges Adjustment — 870 — 870
Green Sales to City Allocated Charges Adjustment — 449 — 449
General Liability Insurance Allocated Charges Adjustment — (24,471) — (24,471)
Information Technology Allocated Charges Adjustment — (42,776) — (42,776)
Staffing
Job ClassificationFY 2014 Actuals
FY 2015 Actuals
FY 2016 Adopted Budget
FY 2017 Adopted Budget
FY 2017 Change $
FY 2017Salary
PUBLIC WORKS • CITY OF PALO ALTO FISCAL YEAR 2017 ADOPTED BUDGET

PUBLIC WORKS
Public Works Administration Allocated Charges Adjustment — (95,941) — (95,941)
General Fund Cost Allocation Plan Adjustment — (141,437) — (141,437)
Adjustments to Costs of Ongoing Activities — 466,945 2,568,481 (2,101,536)
Total FY 2017 Base Budget 17.26 11,757,703 9,538,385 2,219,318
1 Replacement of Co-Owned Fire Truck (VR-17001) — — 158,232 (158,232)
2 Installation of GPS Monitoring — 53,570 — 53,570
3 Municipal Services Center Security Guard Contract — 16,000 — 16,000
Total Budget Adjustments — 69,570 158,232 (88,662)
Total FY 2017 Adopted Budget 17.26 11,827,273 9,696,617 2,130,656
Budget Reconciliation
Positions Expenditures Revenues
Net Vehicle
Replacement and
Maintenance Fund
PUBLIC WORKS • CITY OF PALO ALTO FISCAL YEAR 2017 ADOPTED BUDGET 411

PUBLIC WORKS
412 P
Budget Adjustments
Budget Adjustments Positions Expenditures Revenues
Net Vehicle
Replacement and
Maintenance Fund
1 Replacement of Co-Owned Fire Truck (VR-17001) 0.00 0 158,232 (158,232)
This action provides supplemental funding for the replacement of a Pierce Tractor Drawn 100-foot Aerial Ladder Truck shared with the City of Mountain View. The existing truck is a 1998 Spartan Hi-Tech Quint Aerial Ladder Truck and unable to reach the roofs of newer buildings and heights beyond 75-feet for rescue or fire suppression operations. The Stanford University Medical Center and the Palo Alto Veterans Affairs Hospital are two examples where an effective aerial ladder truck, before and after construction, is necessary. This is a backup apparatus for use when a respective agency's primary vehicle is out of service. This apparatus is jointly owned and operated by the Palo Alto Fire and the Mountain View Fire departments and is being acquired through a cooperative purchasing process. The 1998 agreement outlining the 50/50 split of operation and maintenance for this apparatus has worked well and both agencies have agreed to its renewal and extension. As a result, a transfer of $158,232 from the General Fund to the Vehicle Replacement is required to complete the acquisition of the new fire truck.
Performance Results
The additional reserve fire truck will provide continuous fire suppression capabilities when the active truck is scheduled for maintenance.
UBLIC WORKS • CITY OF PALO ALTO FISCAL YEAR 2017 ADOPTED BUDGET

PUBLIC WORKS
2 Installation of GPS Monitoring 0.00 53,570 0 53,570
This action provides $27,570 in one-time funding and $26,000 in ongoing funding, for a total of $53,570, to install GPS vehicle trackers on 90 General Fund vehicles. According to Policy 4-1 of the City’s Policies and Procedures Manual, City vehicles and equipment must be used a minimum 2,500 miles or 75 percent of annual work days (50 hours in the case of equipment with hour meters) each fiscal year to justify their continued use. Currently staff use various manual logs and outdated systems to track this information. Attaching GPS units to vehicles allows for mileage, location, idle time, fuel usage and other pertinent data to be collected and analyzed more efficiently, ultimately managing GHG emissions and informing fleet replacement decisions.
Performance Results
With more accurate vehicle tracking information, staff will ensure the fleet is efficient and fully utilized, contributing to a smaller greener footprint.
3 Municipal Services Center Security Guard Contract 0.00 16,000 0 16,000
This action provides funding for a security guard contractor at the Municipal Services Center (MSC). Currently, the guard station at the MSC is unmanned and staff has noticed an increase in trespassing into the MSC. The new security guard contractor will ensure that only permitted vehicles and persons enter the MSC. The total cost of the security guard contract is estimated to be $80,000 annually and will be shared proportionally by the MSC tenants. As a result, the cost sharing is $29,600 for Public Works General Fund; $28,800 for Utilities Administration; $16,000 for Public Works Vehicle Maintenance & Replacement Fund; $5,600 for Administrative Services General Fund. (Ongoing: $16,000)
Performance Results
This action ensures that no unauthorized access to the Municipal Services Center will occur which may prevent loss or damage to City property.
Budget Adjustments
Budget Adjustments Positions Expenditures Revenues
Net Vehicle
Replacement and
Maintenance Fund
PUBLIC WORKS • CITY OF PALO ALTO FISCAL YEAR 2017 ADOPTED BUDGET 413


UTILITIES
UTILITIESMission StatementThe City of Palo Alto Utilities’ mission is to provide safe, reliable, environmentally sustainable and cost-effective services.
PurposeThe purpose of the City of Palo Alto Utili-ties is to provide high quality, cost-effec-tive electric, gas, fiber optics, water and wastewater collection services; promote effective energy and water effi-ciency programs; proactively manage infrastructure needs and replace deterio-rated or aging facilities with new technolo-gies to ensure safe and reliable delivery of services; and ensure the City’s utilities are
in sound financial condition.
UTILITIES • CITY OF PALO ALTO FISCAL YEAR 2017 ADOPTED BUDGET 415

UTILITIES
416 U
TILITIES • CITY OF PALO ALTO FISCAL YEAR 2017 ADOPTED BUDGET
UTILITIES
DescriptionPalo Alto is the only city in California that offers a full array of utility services to its citizens and businesses. Because of this, the City has a unique opportunity to partner with the Palo Alto community to enjoy the benefits and achievements of reliable, home-grown, and environmentally-focused utilities. Palo Alto has a tradition of over 100 years of successful public utility operations. It is a tradition that continues to provide the Palo Alto community with safe and reliable utilities service, local decision-making over policies, utility rate-making, environmental programs, and customized services.
The City of Palo Alto Utilities (CPAU) continues to focus on customer service, infrastructure reliability, regulatory compliance and cost containment. Marketing of energy and water efficiency, increasing renewable energy supplies and promoting technological development for utility efficiency services continue to be focal points, especially in light of the City Council’s environmental sustainability priority and state mandated efficiency goals.
ADMINISTRATIONUtilities Administration is responsible for the overall management of the CPAU including com-munication, regulatory compliance, strategic planning, budget coordination, legislation and reg-ulatory policy analysis, and personnel and administrative support to the entire Department.
CUSTOMER SUPPORT SERVICESThis group annually bills $250 million for the City’s electric, natural gas, water, commercial fiber optic, wastewater collection (operated by CPAU), storm drain and refuse (operated by Public Works) services; operates the Customer Service Call Center with 75,000 annual customer inter-actions; reads 90,000 utility meters per month; and implements Credit and Collection policies.
ENGINEERINGEngineering is responsible for managing all phases of CPAU’s capital improvement projects including providing new or upgrading existing service to customers, and replacing and rehabili-tating the City’s electric, fiber, water, gas, and wastewater distribution systems.
UTILITIES • CITY OF PALO ALTO FISCAL YEAR 2017 ADOPTED BUDGET 417

UTILITIES
418 U
OPERATIONSUtilities Operations is responsible for the operations, maintenance, and emergency response for the electric, fiber, water, gas and wastewater distribution systems.
RESOURCE MANAGEMENTResource Management is responsible for: the long-term resource acquisition plan, including electricity, natural gas, and water; contract negotiations to acquire renewable resources; finan-cial planning; rate development; energy efficiency and water conservation programs; and man-agement of key accounts.
Accomplishments Launched the PaloAltoGreen Gas Program, a new voluntary green program to allow
customers to reduce or eliminate the greenhouse gas (GHG) emissions associated with their gas usage.
Launched and achieved very high participation in Peninsula SunShares program, a local solar program that used the power of group buying to gain a discount in the cost of residential solar systems.
Increased the City’s Renewable Portfolio Standard to 25% of retail energy sales supplied by eligible renewable energy resources by the end of FY 2016.
Launched a heat pump water heater pilot program to determine the performance and customer satisfaction of this electrification technology.
Coordinated successful citywide drought response efforts to achieve the state-mandated water use reductions including home water report, increased water efficiency rebates and launched Palo Alto 311 App for drought water waste reporting.
Completed the 2015 Urban Water Management Plan, including the water shortage (drought) contingency plan.
Launched the Home Efficiency Genie program which provides residents with free expert advice, discounted home assessments and resource for energy-efficiency projects.
Launched a new customer engagement portal for residential customers to view and manage their energy and water usages.
Collaborated with Public Works in completion of Environmental Impact Report (EIR) for the recycled water extension to the Stanford Research Park.
Designated as a Reliable Public Power Provider (RP3) by the American Public Power Association for proficiency, sound business practices, and a utility-wide commitment to safe and reliable delivery of electricity, system improvement, energy efficiency, and workforce development.
Won the Beacon Award – Silver Level for leading in implementing innovative energy efficiency and resource conservation programs, achieving notable greenhouse gas emissions reductions.
TILITIES • CITY OF PALO ALTO FISCAL YEAR 2017 ADOPTED BUDGET

UTILITIES
Recognized in Green Power Leadership Club by the Environmental Protection Agency for demonstrating exemplary environmental stewardship.
Placed in the Solar Electric Power Association’s (SEPA) Top Ten list of utilities that integrated the most solar into the grid. Ranked #3 on the Watts-per-Customer list for 2015.
Awarded Tree Line USA Utility designation by the Arbor Day Foundation; in recognition of quality tree care, annual worker training, and tree planting and public education.
Received the highest honor for Sustainability through the Acterra Business Environmental Awards.
Awarded 30 Palo Alto buildings with the Mayor’s Green Business Leader Award – A Palo Alto City Council sponsored annual recognition event - for achieving an Energy Star rating of 75 or above in the Environmental Protection Agency’s Portfolio Manager.
Initiatives Capital Improvement Programs: Continue replacement of aging infrastructure on Electric,
Gas, Fiber, Wastewater Collection, and Water systems; develop a long range master infrastructure plan for Gas and Water utilities.
Sustainability Programs: Develop two new programs to increase the penetration of local solar systems – a community solar program to allow those without good solar access to participate in local solar projects and a solar donation program to assist schools and non- profits with buying solar systems. Evaluate cost-effective programs to support electrification or fuel-switching from natural gas to electricity.
Increase the City’s Renewable Portfolio Standard to 52.5% of retail energy sales supplied by eligible renewable energy resources by the end of FY 2017.
When the Net Energy Metering (NEM) cap is reached (expected by the end of 2016), launch a NEM successor program to provide fair compensation for local solar generation.
Evaluate all water supply alternatives with a focus on recycled water options including nonpotable use, indirect potable reuse, direct potable reuse, on-site water treatment, storm water, and groundwater.
Expand efforts to compete for the $5M Georgetown University Energy Prize by reducing energy consumption through innovation, education and community participation.
Workforce Development: Implement a Succession Development Program to promote talent development and inspire new leaders to ensure a continued level of quality service to the community.
Collaborate with Development Services to streamline the permit application process and provide timely review and approval of project plan submittals.
Technology: Implement an interactive voice response system to provide a 24/7 communication and payment option to customers.
Issue a Request for Proposal for a new best-of-breed customer self-service web application that offers a complete suite of functionality for Utilities specific online processes, mobility, e-billing, and account management services.
UTILITIES • CITY OF PALO ALTO FISCAL YEAR 2017 ADOPTED BUDGET 419

UTILITIES
420
Communications Outreach: Increase customer feedback by providing a coordinated package of surveys and other market research methods to better evaluate the effectiveness of outreach communications.
Key Performance MeasuresCOMPARABLE AND COST-EFFECTIVE SERVICESGoal Ensure fiscally sound and cost-effective services
Objective Reduce the cost of delivering services through best management practices.
FY 2014 Actuals
FY 2015 Actuals
FY 2016 Adopted
FY 2016 Estimated
FY 2017 Adopted
Palo Alto's average residential monthly utility bill above/below the median of neighboring cities
2.00% (7.00)% (6.00)% (6.00)% (6.80)%
Description
This compares the average residential monthly utility bill which includes electricity, gas, water, and wastewater services to the nearby communities (Menlo Park $278.17, Mountain View $211.84, Santa Clara $167.32, Hayward $213.24, Redwood City $264.45, Los Altos $206.42).
PurposeThis measure compares the City's average utility rates charged to residents to other comparable cities (e.g., similar size, similar commodity purchase options, similar geography).
Status
Our electric rates are significantly lower than PGE and slightly higher than Santa Clara. Natural gas rates are lower than surrounding communities due to PGE increasing its distribution rates for capital improvement and maintenance. Water rates are higher than many neighboring communities primarily because of differing system characteristics and levels of infrastructure investment, but also because some communities have different sources of supply. Palo Alto's pristine high quality supply comes from the SFPUC who is in the middle of a $4.6 billion improvement project, and Palo Alto is investing more than other areas in improving our local distribution pipelines and enhancing our emergency water supply system. For 2017, the monthly average for nearby communities is $223.57 and for Palo Alto the average is $209.25. The Fiscal Year 2017 Proposed Measure is to be 6.8% below the average for the comparable cities.
UTILITIES • CITY OF PALO ALTO FISCAL YEAR 2017 ADOPTED BUDGET

UTILITIES
%
0%
0%
2%
7%
2)%
0%
Workload Measures
CUSTOMER SATISFACTIONGoal Provide excellent customer service
ObjectiveMaintain a high level of customer satisfaction, equal to or greater than 83 percent of Palo Alto citizens rating satisfaction of utility services as "Excellent" or "Good" in the National Citizen Survey.
FY 2014 Actuals
FY 2015 Actuals
FY 2016 Adopted
FY 2016 Estimated
FY 2017 Adopted
Percent rating services (electric, gas, wastewater, and water) "Good" or Excellent"
84.00% 84.00% 84.00% 85.00% 85.00%
Description
The National Citizen Survey (NCS) is a collaborative effort between National Research Center, Inc. (NRC) and the International City/County Management Association (ICMA). The NCS was developed by NRC to provide a statistically valid survey of opinions about community and services provided by local governments. The survey results may be used by staff, elected officials and other stakeholders for community planning and resource allocation, program improvement and policy-making. There are ten California communities participating in the survey.
Purpose
The best way to get feedback on whether our customers are satisfied with the nature, extent and delivery of services we provide them is to ask outright, using random-selection survey processes that include a good cross-section of our customer base.
Status
Results are statistically weighted to reflect the proper demographic composition of the entire community. A total of 721 completed surveys were obtained, providing an overall response rate of 25 percent. Typically, response rates obtained on citizen surveys range from 25 percent to 40 percent. From Fiscal Year 2012 to Fiscal Year 2015, Utilities has met its target of 83 percent.
FY 2014 Actuals
FY 2015 Actuals
FY 2016 Adopted
FY 2016 Estimated
FY 2017 Adopted
Total cost of Capital Improvement Program annually (Millions) $34.70 $27.00 $41.20 $30.30 $42.90
Budget SummaryFY 2014 Actuals
FY 2015 Actuals
FY 2016 Adopted Budget
FY 2017 Adopted Budget
FY 2017 Change $
FY 2017Change
Dollars by Fund
Electric Fund - Operating 47,039,928 47,565,953 63,664,278 73,204,664 9,540,384 15.
Electric Supply 81,796,644 91,302,629 89,799,836 101,478,975 11,679,139 13.
Fiber Optics 1,975,736 1,999,420 3,785,219 4,132,432 347,213 9.
Gas Fund - Operating 24,780,905 22,825,964 25,987,534 30,585,351 4,597,817 17.
Gas Supply 15,074,561 11,543,034 16,941,780 14,363,841 (2,577,939) (15.
Wastewater Collection - Operating 16,652,352 15,951,184 20,929,179 23,434,612 2,505,433 12.
UTILITIES • CITY OF PALO ALTO FISCAL YEAR 2017 ADOPTED BUDGET 421

UTILITIES
422
4%
3%
%
7%)
%
1%
0%
5%
%
%
4%
6)%
1)%
9%
8%
5)%
3%
3)%
6%
)%
%
Water Fund - Operating 38,422,764 34,451,902 48,051,612 57,864,802 9,813,190 20.
Total 225,742,893 225,640,086 269,159,438 305,064,677 35,905,239 13.
Revenues
Charges for Services 369,021 529,927 270,000 270,000 — —
Charges to Other Funds 728,607 592,102 687,618 682,265 (5,353) (0.
From Other Agencies 553,014 534,328 576,632 576,632 — —
Net Sales 208,163,762 196,794,497 213,662,121 228,776,506 15,114,385 7.
Operating Transfers-In 1,553,460 751,521 318,719 2,922,786 2,604,067 817.
Other Revenue 10,925,693 11,909,526 9,955,000 18,468,731 8,513,731 85.
Other Taxes and Fines — 112,392 — — — —
Return on Investments 4,996,993 4,442,020 4,442,200 4,442,200 — —
Total Revenues 227,290,550 215,666,313 229,912,290 256,139,120 26,226,830 11.
Positions by Fund
Electric Fund - Operating 104.70 106.11 106.38 104.40 (1.98) (1.8
Electric Supply 8.15 8.15 10.00 8.18 (1.82) (18.2
Fiber Optics 7.24 7.24 6.76 6.82 0.06 0.8
Gas Fund - Operating 51.08 50.52 49.38 51.05 1.67 3.3
Gas Supply 2.28 2.28 2.77 1.65 (1.12) (40.5
Utilities Admin - Operating 19.68 19.52 18.12 18.22 0.10 0.5
Wastewater Collection - Operating 30.22 29.57 29.74 29.17 (0.58) (1.9
Water Fund - Operating 48.18 48.38 46.15 48.58 2.43 5.2
Total 271.53 271.77 269.31 268.06 (1.25) (0.47
Budget SummaryFY 2014 Actuals
FY 2015 Actuals
FY 2016 Adopted Budget
FY 2017 Adopted Budget
FY 2017 Change $
FY 2017Change
UTILITIES • CITY OF PALO ALTO FISCAL YEAR 2017 ADOPTED BUDGET

UTILITIES
ELECTRIC FUNDDescriptionOn January 16, 1900, the City of Palo Alto began operation of its own electric system. A steam engine was the initial source of the City’s electricity, and was replaced by a diesel engine in 1914. As demand for electricity and the population continued to grow, the City of Palo Alto Utilities (CPAU) connected to the Pacific Gas and Electric distribution system and purchased power from additional sources.
The integrity of the infrastructure required for achieving a high level of reliability and value for our customers is of paramount importance to the CPAU. The Electric Fund plans to enhance the customer service connection experience, increase energy efficiency participation, and increase the percentage of electric supply obtained from renewable energy supplies. The City has entered into a number of contracts with producers of wind, landfill gas, and solar energy for more than 15-year terms.
Accomplishments Increased renewable supply sources secured through competitive solicitation. The City’s
qualifying supply for the State’s Renewable Portfolio Standard was 24 percent in 2014, 28 percent in 2015, and is expected to grow to 30 percent in 2016 and 57 percent by 2017, well above required levels.
Launched Peninsula SunShares with a consortium of other cities in the Bay Area, a new solar program under the Local Solar Plan. This program pooled the buying power of the community to offer homeowners discounted pricing on solar systems. Palo Alto had the largest participation of all participating cities to install new solar systems using group buying power.
Launched a pilot program to install heat pump water heaters to learn about this electrification technology as it relates to system performance and customer satisfaction.
Expanded the Demand Response (peak demand reduction) Pilot Program to tie into commercial customer building energy management systems.
UTILITIES • CITY OF PALO ALTO FISCAL YEAR 2017 ADOPTED BUDGET 423

UTILITIES
424
Accepted new applications via the Program for Emerging Technology (PET), including Advanced Lighting, Electric Vehicle Charging, and Smart Grid projects.
Completed work to provide new electric service to several new buildings and other major improvements in the Stanford Hospital/Lucille Packard Hospital area.
Upgraded the Supervisory Control and Data Acquisition (SCADA) system use for real time monitoring and control of the utility’s electric, water, and gas systems.
Completed installation of underground substructures necessary to convert the overhead utility lines to underground in Underground Utility District 47 (area bounded by Forest Ave/Middlefield Road/Addison Avenue/Cowper Street).
Completed substation security measures at two (2) electric substations, with only two remaining to be done.
Met all Western Electricity Coordinating Council (WECC) and North American Electric Reliability Corporation (NERC) regulatory reporting requirements.
Completed development of Electric Underground Construction Standards to guide Engineering and Operations staff on construction practices.
Completed upgrade of the 60 kV protection equipment (Pilot Wire system) between Quarry Substation and Hopkins Substation.
Completed upgrade of electric substation battery systems, used for backup and operation of protection equipment.
Initiatives Develop new solar programs under the Local Solar Plan. These include a new community
solar program and a solar donation program to be launched in 2016 or 2017.
Develop new programs to encourage residential customer ’electrification”, or the substitution of natural gas using appliances for those using electricity.
Implementation of new residential and commercial efficiency programs.
Continue to offer electric safety education presentations to school and community groups.
Increase the City’s Renewable Portfolio Standard (RPS) to 52.2% by the end of FY 2017 as more long-term solar projects come on line. By the end of calendar year 2017, the City’s RPS is expected to increase to about 57%.
Expand the Demand Response (peak demand reduction) Pilot Program to integrate with distributed energy resources.
Evaluate storage alternatives and develop recommendations regarding goals for installation of storage systems.
Expand efforts to compete for the $5 million Georgetown University Energy Prize by saving energy (gas and electricity) in 2015 and 2016.
Launch new portal for residential customers to view their utilities usage for all commodities at one location.
UTILITIES • CITY OF PALO ALTO FISCAL YEAR 2017 ADOPTED BUDGET

UTILITIES
Continue discussions on building a second transmission line to provide electric service to Palo Alto.
Replace deteriorated substation facilities and increase electric system capacity in the Colorado/Hopkins/Quarry load areas to meet projected load growth.
Improve efficiency of Utility Electric System with installation of Power Factor correction capacitor banks.
Add new facilities to meet the electric loads proposed by the VA Hospital for their site upgrades.
Relocate/reconstruct city electric and communication facilities as necessary to facilitate the electrification of the CALTRAIN system.
Complete General Order 95, 128 and 174 Inspection and Maintenance relating to electrical overhead, underground and substation facilities.
Completion of District 24, rebuild underground facilities in the downtown area.
Complete the pole replacement program for 2015/2016.
Continue to plan and replace electric facilities before they reach the end of their useful life and to maintain high system reliability.
Goals and ObjectivesGOAL 1Provide safe and reliable delivery of electric services to our customers.
Objectives: Develop a plan to complete a second electric transmission line source to improve service
reliability.
Provide exceptional system reliability.
Reduce the backlog of infrastructure assets whose ages are beyond their useful lives.
GOAL 2Increase environmental sustainability and promote efficient use of resources.
Objectives: Achieve a Renewable Portfolio Standard (RPS) of 33 percent by 2015.
Achieve the ten-year goal for electric energy efficiency of 4.8 percent of the electric load by 2023.
Measure actual electric energy efficiency achievement.
Increase the penetration of local solar installations so that 4% of the City’s energy use is generated by local solar systems by 2023.
UTILITIES • CITY OF PALO ALTO FISCAL YEAR 2017 ADOPTED BUDGET 425

UTILITIES
426
Key Performance MeasuresENVIRONMENTAL SUSTAINABILITYGoal Support environmental sustainability and promote efficient use of resources
Objective Achieve Renewable Portfolio Standard (RPS) of at least 52% percent by 2017.
FY 2014 Actuals
FY 2015 Actuals
FY 2016 Adopted
FY 2016 Estimated
FY 2017 Adopted
Percent of retail electric sales volume provided by renewable supply resources under long-term PPAs
49.80% 25.70% 35.10% 31.00% 52.30%
Description This measures the fraction of the City's retail electric sales volume that is provided by renewable supply resources that are under long-term agreement.
Purpose
The California Renewable Energy Resources Act (SBX 1 2) requires that utilities supply 33 percent of their total retail electric sales volume with eligible renewable energy resources by 2020. The City's internal target, established by the Long-term Electric Acquisition Plan (LEAP), is to meet at least 33 percent by 2015. In March 2013, the City also adopted a 100 percent carbon neutral electric supply portfolio target. This measure also supports the City to achieve a 100 percent carbon neutral electric supply portfolio.
Status
The City established a target by 2015 to have a 33% renewable portfolio. However, the City was unable to reach this 2015 target and plans to meet or exceed the 2017 target of 52.3%. This target will be reached through the execution of additional long-term renewable energy supply agreements, and through the procurement of short-term renewable energy certificates (RECs). The City's goal exceeds California's RPS mandate of 33% by 2020 (California Renewable Energy Resources Act SBX1-2). The City currently meets its 100% carbon neutral electric supply portfolio target since 2013, primarily through long-term renewable energy supply agreements, supplemented by short-term REC purchases.
SYSTEM RELIABILITYGoal Provide safe and efficient delivery of electric services to our customers.
Objective Provide exceptional system reliability.
FY 2014 Actuals
FY 2015 Actuals
FY 2016 Adopted
FY 2016 Estimated
FY 2017 Adopted
Average duration of customer outages in minutes as reported using industry guidelines
16 47 60 32 29
DescriptionSystem Average Interruptible Duration Index (SAIDI) is a measure of outage duration. It measures the number of minutes over the year that the average customer is without power.
PurposeReliability indices were introduced in order to keep track of utility performance. This information will help Utilities prioritize capital and operating spending so that reliability can be improved without increasing costs.
Status
Despite continuous lineperson and system operator vacancies, The Electric Utility continues to meet the goal of average customer outages being 60 minutes or less in duration for the average customer by minimizing the number of outages and customers directly affected. This can be attributed to the Department's ongoing efforts for infrastructure replacement, outage isolation improvements, system maintenance, and improved response times.
UTILITIES • CITY OF PALO ALTO FISCAL YEAR 2017 ADOPTED BUDGET

UTILITIES
%
5%
5%
)%
)%
Workload Measures
ENVIRONMENTAL SUSTAINABILITY - SOLARGoal Support environmental sustainability and promote efficient use of resources.
Objective Increase the penetration of local solar installations.
FY 2014 Actuals
FY 2015 Actuals
FY 2016 Adopted
FY 2016 Estimated
FY 2017 Adopted
Cumulative installed capacity of photovoltaic (PV) systems measured in megawatts (MW)
5 6 8 8 9
Description
This measures the percentage of the cumulatively installed capacity of PV systems in Palo Alto, measured in MW . It includes PV systems installed prior to the passage of Senate Bill 1 (SB1), which enacts the Million Solar Roofs Initiative and expands upon the current California Solar Initiative (CSI) and the Energy Commission's New Solar Homes Partnership (NSHP).
Purpose
The California Million Solar Roofs Bill (SB1) requires an expanded funding commitment by all California electric utilities, with a Statewide goal to add 3,000 MW of new PV systems over ten years. In addition to complying with state law, PV installations will benefit the environment and expand flexibility to Palo Alto's electric generation portfolio. This measure also supports the City to achieve a 100 percent carbon neutral electric supply portfolio. This measure also supports The City's goal to meet 4% of The City's electricity needs by 2023.
Status
Solar installations continue to grow with lower installation prices. Rebate funds for residential solar have been fully reserved, and we expect the commercial funds to be reserved well before the 2017 goal set by SB1. Changes to The State net metering regulations may impact electric utility changes to PV customers.
FY 2014 Actuals
FY 2015 Actuals
FY 2016 Adopted
FY 2016 Estimated
FY 2017 Adopted
Number of Customer Accounts (Electric) 29,338 29,299 29,299 29,299 29,299
Number of momentary outages 4 1 1 1 0
Percent of residents surveyed who rate the quality of the Electric Utility as "Good" or "Excellent"
73 83 87 87 88
Total Number of Outages 20 19 20 7 20
Budget SummaryFY 2014 Actuals
FY 2015 Actuals
FY 2016 Adopted Budget
FY 2017 Adopted Budget
FY 2017 Change $
FY 2017Change
Dollars by Division
CIP Electric Fund 12,139,969 11,727,427 16,386,639 26,128,692 9,742,053 59.
Electric Administration 19,459,675 20,476,339 24,762,554 25,376,584 614,030 2.
Electric Customer Service 2,032,231 1,548,851 2,348,349 2,226,652 (121,697) (5.2
Electric Demand Side Management 3,187,875 3,559,586 7,492,131 6,817,126 (675,005) (9.0
UTILITIES • CITY OF PALO ALTO FISCAL YEAR 2017 ADOPTED BUDGET 427

UTILITIES
428
)%
4%
6%
8%
)%
)%
%
3%
6%
)%
)%
9%
)%
9%
8%
)%
2%
%
)%
8%
6%
%
%
3%
8%
%
)%
%
Electric Engineering (Operating) 1,280,044 1,405,600 1,929,843 1,841,173 (88,670) (4.6
Electric Operations and Maintenance 9,488,627 10,716,881 12,216,961 13,735,487 1,518,526 12.
Electric Resource Management 81,248,152 89,457,201 88,327,636 98,557,925 10,230,288 11.
Total 128,836,573 138,891,884 153,464,113 174,683,642 21,219,525 13.
Dollars by Category
Salary & Benefits
Healthcare 1,722,630 1,858,579 1,577,720 1,504,340 (73,380) (4.7
Other Benefits 297,786 294,915 239,147 185,936 (53,211) (22.3
Overtime 406,488 519,414 442,173 442,173 — —
Pension 2,213,560 1,851,677 2,240,589 2,270,121 29,532 1.
Retiree Medical 656,811 1,083,423 1,159,756 1,537,264 377,508 32.
Salary 7,051,249 7,873,119 8,708,280 8,634,552 (73,728) (0.8
Workers' Compensation 282,929 241,886 239,250 157,312 (81,938) (34.2
Total Salary & Benefits 12,631,452 13,723,014 14,606,916 14,731,699 124,783 0.
Allocated Charges 8,467,472 8,247,863 9,090,404 8,829,184 (261,220) (2.9
Capital Improvement Program 7,900,770 7,477,068 16,339,130 26,128,692 9,789,562 59.
Contract Services 2,684,756 3,083,615 5,056,414 7,017,914 1,961,500 38.
Debt Service 8,923,951 8,940,084 9,142,923 8,957,186 (185,737) (2.0
Equity Transfer 11,203,000 11,412,000 11,659,000 12,035,000 376,000 3.
Facilities & Equipment 3,387 — 44,475 44,475 — —
General Expense 3,348,605 2,153,071 4,908,817 3,930,817 (978,001) (19.9
Operating Transfers-Out 122,855 661,061 119,415 255,269 135,854 113.
Rents & Leases 4,038,332 4,136,105 5,301,728 5,439,572 137,844 2.
Supplies & Material 592,329 677,677 873,097 873,097 — —
Transfer to Infrastructure 133,687 — — — — —
Utility Purchase 68,785,977 78,380,327 76,321,794 86,440,735 10,118,944 13.
Total Dollars by Expense Category
128,836,572 138,891,886 153,464,111 174,683,641 21,219,530 13.
Revenues
Charges for Services 243,512 421,977 230,000 230,000 — —
Charges to Other Funds 390,991 305,151 300,011 289,096 (10,915) (3.6
Budget SummaryFY 2014 Actuals
FY 2015 Actuals
FY 2016 Adopted Budget
FY 2017 Adopted Budget
FY 2017 Change $
FY 2017Change
UTILITIES • CITY OF PALO ALTO FISCAL YEAR 2017 ADOPTED BUDGET

UTILITIES
%
1%
6%
5%
%
%
1%
%
)%
4%
)%
)%
)%
)%
35
—
20
37
42
53
79
22
67
%
From Other Agencies 4,000 — — — — —
Net Sales 113,054,403 112,001,079 116,654,061 131,990,403 15,336,342 13.
Operating Transfers-In 1,088,463 547,139 135,386 2,678,768 2,543,382 1,878.
Other Revenue 8,474,522 7,865,325 7,778,000 15,514,731 7,736,731 99.
Other Taxes and Fines — 112,392 — — — —
Return on Investments 2,831,222 2,414,464 2,507,700 2,507,700 — —
Total Revenues 126,087,113 123,667,528 127,605,158 153,210,698 25,605,540 20.
Positions by Division
CIP Electric Fund 32.81 32.57 32.14 32.14 — —
Electric Customer Service 13.53 13.63 13.54 12.07 (1.46) (10.81
Electric Demand Side Management 6.57 6.57 6.61 6.85 0.23 3.5
Electric Engineering (Operating) 4.50 4.50 5.73 4.98 (0.75) (13.09
Electric Operations and Maintenance 47.29 48.84 48.36 48.36 (0.00) (0.00
Electric Resource Management 8.15 8.15 10.00 8.18 (1.82) (18.21
Total 112.85 114.26 116.38 112.58 (3.80) (3.27
Staffing
Job ClassificationFY 2014 Actuals
FY 2015 Actuals
FY 2016 Adopted Budget
FY 2017 Adopted Budget
FY 2017 Change $
FY 2017Salary
Account Specialist 0.24 0.24 0.26 0.33 0.07 20,6
Administrative Associate I 1.00 — — — —
Administrative Associate II 3.10 4.10 4.10 4.00 (0.10) 265,2
Assistant Director Administrative Services 0.15 0.15 0.15 0.20 0.05 38,8
Assistant Director Utilities Customer Support Services 0.40 0.40 0.40 0.40 — 66,9
Assistant Director Utilities Engineering 0.40 0.40 0.40 0.40 — 76,0
Assistant Director Utilities Operations 0.60 0.60 0.60 0.60 — 114,0
Assistant Director Utilities/Resource Management 0.50 0.50 0.50 0.50 — 105,6
Business Analyst 2.13 2.13 2.89 2.04 (0.85) 255,9
Budget SummaryFY 2014 Actuals
FY 2015 Actuals
FY 2016 Adopted Budget
FY 2017 Adopted Budget
FY 2017 Change $
FY 2017Change
UTILITIES • CITY OF PALO ALTO FISCAL YEAR 2017 ADOPTED BUDGET 429

UTILITIES
430
24
96
—
02
68
24
01
22
53
23
41
58
30
42
92
85
36
21
—
71
79
33
09
—
04
—
38
24
58
Contracts Administrator 0.10 0.10 0.10 0.10 — 10,9
Coordinator Utilities Projects 1.25 1.80 1.80 1.55 (0.25) 126,7
Coordinator Utilities Safety & Security 0.55 — — — —
Customer Service Representative 1.62 1.62 1.86 1.62 (0.24) 109,3
Customer Service Specialist 0.66 0.66 0.62 0.66 0.04 48,9
Customer Service Specialist-Lead 0.58 0.58 0.62 0.58 (0.04) 46,0
Electric Project Engineer 1.95 1.95 1.95 1.95 — 229,1
Electric Underground Inspector 2.00 2.00 2.00 2.00 — 177,0
Electric Underground Inspector-Lead 1.00 1.00 1.00 1.00 — 94,8
Electrical Equipment Technician — — — 1.00 1.00 78,6
Electrician Assistant I 4.00 4.00 4.00 3.00 (1.00) 181,2
Engineering Manager - Electric 0.55 0.55 0.55 0.55 — 89,7
Engineering Technician III 2.40 2.40 2.40 2.40 — 186,2
Heavy Equipment Operator 2.00 2.00 2.00 2.00 — 166,0
Inspector, Field Services — — — 0.25 0.25 22,5
Lineperson/Cable Specialist 11.00 11.00 11.00 11.00 — 1,186,0
Lineperson/Cable Specialist-Lead 4.00 4.00 4.00 4.00 — 480,3
Manager Customer Service — — 0.33 0.33 — 42,7
Manager Customer Service and Meter Reading 0.33 0.33 — — —
Manager Electric Operations 1.00 1.00 1.00 1.00 — 157,8
Manager Treasury, Debt & Investments — — — 0.30 0.30 39,8
Manager Utilities Compliance 0.15 0.15 0.15 0.15 — 24,2
Manager Utilities Credit & Collection 0.15 0.15 0.15 0.15 — 19,6
Manager Utilities Marketing Services 0.40 0.40 0.40 — (0.40)
Manager Utilities Program Services — — — 0.40 0.40 48,8
Marketing Engineer 1.00 1.00 1.00 — (1.00)
Meter Reader 1.99 1.99 2.41 1.99 (0.42) 115,6
Meter Reader-Lead 0.33 0.33 0.40 0.33 (0.07) 22,3
Metering Technician 2.00 3.00 3.00 3.00 — 317,3
Staffing
Job ClassificationFY 2014 Actuals
FY 2015 Actuals
FY 2016 Adopted Budget
FY 2017 Adopted Budget
FY 2017 Change $
FY 2017Salary
UTILITIES • CITY OF PALO ALTO FISCAL YEAR 2017 ADOPTED BUDGET

UTILITIES
97
72
68
—
14
72
—
27
19
00
58
76
17
45
—
29
64
—
71
27
52
70
63
28
39
78
52
14
Metering Technician-Lead 1.00 1.00 1.00 1.00 — 113,1
Offset Equipment Operator 0.48 0.48 0.48 0.48 — 28,9
Overhead Underground Troubleman 2.00 2.00 2.00 2.00 — 235,7
Planner 0.15 0.15 — — —
Power Engineer 2.30 2.30 2.30 2.30 — 255,1
Principal Business Analyst — — 0.34 0.34 — 47,6
Principal Management Analyst — 0.34 — — —
Project Manager 0.75 0.75 0.75 0.75 — 80,5
Resource Planner 2.65 2.65 3.95 3.65 (0.30) 442,0
SCADA Technologist 1.00 1.00 1.00 1.00 — 126,5
Senior Business Analyst 0.68 0.68 0.68 0.68 — 86,0
Senior Electrical Engineer 3.95 3.95 3.95 3.95 — 557,5
Senior Management Analyst 0.45 0.45 0.45 0.10 (0.35) 12,3
Senior Resource Planner 3.69 3.69 4.08 3.06 (1.02) 445,6
Senior Technologist 0.29 0.29 — — —
Senior Utilities Field Service Representative 0.10 0.10 0.10 0.10 — 9,6
Street Light, Traffic Signal & Fiber Technician 2.00 2.00 3.00 3.00 — 303,5
Street Light, Traffic Signal & Fiber Technician Apprentice 1.00 1.00 — — —
Street Light, Traffic Signal & Fiber-Lead 1.00 1.00 1.00 1.00 — 108,2
Substation Electrician 5.50 5.50 5.50 5.50 — 578,8
Substation Electrician-Lead 2.00 2.00 2.00 2.00 — 236,2
Supervising Electric Project Engineer 1.00 1.00 1.00 1.00 — 137,0
Tree Maintenance Person 1.00 1.00 1.00 1.00 — 75,5
Utilities Compliance Technician 2.00 2.00 2.00 2.00 — 179,5
Utilities Compliance Technician-Lead 1.00 1.00 1.00 1.00 — 115,8
Utilities Credit/Collection Specialist 2.00 2.00 2.00 2.00 — 153,6
Utilities Engineer Estimator 3.25 3.25 3.25 3.25 — 340,9
Utilities Field Services Representative 0.50 0.50 0.50 0.50 — 43,3
Staffing
Job ClassificationFY 2014 Actuals
FY 2015 Actuals
FY 2016 Adopted Budget
FY 2017 Adopted Budget
FY 2017 Change $
FY 2017Salary
UTILITIES • CITY OF PALO ALTO FISCAL YEAR 2017 ADOPTED BUDGET 431

UTILITIES
432
25
58
80
88
29
34
54
03
57
Utilities Key Account Representative 1.90 1.90 1.90 1.60 (0.30) 166,6
Utilities Locator 1.95 1.95 1.95 1.95 — 147,8
Utilities Marketing Program Administrator 2.55 2.55 2.25 1.90 (0.35) 172,8
Utilities Safety Officer — 0.55 0.55 0.55 — 60,6
Utilities Supervisor 5.00 5.00 5.00 5.00 — 671,6
Utilities System Operator 5.00 5.00 5.00 5.00 — 551,3
Sub-total: Full-Time Equivalent Positions
107.67 109.56 112.02 107.44 (4.58) 11,450,5
Temporary/Hourly 5.18 4.70 4.37 5.15 0.78 368,1
Total Positions 112.85 114.26 116.38 112.58 (3.80) 11,818,6
Budget ReconciliationPositions Expenditures Revenues
Net Electric Fund
Prior Year Budget 116.38 153,464,114 127,605,158 25,858,956
Base Adjustments
Adjustments to Costs of Ongoing Activities
Salaries and Benefits Adjustments (3.80) 235,058 — 235,058
Capital Improvement Program Adjustments — 9,789,562 — 9,789,562
Electric Commodity Purchases Expenditure Adjustment — 10,118,944 — 10,118,944
Overhead Construction Services Contract Expenditure Adjustment — 1,000,000 — 1,000,000
Rents & Leases Expenditure Adjustment (COLA) — 137,844 — 137,844
Equity Transfer to General Fund Adjustment — 376,000 — 376,000
Debt Service Expenditure Adjustment — (185,737) — (185,737)
Transfer In from Tech Fund for Elwell Rent Share Revenue Adjustment — — 4,590 (4,590)
Transfer In from Water and Gas Fund for Capital Project EL-11014 Smart Grid Technology Installation Revenue Adjustment
— — 272,670 (272,670)
Palo Alto Green Gas Program Sales Revenue Adjustment — — (10,915) 10,915
Staffing
Job ClassificationFY 2014 Actuals
FY 2015 Actuals
FY 2016 Adopted Budget
FY 2017 Adopted Budget
FY 2017 Change $
FY 2017Salary
UTILITIES • CITY OF PALO ALTO FISCAL YEAR 2017 ADOPTED BUDGET

UTILITIES
Central Valley Project (CVP) O&M Loan Repayment Revenue Adjustment — — 646,731 (646,731)
Electric Connection Fee Charges (various Capital Improvement Projects) Revenue Adjustment — — 7,090,000 (7,090,000)
Electric Sales Revenue Adjustment (11% rate increase & changes in consumption levels) — — 14,736,342 (14,736,342)
Fiber Optic License Fee Allocated Charges Adjustment — 10,307 — 10,307
General Fund Cost Allocation Plan Charges Adjustment — (322,701) — (322,701)
General Liability Insurance Allocated Charges Adjustment — (131,033) — (131,033)
Print & Mail Allocated Charges Adjustment — (81,491) — (81,491)
Utilities Admin Allocated Charges Adjustment — (56,604) — (56,604)
Utility and Public Works Charges to City Allocated Charges Adjustment — 15,757 — 15,757
Vehicle Fund Allocated Charges Adjustment — 304,545 — 304,545
Adjustments to Costs of Ongoing Activities (3.80) 21,210,451 22,739,418 (1,528,967)
Total FY 2017 Base Budget 112.58 174,674,565 150,344,576 24,329,989
Budget Proposals
1 Transfer from the General Fund: Traffic Signal and Streetlight Electric Costs — — 2,266,122 (2,266,122)
2 State & Local Solar Program Funding Adjustment — (638,500) — (638,500)
3 Reclassification: 1.0 Electric Assistant I to 1.0 Electric Equipment Technician — 10,150 — 10,150
4 Reclassification: 1.0 Marketing Engineer to 1.0 Resource Planner (Two 0.5 FTE) — 14,103 — 14,103
5 Title Change: Manager, Utilities Marketing Services to Manager, Utility Program Services — — — —
6 Low Carbon Fuel Standard (LCFS) Program — 600,000 600,000 —
7 Reclassification of 1.0 FTE Senior Management Analyst to 1.0 FTE Utilities Strategic Business Manager
— 26,119 — 26,119
8 Reclassification of 1.0 FTE Coordinator, Utility Projects to 1.0 FTE Inspector, Field Services — (2,796) — (2,796)
Budget Changes — 9,076 2,866,122 (2,857,046)
Total FY 2017 Adopted Budget 112.58 174,683,641 153,210,698 21,472,943
Budget ReconciliationPositions Expenditures Revenues
Net Electric Fund
UTILITIES • CITY OF PALO ALTO FISCAL YEAR 2017 ADOPTED BUDGET 433

UTILITIES
434
Budget AdjustmentsBudget Adjustments Positions Expenditures Revenues
Net Electric Fund
1 Transfer from the General Fund: Traffic Signal and Streetlight Electric Costs 0.00 0 2,266,122 (2,266,122)
This action recognizes a transfer from the General Fund to reimburse the Electric Fund for electricity costs associated with City street light and traffic signal costs. As part of the Electric Fund Cost of Services Analysis (COSA), these costs were identified as more appropriately aligned with the General Fund. This transfer will be evaluated over the next year and the long term implications on staffing and workload impacts will be revisited in the development of the Fiscal Year 2018 budget process. (Ongoing: $2,266,122)
Performance Results
No impacts to current service levels are anticipated as a result of this funding realignment.
2 State & Local Solar Program Funding Adjustment 0.00 (638,500) 0 (638,500)
This action reduces the expenditures in the photo voltaic (PV) rebate program mandated by California Million Solar Roofs Bill (SB1, August 2006) for Fiscal Year 2017 based on the number of rebate applications remaining. The City committed to funding $13 million in PV rebates over 10 years. Based upon the applications received, all $13 million has been reserved, and the City is at the stage of waiting for customers to complete their projects before paying out the rebate. As the state mandated solar program draws to a close, the City will be exploring and proposing new local solar programs to encourage alternative and renewable energy sources. (Ongoing Savings: $638,500)
Performance Results
The number of residential and commercial businesses in Palo Alto generating solar energy will increase in Fiscal Year 2017 as the rebate program funded projects are completed. Staff currently working on the state mandated program will be absorbed into new local solar initiatives as they are developed.
UTILITIES • CITY OF PALO ALTO FISCAL YEAR 2017 ADOPTED BUDGET

UTILITIES
3 Reclassification: 1.0 Electric Assistant I to 1.0 Electric Equipment Technician 0.00 10,150 0 10,150
After review of the Utilities Department staffing, the following adjustments are recommended to assist in retaining, trained and experienced professionals as well as align classifications with the current duties being performed. Reclassify 1.0 Electric Assistant I to 1.0 Electric Equipment Technician. The creation of the Electric Equipment Technician classification will provide the Electric Operations personnel with additional career growth and help the division to retain trained and experienced personnel. The addition of this new classification will serve as an optional career path and bridges the gap between the Electric Assistant I position and the Substation Apprentice position. (Ongoing: $10,150)
Performance Results
The position reclassifications reflect the current operational needs of the Electric Ops section.
4 Reclassification: 1.0 Marketing Engineer to 1.0 Resource Planner (Two 0.5 FTE) 0.00 14,103 0 14,103
This action reclassifies 1.0 FTE Marketing Engineer position to 1.0 FTE Resource Planner position (that will be filled by two 0.5 FTE) to more accurately reflect how the position has been hired and functioning in practice. (Ongoing $14,103)
Performance Results
No impacts to current service levels are anticipated as a result of this title change.
5 Title Change: Manager, Utilities Marketing Services to Manager, Utility Program Services 0.00 0 0 0
This action amends the Table of Organization by retitling the Manager, Utilities Marketing Services to Manager, Utilities Program Services in the Utilities Customer Service Support section to more accurately reflect the duties of the position. Utility Program Services is where customers can find answers regarding energy efficiency programs, green power programs, water efficiency programs, renewable energy programs, water and energy workshops, key account program and connecting to the City's commercial dark fiber backbone. (Ongoing: $0)
Performance Results
No impacts to current service levels are anticipated as a result of this title change.
6 Low Carbon Fuel Standard (LCFS) Program 0.00 600,000 600,000 0
This action adds revenue from the estimated sales of Low Carbon Fuel Standard (LCFS) credits, offset by expenditures promoting Electric Vehicle adoption and related EV programs. The California Air Resources Board (CARB) developed the LCFS program to reduce the carbon intensity of transportation fuels used in California by 10% by 2020. Electric utilities that provide electricity to charge electric vehicles (EVs) are eligible to receive LCFS credits based on the number of EVs in their service territory. The City Council approved a Master Agreement to sell LCFS credits on March 14, 2016. (Ongoing: $0)
Performance Results
The establishment of this program will promote Electric Vehicle use, contributing to the reduction of carbon emissions.
Budget AdjustmentsBudget Adjustments Positions Expenditures Revenues
Net Electric Fund
UTILITIES • CITY OF PALO ALTO FISCAL YEAR 2017 ADOPTED BUDGET 435

UTILITIES
436
7 Reclassification of 1.0 FTE Senior Management Analyst to 1.0 FTE Utilities Strategic Business Manager
0.00 26,119 0 26,119
This action amends the Table of Organization by reclassifying 1.0 Senior Management Analyst position to 1.0 FTE Utilities Strategic Business Manager position to more accurately reflect the duties of the position. Adopting this reclassification will make permanent the functions of a trial over-strength position created last year to serve in this capacity. This position guides improvements to internal processes, customer focused services, workforce development, and financial stability. This position will oversee Utilities strategic plan, operating and CIP budgets, technology road map, workforce development and succession program, and fiber policy. (Ongoing: $26,119)
Performance Results
No impacts to current service levels are anticipated as a result of this title change.
8 Reclassification of 1.0 FTE Coordinator, Utility Projects to 1.0 FTE Inspector, Field Services 0.00 (2,796) 0 (2,796)
This action amends the Table of Organization by reclassifying 1.0 Coordinator Utility Projects to 1.0 Inspector Field Services to more accurately reflect the operational needs of the department. In FY 2013, Utilities reclassified one of three Inspector, Field Services positions to Supervisor, Inspection Services who would supervise, oversee, and ensure that all of the inspector's geospacial and pipe/fitting attribute data is consistently accurate, both from staff and contract inspectors and outside developers in compliance with Utilities Standards. As a result of the reclassification, there are only two inspectors assigned to WGW Engineering to review project plans and verify contract work is in compliance with specifications. Based on the volume of plan reviews and inspections, Utilities is requesting to add back a third field service inspector. The supervision of the inspectors and oversight of the geospacial database will be reassigned to a Senior Engineer. (Ongoing Savings: $2,796)
Performance Results
The position reclassifications reflect the current operational needs of the Electric/Water/Gas/Wastewater inspection services group.
Budget AdjustmentsBudget Adjustments Positions Expenditures Revenues
Net Electric Fund
UTILITIES • CITY OF PALO ALTO FISCAL YEAR 2017 ADOPTED BUDGET

UTILITIES
FIBER OPTICS FUNDDescriptionIn 1996, the City built a dark fiber ring around Palo Alto that would be capable of supporting multiple network developers and service providers with significant growth potential. The fiber backbone network was routed to pass by and provide access to key City facilities and the Palo Alto business community, including research centers and commercial properties.
Dark fiber optics service consists of providing the fiber optics cabling, splice points, service connections, and other infrastructure providing high-capacity bandwidth needed to transport large quantities of data. It does not include the transmitters, receivers, or data itself, which are owned and operated by each customer.
Accomplishments Completed the Fiber-to-the-Premises Master Plan and the Wireless Network Plan.
Completed the physical audit of the dark fiber optic network to enable system improvements, increase capacity for customer connections, and respond more effectively to outages.
Upgraded inter-departmental Dark Fiber databases (Engineering, Operations and Business Development) to fully leverage the physical audit data.
Continued discussions with Google Fiber to build a fiber optic network.
Issued Request for Proposal to secure Engineering and Construction Inspection services to meet the needs of the potential Google Fiber project.
Initiatives Continue the rebuild of City’s dark fiber ring to improve network performance and enable
future expansion opportunities for licensing dark fiber to commercial firms and anchor institutions.
UTILITIES • CITY OF PALO ALTO FISCAL YEAR 2017 ADOPTED BUDGET 437

UTILITIES
438
Finalize a Master Encroachment Agreement, Master License Agreement for utility pole attachments and a Cost Recovery Agreement with Google Fiber to build a citywide fiber optic network in Palo Alto.
Negotiate with Google Fiber to execute a ‘co-build” agreement for a City-owned fiber network built in parallel with Google Fiber’s network.
Issue a Request for Information to determine interest in a public-private partnership for deployment of citywide Fiber-to-the-Premises.
Issue a Request for Proposal to build Wi-Fi and wireless communication facilities for unserved City facilities, Public Safety and Utilities, in addition to offering Wi-Fi connectivity in high-traffic commercial zones such as California Avenue and University Avenue.
Develop a ‘Dig Once” policy or ordinance to support the expansion of broadband in Palo Alto and to preserve City infrastructure.
Complete the conversion of the dark fiber mapping system to AutoCAD AME.
Goals and ObjectivesGOAL 1Increase the value of fiber utility services to customers.
Objectives: Provide high-quality and competitively-priced fiber optic utility services to City
departments and commercial customers in the City of Palo Alto.
Manage costs and add new dark fiber license agreements with commercial customers.
GOAL 2Improve capacity and reliability of the Dark Fiber system.
Objectives: Ensure sufficient fiber optic cables are available to meet future customer needs.
Make system enhancements to prevent damage from outside sources and improve reliability.
UTILITIES • CITY OF PALO ALTO FISCAL YEAR 2017 ADOPTED BUDGET

UTILITIES
%
3%
)%
9%
1%
2%
Key Performance Measures
Workload Measures
CUSTOMER SATISFACTIONGoal Provide excellent customer service.
Objective Provide high-quality and competitively-priced fiber optic utility services to City Departments and commercial customers in the City of Palo Alto.
FY 2014 Actuals
FY 2015 Actuals
FY 2016 Adopted
FY 2016 Estimated
FY 2017 Adopted
Number of commercial fiber connections completed 230 228 240 240 241
DescriptionThis measure shows the growth of the Fiber Enterprise based on customers and connections. Some customers have multiple fiber connections at various locations.
Purpose
The purpose of this measure is to add value to companies doing business in Palo Alto by providing a cost-effective, world class telecommunications system. The goal is to build out and fully leverage the fiber network to add value to the business and other communities as needed.
Status
The Fiber Enterprise continues to build out its network to provide more service options to our ever-expanding customer base. For example, a network was completed for the Palo Alto Unified School District (PAUSD) that will not only serve the schools, but provide fiber access to previously unserved areas.
FY 2014 Actuals
FY 2015 Actuals
FY 2016 Adopted
FY 2016 Estimated
FY 2017 Adopted
Number of Wholesale re-sellers 9 11 10 14 14
Number of Connections serving individual users 75 74 220 220 229
Budget SummaryFY 2014 Actuals
FY 2015 Actuals
FY 2016 Adopted Budget
FY 2017 Adopted Budget
FY 2017 Change $
FY 2017Change
Dollars by Division
CIP Fiber Optics Fund 481,898 412,667 1,763,821 1,858,000 94,179 5.
Fiber Optics Administration 186,332 62,472 800,178 737,271 (62,907) (7.9
Fiber Optics Customer Service 398,448 420,523 706,970 1,017,098 310,129 43.
Fiber Optics Operations and Maintenance 909,058 1,103,758 514,250 520,063 5,813 1.
Total 1,975,736 1,999,420 3,785,219 4,132,432 347,214 9.
UTILITIES • CITY OF PALO ALTO FISCAL YEAR 2017 ADOPTED BUDGET 439

UTILITIES
440
7%
)%
%
0%
0%
%
3%
)%
4%
2%
7%
9%
6%
%
%
2%
%
2%
%
%
%
5%
%
2%
%
9%
%
Dollars by Category
Salary & Benefits
Healthcare 121,877 140,208 135,983 139,646 3,663 2.
Other Benefits 16,204 20,634 18,919 16,310 (2,609) (13.8
Overtime 32,542 28,891 7,854 7,854 — —
Pension 134,907 111,875 168,418 186,904 18,486 11.
Salary 611,858 523,811 680,717 694,424 13,707 2.
Workers' Compensation — — — 10,082 10,082 —
Total Salary & Benefits 917,387 825,418 1,011,891 1,055,220 43,329 4.
Allocated Charges 394,179 693,503 633,044 559,303 (73,741) (11.6
Capital Improvement Program 393,306 309,543 1,763,205 1,858,000 94,795 5.
Contract Services 75,418 99,791 180,300 458,300 278,000 154.
General Expense 4,680 2,999 12,000 14,000 2,000 16.
Operating Transfers-Out 941 9,441 103,091 104,032 941 0.
Rents & Leases 52,468 53,692 72,688 74,577 1,889 2.
Supplies & Material 3,671 5,033 9,000 9,000 — —
Transfer to Infrastructure 133,687 — — — — —
Total Dollars by Expense Category
1,975,736 1,999,420 3,785,219 4,132,432 347,214 9.
Revenues
Charges for Services 4,463 20,026 — — — —
Net Sales 4,476,533 4,606,321 4,475,388 4,886,920 411,532 9.
Operating Transfers-In 204 169 — — — —
Other Revenue 57 2,752 — — — —
Return on Investments 380,404 411,870 366,400 366,400 — —
Total Revenues 4,861,661 5,041,137 4,841,788 5,253,320 411,532 8.
Positions by Division
CIP Fiber Optics Fund 0.79 0.79 0.79 0.79 — —
Fiber Optics Customer Service 3.32 3.32 2.84 2.90 0.06 2.1
Fiber Optics Operations and Maintenance 3.13 3.13 3.13 3.13 — —
Total 7.24 7.24 6.76 6.82 0.06 0.8
Budget SummaryFY 2014 Actuals
FY 2015 Actuals
FY 2016 Adopted Budget
FY 2017 Adopted Budget
FY 2017 Change $
FY 2017Change
UTILITIES • CITY OF PALO ALTO FISCAL YEAR 2017 ADOPTED BUDGET

UTILITIES
95
71
06
82
—
37
55
91
—
02
80
36
64
78
64
75
78
—
14
09
23
Staffing
Job ClassificationFY 2014 Actuals
FY 2015 Actuals
FY 2016 Adopted Budget
FY 2017 Adopted Budget
FY 2017 Change $
FY 2017Salary
Administrative Associate II — — — 0.10 0.10 6,7
Assistant Director Utilities Customer Support Services 0.20 0.20 0.20 0.20 — 33,4
Assistant Director Utilities Engineering 0.05 0.05 0.05 0.05 — 9,5
Business Analyst — — 0.10 0.20 0.10 24,1
Chief Sustainability Officer 0.10 0.10 — — —
Electric Project Engineer 0.05 0.05 0.05 0.05 — 5,3
Manager Utilities Compliance 0.10 0.10 0.10 0.10 — 16,1
Manager Utilities Credit & Collection 0.40 0.40 0.40 0.40 — 52,2
Manager Utilities Marketing Services 0.20 0.20 0.20 — (0.20)
Manager Utilities Program Services — — — 0.20 0.20 24,4
Manager Utilities Telecommunications 1.00 1.00 1.00 1.00 — 126,8
Power Engineer 0.40 0.40 0.40 0.40 — 46,3
Senior Electrical Engineer 0.05 0.05 0.05 0.05 — 6,7
Street Light, Traffic Signal & Fiber Technician 2.00 2.00 2.00 2.00 — 202,3
Street Light, Traffic Signal & Fiber-Lead 1.00 1.00 1.00 1.00 — 89,7
Utilities Key Account Representative 0.60 0.60 0.60 0.70 0.10 72,9
Utilities Locator 0.03 0.03 0.03 0.03 — 2,4
Utilities Marketing Program Administrator 0.10 0.10 — — —
Sub-total: Full-Time Equivalent Positions
6.28 6.28 6.18 6.48 0.30 719,7
Temporary/Hourly 0.96 0.96 0.58 0.34 (0.24) 38,9
Total Positions 7.24 7.24 6.76 6.82 0.06 758,6
UTILITIES • CITY OF PALO ALTO FISCAL YEAR 2017 ADOPTED BUDGET 441

UTILITIES
442
Budget Reconciliation
Positions Expenditures Revenues
Net Fiber Optics
Fund
Prior Year Budget 6.76 3,785,219 4,841,788 (1,056,569)
Adjustments to Costs of Ongoing Activities
Salaries and Benefits Adjustments 0.06 43,747 — 43,747
Capital Improvement Program Expenditure Adjustments — 94,795 — 94,795
Temporary Fiber Program Manager Contract Expenditure Adjustment — 228,000 — 228,000
Fiber Legal Support Expenditure Adjustment — 50,000 — 50,000
Rents and Leases Expenditure Adjustments — 1,889 — 1,889
Transfer Out From Fiber Optic Fund to Technology Fund Expenditure Adjustment — 941 — 941
Fiber Revenue Adjustment (Rate Increase 3.2% COLA) — — 411,532 (411,532)
General Fund Cost Allocation Plan Charges Adjustment† — (69,557) — (69,557)
General Liability Insurance Allocated Charges Adjustment — (7,145) — (7,145)
Utilities Admin Allocated Charges Adjustment — 2,961 — 2,961
Adjustments to Costs of Ongoing Activities 0.06 345,631 411,532 (65,901)
Total FY 2017 Base Budget 6.82 4,130,850 5,253,320 (1,122,470)
Budget Proposals
1 Reclassification of 1.0 FTE Senior Management Analyst to 1.0 FTE Utilities Strategic Business Manager
— 1,582 — 1,582
Budget Changes — 1,582 — 1,582
Total FY 2017 Adopted Budget 6.82 4,132,432 5,253,320 (1,120,888)
UTILITIES • CITY OF PALO ALTO FISCAL YEAR 2017 ADOPTED BUDGET

UTILITIES
Budget Adjustments
Budget Adjustments Positions Expenditures Revenues
Net Fiber Optics
Fund
1 Reclassification of 1.0 FTE Senior Management Analyst to 1.0 FTE Utilities Strategic Business Manager
0.00 1,582 0 1,582
This action amends the Table of Organization by reclassifying 1.0 Senior Management Analyst position to 1.0 FTE Utilities Strategic Business Manager position to more accurately reflect the duties of the position. Adopting this reclassification will make permanent the functions of a trial over-strength position created last year to serve in this capacity. This position guides improvements to internal processes, customer focused services, workforce development, and financial stability. This position will oversee Utilities strategic plan, operating and CIP budgets, technology road map, workforce development and succession program, and fiber policy. (Ongoing: $1,582)
Performance Results
No impacts to current service levels are anticipated as a result of this title change.
UTILITIES • CITY OF PALO ALTO FISCAL YEAR 2017 ADOPTED BUDGET 443

UTILITIES
444
GAS FUNDDescriptionThe municipal natural gas system began operations in 1917 when Palo Alto acquired a privately-owned gas business. During the early years, gas was manufactured from coal tar. This was replaced in the 1920s by natural gas from Pacific Gas and Electric. Today, gas is purchased from several sources. The Gas Utility services include Crossbore Safety, Gas Main Replacements, and Home Energy Audits. The Gas utility infrastructure and its crews maintains an excellent safety record. The gas fund is responsible for planning, designing, budgeting, and constructing major capital improvements to the City’s gas distribution system.
Accomplishments Completed the PVC gas pipeline study for evaluation of enhanced system reliability.
Pipeline improvements recommended from this study will be included in future capital improvement projects.
Completed the design of gas main replacement project GMR 22 to replace approximately 19,440 linear feet of gas main pipelines and 367 service pipelines. This project will also include approximately 2,700 LF of water main to be placed in the joint-trench with gas main on University Avenue.
Initiatives Evaluate the cost-effectiveness and feasibility of ’fuel switching”, or substituting electric
using appliances for those using natural gas.
Promote sustainable PaloAltoGreen Gas program with goals of 20% customer participation and 10% greenhouse gas reductions.
Complete the development of a computer model to perform complex natural gas distribution system analyses.
Expand efforts to compete for the $5 million Georgetown University Energy Prize by saving energy (gas and electricity) in 2015 and 2016.
Continue to enhance outreach for gas safety awareness to all customer groups, as well as non-customers, living around a gas pipeline and/or working with utility services in Palo Alto.
UTILITIES • CITY OF PALO ALTO FISCAL YEAR 2017 ADOPTED BUDGET

UTILITIES
Implementation of new residential and commercial efficiency programs.
Launched new portal for residential customers to view their utilities usage for all commodities at one location.
Goals and ObjectivesGOAL 1Provide safe and efficient delivery of natural gas to our customers.
Objectives: Continue repairing 100 percent of laterals damaged by crossbore within 24 hours.
Remove and replace the remaining acrylonitrile butadien styrene (ABS) pipe from the gas system.
Complete a walking gas leak survey for 50 percent of the City, and a mobile gas leak survey of services in business districts and 100 percent of the City’s gas mains on an annual basis.
GOAL 2Increase environmental sustainability and promote efficient use of natural gas resources.
Objectives: Ten-year goal for natural gas efficiency is a reduction in expected gas use of 2.85 percent by
2023.
Reduce the carbon intensity of the gas portfolio in accordance with the Climate Protection Plan.
Key Performance MeasuresGAS LEAKS REPAIREDGoal Provide safe and efficient delivery of natural gas to customers.
Objective Respond to and repair all Grade 1 gas leaks immediately.
FY 2014 Actuals
FY 2015 Actuals
FY 2016 Adopted
FY 2016 Estimated
FY 2017 Adopted
Percentage of Grade 1 leaks responded to within 24 hours 100.00% 100.00% 100.00% 100.00% 100.00%
Description
This measures the total response time to Grade 1 leaks found during the walking and mobile (vehicle) surveys, and any reported leaks classified as Grade 1. The City's policy is to respond and repair Grade 1 leaks within 24 hours. Grade 1 leaks are hazardous leaks that pose an immediate hazard to persons or property and require continuous action until conditions are no longer hazardous.
Purpose
Leaks are assigned priority gradings according to location, extent of migration, gas concentration, potential for concentration, ignition sources, and potential hazard to the public and property. These priority grades are intended only as guidelines.
Status Utilities Operations responds immediately to Grade 1 leaks. The average repair time can vary depending on the size and location of the gas leak.
UTILITIES • CITY OF PALO ALTO FISCAL YEAR 2017 ADOPTED BUDGET 445

UTILITIES
446
GAS SAFETYGoal Provide safe and efficient delivery of natural gas to our customers.
ObjectiveComplete a walking gas leak survey for 50 percent of the City, and a mobile gas leak survey of services in business districts and 100 percent of the City's gas mains on an annual basis.
FY 2014 Actuals
FY 2015 Actuals
FY 2016 Adopted
FY 2016 Estimated
FY 2017 Adopted
Percentage of gas system surveyed by walking 100.00% 100.00% 100.00% 100.00% 100.00%
Percentage of gas system surveyed by mobile (vehicle) 100.00% 100.00% 100.00% 100.00% 100.00%
Description
A walking survey is conducted to check for gas leaks on service/gas meters and covers one-half of the City (approximately 105 miles of gas mains and 36 miles of service lines) every year, so that the entire City's gas service system can be reviewed in a two-year period. Department of Transportation (DOT) regulations require a survey of the entire City once every five years. The City of Palo Alto gas leak survey exceeds the DOT requirements. In addition to walking survey, a mobile (vehicle) survey of all gas mains and some gas service lines (services in the business district) are conducted annually.
Purpose To ensure the safety of all who live and work in Palo Alto and to comply with Federal (Department of Transportation) requirements.
Status We are meeting the requirements and repairing all discovered gas leaks in a timely manner.
INCREASE ENVIRONMENTAL SUSTAINABILITY AND PROMOTE EFFICIENT USE OF NATURAL GAS RESOURCESGoal Support environmental sustainability and promote efficient use of natural gas
resources.
Objective Ten-year goals for natural gas are a reduction in expected gas use of 2.85 percent by 2023 (2013 base year).
FY 2014 Actuals
FY 2015 Actuals
FY 2016 Adopted
FY 2016 Estimated
FY 2017 Adopted
Natural gas savings achieved annually through efficiency programs
1.20% 0.50% 0.90% 0.90% 0.55%
Description
We measure specific savings achieved from the installation of natural gas efficiency improvements, which we track through our rebate, audit, loan and other incentive programs. We can also track overall savings by customer class, which include behavioral changes, including those implemented as a results of programs such as the Home Energy Reports, which provide customers with information on their home's energy use in comparison to others nearby.
PurposeThe carbon intensity of the natural gas portfolio is a function of where and how the gas is acquired and how much of it is burned in use. Improving gas efficiency directly reduces the gas-related carbon footprint in Palo Alto.
Status
FY 2015 gas efficiency savings were well above the goal, but below the last two years. Nearly two thirds of the gas savings are attributed to the Home Energy Report program. As the cost of gas continued to decrease, we saw a decline in large commercial gas savings projects.
UTILITIES • CITY OF PALO ALTO FISCAL YEAR 2017 ADOPTED BUDGET

UTILITIES
%
7%
4%
4%
6%
4%
)%
)%
7%
3%
)%
%
9%
6%
0%
2%
1%
)%
1%
)%
%
2%
%
Workload MeasuresFY 2014 Actuals
FY 2015 Actuals
FY 2016 Adopted
FY 2016 Estimated
FY 2017 Adopted
Number of Customer Accounts (Gas) 23,592 23,461 23,659 23,659 23,659
Number of gas leaks repaired 137 100 131 131 100
Budget SummaryFY 2014 Actuals
FY 2015 Actuals
FY 2016 Adopted Budget
FY 2017 Adopted Budget
FY 2017 Change $
FY 2017Change
Dollars by Division
CIP Gas Fund 8,879,417 7,460,806 7,134,621 11,111,443 3,976,822 55.
Gas Administration 9,830,091 9,245,419 10,494,355 12,213,114 1,718,759 16.
Gas Customer Service 1,338,432 1,195,633 1,502,959 1,583,952 80,993 5.
Gas Demand Side Management 495,782 631,749 1,330,070 1,471,467 141,397 10.
Gas Engineering (Operating) 351,558 369,154 474,834 528,730 53,896 11.
Gas Operations and Maintenance 4,119,090 4,403,054 5,564,316 4,979,614 (584,703) (10.5
Gas Resource Management 14,841,094 11,074,833 16,428,159 13,060,873 (3,367,286) (20.5
Total 39,855,465 34,380,649 42,929,315 44,949,192 2,019,878 4.
Dollars by Category
Salary & Benefits
Healthcare 900,498 898,497 617,414 619,444 2,030 0.
Other Benefits 144,028 131,774 101,413 78,007 (23,406) (23.1
Overtime 216,622 187,321 151,865 151,865 — —
Pension 996,793 837,860 816,062 905,019 88,957 10.
Retiree Medical 248,987 386,978 414,271 594,708 180,437 43.
Salary 3,060,672 3,143,294 3,224,270 3,448,611 224,342 7.
Workers' Compensation 55,939 43,214 47,300 62,988 15,688 33.
Total Salary & Benefits 5,623,538 5,628,938 5,372,595 5,860,642 488,047 9.
Allocated Charges 3,563,241 3,683,117 4,359,942 4,173,283 (186,659) (4.3
Capital Improvement Program 7,574,629 6,098,939 6,771,382 11,111,443 4,340,061 64.
Contract Services 844,916 841,287 2,387,600 1,446,000 (941,600) (39.4
Debt Service 281,866 265,519 802,615 802,615 — —
Equity Transfer 5,811,000 5,730,000 5,642,000 6,726,000 1,084,000 19.
Facilities & Equipment — — 19,790 19,790 — —
UTILITIES • CITY OF PALO ALTO FISCAL YEAR 2017 ADOPTED BUDGET 447
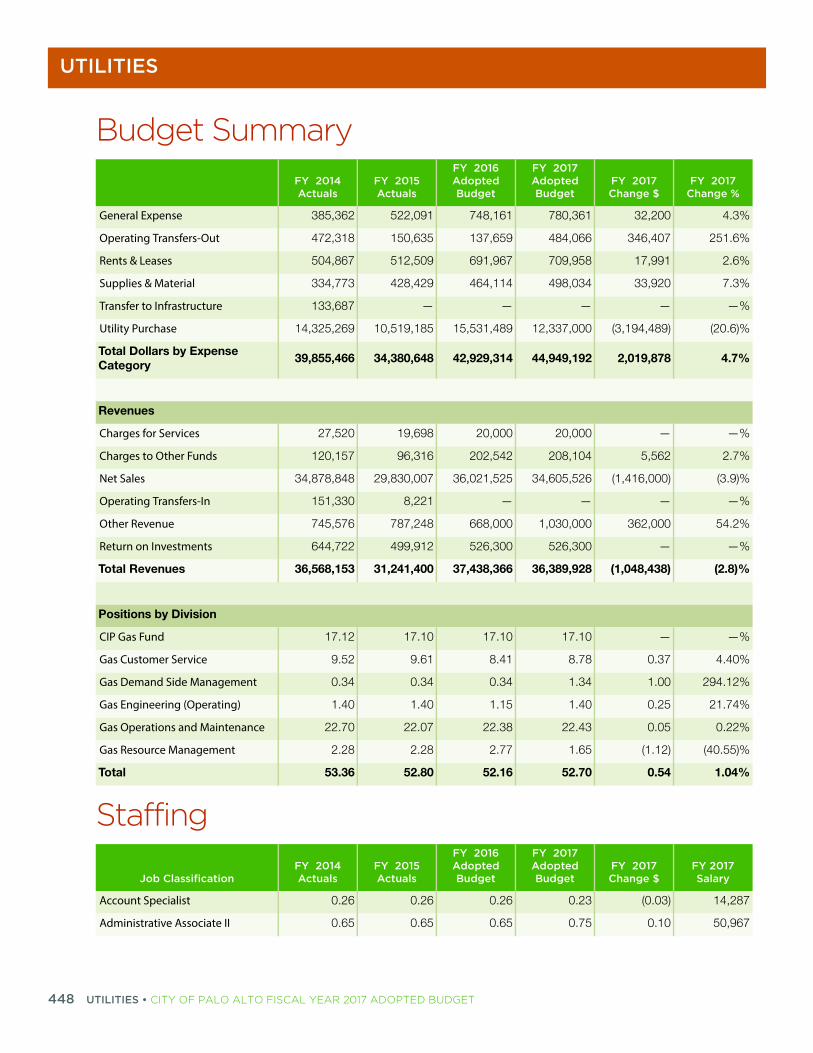
UTILITIES
448
3%
6%
6%
3%
%
)%
7%
%
7%
)%
%
2%
%
)%
%
0%
2%
4%
2%
)%
4%
87
67
%
General Expense 385,362 522,091 748,161 780,361 32,200 4.
Operating Transfers-Out 472,318 150,635 137,659 484,066 346,407 251.
Rents & Leases 504,867 512,509 691,967 709,958 17,991 2.
Supplies & Material 334,773 428,429 464,114 498,034 33,920 7.
Transfer to Infrastructure 133,687 — — — — —
Utility Purchase 14,325,269 10,519,185 15,531,489 12,337,000 (3,194,489) (20.6
Total Dollars by Expense Category
39,855,466 34,380,648 42,929,314 44,949,192 2,019,878 4.
Revenues
Charges for Services 27,520 19,698 20,000 20,000 — —
Charges to Other Funds 120,157 96,316 202,542 208,104 5,562 2.
Net Sales 34,878,848 29,830,007 36,021,525 34,605,526 (1,416,000) (3.9
Operating Transfers-In 151,330 8,221 — — — —
Other Revenue 745,576 787,248 668,000 1,030,000 362,000 54.
Return on Investments 644,722 499,912 526,300 526,300 — —
Total Revenues 36,568,153 31,241,400 37,438,366 36,389,928 (1,048,438) (2.8
Positions by Division
CIP Gas Fund 17.12 17.10 17.10 17.10 — —
Gas Customer Service 9.52 9.61 8.41 8.78 0.37 4.4
Gas Demand Side Management 0.34 0.34 0.34 1.34 1.00 294.1
Gas Engineering (Operating) 1.40 1.40 1.15 1.40 0.25 21.7
Gas Operations and Maintenance 22.70 22.07 22.38 22.43 0.05 0.2
Gas Resource Management 2.28 2.28 2.77 1.65 (1.12) (40.55
Total 53.36 52.80 52.16 52.70 0.54 1.0
Staffing
Job ClassificationFY 2014 Actuals
FY 2015 Actuals
FY 2016 Adopted Budget
FY 2017 Adopted Budget
FY 2017 Change $
FY 2017Salary
Account Specialist 0.26 0.26 0.26 0.23 (0.03) 14,2
Administrative Associate II 0.65 0.65 0.65 0.75 0.10 50,9
Budget SummaryFY 2014 Actuals
FY 2015 Actuals
FY 2016 Adopted Budget
FY 2017 Adopted Budget
FY 2017 Change $
FY 2017Change
UTILITIES • CITY OF PALO ALTO FISCAL YEAR 2017 ADOPTED BUDGET

UTILITIES
09
71
26
19
11
54
68
34
67
24
95
—
02
52
24
68
79
84
87
27
—
98
66
24
20
16
21
Assistant Director Administrative Services 0.10 0.10 0.10 0.05 (0.05) 9,7
Assistant Director Utilities Customer Support Services 0.20 0.20 0.20 0.20 — 33,4
Assistant Director Utilities Engineering 0.20 0.20 0.20 0.20 — 38,0
Assistant Director Utilities Operations 0.15 0.15 0.15 0.15 — 28,5
Assistant Director Utilities/Resource Management 0.25 0.25 0.25 0.25 — 52,8
Business Analyst 1.37 1.37 0.83 1.28 0.45 158,0
Cathodic Protection Technician Assistant 1.00 1.00 1.00 1.00 — 88,5
Cathodic Technician 1.00 1.00 1.00 1.00 — 108,7
Cement Finisher 0.25 0.25 0.25 0.25 — 19,8
Contracts Administrator 0.10 0.10 0.10 0.10 — 10,9
Coordinator Utilities Projects 1.31 1.51 1.51 1.26 (0.25) 120,4
Coordinator Utilities Safety & Security 0.20 — — — —
Customer Service Representative 1.62 1.62 1.50 1.62 0.12 109,3
Customer Service Specialist 0.68 0.68 0.50 0.68 0.18 50,4
Customer Service Specialist-Lead 0.58 0.58 0.50 0.58 0.08 46,0
Engineer 2.00 2.00 2.00 2.00 — 207,9
Engineering Manager - Electric 0.15 0.15 0.15 0.15 — 24,4
Engineering Manager - WGW 0.33 0.33 0.33 0.33 — 51,8
Engineering Technician III 0.70 0.70 0.70 0.70 — 51,1
Equipment Operator 0.43 0.43 0.43 0.43 — 31,5
Gas System Technician 2.00 2.00 2.00 — (2.00)
Gas Systems Technician II 0.90 0.90 0.90 2.90 2.00 236,9
Heavy Equipment Operator 2.57 2.57 2.57 2.52 (0.05) 208,4
Heavy Equipment Operator/Install Repair — — — 0.65 0.65 59,3
Inspector, Field Services 1.17 1.17 1.17 1.42 0.25 128,3
Maintenance Mechanic-Welding 1.00 1.00 1.00 1.00 — 85,4
Manager Customer Service — — 0.33 0.33 — 42,7
Staffing
Job ClassificationFY 2014 Actuals
FY 2015 Actuals
FY 2016 Adopted Budget
FY 2017 Adopted Budget
FY 2017 Change $
FY 2017Salary
UTILITIES • CITY OF PALO ALTO FISCAL YEAR 2017 ADOPTED BUDGET 449

UTILITIES
450
—
93
88
09
—
12
02
06
24
70
—
92
83
20
77
00
27
72
—
29
—
51
—
82
53
—
21
08
56
Manager Customer Service and Meter Reading 0.33 0.33 — — —
Manager Treasury, Debt & Investments — — — 0.10 0.10 13,2
Manager Utilities Compliance 0.25 0.25 0.25 0.25 — 40,3
Manager Utilities Credit & Collection 0.15 0.15 0.15 0.15 — 19,6
Manager Utilities Marketing Services 0.20 0.20 0.20 — (0.20)
Manager Utilities Operations WGW 0.20 0.20 0.20 0.20 — 31,2
Manager Utilities Program Services — — — 0.20 0.20 24,4
Meter Reader 1.98 1.98 1.92 1.98 0.06 115,0
Meter Reader-Lead 0.33 0.33 0.32 0.33 0.01 22,3
Principal Business Analyst — — 0.33 0.33 — 46,2
Principal Management Analyst — 0.33 — — —
Program Assistant I 0.33 0.33 0.33 0.33 — 19,1
Project Engineer 1.00 1.00 1.00 1.00 — 122,3
Resource Planner 1.15 1.15 0.95 0.65 (0.30) 78,2
Restoration Lead 0.43 0.43 0.43 0.43 — 37,6
SCADA Technologist 0.20 0.20 0.20 0.20 — 25,3
Senior Business Analyst 0.66 0.66 0.66 0.66 — 83,5
Senior Engineer 2.70 2.10 2.70 2.70 — 375,8
Senior Management Analyst 0.05 0.05 0.05 — (0.05)
Senior Mechanic 0.33 0.33 0.33 0.33 — 31,8
Senior Project Engineer — 0.60 — — —
Senior Resource Planner 0.46 0.46 0.77 0.45 (0.32) 64,7
Senior Technologist 0.29 0.29 — — —
Senior Utilities Field Service Representative 0.41 0.41 0.41 0.41 — 39,4
Substation Electrician 0.10 0.10 0.10 0.10 — 9,1
Supervisor Inspection Services 0.29 0.29 0.29 — (0.29)
Utilities Engineer Estimator 0.85 0.85 0.85 0.85 — 90,6
Utilities Field Services Representative 1.75 1.75 1.75 1.75 — 151,6
Utilities Install Repair-Lead-Welding Certified 1.30 1.30 1.30 1.30 — 127,4
Staffing
Job ClassificationFY 2014 Actuals
FY 2015 Actuals
FY 2016 Adopted Budget
FY 2017 Adopted Budget
FY 2017 Change $
FY 2017Salary
UTILITIES • CITY OF PALO ALTO FISCAL YEAR 2017 ADOPTED BUDGET

UTILITIES
71
94
09
96
97
79
65
68
41
66
61
42
03
Utilities Install Repair-Welding Certified 1.95 1.95 1.95 1.95 — 167,3
Utilities Install/Repair 4.45 4.45 4.45 3.85 (0.60) 325,7
Utilities Install/Repair Assistant 0.65 0.65 0.65 0.65 — 42,6
Utilities Install/Repair-Lead 1.98 1.98 1.98 1.98 — 189,6
Utilities Key Account Representative 0.35 0.35 0.35 0.45 0.10 46,8
Utilities Locator 0.29 0.29 0.29 0.29 — 23,6
Utilities Marketing Program Administrator 0.35 0.35 0.35 0.70 0.35 62,7
Utilities Safety Officer — 0.20 0.20 0.20 — 22,0
Utilities Supervisor 2.08 2.08 2.08 2.37 0.29 324,1
Water System Operator II 0.66 0.66 0.66 0.66 — 56,7
Sub-total: Full-Time Equivalent Positions
49.67 50.20 49.03 49.83 0.80 4,899,8
Temporary/Hourly 3.69 2.60 3.13 2.88 (0.26) 141,0
Total Positions 53.36 52.80 52.16 52.70 0.54 5,040,9
Budget ReconciliationPositions Expenditures Revenues
Net Gas Fund
Prior Year Budget 52.16 42,929,314 37,438,366 5,490,948
Base Adjustments
One-Time Prior Year Expenditures and Revenues Deleted
Cross-bore Inspection Contract — (1,000,000) — (1,000,000)
One-Time Prior Year Expenditures and Revenues
— (1,000,000) — (1,000,000)
Adjustments to Costs of Ongoing Activities
Salaries and Benefits Adjustments 0.54 260,600 — 260,600
Capital Improvement Program Adjustments — 4,340,061 — 4,340,061
Gas Commodity Purchases Expenditure Adjustment — (3,194,489) — (3,194,489)
Rents and Leases Expenditure Adjustment — 17,991 — 17,991
Hauling/Disposal of Construction Materials Contract Increase Expenditure Adjustment — 50,000 — 50,000
Staffing
Job ClassificationFY 2014 Actuals
FY 2015 Actuals
FY 2016 Adopted Budget
FY 2017 Adopted Budget
FY 2017 Change $
FY 2017Salary
UTILITIES • CITY OF PALO ALTO FISCAL YEAR 2017 ADOPTED BUDGET 451

UTILITIES
452
Debt Service Expenditure Adjustment — 249,865 — 249,865
Equity Transfer to General Fund Expenditure Adjustment — 1,084,000 — 1,084,000
Transfer to Technology Fund Expenditure Adjustment — 179,780 — 179,780
Transfer to Electric Fund Expenditure Adjustment — 136,335 — 136,335
Transfer to Water Fund Expenditure Adjustment — 30,342 — 30,342
Palo Alto Green Gas Program Sales to City Revenue Adjustment — — 5,562 (5,562)
Gas Connection Fees Revenue Adjustment — — 362,000 (362,000)
Gas Sales Revenue Adjustment (Rate Increase, Consumption Decrease, Commodity Cost Decrease)
— — (1,415,998) 1,415,998
General Fund Cost Allocation Plan Charges Adjustment† — (149,942) — (149,942)
General Liability Insurance Allocated Charges Adjustment — (36,635) — (36,635)
Print & Mail Allocated Charges Adjustment — (13,581) — (13,581)
Utilities Admin Allocated Charges Adjustment — (53,165) — (53,165)
Utility and Public Works Charges to City Allocated Charges Adjustment — 13,744 — 13,744
Adjustments to Costs of Ongoing Activities 0.54 2,914,906 (1,048,436) 3,963,342
Total FY 2017 Base Budget 52.70 44,844,220 36,389,930 8,454,290
Budget Proposals
1 Contract for Advisory Consultant for Gas and Water Operations — 65,000 — 65,000
2 Reclassification of 2.0 FTE Gas System Technician I to 2.0 FTE Gas System Technician II
— 11,170 — 11,170
3 Reclassification of 2.0 FTE Heavy Equipment Operators, 1.0 FTE Installer Repairer and 1.0 FTE Assistant Installer Repairer to 4.0 FTE Heavy Equipment Operator/Installer-Repairer
— 3,256 — 3,256
4 Title Change, Manager, Utilities Marketing Services to Manager, Utility Program Services — 0 — 0
Budget ReconciliationPositions Expenditures Revenues
Net Gas Fund
UTILITIES • CITY OF PALO ALTO FISCAL YEAR 2017 ADOPTED BUDGET

UTILITIES
5 Reclassification of 1.0 FTE Senior Management Analyst to 1.0 FTE Utilities Strategic Business Manager
— 12,227 — 12,227
6 Reclassification of 1.0 FTE Coordinator, Utility Projects to 1.0 FTE Inspector, Field Services — (2,796) — (2,796)
7 Reclassification of 1.0 FTE Supervisor, Inspection Services to 1.0 FTE Utilities Supervisor
— 16,115 — 16,115
Budget Changes — 104,972 — 104,972
Total FY 2017 Adopted Budget 52.70 44,949,192 36,389,930 8,559,262
Budget AdjustmentsBudget Adjustments Positions Expenditures Revenues
Net Gas Fund
1 Contract for Advisory Consultant for Gas and Water Operations 0.00 65,000 0 65,000
This action provides funding for an advisory consulting contract to assist with operational evaluations, updating master plans, creating procedures for data collection and reporting to meet compliance requirements, and updating procedure manuals. This service has helped the Sewer Operations improve its processes and meet its compliance obligations. The Gas and Water Operations will benefit from the same type of support. (Ongoing: $65,000)
Performance Results
The addition of these resources to the Gas and Water operation will increase operation efficiencies and help with compliance regulation.
Budget ReconciliationPositions Expenditures Revenues
Net Gas Fund
UTILITIES • CITY OF PALO ALTO FISCAL YEAR 2017 ADOPTED BUDGET 453
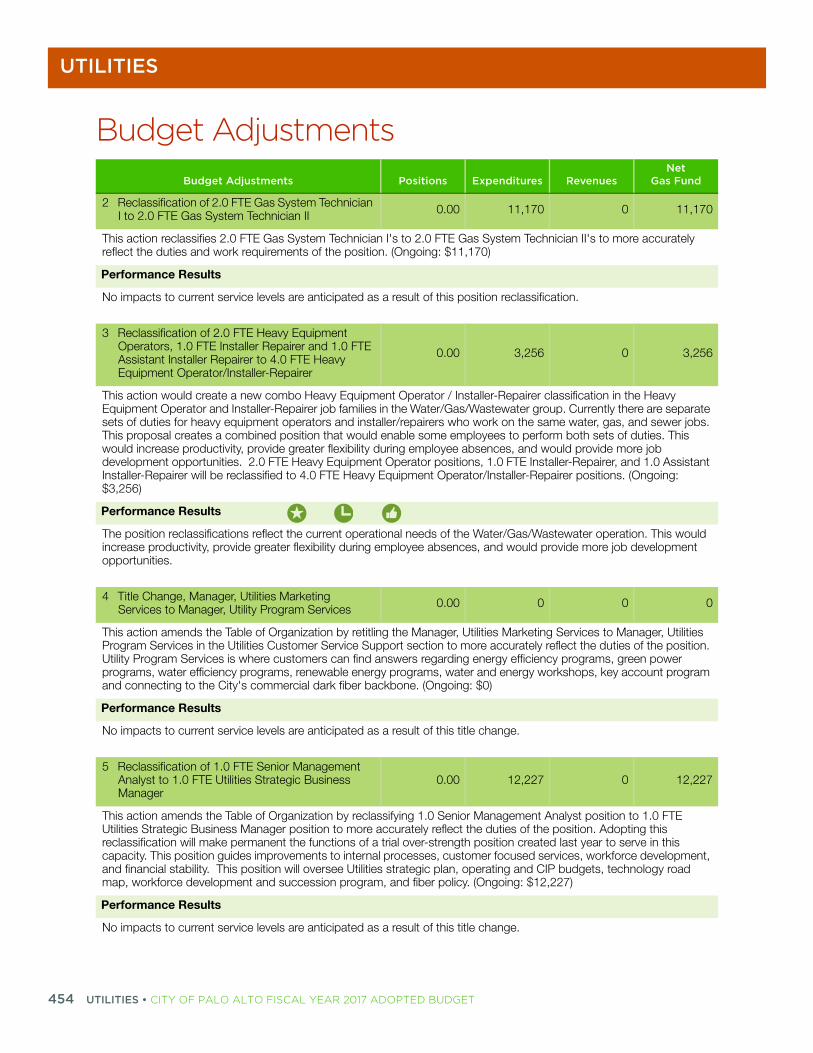
UTILITIES
454
2 Reclassification of 2.0 FTE Gas System Technician I to 2.0 FTE Gas System Technician II 0.00 11,170 0 11,170
This action reclassifies 2.0 FTE Gas System Technician I's to 2.0 FTE Gas System Technician II's to more accurately reflect the duties and work requirements of the position. (Ongoing: $11,170)
Performance Results
No impacts to current service levels are anticipated as a result of this position reclassification.
3 Reclassification of 2.0 FTE Heavy Equipment Operators, 1.0 FTE Installer Repairer and 1.0 FTE Assistant Installer Repairer to 4.0 FTE Heavy Equipment Operator/Installer-Repairer
0.00 3,256 0 3,256
This action would create a new combo Heavy Equipment Operator / Installer-Repairer classification in the Heavy Equipment Operator and Installer-Repairer job families in the Water/Gas/Wastewater group. Currently there are separate sets of duties for heavy equipment operators and installer/repairers who work on the same water, gas, and sewer jobs. This proposal creates a combined position that would enable some employees to perform both sets of duties. This would increase productivity, provide greater flexibility during employee absences, and would provide more job development opportunities. 2.0 FTE Heavy Equipment Operator positions, 1.0 FTE Installer-Repairer, and 1.0 Assistant Installer-Repairer will be reclassified to 4.0 FTE Heavy Equipment Operator/Installer-Repairer positions. (Ongoing: $3,256)
Performance Results
The position reclassifications reflect the current operational needs of the Water/Gas/Wastewater operation. This would increase productivity, provide greater flexibility during employee absences, and would provide more job development opportunities.
4 Title Change, Manager, Utilities Marketing Services to Manager, Utility Program Services 0.00 0 0 0
This action amends the Table of Organization by retitling the Manager, Utilities Marketing Services to Manager, Utilities Program Services in the Utilities Customer Service Support section to more accurately reflect the duties of the position. Utility Program Services is where customers can find answers regarding energy efficiency programs, green power programs, water efficiency programs, renewable energy programs, water and energy workshops, key account program and connecting to the City's commercial dark fiber backbone. (Ongoing: $0)
Performance Results
No impacts to current service levels are anticipated as a result of this title change.
5 Reclassification of 1.0 FTE Senior Management Analyst to 1.0 FTE Utilities Strategic Business Manager
0.00 12,227 0 12,227
This action amends the Table of Organization by reclassifying 1.0 Senior Management Analyst position to 1.0 FTE Utilities Strategic Business Manager position to more accurately reflect the duties of the position. Adopting this reclassification will make permanent the functions of a trial over-strength position created last year to serve in this capacity. This position guides improvements to internal processes, customer focused services, workforce development, and financial stability. This position will oversee Utilities strategic plan, operating and CIP budgets, technology road map, workforce development and succession program, and fiber policy. (Ongoing: $12,227)
Performance Results
No impacts to current service levels are anticipated as a result of this title change.
Budget AdjustmentsBudget Adjustments Positions Expenditures Revenues
Net Gas Fund
UTILITIES • CITY OF PALO ALTO FISCAL YEAR 2017 ADOPTED BUDGET

UTILITIES
6 Reclassification of 1.0 FTE Coordinator, Utility Projects to 1.0 FTE Inspector, Field Services 0.00 (2,796) 0 (2,796)
This action amends the Table of Organization by reclassifying 1.0 Coordinator Utility Projects to 1.0 Inspector Field Services to more accurately reflect the operational needs of the department. In FY 2013, Utilities reclassified one of three Inspector, Field Services positions to Supervisor, Inspection Services who would supervise, oversee, and ensure that all of the inspector's geospacial and pipe/fitting attribute data is consistently accurate, both from staff and contract inspectors and outside developers in compliance with Utilities Standards. As a result of the reclassification, there are only two inspectors assigned to WGW Engineering to review project plans and verify contract work are in compliance with specifications. Based on the volume of plan reviews and inspections, Utilities is requesting to add back a third field service inspector. The supervision of the inspectors and oversight of the geospacial database will be reassigned to a Senior Engineer. (Ongoing Savings: $2,796)
Performance Results
The position reclassifications reflect the current operational needs of the Electric/Water/Gas/Wastewater inspection services group.
7 Reclassification of 1.0 FTE Supervisor, Inspection Services to 1.0 FTE Utilities Supervisor 0.00 16,115 0 16,115
This action reclassifies 1.0 FTE Supervisor, Inspection Services to 1.0 FTE Utilities Supervisor in the Operations Division. There is a need for coordination between the WGW and Electric businesses. The supervisor position will act as a bridge that will allocate resources across the Divisions. The position will also functionally be able to fill in for the operation supervisors positions and develop skills to assume the duties of the other supervisors upon their retirement, which is key to the Utilities succession planning efforts. (Ongoing: $16,115)
Performance Results
The position reclassifications reflect the current operational needs of the Water/Gas/Wastewater & Electric operation. This would increase productivity, provide greater flexibility during employee absences, and would provide more job development opportunities.
Budget AdjustmentsBudget Adjustments Positions Expenditures Revenues
Net Gas Fund
UTILITIES • CITY OF PALO ALTO FISCAL YEAR 2017 ADOPTED BUDGET 455

UTILITIES
456
WASTEWATER COLLECTION FUNDDescriptionIn 1898, Palo Alto approved $28,000 in bond money to fund construction of the City’s first sewer network, which was completed in 1899. Private cesspools and privies were banned, and the City Health Officer had residents connected to the sewer system within a few years.
Wastewater Collection’s staff is responsible for design, construction, operation, and maintenance of approximately 216 miles of sewer mains and over 18,000 City-owned laterals. Staff continues overlapping the design and construction elements of rehabilitation and augmentation projects. Wastewater Collection’s priorities are: maintaining infrastructure reliability; identifying problems in mains and service laterals through expanded use of video technology; complying with all regulatory requirements; and maintaining its excellent safety record.
Accomplishments Surveyed, inspected, and cleaned 3,977 City-owned sewer laterals.
Continued to minimize Sanitary Sewer Overflows (SSOs) by increasing preventive maintenance work on laterals and mains; reduced total number of SSOs by 22% in 2015 compared to 2014
Repaired and/or replaced over 136 laterals with structural damage.
Continued to develop the next phase of the Crossbore program to address partially inspected and uninspected laterals based on a prioritized list and available budget.
Awarded contract for sanitary sewer replacement project SSR 24/25/26 and replaced 5,100 of the 42,000 linear feet of sanitary sewer mains in University South, Professorville, and Old Palo Alto neighborhoods to date.
UTILITIES • CITY OF PALO ALTO FISCAL YEAR 2017 ADOPTED BUDGET

UTILITIES
Completed the design of sanitary sewer replacement project SSR 27 to replace approximately 15,753 linear feet of wastewater main pipelines, 259 lateral pipelines, and 46 manholes.
Initiatives Implement a more aggressive sewer lateral replacement program as a result of the findings
in the crossbore inspection program.
Continue customer and plumber safety outreach about the importance of calling Utilities prior to clearing a sewer lateral to confirm no risk of crossbore.
Reduce the total number of Sanitary Sewer Overflows (SSOs) by 5% annually per State Water Resources Control Board’s requirement.
Request proposals and procure a contractor to do Phase II of the Crossbore program to address high priority laterals.
Replace aging sewer combination cleaning units with new units.
Continue the multi-year construction of sanitary sewer replacement project SSR 24/25/26 to replace approximately 42,398 LF of wastewater main pipelines, 779 lateral pipelines, and 121 manholes.
Award the contract and start the construction of sanitary sewer replacement project SSR 27 to replace approximately 15,753 LF of wastewater main pipelines, 259 lateral pipelines, and 46 manholes.
Goals and ObjectivesGOAL 1Maintain and provide reliable wastewater services to our customers.
Objectives: Clean and maintain 100 percent of the sewer mains in commercial area on a quarterly basis.
Clean and video a minimum of 17 percent of the City-owned laterals annually, to comply with City’s Sewer Overflow Reduction Plan.
Maintain a low level of inflow and infiltration of saltwater into the City’s wastewater system.
Maintain the integrity of our wastewater collection system by replacing mains and laterals as identified on our Wastewater Collection System Rehabilitation/Augmentation Capital Improvement Project plan.
Minimize Sanitary Sewer Overflows and stoppages.
UTILITIES • CITY OF PALO ALTO FISCAL YEAR 2017 ADOPTED BUDGET 457

UTILITIES
458
Key Performance Measures
Workload Measures
MAINTAIN AND PROVIDE RELIABLE SERVICESGoal Maintain and provide a reliable wastewater system to our customers
ObjectiveInspect and clean 100 percent of the sewer mains in commercial areas on a quarterly basis. Clean and video a minimum of 17 percent of the City-owned laterals annually to comply with City's Sewer Overflow Reduction Plan.
FY 2014 Actuals
FY 2015 Actuals
FY 2016 Adopted
FY 2016 Estimated
FY 2017 Adopted
Percent of miles of sewer lines cleaned/treated in a fiscal year 54.00% 61.00% 62.00% 63.00% 63.00%
Percentage of sewer laterals inspected annually 16.00% 22.00% 19.00% 18.00% 19.00%
Description
The purpose of the Sewer System Management Plan (SSMP) is to maintain and improve the condition of the collection system infrastructure; control infiltration and provide appropriate sewer capacity; and minimize the number and impact of sanitary sewer overflows. The goal is to perform sewer main cleaning of the entire collection system every 30 months (81.6 miles per year). This measures inspections and maintenance of 17 percent of City-owned laterals annually using closed-circuit television (CCTV) inspection data, including results of the on-going crossbore lateral inspection program, to target sewer mains and lower laterals for rehabilitation and replacement.
PurposeTo prevent blockage, sewer overflows, and to comply with the City's Sanitary Sewer Management Plan (SSMP), all the City's sewer mains must be cleaned within 30 months.
Status
The City is meeting the objectives of its Sanitary Sewer Management Plan, and through the implementation of an aggressive sewer main cleaning, the number of blockages and overflows have decreased. WGW Operations is on target to complete inspection of 17% or 3,108 laterals of 18,141 in the City.
FY 2014 Actuals
FY 2015 Actuals
FY 2016 Adopted
FY 2016 Estimated
FY 2017 Adopted
Number of Customer Accounts (Wastewater) 22,105 22,241 22,174 22,174 22,174
Number of sewage overflows in a fiscal year 105 96 65 72 64
Percent of sewage spill and line blockage responses within two hours
98.00% 97.00% 100.00% 100.00% 100.00%
Percent of surveyed residents rating the quality of the Sewer Service as good/excellent
89.00% 83.00% 88.00% 88.00% 88.00%
Percent of miles of sewer lines replaced 3.00% 3.00% 2.00% 1.76% 1.94%
UTILITIES • CITY OF PALO ALTO FISCAL YEAR 2017 ADOPTED BUDGET

UTILITIES
%
1%
1%
)%
4%
1%
0%
1%
)%
%
7%
8%
7%
0%
8%
0%
0%
)%
%
%
1%
8%
4%
6%
%
Budget SummaryFY 2014 Actuals
FY 2015 Actuals
FY 2016 Adopted Budget
FY 2017 Adopted Budget
FY 2017 Change $
FY 2017Change
Dollars by Division
CIP Wastewater Collection Fund 5,074,880 3,090,810 6,055,611 6,668,830 613,220 10.
Wastewater Collection Administration 1,701,786 1,454,325 2,562,518 2,616,917 54,399 2.
Wastewater Collection Customer Service 132,713 (323,934) 353,076 271,245 (81,831) (23.2
Wastewater Collection Engineering (Operating) 310,374 318,560 391,212 447,371 56,159 14.
Wastewater Collection Operations and Maintenance 9,432,600 11,423,074 11,566,762 13,430,249 1,863,487 16.
Total 16,652,353 15,962,835 20,929,179 23,434,612 2,505,433 12.
Dollars by Category
Salary & Benefits
Healthcare 533,024 539,838 307,130 325,781 18,651 6.
Other Benefits 78,231 70,690 40,593 34,417 (6,177) (15.2
Overtime 152,654 146,040 47,554 47,554 — —
Pension 558,324 469,096 399,983 426,797 26,814 6.
Retiree Medical 86,804 70,919 80,385 136,521 56,136 69.
Salary 1,427,205 1,122,447 1,548,070 1,606,009 57,939 3.
Workers' Compensation 26,416 18,019 22,339 35,739 13,400 60.
Total Salary & Benefits 2,862,659 2,437,050 2,446,054 2,612,817 166,762 6.
Allocated Charges 1,953,415 2,184,449 2,579,841 2,734,290 154,449 6.
Capital Improvement Program 3,936,230 1,642,939 5,955,478 6,668,830 713,353 12.
Contract Services 154,427 86,187 250,990 247,640 (3,350) (1.3
Debt Service 54,376 50,663 129,001 129,001 — —
Facilities & Equipment 20 — 3,000 3,000 — —
General Expense 73,112 75,022 107,100 122,160 15,060 14.
Operating Transfers-Out 107,522 119,173 107,078 285,689 178,611 166.
Rents & Leases 269,221 276,107 380,741 390,039 9,298 2.
Supplies & Material 244,812 314,451 342,870 386,120 43,250 12.
Transfer to Infrastructure 133,687 — — — — —
UTILITIES • CITY OF PALO ALTO FISCAL YEAR 2017 ADOPTED BUDGET 459

UTILITIES
460
2%
0%
%
%
2%
%
4%
%
1%
%
)%
4%
4%
)%
87
83
19
13
—
57
%
Utility Purchase 6,862,872 8,776,795 8,627,026 9,855,026 1,228,000 14.
Total Dollars by Expense Category
16,652,352 15,962,835 20,929,179 23,434,612 2,505,433 12.
Revenues
Charges for Services 18,121 23,042 10,000 10,000 — —
Charges to Other Funds 30,107 30,107 30,107 30,107 — —
Net Sales 15,877,228 15,494,811 17,064,999 17,947,509 882,510 5.
Operating Transfers-In 42,242 4,467 — — — —
Other Revenue 696,908 1,251,859 652,000 1,046,000 394,000 60.
Return on Investments 309,139 323,123 266,500 266,500 — —
Total Revenues 16,973,745 17,127,410 18,023,605 19,300,115 1,276,510 7.
Positions by Division
CIP Wastewater Collection Fund 13.34 13.00 12.52 12.52 — —
Wastewater Collection Customer Service 2.47 2.47 3.06 2.19 (0.87) (28.48
Wastewater Collection Engineering (Operating) 1.40 1.40 1.15 1.40 0.25 21.7
Wastewater Collection Operations and Maintenance 13.01 12.70 13.02 13.06 0.04 0.3
Total 30.22 29.57 29.74 29.17 (0.58) (1.93
Staffing
Job ClassificationFY 2014 Actuals
FY 2015 Actuals
FY 2016 Adopted Budget
FY 2017 Adopted Budget
FY 2017 Change $
FY 2017Salary
Account Specialist 0.25 0.25 0.25 0.23 (0.02) 14,2
Administrative Associate II 0.40 0.40 0.40 0.40 — 27,1
Assistant Director Utilities Engineering 0.15 0.15 0.15 0.15 — 28,5
Assistant Director Utilities Operations 0.10 0.10 0.10 0.10 — 19,0
Associate Engineer 0.50 0.50 0.50 — (0.50)
Business Analyst 0.75 0.75 0.50 0.75 0.25 91,3
Budget SummaryFY 2014 Actuals
FY 2015 Actuals
FY 2016 Adopted Budget
FY 2017 Adopted Budget
FY 2017 Change $
FY 2017Change
UTILITIES • CITY OF PALO ALTO FISCAL YEAR 2017 ADOPTED BUDGET

UTILITIES
34
62
41
—
64
—
38
06
79
57
08
62
83
95
85
16
82
09
18
74
43
81
05
29
—
—
11
90
30
Cement Finisher 0.50 0.50 0.50 0.50 — 39,7
Contracts Administrator 0.05 0.05 0.05 0.05 — 5,4
Coordinator Utilities Projects 1.25 1.35 1.35 1.10 (0.25) 106,3
Coordinator Utilities Safety & Security 0.10 — — — —
Customer Service Representative 1.20 1.20 1.38 1.20 (0.18) 80,9
Customer Service Specialist — — 0.46 — (0.46)
Customer Service Specialist-Lead 0.25 0.25 0.46 0.25 (0.21) 19,8
Engineer 1.00 1.00 1.00 1.00 — 113,7
Engineering Manager - Electric 0.15 0.15 0.15 0.15 — 24,4
Engineering Manager - WGW 0.34 0.34 0.34 0.34 — 53,4
Engineering Technician III 0.45 0.45 0.45 0.45 — 33,8
Equipment Operator 0.26 0.26 0.26 0.26 — 19,0
Heavy Equipment Operator 2.13 2.13 2.13 0.23 (1.90) 18,3
Heavy Equipment Operator/Install Repair — — — 3.15 3.15 271,8
Industrial Waste Investigator — — — 0.50 0.50 46,5
Inspector, Field Services 1.43 1.43 1.43 1.68 0.25 151,8
Maintenance Mechanic-Welding 0.20 0.20 0.20 0.20 — 17,0
Manager Utilities Credit & Collection 0.15 0.15 0.15 0.15 — 19,6
Manager Utilities Operations WGW 0.30 0.30 0.30 0.30 — 46,8
Program Assistant I 0.34 0.34 0.34 0.34 — 19,7
Project Engineer 2.00 2.00 2.00 2.00 — 214,2
Restoration Lead 0.26 0.26 0.26 0.26 — 22,7
Senior Engineer 1.30 1.15 1.30 1.30 — 184,8
Senior Mechanic 0.33 0.33 0.33 0.33 — 31,8
Senior Project Engineer — 0.15 — — —
Supervisor Inspection Services 0.42 0.42 0.42 — (0.42)
Utilities Engineer Estimator 0.47 0.47 0.47 0.47 — 50,0
Utilities Field Services Representative 1.25 1.25 1.25 1.25 — 108,2
Utilities Install Repair-Lead-Welding Certified 0.24 0.24 0.24 0.24 — 23,5
Staffing
Job ClassificationFY 2014 Actuals
FY 2015 Actuals
FY 2016 Adopted Budget
FY 2017 Adopted Budget
FY 2017 Change $
FY 2017Salary
UTILITIES • CITY OF PALO ALTO FISCAL YEAR 2017 ADOPTED BUDGET 461

UTILITIES
462
98
81
10
42
34
72
98
83
81
Utilities Install Repair-Welding Certified 0.36 0.36 0.36 0.36 — 30,8
Utilities Install/Repair 5.50 5.50 5.50 4.25 (1.25) 347,8
Utilities Install/Repair-Lead 2.00 2.00 2.00 2.00 — 191,6
Utilities Locator 0.39 0.39 0.39 0.39 — 31,9
Utilities Safety Officer — 0.10 0.10 0.10 — 11,0
Utilities Supervisor 1.30 1.30 1.30 1.72 0.42 233,8
Sub-total: Full-Time Equivalent Positions
28.07 28.17 28.77 28.15 (0.62) 2,751,8
Temporary/Hourly 2.15 1.40 0.98 1.02 0.04 42,2
Total Positions 30.22 29.57 29.74 29.17 (0.58) 2,794,1
Budget Reconciliation
Positions Expenditures Revenues
Net Wastewater Collection
Fund
Prior Year Budget 29.74 20,929,179 18,023,605 2,905,574
Adjustments to Costs of Ongoing Activities
Salaries and Benefits Adjustments (0.58) 119,169 — 119,169
Capital Improvement Program Adjustments — 713,352 — 713,352
Rents and Leases Expenditure Adjustment — 9,298 — 9,298
Off-hauling/Disposal of Materials Cost Adjustments — 50,000 — 50,000
Wastewater Treatment Purchases Expenditure Adjustment — 1,228,000 — 1,228,000
Transfer Out to Technology Fund Expenditure Adjustment — 148,268 — 148,268
Transfer Out to Water Fund Expenditure Adjustment — 30,343 — 30,343
Wastewater Treatment Sales Revenue Adjustment (Rate Increase 9%) — — 882,510 (882,510)
Wastewater Connection Fees Revenue Adjustment — — 394,000 (394,000)
Utilities and Public Works Charges to City Allocated Charges Adjustment — 235,247 — 235,247
Staffing
Job ClassificationFY 2014 Actuals
FY 2015 Actuals
FY 2016 Adopted Budget
FY 2017 Adopted Budget
FY 2017 Change $
FY 2017Salary
UTILITIES • CITY OF PALO ALTO FISCAL YEAR 2017 ADOPTED BUDGET

UTILITIES
General Fund Cost Allocation Plan Charges Adjustment — (150,584) — (150,584)
General Liability Insurance Allocated Charges Adjustment — (30,585) — (30,585)
Print & Mail Allocated Charges Adjustment — (4,596) — (4,596)
Utilities Admin Allocated Charges Adjustment — (44,051) — (44,051)
Vehicle Fund Allocated Charges Adjustment — 149,017 — 149,017
Adjustments to Costs of Ongoing Activities (0.58) 2,452,878 1,276,510 1,176,368
Total FY 2017 Base Budget 29.17 23,382,057 19,300,115 4,081,942
Budget Proposals
1 Reclassification of 2.0 FTE Heavy Equipment Operators, 1.0 FTE Installer Repairer and 1.0 FTE Assistant Installer Repairer to 4.0 FTE Heavy Equipment Operator/Installer-Repairer
— 25,244 — 25,244
2 Reclassification of 1.0 FTE Senior Management Analyst to 1.0 FTE Utilities Strategic Business Manager
— 6,768 — 6,768
3 Reclassification of 1.0 FTE Coordinator Utility Projects to 1.0 FTE Inspector Field Services — (2,796) — (2,796)
4 Reclassification of 1.0 FTE Supervisor, Inspection Services to 1.0 FTE Utilities Supervisor
— 23,339 — 23,339
Budget Changes — 52,555 — 52,555
Total FY 2017 Adopted Budget 29.17 23,434,612 19,300,115 4,134,497
Budget Reconciliation
Positions Expenditures Revenues
Net Wastewater Collection
Fund
UTILITIES • CITY OF PALO ALTO FISCAL YEAR 2017 ADOPTED BUDGET 463

UTILITIES
464
Budget Adjustments
Budget Adjustments Positions Expenditures Revenues
Net Wastewater Collection
Fund
1 Reclassification of 2.0 FTE Heavy Equipment Operators, 1.0 FTE Installer Repairer and 1.0 FTE Assistant Installer Repairer to 4.0 FTE Heavy Equipment Operator/Installer-Repairer
0.00 25,244 0 25,244
This action would create a new combo Heavy Equipment Operator / Installer-Repairer classification in the Heavy Equipment Operator and Installer-Repairer job families in the Water/Gas/Wastewater group. Currently there are separate sets of duties for heavy equipment operators and installer/repairers who work on the same water, gas, and sewer jobs. This proposal creates a combined position that would enable some employees to perform both sets of duties. This would increase productivity, provide greater flexibility during employee absences, and would provide more job development opportunities. 2.0 FTE Heavy Equipment Operator positions, 1.0 FTE Installer-Repairer, and 1.0 Assistant Installer-Repairer will be reclassified to 4.0 FTE Heavy Equipment Operator/Installer-Repairer positions. (Ongoing: $1,216)
Performance Results
The position reclassifications reflect the current operational needs of the Water/Gas/Wastewater operation. This would increase productivity, provide greater flexibility during employee absences, and would provide more job development opportunities.
2 Reclassification of 1.0 FTE Sr. Management Analyst to 1.0 FTE Strategic Business Manager 0.00 6,768 0 6,768
This action amends the Table of Organization by reclassifying 1.0 Senior Management Analyst position to 1.0 FTE Utilities Strategic Business Manager position to more accurately reflect the duties of the position. Adopting this reclassification will make permanent the functions of a trial over-strength position created last year to serve in this capacity. This position guides improvements to internal processes, customer focused services, workforce development, and financial stability. This position will oversee Utilities strategic plan, operating and CIP budgets, technology road map, workforce development and succession program, and fiber policy. (Ongoing: $6,768)
Performance Results
No impacts to current service levels are anticipated as a result of this title change.
UTILITIES • CITY OF PALO ALTO FISCAL YEAR 2017 ADOPTED BUDGET

UTILITIES
3 Reclassification of 1.0 FTE Coordinator Utility Projects to 1.0 FTE Inspector Field Services 0.00 (2,796) 0 (2,796)
This action amends the Table of Organization by reclassifying 1.0 Coordinator Utility Projects to 1.0 Inspector Field Services to more accurately reflect the operational needs of the department. In FY 2013, Utilities reclassified one of three Inspector, Field Services positions to Supervisor, Inspection Services who would supervise, oversee, and ensure that all of the inspector's geospacial and pipe/fitting attribute data is consistently accurate from staff, contract inspectors, and outside developers in compliance with Utilities Standards. As a result of the reclassification, there are only two inspectors assigned to WGW Engineering to review project plans and verify contract work is in compliance with specifications. Based on the volume of plan reviews and inspections, Utilities is requesting to add back a third field service inspector. The supervision of the inspectors and oversight of the geospacial database will be reassigned to a Senior Engineer. (Ongoing Savings: $2,796)
Performance Results
The position reclassifications reflect the current operational needs of the Electric/Water/Gas/Wastewater inspection services group.
4 Reclassification of 1.0 FTE Supervisor, Inspection Services to 1.0 FTE Utilities Supervisor 0.00 23,339 0 23,339
This action reclassifies 1.0 FTE Supervisor, Inspection Services to 1.0 FTE Utilities Supervisor in the Operations Division. There is a need for coordination between the WGW and Electric businesses. The supervisor position will act as a bridge that will allocate resources across the Divisions. The position will also functionally be able to fill in for the operation supervisors positions and develop skills to assume the duties of the other supervisors upon their retirement, which is key to the Utilities succession planning efforts. (Ongoing: $23,339)
Performance Results
The position reclassifications reflect the current operational needs of the Water/Gas/Wastewater & Electric operation. This would increase productivity, provide greater flexibility during employee absences, and would provide more job development opportunities.
Budget Adjustments
Budget Adjustments Positions Expenditures Revenues
Net Wastewater Collection
Fund
UTILITIES • CITY OF PALO ALTO FISCAL YEAR 2017 ADOPTED BUDGET 465

UTILITIES
466
WATER FUNDDescriptionFrom 1895 until 1928, the City’s water supply came from deep wells. When the groundwater supply started to decline, water was purchased from the San Francisco Regional Water System to supplement the local water system. Since 1962, when Palo Alto’s wells were discontinued as the primary water system, 100 percent of the water has come from the Regional Water System: 85 percent derived from snow melt flowing into the Hetch Hetchy Reservoir and the balance from runoff stored in San Francisco Bay Area reservoirs. The Water Fund focuses on increasing infrastructure reliability and responsiveness to meet the City’s water supply needs during an emergency; maintaining high-quality and reliable sources of water; updating water efficiency goals; and implementing water efficiency programs and services. Additionally, Engineering is implementing a seismic upgrade to the existing reservoirs, wells and receiving stations to increase supply reliability during catastrophic emergencies.
Accomplishments Achieved drought water savings substantially in excess of the 24% water use reduction
mandated by the State Water Resources Control Board.
Led citywide drought response initiative including water conservation education and water use restriction enforcement.
Completed the 2015 Urban Water Management Plan.
Certified the environmental impact report for the expansion of the recycled water system to deliver recycled water to City parks and the Stanford Research Park.
Completed the Water distribution system seismic evaluation and condition assessment master study to determine the reliability of water system and seismic stability of water pipelines in the Foothills. Pipeline improvements recommended from this study will be included in future capital improvement projects.
UTILITIES • CITY OF PALO ALTO FISCAL YEAR 2017 ADOPTED BUDGET

UTILITIES
Completed the construction of original scope of water main replacement project WMR 25 to replace approximately 12,000 LF of water main pipelines, 225 service pipelines, and 16 fire hydrants. Currently the contractor is working on the additional scope on Hopkins Avenue.
Initiatives Complete the business plan to evaluate the potential expansion of the recycled water
system to deliver recycled water to City parks and the Stanford Research Park.
Work with Public Works to complete the Recycled Water Strategic Plan, a comprehensive evaluation of all potential recycled water supply options including nonpotable reuse, indirect and direct potable reuse, on-site treatment and use, storm water use, and groundwater.
Complete an assessment of potential potable water supplies.
Respond to drought regulations and implement the Urban Water Shortage Contingency Plan to meet usage reduction targets.
Complete the construction of Boronda Reservoir concrete water tank rehabilitation by removing the old steel tension cable and rewrapping with new cable and shotcrete.
Assess the current condition of water reservoirs in the Foothills and identify structural integrity issues. Determine the feasibility and cost effectiveness of alternatives to address the structural integrity issues. Develop a work plan to retrofit the existing reservoirs or to build new reservoirs.
Complete the design of water main replacement project WMR 26 to replace approximately 10,629 water main pipelines, 174 service pipelines, and 40 fire hydrants.
Continue the multi-year construction for seismic upgrade of 2 water steel tanks and 3 turnouts.
Initiated two pilot programs with grants from the Santa Clara Valley Water District (SCVWD). One to develop Business Water Reports for restaurants and hotels and another to install real-time water meters for City facilities and selected commercial properties.
Goals and ObjectivesGOAL 1Provide safe and clean drinking water for our customers.
Objectives: Ensure drinking water meets all regulatory standards.
Maintain and update water infrastructure to ensure reliable service.
Educate customers about backflow prevention as part of the City’s Cross Connection Control Program.
Ensure adequate water supplies are available to meet existing and future water demands.
Complete seismic upgrades to water system (reservoirs, receiving stations and wells).
UTILITIES • CITY OF PALO ALTO FISCAL YEAR 2017 ADOPTED BUDGET 467

UTILITIES
468
GOAL 2Increase environmental sustainability of the water supply system.
Objective: Increase water conservation and efficiency participation.
Develop updated long-term water efficiency goals as part of the 2015 Urban Water Management Plan update.
Evaluate expanding the recycled water delivery system to help drought-proof the system, reuse local water supplies, and reduce the City’s dependence on the Tuolumne River.
Key Performance MeasuresPROVIDE SAFE AND CLEAN DRINKING WATER FOR OUR CUSTOMERSGoal Provide safe and clean drinking water for our customers.
Objective Ensure drinking water meets all regulatory standards.
FY 2014 Actuals
FY 2015 Actuals
FY 2016 Adopted
FY 2016 Estimated
FY 2017 Adopted
Percentage of customer-owned water backflow prevention devices in compliance
96.00% 94.00% 90.00% 94.00% 94.00%
Description
Customer-owned and maintained backflow devices are an integral part of the City's Cross Connection Control Program which began in early 2010. The devices help to ensure that no contaminants of any kind (e.g., chemicals, debris, reclaimed water) enter the potable water system.
PurposeThe California Department of Public Health Services provides regulations for the City and our customers through California Code of Regulations, Title 17. These regulations specify the types of hazards that require backflow devices.
Status
We are achieving a compliance rate of up to 95-96 percent on an annual basis. There are 3,330 backflow devices. This number is growing every year as current codes require backflow installation for residences as well as Commercial properties.
UTILITIES • CITY OF PALO ALTO FISCAL YEAR 2017 ADOPTED BUDGET

UTILITIES
WATER EFFICIENCYGoal Increase environmental sustainability of the water supply system.
Objective Increase water conservation and efficiency participation.
FY 2014 Actuals
FY 2015 Actuals
FY 2016 Adopted
FY 2016 Estimated
FY 2017 Adopted
Water savings achieved through efficiency programs. 0.64% 0.91% 0.91% 0.91% 0.91%
Description
We measure specific savings achieved by the installation of water efficiency improvements through methods we can track: our rebate, audit, loan and other incentive programs. We can also track overall savings by customer class, which include behavioral changes, including those implemented as a result of programs such as the Home Water Reports, which provide customers tools to enable them to manage their own water use.
Purpose
Improving water efficiency for homes and businesses can result in water supply, water operations and wastewater processing savings. This measure supports the Water Fund's ten-year goals for water, to reduce expected water use by 20 percent by 2020.
Status
Water efficiency program savings were significantly higher in FY 2015 compared to FY 2014 due to the California drought and the Governor's Executive Order mandating water conservation. In order to meet local water restrictions, both CPAU and the SCVWD doubled their landscape rebates, resulting in a program that was very popular and resulted in substantial water savings.
WATER QUALITYGoal Ensure the provision of safe and clean drinking water for our customers.
Objective Safe testing of drinking water to meet all regulatory standards.
FY 2014 Actuals
FY 2015 Actuals
FY 2016 Adopted
FY 2016 Estimated
FY 2017 Adopted
Percentage of samples passed from all sampling stations 100.00% 100.00% 100.00% 100.00% 100.00%
Description
The City of Palo Alto (CPA) regularly collects and tests water samples from connection points between the San Francisco Public Utilities Commission/City of Palo Alto (SFPUC/CPA), storage reservoirs, emergency wells, residential, and sample station locations within the distribution system to ensure that the water quality meets all California Department of Public Health (CDPH) and U.S. Environmental Protection Agency (EPA) prescribed regulations that limit the amount of contaminants in the drinking water. The City has 18 sampling stations and collects 84-105 samples monthly to test levels of chlorine residual, coliform and pH levels are within regulatory guidelines. All sample results are reported to CDPH on a monthly basis.
Purpose Complying with regulations guarantees we maintain our high standards of water quality and avoid fines.
Status Palo Alto drinking water continues to be in complete compliance with all existing county, state, and federal standards for water quality.
UTILITIES • CITY OF PALO ALTO FISCAL YEAR 2017 ADOPTED BUDGET 469

UTILITIES
470
%
8%
4%
6%
8%
2%
)%
4%
8%
)%
%
0%
4%
1%
)%
6%
)%
5%
4%
%
Workload MeasuresFY 2014 Actuals
FY 2015 Actuals
FY 2016 Adopted
FY 2016 Estimated
FY 2017 Adopted
Percent of miles of water mains replaced 0.10% 0.00% 0.00% 1.00% 0.90%
Number of customer accounts (Water) 20,087 22,421 19,638 19,638 19,638
Percent of surveyed rating the quality of the Drinking Water (Water) as "Good" or "Excellent"
89.00% 83.00% 88.00% 88.00% 88.00%
Budget SummaryFY 2014 Actuals
FY 2015 Actuals
FY 2016 Adopted Budget
FY 2017 Adopted Budget
FY 2017 Change $
FY 2017Change
Dollars by Division
CIP Water Fund 8,088,995 4,313,935 10,288,169 20,044,312 9,756,143 94.
Water Administration 7,003,097 6,528,352 8,135,564 8,493,164 357,600 4.
Water Customer Service 1,677,926 1,821,447 2,002,659 2,095,208 92,550 4.
Water Engineering (Operating) 391,143 358,128 447,404 504,489 57,085 12.
Water Operations and Maintenance 4,986,274 5,283,426 6,345,288 6,866,562 521,275 8.
Water Resource Management 16,275,328 16,158,265 20,832,529 19,861,067 (971,460) (4.7
Total 38,422,765 34,463,553 48,051,611 57,864,803 9,813,192 20.
Dollars by Category
Salary & Benefits
Healthcare 765,018 759,274 677,040 709,498 32,458 4.
Other Benefits 122,185 108,612 102,592 90,606 (11,986) (11.7
Overtime 206,398 187,046 168,764 168,764 — —
Pension 934,755 787,607 894,784 1,073,736 178,953 20.
Retiree Medical 304,426 221,560 247,218 285,198 37,980 15.
Salary 3,645,983 3,850,986 3,541,733 4,075,232 533,499 15.
Workers' Compensation 123,393 76,724 104,320 57,907 (46,413) (44.5
Total Salary & Benefits 6,102,157 5,991,809 5,736,450 6,460,942 724,492 12.
Allocated Charges 3,444,985 3,633,073 4,035,313 4,028,173 (7,140) (0.2
Capital Improvement Program 7,307,830 3,378,101 10,199,498 20,044,312 9,844,814 96.
Contract Services 373,478 728,992 682,006 827,806 145,800 21.
Debt Service 1,906,221 1,863,964 3,222,606 3,222,606 — —
UTILITIES • CITY OF PALO ALTO FISCAL YEAR 2017 ADOPTED BUDGET

UTILITIES
%
7%
4%
6%
6%
%
)%
4%
%
%
%
)%
1%
5%
%
)%
%
4%
2%
%
8%
6%
%
Facilities & Equipment — 286 2,000 2,000 — —
General Expense 385,806 366,062 547,927 568,146 20,220 3.
Operating Transfers-Out 388,596 63,612 27,381 324,306 296,925 1,084.
Rents & Leases 2,274,743 2,329,829 2,803,606 2,876,500 72,894 2.
Supplies & Material 392,244 437,889 566,860 610,010 43,150 7.
Transfer to Infrastructure 141,415 — — — — —
Utility Purchase 15,705,288 15,669,935 20,227,965 18,900,000 (1,327,964) (6.6
Total Dollars by Expense Category
38,422,763 34,463,554 48,051,611 57,864,802 9,813,191 20.
Revenues
Charges for Services 75,405 45,184 10,000 10,000 — —
Charges to Other Funds 187,352 160,528 154,958 154,958 — —
From Other Agencies 549,014 534,328 576,632 576,632 — —
Net Sales 39,876,751 34,862,279 39,446,148 39,346,148 (100,000) (0.3
Operating Transfers-In 271,221 191,525 183,333 244,018 60,685 33.
Other Revenue 1,008,630 2,002,342 857,000 878,000 21,000 2.
Return on Investments 831,506 792,652 775,300 775,300 — —
Total Revenues 42,799,880 38,588,839 42,003,371 41,985,056 (18,315) (0.0
Positions by Division
CIP Water Fund 9.65 9.53 9.05 9.05 — —
Water Customer Service 10.47 10.80 9.01 9.68 0.67 7.4
Water Engineering (Operating) 1.37 1.37 1.12 1.37 0.25 22.3
Water Operations and Maintenance 24.98 24.97 25.44 25.44 — —
Water Resource Management 1.71 1.71 1.53 3.03 1.50 97.9
Total 48.18 48.38 46.15 48.58 2.43 5.2
Budget SummaryFY 2014 Actuals
FY 2015 Actuals
FY 2016 Adopted Budget
FY 2017 Adopted Budget
FY 2017 Change $
FY 2017Change
UTILITIES • CITY OF PALO ALTO FISCAL YEAR 2017 ADOPTED BUDGET 471

UTILITIES
472
87
67
71
26
19
11
46
67
24
89
—
58
68
17
05
79
84
06
28
20
79
53
04
32
16
—
76
09
Staffing
Job ClassificationFY 2014 Actuals
FY 2015 Actuals
FY 2016 Adopted Budget
FY 2017 Adopted Budget
FY 2017 Change $
FY 2017Salary
Account Specialist 0.25 0.25 0.25 0.23 (0.02) 14,2
Administrative Associate II 0.85 0.85 0.85 0.75 (0.10) 50,9
Assistant Director Utilities Customer Support Services 0.20 0.20 0.20 0.20 — 33,4
Assistant Director Utilities Engineering 0.20 0.20 0.20 0.20 — 38,0
Assistant Director Utilities Operations 0.15 0.15 0.15 0.15 — 28,5
Assistant Director Utilities/Resource Management 0.25 0.25 0.25 0.25 — 52,8
Business Analyst 1.62 1.62 1.68 1.73 0.05 214,4
Cement Finisher 0.25 0.25 0.25 0.25 — 19,8
Contracts Administrator 0.10 0.10 0.10 0.10 — 10,9
Coordinator Utilities Projects 1.19 1.34 1.34 1.09 (0.25) 104,5
Coordinator Utilities Safety & Security 0.15 — — — —
Customer Service Representative 1.56 1.56 1.26 1.56 0.30 105,2
Customer Service Specialist 0.66 0.66 0.42 0.66 0.24 48,9
Customer Service Specialist-Lead 0.59 0.59 0.42 0.59 0.17 46,8
Engineer 1.00 1.00 1.00 1.00 — 113,7
Engineering Manager - Electric 0.15 0.15 0.15 0.15 — 24,4
Engineering Manager - WGW 0.33 0.33 0.33 0.33 — 51,8
Engineering Technician III 0.45 0.45 0.45 1.45 1.00 102,1
Equipment Operator 0.31 0.31 0.31 0.31 — 22,7
Gas Systems Technician II 0.10 0.10 0.10 0.10 — 8,4
Heavy Equipment Operator 2.00 2.00 2.00 1.95 (0.05) 161,1
Heavy Equipment Operator/Install Repair — — — 0.20 0.20 18,2
Inspector, Field Services 1.40 1.40 1.40 1.65 0.25 149,1
Maintenance Mechanic-Welding 0.80 0.80 0.80 0.80 — 68,3
Manager Customer Service — — 0.34 0.34 — 44,0
Manager Customer Service and Meter Reading 0.34 0.34 — — —
Manager Utilities Compliance 0.50 0.50 0.50 0.50 — 80,7
Manager Utilities Credit & Collection 0.15 0.15 0.15 0.15 — 19,6
UTILITIES • CITY OF PALO ALTO FISCAL YEAR 2017 ADOPTED BUDGET

UTILITIES
—
30
02
60
00
—
16
70
—
92
67
56
62
00
27
27
93
—
13
—
86
94
12
—
36
49
00
22
94
42
Manager Utilities Marketing Services 0.20 0.20 0.20 — (0.20)
Manager Utilities Operations WGW 0.50 0.50 0.50 0.50 — 78,0
Manager Utilities Program Services — — — 0.20 0.20 24,4
Meter Reader 2.03 2.03 1.67 2.03 0.36 117,8
Meter Reader-Lead 0.34 0.34 0.28 0.34 0.06 23,0
Planner 0.15 0.15 — — —
Power Engineer 0.30 0.30 0.30 0.30 — 36,4
Principal Business Analyst — — 0.33 0.33 — 46,2
Principal Management Analyst — 0.33 — — —
Program Assistant I 0.33 0.33 0.33 0.33 — 19,1
Project Engineer 2.00 2.00 2.00 2.00 — 244,7
Resource Planner 0.20 0.20 0.10 0.70 0.60 84,1
Restoration Lead 0.31 0.31 0.31 0.31 — 27,1
SCADA Technologist 0.80 0.80 0.80 0.80 — 101,2
Senior Business Analyst 0.66 0.66 0.66 0.66 — 83,5
Senior Engineer 1.00 0.75 1.00 1.00 — 139,1
Senior Mechanic 0.34 0.34 0.34 0.34 — 32,7
Senior Project Engineer — 0.25 — — —
Senior Resource Planner 1.05 1.05 0.55 1.69 1.14 246,1
Senior Technologist 0.29 0.29 — — —
Senior Utilities Field Service Representative 0.49 0.49 0.49 0.49 — 47,1
Senior Water Systems Operator 2.00 2.00 2.00 2.00 — 195,0
Substation Electrician 0.40 0.40 0.40 0.40 — 36,6
Supervisor Inspection Services 0.29 0.29 0.29 — (0.29)
Utilities Engineer Estimator 0.43 0.43 0.43 0.43 — 45,7
Utilities Field Services Representative 1.50 1.50 1.50 1.50 — 129,9
Utilities Install Repair-Lead-Welding Certified 0.46 0.46 0.46 0.46 — 45,1
Utilities Install Repair-Welding Certified 0.69 0.69 0.69 0.69 — 59,2
Utilities Install/Repair 2.05 2.05 2.05 1.90 (0.15) 160,9
Utilities Install/Repair Assistant 0.35 0.35 0.35 0.35 — 22,9
Staffing
Job ClassificationFY 2014 Actuals
FY 2015 Actuals
FY 2016 Adopted Budget
FY 2017 Adopted Budget
FY 2017 Change $
FY 2017Salary
UTILITIES • CITY OF PALO ALTO FISCAL YEAR 2017 ADOPTED BUDGET 473

UTILITIES
474
19
14
11
37
51
99
—
46
63
31
64
95
Utilities Install/Repair-Lead 1.02 1.02 1.02 1.02 — 97,7
Utilities Key Account Representative 0.15 0.15 0.15 0.25 0.10 26,0
Utilities Locator 0.34 0.34 0.34 0.34 — 27,8
Utilities Marketing Program Administrator 1.00 1.00 0.40 0.40 — 39,6
Utilities Safety Officer — 0.15 0.15 0.15 — 16,5
Utilities Supervisor 2.62 2.62 2.62 2.91 0.29 398,4
Water Meter Cross Connection Technician 2.00 2.00 2.00 — (2.00)
Water System Operator I — — — 1.00 1.00 66,8
Water System Operator II 3.34 3.34 3.34 3.34 — 280,9
Sub-total: Full-Time Equivalent Positions
45.18 45.66 42.95 45.85 2.90 4,634,4
Temporary/Hourly 3.00 2.72 3.21 2.73 (0.47) 137,0
Total Positions 48.18 48.38 46.15 48.58 2.43 4,771,4
Budget ReconciliationPositions Expenditures Revenues
Net Water Fund
Prior Year Budget 46.15 48,043,985 42,003,371 6,040,614
Adjustments to Costs of Ongoing Activities
Salaries and Benefits Adjustments 2.43 623,683 — 623,683
Capital Improvement Program Expenditure Adjustments — 9,844,814 — 9,844,814
Water Commodity Purchases Expenditure Adjustments — (1,327,965) — (1,327,965)
Transfer Out to Electric Fund Expenditure Adjustment — 136,335 — 136,335
Transfer Out to Technology Fund Expenditure Adjustment — 160,590 — 160,590
Contract Services for Large Water Meter Calibration Cost Adjustments — 85,000 — 85,000
Off-hauling/Disposal of Materials Cost Adjustments — 50,000 — 50,000
Rents and Leases Expenditure Adjustment — 72,894 — 72,894
Staffing
Job ClassificationFY 2014 Actuals
FY 2015 Actuals
FY 2016 Adopted Budget
FY 2017 Adopted Budget
FY 2017 Change $
FY 2017Salary
UTILITIES • CITY OF PALO ALTO FISCAL YEAR 2017 ADOPTED BUDGET

UTILITIES
Water Utility Sales to the City Revenue Adjustment — — (100,000) 100,000
Transfer In from Wastewater Fund Revenue Adjustment — — 30,343 (30,343)
Transfer In from Gas Fund Revenue Adjustment — — 30,342 (30,342)
Water Connection Fees Revenue Adjustments — — 21,000 (21,000)
Utility and Public Works Charges to the City Allocated Charges — 1,687 — 1,687
General Fund Cost Allocation Plan Charges Adjustment — (53,044) — (53,044)
General Liability Insurance Allocated Charges Adjustment — (51,171) — (51,171)
Print & Mail Allocated Charges Adjustment — (6,565) — (6,565)
Vehicle Fund Allocated Charges Adjustment — 149,371 — 149,371
Utilities Admin Allocated Charges Adjustment — 31,330 — 31,330
Adjustments to Costs of Ongoing Activities 2.43 9,716,959 (18,315) 9,735,274
Total FY 2017 Base Budget 48.58 57,760,944 41,985,056 15,775,888
Budget Proposals
1 Contract for Advisory Consultant for Gas and Water Operations — 65,000 — 65,000
2 Reclassification of 2.0 FTE Water Meter Cross Technicians to 1.0 FTE Water System Operator I and 1.0 FTE Engineering Technician III
— 13,053 — 13,053
3 Reclassify 2.0 FTE Heavy Equipment Operators, 1.0 FTE Installer Repairer and 1.0 FTE Assistant Installer Repairer to 4.0 FTE Heavy Equipment Operator/Installer-Repairer
— 1,216 — 1,216
4 Reclassification of 1.0 FTE Sr. Management Analyst to 1.0 FTE Strategic Business Manager — 11,271 — 11,271
5 Reclassification of 1.0 FTE Coordinator Utility Projects to 1.0 FTE Inspector Field Services — (2,796) — (2,796)
6 Reclassification: 1.0 FTE Supervisor, Inspection Services to 1.0 FTE Utilities Supervisor — 16,115 — 16,115
7 Title Change: Manager, Utilities Marketing Services to Manager, Utility Program Services — 0 — 0
Budget Changes — 103,859 — 103,859
Total FY 2017 Adopted Budget 48.58 57,864,803 41,985,056 15,879,747
Budget ReconciliationPositions Expenditures Revenues
Net Water Fund
UTILITIES • CITY OF PALO ALTO FISCAL YEAR 2017 ADOPTED BUDGET 475

UTILITIES
476
Budget AdjustmentsBudget Adjustments Positions Expenditures Revenues
Net Water Fund
1 Contract for Advisory Consultant for Gas and Water Operations 0.00 65,000 0 65,000
This action provides funding for an advisory consulting contract to assist with operational evaluations, updating master plans, creating procedures for data collection, and reporting to meet compliance requirements, and updating procedure manuals. This service has helped the Sewer Operations improve its processes and meet its compliance obligations. The Gas and Water Operations would benefit from the same type of support. (Ongoing: $65,000)
Performance Results
The addition of these resources to the Gas and Water operation will increase operation efficiencies and help with compliance regulation.
2 Reclassification of 2.0 FTE Water Meter Cross Technicians to 1.0 FTE Water System Operator I and 1.0 FTE Engineering Technician III
0.00 13,053 0 13,053
This action reclassifies 2.0 Water Meter Cross Technicians to 1.0 Water Systems Operator and 1.0 Engineering Technician III. The water meter cross tech positions (meter installers) are consistently subjected to repetitive stress, injury and subsequent disability leave. This reclassification will shift the function and role of the meter installer positions in supporting the water transmission system, thereby increasing productivity and efficiency. The Water System Operator I would be responsible for occasional meter replacements, meter investigations, and backflow testing that are not part of the planned meter replacement program. The Engineering Tech III position would oversee the new water meter construction. Large meter replacement projects are proposed to be funded (and contracted out) through the CIP. (Ongoing: $13,053)
Performance Results
The position reclassifications reflect the current operational needs of the Water operation. This would increase productivity, reduce safety/injury hazards which would reduce employee absences, and would provide more job development opportunities.
UTILITIES • CITY OF PALO ALTO FISCAL YEAR 2017 ADOPTED BUDGET

UTILITIES
3 Reclassify 2.0 FTE Heavy Equipment Operators, 1.0 FTE Installer Repairer and 1.0 FTE Assistant Installer Repairer to 4.0 FTE Heavy Equipment Operator/Installer-Repairer
0.00 1,216 0 1,216
This action would create a new combo Heavy Equipment Operator / Installer-Repairer classification in the Heavy Equipment Operator and Installer-Repairer job families in the Water/Gas/Wastewater group. Currently there are separate sets of duties for heavy equipment operators and installer/repairers who work on the same water, gas, and sewer jobs. This proposal creates a combined position that would enable some employees to perform both sets of duties. This would increase productivity, provide greater flexibility during employee absences, and would provide more job development opportunities. 2.0 FTE Heavy Equipment Operator positions, 1.0 FTE Installer-Repairer, and 1.0 Assistant Installer-Repairer will be reclassified to 4.0 FTE Heavy Equipment Operator/Installer-Repairer positions. (Ongoing: $1,216)
Performance Results
The position reclassifications reflect the current operational needs of the Water/Gas/Wastewater operation. This would increase productivity, provide greater flexibility during employee absences, and would provide more job development opportunities.
4 Reclassification of 1.0 FTE Sr. Management Analyst to 1.0 FTE Strategic Business Manager 0.00 11,271 0 11,271
This action amends the Table of Organization by reclassifying 1.0 Senior Management Analyst position to 1.0 FTE Utilities Strategic Business Manager position to more accurately reflect the duties of the position. Adopting this reclassification will make permanent the functions of a trial over-strength position created last year to serve in this capacity. This position guides improvements to internal processes, customer focused services, workforce development, and financial stability. This position will oversee Utilities strategic plan, operating and CIP budgets, technology road map, workforce development and succession program, and fiber policy. (Ongoing: $11,271)
Performance Results
No impacts to current service levels are anticipated as a result of this title change.
5 Reclassification of 1.0 FTE Coordinator Utility Projects to 1.0 FTE Inspector Field Services 0.00 (2,796) 0 (2,796)
This action amends the Table of Organization by reclassifying 1.0 Coordinator Utility Projects to 1.0 Inspector Field Services to more accurately reflect the operational needs of the department. In FY 2013, Utilities reclassified one of three Inspector, Field Services positions to Supervisor, Inspection Services who would supervise, oversee, and ensure that all of the inspector's geospacial and pipe/fitting attribute data is consistently accurate, both from staff and contract inspectors and outside developers in compliance with Utilities Standards. As a result of the reclassification, there are only two inspectors assigned to WGW Engineering to review project plans and verify contract work is in compliance with specifications. Based on the volume of plan reviews and inspections, Utilities is requesting to add back a third field service inspector. The supervision of the inspectors and oversight of the geospacial database will be reassigned to a Senior Engineer. (Ongoing Savings: $2,796)
Performance Results
The position reclassifications reflect the current operational needs of the Electric/Water/Gas/Wastewater inspection services group.
Budget AdjustmentsBudget Adjustments Positions Expenditures Revenues
Net Water Fund
UTILITIES • CITY OF PALO ALTO FISCAL YEAR 2017 ADOPTED BUDGET 477

UTILITIES
478
6 Reclassification: 1.0 FTE Supervisor, Inspection Services to 1.0 FTE Utilities Supervisor 0.00 16,115 0 16,115
This action reclassifies 1.0 FTE Supervisor, Inspection Services to 1.0 FTE Utilities Supervisor in the Operations Division. There is a need for coordination between the WGW and Electric businesses. The supervisor position will act as a bridge that will allocate resources across the Divisions. The position will also functionally be able to fill in for the operation supervisors positions and develop skills to assume the duties of the other supervisors upon their retirement, which is key to the Utilities succession planning efforts. (Ongoing: $16,115)
Performance Results
The position reclassifications reflect the current operational needs of the Water/Gas/Wastewater & Electric operation. This would increase productivity, provide greater flexibility during employee absences, and would provide more job development opportunities.
7 Title Change, Manager, Utilities Marketing Services to Manager, Utilities Program Services 0.00 0 0 0
This action amends the Table of Organization by retitling the Manager, Utilities Marketing Services to Manager, Utilities Program Services in the Utilities Customer Service Support section to more accurately reflect the duties of the position. Utility Program Services is where customers can find answers regarding energy efficiency programs, green power programs, water efficiency programs, renewable energy programs, water and energy workshops, key account programs and connecting to the City's commercial dark fiber backbone. (Ongoing: $0)
Performance Results
No impacts to current service levels are anticipated as a result of this title change.
Budget AdjustmentsBudget Adjustments Positions Expenditures Revenues
Net Water Fund
UTILITIES • CITY OF PALO ALTO FISCAL YEAR 2017 ADOPTED BUDGET

NON-DEPARTMENTAL
%
0)%
%
%
3%
9%
0%
%
%
%
%
%
NON-DEPARTMENTALDescriptionThe General Fund Non-Departmental budget includes revenue and expenditure appropriations that are not related to a specific department or function. These cost typically benefit the City as a whole and include such items as Cubberley lease payments to Palo Alto Unified School Dis-trict. The Non-Departmental budget may also include estimated provisions or placeholders for certain revenues and expenditures that have not yet materialized or been distributed at the time the budget is developed or adopted. These items can be one-time or ongoing depending on its nature and frequency.
As part of the adoption of the Fiscal Year 2017 Budget, the City Council approved setting aside $750,000 to mitigate the cost of the City's unfunded pension liability. This funding is in addition to the $1.3 million that was set aside at the end of Fiscal Year 2015 for a potential Section 115 Trust Fund, for a total of $2.0 million earmarked for unfunded pension liability costs. Currently this funding remains in the General Fund Budget Stabilization Reserve (BSR) account.
Budget SummaryFY 2014 Actuals
FY 2015 Actuals
FY 2016 Adopted Budget
FY 2017 Adopted Budget
FY 2017 Change $
FY 2017Change
Dollars by Category
Salary & Benefits
Salary & Benefits Reserve — — 1,647,599 — (1,647,599) (100.
Allocated Charges — 757 — 719 719 —
Contract Services (310) — 40,000 40,000 — —
Debt Service 429,019 428,194 430,791 432,149 1,358 0.
General Expense 663,423 271,640 86,756 236,756 150,000 172.
Cubberley - Lease Payments to PAUSD 7,094,234 6,426,080 5,583,641 5,751,150 167,509 3.
Contingent Accounts
City Manager — — 250,000 250,000 — —
City Council — — 250,000 250,000 — —
City Attorney — — 100,000 100,000 — —
Human Resources — — 50,000 50,000 — —
Human Services Resource Allocation Process (HSRAP) — — — 50,000 50,000 —
NON-DEPARTMENTAL • CITY OF PALO ALTO FISCAL YEAR 2017 ADOPTED BUDGET 479

NON-DEPARTMENTAL
480
%
%
%
%
3%
5%
5)%
6%
%
Innovations & Special Events — — 50,000 50,000 — —
Planning & Transportation — — — 500,000 500,000 —
Sustainability — — — 250,000 250,000 —
Budget Uncertainty Reserve — — — 2,000,000 2,000,000 —
Operating Transfers-Out 1,547,241 2,573,060 1,801,177 5,102,329 3,301,152 183.
Rents & Leases 164,000 169,017 173,411 177,786 4,375 2.
Transfer to Infrastructure 17,234,485 19,678,146 20,877,405 18,486,097 (2,391,308) (11.
Total Dollars by Expense Category
27,132,092 29,546,893 31,340,779 33,726,985 2,386,206 7.
Budget ReconciliationPositions Expenditures Revenues
Net General Fund
Prior Year Budget — 31,340,779 — 31,340,779
Adjustments to Costs of Ongoing Activities
Salary and Benefits Reserve Adjustments — (1,647,599) — (1,647,599)
Debt Service Expenditure Adjustments — 1,358 — 1,358
Cubberley Lease Payments to PAUSD Adjustment — 167,509 — 167,509
Information Technology Transfer Adjustment — 246,798 — 246,798
Rents and Leases Expenditure Adjustment — 4,375 — 4,375
Infrastructure Transfer Adjustment — 3,335,692 — 3,335,692
Vehicle Maintenance Fund Transfer Adjustment — 158,232 — 158,232
Airport Fund Transfer Adjustment — 400,000 — 400,000
Print & Mail Allocated Charges Adjustment — 719 — 719
Adjustments to Costs of Ongoing Activities — 2,667,084 — 2,667,084
Total FY 2017 Base Budget — 34,007,863 — 34,007,863
Budget Adjustments
1 Transfer from the General Fund: Traffic Signal and Streetlight Electric Costs — 2,266,122 — 2,266,122
2 Establish Budget Uncertainty Reserve — 2,000,000 — 2,000,000
3 Planning and Transportation Contingency — 500,000 — 500,000
4 Establish Sustainability Contingency — 250,000 — 250,000
Budget SummaryFY 2014 Actuals
FY 2015 Actuals
FY 2016 Adopted Budget
FY 2017 Adopted Budget
FY 2017 Change $
FY 2017Change
NON-DEPARTMENTAL • CITY OF PALO ALTO FISCAL YEAR 2017 ADOPTED BUDGET

NON-DEPARTMENTAL
5 Transfer from the General Fund: Residential Preferential Parking Fund — 230,000 — 230,000
6 2016 Elections Funding — 150,000 — 150,000
7 Establish Human Services Resource Allocation Process (HSRAP) Contingency — 50,000 — 50,000
8 Reduce Transfer to General Capital Improvement Fund — (5,727,000) — (5,727,000)
Total Budget Adjustments — (280,878) — (280,878)
Total FY 2017 Adopted Budget — 33,726,985 — 33,726,985
Budget AdjustmentsBudget Adjustments Positions Expenditures Revenues
Net General Fund
1 Transfer from the General Fund: Traffic Signal and Streetlight Electric Costs 0.00 2,266,122 0 2,266,122
This action recognizes a transfer from the General Fund to reimburse the Electric Fund for electricity costs associated with City street light and traffic signal costs. As part of the Electric Fund Cost of Services Analysis (COSA), these costs were identified as more appropriately aligned with the General Fund. This transfer will be evaluated over the next year and the long term implications on staffing and workload impacts will be revisited in the development of the Fiscal Year 2018 budget process. (Ongoing: $2,266,122)
Performance Results
No impacts to current service levels are anticipated as a result of this funding realignment.
2 Establish Budget Uncertainty Reserve 0.00 2,000,000 0 2,000,000
This action establishes a one-time $2.0 million reserve for unanticipated program financial implications that may arise during Fiscal Year 2017. During the development of the FY 2017 Proposed Budget, a number of significant initiatives are underway such as the renovation of the City’s Golf Course, the Parks Master Plan, the Junior Museum and Zoo new site build and partnership, and negotiations with Stanford University for fire services. Each of these projects are too early in the planning phases to identify concrete financial implications at this time as analysis and discussions need to continue. Therefore, staff is setting aside this one-time reserve in order to proactively plan for these major initiatives and any variations in financial implications from those assumed in the FY 2017 budget. However, in order to use this reserve, additional actions will need to be brought forward to the City Council for review to identify if the financial implications the reserve is recommended to be used for are one-time or ongoing in nature. (Ongoing costs: $0)
Performance Results
No impacts are anticipated as a result of this action.
Budget ReconciliationPositions Expenditures Revenues
Net General Fund
NON-DEPARTMENTAL • CITY OF PALO ALTO FISCAL YEAR 2017 ADOPTED BUDGET 481

NON-DEPARTMENTAL
482
3 Establish Planning and Transportation Contingency 0.00 500,000 0 500,000
This action establishes a $500,000 contingency account for Transportation and Planning projects that may arise over the course of Fiscal Year 2017. Potential uses include urban design support for professional staff and for the development of design guidelines in the Eichler neighborhoods, Middlefield Road traffic analysis and safety enhancements, and Shuttle and RPP expenditures. Any use of the Contingency funding will require City Council Approval. (Ongoing costs: $0)
Performance Results
This funding will increase the Planning and Community Environment Department's quality of work for new priorities that may emerge throughout Fiscal Year 2017 and decrease cycle time while increasing customer satisfaction.
4 Establish Sustainability Contingency 0.00 250,000 0 250,000
Establish a Contingency Account in the amount of $250,000 to potentially fund specific requests that may be brought forward by the Office of Sustainability. Staff anticipates that such requests could include:
a. Community engagement around the S/CAP, including development of supporting presentation materials, web site development, Digital Commenter management and interactive modeling tools ($50,000)
b. Additional research and analysis to refine S/CAP implementation scenarios, adoption rates, estimated costs and projected impacts in response to community and Council input ($100,000);
c. Management of existing and pending pilots and grants (including EV charging and education, sustainability financing strategies, etc), development and management of MaaS (mobility as a service) and other project pilots, and other short term consulting projects that may be needed ($100,000) (Ongoing costs: $0)
Performance Results
This funding will increase the Office of Sustainability effectiveness in the implementation of Sustainability programs, including the Climate Action Plan.
5 Transfer from the General Fund: Residential Preferential Parking Fund 0.00 230,000 0 230,000
This action transfers $230,000 from the General Fund to the Residential Preferential Parking Fund in order to provide initialization funding for two new Residential Parking Permit Programs approved by the City Council subsequent to the presentation of the Fiscal Year 2017 Proposed Operating Budget. (Ongoing costs: $0)
Performance Results
This funding will increase customer satisfaction associated with the Residential Preferential Parking Permit program and decrease cycle time to start the two new programs.
6 2016 Elections Funding 0.00 150,000 0 150,000
This action provides funding for the election costs for four City Council Member seats as well as election notification expenses. (Ongoing costs: $0)
Performance Results
This funding supports the democratic process for electing City Council Members.
Budget AdjustmentsBudget Adjustments Positions Expenditures Revenues
Net General Fund
NON-DEPARTMENTAL • CITY OF PALO ALTO FISCAL YEAR 2017 ADOPTED BUDGET

NON-DEPARTMENTAL
7 Establish Human Services Resource Allocation Process (HSRAP) Contingency 0.00 50,000 0 50,000
This action converts the HSRAP reserve that was initially allocated as part of the Fiscal Year 2015 Adopted Operating budget into an ongoing contingency item. This contingency will be used to offset costs that occur out of the HSRAP grantee cycle, potentially including both new grantees and special hardship cases for existing grantees that would otherwise preclude them from continuing their service to the community. (Ongoing costs: $50,000)
Performance Results
This action will increase customer satisfaction for those receiving service through a HSRAP agency and decrease the cycle time associated with meeting HSRAP agencies' emerging needs that occur outside of the grant cycle.
8 Reduce Transfer to General Capital Improvement Fund 0.00 (5,727,000) 0 (5,727,000)
This action reduces the transfer from the General Fund to the General Capital Improvement Fund in the amount of $5.7 million in recognition of the fact that the Capital Improvement Fund has adequate resources to address its “catch-up” and “keep-up” needs ($1.4 million), and as a result of the deferral of construction activity in projects in the Capital Fund that were originally programmed in Fiscal Year 2017, as well as the increased funding needs in the General Fund. This action budgets a $16.7 million transfer from the General Fund, of which $8.7 million is a base transfer and an additional $8.0 million in Transient Occupancy Tax (TOT) revenues. The City Council earmarked the TOT revenues from a voter approved 2 percent Transient Occupancy Tax (TOT) increase plus revenue from new hotels to infrastructure beginning in January 2015. (Ongoing savings: $1.4 million)
Performance Results
No impacts are anticipated as a result of this action.
Budget AdjustmentsBudget Adjustments Positions Expenditures Revenues
Net General Fund
NON-DEPARTMENTAL • CITY OF PALO ALTO FISCAL YEAR 2017 ADOPTED BUDGET 483

484 • CITY OF PALO ALTO FISCAL YEAR 2017 ADOPTED BUDGET

EMPLOYEE INFORMATION
CITY OF PALO ALTO FISCAL YEAR 2017 ADOPTED BUDGET 485


GENERAL BENEFITS FUND
GENERAL BENEFITS FUND
The General Benefits Fund includes funding for employee pension benefits, health benefits (medical, dental, and vision) for current City employees and several other benefits, such as life insurance, the employee assistance program, and the employee commute program. Funding for retired employees healthcare costs is reflected in the Retiree Health Benefits Fund.
There is an overall net $4.87 million increase in employee pension, healthcare costs, and other benefits costs from the Fiscal Year 2016 Adopted Budget amount of $51.0 million to the Fiscal Year 2017 Adopted Budget amount of $55.87 million. This increase is primarily driven by changes in the pension rate, health care cost increases, and a citywide increase of 12.0 positions, or 1.1 percent (1,040.10 positions in the Fiscal Year 2016 Adopted Budget to 1,052.10 positions in the Fiscal Year 2017 Adopted Budget). It should be noted that two of these positions were already approved by the City Council in Fiscal Year 2016, so 10 positions are recommended to be added in this Budget document. Lastly, as a Fiscal Year 2017 balancing solution, a one-time freeze on department allocated charges from this fund is recommended. This will result in a reduction of $1.3 million in the unrestricted fund balance of the General Benefits Fund, from $2.2 million to $0.9 million, and commensurate savings to all City funds of $1.3 million of which approximately $0.5 million is savings to the General Fund. See the Internal Service Fund Over-view section of this document for further discussion.
PENSION COSTSCalPERS annually prepares an actuarial analysis to determine the City’s pension liability and annual required contribution for miscellaneous and safety employees. This budget includes the most recent pension rates from CalPERS which, compared to the Fiscal Year 2016 rates, repre-sent a 1.2 percentage point increase in pension contribution rate for miscellaneous groups (from 27.7 percent to 28.9 percent) and 3.5 percentage point increase in the pension contribution rate for safety groups (from 41.9 percent to 45.4 percent) for Fiscal Year 2017. With the passage of the California Public Employees’ Pension Reform Act (PEPRA), the City has three retirement tiers for Miscellaneous and Safety employees. As of March 2016, 34 percent of the City’s employees are either in Tier 2 or Tier 3.
As a cost savings measure, the Fiscal Year 2017 Budget assumes a prepayment towards the required employer contribution, totaling $31.96 million Citywide as outlined in the CalPERS actuarial valuation as of June 30, 2014. As opposed to paying the City’s pension contribution every pay period, this lump sum payment, to be paid in July 2016, will result in a $1.13 million pension expense savings citywide, of which $0.72 million is savings in the General Fund. The savings are calculated by CalPERS which assumes an average 7.5 percent investment return ver-sus the City’s Fiscal Year 2016 estimated return on its investment portfolio of 1.85 percent. These savings are partially offset by a return on investment loss of approximately $0.23 million based on the City’s average portfolio interest rate of 1.85 percent. It is important to note that the City is
GENERAL BENEFITS FUND • CITY OF PALO ALTO FISCAL YEAR 2017 ADOPTED BUDGET 487
GENERAL BENEFITS FUND
488
bound by a very conservative investment policy which prohibits investments in equities; how-ever, in fiscal year 2015 CalPERS earned 2.4 percent on its investments.
Another pension cost savings measure pursued by the City through labor negotiations and implemented in Fiscal Year 2016 is having employees pay an additional portion of their pension costs above the current employee contribution level of 9 percent. With the adoption of labor contracts with the International Association of Fire Fighters (IAFF), Police Officers Association (POA), and Service Employees International Union (SEIU) labor groups, IAFF and POA employ-ees agreed to increase their share of the pension contribution by 1 percent annually over the term of the agreement, 10 percent in Fiscal Year 2016, 11 percent in Fiscal Year 2017, and 12 per-cent in Fiscal Year 2018. SEIU employees agreed to increase their contributions by 0.5 percent annually over the term of the agreement, 9.5 percent in Fiscal Year 2017 and 10 percent in Fiscal Year 2018. These additional employee contributions are estimated to generate $0.33 million in savings in Fiscal Year 2017 of which $0.22 million is savings in the General Fund.
HEALTHCARE COSTSThe Fiscal Year 2017 budget for healthcare is based on the health plan choices employees made for calendar year 2016. For calendar year 2017, the budget assumes an 8 percent annual increase in medical costs for labor groups on the 90/10 medical cost plan and a 4 percent annual health care cost increase for the labor groups on the flat rate contribution structure. Fur-ther, this budget includes a 4 percent annual increase in dental and vision costs. Based on the recently approved agreements with IAFF, POA, and SEIU, by January 2017 all employees, except those in the Fire Chief’s Association (FCA) and the Utilities Management Professional Associa-tion of Palo Alto (UMPAPA), will be on the flat rate contribution structure.
A change in the Fiscal Year 2017 Budget related to healthcare costs, is the treatment and bud-geting of the City’s implied subsidy for retiree healthcare. There is a new requirement which dic-tates that government agencies must recognize the true cost of medical health care by active employees and retirees. The health care premiums are the same regardless of age or active sta-tus with the exception of Medicare premiums. The new requirement is intended to recognize that as people age their medical cost increase; therefore, an actuarial calculation has been com-pleted to recognize the higher cost of medical services for retirees, which is reduced from the active employees’ health care costs, also known as the implied subsidy. In Fiscal Year 2017, the full cost of active employee healthcare is budgeted in the various City departments and col-lected in the General Benefits Fund to be paid to CalPERS. In order to account for the implied subsidy, healthcare costs for active employees have been reduced in the General Benefits Fund by $2.29 million and a transfer from the General Benefits Fund of $2.29 million to the Retiree Health Benefits Fund has been established to reflect the full payment of the City’s Annual Required Contribution (ARC) for Retiree Healthcare in the Retiree Health Benefits Fund. Addi-tional discussion of Retiree Healthcare costs and the ARC are located in the Retiree Health Ben-efits Fund section of this document.
GENERAL BENEFITS FUND • CITY OF PALO ALTO FISCAL YEAR 2017 ADOPTED BUDGET

GENERAL BENEFITS FUND
%
)%
2%
7%
0%
0%
0%
%
%
5%
2%
)%
7%
Budget SummaryFY 2014 Actuals
FY 2015 Actuals
FY 2016 Adopted Budget
FY 2017 Adopted Budget
FY 2017 Change $
FY 2017Change
Dollars by Category
Salary & Benefits
Healthcare 16,734,070 16,584,488 19,100,124 18,059,976 (1,040,148) (5.4
Other Benefits 623,267 768,061 1,066,925 1,090,733 23,809 2.
Pension 24,799,284 25,652,887 30,623,592 34,192,389 3,568,796 11.
Salary (105,553) 502,190 19,968 22,963 2,995 15.
Total Salary & Benefits 42,051,068 43,507,626 50,810,609 53,366,060 2,555,452 5.
Contract Services 148,596 56,819 192,125 215,200 23,075 12.
General Expense 2,351 — — — — —
Operating Transfers-Out — — — 2,291,745 2,291,745 —
Total Dollars by Expense Category
42,202,016 43,564,445 51,002,734 55,873,005 4,870,272 9.
Revenues
Other Revenue 41,897,395 44,458,418 50,418,919 54,544,108 4,125,188 8.
Return on Investments 236,181 202,973 231,100 4,000 (227,100) (98.3
Total Revenues 42,133,577 44,661,389 50,650,020 54,548,108 3,898,088 7.
Budget ReconciliationPositions Expenditures Revenues
Net General Benefits Fund
Prior Year Budget 0.48 51,002,734 50,650,020 352,714
Base Adjustments
One-Time Prior Year Expenditures and Revenues Deleted
Employee Wellness Program (0.48) (20,232) — (20,232)
One-Time Prior Year Expenditures and Revenues
(0.48) (20,232) — (20,232)
Adjustments to Costs of Ongoing Activities
Citywide Pension Adjustments — 3,564,932 — 3,564,932
Implied Subsidy Transfer to the Retiree Healthcare Fund — 2,291,745 — 2,291,745
Service Employee International Union (SEIU) Tuition Reimbursement (Part of SEIU contract adopted by City Council April 11, 2016)
— 100,000 — 100,000
Citywide Dental Insurance Adjustments — 37,381 — 37,381
GENERAL BENEFITS FUND • CITY OF PALO ALTO FISCAL YEAR 2017 ADOPTED BUDGET 489

GENERAL BENEFITS FUND
490
Citywide Fingerprinting Consolidation (Shift from Community Services Department $10,000 and Library Department $300) and Adjustments
— 11,875 — 11,875
Public Safety Compliance and Fitness Testing Contract Adjustments — 11,200 — 11,200
Employee Commute Program — 5,315 — 5,315
Citywide Employee Paid Retirement Adjustments — 3,865 — 3,865
Citywide Healthcare Insurance Adjustments — (1,072,014) — (1,072,014)
Administrative Fees Adjustments — (56,550) — (56,550)
State Unemployment Tax Adjustments — (25,000) — (25,000)
Citywide Vision Insurance Adjustments — (5,515) — (5,515)
Department Charges for General Benefits — — 4,125,188 (4,125,188)
Return on Investment Adjustments — — (227,100) 227,100
Adjustments to Costs of Ongoing Activities — 4,867,234 3,898,088 969,144
Total FY 2017 Base Budget — 55,849,736 54,548,108 1,301,628
Budget Adjustments
1 Employee Wellness Program 0.48 23,269 — 23,269
Total Budget Adjustments 0.48 23,269 — 23,269
Total FY 2017 Adopted Budget 0.48 55,873,005 54,548,108 1,324,897
Budget Adjustments
Budget Adjustments Positions Expenditures Revenues
Net General Benefits
Fund
1 Employee Wellness Program 0.48 23,269 0 23,269
This action continues funding for a 0.48 FTE Management Specialist that was added in Fiscal Year 2016 to establish and manage a program to promote Wellness throughout the City. In Fiscal Year 2016, the City signed a three year contract with a consultant to manage the City’s wellness website, offer telephone and online health coaching for employees, and online health management resources through the website. This position will continue to work with the consultant and ensure information about the program is properly communicated to employees. (Ongoing Costs: $23,269)
Performance Results
The Citywide Wellness Program encourages employees to make healthier choices both at work and at home, increasing quality of life and overall satisfaction. In addition, a healthier workforce reduces the potential for injuries and illness, which reduces workers' compensation claims, the amount of time employees are on sick leave, and overall medical insurance claim costs.
Budget ReconciliationPositions Expenditures Revenues
Net General Benefits Fund
GENERAL BENEFITS FUND • CITY OF PALO ALTO FISCAL YEAR 2017 ADOPTED BUDGET

RETIREE HEALTH BENEFIT FUND
RETIREE HEALTH BENEFIT FUND
In addition to providing pension benefits, the City participates in the California Public Employ-ees’ Medical and Hospital Care Act (PEMHCA) program to provide certain health care benefits for retired employees. This fund reflects costs for this program as well as payments for the unfunded liability for future medical benefits that will be provided to current and future retirees. Based on the June 30, 2013 actuarial study results updated by an outside consultant for the lat-est CalPERS mortality rate assumptions, investment gains for the Retiree Healthcare Trust Fund as of June 30, 2015, and the lowering of the assumed investment returns from 7.61 percent to 7.25 percent, the City’s Fiscal Year 2017 annual actuarial required contribution (ARC) is $16.1 mil-lion, an increase of $1.3 million, or 8.8%, from the Fiscal Year 2016 Adopted Budget amount of $14.8 million.
It should be noted that as of the production of this document, an updated draft actuarial study as of June 30, 2015 was received. Since a number of the significant assumption changes were already captured in the revised $16.1 million ARC estimate, this draft report is only marginally different than what was assumed in this budget document and indicates that there may be slight savings of approximately $146,000 in all funds and $107,000 in the General Fund. Since this study is still in draft form and it was given to the City late in the budget document produc-tion process, changes to the City’s retiree healthcare costs were not updated based on the June 30, 2015 actuarial data, and may be updated at a later date in Fiscal Year 2017.
The June 30, 2013 actuarial study was performed in accordance with applicable actuarial stan-dards and Governmental Accounting Standards Board (GASB) Statement No. 45, Accounting and Financial Reporting by Employers for Post-Employment Benefits Other Than Pension. The ARC includes the normal cost of the plan for the fiscal year, plus amortization towards the Unfunded Actuarial Accrued Liability (UAAL). According to the valuation as of June 30, 2013, approximately 31 percent of the UAAL is attributable to current active employees and 69 per-cent is attributable to retirees. The City has established an irrevocable trust fund to account for assets accumulated to offset the retiree medical for current and future retirees. The ARC is fully funded in the City’s General Fund, Enterprise Funds, and Other Funds budgets. Respectively, the General Fund, Enterprise Funds, and Other Funds fund 67 percent, 28 percent, and 5 per-cent of the ARC cost.
As stated above, the ARC assumed for the Fiscal Year 2017 budget is $16.1 million, however, the charges to the City’s funds is budgeted at $13.8 million. The difference of $2.3 million rep-resents the City’s implied subsidy for retiree healthcare. There is a new requirement which dic-tates that government agencies must recognize the true cost of medical health care by active employees and retirees. The health care premiums are the same regardless of age or active sta-tus with the exception of Medicare premiums. The new requirement is intended to recognize that as people age their medical costs increase; therefore, an actuarial calculation has been completed to recognize the higher cost of medical services for retirees, which is reduced from
RETIREE HEALTH BENEFIT FUND • CITY OF PALO ALTO FISCAL YEAR 2017 ADOPTED BUDGET 491

RETIREE HEALTH BENEFIT FUND
492
%
%
5%
4%
4%
%
%
)%
0%
7%
the active employees’ health care costs, also known as the implied subsidy. In Fiscal Year 2017, the full cost of active employee healthcare is budgeted in the various City departments and col-lected in the General Benefits Fund to be paid to CalPERS. In order to account for the implied subsidy, healthcare costs for active employees have been reduced in the General Benefits Fund by $2.29 million and a transfer from the General Benefits Fund of $2.29 million to the Retiree Health Benefits Fund has been established to reflect the full payment of the City’s Annual Required Contribution (ARC) for Retiree Healthcare in the Retiree Health Benefits Fund.
Budget SummaryFY 2014 Actuals
FY 2015 Actuals
FY 2016 Adopted Budget
FY 2017 Adopted Budget
FY 2017 Change $
FY 2017Change
Dollars by Category
Salary & Benefits
Other Benefits 67,410 71,619 60,000 60,000 — —
Retiree Medical 11,577,123 13,643,046 14,445,188 16,100,000 1,654,812 11.
Total Salary & Benefits 11,644,533 13,714,665 14,505,188 16,160,000 1,654,812 11.
Total Dollars by Expense Category
11,644,533 13,714,665 14,505,188 16,160,000 1,654,812 11.
Revenues
From Other Agencies 95,569 — — — — —
Operating Transfers-In — — — 2,291,745 2,291,745 —
Other Revenue 11,552,330 13,467,895 14,445,188 13,808,255 (636,933) (4.4
Return on Investments 50,438 70,997 25,200 57,700 32,500 129.
Total Revenues 11,698,337 13,538,892 14,470,388 16,157,700 1,687,312 11.
Budget Reconciliation
Positions Expenditures Revenues
Net Retiree Health
Benefits Fund
Prior Year Budget — 14,505,188 14,470,388 34,800
Base Adjustments
Adjustments to Costs of Ongoing Activities
Citywide Retiree Health Benefits Adjustment — 1,654,812 (636,933) 2,291,745
Implied Subsidy Transfer from the General Benefits Fund — — 2,291,745 (2,291,745)
Return on Investment Adjustments — — 32,500 (32,500)
Adjustments to Costs of Ongoing Activities — 1,654,812 1,687,312 (32,500)
Total FY 2017 Adopted Budget — 16,160,000 16,157,700 2,300
RETIREE HEALTH BENEFIT FUND • CITY OF PALO ALTO FISCAL YEAR 2017 ADOPTED BUDGET

TABLE OF ORGANIZATION
TABLE OF ORGANIZATION
Table of OrganizationFY 2014 Actuals
FY 2015 Actuals
FY 2016 Adopted Budget
FY 2017 Adopted Budget
FY 2017 Change
FTEFY 2017
Change %
General Fund
Administrative Services
Account Specialist 5.95 5.95 4.95 5.88 0.93 18.79%
Account Specialist-Lead 4.59 4.59 4.59 4.05 -0.54 (11.76)%
Accountant 2.00 2.00 3.00 3.00 0.00 0.00%
Administrative Assistant 1.00 1.00 1.00 1.00 0.00 0.00%
Administrative Associate III 1.00 1.00 1.00 1.00 0.00 0.00%
Assistant Director Administrative Services 1.65 1.65 1.75 1.65 -0.10 (5.71)%
Buyer 2.00 2.00 2.00 1.00 -1.00 (50.00)%
Chief Procurement Officer 1.00 1.00 1.00 1.00 0.00 0.00%
Contracts Administrator 1.70 1.70 1.70 1.70 0.00 0.00%
Director Administrative Services/CFO 0.70 0.70 0.70 0.80 0.10 14.29%
Director Office of Management and Budget 1.00 1.00 1.00 1.00 0.00 0.00%
Manager Accounting 1.00 1.00 1.00 1.00 0.00 0.00%
Manager Budget 0.00 0.00 1.00 1.00 0.00 0.00%
Manager Real Property 1.00 1.00 1.00 1.00 0.00 0.00%
Manager Revenue Collections 0.00 0.00 0.70 0.62 -0.08 (11.43)%
Manager Treasury, Debt & Investments 0.00 0.00 1.00 0.60 -0.40 (40.00)%
Payroll Analyst 2.00 2.00 2.00 2.00 0.00 0.00%
Principal Management Analyst 1.00 1.00 0.00 0.00 0.00 0.00%
Senior Accountant 3.00 3.00 3.00 3.00 0.00 0.00%
Senior Buyer 0.00 0.00 0.00 1.00 1.00 0.00%
Senior Management Analyst 5.90 5.90 4.20 4.90 0.70 16.67%
Storekeeper 0.00 0.00 0.00 1.00 1.00 0.00%
Storekeeper-Lead 1.00 1.00 1.00 0.20 -0.80 (80.00)%
Warehouse Supervisor 0.50 0.50 0.50 0.20 -0.30 (60.00)%
Total Administrative Services 37.99 37.99 38.09 38.60 0.51 1.34%
City Attorney
Assistant City Attorney 1.00 1.00 1.00 1.00 0.00 0.00%
City Attorney 1.00 1.00 1.00 1.00 0.00 0.00%
Claims Investigator 1.00 1.00 1.00 1.00 0.00 0.00%
Legal Fellow 0.00 1.00 1.00 1.00 0.00 0.00%
Legal Services Administrator 1.00 1.00 0.00 0.00 0.00 0.00%
Principal Attorney 0.00 1.00 1.00 1.00 0.00 0.00%
Secretary to City Attorney 1.00 1.00 1.00 1.00 0.00 0.00%
Senior Assistant City Attorney 2.00 2.00 2.00 2.00 0.00 0.00%
Senior Deputy City Attorney 1.00 1.00 1.00 1.00 0.00 0.00%
TABLE OF ORGANIZATION • CITY OF PALO ALTO FISCAL YEAR 2017 ADOPTED BUDGET 493

TABLE OF ORGANIZATION
494
Senior Legal Secretary 1.00 1.00 1.00 1.00 0.00 0.00%
Senior Management Analyst 0.00 0.00 1.00 1.00 0.00 0.00%
Total City Attorney 9.00 11.00 11.00 11.00 0.00 0.00%
City Auditor
Administrative Assistant 1.00 1.00 0.00 0.00 0.00 0.00%
City Auditor 1.00 1.00 1.00 1.00 0.00 0.00%
Performance Auditor 0.50 0.50 0.00 0.00 0.00 0.00%
Performance Auditor I 0.00 0.00 1.00 1.00 0.00 0.00%
Performance Auditor II 0.00 0.00 1.00 1.00 0.00 0.00%
Senior Performance Auditor 2.00 2.00 2.00 2.00 0.00 0.00%
Total City Auditor 4.50 4.50 5.00 5.00 0.00 0.00%
City Clerk
Administrative Associate III 2.00 2.00 2.00 2.00 0.00 0.00%
Assistant City Clerk 1.00 1.00 1.00 1.00 0.00 0.00%
City Clerk 1.00 1.00 1.00 1.00 0.00 0.00%
Deputy City Clerk 1.00 1.00 1.00 1.00 0.00 0.00%
Hearing Officer 0.75 0.75 0.75 0.75 0.00 0.00%
Total City Clerk 5.75 5.75 5.75 5.75 0.00 0.00%
City Manager
Administrative Assistant 1.00 1.00 1.00 1.00 0.00 0.00%
Administrative Associate III 1.00 1.00 1.00 1.00 0.00 0.00%
Assistant City Manager 1.00 2.00 2.00 2.00 0.00 0.00%
Assistant to the City Manager 1.00 0.00 0.00 0.00 0.00 0.00%
Chief Communications Officer 1.00 1.00 1.00 1.00 0.00 0.00%
Chief Sustainability Officer 0.05 0.05 0.00 0.00 0.00 0.00%
City Manager 1.00 1.00 1.00 1.00 0.00 0.00%
Executive Assistant to the City Manager 1.00 1.00 1.00 1.00 0.00 0.00%
Manager Communications 1.00 1.00 1.00 1.00 0.00 0.00%
Manager Economic Development 1.00 1.00 1.00 1.00 0.00 0.00%
Total City Manager 9.05 9.05 9.00 9.00 0.00 0.00%
Community Services
Administrative Assistant 1.00 1.00 1.00 1.00 0.00 0.00%
Administrative Associate III 0.75 0.75 1.00 1.00 0.00 0.25%
Assistant Director Community Services 2.00 2.00 2.00 2.00 0.00 0.00%
Building Serviceperson 2.00 2.00 2.00 2.00 0.00 0.00%
Table of OrganizationFY 2014 Actuals
FY 2015 Actuals
FY 2016 Adopted Budget
FY 2017 Adopted Budget
FY 2017 Change
FTEFY 2017
Change %
TABLE OF ORGANIZATION • CITY OF PALO ALTO FISCAL YEAR 2017 ADOPTED BUDGET

TABLE OF ORGANIZATION
Building Serviceperson-Lead 2.00 2.00 2.00 2.00 0.00 0.00%
Coordinator Recreation Programs 4.00 4.00 4.00 4.00 0.00 0.00%
Director Community Services 1.00 1.00 1.00 1.00 0.00 0.00%
Division Manager Open Space, Parks and Golf 1.00 1.00 1.00 1.00 0.00 0.00%
Heavy Equipment Operator 0.07 0.07 0.07 0.07 0.00 0.00%
Inspector, Field Services 2.00 2.00 2.00 2.00 0.00 0.00%
Junior Museum & Zoo Educator 2.25 2.75 2.75 2.75 0.00 0.00%
Management Analyst 0.00 1.00 1.00 1.00 0.00 0.00%
Management Assistant 1.00 1.00 1.00 1.00 0.00 0.00%
Manager Community Services 6.00 5.00 5.00 5.00 0.00 0.00%
Manager Community Services Senior Program 4.00 5.00 4.00 4.00 0.00 0.00%
Manager Human Services 0.00 0.00 1.00 1.00 0.00 0.00%
Park Maintenance Person 6.00 6.00 6.00 6.00 0.00 0.00%
Park Maintenance-Lead 1.00 1.00 1.00 1.00 0.00 0.00%
Park Ranger 5.00 5.00 5.00 5.00 0.00 0.00%
Parks/Golf Crew-Lead 2.00 2.00 2.00 2.00 0.00 0.00%
Producer Arts/Science Programs 11.75 11.75 12.50 12.50 0.00 0.00%
Program Assistant I 6.75 6.75 7.00 8.00 1.00 14.33%
Program Assistant II 4.00 4.00 4.00 4.00 0.00 0.00%
Project Manager 0.00 0.00 0.00 0.10 0.10 0.00%
Senior Management Analyst 1.00 1.00 1.00 1.00 0.00 0.00%
Sprinkler System Representative 4.00 4.00 4.00 4.00 0.00 0.00%
Superintendent Community Services 2.00 2.00 2.00 2.00 0.00 0.00%
Superintendent Recreation 0.00 0.00 1.00 1.00 0.00 0.00%
Theater Specialist 1.00 1.00 1.00 1.00 0.00 0.00%
Volunteer Coordinator 0.75 0.75 0.00 0.00 0.00 0.00%
Total Community Services 74.32 75.82 77.32 78.42 1.10 1.42%
Development Services
Administrative Assistant 0.00 1.00 1.00 1.00 0.00 0.00%
Administrative Associate II 0.00 3.02 3.02 3.00 -0.02 (0.66)%
Administrative Associate III 0.00 1.01 1.01 1.00 -0.01 (0.99)%
Assistant Chief Building Official 0.00 0.00 1.00 1.00 0.00 0.00%
Assistant Director Public Works 0.00 0.02 0.02 0.00 -0.02 (100.00)%
Associate Engineer 0.00 0.16 0.16 0.02 -0.14 (87.50)%
Associate Planner 0.00 0.90 0.90 0.90 0.00 0.00%
Building Inspector Specialist 0.00 3.00 4.00 4.00 0.00 0.00%
Building/Planning Technician 0.00 1.80 1.80 2.30 0.50 27.78%
Chief Building Official 0.00 1.00 1.00 1.00 0.00 0.00%
Table of OrganizationFY 2014 Actuals
FY 2015 Actuals
FY 2016 Adopted Budget
FY 2017 Adopted Budget
FY 2017 Change
FTEFY 2017
Change %
TABLE OF ORGANIZATION • CITY OF PALO ALTO FISCAL YEAR 2017 ADOPTED BUDGET 495

TABLE OF ORGANIZATION
496
Chief Planning Official 0.00 0.20 0.20 0.00 -0.20 (100.00)%
Code Enforcement Officer 0.00 0.50 0.40 0.40 0.00 0.00%
Code Enforcement-Lead 0.00 0.00 0.20 0.20 0.00 0.00%
Deputy Chief/Fire Marshal 0.00 0.84 0.85 0.80 -0.05 (5.88)%
Development Project Coordinator II 0.00 2.00 2.00 2.00 0.00 0.00%
Development Project Coordinator III 0.00 3.00 3.00 3.00 0.00 0.00%
Development Services Director 0.00 1.00 1.00 1.00 0.00 0.00%
Engineer 0.00 0.62 0.62 0.64 0.02 3.23%
Engineering Technician III 0.00 2.10 2.10 1.78 -0.32 (15.24)%
Fire Fighter 0.00 1.00 1.00 0.00 -1.00 (100.00)%
Fire Inspector 0.00 4.00 4.00 3.20 -0.80 (20.00)%
Hazardous Materials Inspector 0.00 1.90 1.90 1.60 -0.30 (15.79)%
Industrial Waste Inspector 0.00 0.01 0.01 0.01 0.00 0.00%
Industrial Waste Investigator 0.00 0.21 0.21 0.35 0.14 66.67%
Inspector, Field Services 0.00 0.70 0.70 0.68 -0.02 (2.86)%
Management Analyst 0.00 0.01 0.01 1.01 1.00 0.00%
Manager Development Center 0.00 1.00 1.00 1.00 0.00 0.00%
Manager Environmental Control Program 0.00 0.10 0.10 0.10 0.00 0.00%
Manager Planning 0.00 1.80 2.00 2.00 0.00 0.00%
Manager Urban Forestry 0.00 0.04 0.04 0.04 0.00 0.00%
Manager Watershed Protection 0.00 0.05 0.05 0.00 -0.05 (100.00)%
Planner 0.00 0.80 0.25 0.17 -0.08 (32.00)%
Planning Arborist 0.00 0.25 0.25 0.25 0.00 0.00%
Plans Check Engineer 0.00 1.00 0.00 0.00 0.00 0.00%
Project Engineer 0.00 0.15 0.13 0.03 -0.10 (76.92)%
Project Manager 0.00 0.07 0.07 0.07 0.00 0.00%
Senior Engineer 0.00 0.68 0.68 0.46 -0.22 (32.35)%
Senior Industrial Waste Investigator 0.00 0.01 0.01 0.01 0.00 0.00%
Senior Management Analyst 0.00 1.00 1.00 1.00 0.00 0.00%
Senior Planner 0.00 0.40 0.36 0.24 -0.12 (33.33)%
Senior Technologist 0.00 0.50 0.00 0.00 0.00 0.00%
Supervisor Inspection and Surveying 0.00 0.27 0.27 0.27 0.00 0.00%
Surveyor, Public Works 0.00 0.47 0.00 0.00 0.00 0.00%
Total Development Services 0.00 38.59 38.32 36.53 -1.79 (4.67)%
Fire
40-Hour Training Battalion Chief 0.00 1.00 1.00 1.00 0.00 0.00%
40-Hour Training Captain 1.00 0.00 1.00 1.00 0.00 0.00%
Administrative Assistant 1.50 1.50 1.00 1.00 0.00 0.00%
Table of OrganizationFY 2014 Actuals
FY 2015 Actuals
FY 2016 Adopted Budget
FY 2017 Adopted Budget
FY 2017 Change
FTEFY 2017
Change %
TABLE OF ORGANIZATION • CITY OF PALO ALTO FISCAL YEAR 2017 ADOPTED BUDGET

TABLE OF ORGANIZATION
Administrative Associate II 3.00 2.00 2.00 2.00 0.00 0.00%
Battalion Chief 3.00 3.00 3.00 3.00 0.00 0.00%
Business Analyst 0.80 0.80 0.80 0.80 0.00 0.00%
Deputy Chief/Fire Marshal 0.84 0.00 0.00 0.05 0.05 0.00%
Deputy Director Technical Services Division 0.20 0.20 0.20 0.20 0.00 0.00%
Deputy Fire Chief 2.00 2.00 2.00 2.00 0.00 0.00%
Emergency Medical Service Director 1.00 1.00 1.00 1.00 0.00 0.00%
Emergency Medical Services Data Specialist 1.00 1.00 1.00 1.00 0.00 0.00%
Fire Apparatus Operator 30.00 30.00 30.00 30.00 0.00 0.00%
Fire Captain 22.00 22.00 21.00 21.00 0.00 0.00%
Fire Chief 1.00 1.00 1.00 1.00 0.00 0.00%
Fire Fighter 41.00 40.00 40.00 41.00 1.00 2.50%
Fire Inspector 4.00 0.00 0.00 0.80 0.80 0.00%
Geographic Information System Specialist 0.50 0.50 0.50 0.50 0.00 0.00%
Hazardous Materials Inspector 1.90 0.00 0.00 0.30 0.30 0.00%
Police Chief 0.50 0.50 0.00 0.00 0.00 0.00%
Senior Management Analyst 0.50 1.00 1.00 1.00 0.00 0.00%
Senior Technologist 0.00 0.00 0.00 0.00 0.00 0.00%
Total Fire 115.74 107.50 106.50 108.65 2.15 2.02%
Human Resources
Administrative Assistant 1.00 1.00 1.00 1.00 0.00 0.00%
Assistant Director Human Resources 1.00 1.00 1.00 1.00 0.00 0.00%
Director Human Resources/CPO 1.00 1.00 1.00 1.00 0.00 0.00%
Human Resources Assistant 4.00 4.00 0.00 0.00 0.00 0.00%
Human Resources Representative 2.00 2.00 2.00 2.00 0.00 0.00%
Human Resources Technician 0.00 0.00 4.00 4.00 0.00 0.00%
Manager Employee Benefits 1.00 1.00 1.00 1.00 0.00 0.00%
Manager Employee Relations 1.00 1.00 1.00 1.00 0.00 0.00%
Senior Human Resources Administrator 4.00 4.00 4.00 4.00 0.00 0.00%
Senior Management Analyst 1.00 1.00 1.00 1.00 0.00 0.00%
Total Human Resources 16.00 16.00 16.00 16.00 0.00 0.00%
Library
Administrative Assistant 1.00 1.00 1.00 1.00 0.00 0.00%
Assistant Director Library Services 1.00 1.00 1.00 1.00 0.00 0.00%
Business Analyst 1.00 1.00 1.00 1.00 0.00 0.00%
Table of OrganizationFY 2014 Actuals
FY 2015 Actuals
FY 2016 Adopted Budget
FY 2017 Adopted Budget
FY 2017 Change
FTEFY 2017
Change %
TABLE OF ORGANIZATION • CITY OF PALO ALTO FISCAL YEAR 2017 ADOPTED BUDGET 497

TABLE OF ORGANIZATION
498
Coordinator Library Programs 1.00 1.00 1.00 1.00 0.00 0.00%
Director Libraries 1.00 1.00 1.00 1.00 0.00 0.00%
Division Head Library Services 1.00 1.00 1.00 1.00 0.00 0.00%
Librarian 5.00 6.70 7.00 7.00 0.00 0.00%
Library Assistant 5.50 4.50 0.00 0.00 0.00 0.00%
Library Associate 5.00 7.00 7.00 7.00 0.00 0.00%
Library Specialist 7.00 7.00 12.50 12.50 0.00 0.00%
Management Assistant 1.00 1.00 1.00 1.00 0.00 0.00%
Manager Library Services 4.00 4.00 4.00 4.00 0.00 0.00%
Senior Librarian 8.25 8.50 8.50 9.00 0.50 5.88%
Supervising Librarian 0.00 0.00 2.00 2.00 0.00 0.00%
Total Library 41.75 44.70 48.00 48.50 0.50 1.04%
Office of Emergency Services
Director Office of Emergency Services 1.00 1.00 1.00 1.00 0.00 0.00%
Office of Emergency Services Coordinator 1.00 1.00 1.00 1.00 0.00 0.00%
Program Assistant 1.00 1.00 1.00 1.00 0.00 0.00%
Total Office of Emergency Services 3.00 3.00 3.00 3.00 0.00 0.00%
Office of Sustainability
Chief Sustainability Officer 0.50 0.50 1.00 1.00 0.00 0.00%
Total Office of Sustainability 0.50 0.50 1.00 1.00 0.00 0.00%
Planning and Community Environment
Administrative Assistant 2.00 1.00 1.00 1.00 0.00 0.00%
Administrative Associate I 1.00 1.00 1.00 1.00 0.00 0.00%
Administrative Associate II 3.80 1.00 1.00 0.00 -1.00 (100.00)%
Administrative Associate III 2.00 2.00 2.00 3.00 1.00 50.00%
Assistant Director PCE 1.00 1.00 1.00 1.00 0.00 0.00%
Associate Engineer 1.00 1.00 1.00 1.00 0.00 0.00%
Associate Planner 1.00 0.10 0.10 0.10 0.00 0.00%
Building Inspector Specialist 3.00 0.00 0.00 0.00 0.00 0.00%
Building/Planning Technician 2.00 0.20 0.20 0.70 0.50 250.00%
Business Analyst 0.00 1.00 1.00 1.00 0.00 0.00%
Chief Building Official 1.00 0.00 0.00 0.00 0.00 0.00%
Chief Planning Official 1.00 0.80 0.80 1.00 0.20 25.00%
Chief Transportation Official 0.90 0.50 0.50 0.70 0.20 40.00%
Code Enforcement Officer 2.00 1.50 1.60 1.60 0.00 0.00%
Code Enforcement-Lead 0.00 0.00 0.80 0.80 0.00 0.00%
Table of OrganizationFY 2014 Actuals
FY 2015 Actuals
FY 2016 Adopted Budget
FY 2017 Adopted Budget
FY 2017 Change
FTEFY 2017
Change %
TABLE OF ORGANIZATION • CITY OF PALO ALTO FISCAL YEAR 2017 ADOPTED BUDGET

TABLE OF ORGANIZATION
Coordinator Transportation Systems Management 0.50 0.90 0.85 0.60 -0.25 (29.41)%
Development Project Coordinator II 2.00 0.00 0.00 0.00 0.00 0.00%
Development Project Coordinator III 3.00 0.00 0.00 0.00 0.00 0.00%
Development Services Director 1.00 0.00 0.00 0.00 0.00 0.00%
Director Planning/Community Environment 1.00 1.00 1.00 1.00 0.00 0.00%
Engineer 1.00 0.00 0.00 0.00 0.00 0.00%
Management Analyst 0.40 0.40 0.40 0.88 0.48 120.00%
Manager Development Center 1.00 0.00 0.00 0.00 0.00 0.00%
Manager Planning 3.00 1.20 2.00 2.00 0.00 0.00%
Parking Operations-Lead 0.00 0.00 0.30 0.20 -0.10 (33.33)%
Planner 3.75 3.15 3.00 3.83 0.83 27.67%
Plans Check Engineer 1.00 0.00 0.00 0.00 0.00 0.00%
Program Assistant II 0.00 0.00 0.00 0.35 0.35 0.00%
Project Engineer 1.00 1.65 1.65 1.15 -0.50 (30.30)%
Senior Management Analyst 2.00 1.00 1.00 1.00 0.00 0.00%
Senior Planner 7.00 7.60 7.64 6.70 -0.94 (12.30)%
Senior Project Engineer 1.00 0.20 0.00 0.00 0.00 0.00%
Traffic Engineering-Lead 0.00 0.00 1.00 0.10 -0.90 (90.00)%
Transportation Planning Manager 0.00 0.00 0.20 0.85 0.65 325.00%
Total Planning and Community Environment 50.35 28.20 31.04 31.56 0.52 1.68%
Police
Administrative Assistant 0.50 0.50 1.00 1.00 0.00 0.00%
Administrative Associate II 3.00 3.00 3.00 3.00 0.00 0.00%
Animal Control Officer 4.00 3.00 3.00 3.00 0.00 0.00%
Animal Control Officer-Lead 0.00 1.00 1.00 1.00 0.00 0.00%
Animal Services Specialist II 2.00 2.00 2.00 2.00 0.00 0.00%
Assistant Police Chief 1.00 1.00 1.00 1.00 0.00 0.00%
Business Analyst 1.20 1.20 1.20 1.20 0.00 0.00%
Code Enforcement Officer 1.00 1.00 1.00 1.00 0.00 0.00%
Communications Technician 1.00 1.00 1.00 1.00 0.00 0.00%
Community Service Officer 8.50 8.50 8.50 8.50 0.00 0.00%
Court Liaison Officer 1.00 1.00 1.00 1.00 0.00 0.00%
Crime Analyst 1.00 1.00 1.00 1.00 0.00 0.00%
Deputy Director Technical Services Division 0.80 0.80 0.80 0.80 0.00 0.00%
Geographic Information System Specialist 0.50 0.50 0.50 0.50 0.00 0.00%
Table of OrganizationFY 2014 Actuals
FY 2015 Actuals
FY 2016 Adopted Budget
FY 2017 Adopted Budget
FY 2017 Change
FTEFY 2017
Change %
TABLE OF ORGANIZATION • CITY OF PALO ALTO FISCAL YEAR 2017 ADOPTED BUDGET 499

TABLE OF ORGANIZATION
500
Police Agent 19.00 19.00 19.00 19.00 0.00 0.00%
Police Captain 2.00 2.00 2.00 2.00 0.00 0.00%
Police Chief 0.50 0.50 1.00 1.00 0.00 0.00%
Police Lieutenant 5.00 5.00 5.00 5.00 0.00 0.00%
Police Officer 50.00 50.00 50.00 50.00 0.00 0.00%
Police Records Specialist II 6.00 6.00 6.00 6.00 0.00 0.00%
Police Records Specialist-Lead 1.00 1.00 1.00 1.00 0.00 0.00%
Police Sergeant 14.00 14.00 14.00 14.00 0.00 0.00%
Program Assistant II 1.00 1.00 1.00 1.00 0.00 0.00%
Property Evidence Technician 2.00 2.00 2.00 2.00 0.00 0.00%
Public Safety Communications Manager 0.00 0.00 1.00 1.00 0.00 0.00%
Public Safety Dispatcher 16.00 16.00 16.00 16.00 0.00 0.00%
Public Safety Dispatcher-Lead 4.00 4.00 4.00 4.00 0.00 0.00%
Public Safety Manager I 2.00 2.00 0.00 0.00 0.00 0.00%
Public Safety Manager II 1.00 1.00 0.00 0.00 0.00 0.00%
Public Safety Program Manager 0.00 0.00 2.00 2.00 0.00 0.00%
Senior Management Analyst 1.50 1.00 1.00 1.00 0.00 0.00%
Senior Technologist 0.00 0.00 0.00 0.00 0.00 0.00%
Superintendent Animal Services 1.00 1.00 1.00 1.00 0.00 0.00%
Veterinarian 1.00 1.00 1.00 1.00 0.00 0.00%
Veterinarian Technician 2.00 2.00 2.00 2.00 0.00 0.00%
Total Police 154.50 154.00 155.00 155.00 0.00 0.00%
Public Works
Administrative Assistant 1.00 1.00 1.00 1.00 0.00 0.00%
Administrative Associate I 0.60 0.60 0.60 0.60 0.00 0.00%
Administrative Associate II 2.65 2.63 2.63 2.65 0.02 0.76%
Administrative Associate III 0.00 0.00 0.00 0.01 0.01 0.00%
Assistant Director Public Works 1.30 1.28 0.85 0.87 0.02 2.35%
Associate Engineer 0.30 0.30 0.30 0.30 0.00 0.00%
Building Serviceperson 1.00 1.00 1.00 1.00 0.00 0.00%
Building Serviceperson-Lead 1.80 1.80 1.80 1.80 0.00 0.00%
Cement Finisher 0.00 0.00 3.00 3.00 0.00 0.00%
Cement Finisher-Lead 0.00 0.00 0.26 0.26 0.00 0.00%
Coordinator Public Works Projects 0.00 0.00 1.00 0.50 -0.50 (50.00)%
Director Public Works/City Engineer 1.00 1.00 1.00 1.00 0.00 0.00%
Electrician 0.80 0.80 0.80 0.80 0.00 0.00%
Engineer 0.30 0.30 0.40 0.66 0.26 65.00%
Engineering Technician III 3.20 1.20 1.20 1.47 0.27 22.50%
Table of OrganizationFY 2014 Actuals
FY 2015 Actuals
FY 2016 Adopted Budget
FY 2017 Adopted Budget
FY 2017 Change
FTEFY 2017
Change %
TABLE OF ORGANIZATION • CITY OF PALO ALTO FISCAL YEAR 2017 ADOPTED BUDGET

TABLE OF ORGANIZATION
Equipment Operator 3.46 3.46 3.46 3.46 0.00 0.00%
Facilities Carpenter 1.00 1.00 1.00 1.00 0.00 0.00%
Facilities Maintenance-Lead 1.85 1.85 1.85 1.85 0.00 0.00%
Facilities Mechanic 5.55 5.55 5.55 0.00 -5.55 (100.00)%
Facilities Painter 1.75 1.75 1.75 1.75 0.00 0.00%
Facilities Technician 0.00 0.00 0.00 5.55 5.55 0.00%
Heavy Equipment Operator 2.13 2.13 2.33 2.33 0.00 0.00%
Heavy Equipment Operator-Lead 0.85 0.85 0.85 0.85 0.00 0.00%
Inspector, Field Services 1.33 0.83 0.10 0.11 0.01 10.00%
Landscape Architect Park Planner 0.00 0.00 0.10 0.10 0.00 0.00%
Management Analyst 0.60 0.60 0.70 0.70 0.00 0.00%
Manager Facilities 0.00 0.00 0.90 0.90 0.00 0.00%
Manager Maintenance Operations 1.95 1.95 1.20 1.20 0.00 0.00%
Manager Urban Forestry 1.00 0.96 0.96 0.96 0.00 0.00%
Manager Watershed Protection 0.00 0.00 0.00 0.05 0.05 0.00%
Planning Arborist 1.00 0.75 0.75 0.75 0.00 0.00%
Project Engineer 0.30 0.30 0.40 0.50 0.10 25.00%
Project Manager 1.70 1.63 1.63 2.58 0.95 58.28%
Senior Engineer 2.10 1.47 0.57 0.79 0.22 38.60%
Senior Management Analyst 1.11 1.11 1.11 1.11 0.00 0.00%
Senior Project Manager 0.10 0.10 0.10 0.10 0.00 0.00%
Supervisor Inspection and Surveying 0.80 0.53 0.10 0.10 0.00 0.00%
Surveyor, Public Works 0.78 0.31 0.10 0.33 0.23 230.00%
Traffic Controller Maintainer-Lead 1.00 1.00 0.00 0.00 0.00 0.00%
Traffic Controller Maintainer I 1.94 1.94 1.94 1.94 0.00 0.00%
Traffic Controller Maintainer II 2.00 2.00 2.00 2.00 0.00 0.00%
Tree Maintenance Person 1.00 1.00 1.00 1.00 0.00 0.00%
Tree Trim/Line Clear 7.00 7.00 7.00 7.00 0.00 0.00%
Tree Trim/Line Clear-Lead 1.00 1.00 1.00 1.00 0.00 0.00%
Total Public Works 57.25 52.98 54.29 55.93 1.64 3.02%
Total General Fund 579.70 589.58 599.31 603.94 4.63 0.77%
Enterprise Funds
Public Works
Account Specialist 0.45 0.45 0.45 0.30 -0.15 (33.33)%
Accountant 0.40 0.40 0.40 0.40 0.00 0.00%
Administrative Associate I 0.10 0.10 0.10 0.10 0.00 0.00%
Administrative Associate II 2.15 2.15 2.15 2.15 0.00 0.00%
Administrative Associate III 0.10 0.10 0.10 0.10 0.00 0.00%
Table of OrganizationFY 2014 Actuals
FY 2015 Actuals
FY 2016 Adopted Budget
FY 2017 Adopted Budget
FY 2017 Change
FTEFY 2017
Change %
TABLE OF ORGANIZATION • CITY OF PALO ALTO FISCAL YEAR 2017 ADOPTED BUDGET 501

TABLE OF ORGANIZATION
502
Assistant Director Public Works 1.30 1.30 1.30 1.30 0.00 0.00%
Assistant Manager WQCP 2.00 2.00 2.00 2.00 0.00 0.00%
Associate Engineer 1.50 1.35 1.35 1.99 0.64 47.41%
Business Analyst 0.13 0.13 0.00 0.00 0.00 0.00%
Buyer 1.00 1.00 1.00 0.00 -1.00 (100.00)%
Chemist 3.00 3.00 3.00 3.00 0.00 0.00%
Chief Sustainability Officer 0.10 0.10 0.00 0.00 0.00 0.00%
Coordinator Public Works Projects 1.00 1.00 1.00 0.00 -1.00 (100.00)%
Deputy Chief/Fire Marshal 0.08 0.08 0.07 0.07 0.00 0.00%
Electrician 3.00 3.00 3.00 3.00 0.00 0.00%
Electrician-Lead 2.00 2.00 2.00 2.00 0.00 0.00%
Engineer 1.00 1.00 1.00 0.90 -0.10 (10.00)%
Engineering Technician III 0.30 0.20 0.20 0.25 0.05 25.00%
Environmental Specialist 2.00 2.00 2.00 2.00 0.00 0.00%
Equipment Operator 0.54 0.54 0.54 0.54 0.00 0.00%
Facilities Maintenance-Lead 0.00 0.00 0.00 1.00 1.00 0.00%
Hazardous Materials Inspector 0.04 0.04 0.04 0.04 0.00 0.00%
Heavy Equipment Operator 1.61 0.90 0.90 0.90 0.00 0.00%
Heavy Equipment Operator-Lead 1.86 1.15 1.15 1.15 0.00 0.00%
Industrial Waste Inspector 3.00 2.99 2.99 2.99 0.00 0.00%
Industrial Waste Investigator 2.00 1.79 1.79 1.15 -0.64 (35.75)%
Laboratory Technician WQC 2.50 3.00 3.00 3.00 0.00 0.00%
Landfill Technician 1.00 1.00 1.00 1.00 0.00 0.00%
Maintenance Mechanic 7.00 7.00 7.00 0.00 -7.00 (100.00)%
Management Analyst 2.30 2.30 1.30 2.30 1.00 76.92%
Manager Airport 1.00 1.00 1.00 1.00 0.00 0.00%
Manager Environmental Control Program 3.00 3.90 4.90 4.90 0.00 0.00%
Manager Laboratory Services 1.00 1.00 1.00 1.00 0.00 0.00%
Manager Maintenance Operations 0.96 0.96 1.96 1.96 0.00 0.00%
Manager Solid Waste 1.00 1.00 1.00 1.00 0.00 0.00%
Manager Water Quality Control Plant 1.00 1.00 1.00 1.00 0.00 0.00%
Manager Watershed Protection 1.00 0.95 0.95 0.95 0.00 0.00%
Plant Mechanic 0.00 0.00 0.00 7.00 7.00 0.00%
Program Assistant I 1.00 1.00 1.00 1.00 0.00 0.00%
Program Assistant II 2.00 2.00 2.00 2.00 0.00 0.00%
Project Engineer 1.85 1.81 1.83 1.83 0.00 0.00%
Project Manager 0.35 0.35 0.35 1.35 1.00 285.71%
Senior Accountant 0.30 0.30 0.30 0.30 0.00 0.00%
Senior Buyer 0.00 0.00 0.00 1.00 1.00 0.00%
Table of OrganizationFY 2014 Actuals
FY 2015 Actuals
FY 2016 Adopted Budget
FY 2017 Adopted Budget
FY 2017 Change
FTEFY 2017
Change %
TABLE OF ORGANIZATION • CITY OF PALO ALTO FISCAL YEAR 2017 ADOPTED BUDGET

TABLE OF ORGANIZATION
Senior Chemist 1.00 1.00 1.00 1.00 0.00 0.00%
Senior Engineer 1.80 1.76 1.76 3.76 2.00 113.64%
Senior Industrial Waste Investigator 1.00 0.99 0.99 0.99 0.00 0.00%
Senior Management Analyst 0.21 0.21 0.21 0.21 0.00 0.00%
Senior Mechanic 1.00 1.00 1.00 1.00 0.00 0.00%
Senior Operator WQC 6.00 6.00 6.00 6.00 0.00 0.00%
Senior Technologist 1.13 1.13 1.00 1.00 0.00 0.00%
Storekeeper 1.00 1.00 1.00 1.00 0.00 0.00%
Street Maintenance Assistant 0.00 0.00 0.00 1.00 1.00 0.00%
Street Sweeper Operator 5.96 1.63 1.63 1.63 0.00 0.00%
Supervisor WQCP Operations 3.00 3.00 3.00 3.00 0.00 0.00%
Surveyor, Public Works 0.11 0.11 0.35 0.12 -0.23 (65.71)%
Technologist 1.00 1.00 1.00 1.00 0.00 0.00%
Traffic Controller Maintainer I 0.06 0.06 0.06 0.06 0.00 0.00%
WQC Plant Operator II 16.00 16.00 16.00 16.00 0.00 0.00%
Zero Waste Coordinator 2.00 2.00 2.00 1.00 -1.00 (50.00)%
Total Public Works 99.19 94.23 95.12 98.69 3.57 3.75%
Utilities
Account Specialist 2.55 2.55 2.55 1.70 -0.85 (33.33)%
Accountant 0.60 0.60 0.60 0.60 0.00 0.00%
Administrative Assistant 1.00 1.00 1.00 1.00 0.00 0.00%
Administrative Associate I 1.00 0.00 0.00 0.00 0.00 0.00%
Administrative Associate II 5.00 6.00 6.00 6.00 0.00 0.00%
Assistant Director Administrative Services 0.25 0.25 0.25 0.25 0.00 0.00%
Assistant Director Utilities Customer Support Services 1.00 1.00 1.00 1.00 0.00 0.00%
Assistant Director Utilities Engineering 1.00 1.00 1.00 1.00 0.00 0.00%
Assistant Director Utilities Operations 1.00 1.00 1.00 1.00 0.00 0.00%
Assistant Director Utilities/Resource Management 1.00 1.00 1.00 1.00 0.00 0.00%
Associate Engineer 0.50 0.50 0.50 0.00 -0.50 (100.00)%
Business Analyst 6.87 6.87 7.00 7.00 0.00 0.00%
Cathodic Protection Technician Assistant 1.00 1.00 1.00 1.00 0.00 0.00%
Cathodic Technician 1.00 1.00 1.00 1.00 0.00 0.00%
Cement Finisher 1.00 1.00 1.00 1.00 0.00 0.00%
Chief Sustainability Officer 0.35 0.35 0.00 0.00 0.00 0.00%
Contracts Administrator 0.70 0.70 0.70 0.70 0.00 0.00%
Coordinator Utilities Projects 6.00 7.00 7.00 6.00 -1.00 (14.29)%
Table of OrganizationFY 2014 Actuals
FY 2015 Actuals
FY 2016 Adopted Budget
FY 2017 Adopted Budget
FY 2017 Change
FTEFY 2017
Change %
TABLE OF ORGANIZATION • CITY OF PALO ALTO FISCAL YEAR 2017 ADOPTED BUDGET 503

TABLE OF ORGANIZATION
504
Coordinator Utilities Safety & Security 1.00 0.00 0.00 0.00 0.00 0.00%
Customer Service Representative 6.00 6.00 6.00 6.00 0.00 0.00%
Customer Service Specialist 2.00 2.00 2.00 2.00 0.00 0.00%
Customer Service Specialist-Lead 2.00 2.00 2.00 2.00 0.00 0.00%
Deputy Chief/Fire Marshal 0.08 0.08 0.08 0.08 0.00 0.00%
Director Administrative Services/CFO 0.20 0.20 0.20 0.20 0.00 0.00%
Director Utilities 1.00 1.00 1.00 1.00 0.00 0.00%
Electric Project Engineer 2.00 2.00 2.00 2.00 0.00 0.00%
Electric Underground Inspector 2.00 2.00 2.00 2.00 0.00 0.00%
Electric Underground Inspector-Lead 1.00 1.00 1.00 1.00 0.00 0.00%
Electrical Equipment Technician 0.00 0.00 0.00 1.00 1.00 0.00%
Electrician Assistant I 4.00 4.00 4.00 3.00 -1.00 (25.00)%
Engineer 4.00 4.00 4.00 4.00 0.00 0.00%
Engineering Manager - Electric 1.00 1.00 1.00 1.00 0.00 0.00%
Engineering Manager - WGW 1.00 1.00 1.00 1.00 0.00 0.00%
Engineering Technician III 4.00 4.00 4.00 5.00 1.00 25.00%
Equipment Operator 1.00 1.00 1.00 1.00 0.00 0.00%
Gas System Technician 2.00 2.00 2.00 0.00 -2.00 (100.00)%
Gas Systems Technician II 1.00 1.00 1.00 3.00 2.00 200.00%
Hazardous Materials Inspector 0.06 0.06 0.06 0.06 0.00 0.00%
Heavy Equipment Operator 8.70 8.70 8.70 6.70 -2.00 (22.99)%
Heavy Equipment Operator/Install Repair 0.00 0.00 0.00 4.00 4.00 0.00%
Industrial Waste Investigator 0.00 0.00 0.00 0.50 0.50 0.00%
Inspector, Field Services 4.00 4.00 4.00 5.00 1.00 25.00%
Lineperson/Cable Specialist 11.00 11.00 11.00 11.00 0.00 0.00%
Lineperson/Cable Specialist-Lead 4.00 4.00 4.00 4.00 0.00 0.00%
Maintenance Mechanic-Welding 2.00 2.00 2.00 2.00 0.00 0.00%
Manager Communications 1.00 1.00 1.00 1.00 0.00 0.00%
Manager Customer Service 0.00 0.00 1.00 1.00 0.00 0.00%
Manager Customer Service and Meter Reading 1.00 1.00 0.00 0.00 0.00 0.00%
Manager Electric Operations 1.00 1.00 1.00 1.00 0.00 0.00%
Manager Treasury, Debt & Investments 0.00 0.00 0.00 0.40 0.40 0.00%
Manager Utilities Compliance 1.00 1.00 1.00 1.00 0.00 0.00%
Manager Utilities Credit & Collection 1.00 1.00 1.00 1.00 0.00 0.00%
Manager Utilities Marketing Services 1.00 1.00 1.00 0.00 -1.00 (100.00)%
Manager Utilities Operations WGW 1.00 1.00 1.00 1.00 0.00 0.00%
Manager Utilities Program Services 0.00 0.00 0.00 1.00 1.00 0.00%
Manager Utilities Strategic Business 0.00 0.00 0.00 1.00 1.00 0.00%
Table of OrganizationFY 2014 Actuals
FY 2015 Actuals
FY 2016 Adopted Budget
FY 2017 Adopted Budget
FY 2017 Change
FTEFY 2017
Change %
TABLE OF ORGANIZATION • CITY OF PALO ALTO FISCAL YEAR 2017 ADOPTED BUDGET

TABLE OF ORGANIZATION
Manager Utilities Telecommunications 1.00 1.00 1.00 1.00 0.00 0.00%
Marketing Engineer 1.00 1.00 1.00 0.00 -1.00 (100.00)%
Meter Reader 6.00 6.00 6.00 6.00 0.00 0.00%
Meter Reader-Lead 1.00 1.00 1.00 1.00 0.00 0.00%
Metering Technician 2.00 3.00 3.00 3.00 0.00 0.00%
Metering Technician-Lead 1.00 1.00 1.00 1.00 0.00 0.00%
Offset Equipment Operator 0.48 0.48 0.48 0.48 0.00 0.00%
Overhead Underground Troubleman 2.00 2.00 2.00 2.00 0.00 0.00%
Planner 0.30 0.30 0.00 0.00 0.00 0.00%
Power Engineer 3.00 3.00 3.00 3.00 0.00 0.00%
Principal Business Analyst 0.00 0.00 1.00 1.00 0.00 0.00%
Principal Management Analyst 0.00 1.00 0.00 0.00 0.00 0.00%
Program Assistant I 2.50 2.50 2.50 2.50 0.00 0.00%
Project Engineer 5.00 5.00 5.00 5.00 0.00 0.00%
Project Manager 0.75 0.75 0.75 0.75 0.00 0.00%
Resource Planner 5.00 5.00 5.00 6.00 1.00 20.00%
Restoration Lead 1.00 1.00 1.00 1.00 0.00 0.00%
SCADA Technologist 2.00 2.00 2.00 2.00 0.00 0.00%
Senior Accountant 0.70 0.70 0.70 0.70 0.00 0.00%
Senior Business Analyst 2.00 2.00 2.00 2.00 0.00 0.00%
Senior Deputy City Attorney 1.00 1.00 1.00 1.00 0.00 0.00%
Senior Electrical Engineer 4.00 4.00 4.00 4.00 0.00 0.00%
Senior Engineer 5.00 4.00 5.00 5.00 0.00 0.00%
Senior Management Analyst 2.40 2.40 2.40 0.70 -1.70 (70.83)%
Senior Mechanic 1.00 1.00 1.00 1.00 0.00 0.00%
Senior Performance Auditor 1.00 1.00 1.00 1.00 0.00 0.00%
Senior Project Engineer 0.00 1.00 0.00 0.00 0.00 0.00%
Senior Resource Planner 6.00 6.00 6.00 6.00 0.00 0.00%
Senior Technologist 0.87 0.87 0.00 0.00 0.00 0.00%
Senior Utilities Field Service Representative 1.00 1.00 1.00 1.00 0.00 0.00%
Senior Water Systems Operator 2.00 2.00 2.00 2.00 0.00 0.00%
Storekeeper 2.00 2.00 2.00 1.00 -1.00 (50.00)%
Storekeeper-Lead 0.00 0.00 0.00 0.80 0.80 0.00%
Street Light, Traffic Signal & Fiber Technician 4.00 4.00 5.00 5.00 0.00 0.00%
Street Light, Traffic Signal & Fiber Technician Apprentice 1.00 1.00 0.00 0.00 0.00 0.00%
Street Light, Traffic Signal & Fiber-Lead 2.00 2.00 2.00 2.00 0.00 0.00%
Substation Electrician 6.00 6.00 6.00 6.00 0.00 0.00%
Substation Electrician-Lead 2.00 2.00 2.00 2.00 0.00 0.00%
Table of OrganizationFY 2014 Actuals
FY 2015 Actuals
FY 2016 Adopted Budget
FY 2017 Adopted Budget
FY 2017 Change
FTEFY 2017
Change %
TABLE OF ORGANIZATION • CITY OF PALO ALTO FISCAL YEAR 2017 ADOPTED BUDGET 505

TABLE OF ORGANIZATION
506
Supervising Electric Project Engineer 1.00 1.00 1.00 1.00 0.00 0.00%
Supervisor Inspection Services 1.00 1.00 1.00 0.00 -1.00 (100.00)%
Tree Maintenance Person 1.00 1.00 1.00 1.00 0.00 0.00%
Utilities Compliance Technician 2.00 2.00 2.00 2.00 0.00 0.00%
Utilities Compliance Technician-Lead 1.00 1.00 1.00 1.00 0.00 0.00%
Utilities Credit/Collection Specialist 2.00 2.00 2.00 2.00 0.00 0.00%
Utilities Engineer Estimator 5.00 5.00 5.00 5.00 0.00 0.00%
Utilities Field Services Representative 5.00 5.00 5.00 5.00 0.00 0.00%
Utilities Install Repair-Lead-Welding Certified 2.00 2.00 2.00 2.00 0.00 0.00%
Utilities Install Repair-Welding Certified 3.00 3.00 3.00 3.00 0.00 0.00%
Utilities Install/Repair 12.00 12.00 12.00 10.00 -2.00 (16.67)%
Utilities Install/Repair Assistant 1.00 1.00 1.00 1.00 0.00 0.00%
Utilities Install/Repair-Lead 5.00 5.00 5.00 5.00 0.00 0.00%
Utilities Key Account Representative 3.00 3.00 3.00 3.00 0.00 0.00%
Utilities Locator 3.00 3.00 3.00 3.00 0.00 0.00%
Utilities Marketing Program Administrator 4.00 4.00 3.00 3.00 0.00 0.00%
Utilities Safety Officer 0.00 1.00 1.00 1.00 0.00 0.00%
Utilities Supervisor 11.00 11.00 11.00 12.00 1.00 9.09%
Utilities System Operator 5.00 5.00 5.00 5.00 0.00 0.00%
Warehouse Supervisor 0.50 0.50 0.50 0.80 0.30 60.00%
Water Meter Cross Connection Technician 2.00 2.00 2.00 0.00 -2.00 (100.00)%
Water System Operator I 0.00 0.00 0.00 1.00 1.00 0.00%
Water System Operator II 4.00 4.00 4.00 4.00 0.00 0.00%
Total Utilities 255.36 258.36 255.97 257.92 -1.05 (0.41)%
Total Enterprise Fund 354.55 352.59 351.09 353.61 2.52 0.72%
Other Funds
Capital Improvement Fund
Administrative Associate I 0.80 0.80 0.80 0.80 0.00 0.00%
Administrative Associate III 0.90 0.89 0.89 0.89 0.00 0.00%
Assistant Director Public Works 0.15 0.15 0.58 0.58 0.00 0.00%
Associate Engineer 2.70 2.69 2.69 2.69 0.00 0.00%
Cement Finisher 3.00 3.00 0.00 0.00 0.00 0.00%
Cement Finisher-Lead 1.00 1.00 0.74 0.74 0.00 0.00%
Chief Transportation Official 0.00 0.50 0.50 0.30 -0.20 (40.00)%
Contracts Administrator 0.60 0.60 0.60 0.60 0.00 0.00%
Table of OrganizationFY 2014 Actuals
FY 2015 Actuals
FY 2016 Adopted Budget
FY 2017 Adopted Budget
FY 2017 Change
FTEFY 2017
Change %
TABLE OF ORGANIZATION • CITY OF PALO ALTO FISCAL YEAR 2017 ADOPTED BUDGET

TABLE OF ORGANIZATION
Coordinator Public Works Projects 0.00 0.00 1.00 1.50 0.50 50.00%
Coordinator Transportation Systems Management 0.00 0.10 0.15 0.90 0.75 500.00%
Engineer 2.70 2.08 2.98 2.80 -0.18 (6.04)%
Engineering Technician III 0.50 0.50 0.50 0.50 0.00 0.00%
Heavy Equipment Operator 0.20 0.20 0.00 0.00 0.00 0.00%
Inspector, Field Services 0.67 0.47 1.20 1.21 0.01 0.83%
Landscape Architect Park Planner 1.00 1.00 0.90 0.90 0.00 0.00%
Management Analyst 1.50 1.49 1.39 0.89 -0.50 (35.97)%
Manager Facilities 0.00 0.00 0.10 0.1 0.00 0.00%
Manager Maintenance Operations 0.90 0.90 1.65 0.65 -1.00 (60.61)%
Parking Operations-Lead 0.00 0.00 0.00 0.30 0.30 0.00%
Program Assistant I 1.00 1.00 0.00 0.00 0.00 0.00%
Program Assistant II 0.00 0.00 0.00 0.20 0.20 0.00%
Project Engineer 4.85 5.09 4.99 6.49 1.50 30.06%
Project Manager 1.20 1.20 1.20 1.15 -0.05 (4.17)%
Senior Engineer 1.10 1.09 1.99 1.99 0.00 0.00%
Senior Management Analyst 0.60 0.60 0.60 0.60 0.00 0.00%
Senior Planner 0.00 0.00 0.00 0.70 0.70 0.00%
Senior Project Engineer 0.00 0.70 0.00 0.00 0.00 0.00%
Senior Project Manager 0.90 0.90 0.90 0.90 0.00 0.00%
Supervisor Inspection and Surveying 0.20 0.20 0.63 0.63 0.00 0.00%
Surveyor, Public Works 0.11 0.11 0.55 0.55 0.00 0.00%
Traffic Engineering-Lead 0.00 0.00 0.00 0.90 0.90 0.00%
Transportation Planning Manager 0.00 0.00 0.70 0.15 -0.55 (78.57)%
Total Capital Improvement Fund 26.58 27.26 28.23 30.61 2.38 8.43%
Information Technology Fund
Administrative Assistant 1.00 1.00 1.00 1.00 0.00 0.00%
Assistant Director Administrative Services 0.10 0.10 0.00 0.10 0.10 0.00%
Business Analyst 0.00 0.00 1.00 1.00 0.00 0.00%
Desktop Technician 5.00 5.00 5.00 6.00 1.00 20.00%
Director Administrative Services/CFO 0.10 0.10 0.10 0.00 -0.10 (100.00)%
Director Information Technology/CIO 1.00 1.00 1.00 1.00 0.00 0.00%
Management Analyst 1.00 1.00 0.00 0.00 0.00 0.00%
Manager Information Technology 4.00 4.00 4.00 4.00 0.00 0.00%
Manager Information Technology Security 1.00 1.00 1.00 1.00 0.00 0.00%
Principal Business Analyst 0.00 0.00 1.00 1.00 0.00 0.00%
Principal Management Analyst 1.00 1.00 0.00 0.00 0.00 0.00%
Table of OrganizationFY 2014 Actuals
FY 2015 Actuals
FY 2016 Adopted Budget
FY 2017 Adopted Budget
FY 2017 Change
FTEFY 2017
Change %
TABLE OF ORGANIZATION • CITY OF PALO ALTO FISCAL YEAR 2017 ADOPTED BUDGET 507

TABLE OF ORGANIZATION
508
Senior Business Analyst 2.00 0.00 2.00 2.00 0.00 0.00%
Senior Management Analyst 0.00 2.00 1.00 1.00 0.00 0.00%
Senior Technologist 12.00 13.50 15.00 16.00 1.00 6.67%
Technologist 4.00 2.00 2.00 1.00 -1.00 (50.00)%
Total Information Technology Fund 32.20 31.70 34.10 35.10 1.00 2.93%
Printing and Mailing Fund
Manager Revenue Collections 0.00 0.00 0.10 0.10 0.00 0.00%
Offset Equipment Operator 1.52 1.52 1.52 1.52 0.00 0.00%
Senior Management Analyst 0.10 0.10 0.00 0.00 0.00 0.00%
Total Printing and Mailing Fund 1.62 1.62 1.62 1.62 0.00 0.00%
Special Revenue Funds
Account Specialist 1.55 1.55 1.55 1.62 0.07 4.52%
Account Specialist-Lead 0.41 0.41 0.41 0.95 0.54 131.71%
Administrative Associate II 0.40 0.20 0.20 0.20 0.00 0.00%
Building Serviceperson-Lead 0.20 0.20 0.20 0.20 0.00 0.00%
Chief Transportation Official 0.10 0.00 0.00 0.00 0.00 0.00%
Community Service Officer 0.50 0.50 0.50 0.50 0.00 0.00%
Electrician 0.20 0.20 0.20 0.20 0.00 0.00%
Facilities Maintenance-Lead 0.15 0.15 0.15 0.15 0.00 0.00%
Facilities Mechanic 0.45 0.45 0.45 0.00 -0.45 (100.00)%
Facilities Painter 0.25 0.25 0.25 0.25 0.00 0.00%
Facilities Technician 0.00 0.00 0.00 0.45 0.45 0.00%
Heavy Equipment Operator 0.29 0.00 0.00 0.00 0.00 0.00%
Heavy Equipment Operator-Lead 0.29 0.00 0.00 0.00 0.00 0.00%
Management Analyst 0.00 0.00 0.00 0.02 0.02 0.00%
Manger Community Srvcs Sr Program 0.00 1.00 1.00 1.00 0.00 0.00%
Manager Maintenance Operations 0.19 0.19 0.19 0.19 0.00 0.00%
Manager Revenue Collections 0.00 0.00 0.20 0.28 0.08 40.00%
Parking Operations-Lead 0.00 0.00 0.70 0.50 -0.20 (28.57)%
Planner 0.95 0.75 0.75 0.00 -0.75 (100.00)%
Program Assistant II 0.00 0.00 0.00 0.45 0.45 0.00%
Senior Management Analyst 0.20 0.20 0.00 0.00 0.00 0.00%
Senior Planner 0.00 0.00 0.00 0.36 0.36 0.00%
Senior Project Engineer 0.00 0.10 0.00 0.00 0.00 0.00%
Street Maintenance Assistant 2.00 2.00 2.00 2.00 0.00 0.00%
Street Sweeper Operator 1.04 0.37 0.37 0.37 0.00 0.00%
Transportation Planning Manager 0.00 0.00 0.10 0.00 -0.10 (100.00)%
Total Special Revenue Funds 9.17 8.52 9.22 9.69 0.47 5.10%
Table of OrganizationFY 2014 Actuals
FY 2015 Actuals
FY 2016 Adopted Budget
FY 2017 Adopted Budget
FY 2017 Change
FTEFY 2017
Change %
TABLE OF ORGANIZATION • CITY OF PALO ALTO FISCAL YEAR 2017 ADOPTED BUDGET

TABLE OF ORGANIZATION
Vehicle Replacement Fund
Administrative Associate III 1.00 1.00 1.00 1.00 0.00 0.00%
Assistant Director Public Works 0.25 0.25 0.25 0.25 0.00 0.00%
Assistant Fleet Manager 1.00 1.00 1.00 1.00 0.00 0.00%
Equipment Maintenance Service Person 2.00 2.00 2.00 2.00 0.00 0.00%
Fleet Services Coordinator 2.00 2.00 2.00 2.00 0.00 0.00%
Management Analyst 0.20 0.20 0.20 0.20 0.00 0.00%
Manager Fleet 1.00 1.00 1.00 1.00 0.00 0.00%
Mobile Service Technician 1.00 0.00 0.00 0.00 0.00 0.00%
Motor Equipment Mechanic II 7.00 6.00 6.00 6.00 0.00 0.00%
Motor Equipment Mechanic-Lead 0.00 2.00 2.00 2.00 0.00 0.00%
Project Manager 1.00 1.00 1.00 1.00 0.00 0.00%
Senior Management Analyst 0.08 0.08 0.08 0.08 0.00 0.00%
Total Vehicle Replacement Fund 16.53 16.53 16.53 16.53 0.00 0.00%
Workers’ Compensation Fund
Senior Human Resources Administrator 0.00 0.00 0.00 1.00 1.00 0.00%
Total Workers’ Compensation Fund 0.00 0.00 0.00 1.00 1.00 0.00%
Total Other Funds 86.10 85.63 89.70 94.55 4.85 5.41%
Total Citywide Full-Time Positions
1,020.35 1,027.80 1,040.10 1,052.10 12.00 1.15%
Table of OrganizationFY 2014 Actuals
FY 2015 Actuals
FY 2016 Adopted Budget
FY 2017 Adopted Budget
FY 2017 Change
FTEFY 2017
Change %
TABLE OF ORGANIZATION • CITY OF PALO ALTO FISCAL YEAR 2017 ADOPTED BUDGET 509

510 • CITY OF PALO ALTO FISCAL YEAR 2017 ADOPTED BUDGET

SUPPLEMENTAL INFORMATION
CITY OF PALO ALTO FISCAL YEAR 2017 ADOPTED BUDGET 511


FINANCIAL POLICIES
FINANCIAL POLICIESReserve PoliciesOne of the key components of a financially stable organization is the adherence to a policy of maintaining an appropriate level of reserves. The Government Finance Officers Association (GFOA) recommends, at a minimum, that general purpose governments, regardless of size, maintain reserves (unrestricted fund balance) in their General Fund of no less than two months of operating revenues or expenditures, or a minimum of approximately 16.6 percent of General Fund operating expenditures. The GFOA further recommends that reserve levels be directly related to the degree of uncertainty the local government faces; specifically, the greater the uncertainty, the greater the financial resources necessary. Since reserves are used to mitigate risk, during these uncertain economic times, it is crucial that the City continue its practice of adhering to this GFOA guidance. This will provide the City with resources to cope with unfore-seen expenditures, unanticipated events, or revenue shortfalls.
General Fund Budget Stabilization ReserveThe City's Budget Stabilization Reserve (BSR) serves as the primary General Fund reserve. By policy, the BSR is maintained in the range of 15 to 20 percent of General Fund operating expen-ditures, with a target of 18.5 percent. Any reduction to the reserve below 15 percent requires City Council approval. At the discretion of the City Manager, any BSR balance above 18.5 per-cent may be transferred to the Infrastructure Reserve (IR), which was established to provide funding for maintenance and rehabilitation of the City’s capital assets. The BSR is used to fund unanticipated one-time costs as opposed to ongoing or recurring operating expenditures. The City's intent is to fund ongoing programs and services with ongoing dollars.
The City has held a long-standing practice of maintaining a BSR balance of no less than 15 per-cent of General Fund operating expenses. The table below depicts the BSR balances for seven years, last five years of actual ending BSR balances and two years of budgeted ending BSR bal-ances. As discussed in this document, the Fiscal Year 2017 Adopted Budget assumes a BSR ending balance of $41.3 million or 21.3 percent.
Over the years, the City's BSR has served as a repository for unspent operating funds at year-end and to fund one-time unexpected needs that arise outside of the regular budget prepara-
FY 2011
Actuals
FY 2012
Actuals
FY 2013
Actuals
FY 2014
Actuals
FY 2015
Actuals
FY 2016
Adopted
FY 2017
Adopted
Ending BSR Balance (in millions) $26.5 $27.1 $30.4 $33.1 $48.2 $34.6 $41.3
% of Total Expenses 19.00% 18.50% 18.50% 19.33% 25.96% 18.70% 21.27%
FINANCIAL POLICIES • CITY OF PALO ALTO FISCAL YEAR 2017 ADOPTED BUDGET 513

FINANCIAL POLICIES
514 F
tion process. Prudent financial management practices dictate that the BSR not be used to fund or solve on-going, recurring financial needs. The City has adhered to this practice and has not used the BSR to provide ongoing budget stabilization during periods of economic downturns. In Fiscal Year 2014-2015, the BSR closed with an additional $13.5 million set aside pending Coun-cil direction. A total of $8.0 million was reserved for additional capital expenditures, $4.2 million dedicated to Fiscal Year 2015-2016 one-time expenditures, and $1.3 million dedicated to poten-tially address the unfunded pension liability.
HUMAN SERVICES RESOURCE ALLOCATION PROCESS (HSRAP) RESERVEIn Fiscal Year 2015, the City Council set aside an earmarked reserve for the Human Resource Allocation Process (HSRAP) in the amount of $50,000 to be used during future budget cycles. This reserve funding is recommended to be carried forward to Fiscal Year 2017.
Credit Rating AgenciesCredit rating agencies view General Fund reserves as a critical component of strong municipal management. According to Moody's Investors Service, reserves are an important factor in the analysis of a municipality's fiscal health and, therefore, a jurisdiction’s fiscal policies should include a plan for maintaining reserves. Rating agencies view sound reserves favorably, thus improving a municipality's rating and its ability to obtain low-cost financing for important proj-ects. The City is proud to report that both Moody's and Standard and Poor's (S&P) awarded their highest credit ratings, Triple A, to the City's General Obligation Bonds for library and com-munity center capital improvements in 2010 and it was reaffirmed in 2013. These ratings demonstrate that Palo Alto's prudent financial management and fiscal strength are viewed most favorably by credit agencies.
Capital Fund ReserveInfrastructure Reserve (IR)The Infrastructure Reserve (IR) provides a mechanism for financing the City's infrastructure maintenance and rehabilitation requirements and allows for the City to apply for reimbursable infrastructure grants and respond to urgent infrastructure needs. The primary purpose of the IR is to the fund projects which are critical to the maintenance of existing infrastructure. As part of the Council approved Infrastructure Plan, the Infrastructure Reserve will fund $12.5 million of the plans funding needs. Unspent monies from General Fund capital projects are returned to the IR and retained within the Capital Fund. Over the last four fiscal years, General Fund Operating Budget surpluses of $32.6 million have been transfered to the Infrastructure Reserve beyond base budget transfers. Investment income from this reserve is also retained within the IR to fund future capital project needs.
INANCIAL POLICIES • CITY OF PALO ALTO FISCAL YEAR 2017 ADOPTED BUDGET

FINANCIAL POLICIES
Other PoliciesDebtThe City of Palo Alto recognizes the need for spending a prudent amount every year for the ongoing maintenance and replacement of capital assets. An ongoing capital improvement plan is vital to ensure the future viability of services and the City places priority on funding its regular and ongoing capital needs on a pay-as-you-go basis. However, there are times when it is appro-priate to consider debt financing.
The guidelines below support the decision-making process on issuing debt. These guidelines were adopted by the City Council on May 13, 1997 (City Manager's Report 210:97). Staff revised the guidelines at the August, 8, 2015 Finance Committee and the City Council approved these changes as part of the 2017 Adopted Budget in the Debt Service Funds Section and in part below.
Debt financing is only appropriately considered for capital improvements and not for operating expenses. Annual debt service payments should not exceed 10 percent of the annual expendi-ture budget of the General Fund and 15 percent for Enterprise Funds with exceptions needing Council approval. The term of the debt issuance should not exceed the useful life expectancy of the asset acquired, constructed, or improved.
It is appropriate to consider debt financing under the following circumstances:
The project financing can be paid for directly by the users of the facility. One example is capital improvements made to the City's golf course, where debt service payments can be made from the green fees paid by golfers. A second example is capital improvements paid for by assess-ments to property owners, such as a parking assessment for a downtown parking garage.
A significant backlog of Enterprise Fund capital improvement projects has developed and can-not be addressed through the ongoing capital budget without a significant impact on utility rates.
Funding a large project (or grouping of similar projects) would have a significantly negative impact on the availability of financing for other ongoing capital needs.
Capital leases may also be considered for the purchase of large pieces of equipment.
InvestmentsThe basic principles underlying Palo Alto’s investment philosophy are to ensure the safety of public funds, provide that sufficient money is always available to meet current expenditures and achieve a reasonable rate of return on its investments. Safety is the top priority, followed by liquidity and yield.
The City pools cash from all sources and funds - except restricted bond proceeds with fiscal agents - and invests its pooled idle cash in accordance with state law and the City’s charter. The City follows the “Prudent Investor Standard” cited in State Government Code (Section 53600.3). Under this standard, all governing bodies of local agencies or persons authorized to
FINANCIAL POLICIES • CITY OF PALO ALTO FISCAL YEAR 2017 ADOPTED BUDGET 515

FINANCIAL POLICIES
516 F
make investment decisions on behalf of the City are trustees and, therefore, fiduciaries subject to the prudent investor standard. When investing, reinvesting, purchasing, acquiring, exchang-ing, selling or managing public funds, a trustee shall act with the same care, skill, prudence and diligence under the prevailing circumstances that a prudent person acting in a like capacity and familiarity with those matters would use in the same circumstances to safeguard the principal and maintain the liquidity needs of the agency. Prevailing circumstances include, but are not limited to, economic conditions and the anticipated needs of the agency.
The City’s preferred and chief practice is to buy securities and to hold them to their date of maturity rather than trade or sell securities prior to maturity. The City may, however, elect to sell a security prior to its maturity date should there be a significant financial need. If securities are purchased and held to their maturity date, then any changes in the market value of those secu-rities during their life will have no effect on the principal value. Under a buy and hold philosophy, the City is able to protect its invested principal. The economy, money markets and various finan-cial institutions (such as the Federal Reserve System) are monitored carefully to make prudent investments and assess the condition of the City’s portfolio.
A detailed explanation of investment objectives, applicability and general investment guidelines can be found on the City’s website. The Investment policy also delineates authorized invest-ments, authorized investment personnel and administrative procedures.
INANCIAL POLICIES • CITY OF PALO ALTO FISCAL YEAR 2017 ADOPTED BUDGET

BUDGET ADOPTION ORDINANCE
Budget Adoption Ordinance
CITY OF PALO ALTO FISCAL YEAR 2017 ADOPTED BUDGET 517

BUDGET ADOPTION ORDINANCE
518 B
UDGET ADOPTION ORDINANCE • CITY OF PALO ALTO FISCAL YEAR 2017 ADOPTED BUDGET
BUDGET ADOPTION ORDINANCE
BUDGET ADOPTION ORDINANCE • CITY OF PALO ALTO FISCAL YEAR 2017 ADOPTED BUDGET 519

BUDGET ADOPTION ORDINANCE
520
BUDGET ADOPTION ORDINANCE • CITY OF PALO ALTO FISCAL YEAR 2017 ADOPTED BUDGET
APPROPRIATIONS LIMIT RESOLUTION AND CALCULATION
Fiscal Year 2017 Appropriations Limit Resolution and Calculation
CITY OF PALO ALTO FISCAL YEAR 2017 ADOPTED BUDGET 521
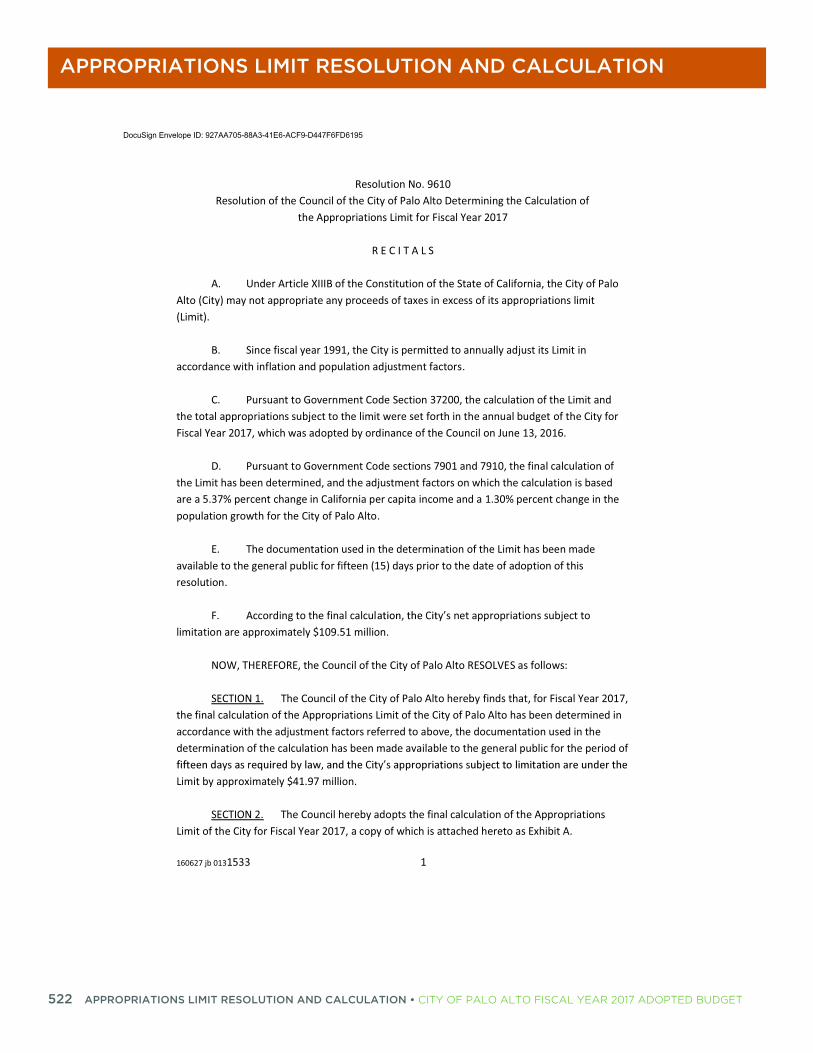
APPROPRIATIONS LIMIT RESOLUTION AND CALCULATION
522
160627 jb 0131533 1
Resolution No. 9610 Resolution of the Council of the City of Palo Alto Determining the Calculation of
the Appropriations Limit for Fiscal Year 2017
R E C I T A L S
A. Under Article XIIIB of the Constitution of the State of California, the City of Palo Alto (City) may not appropriate any proceeds of taxes in excess of its appropriations limit (Limit).
B. Since fiscal year 1991, the City is permitted to annually adjust its Limit in accordance with inflation and population adjustment factors.
C. Pursuant to Government Code Section 37200, the calculation of the Limit and the total appropriations subject to the limit were set forth in the annual budget of the City for Fiscal Year 2017, which was adopted by ordinance of the Council on June 13, 2016.
D. Pursuant to Government Code sections 7901 and 7910, the final calculation of the Limit has been determined, and the adjustment factors on which the calculation is based are a 5.37% percent change in California per capita income and a 1.30% percent change in the population growth for the City of Palo Alto.
E. The documentation used in the determination of the Limit has been made available to the general public for fifteen (15) days prior to the date of adoption of this resolution.
F. According to the final calcul net appropriations subject to limitation are approximately $109.51 million.
NOW, THEREFORE, the Council of the City of Palo Alto RESOLVES as follows:
SECTION 1. The Council of the City of Palo Alto hereby finds that, for Fiscal Year 2017, the final calculation of the Appropriations Limit of the City of Palo Alto has been determined in accordance with the adjustment factors referred to above, the documentation used in the determination of the calculation has been made available to the general public for the period of
Limit by approximately $41.97 million.
SECTION 2. The Council hereby adopts the final calculation of the Appropriations Limit of the City for Fiscal Year 2017, a copy of which is attached hereto as Exhibit A.
DocuSign Envelope ID: 927AA705-88A3-41E6-ACF9-D447F6FD6195
APPROPRIATIONS LIMIT RESOLUTION AND CALCULATION • CITY OF PALO ALTO FISCAL YEAR 2017 ADOPTED BUDGET

APPROPRIATIONS LIMIT RESOLUTION AND CALCULATION
AP
160627 jb 0131533 2
SECTION 3. The Council finds that the adoption of this resolution does not constitute a project under the California Environmental Quality Act, and, therefore, no environmental assessment is necessary.
INTRODUCED AND PASSED: June 27, 2016
AYES: BERMAN, BURT, DUBOIS, FILSETH, HOLMAN, KNISS, SCHARFF, SCHMID, WOLBACH
NOES:
ABSENT:
ABSTENTIONS:
ATTEST: APPROVED:
City Clerk Mayor
City Manager
Senior Assistant City Attorney
Administrative Services Director
DocuSign Envelope ID: 927AA705-88A3-41E6-ACF9-D447F6FD6195
PROPRIATIONS LIMIT RESOLUTION AND CALCULATION • CITY OF PALO ALTO FISCAL YEAR 2017 ADOPTED BUDGET 523
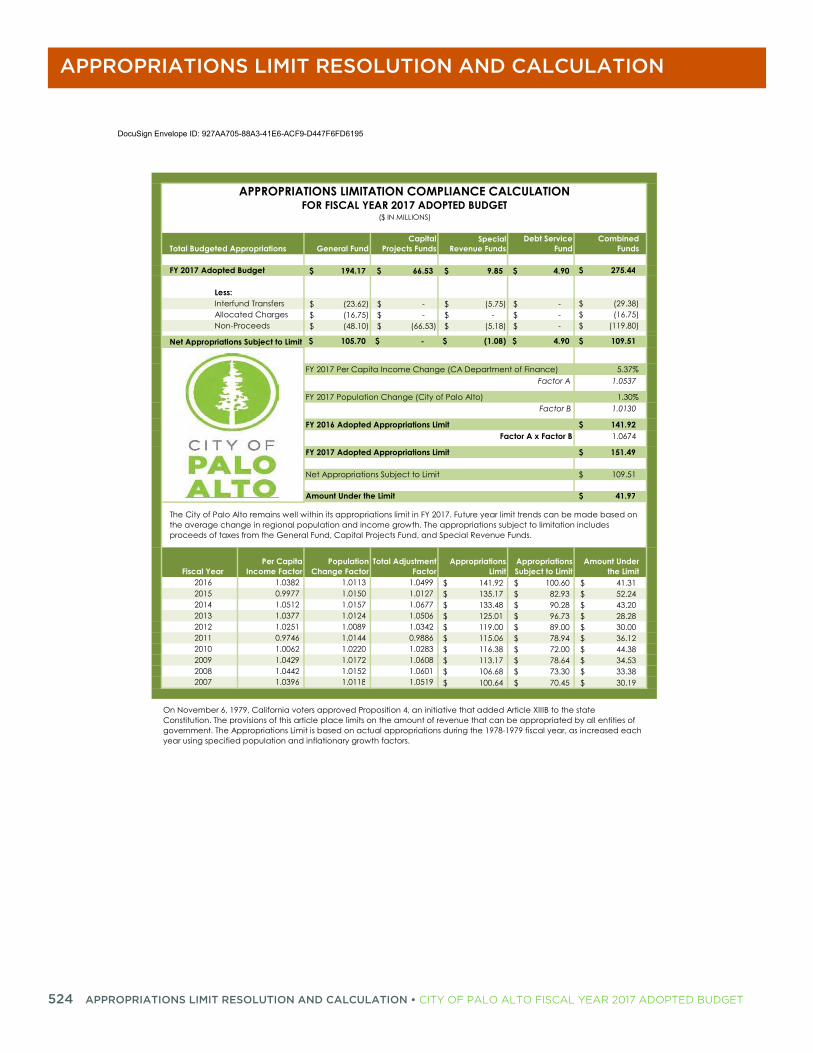
APPROPRIATIONS LIMIT RESOLUTION AND CALCULATION
524
FY 2017 Adopted Budget 194.17$ 66.53$ 9.85$ 4.90$ 275.44$
Less:Interfund Transfers (23.62)$ -$ (5.75)$ -$ (29.38)$Allocated Charges (16.75)$ -$ -$ -$ (16.75)$Non-Proceeds (48.10)$ (66.53)$ (5.18)$ -$ (119.80)$
Net Appropriations Subject to Limit 105.70$ -$ (1.08)$ 4.90$ 109.51$
FY 2017 Per Capita Income Change (CA Department of Finance) 5.37%Factor A 1.0537
FY 2017 Population Change (City of Palo Alto) 1.30%Factor B 1.0130
141.92$ 1.0674
FY 2017 Adopted Appropriations Limit 151.49$
Net Appropriations Subject to Limit 109.51$
Amount Under the Limit 41.97$
1.0382 1.0113 1.0499 141.92$ 100.60$ 41.31$ 0.9977 1.0150 1.0127 135.17$ 82.93$ 52.24$ 1.0512 1.0157 1.0677 133.48$ 90.28$ 43.20$ 1.0377 1.0124 1.0506 125.01$ 96.73$ 28.28$ 1.0251 1.0089 1.0342 119.00$ 89.00$ 30.00$ 0.9746 1.0144 0.9886 115.06$ 78.94$ 36.12$ 1.0062 1.0220 1.0283 116.38$ 72.00$ 44.38$ 1.0429 1.0172 1.0608 113.17$ 78.64$ 34.53$ 1.0442 1.0152 1.0601 106.68$ 73.30$ 33.38$ 1.0396 1.0118 1.0519 100.64$ 70.45$ 30.19$
Factor A x Factor B
Amount Under the Limit
Appropriations Limit
Debt Service Fund
The City of Palo Alto remains well within its appropriations limit in FY 2017. Future year limit trends can be made based on the average change in regional population and income growth. The appropriations subject to limitation includes proceeds of taxes from the General Fund, Capital Projects Fund, and Special Revenue Funds.
Fiscal Year
APPROPRIATIONS LIMITATION COMPLIANCE CALCULATIONFOR FISCAL YEAR 2017 ADOPTED BUDGET
($ IN MILLIONS)
Total Budgeted Appropriations General FundCapital
Projects FundsSpecial
Revenue FundsCombined
Funds
FY 2016 Adopted Appropriations Limit
Per Capita Income Factor
Population Change Factor
Total Adjustment Factor
Appropriations Subject to Limit
On November 6, 1979, California voters approved Proposition 4, an initiative that added Article XIIIB to the state Constitution. The provisions of this article place limits on the amount of revenue that can be appropriated by all entities of government. The Appropriations Limit is based on actual appropriations during the 1978-1979 fiscal year, as increased each year using specified population and inflationary growth factors.
2016201520142013201220112010200920082007
APPROPRIATIONS LIMIT RESOLUTION AND CALCULATION • CITY OF PALO ALTO FISCAL YEAR 2017 ADOPTED BUDGET

GLOSSARY
GLOSSARYKey Budget TermsAccrual Accounting: A method of accounting that recognizes expenses when incurred and revenues when earned rather than when payment is made or received
Adopted Budget: The budget that is approved and enacted by the City Council annually on before June 30th.
Appropriation: The allocation of an expense budget for a particular project or program usually for a spe-cific period of time.
Balanced Budget: A balanced budget exists when total revenues are equal to, or greater than, total expenses.
Bond: A debt investment in which an investor loans money to an entity (governmental or otherwise) that borrows the money for a defined period of time at a fixed interest rate to pay for a variety of projects.
Budget Stabilization Reserve (BSR): The BSR was established as a prudent measure to maintain the City’s fiscal stability in the event that unanticipated events reduce revenue or create obligations that significantly impact the current-year budget. Examples of such events include a downturn in the economy, a natural disaster or actions that may be taken by another governmental agency that reduce revenues and/or increase expenses for the City.
Capital Budget: A plan of proposed capital outlays and the means of financing them for the current fiscal period. In a two-year budget, the second year of the Capital Improvement Program is adopted-in-concept.
Capital Improvement Program (CIP): The City’s plan for current and future projects related to the acquisi-tion, expansion, or rehabilitation of buildings, equipment, parks, streets, and other public infrastructure.
Capital Projects Fund: A fund created to account for all resources to be used for the construction or acquisition of designated fixed assets by a governmental unit except those financed by proprietary or fidu-ciary funds.
City Manager’s Report (CMR): Staff reports for City Council meetings as well as boards and commissions that are prepared by City staff and submitted through the City Manager’s Office.
Comprehensive Plan: The Palo Alto Comprehensive Plan contains the City's official policies on land use and community design, transportation, housing, natural environment, business and economics, and com-munity services. Its focus is on the physical form of the City and is applicable to both public and private properties. The Proposed Budget integrates the 1998-2010 Comprehensive Plan into the budget process.
GLOSSARY • CITY OF PALO ALTO FISCAL YEAR 2017 ADOPTED BUDGET 525

GLOSSARY
526
Cost Accounting: The branch of accounting that provides for the assembling and recording of all the ele-ments of cost incurred to accomplish a purpose, carry on an activity or operation, or complete a unit of work or a specific job.
Enterprise Funds: Funds used to account for services that are provided to the public on a user charge basis, similar to the operation of a commercial business. The City’s enterprise funds include the gas, elec-tric, water, fiber optics and wastewater collection and treatment funds.
Fiduciary Fund: A fund used to account for assets held by the City acting in a fiduciary capacity for other individuals or entities. These funds are operated to carry out the specific actions required by the trust agreements, ordinances and other governing regulations.
Fiscal Agent: A bank or other corporate fiduciary that performs the function of paying, on behalf of the governmental unit, or other debtor, interest on debt or principal of debt when due.
Fiscal Year: A 12-month period of time to which the annual budget applies and at the end of which a gov-ernmental unit determines its financial position and the results of operations. Palo Alto’s fiscal year begins on July 1st and ends on June 30th.
Fixed Assets: Assets such as land, structures and improvements, furniture and/or equipment that are expected to last and/or be used for more than one year.
Full-Time Equivalent (FTE): Used to quantify staffing hours for permanent and temporary employees. A 1.0 FTE employee works full time; a.50 FTE employee works half-time.
Fund Balance: An excess of the assets of a fund over its liabilities.
General Fund: The primary fund used to account for the City’s general purpose revenues such as sales, property, utility users and transient occupancy taxes. General Fund revenues typically pay for citywide ser-vices such as public safety, community development, recreation, libraries and parks. The General Fund is distinguished from Special Funds in that the latter are used to account for revenues that have restricted uses (e.g. gas tax funds that must be used for street maintenance or repair).
Governmental Funds: A generic classification used to refer to all funds other than proprietary and fidu-ciary funds. Governmental funds include the general fund, capital fund, special revenue funds and debt service funds.
Infrastructure Assets: Roads, bridges, curbs and gutters, streets, sidewalks, drainage systems, and lighting systems installed for the common good.
Infrastructure Management Plan (IMP): A portion of the General Fund capital improvement program which focuses on rehabilitating the City's infrastructure. In 1998-99, an outside consultant on the City's infrastructure prepared a report known as the Adamson report. Within this report the City's infrastructure was cataloged and ranked based on when the infrastructure needed to be upgraded or replaced and the cost for each item. At that time, the City Council decided to establish a plan using the Adamson report as a guide for both timeline and cost.
GLOSSARY • CITY OF PALO ALTO FISCAL YEAR 2017 ADOPTED BUDGET

GLOSSARY
Internal Service Funds: These funds provide services to City departments and recover their costs through user charges. For example the Vehicle Replacement Fund is an Internal Service Fund managing the replacement and maintenance of the City fleet.
Method of Accounting: The City's General Fund budget is developed using a modified accrual basis of accounting, with revenues being recorded when measurable and available, and expenditures recorded when the liability is incurred. Enterprise Funds and Internal Service Funds are budgeted on a generally accepted accounting principles (GAAP) basis, which for Proprietary Funds is on a full accrual accounting basis.
Operating Transfer: Amounts transferred between funds, not considered a revenue or expense. For exam-ple, legally authorized transfers from a fund receiving revenue to the fund through which the resources are to be expended.
Pay-As-You-Go-Basis: A term used to describe the financial policy of a governmental unit that finances all of its capital outlays from current revenues rather than by borrowing.
Proposed Budget: The proposed budget is the budget that is sent to the Finance Committee by the City Manager. The proposed budget, including changes made by the Finance Committee during their review, is reviewed and then adopted by the City Council.
Proprietary Funds: A generic classification used to refer to all funds other than governmental funds or fiduciary funds. Proprietary funds include internal service funds and enterprise funds.
Reimbursements: Inter-fund transactions that constitute reimbursements to a fund for expenditures or expenses initially made from it but that properly apply to another fund. For example, the Enterprise Funds reimburse the Technology Fund for CIP projects from which the Enterprise Funds benefit.
Reserve: Represents the portion of fund balance set aside for financing future financing needs and addressing one-time emergency or unanticipated events.
Revenues: Revenues include compensation received by the project for specific services to the public (external revenues), as well as revenues received from other funds (internal revenues).
Special Revenue Funds: These funds account for the proceeds derived from specific revenue sources that are legally restricted to expenditures for specified purposes. The Street Improvement Fund (SIF) is a Spe-cial Revenue Fund that derives its funding from state gas tax revenues. Capital appropriations from the SIF must be spent on the construction and maintenance of the road network system of the City.
GLOSSARY • CITY OF PALO ALTO FISCAL YEAR 2017 ADOPTED BUDGET 527

Copyright © 2022 FDOKUMEN