ADOPTED BUDGET - Clean Water Services
235
Clean Water Services 2550 SW Hillsboro Highway Hillsboro, Oregon 97123 cleanwaterservices.org ADOPTED BUDGET FISCAL YEAR 2018-2019
-
Upload
khangminh22 -
Category
Documents
-
view
2 -
download
0
Transcript of ADOPTED BUDGET - Clean Water Services

Clean Water Services2550 SW Hillsboro Highway
Hillsboro, Oregon 97123cleanwaterservices.org
ADOPTED BUDGETFISCAL YEAR 2018-2019

Clean Water Services Budget Committee FY 2018-19
Board of Directors Members Citizen Members
Andy Duyck, Chairman
Molly Brown
Dick Schouten, District 1
Lori Hennings
Greg Malinowski, District 2
Mike McKillip
Roy Rogers, District 3
Erin Poor
Bob Terry, District 4
Tony Weller
o,

The Government Finance Officers Association of the United States and Canada (GFOA) presented a Distinguished Budget Presentation award to Clean Water Services, Oregon for its annual budget for fiscal year beginning July 1, 2017. In order to receive this award, a governmental unit must publish a budget document that meets program criteria as a policy document, as an operations guide, as a financial plan, and as a communications device. The award is valid for a period of one year only. We believe our current budget continues to conform to program requirements and we are submitting it to GFOA to determine its eligibility for another award. The District has received both the Distinguished Budget Presentation and the Certificate of Achievement for Excellence in Financial Reporting every year it has applied. This represents thirty years for the budget award and thirty-one years for the financial report.

Table of Contents Budget in Brief
Budget Message & Budget Overview .......................................................................................................... 1 About Clean Water Services District History, Economic, and Demographic Information ................................................................... 11 District Map ............................................................................................................................................ 14 Organizational Chart .............................................................................................................................. 15 Strategic Planning District Vision, Mission, and Values ....................................................................................................... 17 Business Planning ................................................................................................................................... 18 Financial Policies ........................................................................................................................................ 27 Budget Process ........................................................................................................................................... 31 Budget Process Calendar ....................................................................................................................... 33 Budget Overview ........................................................................................................................................ 35 Budget Sources & Uses Sources of District Funds ........................................................................................................................ 33 Uses of District Funds ............................................................................................................................. 43 Departmental Summaries ...................................................................................................................... 47 District Summary of Positions ................................................................................................................ 50 Debt Service Debt Service Requirements ................................................................................................................... 51 Capital Projects Summary .......................................................................................................................... 55 Major Sanitary Sewer Projects ............................................................................................................... 56 Major Surface Water Management Projects ......................................................................................... 59 Financial Outlook Future Strategies .................................................................................................................................... 61 Financial Forecast Assumptions ............................................................................................................. 62

Fund and Program Detail
Funds Summary Budget Resources and Requirements FY 2018-19 ................................................................................. 65 Fund Accounting Structure .................................................................................................................... 67 General Fund Program Codes ................................................................................................................ 68 Operating Funds Summary ........................................................................................................................ 69 General Fund 101 ................................................................................................................................... 70 Storm and Surface Water Management Fund 201 ................................................................................ 72
Construction Funds Summary ..................................................................................................................... 75 Sanitary Sewer System LID Construction Fund 108 ............................................................................... 76 Surface Water Management LID Fund 208 ............................................................................................ 77 Sanitary Sewer Construction Fund 112 .................................................................................................. 78 Surface Water Management Construction Fund 212 ............................................................................ 79 Tualatin Basin Water Supply Capital Project Fund 115 .......................................................................... 80
Reserve Funds Summary ............................................................................................................................ 81 Liability Reserve Fund 102 ..................................................................................................................... 82 Sanitary Capital Replacement Fund 106 ................................................................................................ 83 Surface Water Management Capital Replacement Fund 206 ............................................................... 84 Sanitary Capital Reserve Fund 107......................................................................................................... 85 Surface Water Management Capital Reserve Fund 207 ........................................................................ 86 Debt Service Funds Summary .................................................................................................................... 87 Master Plan Update Debt Service Fund 111 .......................................................................................... 88 Revenue Pension Bond Fund 114 .......................................................................................................... 89
Departmental Detail Business Services Department ................................................................................................................... 91
Regulatory Affairs Department ............................................................................................................... 117 Watershed Management Department .................................................................................................... 129 Conveyance Systems Department ........................................................................................................... 137 Wastewater Treatment Department ....................................................................................................... 161 Appendix Chart of Accounts ................................................................................................................................. 195 Sanitary Sewer Capital Project List ...................................................................................................... 196 Surface Water Management Capital Project List ................................................................................. 212 Glossary ................................................................................................................................................ 217 Acronyms and Abbreviations ............................................................................................................... 226
Clean Water Services FY 2018-19 Adopted Budget Page 1
FY 2018-19 Budget Message & Overview
Clean Water Services
Chairman Andy Duyck Members of the Board of Directors Members of the Citizens Budget Committee Clean Water Services’ Customers and Partners: We are pleased to present Clean Water Services’ Adopted Budget for Fiscal Year (FY) 2018-19. This budget message is presented in accordance with Oregon Revised Statutes (ORS), Chapter 294, and is designed to present an overview that will help readers better understand this budget as a financial planning road map. Comparisons in this Budget Message are “budget to budget” to the previously adopted FY 2017-18 budget, unless otherwise noted.
Budget Summary The adopted all-funds budget for FY 2018-19 excluding interfund transfers is $481.3 million, compared to last year’s adopted budget of $466.3 million. This is an increase of $15 million or 3.2%. The total budget includes operating expenditures, capital investments, debt service, other fund level outlays, contingency and unappropriated ending working capital and reserves. Primary ongoing budget revenues are rate revenues from sewer and surface water of $143.9 million and System Development Charges of $20 million. Rate revenues for Sanitary Sewer and Surface Water Management (SWM) are projected to increase by $6.3 million or 4.6%, reflecting the effects of rate changes (discussed below) and customer growth. Primary expenditures include $73 million for departmental operating expenses, $22 million for debt service on outstanding debt obligations, $124.1 million for capital projects, $43.5 million for other fund outlays, and $32.1 million for contingencies. Total expenditures for FY 2018-19 increased by $87.3 million, compared to the prior year, or 49.8%. The following is a summary of the purpose for the increased expenditures: Total departmental operating expenditures are proposed to increase by 2.4% overall. Labor costs are budgeted to increase by $1.3 million or 3.1%. This increase is the result of additional costs from adding 4 positions, a 1.1% increase in total staff. These additional positions will enable the District to continue its excellence in operations and maintenance as well as handle the increasing capital project workload driven by growth in the region and increased regulatory requirements. Materials and services are budgeted to increase by $0.9 million or 3.1% due in part to the increase in costs to address the NPDES and MS4 permit, chemicals, utilities, and contract services. Departmental capital outlay is now reported as part of the Capital Improvement Program (CIP). The CIP is up $44.7 million this year; a 56.3% increase. The significant increase in capital costs is driven by continued growth in the service area which is significantly increasing our investment in new conveyance and treatment infrastructure as well as a continued focus on renewal of existing aged infrastructure. Other fund level outlays is budgeted to increase by $40.9 million. This includes a one-time payment of $38 million in reserves to the Oregon Public Employees Retirement System (PERS) to establish a side-account to cover the unfunded pension liability and stabilize future District rate increases that are applied as a percentage of District payroll. This account will help to maintain reasonable and predictable future utility rates by implementing a proactive strategy to manage the unfunded PERS liability. Another $2.7 million relates to pass-

Clean Water Services FY 2018-19 Adopted Budget Page 2
through revenues to member cities for their local share of industrial revenues. This cost was netted against industrial revenues in prior years.
District Financial Management Financial Management Excellence Recognized District financial management continues to earn honors for excellence in financial reporting and budget presentation, as evidenced by Government Finance Officers Association of the United States and Canada (GFOA) awards to the District for Achievement of Excellence in Financial Reporting and for Distinguished Budget Presentation in the most recent reporting periods. Strategies to Keep the District On-Track Financially This budget has been prepared in accordance with the tenets of Board established financial strategic direction. These are as follows (see page 61 of this document):
Keep Rate Increases Reasonable and Predictable
Maintain Adequate Capacity to Issue Debt
Establish and Maintain Appropriate Financial Reserves
Adopt Sound Financial Policies Controlling Costs Clean Water Services continues to focus on reducing the long-term operating costs of the utility through innovation, using new technology and reorganizing the workforce. Even with an increased investment in the District’s workforce to serve a growing community and increased program requirements, the number of employees per customer served is still less than 6 employees per 10,000. This is a significant decrease of more than 35 percent from the high of 9 employees per 10,000 residents in 1997. In 1997, the estimated population of Washington County was 400,000 and the District had 366 approved FTE. Between 1997 and 2017, the County’s population has grown by 46% while the number of District employees in 2017 at 351 approved FTE still remained below the total number of employees in 1997. Recognized as a Utility of the Future by the Water Environment Federation in October 2016, the District relies on its people to create and innovate the future, to control our destiny. The recognition was a result of many innovations. These innovations include the first in the nation watershed permit allowing stream restoration and shading instead of energy intensive mechanical chillers that creates cooler waters for native fish populations. This saved more than $100 million. Another part of the District’s on-going innovation is recovery of nutrients from the wastewater. CWS pioneered the Ostara process and subsequently improved the process through its WASSTRIP process – a patented invention that nearly doubles the recovery of nutrients as a high value fertilizer. These are just a few of the examples of the innovation that is producing superior ecological outcomes at lower costs helping to keep our utility both ecologically and financially sustainable into the future. Another recent innovation that also helps manage risk and control cost is the District’s new Clean Water Insurance Company, LLC. It began operation on July 1, 2016 as a means to formalize the District’s self-insured insurance programs for the benefit of the District and its ratepayers. The captive, which is managed by the District, will result in long term risk management program savings through access to the reinsurance markets for additional risk financing options such as seismic coverages, as well as provide potential funding of loss prevention and mitigation projects to further protect District assets or recover from a seismic event. In 2017, the captive began providing the District’s vision coverage program for the unrepresented employees. Oregon’s Public Employees Retirement System or PERS has estimated significant liabilities for the District over the next fifteen years that could lead to significant upward pressure on future utility rates unless a PERS stabilization strategy is implemented. During the recent 2018 Session, the Oregon Legislature authorized the

Clean Water Services FY 2018-19 Adopted Budget Page 3
creation of new side accounts that employers may invest in to help offset future PERS rate increases. The District currently has an active existing side account that was bond funded starting in 2004 which has helped hold down the PERS rate increases. This budget plans to fund a new additional $38 million PERS side account, in conformance with the legislative action, which will manage future PERS increases to an estimated high of 21% of payroll, versus an estimated high of 31% of payroll without the side account. District Utility Rates In accordance with Board direction, reasonable and predictable rate increases are vital to the District’s long-term financial health, providing strong assurance that the District is well positioned to meet future needs, equipped with the strongest bond credit ratings and financial flexibility possible. Sanitary sewer rates are increasing by 3% or $1.33 per month in FY 2018-19 for the typical residential customer. In addition to supporting cost effective operations, this increase is needed to sustain the District’s capital investment program, including program enhancements and proper maintenance of assets, as well as meeting increasingly stringent EPA and DEQ regulatory requirements. SWM fees are increasing by $0.50 per month for the typical residential customer. SWM fees fund the operation and maintenance of the public drainage system. The sanitary sewer and SWM rate increases will add an estimated $1.83 per month to the typical residential customer’s combined bill, a total combined rate increase of 3.55%. To help fund District capital investments, sanitary sewer System Development Charges (SDCs) are increasing from $5,500 to $5,650 per Equivalent Dwelling Unit (EDU). SWM SDCs will increase from $530 to $545 per Equivalent Service Unit (ESU). Average combined monthly service fees for Sanitary Sewer and SWM utilities have risen at a ten year average annual rate of 4.28% (see table below) and average District sanitary sewer bills are substantially lower than those of a majority of local service providers (see following chart). This is especially notable since the District provides a substantially higher level of wastewater treatment than nearly all local, regional, and national providers of comparable services.
Combined Sanitary Percentage Rate Increases
Fiscal and SWM Monthly Combined 10-Year
Year Rates (per EDU & ESU) Annual Annual Avg (10-19)
2010 $36.91 3.99%
2011 $39.21 5.58%
2012 $41.25 6.23%
2013 $43.08 5.21%
2014 $44.71 3.78%
2015 $46.36 3.69%
2016 $48.05 3.65%
2017 $49.76 3.56%
2018 $51.52 3.54%
2019 $53.35 3.55% 4.28%
10-Year Utility Rate History
(Single Family Residential)
Sanitary Sewer & SWM Average Monthly Rates

Clean Water Services FY 2018-19 Adopted Budget Page 4
Capacity to Issue Debt To ensure adequate fiscal capacity to issue debt and meet sanitary sewer system expansion needs, the District has a financial practice to maintain coverage ratios above the minimum required by the existing bond covenants to maintain a high bond rating. The FY 2018-19 budget continues this practice with an estimated coverage ratio of 4.47, compared to the minimum coverage requirement of 1.20 times annual debt service. Clean Water Services strong financial position has earned the District Standard & Poor’s highest rating of AAA as well as Aa1 by Moody’s Investors Service. This strong financial performance and bond rating positions the District well for
City / Agency
Level of
Treatment
FY 2017-18
Average
Monthly
Sanitary
Charge
FY 2017-18
Average
Monthly
SWM
Charge
FY 2017-18
Average
Monthly
Combined
Bill
Rate Change
for
FY 2018-19
Estimated
Combined
Monthly Bill
as of
July 1, 2018
Clean Water ServicesAdvanced
Tertiary$43.27 $8.25 $51.52
3% sani &
$.50 SWM$53.35
Lake Oswego
Secondary
provided by
Portland
$70.45 $14.40 $84.853% sani &
7% SWM$87.97
McMinnvilleAdvanced
Tertiary$63.92 $0.00 $63.92 2.8% sani $65.71
Portland Secondary $43.25 $28.61 $71.863% sani &
3% SWM$74.02
Salem
Rates effective 1/1/2018Secondary $41.72 $15.77 $57.49
3% sani &
3% SWM$59.21
Vancouver, WA
Rates effective 1/1/2018
Secondary,
Activated
Sludge
$51.80 (a)
$77.80 (b)$10.13
$61.93 (a)
$87.93 (b)
3% sani &
.4% SWM
$63.57 (a)
$90.27 (b)
Typical Monthly Sewer and SWM Bill Comparisons
(a) Inside city limits (b) Outside city limits
$65.71
$63.57
$59.21
$53.35
$0.00 $10.00 $20.00 $30.00 $40.00 $50.00 $60.00 $70.00
Portland
McMinnville
Vancouver - Inside
Salem
Clean Water Services
Monthly Single Family Combined Bill as of July 1, 2008
$90.27
$87.97
$74.02
$65.71
$63.57
$59.21
$53.35
$0.00 $10.00 $20.00 $30.00 $40.00 $50.00 $60.00 $70.00 $80.00 $90.00 $100.00
Vancouver - Outside
Lake Oswego
Portland
McMinnville
Vancouver - Inside
Salem
Clean Water Services
Monthly Single Family Combined Bill as of July 1, 2018

Clean Water Services FY 2018-19 Adopted Budget Page 5
future bond issuances to fund large infrastructure project investments to meet regulatory and growth requirements. Maintain Financial Reserves Financial reserves provide stable funding for working capital, operating contingencies, and future capital investments for repair and replacement of infrastructure. As noted previously, the District’s FY 2018-19 budget includes a one-time payment of $38 million in reserves to cover the District’s unfunded pension liability and to stabilize future PERS rates. The District’s multi-year financial forecast reflects planned growth in operating reserves to meet future funding needs for operations and capital investments as the District grows to meet regional needs. Surface Water Management (SWM) Fund reserves had been declining in past years as operating and capital project costs exceeded service charges collected. Fiscal controls were put in place in FY 12 to proactively reverse this negative financial trend. The trend ended and cash reserves in the fund are building as planned and are estimated to be $20.9 million at the start of FY 19. The FY 19 budget includes a SWM rate increase of $0.50 per month to fund needed capital replacements such as street sweepers and to provide stormwater treatment to areas with inadequate stormwater management facilities. The District has prioritized SWM capital projects in the 5-year Capital Improvement Program. Financial Policies The Board has established a number of policies which provide management with direction in decision making that fosters financial stability and the ability to accomplish the District’s mission. These policies are detailed on page 27 of this document.
Business Climate and Influences Population Growth Decades of population and employment growth have led various sectors to focus much of their energy and resources on meeting physical infrastructure needs. New and expanded roads, bridges, schools, churches, high-tech manufacturing facilities, hospitals and other "brick-and-mortar" projects, including Clean Water Services’ sanitary sewer and surface water management improvements, have helped define this increasingly urban community. The District currently serves approximately 596,000 residents of urban Washington County, Oregon. The County is expected to add an additional 122,000 people by 2030. Planning well is essential to meet service needs in an effective and cost efficient manner. Regulatory Climate In February 2004, the Oregon Department of Environmental Quality (DEQ) issued Clean Water Services the nation’s first integrated, municipal, watershed-based permit under the Clean Water Act. This innovative permit integrates the District’s four municipal wastewater treatment facilities and the municipal stormwater system permits into an integrated bundle, which changes the regulatory framework allowing the District greater flexibility to take advantage of creative approaches and new solutions, such as the following:
Water quality credit trading for thermal loads between treatment facilities and the release of stored water from Hagg Lake and Barney Reservoirs to the River and Tributaries.
Water quality credit trading for thermal loads between treatment facilities and streamside shading improvements outside and inside the District’s service boundary.
Establishes performance benchmarks for the stormwater management activities of the District, its partner cities and Washington County as a whole.

Clean Water Services FY 2018-19 Adopted Budget Page 6
On April 22, 2016 the District was issued a new Permit which became effective on June 1, 2016. The newly issued permit expands on the Watershed Permit to respond to new growth, maintain current infrastructure investments, provide new discharges, and achieve water quality standards. The new permit achieves these goals by innovative conditions such as:
Operational flexibility to optimize performance between the plants while still achieving water quality for various parameters.
Providing for a new and innovative natural treatment system discharge.
Optimizing discharge limits and compliance measurements by integrating “bubble” loads between District facilities.
Enhance water quality trading between facilities, streamside shading and flow management.
Plan for future growth and development in the basin.
Consolidation of regulatory reporting requirements including electronic reporting for state and federal reporting requirements.
Developed and applied state of the art dynamic water quality models to assess long term strategies for compliance and to provide necessary evaluation of alternatives for changes to Scoggins Dam.
Provided research and data supporting the DEQ development and application of a biotic ligand model criteria for copper and accurate methods for Reasonable Potential Analysis to ensure achievable compliance at the District’s facilities.
The State Regulatory Agency has accepted a petition for reconsideration of certain aspects of the District’s permit. While not a compliance issue, the District is working with the regulator to clarify and respond to the request for reconsideration. There are two principle issues arising from the reconsideration related to mercury and copper criteria. One specific innovative action includes drafting a regulatory strategy that includes a variance application for mercury. The mercury variance is the first in the Pacific Northwest, and first in the Nation, to recognize that natural and human sources of mercury are beyond our control and limit the ability to achieve the current standard. The variance will form the basis for future approaches used for the Willamette Basin Mercury program by Oregon DEQ. The District has also worked with regulatory agencies to develop strategies for complying with the Copper standard which is expressed as a biotic ligand model. Copper has been found to be extremely toxic to salmonids. Innovative approaches to compliance have included the addition of chemicals to achieve higher pH to improve both removal and reduce toxicity of copper and to adjust for winter ammonia removal. The additional cost of pH adjustments is on the order of $561,000 per year. While water quality has improved in the Tualatin River and its tributaries in the last decade, new and more complex challenges have arisen that cannot be solved through pollution control alone. These challenges to the health of the Tualatin River Basin require a cohesive, watershed-based strategy that reaches beyond the existing regulatory framework. The watershed-based permit allows regulators, permit holders and community stakeholders to consider the entire watershed, not just individual point sources, when managing the water resources in the basin. Clean Water Services’ successful track record of implementing complex water quality regulations through partnerships and collaboration is widely recognized as a national model. Investments by Clean Water Services’ customers in a highly advanced wastewater treatment program and a comprehensive surface water management program have paid off in a watershed that is healthier than it has been in generations - and at an affordable cost, in comparison to peer agencies.

Clean Water Services FY 2018-19 Adopted Budget Page 7
Investing in the Tualatin Basin Clear Commitment in our Budget This commitment is apparent in the budget with advanced wastewater treatment and comprehensive stormwater management. Our conveyance and treatment of wastewater produces billions of gallons of clean water, with millions of gallons applied to wetlands, parks, schools, and golf courses. We produce biosolids which helps grow grass seed and forage crops. Recovering resources in the wastewater includes recovering energy – enough to produce millions of kilowatt hours of electric power used to offset over a third of the requirements for treatment. Recovering nutrients also allows the District to create a unique slow release fertilizer that is not only better for plants, but it also helps protect our streams and the Tualatin River. It’s now available to our customers as a retail product called Clean Water Grow.
Our Capital Improvement Program (CIP) reflects our commitment to serve a growing community while maintaining our assets. With significant investment in both increased capacity and renewal of the capital infrastructure that serves our current community, the District will meet its commitment to asset renewal and a thriving community.
Our commitment to the watershed, innovation, and cost effectiveness meet at the new Fernhill Natural Treatment System (NTS). This project now enables the District to utilize existing treatment facilities year round saving capital costs for new treatment of $12 million as well as providing an ecological bridge to return the cleaned water to a vibrant ecological habitat for aquatic life. The District’s commitment to innovation to deliver superior environmental results at a sustainable cost is also a feature of the NTS – a ground breaking new application of nutrient removal in a natural system will enable treatment in significantly less space. And last but not least, the Fernhill Natural Treatment system provides our community with a beautiful space to engage with nature. Our commitment to create beautiful clean water for today and tomorrow means maintaining and adding to the District’s amazing network of pipes, pumps, and plants. This year’s CIP includes investment in a new process treatment train at the Durham facility, adding a major trunk line to serve the southeast area of the District, the long range water supply project to secure our existing investment and add additional capacity, solids process dewatering improvements at both Rock Creek and Durham facilities, investments in improving the people facilities, as well as an investment in a new Customer Information System (utility billing) with the our billing partner Tualatin Valley Water District. These projects increase both our capacity and maintain the existing system to effectively and efficiently use the funds entrusted to us by our ratepayers. Investing in Watershed Health Clean Water Services has spent more than 40 years pursuing a cohesive strategy to advance the health of the Tualatin River Watershed for 596,000 residents in 12 cities. Through innovation, scientific knowledge and creativity we work to improve environmental health and value for our customers. These efforts have paid dividends for water quality, public health, and our community—the Tualatin River is healthier than it has been in generations and has become a valued recreational asset. Investing in Infrastructure, Public Health and the Environment Over the past 10 years, Clean Water Services and our partner Cities have invested more than $450 million to expand, replace and upgrade our community’s four wastewater treatment facilities, 42 pump stations, 851 miles of sewer lines, and 529 miles of storm sewers.
2017-18 Achievements
Cleaned more than 28.4 billion gallons of wastewater.
Recycled 32 dry tons of biosolids a day on to agricultural fields in the Willamette Valley and eastern Oregon to improve soil condition and crop production.
Clean Water Services FY 2018-19 Adopted Budget Page 8
Monitored over 1,500 strict permit conditions at each treatment facility, including monthly, weekly and daily limits established to protect the Tualatin River.
All four District Water Resource Recovery Facilities earned National Association of Clean Water Agency’s highest awards for 100% permit requirements met or exceeded (Gold Award) including more than five consecutive years for three of the facilities (Platinum Award).
Swept more than 13,370 miles of streets collecting almost 667 dump truck loads of debris and cleaned more than 12,093 catch basins collecting material equivalent to 75 dump truck loads to keep pollutants out of our river and streams.
Replaced 233 sanitary sewer laterals and rehabilitated 11,400 linear feet of sewer mains and 277 manholes associated with the Infiltration and Inflow (I/I) reduction program.
District and member cities retrofitted 151 manholes and catch basins to provide additional water quality treatment.
Reviewed and issued site development permits for 29 Residential Subdivisions and 32 Commercial Development/Redevelopment Sites.
Issued 790 connection permits.
Managed 217 pretreatment permits issued to industrial customers to monitor and control their discharges to the wastewater treatment facilities, 353 facilities permitted or inspected discharging to the stormwater conveyance system, 304 Dentist offices to control mercury discharges to the resource recovery facilities, and 177 individual Ecological Business certifications.
Investing in Public Involvement & Education Clean Water Services reaches out to the community to encourage residents to join our efforts in protecting public health, enhancing the region’s environmental quality of life, and planning for the region’s water future.
2017-18 Achievements
The award-winning Tualatin River Rangers program reached nearly 3,000 students and an estimated 6,000 adults at nearly 40 percent of public elementary schools in the Tualatin Basin.
More than 600 high school science students participated in Sewer Science and got hands on education about water treatment followed by a facility tour.
More than 2,000 people from around the world toured Clean Water Services treatment facilities to learn how wastewater is cleaned at a higher level than 98% of the nation’s facilities.
This year the Fernhill Natural Treatment System project continued to attract thousands of visitors including 400 who attended public events (Birds and Brew, public tours, wildlife tracking, birding and health and nature walks), engaged 1,000 students from 15 Tualatin Basin schools in place-based education, hosted tours and projects by students from Pacific University and Portland Community College (PCC) and was the subject of tours or presentations to ten civic and professional groups.
To meet public outreach goals, build credibility as a provider of choice and tell our resource recovery
story, we produce and sell Clean Water Grow® retail fertilizer. Created in 2012, GROW is a slow-release fertilizer using nutrients recovered from used water at our Durham and Rock Creek Water Resource Recovery Facilities through the Ostara Nutrient Recovery system. The result is a high-performing product that benefits the environment, improves operation and maintenance of our resource recovery process, and provides ratepayers with a thriving plant food for their gardens. Today, GROW is sold in almost 200 local and regional stores including Fred Meyer (Kroger Co.), Orchard Supply Hardware, ACE Hardware, and True Value chains. This past year we increased total sales by 100% and launched three new blends for a quartette product line.
Investing in Resource Recovery Wastewater treatment has transformed over the last decade, moving from waste disposal to a growing recognition as resource recovery facilities that produce clean water, recover valuable nutrients, and produce clean, renewable energy. Clean Water Services is on the leading edge of this transformation:

Clean Water Services FY 2018-19 Adopted Budget Page 9
2017-18 Achievements
Provided 130 million gallons of irrigation water to more than 218 acres of athletic fields, golf courses, wetlands and parks from the Durham Advanced Wastewater Treatment Facility.
The Durham and Rock Creek Resource Recovery Facilities recycled phosphorus and ammonia to produce more than 340 tons of Crystal Green® fertilizer for sale to the commercial nursery and turf industry.
Generated 18.9 million kWh of renewable energy by capturing digester gas from the Rock Creek and Durham facilities as well as solar power at Durham to meet approximately 37.5% of the electrical demands for the Durham and Rock Creek Facilities.
Continued the development of Clean Water Grow™, as noted previously, a slow-release fertilizer that helps reduce nutrient runoff to waterways by gently releasing nutrients as plants use them. This product is made possible by the ratepayer’s investment in building the nation’s most advanced resource recovery facilities at the Durham and Rock Treatment Facilities.
Investing in Science Together with the USGS, DEQ, and the Washington County Watermaster, Clean Water Services has conducted comprehensive water quality and flow monitoring of the Tualatin River and its tributaries for more than two decades. This integrated monitoring program has allowed water resource managers to be more responsive to the needs and potential of the watershed.
2017-18 Achievements
The Water Quality Laboratory collected more than 30,000 treatment plant, stormwater, surface water, and industrial samples and performed nearly 140,000 chemical, biological and physical analyses to help Clean Water Services assure the health and safety of the Tualatin River watershed and its residents.
The laboratory monitored 70 water quality parameters at 38 sites on the Tualatin River and its tributaries on a twice per month basis and operates continuous water quality monitoring station on Beaverton Creek.
The Laboratory supported research and projects that included frog embryo survival in Kingfisher Marsh, effects of tributary flow restoration on water quality, harmful algae blooms, and fungal uptake and degradation of pollutants, along with a number of studies on improving efficiencies and effectiveness at the wastewater treatment facilities.
Working with the Watermaster and consultants, Clean Water Services managed and maintained more than 15 stream flow gauging stations to continuously measure the flow in the Tualatin River, Dairy, Fanno, Rock, Beaverton, Gales, Chicken Creeks, and many other Tualatin River tributaries.
Working with the USGS, gathered continuous, real-time water quality data in the Tualatin River and major tributaries.
Regulatory Affairs’ Department staff supported and expanded to nearly 20 operational process, source control, and research studies to increase efficiency including:
o Conducting nitrogen reduction pilot plant studies that produced the design and operational basis for the vertical flow wetlands being installed at the Fernhill Natural Treatment System
o Polymer optimization o Disinfection byproduct reduction and compliance
Investing in Community and Building Partnerships Clean Water Services is building innovative partnerships to create a shared vision and strategy to advance the health of the Tualatin River Watershed:
2017-18 Achievements Worked with the Tualatin Soil and Water Conservation District, Tualatin Hills Park and Recreation
District, U.S. Fish and Wildlife Service, Metro and other partners on over 120 miles of stream corridors that have been restored in agricultural and urban areas. This work provides temperature, water quality, habitat and recreational benefits along the Tualatin River and tributaries.
Inspired Cities, non-profits, park districts, private landowners and agricultural partners to plant a diverse collection of more than 1,000,000 native trees, shrubs and plants along streams, wetlands and the river

Clean Water Services FY 2018-19 Adopted Budget Page 10
to filter pollutants, provide shade and create healthy wildlife habitat as part of the Tree-For-All campaign in each of the last four years.
Catalyzed community organizations to rally thousands of volunteers to get their hands dirty on behalf of Mother Nature. The volunteers donated more than 10,000 hours, an estimated value of $220,000, and they rooted over 25,000 native plants to clean water, purify air, create wildlife habitat, and promote Washington County’s scenic beauty.
Partnered with community restoration organizations to access and deploy advanced technologies that increase efficiency of large scale planting operations and reduce staff time associated with plant inventory management and site review.
Partnered with Metro, Tualatin Riverkeepers, City of Hillsboro and other regional partners on two new nature recreation access points for the Tualatin River Water Trail with significant funding from the Oregon State Parks and Recreation Department.
Galvanized a coalition of community support from urban, agricultural, and government organizations for major restoration efforts at the Wapato Lake National Wildlife Refuge and developed new funding partners from the private and public sector, including Intel, Bonneville Environmental Foundation, Tualatin Soil and Water Conservation District, and Joint Water Commission. The project will safeguard water quality, enhance wetland habitats and increase resilience of water management infrastructure at this influential upper watershed site.
Partnered with Portland Community College and community organizations to construct the Rock Creek Enhancement project, including a regional government (Metro) program Nature-in-Neighborhoods grant supporting education and outreach to culturally diverse groups, as well as 100 acres of stream and wetland enhancement in a strategic area downstream of new development around North Bethany.
Summary Commitment to Service & Financial Sustainability Clean Water Services’ ongoing commitment to service and financial sustainability is demonstrated by:
• Advancing restoration of the ecological integrity of the Tualatin River Watershed, continuing to apply principles of long-term environmental sustainability and continual improvement in the design, construction and operation of its facilities and programs.
• Providing high quality services at a reasonable cost to ratepayers, both now and in the future. • Producing environmental and economic outcomes that are superior to those achievable through the
application of individual state/federal laws, rules and regulations by adopting an integrated watershed based approach.
• Continually seeking out and implementing innovative and cost effective solutions. Epilogue Clean Water Services has long provided cost-effective and environmentally sensitive management of sanitary sewer and surface water management services for the Tualatin Watershed. The District’s ongoing vision and commitment to providing sustainable, high value water resource management services at a reasonable cost continues with this Budget. We thank the Board, our partners and most of all, our ratepayers for enabling this vital work.
Bill Gaffi General Manager

Clean Water Services FY 2018-19 Adopted Budget Page 11
About Clean Water Services History - District Formation Clean Water Services, formerly Unified Sewerage Agency of Washington County, was formed February 4, 1970 as a county service district under Oregon Revised Statutes Chapter 451. It was created by popular vote with the authority to implement sewerage improvements and programs and to provide for the financing of those improvements and programs. The formation of the District unified 26 wastewater treatment plants, consolidating their facilities and operations into one entity. The District began a multi-million dollar pollution control program based on the area-wide wastewater treatment Master Plan. The plan called for the elimination of all treatment plants on the tributaries of the Tualatin River and limited the construction or expansion of major treatment facilities to the Tualatin
River. In July 1989, the Portland Metropolitan Area Local Government Boundary Commission authorized an expansion of the District’s authority to include storm and surface water management services. In this capacity, the District manages nonpoint source pollution, rainfall-related erosion and sedimentation, and rainfall run-off and flood control. The Organization The District is an independent municipal corporation closely allied with Washington County Government. Its Board of Directors consists of five persons serving as the elected Washington County Board of Commissioners. The Board of Directors appoints a 15-member advisory body, the Clean Water Services Advisory Commission (CWAC), to assist the District in its operations. This Commission advises the Board on programs and policies and works closely with the District’s General Manager. Five representatives from the Commission along with the Board of Directors comprise the District’s 10-member Budget Committee which reviews and approves the proposed budget before it goes to the Board of Directors for adoption. The General Manager, who is appointed by the Board of Directors, is the District’s administrator.
Regulatory History and Current Operating Environment The most important requirements for Clean Water Services center on the discharge of highly treated wastewater effluent and stormwater runoff into the Tualatin River Basin. The United States Environmental Protection Agency (EPA) is empowered to develop and enforce regulatory standards for surface water resources throughout the United States. As part of its regulatory effort, the EPA established the National Pollutant Discharge Elimination System (NPDES) to control discharges of effluent. At the state level, the Oregon Department of Environmental Quality (DEQ) acts on behalf of the EPA to administer and enforce EPA programs and state environmental programs and regulations. On February 26, 2004, Clean Water Services was issued an
integrated, municipal NPDES permit. This permit, the first in the nation, outlined the requirements for discharge of treated effluent and stormwater within its service boundary. On April 22, 2016 the District was issued a new permit with an effective date of June 1, 2016. Clean Water Services is in compliance with all of the terms of its NPDES permit.

Clean Water Services FY 2018-19 Adopted Budget Page 12
DEQ has established Total Maximum Daily Loads (TMDLs) and waste load allocations for the Tualatin River. The requirements of the NPDES act as the implementation mechanism for the elements of the Tualatin TMDL directly related to the activities of Clean Water Services. Economic and Demographic Information The District’s service area encompasses most of the developed part of the Tualatin River watershed, an area of approximately 123 square miles. The service area includes more than 95 percent of Washington County’s population. Cities located within and served by the District are as follows: Banks, Beaverton, Cornelius, Durham, Forest Grove, Gaston, Hillsboro, King City, North Plains, Sherwood, Tigard, Tualatin, and a small portion of Lake Oswego. The District contracts services to portions of Multnomah County, Clackamas County, and the City of Portland. The economy of the District's service area reflects the diversification of industry characteristic of the Portland metropolitan area. The county relies more heavily on the high tech industry than other counties in the metropolitan area, and is less dependent on the forest products industry than the state as a whole. Other major county economic clusters include sporting goods and apparel, manufacturing, agriculture, and food processing.
Source: Bureau of Economic Analysis
The region’s population continues to grow at a modest pace. Although official population estimates are not available for special districts, Clean Water Services’ estimates the population of its service area at approximately 596,000, based on 2017 estimates. Population growth within the District’s service area has consistently outpaced population growth within the region over the past decade, and is predicted to continue growing with an estimate of 670,000 by the year 2025. Washington County per capita personal income continues to show signs of modest growth. Washington County’s per capita personal income has consistently outpaced state average and the unemployment rate remains among the lowest in the region.
$25,000
$30,000
$35,000
$40,000
$45,000
$50,000
$55,000
$60,000
2007 2008 2009 2010 2011 2012 2013 2014 2015 2016
Per Capita Personal Income
United States Oregon Washington County

Clean Water Services FY 2018-19 Adopted Budget Page 13
Source: Portland State University Population Research Center
Source: State of Oregon Employment Department
District Customers – Four Types Clean Water Services provides services to four types of customers: cities served as wholesale customers, cities served as retail customers, industrial customers located both within cities and in unincorporated areas, and residential and commercial customers located in unincorporated areas.
0.0%
0.5%
1.0%
1.5%
2.0%
2.5%
2009 2010 2011 2012 2013 2014 2015 2016 2017 2018
State and County Population Trend
Oregon Population Change Washington County Population Change
2008 2009 2010 2011 2012 2013 2014 2015 2016 2017
United States 5.8% 9.3% 9.6% 8.9% 8.1% 7.4% 6.2% 5.3% 4.9% 4.4%
Oregon 6.5% 11.3% 10.6% 9.5% 8.8% 7.9% 6.8% 5.6% 4.8% 4.1%
WashingtonCounty
5.3% 9.5% 9.0% 7.7% 7.1% 6.3% 5.6% 4.7% 4.2% 3.5%
0.0%
2.0%
4.0%
6.0%
8.0%
10.0%
12.0%
Unemployment Rates

Clean Water Services FY 2018-19 Adopted Budget Page 14
Wholesale City Customers The District provides wholesale sewage transport and treatment to seven cities. These cities are Beaverton, Cornelius, Forest Grove, Hillsboro, Sherwood, Tigard, and Tualatin. The service charge for sanitary sewage service for wholesale city customers is based on Clean Water Services’ rate per equivalent dwelling unit (EDU) per month. Rate revenues from these wholesale customers represent about 54% of sanitary sewer service rate revenues. Retail City Customers Clean Water Services provides retail service, sewage treatment, transmission and collection system maintenance to five cities. These cities are: Banks, Durham, Gaston, King City, and North Plains. Rate revenues from these retail customers represent about 2% of sanitary sewer service rate revenues. The District is responsible for billing retail city customers, and returns a franchise fee to retail city customers. Industrial Customers The District currently bills and collects for sewer service to all industrial customers in its service area. Clean Water Services remits to each city an agreed upon percentage of the wastewater volume charge for industrial customers within that city. Rate revenues from these industrial customers represent about 10% of sanitary sewer service rate revenues. Customers in Unincorporated Areas The last category of customers includes residential and commercial customers in unincorporated areas. These customers are charged a fixed rate based upon the number of plumbing fixtures within the dwelling and a variable rate based upon the calculated average domestic water consumption during the “winter” period of November through April of each year. Rate revenue from these customers represent about 34% of sanitary sewer service rate revenues.
District Map

Clean Water Services FY 2018-19 Adopted Budget Page 15
District Organizational Chart
Planning &
Development
Services Division
Reuse/Support
Engineering
Services
Electrical &
Instrumentation &
Controls Division
Finance &
Accounting
Information
Technology
Government &
Public Affairs
Human Resources
Risk & Benefits
Watershed
Management
Department
21 FTE
Wastewater
Treatment
Department
129 FTE
Conveyance
Systems
Department
120 FTE
Field Operations
Division
Engineering
Services Division
Operations Division
Mechanical
Maintenance
Division
Operations
Business Services
Department
45 FTE
Regulatory Affairs
Department
35 FTE
Source Control
Laboratory
Services
Legal
3 FTE
ABC Building
Maintenance
Clean Water
Services Customers
Board of Directors
Clean Water
Services Advisory
Commission
General Manager
Deputy General
Manager

Clean Water Services FY 2018-19 Adopted Budget Page 16
This page intentionally left blank

Clean Water Services FY 2018-19 Adopted Budget Page 17
District Vision, Mission and Values
VISION Enhance the environment and quality of life in the Tualatin River Watershed through
visionary and collaborative management of water resources in partnership with others.
MISSION We provide cost-effective services and environmentally sensitive management
of water resources for the Tualatin River watershed.
VALUES We Value… • Our Employee Team
as Clean Water Services' greatest and trusted resource and asset. • A Supportive, Collaborative Team-Based Work Environment
utilizing timely communication and diverse backgrounds, skills and aspirations of all Clean Water Services employees.
• Active Public Awareness and Involvement in Clean Water Services affairs and regional water resources issues. • Financially Sound, Fiscally Responsible Management maximizing value for Clean Water Services rate payers and investors. • Quality, Cost Effective Customer Service for Clean Water Services customers supported by friendly, service-oriented personnel. • Strong, Visionary and Principle-Based Leadership providing direction and purpose in the achievement of the Clean Water Services mission. • Timely, Efficient Decision-Making at the Appropriate Level of the Organization enabling Clean Water Services to act swiftly, responsibly, and effectively. • Up-to-Date, Scientific and Technical Information available to everyone. • Technical Excellence and Innovation in the management of Clean Water Services' water resource facilities. • Protection of the Public Health and Enhancement of the Environment through the development and delivery of Clean Water Services programs and services. • A Long Range, Comprehensive Basin-Wide Perspective on water resources issues, challenges and opportunities.

Clean Water Services FY 2018-19 Adopted Budget Page 18
Business Planning
Four strategic initiatives focus and drive the District’s efforts to achieve its Vision, Mission and Values. These organization-wide goals set the overall direction for the District both for the short term and long term.
Clean Water Services Strategic Initiatives
Organizational Excellence To maximize the capabilities and effectiveness of our employees and organization. We will provide systems, tools, information, and incentives, and promote a culture that enables our employees to excel individually and collectively. We will reach beyond organizational boundaries to deliver value to our customers and stakeholders. Integrated Water Resource Management To optimize and integrate the management of water resources for the benefit of the public and the environment. We will lead collaborative efforts to meet the present and future water resource needs of the Tualatin River Basin. Competitiveness To provide unparalleled value in the wastewater, surface water, and water resource management services CWS provides to our customers. We will constantly improve ourselves, and identify and take advantage of business opportunities to create value for our ratepayers and stakeholders. We will be broadly recognized as a leader in delivering high quality and cost-effective services. Partnerships To increase the effectiveness of our strategic partnerships. We will strengthen our relationships with other utilities, government agencies, stakeholders, and businesses for our mutual benefit.
Goals and Objectives Goals and objectives, performance measurement, and compensation strategies are integral to any well-run organization. At Clean Water Services, business planning establishes short and long- range goals and objectives.
Annually, each business unit (department or division) establishes objectives that support the strategic initiatives. These objectives are reviewed and approved by the management team to ensure that business units are focused on progressing toward District-wide priorities. After the objectives are finalized, each business unit (department or division) identifies accompanying measures and targets to track progress toward achieving and communicating the intent of the objective against expected performance levels. These specific measures and targets are developed as part of the Goal Sharing program, and
Organizational Excellence
Competitive- ness
Partnerships
Integrated Water
Resource Management Value
Clean Water Services FY 2018-19 Adopted Budget Page 19
may change as new objectives are identified or as more effective and efficient measurements are devised. Progress is measured throughout the fiscal year and reported on a quarterly basis. Performance Measurement The District’s Pay Delivery system for employees consists of two elements: performance based pay and goal sharing. This system has been extensively re-evaluated to refine and improve the overall programs in order to better connect employee compensation to measurable business results. These changes were implemented by the District Board in November of 2008. The pay-for-performance program is focused on the individual level, and is administered through the evaluation process with employees. This also improves the competitiveness of the District’s salary structure. No automatic pay increases are built into the system. The District’s goal sharing program has been very successful in promoting cost savings and service enhancements by encouraging both practical and innovative employee approaches and solutions to improve delivery of priority services to ratepayers. This goal sharing program is entering its twelfth year and provides a critical linkage between employees’ achievement of meeting targets, working together, and the related financial compensation. This will help to carry on the trend of continually increasing employee productivity. In addition to these performance measurement systems, the District tracks and reports on a wide array of other performance indicators for regulatory and operational purposes. District Strategic Initiatives Following are the District’s strategic objectives, measures, and targets for the prior budget year FY 2017-18.
Objective Measure Target Yes No
Effectively meet the District's financial
requirements and commitments for the
internal and external partners,
vendors, and ratepayers.
Percent of quarterly plan commitments
achieved on-schedule.
Complete 90% of planned quarterly activities
for the fiscal year.
X
Meet the commitments IT makes to its
customers
Percent of IT quarterly plan commitments
achieved on schedule
Complete 90% of planned activities each
quarter X
Improve the efficiency and resiliency of
the budget process.
Go live with Questica budget software and
provide user training for the FY 2018-19
Budget.
Complete data set-up in Questica and go live
by December 31, 2017. Provide training to
budget entry staff before January 31, 2018.X
Align the GIS System Program with
District business needs and current
technologies.
Develop a 3-year GIS technology plan for the
District and submit to the DGM for
implementation approval.
The plan will address these topics:
1) ESRI desktop software migration to ArcGIS
Pro
2) Lucity integration with GIS
3) Role of ArcGIS Online in District operations
4) District GIS licensing model
5) Internet of Things (IoT) and GIS
6) District geodatabase architecture
7) District's custom GIS applications and tools
X
Maximize IT production system up-
time.
Hours of production system downtime. No more than a total of 15 hours of
production system downtime over the year
between the hours of 7:30 AM to 5:30 PM, M-
F.
X
Met?

Clean Water Services FY 2018-19 Adopted Budget Page 20
Objective Measure Target Yes No
Document current Site Development
processes and streamline/improve
process in preparation for the pending
collaborative effort Washington County
for sharing electronic plan review
documents through ProjectDox by
AVOLVE.
Complete flowchart mapping of current (AS
IS) and future (TO BE) Site Development
processes that demonstrate processes at a
high level as well as detailed flowcharts for
targeted areas in the process that are directly
impacted by the pending changes associated
with Washington County ProjectDox
implementation. Complete documentation
of rules, standards, and timelines that guide
and determine the processes, as well as the
required products of the workflow, and the
variable workflow process paths associated
with different project types (residential,
commercial, industrial, etc.) and with
variable project outcomes such as Early
Erosion Control (EC).
Chart of CWS’s current Site Development
workflow process. Documentation of the
impacts of electronic plan review to the
current Site Development process.
Identification of potential barriers to
implementation and possible solutions to
those barriers. Recommendations for
modifications to the workflow process to
enable successful implementation. X
Continue to improve and develop new
strategies to maintain a state of the art
O&M program.
Evaluate the potential uses of the Infomaster
software to enhance Conveyance's O&M
programs and asset condition related CIP
projects.
Provide a report and recommendation to the
CSD Director regarding the potential use of
Infomaster to improve Conveyance's O&M
program including a side by side comparison
of one existing process and how Infomaster
could be used to improve the process.
X
Improve Conveyance System Resiliency Identify Critical Infrastructure and Develop
and Document a Resiliency Plan
Present Critical Conveyance Infrastructure
Resiliency Plan to Directors X
Minimize lost work time injuries within
the Department
Improve Department safety program to
ensure compliance with OSHA and other
required training.
Categorize field-based work functions
requiring safety training and prepare a safety
training plan for each applicable function
within the Department.
X
Increase District-wide Emergency
Preparedness Status
Enhance the District's ability to respond to
District and County-wide needs in the event
of an area wide disaster by ensuring routine
and emergency communications systems are
in place.
Deploy fully operational 800 Mhz emergency
radio communications system to applicable
Departments in accordance with the 2017
Communications Plan (ICS 205).
X
Maximize functionality of existing Field
Operations Maintenance Management
Information System.
Increase use of Lucity Web functionality to
optimize District's use of Lucity while
maintaining data quality.
Implement Lucity Mobile and Lucity GIS and
document 3 process improvements resulting
from implementation of these new Lucity
modules.
X
Increase Conveyance Systems
Department's Emergency Preparedness
Status
Enhance the Conveyance Department's
ability to respond to District and County-
wide needs in the event of an area wide
disaster by increasing the Department's
ability to conduct emergency operations.
Prepare and submit a gap analysis of current
emergency operations capabilities of the
Conveyance Department versus the desired
level of service to the CSD Director by
6/30/2018.
X
Improve staff and operational
resiliency
Create a menu of Personal Preparedness
Challenges approved by the CSD Director for
employees to perform and document
including date, description, and lessons
learned.
CSD staff perform and document 265
Personal Preparedness Challenges, with no
more than 3 challenges credited to a single
employee.
X
Improve staff presentation and public
speaking with specific outreach to staff
who are making professional
presentations on behalf of the District.
Number of presenters and number of
practice session for professional
presentations
1) Host 10 different speakers at Clean Water
Toastmasters meetings/events.
2) Equal or exceed average attendance at
Toastmaster's monthly meetings for FY18
compared to FY17 numbers.
3) Incorporate 3 different presentation
practice sessions for staff making
professional presentations on behalf of the
District into a Clean Water Toastmasters
meeting/event.
X
Met?

Clean Water Services FY 2018-19 Adopted Budget Page 21
Objective Measure Target Yes No
Protect infrastructure, plant
operations, public and worker health,
and receiving waters
Efficient response to illicit discharges to
sanitary or storm water conveyance
Completion of one tabletop and one field
trial simulations completed and debriefed X
Providing data and information to
support decisions
Uncovering and utilization of dark data Provide a white paper describing two multi-
disciplinary team projects uncovering and
applying dark data to support decisions.
White paper will provide recommendation
for memorialization for sharing dark data
X
Continuous Process Improvement Completion of BPI Initiatives Complete at least six BPIs in the coming year
with storyboards and present to LTX
Improve District resiliency for large
scale emergency disasters
Provide emergency power and food supply Evaluate options for alternative power at the
ABC and FO and prepare a report.X
This is the second year of a multi-year
goal share measure geared towards the
development of an online Wikipedia-
type page (Wiki) that will aid Clean
Water Services' internal stakeholders in
the development of an enhanced and
common understanding of the Tualatin
River Watershed.
Further develop and refine the format and
content of the Wiki developed during Phase I
to specifically apply to the Fanno Creek
Watershed.
Release the Fanno Creek Watershed Wiki to
internal District employees in a hackathon
format.
X
Create a GIS based stream corridor
condition tool to support the making of
strategic decisions about how to
address hydromodification within a
given basin.
Develop the framework and identify the data
needed to create a map based tool to collect,
manage, and display stream corridor
condition inventory information.
Develop and pilot a map-based tool, using
available data, within two test basins: an
urban infill basin and green field urban
expansion basin.
X
Have a Wiki site accessible for the
District to share information related to
thermal management
Develop and document a framework for the
wiki and draft content pages. This is a multi-
year goal share measure geared towards the
development of an online Wiki-page that
will aid Clean Water Services’ internal
stakeholders in creating and documenting an
integrated Thermal Management strategy for
the District.
Create the framework, draft content pages
for the wiki, and present to the Thermal
Management Team
X
Optimize strategies for achieving
thermal load requirements
Develop information and methods needed to
efficiently evaluate and optimize thermal
load management strategies. Develop a long
term strategy and present to WWTD
leadership and Integrated Planning Team.
Identify, evaluate and present suite of
alternative thermal load management
strategies to WWTD leadership and IP
Steering Committee.X
Develop re-use strategy Discharge up to 5 mgd to TVID and exchange
a portion of the water with stored water
Develop a recommended permit strategy and
schedule X
The development of an adaptive Water
Quality Credit Trading Program for the
District.
Identify a few riparian planting projects
enrolled in the District's trading program that
have physically evolved over time and
evaluate potential crediting methodologies
for these projects. Recommend strategies
for crediting other projects of this nature.
Adaptive Trading white paper presented to
IP Implementation Steering Committee
X
Improve understanding of vegetated
facility performance while increasing
diversity of form and aesthetic appeal.
Create a challenge/competition to design
and incorporate aesthetically pleasing and
highly functional vegetated facilities that
could be used for an educational tour in the
future. Functional focus will be on hydrologic
performance, pollutant removal, and
neighborhood value, while meeting district
D&C standards for design and construction
and goals for maintainability.
Develop a design challenge including criteria
for form, function and aesthetics. Enlist the
aid of industry experts from stormwater and
landscaping industries to act as judges.
Present to the IP Implementation Group. X
Met?

Clean Water Services FY 2018-19 Adopted Budget Page 22
Objective Measure Target Yes No
Develop a standard evaluation system
and repair program to avoid damage to
infrastructure which would result in a
Sanitary Sewer Overflow.
Formal Program development and
documentation
Present a joint Engineering Services/Field
Operations report documenting inspection
methodologies, improvement approaches,
and priorities for the Exposed Sanitary Sewer
Program to the CREW and Conveyance
Department Director.
X
Provide responsive planning and timely
implementation of capital projects to
ensure compliance with regulatory
requirements and support regional
land use planning goals; develop,
perform, and provide oversight of
proactive, cost-effective, and efficient
maintenance and operation programs
which maximize useful life of capital
assets and the economies of scales of
being a regional service provider.
Percentage of projects proceeding on
schedule
75% of projects will meet all scheduled
milestones for the program year
X
Cost Effectively meet Capacity
Demands at Forest Grove WWTP
Develop multi-year program and
measurement criteria.
Present a multi-year implementation plan
and associated measurements to assure
capacity at Forest Grove WWTP to the DGM
and Directors.
X
Document collective vision and current
and future partnership strategies to
facilitate the implementation of basin-
wide integrated water resource
management.
Sub-basin plans clearly demonstrate
functional integration of strategies
implemented across land uses and their
synergistic benefits to ecology and
community.
PSU academic paper documenting TFA
partnership approach completed by
December 30, 2017.
Draft stream corridor stability assessment
tool completed by March 1, 2018.
Strategy and guidance document for future
community-based watershed partnerships.
Present findings to the IP Implementation
Group
X
Integrated Tree for All Partnership
Program
Basin-wide integrated partnership
implementation strategy
Document ecological gaps, goals, and roles of
basin-level planners, regulators and
advocates (e.g. CWS, SWCD, Metro, USFWS,
THPRD, TRK, TRWC). Engage external
coordinator for aspects determined to need
support. Present briefing to IP
Implementation Group.
X
Efficient Permitting Advance permit streamlining effort for
Washington County Land Use Authorization
Submit proposed changes to the Washington
County Comprehensive Development Code
(CDC) to the Long-Range Planning group for
inclusion in their work plan. Proposed
changes will be intended to reduce
unnecessary application material, District
staff time, and County review time for
projects involving enhancement of natural
areas and floodplains
X
Improve the environmental quality of
the Tualatin Basin through CWS
programs.
Identify opportunities for making
programmatic changes that will contribute to
addressing specific environmental
challenges in the Tualatin Basin
Prepare a written report that identifies
environmental quality issues in the Tualatin
Basin that may be due (at least in part) to
stormwater discharges from the CWS MS4
and proposes opportunities for addressing
them. Present findings to IP Implementation
Group.
X
Met?

Clean Water Services FY 2018-19 Adopted Budget Page 23
Objective Measure Target Yes No
Build a coalition of sponsors to study
and understand the demographic and
socio-economic makeup of Washington
County. Information will help create a
shared a shared vision and strategy
with our partners to advance the health
of the Tualatin River Watershed.
Develop a crisp, actionable description of our
Westside reality through community
partnerships and stakeholder interviews.
Develop and complete Westside Values &
Beliefs Report and roll-out plan. Present
findings to Leadership Team and Board of
Directors by June 30, 2018. X
The Clean Water Institute (CWI) is the
nonprofit partner of Clean Water
Services, one of North America’s most
innovative and award-winning water
resource management utilities.
Through CWI, Clean Water Services
engages communities and shares its
expertise. CWI supports ongoing
research to improve water quality,
stream flows and environmental
restoration, while minimizing costs for
Clean Water Services ratepayers.
A clear, concise description of CWI and
it's role in advancing innovation will
more effectively support the marketing
and promotion of the Institute as well
as clarifying it's relationship to CWS.
Update brand for the Clean Water Institute to
effectively and consistently market its
services and clarify its relationship to Clean
Water Services
Create a Brand Identity & Style Guide by April
27, 2018. Present to CWI by May 15, 2018.
X
Ensure employees understand and
value their role and the District's role in
protecting public health and the
environment. Maintain an
organizational model that attracts and
retains the highest caliber of
employees.
Create an updated District overview as part
of the onboarding process for new
employees. Overview informs new
employees of the District’s strategic goals,
values, mission and vision and incorporates a
treatment facility tour.
Revised New Employee Orientation Program
has been reviewed and approved by
Leadership Team by June 29, 2018.
X
The Bureau of Reclamation
Commissioner issued a "Determination
to proceed with a Joint Project"
involving Scoggins Dam in September
2017--the first such determination in
the US under the newly secured
statutory authority. Close coordination
between Reclamation's area, regional
and Dam Safety offices is critical to the
delivery of this project.
Reclamation provides a Tualatin Basin Dam
Safety & Water Supply Joint Project to the
Oregon Congressional delegation staff in
Washington, DC
Briefing is completed by December 22, 2017
X
In the spirit of CWS Passport (a 2017
Goal Share) broaden and deepen the
range of Peer-to-Peer (PPL) employee-
directed learning opportunities, which
help staff better understand their
peers' roles in working for the river.
Continue implementing the peer-to-peer
engagement component of the District's
internal communication plan through an
enhanced series of employee-directed
learning opportunities.
At least 175 employees complete at least two
Clean Water Passport activities. At least 35
employees lead or co-lead a Clean Water
Passport activity. Target to actual summary
charts; Debrief Leadership Team on Clean
Water Passport activities including target to
actual summary charts.
X
Refine effectiveness evaluation tool
and implementation plan developed
last year for one in-class program and
one field program to 1) Measure
student affective or knowledge change
after program participation and 2)
Adapt programing based on results if
necessary.
Refine deployment strategy of pre and post
evaluation for students that participate in
classroom and field study programs
delivered by CWS staff or contracted
partners. Increase number of responses to
River Ranger program from last year (
responses) and create assessment for 8th
grade students that participate in Watershed
Health field programming on school grounds
(participated in Watershed Health activities
at the Tualatin River Farm last year as 7th
graders).
Increase number of students that
participated in River Ranger classroom
assessment from 152 to 300. One assessment
for single-contact programming in the
classroom or in the field that evaluates
changes in knowledge and understanding
complete. Present findings to Leadership
Team.
X
Met?

Clean Water Services FY 2018-19 Adopted Budget Page 24
Objective Measure Target Yes No
Build internal alignment of priorities
and awareness of project progress
among the Fernhill Implementation
Team, as well as consistent external
messaging. Build internal and regional
pride in Fernhill as not only a nature
wonderland but also a national
example of innovative water resources
management and resource recovery.
Develop Fernhill Communications Plan for
internal and external audiences that aligns
with Fernhill Master Plan focus areas, goals
and objectives.
Present Fernhill Communications Plan and
implementation schedule to Fernhill
Implementation Team for approval by March
15, 2018.
X
Manage workflow and District
resources and meet customer needs
Percent of quarterly plan commitments
achieved on schedule
Complete ninety percent of planned
quarterly activities for the fiscal yearX
Enhance inter-workgroup
communication by piloting a process to
improve the efficiency of District Rules
(Rule), Contract and Purchasing Policies
(Policy) and Internal Purchasing
Practices or Processes (Process).
Number of items brought to General
Manager and Deputy General Manager to
decide upon and consider further action.
Bring at least six Rule or Policy improvement
items (as identified and agreed to by the
group) to the General Manager and Deputy
General Manager for consideration for
further action, roughly two per quarter for Q2-
Q4. In addition, suggest at least one Internal
Process Improvement per quarter for Q2-Q4.
X
Revision to current nutrient TMDL to
focus on dissolved ortho-Phosphate
Develop analytical tools and supporting data
needed to update TMDLs
Calibrated water quality model simulating
nutrient and algal growth dynamicsX
Implement at least two "Source Control
of the Future" phase I
recommendations
Develop a strategy to implement
recommendations to mature toward the
Source Control of the Future (SCotF) and
implement at least two "SCotF Phase I"
projects
Report to RAD Management and Deputy GM
on transition plan
X
Efficient operation of laboratory
services
Communication and implementation of a
systematic laboratory workload
identification, evaluation, prioritization and
scheduling process.
Use the developed process in one periodic
session each with RAD, Conveyance, and
WWTD.X
The successful transition to electronic
reporting of the monthly discharge
monitoring reports (DMRs) using DEQ's
NetDMR system.
Provide ongoing review of DEQ's NetDMR
system and work with DEQ and CWS
treatment plant (WWTD) and information
technology (IT) staff to revise and update the
system to meet permit conditions
throughout the year and during the transition
from summer to winter permit conditions.
Work with CWS WWTD staff to not only
understand and be able to navigate the
NetDMR system, but to also be able to
import, report and submit DMRs using
NetDMR. Conduct an internal training on the
NetDMR system.
Develop procedures for the management of
the electronic DMR reporting program
X
Make real time NTS data available for
management and communication.
Provide snapshot of real time NTS data to
inform management activities and
communication.
Beta test version of dashboard for NTS
monitoring available to staff X
Planning for compliance with water
quality based effluent limits
Determine a process for compliance with
phthalates
White Paper recommending a compliance
strategy for phthalates along with
information necessary to support compliance
strategy.
X
Compliance with water quality
standards for disinfection by-products
Evaluate operation strategies to reduce the
formation of disinfection by-products
Complete full scale operation test and report
to RAD and WWT managementX
Advance 1 water concept though
production of High Purity Water
demonstration projects
Determine next steps for high purity water re-
use
White paper submitted to Deputy General
Manager describing options for next steps
with High Purity Water.
X
Permit Compliance Develop implementation strategy to achieve
copper criteria
Recommend copper permit compliance
strategy for permit reconsiderationX
Met?

Clean Water Services FY 2018-19 Adopted Budget Page 25
Objective Measure Target Yes No
District has clear legal authority and
procedures to implement permit
conditions.
Ensure enforcement mechanism are
consistent with current permit requirements
Draft an audit memo reviewing current
District Ordinances and Resolution & Orders
to identify gaps in policies regarding
discharges to the sanitary and storm water
conveyance systems and enforcement of
those rules.
X
Water Supply Options Complete are required steps and
arrangements for geotechnical investigation
Geotechnical Investigation - One drill hole
completed at D/s Dam site X
Identify resources and examine current
communication plans to develop a
compliant strategy for Watershed staff.
Improvements over current strategy in
efficiency and reliability.
Concise, robust, and implementable
communications strategy following an
emergency or disaster.X
Collaboration between Work Groups Develop a framework to manage the new
pump station program.
Develop a bubble diagram that describes
roles and responsibilities of the different
groups that directly and indirectly support
the new Pump Station program within the
Mechanical Maintenance Division.
X
Manage our Assets Responsibly Identify critical equipment to predictively
rebuild/replace in FY19.
Develop a prioritized list of treatment plant
critical equipment to predictively
rebuild/replace.
X
Deliver Projects Just in Time Develop guidelines for consultants to deliver
design projects.
Develop a table of contents for a
comprehensive manual of design guidelines
and populate it with existing documents. X
Manage our Assets Responsibly Develop a fleet management program for
WWTD vehicles that will be coordinated with
the District-wide fleet management
program.
Develop the Departmental process and
metrics for reporting and to manage
maintenance and replacement of WWTD
vehicles to be coordinated with the District-
wide fleet management program.
X
Operate with Zero Permit Violations Develop and implement a system to identify
valves needing to be exercised.
Input into TabWare operator PMs for
exercising identified valves.X
Manage Our Assets Responsibly Develop and implement a program for
annual evaluation of diffuser performance
and fouling.
Submit report of findings and
recommendations to the WWTD Leadership
Team.
X
Employ Best Business Practices Revamp the electronic project filing system
for projects.
Develop and implement new Standard
Operating Procedures for electronic filing of
project documents.
X
Deliver Projects Just-in-Time Increase the accessibility of archived project
documents.
Develop and implement a retrieval system
for archived documents.X
Manage Our Assets Responsibly Increase effectiveness and efficiency of
equipment maintenance record keeping.
Select a new MMIS software package.X
Operate with Zero Permit Violations Increase effective operations of treatment
plants by migrating to an improved a new
SCADA Software Package.
Evaluate and recommend a new SCADA
software package. X
Increase Amount of Self-Generated
Electricity
Maximize digester gas production at Durham. Develop a control loop description for
automating FOG feed.X
Promote Teamwork Improve communication within work groups. Continue the Bringing Out the Best program
with the Durham and Rock Creek Leadership
Teams.
X
Employ Best Business Practices Implement Lean 6-Sigma principles within
O&M.
Institute the 5S System for the Durham
Maintenance shop.X
Manage collaboratively between work
units.
Improve process for locating force mains. Develop flow charts for documenting work
flows for updating force main locating
drawings.
X
Achieve Zero Lost Time Accidents Manage the confined space rescues as a
Department-wide team/resource.
Develop a SharePoint Site for the Confined
Space Rescuer program.X
Met?

Clean Water Services FY 2018-19 Adopted Budget Page 26
Objective Measure Target Yes No
Improve Energy Efficiency Reduce the amount of electricity used at the
four treatment plants.
Achieve 750,000 KW hours in O&M-initiated
energy efficiency measures and record on
the Energy Savings dashboard.
X
Promote Teamwork Minimize the number of false alarm after
hour call-outs.
Accurately utilize the procedures for after-
hours call outs 90% of the time, beginning
October 1, 2017.
X
Manage Our Assets Responsibly Determine and assign maintenance-focused
philosophy for operations of critical
equipment.
Develop Standard Operating Procedures for
including maintenance considerations in how
to operate and rotate between lead and
standby equipment.
X
Operate with Zero Permit Violations Provide clear and consistent methods for
identifying/tracing out exposed piping.
Evaluate and update the plant piping
identification standards.X
Increase Amount of Self-Generated
Electricity
Optimize production pf electricity from the
Durham and Rock Creek Cogen facilities.
Produce the target amount of electricity (set
on October 31) from the Durham and Rock
Creek cogeneration facilities in FY18.
X
Promote Teamwork Promote good housekeeping within the
treatment plants.
Develop and implement a program to keep
the treatment plants "tour ready" and
conduct quarterly inspections.
X
Deliver Projects Just in Time Continuation FY17 Goal Share to develop
templates for front end specifications.
Finalize templates for design-bid-build
projects, CM/GC projects, and for pre-
purchase of equipment.
X
Deliver Projects Just in Time Integrated CIP and umbrella project
scheduling.
Develop a template for integrating the
schedules of all CIP and umbrella projects for
each treatment plant.
X
Met?

Clean Water Services FY 2018-19 Adopted Budget Page 27
Financial Policies
Following are summaries of the District’s financial policies. Accounting, Auditing, and Financial Reporting
The District shall maintain its accounting records and report on its financial condition and results of operations in accordance with Generally Accepted Accounting Principles (GAAP), as promulgated by the Governmental Accounting Standards Board (GASB).
The District shall have an independent financial and compliance audit performed annually in accordance with generally accepted auditing standards and Oregon Revised Statutes.
The District shall publish an audited Comprehensive Annual Financial Report (CAFR) each year. Budgeting, Financial Planning, and Forecasting
The District shall balance budgeted resources with budgeted requirements within each fund to produce a balanced budget per Oregon Administrative Rules 150-294.388(1).
The District shall legally adopt its budget at the fund level with appropriations adopted in the categories of operating expenses, debt service, capital outlay, contingency and operating transfers for each fund, except the General Fund, which shall have appropriations adopted by major expenditure category. Appropriations shall lapse at the end of the fiscal year.
The District shall maintain a budgetary system to monitor and report on actual revenues and expenditures in comparison to budgeted amounts in order to ensure appropriate budgetary compliance.
The District shall include its goal share objectives, measures and targets as well as other measures of performance in its published annual budget.
The District shall appropriate a minimum contingency of 10 percent of total budgeted expenditures in the General Fund and 5 percent of total expenditures for all other District operating and construction funds, within each individual fund.
Strategic utility rate stabilization planning will be facilitated through sustainable budget contingency and carryover balance levels in the General Fund and the Surface Water Management Operating Fund. This approach will help promote reasonable and predictable future rate adjustments, supported by advance multi-year rate forecasting.
The District shall maintain reasonable resources for CIP and Capital Outlay, working capital, and prudent risk management.
The District shall annually prepare a multi-year financial forecast of major revenues, expenditures, and other financing sources and uses for the District.
Clean Water Services FY 2018-19 Adopted Budget Page 28
Capital Improvement Program (CIP) and Budget
The District will plan for capital improvements over a multi-year period of time. The Capital Improvement Program (CIP) will directly relate to the Master Plan, departmental operation plans, and other long-range plans.
The District shall annually prepare and update a multi-year capital improvement program (CIP) to identify and plan for anticipated capital projects and estimated costs and to identify estimated significant impacts on the operating budget.
The District will reasonably maintain its capital assets at a level sufficient to protect the District’s capital investment and to mitigate future maintenance and replacement costs. The budget will provide for adequate maintenance and orderly replacement of capital assets, as resources allow.
The District shall define as CIP capital assets any asset acquired, constructed, financed, modified or replaced by the District with a total cost of $50,000 or more and a useful life of 5 years or more, in accordance with GAAP. Expenditures between $5,000 and $50,000 that result in the creation of a capital asset or extend the useful life of an existing capital asset for at least five years shall be classified as capital outlay within the operating budget.
The District shall include CIP projects and their estimated costs within the operating budget for the period covered by the operating budget for approval by the District’s Budget Committee and adoption by the District’s Board.
Debt Management
The District shall issue long-term debt in accordance with all applicable federal, state and local laws and regulations, as well as District resolutions and orders, for appropriate purposes.
The District shall adhere to full disclosure of financial and pertinent credit information as it relates to the District’s outstanding securities and comply with applicable continuing disclosure requirements.
The District shall strive to maintain credit ratings of A or higher to ensure that borrowing costs are minimized and the District’s access to credit is assured.
The District shall comply with all requirements associated with revenue bonds, including, but not limited to, debt service reserve requirements and debt service coverage ratios.
The District shall use a competitive bidding process in the sale of bonds unless the Board authorizes a negotiated sale process that is expected to produce more favorable results for the District.
Investments
The District’s cash and investments shall be received, safeguarded, invested, and disbursed by the Washington County Treasurer on behalf of the District for District purposes, in accordance with Oregon Revised Statutes.
The District shall monitor the activities of the Washington County Treasurer regarding District cash and investments held by the County to ensure that liquidity and working capital needs are met and that investments are in compliance with Washington County’s investment policy.

Clean Water Services FY 2018-19 Adopted Budget Page 29
Revenue
The District shall maintain sanitary sewer and surface water management rates at levels that are deemed appropriate by the Board to finance costs associated with the following: regulatory requirements, needed program enhancements, maintenance of a competitive workforce, maintenance or replacement of capital assets, debt service related requirements, and to avoid or mitigate rate spikes in the future.
The District will follow an assertive policy of collecting revenues determined to be due to the District.

Clean Water Services FY 2018-19 Adopted Budget Page 30
This page intentionally left blank

Clean Water Services FY 2018-19 Adopted Budget Page 31
The Budget Process The District follows a budget process that is consistent with Oregon Local Budget Law requirements. These requirements are designed to accomplish two very important results:
Utilize standard procedures for preparing, presenting, and administering the budget;
Enhance citizen involvement in the budget process and public exposure to the budget before formal adoption.
The four phases of the budget process include:
Requested
The initial in-house development of the structure, levels of appropriation, and revenue and expenditure estimates. New and revised program approaches are developed and reviewed by staff at this time.
These requests are then reviewed at the Department level and a recommendation sent to the District Leadership Team for collaborative review. All District managers participate in relevant portions of this review and discussions.
Operating and capital budgets are reviewed against previously developed evaluation criteria and District priorities. No budget increases were approved unless they were driven by growing demand for service that could not be met by operating more efficiently and reallocating resources from other programs.
Proposed
The Proposed Budget is prepared under the direction of the Budget Officer, using the results from the District's internal review process as outlined above, and presented to the Budget Committee in a public meeting.
Approved
In the public meeting, the Budget Committee receives the budget document and has the opportunity to amend and/or approve the budget as proposed. After the Budget Committee meeting, the budget is in the approved stage.
Adopted
In a public hearing, the Board of Directors calls for comments from interested parties on the budget and may make revisions in response to those comments. After the public hearing, the Board adopts the budget, formalizing the appropriations for the coming fiscal year.
An increase in appropriations outside of the above process requires a Supplemental Budget, which involves many of the same procedures for notification and public hearings as the adoption of the annual budget. Transfers from the contingency appropriations may be made with Board authorization.

Clean Water Services FY 2018-19 Adopted Budget Page 32
Budget Process The budget process on the following page outlines the four phases of the process the District follows each year in putting together its annual budget. The budget process calendar identifies opportunities for public input while moving toward the actual adoption of appropriations for the coming fiscal year. Accounting Structure The District reports costs in two separate enterprise funds for sanitary sewer and storm water operations. For financial reporting purposes, financial statements are presented on a full accrual basis of accounting. In this method, revenues are recorded when they are earned and expenses are recorded at the time liabilities are incurred regardless of the timing of related cash inflows and outflows. The District’s budget is prepared using the modified accrual basis of accounting. Under modified accrual basis of accounting, revenues are recognized as soon as they are both measureable and available. Measureable means the amount of the transaction can be determined and revenues are considered available when they are collected within the current period or expected to be collected soon enough thereafter to be used to pay liabilities of the current period. For this purpose, revenues are considered available if they are collected within 60 days of the end of the current fiscal period. For legal requirements set forth in Oregon Local Budget Law, the District is required to prepare and adopt a budget by individual funds. Accounting records are maintained on a governmental fund accounting basis, and the resolution authorizing appropriations is adopted by fund each year in the categories of personnel services, materials and services, debt service, capital outlay, contingency, and operating transfers for each fund. The District's budget and financial tracking systems are based on a hierarchy of accounts which start at the Fund level and continue down to specific Projects. Line items are simply the individual expenditure and revenue categories which are tracked during the year (e.g., Electricity, Salaries, Service Charges). For the Operating Funds, it looks like this:
Fund
Department/Division
Division/Program
Project (as needed) The other funds rely on Projects and Line Items to identify budget appropriations dedicated to specific purposes. The fund accounting structure table on page 67 shows the organization of the various funds within the Operating, Construction, Reserve, or Debt fund types. Each tab identifies the various budget components included in that section of the document. A listing of the general fund program codes and the chart of accounts are provided within this document.
Clean Water Services FY 2018-19 Adopted Budget Page 33
Budget Process Calendar FY 2018-19 The outline below illustrates in general terms the process used to arrive at an Adopted Budget.
October through January
Individual program budgets developed using budget software program.
Draft Capital Improvement Program developed using an electronic database.
February and March Requested
Initial meetings with District staff and management to develop current fiscal year expenditures and review initial budget requests as prepared by Division and Department leaders.
Finance Manager and staff develop revenue projections for upcoming fiscal year and conduct rate analysis based on anticipated fund balances and revenues.
April and May Proposed
Proposed Budget prepared for publication.
Mid-April - Required public notice published in a newspaper of general circulation which announces when the Proposed Budget will be available for viewing, as well as the date and purpose of the Budget Committee meeting. The notice is also posted on the District’s website per ORS 294.426(5).
Proposed Budget document published.
Approved
Early May - Budget Committee meeting held for review and revision of Proposed Budget. Public comments received and addressed. When approved, the budget moves forward to the Board of Directors for adoption.
May and June Adopted
Notice published in newspaper of general circulation that a public hearing will be held to review the budget. (Notice includes schedule of appropriations, meeting time, and place.)
Mid June - Board of Directors holds public hearing(s) before the beginning of the fiscal year (July 1) to receive public comment and adopt the budget. At this time, Board also adopts Resolution and Orders setting salaries, staffing levels, and rates and charges.

Clean Water Services FY 2018-19 Adopted Budget Page 34
This page intentionally left blank

Clean Water Services FY 2018-19 Adopted Budget Page 35
Budget Overview Summary Total District revenues are budgeted to decrease by $1.1 million, or 0.6%. Total District expenditures, including operating and capital expenditures, debt service, and other fund outlays are budgeted to increase by $87.3 million, or 49.8%, due primarily to increases in the CIP and a one-time PERS pension liability payment. Combined beginning fund balances are estimated to increase by just under $16.1 million, or 5.5%, largely as a result of sanitary sewer net operating proceeds in the General Fund. The District continues to be in excellent financial condition, as indicated by its credit ratings of AAA from Standard & Poor’s and Aa1 by Moody’s Investors Service. Revenue Highlights The primary ongoing revenue drivers are service charges for sanitary sewer and surface water management (SWM), as well as System Development Charges (SDCs) for sanitary sewer and surface water. Together these revenue sources make up approximately 94.9% of estimated ongoing revenues for FY 2018-19. Service charges are projected to increase by $6.3 million or 4.6%, reflecting the effects of rate changes and growth. System Development Charges are projected to decrease by $4.9 million or 19.6% based on FY18 experience to date. Other sources of operating and non-operating revenue are interest earnings, grants, contributions, other assessments, and miscellaneous fees. These other sources of revenue make up approximately 5.1% of estimated revenues for FY 2018-19. These revenues decreased by $2.5 million or 22% in FY19 mainly due to the exclusion of Build America Bond subsidy payments of $1.5 million. The subsidy payments were excluded because of uncertainty in the ability to collect this payment from the federal government in future years. Expenditure Highlights Total departmental expenditures are budgeted to increase by just over $1.7 million, or 2.4%. Expenditures for personnel services, materials and services, capital investment, debt service, and other fund level outlays are discussed in greater detail below. Personnel Services (Labor) Total personnel services are increasing by $1.3 million, or 3.1%, from the FY 2017-18 adopted budget. The increase in personnel services is primarily due to the addition of 4 full-time equivalent (FTE) positions. The new positions are described in detail in the departmental summaries beginning on page 47. The District is currently in collective bargaining negotiations with the Union. Settlement of the negotiations will likely occur after the budget has been adopted and could impact the personnel services budget. Contingency funds are available and could be utilized with Board authorization if needed. Materials and Services Departmental materials and services are budgeted to increase by $0.9 million or 3.1%, compared to last year’s adopted budget. This increase reflects an anticipated increase in costs associated with the NPDES and MS4 permit, contract services, and increasing energy and chemical costs. Capital Investment (CIP) The District is budgeting an estimated $118.2 million in new sanitary sewer system improvements and $5.8 million in new surface water management system improvements in fiscal 2018-19. These investments are planned to increase system capacity, meet regulatory requirements for water quality, watershed health, and to

Clean Water Services FY 2018-19 Adopted Budget Page 36
prepare for current and future growth. All of the projects scheduled for implementation in this budget have been vetted against previously adopted sanitary and surface water management facilities/master plans. Debt Service Debt service is remaining flat in comparison to the fiscal 2018-19 budget. Other Fund Level Outlays This expenditure type includes utility bad debt expense, franchise fees, and other miscellaneous non-departmental outlays. This category is budgeted to increase by $40.9 million as compared to the prior year due to a one-time $38 million payment to establish a new side account with PERS. This side account would be utilized to cover the unfunded pension liability and to stabilize future PERS rate increases. Another $2.7 million in other fund level outlays relates to pass-through revenues to member cities which in prior years had been netted against revenues. Fund Balances Beginning fund balances are anticipated to increase by approximately $16.1 million or 5.5% over the current budget year primarily due to higher than anticipated net operating proceeds received in fiscal years 2017 and 2018.
Budget Overview – All Funds Summary The chart below shows the District’s all fund information at a summary level, which is presented on the following page in more detail.
$-
$50
$100
$150
$200
$250
$300
$350
FY16 Actual FY17 Actual FY18 Budget FY19 Adopted
in m
illio
ns
FY 2018-19 Budget Overview - All Funds Summary
Combined Beginning Fund Balances Total Operating & Nonoperating Revenues
Total Expenditures Ending Fund Balance & Contingency

Clean Water Services FY 2018-19 Adopted Budget Page 37
FY 2016 FY 2017 FY 2018 FY 2019 % Change
Actual Actual Budget Adopted From FY 18
SOURCES OF FUNDS Budget
Combined Beginning Fund Balance 243,755,934$ 274,809,823$ 292,512,454$ 308,571,600$ 5.5%
Operating Revenue
Service Charges 124,009,983$ 129,330,635$ 137,588,500$ 143,926,000$ 4.6%
Miscellaneous Fees 6,515,243 4,037,080 6,843,000 5,128,400 -25.1%
TBWSP Partner Reimbursement 15,980 104,060 - - (1)
Non-Operating Revenue
System Development Charges 20,712,605$ 26,598,454$ 24,891,700$ 20,001,900$ -19.6%
Grants, Contributions, & Assessments 68,808 47,722 453,900 462,800 2.0%
Build America Bond (BABs) Subsidy 1,560,973 1,529,940 1,560,000 - -100.0%
Interest Earnings 2,318,792 1,364,805 2,409,000 3,175,900 31.8%
Total Operating & Non-Operating Revenues: 155,202,384$ 163,012,696$ 173,746,100$ 172,695,000$ -0.6%
Bond Sale Proceeds - 1,666,804 - -
TOTAL SOURCES 398,958,318$ 439,489,323$ 466,258,554$ 481,266,600$ (2) 3.2%
USES OF FUNDS
Departmental Expenses
Personnel Services 32,559,834$ 33,865,560$ 42,822,200$ 44,144,100$ 3.1%
Materials and Services 23,768,145 25,076,818 27,979,800 28,854,700 3.1%
Capital Outlay 329,179 324,855 459,000 - -100.0%
Total Departmental Expenditures 56,657,158$ 59,267,233$ 71,261,000$ 72,998,800$ 2.4%
Other Uses of Funds
Debt Service 26,135,222$ 26,122,401$ 22,003,646$ 22,001,400$ 0.0%
Construction (CIP) 41,026,972 55,389,228 79,373,100 124,057,300 56.3%
Construction (CIP) TBWSP Partner Share 23,202 20,987 - - (1)
Other Fund Level Outlays 305,941 874,292 2,599,000 43,517,000 1574.4%
Total Expenditures: 124,148,495$ 141,674,141$ 175,236,746$ 262,574,500$ 49.8%
Contingency -$ -$ 22,811,300$ 32,118,000$ 40.8%
Ending Fund Balance 274,809,823 297,815,182 268,210,508 186,574,100 -30.4%
TOTAL USES 398,958,318$ 439,489,323$ 466,258,554$ 481,266,600$ (2) 3.2%
TOTAL FTEs 329.55 338.00 351.00 355.00 1.1%
(1) TBWSP Partner reimbursement pass-throughs are budgeted in accordance with Oregon Budget Law
(2) Excludes transfers between funds, which have a zero net effect on Sources and Uses of Funds, but are budgeted in accordance with Oregon
Budget Law
FY 2018-19 Budget Overview - All Funds
Clean Water Services

Clean Water Services FY 2018-19 Adopted Budget Page 38
This page intentionally left blank

Clean Water Services FY 2018-19 Adopted Budget Page 39
Sources of District Funds
Recent Fiscal Trends Key sources of funds for the District include sanitary sewer revenues, surface water management service revenues, and system development charges. In developing financial plans, staff reviews the history of these key revenues to identify trends that might be useful in formulating assumptions for the current year budget and for financial forecasts over the next five years. Below are brief historical discussions of the key sources of funds, followed by a more detailed discussion of FY 2018-19 sources of District funds. In most cases, the comparative data used is as of FY 2016-17 as audited, with the exception of FY 2017-18 information, which is estimated. Service Revenue The sanitary sewer revenues, which represent service charges assessed of wholesale and retail customers, represent the single largest source of operating revenues for the District. In FY 2017, they amounted to $115.9 million. The surface water management (SWM) revenues, which represent a flat fee assessed of any District customer who uses or discharges stormwater to the public storm and surface water systems, amounted to just under $13.5 million in FY 2017.
The District increased sanitary sewer rates by 3.0% every year from FY 2014 through FY 2018 while SWM rates remained constant at $4.00/month/ESU through FY 2009 with an increase of 25 cents per ESU in FY 2010 and 50 cents per ESU each year from FY 2013 through FY 2018. A 3% sanitary sewer and a 6% (50 cent) SWM rate increase are budgeted for FY 2018-19. Population and economic trends are also used in estimating future revenues. Sanitary sewer revenues are largely affected by land and housing development stemming from population growth. As shown in the following table, the county’s population has increased by approximately 15% since 2009, and state economists expect that trend to continue in Washington County over the next 10 years.
FY 2014 FY 2015 FY 2016 FY 2017
Estimated
FY 2018
Sanitary Sewer Revenue 103,145,531 107,502,738 111,571,933 115,946,429 121,065,900
% Increase 2.5% 4.2% 3.8% 3.9% 4.4%
FY 2014 FY 2015 FY 2016 FY 2017
Estimated
FY 2018
SWM Revenue 10,553,394 11,516,179 12,438,050 13,470,600 14,404,400
% Increase 8.9% 9.1% 8.0% 8.3% 6.9%
$60
$80
$100
$120
$140
FY 2013 FY 2014 FY 2015 FY 2016 Est. FY2017
in m
illio
ns
Sanitary Sewer Revenue
$6
$8
$10
$12
$14
FY 2013 FY 2014 FY 2015 FY 2016 Est. FY2017
in m
illio
ns
SWM Revenue

Clean Water Services FY 2018-19 Adopted Budget Page 40
The largest threat to sanitary sewer revenues would be a slowdown in the region’s economy and subsequent residential housing occupancy. The last economic slowdown did not significantly impact service revenues received from existing residences. Population growth and retainage remain strong in Washington County. As more data becomes available, the District will monitor revenues and adjust projected expenses accordingly. Over a longer term, reserve funds could be used to maintain service levels as needed and beyond that, programs would be evaluated for efficacy based on the changes in demand as well. As the chart below indicates, the ten largest ratepayers comprise only 11.35% of the District’s FY 2017 rate income. This indicates that the business risk of any single customer having a significant direct impact on revenue projections is relatively small.
Year
Population
(estimated)
Personal
Income
(in thousands)
Per Capita
Income
Unemployment
Rate
2018 595,860 n/a n/a 3.4%
2017 583,595 31,588,397$ 54,203$ 3.5%
2016 570,510 30,312,315$ 52,923$ 4.2%
2015 560,465 27,974,919$ 49,762$ 4.7%
2014 550,990 25,628,991$ 46,171$ 5.6%
2013 542,845 25,483,103$ 46,533$ 6.3%
2012 536,370 23,759,750$ 44,028$ 7.1%
2011 532,620 21,771,434$ 40,950$ 7.7%
2010 527,140 21,553,989$ 41,079$ 9.0%
2009 519,925 22,405,740$ 43,438$ 9.5%
Last Ten Years
Demographic Statistics
Washington County, Oregon
Customer Amount %
Intel Corporation - Ronler Acres 7,845,664$ 6.77%
Intel Corporation - Aloha Campus 1,503,229 1.30%
Pacific Foods of Oregon 836,454 0.72%
Maxim Integrated Products 681,691 0.59%
Resers Fine Foods - Jenkins Road 494,997 0.43%
SolarWorld Industries America 477,458 0.41%
Jireh Semiconductor, Inc. 450,787 0.39%
Providence Health Systems - St. Vincent 375,988 0.32%
Hillsboro Landfil l , Inc. 246,214 0.21%
Heritage Village Mobile Home Park 242,670 0.21%
SUBTOTAL (10 largest ratepayers) 13,155,152 11.35%
Balance from other customers 102,791,277 88.65%
Grand Totals 115,946,429$ 100.00%
Fiscal Year 2017
Ten Largest Individual Ratepayers

Clean Water Services FY 2018-19 Adopted Budget Page 41
System Development Charges (SDCs) The second largest source of revenue is SDCs, one-time assessments charged when customers connect to the District’s system. These revenues totaled just under $26.6 million in FY 2017.
As evidenced by large swings from one year to the next, SDC revenues are not very predictable and can be influenced by a few major developments, particularly development by large multi-family, commercial or industrial customers.
FY 2018-19 Sources of Funds On a current year basis, resources for Clean Water Services to provide services and carry out other responsibilities are derived primarily from beginning fund balances and current operating and non-operating revenues. The beginning fund balance consists of estimated balances carried forward from previous fiscal years and the required bond reserve amounts. Current revenues are those earned during the fiscal year from the District’s operations, such as service charges, or received from other sources, such as SDC’s, interest earnings, various fees, and project reimbursements.
Current Revenues Current revenues or resources the District earns during the year account for $172.7 million or about 36% of total resources expected in FY 2018-19. The principal sources of current revenues are sanitary sewer and surface water management (SWM) charges which are labeled Service Charges in the pie chart above. These two sources account for $143.9 million or 83.3% of the District’s total current revenues. The other major sources are system development charges (SDCs), grants, contributions and assessments, and interest earnings.
Est
FY 2014 FY 2015 FY 2016 FY 2017 FY 2018
SDCs 21,130,429 18,962,970 20,712,606 26,598,454 19,298,900
% Increase -33.6% -10.3% 9.2% 28.4% -27.4%
$-
$10
$20
$30
$40
FY 2014 FY 2015 FY 2016 FY 2017 Est FY 2018
in m
illio
ns
System Development Charges
Service Charges$143,926,000
30%
SDC's$20,001,900
4%
Misc Fees & Grants
$5,591,200 1%Interest Earnings
$3,175,900 1%
Operating Fund Balances
$179,766,000 37%
Construction Fund Balances
$72,851,100 15%
Reserve Fund Balances$34,033,700
7%
Debt Svc Fund Balances$21,920,800
5%

Clean Water Services FY 2018-19 Adopted Budget Page 42
Service Charges Based on trend analysis and anticipated rate changes, sanitary sewer service charges are estimated at $128.5 million and SWM charges are estimated at $15.4 million. Rate increases of 3% in sanitary sewer and $0.50 in SWM are built into the revenue estimates along with a modest growth factor of 1%. System Development Charges (SDCs) The second largest source of current revenues, SDCs, amount to just over $20 million or 11.6% of total current revenues. District customers are assessed this one-time system development charge upon connection to the sanitary sewer system. The sanitary sewer SDC is designed to recognize the cost of growth and consists of an improvements assessment for the share of costs related to new capacity and performance improvements, as well as an assessment to share cost burdens with existing customers for collection and treatment systems already built. The District completed an update of the SDC rate study during 2009 and plans to work on updating the rate during fiscal 2019. This budget reflects an increase in the sanitary sewer SDC to $5,650 for FY 2018-19, which is a $150 increase from FY 2017-18. This increase reflects the use of the District’s current methodology and increasing the rate by the ENR construction cost index. The surface water management SDC is a one-time charge designed to recover the cost of surface water management improvements. This budget reflects an increase in the SWM SDC to $545 for FY 2018-19, which is a $15 increase from FY 2017-18. Revenues from both SDCs are dedicated to capital projects and payment of bonded debt service, per Oregon Revised Statutes (ORS 223.302). Miscellaneous Fees, Grants, and Other Revenues The remaining current revenues are comprised of grants, contributions and assessments, interest earnings, and miscellaneous fees accounting for approximately $8.8 million or 5.1% of total current revenues. In previous years a Build America subsidy was also budgeted in this section, but due to the uncertainty of the ability to collect these revenues, the District did not include any subsidy payments as a resource in the FY 2018-19 budget.
Combined Beginning Fund Balances The beginning fund balances for all funds combined consist of unused revenues carried forward from prior fiscal years. In FY 2018-19, these combined balances account for just over $308.5 million, or 64.1% of the total $481.3 million in budgeted District resources. Approximately $11.0 million of this fund balance is held in reserve pursuant to debt service requirements.
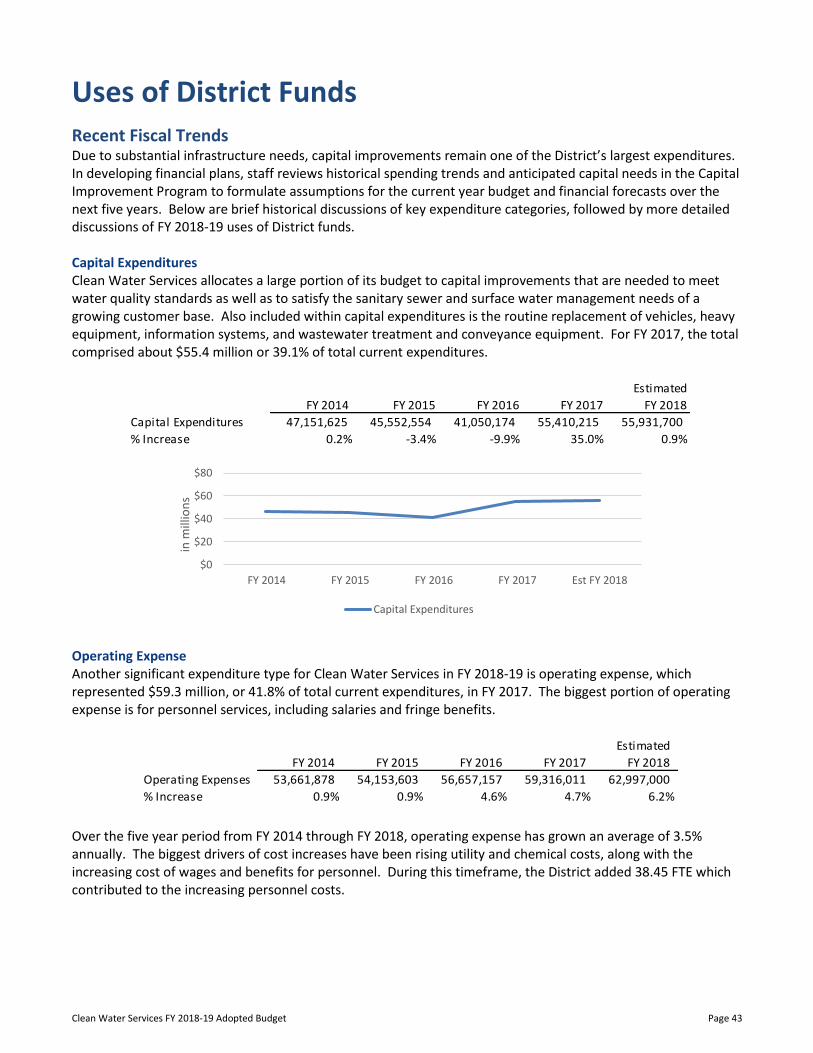
Clean Water Services FY 2018-19 Adopted Budget Page 43
Uses of District Funds
Recent Fiscal Trends Due to substantial infrastructure needs, capital improvements remain one of the District’s largest expenditures. In developing financial plans, staff reviews historical spending trends and anticipated capital needs in the Capital Improvement Program to formulate assumptions for the current year budget and financial forecasts over the next five years. Below are brief historical discussions of key expenditure categories, followed by more detailed discussions of FY 2018-19 uses of District funds. Capital Expenditures Clean Water Services allocates a large portion of its budget to capital improvements that are needed to meet water quality standards as well as to satisfy the sanitary sewer and surface water management needs of a growing customer base. Also included within capital expenditures is the routine replacement of vehicles, heavy equipment, information systems, and wastewater treatment and conveyance equipment. For FY 2017, the total comprised about $55.4 million or 39.1% of total current expenditures.
Operating Expense Another significant expenditure type for Clean Water Services in FY 2018-19 is operating expense, which represented $59.3 million, or 41.8% of total current expenditures, in FY 2017. The biggest portion of operating expense is for personnel services, including salaries and fringe benefits.
Over the five year period from FY 2014 through FY 2018, operating expense has grown an average of 3.5% annually. The biggest drivers of cost increases have been rising utility and chemical costs, along with the increasing cost of wages and benefits for personnel. During this timeframe, the District added 38.45 FTE which contributed to the increasing personnel costs.
FY 2014 FY 2015 FY 2016 FY 2017
Estimated
FY 2018
Capital Expenditures 47,151,625 45,552,554 41,050,174 55,410,215 55,931,700
% Increase 0.2% -3.4% -9.9% 35.0% 0.9%
$0
$20
$40
$60
$80
FY 2014 FY 2015 FY 2016 FY 2017 Est FY 2018
in m
illio
ns
Capital Expenditures
Estimated
FY 2014 FY 2015 FY 2016 FY 2017 FY 2018
Operating Expenses 53,661,878 54,153,603 56,657,157 59,316,011 62,997,000
% Increase 0.9% 0.9% 4.6% 4.7% 6.2%

Clean Water Services FY 2018-19 Adopted Budget Page 44
Combined Ending Fund Balances The ending fund balance for all funds combined includes unrestricted operating cash reserves for sanitary sewer and stormwater operations, restricted reserves for capital construction and debt service funded by bond proceeds, sanitary sewer and stormwater SDC’s restricted for capacity enhancing improvements to the systems, and self-insurance reserves. The unrestricted operating cash reserves are used by the District to finance future capital improvements, maintain existing systems, and provide reserves for working capital needs. The restricted reserves can only be used to fund capital construction or debt service payments. These funds are not available to meet daily operating cash needs.
$0
$20
$40
$60
$80
FY 2014 FY 2015 FY 2016 FY 2017 Est FY 2018
in m
illio
ns
Operating Expenses
Estimated
FY 2014 FY 2015 FY 2016 FY 2017 FY 2018
Sanitary Operating 77,944,671$ 99,092,379$ 124,194,296$ 146,164,594$ 167,606,500$
SWM Operating 4,706,751 6,369,030 9,141,136 10,917,943 12,159,500
Sanitary Construction 69,306,691 55,836,311 64,009,716 63,059,064 66,072,000
SWM Construction 3,100,047 4,607,416 4,565,726 6,415,913 6,779,100
Debt Service 18,505,974 24,151,708 23,473,016 21,926,328 21,920,800
Insurance Liability 5,067,991 5,352,222 5,616,235 5,515,774 5,330,500
Capital Reserve 43,205,159 48,346,867 43,809,698 40,087,350 22,984,200
Capital Replacement - - - 3,728,216 5,719,000
TOTAL 221,837,284$ 243,755,933$ 274,809,823$ 297,815,182$ 308,571,600$
$-
$50,000,000
$100,000,000
$150,000,000
$200,000,000
$250,000,000
$300,000,000
$350,000,000
FY 2014 FY 2015 FY 2016 FY 2017 FY 2018Estimated
Combined Ending Fund Balances

Clean Water Services FY 2018-19 Adopted Budget Page 45
FY 2018-19 Uses of Funds Clean Water Services uses resources to provide sanitary sewer and surface water management services to its customers. Ending fund balances are resources that are not spent during the year but are carried over to subsequent years.
Current Expenditures Current expenditures are funds that are budgeted for the 2019 fiscal year. This includes, among others, payments to construction contractors, wages and benefits to employees and principal and interest on borrowed monies. Current expenditures estimated for FY 2018-19 amount to approximately $262.6 million. The major categories of current expenditures are described below. Capital Outlay and Projects One of the largest expenditures are for capital projects which, combined with capital outlay of just over $0.5 million, amounts to $124.1 million or 47.2% of all current expenditures. In prior years, capital outlay was budgeted with the departmental operating budgets. Effective FY 2018-19, capital outlay is being budgeted as a project within the CIP. Clean Water Services allocates a large portion of its budget to capital improvements needed to meet water quality and quantity standards as well as to satisfy the sanitary sewer and surface water management needs of a growing customer base. Brief descriptions of major capital projects are presented in the Capital Projects Overview section of this document, and the index listing all projects is included in the appendix. Debt Service Debt service for construction of the District’s facilities and other capital improvements as well as pension obligations are expected to amount to $22.0 million in FY 2018-19, or 8.4% of total current expenditures. Debt service represents the repayment of principal and interest costs on bonds issued to finance construction projects and other major capital assets. Borrowing allows the District to spread the costs of a capital project over the life of the asset and thereby avoid sharp increases in rates.
Personnel Services The District expects to spend $44.1 million in FY 2018-19 on salaries and associated fringe benefits for its employees. Total personnel services costs represent about 16.8% of total current expenditures. The net number of full-time equivalent positions (FTE) is increasing by 4 FTE from the fiscal 2018 budget of 351 FTE. At 355 FTE, staffing levels at Clean Water Services remain below the 1997 high of 366 FTE positions, before the District embarked on its Competitiveness Initiative. The following graph indicates the staffing trends over the last five years.
Capital Construction$124,057,300
26%
Operating Expenses
$72,998,800 15%
Debt Service$22,001,400
5%Other Fund Level Outlays$43,517,000
9%
Contingency$32,118,000
7%
Operating Fund Balances
$103,128,600 21%
Construction Fund Balances
$40,048,300 8%
Reserve Fund Balances$22,443,500
5%
Debt Service Fund Balances$20,953,700
4%

Clean Water Services FY 2018-19 Adopted Budget Page 46
Materials and Services The District expects to spend $28.9 million on departmental materials and services in FY 2018-19. This represents approximately 11% of total current expenditures. The single largest cost in this category is for chemicals which account for about $4.1 million or 14% of total materials and services. The second largest materials and services cost is contracted services at just over $3.8 million followed by other governmental services cost of approximately $3.7 million. Combined Ending Fund Balances and Contingencies At the close of the fiscal year, funds remaining comprise the ending fund balance. The ending fund balances are estimated for FY 2018-19 at just under $218.7 million, including $32.1 million that the District will set aside in fiscal 2018-19 for operating contingency in the event of significant unexpected or unforeseen costs. The unappropriated ending fund balance includes restricted funds of approximately $91.4 million for future debt principal and interest payments, self-insurance liability reserves, and capital expansion and renewal reserves. The remaining $127.3 million includes six months operating reserves ($93.4 million), risk loss reserves for seismic events ($10 million), and future water supply needs at Scoggins Dam (the District’s share is an estimated $150 million to construct). Clean Water Services maintains minimum contingencies at 5 to 10 percent of total budget appropriations for this purpose, depending on fund type. The remaining portion of the ending fund balance consists of the same reserves, working capital, and remaining unrestricted funds that comprise the beginning fund balance. Su
111.00 114.00 113.00 118.00 120.00
111.00 117.00 122.00 127.00 129.00
48.55 49.55 50.00 51.00 50.00 16.00 16.00 20.00 21.00 21.00 33.00 33.00 33.00 34.00 35.00
-
50
100
150
200
250
300
350
400
FY 2015Actual
FY 2016Actual
FY 2017Actual
FY 2018Budget
FY 2019Adopted
Districtwide FTE Counts FY 2015 - FY 2019
Conveyance Systems Wastewater Treatment Business Services Watershed Management Regulatory Affairs
319.55 329.55 338.00351.00 355.00

Clean Water Services FY 2018-19 Adopted Budget Page 47
Departmental Summaries Departmental expenses for the District are comprised of costs from five different departments. In total, departmental expenditures for FY 2018-19 are expected to increase by 2.4%. A detailed summary of positions by department and program is available on page 50. Summaries of these costs as well as any significant changes within departments are detailed below. Business Services Department The Business Services Department (BSD) is comprised of the administrative programs that support District operations and services provided to customers. This budget includes the reduction of 1 FTE from the Information Technology program. This Business Systems Analyst 1 position is transferring to the Regulatory Affairs Department and reclassified to an Operations Analyst 1.
Regulatory Affairs Department The Regulatory Affairs Department (RAD) provides technical support to other District divisions and departments in the form of research and data analysis regarding ambient water quality, updates of the Tualatin TMDL, compliance and monitoring, and development of state and federal regulations. RAD also coordinates annual reporting and renewals for NPDES and Clean Air Act permits, implementation of environmental management systems, and regulatory compliance. The District’s industrial pretreatment and stormwater programs are located within RAD. The Laboratory Services Division provides laboratory services for the entire District. In fiscal 2019 the Regulatory Affairs Department budget includes the addition of an Operations Analyst 1 which is a position transferring from Business Services. This reclassified position would provide program support for RAD’s information management systems. These program support tasks require an FTE with detailed knowledge of both permitting and operational requirements of the Regulatory Affairs Department in order to create and maintain a supporting information management system. Housing this position in RAD would allow for timely and efficient information for the complex and dynamic regulatory compliance documentation and reporting requirements. This responsiveness with information management would allow RAD staff to better focus their time and efforts on critical compliance issues rather than data entry and information management.
Business Services
$14,322,30020%
Regulatory Affairs$7,509,100
10%
Watershed Management$6,249,700
9%
Conveyance Systems
$16,362,100 22%
Wastewater Treatment
$28,555,600 39%
Change from
FY 2016 FY 2017 FY 2018 FY 2019 FY 18
Expenditure Summary ACTUAL ACTUAL BUDGET ADOPTED Budget
Departmental Expenses
Personnel Services 6,532,783$ 6,683,363$ 7,876,100$ 7,770,300$
Materials & Services 5,163,334$ 5,479,244$ 6,467,500$ 6,552,000$
Capital Outlay -$ -$ -$ -$
TOTAL DEPARTMENTAL BUDGET 11,696,117$ 12,162,607$ 14,343,600$ 14,322,300$ -0.1%
FTE's 49.55 50.00 51.00 50.00
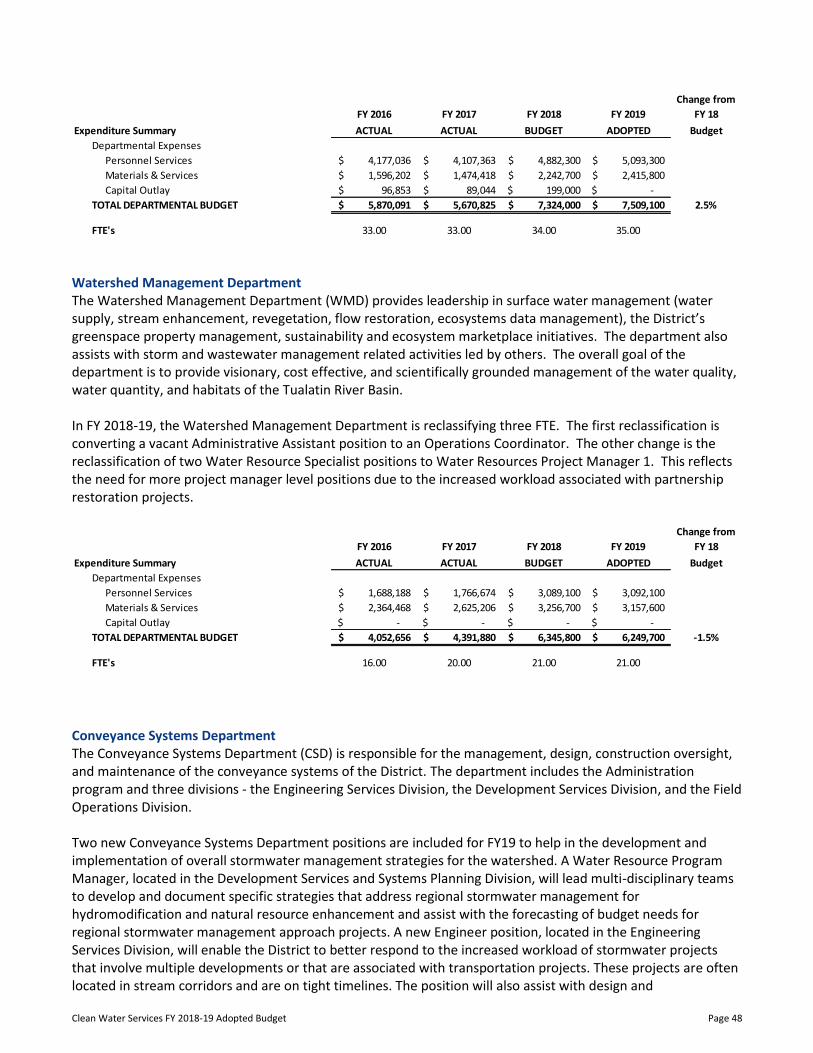
Clean Water Services FY 2018-19 Adopted Budget Page 48
Watershed Management Department The Watershed Management Department (WMD) provides leadership in surface water management (water supply, stream enhancement, revegetation, flow restoration, ecosystems data management), the District’s greenspace property management, sustainability and ecosystem marketplace initiatives. The department also assists with storm and wastewater management related activities led by others. The overall goal of the department is to provide visionary, cost effective, and scientifically grounded management of the water quality, water quantity, and habitats of the Tualatin River Basin. In FY 2018-19, the Watershed Management Department is reclassifying three FTE. The first reclassification is converting a vacant Administrative Assistant position to an Operations Coordinator. The other change is the reclassification of two Water Resource Specialist positions to Water Resources Project Manager 1. This reflects the need for more project manager level positions due to the increased workload associated with partnership restoration projects.
Conveyance Systems Department The Conveyance Systems Department (CSD) is responsible for the management, design, construction oversight, and maintenance of the conveyance systems of the District. The department includes the Administration program and three divisions - the Engineering Services Division, the Development Services Division, and the Field Operations Division. Two new Conveyance Systems Department positions are included for FY19 to help in the development and implementation of overall stormwater management strategies for the watershed. A Water Resource Program Manager, located in the Development Services and Systems Planning Division, will lead multi-disciplinary teams to develop and document specific strategies that address regional stormwater management for hydromodification and natural resource enhancement and assist with the forecasting of budget needs for regional stormwater management approach projects. A new Engineer position, located in the Engineering Services Division, will enable the District to better respond to the increased workload of stormwater projects that involve multiple developments or that are associated with transportation projects. These projects are often located in stream corridors and are on tight timelines. The position will also assist with design and
Change from
FY 2016 FY 2017 FY 2018 FY 2019 FY 18
Expenditure Summary ACTUAL ACTUAL BUDGET ADOPTED Budget
Departmental Expenses
Personnel Services 4,177,036$ 4,107,363$ 4,882,300$ 5,093,300$
Materials & Services 1,596,202$ 1,474,418$ 2,242,700$ 2,415,800$
Capital Outlay 96,853$ 89,044$ 199,000$ -$
TOTAL DEPARTMENTAL BUDGET 5,870,091$ 5,670,825$ 7,324,000$ 7,509,100$ 2.5%
FTE's 33.00 33.00 34.00 35.00
Change from
FY 2016 FY 2017 FY 2018 FY 2019 FY 18
Expenditure Summary ACTUAL ACTUAL BUDGET ADOPTED Budget
Departmental Expenses
Personnel Services 1,688,188$ 1,766,674$ 3,089,100$ 3,092,100$
Materials & Services 2,364,468$ 2,625,206$ 3,256,700$ 3,157,600$
Capital Outlay -$ -$ -$ -$
TOTAL DEPARTMENTAL BUDGET 4,052,656$ 4,391,880$ 6,345,800$ 6,249,700$ -1.5%
FTE's 16.00 20.00 21.00 21.00

Clean Water Services FY 2018-19 Adopted Budget Page 49
implementation of stormwater retrofit projects and projects which fall under an enhanced SWM Small Works Program.
Wastewater Treatment Department The Wastewater Treatment Department (WWTD) provides operation, maintenance, and engineering for the District’s 4 wastewater treatment plants and 42 pump stations. The department includes the Administration program and four divisions – the Operations Division, the Mechanical Maintenance Division, the Electrical Instrumentation & Controls Division (EI&C), and the Treatment Plant Services Division. The FY 2018-19 budget reflects the addition of 2 FTE in WWTD. The Biosolids program is adding an Operations Analyst 2 position to focus on reducing and controlling costs of Biosolids polymer, hauling, and land application which is a $2.5 million cost for WWTD. The Control Systems program is adding the other additional position, which is an Automation Engineer. This position will manage the commissioning of new projects for more efficient and cost effective start-ups. Also included in this FY 2019 budget are three position reclassifications. The Rock Creek Operations program is reclassifying the Operations Analyst 2 position to a Senior Operations Analyst, which will add breadth in assisting implementation of new innovations to improve process control as well as reduce energy and chemical costs. The Technology Development & Research program is including the reclassification of a Senior Process Technologist to a Principal Engineer. This reclassification will add depth to the group and pioneer and model new innovations to improve process control and reduce energy and chemical costs. Finally, the last reclassification will move an existing Landscape Specialist from the Facilities Maintenance program into the Biosolids program as a higher level Landscape Coordinator. This change will provide for higher level expertise in managing the native plant palate, specialized landscape care, and provide a significant interface with the public.
Change from
FY 2016 FY 2017 FY 2018 FY 2019 FY 18
Expenditure Summary ACTUAL ACTUAL BUDGET ADOPTED Budget
Departmental Expenses
Personnel Services 10,506,453$ 11,487,734$ 14,564,600$ 15,317,300$
Materials & Services 12,268,785$ 13,153,247$ 12,766,500$ 13,238,300$
Capital Outlay 69,908$ 49,295$ 65,000$ -$
22,845,146$ 24,690,276$ 27,396,100$ 28,555,600$ 4.2%
FTE's 117.00 122.00 127.00 129.00
Change from
FY 2016 FY 2017 FY 2018 FY 2019 FY 18
Expenditure Summary ACTUAL ACTUAL BUDGET ADOPTED Budget
Departmental Expenses
Personnel Services 9,655,374$ 9,820,426$ 12,410,100$ 12,871,100$
Materials & Services 2,375,356$ 2,344,703$ 3,246,400$ 3,491,000$
Capital Outlay 162,418$ 186,516$ 195,000$ -$
TOTAL DEPARTMENTAL BUDGET 12,193,148$ 12,351,645$ 15,851,500$ 16,362,100$ 3.2%
FTE's 114.00 113.00 118.00 120.00
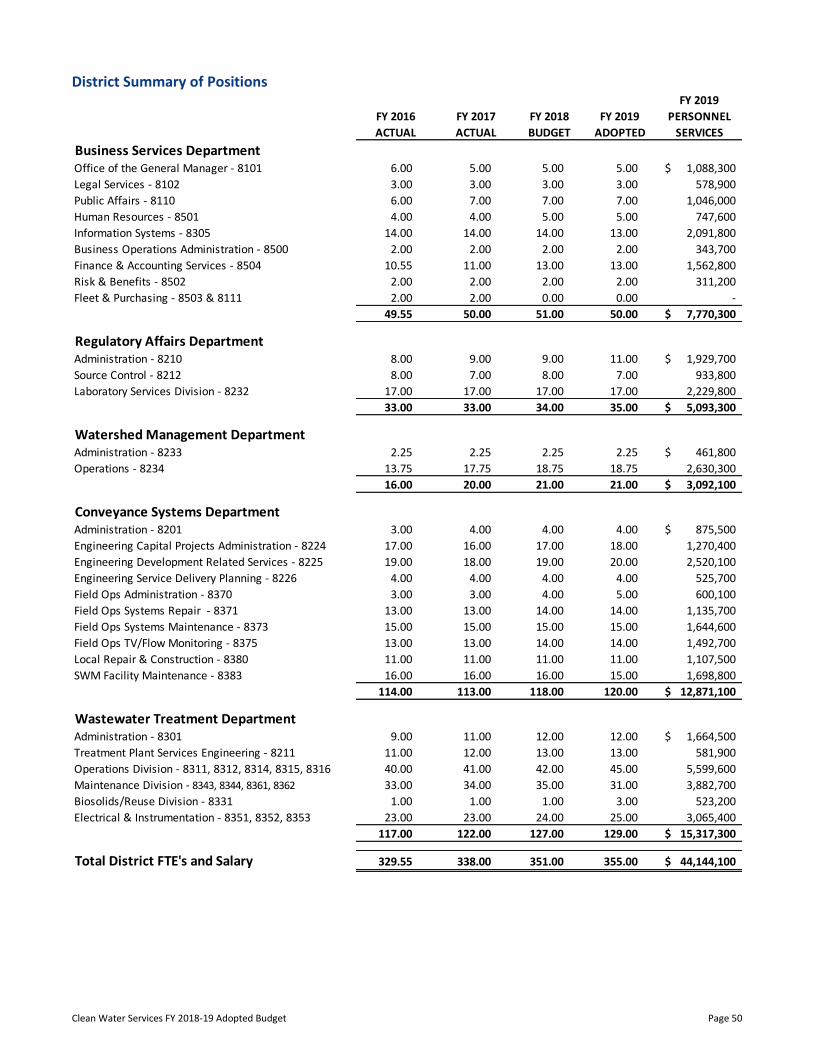
Clean Water Services FY 2018-19 Adopted Budget Page 50
District Summary of Positions
FY 2019
PERSONNEL
SERVICES
Business Services DepartmentOffice of the General Manager - 8101 6.00 5.00 5.00 5.00 1,088,300$
Legal Services - 8102 3.00 3.00 3.00 3.00 578,900
Public Affairs - 8110 6.00 7.00 7.00 7.00 1,046,000
Human Resources - 8501 4.00 4.00 5.00 5.00 747,600
Information Systems - 8305 14.00 14.00 14.00 13.00 2,091,800
Business Operations Administration - 8500 2.00 2.00 2.00 2.00 343,700
Finance & Accounting Services - 8504 10.55 11.00 13.00 13.00 1,562,800
Risk & Benefits - 8502 2.00 2.00 2.00 2.00 311,200
Fleet & Purchasing - 8503 & 8111 2.00 2.00 0.00 0.00 -
49.55 50.00 51.00 50.00 7,770,300$
Regulatory Affairs DepartmentAdministration - 8210 8.00 9.00 9.00 11.00 1,929,700$
Source Control - 8212 8.00 7.00 8.00 7.00 933,800
Laboratory Services Division - 8232 17.00 17.00 17.00 17.00 2,229,800
33.00 33.00 34.00 35.00 5,093,300$
Watershed Management DepartmentAdministration - 8233 2.25 2.25 2.25 2.25 461,800$
Operations - 8234 13.75 17.75 18.75 18.75 2,630,300
16.00 20.00 21.00 21.00 3,092,100$
Conveyance Systems DepartmentAdministration - 8201 3.00 4.00 4.00 4.00 875,500$
Engineering Capital Projects Administration - 8224 17.00 16.00 17.00 18.00 1,270,400
Engineering Development Related Services - 8225 19.00 18.00 19.00 20.00 2,520,100
Engineering Service Delivery Planning - 8226 4.00 4.00 4.00 4.00 525,700
Field Ops Administration - 8370 3.00 3.00 4.00 5.00 600,100
Field Ops Systems Repair - 8371 13.00 13.00 14.00 14.00 1,135,700
Field Ops Systems Maintenance - 8373 15.00 15.00 15.00 15.00 1,644,600
Field Ops TV/Flow Monitoring - 8375 13.00 13.00 14.00 14.00 1,492,700
Local Repair & Construction - 8380 11.00 11.00 11.00 11.00 1,107,500
SWM Facility Maintenance - 8383 16.00 16.00 16.00 15.00 1,698,800
114.00 113.00 118.00 120.00 12,871,100$
Wastewater Treatment DepartmentAdministration - 8301 9.00 11.00 12.00 12.00 1,664,500$
Treatment Plant Services Engineering - 8211 11.00 12.00 13.00 13.00 581,900
Operations Division - 8311, 8312, 8314, 8315, 8316 40.00 41.00 42.00 45.00 5,599,600
Maintenance Division - 8343, 8344, 8361, 8362 33.00 34.00 35.00 31.00 3,882,700
Biosolids/Reuse Division - 8331 1.00 1.00 1.00 3.00 523,200
Electrical & Instrumentation - 8351, 8352, 8353 23.00 23.00 24.00 25.00 3,065,400
117.00 122.00 127.00 129.00 15,317,300$
Total District FTE's and Salary 329.55 338.00 351.00 355.00 44,144,100$
FY 2019
ADOPTED
FY 2016
ACTUAL
FY 2017
ACTUAL
FY 2018
BUDGET

Clean Water Services FY 2018-19 Adopted Budget Page 51
Debt Service Requirements
The District has a policy of utilizing cash, system development charges, and long term debt as tools to manage the funding requirements of its infrastructure investment strategy. As of June 30, 2017 the District’s long term indebtedness consists of the following:
The District’s legal debt limitation, as defined by Oregon Revised Statutes 451.545, shall not exceed 13 percent of the true cash value of all property by law assessable for state and county purposes within the Agency's boundaries. The limitation applies to the aggregate of all outstanding General Obligation Bonds. The District does not have any general obligation debt and hence has not incurred any such debt under the $13.435 billion debt margin allowed by state law. The table below illustrates the debt margin calculation for the past 5 years.
Clean Water Services is required by its bond documents to generate coverage of at least 120% of the annual debt service on its senior lien bonds and at least 110% on its second lien bonds. Senior lien coverage is calculated as the ratio of net revenues (as defined in the bond documents) to annual senior lien bond debt service. Second lien bond coverage is calculated as the ratio of net revenues, less the annual senior lien bond debt service, to the annual second lien bond debt service.
June 30, 2018Date of
Issue
Date of
Maturity Amount Issued
Principal
Outstanding Principal Interest
Serial Revenue Bonds
Senior Lien
2009A Bonds 3/25/2009 10/1/2028 58,755,000 6,420,000 3,130,000 242,750
2010B Bonds 4/28/2010 10/1/2035 90,260,000 83,575,000 3,475,000 4,444,415
2011A Refunding 8/24/2011 10/1/2021 30,255,000 13,845,000 3,210,000 612,000
2011B Bonds 8/24/2011 10/1/2032 50,000,000 41,185,000 1,965,000 1,726,250
2016 Refunding 10/13/2016 10/1/2029 33,225,000 33,225,000 - 1,661,250
Total Serial Revenue Bonds 178,250,000 11,780,000 8,686,665
Special Purpose Revenue Bonds
Pension Bonds 5/27/2004 6/30/2028 15,990,000 12,775,000 760,000 774,628
Total Long Term Debt 191,025,000$ 12,540,000$ 9,461,293$
Debt Service Fiscal 2019
Fiscal Year General
Ended Real Market Legal Debt Obligation Debt
June 30 Value Limitation Indebtedness Margin
2018 $ 103,347,612,510 $ 13,435,189,626 $ - $ 13,435,189,626
2017 93,028,764,748 12,093,739,417 - 12,093,739,417
2016 82,980,385,435 10,787,450,107 - 10,787,450,107
2015 77,171,791,099 10,032,332,843 - 10,032,332,843
2014 68,905,326,845 8,957,692,490 - 8,957,692,490

Clean Water Services FY 2018-19 Adopted Budget Page 52
*Excluding Pension Bonds not subject to covenants.
Schedule of Future Debt Service Requirements of Sewer Revenue Bonds The table below illustrates the debt service requirements over the next 20 years based on current outstanding debt.
2014 Actual 2015 Actual 2016 Actual 2017 Actual2018
Estimated
Net Revenues $79,501,050 $91,026,296 $75,856,933 $89,904,882 $81,335,500
Total Debt Service* $24,814,298 $24,784,461 $24,780,511 $24,710,391 $20,529,925
Sr Debt Svc Coverage 3.20 3.67 3.06 3.64 3.96
$0
$10,000,000
$20,000,000
$30,000,000
$40,000,000
$50,000,000
$60,000,000
$70,000,000
$80,000,000
$90,000,000
$100,000,000
District Debt Service Coverage
3.20 3.67 3.06 3.643.96
Fiscal Year Principal Interest Total
2019 12,540,000$ 9,461,293$ 22,001,293$
2020 13,170,000 8,841,779 22,011,779
2021 13,555,000 8,183,106 21,738,106
2022 14,250,000 7,493,306 21,743,306
2023 11,065,000 6,872,926 17,937,926
2024 11,610,000 6,325,038 17,935,038
2025 12,215,000 5,729,365 17,944,365
2026 12,865,000 5,082,990 17,947,990
2027 13,545,000 4,402,062 17,947,062
2028 13,125,000 3,688,187 16,813,187
2029 10,605,000 3,054,887 13,659,887
2030 8,165,000 2,582,991 10,747,991
2031 8,480,000 2,164,233 10,644,233
2032 8,810,000 1,726,721 10,536,721
2033 9,150,000 1,269,726 10,419,726
2034 5,740,000 870,440 6,610,440
2035 5,955,000 531,227 6,486,227
2036 6,180,000 179,251 6,359,251
2037 0 0 0
2038 0 0 0
191,025,000$ 78,459,528$ 269,484,528$

Clean Water Services FY 2018-19 Adopted Budget Page 53
Projected Bond Issues The number and size of new bond issues for the forecast period is driven by the level of projected capital spending and level of projected operating revenue. In order to responsibly maintain ending reserves and to keep rate increases modest, the District would need to issue debt in increments driven by increasing capital requirements. To date, the District has not issued debt for Surface Water Management projects. The current financial forecast indicates the need to issue approximately $75 million in bonds in FY 2022 to help fund sanitary sewer capital projects. However, forecasted capital requirements could be impacted by increased development that will require the District to accelerate construction of infrastructure to meet system demands, and will be adjusted accordingly.
Excluding Pension Bonds not subject to covenants.
2019Budget
2020Projected
2021Projected
2022Projected
2023Projected
Est. Net Revenues $91,498,300 $94,970,300 $98,069,100 $101,261,200 $104,549,000
Est. Debt Service $20,466,700 $20,412,900 $20,071,450 $22,813,750 $21,748,559
Est. Debt Svc Coverage 4.47 4.65 4.89 4.44 4.81
$0
$20,000,000
$40,000,000
$60,000,000
$80,000,000
$100,000,000
$120,000,000
Projected Debt Service Coverage
4.47 4.65 4.89 4.44 4.81

Clean Water Services FY 2018-19 Adopted Budget Page 54
This page intentionally left blank

Clean Water Services FY 2018-19 Adopted Budget Page 55
Capital Projects Summary
The District annually develops a five-year Capital Improvement Program (CIP). New project requests and updates to the status of existing projects are developed by division and program managers each December and are presented for extensive review by the District’s Leadership Team in the first quarter of each calendar year. A preliminary five-year CIP is recommended as an outcome of this review. The CIP is then analyzed in the context of the ten-year financial plan and projected spending is matched with cash or debt funding, as appropriate. The first year of the CIP is the basis for the budget for the ensuing fiscal year with respect to capital improvements and related professional services. The CIP also has an impact on staffing and materials and services in the operating budget as discussed below. Further information regarding CIP projects can be found on the District’s website: www.cleanwaterservices.org. Prioritization of Capital Projects Projects at the District are largely driven by the need to meet stringent regulatory requirements. Population growth, infrastructure age, and system capacity all impact the Districts ability to meet those requirements. While operating budget impacts are also considered, projects needed to meet regulatory requirements are prioritized. Operating budget impact is assessed secondarily as a part of the project-by-project review of the CIP each year. The District’s operations are large enough that the impact of any one capital improvement project on operating cost is relatively small. In total, however, the impacts can be significant enough to warrant additions to the operating budget. These additions are often partially offset by savings achieved through the use of new capital technology. In addition to considering direct operational budget impacts in project selection, the District also considers operational efficiencies and long-term viability of the system to meet growing capacity needs. Additions in wastewater treatment often arise from a need to increase capacity due to growth, or to replace aged or inadequate equipment. These additions can often impact energy and chemical costs. Collection system and rehabilitation projects tend to result in staffing additions rather than significant materials and services additions. Staffing changes for the collection system are integrated with the District’s Conveyance System Management Plan so as to ensure coordination with member cities for efficient provision of collection system maintenance throughout the service territory. Like sanitary collection and rehabilitation projects, Surface Water Management (SWM) capital projects do not tend to require significant additions to energy or chemical budgets, but can be labor-intensive and lead to added maintenance costs. Maintenance of the SWM system is a primary driver of staffing decisions in the Field Operations Division of the Conveyance Department budget. Sanitary Sewer CIP For sanitary sewer system projects, the major project types are Treatment, Collection, Pump Stations, Rehabilitation, and Support. The District also shares costs with cities and other partners for certain projects. Capital improvements summarized in the CIP do not include collection system projects wholly designed, managed, and maintained by member cities. The budget will typically show the gross project costs for District-managed projects as an appropriation with any shared cost proceeds received as resources.

Clean Water Services FY 2018-19 Adopted Budget Page 56
Major Sanitary Sewer Projects The chart below illustrates the different categories of projects and their corresponding projected costs for the next five years of the budgeted Sanitary CIP:
Fiscal Year 2018-19 Of the $118.2 million in the FY 2018-19 capital budget for sanitary sewer projects, $59.0 million, or 50% is estimated to be spent on the following five projects. A complete project listing is located in the Appendix.
Upper Tualatin Interceptor - $26.9 million Upper Tualatin Interceptor (UT) serves the cities of Tualatin, Tigard, King City, and Sherwood. The UT was constructed in 1980s and consists of approximately 15,000 linear feet of pipe ranging in diameter from 27 to 42 inches. In the 2008 Master Plan update and in the 2013 Model Calibration (and Capacity Analysis) performed by CH2M the UT was identified to be capacity deficient during the five year sanitary sewer flow event at the projected 2025 development levels. The projected capacity deficiencies are attributed to the
Sanitary Sewer CIP FY 2019 - 2023
Budget
Project Type FY 19 FY 20 FY 21 FY 22 FY 23
Collection $44.4 $21.2 $8.2 $6.0 $6.0
Rehabilitation 3.8 2.6 2.7 1.7 1.6
Pump Stations 8.2 6.9 1.4 2.9 11.6
Treatment 39.4 46.8 41.9 32.9 29.7
Watershed Management 16.7 18.3 33.7 70.6 55.9
Support 5.7 3.4 1.0 0.8 0.8
Total $118.2 $99.2 $88.9 $114.9 $105.4
Projected
(in millions)
$-
$10
$20
$30
$40
$50
$60
$70
$80
$90
$100
$110
$120
$130
FY 19 FY 20 FY 21 FY 22 FY 23
mil
lio
ns

Clean Water Services FY 2018-19 Adopted Budget Page 57
future growth within the West Sherwood, South Sherwood, Beef Bend, Tonquin, and Bull Mountain urban reserve (UR) and urban growth (UG) areas. In FY2017, an analysis of the future UG and UR flow inputs into the Upper Tualatin Interceptor (UT) was completed to determine the overall approach and timing required to meet the system demand. The goal of this study was to optimize the existing sanitary system capacity and minimize any required improvements. Twelve alternatives were evaluated and one alterative was selected based on the evaluation of both financial and non-financial impacts from District staff from the Watershed, Conveyance, and Wastewater Treatment departments. In FY2018, design began with the award of the Progressive Design Build contract to the Mortenson Construction and Kennedy Jenks team. In FY2019 the District will complete the design and permitting process and begin construction of the capacity improvements required to support growth within the next five years. Construction will continue through FY2020. Durham Phase 5B3 Secondary Capacity Expansion - $12.2 million This project includes the addition of secondary treatment process train #5 at the Durham Facility and will expand the secondary treatment capacity by approximately 25 MGD, allowing the facility to grow and continue to meet the stringent nutrient removal requirements of its NPDES permit. Project includes: aeration basin and secondary clarifier # 5; underground gallery system expansion to include necessary pumping systems, mixed liquor flow split, and process and aeration piping and utilities; improved Secondary Trains 3 and 4 drain provisions; and associated sitework, aeration, electrical and instrumentation systems extensions. Long Range Water Supply Plan - $8.0 million Clean Water Services is collaborating with Bureau of Reclamation on a Joint Project to combine the necessary seismic modifications of Scoggins Dam with a dam raise for Clean Water Services future water supply needs. Scoggins Dam is owned by Reclamation. The existing dam does not meet Reclamation’s guidelines for public safety and requires corrective action. Reclamation and CWS developed a coordinated project management plan for the Joint Project. Reclamation and CWS are developing feasibility level designs for 3 options (dam safety, dam raise and downstream dam). The expenditures are for preliminary designs and associated study and analyses of the dam raise and the downstream dam option. In the summer of 2017, CWS and Reclamation partnered to conduct a geotechnical investigation (drilling) at the existing dam and downstream dam sites. The drilling operations were completed in late December of 2017. Core samples obtained during drilling will be further analyzed and tested to determine material properties and the suitability of the downstream location for a potential dam site. For FY2019, CWS will be collecting environmental information, continuing engineering feasibility designs, and developing a land acquisition plan. Bull Mountain Trunk Improvements – King City Siphon to SW Myrtle Ave - $6.05 million The Bull Mountain Trunk Improvements were identified in the Upper Tualatin Interceptor Study to provide capacity for near and long-term growth. The improvements will serve areas currently within the existing Urban Growth Boundary including portions of the Bull Mountain, South Cooper Mountain and River Terrace development areas along with areas within the Urban Reserve adjacent to the City of Tigard, City of Beaverton, City of King City, and unincorporated Washington County. The improvements are made up of two segments. Segment A begins at the intersection of SW Fischer Road and SW 131st Ave and extends south down SW 131st to a point approximately 400 feet of SW Bedford St., then east along the bank of the Tualatin River to CWS’s King City Siphon. This segment is approximately 4400 linear feet long and will be the replacement of live existing sewers. The second segment, Segment E begins near the intersection of SW Myrtle and SW Beef Bend Road and extends east on SW Beef Bend Road to SW

Clean Water Services FY 2018-19 Adopted Budget Page 58
131st Ave., then south on SW 131st Ave. to the intersection of SW Fischer Road (where it connects to Segment A). This segment includes the replacement and upsize of approximately 3,300 linear feet of live existing sewer in addition to 2,200 linear feet of new sewer pipe where the existing line is being rerouted out of backyards and into the right-of-way. Durham Operations & Maintenance (O&M) Building Rehabilitation - $5.85 million This project will fully renovate the 32,000 square foot O&M Building at Durham, which was last remodeled in 1995. The Durham O&M Building project is being completed in phases using a CM/GC delivery approach. Construction of Phase 2 is expected to start in spring 2018 and be complete by January 2019. This phase includes fully completing the interior and exterior renovation of the existing facility, as well as construction of a new conference room/Emergency Command Center. Major renovation elements include replacing the deteriorated building exterior and roof systems with new systems to extend the facility’s service life, upgrade the HVAC system to improve energy efficiency, improve fire alarm and sprinkler systems to Factory Mutual Insurance standards, adding additional workspaces and Operations Control Center, improving conference and employee common space room utilization, renovating the existing laboratory and locker rooms spaces, and updating the building lighting systems' energy efficiency.

Clean Water Services FY 2018-19 Adopted Budget Page 59
Major Surface Water Management (SWM) Projects The SWM CIP is financed through transfers from the SWM Operating Fund and the SWM Capital Reserve Fund, the latter of which is funded with SWM system development charges. Some project costs in the Surface Water Management program are shared between the District and other agencies or are otherwise reduced by grant monies. The SWM CIP levels from FY 2019-23 as shown below reflect a prioritized project list based upon available funding. As rates steadily increase, the available fund balance will grow and the District will have the capacity to begin taking on more SWM projects.
Fiscal Year 2018-19 Of the $5.83 million in the capital budget for surface water management projects, $3.28 million, or 56%, will be spent on the following five projects. A complete project listing is located in the Appendix.
North Bethany Stormwater Projects - $1.25 million The North Bethany Stormwater Project is the programmatic placeholder for the North Bethany Storm Facilities to reflect budget impacts until actual projects are identified and commence. It represents construction of 1-2 regional facility(ies) and acquisition of land and/or easements per year. North Bethany Concept and Community Plan was adopted by Washington County in December 2010. Preliminary Engineering is included in FY 2011, 12, & 13. In FY 14, task 1001 completed design and construction for North Bethany Creek Development RWQF (6700) Basin 10, built by developer. FY 15 began
Surface Water Management CIP FY 2019-2023
(in millions)
Budget
Project Type FY 19 FY 20 FY 21 FY 22 FY 23
Stormwater Management $5.15 $4.41 $3.61 $3.21 $2.90
Support 0.28 0.00 0.00 0.00 0.00
Watershed Management 0.40 0.26 0.16 0.07 0.06
Total $5.83 $4.67 $3.77 $3.28 $2.96
Projected
$0
$2
$4
$6
$8
$10
FY 19 FY 20 FY 21 FY 22 FY 23
mil
lio
ns

Clean Water Services FY 2018-19 Adopted Budget Page 60
the design phase for Bethany Creek Enhancement Project (6701). FY 16 began the design phase for projects on the West Tributary of Abbey Creek (WTAC). FY17 continues design and construction of WTAC projects 6700, 6701, 6702, 6703, 6704, 6707, 6708 as well as planning in additional areas. FY18 completed 6701 and 6708. FY 19 anticipates concept planning and easement acquisition for the remaining areas. Permits of Entry have been obtained for the purpose of gathering design data. Both permanent and temporary easements will be required to construct any projects. Abbey Creek West Tributary Reach C - $750,000 The project is part of an integrated strategy to protect the Western Tributary to Abbey Creek (WTAC) by combining upland facilities with riparian and stream improvements to provide broader ecological uplift than regional detention facilities would provide on their own. The Reach C portion of the project focuses on the reconstruction of a large berm which formed the Gooderham pond, replacement of culvert with new flow control to allow a free-flowing stream, removing accumulated sediment, reconstructing a stream channel where the pond was formed, and replacement of a culvert and berm in Reach B. Tualatin Hills Parks & Recreation District will participate in the costs related to the Reach B Culvert and berm, so it can be utilized as a future trail crossing of the Tributary. A real time control unit is anticipated to be installed in the new flow control vault with project 6806 once power is available to the site. King City 131st Avenue SWM Trunk - $750,000 Upsize approximately 1,700 feet of storm pipe (36-inch and 42-inch) within 131st Avenue (between SW Fischer Road and SW Jordan Way) to 48-inch in collaboration with the Bull Mountain Trunk Improvement Project No. 6884. Alternatives considered lining the pipe to deal with the structural defects, but this would reduce the pipe capacity, and our analysis and review of storm reports in the area indicate the pipe is already undersized. We also looked at replacing the pipes with current defects, but that would not address capacity needs. The preferred alternative will address both the structural defects and capacity needs while eliminating the need to impact this area a second time. Pilot Stormwater Recharge Project- $275,000 In collaboration with City of Beaverton, CWS is investigating a stormwater underground injection control using an existing aquafer storage and recovery (ASR) well to determine if this is a feasible best management practice. City of Beaverton has a 20 year old ASR well that they plan to use for reuse water to irrigate the South Cooper Mountain New Development Area. This is an opportunity to see if stormwater can be beneficially used for reuse water and/or stream augmentation in the Summer Creek basin. If Oregon Water Resources Department continues to approve this project in Spring 2018 then grant funding at 75% match (25% CWS) is available for future years. Temporary infrastructure will be constructed near the Beaverton ASR site to perform pilot testing of the stormwater treatment system before it enters the well. Additional testing and analysis may occur in FY20 depending on grant approval, the timing of the storms and when the pilot testing equipment is ready. Subbasin Strategy Development - $250,000 This project is to allocate budget toward development, implementation, and work efforts of a hub responsible for prioritizing, sequencing and assessing subbasin needs and enhancement strategies.

Clean Water Services FY 2018-19 Adopted Budget Page 61
Financial Outlook The purpose of the long range financial plan at Clean Water Services is to identify financial trends, forecast future revenue-raising and spending, and identify strategies to mitigate negative trends and enhance the positive ones. The District has prepared a plan that supports the goal of continued financial health and flexibility. The plan provides background on recent financial trends, presents 10-year financial forecasts, and then defines several strategies that can be implemented to maintain the District’s financial strength. Clean Water Services has a history of sound finances evidenced by its strong credit ratings on its bonded indebtedness over the years and healthy unrestricted financial reserves. The District has more than 20 year history of managing the utility to be competitive with the best in both the private sector and other leading public wastewater and stormwater management agencies. Staffing remains below the FY 1997 level while serving 49% more customers, meeting increased regulatory demands, and delivering more services. This competitive approach coupled with small, predictable rate increases has led to healthy financial reserves to meet future requirements.
Future Strategies To continue a successful track record into the future, the District has crafted financial strategies enabling response in a timely and effective manner to a variety of economic, operational, and regulatory changes. These strategies are presented below.
1. Keep Rate Increases Reasonable and Predictable Planning and implementing reasonable and predictable rate increases helps avoid negative ratepayer reaction, especially during uncertain economic times. Moreover, years without rate increases put added pressure on the District’s reserve and debt service coverage levels. To address both ratepayer and operational issues, the District has adopted a policy of reasonable rate increases on a regular basis, if not annually.
2. Maintain Adequate Capacity to Issue Debt
Borrowing is absolutely essential to finance the large capital investments that are necessary to meet regulatory requirements and growth in customer base. To ensure that the District has adequate fiscal capacity to issue debt, the District has made it a practice to maintain coverage ratios far above those set for debt service coverage.
3. Establish and Maintain Appropriate Financial Reserves
Financial reserves are needed to provide working capital, fund operating contingencies, finance future capital replacement, and cover risk management liabilities. In recent past, cash reserves have been sufficiently high to cover all these needs. Specific target amounts have been set for each reserve type so that the unrestricted ending fund balances are adequate to meet each of those needs.
4. Adopt Sound Financial Policies
Financial policies can provide a broad framework within which the District can make decisions in a financially sound and prudent manner. They should not be so specific that they otherwise constrain management flexibility or prevent efficiency gains. The District has established financial policies for the major areas of financial management. Those policies can be seen elsewhere in the budget document.

Clean Water Services FY 2018-19 Adopted Budget Page 62
Financial Forecast Assumptions The District has prepared multi-year financial forecasts to help plan its revenue raising and borrowing. Although the reliability of financial forecasts decline the longer the planning horizon, the value of forecasts as a policy tool increases as the horizon expands. The longer range forecast makes it possible to see the range of consequences that can result years ahead from various revenue raising and spending decisions and formulate actions to help attain financial goals. District staff made the following assumptions in developing the 10-year forecast. The base year for the forecast is FY 2018 (estimated). Major revenues and expenditures for the forecast period (FY 2019 - FY 2028) are projected based upon a multiplier of the base year. The multiplier in turn is chosen based upon historical trends or staff’s best estimate of future activity for a given revenue or expenditure category.
Customer Usage Revenue Growth Sanitary sewer charges and other minor service assessments are projected to grow by about 1% annually due to customer usage. Staff estimates that 1% revenue growth is sustainable because the average annual growth in Equivalent Dwelling Units has remained close to 1.5% over the past ten years.
SDC Revenue Growth
Because of the unpredictability of this revenue, projections for the forecast period assume that SDC revenues will grow at the rate of population growth, or 1% annually plus a planned rate increase of 3.0% annually, over the next ten years. This assumption is the most vulnerable to the vagaries associated with SDCs that often are a leading indicator of economic activity, but one that can swing dramatically with the timing of only a few major development projects. Fortunately, a significant drop in development and accompanying SDC revenue will also delay those projects in the CIP necessary to serve the new development.
Operating Expense Increases
Like the District’s largest source of revenue, the assumption for increases in operating expenses relies on historical trends and anticipated impacts in the future. Increases are currently estimated to average 4.5% over the forecast period.
Capital Expenditures
The largest portion of capital expenditures is dedicated to capital projects. The District has a reasonably reliable source for those spending projections of the forecast in the form of its capital improvement program. This projection may also be heavily affected by regulatory requirements imposed by the federal and state governments.
Rate Increases Rate increases for the forecast period are derived from all other revenue and spending variables in the forecast, as well as the need to responsibly maintain ending reserves and debt service. The District will continue to propose reasonable annual rate increases to support upcoming capital spending necessitated by federal and state requirements.
The current forecast for Sanitary Sewer operations assumes reasonable and predicable rate increases of 3.0% annually through the forecast period. The current forecast for Surface Water Management operations assumes that the rate will increase $0.50 annually through the forecast period. SWM fund reserves had been declining in past years as operating and capital project costs exceeded service charges collected. Fiscal controls were put in place in FY12 to proactively reverse this negative financial trend. The trend has ended and cash reserves in the fund are building as planned. As the fund balance grows, more projects will be included on the project list. The District will evaluate

Clean Water Services FY 2018-19 Adopted Budget Page 63
options as more information on planned capital expenditures and actual spending levels come into clearer focus in the future.
Bond Issues The number and size of new bond issues for the forecast period is driven primarily by the level of projected capital spending and the level of projected operating revenues and expenditures. For further information refer to the Debt Service Requirements section beginning on page 51.

Clean Water Services FY 2018-19 Adopted Budget Page 64
This page intentionally left blank

Clean Water Services FY 2018-19 Adopted Budget Page 65
Fund and Program Detail

Clean Water Services FY 2018-19 Adopted Budget Page 66
Service SANITARY SEWER SURFACE WATER MANAGEMENT
Fund Number 101 102 106 107 108 111 112 114 201 206 207 208 212
Fund Name General FundLiability
Reserve Fund
Capital
Replacement
Fund
Capital
Reserves Sani
LID
Construction
Sanitary
Master Plan
Update Debt
Service
Sanitary Sewer
Construction
Revenue
Pension Bond
SWM
Operating
SWM Capital
Replacement
Fund
Capital
Reserves
SWM
LID
Construction
SWM
SWM
ConstructionDistrict Total
Resources:
Beginning fund balance 167,606,500$ 5,330,500$ 5,038,900$ 21,740,100$ 1,856,400$ 21,317,000$ 64,215,600$ 603,800$ 12,159,500$ 680,100$ 1,244,100$ 603,500$ 6,175,600$ 308,571,600$
Service charges 128,504,600 15,421,400 143,926,000
System development charges (SDCs) 19,806,300 195,600 20,001,900
Plan check fees 284,900 284,300 569,200
Septage charges 1,052,900 1,052,900
County/City contract maintenance 350,000 350,000
Erosion control fees 263,000 263,000
Grants, contributions, & assessments 300,000 162,800 - 462,800
Reimbursements from developers 1,202,000 300,000 1,502,000
Insurance & third party reimb 5,400 5,400
Bond subsidy - -
Miscellaneous 1,017,000 50,000 159,100 109,800 50,000 1,385,900
Interest on investments 2,400,100 25,400 15,000 118,000 74,500 152,600 315,400 5,300 19,500 3,000 3,100 6,000 38,000 3,175,900
Bond sale proceeds - - - - - - - - - - - - - -
Subtotal 301,166,000 5,361,300 5,053,900 41,664,400 2,093,700 21,469,600 65,783,000 609,100 28,656,800 683,100 1,552,600 609,500 6,563,600 481,266,600
Transfers IN 10,390,100 - 5,000,000 - - 20,466,700 82,209,900 1,534,700 500,000 - 4,075,000 124,176,400
Total Resources 311,556,100$ 5,361,300$ 10,053,900$ 41,664,400$ 2,093,700$ 41,936,300$ 147,992,900$ 2,143,800$ 28,656,800$ 1,183,100$ 1,552,600$ 609,500$ 10,638,600$ 605,443,000$
Requirements:
Departmental:
Business Services Department 14,322,300$ 14,322,300$
Conveyance Systems Department 16,362,100 16,362,100
Regulatory Affairs Department 7,509,100 7,509,100
Watershed Management Department 6,249,700 6,249,700
Wastewater Treatment Department 28,555,600 28,555,600
Subtotal 72,998,800 72,998,800
Non-Departmental:
Capital construction (CIP) 4,298,900 4,687,000 660,000 108,569,400 10,000 25,000 5,807,000 124,057,300
Materials & services 41,518,000 890,000 650,000 50,000 - 100,000 224,000 10,000 25,000 50,000 43,517,000
Debt service - principal 11,780,000 760,000 12,540,000
Debt service - interest 8,686,700 774,700 9,461,400
Contingency 20,041,700 100,000 534,000 2,760,900 100,000 1,050,000 5,500,000 75,000 1,511,400 15,000 30,000 100,000 300,000 32,118,000 Unappropriated ending fund balance 91,097,300 4,371,300 4,182,900 11,293,600 1,283,700 20,419,600 33,823,500 534,100 12,031,300 1,148,100 1,447,600 459,500 4,481,600 186,574,100
Subtotal 229,954,700 5,361,300 10,053,900 14,054,500 2,093,700 41,936,300 147,992,900 2,143,800 13,766,700 1,183,100 1,477,600 609,500 10,638,600 481,266,600
Transfers OUT 81,601,400 27,609,900 - 14,890,100 - 75,000 - 124,176,400
Total Requirements 311,556,100$ 5,361,300$ 10,053,900$ 41,664,400$ 2,093,700$ 41,936,300$ 147,992,900$ 2,143,800$ 28,656,800$ 1,183,100$ 1,552,600$ 609,500$ 10,638,600$ 605,443,000$
Net Increase (Decrease) in Fund Balance (76,509,200)$ (959,200)$ (856,000)$ (10,446,500)$ (572,700)$ (897,400)$ (30,392,100)$ (69,700)$ (128,200)$ 468,000$ 203,500$ (144,000)$ (1,694,000)$ (121,997,500)$
% Change -45.6% -18.0% -48.1% -30.9% -4.2% -47.3% -11.5% -1.1% 16.4% -23.9% -27.4% -39.5%
CLEAN WATER SERVICESAll Funds Summary - Fund Budget Detail
Fiscal Year 2018-2019

Clean Water Services FY 2018-19 Adopted Budget Page 67
Fund Accounting Structure
Fund Type Specific Fund Title Fund
Number Major Revenue
Source Major Expense
Operating Funds
General Fund 101
Service Charges Operations, transfers to fund debt service and construction
Surface Water Management
201 Service Charges Operations, transfers to fund SWM construction
Construction Local Improvement Districts (Sanitary)
108 Assessments & Loans Assessments & Loans
Construction projects for benefited properties Construction projects for benefited properties
Local Improvement Districts (SWM)
208
Sanitary Sewer Construction Fund
112 Bond Proceeds, General Fund & SDC Transfers
Treatment Facility Projects, Conveyance System and Support Projects
SWM Projects and Construction
212 SWM Operating and SDC Transfers
SWM Construction
Reserve Liability 102 General Fund Deductible and Claims
Capital Replacement (Sanitary)
106 General Fund Replacement/renewal of existing assets
Capital Replacement (SWM)
206 SWM General Fund Replacement/renewal of existing assets
Capital Reserves Sanitary
107 SDCs Through fund transfers: Debt Service and Construction Through fund transfers: Debt Service and Construction
Capital Reserves Surface Water Management
207 SDCs
Debt Master Plan Update 111 General Fund & SDC Transfers
Revenue Bond Debt
Revenue Pension Bond Fund
114 General Fund Transfers
Pension Obligation

Clean Water Services FY 2018-19 Adopted Budget Page 68
General Fund Program Codes
Department Program
Department / Division Program Code Code
Business Services Department Office of the General Manager 010 8101
Legal Services 010 8102
Public Affairs 020 8110
Human Resources 020 8501
Information Technology 020 8305
ABC Building Maintenance 020 8507
Finance Administration 050 8500
Risk & Benefits Management 050 8502
Finance & Accounting 050 8504
Regulatory Affairs Department Administration 040 8210
Source Control Division 040 8212
Laboratory Services 040 8232
Watershed Management Department Administration 030 8233
Operations 030 8234
Conveyance Systems Department Administration 061 8201
Engineering Services Division Capital Projects Administration 062 8224
Planning & Development Services Division Development Related Services 062 8225
Systems Delivery Planning 062 8226
Field Operations Division Administration 063 8370
System Repair 063 8371
System Maintenance 063 8373
Local Repair & Construction 063 8380
SWM Surface Facil ity Maintenance 063 8383
TV/Flow Monitoring 063 8375
Wastewater Treatment Department Administration 071 8301
Operations Division Durham Operations 072 8311
Rock Creek Operations 073 8312
Hillsboro Operations 073 8314
Forest Grove Operations 073 8315
Technology Development & Research 074 8316
Mechanical Maintenance Division Durham Mechanical Maintenance 072 8361
Pump Station Maintenance 073 8343
Rock Creek Mechanical Maintenance 073 8344
Facilities Maintenance 074 8362
Reuse/Support Programs Biosolids/Support Program 074 8331
Engineering Services TPS Engineering 075 8211
Electrical & Instrumentation Division Durham E&I Maintenance 072 8351
FG/Hillsboro/Rock Creek E&I Maint. 073 8352
Control Systems 074 8353

Clean Water Services FY 2018-19 Adopted Budget Page 69
Operating Funds Summary The District fund structure includes the following two operating funds:
General Fund 101 Includes appropriation for all personnel-related expenses and materials and services related to day-to-day operations.
Surface Water Management Operating Fund 201 Collects service charge revenues from the SWM program and transfers a portion to the General Fund in support of SWM related operations.
Both funds track not only the revenues from service charges, but also maintain budgetary segregation of these resources and expenses. Beginning in FY 1997-98, the District began to capitalize the personnel and materials and services costs associated with staff whose time is dedicated to capital improvement projects. This practice is continuing in FY 2018-19.

Clean Water Services FY 2018-19 Adopted Budget Page 70
General Fund 101 The District General Fund supports the overall operations of the treatment and conveyance systems through collection of service charge revenues. The FY 2018-19 budget reflects a 3% increase in sewer services charges, which equates to a monthly charge of $44.60 for the average residential customer. Resources in the FY 2018-19 budget total $311.5 million; including service charges of $128.5 million, other revenues of $5.1 million, reimbursement for SWM operating costs of $10.4 million, and $167.6 million in anticipated fund balance carry over from the prior year. Operating expenditures in the FY 2018-19 budget total $73 million, including departmental labor costs of $44.1 million and materials and services of $28.8 million. Nondepartmental materials and services expenditures include a one-time $38 million payment to PERS to fund a new side account. The budget also includes transfers totaling $81.6 million to fund debt service principal and interest payments of $6.6 million, capital construction of $70 million, and replacement reserve of $5 million. Authorized Positions: All District positions are funded in Fund 101. Where appropriate, Fund 101 personnel expenditures are reimbursed by other funds such as SWM Operating Fund 201. The District’s FTE total includes both operating and capital staff. The format of Fund 101 requirements reflects the decision to capitalize staff whose time is dedicated to capital projects.
GENERAL FUND SUMMARY
FUND 101
FY 2016 FY 2017 FY 2018 RESOURCES OR REQUIREMENTS: OBJECT FY 2019 FY 2019 FY 2019
ACTUAL ACTUAL BUDGET CATEGORY CODE PROPOSED APPROVED ADOPTED
RESOURCES
$39,186,539 $40,977,481 $42,652,600 Service Charges 40110 $44,397,200 $44,397,200 $44,397,200
60,671,051 62,759,382 68,339,100 City Service Payments 40120 67,893,500 67,893,500 67,893,500
11,084,003 11,550,958 11,125,400 Industrial/Commercial 40140 15,250,300 15,250,300 15,250,300
0 0 200,000 City Right of Way Fees 40155 200,000 200,000 200,000
24,820 30,291 31,600 Water Usage Accounts 40130 43,600 43,600 43,600
605,520 541,904 657,600 Portland Customers 40150 720,000 720,000 720,000
$111,571,933 $115,860,016 $123,006,300 SERVICE CHARGES Subtotal $128,504,600 $128,504,600 $128,504,600
$267,400 $329,892 $378,000 Plan Check Fees 40190 $284,900 $284,900 $284,900
1,067,339 1,180,279 863,700 Septage Charges 40170 1,052,900 1,052,900 1,052,900
6,704 19,992 0 Sewer Field Services 40250 0 0 0
10,225 0 0 Fines and Penalties 46410 0 0 0
1,398,415 3,198,985 592,600 Miscellaneous Revenue 40200-42000 1,017,000 1,017,000 1,017,000
31,888 2,722 300,000 Grants/Contributions 43010-43040 300,000 300,000 300,000
TRANSFERS FROM:
9,041,393 9,269,384 10,210,200 Fund 201 - SWM Operating 49201 10,390,100 10,390,100 10,390,100
0 0 483,754 Fund 115 - Dissolution of Fund 49115 0 0 0
952,423 642,754 969,100 Investment Interest 44020 2,400,100 2,400,100 2,400,100
Unappropriated Reserves:
99,092,379 124,194,296 145,400,000 Beginning Balance 31100 167,606,500 167,606,500 167,606,500
$223,440,099 $254,698,320 $282,203,654 TOTAL RESOURCES $311,556,100 $311,556,100 $311,556,100

Clean Water Services FY 2018-19 Adopted Budget Page 71
$-
$20,000,000
$40,000,000
$60,000,000
$80,000,000
$100,000,000
$120,000,000
$140,000,000
$160,000,000
$180,000,000
2015 Actual 2016 Actual 2017 Actual 2018 Budget 2019 Adopted
General Fund 101 Revenue & Expenditure Trends(excluding transfers)
Revenues Expenditures Reserves(contingency & unappropriated)
Fund 101 (continued)
FY 2016 FY 2017 FY 2018 RESOURCES OR REQUIREMENTS: OBJECT FY 2019 FY 2019 FY 2019
ACTUAL ACTUAL BUDGET CATEGORY CODE PROPOSED APPROVED ADOPTED
REQUIREMENTS
DEPARTMENTAL
$38,975,348 40,803,916 $46,872,600 Personnel Services 47,994,500 47,994,500 47,994,500
(6,415,514) (6,938,356) (4,050,400) Less Capital Personnel Services (3,850,400) (3,850,400) (3,850,400)
23,768,145 25,125,596 27,979,800 Materials & Services 28,854,700 28,854,700 28,854,700
329,179 324,855 459,000 Capital Outlay 0 0 0
$56,657,158 $59,316,011 $71,261,000 Total Departmental $72,998,800 $72,998,800 $72,998,800
$184,072 $149,319 $400,000 Materials & Services Bad Debt Expense 52905 $500,000 $500,000 $500,000
84,796 94,161 100,000 Materials & Services Franchise Fees 52530 118,000 118,000 118,000
0 0 200,000 City Right of Way Fees 52270 200,000 200,000 200,000
0 0 0 Industrial Local 52270 2,700,000 2,700,000 2,700,000
636,977 562,235 1,904,000 Capital Projects 55000 4,298,900 4,298,900 4,298,900
0 0 0 Nondepartmental Materials & Services 52495 38,000,000 38,000,000 38,000,000
TRANSFERS TO:
300,000 0 0 Liability Reserve 57102 0 0 0
0 5,000,000 6,000,000 Replacement Reserve 57106 5,000,000 5,000,000 5,000,000
10,000,000 7,000,000 1,362,400 Revenue Bond Debt 57111 5,066,700 5,066,700 5,066,700
30,000,000 34,449,300 40,000,000 Capital Construction 57112 70,000,000 70,000,000 70,000,000
1,354,700 1,412,000 1,473,800 Revenue Pension Bond Fund 57114 1,534,700 1,534,700 1,534,700
0 550,700 0 SWM Construction Fund 57212 0 0 0
28,100 0 0 Tualatin Water Supply Cap Proj Fund 57115 0 0 0
RESERVES AND ENDING BALANCES:
0 0 11,386,600 Operating Contingency 58100 20,041,700 20,041,700 20,041,700
124,194,296 146,164,594 148,115,854 Ending Fund Balance 31100 91,097,300 91,097,300 91,097,300
$223,440,099 $254,698,320 $282,203,654 TOTAL REQUIREMENTS $311,556,100 $311,556,100 $311,556,100

Clean Water Services FY 2018-19 Adopted Budget Page 72
Storm & Surface Water Management Fund 201 Introduced in 1990, the District’s Surface Water Management (SWM) Program is based on a monthly service charge of $8.75 per typical household. The larger cities retain a portion of this charge to fund SWM maintenance activities within their respective boundaries.
Resources in the FY 2018-19 budget total $28.7 million; including service charges of $15.4 million, other revenues of $1.1 million, and $12.2 million in anticipated fund balance carry over from the prior year.
Expenditures in the FY 2018-19 budget are primarily attributable to a transfer of approximately $10.4 million to the General Fund (Fund 101) to reimburse for operating expenses, a transfer of $4 million to the SWM Construction Fund (Fund 212) to fund capital projects, and a transfer of $0.5 million to the SWM Capital Replacement Fund (Fund 206).
The District continues to increase rates by 50 cents per year and the FY 2018-19 budget has prioritized capital projects to help stabilize reserves going forward. Adequate reserves are needed to address increased operating costs due to wet weather conditions, regulatory requirements, and increased public demand for services, as well as to fund capital projects.
SURFACE WATER MANAGEMENT OPERATING FUND
FUND 201
FY 2016 FY 2017 FY 2018 RESOURCES OR REQUIREMENTS: OBJECT FY 2019 FY 2019 FY 2019
ACTUAL ACTUAL BUDGET CATEGORY CODE PROPOSED APPROVED ADOPTED
RESOURCES:
Service Charges
$7,945,739 $8,601,661 $9,288,100 CWS Customers 40110 $9,860,600 $9,860,600 $9,860,600
4,492,311 4,868,957 5,294,100 City Customers 40120 5,560,800 5,560,800 5,560,800
350,000 350,000 350,000 County/City Contract Maintenance 40340 350,000 350,000 350,000
371,390 369,201 389,000 Erosion Control Fees 40280/40290 263,000 263,000 263,000
122,843 115,473 126,000 Inspection 40200 109,100 109,100 109,100
285,605 330,193 329,100 Plan Check Fees 40190 284,300 284,300 284,300
744,189 871,142 50,000 Miscellaneous Revenue 40380 50,000 50,000 50,000
65,719 39,559 66,900 Interest on Investments 44020 19,500 19,500 19,500
6,369,030 9,141,136 9,200,000 Beginning Balance 12,159,500 12,159,500 12,159,500
$20,746,826 $24,687,322 $25,093,200 TOTAL RESOURCES $28,656,800 $28,656,800 $28,656,800
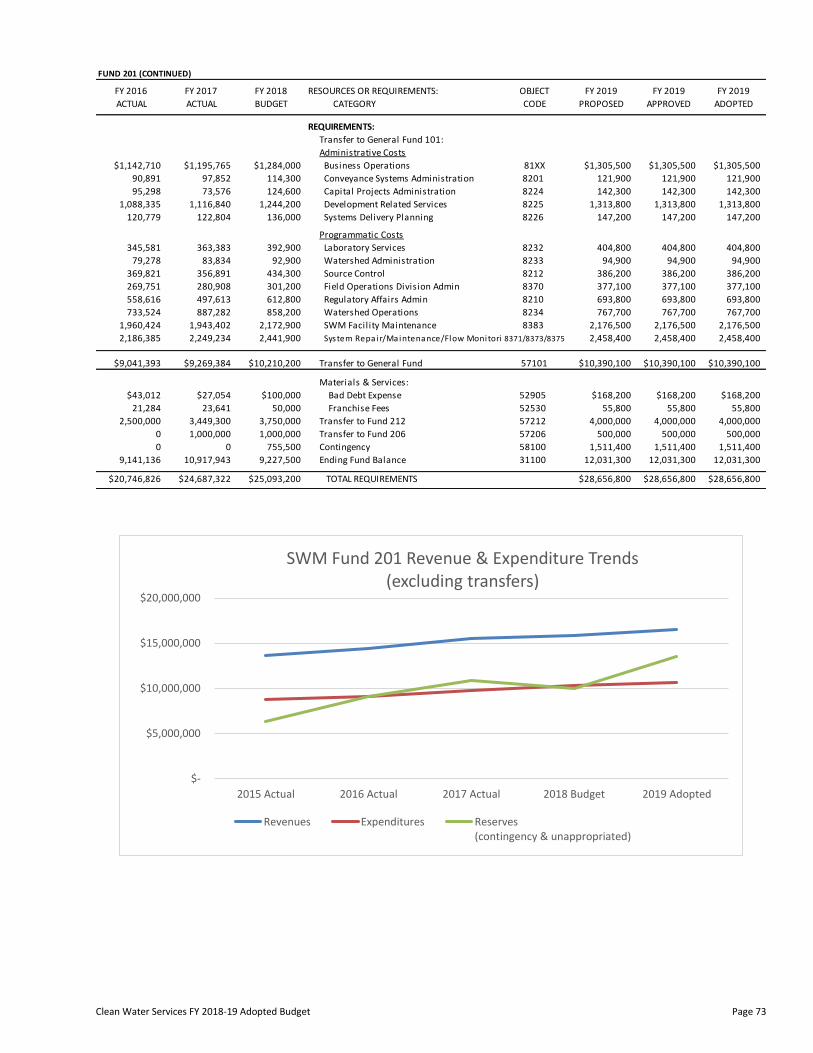
Clean Water Services FY 2018-19 Adopted Budget Page 73
FUND 201 (CONTINUED)
FY 2016 FY 2017 FY 2018 RESOURCES OR REQUIREMENTS: OBJECT FY 2019 FY 2019 FY 2019
ACTUAL ACTUAL BUDGET CATEGORY CODE PROPOSED APPROVED ADOPTED
REQUIREMENTS:
Transfer to General Fund 101:
Administrative Costs
$1,142,710 $1,195,765 $1,284,000 Business Operations 81XX $1,305,500 $1,305,500 $1,305,500
90,891 97,852 114,300 Conveyance Systems Administration 8201 121,900 121,900 121,900
95,298 73,576 124,600 Capital Projects Administration 8224 142,300 142,300 142,300
1,088,335 1,116,840 1,244,200 Development Related Services 8225 1,313,800 1,313,800 1,313,800
120,779 122,804 136,000 Systems Delivery Planning 8226 147,200 147,200 147,200
Programmatic Costs
345,581 363,383 392,900 Laboratory Services 8232 404,800 404,800 404,800
79,278 83,834 92,900 Watershed Administration 8233 94,900 94,900 94,900
369,821 356,891 434,300 Source Control 8212 386,200 386,200 386,200
269,751 280,908 301,200 Field Operations Division Admin 8370 377,100 377,100 377,100
558,616 497,613 612,800 Regulatory Affairs Admin 8210 693,800 693,800 693,800
733,524 887,282 858,200 Watershed Operations 8234 767,700 767,700 767,700
1,960,424 1,943,402 2,172,900 SWM Facility Maintenance 8383 2,176,500 2,176,500 2,176,500
2,186,385 2,249,234 2,441,900 System Repair/Maintenance/Flow Monitoring8371/8373/8375 2,458,400 2,458,400 2,458,400
$9,041,393 $9,269,384 $10,210,200 Transfer to General Fund 57101 $10,390,100 $10,390,100 $10,390,100
Materials & Services:
$43,012 $27,054 $100,000 Bad Debt Expense 52905 $168,200 $168,200 $168,200
21,284 23,641 50,000 Franchise Fees 52530 55,800 55,800 55,800
2,500,000 3,449,300 3,750,000 Transfer to Fund 212 57212 4,000,000 4,000,000 4,000,000
0 1,000,000 1,000,000 Transfer to Fund 206 57206 500,000 500,000 500,000
0 0 755,500 Contingency 58100 1,511,400 1,511,400 1,511,400
9,141,136 10,917,943 9,227,500 Ending Fund Balance 31100 12,031,300 12,031,300 12,031,300
$20,746,826 $24,687,322 $25,093,200 TOTAL REQUIREMENTS $28,656,800 $28,656,800 $28,656,800
$-
$5,000,000
$10,000,000
$15,000,000
$20,000,000
2015 Actual 2016 Actual 2017 Actual 2018 Budget 2019 Adopted
SWM Fund 201 Revenue & Expenditure Trends(excluding transfers)
Revenues Expenditures Reserves(contingency & unappropriated)

Clean Water Services FY 2018-19 Adopted Budget Page 74
This page intentionally left blank

Clean Water Services FY 2018-19 Adopted Budget Page 75
Construction Funds Summary The District’s fund structure includes five funds that provide for the construction of major treatment and sanitary collection system improvements, support facilities, Surface Water Management facilities, local improvement district construction, and one-time or ongoing specialized professional services that relate to capital projects and/or long-term planning. These funds are:
Sanitary Sewer Local Improvement District (LID) Construction Fund 108 Fund 108 finances collection system construction projects benefiting local property owners who pay assessments to fund the projects.
Surface Water Management Local Improvement District (SWM LID) Construction Fund 208 Fund 208 finances storm drainage and other surface water management facilities benefiting local property owners who pay assessments to fund the project.
Sanitary Sewer Construction Fund 112 Fund 112 finances treatment, recycled wastewater, sanitary system collection, and planning and support projects from a combination of revenue bond proceeds, sanitary system development charge (SDC) revenues, and transfers from the District’s General Fund.
Surface Water Management (SWM) Construction Fund 212 Fund 212 finances storm drainage and surface water management facilities, project related studies, and capital equipment needs from a combination of transfers from SWM Fund 201 and the SWM Capital Reserve Fund 207.
Tualatin Basin Water Supply Capital Project Fund 115 Fund 115 was established to finance the Tualatin Basin Water Supply Project, which was a joint project to provide additional water volume to enable continued compliance with water quality requirements. The partnership was dissolved and Fund 115 was also dissolved in FY 2017-18 per R&O 18-3.

Clean Water Services FY 2018-19 Adopted Budget Page 76
Sanitary Sewer System Local Improvement District Construction Fund 108 At the request of interested property owners, the District will assist in the construction of local sanitary sewer system improvements by forming Local Improvement Districts (LIDs). The costs of construction are ultimately funded by assessments paid by benefited property owners. Due to changes in state law and federal regulations for tax exempt financing, the District has financed LIDs internally. It is possible that a LID bond sale may be an option in the future; however this budget assumes continued internal financing.
FUND 108
FY 2016 FY 2017 FY 2018 RESOURCES OR REQUIREMENTS: OBJECT FY 2019 FY 2019 FY 2019
ACTUAL ACTUAL BUDGET CATEGORY CODE PROPOSED APPROVED ADOPTED
RESOURCES:
$0 $0 $178,900 Assessment Principal 46010 $235,000 $235,000 $235,000
12,475 0 12,700 Interest on Investments 44020 37,100 37,100 37,100
9,998 21,604 15,000 Interest on Assessments 44040 37,400 37,400 37,400
0 0 (25,000) Incentives 46015 (72,200) (72,200) (72,200)
1,650,551 1,673,023 1,700,000 Beginning Balance 31100 1,856,400 1,856,400 1,856,400
$1,673,023 $1,694,627 $1,881,600 TOTAL RESOURCES $2,093,700 $2,093,700 $2,093,700
REQUIREMENTS:
LOCAL IMPROVEMENT DISTRICT (LID) PROJECT DETAIL EXPENDITURES:
$0 $0 $50,000 New Projects (LID Support) 6273 $660,000 $660,000 $660,000
$0 $0 $50,000 PROJECT COSTS - SUBTOTAL $660,000 $660,000 $660,000
0 0 50,000 Materials & Services 52240 50,000 50,000 50,000
0 0 100,000 Contingency 58100 100,000 100,000 100,000
1,673,023 1,694,627 1,681,600 Ending Fund Balance 31100 1,283,700 1,283,700 1,283,700
$1,673,023 $1,694,627 $1,881,600 TOTAL REQUIREMENTS $2,093,700 $2,093,700 $2,093,700

Clean Water Services FY 2018-19 Adopted Budget Page 77
Surface Water Management (SWM) Local Improvement District Construction Fund 208 The Surface Water Management Local Improvement District Construction Fund was created to provide for the financing of local storm drainage and surface water management improvements benefiting specific property owners. Benefited property owners ultimately repay the costs of construction. As in the case of the Sanitary System LID Construction Fund, changes in state law and federal regulations have made tax exempt financing unavailable. Fund 208 SWM LID projects will be financed internally. It is possible that a LID bond sale may be an option in the future; however this budget assumes continued internal financing.
SWM - LOCAL IMPROVEMENT DISTRICT CONSTRUCTION FUND SUMMARY
FUND 208
FY 2016 FY 2017 FY 2018 RESOURCE OR REQUIREMENTS OBJECT FY 2019 FY 2019 FY 2019ACTUAL ACTUAL BUDGET CATEGORY CODE PROPOSED APPROVED ADOPTED
RESOURCES:
$55,283 $0 $0 Assessment Principal 46010 $0 $0 $0
(18,363) 0 0 Incentives 46015 0 0 0
5,310 0 5,400 Interest on Investments 44020 5,500 5,500 5,500
0 2,345 500 Interest on Assessments 44040 500 500 500
675,634 595,211 599,000 Beginning Balance 31100 603,500 603,500 603,500
$717,864 $597,556 $604,900 TOTAL RESOURCES $609,500 $609,500 $609,500
REQUIREMENTS:
$122,653 $0 $25,000 Capital Outlay 55300 $25,000 $25,000 $25,000
$122,653 $0 $25,000 PROJECT COSTS - SUBTOTAL $25,000 $25,000 $25,000
0 0 25,000 Materials & Services 52240 25,000 25,000 25,000
0 0 100,000 Contingency 58100 100,000 100,000 100,000
595,211 597,556 454,900 Ending Fund Balance 31100 459,500 459,500 459,500
$717,864 $597,556 $604,900 TOTAL REQUIREMENTS $609,500 $609,500 $609,500
LOCAL IMPROVEMENT DISTRICT (LID)
PROJECT DETAIL EXPENDITURES:

Clean Water Services FY 2018-19 Adopted Budget Page 78
Sanitary Sewer Construction Fund 112
The Sanitary Sewer Construction Fund was created to manage the financing for sanitary sewer capital projects. Treatment, sanitary, collection system, and related support projects and studies are financed from a combination of revenue bond proceeds, sanitary system development charges (SDC) revenues, and cash transfers from the District’s General Fund. The primary budgeted expenditures for this fund consist of the projects included in the first year of the District’s FY 2019 – 2023 five-year capital improvements program (CIP).
SANITARY SEWER CONSTRUCTION FUND
FUND 112
FY 2016 FY 2017 FY 2018 RESOURCE OR REQUIREMENTS OBJECT FY 2019 FY 2019 FY 2019
ACTUAL ACTUAL BUDGET CATEGORY CODE PROPOSED APPROVED ADOPTED
RESOURCES:
$30,000,000 $34,449,300 $40,000,000 Transfer from Fund 101 49101 $70,000,000 $70,000,000 $70,000,000
13,346,000 13,998,800 19,123,400 Transfer from Fund 107 49107 12,209,900 12,209,900 12,209,900
0 197,953 0 Bond Sale Proceeds 46200 0 0 0
794,622 280,515 1,503,600 Contributions-City or Developer 47010 202,000 202,000 202,000
1,000,567 168,962 50,000 Miscellaneous Revenue 40380 50,000 50,000 50,000
0 0 2,000,000 Grants/Contributions 43030 1,000,000 1,000,000 1,000,000
538,499 302,673 547,900 Interest on Investments 44020 315,400 315,400 315,400
53,810,288 61,936,012 59,205,000 Beginning Balance 31100 64,215,600 64,215,600 64,215,600
$99,489,976 $111,334,215 $122,429,900 TOTAL RESOURCES $147,992,900 $147,992,900 $147,992,900
REQUIREMENTS:
CIP PROJECT EXPENDITURES:
$25,155,518 $31,611,785 $38,846,000 Treatment Facilities 55300 $47,621,000 $47,621,000 $47,621,000
8,957,095 13,207,859 16,050,600 Collection and Capital 55800 47,138,400 47,138,400 47,138,400
3,441,351 5,633,888 12,390,000 Planning and Support Projects 55400 13,810,000 13,810,000 13,810,000
$37,553,964 $50,453,532 $67,286,600 PROJECT COSTS - SUBTOTAL $108,569,400 $108,569,400 $108,569,400
$0 $0 $100,000 Materials and Services 52240 $100,000 $100,000 $100,000
0 0 0 Transfer to Fund 111 - Debt Reserve from Proceeds 57111 0 0 0
0 0 5,000,000 Contingency 58100 5,500,000 5,500,000 5,500,000
61,936,012 60,880,683 50,043,300 Ending Fund Balance 31100 33,823,500 33,823,500 33,823,500
$99,489,976 $111,334,215 $122,429,900 TOTAL REQUIREMENTS $147,992,900 $147,992,900 $147,992,900

Clean Water Services FY 2018-19 Adopted Budget Page 79
Surface Water Management (SWM) Construction Fund 212 This fund was established to manage the capital investments and related costs for the Surface Water Management program in a manner similar to the way that Fund 112 is used for the sanitary sewer system. The budget for FY 2018-19 is based on the first year of the Capital Improvements Program (CIP) for FY 2019-2023. The funding sources for FY 2018-19 budgeted project expenditures come from the beginning fund balance and transfers from the Storm and Surface Water Management Fund - 201 and the SWM Capital Reserve Fund - 207.
The District prioritized projects and limited the amounts included in the CIP for FY 2018-19 to continue to build and stabilize reserves in future years.
SWM CONSTRUCTION FUND
FUND 212
FY 2016 FY 2017 FY 2018 RESOURCE OR REQUIREMENTS OBJECT FY 2019 FY 2019 FY 2019
ACTUAL ACTUAL BUDGET CATEGORY CODE PROPOSED APPROVED ADOPTED
RESOURCES:
$2,500,000 $3,449,300 $3,750,000 Transfer from Fund 201 49201 $4,000,000 $4,000,000 $4,000,000
100,000 100,000 100,000 Transfer from Fund 207 49207 75,000 75,000 75,000
0 550,700 0 Transfer from Fund 101 49101 0 0 0
0 0 81,000 Reimbursements from Developers 47010 300,000 300,000 300,000
0 45,000 50,000 Other Charges 46400 50,000 50,000 50,000
36,089 25,311 37,300 Interest on Investments 44020 38,000 38,000 38,000
3,931,782 3,970,515 5,154,000 Beginning Fund Balance 31100 6,175,600 6,175,600 6,175,600
$6,567,871 $8,140,826 $9,172,300 TOTAL RESOURCES $10,638,600 $10,638,600 $10,638,600
REQUIREMENTS:
$2,597,356 $2,322,469 $4,627,500 CIP Project Expenditures $5,807,000 $5,807,000 $5,807,000
0 0 50,000 Materials and Services 52240 50,000 50,000 50,000
0 0 236,000 Contingency 58100 300,000 300,000 300,000
3,970,515 5,818,357 4,258,800 Ending Fund Balance 31100 4,481,600 4,481,600 4,481,600
$6,567,871 $8,140,826 $9,172,300 TOTAL REQUIREMENTS $10,638,600 $10,638,600 $10,638,600

Clean Water Services FY 2018-19 Adopted Budget Page 80
Tualatin Basin Water Supply Capital Project Construction Fund 115 Tualatin Basin Water Supply Project Construction Fund was established in FY 2010 to manage the financing for capital improvements to provide additional water volume in the Tualatin River, enabling continued compliance with water quality requirements. The partners funding the project included the District, the Cities of Hillsboro and Beaverton, the Tualatin Valley Water District and the U.S. Bureau of Reclamation. The District was serving as Project Manager. This partnership was dissolved as the involved agencies opted to pursue alternative sources for future water supply needs. As a result, Fund 115 was dissolved in FY 2017-18 via Resolution and Order #18-3. The fund balance was transferred to the General Fund per ORS 294.353. Any future water supply project work will be funded from Sanitary Sewer Construction Fund 112.
TUALATIN BASIN WATER SUPPLY CAPITAL PROJECT FUND
FUND 115
FY 2016 FY 2017 FY 2018 RESOURCE OR REQUIREMENTS OBJECT FY 2019 FY 2019 FY 2019
ACTUAL ACTUAL BUDGET CATEGORY CODE PROPOSED APPROVED ADOPTED
RESOURCES:
$15,980 $104,060 $0 Contributions from partners 47010 $0 $0 $0
28,100 0 0 Transfer from Fund 101 49101 0 0 0
0 0 0 Transfer from Fund 101 49101 0 0 0
4,331 0 0 Interest on Investments 44020 0 0 0
375,472 400,681 483,754 Beginning Balance 31100 0 0 0
$423,883 $504,741 $483,754 TOTAL RESOURCES $0 $0 $0
REQUIREMENTS:
$0 $0 $0 Materials and Services 52240 $0 $0 $0
23,202 20,987 0 Project Costs - Capital Outlay 55400 0 0 0
0 0 483,754 Transfer to Fund 101 0 0 0
0 0 0 Contingency 58100 0 0 0
400,681 483,754 0 Ending Fund Balance 31100 0 0 0
$423,883 $504,741 $483,754 TOTAL REQUIREMENTS $0 $0 $0
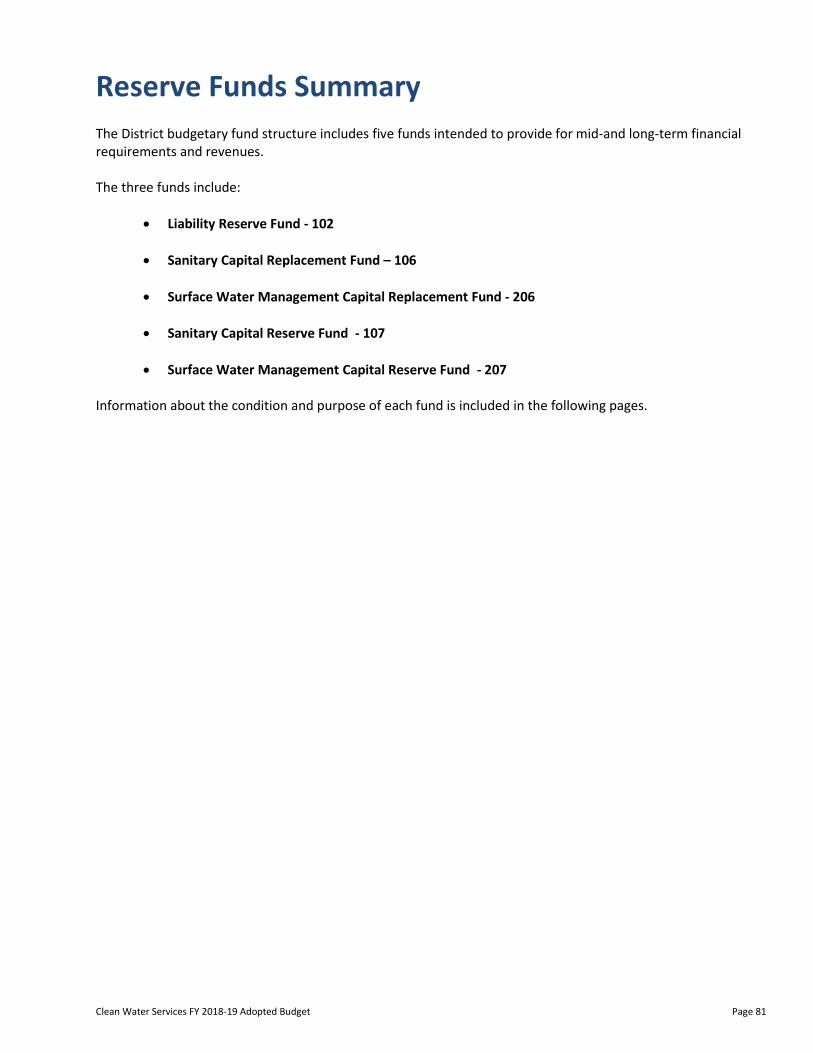
Clean Water Services FY 2018-19 Adopted Budget Page 81
Reserve Funds Summary The District budgetary fund structure includes five funds intended to provide for mid-and long-term financial requirements and revenues. The three funds include:
Liability Reserve Fund - 102
Sanitary Capital Replacement Fund – 106
Surface Water Management Capital Replacement Fund - 206
Sanitary Capital Reserve Fund - 107
Surface Water Management Capital Reserve Fund - 207 Information about the condition and purpose of each fund is included in the following pages.

Clean Water Services FY 2018-19 Adopted Budget Page 82
Liability Reserve Fund 102 The Liability Reserve Fund provides for payments of the retained amount (deductible) of any insured loss and payments for losses that are either uninsured or uninsurable. The District maintains retention levels of $50,000 per occurrence on its liability insurance coverage and $5,000,000 per occurrence on its property coverage. A portion of the ending fund balance is appropriated as Contingency each year in case of significant payments for self-insured programs and insured losses greater than policy limits. Actual expenditures of these funds would require formal Board action. Examples of self-insured risks include:
damage to the District's vehicles and equipment valued at more than $4,500,000
railroad liability, on premises pollution from above ground storage tanks, and off premises pollution liability
legal defense costs associated with any uninsured or insured but contested occurrence
employee-related claims such as medical expenses from volunteers, employee dishonesty resulting in losses greater than $100,000, and Workers' Compensation claims in excess of the standard premium
Anticipated annual expenses are funded by insurance reimbursements and interest earnings. Although expenditures are impossible to predict reliably, appropriations are included in the budget as potential payments against District deductibles in areas of property, legal liability, automobile loss and prior years' workers' compensation claim payments. The contingency enables the District to modify its insurance policies in volatile markets. For example, expanding the "self-funded" liability portion of coverage can be used to keep insured programs affordable when insurance costs increase due to changes in market conditions or insurers' assessment of District risk.
LIABILITY RESERVE FUND SUMMARY
FUND 102
FY 2016 FY 2017 FY 2018 RESOURCE OR REQUIREMENTS OBJECT FY 2019 FY 2019 FY 2019
ACTUAL ACTUAL BUDGET CATEGORY CODE PROPOSED APPROVED ADOPTED
RESOURCES:
$300,000 $0 $0 Transfer from Fund 101 49101 $0 $0 $0
5,219 12,403 0 Payments From Third Parties 46300 0 0 0
0 0 5,000 Workers Compensation Refunds 46320 5,400 5,400 5,400
0 65,707 0 Insurance Reimbursement 46310 0 0 0
47,592 23,725 48,400 Interest on Investments 44020 25,400 25,400 25,400
5,352,222 5,616,235 5,425,000 Beginning Balance 31100 5,330,500 5,330,500 5,330,500
$5,705,033 $5,718,070 $5,478,400 TOTAL RESOURCES $5,361,300 $5,361,300 $5,361,300
REQUIREMENTS:
$5,071 $2,170 $50,000 Workers Comp Medical Claims 52770 $50,000 $50,000 $50,000
0 0 0 Materials & Svcs - Dental Reserve 0 0 0
Materials & Services:
68,536 55,697 350,000 Legal 52710 350,000 350,000 350,000
1,665 7,778 350,000 Property 52720 350,000 350,000 350,000
1,823 801 50,000 Automobile/vehicle-liability 52725 50,000 50,000 50,000
6,530 66 40,000 Automobile/vehicle-collision 52730 40,000 40,000 40,000
5,173 87,153 50,000 Non - Clean Water Services 52735-52750 50,000 50,000 50,000
0 48,631 0 Other Materials & Services 0 0 0
0 0 100,000 Contingency 58100 100,000 100,000 100,000
5,616,235 5,515,774 4,488,400 Ending Fund Balance 31100 4,371,300 4,371,300 4,371,300
$5,705,033 $5,718,070 $5,478,400 TOTAL REQUIREMENTS $5,361,300 $5,361,300 $5,361,300

Clean Water Services FY 2018-19 Adopted Budget Page 83
Sanitary Sewer Capital Replacement Fund 106 The Sanitary Capital Replacement Fund was established in FY 2016-17 for the purpose of routine replacement of rolling stock, computers, and minor treatment facility and collection system needs. This fund will be established and maintained through service charge revenue transferred from the General Fund (Fund 101).
CAPITAL REPLACEMENT FUND SUMMARY
FUND 106
FY 2016 FY 2017 FY 2018 RESOURCE OR REQUIREMENTS OBJECT FY 2019 FY 2019 FY 2019
ACTUAL ACTUAL BUDGET CATEGORY CODE PROPOSED APPROVED ADOPTED
RESOURCES:
$0 $5,000,000 $6,000,000 Transfer from Fund 101 49101 $5,000,000 $5,000,000 $5,000,000
0 12,996 36,000 Interest on Investments 44020 15,000 15,000 15,000
0 0 1,858,000 Beginning Balance 31100 5,038,900 5,038,900 5,038,900
$0 $5,012,996 $7,894,000 TOTAL RESOURCES $10,053,900 $10,053,900 $10,053,900
REQUIREMENTS:
$0 $1,723,903 $5,470,000 Capital Outlay 55000 $4,687,000 $4,687,000 $4,687,000
0 236,502 624,000 Non Departmental Materials & Services 52000 650,000 650,000 650,000
0 0 334,400 Contingency 58100 534,000 534,000 534,000
0 3,052,591 1,465,600 Ending Fund Balance 31100 4,182,900 4,182,900 4,182,900
$0 $5,012,996 $7,894,000 TOTAL REQUIREMENTS $10,053,900 $10,053,900 $10,053,900

Clean Water Services FY 2018-19 Adopted Budget Page 84
Surface Water Management Capital Replacement Fund 206 The SWM Capital Replacement Fund was established in FY 2016-17 for the purpose of routine replacement of rolling stock and collection system needs. This fund will be established and maintained through service charge revenue transferred from the SWM General Fund (Fund 201).
SWM CAPITAL REPLACEMENT FUND SUMMARY
FUND 206
FY 2016 FY 2017 FY 2018 RESOURCE OR REQUIREMENTS OBJECT FY 2019 FY 2019 FY 2019
ACTUAL ACTUAL BUDGET CATEGORY CODE PROPOSED APPROVED ADOPTED
RESOURCES:
$0 $1,000,000 $1,000,000 Transfer from Fund 201 49201 $500,000 $500,000 $500,000
0 2,714 4,500 Interest on Investments 44020 3,000 3,000 3,000
0 0 645,000 Beginning Balance 31100 680,100 680,100 680,100
$0 $1,002,714 $1,649,500 TOTAL RESOURCES $1,183,100 $1,183,100 $1,183,100
REQUIREMENTS:
$0 $327,089 $10,000 Capital Outlay 55000 $10,000 $10,000 $10,000
0 0 10,000 Non Departmental Materials & Services 52000 10,000 10,000 10,000
0 0 15,000 Contingency 58100 15,000 15,000 15,000
0 675,625 1,614,500 Ending Fund Balance 31100 1,148,100 1,148,100 1,148,100
$0 $1,002,714 $1,649,500 TOTAL REQUIREMENTS $1,183,100 $1,183,100 $1,183,100

Clean Water Services FY 2018-19 Adopted Budget Page 85
Sanitary Sewer Capital Reserve Fund 107 New customers are required to pay a System Development Charge (SDC) when connecting for the first time to the District wastewater collection and treatment systems. This fund collects and tracks revenue for the Sanitary SDC’s. The revenues are expended in support of sanitary sewer projects and related debt service by means of transfers to the Sanitary Sewer Construction Fund – 112 and the Master Plan Update Debt Service Fund – 111. Historically, SDC charges constituted a substantial revenue source for the District. However, SDC’s are a very volatile revenue source dependent on the local economy and development climate. Development activity has increased in recent years and revenue is anticipated to continue gradually increasing as the population and commercial development increases over the next four to five years. Some large industrial customers opt to make payments on a deferred basis as is permitted by longstanding policy. The deferral is for two years, but at the end of the two-year period, the SDC is based on the actual flow for the immediately preceding six months. This option, while used rarely, is often chosen by the largest customers and has the effect of delaying the appearance of significant new revenues. The sanitary sewer SDC is increasing from $5,500 to $5,650 per Equivalent Dwelling Unit (EDU) to more accurately reflect the cost of construction.
SANITARY SEWER CAPITAL RESERVE FUND SUMMARY
FUND 107
FY 2016 FY 2017 FY 2018 RESOURCE OR REQUIREMENTS OBJECT FY 2019 FY 2019 FY 2019
ACTUAL ACTUAL BUDGET CATEGORY CODE PROPOSED APPROVED ADOPTED
RESOURCES:
REIMBURSEMENT
$4,642,167 $4,400,522 4,708,900 CWS 41010 3,758,500 3,758,500 3,758,500
7,433,581 9,403,922 11,590,000 Cities 41020 7,665,400 7,665,400 7,665,400
830,480 2,895,933 100,000 City Industrial 41110 619,100 619,100 619,100
IMPROVEMENT
2,583,781 2,464,824 2,598,000 CWS - District Wide 41200 2,194,500 2,194,500 2,194,500
314,037 298,926 485,000 CWS - Local 41205 274,600 274,600 274,600
4,177,947 5,257,314 4,650,000 Cities 41210 5,015,400 5,015,400 5,015,400
472,727 1,648,416 500,000 City Industrial 41310 278,800 278,800 278,800
0 0 0 Miscellaneous Revenue 40380 0 0 0
433,963 197,279 449,300 Interest on Investments 44020 118,000 118,000 118,000
47,755,735 42,963,319 37,959,000 Beginning Balance 31100 21,740,100 21,740,100 21,740,100
$68,644,419 $69,530,455 $63,040,200 TOTAL RESOURCES $41,664,400 $41,664,400 $41,664,400
REQUIREMENTS:
$12,335,100 $16,502,100 17,400,000 Transfer to Fund 111 57111 15,400,000 15,400,000 15,400,000
13,346,000 13,998,800 19,123,400 Transfer to Fund 112 57112 12,209,900 12,209,900 12,209,900
0 0 3,652,300 Contingency 58100 2,760,900 2,760,900 2,760,900
42,963,319 39,029,555 22,864,500 Ending Fund Balance 31100 11,293,600 11,293,600 11,293,600
$68,644,419 $69,530,455 $63,040,200 TOTAL REQUIREMENTS $41,664,400 $41,664,400 $41,664,400

Clean Water Services FY 2018-19 Adopted Budget Page 86
Surface Water Management Capital Reserve Fund 207
As with the sanitary sewer collection and treatment system, new customers are required to pay a System Development Charge (SDC) when they become a part of the District’s Surface Water Management (SWM) system. Similar to the Sanitary Capital Reserve Fund, SWM SDC revenues are accounted for in this fund. The revenues are expended in support of SWM capital projects by means of a transfer to the SWM Construction Fund - 212. The SWM SDC is increasing in FY 2018-19 from $530 to $545 per Equivalent Service Unit (ESU) to more appropriately reflect the cost of SWM capital projects.
SURFACE WATER MANAGEMENT CAPITAL RESERVE FUND SUMMARY
FUND 207
FY 2016 FY 2017 FY 2018 RESOURCE OR REQUIREMENTS OBJECT FY 2019 FY 2019 FY 2019
ACTUAL ACTUAL BUDGET CATEGORY CODE PROPOSED APPROVED ADOPTED
RESOURCES:
Connection Fees
$29,828 $26,488 $25,300 Quality 41410 $6,600 $6,600 $6,600
228,056 202,109 234,500 Quantity 41400 189,000 189,000 189,000
90,725 77,945 75,000 Fees in Lieu Received 41413 109,800 109,800 109,800
6,637 4,874 6,800 Interest on Investments 44020 3,100 3,100 3,100
591,132 846,379 1,066,000 Beginning Balance 31100 1,244,100 1,244,100 1,244,100
$946,379 $1,157,795 $1,407,600 TOTAL RESOURCES $1,552,600 $1,552,600 $1,552,600
REQUIREMENTS:
$100,000 $100,000 $100,000 Transfer to Fund 212 57212 $75,000 $75,000 $75,000
0 0 30,000 Contingency 58100 30,000 30,000 30,000
846,379 1,057,796 1,277,600 Ending Fund Balance 31100 1,447,600 1,447,600 1,447,600
$946,379 $1,157,796 $1,407,600 TOTAL REQUIREMENTS $1,552,600 $1,552,600 $1,552,600

Clean Water Services FY 2018-19 Adopted Budget Page 87
Debt Service Funds Summary The District budget includes two funds that provide for the payment of long term bonded debt. The two funds include:
Master Plan Update Service Fund - 111
Revenue Pension Bond Fund - 114 As of June 30, 2018, principal outstanding on sewer revenue bond debt is $178,250,000 and $12,775,000 in revenue pension bonds. Resources and requirements for each fund are identified on the following pages.

Clean Water Services FY 2018-19 Adopted Budget Page 88
Master Plan Update Debt Service
Fund 111
The Master Plan Update Debt Service Fund provides for the repayment of revenue bonded debt incurred in support of projects identified in the District’s 1985 and 2006 Master Plan Updates, the 1990, 1993, and 2008 Facilities Plans and Updates, and a portion of treatment plant improvements identified in the Capital Improvements Program. As a result of major changes in the municipal bond market during FY 2009, the District opted to hold cash bond reserves to meet bond covenant requirements for its Series 2009A, 2010B, 2011A, and 2011B issues instead of issuing surety reserve policies. The reserved funds are housed in Fund 111 as a restricted portion of the Ending Fund Balance. Future bond issues may include the addition of cash bond reserves as well. The District’s rate covenants on outstanding revenue debt require debt service coverage ratios of at least 1.2 times annual debt service on Senior Lien Parity Obligations plus 1.0 times annual debt service on Subordinate Lien Parity Obligations. Bond coverage as of June 30, 2017 was 3.64 for Senior bonds. The District has no subordinate debt outstanding as of June 30, 2017.
MASTER PLAN UPDATE DEBT SERVICE FUND SUMMARY
FUND 111
FY 2016 FY 2017 FY 2018 RESOURCE OR REQUIREMENTS OBJECT FY 2019 FY 2019 FY 2019
ACTUAL ACTUAL BUDGET CATEGORY CODE PROPOSED APPROVED ADOPTED
RESOURCES:
$10,000,000 $23,502,100 $1,362,400 Transfer from Fund 101 49101 $5,066,700 $5,066,700 $5,066,700
0 0 0 Transfer from Fund 112 49112 0 0 0
12,335,100 0 17,400,000 Transfer from Fund 107 49107 15,400,000 15,400,000 15,400,000
200,687 86,441 204,000 Interest on Investments 44020 152,600 152,600 152,600
0 41,561,794 0 Bond Proceeds 46200 0 0 0
0 (43,426,551) 0 Payment to Refunded Bond Escrow Agent 0 0 0
1,560,973 1,529,940 1,560,000 Series 2010B Build America Bond Subsidy 43050 0 0 0
23,560,642 22,876,891 23,217,000 Beginning Balance 31100 21,317,000 21,317,000 21,317,000
$47,657,402 $46,130,615 $43,743,400 TOTAL RESOURCES $41,936,300 $41,936,300 $41,936,300
REQUIREMENTS:
Series 2004 ($26,455,000)
$3,660,000 $3,860,000 $0 Principal 56100 $0 $0 $0
298,725 101,325 0 Interest 56105 0 0 0
Series 2009A ($58,755,000)
2,735,000 2,845,000 2,975,000 Principal 56100 3,130,000 3,130,000 3,130,000
2,607,513 1,576,923 395,375 Interest 56105 242,750 242,750 242,750
Series 2010A ($8,895,000)
3,080,000 0 0 Principal 56100 0 0 0
77,000 0 0 Interest 56105 0 0 0
Series 2010B ($90,260,000)
0 3,300,000 3,385,000 Principal 56100 3,475,000 3,475,000 3,475,000
4,791,823 4,726,318 4,591,082 Interest 56105 4,444,400 4,444,400 4,444,400
Series 2011A (Refunding Series 2001) ($30,255,000)
2,775,000 2,915,000 3,060,000 Principal 56100 3,210,000 3,210,000 3,210,000
1,060,375 918,125 768,750 Interest 56105 612,000 612,000 612,000
Series 2011B ($50,000,000)
1,755,000 1,815,000 1,890,000 Principal 56100 1,965,000 1,965,000 1,965,000
1,940,075 1,877,450 1,803,350 Interest 56105 1,726,300 1,726,300 1,726,300
Series 2016A (Refunding Series 2009A) ($33,335,000)
0 0 0 Principal 56100 0 0 0
0 775,250 1,661,250 Interest 56105 1,661,250 1,661,250 1,661,250
0 92,541 0 Bond Issuance Costs 56105 0 0 0
0 0 1,026,500 Contingency 58100 1,050,000 1,050,000 1,050,000
Ending Fund Balance
12,987,099 11,020,953 11,020,953 Restricted - Debt Reserve 31100 11,020,953 11,020,953 11,020,953
9,889,792 10,306,730 11,166,140 Unrestricted 31100 9,398,647 9,398,647 9,398,647
$47,657,402 $46,130,615 $43,743,400 TOTAL REQUIREMENTS $41,936,300 $41,936,300 $41,936,300

Clean Water Services FY 2018-19 Adopted Budget Page 89
Revenue Pension Bond Fund 114 The Revenue Pension Bond Fund provides for payment of the Series 2004 Revenue Pension Bonds, which were issued in July of 2004. The proceeds of these bonds were used to finance the unfunded actuarial liability (UAL) of approximately $16 million generated by shortfalls in the Public Employees Retirement System (PERS). The District has elected to fund this liability through the sale of bonds at historically low market rates.
REVENUE PENSION BOND FUND
FUND 114
FY 2016 FY 2017 FY 2018 RESOURCE OR REQUIREMENTS OBJECT FY 2019 FY 2019 FY 2019
ACTUAL ACTUAL BUDGET CATEGORY CODE PROPOSED APPROVED ADOPTED
RESOURCES:
$1,354,700 $1,412,000 $1,473,800 Transfer from Fund 101 49101 $1,534,700 $1,534,700 $1,534,700
5,070 2,530 5,200 Interest on Investments 44020 5,300 5,300 5,300
591,066 596,125 600,700 Beginning Balance 31100 603,800 603,800 603,800
$1,950,836 $2,010,655 $2,079,700 TOTAL RESOURCES $2,143,800 $2,143,800 $2,143,800
REQUIREMENTS:
Series 2004 Revenue Pension Bond
$480,000 $565,000 $660,000 Principal 56100 $760,000 $760,000 $760,000
874,711 847,010 813,839 Interest 56105 774,700 774,700 774,700
0 0 75,000 Contingency 58100 75,000 75,000 75,000
596,125 598,645 530,861 Ending Fund Balance 31100 534,100 534,100 534,100
$1,950,836 $2,010,655 $2,079,700 TOTAL REQUIREMENTS $2,143,800 $2,143,800 $2,143,800

Clean Water Services FY 2018-19 Adopted Budget Page 90
This page intentionally left blank

Clean Water Services FY 2018-19 Adopted Budget Page 91
Business Services Department
The Business Services Department is comprised of the administrative programs that support District operations and services provided to customers. Office of the General Manager The Office of the General Manager (OGM) is responsible for ensuring implementation of the policy direction provided by the Board of Directors and for consideration of advisory input from Clean Water Services’ Citizen Advisory Commission (CWAC). The OGM is also responsible for overall management and administration of District operations, intergovernmental coordination with partner cities, Washington County, and other jurisdictions.
Legal Services The constantly changing legal, regulatory, and business environment faced by Clean Water Services provides challenges that are addressed by in-house legal counsel. Legal Services provides proactive, practical advice to other departments and divisions to meet their business needs while protecting the legal interests of the District. Legal Services provides assistance on enforcement, contract, real property, environmental, regulatory, municipal law and various other legal issues. Legal Services reports directly to the General Manager. Government and Public Affairs The Government and Public Affairs program develops and manages the strategic direction of Clean Water Services’ government relations, legislative affairs, communications, marketing and public involvement strategies to consistently and effectively build awareness, support and credibility with the public, environmental interests, business community, media, key opinion leaders and elected officials. The program is a key element in meeting National Pollution Discharge Elimination System (NPDES) requirements related to public involvement and education, and Endangered Species Act (ESA). Program activities include: Board of Directors communication and coordination of the Board-appointed Clean Water Advisory Commission (CWAC); coordination of District-wide public education, project management, public involvement, media training, publications and emergency response; public involvement planning, coordination and support for capital projects, facility expansions, planning activities and major District initiatives; building partnerships and coordinating volunteer activities with key watershed stakeholder groups; coordinating research services to assess customer values, knowledge and satisfaction with District services; managing and developing District-wide communication and marketing strategy; and coordinating Congressional and Legislative affairs strategies. Human Resources The Human Resources (HR) program is responsible for planning, developing, and implementing employee processes and programs that allow Clean Water Services to remain efficient and innovative while promoting collaboration, continuous learning and employee well-being. Some of the HR program responsibilities include: positive employee-management relations; recruitment, selection, and onboarding; administration of classification and compensation; labor relations to include contract interpretation and dispute resolution; employee training and development; performance evaluations; reporting and analytics; administration of human resources policies and procedures; District compliance with state and federal employment laws.

Clean Water Services FY 2018-19 Adopted Budget Page 92
Information Technology The Information Technology (IT) program develops and manages the strategic direction of Clean Water Services’ information systems by partnering with all other work groups to identify needs and bring solutions to bear that enable organizational excellence and operational efficiency. Division activities include technology vision and direction, infrastructure selection, procurement, installation and support; end-user device selection, installation and support; software selection, installation and support; internet capabilities; and information technology vendor management. For the past several years, the District has had a strategic goal share focusing on improving business processes. Recently the District formed a cross-departmental team, led by the Information Technology Division Manager, which will be learning and utilizing some additional tools for analysis and problem solving. These tools are often referred to as LEAN, Six Sigma, or Structured Process Improvement. The primary focus is process improvement and efficiency, working smarter, to eliminate wasteful process steps, and rework that can free up valuable employees to focus on the District's expanding responsibilities. Finance & Accounting The Finance and Accounting program is responsible for strategic financial planning and direction, financial accounting and reporting, and purchasing. Finance and Accounting provides services related to external financial reporting through the Comprehensive Annual Financial Report (CAFR), general ledger accounting, internal financial reporting, accounts payable and receivable, payroll, and utility billing and collections. This group also manages budget planning, development, and administration; capital improvement program development and project accounting; rate analysis; financial forecasting and planning; and bond issuance and debt management. The group also provides services related to procurement of equipment, goods and services, and supplies, while ensuring District compliance with purchasing rules and regulations. Risk & Benefits The Risk and Benefits program includes risk analysis and reporting, loss prevention and employee safety programs, claims management, employee benefits management and management of the District’s captive, Clean Water Insurance Company, LLC. Administrative Building Complex Building The Administrative Building Complex (ABC) Building program provides for the maintenance of the ABC facility.

Clean Water Services FY 2018-19 Adopted Budget Page 93
Performance Measures
FY 2017 FY 2018 FY 2019
Actual Estimated Target
Inputs
Full time employees 50 51 50
Departmental budget 12,162,607$ 14,143,600$ 14,322,300$
Outputs
Production system availability performance
(hours of downtime) 21.0 <11 <17
Effectiveness Measures
IT project task execution performance 94% 94% 93%
Maintain strong credit ratings AAA/Aa1 AAA/Aa1 AAA/Aa1
Elementary students participating in River Rangers program 3,295 2,624 3,000
High school students participating in Sewer Science program 630 560 500
Public tours of treatment plant facilities completed47 tours
1,812 people
78 tours
2,660 people
60 tours
2,200 people
Number of storm drains marked by volunteers 413 243 250
Number of community events attended by Public Affairs 13 15 17
Maintain coverage ratio in compliance with bond covenants 3.82 3.96 4.47
Efficiency Measures
IT help desk call resolution performance
(% of calls resolved within two business days) 82% 91% 75%
IT help desk responsiveness performance for Priority 1 & 2
calls (missed calls) 0 0 0
IT help desk responsiveness performance for Priority 3 & 4
calls (missed calls) 0 0 <5

Clean Water Services FY 2018-19 Adopted Budget Page 94
This page intentionally left blank

Clean Water Services FY 2018-19 Adopted Budget Page 95
OBJECT CODE FY 2016 ACTUAL FY 2018 BUDGET FY 2019 ADOPTEDChange from FY18
Budget
51100 4,583,250 5,459,900 5,382,700
51130 214,008 266,000 318,400
51140 9,469 27,500 2,000
51170 0 0 0
51600 1,516,577 2,093,700 2,033,300
51761 0 0 2,000
51900 150 200 0
51910 11,160 11,300 11,100
51915 20,310 17,500 20,800
$ 6,354,924 $ 7,876,100 $ 7,770,300 -1.3%
52110 136,479 140,000 140,000
52120 10,608 12,000 15,000
52125 0 0 0
52130 34,570 40,000 40,000
52140 4,279 4,000 4,500
52150 4,098 2,600 4,500
52160 1,591 2,500 2,500
52205 522,579 763,300 625,400
52210 0 0 0
52215 49,177 66,000 72,000
52220 46,300 48,900 50,000
52230 0 0 0
52240 400,230 788,400 822,000
52250 0 0 0
52260 0 0 0
52270 1,551,508 1,645,400 1,699,700
52305 3,127 20,200 20,500
52310 13,516 15,600 15,600
52315 0 0 0
52320 12,675 12,000 12,000
52325 51 0 0
52330 54 0 0
52335 121,098 50,000 50,000
52340 0 0 0
52350 8,556 14,600 14,600
52360 5,504 5,400 5,400
52375 505 3,000 3,000
52380 2,068 0 0
52385 38,823 0 0
52405 86,007 131,900 131,900
52410 60,872 59,500 60,500
52420 25,768 30,500 30,500
52425 284,343 494,900 499,100
52430 12,405 21,300 21,300
52435 50,290 57,600 57,600
52440 4,322 0 0
52445 224,274 250,000 250,000
52470 0 0 0
52475 223 4,500 4,500
52480 57,391 108,600 98,400
52485 84,721 82,300 87,000
52486 733 6,300 6,300
52487 8,191 8,800 8,800
52495 163,662 228,400 250,400
52500 497 500 500
52505 0 0 0
52510 0 0 0
52515 6,355 10,000 10,000
52550 2,835 5,000 5,000
52605 1,150 1,000 1,000
52610 361,906 292,500 292,500
52630 0 0 0
52705 738,070 1,040,000 1,140,000
52890 0 0 0
$ 5,141,409 $ 6,467,500 $ 6,552,000 1.3%
$ - $ - $ - 0.0%
$ 11,496,333 $ 14,343,600 $ 14,322,300 -0.1%
185,257
4,802,566
Business Services Department
150
0
1,553,476
0
13,984
10,359
143,379
$ 6,588,293
21,700
11,160
1,958
4,345
4,222
46,493
0
47,600
67,790
0
535,891
1,500,913
0
227
518,889
2,750
0
12,052
0
14,002
6,338
1,018
20,412
0
43,952
528
112,037
2,837
4,578
782
50,532
7,802
460,515
23,360
62,124
286
0
213,128
4,470
292,729
6,546
204
92,691
61,038
6,343
0
0
204
244,835
1,498
4,635
867,503
0
$ 5,503,796
0
$ 12,092,089
$ - CAPITAL OUTLAY SUBTOTAL
TOTAL EXPENDITURE
MATERIALS & SERVICES SUBTOTAL
Other Chemicals
Insurance
Repair & Maintenance Services
Computer Repair & Maintenance
Bond Trustee Fees
Equipment Rental
Taxes, Assessments & Liens
Bank Service Charge
Other Materials & Services
Permits, Licenses & Fees
Public Information
Travel Expense
Fleet Charges
Private Mileage
Land & Building Rent
Fueling Contract
Training & Education
Telecom Internal
Telephone Services
Software Licenses & Support
Publication Notices
Printing
Dues & Memberships
Books, Subscriptions & Publications
Tri-Met Subsidy
Software Expensed
Computer Equipment Expensed
Small Tools
Safety Equipment
Postage & Freight
Repair & Maintenance Supplies
Construction & Building Supplies
Parts & Equipment
Gas, Oil, Lubrication
Janitorial Supplies
Tech & Scientific Supplies
Other Government Services
Office Supplies
Operating Supplies
Professional Services
Recording Fees
Laundry
Landscape Services
Audit & Accounting Services
Legal Services
Contracted Services
Engineering Services
Garbage
Surface Water Management Charge
Other Utility Services
Water
Purchased Water
Natural Gas
Mobile Computing Allowance
PERSONNEL EXPENSE SUBTOTAL
Electricity
Tuition Reimbursement
Other Employee Allowances
Auto Allowance
Overtime
Out of Class Straight Time
Other Personnel Expenses
Wages & Other Pay
Temporary
OBJECT CODE DESCRIPTION FY 2017 ACTUAL
Department Summary

Clean Water Services FY 2018-19 Adopted Budget Page 96
BUSINESS SERVICES DEPARTMENT
POSITION AND SALARY EXPENSE OFFICE OF THE GENERAL MANAGER 8101
Total
FY 2016 FY 2017 FY 2018 FY 2019 Represented
ACTUAL ACTUAL BUDGET ADOPTED or
FTE Non-Rep
1.00 1.00 1.00 1.00 Deputy General Manager 14 Non
1.00 1.00 1.00 1.00 General Manager Non
3.00 2.00 2.00 2.00 Administrative Associate 3 Non
1.00 1.00 1.00 1.00 Executive Assistant 6 Non
6.00 5.00 5.00 5.00 TOTAL PERSONNEL
Operating
FY 2016 FY 2017 FY 2018 FY 2019 Represented
ACTUAL ACTUAL BUDGET ADOPTED or
FTE Non-Rep
1.00 1.00 1.00 1.00 Deputy General Manager 14 Non
1.00 1.00 1.00 1.00 General Manager Non
3.00 2.00 2.00 2.00 Administrative Associate 3 Non
1.00 1.00 1.00 1.00 Executive Assistant 6 Non
6.00 5.00 5.00 5.00 TOTAL PERSONNEL
Capital
FY 2016 FY 2017 FY 2018 FY 2019 Represented
ACTUAL ACTUAL BUDGET ADOPTED or
FTE Non-Rep
0.00 0.00 0.00 0.00 Deputy General Manager 14 Non
0.00 0.00 0.00 0.00 General Manager Non
0.00 0.00 0.00 0.00 Administrative Associate 3 Non
0.00 0.00 0.00 0.00 Executive Assistant 6 Non
0.00 0.00 0.00 0.00 TOTAL PERSONNEL
CLASSIFICATION TITLE
CLASSIFICATION TITLE
CLASSIFICATION TITLE
SALARY
GRADE
SALARY
GRADE
SALARY
GRADE

Clean Water Services FY 2018-19 Adopted Budget Page 97
FY 2017 ACTUAL FY 2018 BUDGET OBJECT CODE DESCRIPTIONOBJECT
CODE
FY 2019
PROPOSED
FY 2019
APPROVED
589,429 661,300 Wages & Other Pay 51100 704,000 704,000
20,745 176,800 Temporary 51130 126,600 126,600
1,101 0 Overtime 51140 0 0
0 0 Out of Class Straight Time 51170 0 0
169,819 293,400 Other Personnel Expenses 51600 251,600 251,600
0 0 Tuition Reimbursement 51761 0 0
0 0 Other Employee Allow ances 51900 0 0
3,720 3,800 Auto Allow ance 51910 3,700 3,700
3,335 2,900 Mobile Computing Allow ance 51915 2,400 2,400
$ 788,148 $ 1,138,200 $ 1,088,300 $ 1,088,300
0 0 Electricity 52110 0 0
0 0 Water 52120 0 0
0 0 Natural Gas 52130 0 0
0 0 Garbage 52140 0 0
0 0 Surface Water Management Charge 52150 0 0
0 0 Other Utility Services 52160 0 0
34,246 40,200 Contracted Services 52205 40,200 40,200
0 0 Engineering Services 52210 0 0
0 0 Landscape Services 52215 0 0
0 0 Audit & Accounting Services 52220 0 0
0 0 Legal Services 52230 0 0
29,779 25,000 Professional Services 52240 30,000 30,000
0 0 Recording Fees 52250 0 0
0 0 Laundry 52260 0 0
424,330 482,000 Other Government Services 52270 498,100 498,100
996 1,500 Office Supplies 52305 1,500 1,500
10,228 12,000 Operating Supplies 52310 12,000 12,000
0 0 Gas, Oil, Lubrication 52315 0 0
0 0 Janitorial Supplies 52320 0 0
0 0 Tech & Scientif ic Supplies 52325 0 0
0 0 Repair & Maintenance Supplies 52330 0 0
280 0 Construction & Building Supplies 52335 0 0
0 0 Parts & Equipment 52340 0 0
169 0 Small Tools 52350 0 0
0 0 Safety Equipment 52360 0 0
144 0 Postage & Freight 52375 0 0
0 0 Softw are Expensed 52380 0 0
0 0 Computer Equipment Expensed 52385 0 0
89,337 100,000 Dues & Memberships 52405 100,000 100,000
2,169 2,000 Books, Subscriptions & Publications 52410 3,000 3,000
0 0 Tri-Met Subsidy 52420 0 0
0 0 Softw are Licenses & Support 52425 0 0
108 0 Publication Notices 52430 0 0
0 0 Printing 52435 0 0
0 0 Telecom Internal 52440 0 0
0 0 Telephone Services 52445 0 0
32 0 Fueling Contract 52475 0 0
10,790 10,000 Training & Education 52480 10,000 10,000
32,422 31,400 Travel Expense 52485 31,400 31,400
0 0 Fleet Charges 52486 0 0
715 1,200 Private Mileage 52487 1,200 1,200
57,842 10,000 Other Materials & Services 52495 20,000 20,000
0 0 Permits, Licenses & Fees 52500 0 0
0 0 Public Information 52505 0 0
0 0 Taxes, Assessments & Liens 52510 0 0
0 0 Bank Service Charge 52515 0 0
0 0 Bond Trustee Fees 52550 0 0
0 0 Equipment Rental 52605 0 0
0 0 Repair & Maintenance Services 52610 0 0
0 0 Non-vehicle Equipment Repair &
Maintenance
52620 0 0
0 0 Computer Repair & Maintenance 52630 0 0
0 0 Insurance 52705 0 0
0 0 Other Chemicals 52890 0 0
$ 693,588 $ 715,300 $ 747,400 $ 747,400
$ - $ - $ - $ -
$ 1,481,736 $ 1,853,500 $ 1,835,700 $ 1,835,700 $ 1,414,539 TOTAL EXPENDITURE $ 1,835,700
$ - CAPITAL OUTLAY SUBTOTAL $ -
$ 622,450 MATERIALS & SERVICES SUBTOTAL $ 747,400
0 0
0 0
0 0
0 0
0 0
0 0
0 0
0 0
0 0
8,629 20,000
0 0
0 0
25,472 31,400
0 0
1,146 1,200
0 0
8,463 10,000
0 0
0 0
0 0
0 0
7 0
72,672 100,000
1,455 3,000
0 0
1,295 0
325 0
503 0
0 0
216 0
19 0
0 0
0 0
0 0
0 0
0 0
445,494 498,100
116 1,500
11,852 12,000
11,719 30,000
0 0
0 0
0 0
0 0
0 0
33,068 40,200
0 0
0 0
0 0
0 0
0 0
0 0
$ 792,089 PERSONNEL EXPENSE SUBTOTAL $ 1,088,300
0 0
0 0
3,720 3,700
2,880 2,400
0 0
171,195 251,600
0 0
0 126,600
0 0
Expenditure Summary 8101 - Office of the General Manager
FY 2016 ACTUALFY 2019
ADOPTED
614,294 704,000
Business Services Department

Clean Water Services FY 2018-19 Adopted Budget Page 98
BUSINESS SERVICES DEPARTMENT
POSITION AND SALARY EXPENSE LEGAL SERVICES 8102
Total
FY 2016 FY 2017 FY 2018 FY 2019 Represented
ACTUAL ACTUAL BUDGET ADOPTED or
FTE Non-Rep
1.00 1.00 1.00 1.00 Contracts Coordinator 6 Non
1.00 1.00 1.00 1.00 General Counsel 13 Non
1.00 1.00 1.00 1.00 Senior Assistant Legal Counsel 10 Non
3.00 3.00 3.00 3.00 TOTAL PERSONNEL
Operating
FY 2016 FY 2017 FY 2018 FY 2019 Represented
ACTUAL ACTUAL BUDGET ADOPTED or
FTE Non-Rep
1.00 1.00 1.00 1.00 Contracts Coordinator 6 Non
1.00 1.00 1.00 1.00 General Counsel 13 Non
1.00 1.00 1.00 1.00 Senior Assistant Legal Counsel 10 Non
3.00 3.00 3.00 3.00 TOTAL PERSONNEL
Capital
FY 2016 FY 2017 FY 2018 FY 2019 Represented
ACTUAL ACTUAL BUDGET ADOPTED or
FTE Non-Rep
0.00 0.00 0.00 0.00 Contracts Coordinator 6 Non
0.00 0.00 0.00 0.00 General Counsel 13 Non
0.00 0.00 0.00 0.00 Senior Assistant Legal Counsel 10 Non
0.00 0.00 0.00 0.00 TOTAL PERSONNEL
CLASSIFICATION TITLE
CLASSIFICATION TITLE
CLASSIFICATION TITLE
SALARY
GRADE
SALARY
GRADE
SALARY
GRADE

Clean Water Services FY 2018-19 Adopted Budget Page 99
FY 2017 ACTUAL FY 2018 BUDGET OBJECT CODE DESCRIPTIONOBJECT
CODE
FY 2019
PROPOSED
FY 2019
APPROVED
409,589 433,300 Wages & Other Pay 51100 424,600 424,600
0 0 Temporary 51130 0 0
15 1,400 Overtime 51140 0 0
0 0 Out of Class Straight Time 51170 0 0
121,677 133,800 Other Personnel Expenses 51600 149,800 149,800
0 0 Tuition Reimbursement 51761 0 0
0 0 Other Employee Allow ances 51900 0 0
3,720 3,700 Auto Allow ance 51910 3,700 3,700
840 800 Mobile Computing Allow ance 51915 800 800
$ 535,842 $ 573,000 $ 578,900 $ 578,900
0 0 Electricity 52110 0 0
0 0 Water 52120 0 0
0 0 Natural Gas 52130 0 0
0 0 Garbage 52140 0 0
0 0 Surface Water Management Charge 52150 0 0
0 0 Other Utility Services 52160 0 0
22 13,500 Contracted Services 52205 13,500 13,500
0 0 Engineering Services 52210 0 0
0 0 Landscape Services 52215 0 0
0 0 Audit & Accounting Services 52220 0 0
2,750 0 Legal Services 52230 0 0
6,814 30,000 Professional Services 52240 30,000 30,000
227 0 Recording Fees 52250 0 0
0 0 Laundry 52260 0 0
0 0 Other Government Services 52270 0 0
19 300 Office Supplies 52305 300 300
0 0 Operating Supplies 52310 0 0
0 0 Gas, Oil, Lubrication 52315 0 0
0 0 Janitorial Supplies 52320 0 0
0 0 Tech & Scientif ic Supplies 52325 0 0
0 0 Repair & Maintenance Supplies 52330 0 0
0 0 Construction & Building Supplies 52335 0 0
0 0 Parts & Equipment 52340 0 0
0 0 Small Tools 52350 0 0
0 0 Safety Equipment 52360 0 0
0 0 Postage & Freight 52375 0 0
0 0 Softw are Expensed 52380 0 0
0 0 Computer Equipment Expensed 52385 0 0
1,314 1,300 Dues & Memberships 52405 1,300 1,300
1,100 1,500 Books, Subscriptions & Publications 52410 1,500 1,500
0 0 Tri-Met Subsidy 52420 0 0
0 0 Softw are Licenses & Support 52425 0 0
265 0 Publication Notices 52430 0 0
56 0 Printing 52435 0 0
0 0 Telecom Internal 52440 0 0
0 0 Telephone Services 52445 0 0
0 0 Fueling Contract 52475 0 0
5,637 6,500 Training & Education 52480 6,500 6,500
2,931 2,300 Travel Expense 52485 4,000 4,000
0 0 Fleet Charges 52486 0 0
736 1,000 Private Mileage 52487 1,000 1,000
6,354 500 Other Materials & Services 52495 500 500
0 0 Permits, Licenses & Fees 52500 0 0
0 0 Public Information 52505 0 0
0 0 Taxes, Assessments & Liens 52510 0 0
0 0 Bank Service Charge 52515 0 0
0 0 Bond Trustee Fees 52550 0 0
0 0 Equipment Rental 52605 0 0
0 0 Repair & Maintenance Services 52610 0 0
0 0 Non-vehicle Equipment Repair &
Maintenance
52620 0 0
0 0 Computer Repair & Maintenance 52630 0 0
0 0 Insurance 52705 0 0
0 0 Other Chemicals 52890 0 0
$ 28,224 $ 56,900 $ 58,600 $ 58,600
$ - $ - $ - $ -
$ 564,066 $ 629,900 $ 637,500 $ 637,500 $ 570,519 TOTAL EXPENDITURE $ 637,500
$ - CAPITAL OUTLAY SUBTOTAL $ -
$ 30,291 MATERIALS & SERVICES SUBTOTAL $ 58,600
0 0
0 0
0 0
0 0
0 0
0 0
0 0
0 0
0 0
331 500
0 0
0 0
2,138 4,000
0 0
698 1,000
0 0
3,480 6,500
0 0
0 0
0 0
110 0
0 0
1,333 1,300
1,813 1,500
0 0
249 0
0 0
0 0
0 0
57 0
0 0
0 0
0 0
0 0
0 0
0 0
30 0
61 300
0 0
13,667 30,000
0 0
0 0
0 0
0 0
0 0
6,324 13,500
0 0
0 0
0 0
0 0
0 0
0 0
$ 540,228 PERSONNEL EXPENSE SUBTOTAL $ 578,900
0 0
0 0
3,720 3,700
840 800
0 0
127,101 149,800
0 0
0 0
201 0
Expenditure Summary 8102 - Legal Services
FY 2016 ACTUALFY 2019
ADOPTED
408,365 424,600
Business Services Department

Clean Water Services FY 2018-19 Adopted Budget Page 100
BUSINESS SERVICES DEPARTMENT
POSITION AND SALARY EXPENSE PUBLIC AFFAIRS 8110
Total
FY 2016 FY 2017 FY 2018 FY 2019 Represented
ACTUAL ACTUAL BUDGET ADOPTED or
FTE Non-Rep
1.00 1.00 1.00 1.00 Graphics Specialist 5 Non
1.00 1.00 1.00 1.00 Gov't & Public Affairs Manager 11 Non
0.00 1.00 1.00 1.00 Public Affairs Specialist 5 Non
1.00 1.00 1.00 1.00 Public Involvement Coordinator 7 Non
2.00 2.00 2.00 2.00 Sr Public Affairs Specialist 6 Non
1.00 1.00 1.00 1.00 Communications Supervisor 7 Non
6.00 7.00 7.00 7.00 TOTAL PERSONNEL
BUSINESS SERVICES DEPARTMENT
PUBLIC AFFAIRS Operating
FY 2016 FY 2017 FY 2018 FY 2019 Represented
ACTUAL ACTUAL BUDGET ADOPTED or
FTE Non-Rep
1.00 1.00 1.00 1.00 Graphics Specialist 5 Non
0.85 0.85 0.85 0.85 Gov't & Public Affairs Manager 11 Non
0.00 1.00 1.00 1.00 Public Affairs Specialist 5 Non
0.50 0.50 0.60 0.60 Public Involvement Coordinator 7 Non
1.80 2.00 2.00 2.00 Sr Public Affairs Specialist 6 Non
1.00 1.00 1.00 1.00 Communications Supervisor 7 Non
5.15 6.35 6.45 6.45 TOTAL PERSONNEL
BUSINESS SERVICES DEPARTMENT
PUBLIC AFFAIRS Capital
FY 2016 FY 2017 FY 2018 FY 2019 Represented
ACTUAL ACTUAL BUDGET ADOPTED or
FTE Non-Rep
0.00 0.00 0.00 0.00 Graphics Specialist 5 Non
0.15 0.15 0.15 0.15 Gov't & Public Affairs Manager 11 Non
0.00 0.00 0.00 0.00 Public Affairs Specialist 5 Non
0.50 0.50 0.40 0.40 Public Involvement Coordinator 7 Non
0.20 0.00 0.00 0.00 Sr Public Affairs Specialist 6 Non
0.00 0.00 0.00 0.00 Communications Supervisor 7 Non
0.85 0.65 0.55 0.55 TOTAL PERSONNEL
CLASSIFICATION TITLE
CLASSIFICATION TITLE
CLASSIFICATION TITLE
SALARY
GRADE
SALARY
GRADE
SALARY
GRADE

Clean Water Services FY 2018-19 Adopted Budget Page 101
FY 2017 ACTUAL FY 2018 BUDGET OBJECT CODE DESCRIPTIONOBJECT
CODE
FY 2019
PROPOSED
FY 2019
APPROVED
592,486 676,500 Wages & Other Pay 51100 687,400 687,400
47,649 19,200 Temporary 51130 70,800 70,800
3,241 6,600 Overtime 51140 2,000 2,000
0 0 Out of Class Straight Time 51170 0 0
200,440 258,400 Other Personnel Expenses 51600 281,000 281,000
0 0 Tuition Reimbursement 51761 0 0
0 0 Other Employee Allow ances 51900 0 0
0 0 Auto Allow ance 51910 0 0
5,040 3,000 Mobile Computing Allow ance 51915 4,800 4,800
$ 848,856 $ 963,700 $ 1,046,000 $ 1,046,000
0 0 Electricity 52110 0 0
0 0 Water 52120 0 0
0 0 Natural Gas 52130 0 0
0 0 Garbage 52140 0 0
0 0 Surface Water Management Charge 52150 0 0
0 0 Other Utility Services 52160 0 0
0 0 Contracted Services 52205 60,000 60,000
0 0 Engineering Services 52210 0 0
0 0 Landscape Services 52215 0 0
0 0 Audit & Accounting Services 52220 0 0
0 0 Legal Services 52230 0 0
292,421 263,000 Professional Services 52240 291,600 291,600
0 0 Recording Fees 52250 0 0
0 0 Laundry 52260 0 0
38,857 60,000 Other Government Services 52270 62,100 62,100
323 1,500 Office Supplies 52305 1,500 1,500
30 1,100 Operating Supplies 52310 1,100 1,100
0 0 Gas, Oil, Lubrication 52315 0 0
0 0 Janitorial Supplies 52320 0 0
0 0 Tech & Scientif ic Supplies 52325 0 0
11 0 Repair & Maintenance Supplies 52330 0 0
0 0 Construction & Building Supplies 52335 0 0
0 0 Parts & Equipment 52340 0 0
0 0 Small Tools 52350 0 0
0 0 Safety Equipment 52360 0 0
263 1,000 Postage & Freight 52375 1,000 1,000
0 0 Softw are Expensed 52380 0 0
0 0 Computer Equipment Expensed 52385 0 0
10,629 12,200 Dues & Memberships 52405 12,200 12,200
568 2,500 Books, Subscriptions & Publications 52410 2,500 2,500
0 0 Tri-Met Subsidy 52420 0 0
0 0 Softw are Licenses & Support 52425 0 0
138 800 Publication Notices 52430 800 800
46,377 48,900 Printing 52435 48,900 48,900
0 0 Telecom Internal 52440 0 0
0 0 Telephone Services 52445 0 0
255 700 Fueling Contract 52475 700 700
2,185 9,300 Training & Education 52480 10,900 10,900
21,123 9,300 Travel Expense 52485 15,000 15,000
204 300 Fleet Charges 52486 300 300
1,925 2,000 Private Mileage 52487 2,000 2,000
209,840 192,500 Other Materials & Services 52495 204,500 204,500
0 0 Permits, Licenses & Fees 52500 0 0
0 0 Public Information 52505 0 0
0 0 Taxes, Assessments & Liens 52510 0 0
0 0 Bank Service Charge 52515 0 0
0 0 Bond Trustee Fees 52550 0 0
0 0 Equipment Rental 52605 0 0
0 0 Repair & Maintenance Services 52610 0 0
0 0 Non-vehicle Equipment Repair &
Maintenance
52620 0 0
0 0 Computer Repair & Maintenance 52630 0 0
0 0 Insurance 52705 0 0
0 0 Other Chemicals 52890 0 0
$ 625,148 $ 605,100 $ 715,100 $ 715,100
$ - $ - $ - $ -
$ 1,474,003 $ 1,568,800 $ 1,761,100 $ 1,761,100 $ 1,336,585 TOTAL EXPENDITURE $ 1,761,100
$ - CAPITAL OUTLAY SUBTOTAL $ -
$ 529,445 MATERIALS & SERVICES SUBTOTAL $ 715,100
0 0
0 0
0 0
0 0
0 0
0 0
0 0
0 0
0 0
131,150 204,500
0 0
0 0
12,024 15,000
733 300
2,805 2,000
223 700
5,607 10,900
0 0
0 0
0 0
0 800
44,726 48,900
2,656 12,200
754 2,500
0 0
221 0
4,235 0
0 0
0 0
43 1,000
0 0
0 0
0 0
0 0
0 0
0 0
86,471 62,100
167 1,500
0 1,100
237,631 291,600
0 0
0 0
0 0
0 0
0 0
0 60,000
0 0
0 0
0 0
0 0
0 0
0 0
$ 807,140 PERSONNEL EXPENSE SUBTOTAL $ 1,046,000
0 0
0 0
0 0
4,200 4,800
0 0
182,672 281,000
0 0
58,561 70,800
1,695 2,000
Expenditure Summary 8110 - Public Affairs
FY 2016 ACTUALFY 2019
ADOPTED
560,012 687,400
Business Services Department

Clean Water Services FY 2018-19 Adopted Budget Page 102
BUSINESS SERVICES DEPARTMENT
POSITION AND SALARY EXPENSE HUMAN RESOURCES 8501
Total
FY 2016 FY 2017 FY 2018 FY 2019 Represented
ACTUAL ACTUAL BUDGET ADOPTED or
FTE Non-Rep
0.00 0.00 1.00 1.00 Employee & Labor Relations Manager 11 Non
1.00 1.00 0.00 0.00 Human Resources Manager 10 Non
1.00 1.00 1.00 1.00 Human Resources Analyst 6 Non
0.00 0.00 1.00 1.00 Human Resources Specialist 5 Non
2.00 2.00 2.00 2.00 Sr Human Resources Analyst 7 Non
4.00 4.00 5.00 5.00 TOTAL PERSONNEL
Operating
FY 2016 FY 2017 FY 2018 FY 2019 Represented
ACTUAL ACTUAL BUDGET ADOPTED or
FTE Non-Rep
0.00 0.00 1.00 1.00 Employee & Labor Relations Manager 11 Non
1.00 1.00 0.00 0.00 Human Resources Manager 10 Non
1.00 1.00 1.00 1.00 Human Resources Analyst 6 Non
0.00 0.00 1.00 1.00 Human Resources Specialist 5 Non
2.00 2.00 2.00 2.00 Sr Human Resources Analyst 7 Non
4.00 4.00 5.00 5.00 TOTAL PERSONNEL
Capital
FY 2016 FY 2017 FY 2018 FY 2019 Represented
ACTUAL ACTUAL BUDGET ADOPTED or
FTE Non-Rep
0.00 0.00 0.00 0.00 Employee & Labor Relations Manager 11 Non
0.00 0.00 0.00 0.00 Human Resources Manager 10 Non
0.00 0.00 0.00 0.00 Human Resources Analyst 6 Non
0.00 0.00 0.00 0.00 Human Resources Specialist 5 Non
0.00 0.00 0.00 0.00 Sr Human Resources Analyst 7 Non
0.00 0.00 0.00 0.00 TOTAL PERSONNEL
CLASSIFICATION TITLE
CLASSIFICATION TITLE
CLASSIFICATION TITLE
SALARY
GRADE
SALARY
GRADE
SALARY
GRADE

Clean Water Services FY 2018-19 Adopted Budget Page 103
FY 2017 ACTUAL FY 2018 BUDGET OBJECT CODE DESCRIPTIONOBJECT
CODE
FY 2019
PROPOSED
FY 2019
APPROVED
370,976 497,800 Wages & Other Pay 51100 497,400 497,400
15,268 0 Temporary 51130 65,000 65,000
0 0 Overtime 51140 0 0
0 0 Out of Class Straight Time 51170 0 0
116,940 234,000 Other Personnel Expenses 51600 184,400 184,400
0 0 Tuition Reimbursement 51761 0 0
0 0 Other Employee Allow ances 51900 0 0
0 0 Auto Allow ance 51910 0 0
455 1,200 Mobile Computing Allow ance 51915 800 800
$ 503,640 $ 733,000 $ 747,600 $ 747,600
0 0 Electricity 52110 0 0
0 0 Water 52120 0 0
0 0 Natural Gas 52130 0 0
0 0 Garbage 52140 0 0
0 0 Surface Water Management Charge 52150 0 0
0 0 Other Utility Services 52160 0 0
0 0 Contracted Services 52205 0 0
0 0 Engineering Services 52210 0 0
0 0 Landscape Services 52215 0 0
0 0 Audit & Accounting Services 52220 0 0
0 0 Legal Services 52230 0 0
40,261 115,000 Professional Services 52240 115,000 115,000
0 0 Recording Fees 52250 0 0
0 0 Laundry 52260 0 0
0 0 Other Government Services 52270 0 0
1,547 700 Office Supplies 52305 1,000 1,000
0 0 Operating Supplies 52310 0 0
0 0 Gas, Oil, Lubrication 52315 0 0
0 0 Janitorial Supplies 52320 0 0
0 0 Tech & Scientif ic Supplies 52325 0 0
0 0 Repair & Maintenance Supplies 52330 0 0
0 0 Construction & Building Supplies 52335 0 0
0 0 Parts & Equipment 52340 0 0
0 0 Small Tools 52350 0 0
0 0 Safety Equipment 52360 0 0
8 0 Postage & Freight 52375 0 0
0 0 Softw are Expensed 52380 0 0
0 0 Computer Equipment Expensed 52385 0 0
1,342 900 Dues & Memberships 52405 900 900
168 300 Books, Subscriptions & Publications 52410 300 300
0 0 Tri-Met Subsidy 52420 0 0
0 0 Softw are Licenses & Support 52425 0 0
3,519 15,000 Publication Notices 52430 15,000 15,000
95 1,000 Printing 52435 1,000 1,000
0 0 Telecom Internal 52440 0 0
0 0 Telephone Services 52445 0 0
0 0 Fueling Contract 52475 0 0
4,218 34,000 Training & Education 52480 25,000 25,000
3,561 7,000 Travel Expense 52485 7,000 7,000
0 0 Fleet Charges 52486 0 0
134 400 Private Mileage 52487 400 400
11,082 15,000 Other Materials & Services 52495 15,000 15,000
0 0 Permits, Licenses & Fees 52500 0 0
0 0 Public Information 52505 0 0
0 0 Taxes, Assessments & Liens 52510 0 0
0 0 Bank Service Charge 52515 0 0
0 0 Bond Trustee Fees 52550 0 0
0 0 Equipment Rental 52605 0 0
0 0 Repair & Maintenance Services 52610 0 0
0 0 Non-vehicle Equipment Repair &
Maintenance
52620 0 0
0 0 Computer Repair & Maintenance 52630 0 0
0 0 Insurance 52705 0 0
0 0 Other Chemicals 52890 0 0
$ 65,933 $ 189,300 $ 180,600 $ 180,600
$ - $ - $ - $ -
$ 569,573 $ 922,300 $ 928,200 $ 928,200 $ 546,994 TOTAL EXPENDITURE $ 928,200
$ - CAPITAL OUTLAY SUBTOTAL $ -
$ 111,696 MATERIALS & SERVICES SUBTOTAL $ 180,600
0 0
0 0
0 0
0 0
0 0
0 0
0 0
0 0
0 0
10,224 15,000
0 0
0 0
1,622 7,000
0 0
449 400
0 0
7,108 25,000
0 0
0 0
0 0
8,737 15,000
0 1,000
487 900
120 300
0 0
0 0
2,212 0
0 0
0 0
0 0
0 0
0 0
0 0
0 0
0 0
0 0
0 0
322 1,000
143 0
80,250 115,000
0 0
0 0
0 0
0 0
0 0
22 0
0 0
0 0
0 0
0 0
0 0
0 0
$ 435,297 PERSONNEL EXPENSE SUBTOTAL $ 747,600
0 0
0 0
0 0
0 800
0 0
88,547 184,400
0 0
75,201 65,000
86 0
Expenditure Summary 8501 - Human Resources
FY 2016 ACTUALFY 2019
ADOPTED
271,463 497,400
Business Services Department

Clean Water Services FY 2018-19 Adopted Budget Page 104
BUSINESS SERVICES DEPARTMENT
POSITION AND SALARY EXPENSE INFORMATION TECHNOLOGY 8305
Total
FY 2016 FY 2017 FY 2018 FY 2019 Represented
ACTUAL ACTUAL BUDGET ADOPTED or
FTE Non-Rep
1.00 1.00 1.00 0.00 Business Systems Analyst 1 6 Non
2.00 2.00 2.00 2.00 Data Base Administrator 9 Non
1.00 1.00 1.00 1.00 Information Technology Technician 4 Non
1.00 1.00 1.00 1.00 Information Systems Division Manager 11 Non
2.00 2.00 2.00 2.00 Information Systems Manager 10 Non
3.00 3.00 3.00 3.00 Information Technology Analyst 8 Non
1.00 1.00 1.00 1.00 Programmer Analyst 8 Non
3.00 3.00 3.00 3.00 Software Engineer 9 Non
14.00 14.00 14.00 13.00 TOTAL PERSONNEL
Operating
FY 2016 FY 2017 FY 2018 FY 2019 Represented
ACTUAL ACTUAL BUDGET ADOPTED or
FTE Non-Rep
1.00 1.00 1.00 0.00 Business Systems Analyst 1 6 Non
2.00 2.00 2.00 2.00 Data Base Administrator 9 Non
1.00 1.00 1.00 1.00 Information Technology Technician 4 Non
1.00 1.00 1.00 1.00 Information Systems Division Manager 11 Non
2.00 2.00 2.00 2.00 Information Systems Manager 10 Non
3.00 3.00 3.00 3.00 Information Technology Analyst 8 Non
1.00 1.00 1.00 1.00 Programmer Analyst 8 Non
3.00 3.00 3.00 3.00 Software Engineer 9 Non
14.00 14.00 14.00 13.00 TOTAL PERSONNEL
Capital
FY 2016 FY 2017 FY 2018 FY 2019 Represented
ACTUAL ACTUAL BUDGET ADOPTED or
FTE Non-Rep
0.00 0.00 0.00 0.00 Business Systems Analyst 1 6 Non
0.00 0.00 0.00 0.00 Data Base Administrator 9 Non
0.00 0.00 0.00 0.00 Information Technology Technician 4 Non
0.00 0.00 0.00 0.00 Information Systems Division Manager 11 Non
0.00 0.00 0.00 0.00 Information Systems Manager 10 Non
0.00 0.00 0.00 0.00 Information Technology Analyst 8 Non
0.00 0.00 0.00 0.00 Programmer Analyst 8 Non
0.00 0.00 0.00 0.00 Software Engineer 9 Non
0.00 0.00 0.00 0.00 TOTAL PERSONNEL
CLASSIFICATION TITLE
CLASSIFICATION TITLE
CLASSIFICATION TITLE
SALARY
GRADE
SALARY
GRADE
SALARY
GRADE

Clean Water Services FY 2018-19 Adopted Budget Page 105
FY 2017 ACTUAL FY 2018 BUDGET OBJECT CODE DESCRIPTIONOBJECT
CODE
FY 2019
PROPOSED
FY 2019
APPROVED
1,563,787 1,676,000 Wages & Other Pay 51100 1,551,000 1,551,000
101,595 0 Temporary 51130 0 0
8,863 15,000 Overtime 51140 0 0
0 0 Out of Class Straight Time 51170 0 0
487,559 577,500 Other Personnel Expenses 51600 532,000 532,000
0 0 Tuition Reimbursement 51761 0 0
0 0 Other Employee Allow ances 51900 0 0
0 0 Auto Allow ance 51910 0 0
9,160 6,100 Mobile Computing Allow ance 51915 8,800 8,800
$ 2,170,965 $ 2,274,600 $ 2,091,800 $ 2,091,800
0 0 Electricity 52110 0 0
0 0 Water 52120 0 0
0 0 Natural Gas 52130 0 0
0 0 Garbage 52140 0 0
0 0 Surface Water Management Charge 52150 0 0
0 0 Other Utility Services 52160 0 0
27,212 21,700 Contracted Services 52205 21,700 21,700
0 0 Engineering Services 52210 0 0
0 0 Landscape Services 52215 0 0
0 0 Audit & Accounting Services 52220 0 0
0 0 Legal Services 52230 0 0
6,000 80,400 Professional Services 52240 80,400 80,400
0 0 Recording Fees 52250 0 0
0 0 Laundry 52260 0 0
0 0 Other Government Services 52270 0 0
576 1,500 Office Supplies 52305 1,500 1,500
2,740 500 Operating Supplies 52310 500 500
0 0 Gas, Oil, Lubrication 52315 0 0
0 0 Janitorial Supplies 52320 0 0
0 0 Tech & Scientif ic Supplies 52325 0 0
343 0 Repair & Maintenance Supplies 52330 0 0
0 0 Construction & Building Supplies 52335 0 0
0 0 Parts & Equipment 52340 0 0
19,862 14,000 Small Tools 52350 14,000 14,000
0 0 Safety Equipment 52360 0 0
0 0 Postage & Freight 52375 0 0
4,578 0 Softw are Expensed 52380 0 0
2,837 0 Computer Equipment Expensed 52385 0 0
1,188 1,000 Dues & Memberships 52405 1,000 1,000
57,787 50,000 Books, Subscriptions & Publications 52410 50,000 50,000
0 0 Tri-Met Subsidy 52420 0 0
460,395 494,900 Softw are Licenses & Support 52425 499,100 499,100
87 0 Publication Notices 52430 0 0
116 100 Printing 52435 100 100
4,470 0 Telecom Internal 52440 0 0
213,128 250,000 Telephone Services 52445 250,000 250,000
0 0 Fueling Contract 52475 0 0
29,115 30,000 Training & Education 52480 30,000 30,000
14,008 12,100 Travel Expense 52485 12,100 12,100
0 0 Fleet Charges 52486 0 0
1,266 1,800 Private Mileage 52487 1,800 1,800
506 2,000 Other Materials & Services 52495 2,000 2,000
163 0 Permits, Licenses & Fees 52500 0 0
0 0 Public Information 52505 0 0
0 0 Taxes, Assessments & Liens 52510 0 0
0 0 Bank Service Charge 52515 0 0
0 0 Bond Trustee Fees 52550 0 0
0 0 Equipment Rental 52605 0 0
98,351 142,500 Repair & Maintenance Services 52610 142,500 142,500
0 0 Non-vehicle Equipment Repair &
Maintenance
52620 0 0
0 0 Computer Repair & Maintenance 52630 0 0
0 0 Insurance 52705 0 0
0 0 Other Chemicals 52890 0 0
$ 944,729 $ 1,102,500 $ 1,106,700 $ 1,106,700
$ - $ - $ - $ -
$ 3,115,694 $ 3,377,100 $ 3,198,500 $ 3,198,500 $ 2,848,127 TOTAL EXPENDITURE $ 3,198,500
$ - CAPITAL OUTLAY SUBTOTAL $ -
$ 789,486 MATERIALS & SERVICES SUBTOTAL $ 1,106,700
0 0
0 0
106,891 142,500
0 0
0 0
0 0
0 0
0 0
0 0
5,079 2,000
47 0
0 0
22,431 12,100
0 0
1,400 1,800
0 0
23,448 30,000
4,322 0
224,274 250,000
284,295 499,100
0 0
78 100
456 1,000
56,299 50,000
0 0
302 0
25,068 0
8,001 14,000
0 0
70 0
0 0
0 0
0 0
0 0
0 0
51 0
0 0
778 1,500
815 500
0 80,400
0 0
0 0
0 0
0 0
0 0
25,382 21,700
0 0
0 0
0 0
0 0
0 0
0 0
$ 2,058,642 PERSONNEL EXPENSE SUBTOTAL $ 2,091,800
0 0
0 0
0 0
9,030 8,800
0 0
492,209 532,000
0 0
64,223 0
5,744 0
Expenditure Summary 8305 - Information Technology
FY 2016 ACTUALFY 2019
ADOPTED
1,487,435 1,551,000
Business Services Department

Clean Water Services FY 2018-19 Adopted Budget Page 106
BUSINESS SERVICES DEPARTMENT
POSITION AND SALARY EXPENSE BUSINESS OPERATIONS ADMINISTRATION 8500
Total
FY 2016 FY 2017 FY 2018 FY 2019 Represented
ACTUAL ACTUAL BUDGET ADOPTED or
FTE Non-Rep
1.00 1.00 1.00 1.00 Administrative Associate 3 Non
1.00 1.00 1.00 1.00 Business Operations Director 13 Non
2.00 2.00 2.00 2.00 TOTAL PERSONNEL
Operating
FY 2016 FY 2017 FY 2018 FY 2019 Represented
ACTUAL ACTUAL BUDGET ADOPTED or
FTE Non-Rep
1.00 1.00 1.00 1.00 Administrative Associate 3 Non
1.00 1.00 1.00 1.00 Business Operations Director 13 Non
2.00 2.00 2.00 2.00 TOTAL PERSONNEL
Capital
FY 2016 FY 2017 FY 2018 FY 2019 Represented
ACTUAL ACTUAL BUDGET ADOPTED or
FTE Non-Rep
0.00 0.00 0.00 0.00 Administrative Associate 3 Non
0.00 0.00 0.00 0.00 Business Operations Director 13 Non
0.00 0.00 0.00 0.00 TOTAL PERSONNEL
CLASSIFICATION TITLE
CLASSIFICATION TITLE
CLASSIFICATION TITLE
SALARY
GRADE
SALARY
GRADE
SALARY
GRADE

Clean Water Services FY 2018-19 Adopted Budget Page 107
FY 2017 ACTUAL FY 2018 BUDGET OBJECT CODE DESCRIPTIONOBJECT
CODE
FY 2019
PROPOSED
FY 2019
APPROVED
230,446 261,100 Wages & Other Pay 51100 241,900 241,900
0 50,000 Temporary 51130 10,000 10,000
0 0 Overtime 51140 0 0
0 0 Out of Class Straight Time 51170 0 0
66,013 91,900 Other Personnel Expenses 51600 87,300 87,300
0 0 Tuition Reimbursement 51761 0 0
0 0 Other Employee Allow ances 51900 0 0
3,720 3,800 Auto Allow ance 51910 3,700 3,700
840 900 Mobile Computing Allow ance 51915 800 800
$ 301,019 $ 407,700 $ 343,700 $ 343,700
0 0 Electricity 52110 0 0
0 0 Water 52120 0 0
0 0 Natural Gas 52130 0 0
0 0 Garbage 52140 0 0
0 0 Surface Water Management Charge 52150 0 0
0 0 Other Utility Services 52160 0 0
0 0 Contracted Services 52205 0 0
0 0 Engineering Services 52210 0 0
0 0 Landscape Services 52215 0 0
0 0 Audit & Accounting Services 52220 0 0
0 0 Legal Services 52230 0 0
75,699 110,000 Professional Services 52240 110,000 110,000
0 0 Recording Fees 52250 0 0
0 0 Laundry 52260 0 0
0 0 Other Government Services 52270 0 0
0 300 Office Supplies 52305 300 300
0 0 Operating Supplies 52310 0 0
0 0 Gas, Oil, Lubrication 52315 0 0
0 0 Janitorial Supplies 52320 0 0
0 0 Tech & Scientif ic Supplies 52325 0 0
0 0 Repair & Maintenance Supplies 52330 0 0
0 0 Construction & Building Supplies 52335 0 0
0 0 Parts & Equipment 52340 0 0
280 0 Small Tools 52350 0 0
0 0 Safety Equipment 52360 0 0
49 0 Postage & Freight 52375 0 0
0 0 Softw are Expensed 52380 0 0
0 0 Computer Equipment Expensed 52385 0 0
513 700 Dues & Memberships 52405 700 700
54 300 Books, Subscriptions & Publications 52410 300 300
0 0 Tri-Met Subsidy 52420 0 0
120 0 Softw are Licenses & Support 52425 0 0
0 0 Publication Notices 52430 0 0
179 0 Printing 52435 0 0
0 0 Telecom Internal 52440 0 0
0 0 Telephone Services 52445 0 0
0 0 Fueling Contract 52475 0 0
3,250 3,800 Training & Education 52480 2,500 2,500
8,838 8,700 Travel Expense 52485 5,000 5,000
0 0 Fleet Charges 52486 0 0
431 0 Private Mileage 52487 0 0
1,967 1,000 Other Materials & Services 52495 1,000 1,000
0 0 Permits, Licenses & Fees 52500 0 0
0 0 Public Information 52505 0 0
0 0 Taxes, Assessments & Liens 52510 0 0
0 0 Bank Service Charge 52515 0 0
0 0 Bond Trustee Fees 52550 0 0
0 0 Equipment Rental 52605 0 0
0 0 Repair & Maintenance Services 52610 0 0
0 0 Non-vehicle Equipment Repair &
Maintenance
52620 0 0
0 0 Computer Repair & Maintenance 52630 0 0
0 0 Insurance 52705 0 0
0 0 Other Chemicals 52890 0 0
$ 91,379 $ 124,800 $ 119,800 $ 119,800
$ - $ - $ - $ -
$ 392,398 $ 532,500 $ 463,500 $ 463,500 $ 331,352 TOTAL EXPENDITURE $ 463,500
$ - CAPITAL OUTLAY SUBTOTAL $ -
$ 26,247 MATERIALS & SERVICES SUBTOTAL $ 119,800
0 0
0 0
0 0
0 0
0 0
0 0
0 0
0 0
0 0
776 1,000
0 0
0 0
10,411 5,000
0 0
455 0
0 0
3,443 2,500
0 0
0 0
48 0
0 0
417 0
591 700
136 300
0 0
0 0
2,286 0
52 0
0 0
49 0
0 0
0 0
0 0
0 0
0 0
0 0
0 0
0 300
0 0
7,582 110,000
0 0
0 0
0 0
0 0
0 0
0 0
0 0
0 0
0 0
0 0
0 0
0 0
$ 305,105 PERSONNEL EXPENSE SUBTOTAL $ 343,700
0 0
0 0
3,720 3,700
840 800
0 0
71,048 87,300
0 0
0 10,000
0 0
Expenditure Summary 8500 - Finance Administration
FY 2016 ACTUALFY 2019
ADOPTED
229,497 241,900
Business Services Department

Clean Water Services FY 2018-19 Adopted Budget Page 108
BUSINESS SERVICES DEPARTMENT
POSITION AND SALARY EXPENSE FINANCE & ACCOUNTING 8504
Total
FY 2016 FY 2017 FY 2018 FY 2019 Represented
ACTUAL ACTUAL BUDGET ADOPTED or
FTE Non-Rep
0.55 1.00 2.00 2.00 Accounting Specialist 4 Non
3.00 3.00 3.00 3.00 Associate Accounting Clerk 2 Rep
1.00 1.00 1.00 1.00 Business Systems Analyst 2 8 Non
2.00 2.00 2.00 2.00 Customer Service Representative 2 Rep
1.00 1.00 1.00 1.00 Finance Manager 10 Non
1.00 1.00 0.00 0.00 Financial Analyst 6 Non
1.00 1.00 1.00 1.00 Payroll Coordinator 6 Non
1.00 1.00 2.00 2.00 Sr Accountant 6 Non
0.00 0.00 1.00 1.00 Sr Financial Analyst 7 Non
10.55 11.00 13.00 13.00 TOTAL PERSONNEL
Operating
FY 2016 FY 2017 FY 2018 FY 2019 Represented
ACTUAL ACTUAL BUDGET ADOPTED or
FTE Non-Rep
0.55 1.00 2.00 2.00 Accounting Specialist 4 Non
3.00 3.00 3.00 3.00 Associate Accounting Clerk 2 Rep
1.00 1.00 1.00 1.00 Business Systems Analyst 2 8 Non
2.00 2.00 2.00 2.00 Customer Service Representative 2 Rep
1.00 1.00 1.00 1.00 Finance Manager 10 Non
1.00 1.00 0.00 0.00 Financial Analyst 6 Non
1.00 1.00 1.00 1.00 Payroll Coordinator 6 Non
1.00 1.00 2.00 2.00 Sr Accountant 6 Non
0.00 0.00 1.00 1.00 Sr Financial Analyst 7 Non
10.55 11.00 13.00 13.00 TOTAL PERSONNEL
Capital
FY 2016 FY 2017 FY 2018 FY 2019 Represented
ACTUAL ACTUAL BUDGET ADOPTED or
FTE Non-Rep
0.00 0.00 0.00 0.00 Accounting Specialist 4 Non
0.00 0.00 0.00 0.00 Associate Accounting Clerk 2 Rep
0.00 0.00 0.00 0.00 Business Systems Analyst 2 8 Non
0.00 0.00 0.00 0.00 Customer Service Representative 2 Rep
0.00 0.00 0.00 0.00 Finance Manager 10 Non
0.00 0.00 0.00 0.00 Financial Analyst 6 Non
0.00 0.00 0.00 0.00 Payroll Coordinator 6 Non
0.00 0.00 0.00 0.00 Sr Accountant 6 Non
0.00 0.00 0.00 0.00 Sr Financial Analyst 7 Non
0.00 0.00 0.00 0.00 TOTAL PERSONNEL
CLASSIFICATION TITLE
CLASSIFICATION TITLE
CLASSIFICATION TITLESALARY
GRADE
SALARY
GRADE
SALARY
GRADE

Clean Water Services FY 2018-19 Adopted Budget Page 109
FY 2017 ACTUAL FY 2018 BUDGET OBJECT CODE DESCRIPTIONOBJECT
CODE
FY 2019
PROPOSED
FY 2019
APPROVED
888,057 1,038,300 Wages & Other Pay 51100 1,074,800 1,074,800
0 20,000 Temporary 51130 20,000 20,000
714 4,500 Overtime 51140 0 0
0 0 Out of Class Straight Time 51170 0 0
337,332 428,400 Other Personnel Expenses 51600 464,400 464,400
0 0 Tuition Reimbursement 51761 2,000 2,000
0 0 Other Employee Allow ances 51900 0 0
0 0 Auto Allow ance 51910 0 0
840 900 Mobile Computing Allow ance 51915 1,600 1,600
$ 1,226,944 $ 1,492,100 $ 1,562,800 $ 1,562,800
0 0 Electricity 52110 0 0
0 0 Water 52120 0 0
0 0 Natural Gas 52130 0 0
0 0 Garbage 52140 0 0
0 0 Surface Water Management Charge 52150 0 0
0 0 Other Utility Services 52160 0 0
138 0 Contracted Services 52205 0 0
0 0 Engineering Services 52210 0 0
0 0 Landscape Services 52215 0 0
47,600 48,900 Audit & Accounting Services 52220 50,000 50,000
0 0 Legal Services 52230 0 0
5,750 80,000 Professional Services 52240 80,000 80,000
0 0 Recording Fees 52250 0 0
0 0 Laundry 52260 0 0
1,037,725 1,103,400 Other Government Services 52270 1,139,500 1,139,500
1,639 14,200 Office Supplies 52305 14,200 14,200
1,004 2,000 Operating Supplies 52310 2,000 2,000
0 0 Gas, Oil, Lubrication 52315 0 0
0 0 Janitorial Supplies 52320 0 0
0 0 Tech & Scientif ic Supplies 52325 0 0
0 0 Repair & Maintenance Supplies 52330 0 0
0 0 Construction & Building Supplies 52335 0 0
0 0 Parts & Equipment 52340 0 0
0 600 Small Tools 52350 600 600
0 0 Safety Equipment 52360 0 0
295 2,000 Postage & Freight 52375 2,000 2,000
0 0 Softw are Expensed 52380 0 0
0 0 Computer Equipment Expensed 52385 0 0
2,349 8,300 Dues & Memberships 52405 8,300 8,300
279 2,400 Books, Subscriptions & Publications 52410 2,400 2,400
0 0 Tri-Met Subsidy 52420 0 0
0 0 Softw are Licenses & Support 52425 0 0
3,686 4,500 Publication Notices 52430 4,500 4,500
3,710 7,500 Printing 52435 7,500 7,500
0 0 Telecom Internal 52440 0 0
0 0 Telephone Services 52445 0 0
0 0 Fueling Contract 52475 0 0
4,317 12,500 Training & Education 52480 11,000 11,000
4,973 9,000 Travel Expense 52485 9,000 9,000
0 0 Fleet Charges 52486 0 0
855 1,600 Private Mileage 52487 1,600 1,600
2,894 6,900 Other Materials & Services 52495 6,900 6,900
0 0 Permits, Licenses & Fees 52500 0 0
0 0 Public Information 52505 0 0
0 0 Taxes, Assessments & Liens 52510 0 0
6,343 10,000 Bank Service Charge 52515 10,000 10,000
4,635 5,000 Bond Trustee Fees 52550 5,000 5,000
0 0 Equipment Rental 52605 0 0
0 0 Repair & Maintenance Services 52610 0 0
0 0 Non-vehicle Equipment Repair &
Maintenance
52620 0 0
0 0 Computer Repair & Maintenance 52630 0 0
0 0 Insurance 52705 0 0
0 0 Other Chemicals 52890 0 0
$ 1,128,191 $ 1,318,800 $ 1,354,500 $ 1,354,500
$ - $ - $ - $ -
$ 2,355,134 $ 2,810,900 $ 2,917,300 $ 2,917,300 $ 2,246,063 TOTAL EXPENDITURE $ 2,917,300
$ - CAPITAL OUTLAY SUBTOTAL $ -
$ 1,103,967 MATERIALS & SERVICES SUBTOTAL $ 1,354,500
0 0
0 0
0 0
0 0
0 0
2,835 5,000
0 0
0 0
6,355 10,000
4,841 6,900
0 0
0 0
3,246 9,000
0 0
666 1,600
0 0
3,337 11,000
0 0
0 0
0 0
3,431 4,500
4,721 7,500
2,124 8,300
297 2,400
0 0
0 0
1,354 0
0 600
0 0
71 2,000
0 0
0 0
0 0
0 0
0 0
0 0
1,019,513 1,139,500
1,128 14,200
668 2,000
3,082 80,000
0 0
0 0
0 0
46,300 50,000
0 0
0 0
0 0
0 0
0 0
0 0
0 0
0 0
$ 1,142,096 PERSONNEL EXPENSE SUBTOTAL $ 1,562,800
0 0
0 0
0 0
840 1,600
0 0
310,586 464,400
0 2,000
16,023 20,000
1,742 0
Expenditure Summary 8504 - Finance & Accounting
FY 2016 ACTUALFY 2019
ADOPTED
812,905 1,074,800
Business Services Department

Clean Water Services FY 2018-19 Adopted Budget Page 110
BUSINESS SERVICES DEPARTMENT
POSITION AND SALARY EXPENSE RISK & BENEFITS MGMT 8502
Total
FY 2016 FY 2017 FY 2018 FY 2019 Represented
ACTUAL ACTUAL BUDGET ADOPTED or
FTE Non-Rep
1.00 1.00 1.00 1.00 Risk and Benefits Manager 9 Non
1.00 1.00 1.00 1.00 Risk & Safety Analyst 6 Non
2.00 2.00 2.00 2.00
Operating
FY 2016 FY 2017 FY 2018 FY 2019 Represented
ACTUAL ACTUAL BUDGET ADOPTED or
FTE Non-Rep
1.00 1.00 1.00 1.00 Risk and Benefits Manager 9 Non
1.00 1.00 1.00 1.00 Risk & Safety Analyst 6 Non
2.00 2.00 2.00 2.00
Capital
FY 2016 FY 2017 FY 2018 FY 2019 Represented
ACTUAL ACTUAL BUDGET ADOPTED or
FTE Non-Rep
0.00 0.00 0.00 0.00 Risk and Benefits Manager 9 Non
0.00 0.00 0.00 0.00 Risk & Safety Analyst 6 Non
0.00 0.00 0.00 0.00TOTAL PERSONNEL
CLASSIFICATION TITLE
CLASSIFICATION TITLE
CLASSIFICATION TITLESALARY
GRADE
SALARY
GRADE
SALARY
GRADE
TOTAL PERSONNEL
TOTAL PERSONNEL

Clean Water Services FY 2018-19 Adopted Budget Page 111
FY 2017 ACTUAL FY 2018 BUDGET OBJECT CODE DESCRIPTIONOBJECT
CODE
FY 2019
PROPOSED
FY 2019
APPROVED
157,797 215,600 Wages & Other Pay 51100 201,600 201,600
0 0 Temporary 51130 26,000 26,000
50 0 Overtime 51140 0 0
0 0 Out of Class Straight Time 51170 0 0
53,695 76,300 Other Personnel Expenses 51600 82,800 82,800
0 0 Tuition Reimbursement 51761 0 0
150 200 Other Employee Allow ances 51900 0 0
0 0 Auto Allow ance 51910 0 0
1,190 1,700 Mobile Computing Allow ance 51915 800 800
$ 212,882 $ 293,800 $ 311,200 $ 311,200
0 0 Electricity 52110 0 0
0 0 Water 52120 0 0
0 0 Natural Gas 52130 0 0
0 0 Garbage 52140 0 0
0 0 Surface Water Management Charge 52150 0 0
0 0 Other Utility Services 52160 0 0
108,560 117,900 Contracted Services 52205 120,000 120,000
0 0 Engineering Services 52210 0 0
0 0 Landscape Services 52215 0 0
0 0 Audit & Accounting Services 52220 0 0
0 0 Legal Services 52230 0 0
62,166 85,000 Professional Services 52240 85,000 85,000
0 0 Recording Fees 52250 0 0
0 0 Laundry 52260 0 0
0 0 Other Government Services 52270 0 0
240 200 Office Supplies 52305 200 200
0 0 Operating Supplies 52310 0 0
0 0 Gas, Oil, Lubrication 52315 0 0
0 0 Janitorial Supplies 52320 0 0
0 0 Tech & Scientif ic Supplies 52325 0 0
0 0 Repair & Maintenance Supplies 52330 0 0
0 0 Construction & Building Supplies 52335 0 0
0 0 Parts & Equipment 52340 0 0
0 0 Small Tools 52350 0 0
1,018 5,400 Safety Equipment 52360 5,400 5,400
24 0 Postage & Freight 52375 0 0
0 0 Softw are Expensed 52380 0 0
0 0 Computer Equipment Expensed 52385 0 0
5,366 7,500 Dues & Memberships 52405 7,500 7,500
0 500 Books, Subscriptions & Publications 52410 500 500
23,360 30,500 Tri-Met Subsidy 52420 30,500 30,500
0 0 Softw are Licenses & Support 52425 0 0
0 0 Publication Notices 52430 0 0
0 100 Printing 52435 100 100
0 0 Telecom Internal 52440 0 0
0 0 Telephone Services 52445 0 0
0 0 Fueling Contract 52475 0 0
1,525 2,500 Training & Education 52480 2,500 2,500
4,835 2,500 Travel Expense 52485 3,500 3,500
0 0 Fleet Charges 52486 0 0
483 800 Private Mileage 52487 800 800
411 500 Other Materials & Services 52495 500 500
0 0 Permits, Licenses & Fees 52500 0 0
0 0 Public Information 52505 0 0
0 0 Taxes, Assessments & Liens 52510 0 0
0 0 Bank Service Charge 52515 0 0
0 0 Bond Trustee Fees 52550 0 0
0 0 Equipment Rental 52605 0 0
474 0 Repair & Maintenance Services 52610 0 0
0 0 Non-vehicle Equipment Repair &
Maintenance
52620 0 0
0 0 Computer Repair & Maintenance 52630 0 0
867,503 1,040,000 Insurance 52705 1,140,000 1,140,000
0 0 Other Chemicals 52890 0 0
$ 1,075,965 $ 1,293,400 $ 1,396,500 $ 1,396,500
$ - $ - $ - $ -
$ 1,288,847 $ 1,587,200 $ 1,707,700 $ 1,707,700 $ 1,193,183 TOTAL EXPENDITURE $ 1,707,700
$ - CAPITAL OUTLAY SUBTOTAL $ -
$ 918,855 MATERIALS & SERVICES SUBTOTAL $ 1,396,500
0 0
738,070 1,140,000
0 0
0 0
0 0
0 0
0 0
0 0
0 0
1,535 500
0 0
0 0
7,377 3,500
0 0
572 800
0 0
2,505 2,500
0 0
0 0
0 0
127 0
341 100
5,688 7,500
0 500
25,768 30,500
0 0
0 0
0 0
5,504 5,400
0 0
0 0
0 0
0 0
0 0
0 0
0 0
0 0
130 200
0 0
46,300 85,000
0 0
0 0
0 0
0 0
0 0
84,939 120,000
0 0
0 0
0 0
0 0
0 0
0 0
$ 274,328 PERSONNEL EXPENSE SUBTOTAL $ 311,200
0 0
150 0
0 0
1,680 800
0 0
73,220 82,800
0 0
0 26,000
0 0
Expenditure Summary 8502 - Risk & Benefits Management
FY 2016 ACTUALFY 2019
ADOPTED
199,278 201,600
Business Services Department

Clean Water Services FY 2018-19 Adopted Budget Page 112
BUSINESS SERVICES DEPARTMENT
POSITION AND SALARY EXPENSE ABC BUILDING 8507
FY 2016 FY 2017 FY 2018 FY 2019 SALARY Represented
ACTUAL ACTUAL BUDGET ADOPTED GRADE or
FTE Non-Rep
0.00 0.00 0.00 0.00 Non
0.00 0.00 0.00 0.00 TOTAL PERSONNEL
Operating
FY 2016 FY 2017 FY 2018 FY 2019 SALARY Represented
ACTUAL ACTUAL BUDGET ADOPTED GRADE or
FTE Non-Rep
0.00 0.00 0.00 0.00 Non
0.00 0.00 0.00 0.00 TOTAL PERSONNEL
Capital
FY 2016 FY 2017 FY 2018 FY 2019 SALARY Represented
ACTUAL ACTUAL BUDGET ADOPTED GRADE or
FTE Non-Rep
0.00 0.00 0.00 0.00 Non
0.00 0.00 0.00 0.00 TOTAL PERSONNEL
CLASSIFICATION TITLE
CLASSIFICATION TITLE
CLASSIFICATION TITLE

Clean Water Services FY 2018-19 Adopted Budget Page 113
FY 2017 ACTUAL FY 2018 BUDGET OBJECT CODE DESCRIPTIONOBJECT
CODE
FY 2019
PROPOSED
FY 2019
APPROVED
0 0 Wages & Other Pay 51100 0 0
0 0 Temporary 51130 0 0
0 0 Overtime 51140 0 0
0 0 Out of Class Straight Time 51170 0 0
0 0 Other Personnel Expenses 51600 0 0
0 0 Tuition Reimbursement 51761 0 0
0 0 Other Employee Allow ances 51900 0 0
0 0 Auto Allow ance 51910 0 0
0 0 Mobile Computing Allow ance 51915 0 0
$ - $ - $ - $ -
143,379 140,000 Electricity 52110 140,000 140,000
10,359 12,000 Water 52120 15,000 15,000
46,493 40,000 Natural Gas 52130 40,000 40,000
4,222 4,000 Garbage 52140 4,500 4,500
4,345 2,600 Surface Water Management Charge 52150 4,500 4,500
1,958 2,500 Other Utility Services 52160 2,500 2,500
365,713 570,000 Contracted Services 52205 370,000 370,000
0 0 Engineering Services 52210 0 0
67,790 66,000 Landscape Services 52215 72,000 72,000
0 0 Audit & Accounting Services 52220 0 0
0 0 Legal Services 52230 0 0
0 0 Professional Services 52240 0 0
0 0 Recording Fees 52250 0 0
0 0 Laundry 52260 0 0
0 0 Other Government Services 52270 0 0
999 0 Office Supplies 52305 0 0
0 0 Operating Supplies 52310 0 0
0 0 Gas, Oil, Lubrication 52315 0 0
12,052 12,000 Janitorial Supplies 52320 12,000 12,000
0 0 Tech & Scientif ic Supplies 52325 0 0
173 0 Repair & Maintenance Supplies 52330 0 0
43,672 50,000 Construction & Building Supplies 52335 50,000 50,000
0 0 Parts & Equipment 52340 0 0
101 0 Small Tools 52350 0 0
0 0 Safety Equipment 52360 0 0
0 0 Postage & Freight 52375 0 0
0 0 Softw are Expensed 52380 0 0
0 0 Computer Equipment Expensed 52385 0 0
0 0 Dues & Memberships 52405 0 0
0 0 Books, Subscriptions & Publications 52410 0 0
0 0 Tri-Met Subsidy 52420 0 0
0 0 Softw are Licenses & Support 52425 0 0
0 1,000 Publication Notices 52430 1,000 1,000
0 0 Printing 52435 0 0
0 0 Telecom Internal 52440 0 0
0 0 Telephone Services 52445 0 0
0 3,800 Fueling Contract 52475 3,800 3,800
0 0 Training & Education 52480 0 0
0 0 Travel Expense 52485 0 0
0 6,000 Fleet Charges 52486 6,000 6,000
0 0 Private Mileage 52487 0 0
1,833 0 Other Materials & Services 52495 0 0
40 500 Permits, Licenses & Fees 52500 500 500
0 0 Public Information 52505 0 0
0 0 Taxes, Assessments & Liens 52510 0 0
0 0 Bank Service Charge 52515 0 0
0 0 Bond Trustee Fees 52550 0 0
1,498 1,000 Equipment Rental 52605 1,000 1,000
146,010 150,000 Repair & Maintenance Services 52610 150,000 150,000
0 0 Non-vehicle Equipment Repair &
Maintenance
52620 0 0
0 0 Computer Repair & Maintenance 52630 0 0
0 0 Insurance 52705 0 0
0 0 Other Chemicals 52890 0 0
$ 850,638 $ 1,061,400 $ 872,800 $ 872,800
$ - $ - $ - $ -
$ 850,638 $ 1,061,400 $ 872,800 $ 872,800 $ 1,008,972 TOTAL EXPENDITURE $ 872,800
$ - CAPITAL OUTLAY SUBTOTAL $ -
$ 1,008,972 MATERIALS & SERVICES SUBTOTAL $ 872,800
0 0
0 0
255,014 150,000
0 0
0 0
0 0
1,150 1,000
0 0
0 0
1,097 0
450 500
0 0
0 0
0 6,000
0 0
0 3,800
0 0
0 0
0 0
0 0
0 1,000
0 0
0 0
0 0
0 0
0 0
3,344 0
0 0
0 0
0 0
34 0
121,098 50,000
0 0
0 0
12,675 12,000
0 0
0 0
424 0
38 0
0 0
0 0
0 0
49,177 72,000
0 0
0 0
372,844 370,000
0 0
4,279 4,500
4,098 4,500
1,591 2,500
10,608 15,000
34,570 40,000
$ - PERSONNEL EXPENSE SUBTOTAL $ -
136,479 140,000
0 0
0 0
0 0
0 0
0 0
0 0
0 0
0 0
Expenditure Summary 8507 - ABC Building Maintenance
FY 2016 ACTUALFY 2019
ADOPTED
0 0
Business Services Department

Clean Water Services FY 2018-19 Adopted Budget Page 114
BUSINESS SERVICES DEPARTMENT
POSITION AND SALARY EXPENSE FLEET & PURCHASING 8111 & 8503
Total
FY 2016 FY 2017 FY 2018 FY 2019 Represented
ACTUAL ACTUAL BUDGET ADOPTED or
FTE Non-Rep
1.00 1.00 0.00 0.00 Accounting Specialist 4 Non
0.00 0.00 0.00 0.00 Buyer 5 Non
1.00 1.00 0.00 0.00 Fleet & Purchasing Coordinator 7 Non
2.00 2.00 0.00 0.00 TOTAL PERSONNEL
Operating
FY 2016 FY 2017 FY 2018 FY 2019 Represented
ACTUAL ACTUAL BUDGET ADOPTED or
FTE Non-Rep
1.00 1.00 0.00 0.00 Accounting Specialist 4 Non
0.00 0.00 0.00 0.00 Buyer 5 Non
1.00 1.00 0.00 0.00 Fleet & Purchasing Coordinator 7 Non
2.00 2.00 0.00 0.00 TOTAL PERSONNEL
Capital
FY 2016 FY 2017 FY 2018 FY 2019 Represented
ACTUAL ACTUAL BUDGET ADOPTED or
FTE Non-Rep
0.00 0.00 0.00 0.00 Accounting Specialist 4 Non
0.00 0.00 0.00 0.00 Buyer 5 Non
0.00 0.00 0.00 0.00 Fleet & Purchasing Coordinator 7 Non
0.00 0.00 0.00 0.00 TOTAL PERSONNEL
CLASSIFICATION TITLESALARY
GRADE
CLASSIFICATION TITLESALARY
GRADE
CLASSIFICATION TITLESALARY
GRADE
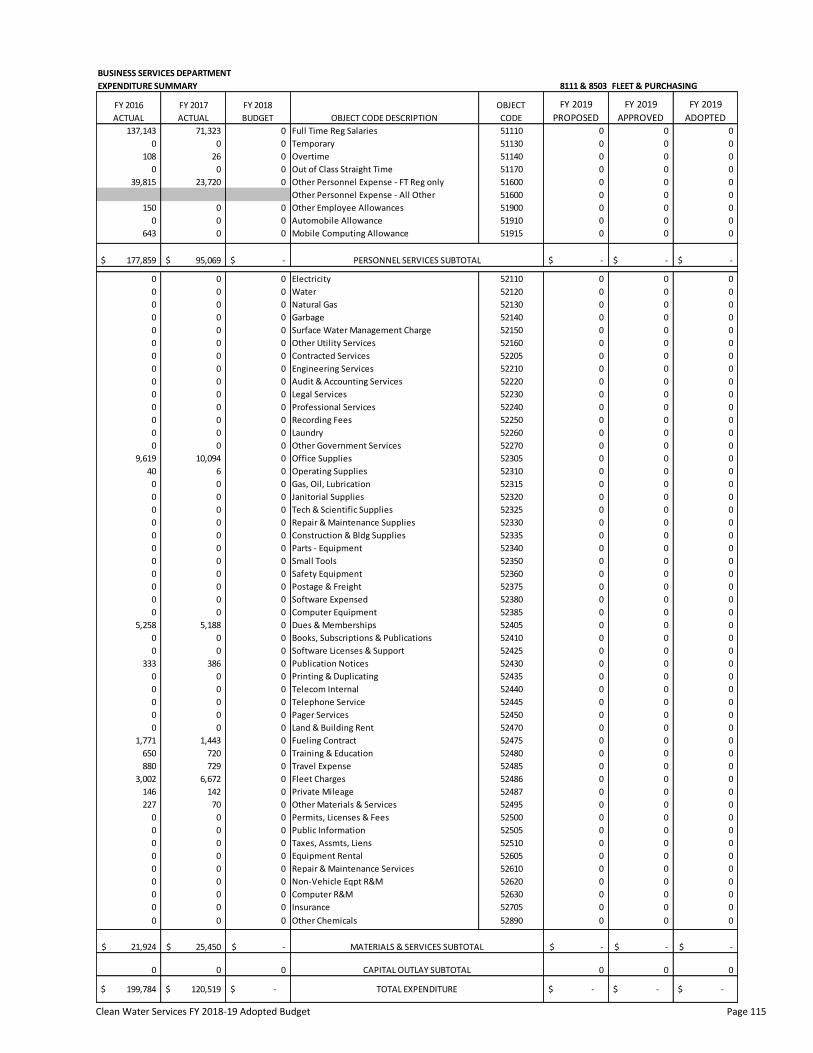
Clean Water Services FY 2018-19 Adopted Budget Page 115
BUSINESS SERVICES DEPARTMENT
EXPENDITURE SUMMARY 8111 & 8503
FY 2016
ACTUAL
FY 2017
ACTUAL
FY 2018
BUDGET OBJECT CODE DESCRIPTION
OBJECT
CODE
FY 2019
PROPOSED
FY 2019
APPROVED
FY 2019
ADOPTED137,143 71,323 0 Full Time Reg Salaries 51110 0 0 0
0 0 0 Temporary 51130 0 0 0
108 26 0 Overtime 51140 0 0 0
0 0 0 Out of Class Straight Time 51170 0 0 0
39,815 23,720 0 Other Personnel Expense - FT Reg only 51600 0 0 0
Other Personnel Expense - All Other 51600 0 0 0
150 0 0 Other Employee Allowances 51900 0 0 0
0 0 0 Automobile Allowance 51910 0 0 0
643 0 0 Mobile Computing Allowance 51915 0 0 0
177,859$ 95,069$ -$ -$ -$ -$
0 0 0 Electricity 52110 0 0 0
0 0 0 Water 52120 0 0 0
0 0 0 Natural Gas 52130 0 0 0
0 0 0 Garbage 52140 0 0 0
0 0 0 Surface Water Management Charge 52150 0 0 0
0 0 0 Other Utility Services 52160 0 0 0
0 0 0 Contracted Services 52205 0 0 0
0 0 0 Engineering Services 52210 0 0 0
0 0 0 Audit & Accounting Services 52220 0 0 0
0 0 0 Legal Services 52230 0 0 0
0 0 0 Professional Services 52240 0 0 0
0 0 0 Recording Fees 52250 0 0 0
0 0 0 Laundry 52260 0 0 0
0 0 0 Other Government Services 52270 0 0 0
9,619 10,094 0 Office Supplies 52305 0 0 0
40 6 0 Operating Supplies 52310 0 0 0
0 0 0 Gas, Oil, Lubrication 52315 0 0 0
0 0 0 Janitorial Supplies 52320 0 0 0
0 0 0 Tech & Scientific Supplies 52325 0 0 0
0 0 0 Repair & Maintenance Supplies 52330 0 0 0
0 0 0 Construction & Bldg Supplies 52335 0 0 0
0 0 0 Parts - Equipment 52340 0 0 0
0 0 0 Small Tools 52350 0 0 0
0 0 0 Safety Equipment 52360 0 0 0
0 0 0 Postage & Freight 52375 0 0 0
0 0 0 Software Expensed 52380 0 0 0
0 0 0 Computer Equipment 52385 0 0 0
5,258 5,188 0 Dues & Memberships 52405 0 0 0
0 0 0 Books, Subscriptions & Publications 52410 0 0 0
0 0 0 Software Licenses & Support 52425 0 0 0
333 386 0 Publication Notices 52430 0 0 0
0 0 0 Printing & Duplicating 52435 0 0 0
0 0 0 Telecom Internal 52440 0 0 0
0 0 0 Telephone Service 52445 0 0 0
0 0 0 Pager Services 52450 0 0 0
0 0 0 Land & Building Rent 52470 0 0 0
1,771 1,443 0 Fueling Contract 52475 0 0 0
650 720 0 Training & Education 52480 0 0 0
880 729 0 Travel Expense 52485 0 0 0
3,002 6,672 0 Fleet Charges 52486 0 0 0
146 142 0 Private Mileage 52487 0 0 0
227 70 0 Other Materials & Services 52495 0 0 0
0 0 0 Permits, Licenses & Fees 52500 0 0 0
0 0 0 Public Information 52505 0 0 0
0 0 0 Taxes, Assmts, Liens 52510 0 0 0
0 0 0 Equipment Rental 52605 0 0 0
0 0 0 Repair & Maintenance Services 52610 0 0 0
0 0 0 Non-Vehicle Eqpt R&M 52620 0 0 0
0 0 0 Computer R&M 52630 0 0 0
0 0 0 Insurance 52705 0 0 0
0 0 0 Other Chemicals 52890 0 0 0
21,924$ 25,450$ -$ -$ -$ -$
0 0 0 0 0 0
199,784$ 120,519$ -$ -$ -$ -$
CAPITAL OUTLAY SUBTOTAL
TOTAL EXPENDITURE
FLEET & PURCHASING
PERSONNEL SERVICES SUBTOTAL
MATERIALS & SERVICES SUBTOTAL

Clean Water Services FY 2018-19 Adopted Budget Page 116
This page intentionally left blank

Clean Water Services FY 2018-19 Adopted Budget Page 117
Regulatory Affairs Department
Administration The Administration program provides technical, scientific, regulatory and policy support to the District. This support involves research, modeling and analysis of environmental data related to the protection of public and watershed health, the implementation of the Tualatin River Total Maximum Daily Loads (TMDLs) and the implementation of and compliance with the District’s watershed-based National Pollutant Discharge Elimination System (NPDES) wastewater discharge permit.
The Administration staff is also responsible for tracking, evaluating and influencing the development of state and federal environmental regulations. The Administration staff writes, reviews, directs and coordinates reports related to monitoring, effluent discharges, non-compliance incidents and permit compliance. This group communicates with state and federal regulatory staff and the District’s partners and co-implementer cities about regulatory compliance and policies. The Administration staff coordinates, tracks and reports on the District’s Water Quality Credit Trading Program for temperature and manages the release of stored water for flow augmentation within the Tualatin River watershed. The Administration staff oversees the District’s intergovernmental agreements related to flow and water quality monitoring and flow augmentation with the Department of Environmental Quality, the U.S. Geological Survey, the Joint Water Commission and the District 18 Watermaster. Administration staffs also participates in various organizations that support clean water and water quality, providing input, support and comments for meetings, workshops and conferences. Source Control The Source Control program is responsible for managing all non-domestic discharges including federally-mandated Industrial Pretreatment Program facilities that discharge to the municipal wastewater treatment facilities. The Source Control staff helps ensure public and worker health and safety and ensures that industrial users do not adversely impact municipal infrastructure, the quality of the wastewater plant effluent or biosolids. The Source Control program regulates all industries that discharge into the sanitary sewer system, including those located in member cities, and regulates the disposal of septic tank pumpage and chemical toilet waste at the District’s treatment plants. Regulation of the permitted industrial users includes receiving and reviewing reports, issuing permits, inspecting industrial sites, sampling, reviewing industrial discharge analytical data and enforcing pretreatment standards and permits. The Source Control Division also has responsibility to reduce the discharge of fats, oils and grease (FOG) to the sanitary sewer system. Source Control is also responsible for implementation of the industrial stormwater program and acts as DEQ’s agent for the 1200-Z NPDES Industrial Stormwater permitting and compliance program. The Source Control Division oversees specific stormwater best-management practices, and conducts inspection and plan reviews for industries’ compliance with DEQ-issued 1200-Z stormwater permits, industrial private water quality facilities and other commercial stormwater systems. The Source Control program maintains the District’s Illicit Discharge Response Program and responds to reports of spills or contamination affecting surface water, storm drainage or sanitary sewers. This includes providing technical assistance to fire and emergency response authorities relating to spills or surface water clean-up

Clean Water Services FY 2018-19 Adopted Budget Page 118
concerns. Source Control staff provides outreach and education, making the public aware of the importance of protecting the public systems and waterways. Source Control also leads the Pollution Prevention activities of the District. The most active outreach program is the Ecological Business (EcoBiz) Certification Program for the automobile services and landscape business sectors (see the web site at www.ecobiz.org). The District continues to work on the Mercury Reduction Outreach Program in conjunction with the Oregon Dental Association and Washington County Dental Society to survey and provide technical assistance to dental facilities. Laboratory Services The Laboratory Services program is the sampling and analysis group for Clean Water Services. The Laboratory provides fundamental data that is the basis for some of the most critical decisions made by the District in areas such as health of the watershed, performance of the treatment plants and compliance with environmental regulations. The Lab performs over 140,000 water quality analyses per year along with extensive sampling services. This work supports activities across the District including wastewater treatment, source control, conveyance, stormwater and Tualatin watershed management. The Laboratory staff routinely analyzes samples they collect for nutrients such as nitrogen, phosphorus, sulfur and potassium; for E. coli bacteria; and for dozens of trace metals including copper, lead, silver, cadmium and zinc. The Lab is capable of measuring mercury at extremely low levels: 0.5 parts per trillion! These analyses provide information related to permit compliance, process operations and watershed health. Laboratory staff also supports data collection and analysis for numerous innovative research and development projects within the District. Some examples are:
The Actiflo process at Rock Creek
Evaluating and calibrating continuous treatment plant process monitoring systems for ammonia, nitrate, phosphorus and solids
The pilot plant studies at Forest Grove that led to the vertical flow wetlands being installed at the Fernhill Natural Treatment System
Method development and ambient and plant data generation to use with the Biotic Ligand Model, which is used to determine regulatory water quality copper toxicity criteria
The Laboratory staff spent several summers monitoring the water quality effects that flow augmentation had on McKay and Dairy creeks and is now maintaining a continuous in-stream water quality monitoring station in Beaverton Creek. For the High Purity Water project, the Laboratory provided the planning, sampling and analyses to demonstrate that the finished water met all applicable drinking water standards. The Lab is now assisting in planning and sampling to assess the feasibility of treating stormwater for aquifer storage in the wet season, and then using it for landscape irrigation in the dry season.

Clean Water Services FY 2018-19 Adopted Budget Page 119
Performance Measures
FY 2017 FY 2018 FY 2019
Actual Estimated Target
Inputs
Number of full time employees 33 34 35
Departmental budget 5,670,825$ 7,274,000$ 7,509,100$
Number of regulatory permits managed 531 480 481
Number of professional services contracts/IGAs managed
annually11 23 20
Number of significant industrial users/septage waste
haulers/1200Z permits managed150 154 155
Outputs
Number of routine regulatory reports generated by NPDES
permitted facilities723 61 61
Number of significant industrial users inspections completed 99 106 75
Number of water quality investigations conducted 70 59 83
Number of businesses certified as EcoBiz businesses 50 57 57
Number of Fat/Oil/Grease inspections/consultations
completed115 140 100
Number of significant industrial users permits modified or
renewed24 11 13
Effectiveness Measures
Number of regulatory violations due to reporting
inadequacies0 0 0
Number of violations noted in regulatory program audit
reports0 0 0
Number of 1200Z permittees exceeding benchmarks 11 8 12
Percentage of significant industrial users in compliance 100% 97% 100%
Number of water quality violations caused by spills in the
stormwater system0 0 0
Number of sanitary sewer overflows with FOG listed as a
significant contributing factor8 1 0
Number of treatment plant upsets or effluent limit violations
caused by industrial discharges0 0 0
Efficiency Measures
Number of revisions or corrections to previously submitted
regulatory reports10 7 0
Number of SIU permits managed per Source Control
employee (case manager)11 9 11
Number of all permits managed per Source Control employee
(case manager)105 94 117
Number of regulatory reports completed accurately and on-
time60 61 61
Total number of food service establishments managed 2,261 2,353 2,360
Number of SIU/1200Z permits renewed on time 100% 100% 100%
* Represents current Grease Inspection Count in PACS, but does not include consultations completed
Clean Water Services FY 2018-19 Adopted Budget Page 120
This page intentionally left blank

Clean Water Services FY 2018-19 Adopted Budget Page 121
Regulatory Affairs Department
OBJECT CODE FY 2016 ACTUAL FY 2018 BUDGET FY 2019 ADOPTEDChange from FY18
Budget
51100 2,928,262 3,082,300 3,228,700
51130 168,636 387,000 397,000
51140 49,300 87,000 65,000
51170 0 1,500 15,000
51600 1,020,045 1,279,100 1,336,800
51761 0 31,200 38,200
51900 2,019 4,400 4,200
51910 0 0 0
51915 8,775 9,800 8,400
$ 4,177,036 $ 4,882,300 $ 5,093,300 4.3%
52110 0 0 0
52120 0 0 0
52130 0 0 0
52140 0 0 0
52150 0 0 0
52160 0 0 0
52205 50 13,000 13,000
52210 0 0 0
52215 0 0 0
52220 0 0 0
52240 979,123 1,400,900 1,409,000
52250 0 0 0
52260 6,106 6,000 7,000
52270 0 0 0
52305 2,231 0 2,500
52310 17,476 43,000 48,000
52315 0 0 0
52320 0 0 0
52325 231,587 336,000 350,000
52330 22 15,000 5,000
52335 0 0 0
52340 0 0 0
52350 125 1,000 1,000
52360 0 0 0
52375 110 2,000 1,000
52385 13,212 6,000 6,000
52405 3,477 5,600 5,600
52410 410 700 700
52425 0 15,000 15,000
52430 463 500 1,500
52435 3,096 4,000 4,000
52470 0 0 0
52475 6,182 11,500 11,500
52480 24,266 43,700 43,700
52485 41,612 38,300 41,700
52486 9,377 10,500 10,500
52487 7,365 11,200 11,600
52495 4,476 1,000 1,000
52500 235,913 256,800 390,500
52505 2,313 6,000 6,000
52510 0 0 0
52605 0 0 0
52610 0 0 0
52620 7,210 15,000 30,000
52630 0 0 0
52705 0 0 0
52905 0 0 0
$ 1,596,202 $ 2,242,700 $ 2,415,800 7.7%
$ 96,853 $ 199,000 $ - -100.0%
$ 5,870,092 $ 7,324,000 $ 7,509,100 2.5%
CAPITAL OUTLAY SUBTOTAL $ 89,044
TOTAL EXPENDITURE $ 5,670,825
MATERIALS & SERVICES SUBTOTAL $ 1,474,418
Bad Debt Expense 0
Insurance 0
Repair & Maintenance Services 0
Non-vehicle Equipment Repair &
Maintenance
4,131
Computer Repair & Maintenance 0
Equipment Rental 0
Taxes, Assessments & Liens 0
Other Materials & Services 2,997
Permits, Licenses & Fees 251,505
Public Information 1,435
Travel Expense 57,869
Fleet Charges 8,229
Private Mileage 9,430
Land & Building Rent 0
Fueling Contract 7,006
Training & Education 37,763
Software Licenses & Support 0
Publication Notices 110
Printing 2,256
Dues & Memberships 5,445
Books, Subscriptions & Publications 34
Computer Equipment Expensed 389
Small Tools 1,698
Safety Equipment 159
Postage & Freight 292
Repair & Maintenance Supplies 274
Construction & Building Supplies 0
Parts & Equipment 0
Gas, Oil, Lubrication 0
Janitorial Supplies 0
Tech & Scientific Supplies 241,771
Other Government Services 0
Office Supplies 1,413
Operating Supplies 28,565
Professional Services 802,845
Recording Fees 0
Laundry 8,399
Landscape Services 0
Audit & Accounting Services 0
Contracted Services 0
Engineering Services 0
Garbage 0
Surface Water Management Charge 0
Other Utility Services 0
Water 0
Natural Gas 0
Mobile Computing Allowance 9,255
PERSONNEL EXPENSE SUBTOTAL $ 4,107,363
Electricity 0
Tuition Reimbursement 916
Other Employee Allowances 1,839
Auto Allowance 0
Overtime 53,656
Out of Class Straight Time 0
Other Personnel Expenses 992,963
Wages & Other Pay 2,800,482
Temporary 248,252
OBJECT CODE DESCRIPTION FY 2017 ACTUAL
Department Summary

Clean Water Services FY 2018-19 Adopted Budget Page 122
REGULATORY AFFAIRS DEPARTMENT
POSITION AND SALARY EXPENSE ADMINISTRATION 8210
Total
FY 2016 FY 2017 FY 2018 FY 2019 Represented
ACTUAL ACTUAL BUDGET ADOPTED or
FTE Non-Rep
1.00 1.00 1.00 1.00 Asst Regulatory Affairs Dept Director 12 Non
0.00 1.00 1.00 1.00 Principal Engineer 10 Non
1.00 1.00 1.00 1.00 Regulatory Affairs Dept Director LT 13 Non
0.00 0.00 0.00 1.00 Operations Analyst 1 6 Non
1.00 1.00 1.00 1.00 Water Resources Prog Manager 9 Non
4.00 4.00 4.00 5.00 Water Resources Analyst - Regulatory 8 Non
1.00 1.00 1.00 1.00 Administrative Associate 3 Non
8.00 9.00 9.00 11.00 TOTAL PERSONNEL
Operating
FY 2016 FY 2017 FY 2018 FY 2019 Represented
ACTUAL ACTUAL BUDGET ADOPTED or
FTE Non-Rep
1.00 1.00 1.00 1.00 Asst Regulatory Affairs Dept Director 12 Non
0.00 1.00 1.00 1.00 Principal Engineer 10 Non
1.00 1.00 1.00 1.00 Regulatory Affairs Dept Director LT 13 Non
0.00 0.00 0.00 1.00 Operations Analyst 1 6 Non
1.00 1.00 1.00 1.00 Water Resources Prog Manager 9 Non
4.00 4.00 4.00 5.00 Water Resources Analyst - Regulatory 8 Non
1.00 1.00 1.00 1.00 Administrative Associate 3 Non
8.00 9.00 9.00 11.00 TOTAL PERSONNEL
Capital
FY 2016 FY 2017 FY 2018 FY 2019 Represented
ACTUAL ACTUAL BUDGET ADOPTED or
FTE Non-Rep
0.00 0.00 0.00 0.00 Asst Regulatory Affairs Dept Director 12 Non
0.00 0.00 0.00 0.00 Principal Engineer 10 Non
0.00 0.00 0.00 0.00 Regulatory Affairs Dept Director LT 13 Non
0.00 0.00 0.00 0.00 Operations Analyst 1 6 Non
0.00 0.00 0.00 0.00 Water Resources Prog Manager 9 Non
0.00 0.00 0.00 0.00 Water Resources Analyst - Regulatory 8 Non
0.00 0.00 0.00 0.00 Administrative Associate 3 Non
0.00 0.00 0.00 0.00 TOTAL PERSONNEL
CLASSIFICATION TITLE
CLASSIFICATION TITLE
CLASSIFICATION TITLE
SALARY
GRADE
SALARY
GRADE
SALARY
GRADE

Clean Water Services FY 2018-19 Adopted Budget Page 123
FY 2017 ACTUAL FY 2018 BUDGET OBJECT CODE DESCRIPTIONOBJECT
CODE
FY 2019
PROPOSED
FY 2019
APPROVED
920,250 1,097,000 Wages & Other Pay 51100 1,285,300 1,285,300
106,441 150,000 Temporary 51130 150,000 150,000
1,878 0 Overtime 51140 0 0
0 0 Out of Class Straight Time 51170 0 0
281,073 405,200 Other Personnel Expenses 51600 460,800 460,800
0 30,000 Tuition Reimbursement 51761 30,000 30,000
150 600 Other Employee Allow ances 51900 0 0
0 0 Auto Allow ance 51910 0 0
3,440 2,000 Mobile Computing Allow ance 51915 3,600 3,600
$ 1,313,232 $ 1,684,800 $ 1,929,700 $ 1,929,700
0 0 Electricity 52110 0 0
0 0 Water 52120 0 0
0 0 Natural Gas 52130 0 0
0 0 Garbage 52140 0 0
0 0 Surface Water Management Charge 52150 0 0
0 0 Other Utility Services 52160 0 0
0 0 Sew er Charges 52170 0 0
0 0 Contracted Services 52205 0 0
0 0 Engineering Services 52210 0 0
0 0 Landscape Services 52215 0 0
0 0 Legal Services 52230 0 0
729,357 1,244,400 Professional Services 52240 1,289,000 1,289,000
0 0 Recording Fees 52250 0 0
0 0 Laundry 52260 0 0
0 0 Other Government Services 52270 0 0
1 0 Office Supplies 52305 0 0
58 2,000 Operating Supplies 52310 2,000 2,000
0 0 Gas, Oil, Lubrication 52315 0 0
0 0 Janitorial Supplies 52320 0 0
379 0 Tech & Scientif ic Supplies 52325 0 0
9 0 Repair & Maintenance Supplies 52330 0 0
0 0 Construction & Building Supplies 52335 0 0
0 0 Parts & Equipment 52340 0 0
0 0 Small Tools 52350 0 0
0 0 Safety Equipment 52360 0 0
34 0 Postage & Freight 52375 0 0
399 0 Softw are Expensed 52380 0 0
0 0 Computer Equipment Expensed 52385 0 0
0 0 Inventory Adjustments 52395 0 0
821 1,000 Dues & Memberships 52405 1,000 1,000
0 500 Books, Subscriptions & Publications 52410 500 500
0 0 Softw are Licenses & Support 52425 0 0
0 0 Publication Notices 52430 0 0
131 1,000 Printing 52435 1,000 1,000
0 0 Land & Building Rent 52470 0 0
0 0 Fueling Contract 52475 0 0
19,848 14,000 Training & Education 52480 14,000 14,000
38,676 21,600 Travel Expense 52485 25,000 25,000
0 0 Fleet Charges 52486 0 0
3,965 4,000 Private Mileage 52487 4,000 4,000
475 1,000 Other Materials & Services 52495 1,000 1,000
251,505 250,800 Permits, Licenses & Fees 52500 384,500 384,500
0 0 Public Information 52505 0 0
0 0 Taxes, Assessments & Liens 52510 0 0
0 0 Equipment Rental 52605 0 0
0 0 Repair & Maintenance Services 52610 0 0
0 0 Non-vehicle Equipment Repair &
Maintenance
52620 0 0
0 0 Computer Repair & Maintenance 52630 0 0
0 0 Insurance 52705 0 0
0 0 Other Chemicals 52890 0 0
$ 1,045,657 $ 1,540,300 $ 1,722,000 $ 1,722,000
$ - $ - $ - $ -
$ 2,358,889 $ 3,225,100 $ 3,651,700 $ 3,651,700 $ 2,642,489 TOTAL EXPENDITURE $ 3,651,700
$ - CAPITAL OUTLAY SUBTOTAL $ -
$ 1,171,898 MATERIALS & SERVICES SUBTOTAL $ 1,722,000
0 0
0 0
0 0
0 0
0 0
0 0
0 0
1,554 1,000
229,783 384,500
0 0
24,919 25,000
0 0
3,771 4,000
0 0
15 0
10,363 14,000
0 0
0 0
751 1,000
708 1,000
111 500
0 0
2,917 0
0 0
0 0
0 0
21 0
0 0
0 0
0 0
0 0
0 0
80 0
0 0
137 0
0 2,000
896,719 1,289,000
0 0
0 0
0 0
0 0
0 0
50 0
0 0
0 0
0 0
0 0
0 0
0 0
$ 1,470,591 PERSONNEL EXPENSE SUBTOTAL $ 1,929,700
0 0
150 0
0 0
3,125 3,600
0 0
326,951 460,800
0 30,000
72,245 150,000
0 0
Expenditure Summary 8210 - Regulatory Affairs Administration
FY 2016 ACTUALFY 2019
ADOPTED
1,068,120 1,285,300
Regulatory Affairs Department

Clean Water Services FY 2018-19 Adopted Budget Page 124
REGULATORY AFFAIRS DEPARTMENT
POSITION AND SALARY EXPENSE SOURCE CONTROL 8212
Total
FY 2016 FY 2017 FY 2018 FY 2019 SALARY Represented
ACTUAL ACTUAL BUDGET ADOPTED GRADE or
FTE Non-Rep
7.00 6.00 6.00 6.00 Source Control Investigator 2 6 Rep
0.00 0.00 1.00 1.00 Source Control Investigator 1 4 Rep
1.00 1.00 1.00 0.00 Source Control Manager 8 Non
8.00 7.00 8.00 7.00 TOTAL PERSONNEL
Operating
FY 2016 FY 2017 FY 2018 FY 2019 SALARY Represented
ACTUAL ACTUAL BUDGET ADOPTED GRADE or
FTE Non-Rep
7.00 6.00 6.00 6.00 Source Control Investigator 2 6 Rep
0.00 0.00 1.00 1.00 Source Control Investigator 1 4 Rep
1.00 1.00 1.00 0.00 Source Control Manager 8 Non
8.00 7.00 8.00 7.00 TOTAL PERSONNEL
Capital
FY 2016 FY 2017 FY 2018 FY 2019 SALARY Represented
ACTUAL ACTUAL BUDGET ADOPTED GRADE or
FTE Non-Rep
0.00 0.00 0.00 0.00 Source Control Investigator 2 6 Rep
0.00 0.00 0.00 0.00 Source Control Investigator 1 4 Rep
0.00 0.00 0.00 0.00 Source Control Manager 8 Non
0.00 0.00 0.00 0.00 TOTAL PERSONNEL
CLASSIFICATION TITLE
CLASSIFICATION TITLE
CLASSIFICATION TITLE

Clean Water Services FY 2018-19 Adopted Budget Page 125
FY 2017 ACTUAL FY 2018 BUDGET OBJECT CODE DESCRIPTIONOBJECT
CODE
FY 2019
PROPOSED
FY 2019
APPROVED
576,473 654,100 Wages & Other Pay 51100 561,700 561,700
41,645 62,000 Temporary 51130 72,000 72,000
11,097 52,000 Overtime 51140 30,000 30,000
0 1,000 Out of Class Straight Time 51170 12,500 12,500
205,462 285,800 Other Personnel Expenses 51600 245,600 245,600
916 1,200 Tuition Reimbursement 51761 8,200 8,200
695 1,200 Other Employee Allow ances 51900 1,400 1,400
0 0 Auto Allow ance 51910 0 0
2,802 4,000 Mobile Computing Allow ance 51915 2,400 2,400
$ 839,090 $ 1,061,300 $ 933,800 $ 933,800
0 0 Electricity 52110 0 0
0 0 Water 52120 0 0
0 0 Natural Gas 52130 0 0
0 0 Garbage 52140 0 0
0 0 Surface Water Management Charge 52150 0 0
0 0 Other Utility Services 52160 0 0
0 0 Sew er Charges 52170 0 0
0 13,000 Contracted Services 52205 13,000 13,000
0 0 Engineering Services 52210 0 0
0 0 Landscape Services 52215 0 0
0 0 Legal Services 52230 0 0
2,205 0 Professional Services 52240 0 0
0 0 Recording Fees 52250 0 0
0 0 Laundry 52260 0 0
0 0 Other Government Services 52270 0 0
417 0 Office Supplies 52305 0 0
3,747 10,000 Operating Supplies 52310 10,000 10,000
0 0 Gas, Oil, Lubrication 52315 0 0
0 0 Janitorial Supplies 52320 0 0
0 0 Tech & Scientif ic Supplies 52325 0 0
265 0 Repair & Maintenance Supplies 52330 0 0
0 0 Construction & Building Supplies 52335 0 0
0 0 Parts & Equipment 52340 0 0
87 1,000 Small Tools 52350 1,000 1,000
0 0 Safety Equipment 52360 0 0
214 0 Postage & Freight 52375 0 0
0 0 Softw are Expensed 52380 0 0
0 0 Computer Equipment Expensed 52385 0 0
0 0 Inventory Adjustments 52395 0 0
4,142 4,100 Dues & Memberships 52405 4,100 4,100
0 200 Books, Subscriptions & Publications 52410 200 200
0 0 Softw are Licenses & Support 52425 0 0
110 500 Publication Notices 52430 1,500 1,500
1,922 3,000 Printing 52435 3,000 3,000
0 0 Land & Building Rent 52470 0 0
2,022 4,800 Fueling Contract 52475 4,800 4,800
13,530 19,700 Training & Education 52480 19,700 19,700
13,505 9,700 Travel Expense 52485 9,700 9,700
3,447 4,000 Fleet Charges 52486 4,000 4,000
3,450 5,600 Private Mileage 52487 5,600 5,600
2,185 0 Other Materials & Services 52495 0 0
0 0 Permits, Licenses & Fees 52500 0 0
1,435 6,000 Public Information 52505 6,000 6,000
0 0 Taxes, Assessments & Liens 52510 0 0
0 0 Equipment Rental 52605 0 0
0 0 Repair & Maintenance Services 52610 0 0
0 0 Non-vehicle Equipment Repair &
Maintenance
52620 0 0
0 0 Computer Repair & Maintenance 52630 0 0
0 0 Insurance 52705 0 0
0 0 Other Chemicals 52890 0 0
$ 52,683 $ 81,600 $ 82,600 $ 82,600
$ - $ - $ - $ -
$ 891,773 $ 1,142,900 $ 1,016,400 $ 1,016,400 $ 922,618 TOTAL EXPENDITURE $ 1,016,400
$ - CAPITAL OUTLAY SUBTOTAL $ -
$ 42,365 MATERIALS & SERVICES SUBTOTAL $ 82,600
0 0
0 0
0 0
0 0
0 0
0 0
0 0
2,374 0
0 0
2,313 6,000
10,687 9,700
1,868 4,000
2,032 5,600
0 0
2,341 4,800
11,350 19,700
0 0
463 1,500
2,345 3,000
2,340 4,100
299 200
0 0
1,752 0
0 0
125 1,000
0 0
80 0
0 0
0 0
0 0
0 0
0 0
0 0
0 0
(50) 0
2,046 10,000
0 0
0 0
0 0
0 0
0 0
0 0
0 13,000
0 0
0 0
0 0
0 0
0 0
0 0
$ 880,253 PERSONNEL EXPENSE SUBTOTAL $ 933,800
0 0
815 1,400
0 0
2,770 2,400
0 12,500
221,761 245,600
0 8,200
40,251 72,000
16,453 30,000
Expenditure Summary 8212 - Source Control
FY 2016 ACTUALFY 2019
ADOPTED
598,204 561,700
Regulatory Affairs Department

Clean Water Services FY 2018-19 Adopted Budget Page 126
REGULATORY AFFAIRS DEPARTMENT
POSITION AND SALARY EXPENSE LABORATORY SERVICES 8232
Total
FY 2016 FY 2017 FY 2018 FY 2019 Represented
ACTUAL ACTUAL BUDGET ADOPTED or
FTE Non-Rep
2.00 2.00 2.00 2.00 Laboratory Technician 3 Rep
1.00 1.00 1.00 1.00 Laboratory Services Division Manager 11 Non
12.00 12.00 12.00 12.00 Laboratory Specialist 5 Rep
1.00 1.00 1.00 1.00 Laboratory Supervisor 8 Non
1.00 1.00 1.00 1.00 Lab Systems & QA/QC Coord 7 Non
17.00 17.00 17.00 17.00 TOTAL PERSONNEL
Operating
FY 2016 FY 2017 FY 2018 FY 2019 Represented
ACTUAL ACTUAL BUDGET ADOPTED or
FTE Non-Rep
2.00 2.00 2.00 2.00 Laboratory Technician 3 Rep
1.00 1.00 1.00 1.00 Laboratory Services Division Manager 11 Non
12.00 12.00 12.00 12.00 Laboratory Specialist 5 Rep
1.00 1.00 1.00 1.00 Laboratory Supervisor 8 Non
1.00 1.00 1.00 1.00 Lab Systems & QA/QC Coord 7 Non
17.00 17.00 17.00 17.00 TOTAL PERSONNEL
Capital
FY 2016 FY 2017 FY 2018 FY 2019 Represented
ACTUAL ACTUAL BUDGET ADOPTED or
FTE Non-Rep
0.00 0.00 0.00 0.00 Laboratory Technician 3 Rep
0.00 0.00 0.00 0.00 Laboratory Services Division Manager 11 Non
0.00 0.00 0.00 0.00 Laboratory Specialist 5 Rep
0.00 0.00 0.00 0.00 Laboratory Supervisor 8 Non
0.00 0.00 0.00 0.00 Lab Systems & QA/QC Coord 7 Non
0.00 0.00 0.00 0.00 TOTAL PERSONNEL
CLASSIFICATION TITLE
CLASSIFICATION TITLE
CLASSIFICATION TITLE
SALARY
GRADE
SALARY
GRADE
SALARY
GRADE

Clean Water Services FY 2018-19 Adopted Budget Page 127
FY 2017 ACTUAL FY 2018 BUDGET OBJECT CODE DESCRIPTIONOBJECT
CODE
FY 2019
PROPOSED
FY 2019
APPROVED
1,303,759 1,331,200 Wages & Other Pay 51100 1,381,700 1,381,700
100,166 175,000 Temporary 51130 175,000 175,000
40,681 35,000 Overtime 51140 35,000 35,000
0 500 Out of Class Straight Time 51170 2,500 2,500
506,429 588,100 Other Personnel Expenses 51600 630,400 630,400
0 0 Tuition Reimbursement 51761 0 0
994 2,600 Other Employee Allow ances 51900 2,800 2,800
0 0 Auto Allow ance 51910 0 0
3,013 3,800 Mobile Computing Allow ance 51915 2,400 2,400
$ 1,955,042 $ 2,136,200 $ 2,229,800 $ 2,229,800
0 0 Electricity 52110 0 0
0 0 Water 52120 0 0
0 0 Natural Gas 52130 0 0
0 0 Garbage 52140 0 0
0 0 Surface Water Management Charge 52150 0 0
0 0 Other Utility Services 52160 0 0
0 0 Sew er Charges 52170 0 0
0 0 Contracted Services 52205 0 0
0 0 Engineering Services 52210 0 0
0 0 Landscape Services 52215 0 0
0 0 Legal Services 52230 0 0
71,283 156,500 Professional Services 52240 120,000 120,000
0 0 Recording Fees 52250 0 0
8,399 6,000 Laundry 52260 7,000 7,000
0 0 Other Government Services 52270 0 0
995 0 Office Supplies 52305 2,500 2,500
24,760 31,000 Operating Supplies 52310 36,000 36,000
0 0 Gas, Oil, Lubrication 52315 0 0
0 0 Janitorial Supplies 52320 0 0
241,392 336,000 Tech & Scientif ic Supplies 52325 350,000 350,000
0 15,000 Repair & Maintenance Supplies 52330 5,000 5,000
0 0 Construction & Building Supplies 52335 0 0
0 0 Parts & Equipment 52340 0 0
1,611 0 Small Tools 52350 0 0
159 0 Safety Equipment 52360 0 0
44 2,000 Postage & Freight 52375 1,000 1,000
0 0 Softw are Expensed 52380 0 0
389 6,000 Computer Equipment Expensed 52385 6,000 6,000
0 0 Inventory Adjustments 52395 0 0
482 500 Dues & Memberships 52405 500 500
34 0 Books, Subscriptions & Publications 52410 0 0
0 15,000 Softw are Licenses & Support 52425 15,000 15,000
0 0 Publication Notices 52430 0 0
203 0 Printing 52435 0 0
0 0 Land & Building Rent 52470 0 0
4,984 6,700 Fueling Contract 52475 6,700 6,700
4,385 10,000 Training & Education 52480 10,000 10,000
5,687 7,000 Travel Expense 52485 7,000 7,000
4,782 6,500 Fleet Charges 52486 6,500 6,500
2,016 1,600 Private Mileage 52487 2,000 2,000
337 0 Other Materials & Services 52495 0 0
0 6,000 Permits, Licenses & Fees 52500 6,000 6,000
0 0 Public Information 52505 0 0
0 0 Taxes, Assessments & Liens 52510 0 0
0 0 Equipment Rental 52605 0 0
0 0 Repair & Maintenance Services 52610 0 0
4,131 15,000 Non-vehicle Equipment Repair &
Maintenance
52620 30,000 30,000
0 0 Computer Repair & Maintenance 52630 0 0
0 0 Insurance 52705 0 0
2 0 Other Chemicals 52890 0 0
$ 376,078 $ 620,800 $ 611,200 $ 611,200
$ 89,044 $ 199,000 $ - $ -
$ 2,420,163 $ 2,956,000 $ 2,841,000 $ 2,841,000 $ 2,304,985 TOTAL EXPENDITURE $ 2,841,000
$ 96,853 CAPITAL OUTLAY SUBTOTAL $ -
$ 381,939 MATERIALS & SERVICES SUBTOTAL $ 611,200
0 0
0 0
0 0
7,210 30,000
0 0
0 0
0 0
548 0
6,130 6,000
0 0
6,006 7,000
7,508 6,500
1,561 2,000
0 0
3,826 6,700
2,553 10,000
0 15,000
0 0
0 0
429 500
0 0
0 0
8,544 6,000
0 0
0 0
0 0
10 1,000
22 5,000
0 0
0 0
0 0
0 0
231,507 350,000
0 0
2,144 2,500
15,430 36,000
82,403 120,000
0 0
6,106 7,000
0 0
0 0
0 0
0 0
0 0
0 0
0 0
0 0
0 0
0 0
$ 1,826,192 PERSONNEL EXPENSE SUBTOTAL $ 2,229,800
0 0
1,054 2,800
0 0
2,880 2,400
0 2,500
471,333 630,400
0 0
56,140 175,000
32,847 35,000
Expenditure Summary 8232 - Laboratory Services
FY 2016 ACTUALFY 2019
ADOPTED
1,261,938 1,381,700
Regulatory Affairs Department

Clean Water Services FY 2018-19 Adopted Budget Page 128
This page intentionally left blank

Clean Water Services FY 2018-19 Adopted Budget Page 129
Watershed Management Department
The Mission of the Watershed Management Department (WMD) is to build and strengthen innovative and resilient partnerships to enhance the benefits that natural resources provide to the community. This is accomplished by working on a landscape scale to restore and manage watershed health in rural and urban communities throughout the Tualatin River Watershed. Serving as a catalyst for streamside restoration, WMD is able to leverage millions of additional dollars
from voluntary incentive Farm Bill programs, conservation districts, local parks and open space providers, cities, Fish & Wildlife Service and more than two dozen nonprofit partners (www.jointreeforall.org). Together these collective resources produce landscape scale results (120 river miles restored) while continuing to support rural and urban economies. By working at the landscape scale we are able to create the watershed resilience needed to address rapid urban growth and the stressors of interesting weather events. In addition, WMD serves as a catalyst for acquiring long term water supplies (http://www.tualatinbasinwatersupply.org/) to help meet future rural and urban water needs and at the same time ensure there is a healthy stream network for local fish and wildlife. Water Resources Infrastructure - Investing in natural capital infrastructure for watershed health.
Tualatin Basin Water Supply and Flow Restoration: Watershed Management staff is working in partnership with other water resource managers to expand opportunities to improve flow and the ecological health of Tualatin River and its tributaries. The department partners with local farmers to enhance fish flows and NPDES regulatory requirements and the same time offer voluntary incentive programs that support a vibrant and healthy agricultural community.
Regional Stream and Wetland Enhancement: Watershed Management staff are working on a variety of projects, including aquatic habitat enhancement, riparian planting, wetland restoration, and treatment facility upgrades across urban and rural areas of the Tualatin River Basin.
Strategic Watershed Assessment & Planning - Utilizing scientific knowledge and innovation to improve
watershed and stream health for community benefit.
The Healthy Streams Strategy: Partnering with over a 100 local nonprofits, governments and private companies, the Regional Conservation Strategy (http://www.theintertwine.org/projects/regional-conservation-strategy) serves as an ecological roadmap for the Great Portland Region. This strategy identifies key factors needed to ensure a healthy watershed and brings the collective efforts of these organizations together to maximize ecological uplift.
Regional Restoration Collaboration: Using NPDES riparian restoration requirements to leverage additional resources allows the District to maximize watershed health benefits and meet multiple community objectives. This planning effort encourages organizations to partner and develop programs that meet shared restoration goals. This approach taps into existing local, state and federal resources and then applies them in a coordinated focused restoration strategy.
Stream Stewardship - Restoring ecological function with sustained action.
Healthy riparian and wetland vegetation is central to Clean Water Services’ strategy for improved water quality and aquatic habitat. Native plant communities stabilize vulnerable stream banks, filter pollution, shade waterways, and provide essential wildlife habitat, among many other benefits.

Clean Water Services FY 2018-19 Adopted Budget Page 130
Restoration sites require active monitoring and stewardship to fully restore ecological functions of these sensitive habitats. CWS oversees a focused effort to maintain the gains and minimize emerging threats to our green infrastructure investments.
Community Watershed Action - Building capacity in our community to sustain our natural capital investments.
By working together with multiple partners WMD is able to focus restoration energy to maximize benefits for watershed health. In 2015 alone these partnerships were able to place more than 2 million native plants in the ground. This approach clearly demonstrates the benefits of working together and creating landscape opportunities for humans and wildlife.
Performance Measures
FY 2017 FY 2018 FY 2019
Actual Estimated Target
Inputs
Full time employees 20 21 21
Departmental budget 4,391,880$ 6,145,800$ 6,249,700$
Outputs
Native plants planted by Tree for All community partners 1,160,028 1,000,000 1,000,000
Volunteers in community restoration events 3,345 5,000 5,000
Enhancement of tributary flows through integrated flow
management (ac-ft) 1,049 1,500 1,500
Agricultural lands enrolled in water quality management
programs (acres) 10,270 11,000 12,500
Effectiveness Measures
Projects meeting ecological function targets 94% 90% 90%
Total thermal load reduction (Kcal) from riparian shade 436,000,000 450,000,000 540,000,000
Stream miles enhanced 120 130 140
Efficiency Measures
Projects meeting budget and schedule expectations
during implementation 85% 100% 87%
Native plants planted per FTE 58,001 50,000 55,000
Partner investment leveraged (annual) 950,000$ 1,000,000$ 1,200,000$
Number of community partners investing 23 25 27
Total acres of donated capital for restoration 4,500 5,000 6,000

Clean Water Services FY 2018-19 Adopted Budget Page 131
Watershed Management Department
OBJECT CODE FY 2016 ACTUAL FY 2018 BUDGET FY 2019 ADOPTEDChange from FY18
Budget
51100 1,235,181 2,089,700 2,096,900
51130 142,499 180,000 191,000
51140 2,122 10,000 0
51170 0 0 0
51600 298,499 798,500 794,200
51761 0 0 0
51900 1,217 1,200 2,000
51910 0 0 0
51915 8,670 9,700 8,000
$ 1,688,188 $ 3,089,100 $ 3,092,100 0.1%
52110 2,590 2,800 2,800
52120 0 0 0
52130 0 0 0
52140 1,001 1,000 1,000
52150 0 0 0
52160 0 0 0
52205 611,965 700,000 540,000
52210 0 0 0
52215 0 0 0
52240 71,420 100,000 100,000
52250 0 0 0
52260 0 0 0
52270 1,154,716 1,765,000 1,965,000
52305 567 1,000 1,000
52310 3,911 0 0
52315 592 0 0
52320 0 0 0
52325 0 0 0
52330 2,012 1,000 1,000
52335 941 5,000 5,000
52340 94 0 0
52350 1,979 15,000 25,000
52360 44 100 5,000
52375 133 0 0
52385 12,061 0 0
52405 8,931 10,000 10,000
52410 1,938 800 800
52425 121 0 2,000
52430 214 0 0
52435 235 0 0
52445 0 0 0
52470 9,213 10,000 10,000
52475 4,321 7,100 7,100
52480 33,550 34,000 39,000
52485 36,839 27,300 37,300
52486 6,469 8,000 8,000
52487 1,711 4,000 4,000
52495 386,397 554,000 379,000
52500 1,412 600 600
52505 0 0 0
52510 8,984 8,000 12,000
52605 0 0 0
52610 106 1,000 1,000
52620 0 1,000 1,000
52630 0 0 0
52705 0 0 0
52890 0 0 0
$ 2,364,468 $ 3,256,700 $ 3,157,600 -3.0%
$ - $ - $ -
$ 4,052,656 $ 6,345,800 $ 6,249,700 -1.5%
CAPITAL OUTLAY SUBTOTAL $ -
TOTAL EXPENDITURE $ 4,391,880
MATERIALS & SERVICES SUBTOTAL $ 2,625,206
Other Chemicals 0
Insurance 0
Repair & Maintenance Services 1,378
Non-vehicle Equipment Repair &
Maintenance
443
Computer Repair & Maintenance 0
Equipment Rental 0
Taxes, Assessments & Liens 10,395
Other Materials & Services 1,449,014
Permits, Licenses & Fees 727
Public Information 0
Travel Expense 39,206
Fleet Charges 7,189
Private Mileage 3,099
Land & Building Rent 10,094
Fueling Contract 6,072
Training & Education 27,781
Telephone Services 85
Software Licenses & Support 1,223
Publication Notices 0
Printing 944
Dues & Memberships 12,479
Books, Subscriptions & Publications 605
Computer Equipment Expensed 0
Small Tools 23,232
Safety Equipment 530
Postage & Freight 303
Repair & Maintenance Supplies 806
Construction & Building Supplies 4,846
Parts & Equipment 0
Gas, Oil, Lubrication 747
Janitorial Supplies 0
Tech & Scientific Supplies 0
Other Government Services 443,217
Office Supplies 1,665
Operating Supplies 2,080
Professional Services 90,285
Recording Fees 0
Laundry 0
Landscape Services 0
Contracted Services 484,981
Engineering Services 0
Garbage 72
Surface Water Management Charge 0
Other Utility Services 0
Water 0
Natural Gas 0
Mobile Computing Allowance 9,722
PERSONNEL EXPENSE SUBTOTAL $ 1,766,674
Electricity 1,708
Tuition Reimbursement 0
Other Employee Allowances 1,240
Auto Allowance 0
Overtime 1,596
Out of Class Straight Time 0
Other Personnel Expenses 249,015
Wages & Other Pay 1,296,976
Temporary 208,125
OBJECT CODE DESCRIPTION FY 2017 ACTUAL
Department Summary
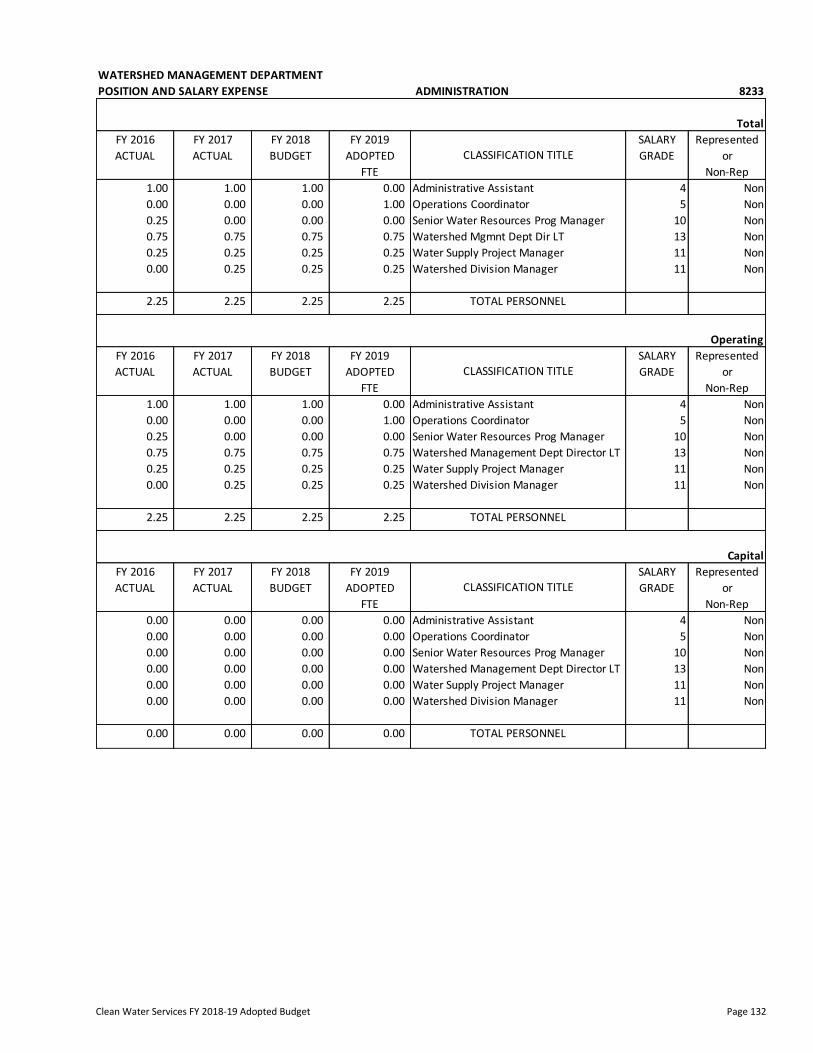
Clean Water Services FY 2018-19 Adopted Budget Page 132
WATERSHED MANAGEMENT DEPARTMENT
POSITION AND SALARY EXPENSE ADMINISTRATION 8233
Total
FY 2016 FY 2017 FY 2018 FY 2019 SALARY Represented
ACTUAL ACTUAL BUDGET ADOPTED GRADE or
FTE Non-Rep
1.00 1.00 1.00 0.00 Administrative Assistant 4 Non
0.00 0.00 0.00 1.00 Operations Coordinator 5 Non
0.25 0.00 0.00 0.00 Senior Water Resources Prog Manager 10 Non
0.75 0.75 0.75 0.75 Watershed Mgmnt Dept Dir LT 13 Non
0.25 0.25 0.25 0.25 Water Supply Project Manager 11 Non
0.00 0.25 0.25 0.25 Watershed Division Manager 11 Non
2.25 2.25 2.25 2.25 TOTAL PERSONNEL
Operating
FY 2016 FY 2017 FY 2018 FY 2019 SALARY Represented
ACTUAL ACTUAL BUDGET ADOPTED GRADE or
FTE Non-Rep
1.00 1.00 1.00 0.00 Administrative Assistant 4 Non
0.00 0.00 0.00 1.00 Operations Coordinator 5 Non
0.25 0.00 0.00 0.00 Senior Water Resources Prog Manager 10 Non
0.75 0.75 0.75 0.75 Watershed Management Dept Director LT 13 Non
0.25 0.25 0.25 0.25 Water Supply Project Manager 11 Non
0.00 0.25 0.25 0.25 Watershed Division Manager 11 Non
2.25 2.25 2.25 2.25 TOTAL PERSONNEL
Capital
FY 2016 FY 2017 FY 2018 FY 2019 SALARY Represented
ACTUAL ACTUAL BUDGET ADOPTED GRADE or
FTE Non-Rep
0.00 0.00 0.00 0.00 Administrative Assistant 4 Non
0.00 0.00 0.00 0.00 Operations Coordinator 5 Non
0.00 0.00 0.00 0.00 Senior Water Resources Prog Manager 10 Non
0.00 0.00 0.00 0.00 Watershed Management Dept Director LT 13 Non
0.00 0.00 0.00 0.00 Water Supply Project Manager 11 Non
0.00 0.00 0.00 0.00 Watershed Division Manager 11 Non
0.00 0.00 0.00 0.00 TOTAL PERSONNEL
CLASSIFICATION TITLE
CLASSIFICATION TITLE
CLASSIFICATION TITLE

Clean Water Services FY 2018-19 Adopted Budget Page 133
FY 2017 ACTUAL FY 2018 BUDGET OBJECT CODE DESCRIPTIONOBJECT
CODE
FY 2019
PROPOSED
FY 2019
APPROVED
248,317 280,900 Wages & Other Pay 51100 289,300 289,300
0 0 Full Time Regular Wages 51110 0 0
56,579 60,000 Temporary 51130 60,000 60,000
0 0 Overtime 51140 0 0
0 0 Out of Class Straight Time 51170 0 0
63,323 107,700 Other Personnel Expenses 51600 111,500 111,500
0 0 Tuition Reimbursement 51761 0 0
0 1,200 Other Employee Allow ances 51900 0 0
0 0 Auto Allow ance 51910 0 0
1,680 1,700 Mobile Computing Allow ance 51915 1,000 1,000
$ 369,899 $ 451,500 $ 461,800 $ 461,800
0 0 Electricity 52110 0 0
0 0 Water 52120 0 0
0 0 Natural Gas 52130 0 0
0 0 Garbage 52140 0 0
0 0 Surface Water Management Charge 52150 0 0
0 0 Other Utility Services 52160 0 0
0 0 Sew er Charges 52170 0 0
0 0 Contracted Services 52205 0 0
0 0 Engineering Services 52210 0 0
0 0 Landscape Services 52215 0 0
0 0 Legal Services 52230 0 0
13,400 0 Professional Services 52240 0 0
0 0 Recording Fees 52250 0 0
0 0 Laundry 52260 0 0
75 0 Other Government Services 52270 0 0
413 1,000 Office Supplies 52305 1,000 1,000
0 0 Operating Supplies 52310 0 0
17 0 Gas, Oil, Lubrication 52315 0 0
0 0 Janitorial Supplies 52320 0 0
0 0 Tech & Scientif ic Supplies 52325 0 0
0 0 Repair & Maintenance Supplies 52330 0 0
0 0 Construction & Building Supplies 52335 0 0
0 0 Parts & Equipment 52340 0 0
0 0 Small Tools 52350 0 0
0 0 Safety Equipment 52360 0 0
180 0 Postage & Freight 52375 0 0
0 0 Softw are Expensed 52380 0 0
0 0 Computer Equipment Expensed 52385 0 0
8,435 8,000 Dues & Memberships 52405 8,000 8,000
25 800 Books, Subscriptions & Publications 52410 800 800
0 0 Softw are Licenses & Support 52425 0 0
0 0 Publication Notices 52430 0 0
680 0 Printing 52435 0 0
0 0 Land & Building Rent 52470 0 0
436 3,800 Fueling Contract 52475 3,800 3,800
3,025 4,000 Training & Education 52480 4,000 4,000
15,083 14,000 Travel Expense 52485 14,000 14,000
1,295 0 Fleet Charges 52486 0 0
1,234 2,000 Private Mileage 52487 2,000 2,000
4,631 4,000 Other Materials & Services 52495 4,000 4,000
0 0 Permits, Licenses & Fees 52500 0 0
0 0 Public Information 52505 0 0
0 0 Taxes, Assessments & Liens 52510 0 0
0 0 Equipment Rental 52605 0 0
0 0 Repair & Maintenance Services 52610 0 0
0 0 Non-vehicle Equipment Repair &
Maintenance
52620 0 0
0 0 Computer Repair & Maintenance 52630 0 0
0 0 Insurance 52705 0 0
0 0 Other Chemicals 52890 0 0
$ 48,929 $ 37,600 $ 37,600 $ 37,600
$ - $ - $ - $ -
$ 418,827 $ 489,100 $ 499,400 $ 499,400 $ 390,595 TOTAL EXPENDITURE $ 499,400
$ - CAPITAL OUTLAY SUBTOTAL $ -
$ 44,371 MATERIALS & SERVICES SUBTOTAL $ 37,600
0 0
0 0
0 0
0 0
0 0
0 0
0 0
5,972 4,000
25 0
0 0
21,849 14,000
0 0
1,305 2,000
0 0
842 3,800
4,902 4,000
0 0
0 0
235 0
6,994 8,000
25 800
0 0
954 0
0 0
0 0
0 0
0 0
0 0
0 0
118 0
0 0
0 0
0 0
365 1,000
46 0
750 0
0 0
0 0
0 0
0 0
0 0
(10) 0
0 0
0 0
0 0
0 0
0 0
0 0
$ 346,224 PERSONNEL EXPENSE SUBTOTAL $ 461,800
0 0
0 0
0 0
1,680 1,000
0 0
65,614 111,500
0 0
0 0
40,876 60,000
0 0
Expenditure Summary 8233 - Watershed Management Administration
FY 2016 ACTUALFY 2019
ADOPTED
238,053 289,300
Watershed Management Department

Clean Water Services FY 2018-19 Adopted Budget Page 134
WATERSHED MANAGEMENT DEPARTMENT
POSITION AND SALARY EXPENSE OPERATIONS 8234
Total
FY 2016 FY 2017 FY 2018 FY 2019 SALARY Represented
ACTUAL ACTUAL BUDGET ADOPTED GRADE or
FTE Non-Rep
0.00 0.00 1.00 1.00 Engineer 8 Non
0.00 1.00 1.00 1.00 Engineering Technician 2 5 Rep
0.00 0.00 1.00 1.00 Engineering Technician 3 6 Rep
1.00 1.00 1.00 1.00 Senior Engineer 9 Non
1.00 1.00 1.00 1.00 GIS Analyst 7 Non
1.00 1.00 1.00 1.00 Principal Engineer 10 Non
0.00 0.00 0.00 2.00 Project Manager 1 6 Non
0.75 0.00 0.00 0.00 Senior Water Resources Prog Manager 10 Non
1.00 1.00 1.00 1.00 Water Resources Analyst - GIS 8 Non
1.00 1.00 1.00 1.00 Water Resources Analyst - Watershed 8 Non
1.00 1.00 1.00 1.00 Water Resources Program Manager 9 Non
3.00 5.00 4.00 4.00 Water Resources Project Manager 7 Non
0.25 0.25 0.25 0.25 Watershed Mgmnt Dept Dir LT 13 Non
3.00 4.00 4.00 2.00 Water Resources Specialist 4 Rep
0.75 0.75 0.75 0.75 Water Supply Project Manager 11 Non
0.00 0.75 0.75 0.75 Watershed Division Manager 11 Non
13.75 17.75 18.75 18.75 TOTAL PERSONNEL
Operating
FY 2016 FY 2017 FY 2018 FY 2019 SALARY Represented
ACTUAL ACTUAL BUDGET ADOPTED GRADE or
FTE Non-Rep
0.00 0.00 0.50 0.50 Engineer 8 Non
0.00 0.50 0.50 0.50 Engineering Technician 2 5 Rep
0.00 0.00 0.50 0.50 Engineering Technician 3 6 Rep
0.25 0.25 0.25 0.25 Senior Engineer 9 Non
1.00 1.00 1.00 1.00 GIS Analyst 7 Non
0.25 0.25 0.25 0.25 Principal Engineer 10 Non
0.00 0.00 0.00 0.00 Project Manager 1 6 Non
0.50 0.00 0.00 0.00 Senior Water Resources Prog Manager 10 Non
1.00 1.00 1.00 1.00 Water Resources Analyst - GIS 8 Non
1.00 1.00 1.00 1.00 Water Resources Analyst - Watershed 8 Non
0.25 0.25 0.25 0.25 Water Resources Program Manager 9 Non
1.50 2.25 1.75 1.75 Water Resources Project Manager 7 Non
0.25 0.25 0.25 0.25 Watershed Mgmnt Dept Dir LT 13 Non
1.00 1.25 1.25 1.25 Water Resources Specialist 4 Rep
0.25 0.25 0.25 0.25 Water Supply Project Manager 11 Non
0.00 0.50 0.50 0.50 Watershed Division Manager 11 Non
7.25 8.75 9.25 9.25 TOTAL PERSONNEL
Capital
FY 2016 FY 2017 FY 2018 FY 2019 SALARY Represented
ACTUAL ACTUAL BUDGET ADOPTED GRADE or
FTE Non-Rep
0.00 0.00 0.50 0.50 Engineer 8 Non
0.00 0.50 0.50 0.50 Engineering Technician 2 5 Rep
0.00 0.00 0.50 0.50 Engineering Technician 3 6 Rep
0.75 0.75 0.75 0.75 Senior Engineer 9 Non
0.00 0.00 0.00 0.00 GIS Analyst 7 Non
0.75 0.75 0.75 0.75 Principal Engineer 10 Non
0.00 0.00 0.00 2.00 Project Manager 1 6 Non
0.25 0.00 0.00 0.00 Senior Water Resources Prog Manager 10 Non
0.00 0.00 0.00 0.00 Water Resources Analyst - GIS 8 Non
0.00 0.00 0.00 0.00 Water Resources Analyst - Watershed 8 Non
0.75 0.75 0.75 0.75 Water Resources Program Manager 9 Non
1.50 2.75 2.25 2.25 Water Resources Project Manager 7 Non
0.00 0.00 0.00 0.00 Watershed Mgmnt Dept Dir LT 13 Non
2.00 2.75 2.75 0.75 Water Resources Specialist 4 Rep
0.50 0.50 0.50 0.50 Water Supply Project Manager 11 Non
0.00 0.25 0.25 0.25 Watershed Division Manager 11 Non
6.50 9.00 9.50 9.50 TOTAL PERSONNEL
CLASSIFICATION TITLE
CLASSIFICATION TITLE
CLASSIFICATION TITLE

Clean Water Services FY 2018-19 Adopted Budget Page 135
FY 2017 ACTUAL FY 2018 BUDGET OBJECT CODE DESCRIPTIONOBJECT
CODE
FY 2019
PROPOSED
FY 2019
APPROVED
1,048,658 1,808,800 Wages & Other Pay 51100 1,807,600 1,807,600
0 0 Full Time Regular Wages 51110 0 0
151,547 120,000 Temporary 51130 131,000 131,000
1,596 10,000 Overtime 51140 0 0
0 0 Out of Class Straight Time 51170 0 0
185,692 690,800 Other Personnel Expenses 51600 682,700 682,700
0 0 Tuition Reimbursement 51761 0 0
1,240 0 Other Employee Allow ances 51900 2,000 2,000
0 0 Auto Allow ance 51910 0 0
8,042 8,000 Mobile Computing Allow ance 51915 7,000 7,000
$ 1,396,775 $ 2,637,600 $ 2,630,300 $ 2,630,300
1,708 2,800 Electricity 52110 2,800 2,800
0 0 Water 52120 0 0
0 0 Natural Gas 52130 0 0
72 1,000 Garbage 52140 1,000 1,000
0 0 Surface Water Management Charge 52150 0 0
0 0 Other Utility Services 52160 0 0
0 0 Sew er Charges 52170 0 0
484,981 700,000 Contracted Services 52205 540,000 540,000
0 0 Engineering Services 52210 0 0
0 0 Landscape Services 52215 0 0
0 0 Legal Services 52230 0 0
76,885 100,000 Professional Services 52240 100,000 100,000
0 0 Recording Fees 52250 0 0
0 0 Laundry 52260 0 0
443,142 1,765,000 Other Government Services 52270 1,965,000 1,965,000
1,252 0 Office Supplies 52305 0 0
2,080 0 Operating Supplies 52310 0 0
729 0 Gas, Oil, Lubrication 52315 0 0
0 0 Janitorial Supplies 52320 0 0
0 0 Tech & Scientif ic Supplies 52325 0 0
806 1,000 Repair & Maintenance Supplies 52330 1,000 1,000
4,846 5,000 Construction & Building Supplies 52335 5,000 5,000
0 0 Parts & Equipment 52340 0 0
23,232 15,000 Small Tools 52350 25,000 25,000
530 100 Safety Equipment 52360 5,000 5,000
122 0 Postage & Freight 52375 0 0
0 0 Softw are Expensed 52380 0 0
0 0 Computer Equipment Expensed 52385 0 0
4,044 2,000 Dues & Memberships 52405 2,000 2,000
580 0 Books, Subscriptions & Publications 52410 0 0
1,223 0 Softw are Licenses & Support 52425 2,000 2,000
0 0 Publication Notices 52430 0 0
264 0 Printing 52435 0 0
10,094 10,000 Land & Building Rent 52470 10,000 10,000
5,636 3,300 Fueling Contract 52475 3,300 3,300
24,756 30,000 Training & Education 52480 35,000 35,000
24,123 13,300 Travel Expense 52485 23,300 23,300
5,894 8,000 Fleet Charges 52486 8,000 8,000
1,865 2,000 Private Mileage 52487 2,000 2,000
1,444,383 550,000 Other Materials & Services 52495 375,000 375,000
727 600 Permits, Licenses & Fees 52500 600 600
0 0 Public Information 52505 0 0
10,395 8,000 Taxes, Assessments & Liens 52510 12,000 12,000
0 0 Equipment Rental 52605 0 0
1,378 1,000 Repair & Maintenance Services 52610 1,000 1,000
443 1,000 Non-vehicle Equipment Repair &
Maintenance
52620 1,000 1,000
0 0 Computer Repair & Maintenance 52630 0 0
0 0 Insurance 52705 0 0
0 0 Other Chemicals 52890 0 0
$ 2,576,277 $ 3,219,100 $ 3,120,000 $ 3,120,000
$ - $ - $ - $ -
$ 3,973,052 $ 5,856,700 $ 5,750,300 $ 5,750,300 $ 3,662,062 TOTAL EXPENDITURE $ 5,750,300
$ - CAPITAL OUTLAY SUBTOTAL $ -
$ 2,320,097 MATERIALS & SERVICES SUBTOTAL $ 3,120,000
0 0
0 0
106 1,000
0 1,000
0 0
0 0
8,984 12,000
380,426 375,000
1,387 600
0 0
14,990 23,300
6,469 8,000
407 2,000
9,213 10,000
3,480 3,300
28,648 35,000
121 2,000
214 0
0 0
1,937 2,000
1,913 0
0 0
11,107 0
1,979 25,000
44 5,000
133 0
2,012 1,000
941 5,000
94 0
473 0
0 0
0 0
1,154,716 1,965,000
201 0
3,866 0
70,670 100,000
0 0
0 0
0 0
0 0
0 0
611,975 540,000
0 0
1,001 1,000
0 0
0 0
0 0
0 0
$ 1,341,965 PERSONNEL EXPENSE SUBTOTAL $ 2,630,300
2,590 2,800
1,217 2,000
0 0
6,990 7,000
0 0
232,884 682,700
0 0
0 0
101,623 131,000
2,122 0
Expenditure Summary 8234 - Watershed Management Operations
FY 2016 ACTUALFY 2019
ADOPTED
997,127 1,807,600
Watershed Management Department

Clean Water Services FY 2018-19 Adopted Budget Page 136
This page intentionally left blank

Clean Water Services FY 2018-19 Adopted Budget Page 137
Conveyance Systems Department The Conveyance Systems Department (CSD) is responsible for the management, design, construction oversight, and maintenance of the conveyance systems of the District. The Department includes the Administration program and three Divisions--the Engineering Services Division, the Development Services and Systems Planning Division, and the Field Operations Division. This year’s budget reflects the addition of two FTE.
Administration Program This program includes the senior management for the Department. Staff provides general and fiscal management of the Department’s programs and interacts with various external agencies on a wide variety of technical and policy issues. This work includes interaction with community and professional organizations and collaborative efforts with other jurisdictions through the City/District Technical Committee, Cooperative Public Agencies of Washington County, and other various partnering efforts. Engineering Services Division The Engineering Services Division provides administration, design, and construction management of the District’s Capital Improvement Program for both Sanitary and Surface Water Management (SWM) Systems. The section is also responsible for administration, design, and construction management of Local Improvement Districts, Inflow and Infiltration (I/I) abatement, and SWM Small Works Program projects. The services provided by this section are driven by the need to comply with legal mandates, protect public health, protect beneficial uses, and meet public demands for efficient responsive service. This year’s budget includes the proposed addition of an Engineer to enable the District to better respond to the increased workload of stormwater projects that involve multiple developments or that are associated with transportation projects. These projects are often located in stream corridors and are on tight timelines. The position will also assist with design and implementation of stormwater retrofit projects and projects which fall under an enhanced SWM Small Works Program. Development Services and Systems Planning Division Within the Development Services and Systems Planning Division, the Development Services program provides services specifically related to private development, including: technical research and customer service; plan review, administration, and inspection of vegetated corridor improvements, erosion control best management practices (BMPs), and sanitary sewer, stormwater quality and quantity facilities; permit issuance for sanitary sewer, surface water and erosion control; record mapping services for the sanitary and surface water systems; and Geographic Information System (GIS) services supporting District programs. This division also includes the Systems Planning program which provides quality control of plan review, erosion control and vegetated corridor inspection programs District-wide. This program is responsible for the implementation of the private storm water quality facilities inspection program, and for management and further analysis of Low Impact Development Approaches (LIDA). The program also assists in District-wide capital planning and analysis including the integration of developer-constructed infrastructure to assure capacity for growth in both the sanitary and storm sewer systems. The second new position being proposed is a Water Resource Program Manager, located in the Development Services and Systems Planning Division. This position will lead multi-disciplinary teams to develop and

Clean Water Services FY 2018-19 Adopted Budget Page 138
document specific strategies that address regional stormwater management for hydromodification and natural resource enhancement and assist with the forecasting of budget needs for regional stormwater management approach projects. Field Operations Division The Field Operations Division maintains the public storm and sanitary sewer collection systems. In addition to Field Operations Administration, the Division includes the System Repair, System Maintenance, Local Repair, TV/Flow Monitoring, and Surface Facility Maintenance operational programs. The operational programs perform cleaning and TV inspection of public storm and sanitary sewer pipes, cleaning catch basins and water quality manholes, street sweeping, leaf pickup in the fall, and maintenance of water quality facilities. The Division responds to emergency requests for service, including storm event response. The Division also performs repairs and rehabilitation of the collection system including line and manhole sealing to reduce inflow and infiltration, localized repairs of damaged or deteriorated facilities, and assistance with neighborhood-wide system rehabilitation projects. Finally, the Division constructs small localized projects including short line extensions, catch basin and inlet installations, and stream corridor enhancements. Performance Measures
FY 2017 FY 2018 FY 2019
Actual Estimated Target
Inputs
Number of full time employees 113 118 120
Departmental budget 12,351,645$ 15,851,500$ 16,362,100$
Outputs
Routine sanitary line cleaning (in feet) 1,070,335 892,380 890,000
Routine sanitary line TV inspection (in feet) 509,832 527,371 493,000
Routine street sweeping (in curbed miles) 13,357 13,865 11,100
Additional areas treated 182 305.6 200
Effectiveness Measures
Major milestone dates met for CIP projects 78% 67% 75%
Customer response calls 830 621 650
Efficiency Measures
Environmental reviews 1,020 1,018 1,000
Permits issued 1,490 1,136 1,100
Sanitary manhole sealing 179 285 275

Clean Water Services FY 2018-19 Adopted Budget Page 139
Conveyance Systems Department
OBJECT CODE FY 2016 ACTUAL FY 2018 BUDGET FY 2019 ADOPTEDChange from FY18
Budget
51100 7,079,660 8,615,600 8,710,900
51130 222,644 145,000 307,000
51140 83,912 124,200 127,700
51170 0 4,000 0
51600 2,241,958 3,494,200 3,690,200
51761 1,137 0 0
51900 13,639 14,000 19,200
51910 0 0 0
51915 12,425 13,100 16,100
$ 9,655,374 $ 12,410,100 $ 12,871,100 3.7%
52110 40,160 39,500 54,500
52120 25,326 22,500 31,000
52125 0 0 0
52130 8,413 7,000 10,000
52140 111,784 144,000 164,000
52150 4,600 4,000 12,000
52160 0 8,000 2,000
52170 11,356 0 12,000
52205 440,284 606,000 662,000
52210 0 40,000 40,000
52215 11,486 16,000 18,000
52240 118,707 350,000 400,000
52250 4,683 5,200 5,200
52260 30,775 28,000 30,100
52270 765 2,000 2,000
52305 9,286 7,800 7,800
52310 117,262 136,000 136,000
52315 26,661 29,300 29,300
52320 3,790 5,000 6,000
52325 0 0 0
52330 258,357 369,200 369,200
52335 140,311 160,000 160,000
52340 721 0 0
52350 28,191 48,300 48,300
52360 22,776 22,000 22,000
52375 2,880 3,000 3,000
52380 167 1,500 2,500
52385 31,408 300 0
52405 10,004 10,300 20,500
52410 198 2,000 2,000
52425 6,050 5,500 7,000
52430 0 700 700
52435 5,044 8,300 9,800
52445 0 0 0
52470 0 0 0
52475 199,097 309,700 309,700
52480 35,181 61,200 66,300
52485 23,913 41,700 46,000
52486 467,031 494,200 514,200
52487 5,200 10,100 10,300
52495 29,400 38,000 42,800
52500 923 3,800 5,000
52505 0 0 0
52510 0 0 0
52515 6,235 6,000 13,000
52605 30,299 49,500 44,500
52610 87,167 91,800 101,800
52620 0 0 0
52630 215 2,000 4,500
52705 0 0 0
52890 19,250 57,000 66,000
52905 0 0 0
$ 2,375,356 $ 3,246,400 $ 3,491,000 7.5%
$ 162,418 $ 195,000 $ - -100.0%
$ 12,193,148 $ 15,851,500 $ 16,362,100 3.2%
CAPITAL OUTLAY SUBTOTAL $ 186,516
TOTAL EXPENDITURE $ 12,351,645
MATERIALS & SERVICES SUBTOTAL $ 2,344,703
Other Chemicals 28,155
Bad Debt Expense 0
Insurance 0
Repair & Maintenance Services 105,869
Non-vehicle Equipment Repair &
Maintenance
0
Computer Repair & Maintenance 0
Equipment Rental 32,966
Taxes, Assessments & Liens 120
Bank Service Charge 13,980
Other Materials & Services 18,460
Permits, Licenses & Fees 913
Public Information 0
Travel Expense 21,462
Fleet Charges 397,608
Private Mileage 12,375
Land & Building Rent 0
Fueling Contract 190,704
Training & Education 39,874
Telephone Services 0
Software Licenses & Support 8,796
Publication Notices 1,218
Printing 9,724
Dues & Memberships 14,224
Books, Subscriptions & Publications 540
Software Expensed 0
Computer Equipment Expensed 0
Small Tools 26,283
Safety Equipment 20,718
Postage & Freight 541
Repair & Maintenance Supplies 247,952
Construction & Building Supplies 122,534
Parts & Equipment 69
Gas, Oil, Lubrication 23,149
Janitorial Supplies 5,589
Tech & Scientific Supplies 0
Other Government Services 3,512
Office Supplies 10,793
Operating Supplies 99,804
Professional Services 125,030
Recording Fees 5,334
Laundry 29,682
Landscape Services 8,907
Sewer Charges 11,702
Contracted Services 456,406
Engineering Services 0
Garbage 164,623
Surface Water Management Charge 4,882
Other Utility Services 0
Water 24,843
Purchased Water 149
Natural Gas 13,566
Mobile Computing Allowance 12,545
PERSONNEL EXPENSE SUBTOTAL $ 9,820,426
Electricity 41,648
Tuition Reimbursement 0
Other Employee Allowances 13,857
Auto Allowance 0
Overtime 97,974
Out of Class Straight Time 0
Other Personnel Expenses 2,335,692
Wages & Other Pay 7,141,382
Temporary 218,976
OBJECT CODE DESCRIPTION FY 2017 ACTUAL
Department Summary

Clean Water Services FY 2018-19 Adopted Budget Page 140
CONVEYANCE SYSTEMS DEPARTMENT
POSITION AND SALARY EXPENSE ADMINISTRATION 8201
Total
FY 2016 FY 2017 FY 2018 FY 2019 Represented
ACTUAL ACTUAL BUDGET ADOPTED or
FTE Non-Rep
1.00 1.00 1.00 1.00 Engineering Division Manager 11 Non
1.00 1.00 1.00 1.00 Conveyance Sys Dept Director LT 13 Non
1.00 1.00 1.00 1.00 Field Operations Division Manager 11 Non
0.00 1.00 1.00 1.00 Planning & Development Svcs Division Mgr 11 Non
3.00 4.00 4.00 4.00 TOTAL PERSONNEL
Operating
FY 2016 FY 2017 FY 2018 FY 2019 Represented
ACTUAL ACTUAL BUDGET ADOPTED or
FTE Non-Rep
0.85 0.85 0.85 0.85 Engineering Division Manager 11 Non
0.85 0.85 0.85 0.85 Conveyance Sys Dept Director LT 13 Non
0.85 0.85 0.85 0.85 Field Operations Division Manager 11 Non
0.00 0.85 0.85 0.85 Planning & Development Svcs Division Mgr 11 Non
2.55 3.40 3.40 3.40 TOTAL PERSONNEL
Capital
FY 2016 FY 2017 FY 2018 FY 2019 Represented
ACTUAL ACTUAL BUDGET ADOPTED or
FTE Non-Rep
0.15 0.15 0.15 0.15 Engineering Division Manager 11 Non
0.15 0.15 0.15 0.15 Conveyance Sys Dept Director LT 13 Non
0.15 0.15 0.15 0.15 Field Operations Division Manager 11 Non
0.00 0.15 0.15 0.15 Planning & Development Svcs Division Mgr 11 Non
0.45 0.60 0.60 0.60 TOTAL PERSONNEL
CLASSIFICATION TITLE
CLASSIFICATION TITLE
CLASSIFICATION TITLE
SALARY
GRADE
SALARY
GRADE
SALARY
GRADE

Clean Water Services FY 2018-19 Adopted Budget Page 141
FY 2017 ACTUAL FY 2018 BUDGET OBJECT CODE DESCRIPTIONOBJECT
CODE
FY 2019
PROPOSED
FY 2019
APPROVED
502,288 648,500 Wages & Other Pay 51100 656,200 656,200
3,725 0 Temporary 51130 0 0
0 0 Overtime 51140 0 0
0 0 Out of Class Straight Time 51170 0 0
114,776 200,200 Other Personnel Expenses 51600 216,100 216,100
0 0 Tuition Reimbursement 51761 0 0
0 100 Other Employee Allow ances 51900 0 0
0 0 Auto Allow ance 51910 0 0
3,080 3,400 Mobile Computing Allow ance 51915 3,200 3,200
$ 623,869 $ 852,200 $ 875,500 $ 875,500
0 0 Electricity 52110 0 0
0 0 Water 52120 0 0
0 0 Natural Gas 52130 0 0
0 0 Garbage 52140 0 0
0 0 Surface Water Management Charge 52150 0 0
0 0 Other Utility Services 52160 0 0
0 0 Sew er Charges 52170 0 0
0 0 Contracted Services 52205 0 0
0 0 Engineering Services 52210 0 0
0 0 Landscape Services 52215 0 0
0 0 Legal Services 52230 0 0
0 50,000 Professional Services 52240 75,000 75,000
224 0 Recording Fees 52250 0 0
0 0 Laundry 52260 0 0
0 0 Other Government Services 52270 0 0
97 500 Office Supplies 52305 500 500
0 0 Operating Supplies 52310 0 0
0 0 Gas, Oil, Lubrication 52315 0 0
0 0 Janitorial Supplies 52320 0 0
0 0 Tech & Scientif ic Supplies 52325 0 0
0 0 Repair & Maintenance Supplies 52330 0 0
0 0 Construction & Building Supplies 52335 0 0
0 0 Parts & Equipment 52340 0 0
157 0 Small Tools 52350 0 0
0 0 Safety Equipment 52360 0 0
83 0 Postage & Freight 52375 0 0
0 0 Softw are Expensed 52380 0 0
0 0 Computer Equipment Expensed 52385 0 0
3,263 2,700 Dues & Memberships 52405 7,700 7,700
134 300 Books, Subscriptions & Publications 52410 300 300
0 0 Softw are Licenses & Support 52425 0 0
0 0 Publication Notices 52430 0 0
1,175 0 Printing 52435 0 0
0 0 Fueling Contract 52475 0 0
5,426 4,700 Training & Education 52480 4,700 4,700
2,893 8,800 Travel Expense 52485 8,800 8,800
0 0 Fleet Charges 52486 0 0
4,124 3,600 Private Mileage 52487 3,600 3,600
6,472 4,000 Other Materials & Services 52495 4,000 4,000
150 0 Permits, Licenses & Fees 52500 0 0
0 0 Public Information 52505 0 0
0 0 Taxes, Assessments & Liens 52510 0 0
0 0 Bank Service Charge 52515 0 0
0 0 Equipment Rental 52605 0 0
0 0 Repair & Maintenance Services 52610 0 0
0 0 Non-vehicle Equipment Repair &
Maintenance
52620 0 0
0 0 Computer Repair & Maintenance 52630 0 0
0 0 Insurance 52705 0 0
0 0 Other Chemicals 52890 0 0
$ 24,199 $ 74,600 $ 104,600 $ 104,600
$ - $ - $ - $ -
$ 648,068 $ 926,800 $ 980,100 $ 980,100
Expenditure Summary 8201 - Conveyance Systems Administration
FY 2016 ACTUALFY 2019
ADOPTED
408,121 656,200
Conveyance Systems Department
0 0
101,909 216,100
0 0
48,316 0
0 0
$ 560,866 PERSONNEL EXPENSE SUBTOTAL $ 875,500
0 0
0 0
0 0
2,520 3,200
0 0
0 0
0 0
0 0
0 0
0 0
0 0
0 0
0 0
0 0
0 0
1,725 500
0 0
14,103 75,000
163 0
0 0
0 0
0 0
0 0
0 0
0 0
0 0
0 0
929 0
0 0
200 0
32 0
1,395 0
0 0
916 0
2,880 7,700
198 300
0 0
6,153 4,700
5,431 4,000
0 0
0 0
8,476 8,800
0 0
1,434 3,600
0 0
0 0
0 0
0 0
0 0
0 0
0 0
$ 44,034 MATERIALS & SERVICES SUBTOTAL $ 104,600
0 0
$ 604,900 TOTAL EXPENDITURE $ 980,100
$ - CAPITAL OUTLAY SUBTOTAL $ -

Clean Water Services FY 2018-19 Adopted Budget Page 142
CONVEYANCE SYSTEMS DEPARTMENT
POSITION AND SALARY EXPENSE CAPITAL PROJECTS ADMINISTRATION 8224
Total
FY 2016 FY 2017 FY 2018 FY 2019 Represented
ACTUAL ACTUAL BUDGET ADOPTED or
FTE Non-Rep
1.00 1.00 1.00 1.00 Administrative Assistant 4 Non
3.00 3.00 3.00 3.00 Construction Inspector 3 6 Rep
0.00 1.00 1.00 1.00 Easement Acquisition Specialist 6 Non
4.00 4.00 4.00 5.00 Engineer 8 Non
1.00 0.00 0.00 0.00 Engineering Technician 2 5 Rep
2.00 2.00 2.00 2.00 Engineering Technician 3 6 Rep
1.00 1.00 0.00 0.00 Principal Engineer 10 Non
1.00 2.00 2.00 2.00 Engineering Project Coordinator 7 Non
2.00 2.00 3.00 3.00 Senior Engineer 9 Non
1.00 0.00 1.00 1.00 Water Resources Project Manager 7 Non
1.00 0.00 0.00 0.00 Water Resources Specialist 4 Rep
17.00 16.00 17.00 18.00 TOTAL PERSONNEL
Operating
FY 2016 FY 2017 FY 2018 FY 2019 Represented
ACTUAL ACTUAL BUDGET ADOPTED or
FTE Non-Rep
0.50 0.50 0.70 0.70 Administrative Assistant 4 Non
0.60 0.60 0.60 0.60 Construction Inspector 3 6 Rep
0.00 0.25 0.25 0.25 Easement Acquisition Specialist 6 Non
1.20 1.20 1.20 1.20 Engineer 8 Non
0.30 0.00 0.00 0.00 Engineering Technician 2 5 Rep
0.60 0.60 0.60 0.60 Engineering Technician 3 6 Rep
0.50 0.50 0.00 0.00 Principal Engineer 10 Non
0.35 0.70 0.70 0.70 Engineering Project Coordinator 7 Non
0.80 0.80 0.80 0.80 Senior Engineer 9 Non
0.40 0.00 0.00 0.00 Water Resources Project Manager 7 Non
0.25 0.00 0.00 0.00 Water Resources Specialist 4 Rep
5.50 5.15 4.85 4.85 TOTAL PERSONNEL
Capital
FY 2016 FY 2017 FY 2018 FY 2019 Represented
ACTUAL ACTUAL BUDGET ADOPTED or
FTE Non-Rep
0.50 0.50 0.30 0.30 Administrative Assistant 4 Non
2.40 2.40 2.40 2.40 Construction Inspector 3 6 Rep
0.00 0.75 0.75 0.75 Easement Acquisition Specialist 6 Non
2.80 2.80 2.80 3.80 Engineer 8 Non
0.70 0.00 0.00 0.00 Engineering Technician 2 5 Rep
1.40 1.40 1.40 1.40 Engineering Technician 3 6 Rep
0.50 0.50 0.00 0.00 Principal Engineer 10 Non
0.65 1.30 1.30 1.30 Engineering Project Coordinator 7 Non
1.20 1.20 2.20 2.20 Senior Engineer 9 Non
0.60 0.00 1.00 1.00 Water Resources Project Manager 7 Non
0.75 0.00 0.00 0.00 Water Resources Specialist 4 Rep
11.50 10.85 12.15 13.15 TOTAL PERSONNEL
CLASSIFICATION TITLE
CLASSIFICATION TITLE
CLASSIFICATION TITLE
SALARY
GRADE
SALARY
GRADE
SALARY
GRADE

Clean Water Services FY 2018-19 Adopted Budget Page 143
FY 2017 ACTUAL FY 2018 BUDGET OBJECT CODE DESCRIPTIONOBJECT
CODE
FY 2019
PROPOSED
FY 2019
APPROVED
391,141 797,300 Wages & Other Pay 51100 850,500 850,500
116,774 40,000 Temporary 51130 60,000 60,000
1,493 5,000 Overtime 51140 5,000 5,000
0 0 Out of Class Straight Time 51170 0 0
(72,404) 301,400 Other Personnel Expenses 51600 345,600 345,600
0 0 Tuition Reimbursement 51761 0 0
1,015 1,200 Other Employee Allow ances 51900 3,200 3,200
0 0 Auto Allow ance 51910 0 0
3,765 4,500 Mobile Computing Allow ance 51915 6,100 6,100
$ 441,784 $ 1,149,400 $ 1,270,400 $ 1,270,400
5 0 Electricity 52110 0 0
0 0 Water 52120 0 0
0 0 Natural Gas 52130 0 0
0 0 Garbage 52140 0 0
0 0 Surface Water Management Charge 52150 0 0
0 0 Other Utility Services 52160 0 0
0 0 Sew er Charges 52170 0 0
3,000 10,000 Contracted Services 52205 10,000 10,000
0 40,000 Engineering Services 52210 40,000 40,000
0 0 Landscape Services 52215 0 0
0 0 Legal Services 52230 0 0
1,865 25,000 Professional Services 52240 25,000 25,000
0 0 Recording Fees 52250 0 0
0 0 Laundry 52260 0 0
675 1,000 Other Government Services 52270 1,000 1,000
236 600 Office Supplies 52305 600 600
59 500 Operating Supplies 52310 500 500
122 0 Gas, Oil, Lubrication 52315 0 0
0 0 Janitorial Supplies 52320 0 0
0 0 Tech & Scientif ic Supplies 52325 0 0
0 0 Repair & Maintenance Supplies 52330 0 0
0 0 Construction & Building Supplies 52335 0 0
0 0 Parts & Equipment 52340 0 0
196 2,100 Small Tools 52350 2,100 2,100
0 800 Safety Equipment 52360 800 800
126 0 Postage & Freight 52375 0 0
0 1,500 Softw are Expensed 52380 1,500 1,500
0 0 Computer Equipment Expensed 52385 0 0
5,195 3,000 Dues & Memberships 52405 5,500 5,500
320 500 Books, Subscriptions & Publications 52410 500 500
0 0 Softw are Licenses & Support 52425 0 0
519 0 Publication Notices 52430 0 0
89 500 Printing 52435 500 500
4,247 4,000 Fueling Contract 52475 4,000 4,000
12,164 11,400 Training & Education 52480 11,400 11,400
7,873 10,100 Travel Expense 52485 10,100 10,100
4,696 5,700 Fleet Charges 52486 5,700 5,700
4,366 3,500 Private Mileage 52487 3,500 3,500
1,562 1,600 Other Materials & Services 52495 2,400 2,400
100 0 Permits, Licenses & Fees 52500 0 0
0 0 Public Information 52505 0 0
0 0 Taxes, Assessments & Liens 52510 0 0
0 0 Bank Service Charge 52515 0 0
0 0 Equipment Rental 52605 0 0
0 0 Repair & Maintenance Services 52610 0 0
0 0 Non-vehicle Equipment Repair &
Maintenance
52620 0 0
0 0 Computer Repair & Maintenance 52630 0 0
0 0 Insurance 52705 0 0
0 0 Other Chemicals 52890 0 0
$ 47,414 $ 121,800 $ 125,100 $ 125,100
$ - $ - $ - $ -
$ 489,198 $ 1,271,200 $ 1,395,500 $ 1,395,500
Expenditure Summary 8224 - Capital Projects Administration
FY 2016 ACTUALFY 2019
ADOPTED
531,341 850,500
Conveyance Systems Department
0 0
(43,844) 345,600
0 0
83,403 60,000
928 5,000
$ 577,173 PERSONNEL EXPENSE SUBTOTAL $ 1,270,400
0 0
1,525 3,200
0 0
3,820 6,100
0 0
0 0
0 0
0 0
0 0
0 0
0 0
0 0
2,990 10,000
0 40,000
644 1,000
1,790 600
25 500
482 25,000
0 0
0 0
30 0
0 0
0 0
0 0
0 0
0 0
0 1,500
14,222 0
141 2,100
0 800
98 0
0 0
0 0
0 500
2,227 5,500
0 500
4,577 4,000
10,059 11,400
1,624 2,400
0 0
0 0
8,795 10,100
4,498 5,700
2,995 3,500
0 0
0 0
0 0
0 0
0 0
0 0
0 0
$ 55,196 MATERIALS & SERVICES SUBTOTAL $ 125,100
0 0
$ 632,369 TOTAL EXPENDITURE $ 1,395,500
$ - CAPITAL OUTLAY SUBTOTAL $ -

Clean Water Services FY 2018-19 Adopted Budget Page 144
CONVEYANCE SYSTEMS DEPARTMENT
POSITION AND SALARY EXPENSE DEVELOPMENT RELATED SERVICES 8225
Total
FY 2016 FY 2017 FY 2018 FY 2019 Represented
ACTUAL ACTUAL BUDGET ADOPTED or
FTE Non-Rep
1.00 1.00 1.00 1.00 Construction Inspection Supervisor 8 Non
5.00 5.00 5.00 5.00 Construction Inspector 2 5 Rep
1.00 1.00 1.00 1.00 Construction Inspector 3 6 Rep
1.00 0.00 0.00 0.00 Development Services Manager 10 Non
1.00 1.00 1.00 1.00 Development Services Supervisor 8 Non
1.00 1.00 1.00 1.00 Engineering Technician 2 5 Rep
2.00 2.00 2.00 2.00 Engineering Technician 3 6 Rep
1.00 1.00 1.00 1.00 GIS Analyst 7 Non
2.00 2.00 2.00 2.00 Permits Technician 2 3 Rep
1.00 1.00 1.00 1.00 Permit/Mapping Supervisor 8 Non
1.00 1.00 1.00 1.00 Plan Reviewer - Engineering 7 Non
1.00 1.00 1.00 1.00 Plan Reviewer - Environmental 7 Non
0.00 0.00 1.00 1.00 Senior Water Resources Program Manager 10 Non
0.00 0.00 0.00 1.00 Water Resources Program Manager 9 Non
1.00 1.00 1.00 1.00 Business Systems Analyst 2 8 Non
19.00 18.00 19.00 20.00 TOTAL PERSONNEL
Operating
FY 2016 FY 2017 FY 2018 FY 2019 Represented
ACTUAL ACTUAL BUDGET ADOPTED or
FTE Non-Rep
1.00 1.00 1.00 1.00 Construction Inspection Supervisor 8 Non
5.00 5.00 5.00 5.00 Construction Inspector 2 5 Rep
1.00 1.00 1.00 1.00 Construction Inspector 3 6 Rep
0.90 0.00 0.00 0.00 Development Services Manager 10 Non
0.90 0.90 0.90 0.90 Development Services Supervisor 8 Non
1.00 1.00 1.00 1.00 Engineering Technician 2 5 Rep
1.90 1.90 1.90 1.90 Engineering Technician 3 6 Rep
1.00 1.00 1.00 1.00 GIS Analyst 7 Non
2.00 2.00 2.00 2.00 Permits Technician 2 3 Rep
1.00 1.00 1.00 1.00 Permit/Mapping Supervisor 8 Non
1.00 1.00 1.00 1.00 Plan Reviewer - Engineering 7 Non
1.00 1.00 1.00 1.00 Plan Reviewer - Environmental 7 Non
0.00 0.00 1.00 1.00 Senior Water Resources Program Manager 10 Non
0.00 0.00 0.00 0.70 Water Resources Program Manager 9 Non
1.00 1.00 1.00 1.00 Business Systems Analyst 2 8 Non
18.70 17.80 18.80 19.50 TOTAL PERSONNEL
Capital
FY 2016 FY 2017 FY 2018 FY 2019 Represented
ACTUAL ACTUAL BUDGET ADOPTED or
FTE Non-Rep
0.00 0.00 0.00 0.00 Construction Inspection Supervisor 8 Non
0.00 0.00 0.00 0.00 Construction Inspector 2 5 Rep
0.00 0.00 0.00 0.00 Construction Inspector 3 6 Rep
0.10 0.00 0.00 0.00 Development Services Manager 10 Non
0.10 0.10 0.10 0.10 Development Services Supervisor 8 Non
0.00 0.00 0.00 0.00 Engineering Technician 2 5 Rep
0.10 0.10 0.10 0.10 Engineering Technician 3 6 Rep
0.00 0.00 0.00 0.00 GIS Analyst 7 Non
0.00 0.00 0.00 0.00 Permits Technician 2 3 Rep
0.00 0.00 0.00 0.00 Permit/Mapping Supervisor 8 Rep
0.00 0.00 0.00 0.00 Plan Reviewer - Engineering 7 Non
0.00 0.00 0.00 0.00 Plan Reviewer - Environmental 7 Non
0.00 0.00 0.00 0.00 Senior Water Resources Program Manager 10 Non
0.00 0.00 0.00 0.30 Water Resources Program Manager 9 Non
0.00 0.00 0.00 0.00 Business Systems Analyst 2 8 Non
0.30 0.20 0.20 0.50 TOTAL PERSONNEL
CLASSIFICATION TITLE
CLASSIFICATION TITLE
CLASSIFICATION TITLE
SALARY
GRADE
SALARY
GRADE
SALARY
GRADE
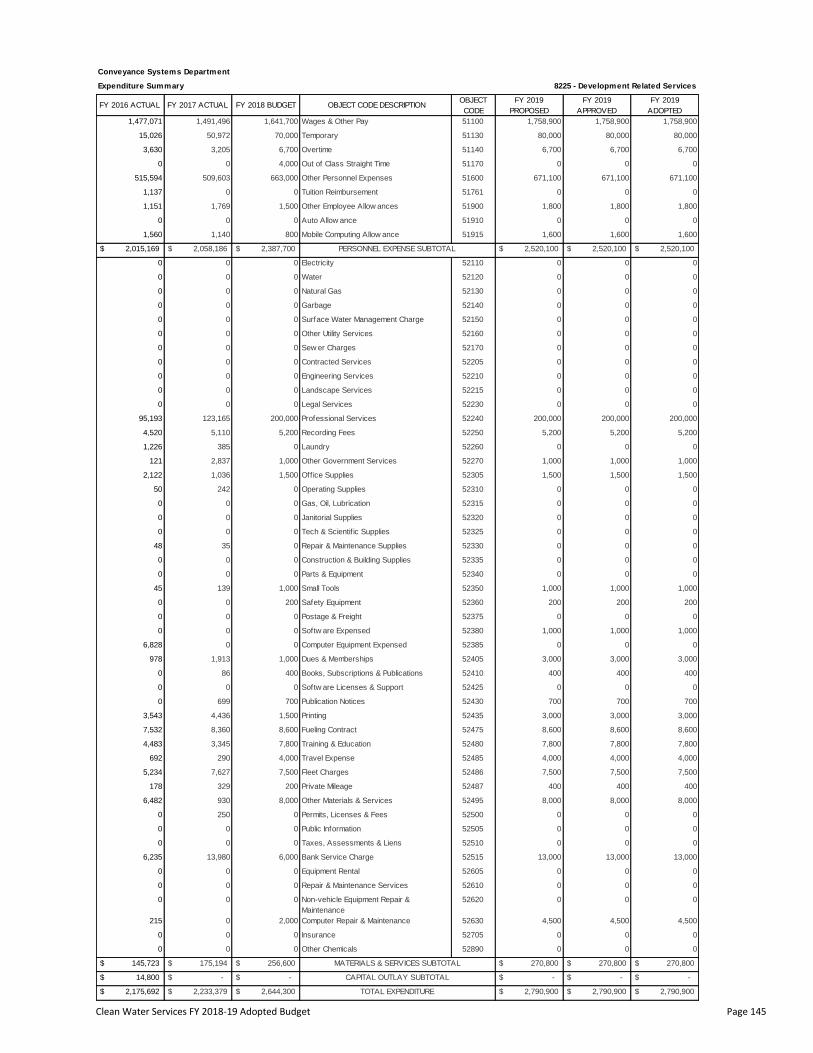
Clean Water Services FY 2018-19 Adopted Budget Page 145
FY 2017 ACTUAL FY 2018 BUDGET OBJECT CODE DESCRIPTIONOBJECT
CODE
FY 2019
PROPOSED
FY 2019
APPROVED
1,491,496 1,641,700 Wages & Other Pay 51100 1,758,900 1,758,900
50,972 70,000 Temporary 51130 80,000 80,000
3,205 6,700 Overtime 51140 6,700 6,700
0 4,000 Out of Class Straight Time 51170 0 0
509,603 663,000 Other Personnel Expenses 51600 671,100 671,100
0 0 Tuition Reimbursement 51761 0 0
1,769 1,500 Other Employee Allow ances 51900 1,800 1,800
0 0 Auto Allow ance 51910 0 0
1,140 800 Mobile Computing Allow ance 51915 1,600 1,600
$ 2,058,186 $ 2,387,700 $ 2,520,100 $ 2,520,100
0 0 Electricity 52110 0 0
0 0 Water 52120 0 0
0 0 Natural Gas 52130 0 0
0 0 Garbage 52140 0 0
0 0 Surface Water Management Charge 52150 0 0
0 0 Other Utility Services 52160 0 0
0 0 Sew er Charges 52170 0 0
0 0 Contracted Services 52205 0 0
0 0 Engineering Services 52210 0 0
0 0 Landscape Services 52215 0 0
0 0 Legal Services 52230 0 0
123,165 200,000 Professional Services 52240 200,000 200,000
5,110 5,200 Recording Fees 52250 5,200 5,200
385 0 Laundry 52260 0 0
2,837 1,000 Other Government Services 52270 1,000 1,000
1,036 1,500 Office Supplies 52305 1,500 1,500
242 0 Operating Supplies 52310 0 0
0 0 Gas, Oil, Lubrication 52315 0 0
0 0 Janitorial Supplies 52320 0 0
0 0 Tech & Scientif ic Supplies 52325 0 0
35 0 Repair & Maintenance Supplies 52330 0 0
0 0 Construction & Building Supplies 52335 0 0
0 0 Parts & Equipment 52340 0 0
139 1,000 Small Tools 52350 1,000 1,000
0 200 Safety Equipment 52360 200 200
0 0 Postage & Freight 52375 0 0
0 0 Softw are Expensed 52380 1,000 1,000
0 0 Computer Equipment Expensed 52385 0 0
1,913 1,000 Dues & Memberships 52405 3,000 3,000
86 400 Books, Subscriptions & Publications 52410 400 400
0 0 Softw are Licenses & Support 52425 0 0
699 700 Publication Notices 52430 700 700
4,436 1,500 Printing 52435 3,000 3,000
8,360 8,600 Fueling Contract 52475 8,600 8,600
3,345 7,800 Training & Education 52480 7,800 7,800
290 4,000 Travel Expense 52485 4,000 4,000
7,627 7,500 Fleet Charges 52486 7,500 7,500
329 200 Private Mileage 52487 400 400
930 8,000 Other Materials & Services 52495 8,000 8,000
250 0 Permits, Licenses & Fees 52500 0 0
0 0 Public Information 52505 0 0
0 0 Taxes, Assessments & Liens 52510 0 0
13,980 6,000 Bank Service Charge 52515 13,000 13,000
0 0 Equipment Rental 52605 0 0
0 0 Repair & Maintenance Services 52610 0 0
0 0 Non-vehicle Equipment Repair &
Maintenance
52620 0 0
0 2,000 Computer Repair & Maintenance 52630 4,500 4,500
0 0 Insurance 52705 0 0
0 0 Other Chemicals 52890 0 0
$ 175,194 $ 256,600 $ 270,800 $ 270,800
$ - $ - $ - $ -
$ 2,233,379 $ 2,644,300 $ 2,790,900 $ 2,790,900
Expenditure Summary 8225 - Development Related Services
FY 2016 ACTUALFY 2019
ADOPTED
1,477,071 1,758,900
Conveyance Systems Department
0 0
515,594 671,100
1,137 0
15,026 80,000
3,630 6,700
$ 2,015,169 PERSONNEL EXPENSE SUBTOTAL $ 2,520,100
0 0
1,151 1,800
0 0
1,560 1,600
0 0
0 0
0 0
0 0
0 0
0 0
0 0
0 0
0 0
0 0
121 1,000
2,122 1,500
50 0
95,193 200,000
4,520 5,200
1,226 0
48 0
0 0
0 0
0 0
0 0
0 0
0 1,000
6,828 0
45 1,000
0 200
0 0
0 0
0 700
3,543 3,000
978 3,000
0 400
7,532 8,600
4,483 7,800
6,482 8,000
0 0
0 0
692 4,000
5,234 7,500
178 400
0 0
0 0
6,235 13,000
0 0
0 0
0 0
215 4,500
$ 145,723 MATERIALS & SERVICES SUBTOTAL $ 270,800
0 0
$ 2,175,692 TOTAL EXPENDITURE $ 2,790,900
$ 14,800 CAPITAL OUTLAY SUBTOTAL $ -

Clean Water Services FY 2018-19 Adopted Budget Page 146
CONVEYANCE SYSTEMS DEPARTMENT
POSITION AND SALARY EXPENSE SYSTEMS PLANNING 8226
Total
FY 2016 FY 2017 FY 2018 FY 2019 Represented
ACTUAL ACTUAL BUDGET ADOPTED or
FTE Non-Rep
1.00 1.00 1.00 1.00 Development Services Supervisor 8 Non
1.00 1.00 1.00 1.00 Inspection Program Manager 7 Non
1.00 1.00 1.00 1.00 Engineering Technician 2 5 Rep
1.00 1.00 1.00 1.00 Plan Reviewer 7 Non
4.00 4.00 4.00 4.00 TOTAL PERSONNEL
Operating
FY 2016 FY 2017 FY 2018 FY 2019 Represented
ACTUAL ACTUAL BUDGET ADOPTED or
FTE Non-Rep
1.00 1.00 1.00 1.00 Development Services Supervisor 8 Non
1.00 1.00 1.00 1.00 Inspection Program Manager 7 Non
1.00 1.00 1.00 1.00 Engineering Technician 2 5 Rep
1.00 1.00 1.00 1.00 Plan Reviewer 7 Non
4.00 4.00 4.00 4.00 TOTAL PERSONNEL
Capital
FY 2016 FY 2017 FY 2018 FY 2019 Represented
ACTUAL ACTUAL BUDGET ADOPTED or
FTE Non-Rep
0.00 0.00 0.00 0.00 Development Services Supervisor 8 Non
0.00 0.00 0.00 0.00 Inspection Program Manager 7 Non
0.00 0.00 0.00 0.00 Engineering Technician 2 5 Rep
0.00 0.00 0.00 0.00 Plan Reviewer 7 Non
0.00 0.00 0.00 0.00 TOTAL PERSONNEL
CLASSIFICATION TITLE
CLASSIFICATION TITLE
CLASSIFICATION TITLE
SALARY
GRADE
SALARY
GRADE
SALARY
GRADE
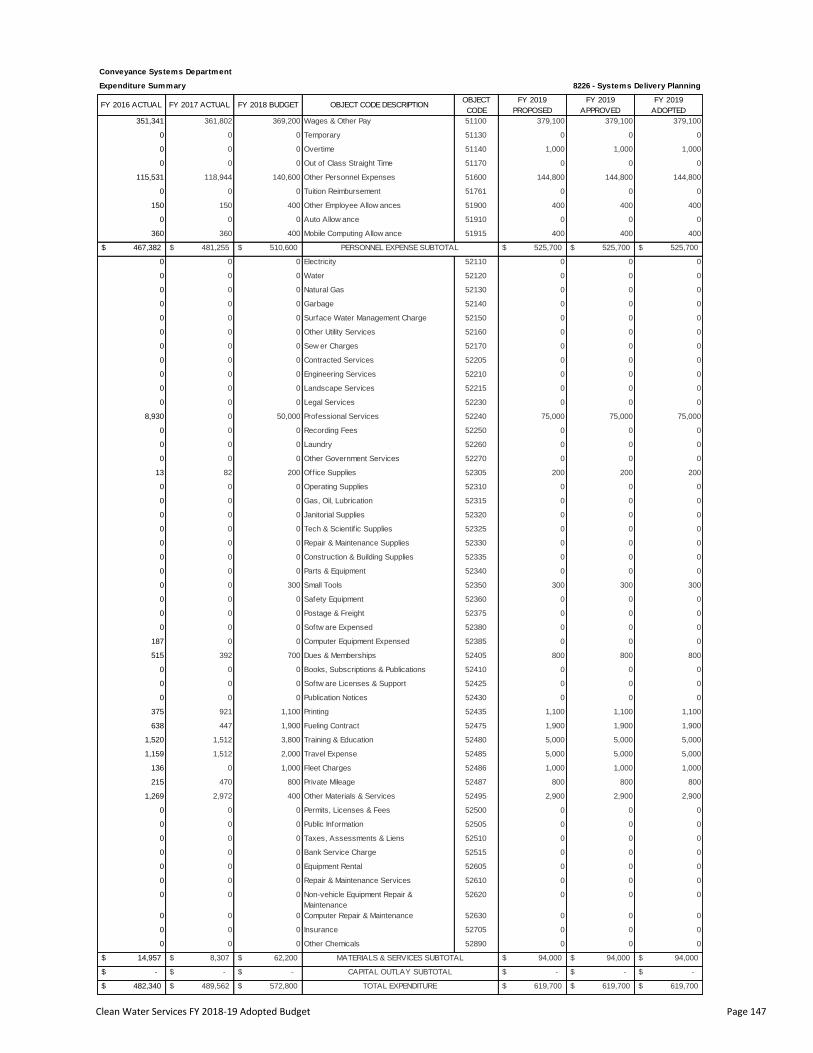
Clean Water Services FY 2018-19 Adopted Budget Page 147
FY 2017 ACTUAL FY 2018 BUDGET OBJECT CODE DESCRIPTIONOBJECT
CODE
FY 2019
PROPOSED
FY 2019
APPROVED
361,802 369,200 Wages & Other Pay 51100 379,100 379,100
0 0 Temporary 51130 0 0
0 0 Overtime 51140 1,000 1,000
0 0 Out of Class Straight Time 51170 0 0
118,944 140,600 Other Personnel Expenses 51600 144,800 144,800
0 0 Tuition Reimbursement 51761 0 0
150 400 Other Employee Allow ances 51900 400 400
0 0 Auto Allow ance 51910 0 0
360 400 Mobile Computing Allow ance 51915 400 400
$ 481,255 $ 510,600 $ 525,700 $ 525,700
0 0 Electricity 52110 0 0
0 0 Water 52120 0 0
0 0 Natural Gas 52130 0 0
0 0 Garbage 52140 0 0
0 0 Surface Water Management Charge 52150 0 0
0 0 Other Utility Services 52160 0 0
0 0 Sew er Charges 52170 0 0
0 0 Contracted Services 52205 0 0
0 0 Engineering Services 52210 0 0
0 0 Landscape Services 52215 0 0
0 0 Legal Services 52230 0 0
0 50,000 Professional Services 52240 75,000 75,000
0 0 Recording Fees 52250 0 0
0 0 Laundry 52260 0 0
0 0 Other Government Services 52270 0 0
82 200 Office Supplies 52305 200 200
0 0 Operating Supplies 52310 0 0
0 0 Gas, Oil, Lubrication 52315 0 0
0 0 Janitorial Supplies 52320 0 0
0 0 Tech & Scientif ic Supplies 52325 0 0
0 0 Repair & Maintenance Supplies 52330 0 0
0 0 Construction & Building Supplies 52335 0 0
0 0 Parts & Equipment 52340 0 0
0 300 Small Tools 52350 300 300
0 0 Safety Equipment 52360 0 0
0 0 Postage & Freight 52375 0 0
0 0 Softw are Expensed 52380 0 0
0 0 Computer Equipment Expensed 52385 0 0
392 700 Dues & Memberships 52405 800 800
0 0 Books, Subscriptions & Publications 52410 0 0
0 0 Softw are Licenses & Support 52425 0 0
0 0 Publication Notices 52430 0 0
921 1,100 Printing 52435 1,100 1,100
447 1,900 Fueling Contract 52475 1,900 1,900
1,512 3,800 Training & Education 52480 5,000 5,000
1,512 2,000 Travel Expense 52485 5,000 5,000
0 1,000 Fleet Charges 52486 1,000 1,000
470 800 Private Mileage 52487 800 800
2,972 400 Other Materials & Services 52495 2,900 2,900
0 0 Permits, Licenses & Fees 52500 0 0
0 0 Public Information 52505 0 0
0 0 Taxes, Assessments & Liens 52510 0 0
0 0 Bank Service Charge 52515 0 0
0 0 Equipment Rental 52605 0 0
0 0 Repair & Maintenance Services 52610 0 0
0 0 Non-vehicle Equipment Repair &
Maintenance
52620 0 0
0 0 Computer Repair & Maintenance 52630 0 0
0 0 Insurance 52705 0 0
0 0 Other Chemicals 52890 0 0
$ 8,307 $ 62,200 $ 94,000 $ 94,000
$ - $ - $ - $ -
$ 489,562 $ 572,800 $ 619,700 $ 619,700
Expenditure Summary 8226 - Systems Delivery Planning
FY 2016 ACTUALFY 2019
ADOPTED
351,341 379,100
Conveyance Systems Department
0 0
115,531 144,800
0 0
0 0
0 1,000
$ 467,382 PERSONNEL EXPENSE SUBTOTAL $ 525,700
0 0
150 400
0 0
360 400
0 0
0 0
0 0
0 0
0 0
0 0
0 0
0 0
0 0
0 0
0 0
13 200
0 0
8,930 75,000
0 0
0 0
0 0
0 0
0 0
0 0
0 0
0 0
0 0
187 0
0 300
0 0
0 0
0 0
0 0
375 1,100
515 800
0 0
638 1,900
1,520 5,000
1,269 2,900
0 0
0 0
1,159 5,000
136 1,000
215 800
0 0
0 0
0 0
0 0
0 0
0 0
0 0
$ 14,957 MATERIALS & SERVICES SUBTOTAL $ 94,000
0 0
$ 482,340 TOTAL EXPENDITURE $ 619,700
$ - CAPITAL OUTLAY SUBTOTAL $ -

Clean Water Services FY 2018-19 Adopted Budget Page 148
CONVEYANCE SYSTEMS DEPARTMENT
POSITION AND SALARY EXPENSE FIELD OPERATIONS ADMINISTRATION 8370
Total
FY 2016 FY 2017 FY 2018 FY 2019 Represented
ACTUAL ACTUAL BUDGET ADOPTED or
FTE Non-Rep
2.00 2.00 2.00 2.00 Administrative Associate 3 Non
1.00 1.00 1.00 2.00 Operations Coordinator 5 Non
0.00 0.00 1.00 1.00 Sr Management Analyst 8 Non
3.00 3.00 4.00 5.00 TOTAL PERSONNEL
Operating
FY 2016 FY 2017 FY 2018 FY 2019 Represented
ACTUAL ACTUAL BUDGET ADOPTED or
FTE Non-Rep
2.00 2.00 2.00 2.00 Administrative Associate 3 Non
1.00 1.00 1.00 2.00 Operations Coordinator 5 Non
0.00 0.00 1.00 1.00 Sr Management Analyst 8 Non
3.00 3.00 4.00 5.00 TOTAL PERSONNEL
Capital
FY 2016 FY 2017 FY 2018 FY 2019 Represented
ACTUAL ACTUAL BUDGET ADOPTED or
FTE Non-Rep
0.00 0.00 0.00 0.00 Administrative Associate 3 Non
0.00 0.00 0.00 0.00 Operations Coordinator 5 Non
0.00 0.00 0.00 0.00 Sr Management Analyst 8 Non
0.00 0.00 0.00 0.00 TOTAL PERSONNEL
CLASSIFICATION TITLE
CLASSIFICATION TITLE
CLASSIFICATION TITLE
SALARY
GRADE
SALARY
GRADE
SALARY
GRADE
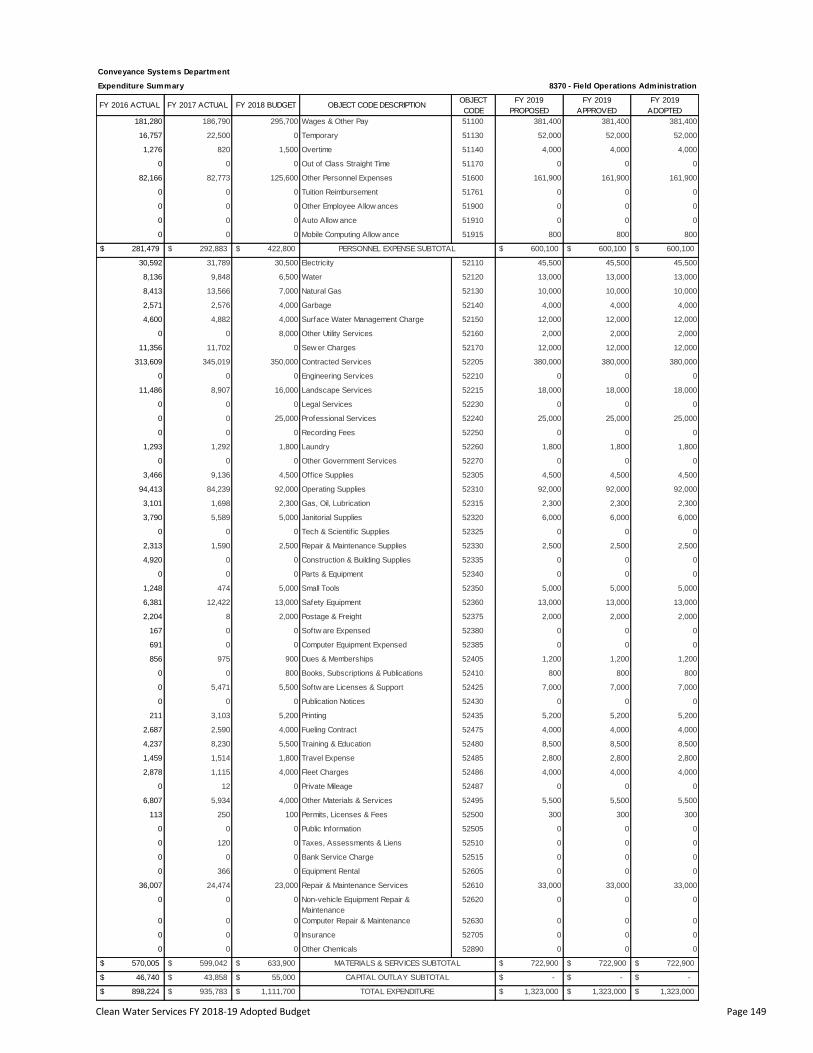
Clean Water Services FY 2018-19 Adopted Budget Page 149
FY 2017 ACTUAL FY 2018 BUDGET OBJECT CODE DESCRIPTIONOBJECT
CODE
FY 2019
PROPOSED
FY 2019
APPROVED
186,790 295,700 Wages & Other Pay 51100 381,400 381,400
22,500 0 Temporary 51130 52,000 52,000
820 1,500 Overtime 51140 4,000 4,000
0 0 Out of Class Straight Time 51170 0 0
82,773 125,600 Other Personnel Expenses 51600 161,900 161,900
0 0 Tuition Reimbursement 51761 0 0
0 0 Other Employee Allow ances 51900 0 0
0 0 Auto Allow ance 51910 0 0
0 0 Mobile Computing Allow ance 51915 800 800
$ 292,883 $ 422,800 $ 600,100 $ 600,100
31,789 30,500 Electricity 52110 45,500 45,500
9,848 6,500 Water 52120 13,000 13,000
13,566 7,000 Natural Gas 52130 10,000 10,000
2,576 4,000 Garbage 52140 4,000 4,000
4,882 4,000 Surface Water Management Charge 52150 12,000 12,000
0 8,000 Other Utility Services 52160 2,000 2,000
11,702 0 Sew er Charges 52170 12,000 12,000
345,019 350,000 Contracted Services 52205 380,000 380,000
0 0 Engineering Services 52210 0 0
8,907 16,000 Landscape Services 52215 18,000 18,000
0 0 Legal Services 52230 0 0
0 25,000 Professional Services 52240 25,000 25,000
0 0 Recording Fees 52250 0 0
1,292 1,800 Laundry 52260 1,800 1,800
0 0 Other Government Services 52270 0 0
9,136 4,500 Office Supplies 52305 4,500 4,500
84,239 92,000 Operating Supplies 52310 92,000 92,000
1,698 2,300 Gas, Oil, Lubrication 52315 2,300 2,300
5,589 5,000 Janitorial Supplies 52320 6,000 6,000
0 0 Tech & Scientif ic Supplies 52325 0 0
1,590 2,500 Repair & Maintenance Supplies 52330 2,500 2,500
0 0 Construction & Building Supplies 52335 0 0
0 0 Parts & Equipment 52340 0 0
474 5,000 Small Tools 52350 5,000 5,000
12,422 13,000 Safety Equipment 52360 13,000 13,000
8 2,000 Postage & Freight 52375 2,000 2,000
0 0 Softw are Expensed 52380 0 0
0 0 Computer Equipment Expensed 52385 0 0
975 900 Dues & Memberships 52405 1,200 1,200
0 800 Books, Subscriptions & Publications 52410 800 800
5,471 5,500 Softw are Licenses & Support 52425 7,000 7,000
0 0 Publication Notices 52430 0 0
3,103 5,200 Printing 52435 5,200 5,200
2,590 4,000 Fueling Contract 52475 4,000 4,000
8,230 5,500 Training & Education 52480 8,500 8,500
1,514 1,800 Travel Expense 52485 2,800 2,800
1,115 4,000 Fleet Charges 52486 4,000 4,000
12 0 Private Mileage 52487 0 0
5,934 4,000 Other Materials & Services 52495 5,500 5,500
250 100 Permits, Licenses & Fees 52500 300 300
0 0 Public Information 52505 0 0
120 0 Taxes, Assessments & Liens 52510 0 0
0 0 Bank Service Charge 52515 0 0
366 0 Equipment Rental 52605 0 0
24,474 23,000 Repair & Maintenance Services 52610 33,000 33,000
0 0 Non-vehicle Equipment Repair &
Maintenance
52620 0 0
0 0 Computer Repair & Maintenance 52630 0 0
0 0 Insurance 52705 0 0
0 0 Other Chemicals 52890 0 0
$ 599,042 $ 633,900 $ 722,900 $ 722,900
$ 43,858 $ 55,000 $ - $ -
$ 935,783 $ 1,111,700 $ 1,323,000 $ 1,323,000
Expenditure Summary 8370 - Field Operations Administration
FY 2016 ACTUALFY 2019
ADOPTED
181,280 381,400
Conveyance Systems Department
0 0
82,166 161,900
0 0
16,757 52,000
1,276 4,000
$ 281,479 PERSONNEL EXPENSE SUBTOTAL $ 600,100
30,592 45,500
0 0
0 0
0 800
2,571 4,000
4,600 12,000
0 2,000
8,136 13,000
8,413 10,000
11,486 18,000
0 0
11,356 12,000
313,609 380,000
0 0
0 0
3,466 4,500
94,413 92,000
0 25,000
0 0
1,293 1,800
2,313 2,500
4,920 0
0 0
3,101 2,300
3,790 6,000
0 0
167 0
691 0
1,248 5,000
6,381 13,000
2,204 2,000
0 7,000
0 0
211 5,200
856 1,200
0 800
2,687 4,000
4,237 8,500
6,807 5,500
113 300
0 0
1,459 2,800
2,878 4,000
0 0
0 0
0 0
0 0
0 0
36,007 33,000
0 0
0 0
$ 570,005 MATERIALS & SERVICES SUBTOTAL $ 722,900
0 0
$ 898,224 TOTAL EXPENDITURE $ 1,323,000
$ 46,740 CAPITAL OUTLAY SUBTOTAL $ -

Clean Water Services FY 2018-19 Adopted Budget Page 150
CONVEYANCE SYSTEMS DEPARTMENT
POSITION AND SALARY EXPENSE SYSTEM REPAIR 8371
Total
FY 2016 FY 2017 FY 2018 FY 2019 Represented
ACTUAL ACTUAL BUDGET ADOPTED or
FTE Non-Rep
12.00 12.00 13.00 13.00 Field Construction/Maintenance Tech 2 5 Rep
1.00 1.00 1.00 1.00 Field Constr/Maint Supervisor 7 Non
13.00 13.00 14.00 14.00 TOTAL PERSONNEL
Operating
FY 2016 FY 2017 FY 2018 FY 2019 Represented
ACTUAL ACTUAL BUDGET ADOPTED or
FTE Non-Rep
4.80 4.80 5.20 5.20 Field Construction/Maintenance Tech 2 5 Rep
0.80 0.80 0.80 0.80 Field Constr/Maint Supervisor 7 Non
5.60 5.60 6.00 6.00 TOTAL PERSONNEL
Capital
FY 2016 FY 2017 FY 2018 FY 2019 Represented
ACTUAL ACTUAL BUDGET ADOPTED or
FTE Non-Rep
7.20 7.20 7.80 7.80 Field Construction/Maintenance Tech 2 5 Rep
0.20 0.20 0.20 0.20 Field Constr/Maint Supervisor 7 Non
7.40 7.40 8.00 8.00 TOTAL PERSONNEL
CLASSIFICATION TITLE
CLASSIFICATION TITLE
CLASSIFICATION TITLE
SALARY
GRADE
SALARY
GRADE
SALARY
GRADE

Clean Water Services FY 2018-19 Adopted Budget Page 151
FY 2017 ACTUAL FY 2018 BUDGET OBJECT CODE DESCRIPTIONOBJECT
CODE
FY 2019
PROPOSED
FY 2019
APPROVED
445,758 753,600 Wages & Other Pay 51100 767,900 767,900
3,332 0 Temporary 51130 0 0
26,991 25,000 Overtime 51140 25,000 25,000
0 0 Out of Class Straight Time 51170 0 0
82,665 309,200 Other Personnel Expenses 51600 339,200 339,200
0 0 Tuition Reimbursement 51761 0 0
1,686 2,000 Other Employee Allow ances 51900 2,800 2,800
0 0 Auto Allow ance 51910 0 0
840 800 Mobile Computing Allow ance 51915 800 800
$ 561,271 $ 1,090,600 $ 1,135,700 $ 1,135,700
0 0 Electricity 52110 0 0
0 0 Water 52120 0 0
0 0 Natural Gas 52130 0 0
0 3,000 Garbage 52140 3,000 3,000
0 0 Surface Water Management Charge 52150 0 0
0 0 Other Utility Services 52160 0 0
0 0 Sew er Charges 52170 0 0
2,544 20,000 Contracted Services 52205 20,000 20,000
0 0 Engineering Services 52210 0 0
0 0 Landscape Services 52215 0 0
0 0 Legal Services 52230 0 0
0 0 Professional Services 52240 0 0
0 0 Recording Fees 52250 0 0
6,017 5,000 Laundry 52260 6,000 6,000
0 0 Other Government Services 52270 0 0
0 0 Office Supplies 52305 0 0
114 2,000 Operating Supplies 52310 2,000 2,000
8,720 7,000 Gas, Oil, Lubrication 52315 7,000 7,000
0 0 Janitorial Supplies 52320 0 0
0 0 Tech & Scientif ic Supplies 52325 0 0
62,766 55,900 Repair & Maintenance Supplies 52330 55,900 55,900
70,673 100,000 Construction & Building Supplies 52335 100,000 100,000
0 0 Parts & Equipment 52340 0 0
7,421 9,200 Small Tools 52350 9,200 9,200
636 0 Safety Equipment 52360 0 0
25 0 Postage & Freight 52375 0 0
0 0 Softw are Expensed 52380 0 0
0 0 Computer Equipment Expensed 52385 0 0
334 300 Dues & Memberships 52405 300 300
0 0 Books, Subscriptions & Publications 52410 0 0
0 0 Softw are Licenses & Support 52425 0 0
0 0 Publication Notices 52430 0 0
0 0 Printing 52435 0 0
28,518 44,200 Fueling Contract 52475 44,200 44,200
3,045 4,600 Training & Education 52480 5,500 5,500
4,614 3,700 Travel Expense 52485 4,000 4,000
78,062 87,500 Fleet Charges 52486 87,500 87,500
1,974 0 Private Mileage 52487 0 0
343 0 Other Materials & Services 52495 0 0
13 0 Permits, Licenses & Fees 52500 0 0
0 0 Public Information 52505 0 0
0 0 Taxes, Assessments & Liens 52510 0 0
0 0 Bank Service Charge 52515 0 0
1,585 13,500 Equipment Rental 52605 13,500 13,500
411 0 Repair & Maintenance Services 52610 0 0
0 0 Non-vehicle Equipment Repair &
Maintenance
52620 0 0
0 0 Computer Repair & Maintenance 52630 0 0
0 0 Insurance 52705 0 0
0 0 Other Chemicals 52890 0 0
$ 277,814 $ 355,900 $ 358,100 $ 358,100
$ 15,071 $ 37,000 $ - $ -
$ 854,156 $ 1,483,500 $ 1,493,800 $ 1,493,800
Expenditure Summary 8371 - System Repair
FY 2016 ACTUALFY 2019
ADOPTED
404,983 767,900
Conveyance Systems Department
0 0
40,211 339,200
0 0
3,470 0
23,575 25,000
$ 475,063 PERSONNEL EXPENSE SUBTOTAL $ 1,135,700
0 0
1,984 2,800
0 0
840 800
0 3,000
0 0
0 0
140 0
0 0
0 0
0 0
0 0
3,400 20,000
0 0
0 0
0 0
894 2,000
0 0
0 0
5,993 6,000
31,147 55,900
101,257 100,000
148 0
10,788 7,000
0 0
0 0
0 0
3,194 0
10,595 9,200
90 0
0 0
0 0
0 0
0 0
256 300
0 0
33,284 44,200
1,860 5,500
86 0
0 0
0 0
563 4,000
95,494 87,500
78 0
14,410 13,500
0 0
0 0
0 0
0 0
0 0
0 0
$ 313,676 MATERIALS & SERVICES SUBTOTAL $ 358,100
0 0
$ 828,047 TOTAL EXPENDITURE $ 1,493,800
$ 39,308 CAPITAL OUTLAY SUBTOTAL $ -

Clean Water Services FY 2018-19 Adopted Budget Page 152
CONVEYANCE SYSTEMS DEPARTMENT
POSITION AND SALARY EXPENSE SYSTEM MAINTENANCE 8373
Total
FY 2016 FY 2017 FY 2018 FY 2019 Represented
ACTUAL ACTUAL BUDGET ADOPTED or
FTE Non-Rep
14.00 14.00 14.00 14.00 Field Construction/Maintenance Tech 2 5 Rep
1.00 1.00 1.00 1.00 Field Constr/Maint Supervisor 7 Non
15.00 15.00 15.00 15.00 TOTAL PERSONNEL
Operating
FY 2016 FY 2017 FY 2018 FY 2019 Represented
ACTUAL ACTUAL BUDGET ADOPTED or
FTE Non-Rep
14.00 14.00 14.00 14.00 Field Construction/Maintenance Tech 2 5 Rep
1.00 1.00 1.00 1.00 Field Constr/Maint Supervisor 7 Non
15.00 15.00 15.00 15.00 TOTAL PERSONNEL
Capital
FY 2016 FY 2017 FY 2018 FY 2019 Represented
ACTUAL ACTUAL BUDGET ADOPTED or
FTE Non-Rep
0.00 0.00 0.00 0.00 Field Construction/Maintenance Tech 2 5 Rep
0.00 0.00 0.00 0.00 Field Constr/Maint Supervisor 7 Non
0.00 0.00 0.00 0.00 TOTAL PERSONNEL
CLASSIFICATION TITLE
CLASSIFICATION TITLE
CLASSIFICATION TITLE
SALARY
GRADE
SALARY
GRADE
SALARY
GRADE

Clean Water Services FY 2018-19 Adopted Budget Page 153
FY 2017 ACTUAL FY 2018 BUDGET OBJECT CODE DESCRIPTIONOBJECT
CODE
FY 2019
PROPOSED
FY 2019
APPROVED
1,034,960 1,100,100 Wages & Other Pay 51100 1,061,000 1,061,000
21,672 35,000 Temporary 51130 42,000 42,000
21,678 30,000 Overtime 51140 30,000 30,000
0 0 Out of Class Straight Time 51170 0 0
423,388 476,800 Other Personnel Expenses 51600 507,800 507,800
0 0 Tuition Reimbursement 51761 0 0
2,207 2,300 Other Employee Allow ances 51900 3,000 3,000
0 0 Auto Allow ance 51910 0 0
840 800 Mobile Computing Allow ance 51915 800 800
$ 1,504,745 $ 1,645,000 $ 1,644,600 $ 1,644,600
0 0 Electricity 52110 0 0
14,996 14,000 Water 52120 16,000 16,000
0 0 Natural Gas 52130 0 0
46,545 75,000 Garbage 52140 75,000 75,000
0 0 Surface Water Management Charge 52150 0 0
0 0 Other Utility Services 52160 0 0
0 0 Sew er Charges 52170 0 0
31,591 102,000 Contracted Services 52205 117,000 117,000
0 0 Engineering Services 52210 0 0
0 0 Landscape Services 52215 0 0
0 0 Legal Services 52230 0 0
0 0 Professional Services 52240 0 0
0 0 Recording Fees 52250 0 0
6,732 6,000 Laundry 52260 6,800 6,800
0 0 Other Government Services 52270 0 0
0 300 Office Supplies 52305 300 300
1,078 700 Operating Supplies 52310 700 700
4,526 4,000 Gas, Oil, Lubrication 52315 4,000 4,000
0 0 Janitorial Supplies 52320 0 0
0 0 Tech & Scientif ic Supplies 52325 0 0
22,464 50,000 Repair & Maintenance Supplies 52330 50,000 50,000
0 0 Construction & Building Supplies 52335 0 0
0 0 Parts & Equipment 52340 0 0
5,357 6,300 Small Tools 52350 6,300 6,300
0 0 Safety Equipment 52360 0 0
0 0 Postage & Freight 52375 0 0
0 0 Softw are Expensed 52380 0 0
0 0 Computer Equipment Expensed 52385 0 0
1,106 1,000 Dues & Memberships 52405 1,000 1,000
0 0 Books, Subscriptions & Publications 52410 0 0
0 0 Softw are Licenses & Support 52425 0 0
0 0 Publication Notices 52430 0 0
0 0 Printing 52435 0 0
50,467 76,000 Fueling Contract 52475 76,000 76,000
1,320 7,300 Training & Education 52480 7,300 7,300
467 1,500 Travel Expense 52485 1,500 1,500
105,453 135,000 Fleet Charges 52486 145,000 145,000
243 0 Private Mileage 52487 0 0
115 0 Other Materials & Services 52495 0 0
0 1,200 Permits, Licenses & Fees 52500 1,200 1,200
0 0 Public Information 52505 0 0
0 0 Taxes, Assessments & Liens 52510 0 0
0 0 Bank Service Charge 52515 0 0
11,113 9,000 Equipment Rental 52605 9,000 9,000
0 8,100 Repair & Maintenance Services 52610 8,100 8,100
0 0 Non-vehicle Equipment Repair &
Maintenance
52620 0 0
0 0 Computer Repair & Maintenance 52630 0 0
0 0 Insurance 52705 0 0
20,880 25,000 Other Chemicals 52890 34,000 34,000
$ 324,451 $ 522,400 $ 559,200 $ 559,200
$ - $ - $ - $ -
$ 1,829,196 $ 2,167,400 $ 2,203,800 $ 2,203,800
Expenditure Summary 8373 - System Maintenance
FY 2016 ACTUALFY 2019
ADOPTED
1,015,601 1,061,000
Conveyance Systems Department
0 0
404,662 507,800
0 0
27,908 42,000
18,246 30,000
$ 1,469,952 PERSONNEL EXPENSE SUBTOTAL $ 1,644,600
0 0
2,696 3,000
0 0
840 800
34,129 75,000
0 0
0 0
15,621 16,000
0 0
0 0
0 0
0 0
45,079 117,000
0 0
0 0
0 300
1,073 700
0 0
0 0
7,235 6,800
29,669 50,000
0 0
0 0
4,177 4,000
0 0
0 0
0 0
3,621 0
1,353 6,300
358 0
0 0
0 0
0 0
0 0
977 1,000
0 0
56,624 76,000
1,465 7,300
122 0
100 1,200
0 0
2,434 1,500
109,688 145,000
216 0
8,968 9,000
0 0
0 0
0 0
0 8,100
0 0
0 0
$ 336,828 MATERIALS & SERVICES SUBTOTAL $ 559,200
13,920 34,000
$ 1,806,780 TOTAL EXPENDITURE $ 2,203,800
$ - CAPITAL OUTLAY SUBTOTAL $ -
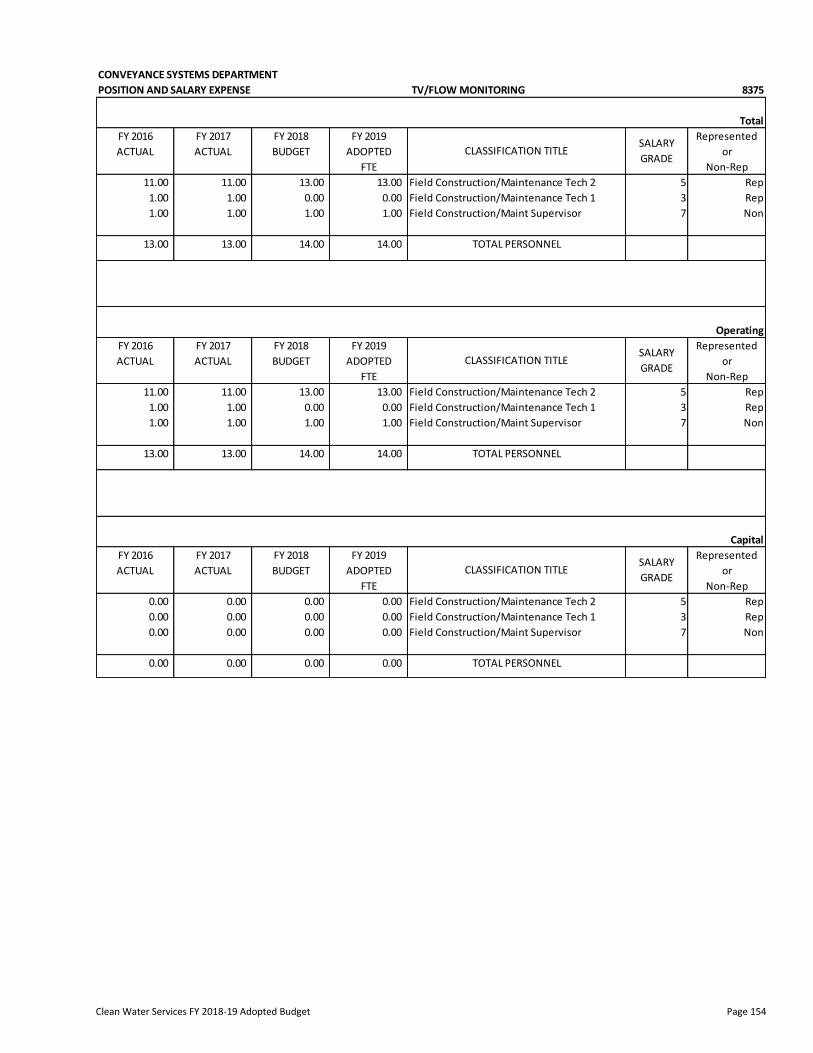
Clean Water Services FY 2018-19 Adopted Budget Page 154
CONVEYANCE SYSTEMS DEPARTMENT
POSITION AND SALARY EXPENSE TV/FLOW MONITORING 8375
Total
FY 2016 FY 2017 FY 2018 FY 2019 Represented
ACTUAL ACTUAL BUDGET ADOPTED or
FTE Non-Rep
11.00 11.00 13.00 13.00 Field Construction/Maintenance Tech 2 5 Rep
1.00 1.00 0.00 0.00 Field Construction/Maintenance Tech 1 3 Rep
1.00 1.00 1.00 1.00 Field Construction/Maint Supervisor 7 Non
13.00 13.00 14.00 14.00 TOTAL PERSONNEL
Operating
FY 2016 FY 2017 FY 2018 FY 2019 Represented
ACTUAL ACTUAL BUDGET ADOPTED or
FTE Non-Rep
11.00 11.00 13.00 13.00 Field Construction/Maintenance Tech 2 5 Rep
1.00 1.00 0.00 0.00 Field Construction/Maintenance Tech 1 3 Rep
1.00 1.00 1.00 1.00 Field Construction/Maint Supervisor 7 Non
13.00 13.00 14.00 14.00 TOTAL PERSONNEL
Capital
FY 2016 FY 2017 FY 2018 FY 2019 Represented
ACTUAL ACTUAL BUDGET ADOPTED or
FTE Non-Rep
0.00 0.00 0.00 0.00 Field Construction/Maintenance Tech 2 5 Rep
0.00 0.00 0.00 0.00 Field Construction/Maintenance Tech 1 3 Rep
0.00 0.00 0.00 0.00 Field Construction/Maint Supervisor 7 Non
0.00 0.00 0.00 0.00 TOTAL PERSONNEL
CLASSIFICATION TITLE
CLASSIFICATION TITLE
CLASSIFICATION TITLE
SALARY
GRADE
SALARY
GRADE
SALARY
GRADE

Clean Water Services FY 2018-19 Adopted Budget Page 155
FY 2017 ACTUAL FY 2018 BUDGET OBJECT CODE DESCRIPTIONOBJECT
CODE
FY 2019
PROPOSED
FY 2019
APPROVED
932,380 1,024,700 Wages & Other Pay 51100 1,019,900 1,019,900
0 0 Temporary 51130 0 0
12,189 11,000 Overtime 51140 11,000 11,000
0 0 Out of Class Straight Time 51170 0 0
381,154 433,100 Other Personnel Expenses 51600 458,200 458,200
0 0 Tuition Reimbursement 51761 0 0
2,160 1,800 Other Employee Allow ances 51900 2,800 2,800
0 0 Auto Allow ance 51910 0 0
840 800 Mobile Computing Allow ance 51915 800 800
$ 1,328,724 $ 1,471,400 $ 1,492,700 $ 1,492,700
9,447 9,000 Electricity 52110 9,000 9,000
0 0 Water 52120 0 0
0 0 Natural Gas 52130 0 0
0 0 Garbage 52140 0 0
0 0 Surface Water Management Charge 52150 0 0
0 0 Other Utility Services 52160 0 0
0 0 Sew er Charges 52170 0 0
5,889 44,000 Contracted Services 52205 50,000 50,000
0 0 Engineering Services 52210 0 0
0 0 Landscape Services 52215 0 0
0 0 Legal Services 52230 0 0
0 0 Professional Services 52240 0 0
0 0 Recording Fees 52250 0 0
4,614 4,900 Laundry 52260 4,900 4,900
0 0 Other Government Services 52270 0 0
202 200 Office Supplies 52305 200 200
17 500 Operating Supplies 52310 500 500
0 1,000 Gas, Oil, Lubrication 52315 1,000 1,000
0 0 Janitorial Supplies 52320 0 0
0 0 Tech & Scientif ic Supplies 52325 0 0
19,890 46,800 Repair & Maintenance Supplies 52330 46,800 46,800
0 0 Construction & Building Supplies 52335 0 0
0 0 Parts & Equipment 52340 0 0
2,860 5,200 Small Tools 52350 5,200 5,200
0 0 Safety Equipment 52360 0 0
299 1,000 Postage & Freight 52375 1,000 1,000
0 0 Softw are Expensed 52380 0 0
0 0 Computer Equipment Expensed 52385 0 0
799 500 Dues & Memberships 52405 500 500
0 0 Books, Subscriptions & Publications 52410 0 0
3,325 0 Softw are Licenses & Support 52425 0 0
0 0 Publication Notices 52430 0 0
0 0 Printing 52435 0 0
18,656 28,500 Fueling Contract 52475 28,500 28,500
2,400 4,500 Training & Education 52480 4,500 4,500
0 1,200 Travel Expense 52485 1,200 1,200
44,801 33,000 Fleet Charges 52486 33,000 33,000
0 0 Private Mileage 52487 0 0
0 0 Other Materials & Services 52495 0 0
0 0 Permits, Licenses & Fees 52500 0 0
0 0 Public Information 52505 0 0
0 0 Taxes, Assessments & Liens 52510 0 0
0 0 Bank Service Charge 52515 0 0
0 0 Equipment Rental 52605 0 0
79,259 45,000 Repair & Maintenance Services 52610 45,000 45,000
0 0 Non-vehicle Equipment Repair &
Maintenance
52620 0 0
0 0 Computer Repair & Maintenance 52630 0 0
0 0 Insurance 52705 0 0
7,275 32,000 Other Chemicals 52890 32,000 32,000
$ 199,731 $ 257,300 $ 263,300 $ 263,300
$ 46,267 $ 40,000 $ - $ -
$ 1,574,722 $ 1,768,700 $ 1,756,000 $ 1,756,000
Expenditure Summary 8375 - TV/Flow Monitoring
FY 2016 ACTUALFY 2019
ADOPTED
958,641 1,019,900
Conveyance Systems Department
0 0
367,293 458,200
0 0
0 0
12,793 11,000
$ 1,341,581 PERSONNEL EXPENSE SUBTOTAL $ 1,492,700
9,174 9,000
2,014 2,800
0 0
840 800
0 0
0 0
0 0
0 0
0 0
0 0
0 0
0 0
9,937 50,000
0 0
0 0
171 200
301 500
0 0
0 0
4,668 4,900
40,712 46,800
0 0
0 0
0 1,000
0 0
0 0
0 0
1,487 0
3,876 5,200
306 0
546 1,000
4,655 0
0 0
0 0
686 500
0 0
18,900 28,500
1,378 4,500
14 0
0 0
0 0
0 1,200
41,107 33,000
0 0
0 0
0 0
0 0
0 0
49,993 45,000
0 0
0 0
$ 193,242 MATERIALS & SERVICES SUBTOTAL $ 263,300
5,330 32,000
$ 1,585,742 TOTAL EXPENDITURE $ 1,756,000
$ 50,919 CAPITAL OUTLAY SUBTOTAL $ -

Clean Water Services FY 2018-19 Adopted Budget Page 156
CONVEYANCE SYSTEMS DEPARTMENT
POSITION AND SALARY EXPENSE LOCAL REPAIR & CONSTRUCTION 8380
Total
FY 2016 FY 2017 FY 2018 FY 2019 Represented
ACTUAL ACTUAL BUDGET ADOPTED or
FTE Non-Rep
10.00 10.00 10.00 10.00 Field Construction/Maintenance Tech 2 5 Rep
1.00 1.00 1.00 1.00 Field Construction/Maint Supervisor 7 Non
11.00 11.00 11.00 11.00 TOTAL PERSONNEL
Operating
FY 2016 FY 2017 FY 2018 FY 2019 Represented
ACTUAL ACTUAL BUDGET ADOPTED or
FTE Non-Rep
9.00 9.00 9.00 9.00 Field Construction/Maintenance Tech 2 5 Rep
1.00 1.00 1.00 1.00 Field Construction/Maint Supervisor 7 Non
10.00 10.00 10.00 10.00 TOTAL PERSONNEL
Capital
FY 2016 FY 2017 FY 2018 FY 2019 Represented
ACTUAL ACTUAL BUDGET ADOPTED or
FTE Non-Rep
1.00 1.00 1.00 1.00 Field Construction/Maintenance Tech 2 5 Rep
0.00 0.00 0.00 0.00 Field Construction/Maint Supervisor 7 Non
1.00 1.00 1.00 1.00 TOTAL PERSONNEL
CLASSIFICATION TITLE
CLASSIFICATION TITLE
CLASSIFICATION TITLESALARY
GRADE
SALARY
GRADE
SALARY
GRADE

Clean Water Services FY 2018-19 Adopted Budget Page 157
FY 2017 ACTUAL FY 2018 BUDGET OBJECT CODE DESCRIPTIONOBJECT
CODE
FY 2019
PROPOSED
FY 2019
APPROVED
703,982 812,900 Wages & Other Pay 51100 751,300 751,300
0 0 Temporary 51130 0 0
9,167 20,000 Overtime 51140 20,000 20,000
0 0 Out of Class Straight Time 51170 0 0
267,280 345,300 Other Personnel Expenses 51600 333,200 333,200
0 0 Tuition Reimbursement 51761 0 0
1,930 2,000 Other Employee Allow ances 51900 2,200 2,200
0 0 Auto Allow ance 51910 0 0
840 800 Mobile Computing Allow ance 51915 800 800
$ 983,199 $ 1,181,000 $ 1,107,500 $ 1,107,500
407 0 Electricity 52110 0 0
0 0 Water 52120 0 0
0 0 Natural Gas 52130 0 0
4,505 7,000 Garbage 52140 7,000 7,000
0 0 Surface Water Management Charge 52150 0 0
0 0 Other Utility Services 52160 0 0
0 0 Sew er Charges 52170 0 0
26,317 40,000 Contracted Services 52205 45,000 45,000
0 0 Engineering Services 52210 0 0
0 0 Landscape Services 52215 0 0
0 0 Legal Services 52230 0 0
0 0 Professional Services 52240 0 0
0 0 Recording Fees 52250 0 0
4,524 4,600 Laundry 52260 4,600 4,600
0 0 Other Government Services 52270 0 0
0 0 Office Supplies 52305 0 0
5,130 4,800 Operating Supplies 52310 4,800 4,800
4,279 5,000 Gas, Oil, Lubrication 52315 5,000 5,000
0 0 Janitorial Supplies 52320 0 0
0 0 Tech & Scientif ic Supplies 52325 0 0
135,167 184,000 Repair & Maintenance Supplies 52330 184,000 184,000
1,036 0 Construction & Building Supplies 52335 0 0
0 0 Parts & Equipment 52340 0 0
9,067 9,200 Small Tools 52350 9,200 9,200
7,648 8,000 Safety Equipment 52360 8,000 8,000
0 0 Postage & Freight 52375 0 0
0 0 Softw are Expensed 52380 0 0
0 0 Computer Equipment Expensed 52385 0 0
80 200 Dues & Memberships 52405 200 200
0 0 Books, Subscriptions & Publications 52410 0 0
0 0 Softw are Licenses & Support 52425 0 0
0 0 Publication Notices 52430 0 0
0 0 Printing 52435 0 0
20,403 47,500 Fueling Contract 52475 47,500 47,500
2,093 4,600 Training & Education 52480 4,600 4,600
2,300 3,700 Travel Expense 52485 3,700 3,700
56,379 62,500 Fleet Charges 52486 62,500 62,500
857 0 Private Mileage 52487 0 0
131 0 Other Materials & Services 52495 0 0
150 1,000 Permits, Licenses & Fees 52500 2,000 2,000
0 0 Public Information 52505 0 0
0 0 Taxes, Assessments & Liens 52510 0 0
0 0 Bank Service Charge 52515 0 0
11,324 12,000 Equipment Rental 52605 12,000 12,000
415 700 Repair & Maintenance Services 52610 700 700
0 0 Non-vehicle Equipment Repair &
Maintenance
52620 0 0
0 0 Computer Repair & Maintenance 52630 0 0
0 0 Insurance 52705 0 0
0 0 Other Chemicals 52890 0 0
$ 292,212 $ 394,800 $ 400,800 $ 400,800
$ 81,320 $ 42,000 $ - $ -
$ 1,356,731 $ 1,617,800 $ 1,508,300 $ 1,508,300
Expenditure Summary 8380 - Local Repair & Construction
FY 2016 ACTUALFY 2019
ADOPTED
638,556 751,300
Conveyance Systems Department
0 0
236,574 333,200
0 0
27,303 0
6,551 20,000
$ 911,568 PERSONNEL EXPENSE SUBTOTAL $ 1,107,500
394 0
1,743 2,200
0 0
840 800
3,024 7,000
0 0
0 0
140 0
0 0
0 0
0 0
0 0
28,351 45,000
0 0
0 0
0 0
7,442 4,800
0 0
0 0
4,417 4,600
126,264 184,000
853 0
19 0
4,711 5,000
0 0
0 0
0 0
0 0
5,625 9,200
15,441 8,000
0 0
0 0
0 0
0 0
240 200
0 0
22,520 47,500
2,442 4,600
0 0
710 2,000
0 0
0 3,700
72,777 62,500
0 0
5,811 12,000
0 0
0 0
0 0
0 700
0 0
0 0
$ 301,180 MATERIALS & SERVICES SUBTOTAL $ 400,800
0 0
$ 1,223,398 TOTAL EXPENDITURE $ 1,508,300
$ 10,651 CAPITAL OUTLAY SUBTOTAL $ -

Clean Water Services FY 2018-19 Adopted Budget Page 158
CONVEYANCE SYSTEMS DEPARTMENT
POSITION AND SALARY EXPENSE SWM SURFACE FACILITY MAINTENANCE 8383
Total
FY 2016 FY 2017 FY 2018 FY 2019 Represented
ACTUAL ACTUAL BUDGET ADOPTED or
FTE Non-Rep
15.00 15.00 15.00 14.00 Field Construction/Maintenance Tech 2 5 Rep
1.00 1.00 1.00 1.00 Field Construction/Maint Supervisor 7 Non
16.00 16.00 16.00 15.00 TOTAL PERSONNEL
Operating
FY 2016 FY 2017 FY 2018 FY 2019 Represented
ACTUAL ACTUAL BUDGET ADOPTED or
FTE Non-Rep
15.00 15.00 15.00 14.00 Field Construction/Maintenance Tech 2 5 Rep
1.00 1.00 1.00 1.00 Field Construction/Maint Supervisor 7 Non
16.00 16.00 16.00 15.00 TOTAL PERSONNEL
Capital
FY 2016 FY 2017 FY 2018 FY 2019 Represented
ACTUAL ACTUAL BUDGET ADOPTED or
FTE Non-Rep
0.00 0.00 0.00 0.00 Field Construction/Maintenance Tech 2 5 Rep
0.00 0.00 0.00 0.00 Field Construction/Maint Supervisor 7 Non
0.00 0.00 0.00 0.00 TOTAL PERSONNEL
CLASSIFICATION TITLE
CLASSIFICATION TITLE
CLASSIFICATION TITLE
SALARY
GRADE
SALARY
GRADE
SALARY
GRADE
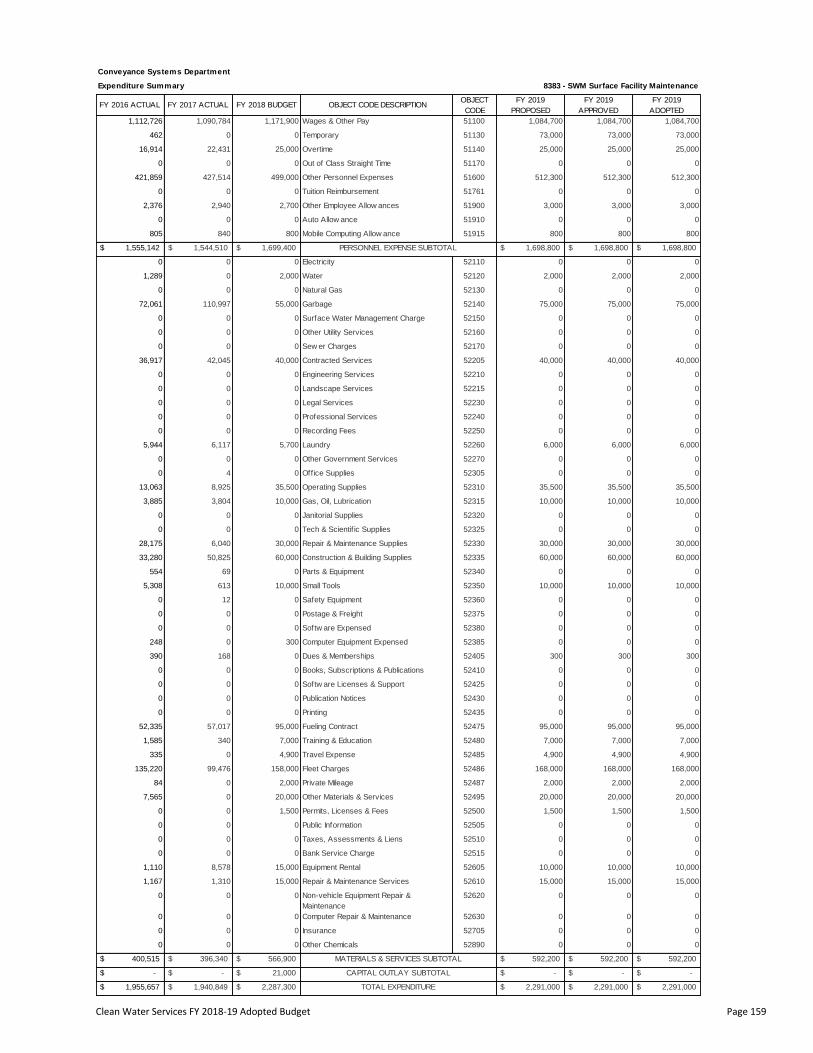
Clean Water Services FY 2018-19 Adopted Budget Page 159
FY 2017 ACTUAL FY 2018 BUDGET OBJECT CODE DESCRIPTIONOBJECT
CODE
FY 2019
PROPOSED
FY 2019
APPROVED
1,090,784 1,171,900 Wages & Other Pay 51100 1,084,700 1,084,700
0 0 Temporary 51130 73,000 73,000
22,431 25,000 Overtime 51140 25,000 25,000
0 0 Out of Class Straight Time 51170 0 0
427,514 499,000 Other Personnel Expenses 51600 512,300 512,300
0 0 Tuition Reimbursement 51761 0 0
2,940 2,700 Other Employee Allow ances 51900 3,000 3,000
0 0 Auto Allow ance 51910 0 0
840 800 Mobile Computing Allow ance 51915 800 800
$ 1,544,510 $ 1,699,400 $ 1,698,800 $ 1,698,800
0 0 Electricity 52110 0 0
0 2,000 Water 52120 2,000 2,000
0 0 Natural Gas 52130 0 0
110,997 55,000 Garbage 52140 75,000 75,000
0 0 Surface Water Management Charge 52150 0 0
0 0 Other Utility Services 52160 0 0
0 0 Sew er Charges 52170 0 0
42,045 40,000 Contracted Services 52205 40,000 40,000
0 0 Engineering Services 52210 0 0
0 0 Landscape Services 52215 0 0
0 0 Legal Services 52230 0 0
0 0 Professional Services 52240 0 0
0 0 Recording Fees 52250 0 0
6,117 5,700 Laundry 52260 6,000 6,000
0 0 Other Government Services 52270 0 0
4 0 Office Supplies 52305 0 0
8,925 35,500 Operating Supplies 52310 35,500 35,500
3,804 10,000 Gas, Oil, Lubrication 52315 10,000 10,000
0 0 Janitorial Supplies 52320 0 0
0 0 Tech & Scientif ic Supplies 52325 0 0
6,040 30,000 Repair & Maintenance Supplies 52330 30,000 30,000
50,825 60,000 Construction & Building Supplies 52335 60,000 60,000
69 0 Parts & Equipment 52340 0 0
613 10,000 Small Tools 52350 10,000 10,000
12 0 Safety Equipment 52360 0 0
0 0 Postage & Freight 52375 0 0
0 0 Softw are Expensed 52380 0 0
0 300 Computer Equipment Expensed 52385 0 0
168 0 Dues & Memberships 52405 300 300
0 0 Books, Subscriptions & Publications 52410 0 0
0 0 Softw are Licenses & Support 52425 0 0
0 0 Publication Notices 52430 0 0
0 0 Printing 52435 0 0
57,017 95,000 Fueling Contract 52475 95,000 95,000
340 7,000 Training & Education 52480 7,000 7,000
0 4,900 Travel Expense 52485 4,900 4,900
99,476 158,000 Fleet Charges 52486 168,000 168,000
0 2,000 Private Mileage 52487 2,000 2,000
0 20,000 Other Materials & Services 52495 20,000 20,000
0 1,500 Permits, Licenses & Fees 52500 1,500 1,500
0 0 Public Information 52505 0 0
0 0 Taxes, Assessments & Liens 52510 0 0
0 0 Bank Service Charge 52515 0 0
8,578 15,000 Equipment Rental 52605 10,000 10,000
1,310 15,000 Repair & Maintenance Services 52610 15,000 15,000
0 0 Non-vehicle Equipment Repair &
Maintenance
52620 0 0
0 0 Computer Repair & Maintenance 52630 0 0
0 0 Insurance 52705 0 0
0 0 Other Chemicals 52890 0 0
$ 396,340 $ 566,900 $ 592,200 $ 592,200
$ - $ 21,000 $ - $ -
$ 1,940,849 $ 2,287,300 $ 2,291,000 $ 2,291,000
Expenditure Summary 8383 - SWM Surface Facility Maintenance
FY 2016 ACTUALFY 2019
ADOPTED
1,112,726 1,084,700
Conveyance Systems Department
0 0
421,859 512,300
0 0
462 73,000
16,914 25,000
$ 1,555,142 PERSONNEL EXPENSE SUBTOTAL $ 1,698,800
0 0
2,376 3,000
0 0
805 800
72,061 75,000
0 0
0 0
1,289 2,000
0 0
0 0
0 0
0 0
36,917 40,000
0 0
0 0
0 0
13,063 35,500
0 0
0 0
5,944 6,000
28,175 30,000
33,280 60,000
554 0
3,885 10,000
0 0
0 0
0 0
248 0
5,308 10,000
0 0
0 0
0 0
0 0
0 0
390 300
0 0
52,335 95,000
1,585 7,000
7,565 20,000
0 1,500
0 0
335 4,900
135,220 168,000
84 2,000
1,110 10,000
0 0
0 0
0 0
1,167 15,000
0 0
0 0
$ 400,515 MATERIALS & SERVICES SUBTOTAL $ 592,200
0 0
$ 1,955,657 TOTAL EXPENDITURE $ 2,291,000
$ - CAPITAL OUTLAY SUBTOTAL $ -

Clean Water Services FY 2018-19 Adopted Budget Page 160
This page intentionally left blank
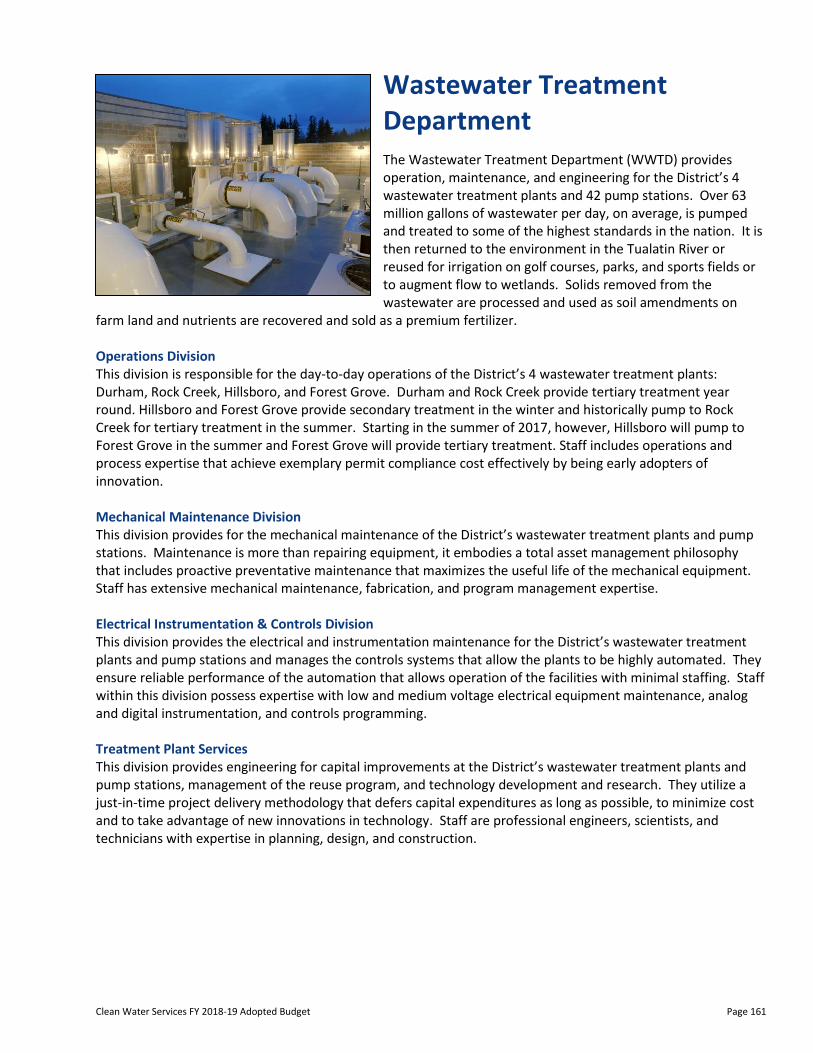
Clean Water Services FY 2018-19 Adopted Budget Page 161
Wastewater Treatment Department
The Wastewater Treatment Department (WWTD) provides operation, maintenance, and engineering for the District’s 4 wastewater treatment plants and 42 pump stations. Over 63 million gallons of wastewater per day, on average, is pumped and treated to some of the highest standards in the nation. It is then returned to the environment in the Tualatin River or reused for irrigation on golf courses, parks, and sports fields or to augment flow to wetlands. Solids removed from the wastewater are processed and used as soil amendments on
farm land and nutrients are recovered and sold as a premium fertilizer. Operations Division This division is responsible for the day-to-day operations of the District’s 4 wastewater treatment plants: Durham, Rock Creek, Hillsboro, and Forest Grove. Durham and Rock Creek provide tertiary treatment year round. Hillsboro and Forest Grove provide secondary treatment in the winter and historically pump to Rock Creek for tertiary treatment in the summer. Starting in the summer of 2017, however, Hillsboro will pump to Forest Grove in the summer and Forest Grove will provide tertiary treatment. Staff includes operations and process expertise that achieve exemplary permit compliance cost effectively by being early adopters of innovation. Mechanical Maintenance Division This division provides for the mechanical maintenance of the District’s wastewater treatment plants and pump stations. Maintenance is more than repairing equipment, it embodies a total asset management philosophy that includes proactive preventative maintenance that maximizes the useful life of the mechanical equipment. Staff has extensive mechanical maintenance, fabrication, and program management expertise. Electrical Instrumentation & Controls Division This division provides the electrical and instrumentation maintenance for the District’s wastewater treatment plants and pump stations and manages the controls systems that allow the plants to be highly automated. They ensure reliable performance of the automation that allows operation of the facilities with minimal staffing. Staff within this division possess expertise with low and medium voltage electrical equipment maintenance, analog and digital instrumentation, and controls programming. Treatment Plant Services This division provides engineering for capital improvements at the District’s wastewater treatment plants and pump stations, management of the reuse program, and technology development and research. They utilize a just-in-time project delivery methodology that defers capital expenditures as long as possible, to minimize cost and to take advantage of new innovations in technology. Staff are professional engineers, scientists, and technicians with expertise in planning, design, and construction.

Clean Water Services FY 2018-19 Adopted Budget Page 162
Performance Measures
FY 2017 FY 2018 FY 2019
Actual Estimated Target
Inputs
Full time employees 122 127 129
Departmental expenditures 24,690,276$ 27,061,100$ 28,555,600$
Treatment plants 4 4 4
Off-site pump stations 42 42 44
Outputs
Total gallons treated (MG) 30,320 24,073 27,197
Total gallons used for irrigation (MG) 66 74.2 90
Power produced (kWh) 19,144,930 18,796,477 18,970,704
Biosolids applied (dry tons) 11,818 11,062 11,440
Phosphorous recovered (tons) 377 755 800
Pieces of equipment maintained 13,770 14,309 14,629
Acres of landscape maintained 85.5 85.5 89
FOG revenue 347,915$ 357,664$ 360,000$
% work orders are preventive maintenance 81% 82% 81%
Effectiveness Measures
NPDES permit compliance - outfalls 001 & 002 0 0 0
Energy neutral % 34% 38% 38%
Priority 1 & 2 work orders 595 838 825
Efficiency Measures
% of influent phosporous recovered in Crystal Green 9.1% 21.8% 23.0%
$/MG 764 1,066 1,001
kWh/MG 1,889 2,118 1,904
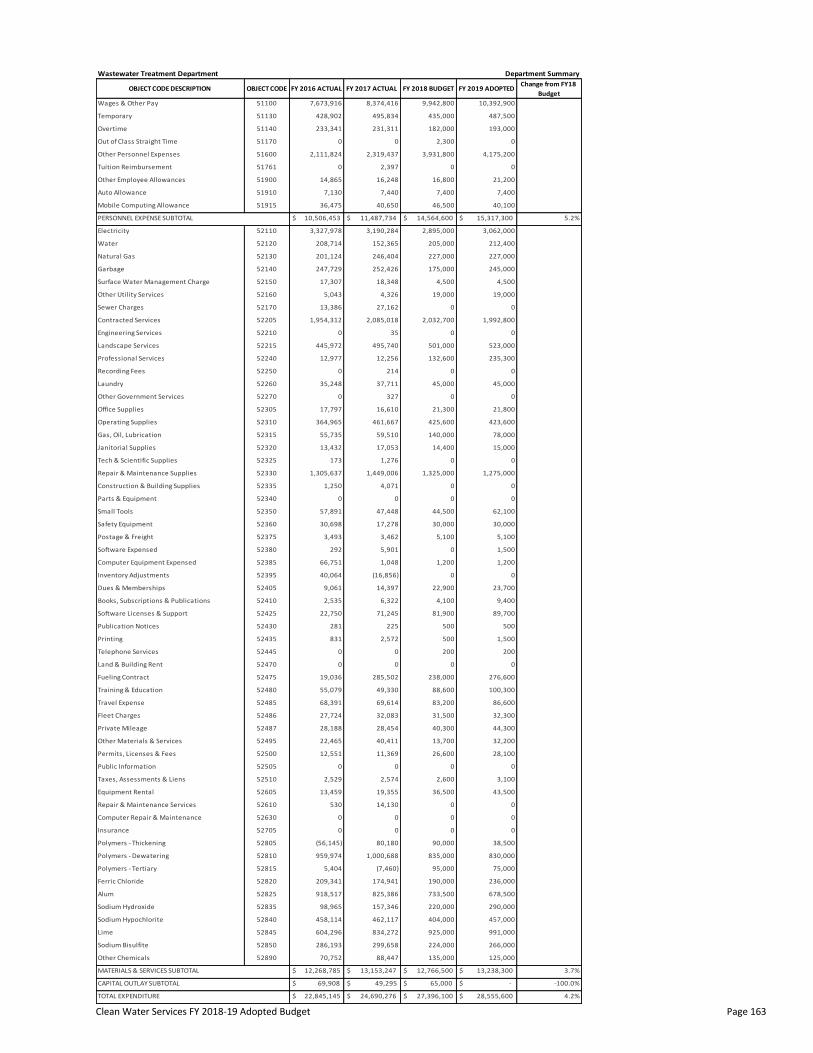
Clean Water Services FY 2018-19 Adopted Budget Page 163
Wastewater Treatment Department
OBJECT CODE FY 2016 ACTUAL FY 2018 BUDGET FY 2019 ADOPTEDChange from FY18
Budget
51100 7,673,916 9,942,800 10,392,900
51130 428,902 435,000 487,500
51140 233,341 182,000 193,000
51170 0 2,300 0
51600 2,111,824 3,931,800 4,175,200
51761 0 0 0
51900 14,865 16,800 21,200
51910 7,130 7,400 7,400
51915 36,475 46,500 40,100
$ 10,506,453 $ 14,564,600 $ 15,317,300 5.2%
52110 3,327,978 2,895,000 3,062,000
52120 208,714 205,000 212,400
52130 201,124 227,000 227,000
52140 247,729 175,000 245,000
52150 17,307 4,500 4,500
52160 5,043 19,000 19,000
52170 13,386 0 0
52205 1,954,312 2,032,700 1,992,800
52210 0 0 0
52215 445,972 501,000 523,000
52240 12,977 132,600 235,300
52250 0 0 0
52260 35,248 45,000 45,000
52270 0 0 0
52305 17,797 21,300 21,800
52310 364,965 425,600 423,600
52315 55,735 140,000 78,000
52320 13,432 14,400 15,000
52325 173 0 0
52330 1,305,637 1,325,000 1,275,000
52335 1,250 0 0
52340 0 0 0
52350 57,891 44,500 62,100
52360 30,698 30,000 30,000
52375 3,493 5,100 5,100
52380 292 0 1,500
52385 66,751 1,200 1,200
52395 40,064 0 0
52405 9,061 22,900 23,700
52410 2,535 4,100 9,400
52425 22,750 81,900 89,700
52430 281 500 500
52435 831 500 1,500
52445 0 200 200
52470 0 0 0
52475 19,036 238,000 276,600
52480 55,079 88,600 100,300
52485 68,391 83,200 86,600
52486 27,724 31,500 32,300
52487 28,188 40,300 44,300
52495 22,465 13,700 32,200
52500 12,551 26,600 28,100
52505 0 0 0
52510 2,529 2,600 3,100
52605 13,459 36,500 43,500
52610 530 0 0
52630 0 0 0
52705 0 0 0
52805 (56,145) 90,000 38,500
52810 959,974 835,000 830,000
52815 5,404 95,000 75,000
52820 209,341 190,000 236,000
52825 918,517 733,500 678,500
52835 98,965 220,000 290,000
52840 458,114 404,000 457,000
52845 604,296 925,000 991,000
52850 286,193 224,000 266,000
52890 70,752 135,000 125,000
$ 12,268,785 $ 12,766,500 $ 13,238,300 3.7%
$ 69,908 $ 65,000 $ - -100.0%
$ 22,845,145 $ 27,396,100 $ 28,555,600 4.2%
CAPITAL OUTLAY SUBTOTAL $ 49,295
TOTAL EXPENDITURE $ 24,690,276
MATERIALS & SERVICES SUBTOTAL $ 13,153,247
Sodium Bisulfite 299,658
Other Chemicals 88,447
Sodium Hydroxide 157,346
Sodium Hypochlorite 462,117
Lime 834,272
Polymers - Tertiary (7,460)
Ferric Chloride 174,941
Alum 825,386
Polymers - Thickening 80,180
Polymers - Dewatering 1,000,688
Insurance 0
Repair & Maintenance Services 14,130
Computer Repair & Maintenance 0
Equipment Rental 19,355
Taxes, Assessments & Liens 2,574
Other Materials & Services 40,411
Permits, Licenses & Fees 11,369
Public Information 0
Travel Expense 69,614
Fleet Charges 32,083
Private Mileage 28,454
Land & Building Rent 0
Fueling Contract 285,502
Training & Education 49,330
Telephone Services 0
Software Licenses & Support 71,245
Publication Notices 225
Printing 2,572
Dues & Memberships 14,397
Books, Subscriptions & Publications 6,322
Software Expensed 5,901
Computer Equipment Expensed 1,048
Inventory Adjustments (16,856)
Small Tools 47,448
Safety Equipment 17,278
Postage & Freight 3,462
Repair & Maintenance Supplies 1,449,006
Construction & Building Supplies 4,071
Parts & Equipment 0
Gas, Oil, Lubrication 59,510
Janitorial Supplies 17,053
Tech & Scientific Supplies 1,276
Other Government Services 327
Office Supplies 16,610
Operating Supplies 461,667
Professional Services 12,256
Recording Fees 214
Laundry 37,711
Landscape Services 495,740
Sewer Charges 27,162
Contracted Services 2,085,018
Engineering Services 35
Garbage 252,426
Surface Water Management Charge 18,348
Other Utility Services 4,326
Water 152,365
Natural Gas 246,404
Mobile Computing Allowance 40,650
PERSONNEL EXPENSE SUBTOTAL $ 11,487,734
Electricity 3,190,284
Tuition Reimbursement 2,397
Other Employee Allowances 16,248
Auto Allowance 7,440
Overtime 231,311
Out of Class Straight Time 0
Other Personnel Expenses 2,319,437
Wages & Other Pay 8,374,416
Temporary 495,834
OBJECT CODE DESCRIPTION FY 2017 ACTUAL
Department Summary

Clean Water Services FY 2018-19 Adopted Budget Page 164
WASTEWATER TREATMENT DEPARTMENT
POSITION AND SALARY EXPENSE ADMINISTRATION 8301
Total
FY 2016 FY 2017 FY 2018 FY 2019 Represented
ACTUAL ACTUAL BUDGET ADOPTED or
FTE Non-Rep
1.00 2.00 2.00 2.00 Administrative Assistant 4 Non
2.00 2.00 2.00 2.00 Administrative Associate 3 Non
1.00 1.00 1.00 1.00 Business Opportunities Manager 10 Non
0.00 1.00 1.00 1.00 Engineering Project Coordinator 7 Non
0.00 0.00 1.00 1.00 Loss Prevention Technician 6 Non
2.00 2.00 1.00 1.00 Operations Division Manager 11 Non
0.00 0.00 1.00 1.00 Treatment Plant Services Manager 12 Non
1.00 1.00 1.00 1.00 Wastewater Treatment Dept Dir LT 13 Non
0.00 0.00 0.00 0.00 Reuse Program Manager 8 Non
1.00 1.00 1.00 1.00 Electrical, Instrumentation & Controls Division Manager 11 Non
1.00 1.00 1.00 1.00 Mechanical Maintenance & Facilities Division Manager 11 Non
9.00 11.00 12.00 12.00 TOTAL PERSONNEL
Operating
FY 2016 FY 2017 FY 2018 FY 2019 Represented
ACTUAL ACTUAL BUDGET ADOPTED or
FTE Non-Rep
0.00 0.00 0.00 0.00 Administrative Assistant 4 Non
1.00 1.00 1.00 1.00 Administrative Associate 3 Non
0.50 0.50 0.50 0.50 Business Opportunities Manager 10 Non
0.00 0.50 0.50 0.50 Engineering Project Coordinator 7 Non
0.00 0.00 0.50 0.50 Loss Prevention Technician 6 Non
1.00 1.00 1.00 1.00 Operations Division Manager 11 Non
0.00 0.00 0.00 0.00 Treatment Plant Services Manager 12 Non
1.00 1.00 1.00 1.00 Wastewater Treatment Dept Dir LT 13 Non
0.00 0.00 0.00 0.00 Reuse Program Manager 8 Non
1.00 1.00 1.00 1.00 Electrical, Instrumentation & Controls Division Manager 11 Non
1.00 1.00 1.00 1.00 Mechanical Maintenance & Facilities Division Manager 11 Non
5.50 6.00 6.50 6.50 TOTAL PERSONNEL
Capital
FY 2016 FY 2017 FY 2018 FY 2019 Represented
ACTUAL ACTUAL BUDGET ADOPTED or
FTE Non-Rep
1.00 2.00 2.00 2.00 Administrative Assistant 4 Non
1.00 1.00 1.00 1.00 Administrative Associate 3 Non
0.50 0.50 0.50 0.50 Business Opportunities Manager 10 Non
0.00 0.50 0.50 0.50 Engineering Project Coordinator 7 Non
0.00 0.00 0.50 0.50 Loss Prevention Technician 6 Non
0.00 0.00 0.00 0.00 Operations Division Manager 11 Non
1.00 1.00 1.00 1.00 Treatment Plant Services Manager 12 Non
0.00 0.00 0.00 0.00 Reuse Program Manager 8 Non
0.00 0.00 0.00 0.00 Wastewater Treatment Dept Dir LT 13 Non
0.00 0.00 0.00 0.00 Reuse Program Manager 8 Non
0.00 0.00 0.00 0.00 Electrical, Instrumentation & Controls Division Manager 11 Non
0.00 0.00 0.00 0.00 Mechanical Maintenance & Facilities Division Manager 11 Non
3.50 5.00 5.50 5.50 TOTAL PERSONNEL
CLASSIFICATION TITLE
CLASSIFICATION TITLE
CLASSIFICATION TITLE
SALARY
GRADE
SALARY
GRADE
SALARY
GRADE

Clean Water Services FY 2018-19 Adopted Budget Page 165
FY 2017 ACTUAL FY 2018 BUDGET OBJECT CODE DESCRIPTIONOBJECT
CODE
FY 2019
PROPOSED
FY 2019
APPROVED
825,619 1,130,900 Wages & Other Pay 51100 1,193,600 1,193,600
49,792 53,000 Temporary 51130 20,000 20,000
1,724 1,000 Overtime 51140 2,000 2,000
0 0 Out of Class Straight Time 51170 0 0
114,262 347,700 Other Personnel Expenses 51600 436,100 436,100
0 0 Tuition Reimbursement 51761 0 0
600 1,500 Other Employee Allow ances 51900 600 600
7,440 7,400 Auto Allow ance 51910 7,400 7,400
4,980 5,600 Mobile Computing Allow ance 51915 4,800 4,800
$ 1,004,416 $ 1,547,100 $ 1,664,500 $ 1,664,500
0 0 Electricity 52110 0 0
0 0 Water 52120 0 0
0 0 Natural Gas 52130 0 0
0 0 Garbage 52140 0 0
0 0 Surface Water Management Charge 52150 0 0
0 0 Other Utility Services 52160 0 0
0 0 Sew er Charges 52170 0 0
6,860 12,000 Contracted Services 52205 7,000 7,000
0 0 Engineering Services 52210 0 0
0 0 Landscape Services 52215 0 0
751 25,000 Professional Services 52240 22,900 22,900
0 0 Recording Fees 52250 0 0
0 0 Laundry 52260 0 0
327 0 Other Government Services 52270 0 0
8,648 15,000 Office Supplies 52305 15,000 15,000
10,053 10,000 Operating Supplies 52310 10,000 10,000
0 0 Gas, Oil, Lubrication 52315 0 0
0 0 Janitorial Supplies 52320 0 0
0 0 Tech & Scientif ic Supplies 52325 0 0
612 0 Repair & Maintenance Supplies 52330 0 0
3,425 0 Construction & Building Supplies 52335 0 0
0 0 Parts & Equipment 52340 0 0
1,540 500 Small Tools 52350 500 500
13,973 30,000 Safety Equipment 52360 30,000 30,000
491 300 Postage & Freight 52375 300 300
0 0 Softw are Expensed 52380 0 0
995 0 Computer Equipment Expensed 52385 0 0
0 0 Inventory Adjustments 52395 0 0
2,986 10,000 Dues & Memberships 52405 10,000 10,000
2,686 1,000 Books, Subscriptions & Publications 52410 1,500 1,500
109 0 Softw are Licenses & Support 52425 0 0
108 0 Publication Notices 52430 0 0
676 0 Printing 52435 1,000 1,000
0 0 Telephone Services 52445 0 0
52 0 Fueling Contract 52475 0 0
22,459 15,000 Training & Education 52480 15,000 15,000
24,321 30,000 Travel Expense 52485 27,000 27,000
0 0 Fleet Charges 52486 0 0
3,768 3,000 Private Mileage 52487 3,000 3,000
23,336 8,000 Other Materials & Services 52495 25,000 25,000
39 0 Permits, Licenses & Fees 52500 0 0
0 0 Public Information 52505 0 0
2,504 2,500 Taxes, Assessments & Liens 52510 3,000 3,000
0 0 Equipment Rental 52605 0 0
0 0 Repair & Maintenance Services 52610 0 0
0 0 Non-vehicle Equipment Repair &
Maintenance
52620 0 0
0 0 Computer Repair & Maintenance 52630 0 0
0 0 Insurance 52705 0 0
0 0 Polymers - Thickening 52805 0 0
0 0 Polymers - Dew atering 52810 0 0
0 0 Polymers - Tertiary 52815 0 0
0 0 Ferric Chloride 52820 0 0
0 0 Alum 52825 0 0
0 0 Sodium Hydroxide 52835 0 0
0 0 Sodium Hypochlorite 52840 0 0
0 0 Lime 52845 0 0
0 0 Sodium Bisulf ite 52850 0 0
0 0 Other Chemicals 52890 0 0
$ 130,718 $ 162,300 $ 171,200 $ 171,200
$ - $ - $ - $ -
$ 1,135,134 $ 1,709,400 $ 1,835,700 $ 1,835,700 $ 1,218,115 TOTAL EXPENDITURE $ 1,835,700
$ - CAPITAL OUTLAY SUBTOTAL $ -
$ 145,665 MATERIALS & SERVICES SUBTOTAL $ 171,200
0 0
0 0
0 0
0 0
0 0
0 0
0 0
0 0
0 0
0 0
0 0
0 0
0 0
0 0
0 0
2,428 3,000
11,816 25,000
0 0
0 0
25,974 27,000
35 0
4,090 3,000
0 0
30,533 15,000
0 0
165 0
0 0
702 1,000
2,630 10,000
1,128 1,500
(107) 0
2,356 0
0 0
1,071 500
25,121 30,000
326 300
59 0
0 0
0 0
0 0
0 0
30 0
0 0
10,259 15,000
11,485 10,000
8,469 22,900
0 0
0 0
0 0
0 0
7,094 7,000
0 0
0 0
0 0
0 0
0 0
0 0
$ 1,072,450 PERSONNEL EXPENSE SUBTOTAL $ 1,664,500
0 0
975 600
7,130 7,400
5,810 4,800
0 0
106,631 436,100
0 0
88,720 20,000
765 2,000
Expenditure Summary 8301 - Wastewater Treatment Admin
FY 2016 ACTUALFY 2019
ADOPTED
862,418 1,193,600
Wastewater Treatment Department

Clean Water Services FY 2018-19 Adopted Budget Page 166
WASTEWATER TREATMENT DEPARTMENTPOSITION AND SALARY EXPENSE BIOSOLIDS REUSE 8331
Total
FY 2016 FY 2017 FY 2018 FY 2019 Represented
ACTUAL ACTUAL BUDGET ADOPTED or
FTE Non-Rep
0.00 0.00 0.00 1.00 Landscape Coordinator 6 Non
0.00 1.00 1.00 1.00 Reuse Manager 8 Non
0.00 0.00 0.00 1.00 Operations Analyst 2 8 Non
0.00 1.00 1.00 3.00 TOTAL PERSONNEL
Operating
FY 2016 FY 2017 FY 2018 FY 2019 Represented
ACTUAL ACTUAL BUDGET ADOPTED or
FTE Non-Rep
0.00 0.00 0.00 1.00 Landscape Coordinator 6 Non
0.00 0.00 0.50 0.50 Reuse Manager 8 Non
0.00 0.00 0.00 1.00 Operations Analyst 2 8 Non
0.00 0.00 0.50 2.50 TOTAL PERSONNEL
Capital
FY 2016 FY 2017 FY 2018 FY 2019 Represented
ACTUAL ACTUAL BUDGET ADOPTED or
FTE Non-Rep
0.00 0.00 0.00 0.00 Landscape Coordinator 6 Non
0.00 1.00 0.50 0.50 Reuse Manager 8 Non
0.00 0.00 0.00 0.00 Operations Analyst 2 8 Non
0.00 1.00 0.50 0.50 TOTAL PERSONNEL
CLASSIFICATION TITLE
CLASSIFICATION TITLE
CLASSIFICATION TITLE
SALARY
GRADE
SALARY
GRADE
SALARY
GRADE

Clean Water Services FY 2018-19 Adopted Budget Page 167
FY 2017 ACTUAL FY 2018 BUDGET OBJECT CODE DESCRIPTIONOBJECT
CODE
FY 2019
PROPOSED
FY 2019
APPROVED
79,087 107,600 Wages & Other Pay 51100 288,500 288,500
49,259 48,000 Temporary 51130 100,000 100,000
22 0 Overtime 51140 0 0
0 0 Out of Class Straight Time 51170 0 0
20,809 48,700 Other Personnel Expenses 51600 132,700 132,700
0 0 Tuition Reimbursement 51761 0 0
150 0 Other Employee Allow ances 51900 400 400
0 0 Auto Allow ance 51910 0 0
840 800 Mobile Computing Allow ance 51915 1,600 1,600
$ 150,166 $ 205,100 $ 523,200 $ 523,200
0 0 Electricity 52110 0 0
0 0 Water 52120 0 0
0 0 Natural Gas 52130 0 0
0 0 Garbage 52140 0 0
0 0 Surface Water Management Charge 52150 0 0
0 0 Other Utility Services 52160 0 0
0 0 Sew er Charges 52170 0 0
1,475,904 1,356,100 Contracted Services 52205 1,302,700 1,302,700
0 0 Engineering Services 52210 0 0
97,346 105,000 Landscape Services 52215 90,000 90,000
0 17,600 Professional Services 52240 127,400 127,400
0 0 Recording Fees 52250 0 0
0 0 Laundry 52260 0 0
0 0 Other Government Services 52270 0 0
0 0 Office Supplies 52305 0 0
0 0 Operating Supplies 52310 0 0
0 0 Gas, Oil, Lubrication 52315 0 0
0 0 Janitorial Supplies 52320 0 0
0 0 Tech & Scientif ic Supplies 52325 0 0
0 0 Repair & Maintenance Supplies 52330 0 0
0 0 Construction & Building Supplies 52335 0 0
0 0 Parts & Equipment 52340 0 0
0 1,000 Small Tools 52350 6,000 6,000
0 0 Safety Equipment 52360 0 0
0 0 Postage & Freight 52375 0 0
0 0 Softw are Expensed 52380 0 0
0 0 Computer Equipment Expensed 52385 0 0
0 0 Inventory Adjustments 52395 0 0
1,403 1,000 Dues & Memberships 52405 1,000 1,000
70 500 Books, Subscriptions & Publications 52410 500 500
0 0 Softw are Licenses & Support 52425 0 0
0 0 Publication Notices 52430 0 0
0 0 Printing 52435 0 0
0 200 Telephone Services 52445 200 200
267,515 209,000 Fueling Contract 52475 247,600 247,600
0 4,500 Training & Education 52480 3,000 3,000
0 2,700 Travel Expense 52485 2,000 2,000
317 500 Fleet Charges 52486 500 500
0 500 Private Mileage 52487 500 500
162 500 Other Materials & Services 52495 500 500
0 0 Permits, Licenses & Fees 52500 0 0
0 0 Public Information 52505 0 0
0 0 Taxes, Assessments & Liens 52510 0 0
0 1,000 Equipment Rental 52605 1,000 1,000
0 0 Repair & Maintenance Services 52610 0 0
0 0 Non-vehicle Equipment Repair &
Maintenance
52620 0 0
0 0 Computer Repair & Maintenance 52630 0 0
0 0 Insurance 52705 0 0
0 0 Polymers - Thickening 52805 0 0
0 0 Polymers - Dew atering 52810 0 0
0 0 Polymers - Tertiary 52815 0 0
0 0 Ferric Chloride 52820 0 0
0 0 Alum 52825 0 0
0 0 Sodium Hydroxide 52835 0 0
0 0 Sodium Hypochlorite 52840 0 0
0 0 Lime 52845 0 0
0 0 Sodium Bisulf ite 52850 0 0
0 0 Other Chemicals 52890 0 0
$ 1,842,716 $ 1,700,100 $ 1,782,900 $ 1,782,900
$ - $ - $ - $ -
$ 1,992,882 $ 1,905,200 $ 2,306,100 $ 2,306,100 $ 1,441,518 TOTAL EXPENDITURE $ 2,306,100
$ - CAPITAL OUTLAY SUBTOTAL $ -
$ 1,441,518 MATERIALS & SERVICES SUBTOTAL $ 1,782,900
0 0
0 0
0 0
0 0
0 0
0 0
0 0
0 0
0 0
0 0
0 0
0 0
0 0
0 0
0 1,000
0 0
713 500
484 0
0 0
2,618 2,000
211 500
794 500
1,756 247,600
2,040 3,000
0 200
0 0
0 0
0 0
525 1,000
81 500
0 0
0 0
0 0
0 6,000
0 0
0 0
0 0
0 0
0 0
0 0
0 0
0 0
0 0
0 0
0 0
1,752 127,400
0 0
0 0
5 90,000
0 0
1,430,542 1,302,700
0 0
0 0
0 0
0 0
0 0
0 0
$ - PERSONNEL EXPENSE SUBTOTAL $ 523,200
0 0
0 400
0 0
0 1,600
0 0
0 132,700
0 0
0 100,000
0 0
Expenditure Summary 8331 - Biosolids/Support
FY 2016 ACTUALFY 2019
ADOPTED
0 288,500
Wastewater Treatment Department

Clean Water Services FY 2018-19 Adopted Budget Page 168
WASTEWATER TREATMENT DEPARTMENT
POSITION AND SALARY EXPENSE ENGINEERING SERVICES 8211
Total
FY 2016 FY 2017 FY 2018 FY 2019 Represented
ACTUAL ACTUAL BUDGET ADOPTED or
FTE Non-Rep
3.00 3.00 3.00 3.00 Construction Coordinator 8 Non
1.00 1.00 0.00 0.00 Engineer 8 Non
1.00 2.00 1.00 1.00 Engineering Technician 3 6 Rep
0.00 0.00 1.00 1.00 Engineering Project Coordinator 7 Non
4.00 4.00 5.00 5.00 Principal Engineer 10 Non
1.00 1.00 1.00 1.00 Senior Operations Analyst 9 Non
1.00 1.00 2.00 2.00 Senior Engineer 9 Non
11.00 12.00 13.00 13.00 TOTAL PERSONNEL
Operating
FY 2016 FY 2017 FY 2018 FY 2019 Represented
ACTUAL ACTUAL BUDGET ADOPTED or
FTE Non-Rep
0.00 0.00 0.00 0.00 Construction Coordinator 8 Non
0.00 0.00 0.00 0.00 Engineer 8 Non
0.00 0.50 0.50 0.50 Engineering Technician 3 6 Rep
0.00 0.00 0.00 0.00 Engineering Project Coordinator 7 Non
0.00 0.00 0.00 0.00 Principal Engineer 10 Non
0.00 0.00 0.00 0.00 Senior Operations Analyst 9 Non
0.00 0.00 0.00 0.00 Senior Engineer 9 Non
0.00 0.50 0.50 0.50 TOTAL PERSONNEL
Capital
FY 2016 FY 2017 FY 2018 FY 2019 Represented
ACTUAL ACTUAL BUDGET ADOPTED or
FTE Non-Rep
3.00 3.00 3.00 3.00 Construction Coordinator 8 Non
1.00 1.00 0.00 0.00 Engineer 8 Non
1.00 1.50 0.50 0.50 Engineering Technician 3 6 Rep
0.00 0.00 1.00 1.00 Engineering Project Coordinator 7 Non
4.00 4.00 5.00 5.00 Principal Engineer 10 Non
1.00 1.00 1.00 1.00 Senior Operations Analyst 9 Non
1.00 1.00 2.00 2.00 Senior Engineer 9 Non
11.00 11.50 12.50 12.50 TOTAL PERSONNEL
CLASSIFICATION TITLE
CLASSIFICATION TITLE
CLASSIFICATION TITLESALARY
GRADE
SALARY
GRADE
SALARY
GRADE

Clean Water Services FY 2018-19 Adopted Budget Page 169
FY 2017 ACTUAL FY 2018 BUDGET OBJECT CODE DESCRIPTIONOBJECT
CODE
FY 2019
PROPOSED
FY 2019
APPROVED
244,689 462,300 Wages & Other Pay 51100 419,800 419,800
142,774 10,000 Temporary 51130 6,500 6,500
1,613 5,000 Overtime 51140 5,000 5,000
0 0 Out of Class Straight Time 51170 0 0
(241,069) 157,900 Other Personnel Expenses 51600 142,000 142,000
0 0 Tuition Reimbursement 51761 0 0
1,745 1,800 Other Employee Allow ances 51900 2,200 2,200
0 0 Auto Allow ance 51910 0 0
8,610 9,000 Mobile Computing Allow ance 51915 6,400 6,400
$ 158,363 $ 646,000 $ 581,900 $ 581,900
21,583 20,000 Electricity 52110 20,000 20,000
0 0 Water 52120 0 0
7,281 4,000 Natural Gas 52130 4,000 4,000
0 0 Garbage 52140 0 0
0 0 Surface Water Management Charge 52150 0 0
0 0 Other Utility Services 52160 0 0
0 0 Sew er Charges 52170 0 0
2,796 2,500 Contracted Services 52205 7,500 7,500
0 0 Engineering Services 52210 0 0
0 0 Landscape Services 52215 0 0
1,620 35,000 Professional Services 52240 30,000 30,000
214 0 Recording Fees 52250 0 0
0 0 Laundry 52260 0 0
0 0 Other Government Services 52270 0 0
4,086 6,000 Office Supplies 52305 6,000 6,000
4,191 8,000 Operating Supplies 52310 8,000 8,000
0 0 Gas, Oil, Lubrication 52315 0 0
0 0 Janitorial Supplies 52320 0 0
0 0 Tech & Scientif ic Supplies 52325 0 0
0 0 Repair & Maintenance Supplies 52330 0 0
0 0 Construction & Building Supplies 52335 0 0
0 0 Parts & Equipment 52340 0 0
47 500 Small Tools 52350 500 500
0 0 Safety Equipment 52360 0 0
30 500 Postage & Freight 52375 500 500
5,410 0 Softw are Expensed 52380 1,500 1,500
0 0 Computer Equipment Expensed 52385 0 0
0 0 Inventory Adjustments 52395 0 0
2,636 4,000 Dues & Memberships 52405 4,000 4,000
851 500 Books, Subscriptions & Publications 52410 2,300 2,300
892 1,200 Softw are Licenses & Support 52425 7,200 7,200
0 500 Publication Notices 52430 500 500
1,686 500 Printing 52435 500 500
0 0 Telephone Services 52445 0 0
857 700 Fueling Contract 52475 700 700
2,957 11,000 Training & Education 52480 7,400 7,400
2,675 14,000 Travel Expense 52485 14,200 14,200
1,320 1,000 Fleet Charges 52486 1,000 1,000
11,125 15,000 Private Mileage 52487 15,000 15,000
4,644 3,000 Other Materials & Services 52495 3,000 3,000
1,569 0 Permits, Licenses & Fees 52500 0 0
0 0 Public Information 52505 0 0
0 0 Taxes, Assessments & Liens 52510 0 0
0 0 Equipment Rental 52605 0 0
0 0 Repair & Maintenance Services 52610 0 0
0 0 Non-vehicle Equipment Repair &
Maintenance
52620 0 0
0 0 Computer Repair & Maintenance 52630 0 0
0 0 Insurance 52705 0 0
0 0 Polymers - Thickening 52805 0 0
0 0 Polymers - Dew atering 52810 0 0
0 0 Polymers - Tertiary 52815 0 0
0 0 Ferric Chloride 52820 0 0
0 0 Alum 52825 0 0
0 0 Sodium Hydroxide 52835 0 0
0 0 Sodium Hypochlorite 52840 0 0
0 0 Lime 52845 0 0
0 0 Sodium Bisulf ite 52850 0 0
0 0 Other Chemicals 52890 0 0
$ 78,470 $ 127,900 $ 133,800 $ 133,800
$ - $ 20,000 $ - $ -
$ 236,832 $ 793,900 $ 715,700 $ 715,700
Expenditure Summary 8211 - TPS Engineering
FY 2016 ACTUALFY 2019
ADOPTED
263,630 419,800
Wastewater Treatment Department
0 0
(205,273) 142,000
0 0
74,740 6,500
2,683 5,000
$ 145,680 PERSONNEL EXPENSE SUBTOTAL $ 581,900
19,449 20,000
1,500 2,200
0 0
8,400 6,400
0 0
0 0
0 0
0 0
5,865 4,000
0 0
0 0
6,780 7,500
0 0
0 0
4,585 6,000
6,192 8,000
46 30,000
0 0
0 0
318 0
0 0
0 0
0 0
0 0
0 0
70 1,500
9,586 0
0 0
112 500
0 0
361 500
384 7,200
0 500
12 500
1,687 4,000
732 2,300
782 700
4,376 7,400
0 0
3,214 3,000
150 0
0 0
14,770 14,200
855 1,000
9,479 15,000
0 0
0 0
0 0
0 0
0 0
0 0
0 0
0 0
0 0
0 0
0 0
0 0
0 0
0 0
$ 89,804 MATERIALS & SERVICES SUBTOTAL $ 133,800
0 0
0 0
$ 235,483 TOTAL EXPENDITURE $ 715,700
$ - CAPITAL OUTLAY SUBTOTAL $ -

Clean Water Services FY 2018-19 Adopted Budget Page 170
WASTEWATER TREATMENT DEPARTMENT
POSITION AND SALARY EXPENSE TECHNOLOGY DEVELOPMENT & RESEARCH 8316
Total
FY 2016 FY 2017 FY 2018 FY 2019 Represented
ACTUAL ACTUAL BUDGET ADOPTED or
FTE Non-Rep
1.00 1.00 1.00 1.00 Operations Analyst 2 8 Non
1.00 1.00 1.00 2.00 Principal Engineer 10 Non
1.00 1.00 1.00 0.00 Sr Process Technologist 9 Non
3.00 3.00 3.00 3.00 TOTAL PERSONNEL
Operating
FY 2016 FY 2017 FY 2018 FY 2019 Represented
ACTUAL ACTUAL BUDGET ADOPTED or
FTE Non-Rep
0.90 0.90 0.90 0.90 Operations Analyst 2 8 Non
0.30 0.30 0.30 0.70 Principal Engineer 10 Non
0.40 0.40 0.40 0.00 Sr Process Technologist 9 Non
1.60 1.60 1.60 1.60 TOTAL PERSONNEL
Capital
FY 2016 FY 2017 FY 2018 FY 2019 Represented
ACTUAL ACTUAL BUDGET ADOPTED or
FTE Non-Rep
0.10 0.10 0.10 0.10 Operations Analyst 2 8 Non
0.70 0.70 0.70 1.30 Principal Engineer 10 Non
0.60 0.60 0.60 0.00 Sr Process Technologist 9 Non
1.40 1.40 1.40 1.40 TOTAL PERSONNEL
CLASSIFICATION TITLE
CLASSIFICATION TITLE
CLASSIFICATION TITLE
SALARY
GRADE
SALARY
GRADE
SALARY
GRADE

Clean Water Services FY 2018-19 Adopted Budget Page 171
FY 2017 ACTUAL FY 2018 BUDGET OBJECT CODE DESCRIPTIONOBJECT
CODE
FY 2019
PROPOSED
FY 2019
APPROVED
163,456 380,500 Wages & Other Pay 51100 382,300 382,300
42,925 25,000 Temporary 51130 25,000 25,000
468 1,000 Overtime 51140 0 0
0 0 Out of Class Straight Time 51170 0 0
(6,851) 133,100 Other Personnel Expenses 51600 131,200 131,200
0 0 Tuition Reimbursement 51761 0 0
0 0 Other Employee Allow ances 51900 0 0
0 0 Auto Allow ance 51910 0 0
2,520 5,000 Mobile Computing Allow ance 51915 3,200 3,200
$ 202,518 $ 544,600 $ 541,700 $ 541,700
0 0 Electricity 52110 0 0
0 0 Water 52120 0 0
0 0 Natural Gas 52130 0 0
0 0 Garbage 52140 0 0
0 0 Surface Water Management Charge 52150 0 0
0 0 Other Utility Services 52160 0 0
0 0 Sew er Charges 52170 0 0
0 0 Contracted Services 52205 0 0
0 0 Engineering Services 52210 0 0
0 0 Landscape Services 52215 0 0
0 25,000 Professional Services 52240 25,000 25,000
0 0 Recording Fees 52250 0 0
0 0 Laundry 52260 0 0
0 0 Other Government Services 52270 0 0
0 0 Office Supplies 52305 0 0
24,908 24,000 Operating Supplies 52310 24,000 24,000
0 0 Gas, Oil, Lubrication 52315 0 0
0 0 Janitorial Supplies 52320 0 0
1,208 0 Tech & Scientif ic Supplies 52325 0 0
0 0 Repair & Maintenance Supplies 52330 0 0
0 0 Construction & Building Supplies 52335 0 0
0 0 Parts & Equipment 52340 0 0
0 500 Small Tools 52350 500 500
0 0 Safety Equipment 52360 0 0
0 0 Postage & Freight 52375 0 0
491 0 Softw are Expensed 52380 0 0
0 0 Computer Equipment Expensed 52385 0 0
0 0 Inventory Adjustments 52395 0 0
732 1,000 Dues & Memberships 52405 1,100 1,100
75 0 Books, Subscriptions & Publications 52410 0 0
0 0 Softw are Licenses & Support 52425 0 0
0 0 Publication Notices 52430 0 0
0 0 Printing 52435 0 0
0 0 Telephone Services 52445 0 0
0 0 Fueling Contract 52475 0 0
4,868 4,100 Training & Education 52480 7,100 7,100
13,914 13,000 Travel Expense 52485 16,000 16,000
0 0 Fleet Charges 52486 0 0
1,275 3,000 Private Mileage 52487 5,000 5,000
88 0 Other Materials & Services 52495 0 0
0 0 Permits, Licenses & Fees 52500 0 0
0 0 Public Information 52505 0 0
0 0 Taxes, Assessments & Liens 52510 0 0
0 0 Equipment Rental 52605 0 0
0 0 Repair & Maintenance Services 52610 0 0
0 0 Non-vehicle Equipment Repair &
Maintenance
52620 0 0
0 0 Computer Repair & Maintenance 52630 0 0
0 0 Insurance 52705 0 0
0 0 Polymers - Thickening 52805 0 0
0 0 Polymers - Dew atering 52810 0 0
0 0 Polymers - Tertiary 52815 0 0
0 0 Ferric Chloride 52820 0 0
0 0 Alum 52825 0 0
0 0 Sodium Hydroxide 52835 0 0
0 0 Sodium Hypochlorite 52840 0 0
0 0 Lime 52845 0 0
0 0 Sodium Bisulf ite 52850 0 0
0 0 Other Chemicals 52890 0 0
$ 47,557 $ 70,600 $ 78,700 $ 78,700
$ - $ - $ - $ -
$ 250,075 $ 615,200 $ 620,400 $ 620,400
Expenditure Summary 8316 - Technology Development & Research
FY 2016 ACTUALFY 2019
ADOPTED
112,013 382,300
Wastewater Treatment Department
0 0
(19,351) 131,200
0 0
81,016 25,000
1,045 0
$ 177,207 PERSONNEL EXPENSE SUBTOTAL $ 541,700
0 0
0 0
0 0
2,485 3,200
0 0
0 0
0 0
0 0
0 0
0 0
0 0
0 0
0 0
0 0
0 0
3,014 24,000
0 25,000
0 0
0 0
48 0
0 0
0 0
0 0
0 0
0 0
0 0
601 0
0 0
0 500
0 0
0 0
0 0
0 0
0 0
564 1,100
0 0
0 0
1,015 7,100
0 0
115 0
0 0
0 0
7,111 16,000
0 0
484 5,000
0 0
0 0
0 0
0 0
0 0
0 0
0 0
0 0
0 0
0 0
0 0
0 0
0 0
0 0
$ 12,951 MATERIALS & SERVICES SUBTOTAL $ 78,700
0 0
0 0
$ 190,159 TOTAL EXPENDITURE $ 620,400
$ - CAPITAL OUTLAY SUBTOTAL $ -

Clean Water Services FY 2018-19 Adopted Budget Page 172
WASTEWATER TREATMENT DEPARTMENT
POSITION AND SALARY EXPENSE DURHAM OPERATIONS 8311
Total
FY 2016 FY 2017 FY 2018 FY 2019 Represented
ACTUAL ACTUAL BUDGET ADOPTED or
FTE Non-Rep
0.50 0.50 0.50 0.50 Operations Analyst 1 5 Non
1.00 1.00 1.00 1.00 Operations Analyst 2 8 Non
1.00 1.00 1.00 1.00 Plant Manager 8 Non
1.00 1.00 1.00 1.00 Senior Operator 6 Rep
12.00 13.00 13.00 13.00 Wastewater Plant Operator 2 5 Rep
15.50 16.50 16.50 16.50 TOTAL PERSONNEL
Operating
FY 2016 FY 2017 FY 2018 FY 2019 Represented
ACTUAL ACTUAL BUDGET ADOPTED or
FTE Non-Rep
0.50 0.50 0.50 0.50 Operations Analyst 1 5 Non
1.00 1.00 1.00 1.00 Operations Analyst 2 8 Non
1.00 1.00 1.00 1.00 Plant Manager 8 Non
1.00 1.00 1.00 1.00 Senior Operator 6 Rep
12.00 13.00 13.00 13.00 Wastewater Plant Operator 2 5 Rep
15.50 16.50 16.50 16.50 TOTAL PERSONNEL
Capital
FY 2016 FY 2017 FY 2018 FY 2019 Represented
ACTUAL ACTUAL BUDGET ADOPTED or
FTE Non-Rep
0.00 0.00 0.00 0.00 Operations Analyst 1 5 Non
0.00 0.00 0.00 0.00 Operations Analyst 2 8 Non
0.00 0.00 0.00 0.00 Plant Manager 8 Non
0.00 0.00 0.00 0.00 Senior Operator 6 Rep
0.00 0.00 0.00 0.00 Wastewater Plant Operator 2 5 Rep
0.00 0.00 0.00 0.00 TOTAL PERSONNEL
CLASSIFICATION TITLE
CLASSIFICATION TITLE
CLASSIFICATION TITLE
SALARY
GRADE
SALARY
GRADE
SALARY
GRADE

Clean Water Services FY 2018-19 Adopted Budget Page 173
FY 2017 ACTUAL FY 2018 BUDGET OBJECT CODE DESCRIPTIONOBJECT
CODE
FY 2019
PROPOSED
FY 2019
APPROVED
1,235,074 1,269,300 Wages & Other Pay 51100 1,291,600 1,291,600
50,488 45,000 Temporary 51130 49,000 49,000
72,530 40,000 Overtime 51140 60,000 60,000
0 0 Out of Class Straight Time 51170 0 0
465,166 540,300 Other Personnel Expenses 51600 559,400 559,400
2,397 0 Tuition Reimbursement 51761 0 0
2,259 2,100 Other Employee Allow ances 51900 3,300 3,300
0 0 Auto Allow ance 51910 0 0
2,520 2,500 Mobile Computing Allow ance 51915 2,400 2,400
$ 1,830,433 $ 1,899,200 $ 1,965,700 $ 1,965,700
826,248 772,000 Electricity 52110 780,000 780,000
54,603 82,000 Water 52120 82,000 82,000
83,299 86,000 Natural Gas 52130 86,000 86,000
101,653 90,000 Garbage 52140 100,000 100,000
13,244 0 Surface Water Management Charge 52150 0 0
1,067 15,000 Other Utility Services 52160 15,000 15,000
27,162 0 Sew er Charges 52170 0 0
69,371 35,000 Contracted Services 52205 65,000 65,000
0 0 Engineering Services 52210 0 0
0 0 Landscape Services 52215 0 0
9,125 5,000 Professional Services 52240 5,000 5,000
0 0 Recording Fees 52250 0 0
0 0 Laundry 52260 0 0
0 0 Other Government Services 52270 0 0
2,695 0 Office Supplies 52305 0 0
70,078 52,000 Operating Supplies 52310 52,000 52,000
368 0 Gas, Oil, Lubrication 52315 0 0
0 0 Janitorial Supplies 52320 0 0
68 0 Tech & Scientif ic Supplies 52325 0 0
99 5,000 Repair & Maintenance Supplies 52330 5,000 5,000
0 0 Construction & Building Supplies 52335 0 0
0 0 Parts & Equipment 52340 0 0
4,200 2,500 Small Tools 52350 2,500 2,500
497 0 Safety Equipment 52360 0 0
0 0 Postage & Freight 52375 0 0
0 0 Softw are Expensed 52380 0 0
0 0 Computer Equipment Expensed 52385 0 0
0 0 Inventory Adjustments 52395 0 0
1,354 1,600 Dues & Memberships 52405 1,600 1,600
486 0 Books, Subscriptions & Publications 52410 0 0
0 0 Softw are Licenses & Support 52425 0 0
0 0 Publication Notices 52430 0 0
105 0 Printing 52435 0 0
0 0 Telephone Services 52445 0 0
0 0 Fueling Contract 52475 0 0
4,506 6,000 Training & Education 52480 6,000 6,000
6,887 3,300 Travel Expense 52485 7,000 7,000
0 0 Fleet Charges 52486 0 0
1,141 2,000 Private Mileage 52487 2,000 2,000
2,275 500 Other Materials & Services 52495 500 500
2,801 5,000 Permits, Licenses & Fees 52500 5,000 5,000
0 0 Public Information 52505 0 0
0 0 Taxes, Assessments & Liens 52510 0 0
0 0 Equipment Rental 52605 0 0
0 0 Repair & Maintenance Services 52610 0 0
0 0 Non-vehicle Equipment Repair &
Maintenance
52620 0 0
0 0 Computer Repair & Maintenance 52630 0 0
0 0 Insurance 52705 0 0
0 30,000 Polymers - Thickening 52805 38,500 38,500
457,310 350,000 Polymers - Dew atering 52810 360,000 360,000
(1,457) 20,000 Polymers - Tertiary 52815 25,000 25,000
63,581 70,000 Ferric Chloride 52820 50,000 50,000
286,119 315,000 Alum 52825 290,000 290,000
68,212 60,000 Sodium Hydroxide 52835 90,000 90,000
241,735 245,000 Sodium Hypochlorite 52840 245,000 245,000
192,285 165,000 Lime 52845 180,000 180,000
113,050 100,000 Sodium Bisulf ite 52850 80,000 80,000
15,836 20,000 Other Chemicals 52890 20,000 20,000
$ 2,720,002 $ 2,537,900 $ 2,593,100 $ 2,593,100
$ - $ - $ - $ -
$ 4,550,435 $ 4,437,100 $ 4,558,800 $ 4,558,800
Expenditure Summary 8311 - Durham Operations
FY 2016 ACTUALFY 2019
ADOPTED
1,081,443 1,291,600
Wastewater Treatment Department
0 0
409,997 559,400
0 0
52,634 49,000
80,396 60,000
$ 1,629,480 PERSONNEL EXPENSE SUBTOTAL $ 1,965,700
1,021,872 780,000
2,490 3,300
0 0
2,520 2,400
104,291 100,000
12,560 0
649 15,000
91,178 82,000
81,683 86,000
0 0
13,381 0
45,239 65,000
0 0
0 0
104 0
44,231 52,000
0 5,000
0 0
0 0
15,695 5,000
0 0
0 0
189 0
0 0
0 0
0 0
11,727 0
27,376 0
3,311 2,500
45 0
0 0
0 0
140 0
0 0
895 1,600
0 0
2 0
2,936 6,000
0 0
452 500
2,436 5,000
0 0
3,937 7,000
0 0
689 2,000
0 0
0 0
0 0
0 0
0 0
0 0
0 38,500
470,620 360,000
60,739 90,000
260,937 245,000
195,630 180,000
5,404 25,000
69,300 50,000
345,648 290,000
$ 3,013,522 MATERIALS & SERVICES SUBTOTAL $ 2,593,100
107,496 80,000
12,733 20,000
$ 4,651,556 TOTAL EXPENDITURE $ 4,558,800
$ 8,554 CAPITAL OUTLAY SUBTOTAL $ -
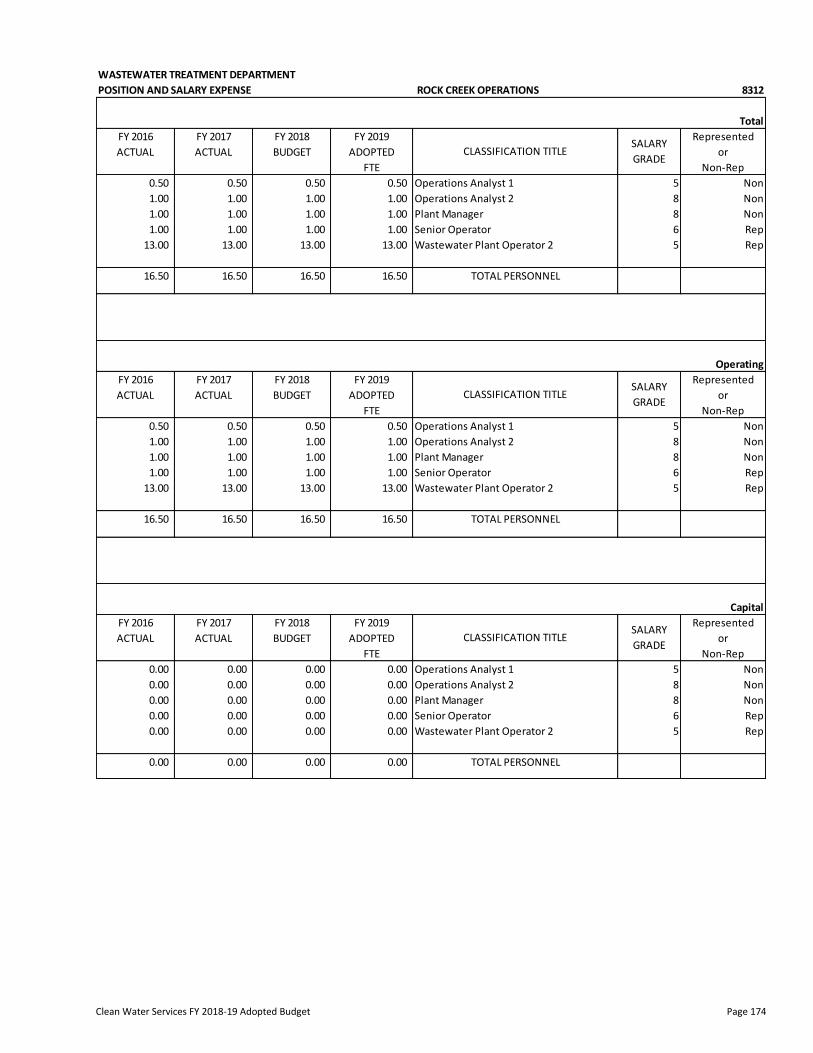
Clean Water Services FY 2018-19 Adopted Budget Page 174
WASTEWATER TREATMENT DEPARTMENT
POSITION AND SALARY EXPENSE ROCK CREEK OPERATIONS 8312
Total
FY 2016 FY 2017 FY 2018 FY 2019 Represented
ACTUAL ACTUAL BUDGET ADOPTED or
FTE Non-Rep
0.50 0.50 0.50 0.50 Operations Analyst 1 5 Non
1.00 1.00 1.00 1.00 Operations Analyst 2 8 Non
1.00 1.00 1.00 1.00 Plant Manager 8 Non
1.00 1.00 1.00 1.00 Senior Operator 6 Rep
13.00 13.00 13.00 13.00 Wastewater Plant Operator 2 5 Rep
16.50 16.50 16.50 16.50 TOTAL PERSONNEL
Operating
FY 2016 FY 2017 FY 2018 FY 2019 Represented
ACTUAL ACTUAL BUDGET ADOPTED or
FTE Non-Rep
0.50 0.50 0.50 0.50 Operations Analyst 1 5 Non
1.00 1.00 1.00 1.00 Operations Analyst 2 8 Non
1.00 1.00 1.00 1.00 Plant Manager 8 Non
1.00 1.00 1.00 1.00 Senior Operator 6 Rep
13.00 13.00 13.00 13.00 Wastewater Plant Operator 2 5 Rep
16.50 16.50 16.50 16.50 TOTAL PERSONNEL
Capital
FY 2016 FY 2017 FY 2018 FY 2019 Represented
ACTUAL ACTUAL BUDGET ADOPTED or
FTE Non-Rep
0.00 0.00 0.00 0.00 Operations Analyst 1 5 Non
0.00 0.00 0.00 0.00 Operations Analyst 2 8 Non
0.00 0.00 0.00 0.00 Plant Manager 8 Non
0.00 0.00 0.00 0.00 Senior Operator 6 Rep
0.00 0.00 0.00 0.00 Wastewater Plant Operator 2 5 Rep
0.00 0.00 0.00 0.00 TOTAL PERSONNEL
CLASSIFICATION TITLE
CLASSIFICATION TITLE
CLASSIFICATION TITLE
SALARY
GRADE
SALARY
GRADE
SALARY
GRADE

Clean Water Services FY 2018-19 Adopted Budget Page 175
FY 2017 ACTUAL FY 2018 BUDGET OBJECT CODE DESCRIPTIONOBJECT
CODE
FY 2019
PROPOSED
FY 2019
APPROVED
1,269,020 1,269,300 Wages & Other Pay 51100 1,303,000 1,303,000
41,798 45,000 Temporary 51130 49,000 49,000
70,740 50,000 Overtime 51140 60,000 60,000
0 0 Out of Class Straight Time 51170 0 0
476,405 542,400 Other Personnel Expenses 51600 563,000 563,000
0 0 Tuition Reimbursement 51761 0 0
2,825 2,100 Other Employee Allow ances 51900 3,300 3,300
0 0 Auto Allow ance 51910 0 0
2,923 2,200 Mobile Computing Allow ance 51915 2,400 2,400
$ 1,863,711 $ 1,911,000 $ 1,980,700 $ 1,980,700
1,467,860 1,375,000 Electricity 52110 1,450,000 1,450,000
17,639 14,000 Water 52120 15,400 15,400
141,606 125,000 Natural Gas 52130 125,000 125,000
116,604 60,000 Garbage 52140 110,000 110,000
0 0 Surface Water Management Charge 52150 0 0
0 0 Other Utility Services 52160 0 0
0 0 Sew er Charges 52170 0 0
300 25,000 Contracted Services 52205 25,000 25,000
0 0 Engineering Services 52210 0 0
0 0 Landscape Services 52215 0 0
0 5,000 Professional Services 52240 5,000 5,000
0 0 Recording Fees 52250 0 0
461 0 Laundry 52260 0 0
0 0 Other Government Services 52270 0 0
626 0 Office Supplies 52305 0 0
86,395 58,000 Operating Supplies 52310 58,000 58,000
60 0 Gas, Oil, Lubrication 52315 0 0
0 0 Janitorial Supplies 52320 0 0
0 0 Tech & Scientif ic Supplies 52325 0 0
0 5,000 Repair & Maintenance Supplies 52330 5,000 5,000
0 0 Construction & Building Supplies 52335 0 0
0 0 Parts & Equipment 52340 0 0
710 1,000 Small Tools 52350 1,000 1,000
0 0 Safety Equipment 52360 0 0
38 0 Postage & Freight 52375 0 0
0 0 Softw are Expensed 52380 0 0
0 0 Computer Equipment Expensed 52385 0 0
6,191 0 Inventory Adjustments 52395 0 0
1,687 1,500 Dues & Memberships 52405 1,500 1,500
74 0 Books, Subscriptions & Publications 52410 3,000 3,000
0 0 Softw are Licenses & Support 52425 0 0
0 0 Publication Notices 52430 0 0
105 0 Printing 52435 0 0
0 0 Telephone Services 52445 0 0
0 0 Fueling Contract 52475 0 0
5,597 7,300 Training & Education 52480 7,300 7,300
5,613 6,000 Travel Expense 52485 6,000 6,000
0 0 Fleet Charges 52486 0 0
1,597 2,200 Private Mileage 52487 2,200 2,200
1,385 500 Other Materials & Services 52495 500 500
318 7,500 Permits, Licenses & Fees 52500 7,500 7,500
0 0 Public Information 52505 0 0
0 0 Taxes, Assessments & Liens 52510 0 0
0 0 Equipment Rental 52605 0 0
0 0 Repair & Maintenance Services 52610 0 0
0 0 Non-vehicle Equipment Repair &
Maintenance
52620 0 0
0 0 Computer Repair & Maintenance 52630 0 0
0 0 Insurance 52705 0 0
80,180 60,000 Polymers - Thickening 52805 0 0
543,377 485,000 Polymers - Dew atering 52810 470,000 470,000
(6,003) 75,000 Polymers - Tertiary 52815 50,000 50,000
111,360 120,000 Ferric Chloride 52820 186,000 186,000
539,266 418,500 Alum 52825 388,500 388,500
75,834 70,000 Sodium Hydroxide 52835 90,000 90,000
215,432 147,000 Sodium Hypochlorite 52840 200,000 200,000
641,988 760,000 Lime 52845 811,000 811,000
186,608 124,000 Sodium Bisulf ite 52850 186,000 186,000
34,312 30,000 Other Chemicals 52890 30,000 30,000
$ 4,277,218 $ 3,982,500 $ 4,233,900 $ 4,233,900
$ 6,985 $ - $ - $ -
$ 6,147,914 $ 5,893,500 $ 6,214,600 $ 6,214,600
Expenditure Summary 8312 - Rock Creek Operations
FY 2016 ACTUALFY 2019
ADOPTED
1,116,784 1,303,000
Wastewater Treatment Department
0 0
434,263 563,000
0 0
76,579 49,000
62,285 60,000
$ 1,694,662 PERSONNEL EXPENSE SUBTOTAL $ 1,980,700
1,528,656 1,450,000
2,232 3,300
0 0
2,520 2,400
122,506 110,000
0 0
0 0
11,413 15,400
105,184 125,000
0 0
0 0
550 25,000
0 0
0 0
2,347 0
59,958 58,000
0 5,000
0 0
0 0
92 5,000
0 0
0 0
0 0
0 0
0 0
0 0
10,674 0
5,895 0
1,426 1,000
0 0
0 0
0 0
140 0
0 0
983 1,500
0 3,000
67 0
3,082 7,300
0 0
1,285 500
161 7,500
0 0
5,184 6,000
0 0
851 2,200
0 0
0 0
0 0
0 0
0 0
0 0
(56,145) 0
489,354 470,000
38,227 90,000
197,177 200,000
408,666 811,000
0 50,000
140,042 186,000
572,869 388,500
$ 3,835,015 MATERIALS & SERVICES SUBTOTAL $ 4,233,900
178,697 186,000
5,676 30,000
$ 5,538,231 TOTAL EXPENDITURE $ 6,214,600
$ 8,554 CAPITAL OUTLAY SUBTOTAL $ -

Clean Water Services FY 2018-19 Adopted Budget Page 176
WASTEWATER TREATMENT DEPARTMENT
POSITION AND SALARY EXPENSE HILLSBORO OPERATIONS 8314
Total
FY 2016 FY 2017 FY 2018 FY 2019 Represented
ACTUAL ACTUAL BUDGET ADOPTED or
FTE Non-Rep
0.00 0.00 0.00 0.50 Operations Analyst 2 8 Non
0.00 0.00 0.00 1.00 Plant Maintenance Technician 2 5 Rep
0.00 0.00 0.00 0.50 Plant Manager 8 Non
0.50 0.50 0.50 0.50 Senior Operator 6 Rep
2.00 2.00 2.00 2.00 Wastewater Plant Operator 2 5 Rep
2.50 2.50 2.50 4.50 TOTAL PERSONNEL
Operating
FY 2016 FY 2017 FY 2018 FY 2019 Represented
ACTUAL ACTUAL BUDGET ADOPTED or
FTE Non-Rep
0.00 0.00 0.00 0.50 Operations Analyst 2 8 Non
0.00 0.00 0.00 1.00 Plant Maintenance Technician 2 5 Rep
0.00 0.00 0.00 0.50 Plant Manager 8 Non
0.50 0.50 0.50 0.50 Senior Operator 6 Rep
2.00 2.00 2.00 2.00 Wastewater Plant Operator 2 5 Rep
2.50 2.50 2.50 4.50 TOTAL PERSONNEL
Capital
FY 2016 FY 2017 FY 2018 FY 2019 Represented
ACTUAL ACTUAL BUDGET ADOPTED or
FTE Non-Rep
0.00 0.00 0.00 0.00 Operations Analyst 2 8 Non
0.00 0.00 0.00 0.00 Plant Maintenance Technician 2 5 Rep
0.00 0.00 0.00 0.00 Plant Manager 8 Non
0.00 0.00 0.00 0.00 Senior Operator 6 Rep
0.00 0.00 0.00 0.00 Wastewater Plant Operator 2 5 Rep
0.00 0.00 0.00 0.00 TOTAL PERSONNEL
CLASSIFICATION TITLE
CLASSIFICATION TITLE
CLASSIFICATION TITLE
SALARY
GRADE
SALARY
GRADE
SALARY
GRADE
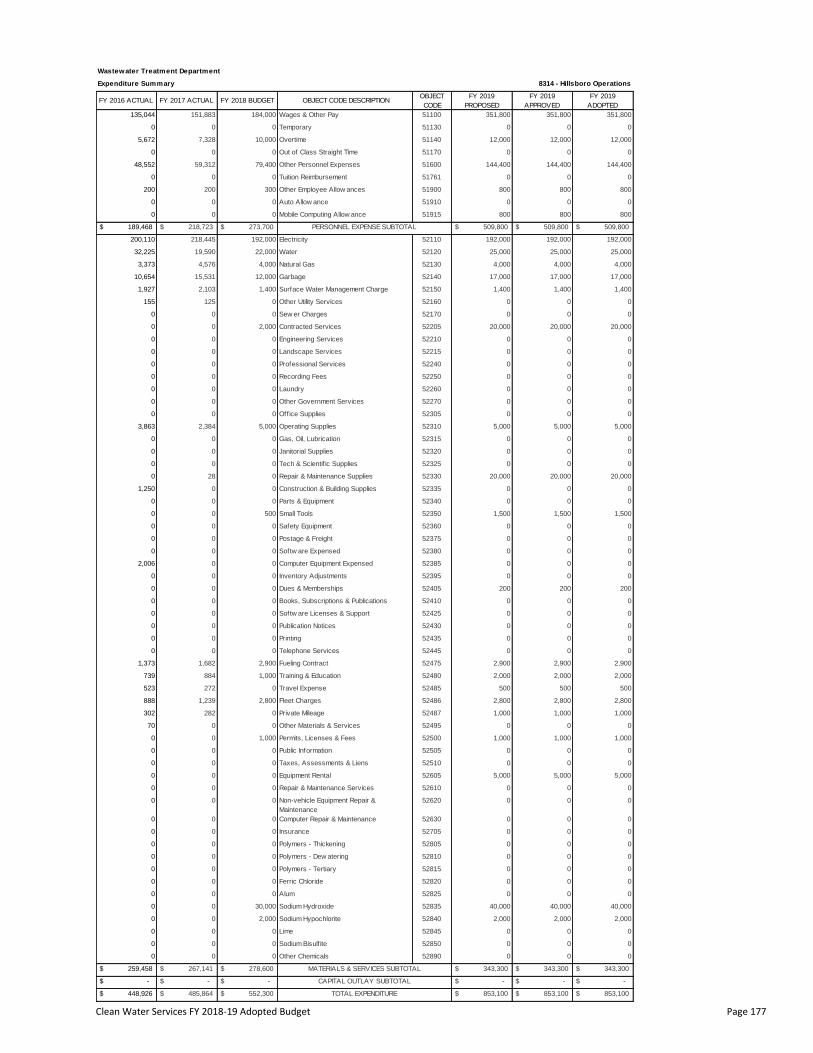
Clean Water Services FY 2018-19 Adopted Budget Page 177
FY 2017 ACTUAL FY 2018 BUDGET OBJECT CODE DESCRIPTIONOBJECT
CODE
FY 2019
PROPOSED
FY 2019
APPROVED
151,883 184,000 Wages & Other Pay 51100 351,800 351,800
0 0 Temporary 51130 0 0
7,328 10,000 Overtime 51140 12,000 12,000
0 0 Out of Class Straight Time 51170 0 0
59,312 79,400 Other Personnel Expenses 51600 144,400 144,400
0 0 Tuition Reimbursement 51761 0 0
200 300 Other Employee Allow ances 51900 800 800
0 0 Auto Allow ance 51910 0 0
0 0 Mobile Computing Allow ance 51915 800 800
$ 218,723 $ 273,700 $ 509,800 $ 509,800
218,445 192,000 Electricity 52110 192,000 192,000
19,590 22,000 Water 52120 25,000 25,000
4,576 4,000 Natural Gas 52130 4,000 4,000
15,531 12,000 Garbage 52140 17,000 17,000
2,103 1,400 Surface Water Management Charge 52150 1,400 1,400
125 0 Other Utility Services 52160 0 0
0 0 Sew er Charges 52170 0 0
0 2,000 Contracted Services 52205 20,000 20,000
0 0 Engineering Services 52210 0 0
0 0 Landscape Services 52215 0 0
0 0 Professional Services 52240 0 0
0 0 Recording Fees 52250 0 0
0 0 Laundry 52260 0 0
0 0 Other Government Services 52270 0 0
0 0 Office Supplies 52305 0 0
2,384 5,000 Operating Supplies 52310 5,000 5,000
0 0 Gas, Oil, Lubrication 52315 0 0
0 0 Janitorial Supplies 52320 0 0
0 0 Tech & Scientif ic Supplies 52325 0 0
28 0 Repair & Maintenance Supplies 52330 20,000 20,000
0 0 Construction & Building Supplies 52335 0 0
0 0 Parts & Equipment 52340 0 0
0 500 Small Tools 52350 1,500 1,500
0 0 Safety Equipment 52360 0 0
0 0 Postage & Freight 52375 0 0
0 0 Softw are Expensed 52380 0 0
0 0 Computer Equipment Expensed 52385 0 0
0 0 Inventory Adjustments 52395 0 0
0 0 Dues & Memberships 52405 200 200
0 0 Books, Subscriptions & Publications 52410 0 0
0 0 Softw are Licenses & Support 52425 0 0
0 0 Publication Notices 52430 0 0
0 0 Printing 52435 0 0
0 0 Telephone Services 52445 0 0
1,682 2,900 Fueling Contract 52475 2,900 2,900
884 1,000 Training & Education 52480 2,000 2,000
272 0 Travel Expense 52485 500 500
1,239 2,800 Fleet Charges 52486 2,800 2,800
282 0 Private Mileage 52487 1,000 1,000
0 0 Other Materials & Services 52495 0 0
0 1,000 Permits, Licenses & Fees 52500 1,000 1,000
0 0 Public Information 52505 0 0
0 0 Taxes, Assessments & Liens 52510 0 0
0 0 Equipment Rental 52605 5,000 5,000
0 0 Repair & Maintenance Services 52610 0 0
0 0 Non-vehicle Equipment Repair &
Maintenance
52620 0 0
0 0 Computer Repair & Maintenance 52630 0 0
0 0 Insurance 52705 0 0
0 0 Polymers - Thickening 52805 0 0
0 0 Polymers - Dew atering 52810 0 0
0 0 Polymers - Tertiary 52815 0 0
0 0 Ferric Chloride 52820 0 0
0 0 Alum 52825 0 0
0 30,000 Sodium Hydroxide 52835 40,000 40,000
0 2,000 Sodium Hypochlorite 52840 2,000 2,000
0 0 Lime 52845 0 0
0 0 Sodium Bisulf ite 52850 0 0
0 0 Other Chemicals 52890 0 0
$ 267,141 $ 278,600 $ 343,300 $ 343,300
$ - $ - $ - $ -
$ 485,864 $ 552,300 $ 853,100 $ 853,100
Expenditure Summary 8314 - Hillsboro Operations
FY 2016 ACTUALFY 2019
ADOPTED
135,044 351,800
Wastewater Treatment Department
0 0
48,552 144,400
0 0
0 0
5,672 12,000
$ 189,468 PERSONNEL EXPENSE SUBTOTAL $ 509,800
200,110 192,000
200 800
0 0
0 800
10,654 17,000
1,927 1,400
155 0
32,225 25,000
3,373 4,000
0 0
0 0
0 20,000
0 0
0 0
0 0
3,863 5,000
0 0
0 0
0 0
0 20,000
1,250 0
0 0
0 0
0 0
0 0
0 0
2,006 0
0 0
0 1,500
0 0
0 0
0 0
0 0
0 0
0 200
0 0
1,373 2,900
739 2,000
0 0
70 0
0 1,000
0 0
523 500
888 2,800
302 1,000
0 5,000
0 0
0 0
0 0
0 0
0 0
0 0
0 0
0 40,000
0 2,000
0 0
0 0
0 0
0 0
$ 259,458 MATERIALS & SERVICES SUBTOTAL $ 343,300
0 0
0 0
$ 448,926 TOTAL EXPENDITURE $ 853,100
$ - CAPITAL OUTLAY SUBTOTAL $ -
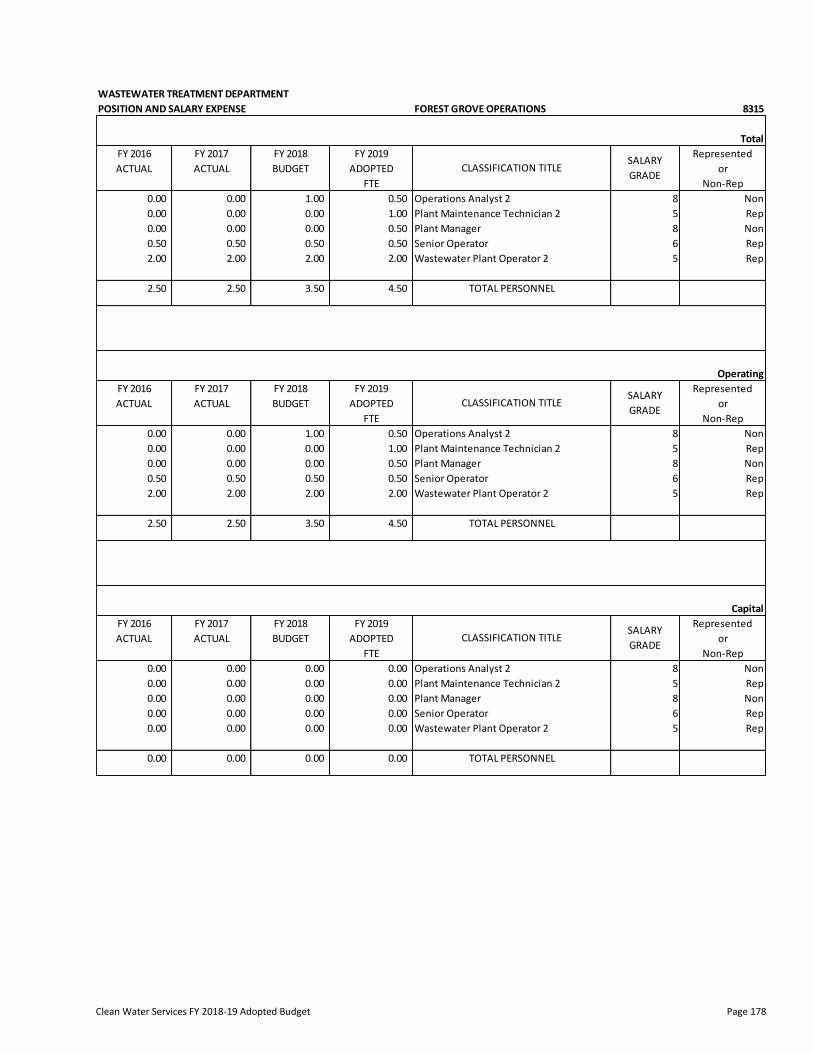
Clean Water Services FY 2018-19 Adopted Budget Page 178
WASTEWATER TREATMENT DEPARTMENT
POSITION AND SALARY EXPENSE FOREST GROVE OPERATIONS 8315
Total
FY 2016 FY 2017 FY 2018 FY 2019 Represented
ACTUAL ACTUAL BUDGET ADOPTED or
FTE Non-Rep
0.00 0.00 1.00 0.50 Operations Analyst 2 8 Non
0.00 0.00 0.00 1.00 Plant Maintenance Technician 2 5 Rep
0.00 0.00 0.00 0.50 Plant Manager 8 Non
0.50 0.50 0.50 0.50 Senior Operator 6 Rep
2.00 2.00 2.00 2.00 Wastewater Plant Operator 2 5 Rep
2.50 2.50 3.50 4.50 TOTAL PERSONNEL
Operating
FY 2016 FY 2017 FY 2018 FY 2019 Represented
ACTUAL ACTUAL BUDGET ADOPTED or
FTE Non-Rep
0.00 0.00 1.00 0.50 Operations Analyst 2 8 Non
0.00 0.00 0.00 1.00 Plant Maintenance Technician 2 5 Rep
0.00 0.00 0.00 0.50 Plant Manager 8 Non
0.50 0.50 0.50 0.50 Senior Operator 6 Rep
2.00 2.00 2.00 2.00 Wastewater Plant Operator 2 5 Rep
2.50 2.50 3.50 4.50 TOTAL PERSONNEL
Capital
FY 2016 FY 2017 FY 2018 FY 2019 Represented
ACTUAL ACTUAL BUDGET ADOPTED or
FTE Non-Rep
0.00 0.00 0.00 0.00 Operations Analyst 2 8 Non
0.00 0.00 0.00 0.00 Plant Maintenance Technician 2 5 Rep
0.00 0.00 0.00 0.00 Plant Manager 8 Non
0.00 0.00 0.00 0.00 Senior Operator 6 Rep
0.00 0.00 0.00 0.00 Wastewater Plant Operator 2 5 Rep
0.00 0.00 0.00 0.00 TOTAL PERSONNEL
CLASSIFICATION TITLE
CLASSIFICATION TITLE
CLASSIFICATION TITLE
SALARY
GRADE
SALARY
GRADE
SALARY
GRADE

Clean Water Services FY 2018-19 Adopted Budget Page 179
FY 2017 ACTUAL FY 2018 BUDGET OBJECT CODE DESCRIPTIONOBJECT
CODE
FY 2019
PROPOSED
FY 2019
APPROVED
192,493 291,600 Wages & Other Pay 51100 372,300 372,300
0 0 Temporary 51130 50,000 50,000
12,877 15,000 Overtime 51140 17,000 17,000
0 2,300 Out of Class Straight Time 51170 0 0
75,855 119,400 Other Personnel Expenses 51600 160,800 160,800
0 0 Tuition Reimbursement 51761 0 0
300 300 Other Employee Allow ances 51900 800 800
0 0 Auto Allow ance 51910 0 0
438 800 Mobile Computing Allow ance 51915 800 800
$ 281,962 $ 429,400 $ 601,700 $ 601,700
264,296 220,000 Electricity 52110 300,000 300,000
45,054 70,000 Water 52120 70,000 70,000
9,641 8,000 Natural Gas 52130 8,000 8,000
11,090 10,000 Garbage 52140 15,000 15,000
1,682 2,000 Surface Water Management Charge 52150 2,000 2,000
432 0 Other Utility Services 52160 0 0
0 0 Sew er Charges 52170 0 0
0 0 Contracted Services 52205 30,000 30,000
0 0 Engineering Services 52210 0 0
64 0 Landscape Services 52215 0 0
760 0 Professional Services 52240 0 0
0 0 Recording Fees 52250 0 0
0 0 Laundry 52260 0 0
0 0 Other Government Services 52270 0 0
81 0 Office Supplies 52305 500 500
5,032 5,600 Operating Supplies 52310 8,600 8,600
0 0 Gas, Oil, Lubrication 52315 0 0
0 0 Janitorial Supplies 52320 0 0
0 0 Tech & Scientif ic Supplies 52325 0 0
12 0 Repair & Maintenance Supplies 52330 30,000 30,000
0 0 Construction & Building Supplies 52335 0 0
0 0 Parts & Equipment 52340 0 0
0 500 Small Tools 52350 1,500 1,500
0 0 Safety Equipment 52360 0 0
0 0 Postage & Freight 52375 0 0
0 0 Softw are Expensed 52380 0 0
0 0 Computer Equipment Expensed 52385 0 0
0 0 Inventory Adjustments 52395 0 0
(33) 500 Dues & Memberships 52405 1,000 1,000
0 0 Books, Subscriptions & Publications 52410 0 0
0 0 Softw are Licenses & Support 52425 0 0
0 0 Publication Notices 52430 0 0
0 0 Printing 52435 0 0
0 0 Telephone Services 52445 0 0
0 0 Fueling Contract 52475 0 0
1,533 1,000 Training & Education 52480 4,000 4,000
3,086 1,600 Travel Expense 52485 3,600 3,600
0 0 Fleet Charges 52486 0 0
3,114 3,000 Private Mileage 52487 4,000 4,000
1,318 0 Other Materials & Services 52495 1,500 1,500
0 1,500 Permits, Licenses & Fees 52500 1,500 1,500
0 0 Public Information 52505 0 0
0 0 Taxes, Assessments & Liens 52510 0 0
0 0 Equipment Rental 52605 5,000 5,000
0 0 Repair & Maintenance Services 52610 0 0
0 0 Non-vehicle Equipment Repair &
Maintenance
52620 0 0
0 0 Computer Repair & Maintenance 52630 0 0
0 0 Insurance 52705 0 0
0 0 Polymers - Thickening 52805 0 0
0 0 Polymers - Dew atering 52810 0 0
0 0 Polymers - Tertiary 52815 0 0
0 0 Ferric Chloride 52820 0 0
0 0 Alum 52825 0 0
13,300 60,000 Sodium Hydroxide 52835 70,000 70,000
4,950 10,000 Sodium Hypochlorite 52840 10,000 10,000
0 0 Lime 52845 0 0
0 0 Sodium Bisulf ite 52850 0 0
0 25,000 Other Chemicals 52890 25,000 25,000
$ 365,413 $ 418,700 $ 591,200 $ 591,200
$ - $ 20,000 $ - $ -
$ 647,376 $ 868,100 $ 1,192,900 $ 1,192,900
Expenditure Summary 8315 - Forest Grove Operations
FY 2016 ACTUALFY 2019
ADOPTED
220,604 372,300
Wastewater Treatment Department
0 0
86,619 160,800
0 0
0 50,000
11,713 17,000
$ 320,285 PERSONNEL EXPENSE SUBTOTAL $ 601,700
197,640 300,000
580 800
0 0
770 800
9,993 15,000
1,578 2,000
421 0
60,864 70,000
5,019 8,000
0 0
0 0
0 30,000
0 0
0 0
112 500
10,053 8,600
0 0
0 0
0 0
20 30,000
0 0
0 0
0 0
0 0
0 0
0 0
371 0
0 0
30 1,500
0 0
0 0
0 0
0 0
0 0
200 1,000
0 0
0 0
393 4,000
0 0
2,672 1,500
0 1,500
0 0
2,613 3,600
0 0
2,362 4,000
0 5,000
0 0
0 0
0 0
0 0
0 0
0 0
0 0
0 70,000
0 10,000
0 0
0 0
0 0
0 0
$ 294,340 MATERIALS & SERVICES SUBTOTAL $ 591,200
0 0
0 25,000
$ 614,625 TOTAL EXPENDITURE $ 1,192,900
$ - CAPITAL OUTLAY SUBTOTAL $ -

Clean Water Services FY 2018-19 Adopted Budget Page 180
WASTEWATER TREATMENT DEPARTMENT
POSITION AND SALARY EXPENSE PUMP STATION MAINTENANCE 8343
Total
FY 2016 FY 2017 FY 2018 FY 2019 Represented
ACTUAL ACTUAL BUDGET ADOPTED or
FTE Non-Rep
0.00 0.00 1.00 1.00 Mechanical Maint Supervisor 7 Non
4.00 4.00 4.00 3.00 Plant Maintenance Technician 2 5 Rep
1.00 1.00 1.00 0.00 Plant Manager 8 Non
0.00 1.00 1.00 1.00 Sr Plant Maintenance Technician 6 Rep
5.00 6.00 7.00 5.00 TOTAL PERSONNEL
Operating
FY 2016 FY 2017 FY 2018 FY 2019 Represented
ACTUAL ACTUAL BUDGET ADOPTED or
FTE Non-Rep
0.00 0.00 1.00 1.00 Mechanical Maint Supervisor 7 Non
4.00 4.00 4.00 3.00 Plant Maintenance Technician 2 5 Rep
1.00 1.00 1.00 0.00 Plant Manager 8 Non
0.00 1.00 1.00 1.00 Sr Plant Maintenance Technician 6 Rep
5.00 6.00 7.00 5.00 TOTAL PERSONNEL
Capital
FY 2016 FY 2017 FY 2018 FY 2019 Represented
ACTUAL ACTUAL BUDGET ADOPTED or
FTE Non-Rep
0.00 0.00 0.00 0.00 Mechanical Maint Supervisor 7 Non
0.00 0.00 0.00 0.00 Plant Maintenance Technician 2 5 Rep
0.00 0.00 0.00 0.00 Plant Manager 8 Non
0.00 0.00 0.00 0.00 Sr Plant Maintenance Technician 6 Rep
0.00 0.00 0.00 0.00 TOTAL PERSONNEL
CLASSIFICATION TITLE
CLASSIFICATION TITLE
CLASSIFICATION TITLESALARY
GRADE
SALARY
GRADE
SALARY
GRADE

Clean Water Services FY 2018-19 Adopted Budget Page 181
FY 2017 ACTUAL FY 2018 BUDGET OBJECT CODE DESCRIPTIONOBJECT
CODE
FY 2019
PROPOSED
FY 2019
APPROVED
412,543 570,400 Wages & Other Pay 51100 407,500 407,500
50,609 60,000 Temporary 51130 48,000 48,000
13,537 15,000 Overtime 51140 15,000 15,000
0 0 Out of Class Straight Time 51170 0 0
154,859 244,600 Other Personnel Expenses 51600 168,900 168,900
0 0 Tuition Reimbursement 51761 0 0
980 500 Other Employee Allow ances 51900 800 800
0 0 Auto Allow ance 51910 0 0
840 1,000 Mobile Computing Allow ance 51915 800 800
$ 633,368 $ 891,500 $ 641,000 $ 641,000
391,852 316,000 Electricity 52110 320,000 320,000
15,479 17,000 Water 52120 20,000 20,000
0 0 Natural Gas 52130 0 0
0 0 Garbage 52140 0 0
1,319 1,100 Surface Water Management Charge 52150 1,100 1,100
2,702 4,000 Other Utility Services 52160 4,000 4,000
0 0 Sew er Charges 52170 0 0
148,280 175,000 Contracted Services 52205 125,000 125,000
0 0 Engineering Services 52210 0 0
0 0 Landscape Services 52215 0 0
0 0 Professional Services 52240 0 0
0 0 Recording Fees 52250 0 0
0 0 Laundry 52260 0 0
0 0 Other Government Services 52270 0 0
43 0 Office Supplies 52305 0 0
495 0 Operating Supplies 52310 0 0
14,091 17,000 Gas, Oil, Lubrication 52315 17,000 17,000
0 0 Janitorial Supplies 52320 0 0
0 0 Tech & Scientif ic Supplies 52325 0 0
194,737 200,000 Repair & Maintenance Supplies 52330 150,000 150,000
0 0 Construction & Building Supplies 52335 0 0
0 0 Parts & Equipment 52340 0 0
4,456 5,000 Small Tools 52350 5,000 5,000
0 0 Safety Equipment 52360 0 0
122 0 Postage & Freight 52375 0 0
0 0 Softw are Expensed 52380 0 0
0 0 Computer Equipment Expensed 52385 0 0
0 0 Inventory Adjustments 52395 0 0
1,412 800 Dues & Memberships 52405 800 800
278 0 Books, Subscriptions & Publications 52410 0 0
24,896 27,500 Softw are Licenses & Support 52425 32,500 32,500
117 0 Publication Notices 52430 0 0
0 0 Printing 52435 0 0
0 0 Telephone Services 52445 0 0
7,471 11,400 Fueling Contract 52475 11,400 11,400
1,321 4,000 Training & Education 52480 4,000 4,000
0 400 Travel Expense 52485 400 400
17,344 17,000 Fleet Charges 52486 17,000 17,000
1,364 2,200 Private Mileage 52487 2,200 2,200
411 0 Other Materials & Services 52495 0 0
5,151 5,500 Permits, Licenses & Fees 52500 5,500 5,500
0 0 Public Information 52505 0 0
70 100 Taxes, Assessments & Liens 52510 100 100
4,818 10,000 Equipment Rental 52605 10,000 10,000
0 0 Repair & Maintenance Services 52610 0 0
0 0 Non-vehicle Equipment Repair &
Maintenance
52620 0 0
0 0 Computer Repair & Maintenance 52630 0 0
0 0 Insurance 52705 0 0
0 0 Polymers - Thickening 52805 0 0
0 0 Polymers - Dew atering 52810 0 0
0 0 Polymers - Tertiary 52815 0 0
0 0 Ferric Chloride 52820 0 0
0 0 Alum 52825 0 0
0 0 Sodium Hydroxide 52835 0 0
0 0 Sodium Hypochlorite 52840 0 0
0 0 Lime 52845 0 0
0 0 Sodium Bisulf ite 52850 0 0
38,300 60,000 Other Chemicals 52890 50,000 50,000
$ 876,528 $ 874,000 $ 776,000 $ 776,000
$ 21,885 $ - $ - $ -
$ 1,531,780 $ 1,765,500 $ 1,417,000 $ 1,417,000
Expenditure Summary 8343 - Pump Station Maintenance
FY 2016 ACTUALFY 2019
ADOPTED
325,653 407,500
Wastewater Treatment Department
0 0
121,701 168,900
0 0
28,429 48,000
4,773 15,000
$ 482,199 PERSONNEL EXPENSE SUBTOTAL $ 641,000
360,251 320,000
804 800
0 0
840 800
287 0
1,242 1,100
3,818 4,000
13,032 20,000
0 0
0 0
5 0
131,641 125,000
0 0
0 0
0 0
4,993 0
0 0
0 0
0 0
139,382 150,000
0 0
0 0
4,417 17,000
0 0
0 0
329 0
3,344 0
0 0
3,899 5,000
4,981 0
0 0
16,624 32,500
0 0
0 0
376 800
345 0
6,494 11,400
1,440 4,000
0 0
0 0
5,074 5,500
0 0
2,120 400
13,070 17,000
2,326 2,200
5,580 10,000
101 100
0 0
0 0
0 0
0 0
0 0
0 0
0 0
0 0
0 0
0 0
0 0
0 0
$ 777,514 MATERIALS & SERVICES SUBTOTAL $ 776,000
0 0
52,343 50,000
$ 1,267,387 TOTAL EXPENDITURE $ 1,417,000
$ 7,673 CAPITAL OUTLAY SUBTOTAL $ -

Clean Water Services FY 2018-19 Adopted Budget Page 182
WASTEWATER TREATMENT DEPARTMENT
POSITION AND SALARY EXPENSE ROCK CREEK MECH MAINT 8344
Total
FY 2016 FY 2017 FY 2018 FY 2019 Represented
ACTUAL ACTUAL BUDGET ADOPTED or
FTE Non-Rep
1.00 1.00 1.00 1.00 Mechanical Maint Supervisor 7 Non
8.00 8.00 8.00 8.00 Plant Maintenance Technician 2 5 Rep
0.50 0.50 0.50 0.50 Sr Engineer - Mechanical 9 Non
1.00 1.00 1.00 1.00 Sr Plant Maintenance Technician 6 Rep
10.50 10.50 10.50 10.50 TOTAL PERSONNEL
Operating
FY 2016 FY 2017 FY 2018 FY 2019 Represented
ACTUAL ACTUAL BUDGET ADOPTED or
FTE Non-Rep
1.00 1.00 1.00 1.00 Mechanical Maint Supervisor 7 Non
8.00 8.00 8.00 8.00 Plant Maintenance Technician 2 5 Rep
0.25 0.25 0.25 0.25 Sr Engineer - Mechanical 9 Non
1.00 1.00 1.00 1.00 Sr Plant Maintenance Technician 6 Rep
10.25 10.25 10.25 10.25 TOTAL PERSONNEL
Capital
FY 2016 FY 2017 FY 2018 FY 2019 Represented
ACTUAL ACTUAL BUDGET ADOPTED or
FTE Non-Rep
0.00 0.00 0.00 0.00 Mechanical Maint Supervisor 7 Non
0.00 0.00 0.00 0.00 Plant Maintenance Technician 2 5 Rep
0.25 0.25 0.25 0.25 Sr Engineer - Mechanical 9 Non
0.00 0.00 0.00 0.00 Sr Plant Maintenance Technician 6 Rep
0.25 0.25 0.25 0.25 TOTAL PERSONNEL
CLASSIFICATION TITLE
CLASSIFICATION TITLE
CLASSIFICATION TITLE
SALARY
GRADE
SALARY
GRADE
SALARY
GRADE

Clean Water Services FY 2018-19 Adopted Budget Page 183
FY 2017 ACTUAL FY 2018 BUDGET OBJECT CODE DESCRIPTIONOBJECT
CODE
FY 2019
PROPOSED
FY 2019
APPROVED
807,033 815,100 Wages & Other Pay 51100 847,200 847,200
0 48,000 Temporary 51130 48,000 48,000
9,781 10,000 Overtime 51140 10,000 10,000
0 0 Out of Class Straight Time 51170 0 0
301,211 346,200 Other Personnel Expenses 51600 376,600 376,600
0 0 Tuition Reimbursement 51761 0 0
1,788 1,400 Other Employee Allow ances 51900 1,900 1,900
0 0 Auto Allow ance 51910 0 0
2,100 1,700 Mobile Computing Allow ance 51915 1,200 1,200
$ 1,121,914 $ 1,222,400 $ 1,284,900 $ 1,284,900
0 0 Electricity 52110 0 0
0 0 Water 52120 0 0
0 0 Natural Gas 52130 0 0
0 0 Garbage 52140 0 0
0 0 Surface Water Management Charge 52150 0 0
0 0 Other Utility Services 52160 0 0
0 0 Sew er Charges 52170 0 0
94,535 75,000 Contracted Services 52205 80,000 80,000
0 0 Engineering Services 52210 0 0
0 0 Landscape Services 52215 0 0
0 0 Professional Services 52240 0 0
0 0 Recording Fees 52250 0 0
0 0 Laundry 52260 0 0
0 0 Other Government Services 52270 0 0
43 0 Office Supplies 52305 0 0
1,274 0 Operating Supplies 52310 0 0
19,928 50,000 Gas, Oil, Lubrication 52315 30,000 30,000
0 0 Janitorial Supplies 52320 0 0
0 0 Tech & Scientif ic Supplies 52325 0 0
354,844 395,000 Repair & Maintenance Supplies 52330 345,000 345,000
0 0 Construction & Building Supplies 52335 0 0
0 0 Parts & Equipment 52340 0 0
8,441 10,000 Small Tools 52350 10,000 10,000
2,134 0 Safety Equipment 52360 0 0
320 2,000 Postage & Freight 52375 2,000 2,000
0 0 Softw are Expensed 52380 0 0
0 0 Computer Equipment Expensed 52385 0 0
0 0 Inventory Adjustments 52395 0 0
488 0 Dues & Memberships 52405 0 0
0 0 Books, Subscriptions & Publications 52410 0 0
0 0 Softw are Licenses & Support 52425 0 0
0 0 Publication Notices 52430 0 0
0 0 Printing 52435 0 0
0 0 Telephone Services 52445 0 0
641 1,600 Fueling Contract 52475 1,600 1,600
1,658 7,200 Training & Education 52480 10,000 10,000
472 1,800 Travel Expense 52485 1,000 1,000
676 900 Fleet Charges 52486 900 900
339 1,000 Private Mileage 52487 1,000 1,000
1,687 0 Other Materials & Services 52495 0 0
0 800 Permits, Licenses & Fees 52500 800 800
0 0 Public Information 52505 0 0
0 0 Taxes, Assessments & Liens 52510 0 0
11,617 7,500 Equipment Rental 52605 7,500 7,500
0 0 Repair & Maintenance Services 52610 0 0
0 0 Non-vehicle Equipment Repair &
Maintenance
52620 0 0
0 0 Computer Repair & Maintenance 52630 0 0
0 0 Insurance 52705 0 0
0 0 Polymers - Thickening 52805 0 0
0 0 Polymers - Dew atering 52810 0 0
0 0 Polymers - Tertiary 52815 0 0
0 0 Ferric Chloride 52820 0 0
0 0 Alum 52825 0 0
0 0 Sodium Hydroxide 52835 0 0
0 0 Sodium Hypochlorite 52840 0 0
0 0 Lime 52845 0 0
0 0 Sodium Bisulf ite 52850 0 0
0 0 Other Chemicals 52890 0 0
$ 499,095 $ 552,800 $ 489,800 $ 489,800
$ 10,370 $ 10,000 $ - $ -
$ 1,631,379 $ 1,785,200 $ 1,774,700 $ 1,774,700
Expenditure Summary 8344 - Rock Creek Mechanical Maintenance
FY 2016 ACTUALFY 2019
ADOPTED
769,872 847,200
Wastewater Treatment Department
0 0
288,677 376,600
0 0
0 48,000
3,773 10,000
$ 1,065,215 PERSONNEL EXPENSE SUBTOTAL $ 1,284,900
0 0
1,353 1,900
0 0
1,540 1,200
0 0
0 0
0 0
0 0
0 0
0 0
0 0
75,390 80,000
0 0
0 0
0 0
30 0
0 0
0 0
0 0
369,735 345,000
0 0
0 0
23,795 30,000
0 0
0 0
0 0
2,297 0
0 0
14,853 10,000
38 0
569 2,000
0 0
0 0
0 0
272 0
0 0
357 1,600
810 10,000
0 0
13 0
504 800
0 0
202 1,000
1,259 900
125 1,000
3,219 7,500
0 0
0 0
0 0
0 0
0 0
0 0
0 0
0 0
0 0
0 0
0 0
0 0
0 0
$ 493,467 MATERIALS & SERVICES SUBTOTAL $ 489,800
0 0
0 0
$ 1,573,364 TOTAL EXPENDITURE $ 1,774,700
$ 14,683 CAPITAL OUTLAY SUBTOTAL $ -

Clean Water Services FY 2018-19 Adopted Budget Page 184
WASTEWATER TREATMENT DEPARTMENT
POSITION AND SALARY EXPENSE DURHAM MECH MAINT 8361
Total
FY 2016 FY 2017 FY 2018 FY 2019 Represented
ACTUAL ACTUAL BUDGET ADOPTED or
FTE Non-Rep
0.00 0.00 0.00 1.00 Engineering Project Coordinator 7 Non
1.00 1.00 1.00 1.00 Mechanical Maint Supervisor 7 Non
8.00 8.00 8.00 7.00 Plant Maintenance Technician 2 5 Rep
0.50 0.50 0.50 0.50 Sr Engineer - Mechanical 9 Non
1.00 1.00 1.00 1.00 Sr Plant Maintenance Technician 6 Rep
10.50 10.50 10.50 10.50 TOTAL PERSONNEL
Operating
FY 2016 FY 2017 FY 2018 FY 2019 Represented
ACTUAL ACTUAL BUDGET ADOPTED or
FTE Non-Rep
0.00 0.00 0.00 1.00 Engineering Project Coordinator 7 Non
1.00 1.00 1.00 1.00 Mechanical Maint Supervisor 7 Non
8.00 8.00 8.00 7.00 Plant Maintenance Technician 2 5 Rep
0.25 0.25 0.25 0.25 Sr Engineer - Mechanical 9 Non
1.00 1.00 1.00 1.00 Sr Plant Maintenance Technician 6 Rep
10.25 10.25 10.25 10.25 TOTAL PERSONNEL
Capital
FY 2016 FY 2017 FY 2018 FY 2019 Represented
ACTUAL ACTUAL BUDGET ADOPTED or
FTE Non-Rep
0.00 0.00 0.00 0.00 Engineering Project Coordinator 7 Non
0.00 0.00 0.00 0.00 Mechanical Maint Supervisor 7 Non
0.00 0.00 0.00 0.00 Plant Maintenance Technician 2 5 Rep
0.25 0.25 0.25 0.25 Sr Engineer - Mechanical 9 Non
0.00 0.00 0.00 0.00 Sr Plant Maintenance Technician 6 Rep
0.25 0.25 0.25 0.25 TOTAL PERSONNEL
CLASSIFICATION TITLE
CLASSIFICATION TITLE
CLASSIFICATION TITLE
SALARY
GRADE
SALARY
GRADE
SALARY
GRADE

Clean Water Services FY 2018-19 Adopted Budget Page 185
FY 2017 ACTUAL FY 2018 BUDGET OBJECT CODE DESCRIPTIONOBJECT
CODE
FY 2019
PROPOSED
FY 2019
APPROVED
821,207 815,100 Wages & Other Pay 51100 861,700 861,700
26,810 48,000 Temporary 51130 48,000 48,000
8,053 10,000 Overtime 51140 10,000 10,000
0 0 Out of Class Straight Time 51170 0 0
293,462 346,300 Other Personnel Expenses 51600 355,000 355,000
0 0 Tuition Reimbursement 51761 0 0
1,549 2,000 Other Employee Allow ances 51900 1,900 1,900
0 0 Auto Allow ance 51910 0 0
2,520 1,700 Mobile Computing Allow ance 51915 2,800 2,800
$ 1,153,601 $ 1,223,100 $ 1,279,400 $ 1,279,400
0 0 Electricity 52110 0 0
0 0 Water 52120 0 0
0 0 Natural Gas 52130 0 0
0 0 Garbage 52140 0 0
0 0 Surface Water Management Charge 52150 0 0
0 0 Other Utility Services 52160 0 0
0 0 Sew er Charges 52170 0 0
75,537 100,000 Contracted Services 52205 60,000 60,000
0 0 Engineering Services 52210 0 0
0 0 Landscape Services 52215 0 0
0 0 Professional Services 52240 0 0
0 0 Recording Fees 52250 0 0
0 0 Laundry 52260 0 0
0 0 Other Government Services 52270 0 0
81 0 Office Supplies 52305 0 0
4,475 0 Operating Supplies 52310 0 0
24,624 72,000 Gas, Oil, Lubrication 52315 30,000 30,000
0 0 Janitorial Supplies 52320 0 0
0 0 Tech & Scientif ic Supplies 52325 0 0
316,425 250,000 Repair & Maintenance Supplies 52330 250,000 250,000
0 0 Construction & Building Supplies 52335 0 0
0 0 Parts & Equipment 52340 0 0
11,625 10,000 Small Tools 52350 10,000 10,000
549 0 Safety Equipment 52360 0 0
2,462 2,000 Postage & Freight 52375 2,000 2,000
0 0 Softw are Expensed 52380 0 0
0 0 Computer Equipment Expensed 52385 0 0
0 0 Inventory Adjustments 52395 0 0
488 0 Dues & Memberships 52405 0 0
0 0 Books, Subscriptions & Publications 52410 0 0
0 0 Softw are Licenses & Support 52425 0 0
0 0 Publication Notices 52430 0 0
0 0 Printing 52435 0 0
0 0 Telephone Services 52445 0 0
347 1,400 Fueling Contract 52475 1,400 1,400
1,240 8,000 Training & Education 52480 10,000 10,000
10 3,300 Travel Expense 52485 3,300 3,300
198 500 Fleet Charges 52486 500 500
1,543 1,000 Private Mileage 52487 1,000 1,000
159 0 Other Materials & Services 52495 0 0
172 500 Permits, Licenses & Fees 52500 500 500
0 0 Public Information 52505 0 0
0 0 Taxes, Assessments & Liens 52510 0 0
1,380 7,500 Equipment Rental 52605 7,500 7,500
14,130 0 Repair & Maintenance Services 52610 0 0
0 0 Non-vehicle Equipment Repair &
Maintenance
52620 0 0
0 0 Computer Repair & Maintenance 52630 0 0
0 0 Insurance 52705 0 0
0 0 Polymers - Thickening 52805 0 0
0 0 Polymers - Dew atering 52810 0 0
0 0 Polymers - Tertiary 52815 0 0
0 0 Ferric Chloride 52820 0 0
0 0 Alum 52825 0 0
0 0 Sodium Hydroxide 52835 0 0
0 0 Sodium Hypochlorite 52840 0 0
0 0 Lime 52845 0 0
0 0 Sodium Bisulf ite 52850 0 0
0 0 Other Chemicals 52890 0 0
$ 455,445 $ 456,200 $ 376,200 $ 376,200
$ 10,055 $ 15,000 $ - $ -
$ 1,619,102 $ 1,694,300 $ 1,655,600 $ 1,655,600
Expenditure Summary 8361 - Durham Mechanical Maintenance
FY 2016 ACTUALFY 2019
ADOPTED
756,901 861,700
Wastewater Treatment Department
0 0
256,677 355,000
0 0
0 48,000
9,081 10,000
$ 1,026,136 PERSONNEL EXPENSE SUBTOTAL $ 1,279,400
0 0
1,586 1,900
0 0
1,890 2,800
0 0
0 0
0 0
0 0
0 0
0 0
0 0
41,661 60,000
0 0
0 0
159 0
1,453 0
0 0
0 0
0 0
303,378 250,000
0 0
0 0
26,747 30,000
0 0
0 0
0 0
1,380 0
0 0
6,319 10,000
299 0
2,187 2,000
0 0
0 0
0 0
0 0
0 0
706 1,400
4,338 10,000
0 0
308 0
1,135 500
0 0
1,803 3,300
21 500
1,028 1,000
3,594 7,500
0 0
0 0
0 0
0 0
0 0
0 0
0 0
0 0
0 0
0 0
0 0
0 0
0 0
$ 396,516 MATERIALS & SERVICES SUBTOTAL $ 376,200
0 0
0 0
$ 1,422,652 TOTAL EXPENDITURE $ 1,655,600
$ - CAPITAL OUTLAY SUBTOTAL $ -

Clean Water Services FY 2018-19 Adopted Budget Page 186
WASTEWATER TREATMENT DEPARTMENT
POSITION AND SALARY EXPENSE FACILITIES MAINTENANCE/SUPPORT SVCS 8362
Total
FY 2016 FY 2017 FY 2018 FY 2019 Represented
ACTUAL ACTUAL BUDGET ADOPTED or
FTE Non-Rep
1.00 1.00 1.00 1.00 Asset Manager 8 Non
0.00 1.00 1.00 0.00 Engineering Project Coordinator 7 Non
0.00 0.00 1.00 1.00 Landscape Program Supervisor 7 Non
1.00 1.00 1.00 0.00 Landscape Specialist 4 Rep
1.00 1.00 0.00 0.00 Landscape Coordinator 6 Non
1.00 0.00 0.00 0.00 Sr Engineer 9 Non
2.00 2.00 2.00 2.00 Storekeeper 2 5 Rep
1.00 1.00 1.00 1.00 Wastewater Treatment Support Supervisor 7 Non
7.00 7.00 7.00 5.00 TOTAL PERSONNEL
Operating
FY 2016 FY 2017 FY 2018 FY 2019 Represented
ACTUAL ACTUAL BUDGET ADOPTED or
FTE Non-Rep
0.50 0.50 0.50 0.50 Asset Manager 8 Non
0.00 1.00 0.50 0.00 Engineering Project Coordinator 7 Non
0.00 0.00 0.50 0.50 Landscape Program Supervisor 7 Non
0.50 0.50 0.50 0.00 Landscape Specialist 4 Rep
1.00 0.50 0.00 0.00 Landscape Coordinator 6 Non
1.00 0.00 0.00 0.00 Sr Engineer 9 Non
2.00 2.00 2.00 2.00 Storekeeper 2 5 Rep
1.00 1.00 1.00 1.00 Wastewater Treatment Support Supervisor 7 Non
6.00 5.50 5.00 4.00 TOTAL PERSONNEL
Capital
FY 2016 FY 2017 FY 2018 FY 2019 Represented
ACTUAL ACTUAL BUDGET ADOPTED or
FTE Non-Rep
0.50 0.50 0.50 0.50 Asset Manager 8 Non
0.00 0.00 0.50 0.00 Engineering Project Coordinator 7 Non
0.00 0.00 0.50 0.50 Landscape Program Supervisor 7 Non
0.50 0.50 0.50 0.00 Landscape Specialist 4 Rep
0.00 0.50 0.00 0.00 Landscape Coordinator 6 Non
0.00 0.00 0.00 0.00 Sr Engineer 9 Non
0.00 0.00 0.00 0.00 Storekeeper 2 5 Rep
0.00 0.00 0.00 0.00 Wastewater Treatment Support Supervisor 7 Non
1.00 1.50 2.00 1.00 TOTAL PERSONNEL
CLASSIFICATION TITLE
CLASSIFICATION TITLE
CLASSIFICATION TITLESALARY
GRADE
SALARY
GRADE
SALARY
GRADE

Clean Water Services FY 2018-19 Adopted Budget Page 187
FY 2017 ACTUAL FY 2018 BUDGET OBJECT CODE DESCRIPTIONOBJECT
CODE
FY 2019
PROPOSED
FY 2019
APPROVED
434,982 598,200 Wages & Other Pay 51100 455,700 455,700
41,380 48,000 Temporary 51130 24,000 24,000
1,303 2,000 Overtime 51140 2,000 2,000
0 0 Out of Class Straight Time 51170 0 0
150,375 246,100 Other Personnel Expenses 51600 190,900 190,900
0 0 Tuition Reimbursement 51761 0 0
907 1,100 Other Employee Allow ances 51900 800 800
0 0 Auto Allow ance 51910 0 0
4,410 6,000 Mobile Computing Allow ance 51915 4,000 4,000
$ 633,356 $ 901,400 $ 677,400 $ 677,400
0 0 Electricity 52110 0 0
0 0 Water 52120 0 0
0 0 Natural Gas 52130 0 0
7,547 3,000 Garbage 52140 3,000 3,000
0 0 Surface Water Management Charge 52150 0 0
0 0 Other Utility Services 52160 0 0
0 0 Sew er Charges 52170 0 0
197,341 222,600 Contracted Services 52205 245,600 245,600
35 0 Engineering Services 52210 0 0
398,331 396,000 Landscape Services 52215 433,000 433,000
0 10,000 Professional Services 52240 10,000 10,000
0 0 Recording Fees 52250 0 0
37,250 45,000 Laundry 52260 45,000 45,000
0 0 Other Government Services 52270 0 0
0 0 Office Supplies 52305 0 0
237,723 246,000 Operating Supplies 52310 246,000 246,000
440 1,000 Gas, Oil, Lubrication 52315 1,000 1,000
17,053 14,400 Janitorial Supplies 52320 15,000 15,000
0 0 Tech & Scientif ic Supplies 52325 0 0
66,636 60,000 Repair & Maintenance Supplies 52330 60,000 60,000
647 0 Construction & Building Supplies 52335 0 0
0 0 Parts & Equipment 52340 0 0
1,419 4,500 Small Tools 52350 14,100 14,100
0 0 Safety Equipment 52360 0 0
0 300 Postage & Freight 52375 300 300
0 0 Softw are Expensed 52380 0 0
0 1,200 Computer Equipment Expensed 52385 1,200 1,200
(22,517) 0 Inventory Adjustments 52395 0 0
745 0 Dues & Memberships 52405 0 0
109 400 Books, Subscriptions & Publications 52410 400 400
1,760 3,200 Softw are Licenses & Support 52425 0 0
0 0 Publication Notices 52430 0 0
0 0 Printing 52435 0 0
0 0 Telephone Services 52445 0 0
4,292 5,700 Fueling Contract 52475 5,700 5,700
170 5,000 Training & Education 52480 2,000 2,000
0 2,500 Travel Expense 52485 1,000 1,000
9,177 7,000 Fleet Charges 52486 7,000 7,000
1,802 2,900 Private Mileage 52487 2,900 2,900
2,616 200 Other Materials & Services 52495 200 200
400 800 Permits, Licenses & Fees 52500 2,300 2,300
0 0 Public Information 52505 0 0
0 0 Taxes, Assessments & Liens 52510 0 0
1,540 2,000 Equipment Rental 52605 2,000 2,000
0 0 Repair & Maintenance Services 52610 0 0
0 0 Non-vehicle Equipment Repair &
Maintenance
52620 0 0
0 0 Computer Repair & Maintenance 52630 0 0
0 0 Insurance 52705 0 0
0 0 Polymers - Thickening 52805 0 0
0 0 Polymers - Dew atering 52810 0 0
0 0 Polymers - Tertiary 52815 0 0
0 0 Ferric Chloride 52820 0 0
0 0 Alum 52825 0 0
0 0 Sodium Hydroxide 52835 0 0
0 0 Sodium Hypochlorite 52840 0 0
0 0 Lime 52845 0 0
0 0 Sodium Bisulf ite 52850 0 0
0 0 Other Chemicals 52890 0 0
$ 964,516 $ 1,033,700 $ 1,097,700 $ 1,097,700
$ - $ - $ - $ -
$ 1,597,872 $ 1,935,100 $ 1,775,100 $ 1,775,100
Expenditure Summary 8362 - Facilities Maintenance
FY 2016 ACTUALFY 2019
ADOPTED
436,716 455,700
Wastewater Treatment Department
0 0
152,321 190,900
0 0
26,784 24,000
397 2,000
$ 619,878 PERSONNEL EXPENSE SUBTOTAL $ 677,400
0 0
650 800
0 0
3,010 4,000
0 3,000
0 0
0 0
0 0
0 0
445,968 433,000
0 0
196,857 245,600
0 0
0 0
0 0
203,462 246,000
2,711 10,000
0 0
35,248 45,000
61,690 60,000
0 0
0 0
527 1,000
13,432 15,000
0 0
0 0
2,367 1,200
0 0
193 14,100
215 0
0 300
0 0
0 0
0 0
0 0
0 400
4,949 5,700
265 2,000
0 0
187 200
1,538 2,300
0 0
60 1,000
9,770 7,000
1,632 2,900
0 2,000
0 0
0 0
0 0
0 0
0 0
0 0
0 0
0 0
0 0
0 0
0 0
0 0
0 0
$ 981,069 MATERIALS & SERVICES SUBTOTAL $ 1,097,700
0 0
0 0
$ 1,615,822 TOTAL EXPENDITURE $ 1,775,100
$ 14,875 CAPITAL OUTLAY SUBTOTAL $ -

Clean Water Services FY 2018-19 Adopted Budget Page 188
WASTEWATER TREATMENT DEPARTMENT
POSITION AND SALARY EXPENSE DURHAM E&I MAINT 8351
Total
FY 2016 FY 2017 FY 2018 FY 2019 Represented
ACTUAL ACTUAL BUDGET ADOPTED or
FTE Non-Rep
3.00 3.00 3.00 3.00 Electrician 2 6 Rep
0.00 0.00 0.00 1.00 Electrical & Instrumentation Technician 6 Rep
3.00 3.00 3.00 3.00 Instrument Technician 2 6 Rep
1.00 1.00 1.00 1.00 Electrical & Instrumentation Supervisor 8 Non
0.50 0.50 0.50 0.50 Field Engineer - Electrical 8 Non
0.50 0.50 0.50 0.50 Field Engineer - Inspection 8 Non
0.50 0.50 0.50 0.50 Senior Engineer - Electrical 9 Non
8.50 8.50 8.50 9.50 TOTAL PERSONNEL
Operating
FY 2016 FY 2017 FY 2018 FY 2019 Represented
ACTUAL ACTUAL BUDGET ADOPTED or
FTE Non-Rep
3.00 3.00 3.00 3.00 Electrician 2 6 Rep
0.00 0.00 0.00 1.00 Electrical & Instrumentation Technician 6 Rep
3.00 3.00 3.00 3.00 Instrument Technician 2 6 Rep
1.00 1.00 1.00 1.00 Electrical & Instrumentation Supervisor 8 Non
0.50 0.50 0.50 0.50 Field Engineer - Electrical 8 Non
0.00 0.00 0.00 0.00 Field Engineer - Inspection 8 Non
0.00 0.00 0.00 0.00 Senior Engineer - Electrical 9 Non
7.50 7.50 7.50 8.50 TOTAL PERSONNEL
Capital
FY 2016 FY 2017 FY 2018 FY 2019 Represented
ACTUAL ACTUAL BUDGET ADOPTED or
FTE Non-Rep
0.00 0.00 0.00 0.00 Electrician 2 6 Rep
0.00 0.00 0.00 0.00 Electrical & Instrumentation Technician 6 Rep
0.00 0.00 0.00 0.00 Instrument Technician 2 6 Rep
0.00 0.00 0.00 0.00 Electrical & Instrumentation Supervisor 8 Non
0.00 0.00 0.00 0.00 Field Engineer - Electrical 8 Non
0.50 0.50 0.50 0.50 Field Engineer - Inspection 8 Non
0.50 0.50 0.50 0.50 Senior Engineer - Electrical 9 Non
1.00 1.00 1.00 1.00 TOTAL PERSONNEL
CLASSIFICATION TITLE
CLASSIFICATION TITLE
CLASSIFICATION TITLE
SALARY
GRADE
SALARY
GRADE
SALARY
GRADE

Clean Water Services FY 2018-19 Adopted Budget Page 189
FY 2017 ACTUAL FY 2018 BUDGET OBJECT CODE DESCRIPTIONOBJECT
CODE
FY 2019
PROPOSED
FY 2019
APPROVED
599,010 706,800 Wages & Other Pay 51100 819,200 819,200
0 2,500 Temporary 51130 10,000 10,000
10,677 8,000 Overtime 51140 0 0
0 0 Out of Class Straight Time 51170 0 0
136,582 275,200 Other Personnel Expenses 51600 304,300 304,300
0 0 Tuition Reimbursement 51761 0 0
1,420 1,600 Other Employee Allow ances 51900 1,700 1,700
0 0 Auto Allow ance 51910 0 0
1,980 2,000 Mobile Computing Allow ance 51915 3,700 3,700
$ 749,669 $ 996,100 $ 1,138,900 $ 1,138,900
0 0 Electricity 52110 0 0
0 0 Water 52120 0 0
0 0 Natural Gas 52130 0 0
0 0 Garbage 52140 0 0
0 0 Surface Water Management Charge 52150 0 0
0 0 Other Utility Services 52160 0 0
0 0 Sew er Charges 52170 0 0
13,658 20,000 Contracted Services 52205 20,000 20,000
0 0 Engineering Services 52210 0 0
0 0 Landscape Services 52215 0 0
0 0 Professional Services 52240 0 0
0 0 Recording Fees 52250 0 0
0 0 Laundry 52260 0 0
0 0 Other Government Services 52270 0 0
7 300 Office Supplies 52305 300 300
5,920 5,000 Operating Supplies 52310 5,000 5,000
0 0 Gas, Oil, Lubrication 52315 0 0
0 0 Janitorial Supplies 52320 0 0
0 0 Tech & Scientif ic Supplies 52325 0 0
292,472 200,000 Repair & Maintenance Supplies 52330 200,000 200,000
0 0 Construction & Building Supplies 52335 0 0
0 0 Parts & Equipment 52340 0 0
9,778 4,000 Small Tools 52350 5,000 5,000
125 0 Safety Equipment 52360 0 0
0 0 Postage & Freight 52375 0 0
0 0 Softw are Expensed 52380 0 0
0 0 Computer Equipment Expensed 52385 0 0
0 0 Inventory Adjustments 52395 0 0
29 500 Dues & Memberships 52405 500 500
1,570 1,200 Books, Subscriptions & Publications 52410 1,200 1,200
0 0 Softw are Licenses & Support 52425 0 0
0 0 Publication Notices 52430 0 0
0 0 Printing 52435 0 0
0 0 Telephone Services 52445 0 0
515 500 Fueling Contract 52475 500 500
580 2,500 Training & Education 52480 10,500 10,500
7,953 2,000 Travel Expense 52485 2,000 2,000
133 600 Fleet Charges 52486 600 600
362 1,000 Private Mileage 52487 1,000 1,000
1,283 500 Other Materials & Services 52495 500 500
564 2,000 Permits, Licenses & Fees 52500 2,000 2,000
0 0 Public Information 52505 0 0
0 0 Taxes, Assessments & Liens 52510 0 0
0 2,500 Equipment Rental 52605 2,500 2,500
0 0 Repair & Maintenance Services 52610 0 0
0 0 Non-vehicle Equipment Repair &
Maintenance
52620 0 0
0 0 Computer Repair & Maintenance 52630 0 0
0 0 Insurance 52705 0 0
0 0 Polymers - Thickening 52805 0 0
0 0 Polymers - Dew atering 52810 0 0
0 0 Polymers - Tertiary 52815 0 0
0 0 Ferric Chloride 52820 0 0
0 0 Alum 52825 0 0
0 0 Sodium Hydroxide 52835 0 0
0 0 Sodium Hypochlorite 52840 0 0
0 0 Lime 52845 0 0
0 0 Sodium Bisulf ite 52850 0 0
0 0 Other Chemicals 52890 0 0
$ 334,951 $ 242,600 $ 251,600 $ 251,600
$ - $ - $ - $ -
$ 1,084,620 $ 1,238,700 $ 1,390,500 $ 1,390,500 $ 1,027,552 TOTAL EXPENDITURE $ 1,390,500
$ - CAPITAL OUTLAY SUBTOTAL $ -
$ 276,371 MATERIALS & SERVICES SUBTOTAL $ 251,600
0 0
0 0
0 0
0 0
0 0
0 0
0 0
0 0
0 0
0 0
0 0
0 0
0 0
0 0
0 2,500
0 0
572 500
724 2,000
0 0
346 2,000
422 600
517 1,000
608 500
1,095 10,500
0 0
0 0
0 0
0 0
356 500
249 1,200
0 0
5,122 0
0 0
20,432 5,000
0 0
29 0
223,889 200,000
0 0
0 0
0 0
0 0
143 0
0 0
230 300
9,954 5,000
0 0
0 0
0 0
0 0
0 0
11,684 20,000
0 0
0 0
0 0
0 0
0 0
0 0
$ 751,181 PERSONNEL EXPENSE SUBTOTAL $ 1,138,900
0 0
1,380 1,700
0 0
1,695 3,700
0 0
138,649 304,300
0 0
0 10,000
33,761 0
Expenditure Summary 8351 - Durham E&I Maintenance
FY 2016 ACTUALFY 2019
ADOPTED
575,695 819,200
Wastewater Treatment Department

Clean Water Services FY 2018-19 Adopted Budget Page 190
WASTEWATER TREATMENT DEPARTMENT
POSITION AND SALARY EXPENSE FG / HB / RC E&I MAINT 8352
Total
FY 2016 FY 2017 FY 2018 FY 2019 Represented
ACTUAL ACTUAL BUDGET ADOPTED or
FTE Non-Rep
3.00 3.00 3.00 3.00 Electrician 2 6 Rep
3.00 3.00 3.00 3.00 Instrument Technician 2 6 Rep
1.00 1.00 1.00 1.00 Electrical & Instrumentation Supervisor 8 Non
1.00 1.00 2.00 1.00 Electrical & Instrumentation Technician 6 Rep
0.50 0.50 0.50 0.50 Field Engineer - Electrical 8 Non
0.50 0.50 0.50 0.50 Field Engineer - Inspection 8 Non
0.00 0.50 0.50 0.50 Senior Engineer - Electrical 9 Non
9.50 9.50 10.50 9.50 TOTAL PERSONNEL
Operating
FY 2016 FY 2017 FY 2018 FY 2019 Represented
ACTUAL ACTUAL BUDGET ADOPTED or
FTE Non-Rep
3.00 3.00 3.00 3.00 Electrician 2 6 Rep
3.00 3.00 3.00 3.00 Instrument Technician 2 6 Rep
1.00 1.00 1.00 1.00 Electrical & Instrumentation Supervisor 8 Non
1.00 1.00 2.00 1.00 Electrical & Instrumentation Technician 6 Rep
0.50 0.50 0.50 0.50 Field Engineer - Electrical 8 Non
0.00 0.00 0.00 0.00 Field Engineer - Inspection 8 Non
0.00 0.00 0.00 0.00 Instrumentation & Control Systems Supervisor 8 Non
0.00 0.00 0.00 0.00 Control Systems Analyst 7 Non
0.00 0.00 0.00 0.00 Senior Engineer - Electrical 9 Non
8.50 8.50 9.50 8.50 TOTAL PERSONNEL
Capital
FY 2016 FY 2017 FY 2018 FY 2019 Represented
ACTUAL ACTUAL BUDGET ADOPTED or
FTE Non-Rep
0.00 0.00 0.00 0.00 Electrician 2 6 Rep
0.00 0.00 0.00 0.00 Instrument Technician 2 6 Rep
0.00 0.00 0.00 0.00 Electrical & Instrumentation Supervisor 8 Non
0.00 0.00 0.00 0.00 Electrical & Instrumentation Technician 6 Rep
0.00 0.00 0.00 0.00 Field Engineer - Electrical 8 Non
0.50 0.50 0.50 0.50 Field Engineer - Inspection 8 Non
0.50 0.00 0.00 0.00 Instrumentation & Control Systems Supervisor 8 Non
0.00 0.00 0.00 0.00 Control Systems Analyst 7 Non
0.00 0.50 0.50 0.50 Senior Engineer - Electrical 9 Non
1.00 1.00 1.00 1.00 TOTAL PERSONNEL
CLASSIFICATION TITLE
CLASSIFICATION TITLE
CLASSIFICATION TITLE
SALARY
GRADE
SALARY
GRADE
SALARY
GRADE

Clean Water Services FY 2018-19 Adopted Budget Page 191
FY 2017 ACTUAL FY 2018 BUDGET OBJECT CODE DESCRIPTIONOBJECT
CODE
FY 2019
PROPOSED
FY 2019
APPROVED
669,650 868,200 Wages & Other Pay 51100 815,600 815,600
0 2,500 Temporary 51130 10,000 10,000
19,801 13,000 Overtime 51140 0 0
0 0 Out of Class Straight Time 51170 0 0
200,769 340,800 Other Personnel Expenses 51600 297,500 297,500
0 0 Tuition Reimbursement 51761 0 0
925 900 Other Employee Allow ances 51900 1,700 1,700
0 0 Auto Allow ance 51910 0 0
3,090 4,000 Mobile Computing Allow ance 51915 3,200 3,200
$ 894,234 $ 1,229,400 $ 1,128,000 $ 1,128,000
0 0 Electricity 52110 0 0
0 0 Water 52120 0 0
0 0 Natural Gas 52130 0 0
0 0 Garbage 52140 0 0
0 0 Surface Water Management Charge 52150 0 0
0 0 Other Utility Services 52160 0 0
0 0 Sew er Charges 52170 0 0
437 7,500 Contracted Services 52205 5,000 5,000
0 0 Engineering Services 52210 0 0
0 0 Landscape Services 52215 0 0
0 0 Professional Services 52240 0 0
0 0 Recording Fees 52250 0 0
0 0 Laundry 52260 0 0
0 0 Other Government Services 52270 0 0
279 0 Office Supplies 52305 0 0
8,739 10,000 Operating Supplies 52310 5,000 5,000
0 0 Gas, Oil, Lubrication 52315 0 0
0 0 Janitorial Supplies 52320 0 0
0 0 Tech & Scientif ic Supplies 52325 0 0
219,420 210,000 Repair & Maintenance Supplies 52330 210,000 210,000
0 0 Construction & Building Supplies 52335 0 0
0 0 Parts & Equipment 52340 0 0
5,233 4,000 Small Tools 52350 4,000 4,000
0 0 Safety Equipment 52360 0 0
0 0 Postage & Freight 52375 0 0
0 0 Softw are Expensed 52380 0 0
0 0 Computer Equipment Expensed 52385 0 0
0 0 Inventory Adjustments 52395 0 0
433 1,000 Dues & Memberships 52405 1,000 1,000
124 500 Books, Subscriptions & Publications 52410 500 500
0 0 Softw are Licenses & Support 52425 0 0
0 0 Publication Notices 52430 0 0
0 0 Printing 52435 0 0
0 0 Telephone Services 52445 0 0
2,130 4,800 Fueling Contract 52475 4,800 4,800
1,024 2,000 Training & Education 52480 2,000 2,000
2,926 1,600 Travel Expense 52485 1,600 1,600
1,679 1,200 Fleet Charges 52486 2,000 2,000
529 2,000 Private Mileage 52487 2,000 2,000
1,047 500 Other Materials & Services 52495 500 500
355 2,000 Permits, Licenses & Fees 52500 2,000 2,000
0 0 Public Information 52505 0 0
0 0 Taxes, Assessments & Liens 52510 0 0
0 6,000 Equipment Rental 52605 3,000 3,000
0 0 Repair & Maintenance Services 52610 0 0
0 0 Non-vehicle Equipment Repair &
Maintenance
52620 0 0
0 0 Computer Repair & Maintenance 52630 0 0
0 0 Insurance 52705 0 0
0 0 Polymers - Thickening 52805 0 0
0 0 Polymers - Dew atering 52810 0 0
0 0 Polymers - Tertiary 52815 0 0
0 0 Ferric Chloride 52820 0 0
0 0 Alum 52825 0 0
0 0 Sodium Hydroxide 52835 0 0
0 0 Sodium Hypochlorite 52840 0 0
0 0 Lime 52845 0 0
0 0 Sodium Bisulf ite 52850 0 0
0 0 Other Chemicals 52890 0 0
$ 244,353 $ 253,100 $ 243,400 $ 243,400
$ - $ - $ - $ -
$ 1,138,588 $ 1,482,500 $ 1,371,400 $ 1,371,400 $ 1,082,700 TOTAL EXPENDITURE $ 1,371,400
$ 15,568 CAPITAL OUTLAY SUBTOTAL $ -
$ 231,789 MATERIALS & SERVICES SUBTOTAL $ 243,400
0 0
0 0
0 0
0 0
0 0
0 0
0 0
0 0
0 0
0 0
0 0
530 0
0 0
0 0
1,066 3,000
0 0
750 500
346 2,000
0 0
1,131 1,600
1,194 2,000
2,446 2,000
1,943 4,800
2,017 2,000
0 0
0 0
0 0
117 0
460 1,000
0 500
0 0
10,781 0
0 0
4,651 4,000
0 0
21 0
191,331 210,000
0 0
0 0
59 0
0 0
0 0
0 0
0 0
6,072 5,000
0 0
0 0
0 0
0 0
0 0
6,873 5,000
0 0
0 0
0 0
0 0
0 0
0 0
$ 835,343 PERSONNEL EXPENSE SUBTOTAL $ 1,128,000
0 0
665 1,700
0 0
2,700 3,200
0 0
186,782 297,500
0 0
0 10,000
17,000 0
Expenditure Summary 8352 - FG/Hillsboro/RC E&I Maintenance
FY 2016 ACTUALFY 2019
ADOPTED
628,196 815,600
Wastewater Treatment Department

Clean Water Services FY 2018-19 Adopted Budget Page 192
WASTEWATER TREATMENT DEPARTMENT
POSITION AND SALARY EXPENSE CONTROL SYSTEMS 8353
Total
FY 2016 FY 2017 FY 2018 FY 2019 Represented
ACTUAL ACTUAL BUDGET ADOPTED or
FTE Non-Rep
1.00 0.00 0.00 0.00 Controls Systems Supervisor 8 Non
3.00 1.00 0.50 0.00 Control Systems Analyst 2 7 Non
0.00 2.00 2.50 4.00 Field Engineer - Automations & Controls 8 Non
0.00 1.00 1.00 1.00 Software Engineer 9 Non
1.00 1.00 1.00 1.00 Sr Engineer - I&C 9 Non
5.00 5.00 5.00 6.00 TOTAL PERSONNEL
Operating
FY 2016 FY 2017 FY 2018 FY 2019 Represented
ACTUAL ACTUAL BUDGET ADOPTED or
FTE Non-Rep
0.50 0.00 0.00 0.00 Controls Systems Supervisor 8 Non
2.50 0.50 0.50 0.00 Control Systems Analyst 2 7 Non
0.00 1.00 1.00 1.50 Field Engineer - Automations & Controls 8 Non
0.00 1.00 1.00 1.00 Software Engineer 9 Non
0.50 0.50 0.50 0.50 Sr Engineer - I&C 9 Non
3.50 3.00 3.00 3.00 TOTAL PERSONNEL
Capital
FY 2016 FY 2017 FY 2018 FY 2019 Represented
ACTUAL ACTUAL BUDGET ADOPTED or
FTE Non-Rep
0.50 0.00 0.00 0.00 Controls Systems Supervisor 8 Non
0.50 0.50 0.00 0.00 Control Systems Analyst 2 7 Non
0.00 1.00 1.50 2.50 Field Engineer - Automations & Controls 8 Non
0.00 0.00 0.00 0.00 Software Engineer 9 Non
0.50 0.50 0.50 0.50 Sr Engineer - I&C 9 Non
1.50 2.00 2.00 3.00 TOTAL PERSONNEL
CLASSIFICATION TITLE
CLASSIFICATION TITLE
CLASSIFICATION TITLE
SALARY
GRADE
SALARY
GRADE
SALARY
GRADE

Clean Water Services FY 2018-19 Adopted Budget Page 193
FY 2017 ACTUAL FY 2018 BUDGET OBJECT CODE DESCRIPTIONOBJECT
CODE
FY 2019
PROPOSED
FY 2019
APPROVED
468,670 473,500 Wages & Other Pay 51100 583,100 583,100
0 0 Temporary 51130 0 0
858 2,000 Overtime 51140 0 0
0 0 Out of Class Straight Time 51170 0 0
118,292 163,700 Other Personnel Expenses 51600 212,400 212,400
0 0 Tuition Reimbursement 51761 0 0
600 1,200 Other Employee Allow ances 51900 1,000 1,000
0 0 Auto Allow ance 51910 0 0
2,880 4,200 Mobile Computing Allow ance 51915 2,000 2,000
$ 591,300 $ 644,600 $ 798,500 $ 798,500
0 0 Electricity 52110 0 0
0 0 Water 52120 0 0
0 0 Natural Gas 52130 0 0
0 0 Garbage 52140 0 0
0 0 Surface Water Management Charge 52150 0 0
0 0 Other Utility Services 52160 0 0
0 0 Sew er Charges 52170 0 0
0 0 Contracted Services 52205 0 0
0 0 Engineering Services 52210 0 0
0 0 Landscape Services 52215 0 0
0 10,000 Professional Services 52240 10,000 10,000
0 0 Recording Fees 52250 0 0
0 0 Laundry 52260 0 0
0 0 Other Government Services 52270 0 0
21 0 Office Supplies 52305 0 0
0 2,000 Operating Supplies 52310 2,000 2,000
0 0 Gas, Oil, Lubrication 52315 0 0
0 0 Janitorial Supplies 52320 0 0
0 0 Tech & Scientif ic Supplies 52325 0 0
3,722 0 Repair & Maintenance Supplies 52330 0 0
0 0 Construction & Building Supplies 52335 0 0
0 0 Parts & Equipment 52340 0 0
0 0 Small Tools 52350 0 0
0 0 Safety Equipment 52360 0 0
0 0 Postage & Freight 52375 0 0
0 0 Softw are Expensed 52380 0 0
53 0 Computer Equipment Expensed 52385 0 0
0 0 Inventory Adjustments 52395 0 0
38 1,000 Dues & Memberships 52405 1,000 1,000
0 0 Books, Subscriptions & Publications 52410 0 0
43,588 50,000 Softw are Licenses & Support 52425 50,000 50,000
0 0 Publication Notices 52430 0 0
0 0 Printing 52435 0 0
0 0 Telephone Services 52445 0 0
0 0 Fueling Contract 52475 0 0
535 10,000 Training & Education 52480 10,000 10,000
1,483 1,000 Travel Expense 52485 1,000 1,000
0 0 Fleet Charges 52486 0 0
213 1,500 Private Mileage 52487 1,500 1,500
0 0 Other Materials & Services 52495 0 0
0 0 Permits, Licenses & Fees 52500 0 0
0 0 Public Information 52505 0 0
0 0 Taxes, Assessments & Liens 52510 0 0
0 0 Equipment Rental 52605 0 0
0 0 Repair & Maintenance Services 52610 0 0
0 0 Non-vehicle Equipment Repair &
Maintenance
52620 0 0
0 0 Computer Repair & Maintenance 52630 0 0
0 0 Insurance 52705 0 0
0 0 Polymers - Thickening 52805 0 0
0 0 Polymers - Dew atering 52810 0 0
0 0 Polymers - Tertiary 52815 0 0
0 0 Ferric Chloride 52820 0 0
0 0 Alum 52825 0 0
0 0 Sodium Hydroxide 52835 0 0
0 0 Sodium Hypochlorite 52840 0 0
0 0 Lime 52845 0 0
0 0 Sodium Bisulf ite 52850 0 0
0 0 Other Chemicals 52890 0 0
$ 49,653 $ 75,500 $ 75,500 $ 75,500
$ - $ - $ - $ -
$ 640,954 $ 720,100 $ 874,000 $ 874,000 $ 510,261 TOTAL EXPENDITURE $ 874,000
$ - CAPITAL OUTLAY SUBTOTAL $ -
$ 12,992 MATERIALS & SERVICES SUBTOTAL $ 75,500
0 0
0 0
0 0
0 0
0 0
0 0
0 0
0 0
0 0
0 0
0 0
0 0
0 0
0 0
0 0
0 0
300 0
0 0
0 0
0 1,000
0 0
1,064 1,500
0 0
0 10,000
0 0
5,578 50,000
0 0
0 0
113 1,000
0 0
0 0
4,140 0
0 0
1,593 0
0 0
0 0
0 0
0 0
0 0
0 0
0 0
0 0
0 0
0 0
205 2,000
0 10,000
0 0
0 0
0 0
0 0
0 0
0 0
0 0
0 0
0 0
0 0
0 0
$ 497,269 PERSONNEL EXPENSE SUBTOTAL $ 798,500
0 0
450 1,000
0 0
2,295 2,000
0 0
105,578 212,400
0 0
0 0
0 0
Expenditure Summary 8353 - Control Systems
FY 2016 ACTUALFY 2019
ADOPTED
388,946 583,100
Wastewater Treatment Department

Clean Water Services FY 2018-19 Adopted Budget Page 194
This page intentionally left blank

Clean Water Services FY 2018-19 Adopted Budget Page 195
Chart of Accounts
Personnel Services 51110 Full Time Regular Salaries 51130 Temporary 51140 Overtime 51600 Other Personnel Expense (OPE) 51900 Other Employee Allowances 51910 Automobile Allowance
Materials and Services 52110 Electricity 52120 Water 52130 Natural Gas 52140 Garbage 52150 Surface Water Management 52160 Other Utility Services 52170 Sewer Utility Services 52205 Contract Services Other 52210 Engineering Services 52215 Landscape Services 52240 Professional Services 52220 Audit and Accounting Services 52230 Legal Services 52250 Recording Fees 52260 Laundry Services 52270 Other Governmental Services
52305 Office Supplies 52310 Operating Supplies 52315 Gas, oil, lubrication 52320 Janitorial Supplies 52325 Tech & Scientific Supplies 52375 Postage and Freight 52330 Repair & Maintenance Supplies 52335 Construction & Building Supplies 52340 Parts Equipment 52350 Small Tools 52360 Safety Equipment 52380 Software Expensed 52385 Computer Equipment
52405 Dues, Memberships, Certifications 52410 Books, Subsc. & Publications 52425 Software Licenses & Support 52430 Publication Notices 52435 Printing & Duplicating 52440 Telecom Internal 52445 Telephone Service 52470 Building & Land Rental 52475 Fuel Contract 52480 Training & Education 52485 Travel Expense
52486 Fleet Charges 52487 Private Mileage 52495 Other Materials and Services
52500 Permits, Licenses & Fees 52505 Public Information 52510 Taxes, Assessment, Liens 52515 Bank Service Charge 52525 Finance Petty Cash Short
52605 Equipment Rental 52610 Repair & Maintenance Services 52630 Computer R&M
52705 Insurance 52720 Property Damage 52735 General Liability
52805 Polymers 52820 Ferric Chloride 52825 Alum 52810 Polymers 52815 Liquid Oxygen 52835 Sodium Hydroxide 52840 Sodium Hypochlorite 52845 Lime 52850 Sodium Bisulfite 52890 Other Chemicals
Capital Outlay - 55000 55200 Land Purchase 55220 Easements 55300 Buildings and Structures 55400 Machinery and 55130 Office Equipment 55120 Data Processing Equipment 55500 Trucks and Autos 55600 Plant Equipment 55700 Construction & Maint. Equip.
Other Expenditures 52905 Bad Debt Expense 56200 Principal-Long Term 56205 Interest – Long Term Contracts 57102 Transfer to Fund 102 57106 Transfer to Fund 106 57111 Transfer to Fund 111 57112 Transfer to Fund 112 57115 Transfer to Fund 115 57206 Transfer to Fund 206 57212 Transfer to Fund 212 58100 Operating Contingency

Clean Water Services FY 2018-19 Adopted Budget Page 196
Sanitary Sewer Capital Project List
FY 2017
Actual
FY 2018
Budget
FY 2018
Revised
FY 2019
Projected
FY 2020
Projected
FY 2021
Projected
FY 2022
Projected
FY 2023
Projected
FY 2019-2023
Projected
6905 UTILITY BILLING SOFTWARE REPLACEM ENT
STUDY
$0 $200,000 $0 $1,500,000 $1,500,000 $200,000 $0 $0 $3,200,000
$0 $200,000 $0 $1,500,000 $1,500,000 $200,000 $0 $0 $3,200,000
2019 CAPITAL OUTLAY FY 2018-19 $0 $0 $0 $503,900 $0 $0 $0 $0 $503,900
$0 $0 $0 $503,900 $0 $0 $0 $0 $503,900
KING CITY - GARDEN VILLAS SANITARY
SEWER LID
$0 $0 $0 $540,000 $1,080,000 $0 $0 $0 $1,620,000
6273 LOCAL IM PROVEM ENT DISTRICT SUPPORT $0 $50,000 $0 $50,000 $50,000 $50,000 $50,000 $50,000 $250,000
6917 SW BAKER LANE SANITARY LID $0 $0 $25,000 $70,000 $0 $0 $0 $0 $70,000
$0 $50,000 $25,000 $660,000 $1,130,000 $50,000 $50,000 $50,000 $1,940,000
BROADM OOR SANITARY SEWER
REPLACEM ENT PH2
$0 $40,000 $0 $10,000 $250,000 $250,000 $0 $0 $510,000
CANYON CREEK SEWER IM PROVEM ENTS $0 $100,000 $25,000 $100,000 $0 $0 $0 $0 $100,000
CEDAR HILLS REHABILITATION PHASE 3 $0 $25,000 $0 $0 $0 $1,000,000 $0 $0 $1,000,000
FOOTHILLS PARK I/I ABATEM ENT
IM PROVEM ENTS
$0 $0 $0 $50,000 $750,000 $0 $0 $0 $800,000
GARDEN HOM E SEWER REHABILITATION
PHASE 2
$0 $0 $0 $920,000 $0 $0 $0 $0 $920,000
HIGH PRIORITY STRUCTURAL REPAIR
PROGRAM
$0 $10,000 $10,000 $10,000 $10,000 $50,000 $300,000 $300,000 $670,000
WEST BASIN I/I $0 $50,000 $10,000 $1,150,000 $1,150,000 $1,000,000 $1,000,000 $1,000,000 $5,300,000
6298 LARGE TRUNKLINE I/I $543 $100,000 $0 $100,000 $100,000 $100,000 $100,000 $0 $400,000
6332 REHABILITATION M ASTER PLANNING $84,253 $100,000 $2,000 $25,000 $25,000 $25,000 $25,000 $25,000 $125,000
6653 EXPOSED LATERALS PROGRAM $7,421 $10,000 $10,000 $160,000 $310,000 $310,000 $310,000 $310,000 $1,400,000
6767 BROADM OOR SANITARY SEWER
REPLACEM ENT
$24,347 $630,000 $280,000 $250,000 $0 $0 $0 $0 $250,000
6824 CHRISTINE CT SLIDE ANALYSIS AND REPAIR $139,244 $355,000 $473,500 $2,000 $0 $0 $0 $0 $2,000
6914 SOUTHWOOD REHABILITATION $0 $995,000 $20,000 $1,025,000 $0 $0 $0 $0 $1,025,000
6918 ALOHA I/I $0 $110,000 $10,000 $20,000 $0 $0 $0 $0 $20,000
$255,808 $2,525,000 $840,500 $3,822,000 $2,595,000 $2,735,000 $1,735,000 $1,635,000 $12,522,000
Home Portfolio
A ctive P ro jects
B usiness Svcs - F inance - B usiness A pplicat io ns
B usiness Svcs - F inance - F inance
C o nveyance - Engr - LID
C o nveyance - Engr - R ehabilitat io n

Clean Water Services FY 2018-19 Adopted Budget Page 197
FY 2017
Actual
FY 2018
Budget
FY 2018
Revised
FY 2019
Projected
FY 2020
Projected
FY 2021
Projected
FY 2022
Projected
FY 2023
Projected
FY 2019-2023
Projected
174th & BRONSON SANITARY SEWER
RELOCATION
$0 $0 $0 $85,000 $0 $0 $0 $0 $85,000
192nd AVE SANITARY SEWER UPGRADE $0 $0 $0 $0 $0 $0 $0 $0 $0
2020 SANITARY SEWER M ASTER PLAN
UPDATE
$0 $0 $0 $0 $250,000 $0 $0 $0 $250,000
BARNES ROAD SANITARY UPGRADE $0 $0 $0 $0 $0 $0 $0 $0 $0
BEAVERTON TRUNK SANITARY UPGRADE $0 $0 $0 $0 $0 $250,000 $0 $0 $250,000
BETHANY LAKE BERM - STUDY $0 $0 $0 $40,000 $0 $0 $0 $0 $40,000
BROOKM AN TRUNK SEWER EXTENSION $0 $0 $0 $350,000 $0 $0 $0 $0 $350,000
BUTTERNUT CREEK SCHOOL SANITARY
UPGRADE
$0 $0 $0 $0 $0 $0 $0 $0 $0
CABERNET STREET SANITARY UPGRADE $0 $0 $0 $0 $0 $0 $0 $0 $0
COUNTRY HAVEN GRAVITY CONNECTION TO
JACOBSON HELVETIA PS
$0 $0 $0 $25,000 $50,000 $350,000 $0 $0 $425,000
CROSS CREEK TRUNK SOUTH R-140 $0 $0 $0 $0 $0 $0 $0 $0 $0
DAWSON TRUNK SITE D CONNECTION $0 $0 $0 $25,000 $400,000 $0 $0 $0 $425,000
DEVELOPM ENT RELATED PROJECTS $0 $1,500,000 $250,000 $600,000 $3,000,000 $3,000,000 $3,000,000 $3,000,000 $12,600,000
DISTRICT SHARE OF CITY PROJECTS $653,242 $1,800,000 $174,000 $500,000 $2,500,000 $2,500,000 $2,500,000 $2,500,000 $10,500,000
FAIRFIELD ST SANITARY UPGRADE $0 $0 $0 $20,000 $0 $0 $0 $0 $20,000
FOOTHILL DR (COM M ONWEALTH LAKE)
SANITARY UPGRADE
$0 $0 $0 $0 $0 $50,000 $0 $0 $50,000
HELVETIA PUM P STATION GRAVITY SEWER
EXTENSION
$0 $0 $0 $0 $0 $0 $0 $0 $0
JOHNSON CREEK SANITARY UPGRADE $0 $0 $0 $20,000 $0 $0 $0 $0 $20,000
M ETZGER/FANNO INTERCEPTOR UNDER
RRX (D-340)
$0 $0 $0 $0 $150,000 $0 $0 $0 $150,000
M ONTCLAIR AREA SEWER REPAIR $0 $0 $0 $160,000 $1,000,000 $0 $0 $0 $1,160,000
NORTH HILLSBORO INDUSTRIAL FM
DISCHARGE TO GRAVITY
$0 $0 $0 $100,000 $500,000 $0 $0 $0 $600,000
NORTH HILLSBORO INDUSTRIAL WEIBEL
CREEK GRAVITY
$0 $0 $0 $300,000 $1,500,000 $0 $0 $0 $1,800,000
RIVER TERRACE N FORCE M AIN REROUTE $0 $0 $0 $0 $0 $0 $0 $0 $0
SHAW ST & 198th SANITARY UPGRADE $0 $0 $0 $0 $0 $0 $0 $0 $0
SHERWOOD TRUNK IM PROVEM ENTS-ROY
ROGERS RD TO WASHINGTON ST
$0 $0 $0 $0 $0 $0 $0 $0 $0
SOUTH COOPER M OUNTAIN SANITARY
M ASTER PLAN PHASES 2&3
$0 $0 $158,900 $158,900 $158,900 $0 $0 $0 $317,800
SW 198th AVENUE SANITARY SEWER
RELOCATION
$0 $0 $0 $10,000 $280,000 $0 $0 $0 $290,000
WASHINGTON STREET SANITARY UPGRADE $0 $0 $0 $0 $0 $0 $0 $0 $0
Home Portfolio
C o nveyance - Engr - Sanitary C o llect io n System

Clean Water Services FY 2018-19 Adopted Budget Page 198
FY 2017
Actual
FY 2018
Budget
FY 2018
Revised
FY 2019
Projected
FY 2020
Projected
FY 2021
Projected
FY 2022
Projected
FY 2023
Projected
FY 2019-2023
Projected
WEST UNION SANITARY UPGRADE $0 $0 $0 $0 $0 $0 $0 $0 $0
6283 UTILITY RELOCATION $8,807 $75,000 $75,000 $75,000 $75,000 $75,000 $75,000 $75,000 $375,000
6399 SANITARY SEWER CAPACITY UPGRADES $4,956 $100,000 $15,000 $100,000 $100,000 $100,000 $100,000 $100,000 $500,000
6493 UPPER TUALATIN INTERCEPTOR (D-250) $298,805 $750,000 $1,200,000 $26,880,000 $5,280,000 $0 $0 $0 $32,160,000
6656 SYSTEM CAPACITY ASSESSM ENTS $117,637 $250,000 $100,000 $250,000 $0 $0 $0 $0 $250,000
6657 ONION FLAT TRUNK SEWER UPGRADE $2,899,935 $5,000 $0 $0 $0 $0 $0 $0 $0
6763 SANITARY SEWER M ASTER PLANS FOR
EXPANSION AREAS
$8,370 $50,000 $10,000 $10,000 $10,000 $10,000 $10,000 $10,000 $50,000
6804 NW 185TH SEWER EXTENSION AT SPRINGVILLE
ROAD
$16,368 $430,000 $15,000 $423,000 $0 $0 $0 $0 $423,000
6826 CEDAR M ILL TRUNK RELOCATION AT
M URRAY/WALKER
$19,997 $1,100,000 $90,000 $950,000 $350,000 $0 $0 $0 $1,300,000
6828 FOOTHILLS PARK SEWER IM PROVEM ENTS $8,944 $20,000 $15,000 $210,000 $0 $0 $0 $0 $210,000
6832 GINGER STREET WEST SANITARY SEWER
UPGRADE (FG-6)
$0 $730,600 $429,500 $1,242,000 $0 $0 $0 $0 $1,242,000
6875 13th AVE TRUNK (FG-8) $0 $0 $0 $0 $0 $0 $0 $0 $0
6882 CEDAR M ILLS TRUNK UPGRADE JENKINS TO
BEAVERTON INTERCEPTOR
$2,326 $200,000 $420,000 $425,000 $2,150,000 $1,620,000 $35,000 $0 $4,230,000
6883 ROY ROGERS GRAVITY RIVER TERRACE
SOUTH PUM P STATION TO LASICH LANE
$7,301 $520,000 $250,000 $1,400,000 $1,300,000 $0 $0 $0 $2,700,000
6884 BULL M T TRUNK IM PROVEM ENTS-KING CITY
SIPHON TO SW M YRTLE AVE
$75,335 $600,000 $1,100,000 $6,050,000 $0 $0 $0 $0 $6,050,000
6895 175TH & KEM M ER SEWER EXTENSION $11,114 $0 $220,000 $0 $0 $0 $0 $0 $0
6908 S HILLSBORO TRUNK SEWER $0 $0 $621,100 $180,000 $0 $0 $0 $0 $180,000
6922 HALL BLVD LATERAL (R-110) $0 $0 $190,000 $1,815,000 $0 $0 $0 $0 $1,815,000
6924 1911/1936 AND TURNER CREEK SANITARY
SEWER I/I ABATEM ENT
$0 $0 $250,000 $912,500 $350,000 $0 $0 $0 $1,262,500
$4,133,137 $8,130,600 $5,583,500 $43,316,400 $19,403,900 $7,955,000 $5,720,000 $5,685,000 $82,080,300
SPRINGER STREET FACILITY
IM PROVEM ENTS
$0 $100,000 $50,000 $100,000 $250,000 $0 $0 $0 $350,000
6377 FLOW M ONITORING EQUIPM ENT RENEWAL
PROGRAM
$92,116 $100,000 $111,000 $110,000 $110,000 $110,000 $110,000 $110,000 $550,000
6777 ROOT LIST REDUCTION $61,024 $100,000 $100,000 $100,000 $120,000 $120,000 $120,000 $120,000 $580,000
6809 FIELD OPERATIONS M ERLO FACILITY
IM PROVEM ENTS
$22,058 $280,000 $30,000 $100,000 $225,000 $0 $0 $0 $325,000
6847 EM ERGENCY COM M UNICATION
IM PROVEM ENTS
$22,660 $100,000 $100,000 $50,000 $0 $0 $0 $0 $50,000
$197,858 $680,000 $391,000 $460,000 $705,000 $230,000 $230,000 $230,000 $1,855,000
Home Portfolio
C o nveyance - F ield Ops - F ield Operat io ns

Clean Water Services FY 2018-19 Adopted Budget Page 199
FY 2017
Actual
FY 2018
Budget
FY 2018
Revised
FY 2019
Projected
FY 2020
Projected
FY 2021
Projected
FY 2022
Projected
FY 2023
Projected
FY 2019-2023
Projected
6221 SANI PASSENGER VEHICLE/LIGHT TRUCK $20,524 $77,000 $148,000 $30,000 $0 $0 $0 $0 $30,000
6303 SANI HEAVY TRUCKS/EQUIPM ENT $0 $372,000 $375,000 $105,000 $0 $0 $0 $0 $105,000
$20,524 $449,000 $523,000 $135,000 $0 $0 $0 $0 $135,000
6840 SANITARY LIGHT VEHICLE REPLACEM ENT $149,144 $0 $25,000 $308,000 $0 $0 $0 $0 $308,000
6841 SANITARY HEAVY VEHICLE REPLACEM ENT $631,779 $860,000 $860,000 $669,000 $0 $0 $0 $0 $669,000
$780,923 $860,000 $885,000 $977,000 $0 $0 $0 $0 $977,000
M ETALS INSTRUM ENTS REPLACEM ENT $0 $290,000 $10,000 $300,000 $0 $0 $0 $0 $300,000
$0 $290,000 $10,000 $300,000 $0 $0 $0 $0 $300,000
6672 HIGH PURITY WATER PROJECT $53,606 $50,000 $367,000 $75,000 $75,000 $0 $0 $0 $150,000
$53,606 $50,000 $367,000 $75,000 $75,000 $0 $0 $0 $150,000
6793 ABC FACILITY UPGRADES $163,127 $650,000 $800,000 $1,900,000 $1,525,000 $500,000 $500,000 $500,000 $4,925,000
6931 FIELD OPS FACILITY UPGRADES $0 $75,000 $50,000 $30,000 $30,000 $30,000 $30,000 $30,000 $150,000
$163,127 $725,000 $850,000 $1,930,000 $1,555,000 $530,000 $530,000 $530,000 $5,075,000
6063 IT COM M UNICATIONS ASSET LIFE-CYCLE
COSTS
$70,236 $70,000 $70,000 $75,000 $75,000 $75,000 $75,000 $75,000 $375,000
6106 IT STORAGE ASSET LIFE CYCLE COSTS $115,054 $100,000 $70,000 $70,000 $70,000 $70,000 $70,000 $70,000 $350,000
6107 IT SERVER ASSET LIFE-CYCLE COSTS $0 $70,000 $70,000 $75,000 $75,000 $75,000 $75,000 $75,000 $375,000
6265 IT END USER DEVICE ASSET LIFE-CYCLE
COSTS
$20,765 $40,000 $40,000 $40,000 $40,000 $40,000 $40,000 $40,000 $200,000
$206,055 $280,000 $250,000 $260,000 $260,000 $260,000 $260,000 $260,000 $1,300,000
6465 FOREST GROVE PROPERTY
ENHANCEM ENTS
$86,867 $220,000 $150,000 $100,000 $50,000 $50,000 $25,000 $0 $225,000
6475 JACKSON BOTTOM PROPERTY
ENHANCEM ENTS
$136,941 $330,000 $420,000 $435,000 $150,000 $150,000 $60,000 $60,000 $855,000
Home Portfolio
C o nveyance - F ield Ops - F leet
C o nveyance - F ield Ops - R eplacement and R enewal (F leet)
Labo rato ry - R egulato ry A ffairs
Off ice o f GM - A dmin - Off ice o f the General M anager
Off ice o f GM - IT - A B C and F O F acilit ies P ro jects
Off ice o f GM - IT - Infrastructure - R eplacement
Watershed M gmt - C WS P ro perty Impro vements

Clean Water Services FY 2018-19 Adopted Budget Page 200
FY 2017
Actual
FY 2018
Budget
FY 2018
Revised
FY 2019
Projected
FY 2020
Projected
FY 2021
Projected
FY 2022
Projected
FY 2023
Projected
FY 2019-2023
Projected
6678 NATURAL SYSTEM RESOURCE
PARTNERSHIPS
$0 $1,000,000 $1,000,000 $500,000 $1,000,000 $1,000,000 $1,000,000 $1,000,000 $4,500,000
6909 TUALATIN RIVER FARM IM PROVEM ENTS $0 $120,000 $120,000 $2,080,000 $3,975,000 $0 $0 $0 $6,055,000
$223,808 $1,670,000 $1,690,000 $3,115,000 $5,175,000 $1,200,000 $1,085,000 $1,060,000 $11,635,000
6483 LONG RANGE WATER SUPPLY PLAN $2,269,727 $5,000,000 $5,741,000 $8,000,000 $9,000,000 $30,000,000 $67,500,000 $53,100,000 $167,600,000
$2,269,727 $5,000,000 $5,741,000 $8,000,000 $9,000,000 $30,000,000 $67,500,000 $53,100,000 $167,600,000
4943 WETLAND M ITIGATION M ONITORING
(SANITARY)
$46,636 $120,000 $100,000 $80,000 $60,000 $60,000 $40,000 $20,000 $260,000
6474 FANNO CREEK - 99W TO BONITA - SANI $167,704 $550,000 $370,000 $1,235,000 $35,000 $20,000 $15,000 $15,000 $1,320,000
6529 NATURAL SYSTEM REGIONAL SERVICES $267,228 $525,000 $310,000 $525,000 $525,000 $525,000 $525,000 $525,000 $2,625,000
6530 COLLABORATIVE REGIONAL RESTORATION $1,097,640 $1,620,000 $1,200,000 $1,150,000 $1,365,000 $765,000 $545,000 $440,000 $4,265,000
6555 SPRINGVILLE TRIB, ROCK CREEK - 185TH TO
KAISER - SANI
$111,870 $70,000 $30,000 $25,000 $20,000 $0 $0 $0 $45,000
6683 RESTORATION M ANAGEM ENT SYSTEM S $169,060 $150,000 $150,000 $150,000 $75,000 $50,000 $0 $0 $275,000
6855 LOCAL RESTORATION PARTNERSHIPS $264,907 $975,000 $605,000 $900,000 $1,025,000 $390,000 $335,000 $150,000 $2,800,000
6856 TUALATIN RIVER REFUGE RESTORATION $168,166 $280,000 $260,000 $965,000 $535,000 $180,000 $135,000 $110,000 $1,925,000
6864 WAPATO LAKE REFUGE RESTORATION $599 $890,000 $250,000 $510,000 $530,000 $460,000 $460,000 $460,000 $2,420,000
$2,293,810 $5,180,000 $3,275,000 $5,540,000 $4,170,000 $2,450,000 $2,055,000 $1,720,000 $15,935,000
CONSTRUCTION M ANAGEM ENT SOFTWARE $0 $0 $0 $0 $0 $0 $0 $0 $0
$0 $0 $0 $0 $0 $0 $0 $0 $0
FOREST GROVE EAST AG LANDS
DEVELOPM ENT
$0 $0 $0 $0 $215,000 $1,240,000 $640,000 $500,000 $2,595,000
FOREST GROVE WEST AG LANDS
DEVELOPM ENT
$0 $0 $0 $0 $0 $0 $220,000 $230,000 $450,000
$0 $0 $0 $0 $215,000 $1,240,000 $860,000 $730,000 $3,045,000
Home Portfolio
Watershed M gmt - F lo w R esto rat io n and R euse
Watershed M gmt - Watershed Enhancement
WWT D - B usiness A pplicat io ns
WWT D - C WS P ro perty Impro vements

Clean Water Services FY 2018-19 Adopted Budget Page 201
FY 2017
Actual
FY 2018
Budget
FY 2018
Revised
FY 2019
Projected
FY 2020
Projected
FY 2021
Projected
FY 2022
Projected
FY 2023
Projected
FY 2019-2023
Projected
DURHAM BACKWASH PUM PING
M ODIFICATIONS
$0 $230,000 $50,000 $225,000 $400,000 $0 $0 $0 $625,000
DURHAM FOG FEED M ODIFICATIONS $0 $0 $30,000 $320,000 $0 $0 $0 $0 $320,000
DURHAM GRIT SYSTEM REHABILITATION $0 $0 $0 $0 $375,000 $0 $0 $0 $375,000
DURHAM LIM E SYSTEM M ODIFICATIONS $0 $0 $0 $400,000 $325,000 $0 $0 $0 $725,000
DURHAM PAVEM ENT REHABILITATION $0 $0 $0 $0 $0 $0 $0 $0 $0
DURHAM PHASE 6B - New Digester $0 $0 $0 $0 $0 $0 $0 $1,000,000 $1,000,000
DURHAM PHASE 7 - Second phase/round of
tertiary upgrading/expansion
$0 $0 $0 $0 $0 $0 $0 $0 $0
DURHAM PHASE 7B - Tertiary Upgrade $0 $0 $0 $0 $0 $0 $0 $0 $0
DURHAM PHASE 8 - Secondary/BNR Train #5 $0 $0 $0 $0 $0 $0 $0 $0 $0
DURHAM POLYM ER FEED SYSTEM
REPLACEM ENT
$0 $0 $0 $0 $300,000 $0 $0 $0 $300,000
DURHAM PRIM ARY SLUDGE HEATING $0 $0 $0 $250,000 $0 $0 $0 $0 $250,000
DURHAM SLUDGE SCREENING $0 $0 $0 $0 $0 $0 $0 $1,500,000 $1,500,000
6368 DURHAM M ISCELLANEOUS UPGRADES $345,344 $350,000 $350,000 $200,000 $250,000 $250,000 $250,000 $250,000 $1,200,000
6687 DURHAM O&M BUILDING REM ODEL/REHAB $1,422,934 $7,150,000 $3,017,000 $5,850,000 $0 $0 $0 $0 $5,850,000
6757 DURHAM PHASE 5B3 - Secondary Capacity
Expansion
$787,804 $2,860,000 $2,450,000 $12,200,000 $12,100,000 $2,600,000 $0 $0 $26,900,000
6789 DURHAM PHASE 5C - Tertiary Clarification
Improvements
$646,238 $150,000 $0 $0 $0 $0 $900,000 $5,200,000 $6,100,000
6834 DURHAM PHASE 6 - Fermenter/WAS
storage/misc.
$57,250 $200,000 $50,000 $0 $1,100,000 $5,500,000 $5,500,000 $0 $12,100,000
6835 DURHAM ODOR CONTROL FOLLOW UP
PROJECTS
$248,022 $205,000 $205,000 $265,000 $0 $0 $0 $0 $265,000
6893 DURHAM PHASE 6C - Sludge Dewatering
Replacement/Rebuild
$0 $2,500,000 $550,000 $3,000,000 $0 $0 $0 $0 $3,000,000
6919 DURHAM DIGESTER GAS SYSTEM
IM PROVEM ENTS
$0 $145,000 $156,000 $115,000 $0 $0 $0 $0 $115,000
6920 DURHAM SULFUREX H2S REM OVAL SYSTEM $0 $0 $350,000 $700,000 $0 $0 $0 $0 $700,000
6933 DURHAM BOILER CONTROLS $0 $125,000 $55,000 $70,000 $0 $0 $0 $0 $70,000
6934 DURHAM IPS HVAC $0 $235,000 $100,000 $135,000 $0 $0 $0 $0 $135,000
$3,507,592 $14,150,000 $7,363,000 $23,730,000 $14,850,000 $8,350,000 $6,650,000 $7,950,000 $61,530,000
Home Portfolio
WWT D - D urham

Clean Water Services FY 2018-19 Adopted Budget Page 202
FY 2017
Actual
FY 2018
Budget
FY 2018
Revised
FY 2019
Projected
FY 2020
Projected
FY 2021
Projected
FY 2022
Projected
FY 2023
Projected
FY 2019-2023
Projected
DURHAM LIQUIDS AND SOLIDS POWER
DISTRIBUTION UPGRADE
$0 $0 $0 $0 $250,000 $1,500,000 $1,400,000 $0 $3,150,000
HILLSBORO ELECTRICAL SWITCHGEAR &
M OTOR CONTROL CENTER REPLACEM ENT
$0 $0 $0 $0 $0 $100,000 $1,000,000 $0 $1,100,000
PROCESS, INNOVATION, ENERGY PROJECTS $0 $0 $0 $200,000 $200,000 $200,000 $200,000 $200,000 $1,000,000
ROCK CREEK WEST SIDE POWER
DISTRIBUTION EXPANSION
$0 $0 $0 $0 $0 $0 $0 $0 $0
SCADA/CONTROL UPGRADE FOR FG AND HB $0 $0 $0 $60,000 $600,000 $0 $0 $0 $660,000
4894 CM M S SOFTWARE PACKAGE $0 $100,000 $150,000 $60,000 $0 $0 $0 $0 $60,000
6860 RIVER ROAD PUM P STATION GENERATOR
REPLACEM ENT
$0 $0 $0 $0 $0 $0 $0 $0 $0
$0 $100,000 $150,000 $320,000 $1,050,000 $1,800,000 $2,600,000 $200,000 $5,970,000
ROCK CREEK CHEM ICAL & DIGESTER
ELEVATORS IM PROVEM ENTS
$0 $0 $0 $210,000 $0 $0 $0 $0 $210,000
6371 FACILITIES M ISCELLANEOUS UPGRADES $65,063 $200,000 $200,000 $250,000 $200,000 $200,000 $200,000 $200,000 $1,050,000
$65,063 $200,000 $200,000 $460,000 $200,000 $200,000 $200,000 $200,000 $1,260,000
FERNHILL VOLUNTEER & VISITOR
IM PROVEM ENTS
$0 $0 $175,000 $300,000 $0 $0 $0 $0 $300,000
FOREST GROVE M ISC. SECONDARY
TREATM ENT IM PROVEM ENTS
$0 $0 $140,000 $270,000 $55,000 $0 $0 $0 $325,000
FOREST GROVE RECYCLED WATER FACILITY $0 $0 $0 $0 $0 $0 $0 $0 $0
FOREST GROVE SUPPLEM ENTAL ALKALINITY $0 $0 $0 $300,000 $0 $0 $0 $0 $300,000
6374 FOREST GROVE M ISCELLANEOUS UPGRADES $43,274 $35,000 $100,000 $100,000 $60,000 $50,000 $40,000 $35,000 $285,000
6698 FERNHILL NTS WEST WETLANDS $8,269,726 $2,000,000 $1,926,000 $251,000 $0 $0 $0 $0 $251,000
6699 FERNHILL NTS UPPER WETLANDS $17,942 $60,000 $150,000 $360,000 $2,300,000 $2,300,000 $3,300,000 $550,000 $8,810,000
6750 FERNHILL NTS SOUTH WETLANDS $390,586 $200,000 $75,000 $200,000 $0 $0 $0 $0 $200,000
6792 FOREST GROVE EFFLUENT PUM P STATION $127,890 $350,000 $200,000 $0 $300,000 $2,200,000 $5,250,000 $2,950,000 $10,700,000
6814 FOREST GROVE ADM INISTRATION BUILDING
IM PROVEM ENTS
$70,922 $700,000 $300,000 $950,000 $0 $0 $0 $0 $950,000
6849 FERNHILL M ISCELLANEOUS IM PROVEM ENTS $201,770 $250,000 $250,000 $200,000 $250,000 $250,000 $250,000 $250,000 $1,200,000
6866 FOREST GROVE AERATION BASIN
M ODIFICATIONS
$73,624 $450,000 $900,000 $2,000 $0 $0 $0 $0 $2,000
6880 FOREST GROVE OUTFALL REPLACEM ENT $187,906 $400,000 $900,000 $200,000 $1,200,000 $900,000 $0 $0 $2,300,000
Home Portfolio
WWT D - Electrical & Instrumentat io n
WWT D - F acilit ies
WWT D - F o rest Gro ve

Clean Water Services FY 2018-19 Adopted Budget Page 203
FY 2017
Actual
FY 2018
Budget
FY 2018
Revised
FY 2019
Projected
FY 2020
Projected
FY 2021
Projected
FY 2022
Projected
FY 2023
Projected
FY 2019-2023
Projected
6896 FOREST GROVE SOLIDS TREATM ENT
ALTERNATIVES PROJECT
$4,071 $50,000 $150,000 $200,000 $700,000 $700,000 $2,200,000 $2,200,000 $6,000,000
6897 FERNHILL PARKING LOT & LANDSCAPE $18,311 $0 $950,000 $350,000 $0 $0 $0 $0 $350,000
6916 FERNHILL LANDSCAPE IM PROVEM ENTS $0 $0 $300,000 $300,000 $0 $0 $0 $0 $300,000
6925 FOREST GROVE SECONDARY CLARIFIERS $0 $200,000 $250,000 $300,000 $4,400,000 $7,700,000 $0 $0 $12,400,000
$9,406,022 $4,695,000 $6,766,000 $4,283,000 $9,265,000 $14,100,000 $11,040,000 $5,985,000 $44,673,000
HILLSBORO ADM INISTRATION BUILDING
IM PROVEM ENTS
$0 $0 $0 $0 $140,000 $500,000 $0 $0 $640,000
HILLSBORO ENTRY GATE AND COLLECTION
BOX M ODIFICATIONS
$0 $0 $150,000 $250,000 $0 $0 $0 $0 $250,000
HILLSBORO HIGH HEAD PUM P STATION AND
CONTROL GATE M ODIFICATIONS
$0 $0 $20,000 $0 $540,000 $540,000 $2,000 $0 $1,082,000
HILLSBORO NATURAL TREATM ENT SYSTEM $0 $0 $0 $0 $0 $0 $0 $0 $0
6373 HILLSBORO M ISCELLANEOUS UPGRADES $139,672 $190,000 $65,000 $95,000 $95,000 $100,000 $100,000 $100,000 $490,000
6812 HILLSBORO ODOR ABATEM ENT $62,951 $840,000 $1,000,000 $1,100,000 $0 $0 $0 $0 $1,100,000
$202,623 $1,030,000 $1,235,000 $1,445,000 $775,000 $1,140,000 $102,000 $100,000 $3,562,000
TVID RECYCLED WATER PIPELINE $0 $30,000 $0 $0 $100,000 $2,800,000 $2,400,000 $8,250,000 $13,550,000
6408 WATER RIGHTS $80 $20,000 $0 $20,000 $20,000 $20,000 $20,000 $20,000 $100,000
6780 ELECTRONIC OPERATORS M ANUAL $216,671 $50,000 $20,000 $50,000 $0 $0 $0 $0 $50,000
6871 FACILITY WAYFINDING & INTERPRETIVE
IM PROVEM ENTS
$17,048 $200,000 $240,000 $300,000 $0 $0 $0 $0 $300,000
$233,799 $300,000 $260,000 $370,000 $120,000 $2,820,000 $2,420,000 $8,270,000 $14,000,000
18th AVENUE PUM P STATION & FORCEM AIN $0 $0 $0 $0 $0 $0 $200,000 $2,050,000 $2,250,000
BANKS FORCE M AIN LOCATION $0 $0 $0 $0 $0 $0 $0 $65,000 $65,000
BUTTERNUT CREEK PUM P STATION PHASE 2 $0 $0 $0 $0 $0 $0 $0 $0 $0
CEDAR STREET PUM P STATION &
FORCEM AIN REPLACEM ENT
$0 $0 $0 $0 $100,000 $0 $0 $0 $100,000
CHILDS PUM P STATION REPLACEM ENT $0 $0 $0 $0 $0 $0 $100,000 $1,800,000 $1,900,000
GASTON FORCEM AIN REPLACEM ENT PH 2 $0 $0 $0 $0 $0 $0 $0 $300,000 $300,000
M CKAY CREEK PUM P STATION AND
FORCEM AIN
$0 $0 $0 $0 $0 $250,000 $2,000,000 $4,750,000 $7,000,000
PUM P STATION LANDSCAPING $0 $0 $0 $0 $0 $0 $0 $0 $0
Home Portfolio
WWT D - H illsbo ro
WWT D - M iscellaneo us (T reatment)
WWT D - P ump Stat io ns (T reatment)

Clean Water Services FY 2018-19 Adopted Budget Page 204
FY 2017
Actual
FY 2018
Budget
FY 2018
Revised
FY 2019
Projected
FY 2020
Projected
FY 2021
Projected
FY 2022
Projected
FY 2023
Projected
FY 2019-2023
Projected
PUM P STATIONS PORTABLE GENERATOR $0 $0 $0 $0 $100,000 $0 $0 $0 $100,000
RIVER TERRACE NORTH 2ND FORCE M AIN $0 $150,000 $250,000 $1,140,000 $3,000 $0 $0 $0 $1,143,000
ROSEDALE PUM P STATION AND FORCEM AIN $0 $0 $0 $0 $0 $0 $0 $200,000 $200,000
SHERWOOD FORCEM AIN UPGRADE $0 $0 $0 $0 $100,000 $775,000 $0 $0 $875,000
STONE CREEK PUM P STATION & FORCEM AIN $0 $0 $0 $0 $0 $0 $0 $300,000 $300,000
STRASBURY PUM P STATION & FORCEM AIN $0 $0 $0 $0 $0 $0 $0 $100,000 $100,000
SW TUALATIN PUM P STATION & FORCEM AIN $0 $0 $0 $0 $0 $0 $300,000 $1,700,000 $2,000,000
SW TUALATIN SATELLITE PUM P STATION &
FORCEM AIN
$0 $0 $0 $0 $0 $0 $0 $0 $0
WQL PUM P STATION UPGRADE $0 $0 $80,000 $200,000 $3,000 $0 $0 $0 $203,000
6380 PUM P STATION M ISCELLANEOUS UPGRADES $23,308 $160,000 $90,000 $300,000 $300,000 $300,000 $300,000 $300,000 $1,500,000
6554 BUTTERNUT PUM P STATION & FORCEM AIN $111,388 $2,350,000 $2,420,000 $5,000 $0 $0 $0 $0 $5,000
6771 ENSCHEDE GRAVITY SEWER $144,463 $470,000 $505,000 $3,000 $0 $0 $0 $0 $3,000
6827 RIVER TERRACE SOUTH PUM P STATION AND
FORCEM AIN
$48,448 $2,550,000 $1,550,000 $3,050,000 $2,000 $0 $0 $0 $3,052,000
6887 OAK VILLAGE & FIR GROVE WET WELL
IM PROVEM ENTS
$6,340 $90,000 $10,000 $0 $80,000 $55,000 $0 $0 $135,000
6902 CORNELIUS PUM P STATION IM PROVEM ENTS $0 $150,000 $260,000 $2,185,000 $3,000 $0 $0 $0 $2,188,000
6903 NORTH HILLSBORO PUM P STATION $0 $1,770,000 $100,000 $775,000 $3,075,000 $3,000 $0 $0 $3,853,000
6923 HELVETIA PUM P STATION & FORCEM AIN $0 $210,000 $200,000 $525,000 $3,125,000 $3,000 $0 $0 $3,653,000
$333,947 $7,900,000 $5,465,000 $8,183,000 $6,891,000 $1,386,000 $2,900,000 $11,565,000 $30,925,000
DURHAM PLANT ROAD REPAIR &
REPLACEM ENT
$0 $270,000 $0 $235,000 $235,000 $0 $0 $0 $470,000
ELECTRICAL EQUIPM ENT REPLACEM ENT &
RENEWAL PROJECTS
$0 $0 $0 $800,000 $800,000 $800,000 $800,000 $800,000 $4,000,000
FACILITIES REPLACEM ENT & RENEWAL $0 $0 $0 $500,000 $500,000 $500,000 $500,000 $500,000 $2,500,000
ROCK CREEK CHEM ICAL BUILDING M AU
REPLACEM ENT
$0 $0 $0 $0 $300,000 $0 $0 $0 $300,000
ROCK CREEK IPS VFD REPLACEM ENT $0 $180,000 $0 $0 $2,600,000 $0 $0 $0 $2,600,000
ROCK CREEK NaOH TANK REPLACEM ENT $0 $550,000 $50,000 $300,000 $0 $0 $0 $0 $300,000
6370 HVAC REPLACEM ENT $72,779 $100,000 $330,000 $0 $0 $0 $0 $0 $0
6850 M ECHANICAL EQUIPM ENT REPLACEM ENT &
RENEWAL
$276,240 $700,000 $400,000 $500,000 $500,000 $500,000 $500,000 $500,000 $2,500,000
Home Portfolio
WWT D - R eplacement and R enewal

Clean Water Services FY 2018-19 Adopted Budget Page 205
FY 2017
Actual
FY 2018
Budget
FY 2018
Revised
FY 2019
Projected
FY 2020
Projected
FY 2021
Projected
FY 2022
Projected
FY 2023
Projected
FY 2019-2023
Projected
6853 INSTRUM ENTATION & CONTROL EQUIPM ENT
REPLACEM ENT & RENEWAL PROJECTS
$201,737 $250,000 $250,000 $300,000 $350,000 $350,000 $350,000 $350,000 $1,700,000
6888 DURHAM CHEM ICAL BUILDING M AU
REPLACEM ENT PROJECT
$8,006 $100,000 $239,691 $195,000 $0 $0 $0 $0 $195,000
$558,762 $2,150,000 $1,269,691 $2,830,000 $5,285,000 $2,150,000 $2,150,000 $2,150,000 $14,565,000
ROCK CREEK AERATION BASIN #8 $0 $0 $0 $0 $0 $0 $0 $0 $0
ROCK CREEK AERATION BASIN #9 $0 $0 $0 $0 $0 $0 $0 $0 $0
ROCK CREEK CHEM ICAL BUILDING
LABRATORY
$0 $0 $0 $500,000 $0 $0 $0 $0 $500,000
ROCK CREEK CHLORINE CONTACT BASIN #4 $0 $0 $0 $100,000 $0 $700,000 $3,450,000 $3,250,000 $7,500,000
ROCK CREEK ENGINEERING BUILDING $0 $0 $0 $0 $0 $0 $0 $0 $0
ROCK CREEK FILTER IM PROVEM ENTS $0 $350,000 $25,000 $375,000 $0 $0 $0 $0 $375,000
ROCK CREEK IPS ODOR CONTROL
IM PROVEM ENTS
$0 $0 $0 $0 $0 $1,000,000 $0 $0 $1,000,000
ROCK CREEK PRIM ARY CLARIFIER #4 $0 $0 $0 $100,000 $1,480,000 $5,250,000 $0 $0 $6,830,000
ROCK CREEK RECYCLED WATER
IM PROVEM ENTS
$0 $0 $0 $0 $0 $200,000 $3,050,000 $0 $3,250,000
ROCK CREEK SITE & ROADWAY
IM PROVEM ENTS
$0 $0 $0 $0 $625,000 $1,970,000 $0 $0 $2,595,000
ROCK CREEK SOLIDS ENHANCED DIGESTION $0 $0 $0 $0 $0 $0 $0 $500,000 $500,000
ROCK CREEK SOLIDS EXPANSION $0 $0 $0 $0 $0 $0 $0 $0 $0
6372 ROCK CREEK M ISCELLANEOUS UPGRADES $318,592 $300,000 $250,000 $200,000 $300,000 $325,000 $325,000 $325,000 $1,475,000
6639 ROCK CREEK ADM INISTRATION BUILDING
IM PROVEM ENTS
$239,062 $900,000 $125,000 $525,000 $4,925,000 $0 $0 $0 $5,450,000
6852 ROCK CREEK DIGESTER #3 & #4 COVER
REPLACEM ENT
$13,606 $1,050,000 $10,000 $375,000 $1,550,000 $0 $0 $0 $1,925,000
6867 ROCK CREEK RESILIENCY PLAN $77,361 $80,000 $50,000 $50,000 $0 $0 $0 $0 $50,000
6870 ROCK CREEK EAST TERTIARY
HYPOCHLORITE IM PROVEM ENTS
$0 $275,000 $200,000 $575,000 $0 $0 $0 $0 $575,000
6879 ROCK CREEK GBT IM PROVEM ENTS $57,100 $1,300,000 $150,000 $1,325,000 $0 $0 $0 $0 $1,325,000
6894 ROCK CREEK SOLIDS DEWATERING $0 $500,000 $180,000 $1,850,000 $6,150,000 $650,000 $0 $0 $8,650,000
6937 ROCK CREEK SRF pH REDUCTION SYSTEM $0 $50,000 $150,000 $25,000 $0 $0 $0 $0 $25,000
$705,721 $4,805,000 $1,140,000 $6,000,000 $15,030,000 $10,095,000 $6,825,000 $4,075,000 $42,025,000
$25,611,912 $61,419,600 $44,279,691 $118,215,300 $99,249,900 $88,891,000 $114,912,000 $105,495,000 $526,763,200
Home Portfolio
WWT D - R o ck C reek
A ctive P ro jects

Clean Water Services FY 2018-19 Adopted Budget Page 206
FY 2017
Actual
FY 2018
Budget
FY 2018
Revised
FY 2019
Projected
FY 2020
Projected
FY 2021
Projected
FY 2022
Projected
FY 2023
Projected
FY 2019-2023
Projected
6654 SW 185TH AND PHEASANT SANITARY SEWER
REHAB
$0 $0 $0 $0 $0 $0 $0 $0 $0
6685 86TH & COPELAND SANITARY SEWER REHAB $28,160 $0 $0 $0 $0 $0 $0 $0 $0
6765 FOREST GROVE 23RD/GALES WAY I/I
ABATEM ENT
$0 $0 $0 $0 $0 $0 $0 $0 $0
6766 BANKS I/I ABATEM ENT $367 $0 $0 $0 $0 $0 $0 $0 $0
6778 LARGE TRUNKLINE M ANHOLE REHAB $343,655 $0 $20,000 $0 $0 $0 $0 $0 $0
6795 UPPER TURNER CREEK REHAB $27,718 $355,000 $0 $0 $0 $0 $0 $0 $0
6818 PACIFIC UNIVERSITY I/I $0 $0 $0 $0 $0 $0 $0 $0 $0
6821 WILLOW CREEK AT HARTUNG FARM $31,887 $3,000 $3,000 $0 $0 $0 $0 $0 $0
6831 CEDAR HILLS REHABILITATION $1,027,055 $0 $0 $0 $0 $0 $0 $0 $0
6877 GARDEN HOM E SEWER REHABILITATION $0 $230,000 $730,000 $0 $0 $0 $0 $0 $0
6889 CASCADIA REHAB $113,458 $0 $0 $0 $0 $0 $0 $0 $0
6899 CEDAR HILLS REHABILITATION PHASE 2 $6,434 $1,050,000 $700,000 $0 $0 $0 $0 $0 $0
$1,578,734 $1,638,000 $1,453,000 $0 $0 $0 $0 $0 $0
KING CITY AND COOK PARK SIPHON
IM PROVEM ENTS
$0 $460,000 $0 $0 $0 $0 $0 $0 $0
6369 SPRINGVILLE TRUNK SEWER UPSIZE $0 $0 $0 $0 $0 $0 $0 $0 $0
6496 DERRY DELL - SANI $0 $0 $0 $0 $0 $0 $0 $0 $0
6581 STEED CREEK SEWER UPSIZE $1,414,598 $0 $0 $0 $0 $0 $0 $0 $0
6648 SCHOLLS FERRY SEWER EXTENSION $0 $0 $0 $0 $0 $0 $0 $0 $0
6693 SOUTH COOPER M T GRAVITY TRUNK TO
RIVER TERRACE PS
$289,689 $0 $0 $0 $0 $0 $0 $0 $0
6762 NORTH HILLSBORO INDUSTRIAL GRAVITY
SEWER @ GENENTECH
$1,108 $0 $0 $0 $0 $0 $0 $0 $0
6764 REAL TIM E FLOW M ONITORING INTERFACE &
CONTROL
$671 $20,000 $0 $0 $0 $0 $0 $0 $0
6784 165th & RIGERT SEWER REPLACEM ENT $5,934 $0 $0 $0 $0 $0 $0 $0 $0
6791 BARROWS ROAD SANITARY SEWER UPSIZE $0 $0 $0 $0 $0 $0 $0 $0 $0
6794 N BETHANY TRUNK SEWER EXTENSION
PHASE 2
$2,671,868 $1,185,000 $1,075,000 $0 $0 $0 $0 $0 $0
6817 N BETHANY SEWER - SW EXTENSION $83,758 $325,000 $430,500 $0 $0 $0 $0 $0 $0
Home Portfolio
C lo sed P ro jects
C o nveyance - Engr - R ehabilitat io n
C o nveyance - Engr - Sanitary C o llect io n System

Clean Water Services FY 2018-19 Adopted Budget Page 207
FY 2017
Actual
FY 2018
Budget
FY 2018
Revised
FY 2019
Projected
FY 2020
Projected
FY 2021
Projected
FY 2022
Projected
FY 2023
Projected
FY 2019-2023
Projected
6820 EAST TIGARD SEWER REPLACEM ENT $0 $942,000 $1,741,600 $0 $0 $0 $0 $0 $0
6861 TURNER CREEK TRUNK DIVERSION $32,397 $105,000 $71,571 $0 $0 $0 $0 $0 $0
$4,500,023 $3,037,000 $3,318,671 $0 $0 $0 $0 $0 $0
6627 M ATERIAL PROCESSING YARD
IM PROVEM ENTS
$2,598,678 $140,000 $709,000 $0 $0 $0 $0 $0 $0
6677 FIELD OPS SECURITY UPGRADE $0 $0 $0 $0 $0 $0 $0 $0 $0
6862 CHERRY LANE FACILITY IM PROVEM ENTS $49,441 $0 $0 $0 $0 $0 $0 $0 $0
6891 LUCITY SOFTWARE ENHANCEM ENT $40,875 $0 $500 $0 $0 $0 $0 $0 $0
$2,688,994 $140,000 $709,500 $0 $0 $0 $0 $0 $0
6858 CORNELIUS PUM P STATION DISCHARGE
LOCATION SEWER REPLACEM ENT
$279,864 $0 $140,000 $0 $0 $0 $0 $0 $0
$279,864 $0 $140,000 $0 $0 $0 $0 $0 $0
6857 195th AND BASELINE SEWER REALIGNM ENT $89,416 $0 $0 $0 $0 $0 $0 $0 $0
$89,416 $0 $0 $0 $0 $0 $0 $0 $0
ABC WQL REPLACE FUM E HOOD DUCTING $0 $200,000 $0 $0 $0 $0 $0 $0 $0
$0 $200,000 $0 $0 $0 $0 $0 $0 $0
6790 ABC HVAC M ANAGEM ENT SYSTEM
UPGRADE OR REPLACEM ENT
$0 $0 $0 $0 $0 $0 $0 $0 $0
6790 ABC HVAC SYSTEM LIFE-CYCLE COSTS $0 $0 $0 $0 $0 $0 $0 $0 $0
$0 $0 $0 $0 $0 $0 $0 $0 $0
6782 PACS 2000 REPLACEM ENT $0 $0 $0 $0 $0 $0 $0 $0 $0
6873 BUDGET AND FORECASTING SOFTWARE $60,550 $50,000 $50,000 $0 $0 $0 $0 $0 $0
6886 ORACLE DISCOVERER REPLACEM ENT $71,100 $0 $0 $0 $0 $0 $0 $0 $0
$131,650 $50,000 $50,000 $0 $0 $0 $0 $0 $0
Home Portfolio
C o nveyance - F ield Ops - F ield Operat io ns
C o nveyance - F ield Ops - R ehabilitat io n
C o nveyance - F ield Ops - Sanitary C o llect io n System
Labo rato ry - A B C and F O F acilit ies P ro jects
Off ice o f GM - IT - A B C and F O F acilit ies P ro jects
Off ice o f GM - IT - B usiness A pplicat io ns

Clean Water Services FY 2018-19 Adopted Budget Page 208
FY 2017
Actual
FY 2018
Budget
FY 2018
Revised
FY 2019
Projected
FY 2020
Projected
FY 2021
Projected
FY 2022
Projected
FY 2023
Projected
FY 2019-2023
Projected
6562 SHOREBIRD SWALE M ITIGATION WETLANDS $2,922 $25,000 $20,000 $0 $0 $0 $0 $0 $0
6611 STREAM OPERATIONS CENTER RELOCATION $97,910 $90,000 $90,000 $0 $0 $0 $0 $0 $0
$100,832 $115,000 $110,000 $0 $0 $0 $0 $0 $0
6401 TUALATIN BASIN WATER SUPPLY PROJECT $1,870 $0 $0 $0 $0 $0 $0 $0 $0
6435 FLOW RESTORATION IM PROVEM ENTS $60,849 $0 $0 $0 $0 $0 $0 $0 $0
$62,719 $0 $0 $0 $0 $0 $0 $0 $0
NATURAL SYSTEM IM PROVEM ENTS - SANI $0 $350,000 $0 $0 $0 $0 $0 $0 $0
6409 GALES CREEK HALF M ILE LANE $41,445 $25,000 $25,000 $0 $0 $0 $0 $0 $0
$41,445 $375,000 $25,000 $0 $0 $0 $0 $0 $0
6471 DURHAM PHASE 5D - New Cogen Facility $186,991 $0 $0 $0 $0 $0 $0 $0 $0
6491 DURHAM PHASE 5B2 - HES/PC Piping
Work/Primary OC/CEPT/ M isc Solids
$374,432 $0 $0 $0 $0 $0 $0 $0 $0
6638 DURHAM INSTRUM ENTATION AND TESTING
FOR 2013 AWT
$1,718 $0 $0 $0 $0 $0 $0 $0 $0
6755 DURHAM SOLIDS BUILDING ODOR CONTROL
M ODIFICATIONS- Phase 2
$1,974,312 $0 $0 $0 $0 $0 $0 $0 $0
6788 DURHAM PHASE 5A2 - TPS Building Rehab $213,024 $890,000 $2,555,000 $0 $0 $0 $0 $0 $0
6813 OSTARA M ISC PROJECTS $0 $0 $0 $0 $0 $0 $0 $0 $0
6823 DURHAM HYPO LOOP REPLACEM ENT/DAY
TANKS
$53,595 $630,000 $1,813,000 $0 $0 $0 $0 $0 $0
6846 DURHAM THICKENING CENTRIFUGE(S) TWAS
DIVERSION
$26,616 $375,000 $100,000 $0 $0 $0 $0 $0 $0
6859 DURHAM OUTFALL D REPAIR $106,721 $120,000 $85,000 $0 $0 $0 $0 $0 $0
6868 DURHAM SECONDARY CLARIFIER #3 FLOOR
SLAB & M ECHANISM REPLACEM ENT
$193,151 $0 $0 $0 $0 $0 $0 $0 $0
6885 DURHAM PE COLLECTION STRUCTURE
REPAIR
$53,864 $500,000 $599,983 $0 $0 $0 $0 $0 $0
6900 DURHAM STRUVITE PREVENTION PROJECT $0 $300,000 $188,000 $0 $0 $0 $0 $0 $0
6907 DURHAM EFFLUENT SAM PLER RELOCATION $0 $275,000 $336,000 $0 $0 $0 $0 $0 $0
6921 DURHAM VFA DELIVERY SYSTEM
IM PROVEM ENTS
$0 $450,000 $270,500 $0 $0 $0 $0 $0 $0
$3,184,424 $3,540,000 $5,947,483 $0 $0 $0 $0 $0 $0
Home Portfolio
Watershed M gmt - C WS P ro perty Impro vements
Watershed M gmt - F lo w R esto rat io n and R euse
Watershed M gmt - Watershed Enhancement
WWT D - D urham
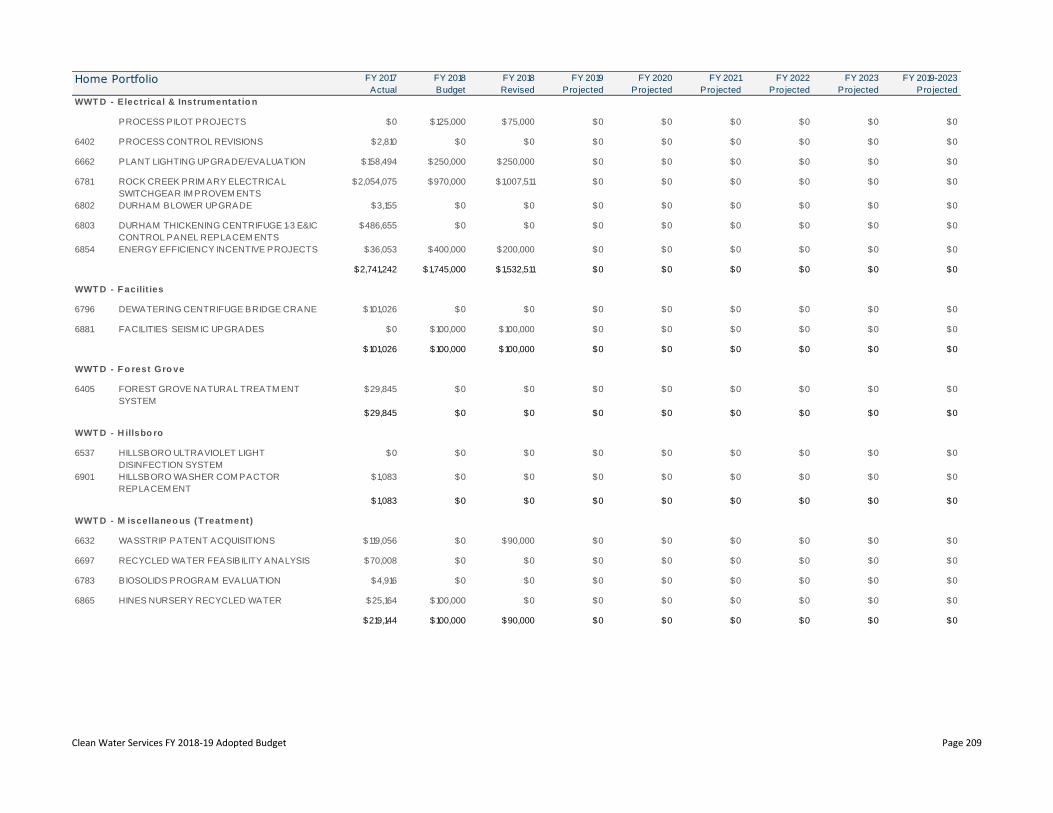
Clean Water Services FY 2018-19 Adopted Budget Page 209
FY 2017
Actual
FY 2018
Budget
FY 2018
Revised
FY 2019
Projected
FY 2020
Projected
FY 2021
Projected
FY 2022
Projected
FY 2023
Projected
FY 2019-2023
Projected
PROCESS PILOT PROJECTS $0 $125,000 $75,000 $0 $0 $0 $0 $0 $0
6402 PROCESS CONTROL REVISIONS $2,810 $0 $0 $0 $0 $0 $0 $0 $0
6662 PLANT LIGHTING UPGRADE/EVALUATION $158,494 $250,000 $250,000 $0 $0 $0 $0 $0 $0
6781 ROCK CREEK PRIM ARY ELECTRICAL
SWITCHGEAR IM PROVEM ENTS
$2,054,075 $970,000 $1,007,511 $0 $0 $0 $0 $0 $0
6802 DURHAM BLOWER UPGRADE $3,155 $0 $0 $0 $0 $0 $0 $0 $0
6803 DURHAM THICKENING CENTRIFUGE 1-3 E&IC
CONTROL PANEL REPLACEM ENTS
$486,655 $0 $0 $0 $0 $0 $0 $0 $0
6854 ENERGY EFFICIENCY INCENTIVE PROJECTS $36,053 $400,000 $200,000 $0 $0 $0 $0 $0 $0
$2,741,242 $1,745,000 $1,532,511 $0 $0 $0 $0 $0 $0
6796 DEWATERING CENTRIFUGE BRIDGE CRANE $101,026 $0 $0 $0 $0 $0 $0 $0 $0
6881 FACILITIES SEISM IC UPGRADES $0 $100,000 $100,000 $0 $0 $0 $0 $0 $0
$101,026 $100,000 $100,000 $0 $0 $0 $0 $0 $0
6405 FOREST GROVE NATURAL TREATM ENT
SYSTEM
$29,845 $0 $0 $0 $0 $0 $0 $0 $0
$29,845 $0 $0 $0 $0 $0 $0 $0 $0
6537 HILLSBORO ULTRAVIOLET LIGHT
DISINFECTION SYSTEM
$0 $0 $0 $0 $0 $0 $0 $0 $0
6901 HILLSBORO WASHER COM PACTOR
REPLACEM ENT
$1,083 $0 $0 $0 $0 $0 $0 $0 $0
$1,083 $0 $0 $0 $0 $0 $0 $0 $0
6632 WASSTRIP PATENT ACQUISITIONS $119,056 $0 $90,000 $0 $0 $0 $0 $0 $0
6697 RECYCLED WATER FEASIBILITY ANALYSIS $70,008 $0 $0 $0 $0 $0 $0 $0 $0
6783 BIOSOLIDS PROGRAM EVALUATION $4,916 $0 $0 $0 $0 $0 $0 $0 $0
6865 HINES NURSERY RECYCLED WATER $25,164 $100,000 $0 $0 $0 $0 $0 $0 $0
$219,144 $100,000 $90,000 $0 $0 $0 $0 $0 $0
Home Portfolio
WWT D - Electrical & Instrumentat io n
WWT D - F acilit ies
WWT D - F o rest Gro ve
WWT D - H illsbo ro
WWT D - M iscellaneo us (T reatment)

Clean Water Services FY 2018-19 Adopted Budget Page 210
FY 2017
Actual
FY 2018
Budget
FY 2018
Revised
FY 2019
Projected
FY 2020
Projected
FY 2021
Projected
FY 2022
Projected
FY 2023
Projected
FY 2019-2023
Projected
6594 DAIRY CREEK PUM P STATION $0 $0 $0 $0 $0 $0 $0 $0 $0
6631 RIVER TERRACE PUM P STATION &
FORCEM AIN
$1,125,747 $2,000 $0 $0 $0 $0 $0 $0 $0
6635 ROCK CREEK RANCH #3 PUM P STATION $0 $0 $0 $0 $0 $0 $0 $0 $0
6637 FORCEM AIN M ISCELLANEOUS UPGRADES $36,285 $150,000 $100,000 $0 $0 $0 $0 $0 $0
6756 GASTON FORCEM AIN REPLACEM ENT $1,253,897 $2,000 $0 $0 $0 $0 $0 $0 $0
6772 BEAVERTON PUM P STATION & FORCE M AIN $84,491 $2,000 $0 $0 $0 $0 $0 $0 $0
6773 BANKS & OAK VILLAGE PUM P STATION
UPGRADE
$8,379 $0 $0 $0 $0 $0 $0 $0 $0
6774 BULL M OUNTAIN PUM P STATION UPGRADE $7,095 $0 $0 $0 $0 $0 $0 $0 $0
6797 BANKS OAK VILLAGE FORCEM AIN
RELOCATION
$104,296 $0 $0 $0 $0 $0 $0 $0 $0
6825 DAWSON CREEK PUM P STATION & GRAVITY
SYSTEM CAPACITY ALTERNATIVES
$240,490 $600,000 $1,000,000 $0 $0 $0 $0 $0 $0
$2,860,680 $756,000 $1,100,000 $0 $0 $0 $0 $0 $0
DURHAM CLARIFIER RECOATING $0 $155,000 $0 $0 $0 $0 $0 $0 $0
ROCK CREEK COATINGS REPLACEM ENT
PROJECTS
$0 $210,000 $0 $0 $0 $0 $0 $0 $0
6091 DIFFUSER REPLACEM ENT $14,775 $0 $0 $0 $0 $0 $0 $0 $0
6131 ROOF REPLACEM ENT $30,092 $200,000 $200,000 $0 $0 $0 $0 $0 $0
6655 M ECHANICAL EQUIPM ENT REPLACEM ENT $37,222 $0 $0 $0 $0 $0 $0 $0 $0
6663 PUM P VFD REPLACEM ENTS $294,682 $0 $0 $0 $0 $0 $0 $0 $0
6664 ELECTRICAL EQUIPM ENT UPGRADE $113,662 $0 $5,795 $0 $0 $0 $0 $0 $0
6836 PUM P VFD REPLACEM ENT/RENEWAL $147,214 $250,000 $250,000 $0 $0 $0 $0 $0 $0
6848 ELECTRICAL EQUIPM ENT M ISC UPGRADES $26,550 $200,000 $200,000 $0 $0 $0 $0 $0 $0
6926 DIFFUSER REPLACEM ENTS $0 $50,000 $50,000 $0 $0 $0 $0 $0 $0
6932 VALVE/GATE & ACTUATORS REPLACEM ENT $0 $250,000 $150,000 $0 $0 $0 $0 $0 $0
$664,197 $1,315,000 $855,795 $0 $0 $0 $0 $0 $0
ROCK CREEK FRONTAGE LANDSCAPE
IM PROVEM ENTS
$0 $85,000 $0 $0 $0 $0 $0 $0 $0
6432 ROCK CREEK IPS WETWELL IM PROVEM ENTS $2,590,600 $0 $0 $0 $0 $0 $0 $0 $0
Home Portfolio
WWT D - P ump Stat io ns (T reatment)
WWT D - R eplacement and R enewal
WWT D - R o ck C reek

Clean Water Services FY 2018-19 Adopted Budget Page 211
FY 2017
Actual
FY 2018
Budget
FY 2018
Revised
FY 2019
Projected
FY 2020
Projected
FY 2021
Projected
FY 2022
Projected
FY 2023
Projected
FY 2019-2023
Projected
6433 ROCK CREEK TERTIARY TREATM ENT $0 $0 $0 $0 $0 $0 $0 $0 $0
6519 WEST BASIN FACILITIES PLAN $0 $0 $0 $0 $0 $0 $0 $0 $0
6593 ROCK CREEK BIOSOLIDS SILOS $2,454 $0 $0 $0 $0 $0 $0 $0 $0
6602 ROCK CREEK HEADWORKS VALVES
REPLACEM ENT
$0 $0 $0 $0 $0 $0 $0 $0 $0
6606 ROCK CREEK DEWATERING CENTRIFUGE
ROTATING ASSEM BLY
$0 $0 $0 $0 $0 $0 $0 $0 $0
6629 ROCK CREEK GRAVITY THICKNERS $23,919 $0 $0 $0 $0 $0 $0 $0 $0
6686 ROCK CREEK DIGESTER GAS UTILIZATION $0 $0 $0 $0 $0 $0 $0 $0 $0
6694 ROCK CREEK HEADWORKS SCREENING
IM PROVEM ENTS
$365,526 $0 $0 $0 $0 $0 $0 $0 $0
6696 ROCK CREEK RECYCLED WATER SYSTEM
IM PROVEM ENTS
$1,135 $0 $0 $0 $0 $0 $0 $0 $0
6754 ROCK CREEK WEST SECONDARY CLARIFIERS
IM PROVEM ENTS
$2,361,037 $25,000 $1,638,900 $0 $0 $0 $0 $0 $0
6787 ROCK CREEK DIGESTER 1 & 2 IM PROVEM ENTS $1,997,402 $70,000 $315,000 $0 $0 $0 $0 $0 $0
6829 ROCK CREEK AERATION BASIN #3 WEST
SELECTOR
$50,906 $0 $7,200 $0 $0 $0 $0 $0 $0
$7,392,979 $180,000 $1,961,100 $0 $0 $0 $0 $0 $0
$26,668,297 $13,291,000 $17,393,060 $0 $0 $0 $0 $0 $0
$52,280,209 $74,710,600 $61,672,751 $118,215,300 $99,249,900 $88,891,000 $114,912,000 $105,495,000 $526,763,200
Conveyance $48,258,400 $23,833,900 $10,970,000 $7,735,000 $7,600,000 $98,397,300
Fleet $1,112,000 $0 $0 $0 $0 $1,112,000
Support $4,568,900 $3,390,000 $990,000 $790,000 $790,000 $10,528,900
Wastewater $47,621,000 $53,681,000 $43,281,000 $35,747,000 $41,225,000 $221,555,000
Watershed $16,655,000 $18,345,000 $33,650,000 $70,640,000 $55,880,000 $195,170,000
TOTAL $118,215,300 $99,249,900 $88,891,000 $114,912,000 $105,495,000 $526,763,200
Home Portfolio
C lo sed P ro jects
A ll P ro jects

Clean Water Services FY 2018-19 Adopted Budget Page 212
Surface Water Capital Project List FY 2017
Actual
FY 2018
Budget
FY 2018
Revised
FY 2019
Projected
FY 2020
Projected
FY 2021
Projected
FY 2022
Projected
FY 2023
Projected
FY 2019-2023
Projected
SWM LID $0 $25,000 $0 $25,000 $25,000 $25,000 $25,000 $25,000 $125,000
$0 $25,000 $0 $25,000 $25,000 $25,000 $25,000 $25,000 $125,000
6838 SWM LIGHT VEHICLE REPLACEM ENT $71,780 $0 $0 $0 $0 $0 $0 $0 $0
$71,780 $0 $0 $0 $0 $0 $0 $0 $0
103RD TO 106TH AVE STORM IM PROVEM ENTS $0 $0 $0 $0 $0 $0 $0 $0 $0
165TH & FLORENCE STORM IM PROVEM ENT $0 $0 $0 $0 $0 $0 $0 $0 $0
176TH & BRITETREE CIR STORM
IM PROVEM ENT
$0 $0 $0 $100,000 $0 $0 $0 $0 $100,000
177TH & VINCENT STORM IM PROVEM ENT $0 $0 $0 $50,000 $110,000 $250,000 $0 $0 $410,000
192ND & BLAINE TER. STORM IM PROVEM ENT $0 $0 $0 $0 $0 $0 $0 $0 $0
195th AND FARM INGTON STREAM
ENHANCEM ENT
$0 $0 $0 $0 $0 $0 $0 $0 $0
209TH & ALEXANDER STORM IM PROVEM ENT $0 $0 $0 $25,000 $100,000 $100,000 $0 $0 $225,000
209TH & BLANTON $0 $0 $0 $0 $0 $0 $0 $0 $0
77TH (BH HWY TO BROADM OOR TERR)
STORM IM P
$0 $0 $0 $0 $0 $0 $0 $0 $0
ABBEY CREEK EAST TRIB SWM
APPROACHES
$0 $50,000 $5,000 $0 $0 $0 $0 $0 $0
ABBEY CREEK WEST TRIB REACH A $0 $270,000 $5,000 $50,000 $475,000 $0 $0 $0 $525,000
ABBEY CREEK WEST TRIB REACH C $0 $720,000 $60,000 $750,000 $0 $0 $0 $0 $750,000
BUTTERNUT CK ENHANCEM ENT AT BALES
POND
$0 $0 $0 $0 $0 $0 $0 $0 $0
CEDAR HILLS BLVD STORM IM PROVEM ENT $0 $0 $0 $0 $0 $0 $0 $0 $0
EDGEM OOR & JENKINS WQF $0 $0 $0 $0 $0 $0 $0 $0 $0
FARM INGTON ROAD & 204TH $0 $0 $0 $0 $0 $0 $0 $0 $0
HOM EWOOD (LAURELWOOD TO 88TH) $0 $0 $0 $0 $0 $0 $0 $0 $0
JAM IESON ROAD STORM WATER
IM PROVEM ENTS
$0 $0 $0 $0 $0 $0 $0 $0 $0
C o nveyance - Engr - LID
C o nveyance - Engr - R eplacement and R enewal (F leet)
C o nveyance - Engr - Sto rmwater C o nveyance System
Home Portfolio
A ctive P ro jects

Clean Water Services FY 2018-19 Adopted Budget Page 213
FY 2017
Actual
FY 2018
Budget
FY 2018
Revised
FY 2019
Projected
FY 2020
Projected
FY 2021
Projected
FY 2022
Projected
FY 2023
Projected
FY 2019-2023
Projected
JAY ST & BURLINGTON/BOWERM AN DR WQF
RETROFIT
$0 $0 $0 $0 $0 $0 $0 $0 $0
LAIDLAW CULVERT $0 $0 $0 $0 $0 $0 $0 $0 $0
LANDAU & 85TH STORM IM PROVEM ENT $0 $0 $0 $0 $0 $0 $0 $0 $0
LANEWOOD ST & SW DELM ONT AVE WQF
RETROFIT
$0 $0 $0 $0 $0 $0 $0 $0 $0
M AUI & 90TH STORM IM PROVEM ENT $0 $0 $0 $0 $0 $0 $0 $0 $0
PILOT STORM WATER RECHARGE PROJECT $0 $200,000 $25,000 $275,000 $325,000 $200,000 $200,000 $0 $1,000,000
QUEEN M ARY AVE STORM IM PROVEM ENT $0 $0 $0 $0 $0 $0 $0 $0 $0
ROSA ROAD AND 185TH STORM IM P $0 $0 $0 $0 $0 $0 $0 $0 $0
SCIENCE PARK DRIVE WQF $0 $0 $0 $0 $0 $0 $0 $0 $0
SKYHAR DRIVE STORM IM PROVEM ENTS $0 $0 $0 $0 $0 $0 $0 $0 $0
STORM IM PROVEM ENTS ON BRENTWOOD
ST, 78TH AVE, LAUREL ST & LAURELWOOD AVE
$0 $0 $0 $0 $0 $0 $0 $0 $0
STORM WATER BASIN M ASTER PLANS $0 $100,000 $5,000 $50,000 $50,000 $100,000 $100,000 $100,000 $400,000
SUBBASIN STRATEGY DEVELOPM ENT $0 $0 $0 $250,000 $0 $0 $0 $0 $250,000
SW DANA CT NEAR 213TH $0 $0 $0 $0 $0 $0 $0 $0 $0
SW PARKVIEW AVE TO M IDEA LANE $0 $0 $0 $0 $0 $0 $0 $0 $0
SW PARRWAY DR $0 $0 $0 $0 $0 $0 $0 $0 $0
YORK AND 192ND $0 $0 $0 $0 $0 $0 $0 $0 $0
4945 SWM SM ALL WORKS / STORM M ASTER
PROJECT
$99,565 $75,000 $75,000 $100,000 $100,000 $100,000 $100,000 $100,000 $500,000
6190 DISTRICT SHARE OF DEVELOPM ENT
PROJECTS
$94,904 $150,000 $170,000 $25,000 $25,000 $25,000 $25,000 $25,000 $125,000
6237 STORM WATER OUTFALL RETROFIT
PROGRAM
$5,420 $15,000 $55,000 $55,000 $400,000 $400,000 $400,000 $400,000 $1,655,000
6346 STORM SEWER DRAINAGE PROJECTS $748 $25,000 $25,000 $225,000 $25,000 $25,000 $25,000 $25,000 $325,000
6378 N BETHANY STORM WATER PROJECTS $114,085 $75,000 $75,000 $1,250,000 $2,000,000 $2,000,000 $2,000,000 $2,000,000 $9,250,000
6443 M CKAY CREEK DRAINAGE M ASTER PLAN $0 $0 $0 $0 $0 $0 $0 $0 $0
6704 SOUTH ANDERSON SWM $0 $0 $0 $0 $0 $0 $0 $0 $0
6705 TUALATIN RIVER URBAN STORM WATER TOOL
CALIBRATION
$3,530 $0 $0 $0 $0 $0 $0 $0 $0
6706 WEST BETHANY CREEK ENHANCEM ENT $36,895 $75,000 $85,000 $150,000 $50,000 $0 $0 $0 $200,000
6707 ABBEY CREEK WEST TRIB BASIN 4 $24,710 $12,500 $12,500 $25,000 $125,000 $0 $0 $0 $150,000
Home Portfolio

Clean Water Services FY 2018-19 Adopted Budget Page 214
FY 2017
Actual
FY 2018
Budget
FY 2018
Revised
FY 2019
Projected
FY 2020
Projected
FY 2021
Projected
FY 2022
Projected
FY 2023
Projected
FY 2019-2023
Projected
JAY ST & BURLINGTON/BOWERM AN DR WQF
RETROFIT
$0 $0 $0 $0 $0 $0 $0 $0 $0
LAIDLAW CULVERT $0 $0 $0 $0 $0 $0 $0 $0 $0
6806 STORM WATER CONV REAL TIM E CONTROL $45,108 $100,000 $25,000 $25,000 $100,000 $100,000 $100,000 $100,000 $425,000
6807 TUALATIN-SHERWOOD RD WQF RETROFIT $0 $0 $0 $0 $0 $0 $0 $0 $0
6808 196TH AND BLANTON CONVEYANCE
PROJECT
$4,518 $15,000 $20,000 $75,000 $0 $0 $0 $0 $75,000
6833 WASHINGTON DRIVE (BIRCH TO CASE COURT) $39,431 $280,000 $585,000 $100,000 $0 $0 $0 $0 $100,000
6869 SOUTHWOOD PARK GREEN STREET STORM
IM PROVEM ENT
$26,083 $350,000 $25,000 $80,000 $350,000 $0 $0 $0 $430,000
6898 RYAN STREET WQF SLOPE STABILIZATION $0 $200,000 $241,100 $2,000 $0 $0 $0 $0 $2,000
6910 BUTTERNUT CK ENHANCEM ENT AT WITZIG
RESERVOIR
$0 $40,000 $10,000 $10,000 $10,000 $160,000 $110,000 $0 $290,000
6911 ABBEY CREEK WEST- REACH C - RTC
PROJECT
$0 $90,000 $60,000 $30,000 $0 $0 $0 $0 $30,000
6913 CEDAR M ILL/N JOHNSON PROJECT
PLANNING
$0 $25,000 $200,000 $220,000 $25,000 $25,000 $25,000 $25,000 $320,000
6929 STORM WATER TOXICITY SOIL M IX ANALYSIS $0 $0 $130,000 $25,000 $0 $0 $0 $0 $25,000
6938 KING CITY 131ST AVE SWM TRUNK (FISHER-
DICKSON)
$0 $0 $300,000 $750,000 $0 $0 $0 $0 $750,000
$494,997 $2,867,500 $2,193,600 $4,697,000 $4,270,000 $3,485,000 $3,085,000 $2,775,000 $18,312,000
ABBEY CREEK WEST TRIB REACH D $0 $20,000 $0 $220,000 $0 $0 $0 $0 $220,000
$0 $20,000 $0 $220,000 $0 $0 $0 $0 $220,000
ARBOR LAKES DECANT VAULT SITE
IM PROVEM ENT
$0 $0 $0 $90,000 $15,000 $0 $0 $0 $105,000
6799 STORM CM P CONVEYANCE REHAB $119,885 $75,000 $75,000 $100,000 $100,000 $100,000 $100,000 $100,000 $500,000
$119,885 $75,000 $75,000 $190,000 $115,000 $100,000 $100,000 $100,000 $605,000
6222 SWM PASSENGER VEHICLE/ LIGHT TRUCK $0 $0 $0 $0 $0 $0 $0 $0 $0
6304 SWM HEAVY TRUCKS/EQUIPM ENT $0 $60,000 $60,000 $75,000 $0 $0 $0 $0 $75,000
$0 $60,000 $60,000 $75,000 $0 $0 $0 $0 $75,000
6839 SWM HEAVY VEHICLE REPLACEM ENT $255,308 $0 $0 $0 $0 $0 $0 $0 $0
$255,308 $0 $0 $0 $0 $0 $0 $0 $0
C o nveyance - F ield Ops - F leet
C o nveyance - F ield Ops - R eplacement and R enewal (F leet)
C o nveyance - Engr - Watershed Enhancement
C o nveyance - F ield Ops - F ield Operat io ns
Home Portfolio

Clean Water Services FY 2018-19 Adopted Budget Page 215
FY 2017
Actual
FY 2018
Budget
FY 2018
Revised
FY 2019
Projected
FY 2020
Projected
FY 2021
Projected
FY 2022
Projected
FY 2023
Projected
FY 2019-2023
Projected
6912 BUTTERNUT PARK STREAM ENHANCEM ENT $0 $25,000 $35,000 $20,000 $0 $0 $0 $0 $20,000
$0 $25,000 $35,000 $20,000 $0 $0 $0 $0 $20,000
WATERSHED VISUALIZATION & ASSESSM ENT
TOOLS
$0 $0 $0 $200,000 $0 $0 $0 $0 $200,000
$0 $0 $0 $200,000 $0 $0 $0 $0 $200,000
4944 WETLAND M ITIGATION M ONITORING (SWM ) $28,710 $85,000 $50,000 $60,000 $20,000 $20,000 $15,000 $10,000 $125,000
6522 PAYM ENT TO PROVIDE PROJECTS $10,150 $50,000 $20,000 $50,000 $50,000 $50,000 $50,000 $50,000 $250,000
6566 ROCK CREEK FLOODPLAIN M ITIGATION $352,827 $380,000 $370,000 $220,000 $160,000 $90,000 $0 $0 $470,000
6800 SPRINGVILLE PAYM ENT TO PROVIDE $284 $7,500 $40,000 $25,000 $25,000 $0 $0 $0 $50,000
6927 VEGETATED CORRIDOR ENHANCEM ENT $0 $0 $0 $50,000 $0 $0 $0 $0 $50,000
$391,971 $522,500 $480,000 $405,000 $255,000 $160,000 $65,000 $60,000 $945,000
$1,333,941 $3,595,000 $2,843,600 $5,832,000 $4,665,000 $3,770,000 $3,275,000 $2,960,000 $20,502,000
6798 SW 107TH SWM IM PROVEM ENTS LID $0 $0 $0 $0 $0 $0 $0 $0 $0
$0 $0 $0 $0 $0 $0 $0 $0 $0
6363 BROOKSIDE CULVERT REPLACEM ENT $19,602 $0 $0 $0 $0 $0 $0 $0 $0
6445 FANNO CREEK DRAINAGE BASIN M ASTER
PLAN
$0 $0 $0 $0 $0 $0 $0 $0 $0
6524 BAUM AN PAYM ENT TO PROVIDE $0 $5,000 $5,000 $0 $0 $0 $0 $0 $0
6588 HWY 99W M EDIAN WQF $175 $0 $0 $0 $0 $0 $0 $0 $0
6619 HIGHWAY 47 M ARTIN RD PAYM ENT TO
PROVIDE
$697 $0 $1,000 $0 $0 $0 $0 $0 $0
6630 170th AT FARM INGTON WQF $23,456 $270,000 $5,000 $0 $0 $0 $0 $0 $0
6643 SWM FACILITIES RETROFIT FOR
HYDROM ODIFICATION
$0 $0 $0 $0 $0 $0 $0 $0 $0
6680 HILLSBORO DAVIS RD PAYM ENT TO PROVIDE $6,745 $7,500 $0 $0 $0 $0 $0 $0 $0
A ctive P ro jects
C lo sed P ro jects
C o nveyance - Engr - LID
C o nveyance - Engr - Sto rmwater C o nveyance System
C o nveyance - F ield Ops - Sto rmwater C o nveyance System
R egulato ry - A dmin - R egulato ry A ffairs
Watershed M gmt - Watershed Enhancement
Home Portfolio

Clean Water Services FY 2018-19 Adopted Budget Page 216
FY 2017
Actual
FY 2018
Budget
FY 2018
Revised
FY 2019
Projected
FY 2020
Projected
FY 2021
Projected
FY 2022
Projected
FY 2023
Projected
FY 2019-2023
Projected
6700 NORTH BETHANY DEVELOPM ENT RWQF
(BASIN 10) 6700 (from 6378)
$436,098 $40,000 $70,000 $0 $0 $0 $0 $0 $0
6701 BETHANY CREEK ENHANCEM ENT PILOT $459,700 $225,000 $150,000 $0 $0 $0 $0 $0 $0
6702 REAL TIM E CONTROL AT BETHANY CREEK
WETLAND
$11,808 $0 $0 $0 $0 $0 $0 $0 $0
6703 NORTH ANDERSON SWM $0 $0 $0 $0 $0 $0 $0 $0 $0
6758 ALDEN WQ FACILITY RETROFIT AND STORM
SYSTEM IM P
($850) $0 $0 $0 $0 $0 $0 $0 $0
6759 SHAW ST AT 192ND STORM (from 6346) $0 $0 $0 $0 $0 $0 $0 $0 $0
6761 SPRINGVILLE ALLENBACH ACRES #3 WQF $0 $0 $0 $0 $0 $0 $0 $0 $0
6776 JOSCELYN WQF $33,292 $5,000 $100,000 $0 $0 $0 $0 $0 $0
6786 ELKS WQF & STREAM ENHANCEM ENT $88,130 $0 $2,000 $0 $0 $0 $0 $0 $0
6805 BARNES RD AT 89TH AVE STORM
IM PROVEM ENT
$0 $0 $0 $0 $0 $0 $0 $0 $0
6811 BURBANK/REGAL/IM PERIAL STORM
IM PROVEM ENT
$0 $0 $0 $0 $0 $0 $0 $0 $0
6822 ROCK CREEK INTEGRATED PLAN $33,353 $20,000 $0 $0 $0 $0 $0 $0 $0
6842 BUTTERNUT CREEK STREAM REHAB AT
GLEN IVY AND BARCELONA
$6,891 $170,000 $8,000 $0 $0 $0 $0 $0 $0
6863 GROUNDWATER RECHARGE FEASIBILITY
STUDY
$84,198 $25,000 $50,000 $0 $0 $0 $0 $0 $0
6876 N BETHANY BASIN 10 CM AC $115,954 $0 $5,500 $0 $0 $0 $0 $0 $0
$1,319,249 $767,500 $396,500 $0 $0 $0 $0 $0 $0
6708 ABBEY CREEK WEST TRIB REACH B $0 $240,000 $290,000 $0 $0 $0 $0 $0 $0
$0 $240,000 $290,000 $0 $0 $0 $0 $0 $0
NATURAL SYSTEM IM PROVEM ENTS - SWM $0 $50,000 $0 $0 $0 $0 $0 $0 $0
$0 $50,000 $0 $0 $0 $0 $0 $0 $0
$1,319,249 $1,057,500 $686,500 $0 $0 $0 $0 $0 $0
$2,653,190 $4,652,500 $3,530,100 $5,832,000 $4,665,000 $3,770,000 $3,275,000 $2,960,000 $20,502,000
Conveyance $5,152,000 $4,410,000 $3,610,000 $3,210,000 $2,900,000 $19,282,000
Fleet $75,000 $0 $0 $0 $0 $75,000
Support $200,000 $0 $0 $0 $0 $200,000
Watershed $405,000 $255,000 $160,000 $65,000 $60,000 $945,000
TOTAL $5,832,000 $4,665,000 $3,770,000 $3,275,000 $2,960,000 $20,502,000
Watershed M gmt - Watershed Enhancement
C lo sed P ro jects
A ll P ro jects
C o nveyance - Engr - Watershed Enhancement
Home Portfolio
Clean Water Services FY 2018-19 Proposed Budget Page 217
Glossary ACCRUAL BASIS OF ACCOUNTING
Method of accounting recognizing transactions when they occur without regard to cash flow timing. ADVISORY COMMISSION
A fifteen member commission appointed by the Board of Directors, also known as Clean Water Services Advisory Commission (CWAC). CWAC provides policy and program analysis and interpretation to the District and acts as a point of appeal for District policy.
APPROPRIATION The legal authorization to spend and collect funds. The Board of Directors adopts a Resolution and Order
setting budget appropriations for the ensuing year. Expenditures cannot legally exceed appropriations, and appropriations lapse at the end of the fiscal year.
APPROVED BUDGET
(see BUDGET PHASES) ASSESSED VALUE (AV)
The value of a property, as determined by the Department of Assessment and Taxation. AV was used to compute the rate per $1,000 needed to pay the District's General Obligation Debt until FY 97-98 when the District chose to come off the tax rolls and retire remaining debt with fund balances and interest earnings.
AVERAGE DAILY FLOW
The average flow in a system during a 24-hour period, expressed in million gallons per day (MGD), and determined for a multiple day period (i.e. month, quarter, year).
AUDIT
The annual review and report of the financial status and procedures of the District, performed by an outside auditor. The report addresses the financial condition of each fund and compares actual expenditure and revenues to budgeted amounts. The audit also reviews procedures for compliance with statutes.
BALANCED BUDGET
A budget in which the resources equal the requirements in every fund. BANCROFT BOND
A funding method that allowed local property owners to finance long-term debt using the credit rating of the District, most often used for Local Improvement Districts. Now referred to as Assessment Bonds.
BASE CHARGE
The portion of the sanitary sewer service charge based on the fixed costs of service. For an individual account it is calculated by multiplying the number of Equivalent Dwelling Units times the base rate.
BASIS OF ACCOUNTING AND BUDGETING
For financial reporting purposes the financial statements are presented on a full accrual basis of accounting, where revenues are recorded when they are earned and expenses are recorded at the time liabilities are incurred regardless of the timing of related cash inflows and outflows. The District's budget is prepared on a modified accrual basis of accounting where revenues are recognized as soon as they are both measureable and available. For financial reporting and operating purposes, the

Clean Water Services FY 2018-19 Adopted Budget Page 218
District’s activities are considered to be comprised of two enterprise operations and, as such, those activities are reported in two enterprise funds. However, for legal requirements set forth in Oregon Local Budget Law, the District is required to prepare and adopt a budget by individual funds.
BENCHMARKING A systematic process of searching for best practices, innovative ideas, and highly effective operating procedures that leads to superior performance -- and then adapting those practices, ideas and procedures to improve the performance of one’s own organization.
BIOSOLIDS
The general term for all solid by-products of the District's treatment processes. The material can be used in composting, as a soil amendment, or applied to farm acreage.
BOARD OF DIRECTORS
The five member policy board for the District, which is also the elected Board of Commissioners for Washington County.
BONDED DEBT
Debt which is in the form of General Obligation or Revenue Bonds. Repayment is made by revenues from tax collections, operating revenues and/or capital contributions.
BOND RATING
A rating based on the issuer's perceived ability to repay a bond debt. The District continues to maintain favorable bond ratings with Standard and Poor’s Corporation and Moody’s Investors Service, Inc, which rated the District’s most recently issued long-term insured revenue bond debt at AA and Aa3, respectively.
BUDGET
(see BUDGET PHASES) BUDGET COMMITTEE The Board of Directors and five citizens appointed by the Board which reviews the Proposed Budget. Their
action on the Proposed Budget results in the Approved Budget. BUDGET PHASES
Local budget law and District procedures require that the adopted budget for each fiscal year be the result of a three step process that requires input by the Board of Directors, the Advisory Commission, management, and citizens before final appropriations are authorized. These three steps include:
Proposed Budget - The document developed by District management based on requests for programs and appropriations from staff and reviewed by the Budget Committee in a public hearing(s). Approved Budget - The Proposed Budget is reviewed, modified, and developed into the Approved Budget, which then is submitted to the Board of Directors for adoption following additional public hearing(s).
Adopted Budget - The acceptance of the Approved Budget authorizes actual appropriations. Rates and charges, staffing levels, and other specific actions are adopted by the Board, in addition to the Budget Resolution.
BUDGET RESOLUTION
The Resolution and Order adopted by the Board of Directors which sets appropriations for the ensuing fiscal year. Expenditures cannot legally exceed appropriations, and appropriations lapse at the end of the fiscal year.

Clean Water Services FY 2018-19 Adopted Budget Page 219
BUSINESS PROCESS REENGINEERING (BPR) This is the fundamental rethinking and radical redesign of business process to achieve dramatic improvements in critical, contemporary measures of performance, such as cost, quality, service, and speed. In conducting BPR, we must ask the most basic questions: Why do we do what we do? And why do we do it the way we do? Asking these fundamental questions forces people to look at the basic rules and assumptions that underlie the way they conduct their business.
CCF
One hundred cubic feet equals 748 gallons, a measure of volume commonly used by the water industry. CAPITAL IMPROVEMENT PROGRAM (CIP)
A detailed description of projects and capital expenditures which is used to plan for financial requirements and construction needs over a five-year period. The District's CIP includes projects needed for expanded treatment facilities, collection systems, and capital replacement and for SWM facilities. The complete five-year CIP is published in a separate document, but the first year is the basis for all construction and capital outlay expenditures included in the budget in funds 108, 208, 112, 115, and 212.
CAPITAL OUTLAY
Expenditures for equipment costing between $5,000 and $50,000. CHART OF ACCOUNTS
A coding structure which defines all financial transactions of the District. The Chart is sufficiently detailed to track individual revenues and expenditures during the fiscal year for any given project, program, division, department, or fund.
CLEAN WATER ACT
The common name of the Federal Water Pollution Control Act. The major objective of this Act is to restore and maintain the chemical, physical, and biological integrity of the nation's waters. The Environmental Protection District (EPA) administers this Act.
CLEAN WATER SERVICES ADVISORY COMMISSION (CWAC) (see ADVISORY COMMISSION)
COMPETITIVENESS A District initiative intended to ensure Clean Water Services provides unparalleled value in the services we provide our customers.
CONNECTION FEE (SANITARY)
A fee charged by the District to recover expenditures for treatment and collection facilities. The funds are placed in the Capital Reserve Fund (107) and transferred to the Sanitary Sewer Construction Fund (112), and other funds, to support improvements to the system. Also referred to as a "System Development Charge" (SDC).
CONNECTION FEE (STORM AND SURFACE WATER)
Similar to the sanitary fee, the charge supports construction of systems designed to collect surface water run-off (e.g. culverts, detention ponds). Also referred to as "Fee in Lieu" of constructing on site facilities. Also referred to as a System Development Charge (SDC).
CONSUMPTION BASED RATES (CBR) The rate structure implemented by the District on July 1, 1994 which incorporates a customer's preceding winter water consumption into the calculation of sanitary sewer bills on the ensuing fiscal year.

Clean Water Services FY 2018-19 Adopted Budget Page 220
CONTINGENCY An appropriated amount in a given fund which can be used for the purchase of Personal Services, Materials & Services, or Capital Outlay. Expenditure of the contingency funds does not require a supplemental budget or public hearing, but does require Board action to transfer the contingency to line item appropriation(s).
DEBT SERVICE
A fund established to account for payment of general long-term debt principal and interest.
DISCRETIONARY RESOURCES Funds that can be spent for virtually any purpose, unlike a grant which must be spent on a specific project. Discretionary resources may be appropriated for any purpose within the restrictions set by the Budget Committee, Local Budget Law, and the Board of Directors.
EFFLUENT The cleaned wastewater flowing out of sewage treatment plants.
ENTERPRISE FUND
A fund established to account for operations that are financed and operated in a manner similar to private business enterprises. They are usually self-supporting. Examples of enterprise funds are those for swimming pools, airports and parking garages.
ENVIRONMENTAL PROTECTION AGENCY (EPA)
An independent agency in the Executive branch of the federal government charged with protecting the environment. Primary functions are to abate and control pollution, conduct research, monitor, set standards and enforce pollution control, and support research and antipollution activities by other governmental, private, and public entities.
EQUIVALENT DWELLING UNIT (EDU)
An average number of fixtures (e.g. sinks) in a residence, which is used to estimate the strength and flow from any type of customer.
ENDANGERED SPECIES ACT (ESA)
The Endangered Species Act (ESA) is federal legislation passed in 1973 designed to protect any species that is in danger of extinction throughout all or significant portion of its range. The U.S. Fish and Wildlife Service (USFW) and the National Marine Fisheries Service (NMFS) share responsibility for administration of the ESA.
EQUIVALENT SERVICE UNIT (ESU) The average amount of impervious surface on a single-family residential property (currently equal to 2,640 square feet). Used to calculate the Surface Water Management connection fee and service charge.
EXPENDITURE
The cost to the District of goods or services utilized. FACILITIES PLAN
Comprehensive plan which reports technical solutions, public values, and programs for the long term achievement of CWS's mission. The plan was updated in Fiscal 2009.
FISCAL YEAR
The period from 12:01 a.m. July 1 to midnight the following June 30.

Clean Water Services FY 2018-19 Adopted Budget Page 221
FLOW
The continuous movement of liquid (or electric current) from one place to another.
FLOW METER A device to measure the amount of flow entering or leaving a particular process.
FORCE MAIN
A pipe that carries wastewater under pressure from a pump to a point of gravity flow downstream. FRANCHISE FEE
A fee paid by the District to member cities to operate within their corporate boundaries. FUND
An independent budgetary, fiscal, and accounting entity used to track the expenditure and collection of appropriations for a specified purpose. The District has thirteen budgetary funds for operations, reserves, debt management and construction. Nine of the funds make up the District’s Sanitary Sewer Service enterprise operation, while the remaining four funds comprise the Surface Water Management enterprise operation. However, for financial statement reporting purposes, a single unitary disclosure is provided for all budgetary funds.
FUND BALANCE
In the case of funds subject to budgetary accounting (which is the case for all of the District’s funds) “Fund Balance” represents the excess of the fund’s assets and estimated revenues for the period over its liabilities, reserves, and appropriations for the period.
GENERAL FUND
The main operating fund used to account for all financial resources, except those required to be accounted for in another fund.
GENERAL OBLIGATION DEBT
Long-term debt which is backed by credit and can be paid by assessment of property taxes. GEOGRAPHIC INFORMATION SYSTEM (GIS)
An information management system based on to the geography of an area. GRAVITY FLOW
Wastewater flowing by gravity from a higher to a lower elevation. IMPELLER
A rotating set of vanes in a pump that pumps or lifts water. INFILTRATION
The water entering a sewer system and service connections through defective pipes, pipe joints, connections, manhole walls, etc. Infiltration does not include inflow.
INFLOW
The water discharged into a sewer system and service connections from roof leaders, cellar, yard and area drains, foundation drains, drains from springs and swampy areas, manhole covers, cross connections, catch basins, storm waters, surface run-off, etc. Inflow does not include infiltration.

Clean Water Services FY 2018-19 Adopted Budget Page 222
INFLUENT
Water, wastewater, or other liquid flowing into a reservoir, basin, or treatment plant.
MANHOLE An opening in a sewer provided to allow operators or equipment to enter or leave the sewer.
MASTER PLAN STUDY The first Master Plan Study was prepared in 1969 in support of the District's formation. The District's capital improvement program for the first 16 years was based on that study. In general, the term refers to any capital program plans adopted and approved by the Directors.
MASTER PLAN UPDATE STUDY
In 1985 the District retained an engineering firm to update the original Master Plan Study. This update focused on the District's capital requirements for the period 1985-2005 based on land use regulations and projected development at the time.
MATERIALS AND SERVICES
Expenditure category including costs of commodities, supplies and services provided by sources either outside or within the District (e.g. interfund reimbursements)
METRO Metropolitan Service District – an elected regional government which provides region-wide planning and
coordination to manage growth, infrastructure, and development issues that cross jurisdictional boundaries.
MONTHLY RATE (STORM AND SURFACE WATER - SWM)
This fee is billed monthly per Equivalent Service Unit. The revenues directly support a variety of water management, erosion control, and system maintenance services.
NUTRIENTS
A general term for the components of wastewater that contribute to the growth of plants, including algae and agricultural crops.
OBJECT CODE
The accounting category to which an expenditure or revenue should be charged. (e.g. Operating Supplies).
OREGON DEPARTMENT OF ENVIRONMENTAL QUALITY
A department in state government under the direction of the Environmental Quality Commission and charged with seeking enforcement of state air and water pollution laws.
OTHER PERSONAL EXPENSE (OPE)
Includes wage related taxes and benefits and the cost of medical insurance for District employees. The item is included in each Program Expenditure Summary Table.
OVERFLOW
Leak or spill of sewage out of the sewage collection system. PAY PLAN
Plan specifying the rate of pay for each job classification and employee of the District.

Clean Water Services FY 2018-19 Adopted Budget Page 223
PERSONAL SERVICES
Expenses related to the compensation of salaried employees, such as health insurance and Social Security.
POTABLE WATER Water that is considered safe for domestic consumption.
PROCESSING TREATMENT PLANT
The treatment plant that treats the sewage from a pump station. PROJECT
A budget unit relating to a defined set of improvements or a study. PROJECT NUMBER
An identification number assigned to a project. PROPOSED BUDGET
(see BUDGET PHASES) PUMP STATION
A pumping facility that lifts the wastewater flow to a high enough elevation that it can flow by gravity. RATE (SANITARY)
The rate charged per dwelling unit for a given period of time for collection and treatment of wastewater. The fee pays for operation and maintenance of the treatment plants and collection system and is a major revenue source for repayment of Revenue Bonds.
RESERVES
Refers to the segregation of a portion of fund balance for specific purposes. RESOURCE
Estimated beginning funds on hand plus anticipated receipts. RESTRICTED FUND BALANCE
Any portion of ending fund balance of which the use is subject to externally enforceable legal restrictions imposed by creditors, grantors, contributors, laws or regulations of other governments.
REPRESENTATIVE SAMPLE
A sample that is nearly identical in content and consistency to the larger body of material being sampled. REVENUE BOND
Long-term debt paid by annual receipts. The District's revenue bond is paid with service charge and connection fee revenues.
SAMPLE POINT
A specific point in a stream, creek or river where consistently representative samples can be taken. SEWAGE
The used water and solids from homes and businesses that flow to a wastewater treatment plant.

Clean Water Services FY 2018-19 Adopted Budget Page 224
SEWER A pipe or conduit that carries wastewater or drainage water. SEWERAGE
The system of sewage collection and treatment works. SERVICE CONNECTIONS
The physical connection of a customer to the sanitary or surface water management systems by a pipe, culvert, or drainage way.
SLUDGE
The semi liquid solids from sewage or industrial wastes (raw or treated) in clarifiers or sedimentation basins.
STORM AND SURFACE WATER MANAGEMENT (SWM) PLAN
The Plan unanimously approved on July 27, 1989, by the Portland Metropolitan Area Local Government Boundary Commission designating CWS as the regional stormwater service provider within CWS boundaries. The initial plan addressed existing and future stormwater quality and quantity issues in CWS’s service area. Elements of the plan are:
a comprehensive maintenance program
watershed planning
engineering
public information
financial management
legal support STORM SEWER
A separate pipe, conduit or open channel that carries runoff from storms, surface drainage and street wash.
STRATEGIC INFORMATION SYSTEM PLAN (SISP)
This is a master plan for the development and implementation of the District’s information technology system to insure that the proper system(s) and support are in place to meet the current and future information technology needs of the District. To establish the SISP requires developing the business process models which will define the business information needs. The SISP also includes development of the information technology architecture model and hardware/software standards, as well as, a capital budget and implementation schedule.
SUPPLEMENTAL BUDGET
A financial plan adopted during a budget period to meet unexpected needs or to appropriate revenues not anticipated when the regular budget was adopted. It cannot be used to authorize a tax.
SYSTEM DEVELOPMENT CHARGE
(see CONNECTION FEE) TITLE 3
Title 3 is the Stream and Floodplain Protection Plan, a section of Metro’s Urban Growth Management Functional Plan. The plan requires local jurisdictions to meet regional performance standards relating to water quality and floodplain management. Key elements of Title 3 compliance are contained within the District’s Design and Construction Standards.

Clean Water Services FY 2018-19 Adopted Budget Page 225
TREATMENT - PRIMARY
The treatment process which removes a substantial portion of solids in the wastewater in settling basins. TREATMENT - SECONDARY
Treatment after the primary treatment which adds biological processes to reduce the pollution loading. This treatment mixes oxygen with the wastewater. The three common types of secondary treatment facilities are trickling filters, activated sludge tanks, and waste stabilization ponds.
TREATMENT - TERTIARY
Treatment after secondary treatment which uses physical, chemical, or biological processes to refine the effluent. The processes may include coagulation and sedimentation, filtration, and other chemical processes to further reduce nutrients in the wastewater.
UNAPPROPRIATED ENDING FUND BALANCE Unappropriated ending fund balances are requirements, but are not appropriated expenditures.
According to Oregon local budget law, ending fund balances and reserves for future expenditures must be included in the totals for each fund in the publication of the budget’s financial summary. This amount cannot be transferred by resolution or used through a supplemental budget, unless necessitated by a qualifying emergency. The purpose of estimating an unappropriated fund balance is to provide a cash or working capital balance with which to begin the following year.
CLEAN WATER SERVICES ADVISORY COMMISSION (CWAC)
(see ADVISORY COMMISSION) USE
The portion of the sanitary sewer charges that is based on the customer's water consumption. WASTEWATER
The used water and solids from homes and businesses that flow to a wastewater treatment plant.
WET WELL A compartment or tank where wastewater is collected. The suction pipe of a pump may be connected to the wet well or a submersible pump may be located in the wet well.
WINTER PERIOD
The period from November 1 through April 30 which is used to determine winter water use for the consumption based rate structure. Water consumption during this period is used to calculate the USE portion for the following year.
WORKING CAPITAL
Funds based on the difference between estimated revenues to be received and the amount expected to be spent.

Clean Water Services FY 2018-19 Adopted Budget Page 226
Acronyms & Abbreviations
ABC Administrative Building Complex
acre-ft Acre feet
ACWA Association of Clean Water Agencies
APWA American Public Works Association
ASR Aquifer Storage and Recovery
AWWA American Water Works Association
BAB Build America Bond
BES (City of Portland) Bureau of Environmental Services
BITC Billing Information Technical Committee
BMP Best Management Practice
BOD Biological Oxygen Demand
BOR (United States) Bureau of Reclamation
BPR Business Process Reengineering
BRJOC Barney Reservoir Joint Ownership Commission
BSD Business Services Department
CAFR Comprehensive Annual Financial Report
CBOD Carbonaceous biological oxygen demand
CCF One hundred cubic feet (unit of volume often used for water)
CCI Committee for Citizen Involvement
CIP Capital Improvement Program (or Plan)
COE (U.S. Army) Corps of Engineers
CPO Citizen Participation Organization
CSMS Conveyance Systems Management Study
CWA (Federal) Clean Water Act
CWAC Clean Water Services Advisory Commission
CWI Clean Water Institute
CWS Clean Water Services
DEQ Department of Environmental Quality
DLID Drainage Local Improvement District
DMA Designated Management Agency
DSL (Oregon) Division of State Lands
E & IC Electrical and Instrumentation Controls
Clean Water Services FY 2018-19 Adopted Budget Page 227
EDU Equivalent Dwelling Unit
EFU Equivalent Financial Unit
EFU Exclusive Farm Use
EM Electronic Mail
EPA (United States) Environmental Protection Agency
EQC (Oregon) Environmental Quality Commission
ESA Endangered Species Act
ESU Equivalent Service Unit
FG Forest Grove
FMIS Financial Management Information System
FO Field Operations
FOT Friends of Trees
FTE Full Time Equivalent
FY Fiscal Year
GAAP Generally Accepted Accounting Principles
GASB Governmental Accounting Standards Board
GF General Fund
GFOA Government Finance Officers Association
GIS Geographic Information System
GPD/gpd A unit of flow measurement in gallons per day
GPM/gpm A unit of flow measurement in gallons per minute
HRIS Human Resources Information Systems
HRMP Human Resource Master Plan
HVAC Heating, Ventilation, Air Conditioning
I & I Inflow and Infiltration
IGA Intergovernmental Agreement
IWRM Integrated Water Resources Management
JBWP Jackson Bottom Wetlands Preserve
JWC Joint Water Commission
LA Load Allocation
LEBO Limited Eligibility Buy Out
LEED Leadership in Energy and Environmental Design
LID Local Improvement District
LIDA Low Impact Development Approaches

Clean Water Services FY 2018-19 Adopted Budget Page 228
LIMS Laboratory Information Management System
LSI Local Sewer Improvement
LT Leadership Team
M & I Municipal and Industrial
MGD Million Gallons Per Day
MO Minute Order (Board item)
MOU Memorandum of Understanding
MS4 Municipal Separate Storm Sewer System
N/A Not available or does not apply
NEDC Northwest Environmental Defense Center
NMFS National Marine Fisheries Service
NPDES National Pollutant Discharge Elimination System
NRCS Natural Resource Conservation Service
NTS Natural Treatment System
OAR Oregon Administrative Rules
ODF&W Oregon Department of Fish and Wildlife
OGFOA Oregon Government Finance Officers Association
OGI Oregon Graduate Institute
OGM Office of the General Manager
OPE Other Personnel Expense
ORS Oregon Revised Statutes
PERS Public Employee Retirement System
PLC A programmable logic controller used to control a variety of functions with multiple inputs
PNPCA Pacific Northwest Pollution Control Association
POTW Publicly Owned Treatment Works
PSI/psi Pounds per square inch (pressure measurement)
RAD Regulatory Affairs Department
R & O Resolution and Order
RC Rock Creek
RM River Mile
RSMC Regional Stormwater Management Charge
SCS (United States) Soil Conservation Service
SDC System Development Charge
SISP Strategic Information Systems Plan

Clean Water Services FY 2018-19 Adopted Budget Page 229
SOD Soil Oxygen Demands
SS Suspended Solids
SSES Sewer System Evaluation Survey
SWCD Soil and Water Conservation District
SWM Surface Water Management
TB-PAC Tualatin Basin Public Awareness Committee (“Partners for Clean Water”)
TDS Total Dissolved Solids
THPRD Tualatin Hills Park and Recreation District
TMDL Total Maximum Daily Load
TRWC Tualatin River Watershed Council
TSS Total Suspended Solids
TVID Tualatin Valley Irrigation District
TVWD Tualatin Valley Water District
TWC The Wetlands Conservancy
UGB Urban Growth Boundary
USA Unified Sewerage Agency
USAAC Unified Sewerage Agency Advisory Commission
USGS United States Geological Survey
WAMCO Water Management Committee of Washington County
WASSTRIP Waste Activated Sludge Stripping to Remove Internal Phosphorus
WEF Water Environment Federation (formerly WPCF or Water Pollution Control Federation)
WES Water Environment Services (of Clackamas County)
WLA Waste Load Allocation
WMD Watershed Management Department
WRD (Oregon) Water Resources Department
WRI Willamette Restoration Initiative
WWTD Wastewater Treatment Department
Clean Water Services FY 2018-19 Adopted Budget Page 230
This page intentionally left blank