ADOPTED BUDGET - Operating and Capital Volume 2
287
2016 ADOPTED BUDGET Operating and Capital Volume 2 Adopted by Council – March 22, 2016
-
Upload
khangminh22 -
Category
Documents
-
view
0 -
download
0
Transcript of ADOPTED BUDGET - Operating and Capital Volume 2

2016ADOPTED BUDGET
Operating and Capital Volume 2
Adopted by Council – March 22, 2016

A
C
AO
dopted
WINNIPE
City o
AdoptOperati
V
d by Co
EG, MANITOBA
of Win
2016ted Bing and
Volume
ouncil M
A, CANADA
nnipe
6 Budged Capite 2
March
eg
et tal
22, 2016

The City of Winnipeg Winnipeg, Manitoba
R3B 1B9
Telephone Number: 311
Toll Free : 1-877-311-4WPG(4974)
City of Winnipeg website: www.winnipeg.ca

City of Winnipeg Council ................................................................................................................. i
Overview ........................................................................................................................................... 1 2016 Adopted Budget Presentation ........................................................................................ 1 Council Recommendations ................................................................................................... 45 Budget Process ..................................................................................................................... 55
Financial Summary ........................................................................................................................... 1
Infrastructure Renewal and Public Works ...................................................................................... 3
Water and Waste, Riverbank Management and the Environment…………………………………23
Property and Development, Heritage and Downtown Development .......................................... 41
Protection, Community Services and Parks / Winnipeg Police Board ...................................... 63
Executive Policy ............................................................................................................................ 107
Appendices
Appendix 1 - Financial Summary Tax Supported ......................................................................................................................... 1 Utility Operations ................................................................................................................... 14 Special Operating Agencies ................................................................................................. 20
Appendix 2 - Grants ....................................................................................................................... 25
Appendix 3 - Reserves .................................................................................................................. 29
Appendix 4 - Tax Supported Transfers from Other Funds ......................................................... 31
Appendix 5 - Operating Budget Reconciliations A. Transfer to Capital Reconciliation ..................................................................................... 33 B. Variances Net of Transfer to Capital / Regional and Local Street Reserves / Frontage Levy .................................................................................................................................. 34 C. Operating Budget Net of Transfer to Capital / Regional and Local Street Renewal Reserves / Frontage Levy ................................................................................................ 35 D. Cash to Capital Surpluses – 2015 Capital Closing Review .............................................. 36
Appendix 6 - Regional and Local Streets Renewal ...................................................................... 39
Appendix 7 - Funding Plan for Southwest Rapid Transitway (Stage 2) / Pembina Highway Underpass ....................................................................................................................................... 41
Table of Contents

Appendix 8 - Fees and Charges – Increases Greater Than Inflation.......................................... 45
Appendix 9 - 2015 Consolidated Budget ...................................................................................... 65
Appendix 10 - Tax Supported Savings Transferred to Regional Streets Renewal Program ... 69
Appendix 11 - Capital Projects Summary ..................................................................................... 71
Appendix 12 - Service Based Budget - Services by Policy Area.............................................. 101
Table of Contents (continued)

Mayor Brian Bowman
John Orlikow River Heights - Fort Garry Ward
Janice LukesSouth Winnipeg -
St. Norbert Ward
Brian MayesSt. Vital Ward
Adopted 2016 Operating Budget - Overview i
rmarsh1
Text Box
City of Winnipeg Council
rmarsh1
Text Box

Standing Policy Committee
on Infrastructure Renewal
andPublic Works
Standing Policy Committee
on Water and Waste, Riverbank
Management and the
Environment
Additional Appropriations
Engineering ServicesFleet ManagementPublic Works MaintenanceTraffic ControlTransitTransportation Planning
Animal ControlBy-law EnforcementCultural ServicesDisaster PlanningFire and Paramedic ServicesHarbour MasterLibrariesMuseumsParks PlanningParks and Open SpacesPublic HealthRecreation & ParksProgramming and Services
Asset ManagementAcquisition of BuildingsBuilding InspectionsCivic BuildingsDevelopment ControlDowntown DevelopmentFacility MaintenanceHeritage MattersHousing PolicyLand AcquisitionLand DevelopmentPlanning & Land UseTransportation PlanningVacant and Derelict Buildings
Engineering ServicesEnvironmental MattersRiverbank ManagementSolid WasteWater, Wastewater and LandDrainage Services
Standing Policy Committee
on Finance
Standing Policy Committee
on Protection,Community
Services and Parks
Standing Policy Committee
on Property and Development,
Heritage and Downtown
Development
City Electorate
CAO
CFO *
City Auditor *
City Clerk *
Governance Committee of Council
City Council
Executive Policy Committee
Standing Policy Committee
on Innovation
APPENDIX "A" to By-law No. 7100/97amended 143/2008; 22/2011; 48/2011;139/2014; 106/2015
Annual reports of SSUsBusiness plans of SSUsIdea Bank ReserveFeasibility studies re. SSUs
* CFO, City Auditor and City Clerk have statutory reporting relationship to City Council
ii Adopted 2016 Operating Budget - Overview
rmarsh1
Text Box
City of Winnipeg Organization

2016
Ado
pted
Ope
ratin
gan
d Ca
pital B
udgets
March 22, 201
6
1
kmorton
Text Box
Return to Table of Contents

2
2016
Bud
get P
rocess
•Bu
dget Con
sulta
tion –Pu
blic Engagem
ent
•Multi‐Year View
•Standing
Policy Co
mmittee
Review
•Co
uncil D
ebate and Ad
optio
n

3
Overview
•Bu
dget Prio
rities
•Ope
ratin
g Bu
dget
•Capital Bud
get
•Future Bud
get C
hallenges

4
2016
Bud
get P
riorities
•Re
cord Street Investm
ent
•Pu
blic Transpo
rtation
•Investing in Safer, Stron
ger
Neighbo
urho
odsand Co
mmun
ity
Amen
ities
•Inno
vatio
n and
Efficiencies
Sturgeon
Creek
Walkw
ay passes u
nder th
e ne
w
Sturgeon
Brid
ge.
2016
–20
18Ad
opted Ope
ratin
g Bu
dget
5
Ice skating at th
e Pe
guis Pavilion
Pon
d.

2016
Highlights
•An
nual 2% prope
rty tax
increase ded
icated
to capita
l (1% to
each of Regional and
Local Street R
enew
al
Programs)
•.33%
prope
rty tax increase
dedicated for future
paym
ents fo
r the
Sou
thwest
Rapid Transitway (Stage 2)
•Co
mbine
d 2.33
% prope
rty
tax increase
6
Sherbroo
k Street with
parking
‐protected
bike lane

2015
Mun
icipal Prope
rty Tax
Compa
rison
Average Hou
se
7

Prop
erty Tax Cha
nges in
Cities
8
•Over the
last 15 years, other cities have continue
d to app
rove
annu
al prope
rty tax increases for u
se fo
r both their o
peratin
g bu
dgets a
nd th
eir capita
l / infrastructure bud
gets.
•Cu
mulatively these am
ount to
significant increases relative to
Winnipe
g’s 6.7%
.
Sou
rce:
Citi
es’ w
ebsi
tes
Cum
ulat
ive
Cum
ulat
ive
1999
to 2
006
2007
2008
2009
2010
2011
2012
2013
2014
2015
1999
to 2
015
2016
Vanc
ouve
r28
.7%
8.0%
1.2%
5.8%
2.0%
2.0%
2.8%
2.0%
1.9%
2.4%
56.8
%2.
3%
Edm
onto
n30
.3%
5.0%
7.5%
7.3%
5.0%
3.9%
5.4%
3.3%
4.9%
5.
7%
78.3
%3.
4%
Cal
gary
30.0
%2.
6%4.
5%5.
3%4.
8%5.
0%6.
0%5.
5%5.
0%4.
5%
73.2
%3.
5%
Sask
atoo
n24
.0%
4.8%
5.4%
2.9%
3.9%
4.0%
4.0%
5.0%
7.43
%5.
34%
66
.8%
3.96
%
Reg
ina
16.9
%3.
9%2.
8%0.
0%4.
0%4.
0%3.
9%4.
5%5.
9%
3.9%
49
.8%
3.3%
Win
nipe
g-6
.0%
0.0%
0.0%
0.0%
0.0%
0.0%
3.5%
3.9%
2.95
%2.
3%6.
7%2.
33%

Average Hom
e Assessed
at
$288
,190
in 201
6
2015
2016
Chan
ge
Mun
icipal prope
rty taxes
(exclude
s scho
ol ta
xes)
$1,618
$ 1,65
6$ 38
2.33
%
9

10
2016
HIGHLIGHTS
•Bu
siness T
ax ra
te re
duced from
5.6% to
5.3%
•Expansion of th
e Sm
all Business T
ax Credit
program
•Re
bate of m
unicipal business taxes for
busin
esses that h
ave a rental value
of
$32,22
0 or less in
201
6 ($30
,000
in 201
5)–Im
pacts 4
8% of all bu
sinesses
–Ap
proxim
ately 5,90
0 bu
sinesses w
ill ben
efit
Fueling the Econ
omy

Dow
ning
Street curb an
d gutter re
placem
ent
11
2016
HIGHLIGHTS
•2%
of p
rope
rty tax increase fu
nds reserves solely
dedicated to th
e rene
wal of regional and
local streets,
back lane
s and
side
walks in th
e capital program
•$1
1 million in dep
artm
ental savings/efficien
cies have
been
reinvested
in re
gion
al street re
newal th
rough
increm
ental cash to capita
l
Ded
icated
Fun
ding
Plan for C
apita
l Street R
enew
al
•Fron
tage levy also
bu
dgeted
in brid
ge
rene
wal capita
l program

Kena
ston
Extension
12
2016
HIGHLIGHTS
•Total Regional and
Local Street R
enew
al Program
‐$105.2 m
illion
–$103.3 m
illion in 2015
–$84.2 million in 2014
•Re
gion
al Streets
–Enhanced
program
‐$18.4 million
–Re
gular p
rogram
‐$27.7 million
•Local Streets
–Enhanced
program
‐$19.4 million
–Re
gular p
rogram
‐$39.7 million
•2012
Total Program
$30
.9 m
illion
2016
Street R
enew
al Cap
ital Program

13
2016
HIGHLIGHTS
•Street Ren
ewal Frontage Levy
–Increase to
$5.45
per fron
tage
foot from
$4.35
–$3
.2 m
illion increase fo
r op
erating mainten
ance
–$1
0 million for capita
l brid
ge
rene
wal program
•An
nual im
pact on a 50
‐foot lot is
$55
Ded
icated
Fun
ding
for S
treets M
ainten
ance
Nairn
Overpass constructio
n

14
HIGHLIGHTS
•Multi‐year fu
nding plan, including
a ta
x increase of .33
% fo
r ten
years b
eginning
in 201
6 consisten
t with
Cou
ncil’s 2
015 plan.
•A previously plann
ed one
‐tim
e transit fare increase of 5
cen
ts
over and
abo
ve th
e regular fare increase will not be
implem
ented. The
Province will instead cost‐share an annu
al
transfer to
the bu
s rep
lacemen
t reserve enabling $1
.7 m
illion
to be de
dicated annu
ally to
ward the project.
Southw
est R
apid Transitw
ay/Pem
bina
Highw
ay
Und
erpa
ss Project
•20
20 –the first ann
ual P3
paym
ent w
ill be requ
ired and is
budgeted
in th
e capital forecast.
Southw
est R
apid Transitw
ay

15
HIGHLIGHTS
•Ope
ratin
g expe
nditu
re of $
200.4 million in 201
6 ($17
4.8 million
in 201
5) fo
r an increase of 1
4.6%
.•
City of W
innipe
g Transit sub
sidy of $69
.9 m
illion in 201
6 ($47
.3
million in 201
5) fo
r an increase of 4
7.8%
.•
Transit UPass
–fall of 201
6
Tran
sit Investm
ents
Tran
sit b
us se
rvicing Ro
ute 10
‐St. B
onifa
ce‐W
olseley

16
HIGHLIGHTS
•Increased investmen
t include
s:–
flow th
rough of transfers for ra
pid transit,
–investmen
t in cash to
capita
l, –
mainten
ance staff for bus fleet e
xpansio
n, te
chno
logical changes,
emissions con
trol work and mou
nting ne
eds in th
e bu
s rep
air
shop
.
Tran
sit Investm
ents
Osborne
Statio
n ‐Sou
thwest R
apid Transitw
ay

17
2016
HIGHLIGHTS
•$150,000
for the
Com
mun
ity Hom
eless
Assistance Team
(CHA
T program)
•2n
dyear of 5
year a
nnual grant of $
150,000 to
the United Way’s Plan
to End
Hom
elessness
•Increase in
Winnipe
g Arts Cou
ncil Fund
ing to $7
per capita
•$1
million of $5 million commitm
ent to supp
ort
the Winnipe
g Art G
allery ‐Inuit A
rt Cen
tre
Investing in Safer, Stron
ger N
eighbo
urho
odsa
nd
Commun
ity Amen
ities

18
2016
HIGHLIGHTS
•Ab
original You
th Strategy fund
ing at $1.75
million
•Ope
ratin
g and capital sup
port to
Assiniboine
Park Con
servancy
–$1
0.51
2 million op
erating grant
–$6
.092
million in capita
l grants
Investing in Safer, Stron
ger N
eighbo
urho
odsa
nd
Commun
ity Amen
ities
•20
17 Canada Summer Gam
es
fund
ing at $750,000, to
ward a total
$3 m
illion commitm
ent

19
2016
HIGHLIGHTS
•Winnipe
g Po
lice Service ‐$
280.7 million an
increase of $
16.7 m
illion or 6.32%
•Fire Param
edic Service ‐$190.3 m
illion an
increase of $
12.0 m
illion or 6.7%
•Investment in pu
blic sa
fety com
prise
s 44.7%
of th
e total tax su
pported bu
dget
Investing in Safer and
Stron
ger N
eighbo
urho
ods‐
Public Safety Pu
blic Safety Em
ergency Re
spon
se units

Commun
ity Param
edic re
cords p
atient care
at M
ain Street Project
20
2016
HIGHLIGHTS
•Co
mmun
ity Param
edic program
expansio
n which will
furthe
r enh
ance se
rvice provision
to vulne
rable
popu
latio
ns–
Enhanced
training
program
for C
ommun
ity Param
edicine
–Ad
ditio
n of re
sources and eq
uipm
ent for th
e Main Street
Project (7 FTEs)
Investing in Safer and
Stron
ger N
eighbo
urho
ods
–Fire Param
edic Service
–Expansion of th
e Em
ergency
Paramed
ics in th
e Co
mmun
ity (E
PIC)
Program (1
7 FTEs)
•Pilot w
ith 1 unit started
in 2013
prop
osed
to expand to 5 units
•Subject to WRH
A Fund
ing
confirm
ation

21
2016
HIGHLIGHTS
•Investmen
t into pu
blic com
mun
ications, including
new
po
sitions fo
r the
Office of P
ublic Engagem
ent
•Fund
ing for a
new
full‐tim
e Fren
ch language se
rvices
coordinator
•$250,000
to stud
y and review
smart g
rowth fu
nding
optio
ns, including
a re
gulatory growth fee
•Fund
ing for a
new
Office of Integrity (Ethics)
Commissione
r
A City Hall tha
t Works

22
HIGHLIGHTS
•Em
bedd
ing the $1
million Inno
vatio
n Capital
Fund
ann
ually to
facilitate investment in ne
w
and inno
vative ideas for im
med
iate and
future sa
vings
–To fu
nd th
e be
st ideas for im
proved
efficien
cy,
service de
livery, accou
ntability and
respon
siven
ess in City
ope
ratio
ns after a
successful laun
ch in
201
5•$5
0,00
0 for 5
years fo
r a new
Research Ch
air
in M
unicipal Infrastructure
Inno
vatio
n an
d Efficiencies

23
2016
HIGHLIGHTS
•Transportatio
n Managem
ent
Centre
•Civil m
arria
ge cerem
onies a
t City
Ha
ll•
Ongoing
dep
artm
ental review
and analysis
–Inno
vatio
n savings o
f $2.9 million
–City‐w
ide vacancy managem
ent
savings target o
f $20
.9 m
illion
Inno
vatio
n an
d Efficiencies
Tran
sportatio
n Man
agem
ent C
entre ‐
Camera an
d mod
em in
stallatio
n

Tax Supp
orted Ope
ratin
g Bu
dget
24
In M
illions of $
2015
Adop
ted
Budget
2016
Ad
opted
Budget
REVE
NUE
Prop
erty Taxes
$ 529
.2
$ 54
9.3
Busin
ess Taxes
58.4
57.3
Other
406.5
448.5
TOTA
L RE
VENUE
$ 994.1
$ 1,055.1
EXPE
NDITURE
S
Departmen
tal
$ 947
.2
$ 982
.8
Corporate
46.9
72.3
TOTA
L EX
PENDITURE
S$ 994.1
$ 1,055.1
SURP
LUS / (DE
FICIT)
$ ‐
$ ‐

25
How
is th
e Mon
ey Spe
nt in
the
Ope
ratin
g Bu
dget?
2016
Ado
pted
Ope
ratin
g B
udge
t -$1
,055
mill
ion
Stre
et S
yste
m, S
olid
Was
te
Col
lect
ion,
Lan
d D
rain
age,
S
treet
Lig
htin
g an
dIn
sect
Con
trol
$258
.9 m
illio
n24
.5%
Tran
sit S
ubsi
dy$6
9.9
mill
ion
6.6%
Pro
perty
, Dev
elop
men
t, P
lann
ing,
Per
mits
and
Bui
ldin
gs$4
5.5
mill
ion
4.3%
Fire
Par
amed
ic S
ervi
ce$1
90.3
mill
ion
18.1
%
Com
mun
ity S
ervi
ces
(e.g
. Lib
rarie
s,
Rec
reat
ion
Ser
vice
s, A
ssin
iboi
ne
Par
k C
onse
rvan
cy)
$111
.4 m
illio
n10
.6%
Org
aniz
atio
nal
Sup
port/
Oth
er(In
form
atio
n Te
chno
logy
, H
uman
Res
ourc
es,
Fina
nce,
Ass
essm
ent,
Chi
ef A
dmin
istra
tive
Offi
ces,
Leg
al,
Cor
pora
te)
$75.
3 m
illio
n7.
1%
City
Cle
rks,
M
ayor
and
Cou
ncil,
O
ffice
of P
olic
y an
dS
trate
gic
Initi
ativ
es,
Mus
eum
s, A
udit
$23.
1 m
illio
n2.
2%
Tax
Supp
orte
d
Pol
ice
Ser
vice
$2
80.7
mill
ion
26.6
%

26
Whe
re doe
s the
Mon
ey Com
e From
in th
e Ope
ratin
g Bu
dget?
Tax
Supp
orte
d
Bus
ines
s Ta
x $5
7.3
mill
ion
5.4%
Pro
perty
Tax
$5
49.3
mill
ion
52.1
%
Oth
er T
axat
ion
$25.
0 m
illio
n2.
4%
Gov
ernm
ent G
rant
s$1
23.6
mill
ion
11.7
%
Tran
sfer
s fro
mO
ther
Fun
ds$5
5.2
mill
ion
5.2%
Lice
nses
, Fin
esan
d Fe
es$5
0.7
mill
ion
4.8%
Inte
rest
and
Oth
er$6
8.4
mill
ion
6.5%
Sal
es o
f Goo
ds &
Ser
vice
s$6
3.2
mill
ion
6.0%
Fron
tage
Lev
y(s
treet
repa
ir)$6
2.4
mill
ion
5.9%
2016
Ado
pted
Ope
ratin
g B
udge
t -$1
,055
mill
ion

Utility
Ope
ratio
ns
27
* Some utilitie
s maintain a retained
earnings/working
capita
l balance
In M
illions of $
2015
Ado
pted
Bu
dget
2016
Ado
pted
Budget
TOTA
L RE
VENUE
$ 568.2
$ 598.7
EXPENDITU
RES
Sewage Disposal
$ 13
5.0
$ 145
.9
Solid
Waste Disp
osal
38.8
40.1
Waterworks
99.6
111.0
Transit
174.8
200.4
Mun
icipal Accom
mod
ations
85.7
75.1
TOTA
LEX
PENDITURE
S$
534.0
$ 572.5
SURP
LUS*
$
34.2
$ 26.2
kmorton
Text Box
Return to Table of Contents

2016
Ado
pted
Cap
ital
Budget
And 20
17 to
202
1Five Year C
apita
l Forecast
28
kmorton
Text Box
Return to Table of Contents

29
Capital B
udget C
ontext
This capital bud
get respo
nds b
y:•
Strategic use of deb
t for inter‐gene
ratio
nal capita
l projects
•Effective 20
16, shifting on
e‐tim
e fin
ancing
sources from
inclusion in th
e op
erating bu
dget to
augmentin
g the
capital program
:–
Prior y
ears’ tax‐sup
ported
capita
l surplus iden
tified in th
e 20
15 capita
l closin
g review
($11
.6 m
illion)
–Surplus transfer from
the Land
Ope
ratin
g Re
serve ($4.9
million in 201
6 and $1
.7 m
illion in each year of capita
l forecast)
•Partne
rships with
other levels of governm
ent to fund
priority projects
The City is cha
llenged
by aging infrastructure and
the infrastructure deficit

30
HIGHLIGHTS
•Local sidew
alk rene
wal ‐record level fun
ding
in 201
6, an
increase of $
1.6 million for a
total of $
2.4 million
•City‐w
ide Ac
cessibility Program
‐an
increase of $
75,000
to $42
5,00
0 each year
•Re
forestation Im
provem
ents Program
‐do
ubled in 201
6,
2017
, 201
8 by $383,000 to $766,000
Strategic Tax‐Supp
orted Ca
pital Investm
ents
•Parks an
d Re
creatio
n En
hancem
ent
Program ‐an
increase of $500,000
to $3.3 million each year
•Off‐le
ash do
g pa
rk m
asterplan‐
$100,000
in 201
6
Pacific
Avenu
e ‐sidew
alk replacem
ent

31
HIGHLIGHTS
•$6
million toward the City’s
$10 million Freedo
m Road
commitm
ent ($4
million
previously app
roved)
•Watermainrene
wals ‐
$19
million
•North End
Sew
age Treatm
ent
Plant –
nutrient re
moval /
upgrade ‐$
651.4 million
Utility
Finan
ced Investmen
ts ‐20
16
•Co
mbine
d Sewer Overflow and
Basem
ent F
lood
Managem
ent S
trategy ‐$
12.7 m
illion
•Sewer Ren
ewals ‐
$16.9 millionFr
eedo
m Roa
d pile in
stallatio
n(pho
to cou
rtesy of Graem
e Loep
pky, Dillon
Con
sulting)

32
HIGHLIGHTS
•Re
newal
–Re
gion
al Streets ‐$2
72.4 m
illion
–Local Streets ‐$3
59.3 m
illion
•Bridges a
nd grade
separatio
ns ‐$254.5 m
illion
–Includ
ing Waverley Street Und
erpass ‐$1
55.1 m
illion
•Total streets program
‐$
995.2 million
6‐Year Street P
rogram
(201
6 –20
21)
Pacific
Avenu
e –po
uring concrete ro
ad slab

Sewer lining
installatio
n33
HIGHLIGHTS
•$109.8 m
illion for p
ublic sa
fety (p
olice and fire
paramed
ic se
rvices)
•$104.8 m
illion for com
mun
ity se
rvices includ
ing
librarie
s and
recreatio
n facilities
•$218.0 m
illion for the
transit sy
stem
•$2
9.6 million for the
solid
waste disp
osal sy
stem
6‐year Cap
ital Investm
ent P
lan of $2.9 billion
•$190.2 m
illion for the
water
system
•$1
billion for the
sewage
disposal sy
stem

Bike
path pa
sses tran
sit statio
n.34
HIGHLIGHTS
•$3
1.9 million for a
ctive transportatio
n facilities
•$4
6.6 million for P
arks and
Ope
n Spaces
•$9
8.9 million for com
mun
ity and
mun
icipal
facilities including
poo
ls and aren
as•$2
8.8 million for land drainage and
floo
d control
6‐year Cap
ital Investm
ent P
lan of $2.9 billion

CAPITA
L PR
OJECT
S
2016
–20
21 Autho
rizations
35
56.9
110.2
230.2
192.0
197.7
904.5
1,20
3.8
60.110
9.8
219.8
203.7
218.0
1,05
9.8
1,02
0.0
020
040
060
080
01,00
01,20
01,40
0
Land
Drainage, Flood
Con
trol
& OtherPublic Safety
Water & Solid W
aste
Commun
ity Services,
Plan
ning, Prope
rty & Develop
men
tMun
icipal Accom
mod
ationsTran
sit
Public W
orks
Sewer
2016
‐202
120
15‐202
0
Exclud
es P3 paym
ents
$ millions

36
Deb
t Strategy ‐P
urpo
se
•To proactively set d
ebt lim
its
•To establish a prud
ent level of d
ebt to supp
ort the
City’s capital infrastructure program
•To m
aintain an
app
ropriate credit rating
•Co
ntinue
d long
‐term financial flexibility and
sustainability

37
Deb
t Strategy ‐B
est P
ractices
•Sustaina
bility/Deb
t Cap
acity
The ability to
sustain de
bt se
rvice costs o
ver the
long
‐term
•Affordab
ility
The ability to
pay deb
t service costs as w
ell as life
cycle costs
to m
aintain the asset
•Flexibility
The ability to
respon
d to emerging
capita
l needs

38
Deb
t Strategy ‐C
redit R
ating
•Moo
dy’s –Aa
1 since Novem
ber 2
006
–In August 2
014, M
oody’s affirmed
the Province of M
anito
ba’s
cred
it ratin
g at Aa1
with
an ou
tlook
of n
egative from
stable.
–Refle
cting the Province of M
anito
ba’s ou
tlook, The
City
of
Winnipe
g’s rating ou
tlook
was dow
ngrade
d from
stable to
ne
gative.
•Th
e City’s cred
it ratin
g ha
s be
nefited
from
:–
Disciplined
financial plann
ing and a proven
track record of
operating surpluses.
–A stable and
diverse econo
my.
–Stable and
predictable re
venu
e sources (prop
erty ta
xes a
nd user
fees).
Stan
dard and
Poo
r’s –AA
/Stable/since Janu
ary
2003
(Re
affirmed
Novem
ber 2
013)

39
Deb
t Strategy
•Co
uncil, on
Octob
er 28, 201
5 revised the
City’s de
bt strategy which includ
es m
axim
um
debt limits
•The ne
w limits will enable the City to
borrow
approxim
ately $2
50 m
illion to fu
nd prio
rity
inter‐gene
ratio
nal projects

NET
DEB
T PE
R CA
PITA
INCR
EASING TO
ADDRE
SS IN
FRAS
TRUCT
URE
NEEDS
40
•Tax‐supp
orted includ
es M
unicipal Accom
mod
ations
•De
benture de
bt and
P3 ob
ligations includ
ed
•Other Entities includ
ed in
2009 and subseq
uent years
•As at D
ecem
ber 3
1st
0
500
1000
1500
2000
2500
199519961997199819992000200120022003200420052006200720082009201020112012201320142015201620172018201920202021
Tax-
supp
orte
dTr
ansi
t &
Uti
lity
Ope
rati
ons
Oth
er E
nti
tiesForecasted

41
Future Bud
get C
hallenges
In M
illions of $
2016
Ado
pted
Bu
dget
2017
Projectio
n2018
Projectio
n
REVE
NUE
Prop
erty Taxes
$ 54
9.3
$ 564
.8$ 58
4.5
Busin
ess Taxes
57.3
57.0
56.7
Other
448.5
435.2
439.0
TOTA
L RE
VENUE
$ 1,055.1
$ 1,057.0
$ 1,080.2
EXPE
NDITURE
S
Departmen
tal
$ 98
2.9
$ 1,030.2
$ 1,060.8
Corporate
72.3
78.5
101.3
TOTA
L EX
PENDITURE
S$ 1,055.1
$ 1,108.7
$ 1,162.1
SURP
LUS / (DE
FICIT)
$ ‐
$ (51
.7)
$ (81
.9)

42
Future Bud
get C
hallenges
•Re
liance on
non
‐recurrin
g on
e‐tim
e revenu
es and
deferral of
spen
ding
and
mainten
ance costs is non
‐sustainable.
•The City’s tax supp
orted bu
dget has a structural deficit:
sustainable revenu
e stream
s do
not cover re
quire
d expe
nditu
res.
•Ope
ratin
g and Capital Bud
gets
–New
long
‐term growth re
venu
e sources w
ill be requ
ired in
the future to
add
ress th
e grow
ing structural deficit.
–Winnipe
g’s infrastructure deficit is estim
ated
at $
7 billion
.
•De
clining Liqu
idity

Future Bud
get C
hallenges
43
kmorton
Text Box
Return to Table of Contents

44 Adopted 2016 Operating Budget - Overview

Council Recommendations - Adoption of the 2016 Budget COUNCIL DECISION (March 22, 2016): Council concurred in the recommendation of the Executive Policy Committee, as amended by the motion of Councillors Gillingham and Browaty (see Item No. 1 of the Report of the Winnipeg Police Board dated March 11, 2016 with excerpt included on page 54 in this budget book), and adopted the following: 1. That the following recommendations with respect to the 2016-2018 Preliminary
Operating Budget be approved:
A. i. That the 2016 Preliminary Operating Budget, including the budgets for reserves (Appendix 3), tabled at the Executive Policy Committee on March 2, 2016, be approved with the following amendments:
a. That all Riverbank Management items and its financial
implications be brought to the Standing Policy Committee on Water and Waste, Riverbank Management and the Environment for the Preliminary 2017 Operating Budget and Financial Plan for 2018 and 2019.
b. That the following be referred to the 2017 budget process:
1. The grant request of $3 million over 5 years from Siloam
Mission; 2. The grant request of $5 million over 10 years from the
Royal Aviation Museum of Western Canada; 3. Establish a new Appendix that lists all Grants by
Department; 4. List the previous year grant amount on both Grant page
appendices for each line item; 5. List the projected future year grant amount on both Grant
page appendices for each line item, if applicable; 6. Provide a clear definition of “Annual Grants”, Multi-year
Grant Agreements”, and “Other Grant Agreements” on the Grant page appendices.
7. That City Council establish a new Council Policy which would assist and direct the Public Service with regard to executing and delivering practical grant agreements that are user friendly and customer service oriented. With this understanding, special consideration shall be given to not-for-profit groups and agencies, both direct and arms-length, of the City of Winnipeg.
Adopted 2016 Operating Budget - Overview 45
kmorton
Text Box
Return to Table of Contents

c. That the $250 appeal hearing fee not be implemented and any
revenue loss be offset against the corporate accounts.
ii. That the 2017 and 2018 projections be received and submitted to Council as information on the preliminary financial plans for those years.
B. That the City’s mill rate be decreased from 13.682 to 12.766 in 2016, to
reflect the general assessment, adjusted for new assessable properties, and for the purpose of raising revenue as required for the annual operating budget.
Note: This mill rate of 12.766 in 2016 includes a 1% property tax increase
dedicated to the renewal of local streets, lanes and sidewalks, a 1% property tax increase dedicated to the renewal of regional streets and sidewalks, and a .33% property tax increase dedicated for payments for the Southwest Rapid Transitway (Stage 2) and Pembina Highway Underpass project, for a total property tax increase of 2.33%.
C. i. That the City’s business tax rate be decreased from 5.6% to 5.3% in
2016; and
ii. That Council enact the Small Business Tax Credit by-law under Subsection 219(2) of the City of Winnipeg Charter, which will provide a full rebate of municipal business taxes for businesses with an annual rental value of $32,220 or less in 2016.
D. That the combined uniform rate for the Street Renewal Frontage Levy be
increased from $4.35 per frontage foot to $5.45 per frontage foot. The increase in the rate per frontage foot is proportionately divided between the water main and sewer main rates on the basis of the current rates, to be used for upgrading, repair, replacement and maintenance of streets and sidewalks.
E. i. That Appendix 8 be amended by replacing the Planning, Property and
Development section, beginning on page 50 and ending on page 56, with the document attached as Appendix A to this motion.
ii. That the amended fees (Appendix 8), levies, and transfers between
funds outlined in the 2016 Operating Budget be approved.
F. That any budget impact resulting from Council approval of the 2016 to 2018 water and sewer rates report be included in the adopted budget, including to specifically have any tax supported dividend decrease up to $200,000 be offset by an increase in the corporate innovations savings account in 2016.
G. That the Winnipeg Police Board request the Winnipeg Police Service to
review the implementation of a 911 fee and report back to Council.
46 Adopted 2016 Operating Budget - Overview

H. That a transfer from the General Purpose Reserve Fund to the General Revenue
Fund be made in 2016 based on the balance in the General Purpose Reserve Fund after the year end surplus is transferred, to a maximum of $16.3 million. If the reserve balance is not sufficient to make the $16.3 million transfer, any shortfall will be addressed during 2016.
I. That a transfer from the Financial Stabilization Reserve Fund to the General
Revenue Fund be made in 2016 based on the balance in the Financial Stabilization Reserve Fund after year-end adjustments to a maximum of $5 million.
J. That the General Revenue Enterprises Fund be closed effective January 1, 2016
on a budget neutral basis, and that a report come forward to the Standing Policy Committee on Finance outlining implications of this initiative, including any ongoing operations.
K. That further to the 2015 operating budget approval on March 23, 2015, as
subsequently amended by Council decision (“Funding Plan for Southwest Rapid Transitway (Stage 2) and Pembina Highway Underpass”) on November 25, 2015, and subject to confirmation satisfactory to the Chief Administrative Officer of funding from the Province of Manitoba in the amount of $1.7 million per year commencing in 2016 on terms and conditions satisfactory to the Chief Administrative Officer, Council amend the 2015 Operating Budget Recommendation 1.N.(iv) to read as follows: “That the funding source from the City be a combination of:
• The dedicated property tax revenue transferred from the General Revenue Fund,
• an annual transfer of $1.7 million per year from the Transit System Fund starting in 2016, and
• an annual grant from the Province starting in 2020.”
L. That the following with respect to the Assiniboine Park Conservancy (APC) in 2016 be approved:
i. A loan guarantee for operational cash flow management purposes in
an amount not to exceed $500,000. ii. The City’s loan guarantee of APC’s non-revolving term loan facility
($9,610,000 outstanding), which expires on December 31, 2016, be extended to December 31, 2018. This guarantee facilitates the ongoing collection of charitable donation pledges which are the source of repayment for the loan facility.
Adopted 2016 Operating Budget - Overview 47

iii. The Chief Financial Officer be delegated the authority to negotiate and approve the terms and conditions of the loan guarantee and all supporting documentation.
M. That Council include in the 2017 projections an operating grant to the Louis Riel
School Division (in trust for Dakota Alumni Field) of $350,000 in support of the Alumni Field Capital Campaign (Dakota). The applicable grant application will be required from the proponent. This is in addition to the $600,000 in support approved in the 2015 budget (recommendation 1.T.) from proceeds of the City/ Qualico River Park South Joint Venture, subject to the proponent providing confirmation of at least matching funding from sources external to the City of Winnipeg.
N. That Council include in the 2017 and 2018 projections, grants to the University
of Winnipeg of $200,000 each year for the “united@winnipeg” youth service summer pilot project. The applicable grant application will be required each year from the proponent.
O. That prior to payment of any grant monies approved in the 2016 operating
budget, the City enter into, execute and deliver grant agreements with each grant recipient, and that the Chief Financial Officer be authorized to negotiate and approve the terms and conditions of each grant agreement in accordance with the budgetary approval and such other terms and conditions deemed necessary by the Director of Legal Services and City Solicitor to protect the interests of the City.
P. That Council enact an amendment to the Expenditures Before Budget Adoption
By-law No. 8164/2002, which specifies that “operating expenses of the City” that includes authority for the Chief Financial Officer to approve payment in advance of annual approval of the City’s operating budget of up to 60% of the annual operating grants to the General Council of Winnipeg Community Centres and community centres funded by the City.
Q. That the Chief Administrative Officer be delegated the authority, for
departmental units under his authority, to transfer funds and/or budgets between departmental units to reflect administrative structure changes made by the Chief Administrative officer and that the City Organizational By-law No. 7100/97 be amended accordingly.
48 Adopted 2016 Operating Budget - Overview
R. That the Chief Financial Officer be delegated the authority to restate the budget subsequent to adoption to reallocate amounts to departments to reflect Council’s ratification of collective agreements, Council’s approval of decisions with budget implications, as well as corporate cost reduction measures, including innovation savings, on a budget neutral basis.
S. That the Director of Legal Services and City Solicitor be requested to submit the
necessary by-laws and policy amendments to implement the above recommendations.
Subsequently on March 23, 2016 Council adopted the Comprehensive Fee Review of Planning, Development and Buildings Fees and Charges. The financial impact of this report has been included in the 2016 adopted budget and 2017 and 2018 projections. Also subsequently on April 27, 2016 Council adopted the 2016 to 2018 Water and Sewer Rates. The financial impact of this report has been included in the 2016 adopted budget and 2017 and 2018 projections.
Adopted 2016 Operating Budget - Overview 49
kmorton
Text Box
Return to Table of Contents
kmorton
Text Box
CAPITAL BUDGET RECOMMENDATIONS 2. That the following recommendations, as amended by the motion of Councillors
Gillingham and Browaty (see Item No. 1 of the Report of the Winnipeg Police Board dated March 11, 2016 with excerpt included on page 54 in this budget book), with respect to the 2016 Preliminary Capital Budget and 2017 to 2021 Five Year Forecast, tabled at the Executive Policy Committee on March 2, 2016, be approved:
A. i. That the 2016 Capital Budget totaling $1,177,680,000 requiring new
borrowing authority of $78.132 million for tax-supported operations, and $603.550 million for utility operations, including the Transit Fund, be approved with the following amendments:
a. That the notes on page 2-49 Athletic Fields – Improvements of the
2016 Capital Budget be amended to identify the following five sites that are going to be worked on this year, namely:
1. Joe Malone Park 2. Kleyson Park 3. Scurfield Park 4. Van Wellegham Park 5. Whyteridge Park
b. That the following be referred to the 2017 budget process:
i. That the Public Service be directed, that in all future
Capital Budgets, they shall list all individual capital project pages by the Department that delivers the operating service from the facility, and not by the utility/department which is providing property management of any facility/project.
ii. That the Public Service be directed, that in all future
Capital Budgets, they shall list on a new line below the ‘Project Name’ which shall state the ‘Standing Policy Committees:’ that will be subject to the review of any budget page.
c. i. That a 2017 authorization of up to $2.4 million for Seven Oaks Indoor Pool – Renewal Plan be included in the budget funded by a partial deferral of the Developer Payback - Twinning of Keewatin Street (AG 15/12) from 2017 to 2018.
ii. The Developer Payback - Twinning of Keewatin Street
(AG 15/12) in 2018 be increased by the same amount,
50 Adopted 2016 Operating Budget - Overview
kmorton
Text Box
Return to Table of Contents

offset by a decrease in the Regional and Local Street Renewal capital program.
ii. That the 2017 to 2021 Five Year Capital Forecast be reviewed and
submitted to Council for adoption in principle.
B. That external borrowing authority of $16,500,000 for the Southwest Rapid Transitway (Stage 2) and Pembina Highway Underpass capital project be approved in replacement of $16,500,000 of debt previously approved as part of the Public Private Partnership. This amount is included in the borrowing authority in recommendation 2.A.i above.
C. That the $1 million Innovation Capital Fund be extended to each year of the
capital program (2016 to 2021) in order to facilitate investment in new and innovative ideas for efficiencies, improved service, accountability and responsiveness of City operations.
D. That the cash to capital contribution be as follows:
Year 2016
$ Millions
75.2282017 78.7782018 80.2782019 70.7782020 72.7782021 74.778
Note: This includes incremental cash to capital invested in the Regional
Streets Renewal program in the amount of $11 million in 2016, and anticipated amounts of $11 million in 2017, and $11.5 million in 2018 (when these investments are combined with the $6.5 million in 2015, a total of $40 million has been invested).
E. That $11.6 million in prior years’ tax supported cash to capital surplus
identified in the 2015 capital closing review (Appendix 5D), due to projects coming under budget, be utilized as a financing source in the 2016 capital budget and 2017 forecast.
F. That a transfer from the Land Operating Reserve Fund to the General Capital
Fund be made in 2016 to a maximum of $4.9 million provided the Reserve’s unallocated equity balance does not enter into a deficit position. Should the unallocated equity balance be such that the full $4.9 million transfer cannot be made, any shortfall will be addressed during 2016.
G. That all other transfers from prior years’ surplus, to/from reserves and other
funds outlined in the capital budget be approved.
Adopted 2016 Operating Budget - Overview 51

H. That amendment to previous years’ capital budget authorizations as outlined in
Volume 3, Appendix 9 be approved. I. That Council authorize the expenditure of up to $3.8 million for
Recreation Facility Replacement - New Infrastructure in 2016 or prior to the adoption of the 2017 Capital Budget as a first charge against the General Capital Fund, in accordance with Subsection 288(2) of the City of Winnipeg Charter, to facilitate timely work on the Waverley West community campus.
J. That Council authorize the expenditure of up to $250,000 for the St. James Civic
Centre in 2016 or prior to the adoption of the 2017 Capital Budget as a first charge against the General Capital Fund, in accordance with Subsection 288(2) of the City of Winnipeg Charter, to facilitate timely planning work for the St. James Civic Centre project and to confirm a class 3 estimate.
K. That Council enact an amendment to the Expenditures Before Budget Adoption
By-law No. 8164/2002, which authorizes expenditure of up to 30% of the annual lease payments prior to the adoption of the annual capital budget, in the event the capital budget is adopted after December 31, as a first charge against the General Capital Fund, in accordance with Subsection 288(2) of the City of Winnipeg Charter, to facilitate making the required contractual monthly lease payments for the City’s P3 projects. This authorization currently applies to the following projects, Disraeli Bridge and Overpass Facility, Chief Peguis Trail – Henderson Highway to Lagimodiere Boulevard, and the East District Police Station and annual amounts are included in the respective capital detail sheets.
L. That Recommendation two of the report entitled “Capital Integration Project
– Southwest Transitway (Stage 2) and Pembina Highway Underpass” dated May 9, 2014, approved by Council on June 25, 2014, be amended to add the following language at the end of such recommendation:
“and that such delegation to the Chief Administrative Officer include all necessary power and authority to:
i. identify the Preferred Proponent in accordance with the Request for
Proposal (RFP No. 201-2014 B); and ii. award the Project to the Preferred
Proponent.”
52 Adopted 2016 Operating Budget - Overview

M. That the City execute, deliver and perform the agreement to Design, Build, Finance, (Operate) and Maintain the City of Winnipeg’s Southwest Rapid Transitway (Stage 2) and Pembina Highway Underpass (the “Project Agreement”) and all such other agreements ancillary to the Project Agreement as deemed necessary by the Director of Legal Services and City Solicitor (the “Ancillary Agreements”), and that authority be delegated to the Chief Administrative Officer to approve the terms and conditions of, and deliver, the Project Agreement and all Ancillary Agreements.
N. That Council authorize the Community Centre Renovation Grant Program
(CCRGP) to interim finance up to $167,000 for a funding shortfall in 2016 for the Garden City Community Centre Seven Oaks Arena project and that future negotiations with the Province of Manitoba establish repayment of this amount from the 2017 Manitoba Winnipeg Infrastructure Agreement (MWIA) funding and that the Chief Financial Officer be authorized to negotiate and approve the terms and conditions of any agreements required to implement the intent of the foregoing.
O. That the Southwest Rapid Transitway (Stage 2) and Pembina Highway
Underpass capital project be updated to reflect confirmed P3 Canada funding of up to $137.3 million.
P. That the Chief Financial Officer be given the authority to redistribute
financing sources, including provincial funding, federal gas tax revenue, cash to capital and debt financing in accordance with Council approved borrowing by-laws, provided the total approved financing is not exceeded, to ensure the most effective use and timing of financing sources.
Q. That unutilized borrowing authority in the Sewage Disposal Utility of
$58.429 million be cancelled as follows:
R. That the Director of Legal Services and City Solicitor be requested to submit
the necessary borrowing by-law directly to Council.
3. That the Proper Officers of the City be authorized to do all things necessary to implement the foregoing.
By-Law Number
$000s
183/2004 4,02532/2007 600219/2007 17,37523/2013 19,8585/2015 16,571Total 58,429
Adopted 2016 Operating Budget - Overview 53
kmorton
Text Box
Return to Table of Contents
kmorton
Text Box

WINNIPEG POLICE BOARD BUDGET RECOMMENDATIONS
COUNCIL DECISION (March 22, 2016): Council concurred in the recommendation of the Winnipeg Police Board, as amended, and adopted the following: 3. A. That the Board recommend that Council enter into negotiations with the
Government of Manitoba to align its support to policing in Winnipeg with the shared priorities set out in the strategic plan established by the Board for the Winnipeg Police Service.
B. That the Board recommend that Council consult with the Winnipeg Police Board
on the mandate for collective bargaining negotiations, with respect to matters that affect the role of the Board.
C. That the Board recommend that Council allocate additional staff resources to the
Winnipeg Police Board, from within the existing City staff complement, to provide up to .25 FTE to strengthen the capacity of the Board to carry out independent financial analysis and review and expenditure management oversight, with the staff person having a dual reporting relationship to the Board’s Executive Director and his or her current supervisor.
4. That the 2016 Preliminary Capital and Operating Budgets of the Winnipeg Police Service be amended as follows:
A. That the 2016 Preliminary Capital Budget be amended by partially deferring the Police Divisions Systems Upgrades project by $1 million (Volume 3 page 2-94) to the 2017 Capital Forecast;
B. That the 2017 Capital Forecast for the Body Worn Camera System project
(Volume 3 page 2-98) of $1 million be deleted in order to accommodate the capital project deferral noted above;
C. That the reduction in 2016 Capital Budget of $1 million due to capital project deferrals noted above will result in savings in the Winnipeg Police Service operating budget through a corresponding reduction in the department’s transfer to capital account, and thereby a reduction in the expenditure management amount to $2.5 million to maintain a year over year increase of 6.32% for departmental expenditures overall;
D. That all relevant references to cash to capital amounts for the Winnipeg Police Service and City-wide be adjusted accordingly, as required throughout the budget volumes.
54 Adopted 2016 Operating Budget - Overview
kmorton
Text Box
Return to Table of Contents
kmorton
Text Box

Budget Process
A public budget consultation process was undertaken for the 2016 budget. The 2016 Budget Consultation process allowed citizens to provide feedback through various online tools, including electronic kiosks located in public facilities, and in-person options. An annual citizen survey was also undertaken.
The previous year’s adopted budget, adjusted to reflect recent City Council approvals and any new developments, forms the starting point for budget development.
Budgets are updated by the departments and submitted for administrative review and corporate compilation.
The Executive Policy Committee has responsibility for budget development.
The Preliminary Operating and Capital Budget is tabled at a meeting of Executive Policy Committee.
The Executive Policy Committee refers the preliminary operating and capital budget to the City’s Standing Policy Committees for review and recommendations. Each Committee reviews the part of the budget related to its jurisdiction:
Infrastructure Renewal and Public Works, Water and Waste, Riverbank Management and the
Environment, Property and Development, Heritage and Downtown
Development, Protection, Community Services and Parks, and The Winnipeg Police Board
The Committees hear presentations by departments. Members of the public may also make presentations at these meetings.
STEP 1
Public Consultation
STEP 2
Initial Development
STEP 4
Committee Review
STEP 3
Table Preliminary
Budgets
Adopted 2016 Operating Budget - Overview 55
kmorton
Text Box
Return to Table of Contents
kmorton
Text Box

The Executive Policy Committee provides for delegations from the public and reviews the recommendations from the Standing Policy Committees. Recommendations are finalized by the Executive Policy Committee and forwarded to Council.
Council debates, amends, and adopts the operating and capital
budget received from the Executive Policy Committee. Council then passes a by-law to set the mill rate for the
operating tax-supported budget. Council also gives first reading, if required, of a borrowing by-
law to externally finance the capital program. In accordance with legislation, approval of the borrowing is then requested of the Provincial Minister of Finance. Once authorization is received from the Minister, Council gives second and third readings of the by-law before it is passed.
Council must adopt the operating budget no later than March 31 each year, and the capital budget and five-year forecast by December 31 each year, as required by “The City of Winnipeg Charter”.
Budget Amendments
Operating Budget Amendment Process
From time to time during the year, it may be necessary to amend the operating budget for new programming or existing programming. New programming must be approved by Council. The Standing Policy Committee on Finance is the body authorized to approve the addition of budgeted amounts to existing programming. The Public Service has some flexibility.
Capital Budget Amendment Process
From time to time during the year, it may be necessary to amend the capital budget. Any new capital project, whether funded by surpluses from other projects or by new funding, must be approved by Council. Additional borrowing authority must be approved by the Minister of Finance of the Province of Manitoba and enacted through a by-law of Council.
A Standing Policy Committee of Council can approve transfers of budgets between existing capital projects. If the transfer is smaller than $100,000 or 25% of the budget being increased (whichever is the lesser), the transfer can be approved by the Public Service.
STEP 5
Council Approval
56 Adopted 2016 Operating Budget - Overview

2016 Adopted Operating Budget - All ServicesTax Supported, Utilities and SOAs
Page #Service
RevenueInvestment
(Cost) Net FTEsInfrastructure Renewal and Public Works
3 Roadway Construction and Maintenance 65.626 93.906 (28.280) 232 7 Transportation Planning and Traffic Management 2.416 21.872 (19.456) 166
10 Roadway Snow Removal and Ice Control 0.185 33.523 (33.338) 137 13 Public Transit 200.410 200.410 - 1,562
Public Transit - Subsidy - 69.919 (69.919) 16 City Beautification 0.096 17.071 (16.975) 123 19 Fleet Management (SOA) 50.544 50.776 (0.232) 136 21 Parking Authority (SOA) 16.814 17.068 (0.254) 59
Infrastructure Renewal and Public Works 336.091 504.545 (168.454) 2,415 Water and Waste, Riverbank Management and the Environment
23 Water 113.812 110.964 2.848 414 26 Wastewater 166.067 145.939 20.128 410 29 Land Drainage and Flood Control 10.472 11.353 (0.881) 25 32 Solid Waste Collection 1.081 19.928 (18.847) 12 34 Solid Waste Disposal 17.253 12.909 4.344 41 37 Recycling and Waste Diversion 26.083 27.222 (1.139) 66
Water and Waste, Riverbank Management and the Environment
334.768 328.315 6.453 968
Property and Development, Heritage and Downtown Development
41 City Planning 0.003 1.976 (1.973) 17 44 Neighbourhood Revitalization 1.143 9.028 (7.885) 28 47 Development Approvals, Building Permits and Inspections 25.991 18.847 7.144 207 50 Economic Development 1.401 1.989 (0.588) 4 52 Heritage Conservation - 0.462 (0.462) 3 54 Property Asset Management 16.022 14.835 1.187 41 57 Municipal Accommodations 75.098 75.098 - 296 59 Cemeteries 1.321 2.403 (1.082) 25
Property and Development, Heritage and Downtown Development
120.979 124.638 (3.659) 621
Protection, Community Services and Parks / Winnipeg Police Board
63 Police Response 22.085 230.156 (208.071) 1,558 66 Crime Prevention 3.963 45.712 (41.749) 299 69 Traffic Safety and Enforcement 22.001 18.211 3.790 89 72 Fire and Rescue Response 4.453 115.890 (111.437) 852 75 Fire and Injury Prevention 0.440 5.709 (5.269) 41 78 Medical Response 54.537 68.346 (13.809) 492 81 Disaster Preparedness and Response - 0.373 (0.373) 2 83 Recreation 13.363 52.448 (39.085) 358 86 Parks and Urban Forestry 1.764 39.939 (38.175) 315 90 Golf Services (SOA) 3.462 2.750 0.712 24
Golf Services - Subsidy - 0.750 (0.750) 92 Community Liveability 0.842 4.880 (4.038) 44 95 Libraries 2.934 31.047 (28.113) 286 98 Arts, Entertainment and Culture - 26.050 (26.050) 6
101 Insect Control 3.007 10.016 (7.009) 68 104 Animal Services (SOA) 3.880 3.785 0.095 28
Animal Control and Care - Subsidy - 1.379 (1.379) Protection, Community Services and Parks / Winnipeg Police Board
136.731 657.441 (520.710) 4,462
Executive Policy Committee107 Organizational Support Services 0.859 44.303 (43.444) 363 110 Assessment, Taxation and Corporate 797.563 22.186 775.377 143 114 Contact Centre - 311 1.449 5.949 (4.500) 87 116 Council Services 0.114 14.676 (14.562) 79
Executive Policy Committee 799.985 87.114 712.871 672
Total City Services (unconsolidated) 1,728.554 1,702.053 26.501 9,138
Services(millions of $)
2016 Adopted Budget
Adopted 2016 Operating Budget - Service Based 1
kmorton
Text Box
Return to Table of Contents

2016 Adopted Operating Budget - All ServicesTax Supported, Utilities and SOAs
Notes: Amounts in the financial tables are system generated and rounded to the nearest thousand. Therefore, totals and sub-totals may be impacted.
2 Adopted 2016 Operating Budget - Service Based

Roadway Construction and MaintenanceIncludes:
• Bridge Construction & Maintenance• Regional Streets Construction & Maintenance• Local Streets Construction & Maintenance• Regional Sidewalk Construction & Maintenance• Local Sidewalk Construction & Maintenance
Description Key GoalsTo provide citizens with access to well-maintained roadways, sidewalks and bridges in order to ensure the safe, efficient movement of people, goods and services.
1. Expand and refine Roadway Asset Management systems.
2. Support Downtown revitalization.3. Provide optimized delivery of infrastructure projects.4. Utilize principles of environmental stewardship.5. Coordinate processes with other major project
stakeholders.6. Implement active transportation components in
regional street projects where feasible.
Service Level Statistics Description 2012 2013 2014Roadway transferred from developers (lane-km) 50.57 71.28 53.2Capital Addition of Regional Streets (lane-km) 6.8 17.5 27.8Capital Reconstruction of Regional Streets (lane-km) 1.5 0 10.2Capital Rehabilitation of Regional Streets (lane-km) 17.7 24 25.2Capital Reconstruction of Local Streets (lane-km) 3.75 8.42 19.2Capital Rehabilitation of Local Streets (lane-km) 61.46 67.28 85.66Capital Addition of Surfaced Alleys (lane-km) 0.414 0.662 0.501Capital Reconstruction of Alleys (lane-km) 4.34 8.36 3.16New Pedestrian/Cycle Pathways (meters) 2,270 6,735 7,969Major Bridge Rehabilitations 4 locations
$13,850,0003 locations
$19,045,6542 locations $4,157,000
Significant Bridge Maintenance Repair Works 25 locations $601,000
27 locations $504,000
26 locations $775,500
Slope Stabilization Works nil
1 location $1,500,000 nil
Bridge Deck Sealing Program 6 locations $22,600
23 locations $171,400
20 locations $146,300
Overhead Sign Structure Maintenance 2 locations $46,400
3 locations $76,500
5 locations $147,400
Adopted 2016 Operating Budget - Service Based 3
kmorton
Text Box
Return to Table of Contents
kmorton
Text Box
Return to Summary

Roadway Construction and MaintenanceContributing DepartmentsPublic Works 100 %
Operating Budget
(in millions of $)2014
Actual2015
Budget
2016AdoptedBudget
Variance Expl.
2017Projected
2018Projected
Service revenue 43.141 49.719 65.626 67.193 72.409Provincial funding (service specific) - - - - -
Revenues 43.141 49.719 65.626 1 67.193 72.409
Salaries and benefits 15.874 16.559 17.234 17.558 17.969Services 13.371 13.359 13.447 13.854 14.259Materials, parts, and supplies 8.484 11.024 10.658 10.726 10.778Assets and purchases 0.045 0.031 0.033 0.033 0.033Debt and finance charges 14.510 9.648 8.786 9.367 8.088Grants, transfers and other 1.768 1.860 1.927 1.928 1.928Recoveries (12.200) (13.997) (14.158) (14.198) (14.240)
Operating Expenses 41.854 38.485 37.928 39.268 38.815
Transfer to Capital 13.393 20.273 12.478 13.863 14.991
Transfer to Capital - Frontage Levy - - 10.000 10.000 11.000
Transfer to Local Street Renewal Reserve
9.200 14.100 19.000 23.900 28.800
Transfer to Regional Street Renewal Reserve
4.700 9.600 14.500 19.400 24.300
Total Expenses 69.147 82.457 93.906 2 106.431 117.906
Mill Rate Support/(Contribution) 26.006 32.738 28.279 39.238 45.497Full-time Equivalent Positions 239 230 232 232 232
Explanation of 2016 change from 2015
(in millions of $)1 Revenues
Increase in frontage levy revenue 13.245Transfer of surplus from General Revenue Enterprise Fund 2.400Experience rebate from Manitoba Public Insurance for Equipment Operator Training program
0.172
Miscellaneous adjustments 0.09015.907
4 Adopted 2016 Operating Budget - Service Based

Roadway Construction and Maintenance2 Expenses
Transfer to Capital - Frontage Levy 10.000Transfer to Regional Street Renewal Reserve 4.900Transfer to Local Street Renewal Reserve 4.900Increase in salaries and benefits 0.409Increase in salaries and benefits for additional asset management staff 0.266Decrease in recovery from Winnipeg Fleet Management Agency for Equipment Operator Training program
0.195
Increase in facility costs 0.128Grant to University of Manitoba for Research Chair in Municipal Infrastructure 0.050Transfer to Capital (7.795)Decrease in debt and finance charges (0.862)Increase in recoveries from capital program for additional asset management expenditures
(0.560)
Decrease in fleet equipment and fleet-related accounts (0.139)Miscellaneous adjustments (0.043)
11.449
Full-time Equivalent PositionsIncrease of 2 FTEs due to additional asset management staff.
Service Detail
Sub-services (in millions of $)2014
Actual2015
Budget
2016AdoptedBudget
2017 Projection
2018 Projection
Bridge Constr & Maint Revenue 0.003 - 10.012 10.012 11.012Operating expenses 7.246 5.826 2.841 2.879 2.921Transfer to Capital 7.870 5.429 13.478 11.638 18.644
15.113 11.255 6.307 4.505 10.553
Regl Streets Constr & Maint Revenue 22.786 26.298 29.223 30.214 32.449Operating expenses 15.689 15.006 18.143 18.987 18.314Transfer to Capital 9.312 19.543 21.017 29.024 28.946
2.214 8.251 9.936 17.797 14.812
Local Streets Constr & Maint Revenue 17.620 21.614 24.388 24.884 26.714Operating expenses 16.220 15.469 15.126 15.554 15.696Transfer to Capital 9.237 17.801 19.435 23.900 28.800
7.837 11.656 10.173 14.569 17.783
Regl Sidewalk Constr & Maint Revenue 1.641 0.535 0.590 0.614 0.657Operating expenses 1.081 0.821 0.468 0.477 0.487Transfer to Capital 0.875 1.124 1.899 2.351 2.451
0.315 1.410 1.777 2.214 2.281
Local Sidewalk Constr & Maint Revenue 1.091 1.273 1.413 1.469 1.578Operating expenses 1.618 1.363 1.350 1.372 1.396Transfer to Capital - 0.075 0.149 0.251 0.250
0.527 0.165 0.086 0.153 0.068
Mill Rate Support/(Contribution) 26.006 32.738 28.279 39.238 45.497
Adopted 2016 Operating Budget - Service Based 5

Roadway Construction and Maintenance
Additional Financial Information
Reserves
Balance, December 31 (in millions of $)2014
Actual2015
Actual
2016AdoptedBudget
2017 Projection
2018Projection
Federal Gas Tax Reserve 0.129 0.173 0.174 0.175 0.176Local Street Renewal Reserve 0.850 1.236 0.386 0.387 0.388Regional Street Renewal Res 0.187 0.617 0.430 0.431 0.433
Note: Balances in Federal Gas Tax Reserve include Winnipeg Transit portion.
Capital Budget2016
Adopted2017 - 2021
Forecast6 YearTotal
(In millions of $) 298.269 685.761 984.030
6 Adopted 2016 Operating Budget - Service Based
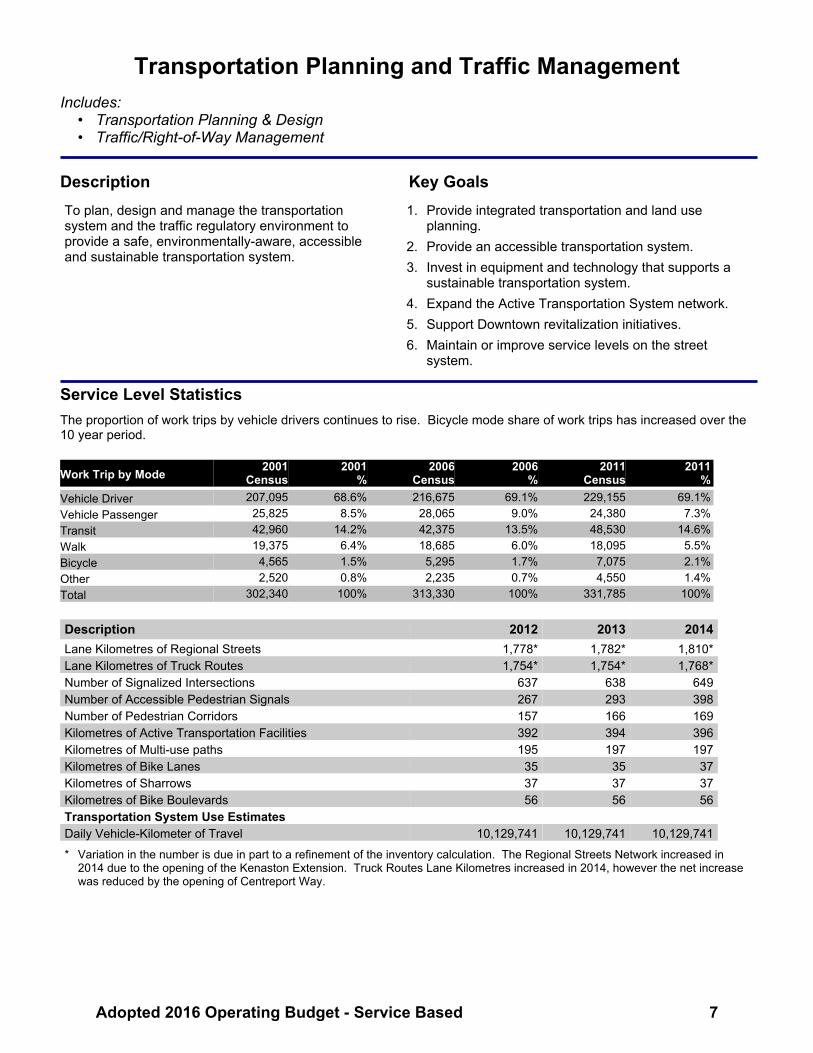
Transportation Planning and Traffic ManagementIncludes:
• Transportation Planning & Design• Traffic/Right-of-Way Management
Description Key GoalsTo plan, design and manage the transportation system and the traffic regulatory environment to provide a safe, environmentally-aware, accessible and sustainable transportation system.
1. Provide integrated transportation and land use planning.
2. Provide an accessible transportation system.3. Invest in equipment and technology that supports a
sustainable transportation system.4. Expand the Active Transportation System network.5. Support Downtown revitalization initiatives.6. Maintain or improve service levels on the street
system.
Service Level StatisticsThe proportion of work trips by vehicle drivers continues to rise. Bicycle mode share of work trips has increased over the 10 year period.
Work Trip by Mode 2001Census
2001%
2006Census
2006%
2011Census
2011%
Vehicle Driver 207,095 68.6% 216,675 69.1% 229,155 69.1%Vehicle Passenger 25,825 8.5% 28,065 9.0% 24,380 7.3%Transit 42,960 14.2% 42,375 13.5% 48,530 14.6%Walk 19,375 6.4% 18,685 6.0% 18,095 5.5%Bicycle 4,565 1.5% 5,295 1.7% 7,075 2.1%Other 2,520 0.8% 2,235 0.7% 4,550 1.4%Total 302,340 100% 313,330 100% 331,785 100%
Description 2012 2013 2014Lane Kilometres of Regional Streets 1,778* 1,782* 1,810*Lane Kilometres of Truck Routes 1,754* 1,754* 1,768*Number of Signalized Intersections 637 638 649Number of Accessible Pedestrian Signals 267 293 398Number of Pedestrian Corridors 157 166 169Kilometres of Active Transportation Facilities 392 394 396Kilometres of Multi-use paths 195 197 197Kilometres of Bike Lanes 35 35 37Kilometres of Sharrows 37 37 37Kilometres of Bike Boulevards 56 56 56Transportation System Use Estimates Daily Vehicle-Kilometer of Travel 10,129,741 10,129,741 10,129,741
* Variation in the number is due in part to a refinement of the inventory calculation. The Regional Streets Network increased in 2014 due to the opening of the Kenaston Extension. Truck Routes Lane Kilometres increased in 2014, however the net increase was reduced by the opening of Centreport Way.
Adopted 2016 Operating Budget - Service Based 7
kmorton
Text Box
Return to Summary

Transportation Planning and Traffic ManagementContributing DepartmentsPublic Works 99 %Planning, Prop. & Devl. 1 %
Operating Budget
(in millions of $)2014
Actual2015
Budget
2016AdoptedBudget
Variance Expl.
2017 Projection
2018 Projection
Service revenue 2.161 2.074 2.416 2.453 2.494Provincial funding (service specific) - - - - -
Revenues 2.161 2.074 2.416 1 2.453 2.494
Salaries and benefits 13.088 13.321 14.131 14.526 14.892Services 2.928 2.709 2.963 3.051 3.075Materials, parts and supplies 2.663 2.220 2.261 2.438 2.453Assets and purchases 0.073 0.072 0.077 0.077 0.077Debt and finance charges 0.680 0.609 0.017 0.017 0.016Grants, transfers and other 0.973 1.054 1.064 1.064 1.064Recoveries (6.081) (4.012) (3.743) (3.263) (3.287)
Operating expenses 14.324 15.973 16.770 17.909 18.290
Transfer to Capital 2.680 5.925 5.102 2.003 3.827
Total Expenses 17.004 21.899 21.872 2 19.912 22.117
Mill Rate Support/(Contribution) 14.843 19.824 19.456 17.459 19.623Full-time Equivalent Positions 160 161 166 167 167
Explanation of 2016 Change from 2015
(in millions of $)1 Revenues
Increase in street rental permits 0.229Experience rebate from Manitoba Public Insurance for Equipment Operator Training program
0.050
Miscellaneous adjustments 0.0630.342
2 ExpensesIncreased funding for Transportation Management Centre 1.100Increase in salaries and benefits 0.430Increase in fleet equipment and fleet-related accounts 0.064Decrease in recovery from Winnipeg Fleet Management Agency for Equipment Operator Training program
0.056
Transfer to Capital (0.823)Decrease in debt and finance charges (0.592)Increase in recoveries from capital program for additional asset management expenditures
(0.192)
Increase in recoveries from capital program for pedestrian and bicycle path planning position
(0.082)
Miscellaneous adjustments 0.012(0.027)
8 Adopted 2016 Operating Budget - Service Based

Transportation Planning and Traffic Management
Full-time Equivalent PositionsIncrease of 5 FTEs for Transportation Management Centre (4) and for pedestrian and bicycle path planning (1).
Service Detail
Sub-services (in millions of $)2014
Actual2015
Budget
2016AdoptedBudget
2017Projection
2018 Projection
Transportation Plan & Design Revenue 0.061 0.041 0.058 0.059 0.060Operating expenses 2.042 1.593 1.302 1.336 1.380Transfer to Capital 2.380 5.626 4.801 1.702 3.528
4.361 7.179 6.045 2.979 4.848
Traffic/Right of Way Mgt Revenue 2.099 2.034 2.358 2.394 2.434Operating expenses 12.281 14.380 15.469 16.573 16.909Transfer to Capital 0.300 0.299 0.301 0.301 0.299
10.482 12.646 13.412 14.480 14.775
Mill Rate Support/(Contribution) 14.843 19.824 19.456 17.459 19.623
Additional Financial Information
Capital Budget2016
Adopted2017 - 2021
Forecast6 YearTotal
(In millions of $) 6.480 18.400 24.880
Adopted 2016 Operating Budget - Service Based 9

Roadway Snow Removal and Ice ControlIncludes:
• Regional Streets Snow and Ice Removal• Local Streets Snow and Ice Removal• Sidewalk Snow and Ice Removal• Park & Facility Snow and Ice Removal• Snow Disposal Sites
Description Key GoalsUndertake effective roadway snow and ice control services in order to provide safe and accessible conditions on city streets and sidewalks during the winter season.
1. To provide the citizens of Winnipeg with safe and accessible roadway infrastructure during the winter months by delivering efficient and effective snow and ice control services.
2. To implement Best Management Practices for the municipal use of road salt for snow and ice control in winter months in accordance with Environment Canada's Code of Practice for Road Salt Management.
3. To work closely with the private sector to ensure there is a sustainable quantity of private sector equipment to assist the City in carrying out the winter snow clearing operations.
4. To examine various options for the provision of snow disposal sites and develop a long term strategy to provide this service in a cost-effective manner in the future.
Service Level StatisticsDescription 2012 2013 2014Annual Snowfall (centimetres) 112 150 131Days of Snowfall (3 cm or more) 14 15 57Regional Streets - Priority 1 Truck Plows (Department budgets for 3 events) 4 7 7Regional Streets - Priority 1 Grader Plows (Department budgets for 3 events) 2 3 4Bus Routes and Truck Routes - Priority 2 Truck Plows (Department budgets for 3 events) 4 6 7Bus Routes and Truck Routes - Priority 2 Grader Plows (Department budgets for 2 events) 2 3 5Residential Streets - Priority 3 Grader Plows (Department budgets 2 events) 1 3 3Alleys (Department Budgets for 2 events) 2 6 7Salt Applied (tonnes) 25,835 22,547 29,484Sand Applied (tonnes) 60,485 105,000 97,200Snow Removed/Hauled (cubic metres) 64,003 757,982 1,526,000Sidewalks Plowed (kilometres) 33,826 42,632 31,607
10 Adopted 2016 Operating Budget - Service Based
kmorton
Text Box
Return to Summary

Roadway Snow Removal and Ice ControlContributing DepartmentsPublic Works 100 %
Operating Budget
(in millions of $)2014
Actual2015
Budget
2016AdoptedBudget
Variance Expl.
2017 Projection
2018 Projection
Service revenue 0.006 0.014 0.185 0.188 0.192Provincial funding (service specific) - - - - -
Revenues 0.006 0.014 0.185 1 0.188 0.192
Salaries and benefits 11.244 9.224 9.569 9.762 9.999Services 40.126 17.939 18.171 19.661 20.276Materials, parts, and supplies 5.649 4.769 4.555 4.615 4.662Assets and purchases 0.013 0.011 0.012 0.012 0.012Debt and finance charges 0.098 0.070 0.016 0.016 0.016Grants, transfers and other 1.529 1.531 1.364 1.366 1.368Recoveries (0.719) (0.364) (0.164) (0.164) (0.165)
Operating expenses 57.940 33.181 33.523 35.269 36.169
Transfer to Capital - - - - -
Total Expenses 57.940 33.181 33.523 2 35.269 36.169
Mill Rate Support/(Contribution) 57.934 33.166 33.339 35.081 35.977Full-time Equivalent Positions 150 136 137 137 137
Explanation of 2016 Change from 2015
(in millions of $)1 Revenues
Experience rebate from Manitoba Public Insurance for Equipment Operator Training program
0.170
Miscellaneous adjustments 0.0010.171
2 ExpensesIncrease in salaries and benefits 0.231Decrease in recovery from Winnipeg Fleet Management Agency for Equipment Operator Training program
0.193
Increase in salaries and benefits for additional asset management staff 0.114Decrease in facility costs (0.103)Decrease in debt and finance charges (0.054)Miscellaneous adjustments (0.039)
0.342
Full-time Equivalent PositionsIncrease due to refinement of service based view.
Adopted 2016 Operating Budget - Service Based 11

Roadway Snow Removal and Ice Control
Service Detail
Sub-services (in millions of $)2014
Actual2015
Budget
2016AdoptedBudget
2017 Projection
2018 Projection
Regl Streets Snow/Ice Removal Revenue 0.006 - 0.069 0.070 0.072Operating expenses 21.752 12.234 12.375 12.889 13.170Transfer to Capital - - - - -
21.746 12.234 12.306 12.819 13.098
Local Streets Snow/Ice Removal Revenue - 0.007 0.079 0.080 0.082Operating expenses 27.933 15.311 15.455 16.350 16.795Transfer to Capital - - - - -
27.933 15.304 15.376 16.269 16.713
Sidewalk Snow/Ice Removal Revenue - 0.007 0.019 0.019 0.019Operating expenses 3.550 3.823 3.873 4.182 4.324Transfer to Capital - - - - -
3.550 3.816 3.855 4.163 4.305
Parks,Facility Snow,Ice Remove Revenue - - 0.015 0.015 0.016Operating expenses 0.948 1.140 1.135 1.160 1.188Transfer to Capital - - - - -
0.948 1.140 1.120 1.144 1.172
Snow Disposal Sites Revenue - - 0.003 0.004 0.004Operating expenses 3.756 0.672 0.686 0.689 0.692Transfer to Capital - - - - -
3.756 0.672 0.682 0.685 0.689
Mill Rate Support/(Contribution) 57.934 33.166 33.339 35.081 35.977
12 Adopted 2016 Operating Budget - Service Based

Public TransitIncludes:
• Regular Transit• Handi-Transit• Chartered and Special Events Transit
Description Key GoalsTo plan, develop, and operate public transportation service in Winnipeg that: - Provides mobility for those who do not or choose not to use other modes; - Provides weekday peak period service levels that minimize the City's requirement for investment in roadway and bridge infrastructure; - Reduces pollution generated by the overall urban transportation system; and - Reduces energy use by urban transportation. To provide a parallel public transportation service for people who are unable to safely and independently maneuver the fixed route transit system due to a significant impairment to their mobility or a cognitive disability in accordance with eligibility criteria.
1. Improve accessibility, mobility, comfort, convenience, and safety.
2. Improve speed, reliability and ridership.3. Improve environmental sustainability.4. Improve productivity.5. Improve passenger information.6. Improve service reliability. (Handi-Transit)7. Improve productivity. (Handi-Transit)8. Improve customer relations. (Handi-Transit)
Service Level Statistics
Regular and Chartered Transit Handi-TransitDescription 2012 2013 2014Number of Buses in Fleet 565 570 579Easy Access Buses: Number 505 536 546Easy Access Buses: % of Fleet 90% 94% 94%Bus Hours Operated 1,483,561 1,517,237 1,524,643Bus Kilometres Operated 29,146,974 29,689,903 29,763,750Passengers Carried: Annual 48,930,272 49,553,997 49,867,683Passengers Carried: Average Weekday 170,543 173,988 175,388Number of Routes 93 93 93Number of Bus Stops 5,133 5,145 5,176
Description 2012 2013 2014Active Registrants at Year End 7,827 7,486 7,471% of Registrants Age 65+ 74% 73% 73%Passengers Carried: Annual 487,989 487,519 465,696Passengers Carried: Average Weekday 1,638 1,623 1,524Customer No Shows (Annual) 6,744 7,060 7,343Trip Requests Unable to Provide 3,568 4,522 3,773Priority 1 - % of Passengers Carried (Work, Medical, Post-Secondary) 55% 56% 55%Wheelchair - % of Passengers Carried 30% 30% 30%Ambulant - % of Passengers Carried 70% 70% 70%
Adopted 2016 Operating Budget - Service Based 13
kmorton
Text Box
Return to Summary

Public TransitContributing DepartmentsTransit 100 %
Operating Budget
(in millions of $)2014
Actual2015
Budget
2016AdoptedBudget
Variance Expl.
2017 Projection
2018 Projection
Service revenue 81.845 86.337 84.184 86.652 89.378Provincial funding (service specific) 39.543 41.144 46.307 47.076 48.921
Revenues 121.388 127.481 130.491 1 133.727 138.298
Salaries and benefits 98.268 107.711 112.168 117.083 121.872Services 17.581 19.043 19.633 20.543 21.165Materials, parts, and supplies 33.234 29.430 31.097 29.295 30.416Assets and purchases 0.218 0.689 0.729 0.681 0.658Debt and finance charges 10.716 11.359 9.645 10.337 10.457Grants, transfers and other 12.257 9.785 14.066 18.344 20.606Recoveries (3.444) (3.187) (4.101) (4.215) (4.256)
Operating Expenses 168.831 174.831 183.237 192.068 200.918
Transfer to Capital - - 17.173 7.041 11.896
Total Expenses 168.831 174.831 200.410 2 199.109 212.814
Mill Rate Support/(Contribution) 47.443 47.350 69.919 65.382 74.515Full-time Equivalent Positions 1,491 1,545 1,562 1,580 1,587
Explanation of 2016 Change from 2015
(in millions of $)1 Revenues
Increase in Provincial operating and support grants 5.163Revised goods and services revenue projection (based on expected capacity and ridership)
(2.292)
Increase in miscellaneous revenues 0.1393.010
2 ExpensesTransfer to Capital, this variance includes $1.563 million budgeted in 2015 corporate accounts and $4.171 million in 2015 debt and finance charges
17.173
Increase in bus parts 6.427Increase in salaries and benefits 4.457Transfer to Southwest Rapid Transitway (Stage 2) and Pembina Highway Underpass Payment Reserve
3.400
Increase in transfer to Transit Bus Replacement Reserve 0.962Increase in handi-transit contractor fees 0.255Increase in building maintenance 0.190Decrease in motive fuel cost projection (4.915)Decrease in debt servicing costs (1.714)Increase in recoveries (0.915)Increase in miscellaneous expenses 0.259
25.579
Full-time Equivalent PositionsIncrease of 17 FTEs attributed to added service for UPass, including bus maintenance capacity as a result of emission controls and technology changes.
14 Adopted 2016 Operating Budget - Service Based

Public TransitService Detail
Sub-services (in millions of $)2014
Actual2015
Budget
2016AdoptedBudget
2017 Projection
2018 Projection
Regular Transit Revenue 114.741 120.412 123.155 126.161 130.440Operating expenses 157.355 162.643 170.684 179.031 187.383Transfer to Capital - - 17.041 6.987 11.804
42.614 42.231 64.570 59.857 68.748
Handi-Transit Revenue 5.742 6.218 6.478 6.698 6.979Operating expenses 10.571 11.336 11.695 12.168 12.655Transfer to Capital - - 0.132 0.054 0.092
4.830 5.119 5.349 5.525 5.767
Chartered Bus & Special Events
Revenue 0.905 0.852 0.857 0.868 0.879Operating expenses 0.905 0.852 0.857 0.868 0.879Transfer to Capital - - - - -
- - - - -
Mill Rate Support/(Contribution) 47.443 47.350 69.919 65.382 74.515
Additional Financial Information
Reserves
Balance, December 31 (in millions of $)2014
Actual2015
Actual
2016AdoptedBudget
2017 Projection
2018Projection
SW Rapid Transit Corridor Res 8.914 4.729 3.073 3.082 3.092SW Rpd Trwy - 2 & Peb Hwy Udrp - - 3.406 8.525 15.563Transit Bus Replacemt Res 16.766 11.552 0.263 0.349 0.378
Capital Budget2016
Adopted2017 - 2021
Forecast6 YearTotal
(in millions of $) 43.881 174.165 218.046
Adopted 2016 Operating Budget - Service Based 15

City BeautificationIncludes:
• Litter Collection• Public Gardens / Landscaping• Ornamental Lighting / Flags & Banners / Public Art• Graffiti Control• Regional Street Cleaning• Local Street Cleaning
Description Key GoalsTo provide citizens and visitors with flower gardens, streetscaping, cleanliness, graffiti control and public art in order to promote the aesthetic appeal of the City of Winnipeg.
1. Maintain and continuously improve image route streetscaping to contribute to the beautification of our city.
2. Continue to beautify the city through enhanced floral displays, streetscaping, street cleaning and other clean and green initiatives.
3. Reduce graffiti occurrences through ongoing education and awareness while improving the level of service for graffiti removal through partnerships with volunteer community groups and maintaining a database for tracking graffiti incidents.
Service Level StatisticsDescription 2012 2013 2014Number of litter containers in park sites 2,750* 2,750* 2,750*Number of street litter containers 1,587 1,566 1,591Tonnes of boulevard abrasives removed (streets only) 32,070 24,045 22,000Flower Beds (raised/fixed) (m2) 3,267* 3,267* 3,267*Flower Beds (in-ground) (m2) 23,391* 23,391* 23,391*Flower planters ( m2) 1,604* 1,604* 1,604*Hanging baskets (m2 ) 10* 10* 10*Number of park lighting units 3,828* 3,828* 3,828*Number of community clean up & Adopt-A-Park projects 27 28 22Number of graffiti tags removed 15,413 8,637 15,510Square metres of graffiti removed 53,520 43,152 41,586Number of graffiti sites treated 6,716 3,842 6,971Number of public art projects completed 6** 5** 6**Number of flags 67* 67* 67*
* A physical inventory was conducted under the 2012 Parks and Open Space Asset Management data capture. Inventory excludes Assiniboine Park.
** Source: Winnipeg Arts Council
16 Adopted 2016 Operating Budget - Service Based
kmorton
Text Box
Return to Summary

City BeautificationContributing DepartmentsPublic Works 99 %Planning, Prop. & Devl. 1 %
Operating Budget
(in millions of $)2014
Actual2015
Budget
2016AdoptedBudget
Variance Expl.
2017 Projection
2018 Projection
Service revenue 0.007 0.007 0.096 0.098 0.100Provincial funding (service specific) - - - - -
Revenues 0.007 0.007 0.096 1 0.098 0.100
Salaries and benefits 7.904 7.950 8.212 8.363 8.567Services 6.432 6.294 6.296 6.412 6.522Materials, parts, and supplies 1.483 1.126 1.090 1.119 1.141Assets and purchases 0.039 0.031 0.037 0.037 0.037Debt and finance charges 0.050 0.028 0.024 0.024 0.024Grants, transfers and other 1.612 1.585 1.673 1.681 1.689Recoveries (0.683) (0.498) (0.395) (0.396) (0.397)
Operating expenses 16.837 16.516 16.936 17.240 17.582
Transfer to Capital 0.473 0.147 0.135 0.136 0.119
Total Expenses 17.310 16.663 17.071 2 17.375 17.700
Mill Rate Support/(Contribution) 17.303 16.656 16.974 17.278 17.601Full-time Equivalent Positions 128 122 123 124 124
Explanation of 2016 Change from 2015
(in millions of $)1 Revenues
Experience rebate from Manitoba Public Insurance for Equipment Operator Training program
0.089
0.089
2 ExpensesIncrease in salaries and benefits 0.202Increase in facility costs 0.133Decrease in recovery from Winnipeg Fleet Management Agency for Equipment Operator Training program
0.100
Increase in salaries and benefits for additional asset management staff 0.060Decrease in fleet equipment and fleet-related accounts (0.058)Transfer to Capital (0.012)Miscellaneous adjustments (0.017)
0.408
Full-time Equivalent PositionsIncrease of 1 FTE due to additional asset management staff.
Adopted 2016 Operating Budget - Service Based 17

City Beautification
Service Detail
Sub-services (in millions of $)2014
Actual2015
Budget
2016AdoptedBudget
2017 Projection
2018 Projection
Litter Collection Revenue - - 0.022 0.022 0.023Operating expenses 3.497 3.883 3.929 4.015 4.116Transfer to Capital - - - - -
3.497 3.883 3.907 3.993 4.093
Public Gardens/Landscaping Revenue 0.006 0.007 0.029 0.029 0.030Operating expenses 3.941 4.048 4.098 4.177 4.274Transfer to Capital 0.430 0.122 0.121 0.113 0.099
4.366 4.164 4.190 4.261 4.343
OrnLight/Flags,Banners/PubArt Revenue - - 0.004 0.004 0.004Operating expenses 0.785 0.793 0.789 0.801 0.817Transfer to Capital 0.043 0.024 0.014 0.022 0.020
0.828 0.817 0.799 0.819 0.832
Graffiti Control Revenue 0.001 - 0.006 0.006 0.006Operating expenses 1.221 1.296 1.502 1.517 1.537Transfer to Capital - - - - -
1.220 1.296 1.496 1.511 1.531
Regional Street Cleaning Revenue - - 0.019 0.019 0.020Operating expenses 3.239 3.299 3.355 3.407 3.458Transfer to Capital - - - - -
3.239 3.299 3.336 3.388 3.438
Local Street Cleaning Revenue - - 0.016 0.017 0.017Operating expenses 4.153 3.197 3.263 3.322 3.380Transfer to Capital - - - - -
4.153 3.197 3.247 3.306 3.363
Mill Rate Support/(Contribution) 17.303 16.656 16.974 17.278 17.601
Additional Financial Information
Capital Budget2016
Adopted2017 - 2021
Forecast6 YearTotal
(In millions of $) 0.900 4.000 4.900
18 Adopted 2016 Operating Budget - Service Based

Winnipeg Fleet Management Agency (SOA)
Description Key GoalsWinnipeg Fleet Management Agency provides economical, state-of-the-art, safe and eco-friendly fleet vehicle, equipment and other asset management services to The City of Winnipeg and other public sector organizations, in support of their service delivery. The Agency delivers the following comprehensive fleet management services to City of Winnipeg departments: 1. Specification, inspection and contract administration 2. Insurance, licensing and registration 3. Manufacturing and fabrication 4. Seasonal and short-term rentals 5. Surplus sales and disposal 6. Fleet supply with maintenance lease 7. Fuel 8. Repair and maintenance
1. Provide planned, and unscheduled, fleet vehicles and equipment to City departments, meeting operational performance, environmental, and safety requirements.
2. Maintain Fleet Service Centres to support the City's geographically dispersed and varying fleet, providing superior customer service, reliability and safety.
3. Manage the City's fuel distribution system on a day-to-day and emergency basis, providing a safe, dependable and convenient fuel supply.
4. Encourage fleet greenhouse gas emission awareness through research, education, testing, and offering environmentally friendly vehicles and equipment, recommendations and alternative fuels.
Service Level StatisticsDescription 2012 2013 2014Number of vehicle and equipment units managed* 2,014 2,224 2,317Number of vehicle and equipment bid opportunities completed 75 55 46Number of vehicle and equipment units acquired 182 236 175Number of insurance and license registrations completed 1,768 1,805 1,893Number of service repairs, by work order lines completed 36,248 29,298 34,687Number of service labour hours completed 64,685 66,035 57,336Number of parts transactions 40,846 34,511 39,661Number of fuel fill-up transactions and odometer readings verified 112,144 116,205 118,899Litres of unleaded gasoline, clear diesel, and marked diesel provided 8,096,954 8,133,861 8,293,750Number of vehicle and equipment motor pool rental days provided 74,472 89,703 84,619Number of vehicle and equipment units disposed 115 26 81
* The increase in fleet units managed reflects expansion of the Winnipeg Police Service fleet, conversion of a portion of external rentals to internal rentals and external long-term rentals to fleet leases, and fleet units awaiting disposal.
Adopted 2016 Operating Budget - Service Based 19
kmorton
Text Box
Return to Summary

Winnipeg Fleet Management Agency (SOA)Contributing DepartmentsFleet Management 100 %
Operating Budget
(in millions of $)2014
Actual2015
Budget
2016AdoptedBudget
Variance Expl.
2017 Projection
2018 Projection
Service Revenue 48.918 50.737 50.377 51.379 52.404Provincial funding (service specific) 0.159 0.159 0.166 0.170 0.173
Revenues 49.077 50.896 50.544 1 51.549 52.577
Salaries and benefits 8.997 11.246 11.425 11.625 11.896Services 9.053 7.504 7.776 7.760 7.841Materials, parts, and supplies 12.210 12.141 12.254 12.500 12.750Assets and purchases 0.145 0.189 0.351 0.204 0.207Debt and finance charges 16.064 18.461 16.185 17.058 17.980Grants, transfers and other * 3.140 1.532 2.783 1.663 1.992Recoveries (0.011) (0.007) - - -
Expenses 49.598 51.065 50.776 2 50.811 52.665
Surplus/(Deficit) (0.521) (0.169) (0.232) 0.738 (0.088)Full-time Equivalent Positions 113 136 136 136 136
* Restated to reflect Winnipeg Fleet Management Agency (SOA) dividend.
Winnipeg Fleet Management Agency (FMA) is a Special Operating Agency (SOA) with its own operating charter approved by Council. SOA budgets are subject to change based on Council approvals in the business plan report process.
The 2016 budgeted dividend to the General Revenue Fund is $1.492 million.
Explanation of 2016 Change from 2015
(in millions of $)1 Revenues
Increase in fuel sales 0.503Increase in rental income 0.311Increase in gain on sale of capital assets 0.200Increase in services and parts revenue 0.042Decrease in fleet leases (1.408)
(0.352)
2 ExpensesIncrease in dividend to General Revenue Fund 1.400Increase in fuel 0.458Increase in services 0.272Increase in salaries and benefits 0.180Decrease in amortization (1.926)Decrease in interest (0.350)Decrease in parts (0.310)Miscellaneous adjustments (0.013)
(0.289)
20 Adopted 2016 Operating Budget - Service Based

Winnipeg Parking Authority (SOA)
Description Key GoalsThe Parking Authority manages fees for on and off-street parking and City owned public parking facilities. It provides leadership to local parking service providers, and encourages the development of all parking services in support of public policy objectives.
1. Manage a dynamic service delivery structure for all on-street and off-street parking.
2. Improve the quality of service offered to customers.3. Maintain coordination with key stakeholder groups.4. Provide effective facilities management, optimizing the
productive use of physical assets.5. Optimize use of off-street facilities for longer-term
parking, and on-street parking for short-term occupancy.
Service Level StatisticsDescription 2012 2013 2014Number of Pay Stations on Street* 626 637 631Number of Pay Stations in City Lots 12 10 12Number of Parking and Non-Moving Violations Issued 164,041 142,697 152,181Number of High Demand On-Street Spaces 1,271 1,305 1,298Number of Low Demand On-Street Spaces 2,486 2,507 2,507
* Long term construction projects can impact the number of on-street paystations on a year over year basis.
Adopted 2016 Operating Budget - Service Based 21
kmorton
Text Box
Return to Summary

Winnipeg Parking Authority (SOA)Contributing DepartmentsParking Authority SOA 100 %
Operating Budget
(in millions of $)2014
Actual2015
Budget
2016AdoptedBudget
Variance Expl.
2017 Projection
2018 Projection
Service Revenue 16.828 17.165 16.784 16.962 17.145Provincial funding (service specific) 0.042 0.030 0.030 0.030 0.030
Revenues 16.870 17.195 16.814 1 16.992 17.175
Salaries and benefits 2.526 4.000 4.048 4.192 4.348Services 6.638 7.295 7.569 7.687 7.629Materials, parts, and supplies 1.125 1.885 1.634 1.592 1.615Assets and purchases 0.041 0.064 0.079 0.065 0.065Debt and finance charges 2.781 2.782 2.475 2.592 1.916Grants, transfers and other 3.068 1.522 1.265 3.106 1.167Recoveries (0.006) (0.003) (0.003) (0.003) (0.003)
Expenses 16.173 17.545 17.068 2 19.231 16.738
Surplus/(Deficit) 0.697 (0.350) (0.254) (2.239) 0.437Full-time Equivalent Positions 41 59 59 59 59
Winnipeg Parking Authority (WPA) is a Special Operating Agency (SOA) with its own operating charter approved by Council. SOA budgets are subject to change based on Council approvals in the business plan report process.
Explanation of 2016 Change from 2015
(in millions of $)1 Revenues
Increase in meter revenue 0.176Increase in special events revenue 0.110Decrease in enforcement revenue (0.465)Decrease in surface parking lot revenue (0.158)Miscellaneous adjustments (0.044)
(0.381)
2 ExpensesIncrease in services 0.274Increase in salary and benefits 0.048Decrease in materials, parts and supplies and other expenses due to one-time expenditures in 2015 related to new Municipal By-Law Enforcement Act
(0.519)
Decrease in debt and finance charges (0.307)Miscellaneous adjustments 0.027
(0.477)
22 Adopted 2016 Operating Budget - Service Based
kmorton
Text Box
Return to Table of Contents

WaterIncludes:
• Water Supply and Treatment• Water Distribution
Description Key GoalsTo provide citizens with a safe and adequate supply of potable water for residential and commercial use through water supply, storage, treatment, pumping, distribution and metering.
1. To improve the state of the environment and public health.
2. To exceed our customers' needs and expectations.3. To continue improving water quality through ongoing
operation and maintenance of the water treatment plant and the water distribution systems.
4. To increase the efficiency and effectiveness of our services.
5. To implement best practices.6. To maintain a high quality safe working environment.7. To improve information management.
Service Level StatisticsDescription 2012 2013 2014Number of residential accounts 187,279 189,216 191,092Number of commercial and industrial accounts 10,372 10,410 10,473Number of complaints - taste and odour * 198 215 155Average daily volume of water pumped (ML/D) 229 204 211Average volume of water pumped daily per capita (litres) 328 285 297Kilometres of distribution water mains 2,557 2,585 2,592Kilometres of feeder mains 150 150 150Kilometres of water mains cleaned 306 344 647Number of water main breaks 840 695 777Number of hydrants 21,101 21,335 21,692Number of water quality tests conducted ** 49,839 56,967 64,454Average monthly residential water bill $24.09 $26.27 $27.02Number of reservoirs 4 4 4Reservoir capacity (ML) 9,510 9,510 9,510Number of Water Treatment Plants 1 1 1Number of Water Treatment Plant tests conducted ** 37,259 44,045 48,927
* Reflects complaints received through the City's 311 system.** 2013 restated to correct a reporting error.
Adopted 2016 Operating Budget - Service Based 23
kmorton
Text Box
Return to Summary
kmorton
Text Box
Return to Table of Contents

WaterContributing DepartmentsWater and Waste 100 %
Operating Budget
(in millions of $)2014
Actual2015
Budget
2016AdoptedBudget
Variance Expl.
2017 Projection
2018 Projection
Service revenue 101.526 106.798 112.925 127.603 132.348Provincial funding (service specific) 0.734 0.820 0.887 0.872 0.879
Revenues 102.261 107.618 113.812 1 128.475 133.227
Salaries and benefits 30.409 32.074 32.293 33.155 34.097Services 24.277 21.028 20.746 21.255 21.449Materials, parts, and supplies 15.954 14.985 15.134 15.644 15.726Assets and purchases 0.776 0.984 1.102 0.990 0.946Debt and finance charges* 10.982 14.736 12.993 13.177 13.369Grants, transfers and other ** 31.472 35.916 36.503 38.322 39.884Recoveries (5.378) (7.742) (7.807) (8.123) (8.145)
Expenses 108.492 111.982 110.964 2 114.420 117.326
Surplus/(Deficit) (6.231) (4.364) 2.848 14.055 15.901Full-time Equivalent Positions 420 415 414 414 414
* 2014 Actual does not include principal payments on debt.
** Restated to reflect Water Utility dividend.
The Water Utility maintains a retained earnings/working capital balance to fund capital projects on a pay as you go basis and to provide a reserve to prevent significant rate increases in the event of major unforeseen expenditures or shortfalls in revenue. The 2016 budgeted dividend is $13.205 million.
Explanation of 2016 Change from 2015
(in millions of $)1 Revenues
Increase in water sales revenue 6.902Decrease in interest earned (0.382)Miscellaneous adjustments (0.326)
6.194
2 ExpensesDecrease in debt and finance charges (1.743)Decrease in allocated department costs (0.361)Increase in water utility dividend transfer to General Revenue Fund 0.826Miscellaneous adjustments 0.260
(1.018)
Full-time Equivalent PositionsDecrease due to refinement of service based view.
24 Adopted 2016 Operating Budget - Service Based

Water
Service Detail
Sub-Services (in millions of $)2014
Actual2015
Budget
2016AdoptedBudget
2017 Projection
2018 Projection
Water Supply & Treatment Revenue 51.050 53.625 56.835 64.166 66.542Expense 48.075 55.213 54.589 56.242 57.655
2.975 (1.588) 2.245 7.924 8.886
Water Distribution Revenue 51.211 53.993 56.977 64.309 66.685Expense 60.417 56.769 56.374 58.178 59.671
(9.206) (2.776) 0.603 6.131 7.014
Surplus/(Deficit) (6.231) (4.364) 2.848 14.055 15.901
Additional Financial Information
Reserves
Balance, December 31 (in millions of $)2014
Actual2015
Actual
2016AdoptedBudget
2017 Projection
2018Projection
Watermain Renewal Reserve 3.562 5.161 3.726 3.291 3.856
Capital Budget2016
Adopted2017 - 2021
Forecast6 YearTotal
(in millions of $) 45.320 144.899 190.219
Adopted 2016 Operating Budget - Service Based 25

WastewaterIncludes:
• Wastewater Collection• Wastewater Treatment
Description Key GoalsTo provide property owners with the collection, transmission, disposal, treatment and monitoring of wastewater in order to ensure the environmentally appropriate handling of high volume sewage discharge.
1. To improve the state of the environment / public health.
2. To exceed our customers' needs and expectations.3. To increase the efficiency and effectiveness of our
services.4. To successfully develop and implement the Winnipeg
Sewage Treatment Program.5. To operate and upgrade the Sewage Treatment Plants
to achieve environmental licence requirements.6. To strive to better monitor and reduce combined sewer
overflows.7. To implement best practices throughout the
Department.8. To maintain a high quality safe working environment
for our staff.9. To improve information management in the
Department.
Service Level StatisticsDescription 2012 2013 2014Number of billed sewer accounts 197,530 199,498 201,439Number of complaints - raw sewer backup* 748 1,017 1,313Number of complaints - clean sewer backup* 495 772 1,099Volume of wastewater processed (ML/D) 248 245 279Kilometres of collection system pipeline** 2,549 2,579 2,583Number of pumping stations 74 74 74Number of diversion chambers 14 14 14Kilometres of sewer inspected and cleaned 169 104 152Number of industrial waste tests conducted 26,761 40,938 50,403Number of treatment plant tests conducted 107,601 110,796 117,540Number of maintenance holes 45,518 46,266 46,524Average monthly residential sewer bill $31.75 $36.09 $38.32
* Reflects total complaints received through the City's 311 system. After investigation, it has been determined that a high percentage of these are problems within the customer's system, not the City system.
** Includes sanitary, combined and interceptor sewers.
26 Adopted 2016 Operating Budget - Service Based
kmorton
Text Box
Return to Summary

WastewaterContributing DepartmentsWater and Waste 100 %
Operating Budget
(in millions of $)2014
Actual2015
Budget
2016AdoptedBudget
Variance Expl.
2017 Projection
2018 Projection
Service revenue 151.622 159.302 165.182 181.250 198.885Provincial funding (service specific) 0.829 0.882 0.885 0.885 0.905
Revenues 152.451 160.184 166.067 1 182.135 199.790
Salaries and benefits 27.732 31.230 31.573 32.893 34.067Services 23.253 27.075 29.157 31.069 32.049Materials, parts, and supplies 10.411 10.330 10.975 11.164 12.199Assets and purchases 0.126 0.126 0.066 0.067 0.069Debt and finance charges* 0.150 0.005 0.010 1.173 6.747Grants, transfers and other ** 73.382 86.708 76.270 82.658 87.816Recoveries (1.509) (2.119) (2.112) (2.115) (2.119)
Expenses 133.545 153.356 145.939 2 156.908 170.828
Surplus/(Deficit) 18.906 6.828 20.128 25.228 28.962Full-time Equivalent Positions 403 414 410 418 419
* 2014 Actual does not include principal payments on debt.
** Restated to reflect Sewer Utility dividend.
The Wastewater Utility maintains a retained earnings/working capital balance to fund a portion of its capital program on a pay as you go basis and to provide a reserve to prevent significant rate increases in the event of major unforeseen expenditures or shortfalls in revenue. The 2016 budgeted dividend is $18.763 million.
Explanation of 2016 Change from 2015
(in millions of $)1 Revenues
Increase in sewer services revenue 3.440Increase in industrial waste revenue 1.600Increase in hauled waste revenue 0.775Miscellaneous adjustments 0.068
5.883
2 ExpensesIncrease in non professional services 1.531Increase in transfer to environmental projects reserve 0.807Increase in property taxes 0.486Increase in large volume sewer discount program support 0.414Increase in dividend transfer to General Revenue Fund 0.410Increase in salaries and benefits 0.343Increase in allocated departmental costs 0.213Increase in light and power 0.190Decrease in transfer to Sewer Rehabilitation Reserve (9.400)Decrease in transfer to Land Drainage and Flood Control (1.330)Decrease in grants - cash, reclassified to non-professional services (1.300)Miscellaneous adjustments 0.219
(7.417)
Adopted 2016 Operating Budget - Service Based 27

Wastewater
Full-time Equivalent PositionsDecrease due to allocation of internal support.
Service Detail
Sub-services (in millions of $)2014
Actual2015
Budget
2016AdoptedBudget
2017 Projection
2018 Projection
Wastewater Collection Revenue 73.202 77.842 79.574 87.465 96.142Expense 59.512 67.555 63.406 68.023 74.082
13.689 10.287 16.168 19.442 22.059
Wastewater Treatment Revenue 79.250 82.342 86.493 94.671 103.648Expense 74.033 85.801 82.533 88.884 96.745
5.217 (3.459) 3.960 5.786 6.903
Surplus/(Deficit) 18.906 6.828 20.128 25.228 28.962
Additional Financial Information
Reserves
Balance, December 31 (in millions of $)2014
Actual2015
Actual
2016AdoptedBudget
2017 Projection
2018Projection
Environmental Projects Reserve 73.006 83.215 88.335 88.779 80.536Sewer System Rehab Reserve 15.327 19.418 11.452 7.474 5.491
Capital Budget2016
Adopted2017 - 2021
Forecast6 YearTotal
(In millions of $) 702.450 317.575 1,020.025
28 Adopted 2016 Operating Budget - Service Based

Land Drainage and Flood ControlIncludes:
• Flood Control• Land Drainage
Description Key GoalsTo provide property owners with storm and flood water control in order to prevent flood damage to property.
1. To improve the state of the environment / public health.2. To exceed our customers' needs and expectations.3. To increase the efficiency and effectiveness of our
services.4. To implement best practices throughout the
Department.5. To maintain a high quality safe working environment for
our staff.6. To investigate options to improve aesthetics at
stormwater retention basins (SRB).
Service Level StatisticsDescription 2012 2013 2014Number of stormwater retention basins (SRB) 69 71 82Number of permanent flood pumping stations* 34 34 34Number of SRB pumping stations 5 5 5Number of land drainage underpass stations 10 10 10Kilometres of land drainage sewer mains 1,139 1,173 1,178Kilometres of storm relief sewer mains 187 187 187Peak river elevations (>8.5 feet) - spring 18.9 18.8 19.1Peak river elevations (>8.5 feet) - summer 16.6 16.5 17.6
* Six of the permanent flood pumping stations are combined with sanitary lift stations.
Adopted 2016 Operating Budget - Service Based 29
kmorton
Text Box
Return to Summary

Land Drainage and Flood ControlContributing DepartmentsWater and Waste 92 %Public Works 8 %
Operating Budget
(in millions of $)2014
Actual2015
Budget
2016Adopted Budget
Variance Expl.
2017 Projection
2018 Projection
Service Revenue 11.623 11.802 10.472 11.501 10.534Provincial funding (service specific) - - - - -
Revenues 11.623 11.802 10.472 1 11.501 10.534
Salaries and Benefits 2.227 2.246 1.879 2.074 2.094Services 3.044 2.583 2.584 2.419 2.450Materials, parts and supplies 0.758 0.651 0.728 0.724 0.728Assets and purchases - - 0.030 - -Debt and finance charges 2.825 1.600 1.005 1.066 0.697Grants, transfers and other 0.003 0.003 0.001 0.001 0.001Recoveries (0.571) (0.001) - - -
Operating expenses 8.285 7.083 6.228 6.284 5.970
Transfer to Capital 4.598 7.445 5.125 5.899 5.751
Total Expenses 12.883 14.528 11.353 2 12.183 11.720
Mill Rate Support/(Contribution) 1.260 2.726 0.881 0.682 1.186Full-time Equivalent Positions 34 32 25 25 25
Explanation of 2016 Change from 2015
(in millions of $)1 Revenues
Decrease in transfer from Wastewater (1.330)(1.330)
2 ExpensesTransfer to Capital (2.320)Decrease in debt and finance charges (0.595)Decrease in salaries and benefits (0.367)Miscellaneous adjustments 0.107
(3.175)
Full-time Equivalent PositionsDecrease in operational requirements.
30 Adopted 2016 Operating Budget - Service Based

Land Drainage and Flood ControlService Detail
Sub-services (in millions of $)2014
Actual2015
Budget
2016Adopted Budget
2017 Projection
2018 Projection
Flood Control Revenue - - - - -Operating expenses 3.859 2.391 2.067 2.102 1.959Transfer to Capital 2.149 2.126 1.903 2.322 2.042
6.008 4.518 3.969 4.424 4.001
Land Drainage Revenue 11.623 11.802 10.471 11.501 10.534Operating expenses 4.426 4.692 4.161 4.182 4.011Transfer to Capital 2.449 5.318 3.222 3.577 3.708
(4.748) (1.791) (3.088) (3.741) (2.815)
Mill Rate Support/(Contribution) 1.260 2.726 0.881 0.682 1.186
Additional Financial Information
Capital Budget2016
Adopted2017 - 2021
Forecast6 YearTotal
(In millions of $) 7.754 34.595 42.349
Adopted 2016 Operating Budget - Service Based 31

Solid Waste Collection
Description Key Goals2014 was the second year of implementation of the Comprehensive Integrated Waste Management Strategy (CIWMS). The amount of garbage collected and landfilled through the residential collection program in 2014 decreased 19.2% from 2011 tonnage, the last full year for the old services. The collection services include weekly collection of garbage carts from all single-family homes. Other miscellaneous services include surplus waste collection, large item collection, dead animal collection and collection of appliances.
1. To improve the state of the environment / public health.
2. To exceed our customers' needs and expectations.3. To increase the efficiency and effectiveness of our
services.4. To implement best practices throughout the
Department.5. To maintain a high quality safe working environment
for our staff.
Service Level StatisticsDescription 2012 2013 2014Number of dwelling units served 283,546 286,600 289,137Number of small commercial clients 563 579 606Number of small commercial billings per year 2,252 2,316 2,424Weight of residential garbage collected (tonnes) 201,741 173,897 176,011Weight of garbage generated per capita (kilograms) 286 249 248Number of garbage collection contracts 7 7 7Number of large item pick ups per year* 9,095 13,295 13,339
* 2013 numbers have been restated.
32 Adopted 2016 Operating Budget - Service Based
kmorton
Text Box
Return to Summary

Solid Waste CollectionContributing DepartmentsWater and Waste 100 %
Operating Budget
(in millions of dollars)2014
Actual2015
Budget
2016AdoptedBudget
Variance Expl.
2017 Projection
2018 Projection
Service revenue 0.860 1.075 1.081 1.159 1.189Provincial funding (service specific) - - - - -
Revenues 0.860 1.075 1.081 1 1.159 1.189
Salaries and benefits 1.280 1.219 1.013 1.031 1.055Services 16.684 17.595 18.626 19.884 22.643Materials, parts, and supplies 0.073 0.049 0.049 0.049 0.049Assets and purchases 0.014 0.186 0.169 0.172 0.177Debt and finance charges (0.006) 0.008 0.008 0.008 0.008Grants, transfers and other 0.100 0.064 0.062 0.062 0.062Recoveries (0.008) - - - -
Operating Expenses 18.137 19.122 19.928 21.207 23.994
Transfer to Capital - - - - -
Total Expenses 18.137 19.122 19.928 2 21.207 23.994
Mill Rate Support/(Contribution) 17.277 18.047 18.847 20.048 22.805Full-time Equivalent Positions 18 15 12 12 12
Explanation of 2016 Change from 2015
(in millions of $)1 Revenues
Increase in bulky waste revenue 0.113Increase in revenue from garbage cart billings 0.050Decrease in small commercial revenue (0.157)
0.006
2 ExpensesIncrease in collection contract costs 0.864Increase in landfill tipping fees 0.209Decrease in salaries and benefits (0.206)Miscellaneous adjustments (0.061)
0.806
Full-time Equivalent PositionsDecrease due to refinement of service-based view.
Adopted 2016 Operating Budget - Service Based 33

Solid Waste Disposal
Description Key GoalsThe Brady Road Resource Management Facility is the only active landfill for the City of Winnipeg and takes all of the City's residential garbage and some of the commercial garbage. The facility is open every day of the year except for New Year's Day, Remembrance Day, and Christmas Day. This area also includes the maintenance and environmental monitoring of the 33 closed landfills within the City.
1. To improve the state of the environment / public health.
2. To increase opportunities to reduce the amount of material landfilled.
3. To exceed our customers' needs and expectations.4. To increase the efficiency and effectiveness of our
services.5. To implement best practices throughout the
Department.6. To maintain a high quality safe working environment
for our staff.7. To initiate landfill gas recovery projects to reduce
greenhouse gases.
Service Level StatisticsDescription 2012 2013 2014Number of tonnes disposed 432,653 394,924 392,996Total number of small load vehicles* 93,585 93,506 91,968Total number of commercial and residential vehicles 62,537 67,485 65,691Number of landfill accounts 823 851 906Number of landfill billings per year 9,876 10,212 10,872
* Small load vehicles statistics represent residents hauling their own residential garbage (old fences, furniture and fixtures etc.) by car or truck to the landfill.
34 Adopted 2016 Operating Budget - Service Based
kmorton
Text Box
Return to Summary

Solid Waste DisposalContributing DepartmentsWater and Waste 100 %
Operating Budget
(in millions of $)2014
Actual2015
Budget
2016AdoptedBudget
Variance Expl.
2017 Projection
2018 Projection
Service revenue 21.287 14.147 15.169 15.866 16.273Provincial funding (service specific) 5.197 1.939 2.084 2.057 2.059
Revenues 26.484 16.086 17.253 1 17.923 18.331
Salaries and benefits 3.393 3.884 3.136 3.241 3.367Services 7.267 7.997 7.955 8.091 8.115Materials, parts, and supplies 0.623 0.643 0.561 0.563 0.566Assets and purchases - 0.091 0.095 0.095 0.005Debt and finance charges* 0.446 0.366 0.335 0.398 0.462Grants, transfers and other 1.632 0.673 0.833 0.843 0.853Recoveries (0.087) (0.005) (0.005) (0.005) (0.005)
Expenses 13.274 13.647 12.909 2 13.225 13.363
Surplus/(Deficit) 13.210 2.439 4.344 4.698 4.968Full-time Equivalent Positions 53 53 41 41 41
*2014 Actual does not include principal payments on debt.
The Solid Waste Utility maintains a retained earnings/working capital balance to fund a portion of its capital program on a pay as you go basis, and to provide a reserve to prevent significant rate increases in the event of major unforeseen expenditures or shortfalls in revenue.
Explanation of 2016 Change from 2015
(in millions of $)1 Revenues
Net increase in tipping fee revenue 0.976Increase in government grants 0.145Miscellaneous adjustments 0.046
1.167
2 ExpensesDecrease in salaries and benefits (0.748)Decrease in leachate hauling costs (0.254)Decrease in fleet and equipment costs (0.123)Increase in allocated department costs 0.306Miscellaneous adjustments 0.081
(0.738)
Full-time Equivalent PositionsDecrease due to refinement of service based view including reallocation to Recycling and Waste Diversion.
Adopted 2016 Operating Budget - Service Based 35

Solid Waste Disposal
Additional Financial Information
Reserves
Balance, December 31 (in millions of $)2014
Actual2015
Actual
2016AdoptedBudget
2017 Projection
2018Projection
Brady Landfill Rehab Reserve 5.280 5.646 6.160 6.681 7.211
Capital Budget2016
Adopted2017 - 2021
Forecast6 YearTotal
(In millions of $) 5.750 18.700 24.450
36 Adopted 2016 Operating Budget - Service Based

Recycling and Waste DiversionIncludes:
• Recycling• Waste Diversion
Description Key Goals2014 was the second year of implementation of the Comprehensive Integrated Waste Management Strategy (CIWMS). Winnipeg's diversion rate in 2014 was 29.7%, surpassing the 2014 targeted diversion rate of 25%. In 2014 we experienced a 28% increase in yard waste composted and a 1.6% increase in recycling material collected through curbside, depot and public space collection programs. In its first full year of operation, the new landfill gas system at the Brady Road Resource Management Facility captured and flared 109,740 tonnes of carbon dioxide. This is equivalent to avoiding the carbon dioxide emissions of 23,046 passenger cars. In 2014, almost 30,000 metric tonnes of yard waste was composted on the nine-hectare compost pad. Additionally, construction was completed on a new three-hectare pilot facility at the Brady Road Resource Management Facility that will compost about 20% of the more than 50,000 tonnes of the nutrient-rich end product of sewage treatment (biosolids) produced each year at the City's three sewage treatment plants. Waste minimization services include waste diversion depots and an educational program that supports backyard composting, grasscycling, giveaway weekends, and other waste diversion initiatives. The Brady Road Resource Management Facility is the future home to the first 4R Winnipeg Depot, scheduled to open in early 2016.
1. To improve the state of the environment / public health.
2. To increase the opportunity to reduce the amount of material being landfilled.
3. To exceed our customers' needs and expectations.4. To increase the efficiency and effectiveness of our
services.5. To implement best practices throughout the
Department.6. To maintain a high quality safe working environment
for our staff.
Service Level StatisticsDescription 2012 2013 2014Number of dwelling units served 283,546 286,600 289,137Weight of residential recycling material collected (tonnes) 48,133 53,657 54,464Average weight of residential recycling per household (kg) 170 187 188Total compostable yard waste (tonnes) 11,327 23,223 29,754Total Chip-In program recycling (tonnes) 71 66 48Average commodity price per tonne of recyclables sold $97.40 $88.17 $95.02
Adopted 2016 Operating Budget - Service Based 37
kmorton
Text Box
Return to Summary

Recycling and Waste DiversionContributing DepartmentsWater and Waste 100 %
Operating Budget
(in millions of $)2014
Actual2015
Budget
2016AdoptedBudget
Variance Expl.
2017 Projection
2018 Projection
Service revenue 10.064 20.940 22.788 24.890 27.861Provincial funding (service specific) 0.029 2.790 3.295 3.295 3.295
Revenues 10.093 23.730 26.083 1 28.185 31.156
Salaries and benefits 2.008 2.626 4.137 5.148 6.288Services 17.846 19.824 20.735 23.878 31.083Materials, parts, and supplies 0.072 0.160 0.393 0.517 0.650Assets and purchases 0.059 0.197 0.168 0.171 0.175Debt and finance charges - 2.376 2.377 2.937 3.504Grants, transfers and other 0.054 0.368 0.103 0.103 0.103Recoveries (0.027) (0.387) (0.692) (0.708) (0.729)
Expenses 20.013 25.165 27.222 2 32.046 41.074
Surplus/(Deficit) (9.920) (1.435) (1.139) (3.861) (9.918)Full-time Equivalent Positions 27 40 66 81 98The Solid Waste Utility maintains a retained earnings/working capital balance to fund a portion of its capital program on a pay as you go basis, and to provide a reserve to prevent significant rate increases in the event of major unforeseen expenditures or shortfalls in revenue.
Explanation of 2016 Change from 2015
(in millions of $)1 Revenues
Increase in small load tipping fees 0.958Increase in waste diversion user fee 0.734Increase in government grants 0.505Miscellaneous adjustments 0.156
2.353
2 ExpensesIncrease in salaries and benefits 1.512Increase in collection costs for leaf and yard waste 0.518Increase in recycling processing costs 0.428Increase in fleet costs 0.418Decrease in composting costs for leaf and yard waste (0.324)Decrease in transfer to the Waste Diversion Reserve (0.300)Miscellaneous adjustments (0.195)
2.057
Full-time Equivalent PositionsIncrease due to additional positions for the 4R Winnipeg Depots and refinement of service-based view.
38 Adopted 2016 Operating Budget - Service Based

Recycling and Waste DiversionService Detail
Sub-services (in millions of $)2014
Actual2015
Budget
2016Adopted Budget
2017 Projection
2018 Projection
Recycling Revenue 10.093 16.689 17.184 19.077 21.715Operating expenses 19.831 19.286 19.673 22.533 29.477Transfer to Capital - - - - -
(9.739) (2.597) (2.490) (3.456) (7.762)
Waste Diversion Revenue - 7.041 8.899 9.108 9.442Operating expenses 0.181 5.879 7.549 9.513 11.597Transfer to Capital - - - - -
(0.181) 1.162 1.351 (0.406) (2.156)
Surplus/(Deficit) (9.920) (1.435) (1.139) (3.861) (9.918)
Additional Financial Information
Reserves
Balance, December 31 (in millions of $)2014
Actual2015
Actual
2016AdoptedBudget
2017 Projection
2018Projection
Waste Diversion Reserve 1.312 2.369 1.694 1.522 1.526
Capital Budget2016
Adopted2017 - 2021
Forecast6 YearTotal
(In millions of $) 0.400 4.750 5.150
Adopted 2016 Operating Budget - Service Based 39
kmorton
Text Box
Return to Table of Contents
40 Adopted 2016 Operating Budget - Service Based

City PlanningIncludes:
• Area Development & Renewal Planning• City-wide Long Range Planning
Description Key GoalsTo manage a wide range of planning initiatives, such as the OurWinnipeg Development Plan and Complete Communities Direction Strategy, which guide growth and change in Winnipeg. The service reviews ongoing development proposals in a fair and objective manner to ensure the creation of sustainable and complete communities that are responsive to community values, while advising Council on planning processes and development applications. The service enables development and growth that follows the City's development plan through local area planning initiatives, policies, regulations, guidelines and tools while working collaboratively with stakeholders.
1. Support the implementation of OurWinnipeg through a range of effective tools and guidelines.
2. Ensure the City has an adequate supply of land to accommodate projected growth in a sustainable manner.
3. Enhance existing infrastructure and assets in ways that make most amenities for daily living universally accessible.
4. Integrate land use and infrastructure planning in support of the creation of complete communities.
Service Level Statistics
Description 2012 2013 2014No. of Development Servicing Agreements Administered 34 17 53No. of Urban Design Applications Reviewed 111 82 89No. of Zoning Agreements Processed 82 46 83No. of Survey Information Requests (for construction work) 1,974 2,307 2,216No. of Surveys Performed (Contract / In-house) 38 / 106 45 / 95 32 / 70No. of Survey Monuments Restored 148 88 32No. of Street Closings / Openings 16 29 15Number of new *greenfield dwelling units 2,127 1,900 2,096Number of new **infill dwelling units 1,056 1,184 2,149No. of new dwelling units within 400 meters of a regional mixed-use corridor 256 476 872
* Greenfield refers to units built in areas designated as 'Emerging Communities' and 'New Communities'. 'Emerging Communities' are a subset of 'Areas of Stability - Recent Communities' that have been recently planned and are still under development.
** Infill refers to units built in 'Areas of Stability', excluding 'Emerging Communities'.
Adopted 2016 Operating Budget - Service Based 41
kmorton
Text Box
Return to Summary
kmorton
Text Box
Return to Table of Contents

City PlanningContributing DepartmentsPlanning, Prop. & Devl. 100 %
Operating Budget
(in millions of $)2014
Actual2015
Budget
2016AdoptedBudget
Variance Expl.
2017 Projection
2018 Projection
Service revenue 0.028 0.003 0.003 - 0.001Provincial funding (service specific) - - - - -
Revenues 0.028 0.003 0.003 1 - 0.001
Salaries and benefits 1.231 1.440 1.547 1.661 1.718Services 0.161 0.200 0.217 0.190 0.191Materials, parts, and supplies 0.002 0.003 0.003 0.003 0.003Assets and purchases 0.003 0.004 0.004 0.004 0.004Debt and finance charges 0.033 0.014 0.012 0.012 0.012Grants, transfers and other 0.024 0.040 0.043 0.043 0.043Recoveries (0.039) (0.066) (0.072) (0.073) (0.075)
Operating expenses 1.415 1.634 1.755 1.840 1.897
Transfer to Capital 0.312 0.367 0.221 0.344 0.302
Total Expenses 1.727 2.001 1.976 2 2.183 2.199
Mill Rate Support/(Contribution) 1.698 1.998 1.973 2.183 2.198Full-time Equivalent Positions 14 16 17 18 18
Explanation of 2016 Change from 2015
(in millions of $)1 Revenues n/a
2 ExpensesIncrease in salaries and benefits expense to reflect Council adoption of the Comprehensive Fee Review of Planning, Development and Building Fees and Charges report (March 23, 2016)
0.068
Increase in salaries and benefits due to collective agreements 0.039Transfer to Capital (0.146)Miscellaneous adjustments 0.014
(0.025)
Full-time Equivalent PositionsIncrease in 2 FTEs (prorated to 1 FTE in 2016) to reflect Council adoption of the Comprehensive Fee Review of Planning, Development and Building Fees and Charges report (March 23, 2016).
42 Adopted 2016 Operating Budget - Service Based
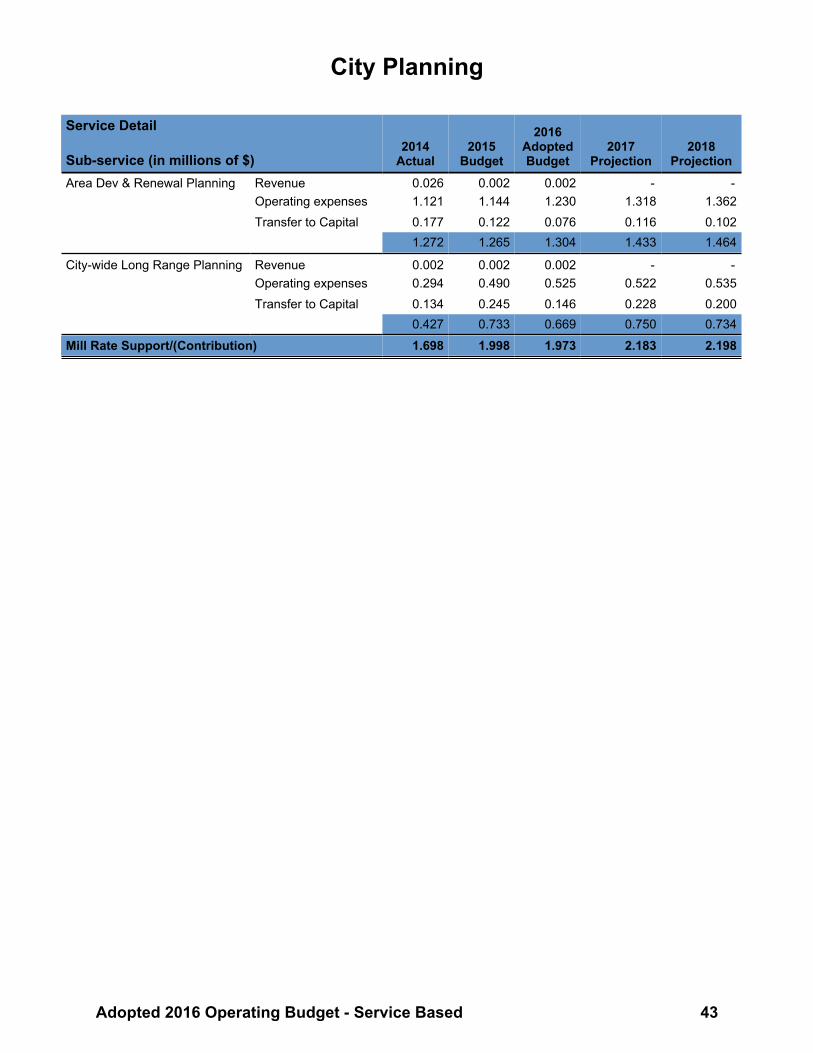
City Planning
Service Detail
Sub-service (in millions of $)2014
Actual2015
Budget
2016AdoptedBudget
2017 Projection
2018Projection
Area Dev & Renewal Planning Revenue 0.026 0.002 0.002 - -Operating expenses 1.121 1.144 1.230 1.318 1.362Transfer to Capital 0.177 0.122 0.076 0.116 0.102
1.272 1.265 1.304 1.433 1.464
City-wide Long Range Planning Revenue 0.002 0.002 0.002 - -Operating expenses 0.294 0.490 0.525 0.522 0.535Transfer to Capital 0.134 0.245 0.146 0.228 0.200
0.427 0.733 0.669 0.750 0.734
Mill Rate Support/(Contribution) 1.698 1.998 1.973 2.183 2.198
Adopted 2016 Operating Budget - Service Based 43

Neighbourhood RevitalizationIncludes:
• Community Development • Housing Initiatives
Description Key GoalsProvide neighbourhood residents with tools and support to build resilient, healthy communities and to promote and deliver community based projects and programs that support sustainable neighbourhoods and healthy communities. This service is provided jointly by Planning, Property and Development, Community Services, and Corporate Support Services. Service activities include the administration of Council's neighbourhood and housing programs including, but not limited to: - Aboriginal Relations - Housing Renewal, Building Communities and Affordable Housing Initiatives - Residential Infill Tax Credit Program - Neighbourhood Multi-Family / Mixed-Use Building Grant Program - Downtown Multi-Family / Mixed-Use Building Grant Program - LiveSAFE in Winnipeg - Crime Prevention through Social Development - Delivery of Homelessness Partnering Strategy - Downtown Residential Development Grant Program
1. Increase community confidence in their neighbourhood and encourage residents to remain and invest in their own communities.
2. Encourage and promote community involvement in defining neighbourhood values and needs and prioritizing neighbourhood infrastructure improvement projects that meet those values and needs.
3. Participate directly in the revitalization of the downtown as a collection of vibrant residential neighbourhoods.
4. Facilitate the development of recreation services that are more responsive to the specific recreational needs of communities with a priority focus on high needs neighbourhoods.
5. Develop, maintain and enhance initiatives and partnerships based on community and corporate priorities to support the engagement and participation of Aboriginal citizens.
6. Work in partnership with community and other levels of government to develop and implement a continuum of crime prevention initiatives.
Service Level StatisticsDescription 2012 2013 2014Targeted Development Grant Programs - # of units created 479 399 200Housing Reserve - $ invested in neighbourhood revitalization and aboriginal housing via housing coordination, infill development, fix up grants, etc. 872,699 788,230 1,021,578Homelessness Partnering Strategy - Funds invested to address homelessness* 0 1,261,186 11,340,578Building Communities Funding ($ 000's) / Projects completed $2,750/10 $3,900/21 $4,205/34Number of Park Projects (New / Completed) 34/27 60/57 37/32Number of Neighbourhood Development Projects (participated in) ** 93 71 57Number of Community Networks (participated in) ** 120 112 45Number of Community Consultations Facilitated ** 34 28 16Number of Internal partnerships and initiatives maintained, developed or enhanced that support Aboriginal citizen participation in the civic system*** 13 22 22Number of external partnerships and initiatives maintained, developed or enhanced that support Aboriginal citizens participation in Winnipeg's economy*** 9 24 30
* Federal Fiscal Year (April to March)** Community Development and Recreation Services. The decreases in the measures for 2014 are a result of a reduction in
resources allocated to community development-related supports.*** Please note that 2012 reflects Aboriginal Youth Strategy, Oshki Annishinabe Nigaaniwak (OAN) statistics only and 2013/2014
include additional partnerships and initiatives due to the creation of the Aboriginal Relations Division in Corporate Support Services.
44 Adopted 2016 Operating Budget - Service Based
kmorton
Text Box
Return to Summary

Neighbourhood RevitalizationContributing DepartmentsCommunity Services 38 %Planning, Prop. & Devl. 36 %Corporate Accounts 26 %
Operating Budget
(in millions of $)2014
Actual2015
Budget
2016AdoptedBudget
Variance Expl.
2017Projection
2018Projection
Service revenue 1.723 1.002 0.893 0.641 0.641Provincial funding (service specific) 0.018 0.250 0.250 0.250 0.250
Revenues 1.741 1.252 1.143 1 0.891 0.891
Salaries and benefits 2.488 2.417 2.389 2.445 2.526Services 0.364 0.292 0.224 0.215 0.216Materials, parts, and supplies 0.021 0.016 0.016 0.014 0.016Assets and purchases 0.003 0.007 0.007 0.007 0.007Debt and finance charges 1.579 0.737 0.572 0.484 0.432Grants, tranfers and other 3.085 3.775 4.269 4.595 4.245Recoveries (0.289) (0.713) (0.259) (0.247) (0.255)
Operating expenses 7.253 6.531 7.218 7.512 7.186
Transfer to Capital 2.162 1.877 1.811 1.926 1.932
Total Expenses 9.415 8.408 9.028 2 9.438 9.118
Mill Rate Support/(Contribution) 7.674 7.156 7.885 8.547 8.227Full-time Equivalent Positions 31 29 28 29 29
Explanation of 2016 Change from 2015
(in millions of $)1 Revenues
Increase in federal grants related to the Homelessness Partnering Strategy program due to change in accounting from federal recoveries
0.391
Decrease in transfer from Housing Rehabilitation Investment Reserve (0.500)(0.109)
2 ExpensesDecrease in federal recoveries due to change in accounting to federal grants 0.391Increase in grants for City's share of operating losses related to social housing projects in accordance with funding arrangements
0.390
Decrease in debt and finance charges (0.165)Transfer to Capital (0.066)Miscellaneous adjustments 0.070
0.620
Full-time Equivalent PositionsDecrease due to the refinement of the service based view.
Adopted 2016 Operating Budget - Service Based 45

Neighbourhood Revitalization
Service Detail
Sub-service (in millions of $)2014
Actual2015
Budget
2016AdoptedBudget
2017 Projection
2018 Projection
Community Development Revenue 0.018 0.501 0.501 0.500 0.500Operating expenses 4.191 4.401 4.395 4.665 4.309Transfer to Capital 2.158 1.877 1.807 1.924 1.929
6.331 5.777 5.701 6.088 5.738
Housing Initiatives Revenue 1.723 0.751 0.642 0.391 0.391Operating expenses 3.062 2.130 2.823 2.847 2.877Transfer to Capital 0.004 - 0.004 0.002 0.003
1.343 1.379 2.185 2.458 2.488
Mill Rate Support/(Contribution) 7.674 7.156 7.885 8.547 8.227
Additional Financial Information
Reserves
Balance, December 31 (in millions of $)2014
Actual2015
Actual
2016AdoptedBudget
2017 Projection
2018Projection
Housing Rehab Invest Reserve 2.158 4.136 3.888 3.890 3.891Multi-Family Dwell Tax Inv Res 5.536 4.600 5.140 5.782 5.650
Capital Budget2016
Adopted2017 - 2021
Forecast6 YearTotal
(In millions of $) 2.590 20.462 23.052
46 Adopted 2016 Operating Budget - Service Based

Development Approvals, Building Permits and InspectionsIncludes:
• Residential Development Approvals & Inspections• Commercial Development Approvals & Inspections
Description Key GoalsEnsure compliance with provincial building codes, by-laws and standards through consultation, education, administration, inspections and the regulatory enforcement of property standards, construction, renovation, and demolition of buildings. This service includes: - Plan examination - Inspections for compliance with codes and other by-law standards - Enforcement action including warnings, penalties, and charges
1. Ensure safe, healthy, accessible buildings through the administration and enforcement of building by-laws and property standards.
2. Continue to streamline the building permit application and approval process for industry professionals and non-professional customers.
3. Enhance our customers' awareness of necessary, safety and non-safety-related building project requirements.
4. Improve our ability to provide timely site inspection services and proactive by-law enforcement.
5. Pursue financial self-sufficiency.6. Transparency of actual performance to targets.
Service Level StatisticsDescription 2012 2013 2014Total New Dwelling Units Created 3,574 3,730 4,625Permit Volumes
Total Residential Permits Issued 6,950 5,724 5,791Total Non-Residential Permits Issued 3,054 2,644 2,739Total Other Building Permits Issued 17,413 17,675 17,598
Total Permits Issued 27,417 26,043 26,128Total Permit Fees $18,609,452 $20,776,399 $22,074,814
Permit Values (in thousands of $) Total for Residential Permit Values 753,421 762,972 849,373Total for Non-Residential Permit Values 777,040 1,001,665 675,922
Total Permit Values 1,530,460 1,764,637 1,525,295Plan Examination Volume (Number of Plans Reviewed): Residential 4,253 3,747 4,455 Commercial 4,773 4,859 5,764 TOTAL 9,026 8,606 10,219Inspection Volume (Number Conducted):
Residential 44,635 55,001 65,526Commercial 42,345 36,486 41,824
Adopted 2016 Operating Budget - Service Based 47
kmorton
Text Box
Return to Summary

Development Approvals, Building Permits and InspectionsContributing DepartmentsPlanning, Prop. & Devl. 98 %Public Works 2 %
Operating Budget
(in millions of $)2014
Actual2015
Budget
2016AdoptedBudget
Variance Expl.
2017Projection
2018Projection
Service revenue 25.315 20.989 25.991 28.380 28.921Provincial funding (service specific) - - - - -
Revenues 25.315 20.989 25.991 1 28.380 28.921
Salaries and benefits 15.134 14.418 16.824 17.705 18.225Services 1.545 1.594 1.648 1.564 1.565Materials, parts and supplies 0.105 0.101 0.090 0.091 0.091Assets and purchases 0.098 0.085 0.084 0.084 0.084Debt and finance charges 0.305 0.305 0.303 0.303 0.303Grants, transfers and other 1.221 0.625 0.606 0.606 0.606Recoveries (0.468) (0.333) (0.916) (0.284) (0.284)
Operating expenses 17.941 16.795 18.640 20.069 20.589
Transfer to Capital 0.888 0.171 0.208 0.223 0.216
Total Expenses 18.829 16.966 18.847 2 20.292 20.805
Mill Rate Support/(Contribution) (6.486) (4.023) (7.144) (8.088) (8.116)Full-time Equivalent Positions 199 180 207 212 212
Explanation of 2016 Change from 2015
(in millions of $)1 Revenues
Increase in land development, variance and conditional use fees to move toward full cost recovery
2.093
Increase in regulation fee revenue due to inflation and revised volume estimate 1.301Increase in revenue to reflect Council adoption of the Comprehensive Fee Review of Planning, Development and Building Fees and Charges report (March 23, 2016)
1.233
Enforcement of non-compliance with Residential Fire Safety by-law 0.3755.002
2 ExpensesIncrease in salaries and benefits expense to reflect Council adoption of the Comprehensive Fee Review of Planning, Development and Building Fees and Charges report (March 23, 2016)
1.233
Consistent with the intent of the above, additional salaries and benefits fully offset by FTE recoveries from the Permit Reserve
0.565
Increase in salaries and benefits due to collective agreements 0.376Increase in salaries and benefits due to addition of 4 positions related to land development, zoning and permits, and inspections
0.232
Transfer to Capital 0.037Increase in FTE recoveries from the Permit Reserve to reflect Council adoption of the Comprehensive Fee Review of Planning, Development and Building Fees and Charges report (March 23, 2016)
(0.633)
Miscellaneous adjustments 0.0711.881
48 Adopted 2016 Operating Budget - Service Based
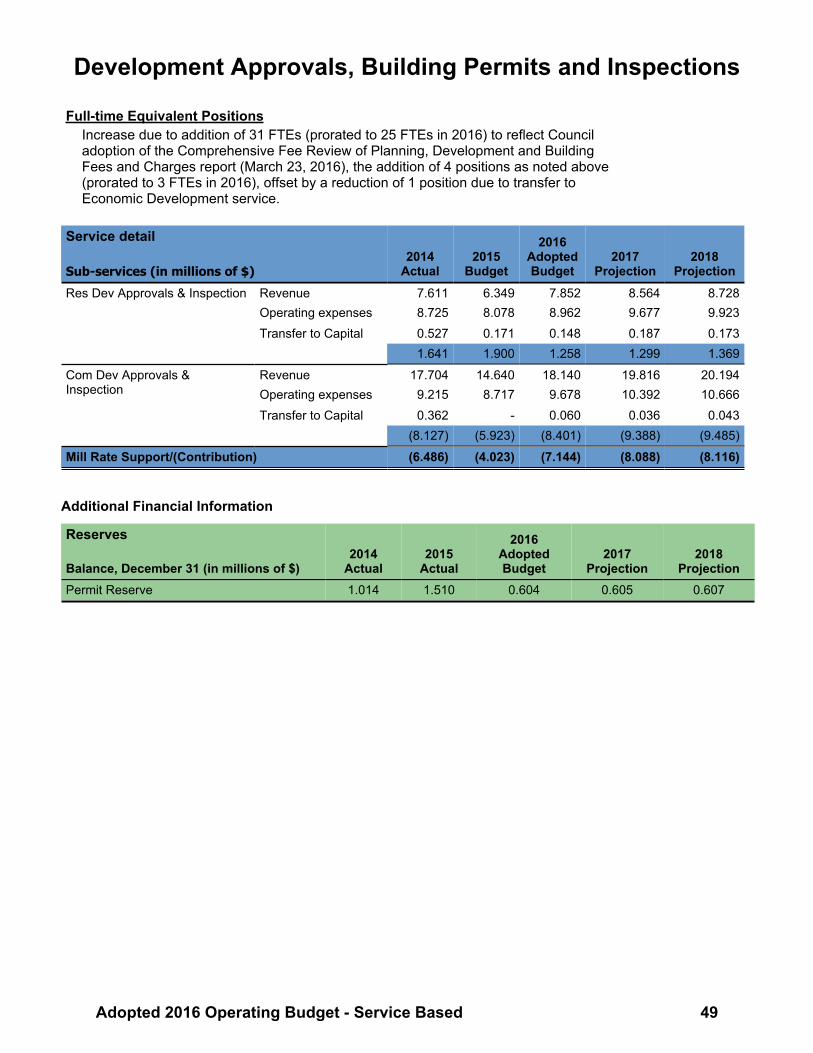
Development Approvals, Building Permits and Inspections
Full-time Equivalent PositionsIncrease due to addition of 31 FTEs (prorated to 25 FTEs in 2016) to reflect Council adoption of the Comprehensive Fee Review of Planning, Development and Building Fees and Charges report (March 23, 2016), the addition of 4 positions as noted above (prorated to 3 FTEs in 2016), offset by a reduction of 1 position due to transfer to Economic Development service.
Service detail
Sub-services (in millions of $)2014
Actual2015
Budget
2016AdoptedBudget
2017 Projection
2018Projection
Res Dev Approvals & Inspection Revenue 7.611 6.349 7.852 8.564 8.728Operating expenses 8.725 8.078 8.962 9.677 9.923Transfer to Capital 0.527 0.171 0.148 0.187 0.173
1.641 1.900 1.258 1.299 1.369
Com Dev Approvals & Inspection
Revenue 17.704 14.640 18.140 19.816 20.194Operating expenses 9.215 8.717 9.678 10.392 10.666Transfer to Capital 0.362 - 0.060 0.036 0.043
(8.127) (5.923) (8.401) (9.388) (9.485)
Mill Rate Support/(Contribution) (6.486) (4.023) (7.144) (8.088) (8.116)
Additional Financial Information
Reserves
Balance, December 31 (in millions of $)2014
Actual2015
Actual
2016AdoptedBudget
2017 Projection
2018Projection
Permit Reserve 1.014 1.510 0.604 0.605 0.607
Adopted 2016 Operating Budget - Service Based 49

Economic Development
Description Key GoalsTo provide information to Council and economic development agencies as well as coordinate resources across City departments in order to respond effectively to high priority projects of strategic and economic importance to the City. Service activities include: - Collaborate with the Province of Manitoba, Economic Development Winnipeg, CentreVenture and other stakeholders to deliver Winnipeg's Economic Development Strategy. - Coordinate interdepartmental technical assistance and due diligence on proposals and initiatives. - Negotiate incentive strategies through business plan and pro-forma analysis. - Manage strategic projects. - Assist in the preparation of communication strategies. - Support 16 Business Improvement Zones (BIZ), representing more than 4,500 businesses throughout the City.
1. Build a strong economic climate for Winnipeg.2. Identify priority investments that support economic
development activity.3. Assist in the development of taxation policy that
enables economic opportunity.4. Broaden service access and convenience to
customers wanting to do business with the City.5. Capitalize on opportunities to establish
intergovernmental and public private partnerships.
Service Level StatisticsDescription 2012 2013 2014Residential Building Permits Issued 7,028 5,795 5,844Residential Building Permit Value (in millions) $762 $768 $861Commercial Building Permits Issued 3,086 2,666 2,751Commercial Building Permit Value (in millions) $779 $1,014 $676Total Building Permit Value (in millions) $1,514 $1,782 $1,538Number of Downtown Development Applications (Construct New, Construct Addition, Alter Exterior)
17 21 21
Construction Value of Downtown Projects Above (in millions) $4 $36 $31Number of Major City-Wide Development Projects (>$2 million)
93 94 91
Construction Value of Major City-Wide Projects (in millions) (>$2 million)
$575 $653 $582
Number of Business Improvement Zones / Businesses in Improvement Zones
16 / 4,796 16 / 4,781 16 / 4,751
50 Adopted 2016 Operating Budget - Service Based
kmorton
Text Box
Return to Summary

Economic DevelopmentContributing DepartmentsPlanning, Prop. & Devl. 65 %City Clerks 16 %Mayor's Office 12 %Corporate 7 %
Operating Budget
(in millions of $)2014
Actual2015
Budget
2016AdoptedBudget
Variance
Expl.2017
Projection2018
ProjectionService revenue 0.401 0.001 1.401 - -Provincial funding (service specific) - - - - -
Revenues 0.401 0.001 1.401 1 0.000 0.000
Salaries and benefits 0.371 0.320 0.406 0.414 0.426Services 0.379 0.468 0.490 0.470 0.470Materials, parts and supplies 0.035 0.024 0.024 0.024 0.024Assets and purchases 0.004 0.002 0.002 0.002 0.002Debt and finance charges 0.553 0.355 0.153 0.147 0.142Grants, transfers and other 0.707 0.420 0.920 0.320 0.320Recoveries (0.008) (0.008) (0.008) (0.008) (0.008)
Operating expenses 2.041 1.583 1.987 1.370 1.376
Transfer to Capital 0.002 - 0.002 0.001 0.001
Total Expenses 2.043 1.583 1.989 2 1.371 1.378
Mill Rate Support/(Contribution) 1.642 1.582 0.588 1.371 1.378Full-time Equivalent Positions 4 3 4 4 4
Explanation of 2016 Change from 2015
(in millions of $) 1 Revenues
One-time transfer from Economic Development Investment Reserve 1.4001.400
2 ExpensesIncrease in Centre Venture operating grant 0.500Increase in salaries and benefits due to transfer of 1 position from Development Approvals, Building Permits and Inspections service
0.084
Decrease in debt and finance charges (0.202)Miscellaneous adjustments 0.024
0.406
Full-time Equivalent PositionsIncrease due to transfer of 1 position as noted above.
Additional Financial InformationReserves
Balance, December 31 (in millions of $)2014
Actual2015
Actual
2016AdoptedBudget
2017 Projection
2018Projection
Economic Dev Invest Reserve 3.698 3.523 0.820 0.625 0.534
Adopted 2016 Operating Budget - Service Based 51

Heritage Conservation
Description Key GoalsTo promote the long-term conservation of heritage assets in the City of Winnipeg.
1. Ensure the long-term conservation of heritage resources in Winnipeg through the implementation of new incentives, integrated planning, district/area designation, regulatory reforms, well established design standards and principled design review.
2. Be a catalyst for greater public awareness, education and participation in heritage conservation.
3. Improve the suitability of Heritage Buildings for occupancy by City Departments and other civic uses.
Service Level StatisticsDescription 2012 2013 2014Total Listed Historic Resources 235 237 242Total Nominated Resources n/a n/a 132Total Commemorated Resources n/a n/a 337Number of Nominated Resources Evaluated for Historical Listing 7 9 14Number of Nominated Resources Listed as Historical 6 2 7Number of Nominated Resources Pending Listing 3 2 7Number of Resources Commemorated* n/a n/a 5Number of Historical Resources Evaluated for De-listing 1 3 1Number of Heritage Resources De-Listed 1 3 0Number of Buildings Receiving Heritage Support from City Council ** 5 0 25Number of Heritage Permits Issued 19 20 21
* The Commemorated list came into effect June 1, 2014 with the enactment of the Historical Resources By-law 55/2014.** These numbers were changed starting in 2014 to reflect the total number of buildings receiving the Heritage Conservation Tax
Credit as well as funding support through the Gail Parvin Hammerquist Fund.
52 Adopted 2016 Operating Budget - Service Based
kmorton
Text Box
Return to Summary

Heritage ConservationContributing DepartmentsPlanning, Prop. & Devl. 100 %
Operating Budget
(in millions of $)2014
Actual2015
Budget
2016AdoptedBudget
Variance Expl.
2017Projection
2018Projection
Service revenue - - - - -Provincial funding (service specific) - - - - -
Revenues - - - 1 - -
Salaries and benefits 0.026 0.247 0.268 0.274 0.282Services 0.005 0.014 0.013 0.011 0.012Materials, parts, and supplies - 0.001 0.001 0.001 0.001Assets and purchases - - - - -Debt and finance charges 0.005 0.002 0.002 0.002 0.002Grants, transfers and other 0.030 0.057 0.057 0.057 0.057Recoveries (0.002) (0.043) (0.047) (0.048) (0.049)
Operating expenses 0.064 0.278 0.294 0.297 0.304
Transfer to Capital - 0.294 0.168 0.269 0.235
Total Expenses 0.064 0.571 0.462 2 0.566 0.539
Mill Rate Support/(Contribution) 0.064 0.571 0.462 0.566 0.539Full-time Equivalent Positions 0 3 3 3 3
Explanation of 2016 Change from 2015
(in millions of $) 1 Revenues: n/a
2 ExpensesTransfer to Capital (0.126)Miscellaneous adjustments 0.017
(0.109)
Additional Financial Information
Reserves
Balance, December 31 (in millions of $)2014
Actual2015
Actual
2016AdoptedBudget
2017 Projection
2018Projection
Heritage Investment Reserve 0.304 0.143 0.004 0.024 0.050
Capital Budget2016
Adopted2017 - 2021
Forecast6 YearTotal
(In millions of $) 0.200 1.271 1.471
Adopted 2016 Operating Budget - Service Based 53
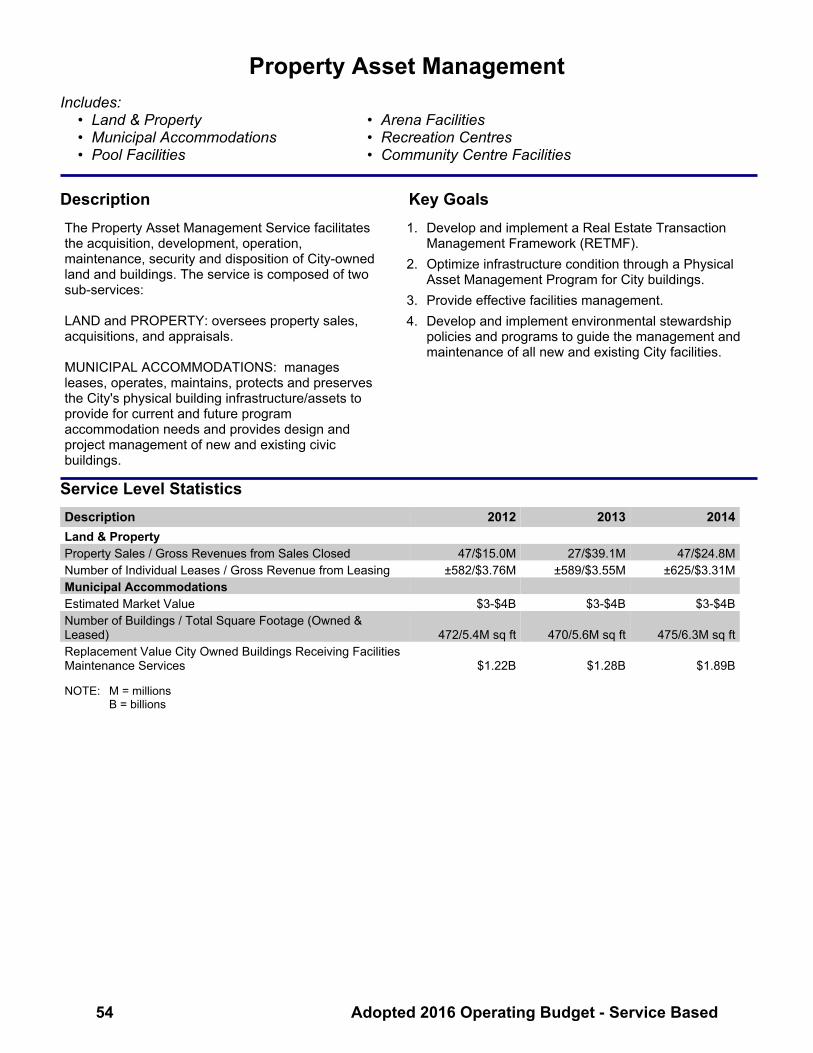
Property Asset ManagementIncludes:
• Land & Property • Arena Facilities• Municipal Accommodations • Recreation Centres• Pool Facilities • Community Centre Facilities
Description Key GoalsThe Property Asset Management Service facilitates the acquisition, development, operation, maintenance, security and disposition of City-owned land and buildings. The service is composed of two sub-services: LAND and PROPERTY: oversees property sales, acquisitions, and appraisals. MUNICIPAL ACCOMMODATIONS: manages leases, operates, maintains, protects and preserves the City's physical building infrastructure/assets to provide for current and future program accommodation needs and provides design and project management of new and existing civic buildings.
1. Develop and implement a Real Estate Transaction Management Framework (RETMF).
2. Optimize infrastructure condition through a Physical Asset Management Program for City buildings.
3. Provide effective facilities management.4. Develop and implement environmental stewardship
policies and programs to guide the management and maintenance of all new and existing City facilities.
Service Level StatisticsDescription 2012 2013 2014Land & Property Property Sales / Gross Revenues from Sales Closed 47/$15.0M 27/$39.1M 47/$24.8MNumber of Individual Leases / Gross Revenue from Leasing ±582/$3.76M ±589/$3.55M ±625/$3.31MMunicipal Accommodations Estimated Market Value $3-$4B $3-$4B $3-$4BNumber of Buildings / Total Square Footage (Owned & Leased) 472/5.4M sq ft 470/5.6M sq ft 475/6.3M sq ftReplacement Value City Owned Buildings Receiving Facilities Maintenance Services $1.22B $1.28B $1.89B
NOTE: M = millions B = billions
54 Adopted 2016 Operating Budget - Service Based
kmorton
Text Box
Return to Summary

Property Asset Management - Tax SupportedContributing DepartmentsPlanning, Prop. & Devl. 100 %
Operating Budget
(in millions of $)2014
Actual2015
Budget
2016AdoptedBudget
Variance Expl.
2017 Projection
2018 Projection
Service Revenue 15.485 17.678 16.022 13.407 11.566Provincial funding (service specific) - - - - -
Revenues 15.485 17.678 16.022 1 13.407 11.566
Salaries and benefits 2.786 3.091 3.311 3.389 3.486Services 0.208 0.206 0.292 0.214 0.214Materials, parts, and supplies 0.014 0.013 0.016 0.016 0.016Assets and purchases 0.013 0.015 0.019 0.019 0.019Debt and finance charges 0.047 0.020 0.018 0.017 0.017Grants, transfers and other 8.313 17.932 12.287 11.673 11.673Recoveries (0.992) (1.138) (1.165) (1.173) (1.184)
Operating expenses 10.390 20.138 14.777 14.155 14.241
Transfer to Capital 0.048 0.150 0.058 0.335 0.282
Total Expenses 10.438 20.288 14.835 2 14.489 14.522
Mill Rate Support/(Contribution) (5.047) 2.610 (1.187) 1.082 2.957Full-time Equivalent Positions 35 39 41 41 41
Explanation of 2016 Change from 2015
(in millions of $) 1 Revenues
Increase in transfer from Municipal Accommodations Fund 5.544Decrease in transfer from Land Operating Reserve (7.200)
(1.656)
2 ExpensesIncrease in salaries and benefits due to refinement of service based view 0.220Decrease in transfer to Municipal Accommodations Fund for vacant, common, and corporate space
(5.581)
Transfer to Capital (0.092)(5.453)
Full-time Equivalent PositionsIncrease due to the refinement of the service based view.
Adopted 2016 Operating Budget - Service Based 55

Property Asset Management - Tax Supported
Service Detail
Sub-services (in millions of $)2014
Actual2015
Budget
2016AdoptedBudget
2017Projection
2018Projection
Municipal Accommodations Revenue 3.625 10.472 16.016 13.407 11.565Operating expenses 8.664 18.192 12.794 12.157 12.182Transfer to Capital 0.026 - 0.036 0.022 0.026
5.065 7.720 (3.185) (1.228) 0.643
Land and Property Revenue 11.860 7.206 0.006 0.001 0.001Operating expenses 1.726 1.946 1.983 1.997 2.059Transfer to Capital 0.022 0.150 0.022 0.313 0.256
(10.112) (5.110) 1.998 2.310 2.314
Mill Rate Support/(Contribution) (5.047) 2.610 (1.187) 1.082 2.957
Additional Financial Information
Reserves
Balance, December 31 (in millions of $)2014
Actual2015
Actual
2016AdoptedBudget
2017 Projection
2018Projection
Land Operating Reserve 39.759 26.715 12.209 14.275 14.246
Capital Budget2016
Adopted2017 - 2021
Forecast6 YearTotal
(In millions of $) 0.200 1.939 2.139
56 Adopted 2016 Operating Budget - Service Based

Property Asset Management - Municipal AccommodationsContributing DepartmentsPlanning, Prop. & Devl. 100 %
Operating Budget
(in millions of $)2014
Actual2015
Budget
2016AdoptedBudget
Variance Expl.
2017 Projection
2018 Projection
Service revenue 74.276 85.464 74.848 79.114 81.252Provincial funding (service specific) 0.321 0.250 0.250 0.250 0.250
Revenues 74.597 85.714 75.098 1 79.364 81.502
Salaries and benefits 18.585 18.919 20.285 20.696 21.216Services 30.217 30.769 29.568 29.236 29.296Materials, parts, supplies 5.666 5.086 5.084 5.026 5.082Assets and purchases 0.014 0.027 0.027 0.027 0.027Debt and finance charges 8.477 11.418 3.523 4.337 4.827Grants, transfers and other 5.944 11.787 17.337 14.736 12.895Recoveries (4.206) (2.764) (3.201) (3.215) (3.215)
Operating expenses 64.696 75.242 72.624 70.844 70.128
Transfer to Capital 9.901 10.472 2.474 8.520 11.374
Total Expenses 74.597 85.714 75.098 2 79.364 81.502
Surplus/(Deficit) - - - - -Full-time Equivalent Positions 287 282 296 296 296
Explanation of 2016 Change from 2015
(in millions of $) 1 Revenues
Increase in transfer from General Revenue Fund for accommodation charges 0.734Increase in rental rates - encroachments 0.375Increase in transfer from other departments and miscellaneous adjustments 0.045Decrease in transfer from the Police Service, related to debt and finance charges for Police Headquarters recorded directly in Police Service budget effective 2016
(7.819)
Decrease in transfer from Community Services for capital expenditures (3.951)(10.616)
2 ExpensesIncrease in transfer to General Revenue Fund 5.544Increase in salaries and benefits for 13 temporary maintenance staff for Police Headquarters and the Office Tower complex
0.868
Increase in salaries and benefits 0.498Transfer to Capital (7.998)Debt and finance charges for Police Headquarters recorded directly in Police Service budget effective 2016
(7.819)
Decrease in contract services that offset temporary Police Headquarters' positions noted above
(0.868)
Increase in recoveries relating to Fire Paramedic locations (0.275)Decrease in utilities cost related to delayed occupancy of Police Headquarters (0.265)Decrease in utilities cost (0.150)Miscellaneous adjustments (0.151)
(10.616)
Adopted 2016 Operating Budget - Service Based 57
kmorton
Text Box
Return to Summary

Property Asset Management - Municipal Accommodations
Full-time Equivalent PositionsIncrease of 13 temporary FTE's in 2016 to provide maintenance support to the Police Headquarters and theOffice Tower complex and 1 permanent FTE (.75 in 2016) to negotiate and administer encroachment agreements.
Service Detail
Sub-services (in millions of $)2014
Actual2015
Budget
2016AdoptedBudget
2017 Projection
2018 Projection
Municipal Accommodations Revenue 52.030 62.768 56.168 55.827 55.881Operating expenses 45.964 56.689 53.988 51.811 50.663Transfer to Capital 5.999 6.080 2.033 3.828 5.021
(0.067) - (0.148) (0.187) (0.197)
Pool Facilties Revenue 14.213 14.382 11.765 15.554 14.807Operating expenses 10.654 10.373 11.098 11.382 11.645Transfer to Capital 2.810 3.300 0.279 3.870 2.862
(0.748) (0.709) (0.388) (0.303) (0.301)
Arena Facilities Revenue 4.876 5.328 4.446 4.647 5.175Operating expenses 5.627 5.651 5.109 5.177 5.289Transfer to Capital 0.363 0.363 0.008 0.108 0.533
1.115 0.686 0.671 0.638 0.647
Recreation Centres Revenue 1.952 1.707 1.644 1.929 3.824Operating expenses 1.713 1.628 1.519 1.546 1.584Transfer to Capital 0.200 0.200 0.103 0.353 2.213
(0.039) 0.121 (0.023) (0.030) (0.027)
Community Centre Facilities Revenue 1.527 1.529 1.075 1.408 1.816Operating expenses 0.737 0.901 0.911 0.928 0.948Transfer to Capital 0.529 0.529 0.052 0.362 0.746
(0.262) (0.099) (0.112) (0.119) (0.122)
Surplus/(Deficit) - - - - -
Additional Financial Information
Capital Budget2016
Adopted2017 - 2021
Forecast6 YearTotal
(In millions of $) 3.166 19.777 22.943
58 Adopted 2016 Operating Budget - Service Based
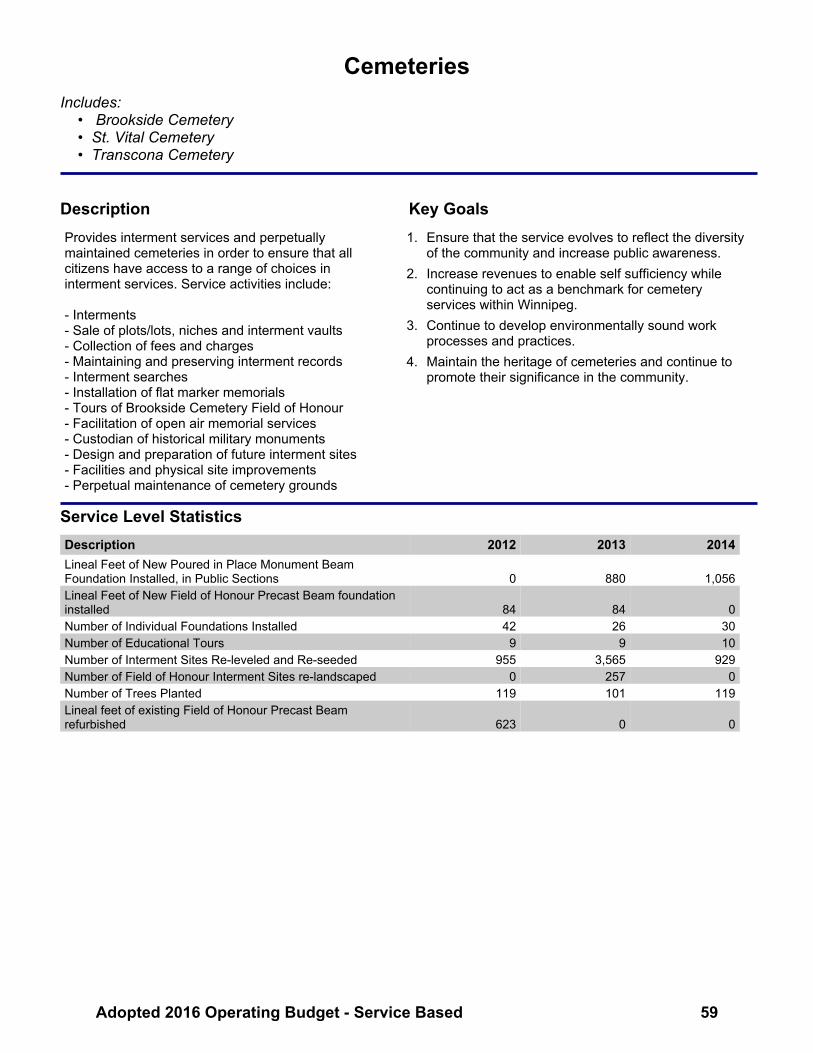
CemeteriesIncludes:
• Brookside Cemetery• St. Vital Cemetery• Transcona Cemetery
Description Key GoalsProvides interment services and perpetually maintained cemeteries in order to ensure that all citizens have access to a range of choices in interment services. Service activities include: - Interments - Sale of plots/lots, niches and interment vaults - Collection of fees and charges - Maintaining and preserving interment records - Interment searches - Installation of flat marker memorials - Tours of Brookside Cemetery Field of Honour - Facilitation of open air memorial services - Custodian of historical military monuments - Design and preparation of future interment sites - Facilities and physical site improvements - Perpetual maintenance of cemetery grounds
1. Ensure that the service evolves to reflect the diversity of the community and increase public awareness.
2. Increase revenues to enable self sufficiency while continuing to act as a benchmark for cemetery services within Winnipeg.
3. Continue to develop environmentally sound work processes and practices.
4. Maintain the heritage of cemeteries and continue to promote their significance in the community.
Service Level StatisticsDescription 2012 2013 2014Lineal Feet of New Poured in Place Monument Beam Foundation Installed, in Public Sections 0 880 1,056Lineal Feet of New Field of Honour Precast Beam foundation installed 84 84 0Number of Individual Foundations Installed 42 26 30Number of Educational Tours 9 9 10Number of Interment Sites Re-leveled and Re-seeded 955 3,565 929Number of Field of Honour Interment Sites re-landscaped 0 257 0Number of Trees Planted 119 101 119Lineal feet of existing Field of Honour Precast Beam refurbished 623 0 0
Adopted 2016 Operating Budget - Service Based 59
kmorton
Text Box
Return to Summary

CemeteriesContributing DepartmentsPlanning, Prop. & Devl. 100 %
Operating Budget
(in millions of $)2014
Actual2015
Budget
2016AdoptedBudget
Variance Expl.
2017 Projection
2018Projections
Service revenue 1.239 1.192 1.321 1.404 1.444Provincial funding (service specific) - - - - -
Revenues 1.239 1.192 1.321 1 1.404 1.444
Salaries and benefits 1.537 1.523 1.629 1.680 1.722Services 0.505 0.533 0.544 0.555 0.562Materials, parts and supplies 0.154 0.125 0.101 0.097 0.098Assets and purchases 0.009 0.009 0.008 0.008 0.008Debt and finance charges 0.041 0.024 0.023 0.023 0.022Grants, transfers and other 0.148 0.130 0.183 0.196 0.200Recoveries (0.379) (0.313) (0.321) (0.324) (0.332)
Operating expenses 2.013 2.031 2.167 2.234 2.279
Transfer to Capital 0.204 0.260 0.236 0.210 0.253
Total Expenses 2.217 2.291 2.403 2 2.444 2.532
Mill Rate Support/(Contribution) 0.979 1.099 1.082 1.040 1.088Full-time Equivalent Positions 25 24 25 26 26
Explanation of 2016 Change from 2015
(in millions of $)1 Revenues
Increase in Cemeteries revenues due to inflation and increased sales volume of cemetery services and interment products
0.129
0.129
2 ExpensesIncrease in salaries and benefits in accordance with collective agreements and addition of a Clerk C
0.106
Increase in transfer to Perpetual Maintenance Funds 0.052Transfer to Capital (0.024)Miscellaneous adjustments (0.022)
0.112
Full-time Equivalent PositionsIncrease of a Clerk C due to increased client contact in Brookside office (prorated for 9 months in 2016) as well as refinement of the service based view.
60 Adopted 2016 Operating Budget - Service Based

Cemeteries
Additional Financial Information
Reserves
Balance, December 31 (in millions of $)2014
Actual2015
Actual
2016AdoptedBudget
2017 Projection
2018Projection
Perpetual Mtce-Brookside Cem 14.938 15.696 16.056 16.457 16.871Perpetual Mtce-St Vital Cem 0.880 1.115 1.159 1.205 1.252Perpetual Mtce-Transona Cem 0.615 0.777 0.808 0.840 0.873
Capital Budget2016
Adopted2017 - 2021
Forecast6 YearTotal
(In millions of $) 0.432 2.002 2.434
Adopted 2016 Operating Budget - Service Based 61
kmorton
Text Box
Return to Table of Contents
kmorton
Text Box

62 Adopted 2016 Operating Budget - Service Based

Police ResponseIncludes:
• Police Response• Contract Policing• Crime Investigation• Police Training
Description Key GoalsThe Police Response Service provides emergency, urgent, and non-urgent responses to public calls for service. This includes disaster situations, danger to life and property situations, and lower risk to persons and property situations. In addition, the Service undertakes criminal investigations potentially leading to offender identification, arrest or other resolution. The Service is also responsible for training all police and civilian members of the Winnipeg Police Service (WPS). Finally, the Service ensures public order through planned response to large public events such as professional sporting matches and film industry productions. The Service must efficiently marshal its resources to ensure that adequate response is always available to answer to public needs.
1. Reduce crime through evidence-based policing strategies.
2. Improve public service delivery in frontline operations.3. Focus on downtown safety while balancing the needs
of targeted neighbourhoods.4. Focus on criminal prosecutions through improved
quality and timeliness of report and evidence disclosure.
Service Level StatisticsDescription 2012 2013 2014Police Officer Complement (Authorised) 1,442 1,463 1,430Civilian Staff Complement (Authorised) 440 465 477Total Calls for Service to the Communications Centre 596,963 530,620 532,304Police-initiated events 49,224 63,606 79,344% of Total Calls 27.29% 34.20% 39.07%Dispatched via Alternate Phone Response (APR) 3,320 1,534 1,131% of Total Calls 1.84% 0.80% 0.56%Total Dispatched and Police-Initiated Calls 180,369 185,837 203,103% of Total Calls 30.21% 35.02% 38.16%Calls Handled via Other Means 416,594 344,783 329,201% of Total Calls 69.79% 64.98% 61.84%Dispatched and Police-Initiated Calls by Priority Level
Priority 0: Major Disaster; Officer in Need of Assistance 600 616 554Priority 1: Danger to Life or Grievous Bodily Harm 1,900 1,948 2,012Priority 2: Impending Danger to Life or Grievous Bodily Harm 12,078 11,057 11,959Priority 3: Urgent Person Incident 65,784 61,696 64,094Priority 4: Urgent Property Incident 7,341 7,056 6,973Priority 5: Non-Urgent Person Incident 19,627 18,588 17,371Priority 6: Non-Urgent Property Incident 2,722 2,587 2,268Priority 7: Low Risk or Threat 56,914 70,380 79,272Priority 8: Telephone Response 6,073 6,089 11,530Priority 9: Planned Response 7,330 5,820 7,070
Adopted 2016 Operating Budget - Service Based 63
kmorton
Text Box
Return to Summary
kmorton
Text Box
Return to Table of Contents
kmorton
Text Box

Police ResponseContributing DepartmentsPolice 100 %
Operating Budget
(in millions of $)2014
Actual2015
Budget
2016AdoptedBudget
Variance Expl.
2017 Projection
2018 Projection
Service revenue 7.454 4.154 4.829 4.612 4.468Provincial funding (service specific) 16.923 16.891 17.256 17.188 17.359
Revenues 24.377 21.045 22.085 1 21.800 21.827
Salaries and benefits 182.541 184.122 192.224 196.030 200.054Services 10.241 10.792 11.078 11.183 11.421Materials, parts, and supplies 4.464 4.523 4.267 4.323 4.365Assets and purchases 2.207 1.568 1.501 1.509 1.512Debt and finance charges 0.477 5.873 8.144 8.974 9.481Grants, transfers and other 9.112 4.775 5.897 6.644 6.646Recoveries (0.620) (0.377) (0.233) (0.235) (0.237)
Operating expenses 208.423 211.275 222.878 228.428 233.241
Transfer to Capital 4.143 4.986 7.278 2.790 5.872
Total Expenses 212.566 216.261 230.156 2 231.218 239.113
Mill Rate Support/(Contribution) 188.189 195.216 208.070 209.417 217.286Full-time Equivalent Positions 1,567 1,551 1,558 1,565 1,567
Explanation of 2016 Change from 2015
(in millions of $)1 Revenues
Increase in MPI funding related to accident prevention at high-risk intersections 0.500Increase in Provincial funding for the Police helicopter 0.290Increase in Provincial funding related to the Gang Response and Suppression Plan (GRASP)
0.150
Miscellaneous adjustments 0.1001.040
2 ExpensesIncrease in salaries and benefits 8.102Increase in facility costs, mainly related to the Police Headquarters 3.622Transfer to Capital 2.292Increase in debt and finance costs, mainly related to the new Police Headquarters 2.271Increase in uniform costs 0.147Increase in IT consulting costs 0.105Corporate adjustment to reflect a year over year increase of 6.32% for Police Service expenditures overall
(2.500)
Decrease in fuel costs due to lower price forecasts (0.390)Miscellaneous adjustments 0.246
13.895
Full-time Equivalent PositionsNet increase of 7 FTEs due to the inclusion of FTEs that were delayed from the previous year, offset by an adjustment to vacancy management. These positions relate to 8 cadets for headquarters security and 2 positions for Transit buses.
64 Adopted 2016 Operating Budget - Service Based

Police Response
Service Detail
Sub-services (in millions of $)2014
Actual2015
Budget
2016AdoptedBudget
2017 Projection
2018 Projection
Police Response Revenue 17.177 16.750 17.214 16.920 17.008Operating expenses 129.033 134.849 142.357 147.923 152.789Transfer to Capital 4.143 4.986 7.278 2.790 5.872
115.999 123.085 132.421 133.793 141.653
Contract Policing Revenue 4.369 1.525 1.390 1.450 1.457Operating expenses 3.675 1.630 1.565 1.595 1.635Transfer to Capital - - - - -
(0.694) 0.105 0.175 0.145 0.179
Crime Investigation Revenue 2.818 2.739 3.418 3.416 3.355Operating expenses 66.038 68.512 70.687 73.219 75.561Transfer to Capital - - - - -
63.220 65.773 67.269 69.804 72.206
Police Training Revenue 0.012 0.031 0.063 0.015 0.007Operating expenses 9.677 6.284 8.269 5.691 3.256Transfer to Capital - - - - -
9.664 6.253 8.206 5.676 3.248
Mill Rate Support/(Contribution) 188.189 195.216 208.070 209.417 217.286
Additional Financial Information
Capital Budget2016
Adopted2017 - 2021
Forecast6 YearTotal
(In millions of $) 12.197 44.216 56.413
Adopted 2016 Operating Budget - Service Based 65

Crime PreventionIncludes:
• Community Policing• Street Lighting • Park Patrol• Crime Prevention Initiatives
Description Key GoalsTo provide citizens with crime awareness and education, enhanced relationships with targeted neighbourhoods and schools, as well as provide effective street lighting in order to proactively aid in crime prevention and disorder.
1. Promote positive interaction within neighbourhoods and among cultural groups.
2. Reduce crime victimization.3. Increase effectiveness and cost efficiencies of street
lighting.
Service Level StatisticsDescription 2012 2013 2014Community Policing [1] Number of Commercial/Business Crime Prevention Presentations 10 33 6Number of Personal/Residential Crime Prevention Presentations 130 134 177Number of Cultural/Diversity Presentations by Diversity Relations Officers 67 68 79Number of Safety Audits Conducted 1 4 11Number of Special Event Attendances 179 244 235Number of Community/Cultural Meeting Attendances by Diversity Relations Officers 45 87 100Number of Cultural/Diversity Event Attendances by Diversity Relations Officers 21 69 92Number of Crime Victim Follow-up Contacts 6,724 5,557 4,949Number of School Presentations (during school year) 709 855 922Park Patrol [2] Number of Criminal Code Occurrences 57 57 26**Number of Provincial Statute Occurrences 134 338 26**Number of Municipal By-Law Occurrences 119 169 120Street Lighting [2] Number of Lane Lights [3] 8,397 8,402 8,403Number of Street Lights [3] 65,639 65,695 66,297Number of Streetscaping Lights (Decorative only) [3] 2,932 2,932 2,985Number of Lighting Complaints Requiring a Lighting Upgrade 12* 7 6Number of Lighting Complaints 58 87 84
[1] Includes only school presentations to May 29, 2014. Presentation data for June is not yet available.[2] Data supplied by the Public Works Department.[3] Data supplied by Manitoba Hydro.* Restated.** Part year only.
66 Adopted 2016 Operating Budget - Service Based
kmorton
Text Box
Return to Summary

Crime PreventionContributing DepartmentsPolice 72 %Public Works 28 %
Operating Budget
(in millions of $)2014
Actual 2015
Budget
2016AdoptedBudget
Variance Expl.
2017 Projection
2018 Projection
Service revenue 1.548 1.334 1.237 1.224 1.239Provincial funding (service specific) 2.432 2.586 2.726 2.763 2.823
Revenues 3.980 3.920 3.963 1 3.987 4.062
Salaries and benefits 27.701 29.400 30.581 31.788 33.095Services 12.493 13.179 13.584 14.249 14.948Materials, parts and supplies 0.509 0.525 0.529 0.532 0.536Assets and purchases 0.043 0.062 0.056 0.057 0.057Debt and finance charges 0.001 - - - - Grants, transfers and other 1.174 0.655 0.968 1.179 1.180Recoveries (0.041) (0.023) (0.008) (0.008) (0.008)
Operating expenses 41.880 43.798 45.712 47.798 49.807
Transfer to Capital - - - - -
Total Expenses 41.880 43.798 45.712 2 47.798 49.807
Mill Rate Support/(Contribution) 37.900 39.879 41.749 43.811 45.745Full-time Equivalent Positions 295 296 299 299 299
Explanation of 2016 Change from 2015
(in millions of $)1 Revenues
Miscellaneous adjustments 0.0430.043
2 ExpensesIncrease in salaries and benefits 1.181Increase in the cost of street lighting 0.441Increase in facility costs, mainly related to the Police Headquarters 0.313Miscellaneous adjustments (0.021)
1.914
Full-time Equivalent PositionsIncrease of 3 FTEs due to transfers within the Police Service and refinement of the service based view.
Adopted 2016 Operating Budget - Service Based 67

Crime Prevention
Service Detail
Sub-services (in millions of $)2014
Actual2015
Budget
2016AdoptedBudget
2017 Projection
2018 Projection
Community Policing Revenue 2.760 2.929 3.015 3.036 3.095Operating expenses 24.128 25.530 27.067 28.372 29.526Transfer to Capital - - - - -
21.368 22.601 24.052 25.336 26.430
Street Lighting Revenue - - - - -Operating expenses 11.782 12.522 12.963 13.616 14.308Transfer to Capital - - - - -
11.782 12.522 12.963 13.616 14.308
Park Patrol Revenue - - - - -Operating expenses 0.902 - - - -Transfer to Capital - - - - -
0.902 - - - -
Crime Prevention Initiatives Revenue 1.220 0.991 0.948 0.951 0.967Operating expenses 5.068 5.747 5.682 5.810 5.973Transfer to Capital - - - - -
3.848 4.756 4.735 4.859 5.007
Mill Rate Support/(Contribution) 37.900 39.879 41.749 43.811 45.745
68 Adopted 2016 Operating Budget - Service Based
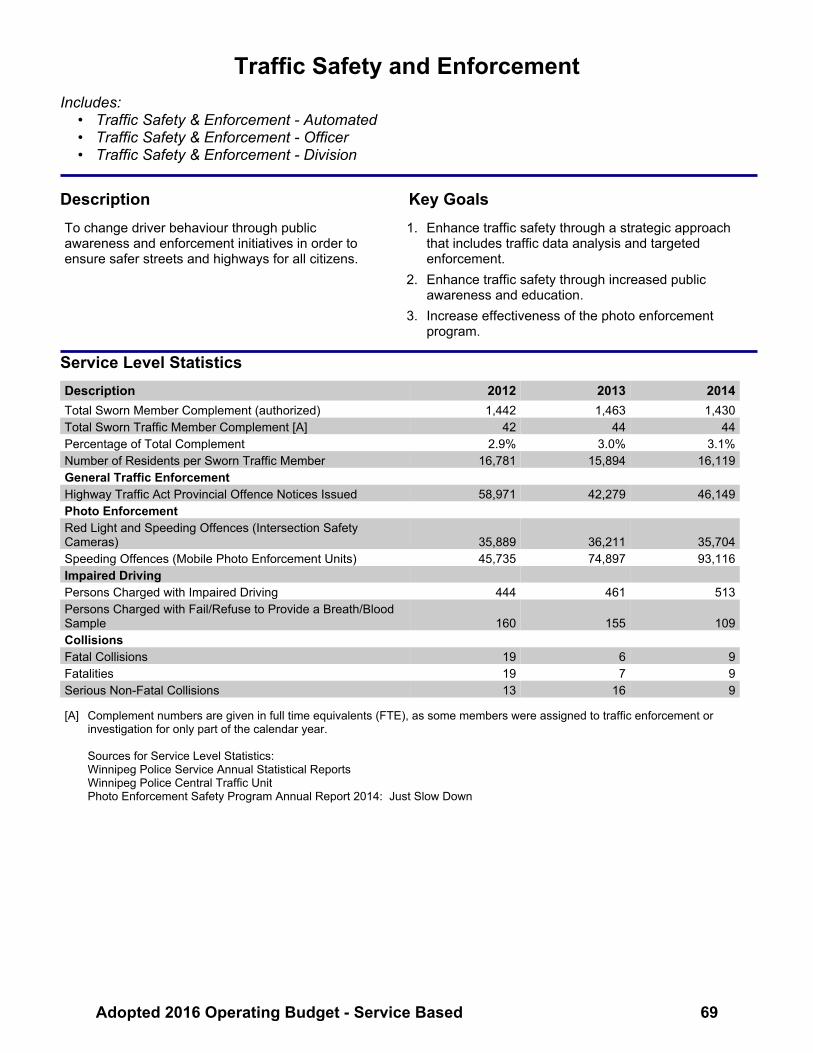
Traffic Safety and EnforcementIncludes:
• Traffic Safety & Enforcement - Automated• Traffic Safety & Enforcement - Officer• Traffic Safety & Enforcement - Division
Description Key GoalsTo change driver behaviour through public awareness and enforcement initiatives in order to ensure safer streets and highways for all citizens.
1. Enhance traffic safety through a strategic approach that includes traffic data analysis and targeted enforcement.
2. Enhance traffic safety through increased public awareness and education.
3. Increase effectiveness of the photo enforcement program.
Service Level StatisticsDescription 2012 2013 2014Total Sworn Member Complement (authorized) 1,442 1,463 1,430Total Sworn Traffic Member Complement [A] 42 44 44Percentage of Total Complement 2.9% 3.0% 3.1%Number of Residents per Sworn Traffic Member 16,781 15,894 16,119General Traffic Enforcement Highway Traffic Act Provincial Offence Notices Issued 58,971 42,279 46,149Photo Enforcement Red Light and Speeding Offences (Intersection Safety Cameras) 35,889 36,211 35,704Speeding Offences (Mobile Photo Enforcement Units) 45,735 74,897 93,116Impaired Driving Persons Charged with Impaired Driving 444 461 513Persons Charged with Fail/Refuse to Provide a Breath/Blood Sample 160 155 109Collisions Fatal Collisions 19 6 9Fatalities 19 7 9Serious Non-Fatal Collisions 13 16 9
[A] Complement numbers are given in full time equivalents (FTE), as some members were assigned to traffic enforcement or investigation for only part of the calendar year. Sources for Service Level Statistics: Winnipeg Police Service Annual Statistical Reports Winnipeg Police Central Traffic Unit Photo Enforcement Safety Program Annual Report 2014: Just Slow Down
Adopted 2016 Operating Budget - Service Based 69
kmorton
Text Box
Return to Summary

Traffic Safety and EnforcementContributing DepartmentsPolice 100 %
Operating Budget
(in millions of $)2014
Actual2015
Budget
2016AdoptedBudget
Variance Expl.
2017 Projection
2018 Projection
Service revenue 19.133 19.905 22.001 21.831 21.815Provincial funding (service specific) - - - - -
Revenues 19.133 19.905 22.001 1 21.831 21.815
Salaries and benefits 9.853 10.979 11.447 11.802 12.174Services 4.530 5.410 6.154 6.188 6.288Materials, parts, and supplies 0.169 0.205 0.188 0.190 0.192Assets and purchases 0.026 0.049 0.046 0.046 0.046Debt and finance charges - - - - -Grants, transfers and other 0.337 0.242 0.384 0.459 0.459Recoveries (0.022) (0.006) (0.008) (0.008) (0.008)
Operating expenses 14.894 16.879 18.211 18.678 19.151
Transfer to Capital - - - - -
Total Expenses 14.894 16.879 18.211 2 18.678 19.151
Mill Rate Support/(Contribution) (4.239) (3.026) (3.790) (3.154) (2.663)
Full-time Equivalent Positions 81 88 89 89 89
Explanation of 2016 Change from 2015
(in millions of $)1 Revenues
Increase in photo enforcement revenue 2.319Decrease in traditional enforcement revenue (0.200)Miscellaneous (0.023)
2.096
2 ExpensesIncrease in expenses related to photo enforcement 0.752Increase in salaries and benefits 0.468Increase in facility costs, mainly related to the Police Headquarters 0.142Miscellaneous adjustments (0.030)
1.332
Full-time Equivalent PositionsIncrease of 1 FTE due to transfers within the Police Service.
70 Adopted 2016 Operating Budget - Service Based

Traffic Safety and Enforcement
Service Detail
Sub-services (in millions of $)2014
Actual2015
Budget
2016AdoptedBudget
2017 Projection
2018 Projection
Traffic Safety-Automated Revenue 14.603 14.931 17.250 17.050 17.050Operating expenses 4.725 5.657 6.425 6.456 6.562Transfer to Capital - - - - -
(9.878) (9.274) (10.825) (10.594) (10.488)
Traffic Safety-Officer Revenue 4.530 2.974 3.151 3.181 3.165Operating expenses 8.488 9.688 10.315 10.720 11.043Transfer to Capital - - - - -
3.958 6.714 7.165 7.539 7.879
Traffic Safety-Division Revenue - 2.000 1.600 1.600 1.600Operating expenses 1.681 1.534 1.470 1.501 1.546Transfer to Capital - - - - -
1.681 (0.466) (0.130) (0.099) (0.054)
Mill Rate Support/(Contribution) (4.239) (3.026) (3.790) (3.154) (2.663)
Adopted 2016 Operating Budget - Service Based 71
kmorton
Text Box
Return to Table of Contents

Fire and Rescue ResponseIncludes:
• Fire and Rescue Response• Fire Investigation
Description Key GoalsTo provide quick, proficient, emergency and non-emergency fire suppression and rescue assistance to victims of fire, accidents, and other disasters or emergencies in order to prevent or minimize loss of life or property. This includes fire suppression, notification and evacuation of citizens, rescue services including motor vehicle extrication, high angle, trench, elevator, water, and ice rescue, investigation and mitigation of carbon monoxide or other gas leaks, and other hazardous materials incidents. Additional contributions include standby fire and rescue service at public events, support to public education programs, supplement fire inspection and by-law enforcement program, fire investigation services potentially leading to offender identification, arrest and/or counselling in regard to incidents of deliberately set fires and response to medical emergencies.
1. Improve capacity to effectively respond to emergencies and disasters in a manner that is financially sustainable for the citizens of Winnipeg.
2. Invest in technology, equipment, and staff training to maximize safety for all emergency responders as well as the public.
3. Invest in technology, equipment, and staff training to protect the environment.
4. Ensure a respectful work environment and positive public image.
Service Level StatisticsDescription 2012 2013 2014Total Fires 2,773 1,926 1,596Alarm - No Fire 7,673 7,558 7,961Gas/Odor/Hazardous Materials Emergencies 1,038 924 1,013Miscellaneous Emergencies 4,274 4,109 4,784Rescue Emergencies 159 121 167Fire Investigations 518 445 285Arson Determinations* 286 n/a n/a
* Winnipeg Police Service reports Arson Determinations.
72 Adopted 2016 Operating Budget - Service Based
kmorton
Text Box
Return to Summary

Fire and Rescue ResponseContributing DepartmentsFire Paramedic Service 100 %
Operating Budget
(in millions of $)2014
Actual2015
Budget
2016AdoptedBudget
Variance Expl.
2017 Projection
2018 Projection
Service revenue 0.549 0.420 0.726 0.712 0.698Provincial funding (service specific) 4.582 3.726 3.726 3.726 3.726
Revenues 5.131 4.146 4.453 1 4.439 4.424
Salaries and benefits 97.706 99.722 103.431 105.637 108.399Services 4.671 4.341 5.223 5.994 6.226Materials, parts, and supplies 2.211 3.008 2.918 3.708 3.723Assets and purchases 0.150 0.620 0.429 0.429 0.437Debt and finance charges 0.844 0.739 0.798 0.835 0.780Grants, transfers and other 1.109 1.043 1.012 1.014 1.015Recoveries (0.175) (0.040) (0.051) (0.053) (0.055)
Operating expenses 106.517 109.433 113.760 117.563 120.526
Transfer to Capital - 2.344 2.130 8.435 4.116
Total Expenses 106.517 111.777 115.890 2 125.998 124.642
Mill Rate Support/(Contribution) 101.385 107.631 111.438 121.559 120.218Full-time Equivalent Positions 845 851 852 852 852
Explanation of 2016 Change from 2015
(in millions of $)1 Revenues
Increase in revenues to align budget with actual volume experience 0.3070.307
2 ExpensesIncrease in salaries and benefits 3.709Increase in fleet lease costs to enable replacement of aging apparatus 0.734Transfer to Capital (0.214)Reduced equipment purchases (0.179)Miscellaneous adjustments 0.063
4.113
Full-time Equivalent PositionsIncrease of 1 FTE due to a refinement of the service based view.
Adopted 2016 Operating Budget - Service Based 73
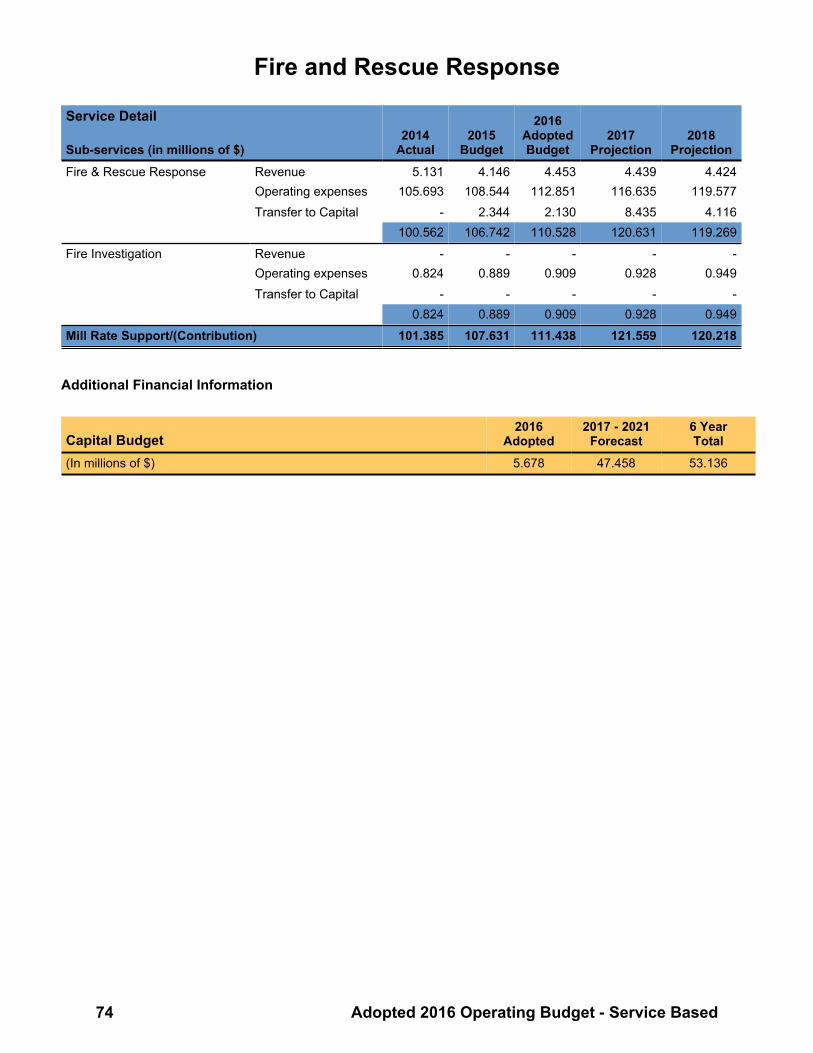
Fire and Rescue Response
Service Detail
Sub-services (in millions of $)2014
Actual2015
Budget
2016AdoptedBudget
2017 Projection
2018 Projection
Fire & Rescue Response Revenue 5.131 4.146 4.453 4.439 4.424Operating expenses 105.693 108.544 112.851 116.635 119.577Transfer to Capital - 2.344 2.130 8.435 4.116
100.562 106.742 110.528 120.631 119.269
Fire Investigation Revenue - - - - -Operating expenses 0.824 0.889 0.909 0.928 0.949Transfer to Capital - - - - -
0.824 0.889 0.909 0.928 0.949
Mill Rate Support/(Contribution) 101.385 107.631 111.438 121.559 120.218
Additional Financial Information
Capital Budget2016
Adopted2017 - 2021
Forecast6 YearTotal
(In millions of $) 5.678 47.458 53.136
74 Adopted 2016 Operating Budget - Service Based

Fire and Injury PreventionIncludes:
• Fire & Injury Prevention Education• Fire Inspection
Description Key GoalsTo protect citizens, and minimize loss of life and property due to fire through ensuring adherence to existing building standards for construction, safety, and egress. To provide citizens with fire and life safety education, advice, and promote safe choices that will reduce the need for emergency fire, rescue and medical services.
1. Ensure safety of housing and other buildings through plan examinations, inspections, and fire code and by-law enforcement.
2. Identify and engage key target audiences to maximize effectiveness of educational opportunities.
3. Decrease the incidence of fire or injury emergencies through expansion of public education programs.
4. Investigate and pursue partnerships to enhance ability to prevent fire and injuries.
5. Save lives through promotion of public access defibrillation, and 'demand reduction' initiatives such as plan examinations and residential sprinklers.
Service Level StatisticsDescription 2012 2013 2014Fire Prevention By-Law/Building Code Inspections [A]* 6,396 7,890 7,536Operations Inspections* 2,861 2,825 2,861Permits Issued* 300 292 286Property File Searches/Plans Examined* 892 836 927Fire Safety House 400 185 190Other Community Events 233 407 101Fire Safety Lectures/Presentations [B] 404 308 323Medical/Injury Prevention Lectures/Presentations [B] 0 9 38Youth Fire Stop [C] 78 139 40Career Symposiums 8 0 5Car Seat Inspections 93 153 210Evacuation Fire Drills 148 143 144Fire/Paramedic Station Tours 346 446 320Public Service Announcements (Media) [D] 70 25 24Arson Prevention Initiative [E] 153 398 145
* 2013 Data restated to correct reporting error.[A] WFPS continues to achieve service efficiencies by focusing fire and injury prevention education lectures on larger groups, and
inspections of bigger and 'high risk' occupancies such as hotels and rooming houses which require more resources. Operations crews are increasingly responsible for performing regular inspections.
[B] The Public Education Branch provides fire safety presentations to all public requests (schools, seniors residences, etc.)[C] Youth Fire Stop Program numbers are dependant on the referral process.[D] WFPS is embracing social media as a means of distributing information on Fire and Injury Prevention.[E] 2014 saw a continuing effort among City of Winnipeg departments.
Adopted 2016 Operating Budget - Service Based 75
kmorton
Text Box
Return to Summary

Fire and Injury PreventionContributing DepartmentsFire Paramedic Service 100 %
Operating Budget
(in millions of $)2014
Actual2015
Budget
2016Adopted
BudgetVariance
Expl. 2017
Projection2018
ProjectionService revenue 0.314 0.234 0.390 0.412 0.432Provincial funding (service specific) 0.050 0.050 0.050 0.050 0.050
Revenues 0.364 0.284 0.440 1 0.462 0.483
Salaries and benefits 4.409 4.655 4.782 4.889 5.019Services 0.347 0.357 0.418 0.419 0.422Materials, parts, and supplies 0.091 0.115 0.123 0.125 0.126Assets and purchases 0.034 0.062 0.050 0.051 0.051Debt and finance charges - - - - -Grants, transfers and other 0.400 0.339 0.338 0.338 0.338Recoveries (0.002) - (0.002) (0.002) (0.002)
Operating expenses 5.280 5.527 5.709 5.820 5.953
Transfer to Capital - - - - -
Total Expenses 5.280 5.527 5.709 2 5.820 5.953
Mill Rate Support/(Contribution) 4.916 5.243 5.269 5.358 5.470Full-time Equivalent Positions 41 42 41 41 41
Explanation of 2016 Change from 2015
(in millions of $)1 Revenues
Increase in revenues to align budget with actual volume experience 0.1560.156
2 ExpensesIncrease in salaries and benefits 0.127Miscellanous adjustments 0.055
0.182
Full-time Equivalent PositionsDecrease of 1 FTE due to a refinement of the service based view.
76 Adopted 2016 Operating Budget - Service Based

Fire and Injury Prevention
Service Detail
Sub-services (in millions of $)2014
Actual2015
Budget
2016 Adopted
Budget2017
Projection2018
Projection
Fire & Injury Prev Education Revenue 0.004 - - - -Operating expenses 1.110 1.058 1.108 1.137 1.169Transfer to Capital - - - - -
1.106 1.058 1.108 1.137 1.168
Fire Inspection Revenue 0.360 0.284 0.440 0.462 0.482Operating expenses 4.170 4.469 4.601 4.683 4.785Transfer to Capital - - - - -
3.810 4.185 4.161 4.221 4.302
Mill Rate Support/(Contribution) 4.916 5.243 5.269 5.358 5.470
Adopted 2016 Operating Budget - Service Based 77

Medical ResponseIncludes:
• Medical Response• Medical Transfers
Description Key GoalsTo provide quick, proficient primary response to all medical emergency situations, including the provision of pre-hospital patient care, patient transport to hospital, patient transfer services between facilities, and standby at critical police and fire rescue incidents, and special events.
1. Improve capacity to effectively respond to medical emergencies in a manner that is financially sustainable for the citizens of Winnipeg.
2. Improve quality of medical service provided.3. Expand the quality improvement process to quantify
and improve customer satisfaction.4. Pursue partnerships to enhance delivery of medical
service.5. Ensure a respectful work environment and positive
public image.
Service Level StatisticsDescription 2012 2013 2014Emergency Medical Incidents 64,998 63,619 66,161Medical Incidents with ambulance dispatched (Emergency) 56,078 54,020 55,687Medical Incidents with only fire dispatched (Emergency) 8,920 9,599 10,474Scheduled Inter-facility Patient Transfers 8,506 7,531 8,317Emergency Patient Transports 50,027 46,482 46,448Patients Assessed or Treated at Scene (not transported) 15,289 16,366 17,548Total Patient Contacts (excluding Community Paramedicine) 73,698 70,044 70,714Patient Contacts per Thousand Population 104.6 100.2 99.7Main Street Project Patient Contacts 11,248 12,299 14,041Community Paramedicine Patient Contacts (EPIC)* 0 1,058 1,186
* Community Paramedicine Patient Contacts (EPIC) data capture began in early 2013.
78 Adopted 2016 Operating Budget - Service Based
kmorton
Text Box
Return to Summary

Medical ResponseContributing DepartmentsFire Paramedic Service 100 %
Operating Budget
(in millions of $)2014
Actual2015
Budget
2016AdoptedBudget
Variance Expl.
2017 Projection
2018 Projection
Service revenue 27.581 28.219 29.262 29.814 30.364Provincial funding (service specific) 19.244 21.115 25.276 31.042 28.015
Revenues 46.824 49.334 54.537 1 60.856 58.379
Salaries and benefits 46.481 48.901 54.858 57.377 58.872Services 4.628 4.571 4.667 4.731 4.764Materials, parts and supplies 1.903 2.009 2.213 1.932 1.941Assets and purchases 0.564 0.972 1.128 1.324 1.346Debt and finance charges 3.492 2.245 2.295 2.311 2.287Grants, transfers and other 1.345 1.034 0.999 0.999 1.000Recoveries (0.017) - (0.017) (0.020) (0.023)
Operating expenses 58.397 59.733 66.143 68.653 70.187
Transfer to Capital - 1.004 2.203 8.841 2.723
Total Expenses 58.397 60.737 68.346 2 77.495 72.909
Mill Rate Support/(Contribution) 11.572 11.403 13.809 16.638 14.530Full-time Equivalent Positions 476 476 492 498 498
Explanation of 2016 Change from 2015
(in millions of $)1 Revenues
Increase in Provincial/Winnipeg Regional Health Authority (WRHA) funding for the Fire Paramedic Service, including an expansion of community paramedicine service subject to funding confirmation in the amount of $2,560,794
4.161
Increase in ambulance service revenue related to increases in volume, mainly for treatment with no transport
0.516
Increase in holding charges revenue based on a reduced acceptable waiting period 0.400Miscellaneous adjustments 0.126
5.203
2 ExpensesIncrease in salaries and benefits 5.956Transfer to Capital 1.199Increased protective clothing costs 0.190Increase in equipment purchases 0.167Reduction in fuel expenses, due to lower price forecasts (0.053)Miscellaneous adjustments 0.150
7.609
Full-time Equivalent PositionsAn increase of 18 FTEs for paramedics related to an expansion of service at the Main Street Project (MSP) (5.25) and Emergency Paramedics in the Community (EPIC) (12.75), both subject to WRHA approval. A decrease of 1 FTE for an IS specialist and 1 FTE related to a refinement of the service based view.
Adopted 2016 Operating Budget - Service Based 79

Medical Response
Service Detail
Sub-services (in millions of $)2014
Actual2015
Budget
2016AdoptedBudget
2017 Projection
2018 Projection
Medical Response Revenue 40.543 41.811 51.667 57.886 55.408Operating expenses 52.113 52.280 58.896 61.247 62.616Transfer to Capital - 1.004 1.902 7.857 2.513
11.570 11.473 9.131 11.218 9.720
Medical Transfers Revenue 6.281 7.523 2.870 2.971 2.971Operating expenses 6.283 7.453 7.248 7.407 7.571Transfer to Capital - - 0.301 0.984 0.210
0.002 (0.070) 4.678 5.420 4.810
Mill Rate Support/(Contribution) 11.572 11.403 13.809 16.638 14.530
Capital Budget2016
Adopted2017 - 2021
Forecast6 YearTotal
(In millions of $) 0.116 0.119 0.235
80 Adopted 2016 Operating Budget - Service Based

Disaster Preparedness and Response
Description Key GoalsTo provide a prompt and coordinated response by the City of Winnipeg to major peacetime disasters by: - Minimizing the impact of an emergency or disaster on the City of Winnipeg. - Protecting and preserving the health and property of the citizens of Winnipeg. - Maintaining and restoring essential services during an emergency or disaster. - Acting as a host community for evacuees from outside the city upon request from the proper authority.
1. Prepare and test plans and strategies for new and emerging health risks and hazards.
2. Develop new and/or enhance current partnerships with other levels of government, authorities and community agencies.
3. Enhance the City's emergency plan to be more responsive to the needs of at risk populations (e.g. disabled, seniors, and children) and geographic communities and stakeholders within Winnipeg.
4. Provide emergency preparedness education and training to staff, partnering agencies and the general community.
Service Level StatisticsDescription 2012 2013 2014Presentations/Consultations 64 51 42Disaster Management Training Sessions 5 5 6Individuals Trained 162 170 161Exercises (internal and with stakeholders) 6 7 8Emergency Operations Centre/Multiple Department Activation 2 2 2Emergency Operations Centre - Days Activated* 4 2 32Number of people evacuated/evacuation alert 357 207 250Number of people directly assisted 131 116 50
* In 2014, the EOC was open for 30 days due to frozen pipe events and 2 days for summer heat alerts.
Adopted 2016 Operating Budget - Service Based 81
kmorton
Text Box
Return to Summary

Disaster Preparedness and ResponseContributing DepartmentsFire Paramedic Service 88 %Community Services 12 %
Operating Budget
(in millions of $)2014
Actual2015
Budget
2016AdoptedBudget
Variance Expl.
2017 Projection
2018 Projection
Service revenue - - - - -Provincial funding (service specific) - - - - -
Revenues - - - 1 - -
Salaries and benefits 0.183 0.179 0.232 0.478 0.702Services 0.043 0.045 0.047 0.048 0.048Materials, parts, and supplies 0.002 0.008 0.006 0.006 0.006Assets and purchases 0.002 0.005 0.003 0.003 0.003Debt and finance charges - - - - -Grants, transfers and other 0.093 0.088 0.088 0.088 0.088Recoveries - (0.002) (0.004) (0.005) (0.005)
Operating expenses 0.323 0.324 0.373 0.618 0.842
Transfer to Capital - - - - -
Total Expenses 0.323 0.324 0.373 2 0.618 0.842
Mill Rate Support/(Contribution) 0.323 0.324 0.373 0.618 0.842Full-time Equivalent Positions 2 2 2 5 6
Explanation of 2016 Change from 2015
(in millions of $)1 Revenues n/a
2 ExpensesIncrease in salaries and benefits 0.053Miscellaneous adjustments (0.004)
0.049
Full-time Equivalent PositionsAddition of 1 FTE for an administrative assistant to support the Disaster Preparedness and Response unit, offset by a refinement of the service based view.
82 Adopted 2016 Operating Budget - Service Based
kmorton
Text Box
Return to Table of Contents

RecreationIncludes:
• Aquatics Programs • Community Centres• Arenas • Ice Skating • Casual Facility Use • Recreation Programs
Description Key GoalsProvide high quality aquatics, recreation and leisure opportunities/programs in order to enhance life skills, community leadership development and overall quality of life for citizens in our neighbourhoods.
1. Continuously improve services to be more responsive to the recreational, cultural and leisure needs of Winnipeggers.
2. Provide leadership and support the work of other service providers to build the foundation for quality of life and to promote a safe and healthy community.
3. Provide recreation services by collaborating and leveraging resources through partnerships.
4. Provide equitable opportunities to participate in recreation programs and services.
5. Provide meaningful and relevant recreational opportunities to increase the participation of Aboriginal youth in City of Winnipeg services.
6. Provide community development and recreation opportunities for vulnerable youth as an integral component of crime prevention efforts.
7. Provide safe and healthy environments in the delivery of programs conducive to an enjoyable experience and personal well-being.
Service Level StatisticsDescription 2012 2013 2014% of Prime Time Ice Sold in the Regular Season [A] 92% 91% 87% [B]Number of Recreation and Leisure Programs 3,435 3,158 3,212Number of Aquatic Classes Annually 7,660 8,125 7,677 [C]Number of Hours of Wading Pool Free Programming 26,698 26,739 26,174Number of Hours of Spray Pad Free Programming [D] 7,912 9,968 13,893Total Value of Registered Programming/Facility Access Pass Fee Waivers $210,326 $188,291 $185,304Total Value of Admissions to Free Swims $378,640 $498,242 $617,643 [E]Number of Public Swim Visits to Outdoor Pools 106,426 96,971 99,100
[A] For each calendar year, the regular season consists of January 1 - February 28 and October 1 - December 31.[B] The % of prime time ice sold in the regular season decreased due to the revision of cancellation/return policies in fall 2014.[C] The number of aquatic classes offered decreased due to the closure of Elmwood Kildonans Pool (May 8 - December 31, 2104).[D] In 2014, 12 unsupervised spray pads operated from June 2 - Sept 14. All spray pads operated under extended hours from June
2 - Sept 1, and the season for all spray pads was extended until Sept 14 with extended hours. This resulted in an increase in the hours of spray pad programming in 2014. The 2013 result has been restated to include the St. James Assiniboia Pool Spray Pad, which opened at the beginning of the 2013 season.
[E] As part of a 2-year pilot project, admission to all five non-heated outdoor pools was free in the summer of 2014, which led to an increase in the total value of admissions to free swims. 2014 was the first year of the pilot project.
Adopted 2016 Operating Budget - Service Based 83
kmorton
Text Box
Return to Summary

RecreationContributing DepartmentsCommunity Services 100 %
Operating Budget
(in millions of $)2014
Actual2015
Budget
2016AdoptedBudget
Variance Expl.
2017 Projection
2018 Projection
Service Revenue 12.860 13.464 12.863 12.833 12.833Provincial funding (service specific) 0.500 0.500 0.500 0.500 0.500
Revenues 13.360 13.964 13.363 1 13.333 13.333
Salaries and benefits 18.617 19.243 19.958 20.379 20.884Services 2.945 3.183 3.091 3.107 3.098Materials, parts, and supplies 0.440 0.520 0.528 0.521 0.527Assets and purchases 0.094 0.113 0.092 0.092 0.093Debt and finance charges 0.181 0.196 0.346 0.392 0.395Grants, transfers and other 26.516 27.053 27.353 29.789 33.259Recoveries (0.518) (0.410) (0.512) (0.556) (0.564)
Operating expenses 48.276 49.898 50.857 53.725 57.693
Transfer to Capital 5.004 5.182 1.592 8.085 7.009
Total Expenses 53.280 55.080 52.448 2 61.810 64.702
Mill Rate Support/(Contribution) 39.920 41.116 39.085 48.477 51.369Full-time Equivalent Positions 355 356 358 360 360
Explanation of 2016 Change from 2015
(in millions of $)1 Revenues
Decrease in arena revenue primarily due to the Vimy, Old Ex and Roland Michener arenas decommissioned in 2015
(0.245)
Decrease in corporate employee wellness pass revenue to better align with historical actuals
(0.110)
Decrease in aqua fitness revenue to better align with historical actuals (0.100)Decrease in program registration fee revenue to better align with historical actuals (0.075)Miscellaneous adjustments (0.071)
(0.601)
2 ExpensesIncrease in salaries and benefits 0.715Increase in grants as per Council approved arena strategies and Universal Funding Formula grants to community centres
0.362
Transfer to Capital (3.590)Miscellaneous adjustments (0.119)
(2.632)
Full-time Equivalent PositionsIncrease primarily due to FTE's added to support the Council approved outdoor pool enhancements, the rebuilt East Elmwood Leisure Centre, and refinement of service based view.
84 Adopted 2016 Operating Budget - Service Based

Recreation
Service Detail
Sub-services (in millions of $)2014
Actual2015
Budget
2016AdoptedBudget
2017 Projection
2018 Projection
Arenas Revenue 3.109 2.965 2.720 2.720 2.720Operating expenses 4.468 5.089 4.579 4.683 4.790Transfer to Capital 0.363 0.363 0.008 0.108 0.533
1.722 2.487 1.867 2.071 2.603
Aquatics Programs Revenue 2.917 3.616 3.549 3.519 3.519Operating expenses 10.054 10.374 10.882 11.064 11.297Transfer to Capital 1.468 1.650 0.139 1.997 1.546
8.605 8.409 7.472 9.543 9.323
Ice Skating Revenue 0.392 0.386 0.386 0.386 0.386Operating expenses 0.999 0.905 0.816 0.824 0.833Transfer to Capital 0.063 - - 0.062 0.115
0.670 0.519 0.430 0.501 0.562
Recreation Programs Revenue 1.677 1.835 1.682 1.682 1.682Operating expenses 7.358 8.120 8.258 8.603 8.760Transfer to Capital 0.588 0.495 0.627 1.810 1.320
6.269 6.780 7.202 8.731 8.398
Casual Facility Use Revenue 5.030 4.926 4.791 4.791 4.791Operating expenses 17.148 16.739 17.224 19.229 22.522Transfer to Capital 1.992 2.145 0.766 3.745 2.750
14.110 13.957 13.199 18.183 20.481
Community Centres Revenue 0.235 0.235 0.235 0.235 0.235Operating expenses 8.039 8.609 9.098 9.322 9.492Transfer to Capital 0.529 0.529 0.052 0.362 0.746
8.333 8.903 8.914 9.449 10.002
Golf Courses Revenue 0.001 0.001 - - -Operating expenses 0.210 0.061 - - -Transfer to Capital 0.002 - - - -
0.212 0.061 - - -
Mill Rate Support/(Contribution) 39.920 41.116 39.085 48.477 51.369
Additional Financial Information
Reserves
Balance, December 31 (in millions of $)2014
Actual2015
Actual
2016AdoptedBudget
2017 Projection
2018Projection
Wading & Outdr Extd Season Res 0.063 - - - -
Capital Budget2016
Adopted2017 - 2021
Forecast6 YearTotal
(In millions of $) 10.268 63.977 74.245
Adopted 2016 Operating Budget - Service Based 85

Parks and Urban ForestryIncludes:
• Park Grass Maintenance • Dutch Elm Disease Control (DED)• Park Amenity Maintenance • Weed Control• Athletic Field Maintenance • Natural Areas Management• Park Pathway Maintenance • Playground Management• Park Planning / Development • Winter Amenity Maintenance• Tree Planting • Boulevard Maintenance• Tree Pruning & Removal (non-DED)
Description Key GoalsTo enhance the quality of life for citizens and visitors by providing services that focus on maintenance, preservation and stewardship of parks, open spaces, the urban forest and natural areas. This service includes park, boulevard, and open space maintenance; litter collection; athletic field maintenance; pathway maintenance; park planning and development (shared with Planning, Property and Development); tree planting, pruning, removal; Dutch Elm Disease control (inspection, removal, disposal, public education); weed control (inspection, serving of weed notices); natural areas management (replanting of native species, controlled burns, native and invasive species monitoring, education); playground equipment inspection and repair; and winter amenity maintenance (knock-down hockey rinks, pleasure skating rinks/ponds, toboggan slides/hills, park pathway snow clearing, cross-country ski trails and speed skating oval maintenance).
1. Maintain and improve parks, athletic fields, playgrounds and related amenities to meet community leisure needs and interests.
2. Provide natural environment and conservation education.
3. Preserve and enhance natural areas across the City's park and open space system.
4. Protect and enhance the urban forest through effective tree care practices and replacement planting.
5. Invest strategically in new and existing infrastructure.
Service Level StatisticsDescription 2012 2013 2014Number of park and open space parcels 1,333 [B] 1,336 [B] 1,346 [B]Total hectares of parks and open spaces 3,591 [A],[ B] 3,510 [A],[B] 3,528 [B]Hectares of park and boulevard turf mowing 2,554 [B] 2,456 [B] 2,234 [A], [B]Park pathways/walkways maintained (linear km.)** 217 [B] 231 [B] 231 [B]Number of environmental program participants 8,456 9,633 4,181Ecologically significant natural areas 449 457 459Number of athletic fields 604 604* 604*Number of boulevard and park trees*** 280,000 299,675 299,001Number of trees planted 1,446 2,292 2,245Number of DED trees and non-DED trees removed 4,930/2,028 6,508/2,012 5,257/2,661Number of trees pruned 23,147 23,783 24,495Number of playground equipment sites inspected and maintained (includes toboggan slide sites) 485* 505* 505*
* New Geographic Information System being implemented, inventory is being refined.** Statistic only includes pathways contained within park sites, does not include 33 km of cross country ski trails.*** Estimated number of trees; multi-year tree inventory is being conducted. [A] Includes 604 hectares of boulevard turf, 231 hectares of Atheltic Field turf, 223 hectare reduction for grey infrastructure
(non-turf) adjustment. [B] Measures do not include data from Assiniboine Park.
86 Adopted 2016 Operating Budget - Service Based
kmorton
Text Box
Return to Summary

Parks and Urban ForestryContributing DepartmentsPublic Works 96 %Planning, Prop. & Devl. 4 %
Operating Budget(in millions of $) 2014
Actual2015
Budget
2016AdoptedBudget
Variance Expl.
2017 Projection
2018 Projection
Service revenue 0.614 0.588 0.759 0.771 0.785Provincial funding (service specific) 1.002 1.005 1.005 1.005 1.005
Revenue 1.616 1.593 1.764 1 1.776 1.790
Salaries and benefits 19.776 19.819 20.540 20.908 21.418Services 10.593 10.676 10.748 10.847 11.111Materials, parts, and supplies 3.202 2.874 2.736 2.790 2.832Assets and purchases 0.041 0.039 0.039 0.039 0.039Debt and finance charges 1.130 1.135 0.036 0.035 0.035Grants, transfers and other 3.287 3.556 3.448 3.479 3.512Recoveries (3.833) (2.364) (2.278) (2.283) (2.290)
Operating expenses 34.198 35.733 35.269 35.815 36.657
Transfer to Capital 10.202 3.358 4.669 4.922 4.547
Total Expenses 44.400 39.091 39.939 2 40.738 41.204
Mill Rate Support/(Contribution) 42.784 37.498 38.175 38.961 39.414Full-time Equivalent Positions 322 313 315 316 316
Explanation of 2016 Change from 2015
(in millions of $)1 Revenues
Experience rebate from Manitoba Public Insurance for Equipment Operator Training program
0.137
Miscellaneous adjustments 0.0340.171
2 ExpensesTransfer to Capital 1.311Increase in salaries and benefits 0.569Decrease in recovery from Winnipeg Fleet Management Agency for Equipment Operator Training program
0.155
Increase in salaries and benefits for additional asset management staff 0.152Additional funding for project to review and revise athletic field booking policies and fee structure
0.100
Decrease in debt and finance charges (1.099)Decrease in fleet equipment and fleet-related accounts (0.289)Miscellaneous adjustments (0.051)
0.848
Full-time Equivalent PositionsIncrease of 2 FTEs due to additional asset management staff.
Adopted 2016 Operating Budget - Service Based 87

Parks and Urban Forestry
Service Detail
Sub-services (in millions of $)2014
Actual2015
Budget
2016AdoptedBudget
2017 Projection
2018 Projection
Park Grass Maintenance Revenue - - 0.035 0.035 0.036Operating expenses 7.252 7.694 7.797 7.948 8.135Transfer to Capital - - - - -
7.252 7.694 7.762 7.912 8.098Park Amenity Maintenance Revenue 0.197 0.037 0.046 0.047 0.047
Operating expenses 3.617 3.950 3.846 3.914 4.001Transfer to Capital 3.009 - 1.418 1.392 1.237
6.429 3.913 5.218 5.259 5.191Athletic Field Maintenance Revenue 0.289 0.414 0.449 0.458 0.467
Operating expenses 2.389 2.808 2.850 2.796 2.856Transfer to Capital 0.500 0.062 0.100 0.100 0.101
2.600 2.456 2.501 2.439 2.490Park Pathway Maintenance Revenue - - 0.002 0.002 0.002
Operating expenses 0.272 0.305 0.289 0.295 0.302Transfer to Capital 0.151 0.149 0.076 0.075 0.075
0.423 0.455 0.363 0.368 0.374Park Planning/Development Revenue 0.002 0.018 0.023 0.022 0.022
Operating expenses 2.855 2.882 2.678 2.725 2.811Transfer to Capital 3.842 2.953 0.969 1.247 1.028
6.695 5.816 3.623 3.950 3.817Tree Planting Revenue - - 0.004 0.004 0.004
Operating expenses 1.604 1.851 1.735 1.767 1.802Transfer to Capital - - 0.383 0.382 0.383
1.604 1.851 2.115 2.145 2.182Tree Pruning & Removal Revenue 0.001 - 0.025 0.025 0.026
Operating expenses 4.747 4.663 4.613 4.700 4.796Transfer to Capital 0.500 0.193 0.325 0.326 0.325
5.246 4.856 4.914 5.001 5.096Dutch Elm Disease Control Revenue 1.000 1.000 1.019 1.019 1.019
Operating expenses 4.799 4.893 4.905 4.994 5.111Transfer to Capital 1.300 - 0.325 0.326 0.325
5.098 3.893 4.212 4.301 4.417Weed Control Revenue 0.098 0.085 0.092 0.094 0.096
Operating expenses 0.797 0.904 0.894 0.910 0.950Transfer to Capital - - - - -
0.699 0.819 0.802 0.816 0.854Natural Areas Management Revenue 0.020 0.039 0.043 0.043 0.043
Operating expenses 0.776 0.940 0.947 0.962 0.982Transfer to Capital - - - - -
0.757 0.901 0.904 0.919 0.939Playground Management Revenue - - 0.006 0.006 0.006
Operating expenses 0.802 0.999 0.767 0.781 0.798Transfer to Capital 0.900 - 1.072 1.074 1.073
1.702 0.999 1.834 1.849 1.865
88 Adopted 2016 Operating Budget - Service Based

Parks and Urban Forestry
Service Detail
Sub-services (in millions of $)2014
Actual2015
Budget
2016AdoptedBudget
2017 Projection
2018 Projection
Winter Amenity Maintenance Revenue 0.009 - 0.008 0.008 0.008Operating expenses 1.298 1.245 1.259 1.282 1.311Transfer to Capital - - - - -
1.289 1.245 1.251 1.274 1.303Boulevard Maintenance Revenue - - 0.013 0.013 0.014
Operating expenses 2.990 2.599 2.689 2.741 2.802Transfer to Capital - - - - -
2.990 2.599 2.676 2.728 2.788Mill Rate Support/(Contribution) 42.784 37.498 38.175 38.961 39.414
Additional Financial Information
Reserves
Balance, December 31 (in millions of $)2014
Actual2015
Actual
2016AdoptedBudget
2017 Projection
2018Projection
Land Dedication Reserve 7.116 7.307 8.052 8.300 8.549
Capital Budget2016
Adopted2017 - 2021
Forecast6 YearTotal
(In millions of $) 8.341 39.125 47.466
Adopted 2016 Operating Budget - Service Based 89

Golf Services (SOA)
Description Key GoalsThe City of Winnipeg has operated municipal golf courses since 1921. Winnipeg Golf Services was established in 2002 to administer the City's 12 golf course assets. The Agency is responsible for operating and maintaining golf courses, managing contracts and leases for City lands used by privately operated golf courses, managing a contracted cross country ski operation and other services compatible with a golf operation.
1. Improve golf course playability.2. Provide high quality customer service.3. Ensure financial and environmental sustainability.4. Improve the image of municipal courses.5. Increase revenues from associated services.
Service Level StatisticsDescription 2012 2013 2014Kildonan (39.49 hectares)
Days Open 202 169 175Total Rounds 29,481 28,753 27,631
Windsor (46.13 hectares) Days Open 192 153 161Total Rounds 25,212 22,500 20,058
Crescent Drive (15.39 hectares) Days Open 161 156 148Total Rounds 16,006 13,936 13,562
Harbour View (12.8 hectares) Days Open 201 164 180Total Rounds 15,010 13,298 10,083
There are four different types of arrangements under which the golf courses are managed. City Operated and Maintained: Kildonan Park, Windsor Park, Crescent Drive Leased Properties: Rossmere, St. Boniface, Transcona, Wildwood Club, Assiniboine, Canoe Club, Tuxedo Managed Contract: John Blumberg City Maintained/Contractor Operated: Harbour View Golf Course and Recreation Complex
90 Adopted 2016 Operating Budget - Service Based
kmorton
Text Box
Return to Summary

Golf Services (SOA)Contributing DepartmentsGolf Services SOA 100 %
Operating Budget
(in millions of $)2014
Actual2015
Budget
2016AdoptedBudget
Variance Expl.
2017 Projection
2018 Projection
Service Revenue 3.018 2.862 2.688 2.607 2.740Grant from the City 0.150 0.750 0.750 0.750 0.750Provincial funding (service specific) 0.023 0.028 0.024 0.024 0.025
Revenues 3.191 3.641 3.462 1 3.381 3.515
Salaries and benefits 1.233 1.441 1.506 1.533 1.572Services 0.594 0.723 0.605 0.601 0.610Materials, parts, and supplies 0.171 0.222 0.182 0.185 0.189Assets and purchases - 0.001 - - -Debt and finance charges 0.222 0.277 0.285 0.290 0.295Grants, transfers and other 0.167 0.206 0.172 0.176 0.179Recoveries (0.017) (0.011) - - -
Expenses 2.369 2.860 2.750 2 2.786 2.845
Surplus/(Deficit) 0.821 0.781 0.712 0.596 0.670Full-time Equivalent Positions 20 24 24 24 24Winnipeg Golf Services is a Special Operating Agency (SOA) with its own operating charter approved by Council. SOA budgets are subject to change based on Council approvals in the business plan report process.
Explanation of 2016 Change from 2015
(in millions of $)1 Revenues
Increase in transfer from Golf Course Reserve 0.101Decrease in green fee revenue (0.225)Decrease in equipment rental revenue (0.048)Decrease in fixed asset rental (0.017)Miscellaneous adjustments 0.010
(0.179)
2 ExpensesIncrease in salary and benefits in accordance with collective agreements 0.065Decrease due to reduced service costs (0.118)Miscellaneous adjustments (0.057)
(0.110)
Additional Financial Information
Reserves
Balance, December 31 (in millions of $)2014
Actual2015
Actual
2016AdoptedBudget
2017 Projection
2018Projection
Golf Course Reserve 0.496 0.453 0.333 0.295 0.238
Adopted 2016 Operating Budget - Service Based 91

Community LiveabilityIncludes:
• Community By-law Enforcement• Bicycle Recovery• Citizen Crisis Response• Social Grants
Description Key GoalsThrough outreach, promotion, prevention, protection and regulatory services, support the development of a healthy community including: - Community By-law Enforcement Services (CBES) with a focus on neighbourhood liveability including housing and property standards. - Business Licensing (Doing Business in Winnipeg By-law) and Taxicabs. - Crisis response coordination - connecting citizens to available services as required in relation to mandated city services. - Emergency health and social services response to citizens during local emergencies and disasters. - Administration of social grants to community organizations to provide a service that the City of Winnipeg would otherwise need to provide in support of safe and healthy neighbourhoods. - Administration of a bicycle recovery program.
1. To continue to build and enhance performance measurement/accountability systems in order to improve service quality, operational due diligence, and customer service.
2. To continue to build on the success of our community-based civic engagement model to strengthen partnerships and increase community capacity.
3. To continue to deliver an efficient and comprehensive Vacant Building Program designed to accelerate property restoration and re-occupancy.
Service Level StatisticsDescription 2012 2013 2014No. of Service Requests 15,287 16,460 14,717No. of Service Requests per By-Law Officer 659 712 654No. of Property Standards Inspections/Officer & By-Law Support Worker Visits* 21,311 24,128 30,060No. of Vacant Buildings as at January 1** 431 397 390No. of Vacant Buildings Added to the List During the Year 181 186 144No. of Vacant Buildings Removed from the List During the Year 215 193 176No. of Vacant Buildings as at December 31 397 390 358No. of Compliance Orders Issued 5,874 6,118 6,046No. of Common Offence Notices Issued (Tickets) 527 564 455No. of Property Clean-Ups Conducted by the Public Service 158 287 286No. of Business Types Regulated 26 27 27No. of Business Licenses Issued*** 6,330 6,033 5,662No. of Taxi Cab Licenses Issued 770 748 775No of Crisis Response/Resource Connection/Information Referrals Responded to 560 537 497No. of Emergencies Responded/No. of Individuals Impacted 11 / 131 6 / 116 4 / 250
* The increase in Officer/By-law Support Worker visits in 2014 is due to an increase in temporary seasonal staff.** The Vacant Building Program started in October 2010. At that time, there were 577 vacant buildings.*** The number of business licenses issued includes taxi cab licenses.
92 Adopted 2016 Operating Budget - Service Based
kmorton
Text Box
Return to Summary

Community LiveabilityContributing DepartmentsCommunity Services 100 %
Operating Budget
(in millions of $)2014
Actual2015
Budget
2016AdoptedBudget
Variance Expl.
2017 Projection
2018 Projection
Service revenue 1.399 1.038 0.842 0.842 0.842Provincial funding (service specific) - - - - -
Revenues 1.399 1.038 0.842 1 0.842 0.842
Salaries and benefits 3.002 3.170 3.266 3.375 3.475Services 0.494 0.506 0.569 0.570 0.570Materials, parts, and supplies 0.049 0.077 0.071 0.069 0.072Assets and purchases 0.013 0.022 0.021 0.021 0.021Debt and finance charges 0.015 0.031 0.018 0.017 0.017Grants, transfers and other 1.040 1.143 1.135 1.135 1.135Recoveries (0.162) (0.128) (0.201) (0.214) (0.216)
Operating expenses 4.450 4.821 4.880 4.973 5.075
Transfer to Capital - - - - -
Total Expenses 4.450 4.821 4.880 2 4.973 5.075
Mill Rate Support/(Contribution) 3.051 3.783 4.038 4.131 4.233Full-time Equivalent Positions 44 43 44 44 44
Explanation of 2016 Change from 2015
(in millions of $)1 Revenues
Decrease in general health license revenue to complete the transition to the Province on March 31, 2015
(0.190)
Miscellaneous adjustments (0.006)(0.196)
2 ExpensesIncrease in salaries and benefits 0.096Miscellaneous adjustments (0.037)
0.059
Full-time Equivalent PositionsIncrease due to refinement of service based view.
Adopted 2016 Operating Budget - Service Based 93

Community Liveability
Service Detail
Sub-services (in millions of $)2014
Actual2015
Budget
2016AdoptedBudget
2017 Projection
2018 Projection
Community Health Inspection Revenue 0.665 0.196 - - -Operating expenses 0.412 0.143 - - -Transfer to Capital - - - - -
(0.253) (0.052) - - -
Community By-law Enforcement
Revenue 0.638 0.760 0.760 0.760 0.760Operating expenses 3.050 3.538 3.735 3.750 3.915Transfer to Capital - - - - -
2.412 2.778 2.975 2.990 3.156
Bicycle Recovery Revenue 0.096 0.082 0.082 0.082 0.082Operating expenses 0.172 0.184 0.186 0.188 0.189Transfer to Capital - - - - -
0.075 0.102 0.104 0.106 0.107
Citizen Crisis Response Revenue - - - - -Operating expenses 0.204 0.187 0.190 0.264 0.197Transfer to Capital - - - - -
0.204 0.187 0.190 0.264 0.197
Social Grants Revenue - - - - -Operating expenses 0.613 0.768 0.769 0.771 0.773Transfer to Capital - - - - -
0.613 0.768 0.769 0.771 0.773
Mill Rate Support/(Contribution) 3.051 3.783 4.038 4.131 4.233
94 Adopted 2016 Operating Budget - Service Based

LibrariesIncludes:
• Library Circulation • Children's Library• Library Information
Description Key GoalsTo enrich the lives of all Winnipeg citizens and their communities by providing high quality, responsive and innovative library services.
1. Provide excellent customer service as public needs evolve.
2. Enhance strategic partnerships with organizations to better meet the unique needs of the community.
3. Invest in more programs and services that advance digital literacy.
4. Support the development of early literacy skills in young children through increased investment in materials, services and programs for families, childcare providers and educators.
5. Ensure all library branches are welcoming and accessible destinations.
6. Adjust open hours of library branches to encourage new library users to visit and to be more convenient.
7. Select material that reflects the diverse needs of the community so that relevant print, digital and special collections are freely available.
8. Increase awareness of the library and its benefits through expanded promotion of programs/services.
9. Develop stronger relationships with newcomers and Indigenous peoples by providing responsive programs and services.
10. Provide opportunities for older adults to meet, learn and contribute so that we build strong connections within the community.
11. Expand the impact of the library beyond branches through community outreach and digital services.
Service Level StatisticsDescription 2012* 2013* 2014*Number of Items Circulated 5,599,002 5,330,496 5,211,846Number of Information Questions Answered 371,745 333,841 186,035**Number of Library Material Holdings*** 1,416,835 1,289,209 1,284,883Number of Library Programs 3,146 3,350 3,803Number of Attendees at Programs 74,127 80,382 91,145Number of Computer Bookings 555,625 525,858 529,923Number of Visits to Library Website**** 2,202,089 8,949,159 10,499,707Number of Annual In-person Visits 2,692,447 2,736,059 2,861,674
* In 2012, 2 libraries were closed for renovations for a total of 8 weeks of closures; In 2013, 1 library was closed for renovations for a total of 34 weeks of closures; In 2014, 4 libraries were closed for repair/renovations for a total of 20 weeks of closures.
** New tracking software was used in 2014. Results reflect true information questions.*** Ongoing removal of outdated/worn material and replacement, where possible, with electronic resources. Ebook collection is no
longer combined with the Provincial collection therefore reflects only Winnipeg's collection.**** 2012 and 2013 data restated to better reflect OMBI reporting. Data for all years now includes social media activity. Starting in
2013 online catalogue sessions are also included.
Adopted 2016 Operating Budget - Service Based 95
kmorton
Text Box
Return to Summary
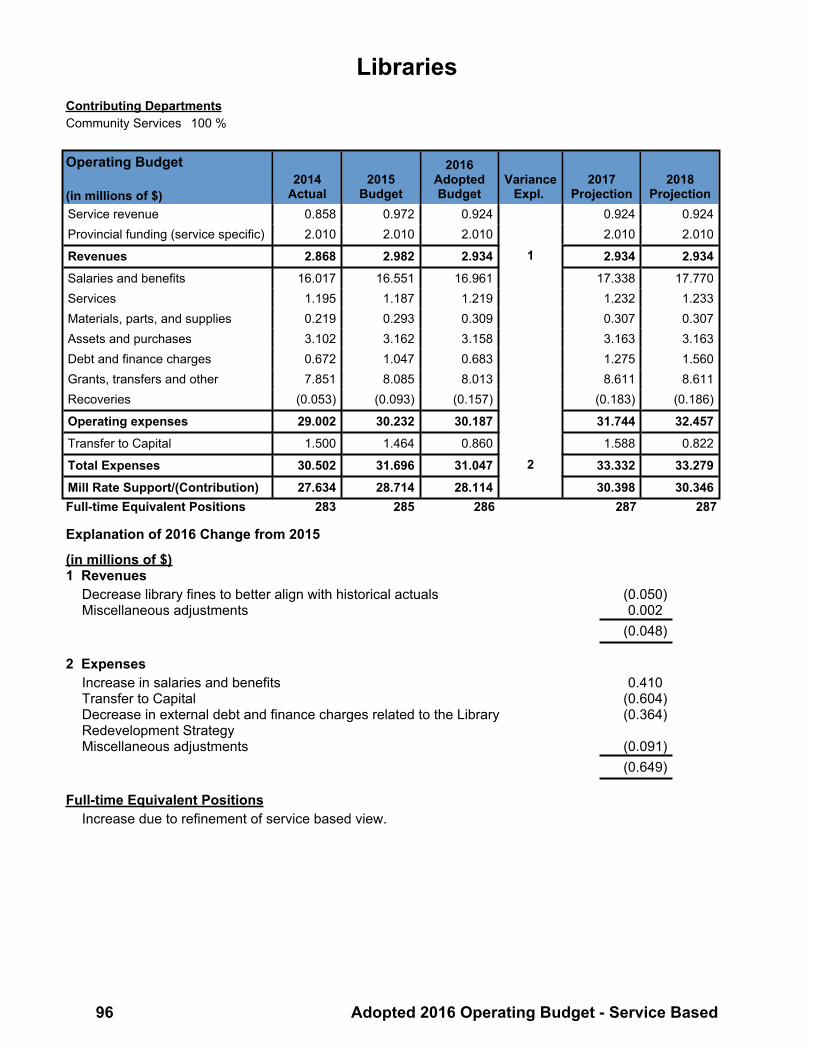
LibrariesContributing DepartmentsCommunity Services 100 %
Operating Budget
(in millions of $)2014
Actual2015
Budget
2016AdoptedBudget
Variance Expl.
2017 Projection
2018 Projection
Service revenue 0.858 0.972 0.924 0.924 0.924Provincial funding (service specific) 2.010 2.010 2.010 2.010 2.010
Revenues 2.868 2.982 2.934 1 2.934 2.934
Salaries and benefits 16.017 16.551 16.961 17.338 17.770Services 1.195 1.187 1.219 1.232 1.233Materials, parts, and supplies 0.219 0.293 0.309 0.307 0.307Assets and purchases 3.102 3.162 3.158 3.163 3.163Debt and finance charges 0.672 1.047 0.683 1.275 1.560Grants, transfers and other 7.851 8.085 8.013 8.611 8.611Recoveries (0.053) (0.093) (0.157) (0.183) (0.186)
Operating expenses 29.002 30.232 30.187 31.744 32.457
Transfer to Capital 1.500 1.464 0.860 1.588 0.822
Total Expenses 30.502 31.696 31.047 2 33.332 33.279
Mill Rate Support/(Contribution) 27.634 28.714 28.114 30.398 30.346Full-time Equivalent Positions 283 285 286 287 287
Explanation of 2016 Change from 2015
(in millions of $)1 Revenues
Decrease library fines to better align with historical actuals (0.050)Miscellaneous adjustments 0.002
(0.048)
2 ExpensesIncrease in salaries and benefits 0.410Transfer to Capital (0.604)Decrease in external debt and finance charges related to the Library Redevelopment Strategy
(0.364)
Miscellaneous adjustments (0.091)(0.649)
Full-time Equivalent PositionsIncrease due to refinement of service based view.
96 Adopted 2016 Operating Budget - Service Based

Libraries
Service Detail
Sub-services (in millions of $)2014
Actual2015
Budget
2016AdoptedBudget
2017 Projection
2018 Projection
Library Circulation Revenue 2.025 1.789 1.760 1.760 1.760Operating expenses 16.909 17.467 17.468 18.369 18.754Transfer to Capital 0.900 0.498 0.292 0.540 0.279
15.784 16.175 16.000 17.149 17.273
Library Information Revenue 0.527 0.746 0.733 0.733 0.733Operating expenses 7.817 8.209 8.376 8.797 9.016Transfer to Capital 0.375 0.483 0.284 0.524 0.271
7.665 7.946 7.926 8.587 8.554
Children's Library Revenue 0.316 0.447 0.440 0.440 0.440Operating expenses 4.276 4.556 4.344 4.578 4.687Transfer to Capital 0.225 0.483 0.284 0.524 0.271
4.185 4.592 4.187 4.662 4.518
Mill Rate Support/(Contribution) 27.634 28.714 28.114 30.398 30.346
Additional Financial Information
Capital Budget2016
Adopted2017 - 2021
Forecast6 YearTotal
(In millions of $) 8.873 24.561 33.434
Adopted 2016 Operating Budget - Service Based 97

Arts, Entertainment and CultureIncludes:
• Arts, Entertainment and Culture Grants • Museums• Arts, Entertainment and Culture Events • Assiniboine Park Conservancy
Description Key GoalsTo provide citizens and visitors with attractions, entertainment, arts and cultural events that contribute to a dynamic urban image, economic development and a vibrant city lifestyle through: - Operating and capital grant support to the Assiniboine Park Conservancy Inc., a not-for-profit corporation established to manage, fundraise and redevelop Assiniboine Park and its attractions. Assiniboine Park is a 400 acre manicured English landscape style park featuring a zoo with one of Canada's largest animal collections, a conservatory with ever-changing botanic displays, outdoor gardens, theatre, performance and art displays, annual community events, trails, meadows and athletic fields for year-round leisure activities; - Grant support to museums, arts, entertainment and cultural communities to provide a wide range of events, shows and displays for Winnipeg residents and visitors to the City; and - Attracting and assisting film-makers and event organizers by providing logistical support, facilitated contact and liaison with civic departments, private sector business and organizations in support of a welcoming community for film activities and a strong and vibrant calendar of cultural and special events.
1. Work with Assiniboine Park Conservancy to support capital development and improvement to the Park.
2. Support film, culture and special events by working cooperatively with civic departments and other organizations to provide logistical support to the film industry, event organizers, and arts organizations.
Service Level StatisticsDescription 2012 2013 2014Film, Culture, and Special Events Visitors Attending Festivals (Source: Winnipeg Arts Council) 1,193,310 1,103,805 1,235,621Visitors Attending Cultural Events (Source: Winnipeg Arts Council) 2,774,405 2,587,514 2,747,613Cultural Labour Force (Source: Arts and Cultural Industries) 25,000* 25,000* 25,000*Manitoba Value in Film Industry (Source: Manitoba Film & Sound) $95.0 million $108.8 million $106.0 millionSpecial Events Held in Winnipeg 352 335 362Number of Full Length Feature Films Filmed in Winnipeg 14 13 13
* TICKET TO THE FUTURE Report - Winnipeg Arts Council
98 Adopted 2016 Operating Budget - Service Based
kmorton
Text Box
Return to Summary

Arts, Entertainment and CultureContributing DepartmentsCommunity Services 70 %City Clerks 25 %Museums 4 %CAO Office 1 %
Operating Budget
(in millions of $)2014
Actual2015
Budget
2016AdoptedBudget
Variance Expl.
2017 Projection
2018 Projection
Service revenue 0.031 - - - -Provincial funding (service specific) - - - - -
Revenues 0.031 - - 1 - -
Salaries and benefits 0.395 0.440 0.451 0.462 0.477Services 0.100 0.051 0.048 0.046 0.045Materials, parts and supplies 0.008 0.016 0.016 0.016 0.015Assets and purchases - - - - -Debt and finance charges 0.269 1.547 1.589 1.555 1.559Grants, transfers and other 17.934 17.028 17.856 17.731 18.096Recoveries (0.002) (0.001) (0.001) (0.001) (0.001)
Operating expenses 18.704 19.081 19.958 19.809 20.191
Transfer to Capital 14.374 9.318 6.092 - 5.123
Total Expenses 33.078 28.399 26.050 2 19.809 25.314
Mill Rate Support/(Contribution) 33.048 28.399 26.050 19.809 25.314Full-time Equivalent Positions 6 6 6 6 6
Explanation of 2016 Change from 2015
(in millions of $)1 Revenues n/a
2 ExpensesGrant for Winnipeg Art Gallery - Inuit Art Centre 1.000Increase in grant for Winnipeg Arts Council 0.313Grant for Downtown BIZ - Community Homeless Assistance Team (CHAT) 0.150One time grant for Economic Development Winnipeg - Yes! Winnipeg 0.135Increase in debt and finance charges 0.042One time grant for Manitoba Theatre for Young People (MYTP) 0.030Grant for Downtown BIZ - Manyfest 0.020One time grant for Winnipeg Parade Committee - Santa Claus Parade 0.020One time grant for Manito Ahbee Festival 0.013Grant for Take Pride Winnipeg - Green Wave 0.012Increase in salaries and benefits 0.011Transfer to Capital (3.226)Operating grant for Assiniboine Park Conservancy (2015 - $11,376,000; 2016 - $10,512,000)
(0.864)
Miscellaneous adjustments (0.005)(2.349)
Adopted 2016 Operating Budget - Service Based 99

Arts, Entertainment and Culture
Service Detail
Sub-services (in millions of $)2014
Actual2015
Budget
2016AdoptedBudget
2017 Projection
2018 Projection
Arts, Ent & Culture Grants Revenue - - - - -Operating expenses 4.790 4.713 6.406 5.943 5.943Transfer to Capital - - - - -
4.790 4.713 6.406 5.943 5.943
Arts, Ent & Culture Events Revenue 0.031 - - - -Operating expenses 0.406 0.390 0.397 0.406 0.417Transfer to Capital - - - - -
0.375 0.390 0.397 0.406 0.417
Museums Revenue - - - - -Operating expenses 0.979 1.031 1.031 1.031 1.031Transfer to Capital - - - - -
0.979 1.031 1.031 1.031 1.031
Assiniboine Park Conservancy Revenue - - - - -Operating expenses 12.529 12.946 12.125 12.430 12.800Transfer to Capital 14.374 9.318 6.092 - 5.123
26.903 22.264 18.217 12.430 17.923
Mill Rate Support/(Contribution) 33.048 28.399 26.050 19.809 25.314
Additional Financial Information
Capital Budget2016
Adopted2017 - 2021
Forecast6 YearTotal
(In millions of $) 7.342 22.619 29.961
100 Adopted 2016 Operating Budget - Service Based
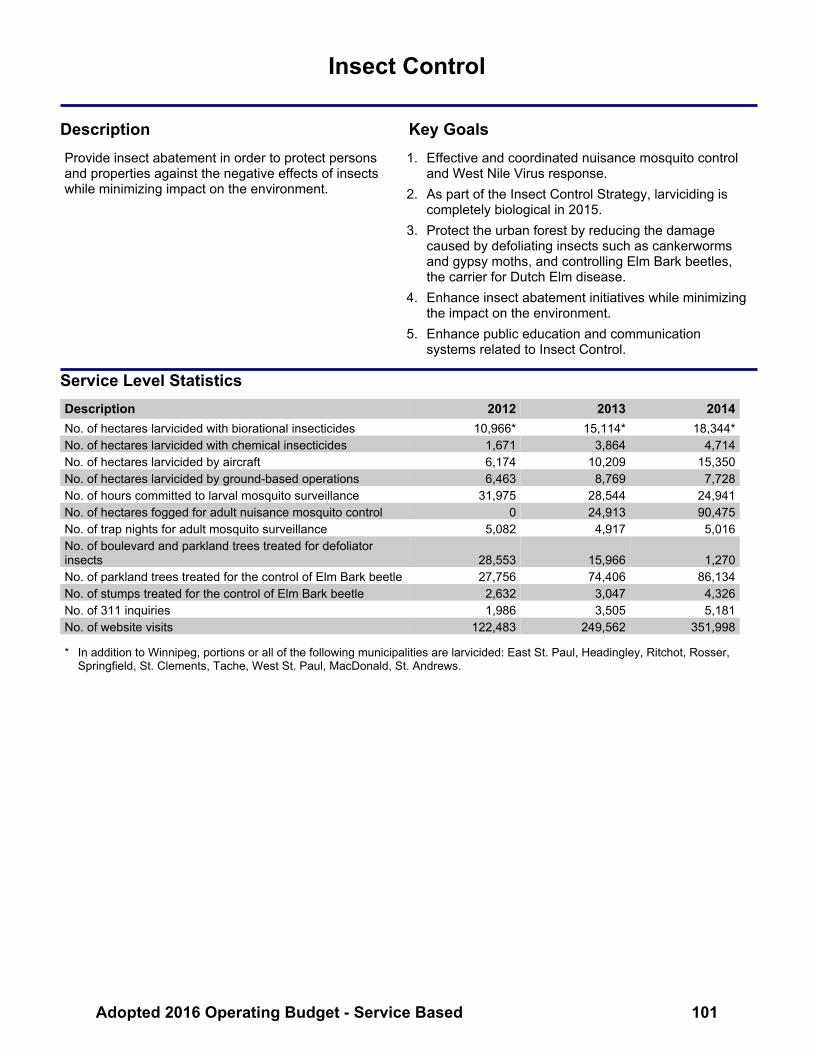
Insect Control
Description Key GoalsProvide insect abatement in order to protect persons and properties against the negative effects of insects while minimizing impact on the environment.
1. Effective and coordinated nuisance mosquito control and West Nile Virus response.
2. As part of the Insect Control Strategy, larviciding is completely biological in 2015.
3. Protect the urban forest by reducing the damage caused by defoliating insects such as cankerworms and gypsy moths, and controlling Elm Bark beetles, the carrier for Dutch Elm disease.
4. Enhance insect abatement initiatives while minimizing the impact on the environment.
5. Enhance public education and communication systems related to Insect Control.
Service Level StatisticsDescription 2012 2013 2014No. of hectares larvicided with biorational insecticides 10,966* 15,114* 18,344*No. of hectares larvicided with chemical insecticides 1,671 3,864 4,714No. of hectares larvicided by aircraft 6,174 10,209 15,350No. of hectares larvicided by ground-based operations 6,463 8,769 7,728No. of hours committed to larval mosquito surveillance 31,975 28,544 24,941No. of hectares fogged for adult nuisance mosquito control 0 24,913 90,475No. of trap nights for adult mosquito surveillance 5,082 4,917 5,016No. of boulevard and parkland trees treated for defoliator insects 28,553 15,966 1,270No. of parkland trees treated for the control of Elm Bark beetle 27,756 74,406 86,134No. of stumps treated for the control of Elm Bark beetle 2,632 3,047 4,326No. of 311 inquiries 1,986 3,505 5,181No. of website visits 122,483 249,562 351,998
* In addition to Winnipeg, portions or all of the following municipalities are larvicided: East St. Paul, Headingley, Ritchot, Rosser, Springfield, St. Clements, Tache, West St. Paul, MacDonald, St. Andrews.
Adopted 2016 Operating Budget - Service Based 101
kmorton
Text Box
Return to Summary

Insect ControlContributing DepartmentsPublic Works 100 %
Operating Budget
(in millions of $)2014
Actual2015
Budget
2016AdoptedBudget
Variance Expl.
2017 Projection
2018 Projection
Service revenue 1.805 0.007 0.707 0.007 0.007Provincial funding (service specific) 2.300 2.300 2.300 2.300 2.300
Revenues 4.105 2.307 3.007 1 2.307 2.307
Salaries and benefits 4.066 3.953 4.029 4.099 4.199Services 1.812 3.634 3.240 3.245 3.250Materials, parts, and supplies 1.919 2.655 2.648 2.654 2.659Assets and purchases 0.183 0.104 0.136 0.136 0.136Debt and finance charges - - - - -Grants, transfers and other 0.823 0.111 0.112 0.112 0.113Recoveries (1.142) (0.149) (0.149) (0.149) (0.149)
Operating expenses 7.661 10.307 10.016 10.096 10.209
Transfer to Capital - 0.299 - 0.731 -
Total Expenses 7.661 10.606 10.016 2 10.828 10.209
Mill Rate Support/(Contribution) 3.557 8.300 7.009 8.521 7.902
Full-time Equivalent Positions 64 68 68 68 68
Explanation of 2016 Change from 2015
(in millions of $)1 Revenues
Transfer from Insect Control Reserve 0.7000.700
2 ExpensesIncrease in salaries and benefits 0.076Reduction in requirement for aircraft hire for mosquito larviciding (0.397)Transfer to Capital (0.299)Decrease in fleet equipment and fleet-related accounts (0.071)Miscellaneous adjustments 0.101
(0.590)
102 Adopted 2016 Operating Budget - Service Based

Insect Control
Additional Financial Information
Reserves
Balance, December 31 (in millions of $)2014
Actual2015
Actual
2016AdoptedBudget
2017 Projection
2018Projection
Insect Control Reserve 2.003 2.654 1.961 1.966 1.972
Capital Budget2016
Adopted2017 - 2021
Forecast6 YearTotal
(In millions of $) - 0.732 0.732
Adopted 2016 Operating Budget - Service Based 103

Animal Services (SOA)
Description Key GoalsTo provide animal control measures under the City of Winnipeg Act and related by-laws. The Agency's service consists of four sub-service areas: - Licensing: Animal licensing and registration, animal permits. - Kenneling: Kenneling and care for stray animals and dogs running at large picked up by the Agency, quarantine kennelling for biting dogs. - Adoption/Community Education: Provides adoption opportunities for unclaimed dogs reducing euthanasia. Provides outreach pet ownership and animal safety education to school groups and various service organizations. - By-Law Enforcement: Enforcement of all animal related by-laws, neighbourhood dispute resolution, investigation and response, picking up injured animals, after hours emergency response, police and fire assists, investigation of illegal animal complaints. The Agency also provides funding to the Winnipeg Humane Society for the intake/sheltering of stray cats, care of injured animals and a subsidized cat spray/neutering program.
1. Reduce reliance on the Agency's mill-rate support.2. Increase customer service and satisfaction.3. Improve health and safety of neighbourhoods.4. Improve the Agency's public image.
Service Level StatisticsDescription 2012 2013 2014Number of requests for service 13,396 12,162 10,233Number of dogs impounded 1,601 1,317 1,108Number of dogs adopted 497 363 371Number of dogs returned to owners by the Animal Services Agency 819 692 671Number of dogs reunited with their owner by 311* 927 856 646Number of dogs sent to rescues 130 152 61Number of dogs euthanized 91 70 52Number of biting dog complaints** 423 402 269Number of biting dogs quarantined 126 100 71Number of dogs running at large complaints 2,897 2,755 2,505Number of cats running at large complaints 544 487 374Number of active dog licenses 63,689 64,538 60,453Number of by-law charges laid 1,522 1,283 795
* 311 reunites dogs wearing licenses with their owners 24/7. These dogs were returned to their owners without having to set foot in the Animal Services facility.
** Starting in 2014, biting dog complaints only include cases with human involvement.
104 Adopted 2016 Operating Budget - Service Based
kmorton
Text Box
Return to Summary

Animal Services (SOA)Contributing DepartmentsAnimal Services SOA 100 %
Operating Budget
(in millions of $)2014
Actual2015
Budget
2016AdoptedBudget
Variance Expl.
2017 Projection
2018 Projection
Service Revenue 1.823 2.278 2.472 2.550 2.573Grant from the City 1.404 1.404 1.379 1.320 1.320Provincial funding (service specific) 0.028 0.026 0.028 0.029 0.030
Revenues 3.256 3.708 3.880 1 3.898 3.922
Salaries and benefits 1.560 1.757 1.772 1.829 1.892Services 0.529 0.803 0.752 0.764 0.774Materials, parts and supplies 0.195 0.132 0.173 0.177 0.180Assets and purchases 0.006 0.003 0.003 0.003 0.003Debt and finance charges 0.036 0.064 0.055 0.056 0.057Grants, transfers and other 0.741 0.833 1.030 1.038 1.048Recoveries - - - - -
Expenses 3.067 3.592 3.785 2 3.867 3.956
Surplus/(Deficit) 0.189 0.117 0.095 0.032 (0.034)Full-time Equivalent Positons 27 28 28 28 28
Animal Services is a Special Operating Agency (SOA) with its own operating charter approved by Council. SOA budgets are subject to change based on Council approvals in the business plan report process. The mill rate support grant from the City is administered through the Community Services Department. This includes funding in the amount of $652,273 annually for a Service Agreement with the Winnipeg Humane Society for the intake/sheltering of stray cats, care of injured animals and a subsidized cat spray/neutering program.
Explanation of 2016 Change from 2015
(in millions of $)1 Revenues
Net increase in regulation revenue due to increased fees 0.190Net decrease in transfer from the General Revenue Fund (0.025)Miscellaneous adjustments 0.007
0.172
2 ExpensesIncrease in service agreement with the Winnipeg Humane Society 0.152Increase in grants in support of expanded cat spay and neuter program 0.036Increase in salaries and benefits 0.015Miscellaneous adjustments (0.010)
0.193
Adopted 2016 Operating Budget - Service Based 105
kmorton
Text Box
Return to Table of Contents
kmorton
Text Box

106 Adopted 2016 Operating Budget - Service Based

Organizational Support ServicesIncludes:
• Chief Administrative Offices • Information Technology Management• Communications • Legal Services• Financial Management • Production Services• Human Resource Management
Description Key GoalsOrganizational Support Services provides leadership and professional services to support the delivery of public services to the citizens of Winnipeg. By providing financial, human resource, and other specialized services, Organizational Support Services ensures that the civic organization has the capability and technical expertise to support the delivery of public services.
1. To provide organizational leadership in implementing Council's policies and priorities through proactive organizational planning, effective issues management, strategic communications, the provision of professional advice and follow-up through report management.
2. To provide sound financial stewardship towards responsible City government by strengthening financial performance, improving information for decision-making and managing risks and exposures.
3. To provide the organization with efficient and effective human resource management support in order to sustain a diverse, respectful, safe, healthy and productive workforce.
4. To provide strategic direction and leadership in the planning and governance of City-wide Information Technology, and provide innovative and cost effective IT shared services to departments.
5. To provide a full range of legal services to Council and its committees, the Chief Administrative Officer, and the civic public service.
6. To deliver effective and cost efficient printing, graphic design, translation and mail services to the civic public service and elected officials.
Service Level StatisticsDescription 2012 2013 2014Tax Supported Operating Budget $893 million $923 million $969 millionUtility Operating Budget (expenditures) $478 million $490 million $511 millionSpecial Operating Agencies Operating Budget (expenditures) $63 million $66 million $69 millionCapital Budget $393 million $375 million $379 millionSalaries and Benefits as a % of total consolidated operating expenditures (Annual Financial Report) 53.5% 52.2% 51.8%Average Annual Headcount 10,080 10,143 10,206Average Age of City Employees / Average Years of Service 42 / 13 42 / 12.3 42 / 12.2Number of News Releases 345 424 489Website Visits 16.7 million 19.5 million 22.3 millionE-mail Accounts 7,109 7,146 7,352By-laws Passed* 155 149 140By-law Court Guilty Pleas and Default Convictions 1,337 2,075 1,625Pieces of Mail Processed 3.2 million 3.6 million 3.8 millionTranslation - Words Translated 166,290 160,027 219,049**Number of Workers Compensation Claims 1,081 1,107 1,089* 2012 and 2013 reported by-laws drafted and/or amended.** Significant increase due to the civic election.
Adopted 2016 Operating Budget - Service Based 107
kmorton
Text Box
Return to Summary
kmorton
Text Box
Return to Table of Contents
kmorton
Text Box

Organizational Support ServicesContributing DepartmentsCorporate Support Services 66 %Corporate Finance 20 %Other 14 %
Operating Budget
(in millions of $)2014
Actual2015
Budget
2016AdoptedBudget
Variance Expl.
2017 Projection
2018 Projection
Service revenue 0.697 0.784 0.859 0.899 0.936Provincial funding (service specific) - - - - -
Revenues 0.697 0.784 0.859 1 0.899 0.936
Salaries and benefits 29.890 32.010 34.253 35.341 36.031Services 3.649 4.044 4.290 4.015 4.049Materials, parts and supplies 3.045 3.455 3.630 3.588 3.972Assets and purchases 0.567 0.521 0.528 0.525 0.528Debt and finance charges 0.361 0.238 0.220 0.213 0.207Grants, transfers and other 3.030 2.436 4.046 3.282 3.314Recoveries (5.395) (5.300) (6.538) (6.509) (6.242)
Operating expenses 35.147 37.404 40.429 40.455 41.858
Transfer to Capital 2.211 2.794 3.874 3.737 2.870
Total Expenses 37.358 40.198 44.303 2 44.192 44.728
Mill Rate Support/(Contribution) 36.660 39.414 43.444 43.293 43.792Full-time Equivalent Positions 334 347 363 365 362
Explanation of 2016 Change from 2015
(in millions of $)1 Revenues
Miscellaneous adjustments 0.0750.075
2 ExpensesIncrease in salaries and benefits excluding additional positions temporarily recovered from other funds
1.703
Transfer to Computer Replacement Reserve (City-wide Critical Systems component)
1.608
Transfer to Capital 1.080Increase in salaries and benefits for additional positions fully recovered from other funds
0.540
Increase in recoveries for salaries and benefits from other funds (0.540)Recovery of information technology costs from Contact Centre - 311 (0.452)Miscellaneous adjustments 0.166
4.105
Full-time Equivalent PositionsIncrease of 16 FTEs mainly due to the addition of positions for Information Technology Management and Communications, 5.74 FTEs are fully recovered from other funds.
108 Adopted 2016 Operating Budget - Service Based

Organizational Support Services
Service Detail
Sub-services (in millions of $)2014
Actual2015
Budget
2016AdoptedBudget
2017 Projection
2018 Projection
Chief Administrative Offices Revenue - - - - -Operating expenses 1.381 1.501 1.526 1.558 1.597Transfer to Capital - - - - -
1.380 1.501 1.526 1.558 1.597
Communications Revenue - - - - -Operating expenses 0.715 0.843 1.315 1.579 1.632Transfer to Capital - - - - -
0.715 0.843 1.315 1.579 1.632
Financial Management Revenue 0.150 0.025 0.063 0.100 0.138Operating expenses 8.157 8.830 9.016 9.237 9.515Transfer to Capital 0.250 0.300 - - -
8.257 9.105 8.953 9.137 9.377
Human Resource Management Revenue - - - - -Operating expenses 6.057 6.110 6.412 6.294 6.442Transfer to Capital - - - - -
6.057 6.110 6.412 6.294 6.442
Info Technology Management Revenue 0.178 0.146 0.146 0.146 0.146Operating expenses 15.011 15.729 17.734 17.244 18.021Transfer to Capital 1.961 2.494 3.874 3.737 2.870
16.794 18.077 21.462 20.835 20.745
Legal Services Revenue 0.369 0.613 0.651 0.653 0.653Operating expenses 2.667 3.135 3.183 3.277 3.360Transfer to Capital - - - - -
2.298 2.523 2.533 2.624 2.707
Production Services Revenue - - - - -Operating expenses 1.160 1.256 1.243 1.266 1.292Transfer to Capital - - - - -
1.160 1.256 1.243 1.266 1.292
Mill Rate Support/(Contribution) 36.660 39.414 43.444 43.293 43.792
Additional Financial Information
Capital Budget2016
Adopted2017 - 2021
Forecast6 YearTotal
(In millions of $) 6.073 14.576 20.649
Adopted 2016 Operating Budget - Service Based 109

Assessment, Taxation and CorporateIncludes:
• Assessment and Taxation• Corporate Accounts
Description Key GoalsTo provide timely and accurate property and business valuations, tax billing and collection services. General revenue and corporate expenses/savings that are not attributable directly to any other public or internal service, include: - Taxation revenue and tax credits. - Unconditional grants from the Province of Manitoba. - Provincial payroll tax and offsetting support grant from the Province. - Revenue from sale of Winnipeg Hydro/utility dividends. - Pension contribution adjustments. - Interest income. - Debt and finance charges not attributable to any other City services. - Corporate risk management.
1. Provide valuations that are accessible to the public.2. Reduce the financial risk of assessment appeals.3. Provide accurate valuations that are fair and timely.4. Enhance the understanding of valuations and their
underlying principles both internally and externally.5. Deliver a timely, accurate tax billing and collection
service.6. Improve customer service.
Service Level StatisticsDescription 2012 2013 2014Budgeted Revenue: Property tax $460.9 million $484.2 million $510.6 million Business tax $57.6 million $58.3 million $59.7 million Other taxation $18.2 million** $20.3 million $25.4 millionProperty Tax: Residential properties 202,237 204,307 207,921 Non-residential properties 13,779 13,844 13,940 % Residential 93.6% 93.7% 93.7% % Non-residential 6.4% 6.3% 6.3% Total market value assessment $68.1 billion $69.1 billion $74.8 billion Total taxable portioned assessment $31.2 billion $31.7 billion $36.2 billion % Residential 73.2% 73.2% 73.8% % Non-residential 26.8% 26.8% 26.2%Number of real and personal property assessment notices produced 211,267* 23,060 214,673*Business tax: Number of businesses 15,751 15,799 15,729Collections: Current 97.8% 97.2% 97.5%Arrears 65.0% 64.0% 58.8%
* General Reassessment** In 2012 Entertainment Funding Tax reimbursements have been recorded as a contra-revenue account instead of an expense.
110 Adopted 2016 Operating Budget - Service Based
kmorton
Text Box
Return to Summary

Assessment, Taxation and CorporateContributing DepartmentsAssessment & Taxation 90 %Corporate Accounts 10 %
Operating Budget
(in millions of $)2014
Actual2015
Budget
2016AdoptedBudget
Variance Expl.
2017 Projection
2018 Projection
Property Taxation 510.980 529.168 549.345 564.771 584.477Business Taxation 59.688 58.366 57.267 57.024 56.732Other Taxation 24.347 24.290 24.955 25.524 26.197Provincial grants 68.344 67.842 68.113 68.488 68.707Sale of Winnipeg Hydro/Utility Dividend 35.988 46.732 47.969 51.595 54.215Transfers from Other City Funds 16.613 13.984 22.360 0.060 0.060Other corporate revenue (primarily tax penalty interest and general government charges)
36.408 24.706 27.554 25.399 25.410
Revenues 752.368 765.087 797.563 1 792.862 815.799
Salaries and benefits (1.853) 1.165 0.281 0.600 8.087Services 3.312 4.163 3.778 4.203 4.155Materials, parts and supplies 0.318 0.346 0.384 0.374 0.361Assets and purchases 0.027 0.034 0.031 0.031 0.031Debt and finance charges 3.539 2.177 2.481 2.652 2.809Grants, transfers and other 18.103 15.379 15.699 24.696 31.130Recoveries (0.324) (0.504) (0.499) (0.499) (0.499)
Operating expenses 23.122 22.763 22.155 32.057 46.073
Transfer to Capital 0.400 (3.179) 0.031 1.470 0.920
Total Expenses 23.522 19.584 22.186 2 33.527 46.993
Mill Rate Support/(Contribution) (728.846) (745.504) (775.377) (759.335) (768.806)Full-time Equivalent Positions 143 143 143 130 130
Adopted 2016 Operating Budget - Service Based 111

Assessment, Taxation and CorporateExplanation of 2016 Change from 2015
(in millions of $)1 Revenues
Net increase in municipal property tax revenue reflects a mill rate of 12.766 and includes a 2.33% property tax increase, with 1% increase for the renewal of local streets, lanes and sidewalks and 1% increase for the renewal of regional streets and sidewalks, and a .33% increase for the Southwest Rapid Transitway (Stage 2)
20.177
Transfer from the General Purpose Reserve (including $16.3 million from the 2015 surplus)
15.376
Increase in tax penalties interest revenue 3.750Fleet Management dividend 1.400Increase in Utility dividend 1.237Increase in tax data access fee revenue due to a rate increase 0.768Increase in electricity and gas tax revenue due to rate increases by Manitoba Hydro 0.669Increase in provincial support grant 0.271Transfer from the Financial Stabilization Reserve (4.200)Parking Authority dividend (3.000)Transfer from the Insurance Reserve (2.500)Decrease in business tax revenue including a rate reduction from 5.6% to 5.3%, an amended small business tax credit program, as well as incremental business taxes transferred to the Economic Development Reserve
(1.099)
Transfer from the Workers Compensation Reserve (0.300)Miscellaneous adjustments (0.073)
32.476
2 ExpensesTransfer to Capital, including non-recurring surplus capital savings of $5.5 million in 2015
3.960
Increase in provincial payroll tax 1.014Increase in insurance costs reflecting recent experience with claims and premiums 0.720Net increase in debt and finance charges 0.304Corporate accounts including risk management (3.141)Miscellaneous adjustments (0.255)
2.602
112 Adopted 2016 Operating Budget - Service Based

Assessment, Taxation and Corporate
Service DetailSub-services (in millions of $) 2014
Actual2015
Budget
2016AdoptedBudget
2017 Projection
2018 Projection
Assessment and Taxation Revenue 609.609 626.790 651.088 666.630 686.728Operating expenses 20.247 19.170 19.386 19.199 19.510Transfer to Capital 0.400 1.350 0.600 1.470 0.920
(588.962 ) (606.271) (631.102) (645.960) (666.298)
Corporate Revenue 142.759 138.297 146.476 126.232 129.072Operating expenses 2.875 3.593 2.770 12.858 26.563Transfer to Capital - (4.529) (0.569) - -
(139.884) (139.233) (144.275) (113.374) (102.509)
Mill Rate Support/(Contribution) (728.846) (745.504) (775.377) (759.335) (768.806)
Additional Financial Information
Reserves
Balance, December 31 (in millions of $)2014
Actual2015
Actual
2016AdoptedBudget
2017 Projection
2018Projection
Commitment Reserve 3.739 4.685 1.370 1.533 1.351Computer Replacement Reserve 1.221 1.260 0.238 0.676 1.393Destination Marketing Reserve 8.037 10.676 12.196 13.730 15.309Financial Stabilization Res 81.784 75.632 71.652 72.619 73.600General Purpose Reserve 0.937 16.440 0.163 0.164 0.165Insurance Reserve 5.244 0.509 1.812 1.818 1.824Workers Compensation Reserve 5.217 4.748 3.410 3.420 3.077
Capital Budget2016
Adopted2017 - 2021
Forecast6 YearTotal
(In millions of $) - 2.090 2.090
Adopted 2016 Operating Budget - Service Based 113

Contact Centre - 311
Description Key GoalsTo provide accurate information and enhanced customer service through requests for non-emergency services to the citizens and customers of the City of Winnipeg through a single point of contact.
1. Improve citizen satisfaction through the ease of use and access to 311.
2. Improve call tracking capabilities to better analyze citizen needs for service.
3. Improve City services through results management.4. Improve service request routing and tracking to ensure
accountability to citizens.
Service Level StatisticsDescription 2012 2013 2014Total Calls Received 1,934,948 1,867,322 1,510,348Total Calls Answered 1,653,379 1,515,970 1,037,811Number of Service Requests 353,664 436,115 419,080Number of Information Requests 1,299,715 1,210,139 869,508Number of Emails 61,336 74,275 105,471Average Talk Time (in minutes) 3:17 3:48 3:32Average Wait Time (in minutes) 1:21 2:02 4:19Number of Self Service Online n/a 1,321 2,869Number of Mobile App Interactions* n/a 646 1,343Number of In-person Interactions* n/a 10,688 29,081
Note: The difference between Total Calls Received and Total Calls Answered is due to a combination of abandoned calls, as well as the use of an Interactive Voice Response (IVR) system which answers the caller's question without needing to speak to an agent.
* Mobile app and in-person counter services launched September 2013.
114 Adopted 2016 Operating Budget - Service Based
kmorton
Text Box
Return to Summary

Contact Centre - 311Contributing DepartmentsCorporate Support Services 100 %
Operating Budget
(in millions of $)2014
Actual2015
Budget
2016AdoptedBudget
Variance Expl.
2017 Projection
2018 Projection
Service revenue 1.453 1.448 1.449 1.450 1.451Provincial funding (service specific) - - - - -
Revenues 1.453 1.448 1.449 1 1.450 1.451
Salaries and benefits 4.888 4.927 5.020 5.133 5.269Services 0.159 0.164 0.614 0.614 0.614Materials, parts, and supplies 0.021 0.020 0.020 0.020 0.020Assets and purchases 0.014 0.023 0.007 0.007 0.007Debt and finance charges 0.003 0.001 0.001 0.001 0.001Grants, transfers and other 0.270 0.271 0.299 0.299 0.299Recoveries (0.068) (0.012) (0.012) (0.012) (0.012)
Operating expenses 5.287 5.395 5.949 6.062 6.197
Transfer to Capital - - - - -
Total Expenses 5.287 5.395 5.949 2 6.062 6.197
Mill Rate Support/(Contribution) 3.834 3.947 4.500 4.612 4.746Full-time Equivalent Positions 101 86 87 87 87
Explanation of 2016 Change from 2015
(in millions of $)1 Revenues
Miscellaneous adjustments 0.0010.001
2 ExpensesIncrease in salaries and benefits 0.093Include information technology costs as per 311 Audit Recommendation adopted by Council February 25, 2015
0.452
Miscellaneous adjustments 0.0090.554
Full-time Equivalent PositionsIncrease due to the refinement of the service based view.
Adopted 2016 Operating Budget - Service Based 115

Council ServicesIncludes:
• Auditing• Mayor and Council• Archives• Elections• Citizen Access and Appeals• Council Support• Executive Support
AuditDescription Key GoalsThe purpose of the Audit Department is to provide independent and objective information, advice and assurance with respect to the performance of civic services in support of open, transparent and accountable government. The Audit Department's primary client is City Council, through the Audit Committee (Executive Policy Committee). The value to Council is the ability to use credible information to support their decision-making efforts. Stakeholders are civic managers and citizens who are the recipients of our public reports.
1. To provide independent and objective assurance on the efficiency and effectiveness of City operations as well as timely, relevant and value-added recommendations for improvement.
2. To influence organizational outcomes and accountability by promoting good governance, effective risk management and controllership, and comprehensive and transparent performance information.
3. To deliver high quality, cost-effective audit services.
Service Level StatisticsDescription 2012 2013 2014Audit Committee Meetings 3 3 3Audit Reports Completed Assurance Projects 6 6 6Advisory Projects 5 8 5Investigations Projects 0 1 2Projects in Process 7 5 8
116 Adopted 2016 Operating Budget - Service Based
kmorton
Text Box
Return to Summary

Council Services
City ClerksDescription Key GoalsThe City Clerk's Department provides direct policy, procedural and administrative services to the Mayor, Speaker and Members of Council, Executive Policy Committee, Standing Policy Committees, the Mayor's Office and Senior Administrators. The Department is the gateway to the City for political decision-making and providing access to information about the City, its services and the decision-making process. It captures, communicates and maintains a complete and accurate record of all Council decisions since the City's inception. The City Clerk's Department has statutory responsibility for the administration of elections and by-elections as designated by The City of Winnipeg Charter, The Municipal Councils and School Boards Elections Act and for supporting Council and its Committees under The City Organization By-law. The City Clerk is also designated as the head of the public body under The Freedom of Information and Protection of Privacy Act (FIPPA). The Department leads the City-wide Records Management program and preserves civic history through the operation of the City Archives. The Department also undertakes all hearings related to assessment appeals through the Board of Revision.
1. To lead in the provision of customer service to our varied clients including the Mayor's Office, Councillors, the Administration and the Public.
2. Enable cost savings and improve delivery of services to Council and the Public through the ongoing development of information technology by continuing to enhance e-government and other electronic systems.
3. Review existing systems to ensure they are in keeping with changing environmental conditions and making full usage of technology and processes to reduce costs and maximize efficiency.
4. Ensure democracy at the local government level with ongoing election planning and delivery for by-elections and general elections.
Service Level StatisticsDescription 2012 2013 2014Total Committee meetings held 390 381 369Public Council / Standing Committee meetings undertaken 111 113 103Board of Revision Appeals filed 985 4,880 496Board of Revision hearings 250 292 155Board of Adjustment meetings 23 23 21Board of Adjustment orders issued 402 376 394Appeal Committee meetings 18 20 17Appeal Committee hearings 84 100 84Decision Making Information System site visits 56,110,348 65,092,422 69,123,471Decision Making Information System documents posted 787 852 861By-laws passed 155 149 140FIPPA requests processed 801 867 1,038Records requested from Records Centre 981 1,232 1,257Records requested from Archives 4,218 1,639* 1,465*In-person visits to Archives 1,203 720* 277*Mail and phone inquiries processed by Archives 1,444 587* 847*Public tours 46 37* 25Archival Exhibits 5 2* 6*Records transferred to Archives/Records Centre 2,313 1,704* 803*Records destroyed - By-law 166/2003 (Cu. Ft.) 3,122 900* 940*
* The Archives building at 380 William Avenue was closed from June 2013 to June 10, 2014. Researcher Services were limited until the move into temporary space was completed as a considerable volume of records were inaccessible.
Adopted 2016 Operating Budget - Service Based 117

Council ServicesContributing DepartmentsCity Clerk's 50 %Council 24 %Mayor's Office 11 %Audit 9 %Policy & Strategic Initiatives 6 %Operating Budget
(in millions of $)2014
Actual2015
Budget
2016AdoptedBudget
Variance Expl.
2017 Projection
2018 Projection
Service revenue 0.143 0.456 0.114 0.506 0.106Provincial funding (service specific) - - - - -
Revenues 0.143 0.456 0.114 1 0.506 0.106
Salaries and benefits 7.481 7.033 7.269 7.421 8.677Services 4.801 3.194 3.146 3.134 5.022Materials, parts, and supplies 0.250 0.158 0.154 0.154 0.236Assets and purchases 0.133 0.032 0.033 0.033 0.133Debt and finance charges (2.052) 0.688 0.687 0.687 (2.184)Grants, transfers and other* 2.319 1.710 1.736 1.739 2.339Recoveries (0.889) (0.100) (0.100) (0.100) (0.958)
Operating expenses 12.042 12.714 12.926 13.067 13.264
Transfer to Capital 2.450 1.750 1.750 2.100 1.450
Total Expenses 14.492 14.464 14.676 2 15.167 14.714
Mill Rate Support/(Contribution) 14.349 14.008 14.562 14.661 14.608Full-time Equivalent Positions 94 78 79 79 81* Civic Initiatives, Promotional and Protocol (partially allocated to the Economic Development Service) are Mayor's Office programs that may include making grants: (a) to assist a charitable or non-profit organization, association or corporation; (b) to aid sports and recreation; (c) to support economic and cultural development; (d) to improve, preserve, repair, maintain, convert or develop any property in the City; or (e) for any other purpose that the Mayor considers may be in the interests or to the advantage of the City or its citizens.Explanation of 2016 Change from 2015
(in millions of $)1 Revenues
Decrease in revenue primarily due to Board of Revision appeals filing fee revenue (0.342)(0.342)
2 ExpensesDecrease in services mainly due to cyclical appeals hearings and one time costs in 2015
(0.270)
Increase in salaries and benefits 0.237Increase in Audit department mainly due to the creation of Independent Fairness Commissioner (IFC)
0.132
Increase in City Clerks department due to the creation of Office of Integrity Commissioner
0.100
Miscellaneous adjustments 0.0130.212
Full-time Equivalent PositionsIncrease in 1 FTE for the Office of Policy and Strategic Initiatives.
118 Adopted 2016 Operating Budget - Service Based

Council Services
Service Detail
Sub-services (in millions of $)2014
Actual2015
Budget
2016AdoptedBudget
2017 Projection
2018 Projection
Auditing Revenue 0.015 - - - -Operating expenses 1.546 1.230 1.368 1.316 1.316Transfer to Capital - - - - -
1.531 1.230 1.368 1.316 1.316
Mayor and Council Revenue 0.001 - - - -Operating expenses 5.132 5.435 5.471 5.483 5.555Transfer to Capital - - - - -
5.131 5.435 5.471 5.483 5.555
Archives-City Clerks Revenue - - - - -Operating expenses 0.452 0.738 0.732 0.751 0.774Transfer to Capital - - - - -
0.452 0.738 0.732 0.751 0.774
Elections-City Clerks Revenue 0.036 - - - -Operating expenses 0.683 0.687 0.687 0.687 0.728Transfer to Capital - - - - -
0.647 0.687 0.687 0.687 0.728
Citizen Access and Appeals Revenue 0.083 0.450 0.070 0.450 0.050Operating expenses 0.635 0.790 0.683 0.786 0.712Transfer to Capital - - - - -
0.552 0.340 0.613 0.336 0.662
Council Support-City Clerks Revenue 0.009 0.006 0.044 0.056 0.056Operating expenses 3.200 3.111 3.178 3.228 3.348Transfer to Capital 2.450 1.750 1.750 2.100 1.450
5.641 4.855 4.884 5.272 4.742
Executive Support Revenue - - - - -Operating expenses 0.393 0.723 0.807 0.817 0.831Transfer to Capital - - - - -
0.393 0.723 0.807 0.817 0.831
Mill Rate Support/(Contribution) 14.349 14.008 14.562 14.661 14.608
Additional Financial Information
Capital Budget2016
Adopted2017 - 2021
Forecast6 YearTotal
(In millions of $) 1.000 5.850 6.850
Adopted 2016 Operating Budget - Service Based 119
kmorton
Text Box
Return to Table of Contents

120 Adopted 2016 Operating Budget - Service Based

The Ci
App
201Ope
ity of Win
pend
16 Aderatin
nnipeg
dices
dopteng an
s
ed nd Caapitaal Buudgett
kmorton
Text Box
Return to Table of Contents


Appendix 1
2015 2016Adopted Adopted Variance 2017 2018Budget Budget $ Projection Projection
Revenue:529,168,124$ 549,345,228$ 20,177,104$ 1 564,771,346$ 584,477,463$ 58,365,865 57,267,226 (1,098,639) 2 57,024,226 56,732,226
Other taxation 24,290,000 24,955,247 665,247 3 25,524,141 26,196,921 Street renewal frontage levy 49,128,960 62,374,008 13,245,048 4 66,357,499 71,557,201 Government grants 118,289,927 123,618,578 5,328,651 5 129,730,016 127,152,771 Regulation fees 45,328,657 50,757,683 5,429,026 6 53,314,000 53,188,847 Sale of goods and services 59,008,364 63,169,506 4,161,142 7 63,478,034 64,340,993 Interest 13,386,865 17,101,684 3,714,819 8 16,601,694 16,601,704 Transfers from other funds 45,779,029 55,203,239 9,424,210 9 26,547,000 23,739,497 Other 51,351,508 51,337,486 (14,022) 10 53,612,583 56,243,019 Total Revenue 994,097,299$ 1,055,129,885$ 61,032,586$ 1,056,960,539$ 1,080,230,642$
Expenditures:Departmental:
Police Service 263,977,645$ 280,669,573$ 16,691,928$ 11 283,621,737$ 293,297,281$ Public Works 204,446,999 215,520,928 11,073,929 12 229,079,587 244,470,745 Fire Paramedic Service 178,321,417 190,273,654 11,952,237 13 209,885,223 204,299,938 Community Services 118,568,706 111,408,533 (7,160,173) 14 117,607,368 125,768,119 Planning, Property and Development 48,513,442 45,528,018 (2,985,424) 15 46,941,437 47,447,678 Water and Waste 30,923,306 30,399,443 (523,863) 16 32,707,907 34,527,947 Street Lighting 12,521,647 12,962,647 441,000 17 13,616,350 14,308,395 Corporate Support Services 32,963,368 37,253,982 4,290,614 18 36,628,829 36,855,477 Assessment and Taxation 20,519,895 19,985,887 (534,008) 19 20,669,266 20,430,065 Corporate Finance 9,129,967 9,015,503 (114,464) 20 9,237,389 9,514,871 City Clerks 12,947,687 14,550,008 1,602,321 21 14,576,884 14,047,364 Other departments 14,396,556 15,205,821 809,265 22 15,621,544 15,901,385 Sub-total Departmental 947,230,635$ 982,773,997$ 35,543,362$ 1,030,193,521$ 1,060,869,265$
Corporate:Debt and finance charges 503,222$ 542,945$ 39,723$ 23 561,894$ 479,957$ Taxes 9,562,560 10,576,362 1,013,802 24 10,795,185 11,011,089 Insurance and damage claims 3,410,650 4,130,682 720,032 25 4,247,216 4,369,577 Contribution to Transit 47,349,724 69,918,833 22,569,109 26 65,381,723 74,515,161 Other (13,959,492) (12,812,934) 1,146,558 27 (2,503,253) 10,874,236 Sub-total Corporate 46,866,664$ 72,355,888$ 25,489,224$ 78,482,765$ 101,250,020$
Total Expenditures 994,097,299$ 1,055,129,885$ 61,032,586$ 1,108,676,286$ 1,162,119,285$ Shortfall -$ -$ -$ (51,715,747)$ (81,888,643)$
Notes:
2) The variance includes the change in the transfer to capital based on the 2016 capital budget (see Appendix 5).
Business tax
THE CITY OF WINNIPEG2016 Adopted Operating Budget and 2017 and 2018 Projections
TAX SUPPORTED SUMMARY
Property tax
1) 2015 Adopted Budget is restated to reflect the transfer of the Communications division from Corporate Support Services to the Chief Administrative Offices.
Adopted 2016 Operating Buddget - Appendices 1
kmorton
Text Box
Return to Table of Contents

Appendix 1
THE CITY OF WINNIPEG2016 Adopted Operating Budget
TAX SUPPORTED REVENUE - 2016 Compared to 2015
Expl.No. Explanations Variance
1 Property tax $ 20,177,104 2016 property tax revenue reflects a mill rate of 12.766 and includes a 1% property tax increase dedicated to the renewal of local streets, lanes and sidewalks, an additional 1% property tax increase dedicated to the renewal of regional streets and sidewalks, and a .33% property tax increase dedicated to the second phase of the Southwest Rapid Transitway, for a total property tax increase of 2.33%.
2 Business tax $ (1,098,639)2016 business tax rate has been reduced from 5.6% to 5.3%. The small business tax credit program has been amended to provide a full rebate in 2016 to businesses with an annual rental value of $32,220 (2015 - $30,000) or less.
3 Other taxationNet increase in Electricity and Natural Gas Tax revenue. 669,000$ Decrease in miscellaneous taxation revenue. (3,753)Total $ 665,247
4 Street renewal frontage levyIncrease in Street renewal frontage levy revenue, including a rate change from $4.35 to $5.45 per frontage foot. This includes growth, construction inflation and $10,000,000 allocated to the capital budget for bridge renewal projects.
$ 13,245,048
2 Adopted 2016 Operating Buddget - Appendices

Appendix 1
THE CITY OF WINNIPEG2016 Adopted Operating Budget
TAX SUPPORTED REVENUE - 2016 Compared to 2015
Expl.No. Explanations Variance
5 Government grantsIncrease in Provincial/Winnipeg Regional Health Authority (WRHA) funding for the Fire Paramedic Service, including an expansion of community paramedicine service subject to funding confirmation in the amount of $2,560,794.
4,160,912$
Increase in Provincial funding for the Police service related to the helicopter, cadets and other funding in accordance with existing agreements.
505,665
Federal grant for the Homelessness Partnering Strategy recorded as revenue effective 2016, previously recorded as a recovery.
391,200
Increase in Provincial payroll tax refund. 270,874 Total $ 5,328,651
6 Regulation feesIncrease in photo enforcement revenue. 2,319,000$ Increase in revenue to reflect Council's adoption of the Comprehensive Fee Review of Planning, Development and Building Fees and Charges report (March 23, 2016).
1,418,800
Increase in building and electrical permit fee revenue. 1,063,627 Net increase in fee revenue related to zoning and sub-divisions. 823,699 Fire-code inspection and compliance penalties. 375,000 Decrease in alarm permit and renewal revenue based on billing cycle. (473,155) Decrease in fine revenue, including a reduction in police and library fine revenue.
(250,000)
Decrease due to elimination of appeal hearing fee. (18,750) Net increase in other miscellaneous revenue. 170,805 Total $ 5,429,026
Adopted 2016 Operating Buddget - Appendices 3

Appendix 1
THE CITY OF WINNIPEG2016 Adopted Operating Budget
TAX SUPPORTED REVENUE - 2016 Compared to 2015
Expl.No. Explanations Variance
7 Sale of goods and servicesNet increase in revenue related to legal and administrative agreements, mainly due to an increase in land development fee revenue.
1,297,341$
Increase in contract police service revenue, mainly related to Manitoba Public Insurance (MPI) contracts.
777,763
Increase in Legal Data Resource Corporation (LDRC) fee revenue. 768,000 Net increase in Fire Paramedic Service medical response user fee revenue, due to higher projected call volumes.
515,512
Increase in WRHA fee revenue relating to ambulance waiting periods at hospitals.
400,000
Increase in record searches revenue. 248,775 Increase in sundry fee revenue related to fire inspections and prevention.
181,000
Net increase in cemetery fee revenue. 129,610 Decrease in program registration and arena revenue to reflect actual experience.
(422,992)
Net increase in other sales of goods and services. 266,133 Total $ 4,161,142
8 InterestIncrease in tax penalties interest revenue. $ 3,750,000 Increase in capital construction interest revenue. 200,000 Net decrease in other interest income and debt charges recoverable. (235,181)Total $ 3,714,819
4 Adopted 2016 Operating Buddget - Appendices

Appendix 1
THE CITY OF WINNIPEG2016 Adopted Operating Budget
TAX SUPPORTED REVENUE - 2016 Compared to 2015
Expl.No. Explanations Variance
9 Transfers from other fundsIncreases / (decreases) in transfers from other funds:- General Purpose Reserve. $ 15,376,000 - Municipal Accommodations. 5,543,563 - General Revenue Enterprises Fund. 2,433,741 - Economic Development Investment Reserve. 1,400,000 - Insect Control Reserve. 700,000 - Land Operating Reserve. (7,200,000)- Financial Stabilization Reserve. (4,200,000)- Insurance Reserve. (2,500,000)- Sewage Disposal for land drainage. (1,330,237)- Housing Rehabilitation Investment Reserve. (500,000)- Workers Compensation Reserve. (300,000)- Net increase in other transfers. 1,143 Total $ 9,424,210
10 OtherUtility dividend. $ 1,236,792 Fleet Management Agency dividend. 1,400,000 Rebate from MPI related to increased training and experience for equipment operators.
619,622
Winnipeg Parking Authority dividend. (3,000,000) Decrease in other miscellaneous revenue, mainly due to the elimination of a 2% "cash" discount, as per Council's adoption of the Comprehensive Fee Review of Planning, Development and Building Fees and Charges report (March 23, 2016).
(270,436)
$ (14,022)
Adopted 2016 Operating Buddget - Appendices 5
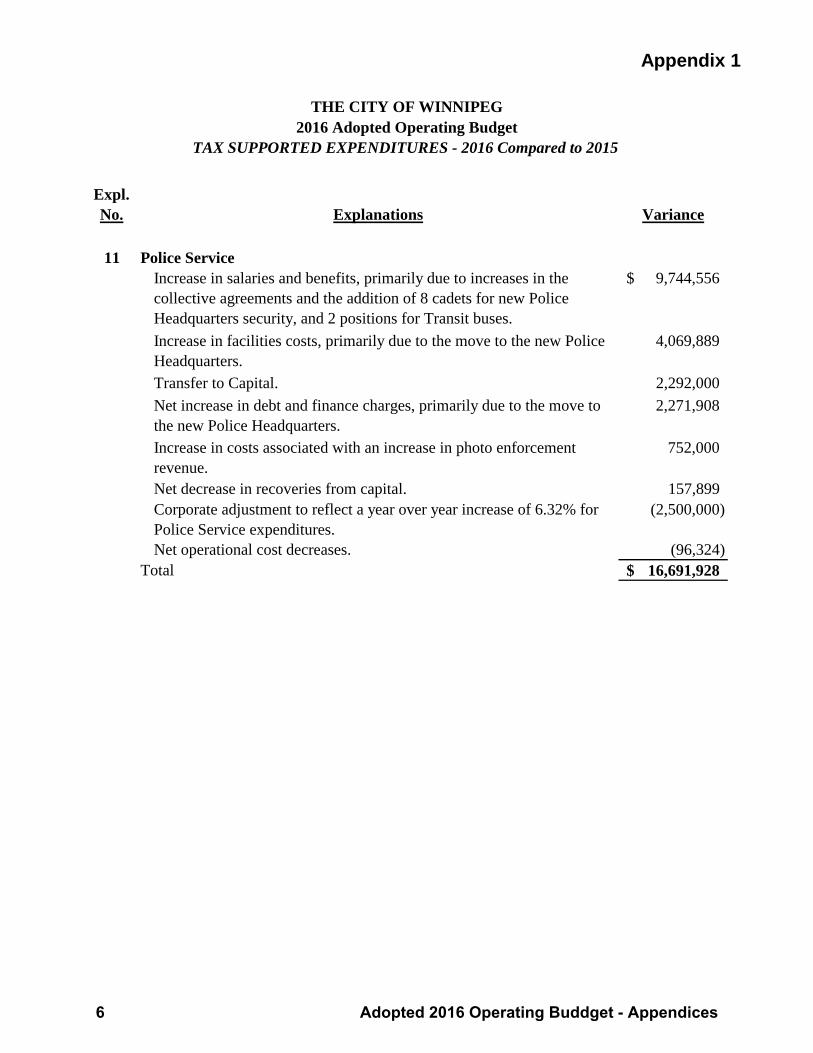
Appendix 1
THE CITY OF WINNIPEG2016 Adopted Operating Budget
TAX SUPPORTED EXPENDITURES - 2016 Compared to 2015
Expl.No. Explanations Variance
11 Police ServiceIncrease in salaries and benefits, primarily due to increases in the collective agreements and the addition of 8 cadets for new Police Headquarters security, and 2 positions for Transit buses.
9,744,556$
Increase in facilities costs, primarily due to the move to the new Police Headquarters.
4,069,889
Transfer to Capital. 2,292,000 Net increase in debt and finance charges, primarily due to the move to the new Police Headquarters.
2,271,908
Increase in costs associated with an increase in photo enforcement revenue.
752,000
Net decrease in recoveries from capital. 157,899 Corporate adjustment to reflect a year over year increase of 6.32% for Police Service expenditures.
(2,500,000)
Net operational cost decreases. (96,324) Total 16,691,928$
6 Adopted 2016 Operating Buddget - Appendices

Appendix 1
THE CITY OF WINNIPEG2016 Adopted Operating Budget
TAX SUPPORTED EXPENDITURES - 2016 Compared to 2015
Expl.No. Explanations Variance
12 Public WorksFrontage levy - Transfer to Capital for bridge renewal. 10,000,000$ Transfer to Local Street Renewal Reserve. 4,900,000 Transfer to Regional Street Renewal Reserve. 4,900,000 Increase in salaries and benefits, including 5.5 additional asset management positions for $654,995 and 1 pedestrian and bicycle path planning position for $81,858, fully recovered from capital.
1,641,468
Transportation Management Centre. 1,100,000 Decrease in recoveries for Equipment Operator training funding, now recorded as revenue.
703,000
Net increase in fleet costs. 339,717 Increase in facilities costs. 154,639 Grant to the University of Manitoba for a Research Chair in Municipal Infrastructure.
50,000
Transfer to Capital. (8,837,000)Decrease in debt and finance charges. (2,694,639)Decrease in fuel costs, primarily due to lower price estimates. (834,023)Decrease in contract services costs related to mosquito control program. (300,000)Net operational cost decreases. (49,233)
Total 11,073,929$
Adopted 2016 Operating Buddget - Appendices 7

Appendix 1
THE CITY OF WINNIPEG2016 Adopted Operating Budget
TAX SUPPORTED EXPENDITURES - 2016 Compared to 2015
Expl.No. Explanations Variance
13 Fire Paramedic ServiceIncrease in salaries and benefits, including an expansion of community paramedicine service with the addition of 7 paramedics (5.25 FTEs prorated for 2016) for the Main Street Project (MSP) and 17 paramedics (12.75 FTEs prorated for 2016) for the Emergency Paramedics in the Community (EPIC) program, subject to funding confirmation by the WRHA ($2,560,794). In addition, 1 position (.75 FTE prorated for 2016) for disaster preparedness and response activities.
9,842,734$
Transfer to Capital. 985,000 Increase in fleet costs, primarily leasing costs to replace aging fire apparatus.
860,158
Increase in uniform costs. 137,167 Increase in debt and finance charges. 109,580 Net operational cost increases. 17,598
Total 11,952,237$
14 Community ServicesDecrease in transfer to Municipal Accommodations related to capital expenditures.
(3,950,856)$
Transfer to Capital. (3,436,000) Grant of $10,512,000 to Assiniboine Park Conservancy (APC). (864,000) Increase in recoveries, primarily from capital for 3 asset management positions (2.30 FTEs prorated in 2016).
(263,672)
Decrease in facilities costs. (136,037) Net decrease in debt and finance charges. (110,279) Increase in salaries and benefits. 1,264,188 Increase in grants to community centres. 162,750 One-time grant to General Council of Winnipeg Community Centres (GCWCC) for facilities costs.
30,336
Net operational cost increases. 143,397 Total (7,160,173)$
8 Adopted 2016 Operating Buddget - Appendices

Appendix 1
THE CITY OF WINNIPEG2016 Adopted Operating Budget
TAX SUPPORTED EXPENDITURES - 2016 Compared to 2015
Expl.No. Explanations Variance
15 Planning, Property and Development
Transfer to Municipal Accommodations for vacant, common and corporate space, including the impact of the new Police Headquarters, now recorded in the Police Service budget.
(5,580,348)$
Transfer to Capital. (1,028,000) Recoveries from the Permit Reserve as part of Council's adoption of the Comprehensive Fee Review of Planning, Development and Building Fees and Charges report (March 23, 2016).
(632,907)
Decrease in debt and finance charges. (193,364) Increase in salaries and benefits, $1,233,000 fully offset by new revenue and $632,907 fully offset by recoveries from the Permit Reserve, related to 33 positions (prorated to 26 FTEs for 2016) as part of Council's adoption of the Comprehensive Fee Review of Planning, Development and Building Fees and Charges report (March 23, 2016).
1,865,907
Increase in salaries and benefits, including 4 new positions related to land development, zoning and permits, and inspections.
1,090,272
Increase in CentreVenture's operating grant. 500,000 Increase in the grant provided to Manitoba Housing and Renewal Corporation for the City's share of net operating costs in accordance with funding arrangement.
469,726
Net decrease in recoveries, mainly related to the Homelessness Partnering Strategy, in the amount of $391,200, recorded as revenue effective 2016.
450,829
Increase in the cost of consulting services. 228,889 Net operational cost decreases. (156,428)
Total (2,985,424)$
16 Water and WasteDecrease in salaries and benefits. (575,061)$ Decrease in debt and finance charges. (549,334) Transfer to Capital. (520,000) Increase in garbage collection contract costs. 865,420 Increase in landfill tipping fee costs. 209,033 Net operational cost increases. 46,079
Total (523,863)$
Adopted 2016 Operating Budget - Appendices 9

Appendix 1
THE CITY OF WINNIPEG2016 Adopted Operating Budget
TAX SUPPORTED EXPENDITURES - 2016 Compared to 2015
Expl.No. Explanations Variance
17 Street LightingIncrease in expenditures due to Manitoba Hydro rate increases, and new installations and upgrades.
441,000$
18 Corporate Support ServicesTransfer to the Computer Replacement Reserve for City-wide essential systems.
1,607,569$
Transfer to Capital. 1,380,000 Increase in salaries and benefits, including the addition of 9 positions (6.75 FTEs prorated for 2016) for project management and IT related projects, partially recovered ($293,011) from capital.
1,263,497
Increase in allocated departmental costs related to IT costs for the 311 Contact Centre, fully offset by recoveries from other departments.
454,727
Net increase in services costs, including $178,706 for training, workshops and tuition.
228,506
One-time increase in grant to Ka Ni Kanichik to support the Honouring Gifts program.
24,000
Increase in recoveries including salaries and benefits and costs associated with the 311 Contact Centre.
(855,611)
Net operational cost increases. 187,926 Total 4,290,614$
10 Adopted 2016 Operating Buddget - Appendices

Appendix 1
THE CITY OF WINNIPEG2016 Adopted Operating Budget
TAX SUPPORTED EXPENDITURES - 2016 Compared to 2015
Expl.No. Explanations Variance
19 Assessment and TaxationTransfer to Capital. (750,000)$ Decrease in postage due to a reduction in volume (assessment cycle). (129,000) Increase in salaries and benefits, primarily related to the temporary positions for the 2016 Added Value program.
331,132
Net operational cost increases. 13,860 Total (534,008)$
20 Corporate FinanceIncrease in salaries and benefits, mainly related to annualized Asset Management positions (1.50 FTEs) and a position for inventory control oversight and a position to manage the Group Life Insurance Fund (1.50 FTEs prorated for 2016).
561,309$
Increase in recoveries, primarily related to added positions to support Corporate initiatives noted above.
(404,227)
Transfer to Capital. (300,000) Net operational cost increases. 28,454
Total (114,464)$
Adopted 2016 Operating Buddget - Appendices 11

Appendix 1
THE CITY OF WINNIPEG2016 Adopted Operating Budget
TAX SUPPORTED EXPENDITURES - 2016 Compared to 2015
Expl.No. Explanations Variance
21 City ClerksGrant to the Winnipeg Art Gallery - Inuit Art Centre. 1,000,000$ Increase in grant to the Winnipeg Arts Council. 312,767 One-time grant for the Downtown Biz - Community Homeless Assistance Team (CHAT).
150,000
One-time grant for Economic Development Winnipeg - Yes! Winnipeg. 135,000 One-time grant for the Manitoba Theatre for Young People (MTYP). 30,000 One-time grant for in-kind services to support the Downtown Biz - Manyfest.
20,000
One-time grant for the Winnipeg Parade Committee - Santa Claus Parade.
20,000
One-time grant to Manito Ahbee Festival for both cash and in-kind support.
12,500
One-time increase in grant to Take Pride Winnipeg to support the Green Wave program.
12,000
Decrease in salaries and benefits. (21,817) Net operational cost decreases. (68,129)
Total 1,602,321$
22 Other departmentsIncrease in salaries and benefits, including the addition of 6 communications positions (4.0 FTEs prorated for 2016) for corporate communications and the Office of Public Engagement.
766,430$
Net operational cost increases. 42,835 Total 809,265$
12 Adopted 2016 Operating Buddget - Appendices

Appendix 1
THE CITY OF WINNIPEG2016 Adopted Operating Budget
TAX SUPPORTED EXPENDITURES - 2016 Compared to 2015
Expl.No. Explanations Variance
23 Debt and finance chargesIncrease in corporate debt and finance charges. 39,723$
24 TaxesIncrease in provincial payroll tax estimate. 1,013,802$
25 Insurance and damage claimsIncrease in insurance costs reflecting recent experience with claims and premiums.
720,032$
26 Contribution to TransitContribution to Transit (refer to variance explanation #5 under "Utility Operations" section of this appendix for additional information on Transit).
22,569,109$
27 OtherTransfer to Capital including non-recurring capital surplus savings of $5.5 million in 2015.
3,959,995$
Net decreases, including provision for corporate risk management. (3,025,699) Miscellaneous adjustments. 212,262
Total 1,146,558$
Adopted 2016 Operating Buddget - Appendices 13

Appendix 1
2015 2016Adopted Adopted Expl. 2017 2018Budget Budget Variance No. Projection Projection
$ $ $ $ $Municipal Accommodations
Revenue 85,714,008 75,097,888 (10,616,120) 79,364,363 81,502,487 Expenditure 85,714,008 75,097,888 (10,616,120) 79,364,363 81,502,487 Surplus/(Deficit) - - - 1 - -
Sewage Disposal *Revenue 160,183,729 166,067,091 5,883,362 182,135,353 199,789,547 Expenditure** 153,355,665 145,939,087 (7,416,578) 156,907,507 170,827,598 Surplus/(Deficit) 6,828,064 20,128,004 13,299,940 2 25,227,846 28,961,949
Solid Waste Disposal *Revenue 39,816,193 43,335,644 3,519,451 46,107,837 49,487,414 Expenditure 38,812,335 40,131,112 1,318,777 45,271,011 54,436,871 Surplus/(Deficit) 1,003,858 3,204,532 2,200,674 3 836,826 (4,949,457)
Waterworks *Revenue 107,617,870 113,811,881 6,194,011 128,474,856 133,226,743 Expenditure ** 111,982,028 110,963,746 (1,018,282) 114,420,024 117,326,109 Surplus/(Deficit) (4,364,158) 2,848,135 7,212,293 4 14,054,832 15,900,634
TransitRevenue 174,830,859 200,409,733 25,578,874 199,108,852 212,813,529 Expenditure 174,830,859 200,409,733 25,578,874 199,108,852 212,813,529 Surplus/(Deficit) - - - 5 - -
TotalRevenue 568,162,659 598,722,237 30,559,578 635,191,261 676,819,720 Expenditures 564,694,895 572,541,566 7,846,671 595,071,757 636,906,594 Surplus/(Deficit) 3,467,764 26,180,671 22,712,907 40,119,504 39,913,126
*
**
Utility maintains a retained earnings/working capital balance to fund all or a portion of its capital program on a pay as you go basis, to provide a reserve to prevent significant rate increases in the event of major unforeseen expenditures or shortfalls in revenue.
THE CITY OF WINNIPEG
UTILITY OPERATIONS2016 Adopted Operating Budget and 2017 and 2018 Projections
Waterworks and Sewage Disposal's 2015 expenditures have been restated to include the dividend transferred to the General Revenue Fund to provide consistent disclosure with 2016.
14 Adopted 2016 Operating Buddget - Appendices
kmorton
Text Box
Return to Table of Contents

Appendix 1
Expl.No. Explanations Variance
1 Municipal AccommodationsRevenue Changes:
Decrease in transfer from the Police Service related to debt and finance charges for Police Headquarters recorded directly in Police Service budget effective 2016.
$ (7,819,285)
Decrease in transfer from Community Services related to capital investments.
(3,950,856)
Increase in recoveries from tax-supported client departments. 733,946 Increase in revenue related to encroachment licenses issued to reflect fair market rental rates for encroachments on City-owned properties.
375,000
Net increase in transfer from other Funds for facilities charges. 108,513 Miscellaneous adjustments. (63,438)
$ (10,616,120)
Expenditure Changes:Transfer to Capital. $ (7,998,000)Debt and finance charges for Police Headquarters recorded directly in Police Service budget effective 2016.
(7,819,285)
Decrease in utilities costs primarily related to the delay in occupancy of the Police Headquarters.
(415,000)
Increase in recoveries related to Fire Paramedic Service locations. (275,000)Increase in the transfer to the General Revenue Fund. 5,543,563 Increase in salaries and benefits, including 13 temporary maintenance staff for the Police Headquarters, offset by a corresponding reduction in contract services.
497,981
Miscellaneous adjustments. (150,379) $ (10,616,120)
Variance. $ -
THE CITY OF WINNIPEG2016 Adopted Operating Budget
UTILITY OPERATIONS - 2016 Compared to 2015
Adopted 2016 Operating Buddget - Appendices 15

Appendix 1
Expl.No. Explanations Variance
THE CITY OF WINNIPEG2016 Adopted Operating Budget
UTILITY OPERATIONS - 2016 Compared to 2015
2 Sewage Disposal Revenue Changes:
Increase in sewer services revenue. $ 3,439,986 Increase in industrial waste surcharges. 1,600,000 Increase in hauled waste revenue. 775,000 Miscellaneous adjustments. 68,376
$ 5,883,362
Expenditure Changes:Decrease in transfer to Sewer Rehabilitation Reserve. $ (9,400,000)Decrease in transfer to land drainage. (1,330,237)Increase in transfer to Environmental Projects Reserve. 806,760 Increase in dividend transfer to the General Revenue Fund. 410,991 Increase in property tax. 486,495 Increase in large volume sewer discount program support. 414,000 Increase in utilities costs. 383,000 Increase in salaries and benefits. 343,074 Increase in allocated departmental costs. 212,600 Increase in landfill tipping fees for the disposal of biosolids. 183,700 Miscellaneous adjustments. 73,039
$ (7,416,578)Increase in surplus. $ 13,299,940
Note: Utility maintains a retained earnings/working capital balance to fund a portion of its capital program on a pay as you go basis, to provide a reserve to prevent significant rate increases in the event of major unforeseen expenditures or shortfalls in revenue.
16 Adopted 2016 Operating Buddget - Appendices

Appendix 1
Expl.No. Explanations Variance
THE CITY OF WINNIPEG2016 Adopted Operating Budget
UTILITY OPERATIONS - 2016 Compared to 2015
3 Solid Waste Disposal Revenue Changes:
Net increase in tipping fee revenue. $ 2,048,423 Waste diversion user fee revenue. 734,000 Increase in Waste Reduction Support grant and other Provincial grants.
650,288
Miscellaneous adjustments. 86,740 $ 3,519,451
Expenditure Changes:Increase in salaries and benefits. $ 979,594 Increase in leaf and yard waste collection costs. 517,660 Increase in Transfer to the Landfill Rehabilitation Reserve. 186,030 Net increase in the cost of services. 134,923 Increase in recoveries. (305,141)Transfer to Waste Diversion Reserve. (300,000)Decrease in debt and finance charges. (30,217)Miscellaneous adjustments. 135,928
$ 1,318,777 Increase in surplus. $ 2,200,674
Note: Utility maintains a retained earnings/working capital balance to fund a portion of its capital program on a pay as you go basis and to provide a reserve to prevent significant rate increase in the event of major unforeseen expenditures or shortfalls in revenue.
Adopted 2016 Operating Buddget - Appendices 17

Appendix 1
Expl.No. Explanations Variance
THE CITY OF WINNIPEG2016 Adopted Operating Budget
UTILITY OPERATIONS - 2016 Compared to 2015
4 Waterworks Revenue Changes:
Increase in water sales revenue. $ 6,901,751 Decrease in interest revenue. (382,472)Miscellaneous adjustments. (325,268)
$ 6,194,011 Expenditure Changes:
Decrease in debt and finance charges. $ (1,742,911)Decrease in allocated department costs. (361,153) Increase in Water Utility Dividend. 825,801 Increase in salaries and benefits. 219,044 Miscellaneous adjustments. 40,937
$ (1,018,282)Variance. $ 7,212,293
Note: Utility maintains a retained earnings/working capital balance to fund capital projects on a pay as you go basis, to provide a reserve to prevent significant rate increases in the event of major unforeseen expenditures or shortfalls in revenue.
18 Adopted 2016 Operating Buddget - Appendices

Appendix 1
Expl.No. Explanations Variance
THE CITY OF WINNIPEG2016 Adopted Operating Budget
UTILITY OPERATIONS - 2016 Compared to 2015
5 Transit Revenue Changes:
Increase in transfer from the General Revenue Fund. $ 22,569,109 Increase in Provincial operating grant. 5,162,988 Revised goods and services revenue projection (based on expected capacity and ridership).
(2,292,514)
Miscellaneous adjustments. 139,291 $ 25,578,874
Expenditure Changes:Transfer to Capital, including $1.563 million budgeted in 2015 in corporate accounts and capital amounts of $4.171 million in 2015 debt and finance charges.
$ 17,173,000
Increase in bus parts costs. 6,426,780 Increase in salaries and benefits. 4,457,033 Transfer to the Southwest Rapid Transitway (Stage 2) and Pembina Highway Underpass Payment Reserve.
3,400,000
Increase in transfer to Bus Replacement Reserve. 962,219 Net increase in services costs, mainly related to an increase in handi-transit contractor fees.
590,490
Decrease in motive fuel costs, mainly due to lower fuel price estimates.
(4,915,440)
Decrease in debt and finance charges. (1,714,179)Net increase in recoveries. (914,975)Miscellaneous adjustments. 113,946
$ 25,578,874 Variance. $ -
Adopted 2016 Operating Buddget - Appendices 19

Appendix 1
2015 2016Adopted Adopted Expl. 2017 2018Budget Budget Variance No. Projection Projection
$ $ $ $ $Fleet Management
Revenue 50,895,649 50,543,820 (351,829) 51,548,728 52,576,724 Expenditure* 51,064,651 50,775,715 (288,936) 50,811,039 52,664,977 Surplus/(Deficit) (169,002) (231,895) (62,893) 1 737,689 (88,253)
Parking AuthorityRevenue 17,195,356 16,814,222 (381,134) 16,992,286 17,174,879 Expenditure 17,545,200 17,068,154 (477,046) 19,231,048 16,737,617 Surplus/(Deficit) (349,844) (253,932) 95,912 2 (2,238,762) 437,262
Golf ServicesRevenue 3,640,817 3,461,917 (178,900) 3,381,298 3,515,171 Expenditure 2,859,794 2,749,815 (109,979) 2,785,677 2,845,034 Surplus/(Deficit) 781,023 712,102 (68,921) 3 595,621 670,137
Animal ServicesRevenue 3,708,321 3,879,600 171,279 3,898,425 3,922,325 Expenditure 3,591,558 3,784,624 193,066 3,866,885 3,955,945 Surplus/(Deficit) 116,763 94,976 (21,787) 4 31,540 (33,620)
TotalRevenue 75,440,143 74,699,559 (740,584) 75,820,737 77,189,099 Expenditures 75,061,203 74,378,308 (682,895) 76,694,649 76,203,573 Surplus/(Deficit) 378,940 321,251 (57,689) (873,912) 985,526
THE CITY OF WINNIPEG
SPECIAL OPERATING AGENCIES2016 Adopted Operating Budget and 2017 and 2018 Projections
Note: Special Operating Agency budgets are subject to change based on Council approvals in the business plan report process.
*Fleet Management Agency's 2015 expenditures have been restated to include the dividend transferred to the General Revenue Fund to provide consistent disclosure with 2016.
20 Adopted 2016 Operating Buddget - Appendices
kmorton
Text Box
Return to Table of Contents

Appendix 1
THE CITY OF WINNIPEG2016 Adopted Operating Budget
SPECIAL OPERATING AGENCIES - 2016 Compared to 2015
Expl.No. Explanations Variance
1 Fleet ManagementRevenue Changes:Decrease in fleet leases. $ (1,407,888)Increase in fuel sales. 503,148Increase in rental income. 311,220Increased revenue from the sale of surplus equipment. 200,000Net increase in services and parts revenue. 41,691
$ (351,829)
Expenditure Changes:Decrease in amortization. $ (1,926,252)Decrease in interest expense. (349,424)Net decrease in parts. (309,552)Dividend transfer to the General Revenue Fund. 1,400,000Increase in fuel costs. 457,416Net increase in service costs. 272,320Increase in salaries and benefits. 179,711Miscellaneous adjustments. (13,155)
$ (288,936)Increase in deficit. $ (62,893)
Adopted 2016 Operating Buddget - Appendices 21

Appendix 1
THE CITY OF WINNIPEG2016 Adopted Operating Budget
SPECIAL OPERATING AGENCIES - 2016 Compared to 2015
Expl.No. Explanations Variance
2 Parking AuthorityRevenue Changes:
Decrease in enforcement revenue. $ (464,607)Decrease in surface parking lot revenue. (158,000)Increase in parking meter revenue. 176,000Increase in special events revenue. 110,000Miscellaneous adjustments. (44,527)
$ (381,134)
Expenditure Changes:Decrease in expenditures related to the 2015 implementation of the new Municipal By-Law Enforcement Act.
$ (519,000)
Decrease in debt and finance charges. (306,881)Net increase in services costs. 274,103Increase in salaries and benefits. 47,807Miscellaneous adjustments. 26,925
$ (477,046)Decrease in deficit. $ 95,912
22 Adopted 2016 Operating Buddget - Appendices
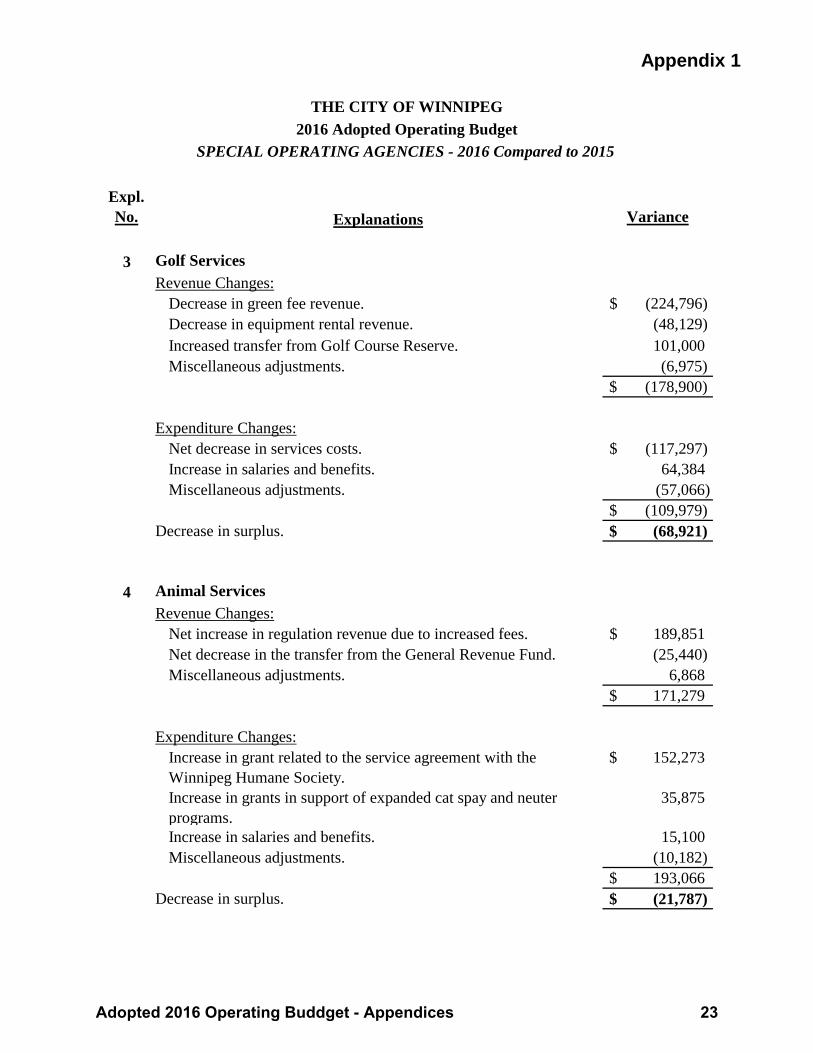
Appendix 1
THE CITY OF WINNIPEG2016 Adopted Operating Budget
SPECIAL OPERATING AGENCIES - 2016 Compared to 2015
Expl.No. Explanations Variance
3 Golf ServicesRevenue Changes:
Decrease in green fee revenue. $ (224,796)Decrease in equipment rental revenue. (48,129)Increased transfer from Golf Course Reserve. 101,000 Miscellaneous adjustments. (6,975)
$ (178,900)
Expenditure Changes:Net decrease in services costs. $ (117,297)Increase in salaries and benefits. 64,384 Miscellaneous adjustments. (57,066)
$ (109,979)Decrease in surplus. $ (68,921)
4 Animal ServicesRevenue Changes:
Net increase in regulation revenue due to increased fees. $ 189,851 Net decrease in the transfer from the General Revenue Fund. (25,440)Miscellaneous adjustments. 6,868
$ 171,279
Expenditure Changes:Increase in grant related to the service agreement with the Winnipeg Humane Society.
$ 152,273
Increase in grants in support of expanded cat spay and neuter programs.
35,875
Increase in salaries and benefits. 15,100 Miscellaneous adjustments. (10,182)
$ 193,066 Decrease in surplus. $ (21,787)
Adopted 2016 Operating Buddget - Appendices 23
kmorton
Text Box
Return to Table of Contents

24 Adopted 2016 Operating Buddget - Appendices

Appendix 2
y Organization 2016
Annual Grant AgreementsAge and Opportunity Centre - Older victims services 20,250$ Age and Opportunity Centre - Preventative programming for senior citizens
80,100
Andrews Street Family Centre 45,700 Art City 100,000 Big Brothers Big Sisters of Winnipeg 12,000 Block Parents 17,564 Broadway Neighbourhood Centre 120,500 Broadway Neighbourhood Centre - Just TV 150,000 CentreVenture 600,000 Coalition to Save the Elms* 20,000 Dalnavert Museum 21,000 Downtown Winnipeg Biz* 232,000 Downtown Winnipeg Biz - Community Homeless Assistance Team (CHAT)
150,000
Economic Development Winnipeg - YES! Winnipeg 135,000 Edge Clay Center 10,000 Exchange District Biz* 68,000 Exchange District Biz - Historic Exchange Walking Tour 3,150 Fire Fighter Historical Society 25,406 Forks Renewal Corporation* 1,200 Fort Whyte Alive 60,000 Grant's Old Mill Museum 17,240 Green Action Centre 35,000 Heritage Winnipeg Corporation 34,750 Historical Museum of St. James-Assiniboia 83,391 Immigrant and Refugee Community Organization of Manitoba
73,810
Ka Ni Kanichihk Inc - Honouring Gifts 24,000 Sub-Total 2,140,061
* Includes Community Partnerships.
THE CITY OF WINNIPEG2016 Adopted Operating Budget
Listing of Grants/Payments
Note: This grants appendix is not inclusive of all City of Winnipeg grants (e.g. grants from reserves authorized through separate reports, in-kind grants, etc.)
Adopted 2016 Operating Buddget - Appendices 25
kmorton
Text Box
Return to Table of Contents

Appendix 2
y Organization 2016
Ma Mawi Wi Chi Itata Centre - Positive Athletic Cutural Experience (PACE)
60,000
Main Street Project 96,000 Manito Ahbee Festival Inc. 5,000 Manitoba Children's Museum 120,000 Manitoba Eco Network* 5,000 Manitoba Museum 55,000 Manitoba Theatre for Young People 30,000 Mediation Services 5,000 Norwood Lawn Bowling Club* 16,851 Ross House Museum 31,077 Rossbrook House 256,339 Save Our Seine 30,000 Seven Oaks House Museum 28,226 Spence Neighbourhood Association* 23,150 St. Boniface Hospital* 11,261 St. Boniface Museum 450,000 Take Pride Winnipeg* 230,000 Take Pride Winnipeg - Green Wave program 12,000 Take Pride Winnipeg - Graffiti Control* 20,000 The Immigrant Centre 27,000 Transcona Museum 155,000 Ukrainian Cultural and Education Centre 15,000 United Way Winnipeg - 'Peg' Community Indicators System 30,000 University of Manitoba - Research Sustainable Wastewater Treatment and Nutrient Recovery
30,000
Urban Angling Partnership 5,000 West End Biz* 40,500 Western Canada Aviation Museum 55,000 Winnipeg Arts Council Grants 4,645,319 Winnipeg Art Gallery - Inuit Art Centre 1,000,000 Winnipeg Boys and Girls Club* 181,148 Winnipeg Foundation - Nourishing Potential Fund 83,333 Winnipeg Harvest 50,000 Winnipeg Parade Committee - Santa Claus Parade 20,000 Winnipeg Public Library Board 79,315 Winnipeg Police Museum 18,000
Category Sub-Total 10,059,580
* Includes Community Partnerships.
26 Adopted 2016 Operating Buddget - Appendices

Appendix 2
y Organization 2016Multi-Year Arrangements
Assiniboine Park Conservancy 10,512,000$ Band 40 Aboriginal Youth Scholarship 4,000 CentreVenture - Youth for Christ building 241,597 East End Community Centre 189,972 Garden City Community Centre 358,929 Manitoba Housing and Renewal Corporation 650,000 True North - Refund of Business Tax 232,000 True North - Refund of Entertainment Funding Tax** 6,790,000 United Way Winnipeg - Plan to End Homelessness (annual grant ending in 2019)
150,000
University of Manitoba - Research Chair in Municipal Infrastructure (annual grant ending in 2020)
50,000
Winnipeg Football Club Entertainment Funding Tax 1,400,000 Winnipeg Goldeyes - Refund of Entertainment Funding Tax* 270,000 Winnipeg Goldeyes - Grant for Municipal Property Tax 46,500 Winnipeg Housing Rehabilitation Corporation 180,000
Category Sub-Total 21,074,998
Other ProgramsAboriginal Youth Strategy (see next page for details) 1,750,000$ Civic Initiatives, Promotional and Protocol 513,000 Community Centres 5,469,268 General Council of Winnipeg Community Centres* 1,446,725 General Council of Winnipeg Community Centres - Lease Top-Up
30,336
Graffiti Control Partner Funding Allocation* 210,000 Local Grants (Per Capita Grants) 167,481 Minimal Municipal Services 310,000 Province of Manitoba (Off The Wall Program) - Graffiti Control*
10,000
River East Neighborhood Network - Trails Committee* 9,000 Transit Community Events Support 24,300 Estimated grants in support of cat spay and neuter programs 125,000 Winnipeg Humane Society (WHS) 652,273 Winnipeg Soccer Federation 27,145
Category Subtotal 10,744,528
Cumulative Total 41,879,106$ * Includes Community Partnerships.
** Grant is recorded as an offset to the Refundable Entertainment Funding Tax Revenue.
Adopted 2016 Operating Buddget - Appendices 27

Appendix 2
2016
Aboriginal Youth Strategy: - Indigenous Leadership Development Institute Aboriginal Construction Technology Program
99,370$
- Assembly of Manitoba Chiefs - Eagle's Nest Youth Centre
146,500
- Boys and Girls Club - Youth Recreation Activity Worker Program
20,000
- Broadway Neighbourhood Centre - Just TV
41,380
- Ka Ni Kanichihk Inc. - Honouring our Gifts
131,230
- Ma Mawi Wi Chi Itata Centre - The Future is Yours
107,331
- Ndinaweaaganag Endaawaad Inc. - Youth Resource Centre Recreation Program
51,000
- Spence Neighbourhood Association - First Jobs 4 Youth Project
36,174
- Resource Assistance for Youth - Growing Opportunities
82,745
- Internal City of Winnipeg Projects 284,270
- Infrastructure training/apprenticeship program* 750,000
Total Aboriginal Youth Strategy 1,750,000$
*Infrastructure training/apprenticeship program (cash and in-kind services) – the City of Winnipeg 1/3 share of up to $250,000 in the program is subject to 1/3 funding from the Province and 1/3 funding from the private sector.
THE CITY OF WINNIPEG2016 Adopted Operating Budget
28 Adopted 2016 Operating Buddget - Appendices
kmorton
Text Box
Return to Table of Contents

2016 Adopted Budget
(in $000's) 2015 Actual Revenue Expenditures
EstimatedClosing
Balance *
Stabilization ReserveFinancial Stabilization 75,632 1,324 5,303 71,652 Subtotal 75,632 1,324 5,303 71,652
Capital ReservesWatermain Renewal 5,161 16,595 18,030 3,726 Sewer System Rehabilitation 19,418 16,080 24,046 11,452 Environmental Projects 83,215 19,284 14,164 88,335 Brady Landfill Site Rehabilitation 5,646 530 16 6,160 Waste Diversion 2,369 12 687 1,694 Golf Course 453 152 272 333 Computer Replacement 1,260 1,760 2,782 238 Transit Bus Replacement 11,552 6,623 17,912 263 Southwest Rapid Transit Corridor 4,729 23 1,680 3,073 Southwest Rapid Transitway (Stage 2) and Pembina Highway Underpass Payment
- 3,414 8 3,406
Federal Gas Tax 173 41,951 41,950 174 Local Street Renewal 1,236 19,006 19,856 386 Regional Street Renewal 617 14,504 14,690 430 Subtotal 135,828 139,934 156,093 119,670
Special Purpose ReservesWorkers Compensation 4,748 1,325 2,664 3,410 Brookside Cemetery 15,696 713 353 16,056 St. Vital Cemetery 1,115 63 18 1,159 Transcona Cemetery 777 43 12 808 Insurance 509 4 (1,299) 1,812 Contributions in Lieu of Land Dedication 7,307 1,634 889 8,052 Land Operating 26,715 27,176 41,683 12,209 Wading & Outdoor Pool Extended Season - 352 352 - Commitment 4,685 2,746 6,061 1,370 Heritage Investment 143 814 952 4 Housing Rehabilitation Investment 4,136 6,228 6,476 3,888 Economic Development Investment 3,523 2,566 5,269 820 General Purpose 16,440 58 16,333 163 Multi-Family Dwelling Tax Investment 4,600 2,640 2,100 5,140 Insect Control 2,654 16 709 1,961 Permit 1,510 7 914 604 Destination Marketing 10,676 9,175 7,656 12,196 Subtotal 105,235 55,560 91,142 69,652
Total 316,695 196,818 252,538 260,974
* Estimated closing balance may not result in the 2015 Actual plus revenue less expenditures due to rounding.
Reserves - Budget Summary
Appendix 3
Adopted 2016 Operating Budget - Appendices 29
kmorton
Text Box
Return to Table of Contents
30 Adopted 2016 Operating Budget - Appendices

Appendix 4
Tax Supported Transfers From Other Funds
Transfers from Other Funds 2015 Adopted
2016 Adopted Variance
General Purpose Reserve. $ 924,000 $ 16,300,000 $ 15,376,000 Financial Stabilization Reserve. 9,200,000 5,000,000 (4,200,000)Insect Control Reserve. - 700,000 700,000 Workers Compensation Reserve. 1,300,000 1,000,000 (300,000)Insurance Reserve. 2,500,000 - (2,500,000)Economic Development Investment Reserve. - 1,400,000 1,400,000 Housing Rehabilitation Investment Reserve. 750,000 250,000 (500,000)General Revenue Enterprises Fund. - 2,433,741 2,433,741 Sewer Utility for Land Drainage costs. 11,551,721 10,221,484 (1,330,237)Land Operating Reserve. 7,435,000 235,000 (7,200,000)Municipal Accommodations. 10,464,732 16,008,295 5,543,563 Destination Marketing Reserve. 60,000 60,000 - For 311 Contact Centre services provided. 1,447,738 1,448,881 1,143 Business Technology Services (BTS) transfers. 145,838 145,838 -
Total $ 45,779,029 $ 55,203,239 $ 9,424,210
Adopted 2016 Operating Budget - Appendices 31
kmorton
Text Box
Return to Table of Contents

32 Adopted 2016 Operating Budget - Appendices

Appendix 5A
Departments
2015 Adopted Budget
2016 Adopted Budget Variance
Winnipeg Police Service $ 4,986,000 $ 7,278,000 $ 2,292,000 Public Works 31,131,000 22,294,000 (8,837,000)Fire Paramedic Service 3,348,000 4,333,000 985,000 Community Services 13,204,000 9,768,000 (3,436,000)Planning, Property and Development 2,856,000 1,828,000 (1,028,000)Water and Waste (Land Drainage) 4,945,000 4,425,000 (520,000)Corporate Support Services 2,494,000 3,874,000 1,380,000 Assessment and Taxation/Local Improvements 1,350,000 600,000 (750,000)Corporate Finance 300,000 - (300,000)City Clerks 1,750,000 1,750,000 - Corporate 970,995 (569,010) (1,540,005)Total tax supported $ 67,334,995 $ 55,580,990 $ (11,754,005)Transit 4,170,995 17,173,000 13,002,005 Municipal Accommodations 10,472,010 2,474,010 (7,998,000)Total City Transfer to Capital $ 81,978,000 $ 75,228,000 $ (6,750,000)
Corporate - Savings from capital closure (5,500,000) - 5,500,000
TOTAL $ 76,478,000 $ 75,228,000 $ (1,250,000)
Notes:
4. Year over year Total City Transfer to Capital change: a) replacement with Frontage Levy financing dedicated to capital (10,000,000)
(1,700,000) 4,950,000
(6,750,000)
c) other increase, including incremental cash to capital of $4.5 million ($11 million in 2016 less $6.5 million in 2015 invested in the Regional Street Renewal capital program)
b) replacement with Land Operating Reserve financing dedicated to capital
Transfer to Capital Reconciliation
3. Municipal Accommodations' 2015 adopted budget and 2016 adopted budget reflect internal financing interest on a portion of the Police Headquarters which is included in the transfer to capital totals in an amount of $569,010. This is offset as a Corporate adjustment above.
1. 2015 transfers to capital are based on the 2015 Adopted Capital Budget adjusted for assumed provincial funding. 2016 transfers are based on the 2016 Adopted Capital Budget adjusted for assumed provincial funding.
2. Public Works transfer to capital excludes transfers to the regional and local streets reserves (2015 - $23.7 million and 2016 - $33.5 million) and transfer to capital - frontage levy of $10 million.
Adopted 2016 Operating Budget - Appendices 33
kmorton
Text Box
Return to Table of Contents

Appendix 5B
2015 2016 Cash to Frontage LevyAdopted Adopted Capital / Reserves OtherBudget Budget Variance Variance Variances
Expenditures:Departmental:
Police Service 263,977,645$ 280,669,573$ 2,292,000$ 14,399,928$ Public Works 204,446,999 215,520,928 (8,837,000) 19,800,000 110,929 Fire Paramedic Service 178,321,417 190,273,654 985,000 10,967,237 Community Services 118,568,706 111,408,533 (3,436,000) (3,724,173) Planning, Property and Development 48,513,442 45,528,018 (1,028,000) (1,957,424) Water and Waste 30,923,306 30,399,443 (520,000) (3,863) Street Lighting 12,521,647 12,962,647 - 441,000 Corporate Support Services 32,963,368 37,253,982 1,380,000 2,910,614 Assessment and Taxation 20,519,895 19,985,887 (750,000) 215,992 Corporate Finance 9,129,967 9,015,503 (300,000) 185,536 City Clerks 12,947,687 14,550,008 - 1,602,321 Other departments 14,396,556 15,205,821 - 809,265 Sub-total Departmental 947,230,635$ 982,773,997$ (10,214,000)$ 19,800,000$ 25,957,362$
Corporate:Debt and finance charges 503,222$ 542,945$ 39,723$ Taxes 9,562,560 10,576,362 1,013,802 Insurance and damage claims 3,410,650 4,130,682 720,032 Contribution to Transit 47,349,724 69,918,833 22,569,109 Other (13,959,492) (12,812,934) 3,959,995 (2,813,437) Sub-total Corporate 46,866,664$ 72,355,888$ 3,959,995$ -$ 21,529,229$
Total Expenditures 994,097,299$ 1,055,129,885$ (6,254,005)$ 19,800,000$ 47,486,591$
1. Public Works' transfer to capital variance includes transfers to the regional and local street renewal reserves of $9.8 million (2015 - $23.7 million and 2016 - $33.5 million) and transfer to capital - frontage levy of $10 million.
2. 2015 Adopted Budget is restated to reflect the transfer of the Communications Division from Corporate Support Services to Chief Administrative Offices.
2016 Operating Budget ReconciliationVariances Net of Transfer to Capital / Regional and Local Street Renewal Reserves / Frontage LevyTax Supported Summary
Notes:
Transfer to Capital
34 Adopted 2016 Operating Budget - Appendices
kmorton
Text Box
Return to Table of Contents

Appendix 5C
2016 Operating Budget Reconciliation
Tax Supported Summary
2015 2016Net Budget Net Budget Variance
Expenditures:Departmental:
Police Service 258,991,645$ 273,391,573$ 14,399,928$ Public Works 149,615,999 149,726,928 110,929 Fire Paramedic Service 174,973,417 185,940,654 10,967,237 Community Services 105,364,706 101,640,533 (3,724,173) Planning, Property and Development 45,657,442 43,700,018 (1,957,424) Water and Waste 25,978,306 25,974,443 (3,863) Street Lighting 12,521,647 12,962,647 441,000 Corporate Support Services 30,469,368 33,379,982 2,910,614 Assessment and Taxation 19,169,895 19,385,887 215,992 Corporate Finance 8,829,967 9,015,503 185,536 City Clerks 11,197,687 12,800,008 1,602,321 Other departments 14,396,556 15,205,821 809,265 Sub-total Departmental 857,166,635$ 883,123,997$ 25,957,362$
Corporate:Debt and finance charges 503,222$ 542,945$ 39,723$ Taxes 9,562,560 10,576,362 1,013,802 Insurance and damage claims 3,410,650 4,130,682 720,032 Contribution to Transit 47,349,724 69,918,833 22,569,109 Other (9,430,487) (12,243,924) (2,813,437) Sub-total Corporate 51,395,669$ 72,924,898$ 21,529,229$
908,562,304$ 956,048,895$ 47,486,591$
Capital:Transfer to Capital Tax Supported 60,834,995 44,580,990 (16,254,005)Incremental Transfer to Capital 6,500,000 11,000,000 4,500,000Transfer to Regional Street Renewal Reserve 9,600,000 14,500,000 4,900,000Transfer to Local Street Renewal Reserve 14,100,000 19,000,000 4,900,000Transfer to Capital - Frontage Levy - 10,000,000 10,000,000 Capital Closing Surplus (5,500,000) - 5,500,000
Total Transfer to the General Capital Fund 85,534,995$ 99,080,990$ 13,545,995$
994,097,299$ 1,055,129,885$ 61,032,586$
Budget Net of Transfer to Capital / Regional and Local Street Renewal Reserves / Frontage Levy
Total Expenditures before Transfer to the General Capital Fund
Total Expenditures
Adopted 2016 Operating Budget - Appendices 35
kmorton
Text Box
Return to Table of Contents
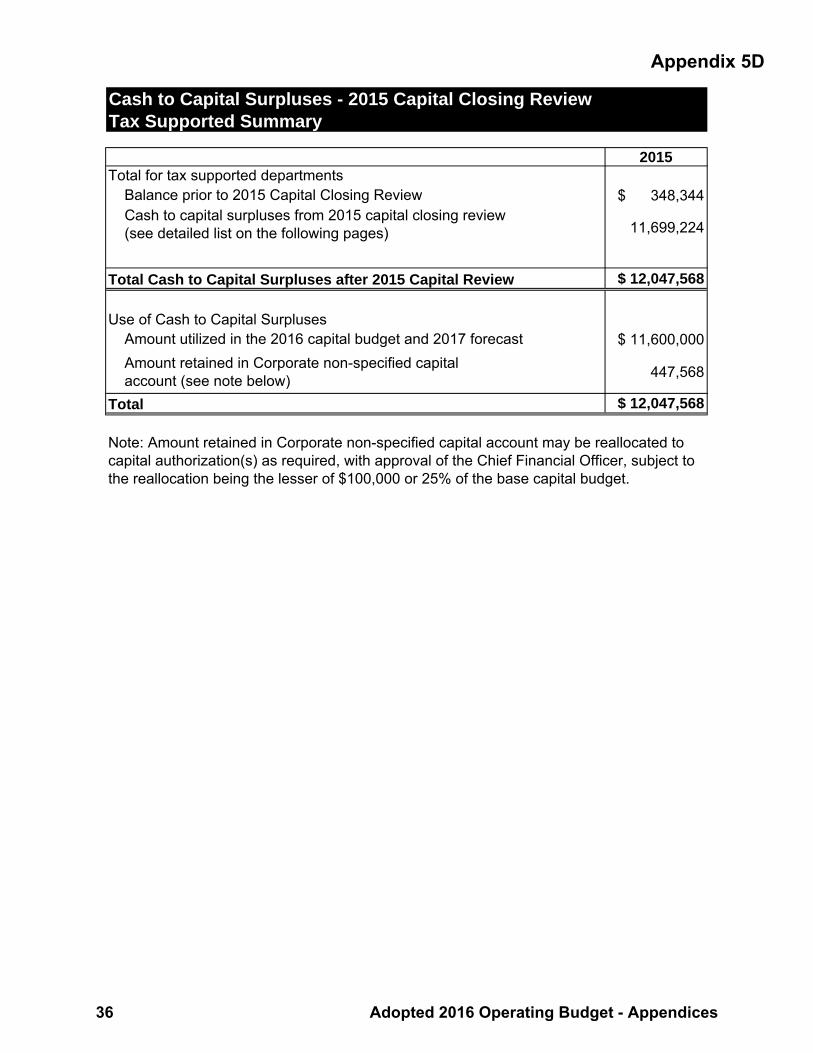
Appendix 5D
2015Total for tax supported departments
$ 348,344
11,699,224
$ 12,047,568
$ 11,600,000 Amount retained in Corporate non-specified capital account (see note below) 447,568
$ 12,047,568
Amount utilized in the 2016 capital budget and 2017 forecast
Total
Note: Amount retained in Corporate non-specified capital account may be reallocated to capital authorization(s) as required, with approval of the Chief Financial Officer, subject to the reallocation being the lesser of $100,000 or 25% of the base capital budget.
Tax Supported SummaryCash to Capital Surpluses - 2015 Capital Closing Review
Balance prior to 2015 Capital Closing Review
Total Cash to Capital Surpluses after 2015 Capital Review
Cash to capital surpluses from 2015 capital closing review (see detailed list on the following pages)
Use of Cash to Capital Surpluses
36 Adopted 2016 Operating Budget - Appendices
kmorton
Text Box
Return to Table of Contents

Appendix 5D
Project NameProject
Year Net SurplusPublic WorksChief Peguis Trail - Henderson Hwy to Lagimodiere Blvd 2007 12,513$ Disraeli Bridge and Overpass Facility 2008 363,992Red River Crossing Feasibility 2009 28,818Waverley West Arterial Roads project 2010 5,461,555Pembina Highway Underpass 2011 140,000Portage Avenue Bridge (Sturgeon Creek) 2012 822,667Engineering Division Research 2012 3,029St. James Street Bridge (Omand's Creek) 2013 180,000Regional and Community Parks - Buildings 2013 200,000Disraeli Bridge and Overpass Facility 2014 828,935Asset Management - Traffic Signals/Services 2014 2Total Public Works 8,041,511
Municipal Accommodations & Planning, Property and DevelopmentPan Am Pool Building Envelope 2010 99,390Fort Rouge Leisure Centre Refurbishment 2012 86,838Bomb Magazine Storage Facility 2012 86,624General Building Renovation / Refurbishment 2013 62,932Fire / Life Safety / Regulatory Upgrades 2013 40,612Energy Conservation 2013 101,327Historic Buildings 2013 82,722Security / Building Automation System Initiatives 2013 113,920Cooling Plant - Public Safety Building - 151 Princess Street 2013 364,984Arenas* 2013 (2,648)Outdoor Aquatic Facilities 2013 5,365Community Facilities 2013 172,499Building Communities - Administration 2011 9,906Weather Protected Walkway System 2012 23,967Land Acquisition for General Unspecified Purposes 2013 291,215Cemeteries - Improvements 2013 83,757Developer Payback 2013 67,407Riverbank Greenway Programs 2013 39,500Millennium Library Park Redevelopment 2013 15,064Community Centres - Refurbishment* 2013 (10,719)Total Municipal Accommodations & Planning, Property and Development
1,734,662
Community Services Recreation Refurbishment and Redevelopment 2011 1,842Library Renovation / Refreshment 2012 43,315Library Facility Safety and Accessibility Improvements Program 2013 82,373Recreational Facility Safety and Accessibility Improvements Program 2013 7,153
Total Community Services 134,683
Tax Supported Departments
Cash to Capital - 2015 Capital Closing ReviewList of Project Net Surpluses Closed
* Bracketed amounts disclosed above represent cash to capital investment for specific projects as indicated.
Adopted 2016 Operating Budget - Appendices 37

Appendix 5D
Project NameProject
Year Net Surplus
Tax Supported Departments
Cash to Capital - 2015 Capital Closing ReviewList of Project Net Surpluses Closed
Winnipeg Police Service In Car Computing 2013 66,044Total Winnipeg Police Service 66,044
Fire Paramedic Service Asset Management Program 2013 34,599Facilities Replacement - Station 11 2013 264,488Facilities Replacement - Station 19 2013 1,403,411Total Fire Paramedic Service 1,702,498
Corporate Support Services PeopleSoft Upgrade 2012 23E-Government 2013 1,443PeopleSoft 2013 43Total Corporate Support Services 1,509
AssessmentAssessment Automation 2012 18,317Total Assessment 18,317
Net cash to capital surpluses from 2015 capital closing review 11,699,224$
38 Adopted 2016 Operating Budget - Appendices
kmorton
Text Box
Return to Table of Contents

Appendix 6
Regional and Local Streets Renewal Regional Streets Within the City of Winnipeg there are over 10 million daily vehicle-kilometres of travel, with about 80% of this traffic volume travelling on regional roads – the remaining 20% travel on local streets. The regional system is made up of about 1,800 lane kilometres of regional streets which forms the backbone of the City’s transportation system. In 2012, the City budgeted $11 million for regional street renewal, followed by just under $17 million in 2013. This was insufficient to meet the needed repairs to the regional street system. At this funding level, the condition of the City’s regional streets was expected to drop significantly over the next 10 years as illustrated in the table below. The percentage of regional streets in poor condition was expected to increase from 16% to 27% over 10 years.
Pavement Condition Regional Streets 2012
2022 With Historical
Funding New / Good 57% 49% Fair 27% 24% Poor 16% 27%
A sustainable level of funding for regional streets is in the range of $60 million per year in today’s dollars based on a 25-year view and using a proper asset management approach. Thus we were funding only about a quarter of what was required, resulting in a shortfall in funding of about $45 million per year in today’s dollars. Cumulatively over the next 25 years, the funding shortfall for regional streets totals $1.4 billion with construction inflation factored in. Recent public budget consultation found that (excerpt from MNP’s 2013 report):
“Developing and maintaining the infrastructure, particularly the repair of roads and streets, was identified as a high priority in all components of consultation. Approximately 80% of all survey respondents identified repair and maintenance of streets as one of the top priorities.”
Following 2014’s introduction of the Regional Street Renewal Reserve, the City has established a permanent enhanced program for regional streets. The new revenue is dedicated to a regional street renewal reserve and used solely for the renewal of regional streets and sidewalks.
Adopted 2016 Operating Budget - Appendices 39
kmorton
Text Box
kmorton
Text Box
Return to Table of Contents

Appendix 6
Long Term Proposal for Regional Street Renewals – In the event the City does not receive significant new growth revenue from other levels of government, the following plan is proposed. Dedicated annual 1% property tax increase for each of nine years (2014 to 2022) committed to increasing funding for the renewal of regional streets. A small portion of this funding would be used to finance $25 million of borrowing over the first three years ($10 million in 2014, $10 million in 2015, and $5 million in 2016). After nine years of 1% property tax increases, the rate would drop to a level to deal with construction inflation. The year 2023 would be a transition year between the full 1% property tax increase and the required 0.3% increase required to deal with construction inflation. The overall plan would achieve a sustainable funding level for the renewal of regional streets. Local Streets In 2011, 20% of local streets along with 16% of back lanes were in poor condition. Winnipeggers’ satisfaction with the condition of local streets was low at 40% (poll June 2012). Only one other City service had a lower satisfaction: condition of regional streets, at 38%. In 2012 and 2013, the City’s planned spending on the base local street renewal program was about $20 million per year. This includes the $5 million TBO (thin bituminous overlay) program, $3 million for gravel roads and $0.9 million for sidewalk and pathways. Net of the three components just listed, only about $11 million annually was left for the renewal of local streets and back lanes. A sustainable level of funding for local streets and back lanes is in the range of $80 million per year based on a 25-year view and on a proper asset management approach. Thus the City was funding less than 15% of what was required, resulting in a shortfall in funding of $67 million per year in today’s dollars. At that funding level, cumulatively over the next 25 years and adding in construction inflation, the funding shortfall for local streets and back lanes would total $3.6 billion. Long Term Proposal for Local Street Renewals – In the event the City does not receive significant new growth revenue from other levels of government, the following plan is proposed. Dedicated annual 1% property tax increase for each of 9 years committed to increasing funding for the renewal of local streets, back lanes and sidewalks. A small portion of this funding would be used to finance $27 million of borrowing beginning in 2013 ($10 – $10 – $6 – $1). In the tenth year, the new street property tax funding could be exchanged with the current frontage levy. Thereafter the frontage levy rate could be increased annually by $1.00 per foot frontage for an estimated 13 years. The overall plan would achieve a sustainable funding level for the renewal of local streets. The proposal would result in the regional and local street renewal programs being funded with a sustainable funding source and mostly on a cash basis. In addition, a significant increase in City spending on street renewal would have a strong positive economic impact.
40 Adopted 2016 Operating Budget - Appendices
kmorton
Text Box
Return to Table of Contents
Appendix 7
Funding Plan for Southwest Rapid Transitway (Stage 2) and Pembina Highway Underpass This combined project is made up of two components: the widening of Pembina Highway through the Pembina Underpass at Jubilee, and the construction of Stage 2 of the Southwest Rapid Transitway. On June 25, 2014, Council amended the 2014 Capital Budget and approved the project. The estimated cost of the project is approximately $590 million. The Federal Government through PPP Canada has committed approximately $140 million and the Province of Manitoba has committed $225 million towards the project. The City of Winnipeg share is also $225 million equivalent but in the form of annual P3 payments for 30 years as well as annual debt payments. The first P3 payment is required in 2020. In addition, annual operating and maintenance P3 payments are required. These will be cost shared between the City and the Province of Manitoba. Thus in 2020, the City’s total P3 annual payment (first) is estimated at $18.4 million along with a City debt repayment amount of $1.3 million also starting up in 2020 – for a total annual payment of $19.7 million. Background – Both projects are necessary to maintain / improve the public’s service expectations. Over the next several decades, a significant portion of the expected growth in Winnipeg’s population will occur in the southwest quadrant of the City. Increases in traffic congestion will be detrimental to both auto drivers and transit passengers alike. The widening of the Pembina Underpass will relieve some of the congestion already experienced in the vicinity of Pembina & Jubilee. The construction of Stage 2 of the Southwest Rapid Transitway will not only improve on existing transit travel times, it will increase reliability, convenience and competiveness as well as attract additional riders. The Transitway will prevent transit travel times along the corridor from increasing as traffic congestion worsens in the coming years. Southwest Rapid Transitway (Stage 2), Project Overview – Stage 2 of the Southwest Transitway (SWT) will be a dedicated corridor that will extend from Pembina & Jubilee to the University of Manitoba and to Markham Road. As shown in Figure 1 (next page), Stage 2 will extend westward through the Parker Lands, then southeast along a Manitoba Hydro right-of-way, crossing McGillivray, Clarence and Chevrier before crossing under the CN Letellier subdivision. The transitway will then run parallel to the CN railway as it crosses Bishop Grandin and Chancellor. An access to Southpark Drive will allow some routes to enter the University of Manitoba/Investors Group Field via the Southwood Lands. The transitway will extend as far south as Markham, where routes serving Waverley West, Fort Richmond, Richmond West and St. Norbert will enter/exit the transitway.
Adopted 2016 Operating Budget - Appendices 41
kmorton
Text Box
Return to Table of Contents

PembinUnderpProject CombineconstrucTransitwwideningHighwaywhich wfollowingimproveof third nlane to lanes inincreaseimproveand thebicycle facilitiesPembinathrough Highway To makwideningHighwayassociatwill inclubridge HighwayrelocatioLetellier and thSubdivis
FAlignmen
na Higass WidOverview
ed with ction of way will bg of the Pey Undewill includg roments: anorthbound
allow for n each dired lane d left turn
e constructand pede
on both sia Hi
the Pey Underpas
ke way fog of the Pey Undeted railway ude a new C
over Pey and on on th
Subdivisiohe CN sion near Ju
Figure 1 – Prnt and Appro
Station Lo
ghway ening,
the the
be the embina erpass
de the oadway ddition
d traffic three
rection; width;
n lane; tion of estrian ides of ghway
embina ss.
or the embina erpass,
works CN rail embina
track e CN n Rivers ubilee.
oposed oximate
ocations
Appenddix 7
42 Adopted 2016 Operating Budget - Appendices
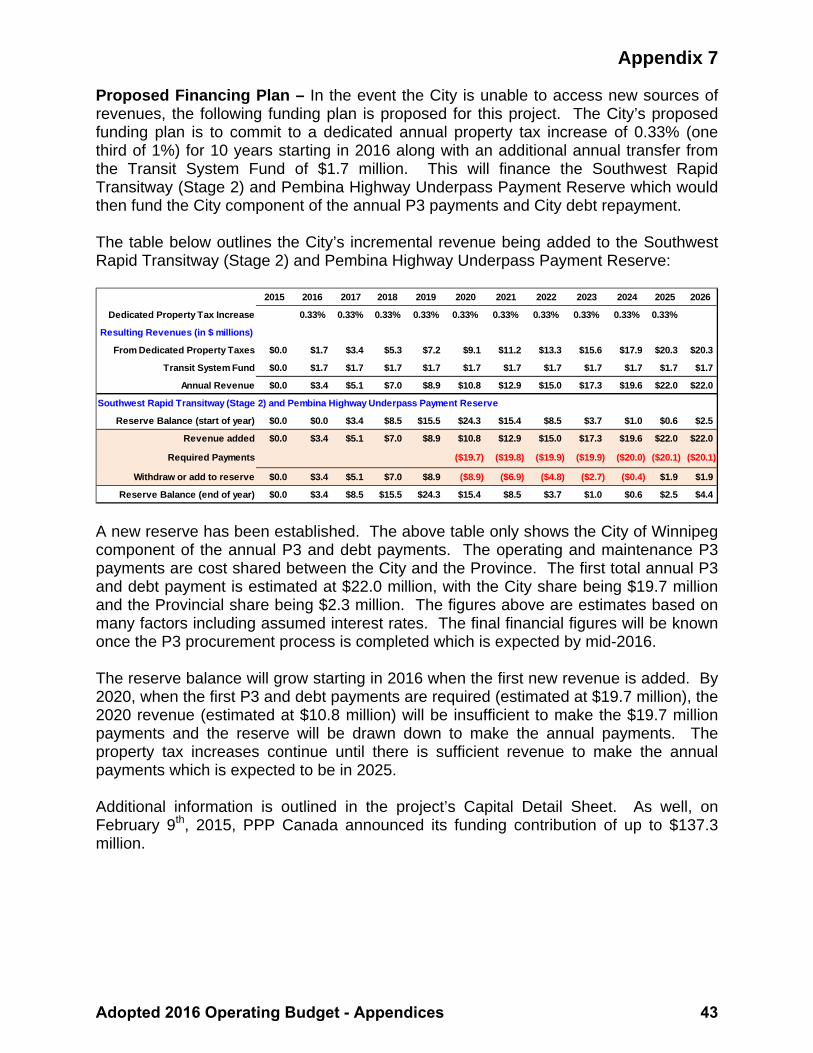
Appendix 7
Proposed Financing Plan – In the event the City is unable to access new sources of revenues, the following funding plan is proposed for this project. The City’s proposed funding plan is to commit to a dedicated annual property tax increase of 0.33% (one third of 1%) for 10 years starting in 2016 along with an additional annual transfer from the Transit System Fund of $1.7 million. This will finance the Southwest Rapid Transitway (Stage 2) and Pembina Highway Underpass Payment Reserve which would then fund the City component of the annual P3 payments and City debt repayment. The table below outlines the City’s incremental revenue being added to the Southwest Rapid Transitway (Stage 2) and Pembina Highway Underpass Payment Reserve:
A new reserve has been established. The above table only shows the City of Winnipeg component of the annual P3 and debt payments. The operating and maintenance P3 payments are cost shared between the City and the Province. The first total annual P3 and debt payment is estimated at $22.0 million, with the City share being $19.7 million and the Provincial share being $2.3 million. The figures above are estimates based on many factors including assumed interest rates. The final financial figures will be known once the P3 procurement process is completed which is expected by mid-2016. The reserve balance will grow starting in 2016 when the first new revenue is added. By 2020, when the first P3 and debt payments are required (estimated at $19.7 million), the 2020 revenue (estimated at $10.8 million) will be insufficient to make the $19.7 million payments and the reserve will be drawn down to make the annual payments. The property tax increases continue until there is sufficient revenue to make the annual payments which is expected to be in 2025. Additional information is outlined in the project’s Capital Detail Sheet. As well, on February 9th, 2015, PPP Canada announced its funding contribution of up to $137.3 million.
2015 2016 2017 2018 2019 2020 2021 2022 2023 2024 2025 2026
Dedicated Property Tax Increase 0.33% 0.33% 0.33% 0.33% 0.33% 0.33% 0.33% 0.33% 0.33% 0.33%
Resulting Revenues (in $ millions)
From Dedicated Property Taxes $0.0 $1.7 $3.4 $5.3 $7.2 $9.1 $11.2 $13.3 $15.6 $17.9 $20.3 $20.3
Transit System Fund $0.0 $1.7 $1.7 $1.7 $1.7 $1.7 $1.7 $1.7 $1.7 $1.7 $1.7 $1.7
Annual Revenue $0.0 $3.4 $5.1 $7.0 $8.9 $10.8 $12.9 $15.0 $17.3 $19.6 $22.0 $22.0
Southwest Rapid Transitway (Stage 2) and Pembina Highway Underpass Payment Reserve
Reserve Balance (start of year) $0.0 $0.0 $3.4 $8.5 $15.5 $24.3 $15.4 $8.5 $3.7 $1.0 $0.6 $2.5
Revenue added $0.0 $3.4 $5.1 $7.0 $8.9 $10.8 $12.9 $15.0 $17.3 $19.6 $22.0 $22.0
Required Payments ($19.7) ($19.8) ($19.9) ($19.9) ($20.0) ($20.1) ($20.1)
Withdraw or add to reserve $0.0 $3.4 $5.1 $7.0 $8.9 ($8.9) ($6.9) ($4.8) ($2.7) ($0.4) $1.9 $1.9
Reserve Balance (end of year) $0.0 $3.4 $8.5 $15.5 $24.3 $15.4 $8.5 $3.7 $1.0 $0.6 $2.5 $4.4
Adopted 2016 Operating Budget - Appendices 43
kmorton
Text Box
Return to Table of Contents

44 Adopted 2016 Operating Budget - Appendices
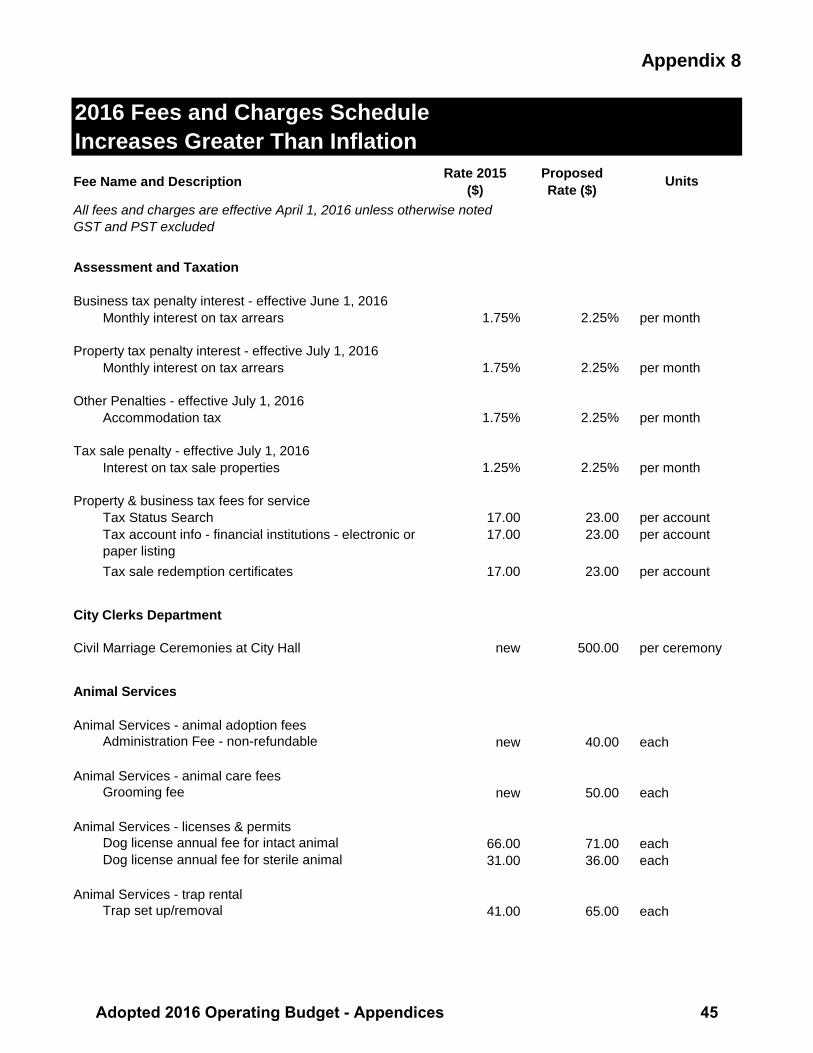
Appendix 8
Fee Name and Description Rate 2015($)
Proposed Rate ($)
All fees and charges are effective April 1, 2016 unless otherwise noted
Assessment and Taxation
Business tax penalty interest - effective June 1, 2016Monthly interest on tax arrears 1.75% 2.25% per month
Property tax penalty interest - effective July 1, 2016Monthly interest on tax arrears 1.75% 2.25% per month
Other Penalties - effective July 1, 2016Accommodation tax 1.75% 2.25% per month
Tax sale penalty - effective July 1, 2016Interest on tax sale properties 1.25% 2.25% per month
Property & business tax fees for serviceTax Status Search 17.00 23.00 per accountTax account info - financial institutions - electronic or paper listing
17.00 23.00 per account
Tax sale redemption certificates 17.00 23.00 per account
City Clerks Department
Civil Marriage Ceremonies at City Hall new 500.00 per ceremony
Animal Services
Animal Services - animal adoption feesAdministration Fee - non-refundable new 40.00 each
Animal Services - animal care feesGrooming fee new 50.00 each
Animal Services - licenses & permits Dog license annual fee for intact animal 66.00 71.00 eachDog license annual fee for sterile animal 31.00 36.00 each
Animal Services - trap rentalTrap set up/removal 41.00 65.00 each
2016 Fees and Charges ScheduleIncreases Greater Than Inflation
GST and PST excluded
Units
Adopted 2016 Operating Budget - Appendices 45
kmorton
Text Box
Return to Table of Contents

Appendix 8
Fee Name and Description Rate 2015($)
Proposed Rate ($)
2016 Fees and Charges ScheduleIncreases Greater Than Inflation
Units
Cemeteries
Traditional in ground propertyContinuous Foundation Property - Interior Location 2,225.00 2,450.00 eachContinuous Foundation Property - Premium Location 2,660.00 2,925.00 eachFlat Marker Lot - Interior Location 1,765.00 1,945.00 eachFlat Marker Lot - Premium Location 2,205.00 2,425.00 eachInfant Lot (Permits up to 2 Years of Age) 260.00 275.00 eachChild Lot (Permits 2 to 10 Years of Age) 620.00 655.00 eachField of Honour Lot (Regimental No.required) 1,300.00 1,430.00 eachSocial Services Clients - Full Size Casket Lot 1,765.00 1,945.00 eachCremation Lot for 2 Cremains 1,030.00 1,135.00 eachFamily Cremation Plot for 4 Cremains 1,500.00 1,655.00 eachHistoric Property Sections - Only Available as single lots
3,100.00 3,420.00 each
Cremation Upright Monument Lot for 2 1,650.00 1,820.00 each
Columbaria packagesSquare – Gold Premium 3,755.00 3,945.00 eachSquare – Gold Standard 3,515.00 3,695.00 eachSquare - Silver Premium 3,200.00 3,360.00 eachSquare - Silver Standard 2,855.00 3,000.00 eachY-Niche - Gold 3,515.00 3,695.00 eachY-Niche - Silver 3,200.00 3,360.00 eachSunset Round - Gold 3,515.00 3,695.00 eachSunset Round - Silver 3,200.00 3,360.00 eachEstate Two Niche Columbaria per unit 7,205.00 7,565.00 eachEstate Columbaria: 1st sold niche per unit, includes Free choice of standard roof peak engraving designs. (Not permitted on Vase units) Subject to availability
new 3,990.00 each
Estate Columbaria: remaining niche/s in partially sold unit. Per niche (Not permitted on Vase units) Subject to availability
new 3,575.00 each
Triangle - Gold 2,950.00 3,100.00 eachTriangle - Silver 2,745.00 2,885.00 eachPlaque or Engraved Low 2,745.00 2,885.00 eachRound - Silver 2,745.00 2,885.00 eachRound - Gold 2,950.00 3,100.00 eachVeterans Field of Honour Columbaria Niche per unit. Includes Veterans inurnment. Available for preneed purchases but Veteran must be the first interment.
2,820.00 2,965.00 each
46 Adopted 2016 Operating Budget - Appendices

Appendix 8
Fee Name and Description Rate 2015($)
Proposed Rate ($)
2016 Fees and Charges ScheduleIncreases Greater Than Inflation
Units
Vaults/liners/urnsWhitex No. 2 Concrete Liner - Adult 1,950.00 2,045.00 eachMonticello No. 4 (Fiberglass) Vault Adult 2,500.00 2,750.00 eachCremation Vault/Liner install fee - max 12" squared size permitted in cremation lot. Maximum 15" size permitted in full size lot (where not purchased in-house)
115.00 125.00 each
Traditional interment feesChild 2-10 years (max 5' casket) 400.00 440.00 eachOver 5FT: Single Depth 980.00 1,080.00 eachOver 5FT: Double Depth (Subject to conditions and availability)
1,500.00 1,650.00 each
Pallbearer Casket Assistance per 2 pallbearers and/or use of pallbearer carriage (subject to staff availability) -Carriage at Brookside only
50.00 55.00 per 2
Nov 1st to Apr 30th Interment Seasonal Accessibility & Reinstatement Fee.
110.00 120.00 each
Cremation interment feesSingle Depth 415.00 460.00 eachDouble Depth 590.00 650.00 eachUrn Placed in a casket. Administrators permission must be obtained. Urn is recorded and counted as one of the four permitted forms of interment per lot.
150.00 155.00 each
Nov 1st to Apr 30th Interment Seasonal Accessibility & Reinstatement Fee.
110.00 120.00 each
Sub-surface Ash Crypt 310.00 360.00 eachNiche Inurnment 305.00 350.00 eachNiche opening to allow removal of companion urn for 2nd inurnment
77.00 90.00 each
Disinterment5ft and Over 5ft length Single Depth Casket Disinterment
3,025.00 3,510.00 each
5ft and Over 5ft length Double Depth Casket Disinterment
5,610.00 6,510.00 each
Cremated Remains at single depth 565.00 655.00 eachCremated Remains at double depth 750.00 870.00 eachDisinterment being interred into new City cemetery property receive a 5% discount on the disinterment fee. (Property must be purchased at time of disinterment).
new 5% each
Adopted 2016 Operating Budget - Appendices 47

Appendix 8
Fee Name and Description Rate 2015($)
Proposed Rate ($)
2016 Fees and Charges ScheduleIncreases Greater Than Inflation
Units
Saturday/late funeral additional feesLate funeral departing interment property after 3:45, Monday through Friday - per 1/2 hour or part thereof
165.00 170.00 each
In ground Cremation Interment before Noon Saturday 290.00 305.00 eachFull casket, Saturday 835.00 878.00 eachInfant up to 2 years of age, Saturday casket interment before 12 Noon
295.00 310.00 each
Child 2-10 years of age, Saturday casket interment before 12 Noon
420.00 440.00 each
Niche Inurnment before Noon 245.00 255.00 eachCremation Scattering/Ossuary/Sub Surface Ash Crypt Interment before Noon
245.00 255.00 each
Monument foundation feesCement Slab - Single 375.00 385.00 eachInterment site Concrete Curb Set Removal and Disposal (discount is provided on any new installed foundation)
new 375.00 each
Monument/marker/vase installation/removal feesMilitary Upright Monument 185.00 195.00 eachFlat Marker Exchange or Removal 110.00 115.00 eachFlat Marker - Minimum sized 20" X 10" 200.00 210.00 eachFlat Marker - Greater Than Minimum size 1.05 1.15 per sq. inchFlat Markers installed with an attached Vase; applicable flat marker install fee plus
65.00 70.00 each
Separate Single Invertible Memorial Vase 165.00 175.00 eachMilitary Monument Removal 305.00 335.00 eachPre-Installed Flat Marker Removal for 1st Interment 190.00 200.00 eachFlat Marker, Vase or Foundation disposal fee (Removal fee charged separately)
new 180.00 each
Memorial installation - permitsPer Memorial installed on a Foundation/Per Sub Base/Per Memorial Engraved on site
100.00 120.00 each
Per Picture Disc or Tag Affixed to a Monument 100.00 120.00 each
MemorialsMemorial Bench - Donated Wooden incl. foundation 1,620.00 1,950.00 eachMemorial Bench -Bronze Plaque 295.00 305.00 eachBlack Granite Memorial Bench incl. foundation 3,630.00 3,750.00 eachRose Granite Memorial Bench incl. foundation 3,350.00 3,450.00 eachBook of Memories - plaque 230.00 235.00 eachNatural Granite Memory Stone with Bronze Plaque (Excludes interment/scattering of Cremated Remains - sold Separately)
1,430.00 1,645.00 each
48 Adopted 2016 Operating Budget - Appendices

Appendix 8
Fee Name and Description Rate 2015($)
Proposed Rate ($)
2016 Fees and Charges ScheduleIncreases Greater Than Inflation
Units
Donated Cremation Garden Evergreen Standard Memorial Shrub
205.00 210.00 each
Donated Cremation Garden Deciduous Standard Memorial Shrub
130.00 135.00 each
6" X 4" Oval Bronze Plaque for Standard Memorial Tree or Shrub
335.00 345.00 each
12" X 8" Cremation Garden Bronze Plaque 680.00 705.00 eachNatural Granite Memory Stone Small with Bronze Plaque (Excludes interment/scattering of Cremated Remains - sold Separately)
810.00 935.00 each
Memorial Disposal Fee new 165.00 each
Miscellaneous feesExpress Order (Where service is requested to be completed within 10 working days of receipt of the order) Engraving or Installation Services (Subject to availability)
new 45.00 each
Transfer of Deed incl. Letter of Confirmation 110.00 120.00 eachLetter of Property Ownership Confirmation 110.00 120.00 eachTree/Shrub Removal from Property 310.00 360.00 eachInterment site GPS 45.00 50.00 eachInterment site or Memorial Photo (Max 2 jpeg or computer print only)
50.00 55.00 each
Cheques returned unpaid by Financial institution 45.00 65.00 eachInterest charged on overdue accounts, charged daily, applied monthly and compounded.
Interest charged on
overdue accounts,
charged daily at 1.50%
applied monthly and
Compounded.
Interest charged on
overdue accounts,
charged daily at 1.75%
applied monthly and
Compounded.
each
Administration fee Administration fee - 12% or
$75.00 minimum
whichever is greater.
Administration fee - 12% or
$100.00 minimum
whichever is greater.
each
Adopted 2016 Operating Budget - Appendices 49

Appendix 8
Fee Name and Description Rate 2015($)
Proposed Rate ($)
2016 Fees and Charges ScheduleIncreases Greater Than Inflation
Units
Columbaria sundriesEstate Niche Vase Granite (Includes Installation) (Applicable only if complete columbaria unit is purchased)
180.00 192.00 each
Columbaria Motif Engraving on Niche Door (Must be ordered at the time of ordering the standard door engraving)
80.00 85.00 each
Columbaria Motif Engraving on Niche Door (Must be ordered at the time of ordering the standard door engraving)
125.00 133.00 two
Columbaria Motif Engraving on Niche Door ordered separately from 1st service
200.00 213.00 each
Estate Columbaria Family Name Engraving (Applicable only if complete columbaria unit is purchased)
420.00 445.00 each
Additional Engraving Service on Niche Door 220.00 240.00 eachEngraved Niche Plaque Refurbishment new 135.00 each
Property, Planning and Development
Development Approvals, Building Permits and Inspections
Penalties for Non-Compliance with Residential Fire Safety By-Law (4304/86) - Minimum penalty $500.00; Maximum penalty $5,000.00(Penalties double each subsequent year of non-compliance)
new 100.00 Per unit within non-compliant building
Administration fee for collection process on overdue accounts
new 150.00 Per overdue invoice
Simple Encroachments (building elements, fences, etc.)
Simple - ResidentialTo permit an encroachment related to single-family and two-family dwellings and accessory structures
86.00 125.00 each
Annual encroachment license for all other types of encroachments, Single family and 2-family dwellings: first 5 m² or less of space occupied
new methodology
75.00 each
Annual encroachment license for all other types of encroachments, Single family and 2-family dwellings: each additional 5 m² or portion thereof
new methodology
40.00 each
50 Adopted 2016 Operating Budget - Appendices

Appendix 8
Fee Name and Description Rate 2015($)
Proposed Rate ($)
2016 Fees and Charges ScheduleIncreases Greater Than Inflation
Units
Simple - CommercialTo permit an encroachment related to all other property types including multiple-family and row housing, commercial or industrial, and seasonal patios
172.00 200.00 each
Annual encroachment license for all other types of encroachments: first 5 sqm or less of space occupied
69.00 delete each
Annual encroachment license for all other types of encroachments: each additional 5 sqm or portion thereof
36.00 delete each
Annual encroachment license for all other types of encroachments, Non-single family and 2-family dwellings: first 5 m² or less of space occupied
new methodology
100.00 each
Annual encroachment license for all other types of encroachments, Non-single family and 2-family dwellings: each additional 5m² or portion thereof
new methodology
60.00 each
Sign Encroachments (not of an unusual nature)
Annual encroachment license for first year - signs encroaching less than 3 sq. meters
79.00 delete each
Annual encroachment license for the first year - signs encroaching 3 to 6 sq. meters
129.00 delete each
Annual encroachment license for the first year - signs encroaching 6.1 to 9 sq. meters
172.00 delete each
Annual encroachment license for the first year - signs encroaching 9.1 to 18 sq. meters
255.00 delete each
Annual encroachment license for the first year - signs encroaching more than 18.1 sq. meters
384.00 delete each
Annual sign encroachment licenses after the 1st year 62.00 delete eachTo permit a sign encroachment (Initial processing fee)
new methodology
150.00 each
Annual Base rate per year (applied each year to cover costs of administration)
new methodology
50.00 each
Rate per square meter (first year rates per square meter to be charged on a pro-rated fashion for each month or part there-of)
new methodology
12.00 each
Adopted 2016 Operating Budget - Appendices 51

Appendix 8
Fee Name and Description Rate 2015($)
Proposed Rate ($)
2016 Fees and Charges ScheduleIncreases Greater Than Inflation
Units
All other encroachments including those of an unusual or commercial nature
To permit an encroachment of an unusual or commercial nature requiring approval of the Designated Employee
255.00 delete each
To permit an encroachment of an unusual or commercial nature requiring City approval pursuant to clause 4(1)(c) or (d) of Encroachment By-law No. 692/74
255.00 delete each
Legal Fees for Property Management Agreement – Encroachment Agreement: Simple
1,160.00 delete each
To permit an encroachment of an unusual or commercial nature requiring approval of a designated employee but not Council approval (not including seasonal patios) with simple legal agreements (includes legal processing fees set at $1,160 for 2016)
new methodology
1,500.00 each
To permit an encroachment of an unusual or commercial nature requiring Council approval (not including seasonal patios) with simple legal agreements (includes legal processing fees set at $1,160 for 2016)
new methodology
2,000.00 each
Legal Fees for Property Management Agreement – Encroachment Agreement: Complex
2,900.00 delete each
To permit an encroachment of an unusual or commercial nature requiring Council approval (not including seasonal patios) with complex legal agreements (includes legal processing fees set at $2,900 for 2016)
new methodology
4,500.00 each
To permit an encroachment of an unusual or commercial nature requiring approval of a designated employee but not Council approval (not including seasonal patios) with complex legal agreements (includes legal processing fees set at $2,900 for 2016)
new methodology
3,700.00 each
Encroachment license annual rate for each 5 square meters or portion thereof
36.00 delete each
Annual Administration Fee for all other Encroachment types including those of unusual or commercial nature
250.00 375.00 each
Encroachment license annual rate for each square meter or portion thereof
new methodology
25.00 each
Encroachment Discharge fee (all encroachment types except seasonal patios)
126.00 100.00 each
To permit all other types of encroachments 86.00 delete each
52 Adopted 2016 Operating Budget - Appendices

Appendix 8
Fee Name and Description Rate 2015($)
Proposed Rate ($)
2016 Fees and Charges ScheduleIncreases Greater Than Inflation
Units
Development Applications And Agreements
Land Development Administration Fee per Acre 1,200.00 2,138.00 per acreDAS fee (subdivide property and create new rights-of-way; public hearing required for subdivision approval)
1,510.00 delete each
DAS fee (subdivide property and create new rights-of-way; public hearing required for subdivision approval); Base fee
new methodology
6,450.00 each
DAS fee (subdivide property and create new rights-of-way; public hearing required for subdivision approval): Per Acre to a maximum of $20,000
new methodology
400 (max 20,000)
per acre
DASSF fee (subdivide property but will not create new rights-of-way; public hearing not required)
622.00 delete each
DASSF fee (subdivide property but will not create new rights-of-way; public hearing not required): Base fee
new methodology
3,450.00 each
DASSF fee (subdivide property but will not create new rights-of-way; public hearing not required): Per Acre to a maximum of $15,000
new methodology
400 (max 50,000)
per acre
DASZ fee (approval of plan of subdivision and rezoning of the land contained in the subdivision)
1,510.00 delete each
DASZ fee (approval of plan of subdivision and rezoning of the land contained in the subdivision): Base fee
new methodology
12,375.00 each
DASZ fee (approval of plan of subdivision and rezoning of the land contained in the subdivision): Per Acre to a maximum of $50,000
new methodology
400 (max 50,000)
per acre
Extension fees - for an extension of Council for enactment of a by-law under a DAS/DASZ file
365.00 delete each
DAZ extension fees: time extension approved by Council
546.00 delete each
Extension fees - for an extension of the time period approved by Council for enactment of a by-law under a DAS/DAZ/DASZ file
DAS/DASZ: 365.00
DAZ: 546.00
719.00 each
Extension fees - for an extension of the time period for the Standing Policy Committee on Property and Development to complete a DASSF application
365.00 719.00 each
Extension fees - for time extension of the one year limitation for registration of plan of subdivision in the WLTO
228.00 365.00 each
DAPS filing fee (development application for the approval of a plan of survey)
622.00 delete each
DAPS filing fee (development application for the approval of a plan of survey): Base fee
new methodology
3,450.00 each
DAPS filing fee (development application for the approval of a plan of survey): Per Acre to a maximum of $15,000
new methodology
400 (max 15,000)
per acre
Servicing agreement 668.00 1,168.00 each
Adopted 2016 Operating Budget - Appendices 53

Appendix 8
Fee Name and Description Rate 2015($)
Proposed Rate ($)
2016 Fees and Charges ScheduleIncreases Greater Than Inflation
Units
Consent to assign servicing or development agreement
new 719.00 each
DAO fee(application for a street, lane or walkway opening)
944.00 1,100.00 each
DAC fee (application for a street, lane or walkway closing)
944.00 2,000.00 each
DAOC fee (application for a street, lane or walkway opening and closing)
944.00 2,000.00 each
CONDO fee: application for the approval of a condominium plan
424.00 4,000.00 each
CA fee: each consent, for approval to convey 448.00 3,000.00 eachDAZ filing fees: rezoning of land or zoning text amendment
1,484.00 delete each
DAZ fee: rezoning of land or zoning text amendment: Base fee
new methodology
11,250.00 each
DAZ fee: rezoning of land or zoning text amendment: Per Acre to a maximum of $50,000
new methodology
400 (max 50,000)
per acre
Zoning agreement amendments 1,301.00 1,800.00 each
Variances And Conditional Uses
Conditional Use: applications for sign approval and other conditional uses
1,229.00 delete each
Conditional Use: Residential - single or 2 family 426.00 600.00 eachConditional Use: Residential - single or 2 family - Post Use without approval
852.00 900.00 each
Conditional Use: Other Residential & Commercial 1,229.00 2,500.00 eachConditional Use: Other Residential & Commercial - Post Use without approval
2,458.00 5,000.00 each
Attached Secondary Suite: Residential - single or 2 family
426.00 250.00 each
Attached Secondary Suite: Residential - single or 2 family - Post -Use without approval
852.00 600.00 each
Detached Secondary Suite: Residential - single or 2 family
426.00 600.00 each
Detached Secondary Suite: Residential - single or 2 family - Post -Use without approval
852.00 1,000.00 each
Variance application fee - 1 or 2 family dwelling on a single site
426.00 delete each
Variance application fee - 1 or 2 family dwellings - multiple variance - same site
45.00 delete each
Variance application fee - 1 or 2 family dwellings - multiple variance - identical variance - multiple sites
45.00 delete each
Variance application fee - vary maximum height in multi-residential
1,515.00 delete each
Variance application fee - any other type 852.00 delete eachVariance application fee - multiple variances for any other type of variance on the same site
168.00 delete each
54 Adopted 2016 Operating Budget - Appendices

Appendix 8
Fee Name and Description Rate 2015($)
Proposed Rate ($)
2016 Fees and Charges ScheduleIncreases Greater Than Inflation
Units
Variance application fee as determined by the designated employee - 1 & 2 family dwellings - more than 7.62 cm, each lot
126.00 delete each
Variance application fee as determined by the designated employee - 1 & 2 family dwellings - more than 7.62 cm, each lot - within limit
253.00 delete each
Variance application fee as determined by the designated employee - 1 & 2 family dwellings - less than 7.62 cm, each lot
253.00 delete each
Variance application fee as determined by the designated employee - 1 & 2 family dwellings - less than 7.62 cm, each lot - within limit
576.00 delete each
Variance application fee - other than 1 & 2 family dwellings - any other type
576.00 delete each
Variance application fee as determined by the designated employee - multiple variance same site
45.00 delete each
Variance application fee as determined by the designated employee - multiple variance - identical variance - multiple site
45.00 delete each
Variance application fee - temporary use and/or density
1,229.00 1,500.00 each
Type A Variance: Residential - single or 2 family, Accessory Structures, Before construction
new methodology
100.00 each
Type A Variance: Residential - single or 2 family, Accessory Structures, Post construction
new methodology
150.00 each
Type A Variance: Residential - single or 2 family, New/Additions, Before construction
new methodology
150.00 each
Type A Variance: Residential - single or 2 family, New/Additions, Post construction
new methodology
300.00 each
Type A Variance: Other Residential & Commercial, Before construction
new methodology
550.00 each
Type A Variance: Other Residential & Commercial, Before construction
new methodology
800.00 each
Type A Variance, Each Additional Variance: Residential - single or 2 family, Accessory Structures, Before construction
new methodology
50.00 each
Type A Variance, Each Additional Variance: Residential - single or 2 family, Accessory Structures, Post construction
new methodology
75.00 each
Type A Variance, Each Additional Variance: Residential - single or 2 family, New/Additions, Before construction
new methodology
100.00 each
Type A Variance, Each Additional Variance: Residential - single or 2 family, New/Additions, Post construction
new methodology
200.00 each
Type A Variance, Each Additional Variance: Other Residential & Commercial, Before construction
new methodology
200.00 each
Adopted 2016 Operating Budget - Appendices 55

Appendix 8
Fee Name and Description Rate 2015($)
Proposed Rate ($)
2016 Fees and Charges ScheduleIncreases Greater Than Inflation
Units
Type A Variance, Each Additional Variance: Other Residential & Commercial, Post construction
new methodology
300.00 each
Type B Variance: Residential - single or 2 family, Accessory Structures, Before construction
new methodology
350.00 each
Type B Variance: Residential - single or 2 family, Accessory Structures, Post construction
new methodology
550.00 each
Type B Variance: Residential - single or 2 family, New/Additions, Before construction
new methodology
600.00 each
Type B Variance: Residential - single or 2 family, New/Additions, Post construction
new methodology
900.00 each
Type B Variance: Other Residential & Commercial, Before construction
new methodology
1,200.00 each
Type B Variance: Other Residential & Commercial, Post construction
new methodology
2,500.00 each
Type B Variance, Each Additional Variance: Residential - single or 2 family, Accessory Structures, Before construction
new methodology
100.00 each
Type B Variance, Each Additional Variance: Residential - single or 2 family, Accessory Structures, Post construction
new methodology
150.00 each
Type B Variance, Each Additional Variance: Residential - single or 2 family, New/Additions, Before construction
new methodology
200.00 each
Type B Variance, Each Additional Variance: Residential - single or 2 family, New/Additions, Post construction
new methodology
300.00 each
Type B Variance, Each Additional Variance: Other Residential & Commercial, Before construction
new methodology
300.00 each
Type B Variance, Each Additional Variance: Other Residential & Commercial, Post construction
new methodology
450.00 each
Type C Variance: Residential - single or 2 family, Before construction
new methodology
600.00 each
Type C Variance: Residential - single or 2 family, Post construction
new methodology
900.00 each
Type C Variance: Other Residential & Commercial, Before construction
new methodology
2,000.00 each
Type C Variance: Other Residential & Commercial, Post construction
new methodology
4,000.00 each
Type C Variance, Each Additional Variance: Residential - single or 2 family, Before construction
new methodology
200.00 each
Type C Variance, Each Additional Variance: Residential - single or 2 family, Post construction
new methodology
300.00 each
Type C Variance, Each Additional Variance: Other Residential & Commercial, Before construction
new methodology
500.00 each
Type C Variance, Each Additional Variance: Other Residential & Commercial, Post construction
new methodology
750.00 each
56 Adopted 2016 Operating Budget - Appendices

Appendix 8
Fee Name and Description Rate 2015($)
Proposed Rate ($)
2016 Fees and Charges ScheduleIncreases Greater Than Inflation
Units
Type D Variance: Other Residential & Commercial, Before construction
new methodology
2,000.00 each
Type D Variance: Other Residential & Commercial, Post construction
new methodology
4,000.00 each
Type D Variance, Each Additional Variance: Other Residential & Commercial, Before construction
new methodology
500.00 each
Type D Variance, Each Additional Variance: Other Residential & Commercial, Post construction
new methodology
750.00 each
Site plan review 191.00 delete eachSite plan review - director new
methodology 200.00 each
Site plan review - committee new methodology
350.00 each
Design review (zoning agreement) 191.00 200.00 eachSite plan or design review - 2nd and each subsequent review
191.00 200.00 each
Parking / Transportation Management plan review 191.00 250.00 eachAlternative equivalent compliance approval 191.00 250.00 eachZoning memorandum fees per lot: for single-family and two-family dwellings
62.00 50.00 each
Zoning memorandum fees per principal building: other than single or two family dwellings - principal building and accessory buildings
189.00 200.00 each
Provencher Blvd development application - urban design review - new building
581.00 delete each
Provencher Blvd development application - urban design review - signs only
145.00 delete each
Provencher Blvd development application - urban design review - all other development apps
232.00 delete each
Downtown development application: urban design review - new building or new addition
643.00 740.00 each
Downtown development application: urban design review - new building or new addition second and each subsequent review
new 444.00 each
Downtown development application: urban design review - signs only
126.00 180.00 each
Downtown development application: urban design review - all other development applications
255.00 280.00 each
Adopted 2016 Operating Budget - Appendices 57

Appendix 8
Fee Name and Description Rate 2015($)
Proposed Rate ($)
2016 Fees and Charges ScheduleIncreases Greater Than Inflation
Units
Historical Buildings Certificate 152.00 delete eachHeritage Permit application: Historic Building review - new addition
new methodology
740.00 each
Heritage Permit application: Historic Building review – new addition second and each subsequent review
new methodology
444.00 each
Heritage Permit application: Historic Building review - signs only
new methodology
180.00 each
Heritage Permit application: Historic Building review - all other development applications
new methodology
280.00 each
Development Application: urban design review as determined by the designated employee - new building
581.00 400.00 each
Development Application: urban design review as determined by the designated employee - signs only
145.00 150.00 each
Development Application: urban design review as determined by the designated employee - all other development applications
232.00 250.00 each
Urban Design Review Appeal new 750.00 eachHistorical Building Review Appeal new 750.00 eachZoning form letter: verifying existing zoning for a specific property
62.00 50.00 each
Zoning letter: verifying existing land use on a specific property
129.00 delete each
Zoning letter: verifying existing land use on a specific property - single and 2 family dwellings
new methodology
129.00 each
Zoning letter: verifying existing land use on a specific property - all other
new methodology
200.00 each
Zoning letter: providing other information regarding specific property
129.00 200.00 each
Zoning letter: a lot of record search plus any direct Manitoba Land Title search costs
408.00 250.00 each
Request to demolish an existing residence without a building permit to replace the demolished residence
126.00 500.00 each
58 Adopted 2016 Operating Budget - Appendices

Appendix 8
Fee Name and Description Rate 2015($)
Proposed Rate ($)
2016 Fees and Charges ScheduleIncreases Greater Than Inflation
Units
Finance
Loan guarantee application feeLoan guarantees under $500,000 new 500.00 per applicationLoan guarantees $500,000 and over new 1,500.00 per applicationLoan guarantee standby fee to Community Centres new 0.25% per year end on
o/s balanceLoan guarantee standby fee to organizations affiliated with the City and external parties
new 0.50% per year end on o/s balance
Solid Waste Collection and Disposal
Payment Transfer Fee new 15.00 per transfer
DisposalResidential waste delivered to a 4R Winnipeg Depot except the Brady Road Resource Management Facility location
new 15.00 for the equivalent of 3 bags
Registered charitable organizations demonstrating 70% diversion
18.38 25.25/tonne with a 15 minimum
per tonne
Solid waste delivered to Brady Road Resource Management Facility
61.00 71.00/tonne with a 15 minimum
per tonne
Solid waste from municipalities outside the City of Winnipeg delivered to Brady Road Resource Management Facility pursuant to agreements with the City
61.00 71.00/tonne with a 15 minimum
per tonne
Asbestos delivered to Brady Road Resource Management Facility
160.00 165.00/tonne with a 15 minimum
per tonne
Dead animal stock delivered to Brady Road Resource Management Facility pursuant to agreements with the City
65.00 71.00/tonne with a 15 minimum
per tonne
Additional Collection Service FeesExtra garbage bags (surplus waste) that do not fit in containers - up to 3 standard sized garbage bags
10.00 15.00 per pickup
Adopted 2016 Operating Budget - Appendices 59

Appendix 8
Fee Name and Description Rate 2015($)
Proposed Rate ($)
2016 Fees and Charges ScheduleIncreases Greater Than Inflation
Units
Wastewater
Payment Transfer Fee new 15.00 per transfer
Service Permit for New/Renewed/Repaired/Abandoned Sewer Service Pipe (Effective January 1, 2016)Single family residential 125.00 130.00 eachOther than single family residential 190.00 220.00 eachExtra charge for after regular working hours including weekends and holidays
200.00 216.00 each
Re-inspection during regular working hours 60.00 70.00 each
Sewer Contractor's LicenceInitial year or part thereof (Effective January 1, 2016) 370.00 400.00 eachAnnual renewal (Effective January 1, 2016) 210.00 225.00 each
Water
Payment Transfer Fee new 15.00 per transfer
Service Permit for New/Renewed/Repaired/Abandoned Water Service Pipe (Effective January 1, 2016)Single family residential 125.00 130.00 eachOther than single family residential 190.00 220.00 eachExtra charge for after regular working hours including weekends and holidays
200.00 216.00 each
Re-inspection during regular working hours 60.00 70.00 each
Water Contractor's LicenceInitial year or part thereof (Effective January 1, 2016) 370.00 400.00 eachAnnual renewal (Effective January 1, 2016) 210.00 225.00 each
Water Meter Lock Out FeesInstall lock out device new 52.00 eachRemove lock out device new 52.00 eachReplace lost or damaged lock out device new 45.00 eachInstall By-pass lock new 110.00 each
Development Permits, Mechanical PermitsFor first backflow prevention device with test cocks new 188.00 eachFor each additional backflow prevention device with test cocks
new 26.00 each
60 Adopted 2016 Operating Budget - Appendices

Appendix 8
Fee Name and Description Rate 2015($)
Proposed Rate ($)
2016 Fees and Charges ScheduleIncreases Greater Than Inflation
Units
Traffic Safety & Enforcement
Police escort of oversized LoadIncludes 2 officers and 2 vehicles 825.00 857.14 each
Fire and Injury Prevention
Inspection FeeFireworks site inspection - less than 3 hours inspection time
222.00 278.00 each
Fireworks site inspection - for each additional hour or part thereof
100.00 125.00 per hour or part thereof
Fireworks site inspection outside of regular office hours
100.00 125.00 per hour or part thereof
High Hazard (F1) Occupancies 150.00 188.00 per hour or part thereof
Residential care facility 174.00 218.00 eachElderly persons' housing 100.00 125.00 per hour or part
thereofChild care centre 100.00 125.00 per hour or part
thereofPersonal care home 100.00 125.00 per hour or part
thereofHospital 100.00 125.00 per hour or part
thereofPremises licensed by the Manitoba Liquor Control Commission
100.00 125.00 per hour or part thereof
Public or private school 100.00 125.00 per hour or part thereof
University or college 100.00 125.00 per hour or part thereof
Arena 100.00 125.00 per hour or part thereof
Curling rink 100.00 125.00 per hour or part thereof
Adopted 2016 Operating Budget - Appendices 61

Appendix 8
Fee Name and Description Rate 2015($)
Proposed Rate ($)
2016 Fees and Charges ScheduleIncreases Greater Than Inflation
Units
Community club 100.00 125.00 per hour or part thereof
Hotel or motel 100.00 125.00 per hour or part thereof
Restaurant (located in residential building) 100.00 125.00 per hour or part thereof
Second and subsequent re-inspection 83.00 104.00 eachThird and subsequent re-inspection to check on compliance when fire crews have conducted initial inspection
112.00 140.00 each
Post-fire inspection 100.00 125.00 per hour or part thereof
Inspection of a building when a response to a complaint reveals the need for a full inspection
100.00 125.00 per hour or part thereof
After normal business hours inspection 100.00 125.00 per hour or part thereof
Requested inspection 100.00 125.00 per hour or part thereof
Permit FeeFireworks display permit - pyrotechnic special effects 167.00 209.00 each
Fireworks display permit - high hazard 167.00 209.00 eachSmall quantity fireworks distribution storage permit (annual fee)
27.00 34.00 each
Fireworks distribution permit (annual fee) 112.00 140.00 eachDangerous quantity fireworks storage permit (annual fee)
222.00 278.00 each
Open-air fire permit 83.00 104.00 eachPermit cancellation fee 27.00 34.00 each
Miscellaneous FeesSecond and subsequent review of fire safety plan 112.00 140.00 eachEmergency installation of smoke alarm 112.00 140.00 eachAnnual license fee for licensed service person 21.00 26.00 eachFine for unlicensed service person (discounted to $300 for early payment)
552.00 690.00 each
Public education services provided outside regular office hrs
88.00 110.00 per hour or part thereof
Fire Extinguisher training licence fee (five years) 106.00 133.00 each
62 Adopted 2016 Operating Budget - Appendices
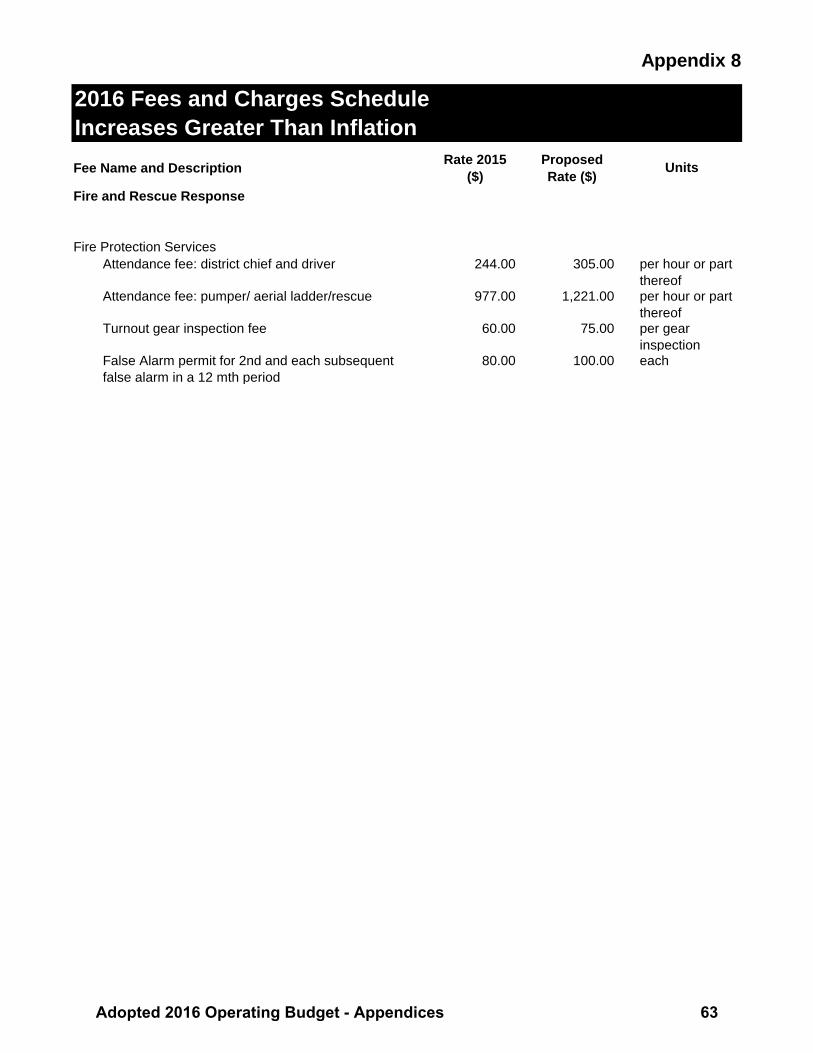
Appendix 8
Fee Name and Description Rate 2015($)
Proposed Rate ($)
2016 Fees and Charges ScheduleIncreases Greater Than Inflation
Units
Fire and Rescue Response
Fire Protection ServicesAttendance fee: district chief and driver 244.00 305.00 per hour or part
thereofAttendance fee: pumper/ aerial ladder/rescue 977.00 1,221.00 per hour or part
thereofTurnout gear inspection fee 60.00 75.00 per gear
inspectionFalse Alarm permit for 2nd and each subsequent false alarm in a 12 mth period
80.00 100.00 each
Adopted 2016 Operating Budget - Appendices 63
kmorton
Text Box
Return to Table of Contents

64 Adopted 2016 Operating Budget - Appendices

Appendix 9
(in thousands of dollars) 2015 2014 Change
RevenuesTaxation 660,243$ 633,537$ 26,706$ Sale of services and regulatory fees 550,604 537,737 12,867 Government transfers 177,042 163,884 13,158 Land sales and other revenue 57,033 56,602 431 Investment income 33,573 34,867 (1,294) Total Revenues 1,478,495 1,426,627 51,868
ExpensesProtection and community services 477,569 461,328 16,241 Utility operations 392,477 376,922 15,555 Public works 323,659 320,049 3,610 Property and development 165,616 134,102 31,514 Finance and administration 78,992 80,580 (1,588) Civic corporations 70,850 73,309 (2,459) General government 32,234 46,809 (14,575) Total Expenses 1,541,397 1,493,099 48,298
(62,902) (66,472) 3,570
OtherGovernment transfers related to capital 205,418 150,869 54,549 Developer contributions-in-kind related to capital 71,400 66,000 5,400
276,818 216,869 59,949 Excess Revenues Over Expenses 213,916$ 150,397$ 63,519$
THE CITY OF WINNIPEG2015 Consolidated Budget
Deficiency Revenues Over Expenses Before Other
Adopted 2016 Operating Budget - Appendices 65
kmorton
Text Box
Return to Table of Contents

Appendix 9
Adopted Consolidating Consolidated(in thousands of dollars) Budget * Entries Budget
RevenuesTaxation 672,888$ (12,645)$ 660,243$ Sale of services and regulatory fees 594,213 (43,609) 550,604 Government transfers 174,738 2,304 177,042 Land sales and other revenue 322,186 (265,153) 57,033 Investment income 36,290 (2,717) 33,573 Total Revenues 1,800,315 (321,820) 1,478,495
ExpensesProtection and community services 565,906 (88,337) 477,569 Utility operations 537,095 (144,618) 392,477 Public works 363,940 (40,281) 323,659 Property and development 231,225 (65,609) 165,616 Finance and administration 119,013 (40,021) 78,992 Civic corporations - 70,850 70,850 General government 46,867 (14,633) 32,234 Total Expenses 1,864,046 (322,649) 1,541,397
(63,731) 829 (62,902)
OtherGovernment transfers related to capital
Province of Manitoba - 130,099 130,099 Federal gas tax 41,358 - 41,358 Other capital funding - 33,961 33,961 Total government transfers related to capital 41,358 164,060 205,418
Developer contributions-in-kind related to capital - 71,400 71,400 41,358 235,460 276,818
(22,373)$ 236,289$ 213,916$
* The Adopted Budget consists of the following components:
Revenue Expenses
Excess/(Deficiency) Revenues Over
Expenses - Tax supported 994,097 994,097 - - Utilities 568,163 533,963 34,200 - Special Operating Agencies 75,440 74,970 470 - Reserves 203,973 261,016 (57,043)
Total 1,841,673 1,864,046 (22,373)
THE CITY OF WINNIPEG2015 Consolidated Budget Reconciliation
Excess/(Deficiency) Revenues Over Expenses Before Other
Excess/(Deficiency) Revenues Over Expenses
66 Adopted 2016 Operating Budget - Appendices

Appendix 9
Explanation of Consolidating Entries from Adopted Budget (in thousands of dollars)
Revenues1. Eliminate inter-fund transfers. (488,081) 2. Eliminate fleet charges paid by City entities. (48,637) 3. Eliminate grants to Civic Corporations. (46,966) 4. Eliminate property taxes paid by City entities. (14,308) 5. Eliminate water revenue paid by City entities. (2,927) 6. Eliminate general government charges. (3,451) 7. Include capital related revenue not included in the Other category. 143,914 8. Include revenue for Civic Corporations. 130,951 9. Include revenue for General Revenue Enterprises Fund. 5,887
10. Other. 1,798
(321,820)
Expenses1. Eliminate inter-fund transfers. (562,153) 2. Eliminate fleet charges paid by City entities. (48,367) 3. Eliminate grants paid to Civic Corporations. (46,392) 4. Eliminate principal payments in Utilities and debt charges in Municipal Accommodations. (19,065) 5. Eliminate property taxes paid by City entities. (14,308) 6. Eliminate water expense paid by City entities. (2,927) 7. Eliminate general government charges. (3,451) 8. Include capital expenses. 280,098 9. Include expenses for Civic Corporations. 70,850
10. Increase in liability for environmental issues, vacation and workers' compensation. 10,434 11. Include expenses for General Revenue Enterprises Fund. 6,148 12. Change in sinking fund position. 2,185 13. Other. 4,299
(322,649)
OtherInclude estimates for revenue related to capital funding from government and developers. 235,460
Adopted 2016 Operating Budget - Appendices 67

Appendix 9
(For the year ended December 31 in thousands of dollars) 2015 2014 Change
Excess Revenues Over Expenses 213,916$ 150,397$ 63,519$ Amortization of tangible capital assets 217,718 209,278 8,440 Proceeds on disposal of tangible capital assets 2,350 8,100 (5,750) Loss on sale of tangible capital assets 1,900 634 1,266
(2,000) (785) (1,215)
Acquisition of tangible capital assets (598,939) (669,625) 70,686 Decrease in Net Financial Assets (165,055) (302,001) 136,946
Net Financial Liabilities, Beginning of Year (509,896) (411,063) (98,833)
Net Financial Liabilities, End of Year (674,951)$ (713,064)$ 38,113$
THE CITY OF WINNIPEGConsolidated Budget
of Change in Net Financial Liabilities
Change in inventories, prepaid expenses and deferred charges
68 Adopted 2016 Operating Budget - Appendices

Appendix 10
Department Description 2016 1 Public Works Longer lasting biological products for larviciding results
in less aircraft hire, while maintaining effective mosquito control under average weather conditions.
300,000$
2 Surplus in Insect Control Reserve. Analysis of the reserve balance indicates sufficiency for average conditions.
700,000
3 Surplus from General Revenue Enterprise Fund from street cuts program.
2,400,000
4 Planning, Property & Development
One year deferral on incremental taxes transferred to the Economic Development Investment Reserve. Analysis of the Reserve balance indicates tax grants paid out of the Reserve have been less than previously budgeted.
1,050,000
5 Housing Rehabilitation Investment Reserve surplus. 250,000
6 Energy Conservation Initiative - heating/cooling set point reduced/increased by 1°C during heating/cooling season for occupied space.
150,000
7 Assessment and Taxation 2016 Value Added program. 898,605
8 Revised estimate for Assessment Appeals. 1,000,000
9 Corporate Finance Revised estimate for capital construction interest / overhead based on size of City's capital program.
400,000
10 Corporate Debt and finance savings resulting from delay in issuing debt.
254,928
11 Innovation savings held corporately. 2,700,000 12 Revised estimate for disability savings to reflect actual
experience.1,000,000
Total 11,103,533$
Tax Supported Savings Transferred to Regional Streets Renewal Program
Adopted 2016 Operating Budget - Appendices 69
kmorton
Text Box
Return to Table of Contents

70 Adopted 2016 Operating Budget - Appendices

The
City
of W
inni
peg
CA
PIT
AL
PR
OJE
CT
S S
UM
MA
RY
2016
Ado
pted
Cap
ital
Bud
get
and
2017
to
2021
Five
Yea
r Fo
reca
st
Appendix 11
Adopted 2016 Operating Budget - Appendices 71
kmorton
Text Box
Return to Table of Contents

Not
es: 1.
Cap
ital b
udge
t am
ount
s ar
e es
timat
es o
nly
and
are
subj
ect t
o m
ater
ials
m
anag
emen
t pol
icy
(e.g
. ten
ders
, bid
s, a
nd c
ontra
ct a
war
ds in
clud
ing
Pub
lic P
rivat
e P
artn
ersh
i ppr
opos
als)
.
2.In
the
atta
ched
Cap
ital P
roje
cts
List
ing,
tax
supp
orte
d ca
pita
l pro
ject
s ar
e fin
ance
d by
cas
h to
cap
ital u
nles
s an
othe
r fun
ding
sou
rce
is d
iscl
osed
for t
he p
roje
ct.
In
addi
tion,
Man
itoba
Win
nipe
g In
frast
ruct
ure
Agr
eem
ent f
undi
ng a
mou
nts
are
not a
ll al
loca
ted
to in
divi
dual
cap
ital p
roje
cts.
Thi
s un
allo
cate
d pr
ovin
cial
fund
ing
will
offs
et
cash
to c
apita
l req
uire
men
ts in
pro
ject
bud
gets
.
3.Th
e P
ublic
Ser
vice
use
s a
cost
est
imat
e cl
assi
ficat
ion
syst
em b
ased
on
the
Ass
ocia
tion
for t
he A
dvan
cem
ent o
f Cos
t Eng
inee
ring
(AA
CE
) Int
erna
tiona
l R
ecom
men
ded
Pra
ctic
es fo
r cap
ital b
udge
t est
imat
es -
see
Vol
ume
3, A
ppen
dix
2.
Appendix 11
72 Adopted 2016 Operating Budget - Appendices

Sum
mar
y of
Cap
ital P
rogr
am …
……
……
……
……
……
……
……
……
……
……
……
…75
Sum
mar
y of
Fin
anci
ng S
ourc
es …
……
……
……
……
……
……
……
……
……
……
……
76
Tax
Supp
orte
d, T
rans
it an
d M
unic
ipal
Acc
omm
odat
ions
Pub
lic W
orks
……
……
……
……
……
……
……
……
……
……
……
……
……
……
……
……
80
Com
mun
ity S
ervi
ces
……
……
……
……
……
……
……
……
……
……
……
……
……
……
…85
Win
nipe
g P
olic
e S
ervi
ce …
……
……
……
……
……
……
……
……
……
……
……
……
……
87
Fire
Par
amed
ic S
ervi
ce …
……
……
……
……
……
……
……
……
……
……
……
……
……
…88
Pla
nnin
g, P
rope
rty a
nd D
evel
opm
ent …
……
……
……
……
……
……
……
……
……
……
…89
Mun
icip
al A
ccom
mod
atio
ns …
……
……
……
……
……
……
……
……
……
……
……
……
…90
City
Cle
rks
……
……
……
……
……
……
……
……
……
……
……
……
……
……
……
……
…92
Cor
pora
te S
uppo
rt S
ervi
ces
……
……
……
……
……
……
……
……
……
……
……
……
……
92
Ass
essm
ent a
nd T
axat
ion…
……
……
……
……
……
……
……
……
……
……
……
……
……
93
Oth
er P
roje
cts
……
……
……
……
……
……
……
……
……
……
……
……
……
……
……
……
93
Tran
sit …
……
……
……
……
……
……
……
……
……
……
……
……
……
……
……
……
……
94
Wat
er a
nd W
aste
- G
ener
al C
apita
l Fun
d …
……
……
……
……
……
……
……
……
……
…95
Self-
Supp
ortin
g U
tiliti
esW
ater
wor
ks S
yste
m …
……
……
……
……
……
……
……
……
……
……
……
……
……
……
96
Sew
age
Dis
posa
l Sys
tem
……
……
……
……
……
……
……
……
……
……
……
……
……
…98
Sol
id W
aste
Dis
posa
l Sys
tem
……
……
……
……
……
……
……
……
……
……
……
……
…10
0
Tabl
e of
Con
tent
sAppendix 11
Adopted 2016 Operating Budget - Appendices 73

Appendix 11
74 Adopted 2016 Operating Budget - Appendices

CA
PITA
L PR
OJE
CTS
SU
MM
AR
Y6
YEAR
(in T
hous
ands
of $
)B
UD
GET
TOTA
L20
1620
1720
1820
1920
2020
2120
16 -
2021
SUM
MAR
Y O
F C
APIT
AL P
RO
GR
AM
Pub
lic W
orks
310,
615
139,
880
153,
595
137,
197
151,
056
149,
486
1,04
1,82
9W
ater
and
Was
te -
Gen
eral
Cap
ital F
und
4,92
55,
900
5,25
04,
700
5,00
03,
000
28,7
75C
omm
unity
Ser
vice
s an
d C
omm
unity
Ince
ntiv
e G
rant
s19
,995
16,0
3416
,960
16,7
6713
,491
21,5
8910
4,83
6W
inni
peg
Pol
ice
Ser
vice
12,1
9723
,488
5,87
24,
767
3,02
07,
069
56,4
13Fi
re P
aram
edic
Ser
vice
5,79
417
,276
8,05
68,
381
5,25
88,
606
53,3
71P
lann
ing,
Pro
perty
and
Dev
elop
men
t5,
034
5,93
35,
768
7,53
45,
456
3,79
933
,524
City
Cle
rks
1,75
02,
100
1,45
01,
000
1,00
01,
200
8,50
0C
orpo
rate
Sup
port
Ser
vice
s5,
523
4,04
32,
996
1,65
12,
951
2,93
520
,099
Ass
essm
ent a
nd T
axat
ion
3,00
03,
870
3,32
03,
350
3,20
03,
350
20,0
90O
ther
Pro
ject
s55
055
0To
tal T
ax S
uppo
rted
36
9,38
321
8,52
420
3,26
718
5,34
719
0,43
220
1,03
41,
367,
987
Mun
icip
al A
ccom
mod
atio
ns10
,496
17,1
6011
,192
8,92
48,
953
8,69
765
,422
Tran
sit
43,8
8125
,981
31,4
6841
,336
37,0
3438
,346
218,
046
Tota
l Tax
Sup
port
ed, T
rans
it an
d M
unic
ipal
Ac
com
mod
atio
ns42
3,76
026
1,66
524
5,92
723
5,60
723
6,41
924
8,07
71,
651,
455
Self-
Supp
ortin
g U
tiliti
esW
ater
wor
ks S
yste
m45
,320
35,3
2032
,083
21,8
9525
,416
30,1
8519
0,21
9S
ewag
e D
ispo
sal S
yste
m70
2,45
052
,387
86,7
8159
,515
62,5
4756
,345
1,02
0,02
5S
olid
Was
te D
ispo
sal S
yste
m6,
150
9,75
04,
000
2,90
03,
850
2,95
029
,600
Tota
l Sel
f-Sup
port
ing
Util
ities
753,
920
97,4
5712
2,86
484
,310
91,8
1389
,480
1,23
9,84
4
TOTA
L C
APIT
AL P
RO
GR
AM1,
177,
680
359,
122
368,
791
319,
917
328,
232
337,
557
2,89
1,29
9
ADO
PTED
CAP
ITAL
FOR
ECAS
T
Appendix 11
Adopted 2016 Operating Budget - Appendices 75

CA
PITA
L PR
OJE
CTS
SU
MM
AR
Y6
YEAR
(in T
hous
ands
of $
)B
UD
GET
TOTA
L20
1620
1720
1820
1920
2020
2120
16 -
2021
ADO
PTED
CAP
ITAL
FOR
ECAS
T
SUM
MAR
Y O
F FI
NAN
CIN
G S
OU
RC
ESC
ash
to C
apita
l75
,228
78,7
7880
,278
70,7
7872
,778
74,7
7845
2,61
8Fr
onta
ge L
evy
10,0
0010
,000
11,0
0011
,000
11,0
0011
,000
64,0
00P
ublic
Priv
ate
Par
tner
ship
Ann
ual S
ervi
ce /
Fina
ncin
g P
aym
ents
(28,
018)
(27,
978)
(27,
970)
(24,
704)
(45,
099)
(45,
294)
(199
,063
)
Res
erve
s:- T
rans
it B
us R
epla
cem
ent
6,51
68,
994
9,33
59,
346
9,56
59,
960
53,7
16- S
outh
wes
t Rap
id T
rans
itway
(Sta
ge 2
) and
Pem
bina
H
ighw
ay U
nder
pass
Pay
men
t 22
,050
22,1
5044
,200
- Wat
er M
ain
Ren
ewal
19,0
0019
,500
19,5
0020
,000
20,5
0022
,000
120,
500
- Sew
er S
yste
m R
ehab
ilitat
ion
16,9
0017
,800
18,2
0019
,500
20,5
0021
,500
114,
400
- Env
ironm
enta
l Pro
ject
s30
,648
19,8
0032
,764
32,3
0035
,784
21,5
1817
2,81
4- L
and
Ope
ratin
g26
,007
3,24
02,
665
1,70
01,
700
1,70
037
,012
- Com
mitm
ent
200
200
- Com
pute
r Rep
lace
men
t1,
061
306
126
608
146
2,24
7- L
ocal
Stre
et R
enew
al18
,375
22,4
1027
,310
32,2
1037
,110
42,0
1017
9,42
5- R
egio
nal S
treet
Ren
ewal
13,4
0518
,003
22,9
0327
,803
32,7
0337
,603
152,
420
- Eco
nom
ic D
evel
opm
ent I
nves
tmen
t1,
826
2,54
93,
417
2,77
010
,562
Inte
rim F
inan
cing
(Rep
aym
ent)
(16,
642)
(2,8
70)
(95)
(95)
(95)
(19,
797)
Con
tribu
tions
from
Oth
er L
evel
s of
Gov
ernm
ent:
- Fed
eral
Gas
Tax
41,9
5041
,950
43,9
4843
,948
43,9
4843
,948
259,
692
- Vet
eran
s A
ffairs
Can
ada
200
200
150
150
150
170
1,02
0- B
uild
ing
Can
ada
Fund
(Fed
eral
Gov
ernm
ent)
45,8
7545
,875
- Man
itoba
Win
nipe
g In
frast
ruct
ure
Agr
eem
ent (
MW
IA) /
P
rovi
ncia
l Fu
ndin
g fo
r Roa
d Im
prov
emen
ts40
,416
38,1
6630
,316
36,6
6636
,666
36,6
6621
8,89
6
- Man
itoba
Win
nipe
g In
frast
ruct
ure
Fund
- E
xten
sion
5,00
05,
000
5,00
05,
000
20,0
00- P
rovi
ncia
l Roa
d In
vest
men
t Fun
d9,
000
9,00
09,
000
27,0
00- P
rovi
ncia
l Fun
ding
for W
aver
ley
Stre
et a
t CN
Mai
nlin
e (R
iver
s) G
rade
Sep
arat
ion
45,8
7545
,875
- Bui
ldin
g M
anito
ba F
und
17,8
4017
,840
17,8
4015
,040
10,8
4010
,840
90,2
40- T
rans
fer f
rom
Prio
r Yea
r Sur
plus
- M
anito
ba W
inni
peg
Infra
stru
ctur
e Fu
nd10
03,
900
4,00
0
Appendix 11
76 Adopted 2016 Operating Budget - Appendices

CA
PITA
L PR
OJE
CTS
SU
MM
AR
Y6
YEAR
(in T
hous
ands
of $
)B
UD
GET
TOTA
L20
1620
1720
1820
1920
2020
2120
16 -
2021
ADO
PTED
CAP
ITAL
FOR
ECAS
T
Oth
er F
unde
rs:
- Dev
elop
er F
undi
ng /
Dev
elop
er C
apac
ity C
harg
es50
050
050
01,
500
- CN
Rai
l Cos
t Sha
ring
7,50
07,
500
- Spo
nsor
ship
/ S
pons
or W
inni
peg
9595
9595
380
Ret
aine
d E
arni
ngs
- Tra
nsit
5,08
25,
082
Ret
aine
d E
arni
ngs
- Util
ities
105,
486
30,6
5748
,400
10,2
1015
,029
24,4
6223
4,24
4D
ebt
681,
682
33,7
5614
,109
6,20
02,
400
2,40
074
0,54
7W
ater
way
s M
anag
emen
t Fun
d (fo
rmer
ly -
Riv
erba
nk
Man
agem
ent C
omm
ittee
Fun
d)62
262
2
Tran
sfer
s fro
m O
ther
Cap
ital A
ccou
nts
/ Sur
plus
Cap
ital
12,5
467,
526
20,0
72
TOTA
L FI
NAN
CIN
G S
OU
RC
ES1,
194,
180
359,
122
368,
791
319,
917
328,
232
337,
557
2,90
7,79
9
Pub
lic P
rivat
e P
artn
ersh
ip A
utho
rizat
ion
(16,
500)
(16,
500)
TOTA
L C
APIT
AL P
RO
GR
AM1,
177,
680
359,
122
368,
791
319,
917
328,
232
337,
557
2,89
1,29
9
Appendix 11
Adopted 2016 Operating Budget - Appendices 77
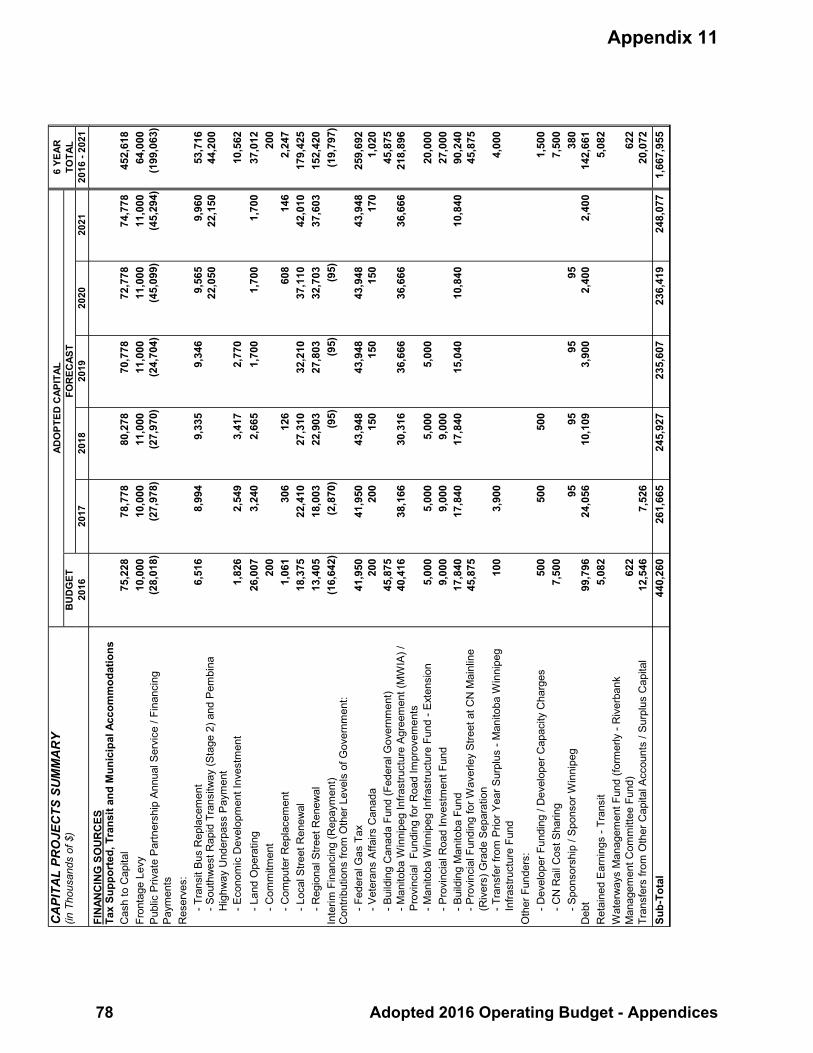
CA
PITA
L PR
OJE
CTS
SU
MM
AR
Y6
YEAR
(in T
hous
ands
of $
)B
UD
GET
TOTA
L20
1620
1720
1820
1920
2020
2120
16 -
2021
ADO
PTED
CAP
ITAL
FOR
ECAS
T
FIN
ANC
ING
SO
UR
CES
Tax
Supp
orte
d, T
rans
it an
d M
unic
ipal
Acc
omm
odat
ions
Cas
h to
Cap
ital
75,2
2878
,778
80,2
7870
,778
72,7
7874
,778
452,
618
Fron
tage
Lev
y 10
,000
10,0
0011
,000
11,0
0011
,000
11,0
0064
,000
Pub
lic P
rivat
e P
artn
ersh
ip A
nnua
l Ser
vice
/ Fi
nanc
ing
Pay
men
ts(2
8,01
8)(2
7,97
8)(2
7,97
0)(2
4,70
4)(4
5,09
9)(4
5,29
4)(1
99,0
63)
Res
erve
s:- T
rans
it B
us R
epla
cem
ent
6,51
68,
994
9,33
59,
346
9,56
59,
960
53,7
16- S
outh
wes
t Rap
id T
rans
itway
(Sta
ge 2
) and
Pem
bina
H
ighw
ay U
nder
pass
Pay
men
t 22
,050
22,1
5044
,200
- Eco
nom
ic D
evel
opm
ent I
nves
tmen
t1,
826
2,54
93,
417
2,77
010
,562
- Lan
d O
pera
ting
26,0
073,
240
2,66
51,
700
1,70
01,
700
37,0
12- C
omm
itmen
t20
020
0- C
ompu
ter R
epla
cem
ent
1,06
130
612
660
814
62,
247
- Loc
al S
treet
Ren
ewal
18,3
7522
,410
27,3
1032
,210
37,1
1042
,010
179,
425
- Reg
iona
l Stre
et R
enew
al13
,405
18,0
0322
,903
27,8
0332
,703
37,6
0315
2,42
0In
terim
Fin
anci
ng (R
epay
men
t)(1
6,64
2)(2
,870
)(9
5)(9
5)(9
5)(1
9,79
7)C
ontri
butio
ns fr
om O
ther
Lev
els
of G
over
nmen
t:- F
eder
al G
as T
ax41
,950
41,9
5043
,948
43,9
4843
,948
43,9
4825
9,69
2- V
eter
ans
Affa
irs C
anad
a20
020
015
015
015
017
01,
020
- Bui
ldin
g C
anad
a Fu
nd (F
eder
al G
over
nmen
t)45
,875
45,8
75- M
anito
ba W
inni
peg
Infra
stru
ctur
e A
gree
men
t (M
WIA
) /
Pro
vinc
ial
Fund
ing
for R
oad
Impr
ovem
ents
40,4
1638
,166
30,3
1636
,666
36,6
6636
,666
218,
896
- Man
itoba
Win
nipe
g In
frast
ruct
ure
Fund
- E
xten
sion
5,00
05,
000
5,00
05,
000
20,0
00- P
rovi
ncia
l Roa
d In
vest
men
t Fun
d9,
000
9,00
09,
000
27,0
00- B
uild
ing
Man
itoba
Fun
d17
,840
17,8
4017
,840
15,0
4010
,840
10,8
4090
,240
- Pro
vinc
ial F
undi
ng fo
r Wav
erle
y S
treet
at C
N M
ainl
ine
(Riv
ers)
Gra
de S
epar
atio
n45
,875
45,8
75
- Tra
nsfe
r fro
m P
rior Y
ear S
urpl
us -
Man
itoba
Win
nipe
g In
frast
ruct
ure
Fund
100
3,90
04,
000
Oth
er F
unde
rs:
- Dev
elop
er F
undi
ng /
Dev
elop
er C
apac
ity C
harg
es50
050
050
01,
500
- CN
Rai
l Cos
t Sha
ring
7,50
07,
500
- Spo
nsor
ship
/ S
pons
or W
inni
peg
9595
9595
380
Deb
t99
,796
24,0
5610
,109
3,90
02,
400
2,40
014
2,66
1R
etai
ned
Ear
ning
s - T
rans
it5,
082
5,08
2W
ater
way
s M
anag
emen
t Fun
d (fo
rmer
ly -
Riv
erba
nk
Man
agem
ent C
omm
ittee
Fun
d)62
262
2Tr
ansf
ers
from
Oth
er C
apita
l Acc
ount
s / S
urpl
us C
apita
l12
,546
7,52
620
,072
Sub-
Tota
l44
0,26
026
1,66
524
5,92
723
5,60
723
6,41
924
8,07
71,
667,
955
Appendix 11
78 Adopted 2016 Operating Budget - Appendices

CA
PITA
L PR
OJE
CTS
SU
MM
AR
Y6
YEAR
(in T
hous
ands
of $
)B
UD
GET
TOTA
L20
1620
1720
1820
1920
2020
2120
16 -
2021
ADO
PTED
CAP
ITAL
FOR
ECAS
T
Pub
lic P
rivat
e P
artn
ersh
ip A
utho
rizat
ion
(16,
500)
(16,
500)
Tota
l Tax
Sup
port
ed, T
rans
it an
d M
unic
ipal
Ac
com
mod
atio
ns42
3,76
026
1,66
524
5,92
723
5,60
723
6,41
924
8,07
71,
651,
455
Self-
Supp
ortin
g U
tiliti
esR
eser
ves:
- Sew
er S
yste
m R
ehab
ilitat
ion
16,9
0017
,800
18,2
0019
,500
20,5
0021
,500
114,
400
- Wat
er M
ain
Ren
ewal
19,0
0019
,500
19,5
0020
,000
20,5
0022
,000
120,
500
- Env
ironm
enta
l Pro
ject
s30
,648
19,8
0032
,764
32,3
0035
,784
21,5
1817
2,81
4R
etai
ned
Ear
ning
s - U
tiliti
es10
5,48
630
,657
48,4
0010
,210
15,0
2924
,462
234,
244
Deb
t58
1,88
69,
700
4,00
02,
300
597,
886
Tota
l Sel
f-Sup
port
ing
Util
ities
753,
920
97,4
5712
2,86
484
,310
91,8
1389
,480
1,23
9,84
4
TOTA
L FI
NAN
CIN
G S
OU
RC
ES1,
177,
680
359,
122
368,
791
319,
917
328,
232
337,
557
2,89
1,29
9
Appendix 11
Adopted 2016 Operating Budget - Appendices 79

CA
PITA
L PR
OJE
CTS
SU
MM
AR
YVo
l. 3
6 YE
AR(in
Tho
usan
ds o
f $)
PAG
EB
UD
GET
TOTA
LN
O.
2016
2017
2018
2019
2020
2021
2016
- 20
21
ADO
PTED
CAP
ITAL
FOR
ECAS
T
CAP
ITAL
PR
OJE
CTS
LIS
TIN
G
PUB
LIC
WO
RK
SA
ctiv
e Tr
ansp
orta
tion
Faci
litie
sR
ecre
atio
nal W
alkw
ays
and
Bic
ycle
Pat
hs -
Var
ious
Loc
atio
ns2-
11,
300
1,50
01,
500
1,50
01,
500
1,50
08,
800
New
Reg
iona
l Sid
ewal
ks2-
31,
000
1,20
01,
200
1,20
01,
200
1,20
07,
000
New
Non
-Reg
iona
l Sid
ewal
ks2-
430
050
050
050
050
050
02,
800
Bic
ycle
Cor
ridor
s2-
51,
500
2,00
02,
200
2,20
02,
200
2,20
012
,300
Ped
estri
an a
nd C
yclin
g G
rade
Sep
arat
ions
2-6
1,00
01,
000
Tota
l Act
ive
Tran
spor
tatio
n Fa
cilit
ies
4,10
06,
200
5,40
05,
400
5,40
05,
400
31,9
00
Reg
iona
l Str
eets
Stre
et Im
prov
emen
tsD
evel
oper
Pay
back
- V
ario
us L
ocat
ions
- Cas
h to
Ca p
ital
8,46
53,
200
16,1
1327
,778
- Tra
nsfe
r fro
m C
orpo
rate
Non
-Spe
cifie
d C
apita
l Acc
ount
1,60
01,
600
Tota
l Dev
elop
er P
ayba
ck -
Var
ious
Loc
atio
ns2-
710
,065
3,20
016
,113
29,3
78Tu
xedo
Yar
ds D
evel
opm
ent
- Eco
nom
ic D
evel
opm
ent I
nves
tmen
t Res
erve
2-8
1,82
62,
549
3,41
72,
770
10,5
62Tr
ansp
orta
tion
Mas
ter P
lan
2-9
250
250
250
250
1,00
0Tr
ansp
orta
tion
Man
agem
ent C
entre
2-10
1,00
01,
000
Traf
fic S
igna
ls Im
prov
emen
ts2-
111,
030
1,03
01,
030
1,03
01,
030
1,03
06,
180
Traf
fic S
igna
ls L
oops
2-12
250
250
250
250
250
250
1,50
0Tr
affic
Eng
inee
ring
Impr
ovem
ents
- V
ario
us L
ocat
ions
2-
131,
900
1,90
01,
900
1,90
01,
900
1,90
011
,400
Ken
asto
n B
oule
vard
- N
ess
Ave
nue
to T
aylo
r Ave
nue
2-14
100
100
100
100
100
100
600
Hen
ders
on H
ighw
ay N
orth
of G
ilmor
e to
City
Lim
it2-
1570
070
0P
relim
inar
y / D
etai
led
Des
ign
for B
uild
ing
Can
ada
Fund
P
roje
cts
2-16
2,20
02,
200
Inne
r-R
ing
Roa
d - F
unct
iona
l Des
ign
2-17
2,00
02,
000
2,00
06,
000
Tota
l Str
eet I
mpr
ovem
ents
8,30
615
,894
12,8
478,
300
21,6
433,
530
70,5
20
Appendix 11
80 Adopted 2016 Operating Budget - Appendices

CA
PITA
L PR
OJE
CTS
SU
MM
AR
YVo
l. 3
6 YE
AR(in
Tho
usan
ds o
f $)
PAG
EB
UD
GET
TOTA
LN
O.
2016
2017
2018
2019
2020
2021
2016
- 20
21
ADO
PTED
CAP
ITAL
FOR
ECAS
T
Reg
iona
l and
Loc
al S
tree
t Ren
ewal
- Fi
rst c
harg
e ag
ains
t 20
16 C
apita
l Bud
get o
f up
to $
1 m
illio
n fo
r the
Gra
nula
r Lan
e Im
prov
emen
t Pro
gram
(Cou
ncil
Sep
tem
ber 3
0, 2
015)
- Cas
h to
Cap
ital
22,8
6813
,876
12,7
2810
,147
7,02
614
,649
81,2
94- F
ront
a ge
Levy
5,00
05,
000
- Fed
eral
Gas
Tax
12,0
2912
,104
13,8
8617
,236
18,9
3618
,886
93,0
77- P
rovi
ncia
l Bui
ldin
g M
anito
ba F
und
- Roa
ds14
,000
14,0
0014
,000
7,00
07,
000
7,00
063
,000
- Pro
vinc
ial R
oad
Inve
stm
ent F
und
9,00
09,
000
9,00
027
,000
- Pro
vinc
ial M
anito
ba W
inni
peg
Infra
stru
ctur
e Fu
nd5,
000
5,00
05,
000
5,00
020
,000
- Loc
al S
treet
Ren
ewal
Res
erve
/ In
tere
st18
,375
22,4
1027
,310
32,2
1037
,110
42,0
1017
9,42
5- R
egio
nal S
treet
Ren
ewal
Res
erve
/ In
tere
st13
,405
18,0
0322
,903
27,8
0332
,703
37,6
0315
2,42
0- E
xter
nal D
ebt
6,90
06,
900
- Tra
nsfe
r fro
m C
orpo
rate
Non
-Spe
cifie
d C
apita
l Acc
ount
3,58
43,
584
Tota
l Reg
iona
l and
Loc
al S
tree
t Ren
ewal
2-18
105,
161
94,3
9310
4,82
799
,396
102,
775
125,
148
631,
700
Wat
erw
ay C
ross
ings
and
Gra
de S
epar
atio
nsW
aver
ley
Stre
et a
t CN
Mai
nlin
e (R
iver
s) G
rade
Sep
arat
ion
- Pro
vinc
ial G
over
nmen
t Fun
ding
45,8
7545
,875
- Bui
ldin
g C
anad
a Fu
nd (F
eder
al G
over
nmen
t)45
,875
45,8
75- E
xter
nal D
ebt
63,3
3263
,332
Tota
l Wav
erle
y S
treet
at C
N M
ainl
ine
(Riv
ers)
Gra
de
Sep
arat
ion
2-24
155,
082
155,
082
Loui
se B
ridge
(Red
Riv
er)
2-25
500
500
CP
R Y
ards
Fun
ctio
nal C
ross
ing
Stu
dy -
betw
een
McP
hilli
ps
Stre
et a
nd M
ain
Stre
et2-
262,
000
2,00
0
Ferm
or A
venu
e B
ridge
(Sei
ne R
iver
)- F
ront
age
Levy
2-27
1,00
01,
200
10,1
006,
700
19,0
00S
aska
tche
wan
Ave
nue
Cul
vert
(Stu
rgeo
n C
reek
)- C
ash
to C
apita
l 7,
100
7,10
0- F
ront
age
Levy
1,00
01,
000
900
2,90
0To
tal S
aska
tche
wan
Ave
nue
Cul
vert
(Stu
rgeo
n C
reek
)2-
281,
000
1,00
08,
000
10,0
00
Appendix 11
Adopted 2016 Operating Budget - Appendices 81

CA
PITA
L PR
OJE
CTS
SU
MM
AR
YVo
l. 3
6 YE
AR(in
Tho
usan
ds o
f $)
PAG
EB
UD
GET
TOTA
LN
O.
2016
2017
2018
2019
2020
2021
2016
- 20
21
ADO
PTED
CAP
ITAL
FOR
ECAS
T
Nes
s A
venu
e C
ulve
rt (S
turg
eon
Cre
ek) -
Firs
t cha
rge
on 2
016
Cap
ital B
udge
t of u
p to
$11
mill
ion
(Cou
ncil
July
15,
201
5)- F
ront
age
Levy
4,00
04,
000
- Pro
vinc
ial F
undi
ng fo
r Roa
d Im
prov
emen
ts4,
000
4,00
0To
tal N
ess
Ave
nue
Cul
vert
(Stu
rgeo
n C
reek
)2-
298,
000
8,00
0S
aska
tche
wan
Ave
nue
Brid
ge (O
man
d's
Cre
ek)
- Firs
t ch
arge
on
2016
Cap
ital B
udge
t of u
p to
$2.
3 m
illio
n (C
ounc
il Ju
ly 1
5, 2
015)
- Cas
h to
Cap
ital
300
300
- Fro
ntag
e Le
vy1,
000
1,00
0- P
rovi
ncia
l Fun
ding
for R
oad
Impr
ovem
ents
1,00
01,
000
Tota
l Sas
katc
hew
an A
venu
e B
ridge
(Om
and'
s C
reek
)2-
302,
300
2,30
0Ly
ndal
e D
rive
- Ret
aini
ng W
all R
ehab
ilita
tion
- Cas
h to
Cap
ital
250
250
- Fro
ntag
e Le
vy3,
500
3,50
0- P
rovi
ncia
l Fun
ding
for R
oad
Impr
ovem
ents
250
1,50
01,
750
Tota
l Lyn
dale
Driv
e - R
etai
ning
Wal
l Reh
abili
tatio
n2-
3150
05,
000
5,50
0O
sbor
ne S
treet
Und
erpa
ss- F
ront
age
Levy
1,25
01,
250
- Pro
vinc
ial F
undi
ng fo
r Roa
d Im
prov
emen
ts1,
250
1,25
0To
tal O
sbor
ne S
treet
Und
erpa
ss2-
322,
500
2,50
0D
ublin
Ave
nue
Brid
ge (O
man
d's
Cre
ek)
- Cas
h to
Cap
ital
700
700
- Fro
ntag
e Le
vy70
06,
800
7,50
0To
tal D
ublin
Ave
nue
Brid
ge (O
man
d's
Cre
ek)
2-33
700
700
6,80
08,
200
She
rwin
Roa
d B
ridge
(Om
and'
s C
reek
)- C
ash
to C
apita
l 70
070
0- F
ront
age
Levy
2,80
02,
800
Tota
l She
rwin
Roa
d B
ridge
(Om
and'
s C
reek
)2-
3470
02,
800
3,50
0P
embi
na H
ighw
ay O
verp
ass
(Bis
hop
Gra
ndin
) Reh
abili
tatio
n- F
ront
age
Levy
2-35
1,00
02,
000
3,00
0S
t. Ja
mes
Brid
ge S
outh
Bou
nd- F
ront
age
Levy
2-36
3,24
52,
163
5,40
8
Appendix 11
82 Adopted 2016 Operating Budget - Appendices

CA
PITA
L PR
OJE
CTS
SU
MM
AR
YVo
l. 3
6 YE
AR(in
Tho
usan
ds o
f $)
PAG
EB
UD
GET
TOTA
LN
O.
2016
2017
2018
2019
2020
2021
2016
- 20
21
ADO
PTED
CAP
ITAL
FOR
ECAS
T
St.
Vita
l Brid
ge R
ehab
ilita
tion
- Fro
ntag
e Le
vy2-
371,
000
1,00
0W
ater
way
Cro
ssin
g an
d G
rade
Sep
arat
ions
- A
nnua
l Pro
gram
- C
ash
to C
apita
l 1,
945
3,00
02,
813
2,60
010
,358
- Fro
ntag
e Le
vy3,
000
1,05
518
740
03,
000
7,64
2To
tal W
ater
way
Cro
ssin
g an
d G
rade
Sep
arat
ions
- A
nnua
l P
rogr
am2-
383,
000
3,00
03,
000
3,00
03,
000
3,00
018
,000
Dis
rael
i Brid
ge a
nd O
verp
ass
Faci
lity
- Firs
t cha
rge
on 2
016
Cap
ital B
udge
t of u
p to
$3,
000,
000
(Cou
ncil
Dec
embe
r 9,
2015
)- C
ash
to C
apita
l 95
091
086
566
265
055
04,
587
- Fed
eral
Gas
Tax
17,4
5017
,415
17,3
8514
,238
12,5
5012
,700
91,7
38- P
ublic
Priv
ate
Par
tner
ship
Ann
ual S
ervi
ce /
Fina
ncin
g P
aym
ents
(11,
859)
(11,
909)
(11,
959)
(11,
993)
(12,
014)
(12,
064)
(71,
798)
- Deb
t ser
vici
ng -
repa
ymen
t of d
ebt
(6,5
41)
(6,4
16)
(6,2
91)
(2,9
07)
(1,1
86)
(1,1
86)
(24,
527)
Tota
l Dis
rael
i Brid
ge a
nd O
verp
ass
Faci
lity
2-39
Cha
rlesw
ood
Brid
ge
- Cas
h to
Cap
ital
1,47
81,
478
1,47
81,
478
1,47
81,
478
8,86
8- P
ublic
Priv
ate
Par
tner
ship
Lea
se P
aym
ents
(1,4
78)
(1,4
78)
(1,4
78)
(1,4
78)
(1,4
78)
(1,4
78)
(8,8
68)
Tota
l Cha
rlesw
ood
Brid
ge2-
41P
less
is R
oad
Twin
ning
and
Gra
de S
epar
atio
n at
CN
Rai
l - C
ash
to C
apita
l 3,
000
3,00
0- C
N R
ail C
ost S
harin
g7,
500
7,50
0To
tal P
less
is R
oad
Twin
ning
and
Gra
de S
epar
atio
n at
CN
R
ail
2-42
10,5
0010
,500
Tota
l Wat
erw
ay C
ross
ings
and
Gra
de S
epar
atio
ns18
3,88
213
,445
21,8
0015
,763
13,6
006,
000
254,
490
New
Tra
nspo
rtat
ion
Faci
litie
sC
hief
Peg
uis
Trai
l - H
ende
rson
Hig
hway
to L
agim
odie
re
Bou
leva
rd -
Firs
t cha
rge
on 2
016
Cap
ital B
udge
t of u
p to
$1
,560
,000
(Cou
ncil
Dec
embe
r 9, 2
015)
- Cas
h to
Cap
ital
785
860
950
1,19
31,
250
1,39
56,
433
- Fed
eral
Gas
Tax
6,36
56,
325
6,28
06,
077
6,06
55,
965
37,0
77- P
ublic
Priv
ate
Par
tner
ship
Ann
ual S
ervi
ce /
Fina
ncin
g P
aym
ents
(6,1
71)
(6,2
06)
(6,2
51)
(6,2
91)
(6,3
36)
(6,3
81)
(37,
636)
- Deb
t ser
vici
ng -
repa
ymen
t of d
ebt
(979
)(9
79)
(979
)(9
79)
(979
)(9
79)
(5,8
74)
Tota
l Chi
ef P
egui
s Tr
ail -
Hen
ders
on H
ighw
ay to
Lag
imod
iere
B
oule
vard
2-43
Tota
l New
Tra
nspo
rtat
ion
Faci
litie
s
Appendix 11
Adopted 2016 Operating Budget - Appendices 83

CA
PITA
L PR
OJE
CTS
SU
MM
AR
YVo
l. 3
6 YE
AR(in
Tho
usan
ds o
f $)
PAG
EB
UD
GET
TOTA
LN
O.
2016
2017
2018
2019
2020
2021
2016
- 20
21
ADO
PTED
CAP
ITAL
FOR
ECAS
T
Oth
er S
tree
ts P
roje
cts
Ass
et M
anag
emen
t Sys
tem
- V
ario
us D
ivis
ions
2-45
100
100
100
100
100
500
Land
Dra
inag
e S
ewer
s - R
egio
nal /
Loc
al S
treet
s2-
4670
01,
000
1,00
01,
000
300
300
4,30
0La
nd A
cqui
sitio
n - T
rans
porta
tion
Rig
ht o
f Way
2-
4730
030
030
030
030
030
01,
800
Tota
l Oth
er S
tree
ts P
roje
cts
1,00
01,
400
1,40
01,
400
700
700
6,60
0
TOTA
L ST
REE
TS P
RO
JEC
TS30
2,44
913
1,33
214
6,27
413
0,25
914
4,11
814
0,77
899
5,21
0
Park
s an
d O
pen
Spac
eR
efor
esta
tion
- Im
prov
emen
ts
2-48
766
766
766
383
383
383
3,44
7A
thle
tic F
ield
s - I
mpr
ovem
ents
2-49
200
200
200
200
200
200
1,20
0P
arks
- Im
prov
emen
ts2-
5085
070
075
565
565
565
54,
270
Reg
iona
l and
Com
mun
ity P
arks
- B
uild
ings
2-51
1,20
01,
300
850
950
950
370
5,62
0O
ff Le
ash
Dog
Par
k M
aste
r Pla
n2-
5310
010
0H
ards
urfa
ce U
pgra
ding
2-
5415
015
015
015
015
015
090
0P
arks
and
Rec
reat
ion
Enh
ance
men
t Pro
gram
2-55
3,30
03,
300
3,30
03,
300
3,30
03,
300
19,8
00In
sect
Con
trol -
Rep
lace
3 G
rey
Stre
et O
pera
tions
Bui
ldin
g2-
5673
273
2U
rban
For
est E
nhan
cem
ent P
rogr
am2-
571,
300
1,30
01,
300
1,30
01,
300
1,30
07,
800
Brid
gwat
er F
ores
t Fou
ntai
n R
esto
ratio
n2-
5810
010
0R
egio
nal P
arks
Inve
stm
ent S
trate
gy2-
5920
010
030
0K
ilcon
a P
ark
Mas
ter P
lan
2-60
2,35
02,
350
Tota
l Par
ks a
nd O
pen
Spac
e8,
166
8,54
87,
321
6,93
86,
938
8,70
846
,619
TOTA
L PU
BLI
C W
OR
KS
310,
615
139,
880
153,
595
137,
197
151,
056
149,
486
1,04
1,82
9
Appendix 11
84 Adopted 2016 Operating Budget - Appendices

CA
PITA
L PR
OJE
CTS
SU
MM
AR
YVo
l. 3
6 YE
AR(in
Tho
usan
ds o
f $)
PAG
EB
UD
GET
TOTA
LN
O.
2016
2017
2018
2019
2020
2021
2016
- 20
21
ADO
PTED
CAP
ITAL
FOR
ECAS
T
CO
MM
UN
ITY
SER
VIC
ESC
omm
unity
Ince
ntiv
e G
rant
Pro
gram
2-61
1,66
51,
698
1,73
21,
767
1,80
21,
838
10,5
02Li
brar
y Fa
cilit
y S
afet
y, S
ecur
ity a
nd A
cces
sibi
lity
Impr
ovem
ents
Pro
gram
2-
6225
631
231
832
433
033
61,
876
Libr
ary
Inte
rior I
nfra
stru
ctur
e R
epla
cem
ent P
rogr
am
2-63
150
300
306
312
318
325
1,71
1Li
brar
y Te
chno
logy
Upg
rade
and
Rep
lace
men
t Pro
gram
2-64
350
500
510
520
530
541
2,95
1Li
brar
y R
efur
bish
men
t and
Red
evel
opm
ent P
rogr
am -
Exis
ting
Infra
stru
ctur
e2-
6525
050
051
052
053
054
12,
851
Mill
enni
um L
ibra
ry "M
aker
Spa
ce" P
roje
ct2-
6650
050
0Li
brar
y Fa
cilit
y R
edev
elop
men
t - S
t. V
ital L
ibra
ry2-
6710
710
7Li
brar
y Fa
cilit
y R
edev
elop
men
t - R
iver
Hei
ghts
Lib
rary
- Ext
erna
l Deb
t2-
695,
060
5,06
0Li
brar
y Fa
cilit
y R
edev
elop
men
t - W
est K
ildon
an L
ibra
ry2-
702,
000
2,00
0Li
brar
y Fa
cilit
y R
edev
elop
men
t - S
t. Ja
mes
Lib
rary
- Ext
erna
l Deb
t2-
716,
492
6,49
2W
aver
ley
Wes
t Lib
rary
2-72
100
7,58
67,
686
Libr
ary
Ref
urbi
shm
ent a
nd R
edev
elop
men
t Pro
gram
- E
xist
ing
Infra
stru
ctur
e: C
orni
sh L
ibra
ry- C
ash
to C
apita
l36
636
6- I
nter
im F
inan
cing
from
the
Gen
eral
Cap
ital F
und
(Rep
aym
ent)
1,10
0(1
,100
)-
- Ext
erna
l Deb
t73
473
4To
tal L
ibra
ry R
efur
bish
men
t and
Red
evel
opm
ent P
rogr
am -
Exi
stin
g In
frast
ruct
ure:
Cor
nish
Lib
rary
2-73
1,10
01,
100
Libr
ary
Ref
urbi
shm
ent a
nd R
edev
elop
men
t Pro
gram
- E
xist
ing
Infra
stru
ctur
e: S
t. Jo
hn's
Lib
rary
- Cas
h to
Cap
ital
366
366
- Int
erim
Fin
anci
ng fr
om th
e G
ener
al C
apita
l Fun
d (R
epay
men
t)1,
100
(1,1
00)
-
- Ext
erna
l Deb
t73
473
4To
tal L
ibra
ry R
efur
bish
men
t and
Red
evel
opm
ent P
rogr
am -
Exi
stin
g In
frast
ruct
ure:
St.
John
's L
ibra
ry2-
741,
100
1,10
0
T ynd
all P
ark
- Fea
sibi
lity
Stud
y- T
rans
fer f
rom
Prio
r Yea
r Sur
plus
- M
anito
ba W
inni
peg
Infra
stru
ctur
e Fu
nd (M
WIF
200
8, 2
009
& 2
010)
2-75
100
100
Appendix 11
Adopted 2016 Operating Budget - Appendices 85

CA
PITA
L PR
OJE
CTS
SU
MM
AR
YVo
l. 3
6 YE
AR(in
Tho
usan
ds o
f $)
PAG
EB
UD
GET
TOTA
LN
O.
2016
2017
2018
2019
2020
2021
2016
- 20
21
ADO
PTED
CAP
ITAL
FOR
ECAS
T
Rec
reat
iona
l Fac
ility
Saf
ety,
Sec
urity
and
Acc
essi
bilit
y Im
prov
emen
ts P
rogr
am2-
7615
315
615
916
216
516
896
3
Fitn
ess
Equ
ipm
ent U
pgra
de P
rogr
am2-
7723
922
223
322
723
023
51,
386
Rec
reat
ion
Equ
ipm
ent P
rogr
am
2-78
608
400
400
1,40
8E
ast E
lmw
ood
Leis
ure
Cen
tre A
men
ities
and
Equ
ipm
ent
2-79
208
208
Rec
reat
ion
Faci
lity
Rep
lace
men
t - N
ew In
frast
ruct
ure
2-80
300
3,80
07,
000
5,00
016
,100
Rec
reat
ion
Ref
urbi
shm
ent a
nd R
edev
elop
men
t Pro
gram
- Ex
istin
g In
frast
ruct
ure
2-82
2,00
02,
000
Pan
Am
Poo
l2-
831,
400
1,40
0B
oni-V
ital P
ool
2-84
100
5,88
05,
980
Spr
ay P
ad D
evel
opm
ent -
Old
Ex
Wad
ing
Poo
l Site
2-85
750
750
Spr
ay P
ad D
evel
opm
ent -
Fre
ight
hous
e O
utdo
or P
ool S
ite2-
8675
075
0B
usin
ess
App
licat
ion
Sys
tem
s2-
8725
030
631
286
8Te
chno
logy
Upg
rade
and
Rep
lace
men
t Pro
gram
2-88
306
325
631
Com
mun
ity C
entre
Ren
ovat
ion
Gra
nt P
rogr
am (C
CR
GP
)- L
and
Ope
ratin
g R
eser
ve2-
8996
596
596
52,
895
Ass
inib
oine
Par
k C
onse
rvan
cy (A
PC
) - In
frast
ruct
ure
and
Sus
tain
abili
ty -
Firs
t cha
rge
on 2
016
Cap
ital B
udge
t of u
p to
$1
.041
mill
ion
(Cou
ncil
Mar
ch 2
3, 2
015)
- Cas
h to
Cap
ital
5,12
31,
543
5,12
35,
123
2,00
02,
000
20,9
12- T
rans
fer f
rom
Cor
pora
te N
on-S
peci
fied
Cap
ital A
ccou
nt
3,58
03,
580
Tota
l Ass
inib
oine
Par
k C
onse
rvan
cy (A
PC
) - In
frast
ruct
ure
and
Sus
tain
abili
ty
2-90
5,12
35,
123
5,12
35,
123
2,00
02,
000
24,4
92
Ass
inib
oine
Par
k C
onse
rvan
cy (A
PC
) - C
apita
l Dev
elop
men
t P
lan
2-91
969
969
TOTA
L C
OM
MU
NIT
Y SE
RVI
CES
19
,995
16,0
3416
,960
16,7
6713
,491
21,5
8910
4,83
6
Appendix 11
86 Adopted 2016 Operating Budget - Appendices

CA
PITA
L PR
OJE
CTS
SU
MM
AR
YVo
l. 3
6 YE
AR(in
Tho
usan
ds o
f $)
PAG
EB
UD
GET
TOTA
LN
O.
2016
2017
2018
2019
2020
2021
2016
- 20
21
ADO
PTED
CAP
ITAL
FOR
ECAS
T
WIN
NIP
EG P
OLI
CE
SER
VIC
EP
25 P
ublic
Saf
ety
Rad
io S
yste
m (f
orm
erly
Tru
nk R
adio
S
yste
m) -
Firs
t cha
rge
on 2
016
Cap
ital B
udge
t of u
p to
$6
,580
,000
(Cou
ncil
Nov
embe
r 25,
201
5)- C
ash
to C
apita
l5,
280
5,28
0- T
rans
fer f
rom
Prio
r Yea
r Aut
horiz
atio
n (2
015
Pol
ice
Div
isio
ns S
yste
ms
Upg
rade
)1,
300
1,30
0
Tota
l P25
Pub
lic S
afet
y R
adio
Sys
tem
2-
926,
580
6,58
0N
orth
Sta
tion
Info
rmat
ion
Tech
nolo
gy R
equi
rem
ents
2-93
490
490
Pol
ice
Div
isio
ns S
yste
ms
Upg
rade
s2-
9410
02,
300
2,40
0P
25 P
ublic
Saf
ety
Rad
io S
yste
m (f
orm
erly
Rad
io U
pgra
de fo
r D
istri
cts
3 an
d 4)
- Fi
rst c
harg
e on
201
6 C
apita
l Bud
get o
f up
to $
490,
000
(Cou
ncil
Nov
embe
r 25,
201
5)
2-95
490
490
Mob
ile a
nd T
rans
ient
Use
rs2-
9625
025
0M
ajor
Cas
e M
anag
emen
t Sys
tem
Exp
ansi
on2-
971,
158
500
1,65
8P
olic
e H
eadq
uarte
rs B
uild
ing
Sys
tem
s S
afeg
uard
s
- Tra
nsfe
r fro
m P
rior Y
ear A
utho
rizat
ion
2-98
290
510
800
Ele
ctro
nic
Tick
etin
g- T
rans
fer f
rom
Prio
r Yea
r Aut
horiz
atio
n (2
014
Pol
ice
Com
mun
icat
ion
Cen
tre)
2-99
200
200
Eas
t Dis
trict
Pol
ice
Sta
tion
- Firs
t cha
rge
on 2
016
Cap
ital
Bud
get o
f up
to $
247,
500
(Cou
ncil
Dec
embe
r 9, 2
015)
- Cas
h to
Cap
ital
990
990
1,01
21,
056
1,05
61,
056
6,16
0- P
ublic
Priv
ate
Par
tner
ship
Lea
se P
aym
ents
(990
)(9
90)
(1,0
12)
(1,0
56)
(1,0
56)
(1,0
56)
(6,1
60)
Tota
l Eas
t Dis
trict
Pol
ice
Sta
tion
2-10
0N
orth
Dis
trict
Pol
ice
Sta
tion
- Tra
nsfe
r fro
m P
rior Y
ear A
utho
rizat
ion
(201
2 N
orth
D
istri
ct P
olic
e S
tatio
n fo
rmer
ly P
olic
e B
uild
ing
Rep
lace
men
t)
3,12
93,
129
- Ext
erna
l Deb
t20
,188
20,1
88To
tal N
orth
Dis
trict
Pol
ice
Sta
tion
2-10
13,
129
20,1
8823
,317
Win
nipe
g P
olic
e H
eadq
uarte
rs R
edev
elop
men
t- I
nter
im F
inan
cing
from
Gen
eral
Cap
ital F
und
(Rep
aym
ent)
(18,
967)
(18,
967)
- Lan
d O
pera
ting
Res
erve
18,9
6718
,967
Tota
l Win
nipe
g P
olic
e H
eadq
uarte
rs R
edev
elop
men
t2-
102
Bui
ldin
g V
ideo
Sur
veill
ance
Sys
tem
s2-
103
4,16
04,
160
Inte
llige
nce
Led
Rep
ortin
g (P
hase
2)
2-10
41,
050
1,05
0W
PS D
ata
Inte
grat
ion,
Aud
iting
and
Qua
lity
Sol
utio
n To
ol2-
105
662
662
Aut
omat
ed F
inge
rprin
t Ide
ntifi
catio
n S
yste
m (A
FIS
) 2-
106
500
500
Appendix 11
Adopted 2016 Operating Budget - Appendices 87

CA
PITA
L PR
OJE
CTS
SU
MM
AR
YVo
l. 3
6 YE
AR(in
Tho
usan
ds o
f $)
PAG
EB
UD
GET
TOTA
LN
O.
2016
2017
2018
2019
2020
2021
2016
- 20
21
ADO
PTED
CAP
ITAL
FOR
ECAS
T
Tech
nolo
gy U
pgra
des
- Inf
orm
atio
n S
yste
ms
2-10
71,
200
1,20
0In
Car
Com
putin
g 2-
108
1,50
01,
500
Bom
b U
nit T
ruck
Rep
lace
men
t2-
109
300
300
Fire
Sup
pres
sion
Sys
tem
2-11
076
776
7N
ext G
ener
atio
n 91
12-
111
800
1,00
01,
800
Com
mun
icat
ion
Cen
tre B
ack
Up
Site
Upg
rade
2-11
240
040
0R
iver
Pat
rol B
uild
ing
2-11
31,
820
1,82
0A
rchi
val a
nd E
xhib
it B
uild
ing
2-11
42,
519
2,51
9C
ompu
ter A
ssis
ted
Dis
patc
h U
pgra
de2-
115
950
950
Sch
edul
e an
d M
anag
emen
t Sys
tem
Upg
rade
2-11
650
050
0P
olic
e H
eadq
uarte
rs In
form
atio
n S
yste
m U
pgra
des
2-11
72,
100
2,10
0
TOTA
L W
INN
IPEG
PO
LIC
E SE
RVI
CE
12,1
9723
,488
5,87
24,
767
3,02
07,
069
56,4
13
FIR
E PA
RAM
EDIC
SER
VIC
EFa
cilit
ies
Opt
imiz
atio
n (fo
rmer
ly F
acili
ties
Rep
lace
men
t, R
eloc
atio
n an
d E
nhan
cem
ent P
rogr
am)
- Cas
h to
Cap
ital
250
925
2,71
74,
839
8,73
1- E
xter
nal D
ebt
440
1,21
71,
500
3,15
7To
tal F
acili
ties
Opt
imiz
atio
n2-
118
690
925
3,93
46,
339
11,8
88P
25 P
ublic
Saf
ety
Rad
io S
yste
m (f
orm
erly
Rep
lace
men
t R
adio
Sys
tem
) - F
irst c
harg
e on
201
6 C
apita
l Bud
get o
f up
to
$3,7
28,0
00 (C
ounc
il N
ovem
ber 2
5, 2
015)
- Cas
h to
Cap
ital
2,70
72,
707
- Tra
nsfe
r fro
m P
rior Y
ear A
utho
rizat
ion
(201
5 S
tatio
n C
apita
l Mai
nten
ance
/ 20
15 9
11 C
all C
entre
Res
ilien
ce)
1,02
11,
021
Tota
l P25
Pub
lic S
afet
y R
adio
Sys
tem
2-11
93,
728
3,72
8E
quip
men
t Obs
oles
cenc
e2-
120
1,26
04,
457
1,01
077
273
973
98,
977
911
Cal
l Cen
tre R
esili
ence
2-12
186
126
012
41,
245
Com
pute
r Aid
ed D
ispa
tch
(CA
D)
2-12
27,
095
7,09
5S
tatio
n C
apita
l Mai
nten
ance
2-12
33,
938
2,85
21,
270
4,40
07,
743
20,2
03D
econ
tam
inat
ion
Uni
t2-
124
116
116
Em
erge
ncy
Med
ical
Ser
vice
(EM
S) T
rain
ing
Equ
ipm
ent
2-12
511
911
9
TOTA
L FI
RE
PAR
AMED
IC S
ERVI
CE
5,79
417
,276
8,05
68,
381
5,25
88,
606
53,3
71
Appendix 11
88 Adopted 2016 Operating Budget - Appendices

CA
PITA
L PR
OJE
CTS
SU
MM
AR
YVo
l. 3
6 YE
AR(in
Tho
usan
ds o
f $)
PAG
EB
UD
GET
TOTA
LN
O.
2016
2017
2018
2019
2020
2021
2016
- 20
21
ADO
PTED
CAP
ITAL
FOR
ECAS
T
PLAN
NIN
G, P
RO
PER
TY A
ND
DEV
ELO
PMEN
TC
ompu
ter A
utom
atio
n2-
126
200
120
144
133
119
143
859
Riv
erba
nk G
reen
way
Pro
gram
s2-
127
443
405
406
411
453
424
2,54
2C
emet
erie
s - I
mpr
ovem
ents
- Cas
h to
Cap
ital
232
208
250
240
248
236
1,41
4- V
eter
ans
Affa
irs C
anad
a20
020
015
015
015
017
01,
020
Tota
l Cem
eter
ies
- Im
prov
emen
ts2-
128
432
408
400
390
398
406
2,43
4D
ownt
own
Enh
ance
men
t Pro
gram
2-12
940
040
040
040
040
040
02,
400
BIZ
Zon
es, I
mag
e R
oute
s an
d N
eigh
bour
hood
Mai
n S
treet
s 2-
131
400
400
400
400
400
400
2,40
0P
ublic
Art
Stra
tegy
2-13
250
050
050
050
050
050
03,
000
Land
Acq
uisi
tion
for G
ener
al U
nspe
cifie
d P
urpo
ses
2-13
330
024
022
827
423
81,
280
Dev
elop
er P
ayba
ck2-
134
275
280
278
292
274
280
1,67
9R
iver
bank
Sta
biliz
atio
n - P
hysi
cal A
sset
Pro
tect
ion
- Cas
h to
Cap
ital
378
1,00
01,
000
1,00
01,
038
1,00
85,
424
- Wat
erw
ays
Man
agem
ent F
und
(form
erly
- R
iver
bank
M
anag
emen
t Com
mitt
ee F
und)
622
622
- Tra
nsfe
r fro
m P
rior Y
ear A
utho
rizat
ion
(201
1 C
hurc
hill
Par
k R
iver
bank
Sta
biliz
atio
n)68
668
6To
tal R
iver
bank
Sta
biliz
atio
n - P
h ysi
cal A
sset
Pro
tect
ion
2-13
51,
686
1,00
01,
000
1,00
01,
038
1,00
86,
732
Bui
ldin
g C
omm
uniti
es In
itiat
ive II I
- Cas
h to
Cap
ital
360
190
800
1,35
0- L
and
Ope
ratin
g R
eser
ve25
070
01,
000
1,70
03,
650
- Man
itoba
Win
nipe
g In
frast
ruct
ure
Agr
eem
ent (
MW
IA)
250
1,06
01,
000
1,89
080
05,
000
Tota
l Bui
ldin
g C
omm
uniti
es In
itiat
ive II I
2-13
750
02,
120
2,00
03,
780
1,60
010
,000
May
fair
Rec
reat
ion
Cen
tre R
edev
elop
men
t- T
rans
fer f
rom
Prio
r Yea
r Aut
horiz
atio
n (2
013
May
fair
Rec
reat
ion
Cen
tre R
edev
elop
men
t)2-
138
198
198
TOTA
L PL
ANN
ING
, PR
OPE
RTY
AN
D D
EVEL
OPM
ENT
5,03
45,
933
5,76
87,
534
5,45
63,
799
33,5
24
Appendix 11
Adopted 2016 Operating Budget - Appendices 89

CA
PITA
L PR
OJE
CTS
SU
MM
AR
YVo
l. 3
6 YE
AR(in
Tho
usan
ds o
f $)
PAG
EB
UD
GET
TOTA
LN
O.
2016
2017
2018
2019
2020
2021
2016
- 20
21
ADO
PTED
CAP
ITAL
FOR
ECAS
T
MU
NIC
IPAL
AC
CO
MM
OD
ATIO
NS
Gen
eral
Bui
ldin
g R
enov
atio
n an
d R
efur
bish
ing
- Cas
h to
Cap
ital
100
500
500
500
500
2,10
0- L
and
Ope
ratin
g R
eser
ve10
010
0To
tal G
ener
al B
uild
ing
Ren
ovat
ion
and
Ref
urbi
shin
g2-
139
100
100
500
500
500
500
2,20
0A
ccom
mod
atio
n Fa
cilit
ies
- Cas
h to
Cap
ital
851
1,29
21,
819
139
904,
191
- Lan
d O
pera
ting
Res
erve
525
700
1,70
01,
700
4,62
5To
tal A
ccom
mod
atio
n Fa
cilit
ies
2-14
052
585
11,
992
1,81
91,
839
1,79
08,
816
Mill
enni
um L
ibra
ry -
HV
AC
and
Tem
pera
ture
Con
trol
Impr
ovem
ents
2-14
150
01,
000
1,50
0
Fire
/ Li
fe S
afet
y / R
egul
ator
y U
pgra
des
- Cas
h to
Cap
ital
588
720
759
708
704
3,47
9- L
and
Ope
ratin
g R
eser
ve33
933
9To
tal F
ire /
Life
Saf
ety
/ Reg
ulat
ory
Upg
rade
s 2-
142
339
588
720
759
708
704
3,81
8E
nerg
y C
onse
rvat
ion
2-14
310
010
014
015
813
013
676
4Te
nant
Impr
ovem
ent P
repa
ymen
t - M
ajor
Dep
artm
ent
2-14
419
315
518
618
371
7H
isto
ric B
uild
ings
- Cas
h to
Cap
ital
200
270
214
217
220
1,12
1- L
and
Ope
ratin
g R
eser
ve20
020
0To
tal H
isto
ric B
uild
ings
2-14
520
020
027
021
421
722
01,
321
Gen
erat
or S
et R
epla
cem
ent a
nd U
pgra
des
2-14
613
011
313
612
350
2Se
curit
y / B
uild
ing
Auto
mat
ion
Syst
em In
itiat
ives
- Cas
h to
Cap
ital
240
240
240
240
240
1,20
0- L
and
Ope
ratin
g R
eser
ve24
024
0To
tal S
ecur
it y /
Bui
ldin
g Au
tom
atio
n S
yste
m In
itiat
ives
2-14
724
024
024
024
024
024
01,
440
Com
mun
ity C
entre
s - R
efur
bish
ing
and
Impr
ovem
ents
- C
ash
to C
apita
l42
064
467
366
766
13,
065
- Lan
d O
pera
ting
Res
erve
400
400
- Man
itoba
Win
nipe
g In
frast
ruct
ure
Agr
eem
ent (
MW
IA)
300
200
500
Tota
l Com
mun
ity C
entre
s - R
efur
bish
ing
and
Impr
ovem
ents
2-
148
700
620
644
673
667
661
3,96
5A
rena
s- C
ash
to C
apita
l10
052
552
556
553
32,
248
- Lan
d O
pera
ting
Res
erve
300
300
- Man
itoba
Win
nipe
g In
frast
ruct
ure
Agr
eem
ent (
MW
IA)
225
225
450
Tota
l Are
nas
2-14
952
532
552
552
556
553
32,
998
Indo
or A
quat
ic F
acili
ties
- Cas
h to
Cap
ital
1,21
82,
470
2,51
82,
516
2,35
911
,081
- Lan
d O
pera
ting
Res
erve
268
268
- Man
itoba
Win
nipe
g In
frast
ruct
ure
Agr
eem
ent (
MW
IA)
267
1,18
71,
454
Tota
l Ind
oor A
quat
ic F
acili
ties
2-15
053
52,
405
2,47
02,
518
2,51
62,
359
12,8
03P
an A
m P
ool -
Boi
ler S
yste
m R
epla
cem
ent
- Lan
d O
pera
ting
Res
erve
636
636
- Man
itoba
Win
nipe
g In
frast
ruct
ure
Agr
eem
ent (
MW
IA)
606
606
Tota
l Pan
Am
Poo
l - B
oile
r Sys
tem
Rep
lace
men
t2-
151
1,24
21,
242
Appendix 11
90 Adopted 2016 Operating Budget - Appendices

CA
PITA
L PR
OJE
CTS
SU
MM
AR
YVo
l. 3
6 YE
AR(in
Tho
usan
ds o
f $)
PAG
EB
UD
GET
TOTA
LN
O.
2016
2017
2018
2019
2020
2021
2016
- 20
21
ADO
PTED
CAP
ITAL
FOR
ECAS
T
Pan
Am
Indo
or P
ool -
Par
king
Lot
Ref
urbi
shm
ent
- Cas
h to
Cap
ital
8463
147
- Lan
d O
pera
ting
Res
erve
292
292
- Man
itoba
Win
nipe
g In
frast
ruct
ure
Agr
eem
ent (
MW
IA)
377
6344
0To
tal P
an A
m In
door
Poo
l - P
arki
ng L
ot R
efur
bish
men
t2-
152
753
126
879
Sev
en O
aks
Indo
or P
ool -
Ren
ewal
Pla
n2-
153
2,40
02,
400
Out
door
Aqu
atic
Fac
ilitie
s- C
ash
to C
apita
l17
521
734
033
834
034
21,
752
- Man
itoba
Win
nipe
g In
frast
ruct
ure
Agr
eem
ent (
MW
IA)
175
125
300
Tota
l Out
door
Aqu
atic
Fac
ilitie
s2-
154
350
342
340
338
340
342
2,05
2C
omm
unity
Fac
ilitie
s2-
155
200
200
260
212
214
217
1,30
3B
uild
ing
Ass
et /
Wor
k M
anag
emen
t Pro
gram
2-15
616
215
216
317
517
016
498
6U
FF -
Hoc
key
Pen
Lig
ht S
tand
ard
Rep
lace
men
t2-
157
100
100
100
100
100
100
600
City
-Wid
e A
cces
sibi
lity
Pro
gram
- Cas
h to
Cap
ital
7542
542
542
542
542
52,
200
- Lan
d O
pera
ting
Res
erve
350
350
Tota
l City
-Wid
e A
cces
sibi
lity
Prog
ram
2-15
842
542
542
542
542
542
52,
550
Tran
scon
a C
ente
nnia
l Poo
l- T
rans
fer f
rom
Cor
pora
te N
on-S
peci
fied
Cap
ital A
ccou
nt1,
000
1,00
0- I
nter
im F
inan
cing
from
Lan
d O
pera
ting
Res
erve
(R
epay
men
t)57
5(5
75)
-
- Lan
d O
pera
ting
Res
erve
725
575
1,30
0To
tal T
rans
cona
Cen
tenn
ial P
ool
2-15
92,
300
2,30
0S
t. Ja
mes
Civ
ic C
entre
- Cas
h to
Cap
ital
250
2,08
02,
330
- Tra
nsfe
r fro
m C
orpo
rate
Non
-Spe
cifie
d C
apita
l Acc
ount
1,83
61,
836
- Tra
nsfe
r fro
m P
rior Y
ear S
urpl
us -
Man
itoba
Win
nipe
g In
frast
ruct
ure
Fund
(MW
IF 2
008,
200
9 &
201
0)3,
900
3,90
0To
tal S
t. Ja
mes
Civ
ic C
entre
2-
160
5,98
62,
080
8,06
6C
ity H
all -
Bui
ldin
g R
efur
bish
men
t- C
omm
itmen
t Res
erve
200
200
- Lan
d O
pera
ting
Res
erve
1,00
01,
000
2,00
0To
tal C
it y H
all -
Bui
ldin
g R
efur
bish
men
t2-
161
1,20
01,
000
2,20
0E
ast Y
ard
Com
plex
Dev
elop
men
t- I
nter
im F
inan
cing
from
Lan
d O
pera
ting
Res
erve
(R
epay
men
t)(4
50)
(450
)
- Lan
d O
pera
ting
Res
erve
450
450
Tota
l Eas
t Yar
d C
ompl
ex D
evel
opm
ent
2-16
2S
herb
rook
Poo
l Reo
peni
ng- K
insm
en C
lub
of W
inni
peg
(Spo
nsor
Win
nipe
g)95
9595
9538
0- I
nter
im F
inan
cing
from
Gen
eral
Cap
ital F
und
/ (R
epay
men
t)(9
5)(9
5)(9
5)(9
5)(3
80)
Tota
l She
rbro
ok P
ool R
eope
ning
2-16
3
TOTA
L M
UN
ICIP
AL A
CC
OM
MO
DAT
ION
S10
,496
17,1
6011
,192
8,92
48,
953
8,69
765
,422
Appendix 11
Adopted 2016 Operating Budget - Appendices 91

CA
PITA
L PR
OJE
CTS
SU
MM
AR
YVo
l. 3
6 YE
AR(in
Tho
usan
ds o
f $)
PAG
EB
UD
GET
TOTA
LN
O.
2016
2017
2018
2019
2020
2021
2016
- 20
21
ADO
PTED
CAP
ITAL
FOR
ECAS
T
CIT
Y C
LER
KS
Inno
vatio
n C
apita
l Fun
d2-
165
1,00
01,
000
1,00
01,
000
1,00
01,
000
6,00
0C
orpo
rate
Rec
ords
Cen
tre2-
166
150
150
Ele
ctio
n S
yste
ms
2-16
720
020
020
060
0D
ecis
ion
Mak
ing
Info
rmat
ion
Syst
em(D
MIS
) Rep
lace
men
t2-
168
250
250
2017
Can
ada
Sum
mer
Gam
es2-
169
750
750
1,50
0
TOTA
L C
ITY
CLE
RK
S 1,
750
2,10
01,
450
1,00
01,
000
1,20
08,
500
CO
RPO
RAT
E SU
PPO
RT
SER
VIC
ESC
omm
unic
atio
n To
wer
Rel
ocat
ion
- Firs
t cha
rge
on 2
016
Cap
ital B
udge
t of u
p to
$85
0,00
0 (C
ounc
il Ju
ly 1
5, 2
015)
2-17
085
085
0P
eopl
eSof
t Upg
rade
- Cas
h to
Cap
ital
500
1,80
041
22,
712
- Tra
nsfe
r fro
m P
rior Y
ear A
utho
rizat
ion
588
588
Tota
l Peo
pleS
oft U
pgra
de2-
171
1,08
81,
800
412
3,30
0C
omm
unic
atio
ns N
etw
ork
Infra
stru
ctur
e2-
172
225
375
540
267
375
776
2,55
8En
terp
rise
Com
putin
g In
itiat
ives
- Cas
h to
Cap
ital
835
794
1,50
31,
127
1,32
81,
763
7,35
0- T
rans
fer f
rom
Com
pute
r Rep
lace
men
t Res
erve
1,06
130
612
660
814
62,
247
Tota
l Ent
erpr
ise
Com
putin
g In
itiat
ives
2-17
31,
896
1,10
01,
629
1,12
71,
936
1,90
99,
597
Prin
t Ass
et R
enew
al2-
174
167
167
Aer
ial I
mag
ery
Ren
ewal
Pro
gram
2-17
515
016
519
050
5S
oftw
are
Ren
ewal
Pro
gram
2-17
615
715
731
431
1 R
enew
al
2-17
710
045
025
010
045
025
01,
600
Tera
span
Fib
re R
ing
Ren
ewal
2-17
811
911
9In
frast
ruct
ure
Ser
vice
Enh
ance
men
ts2-
179
150
100
250
Can
dida
te G
atew
ay2-
180
621
218
839
TOTA
L C
OR
POR
ATE
SUPP
OR
T SE
RVI
CES
5,52
34,
043
2,99
61,
651
2,95
12,
935
20,0
99
Appendix 11
92 Adopted 2016 Operating Budget - Appendices

CA
PITA
L PR
OJE
CTS
SU
MM
AR
YVo
l. 3
6 YE
AR(in
Tho
usan
ds o
f $)
PAG
EB
UD
GET
TOTA
LN
O.
2016
2017
2018
2019
2020
2021
2016
- 20
21
ADO
PTED
CAP
ITAL
FOR
ECAS
T
ASSE
SSM
ENT
AND
TAX
ATIO
NA
sses
smen
t Aut
omat
ion
2-18
187
032
035
020
035
02,
090
Loca
l Im
prov
emen
ts -
Ong
oing
Pro
gram
- Cas
h to
Cap
ital
600
600
600
600
600
600
3,60
0- E
xter
nal D
ebt
2,40
02,
400
2,40
02,
400
2,40
02,
400
14,4
00To
tal L
ocal
Impr
ovem
ents
- O
ngoi
ng P
rogr
am2-
182
3,00
03,
000
3,00
03,
000
3,00
03,
000
18,0
00
TOTA
L AS
SESS
MEN
T AN
D T
AXAT
ION
3,00
03,
870
3,32
03,
350
3,20
03,
350
20,0
90
OTH
ER P
RO
JEC
TSP
eopl
eSof
t Acc
ount
s R
ecei
vabl
e an
d B
illin
g- T
rans
fer f
rom
Prio
r Yea
r Aut
horiz
atio
n (2
013
Peo
pleS
oft
Acc
ount
s R
ecei
vabl
e an
d B
illin
g)2-
183
550
550
TOTA
L O
THER
PR
OJE
CTS
550
550
Appendix 11
Adopted 2016 Operating Budget - Appendices 93

CA
PITA
L PR
OJE
CTS
SU
MM
AR
YVo
l. 3
6 YE
AR(in
Tho
usan
ds o
f $)
PAG
EB
UD
GET
TOTA
LN
O.
2016
2017
2018
2019
2020
2021
2016
- 20
21
ADO
PTED
CAP
ITAL
FOR
ECAS
T
TRAN
SIT
Inno
vativ
e Tr
ansi
t Pro
gram
- Cas
h to
Cap
ital
1,00
01,
000
1,00
01,
000
1,00
01,
000
6,00
0- R
etai
ned
Ear
ning
s1,
425
1,42
5To
tal I
nnov
ativ
e Tr
ansi
t Pro
gram
2-18
42,
425
1,00
01,
000
1,00
01,
000
1,00
07,
425
Tran
sit B
uild
ing
Rep
lace
men
t / R
efur
bish
men
t2-
185
4,50
04,
573
4,50
66,
536
6,53
66,
536
33,1
87Tr
ansi
t Bus
es -
Firs
t cha
rge
on 2
016
Cap
ital B
udge
t of u
p to
$5
.164
mill
ion
(Cou
ncil
Mar
ch 2
5, 2
015)
- Cas
h to
Cap
ital
9,17
31,
468
6,39
010
,017
9,69
610
,613
47,3
57- T
rans
it B
us R
epla
cem
ent R
eser
ve6,
516
8,99
49,
335
9,34
69,
565
9,96
053
,716
- Ext
erna
l Deb
t5,
164
5,16
4- P
rovi
ncia
l Bui
ldin
g M
anito
ba F
und
3,84
03,
840
3,84
08,
040
3,84
03,
840
27,2
40- F
eder
al G
as T
ax6,
106
6,10
66,
397
6,39
76,
397
6,39
737
,800
- Ret
aine
d E
arni
ngs
1,65
71,
657
Tota
l Tra
nsit
Buse
s2-
186
32,4
5620
,408
25,9
6233
,800
29,4
9830
,810
172,
934
Sou
thw
est R
apid
Tra
nsitw
ay (S
tage
2) a
nd P
embi
na H
ighw
ay
Und
erpa
ss- P
ublic
Priv
ate
Par
tner
ship
(City
)(1
6,50
0)(1
6,50
0)- E
xter
nal D
ebt
16,5
0016
,500
- Sou
thw
est R
apid
Tra
nsitw
ay (S
tage
2) a
nd P
embi
na
Hig
hway
Und
erpa
ss P
aym
ent R
eser
ve22
,050
22,1
5044
,200
- P3
Ann
ual S
ervi
ce /
Fina
ncin
g Pa
ymen
ts (P
rovi
nce)
(2,3
00)
(2,3
45)
(4,6
45)
- P3
Ann
ual S
ervi
ce /
Fina
ncin
g P
aym
ents
(City
)(1
8,45
0)(1
8,50
5)(3
6,95
5)- E
xter
nal D
ebt A
nnua
l Ser
vice
Pay
men
ts (C
ity)
(1,3
00)
(1,3
00)
(2,6
00)
Tota
l Sou
thw
est R
apid
Tra
nsitw
ay (S
tage
2) a
nd P
embi
na
Hi g
hway
Und
erpa
ss2-
187
Rap
id T
rans
it P
lann
ing
and
Des
ign
- Firs
t cha
rge
on 2
016
Cap
ital B
udge
t of u
p to
$2.
5 m
illio
n (C
ounc
il M
arch
23,
201
5)2-
190
2,50
02,
500
Land
Acq
uisi
tion
- Ret
aine
d E
arni
ngs
2-19
12,
000
2,00
0
TOTA
L TR
ANSI
T43
,881
25,9
8131
,468
41,3
3637
,034
38,3
4621
8,04
6
Appendix 11
94 Adopted 2016 Operating Budget - Appendices

CA
PITA
L PR
OJE
CTS
SU
MM
AR
YVo
l. 3
6 YE
AR(in
Tho
usan
ds o
f $)
PAG
EB
UD
GET
TOTA
LN
O.
2016
2017
2018
2019
2020
2021
2016
- 20
21
ADO
PTED
CAP
ITAL
FOR
ECAS
T
WAT
ER A
ND
WAS
TE -
GEN
ERAL
CAP
ITAL
FU
ND
Land
Dra
inag
e an
d Fl
ood
Con
trol
Fi
nanc
ed b
y C
ash
to C
apita
l:Fl
ood
Pum
ping
Sta
tion
Reh
abili
tatio
n2-
192
1,00
01,
000
1,00
01,
000
1,00
01,
000
6,00
0La
nd D
rain
age
and
Com
bine
d S
ewer
s O
utfa
ll G
ate
Stru
ctur
es2-
193
2,60
02,
400
1,75
01,
700
2,00
010
,450
Floo
d M
anua
l Upg
rade
s2-
194
325
325
Dev
elop
men
t Agr
eem
ent P
ayba
cks
- Dev
elop
er C
apac
ity C
harg
es2-
195
500
500
500
1,50
0O
utfa
ll R
ehab
ilita
tion
2-19
650
02,
000
2,00
02,
000
2,00
02,
000
10,5
00
Tota
l Lan
d D
rain
age
and
Floo
d C
ontr
ol
4,92
55,
900
5,25
04,
700
5,00
03,
000
28,7
75
TOTA
L W
ATER
AN
D W
ASTE
- G
ENER
AL C
APIT
AL F
UN
D4,
925
5,90
05,
250
4,70
05,
000
3,00
028
,775
Appendix 11
Adopted 2016 Operating Budget - Appendices 95

CA
PITA
L PR
OJE
CTS
SU
MM
AR
YVo
l. 3
6 YE
AR(in
Tho
usan
ds o
f $)
PAG
EB
UD
GET
TOTA
LN
O.
2016
2017
2018
2019
2020
2021
2016
- 20
21
ADO
PTED
CAP
ITAL
FOR
ECAS
T
WAT
ERW
OR
KS
SYST
EMW
ater
wor
ks S
yste
m -
Supp
ly a
nd T
reat
men
tFi
nanc
ed b
y W
ater
wor
ks R
etai
ned
Earn
ings
:S
hoal
Lak
e A
qued
uct,
Falc
on R
iver
Div
ersi
on B
ridge
s an
d Fr
eedo
m R
oad
Con
stru
ctio
n2-
197
6,00
06,
000
Sho
al L
ake
Aqu
educ
t Ass
et P
rese
rvat
ion
2-19
855
01,
200
600
2,59
54,
945
Sho
al L
ake
Aqu
educ
t Int
ake
Faci
lity
Reh
abili
tatio
n2-
199
1,46
52,
300
5020
01,
025
1,33
06,
370
Bra
nch
Aqu
educ
t Con
ditio
n A
sses
smen
t and
Reh
abili
tatio
n2-
200
1,00
01,
000
Tach
e B
oost
er P
umpi
ng S
tatio
n2-
201
1,00
02,
600
1,73
65,
336
Pum
ping
Sta
tions
Rel
iabi
lity
Upg
rade
s2-
202
825
825
Pum
ping
Sta
tions
and
Res
ervo
irs S
truct
ural
Upg
rade
s - F
irst
char
ge o
n 20
16 C
apita
l Bud
get o
f up
to $
8,70
0,00
0 (C
ounc
il D
ecem
ber 9
, 201
5)
2-20
38,
700
400
400
400
9,90
0
Chl
orin
atio
n U
pgra
ding
at P
umpi
ng S
tatio
ns2-
204
2,75
02,
750
Wat
er S
uper
viso
ry C
ontro
l and
Dat
a A
cqui
sitio
n (S
CA
DA
) U
pgra
de2-
205
3,90
095
04,
850
Wat
erw
orks
Sys
tem
Sec
urity
Upg
rade
s2-
206
600
500
1,10
0R
egul
ator
y A
sses
smen
t of W
ater
Sys
tem
Infra
stru
ctur
e an
d S
uppl
y S
ourc
es2-
207
450
575
1,02
5
Wat
er T
reat
men
t Pla
nt C
apac
ity V
alid
atio
n2-
208
150
150
Bra
nch
1 A
qued
uct a
t Sei
ne R
iver
- R
iver
bank
Sta
biliz
atio
n (E
ast S
ide)
2-20
91,
450
1,45
0
Stu
dy o
f Nat
ural
Gas
Pow
ered
Bac
kup
Pum
ps fo
r Hur
st
Pum
ping
Sta
tion
2-21
040
040
0
Dea
con
Res
ervo
ir C
ell R
ehab
ilita
tion
2-21
187
587
5D
eaco
n B
oost
er P
umpi
ng S
tatio
n S
uctio
n H
eade
r Div
ider
W
all a
nd V
alve
2-
212
200
200
Hur
st P
umpi
ng S
tatio
n B
uild
ing
- Stru
ctur
al R
epai
rs2-
213
1,77
01,
770
Tota
l Wat
erw
orks
Sys
tem
- Su
pply
and
Tre
atm
ent
24,5
409,
495
4,70
060
03,
161
6,45
048
,946
Appendix 11
96 Adopted 2016 Operating Budget - Appendices

CA
PITA
L PR
OJE
CTS
SU
MM
AR
YVo
l. 3
6 YE
AR(in
Tho
usan
ds o
f $)
PAG
EB
UD
GET
TOTA
LN
O.
2016
2017
2018
2019
2020
2021
2016
- 20
21
ADO
PTED
CAP
ITAL
FOR
ECAS
T
Wat
erw
orks
Sys
tem
- D
istr
ibut
ion
Fina
nced
by
Wat
erw
orks
Ret
aine
d Ea
rnin
gs:
Sas
katc
hew
an A
venu
e W
ater
Mai
n2-
214
4,83
04,
830
Tran
scon
a W
ater
Mai
n R
elia
bilit
y U
pgra
de2-
215
5,78
85,
788
Feed
er M
ain
Con
ditio
n A
sses
smen
t and
Reh
abili
tatio
n2-
216
1,00
01,
000
1,00
075
01,
500
1,50
06,
750
Bui
ldin
g R
enov
atio
ns -
1199
Pac
ific
Ave
nue
2-21
711
011
0C
usto
mer
Bill
ing
and
Wor
k M
anag
emen
t Sys
tem
s U
pgra
des
Pro
gram
2-21
838
049
598
554
525
523
52,
895
Web
Sel
f Ser
vice
2-21
940
040
0W
ater
Mai
n R
enew
als
- Wat
er M
ain
Ren
ewal
Res
erve
2-22
019
,000
19,5
0019
,500
20,0
0020
,500
22,0
0012
0,50
0
Tota
l Wat
erw
orks
Sys
tem
- D
istr
ibut
ion
20,7
8025
,825
27,3
8321
,295
22,2
5523
,735
141,
273
TOTA
L W
ATER
WO
RK
S SY
STEM
(Util
ity S
uppo
rted
)45
,320
35,3
2032
,083
21,8
9525
,416
30,1
8519
0,21
9
Appendix 11
Adopted 2016 Operating Budget - Appendices 97

CA
PITA
L PR
OJE
CTS
SU
MM
AR
YVo
l. 3
6 YE
AR(in
Tho
usan
ds o
f $)
PAG
EB
UD
GET
TOTA
LN
O.
2016
2017
2018
2019
2020
2021
2016
- 20
21
ADO
PTED
CAP
ITAL
FOR
ECAS
T
SEW
AGE
DIS
POSA
L SY
STEM
Sew
age
Dis
posa
l Sys
tem
- Tr
eatm
ent
Fina
nced
by
Sew
age
Dis
posa
l Sys
tem
Ret
aine
d Ea
rnin
gs:
Bio
solid
s - A
ltern
ativ
e D
ispo
sal D
eliv
ery
and
Man
agem
ent
Sys
tem
- Env
ironm
enta
l Pro
ject
s R
eser
ve50
050
0- R
etai
ned
Ear
ning
s22
,050
1,00
023
,050
Tota
l Bio
solid
s - A
ltern
ativ
e D
ispo
sal D
eliv
ery
and
Man
agem
ent S
yste
m2-
221
500
22,0
501,
000
23,5
50
Was
tew
ater
Sys
tem
Sec
urity
Upg
rade
s2-
222
500
500
500
1,50
0N
orth
End
Sew
age
Trea
tmen
t Pla
nt (N
EW
PC
C) -
Nut
rient
R
emov
al /
Upg
rade
- Ret
aine
d E
arni
ngs
54,6
6154
,661
- Env
ironm
enta
l Pro
ject
s R
eser
ve17
,449
17,4
49- E
xter
nal D
ebt
579,
286
579,
286
Tota
l Nor
th E
nd S
ewag
e Tr
eatm
ent P
lant
(NE
WP
CC
) -
Nut
rient
Rem
oval
/ U
pgra
de2-
223
651,
396
651,
396
Wes
t End
Sew
age
Trea
tmen
t Pla
nt (W
EW
PC
C) -
Effl
uent
M
onito
ring
Sta
tion
- (fo
rmer
ly -
Wes
t End
Wat
er P
ollu
tion
Con
trol C
entre
(WE
WP
CC
) - S
ettli
ng Im
prov
emen
t)
2-22
445
045
0
Pro
cess
Con
trol S
yste
m M
aste
r Pla
n an
d U
pgra
de -
(form
erly
-W
ater
Pol
lutio
n C
ontro
l Cen
tres
(WP
CC
) - D
istri
bute
d C
ontro
l S
yste
m (D
CS
) and
Hum
an M
achi
ne In
terfa
ce (H
MI)
Upg
rade
s)
2-22
55,
000
5,00
0
Ass
et R
efur
bish
men
t and
Rep
lace
men
t Pro
gram
2-22
62,
000
2,00
02,
000
2,00
02,
000
2,00
012
,000
Ora
cle
Wor
k A
sset
Man
agem
ent (
OW
AM
) Fin
e G
rain
Acc
ess
2-22
779
579
5W
aste
wat
er In
form
atio
n M
anag
emen
t Sys
tem
(WIM
S)
Das
hboa
rd2-
228
1,40
01,
400
Tota
l Sew
age
Dis
posa
l Sys
tem
- Tr
eatm
ent
656,
541
2,00
029
,050
2,50
02,
500
3,50
069
6,09
1
Appendix 11
98 Adopted 2016 Operating Budget - Appendices

CA
PITA
L PR
OJE
CTS
SU
MM
AR
YVo
l. 3
6 YE
AR(in
Tho
usan
ds o
f $)
PAG
EB
UD
GET
TOTA
LN
O.
2016
2017
2018
2019
2020
2021
2016
- 20
21
ADO
PTED
CAP
ITAL
FOR
ECAS
T
Sew
age
Dis
posa
l Sys
tem
- C
olle
ctio
nFi
nanc
ed b
y Se
wag
e D
ispo
sal S
yste
m R
etai
ned
Earn
ings
:A
rc F
lash
Haz
ard
Ana
lysi
s an
d R
emed
iatio
n2-
229
1,10
040
01,
500
Lift
Sta
tions
Upg
radi
ng2-
230
2,45
02,
582
2,72
22,
870
3,02
83,
150
16,8
02P
less
is R
oad
Inte
rcep
tor
2-23
17,
300
7,30
0K
enas
ton
Bou
leva
rd In
terc
epto
r2-
232
6,44
26,
442
Com
bine
d S
ewer
Ove
rflow
and
Bas
emen
t Flo
od M
anag
emen
t S
trate
gy
- Env
ironm
enta
l Pro
ject
s R
eser
ve2-
233
12,6
9919
,800
32,7
6432
,300
35,7
8421
,518
154,
865
Com
min
utor
Cha
mbe
r Reh
abili
tatio
n P
rogr
am2-
235
1,00
01,
100
1,10
01,
200
4,40
0N
orth
east
Inte
rcep
tor R
iver
Cro
ssin
g U
pgra
de2-
236
11,0
0011
,000
D'A
rcy
Lift
Sta
tion
Load
She
ddin
g U
pgra
de2-
237
400
400
Col
lect
ion
Sys
tem
Pow
er R
elia
bilit
y S
tudy
2-23
812
012
0W
WD
Bus
ines
s In
telli
genc
e 2-
239
150
210
1,56
060
048
03,
000
Cus
tom
er B
illin
g an
d W
ork
Man
agem
ent S
yste
ms
Upg
rade
s P
rogr
am2-
240
380
495
985
545
255
235
2,89
5
HR
Doc
umen
t Man
agem
ent S
yste
m2-
241
300
300
Geo
grap
hica
l Inf
orm
atio
n S
yste
m a
nd P
ublic
Wor
ks M
anag
er
Upg
rade
s2-
242
310
310
Cor
pora
te a
nd D
epar
tmen
tal A
sset
Man
agem
ent P
lans
2-24
320
020
0S
ewer
Ren
ewal
s - F
irst c
harg
e on
201
6 C
apita
l Bud
get o
f up
to $
2,50
0,00
0 (C
ounc
il D
ecem
ber 9
, 201
5)- S
ewer
Sys
tem
Reh
abili
tatio
n R
eser
ve2-
244
16,9
0017
,800
18,2
0019
,500
20,5
0021
,500
114,
400
Tota
l Sew
age
Dis
posa
l Sys
tem
- C
olle
ctio
n45
,909
50,3
8757
,731
57,0
1560
,047
52,8
4532
3,93
4
TOTA
L SE
WAG
E D
ISPO
SAL
SYST
EM70
2,45
052
,387
86,7
8159
,515
62,5
4756
,345
1,02
0,02
5
Appendix 11
Adopted 2016 Operating Budget - Appendices 99

CA
PITA
L PR
OJE
CTS
SU
MM
AR
YVo
l. 3
6 YE
AR(in
Tho
usan
ds o
f $)
PAG
EB
UD
GET
TOTA
LN
O.
2016
2017
2018
2019
2020
2021
2016
- 20
21
ADO
PTED
CAP
ITAL
FOR
ECAS
T
SOLI
D W
ASTE
DIS
POSA
L SY
STEM
Solid
Was
te D
ispo
sal S
yste
m -
Land
fill
Fina
nced
by
Solid
Was
te D
ispo
sal R
etai
ned
Earn
ings
:B
rady
Roa
d R
esou
rce
Man
agem
ent F
acili
ty -
Adm
inis
tratio
n B
uild
ing
- Ext
erna
l Deb
t2,
450
2,45
0- R
etai
ned
Ear
ning
s55
050
600
Tota
l Bra
dy R
oad
Res
ourc
e M
anag
emen
t Fac
ility
- A
dmin
istra
tion
Bui
ldin
g2-
245
550
2,50
03,
050
Bra
dy R
oad
Res
ourc
e M
anag
emen
t Fac
ility
- A
ltern
ativ
e E
nerg
y Fe
asib
ility
Stu
dy2-
246
200
200
Bra
dy R
oad
Res
ourc
e M
anag
emen
t Fac
ility
- C
ell
Con
stru
ctio
n - P
hase
1
- Ret
aine
d E
arni
ngs
2,60
02,
600
- Ext
erna
l Deb
t2,
100
2,20
02,
300
6,60
0To
tal B
rady
Roa
d R
esou
rce
Man
agem
ent F
acili
ty -
Cel
l C
onst
ruct
ion
- Pha
se 1
2-
247
2,60
02,
100
2,20
02,
300
9,20
0
Bra
dy R
oad
Res
ourc
e M
anag
emen
t Fac
ility
- C
ell
Con
stru
ctio
n - P
hase
22-
248
600
3,85
02,
950
7,40
0
Bra
dy R
oad
Res
ourc
e M
anag
emen
t Fac
ility
- D
rain
age,
R
oadw
ays
and
Site
Impr
ovem
ents
- Ext
erna
l Deb
t2-
249
600
400
1,00
0B
rady
Roa
d R
esou
rce
Man
agem
ent F
acili
ty -
Land
fill G
as
Cap
ture
Exp
ansi
on -
Pha
se 2
- Ext
erna
l Deb
t2-
250
1,60
01,
800
3,40
0C
lose
d La
ndfil
l Site
Impr
ovem
ent
2-25
120
020
0To
tal S
olid
Was
te D
ispo
sal S
yste
m -
Land
fill
5,75
05,
000
4,00
02,
900
3,85
02,
950
24,4
50So
lid W
aste
Dis
posa
l Sys
tem
- C
olle
ctio
nFi
nanc
ed b
y So
lid W
aste
Dis
posa
l Ext
erna
l Deb
t:C
ompr
ehen
sive
Inte
grat
ed W
aste
Man
agem
ent S
trate
gy
(CIW
MS
) - 4
R W
inni
peg
Dep
ots
(Com
mun
ity R
esou
rce
Rec
over
y C
entre
s)
2-25
240
04,
750
5,15
0
Tota
l Sol
id W
aste
Dis
posa
l Sys
tem
- C
olle
ctio
n40
04,
750
5,15
0
TOTA
L SO
LID
WAS
TE D
ISPO
SAL
SYST
EM6,
150
9,75
04,
000
2,90
03,
850
2,95
029
,600
Appendix 11
100 Adopted 2016 Operating Budget - Appendices
kmorton
Text Box
Return to Table of Contents

Appendix 12
Service Sub-Service Service Sub-Service
Roadway Constr. & Maintenance Bridge Constr & Maint Police Response Police ResponseRegl Streets Constr & Maint Contract PolicingLocal Streets Constr & Maint Crime InvestigationRegl Sidewalk Constr & Maint Police TrainingLocal Sidewalk Constr & Maint Crime Prevention Community Policing
Transp. Planning & Traffic Mgmt Transportation Plan & Design Street LightingTraffic/Right of Way Mgt Park Patrol
Roadway Snow Rmvl & Ice Cont Regl Streets Snow & Ice Removal Crime Prevention InitiativesLocal Streets Snow & Ice Removal Traffic Safety & Enforcement Traffic Safety-AutomatedSidewalk Snow & Ice Removal Traffic Safety-OfficerParks & Facility Snow & Ice Removal Traffic Safety-DivisionSnow Disposal Sites Fire and Rescue Response Fire & Rescue Response
Public Transit Regular Transit Fire InvestigationHandi-Transit Fire and Injury Prevention Fire & Injury Prev EducationChartered & Special Events Transit Fire Inspection
City Beautification Litter Collection Medical Response Medical ResponsePublic Gardens/Landscaping Medical TransfersOrnLight/Flags,Banners/PubArt Disaster Preparedness & Resp Disaster Preparedness & ResponseGraffiti Control Recreation ArenasRegional Street Cleaning Aquatics ProgramsLocal Street Cleaning Ice Skating
Fleet Management SOA Fleet Management Recreation ProgramsParking Authority SOA Parking Facilities Casual Facility Use
On Street Parking Enfrcmt Community Centres On-Street Parking Parks & Urban Forestry Park Grass Maintenance
Park Amenity MaintenanceWater Water Supply & Treatment Athletic Field Maintenance
Water Distribution Park Pathway MaintenanceWastewater Wastewater Collection Park Planning/Development
Wastewater Treatment Tree PlantingLand Drainage & Flood Control Flood Control Tree Pruning & Removal
Land Drainage Dutch Elm Disease ControlSolid Waste Collection & Disp Solid Waste Collection Weed Control
Solid Waste Disposal Natural Areas ManagementRecycling & Waste Diversion Recycling Playground Management
Waste Diversion Winter Amenity MaintenanceBoulevard Maintenance
City Planning Area Dev & Renewal Planning Community Liveability Community Health InspectionCity-wide Long Range Planning Community By-law Enforcement
Neighbourhood Revitalization Community Development Bicycle RecoveryHousing Initiatives Citizen Crisis ResponseRes Dev Approvals & Inspection Social GrantsCom Dev Approvals & Inspection Libraries Library Circulation
Economic Development Economic Development Library InformationHeritage Conservation Heritage Conservation Children's LibraryProperty Asset Management Municipal Accommodations Arts, Entertainment & Culture Arts, Ent & Culture Grants
Pool Facilities Arts, Ent & Culture EventsArena Facilities MuseumsRecreation Centres Assiniboine Park ConservancyCommunity Centre Facilities Insect Control Insect ControlLand and Property Golf Services SOA Golf Courses
Cemeteries Cemeteries Animal Services SOA Animal Control & Care
Organizational Support Services Chief Administrative OfficesCommunicationsFinancial ManagementHuman Resource ManagementInfo Technology ManagementLegal ServicesProduction Services
Assessment, Taxation & Corporate Assessment and TaxationCorporate
Contact Centre - 311 Contact Centre - 311Council Services Auditing
Mayor and CouncilArchives-City ClerksElections-City ClerksCitizen Access and AppealsCouncil Support-City ClerksExecutive Support
Executive Policy
Service Based Budget - Services By Policy Area
Water and Waste, Riverbank Management and the Environment
Property and Development, Heritage and Downtown Development
Dev Approvals, Bldg Permits & Inspections
Infrastructure Renewal and Public Works Protection, Community Services & Parks / Winnipeg Police Board
Adopted 2016 Operating Budget - Appendices 101
kmorton
Text Box
Return to Table of Contents

102 Adopted 2016 Operating Budget - Appendices