2008-2009 Annual Business Plan and Budget - Light ...
194
2008-2009 Annual Business Plan and Budget Light Regional Council PO Box 72 KAPUNDA SA 5373 Ph : ( 08) 8525 3200 Fax: ( 08) 8566 3262 Email: [email protected] a.gov.au 93 Main Street KAPUNDA SA 5373
-
Upload
khangminh22 -
Category
Documents
-
view
5 -
download
0
Transcript of 2008-2009 Annual Business Plan and Budget - Light ...

2008-2009
Annual Business Plan and Budget
Light Regional Council PO Box 72
KAPUNDA SA 5373 Ph: (08) 8525 3200 Fax: (08) 8566 3262
Email: [email protected] a.gov.au
93 Main Street KAPUNDA SA 5373

2008-2009 Annual Business Plan 2
Contents Overview
Opening Commentary from the Mayor and Chief Executive Officer
3
State Legislation 5
Public Consultation
5
Glossary of Terms
6
General Information 8 Assessment of 2007/08 Financial Year Objectives 10 Strategic Plan and Long Term Objectives 22 2008/09 Annual Objectives and Activities (inc luding performance measures)
24
Financ ial Requirements and Summary of Financial Statements
31
Rating Structure and Policy 39 Financ ial Impacts of Infrastructure Management 43 Summary Tables of Income and Expenditure 46 Loan Pr inc ipal Repayments 49 Summary of Total Expenditure and Income 51
2008-2009 Annual Business Plan 3
Overview Opening Co mmentary fro m t he Mayor and Chief Executive Officer The Annual Business Plan sets out the Council ’s proposed serv ices, programs and projects f or the 2008/ 2009 f inanc ial year. It aims to maintain eff icient serv ices for the community and to undertake significant inf rastructure development f or the benefit of the region as a whole. Specific objectives f or the year are consistent with the strategies and actions discussed in Council ’s draf t Strategic Management Plan f or the period covering t he years 2008 to 2018. The new ten year plan is currently in draft f orm and has been released f or public comment during June 2008. The Public Consultation period wi ll cover the month of July 2008 with a report due back t o Counci l to adopt the plan in August. It is a comprehensive document which f ocuses on the big picture while placing due regard on core programs and t he phi losophy of place management. Strat egic Plan The central tenet of Council’s new strategic plan is to promote the opport unity for development and growth within t he region, not f or growth’s sake, but sust ainable development which adds value and qual ity inf rastructure to a region that has a unique blend of urban pursuit, industrial and commercial venture, and rural enterprise. The Plan has direct linkages into the South Australian St ate Strategic Plan and the work being undertaken by groups such as the Wakefield Group and the Barossa Regional Spatial Framework group of Councils, and reports such as the Wine Industry Impact Review. It talks about maintaining core serv ices but places a premium on the development of appropriat e infrastructure (such as Waste Water Treatment Plants) to manage to project ed residential, commercial and industrial development predict ed to occur within the Council region in the next few years. For example Counc il is already aware of the potential f or 1,000 residential al lotments coming on stream wit hin existing t ownship boundaries in the short to medium term. Development of 330 allotments has already commenced in the Freeling Township to the nort h and south of Hanson Street, while a f urther 60 al lotment subdiv ision is currently being developed at Greenock. Council has been one of the f astest growing Councils per head of population in South Australia for a number of years, with the trend set to continue going f orward. Council ’s Urban Planning strategy is central t o the plan as Counc il must maint ain appropriate controls to ensure proper developments occur. The plan places a f ocus on Council’s operational financial sustainabi lity (conservatively predicted to be achieved in the 2013/2014 f inancial year) but also establishes a definitive planned road inf rastructure f unding program. This program is built on the back of the Accelerated Roads Funding Program introduced in the 2007/ 2008 f inancial year, when Council recognized that t he qual ity of road inf rastruct ure was an issue f or its community and then t aking the bold step to f und (by borrowings ) those road works to the value $5. 0m over the 2007/2008 and 2008/ 2009 periods. Annual Objectives The 2008/2009 f inancial year looms as a particularly exciting one for the Light Regional Council wit h many and varied major outcomes expected. Council ’s Annual Business Planning process is an opportunity to reassess Counc il’s position relative to the needs of present and f uture communities within the Council area. These needs include, maintaining and improving the management of major inf rastruct ure assets, prov iding community support programs, maint aining and improving open space, improv ing the community ’s access to information, building a strong economy and maint aining our nat ural resources. A balance is required bet ween del ivering community outcomes and maintaining financial sustainability.

2008-2009 Annual Business Plan 4
In particular the f inal adoption of the 2008 to 2018 Strategic Management Plan projecting Council ’s future direction will be a major highlight. The document is designed to be updat ed as needed. Aligned t o this is the adoption of the Infrastructure and Asset Management Plan. Council is keen t o maint ain its input into t he “Barossa Belt” Regional Spatial Plan being developed in conjunction with The Barossa, Gawler and Mallala Councils and State Government agencies. Input is also being prov ided by ot her neighbouring Councils. The plan is to highlight f uture development areas and to put appropriate strategies in place f rom both planning and infrastructure and assets management perspectives to ensure orderly development across t he entire region. Council ’s $4.0m road works program during 2008/ 2009 will see the final st age of the Accelerated Road Works Program completed, however the program sets t he stage for t he reinv igorated capital works program being considered as part of the new Strat egic Plan. Coupled with t he development of an Asset Rationalisation Fund (f or f uture funding of community projects), and the Federal Government f unded $6.0m upgrade of the Main North Road (in partnership wit h the Department f or Transport, Energy and Inf rastructure), places the f ocus f airly and squarely on better roads. The prov ision of new and upgraded public conveniences throughout the t owns of the region will also be a major f ocus this year. Rev iew and design of community facilities of f ered at Hewett and Kapunda (Dutton Park) f orm part of Counc il’s vision. Counci l is particularly keen to have the redevelopment of Freeling Main Street (on ground works) progressed and f inalised, after hav ing a substantial amount of grant funding provided f rom the State Government f or this project (undergrounding of power occurred in the 2007/2008 f inancial year). Planning will continue f or the undergrounding of power at Murray Street, Greenock. From an operational sense, Council will look to implement a ‘speedy’ development appl ication system f or new subdiv ision residential developments. Council resolved to increase revenue received f rom general rates by 7.5%, that is the annual cost of liv ing or Consumer Price Index f igure over the past t welve months (4.5% to the period ending 31 March 2008), and t he impact of assessment growt h through t he creation of newly rateable properties in the Light Region (2% t o 21 June 2008). An additional 1% general rate revenue will also be raised specif ically f or the purposes of funding inf rastructure projects. Council cannot reach its goals in isolation. We wil l also use our resources efficiently by collaborating wit h other sectors of the community and spheres of government t o maximise benef its f or our local community . We must f ind a balance in our decision making bet ween social, cultural, economic and env ironmental issues to ensure our region remains strong, now and in the f uture.
Robert Hornsey , Mayor Brian Carr, Chief Executive Of f icer

2008-2009 Annual Business Plan 5
State Legislation Section 123 of the Local Government Act 1999 describes that Councils must do certain things when considering the issue of budgets:
• A counci l must have a Budget f or each f inanc ial year.
• Each budget must comply wit h standards and principles presc ribed by legislation and must be adopted af ter 31 May and bef ore 31 August f or the f inancial year.
• A counci l must prepare an Annual Business Plan which addresses the activ ities that the council intends t o undert ake in the ensuing year to achieve its objectives; and t he measures (f inancial and non-f inanc ial) that the council wil l use to assess its perf ormance against its objectives.
Legislation among other things requires Counci ls in t his Stat e to prov ide a great er emphasis on long term financial planning and infrastructure and asset management planning. Council wi ll have these plans in place during the 2008 calendar year. These requirements in particular will see an increased f ocus of resources by Counc il in the f orthcoming f inancial year when it finalises its Strat egic Plan covering the period 2008-2018.
Public Consultation Each Counc il must consult with t he public in relation to the strategy , content and impact of its Annual Business Plan and Budget documents. To this end Council undertook a period of public consultation wit h its community in relation to its Annual Business Plan. The period of public consult ation commenced in May 2008 f ollowing the publ ication of notices in newspapers circulating within the Council area. A publ ic meeting was held on Wednesday , 4 June 2008 where written and verbal submissions could be made by the community directly to the Counc il. The public consult ation period then f ormal ly concluded on Friday, 13 June 2008. Copies of the document were also placed on Counci l’s websit e at www.light.sa. gov .au and at Council’s off ices and libraries to enable ample opportunity f or members of the public to access the documents. A subsequent report and recommendations were present ed t o Counci l at its June 2008 mont hly meeting and at a special meeting on Tuesday , 24 June 2008. The Annual Business Plan and Budget was adopted at a special meeting of Council on Tuesday , 1 July 2008.
2008-2009 Annual Business Plan 6
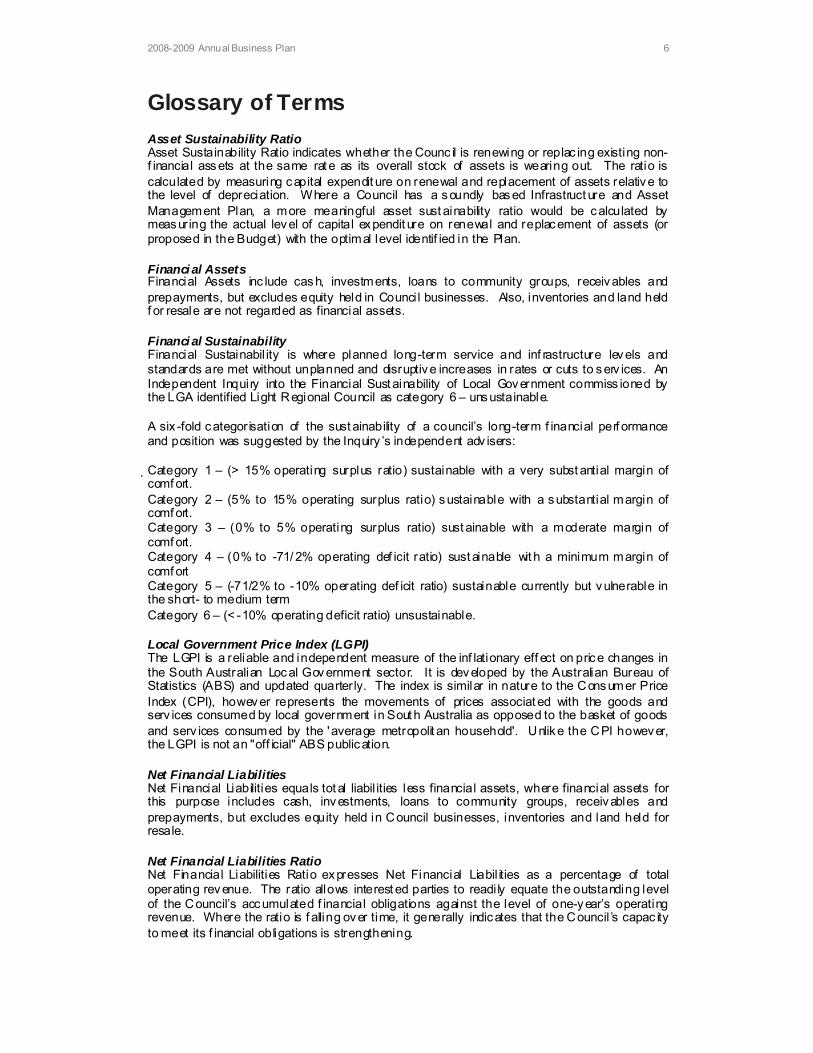
Glossary of Terms Asset Sustainability Ratio Asset Sustainability Ratio indicates whether the Counc il is renewing or replac ing existing non-f inancial assets at the same rat e as its overall stock of assets is wearing out. The ratio is calculated by measuring capital expendit ure on renewal and replacement of assets relative to the level of depreciation. Where a Council has a soundly based Infrastruct ure and Asset Management Plan, a more meaningful asset sust ainability ratio would be calculated by measuring the actual level of capital expendit ure on renewal and replacement of assets (or proposed in the Budget) with the optimal level identif ied in the Plan. Financi al Assets Financial Assets inc lude cash, investments, loans to community groups, receivables and prepayments, but excludes equity held in Counci l businesses. Also, inventories and land held f or resale are not regarded as financial assets. Financi al Sustainability Financial Sustainabil ity is where planned long-term service and inf rastructure levels and standards are met without unplanned and disruptive increases in rates or cuts to serv ices. An Independent Inquiry into the Financial Sust ainability of Local Government commiss ioned by the LGA identified Light Regional Council as category 6 – unsustainable. A six -fold categorisation of the sust ainability of a council’s long-term f inancial perf ormance and position was suggested by the Inquiry ’s independent adv isers: Category 1 – (> 15% operating surplus ratio) sustainable with a very subst antial margin of comf ort. Category 2 – (5% to 15% operating surplus ratio) sustainable with a substantial margin of comf ort. Category 3 – (0% to 5% operating surplus ratio) sust ainable with a moderate margin of comf ort. Category 4 – (0% to -71/ 2% operating def icit ratio) sust ainable wit h a minimum margin of comf ort Category 5 – (-71/2% to -10% operating def icit ratio) sustainable currently but vulnerable in the short- to medium term Category 6 – (< -10% operating deficit ratio) unsustainable. Local Government Price Index (LGPI) The LGPI is a reliable and independent measure of the inf lationary eff ect on price changes in the South Australian Local Government sector. It is developed by the Australian Bureau of Statistics (ABS) and updated quarterly. The index is similar in nature to the Consumer Price Index (CPI), however represents the movements of prices associat ed with the goods and serv ices consumed by local government in Sout h Australia as opposed to the basket of goods and serv ices consumed by the 'average metropolit an household'. Unlike the CPI however, the LGPI is not an "off icial" ABS publication. Net Financial Liabilities Net Financial Liabilities equals tot al liabil ities less financial assets, where financial assets for this purpose includes cash, investments, loans to community groups, receivables and prepayments, but excludes equity held in Council businesses, inventories and land held for resale. Net Financial Liabilities Ratio Net Financial Liabilities Ratio expresses Net Financial Liabil ities as a percentage of total operating revenue. The ratio allows interest ed parties to readi ly equate the outstanding level of the Council’s accumulated f inancial obligations against the level of one-year’s operating revenue. Where the ratio is f alling over time, it generally indicates that the Council ’s capac ity to meet its f inancial obligations is strengthening.

2008-2009 Annual Business Plan 7
Net Lending/(Borrowing) Net Lending/(Borrowing) equals Operating Surplus/(Def icit), less net outlays on non-f inanc ial assets. The Net Lending/(Borrowing) result is a measure of the Council ’s overall (i.e. Operating and Capit al) budget on an accrual basis. Achieving a zero result on the Net Lending / (Borrowing) measure in any one year essential ly means t hat the Counc il has met all of its expenditure (bot h operating and capital) f rom the current year’s revenues. Non-financi al or Physical Assets Non-f inancial or Physical Assets mean inf rastruct ure, land, buildings, plant, equipment, f urniture and f ittings, library books and invent ories. Oper ating Defici t Operating Deficit is where operating revenues less operating expenses is negative and operating income is theref ore not suff icient to cover al l operating expenses. Oper ating Expenses Operating Expenses are operating expenses including depreciation but exc luding losses on disposal or revaluation of non-financial assets. Oper ating Revenues Operating Revenues are operating revenues shown in the Income Statement but exc lude prof it on disposal of non–f inancial assets and amounts received specif ically f or new/upgraded assets, eg. f rom a developer. For ratios calculat ed where the denominat or specif ied is total operating revenue or rate revenue, Natural Resource Management (NRM) levy revenue is excluded. Oper ating Surplus Operating Surplus is where operating revenues less operating expenses is positive and operating revenue is therefore suff icient to cover all operating expenses.
2008-2009 Annual Busi ness Plan 8
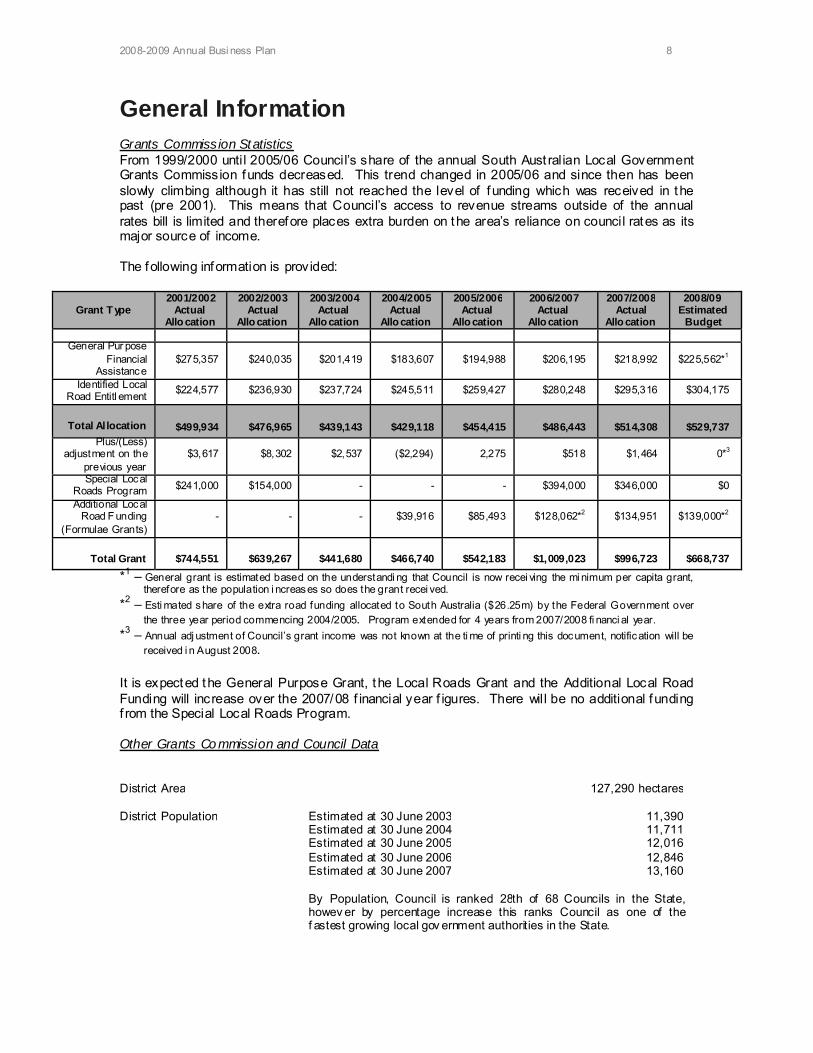
General Information Grants Commission Statistics From 1999/2000 until 2005/06 Council’s share of the annual South Aust ralian Local Government Grants Commission funds decreased. This trend changed in 2005/06 and since then has been slowly climbing although it has still not reached the level of funding which was received in the past (pre 2001). This means that Council’s access to revenue streams outside of the annual rates bill is limited and therefore places extra burden on the area’s reliance on council rates as its major source of income. The following information is provided:
Grant T ype 2001/2002
Actual Allo cation
2002/2003 Actual
Allo cation
2003/2004 Actual
Allo cation
2004/2005 Actual
Allo cation
2005/2006 Actual
Allo cation
2006/2007 Actual
Allo cation
2007/2008 Actual
Allo cation
2008/09 Estimated
Budget
General Pur pose Financial
Assistance $275,357 $240,035 $201,419 $183,607 $194,988 $206,195 $218,992 $225,562*1
Identified Local Road Entitl ement $224,577 $236,930 $237,724 $245,511 $259,427 $280,248 $295,316 $304,175
Total Allocation
$499,934
$476,965
$439,143
$429,118
$454,415
$486,443
$514,308
$529,737 Plus/(Less)
adjustment on the previous year
$3,617 $8,302 $2,537 ($2,294) 2,275 $518 $1,464 0*3
Special Local Roads Program $241,000 $154,000 - - - $394,000 $346,000 $0
Additional Local Road F unding
(Formulae Grants) - - - $39,916 $85,493 $128,062*2 $134,951 $139,000*2
Total Grant
$744,551
$639,267
$441,680
$466,740
$542,183
$1,009,023
$996,723
$668,737
*1 – General grant is estimated based on the understandi ng that Council is now recei ving the mi nimum per capita grant, therefore as the population i ncreases so does the grant recei ved.
*2 – Esti mated share of the extra road funding allocated to South Australia ($26.25m) by the Federal Government over the three year period commencing 2004/2005. Program extended for 4 years from 2007/2008 fi nanci al year.
*3 – Annual adj ustment of Council’s grant income was not known at the ti me of printi ng this document, notification will be received i n August 2008.
It is expected the General Purpose Grant, the Local Roads Grant and the Additional Local Road Funding will increase over the 2007/08 f inancial year f igures. There will be no additional funding f rom the Special Local Roads Program. Other Grants Co mmission and Council Data District Area 127,290 hectares District Population Estimated at 30 June 2003 11,390 Estimated at 30 June 2004 11,711 Estimated at 30 June 2005 12,016 Estimated at 30 June 2006 12,846 Estimated at 30 June 2007 13,160 By Population, Council is ranked 28th of 68 Councils in the State,
howev er by percentage increase this ranks Council as one of the f astest growing local gov ernment authorities in the State.

2008-2009 Annual Busi ness Plan 9
Road Length Council has a total of 1,448 kilometres of road within its area, which ranks it 19th of 68 councils in the State. Road ty pes are:
Sealed 149 kms Formed 1,240 kms Unf ormed 59 kms Council’s road infrastructure can be f urther classif ied as: Sealed Roads in Built Up Areas 65 kms Sealed Roads in Non Built Up
Areas 84 kms
Unsealed Roads in Built Up Areas 27 kms Unsealed Roads in Non Built Up
Areas 1,211 kms
Unf ormed Roads 59 kms Dev elopment Applications The number of New Dev elopments and Additions processed f or the
2006/07 period was 826. Other Based on the level of general council rates generated for the 2007/08 f inancial year, a 1% increase on general rates is equivalent to $80,317. Staff Issues At the time of preparing this Plan, Council employed the following full time, part time and casual staff (shown in terms of full time equivalent staf f numbers, i.e. f te): Department Number of
Emplo yees at 30/6/2004
(fte)
Number of Emplo yees at
30/6/2005 (fte)
Number of Emplo yees at
30/6/2006 (fte)
Number of Emplo yees at
30/6/2007 (fte)
Estimated Number of
Emplo yees at 1/5/2008
(fte) Corporate Services (includes Executiv e staff)
14.1 14.5 17.2 14.2 17.8
Human Services (includes Libraries)
2.8 5.3 6.3 5.8 5.1
Env ironmental Serv ices 7.4 8.7 10.3 10.0 10 Engineering and Inf rastructure Services
22.4 20.9 18.1 17.0 26
Total Staff 46.7 49.4 51.9 47.0 58.9 The increased positions have been the result of f illing vacant positions and additional positions required f rom the signif icant increase in inf rastructure works. Increases to salaries and wages are set through an Enterprise Bargaining Agreement.
2008-2009 Annual Busi ness Plan 10
Assessment of 2007/08 Financial Year Objectives In accordance with Clause 2 of Schedule 4 to the Local Government Act 1999, Council is required to measure its performance against the implementation of those activ ities by way of both f inancial or non-f inancial performance indicators and report on that performance outcome as part of its Annual Report to its constituency.
Council highlighted during the preparation of its 2007/2008 Annual Business Plan various activ ities by which it intended to measure its performance for the year.
There are a number of activ ities to measure which will be shown in the Annual Report by way of performance targets and classif ied as follows:
• ‘Reviewed & deferred’ – Determined as not being required to be completed following
budget review or in preparation of the 2007/2008 Annual Budget due to other emerging priorities.
• ‘Actioned’ – Determined to be an approved carried forward project – a project not
expected to be completed during the target year due to resourcing constraints or other emerging priorities.
• ‘Commenced’ – Project has commenced and reached a stage of development with
Council or appropriate policy committee.
• ‘Substantially Completed’ – Project has commenced and reached a stage of substantial development (>75%) with Council or appropriate policy committee.
• ‘Completed as Planned’ – Project has reached def ined objective.
• ‘Exceeded Target’ - Project exceeds target set.
The activ ities to be measured are il lustrated in the following document titled ‘2007/08 Annual Statement’.

2008-2009 Annu al Business Plan 11
2007/08 Annual Statement
Operational Area Strategy Action Measurab le Outcom e Action Status Comments
Community & Cultural Development
To de velop a fra m ework to incorpora te into Co uncil's com municatio n and inform atio n strat eg y.
Revie w and upd ate Co uncil's Comm unit y Servic e's D irectory an d Co mm unit y Newslet ter.
Financial – Pu blicatio n of appro priate doc umen ts within budget . Non-Financi al – Positive a nd relevant in formatio n disse mina tion and cons ulta tion.
COMMENCED Com munit y Directory infor matio n h as b een upd ate d. Currently upda ting the CISA da tabase bef ore pr inti ng .
Optimise t he use of Cou ncil owne d f acilities b y pro vi ding sustainable multif uncti onal com munit y ser vice facilities.
Underta ke fe asibility studi es on iden tified commu nity asse ts in accord anc e wit h an Asset Rati onalisa tion Prog ram f or the centralisati on of c ommu nit y g rou ps.
Financial – Decre ased an nual mainten anc e costs. M an ag em ent Fees p aid to c ommu nit y as p er budget alloc ations . Non–Financial – Co mmunit y support and ag reem ent ob tain ed for m ulti-usage of ke y facilities based on l og ical outc omes. Revie w und erta ke n of Co mmunit y Lan d M a nag e men t Pl ans.
COMMENCED Project has co mme nce d on an a d hoc basis foc using on co mpleting outda ted lease arrange ments an d on m aint enance issues wit h sp ecific pu blic building s (eg. Wasle ys Small Hall) . Larg er Revie w of M ulti-usag e and Com munit y Land Re view yet t o occ ur.
Sup port t he pro vision and diversity of acti vities t hat enriches local c ulture and devel ops a se nse of id entit y and pr ide .
Promote an d su pport co mmunit y based projects an d cultural e vents (eg Australia Day Award Celebrations, Aus tralian citizenship c eremoni es etc) t hat eng e nder civic pr id e a nd wellbeing .
Financial – B udg et allocations m et. Non-Financi al – W ell attend ed functi ons an d e ve nts, enh anc ement of sens e of commu nity.
SUBSTANTIALLY COMPLETED
Council support ed fu nctio ns, in partic ular the T our Down Un der and A ustralia Da y functi ons, ha ve be en well su pp orted b y bot h sector a nd co mmunit y. The Bobfest even t has been resc he dule d to occur at Bala klava in April 20 08.
Develop a ser vice d elivery mo del f or th e pro vision of q uality ag ed care a nd sup port services .
Develop su pp ort servic es in the are as of Home Assist, trans port, i nformati on, therap y ser vices and soci al supp ort.
Financial – B udg et allocations m et. Non-Financi al – M arketi ng of availabl e progra ms to ens ure t a ke up (where able) by Light reg ion residents .
COMMENCED - ONGOING
Home Assist, co m mu nit y transp ort & leisure op tion s ervices sup port ed b y Council a nd con tinu e t o run .

2008-2009 Annu al Business Plan 12
Operational Area Strategy Action Measurab le Outcom e Action Status Comments
Prom ote servic es, facilities and prog ra ms that will enco urag e the p articipati on of yout h within th e reg ion.
Facilitate t he de velo pm ent of co mm unit y programs to assist young peo ple in the transition from scho ol to work b y de vel oping yout h trai ning a nd e mplo ym ent programs a nd a youth men toring prog ram in collab orati on wit h t he Baross a and Light Regional De vel opme nt Boar d's Yo uth Ambassador Pr og ram. Underta ke an assess me nt of e xisting resources t o su pport th e re view and de vel op me nt of yo uth services.
Financial – B udg et allocations m et. Non-Financi al – Ap point m ent of Volun te er Yo uth Ad vis ory Committee Coordinat or. M aintain involve men t of yout h in th eir committe e. Mar keting of a vailable programs in B arossa an d Lig ht reg ion. Increased participa tion rates.
SUBSTANTIALLY COMPLETED
Increased collab orati ve a ppro ach to provision of Yo uth S ervices in co nju nction with Th e B arossa Council’s Yo uth Developme nt Officer. Wor kforce De velopm ent Network esta blished Yo uth Lea ders hip prog ram com plete d. Operation Flind ers Prog ram com mencing in Octo ber 200 8.
To co-op erate with o ther sta ke hold ers in enha ncing com munit y s afet y and prom oting acce pt able stan dards o f co mm unit y beh a viour.
Ado pt C rime Pre ve ntion throug h En viron me ntal D esig n pr inciples for the passi ve r educ tion of unacce pt able beh aviour.
Financial – B udg et allocations m et. Non-Financi al – Pro mot e n on accep tance o f des tructi ve beh aviour. Eng ender co mmunit y support for re porting u nacce pt able beh aviour. Obtain r esourc es f or commu nity service prog rams.
COMMENCED - ONGOING
Developed a p artnershi p with SAPO L and Neig hbourh oo d Watc h. Beg un inst allation o f closed circuit TV syst em in K ap un da.
Governance Prom ote t he role and intang ible social be ne fit o f the positio n o f being an elected me mb er wit hin t he Cou ncil area.
Activel y pro mote elect ed m embers as civic leaders wit hin the local co mmunit y an d the contribu tions ma de t hroug h me mb ership of var io us loc al co mm unit y c ommittees .
Financial – B udg et allocations m et. Non-Financi al – Prom ote responsi bility, trust a nd accou nta bility as key elem ents of local representa tion. E nsure commu nity voice is he ard. Enh anc e co mm unit y su pp ort to Council com mitte e syst em.
COMMENCED Introd uctio n of Public F orum t o Co uncil’s monthl y me eting has pro vid ed an opp ortunit y for me mbers of th e pu blic to provide opi nion directl y t o t he C ouncil. Revie w of C ou ncil Com mitt ee s tructure com mence d at a worksho p on 1 2 Febru ary 200 8, inclusi ve of direct com munit y in put into discretionar y co mmitt ees a nd wor king g roups.
Attract a nd re tain a dyn amic and prog ressi ve workforce throug h the pro moti on of Lig ht Reg ional Cou ncil as an emplo yer of ch oice.
Develop a Hu ma n Reso urce Man ag em ent Frame work incorpor ating p olicy de vel op me nt which places an e mphasis on staff ret enti on, succession pla nni ng , and professi onal career p ath de vel op me nt. Promote Council within ed ucati onal institutio ns a nd prof ession al org anisa tions as a progressive , dyn amic and de velo ping council.
Financial – B udg et allocations m et. Non-Financi al – S uita bly q u alified staff e m plo ye d at in dustry ra tes. Reten tion o f staff, in particul ar professio nal s taff. Appropriate training pro vide d. Contacts a nd programs de velop ed with educatio nal instit utio ns pro mo ting career d evelopm ent opport unities within th e loc al g o vern ment s ector.
COMMENCED Impl ement atio n of re vised Corporate Structure at 15 M ay 2 00 7 has prog ressed. Qualified staff ha ve be en ap poin ted to positio ns as th e y ha ve bec om e availabl e. Revie w o f Acco unting Servic es area occurr ing since the ap poin tm ent of M r. C leve Co yle. Current st aff p erform anc e revie w m ethod is

2008-2009 Annu al Business Plan 13
Operational Area Strategy Action Measurab le Outcom e Action Status Comments
being revie we d. Relations hips h ave been de velop ed with UniSA a nd the LGA’s Sh ape Yo ur World cam paign t o pr omote local g o vern men t as a fa voura ble c areer path.
Revie w t he strat egic risk ma nage ment fra me wor k, consiste nt wit h pu blic interest, hu man saf et y, environme ntal fact ors and com mon la w.
Contin ue th e organisation's focus on occup ational he alth, safet y a nd welfare programs a nd prog ress to wards an accredite d safet y man agem ent s yst em in accorda nce with in dustr y st andards.
Financial – B udg et allocations m et. Rebat e ob tain ed o n Wor kers Comp ensatio n and Liability insuranc e sch em es. Non-Financi al – N il wor kers compens atio n inj ur ies t o st aff. Reduc ed n u mber of liabilit y claims lodged. Co ntinu ance of pro acti ve OHSW prog rams. D eplo yment of r isk strat eg y plans .
COMMENCED OHSW & IM h as con tinued to recei ve creditabl e results wit h 2 Lost Time Inj ur ies experience d in t he p ast 5 years. Council recei ve d an audit scor e of 99.2% and a re bat e o f $10 0,280. In additio n, t wo project su b missions were finalists in the 200 7 OHS Bes t Practice A war ds. Chem Al ert has be en co ntract ed t o pro vide a professional ch emical m an ag em ent syst em . One ke y ar ea of ‘Jo b I nstructio ns & Proced ures’ will be ad dressed.
To pro vide f unctio nal and cost effecti ve i nfor matio n and com municatio n tech nol ogies that en hances Co uncil's service deli ver y.
Implem ent eSer vices p aym ent and customer e nquiry mo dul e to en ha nce customer c ont act and inf orma tion dissemi natio n an d re vie w an nually to det ermin e ef fecti veness .
Financial – Impl ement c usto m er service and e Services pa ym ent solutio ns within bu dg et. Non-Financi al – Implem ent effective co mmunica tions s yst ems to impro ve workflo w ma nag e me nt. Revie w we bsite struct ure a nd content. R e view co mmunications strateg ies.
COMMENCED-ONGOING
Auth ority e-Ser vices m odul e h as b een partiall y de velop ed h owe ver is ye t to be imple mente d a nd is likel y t o be def erred to 200 8/2 00 9 to ena ble re-assess ment of wor k un derta ken to d ate an d s taff resources and s kill se ts n eede d to mai ntain syst ems. Auth ority Custo mer Relati ons M an ag em ent Sys te m has be en implemen ted a nd is being utilised, in particular by Infras tructure and W orks Dep artm ent. Council’s Website struct ure and cont ent has undergon e re vie w wit h c ontacts, meeting ag en das & min utes , and p olicies (other t ha n OHS W) ha ving und erg one revie w to date. T his item is ong oing . Council’s Public Consult atio n Policy was revie wed at the Septe mb er 200 7 mee ting .

2008-2009 Annu al Business Plan 14
Operational Area Strategy Action Measurab le Outcom e Action Status Comments
Develop a ro bust frame work
of policies an d proce dures that pro vid e f or an appro priate le vel of c ontrol over g overnance co mplia nce, financi al reporting and certification , an d asset ma nage ment while enca psula ting the philosophies o f tr iple b ott om line rep orting a nd acc epted busin ess prac tice.
Develop and i mple ment a plan in reg ard to the fut ure fina ncial s ustai na bility of Council, in particul ar foc using on opti mising Council's opera ting costs and ph ysical ass ets t hroug h t he efficient and effective man ag emen t of perf ormance to targ ets set in An nu al B usiness Pla ns while adh ering to legislative compliance. Develop and i mple me nt a ppropriate Asset M anag e men t S ys tems t o exp edit e the efficien t and effec tive collectio n, storag e and reporting of Cou ncil o wned infrastructure a nd ph ysical ass ets. Revie w an nu ally. In vestig ate a nd impl ement a ppro priate Electronic Docume nt Man ag em ent Sys te ms t o e xpe dite the ef ficient ma nag e men t of pa per and electronic records in accorda nce with acc epted industr y practic e an d legislative req uiremen ts ( inclusi ve of recor ding current hard files to el ectronic format, assess men t of physical st orag e ar eas, and cou ncil p olicy).
Financial – Te n Y ear Fin ancial Plan Stat ements establish ed . Non-Financi al – Sust ainability Inq uiry reco mm endati ons m et. Revie w of EDM S soluti ons a nd hard record st orage un derta ken and f ut ure directio n pla n de vis ed. Revise d Strateg ic Plan adopt ed. Ten (10) Year Financi al Plan complete d and adop ted . A udit Committee wor king prog ram complete d and activities of committe e revie wed. Revie w Council com mitte e struc ture.
COMMENCED-ONGOING
A long-term fi na ncial pla n has b een devel ope d which ad dresses t wo of the main prior ities o f Cou ncil i.e. re mo vi ng the opera ting de ficit to m a ke the Cou ncil sustain able and br ing ing the R oad Prog ram up t o d at e. Currently transferr ing the long-term projection t o a model pro vided b y th e Loc al Governme nt Association. D raft Plan presen tati on t o Council im min en t. Intern al Ass et M anag eme nt Wor king Gr oup has be en create d to progress the devel opme nt of th e Infras tructure and Asset Ma nage ment Plan. A consid erable amoun t o f d ata has been g athered. M aunsell E ng ineering has be en co ntrac ted to conclude an o verarching policy docu ment. Audit Co m mitte e worki ng prog ram has bee n revie wed and u pda te d to co nclud e at June 2 00 8. S ustainabilit y Inq uiry recom me nd atio ns t o b e ad dressed b y Com mitte e. Council m eeting format an d Co mmit tee structure h ave been re vie we d. Re port to be present ed on Co mmittee struct ure at M ay 2008 meeting. In vestigatio n int o EDMS will be def erred to 200 8/2 00 9 du e to lac k of staff reso urces to ena ble ap propriate in vestigati ve ph ase to occur in this fi nanci al year. Applic ations have rece ntly been called f or a Records Officer to replace the Ad min Supp ort Officer role ( followi ng that o fficer ’s resig nation) to offer full time s upport to the Records M a nag e men t Of ficer.

2008-2009 Annu al Business Plan 15
Operational Area Strategy Action Measurab le Outcom e Action Status Comments
Economic Development and Tourism
Maxi mise op port unities f or the ef fecti ve partn ering bet we en ke y t ourism sta ke hold ers, g o vern m ent and th e co mmu nit y.
Work closel y with C lare Valle y Tourism M arketi ng, Baross a M ar ke ting an d the C lare Valle y Tourism Allianc e to impleme nt the recom mend atio ns d erived from in dustry sect or pla ns.
Non-Financi al – Partn ership arrang ements enh anc ed. Appro priates prog rams de velope d.
COMMENCED (ONGOING)
Council h ost ed an d org anis ed t he 2 007 Visitor Inf orma tion Centr e Confere nce in M ay i n co nju nctio n with Burra & Clare. D irect econ omic imp act i n reg ion. Council acti vely p articipat es in and facilitates tourism initiati ves such as the Heartland Heritage Trail completed in Dec 07which e nco mpasses to wns through out the reg io n. Council h as a repres entati ve on the Barossa Wine & Tourism Board and Tourism B arossa and mai ntai ns reg ular cont act wit h the Sout h Australian Tourism Com mission.
Develop local infrastruc ture that s up ports t he lo ng term viability a nd sustain abilit y of tour ism wit hin t he r eg ion.
Ide ntif y f un ding o pp ortuniti es and establish a prog ra m f or th e f urther enh anc ement of local to ur ism icons (eg M ap the M in er, Kap un da Mine and the Pines Reser ve).
Financial – Kap un da Tourism a nd Leisure Park proj ects com plet ed within b udg et allocati on. Kap un da M in e pl anning de vel op me nt projec t com plet ed within b udg et. Non-Financi al – Improve ment of road an d acc ommo da tion infrastructure, defi nition of camping a nd sit e areas at Kap un da Par k. Establish t wo ne w miners’ ca bins. So urce f unding opp ortu nities for proj ects arising from Ka pu nda M ine site Conser vati on M anag ement plan project.
COMMENCED
Will be com plet ed b y 30 J une 2 008. URPS h a ve be en e ngag ed to de velop a Conservati on Man agem en t Plan f or Kap un da’s H ist or ic Mine Site. Once com plete fin ding sources will be investigate d f urther. . 3 to be co mple te d b y 30 Ju ne 2008.
Foster eff ecti ve pu blic and priva te partners hips to ma nage sustain able devel opme nt o n a reg ional basis.
Active e ng ag em ent an d in vest ment in the Barossa & Light Reg ional De velop m ent Board Inc thro ug h t he reso urce ag ree m ent with t he Dep artm ent of Trade & Econ omic Develop me nt an d t he Baross a Co uncil.
Financial – Gra nt f unding obt aine d. B udget alloc atio ns met. Non-Financi al – Undert a ke de vel op me nt of regio nal b usiness forum.
COMMENCED Council me mb ership o f BLD mai ntai ned with acti ve in volve men t. Co uncil officers atte nd ed Pu blic Privat e Part nerships conf erenc e.

2008-2009 Annu al Business Plan 16
Operational Area Strategy Action Measurab le Outcom e Action Status Comments
Facilitate meetings and fact fin ding wor ksh ops with ke y sta keh olders to promote b usiness o pport unities and reg ional profile.
Ide ntif y and p ursue appro priate in vest m ent opp ortunities for th e reg ion to enco urag e di versit y withi n the industr ial, ret ail and com mercial business sec tors.
Eng ag ement of c omm unities, creation of partnerships and recr uitment of resources for impleme ntati on of master plan ning strateg ies f or townships.
Compl etion of t he King sf ord Reg ional Ind ustr ial Park infrastruc ture pl an and neg otiati on with stakeh olders to ac hieve impleme nta tion. See k pri va te sect or in vest ment f or strateg ic investm ent projects within the reg ion.
Financial – Gra nt funding ob tain ed for King sford P ar k infrastruc ture Project. Pr ivat e sect or contribu tions ma de a nd Budg et allocatio ns met. Non-Financi al – Cons ulta tion und erta ken. Kingsford infrastructure built.
SUBSTANTIALLY COMPLETED
King sford Reg io nal I ndustr ial Estat e Mast er Plan com plete d with De velo pment Plan Ame nd me nt currentl y bef ore the M inister for final a uthorisation . D iscussions o ng oing with pr ivat e sect or a nd stat e go vernm ent over deli ver y of ke y internal and e xtern al infrastruct ure.
Librar y Services
Prom ote best practice m odels in the partnering of libr ary and i nfor mation ser vices across Local Go vern m ent reg ions.
Using best practice mo dels, de velop practical strateg ies for p artn erships f or library a nd infor mation s ervic es.
Financial – Reg ion al librar y ser vice functi oning within budg et. Non-Financi al – R egional c o-opera tion. Increased library borrowi ngs. Prom otion of regional library co-o perati on. I ncreas ed patronag e. I ncre ased LINK ma nag e men t me mbership.
COMMENCED Exc ee de d – th e bu dget h as reduc ed with the inclusi on of Gawler int o th e Lin k memb ership.
To devel op support ser vice prog rams for children and yout h within t he co mmunit y to me et t heir pers onal devel opme nt a nd ed ucati onal nee ds
Develop a nd implem ent h olida y programmes that enco urag e reading and the de velop me nt of literacy s kills f or school aged c hildren
Non-Financi al – Est ablish suit able programmes. Achi eve appro priate atte nd ance levels. Prom ote literacy s kills.
COMMENCED Prog ramm es imple ment ed at b oth Kap un da an d Freeling , sessio ns are limited to 2 5 a nd this is fille d at m ost s essio ns.
To conti nu ously im prove com munit y access t o library services throug h the inno vati ve us e of techn olog y and volu nte er su pp ort.
Revie w the library ser vices curren t access points .
In vestig ate e xisting technological access points use d in bo th t he librar y a nd ret ail sectors. Implem ent e-ser vices in libr ary branc hes
Financial – LINK s ys tem budg et allocatio n met . Non-Financi al - Regional co-opera tion a nd ser vice g row th. Increas ed librar y borrowi ng s. Promotion of reg ion al library c o-opera tion. Incr ease d patro nag e.
COMMENCED Exc ee de d – th e bu dget h as reduc ed with the inclusi on of Gawler int o th e Lin k memb ership (b y ap prox. 12%). Corporat e m an ag ement u ndert oo k an anal ysis of placing Cou ncil servic es into library br anches an d it was deci ded that the deman d was no t there at this st age.
2008-2009 Annu al Business Plan 17
Operational Area Strategy Action Measurab le Outcom e Action Status Comments
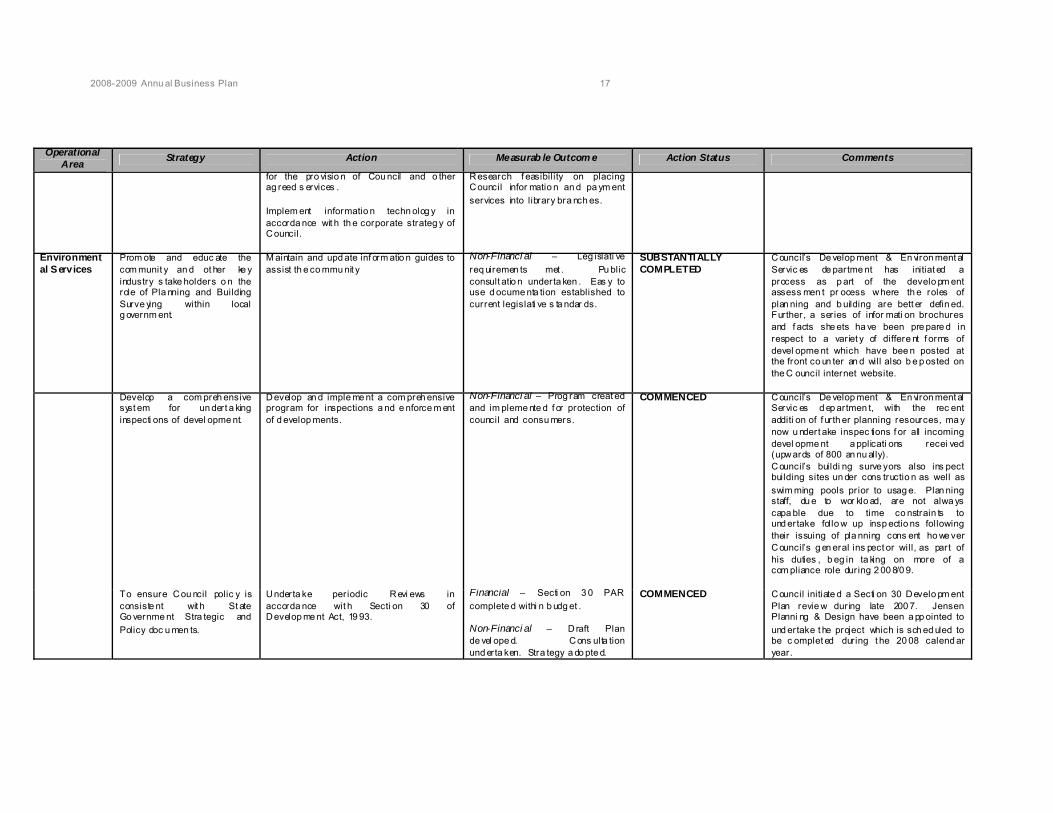
for the pro visio n of Cou ncil and o ther ag reed s ervices . Implem ent informatio n techn olog y in accorda nce wit h th e corporate strateg y of Council.
Research f easibility on placing Council infor matio n an d pa ym ent services into library bra nch es.
Environmental Services
Prom ote and educ ate the com munit y an d ot her ke y industry s take holders o n the role of Pla nning and Building Surve ying within local g overnm ent.
M aintain and upd ate inf orm atio n guides to assist th e co mmu nit y
Non-Financi al – Leg islati ve req uiremen ts met . Pu blic consult atio n underta ken . Eas y to use d ocume nta tion established to current legislati ve s ta ndar ds.
SUBSTANTIALLY COMPLETED
Council’s De velop ment & En viron ment al Servic es de partme nt has initiat ed a process as p art of the develo pm ent assess men t pr ocess where th e roles of plan ning and b uilding are bett er defin ed. Further, a ser ies of infor mati on brochures and f acts she ets ha ve been pre pare d in respect to a var iet y of differe nt f orms of devel opme nt which have bee n posted at the front co un ter an d will also b e p osted on the C ouncil internet website.
Develop a com preh ensive syst em for un dert a king inspecti ons of devel opme nt.
Develop an d imple me nt a com preh ensive program for inspections a nd e nforce m ent of d evelop ments.
Non-Financi al – Prog ram creat ed and im pleme nte d f or protection of council and consu mers.
COMMENCED Council’s De velop ment & En viron ment al Servic es d ep artmen t, with the rec ent additi on of f urth er planning resources, ma y now u ndert ake inspec tions f or all incoming devel opme nt a pplicati ons recei ved (upwards of 800 an nu ally). Council’s buildi ng surve yors also ins pect building sites un der cons tructio n as well as swim ming pools pr ior to usag e. Plan ning staff, du e to wor klo ad, are not alwa ys capa ble due to time co nstrain ts to und ertake follo w up insp ectio ns following their issuing of pla nning cons ent ho we ver Council’s g en eral ins pect or will, as part of his duties , b eg in ta king on more of a com pliance role during 2 00 8/0 9.
To ensure Cou ncil polic y is consiste nt wit h St ate Go vernme nt Stra tegic and Policy doc u men ts.
Underta ke periodic Revi ews in accorda nce wit h Secti on 30 of Develop me nt Act, 19 93.
Financial – Secti on 3 0 PAR complete d withi n b udg et . Non-Financi al – D raft Plan de vel ope d. Cons ulta tion und erta ken. Stra tegy a do pte d.
COMMENCED Council initiate d a Secti on 30 Develo pm ent Plan revie w during late 200 7. Jensen Planni ng & Design have been a pp ointed to und ertake t he project which is sch ed uled to be c omplet ed during t he 20 08 calend ar year.

2008-2009 Annu al Business Plan 18
Operational Area Strategy Action Measurab le Outcom e Action Status Comments
To foster acti ve an d vibrant
townshi ps that acc o mm od ate reg ional growth in an inno vati ve an d sustain able ma nner.
Prepare Green ock U rban Desig n Frame work. Implem ent Fre eling U rban Desig n Frame work Project. Prepare Pa per T owns P AR ( in h ouse).
Financial – Grant fu nding a nd de vel oper contr ibutio ns obt ain ed. Compl ete projects wit hin bu dget. Non-Financi al – Complete Freeling infrastructure works, incl usive of off-stree t p arking , streetsc ap e a nd und erg roundi ng of street lighting . Develop Gre enoc k pl an, u ndert a ke consult atio n. Prep are Pap er Towns PAR and co nsult .
COMMENCED COMMENCED ON-HOLD
Green oc k UDF unable t o be impl emen ted until PLEC project c o mplet ed i n Greenoc k. Indica tive timing during 20 10 calend ar ye ar for un derg roun ding o f powerlines. Freeling UDF being t urned to det ailed desig ns earl y 2 00 8 before t en dering process f or co nstruction. Pap er To wns DPA n ot yet c om me nced as a pro posal has be en p ut t o t he st ate g overn ment sugg esting the issu e be tackled at a reg ional or st at e le vel.
Plan for strateg ic op en sp ace, trails and r ecreati onal facilities associat ed with existi ng and new devel opme nt.
Participate in Par klands 20 36 Process. Underta ke Region al Trails St ud y.
Financial – C om plete within budget . So urce f unding opp ortu nities. Non-Financi al – Stud y und erta ken. D raft plan de vel op ed. Consult ation un derta ken. Strat eg y ado pte d.
REVIEW ED & DEFERRED
The pr ojects list ed are no long er consid ered to b e a rele vant pr ior ity g i ven Council’s invol vem ent in s e veral si milar projects eith er recentl y co mpl ete d or com mence d. Similar projects incl ude; The Barossa Lan dsca pe St ud y, Region al Tourism DPA, & Reser ve M an ag em ent Plans.
Protect an d s upport the use of pr imar y pro duc tion land from t he intrusion of incom pati ble de vel op me nt.
Underta ke a Rural L an dsca pe Charact er Assessm en t Stud y.
Non-Financi al – Stud y und erta ken. D raft plan de vel op ed. Consult ation un derta ken. Strat eg y ado pte d.
COMMENCED The projec t which has com me nced is revie wing the rural areas in relati on to township and rural living g rowt h. The project is not known as a Rural La ndsc ape Character Assessme nt but is ta ki ng the form of a Non-Urban Living / Rural Lifest yle Stud y. The stud y which will inform subseq uent DPA’s is scheduled f or com pletio n during the 200 8 cale nd ar ye ar.
Determin e th e most eff ecti ve and efficie nt means for the future pro visio n and ma nage ment of co mm unit y efflu ent disp osal sch e mes. Maxi mise the re-use and val ue addi ng of grey water in pursuit of wat er conser va tion and en vironme ntal sustainability.
Collaborat e wit h t he Local G o vern ment Association to det ermine o n a St ate or reg ional b asis t he m ost eff ective and efficien t mea ns f or th e f uture pro visio n and ma nag e men t of ef flue nt disposal. Ide ntif y po ten tial joint venture p artn ers in the un dert a king of a feasibility stu d y on the lo ng term eco nomic via bility of public, pr ivate partn erships an d alliances.
Financial – Co mple te pro pos ed CWMS capital projects within budget . Ob tain g ran t funding a nd de vel opers contr ibu tion opp ortu nities. Non-Financi al – Partn erships identifi ed. Water re-use strateg ies put i n place. Com mercial arrang ements est ablish ed.
COMMENCED Council h as initiated thre e major u pgrades to th e Comm unit y Wast ewat er M anag ement S yst ems. Th ese are f or the towns of Green ock, Freeling an d K ap und a. Council has be en fortun ate in rec eivi ng a major g rant of $ 1. 4M from the Com mon wealt h Go vern me nt to assist with thes e upg rades.

2008-2009 Annu al Business Plan 19
Operational Area Strategy Action Measurab le Outcom e Action Status Comments
Promote and enc ourag e la nd de vel op ers to a do pt water c onservatio n strat egies t hat incorporate th e us e of grey wa ter re-use initiatives. Negotiate co mm ercial agree me nts for the re-use of g rey wa ter for co mm unit y ben efit.
Kap un da and Freeling will h a ve a Waste Wat er Treatme nt Plant construct ed. The syst ems pr od uce a hig h q ualit y trea ted wat er which c an be use d for horticult ural and amenit y purposes. T hes e pla nts also offer c onsiderable water sa vi ngs as the older lag oo n treat ment syste ms los e a significant pro portio n of treat ed wa ter to evap oratio n.
To promot e a nd s up port best practice in en viron ment ally responsi ble waste ma nage ment and resource reco ver y.
Underta ke a n ass essm ent on t he be nefits of intro ducing a reg ional hard ref use collection.
Develop a waste in ve ntor y an d fin ancial resource r eco ver y model for each stre am of wast e.
Underta ke a n ass ess men t o f a vailable air space and com plianc e with Cou ncil’s Wast e M an ag em ent Strateg y rep ort.
Financial – B udg et allocations m et. Non-Financi al – I nves tig ate hard waste collection op portu nities. Provi de ef fecti ve g reen waste collection service . Implem ent eWas te stra teg y. De velop L an dfill En viron me ntal M an ag em ent Plans. Obt ain EPA a ppro val of LEMPs.
COMMENCED During 2007 Cou ncil increas ed the freq uenc y of the kerbsid e c ollection of g reen was te t o fortnig htl y. This has seen a significant reduc tion in g reen was te b eing place d in the residu al waste bins, which end up in la ndfill. A closure pla n has bee n d e vel oped f or Roseworth y waste ma nage ment st ation and a LEM P has b een pro duced for the Kap un da st atio n. These pla ns will g uide the devel opme nt of fut ure transf er st atio ns f or bett er se para tion of wast e a nd rec ycling . These pla ns h ave also co nsid ered the remaining available airspac e a t each locatio n. The developme nt of trans fer statio ns will ena ble t he de vel op me nt o f an e-waste collection syste m plus oth er difficult to dispos e of wast e stre ams. Council is still considering the relative merits of i ntrod ucing h ard waste collections .
Revie w of Council's Order Making P owers a nd B y-laws to e nsure me mb ers of the com munit y refrain fro m th ose even ts a nd actions con tained within Sections 246 and 254
Revie w of By-laws and Ord er M a king Po wers ap propriat e to prot ect the well being of the com munit y.
Non-Financi al – Compl ete B y-La w review. Underta ke cons ultati on. Ado pt re vise d By- Laws.
COMMENCED Council’s by-la ws will be placed o n pu blic displa y f or a thre e we ek period com mencing in F ebru ary 2 008. An y propos ed amen dments t o th e by- la ws will then be f orwarde d t o Council f or consid eratio n in April 20 08 .

2008-2009 Annu al Business Plan 20
Operational Area Strategy Action Measurab le Outcom e Action Status Comments
of t he L ocal G o vern ment Act 199 9.
Infrastructure and W orks
Finalise the Asset Manage ment Plans for all classes of pu blic infrastruct ure ass ets u nder the care, con trol and ma nage ment o f Cou ncil.
Consolid ate all asset ma nage me nt plans to for m a single refer ence doc u men t f or the ma nag e me nt, mainte nanc e, re ne wal and n ew pro visio n of infrastruc ture services . Implem ent an d re vie w asse t m an ag ement plan i n acc ordance wit h existi ng policies.
Financial – B udg et allocations m et. Funding achie ved. Non-Financi al – Adoptio n of Infrastructure and Asset M anag e men t Pla n. Deli very of pr iority bas ed wor ks program. Underta ke ad dition al strateg ic accelerat ed road wor ks program. Positi ve e ffect o n infrastruc ture bac klog .
SUBSTANTIALLY COMPLETED
A re vised wor king draft of the I nfras tructure & Asset M anag eme nt Pla n is likel y t o be presen te d to th e elected b od y f or end orsement pr ior to the end of 07 /08 financi al year.
Contr ibut e to the State and Federal Go vern ments' infrastruct ure plans t hroug h participati ng in the identification of sustain able infrastruct ure projects of reg ional sig nificance
To lob b y St ate an d Fe deral Go vern m ents for the f air and equit able distr ibutio n of fun ding an d man agem en t resp onsibilities for pu blic infrastr ucture . To sec ure Sta te, Fe deral an d pr ivate fun ding for the co nstruction of infrastructure t hat will allow for the de vel op me nt of lan d for ind ustr ies of reg ional sig nificanc e at t he King sford Regional In dustr ial Esta te. Sup port the planning an d de velop ment f or the Northern E xpresswa y to provi de a direct freig ht lin k b et we en th e region and Port A delai de. Contin ue t o lob b y State and Fe deral Go vern ments to o bt ain sup port and fun ding for the Ros e worth y Road east/west co nnec tor as id entifi ed in the Northern Reg ion Transport and Infrastructure Plan . Obtai n fundi ng from State an d Fe deral Go vern ments t o enable th e de velop m ent of t he s hare d use pa th along t he North Para R iver, in acc orda nce with th e Hewett Local Strat eg ic Bicycle Pla n.
Financial – Incre ased Grants Commission g rants . Strateg ic programs deli vere d wit hin budg et. Contract ual ser vices a nd m ater ials savi ng s achieve d throug h bul k purchas e a nd c ollab oratio n with DTEI on reg ional pr ojects. Strateg ic g rant f un ding obtai ned . Non-Financi al – L ob b y Passeng er Transport s ervic e im pro ve me nt. Ad voc ate f or appro priate commu nit y o utcom es while supporting NEXY project. Strateg ic reg ional ro ad infrastructure pr iorities m et ( i.e. Wa ke field Group an d B arossa Access Stu d y). Strateg ies impleme nte d t o pr og ress Kingsford infrastructure de velop men t.
COMMENCED Stag e 1 c onstruction of shared use p ath com plete d (He wett Bicycle Pa th project) . Current funding applica tion with St ate Governme nt se e king assistanc e to deliver subseq uent cha nges. Federal Go ver nment funding f or Ka pund a-M arrabel Road ($ 3M ) and Ga wler-Tarlee Road ($6M ). Unsuccessf ul lob b y for Thiele H ig hway ($3.6M ), Go mersal Road ($1.2M ) and Kap unda-Tarlee Ro ad ($3. 2M ). Combi ned with DTE I t o co mpl ete Ka pund a-M arrabel works. Atte nd ed reg ion al transp ort meeting at Elizabeth (Wa kefield Group) an d put forward vie ws o n hea vy transp ort on rural road net works from LRC p oint of vi ew . King sford In dustr ial site infras tructure g rant funding received ($ 60 0k). Works yet t o be com mence d. Significant in vol ve ment in lo bb yi ng on beh alf of com munit y g rou ps (GHRC and ASC) an d Council on N EXY project outc omes. Outcom es inclu de ne w site GHRC training facility, com munit y land swa p, secure d Buc hfel de Cemet ery site,
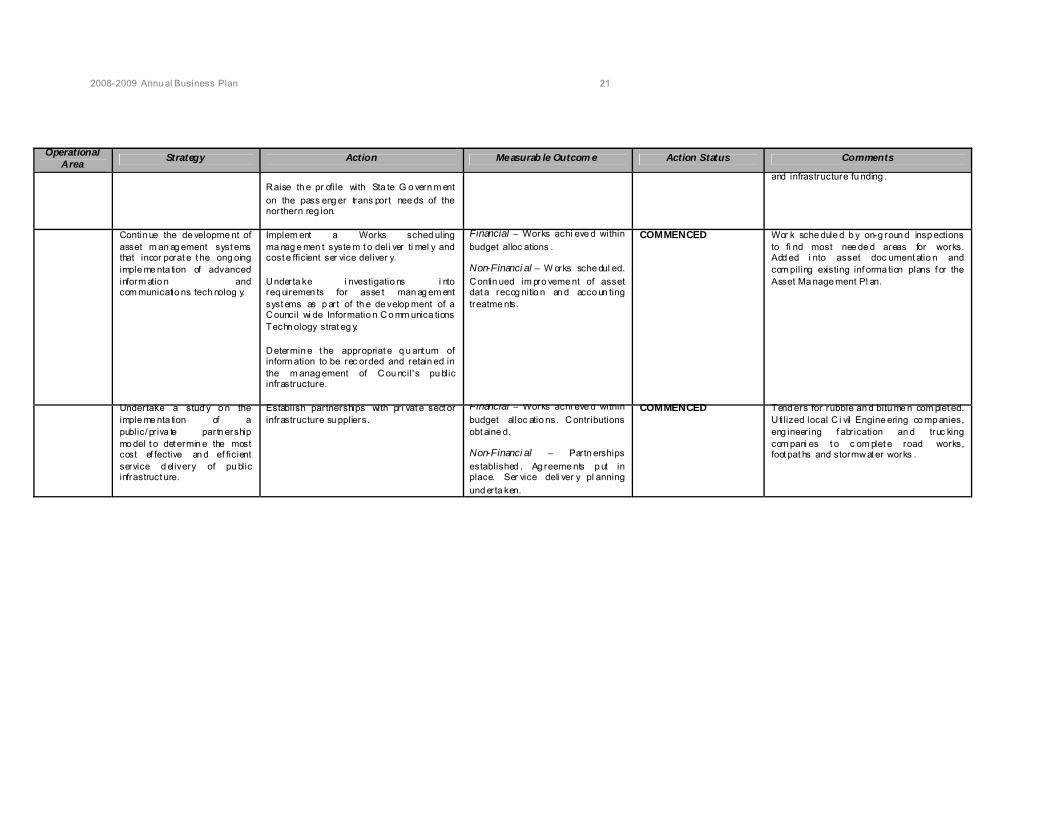
2008-2009 Annu al Business Plan 21
Operational Area Strategy Action Measurab le Outcom e Action Status Comments
Raise th e pr ofile with Sta te G o vern m ent on the pass eng er trans port nee ds of the northern reg ion.
and infrastructure fu nding .
Contin ue the de velopme nt of asset m an ag ement syst ems that incor porat e t he ong oing imple me nta tion of advanced inform atio n and com municatio ns tech nolog y.
Implem ent a Works sched uling ma nag e men t syste m t o deli ver ti mel y and cost e fficient ser vice deliver y. Underta ke i nvestigatio ns i nto req uiremen ts for asse t man ag em ent syst ems as p art of th e de velop ment of a Council wi de Informatio n Co mm unica tions Techn ology strat eg y. Determin e t he appropriat e q u ant um of inform ation to be rec orded and retain ed in the m anag ement of Cou ncil's pu blic infrastructure.
Financial – Works achi eve d within budget alloc ations . Non-Financi al – W orks sche dul ed. Contin ued im pro veme nt of asset dat a recog nitio n an d acco un ting treatme nts.
COMMENCED Wor k sche dule d b y on-g roun d insp ections to fi nd most nee de d areas for works. Add ed i nto asset doc ument atio n and com piling existing inf orma tion plans f or the Asset Ma nage ment Pl an.
Undertake a stud y o n the imple me nta tion of a public/ pr iva te partn ership mo del t o det ermin e the most cost ef fective an d ef ficient service d elivery of pu blic infrastruct ure.
Establish partnerships with pr i vat e sect or infrastructure su ppliers.
Financial – Works achi eve d within budget alloc atio ns. Contr ibutions obt aine d. Non-Financi al – Partn erships established . Ag reeme nts p ut in place. Ser vice deli ver y pl anning und erta ken.
COMMENCED Tend ers for rubble an d bitu me n com plet ed. U tilized local C i vil Engine ering co mp anies, eng ineering f abrication an d truc king com pani es t o c om plet e road works, foot pat hs and stormwat er works .

200 8-20 09 An nu al Busi ness Plan 22
Strategic Plan and Long Term Objectives The key plan of a Counci l is its Strategic Management Plan, which identif ies the objectiv es and f uture d irection of Council. It also contains goals, strategies and perf orm anc e ind icators. C ouncil has recently issued f or public c ons ultation a new Strat egic Management Plan covering the y ears 2008 to 2018. This Annual Business Plan relat es to the prev ious Strategic P lan and, is in eff ect, in transition f rom the previous strategies moving towards t he new initiatives set down in the new D raf t Strategic Plan. Following is a diagrammatic representation of the connection bet ween Council’s Strategic Plan, Annual Business Plan and the Annual Budget.
Council’s Vision and aspi rations hav e been enc aps ulat ed in the statement “A vibrant growing community to be supported by quality infrastructure, a sustainable environment and excel lent services that meet everybody’s needs and maint ains our unique lifestyle”. Ultimat ely though Counci l’s k ey strategy f or its community is to ensure its s ustainabil ity into the f uture. Part of achiev ing this goal will be to ensure that:
Residential, Commercial and Industria l developm ent already targeted f or the reg ion will be undert aken by developers that provide the comm unity with quality inf rastructure at min imal or no c ost to Counci l’s ratepayers.
That appropriat e plans are established to facilit ate appropriat e developm ent in the
reg ion in col laboration with all levels of gov ernment, t he private s ector and the community .
Quality infrastructure is prov ided taking into account t he f uture growt h of the area
caus ed by projects undert aken by other levels of Gov ernment and the private sector, f or ex am ple t he duplic ation of the Sturt Highway f rom Gawler t o Greenock,
Strategic Plan (Goals and Direction)
10 Year Infrastruct ure & Ass et Management
Plan
10 Year Financial Plan
2008/09 Annual Business Plan (Objectiv es, Perf orm anc e Meas ures)
2008/09 Annual Budget (Funding Strateg ies, etc)

200 8-20 09 An nu al Busi ness Plan 23
the Northern Express way major road inf rastructure dev elopment, and the dev elopment of the Kingsford R egional Industrial Park Master Plan and inf rastructure.
Priority inf rastructure projects are undertaken that prov ide maximum long term
benefits to the community both in terms of funds spent and ac hiev ing proactiv e outcomes. In particular, Council will c omplete its accelerat ed $5.0M road works program ov er t wo f inancia l years in a bold move to proactiv ely deal wit h the backlog of rural road resheeting and township road sealing and resealing.
On c reating appropr iat e phy sical inf rastructure, estab lish programs that deliv er
improv ed soc ial and cult ural outcomes f or the residents on t he reg ion. During 2008/ 09 t he f ollowing major Outcom es/Highl ights are planned:
No. Outco mes/Highlights 1 Adoption of Counc il’s 2008-2018 Strategic Plan.
2 Adoption of Inf rastructure & Ass ets Management Plan.
3 Input into the Barossa Belt Regional Spatial Plan.
4 Establis hment of a Baross a Belt Regional Inf rastructure & Ass ets Management Plan subject to external funding.
5 Implementation of the Roadworks program; c ompletion of any carried f orward pro jects from 2007/08 and c ompletion of the 2008/09 $4.0M capital program.
6 Establis hment of an Ass et Rational isation F und of $2.4m; s etting as ide $1.0m f or capital road works up to 2012/ 13 and the application of other monies towards community projects; during 2008/09 public to ilets are to be const ructed in Greenock, Kapunda, Freel ing, Ros eworthy and poss ibly Wasley s.
7 In part ners hip with t he D epartment of Transport, Energy and I nf rastructure (D TEI), commence the Main N orth Road $6.0m project and any proceeds from priv ate works to be deposit ed into the Asset Rationalisation Fund.
8 Strictly monitor subdiv isions under construction ensur ing an appropr iate ass et handov er proc ess; subdiv isions under c onstruction include: Greenock, Freeling and H ewett. F urther, it is noted that the CW MS upgrades for Kapunda will be undertaken during 2008/09.
9 Fina lise des ign and preparation of grant applic ations f or the propos ed H ewett Comm unity Centre.
10 Undert ake a Section 30 rev iew dealing wit h suc h matters as: • Spatia l Planning ( local and regional contexts) • Master Planning – Ros eworthy • Paper Towns • Rural Living
11 Undert ake a ho listic view of Dutton Park as a m ajor regional recreation c entre.
12 Establis h, in c onjunction with State Gov ernment, the PLEC/ Main Street pro ject at
Greenock.
13 Introduc e a speedy ‘DA’ sy stem f or residential developm ent in the new subdiv isions.
14 Prepare, under a new, simpl if ied budget model, draf t budgets f or the financ ial years: - 2009/ 10 - 2010/ 11 - 2011/ 12 Suc h draf t budgets to align with C ouncil’s Strateg ic Plan and Inf rastructure & Assets Management Plan.

200 8-20 09 An nu al Busi ness Plan 24
2008/09 Annual Objectives and Activities (including performance measures)
Oper ational Area Strategy Action Measur able Outcome Financial Non-Financial Community & Cultural Development
To de velop a frame work to incorpora te in to Council's com mu nicatio n and inf orma tion strateg y.
Review a nd u pd ate Council's Comm unit y Service's D irectory a nd Com munity Ne wsletter.
Positive and rele vant informatio n disse mina tion and cons ulta tion.
Optimis e the us e of Cou ncil owned f acilities b y provi ding sustain able multif uncti onal com mu nit y ser vice facilities.
Underta ke feasi bility studies o n id en tified com mu nit y assets in accorda nce with an Asset Ration alisation Prog ra m for the c entralisa tion of com mu nit y g roups .
Decrease d ann ual main ten anc e c osts. M anag e men t Fees paid to com mu nit y as per b udget allocatio ns.
Com munit y supp ort a nd ag reem ent o btai ned f or multi-usag e of ke y facilities base d on log ical outco mes. Review un derta ken of Com munit y La nd Manag e men t Pla ns.
Sup port t he pro visio n a nd diversity of activities t hat enriches local c ultur e a nd de velops a s ense of id entit y a nd pr ide.
Promote a nd sup port com mu nit y b ase d projects and cult ural e ve nts (eg Australia Day Award Celebrations, Australian citizenship ceremonies etc) that e ng en der civic pr ide and wellbeing .
Budget alloca tions met.
Well at tende d f unc tions and even ts, e nh ance m ent of se nse of c omm unit y.
Develop a ser vice delivery mo del f or th e pro vision of q ualit y ag ed car e a nd sup port s ervic es
Develop sup port ser vices in the areas of Ho me Assist, trans port, informatio n, th erapy services and s ocial su pp ort
Budget alloca tions met.
Marketi ng of a vailable prog rams to ensure t a ke up (where abl e) b y Lig ht reg ion reside nts.
Governance Promote the role and int ang ible social be nefit of th e positio n of being an elected m em ber within the Council area.
Activel y pro mote elect ed me mbers as civic lead ers within t he local co mm unit y and the c ontr ib utio ns ma de through m e mbers hip of var io us loc al co mm unit y com mitte es.
Budget alloca tions met.
Promote resp onsibility, trust an d acco un tabilit y as ke y ele men ts of local represe ntati on. Ensure com mu nit y voice is he ard. Enh anc e co mm unity supp ort to Cou ncil com mitte e s yst em .
Attract an d ret ain a dyna mic a nd prog ressive workforce through the pro motio n of Light Reg ional Council as an empl oyer of choice.
Develop a Hum an Resource Man agem ent Frame work inc orpora ting policy d e velo pmen t which places an e mp hasis on staff rete ntio n, succession plan ning , an d professi onal career p ath d e velo pmen t. Promote Co uncil within educ atio nal institu tions a nd professio nal org anisa tions as a progressive, dyn amic and de veloping cou ncil.
Budget alloca tions met.
Suita bly q u alified st aff em ploye d at industr y rates. Retention of staff, in particular professi onal staff. Ap propriat e trai ning pro vide d. Cont acts a nd prog rams d e velo pe d with educ atio nal i nstitu tions prom oting care er de velop ment op portunities within th e loc al go vern m ent sector.
Review t he strat eg ic r isk ma nag e men t fra me work, consiste nt with p ublic int erest, hu man sa fet y, e nvironme ntal factors an d co mmon la w.
Contin ue th e org anisatio n's focus on occu pati onal healt h, s afe t y and welfare prog rams an d prog ress towards a n accredit ed safet y man agem ent syst em in accord ance with industr y stan dards
Budget allocations m et. Rebat e o btain ed on Wor kers Com pe nsati on and Lia bility i nsura nce sche mes.
Nil workers compe nsa tion injur ies to staff. Reduc ed nu mber of liabilit y claims lodg ed. Co ntinuance of proacti ve OHSW prog rams. De plo ymen t of risk strat egy plans .
To pro vid e func tional a nd cost effec tive in form atio n a nd com mu nicatio n tech nol og ies that en ha nces Cou ncil's service deliver y.
Impl em ent eSer vices pa ymen t a nd c usto mer enq uiry m od ule to enha nce customer contact a nd informatio n disse mina tion and r e view annu ally to det ermin e ef fecti veness .
Impl em ent c usto mer service a nd e Ser vices pa ymen t sol utions wit hin budg et .
Impl em ent eff ecti ve com mu nicatio ns s yst ems to i mpro ve wor kflow ma nag e men t. Re view we bsite struct ure a nd cont ent. Re view com mu nicatio ns strateg ies.
Develop a robus t fram e wor k of policies and proc ed ures t hat pro vide for an a ppropriate le vel of co ntrol o ver g overna nce
Develop and i mpl ement a plan in regard to th e fu ture financi al sustain abilit y of Council, in particular
Ten Y ear Financial Pl an Stat em ents est ablished.
Sustai na bility Inq uiry recomme nd ations m et. Review of EDMS solu tions and har d record storage

200 8-20 09 An nu al Busi ness Plan 25
Oper ational Area Strategy Action Measur able Outcome com pliance, fina ncial rep orting and c ertification, a nd asset ma nag e men t while enca psulating th e philoso phies of tr iple bo tto m line rep orting and acce pt ed busin ess practice.
focusing o n optimising Council's o perati ng costs and physical assets through t he efficie nt a nd effec tive m an ag emen t of performance to targets set in Annu al Busin ess Plans while a dh ering to leg islative c om pliance. Develop and i mple m ent appropriate Asset M anag e men t Systems to expe dite the efficient a nd effec tive collectio n, storage and rep orting of Cou ncil owned infrastruct ure a nd ph ysical asse ts. Review ann uall y. In vestig at e a nd i mple m ent appropriate El ectronic Docum ent Man agem ent Sys tems t o expedit e t he efficien t man ag em ent of pap er and el ectronic records in acc orda nce with accepted ind ustr y practice and legislati ve req uirements (inclusi ve of recording current hard files to electro nic form at, assess ment of ph ysical storage areas, a nd cou ncil policy)
und erta ken and fu ture direction plan devis ed. Revise d Strateg ic Plan ado pte d. T en (1 0) Ye ar Financial Pl an c omplet ed and a dopte d. A udit Com mitte e wor king prog ram com plet ed a nd activiti es of c ommitt ee revie wed. Re vie w Cou ncil com mitte e structure.
Economic Developm ent and Tourism
M axi mise o pp ortuniti es for t he effec tive partn ering bet wee n key tourism sta keholders, g overn m ent an d t he c om munity.
Wor k closel y with C lare Valley Tourism M arketi ng , Barossa Mar keting and t he C lare Valle y Tourism Alliance t o imple m ent t he recomme nd ations derived from in dustry s ect or pla ns.
Partnership arra ng em ents enh anc ed. Appropriates prog rams de velope d.
Develop l ocal infrastruct ure t hat supp orts th e long term via bility and s ustain abilit y of tour ism within th e reg ion.
Ide ntif y fun ding opp ortu nities a nd est ablish a prog ram f or the f urther enh anc ement of local tour ism icons (eg Map the M iner, Kapun da M ine a nd the Pines Reserve).
Kap un da T ourism a nd Leisure Par k projects com plete d within b udget allocatio n. K apund a M ine plan ning de velop ment project compl ete d wit hin budg et .
Improve men t of ro ad a nd acco mm odation infrastruct ure, definitio n of cam ping and site are as at Kap unda P ark. Est ablish two new mi ners’ ca bins. Source fun ding opp ortu nities for projects ar ising from Kapun da M ine site Conserva tion Manag e men t plan project .
Foster eff ective pu blic and pr iva te p artn erships to ma nage sustain able d evelo pm ent o n a reg ional b asis.
Active eng ag eme nt a nd invest ment in th e Barossa & Light Reg ional Develop ment B oard Inc through t he res ource ag reem ent with t he Depart me nt of Trade & Economic De velop m ent and the B arossa C ouncil. Facilitate m eeti ng s and fact fin ding worksh ops with ke y stakeh old ers to promote b usiness opp ortu nities an d reg ional profile.
Grant f unding obt ained. Budget alloca tions met.
Underta ke d e velo p men t of reg ional b usiness foru m.
Ide ntif y and purs ue a ppro priate invest ment opportu nities for t he reg ion to e nco urage diversity within t he in dustr ial, ret ail and com mercial busin ess sec tors.
Eng ag em ent of com mu nities, creation of partnerships a nd recruitme nt of resources for im ple mentati on of mast er plan ning strat eg ies
Grant fu nding ob tained for King sford Park infrastruct ure Proj ect. Pr ivate sect or contr ibuti ons ma de. B udg et allocati ons met .
Consult ation und erta ken. King sford infrastruc ture built.
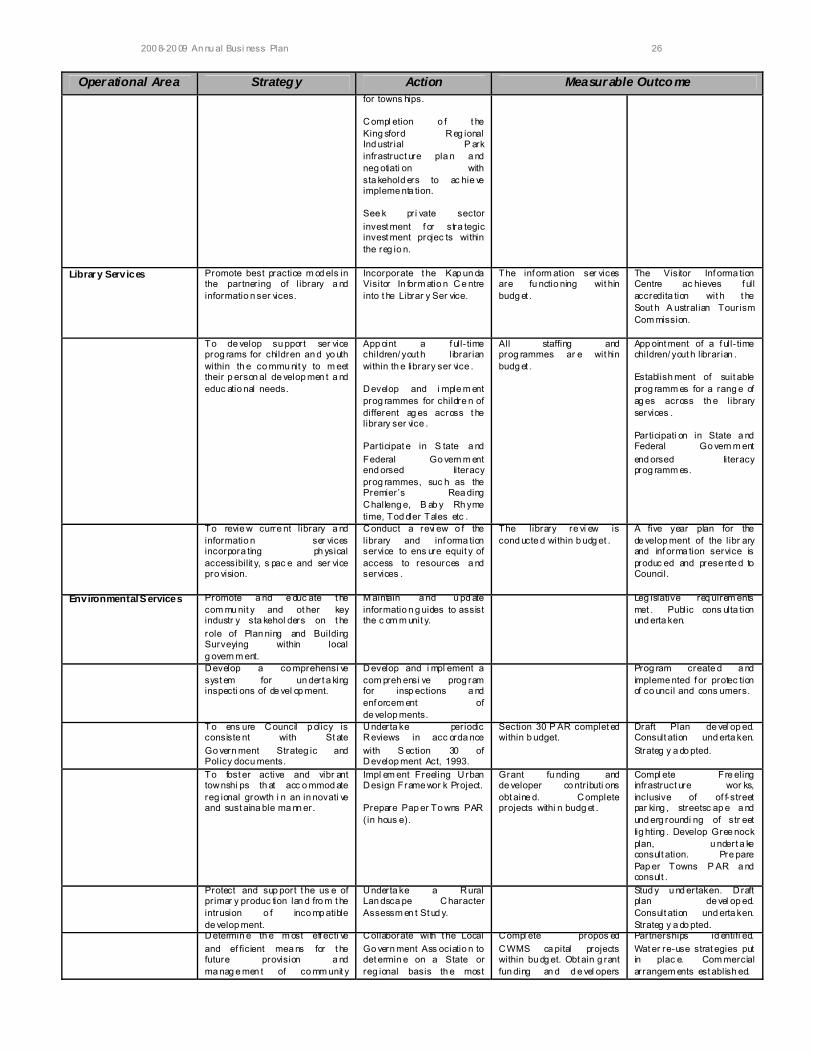
200 8-20 09 An nu al Busi ness Plan 26
Oper ational Area Strategy Action Measur able Outcome for towns hips.
Compl etion o f t he King sford Reg ional Ind ustr ial P ark infrastruct ure pla n a nd neg otiati on with sta kehold ers to ac hie ve impleme nta tion. See k pr i vate sector invest ment f or stra tegic invest ment projec ts within the reg io n.
Librar y Services Promote best practice m od els in the partnering of library a nd informatio n ser vices.
Incorporate t he Kap un da Visitor In form atio n Ce ntre into t he Librar y Ser vice.
The inf orm ation ser vices are fu nctio ning wit hin budg et .
The Visitor Inf orma tion Centre ac hieves f ull accredita tion wit h t he Sout h A ustralian Tourism Com mission.
To de velop su pport ser vice prog rams for children an d yo uth within th e co mmu nit y to m eet their p erson al de velop men t a nd educ atio nal needs.
App oint a f ull- time children/ yout h librar ian within th e library ser vice . Develop and i mple m ent prog rammes for childre n of different ag es across t he library ser vice . Participat e in S tate a nd Federal Go vern m ent end orsed literacy prog rammes, suc h as the Premier’s Rea ding Challeng e, B ab y Rh yme time, Tod dler Tales etc .
All staffing and prog rammes ar e wit hin budg et .
App oint ment of a f ull- time children/ yout h librar ian . Establish ment of suit able prog ramm es for a rang e of ag es across th e library services . Participati on in State a nd Federal Go vern m ent end orsed literacy prog ramm es.
To revie w curre nt library a nd informatio n ser vices incorpora ting ph ysical accessibilit y, s pac e and ser vice pro vision.
Conduct a revi ew o f the library and inf orma tion service to ens ure equit y of access to resources a nd services .
The library re vi ew is cond ucte d within b udg et .
A five year plan for the de velop ment of the libr ary and inf orma tion service is produc ed and prese nte d to Council.
Environmental Services Promote a nd e duc ate t he com mu nit y and ot her key industr y sta kehol ders on t he role of Plan ning and Building Surveying within local g overn m ent.
M aintain a nd u pd ate informatio n g uides to assist the c om m unit y.
Leg islative req uirem ents met . Public cons ulta tion und erta ken.
Develop a co mprehensi ve syst em for un dert a king inspecti ons of de vel op ment.
Develop and i mpl ement a com preh ensi ve prog ram for insp ections a nd enf orcem ent of de velop ments.
Prog ram create d a nd impleme nted f or protec tion of co uncil and cons umers.
To ens ure Council p olicy is consiste nt with St ate Go vern ment Strateg ic and Policy docu ments.
Underta ke periodic Reviews in acc orda nce with S ection 30 of Develop ment Act, 1993.
Section 30 P AR complet ed within b udget.
Draft Plan de vel op ed. Consult ation und erta ken. Strateg y a do pted.
To fost er active and vibr ant townshi ps th at acc o mmod ate reg ional growth i n an in novati ve and sust aina ble ma nn er.
Impl em ent Freeling U rban Design Frame wor k Project. Prepare Pap er To wns PAR ( in hous e).
Grant fu nding and de veloper co ntr ibuti ons obt aine d. Complete projects withi n budg et .
Compl ete Fre eling infrastruct ure wor ks, inclusive of of f-street par king , streetsc ap e a nd und erg roundi ng of str eet lig hting . Develop Gree nock plan, u ndert a ke consult ation. Pre pare Pap er Towns P AR a nd consult .
Protect and sup port t he us e of pr imar y produc tion lan d fro m t he intrusion o f inco mp atible de velop ment.
Underta ke a Rural Lan dsca pe Character Assessm en t St ud y.
Stud y u nd ertaken. D raft plan de vel op ed. Consult ation und erta ken. Strateg y a do pted.
Determin e th e m ost eff ecti ve and ef ficient mea ns for t he future provision a nd ma nag e men t of co mm unit y
Collaborate with t he Local Go vern ment Ass ociatio n to det ermin e on a State or reg ional basis th e most
Compl ete propos ed CWMS ca pital projects within bu dg et. Obt ain g rant fun ding an d d e vel opers
Partnerships id entifi ed. Wat er re-use strat egies put in plac e. Com mercial arrangem ents est ablish ed.

200 8-20 09 An nu al Busi ness Plan 27
Oper ational Area Strategy Action Measur able Outcome efflu ent dis pos al sche mes. M axi mise th e re-use a nd value addi ng of g rey wat er in pursuit of wat er cons ervatio n a nd en viron mental sust aina bility.
effec tive a nd ef ficient me ans for t he fu ture pro vision an d man agem ent of e fflue nt dispos al. Ide ntif y p ot enti al joint ve nt ure partners in t he und erta king of a feasi bility stud y o n th e long term econ omic viabilit y of public, pr iva te partn erships a nd alliances. Promote and encourage land de velo pers t o ad opt wat er co nser va tion strateg ies tha t incorpor ate the use of g rey water re-use initi atives. Neg otiate c om mercial ag reem ents f or th e re-use of g re y wat er for com mu nit y b enefit.
contr ibu tion op port unities .
To pro mote and supp ort best practice in en viron ment ally responsi ble waste man agem ent and reso urce reco ver y.
Underta ke an assess m ent on t he benefits of introduci ng a reg ional hard refuse c ollectio n.
Develop a waste in ve nt ory and fin anci al resource reco ver y m od el for e ach stream of waste.
Underta ke an assess m ent of a vaila ble air sp ace a nd com pliance with Cou ncil’s Waste Man agem ent Strateg y report.
Budget alloca tions met.
In vestig at e har d waste collection opportunities. Provi de effec tive g reen wast e collection ser vice. Impl em ent eW aste strateg y. De velo p Lan dfill En viron mental Manag e men t Pl ans. Obtain EPA appr oval of LEM Ps.
Review of Cou ncil's Order M aking Powers a nd B y-la ws to ensure m embers of t he com mu nit y refrain fro m th ose even ts a nd actions contain ed within S ectio ns 246 a nd 2 54 of the Loc al Go vern ment Act 1 999.
Review of By-laws a nd Order Ma king Po wers appropriate to pro tect t he well being of t he com mu nit y.
Compl ete B y-Law re vie w. Underta ke cons ultati on. Ado pt re vise d By- La ws.
Strateg y and Project Planning
To facilitat e a collaborati ve partnership with St ate Go vern ment t o acti vel y contr ibu te to polic y de velop m ent that promo tes a positi ve outc om e f or Cou ncil.
Compl ete Traffic Stud y at Xa vier College, Gawler Belt and Comme nce impleme nta tion of finding s.
Obtain fu ndi ng partners Budget alloca tion m et.
Develop projec t pla n. Improved saf et y as pects for pedestria n and vehicle traffic. Reduce traffic an d sa fety com plaints. Provi de new i nfrastruct ure, i.e. re vised i ntersec tion treat me nt, fo otp aths a nd par king areas .
To ens ure Council p olicy is consiste nt with St ate Go vern ment Strateg ic and Policy docu ments.
Finalise Council Stra tegic M anag e men t Pla n (SM P).
SM P alig nme nt with St ate strateg ies. Underta ke pu blic consult ation on stra tegic plan suite of docum ents Ado pt co mpl eted Stra tegic Manag e men t Plan (including 10 Ye ar Financial Plan) Ado pt Infrastruct ure & Asset M anag eme nt Pl an, Version 1.
Develop Ros eworthy Township (& Enviro ns) mast er plan inc orpora ting g rowth o ptions a nd stormwat er m anag ement .
Budget alloca tion m et. Prepare projec t br ief . Consult ant ap poin tmen t. Strateg ic p artn er a nd com mu nit y co nsult atio n. Develop s trateg y f or townshi p & stor mwat er ma nag e men t ( in particul ar

200 8-20 09 An nu al Busi ness Plan 28
Oper ational Area Strategy Action Measur able Outcome “Chain of Po nds” c onc ept).
Develop Ka pund a M ine Site De velop me nt Plan Ame nd ment (DPA).
Budget alloca tion m et. Obtain fu ndi ng partners.
Prepare projec t br ief . Consult ant ap poin tmen t. Strateg ic p artn er a nd com mu nit y co nsult atio n. Prepare an d c omme nce project plan acti ng on recomme nd ations of Conser vation Man agem ent Plan.
Develop Nort hern Express way Resid ual La nd M aster Plan.
Budget alloca tion m et.
Prepare project br ief f or de velop ment of long term ma nag e men t pl an of residual aer odro me (Council) land site d arou nd the Nort hern Express way de velop ment a t B uchf eld e. Consult ant ap poin tmen t Strateg ic p artn er a nd com mu nit y co nsult atio n
Protect and sup port t he us e of pr imar y produc tion lan d fro m t he intrusion o f inco mp atible de velop ment.
Develop Rur al Livi ng and Pap er To wn DPA’s.
Budget Alloca tions met. Prepare Stat eme nts of Inte nt. Prepare project br iefs a nd app oint c ons ultants. Act on reco mmen da tions of Non-Urba n & Rural Living S tu dy Underta ke co mm unity consult ation.
Prepare a M a nag e me nt Plan for the eff ecti ve and ef ficient main ten anc e and r ene wal of com mu nit y o wned ass ets.
Underta ke M inor rede vel op me nt of Fre eling Council Office desig n to cater f or short t erm operation al n eeds.
Budget Alloca tion m et. Finalise d esig n ele ments to pro vide addition al work space at Fre eling office within OHSW g uidelines. Provi de a dditi onal wor ksp ace for s hort t erm staff ne eds. Underta ke c onstr uctio n in timel y ma nn er with mi nimal staff and c usto m er disruptio n. Com menc e de velop m ent me dium to long t erm operation al pla n optio ns (3 to 1 0 ye ars).
Review L and Use op tions at Fid dle wood Drive Reserve, Fre eling .
Budget alloca tion m et. Finalise scope f or Fiddlewoo d Drive Reser ve future o ptions projec t. App oint consulta nt to prepar e report. Underta ke pu blic consult ation o n fu ture use and infrastruc ture options. Review stor mwat er drainag e ele m ents within & associat ed with t he subdivisio n.
Develop Pu blic Con ve nienc e construc tion prog ram f or to wns hips.
Compl ete Ros eworthy a nd Greenoc k pu blic con venience co nstructi on wor ks within allocat ed budg et .
Prepare pu blic con venience construc tion prog ram f or Fre eling, Greenoc k, K apun da, Roseworthy a nd Wasle ys townshi ps. Underta ke a ppropriate com mu nit y cons ultati on at each to wnship. Finalise de velop ment of structural design for pu blic con veniences. Construct f acilities at Greenoc k and Ros eworthy townshi ps.
Com mence impleme nta tion of Lan dfill En viron mental M anag e men t Plans (LEMP) for Kapu nda a nd
Budget alloca tions met Obtain strateg ic partn er or state g o vern ment fundi ng assistanc e.
Com menc e impleme ntation of LEMP recomme nd ations. App oint consulta nts to project manage m ent o n-

200 8-20 09 An nu al Busi ness Plan 29
Oper ational Area Strategy Action Measur able Outcome Roseworthy Ref use Depots .
ground works. Com menc e on grou nd reme dial wor ks.
Determin e th e m ost eff ecti ve and ef ficient mea ns for t he future provision a nd ma nag e men t of co mm unit y efflu ent disp osal sche mes.
Finalise im ple menta tion plans f or Co mm unit y Waste W at er Man agem ent Sys tem upg rad es for townshi ps.
Compl ete co nstructio n of Kap un da C WM S m ain drain upg rade wit hin budg et . Obtain Strat egic Partner contr ibu tions . Obtain sta te or fe deral g rant fu nding assist anc e.
Com menc e construc tion Kap unda W aste W at er Treatment Pla nt (W WTP) Obtain ap provals f or Freeling WWTP Obtain ap pro val f or Freeling CWMS lag o on rede vel op me nt Prepare a nd i mple m ent project plan f or rede vel op me nt of Fre eling CWMS lagoo ns Impl em ent project plan f or rede vel op me nt of Greenoc k CWMS
Infrastructure and Works Finalise t he Asset Man agem ent Plans for all classes o f pu blic infrastruct ure assets u nder the care, c ontrol and man agem ent of Council.
Consolid ate all asset ma nag e men t pla ns to f orm a single refere nce docu me nt f or the ma nag e men t, main ten anc e, ren e wal a nd ne w pro visio n of infrastruct ure ser vices. Impl em ent a nd re view asset m anag e me nt pla n in accorda nce wit h existing policies.
Budget allocations m et. Funding achie ved.
Ado ptio n of I nfrastruc ture and Ass et Man agem ent Plan. Deliver y of pr ior ity base d wor ks prog ram. Underta ke a dditi onal strateg ic accelerat ed ro ad wor ks pr og ram. Positi ve effec t on infrastruc ture bac klog .
Contribut e t o t he S tate a nd Federal Governme nts' infrastruct ure pl ans through participati ng in t he ide ntifica tion of sust aina ble infrastruc ture projects of reg ion al sig nificanc e.
To lobb y Stat e an d Fe deral Go vern ments for the f air and eq uita ble distribu tion of f un ding a nd ma nag e men t responsi bilities for pu blic infrastruct ure. To sec ure St at e, Fe deral and pr i vate f undi ng for t he constructi on of infrastruct ure tha t will allow for the d e vel op me nt of la nd for ind ustr ies o f reg ional sig nificance at t he King sford Reg ional Ind ustr ial Est ate. Sup port t he pla nni ng and de velop ment f or t he Northern E xpress wa y to pro vide a direct freight link bet ween t he reg ion a nd Port Adelai de. Contin ue t o lob b y St ate and Fed eral Go vernm ents to obt ain support a nd fun ding for the Ros eworthy Road e ast/ west c onn ector as ide ntifie d in t he Northern Reg ion Trans port and Infr astruct ure Plan. Raise the pr ofile wit h St ate Go vern ment on t he passeng er transport ne eds of t he northern reg ion.
Increas ed Gra nts Com mission g rants. Strateg ic prog rams delivered withi n bu dg et. Contract ual ser vices a nd mat erials sa vings achie ved through bul k p urchase a nd collabora tion with DTEI on reg ional proj ects. Strat egic g rant fu nding o btai ned.
Lob b y P asse ng er Transport ser vice improve m ent. Ad vocat e f or appropriate co mm unity outc om es while su pporting NEXY projec t. Stra tegic reg ional road infrastruc ture pr ior ities met ( ie. Wakefield Group an d Barossa Access Stud y). Strat eg ies impleme nted to proce ed King sford infrastruc ture de velop ment.

200 8-20 09 An nu al Busi ness Plan 30
Oper ational Area Strategy Action Measur able Outcome Contin ue th e de velop me nt of
asset ma nag e me nt sys te ms t hat incorpora te t he ong oing impleme nta tion of ad vanc ed informatio n a nd c o mm unica tions tech nolog y.
Impl em ent a W orks scheduling man agem ent syst em t o d eliver timel y and cost e fficient ser vice deliver y. Underta ke inves tigations into req uire ments for asset ma nag e men t syst ems as part of t he de velop ment of a Council wi de I nf orma tion Com municatio ns Technology strat eg y. Determin e t he a ppro priate q uantu m of infor mati on to be recorded and retain ed in the ma nag e men t of Council's pu blic infrastruct ure.
Wor ks ac hie ve d wit hin budg et alloc ations .
Wor ks schedul ed. Continued i mpro vemen t of asset da ta rec og nition a nd accounting tre atmen ts.
Underta ke a stu dy on t he impleme nta tion of a public/ pr ivate part nership m odel to det ermin e t he m ost cost effec tive an d e fficien t ser vice deliver y of p ublic infras tructure.
Establish partners hips with pr iva te s ector infrastruc ture suppliers.
Wor ks ac hie ve d wit hin budg et allocatio ns. Contributi ons obt ain ed.
Partnerships est ablish ed. Ag reeme nts put in pl ace. Service delivery plan ning und erta ken.

2008-2009 Annu al Business Plan 31
Financial Requirements and Summary of Financial Statements Council ’s estimated operating income and ex penditure for the 2008/09 f inanc ial year is identif ied in t he f ollowing graphs. Council rates and separate c harges f or this f inancial y ear are estimat ed to be $10. 4M. To obta in this level of f unding Counci l will need to increas e its general rate income by an inf lation f actor (4. 5%), acc ount for new ass essment growt h (2.0%) and rais e an ext ra 1% general rat e revenue (to be s pecif ically f or inf rastructure purposes ), a total of 7.5% over the 2007/08 financial y ear. Loan borrowings of approximate ly $4.9M are proposed. This figure includes a strat egic borrowing t o complet e the $5M accelerated c apit al road works program which began in 2007/ 08 and is v alued at $2.5M in 2008/ 09. Counc il undertook th is program to remedy a sign if icant backlog of inf rastructure works and provide the com munity with a proactiv e means of improv ing its inf rastructure and reducing immediate road and storm water maintenance costs. C ouncil is aware that there wi ll be ef f ects on its operating ba lances f or ensuing y ears f rom the repayment of loans; howev er its be lief is that these eff ects will be compens ated by the deliv ery of other opport unities resulting f rom developmenta l growth and the rev iew of Council ’s own ass ets. Council has been m aintaining an operating def icit f or many y ears. This means that not enough revenue is earned to cov er ex pendit ure (including depreciation) and theref ore creat es reliance on receiv ing grants and other forms of inc om e to cov er maint enance of inf rastruct ure etc. This ‘ot her income’ is normally not suff icient and leads to maint enance of inf rastructure being def erred. Long term, as part of its f orward strategy , Council plans to remove the operating def icit and bec ome sustainable through its own rev enue. In Council ’s long-t erm f inancial plan it is evident that the operating deficit will be aff ected by the repay ment of loans but it also identif ies a signif icant reduction to this operating deficit up to the end of 2012/13 when it becomes an operating s urplus. The figures in the plan are cons erv ative and it is expected by introducing ot her in itiatives the operating balanc e will be in surp lus by Counci l’s target y ear of 2011/12.
Operating Balances
-3,000,000
-2,000,000
-1,000,000
-
1,000,000
2,000,000
3,000,000
2008/09 2009/10 2010/11 2011/12 2012/13 2013/14 2014/15 2015/16 2016/17 2017/18 2018/19
Therefore, the strategy mentioned above will address two of the main c onc erns of Council:
• To remov e the operating def icit • To br ing the Inf rastructure m aintenance program up-t o-date.

2008-2009 Annu al Business Plan 32 The f ollowing graph il lustrates rev enue receiv ed by ty pe and is extracted f rom Council’s long-term projection.
77%
2%1%
6%4%
2% 2% 5%
2008/2009 Income Statement (Operating) Revenue
Rates
Statutory charges
User charges
Other grants, subsid ies and contributions
Investment Income
Reimbursements
Commercial activity revenue
Other Revenues
Rates acc ount f or 77% of Council ’s revenue f ollowed by Grants and Subsidies at 6%. The f ollowing graph illustrates ex penditure al loc ated by ty pe and is extracted from Council’s long-t erm pro jection.
30%
38%
6%
26%
2008/2009 Income Statement (Operating) Expenses
Employee Costs
Materials , contracts and other services
Finance Costs
Depreciation, Amortisation & Impairment
The major portion of Counc il’s expenditure is allocated to Materials, Contracts and Ot her (38%) with Employee Costs requiring 30% of the Budget. Depreciation accounts for 26% of operational expendit ure.

2008-2009 Annu al Business Plan 33 The f ollowing graph is representativ e of capital expenditur e proposed by percentage of business activ ity .
50.3%
0.3%0.7%
5.6%1.1%
1.7%
39.5%0.8%
2008/2009 Capital Expenditure (by Function)
Business Undertakings
Community Services
Culture
Environment
Recreation
Regulatory Services
Transport
Governance (Inc. Rates)
Transport and Inf rastructure is a main component at 40%. Business Undertakings (inc orporating C omm unity Waste Water Management Sy stems) acc ounts f or 50% of projected capital expenses.

2008-2009 Annu al Business Plan 34 The pro ject ed financia l statem ents f or the year ending 30 J une 2009 f ollow.
MARCH REVIEW2009 2008
REVENUESRates 10,455,350 9,759,480 Statutory charges 328,500 369,160 User charges 102,100 137,970 Other grants, subsidies and contribut ions 843,100 990,640 Investment Income 567,000 365,000 Reimbursements 249,560 230,415 Commercial activity revenue 282,330 9,836,620 Other Revenues 687,270 287,830 Share of prof it - joint ventures and associates - TOTAL REVENUES 13,515,211 21,977,115
EXPENSESEmployee Costs 4,500,380 3,764,302 Materials, contracts and other services 5,732,555 15,579,858 Finance Costs 977,030 650,290 Depreciation, Amortisation & Impairment 3,881,110 3,922,450 Designated Expenses - Share of loss - joint ventures & associates - TOTAL EXPENSES 15,091,075 23,916,900
OPERATING SURPLUS / (DEFICIT) BEFORE CAPITAL AMOUNTS (1,575,865) (1,939,785)
Gain (loss) on disposal of assets 89,280 Amounts specifically for new or upgraded assets 3,043,180 995,430 Physical resources received f ree of chargeNET SURPLUS (DEFICIT) 1,467,315 (855,075)
LIGHT REGIONAL COUNCIL
BUDGETED INCOME STATEMENTfor the year ended 30 June 2009

2008-2009 Annu al Business Plan 35
MARCH REVIEW2009 2008
ASSETSCurrent AssetsCash and cash equivalents 967,520 3,287,534 Trade & other receivables 535,021 535,021 Other Financial Assets 3,022 3,022 Inven tories 329,887 329,887
1,835,450 4,155,464 Non-current Assets held for Sale
Total Current Assets 1,835,450 4,155,464
Non-Current AssetsFinancial Assets 163,692 163,692 Investments accounted for using the equity method - Investment Property - Property, Plant and Equipment 87,855,026 80,686,866 Other Non-current Assets -
Total Non -Current Assets 88,018,718 80,850,558 Total Assets 89,854,167 85,006,022
LIABILITIESCurrent LiabilitiesTrade & Other Payables 388,403 388,403 Borrowings 1,065,690 916,660 Short-term Provisions 477,088 477,088 Other Current Liabilities -
1,931,181 1,782,151 Liabilities relating to Non-current Assets he ld for Sale
Total Current Liabilities 1,931,181 1,782,151
Non-current LiabilitiesTrade & Other Payables - Long-term Borrowings 13,728,063 10,496,263 Long-term Provisions 222,100 222,100 Other Non-current Liabilities -
Total Non-current Liabilities 13,950,163 10,718,363 Total Liabil ities 15,881,344 12,500,514 NET ASSETS 73,972,823 72,505,508
EQUITYAccumulated Surplus 11,003,690 7,556,164 Asset Revaluation Reserve 60,958,158 60,958,158 Other Reserves 2,010,976 3,991,186 TOTAL EQUITY 73,972,823 72,505,508
LIGHT REGIONAL COUNCIL
BUDGETED BALANCE SHEETas at 30 June 2009

2008-2009 Annu al Business Plan 36
MARCH REVIEW2009 2008
ACCUMULATED SURPLUSBalance at end of previous reporting period 7,556,164 8,052,960 Net Result for Year 1,467,315 (855,076)Transfers To Other Reserves (1,023,480) (3,378,390)Transfers from Other Reserves 3,003,690 3,736,670 Adjustment due to compliance with revised Accounting Standards -
Balance at end of period 11,003,690 7,556,164
ASSET REVALUATION RESERVEBalance at end of previous reporting period 60,958,158 60,958,158 Revaluation increments / (decrements) in respect of infrastructure, property, plant & equipment -
Adjustment due to compliance with revised Accounting Standards -
Balance at end of period 60,958,158 60,958,158
OTHER RESERVESBalance at end of previous reporting period 3,991,186 4,349,466 Transfers from Accumulated Surplus (3,003,690) (1,661,970)Transfers to Accumulated Surplus 1,023,480 1,303,690 Balance at end of period 2,010,976 3,991,186
TOTAL EQUITY AT END OF REPORTING PERIOD
73,972,823 72,505,508
LIGHT REGIONAL COUNCIL
BUDGETED STATEMENT OF CHANGES IN EQUITYfor the year ended 30 June 2009

2008-2009 Annu al Business Plan 37
MARCH REVIEW2009 2008
CASH FLOWS FROM OPERATING ACTIVITIESReceipts Investment income 567,000 365,000 Other operating revenues 12,948,211 21,612,115 Payments - Finance Costs (977,030) (650,290) Other payments (10,232,935) (19,344,161)
Net Cash provided by (or used in) Operating Activities 2,305,245 1,982,664
CASH FLOWS FROM INVESTING ACTIVITIESReceipts
Grants specifically for new or upgraded assets 3,043,180 995,430 Sale of replaced assets 355,110 362,030 Sale of surplus assets 1,277,250 Sale of investment propertyNet disposal of available -for-sale Financial AssetsSale of real estate developmentsRepayments of loans by community groupsDistributions received from associated entities
PaymentsExpenditure on renewal/replacement of assets (11,404,380) (10,521,481) Expenditure on new/upgraded assetsPurchase of Investment PropertyNet purchase of available-for-sale Financial AssetsDevelopment of real estate for saleLoans made to community groupsCapital contributed to associated entities
Net Cash provided by (or used in) Investing Activities (8,006,090) (7,886,771)
CASH FLOWS FROM FINANCING ACTIVITIESReceipts Proceeds from Borrowings 4,912,470 4,000,000 Proceeds from Aged Care Facility deposits - Payments Repayments of Borrowings (1,531,640) (1,273,580) Repayment of Finance Lease Liabilities - Repayment of Aged Care Facility deposits -
Net Cash provided by (or used in) Financing Activities 3,380,830 2,726,420 Net Increase (Decrease) in cash held (2,320,014) (3,177,687)
Cash & cash equivalents at beginning of period 3,287,534 6,465,221 Cash & cash equivalents at end of period 967,520 3,287,534
LIGHT REGIONAL COUNCIL
BUDGETED CASH FLOW STATEMENTfor the year ended 30 June 2009

2008-2009 Annu al Business Plan 38
LIGHT REGIONAL COUNCIL
for the year ended 30 June, 2009
MARCH REVIEW2009 2008
Operating Revenues 13,515,211 21,977,115less Operating Expenses (15,091,075) (23,916,900)Operating Surplus / (Deficit) before Capital Amounts (1,575,865) (1,939,785)
less Net Outlays on Existing AssetsCapital Expenditure on renewal and replacement of Existing Assets (489,200) (472,500)
less Depreciation, Amortisation and Impairment 3,881,110 3,922,450less Proceeds from Sale of Replaced Assets 355,110 362,030
3,747,020 3,811,980
less Net Outlays on New and Upgraded AssetsCapital Expenditure on New and Upgraded Assets(including investment property & real estate developments) (10,915,180) (10,048,981)
less Amounts received specifically for New and Upgraded Assets 3,043,180 995,430
less Proceeds from Sale of Surplus Assets(including investment property and real estate developments)
- 1,277,250(7,872,000) (7,776,301)
Net Lending / (Borrowing) for Financial Year 2,549,115 2,024,536
BUDGETED UNIFORM PRESENTATION OF FINANCES

2008-2009 Annu al Business Plan 39
Rating Structure and Policy Strategi c Focus In proposing its rates f or the 2008/2009 f inanc ial y ear Council wi ll consider its Ten Year Strat egic Management Plan 2008 to 2018, the current economic climate, specif ic issues f aced by the comm unity , the budget for the 2008/2009 f inancial year and the im pact of rates on the comm unity – in partic ular householders and primary producers.
The ‘Light Regional Council Rating R ev iew Adv isory Committee’, a Section 41 committee of Council, has continued to aid C ounci l, wit h the rev iew of rating and valuation data and f ormulating recommendations to Counci l in regard t o setting rates for t he year. An im portant part of the C ommittee’s structure is its m embers hip whic h comprises both Counci l nominated represent ativ es and community repres ent ativ es f rom the public arena.
Land us e cat egories as prov ided in the Loc al Government (General ) R egulations 1999 are used as the basis of Council’s general rate c alculation.
Method used to value land All land wit hin a council area, except f or land s pec if ically exempt (eg. crown land, counci l occupied land), is rat eable. Council has decided to c ontinue t o us e capita l v alue as t he basis f or v aluing land within the counci l area. Counci l considers t hat this met hod of v aluing land prov ides the f airest method of distributing the rat es across al l rat epay ers. Council will be adopting t he v aluations made by the Valuer-General and whic h are applicable f or the f inancial y ear comm enc ing 1 July 2008. If a property owner is diss atisfied with a property valuation, then an objection may be made t o the Valuer-General in wr iting, within 60 day s of receiving notice of the valuation, explaining the basis for the ob jection. Furt her contact details can be obtained from Counc il’s Rates Ass essm ent Of f icers on telephone (08) 8525 3200. It is important to note that Council has no role in the v aluation process. Impact of Rates The f ollowing dat a provides inform ation in regard to rate m odel ling done f or the f ormulation of this Annual Business Plan and Budget.
Differ ential General Rates Every resident benef its in some part from the general amenity of the council area, whet her that is at the pres ent time or in t he f uture. The amenity includes the loc al ec onomy , genera l council operations and the ability to use council f acilities.
Financial Year >>> 2003/2004 2004/2005 2005/2006
2006/2007 2007/2008 2008/2009 Change on
Previous Year
Total Ca pital V alu ation $1, 281 ,6 87, 38 0 $1, 719,8 69,02 0 $2, 076,2 24,58 0 $2, 137,7 58,50 0 $2,214 ,602, 460 $2,465,727,320 +11.34% Numb er of Rate abl e Assessm ents
629 0 658 7 668 0 679 1 6865 7003 +2.01%
Gen eral Rat e Reve nue $5, 883 ,3 42 $6, 56 3,3 04 $7, 204 ,1 01 $7, 617 ,9 70 $8, 031 ,369 $8,634,000 +7.5% Residen tial Rat e in the $
$0. 004 93 70 6 $0. 003 75 45 $0. 003 4 $0. 00352 5 $0. 00357 $0.00343 -3.92%
Primary Production Rate in th e $
$0. 00370 28 $0. 003 00 36 $0. 002 72 $0. 002 82 $0.002 856 $0.002744 -3.92%
Refuse Collection & Disposal Charg e ( including green was te)
$14 1.4 0 $141.4 0 $14 3.1 0 $16 5.4 0 $19 6.80 $209.80 +6.6%
Refuse Collection & Disposal Charg e (not including g reen waste)
$140.75 -
STEDS Ch arg e (Exa mple sho wn is for Kap unda Syste m)
$26 0 $28 8 $33 8 $34 8 $358 $368 +2.79%
Minimum Rat e $43 5 $50 0 $55 0 $57 0 $580 $600 +3.45%
2008-2009 Annu al Business Plan 40
It is acknowledged that the sy stem of council rat es is in essence a sy stem of taxation against property prescribed through the prov isions of the Loc al Gov ernment Act 1999. In addition Council raises incom e by way of separate c harges f or t he Ref use Collection and Community Wastewater Management Sy stems, and acts as a c ollection agent of behalf of the Stat e Gov ernm ent in regard to t he c ollection of income f or t he N atural Res ource Management Boards. In the 2008/2009 Budget Counc il proposes to rais e t otal rat e related rev enue of $10,455,350 in a total operating revenue budget of $13,515,211. Land Use is used as the factor to apply diff erential rates. If a ratepay er believ es that a particu lar property has been wrongly classif ied by the C ouncil as to its land use, then t hey may object (to Counc il) to that land use within 60 day s of being notified. A ratepay er m ay discuss the matter with C ouncil ’s Rates Assessment Off icers, on (08) 8525 3200 in the f irst instanc e. Objections may be lodged to land use attributed to property for the purpos es of raising council rates. C ouncil wi ll t hen undertak e a system of rev iew. Minimum Rate A Counci l may impos e a minimum amount payable by way of rates, prov ided that it has not imposed a f ixed charge. Where two or m ore adjoining properties hav e the same owner and are occupied by the sam e occupier, only one min imum rate is pay able by the rat epay er. Where a Council imposes a m inimum rate it m ust not apply to more than 35% of properties in the Council area. In 2008/2009 Counc il propos es to impose a m inimum rate of $600 which aff ected 1,274 (18%) rat eable properties. Counci l considers it appropriate t hat a ll rat eable properties make a bas e lev el c ontr ibution to the cost of admin ister ing Council’s activ ities and to t he cost of creating and maintaining the phy sical inf rastructure that supports eac h property .
Natur al Resource Management Board Levi es Council is loc ated with in the boundar ies of three N atural R es ourc e Management Board areas; however Counc il is only required to fund the operations of the Adelaide and Mount Lofty Ranges Nat ural Res ource Management Board and the N orthern and Y ork e Penins ula Natura l Resourc es Management Board. Contributions are sought in 2008/ 2009 tot alling $135,310 (Adelaide and Mount Lof ty) and $95,960 (Northern and Yorke). A map of the catchm ent areas s howing t hos e properties wit hin the boundary is on dis play at Council ’s of f ices. Council is operating as a revenue c ollector for the Nat ural R esource Managem ent Boards in t his regard. It does not ret ain this rev enue or determine how the revenue is spent. Ser vice Charges Council prov ides a C ommunity W astewater Management System to residential and comm ercial properties in Kapunda, Freel ing, Greenock and Roseworthy . The full cost of operating and m aintaining this s erv ice f or the 2007/08 f inancial year was budgeted to be $6,661,610, whic h includes major capita l works at the Kapunda, Freel ing and Greenock schemes. C ouncil recov ered this c ost through v arious m eans including the imposition of a serv ice charge of $368 per unit f or each property f or which t he serv ice is av ailable. Where the serv ice is prov ided t o non-rat eable land, a serv ice charge is lev ied against the land.
The Council a lso prov ides a ref use c ollection service inc lusiv e of recycling collections wit hin the t owns hips of Kapunda, Freeling, Hewett, Greenock, Roseworthy and Wasley s. The serv ice is also prov ided to those ratepay ers in Council’s area that are able to access the serv ice along the des ignat ed collection routes. The f ull cost of operating and maintaining this serv ice f or 2008/ 2009 is budget ed to be $934, 260. Counc il proposes to recov er t his c ost through the impost of a serv ice charge of $209.80 f or each property f or whic h the service is utilis ed (inclusiv e of green organics collection); and t hrough the im post of a service c harge of $140. 75 f or eac h property f or which the serv ice is utilised (exclus iv e of green organics collection). Where the s erv ice is provided t o non-rateable land, a s erv ice c harge is lev ied against the land.
2008-2009 Annu al Business Plan 41
Rate Concessions The State Government f unds (and admin isters) a v ariety of concess ions on Council rat es. Eligib le pensioners may be entitled to a rebate on Council rates, wat er rates and CW MS (f ormerly STEDS) charges where appl icable. Appl ication f orms, whic h include inf ormation on the c onc essions, are av ailable f rom C ouncil’s off ices, or by telephoning Council’s Rat es Assessment Off icers, on (08) 8525 3200. C onc essions are on ly av ailable on the principa l plac e of residence. Self Funded Retiree Concession This conc ession has been av ailable f rom 1 July 2001 and is administ ered by Rev enue SA. A self -f unded retiree, currently holding a St ate Seniors Card, may be eligib le f or a concession toward Council R ates. In the cas e of couples, bot h m ust qualify , or if only one holds a Stat e Senior’s Card, the ot her must not be in paid em ploy ment f or more than 20 hours per week. Further information c an be obt ained f rom the Rev enue SA Call Centre on 1300 366 150. Unemployed Persons Concessions The Departm ent of Families and Communities m ay assist with the payment of Counc il rat es f or a principal plac e of residence (remissions are not availab le on v acant land or renta l premises). Pleas e c ontact y our nearest Department of Family and Communities of fice for deta ils. Payment of Rates Under Section 181 of the Local Gov ernm ent Act 1999, Council m ust prov ide the opportunity f or all ratepayers to pay rates by quarterly instalm ents. Council pay ment dates in the 2008/ 2009 f inancial y ear will be 12 Sept ember 2008, 12 Dec ember 2008, 13 Marc h 2009 and 12 June 2009. Late Payment of Rates The Loc al Government Act 1999 provides t hat C ouncils impose an initial penalty of 2% on any pay ment for rates, whether by instalment or otherwis e, that is receiv ed late. A payment that continues t o be late is then charged an interest rat e, set each year acc ord ing to a f orm ula in the Act, f or eac h m onth it continues to be late. Counci l al lows a f urther three working days af ter the due dat e f or payment as a grace period. Thereaf ter late pay ment penalties are applied in acc ordance with the Loc al Gov ernm ent Act 1999. Council issues a final notice f or pay ment of rates when rates are ov erdue i.e. unpaid by the due date. Should rates rem ain unpaid m ore than 21 day s af ter the issue of the final notice then the Council will ref er the debt to t heir debt col lection agency f or collection. The debt collection agency charges co llection f ees that are rec ov erable f rom the ratepay er. Al l costs incurred by Counci l in the recovery of outstanding rates and fines are pay able by the ratepayer. When Counc il receiv es a payment in res pect of ov erdue rat es, Council appl ies the money receiv ed as f ollows:
firstly – in pay ment of any costs awarded to, or rec ov erable by , the Counci l in any court proc eedings undertak en by the Council f or the rec overy of the rat es;
secondly – in s atisf action f or any liabil ity for interest; thirdly – in pay ment of any f ine; fourthly – in satisf action of liabi lities f or rates in the order in whic h thos e liabilities
arose in payment of rates, in date order of the ir imposition (starting with the o ldest account f irst).
Remission and Postponement o f Rates Post pone ment or Rates - Hardship Section 182 of the Local Government Act 1999 permits Council, on the appl ication of the ratepayer, t o partial ly or wholly remit rates or to postpone rates, on the basis of hards hip. Where a rat epay er is suff ering hards hip in paying rates they are inv ited to c ont act Council’s Rates Assessment Officers, on (08) 8525 3200 to d iscuss t he matt er. Suc h enquiries are treat ed conf identially by Council.

2008-2009 Annu al Business Plan 42
Seniors Rat e Postponement Section 182A of the Loc al Government Act prov ides t he option f or State Senior C ard holders to apply to post pone part of their counci l rates on a long term basis. The def erred amount is subject to monthly int erest c harge, with the acc rued debt being pay able on the disposal or sale of the property. Postponement is similar to a rev erse mortgage by rely ing on the equity in the property . A ratepay er who has a St ate Seniors Card may apply for postponem ent of a portion of the c ounci l rates pay able on property they own if it is thei r principal place of residence and if no other person other than their spous e has an interest as owner of the property and there is appropriate equity in the property. Further information c an be obtained f rom Council’s R ates Assess ment Of f icers on telephone (08) 8525 3200. Rebate o f Rates The Loc al Government Act 1999 requi res Councils t o rebat e the rates pay able for certain land uses. This includes 100% rate rebates granted on Places of W orship, Public Cemeteries, Hospitals and land occupied by Univ ers ities, and 75% rate rebates hav e been granted on Educational f acilities (subject to some qual if ications). Discretionary rebates may be applied by the Counci l under Section 166 of the Act. Counci l annually considers m any applications for rat e rebates and has in the past, and is again for the 2008/ 2009 f inancial y ear, proposing to rebat e rates c harged to var ious dist rict com munity and sporting organis ations. Sal e of Land for Non-Payment of Council Rates The Local Governm ent Act 1999 provides that a C ouncil m ay sell any property where the rates hav e been in arrears f or three years or m ore. The C ouncil is required to notif y the principal ratepay er and the owner (if not the sam e person) of the land of its intention to sel l the land and prov ide the owner with det ails of the outstanding amounts. If pay ment of the outstanding amount is not receiv ed within one m ont h the property may be sold. Except in extraordinary circumstanc es, the Counci l enf orces the sale of land for arrears of rates. Disclai mer A rate cannot be chal lenged on t he basis of non-compliance with t his policy and m ust be paid in acc ordance wit h the required payment prov isions.

2008-2009 Annu al Business Plan 43
Financial Impacts of Infrastructure Management Council has adopt ed t he f ollowing key f inanc ial targets (subject to am endment f ollowing the adoption of Council ’s draf t Strateg ic Managem ent P lan f or 2008 to 2018):
Indic ator I – Operating Surplus Long Term, to achiev e a zero operating surplus by 30 June 2012. Short Term, to reduce the overall gap bet ween operational revenue and operational expenses by between $200, 000 and $300,000 net of any changes in depreciation (all in com par ison to the 2006/07 f inancial y ear f igures) as a minimum f or the 2007/08 f inancial y ear and wit hout the budget strategies propos ed hav ing an adverse impact on the underlying operating result or achiev ement of targets for other f inancial indic ators proposed by way of this resolution in f uture y ears. Th is goal was reconf irmed as a target f or the 2008/ 2009 budget in c ompar ison to the previous y ear.
Indic ator 2 – Operating Surplus R atio Long Term, to achieve a zero perc ent operating s urplus ratio by 30 June 2012. Short Term, improve (reduce) the indicator by 10%, whic h is a ratio of -20% or less by 30 June 2008. Th is goal was reconfirm ed as abov e f or 2008/ 2009 y ear.
Indic ator 3 – Net Financial Liabil ities Long Term, be no greater than its annual operating rev enue and not less than zero.
Indic ator 4 – Net Financial Liabil ities R atio Long Term, the ratio is greater than zero but less t han 100% of total operating revenue.
Indic ator 5 – Interest Cov er Ratio Long Term, the ratio should be less than 10% of operating rev enue.
Indic ator 6 – Ass et Sustainabi lity Ratio Long Term, t hat Council’s outlay s on renewing/replacing ass ets be equal to or better than the rate of annual deprec iation of assets over a rolling three y ear period. Short Term, t hat Counci l aim to increase this ratio by 10% per annum for the next three f inancial years. This goal was rec onfirmed as above for 2008/ 2009 y ear.

200 8/0 9 A nnual Busin ess Pl an 44
Lo cal Government Financial Indicators
2002 2003 2004 2005 2006 2007 2008 2008 2008 2008 2009Actual Actu al Actu al Actu al Actual Actual Adopted Bu dget Sept. Review Dec Review Mar Review Draft Budg et
Indicator 1. Op eratin g Surplu s -3,260,978 -3,026,602 -2,214,874 -2,369,985 -1,214,883 -722,154 -1,926,910 -2,177,440 -2,088,720 -1,939,785 -1,577,403
Indicator 2. Op eratin g Surplu s Ratio -63.45% -49.45% -32.56% -31.03% -14.30% -7.90% -19.78% -22.35% -21.40% -19.88% -15.09%
Indicator 3. Net Financial Liab ili ties $000 2,384 2,921 3,594 4,096 3,256 1,635 3,078 5,861 5,789 1,911 14,214
Indicator 4. Net Financial Liab ili ties Ratio 33.57% 35.40% 40.69% 41.09% 28.82% 13.37% 13.83% 26.33% 25.84% 8.70% 105.17%
Indicator 5. Interest Cover Ratio 3.16% 3.06% 3.42% 3.28% 2.24% 1.43% 1.41% 1.43% 1.37% 1.32% 3.17%
Indicator 6. Asset Sustainabi li ty Ratio 225.57% 80.41% 121.97% 82.14% 79.81% 97.08% 361.47% 417.14% 417.79% 263.53% 293.84%
Indicator 7. Asset Co nsump tion Ratio To be calculated at a l ater date - further invest igat ion is required.
-3 ,500, 000-3 ,000, 000-2 ,500, 000-2 ,000, 000-1 ,500, 000-1 ,000, 000
- 500, 0000
Bud get Revi ew Rev iew Revi ew Bud get
A ct ual Act ua l A ctu al Act ua l A ctu al A ct ua l Ad opt ed S ept embe r Decemb er Ma rch Draf t
200 2 2 003 200 4 2 005 200 6 20 07 200 8 20 08 200 8 20 08 200 9
Op
. R
eve
nu
e / O
p.
Ex
pen
se
s
Operat ing Surplus
-70%-60%-50%-40%-30%-20%-10%
0%
Budget Revi ew R eview Review Budget
Act ual A ctual Actua l Act ual A ctual Actua l A dopted Septem ber D ecem ber M arch Dr af t
2002 2003 2004 2005 2006 2007 2008 2008 2008 2008 2009O
pera
tin
g S
urp
lus
/ R
ate
s
Operat ing S urplus Rat io
0
5,00 0
1 0,00 0
1 5,00 0
Bu dget R eview R evie w R evi ew Budg et
Act ual Act ual Act ual Ac tual A ctua l A ctu al A dopt ed S ept ember Dec emb er Marc h Draf t
200 2 20 03 2 004 2005 2006 2007 200 8 200 8 20 08 2 008 2009
To
ta
l L
iab
ilit
ies -
Fin
an
cia
l A
sse
ts ($
000
)
Ne t Financia l Liabilit ies
0%2 0%4 0%6 0%8 0%
10 0%12 0%
Bu dge t Rev iew Revi ew Revie w Bu dget
A ctu al Act ua l A ct ual A ct ual Ac tu al Act ua l A dop te d S ep tem ber Dec embe r Ma rc h Dra ft
2002 2 003 20 04 200 5 2 006 20 07 20 08 2008 2 008 20 08 200 9
Ne
t F
ina
ncia
l L
iab
ilit
ies
/
Op
. R
eve
nu
e
Net Fi nanci al Liabili ties Ratio
0.0 %0.5 %1.0 %1.5 %2.0 %2.5 %3.0 %3.5 %4.0 %
B udget R eview R eview R eview B udget
Act ual Act ual Act ual Act ual Act ual Act ual Adop ted S ept ember Dece mb er March D ra ft
20 02 20 03 20 04 20 05 20 06 20 07 20 08 20 08 20 08 200 8 200 9
Inte
rest
on
Lo
an
s / O
p.
Rev
en
ue
Interes t Cover R atio
0%5 0%
100 %150 %200 %250 %300 %350 %400 %450 %
Bud get Re vie w Revi ew Revi ew B ud get
A ct ual A ct ual A ct ual Act ua l Ac tu al A ctu al A dopt ed Se pt ember Dece mber March Draf t
200 2 200 3 20 04 2 005 2 006 2007 200 8 20 08 20 08 2 008 2 009Ca
p. E
xpe
nd
iture
/ D
ep
reci
atio
n
Asset Sustainability Ratio

2008/0 9 A nn ual Busin ess Plan 45
Comment ary on Financial Impacts Council ’s def icit in 2008/09 is the result of operating expenses of $15.1m f unded by operating income of $13.5m. Furt herm ore, rate rev enue budgeted was to the value of approximately $10.4m. Council ’s balance s heet d isplay ed net assets of approx imat ely $74m which included capital works of $11. 4m funded by a combination of rate rev enue, developer contributions and loan f unds. Council budgeted to c ontinue with an acc elerated capital road works program to the v alue of $2. 5 mi llion in addition to its regular annual capital works program, to address t he sev ere deterioration of its road network. The acceleration program was comm enc ed with t he allocation of $2.5m spent in the 2007/2008 f inancia l year. Council also budgeted to borrow $1.5 million f or its regular annual capital works program and approxim ately $0.9m for the Community Waste water Management Sy stems. Comment ary on Financial Indicat ors Indic ators 1 and 2 - Council will meet its target reduction to the operating def icit in 2008/09. Net reduction of the operating def icit is approx imately $360,000 when compared to the revised 2007/ 08 f igure. Council theref ore remains on track to meet its long term goal of achieving a zero operating s urplus by 30 June 2012. Operating Surplus Ratio is reduc ed to -15.09%. Indic ators 3 and 4 - Net Financial Liabilities shows an am ount of approximat ely $14.2 million. This equates to a N et Financial Liab ilities Ratio of 105.17% which ess entially is due to a continued reliance on increas ed loan borrowings to undertak e the accelerated capital works program on Council’s roads and build upgraded Com munity W astewater Managem ent Systems at Kapunda, Freel ing and Greenock. Furt hermore, Council has budget ed to us e a large am ount of its f inancial assets (reserve f unds and s urplus cash holdings ) to carry out its operating and capita l ex penditure, a lso aff ecting t his indic ator. The ind icat or is s lightly above the target set by the Audit C ommitt ee of being equal to or less than the value of operating revenue. Indic ator 5, I nterest Cov er R atio, shows t hat Council has budget ed to us e 3. 17% of its operating rev enue (less inv estment income and commerc ial activ ities income) in pay ing interest on its loans. The target set by Council’s Audit Com mittee f or this indicator is less than 10% of the operating rev enue, whic h is comf ortably achieved. Asset Sustainability Ratio, which is indic ator 6, s hows that Counci l has budgeted to outlay an amount on renewing and replacing assets, whic h is 2.93 tim es that of its annual budget ed depreciation of $3.88 mil lion. The target set by Council’s Audit Committee was that Council outlay an amount equal to or better t han the rate of annual depreciation and in the short t erm this ratio be increas ed by 10% per annum. Council ’s 2008/2009 budget ac hiev es this comf ortab ly .

2008/0 9 A nn ual Busin ess Plan 46
The f ollowing Tables prov ide the split of the net im pact on rating, net income and net expendit ure in 2008/ 2009.
Summary Tables of Income and Expenditure
2006/07 Apl. Rev. Service Provision Area Item No. 2007/08
586,180 555,370 Corporate Management 1 663,15019,310 17,960 Occupational Health and Safety 2 30,080
-100,130 -95,080 Regional Development 3 45,890117,490 135,710 Tourism 4 165,330
-0 104,010 Tourist Leisure Park 5 -1-175,530 -149,050 Commercial Activities - Other 6 -3,740195,830 206,710 Elected Members 7 261,260
10,590 10,290 Aged & Social Care 8 11,910-1,730 -840 Youth Services 9 5,650
177,380 158,340 Community Services 10 195,019347,020 359,750 Library Services 11 509,019
-468,880 -272,920 Finance & Administration 12 216,94955,820 38,030 Contract Management 13 44,410
113,790 121,360 Information Technology and Telecommunications 14 87,58081,600 87,400 Office Expenses 15 9,770
-7,655,250 -7,638,330 Rating & Property 16 -8,763,43033,780 44,700 Records Management 17 47,33024,210 24,210 Cultural Services 18 30,09093,370 172,480 Halls & Institutes 19 87,820
351,290 388,000 Parks & Reserves 20 313,72040,160 37,580 Public Conveniences 21 51,680
144,160 226,270 Sport & Recreation 22 185,519500 420 Street Furniture 23 0
169,510 181,200 Street Lighting 24 151,09010,440 86,370 Streetscaping 25 9,53033,030 36,040 Cemeteries 26 51,430
7,010 -3,330 Aerodromes 27 8100 1,560 Private Works 28 230
-170,070 -99,250 Plant Operations 29 -176,410-245,710 -257,290 Indirect Allocations 30 -356,930419,360 353,110 Strategy and Project Planning 31 1,200,580
10 4,690 Quarries 32 100438,790 572,590 Stormwater Maintenance & Construction 33 883,400
66,480 79,020 Bridge Maintenance & Construction 34 104,6802,454,040 3,528,400 Roads Maintenance & Construction 35 1,520,460
161,330 236,850 Footpath Maintenance & Construction 36 486,820139,120 101,430 Traffic Control Maintenance & Construction 37 131,520927,240 924,180 Development & Planning 38 931,610
43,180 42,210 Fire Services 39 24,020-390 -1,370 Dog and Cat Control 40 62,260
31,390 28,660 By-Laws 41 28,2305,010 5,830 Animal and Plant Control 42 0
80,670 82,980 Health Services 43 146,62078,810 85,420 Waste Management Services 44 108,039
554,960 622,280 Waste Collection & Recycling 45 816,270-350 352,140 Community Waste Water Management Systems 46 2
40,240 46,680 Wetlands 47 19,630($764,941) $1,542,769 TOTAL - DEFICIT (SURPLUS) 339,001
Surplus Brought Forward - CommittedSurplus Brought Forward - Un-Committed ($340,030)
($764,941) ($519,519) NET - DEFICIT (SURPLUS) ($1,029)
EXECUTIVE SUMMARY - NET IMPACT ON RATING EFFORT

2008/0 9 A nn ual Busin ess Plan 47
2006/07 Apl. Rev. Service Provision Area Item No. 2007/08
53,630 64,900 Corporate Management 1 54,980144,580 145,030 Occupational Health and Safety 2 150,690174,440 1,478,520 Regional Development 3 30,000168,280 154,150 Tourism 4 41,170481,970 511,100 Tourist Leisure Park 5 325,500207,900 202,640 Commercial Activities - Other 6 21,830
0 0 Elected Members 7 00 10 Aged & Social Care 8 0
9,240 10,150 Youth Services 9 4,3001,500 1,910 Community Services 10 1,480
79,090 167,740 Library Services 11 141,6101,065,750 1,243,820 Finance & Administration 12 1,419,860
103,510 103,830 Contract Management 13 90,270311,450 311,870 Information Technology and Telecommunications 14 539,580329,790 499,050 Office Expenses 15 217,630
8,454,170 8,429,080 Rating & Property 16 9,782,56078,650 100,400 Records Management 17 121,930
0 0 Cultural Services 18 00 319,500 Halls & Institutes 19 0
34,450 38,990 Parks & Reserves 20 41,5000 0 Public Conveniences 21 0
150,990 189,290 Sport & Recreation 22 84,0200 0 Street Furniture 23 00 7,000 Street Lighting 24 0
1,120,000 1,052,730 Streetscaping 25 039,000 39,710 Cemeteries 26 14,500
2,890 8,620 Aerodromes 27 3,4500 11,250 Private Works 28 0
1,173,110 1,292,650 Plant Operations 29 975,470933,890 954,810 Indirect Allocations 30 1,115,380
78,840 103,800 Strategy and Project Planning 31 92,52011,150 53,760 Quarries 32 559,900
638,260 623,570 Stormwater Maintenance & Construction 33 50,000567,480 1,157,340 Bridge Maintenance & Construction 34 164,000
3,271,910 3,533,160 Roads Maintenance & Construction 35 4,639,180165,390 165,440 Footpath Maintenance & Construction 36 88,800
71,460 75,310 Traffic Control Maintenance & Construction 37 400,000368,540 468,060 Development & Planning 38 314,720
6,340 4,500 Fire Services 39 5,040109,780 110,930 Dog and Cat Control 40 109,540
160 450 By-Laws 41 9900 0 Animal and Plant Control 42 0
38,710 47,250 Health Services 43 69,560133,280 145,230 Waste Management Services 44 226,430189,450 246,480 Waste Collection & Recycling 45 46,000
3,069,810 3,161,710 Community Waste Water Management Systems 46 6,467,68080 120 Wetlands 47 0
23,838,920 27,235,860 TOTAL - DEFICIT (SURPLUS) 28,412,070Surplus Brought Forward - CommittedSurplus Brought Forward - Un-Committed
23,838,920 27,235,860 NET - DEFICIT (SURPLUS) 28,412,070
EXECUTIVE SUMMARY - NET INCOME

2008/0 9 A nn ual Busin ess Plan 48
2006/07 Apl. Rev. Service Provision Area Item No. 2007/08
639,810 620,270 Corporate Management 1 718,130163,890 162,990 Occupational Health and Safety 2 180,770
74,310 1,383,440 Regional Development 3 75,890285,770 289,860 Tourism 4 206,500481,970 615,110 Tourist Leisure Park 5 325,499
32,370 53,590 Commercial Activities - Other 6 18,090195,830 206,710 Elected Members 7 261,260
10,590 10,300 Aged & Social Care 8 11,9107,510 9,310 Youth Services 9 9,950
178,880 160,250 Community Services 10 196,499426,110 527,490 Library Services 11 650,630596,870 970,900 Finance & Administration 12 1,636,809159,330 141,860 Contract Management 13 134,680425,240 433,230 Information Technology and Telecommunications 14 627,160411,390 586,450 Office Expenses 15 227,400798,920 790,750 Rating & Property 16 1,019,130112,430 145,100 Records Management 17 169,260
24,210 24,210 Cultural Services 18 30,09093,370 491,980 Halls & Institutes 19 87,820
385,740 426,990 Parks & Reserves 20 355,22040,160 37,580 Public Conveniences 21 51,680
295,150 415,560 Sport & Recreation 22 269,539500 420 Street Furniture 23 0
169,510 188,200 Street Lighting 24 151,0901,130,440 1,139,100 Streetscaping 25 9,530
72,030 75,750 Cemeteries 26 65,9309,900 5,290 Aerodromes 27 4,260
0 12,810 Private Works 28 2301,003,040 1,193,400 Plant Operations 29 799,060
688,180 697,520 Indirect Allocations 30 758,450498,200 456,910 Strategy and Project Planning 31 1,293,100
11,160 58,450 Quarries 32 560,0001,077,050 1,196,160 Stormwater Maintenance & Construction 33 933,400
633,960 1,236,360 Bridge Maintenance & Construction 34 268,6805,725,950 7,061,560 Roads Maintenance & Construction 35 6,159,640
326,720 402,290 Footpath Maintenance & Construction 36 575,620210,580 176,740 Traffic Control Maintenance & Construction 37 531,520
1,295,780 1,392,240 Development & Planning 38 1,246,33049,520 46,710 Fire Services 39 29,060
109,390 109,560 Dog and Cat Control 40 171,80031,550 29,110 By-Laws 41 29,220
5,010 5,830 Animal and Plant Control 42 0119,380 130,230 Health Services 43 216,180212,090 230,650 Waste Management Services 44 334,469744,410 868,760 Waste Collection & Recycling 45 862,270
3,069,460 3,513,850 Community Waste Water Management Systems 46 6,467,68040,320 46,800 Wetlands 47 19,630
23,073,979 28,778,629 TOTAL - DEFICIT (SURPLUS) 28,751,064Surplus Brought Forward - CommittedSurplus Brought Forward - Un-Committed
23,073,979 28,778,629 NET - DEFICIT (SURPLUS) 28,751,064
EXECUTIVE SUMMARY - NET EXPENDITURE

2008/0 9 A nn ual Busin ess Plan 49
Loan Principal Repayments Council as part of its financing strategy, f inances capital works by way of loan f unds. The f unds are taken out wit h the Local Gov ernm ent Financ e Author ity of South Australia in t he main with other loan f unds being prov ided by state and federal gov ernm ent for spec ific projects. The f ollowing loan schedule prov ides the f orecast ed principal repayments and purpos e of f unding. Principal Deb. Item Purpose Last Principal Interest Principal
Paid No. No. Payment Sum Rate Paid2007/08 Date $ % 2008/09
$ $
22,420 4 19 Hewett Hall 17/02/2017 450,000 8.25 24,0102,490 4 22 Hewett Other Facilit ies 17/02/2017 50,000 8.25 2,670
9,210 5 35 1996/97 Road Construction 15/08/2007 135,000 7.10 0
7,850 6 46 Kapunda CWMS Extensions 15/08/2007 115,000 7.10 0
14,990 9 33 Freeling Drainage 15/06/2008 115,200 6.30 0
6,750 11 35 Moppa Road Construc tion 15/06/2008 51,890 6.30 0
9,110 12 46 Kapunda CWMS 15/06/2008 70,000 6.30 0
50,100 13 35 Capital Resheeting 1997/98 15/06/2008 385,000 6.30 0
26,850 15 35 Formed and Surfaced Roads 1998/99 15/04/2009 219,210 6.35 28,580
34,390 16 35 Sealed Roads 1998/99 15/04/2009 280,790 6.35 36,610
58,780 17 35 Formed Roads 1999/2000 17/01/2010 500,000 7.50 63,270
34,330 18 5 Construct 8 Cabins – Dutton Park 17/01/2010 292,000 7.50 36,950
1,170 19 22 Re-Surface Dutton Park Tennis Courts 15/06/2010 10,000 7.40 1,260
11,970 20 46 Dutton Park Water Line 15/06/2010 102,000 7.40 12,870
31,680 21 46 Dutton Park Beautification Lake 15/06/2010 270,000 7.40 34,070
44,100 22 35 Sealed Roads 2000/01 15/09/2010 390,000 7.35 47,40098,380 22 Formed Roads 2000/01 15/09/2010 870,000 7.35 105,75027,140 22 33 Stormwater 2000/01 15/09/2010 240,000 7.35 29,170
10,490 23 22 Kapunda Golf Course 15/12/2010 170,000 6.95 11,230
5,490 24 46 Greenock CWMS Pump 15/06/2011 50,650 6.70 5,870
7,610 27 12 Office Equipment 2001/02 15/03/2012 75,000 6.65 8,13017,260 27 33 Stormwater Drainage 2001/02 15/03/2012 170,000 6.65 18,4305,080 27 21 Public Conveniences 2001/02 15/03/2012 50,000 6.65 5,4205,080 27 18 Halls 2001/02 15/03/2012 50,000 6.65 5,420
40,610 27 35 Formed Roads 2001/02 15/03/2012 400,000 6.65 43,3504,570 27 37 Traff ic Control 2001/02 15/03/2012 45,000 6.65 4,880
11,170 27 34 Bridges 2001/02 15/03/2012 110,000 6.65 11,9204,060 27 36 Footpaths 2001/02 15/03/2012 40,000 6.65 4,3406,090 27 29 Major Plant 2001/02 15/03/2012 60,000 6.65 6,500
11,320 28 46 Kapunda CWMS Lagoon Walls 15/03/2012 111,490 6.65 12,0905,580 28 46 Greenock CWMS Lagoon Walls 15/03/2012 55,000 6.65 5,960

2008/0 9 A nn ual Busin ess Plan 50
22,840 29 33 Gawler River Infrastructure 15/03/2012 225,000 6.70 24,400
1,020 30 22 Wasleys Netball / Tennis Courts 15/03/2012 10,000 6.65 1,080
1,630 31 17 Records Management 2002/03 17/03/2013 17,000 5.67 1,7302,860 31 44 Kapunda WM Stat ion 2002/03 17/03/2013 29,750 5.67 3,0203,870 31 44 Roseworthy WM Stat ion 2002/03 17/03/2013 40,250 5.67 4,0902,500 31 33 Stormwater 2002/03 17/03/2013 26,040 5.67 2,6402,500 31 26 Cemeteries 2002/03 17/03/2013 26,000 5.67 2,640
13,860 31 24 Street Lighting 2002/03 17/03/2013 144,500 5.67 14,6601,920 31 19 Public Venues 2002/03 17/03/2013 20,000 5.67 2,030
28,550 31 35 Sealed Roads 2002/03 17/03/2013 297,440 5.67 30,20046,180 31 35 Formed Roads 2002/03 17/03/2013 481,020 5.67 48,830
960 31 34 Bridges 2002/03 17/03/2013 10,000 5.67 1,020960 31 36 Footpaths 2002/03 17/03/2013 10,000 5.67 1,020
19,010 31 29 Machinery Operating 2002/03 17/03/2013 198,000 5.67 20,100
1,770 32 19 Public Venues 2003/04 15/01/2014 20,000 6.90 1,9002,710 32 44 Kapunda W.M. Station 2003/04 15/01/2014 30,570 6.90 2,9007,130 32 24 Street Lighting 2003/04 15/01/2014 80,500 6.90 7,630
28,190 32 35 Sealed Roads 2003/04 15/01/2014 318,000 6.90 30,16043,750 32 35 Formed Roads 2003/04 15/01/2014 493,600 6.90 46,8208,860 32 34 Bridges 2003/04 15/01/2014 100,000 6.90 9,4903,950 32 46 Kapunda STEDS 2003/04 15/01/2014 44,580 6.90 4,230
10,440 32 33 Stormwater 2003/04 15/01/2014 117,750 6.90 11,17026,150 32 29 Machinery Operating 2003/04 15/01/2014 295,000 6.90 27,980
8,910 33 33 North Para Linear Park Stage 3 15/05/2014 100,000 6.65 9,510
21,170 34 33 Stormwater 2004/05 17/01/2015 250,000 6.15 22,49029,630 34 35 Sealed Roads 2004/05 17/01/2015 350,000 6.15 31,48055,030 34 35 Formed Roads 2004/05 17/01/2015 650,000 6.15 58,46021,170 34 29 Machinery Operating 2004/05 17/01/2015 250,000 6.15 22,4901,690 34 19 Kapunda SM Hall 2004/05 17/01/2015 20,000 6.15 1,800
800 35 15 Freeling Office 2005/06 15/02/2016 10,000 6.15 8501,590 35 19 Kapunda SM Hall 2005/06 15/02/2016 20,000 6.15 1,6901,240 35 20 Davidson Reserve 2005/06 15/02/2016 15,500 6.15 1,310
800 35 22 Kapunda Swimming Pool 2005/06 15/02/2016 10,000 6.15 85011,160 35 24 Street Lighting 2005/06 15/02/2016 140,000 6.15 11,8505,580 35 25 Streetscaping 2005/06 15/02/2016 70,000 6.15 5,930
16,730 35 33 Stormwater 2005/06 15/02/2016 210,000 6.15 17,7803,980 35 34 Bridges 2005/06 15/02/2016 50,000 6.15 4,230
17,830 35 35 Sealed Roads 2005/06 15/02/2016 223,800 6.15 18,95048,370 35 35 Formed Roads 2005/06 15/02/2016 607,000 6.15 51,3909,060 35 37 Traffic Control 2005/06 15/02/2016 113,700 6.15 9,620
25,390 36 45 Recycling - Green Waste Collection 15/03/2012 94,000 6.15 27,160
7,200 37 2006/07 Tourist Leisure Park 15/02/2017 100,000$ 6.99 7,7102,880 37 2006/07 Freeling Office 15/02/2017 40,000$ 6.99 3,090
720 37 2006/07 Davidson Reserve 15/02/2017 10,000$ 6.99 7701,080 37 2006/07 Cemetery - Kapunda 15/02/2017 15,000$ 6.99 1,1608,930 37 2006/07 Stormwater 15/02/2017 124,030$ 6.99 9,5602,450 37 2006/07 Sealed Roads 15/02/2017 34,090$ 6.99 2,630
57,400 37 2006/07 Formed Roads 15/02/2017 797,290$ 6.99 61,4803,600 37 2006/07 Footpaths 15/02/2017 50,000$ 6.99 3,8601,440 37 2006/07 Kapunda Waste Management Station 15/02/2017 20,000$ 6.99 1,540
0 38 2007/08 Sealed Roads Accelerated Capital Works 15/04/2018 1,250,000 7.75 86,7000 38 2007/08 Formed Roads Accelerated Capital Works 15/04/2018 1,250,000 7.75 86,700
0 39 2007/08 Formed Roads 15/04/2018 1,500,000 7.75 104,030
1,273,560 Total 1,532,960

2008/0 9 A nn ual Busin ess Plan 51
Summary of Total Expenditure & Income The f ollowing Table identif ies the apportionm ent of operating and capital expendit ure and rev enue for 2008/ 2009.
ITEM NO. 01 - 47
2007/08 Mar Review Inflows (Outflows) Ref No. 2008/09
Inflows Source of Funding - Operating
9,743,200 9,759,480 Rating 1.01 10,455,350303,500 369,160 Statutory Charges 1.02 328,500
89,800 106,470 User Charges 1.03 102,100973,910 988,470 Grants and Subsidies - Operating 1.04 791,100365,000 365,000 Investment Income 1.05 567,000
64,000 33,670 Donations 1.06 52,000299,820 232,510 Reimbursements 1.07 249,560
9,916,000 236,290 Commercial Activities 1.08 282,330497,490 165,870 Other 1.09 687,270
0 0 Plant Hire Recouped 768,6700 0 Salaries and Wages Oncosts Recouped 682,120
2,426,920 2,426,920 FCA Oncosts Recouped 1.09 2,120,22024,679,640 14,683,840 Total Operating Revenue 17,086,220
Inflows Source of Funding - Recoupments
4,578,800 3,780,210 Recoupments 1.10 3,003,6904,578,800 3,780,210 Total Recoupments 3,003,690
Inflows Source of Funding - Capital
461,540 566,060 Grants and Subsidies - Capital 1.11 274,8001,298,750 533,890 Donations and Contributions 1.12 2,768,380
272,750 1,624,260 Sale of Assets 1.14 355,11011,400 11,400 Other Capital Revenue 1.15 11,400
7,547,990 4,000,000 Loans 1.16 4,912,4709,592,430 6,735,610 Total Capital Inflows 8,322,160
38,850,870 25,199,660 TOTAL INFLOWS 28,412,070
(Outflows) Total Operating Cost of Service
3,804,960 3,808,960 Salaries and Wages 1.17 4,579,870417,800 417,800 Salaries and Wages Oncosts 1.18 529,410
13,005,520 3,176,520 Contractual Services 1.19 3,346,3601,305,040 1,112,590 Materials 1.20 985,730
673,190 650,270 Finance Charges 1.21 977,0303,922,450 3,922,450 Depreciation 1.22 3,881,110
522,420 523,990 Plant Hire 1.23 530,8801,734,620 1,790,960 Other 1.24 1,721,7601,220,570 1,219,530 FCA Oncosts 1.25 2,120,530
26,606,570 16,623,070 Total Operating Expenses 18,672,680
(Outflows) Appropriations
461,560 3,378,390 Appropriations 1.26 1,023,480461,560 3,378,390 Total Appropriations Expenses 1,023,480
(Outflows) Capital Acquisitions
13,410,650 8,874,470 Infrastructure 1.27 10,569,08025,550 25,570 Structures 1.28 56,100
534,800 656,720 Buildings 1.29 60,000414,130 883,760 Plant and Machinery 1.30 685,200
14,000 10,140 Furniture and Fittings 1.31 9,00032,500 71,480 Office Equipment 1.32 25,000
14,431,630 10,522,140 Total Capital Expenses 11,404,380
(Outflows) Loan Principal Repayments
1,273,560 1,273,580 Loan Principal Repaym ents 1.33 1,531,6401,273,560 1,273,580 Total Loan Principal Repayments 1,531,640
42,773,320 31,797,180 TOTAL OUTFLOWS 32,632,180
-3,922,450 -3,922,450 Less: Non-Cash Items/Depreciation 1.22 -3,881,110
0 2,675,070 NET IMPACT ON RATING EFFORT 339,000
0 0 Balance brought forward - Committed 00 0 Balance brought forward - Un - Committed -340,030
$0 $2,675,070 (Surplus) / Deficit ($1,030)
SERVICE PROVISION AREA Overall Summary Items 1 - 47

ITEM NO. 01 - 47
2007/08 Mar Review Inflows (Outflows) Ref No. 2008/09
Inflows Source of Funding - Operating
9,743,200 9,759,480 Rating 1.01 10,455,350303,500 369,160 Statutory Charges 1.02 328,500
89,800 106,470 User Charges 1.03 102,100973,910 988,470 Grants and Subsidies - Operating 1.04 791,100365,000 365,000 Investment Income 1.05 567,000
64,000 33,670 Donations 1.06 52,000299,820 232,510 Reimbursements 1.07 249,560
9,916,000 236,290 Commercial Activities 1.08 282,330497,490 165,870 Other 1.09 687,270
0 0 Plant Hire Recouped 768,6700 0 Salaries and Wages Oncosts Recouped 682,120
2,426,920 2,426,920 FCA Oncosts Recouped 1.09 2,120,22024,679,640 14,683,840 Total Operating Revenue 17,086,220
Inflows Source of Funding - Recoupments
4,578,800 3,780,210 Recoupments 1.10 3,003,6904,578,800 3,780,210 Total Recoupments 3,003,690
Inflows Source of Funding - Capital
461,540 566,060 Grants and Subsidies - Capital 1.11 274,8001,298,750 533,890 Donations and Contributions 1.12 2,768,380
272,750 1,624,260 Sale of Assets 1.14 355,11011,400 11,400 Other Capital Revenue 1.15 11,400
7,547,990 4,000,000 Loans 1.16 4,912,4709,592,430 6,735,610 Total Capital Inflows 8,322,160
38,850,870 25,199,660 TOTAL INFLOWS 28,412,070
(Outflows) Total
SERVICE PROVISION AREA Overall Summary Items 1 - 47
(Outflows) Total Operating Cost of Service
3,804,960 3,808,960 Salaries and Wages 1.17 4,579,870417,800 417,800 Salaries and Wages Oncosts 1.18 529,410
13,005,520 3,176,520 Contractual Services 1.19 3,346,3601,305,040 1,112,590 Materials 1.20 985,730
673,190 650,270 Finance Charges 1.21 977,0303,922,450 3,922,450 Depreciation 1.22 3,881,110
522,420 523,990 Plant Hire 1.23 530,8801,734,620 1,790,960 Other 1.24 1,721,7601,220,570 1,219,530 FCA Oncosts 1.25 2,120,530
26,606,570 16,623,070 Total Operating Expenses 18,672,680
(Outflows) Appropriations
461,560 3,378,390 Appropriations 1.26 1,023,480461,560 3,378,390 Total Appropriations Expenses 1,023,480
(Outflows) Capital Acquisitions
13,410,650 8,874,470 Infrastructure 1.27 10,569,08025,550 25,570 Structures 1.28 56,100
534,800 656,720 Buildings 1.29 60,000414,130 883,760 Plant and Machinery 1.30 685,200
14,000 10,140 Furniture and Fittings 1.31 9,00032,500 71,480 Office Equipment 1.32 25,000
14,431,630 10,522,140 Total Capital Expenses 11,404,380
(Outflows) Loan Principal Repayments
1,273,560 1,273,580 Loan Principal Repayments 1.33 1,531,6401,273,560 1,273,580 Total Loan Principal Repayments 1,531,640
42,773,320 31,797,180 TOTAL OUTFLOWS 32,632,180
-3,922,450 -3,922,450 Less: Non-Cash Items/Depreciation 1.22 -3,881,110
0 2,675,070 NET IMPACT ON RATING EFFORT 339,000
0 0 Balance brought forward - Committed 00 0 Balance brought forward - Un - Committed -340,030
$0 $2,675,070 (Surplus) / Deficit ($1,030)

ITEM NO. 01
2007/08 Mar Review Inflows (Outflows) Account No. Ref No. 2008/09
Inflows Source of Funding - Operating
0 0 Rating 1012/1302/1602 1.01 00 0 Statutory Charges 1012/1302/1602 1.02 00 0 User Charges 1012/1302/1602 1.03 00 0 Grants and Subsidies - Operating 1012/1302/1602 1.04 00 0 Investment Income 1012/1302/1602 1.05 00 0 Donations 1012/1302/1602 1.06 00 2,140 Reimbursements 1012/1302/1602 1.07 00 0 Commercial Activities 1012/1302/1602 1.08 0
8,170 10,040 Other 1012/1302/1602 1.09 8,9800 0 Plant Hire Recouped 1012/1302/1602 00 0 Salaries and Wages Oncosts Recouped 1012/1302/1602 00 0 FCA Oncosts Recouped 1012/1302/1602 1.10 0
8,170 12,180 Total Operating Income 8,980
Inflows Source of Funding - Recoupments
0 0 Recoupments 1013/1303/1603 1.11 00 0 Total Recoupments 0
Inflows Source of Funding - Capital
0 0 Grants and Subsidies - Capital 1017/1307/1607 1.12 00 0 Donations and Contributions 1017/1307/1607 1.13 0
45,460 52,720 Sale of Assets 1017/1307/1607 1.14 46,0000 0 Other Capital Revenue 1017/1307/1607 1.15 00 0 Loans 1017/1307/1607 1.16 0
45,460 52,720 Total Capital Income 46,000
SERVICE PROVISION AREA CORPORATE MANAGEMENT
53,630 64,900 TOTAL INFLOWS 54,980
(Outflows) Total Operating Cost of Service
423,020 406,320 Employee Costs 1010/1300/1600 1.17 471,4100 0 Salaries and Wages Oncosts 1010/1300/1600 1.18 0
46,100 41,960 Contractual Services 1010/1300/1600 1.19 35,5104,000 3,920 Materials 1010/1300/1600 1.20 7,380
0 0 Finance Charges 1010/1300/1600 1.21 00 0 Depreciation 1010/1300/1600 1.22 0
22,600 22,600 Plant Hire 1010/1300/1600 1.23 24,0006,840 8,330 Other 1010/1300/1600 1.24 7,510
75,990 75,990 FCA Oncosts 1010/1300/1600 1.25 108,180578,550 559,120 Total Operating Expenses 653,990
(Outflows) Appropriations
0 0 Appropriations 1011/1301/1601 1.26 00 0 Total Appropriations 0
(Outflows) Capital Acquisitions
0 0 Infrastructure 1015/1305/1605 1.27 00 0 Structures 1015/1305/1605 1.28 00 0 Buildings 1015/1305/1605 1.29 0
61,260 61,150 Plant and Machinery 1015/1305/1605 1.30 64,1400 0 Furniture and Fittings 1015/1305/1605 1.31 00 0 Office Equipment 1015/1305/1605 1.32 0
61,260 61,150 Total Capital Expenses 64,140
(Outflows) Loan Principal Repayments
0 0 Loan Principal Repayments 1015/1305/1605 1.33 00 0 Total Loan Principal Repayments 0
639,810 620,270 TOTAL OUTFLOWS 718,130
0 0 Less: Non-Cash Items/Depreciation 1010/1300/1600 1.22 0
586,180 555,370 NET IMPACT ON RATING EFFORT 663,150

ITEM 01 REFERENCE 2008/09CORPORATE MANAGEMENT TO SUMMARY
This budget item recognises the costs associated with the ExecutiveManagement team and their support staff.
The Chief Executive Officer of Council is the most seniormanagement officer employed by Council. The role encompassesthe implementation of Council decisions made at Council andCommittee meetings, the implementation of Council policy and theoverall responsibility for Council's operations as determined by theLocal Government Act 1999, its Regulations and other applicableActs and Regulations.
The Deputy CEO supervises the Governance, Corporate Services,Information Technology and Telecommunications, Administration,Customer Services, Accounting and Finance functions of Council.He acts in the role of CEO as and when required.
Plant and MachineryEstimated trade-in of 2 Sedan type motor vehicles @ $23,000 each.Change over estimates have been based upon trading the vehiclesat 40 000 kilometres
CAPITAL INCOME
at 40,000 kilometres.
Sale of Assets - Motor Vehicles 1.14 46,000
Allocation of Employee CostsChief Executive Officer (CEO) 100%Executive Assistant - CEO 100%Deputy CEO (DCEO) 100%Executive Assistant - DCEO 100%
Employee Costs 1.17 471,410
Professional Services 1.19 3,500Legal Fees 1.19 20,900Public Relations 1.19 11,110
Motor Vehicle Operating Costs (2 vehicles) 1.23 24,000
Plant and MachineryProvision is made to supply motor vehicles as part of salarypackaging for senior staff and other officers of Council. Provision ismade to purchase 2 sedan type vehicle @ $33,180 and $30,960each.
Purchase of Assets - Motor Vehicles 1.30 64,140
OPERATING EXPENSES
CAPITAL EXPENDITURE

ITEM NO. 02
2007/08 Mar Review Inflows (Outflows) Account No. Ref No. 2008/09
Inflows Source of Funding - Operating
0 0 Rating 1032 2.01 00 0 Statutory Charges 1032 2.02 00 0 User Charges 1032 2.03 00 0 Grants and Subsidies - Operating 1032 2.04 00 0 Investment Income 1032 2.05 00 0 Donations 1032 2.06 00 110 Reimbursements 1032 2.07 00 0 Commercial Activities 1032 2.08 0
1,510 1,850 Other 1032 2.09 1,5700 0 Plant Hire Recouped 00 0 Salaries and Wages Oncosts Recouped 0
143,070 143,070 FCA Oncosts Recouped 1032 2.10 149,120144,580 145,030 Total Operating Income 150,690
Inflows Source of Funding - Recoupments
0 0 Recoupments 1033 2.11 00 0 Total Recoupments 0
Inflows Source of Funding - Capital
0 0 Grants and Subsidies - Capital 1037 2.12 00 0 Donations and Contributions 1037 2.13 00 0 Sale of Assets 1037 2.14 00 0 Other Capital Revenue 1037 2.15 00 0 Loans 1037 2.16 00 0 Total Capital Income 0
SERVICE PROVISION AREA OCCUPATIONAL HEALTH AND SAFETY
144,580 145,030 TOTAL INFLOWS 150,690
(Outflows) Total Operating Cost of Service
78,500 78,000 Employee Costs 1030 2.17 82,2300 0 Salaries and Wages Oncosts 1030 2.18 00 990 Contractual Services 1030 2.19 1,100
200 0 Materials 1030 2.20 2100 0 Finance Charges 1030 2.21 00 0 Depreciation 1030 2.22 00 0 Plant Hire 1030 2.23 0
68,300 67,110 Other 1030 2.24 72,16016,890 16,890 FCA Oncosts 1030 2.25 25,070
163,890 162,990 Total Operating Expenses 180,770
(Outflows) Appropriations
0 0 Appropriations 1031 2.26 00 0 Total Appropriations 0
(Outflows) Capital Acquisitions
0 0 Infrastructure 1035 2.27 00 0 Structures 1035 2.28 00 0 Buildings 1035 2.29 00 0 Plant and Machinery 1035 2.30 00 0 Furniture and Fittings 1035 2.31 00 0 Office Equipment 1035 2.32 00 0 Total Capital Expenses 0
(Outflows) Loan Principal Repayments
0 0 Loan Principal Repayments 1035 2.33 00 0 Total Loan Principal Repayments 0
163,890 162,990 TOTAL OUTFLOWS 180,770
0 0 Less: Non-Cash Items/Depreciation 1030 2.22 0
19,310 17,960 NET IMPACT ON RATING EFFORT 30,080

ITEM 02 REFERENCE 2008/09OCCUPATIONAL HEALTH AND SAFETY TO SUMMARY
This function recognises the direct cost to Council of employing asuitably qualified Risk Management Officer to implement therequirements of the Occupational Health Safety and Welfare Actand Regulations. The officer concerned also manages Council'sinsurance portfolio and community land database.
Allocation of Employee CostsRisk Management Officer 100%
Employee Costs 2.17 82,230
Insurance - Public Liability 2.24 59,090
OPERATING EXPENSES
Responsible Officer: Chief Executive Officer

ITEM NO. 03
2007/08 Mar Review Inflows (Outflows) Account No. Ref No. 2008/09
Inflows Source of Funding - Operating
0 0 Rating 1042 3.01 00 0 Statutory Charges 1042 3.02 00 0 User Charges 1042 3.03 00 0 Grants and Subsidies - Operating 1042 3.04 00 0 Investment Income 1042 3.05 00 0 Donations 1042 3.06 00 90 Reimbursements 1042 3.07 00 0 Commercial Activities 1042 3.08 00 0 Other 1042 3.09 00 0 Plant Hire Recouped 00 0 Salaries and Wages Oncosts Recouped 00 0 FCA Oncosts Recouped 1042 3.10 00 90 Total Operating Income 0
Inflows Source of Funding - Recoupments
134,440 138,680 Recoupments 1043 3.11 0134,440 138,680 Total Recoupments 0
Inflows Source of Funding - Capital
0 0 Grants and Subsidies - Capital 1047 3.12 040,000 62,500 Donations and Contributions 1047 3.13 30,000
0 1,277,250 Sale of Assets 1047 3.14 00 0 Other Capital Revenue 1047 3.15 00 0 Loans 1047 3.16 0
40,000 1,339,750 Total Capital Income 30,000
SERVICE PROVISION AREA REGIONAL DEVELOPMENT
174,440 1,478,520 TOTAL INFLOWS 30,000
(Outflows) Total Operating Cost of Service
0 0 Employee Costs 1040 3.17 00 0 Salaries and Wages Oncosts 1040 3.18 0
2,000 120,220 Contractual Services 1040 3.19 0300 280 Materials 1040 3.20 330
0 0 Finance Charges 1040 3.21 00 0 Depreciation 1040 3.22 00 0 Plant Hire 1040 3.23 0
31,950 35,950 Other 1040 3.24 44,88060 60 FCA Oncosts 1040 3.25 680
34,310 156,510 Total Operating Expenses 45,890
(Outflows) Appropriations
40,000 1,222,380 Appropriations 1041 3.26 30,00040,000 1,222,380 Total Appropriations 30,000
(Outflows) Capital Acquisitions
0 4,550 Infrastructure 1045 3.27 00 0 Structures 1045 3.28 00 0 Buildings 1045 3.29 00 0 Plant and Machinery 1045 3.30 00 0 Furniture and Fittings 1045 3.31 00 0 Office Equipment 1045 3.32 00 4,550 Total Capital Expenses 0
(Outflows) Loan Principal Repayments
0 0 Loan Principal Repayments 1045 3.33 00 0 Total Loan Principal Repayments 0
74,310 1,383,440 TOTAL OUTFLOWS 75,890
0 0 Less: Non-Cash Items/Depreciation 1040 3.22 0
-100,130 -95,080 NET IMPACT ON RATING EFFORT 45,890

ITEM 03 REFERENCE 2008/09REGIONAL DEVELOPMENT TO SUMMARY
Key GoalTo encourage economical and sustainable regional development toenhance the lifestyle and well being of the region.
Strategies1. Establish effective partnerships between key stakeholders withinthe community and regional, state and federal authorities.2. Develop a council policy in regard to economic development whichincorporates support initiatives and/or incentives which are relevantand realistic having due regard to the natural and economic diversityof the region.
Contributions - McKinlay Infrastructure 3.13 30,000
Subscriptions and MembershipsAn allocation is made for membership fees to the Barossa and LightRegional Development Board Incorporated (BLD). BLD is anindependent association charged with the responsibility of facilitatingeconomic growth and activity within the Barossa and Light Region.BLD is f nded jointl b the Barossa and Light Co ncils and the
CAPITAL INCOME
OPERATING EXPENSES
BLD is funded jointly by the Barossa and Light Councils and theState Government. Membership to BLD board is comprised of ablend of local government, business, industry and communityrepresentatives. BLD is charged with identifying local area priorities through activeinvolvement and leadership in the community and then to advisegovernment authorities of the most effective and efficient means ofachieving results for the regional community. It aims to fosteractivities that improve economic output and create employment,which is sustainable and consistent with the social, cultural andenvironmental aspirations of the region. BLD has identified severalbroad areas of development opportunity for the region which include,but are not limited to, food production & processing, water resources,transport, industry, education & training, tourism, IT andcommunications.
Subscriptions 3.24 31,750
ContributionsAllocation is made to provide the Wakefield Group with a contributiontowards developing a brief for the 'Sustainable Water ManagementMaster Plan'. 10,000
This project specifically aims to co-ordinate long term strategicplanning for sustainable growth and building resilience to the effectsof climate change and drought across the Barossa SASP region. 2,000
Appropriation to McKinlay Infrastructure Reserve 3.26 30,000
APPROPRIATIONS
OPERATING EXPENSES

ITEM NO. 04
2007/08 Mar Review Inflows (Outflows) Account No. Ref No. 2008/09
Inflows Source of Funding - Operating
0 0 Rating 1062/2812/2822 4.01 00 0 Statutory Charges 1062/2812/2822 4.02 00 0 User Charges 1062/2812/2822 4.03 00 0 Grants and Subsidies - Operating 1062/2812/2822 4.04 00 0 Investment Income 1062/2812/2822 4.05 00 2,170 Donations 1062/2812/2822 4.06 00 11,890 Reimbursements 1062/2812/2822 4.07 4400 0 Commercial Activities 1062/2812/2822 4.08 0
1,420 1,770 Other 1062/2812/2822 4.09 7300 0 Plant Hire Recouped 00 0 Salaries and Wages Oncosts Recouped 00 0 FCA Oncosts Recouped 1062/2812/2822 4.10 0
1,420 15,830 Total Operating Income 1,170
Inflows Source of Funding - Recoupments
123,320 123,320 Recoupments 1063/2813/2823 4.11 0123,320 123,320 Total Recoupments 0
Inflows Source of Funding - Capital
43,540 15,000 Grants and Subsidies - Capital 1067/2817/2827 4.12 20,0000 0 Donations and Contributions 1067/2817/2827 4.13 00 0 Sale of Assets 1067/2817/2827 4.14 00 0 Other Capital Revenue 1067/2817/2827 4.15 00 0 Loans 1067/2817/2827 4.16 20,000
43,540 15,000 Total Capital Income 40,000
SERVICE PROVISION AREA TOURISM
168,280 154,150 TOTAL INFLOWS 41,170
(Outflows) Total Operating Cost of Service
75,350 74,440 Employee Costs 1060/2810/2820 4.17 40,4400 0 Salaries and Wages Oncosts 1060/2810/2820 4.18 0
39,870 45,930 Contractual Services 1060/2810/2820 4.19 48,29015,150 15,020 Materials 1060/2810/2820 4.20 12,10013,080 10,260 Finance Charges 1060/2810/2820 4.21 11,8005,960 5,960 Depreciation 1060/2810/2820 4.22 5,960
0 1,000 Plant Hire 1060/2810/2820 4.23 038,000 38,890 Other 1060/2810/2820 4.24 37,09017,250 17,250 FCA Oncosts 1060/2810/2820 4.25 16,780
204,660 208,750 Total Operating Expenses 172,460
(Outflows) Appropriations
0 0 Appropriations 1061/2811/2821 4.26 00 0 Total Appropriations 0
(Outflows) Capital Acquisitions
87,070 87,070 Infrastructure 1065/2815/2825 4.27 40,0000 0 Structures 1065/2815/2825 4.28 00 0 Buildings 1065/2815/2825 4.29 00 0 Plant and Machinery 1065/2815/2825 4.30 00 0 Furniture and Fittings 1065/2815/2825 4.31 00 0 Office Equipment 1065/2815/2825 4.32 0
87,070 87,070 Total Capital Expenses 40,000
(Outflows) Loan Principal Repayments
0 0 Loan Principal Repayments 1065/2815/2825 4.33 00 0 Total Loan Principal Repayments 0
291,730 295,820 TOTAL OUTFLOWS 212,460
-5,960 -5,960 Less: Non-Cash Items/Depreciation 1060/2810/2820 4.22 -5,960
117,490 135,710 NET IMPACT ON RATING EFFORT 165,330

ITEM 04 REFERENCE 2008/09TOURISM TO SUMMARY
This item details the budget for Tourism.
Tourism is identified as the second largest export industry nationallyreaching out and embracing a number of industries withinthemselves. Council's strategic goal is to develop and promotesustainable tourism destinations within the Council's region that willcontribute to economic growth and achieve simultaneous communitybenefit.
Provision has been made in the current budget to further developongoing partnerships between key stakeholders within thecommunity, State and Federal governments. It further provides forsupport initiatives to be developed locally to facilitate sustainabletourism development.
Tourism Signage ProjectProvision is made to undertake a Tourism Signage Project in key
tourism areas within the district. Grant funding will be sought from
the South Australian Tourism Commission to assist with this project
CAPITAL INCOME
the South Australian Tourism Commission to assist with this project.
Grants and Subsidies 4.12 20,000
Allocation of Employee CostsManager - Tourism & Special Projects 50%
Employee Costs 4.17 40,440
Tourism Events
- BOBFESTProvision has been made for the continuation of funding support toorganising committees of tourism events that can demonstrate aneconomic stimulus to the local and surrounding communities.Contained within the budget allocation is an amount of $5,000 tocontribute to BOBFEST 2009.
- Kapunda Historic Mine Site Tourism PlanProvision is made to engage consultants to develop a tourismstrategy for the mine site, in line with recommendations made in theKapunda Historic Mine Site Conservation Management Plan.
- Tour Down UnderCouncil successfully hosted Tour Down Under functions inGreenock and following on from these events Council resolved todeliver complimentary serves of activities to not only enhance thecycling race but to provide the local community with an opportunityto be part of a major tourist event, bringing the Light region to theattention of the broader community and for local businesses to
OPERATING EXPENSES

ITEM 04 REFERENCE 2008/09TOURISM TO SUMMARY
- South Australian Living Artists Festival (SALA)An allocation of $2000 has been made to support the 2008 SouthAustralian Living Artists Festival (SALA) in the Clare Valley inAugust 2008.
Tourism Events 4.19 25,000
Motor Vehicle Running Expense - Fuel Only (1 vehicle) 4.20 7,000
Operating Lease - Motor Vehicle 4.21 11,800
Subscriptions and MembershipsCouncil is currently a key financial stakeholder of the Clare ValleyTourism and Tourism Barossa Marketing Committees. Council is inits fourth year of a five year funding agreewment with CVTM andhas recently signed off on a renewed three year agreement withTourism Barossa. These agreements are aligned with Council's 10year Strategic Plan and the State's five year Tourism Strategic Plan.Council's contributions to the individual marketing boards arerepresented as follows:Barossa Wine and Tourism - $21,000 (+ GST)Clare Valley Tourism Marketing - $13,000 (+ GST)
Subscriptions / Membership Fees 4.24 34,000
Regional Signage ProjectProvision is made to undertake the initial stage of a regional signageproject. The project will occur over a two year period enhancingdirectional signage in key tourism areas.
Capital Works - Infrastructure 4.27 40,000
CAPITAL EXPENDITURE

ITEM NO. 05
2007/08 Mar Review Inflows (Outflows) Account No. Ref No. 2008/09
Inflows Source of Funding - Operating
0 0 Rating 1072 5.01 00 0 Statutory Charges 1072 5.02 00 0 User Charges 1072 5.03 00 0 Grants and Subsidies - Operating 1072 5.04 00 0 Investment Income 1072 5.05 00 0 Donations 1072 5.06 00 0 Reimbursements 1072 5.07 0
200,000 226,430 Commercial Activities 1072 5.08 260,5000 2,700 Other 1072 5.09 00 0 Plant Hire Recouped 00 0 Salaries and Wages Oncosts Recouped 00 0 FCA Oncosts Recouped 1072 5.10 0
200,000 229,130 Total Operating Income 260,500
Inflows Source of Funding - Recoupments
281,970 281,970 Recoupments 1073 5.11 65,000281,970 281,970 Total Recoupments 65,000
Inflows Source of Funding - Capital
0 0 Grants and Subsidies - Capital 1077 5.12 00 0 Donations and Contributions 1077 5.13 00 0 Sale of Assets 1077 5.14 00 0 Other Capital Revenue 1077 5.15 00 0 Loans 1077 5.16 00 0 Total Capital Income 0
SERVICE PROVISION AREA TOURIST LEISURE PARK
481,970 511,100 TOTAL INFLOWS 325,500
(Outflows) Total Operating Cost of Service
0 0 Employee Costs 1070 5.17 00 0 Salaries and Wages Oncosts 1070 5.18 0
68,610 75,660 Contractual Services 1070 5.19 94,09031,600 28,530 Materials 1070 5.20 43,40017,070 17,070 Finance Charges 1070 5.21 14,43019,600 19,600 Depreciation 1070 5.22 19,430
0 0 Plant Hire 1070 5.23 014,560 14,640 Other 1070 5.24 15,300
270 270 FCA Oncosts 1070 5.25 2,800151,710 155,770 Total Operating Expenses 189,449
(Outflows) Appropriations
2,560 128,080 Appropriations 1071 5.26 38,8202,560 128,080 Total Appropriations 38,820
(Outflows) Capital Acquisitions
31,970 32,630 Infrastructure 1075 5.27 15,0000 0 Structures 1075 5.28 0
260,000 260,000 Buildings 1075 5.29 50,0001,300 11,300 Plant and Machinery 1075 5.30 0
10,000 0 Furniture and Fittings 1075 5.31 7,0002,500 5,400 Office Equipment 1075 5.32 0
305,770 309,330 Total Capital Expenses 72,000
(Outflows) Loan Principal Repayments
41,530 41,530 Loan Principal Repayments 1075 5.33 44,66041,530 41,530 Total Loan Principal Repayments 44,660
501,570 634,710 TOTAL OUTFLOWS 344,929
-19,600 -19,600 Less: Non-Cash Items/Depreciation 1070 5.22 -19,430
-0 104,010 NET IMPACT ON RATING EFFORT -1

ITEM 05 REFERENCE 2008/09TOURIST LEISURE PARK TO SUMMARY
Council owns and operates, through a caretaker, a Tourist LeisurePark situated at Dutton Park in Kapunda. The type ofaccommodation available ranges from caravans to cabins to minerscottages. They are available for long or short stay.
Rental Income - Cabins/Caretaker's Residence/Cottages 5.08 255,000
Stage 3 - Amenities Block and Village Green
Provision is made to upgrade the amenities block and village greenin acccordance with the Tourist and Leisure Park's Master Plan.Recoupment from Tourist Leisure Park Fund 5.11 50,000Recoupment from Kapunda STEDS Reserve 5.11 15,000
Management Fee - Park Caretaker 5.19 75,000Maintenance - Buildings 5.19 7,510
OPERATING EXPENSES
OPERATING INCOME
RECOUPMENTS
Utilities - Electricity 5.20 15,680
Upgrade Park Signage 5.20 10,000
Interest on Loans 5.21 11,430
Depreciation - Buildings 5.22 12,260
Advertising 5.24 5,000Telephone 5.24 5,000
Tourist Leisure Park Irrigation Infrastructure UpgradeAn allocation is made to upgrade the irrigation infrastructure for theTourist and Leisure Park, as per December 2007 Council Meeting -to be funded from Kapunda STEDS Reserve.Infrastructure 5.27 15,000
Stage 3 - Amenities Block and Village Green
Provision is made to upgrade the amenities block and village greenin acccordance with the Tourist and Leisure Park's Master Plan.Buildings 5.29 50,000
Replacement of Furniture and Fittings
Provision is made for the purchase of futons, chairs etc to replaceold and worn out furniture, some of which is now eight years old.Furniture and Fittings 5.31 7,000
CAPITAL EXPENDITURE

ITEM NO. 06
2007/08 Mar Review Inflows (Outflows) Account No. Ref No. 2008/09
Inflows Source of Funding - Operating
0 0 Rating 1082 8.01 00 0 Statutory Charges 1082 8.02 00 0 User Charges 1082 8.03 00 0 Grants and Subsidies - Operating 1082 8.04 00 0 Investment Income 1082 8.05 00 0 Donations 1082 8.06 00 0 Reimbursements 1082 8.07 0
21,000 9,860 Commercial Activities 1082 8.08 21,8300 0 Other 1082 8.09 00 0 Plant Hire Recouped 00 0 Salaries and Wages Oncosts Recouped 00 0 FCA Oncosts Recouped 1082 8.10 0
21,000 9,860 Total Operating Income 21,830
Inflows Source of Funding - Recoupments
186,900 192,780 Recoupments 1083 8.11 0186,900 192,780 Total Recoupments 0
Inflows Source of Funding - Capital
0 0 Grants and Subsidies - Capital 1087 8.12 00 0 Donations and Contributions 1087 8.13 00 0 Sale of Assets 1087 8.14 00 0 Other Capital Revenue 1087 8.15 00 0 Loans 1087 8.16 00 0 Total Capital Income 0
SERVICE PROVISION AREA COMMERCIAL ACTIVITIES - OTHER
207,900 202,640 TOTAL INFLOWS 21,830
(Outflows) Total Operating Cost of Service
0 0 Employee Costs 1080 8.17 00 0 Salaries and Wages Oncosts 1080 8.18 0
12,370 34,830 Contractual Services 1080 8.19 12,390900 1,110 Materials 1080 8.20 990
0 0 Finance Charges 1080 8.21 017,070 17,070 Depreciation 1080 8.22 15,520
0 0 Plant Hire 1080 8.23 04,040 2,590 Other 1080 8.24 4,210
60 60 FCA Oncosts 1080 8.25 50034,440 55,660 Total Operating Expenses 33,610
(Outflows) Appropriations
0 0 Appropriations 1081 8.26 00 0 Total Appropriations 0
(Outflows) Capital Acquisitions
0 0 Infrastructure 1085 8.27 00 0 Structures 1085 8.28 0
15,000 15,000 Buildings 1085 8.29 00 0 Plant and Machinery 1085 8.30 00 0 Furniture and Fittings 1085 8.31 00 0 Office Equipment 1085 8.32 0
15,000 15,000 Total Capital Expenses 0
(Outflows) Loan Principal Repayments
0 0 Loan Principal Repayments 1085 8.33 00 0 Total Loan Principal Repayments 0
49,440 70,660 TOTAL OUTFLOWS 33,610
-17,070 -17,070 Less: Non-Cash Items/Depreciation 1080 8.22 -15,520
-175,530 -149,050 NET IMPACT ON RATING EFFORT -3,740

ITEM 06 REFERENCE 2008/09COMMERCIAL ACTIVITIES - OTHER TO SUMMARY
The Light Regional Council has a number of properties locatedthroughout the district which it leases to third parties under amemorandum of lease agreement. Each lease provides for thecovenants under which Council and the respective lessee mutuallyagreed hereto.
Those properties are as follows:
Gawler River School HouseKapunda RSL Building (former Thrift Shop) Clare RoadKapunda RSL Building (former CAFHS) Kapunda StreetLimavardy Pty Ltd - CT 3104/55 Pt Sec 38 & 93 Hd Mudla Wirra
Telstra - Gundry’s Hill, Kapunda - 2/7 Hanson Street, Freeling - 3/7 Hanson Street, FreelingDTEI SA - 4/7 Hanson Street, FreelingGreenock Vines, Greenock - Kapunda Road, Greenock
Rental Income 8.08 21,830
OPERATING INCOME
OPERATING EXPENSES
Professional Services 8.19 10,000
Depreciation - Buildings 8.22 12,060
OPERATING EXPENSES
Responsible Officer: Chief Executive Officer
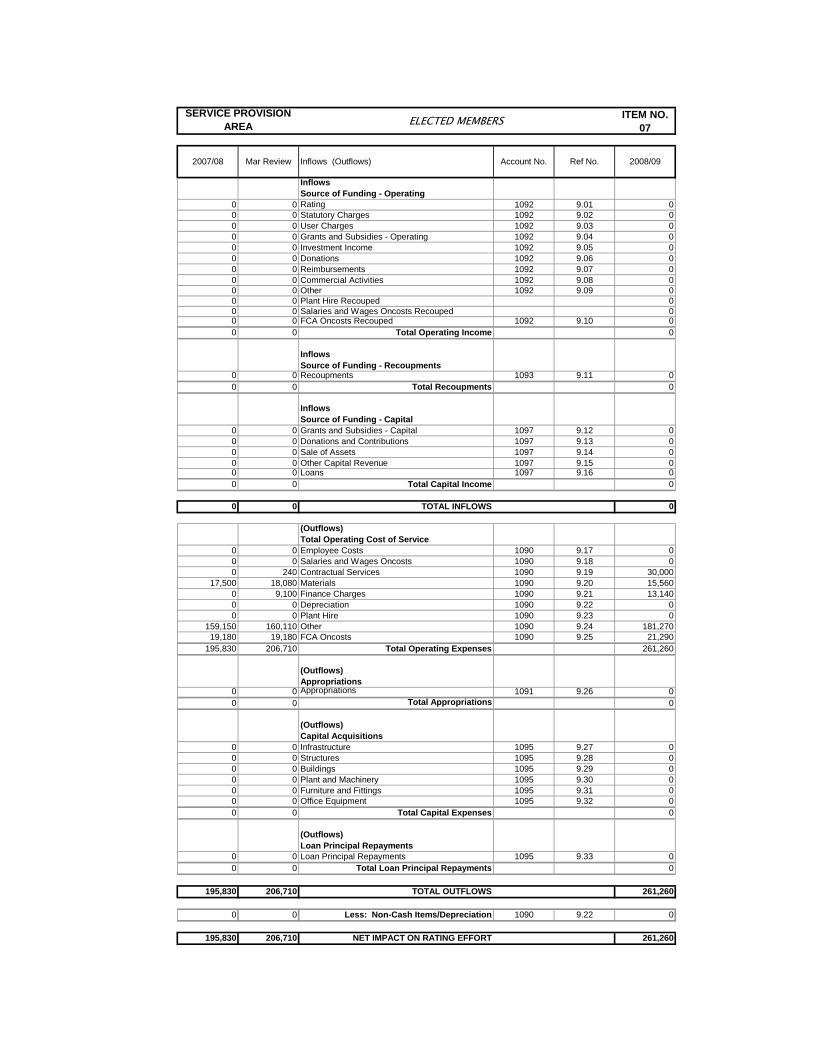
ITEM NO. 07
2007/08 Mar Review Inflows (Outflows) Account No. Ref No. 2008/09
Inflows Source of Funding - Operating
0 0 Rating 1092 9.01 00 0 Statutory Charges 1092 9.02 00 0 User Charges 1092 9.03 00 0 Grants and Subsidies - Operating 1092 9.04 00 0 Investment Income 1092 9.05 00 0 Donations 1092 9.06 00 0 Reimbursements 1092 9.07 00 0 Commercial Activities 1092 9.08 00 0 Other 1092 9.09 00 0 Plant Hire Recouped 00 0 Salaries and Wages Oncosts Recouped 00 0 FCA Oncosts Recouped 1092 9.10 00 0 Total Operating Income 0
Inflows Source of Funding - Recoupments
0 0 Recoupments 1093 9.11 00 0 Total Recoupments 0
Inflows Source of Funding - Capital
0 0 Grants and Subsidies - Capital 1097 9.12 00 0 Donations and Contributions 1097 9.13 00 0 Sale of Assets 1097 9.14 00 0 Other Capital Revenue 1097 9.15 00 0 Loans 1097 9.16 00 0 Total Capital Income 0
SERVICE PROVISION AREA ELECTED MEMBERS
0 0 TOTAL INFLOWS 0
(Outflows) Total Operating Cost of Service
0 0 Employee Costs 1090 9.17 00 0 Salaries and Wages Oncosts 1090 9.18 00 240 Contractual Services 1090 9.19 30,000
17,500 18,080 Materials 1090 9.20 15,5600 9,100 Finance Charges 1090 9.21 13,1400 0 Depreciation 1090 9.22 00 0 Plant Hire 1090 9.23 0
159,150 160,110 Other 1090 9.24 181,27019,180 19,180 FCA Oncosts 1090 9.25 21,290
195,830 206,710 Total Operating Expenses 261,260
(Outflows) Appropriations
0 0 Appropriations 1091 9.26 00 0 Total Appropriations 0
(Outflows) Capital Acquisitions
0 0 Infrastructure 1095 9.27 00 0 Structures 1095 9.28 00 0 Buildings 1095 9.29 00 0 Plant and Machinery 1095 9.30 00 0 Furniture and Fittings 1095 9.31 00 0 Office Equipment 1095 9.32 00 0 Total Capital Expenses 0
(Outflows) Loan Principal Repayments
0 0 Loan Principal Repayments 1095 9.33 00 0 Total Loan Principal Repayments 0
195,830 206,710 TOTAL OUTFLOWS 261,260
0 0 Less: Non-Cash Items/Depreciation 1090 9.22 0
195,830 206,710 NET IMPACT ON RATING EFFORT 261,260

ITEM 07 REFERENCE 2008/09ELECTED MEMBERS TO SUMMARY
The elected representation of the council area consists of theMayor, who is elected generally by the voters of the council areaand by ten (10) councillors representing four (4) separate Wards,who are elected by the voters of the Wards concerned.
Council's four Wards are:
Dutton Ward , is generally located in the north of the Council areaand includes the localities of Hamilton, Allendale North, Kapunda,St. Johns, Ebenezer, Truro, Koonunga, St. Kitts, Bagot Well andHansborough. Dutton Ward is represented by 3 councillors fromthe November 2006 election.Laucke Ward , is generally located in the east of the Council areaand includes the localities of Moppa, Nuriootpa, Nain, Daveyston,Greenock, Marananga, Stonewell, Tanunda, Seppeltsfield, Shea-oak Log, Rosedale, Gomersal, Lyndoch and Rowland Flat. LauckeWard is represented by 2 councillors from the November 2006election.Light Ward , is generally situated in the central and western areasof Council and includes the localities of Pinkerton Plains, HamleyBridge, Magdalla, Wasleys, Templers, Woolsheds, Kangaroo Flat,Morn Hill, Freeling, Bethel and Fords. Light Ward is represented by2 councillors from the November 2006 election.Mudla Wirra Ward, is situated in the south of the council area andincludes the localities of Reeves Plains, Ward Belt, Gawler River,Buchfelde, Gawler Belt, Reid, Roseworthy, Kingsford and Hewett.Mudla Wirra Ward is represented by 3 councillors from theNovember 2006 election.
In formulating this budget the recent amendments to the LocalGovernment Act 1999 and the Local Government (Elections) Act1999 have been taken into account. The amendments have seenan increase to the length of terms of local government electedofficials to four years.
Elector Representation ReviewThe next general Local Government election is scheduled forNovermber 2010. Any review undertaken would need to becompleted up to 12 months prior to the election occuring. On thatbasis, an allocation has been made for an Elector RepresentationReview to commence in the 2008/2009 year.Professional Services 27,500
Council and Committee MeetingsAllocation has been made for expenses associated with suppersand light refreshments associated with official meetings of Council,which include sub committees.
Food Provisions 9.20 10,100
OPERATING EXPENSES

ITEM 07 REFERENCE 2008/09ELECTED MEMBERS TO SUMMARY
Annual Mayoral FunctionAnnually Council's Mayor hosts an end of year function for staff,contractors and other invited guests in recognition for thecontribution made over the course of the year to Council'scommunity.
Food Provisions and Equipment Hire 9.20 4,000
TrainingChanges made to the Local Government Act 1999 adopted inAugust 2005 required Councils to adopt a Training andDevelopment Policy for council members by 1 July 2006. Under thenew provisions of the Act, Councils will be required to report to thecommunity, as part of the annual report, on the training undertakenduring the financial year by its members. As highlighted within Council's Strategic Management Plan, anallocation is made for elected member training. It is proposed tocontinue with increased training budget allocation to maintain theelected members knowledge base in regard to current issuesaffecting the local government sector.A number of conferences are arranged during the year, relevant toCouncil’s operation. It is considered essential that a budgetprovision be made for the registration and associated costs ofmembers attending these functions which include:
LG Elected Member Residential Seminar (conducted by the LGA and Norman Waterhouse)Local Government Week LGA Roads Conference Local Government Association General Meetings AGM Local Government Managers Association Other Local Government Seminars ALGA Conference
It is anticipated that the elected members may also attend variousindustry subsidised training courses throughout the financial year,which may include the following courses and seminars:
Chairing Skills for Mayors and Committee ChairsCouncil and Committee Meeting ProceduresEnvironment Resources and Development Court ProcessesGovernance Roles and Responsibilities on External BoardsConflict of Interest & Register of InterestsStrategic PlanningPolicy DevelopmentDeveloping Public Speaking SkillsComplaints Handling & Review of Council DecisionsFinancial SustainabilityMedia Interaction and Awareness SeminarsAustralian Company Directors Training Course
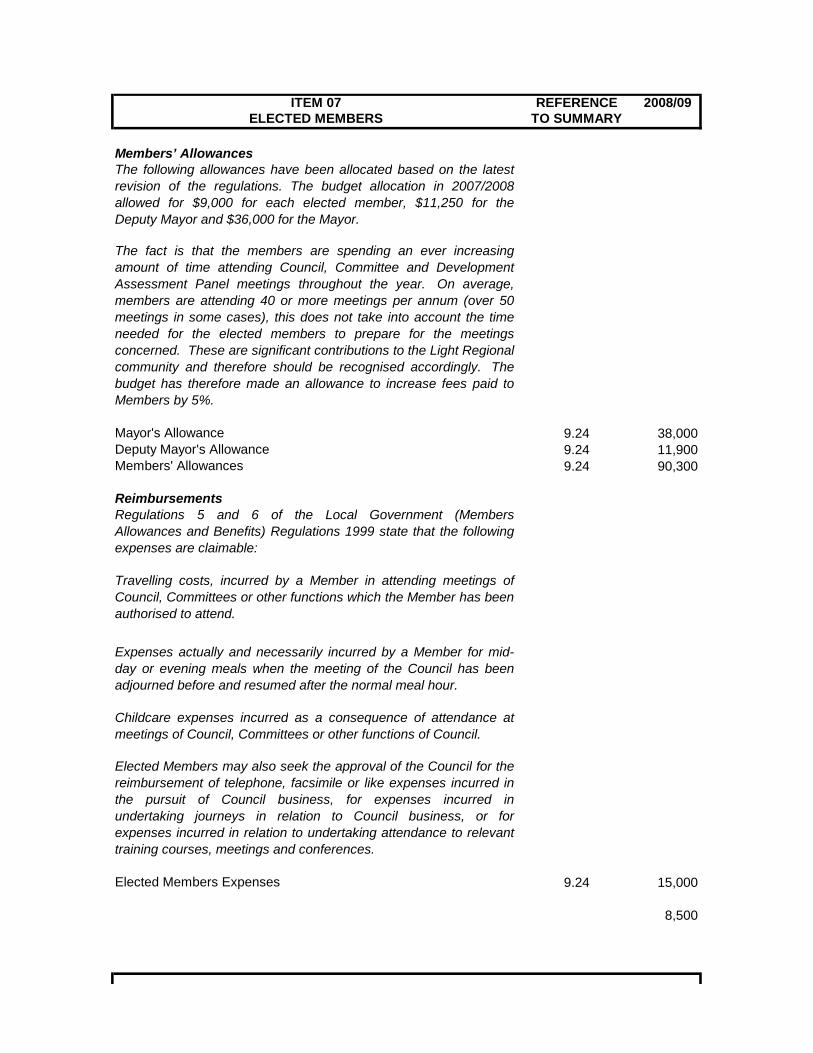
ITEM 07 REFERENCE 2008/09ELECTED MEMBERS TO SUMMARY
Members’ AllowancesThe following allowances have been allocated based on the latestrevision of the regulations. The budget allocation in 2007/2008allowed for $9,000 for each elected member, $11,250 for theDeputy Mayor and $36,000 for the Mayor.
The fact is that the members are spending an ever increasingamount of time attending Council, Committee and DevelopmentAssessment Panel meetings throughout the year. On average,members are attending 40 or more meetings per annum (over 50meetings in some cases), this does not take into account the timeneeded for the elected members to prepare for the meetingsconcerned. These are significant contributions to the Light Regionalcommunity and therefore should be recognised accordingly. Thebudget has therefore made an allowance to increase fees paid toMembers by 5%.
Mayor's Allowance 9.24 38,000Deputy Mayor's Allowance 9.24 11,900Members' Allowances 9.24 90,300
ReimbursementsRegulations 5 and 6 of the Local Government (MembersAllowances and Benefits) Regulations 1999 state that the followingexpenses are claimable:
Travelling costs, incurred by a Member in attending meetings ofCouncil, Committees or other functions which the Member has beenauthorised to attend.
Expenses actually and necessarily incurred by a Member for mid-day or evening meals when the meeting of the Council has beenadjourned before and resumed after the normal meal hour.
Childcare expenses incurred as a consequence of attendance atmeetings of Council, Committees or other functions of Council.
Elected Members may also seek the approval of the Council for thereimbursement of telephone, facsimile or like expenses incurred inthe pursuit of Council business, for expenses incurred inundertaking journeys in relation to Council business, or forexpenses incurred in relation to undertaking attendance to relevanttraining courses, meetings and conferences.
Elected Members Expenses 9.24 15,000
8,500
Off C f Off
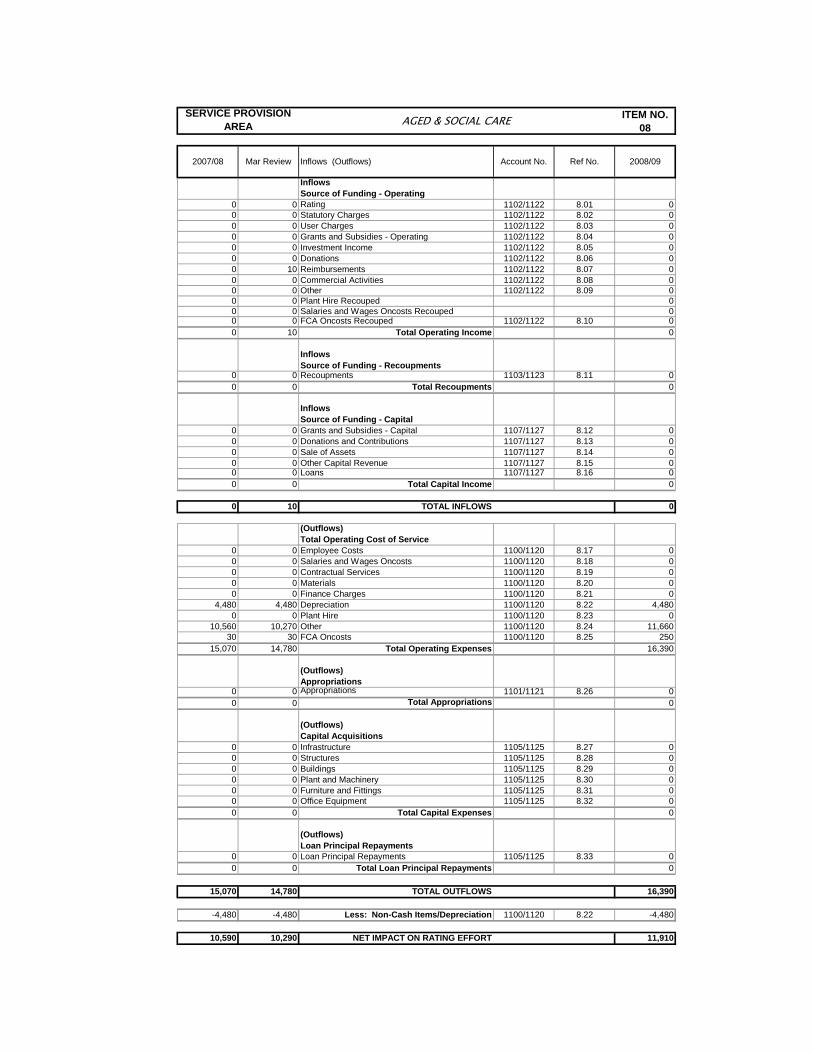
ITEM NO. 08
2007/08 Mar Review Inflows (Outflows) Account No. Ref No. 2008/09
Inflows Source of Funding - Operating
0 0 Rating 1102/1122 8.01 00 0 Statutory Charges 1102/1122 8.02 00 0 User Charges 1102/1122 8.03 00 0 Grants and Subsidies - Operating 1102/1122 8.04 00 0 Investment Income 1102/1122 8.05 00 0 Donations 1102/1122 8.06 00 10 Reimbursements 1102/1122 8.07 00 0 Commercial Activities 1102/1122 8.08 00 0 Other 1102/1122 8.09 00 0 Plant Hire Recouped 00 0 Salaries and Wages Oncosts Recouped 00 0 FCA Oncosts Recouped 1102/1122 8.10 00 10 Total Operating Income 0
Inflows Source of Funding - Recoupments
0 0 Recoupments 1103/1123 8.11 00 0 Total Recoupments 0
Inflows Source of Funding - Capital
0 0 Grants and Subsidies - Capital 1107/1127 8.12 00 0 Donations and Contributions 1107/1127 8.13 00 0 Sale of Assets 1107/1127 8.14 00 0 Other Capital Revenue 1107/1127 8.15 00 0 Loans 1107/1127 8.16 00 0 Total Capital Income 0
SERVICE PROVISION AREA AGED & SOCIAL CARE
0 10 TOTAL INFLOWS 0
(Outflows) Total Operating Cost of Service
0 0 Employee Costs 1100/1120 8.17 00 0 Salaries and Wages Oncosts 1100/1120 8.18 00 0 Contractual Services 1100/1120 8.19 00 0 Materials 1100/1120 8.20 00 0 Finance Charges 1100/1120 8.21 0
4,480 4,480 Depreciation 1100/1120 8.22 4,4800 0 Plant Hire 1100/1120 8.23 0
10,560 10,270 Other 1100/1120 8.24 11,66030 30 FCA Oncosts 1100/1120 8.25 250
15,070 14,780 Total Operating Expenses 16,390
(Outflows) Appropriations
0 0 Appropriations 1101/1121 8.26 00 0 Total Appropriations 0
(Outflows) Capital Acquisitions
0 0 Infrastructure 1105/1125 8.27 00 0 Structures 1105/1125 8.28 00 0 Buildings 1105/1125 8.29 00 0 Plant and Machinery 1105/1125 8.30 00 0 Furniture and Fittings 1105/1125 8.31 00 0 Office Equipment 1105/1125 8.32 00 0 Total Capital Expenses 0
(Outflows) Loan Principal Repayments
0 0 Loan Principal Repayments 1105/1125 8.33 00 0 Total Loan Principal Repayments 0
15,070 14,780 TOTAL OUTFLOWS 16,390
-4,480 -4,480 Less: Non-Cash Items/Depreciation 1100/1120 8.22 -4,480
10,590 10,290 NET IMPACT ON RATING EFFORT 11,910

ITEM 08 REFERENCE 2008/09AGED & SOCIAL CARE TO SUMMARY
Leisure OptionsLeisure Options is a joint venture between Home and CommunityCare Program, The Barossa Council and the Light RegionalCouncil. It is a community service aiming to provide recreationalopportunities for people with a disability, the frail, aged and theircarers. Allocation is made for a Leisure Options program to runcommunity based activities, support groups and events.
Contributions 8.24 3,000
Home Assistance ContributionHomeAssist is a joint venture between the Home and CommunityCare Program, The Barossa Council and Light Regional Council.The aim of the scheme is to assist people who are frail, aged orhave a disability and their carers. The scheme is administered byThe Barossa Council. The allocation is increased over the2007/2008 financial year based on CPI of 4.5%.
Contributions 8.24 6,790
OPERATING EXPENSES
Responsible Officer: Corporate Manager Community Development

ITEM NO. 09
2007/08 Mar Review Inflows (Outflows) Account No. Ref No. 2008/09
Inflows Source of Funding - Operating
0 0 Rating 1132 9.01 00 0 Statutory Charges 1132 9.02 00 0 User Charges 1132 9.03 0
4,300 4,950 Grants and Subsidies - Operating 1132 9.04 4,3000 0 Investment Income 1132 9.05 00 0 Donations 1132 9.06 00 900 Reimbursements 1132 9.07 00 0 Commercial Activities 1132 9.08 0
770 0 Other 1132 9.09 00 0 Plant Hire Recouped 00 0 Salaries and Wages Oncosts Recouped 00 0 FCA Oncosts Recouped 1132 9.10 0
5,070 5,850 Total Operating Income 4,300
Inflows Source of Funding - Recoupments
4,170 4,300 Recoupments 1133 9.11 04,170 4,300 Total Recoupments 0
Inflows Source of Funding - Capital
0 0 Grants and Subsidies - Capital 1137 9.12 00 0 Donations and Contributions 1137 9.13 00 0 Sale of Assets 1137 9.14 00 0 Other Capital Revenue 1137 9.15 00 0 Loans 1137 9.16 00 0 Total Capital Income 0
SERVICE PROVISION AREA YOUTH SERVICES
9,240 10,150 TOTAL INFLOWS 4,300
(Outflows) Total Operating Cost of Service
0 0 Employee Costs 1130 9.17 00 0 Salaries and Wages Oncosts 1130 9.18 0
3,000 2,250 Contractual Services 1130 9.19 3,0002,600 3,600 Materials 1130 9.20 2,600
0 0 Finance Charges 1130 9.21 00 0 Depreciation 1130 9.22 00 0 Plant Hire 1130 9.23 0
1,900 3,450 Other 1130 9.24 4,20010 10 FCA Oncosts 1130 9.25 150
7,510 9,310 Total Operating Expenses 9,950
(Outflows) Appropriations
0 0 Appropriations 1131 9.26 00 0 Total Appropriations 0
(Outflows) Capital Acquisitions
0 0 Infrastructure 1135 9.27 00 0 Structures 1135 9.28 00 0 Buildings 1135 9.29 00 0 Plant and Machinery 1135 9.30 00 0 Furniture and Fittings 1135 9.31 00 0 Office Equipment 1135 9.32 00 0 Total Capital Expenses 0
(Outflows) Loan Principal Repayments
0 0 Loan Principal Repayments 1135 9.33 00 0 Total Loan Principal Repayments 0
7,510 9,310 TOTAL OUTFLOWS 9,950
0 0 Less: Non-Cash Items/Depreciation 1130 9.22 0
-1,730 -840 NET IMPACT ON RATING EFFORT 5,650

ITEM 09 REFERENCE 2008/09YOUTH SERVICES TO SUMMARY
Light Regional Council Youth Advisory Committee (LirYAC) was re-established during Youth Week 2005. Membership includes youngpeople aged 12-24 who live, work or go to school in the region.LirYAC is actively involved in running of the annual Youth Weekcelebrations and in advising Council on a range of issues affectingyouth within the region. The budget makes provision for theCommittee to focus its activities on youth policy development,training and employment opportunities and activities.
State Government GrantGrant allocations are made to recognise State Governmentcontributions toward the provision of Youth Week activities and forthe ongoing role of the Youth Advisory Committee. The fundingsupport for the Youth Advisory Committee is the first contribution inthe second round of funding.
Grants and Subsidies 9.04 4,300
OPERATING INCOME
OPERATING EXPENSES
Young people aged between 14 and 25 are encouraged to beinvolved in a Youth Advisory Committee (YAC). This grouprepresents local youth issues, provides advice, consults with otherlocal young people and drives National Youth Week. Both the LightRegional and Barossa YACs have merged together to form onecommittee working together across both regions.
Contractors 9.19 3,000
Allocation is made for the expense incurred in the running of theYouth Advisory Committee and Youth Week activities.
Materials 9.20 2,600
Youth Training/ Mentoring/ Employment ProgramAllocation is made for the sponsorship or achievement programwhich recognises the achievements of the youth residing in theCouncil area. The program aims to provide minimal funding foryouth who display considerable talent in cultural, sporting andcommunity service activities to enable those persons to enhancetheir talents - whether that be by attending appropriate training andpersonal development programs, participation in State or Nationalteams. The maximum contribution will be set at $300 percontribution.
Contributions 9.24 1,500
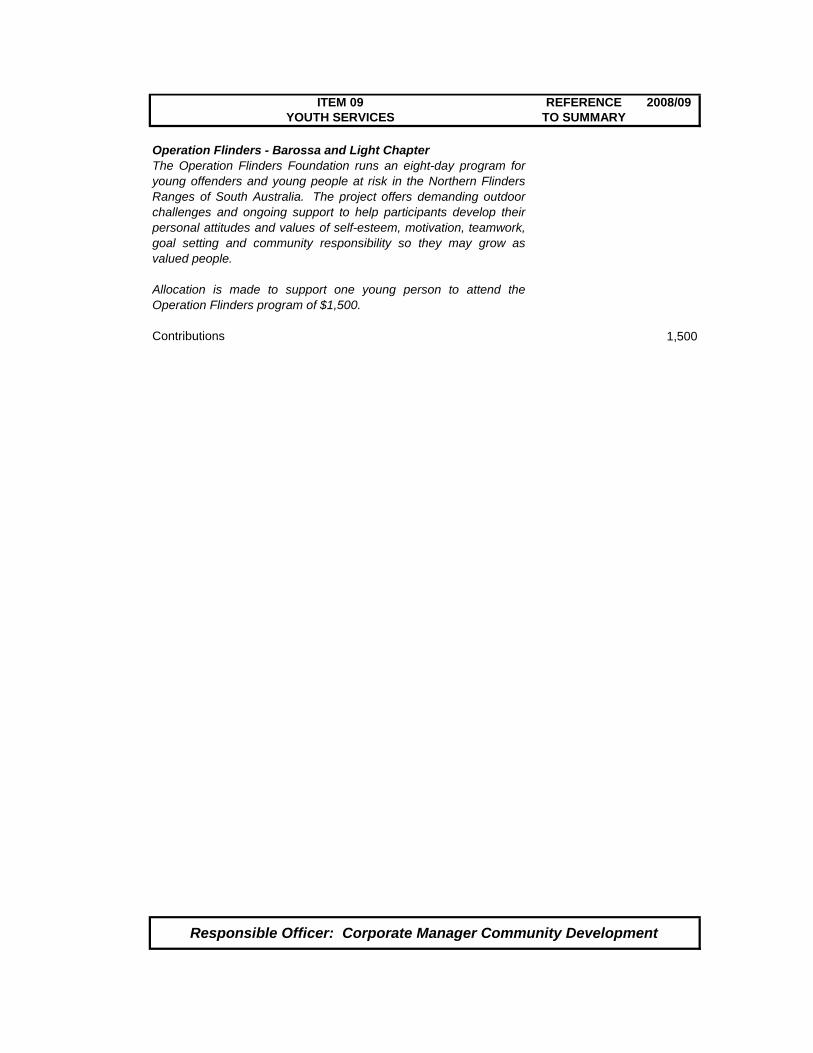
ITEM 09 REFERENCE 2008/09YOUTH SERVICES TO SUMMARY
Operation Flinders - Barossa and Light ChapterThe Operation Flinders Foundation runs an eight-day program foryoung offenders and young people at risk in the Northern FlindersRanges of South Australia. The project offers demanding outdoorchallenges and ongoing support to help participants develop theirpersonal attitudes and values of self-esteem, motivation, teamwork,goal setting and community responsibility so they may grow asvalued people.
Allocation is made to support one young person to attend theOperation Flinders program of $1,500.
Contributions 1,500
Responsible Officer: Corporate Manager Community Development

ITEM NO. 10
2007/08 Mar Review Inflows (Outflows) Account No. Ref No. 2008/09
Inflows Source of Funding - Operating
0 0 Rating 1142/1152 10.01 00 0 Statutory Charges 1142/1152 10.02 00 0 User Charges 1142/1152 10.03 00 0 Grants and Subsidies - Operating 1142/1152 10.04 00 0 Investment Income 1142/1152 10.05 00 0 Donations 1142/1152 10.06 00 60 Reimbursements 1142/1152 10.07 00 0 Commercial Activities 1142/1152 10.08 0
1,500 1,850 Other 1142/1152 10.09 1,4800 0 Plant Hire Recouped 00 0 Salaries and Wages Oncosts Recouped 00 0 FCA Oncosts Recouped 1142/1152 10.10 0
1,500 1,910 Total Operating Income 1,480
Inflows Source of Funding - Recoupments
0 0 Recoupments 1143/1153 10.11 00 0 Total Recoupments 0
Inflows Source of Funding - Capital
0 0 Grants and Subsidies - Capital 1147/1157 10.12 00 0 Donations and Contributions 1147/1157 10.13 00 0 Sale of Assets 1147/1157 10.14 00 0 Other Capital Revenue 1147/1157 10.15 00 0 Loans 1147/1157 10.16 00 0 Total Capital Income 0
SERVICE PROVISION AREA COMMUNITY SERVICES & DEVELOPMENT
1,500 1,910 TOTAL INFLOWS 1,480
(Outflows) Total Operating Cost of Service
77,260 76,530 Employee Costs 1140/1150 10.17 78,0100 0 Salaries and Wages Oncosts 1140/1150 10.18 0
5,000 5,050 Contractual Services 1140/1150 10.19 7,50010,050 7,180 Materials 1140/1150 10.20 11,12013,200 10,420 Finance Charges 1140/1150 10.21 10,42012,390 12,390 Depreciation 1140/1150 10.22 16,280
0 0 Plant Hire 1140/1150 10.23 038,850 29,590 Other 1140/1150 10.24 44,54024,520 24,520 FCA Oncosts 1140/1150 10.25 36,910
181,270 165,680 Total Operating Expenses 204,779
(Outflows) Appropriations
5,000 5,000 Appropriations 1141/1151 10.26 5,0005,000 5,000 Total Appropriations 5,000
(Outflows) Capital Acquisitions
0 0 Infrastructure 1145/1155 10.27 00 0 Structures 1145/1155 10.28 00 0 Buildings 1145/1155 10.29 00 0 Plant and Machinery 1145/1155 10.30 00 0 Furniture and Fittings 1145/1155 10.31 0
5,000 1,960 Office Equipment 1145/1155 10.32 3,0005,000 1,960 Total Capital Expenses 3,000
(Outflows) Loan Principal Repayments
0 0 Loan Principal Repayments 1145/1155 10.33 00 0 Total Loan Principal Repayments 0
191,270 172,640 TOTAL OUTFLOWS 212,779
-12,390 -12,390 Less: Non-Cash Items/Depreciation 1140/1150 10.22 -16,280
177,380 158,340 NET IMPACT ON RATING EFFORT 195,019

ITEM 10 REFERENCE 2008/09COMMUNITY SERVICES & DEVELOPMENT TO SUMMARY
The role of the Corporate Manager, Community Development is toimplement projects within a strength based community developmentframework to address strategies in Light Regional Council's socialplan. The Corporate Manager, Community Developmentcollaborates and negotiates with a range of service providers, liaiseswith the incorporated bodies, runs community awareness programs,develops policies in relation to Community services, coordinatescultural events and promotes the Council to the Community.
The Light Regional Council is committed to the prevention of graffitiand vandalism in the community through the implementation ofinitiatives in partnership with the community, local Police and keystakeholders. These partnerships will enable the development of asafety plan to reduce the impact of unacceptable social behaviourand provide support for crime prevention strategies and programs.
Allocation of Employee CostsCorporate Manager, Community Development 100%
OPERATING EXPENSES
Employee Costs 10.17 78,010
Community NewsletterAn allocation is made for Council to place a quarter page newsletter
in the Leader, the Herald and the Bunyip on a quarterly basis.
Public Relations 10.19 5,000
Australia Day FunctionCouncil holds an annual Australia Day function to celebrateAustralia Day and to recognise outstanding contributions fromindividuals within the Council region. The allocation is made to fundthe running costs of staging the event.
Food Provisions 10.20 1,200
Community EventsAn allocation is made to help support community groups within theLight region hold one-off events (eg. Morning tea, marquees etc).
Contractors 10.19 500Food Provisions 10.20 500
Motor VehicleProvision is made to provide a motor vehicle for the CorporateManager, Community Development.
Fuels and Oils 10.20 7,000
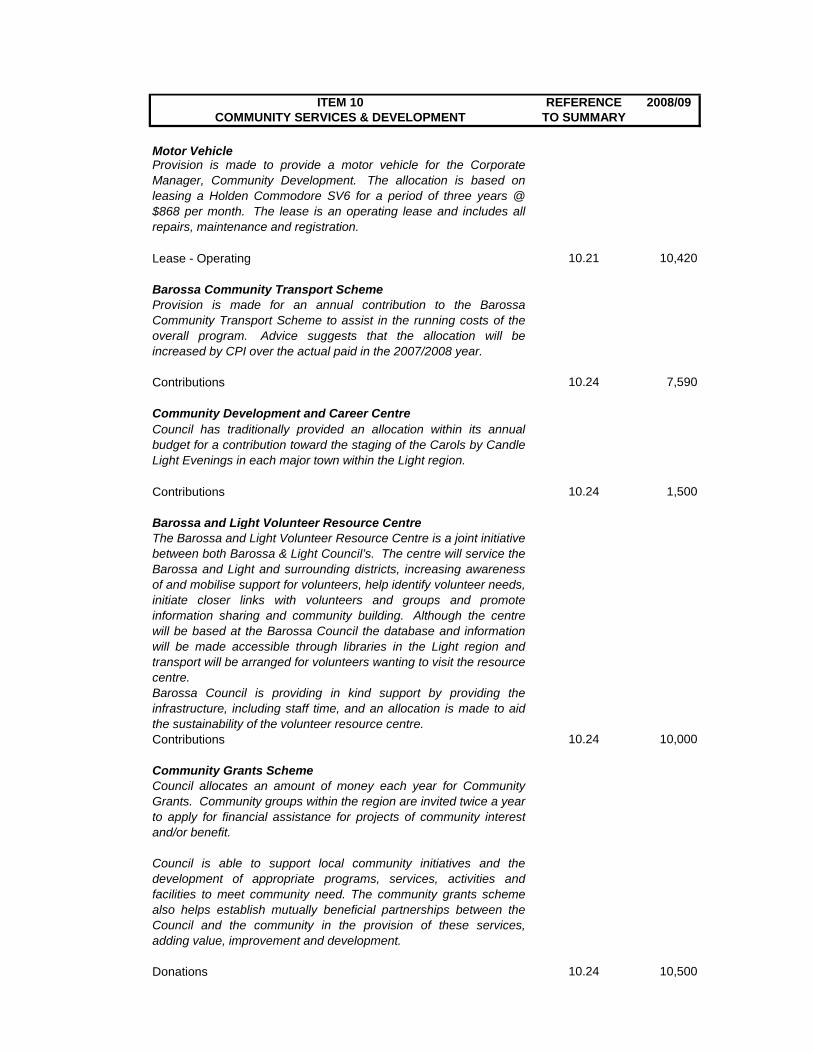
ITEM 10 REFERENCE 2008/09COMMUNITY SERVICES & DEVELOPMENT TO SUMMARY
Motor VehicleProvision is made to provide a motor vehicle for the CorporateManager, Community Development. The allocation is based onleasing a Holden Commodore SV6 for a period of three years @$868 per month. The lease is an operating lease and includes allrepairs, maintenance and registration.
Lease - Operating 10.21 10,420
Barossa Community Transport SchemeProvision is made for an annual contribution to the BarossaCommunity Transport Scheme to assist in the running costs of theoverall program. Advice suggests that the allocation will beincreased by CPI over the actual paid in the 2007/2008 year.
Contributions 10.24 7,590
Community Development and Career CentreCouncil has traditionally provided an allocation within its annualbudget for a contribution toward the staging of the Carols by CandleLight Evenings in each major town within the Light region.
Contributions 10 24 1 500Contributions 10.24 1,500
Barossa and Light Volunteer Resource CentreThe Barossa and Light Volunteer Resource Centre is a joint initiativebetween both Barossa & Light Council’s. The centre will service theBarossa and Light and surrounding districts, increasing awarenessof and mobilise support for volunteers, help identify volunteer needs,initiate closer links with volunteers and groups and promoteinformation sharing and community building. Although the centrewill be based at the Barossa Council the database and informationwill be made accessible through libraries in the Light region andtransport will be arranged for volunteers wanting to visit the resourcecentre. Barossa Council is providing in kind support by providing theinfrastructure, including staff time, and an allocation is made to aidthe sustainability of the volunteer resource centre.Contributions 10.24 10,000
Community Grants SchemeCouncil allocates an amount of money each year for CommunityGrants. Community groups within the region are invited twice a yearto apply for financial assistance for projects of community interestand/or benefit.
Council is able to support local community initiatives and thedevelopment of appropriate programs, services, activities andfacilities to meet community need. The community grants schemealso helps establish mutually beneficial partnerships between theCouncil and the community in the provision of these services,adding value, improvement and development.
Donations 10.24 10,500

ITEM 10 REFERENCE 2008/09COMMUNITY SERVICES & DEVELOPMENT TO SUMMARY
Heritage Incentive GrantsTo assist in the protection of the built heritage in the region Council
has allocated an amount of money for heritage incentive grants.
This budget line was previously under Item 98 - Planning PolicyDonations 10.24 8,000
Appropriation to Community Bus Replacement Reserve 10.26 5,000
Crime PreventionAn allocation is made to “top up” existing funds for the purchase ofsecurity lighting, surveillance cameras and surveillance technicalsupport.
Purchase and Installation of Security Equipment 10.32 3,000
APPROPRIATIONS
CAPITAL EXPENDITURE
Responsible Officer: Corporate Manager Community Development

ITEM NO. 11
2007/08 Mar Review Inflows (Outflows) Account No. Ref No. 2008/09
Inflows Source of Funding - OperatingRating 1212 - 1242 11.01 0Statutory Charges 1212 - 1242 11.02 0
1,100 930 User Charges 1212 - 1242 11.03 19,00075,700 80,470 Grants and Subsidies - Operating 1212 - 1242 11.04 91,920
Investment Income 1212 - 1242 11.05 0Donations 1212 - 1242 11.06 0
0 1,400 Reimbursements 1212 - 1242 11.07 00 Commercial Activities 1212 - 1242 11.08 0
2,290 3,890 Other 1212 - 1242 11.09 7,060Plant Hire Recouped 0Salaries and Wages Oncosts Recouped 0FCA Oncosts Recouped 1212 - 1242 11.10 0
79,090 86,690 Total Operating Income 117,980
Inflows Source of Funding - Recoupments
81,050 Recoupments 1213 - 1243 11.11 00 81,050 Total Recoupments 0
Inflows Source of Funding - Capital
0 0 Grants and Subsidies - Capital 1217 - 1247 11.12 00 0 Donations and Contributions 1217 - 1247 11.13 00 0 Sale of Assets 1217 - 1247 11.14 23,6300 0 Other Capital Revenue 1217 - 1247 11.15 00 0 Loans 1217 - 1247 11.16 00 0 Total Capital Income 23,630
SERVICE PROVISION AREA LIBRARY SERVICES
79,090 167,740 TOTAL INFLOWS 141,610
(Outflows) Total Operating Cost of Service
223,000 242,270 Employee Costs 1210 - 1240 11.17 334,580Salaries and Wages Oncosts 1210 - 1240 11.18 0
61,520 132,150 Contractual Services 1210 - 1240 11.19 102,91064,530 73,040 Materials 1210 - 1240 11.20 77,4009,000 8,180 Finance Charges 1210 - 1240 11.21 9,090
27,730 27,730 Depreciation 1210 - 1240 11.22 31,3300 0 Plant Hire 1210 - 1240 11.23 12,000
10,170 13,960 Other 1210 - 1240 11.24 17,47055,890 55,890 FCA Oncosts 1210 - 1240 11.25 54,590
451,840 553,220 Total Operating Expenses 639,370
(Outflows) Appropriations
0 0 Appropriations 1211 - 1241 11.26 00 0 Total Appropriations 0
(Outflows) Capital AcquisitionsInfrastructure 1215 - 1245 11.27 0Structures 1215 - 1245 11.28 0Buildings 1215 - 1245 11.29 10,000Plant and Machinery 1215 - 1245 11.30 30,590
2,000 2,000 Furniture and Fittings 1215 - 1245 11.31 2,0000 Office Equipment 1215 - 1245 11.32 0
2,000 2,000 Total Capital Expenses 42,590
(Outflows) Loan Principal RepaymentsLoan Principal Repayments 1215 - 1245 11.33 0
0 0 Total Loan Principal Repayments 0
453,840 555,220 TOTAL OUTFLOWS 681,960
-27,730 -27,730 Less: Non-Cash Items/Depreciation 1210 - 1240 11.22 -31,330
347,020 359,750 NET IMPACT ON RATING EFFORT 509,019
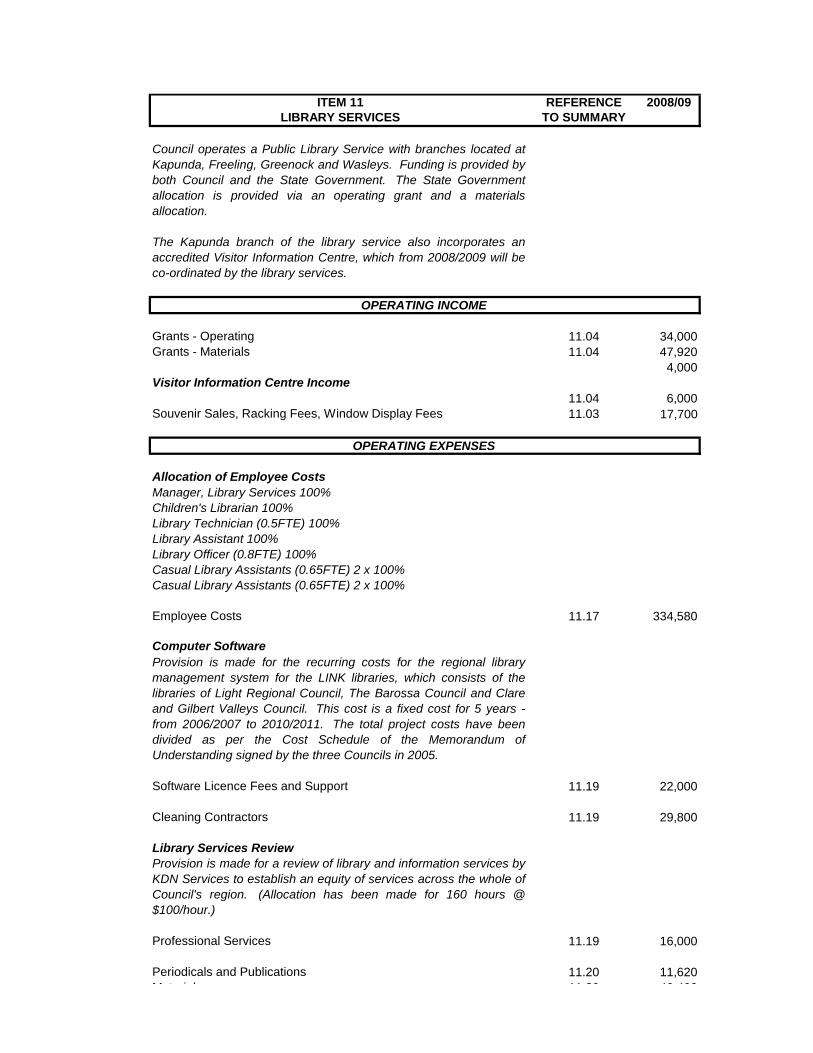
ITEM 11 REFERENCE 2008/09LIBRARY SERVICES TO SUMMARY
Council operates a Public Library Service with branches located atKapunda, Freeling, Greenock and Wasleys. Funding is provided byboth Council and the State Government. The State Governmentallocation is provided via an operating grant and a materialsallocation.
The Kapunda branch of the library service also incorporates anaccredited Visitor Information Centre, which from 2008/2009 will beco-ordinated by the library services.
Grants - Operating 11.04 34,000Grants - Materials 11.04 47,920
4,000Visitor Information Centre Income
11.04 6,000Souvenir Sales, Racking Fees, Window Display Fees 11.03 17,700
Allocation of Employee CostsManager Library Services 100%
OPERATING INCOME
OPERATING EXPENSES
Manager, Library Services 100%Children's Librarian 100%Library Technician (0.5FTE) 100% Library Assistant 100%Library Officer (0.8FTE) 100%Casual Library Assistants (0.65FTE) 2 x 100%Casual Library Assistants (0.65FTE) 2 x 100%
Employee Costs 11.17 334,580
Computer SoftwareProvision is made for the recurring costs for the regional librarymanagement system for the LINK libraries, which consists of thelibraries of Light Regional Council, The Barossa Council and Clareand Gilbert Valleys Council. This cost is a fixed cost for 5 years -from 2006/2007 to 2010/2011. The total project costs have beendivided as per the Cost Schedule of the Memorandum ofUnderstanding signed by the three Councils in 2005.
Software Licence Fees and Support 11.19 22,000
Cleaning Contractors 11.19 29,800
Library Services ReviewProvision is made for a review of library and information services byKDN Services to establish an equity of services across the whole ofCouncil's region. (Allocation has been made for 160 hours @$100/hour.)
Professional Services 11.19 16,000
Periodicals and Publications 11.20 11,620M t i l 11 20 40 400

ITEM 11 REFERENCE 2008/09LIBRARY SERVICES TO SUMMARY
Volunteer Function
The Library has the services of many volunteers (there are currently12 volunteers working in the libraries) which enable a quality serviceto be provided. In the last financial year the volunteers provided thelibrary service with over 1,500 hours of time. In appreciation of thiswork and dedication, basic tea and coffee facilities are provided.Also an amount is set aside to provide a function at the end of thecalendar year to thank the volunteers for the hours they give to thelibrary service and their local community.
Food Provisions 11.20 720
Stationery and Office Supplies 11.20 4,540
Souvenirs 11.20 4,000
ComputersAs part of the regional library management system Council hasentered into a three year lease agreement with IBM GlobalFinancing Australia Ltd to lease the personal computers for thelibrary service, which concludes in July, 2009.
Lease Payments - Computers 11.21 9,090
Utilities - Electricity 11.20 8,780
KLTI Contribution
An allowance is made for a tourism and business contribution as perthe 'Memorandum of Understanding' between KLTI and Council.
Contributions 11.24 3,500
Tourism Familiarisation TourProvision is made to host 3 annual bus tours for staff and volunteersto familiarise them with neighbouring regions and tourismattractions.
11.24 3,000
Depreciation - Office Equipment 11.22 8,270
Depreciation - Buildings 11.22 11,760
Plant and MachineryProvision is made to purchase 1 sedan type motor vehicle (HoldenCaptiva Diesel) @ $30,590 each.
30,590
CAPITAL EXPENDITURE

ITEM 11 REFERENCE 2008/09LIBRARY SERVICES TO SUMMARY
Library Expansion
Provision is made for the expansion of the Freeling Library intoShop 2 of the Hanson Street shops. With the current developmentbeing undertaken in Freeling, it is anticipated that this will lead to anincreased demand on the library service, including an increase inopening hours and the provision of a full range of services.
Capital - Buildings 11.32 10,000
Responsible Officer: Manager – Library Services

ITEM NO. 12
2007/08 Mar Review Inflows (Outflows) Account No. Ref No. 2008/09
Inflows Source of Funding - OperatingRating 1312-1342,1372 12.01 0Statutory Charges 1312-1342,1372 12.02 0
120 User Charges 1312-1342,1372 12.03 0200,070 206,190 Grants and Subsidies - Operating 1312-1342,1372 12.04 225,560295,200 295,200 Investment Income 1312-1342,1372 12.05 567,000
Donations 1312-1342,1372 12.06 0500 7,390 Reimbursements 1312-1342,1372 12.07 500
Commercial Activities 1312-1342,1372 12.08 025,350 29,500 Other 1312-1342,1372 12.09 38,060
Plant Hire Recouped 0Salaries and Wages Oncosts Recouped 0
182,220 182,220 FCA Oncosts Recouped 1312-1342,1372 12.10 588,740703,460 720,500 Total Operating Income 1,419,860
Inflows Source of Funding - Recoupments
0 502,410 Recoupments 1313-1343,1373 12.11 00 502,410 Total Recoupments 0
Inflows Source of Funding - Capital Grants and Subsidies - Capital 1317-1347,1377 12.12 0Donations and Contributions 1317-1347,1377 12.13 0
20,910 Sale of Assets 1317-1347,1377 12.14 0Other Capital Revenue 1317-1347,1377 12.15 0
362,290 Loans 1317-1347,1377 12.16 0362,290 20,910 Total Capital Income 0
SERVICE PROVISION AREA FINANCE & ADMINISTRATION
1,065,750 1,243,820 TOTAL INFLOWS 1,419,860
(Outflows) Total Operating Cost of Service
363,940 393,890 Employee Costs 1310-1340,1370 12.17 700,110Salaries and Wages Oncosts 1310-1340,1370 12.18 0
17,500 185,830 Contractual Services 1310-1340,1370 12.19 110,380410 890 Materials 1310-1340,1370 12.20 1,350
41,060 45,880 Finance Charges 1310-1340,1370 12.21 51,810Depreciation 1310-1340,1370 12.22 0
7,500 Plant Hire 1310-1340,1370 12.23 02,840 9,730 Other 1310-1340,1370 12.24 15,540
125,060 125,060 FCA Oncosts 1310-1340,1370 12.25 197,490550,810 768,780 Total Operating Expenses 1,076,679
(Outflows) Appropriations
124,770 Appropriations 1311-1341,1371 12.26 552,0000 124,770 Total Appropriations 552,000
(Outflows) Capital AcquisitionsInfrastructure 1315-1345,1375 12.27 0Structures 1315-1345,1375 12.28 0Buildings 1315-1345,1375 12.29 0
31,290 Plant and Machinery 1315-1345,1375 12.30 0Furniture and Fittings 1315-1345,1375 12.31 0
30,630 30,630 Office Equipment 1315-1345,1375 12.32 030,630 61,920 Total Capital Expenses 0
(Outflows) Loan Principal Repayments
15,430 15,430 Loan Principal Repayments 1315-1345,1375 12.33 8,13015,430 15,430 Total Loan Principal Repayments 8,130
596,870 970,900 TOTAL OUTFLOWS 1,636,809
0 0 Less: Non-Cash Items/Depreciation 1310-1340,1370 12.22 0
-468,880 -272,920 NET IMPACT ON RATING EFFORT 216,949

ITEM 12 REFERENCE 2008/09FINANCE & ADMINISTRATION TO SUMMARY
The Finance and Administration function comes within the control ofthe Corporate Services Department and includes investments,payroll, human resources and customer services functions. Inessence this section of Council's operations manages the day today financial transactions of Council. This includes generalaccounting, budgeting and production of end of year financialstatements, accounts paid and payable. It also manages the day today processes associated with calculating Council's payroll, itsdistribution to employees and the ancillary distribution of PAYG taxand other employee related deductions.
This item also accounts for the investment interest that Councilreceives on funds not being utilised in day to day operations. Aspolicy Council currently invests all surplus funds with the LocalGovernment Finance Authority of South Australia.
The Customer Service function is shared between the Freeling andKapunda offices with full time customer services officers beinglocated at Freeling and Kapunda. The Customer Services Officersprovide the first line service to Council's customers at the frontcounter and the Council's telephone system with the provision ofreceptionist duties.
Grants - Grants Commission 12.04 225,560
Interest Received LGFAInterest is calculated on Councils reserve funds and 24 hour at callfunds held throughout the course of the reporting period. Interest isalso calculated on Councils funds held in everyday transactionaccounts with Bank SA.
Interest Received on Investments 12.05 267,000
12.05 300,000
LGFA BonusIncome calculated on the value of average daily deposits and loansoutstanding throughout the reporting period with the LocalGovernment Finance Authority (LGFA) based on previous year’sissues.
Operating Income - Other 12.09 26,500
OPERATING INCOME

ITEM 12 REFERENCE 2008/09FINANCE & ADMINISTRATION TO SUMMARY
Allocation of Employee CostsFinancial Consultant (PTE 0.20)Finance Manager 100%Project Accountant 80%Assistant Accountant 100%Creditors/Debtors Clerk 100%Customer Services Team Leader 65%Manager - Tourism & Special Projects 50% Customer Services Officer, Kapunda 100%Customer Services Officer, Freeling 100%Customer Services Officer, Freeling 70%Customer Services Relief Officer 100%Records Assistant 20%
Employee Costs 12.17 629,110
Fringe Benefits TaxProvision is made for the tax incurred by Council in providingbenefits to employees other than salary. These are known as FringeBenefits.
OPERATING EXPENSES
Fringe Benefits Tax 12.17 71,000
Audit Fees 12.19 8,150Professional Services - Audit Committee Members 12.19 15,150Professional Services - Asset Revaluation Program 12.19 35,000
Governance, Internal Audit and StrategyProvision is made for consultants to assist staff with Long TermFinancial Plans and Infrastructure and Asset Management Plans.
Professional Services 12.19 5,000
Printing - Budgets, Budget Newsletters, Annual Reports 12.19 15,150
Human Resource ManagementProfessional Services 12.19 20,000
Legal Expenses 12.19 10,000
Advertising 12.24 5,000
Bank Charges and Stamp Duty 12.21 24,300Interest payable on Internal Loans 12.21 25,250
Loan Principal Repayments 12 8,130
Responsible Officer: Deputy Chief Executive Officer
LOAN PRINCIPAL REPAYMENTS
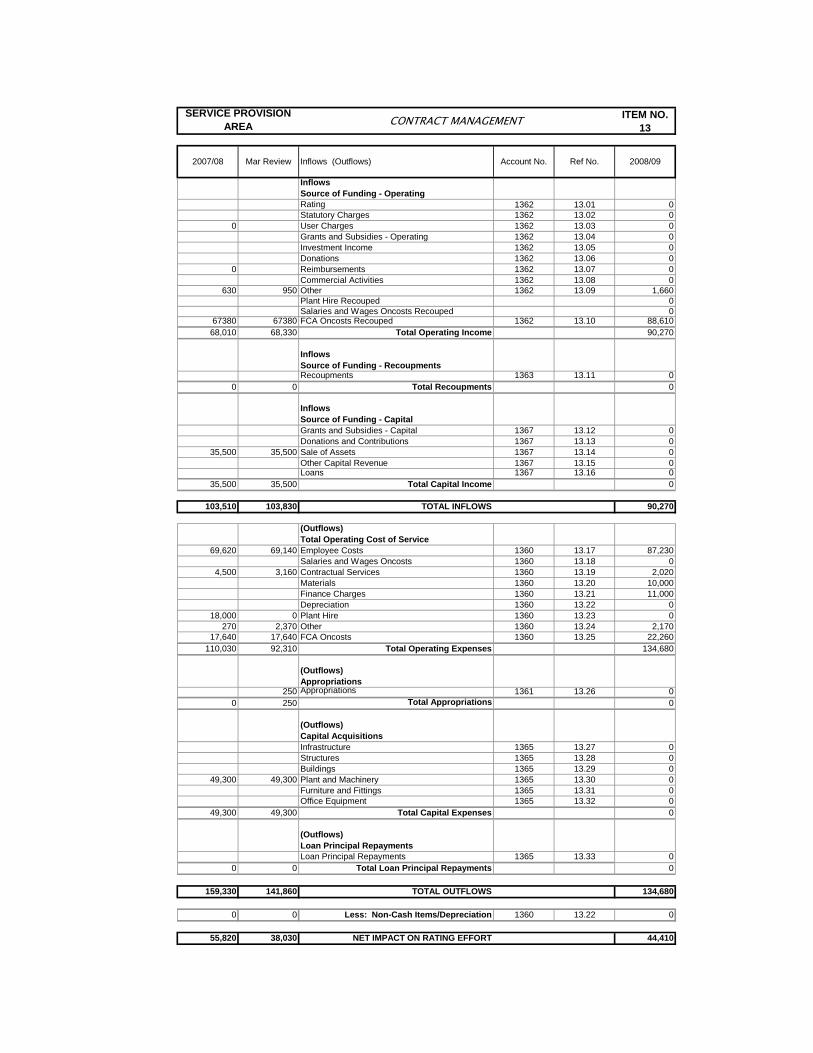
ITEM NO. 13
2007/08 Mar Review Inflows (Outflows) Account No. Ref No. 2008/09
Inflows Source of Funding - OperatingRating 1362 13.01 0Statutory Charges 1362 13.02 0
0 User Charges 1362 13.03 0Grants and Subsidies - Operating 1362 13.04 0Investment Income 1362 13.05 0Donations 1362 13.06 0
0 Reimbursements 1362 13.07 0Commercial Activities 1362 13.08 0
630 950 Other 1362 13.09 1,660Plant Hire Recouped 0Salaries and Wages Oncosts Recouped 0
67380 67380 FCA Oncosts Recouped 1362 13.10 88,61068,010 68,330 Total Operating Income 90,270
Inflows Source of Funding - RecoupmentsRecoupments 1363 13.11 0
0 0 Total Recoupments 0
Inflows Source of Funding - Capital Grants and Subsidies - Capital 1367 13.12 0Donations and Contributions 1367 13.13 0
35,500 35,500 Sale of Assets 1367 13.14 0Other Capital Revenue 1367 13.15 0Loans 1367 13.16 0
35,500 35,500 Total Capital Income 0
SERVICE PROVISION AREA CONTRACT MANAGEMENT
103,510 103,830 TOTAL INFLOWS 90,270
(Outflows) Total Operating Cost of Service
69,620 69,140 Employee Costs 1360 13.17 87,230Salaries and Wages Oncosts 1360 13.18 0
4,500 3,160 Contractual Services 1360 13.19 2,020Materials 1360 13.20 10,000Finance Charges 1360 13.21 11,000Depreciation 1360 13.22 0
18,000 0 Plant Hire 1360 13.23 0270 2,370 Other 1360 13.24 2,170
17,640 17,640 FCA Oncosts 1360 13.25 22,260110,030 92,310 Total Operating Expenses 134,680
(Outflows) Appropriations
250 Appropriations 1361 13.26 00 250 Total Appropriations 0
(Outflows) Capital AcquisitionsInfrastructure 1365 13.27 0Structures 1365 13.28 0Buildings 1365 13.29 0
49,300 49,300 Plant and Machinery 1365 13.30 0Furniture and Fittings 1365 13.31 0Office Equipment 1365 13.32 0
49,300 49,300 Total Capital Expenses 0
(Outflows) Loan Principal RepaymentsLoan Principal Repayments 1365 13.33 0
0 0 Total Loan Principal Repayments 0
159,330 141,860 TOTAL OUTFLOWS 134,680
0 0 Less: Non-Cash Items/Depreciation 1360 13.22 0
55,820 38,030 NET IMPACT ON RATING EFFORT 44,410
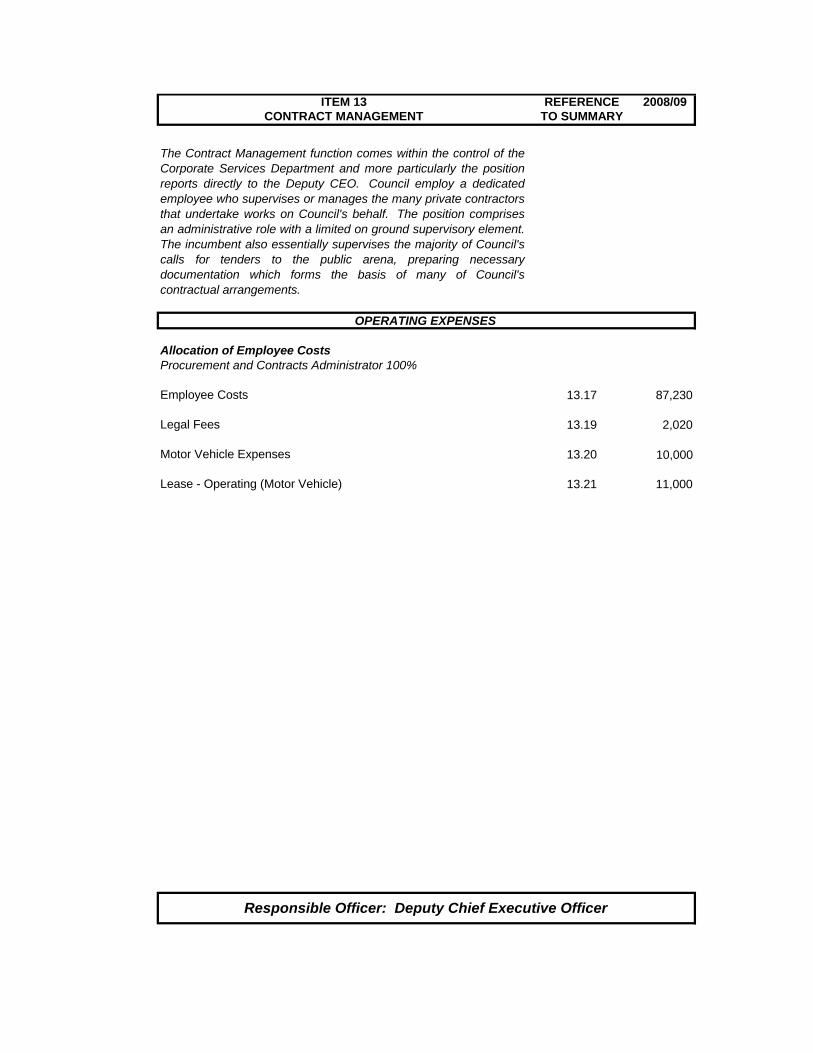
ITEM 13 REFERENCE 2008/09CONTRACT MANAGEMENT TO SUMMARY
The Contract Management function comes within the control of theCorporate Services Department and more particularly the positionreports directly to the Deputy CEO. Council employ a dedicatedemployee who supervises or manages the many private contractorsthat undertake works on Council's behalf. The position comprisesan administrative role with a limited on ground supervisory element.The incumbent also essentially supervises the majority of Council'scalls for tenders to the public arena, preparing necessarydocumentation which forms the basis of many of Council'scontractual arrangements.
Allocation of Employee CostsProcurement and Contracts Administrator 100%
Employee Costs 13.17 87,230
Legal Fees 13.19 2,020
Motor Vehicle Expenses 13.20 10,000
Lease - Operating (Motor Vehicle) 13.21 11,000
OPERATING EXPENSES
Responsible Officer: Deputy Chief Executive Officer

ITEM NO. 14
2007/08 Mar Review Inflows (Outflows) Account No. Ref No. 2008/09
Inflows Source of Funding - OperatingRating 1382 14.01 0Statutory Charges 1382 14.02 0User Charges 1382 14.03 0Grants and Subsidies - Operating 1382 14.04 0Investment Income 1382 14.05 0Donations 1382 14.06 0Reimbursements 1382 14.07 40,100Commercial Activities 1382 14.08 0
800 1,220 Other 1382 14.09 2,450Plant Hire Recouped 0Salaries and Wages Oncosts Recouped 0
310,650 310,650 FCA Oncosts Recouped 1382 14.10 497,030311,450 311,870 Total Operating Income 539,580
Inflows Source of Funding - Recoupments
0 Recoupments 1383 14.11 00 0 Total Recoupments 0
Inflows Source of Funding - Capital Grants and Subsidies - Capital 1387 14.12 0Donations and Contributions 1387 14.13 0Sale of Assets 1387 14.14 0Other Capital Revenue 1387 14.15 0Loans 1387 14.16 0
0 0 Total Capital Income 0
SERVICE PROVISION AREA INFORMATION TECHNOLOGY AND TELECOMMUNICATIONS
311,450 311,870 TOTAL INFLOWS 539,580
(Outflows) Total Operating Cost of Service
91,820 85,850 Employee Costs 1380 14.17 126,420Salaries and Wages Oncosts 1380 14.18 0
242,810 267,250 Contractual Services 1380 14.19 293,9203,700 3,700 Materials 1380 14.20 2,020
12,000 Finance Charges 1380 14.21 70,100Depreciation 1380 14.22 0
1,200 1,200 Plant Hire 1380 14.23 07,050 4,990 Other 1380 14.24 88,720
16,090 16,090 FCA Oncosts 1380 14.25 23,980374,670 379,080 Total Operating Expenses 605,160
(Outflows) Appropriations
0 160 Appropriations 1381 14.26 00 160 Total Appropriations 0
(Outflows) Capital AcquisitionsInfrastructure 1385 14.27 0Structures 1385 14.28 0Buildings 1385 14.29 0Plant and Machinery 1385 14.30 0Furniture and Fittings 1385 14.31 0
50,570 53,990 Office Equipment 1385 14.32 22,00050,570 53,990 Total Capital Expenses 22,000
(Outflows) Loan Principal RepaymentsLoan Principal Repayments 1385 14.33 0
0 0 Total Loan Principal Repayments 0
425,240 433,230 TOTAL OUTFLOWS 627,160
0 0 Less: Non-Cash Items/Depreciation 1380 14.22 0
113,790 121,360 NET IMPACT ON RATING EFFORT 87,580

ITEM 14 REFERENCE 2008/09INFORMATION TECHNOLOGY AND TELECOMMUNICATIONS TO SUMMARY
Information Technology and Telecommunications (IT) disciplinesform an increasingly large part of the Council's operations on a dayto day basis, whether that be from the act of producingdocumentation, through to computing and graphical informationsystems. This budget is the second year that Council has chosen toshow separately expense estimates detailing the cost of IT toCouncil.
IT Support Officer - 50% reimbursement from Mallala Council due tohalf share of this resource.Reimbursements - Other 40,100
Allocation of Employee CostsProject Accountant 20% Customer Services Team Leader 35%IT Support Officer 100% - Half share with Mallala - refer income
Employee Costs 14 17 126 420
OPERATING EXPENSES
OPERATING INCOME
Employee Costs 14.17 126,420
MapInfo Geographical Information System & Road SurfaceManager Systems Support
Provision is made for MapInfo Consultants (BC Tonkin andAssociates), SA State Strategic Partner) to undertake consultancywork for system support, maintenance and development.
GIS/RSM Systems Support 14.19 13,560
Server Maintenance & SupportProvision is made for maintenance and support of the servers.
Hardware and software support 14.19 55,150
Professional Services - Hardware and Software support 14.19 35,000
Authority Corporate Local Government SystemIn September 2006, Council signed a Managed Service Agreementwith Civica to provide for the maintenance, backup and upgrade ofhardware and software to operate their Authority products. Civica'Authority' Annual Software Licence Fees include program licensing,Informix database licence, eServices licence, Websphere licence,and the GIS integration annual fee and are all included in theManaged Service Fee.
Professional Services - Managed Service 14.19 125,400
MapInfo Graphical Information SystemAnnual License and Maintenance Fee 14.19 13,920
M i t Offi E i t 14 19 5 000

ITEM 14 REFERENCE 2008/09INFORMATION TECHNOLOGY AND TELECOMMUNICATIONS TO SUMMARY
Authority Corporate Local Government System
Civica 'Authority' Packaged Service Provision Arrangement,including upgrade of system programs to the latest AuthorityRelease Versions inclusive of eServices, Disaster RecoveryModule, refresher training program (scheduled for the anniversary ofgo live including training for new personnel), and purchase of annualmaintenance management from Civica for the company toundertake monthly program patching and deployment.
Packaged Service Provision Agreement 14.19 20,000
GIS System SupportProvision is made for MapInfo Consultants (BC Tonkin andAssociates, SA State Distributor) to undertake consultancy work forsystem support, maintenance and development.
Consultants - GIS System Support 14.19 13,000
Microwave Equipment An allocation is made for the lease of microwave equipment which iscurrently providing broadband data and voice services between theKapunda and Freeling council officesKapunda and Freeling council offices.
Finance Charges - Other 14.21 27,000
Staff ComputersProvision is made for leasing computers from CBA for Council staff.This is a three year lease which commenced in April 2008.Finance Charges - Lease Payments 14.21 38,400
Lease of ServersProvision is made for the lease of new servers to replace the currentservers which are over 4 years old and out of warranty.Finance Charges - Lease Payments 14.21 19,000
TelecommunicationsProvision is made for the cost of providing landlines and mobilephones to Council employees. In June 2007, Council signed a twoyear agreement with 3 Mobile to cater for its mobile communicationneeds.
Telephones 14.24 97,700
Purchase of Computer EquipmentPurchase of IT Equipment
Capital Purchase - Computer Equipment 14.32 22,000
CAPITAL EXPENDITURE
Responsible Officer: Deputy Chief Executive Officer

ITEM NO. 15
2007/08 Mar Review Inflows (Outflows) Account No. Ref No. 2008/09
Inflows Source of Funding - OperatingRating 1392/1402 15.01 0Statutory Charges 1392/1402 15.02 0
250 370 User Charges 1392/1402 15.03 0Grants and Subsidies - Operating 1392/1402 15.04 0Investment Income 1392/1402 15.05 0Donations 1392/1402 15.06 0Reimbursements 1392/1402 15.07 0Commercial Activities 1392/1402 15.08 0
2,060 Other 1392/1402 15.09 0Plant Hire Recouped 0Salaries and Wages Oncosts Recouped 0
289,540 289,540 FCA Oncosts Recouped 1392/1402 15.10 217,630289,790 291,970 Total Operating Income 217,630
Inflows Source of Funding - Recoupments
0 167,080 Recoupments 1393/1403 15.11 00 167,080 Total Recoupments 0
Inflows Source of Funding - Capital Grants and Subsidies - Capital 1397/1407 15.12 0Donations and Contributions 1397/1407 15.13 0Sale of Assets 1397/1407 15.14 0Other Capital Revenue 1397/1407 15.15 0
40,000 40,000 Loans 1397/1407 15.16 040,000 40,000 Total Capital Income 0
SERVICE PROVISION AREA OFFICE EXPENDITURE
329,790 499,050 TOTAL INFLOWS 217,630
(Outflows) Total Operating Cost of Service
0 1,410 Employee Costs 1390/1400 15.17 1,8002,690 Salaries and Wages Oncosts 1390/1400 15.18 1,760
116,470 124,730 Contractual Services 1390/1400 15.19 91,15061,950 55,910 Materials 1390/1400 15.20 57,020
600 800 Finance Charges 1390/1400 15.21 3,05088,730 88,730 Depreciation 1390/1400 15.22 97,660
0 360 Plant Hire 1390/1400 15.23 0134,070 140,130 Other 1390/1400 15.24 62,85020,050 20,050 FCA Oncosts 1390/1400 15.25 5,830
421,870 434,810 Total Operating Expenses 321,120
(Outflows) Appropriations
0 3,080 Appropriations 1391/1401 15.26 00 3,080 Total Appropriations 0
(Outflows) Capital AcquisitionsInfrastructure 1395/1405 15.27 0
20,000 30,000 Structures 1395/1405 15.28 00 144,080 Buildings 1395/1405 15.29 0
17,000 17,000 Plant and Machinery 1395/1405 15.30 025,000 29,960 Furniture and Fittings 1395/1405 15.31 015,500 15,500 Office Equipment 1395/1405 15.32 077,500 236,540 Total Capital Expenses 0
(Outflows) Loan Principal Repayments
750 750 Loan Principal Repayments 1395/1405 15.33 3,940750 750 Total Loan Principal Repayments 3,940
500,120 675,180 TOTAL OUTFLOWS 325,060
-88,730 -88,730 Less: Non-Cash Items/Depreciation 1390/1400 15.22 -97,660
81,600 87,400 NET IMPACT ON RATING EFFORT 9,770

ITEM 15 REFERENCE 2008/09OFFICE EXPENDITURE TO SUMMARY
The principal office of Council is situated at 93 Main Street,Kapunda. The Kapunda office houses the Governance, CorporateServices, Finance, Tourism and Community Services departmentsof Council including the chamber at which Council holds itsmeetings. The Chief Executive Officer and the Deputy ChiefExecutive Officer are situated at the Kapunda office. At the time ofcompiling this budget document, 18 members of Council'sadministration staff are working at the Kapunda office.
The branch office of Council is situated at Hanson Street, Freeling.The Freeling office houses the Works, Development, Planning andEnvironmental Services departments of Council and is the mainentry point for telecommunications reception to the organisation.Two Corporate Managers are situated at the Freeling office, housinga total of 18 administration staff.
PrintersThis item entails the purchase of letterheads, envelopes, specificcomputer stationery and cheques. The printing of Council’s logohas also been provided for in the budget. Printing of Council'spublic documents is budgeted for under Item 12 of this budget
OPERATING EXPENSES
public documents is budgeted for under Item 12 of this budget.
Printers 15.19 5,000
Cleaning Contractors 15.19 30,330
Maintenance - Office Equipment (Photocopiers) 15.19 26,260
Maintenance - Buildings 15.19 0
Maintenance - Grounds 15.19 13,970
Utilities - Electricity 15.20 110
Stationery and Office Supplies 15.20 8,080
Depreciation - Office Equipment 15.22 0
Depreciation - Buildings 15.22 4,620
Insurance - Buildings and Contents 15.24 300
Postage 15.24 16,200
Insurance - Buildings and ContentsSubscriptions / Membership Fees 15.24 0
Responsible Officer: Deputy Chief Executive Officer
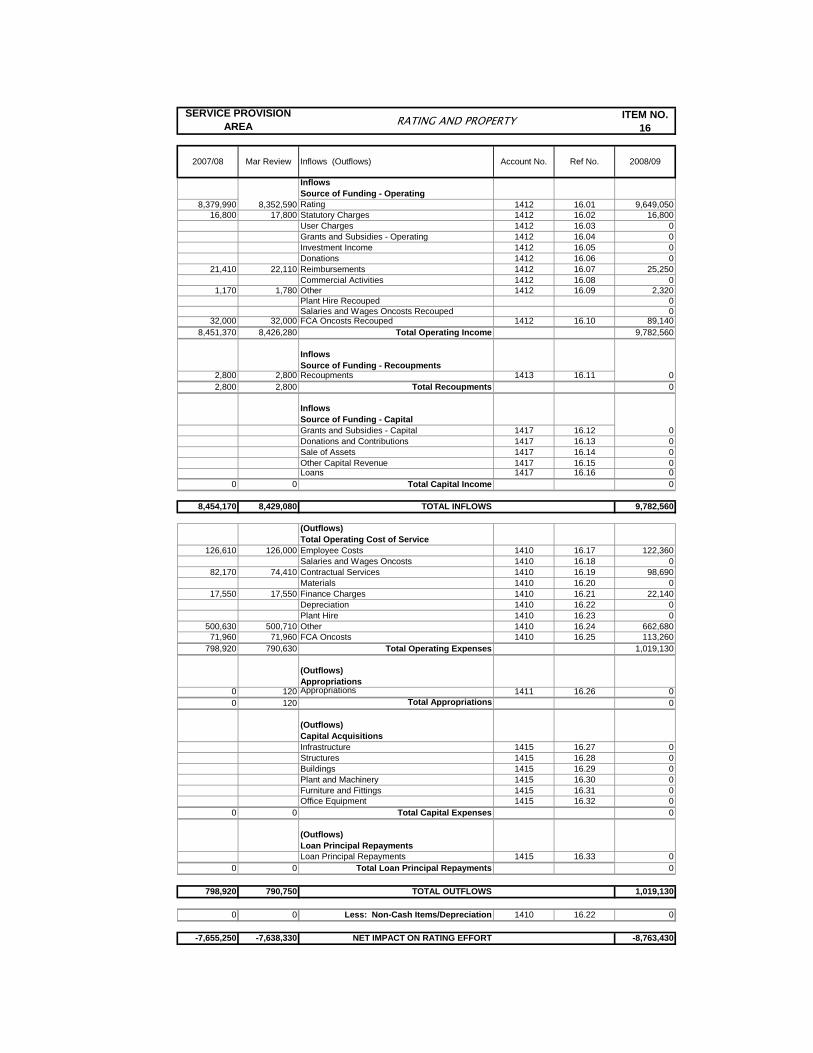
ITEM NO. 16
2007/08 Mar Review Inflows (Outflows) Account No. Ref No. 2008/09
Inflows Source of Funding - Operating
8,379,990 8,352,590 Rating 1412 16.01 9,649,05016,800 17,800 Statutory Charges 1412 16.02 16,800
User Charges 1412 16.03 0Grants and Subsidies - Operating 1412 16.04 0Investment Income 1412 16.05 0Donations 1412 16.06 0
21,410 22,110 Reimbursements 1412 16.07 25,250Commercial Activities 1412 16.08 0
1,170 1,780 Other 1412 16.09 2,320Plant Hire Recouped 0Salaries and Wages Oncosts Recouped 0
32,000 32,000 FCA Oncosts Recouped 1412 16.10 89,1408,451,370 8,426,280 Total Operating Income 9,782,560
Inflows Source of Funding - Recoupments
2,800 2,800 Recoupments 1413 16.11 02,800 2,800 Total Recoupments 0
Inflows Source of Funding - Capital Grants and Subsidies - Capital 1417 16.12 0Donations and Contributions 1417 16.13 0Sale of Assets 1417 16.14 0Other Capital Revenue 1417 16.15 0Loans 1417 16.16 0
0 0 Total Capital Income 0
SERVICE PROVISION AREA RATING AND PROPERTY
8,454,170 8,429,080 TOTAL INFLOWS 9,782,560
(Outflows) Total Operating Cost of Service
126,610 126,000 Employee Costs 1410 16.17 122,360Salaries and Wages Oncosts 1410 16.18 0
82,170 74,410 Contractual Services 1410 16.19 98,690Materials 1410 16.20 0
17,550 17,550 Finance Charges 1410 16.21 22,140Depreciation 1410 16.22 0Plant Hire 1410 16.23 0
500,630 500,710 Other 1410 16.24 662,68071,960 71,960 FCA Oncosts 1410 16.25 113,260
798,920 790,630 Total Operating Expenses 1,019,130
(Outflows) Appropriations
0 120 Appropriations 1411 16.26 00 120 Total Appropriations 0
(Outflows) Capital AcquisitionsInfrastructure 1415 16.27 0Structures 1415 16.28 0Buildings 1415 16.29 0Plant and Machinery 1415 16.30 0Furniture and Fittings 1415 16.31 0Office Equipment 1415 16.32 0
0 0 Total Capital Expenses 0
(Outflows) Loan Principal RepaymentsLoan Principal Repayments 1415 16.33 0
0 0 Total Loan Principal Repayments 0
798,920 790,750 TOTAL OUTFLOWS 1,019,130
0 0 Less: Non-Cash Items/Depreciation 1410 16.22 0
-7,655,250 -7,638,330 NET IMPACT ON RATING EFFORT -8,763,430

ITEM 16 REFERENCE 2008/09RATING AND PROPERTY TO SUMMARY
Council charges general rates against rateable assessments of landby using the method of land use category. The nine categories arethose referred to in the Local Government (General) Regulations1999. Differential rates in the dollar are applied against the propertyowners assessment which when multiplied by the capital valuationattributed to the property by the Valuer-General of South Australia,calculates the annual general rate payable by the land owner (oroccupier, whichever is applicable). It is proposed that Councilcontinue to utilise the rating by Land Use Category method forraising its general rate. In addition to the general rate, Councilapplies charges for refuse disposal and CWMS under a separatecharge mechanism.
Council acts as a collection agent for the State Government inthat the Natural Resources Management levy is collected by Counciland is then forwarded to the State on a quarterly basis as invoiced.
The 2008/2009 income to be collected from rates will consist ofthree components being:
OPERATING INCOME
General RatesCWMS chargesRefuse Collection/Disposal charges
General Rates 16.01 8,634,000
Refuse Collection & Disposal Separate Charge
Revenue to be raised from the Garbage Service charge iscalculated at $209.80 per collection for the 3 bin system by the totalnumber of collections, which is 3,387. The cost of LEMPs andLevies on Waste Management Stations is not included in calculatingthis charge. The charge is calculated based on a weekly rubbish,fortnightly recycling and fortnightly green waste collection. Revenueto be raised from the Garbage Service charge is calculated at$140.75 per collection for the 2 bin system by the total number ofcollections, which is 328. This charge is calculated based on aweekly rubbish and fortnightly recycling collection.
Waste Collection & Disposal Separate Charge 16.01 756,780
Natural Resource Management Board Levies
The Natural Resource Management Board Levies are raised inaccordance with Section 92 of the Natural Resource ManagementAct 2004. Council acts only as a collection agent for the Boardin this regard and all funds collected are forwarded to theBoard for its use. Council's region is contained within the areas ofthree separate Natural Resource Management Boards.
Adelaide and Mount Lofty Ranges Natural Resource ManagementB d L 16 01 135 310

ITEM 16 REFERENCE 2008/09RATING AND PROPERTY TO SUMMARY
Fines Raised
Section 181(8) of the Local Government Act 1999 states that if aninstalment of rates is not paid on or before the date on which it fallsdue, a fine of 2 per cent of the amount of the instalment is payable,and on the expiration of each month from that date, interest at theprescribed percentage of the amount in arrears (including theamount of any previous unpaid fine or interest) is payable.
Fines - Overdue Rates 16.01 27,000
Fees - Rate Searches 16.02 16,800
Reimbursement - Debt Collection Costs 16.07 23,000
Allocation of Employee CostsRates & Assessment Officer x 2 100%
Employee Costs 16.17 122,360
Legal Costs
OPERATING EXPENSES
Legal Costs
Allocation to cover the costs of summons fees, in accordance withCouncil’s debt recovery policy, which are recoverable from thedefendant and legal advice on general matters pertaining to rates.
Debt Collection Agency 16.19 23,000
Legal Fees 16.19 12,850
Assessment RecordsCouncil employs the services of the Valuer General who providesCouncil with a relevant listing each year in addition to monthly LOTSreports and provision for supplying certificates of title.
Valuers 16.19 38,380
Rate Notices
It is proposed that Council will utilise the services of “SALMAT andKwik-Kopy” in the printing and mailing of Council’s Rate Notices.The Notices are printed, folded and placed in envelopes, togetherwith inserts. It is considered to be a cost-effective method, incomparison to the time involved by Council staff in utilising borrowedequipment and the actual time involved in inserting notices by staff.
Rate Notice Print and DistributionPrintingProduction and DistributionCD Rom Copy of Production runs (4)
Printers 16.19 18,000
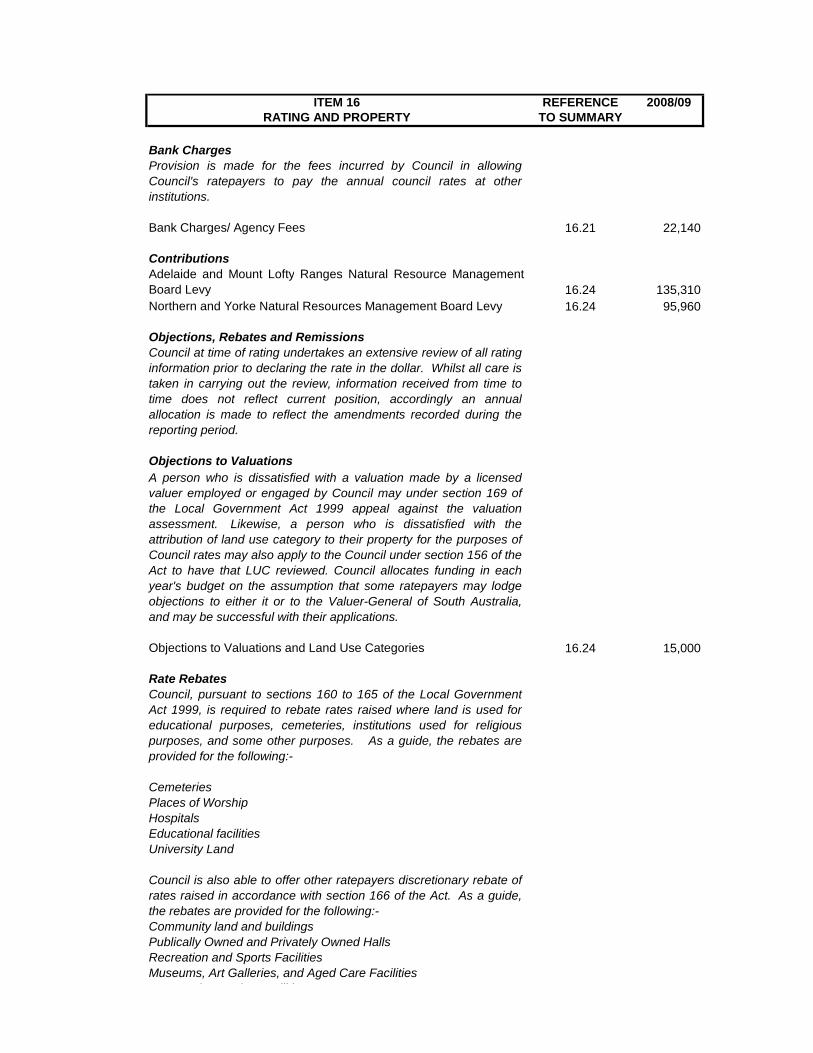
ITEM 16 REFERENCE 2008/09RATING AND PROPERTY TO SUMMARY
Bank ChargesProvision is made for the fees incurred by Council in allowingCouncil's ratepayers to pay the annual council rates at otherinstitutions.
Bank Charges/ Agency Fees 16.21 22,140
ContributionsAdelaide and Mount Lofty Ranges Natural Resource ManagementBoard Levy 16.24 135,310Northern and Yorke Natural Resources Management Board Levy 16.24 95,960
Objections, Rebates and RemissionsCouncil at time of rating undertakes an extensive review of all ratinginformation prior to declaring the rate in the dollar. Whilst all care istaken in carrying out the review, information received from time totime does not reflect current position, accordingly an annualallocation is made to reflect the amendments recorded during thereporting period.
Objections to ValuationsA person who is dissatisfied with a valuation made by a licensedvaluer employed or engaged by Council may under section 169 ofvaluer employed or engaged by Council may under section 169 ofthe Local Government Act 1999 appeal against the valuationassessment. Likewise, a person who is dissatisfied with theattribution of land use category to their property for the purposes ofCouncil rates may also apply to the Council under section 156 of theAct to have that LUC reviewed. Council allocates funding in eachyear's budget on the assumption that some ratepayers may lodgeobjections to either it or to the Valuer-General of South Australia,and may be successful with their applications.
Objections to Valuations and Land Use Categories 16.24 15,000
Rate RebatesCouncil, pursuant to sections 160 to 165 of the Local GovernmentAct 1999, is required to rebate rates raised where land is used foreducational purposes, cemeteries, institutions used for religiouspurposes, and some other purposes. As a guide, the rebates areprovided for the following:-
Cemeteries Places of WorshipHospitalsEducational facilitiesUniversity Land
Council is also able to offer other ratepayers discretionary rebate ofrates raised in accordance with section 166 of the Act. As a guide,the rebates are provided for the following:-Community land and buildingsPublically Owned and Privately Owned HallsRecreation and Sports FacilitiesMuseums, Art Galleries, and Aged Care FacilitiesC it S i F iliti

ITEM 16 REFERENCE 2008/09RATING AND PROPERTY TO SUMMARY
Write offs
Provision is made for a project to be undertaken through section 184of the Local Government Act 1999 to initially investigate andultimately offer for sale various assessments that have had councilrates outstanding for three years or more.
Write Offs - Major 16.24 50,000
Responsible Officer: Deputy Chief Executive Officer

ITEM NO. 17
2007/08 Mar Review Inflows (Outflows) Account No. Ref No. 2008/09
Inflows Source of Funding - OperatingRating 1422 17.01 0
0 Statutory Charges 1422 17.02 070 User Charges 1422 17.03 0
Grants and Subsidies - Operating 1422 17.04 0Investment Income 1422 17.05 0Donations 1422 17.06 0
0 320 Reimbursements 1422 17.07 0Commercial Activities 1422 17.08 0
630 950 Other 1422 17.09 1,850Plant Hire Recouped 0Salaries and Wages Oncosts Recouped 0
78,020 78,020 FCA Oncosts Recouped 1422 17.10 120,08078,650 79,360 Total Operating Income 121,930
Inflows Source of Funding - Recoupments
0 21,040 Recoupments 1423 17.11 00 21,040 Total Recoupments 0
Inflows Source of Funding - Capital Grants and Subsidies - Capital 1427 17.12 0Donations and Contributions 1427 17.13 0Sale of Assets 1427 17.14 0Other Capital Revenue 1427 17.15 0Loans 1427 17.16 0
0 0 Total Capital Income 0
SERVICE PROVISION AREA RECORDS MANAGEMENT
78,650 100,400 TOTAL INFLOWS 121,930
(Outflows) Total Operating Cost of Service
66,900 87,660 Employee Costs 1420 17.17 97,110Salaries and Wages Oncosts 1420 17.18 0
7,440 21,640 Contractual Services 1420 17.19 18,6704,000 4,130 Materials 1420 17.20 3,500
710 710 Finance Charges 1420 17.21 5200 0 Depreciation 1420 17.22 0
Plant Hire 1420 17.23 05,220 2,660 Other 1420 17.24 2,130
26,610 26,610 FCA Oncosts 1420 17.25 45,600110,880 143,410 Total Operating Expenses 167,530
(Outflows) Appropriations
0 140 Appropriations 1421 17.26 00 140 Total Appropriations 0
(Outflows) Capital AcquisitionsInfrastructure 1425 17.27 0Structures 1425 17.28 0Buildings 1425 17.29 0Plant and Machinery 1425 17.30 0Furniture and Fittings 1425 17.31 0Office Equipment 1425 17.32 0
0 0 Total Capital Expenses 0
(Outflows) Loan Principal Repayments
1,550 1,550 Loan Principal Repayments 1425 17.33 1,7301,550 1,550 Total Loan Principal Repayments 1,730
112,430 145,100 TOTAL OUTFLOWS 169,260
0 0 Less: Non-Cash Items/Depreciation 1420 17.22 0
33,780 44,700 NET IMPACT ON RATING EFFORT 47,330

ITEM 17 REFERENCE 2008/09RECORDS MANAGEMENT TO SUMMARY
Records Management includes a variety of activities such as filing,registration of correspondence, storage of records, indexing andarchival practices. It is essential that these activities are conductedin a coordinated manner as a records management system in orderto provide services that contribute to the efficient use of resources.
Allocation of Employee CostsRecords Management Officer 100%Records Assistant 80%
Employee Costs 17.17 97,110
Sentencing and ArchivingProvision is made for the continuing Archiving and Sentencing ofcouncil records in accordance with State Records procedures andguidelines. It is proposed that the annual allocation be continued inorder to regularly review records to ensure that they kept inaccordance with State Records guidelines and that Councilcontinually maintains a program of removing records that can bestored off-site at the State Records storage centre in Adelaide, ordestroyed in accordance with the guidelines. This program is
OPERATING EXPENSES
destroyed in accordance with the guidelines. This program isundertaken in order that Council is able to maximise the physicalstorage available to it at the Kapunda Office fire proof records room.This work has been undertaken for Council in recent years by JanLawrence and Associates, and therefore it proposed that thepractice continues with the program.
Professional Services - Sentencing and Archiving, Destruction ofRecords etc 17.19 6,250
Electronic Records ManagementProvision is made for the purchase of EDMS software. (Note:purchase of a scanner for this project has been included in theInformation Technology budget - Item 26.)
Software Support and Licensing 2,400
Responsible Officer: Deputy Chief Executive Officer

ITEM NO. 18
2007/08 Mar Review Inflows (Outflows) Account No. Ref No. 2008/09
Inflows Source of Funding - OperatingRating 1432 18.01Statutory Charges 1432 18.02User Charges 1432 18.03Grants and Subsidies - Operating 1432 18.04Investment Income 1432 18.05Donations 1432 18.06Reimbursements 1432 18.07Commercial Activities 1432 18.08Other 1432 18.09Plant Hire RecoupedSalaries and Wages Oncosts RecoupedFCA Oncosts Recouped 1432 18.10
0 0 Total Operating Income 0
Inflows Source of Funding - RecoupmentsRecoupments 1433 18.11
0 0 Total Recoupments 0
Inflows Source of Funding - Capital Grants and Subsidies - Capital 1437 18.12Donations and Contributions 1437 18.13Sale of Assets 1437 18.14Other Capital Revenue 1437 18.15Loans 1437 18.16
0 0 Total Capital Income 0
SERVICE PROVISION AREA CULTURAL SERVICES
0 0 TOTAL INFLOWS 0
(Outflows) Total Operating Cost of ServiceEmployee Costs 1430 18.17 0Salaries and Wages Oncosts 1430 18.18 0
0 0 Contractual Services 1430 18.19 9,690Materials 1430 18.20 0Finance Charges 1430 18.21 0
0 0 Depreciation 1430 18.22 24,250Plant Hire 1430 18.23 0
24,210 24,210 Other 1430 18.24 19,5900 0 FCA Oncosts 1430 18.25 810
24,210 24,210 Total Operating Expenses 54,340
(Outflows) Appropriations
0 0 Appropriations 1431 18.26 00 0 Total Appropriations 0
(Outflows) Capital AcquisitionsInfrastructure 1435 18.27 0Structures 1435 18.28 0Buildings 1435 18.29 0Plant and Machinery 1435 18.30 0Furniture and Fittings 1435 18.31 0Office Equipment 1435 18.32 0
0 0 Total Capital Expenses 0
(Outflows) Loan Principal RepaymentsLoan Principal Repayments 1435 18.33 0
0 0 Total Loan Principal Repayments 0
24,210 24,210 TOTAL OUTFLOWS 54,340
0 0 Less: Non-Cash Items/Depreciation 1430 18.22 -24,250
24,210 24,210 NET IMPACT ON RATING EFFORT 30,090

ITEM 18 REFERENCE 2008/09CULTURAL SERVICES TO SUMMARY
According to the Australian Bureau of Statistics, the term 'Culture'includes activities such as Library Services, Cultural Venues (eg.Performing art venues, theatres, community halls and centres),monuments, statues, historic objects and sites, National Estate andTrust listed buildings and sites, museums, art galleries andinterpretive centres.
Cultural activities can also include cultural festivals, concerts, artists,orchestras, writers, broadcasting and film production, flora andfauna parks (ie. zoos and botanical gardens).
Many of the above mentioned activities are allocated elsewhere inCouncil's budget, for example a separate item for Libraries has beencreated. Items have also been created for the many public venueslocated in the major towns of Council's district.
Therefore, in essence this item is devoted to the allocation offunding for cultural programs in the region.
Surveying of Kapunda Museum BuildingProfessional Services 18 19 6 000
OPERATING EXPENSES
Professional Services 18.19 6,000
Painting ProgramCouncil has entered into a contract with Programmed MaintenanceServices Pty Ltd to provide a painting maintenance program for theKapunda Museum building.
Maintenance - Buildings 18.19 3,370
Depreciation - Buildings 18.22 23,120
Kidman Art Show
Council received correspondence from the Rotary Club of Kapundain regard to the provision of sponsorship toward the InauguralKidman Art Show held in October 2007. The club has sought a totalof $5,000 for future sponsorship which has been budgeted for byCouncil. Other private sponsors have also been obtained. In returnfor Council's sponsorship, Council will 'acquire' the winning entry.
Contributions 18.24 5,000
Contributions - Kapunda Art Gallery rental agreement 18.24 2,960
Contributions 18.24 600
Insurance - Buildings and Contents 18.24 10,840
Responsible Officer: Deputy Chief Executive Officer

ITEM NO. 19
2007/08 Mar Review Inflows (Outflows) Account No. Ref No. 2008/09
Inflows Source of Funding - OperatingRating 1442-1482,1502 19.01 0Statutory Charges 1442-1482,1502 19.02 0
0 950 User Charges 1442-1482,1502 19.03 00 Grants and Subsidies - Operating 1442-1482,1502 19.04 0
Investment Income 1442-1482,1502 19.05 0Donations 1442-1482,1502 19.06 0
800 Reimbursements 1442-1482,1502 19.07 0Commercial Activities 1442-1482,1502 19.08 0Other 1442-1482,1502 19.09 0Plant Hire Recouped 0Salaries and Wages Oncosts Recouped 0FCA Oncosts Recouped 1442-1482,1502 19.10 0
0 1,750 Total Operating Income 0
Inflows Source of Funding - Recoupments
6,350 Recoupments 1443-1483,1503 19.11 00 6,350 Total Recoupments 0
Inflows Source of Funding - Capital Grants and Subsidies - Capital 1447-1487,1507 19.12 0Donations and Contributions 1447-1487,1507 19.13 0Sale of Assets 1447-1487,1507 19.14 0Other Capital Revenue 1447-1487,1507 19.15 0
0 311,400 Loans 1447-1487,1507 19.16 00 311,400 Total Capital Income 0
SERVICE PROVISION AREA HALLS AND INSTITUTES
0 319,500 TOTAL INFLOWS 0
(Outflows) Total Operating Cost of Service
1,000 470 Employee Costs 1440-1480,1500 19.17 4801,900 900 Salaries and Wages Oncosts 1440-1480,1500 19.18 470
22,760 25,990 Contractual Services 1440-1480,1500 19.19 26,990780 3,160 Materials 1440-1480,1500 19.20 5,710
6,490 33,380 Finance Charges 1440-1480,1500 19.21 4,95046,280 46,280 Depreciation 1440-1480,1500 19.22 32,680
720 210 Plant Hire 1440-1480,1500 19.23 031,160 38,580 Other 1440-1480,1500 19.24 34,5303,240 3,240 FCA Oncosts 1440-1480,1500 19.25 1,860
114,330 152,210 Total Operating Expenses 107,670
(Outflows) Appropriations
14,000 44,000 Appropriations 1441-1481,1501 19.26 014,000 44,000 Total Appropriations 0
(Outflows) Capital AcquisitionsInfrastructure 1445-1485,1505 19.27 0Structures 1445-1485,1505 19.28 0
0 Buildings 1445-1485,1505 19.29 0Plant and Machinery 1445-1485,1505 19.30 0Furniture and Fittings 1445-1485,1505 19.31 0Office Equipment 1445-1485,1505 19.32 0
0 0 Total Capital Expenses 0
(Outflows) Loan Principal Repayments
11,320 342,050 Loan Principal Repayments 1445-1485,1505 19.33 12,83011,320 342,050 Total Loan Principal Repayments 12,830
139,650 538,260 TOTAL OUTFLOWS 120,500
-46,280 -46,280 Less: Non-Cash Items/Depreciation 1440-1480,1500 19.22 -32,680
93,370 172,480 NET IMPACT ON RATING EFFORT 87,820

ITEM 19 REFERENCE 2008/09HALLS AND INSTITUTES TO SUMMARY
Council is responsible under the management lease to maintain ingood repair the fabric of all its halls and institutes in good andtenantable condition, the examination and installation of the taggingof electrical appliances and fittings, the cost of providing contracthygiene services for amenities where situated within the hall,installation and inspections of fire extinguishers, annual inspectionof the hall to ascertain the presence of white ants and vermin, theinsurance of the building, payment of all taxes excluding water ratesand an annual management fee as negotiated with the respectiveCommittees.
Wages - Council Labour 19.17 480Wages Overheads (98% of Wages) 19.18 470
Surveying of Kapunda InstituteProvision is made for surveying of the buildingProfessional Services 19.19 6,000
Cleaning - Wasleys Institute Toilet 19.19 7,170
Maintenance Painting (Kapunda Institute) 19 19 2 590
OPERATING EXPENSES
Maintenance - Painting (Kapunda Institute) 19.19 2,590Maintenance - Painting (Freeling Institute) 19.19 3,010Maintenance - Painting (Greenock Institute) 19.19 1,780Maintenance - Painting (Wasleys Institute) 19.19 2,910
Utilities - Electricity, Water and Excess Water 19.20 3,160
Depreciation - Buildings 19.22 32,680
Contributions - Management Fees (Kapunda Institute) 19.24 8,550Contributions - Management Fees (Freeling Institute) 19.24 2,620Contributions - Management Fees (Greenock Institute) 19.24 2,620Contributions - Management Fees (Wasleys Institute) 19.24 5,140Contributions - Management Fees (7 Other Halls and Institutes) 19.24 2,610
Insurance - Buildings and Contents (Kapunda Institute) 19.24 5,140Insurance - Buildings and Contents (Freeling Institute) 19.24 2,710Insurance - Buildings and Contents (Greenock Institute) 19.24 510Insurance - Buildings and Contents (Wasleys Institute) 19.24 2,530Insurance - Buildings and Contents (7 Other Halls and Institutes) 19.24 1,810
Loan Principal Repayments (Kapunda Institute) 19.33 12,830
LOAN PRINCIPAL REPAYMENTS
Responsible Officer: Corporate Manager – Infrastructure and Works
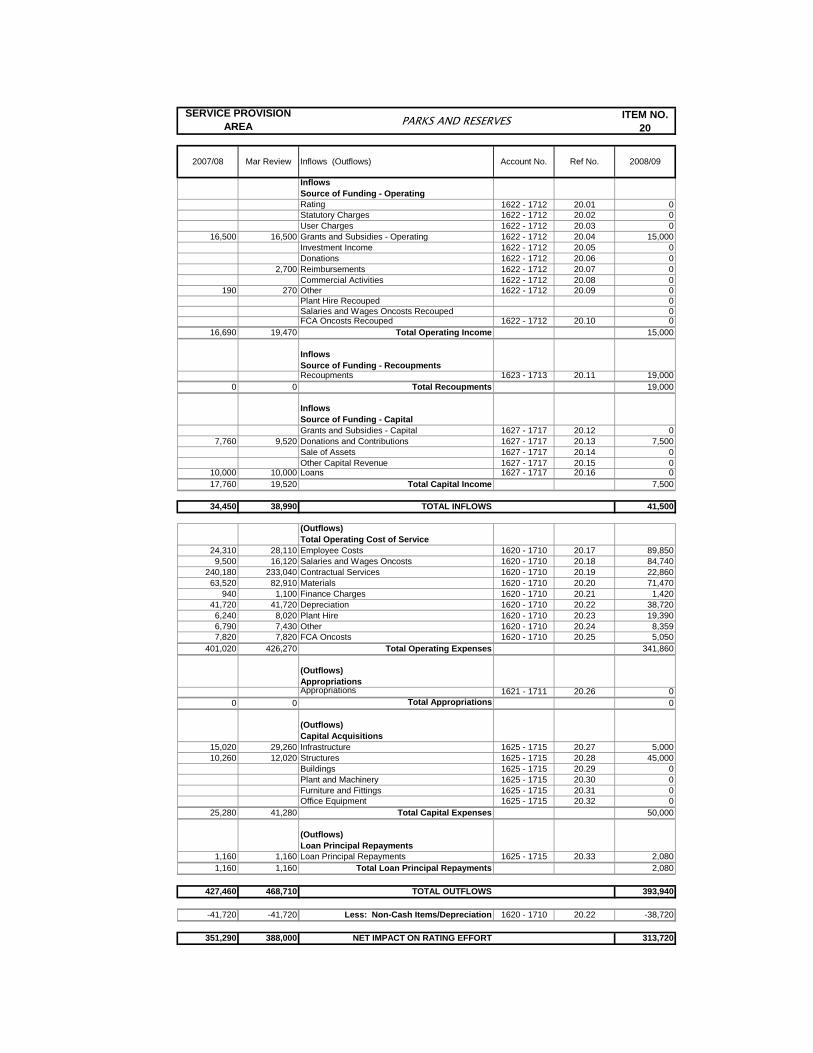
ITEM NO. 20
2007/08 Mar Review Inflows (Outflows) Account No. Ref No. 2008/09
Inflows Source of Funding - OperatingRating 1622 - 1712 20.01 0Statutory Charges 1622 - 1712 20.02 0User Charges 1622 - 1712 20.03 0
16,500 16,500 Grants and Subsidies - Operating 1622 - 1712 20.04 15,000Investment Income 1622 - 1712 20.05 0Donations 1622 - 1712 20.06 0
2,700 Reimbursements 1622 - 1712 20.07 0Commercial Activities 1622 - 1712 20.08 0
190 270 Other 1622 - 1712 20.09 0Plant Hire Recouped 0Salaries and Wages Oncosts Recouped 0FCA Oncosts Recouped 1622 - 1712 20.10 0
16,690 19,470 Total Operating Income 15,000
Inflows Source of Funding - RecoupmentsRecoupments 1623 - 1713 20.11 19,000
0 0 Total Recoupments 19,000
Inflows Source of Funding - Capital Grants and Subsidies - Capital 1627 - 1717 20.12 0
7,760 9,520 Donations and Contributions 1627 - 1717 20.13 7,500Sale of Assets 1627 - 1717 20.14 0Other Capital Revenue 1627 - 1717 20.15 0
10,000 10,000 Loans 1627 - 1717 20.16 017,760 19,520 Total Capital Income 7,500
SERVICE PROVISION AREA PARKS AND RESERVES
34,450 38,990 TOTAL INFLOWS 41,500
(Outflows) Total Operating Cost of Service
24,310 28,110 Employee Costs 1620 - 1710 20.17 89,8509,500 16,120 Salaries and Wages Oncosts 1620 - 1710 20.18 84,740
240,180 233,040 Contractual Services 1620 - 1710 20.19 22,86063,520 82,910 Materials 1620 - 1710 20.20 71,470
940 1,100 Finance Charges 1620 - 1710 20.21 1,42041,720 41,720 Depreciation 1620 - 1710 20.22 38,7206,240 8,020 Plant Hire 1620 - 1710 20.23 19,3906,790 7,430 Other 1620 - 1710 20.24 8,3597,820 7,820 FCA Oncosts 1620 - 1710 20.25 5,050
401,020 426,270 Total Operating Expenses 341,860
(Outflows) AppropriationsAppropriations 1621 - 1711 20.26 0
0 0 Total Appropriations 0
(Outflows) Capital Acquisitions
15,020 29,260 Infrastructure 1625 - 1715 20.27 5,00010,260 12,020 Structures 1625 - 1715 20.28 45,000
Buildings 1625 - 1715 20.29 0Plant and Machinery 1625 - 1715 20.30 0Furniture and Fittings 1625 - 1715 20.31 0Office Equipment 1625 - 1715 20.32 0
25,280 41,280 Total Capital Expenses 50,000
(Outflows) Loan Principal Repayments
1,160 1,160 Loan Principal Repayments 1625 - 1715 20.33 2,0801,160 1,160 Total Loan Principal Repayments 2,080
427,460 468,710 TOTAL OUTFLOWS 393,940
-41,720 -41,720 Less: Non-Cash Items/Depreciation 1620 - 1710 20.22 -38,720
351,290 388,000 NET IMPACT ON RATING EFFORT 313,720

ITEM 20 REFERENCE 2008/09PARKS AND RESERVES TO SUMMARY
Funding is provided in the budget to maintain the public reserves,parks and gardens in the Council area and to preserve and enhancethe unique landscape qualities of the lower north region. Some ofthese areas are Davidson reserve, Freeling Goods Shed reserve,Pines reserve, Hill Street playground, Greenock Village square andSamuel Dawkins reserve.
Modular Playground Equipment
The Lions Club of Kapunda District Inc. has requested Council'sconsideration to funding the purchase of modular playgroundequipment suitable for small children, to be located within the facility.To assist Council and its community in the further enhancement ofthis facility the Lions Club of Kapunda District Inc. has committed acontribution of $7,500.
Contributions 20.13 7,500
Wages Council Labour 20 17 89 850
CAPITAL INCOME
OPERATING EXPENSES
Wages - Council Labour 20.17 89,850Wages Overheads (98% of Wages) 20.18 84,740Plant Operating Costs 20.23 19,390
Hill Street Playground
The Kapunda Lions Club undertake maintenance and enhancementof the Hills Street Playground in Kapunda. Council provide anallocation for the Lions Club to undertake these works. A furtherallocation of $2,000 is also included to assist with the removal ofpine trees along the eastern side of the playground.
Contractors 20.19 6,500
Maintenance (Davidson Reserve) 20.19 3,110Maintenance (Freeling Goods Shed Reserve) 20.19 4,740
Maintenance - Infrastructure (Davidson Reserve Boardwalk) 20.19 5,000
Maintenance - Grounds (Dutton Park Memorial Gardens) 20.19 6,000Maintenance - Grounds (Dutton Park Memorial Gardens) 20.20 2,000
Hewett/ McKinlay Township
Maintenance - Grounds (Hewett/ McKinlay Township) 20.19 6,000
Utilities - Electricity, Water and Excess Water 20.20 14,660Utilities (Hewett/ McKinlay Township) 20.20 32,700
Depreciation - Structures 20.22 38,720

ITEM 20 REFERENCE 2008/09PARKS AND RESERVES TO SUMMARY
Beautification of Davidson Reserve
Provision is made for the continuation of the beautification project atDavidson Reserve in conjunction with the Rotary Club of Kapunda(Stage 3 of 3 stages). The stage 3 project encompasses the centralarea of the park with proposed works to include garden beds,footpaths and irrigation.
Capital Purchases - Infrastructure 20.27 5,000
Modular Playground Equipment
The Lions Club of Kapunda District Inc. has requested Council'sconsideration to funding the purchase of modular playgroundequipment suitable for small children, to be located within the facility.To assist Council and its community in the further enhancement ofthis facility the Lions Club of Kapunda District Inc. has committed acontribution of $7,500.
Capital Purchase 20.28 15,000
CAPITAL EXPENDITURE
Car Park - Crase Street, KapundaProvision is made for a car park to be constructed at Crase Street,Kapunda. 20.28 30,000
Responsible Officer: Corporate Manager – Infrastructure and Works

ITEM NO. 21
2007/08 Mar Review Inflows (Outflows) Account No. Ref No. 2008/09
Inflows Source of Funding - OperatingRating 1752 - 1792 21.01 0Statutory Charges 1752 - 1792 21.02 0User Charges 1752 - 1792 21.03 0Grants and Subsidies - Operating 1752 - 1792 21.04 0Investment Income 1752 - 1792 21.05 0Donations 1752 - 1792 21.06 0Reimbursements 1752 - 1792 21.07 0Commercial Activities 1752 - 1792 21.08 0Other 1752 - 1792 21.09 0Plant Hire Recouped 0Salaries and Wages Oncosts Recouped 0FCA Oncosts Recouped 1752 - 1792 21.10 0
0 0 Total Operating Income 0
Inflows Source of Funding - RecoupmentsRecoupments 1753 - 1793 21.11 0
0 0 Total Recoupments 0
Inflows Source of Funding - Capital Grants and Subsidies - Capital 1757 - 1797 21.12 0Donations and Contributions 1757 - 1797 21.13 0Sale of Assets 1757 - 1797 21.14 0Other Capital Revenue 1757 - 1797 21.15 0Loans 1757 - 1797 21.16 0
0 0 Total Capital Income 0
SERVICE PROVISION AREA PUBLIC CONVENIENCES
0 0 TOTAL INFLOWS 0
(Outflows) Total Operating Cost of Service
1,000 950 Employee Costs 1750 - 1790 21.17 3,8201,900 1,780 Salaries and Wages Oncosts 1750 - 1790 21.18 3,740
23,540 22,320 Contractual Services 1750 - 1790 21.19 32,1802,080 2,690 Materials 1750 - 1790 21.20 3,3002,190 2,170 Finance Charges 1750 - 1790 21.21 1,5102,450 1,730 Depreciation 1750 - 1790 21.22 4,2801,770 190 Plant Hire 1750 - 1790 21.23 01,010 810 Other 1750 - 1790 21.24 9701,920 1,920 FCA Oncosts 1750 - 1790 21.25 740
37,860 34,560 Total Operating Expenses 50,540
(Outflows) AppropriationsAppropriations 1751 - 1791 21.26 0
0 0 Total Appropriations 0
(Outflows) Capital AcquisitionsInfrastructure 1755 - 1795 21.27 0Structures 1755 - 1795 21.28 0Buildings 1755 - 1795 21.29 0Plant and Machinery 1755 - 1795 21.30 0Furniture and Fittings 1755 - 1795 21.31 0Office Equipment 1755 - 1795 21.32 0
0 0 Total Capital Expenses 0
(Outflows) Loan Principal Repayments
4,750 4,750 Loan Principal Repayments 1755 - 1795 21.33 5,4204,750 4,750 Total Loan Principal Repayments 5,420
42,610 39,310 TOTAL OUTFLOWS 55,960
-2,450 -1,730 Less: Non-Cash Items/Depreciation 1750 - 1790 21.22 -4,280
40,160 37,580 NET IMPACT ON RATING EFFORT 51,680

ITEM 21 REFERENCE 2008/09PUBLIC CONVENIENCES TO SUMMARY
Expenditure is allocated to maintain the public convenienceslocated in Council's area. Some of the major facilities include thosesituated on Hill street, Davidson reserve, Mattiske park andGreenock institute.
Wages - Council Labour 21.17 3,820Wages Overheads (98% of Wages) 21.18 3,740
Health/ Sanitary Services 21.19 880
Cleaning Contractors 21.19 19,900
Maintenance - Vandalism Repairs 21.19 8,000
Loan Principal Repayments 21.33 5,420
OPERATING EXPENSES
LOAN PRINCIPAL REPAYMENTS
Responsible Officer: Corporate Manager – Infrastructure and Works

ITEM NO. 22
2007/08 Mar Review Inflows (Outflows) Account No. Ref No. 2008/09
Inflows Source of Funding - OperatingRating 1902 - 1962 22.01 0Statutory Charges 1902 - 1962 22.02 0User Charges 1902 - 1962 22.03 0Grants and Subsidies - Operating 1902 - 1962 22.04 0Investment Income 1902 - 1962 22.05 0Donations 1902 - 1962 22.06 0
9,400 13,100 Reimbursements 1902 - 1962 22.07 6,670Commercial Activities 1902 - 1962 22.08 0Other 1902 - 1962 22.09 0Plant Hire Recouped 0Salaries and Wages Oncosts Recouped 0FCA Oncosts Recouped 1902 - 1962 22.10 0
9,400 13,100 Total Operating Income 6,670
Inflows Source of Funding - Recoupments
129,750 129,750 Recoupments 1903 - 1963 22.11 0129,750 129,750 Total Recoupments 0
Inflows Source of Funding - Capital
0 Grants and Subsidies - Capital 1907 - 1967 22.12 20,000Donations and Contributions 1907 - 1967 22.13 0Sale of Assets 1907 - 1967 22.14 0
11,840 11,840 Other Capital Revenue 1907 - 1967 22.15 7,3500 34,600 Loans 1907 - 1967 22.16 50,000
11,840 46,440 Total Capital Income 77,350
SERVICE PROVISION AREA SPORT AND RECREATION
150,990 189,290 TOTAL INFLOWS 84,020
(Outflows) Total Operating Cost of Service
0 15,460 Employee Costs 1900 - 1960 22.17 2,8500 28,470 Salaries and Wages Oncosts 1900 - 1960 22.18 2,790
53,830 48,700 Contractual Services 1900 - 1960 22.19 43,72913,000 16,480 Materials 1900 - 1960 22.20 16,42010,000 12,990 Finance Charges 1900 - 1960 22.21 9,090
175,540 175,540 Depreciation 1900 - 1960 22.22 154,7100 14,880 Plant Hire 1900 - 1960 22.23 0
75,700 78,940 Other 1900 - 1960 22.24 101,030280 280 FCA Oncosts 1900 - 1960 22.25 4,930
328,350 391,740 Total Operating Expenses 335,549
(Outflows) AppropriationsAppropriations 1901 - 1961 22.26 0
0 0 Total Appropriations 0
(Outflows) Capital Acquisitions
0 20,270 Infrastructure 1905 - 1965 22.27 70,0000 Structures 1905 - 1965 22.28 5,100
129,750 129,750 Buildings 1905 - 1965 22.29 0Plant and Machinery 1905 - 1965 22.30 0Furniture and Fittings 1905 - 1965 22.31 0Office Equipment 1905 - 1965 22.32 0
129,750 150,020 Total Capital Expenses 75,100
(Outflows) Loan Principal Repayments
12,590 49,340 Loan Principal Repayments 1905 - 1965 22.33 13,60012,590 49,340 Total Loan Principal Repayments 13,600
470,690 591,100 TOTAL OUTFLOWS 424,249
-175,540 -175,540 Less: Non-Cash Items/Depreciation 1900 - 1960 22.22 -154,710
144,160 226,270 NET IMPACT ON RATING EFFORT 185,519

ITEM 22 REFERENCE 2008/09SPORT AND RECREATION TO SUMMARY
Various sporting complexes located centrally within the varioustownships in the Council area are managed and operated bymanagement committees and incorporated bodies under lease fromCouncil. Dutton Park, Freeling Recreation Park, GreenockCentenary Park, Hewett Sporting Complex, Roseworthy RecreationPark, Wasleys Recreation Park and Kapunda Swimming Pool areamong the complexes budgeted for in this item.
The objectives of the incorporated body are to establish andmaintain a Public Recreation Ground and Sporting Facilities formembers and for the Inhabitants of the Town and District, itsenvirons and visitors.
The Committees finance the ongoing operations of the sportingcomplexes by receiving an annual management fee from Counciland by raising money by means of voluntary contributions,organised social functions, entrance fees or hire charges to, or for,the area or part thereof, generally for the purpose of carrying out theobjectives of the institution.
Council is responsible under the management lease to maintain ingood repair the fabric of all buildings in good and tenantablegood repair the fabric of all buildings in good and tenantablecondition, the examination and installation of the tagging of electricalappliances and fittings, the cost of providing contract hygieneservices for amenities situated within the park grounds, installationand inspections of fire extinguishers, annual inspection of buildingsto ascertain the presence of white ants and vermin, the insurance ofthe buildings, payment of all taxes excluding water rates, and anannual management fee as negotiated with the respectivemanagement committees.
Reimbursements (Dutton Park) 22.07 6,300
Reimbursements (Dutton Park) 22.15 6,330
Property MaintenanceProgrammed Maintenance Services are currently contracted toCouncil for a term of seven (7) years, which is currently underreview. The contract is to provide exterior painting services toensure the surfaces of all buildings and structures within Council'sdesignated parks are maintained in good repair and condition,including an annual cleaning of all gutters on building structures. Allworks associated with the maintenance of the fabric of the building,outside of the scope of works of the Programmed MaintenanceServices contract, are to be undertaken by a suitably qualifiedcontractor within the budget allocations of the repairs and
i t ti it t i d i thi i i i
OPERATING INCOME
CAPITAL INCOME
OPERATING EXPENSES

ITEM 22 REFERENCE 2008/09SPORT AND RECREATION TO SUMMARY
Maintenance - Buildings (Dutton Park, Kapunda) 22.19 15,050Maintenance - Buildings (Freeling Recreation Park) 22.19 5,630Maintenance - Buildings (Greenock Recreation Park) 22.19 4,260Maintenance - Buildings (Wasleys Recreation Park) 22.19 1,800Maintenance - Buildings (Kapunda Swimming Pool) 22.19 1,390Maintenance - Contractors (Roseworthy Recreation Park)
Maintenance - Vandalism (Dutton Park, Kapunda) 22.25 2,000Maintenance - Vandalism (Freeling Recreation Park) 22.25 2,000Maintenance - Vandalism (Greenock Recreation Park) 22.25 2,000
Cleaning - Toilet Block (Greenock Recreation Park) 22.19 3,040
Kapunda Swimming PoolUnder the terms of the Management Agreement with the PoolCommittee, Council's obligation is to provide funding for the poolchemicals utilised during the summer swimming season.
Materials 22.20 7,070
Depreciation - Structures 22.22 86,620Depreciation - Buildings 22.22 68,090
Contributions - Management Fees (Dutton Park, Kapunda) 22.24 26,700Contributions - Management Fees (Freeling Recreation Park) 22.24 21,570Contributions - Management Fees (Greenock Recreation Park) 22.24 13,060Contributions - Management Fees (Wasleys Recreation Park) 22.24 7,500Contributions - Management Fees (Kapunda Swimming Pool) 22.24 10,280
Insurance - Buildings and Contents (Dutton Park, Kapunda) 22.24 3,370Insurance - Buildings and Contents (Freeling Recreation Park) 22.24 4,170Insurance - Buildings and Contents (Greenock Recreation Park) 22.24 1,880Insurance - Buildings and Contents (Wasleys Recreation Park) 22.24 990Insurance - Buildings and Contents (Kapunda Swimming Pool) 22.24 3,710Insurance - Other (Kapunda Swimming Pool) 22.24 4,830
Loan Principal Repayments (Dutton Park - Tennis Courts) 22.33 1,170Loan Principal Repayments (Dutton Park - Kapunda Golf Club) 22.33 10,490Loan Principal Repayments (Wasleys Netball & Tennis Courts) 22.33 1,090Loan Principal Repayments (Kapunda Swimming Pool) 22.33 850
Kapunda Trotting Track Infield RedevelopmentProvision is made for the Kapunda Trotting Track Infieldredevelopment. Part grant funding will be received from theDepartment of Recreation and Sport ($20,000)Capital - Infrastructure - Contractors 20.27 70,000
Boundary Fence between Golf Club & Dutton ParkCapital - Structures - Contractors 20.28 5,100
LOAN PRINCIPAL REPAYMENTS
CAPITAL EXPENDITURE

ITEM NO. 23
2007/08 Mar Review Inflows (Outflows) Account No. Ref No. 2008/09
Inflows Source of Funding - OperatingRating 1972/1982 23.01 0Statutory Charges 1972/1982 23.02 0User Charges 1972/1982 23.03 0Grants and Subsidies - Operating 1972/1982 23.04 0Investment Income 1972/1982 23.05 0Donations 1972/1982 23.06 0Reimbursements 1972/1982 23.07 0Commercial Activities 1972/1982 23.08 0Other 1972/1982 23.09 0Plant Hire Recouped 0Salaries and Wages Oncosts Recouped 0FCA Oncosts Recouped 1972/1982 23.10 0
0 0 Total Operating Income 0
Inflows Source of Funding - RecoupmentsRecoupments 1973/1983 23.11 0
0 0 Total Recoupments 0
Inflows Source of Funding - Capital Grants and Subsidies - Capital 1977/1987 23.12 0Donations and Contributions 1977/1987 23.13 0Sale of Assets 1977/1987 23.14 0Other Capital Revenue 1977/1987 23.15 0Loans 1977/1987 23.16 0
0 0 Total Capital Income 0
SERVICE PROVISION AREA STREET FURNITURE
0 0 TOTAL INFLOWS 0
(Outflows) Total Operating Cost of Service
0 70 Employee Costs 1970/1980 23.17 00 130 Salaries and Wages Oncosts 1970/1980 23.18 00 110 Contractual Services 1970/1980 23.19 0
500 0 Materials 1970/1980 23.20 0Finance Charges 1970/1980 23.21 0Depreciation 1970/1980 23.22 0
0 110 Plant Hire 1970/1980 23.23 0Other 1970/1980 23.24 0
0 FCA Oncosts 1970/1980 23.25 0500 420 Total Operating Expenses 0
(Outflows) AppropriationsAppropriations 1971/1981 23.26 0
0 0 Total Appropriations 0
(Outflows) Capital AcquisitionsInfrastructure 1975/1985 23.27 0Structures 1975/1985 23.28 0Buildings 1975/1985 23.29 0Plant and Machinery 1975/1985 23.30 0Furniture and Fittings 1975/1985 23.31 0Office Equipment 1975/1985 23.32 0
0 0 Total Capital Expenses 0
(Outflows) Loan Principal RepaymentsLoan Principal Repayments 1975/1985 23.33 0
0 0 Total Loan Principal Repayments 0
500 420 TOTAL OUTFLOWS 0
0 0 Less: Non-Cash Items/Depreciation 1970/1980 23.22 0
500 420 NET IMPACT ON RATING EFFORT 0

ITEM 23 REFERENCE 2008/09STREET FURNITURE TO SUMMARY
No longer in use

ITEM NO. 24
2007/08 Mar Review Inflows (Outflows) Account No. Ref No. 2008/09
Inflows Source of Funding - OperatingRating 1902 24.01 0Statutory Charges 1902 24.02 0User Charges 1902 24.03 0Grants and Subsidies - Operating 1902 24.04 0Investment Income 1902 24.05 0
7,000 Donations 1902 24.06 0Reimbursements 1902 24.07 0Commercial Activities 1902 24.08 0
0 Other 1902 24.09 0Plant Hire Recouped 0Salaries and Wages Oncosts Recouped 0FCA Oncosts Recouped 1902 24.10 0
0 7,000 Total Operating Income 0
Inflows Source of Funding - RecoupmentsRecoupments 1903 24.11 0
0 0 Total Recoupments 0
Inflows Source of Funding - Capital Grants and Subsidies - Capital 1907 24.12 0Donations and Contributions 1907 24.13 0Sale of Assets 1907 24.14 0Other Capital Revenue 1907 24.15 0
0 Loans 1907 24.16 00 0 Total Capital Income 0
SERVICE PROVISION AREA STREET LIGHTING
0 7,000 TOTAL INFLOWS 0
(Outflows) Total Operating Cost of Service
0 Employee Costs 1900 24.17 00 Salaries and Wages Oncosts 1900 24.18 00 8,420 Contractual Services 1900 24.19 0
120,000 103,240 Materials 1900 24.20 100,00019,070 19,070 Finance Charges 1900 24.21 15,200
Depreciation 1900 24.22 00 Plant Hire 1900 24.23 00 27,030 Other 1900 24.24 0
160 160 FCA Oncosts 1900 24.25 1,730139,230 157,920 Total Operating Expenses 116,930
(Outflows) AppropriationsAppropriations 1901 24.26 0
0 0 Total Appropriations 0
(Outflows) Capital AcquisitionsInfrastructure 1905 24.27 0Structures 1905 24.28 0Buildings 1905 24.29 0Plant and Machinery 1905 24.30 0Furniture and Fittings 1905 24.31 0Office Equipment 1905 24.32 0
0 0 Total Capital Expenses 0
(Outflows) Loan Principal Repayments
30,280 30,280 Loan Principal Repayments 1905 24.33 34,16030,280 30,280 Total Loan Principal Repayments 34,160
169,510 188,200 TOTAL OUTFLOWS 151,090
0 0 Less: Non-Cash Items/Depreciation 1900 24.22 0
169,510 181,200 NET IMPACT ON RATING EFFORT 151,090

ITEM 24 REFERENCE 2008/09STREET LIGHTING TO SUMMARY
Council's long term objective is to optimise the standard of publicstreet lighting provided to the community by planning, reviewing andmonitoring assets efficiently and cost effectively. Council requestsprovision of street lighting throughout the district from ETSA Utilitieswhere installation upon approval occurs and subsequent tariff ischarged to community.
The provision of street lighting within the townships is considered onexisting ETSA infrastructure to ensure that appropriate security andenhancement occurs.
Utilities - Electricity 24.20 100,000
Interest on Loans 24.21 15,200
Loan Principal Repayments (Undergrounding of Power) 24.33 34,160
OPERATING EXPENSES
LOAN PRINCIPAL REPAYMENTS
Responsible Officer: Corporate Manager – Infrastructure and Works

ITEM NO. 25
2007/08 Mar Review Inflows (Outflows) Account No. Ref No. 2008/09
Inflows Source of Funding - OperatingRating 2002 25.01 0Statutory Charges 2002 25.02 0User Charges 2002 25.03 0Grants and Subsidies - Operating 2002 25.04 0Investment Income 2002 25.05 0Donations 2002 25.06 0Reimbursements 2002 25.07 0Commercial Activities 2002 25.08 0Other 2002 25.09 0Plant Hire Recouped 0Salaries and Wages Oncosts Recouped 0FCA Oncosts Recouped 2002 25.10 0
0 0 Total Operating Income 0
Inflows Source of Funding - Recoupments
570,000 570,000 Recoupments 2003 25.11 0570,000 570,000 Total Recoupments 0
Inflows Source of Funding - Capital
200,000 200,000 Grants and Subsidies - Capital 2007 25.12 0350,000 282,730 Donations and Contributions 2007 25.13 0
Sale of Assets 2007 25.14 0Other Capital Revenue 2007 25.15 0
0 Loans 2007 25.16 0550,000 482,730 Total Capital Income 0
SERVICE PROVISION AREA STREETSCAPING
1,120,000 1,052,730 TOTAL INFLOWS 0
(Outflows) Total Operating Cost of ServiceSalaries and Wages 2000 25.17 0Salaries and Wages Oncosts 2000 25.18 0
0 Contractual Services 2000 25.19 00 Materials 2000 25.20 0
4,230 4,230 Finance Charges 2000 25.21 3,5500 Depreciation 2000 25.22 0
Plant Hire 2000 25.23 0Other 2000 25.24 0
960 960 FCA Oncosts 2000 25.25 505,190 5,190 Total Operating Expenses 3,600
(Outflows) Appropriations
102,000 Appropriations 2001 25.26 00 102,000 Total Appropriations 0
(Outflows) Capital Acquisitions
1,120,000 1,026,660 Infrastructure 2005 25.27 0Structures 2005 25.28 0Buildings 2005 25.29 0Plant and Machinery 2005 25.30 0Furniture and Fittings 2005 25.31 0Office Equipment 2005 25.32 0
1,120,000 1,026,660 Total Capital Expenses 0
(Outflows) Loan Principal Repayments
5,250 5,250 Loan Principal Repayments 2005 25.33 5,9305,250 5,250 Total Loan Principal Repayments 5,930
1,130,440 1,139,100 TOTAL OUTFLOWS 9,530
0 0 Less: Non-Cash Items/Depreciation 2000 25.22 0
10,440 86,370 NET IMPACT ON RATING EFFORT 9,530

ITEM 25 REFERENCE 2008/09STREETSCAPING TO SUMMARY
Council provides funding to generally improve the appearance ofstreetscapes within its townships through targeted developmentprograms.
Interest on Loans 25.21 3,550
Loan Principal Repayments (Freeling Main Street Upgrade) 25.33 5,930
OPERATING EXPENSES
LOAN PRINCIPAL REPAYMENTS
Responsible Officer: Corporate Manager – Infrastructure and Works

ITEM NO. 26
2007/08 Mar Review Inflows (Outflows) Account No. Ref No. 2008/09
Inflows Source of Funding - OperatingRating 2102 - 2132 26.01 0Statutory Charges 2102 - 2132 26.02 0
24,000 23,520 User Charges 2102 - 2132 26.03 14,5001,190 Grants and Subsidies - Operating 2102 - 2132 26.04 0
Investment Income 2102 - 2132 26.05 0Donations 2102 - 2132 26.06 0Reimbursements 2102 - 2132 26.07 0Commercial Activities 2102 - 2132 26.08 0Other 2102 - 2132 26.09 0Plant Hire Recouped 0Salaries and Wages Oncosts Recouped 0FCA Oncosts Recouped 2102 - 2132 26.10 0
24,000 24,710 Total Operating Income 14,500
Inflows Source of Funding - RecoupmentsRecoupments 2103 - 2133 26.11 0
0 0 Total Recoupments 0
Inflows Source of Funding - Capital Grants and Subsidies - Capital 2107 - 2137 26.12 0Donations and Contributions 2107 - 2137 26.13 0Sale of Assets 2107 - 2137 26.14 0Other Capital Revenue 2107 - 2137 26.15 0
15,000 15,000 Loans 2107 - 2137 26.16 015,000 15,000 Total Capital Income 0
SERVICE PROVISION AREA CEMETERIES
39,000 39,710 TOTAL INFLOWS 14,500
(Outflows) Total Operating Cost of Service
6,000 7,200 Employee Costs 2100 - 2130 26.17 10,85011,400 12,930 Salaries and Wages Oncosts 2100 - 2130 26.18 10,64914,400 12,070 Contractual Services 2100 - 2130 26.19 8,8403,410 3,690 Materials 2100 - 2130 26.20 5,0101,080 1,150 Finance Charges 2100 - 2130 26.21 1,7604,790 4,790 Depreciation 2100 - 2130 26.22 4,6103,790 5,080 Plant Hire 2100 - 2130 26.23 11,570
700 700 Other 2100 - 2130 26.24 75013,890 13,890 FCA Oncosts 2100 - 2130 26.25 6,70059,460 61,500 Total Operating Expenses 60,740
(Outflows) AppropriationsAppropriations 2101 - 2131 26.26 0
0 0 Total Appropriations 0
(Outflows) Capital AcquisitionsInfrastructure 2105 - 2135 26.27 0
15,000 16,680 Structures 2105 - 2135 26.28 6,000Buildings 2105 - 2135 26.29 0Plant and Machinery 2105 - 2135 26.30 0Furniture and Fittings 2105 - 2135 26.31 0Office Equipment 2105 - 2135 26.32 0
15,000 16,680 Total Capital Expenses 6,000
(Outflows) Loan Principal Repayments
2,360 2,360 Loan Principal Repayments 2105 - 2135 26.33 3,8002,360 2,360 Total Loan Principal Repayments 3,800
76,820 80,540 TOTAL OUTFLOWS 70,540
-4,790 -4,790 Less: Non-Cash Items/Depreciation 2100 - 2130 26.22 -4,610
33,030 36,040 NET IMPACT ON RATING EFFORT 51,430

ITEM 26 REFERENCE 2008/09CEMETERIES TO SUMMARY
Council owns and operates various cemeteries that are recognisedas requiring regular maintenance and up keep.
The budget allocation provides for repairs to rubble walkways,vegetation control, maintenance to cemetery fencing and theupkeep of the general amenity of the site.
User Charges - Burial, Lease and Internment 26.03 14,500
Wages - Council Labour 26.17 10,850Wages Overheads (98% of Wages) 26.18 10,649Plant Operating Costs 26.23 11,570
Contractors - Grave Digging 26.19 8,840
New Beam - Freeling CemeteryProvision is made for a new beam.Capital Purchase 26 28 6 000
OPERATING INCOME
OPERATING EXPENSES
CAPITAL EXPENDITURE
Capital Purchase 26.28 6,000
Loan Principal Repayments (Capital Works 2002/2003) 26.33 3,800
LOAN PRINCIPAL REPAYMENTS
Responsible Officer: Corporate Manager – Infrastructure and Works

ITEM NO. 27
2007/08 Mar Review Inflows (Outflows) Account No. Ref No. 2008/09
Inflows Source of Funding - OperatingRating 1902 56.01 0Statutory Charges 1902 56.02 0User Charges 1902 56.03 0Grants and Subsidies - Operating 1902 56.04 0Investment Income 1902 56.05 0Donations 1902 56.06 0
2,890 8,620 Reimbursements 1902 56.07 3,450Commercial Activities 1902 56.08 0Other 1902 56.09 0Plant Hire Recouped 0Salaries and Wages Oncosts Recouped 0FCA Oncosts Recouped 1902 56.10 0
2,890 8,620 Total Operating Income 3,450
Inflows Source of Funding - RecoupmentsRecoupments 1903 56.11 0
0 0 Total Recoupments 0
Inflows Source of Funding - Capital Grants and Subsidies - Capital 1907 56.12 0Donations and Contributions 1907 56.13 0Sale of Assets 1907 56.14 0Other Capital Revenue 1907 56.15 0Loans 1907 56.16 0
0 0 Total Capital Income 0
SERVICE PROVISION AREA AERODROMES
2,890 8,620 TOTAL INFLOWS 3,450
(Outflows) Total Operating Cost of Service
0 Employee Costs 1900 56.17 0Salaries and Wages Oncosts 1900 56.18 0
5,000 Contractual Services 1900 56.19 0Materials 1900 56.20 0Finance Charges 1900 56.21 0
32,850 32,850 Depreciation 1900 56.22 28,830Plant Hire 1900 56.23 0
3,020 3,410 Other 1900 56.24 3,7701,880 1,880 FCA Oncosts 1900 56.25 490
42,750 38,140 Total Operating Expenses 33,090
(Outflows) AppropriationsAppropriations 1901 56.26 0
0 0 Total Appropriations 0
(Outflows) Capital AcquisitionsInfrastructure 1905 56.27 0Structures 1905 56.28 0Buildings 1905 56.29 0Plant and Machinery 1905 56.30 0Furniture and Fittings 1905 56.31 0Office Equipment 1905 56.32 0
0 0 Total Capital Expenses 0
(Outflows) Loan Principal RepaymentsLoan Principal Repayments 1905 56.33 0
0 0 Total Loan Principal Repayments 0
42,750 38,140 TOTAL OUTFLOWS 33,090
-32,850 -32,850 Less: Non-Cash Items/Depreciation 1900 56.22 -28,830
7,010 -3,330 NET IMPACT ON RATING EFFORT 810
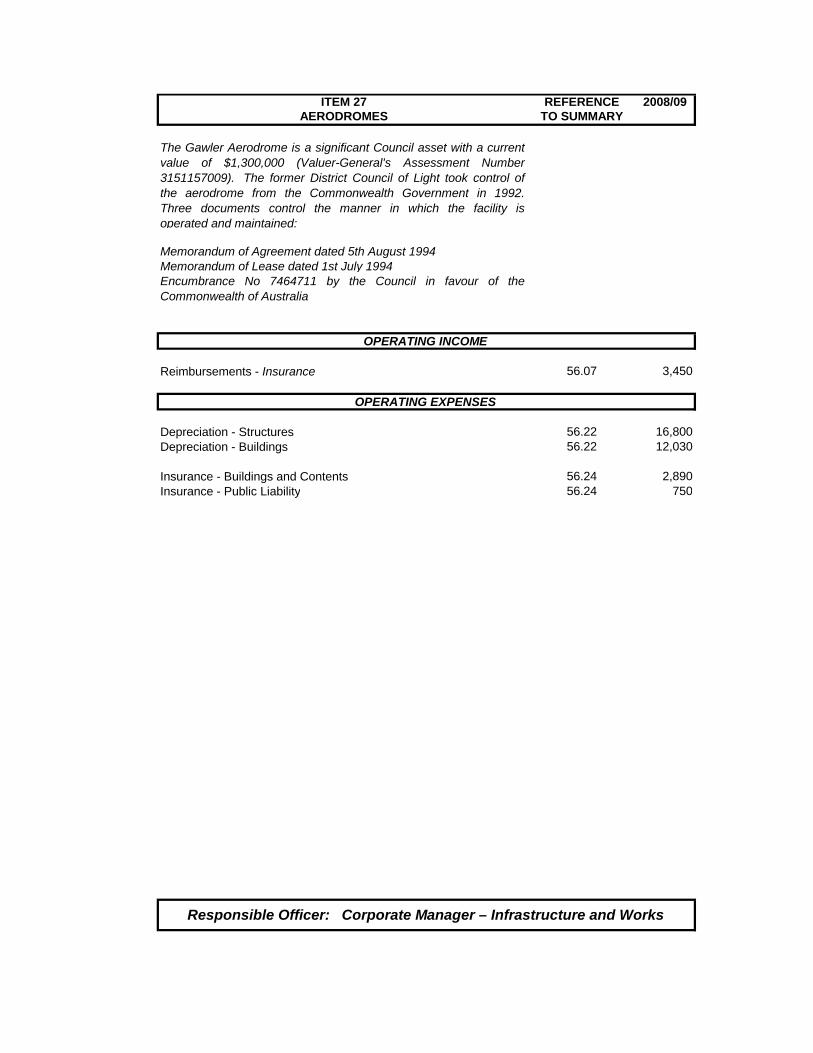
ITEM 27 REFERENCE 2008/09AERODROMES TO SUMMARY
The Gawler Aerodrome is a significant Council asset with a currentvalue of $1,300,000 (Valuer-General's Assessment Number3151157009). The former District Council of Light took control ofthe aerodrome from the Commonwealth Government in 1992.Three documents control the manner in which the facility isoperated and maintained:
Memorandum of Agreement dated 5th August 1994Memorandum of Lease dated 1st July 1994Encumbrance No 7464711 by the Council in favour of theCommonwealth of Australia
Reimbursements - Insurance 56.07 3,450
Depreciation - Structures 56.22 16,800Depreciation - Buildings 56.22 12,030
Insurance - Buildings and Contents 56.24 2,890Insurance - Public Liability 56 24 750
OPERATING INCOME
OPERATING EXPENSES
Insurance - Public Liability 56.24 750
Responsible Officer: Corporate Manager – Infrastructure and Works
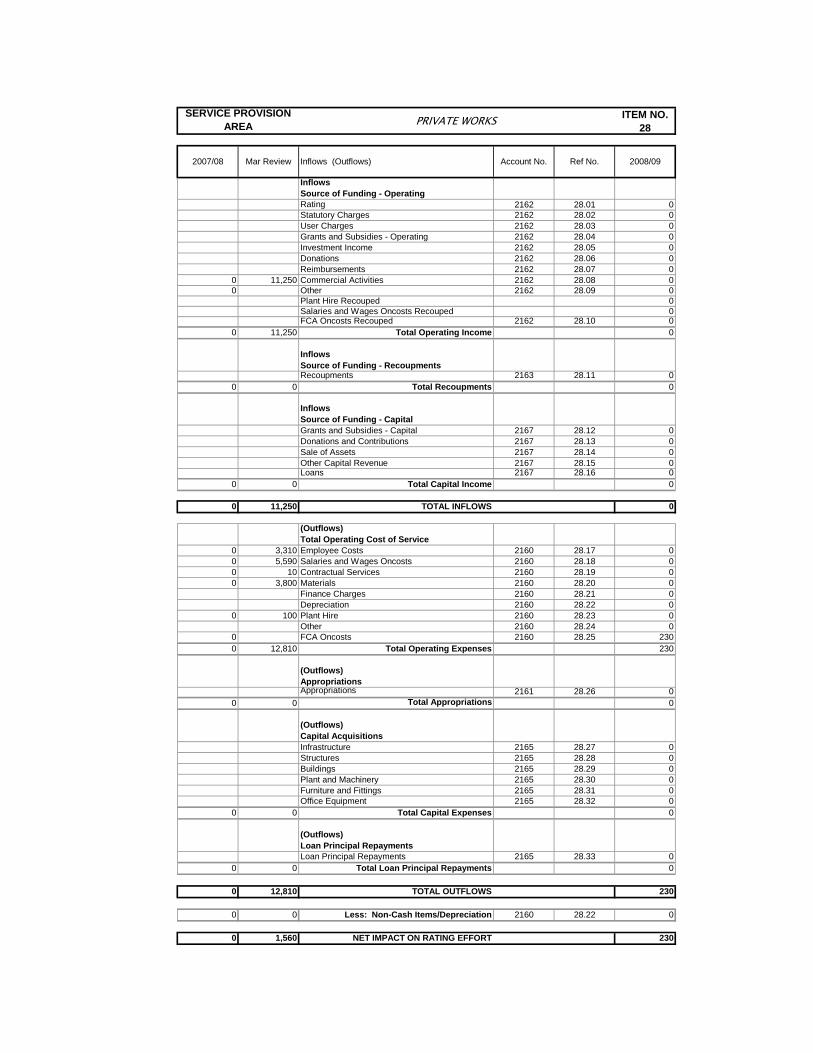
ITEM NO. 28
2007/08 Mar Review Inflows (Outflows) Account No. Ref No. 2008/09
Inflows Source of Funding - OperatingRating 2162 28.01 0Statutory Charges 2162 28.02 0User Charges 2162 28.03 0Grants and Subsidies - Operating 2162 28.04 0Investment Income 2162 28.05 0Donations 2162 28.06 0Reimbursements 2162 28.07 0
0 11,250 Commercial Activities 2162 28.08 00 Other 2162 28.09 0
Plant Hire Recouped 0Salaries and Wages Oncosts Recouped 0FCA Oncosts Recouped 2162 28.10 0
0 11,250 Total Operating Income 0
Inflows Source of Funding - RecoupmentsRecoupments 2163 28.11 0
0 0 Total Recoupments 0
Inflows Source of Funding - Capital Grants and Subsidies - Capital 2167 28.12 0Donations and Contributions 2167 28.13 0Sale of Assets 2167 28.14 0Other Capital Revenue 2167 28.15 0Loans 2167 28.16 0
0 0 Total Capital Income 0
SERVICE PROVISION AREA PRIVATE WORKS
0 11,250 TOTAL INFLOWS 0
(Outflows) Total Operating Cost of Service
0 3,310 Employee Costs 2160 28.17 00 5,590 Salaries and Wages Oncosts 2160 28.18 00 10 Contractual Services 2160 28.19 00 3,800 Materials 2160 28.20 0
Finance Charges 2160 28.21 0Depreciation 2160 28.22 0
0 100 Plant Hire 2160 28.23 0Other 2160 28.24 0
0 FCA Oncosts 2160 28.25 2300 12,810 Total Operating Expenses 230
(Outflows) AppropriationsAppropriations 2161 28.26 0
0 0 Total Appropriations 0
(Outflows) Capital AcquisitionsInfrastructure 2165 28.27 0Structures 2165 28.28 0Buildings 2165 28.29 0Plant and Machinery 2165 28.30 0Furniture and Fittings 2165 28.31 0Office Equipment 2165 28.32 0
0 0 Total Capital Expenses 0
(Outflows) Loan Principal RepaymentsLoan Principal Repayments 2165 28.33 0
0 0 Total Loan Principal Repayments 0
0 12,810 TOTAL OUTFLOWS 230
0 0 Less: Non-Cash Items/Depreciation 2160 28.22 0
0 1,560 NET IMPACT ON RATING EFFORT 230

ITEM 28 REFERENCE 2008/09PRIVATE WORKS TO SUMMARY
Council does not actively seek to undertake private works, however,on request, will provide this service at full cost recovery to Council.Examples of these undertakings may be pipe driveway crossinginstallations, minor bitumen sealing works and maintenancegrading.
The Gawler/Tarlee Road and Kingsford Industrial Estate projectshave been carried forward from the 2007/2008 budget and thereforedo not appear in this budget item.
Responsible Officer: Corporate Manager – Infrastructure and Works

ITEM NO. 29
2007/08 Mar Review Inflows (Outflows) Account No. Ref No. 2008/09
Inflows Source of Funding - OperatingRating 2172 29.01 0Statutory Charges 2172 29.02 0User Charges 2172 29.03 0Grants and Subsidies - Operating 2172 29.04 0Investment Income 2172 29.05 0Donations 2172 29.06 0Reimbursements 2172 29.07 0Commercial Activities 2172 29.08 0
0 4,900 Other 2172 29.09 10,800962,110 962,110 Plant Hire Recouped 2172 29.10 768,670
Salaries and Wages Oncosts Recouped 0FCA Oncosts Recouped 0
962,110 967,010 Total Operating Income 779,470
Inflows Source of Funding - Recoupments
0 114,640 Recoupments 2173 29.11 00 114,640 Total Recoupments 0
Inflows Source of Funding - Capital Grants and Subsidies - Capital 2177 29.12 0Donations and Contributions 2177 29.13 0
211,000 211,000 Sale of Assets 2177 29.14 15,000Other Capital Revenue 2177 29.15 0Loans 2177 29.16 181,000
211,000 211,000 Total Capital Income 196,000
SERVICE PROVISION AREA PLANT OPERATIONS
1,173,110 1,292,650 TOTAL INFLOWS 975,470
(Outflows) Total Operating Cost of Service
43,560 10,650 Employee Costs 2170 29.17 082,770 17,670 Salaries and Wages Oncosts 2170 29.18 093,470 97,110 Contractual Services 2170 29.19 160,000
514,500 528,060 Materials 2170 29.20 263,70041,680 41,680 Finance Charges 2170 29.21 35,620
229,900 229,900 Depreciation 2170 29.22 137,8800 2,160 Plant Hire 2170 29.23 0
59,510 60,880 Other 2170 29.24 56,870920 920 FCA Oncosts 2170 29.25 9,790
1,066,310 989,030 Total Operating Expenses 663,860
(Outflows) Appropriations
4,640 Appropriations 2171 29.26 00 4,640 Total Appropriations 0
(Outflows) Capital AcquisitionsInfrastructure 2175 29.27 0Structures 2175 29.28 0Buildings 2175 29.29 0
98,600 361,600 Plant and Machinery 2175 29.30 196,000Furniture and Fittings 2175 29.31 0
0 Office Equipment 2175 29.32 098,600 361,600 Total Capital Expenses 196,000
(Outflows) Loan Principal Repayments
68,030 68,030 Loan Principal Repayments 2175 29.33 77,08068,030 68,030 Total Loan Principal Repayments 77,080
1,232,940 1,423,300 TOTAL OUTFLOWS 936,940
-229,900 -229,900 Less: Non-Cash Items/Depreciation 2170 29.22 -137,880
-170,070 -99,250 NET IMPACT ON RATING EFFORT -176,410

ITEM 29 REFERENCE 2008/09PLANT OPERATIONS TO SUMMARY
Council is required to operate Plant and Machinery in order to carryout the day to day function of maintaining its current infrastructureand constructing new infrastructure assets.
Diesel Fuel RebateThe ATO allows a rebate on certain plant items diesel usage.Diesel Fuel Rebate 29.09 10,800
Plant Hire Recovery 29.10 768,670
Plant and MachineryEstimated trade-in of 1 Utility vehicle @ $15,000.
Sale of Assets - Motor Vehicles 29.14 15,000
Plant Operating Costs - Repairs and Maintenance 29.19 160,000Plant Operating Costs F el (Diesel) 29 20 7 500
OPERATING INCOME
CAPITAL INCOME
OPERATING EXPENSES
Plant Operating Costs - Fuel (Diesel) 29.20 7,500Plant Operating Costs - Fuel (Petrol) 29.20 76,000Plant Operating Costs - Oils/Greases/Lubricants 29.20 200Plant Operating Costs - Tyres 29.20 40,000Plant Operating Costs - Plant and Machinery Parts 29.20 20,000Materials issued from Stores (Diesel) 29.20 120,000.Interest on Loans 29.21 35,620
Depreciation - Plant and Equipment 29.22 137,880
Insurance - Major and Minor Plant 29.24 20,870Motor Vehicle Registration Fees 29.24 35,000
Purchase of RollerProvision is made to purchase a 11-12 tonne vibrating roller in orderto gain suitable standards of 98% compaction for its roadconstruction program.Capital Purchases - Major Plant 29.30 140,000
Purchase of 3T TruckProvision is made to purchase a 3T Truck to replace the works
utility type vehicle (Holden Rodeo 4x4 Crew Cab Diesel) @ $56,000. Capital Purchases 29.30 56,000
Loan Principal Repayments (Plant Purchases) 29.33 77,080
LOAN PRINCIPAL REPAYMENTS
CAPITAL EXPENDITURE

ITEM NO. 30
2007/08 Mar Review Inflows (Outflows) Account No. Ref No. 2008/09
Inflows Source of Funding - OperatingRating 2182 30.01 0Statutory Charges 2182 30.02 0User Charges 2182 30.03 0Grants and Subsidies - Operating 2182 30.04 0Investment Income 2182 30.05 0Donations 2182 30.06 0
0 1,670 Reimbursements 2182 30.07 0Commercial Activities 2182 30.08 0
6,590 21,470 Other 2182 30.09 22,590Plant Hire Recouped 0Salaries and Wages Oncosts Recouped 682,120
877,300 877,300 FCA Oncosts Recouped 2182 30.10 369,870883,890 900,440 Total Operating Income 1,074,580
Inflows Source of Funding - Recoupments
50,000 54,370 Recoupments 2183 30.11 050,000 54,370 Total Recoupments 0
Inflows Source of Funding - Capital Grants and Subsidies - Capital 2187 30.12 0Donations and Contributions 2187 30.13 0Sale of Assets 2187 30.14 40,800Other Capital Revenue 2187 30.15 0Loans 2187 30.16 0
0 0 Total Capital Income 40,800
SERVICE PROVISION AREA INDIRECT ALLOCATIONS
933,890 954,810 TOTAL INFLOWS 1,115,380
(Outflows) Total Operating Cost of Service
298,780 290,760 Employee Costs 2180 30.17 431,880Salaries and Wages Oncosts 2180 30.18 0
17,900 14,320 Contractual Services 2180 30.19 8,44033,650 33,610 Materials 2180 30.20 24,380
Finance Charges 2180 30.21 014,160 14,160 Depreciation 2180 30.22 14,230
0 19,510 Plant Hire 2180 30.23 24,12020,600 18,560 Other 2180 30.24 5,89078,250 78,250 FCA Oncosts 2180 30.25 207,160
463,340 469,170 Total Operating Expenses 716,100
(Outflows) AppropriationsAppropriations 2181 30.26 0
0 0 Total Appropriations 0
(Outflows) Capital AcquisitionsInfrastructure 2185 30.27 0Structures 2185 30.28 0
235,000 239,730 Buildings 2185 30.29 00 1,780 Plant and Machinery 2185 30.30 56,580
4,000 1,000 Furniture and Fittings 2185 30.31 0Office Equipment 2185 30.32 0
239,000 242,510 Total Capital Expenses 56,580
(Outflows) Loan Principal RepaymentsLoan Principal Repayments 2185 30.33 0
0 0 Total Loan Principal Repayments 0
702,340 711,680 TOTAL OUTFLOWS 772,680
-14,160 -14,160 Less: Non-Cash Items/Depreciation 2180 30.22 -14,230
-245,710 -257,290 NET IMPACT ON RATING EFFORT -356,930

ITEM 30 REFERENCE 2008/09INDIRECT ALLOCATIONS TO SUMMARY
The function Indirect Allocations refers to expenses incurred throughthe day to day operations of Council's outside workforce that cannotbe directly charged out to projects and works undertaken.Expenses include items such depot costs, annual leave, sick leaveetc.
A process is then put in place that accumulates all indirect costs sothat these costs are expensed to works and projects by means of anoverhead or oncost charge. Therefore for each hour worked on thejob by the members of Council's outside workforce, a second labour(or oncost/overhead charge) is levied against the job to expenseindirect costs.
Workers Compensation Bonus 30.09 22,590Labour Overhead Recovered 30.10 682,120
Plant and MachineryEstimated trade-in of 2 Holden Rodeo Utilities @ $20,400 each.Change over estimates have been based upon trading the vehicles
OPERATING INCOME
CAPITAL INCOME
Change over estimates have been based upon trading the vehiclesat 80,000 kilometres. Sale of Assets - Motor Vehicles 30.14 40,800
Allocation of Employee CostsCorporate Manager - Infrastructure & Works 100%Technical Officer 100%Administration Officer, Works 100%Project Administrator, Works 80%
Costs associated with Council's labour work force are allocated tothis budgeted item. These costs include training, allowances, annualleave, sick leave, long service leave, public holidays,superannuation, workers compensation and personal accidentinsurance.
Employee Costs 30.17 431,880
Maintenance - Plant and Equipment 30.19 2,000
Protective Clothing 30.20 13,000Tools/ Equipment 30.20 3,000
Motor Vehicle Operating Costs (2 vehicles) 30.23 24,120
Plant and MachineryProvision is made to purchase 2 utility type motor vehicles (HoldenRodeo 4x2 Crew Cab Petrol) @ $28,290 each. 56,580
OPERATING EXPENSES
CAPITAL EXPENDITURE

ITEM NO. 31
2007/08 Mar Review Inflows (Outflows) Account No. Ref No. 2008/09
Inflows Source of Funding - OperatingRating 2192/2522 31.01 0Statutory Charges 2192/2522 31.02 0User Charges 2192/2522 31.03 0Grants and Subsidies - Operating 2192/2522 31.04 0Investment Income 2192/2522 31.05 0Donations 2192/2522 31.06 0
0 660 Reimbursements 2192/2522 31.07 0Commercial Activities 2192/2522 31.08 0
2,090 8,710 Other 2192/2522 31.09 12,220Plant Hire Recouped 0Salaries and Wages Oncosts Recouped 0FCA Oncosts Recouped 2192/2522 31.10 0
2,090 9,370 Total Operating Income 12,220
Inflows Source of Funding - Recoupments
17,680 Recoupments 2193/2523 31.11 00 17,680 Total Recoupments 0
Inflows Source of Funding - Capital Grants and Subsidies - Capital 2197/2527 31.12 0Donations and Contributions 2197/2527 31.13 0
76,750 76,750 Sale of Assets 2197/2527 31.14 80,300Other Capital Revenue 2197/2527 31.15 0Loans 2197/2527 31.16 0
76,750 76,750 Total Capital Income 80,300
SERVICE PROVISION AREA STRATEGY AND PROJECT PLANNING
78,840 103,800 TOTAL INFLOWS 92,520
(Outflows) Total Operating Cost of Service
235,390 236,430 Employee Costs 2190/2520 31.17 631,430Salaries and Wages Oncosts 2190/2520 31.18 0
45,800 2,620 Contractual Services 2190/2520 31.19 222,0001,200 1,290 Materials 2190/2520 31.20 6,600
Finance Charges 2190/2520 31.21 0Depreciation 2190/2520 31.22 0
15,000 10,500 Plant Hire 2190/2520 31.23 61,52011,280 12,440 Other 2190/2520 31.24 14,45086,080 86,080 FCA Oncosts 2190/2520 31.25 244,360
394,750 349,360 Total Operating Expenses 1,180,360
(Outflows) Appropriations
4,100 Appropriations 2191/2521 31.26 00 4,100 Total Appropriations 0
(Outflows) Capital AcquisitionsInfrastructure 2195/2525 31.27 0Structures 2195/2525 31.28 0Buildings 2195/2525 31.29 0
103,450 103,450 Plant and Machinery 2195/2525 31.30 112,740Furniture and Fittings 2195/2525 31.31 0Office Equipment 2195/2525 31.32 0
103,450 103,450 Total Capital Expenses 112,740
(Outflows) Loan Principal RepaymentsLoan Principal Repayments 2195/2525 31.33 0
0 0 Total Loan Principal Repayments 0
498,200 456,910 TOTAL OUTFLOWS 1,293,100
0 0 Less: Non-Cash Items/Depreciation 2190/2520 31.22 0
419,360 353,110 NET IMPACT ON RATING EFFORT 1,200,580

ITEM 31 REFERENCE 2008/09STRATEGY AND PROJECT PLANNING TO SUMMARY
The budget provision provides for the development andimplementation of strategy to carry out infrastructure and otherprojects of Council to deliver an outcome in line with best practice inthe industry.
Workers Compensation Bonus 31.09 12,220
Plant and Machinery
Estimated trade-in of 1 Sedan type motor vehicle @ 23,000, 1 sedan type motor vehicle @ 16,500 and 2 Rodeo Utilities @ 20,400 each.Change over estimates have been based upon trading the sedanvehicles at 40,000 km and utilities at 80,000 km.
Sale of Assets - Motor Vehicles 31.14 80,300
Allocation of Employee Costs
OPERATING INCOME
CAPITAL INCOME
OPERATING EXPENSES
Allocation of Employee CostsCorporate Manager, Strategy and Project Planning 100%Admin Assistant, 80%Technical Officer - Infrastructure & Assets 100%Development Engineer 100%Assets Support Officer 100%Environmental Projects Officer 60%Development & Environment Advisor 20%Project Administrator 20%
Employee Costs 31.17 631,430
Fiddlewood Drive Concept & Project ManagementThis project is designed to reconfigure the main reserve within theresidential estate to realise additional development potential andcommunity facilities on the site of the reserve.Professional Services 31.19 15,000
Dutton Park StrategyMinimal budget outlay required with majority of the review andforward planning to be undertaken in-house through a ‘to beestablished’ committee of staff.Professional Services 31.19 2,000
Kapunda Residential PARLocal Heritage PAR
Non Urban Living/Rural Lifestyle StudyCouncil proposed, in the 2005/2006 financial year, to undertake astudy to solve the problems identified by Council and landowners inthe rural living zone.Professional Services 31.19 30,000

ITEM 31 REFERENCE 2008/09STRATEGY AND PROJECT PLANNING TO SUMMARY
Kapunda Car Park Fund
The creation of a car park fund is designed to facilitate developmentwithin the Main Street precinct where developers are unable toprovide onsite car parking due to site constraints. The fund (in orderto be legally recognized through the planning process) needs to beimplemented through a Development Plan Amendment.Professional Services 31.19 10,000
Kingsford PAR
Council, in collaboration with the Northern Adelaide and BarossaCatchment Water Management Board and the Department of Tradeand Economics, are undertaking a master plan and rezoning for theKingsford Regional Industrial Park which will seek to introduceguidelines that will facilitate orderly and collaborative approachesamongst landowners for infrastructure development, particularly inrespect to stormwater management and traffic movements. Professional Services 31.19 10,000
Kapunda Historic Mine Site &/or Town Centre DPARezoning and amending of policy provisions as they relate to theKapunda Historic Mine Site and/ or Town Centre zone adjacent toKapunda Historic Mine Site and/ or Town Centre zone adjacent tothe Mine Site pending the recommendations of the currentConservation Management Plan.Professional Services 31.19 30,000
Roseworthy Masterplan & DPA (Chain of Ponds)
This important locality recognized in Council’s Strategic Plan and theBarossa Regional Spatial Framework requires detailed planning andinfrastructure investigations in order to ensure orderly and economicgrowth of the township in a well managed approach to townshipdevelopment. Retail and community services will also need to beconsidered through the investigations. Key strategic project.Professional Services 31.19 60,000
Professional Services (Includes Section 30 Review) 35,300
Legal Fees 31.19 14,100
Motor Vehicle Operating Costs (4 Vehicles) 31.23 61,520
Plant and MachineryProvision is made to purchase 1 sedan type motor vehicle (HoldenCommodore SV6) @ 30,960, 1 sedan type motor vehicle (HoldenEpica) @ 25,200 and 2 utility type motor vehicles (Holden Rodeo4x2 Crew Cab Petrol) @ 28,290 each.
Purchase of Assets - Motor Vehicles 31.30 112,740
CAPITAL EXPENDITURE
Responsible Officer: Corporate Manager – Strategy and Project Planning

ITEM NO. 32
2007/08 Mar Review Inflows (Outflows) Account No. Ref No. 2008/09
Inflows Source of Funding - OperatingRating 2202 - 2262 32.01 0Statutory Charges 2202 - 2262 32.02 0User Charges 2202 - 2262 32.03 0Grants and Subsidies - Operating 2202 - 2262 32.04 0Investment Income 2202 - 2262 32.05 0Donations 2202 - 2262 32.06 0Reimbursements 2202 - 2262 32.07 0Commercial Activities 2202 - 2262 32.08 0
0 Other 2202 - 2262 32.09 559,900Plant Hire Recouped 0Salaries and Wages Oncosts Recouped 0FCA Oncosts Recouped 2202 - 2262 32.10 0
0 0 Total Operating Income 559,900
Inflows Source of Funding - Recoupments
11,150 53,760 Recoupments 2203 - 2263 32.11 011,150 53,760 Total Recoupments 0
Inflows Source of Funding - Capital Grants and Subsidies - Capital 2207 - 2267 32.12 0Donations and Contributions 2207 - 2267 32.13 0Sale of Assets 2207 - 2267 32.14 0Other Capital Revenue 2207 - 2267 32.15 0Loans 2207 - 2267 32.16 0
0 0 Total Capital Income 0
SERVICE PROVISION AREA QUARRIES
11,150 53,760 TOTAL INFLOWS 559,900
(Outflows) Total Operating Cost of ServiceEmployee Costs 2200 - 2260 32.17 0Salaries and Wages Oncosts 2200 - 2260 32.18 0
0 20,270 Contractual Services 2200 - 2260 32.19 480,000Materials 2200 - 2260 32.20 0Finance Charges 2200 - 2260 32.21 0Depreciation 2200 - 2260 32.22 0Plant Hire 2200 - 2260 32.23 0
11,150 15,440 Other 2200 - 2260 32.24 75,20010 10 FCA Oncosts 2200 - 2260 32.25 4,800
11,160 35,720 Total Operating Expenses 560,000
(Outflows) Appropriations
0 22,730 Appropriations 2201 - 2261 32.26 00 22,730 Total Appropriations 0
(Outflows) Capital AcquisitionsInfrastructure 2205 - 2265 32.27 0Structures 2205 - 2265 32.28 0Buildings 2205 - 2265 32.29 0Plant and Machinery 2205 - 2265 32.30 0Furniture and Fittings 2205 - 2265 32.31 0Office Equipment 2205 - 2265 32.32 0
0 0 Total Capital Expenses 0
(Outflows) Loan Principal RepaymentsLoan Principal Repayments 2205 - 2265 32.33 0
0 0 Total Loan Principal Repayments 0
11,160 58,450 TOTAL OUTFLOWS 560,000
0 0 Less: Non-Cash Items/Depreciation 2200 - 2260 32.22 0
10 4,690 NET IMPACT ON RATING EFFORT 100

ITEM 32 REFERENCE 2008/09QUARRIES TO SUMMARY
Pavement Material Recovered (Virgara Quarry) 32.09 352,450Pavement Material Recovered (Bubner No. 2 Quarry) 32.09 207,450
Contractors - Raising and Crushing (Virgara Quarry) 32.19 300,000Contractors - Raising and Crushing (Bubner No. 2 Quarry) 32.19 180,000
Royalties (Virgara Quarry) 32.24 50,000Royalties (Bubner No. 2 Quarry) 32.24 25,000
OPERATING INCOME
OPERATING EXPENSES
Responsible Officer: Corporate Manager – Infrastructure and Works

ITEM NO. 33
2007/08 Mar Review Inflows (Outflows) Account No. Ref No. 2008/09
Inflows Source of Funding - OperatingRating 2302 - 2312 33.01 0Statutory Charges 2302 - 2312 33.02 0User Charges 2302 - 2312 33.03 0Grants and Subsidies - Operating 2302 - 2312 33.04 0Investment Income 2302 - 2312 33.05 0
15,000 160 Donations and Contributions 2302 - 2312 33.06 0Reimbursements 2302 - 2312 33.07 0Commercial Activities 2302 - 2312 33.08 0
290 440 Other 2302 - 2312 33.09 0Plant Hire Recouped 0Salaries and Wages Oncosts Recouped 0FCA Oncosts Recouped 2302 - 2312 33.10 0
15,290 600 Total Operating Income 0
Inflows Source of Funding - Recoupments
498,940 498,940 Recoupments 2303 - 2313 33.11 0498,940 498,940 Total Recoupments 0
Inflows Source of Funding - Capital Grants and Subsidies - Capital 2307 - 2317 33.12 0Donations and Contributions 2307 - 2317 33.13 0Sale of Assets 2307 - 2317 33.14 0Other Capital Revenue 2307 - 2317 33.15 0
124,030 124,030 Loans 2307 - 2317 33.16 50,000124,030 124,030 Total Capital Income 50,000
SERVICE PROVISION AREA STORMWATER MAINTENANCE & CONSTRUCTION
638,260 623,570 TOTAL INFLOWS 50,000
(Outflows) Total Operating Cost of Service
70,890 69,100 Employee Costs 2300 - 2310 33.17 38,89076,100 69,140 Salaries and Wages Oncosts 2300 - 2310 33.18 38,11026,600 29,670 Contractual Services 2300 - 2310 33.19 32,32011,500 16,520 Materials 2300 - 2310 33.20 20,20062,390 62,950 Finance Charges 2300 - 2310 33.21 53,11090,500 90,500 Depreciation 2300 - 2310 33.22 215,34051,050 51,050 Plant Hire 2300 - 2310 33.23 11,9304,000 4,000 Other 2300 - 2310 33.24 4,180
11,860 11,860 FCA Oncosts 2300 - 2310 33.25 47,170404,890 404,790 Total Operating Expenses 461,250
(Outflows) Appropriations
800 Appropriations 2301 - 2311 33.26 00 800 Total Appropriations 0
(Outflows) Capital Acquisitions
637,970 756,380 Infrastructure 2305 - 2315 33.27 551,840Structures 2305 - 2315 33.28 0Buildings 2305 - 2315 33.29 0Plant and Machinery 2305 - 2315 33.30 0Furniture and Fittings 2305 - 2315 33.31 0Office Equipment 2305 - 2315 33.32 0
637,970 756,380 Total Capital Expenses 551,840
(Outflows) Loan Principal Repayments
124,690 124,690 Loan Principal Repayments 2305 - 2315 33.33 135,650124,690 124,690 Total Loan Principal Repayments 135,650
1,167,550 1,286,660 TOTAL OUTFLOWS 1,148,740
-90,500 -90,500 Less: Non-Cash Items/Depreciation 2300 - 2310 33.22 -215,340
438,790 572,590 NET IMPACT ON RATING EFFORT 883,400
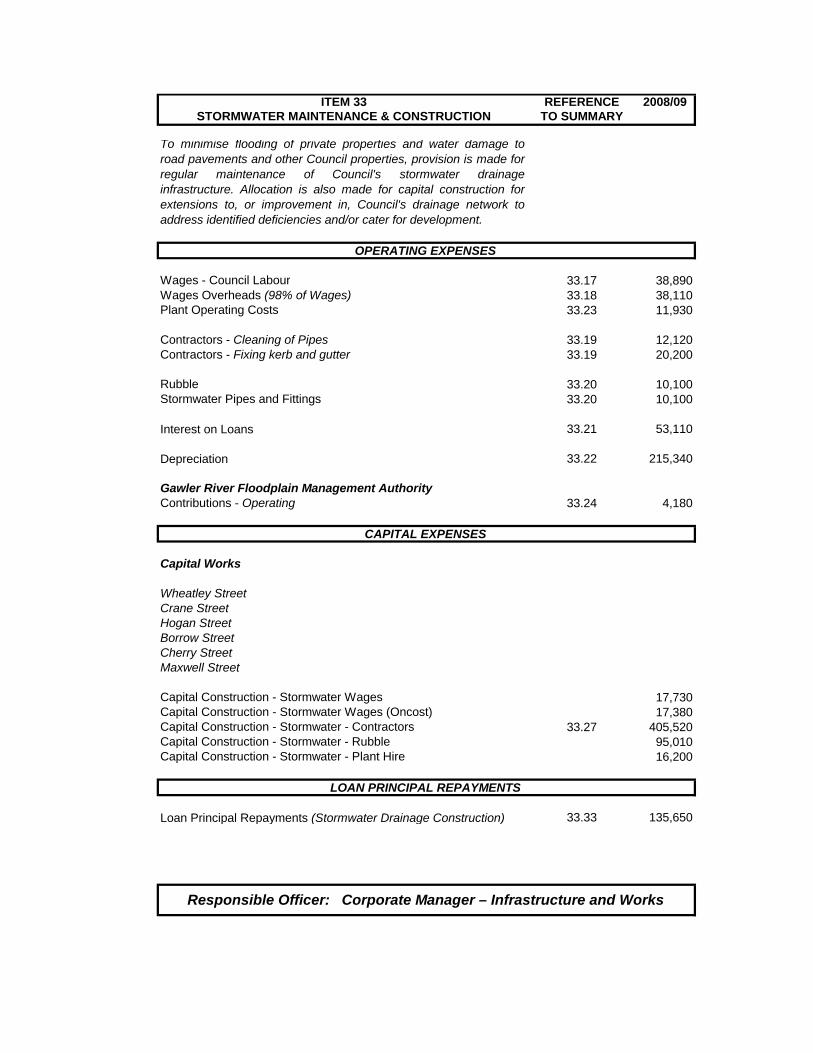
ITEM 33 REFERENCE 2008/09STORMWATER MAINTENANCE & CONSTRUCTION TO SUMMARY
To minimise flooding of private properties and water damage toroad pavements and other Council properties, provision is made forregular maintenance of Council's stormwater drainageinfrastructure. Allocation is also made for capital construction forextensions to, or improvement in, Council's drainage network toaddress identified deficiencies and/or cater for development.
Wages - Council Labour 33.17 38,890Wages Overheads (98% of Wages) 33.18 38,110Plant Operating Costs 33.23 11,930
Contractors - Cleaning of Pipes 33.19 12,120Contractors - Fixing kerb and gutter 33.19 20,200
Rubble 33.20 10,100Stormwater Pipes and Fittings 33.20 10,100
Interest on Loans 33.21 53,110
Depreciation 33.22 215,340
Gawler River Floodplain Management Authority
OPERATING EXPENSES
Gawler River Floodplain Management AuthorityContributions - Operating 33.24 4,180
Capital Works
Wheatley StreetCrane StreetHogan StreetBorrow StreetCherry StreetMaxwell Street
Capital Construction - Stormwater Wages 17,730Capital Construction - Stormwater Wages (Oncost) 17,380Capital Construction - Stormwater - Contractors 33.27 405,520Capital Construction - Stormwater - Rubble 95,010Capital Construction - Stormwater - Plant Hire 16,200
Loan Principal Repayments (Stormwater Drainage Construction) 33.33 135,650
CAPITAL EXPENSES
LOAN PRINCIPAL REPAYMENTS
Responsible Officer: Corporate Manager – Infrastructure and Works

ITEM NO. 34
2007/08 Mar Review Inflows (Outflows) Account No. Ref No. 2008/09
Inflows Source of Funding - OperatingRating 2352 34.01 0Statutory Charges 2352 34.02 0User Charges 2352 34.03 0
3,500 Grants and Subsidies - Operating 2352 34.04 0Investment Income 2352 34.05 0Donations 2352 34.06 0Reimbursements 2352 34.07 0Commercial Activities 2352 34.08 0
60 90 Other 2352 34.09 0Plant Hire Recouped 0Salaries and Wages Oncosts Recouped 0FCA Oncosts Recouped 2352 34.10 0
60 3,590 Total Operating Income 0
Inflows Source of Funding - Recoupments
292,750 312,020 Recoupments 2353 34.11 0292,750 312,020 Total Recoupments 0
Inflows Source of Funding - Capital
274,670 274,670 Grants and Subsidies - Capital 2357 34.12 0567,060 Donations and Contributions 2357 34.13 82,000
Sale of Assets 2357 34.14 0Other Capital Revenue 2357 34.15 0
0 Loans 2357 34.16 82,000274,670 841,730 Total Capital Income 164,000
SERVICE PROVISION AREA BRIDGE MAINTENANCE & CONSTRUCTION
567,480 1,157,340 TOTAL INFLOWS 164,000
(Outflows) Total Operating Cost of Service
8,490 7,490 Employee Costs 2350 34.17 17,7803,800 1,900 Salaries and Wages Oncosts 2350 34.18 17,4209,000 6,000 Contractual Services 2350 34.19 2,020
350 350 Materials 2350 34.20 2,45013,990 13,990 Finance Charges 2350 34.21 10,68078,830 78,830 Depreciation 2350 34.22 86,1001,720 1,120 Plant Hire 2350 34.23 2,110
580 580 Other 2350 34.24 1,0705,210 5,210 FCA Oncosts 2350 34.25 24,490
121,970 115,470 Total Operating Expenses 164,120
(Outflows) Appropriations
4,340 Appropriations 2351 34.26 00 4,340 Total Appropriations 0
(Outflows) Capital Acquisitions
567,420 1,171,980 Infrastructure 2355 34.27 164,000Structures 2355 34.28 0Buildings 2355 34.29 0Plant and Machinery 2355 34.30 0Furniture and Fittings 2355 34.31 0Office Equipment 2355 34.32 0
567,420 1,171,980 Total Capital Expenses 164,000
(Outflows) Loan Principal Repayments
23,400 23,400 Loan Principal Repayments 2355 34.33 26,66023,400 23,400 Total Loan Principal Repayments 26,660
712,790 1,315,190 TOTAL OUTFLOWS 354,780
-78,830 -78,830 Less: Non-Cash Items/Depreciation 2350 34.22 -86,100
66,480 79,020 NET IMPACT ON RATING EFFORT 104,680

ITEM 34 REFERENCE 2008/09BRIDGE MAINTENANCE & CONSTRUCTION TO SUMMARY
Council has numerous bridges within its region of varying sizes andconfigurations. Provision is made to undertake both routine andreactive maintenance works on a number of Council bridges tomaintain the integrity of the structures and provide safe crossingpoints for commuters. Furthermore, Council programs for theregular replacement of bridges identified as under capacity to meetneeds of ever increasing traffic masses and volumes.
Smyth Road Bridge UpgradeBarossa Council half share cost for the upgrade of Smyth RoadBridge.Capital Contributions - Other 34.13 82,000
Wages - Council Labour 34.17 17,780Wages Overheads (98% of Wages) 34.18 17,420Plant Operating Costs 34.23 2,110
Maintenance - Infrastructure 34.19 2,020Materials - Infrastructure 34 20 1 010
OPERATING EXPENSES
CAPITAL INCOME
Materials - Infrastructure 34.20 1,010
Interest on Loans 34.21 10,680
Depreciation 34.22 86,100
Smyth Road Bridge upgradeProvision is made for the upgrade of Smyth Road Bridge - costs tobe shared equally with Barossa CouncilCapital Construction - Bridges 34.27 164,000
Loan Principal Repayments (Bridge Construction) 34.33 26,660
CAPITAL EXPENSES
LOAN PRINCIPAL REPAYMENTS
Responsible Officer: Corporate Manager – Infrastructure and Works

ITEM NO. 35
2007/08 Mar Review Inflows (Outflows) Account No. Ref No. 2008/09
Inflows Source of Funding - OperatingRating 2402 - 2442 35.01 0Statutory Charges 2402 - 2442 35.02 0
10,510 10,510 User Charges 2402 - 2442 35.03 6,000387,000 408,310 Grants and Subsidies - Operating 2402 - 2442 35.04 443,180
Investment Income 2402 - 2442 35.05 00 Donations and Contributions 2402 - 2442 35.06 00 Reimbursements 2402 - 2442 35.07 0
Commercial Activities 2402 - 2442 35.08 0760 1350 Other 2402 - 2442 35.09 0
Plant Hire RecoupedSalaries and Wages Oncosts RecoupedFCA Oncosts Recouped 2402 - 2442 35.10 0
398,270 420,170 Total Operating Income 449,180
Inflows Source of Funding - Recoupments
1,182,220 1,008,610 Recoupments 2423 - 2443 35.11 677,0001,182,220 1,008,610 Total Recoupments 677,000
Inflows Source of Funding - Capital
1,050,330 1,101,000 Grants and Subsidies - Capital 2427 - 2447 35.12 234,800172,000 172,000 Donations and Contributions 2427 - 2447 35.13 0
Sale of Assets 2427 - 2447 35.14 0Other Capital Revenue 2427 - 2447 35.15 0
469,090 831,380 Loans 2427 - 2447 35.16 3,278,2001,691,420 2,104,380 Total Capital Income 3,513,000
SERVICE PROVISION AREA ROAD MAINTENANCE & CONSTRUCTION
3,271,910 3,533,160 TOTAL INFLOWS 4,639,180
(Outflows) Total Operating Cost of Service
222,930 265,650 Employee Costs 2400 - 2440 35.17 257,590270,880 286,610 Salaries and Wages Oncosts 2400 - 2440 35.18 238,780522,600 497,960 Contractual Services 2400 - 2440 35.19 244,000143,750 172,220 Materials 2400 - 2440 35.20 114,000315,500 319,230 Finance Charges 2400 - 2440 35.21 578,670
2,604,610 2,604,610 Depreciation 2400 - 2440 35.22 2,532,200369,380 339,330 Plant Hire 2400 - 2440 35.23 207,340
1,050 3,020 Other 2400 - 2440 35.24 2,00042,710 42,710 FCA Oncosts 2400 - 2440 35.25 298,820
4,493,410 4,531,340 Total Operating Expenses 4,473,400
(Outflows) Appropriations
761,050 Appropriations 2421 - 2441 35.26 00 761,050 Total Appropriations 0
(Outflows) Capital Acquisitions
3,192,910 3,729,540 Infrastructure 2410 - 2445 35.27 3,208,920Structures 2410 - 2445 35.28 0Buildings 2410 - 2445 35.29 0Plant and Machinery 2410 - 2445 35.30 0Furniture and Fittings 2410 - 2445 35.31 0Office Equipment 2410 - 2445 35.32 0
3,192,910 3,729,540 Total Capital Expenses 3,208,920
(Outflows) Loan Principal Repayments
644,240 644,240 Loan Principal Repayments 2410 - 2445 35.33 1,009,520644,240 644,240 Total Loan Principal Repayments 1,009,520
8,330,560 9,666,170 TOTAL OUTFLOWS 8,691,840
-2,604,610 -2,604,610 Less: Non-Cash Items/Depreciation 2400 - 2440 35.22 -2,532,200
2,454,040 3,528,400 NET IMPACT ON RATING EFFORT 1,520,460
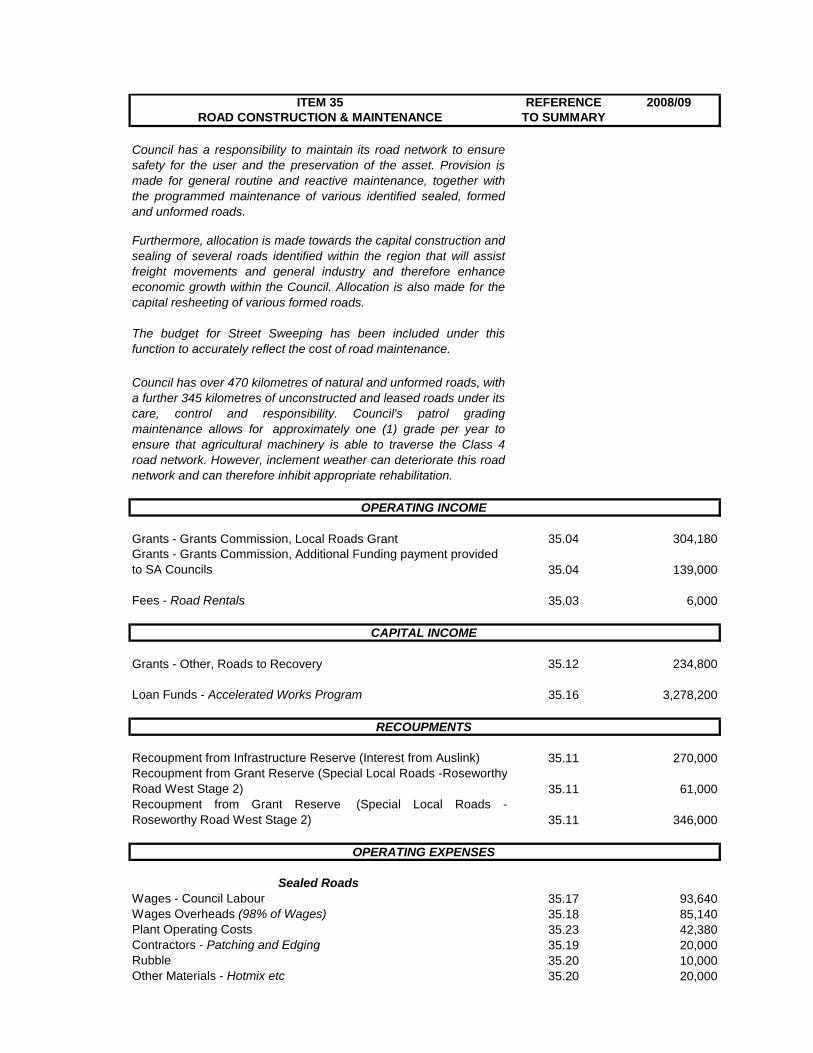
ITEM 35 REFERENCE 2008/09ROAD CONSTRUCTION & MAINTENANCE TO SUMMARY
Council has a responsibility to maintain its road network to ensuresafety for the user and the preservation of the asset. Provision ismade for general routine and reactive maintenance, together withthe programmed maintenance of various identified sealed, formedand unformed roads.
Furthermore, allocation is made towards the capital construction andsealing of several roads identified within the region that will assistfreight movements and general industry and therefore enhanceeconomic growth within the Council. Allocation is also made for thecapital resheeting of various formed roads.
The budget for Street Sweeping has been included under thisfunction to accurately reflect the cost of road maintenance.
Council has over 470 kilometres of natural and unformed roads, witha further 345 kilometres of unconstructed and leased roads under itscare, control and responsibility. Council's patrol gradingmaintenance allows for approximately one (1) grade per year toensure that agricultural machinery is able to traverse the Class 4road network. However, inclement weather can deteriorate this roadnetwork and can therefore inhibit appropriate rehabilitation.
Grants - Grants Commission, Local Roads Grant 35.04 304,180Grants - Grants Commission, Additional Funding payment provided to SA Councils 35.04 139,000
Fees - Road Rentals 35.03 6,000
Grants - Other, Roads to Recovery 35.12 234,800
Loan Funds - Accelerated Works Program 35.16 3,278,200
Recoupment from Infrastructure Reserve (Interest from Auslink) 35.11 270,000Recoupment from Grant Reserve (Special Local Roads -RoseworthyRoad West Stage 2) 35.11 61,000Recoupment from Grant Reserve (Special Local Roads -Roseworthy Road West Stage 2) 35.11 346,000
Sealed RoadsWages - Council Labour 35.17 93,640Wages Overheads (98% of Wages) 35.18 85,140Plant Operating Costs 35.23 42,380Contractors - Patching and Edging 35.19 20,000Rubble 35.20 10,000Other Materials - Hotmix etc 35.20 20,000
OPERATING INCOME
CAPITAL INCOME
OPERATING EXPENSES
RECOUPMENTS
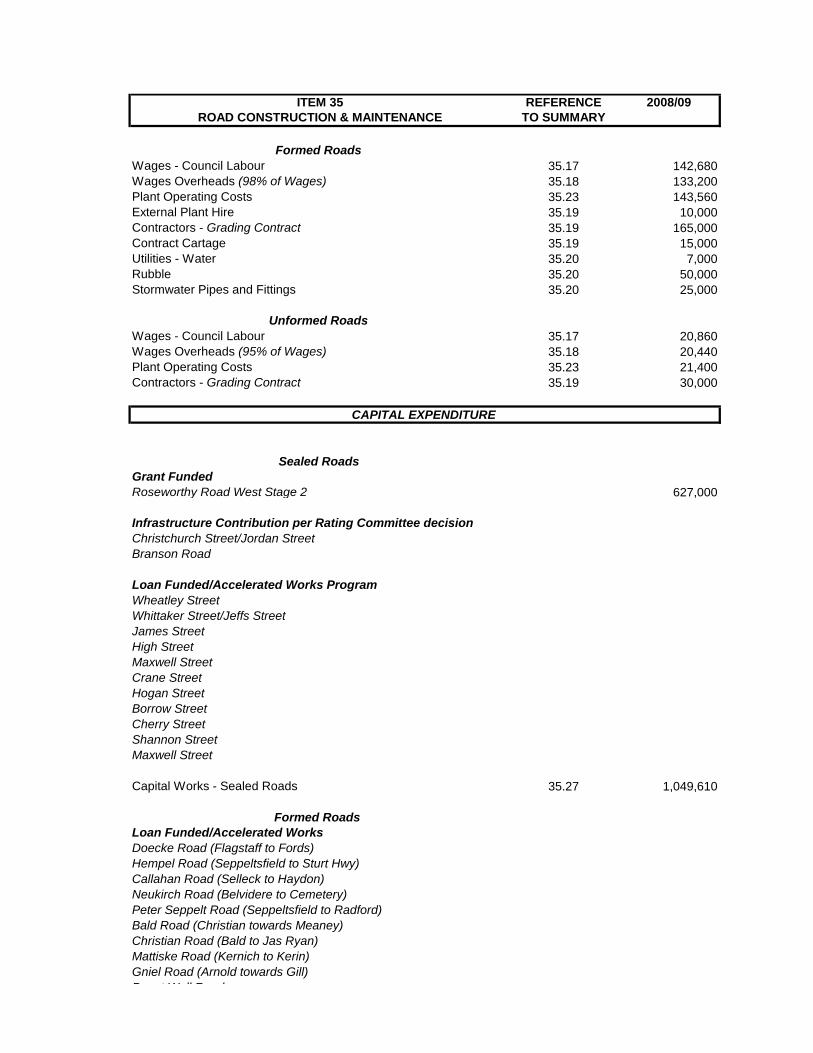
ITEM 35 REFERENCE 2008/09ROAD CONSTRUCTION & MAINTENANCE TO SUMMARY
Formed RoadsWages - Council Labour 35.17 142,680Wages Overheads (98% of Wages) 35.18 133,200Plant Operating Costs 35.23 143,560External Plant Hire 35.19 10,000Contractors - Grading Contract 35.19 165,000Contract Cartage 35.19 15,000Utilities - Water 35.20 7,000Rubble 35.20 50,000Stormwater Pipes and Fittings 35.20 25,000
Unformed RoadsWages - Council Labour 35.17 20,860Wages Overheads (95% of Wages) 35.18 20,440Plant Operating Costs 35.23 21,400Contractors - Grading Contract 35.19 30,000
Sealed RoadsGrant FundedRoseworthy Road West Stage 2 627 000
CAPITAL EXPENDITURE
Roseworthy Road West Stage 2 627,000
Infrastructure Contribution per Rating Committee decisionChristchurch Street/Jordan StreetBranson Road
Loan Funded/Accelerated Works ProgramWheatley StreetWhittaker Street/Jeffs StreetJames StreetHigh StreetMaxwell StreetCrane StreetHogan StreetBorrow StreetCherry StreetShannon StreetMaxwell Street
Capital Works - Sealed Roads 35.27 1,049,610
Formed Roads Loan Funded/Accelerated WorksDoecke Road (Flagstaff to Fords)Hempel Road (Seppeltsfield to Sturt Hwy)Callahan Road (Selleck to Haydon)Neukirch Road (Belvidere to Cemetery)Peter Seppelt Road (Seppeltsfield to Radford)Bald Road (Christian towards Meaney)Christian Road (Bald to Jas Ryan)Mattiske Road (Kernich to Kerin)Gniel Road (Arnold towards Gill)B t W ll R d

ITEM 35 REFERENCE 2008/09ROAD CONSTRUCTION & MAINTENANCE TO SUMMARY
Tableland Road (Noack to Boundary)

ITEM 35 REFERENCE 2008/09ROAD CONSTRUCTION & MAINTENANCE TO SUMMARY
Formed Roads (Continued)Loan Funded/Accelerated WorksNottle Road (Parkers to Ward Belt)Selleck Road (Graingers to Callahan)Stone Road (Kangaroo Flat towards College)Oates Road (Mallala to Fairlie)Boundary Road (Two Wells to Days House)Hatcher Road (Mortimer to Boundary)Hayman Road (Two Wells to Wilkinson)Gawler River Road (Heaslip to Wilkinson)Mendrin Road (Clancy to Heyworth)Shanahan RoadKrause Drive (start to Mallala)Kangaroo Flat Road (Stone to Kreig)Parkers Road (Woods to Leak)Wingate Road (Two Wells towards Ward Belt)Whitelaw Road (Two Wells to Ward Belt)Graingers Road (Mudla Wirra to Piggery)
Capital Works - Formed Roads 35.27 1,532,310
Responsible Officer: Corporate Manager – Infrastructure and Works

ITEM NO. 36
2007/08 Mar Review Inflows (Outflows) Account No. Ref No. 2008/09
Inflows Source of Funding - OperatingRating 2452 36.01 0Statutory Charges 2452 36.02 0User Charges 2452 36.03 0Grants and Subsidies - Operating 2452 36.04 0Investment Income 2452 36.05 0Donations 2452 36.06 0Reimbursements 2452 36.07 0Commercial Activities 2452 36.08 0
100 150 Other 2452 36.09 0Plant Hire Recouped 0Salaries and Wages Oncosts Recouped 0FCA Oncosts Recouped 2452 36.10 0
100 150 Total Operating Income 0
Inflows Source of Funding - Recoupments
115,290 115,290 Recoupments 2453 36.11 0115,290 115,290 Total Recoupments 0
Inflows Source of Funding - Capital Grants and Subsidies - Capital 2457 36.12 0
0 Donations and Contributions 2457 36.13 0Sale of Assets 2457 36.14 0Other Capital Revenue 2457 36.15 0
50,000 50,000 Loans 2457 36.16 88,80050,000 50,000 Total Capital Income 88,800
SERVICE PROVISION AREA FOOTPATH MAINTENANCE & CONSTRUCTION
165,390 165,440 TOTAL INFLOWS 88,800
(Outflows) Total Operating Cost of Service
35,270 45,430 Employee Costs 2400/2450 36.17 60,30047,560 66,370 Salaries and Wages Oncosts 2400/2450 36.18 57,44042,000 37,690 Contractual Services 2400/2450 36.19 10,0005,000 24,800 Materials 2400/2450 36.20 8,0002,170 2,390 Finance Charges 2400/2450 36.21 4,690
126,830 126,830 Depreciation 2400/2450 36.22 133,62015,460 21,670 Plant Hire 2400/2450 36.23 31,390
Other 2400/2450 36.24 09,250 9,250 FCA Oncosts 2400/2450 36.25 32,860
283,540 334,430 Total Operating Expenses 338,300
(Outflows) Appropriations
0 Appropriations 2451 36.26 00 0 Total Appropriations 0
(Outflows) Capital Acquisitions
165,300 189,980 Infrastructure 2410/2455 36.27 361,720Structures 2410/2455 36.28 0Buildings 2410/2455 36.29 0Plant and Machinery 2410/2455 36.30 0Furniture and Fittings 2410/2455 36.31 0Office Equipment 2410/2455 36.32 0
165,300 189,980 Total Capital Expenses 361,720
(Outflows) Loan Principal Repayments
4,710 4,710 Loan Principal Repayments 2410/2455 36.33 9,2204,710 4,710 Total Loan Principal Repayments 9,220
453,550 529,120 TOTAL OUTFLOWS 709,240
-126,830 -126,830 Less: Non-Cash Items/Depreciation 2400/2450 36.22 -133,620
161,330 236,850 NET IMPACT ON RATING EFFORT 486,820

ITEM 36 REFERENCE 2008/09FOOTPATH MAINTENANCE & CONSTRUCTION TO SUMMARY
Council pursues a goal of maintaining footpaths in a safe andenvironmentally friendly condition to facilitate the passage ofpedestrian traffic.
Council’s current footpath network incorporates approximately 50kilometres with various surfaces, which include gravel, concrete,paved and bitumen.
Allocation is made towards general routine and reactive footpathmaintenance, together with provision for new footpath constructionin the McKinlay Ridge and Estate developments and also inassociation with township roads constructions.
Wages - Council Labour 36.17 60,300Wages Overheads (98% of Wages) 36.18 57,440Plant Operating Costs 36.23 31,390
Contractors 36.19 10,000Rubble 36.20 5,000Stormwater Pipes and Fittings 36.20 2,000Other Materials 36 20 1 000
OPERATING EXPENSES
Other Materials 36.20 1,000
Infrastructure Contribution per Rating Committee decisionChristchurch Street/Jordan StreetBranson Road
Loan Funded/Accelerated WorksWheatley StreetWhittaker Street/Jeffs StreetJames StreetHigh StreetMaxwell StreetCrane StreetHogan StreetBorrow StreetCherry StreetShannon StreetMaxwell Street
Capital Construction - Footpaths - Wages 36.27 35,470Capital Construction - Footpaths - Wages (Oncost) 36.27 34,760Capital Construction - Footpaths - Contractors 36.27 262,110Capital Construction - Footpaths - Materials 36.27 10,790Capital Construction - Footpaths - Plant Hire 36.27 18,590
CAPITAL EXPENDITURE
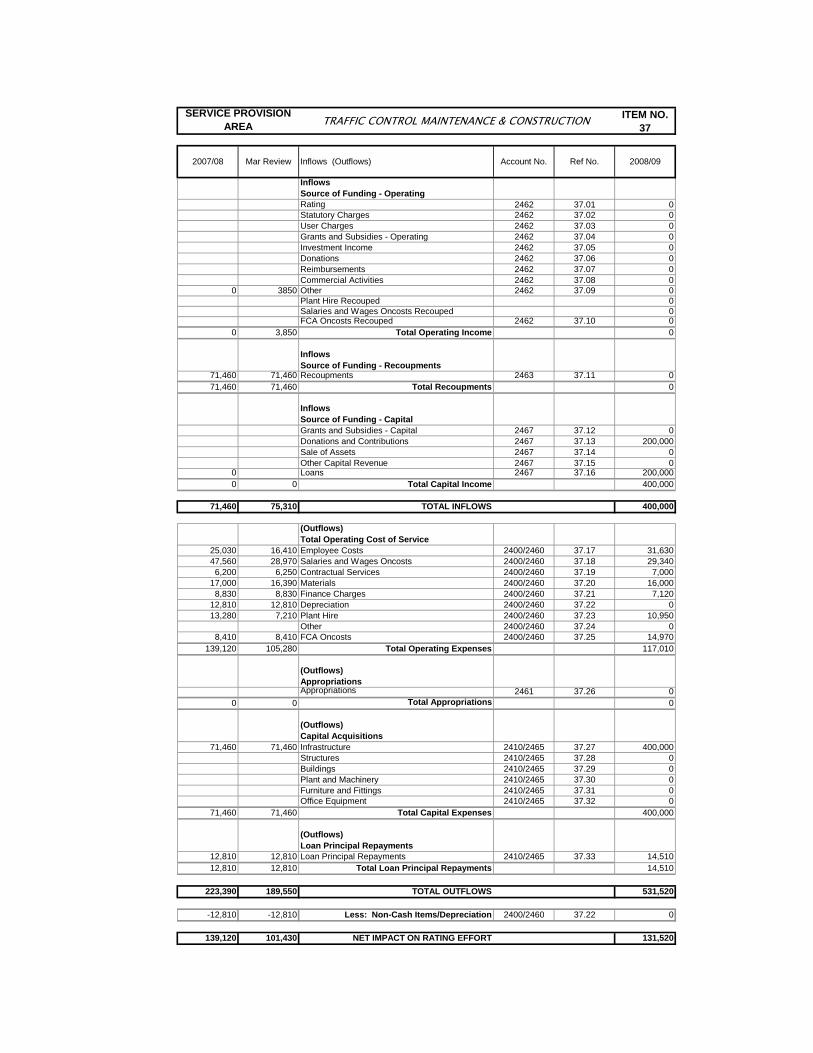
ITEM NO. 37
2007/08 Mar Review Inflows (Outflows) Account No. Ref No. 2008/09
Inflows Source of Funding - OperatingRating 2462 37.01 0Statutory Charges 2462 37.02 0User Charges 2462 37.03 0Grants and Subsidies - Operating 2462 37.04 0Investment Income 2462 37.05 0Donations 2462 37.06 0Reimbursements 2462 37.07 0Commercial Activities 2462 37.08 0
0 3850 Other 2462 37.09 0Plant Hire Recouped 0Salaries and Wages Oncosts Recouped 0FCA Oncosts Recouped 2462 37.10 0
0 3,850 Total Operating Income 0
Inflows Source of Funding - Recoupments
71,460 71,460 Recoupments 2463 37.11 071,460 71,460 Total Recoupments 0
Inflows Source of Funding - Capital Grants and Subsidies - Capital 2467 37.12 0Donations and Contributions 2467 37.13 200,000Sale of Assets 2467 37.14 0Other Capital Revenue 2467 37.15 0
0 Loans 2467 37.16 200,0000 0 Total Capital Income 400,000
SERVICE PROVISION AREA TRAFFIC CONTROL MAINTENANCE & CONSTRUCTION
71,460 75,310 TOTAL INFLOWS 400,000
(Outflows) Total Operating Cost of Service
25,030 16,410 Employee Costs 2400/2460 37.17 31,63047,560 28,970 Salaries and Wages Oncosts 2400/2460 37.18 29,3406,200 6,250 Contractual Services 2400/2460 37.19 7,000
17,000 16,390 Materials 2400/2460 37.20 16,0008,830 8,830 Finance Charges 2400/2460 37.21 7,120
12,810 12,810 Depreciation 2400/2460 37.22 013,280 7,210 Plant Hire 2400/2460 37.23 10,950
Other 2400/2460 37.24 08,410 8,410 FCA Oncosts 2400/2460 37.25 14,970
139,120 105,280 Total Operating Expenses 117,010
(Outflows) AppropriationsAppropriations 2461 37.26 0
0 0 Total Appropriations 0
(Outflows) Capital Acquisitions
71,460 71,460 Infrastructure 2410/2465 37.27 400,000Structures 2410/2465 37.28 0Buildings 2410/2465 37.29 0Plant and Machinery 2410/2465 37.30 0Furniture and Fittings 2410/2465 37.31 0Office Equipment 2410/2465 37.32 0
71,460 71,460 Total Capital Expenses 400,000
(Outflows) Loan Principal Repayments
12,810 12,810 Loan Principal Repayments 2410/2465 37.33 14,51012,810 12,810 Total Loan Principal Repayments 14,510
223,390 189,550 TOTAL OUTFLOWS 531,520
-12,810 -12,810 Less: Non-Cash Items/Depreciation 2400/2460 37.22 0
139,120 101,430 NET IMPACT ON RATING EFFORT 131,520

ITEM 37 REFERENCE 2008/09TRAFFIC CONTROL MAINTENANCE & CONSTRUCTION TO SUMMARY
Traffic control measures such as line marking, sign posting andguard rails are essential for the safety of road users. Much ofCouncil’s road network has traffic control measures which need tobe upgraded to meet Australian Standards and the requirements ofthe Australian Road Rules.
Xavier College Traffic StudyContribution from DTEI 37.13 200,000
Contractors 37.19 5,000Signs and Posts 37.20 15,000
Xavier College Traffic Study
Capital Construction - Traffic Control - Professional Services 37.27 400,000
CAPITAL INCOME
OPERATING EXPENSES
CAPITAL EXPENDITURE
Responsible Officer: Corporate Manager – Infrastructure and Works

ITEM NO. 38
2007/08 Mar Review Inflows (Outflows) Account No. Ref No. 2008/09
Inflows Source of Funding - OperatingRating 2502/2522 38.01 0
166,200 193,190 Statutory Charges 2502/2522 38.02 188,0002,800 User Charges 2502/2522 38.03 1,5005,000 30,000 Grants and Subsidies - Operating 2502/2522 38.04 0
Investment Income 2502/2522 38.05 0Donations 2502/2522 38.06 0
1,500 5,490 Reimbursements 2502/2522 38.07 6,300Commercial Activities 2502/2522 38.08 0
5,040 38,230 Other 2502/2522 38.09 10,850Plant Hire Recouped 0Salaries and Wages Oncosts Recouped 0FCA Oncosts Recouped 2502/2522 38.10 0
180,540 266,910 Total Operating Income 206,650
Inflows Source of Funding - Recoupments
13,150 Recoupments 2503/2523 38.11 00 13,150 Total Recoupments 0
Inflows Source of Funding - Capital Grants and Subsidies - Capital 2507/2527 38.12 0Donations and Contributions 2507/2527 38.13 0
188,000 188,000 Sale of Assets 2507/2527 38.14 108,070Other Capital Revenue 2507/2527 38.15 0Loans 2507/2527 38.16 0
188,000 188,000 Total Capital Income 108,070
SERVICE PROVISION AREA DEVELOPMENT AND PLANNING
368,540 468,060 TOTAL INFLOWS 314,720
(Outflows) Total Operating Cost of Service
551,250 552,800 Employee Costs 2500/2520 38.17 566,040Salaries and Wages Oncosts 2500/2520 38.18 0
183,100 239,670 Contractual Services 2500/2520 38.19 155,0706,500 5,640 Materials 2500/2520 38.20 9,530
0 Finance Charges 2500/2520 38.21 0Depreciation 2500/2520 38.22 0
65,700 65,700 Plant Hire 2500/2520 38.23 61,20031,510 41,610 Other 2500/2520 38.24 13,560
162,720 162,720 FCA Oncosts 2500/2520 38.25 269,4501,000,780 1,068,140 Total Operating Expenses 1,074,850
(Outflows) Appropriations
0 29,100 Appropriations 2501/2521 38.26 00 29,100 Total Appropriations 0
(Outflows) Capital AcquisitionsInfrastructure 2505/2525 38.27 0Structures 2505/2525 38.28 0Buildings 2505/2525 38.29 0
295,000 295,000 Plant and Machinery 2505/2525 38.30 171,480Furniture and Fittings 2505/2525 38.31 0Office Equipment 2505/2525 38.32 0
295,000 295,000 Total Capital Expenses 171,480
(Outflows) Loan Principal Repayments
0 Loan Principal Repayments 2505/2525 38.33 00 0 Total Loan Principal Repayments 0
1,295,780 1,392,240 TOTAL OUTFLOWS 1,246,330
0 0 Less: Non-Cash Items/Depreciation 2500/2520 38.22 0
927,240 924,180 NET IMPACT ON RATING EFFORT 931,610

ITEM 38 REFERENCE 2008/09DEVELOPMENT ASSESSMENT TO SUMMARY
Provision is made under the Development Act, 1993 for Council toreceive Development Applications for Provisional Development PlanConsent, land Division Consent and Provisional Building RulesConsent. Council is also responsible for providing expert advice tothe community and undertaking enforcement action for breaches ofthe Development Act. Council employs the services of appropriatelyqualified staff in the planning and building surveying disciplines toassess development applications in accordance with legislativeframework. Provision is made for professional legal and engineeringservices to assist in delivering this function of Council.
This item also provides funding for the services of Council's PolicyPlanner and the development of Council planning policy and PlanningAmendment Reviews. Council needs to constantly review itsplanning and development policy to ensure that future developmentswithin the area are carried out in accordance with state developmentpolicy and with Council's own development requirements for theregion.
The Development Act 1993 makes provision for the charging of feesand expenses for the assessment of Provisional Development Plan
OPERATING INCOME
and expenses for the assessment of Provisional Development PlanConsent and Building Rules Consent applications.
The value of fees is dependent upon the complexity of the planningassessment and nature of building work undertaken and is based onthe following guidelines.
Every Application requires a combination of the following:
Lodgement Fee (Schedule 6(1))<$5,000 - $48.50>$5,000 - $103.50 (and includes building work)
Planning Assessment Fee (Schedule 6(2))$30.25 - for est. cost up to $10,000
Planning Assessment Fee (Schedule 6(2))$83.00 - for est. cost exceeding $10,000but not exceeding $100,000
Planning Assessment Fee (Schedule 6(2))0.125% - for est. cost exceeding $100,000
Lodgement and Planning Assessment Fees do not attract GST
Building Rules Fees: Dwellings and/or additions @ $2.28 per square metre (inclusive of GST)Note: Minimum Fee $51.50 (inclusive of GST)
Domestic Garages, Carports and the like @ $0.68 per square metre (inclusive of GST)N t Mi i F $51 50 (i l i f GST)

ITEM 38 REFERENCE 2008/09DEVELOPMENT ASSESSMENT TO SUMMARY
Workers Compensation Bonus 38.09 10,850
Plant and MachineryEstimated trade-in of 2 sedan type vehicles @ $18,000 each, 1 sedantype vehicle @ $23,000, 1 sedan type vehicle @ $17,270, 1 sedantype vehicle @ $15,300 and 1 sedan type vehicle @ $16,500.Change over estimates have been based upon trading the vehicles at40,000 kilometres.
Sale of Assets - Motor Vehicles 38.14 108,070
Allocation of Employee CostsManager, Development & Environmental Services 50%Senior Planning Officer - D. Assessment 100%Development & Environment Advisor 80%Building Surveyors 100% x 2Development Officer 100%Team Leader - Administration 80% Administration Officer 100%
CAPITAL INCOME
OPERATING EXPENSES
Administration Officer 100%Customer Service Officer, Freeling 30%
Employee Costs 38.17 566,040
ConsultantsContribution to Department for Environment and Heritage for Heritage Advisor.
Heritage Advisor 38.19 10,000
ConsultantsProvision is made for the engagement of a qualified building surveyorto assess Development Applications for compliance with the BuildingRules for buildings in excess of 2000 m² and/or where engineeringcalculations are required (25% of prescribed Building Rules fees forfooting reports).
Building Surveyor 38.19 20,000
ConsultantsProvision is made for the engagement of professional engineeringservices to provide expert advice on development applications
Engineer 38.19 25,000
ConsultantsProvision is made for the engagement of Consultants to assistCouncil staff in the assessment of development applications whereexternal planning advice is required.
Planning Consultants 38.19 5,050

ITEM 38 REFERENCE 2008/09DEVELOPMENT ASSESSMENT TO SUMMARY
Building Fire Safety CommitteeProvision is made for the attendance of four Building Fire SafetyCommittee meetings by Mr Peter Harmer of Harmer CLG.
Professional Services 38.19 3,500
Development Assessment PanelProvision is made to meet the costs of payment of specialistmembers on Council's Development Assessment Panel. This followsamendments to the Development Act 1993 as a result of theDevelopment (Panels) Amendment Bill.
Professional Services 38.19 20,000
Flood MappingCouncil's electronic mapping system needs to be updated to reflectthe recent amendments to the Gawler River floodplain. This tool isnecessary in the provision of accurate planning advice.
Professional Services 38.19 5,000
Zone UpdateCouncil's electronic mapping systems needs to be updated to reflectCouncil s electronic mapping systems needs to be updated to reflectactual zone and policy area boundary interfaces. This tool isnecessary in the provision of accurate planning advice.
Professional Services 38.19 5,000
Register On-LineThe State Government has introduced an initiative whereby Councilsare required to be able to receive development applications on-line by2009. The necessary upgrading to our computer systems will need tooccur to facilitate this initiative.
Professional Services 38.19 5,000
Legal Services
Officers of Council are required to engage the services of legalpractitioners to assist in the clarification of the Development Act andadvise in matters which are heard in the Environment Resources andDevelopment Court as a result of the applicant appealing Council’sdecision regarding a proposed development. Additional funds areneeded to accommodate the higher number of deeds and LMA'snecessary for development proposals, as well as to cover the cost ofattending Appeals before the ERD court. The Wasleys land divisionAppeal is likely to cost in the vicinity of $20,000 to defend.Legal Fees 38.19 55,000
Motor Vehicle Operating Costs (6 Vehicles) 38.23 61,200Advertising 38.24 4,550

ITEM 38 REFERENCE 2008/09DEVELOPMENT ASSESSMENT TO SUMMARY
Plant and MachineryProvision is made to purchase 6 sedan type motor vehicles (2 xHolden Epica CDX Petrol @ $25,200, 2 x Holden Omega @ $28,470,1 x Holden Captiva @ $33,180 and 1 x Holden Commodore SV6 @$30,960).
Purchase of Assets - Motor Vehicles 38.30 171,480
CAPITAL EXPENDITURE
Responsible Officer: Corporate Manager – Development & Environmental Services

ITEM NO. 39
2007/08 Mar Review Inflows (Outflows) Account No. Ref No. 2008/09
Inflows Source of Funding - OperatingRating 2552/2562 39.01 0Statutory Charges 2552/2562 39.02 0User Charges 2552/2562 39.03 0Grants and Subsidies - Operating 2552/2562 39.04 0Investment Income 2552/2562 39.05 0Donations 2552/2562 39.06 0
5,950 3,780 Reimbursements 2552/2562 39.07 4,750Commercial Activities 2552/2562 39.08 0
390 720 Other 2552/2562 39.09 290Plant Hire Recouped 0Salaries and Wages Oncosts Recouped 0FCA Oncosts Recouped 2552/2562 39.10 0
6,340 4,500 Total Operating Income 5,040
Inflows Source of Funding - RecoupmentsRecoupments 2553/2563 39.11 0
0 0 Total Recoupments 0
Inflows Source of Funding - Capital Grants and Subsidies - Capital 2557/2567 39.12 0Donations and Contributions 2557/2567 39.13 0Sale of Assets 2557/2567 39.14 0Other Capital Revenue 2557/2567 39.15 0Loans 2557/2567 39.16 0
0 0 Total Capital Income 0
SERVICE PROVISION AREA FIRE SERVICES
6,340 4,500 TOTAL INFLOWS 5,040
(Outflows) Total Operating Cost of Service
26,960 26,970 Employee Costs 2550/2560 39.17 15,330Salaries and Wages Oncosts 2550/2560 39.18 0
4,500 2,350 Contractual Services 2550/2560 39.19 3,5402,700 2,350 Materials 2550/2560 39.20 2,280
0 Finance Charges 2550/2560 39.21 017,640 17,640 Depreciation 2550/2560 39.22 14,6205,850 5,850 Plant Hire 2550/2560 39.23 2,4002,850 2,530 Other 2550/2560 39.24 3,2606,660 6,660 FCA Oncosts 2550/2560 39.25 2,250
67,160 64,350 Total Operating Expenses 43,680
(Outflows) AppropriationsAppropriations 2551/2561 39.26 0
0 0 Total Appropriations 0
(Outflows) Capital AcquisitionsInfrastructure 2555/2565 39.27 0Structures 2555/2565 39.28 0Buildings 2555/2565 39.29 0Plant and Machinery 2555/2565 39.30 0Furniture and Fittings 2555/2565 39.31 0Office Equipment 2555/2565 39.32 0
0 0 Total Capital Expenses 0
(Outflows) Loan Principal Repayments
0 Loan Principal Repayments 2555/2565 39.33 00 0 Total Loan Principal Repayments 0
67,160 64,350 TOTAL OUTFLOWS 43,680
-17,640 -17,640 Less: Non-Cash Items/Depreciation 2550/2560 39.22 -14,620
43,180 42,210 NET IMPACT ON RATING EFFORT 24,020

ITEM 39 REFERENCE 2008/09FIRE SERVICES TO SUMMARY
Reimbursements - Block Slashing 39.07 2,000Reimbursements - CFS 39.07 2,750
Allocation of Employee CostsGeneral Inspector 20%
Employee Costs 39.17 15,330
Contractors - Block Slashing 39.19 2,020
OPERATING INCOME
OPERATING EXPENSES
Responsible Officer: Corporate Manager – Development & Environmental Services

ITEM NO. 40
2007/08 Mar Review Inflows (Outflows) Account No. Ref No. 2008/09
Inflows Source of Funding - OperatingRating 2572 40.01 0
79,300 78,780 Statutory Charges 2572 40.02 87,000User Charges 2572 40.03 100Grants and Subsidies - Operating 2572 40.04 0Investment Income 2572 40.05 0Donations 2572 40.06 0
1,490 Reimbursements 2572 40.07 0Commercial Activities 2572 40.08 0
310 470 Other 2572 40.09 1,530Plant Hire Recouped 0Salaries and Wages Oncosts Recouped 0FCA Oncosts Recouped 2572 40.10 0
79,610 80,740 Total Operating Income 88,630
Inflows Source of Funding - Recoupments
6,670 6,690 Recoupments 2573 40.11 06,670 6,690 Total Recoupments 0
Inflows Source of Funding - Capital Grants and Subsidies - Capital 2577 40.12 0Donations and Contributions 2577 40.12 0
23,500 23,500 Sale of Assets 2577 40.12 20,910Other Capital Revenue 2577 40.12 0Loans 2577 40.12 0
23,500 23,500 Total Capital Income 20,910
SERVICE PROVISION AREA DOG CONTROL
109,780 110,930 TOTAL INFLOWS 109,540
(Outflows) Total Operating Cost of Service
32,380 32,390 Employee Costs 2570 40.17 79,370Salaries and Wages Oncosts 2570 40.18 0
7,000 6,730 Contractual Services 2570 40.19 19,1409,000 9,270 Materials 2570 40.20 7,780
Finance Charges 2570 40.21 0Depreciation 2570 40.22 0
7,650 7,650 Plant Hire 2570 40.23 10,20010,750 10,720 Other 2570 40.24 10,19013,110 13,110 FCA Oncosts 2570 40.25 19,74079,890 79,870 Total Operating Expenses 146,420
(Outflows) Appropriations
190 Appropriations 2571 40.26 00 190 Total Appropriations 0
(Outflows) Capital AcquisitionsInfrastructure 2575 40.27 0Structures 2575 40.28 0Buildings 2575 40.29 0
29,500 29,500 Plant and Machinery 2575 40.30 25,380Furniture and Fittings 2575 40.31 0Office Equipment 2575 40.32 0
29,500 29,500 Total Capital Expenses 25,380
(Outflows) Loan Principal RepaymentsLoan Principal Repayments 2575 40.33 0
0 0 Total Loan Principal Repayments 0
109,390 109,560 TOTAL OUTFLOWS 171,800
0 0 Less: Non-Cash Items/Depreciation 2570 40.22 0
-390 -1,370 NET IMPACT ON RATING EFFORT 62,260
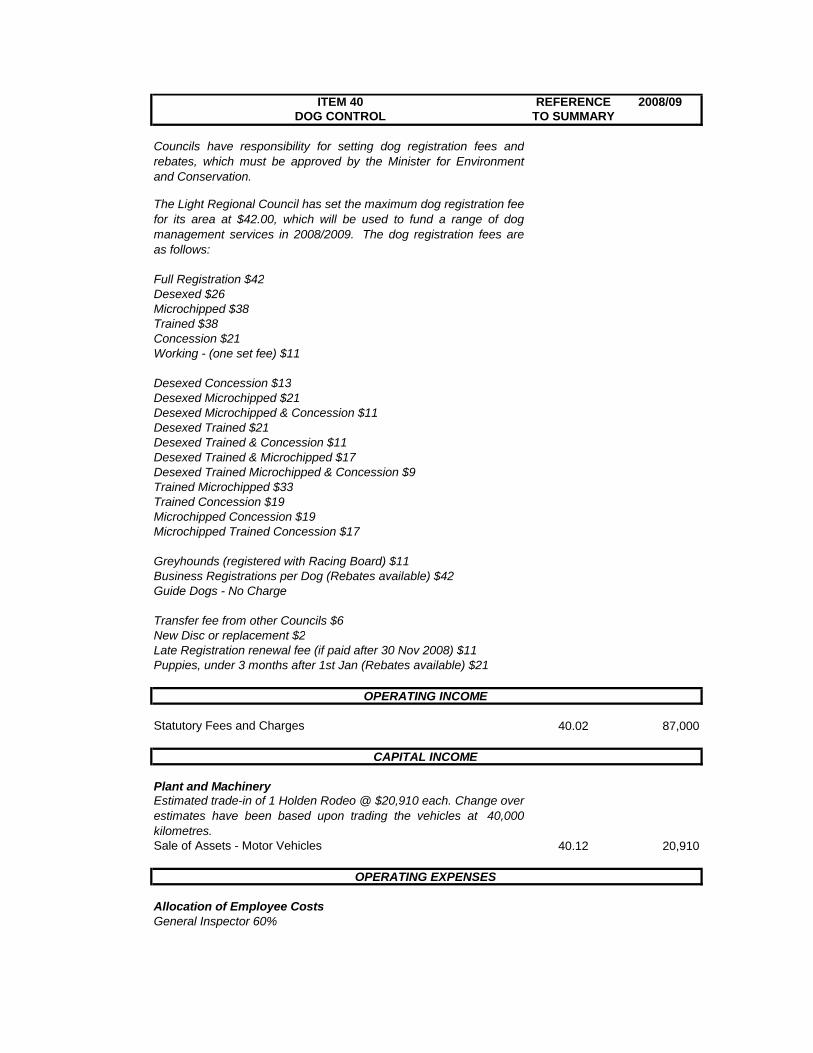
ITEM 40 REFERENCE 2008/09DOG CONTROL TO SUMMARY
Councils have responsibility for setting dog registration fees andrebates, which must be approved by the Minister for Environmentand Conservation.
The Light Regional Council has set the maximum dog registration feefor its area at $42.00, which will be used to fund a range of dogmanagement services in 2008/2009. The dog registration fees areas follows:
Full Registration $42Desexed $26Microchipped $38Trained $38Concession $21Working - (one set fee) $11
Desexed Concession $13Desexed Microchipped $21Desexed Microchipped & Concession $11Desexed Trained $21Desexed Trained & Concession $11Desexed Trained & Microchipped $17Desexed Trained Microchipped & Concession $9Trained Microchipped $33pp $Trained Concession $19Microchipped Concession $19Microchipped Trained Concession $17
Greyhounds (registered with Racing Board) $11Business Registrations per Dog (Rebates available) $42Guide Dogs - No Charge
Transfer fee from other Councils $6New Disc or replacement $2Late Registration renewal fee (if paid after 30 Nov 2008) $11Puppies, under 3 months after 1st Jan (Rebates available) $21
Statutory Fees and Charges 40.02 87,000
Plant and MachineryEstimated trade-in of 1 Holden Rodeo @ $20,910 each. Change overestimates have been based upon trading the vehicles at 40,000kilometres.Sale of Assets - Motor Vehicles 40.12 20,910
Allocation of Employee CostsGeneral Inspector 60%
OPERATING INCOME
CAPITAL INCOME
OPERATING EXPENSES

ITEM 40 REFERENCE 2008/09DOG CONTROL TO SUMMARY
Employee Costs 40.17 79,370
Dog Report Notices
Council sends reminder notices for re-registration of dogs. Fundsare required to employ a contractor to produces a Civica report toautomatically generate the dog registration renewal notices.
40.19 10,000
SignageFunds are allocated for the purchase and installation of appropriatesignage within Council's various open space precincts. Signage isrequired to alert dog owners of areas where restraining of dogs onleashes is necessary.Signs and Posts 40.20 5,050
Motor Vehicle Operating Costs 40.23 10,200
Levies - Dog and Cat Management Board 40.24 7,370
Plant and MachineryProvision is made to purchase 1 utility type motor vehicle (Holden
CAPITAL EXPENDITURE
Provision is made to purchase 1 utility type motor vehicle (HoldenCommodore VE) @ $25,380 each. Costs to get the vehicle fittedwith fixtures and fittings for the General Inspector's work are alsoincluded in the total cost of purchase.
Purchase of Assets - Motor Vehicles 40.30 25,380
Responsible Officer: Corporate Manager – Development & Environmental Services

ITEM NO. 41
2007/08 Mar Review Inflows (Outflows) Account No. Ref No. 2008/09
Inflows Source of Funding - OperatingRating 2582 41.01 0
0 70 Statutory Charges 2582 41.02 700User Charges 2582 41.03 0Grants and Subsidies - Operating 2582 41.04 0Investment Income 2582 41.05 0Donations 2582 41.06 0Reimbursements 2582 41.07 0Commercial Activities 2582 41.08 0
160 380 Other 2582 41.09 290Plant Hire Recouped 0Salaries and Wages Oncosts Recouped 0FCA Oncosts Recouped 2582 41.10 0
160 450 Total Operating Income 990
Inflows Source of Funding - Recoupments
0 Recoupments 2583 41.11 00 0 Total Recoupments 0
Inflows Source of Funding - Capital Grants and Subsidies - Capital 2587 41.12 0Donations and Contributions 2587 41.13 0Sale of Assets 2587 41.14 0Other Capital Revenue 2587 41.15 0
0 Loans 2587 41.16 00 0 Total Capital Income 0
SERVICE PROVISION AREA BY-LAWS
160 450 TOTAL INFLOWS 990
(Outflows) Total Operating Cost of Service
16,790 16,970 Employee Costs 2580 41.17 14,820Salaries and Wages Oncosts 2580 41.18 0
6,500 3,880 Contractual Services 2580 41.19 2,0101,000 1,000 Materials 2580 41.20 1,000
Finance Charges 2580 41.21 0Depreciation 2580 41.22 0
3,600 3,600 Plant Hire 2580 41.23 2,400500 500 Other 2580 41.24 1,000
3,160 3,160 FCA Oncosts 2580 41.25 7,99031,550 29,110 Total Operating Expenses 29,220
(Outflows) AppropriationsAppropriations 2581 41.26 0
0 0 Total Appropriations 0
(Outflows) Capital Acquisitions
0 Infrastructure 2585 41.27 0Structures 2585 41.28 0Buildings 2585 41.29 0Plant and Machinery 2585 41.30 0Furniture and Fittings 2585 41.31 0Office Equipment 2585 41.32 0
0 0 Total Capital Expenses 0
(Outflows) Loan Principal RepaymentsLoan Principal Repayments 2585 41.33 0
0 0 Total Loan Principal Repayments 0
31,550 29,110 TOTAL OUTFLOWS 29,220
0 0 Less: Non-Cash Items/Depreciation 2580 41.22 0
31,390 28,660 NET IMPACT ON RATING EFFORT 28,230

ITEM 41 REFERENCE 2008/09BY-LAWS TO SUMMARY
Council is required to have an authorised officer who is responsiblefor the administration of Council By-Laws. These By-Laws includeParking, Noise Pollution (Animals) and Litter Control. This officer isauthorised to investigate complaints and take appropriate actionwhich may include the issuing of expiation notices for offencescommitted.
Statutory Fees and Charges 41.02 700
Allocation of Employee CostsGeneral Inspector 20%
Employee Costs 41.17 14,820
OPERATING INCOME
OPERATING EXPENSES
Responsible Officer: Corporate Manager – Development & Environmental Services

ITEM NO. 42
2007/08 Mar Review Inflows (Outflows) Account No. Ref No. 2008/09
Inflows Source of Funding - OperatingRating 2752 42.01 0Statutory Charges 2752 42.02 0User Charges 2752 42.03 0Grants and Subsidies - Operating 2752 42.04 0Investment Income 2752 42.05 0Donations 2752 42.06 0Reimbursements 2752 42.07 0Commercial Activities 2752 42.08 0Other 2752 42.09 0Plant Hire Recouped 0Salaries and Wages Oncosts Recouped 0FCA Oncosts Recouped 2752 42.10 0
0 0 Total Operating Income 0
Inflows Source of Funding - RecoupmentsRecoupments 2753 42.11 0
0 0 Total Recoupments 0
Inflows Source of Funding - Capital Grants and Subsidies - Capital 2757 42.12 0Donations and Contributions 2757 42.13 0Sale of Assets 2757 42.14 0Other Capital Revenue 2757 42.15 0Loans 2757 42.16 0
0 0 Total Capital Income 0
SERVICE PROVISION AREA ANIMAL & PLANT CONTROL
0 0 TOTAL INFLOWS 0
(Outflows) Total Operating Cost of Service
0 Employee Costs 2750 42.17 00 Salaries and Wages Oncosts 2750 42.18 0
5,000 5,640 Contractual Services 2750 42.19 0Materials 2750 42.20 0Finance Charges 2750 42.21 0Depreciation 2750 42.22 0
0 Plant Hire 2750 42.23 00 180 Other 2750 42.24 0
10 10 FCA Oncosts 2750 42.25 05,010 5,830 Total Operating Expenses 0
(Outflows) AppropriationsAppropriations 2751 42.26 0
0 0 Total Appropriations 0
(Outflows) Capital AcquisitionsInfrastructure 2755 42.27 0Structures 2755 42.28 0Buildings 2755 42.29 0Plant and Machinery 2755 42.30 0Furniture and Fittings 2755 42.31 0Office Equipment 2755 42.32 0
0 0 Total Capital Expenses 0
(Outflows) Loan Principal RepaymentsLoan Principal Repayments 2755 42.33 0
0 0 Total Loan Principal Repayments 0
5,010 5,830 TOTAL OUTFLOWS 0
0 0 Less: Non-Cash Items/Depreciation 2750 42.22 0
5,010 5,830 NET IMPACT ON RATING EFFORT 0

ITEM 42 REFERENCE 2008/09ANIMAL AND PLANT CONTROL TO SUMMARY
No longer in use

ITEM NO. 43
2007/08 Mar Review Inflows (Outflows) Account No. Ref No. 2008/09
Inflows Source of Funding - OperatingRating 2602 - 2622 43.01 0
34,000 37,620 Statutory Charges 2602 - 2622 43.02 36,000User Charges 2602 - 2622 43.03 0
4,000 8,220 Grants and Subsidies - Operating 2602 - 2622 43.04 11,140Investment Income 2602 - 2622 43.05 0Donations 2602 - 2622 43.06 0
0 310 Reimbursements 2602 - 2622 43.07 0Commercial Activities 2602 - 2622 43.08 0
710 1,100 Other 2602 - 2622 43.09 2,020Plant Hire Recouped 0Salaries and Wages Oncosts Recouped 0FCA Oncosts Recouped 2602 - 2622 43.10 0
38,710 47,250 Total Operating Income 49,160
Inflows Source of Funding - RecoupmentsRecoupments 2603 - 2623 43.11 0
0 0 Total Recoupments 0
Inflows Source of Funding - Capital Grants and Subsidies - Capital 2607 - 2627 43.12 0Donations and Contributions 2607 - 2627 43.13 0Sale of Assets 2607 - 2627 43.14 20,400Other Capital Revenue 2607 - 2627 43.15 0Loans 2607 - 2627 43.16 0
0 0 Total Capital Income 20,400
SERVICE PROVISION AREA HEALTH SERVICES
38,710 47,250 TOTAL INFLOWS 69,560
(Outflows) Total Operating Cost of Service
76,840 76,910 Employee Costs 2600 - 2620 43.17 107,9300 Salaries and Wages Oncosts 2600 - 2620 43.18 0
7,550 6,410 Contractual Services 2600 - 2620 43.19 25,6702,250 2,150 Materials 2600 - 2620 43.20 5,750
0 Finance Charges 2600 - 2620 43.21 0Depreciation 2600 - 2620 43.22 0
1,120 12,120 Plant Hire 2600 - 2620 43.23 15,0003,520 4,540 Other 2600 - 2620 43.24 3,560
26,100 26,100 FCA Oncosts 2600 - 2620 43.25 29,980117,380 128,230 Total Operating Expenses 187,890
(Outflows) AppropriationsAppropriations 2601 - 2621 43.26 0
0 0 Total Appropriations 0
(Outflows) Capital AcquisitionsInfrastructure 2605 - 2625 43.27 0Structures 2605 - 2625 43.28 0Buildings 2605 - 2625 43.29 0
2,000 2,000 Plant and Machinery 2605 - 2625 43.30 28,290Furniture and Fittings 2605 - 2625 43.31 0
0 Office Equipment 2605 - 2625 43.32 02,000 2,000 Total Capital Expenses 28,290
(Outflows) Loan Principal Repayments
0 Loan Principal Repayments 2605 - 2625 43.33 00 0 Total Loan Principal Repayments 0
119,380 130,230 TOTAL OUTFLOWS 216,180
0 0 Less: Non-Cash Items/Depreciation 2600 - 2620 43.22 0
80,670 82,980 NET IMPACT ON RATING EFFORT 146,620

ITEM 43 REFERENCE 2008/09HEALTH SERVICES TO SUMMARY
Council strives to achieve the highest possible standard in meeting itsstatutory responsibilities in public and environmental health. Council isrequired under the Public and Environmental Health Act to carry outthe administration of Septic Tank installations, follow up notifiablediseases, ensure that public pools are maintained within prescribedlimits and ensure that insanitary conditions are not permitted to existwithin the district.
Council has a commitment to provide assistance to the community inthe effective and ongoing control of pests such as European Wasps,rats, mosquitoes, midges and pigeons which present a direct impact tohealth and/or the comfort and well being of residents and to provideadvice and assistance to residents in the control of vermin and insectpests within residential areas of the district. This work would be doneby a private contractor.
Staff duties are to carry out inspections, follow up complaints andprovide assistance and advice to residents on all matters relating topublic and environmental health. The officers shall be responsible formaintaining an accurate and up to date waste control register andcomplaints register and shall regularly report to Council of activitiesundertaken in carrying out this function.
Council is required under the Food Act to ensure food for humanCouncil is required under the Food Act to ensure food for humanconsumption that is offered for sale or is prepared, manufactured ortransported within its area complies with the Food Standards Codeand is fit for human consumption.
Two clinics per year are conducted at the Kapunda High School andXavier College offering Hepatitis B vaccines to the Year eightstudents.
Once per year a clinic is conducted at the Kapunda High School andXavier College offering Adult DTPA to the year nine students.
Council strives to ensure that all children in the district, regardless ofrace, sex, disability or other impairment have free access to the fullrange of immunisations as recommended in the NH & MRCimmunisation schedule. It is an objective of Council to maintainchildhood immunisation levels at 95% or above.
Hepatitis B vaccines are given to Council staff as required under OHSand all staff are offered an Influenza vaccination.
The Environmental Health Officer supervises immunisation clinics.This function also requires the officers to stay informed of changes inimmunisation practices, promote the service to the community andregularly report to Council on the efficiency of the programme.

ITEM 43 REFERENCE 2008/09HEALTH SERVICES TO SUMMARY
Septic TanksCouncil receives fees for approval and inspection of septic tankinstallations, the fee structure is set down in the Public andEnvironmental Health Regulations and is $82.50 for application and$89.50 for each of the three standard inspections. Estimate based onapproximately 95 applications at the maximum amount of $351.00 perapplication. These fees do not attract GST.Fees - Septic Tank Approvals and Inspections 43.02 34,000
Fees - Food Inspections 43.02 2,000Grants - Immunisation 43.04 11,140
Plant and MachineryEstimated trade-in of 1 utility type vehicle @ $20,400. Change overestimates have been based upon trading the vehicles at 80,000kilometres.
Sale of Assets - Motor Vehicles 43.14 20,400
OPERATING INCOME
CAPITAL INCOME
OPERATING EXPENSES
Allocation of Employee CostsEnvironmental Health Officer 100%Team Leader - Administration 10%
Employee Costs 43.17 107,930
Contractors - Eradication of Wasps and Bees 43.19 20,710
Motor Vehicle Operating Costs (1 vehicle) 43.23 10,200
Plant and MachineryProvision is made to purchase 1 utility type motor vehicle (HoldenRodeo 4x2 Crew Cab) @ $28,290 each.
Purchase of Assets - Motor Vehicles 43.30 28,290
OPERATING EXPENSES
CAPITAL EXPENDITURE
Responsible Officer: Corporate Manager – Development & Environmental Services

ITEM NO. 44
2007/08 Mar Review Inflows (Outflows) Account No. Ref No. 2008/09
Inflows Source of Funding - OperatingRating 2632/2642 44.01 0Statutory Charges 2632/2642 44.02 0
33,410 45,260 User Charges 2632/2642 44.03 51,000Grants and Subsidies - Operating 2632/2642 44.04 0Investment Income 2632/2642 44.05 0Donations 2632/2642 44.06 0
79,670 79,670 Reimbursements 2632/2642 44.07 125,430Commercial Activities 2632/2642 44.08 0
200 300 Other 2632/2642 44.09 0Plant Hire Recouped 0Salaries and Wages Oncosts Recouped 0FCA Oncosts Recouped 2632/2642 44.10 0
113,280 125,230 Total Operating Income 176,430
Inflows Source of Funding - RecoupmentsRecoupments 2633/2643 44.11 0
0 0 Total Recoupments 0
Inflows Source of Funding - Capital Grants and Subsidies - Capital 2637/2647 44.12 0Donations and Contributions 2637/2647 44.13 0Sale of Assets 2637/2647 44.14 0Other Capital Revenue 2637/2647 44.15 0
20,000 20,000 Loans 2637/2647 44.16 50,00020,000 20,000 Total Capital Income 50,000
SERVICE PROVISION AREA WASTE MANAGEMENT SERVICES
133,280 145,230 TOTAL INFLOWS 226,430
(Outflows) Total Operating Cost of Service
25,260 26,200 Employee Costs 2630/2640 44.17 4,4009,500 3,570 Salaries and Wages Oncosts 2630/2640 44.18 4,310
86,720 111,020 Contractual Services 2630/2640 44.19 148,8307,550 5,290 Materials 2630/2640 44.20 2,9204,670 4,760 Finance Charges 2630/2640 44.21 4,8202,600 2,600 Depreciation 2630/2640 44.22 2,4606,900 6,900 Plant Hire 2630/2640 44.23 0
29,300 29,720 Other 2630/2640 44.24 61,11013,300 13,300 FCA Oncosts 2630/2640 44.25 6,530
185,800 203,360 Total Operating Expenses 235,379
(Outflows) AppropriationsAppropriations 2631/2641 44.26 0
0 0 Total Appropriations 0
(Outflows) Capital AcquisitionsInfrastructure 2635/2645 44.27 90,000
20,000 21,000 Structures 2635/2645 44.28 0Buildings 2635/2645 44.29 0Plant and Machinery 2635/2645 44.30 0Furniture and Fittings 2635/2645 44.31 0Office Equipment 2635/2645 44.32 0
20,000 21,000 Total Capital Expenses 90,000
(Outflows) Loan Principal Repayments
8,890 8,890 Loan Principal Repayments 2635/2645 44.33 11,5508,890 8,890 Total Loan Principal Repayments 11,550
214,690 233,250 TOTAL OUTFLOWS 336,929
-2,600 -2,600 Less: Non-Cash Items/Depreciation 2630/2640 44.22 -2,460
78,810 85,420 NET IMPACT ON RATING EFFORT 108,039

ITEM 44 REFERENCE 2008/09WASTE MANAGEMENT SERVICES TO SUMMARY
Council owns and operates Landfill Waste Management Depots atScotties Grave Road, Kapunda and Haydon Road, Kangaroo Flat.Payment is required by residents who wish to deposit material at thewaste management stations.
Council on the ratification of its Waste Management Strategy applied tothe Environment Protection Agency to extend the life of the Kapunda andRoseworthy Waste Management Stations. Council has successfullysubmitted a Management Plan to the Environment Protection Agencywhich meets the stringent guidelines and criteria in the management oflandfill sites.
User Charges - Waste Management 44.03 50,000
Landfill Environmental Management Plan (LAMP)Professional Services 44.19 30,400
Contractors - Landfill Compaction 44.19 80,760
Contractors - Green organic mulching 44 19 20 500
OPERATING INCOME
OPERATING EXPENSES
Contractors - Green organic mulching 44.19 20,500
Contractors - Superintendence, Tyre Salvage 44.19 14,150
Solid Waste Levy - Environment Protection Authority 44.24 59,340
Roseworthy Waste Management Station Closure WorksCapital Purchases - Infrastructure 90,000
Loan Principal Repayments (Construction) 44.33 15,640
LOAN PRINCIPAL REPAYMENTS
Responsible Officer: Corporate Manager – Infrastructure and Works
CAPITAL EXPENDITURE

ITEM NO. 45
2007/08 Mar Review Inflows (Outflows) Account No. Ref No. 2008/09
Inflows Source of Funding - OperatingRating 2652 - 2672 45.01 0Statutory Charges 2652 - 2672 45.02 0
10,000 14,030 User Charges 2652 - 2672 45.03 10,000Grants and Subsidies - Operating 2652 - 2672 45.04 0Investment Income 2652 - 2672 45.05 0Donations 2652 - 2672 45.06 0
24,300 25,290 Reimbursements 2652 - 2672 45.07 36,000Commercial Activities 2652 - 2672 45.08 0
210 320 Other 2652 - 2672 45.09 0Plant Hire Recouped 0Salaries and Wages Oncosts Recouped 0FCA Oncosts Recouped 2652 - 2672 45.10 0
34,510 39,640 Total Operating Income 46,000
Inflows Source of Funding - Recoupments
30,900 30,900 Recoupments 2653 - 2673 45.11 030,900 30,900 Total Recoupments 0
Inflows Source of Funding - Capital
30,040 30,040 Grants and Subsidies - Capital 2657 - 2677 45.12 0Donations and Contributions 2657 - 2677 45.13 0Sale of Assets 2657 - 2677 45.14 0Other Capital Revenue 2657 - 2677 45.15 0
94,000 145,900 Loans 2657 - 2677 45.16 0124,040 175,940 Total Capital Income 0
SERVICE PROVISION AREA WASTE COLLECTION AND RECYCLING
189,450 246,480 TOTAL INFLOWS 46,000
(Outflows) Total Operating Cost of Service
26,310 33,270 Employee Costs 2650 - 2670 45.17 12,0007,600 19,570 Salaries and Wages Oncosts 2650 - 2670 45.18 11,760
477,380 522,490 Contractual Services 2650 - 2670 45.19 631,71030,000 30,350 Materials 2650 - 2670 45.20 27,5003,760 Finance Charges 2650 - 2670 45.21 7,800
23,230 23,230 Depreciation 2650 - 2670 45.22 71,9904,280 9,380 Plant Hire 2650 - 2670 45.23 8,2002,540 4,300 Other 2650 - 2670 45.24 1,550
29,870 29,870 FCA Oncosts 2650 - 2670 45.25 134,590604,970 672,460 Total Operating Expenses 907,100
(Outflows) Appropriations
0 Appropriations 2651 - 2671 45.26 00 0 Total Appropriations 0
(Outflows) Capital AcquisitionsInfrastructure 2655 - 2675 45.27 0Structures 2655 - 2675 45.28 0Buildings 2655 - 2675 45.29 0
154,840 214,880 Plant and Machinery 2655 - 2675 45.30 04,650 Furniture and Fittings 2655 - 2675 45.31 0
Office Equipment 2655 - 2675 45.32 0154,840 219,530 Total Capital Expenses 0
(Outflows) Loan Principal Repayments
7,830 Loan Principal Repayments 2655 - 2675 45.33 27,1607,830 0 Total Loan Principal Repayments 27,160
767,640 891,990 TOTAL OUTFLOWS 934,260
-23,230 -23,230 Less: Non-Cash Items/Depreciation 2650 - 2670 45.22 -71,990
554,960 622,280 NET IMPACT ON RATING EFFORT 816,270

ITEM 45 REFERENCE 2008/09WASTE COLLECTION AND RECYCLING TO SUMMARY
Council provides a waste, recycling and green organic collectionservice to residents in the region. Council's contractor conducts agarbage pick up service from township areas and portions of therural area.
User Charges - Waste, Recycling and Green Organics 45.03 10,000Reimbursements - Bin Purchase 45.07 25,000Reimbursements - Drum Muster 45.07 11,000
Wages - Council Labour 45.17 12,000Wages Overheads (98% of Wages) 45.18 11,760Plant Operating Costs 45.23 8,200
Bin StickersProvision is made for printing and posting of waste collectionstickers.
Printers 45.19 5,000
Disposal Costs
OPERATING INCOME
OPERATING EXPENSES
Disposal CostsProvision is made to compensate Council's Waste ManagementStations for garbage collected from Council's pick up service anddeposited there.Disposal Costs - Internal 45.19 125,430
Disposal CostsProvision is made for Solo Resource Recovery to provide a weeklygarbage pick up service to Council ratepayers.
Disposal Costs - External - includes Streets & Reserves Collection 45.19 228,600
Disposal CostsProvision is made for Solo Resource Recovery to provide Councilratepayers with a kerbside recycling service every fortnight.Contractors 45.19 112,400
Contractors - Recycling (NAWMA) 45.19 32,000
Disposal CostsProvision is made for Solo Resource Recovery to provide acollection service for Green Organics every fortnight.Contractors - Green Organics Collection 45.19 102,000
Green Organics ProcessingProvision is made for Pete's Soils to provide a processing servicefor Green Organics collected.Contractors - Green Organics Processing 45.19 14,340
Purchase of Bins 45.20 22,500

ITEM 45 REFERENCE 2008/09WASTE COLLECTION AND RECYCLING TO SUMMARY
Drum Muster 45.19 11,000
Interest on Loans 45.21 7,800
Loan Principal Repayments (Green Waste/Organics Collection) 45.33 27,160
LOAN PRINCIPAL REPAYMENTS
Responsible Officer: Corporate Manager – Infrastructure and Works

ITEM NO. 46
2007/08 Mar Review Inflows (Outflows) Account No. Ref No. 2008/09
Inflows Source of Funding - Operating
745,420 748,200 Rating 2702 - 2732 46.01 806,300Statutory Charges 2702 - 2732 46.02 0
50,500 53,000 User Charges 2702 - 2732 46.03 0Grants and Subsidies - Operating 2702 - 2732 46.04 0Investment Income 2702 - 2732 46.05 0Donations 2702 - 2732 46.06 52,000
500 590 Reimbursements 2702 - 2732 46.07 670Commercial Activities 2702 - 2732 46.08 0
600 830 Other 2702 - 2732 46.09 620Plant Hire Recouped 0Salaries and Wages Oncosts Recouped 0FCA Oncosts Recouped 2702 - 2732 46.10 0
797,020 802,620 Total Operating Income 859,590
Inflows Source of Funding - Recoupments
768,420 854,720 Recoupments 2703 - 2733 46.11 2,242,690768,420 854,720 Total Recoupments 2,242,690
Inflows Source of Funding - Capital Grants and Subsidies - Capital 2707 - 2737 46.12 0
1,465,000 1,465,000 Donations and Contributions 2707 - 2737 46.13 2,448,88035,500 35,500 Sale of Assets 2707 - 2737 46.14 03,870 3,870 Other Capital Revenue 2707 - 2737 46.15 4,050
Loans 2707 - 2737 46.16 912,4701,504,370 1,504,370 Total Capital Income 3,365,400
SERVICE PROVISION AREA COMMUNITY WASTE WATER MANAGEMENT SYSTEMS
3,069,810 3,161,710 TOTAL INFLOWS 6,467,680
(Outflows) Total Operating Cost of Service
78,980 78,000 Employee Costs 2700 - 2730 46.17 60,93020,920 20,920 Salaries and Wages Oncosts 2700 - 2730 46.18 28,101
116,250 122,950 Contractual Services 2700 - 2730 46.19 100,70024,970 25,320 Materials 2700 - 2730 46.20 21,25027,410 27,410 Finance Charges 2700 - 2730 46.21 14,550
192,680 192,680 Depreciation 2700 - 2730 46.22 193,93043,640 43,640 Plant Hire 2700 - 2730 46.23 15,16021,820 21,290 Other 2700 - 2730 46.24 24,42031,650 31,650 FCA Oncosts 2700 - 2730 46.25 67,210
558,320 563,860 Total Operating Expenses 526,251
(Outflows) Appropriations
192,510 631,360 Appropriations 2701 - 2731 46.26 397,660192,510 631,360 Total Appropriations 397,660
(Outflows) Capital Acquisitions
2,340,000 2,340,000 Infrastructure 2705 - 2735 46.27 5,662,600Structures 2705 - 2735 46.28 0Buildings 2705 - 2735 46.29 0
64,300 64,300 Plant and Machinery 2705 - 2735 46.30 0Furniture and Fittings 2705 - 2735 46.31 0Office Equipment 2705 - 2735 46.32 0
2,404,300 2,404,300 Total Capital Expenses 5,662,600
(Outflows) Loan Principal Repayments
107,010 107,010 Loan Principal Repayments 2705 - 2735 46.33 75,100107,010 107,010 Total Loan Principal Repayments 75,100
3,262,140 3,706,530 TOTAL OUTFLOWS 6,661,610
-192,680 -192,680 Less: Non-Cash Items/Depreciation 2700 - 2730 46.22 -193,930
-350 352,140 NET IMPACT ON RATING EFFORT 2

ITEM 46 REFERENCE 2008/09COMMUNITY WASTE WATER MANAGEMENT SYSTEMS TO SUMMARY
Much of the district has soils which consist of heavy clays that are poorlydrained and make on site disposal of effluent very difficult. In an effort toremedy this problem and ensure effluent is disposed of in a sanitarymanner which does not create a threat to public health, Council hasinstalled Community Waste Water Management Systems (CWMS) in thetowns of Kapunda, Greenock, Freeling and Roseworthy. A CWMS relieson primary treatment of household sewerage in a septic tank installed inthe ratepayer’s property, the treated sewerage (effluent) runs into anetwork of gravity drains and/or rising mains, owned by Council andgenerally installed along road reserves. The effluent is fed into asecondary treatment system of lagoons.
Kapunda CWMS
The CWMS in Kapunda was installed in 1968 and was one of the firstCWMS installations in South Australia. The scheme currently hasapproximately 30 km of gravity drains mains, the majority of which areearthenware and subject to high maintenance costs. There are threepump stations in the town, one at the intersection of Blackwell St andChapel St which pumps effluent along a 300mm rising main to thegravity line on Crase St. One pump chamber is on Cameron St. Thispump station pumps effluent along a 550m rising main to the gravity linepump station pumps effluent along a 550m rising main to the gravity lineon Crase St. The third pump station is located on Perry Road, Kapundawhich was installed to service the Kapunda Estate. Secondary effluenttreatment is carried out by a series of 6 ponds located on Section 1404in the Hundred of Kapunda. Final use of effluent is achieved by acombination of evaporation, irrigation of the town oval, caravan park andgolf course.
Freeling CWMSThe CWMS in Freeling was installed in 1982. The scheme currently hasapproximately 8 km of gravity drains mains, all of which are UPVC andapproximately 8km of rising mains. There are five pump stations in thetown, one at the intersection of Church St and Kirchner St, FreelingRecreation Park adjacent to Hanson St., Gray St., Derby St. andFiddlewood Drive.
Secondary effluent treatment is carried out by a lagoon system locatedon Lot 102 Part Section 407 in the Hundred of Nuriootpa, final disposalis achieved by evaporation. Reclaimed water is utilised by a primaryproducer.
Greenock CWMS
The CWMS in Greenock was installed in 1985. The scheme currentlyhas approximately 5 km of gravity drains mains, all of which are UPVCand approximately 6km of rising mains. There are two pump stations inthe town, one of which is on Adelaide Road and pumps effluent to themain pumping chamber on George St. Secondary effluent treatment iscarried out by a lagoon system located on Section 151 in the Hundred ofNuriootpa, final disposal is achieved by evaporation and irrigation ofvines on adjacent land owned by Mr. Bevan Roenfeldt.

ITEM 46 REFERENCE 2008/09COMMUNITY WASTE WATER MANAGEMENT SYSTEMS TO SUMMARY
Roseworthy CWMSThe CWMS at Roseworthy was commissioned in January 1997. Thescheme currently has approximately 5 km of gravity drains mains whichare all new UPVC. Secondary effluent treatment is carried out by anaerobic waste water treatment plant located on Section 85 in theHundred of Mudla Wirra. Final disposal is achieved by irrigation onadjacent community land.
CWMS Separate Charges
The following Community Waste Water Management System (CWMS)separate charges have been calculated on the establishment, futurereplacement and ongoing maintenance costs of the individual schemesthat are located within the specified townships.
Kapunda (1223 charges) at $368 eachKapunda CWMS Service Charges 46.01 450,060
Freeling (483 charges) at $368 eachFreeling CWMS Service Charges 46.01 177,750
OPERATING INCOME
Greenock (307 charges) at $368 eachGreenock CWMS Service Charges 46.01 112,980
Roseworthy (178 charges) at $368 eachRoseworthy CWMS Rates 46.01 65,510
Augmentation Charges
Provision is made for the receipt of CWMS Augmentation funds fromproperty developers. Council's CWMS augmentation charge is leviedpursuant section 188 of the Local Government Act 1999, to fund futuredevelopment works to the CWMS and is chargeable in accordance withCouncil's adopted policy on the issue. The CWMS augmentation chargeis 4,000 (GST exclusive) per allotment of land.
Allocation is made to receive 13 applications.
Augmentation Charge 46.03 52,000
Waste Water Treatment PlantsRecoupments from Kapunda CWMS Reserve 46.11 990,000Recoupment from Freeling CWMS Reserve 46.11 795,000Recoupment from Greenock CWMS Reserve 46.11 456,000
Loan Funds 46.16 912,470
RECOUPMENTS
CAPITAL INCOME
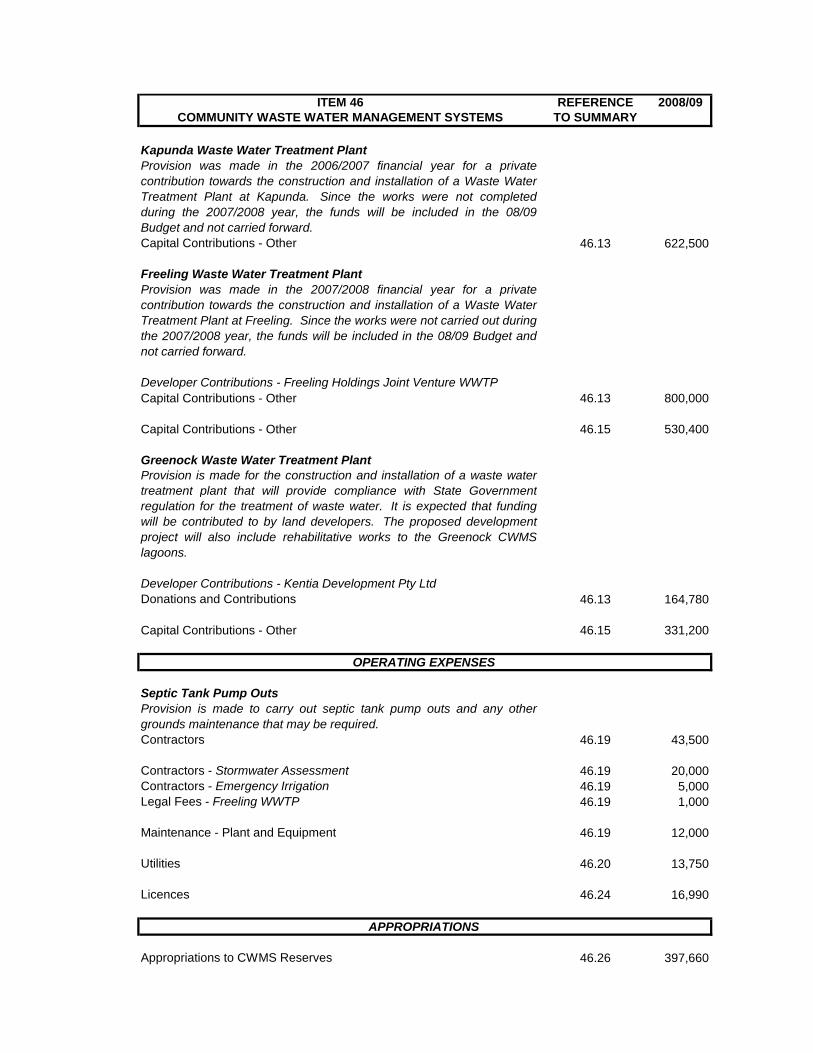
ITEM 46 REFERENCE 2008/09COMMUNITY WASTE WATER MANAGEMENT SYSTEMS TO SUMMARY
Kapunda Waste Water Treatment PlantProvision was made in the 2006/2007 financial year for a privatecontribution towards the construction and installation of a Waste WaterTreatment Plant at Kapunda. Since the works were not completedduring the 2007/2008 year, the funds will be included in the 08/09Budget and not carried forward.Capital Contributions - Other 46.13 622,500
Freeling Waste Water Treatment PlantProvision was made in the 2007/2008 financial year for a privatecontribution towards the construction and installation of a Waste WaterTreatment Plant at Freeling. Since the works were not carried out duringthe 2007/2008 year, the funds will be included in the 08/09 Budget andnot carried forward.
Developer Contributions - Freeling Holdings Joint Venture WWTPCapital Contributions - Other 46.13 800,000
Capital Contributions - Other 46.15 530,400
Greenock Waste Water Treatment PlantProvision is made for the construction and installation of a waste watertreatment plant that will provide compliance with State Governmenttreatment plant that will provide compliance with State Governmentregulation for the treatment of waste water. It is expected that fundingwill be contributed to by land developers. The proposed developmentproject will also include rehabilitative works to the Greenock CWMSlagoons.
Developer Contributions - Kentia Development Pty LtdDonations and Contributions 46.13 164,780
Capital Contributions - Other 46.15 331,200
Septic Tank Pump OutsProvision is made to carry out septic tank pump outs and any othergrounds maintenance that may be required.Contractors 46.19 43,500
Contractors - Stormwater Assessment 46.19 20,000Contractors - Emergency Irrigation 46.19 5,000Legal Fees - Freeling WWTP 46.19 1,000
Maintenance - Plant and Equipment 46.19 12,000
Utilities 46.20 13,750
Licences 46.24 16,990
Appropriations to CWMS Reserves 46.26 397,660
APPROPRIATIONS
OPERATING EXPENSES

ITEM 46 REFERENCE 2008/09COMMUNITY WASTE WATER MANAGEMENT SYSTEMS TO SUMMARY
Kapunda Waste Water Treatment Plant
Council foreshadows that future planning in relation to the KapundaCWMS will see the need for the installation of a waste water treatmentplant that will provide compliance with State Government regulation forthe treatment of waste water. No allocation is made in this budgetdocument at this time for that major item of expense, however it isbelieved that to provide a suitable waste water treatment plant will costin the order of $2,200,000. Since the works were not finished in the2007/2008 financial year, the remainder of the project has been includedin the 2008/2009 budget.
Capital Purchases - Infrastructure 46.27 2,198,300
Freeling Waste Water Treatment PlantWaste Water Treatment Plant
Capital Purchases - Infrastructure 46.27 2,185,650
Greenock Waste Water Treatment PlantProvision is made for the construction and installation of a waste water
CAPITAL EXPENDITURE
Provision is made for the construction and installation of a waste watertreatment plant that will provide compliance with State Governmentregulation for the treatment of waste water. It is expected that fundingwill be contributed to by land developers. The proposed developmentproject will also include rehabilitative works to the Greenock CWMSlagoons. Includes Adelaide Road pump station storage augmentation($45,000). Since the works were not carried out in the 2007/2008financial year, the entire project has been included in the 2008/2009budget.
Capital Purchases - Infrastructure 46.27 1,278,650
Responsible Officer: Corporate Manager – Strategy and Project Planning & Corporate Manager – Infrastructure and Works

ITEM NO. 47
2007/08 Mar Review Inflows (Outflows) Account No. Ref No. 2008/09
Inflows Source of Funding - OperatingRating 2762/2782 47.01 0Statutory Charges 2762/2782 47.02 0User Charges 2762/2782 47.03 0Grants and Subsidies - Operating 2762/2782 47.04 0Investment Income 2762/2782 47.05 0Donations 2762/2782 47.06 0Reimbursements 2762/2782 47.07 0Commercial Activities 2762/2782 47.08 0
80 120 Other 2762/2782 47.09 0Plant Hire Recouped 0Salaries and Wages Oncosts Recouped 0FCA Oncosts Recouped 2762/2782 47.10 0
80 120 Total Operating Income 0
Inflows Source of Funding - Recoupments
0 Recoupments 2763/2783 47.11 00 0 Total Recoupments 0
Inflows Source of Funding - Capital Grants and Subsidies - Capital 2767/2787 47.12 0
0 Donations and Contributions 2767/2787 47.13 0Sale of Assets 2767/2787 47.14 0Other Capital Revenue 2767/2787 47.15 0Loans 2767/2787 47.16 0
0 0 Total Capital Income 0
SERVICE PROVISION AREA WETLANDS
80 120 TOTAL INFLOWS 0
(Outflows) Total Operating Cost of Service
8,360 9,580 Employee Costs 2760/2780 47.17 00 2,320 Salaries and Wages Oncosts 2760/2780 47.18 0
10,000 10,190 Contractual Services 2760/2780 47.19 02,500 2,710 Materials 2760/2780 47.20 5,5005,510 5,510 Finance Charges 2760/2780 47.21 4,990
170 170 Depreciation 2760/2780 47.22 01,500 3,850 Plant Hire 2760/2780 47.23 0
60 250 Other 2760/2780 47.24 704,050 4,050 FCA Oncosts 2760/2780 47.25 160
32,150 38,630 Total Operating Expenses 10,720
(Outflows) AppropriationsAppropriations 2761/2781 47.26 0
0 0 Total Appropriations 0
(Outflows) Capital Acquisitions
0 Infrastructure 2765/2785 47.27 0Structures 2765/2785 47.28 0Buildings 2765/2785 47.29 0Plant and Machinery 2765/2785 47.30 0Furniture and Fittings 2765/2785 47.31 0Office Equipment 2765/2785 47.32 0
0 0 Total Capital Expenses 0
(Outflows) Loan Principal Repayments
8,340 8,340 Loan Principal Repayments 2765/2785 47.33 8,9108,340 8,340 Total Loan Principal Repayments 8,910
40,490 46,970 TOTAL OUTFLOWS 19,630
-170 -170 Less: Non-Cash Items/Depreciation 2760/2780 47.22 0
40,240 46,680 NET IMPACT ON RATING EFFORT 19,630

ITEM 47 REFERENCE 2008/09WETLANDS TO SUMMARY
Allocation is made for maintenance costs associated with theWetlands situated adjacent to the Freeling Recreation Reserve and inHewett.
OPERATING EXPENSES
Maintenance - Plants, Mulch, Path Maintenance 47.20 4,000
Responsible Officer: Corporate Manager – Infrastructure and Works

Schedule of Fees and Charges (last amended 1 July 2008)

GST applicabl e items indicated by an asteris k (*) Page 2
Contents Programme Name Activi ty Page No. By -laws Clean Air Expiations 15 Impounding Fees 15 Litter Expiations 15 Litter Fines 16 Parking Expiations 13 Parking Fines 15 Caravan and Tourist Park 19 Cemeteries 16 Corporate Serv ices Freedom of Inf ormation 6 Photocopying, Registers and Ret urns 4 Codes, Meeting Papers, Policy and Administrative
Documents, By -Laws 5
Development Act Development Application Fees 8 Prov isional Building Rules Consent 10 Dog Control Dog Fines f rom Prosecutions 13 Fee f or Seizure and Det ention of a Dog 13 Registration and Renewal Fees 12 Domestic Refuse Collection Township and Rural Collection 18 Fire Prevention Bushfire Prevention Fees 16 Health Serv ices – Environmental Health
Waste Water Treatment Systems 11
Introduction Introduction 3 Library Serv ices 8 Maintenance Road Verges and Reserves
Permits Public Roads 18
Private Works 20 Rating and Property Certificate of Liabilities 7 Fines and Interest 8 Rates Raised 7 Section 7 Statements 8 Waste Management Ref use Tips 18
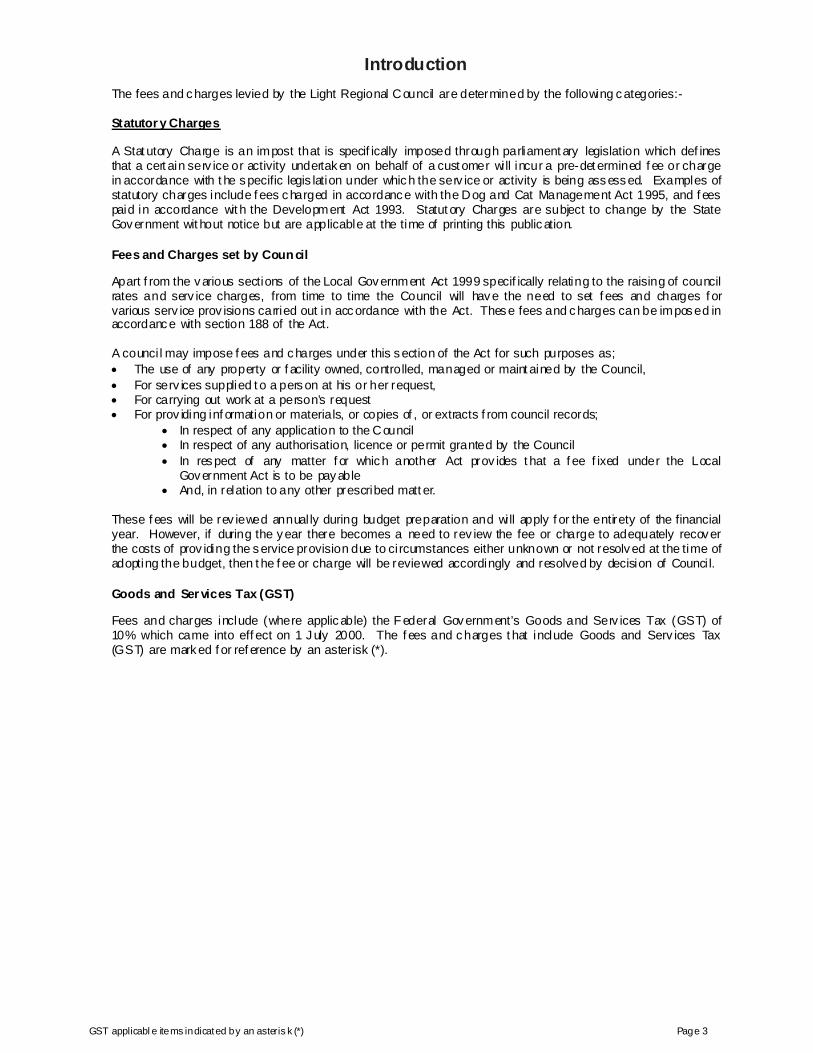
GST applicabl e items indicated by an asteris k (*) Page 3
Introduction The fees and charges levied by the Light Regional Council are determined by the following categories:- Statutor y Charges A Stat utory Charge is an impost that is specif ically imposed through parliament ary legislation which def ines that a cert ain serv ice or activity undertaken on behalf of a cust omer wi ll incur a pre-det ermined f ee or charge in accordance with t he specific legis lation under which the serv ice or activity is being assessed. Examples of statutory charges include f ees charged in accordance with the Dog and Cat Management Act 1995, and f ees paid in accordance wit h the Development Act 1993. Statut ory Charges are subject to change by the State Government wit hout notice but are applicable at the time of printing this publication. Fees and Charges set by Council Apart f rom the various sections of the Local Government Act 1999 specif ically relating to the raising of council rates and serv ice charges, from time to time the Council will have the need to set f ees and charges f or various serv ice prov isions carried out in accordance with the Act. These fees and charges can be imposed in accordance with section 188 of the Act. A counci l may impose f ees and charges under this section of the Act for such purposes as; • The use of any property or f acility owned, controlled, managed or maint ained by the Council, • For serv ices supplied t o a person at his or her request, • For carrying out work at a person’s request • For prov iding inf ormation or materials, or copies of , or extracts f rom council records;
• In respect of any application to the Council • In respect of any authorisation, licence or permit granted by the Council • In respect of any matter f or which another Act prov ides t hat a f ee f ixed under the Local
Government Act is to be payable • And, in relation to any other prescribed matt er.
These f ees will be rev iewed annual ly during budget preparation and wi ll apply f or the entirety of the financial year. However, if during the year there becomes a need to rev iew the fee or charge to adequately recover the costs of prov iding the service provision due to circumstances either unknown or not resolved at the time of adopting the budget, then t he f ee or charge will be reviewed accordingly and resolved by decision of Counci l. Goods and Ser vices Tax (GST) Fees and charges include (where applicable) the Federal Government’s Goods and Serv ices Tax (GST) of 10% which came into eff ect on 1 July 2000. The f ees and charges t hat include Goods and Serv ices Tax (GST) are marked f or ref erence by an asterisk (*).

GST applicabl e items indicated by an asteris k (*) Page 4
Schedule PROGRAMME NAME - CORPORATE SERVICES
PHOTOCOPYING
The Local Government Act 1999 requires Councils to make inf ormation available from time t o time t o persons requiring such inf ormation. The documents specif ied in the Act may be inspect ed (without charge) at t he principal of f ice of the Council during ordinary off ice hours. However a person is also entitled to purchase a copy of this inf ormation, on the payment of a f ee f ixed by the Council (see section 188 of the Local Government Act 1999). Counci l does not seek to make a profit on user charges, but rat her charges are established on a cost neut ral basis t aking int o account costs of staff time, materials and equipment usage.
GENERAL PHOTOCOPYI NG CHARGES
A4 page single side (per copy ), single copy $1.00* A4 page single side (per copy ), single copy in colour $2.00* A4 page duplex (per copy ), single copy $1.10* A4 page duplex (per copy ), single copy in colour $2.50* A3 page single side (per copy ), single copy $1.10* A3 page duplex (per copy ), single copy in colour $2.50* Note – Where more than one copy is requested, add $0.25* per copy f or standard black and white print, or $0.75* per copy f or colour print
PUBLIC DOCUMENTS – REQUIRED UNDER LEGISLATION REVIEW OF COUNCIL CONSTI TUTION, W ARDS AND BOUND ARIES
Subject Authority Charge Reports on rev iews of Counc il composition or ward structure
LG Act 1999 Chapter 3 Part 1 Division 2
No copies provided, theref ore no charge
Reports t o the Minister provided t o the Counci l by the Boundary Adjustment Faci litation Panel
LG Act 1999 Chapter 3 Part 2 Division 4 or 5
No copies provided, theref ore no charge
Summary of issues surrounding a proposal t o be submitted to a poll
LG Act 1999 Chapter 3 Part 2 Division 5
No copies provided, theref ore no charge
REGISTERS AND RETURNS Register of Interests (Application must be made in writing to the CEO)
LG Act 1999 S.70(2) $1.00 per A4 page*
Register of Allowances and Benef its LG Act 1999 S.79(4) $1.00 per A4 page* Register of Salaries Extract Full register (3 pages)
LG Act 1999 S.105(4) $1.00 per A4 page* $3.00*
Register of Community Land LG Act 1999 S.207(4) $1.00 per A4 page* $50.00 per set*
Register of Public Roads LG Act 1999 S.231(4) $1.00 per A4 page* $10.00 per set*
Register of By -Laws Extract Full set (17 pages )
LG Act 1999 S.252(4) $1.00 per A4 page* $5.00*
By-Laws made by Counci l – Certif ied Copy Single By -Law Full set of By -Laws
LG Act 1999 S.252(5) $5.00 per By -Law* $10.00*
Campaign Donations Returns LG(Elections ) Act 1999 $1.00 per A4 page*

GST applicabl e items indicated by an asteris k (*) Page 5
CODES
Code of Practice Complete Code
LG Act 1999 S.92(7) Price not available at the time of publishing this document
Code of Conduct Complete code
LG Act 1999 S110(7) $4.00 per set *
MEETING PAPERS
Public notice of meeting and agenda LG Act 1999 S.84(3) $1.00* per A4 page, or
$15.00 per set * Public notice of committee meetings and agenda
LG Act 1999 S.88(3) $1.00 per A4 page*, or $5.00* per set
Minutes of meetings LG Act 1999 S.91(6) $1.00* per A4 page, or $5.00 per set *
Document available f or inspection LG Act 1999 S.91(5) No charge
POLICY AND ADMINI STRATI VE DOCUMENTS
Record of delegations LG Act 1999 S.44(8) $1.00 per A4 page*, or $15.00* per set
Contract and tender policy Code of tendering
Tenders & quotations policy Procurements Pol icy
LG Act 1999 S.49(5) $5.00 per set * $5.00 per set * $5.00 per set *
Pol icy f or the reimbursement of member’s expenses
LG Act 1999 S.77(4) Not available, paid in accordance with LG Act and Regulations.
Strat egic Management Plan LG Act 1999 S.122(7) $20.00 (f or hard copy consultation version) Free, f or electronic version
Annual Business Plan (af ter adoption by Council )
LG Act 1999 S. 123(9) $8.00 per copy*
Annual Budget (af ter adoption by Council ) – Full Version
LG Act 1999 S.123(9) $70.00 per copy *
Annual Budget (af ter adoption by Council ) – Conc ise Vers ion
LG Act 1999 S.123(9) $30.00 per copy *
Audited f inanc ial st atement LG Act 1999 S.127(5) $15.00 per copy * Annual report LG Act 1999 S.131(8) $50.00 per copy * Assessment record LG Act 1999 S.174(2) $1.00 per A4 page* Rating policy LG Act 1999 S.171(3) $5.00 per pol icy* Public consultation policy LG Act 1999 S.50(a) $5.00 per pol icy * Management plans for community land LG Act 1999 S.197(a) $1.00 per A4 page* Pol icy on the making of orders LG Act 1999 S.254 $5.00 per pol icy * Procedures f or the rev iew of Council decis ions LG Act 1999 Chapter 3 Part 2 $5.00 per pol icy * Charter f or subsidiaries est ablished by the Council or f or which the Counc il is a constituent Council
LG Act 1999 S.132 Not available
Accounting policies LG Act 1999 S.259 $5.00 per pol icy * Conf lict resolution policy and procedures LG Act 1999 S.259 $5.00 per pol icy * Sexual harassment grievance procedures LG Act 1999 S.259 $5.00 per pol icy * Vot ers roll LG (Elections) Act 1999
S.15(15) $50.00 per set *
Public inspection of returns LG (Elections ) Act 1999 Division 1 S.87(3)
$1.00 per A4 page*
Full Copy of Council Policy Document $100 per set*

GST applicabl e items indicated by an asteris k (*) Page 6
BY-LAWS
Register of by -laws Extract Full set
LG Act 1999 S.252(4) $1.00 per A4 page* $5.00 per set *
By -laws made by Council - Certified Copy Single by -law Full set of By -laws
LG Act 1999 S.252(5) $5.00 per by -law * $10.00 per set *
FREEDOM OF INFORMATI ON
From 1 July 2002, Freedom of Inf ormation requests are dealt wit h in accordance wit h the Freedom of Inf ormation Act 1991. Counci l must allow public access to certain Council documents and to furnish copies of those documents if required. The fees f or making an application under the Freedom of Inf ormation legislation are set down in the Freedom of Inf ormation (Fees and Charges ) Regulations 2003.
SCHEDULE OF FEES
APPLICATI ON FEE $26.75 per request SEARCH FEE $9.95 f or each 15 minutes spent dealing with t he
application and giv ing access to documents. PERSONAL AFFAIRS No search f ee for the f irst two hours.
$9.95 for each subsequent 15 minutes. PHOTOCOPI ES $0.15 per page. TRANSCRI PTS $5.95 per page PHOTOS, X-RAYS, VIDEO TAPES, COMPUTER TAPE OR DISK
Actual cost incurred to produce.
INTERNAL REVIEW $26.75 per page MEMBERS OF PARLI AMENT Free access per request to $1000.00 inclus ive of
application and search f ees. The cost is calculated at the same rate as f or public access.
WAIVERS Agenc ies may waive or remit both the application and search f ees as may be necessary to ensure that disadvantaged persons are not prevented f rom exerc ising rights under these Acts by reason of hardship. Ref er to Regulation 5 of the Regulations f or conditions.

GST applicabl e items indicated by an asteris k (*) Page 7
PROGRAMME – RATING AND PROPERTY
RATES RAI SED
General Rate LG Act 1999 S.150, 153(2),153(1)(b) and 156 (1)(a), and Regulation 10, LG (General) Regulations, 1999 LG Act 1999 S. 158 (1)(a)
Rate per cents in the dollar of Capital Value by Land Use Cat egory; Categories 1 (residential) and 9 (other), 0. 343 cents (f or 2008/2009 year) Categories 2 (commerc ial-shop) and 3 (commerc ial-off ice), 0.60025 cents (f or 2008/ 2009 year) Categories 4 (commerc ial-other), 0.686 cents (for 2008/2009 year) Categories 5 (industrial-light) and 6 (indust rial-other), 0. 94325 cents (for 2008/ 2009 year) Category 7 (primary production), 0.2744 cents (f or 2008/2009 year) Category 8 (vacant land), 0.42875 cents (f or 2008/ 2009 f inancial year) $600. 00 Minimum Rate (f or 2008/2009 year)
Kapunda Community Wastewater Management System
LG Act 1999 S.146(d) & 155 $368. 00 per connection point (for 2008/2009 year)
Freeling Community Wastewater Management System
LG Act 1999 S.146(d) & 155 $368. 00 per connection point (for 2008/2009 year)
Greenock Community Wastewater Management System
LG Act 1999 S.146(d) & 155 $368. 00 per connection point (for 2008/2009 year)
Rosewort hy Community Wastewater Management System
LG Act 1999 S.146(d) & 155 $368. 00 per connection point (for 2008/2009 year)
Refuse Col lection and Recycling Serv ice LG Act 1999 S.146(d) & 155 $209. 80 per 3 bin service f or (2008/2009 year) $140. 75 per 2 bin service f or (2008/2009 year)
Adelaide and Mount Lof ty Ranges Nat ural Resource Management Board Levy
Natural Resources Management Act, 2004 S.92
0.007870 cents (f or 2008/ 2009 year)
Northern and Yorke Nat ural Resources Management Board Levy
Natural Resources Management Act, 2004 S.92
0.01533 cents (f or 2008/ 2009 year)
River Murray Natural Resource Management Board Levy
Natural Resources Management Act, 2004 S.92
No charge to be levied f or 2008/ 2009 year
CERTIFICATE OF LIABILI TIES
Outstanding liabil ity f or rates, charges and f ines
LG Act 1999 S.187(1) $10.00 per assessment

GST applicabl e items indicated by an asteris k (*) Page 8
SECTION 7 CERTIFICATES
Any charge or encumbrance over land Land and Business (Sale and
Conveyancing) Act,1994 S.12 $30.00 per assessment
FINES / INTEREST
If an instalment of rates is not paid on or before the date on which it f alls due, the instalment wi ll be regarded as being in arrears (LG Act 1999 S.181(8)(a)).
Fine on instalment in arrears LG Act 1999 S.181(8)(b) 2% of amount of
instalment payable Interest on instalment in arrears LG Act 1999 S.181(8)(c) On expiration of each f ull
mont h f rom that date – 0.9375% (currently the presc ribed percentage) of the amount in arrears (including unpaid f ines but excluding int erest f rom prev ious months). The presc ribed percentage is amended annually f ollowing adv ice received f rom the Local Government Association of South Australia.
PROGRAMME – LIBRARY SERVICES
Photocopies $0.20 per copy * Replacement of borrower’s card $1.00 per card * Replacement of lost or damaged library material Replacement Cost plus $5.00
processing charge* Printing inf ormation f rom the Internet $0.20 per page* Community Services Directory First Edition, free of charge
Copy sent with new residents pack, f ree of charge Subsequent Editions: $5.00 per copy .
PROGRAMME – DEVELOPMENT ACT The Development Act 1993 and Development Regulations 1993 presc ribe the f ees relating to applications f or Development Plan Consent and Bui lding Rules consent. Certain types of application must be given public notice in a newspaper circulating throughout the Council area. Council has the power to set the fee for this cost component. DEVELOPMENT APPLICATION FEES
Development Regulations 1999,Schedule 6 Lodgement Fee, < $5, 000 Item 1.(1) $48.50 Lodgement Fee, > $5, 000 Item 1 (1) (c ) $103. 50 Additional Lodgement Fee – non-complying Item 1.(1) (a) $75.00
Development Plan Assessment Fee Item 1.(2)(c) $30.25

GST applicabl e items indicated by an asteris k (*) Page 9
(Development Cost up t o $10,000) Development Plan Assessment Fee (Development Cost $10,000 up to $100,000)
Item 1.(2)(d) $83.00
Development Plan Assessment Fee (Development Cost over $100,000)
Item 1.(2)(e) 0.125% of Development Cost – Max.$200,000
Statement of Requirements Fee (boundary adjustment)
Item 1.(3)(b) (i ) $221. 00
Statement of Requirements Fee (additional allotments)
Item 1.(3)(b) (i i) $313. 00
Non-complying Administration Fee Item 1.(4)(a) $95.00 Non-complying Assessment Fee (Development Cost up t o $10,000)
Item 1.(4)(b)( i) $40.00
Non-complying Assessment Fee (Development Cost up $10,000 up to $100,000)
Item 1.(4)(b)( ii) $95.00
Non-complying Assessment Fee (Development Cost over $100,000)
Item 1.(4)(b)( iii) 0.125% of Development Cost – Max.$200,000
Referral Fee Item 1.(5)(a)( i) $167. 00 Referral Fee (Development Costs exceeds $1,000,000)
Item 1.(5)(a)( ii) $278. 00
Referral Fee (If it f alls within the ambit of clauses 1(6), 2(3), 2(7), 2 (8), 2(10) or 3(3) of Schedule 22 – for ref erral to the EPA)
Item 1.(5)(b)( i) $278. 00
Referral Fee (If it f alls within the ambit of item 19, 20 or 21 - f or referral under those items)
Item 1.(5)(b)( ii) $278. 00
Public Notif ication Fee Item 1.(6) $80.00 Bui lding Rules Fee (Minimum Fee) Item 1.(8)(a) $50.00* Class 1, 2 & 4 $2.28 sq. metre Class 3, 5 & 6 $2.93 sq. metre Class 7 & 8 $1.94 sq. metre Class 9a & 9c $3.32 sq. metre Class 9b $3.02 sq. metre Class 10 $0.68 sq. metre Bui lding Rules Fee (Minimum Fee) Item 1.(8)(b) $51.50 * Bui lding Rules Fee (Minimum Fee) Item 1.(8) F $51.50 * Consent to development at variance wit h Bui lding Rules
Item 1.(9) $117. 00 *
Referral to Bui lding Rules Assessment Commission
Item 1.(10) $235. 00
Development Authorisation (St aged Consents) Fee
Item1.(11) $46.75
Application f or assignment of , or change in, classif ication of a building (Minimum Fee)
Item 2.(a) $50.00 *

GST applicabl e items indicated by an asteris k (*) Page 10
Application f or assignment of , or change in, classif ication of a building (Minimum Fee)
Item 2.(b) $50.00 *
Application f or assignment of , or change in, classif ication of a building (Minimum Fee)
Item 2.F $50.00 *
Certif icate of Occupancy Fee Item 3. $33.50 * Application f or issue of schedule of essential saf ety prov isions
Item 4. $72.50 *
Referral to Bui lding Rules Assessment Commission
Item 6.(a) $368. 00
Referral to Bui lding Rules Assessment Commission
Item 6.(b) $807. 00
Fees not Gazetted
Advertisement Fee (Determined by Council ) Schedule 6, Item 1.(7) $225. 00* Levy on Building Rules Assessment Fee (5% of the GST-exclusive value to be remitted t o the Development Assessment Commiss ion
Schedule 6, Item 5 Actual Cost
PROVI SIONAL BUILDING RULES CONSENT The Development Act 1993, as amended requires t hat any bui lding work to be perf ormed in the Light Regional Council area must f irst be approved by Council. Application f ees are calculated pursuant to Schedule 6 of the Development Regulations 1993, according to set formulae depending upon t he type of structure: Eg. For a building or struct ure that has a floor area F = 0.0023 x CI x A x CF
Where: F is the fee (in dol lars) payable CI is the const ruction index determined by the Minister f rom time to time and set out in the Schedule of Construction Indices publ ished in the Gazette. A is the prescribed f loor area. CF is the complexity factor as set out in Schedule 6.
Fee if the application requires a relevant aut hority to assess the development against the prov isions of the building rules: (a) Lodgement Fee < $5,000 = $ 48. 50 *
> $5,000 = $103. 50 * (b) In the case of a building that has a f loor area
Fee = 0.0023 x CI x A x CF A – is the prescribed f loor area (Complexity factor of 1) Class 1, 2, 4 0.0023 x 957 x Area x 1 = Area x $2.20 Class 3, 5, 6 0.0023 x 1274 x Area x 1 = Area x $2.93 Class 7, 8 0.0023 x 845 x Area x 1 = Area x $1.94

GST applicabl e items indicated by an asteris k (*) Page 11
Class 9a & 9c 0.0023 x 1445 x Area x 1 = Area x $3.32 Class 9b 0.0023 x 1314 x Area x 1 = Area x $3.02 Class 10 0.0023 x 286 x Area x 1 = Area x $0.66 Demolition f ee = 0. 0023 x CI x Area x 0.2 Minimum f ee $51.50 *
PROGRAMME – HEALTH SERVICES – ENVIRONMENTAL HEALTH In its capacity as the Authority f or the Light Regional Council area under Section 3(1) of the Public and Env ironment al Healt h Act, 1987, as amended, Council administers t he prov isions of this Act instigating court proceedings against off enders where necessary . Fines prescribed by the Act plus any costs awarded against off enders are paid into Court and f rom there are remitted to Council.
WASTE WATER TREATMENT SYSTEMS REGULATI ONS UNDER THE PUBLIC AND ENVIRONMENTAL HEALTH ACT 1987
SCHEDULE 2 - Fees PART A - Thi s part applies if the authority is a council 1. Installation or alteration of a wast e control system – other than a t emporary f acility.
(1) For the purposes of this item, the capacity of a wast e control system wil l be taken to include (if relevant) t he combined sludge scum and hydraulic loadings f or bot h sewage and sul lage wast e material.
(2) Fees payable in relation to an application f or approval to install or alter a waste control system – (a) if the system’s capacity does not exceed 5, 000 litres = $79.50 (b) if the system’s capacity exceeds 5, 000 litres = $79.50, plus $17.30 f or each 1,000 litres (or
part thereof ) in capacity in excess of 5,000 litres, plus $86.50 for each inspection required by the Council.
2. Installation or alteration of a temporary wast e control system. Fees payable in relation to an application f or approval to install a temporary waste control system – (a) if the system wi ll service not more t han 10 persons = $35.25
(b) if the system wil l service more than 10 persons, but not more than 100 persons = $71.00, plus $17.30
for each 1, 000 litres (or part thereof ) in capacity in excess of 5,000 l itres ( if any)
(c) if the system wi ll service more than 100 persons = $79.50 plus $17.30 for each 1, 000 litres (or part thereof ) in capac ity in excess of 5,000 litres (if any),
plus $86.50 for each inspection required by the Council.
3. Fee payable in relation to the connection of a waste control system to a STED scheme or sewer –
(a) existing system = $79. 50 (b) new system –
(i) if the system’s capacity does not exceed 5, 000 litres = $79.50 (ii) if the system’s capacity exceeds 5,000 litres = $79.50, plus $17.30 for each 1,000 litres (or
part thereof ) in capacity in excess of 5,000 litres, plus $86.50 for each inspection required by the Council.
4. Fee payable if matter must be ref erred to the Commission – ref erral fee = $32.25, plus $86.50 for each
inspection (if any) carr ied out by the Commission.
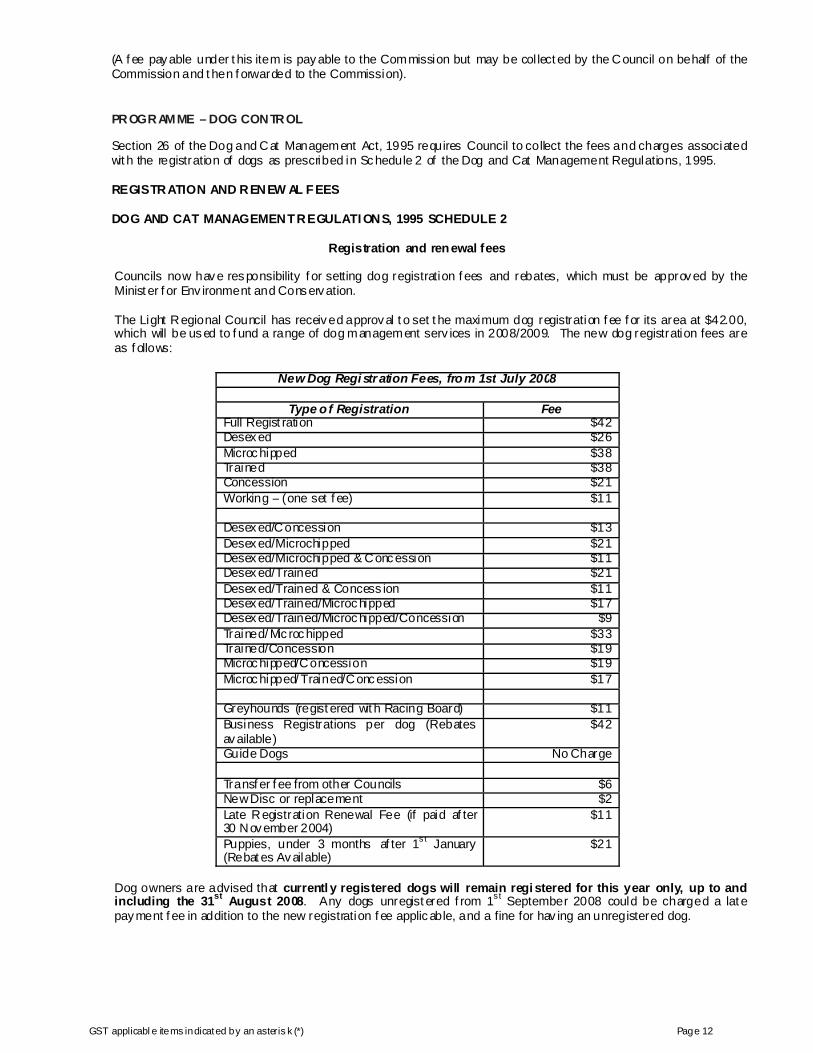
GST applicabl e items indicated by an asteris k (*) Page 12
(A f ee payable under t his item is payable to the Commission but may be col lect ed by the Council on behalf of the Commission and t hen f orwarded to the Commission).
PROGRAMME – DOG CONTROL Section 26 of the Dog and Cat Management Act, 1995 requires Council to collect the fees and charges associated wit h the registration of dogs as prescribed in Schedule 2 of the Dog and Cat Management Regulations, 1995.
REGISTRATION AND RENEW AL FEES
DOG AND CAT MANAGEMENT REGULATI ONS, 1995 SCHEDULE 2
Registration and renewal fees
Councils now have responsibility f or setting dog registration f ees and rebates, which must be approved by the Minist er f or Env ironment and Conservation. The Light Regional Council has received approval t o set t he maximum dog registration f ee f or its area at $42.00, which will be used to f und a range of dog management serv ices in 2008/2009. The new dog registration fees are as f ollows:
New Dog Regi str ation Fees, from 1st July 2008
Type o f Registration Fee
Full Regist ration $42 Desexed $26 Microchipped $38 Trained $38 Concession $21 Working – (one set f ee) $11 Desexed/Concession $13 Desexed/Microchipped $21 Desexed/Microchipped & Concession $11 Desexed/Trained $21 Desexed/Trained & Concess ion $11 Desexed/Trained/Microchipped $17 Desexed/Trained/Microchipped/Concession $9 Trained/ Mic rochipped $33 Trained/Concession $19 Microchipped/Concession $19 Microchipped/ Trained/Concession $17 Greyhounds (regist ered wit h Racing Board) $11 Business Registrations per dog (Rebates available)
$42
Guide Dogs No Charge Transf er f ee from other Councils $6 New Disc or replacement $2 Late Registration Renewal Fee (if paid af ter 30 November 2004)
$11
Puppies, under 3 months af ter 1st January (Rebat es Available)
$21
Dog owners are advised that currentl y registered dogs will remain regi stered for this year only, up to and including the 31st August 2008. Any dogs unregist ered f rom 1st September 2008 could be charged a lat e payment f ee in addition to the new registration f ee applicable, and a fine for hav ing an unregistered dog.

GST applicabl e items indicated by an asteris k (*) Page 13
Concessions An additional t wo concess ions have been added to t he amended Act allowing f or people who have their dog microchipped, or who have trained t heir dog to a cert ain level (presently considered to be equivalent to Level 2), to receive a discount if ev idence is submitted at the time of regist ration. Acceptable ev idence can be: • For microchipping - a microchip regist ration certif icate showing the registration det ails on the dat abase are
current. These can be obtained f rom the registry holding the details of your dog’s microchip. • For training - must be writt en certif ication f rom Dog Obedience clubs and other accredited training
organisations, that the dog has reached and passed an appropriate level, presently considered to be Level 2 obedience training. Once t he Dog and Cat Management Board has considered f urther detai l, other levels may be acc redited by the Board.
FEE FOR SEIZURE AND DETENTION OF A DOG DOG AND CAT MANAGEMENT REGULATI ONS, 1995 SCHEDULE 2, ITEM 3
(a) f or the initial seizure and det ention: Fee $40.00, plus (b) f or each 24 hours or part of 24 hours during which the dog is detained at a facility f or the detention of dogs:
Fee $10.00 DOG FINES FROM PROSECUTIONS Section 26 of the Dog and Cat Management Act, 1995, obliges Council to administer and enf orce the prov isions of that Act, instigating Court proceedings against of fenders where necessary. Div isional f ines as set down in t he Act and prescribed in Section 28a of the Acts Interpretation Act, 1915 as amended plus any costs awarded against off enders are paid into Court and f rom there remitted to Counci l.
PROGRAMME – BY-LAWS INSPECTORI AL SERVICES PARKING EXPI ATI ONS Council may issue expiation notices f or prescribed offences under the Australian Road Rules, 1999.
Description of Offence Item Expi ation Fee
Stopping where ‘no stopping’ sign applies 167 $54.00 Stopping where ‘no parking’ sign applies 168(1) $40.00 Stopping on road with continuous yellow edge line
169 $54.00
Stopping in intersection 170(1) $54.00 Stopping wit hin 20 metres of int ersection wit h traffic lights
170(2) $54.00
Stopping within 10 metres of intersection wit hout traf fic lights
170(3) $54.00
Stopping on or near chi ldren’s crossing 171(1) $54.00 Stopping on or near pedestrian c rossing (except at int ersection)
172(1) $54.00
Stopping on or near marked f oot crossing (except at int ersection)
173(1) $54.00
Stopping at or near bicycle crossing lights (except at int ersection)
174(2) $54.00
Stopping on or near level crossing 175(1) $54.00 Stopping on clearway 176(1) $158. 00 Stopping on f reeway 177(1) $158. 00 Stopping in emergency stopping lane 178 $158. 00 Stopping in loading zone 179(1) $33.00 Stopping in loading zone – exceeding time in 179(2) $33.00

GST applicabl e items indicated by an asteris k (*) Page 14
loading zone Stopping in truck zone 180(1) $33.00 Stopping in works zone 181(1) $33.00 Stopping in taxi zone 182(1) $79.00 Stopping in bus zone 183(1) $79.00 Stopping in minibus zone 184(1) $54.00 Stopping in permit zone 185(1) $33.00 Stopping in mail zone 186(1) $33.00 Stopping in bus lane, trans it lane or truck lane 187(1) $158. 00 Stopping in bicycle lane 187(2) $158. 00 Stopping in tram lane or on tram tracks 187(3) $158. 00 Stopping in shared zone 188 $33.00 Double parking 189(1) $54.00 Stopping in or near saf ety zone 190(1) $33.00 Stopping near obstruction 191 $71.00 Stopping on bridge, causeway , ramp or similar structure
192(1) $54.00
Stopping in tunnel or underpass 192(2) $71.00 Stopping on crest or curve outside built -up area
193(1) $71.00
Stopping near f ire hydrant, etc. 194(1) $40.00 Stopping at or near bus stop 195(1) $54.00 Stopping at or near tram stop 196(1) $54.00 Stopping on path, div iding strip or nat ure strip 197(1) $54.00 Obstructing access to and from f ootpath ramp etc.
198(1) $40.00
Obstructing access to and f rom driveway etc. 198(2) $40.00 Stopping near post-box 199(1) $54.00 Stopping heavy or long vehicle on road outside bui lt-up area except on shoulder of road
200(1) $71.00
Stopping heavy or long vehicle on road in bui lt-up area f or longer than permitted time
200(2) $71.00
Stopping on road with ‘bicycle parking’ sign 201 $33.00 Stopping on road with ‘motor bike parking’ sign 202 $33.00 Stopping in park ing area f or people wit h disabil ities
203(1) $235. 00
Stopping in slip lane 203A $54.00 Parking f or longer than indicated where ‘permissive parking’ sign applies
205 $20.00
Failing to pay fee etc. for park ing where f ees payable
207(2) $20.00
Failing to park on road (except in median strip parking area) in accordance with rule – parallel parking
208(1) $33.00
Failing to park in median strip parking area in accordance with rule – parallel park ing
209(2) $33.00
Failing to park in accordance with rule – angle parking
210(1) $33.00
Parking on road, etc. where ‘park in bays only ’ sign applies
211(1) $20.00
Parking in parking bays – f ailing to park vehicle wholly within park ing bay
211(2) $20.00
Parking in parking bays – f ailing t o park long or wide vehicle in minimum number of parking bays needed to park vehicle
211(3) $20.00
Further Off ence RTA 174B $20.00
Pursuant t o Regulation 7(1) of the Expiation of Off ences Regulations, 1996 the fee f or late payment of an expiation f ee is $30. 00, plus the cost of one motor vehicle registration search fee.

GST applicabl e items indicated by an asteris k (*) Page 15
Private Par king Areas Act & Regulations – Expiation of Offences
(No Standing Area) Section 8(1) $54.00 (Disabled Persons Parking Area) Section 8(2) $235. 00 (A Permit Parking Area) Section 8(3) $33.00 (Loading Area) Section 8(4) $33.00 (A Restricted Parking Area) Section 8(5) $33.00 (In Excess of Time Limit) Section 8(6) $20.00 (Not Within One Park ing Space) Regulation 5(1)(a) $20.00 (Space Already Occupied by Anot her Vehic le) Regulation 5(1)(b) $30.00 (Protrudes over a Walkway or Pedestrian Access )
Regulation 6 $40.00
(Obstructs Vehicular or Pedestr ian Access) Regulation 7 $40.00 (Use f or a Purpose not related to Park ing) Regulation 8 $21.00 (Deface, Damage or Interf ere wit h any Notice, Sign or Line)
Regulation 9(a) $53.00
Further Off ence Regulation 12 $20.00
PARKING FINES FROM PROSECUTIONS
In the enf orcement of the Australian Road Rules, 1999, Counc il is required t o instigate Court proceedings against off enders where necessary . Fines as prescribed in the Rules plus any costs that may be awarded against off enders are paid into Court and f rom there remitted to Counci l.
IMPOUNDING FEES
Section 237 of the Local Government Act, 1999 authorises Council to remove or impound any vehicle abandoned in a public place. Notice of such removal must be served upon the owner if known, or if unknown, notice may be given by way of newspaper advertisement. All costs incurred by Counci l are recoverable f rom the owner and if not paid wit hin 14 days of the serv ice of notice, the vehicle may be sold or otherwise disposed of . Fees charged are costs incurred.
CLEAN AIR EXPI ATIONS
Pursuant t o the Env ironment Protection Act, 1993, Council may issue the f ollowing expiation notices f or off ences against any prov ision of the regulations.
Description of Offence Expi ation Fee $
Open fire on waste disposal depot wit hout Counc il consent 100.00 Open fire on non-domestic premises wit hout Council consent 300.00 Breach of open f ire permit conditions 100.00 Burning of wood treated with copper – chrome – arsenate preservatives
100.00
Fire in the open on any street, road or laneway 100.00
LITTER EXPI ATIONS Pursuant t o Section 5(1) of the Expiation of Off ences Act, 1996, Council may issue expiation notices f or off ences against the prov isions of Section 235 of the Local Government Act, 1999.
Description of Offence Expi ation Fee $
Item 1: Off ence under Section 235 of the Act (depositing litter, ref use, waste matter, goods etc. on a street, road or publ ic place)
315.00
Pursuant to Regulation 7(1)(a) of the Expiation of Offences Act, 1996, the f ee f or late payment of an expiation f ee is $30.00.

GST applicabl e items indicated by an asteris k (*) Page 16
LITTER FINES FROM PROSECUTIONS Section 235 of the Local Government Act, 1999, authorises Counc il to instigate proceedings f or of f ences relating to the depos iting of litter or waste matter in a public place. Fines, as prescribed in the Act, plus any costs awarded against off enders are paid into Court and f rom there remitted to Council.
PROGRAMME – FIRE PREVENTI ON BUSHFIRE PREVENTI ON FEES If Counc il believes that conditions on private land are such as to cause an unreasonable risk of the outbreak of f ire on the land, or the spread of f ire through the land, due t o t he presence of inflammable undergrowth or other inf lammable or combustible materials or subst ances, Counci l may, by notice in writing, require the owner to take specif ied action to remedy the situation within such time as may be specif ied in the notice. Fire and Emergency Services Act 2005, Section 56 Fire and Emergency Services Act 2005, Schedule 12 If a person fails to comply wit h the requirements of a notice issued under the above aut horities, Council wi ll proceed t o carry out those requirements and may recover the expenses incurred as a debt due to it from the person to whom the notice was addressed. South Australian Metropolit an Fire Serv ice Act, 1936, Section 60B (10) Country Fires Act, 1989, Section 40. (9)
Fee Contractor’s Charge (including GST) Plus Administration Charge $55.00 (inc luding GST)
Note: Any expenses recoverable, as above, wil l be a charge against the land t o which they relat e, and may be recovered as if they were rat es in arrears.
PROGRAMME – CEMETERIES KAPUNDA, FREELING AND GREENOCK PUBLIC CEMETERIES
GRAVE SI TES
Kapunda Old Section, Kapunda New (Beam) Section, Freeling, Greenock and Loos Cemeteries
Licence (Lease) to use gr ave site, $660.00 per site * Note • No advance licenses will be available in the Kapunda Old Section after the New (Beam) Section
comes into use. Grave Site 9’x 3’. • Kapunda New (Beam) Section grave site (2.7m x 1.1m). Licenses in the New Section are
available only at first use of each site ie. advance l icenses are not available
Interment (Gr ave Digging) All hours – Full Cost Reimbursement, plus administration fee of $187. 00*. (Note, overtime rates apply outside normal hours.)
Removal/Breaking of Slab Full Cost Reimbursement, plus administration f ee of $60.50*.
Re-Opening of Gr aves $187. 00* Placing of Ashes on Burial Site $242. 00*
Memorial Per mits $60.50 per memorial.* (Not e, this permit must be obtained
bef ore any memorial is erect ed)

GST applicabl e items indicated by an asteris k (*) Page 17
CREMATIVE NICHE W ALL (COLUMB ARIUM)
Licence (Lease) to use niche $550. 00 per sit e * Interment Fees $290. 00 per container * Memorial Pl aques Full Cost Reimbursement. (Note, plaques to be purchased
through Council)
GARDENS
Licence (Lease) to use niche $660. 00 per sit e * Interment Fees $280. 00 per container * Memorial Pl aques Full Cost Reimbursement. (Not e, plaques to be purchased
through Council)
TERMS OF LEASE
Grave Sites 50 Years Cremation Ni ches 30 Years Gardens 30 Years

GST applicabl e items indicated by an asteris k (*) Page 18
PROGRAMME – DOMESTIC REFUSE COLLECTI ON The Light Regional Council prov ides a domestic ref use collection service in townships. The cost of this serv ice is recovered by means of an annual serv ice charge raised t o township ratepayers. This serv ice charge is determined by Council in accordance with section 146(d) of the Local Government Act, 1999. (see Rating and Property ). PROGRAMME – W ASTE MANAGEMENT REFUSE TI P FEES Council provides refuse tips at Kapunda and Roseworthy for the benef it of ratepayers. Charges are fixed by Council pursuant to Section 188 of the Local Government Act, 1999. The charges stated below will apply .
Size of Load General Waste Green Organics/Recycling Car Boot $11.00 * $10.00 * Small Trailer / Utility $25.00 * $20.00 * Small Trailer / Utility with sides $33.00 * $25.00 * 1 Tonne Tray Top / Tandem Trailer $44.00 * $35.00 * 1 Tonne Tray Top / Tandem Trailer with sides $60.00 * $50.00 * Trucks under 5 Tonne $170. 00 * $140. 00 * 6 – 8 Tonne Truck $240. 00 * $190. 00 * 9 – 12 Tonne Truck $330. 00 * $250. 00 * Car Bodies $70.00 * Semi Tippers Not Permitted
Tyre Disposal No Rim Rim Car $5.00 * $8.00 * Light Truck $8.00 * $18.00 * Heavy Truck $11.00 * Super Single $27.00 *
PROGRAMME – MAINTENANCE ROAD VERGES AND RESERVES
PERMI TS - PUBLIC RO ADS
Sections 222 to 225 of the Local Government Act 1999 aut horise Councils t o issue permits f or the business use of a road reserve. Conditions and charges are f ixed by Counci l pursuant to section 224 of the above Act.
Type o f Land in Reserve Per mit Fee
Arable $40.00 per hectare* Non-arable $15.00 per hectare* Minimum Charge $20.00*

GST applicabl e items indicated by an asteris k (*) Page 19
PROGRAMME – KAPUNDA CARAV AN AND TOURIST PARK
Council manages and maintains t he Kapunda Caravan and Tourist Park at Dutton Park in the Township of Kapunda. Council employs a Manager whose role is to take book ings and maint ain the f acility. The f ees charged to stay at the facility are as f ollows:
Kapunda Tourist and Leisure Par k Accommodation Rates 2008/ 2009 (Rates ar e GST Inclu sive)
Accommodation Type Standard Off Peak Rate
One Night Weekend Rate
Peak Tariff Rate (Christmas, Easter &
Long W eekends, Celtic Festival et c)
Special Events Rate
(Barossa Under the Stars, Day on the Green, Vintage
Festiv al etc) Note; Long W eekends
2 night minimum stay, Easter 3 nights min. stay, Christmas 2 night min. stay.
Prices based on twin share per night
Prices b ased on twin share per night
Prices based on t win share per night
Prices based on twin share per night
Cabins Deluxe Cottage $ 80. 00 $ 90. 00 $ 95.00 $110. 00 Jayco Cabin $ 65. 00 $ 75. 00 $ 85.00 $100. 00 Bushland Cabin 2 bedroom (small)
$ 90. 00 $100. 00 $105.00 $120. 00
Bushland Cabin 3 bedroom (large)
$105. 00 $115. 00 $120.00 $130. 00
EXTRA PERSONS: Under 5 Years
Free of Charge
5 to 12 Years $ 6.00 $ 6.00 $ 10.00 $ 10. 00 13 Years and over $ 12. 00 $ 12. 00 $ 16.00 $ 20. 00
Linen Sheet hire – one off charge
$6.00 per set $6.00 per set $6.00 per set $6.00 per set
Towel hire – one of f charge
$4.00 per set $4.00 per set $4.00 per set $4.00 per set
Other Sites Powered Site $ 20. 00 $ 20. 00 $ 25.00 $ 25. 00 Un-Powered Sit e (per peson)
$ 7.00 $ 7.00 $ 10.00 $ 10. 00
EXTRA PERSONS: Under 5 Years
Free of Charge
5 Years and over $ 4.00 $ 4.00 $ 6.00 $ 6.00
Shower use $ 4.00 $ 4.00 $ 4.00 $ 4.00 On-site Van St orage $1.00 per day $1.00 per day $1.00 per day $1.00 per day
Long Term Residents in own van (28 day qualif ying period appl ies)
$20.00 per night f or the f irst 28 nights, then $75.00 per week f or one person thereafter, $4.00 per extra person per night. Electricity usage is determined by a meter and charged on a monthly basis. When a met er is unavailable, long term res idents pay an additional $15. 00 per week for utilities.
Conditions Visitors stay ing f or a week’s duration will receive the 7th consecutive night at no cost. Conditions apply to persons stay ing at the park on a long term basis. Cash bonds or Credit Card imprints may be required during the course of the stay . Deposits are requir ed for all on-site accommodation 1 night stay , 50% deposit 2 (or more) nights stay, 1st night tarif f

GST applicabl e items indicated by an asteris k (*) Page 20
Refund/Cancellation A minimum 7 days notice is required. An admin/booking f ee of $15.00 wi ll be retained. NO REFUNDS will be given f or peak period or special event bookings or f or cancellations ins ide of 7 days. Rates may vary at the discretion of the Caravan Park Manager in consult ation wit h Council’s Manager, Tourism f or promotional purposes.
Schedule of f ees is available on the webs ite: www.kapundat ouristpark.com
PROGRAMME – PRIVATE WORKS
Council may participate in private works within the Council region that demonstrat e an equitable return on expenditure, taking into account the availability of Council resources. Fees are calculated on t he basis of cost plus overheads (GST Inc lusive). Fees are recoverable under section 213 of the Local Government Act.